Archive for dairy farm expansion

Why Greg Bethard Passed on Private Equity — and the $6,638‑Per‑Cow Debt Line Behind That Call

Greg Bethard told a roomful of dairy operators he doesn’t want investors — he wants partners who know what a bad milk year smells like.

“We are looking for partners, not investors.”

That’s how Greg Bethard opened his talk at the 2025 MILK Business Conference. He’s the CEO and managing partner of High Plains Ponderosa Dairy near Plains, Kansas — a rotary‑parlor operation that ships milk to the Hilmar Cheese Co. plant in Dodge City and earned the 2025 Kansas Distinguished Dairy Award. Bethard has expanded without private equity, choosing people who already understand cows and volatility over funds that want out in five to seven years. Sitting beside him on the panel were TJ Tuls, a fourth‑generation Nebraska dairy farmer, and Hank Hafliger of Cedar Ridge Dairy in Filer, Idaho. Different herds, different structures, same basic bet: keep the timeline with the cows and the family, not the fund clock.

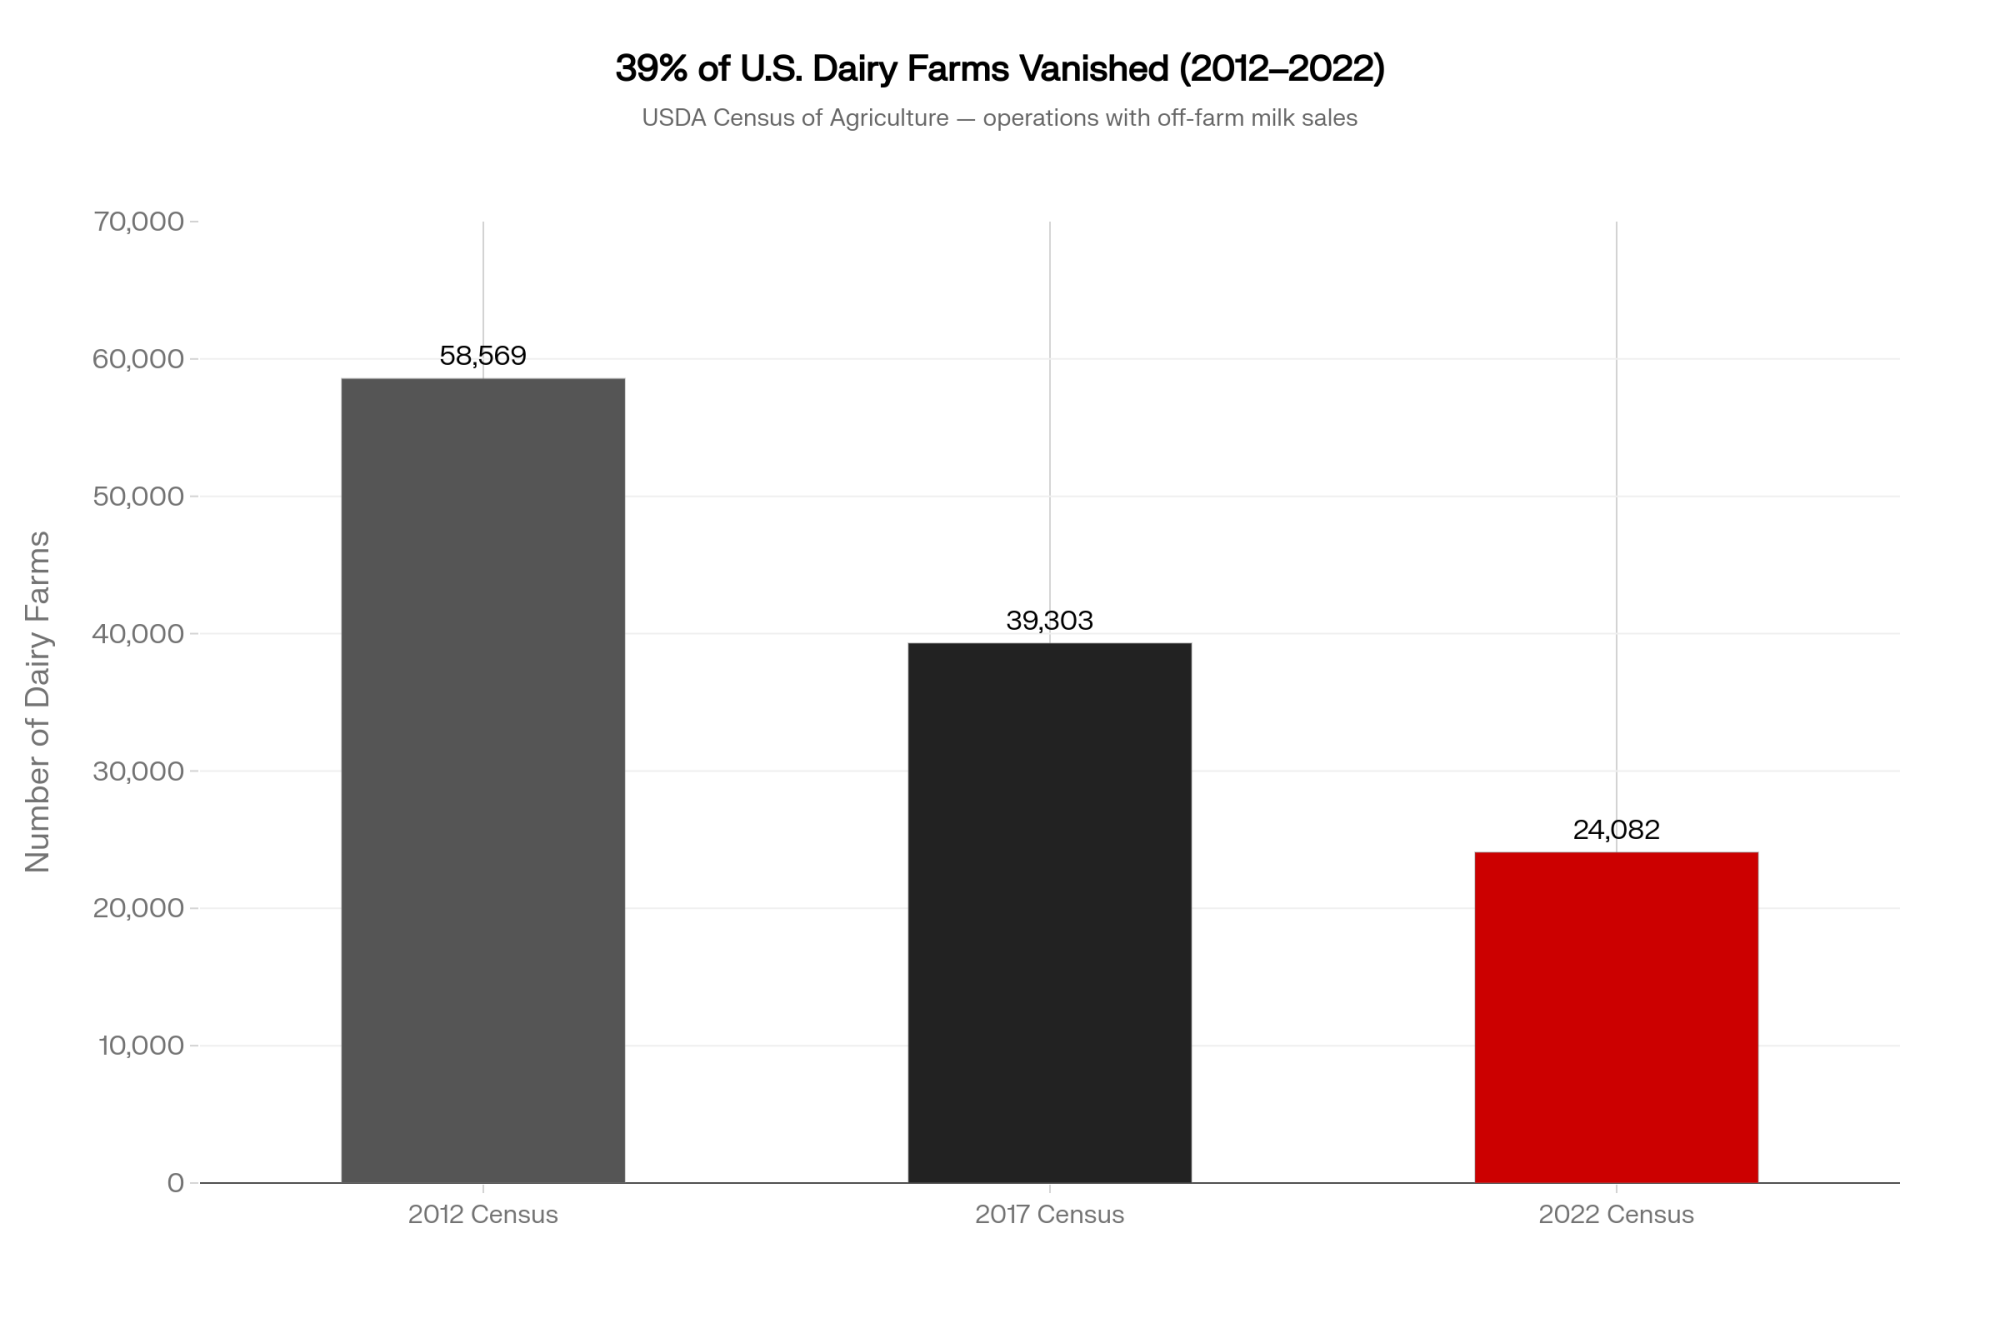
Nearly 4 in 10 U.S. dairy farms with off‑farm milk sales disappeared between 2017 and 2022. Cow numbers barely moved — still around 9.3–9.4 million head — but milk shifted hard into fewer, bigger herds. Those herds now face a blunt question: do you take fast capital and more leverage, or do you find slower money that lets you sleep at night?
The Fork Every Growing Dairy Hits

Any serious expansion now runs into the same wall: your own balance sheet.
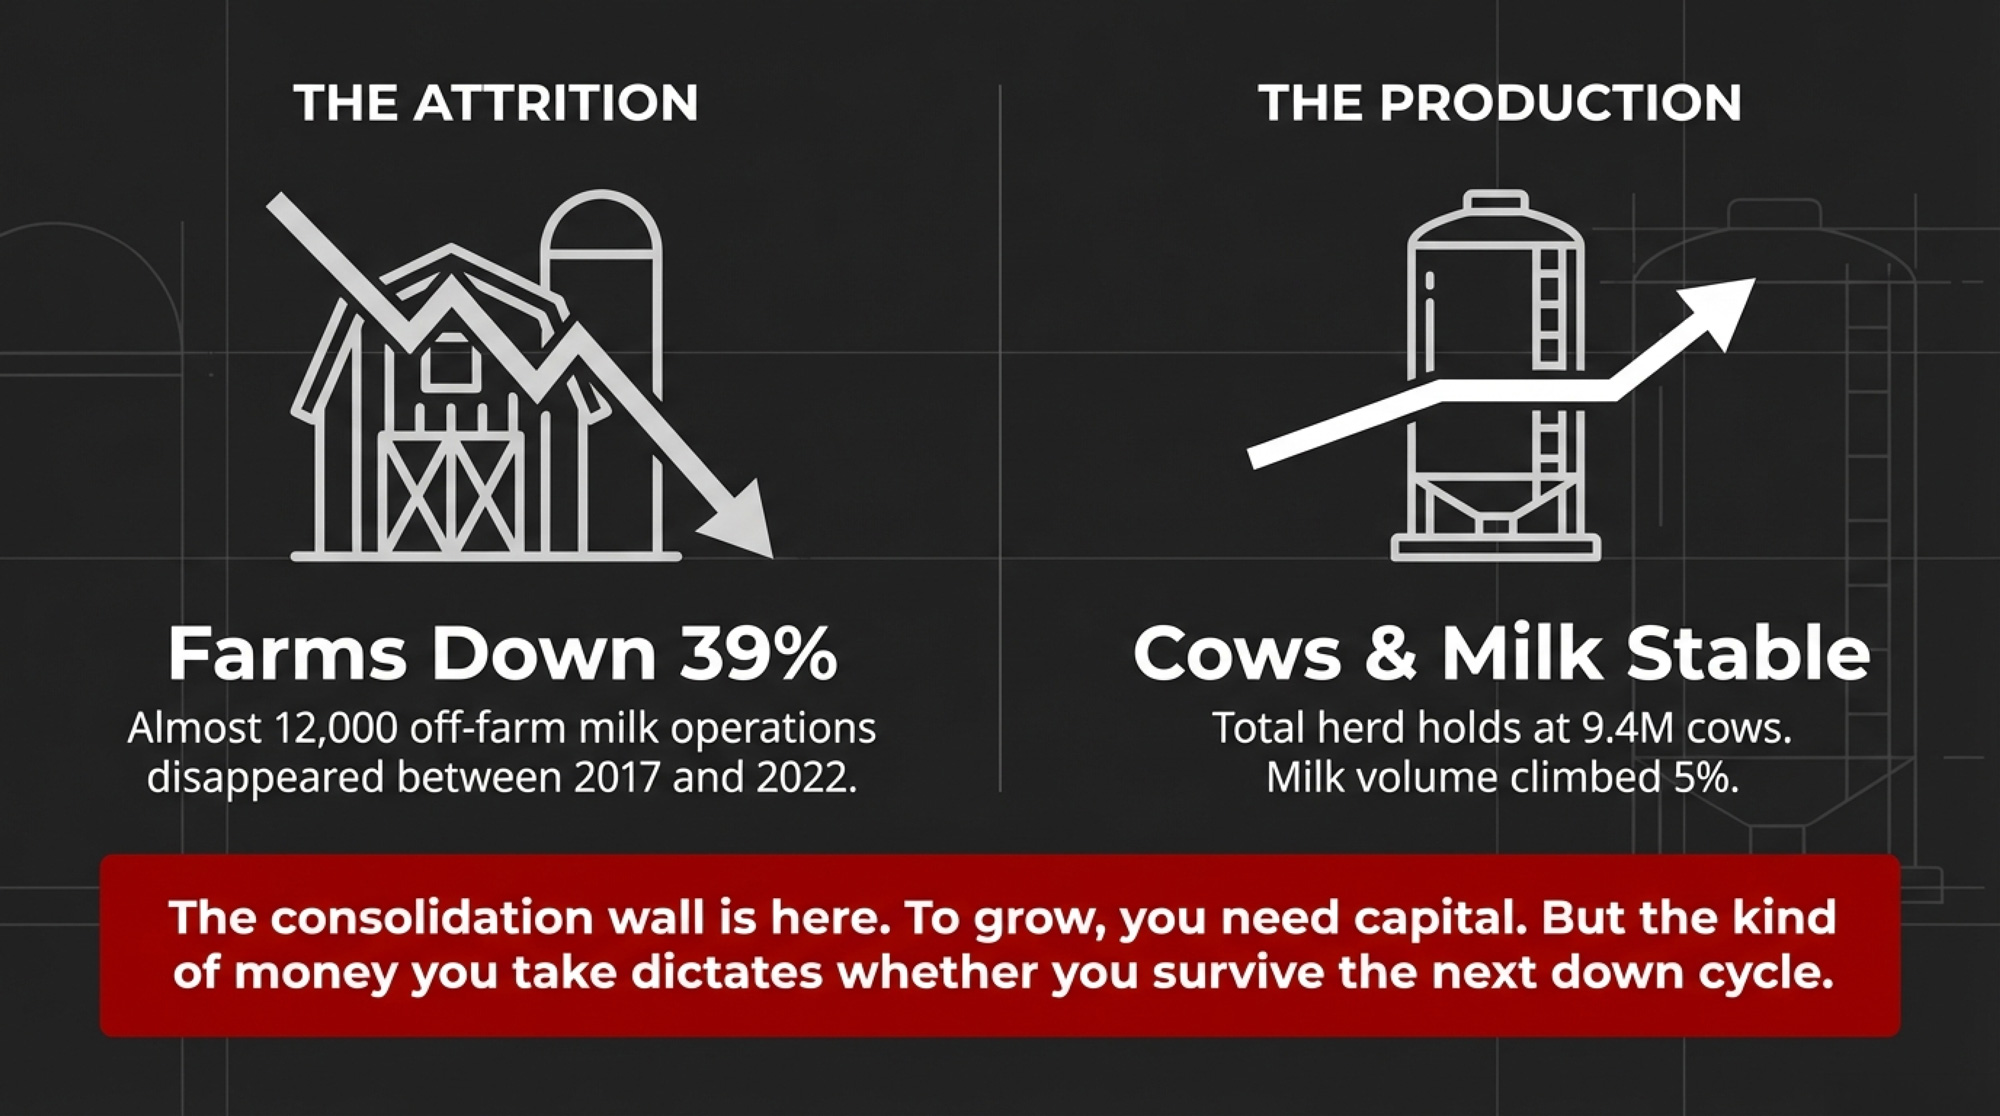
USDA’s 2022 Census of Agriculture shows the number of dairy operations with off‑farm milk sales fell from 39,303 in 2017 to 24,082 in 2022 — almost 12,000 farms gone, roughly a 39% decline. Over that stretch, total cow numbers held near 9.3–9.4 million while milk volume climbed about 5%. Just over 2,000 herds with 1,000‑plus cows now produce about two‑thirds of the country’s milk by value, according to Census analysis and Rabobank estimates. PE funds look at that curve and see a defensive thesis. People still buy food in a downturn.

You know the other side of it. A heifer you raise this year won’t really pay back until her second or third lactation. You invest for years before you know whether genetics and cow‑care decisions actually worked. When you finance that biology with a five‑ to seven‑year buy‑grow‑flip model, something gives — either the cows, the capital, or your control.

Three Families, Three Very Different Paths

What made the MILK Business panel worth paying attention to wasn’t just that Bethard, Tuls, and Hafliger all said no to PE. It’s that each built a completely different alternative — and accepted the trade‑offs that came with it.

OperatorCapital ModelStructureGeographic AnchorCore Trade-OffExit Timeline
Greg Bethard— High Plains Ponderosa Dairy, KSPatient ag-industry partners; no PEPrivate partnershipPlains, KS → Hilmar Cheese, Dodge CitySlower growth; full cow-level decision controlNone — family timeline
TJ Tuls — Nebraska, DARI ProcessingBank + infrastructure lenders for $165M greenfield plantFamily + lendersSeward Rail Campus, NEConcentration risk; construction/ramp-up execution riskNone — generational build
Hank Hafliger— Cedar Ridge Dairy, IDFamily equity + bank debt; no outside shareholdersMulti-site family unified businessFiler, ID (moved from CA)High people/alignment demands across kids and in-lawsNone — family-controlled
PE-Backed Generic ModelPrivate equity fund; limited partnersFund-controlled; DSCR covenantsProcessor clusters; “packageable” geography5–7 yr hold period; drag-along exit rights; covenant restrictions5–7 years (fund clock)

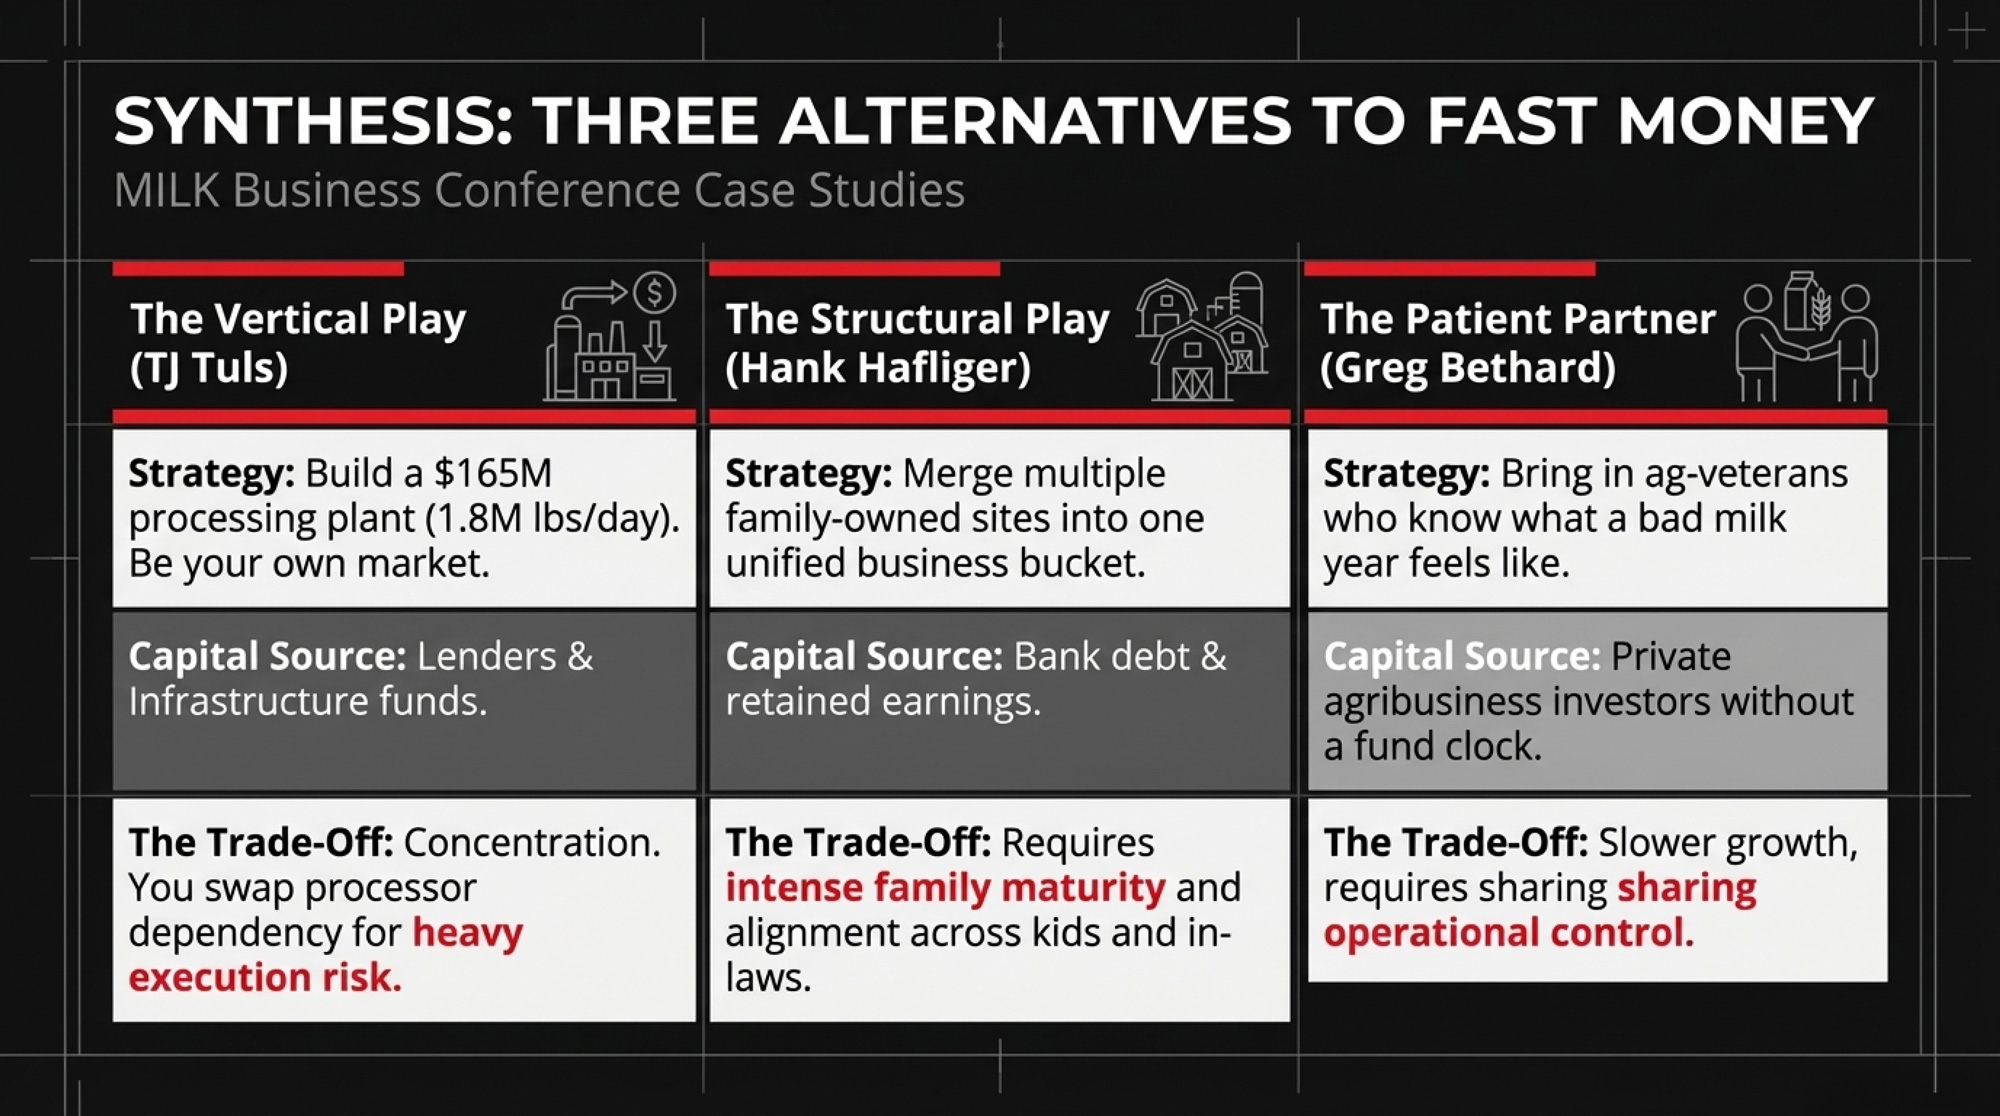
TJ Tuls went vertical. His family is building DARI Processing at Nebraska’s Seward Rail Campus — reported in mid‑2025 coverage as the state’s first major greenfield dairy plant in more than six decades. Trade and state sources peg the project at about $165 million, designed to handle roughly 1.8 million pounds of milk per day, with groundbreaking in 2025 and start‑up targeted around 2027. When asked where he’d build a new dairy, Tuls didn’t hesitate: “Close to a milk plant.” His family decided to be the milk plant. Their capital partners are lenders and infrastructure‑focused entities, not limited partners, grading them on quarterly IRR.

The trade‑off is concentration. If DARI hits a rough patch — construction overruns, a slower ramp‑up, margin squeeze — every part of the family’s operation feels it. You swap processor dependency for execution risk. Not every family wants that exposure.

Hank Hafliger went structural. Cedar Ridge Dairy started in California before the family moved the operation to Filer, Idaho. Today, Hank owns it with three of his children and their spouses, running multiple dairy sites as a single unified business. No PE fund. No outside equity. Bank debt, retained earnings, and a family agreement that everything lands in one bucket. “By running them as one, we don’t have that ‘my dairy is doing better than yours’ conflict,” Hafliger told the crowd. “It’s about maturity, learning to relax and let things happen rather than trying to force them.”

That model asks a lot of people, not just paper. Not every family can operate three sites as one business without it fracturing. When it works, you get alignment across kids, in‑laws, and locations. When it doesn’t, the damage runs deeper than dollars.
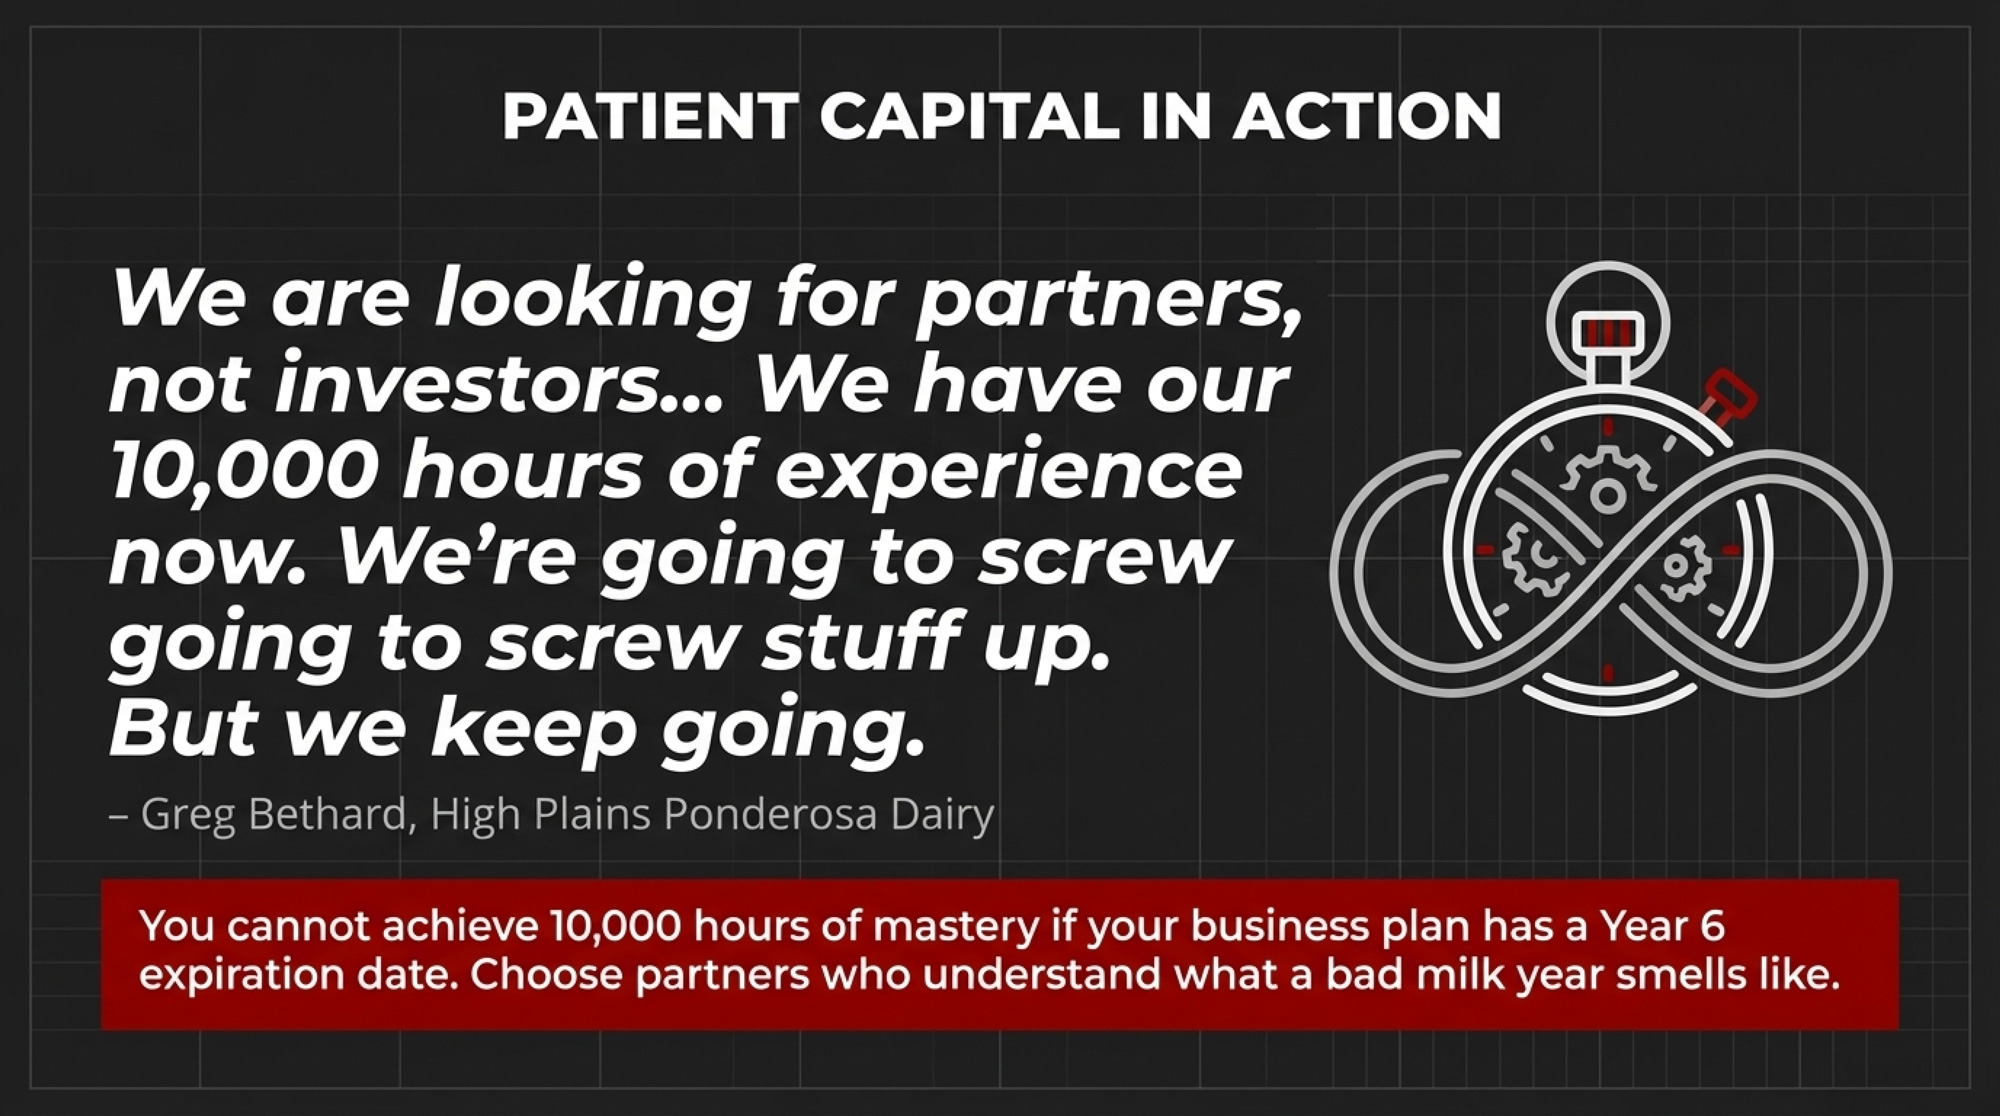
Bethard went for patient partners with ag scars. High Plains Ponderosa has grown by bringing in people who already know what a bad milk year feels like — not financial sponsors planning a sale before the heifers from this year ever calve. He’s honest about the early expansion learning curve. “We have our 10,000 hours of experience now,” he said, borrowing Malcolm Gladwell’s mastery concept. “We’re going to screw stuff up. There are going to be bad days… But we keep going at it, and we’ll get it figured out.”

You don’t get to 10,000 hours if the business plan has a Year 6 expiration date.

What Does $6,638 of Debt Per Cow Actually Look Like?

Here’s where this stops being theoretical and starts hitting your spreadsheet.
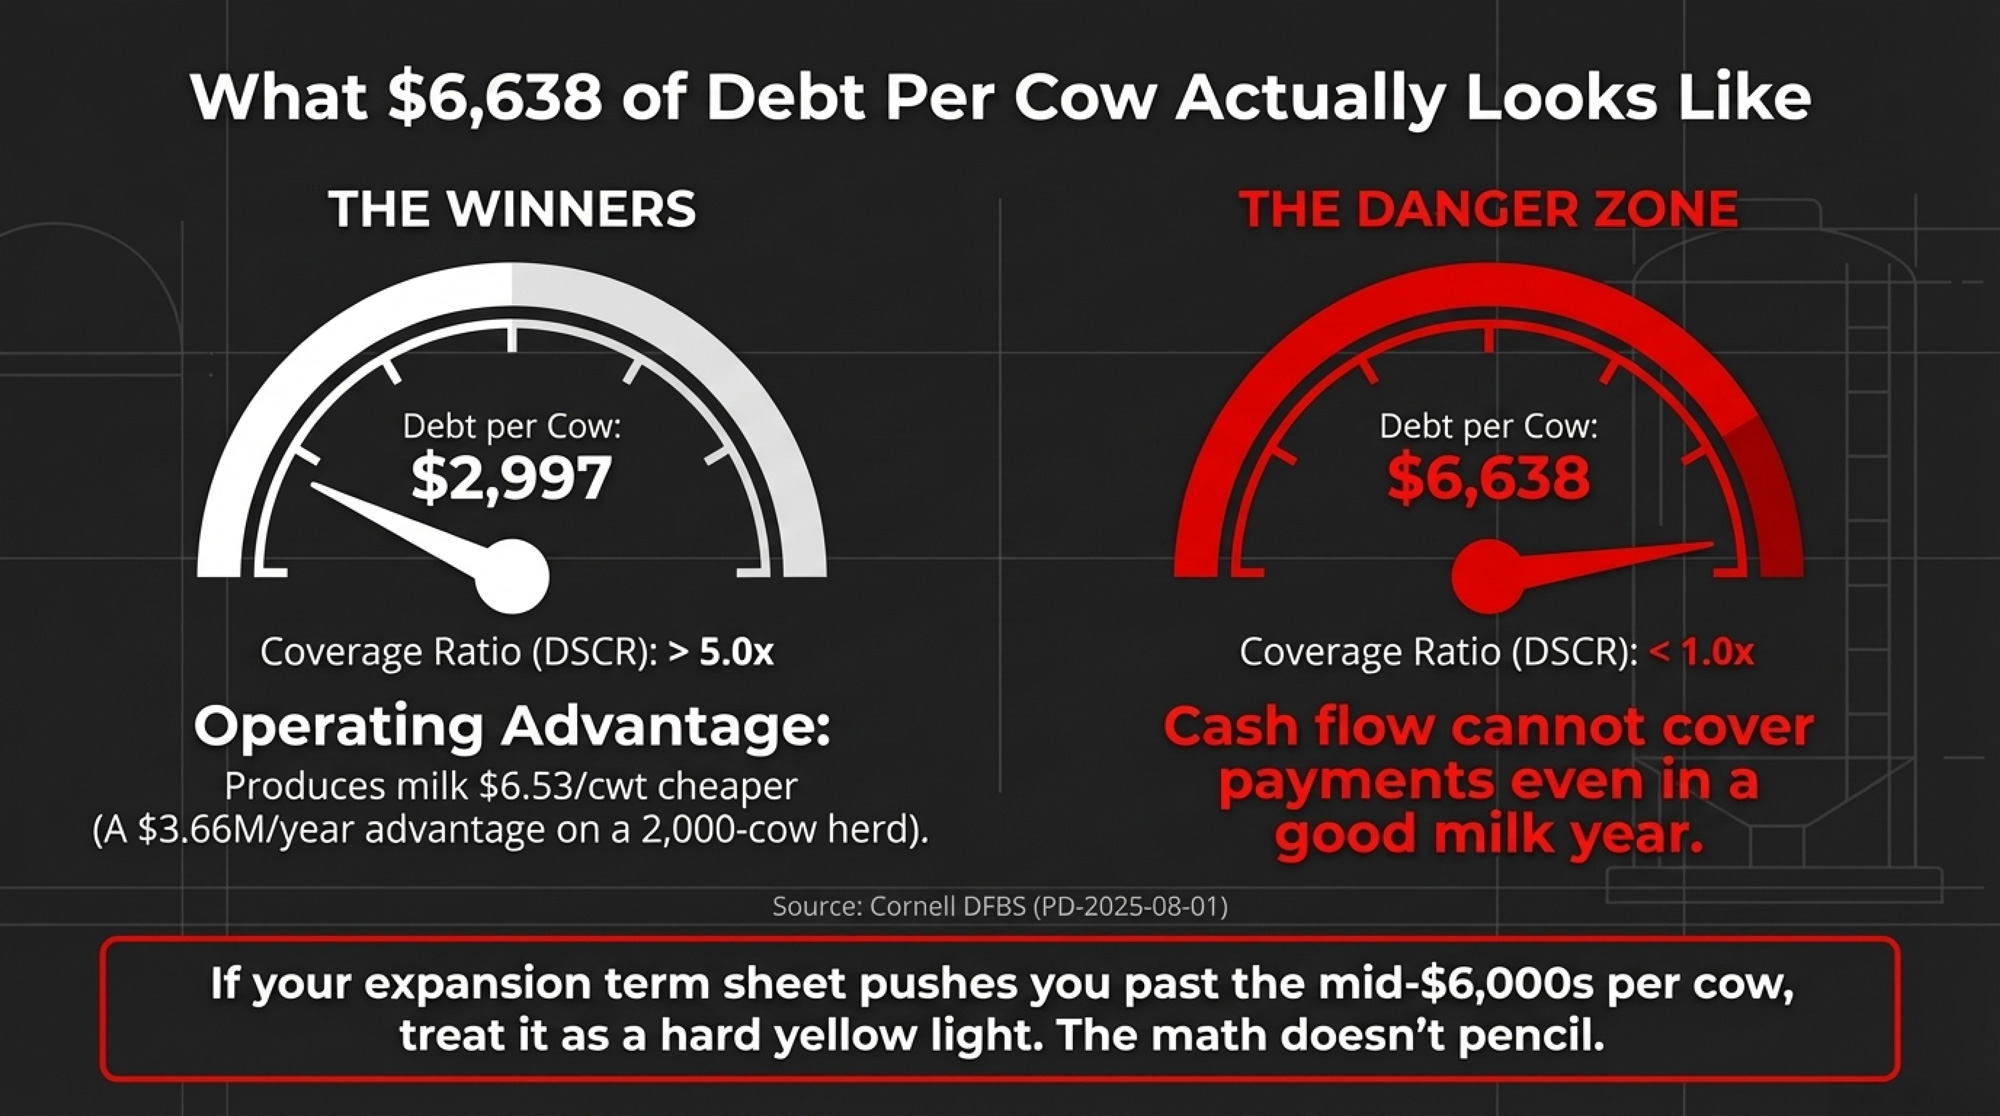
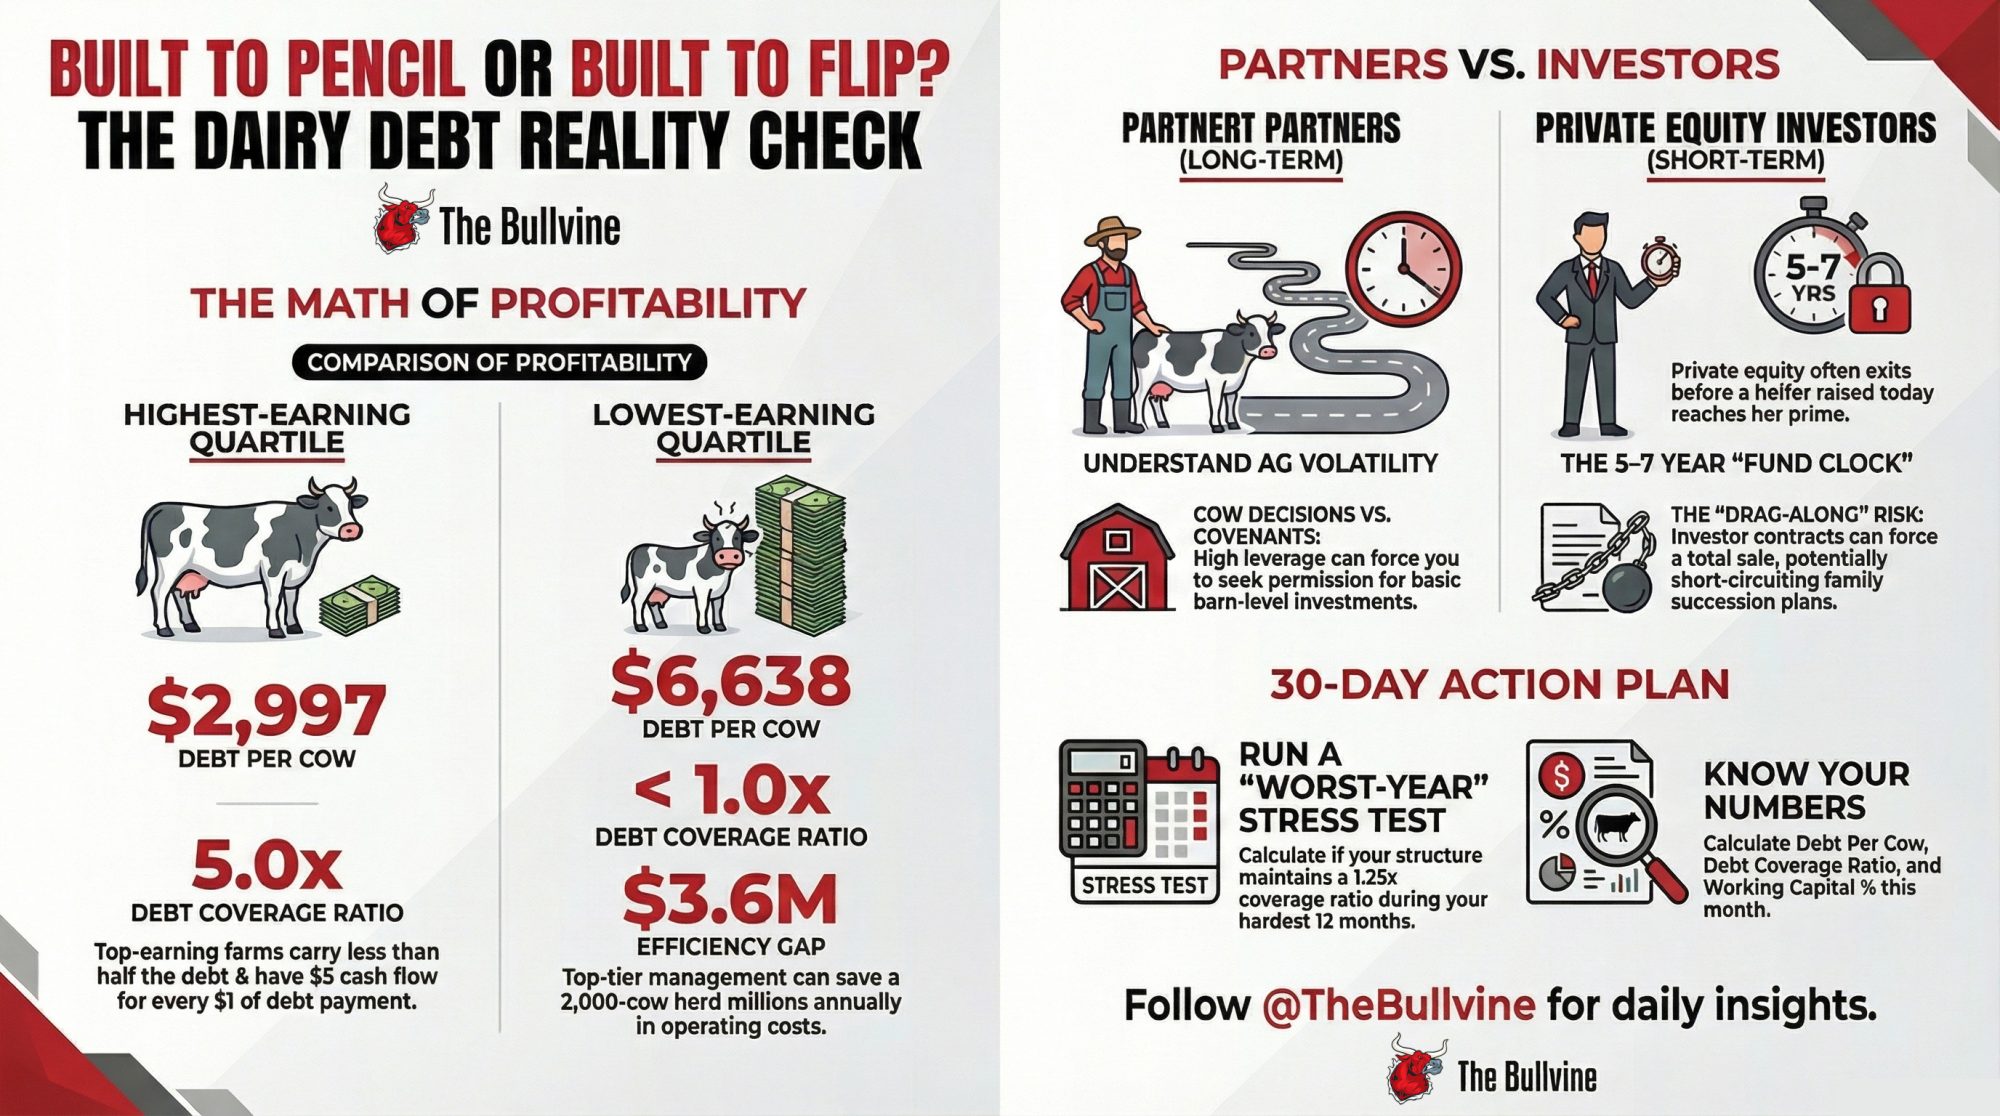
Cornell’s July 2025 bulletin “Comparing New York dairy farm characteristics, costs, and returns by profitability, 2024” (PD‑2025‑08‑01) sorted 129 New York dairy farms into earnings quartiles. The patterns are stark. More profitable herds consistently carried less debt per cow, held stronger debt coverage ratios, and produced milk at a substantially lower cost per cwt than the least profitable group. In that dataset, the highest‑earning quartile averaged about $2,997 of debt per cow with a debt coverage ratio north of — roughly five dollars of cash flow for every dollar of scheduled principal and interest. The lowest‑earning quartile? About $6,638 per cow, with coverage under . Cash flow couldn’t cover the payments. And this was during a year when average net farm income per cow jumped sharply.
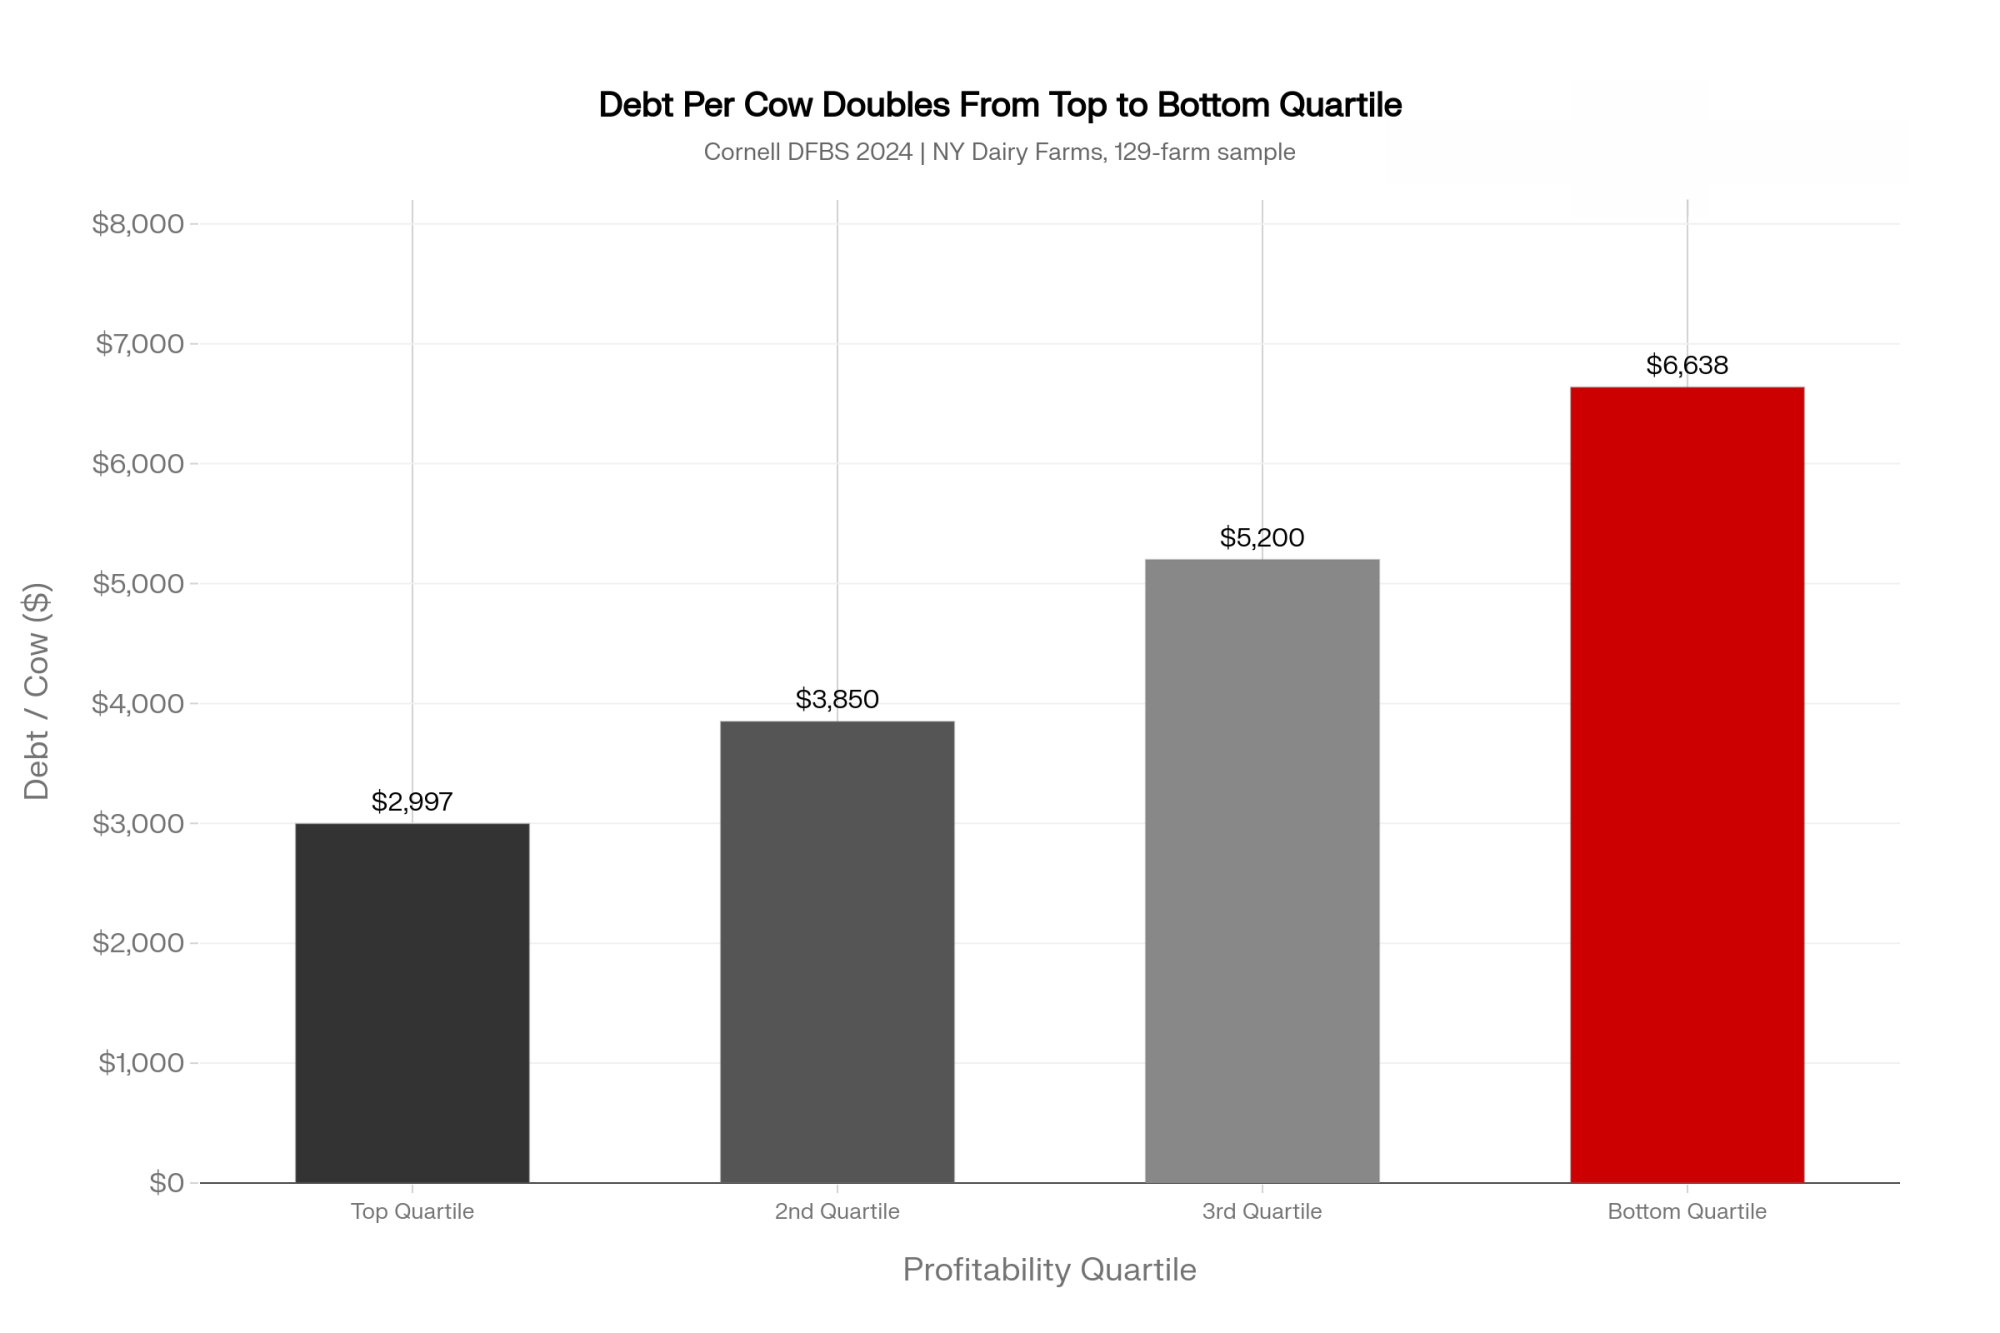
Even in one of the best income years in recent memory, the most leveraged herds couldn’t comfortably service their debt.

The cost‑of‑production gap runs parallel. Cornell’s public DFBS tables show top‑quartile farms producing milk several dollars per cwt cheaper than the bottom group — a function of better feed efficiency, labor productivity, and fixed‑cost absorption. Using a spread of roughly $6.53/cwt between the top and bottom quartiles, run that through a real herd: 2,000 cows shipping 280 cwt per cow per year gives you 560,000 cwt. Multiply by $6.53, and you’re looking at approximately $3.66 million per year in operating‑cost difference. Same milk prices. Same feed markets. Very different bank statements.
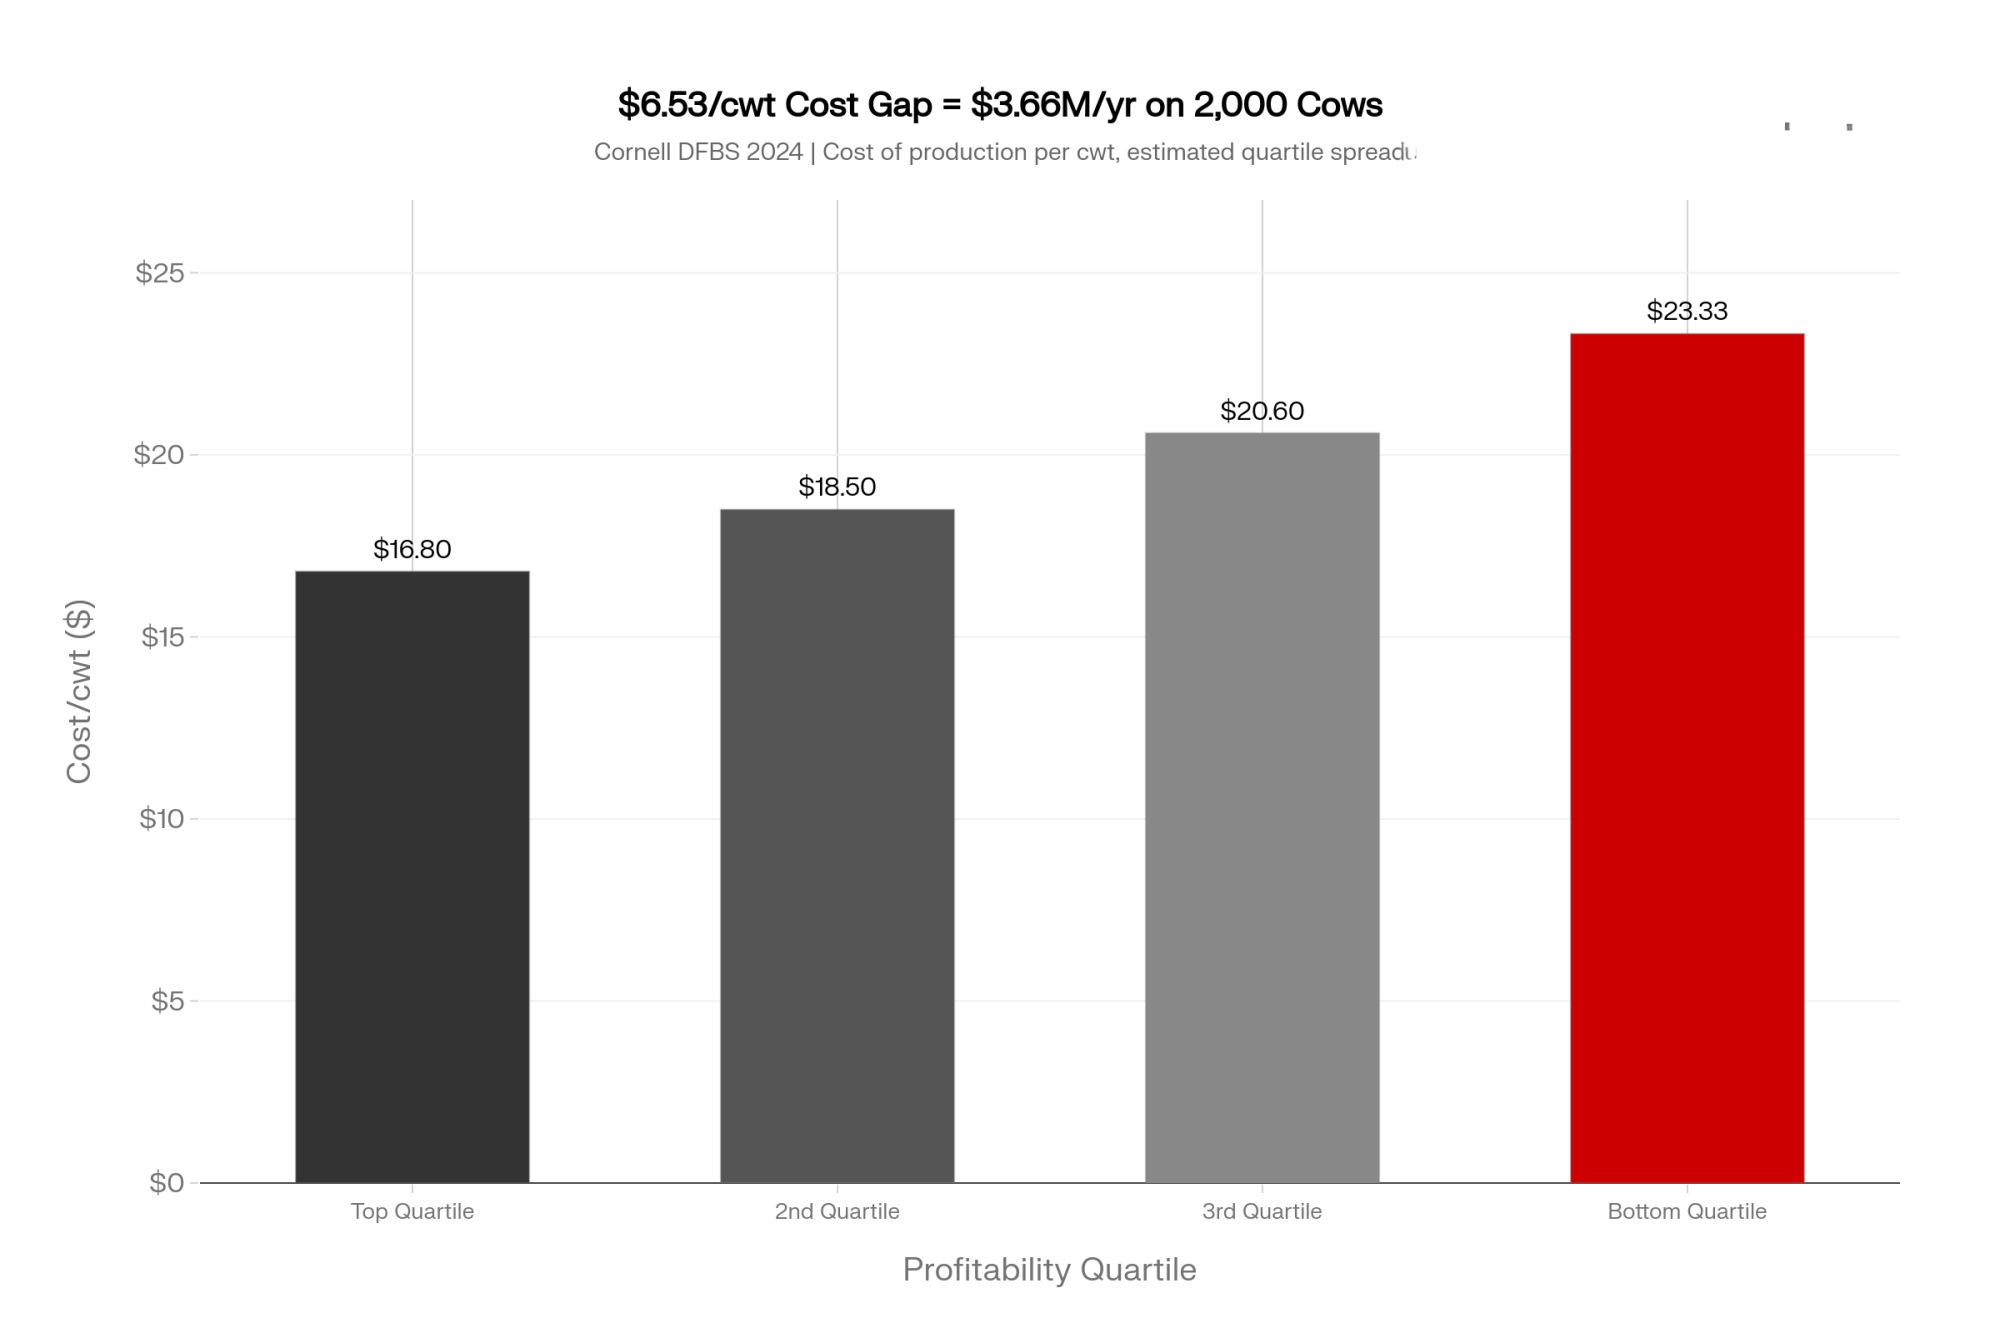
That’s New York data, not a national average — your region’s numbers will look different. But the pattern between top and bottom tends to hold across state farm‑business summaries. When any capital source — PE or otherwise — pushes you toward that $6,600‑per‑cow neighborhood before your earnings and cost structure say you belong there, the term sheet isn’t your biggest problem. The math is.

Is the Deal Built to Pencil — or Built to Sell?

This is the economic question you actually live with: can you still hit your numbers when things go sideways?
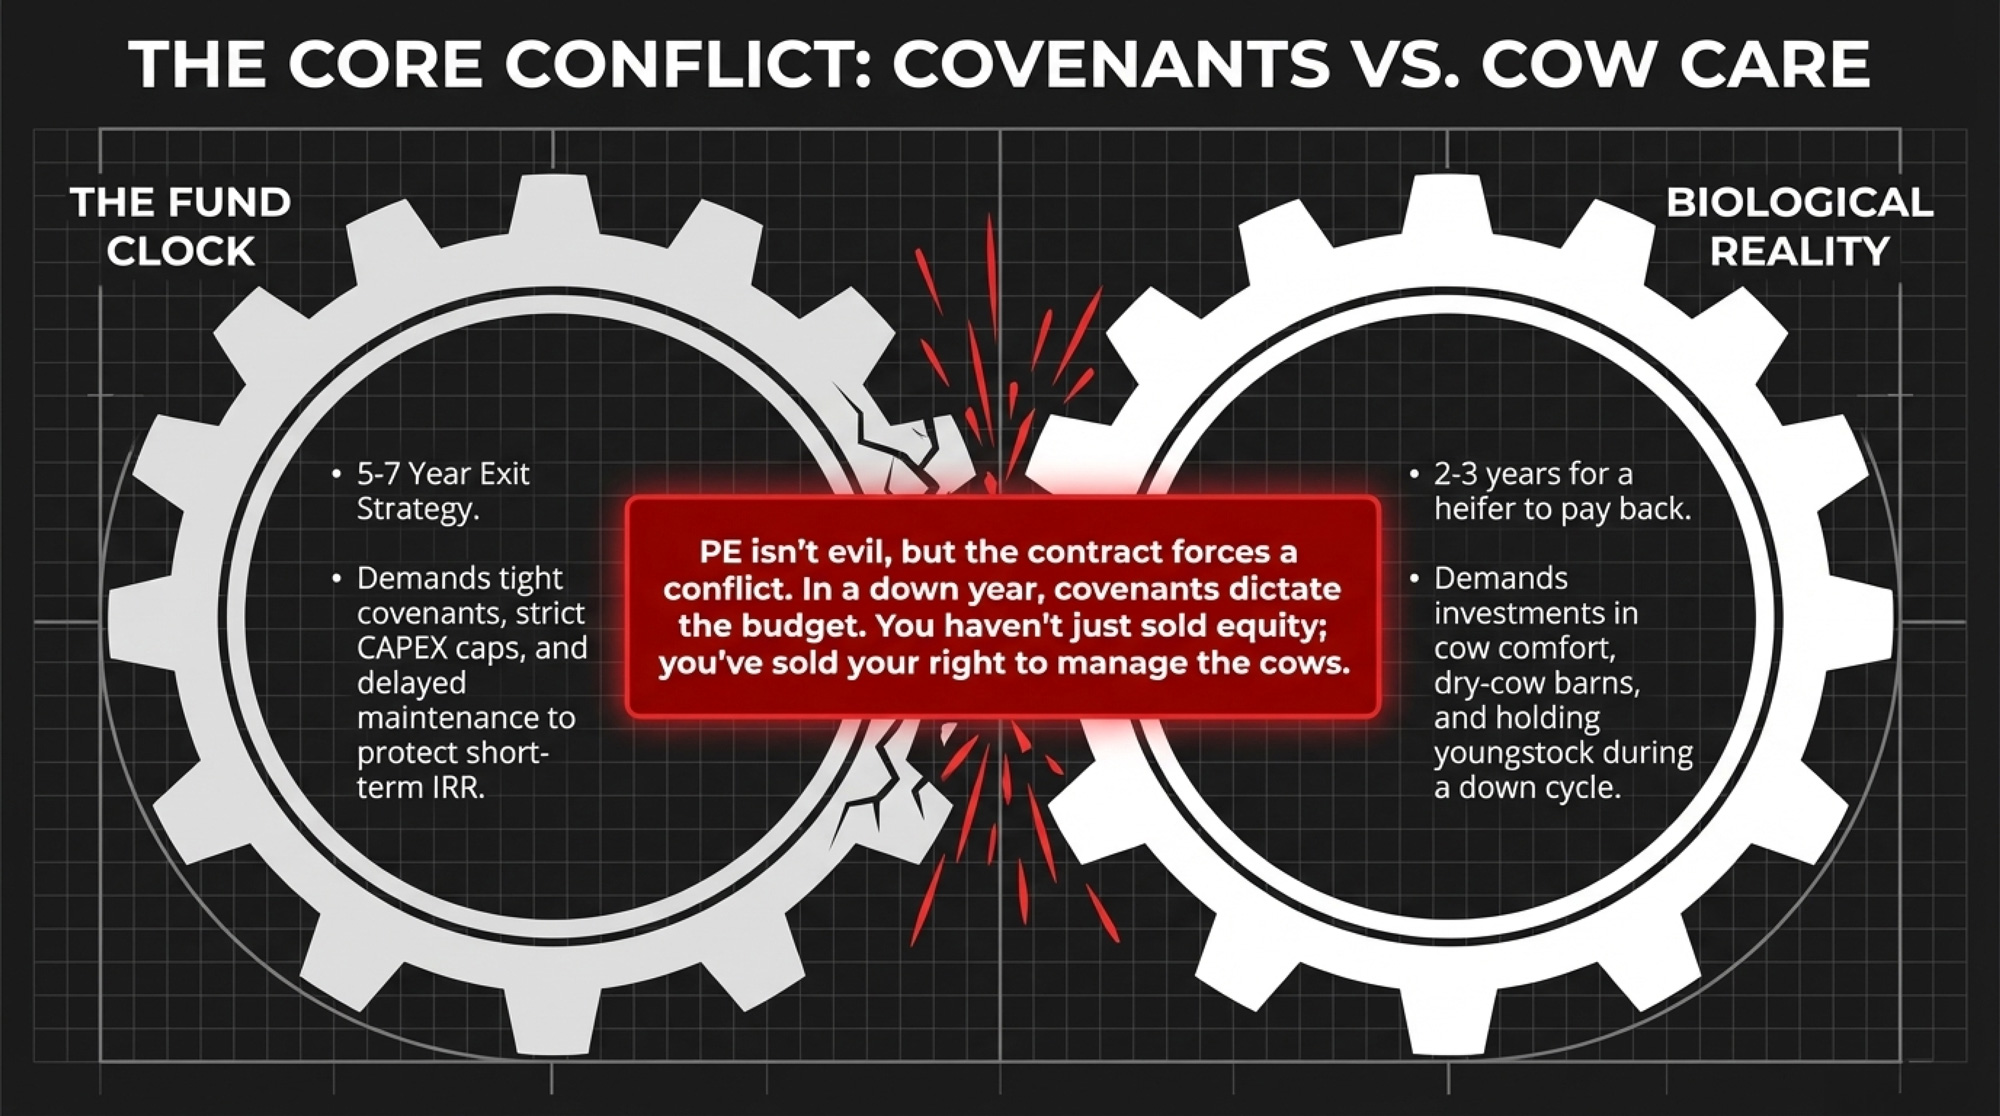
Highly leveraged structures — PE‑backed or just aggressive debt — usually come with tighter covenants than a traditional bank expansion. DSCR floors, restrictions on new borrowing, caps on capex, and sometimes approval requirements on major operational changes. None of that bites when milk is good, and feed is reasonable. It bites when you need breathing room.

You’ve probably had that year already. Health wreck, feed quality issue you chase for months, or a long run of heat that drags component tests. Your instinct says: slow expansion, keep youngstock, invest in a dry‑cow barn or fans, buy time to reset. Tight covenants can push in the opposite direction: freeze spending, delay maintenance, and more milk per stall. That’s the structural conflict Bethard described on the panel — not that PE is evil, but that the contract can force you to make the opposite call from what your gut and cows are telling you.
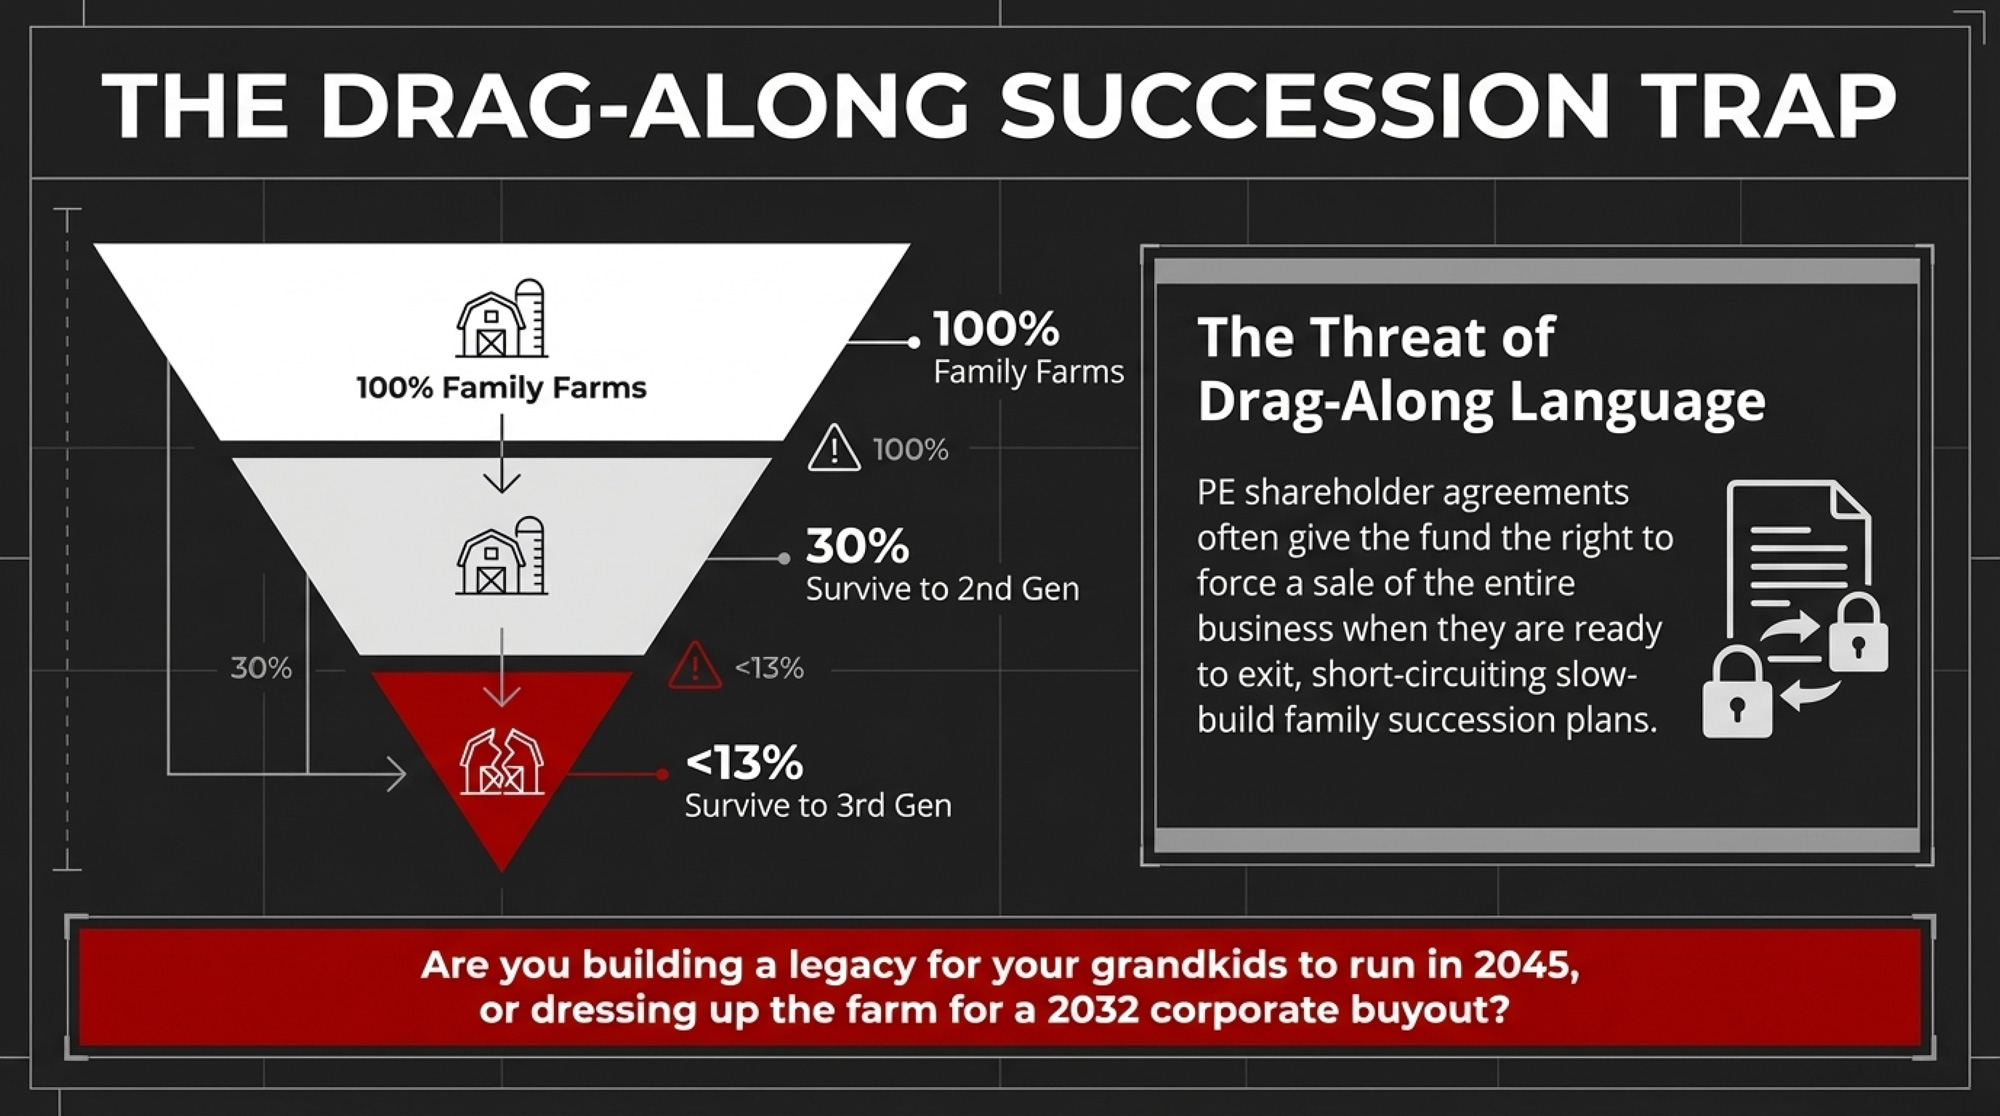
Then there’s drag‑along language. Many PE shareholder agreements give the fund the right to force a sale of the whole business when they exit. In corporate settings, that’s standard. On a family place, depending on how it’s written, it can short‑circuit a slow‑build succession plan. Cross‑industry family‑business research consistently reports that only about 30% of family businesses transition to the second generation, and fewer than 12–13% make it to the third. Contract provisions that accelerate a sale timeline don’t improve those odds.

Before you stare at the check size, it’s fair to ask: Is this structure built to pencil through your worst 12‑month stretch, or is it built to be easy to sell?

Can You Still Make Cow‑Level Decisions When Covenants Control the Budget?

This is the operational version of the same question.

Ask anyone who’s lived under tight covenants. The day‑to‑day pressure doesn’t feel like “capital structure.” It feels like arguing with your own spreadsheet about things you’d normally just do..

Do you need a lender sign‑off to build that fresh‑pen addition you know would take stress off transition cows? Does a board have to agree before you hang more fans, add a hoof‑trimming visit, or keep more heifers this year instead of selling? On paper, those are capital‑allocation decisions. In the barn, they’re cow‑care decisions that directly change milk, longevity, and cull rates.

Bethard was blunt on this point. When you pick partners, you’re also picking who sits at the table when there’s a tough quarter. He wants people who understand that holding onto extra heifers in a bad year can be the best long‑term move, even if it drags DSCR in the short run.

If a deal puts you in a position where every down‑cycle adjustment needs outside permission, you haven’t just sold equity. You’ve sold a chunk of how you manage cows.

Is Your Expansion Built to Stay — or Built to Flip?

Location exposes what you really believe about your time horizon.
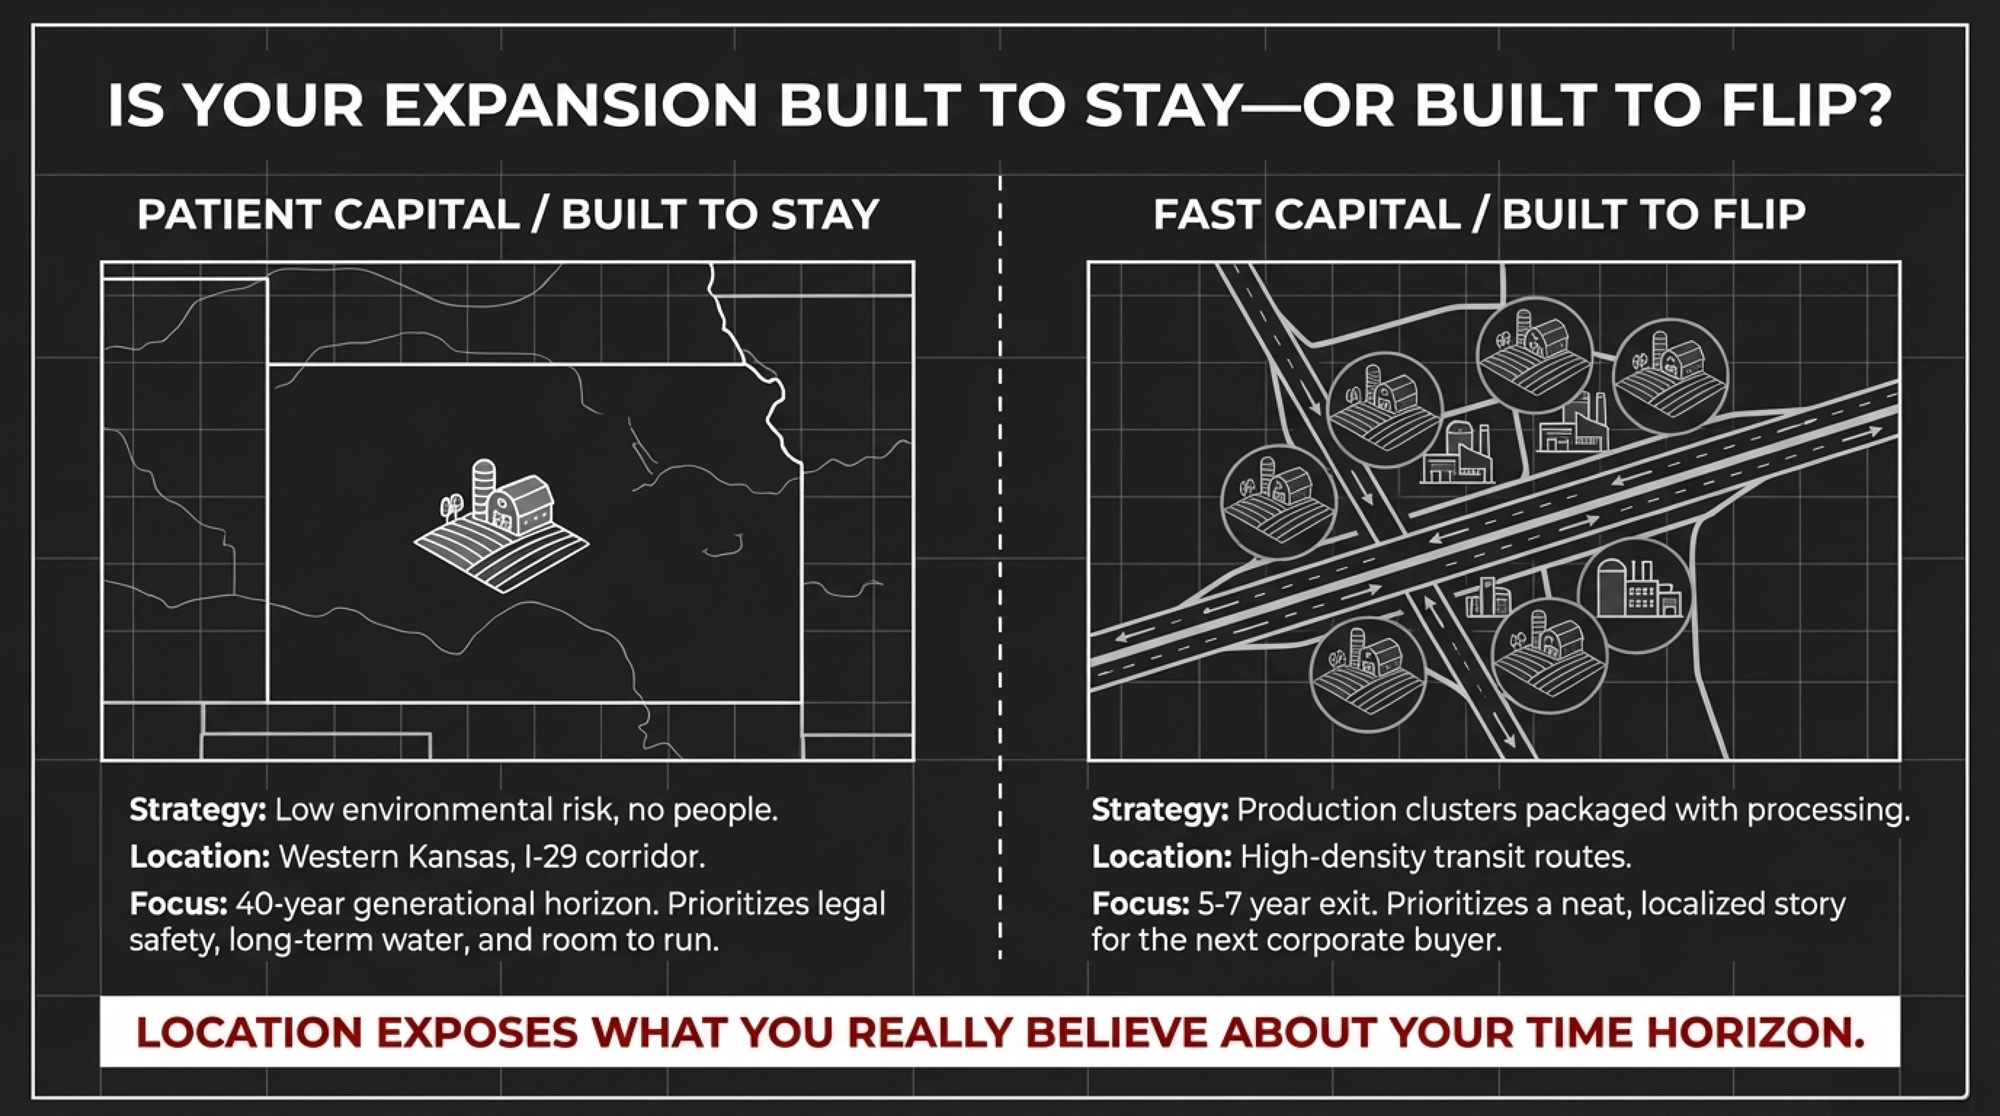
Bethard told the audience that if he were siting a new dairy today, he’d look for “low environmental risk and a place without a lot of people.” Fewer neighbors, less legal risk, more room to run. Tuls’ answer was short: “Close to a milk plant.” For him, that means DARI — because that’s the anchor his family is building generations around.

Investors running a shorter‑term play often think about geography differently. They like production clusters that can be packaged with processing capacity and sold together: multiple herds within hauling distance of a plant, good roads, a neat story for the next buyer. That doesn’t automatically make a site wrong for a 40‑year plan. But it means you need to double‑check the long‑term water, permitting, and community story — not just the current land price.

Bethard noted you need a contract before you can even build now. That reality has pushed new capacity toward regions like western Kansas and the I‑29 corridor, where processors like Hilmar and Valley Queen are pulling milk into existence rather than chasing existing herds. If you’re choosing a spot for your grandkids to renew contracts in 2045, that’s a completely different filter than picking the easiest site to sell in 2032.

Options and Trade‑Offs for Farmers

You don’t need a PE term sheet on your desk for this to matter. Any expansion that stretches your balance sheet forces you to pick a path.
PathTypical Debt/CowDSCR in Bad YearCow-Level Decision ControlExit PressureBest ForYellow / Red Flag
1. Traditional Debt + Patient Bank~$2,997–$4,500>1.25× if sized rightFull — no outside approvalNoneSolid profitability, clean financials, moderate growth🔴 Red if debt pushed past ~$5,500/cow
2. Strategic Partners (No Fund Clock)$3,500–$5,500>1.0× if structured correctlyHigh — per operating agreementMinimal if agreements are written rightExpansion beyond bank capacity; multigenerational family🟡 Yellow if partners want short-term return hurdles
3. Private Equity / PE-Style Equity$4,500–$6,638+May drop below 1.0× under covenantsReduced — capex/hiring may require board approvalHigh — 5–7 yr hold, drag-along rightsRapid roll-up, processing integration, very large facilities🔴 Red if DSCR <1.0× in bad-year scenario
4. Slow-Build / Do Less, Better<$3,500Typically >1.5×Full — sole-prop or tight familyNoneOperations with sub-optimal cost structure needing reset🟡 Yellow if facility is fundamentally inefficient

Path 1: Traditional Debt + Patient Partners

When it makes sense: You’ve got solid profitability, reasonable leverage, and a lender who understands your history. Your debt per cow sits closer to that top‑quartile DFBS band than the most leveraged group, and your coverage ratio stays above roughly 1.25× even when you run a bad‑year scenario.

What it requires: Clean financials, believable projections, and genuine working capital. In Cornell’s 2024 DFBS, the most profitable quartile held substantially more working capital relative to operating expenses than the least profitable group. You don’t need to match any specific benchmark exactly, but you need real cushion — not wishful thinking.

Risks and limits: You’re still exposed to milk price and interest‑rate swings. Size the project too aggressively relative to your earnings, and the “traditional” deal lands you in bottom‑quartile debt territory without a PE fund anywhere in the picture.
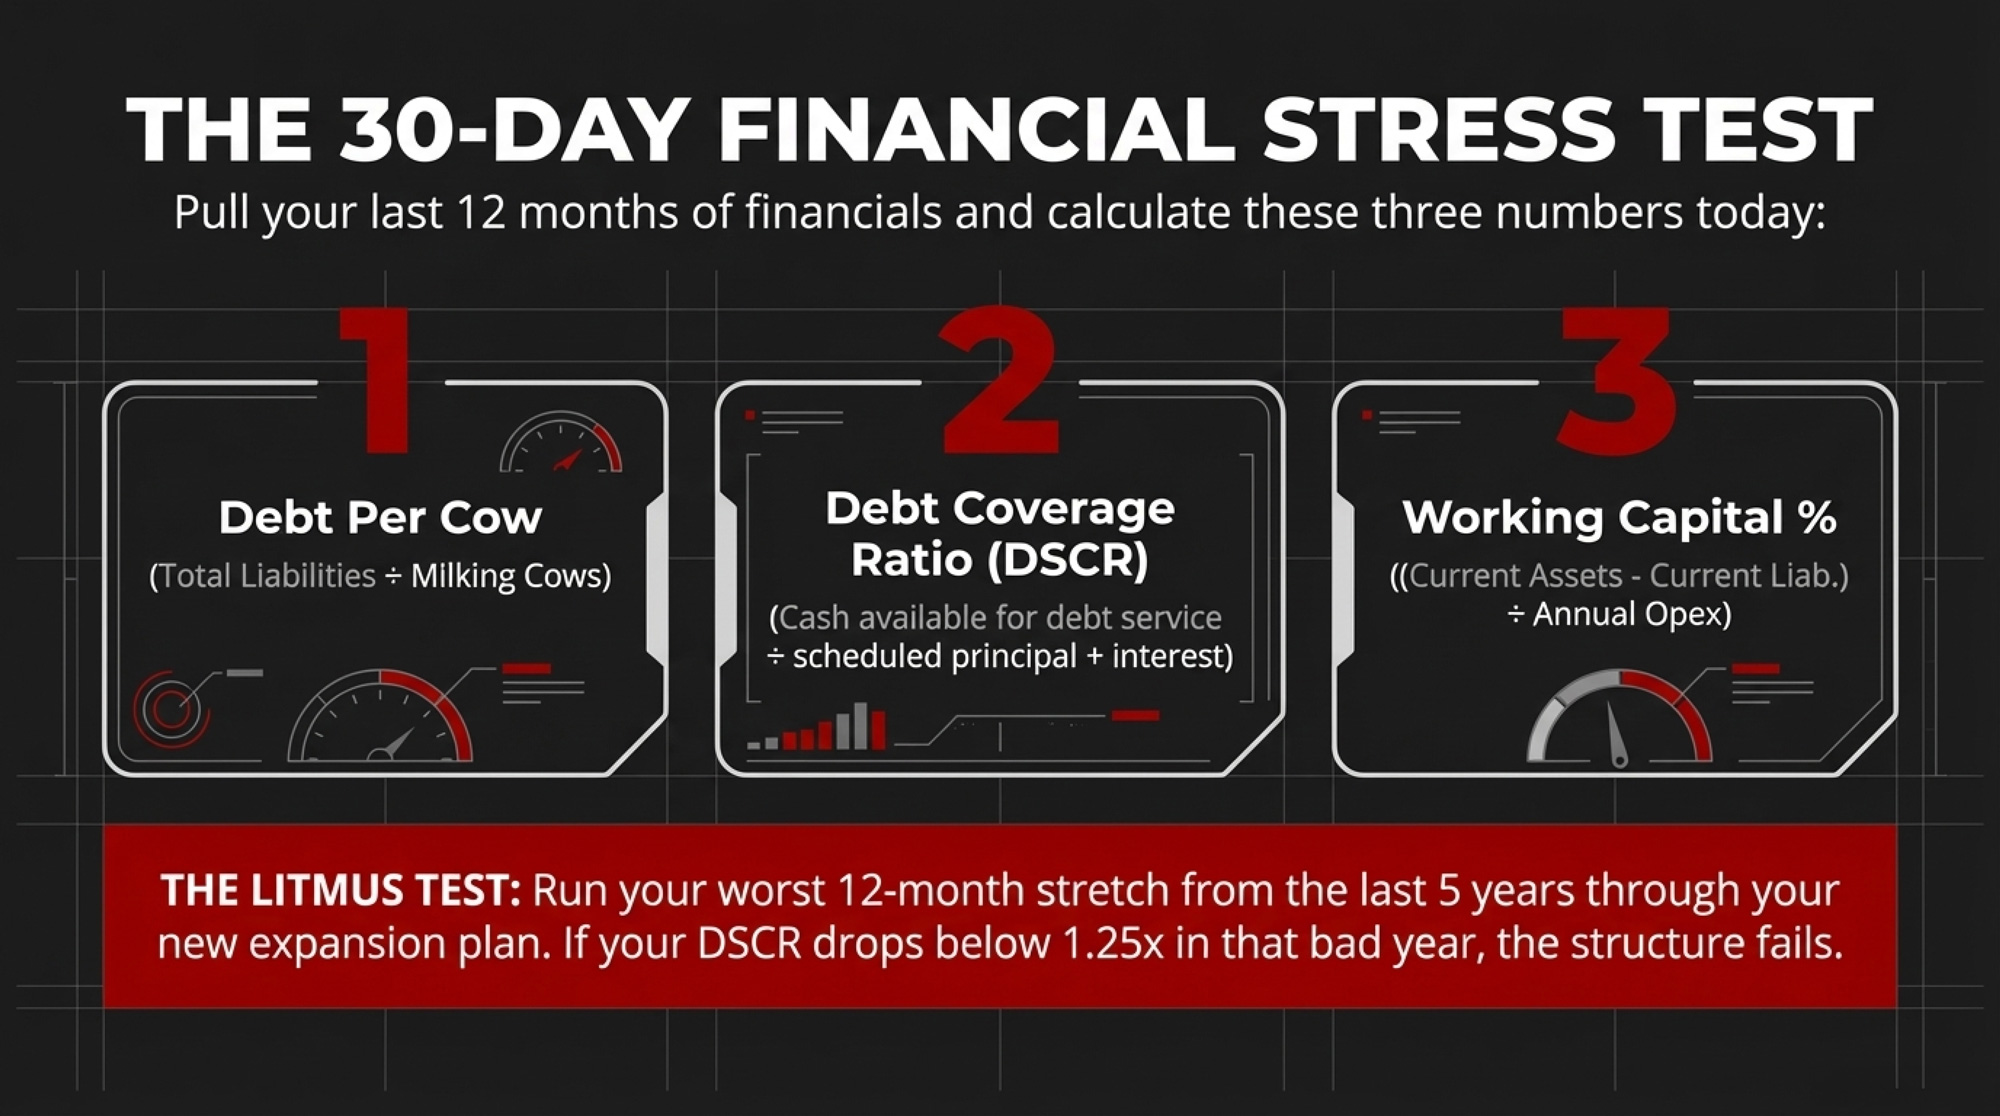
30‑day action: Pull your last 12 months of financials this month and calculate three numbers:

  • Debt per cow (total liabilities ÷ milking cows)
  • Debt coverage ratio (cash available for debt service ÷ scheduled principal + interest)
  • Working capital % ((current assets − current liabilities) ÷ annual operating expenses)

Then run your worst 12‑month stretch from the last five years through your next‑step plan. If this structure keeps DSCR above ~1.25× in that bad year, it stays on the table. If it drops below 1.0×, the red flag goes up.

Path 2: Strategic Partners Without a Fund Clock

When it makes sense: You need more capital than your bank will supply alone, but you want partners who’ll stay through cycles — family members, neighbors, or agribusiness investors who aren’t running a 5‑ to 7‑year fund. This is the space Bethard lives in, and it’s what Hafliger built with his kids and spouses across multiple Idaho sites.

What it requires: Hard conversations about control. Operating agreements that spell out who decides what: capex thresholds, hiring and firing senior managers, land purchases, and dividend policy. A common understanding that you’re building for 20–40 years, not dressing the place up for a sale.

Risks and limits: People risk. These deals fall apart when expectations around distributions, lifestyle, or succession were never put on paper. Even without PE, your partners may still want tighter covenants than a simple family sole‑prop structure.

Signals to watch: If a potential partner insists on sale or IPO timelines, short‑term return hurdles, or aggressive drag‑along rights, you’re drifting back into fund‑clock land. That’s not automatically wrong — but call it what it is.

Path 3: Private Equity or PE‑Style Outside Equity

When it makes sense: You’re chasing a very specific play: rapid multi‑site roll‑up, vertical integration into processing, or a large‑scale facility where the check size isn’t realistic any other way. Teams like Tuls’ on the processing side live near this territory, even if their specific capital stack isn’t classic PE.

What it requires: Exceptional cost of production, real management depth, and a story that sells in a boardroom as well as it does in the parlor. You need a cold‑eyed lawyer walking you through every clause: covenants, drag‑along, tag‑along, non‑competes, and reserved matters.

Risks and limits: The fund’s holding period is usually 5–7 years. That’s a heifer and a half. If milk prices and interest rates don’t cooperate, pressure to hit IRR targets can show up as stalled maintenance, pushed cows, or delayed people investments. At the family level, drag‑along language can force a sale on a timeline that doesn’t match the next generation’s readiness.

Forward‑looking signals: Where are interest rates headed over the next 3–5 years? How tight are current milk‑supply contracts in your region, and how long are they written for? Are lenders and investors pricing in environmental and labor risk — or assuming they’ll be gone by the time it matters?

Path 4: Slow‑Build or “Do Less, Better”

When it makes sense: Your numbers don’t justify aggressive leverage, you don’t like the idea of outside veto power, and there’s still a path to solid profitability by tightening the cost of production and modestly growing components instead of cow numbers.

What it requires: Patience. Relentless work on cost per cwt instead of headline herd size — feed efficiency, cow longevity, reproduction, labor efficiency. In DFBS data, the most profitable, lower‑debt farms didn’t just borrow less; they also produced milk several dollars per cwt cheaper. That combination is what gives them room to breathe.

Risks and limits: You may age out of opportunities if processors shift or neighbors move faster. And if your current facility is fundamentally inefficient, no amount of small tweaks fully fixes that.

Forward‑looking signals: Watch how processors tweak premiums in your area, what they say about components, and whether they start writing water‑ or sustainability‑linked clauses into contracts. That tells you how far a “do less, better” strategy can carry you where you sit.
Key Takeaways

  • If your expansion plan pushes debt past the mid‑$6,000s per cow, treat that as a hard yellow light.Cornell’s 2024 DFBS shows the lowest‑earning New York quartile at about $6,638 per cow with debt coverage under 1×, even in a strong income year. Top earners sat near $2,997 with coverage above 5×. 
  • If one capital structure survives your worst recent 12‑month stretch and another fails the DSCR test, believe the math. Run both through your ugliest year. The structure that keeps coverage above roughly 1.25× when everything goes wrong is the one you can build on.
  • If you can’t approve cow‑comfort or youngstock spending in a down year without outside sign‑off, someone else is making your cow‑level calls. Any deal that pulls basic barn decisions into board or lender approval changes how you manage stress years. 
  • If there’s drag‑along language, understand what it can force — and when. Cross‑industry benchmarks say only about 30% of family businesses survive to the second generation and fewer than 13% reach the third.  You don’t want contract terms cutting those odds even further. 

The Bottom Line

Hafliger’s grandkids are already counting cows. Bethard talks about 10,000 hours of expansion scars. Tuls is backing a $165 million plant with no exit date in the plan.

None of them got there quickly. All of them got there on terms they chose.

So here’s the question worth sitting with: five years from now, do you want to be explaining your decisions to a board — or to your kids?

We’re building the full debt‑per‑cow stress‑test model now — covenant math, leverage thresholds by herd size, and a PE‑vs‑partner calculator you can drop your own numbers into. Watch for it in The Bullvine Weekly and our follow‑up economics deep dive.

Source note: Quotes and panel insights are drawn from MILK Business Conference coverage in Dairy Herd Management. Financial patterns are based on Cornell’s 2024 Dairy Farm Business Summary bulletin, “Comparing New York dairy farm characteristics, costs, and returns by profitability, 2024” (PD‑2025‑08‑01).

Learn More

The Sunday Read Dairy Professionals Don’t Skip.

Every week, thousands of producers, breeders, and industry insiders open Bullvine Weekly for genetics insights, market shifts, and profit strategies they won’t find anywhere else. One email. Five minutes. Smarter decisions all week.
NewsSubscribe
First
Last
Consent

From 640 Acres to 50: Wisconsin’s Foreign Land Crackdown and the New Rules for Dairy Expansion Money

Foreign money looks cheap until CFIUS, AFIDA and a 50‑acre cap show up at your kitchen table. Still think it’s the best deal?

Executive Summary: Wisconsin’s AB 218 would slash the state’s foreign‑owned ag land cap from 640 acres to 50, putting a lot of dairy expansion plans that use foreign partners straight into the risk zone. This feature shows how that change, plus CFIUS review fees and AFIDA penalty math, can turn foreign capital from “cheaper money” into slower, more expensive, and higher‑risk money once you count the friction. A 1,400‑cow Wisconsin family dairy serves as the working example to compare domestic and foreign funding using real Seventh District interest rates, CFIUS filing fees, and AFIDA non‑compliance exposure. The article also unpacks how solar, wind, and digester projects can quietly trigger foreign‑ownership rules in the top five dairy states — none of which provide carveouts for energy deals. Arizona’s Fondomonte case drives the point home with wells dropping more than 200 feet, lawsuits, lease cancellations, and a new active management area landing on an operation that was legal when it started. It all builds to one survival test and a practical checklist to help you decide when foreign money is a smart preference for your dairy and when it’s a bet that could take the whole farm down with it.

Picture a typical 1,400‑cow family dairy in southwestern Wisconsin. It’s late 2025, chores are done, and the kitchen table is buried under barn plans, lender letters, and a milk cheque. The family needs about $8.2 million for a new freestall, 400 more acres, and modernized equipment. Farm Credit will stretch to roughly $5.5 million. A European ag fund is offering to fill the $3 million gap as equity.

Looks like the deal that gets the barn built and the next generation anchored. Then their lawyer starts talking about foreign ownership caps, CFIUS, and AFIDA—and suddenly this isn’t a straightforward capital decision anymore. It’s a question about whether foreign investment belongs in your operation’s future, and what happens if regulators rewrite the rules after you’ve already built around the money.

Two Federal Acronyms That Now Sit at Your Kitchen Table

Foreign capital used to mean one thing for most dairies: a bigger cheque or a more flexible partner. In 2025–2026, it also means regulators have a say in who you do business with.

CFIUS — the Committee on Foreign Investment in the United States — is the big one. On July 7, 2025, the USDA signed a memorandum of understanding with the Treasury to coordinate on reviews of transactions involving farmland, ag businesses, or ag biotech. That formally pulled agriculture into what used to be a defence‑tech conversation. Once CFIUS accepts a filing, it has 45 days for an initial review. If a full investigation follows, that’s another 45 days, plus 15 days for a presidential decision — and that’s before your state‑level reviews even start. 

CFIUS also charges filing fees based on transaction value: for a deal in the $5 million to $50 million range — which covers most dairy expansions involving foreign equity — the fee alone is $7,500, according to the U.S. Treasury’s published fee schedule. And as of 2024, the maximum CFIUS penalty for violations was raised to $5 million per violation, according to a DLA Piper analysis of the 2024 annual report.

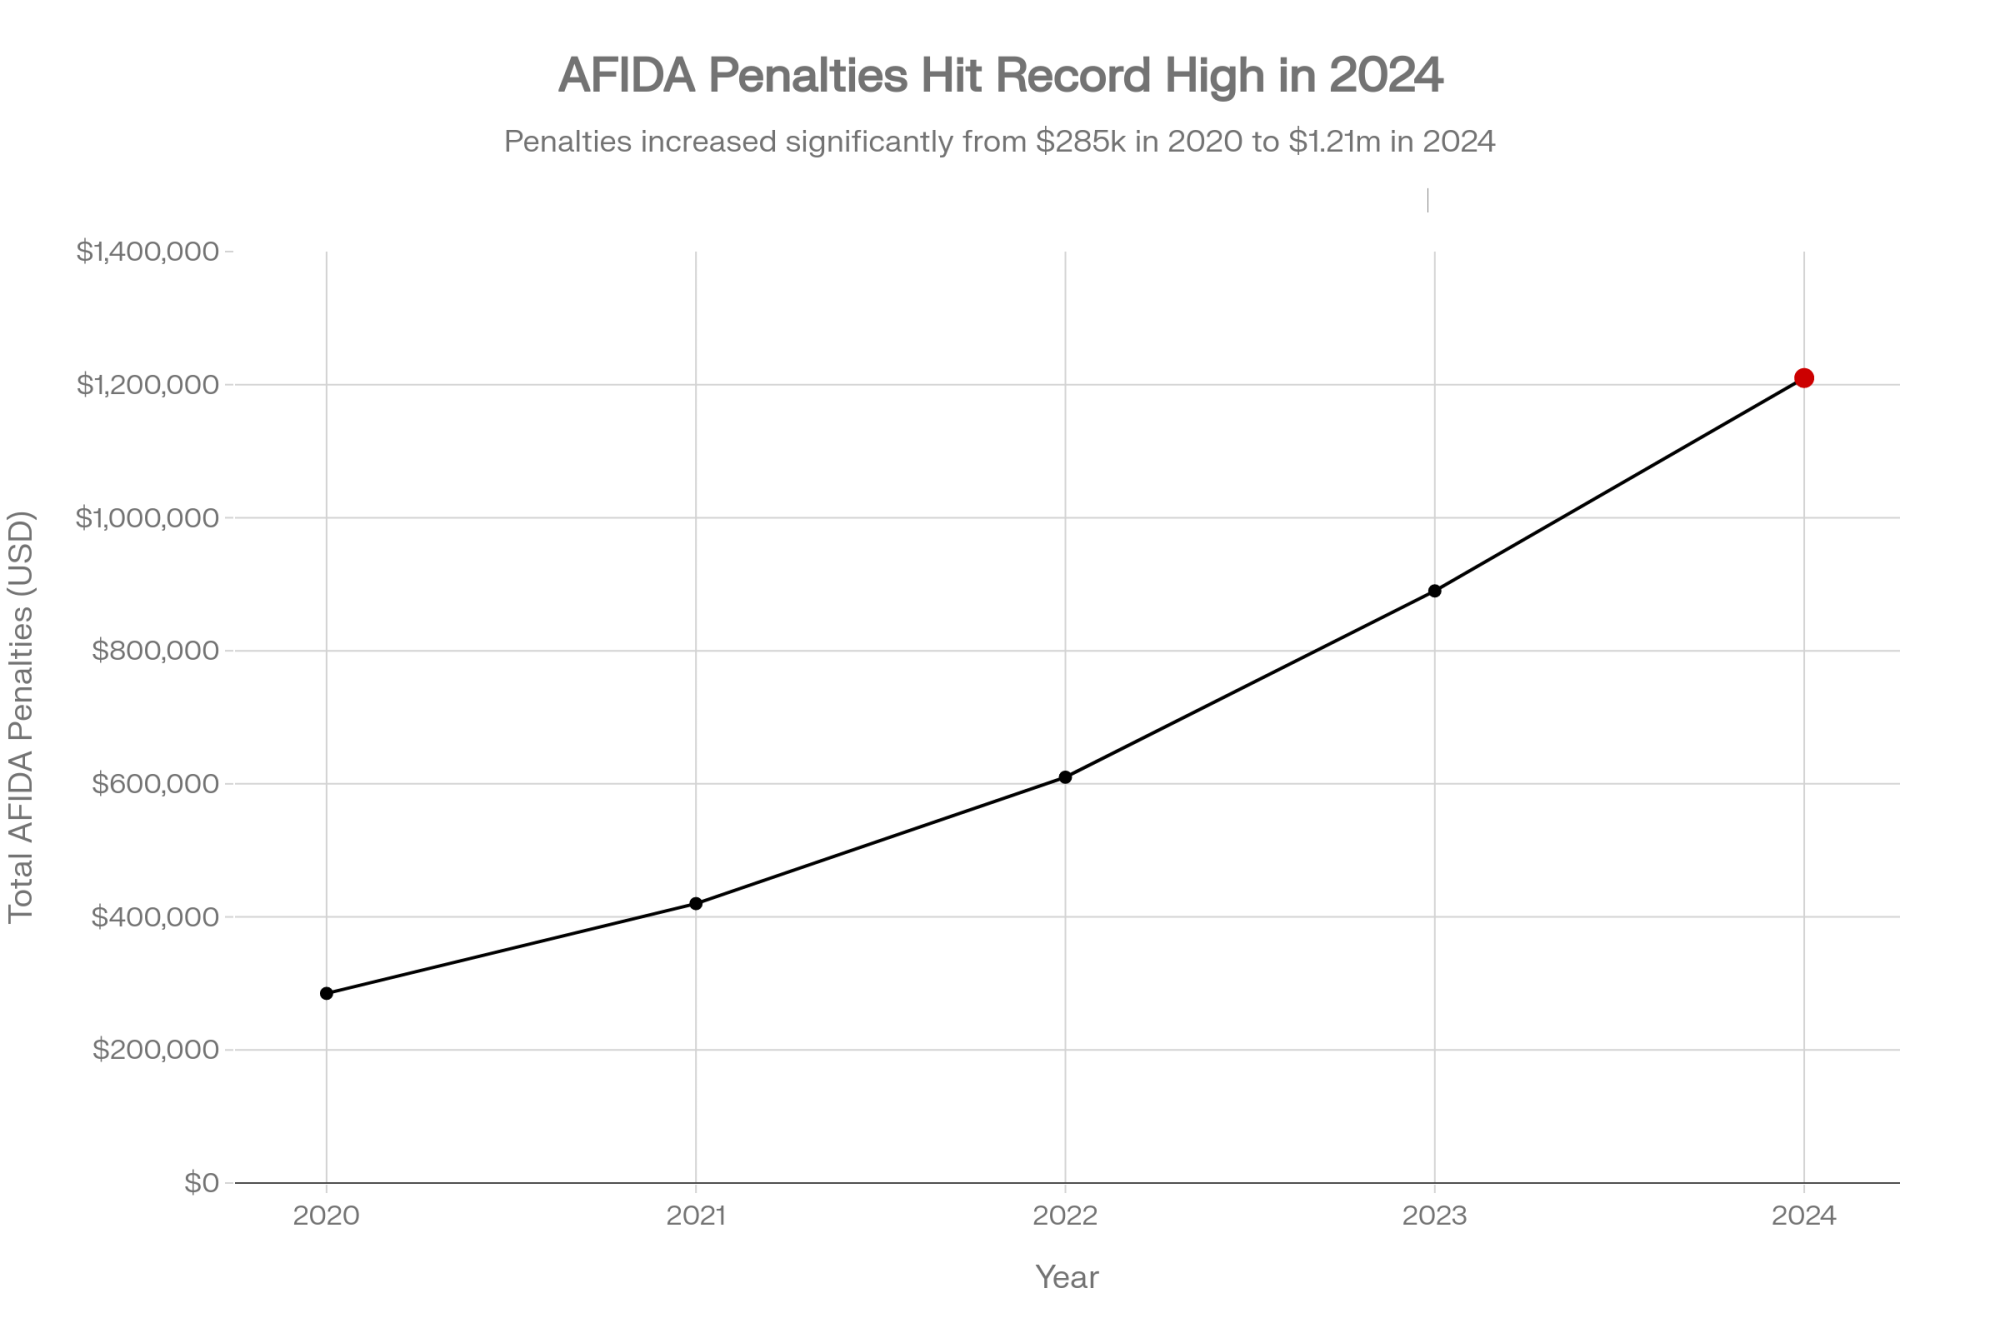
Then there’s AFIDA — the Agricultural Foreign Investment Disclosure Act. It’s tracked foreign interests in U.S. ag land since 1978, but USDA is modernizing enforcement with an online portal and tougher penalties. In 2024, AFIDA penalties exceeded $1.2 million — the highest single‑year total on record — predominantly for late filings, according to an American Farm Bureau Federation analysis. The penalty structure isn’t trivial: under federal regulations, late filings carry a fine of 0.1% of the fair market value of the foreign person’s interest per week the violation continues, capped at 25% of FMV. Failure to file or to submit false information can trigger fines of up to 25% outright, per the National Agricultural Law Center.

The scale of foreign ownership keeps climbing. The 2022 AFIDA annual report showed more than 43 million acres in foreign hands, per a January 2024 GAO report. The most recent USDA data pushes that to nearly 45 million acres — about 3.6% of all privately held farmland — with Canadian investors holding the largest share. An AFBF analysis of the 2023 data, reported by Brownfield in June 2025, put the total closer to 46 million acres. Up more than 1.5 million in a single year.

And then there’s a fast‑moving state‑by‑state patchwork on top of it all.

The State‑by‑State Patchwork Is Moving Fast

On top of the federal layer, states are writing their own rules — and they vary wildly. Here’s where the top five dairy‑producing states stand right now:

StateCurrent Restriction?Pending LegislationEnergy Carveout?
WisconsinYes — 640‑acre cap under §710.02 (AG upheld, 2014)AB 218 would reduce the cap to 50 acres, add a 10‑mile military buffer, and ban adversaries. Passed Assembly; pending Senate committee. Session ends ~March 2026.No
CaliforniaNo — Art. I §20 gives noncitizens equal property rightsSB 1084 passed the legislature 75–0 / 37–0 in 2022, but Gov. Newsom vetoed it Sept. 27, 2022No
IdahoYes — adversary‑nation banSB 1149 & HB 356 (April 2025) added AG enforcement, expanded the banned‑country listNo
TexasYes — S.B. 17 effective Sept. 1, 2025Criminal offense for designated‑country nationals acquiring real propertyNo
New YorkNo — N.Y. Real Prop. Law §10 gives noncitizens equal rightsA3440 (Jan. 2025, Assemblymember Santabarbara) would ban adversary‑nation purchases; referred to Judiciary Committee, no vote yetNo

Sources: Climate Solutions Law, January 2026; Wisconsin Legislature records; NY Senate; governor’s veto message (CA). According to a Climate Solutions Law analysis, New York has nearly 2,800 dairy farms and approximately 950,000 acres (~5%) of private ag land in foreign hands.

Notice the last column. Not one of these five states carves out renewable energy deals from foreign ownership restrictions. That matters — and we’ll come back to it.

Under Wisconsin Statute §710.02, non‑resident aliens and foreign corporations can’t acquire, own, or hold — directly or indirectly — more than 640 acres of land in the state. That’s been the law for decades, and the Wisconsin Attorney General upheld it in a 2014 advisory opinion. But proposed Assembly Bill 218, introduced in April 2025 by Representative Clint Moses and a bipartisan group of cosponsors, would slash that cap to 50 acres for agricultural land, widen who counts as a foreign person under the law, and cut the sell‑off window from four years to three. Assembly Substitute Amendment 1 added restrictions within ten miles of military bases and a flat ban on adversary‑nation ownership. According to a January 2026 Climate Solutions Law analysis, AB 218 passed the Assembly and is pending in a Senate committee — with the Wisconsin legislative session ending around early March 2026.

Beyond Wisconsin, Idaho, Texas, and Florida — along with Arkansas, Tennessee, Montana, and others — have passed laws restricting or banning adversary‑nation buyers from holding interests in agricultural land. Idaho tightened its rules further in April 2025 with Senate Bill 1149 and House Bill 356, adding enforcement through the Attorney General’s office. Texas’s S.B. 17, effective September 1, 2025, creates a criminal offense for nationals of designated countries acquiring real property. On September 11, 2024, the U.S. House passed Representative Dan Newhouse’s Protecting American Agriculture from Foreign Adversaries Act (H.R. 9456) by a bipartisan vote of 269–149, per congress.gov. As of late 2025, roughly 36 states have enacted some form of restriction on foreign ownership of real property. The list is still growing.

How Foreign Investment Actually Changes Your Expansion Math

Back to that Wisconsin dairy. Once the attorney digs in, the “simple” equity offer gets complicated fast.

Under §710.02, if the fund takes a 25% stake in a single LLC holding both cows and 1,250 acres, regulators could count 312.5 of those acres as foreign‑owned. Today, that passes under the 640‑acre cap. If AB 218 becomes law and drops the limit to 50 acres, the same deal is suddenly offside — a structure that was legal on signing day could violate state law a year later.

The standard workaround: land in one domestic entity owned entirely by the family; cows, equipment, and employees in a separate operating company; foreign investor buys into the operating entity only. That keeps foreign money away from direct land ownership. But it comes with real friction.

 Domestic Lender (e.g., Farm Credit)Foreign Equity Fund
Typical Rate (mid‑2025, Seventh District)7.02% – 7.63%Often 1–2 points lower (base)
CFIUS Filing FeeN/A$7,500 (for $5M–$50M transaction value)
Closing Timeline60 – 90 days120 – 180 days (CFIUS + state review)
Ongoing ReportingStandard bank covenantsAFIDA filings, multi‑entity accounting, and potential federal audit
Regulatory RiskLowHigh (state law shifts, CFIUS scrutiny)
Non‑Compliance ExposureStandard loan defaultAFIDA: up to 25% of FMV; CFIUS: up to $5M per violation

Domestic rates from the Federal Reserve Bank of Chicago AgLetter, August 2025 (Seventh District, as of July 1, 2025) — the lowest real estate rates in that region since Q4 2022. CFIUS filing fee per U.S. Treasury fee schedule. The 120–180‑day foreign timeline reflects CFIUS’s statutory 45+45+15‑day review structure plus state processes. AFIDA penalty structure per National Agricultural Law Center (October 2025) and Polsinelli (January 2025). CFIUS penalty ceiling per DLA Piper analysis, August 2025.

On top of these verified costs, ag attorneys who handle foreign‑involved transactions report that total legal and compliance fees — including state‑law opinions, multi‑entity structuring, AFIDA analysis, and CFIUS consultation — run significantly higher than a comparable domestic deal. The Wisconsin State Bar’s October 2025 analysis of §710.02 makes clear that even figuring out who qualifies as a “foreign person” under the statute requires significant legal work. And Bloomberg Law’s October 2025 analysis warns that participants should “expect USDA involvement and prepare for inquiries related to biosecurity measures, agricultural health risks, research affiliations, supply chain vulnerabilities, cybersecurity practices, and land‑use plans.”

Capital SourceTypical Rate (mid-2025, Seventh District)CFIUS Filing FeeClosing TimelineOngoing ReportingRegulatory RiskNon-Compliance Exposure
Domestic Lender (e.g., Farm Credit)7.02% – 7.63%N/A60–90 daysStandard bank covenantsLowStandard loan default
Foreign Equity FundOften 1–2 points lower (base)$7,500120–180 daysAFIDA filings, multi-entity accounting, federal auditHighAFIDA: up to 25% of FMV; CFIUS: up to $5M per violation

Even if the foreign base rate is lower, how much cheaper is that equity really once you stack the friction on top? For single‑site expansions where foreign terms aren’t dramatically stronger than the best domestic offer, the friction usually tips the math back toward staying local.

Cost ComponentDomestic Term Sheet ($3M, Farm Credit)Foreign Equity Fund ($3M)
Base Rate / Expected Return7.25%5.50%
CFIUS Filing Fee$0$7,500
Legal & Structuring (Multi-Entity Setup)$8,000 – $12,000$25,000 – $40,000
Ongoing Compliance (AFIDA, Audit, Reporting)Minimal (standard covenants)$5,000 – $8,000/year
Timeline to Close (Opportunity Cost)60–90 days120–180 days
Potential AFIDA/CFIUS Exposure (Risk-Adjusted)None<span style=”color:#CC0000″>Up to $750,000 (25% of $3M land FMV) + $5M CFIUS penalty risk</span>
True First-Year All-In Cost~$225,750**~$210,000 + $13,000–$48,000 friction = $223,000–$258,000

When Your Solar Lease Triggers Foreign Ownership Rules

This isn’t just about barns and freestalls. It runs straight through the new revenue streams many dairies are chasing.

Some dairy operations in the upper Midwest and Great Lakes region see utility‑scale solar ground‑lease offers ranging from roughly $800 to $1,500 per acre per year on 20–35‑year terms, depending on grid access and project scale. That’s income that doesn’t move with the milk price. But look at who’s behind the developer — a lot of “U.S.‑branded” solar and wind companies are ultimately owned by European utilities, Canadian pension funds, or Asian trading houses. A June 2025 Brownfield analysis noted that much of the foreign‑owned farmland in Texas — roughly 5.7 million acres — is already tied to timber and wind rather than traditional agriculture.

In a cap state like Wisconsin, a 25‑year ground lease on 150–200 acres may be treated as an “interest in agricultural land.” In a ban state, a long‑term lease tied to an adversary nation is dead on arrival. And as the table above shows: no energy carveouts in any of the top five dairy states. A January 2025 Polsinelli analysis specifically warned renewable energy developers that AFIDA penalties are now a real cost — failure‑to‑report fines can hit 25% of fair market value.

According to a December 2025 Dairy Business MEA report citing MarketIntelo research, the global dairy farm biogas market was valued at ~US$4.2 billion in 2024 and is projected to reach ~US$10.7 billion by 2033 at a 10.8% CAGR. The opportunity is real. But if foreign money is behind your digester, you need to know whether your state treats that site as an interest in land — and whether you’re close enough to a military base to trigger extra CFIUS scrutiny. Under AB 218’s proposed amendment, Wisconsin would add a ten‑mile buffer zone around military installations.

The Fondomonte Warning Shot

This might feel a world away from your freestall. It’s not.

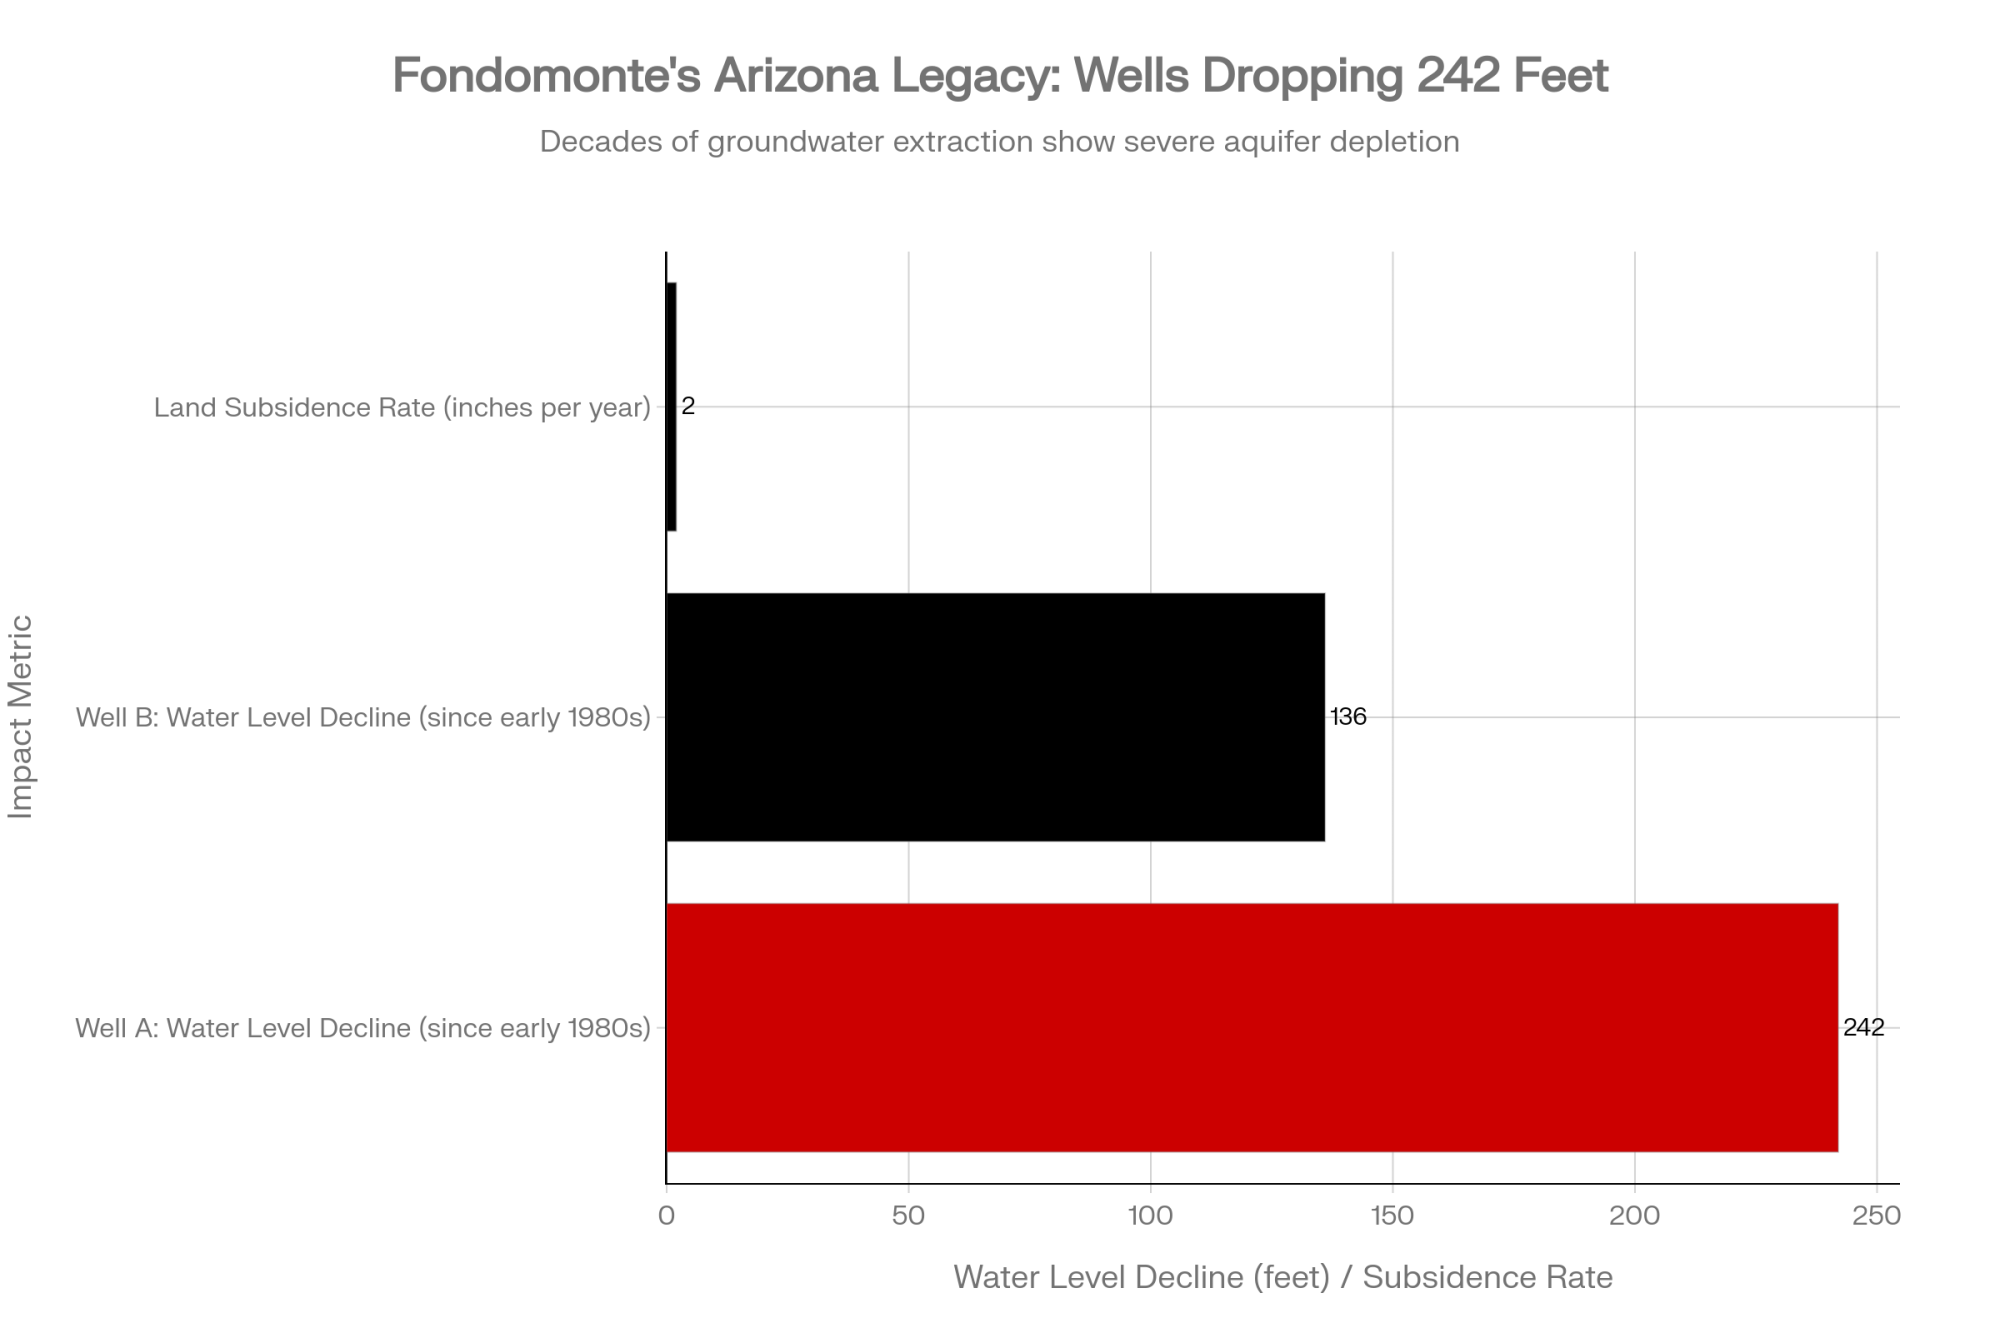
Fondomonte, a subsidiary of Saudi dairy giant Almarai, has been growing alfalfa in Arizona’s Ranegras Plain groundwater basin and shipping it overseas. According to an extensive Los Angeles Times investigation published December 27, 2025, well data tells a stark story: one well’s water level dropped 242 feet since the early 1980s; another declined 136 feet. Arizona’s chief hydrologist, Ryan Mitchell, told residents that current pumping “isn’t sustainable” and land is sinking as much as 2 inches per year in parts of the basin.

Arizona AG Kris Mayes filed a lawsuit alleging Fondomonte uses at least 36 wells and accounts for more than 80% of all pumping in the basin. The state had already terminated Fondomonte’s leases on 3,520 acres of state‑owned farmland after an Arizona Republic investigation revealed below‑market rates — about $83,000 annually for over 6,000 combined acres. Then, on January 9, 2026, Arizona’s Department of Water Resources designated a new active management area in the Ranegras basin — the state’s eighth — prohibiting additional irrigation of farmland. Fondomonte owns 22,873 acres in La Paz County.

Here’s what matters for your dairy: Fondomonte’s structure was legal when it began. A decade later, lease terminations, lawsuits, and a brand‑new AMA designation are reshaping what the company can do on land it owns and leases. A domestic company running the same heavy‑pump, export‑only model would’ve hammered the same aquifer. But most foreign‑ownership bills target who owns the land, not how they use it. That gap matters — and it won’t protect you when the political wind shifts.

The One Question You Can’t Afford to Skip

Before you decide whether your dairy should take foreign money, run every deal through this filter:

If this deal gets blocked, unwound, or challenged eighteen months from now, can my operation survive the fallout?

Don’t answer with your heart. Walk through the ugly versions.

ScenarioWhat HappensRisk Level If No Domestic Backup
Deal Blocked Before ClosingCFIUS flags the structure after 6 months, legal fees, steel orders placed. Foreign fund walks.High Risk — Can you activate a domestic term sheet on 30 days’ notice?
Deal Challenged After ClosingBarn is full, cows are milking, state tightens the cap. You’re forced to buy out foreign partner or refinance domestically under pressure.High Risk — Do you have $3M+ in emergency refinancing capacity?
Deal Becomes Political AnchorStructure is legal, but partner’s home country is all over the news. Co-op board, banker, and neighbors ask uncomfortable questions.High Risk — Are you prepared to carry reputational and credit risk for 10+ years?

Deal blocked before closing. You’ve spent six months, paid lawyers, maybe ordered steel. Then CFIUS flags the structure. The fund walks. Do you have a domestic lender with a live term sheet ready to step in?

Deal challenged after closing. The barn is full, the acres are in rotation. Then your state tightens the cap. Can you afford to buy out your foreign partner or refinance domestically on short notice? That’s what’s playing out in Arizona right now.

Deal becomes a political anchor. The structure is legal, but your partner’s home country is all over the news. Your co‑op board asks uncomfortable questions. Your banker quietly re‑assesses risk. Are you ready to carry that for a decade?

When foreign money is a preference — cheaper or more flexible, but not your only lifeline — you can price the regulatory risk and make a clear‑eyed call. When it’s a lifeline, you’re betting the farm on a political horizon nobody can predict.

What This Means for Your Operation

  • Nail down whether your deal truly touches land. Operating lines, equipment loans, and barn builds with domestic lenders usually don’t trigger foreign‑ownership rules. The moment a foreign party will own, lease, or hold security over your land — even indirectly — you’re in the regulated zone. Wisconsin’s statute covers direct and indirect interests.
  • Map the foreign “nexus” before you fall in love with the terms. Ask bluntly: who ultimately owns this fund, the developer or the lender? Is adversary‑nation capital in the stack? Vague answers are a warning sign, not an invitation to keep talking.
  • Know your state’s line in the sand. Use the five‑state table above as a starting point — then have your ag lawyer dig into your specific statutes before committing to any structure. California and New York have no restrictions today, but SB 1084’s unanimous passage (before the veto) and A3440’s introduction tell you where the current is running.
  • Price the friction into your cost of capital. Add CFIUS filing fees ($7,500 for most dairy‑scale deals), potential AFIDA exposure (0.1% of FMV per week for late filings), multi‑entity legal structuring, and ongoing compliance costs before declaring foreign capital “cheaper.” Compare that to a current domestic term sheet dated in 2025, not 2021.
  • Line up domestic options first—not as a backup. Talk to Farm Credit, your primary bank, and at least one other lender before you go deep with a foreign investor. If a foreign deal falls apart at the last minute, you want to be adjusting an existing domestic proposal rather than starting from scratch.
  • Think about succession and exit. A buyer pool that depends on foreign capital is a buyer pool you don’t fully control. Under current Wisconsin law, violators of the 640‑acre cap face forced divestiture within 4 years — AB 218 would cut that to 3 years.
  • Treat two‑entity structures as tools, not magic. Separating land and operations can keep some foreign deals alive. But the Wisconsin State Bar’s October 2025 analysis notes that even the “permitted purpose” exceptions under §710.02 require careful structuring. For smaller deals, a cleaner domestic structure at a slightly higher rate is often cheaper and safer.

Key Takeaways

  • The real question on foreign investment isn’t “is it legal?” It’s “can my dairy survive if this deal gets taken away after we’ve built around it?”
  • Foreign‑linked money now carries verified, concrete friction costs — a $7,500 CFIUS filing fee, AFIDA penalties up to 25% of FMV for non‑compliance, potential CFIUS penalties of up to $5 million per violation, timelines of 120–180 days, and multi‑entity structuring complexity — that must be added to your cost‑of‑capital math before you compare it to domestic options.
  • State laws and your partner’s home country matter as much as the rate and terms. California and New York have no restrictions today, but both saw unanimous or near‑unanimous legislative votes to add them — only a governor’s veto and committee timing stand in the way. Idaho, Texas, and Wisconsin already have restrictions with real teeth — and none of the top five dairy states carve out energy deals.
  • Domestic capital at 7% in the Seventh District looks expensive until you price in compliance friction and regulatory risk on the foreign side. That gap shrinks fast.
  • The Fondomonte case is a live example of what happens when foreign‑linked agricultural deals meet shifting regulatory ground — wells dropping 242 feet, an 80%‑of‑basin pumping allegation, and a brand‑new active management area imposed in January 2026.
  • Roughly 36 states now have foreign ownership restrictions on the books, and the list is still growing.

The Bottom Line

Most of these conversations won’t happen in a boardroom. They’ll happen right where this one started — around the kitchen table, after chores, with kids drifting in and out and tomorrow’s milking already on your mind. If foreign money helps you build what your dairy needs without putting that table at risk, it deserves a hard look. If it only works as long as politicians and regulators stand still, you’re better off tightening the plan and betting on capital you can count on when the rules shift again.

Complete references and supporting documentation are available upon request by contacting the editorial team at editor@thebullvine.com.

Learn More

The Sunday Read Dairy Professionals Don’t Skip.

Every week, thousands of producers, breeders, and industry insiders open Bullvine Weekly for genetics insights, market shifts, and profit strategies they won’t find anywhere else. One email. Five minutes. Smarter decisions all week.

NewsSubscribe
First
Last
Consent

80% Full or 95% Desperate: The $400,000 Difference in Dairy Expansion Timing

Expand at 80%: 28 months of cash runway. Expand at 95% = 8 months. Which farm survives the next milk price crash?

EXECUTIVE SUMMARY: Timing your expansion at 80% capacity versus 95% isn’t just about convenience—it’s a $400,000 decision that determines whether you’ll survive the next downturn. At 80% utilization, you have $400-600K working capital and 28 months of financial runway; at 95%, you’re down to $300K and 8 months before crisis hits. The hidden killer nobody’s calculating: heifer costs exploded from $1,800 to $4,000 between 2023 and 2025, adding an unbudgeted quarter-million to every expansion. Smart operators now work backwards from a 36-month timeline, securing heifer supplies before designing parlors. But here’s the plot twist—producers choosing NOT to expand are often outperforming expansion operations by 40%, using premium markets, cooperatives, and value-added processing to build margins without debt. This isn’t about getting bigger anymore; it’s about getting smarter with the assets you already have.

Dairy farm expansion strategy

I just came back from a producer panel in Madison, and—true to form—by the time coffee hit the table, we were deep into a debate: When’s the right time to expand? The folks from Texas mentioned USDA’s October 2025 figures—Texas added nearly 47,000 cows in the last twelve months. South Dakota? State data shows a 65% herd increase since 2019, thanks in part to Valley Queen’s ambitious processing expansion. And you can’t ignore Rabobank’s latest numbers: we’re talking billions in new dairy plant investment rolling out across the country through 2028. It’s a wild time for U.S. dairy.

But I noticed something as these success stories bounced around the room—nobody wanted to bring up the producers struggling under new debt loads or the expansions that triggered more stress than success. After reviewing cases with financial advisors, talking with university folks, and swapping stories with dairies from Georgia to Washington, I’m convinced we need a new framework for thinking about expansion. Let’s get practical.

The 80% Trigger—And Why Most Expansion Happens Too Late

Looking at this trend, it’s natural to assume the decision comes when the parlor’s maxed out, the labor’s grinding, and you’re racing against milk production efficiency limits. Michigan State University’s 2024 expansion analysis, along with similar work from Wisconsin’s Center for Dairy Profitability, reveals a different story. Their advice? Expand at 80% utilization—not after the wheels come off at 95%. When you do, your odds of profit skyrocket.

Here’s what I see in operations working at that 80% sweet spot:

  • Working capital sitting comfortably between $400,000 and $600,000 (not drained by constant cow turnover)
  • Debt-to-equity ratios below 0.5, so lenders trust you to ride out rough spots
  • Maybe 18–24 months’ cash cushion if things go sideways

But at 95%? Working capital has likely dropped below $300,000, debt pressures are building, and every new day at full tilt erodes your negotiating position. Lenders notice. Suddenly, rates creep up, terms get shorter, and flexibility disappears. This isn’t theoretical—producers in Iowa and New York both told me their latest refinancing offers came with “crisis” pricing, not partnership terms.

What’s particularly noteworthy is how that 80% number gives you time: time to fix bottlenecks, test labor models, and roll out changes before you’re under the gun. That breathing room is worth more than any construction discount you’ll ever get for waiting to expand.

The $400,000 Safety Net: Why 80% Capacity Expansion Timing Creates Financial Runway

Hidden Heifer Costs: The Expansion Killer in Plain Sight

What’s interesting here is how expansion plans rarely factor in the real price of replacements. CoBank’s October 2025 Dairy Quarterly puts current U.S. heifer inventories at a two-decade low—just shy of 3.9 million head. That’s about 18% lower than where we stood in 2018. And based on what I see at auctions and in dealer quotes around Wisconsin and Pennsylvania, a replacement heifer that cost $1,800 a couple of years back is now going for $3,500 to $4,000, with the best lines topping $5,000 on strong-herd sales.

USDA’s Livestock, Dairy, and Poultry Outlook supports this, showing heifer supply tightness through at least 2026. Plan for earlier recovery at your peril.

So if you’re modeling a jump from 300 to 450 cows, here’s what you’re really looking at:

The Quarter-Million Dollar Surprise Nobody Budgets For

Hidden Cost CategoryWhat You BudgetedWhat You’ll Actually Pay
Heifer Premium (150 head @ current market)$270,000 (@ $1,800/head)$525,000-$600,000 (@ $3,500-$4,000/head)
Additional Heifer Acquisition Cost+$255,000 to $330,000
Feed & Labor During 24-Month DevelopmentIncluded in operations+$50,000 (Cornell Pro-Dairy estimates)
Transition Health Management$5,000+$10,000-$15,000 (U of MN veterinary studies)
Overlapping Debt ServiceOften ignored+$35,000-$50,000
Total Unbudgeted:$350,000-$445,000

Bottom line? That quarter-million to nearly half-million dollar hole in your expansion budget isn’t a rounding error—it’s the difference between profit and bankruptcy. As Dr. Christopher Wolf at Cornell reminded us at a recent extension webinar, it’s not about filling the barn—it’s about whether you can afford to fill those stalls with cows that pay you back at today’s prices.

The Quarter-Million Dollar Surprise: Hidden Heifer Costs That Bankrupt Expansion Plans

Backward Planning: The 36-Month Expansion Timeline

From what I’ve seen in successful multisite operations across the Midwest and Northeast, the farms that ‘nail’ expansion don’t start with construction—they start three years out and work backwards.

Here’s how it plays out on farms that have grown without regrets:

  • At 36 months out, they’re assessing heifer facilities: can we build enough of our own, or do we need to secure outside sources? Consultants (think folks from Compeer Financial or university extension) are already involved, running stress tests and flagging operational or management gaps.
  • By 24 months, most of these producers are disabling beef semen programs and boosting sexed dairy semen use, which stings when you’re giving up $750–$900/hd for beef-dairy cross calves (just check any current USDA market report). Still, it’s necessary to provide the replacements.
  • 12 months out sees the start of construction—parlor design reflects actual heifer capacity, not fantasy projections. You’ll see operations using this window to bulletproof their management structure, too.

After the parlor goes live, it’s all about measured, gradual onboarding. Bringing heifers in over 12–16 weeks—rather than in one massive wave—gives everyone (cows and people) time to adapt, keeps butterfat performance on track, and helps maintain fresh cow management discipline.

One consultant put it to me like this: by the time you ‘decide’ to expand, if you’re doing it right, you’re really just executing the plan you made three years ago.

Designing for the Herd You’ll Have—Not the Cows You’ve Got

I visited a 400-to-650 cow Michigan operation that offers a simple but profound lesson: they built everything 50% bigger than needed—holding areas, feed alleys, manure storage, you name it. Wisconsin’s Dairyland Initiative supports this “150% Rule” in their 2024 planning guidelines, and the cost savings down the line are enormous.

Get this—building a larger holding pen initially costs $35,000–$50,000, while reconstructing a cramped one later runs $80,000–$120,000 and may force a multi-month shutdown. Operations from California (with tougher water board restrictions) to the Southeast (dealing with heat stress) should adapt the concept, but the “plan for growth” mindset seems universally valuable. Even Mountain West dairies dealing with seasonal water access and Southwest operations managing extreme summer temps are finding this forward-thinking approach pays dividends.

Modular barns—clusters of 250–350 stalls with independent ventilation—are growing popular in Idaho and Pennsylvania. You can add a new block without disrupting milk flow, which makes sense given the unpredictability of future herd size. Feed alleys and equipment, according to dealer experience and recent construction bids I’ve seen, cost more up front but save $100,000+ against retrofits later.

Building manure management for the next generation, not just today, is critical. One producer in central Wisconsin told me his “build only what you need now” approach meant a catastrophic $120,000 retrofit and 3 months of idle time when expansion couldn’t wait any longer.

Labor Is Now the True Bottleneck

Let’s talk labor, because nearly every operator I know admits it’s the limiting factor—sometimes more than parlor stalls or feed space. USDA’s 2025 Farm Labor Survey reports annual turnover rates near 40%, and Texas A&M’s economists calculate it costs $15,000–$25,000 every time you lose a trained hand. Think about it: that’s four to five cows’ worth of revenue lost every single year, just to churn.

I’m seeing operations adapt by leveraging automation—robotic milking, sort gates, feed pushers. The latest Lely and DeLaval systems, as deployed in California and New York herds, reduce labor needs up to 60% and pay for themselves in under two years if you’re in a tight labor market. This is transforming dairy farm management at every scale. And the non-wage elements—affordable housing, pickup shuttles, flexible shifts, pathways to supervisor roles—are finally getting attention. The University of Vermont’s 2024 dairy labor research suggests these perks cut turnover from 45% to 15% in pilot projects.

Big, multi-barn operations in the Midwest offer something else: real career ladders, so entry-level milkers can move up to shift lead or assistant manager roles as the farm grows. One HR director told me what keeps people isn’t just a fair hourly rate—it’s the chance to stick around and grow, plus an environment that respects their families and ideas.

The First Real Investment: Honest, Independent Analysis

Nearly every expansion I’ve seen succeed started with a $15,000–$35,000 commitment to serious, unbiased planning—a line item paid to consultants from Farm Credit, extension, or non-affiliated ag business planners. They’re not selling rotary parlors or advocating for any specific supplier. They’re just there to ask the brutal questions:

  • Would you expand if milk dropped $3/cwt for a year?
  • Can your buyer really take another 20% peak milk during the spring flush?
  • Does your current team have the management capacity for multisite or larger-scale operation, or are you training up as you go?

And here’s the value: good consultants model all this and often point out that your “8-year payback” plan will actually take 14 years under today’s risk profile. Sometimes, they even tell producers not to expand at all—which, believe it or not, is the advice that saves the most equity in the long run.

Choosing “Not to Expand”—and Winning Anyway

The Contrarian Play: Why NOT Expanding Often Beats Bigger-Herd Economics

What’s encouraged me most recently is meeting producers who took “no” for an answer after running the numbers—and ended up thriving. How? By focusing on premiums and efficiency, not just scale.

Consider organic transitions. The Organic Trade Association’s 2025 report shows price increases of 20–40% for certified milk. A2 milk and high-component lines command similar, sometimes higher, premiums. Even old-fashioned quality bonuses—holding SCC well under 100,000—mean an extra 40 to 60 cents per hundredweight at most Midwest and Northeast processors.

Out East, producer co-ops like Hudson Valley Fresh help members—regardless of herd size—earn meaningful premiums and negotiate better hauling and input deals. And Cornell’s Dairy Foods Extension has shown that on-farm cheese and yogurt ventures (with $150,000–$300,000 startup investment) routinely pay back in two to three years when executed well.

Don’t discount Vermont’s recovery model after 2015–17’s price crash. Instead of growing bigger, groups of family dairies leaned into direct-market sales, branded fluid milk, and value-added production. Their net margins—documented in Vermont Agency of Agriculture data—eclipsed many larger commodity peers.

A Farmer’s Framework for Deciding

For everyone I meet seriously eyeing expansion, here’s my basic checklist—honed from the best minds at Farm Credit, university extension, and my own seat-of-the-pants experience:

  • Stress test: How many months of negative cash flow can you truly weather? Most lenders want to see at least a year of history.
  • Scenario planning: Run the numbers for stable, down 12%, and down 15–20% price scenarios. Use current heifer prices and milk market conditions from sources like the USDA’s recent outlooks—never last year’s cheapest quotes.
  • Hidden costs: Don’t ignore transition losses (15–20% production dips are well-documented by Michigan State), overlapping debt, or retraining expenses.
  • Management readiness: Be honest—can your team adapt to delegation and documentation, or do you need to build that muscle before you break ground?
  • Alternatives analysis: Is there a premium brand, co-op, or processing venture you’re overlooking that could offer similar ROI with less debt risk?

If you’re short on any of those, slow down. Your farm’s resilience will depend on finding the right fit—not just the biggest number.

Looking Ahead: The Hard Truth About Smart Growth

Here’s what nobody wants to admit at those polite industry conferences: The era of “expand or die” is dead. It’s been replaced by “expand smart or die slowly.”

The data doesn’t lie. Based on Farm Credit lending data and recent expansion studies, operations expanding at 95% utilization with depleted working capital face substantially higher failure rates than those expanding from positions of strength. Farms that ignore the quarter-million-dollar heifer reality end up selling at distressed prices within five years. And those waiting for the “perfect moment” to expand? They’re still waiting while their neighbors either scaled strategically or pivoted to premium markets that pay double commodity prices.

The new reality is this: Smart growth beats fast growth. No growth beats dumb growth. And sometimes, the boldest move isn’t building bigger—it’s having the guts to stay exactly where you are and do it better than anyone else.

That 80% rule? It’s not just about timing. It’s about having enough oxygen in your operation to think clearly, plan strategically, and execute flawlessly. Because in today’s dairy economy, the difference between thriving and surviving isn’t the size of your herd—it’s the size of your margin for error.

And if that margin’s already gone? Well, maybe it’s time to stop focusing on expansion plans and start focusing on what actually makes money in this business. Because I’ll tell you what—it’s not always more cows.

KEY TAKEAWAYS

  • Your expansion trigger is 80%, not 95%—miss this and you’re $400,000 poorer: At 80% you have resources to plan; at 95% you’re making desperate decisions with 8 months runway instead of 28
  • Budget $4,000 per heifer, not $1,800—then add $100,000 for surprises: The quarter-million dollar gap between planned and actual heifer costs is bankrupting more expansions than milk prices
  • Winners plan backwards from a 36-month timeline: Secure heifer genetics at -24 months (yes, give up those $900 beef calves), build replacement inventory at -18 months, break ground at -12 months
  • The highest ROI might be NOT expanding: Producers capturing organic premiums (20-40%), joining cooperatives, or adding on-farm processing are beating expansion economics by staying exactly where they are

Complete references and supporting documentation are available upon request by contacting the editorial team at editor@thebullvine.com.

Learn More:

The Sunday Read Dairy Professionals Don’t Skip.

Every week, thousands of producers, breeders, and industry insiders open Bullvine Weekly for genetics insights, market shifts, and profit strategies they won’t find anywhere else. One email. Five minutes. Smarter decisions all week.
NewsSubscribe
First
Last
Consent

The Great Dairy Migration: How Regional Economics Are Reshaping America’s Milk Map

Kansas milk production surges 15.7% while traditional dairy states bleed $178,000 annually per 1,000-cow operation. Your location is killing profits.

Here’s an industry secret that the National Milk Producers Federation and state dairy associations don’t want you to discover: While they’ve been selling you the romantic notion of “traditional dairy heritage,” the brutal mathematics of regional profitability just exposed a $12.70 per hundredweight chasm between winners and losers. California posted net returns of +$5.42 per cwt while Michigan bled -$7.28 per cwt—that’s $178,000 annually, vanishing from a 1,000-cow operation before you even consider the compounding effects over decades.

But here’s what should terrify every dairy professional reading this: The same industry publications that celebrate “family dairy heritage” systematically ignore the geographic revolution reshaping American milk production. While you’ve been optimizing feed conversion ratios to squeeze out marginal gains, entire regions have been constructing cost advantages that are so devastating they make your on-farm improvements look like rearranging deck chairs on the Titanic.

The uncomfortable question that the Wisconsin Dairy Alliance and Pennsylvania Dairy Promotion Program won’t address: Why are their organizations still promoting expansion in regions where the fundamental economics guarantee failure? May 2025 production data reveals Kansas exploding with 15.7% growth while traditional strongholds like California declined 1.8%. Yet where’s the honest discussion from these legacy dairy organizations about what this geographic disruption really means for your operation’s survival?

This isn’t about preserving dairy nostalgia—it’s about confronting an industry establishment that profits from keeping you anchored to inefficient locations while smart money floods toward regions with systematic competitive advantages.

Why This Global Realignment Matters for Your Operation

The national average cost per hundredweight hit $23.60 in 2024, delivering a modest $1.42 per cwt net return. But this aggregate figure masks a regional profitability crisis that should force every serious dairy professional to question everything they’ve been told about optimal dairy geography. Feed costs alone represent 48% of total production costs globally, while labor expenses are projected to reach a staggering $53.5 billion in 2025—a 9.5% surge since 2023.

Regional cost differentials aren’t statistical curiosities—they’re the difference between building wealth and bleeding equity. When transportation costs alone increased 21% in one year, from 51 cents to 62 cents per cwt, operations shipping milk beyond 50 miles effectively pay a “hidden tax” of 35-93 cents per cwt. For a 1,000-cow operation, this transportation burden can exceed $164,000 annually in completely avoidable expenses.

Global Context That Changes Everything: While U.S. producers fight over shrinking margins, EU milk production is forecasted to decline by 0.2% to 149.4 million metric tons in 2025, primarily due to environmental regulations. This creates massive export opportunities for strategically positioned U.S. operations, as the U.S. exports nearly one-fifth of its dairy components, with Mexico, Canada, and China accounting for about 40% of total U.S. dairy export value. However, trade volatility, such as China’s 84% tariff on whey exports, demonstrates how quickly global competitive advantages can shift.

The Scale Economics Truth That Demolishes Industry Mythology

Let’s destroy the most dangerous myth perpetuated by the American Dairy Association and other heritage organizations: that efficient small-scale operations can compete with modern economies of scale.

USDA Economic Research Service data exposes a truth so stark it should end every debate about farm size strategy: the average total cost per 100 pounds of milk is $42.70 for herds under 50 cows versus $19.14 for farms with 2,000+ cows. That $23.56 per cwt differential creates an $83,220 annual viability gap for a 500-cow operation—before considering any regional cost factors.

This isn’t a gradual trend—it’s an economic death sentence for mid-size operations clinging to outdated scale assumptions.

Herd Size CategoryAverage Total Cost per 100 lbsCompetitive Reality
Under 50 cows$42.70 per cwtFinancial death spiral
2,000+ cows$19.14 per cwtCompetitive baseline
Cost Differential$23.56 per cwt$83,220 annual gap for 500-cow operation

Here’s the question that should keep every traditional dairy organization board member awake tonight: If your members’ operations aren’t positioned to achieve this scale advantage, how long can they survive while competitors capture $23.56 per cwt systematic advantages through sheer operational size?

Regional Profitability: The Net Return Reality That Exposes Everything

Regional dairy profitability varies dramatically across states, with California leading at +$5.42/cwt while Michigan faces -$7.28/cwt losses

The dairy industry’s regional cheerleading organizations have been masking a profitability bloodbath that demands an immediate strategic response.

While the national narrative celebrates dairy’s return to profitability, state-level data reveals a severe geographic divide that should force every producer to recalculate their location strategy immediately.

State2024 Net Returns per cwtAnnual Impact (1,000-cow operation)
California+$5.42+$76,000 profit advantage
Iowa+$1.40+$19,600 profit advantage
Kentucky+$1.13+$15,820 profit advantage
Wisconsin-$0.04-$560 loss
New York-$1.46-$20,440 annual loss
Indiana-$4.60-$64,400 annual loss
Pennsylvania-$7.06-$98,840 annual loss
Michigan-$7.28-$101,920 annual loss

The brutal mathematics: A Michigan operation starts yearly at $12.70 per cwt behind California—that’s $178,000 annually before considering any management differences. Over a typical 20-year facility depreciation period, this location disadvantage compounds to $3.56 million in lost competitive advantage.

Why This Matters for Your Operation: These aren’t temporary market fluctuations—they represent structural cost disadvantages that compound annually. Pennsylvania and Michigan operations suffered consistent losses even as the national average improved, indicating that their fundamental cost structures are systematically uncompetitive while traditional dairy organizations in these states continue promoting local expansion.

Labor Economics: The 25% Cost Category That’s Bankrupting Traditional Regions

Here’s an industry reality that the United Farm Workers and state agricultural labor organizations desperately want to obscure: regional labor regulations are creating massive competitive gaps that are driving the geographic realignment we’re witnessing.

Labor costs represent approximately 25% of total dairy farm operating expenses nationally, but regulatory variations create systematic advantages that dwarf any efficiency improvement you can achieve through management. Labor expenses are projected to explode to $53.5 billion in 2025, representing a 9.5% surge since 2023.

RegionAverage Hourly Wage (2025)Regulatory Burden Reality
National Average$19.52Baseline comparison
Wisconsin$18.34 (range: $11.40-$23.54)Moderate regulatory environment
California$17.93 (range: $11.15-$23.01)Devastating regulatory overhead
New York$15.50-$17.00 minimumEscalating regulatory costs

But wage rates tell only a fraction of the story. California’s agricultural labor regulations create layers of hidden costs that make wage comparisons irrelevant. Starting January 2025, California operations must compensate workers for rest periods, provide three days of paid sick leave for employees working 30+ days annually, and pay overtime for work exceeding 8 hours daily or 40 hours weekly.

The Automation Imperative

Strategic automation can reduce annual labor costs per cow from $375 to $165—a 56% reduction that achieves payback in under two years during labor shortages. Robotic milking systems, requiring $200,000-$300,000 per unit investment, offer 7-year payback periods compared to over 15 years for conventional parlor upgrades while boosting production by 15-20%.

But here’s the infrastructure reality that regional development organizations won’t admit: The Midwest and Northeast support automation adoption better due to established electrical infrastructure and equipment dealer proximity. Emerging dairy regions like Texas and Kansas often lack the necessary infrastructure to support advanced automation systems.

Why This Matters for Your Operation: If your expansion region can’t support the automation essential for competitive labor costs, you’re not capturing regional advantages—you’re creating hidden operational disadvantages that compound over decades.

Feed Economics: Global Market Forces Reshaping Regional Competition

Feed expenses represent over 40% of total operating costs nationally, but global feed costs surged 19% on average from 2019 to 2024, with feed accounting for at least 48% of total production costs in major dairy regions.

2025 Feed Price Projections:

  • Corn: $4.20-$4.39 per bushel
  • Soybean Meal: $300-$310 per ton
  • Alfalfa Hay: $170-$180 per ton
RegionCorn ($/bushel)Alfalfa Hay ($/ton)Hidden Cost Reality
Wisconsin$4.4$160Competitive feed access
New York$3.8$226$66/ton alfalfa penalty
IowaMarket rates$105Superior alfalfa advantage
CaliforniaMarket rates$251$146/ton alfalfa penalty vs. Iowa

The Critical Insight: New York’s apparent corn advantage evaporates when alfalfa costs $66 per ton more than Iowa. For a 1,000-cow operation consuming 8-10 tons of alfalfa daily, this difference costs $192,000-$240,000 annually in feed expenses alone.

Global Feed Market Disruption: While U.S. producers struggle with regional variations, international feed market volatility creates additional competitive pressures. Global feed costs rising 19% from 2019-2024 reflect broader commodity market disruption affecting all major dairy regions, including China, Australia, and Argentina. Strategic U.S. producers can leverage this global supply chain disruption by positioning near domestic feed production centers and processing infrastructure.

Advanced Feed Efficiency Technology

Precision feeding systems and AI-driven ration optimization can cut feed costs by 5-10% while maintaining or improving production. Advanced strategies focusing on overall feed efficiency can save up to $470 per cow annually.

Why This Matters for Your Operation: Feed logistics optimization requires systematic analysis of total delivered costs rather than commodity price comparisons like optimizing dry matter intake for peak lactation cows. Regional processing proximity increasingly determines profitability more than on-farm efficiency alone.

Water and Utilities: The Infrastructure Crisis Traditional Regions Won’t Address

Here’s a cost category that exposes traditional dairy regions’ long-term viability crisis: water and utility access.

California’s Water Cost Reality:

  • Application fees: $5,000-$811,000 based on acre-feet per year
  • Annual permit fees: $350 plus $0.12 per acre-foot over 10 acre-feet
  • Water quality fees for CAFOs increased 5.3-5.5% in 2024-25

Compare this to Idaho’s water right rentals increasing from $23 to $33 per acre-foot in 2025—a difference exceeding $50,000 annually for large operations.

Regional Utility Cost Variations:

  • Natural Gas: West (-6%), South (-4%), Northeast (+1%), Midwest (+11%)
  • Electricity: U.S. average residential price projected +2% to 16.8 cents per kWh

That Midwest natural gas increase of 11% hammers traditional dairy regions during winter heating months, while California’s renewable energy transition creates compounding cost pressures.

Technology Integration: The Survival Imperative Reshaping Regional Competitiveness

Let’s confront the conservative dairy establishment’s technology adoption crisis with unforgiving ROI data.

Modern dairy technology adoption has evolved from optional enhancement to survival-critical requirement. The dairy industry’s historically conservative approach to automation is now proving to be a competitive death sentence for operations lacking strategic vision.

TechnologyInvestmentROI PerformanceStrategic Reality
Robotic Milking Systems$200,000-$300,0007-year payback, 15-20% production increaseSurvival-critical
Automated MonitoringVariable$32,611 annual ROI, $668,000 added revenueImmediate advantage
Precision FeedingVariable$137 per cow annual profit, 18% waste reductionEfficiency multiplier

The Geographic Technology Divide

Regional infrastructure determines implementation feasibility more than most producers realize. The Midwest and Northeast support automation adoption better due to the proximity of established electrical infrastructure and equipment dealers.

The uncomfortable reality: Despite rapid growth, emerging dairy regions like Texas and Kansas often lack the necessary infrastructure to support advanced automation systems. This creates hidden implementation costs that must be factored into expansion decisions.

Global Technology Adoption Context: While U.S. dairy technology adoption lags behind precision agriculture sectors, international competitors are rapidly implementing Industry 4.0 frameworks combining robotics, AI, IoT, and big data as main enablers. Despite production constraints, European operations maintain technological superiority that U.S. producers must match to compete in global export markets.

Capital Investment and the Federal Tax Cliff

MetricConventional ParlorRobotic Milking System
Initial Investment$150,000$200,000-$300,000
Annual Labor Savings$0$210 per cow
Milk Production Increase0%15-20%
Payback Period (Years)15+7
Annual ROI after Payback$-$160,600

Here’s a policy disaster that will reshape investment decisions through 2027: the systematic destruction of equipment depreciation benefits.

New Facility Construction Costs (2025):

  • Robotic Milking Facilities: $14,000-$15,000 per stall
  • Individual Robotic Systems: $200,000-$300,000 per unit
  • Freestall Barns: $3,000-$3,500 per stall
Bonus depreciation benefits are rapidly phasing out, reducing tax deductions for dairy equipment purchases by $200,000 since 2022

The Tax Policy Destruction Timeline: Bonus depreciation dropped to 60% in 2025, reaching 0% by 2027. A $500,000 robotic milker purchased in 2025 yields only a $300,000 deduction compared to the full $500,000 in 2022.

Federal Estate Tax Cliff: The federal estate tax exemption drops by 50% to approximately $7 million per individual on January 1, 2026. For family operations with significant land holdings, this could force asset sales to cover potential 40% taxes on values exceeding the lowered exemption.

Global Export Opportunities: The Competitive Advantage Traditional Regions Are Missing

Here’s the strategic context that state dairy organizations systematically ignore: global production constraints create export opportunities that efficient U.S. operations can capture.

International Market Disruption:

  • EU milk production is forecasted to decline by 0.2% to 149.4 million metric tons in 2025 due to environmental regulations
  • The U.S. exports nearly one-fifth of dairy components, primarily non-fat solids
  • Mexico, Canada, and China account for about 40% of total U.S. dairy export value

However, trade volatility introduces strategic risks: China’s 84% tariff on whey exports demonstrates how quickly global competitive advantages can shift. However, skim-solids basis exports remained strong, with high global prices for butter and Cheddar cheese supporting higher fat-basis exports in 2024.

Why This Matters: Efficiently positioned U.S. operations with superior cost structures and modern technology can capture market share from constrained international competitors. Regional positioning near modern processing infrastructure becomes critical for export market access and compliance with quality standards.

Strategic Decision Framework: Your 90-Day Emergency Response Plan

The data reveals systematic regional advantages that demand immediate strategic response, not gradual adaptation.

Week 1-2: Regional Cost Crisis Assessment

  • Calculate current per-cwt costs across all major categories using USDA cost estimation methodologies
  • Identify the three most promising expansion regions based on processing proximity and regulatory environment
  • Quantify transportation costs using the 21% increase benchmark in hauling charges

Week 3-4: Technology Survival Assessment

  • Evaluate automation ROI using verified performance data: 7-year payback for robotic systems
  • Calculate remaining bonus depreciation benefits for 2025 equipment purchases (60% current rate)
  • Assess regional infrastructure capability for technology integration

Week 5-8: Financial Reality Modeling

  • Project 20-year net present value for current location versus expansion alternatives
  • Factor estate tax implications of the 2026 exemption reduction (50% decrease)
  • Model technology adoption urgency before tax incentive elimination

Week 9-12: Strategic Implementation

  • Develop implementation roadmap for identified opportunities
  • Secure financing commitments before tax cliff impacts
  • Establish processor relationships in competitively positioned regions

ROI Calculation Reality: A $5 per cwt regional advantage translates to $70,000 annually for a 1,000-cow operation. Over 20 years, that will result in a competitive advantage of $1.4 million before considering the compound effects of reinvestment.

The Bottom Line: Your Geographic Destiny Is Being Decided Right Now

Remember that explosive Kansas production increase of 15.7% we opened with? That wasn’t market randomness—it was the visible result of systematic regional advantages that strategic producers recognized and leveraged while traditional dairy organizations kept their members anchored to failing conventional thinking.

The three unavoidable truths this analysis exposes:

First, regional cost advantages compound faster than any on-farm efficiency improvement you can achieve. While you’re optimizing conception rates to improve reproductive efficiency, entire regions are constructing $5+ per cwt structural advantages that dwarf individual farm improvements. The national average cost per cwt of $23.60 masks regional variations that create $178,000 annual profit swings for 1,000-cow operations.

Second, the technology adoption timeline has collapsed beyond most producers’ adaptation capacity. Labor costs represent 25% of total dairy farm operating expenses and are projected to reach $53.5 billion in 2025, making automation adoption survival-critical rather than optional. Strategic automation can reduce annual labor costs per cow from $375 to $165—a 56% reduction that pays for itself in under two years.

Third, global market disruption creates permanent strategic windows that reward the prepared. EU production decline of 0.2% to 149.4 million metric tons creates export opportunities for strategically positioned U.S. operations. The federal estate tax exemption drops by 50% on January 1, 2026, while bonus depreciation continues to be eliminated through 2027. Regional processing infrastructure investments are creating permanent competitive advantages for strategically positioned operations.

Your Emergency Action Imperative:

Create a spreadsheet comparing your current location against three promising expansion regions across all cost categories—labor, land, feed, utilities, taxes, and regulatory compliance. Calculate the per-cwt differential for each category and multiply by your annual production to quantify the real dollar impact using USDA cost estimation methodologies.

Scale economies dramatically reduce dairy production costs, with large farms enjoying a $23.56/cwt advantage over small operations

Here’s your final challenge to every traditional dairy organization promoting “local heritage”: If current USDA data shows herds under 50 cows costing $42.70 per cwt versus $19.14 for 2,000+ cow operations, and regional variations create additional $12+ per cwt differentials, how can they ethically continue promoting expansion in systematically disadvantaged regions while competitors capture advantages that compound for decades?

The great dairy migration is accelerating based on verifiable economic reality, not heritage nostalgia. Your analysis will reveal whether you’re positioned for profitable growth or anchored to increasingly expensive geography that traditional dairy organizations won’t honestly discuss. The producers who dominate the next decade won’t be those perfecting yesterday’s systems in yesterday’s locations. They’ll be the ones who recognize that regional competitive advantages determine long-term viability more than any single management practice.

Don’t let industry romanticism about dairy heritage blind you to economic reality. The numbers don’t care about your grandfather’s legacy—they only reward profitable positioning. Make sure your next strategic decision aligns with mathematical truth rather than geographic sentiment that costs $178,000 annually.

The dairy industry’s geographic realignment is rewriting regional competitiveness rules based on documented cost structures and production shifts. Position yourself to profit from this transformation rather than become a footnote in someone else’s success story.

KEY TAKEAWAYS

  • Scale Economics Reality Check: USDA data proves operations under 50 cows face $23.56 per cwt cost disadvantage versus 2,000+ cow facilities—that’s $83,220 annually for 500-cow operations, making strategic expansion survival-critical rather than optional growth
  • Geographic Profit Destruction: Traditional dairy strongholds like Michigan (-$7.28 per cwt) and Pennsylvania (-$7.06 per cwt) create systematic competitive disadvantages totaling $178,000 annually for 1,000-cow operations compared to California’s +$5.42 per cwt returns
  • Automation Investment Urgency: Strategic automation reduces annual labor costs per cow from $375 to $165 (56% reduction), with robotic milking systems offering 7-year payback versus 15+ years for conventional parlors, plus 15-20% production increases
  • Tax Policy Cliff Crisis: Bonus depreciation drops to 60% in 2025 and reaches 0% by 2027, while federal estate tax exemption cuts by 50% January 1, 2026—a $500,000 robotic milker yields only $300,000 deduction in 2025 versus full $500,000 in 2022
  • Transportation Cost Hidden Tax: Milk hauling charges increased 21% annually (51¢ to 62¢ per cwt), creating 35-93¢ per cwt “hidden tax” for operations shipping beyond 50 miles—strategic processor proximity now determines profitability more than feed conversion efficiency

EXECUTIVE SUMMARY

The dairy industry’s most sacred assumption—that traditional dairy states offer optimal production environments—just got demolished by USDA data revealing a devastating $12.70 per hundredweight profitability chasm between regions. While Wisconsin Dairy Alliance and Pennsylvania Dairy Promotion Program continue promoting local expansion, California operations post +$5.42 per cwt net returns while Michigan bleeds -$7.28 per cwt—creating $178,000 annual profit swings for 1,000-cow operations. Scale economics data exposes an even more brutal reality: herds under 50 cows cost $42.70 per cwt versus $19.14 for 2,000+ cow operations, representing an $83,220 annual viability gap for mid-size producers. With labor costs exploding to $53.5 billion in 2025 (9.5% increase) and transportation expenses jumping 21% annually, strategic regional positioning now trumps on-farm efficiency improvements. Global market disruption—including EU production declining 0.2% due to environmental regulations—creates massive export opportunities for strategically positioned U.S. operations with superior cost structures. The federal estate tax exemption drops 50% on January 1, 2026, while bonus depreciation phases out through 2027, creating urgent strategic windows for expansion decisions. Calculate your current location’s per-cwt disadvantage immediately—your geographic destiny is being decided right now, not when market pressure forces reactive decisions.

Complete references and supporting documentation are available upon request by contacting the editorial team at editor@thebullvine.com.

Learn More:

The Sunday Read Dairy Professionals Don’t Skip.

Every week, thousands of producers, breeders, and industry insiders open Bullvine Weekly for genetics insights, market shifts, and profit strategies they won’t find anywhere else. One email. Five minutes. Smarter decisions all week.

NewsSubscribe
First
Last
Consent
Send this to a friend