Archive for Dairy Farm Profitability – Page 4

Your $1,200 Beef Calves Are Worth Protecting – And Now You Actually Can

Beef crosses went from $50 to $1,200 in three years. Smart producers aren’t asking ‘how long will this last?’—they’re asking ‘how do I protect it?’ July’s changes made it possible.

Executive Summary: Beef income exploded from 5% to 25% of dairy revenue in just three years—that’s $650,000+ annually for a typical 500-cow operation—yet most producers are protecting their milk while leaving their beef income completely exposed. History shows cattle markets crash hard every 5-8 years, with potential losses exceeding $200,000 that can force operations to delay expansion or exit entirely. The breakthrough came July 2025 when USDA finally fixed LRP insurance for dairy, valuing beef-cross calves at their real $1,200-1,370 price instead of the insulting $275 coverage that made insurance worthless. After 35-55% government subsidies, comprehensive protection costs just $6,200 annually—about what you spend on two months of mineral supplement. October’s 11.5% price drop in 12 days isn’t normal market movement; it’s volatility returning, and smart producers are locking in protection now while it’s still affordable. Whether you choose insurance, contracts, or another approach, this guide provides the practical roadmap to protect the beef income that’s become essential to your operation’s future.”

If you’ve been to any dairy meetings lately—whether it’s in Wisconsin or Pennsylvania—you know the conversation has shifted. Sure, we’re still talking about milk prices and feed costs, because those never go away. But here’s what’s interesting: everywhere I go, the main topic is beef-on-dairy calves trading at $1,200 a head. And more importantly, everyone’s wondering how long this can last.

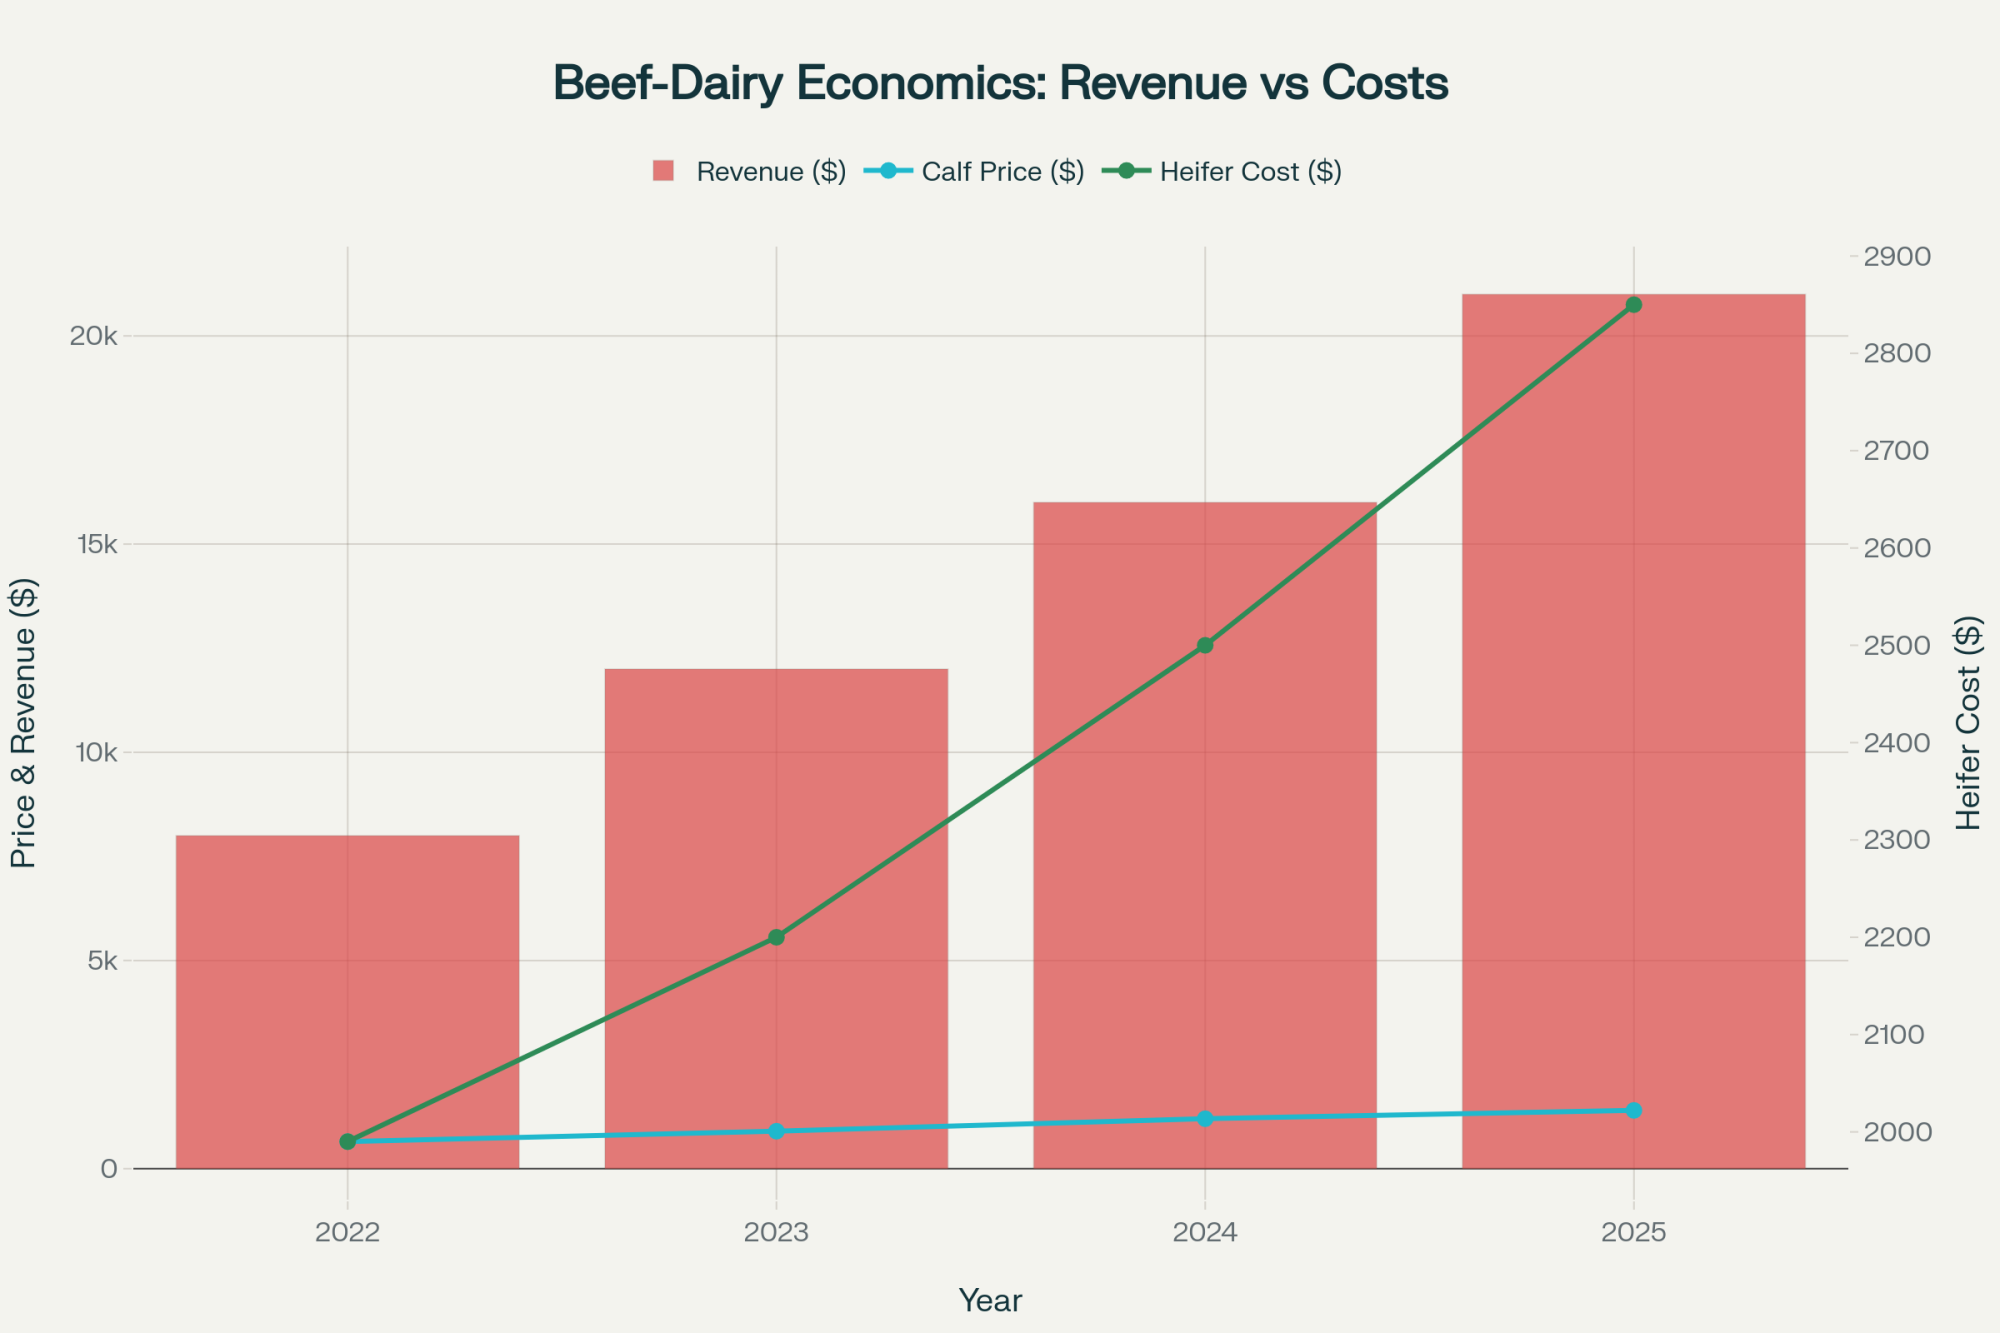
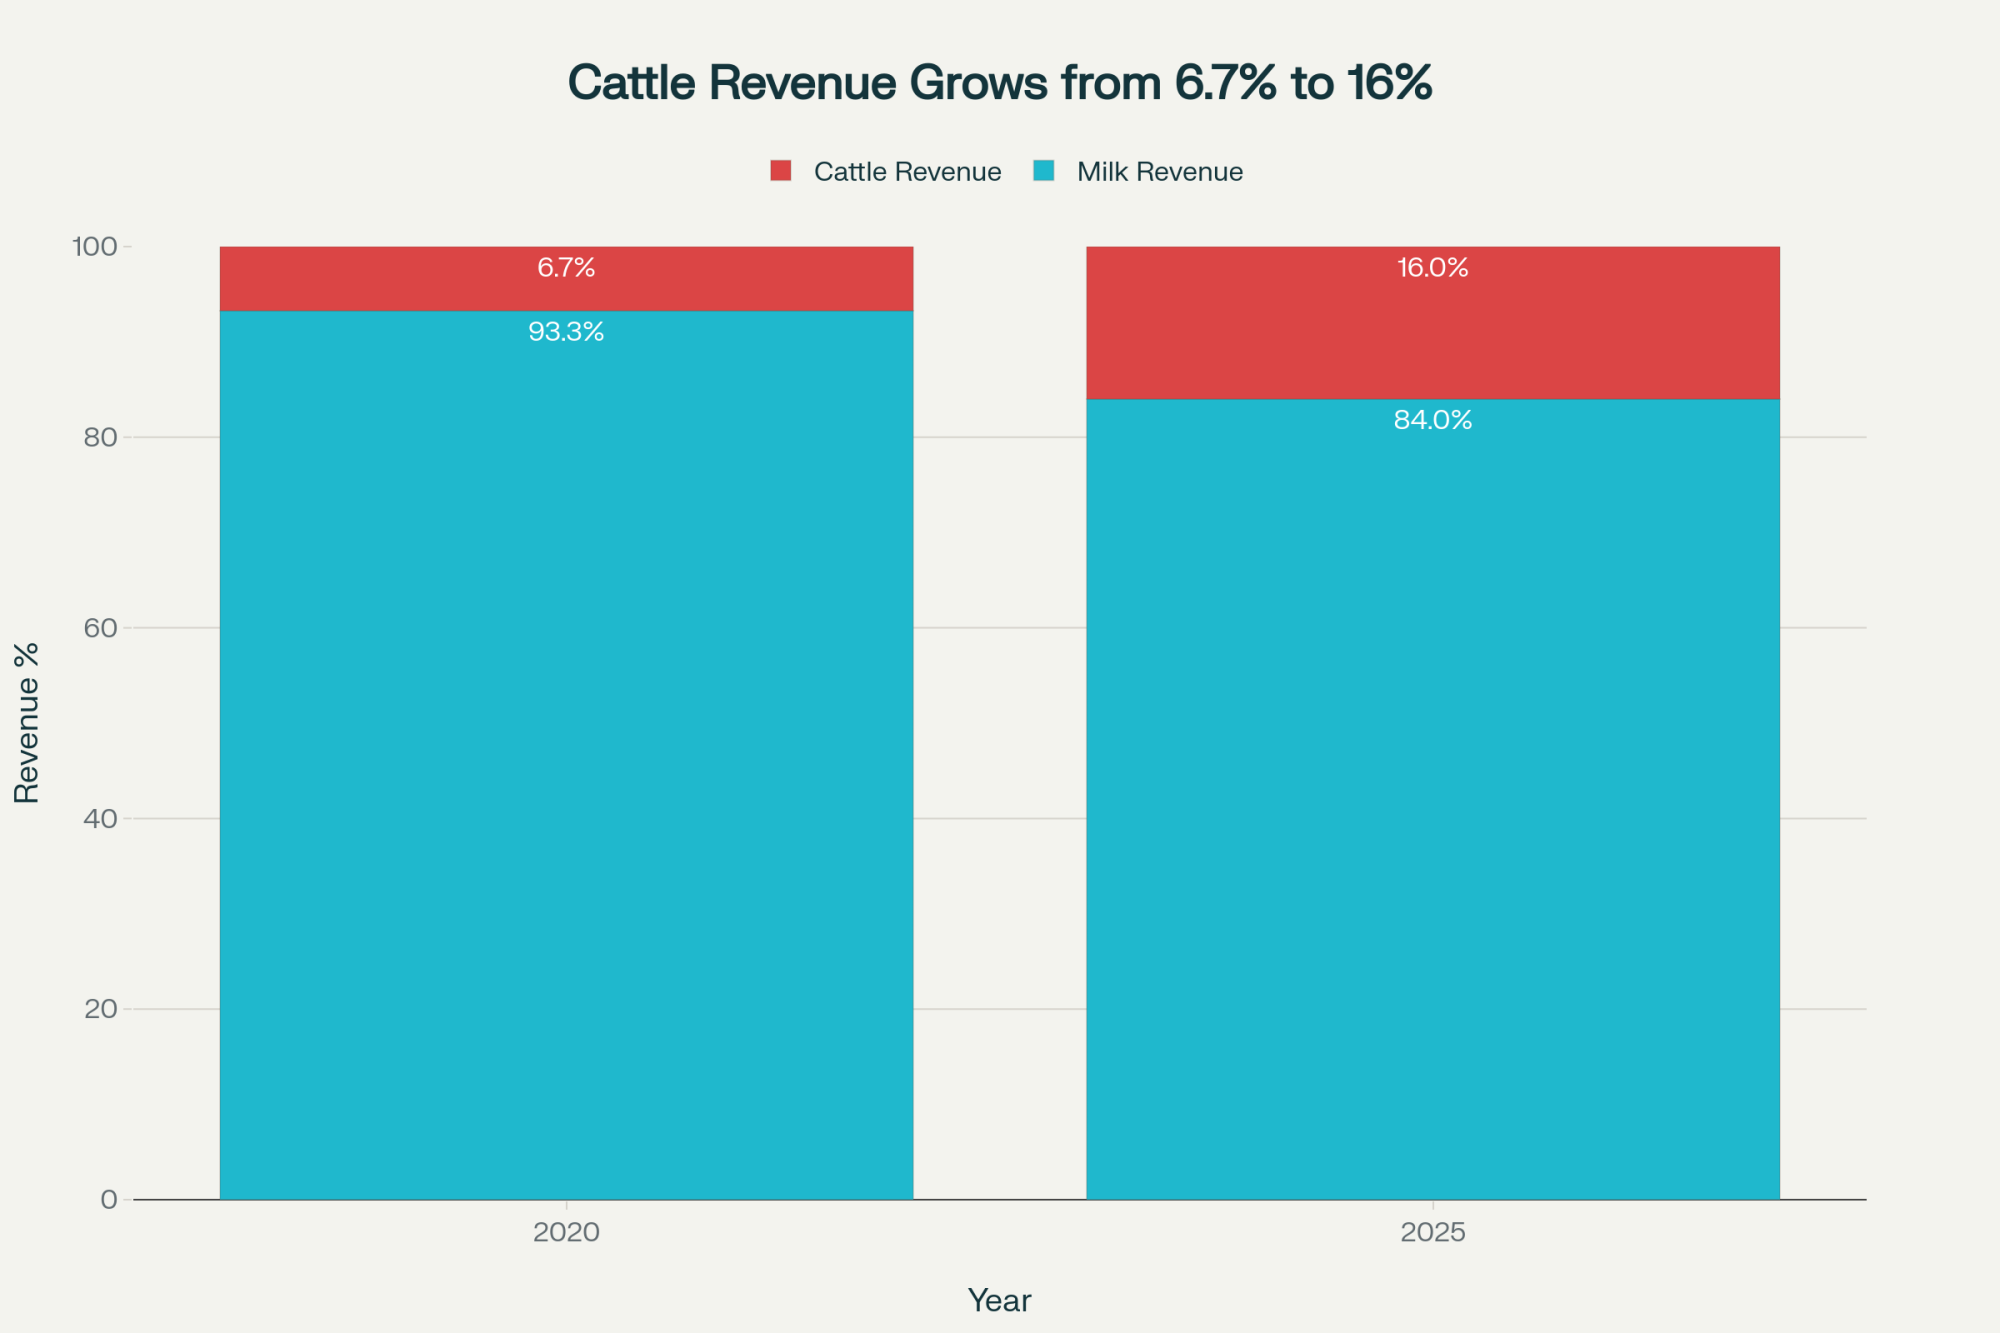
What I’ve found is we’re living through one of the most significant transformations in modern dairy. In just three years, beef income has gone from being this minor thing—you know, maybe 5-10% of revenue when we were lucky to get fifty bucks for a Holstein bull calf—to representing 20-25% of total farm income for operations that have really embraced beef-on-dairy breeding. University of Wisconsin Extension has been tracking this, and their analysis aligns with what USDA market reports show.

“We went from dreading bull calves to actually planning our cash flow around them. It’s a complete mental shift.”
— Wisconsin dairy producer

Here’s something worth thinking about: A typical 500-cow dairy that’s generating, say, $3 million in milk sales can now add $750,000 or more from beef-on-dairy calves and cull cows. That’s not pocket change—that’s genuine business diversification. Yet many of us are still approaching this revenue stream the way we always have, which might not be enough given these new market dynamics.

What’s encouraging is that, starting July 1, 2025, the USDA restructured its Livestock Risk Protection program to better align with what we actually need. You can find all the details in their Product Management Bulletin PM-25-028 if you want to dig into the specifics. But I’ll be honest—these aren’t simple programs. There’s definitely a learning curve.

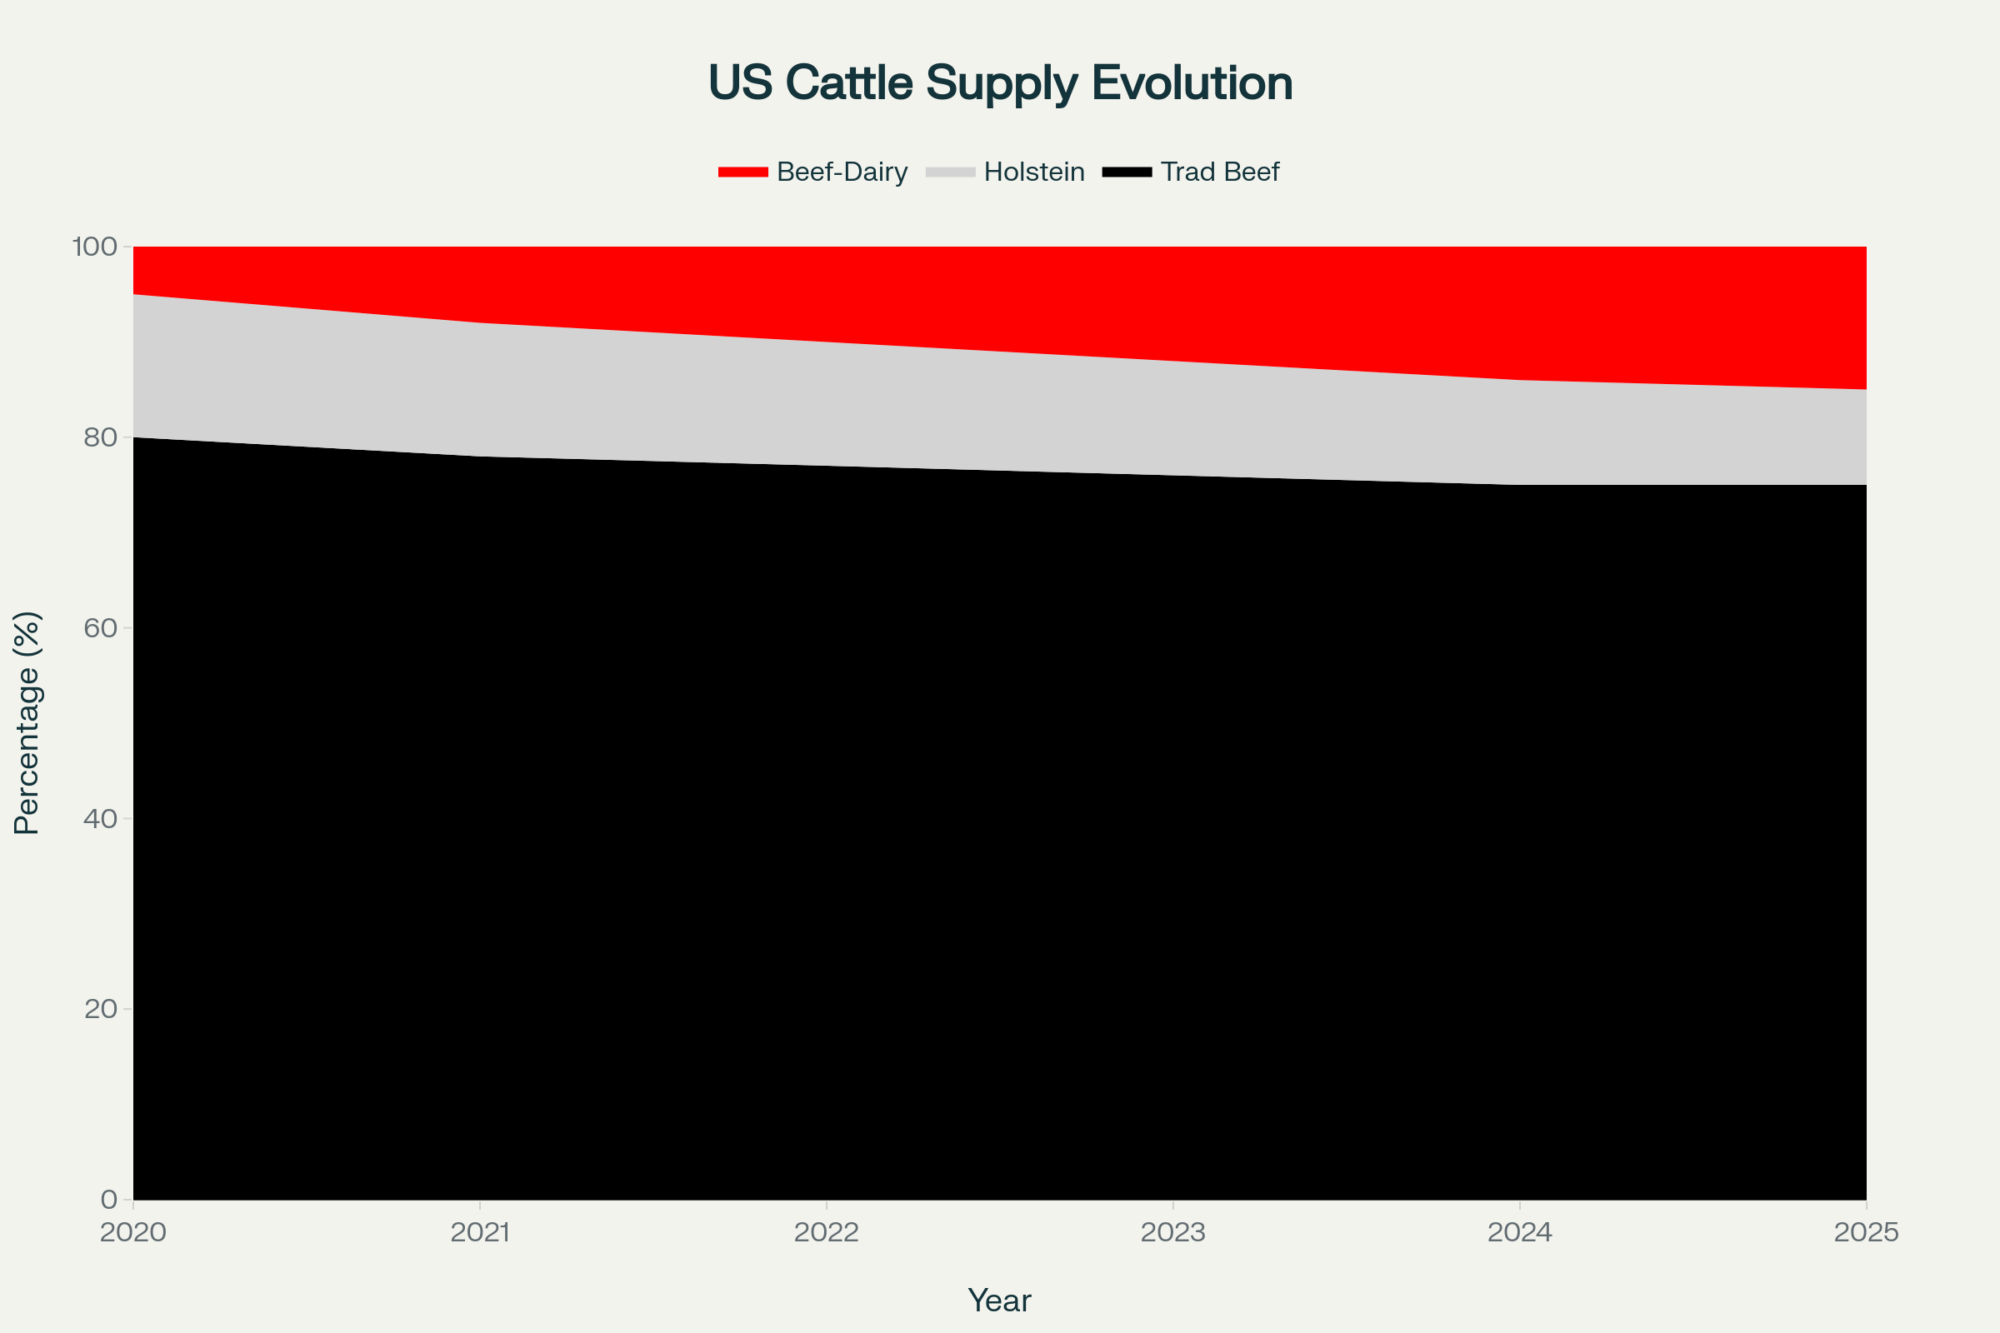
The Beef-Cross Revolution: From $50 to $1,200 in Three Years – This isn’t gradual growth, it’s a complete transformation of dairy economics. Andrew says this chart should be on every dairy farm’s office wall as a reminder that diversification isn’t optional anymore

How We Got Here (And Why It Matters)

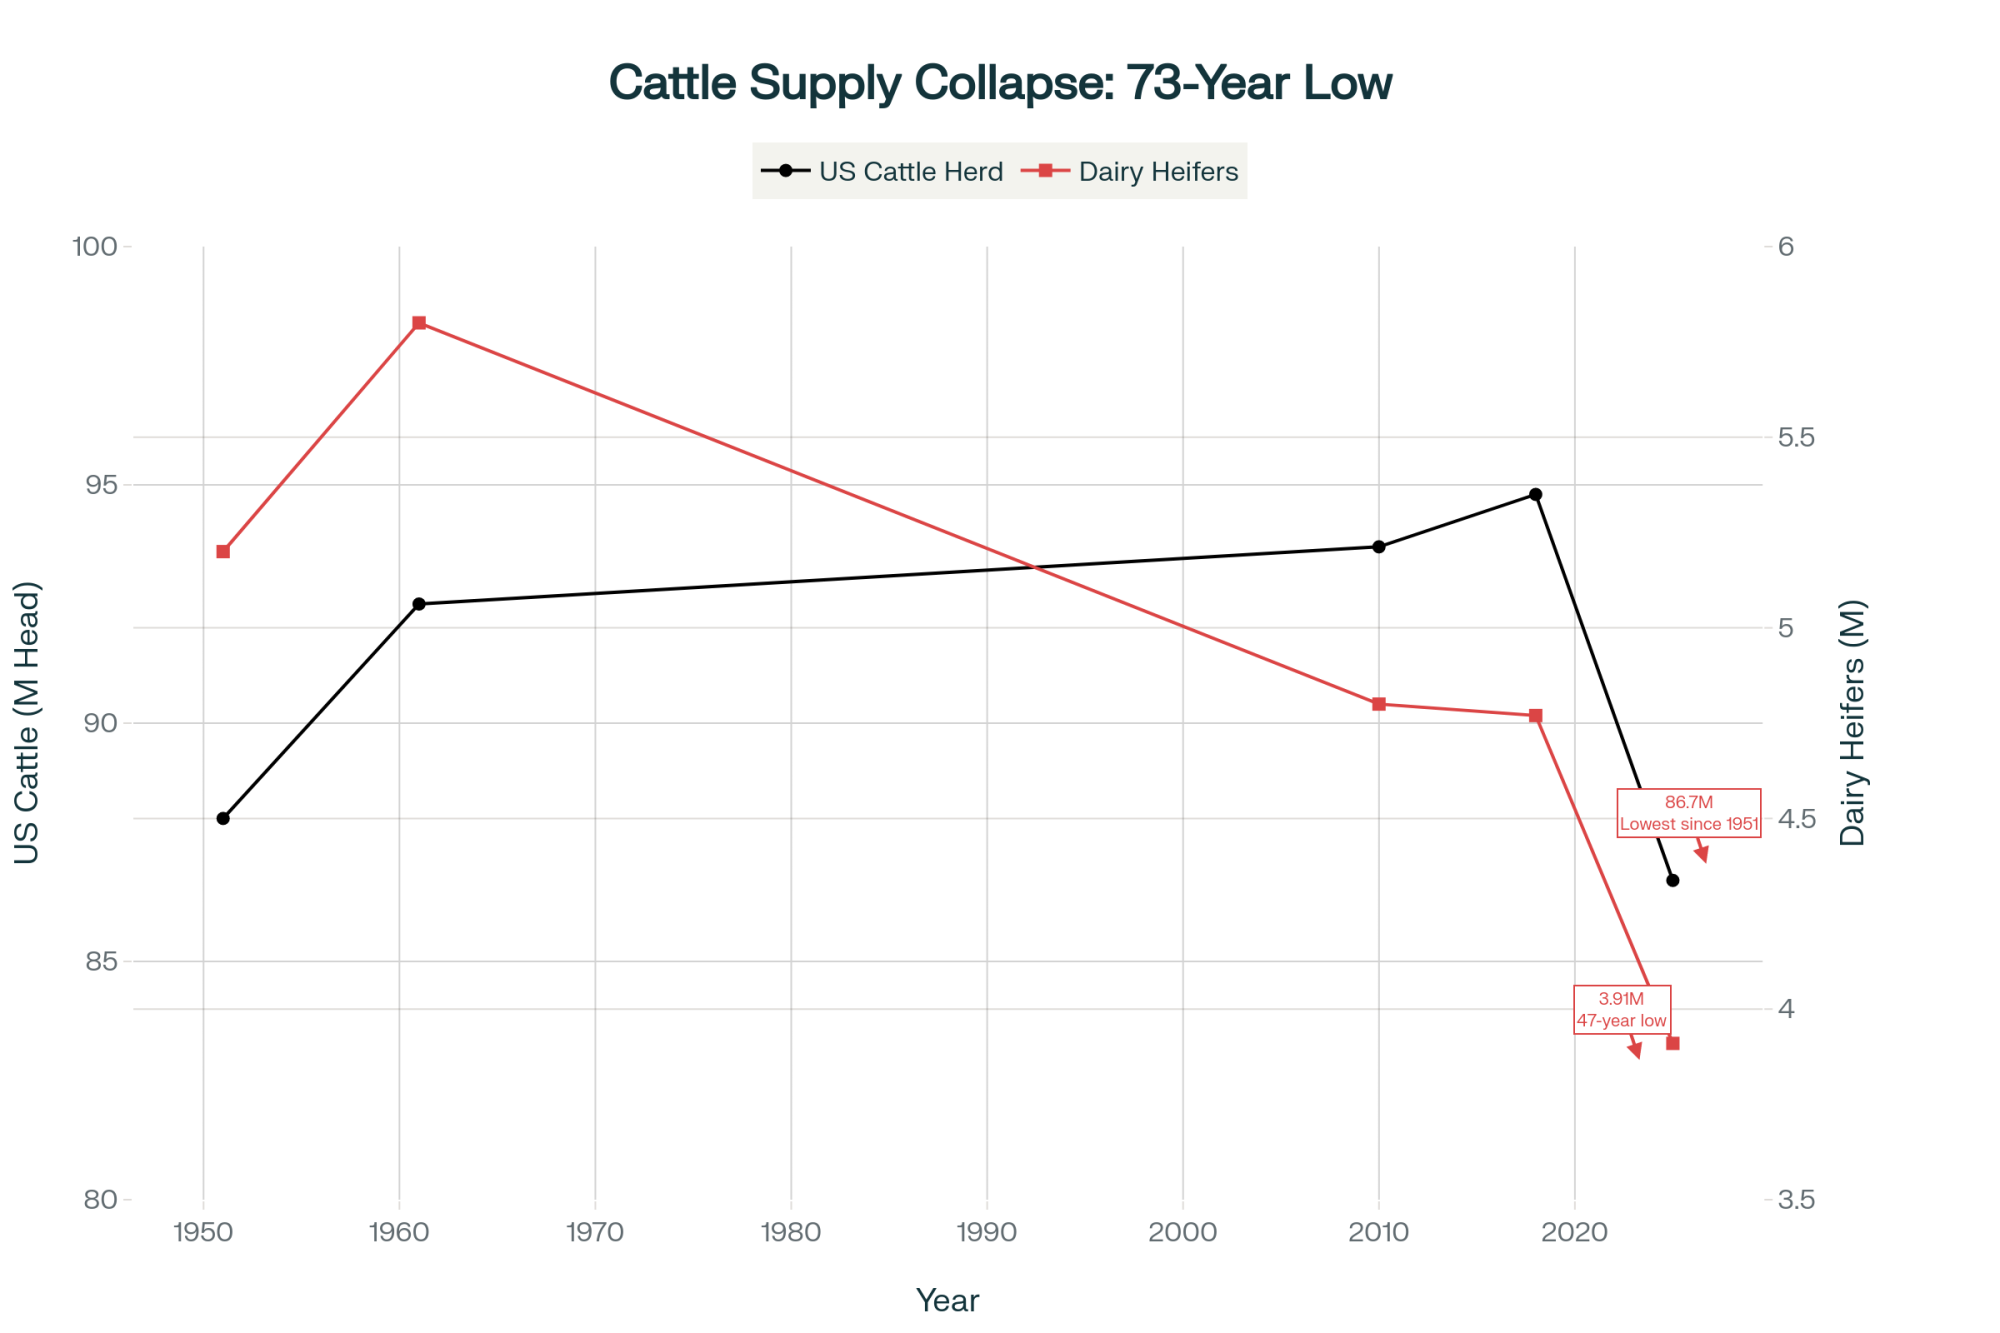
We’re Back to 1951—And That’s Not Good News for the Long Term – The cattle inventory crisis explains everything: why your calves are suddenly worth $1,200, and why that won’t last forever.

You probably know this already, but the way several trends came together created today’s opportunity. And understanding this helps explain both the upside and the risks.

The cattle inventory situation is pretty remarkable when you look at the numbers. USDA’s January 2024 Cattle Inventory Report shows we’re at 87.2 million total cattle—that’s the lowest since 1951. Can you believe that? The 2023 calf crop was just 33.6 million head, the smallest since 1948. We’re talking about five straight years of herd reduction, driven by drought out west, input costs that made everyone’s eyes water, and interest rates that made it nearly impossible for cow-calf folks to rebuild.

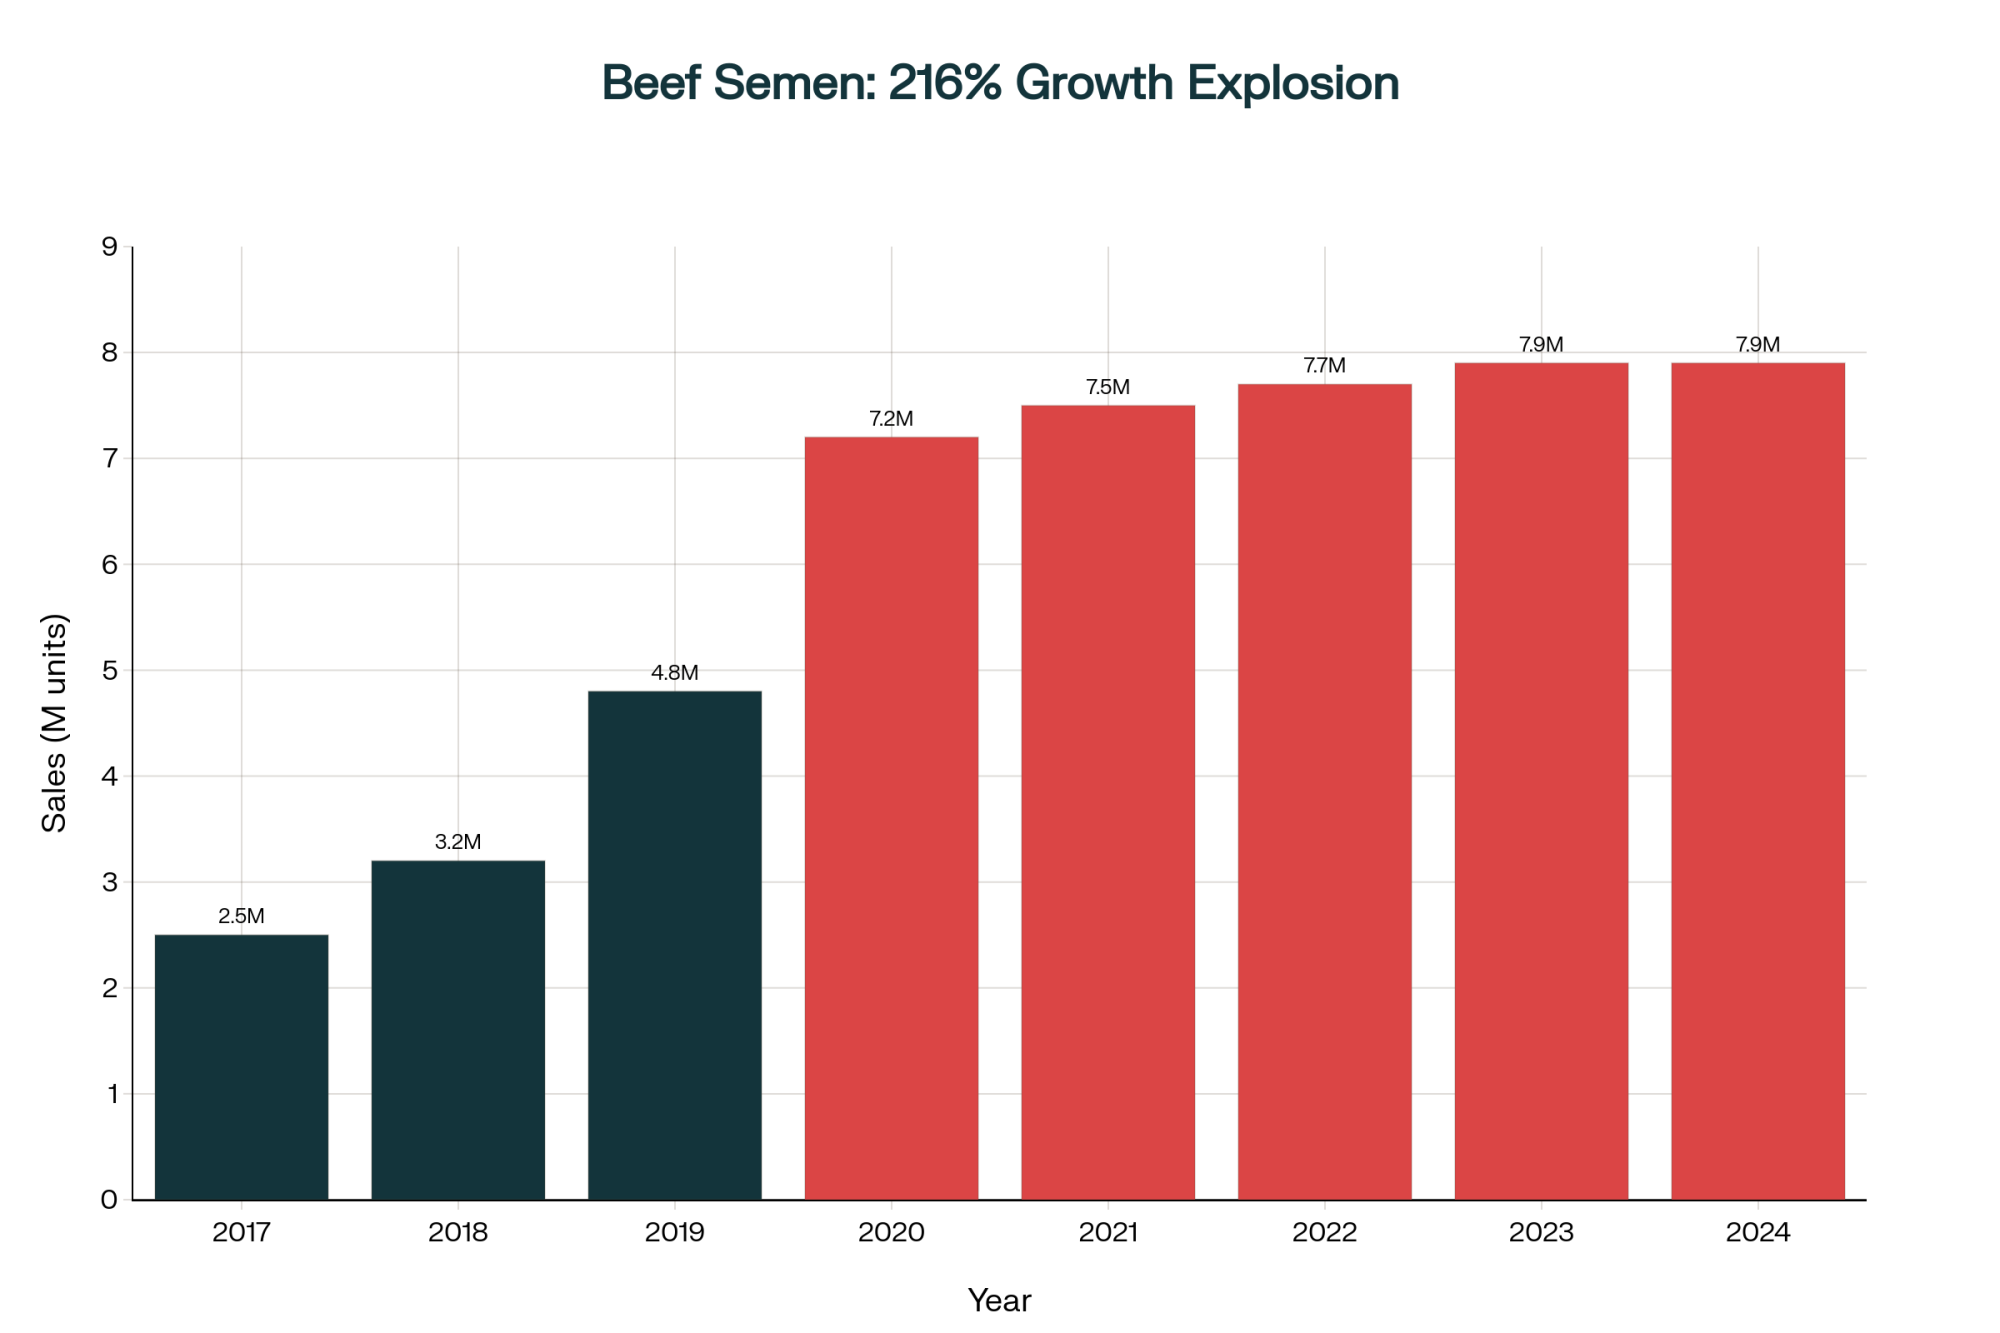
Meanwhile—and this is fascinating—sexed semen technology finally started delivering on its promises. The National Association of Animal Breeders reports that modern sexed semen hits 90-95% accuracy with conception rates that are actually competitive with conventional semen now. By 2024, sexed semen made up 61% of all dairy semen used in U.S. herds. That’s incredible growth from basically nothing a decade ago.

A New Revenue Reality

Where Dairy Income Comes from Now

  • Milk Sales: 75-80%
  • Beef-Cross Calves: 15-18%
  • Cull Cows: 5-7%

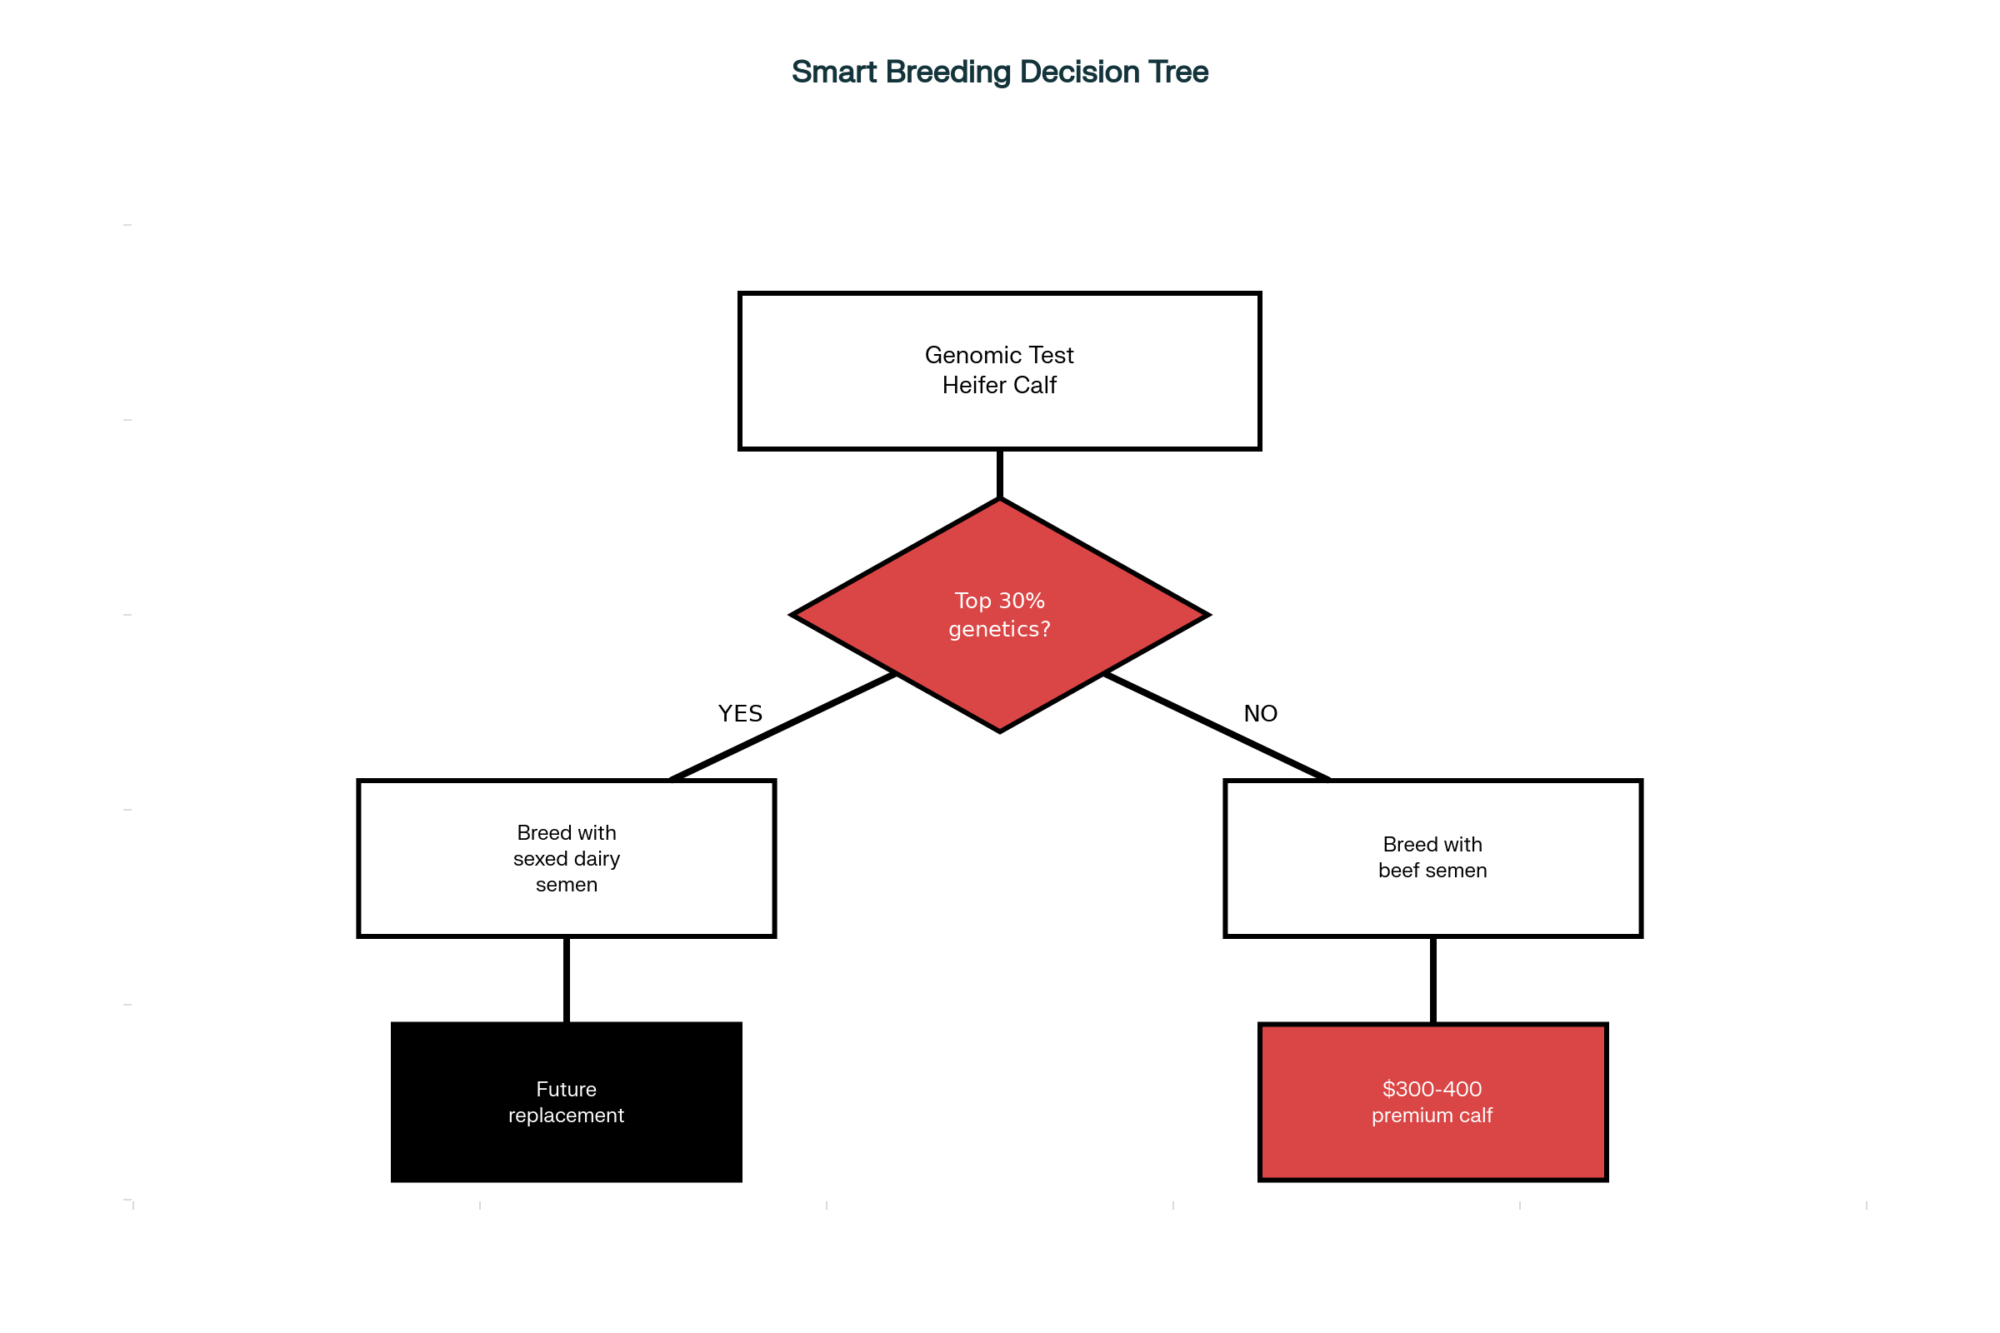
This technology shift changed everything. Now we can breed our best 35-40% of cows for replacements and put the rest to beef. As one Wisconsin producer put it to me recently, “We went from dreading bull calves to actually planning our cash flow around them. It’s a complete mental shift.”

And the economics… well, they became impossible to ignore. Holstein bulls that used to bring $50-150 are now competing with beef-on-dairy crosses pulling $1,000-1,450 per head—that’s what Superior Livestock Auction data from Pennsylvania and Wisconsin markets shows. Do the math on a 500-cow operation breeding 65% to beef, and you’re looking at roughly $250,000 in additional calf revenue. That’s like producing an extra million pounds of milk at current Class III prices.

What These New Tools Actually Do for Us

Before July 2025, if you wanted to protect beef income through insurance, you were basically out of luck. The products available were designed for beef feedlots, not dairy farms selling day-old calves and cull cows.

Finally, Real Coverage for Cull Cows

Here’s what still gets me about the old system—dairy cull cows had zero LRP coverage options. None. Think about that… An operation culling 175 cows annually at current values—we’re talking $350,000 or more—had no insurance protection available whatsoever.

“For that typical 175-cow culling program, that’s serious money at risk.”

CME market data and USDA Agricultural Marketing Service reports show cull cow prices can swing wildly—from $165/cwt down to $100/cwt when things get rough. For that typical 175-cow culling program, that’s serious money at risk.

The new “Fed Cattle – Cull Cows” category in the 2026 LRP Insurance Standards Handbook finally addresses this. What I really appreciate is how practical it is—13-week protection periods that match how we actually market cull cows, with pricing based on real cull cow values instead of fed cattle prices that never made sense for us. And with USDA Risk Management Agency subsidies of 35-55%, the actual cost comes down to about $14-21 per head. That’s manageable.

Beef-Cross Calves: Protection That Actually Works

The old “Unborn Calves, Predominantly Dairy” coverage was… well, let’s just say it didn’t work. It valued protection at about 110% of the CME Feeder Cattle Index according to the old actuarial documents. So when your beef-cross calves are selling for $1,000-1,400 but the insurance values them at $275, what’s the point?

The Value Gap: Old vs. New LRP

The $925 Gap That Could’ve Bankrupted You – Old livestock insurance was a joke, covering barely 23% of what your calves were worth.

What Your Calves Are Actually Worth vs. What Insurance Covered

  • Actual Market Value: $1,000-1,400
  • Old LRP Coverage: $275
  • New LRP Coverage: $1,200-1,370

Agricultural economists at Kansas State and other universities have documented this disconnect—we were basically insuring 25-30% of actual value. One economist described it as insuring only your truck’s tires, rather than the whole vehicle. Pretty accurate, if you ask me.

The new “Feeder Cattle – Unborn Calves” category uses dynamic Price Adjustment Factors published monthly by RMA, which actually reflect reality. The latest RMA pricing shows expected values ranging from $1,200 to $1,370 per head, depending on when you’re marketing. You can get coverage for 70-100% of those values, though there’s one catch—calves have to be sold within 14 days of birth. But that’s how most of us market them anyway, so it works.

Regional Differences Matter More Than You’d Think

What’s happening in Texas is quite different from what we’re seeing here in the Upper Midwest or Northeast. Those big Texas operations—you know, the 2,000+ cow places—they shifted to beef-on-dairy really wholly and fast. They had the scale to work directly with feedlots and set up sophisticated breeding programs.

Meanwhile, in Wisconsin and Minnesota, where most of us run 400-800 cows, it’s been more gradual. University Extension folks across the Midwest have noticed that producers here need time to build buyer relationships and understand how our local prices relate to the broader market. We couldn’t just ship direct to feedlots like the big Southwest dairies—we had to build those connections first.

Pennsylvania’s interesting, too. Penn State Extension research shows that their veal markets and proximity to Eastern feedlots yield nice premiums—$931-1,075 per head, compared to $690-945 in Wisconsin. Those regional differences really change the economics of insurance.

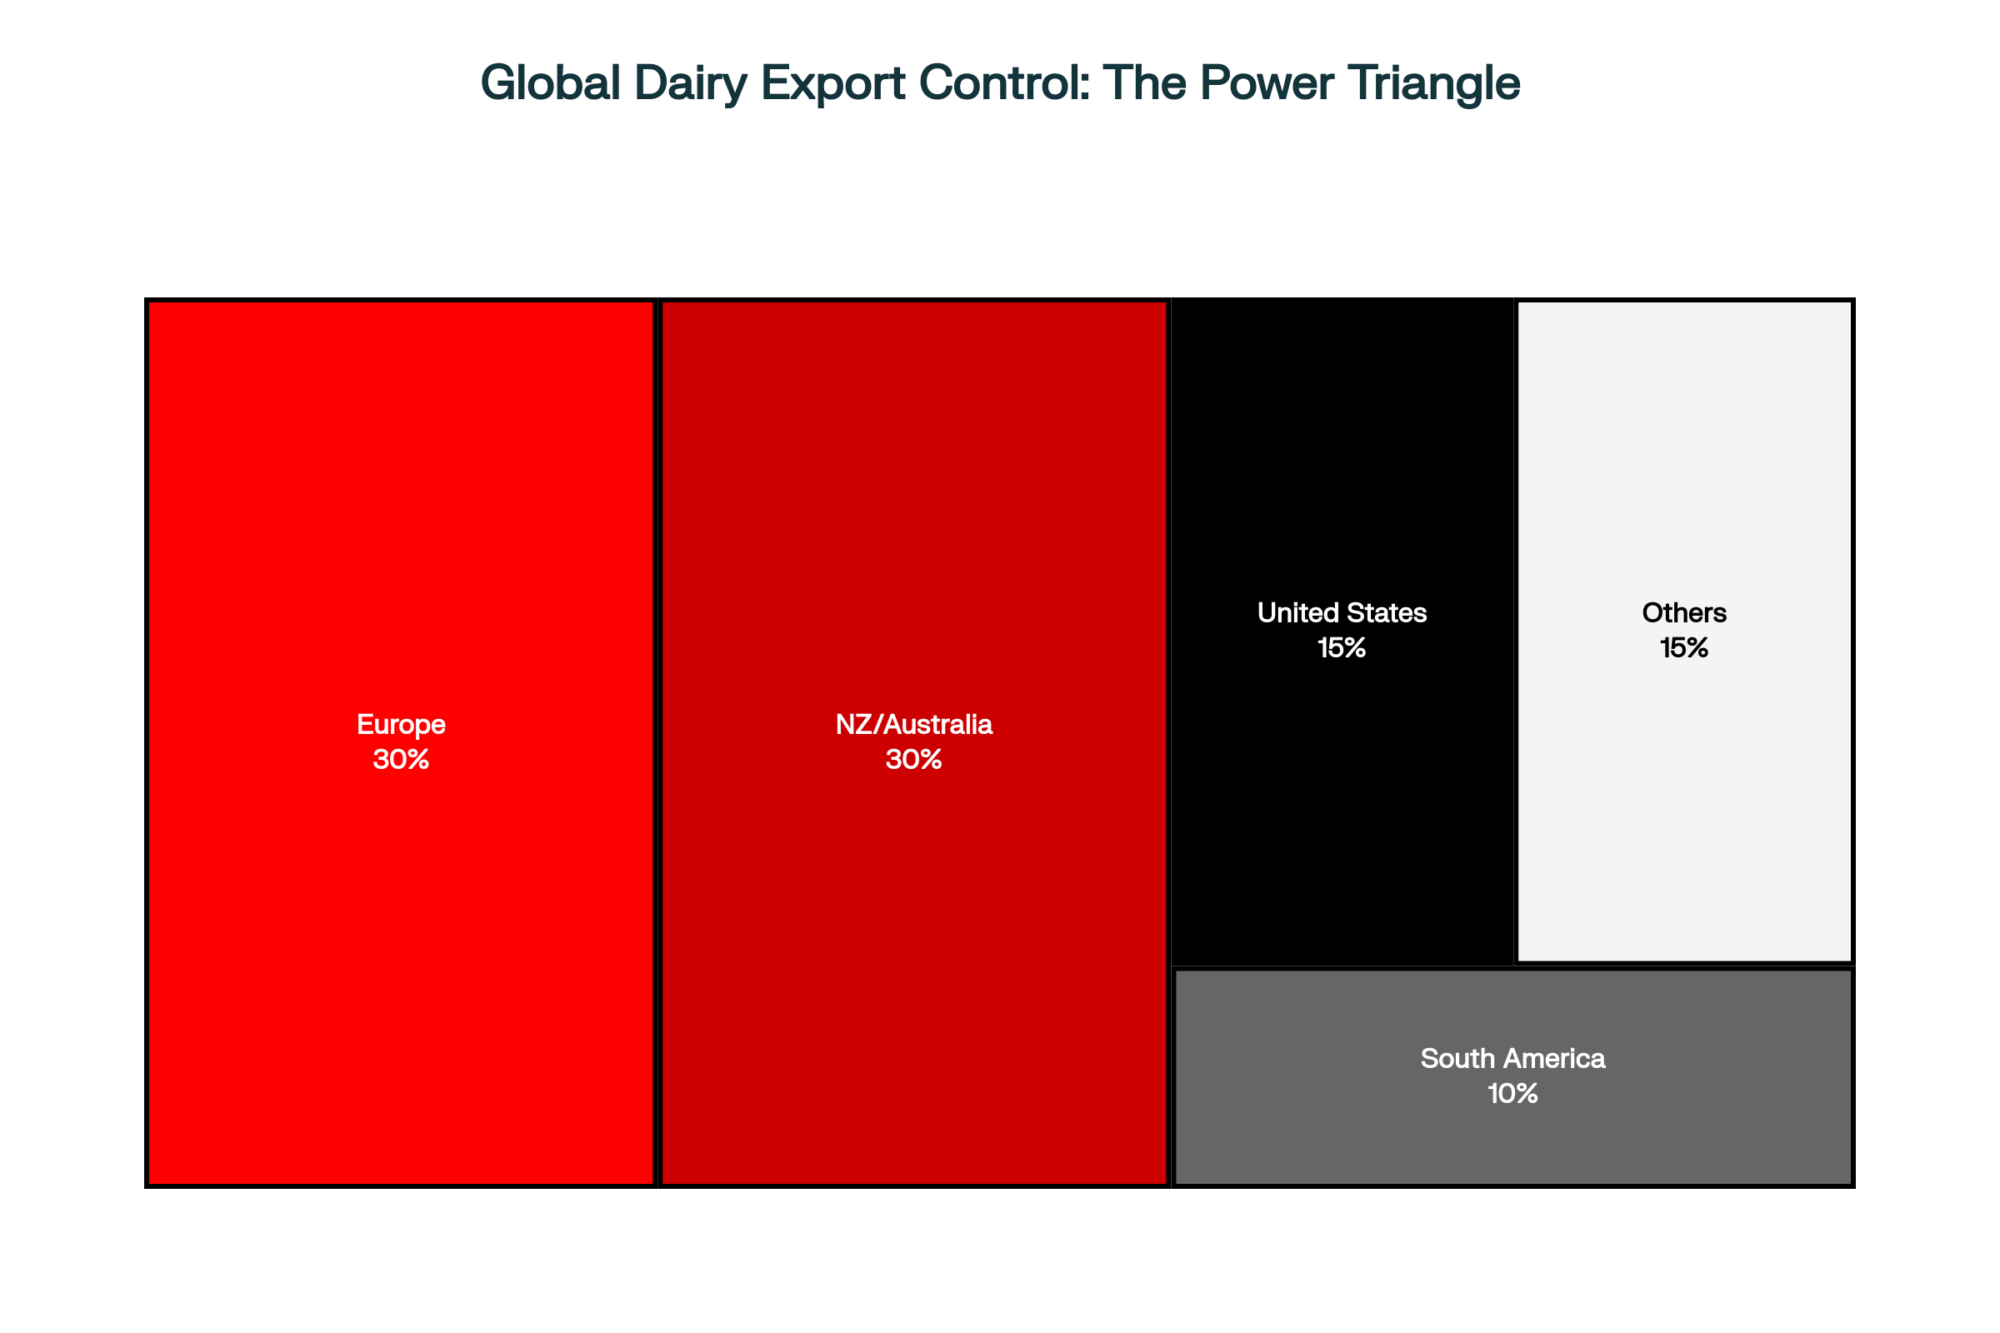
What’s interesting here is how Europe and Australia handle this differently. They rely more on cooperative structures and supply management—less individual insurance, more collective bargaining power. There’s something to learn from both approaches, though our system offers more flexibility if you’re willing to navigate the complexity.

Let’s Talk Real Numbers

So what does protection actually cost for a typical 500-cow dairy? Using October 2025 market data:

Your current annual beef income looks like this: Based on Wisconsin auction reports, 249 beef-cross calves at $1,239 each brings in $308,000. Add 175 cull cows at $140/cwt for 1,400-pound cows (that’s USDA-AMS data), and you’re looking at another $343,000. Total beef revenue exceeds $651,000 annually.

But if markets crash like they have before: CattleFax documented the 2015 correction at 31% within 12 months. Apply that today—calves drop to $800 (you lose $109,000) and cull cows fall to $100/cwt (another $98,000 gone). That’s over $207,000 at risk.

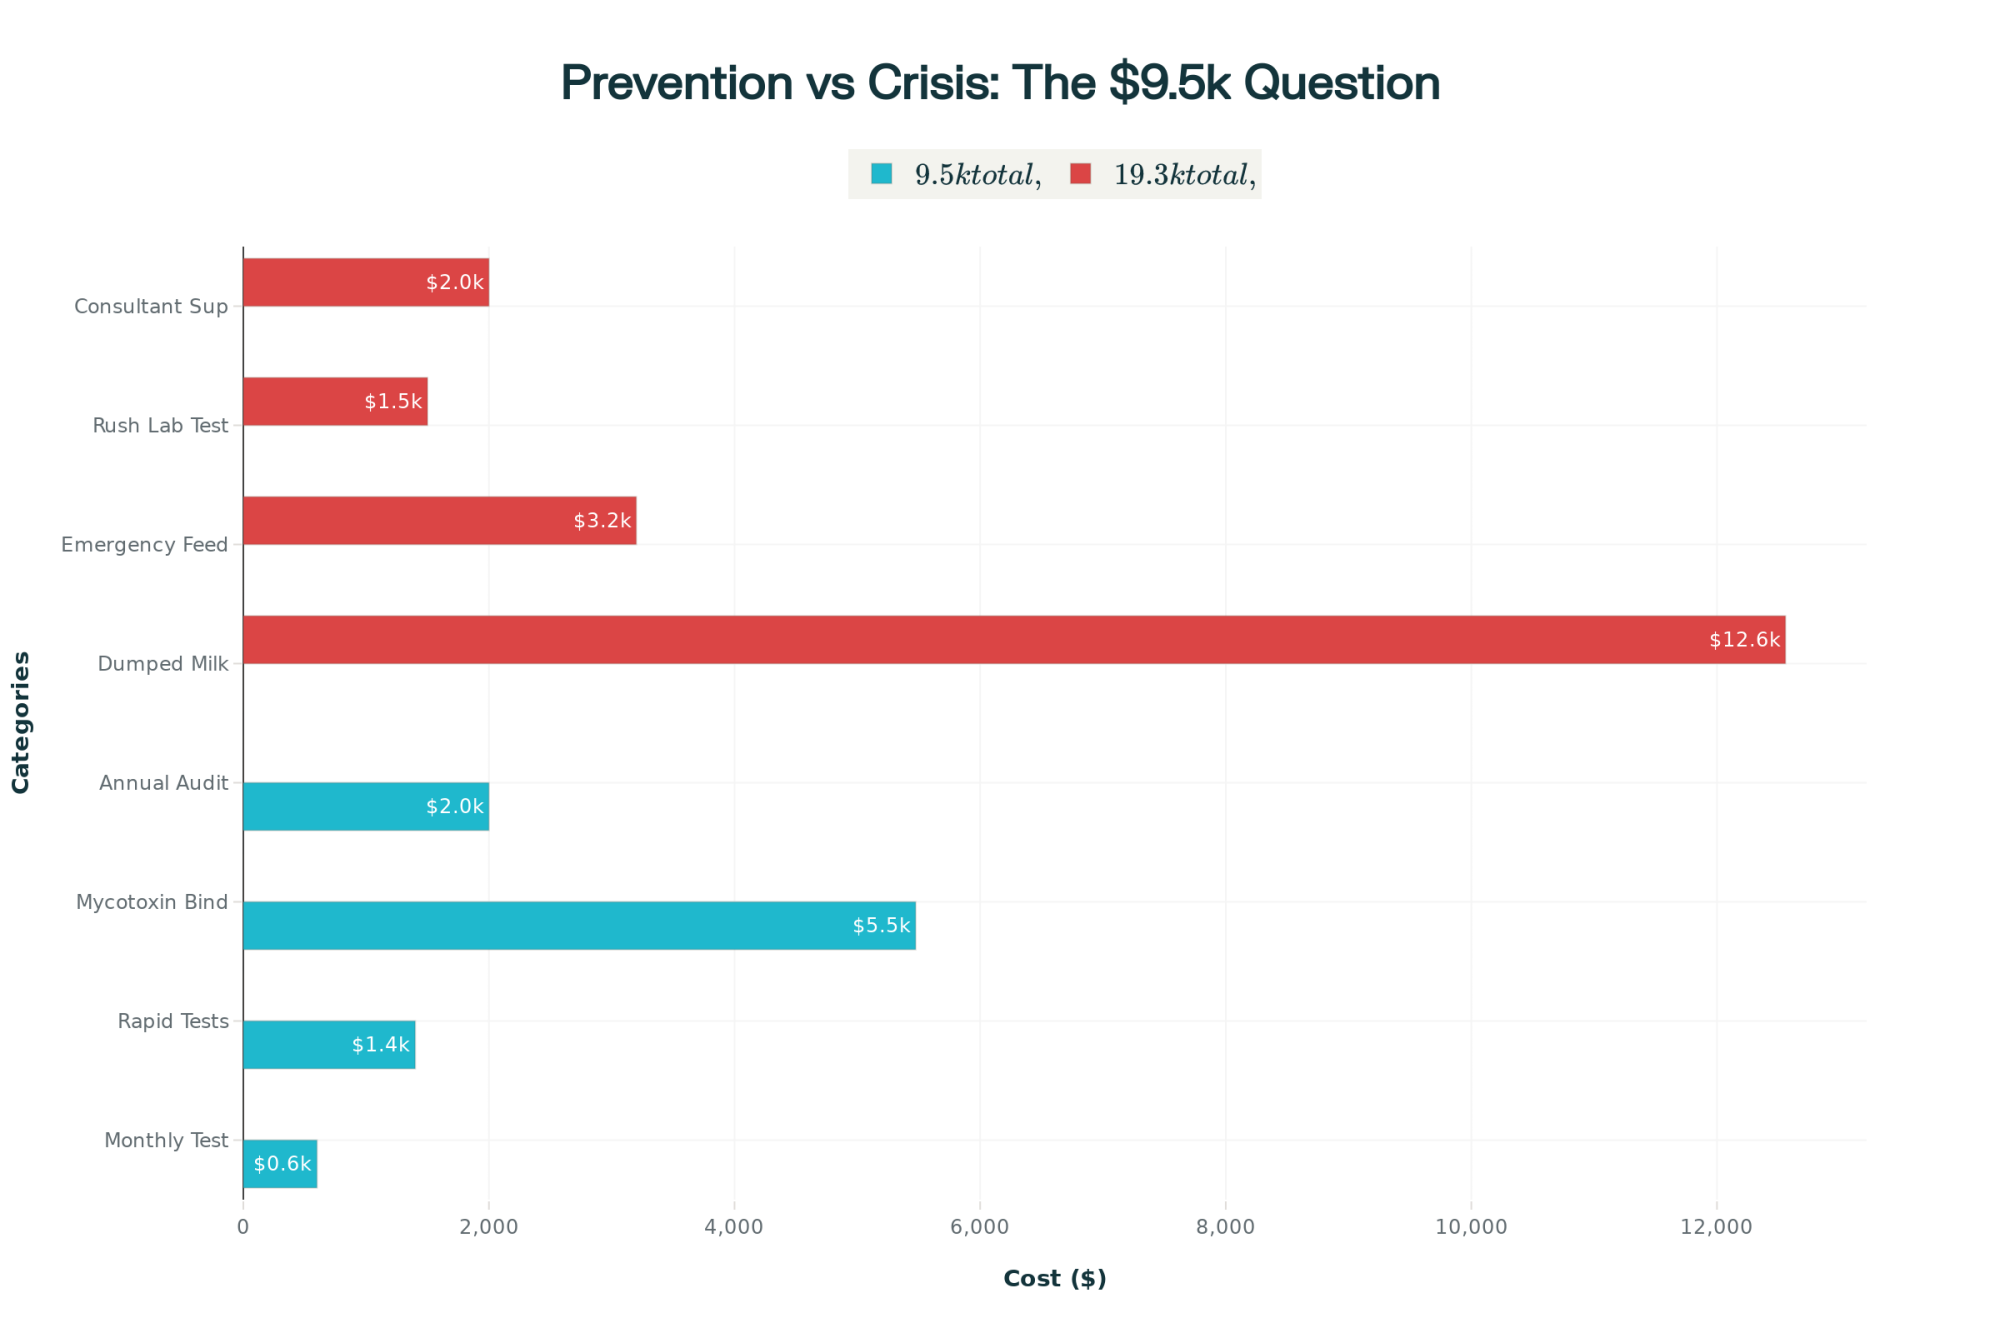
Here’s what protection costs after subsidies: Calf coverage at 90% runs about $2,540 annually. Cull cow coverage at 90% is around $3,675. So your total annual premium is $6,215—basically 1% of your beef income protecting against 30-40% potential losses.

Insurance folks who’ve been doing this for years will tell you—and history backs this up—major corrections happen every 5-8 years. When they do, operations with coverage get indemnity checks while their neighbors… well, they’re scrambling. It’s worth noting that crop insurance adoption took decades to reach current levels—we’re seeing similar patterns with livestock protection now.

From 5% to 22.5% in Three Years—This Is Why It’s Called a Revolution – Traditional dairy producers thought of beef income as “beer money.” Today it’s paying for new equipment, covering debt, and funding expansion.

Why Aren’t More Folks Using These Tools?

Despite the math being pretty compelling, adoption’s still low. Research from our land-grant universities points to several reasons, and they’re all legitimate concerns.

The knowledge gap is real. Most of us spent decades learning milk markets—we know Class III like the back of our hand. But cattle pricing, CME futures, basis risk? That’s all new territory. Extension programs are trying to help, but it takes time.

Then there’s what I call the trusted advisor disconnect. Your vet, your nutritionist—research shows these are the people we actually listen to and trust. But they don’t typically know insurance. Meanwhile, many crop insurance agents who handle Dairy Revenue Protection (DRP) aren’t licensed for livestock products. So there’s this gap right when we need guidance most.

And let’s be honest—we’re all stretched thin. When you’re dealing with labor shortages, equipment that needs fixing, keeping milk quality where it needs to be… adding “figure out complex insurance” to the list feels overwhelming. Especially during transition periods when fresh cow management takes all your attention. I’ve noticed that operations with dedicated financial managers adopt these tools faster—but not everyone has that luxury.

Different Approaches Can Work Too

Now, it’s important to acknowledge that insurance isn’t the only way to manage this risk. Some operations have found other approaches that work well for them.

I was talking with an Oregon producer recently who’s got direct contracts with a regional grass-fed program. “They take all our beef crosses at a guaranteed premium over market,” he explained. “For us, that predictability is worth more than insurance. We know what we’re getting, and we don’t worry about whether our local prices match up with CME indices.”

That’s a valid approach. If you’ve got solid contracts, strong financials, or other marketing arrangements that work, LRP might not be essential for you. Look at Canada—their producers rely more on supply management and cooperatives than individual insurance, and they manage okay.

Building Your Protection Strategy

What successful producers have figured out—especially those who made it through 2020’s market chaos—is that protection works best when you layer different tools.

Start with Dairy Margin Coverage (DMC) as your foundation. FSA data shows Tier 1 coverage at $9.50 margin protection costs just $75 annually for the first 5 million pounds. Over the program’s history, it’s paid out an average of $1.17/cwt. You can’t beat that value.

If you’re producing over 5 million pounds, seriously consider Dairy Revenue Protection (DRP) at 95% coverage. Yes, it runs $48,000-80,000 annually for a 500-cow operation, but government subsidies cover 44% of that. It protects both your price and production risks on milk.

Then add the new LRP tools:

  • Beef-cross calves: Get 90-95% coverage, purchased 13-43 weeks before they’re born
  • Cull cows: 13-week coverage that matches your culling schedule
  • Combined cost: roughly $6,000-8,000 annually for solid beef income protection

All told, you’re investing about 3-5% of gross revenue to protect against 30-50% potential losses in a downturn. This development suggests we’re entering a period where comprehensive risk management is becoming standard practice, not optional.

Quick Cost Breakdown by Herd Size

Herd SizeAnnual Beef Income*LRP Premium CostWhat You’re Protecting
200 cows$260,000$2,500$78,000
500 cows$651,000$6,200$195,000
1,000 cows$1,302,000$12,400$390,000
*At current market conditions   

Learning from Early Adopters

A Pennsylvania producer who started coverage in August 2025 shared something interesting with me. When October’s volatility hit—USDA reports show prices dropped 11.5% in just 12 days—he had protection at $1,130 per calf.

“My neighbors were calling emergency meetings with their bankers,” he said. “We had coverage. Sure, we didn’t get peak prices, but we weren’t losing money either. The key was starting with some coverage and learning as we went, instead of waiting for perfect timing.”

That pragmatic approach really resonates—get something in place, learn the system, then optimize. Looking at this trend, it’s clear that producers who build risk management expertise now will have significant advantages going forward.

Common Pitfalls to Watch For

Based on what agents and producers who’ve been through this tell me, here are the main things to avoid:

Waiting for the “right time” is the biggest mistake. Markets turn faster than you’d think. Once volatility shows up, premiums often double.

Don’t under-insure just to save on premiums. Saving $2,000 doesn’t help much if you’re still exposed to $100,000 in losses. Remember, these are tax-deductible business expenses—factor that into your calculations.

Read the details carefully. That 14-day marketing window for calves? Miss it, and your coverage doesn’t apply. Keep good records of birthdates and sale dates.

And find an agent who actually knows dairy livestock insurance, not someone who mainly works with beef operations. There’s a difference.

Why Timing Matters So Much

History gives us some important lessons here. CattleFax documented the 2015 crash—fed cattle went from $175/cwt to $120/cwt in less than a year. They called it the fastest decline ever recorded. Then in 2020, when COVID hit, feeder cattle lost $33/cwt in just 13 weeks.

And right now? We’ve already seen beef-on-dairy calf prices drop 11.5% in 12 days this October. That’s not normal market movement—that’s volatility coming back.

Dr. Derrell Peel at Oklahoma State has studied cattle cycles for thirty years. His research consistently shows that if you wait until you “see trouble coming” to buy insurance, it’s already too late—premiums have doubled and coverage floors are below current prices.

What’s Coming Down the Road

Several things suggest this opportunity window might not stay open as long as we’d like.

Beef herd rebuilding is starting. State inventory data shows expansion happening across Montana, the Dakotas, and Texas. As beef cattle supplies get back to normal over the next 3-5 years, our premium prices for dairy-beef crosses will probably come down. These $1,000+ calves might be temporary.

Those generous subsidies aren’t guaranteed forever, either. Congressional Budget Office analysis shows the current 35-55% premium subsidies came from COVID-era funding. With the farm bill already delayed two years and budget pressures building, who knows what future support will look like. Some states are developing their own supplemental programs, but nothing’s certain.

And here’s something interesting: if you follow genetics, the market’s starting to differentiate. ABS Global and Select Sires report that feedlots increasingly want verified genetics with carcass data. Generic crosses might fall back to $600-800 while premium verified genetics hold their value. What farmers are finding is that investing in documented genetics now positions them for when the market gets more selective.

Options for Smaller Operations

Not every 200-cow operation can spend time figuring out complex insurance programs, and that’s perfectly understandable. What’s encouraging is seeing cooperatives step up.

Vermont and Maine producers are working through their co-ops to access group risk management. Agri-Mark’s running a pilot where their risk management team handles LRP enrollment for members, spreading the expertise cost across farms. You lose some individual optimization, but it’s better than no protection at all.

Looking at this trend, smaller operations might actually have an advantage—they can leverage collective expertise without bearing the full burden themselves.

Your Next Steps: A Timeline That Works

If you’re ready to explore this, here’s a practical approach:

First week: Call your current insurance agent plus 2-3 livestock specialists. Ask specifically about dairy LRP experience, especially with the new beef-cross and cull cow options. The RMA Agent Locator helps find qualified folks in your area.

Second week: Pull together your data—breeding records, calving schedules, and when you typically cull. Figure out your actual beef income exposure. Your Extension agent can help—they’ve got spreadsheets ready to go.

Third week: Review proposals and compare options. Here’s something important—talk to your lender about this. Many banks offer better terms or even help with premium financing when you’ve got good risk management in place. As one banker told me, “We’d rather finance insurance premiums than deal with bankruptcies.”

Fourth week: Get initial coverage going for your next calving group and upcoming culls. Set up quarterly check-ins because this isn’t “set and forget”—markets change, your operation evolves, coverage should adapt.

The Bottom Line

This transformation in dairy beef income creates both huge opportunities and real risks that need managing. The USDA’s new LRP tools offer meaningful protection, but only if we understand them and act before volatility makes coverage too expensive.

We’re witnessing a fundamental shift from single-product dairy operations to diversified businesses. Those who recognize this and adapt will be the ones expanding in 2028. Those who don’t… well, they’ll have some tough conversations ahead.

The tools are there. Government subsidies cover 35-55% of premium costs. The math works. But tools only help if you use them.

With beef income at historic highs but already showing volatility, the window for affordable protection is open but narrowing. Every producer I know who’s been through previous crashes says the same thing: “I wish I’d bought insurance when times were good and premiums were cheap.”

That time is right now. Make the calls. Run your numbers. Get protected. Whether you choose insurance, contracts, or another approach, make sure you’ve got a plan that fits your operation.

“Hoping for the best isn’t risk management—it’s gambling with your family’s future.”

For more information on LRP enrollment, contact a licensed livestock insurance agent or visit rma.usda.gov for resources and agent locator tools. Your state Extension service offers educational programs on risk management strategies specifically for dairy operations.

Key Takeaways:

  • You’re protecting your milk but gambling with your beef—that 25% of revenue ($650K+ annually) needs coverage just as much as your milk income does
  • July 2025 changed everything: USDA finally valued dairy beef calves at their real $1,200-1,370 price for insurance, not the useless $275 that made coverage pointless
  • Simple math, huge impact: Invest $6,200 annually (after 35-55% subsidies) to protect $651,000 in beef income—that’s using 1% to protect against 30-40% crashes
  • The window is closing fast: October’s 11.5% price drop in 12 days proves volatility is returning, and waiting means doubled premiums or no coverage at all
  • You have options: Whether through insurance, direct contracts, or cooperative programs, successful operations are implementing beef income protection now—our 4-week guide shows you exactly how

Complete references and supporting documentation are available upon request by contacting the editorial team at editor@thebullvine.com.

Learn More:

The Sunday Read Dairy Professionals Don’t Skip.

Every week, thousands of producers, breeders, and industry insiders open Bullvine Weekly for genetics insights, market shifts, and profit strategies they won’t find anywhere else. One email. Five minutes. Smarter decisions all week.

NewsSubscribe
First
Last
Consent

CME Dairy Market Report October 30, 2025: Today’s Historic Class Price Gap Is Creating $3,800 Monthly Winners and Losers

Two identical farms. One gets $17.81/cwt today. The other? $13.75. The ONLY difference: where their milk truck goes.

Executive Summary: Today’s dairy market delivered a brutal verdict: if your milk goes to cheese, you’re winning at $17.81/cwt – but if it’s heading to powder, you’re bleeding money at $13.75. This historic $4 gap means identical farms are now separated by $3,800 per 100 cows per month, and NDM’s collapse today (seven sellers, zero buyers) signals it’s getting worse. While cheese held firm above $1.82, powder crashed by 2.25 cents amid intensifying European competition and weakening global demand. Feed costs keep climbing – corn hit $4.35/bu, soybean meal $308/ton – squeezing everyone’s margins, but only cheese producers have the pricing power to survive. The industry’s geographic revolution accelerates as Texas adds 50,000 cows and builds massive new plants while California and Wisconsin struggle with regulations and aging infrastructure. Smart operators are locking in Q1 2026 Class III near $18 and making hard decisions about their future – because in this market, standing still means falling behind.

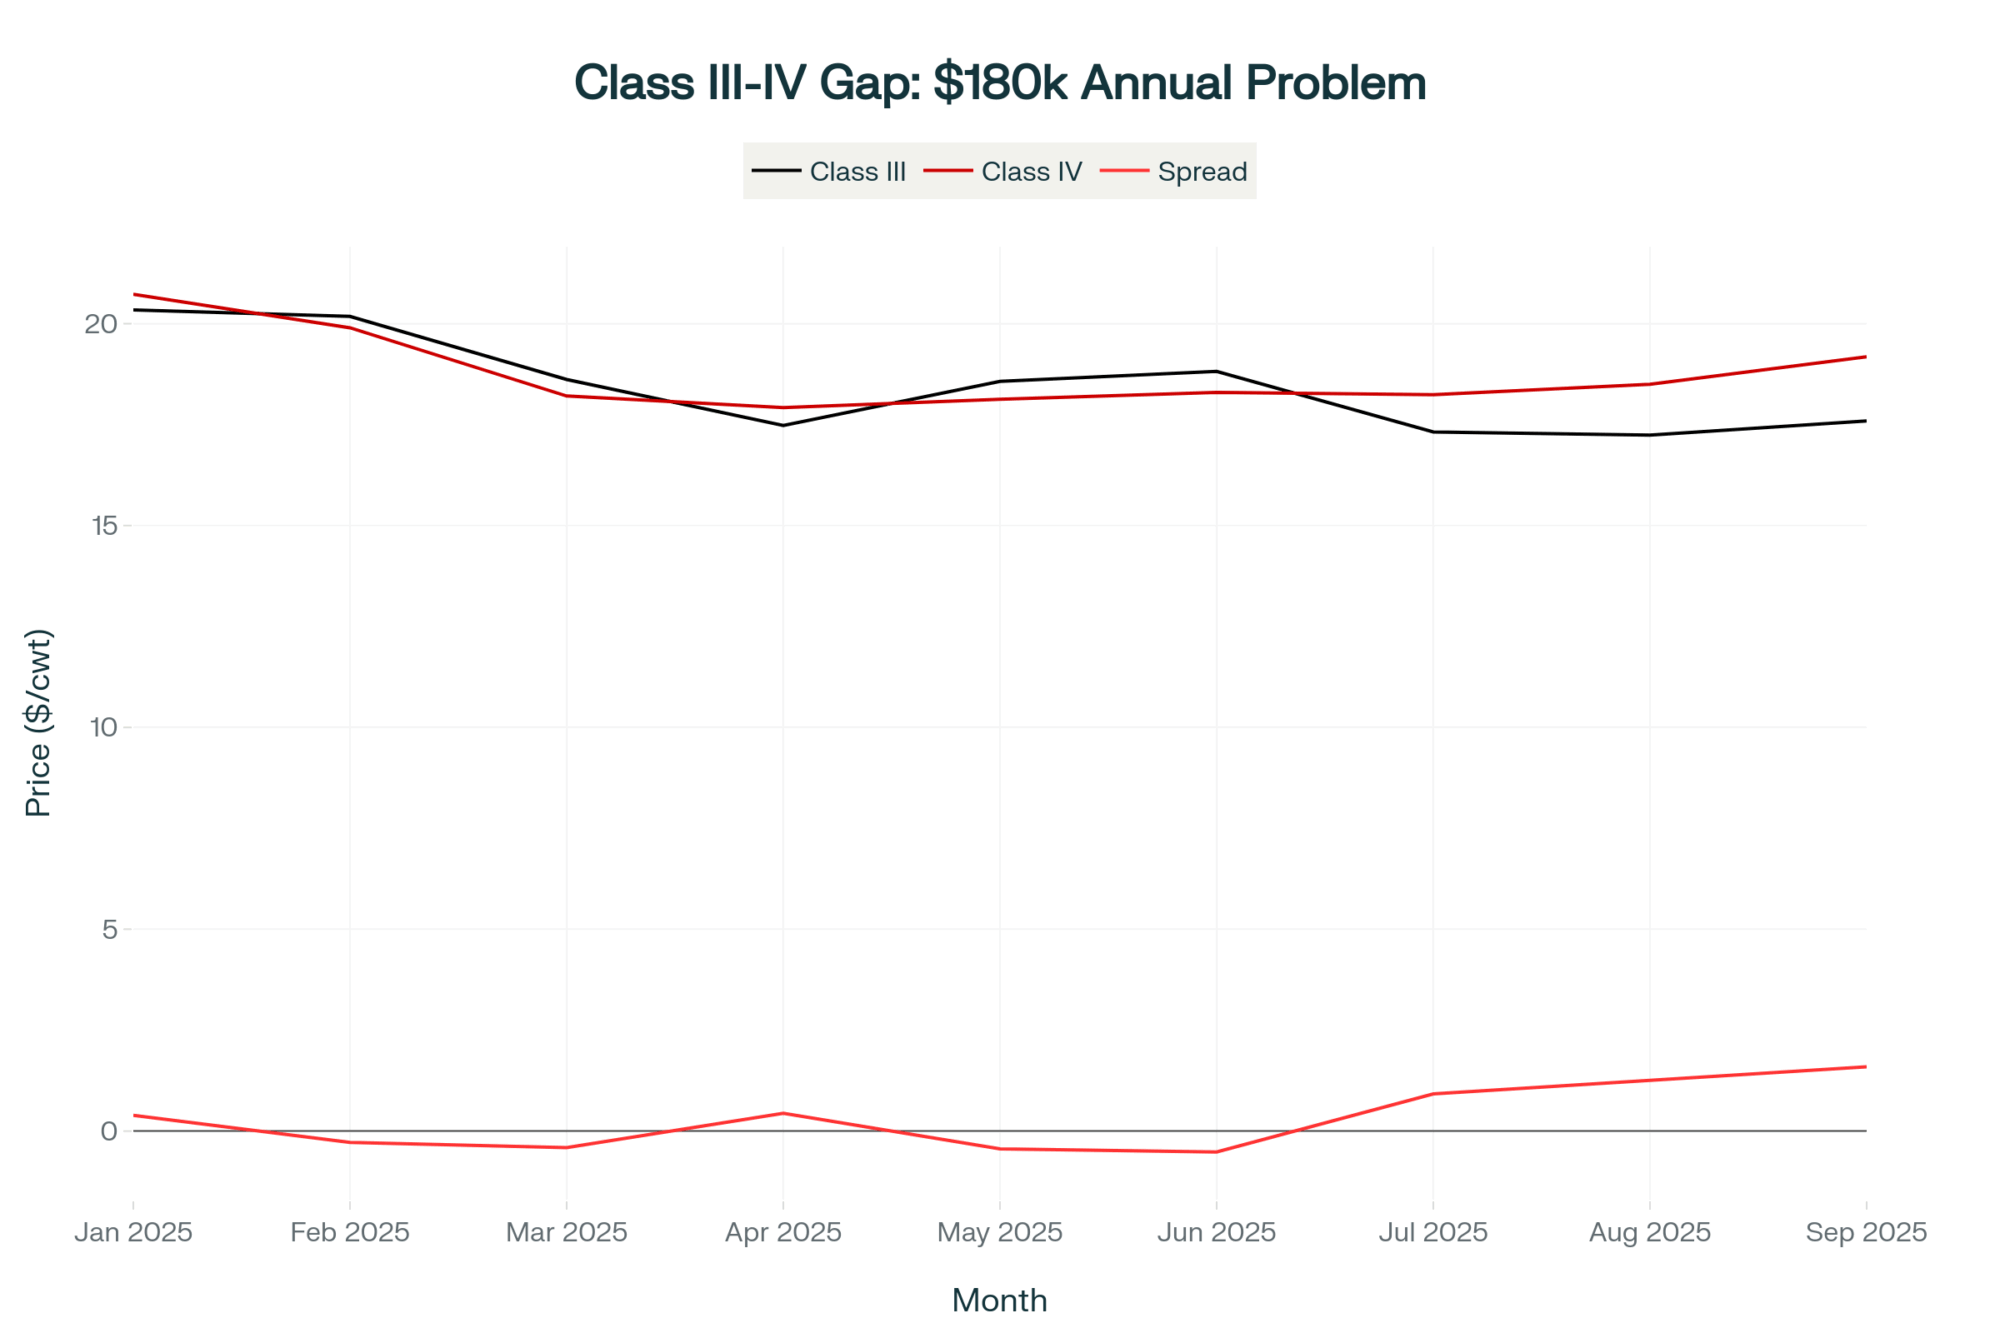
Dairy Class Price Gap

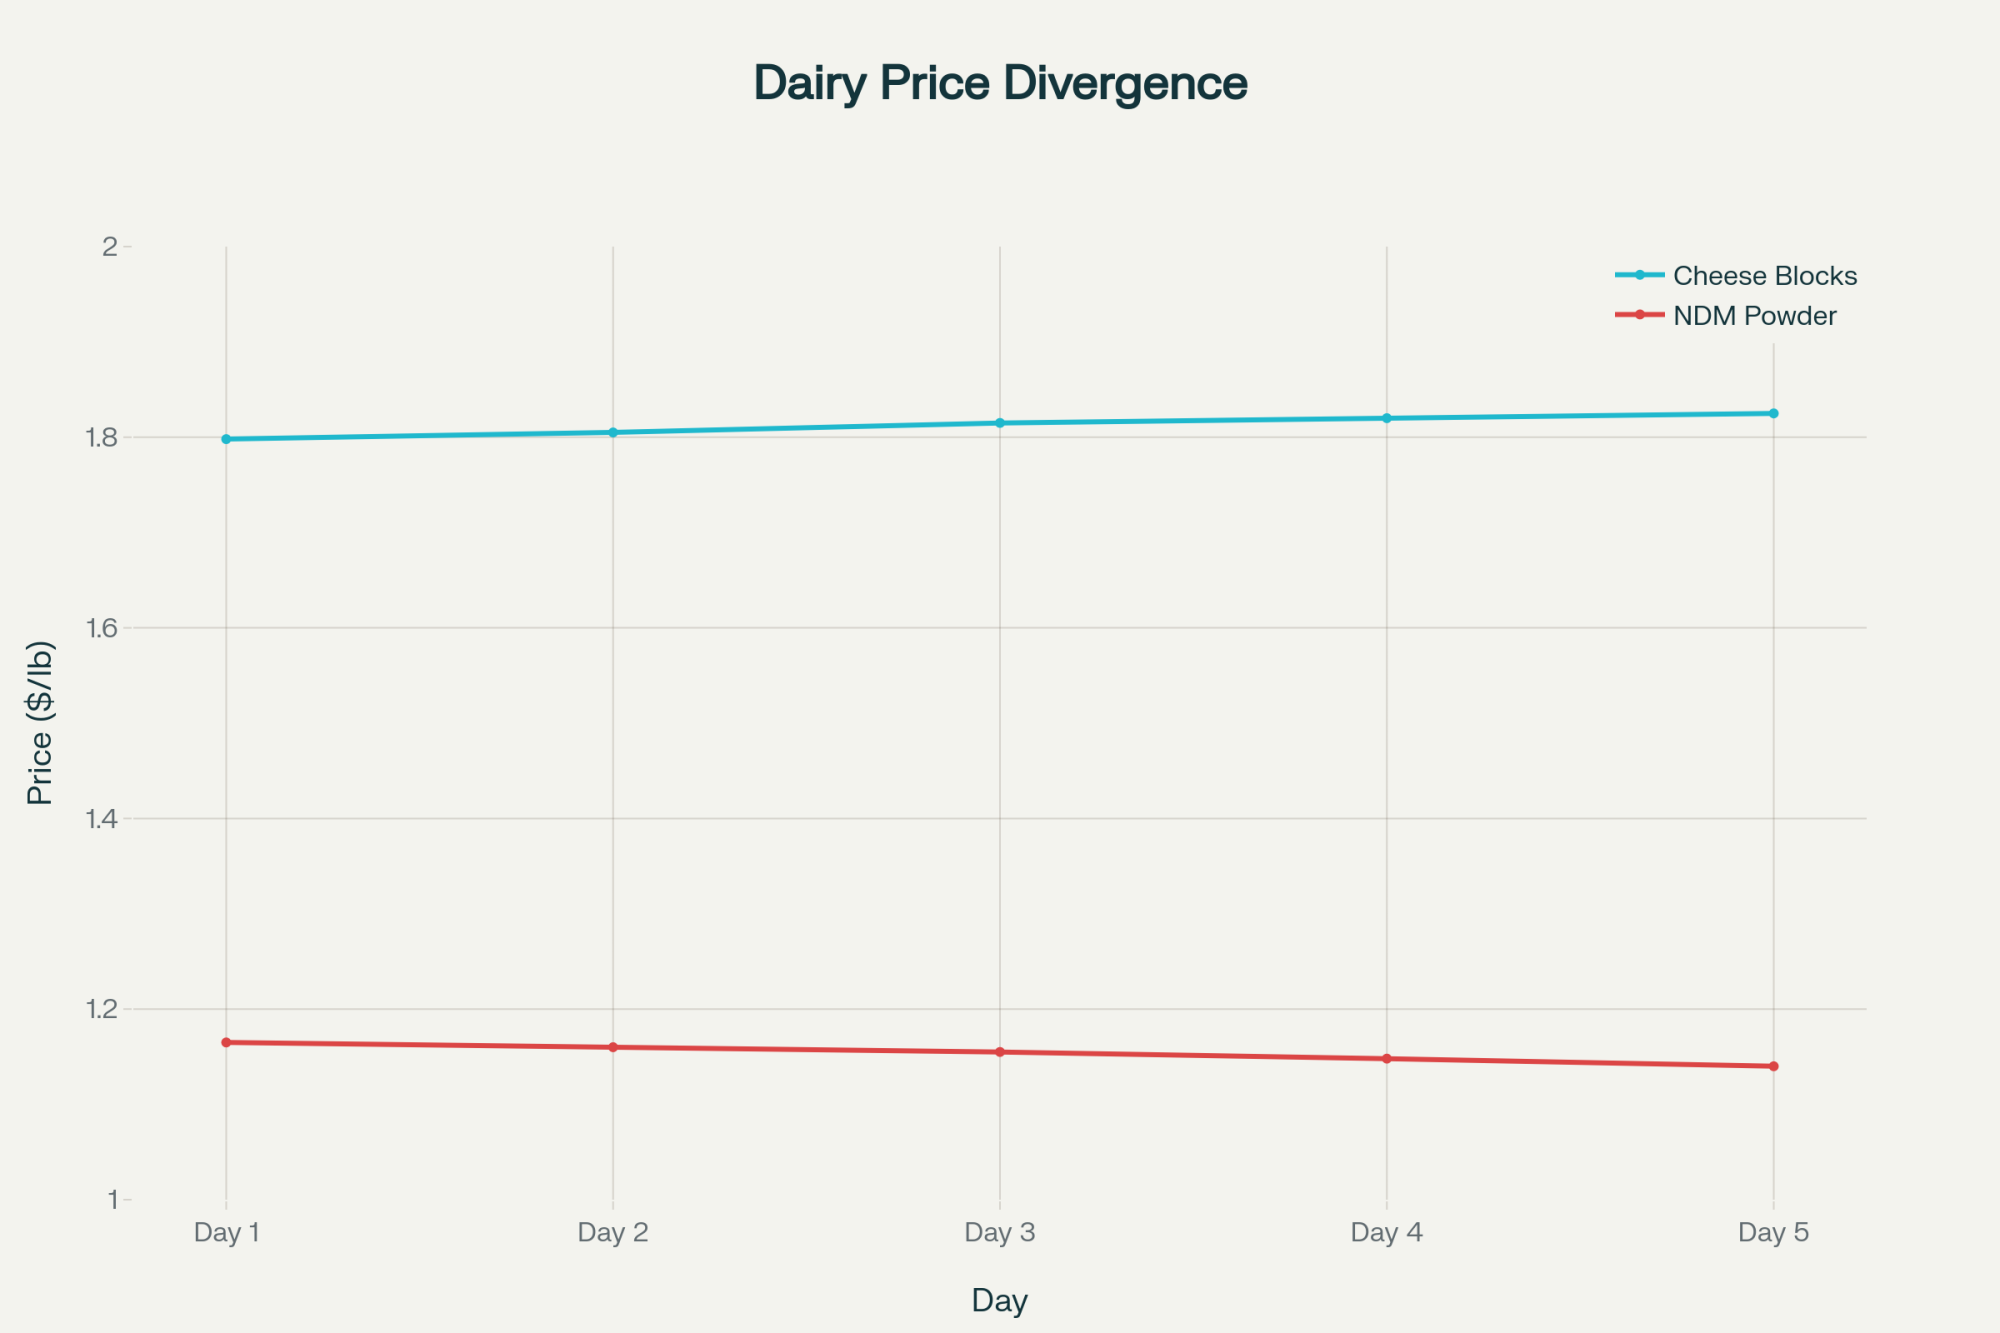
Let me tell you what’s happening in the dairy markets today —and, more importantly, what it means for your next milk check. We saw cheese prices hold steady above $1.82, which is good news if you’re shipping to a cheese plant. But if your milk’s going into powder? That 2.25-cent drop in NDM to $1.14 is going to sting. This growing divergence between Class III and Class IV prices — now nearly $4 per hundredweight — is creating clear winners and losers depending on where your tanker is unloaded.

Looking at today’s trading, what’s interesting here is the complete absence of action in cheese despite decent bid support. No trades in blocks or barrels isn’t unusual after a week-long rally, but the seven offers stacked up against zero bids in NDM? That tells you everything about where sentiment is heading for powder markets.

Two Identical Farms, One Brutal Verdict: The $3,800 monthly gap reveals how processor relationships now matter more than production efficiency—cheese-bound operations at $17.81/cwt are winning while powder-plant farmers bleed at $13.75/cwt.

Today’s Price Action — What These Numbers Mean for Your Farm

ProductPriceToday’s MoveWeekly TrendReal Impact on Your Farm
Cheese Blocks$1.8250/lbUnchangedUp 1.4%Holding firm above $1.82 keeps Class III near $17.80
Cheese Barrels$1.8200/lbUnchangedUp 1.4%Steady demand supporting the cheese complex strength
Butter$1.5725/lb+1.75¢Down 0.1%Small bounce won’t offset NDM weakness for Class IV
NDM Grade A$1.1400/lb-2.25¢Up 3.4%Sharp drop pulls November Class IV below $14
Dry Whey$0.7000/lbUnchangedUp 3.2%Steady support for Class III other solids value
Market Sentiment Splits Violently: Cheese’s steady climb to $1.83 contrasts with NDM’s freefall to $1.14—today’s seven sellers against zero buyers signals powder markets haven’t found bottom yet, widening the Class III/IV chasm to historic levels.

The cheese market’s taking a breather after climbing steadily all week. With blocks and barrels both parked above $1.82, processors seem content with their inventory levels heading into the November holiday demand. That’s actually constructive for maintaining these price levels.

But here’s where it gets concerning — NDM dropping 2.25 cents on heavy offers and absolutely no buying interest. When you see seven sellers trying to unload product with no takers, that’s a market looking for a floor. This weakness directly hits anyone shipping to butter-powder plants, pulling that November Class IV price down toward $14 or potentially lower.

From the Trading Floor — Reading Between the Lines

Bid/Ask Dynamics Tell the Story

The order book today painted two very different pictures. Cheese showed balance with just two bids and two offers on blocks, nothing on barrels — that’s a market comfortable with current levels. But NDM? Zero bids against seven offers is about as bearish as it gets. As one Chicago floor trader told me this morning, “Nobody wants to catch a falling knife in powder right now.”

Trading volumes stayed extremely light — only two loads of butter actually changed hands. The lack of cheese trades doesn’t worry me; it’s normal consolidation. But NDM’s inability to attract even a single bid at progressively lower prices? That suggests we haven’t found the bottom yet.

Volume Patterns and Market Mechanics

What caught my attention was the timing of those NDM offers. They started appearing early and kept building throughout the session, with sellers growing increasingly anxious as the day wore on. The price had to drop 2.25 cents just to clear the board, and even then, no actual trades occurred — just a lower posted price trying to entice buyers who weren’t there.

Where We Stand Globally — And Why It Matters

You want to know why NDM’s struggling? Look at global prices. U.S. NDM at $1.14 per pound is now squeezed between New Zealand at roughly $1.15 and Europe, sitting around $1.00 (based on current exchange rates). That 14-cent premium over European powder is killing our competitiveness in key export markets like Mexico and Southeast Asia.

The real opportunity — and I’ve been saying this for weeks — is in butter. At $1.5725, we’re trading at a massive discount: 89 cents below Europe and $1.40 below New Zealand. Yet nobody’s stepping up to arbitrage this gap. Either U.S. butter is about to rally hard, or global prices are set for a major correction. Something’s got to give.

Market Inefficiency or Warning Signal? The $1.40 butter discount to New Zealand defies arbitrage logic—either U.S. prices are set to rally hard, or global markets face a major correction. Smart money is watching this gap obsessively.

According to Rick Naerebout, CEO of the Idaho Dairymen’s Association, “We’re seeing strong interest from international buyers for U.S. butter at these levels, but the logistics of securing a consistent supply through Q1 2026 is holding back larger commitments.”

Feed Costs Keep Creeping Higher

Your feed bills aren’t doing you any favors right now. December corn futures closed at $4.3450 per bushel, up 6.5 cents this week. December soybean meal hit $308.70 per ton, gaining $11.

For a typical Upper Midwest dairy running a standard TMR, you’re looking at an extra $0.15-0.25 per cow per day in feed costs from this week’s rally alone. With the milk-to-feed ratio barely treading water, these incremental cost increases are directly eating into your already thin margins.

Dr. Bill Weiss from Ohio State’s dairy nutrition program notes, “The projected feed cost index for 2025 sits at 92, suggesting an 8% decrease from 2024 levels, but current futures pricing indicates that relief may not materialize until late Q1 2026.”

Production Reality Check — Where the Milk’s Coming From

USDA’s latest projections have milk production at 230.0 billion pounds in 2025 and 231.3 billion pounds in 2026 — both revised upward from previous estimates. But here’s what matters: where that milk’s being produced and who’s got the processing capacity to handle it.

The geographic shift is striking. Texas posted a jaw-dropping 10.6% surge in April 2025, hitting 1.511 billion pounds. Idaho’s up 4.2% at 1.471 billion pounds. Meanwhile, California’s still recovering from H5N1 impacts, down 1.4%, and Wisconsin — the traditional dairy heartland — barely grew at 0.1%.

This isn’t just statistics; it’s a fundamental realignment of the U.S. dairy industry. Texas added 50,000 cows in the past year. Idaho gained 28,000. Kansas jumped 16,000. These states are building new processing capacity to match — Leprino’s massive cheese plant in Lubbock will process a million pounds daily when it opens in 2025.

The Geographic Revolution Is Here: Texas’s 50,000-cow expansion and Idaho’s 28,000 additions expose the brutal reality—dairy’s future belongs to states with water rights, minimal regulations, and new $11B processing infrastructure, not nostalgic traditions.

What’s Really Driving These Markets

Domestic Demand Dynamics

Holiday cheese demand is providing the floor under current prices. Retailers are actively building inventory for Thanksgiving promotions, keeping both block and barrel prices well-supported above $1.82. Food service demand remains steady, according to several major processors I spoke with this week.

But butter’s a different story. Inventories appear more than adequate for holiday baking needs. As one major retailer’s dairy buyer put it, “We’re covered through New Year’s at current consumption rates. No need to chase prices higher.”

Export Markets — The Pressure Points

U.S. Dairy Export Council data shows we’re in a knife fight with the EU for market share in Mexico. Today’s NDM price drop was necessary to stay competitive. But the bigger story is Southeast Asia, where demand continues to grow at 4-6% annually, according to recent USDEC reports.

The massive butter discount to global prices should be creating export opportunities, but logistics remain challenging. “We need consistent supply commitments through Q2 2026 to make these international contracts work,” notes a major exporter who requested anonymity.

Forward Markets and What They’re Telling Us

November Class III futures settled at $17.81 yesterday — today’s stable cheese market keeps that outlook intact. November Class IV at $14.02 faces more downward pressure after today’s NDM drop, potentially testing below $14.

Looking ahead, markets are pricing Class III around $17.30 for Q4 2025 and $16.85 for the first half of 2026. Class IV projections sit at $16.00 for Q4 and $15.75 for H1 2026. This persistent $1.50+ spread between Class III and Class IV isn’t going away anytime soon.

USDA’s all-milk price forecast for 2025 sits at $21.35 per hundredweight, with 2026 projected at $20.40 — both recently revised downward due to growing milk supplies and moderate demand growth.

From the Farm — Producer Perspectives

“We’re holding our own with these cheese prices, but barely,” says Jim Henderson, who milks 450 cows near New Glarus, Wisconsin. “Feed costs keep nibbling away at margins. If Class III drops below $17.50, we’ll have to make some hard decisions about culling.”

Down in Texas, the mood’s different. “We’re expanding,” states Maria Rodriguez, managing a 2,500-cow operation outside Dalhart. “With Leprino coming online next year, we need the milk ready. These prices work for us with our cost structure.”

In Pennsylvania, third-generation dairyman Tom Mitchell is more cautious: “I’m locking in 30% of my Q1 2026 milk at $18.85 Class III. After what we went through in 2023, I’m not taking chances. Better to know your margin than hope for higher prices.”

Regional Spotlight: The Changing Landscape

Wisconsin and Minnesota — The traditional dairy heartland is holding steady but not growing. Corn harvest is complete with good yields, helping stabilize the local feed basis. Cheese plants are operating at capacity due to holiday orders. Spot milk premiums remain steady, reflecting balanced supply-demand dynamics. The real concern? Younger producers are questioning long-term viability with these margins.

Texas and the Southwest — This is where the action is. With Cacique’s Amarillo facility now operational and Leprino’s Lubbock plant set to come online in 2025, processing capacity is finally catching up with production growth. Land values of $6,000-$8,000 per acre remain reasonable compared to traditional dairy regions. Water availability varies by location, but it hasn’t yet constrained growth.

California — Still recovering from H5N1 impacts and facing ongoing water challenges. The proposed Dairy Order requiring nitrogen discharge limits of 10 milligrams per liter will add costs. As dairy farmer John Silva near Tulare explains, “Between water regulations, air quality rules, and labor laws, it’s getting harder to compete. Some neighbors are selling to almond growers.”

Idaho — Continuing its steady expansion, with milk production up 4.2% year-over-year. The state now ranks fourth nationally, accounting for 7.5% of total U.S. production. Processing capacity remains the constraint, but several expansion projects are in the planning stages.

Three Market Scenarios for Next Week

Bull Case (25% probability): Cheese breaks above $1.85 on strong holiday orders, pulling Class III toward $18.50. Export buyers finally move on discounted butter, sparking a rally above $1.65. This scenario requires an unexpected surge in demand or a production disruption.

Base Case (60% probability): Cheese consolidates between $1.80 and $1.85. NDM continues sliding toward $1.10. Butter stays range-bound $1.55-1.60. Class III pays $17.50-18.00, while Class IV pays $13.75. Feed costs remain elevated.

Bear Case (15% probability): Cheese breaks below $1.80 on profit-taking. NDM accelerates decline toward $1.05. Growing milk supplies overwhelm demand. Class III drops toward $17, Class IV toward $13.50. This requires significant demand destruction or a major production surge.

What Farmers Should Do Now

Price Risk Management Lock in 25-30% of Q1 2026 milk production through Class III futures near $18. Use Dairy Revenue Protection for catastrophic coverage below $16. Consider collar strategies to maintain upside while protecting downside — buying $17 puts while selling $19 calls, for instance.

Feed Strategy Book 40-50% of Q1 2026 corn needs at current levels. Soybean meal showing concerning strength — if you lack coverage through winter, act before it breaks $320/ton. Watch South American weather closely; any production issues there will drive prices higher.

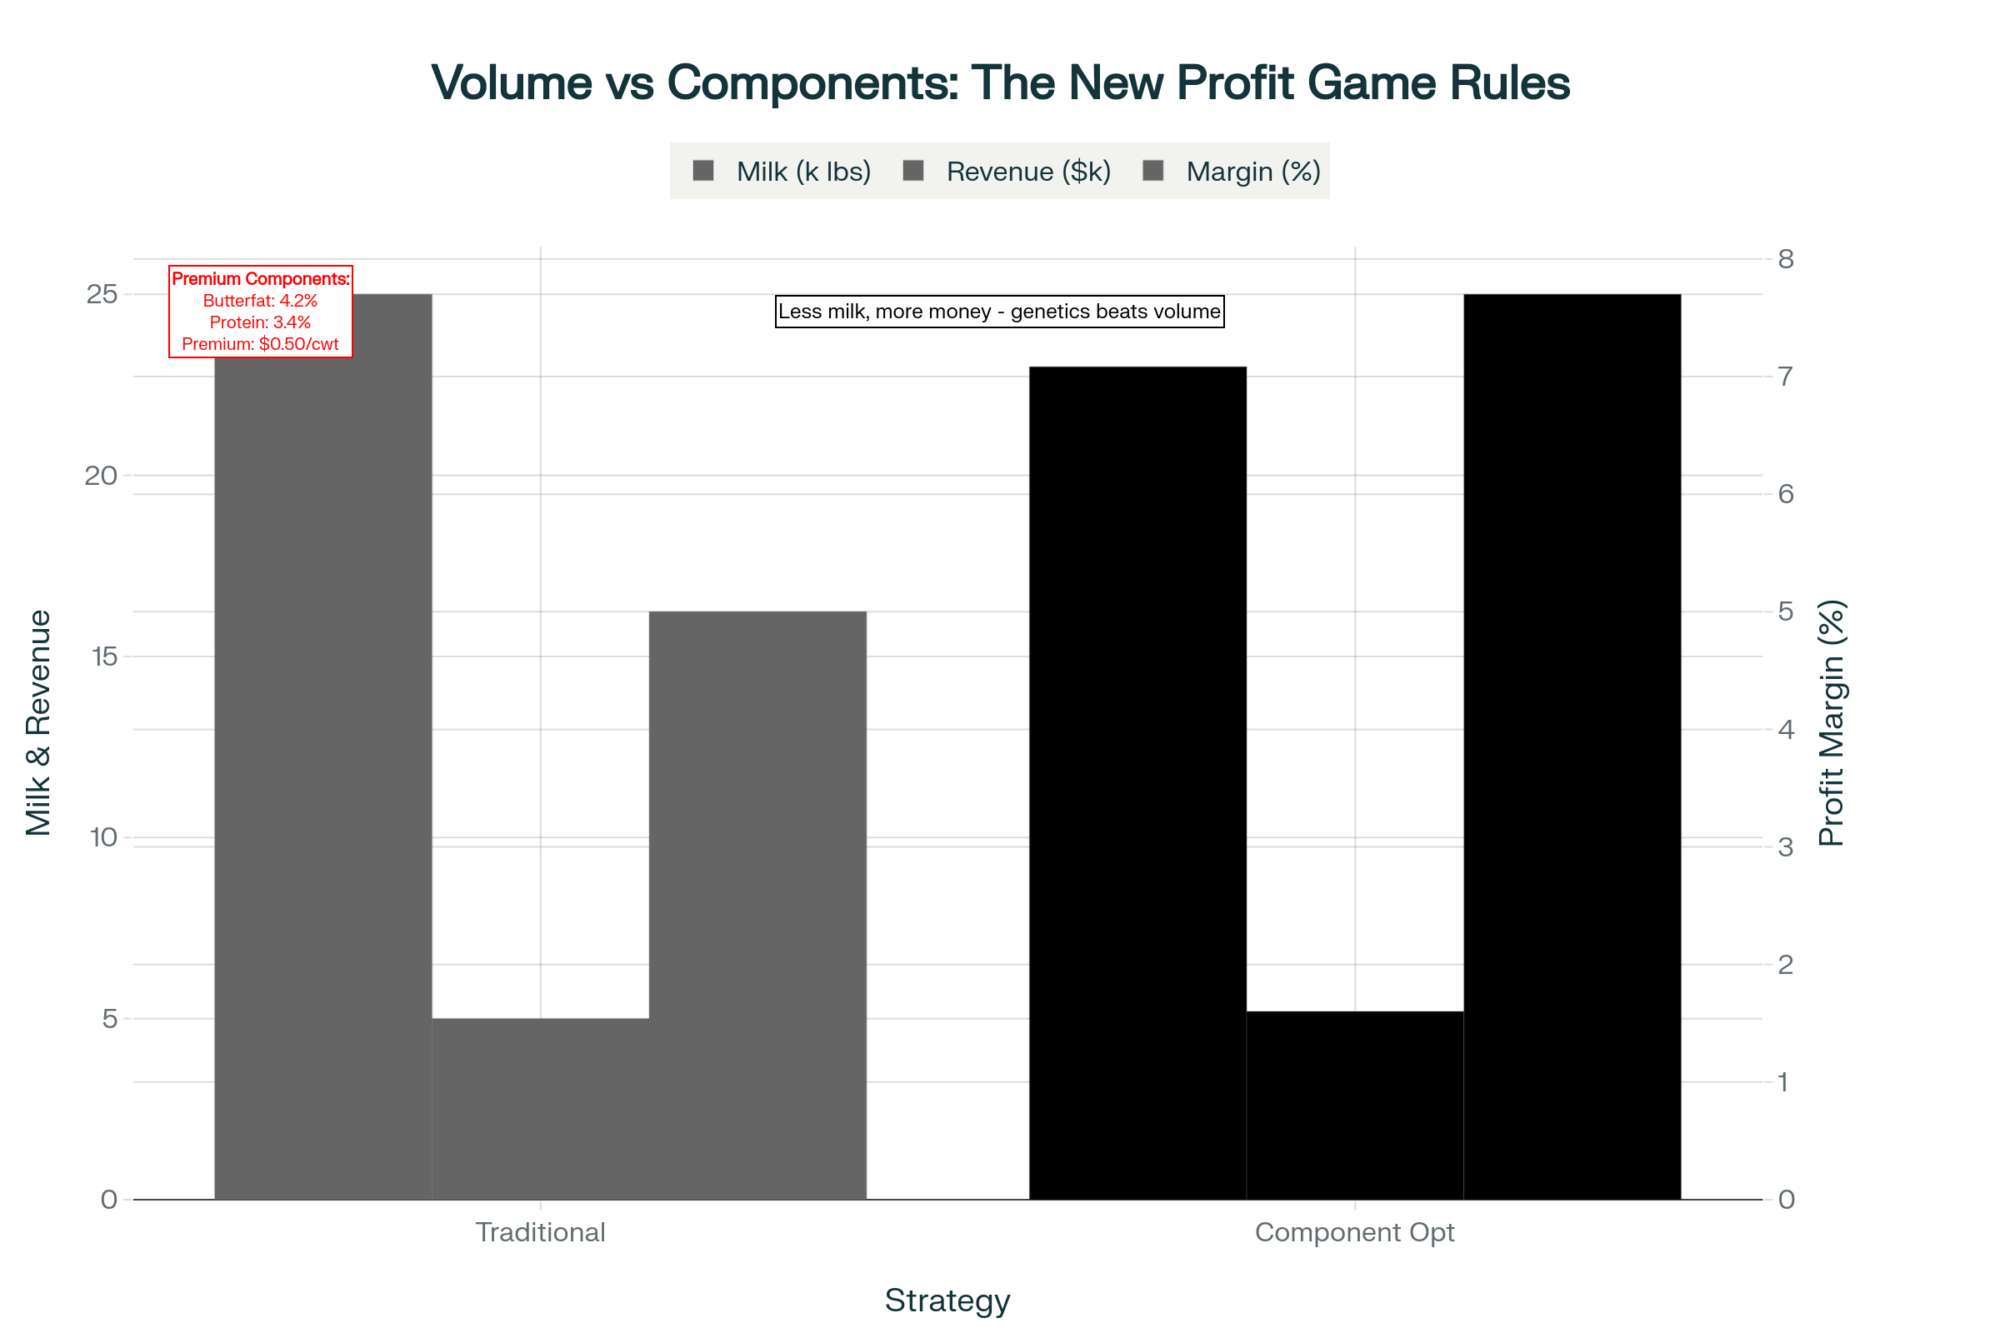
Operational Decisions With the massive Class III/IV spread, every percentage point of protein and fat matters. Work with your nutritionist to fine-tune rations. Consider genomic testing to identify your highest component producers. Cull decisions should factor in not just production but component quality.

Cash Flow Planning. That gap between Class III and Class IV means uneven milk checks depending on your plant’s utilization. Budget conservatively. Build working capital while cheese prices hold. Consider equipment purchases now rather than waiting for potentially tighter margins in 2026.

Industry Intelligence — What’s Coming Down the Pike

Federal Order Reform Impact The comment period for FMMO reform closes soon. Key proposals include updating milk component values, revising Class I pricing, and adjusting make allowances. “These changes could shift milk values by $1-2 per hundredweight once implemented,” notes Dr. Marin Bozic, dairy economist at the University of Minnesota.

Processing Capacity Expansion Beyond Leprino: In Texas, significant capacity is coming online. Chobani’s $500 million Idaho expansion, Select Milk’s powder facility upgrades, and multiple smaller cheese plants across the Midwest. The industry’s investing over $11 billion in new capacity through 2026, according to the International Dairy Foods Association.

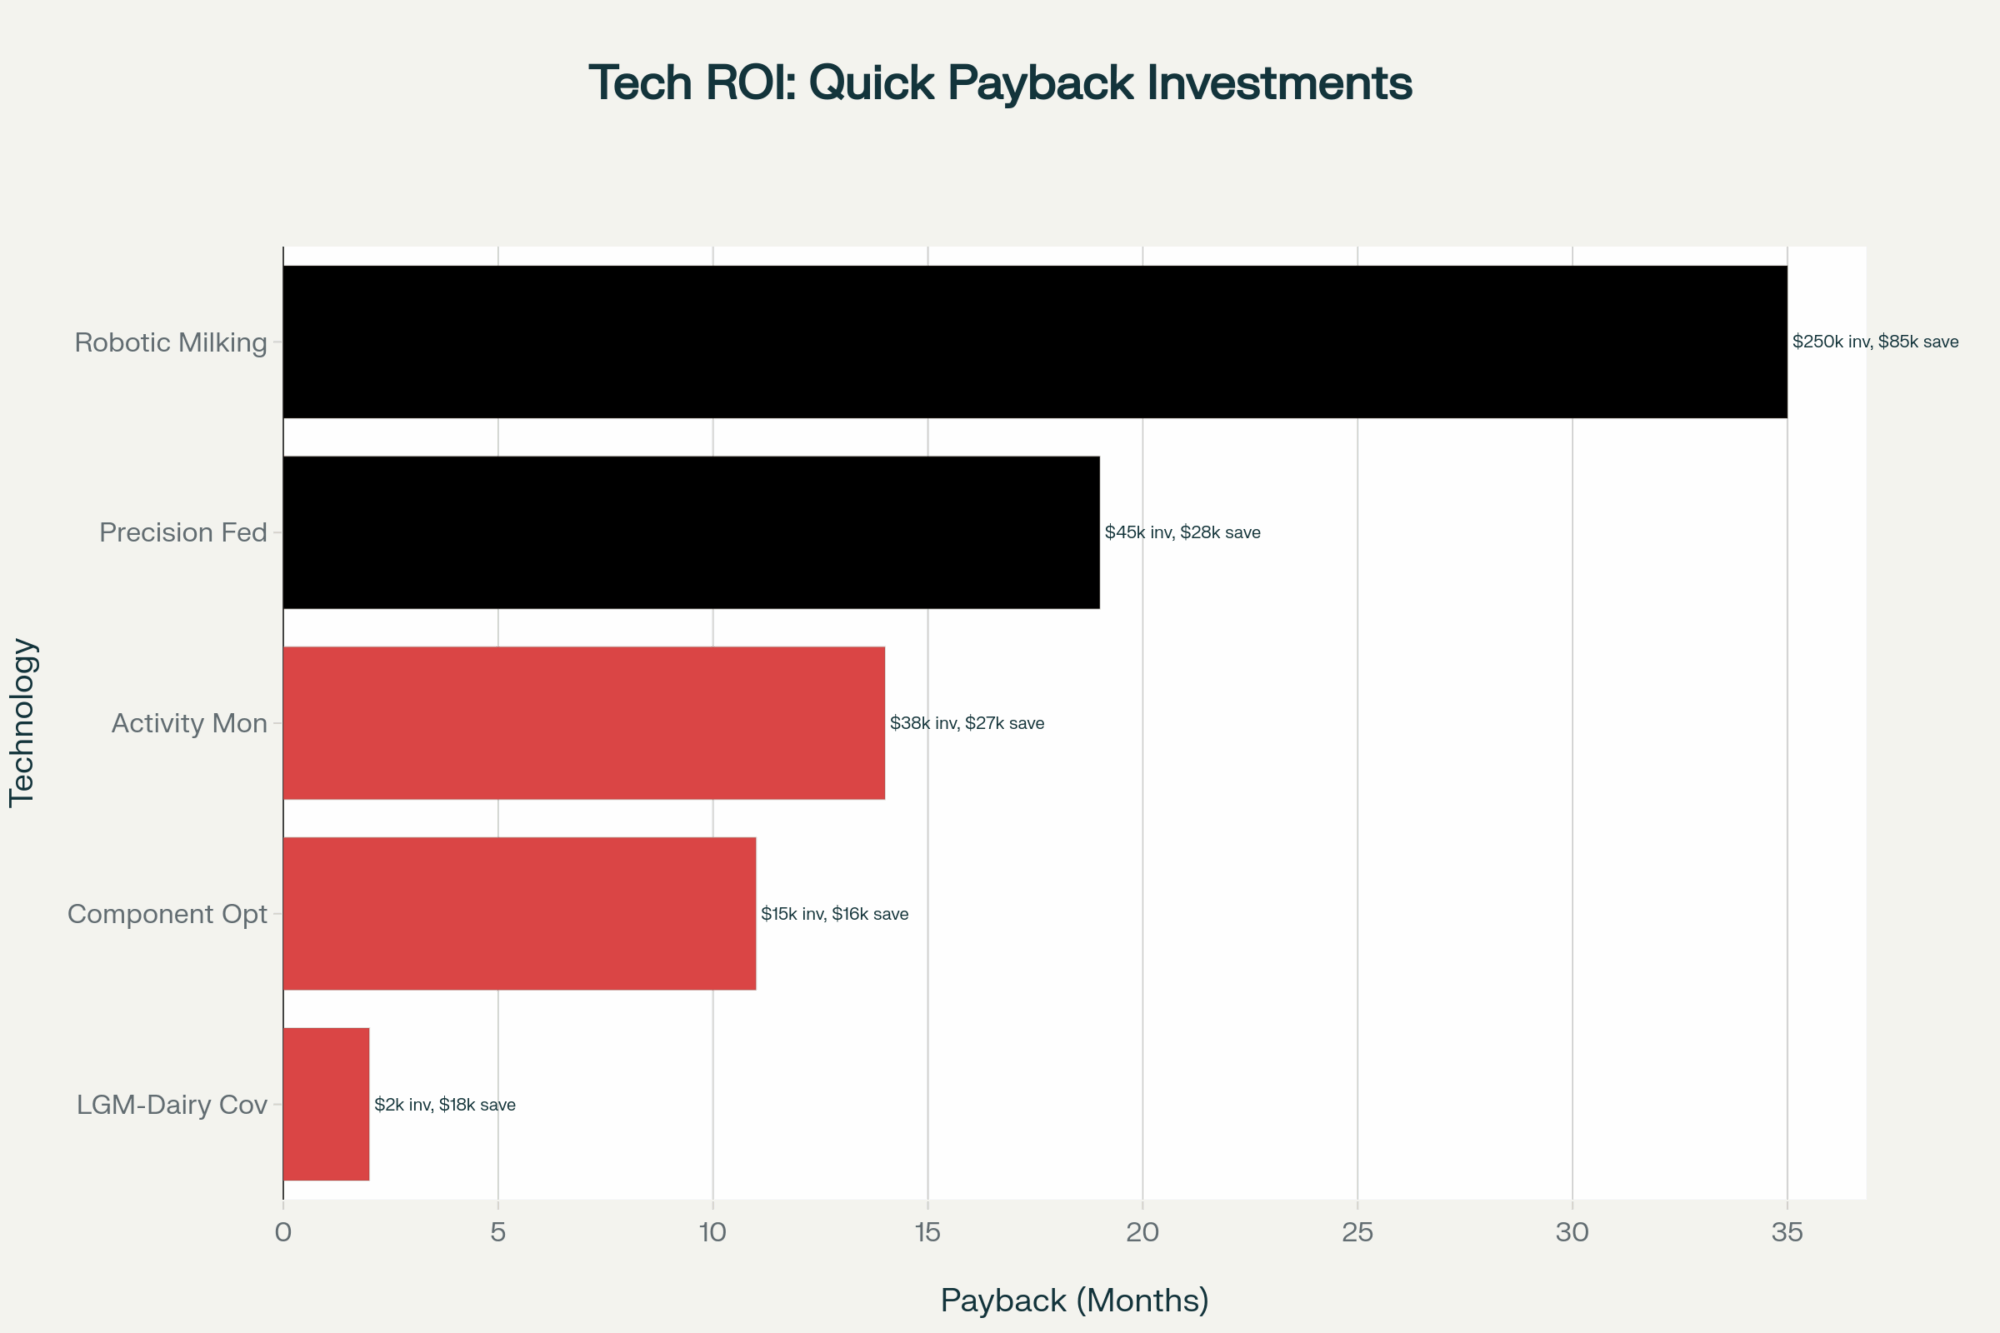
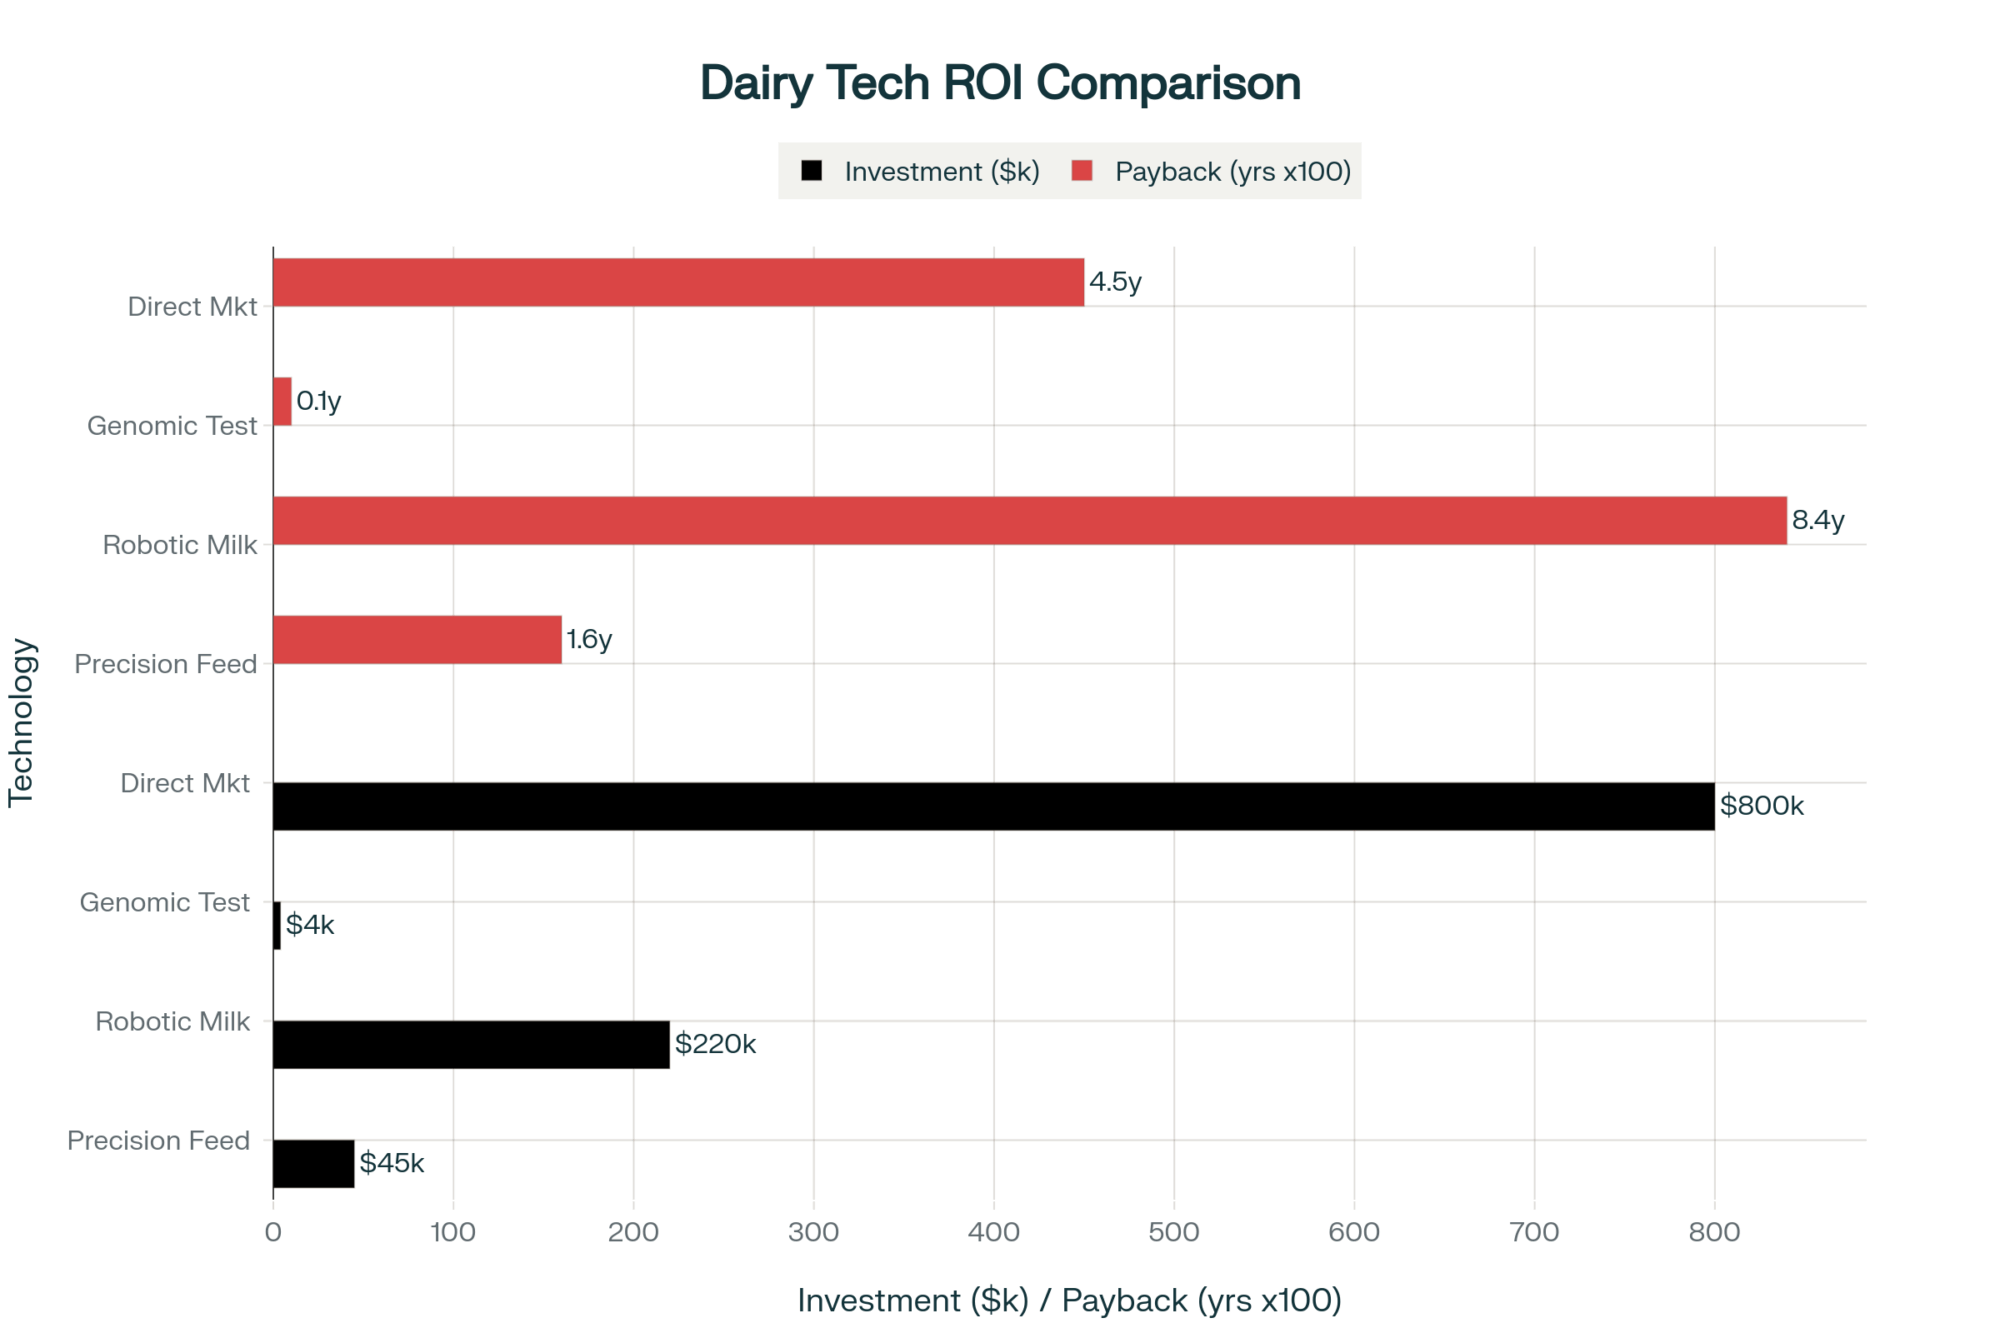
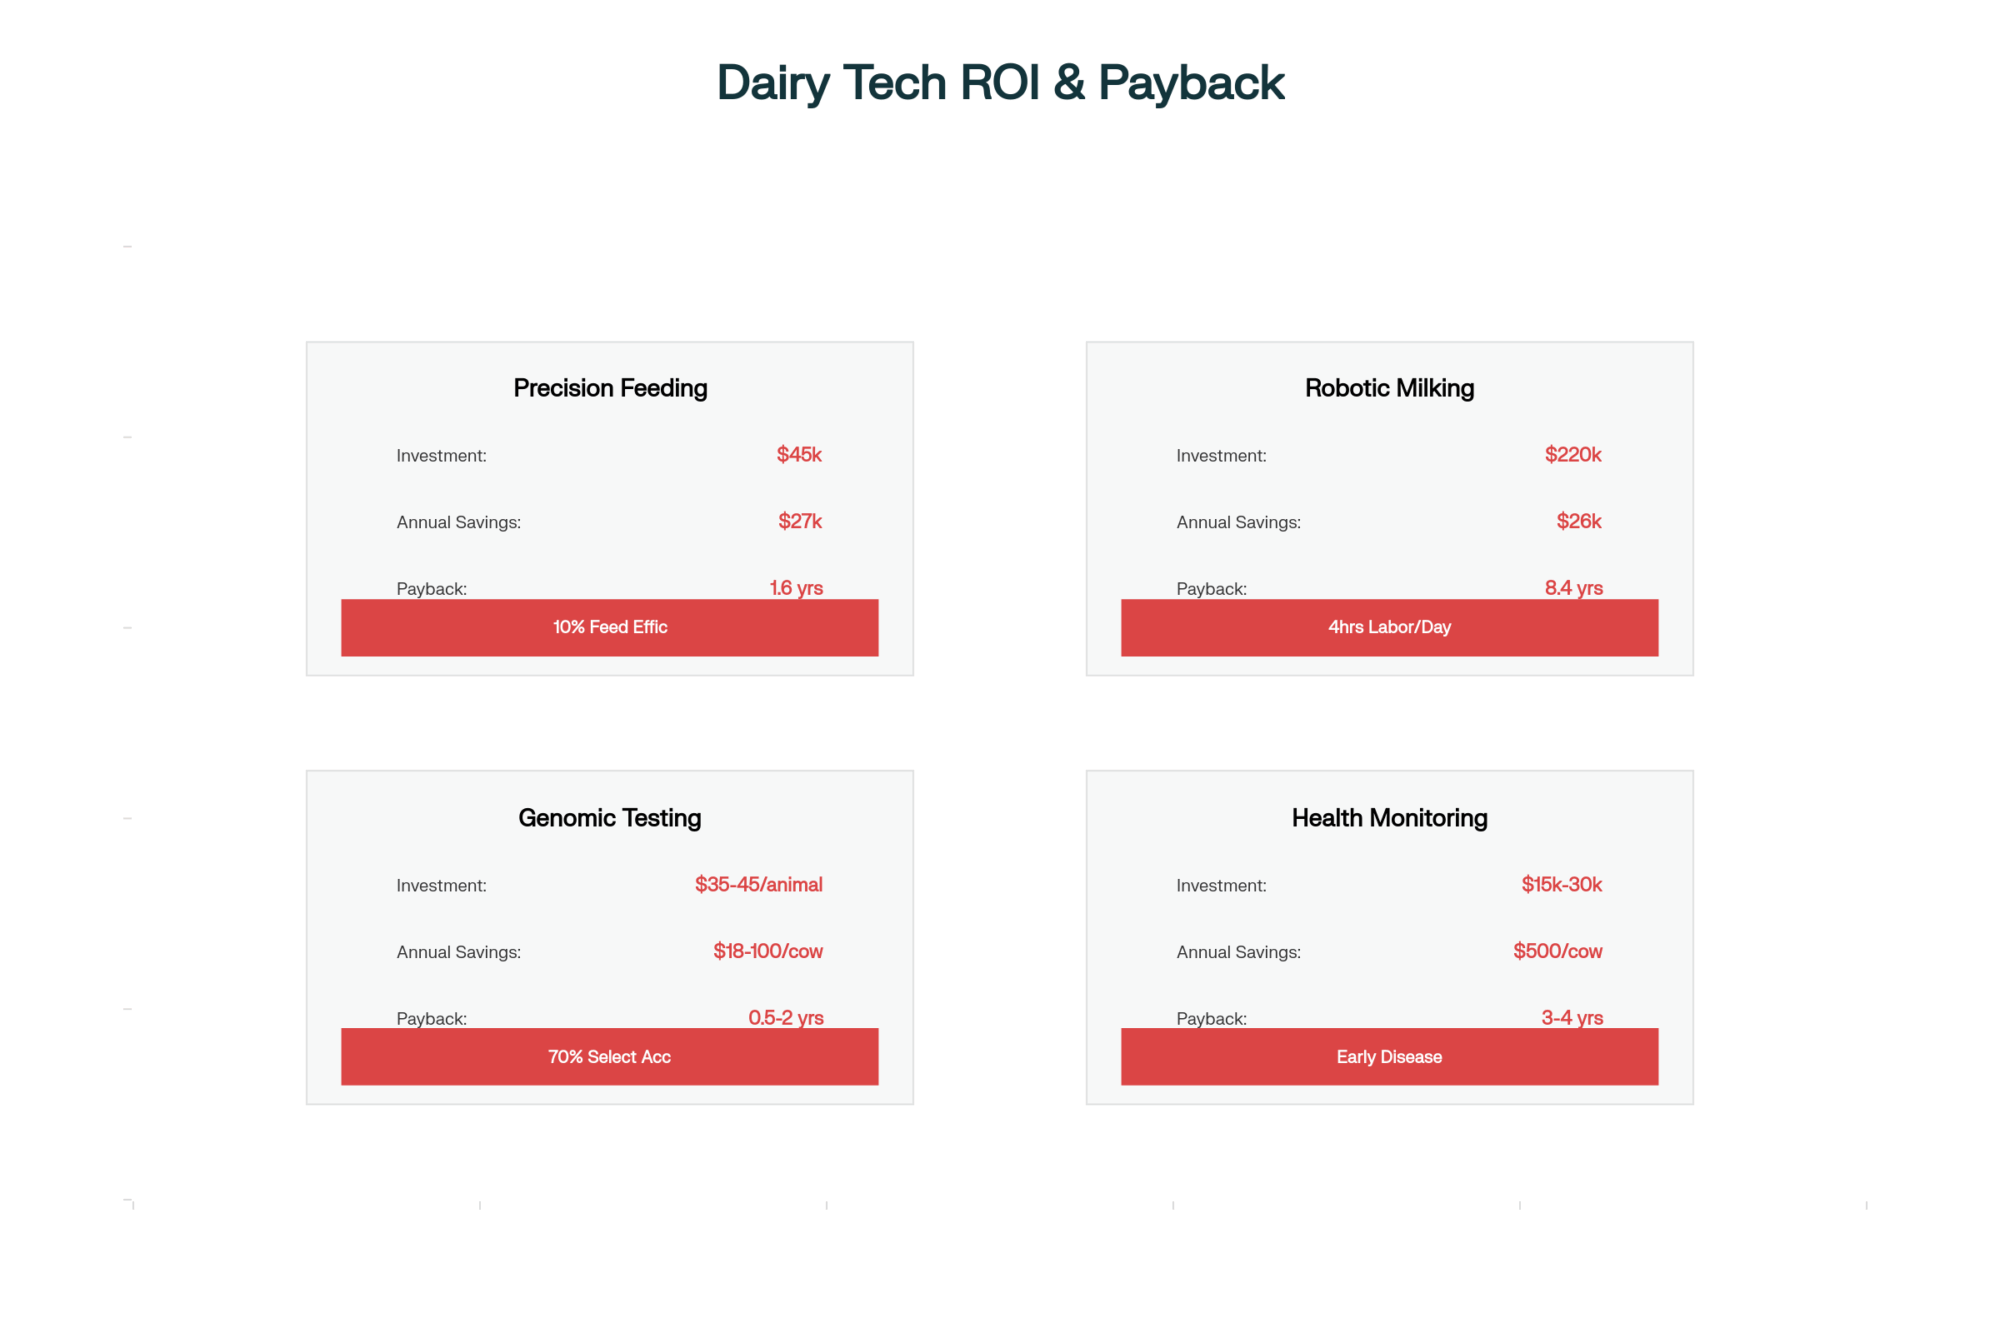
Technology Adoption: Robotic milking systems are no longer just for small farms. Several 1,000+ cow operations are installing robots, citing labor savings and improved cow health. “The payback’s under five years at current milk prices,” reports one Wisconsin producer who installed 24 robots last year.

The Brutal Mathematics of Plant Relationships: That ‘small’ $3,800 monthly difference compounds into $45,600 annually—enough to fund expansion, hire workers, or justify switching processors. This chart is why powder-plant farmers are calling cheese plants this week.

The Bottom Line — Context for Today’s Market

Today was a pause day after cheese’s weeklong rally. That’s normal, healthy even. The stability above $1.82 suggests these levels are sustainable through holiday demand.

But NDM’s accelerating weakness is concerning. This isn’t just market noise — it reflects fundamental oversupply in global powder markets and weak demand from key importers. When you can’t find a single bid at progressively lower prices, more downside usually follows.

The growing spread between Class III and Class IV — now approaching $4 per hundredweight — creates distinct winners and losers. If you’re shipping to a cheese plant, you’re in decent shape. Butter-powder plants? That’s a different story entirely.

Compared to last October, we’re in a better position on cheese but significantly worse on powder and butter. This divergence isn’t resolving anytime soon. Success in this environment requires active management — of price risk, feed costs, and operational efficiency. The days of riding market waves without a strategy are over.

What’s clear is that the U.S. dairy industry is undergoing fundamental restructuring. Production is shifting to states with fewer regulatory constraints and newer infrastructure. Traditional dairy regions face mounting challenges. Processing capacity is playing catch-up to this geographic realignment.

Smart money’s positioning for this new reality. The question is: are you adapting fast enough to thrive in tomorrow’s dairy industry, or are you hoping yesterday’s strategies will somehow work in tomorrow’s markets? 

Key Takeaways: 

  • The $45,600 Question: Same milk, same work, but cheese-bound farms earn $17.81/cwt while powder operations bleed at $13.75 – your plant relationship now matters more than your production efficiency
  • NDM’s Zero-Bid Disaster: Today’s seven sellers vs zero buyers signals something darker – U.S. powder can’t compete with Europe’s $1.00/lb pricing, and the gap’s widening
  • Geographic Exodus Accelerates: Texas added 50,000 cows while California lost 8,000 – follow the milk to states with water rights, sane regulations, and new $11B in processing capacity
  • Feed Math That Kills: At $4.35 corn and $308 soy meal, you need $18+ milk to maintain 2019 margins – only cheese producers have a shot
  • Your 72-Hour Decision: Lock in 30% of Q1 2026 at $18+ Class III before smart money takes it all – standing still in this market means falling behind

Complete references and supporting documentation are available upon request by contacting the editorial team at editor@thebullvine.com.

Learn More:

The Sunday Read Dairy Professionals Don’t Skip.

Every week, thousands of producers, breeders, and industry insiders open Bullvine Weekly for genetics insights, market shifts, and profit strategies they won’t find anywhere else. One email. Five minutes. Smarter decisions all week.
NewsSubscribe
First
Last
Consent

Lovholm Holsteins: The Only Farm to Breed 2 World Dairy Expo Holstein Champions Milks 72 Cows in Tie-Stalls

Small farm. Big dreams. Historic achievement. How 72 cows beat every Holstein powerhouse on Earth—twice.

Game over. Kandy Cane is crowned Grand Champion at World Dairy Expo. While the banner will hang in the Lambs’ barn, it’s the Lovholm prefix, belonging to a 72-cow farm in Saskatchewan, that’s now etched twice into Holstein history.

Look, I get it. When you hear a tie-stall operation from Saskatchewan—Saskatchewan!—just bred their second World Dairy Expo Grand Champion, your first thought is probably “that can’t be right.” Mine was too.

But here’s what nobody in the industry wants to admit: While their fancy mating programs and big marketing budgets were chasing genomic rabbits down expensive holes, Michael and Jessica Lovich were quietly proving that old-school cow sense still beats computer algorithms.

And while they don’t have the purple banners to show for it—those hang in other people’s barns—they’ve got something better: their prefix in the history books.

The Day That Changed Everything (Again)

October 3, 2025. Michael Lovich was in the stands at World Dairy Expo, his heart feeling like it was gonna pop out of his chest.

You know that spot, right where you can see everything? That’s where he sat, watching Judge Aaron Eaton work through that incredible five-year-old class. You’d think after breeding one WDE champion a decade earlier, he’d have nerves of steel.

Not even close.

“I was probably the most nervous guy in the barn because I was shaking so bad I couldn’t even hold my phone for pictures,” he told me later.

Back home near Balgonie—that’s about 30 minutes east of Regina, for those keeping track—Jessica had given up pretending to eat lunch. She was puttering around the kitchen, laptop streaming the show, while their three daughters huddled around various screens in their car at school. The smell of morning silage still hung in the air from chores, mixing with untouched sandwiches.

School? Yeah, they got permission to skip class. Some things matter more than algebra.

“Somebody tapped me and said, ‘Are you happy?'” Michael recalls about that first pull. “I said, ‘Nope, not until we’re in the final lineup.’ There’s no sitting down until he does his reasons, and we get the nod for first place. It’s only the first pull.”

That’s the difference between people who’ve been there and wannabes. Michael knew that the first pull meant nothing, as he had changed his mind several times earlier in the day. But the judge, Aaron Eaton, had made up his mind, as he would say in his reasons: “When she came in the ring, it was game over.”

And let me tell you, in a class that deep—every single cow could’ve been champion at most other shows—nothing was guaranteed.

The Ornery Heifer Nobody Else Wanted

Here’s the kicker about Kandy Cane: she wasn’t even supposed to be their keeper.

“She was always that cow,” Jessica laughs, and if you’ve ever had one of those in your barn, you know exactly what she means. Born October 20, 2020, headstrong from day one. The kind that makes you check the calendar when she’s due to calve because you know she’ll pick the worst possible night.

They’d actually assigned her as a 4-H project calf to a local town kid. Their own daughters picked different heifers—ones that looked more promising, walked better, didn’t fight you every step to the milk house.

But Jessica’s dad saw something when she was boarding at his place in Alberta: he spotted her out on the pasture as a bred heifer, standing apart from the others, her deep body already showing, even though she was immature.

“He’s like, ‘I really like that heifer. Who is she? What is she? How much do you want for her?'” Jessica remembers.

“She’s not for sale, Dad. She’s got to come home.”

Fast forward to Saskatoon Dairy Expo 2024. Kandy Cane’s being her usual difficult self in the ring—with the Lovichs themselves trying to keep her moving forward. Interested buyers approach with decent offers—we’re talking decent money, the kind that pays for half a year’s worth of grain—but not quite what they were asking.

Then boom—she wins the four-year-old class.

After that win, suddenly everyone wanted to pay. Michael’s response? “That’s like betting on a hockey game and waiting for the third period to be done before you place your bet.”

Price had gone up.

Most walked away. But when the Lambs from Oakfield, New York, finally came calling—after a fateful bus conversation would seal the deal—they paid it.

The handshake was on a bus; the result is in the barn. Kandy Cane settles into her new home at Oakfield Corners in May 2024, beginning the historic partnership between the Lovichs and the Lambs that was built on a shared belief in honest, great-boned cows.

The Partnership That Actually Worked

The real magic started on a bus, of all places.

You know those convention buses—too hot, smells like coffee and exhaustion. Michael found himself sitting next to Jonathan Lamb, heading to a Master Breeder banquet during the 2024 National Holstein Convention.

They got to talking—not about indexes or genomics, but about honest cows. Real cows. The kind that work in anybody’s barn, whether you’re milking in a brand-new rotary or your grandfather’s tie-stalls.

That conversation planted the seed. When the Lambs decided they wanted Kandy Cane after Saskatoon, the relationship was already there. The trust was built.

“The coolest part of the whole Kandy Cane story?” Jessica tells me. “We gained a friendship out of the deal.”

The result of a partnership built on trust. Here, Lovhill Sidekick Kandy Cane displays the championship ‘bloom’ she gained under the expert care of Jonathan and Alicia Lamb, winning at the Northeast Spring National Show—a powerful preview of the history she was about to make.

Under the Lambs’ management, with Jamie Black finally getting his hands on the halter, Kandy Cane transformed. She filled out, gained that bloom that separates good cows from champions. The kind of condition where the hair shines like silk, and every step looks purposeful.

But here’s what matters: she stayed honest.

The Breeding Philosophy Nobody Wants to Hear

The matriarchal link: Lovhill Gold Karat (EX-95). As Kandy Cane’s grandam and Katrysha’s full sister, her influence runs deep through the Lovholm herd. She’s a living testament to why the Lovichs prioritize proven genetics and cow sense over chasing the latest genomic numbers.

“Genomics? What are those?” Michael jokes when I ask about his breeding strategy.

Except it’s not really a joke.

“Cow families are probably number one,” Michael states flatly. “If I don’t like the cow family the bull comes from, we won’t use him. When I see bulls that are out of three unscored dams, I don’t care what the numbers are.”

Think about that for a second. In October 2025, when we have genomic testing on 10 million cattle globally and everyone’s breeding for indexes that change every four months, these individuals are breeding the way their parents (Ev and Marylee Simanton and Garry and Dianne Lovich) and their closest mentors taught them twenty years ago.

And they’re beating everyone.

The Lovichs’ cows typically have an average productive lifespan of 8-10 years. Industry average? Four to five, if you’re lucky. That’s five extra years of milk checks versus the cost of replacement. Do the math on that ROI—it’s not about peak lactation, it’s about lifetime profitability.

Saskatchewan: The Last Place You’d Look (Which Is Why It Works)

When Michael and Jessica left Alberta in 2015 to buy Prairie Diamond Farm, people thought they were crazy. Leaving established dairy country for… Saskatchewan?

The succession plan with Michael’s parents hadn’t worked out. “We don’t dwell on it,” Jessica says diplomatically. “And you know what? Maybe it was the best move that could have ever happened to us.”

Saskatchewan offered something unexpected: freedom to farm their way.

The Dairy Entrant Assistance Program gave them 20 kilos of free quota if they matched it. The Strudwick farm was available, and they were seeking someone to carry on their legacy.

“People think we’re out here on the prairies completely alone,” Jessica explains. “But there’s 10 or 12 of us that are quite close together. We help each other. And a three-hour drive to go visit a friend? That’s nothing.”

Long before their second World Champion, the Lovichs were already being recognized for their vision. Pictured here after being named Saskatchewan’s 2021 Outstanding Young Farmers, it was proof their risky move from Alberta had blossomed into a model of agricultural success.

Here’s what gets me: 72 cows in tie-stalls. Every cow gets individual attention. Nobody’s pushing for 40,000-pound lactations that burn cows out by third calving.

They’re growing as much of their own feed as possible on 500 acres. Selling some straw and compost to neighbors. Building a sustainable operation that works with the land, not against it.

Three Daughters and the Farm’s Future

The Lovich girls—Reata, Renelle, and Raelyn—aren’t just farm kids. They’re the next generation of this breeding philosophy.

“It’s a matter of survival around here,” Jessica laughs. “If you’re not in the barn doing chores, you’re in the kitchen cooking supper.”

Reata’s planning to be the farm vet. Renelle will handle the cropping. Raelyn? She’s already declared herself future farm manager “because she knows all the cows already.”

They’ve got their own cattle—including a Jersey their Uncle Jon and Auntie Sandy sent for Christmas. “Now I’ve got to keep Jersey semen in the tank,” Michael grumbles, but you can see he’s proud.

When Kandy Cane won at Expo?  They were crying, they were laughing, they were super excited,” Jessica recalls. “They’ve been coming with me to shows since they were born. They’ve slept on hay bales at shows for 14, 16 years.”

These kids aren’t learning dairy from textbooks. They’re learning it at 5 a.m. before school, one cow at a time.

The heart of Lovholm Holsteins: Michael, Jessica, Reata, Renelle, and Raelyn Lovich. These three daughters represent the next generation carrying forward a breeding philosophy that prioritizes cow sense, hard work, and faith over fads, ensuring the farm’s future.

The Faith Component Nobody Talks About

“You can’t take any of this with you when you leave this earth,” Jessica says, and she means it. “But all of it can be taken from you in an instant. So every day, we just give God the glory.”

It is evident in how they conduct business. They price cattle fairly. Sell to people who’ll treat them right. Maintain relationships long after cheques clear.

When Jessica mentions that Jonathan Lamb “just happened” to sit next to Michael on that bus? She sees providence.

Either way, it worked.

The Numbers That Should Terrify Every Mega-Dairy

Let’s talk brass tacks. In a 72-cow herd, the Lovichs have built this:

LOVHOLM BY THE NUMBERS:

  • 19 Multiple Excellent cows
  • 14 Excellent
  • 38 Very Good
  • 11 Good Plus
  • 2025: 1 Super 3
    • 12 Superior Lactations
    • 12 * Brood Cows
    • 11 Longtime production awards, including 1- 120 000kg 
  • Average productive life: 8-10 years (vs. 4-5 industry average)
  • 2 World Dairy Expo Grand Champions bred
  • 72 total milking cows

Bulls like Sidekick were used—not because of genomics, but because “he had what we figured we needed.”

That’s the difference. They’re breeding for their barn, their management, their future. Not for some index that’ll change next proof run.

What This Really Means (The Part That’ll Piss People Off)

Two World Dairy Expo Grand Champions from one prefix. Nobody else has done it.

Not the operations that have been breeding Holsteins for 100 years. Not the genetic companies with donor programs. Not the show string specialists.

A 72-cow tie-stall farm in Saskatchewan did it. Twice.

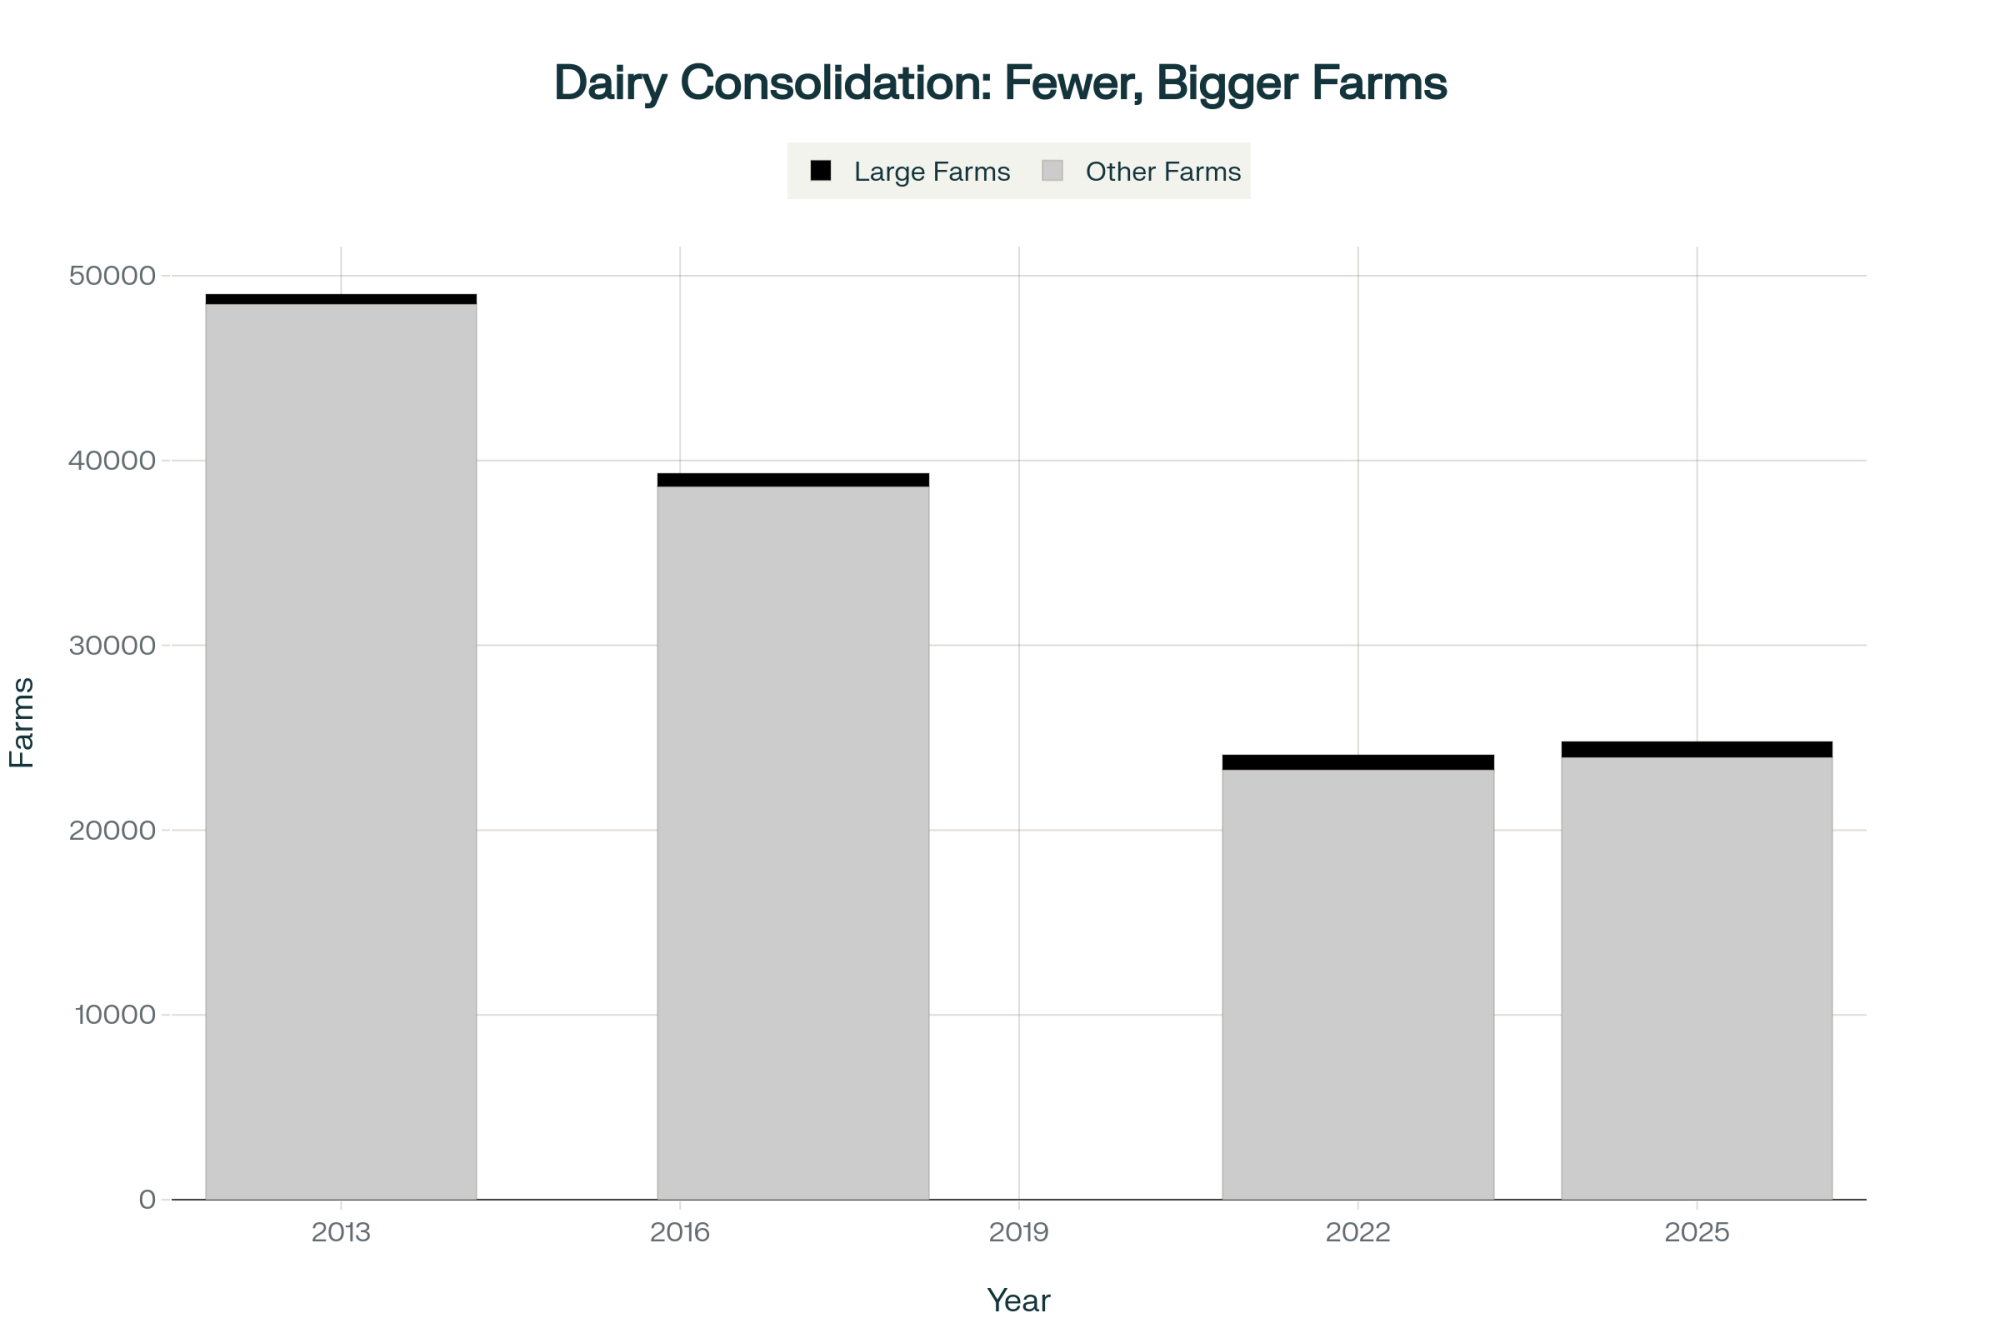
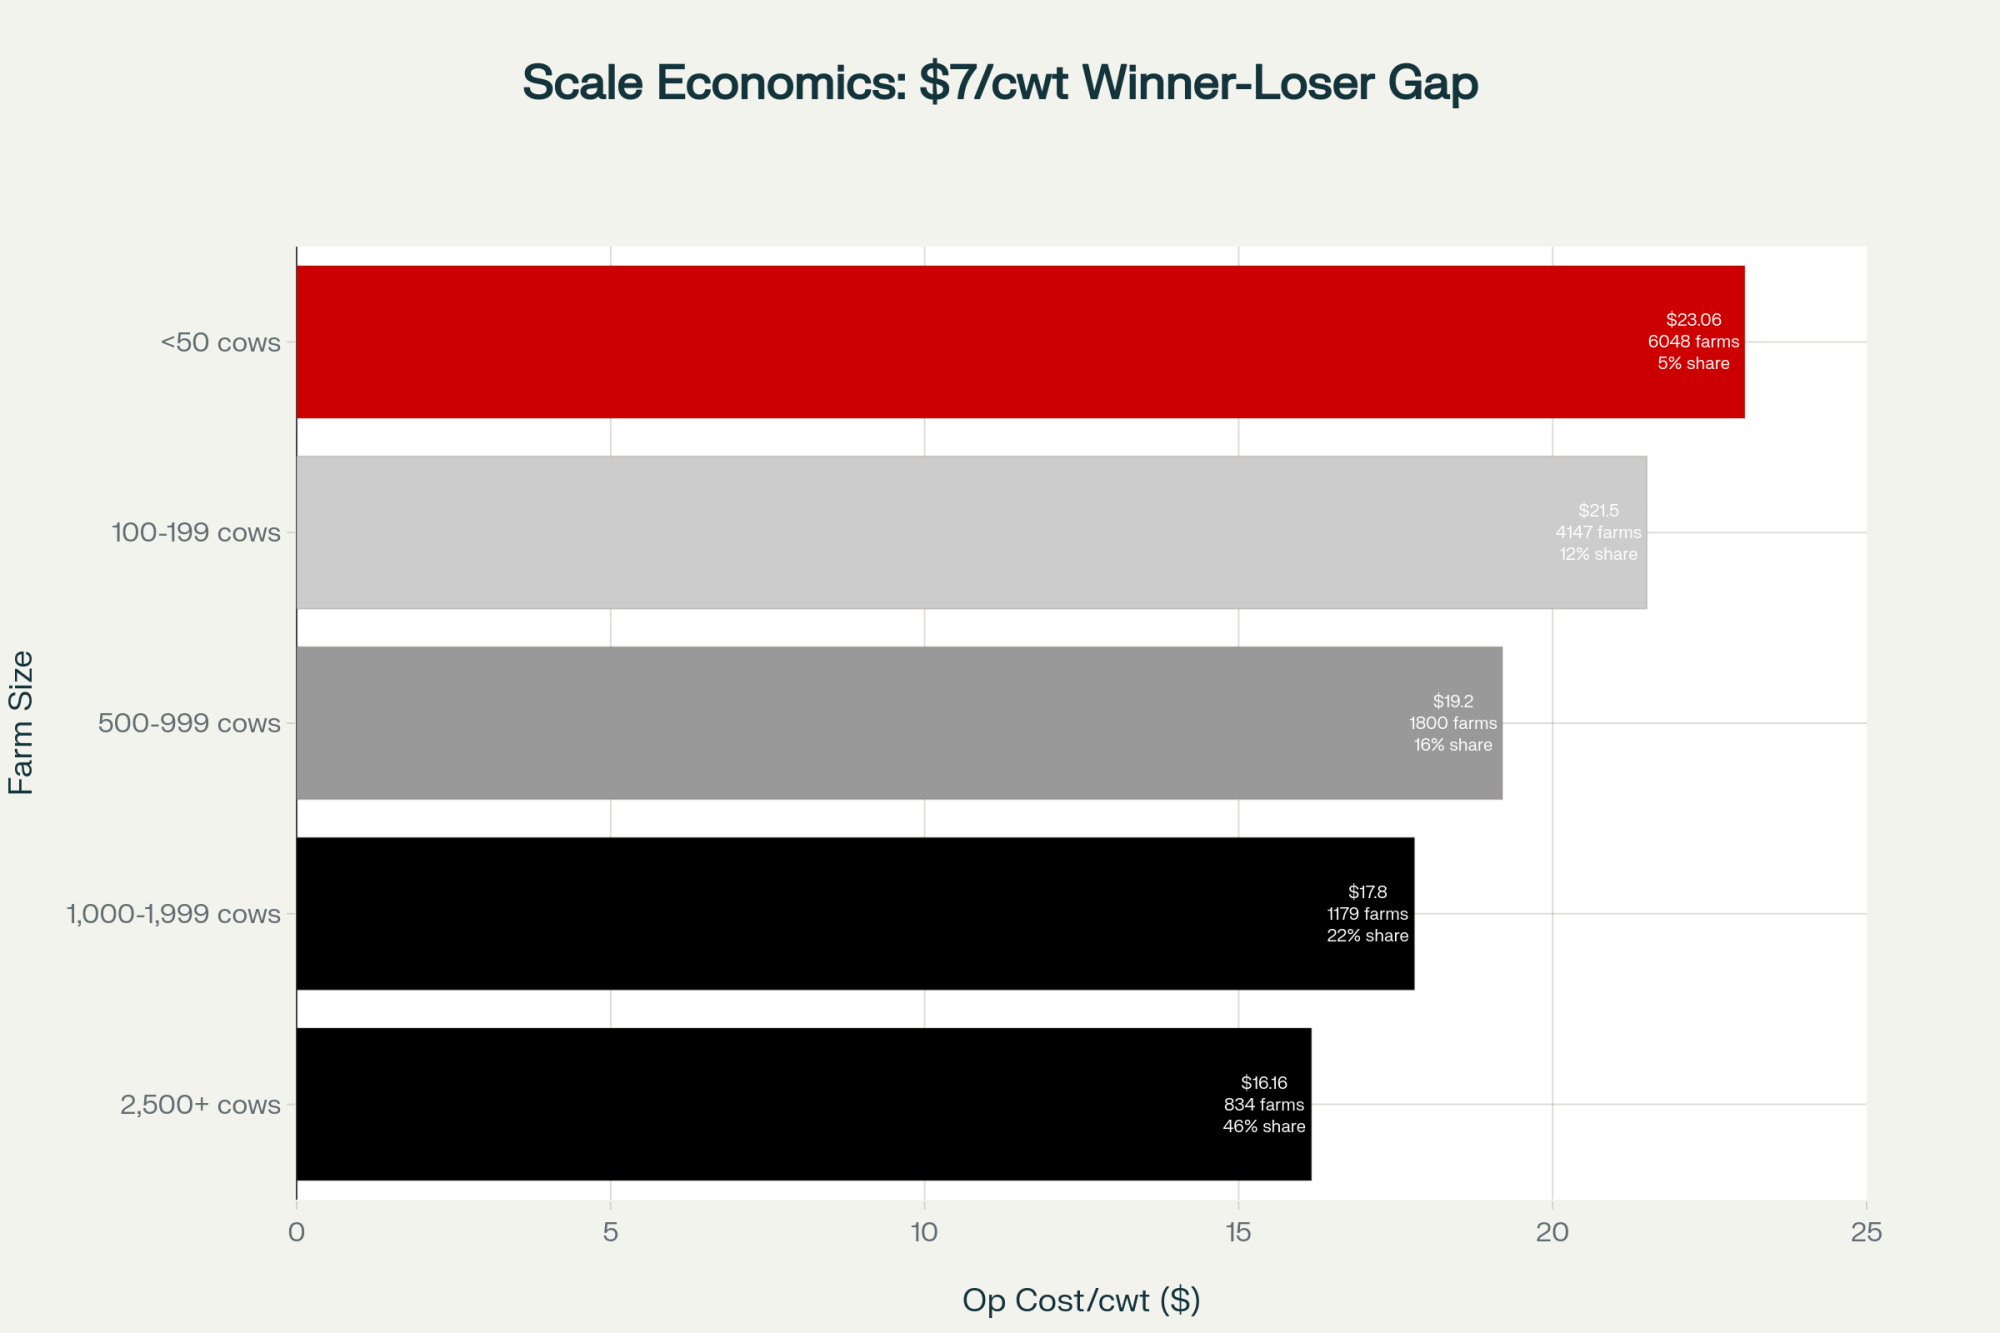
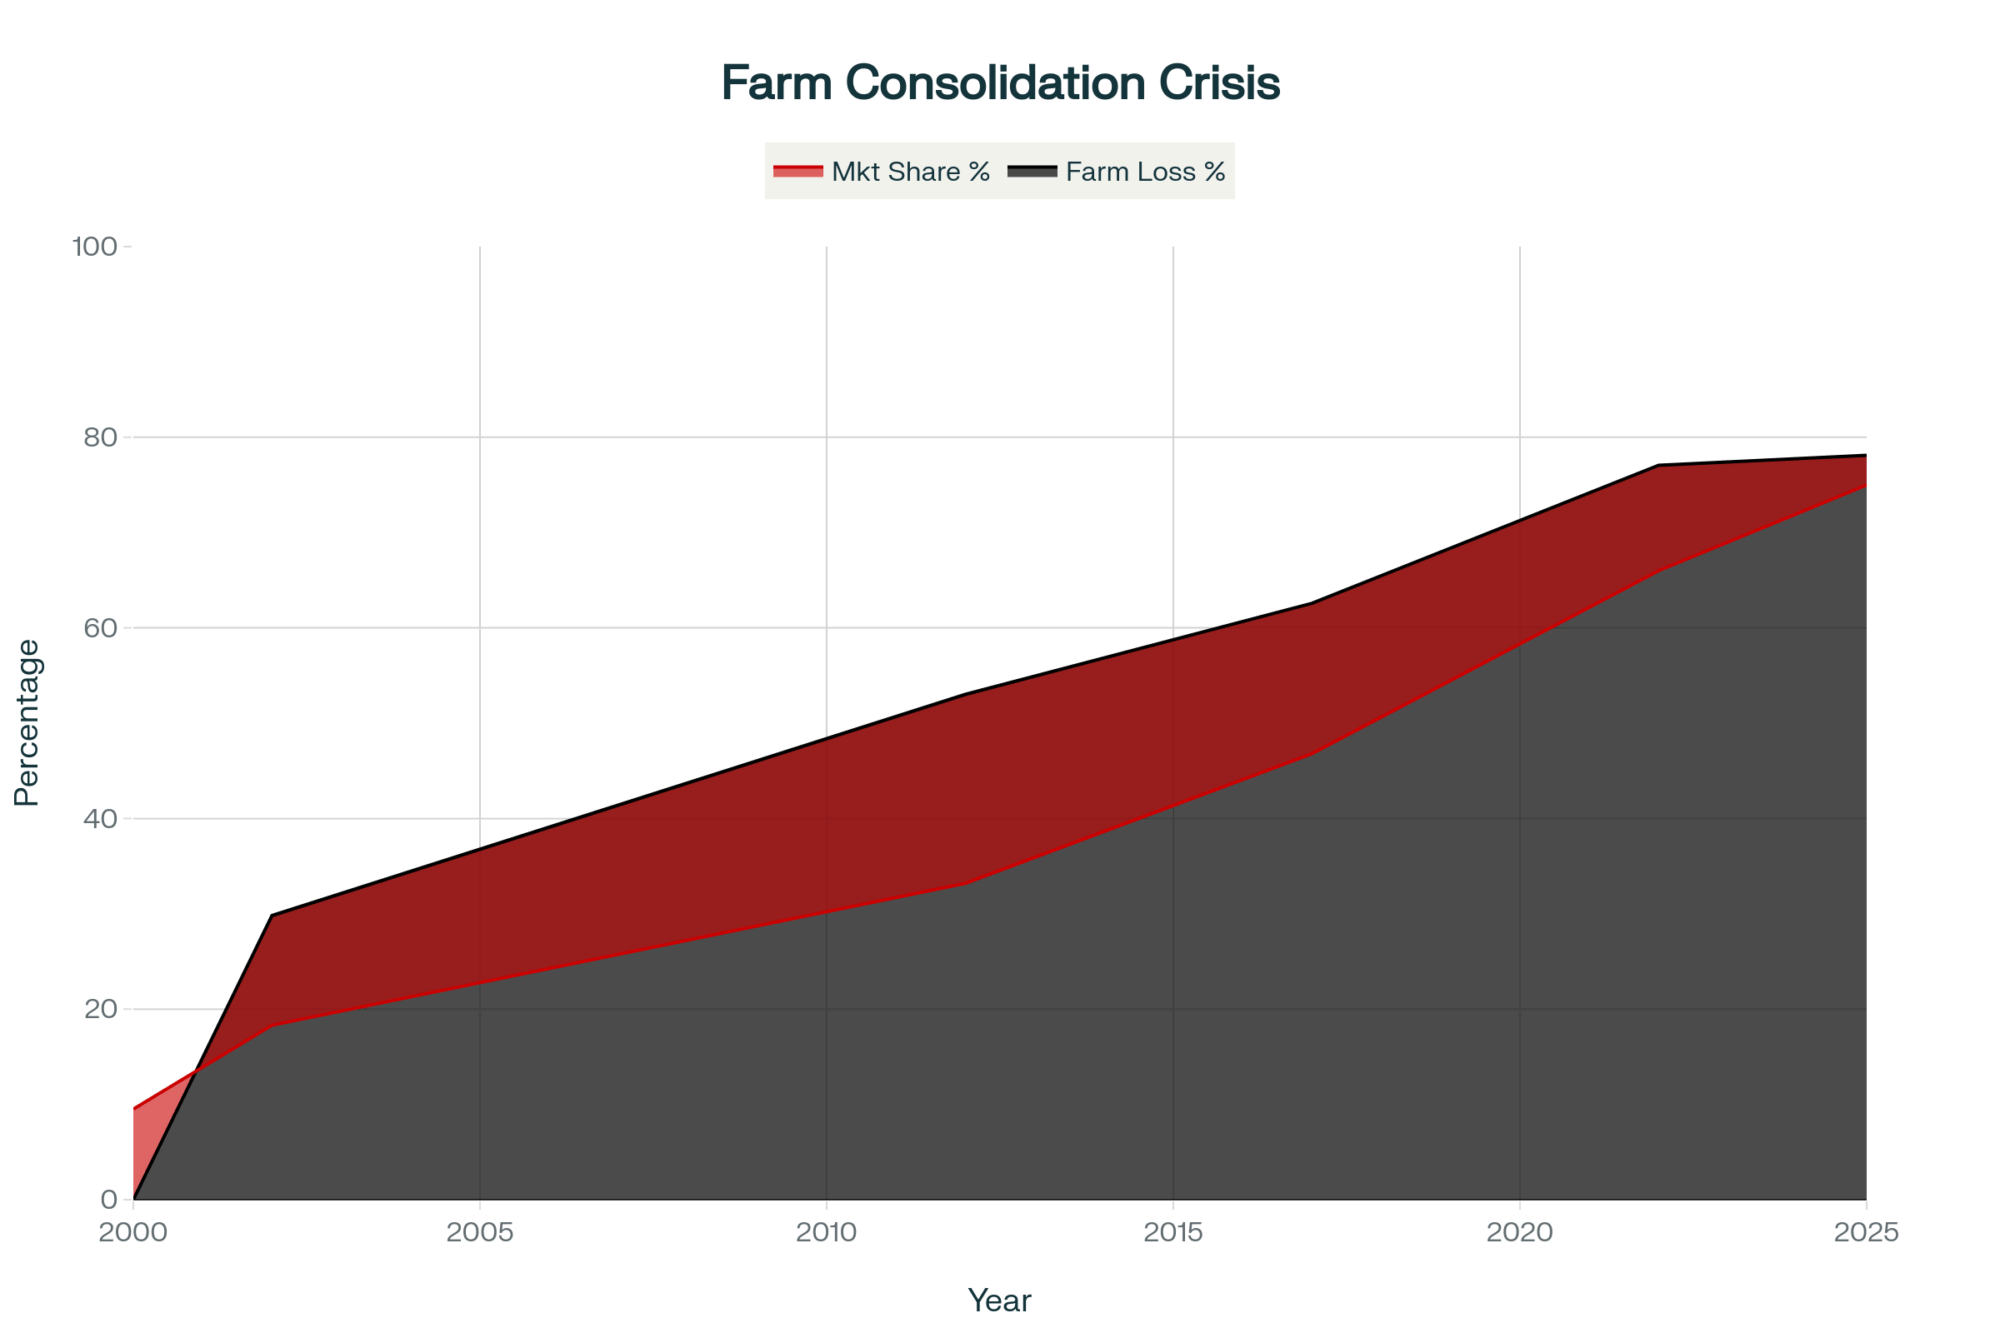
The industry’s consolidating faster than ever. Three farms close daily, while mega-dairies expand. Operations with 2,500+ cows control nearly half of milk production.

But when you can breed cows that last twice as long? Your economics change completely.

Lower overhead. Fewer replacements. Less transition cow drama.

Suddenly, that 72-cow operation doesn’t look so backward.

The Morning After Nothing Changed (Everything Changed)

The morning after Kandy Cane won, Jessica was back in the barn at 5 a.m. with the girls. Michael was still in Madison, probably hadn’t slept.

But back home? Same 72 cows needing milked. Same routine.

“For all the acclaim we have, we still don’t have a grand champion banner hanging anywhere on our farm,” Jessica points out.

No bitterness. Just a fact.

The first of two. Lovhill Goldwyn Katrysha’s historic win at the 2015 World Dairy Expo. Her victory put the Lovholm prefix on the map and set the stage for her herdmate, Kandy Cane, to make them the only breeders in history to achieve this twice.

Both champions’ banners hang in other people’s barns. Kandy Cane’s purple and gold heads to New York. Katrysha’s from 2015? Hangs proudly at MilkSource Genetics.

They bred Holstein history twice, but don’t have the banners. Because sometimes you sell your best to keep the lights on. That’s dairy farming in 2025.

But breeding great cattle is its own reward. The Lovholm name in those pedigrees? Worth more than any banner.

So What’s Next?

“Is there a third one coming?” I had to ask.

Jessica laughed. “We always got to dream bigger, right?”

Then she got serious: “We want to keep breeding functional cows. Cows we enjoy milking. Cows that can maybe have a little bit of fun at shows.”

Not world-beaters. Not genomic wonders.

Functional cows.

And that’s exactly why they’ll probably breed another champion.

The Lesson Nobody Wants to Learn

Here’s what bothers me: We all know this story. Small farm beats big guys. David and Goliath, dairy edition.

We love these stories at Expo, standing around at 2 a.m. with a beer, talking about the good old days.

But come Monday morning? We go right back to chasing the newest index. The hottest sire. The genomic flavor of the month.

The Lovichs aren’t just breeding better cows. They’re proving there’s another way.

Not backwards. Different. Focused on what actually matters when you’re trying to make a living milking cows.

You want to know why a 72-cow farm just schooled the entire Holstein industry?

Because they were actually farming. Not playing a genetic lottery. Not building cow factories. Farming.

And twice now, when the best cattle in the world stood in Madison, their way won.

The Walk We All Need to Take

The longest walk isn’t from barn to show ring. It’s from yesterday’s assumptions to tomorrow’s reality.

Michael and Jessica Lovich have walked it twice. With Saskatchewan stubbornness and the radical belief that good cows, raised right, still matter most.

The question isn’t whether they’ll breed a third champion. They probably will.

The question is whether the rest of us will finally realize what they’ve been showing us: Sometimes the future of dairy farming looks a lot like its past.

Just with better cattle, stronger families, and the courage to trust what you see in your barn more than what you read on a screen.

And if a 72-cow farm from Saskatchewan can breed two World Champions by ignoring what everyone else is doing, maybe we’ve all been looking in the wrong places.

KEY TAKEAWAYS 

  • First in History: Lovholm is the ONLY prefix to breed 2 World Dairy Expo Holstein Grand Champions—from a 72-cow tie-stall operation in Saskatchewan
  • Longevity = Profitability: Their 8-10-year productive average vs. the industry standard of 4-5 means 2x the lifetime profit per cow. Do that math on your replacements.
  • Banners vs. Legacy: They sold both champions to survive and don’t own the banners—but “Lovholm” in those pedigrees forever proves that excellence transcends ownership
  • Your Wake-Up Call: If a 72-cow farm can beat every unlimited-budget operation twice, maybe it’s time to stop looking at screens and start looking at cows

EXECUTIVE SUMMARY

What farmers are discovering through the Lovich story: everything you think you know about breeding champions is wrong. Michael and Jessica Lovich just became the first and only breeders to produce TWO different World Dairy Expo Holstein Grand Champions—from a 72-cow tie-stall operation in Saskatchewan. They achieved this by completely rejecting genomics in favor of cow families and visual appraisal, the same approach their parents taught them 20 years ago. Their cows average 8-10 productive years, versus the industry standard of 4-5, transforming the economics of their operation through longevity rather than peak production. Despite having to sell both champions to keep their farm afloat (the banners hang in other barns), the Lovholm prefix now stands alone in Holstein history. While the industry consolidates into mega-dairies chasing quarterly genomic updates, this couple proved that 72 cows, managed right, can beat operations with unlimited budgets—twice.

Learn More:

The Sunday Read Dairy Professionals Don’t Skip.

Every week, thousands of producers, breeders, and industry insiders open Bullvine Weekly for genetics insights, market shifts, and profit strategies they won’t find anywhere else. One email. Five minutes. Smarter decisions all week.

NewsSubscribe
First
Last
Consent

Why 88% of Fonterra Farmers Just Voted to Sell Their Brands for 12 Cents on the Dollar

$320K today or $3.7M over 10 years? When your bank’s calling and debt’s at 7%, that’s not really a choice. 88% of farmers agreed.

Executive Summary: Yesterday’s 88.47% vote to sell Fonterra’s brands for $4.22 billion was mathematical destiny: farmers trading $3.7M in future value for $320K in immediate debt relief. With 75% of recipients sending payouts straight to banks, this wasn’t a strategy—it was survival. The predictable outcome followed 13 years of structural changes: tradeable shares (2012), flexible shareholding (2021), and production-weighted voting that gave debt-heavy large farms control. The same pattern—debt pressure, governance changes, asset sales—is unfolding from Arla-DMK to DFA. As Keith Woodford warns: ‘The best time to protect your cooperative is when you don’t desperately need to.’ For farmers whose cooperatives show warning signs (debt-funded growth, executive pay spikes, voting reforms), Fonterra’s story isn’t distant news—it’s your preview unless you organize now.”

Picture this familiar scene: you’re in the milking parlor at 5:30 AM, checking your phone between rotations while the cows move through their routine. That’s exactly where many Fonterra farmers found themselves yesterday morning, October 31st, absorbing the news.

The vote had closed—88.47% of shareholders approved selling Anchor, Mainland, and Kāpiti to French dairy company Lactalis for NZ$4.22 billion.

What makes this particularly noteworthy isn’t just the sale itself. It’s what this decision reveals about how dairy cooperatives are evolving to meet modern challenges—something we’re seeing from California’s Central Valley to the Netherlands’ dairy regions.

Fonterra’s voting approval rates climbed from 66.45% to 88.47% over 13 years—not because farmers gained enthusiasm, but because debt left them no choice. Each governance “reform” tightened the noose

Transaction Overview:

  • Sale price: NZ$4.22 billion (approximately US$2.42 billion)
  • Shareholder approval: 88.47% on October 30, 2025
  • Capital distribution: NZ$3.2 billion returning to shareholders
  • Per-farm benefit: NZ$320,000 average (ASB Bank analysis suggests closer to $392,000)
  • Brands transferred: Anchor, Mainland, Kāpiti, plus various licensing agreements
  • Recent performance: Consumer division achieving 103% quarter-on-quarter profit growth

Key Financial Metrics:

  • NZ dairy sector debt: NZ$64 billion (RBNZ, 2024)
  • Average interest on NZ$500,000 at 7%: NZ$35,000 annually
  • Consumer division quarterly profit: NZ$319 million (103% increase YoY)
  • Voting progression: 66.45% (2012) → 85.16% (2021) → 88.47% (2025)

Financial Realities Driving Change

Looking at BakerAg’s October survey of 164 Fonterra suppliers, the findings align with what we’re hearing across dairy regions globally. Three-quarters plan to use their capital distribution primarily for debt reduction.

Farmers traded $3.7 million in projected 10-year brand value for $320K immediate cash—a 91% discount driven by 7% interest rates they couldn’t afford to ignore

The average farm expects to send about 72%—roughly NZ$230,400—straight to debt servicing.

Keith Woodford, who spent three decades as a Lincoln University professor tracking New Zealand dairy economics, puts it simply:

“The debt servicing relief is what drove this vote. When you’re paying 7% interest on half a million in debt, that’s $35,000 annually just in interest. The ability to cut that in half changes your whole operation’s viability.”

This resonates with Wisconsin operations facing similar pressures. Immediate financial relief often takes precedence over longer-term considerations—not because producers lack vision, but because survival math is unforgiving.

What’s interesting here is the performance of these consumer brands. Fonterra’s May financial report shows NZ$319 million in quarterly operating profit—up 103% year-over-year.

These weren’t struggling assets. They were growing rapidly.

But when you need capital today, tomorrow’s potential becomes someone else’s opportunity.

Miles Hurrell, Fonterra’s CEO since 2018, emphasized during the August announcement that this lets them focus on ingredients and foodservice—their core strengths. The consumer business generated NZ$5.4 billion in revenue, but accounted for less than 7% of total milk solids. We’re hearing the same efficiency argument in European cooperatives, too.

How Voting Power Actually Works

Here’s something that surprises many outside observers. Fonterra doesn’t use one-member-one-vote like smaller Midwest cooperatives.

They have production-weighted voting—one vote per 1,000 kilograms of milk solids, backed by paid shares.

DairyNZ’s 2023-24 statistics show the average New Zealand herd runs about 441 cows producing 393 kg of milk solids each. Do the math: that’s roughly 173,000 kg MS annually, giving that farm 173 votes.

Large Canterbury farms wield 2.27x the voting power of average operations and receive 3x the capital—meaning the most indebted farms controlled the sale that was supposed to save everyone

But a 1,000-cow Canterbury operation? They’re producing 393,000 kg MS—that’s 393 votes, more than double.

Peter McBride, Fonterra’s Chairman, calls this outcome a clear mandate showing farmer control. Technically true, though it highlights how voting structure shapes outcomes.

ASB Bank’s analysis shows the payout distribution mirrors this structure:

  • Smaller operations (100,000-150,000 kg MS): $150,000-$230,000
  • Large Canterbury farms (350,000+ kg MS): $700,000 or more

The Path That Led Here

Understanding yesterday requires examining the past decade’s progression.

2012: Trading Among Farmers

TAF addressed redemption risk—the potential crisis if many farmers exited simultaneously. It passed with 66.45% approval on June 25, 2012, though about a third opposed or abstained.

Dutch cooperative expert Onno van Bekkum warned TAF would separate ownership from control in fundamental ways. Opposition leader Lachlan McKenzie called it “morally wrong” in media interviews.

But the board proceeded, creating tradeable shares and opening the Fonterra Shareholders’ Fund to outside investors.

2021: Flexible Shareholding

In December 2021, 85.16% approval was granted for shareholding, increasing from 33% to 400% of production requirements.

Fonterra’s August 2024 report shows the results:

  • 1,422 farms now exceed 120% of the standard shareholding
  • 552 hold minimal 33% positions

John Shewan, chairing the Shareholders’ Fund, called it a mixed blessing, noting a 20% decline in unit value during consultation.

2025: The Pattern Emerges

Notice the progression: 66.45%, then 85.16%, now 88.47%.

That’s not growing enthusiasm—it’s something else. Maybe changing demographics. Maybe mounting pressure.

Keith Woodford observes that each restructure makes the next more likely:

“Once you start down this path, reversal becomes increasingly difficult.”

Global Patterns Worth Watching

Fonterra’s not alone here. The June announcement of Arla and DMK merging into a €19 billion entity sparked similar discussions.

Kjartan Poulsen, an Arla member who also heads the European Milk Board, stated bluntly in October:

“Co-operatives have ceased to be the representatives of producers’ interests they claim to be on paper.”

In North America, DFA acquired 44 Dean Foods facilities after the 2020 bankruptcy, becoming both the largest milk producer and processor.

The subsequent class action by Food Lion and Maryland and Virginia Milk Producers alleges this creates dynamics that “compel cooperatives and independent dairy farmers to either join DFA or cease to exist.”

Common threads emerge:

  • Rising debt
  • Efficiency pressures
  • Governance structures increasingly resembling corporate models

The Compensation Question

CEO Miles Hurrell’s $8.32M compensation package dwarfs the $150K average farmer return by 55.5x—raising questions about whose interests drive ‘cooperative’ decisions

The New Zealand Herald reported in October 2024 that Fonterra’s CEO compensation hit NZ$8.32 million. Base salary runs about NZ$1.95 million, with incentives tied to Return on Capital Employed and share price performance.

Here’s where it gets interesting. Improving ROCE by selling capital-intensive assets—even profitable ones—can trigger bonuses, regardless of the long-term impact on members.

It’s what academics call a principal-agent problem: decision-makers’ incentives potentially diverging from those they represent.

This pattern extends beyond Fonterra. Cooperative executive packages increasingly mirror corporate structures, raising questions about alignment.

Current Debt Reality

NZ dairy debt peaked at $41.7B in 2018 and dropped to $35.3B by 2025—progress, yes, but at 7% interest, that remaining $35B still costs the sector $2.47 billion annually

Reserve Bank of New Zealand data shows dairy sector debt at NZ$64 billion. DairyNZ’s 2023-24 survey found that debt-to-asset ratios increased by 1.8 percentage points last season, reversing the progress in deleveraging.

Input costs compound this. Consider a typical Waikato farm with NZ$500,000 in debt at 7%—that’s $35,000 in annual interest.

When offered $320,000 to cut that burden by two-thirds, philosophical debates about cooperative principles take a back seat.

Producers consistently report they’re not selling eagerly. They’re protecting against scenarios where consecutive tough seasons force a complete exit. That capital buffer might determine whether the next generation continues farming.

Supply Agreement Details

The Lactalis deal includes two key contracts:

  1. 10-year Raw Milk Supply Agreement: Up to 350 million liters annually, plus 200 million more at premium pricing
  2. Global Supply Agreement: Three years initially for ingredients, auto-renewing unless terminated with 36 months’ notice

Miles Hurrell notes that Lactalis becomes a cornerstone customer.

Winston Peters, New Zealand’s Deputy Prime Minister with a farming background, sees it differently. His October 7 letter warns:

“After three years, Lactalis gains flexibility on milk sourcing for these brands—potentially diluting with alternatives.”

Fonterra clarifies that the 36-month notice effectively guarantees a minimum of 6 years. Still, Peters’ point about long-term leverage resonates with farmers remembering past processor consolidations.

Practical Insights for Producers

Drawing from Fonterra’s experience, several patterns merit attention:

Warning Signals

  • Debt-financed growth rather than retained earnings
  • Executive compensation outpacing member returns
  • Share trading or ownership flexibility proposals
  • External strategic reviews
  • Rising approval rates on successive changes

The intervention window closes quickly. Once voting concentrates and pressure intensifies, changing course becomes exponentially harder.

Breaking the Isolation

BakerAg’s survey revealed widespread isolation among farmers with reservations. Many assumed neighbors supported the proposal, creating silence that reinforces itself.

Research consistently shows that producers with strong peer networks resist short-term pressures more effectively when evaluating strategic choices.

Action Steps

Near-term:

  • Talk with neighbors about governance—you’d be surprised how many share your concerns
  • Understand your voting system
  • Seek compensation transparency
  • Track debt trajectories

Medium-term:

  • Strengthen balance sheets for voting independence
  • Consider board service or supporting aligned candidates
  • Advocate for appropriate approval thresholds
  • Build communication networks

Long-term:

  • Diversify market relationships
  • Educate the next generation on cooperative principles
  • Document experiences for future members

Looking Forward

The Fonterra vote illuminates tensions between immediate needs and long-term positioning that define modern dairy economics. That 88.47% likely reflects not enthusiasm but recognition of limited alternatives.

The generational dimension adds complexity. Families who built these brands face wrenching decisions, trading legacy for relief. Yet when survival’s uncertain, strategic control becomes secondary.

For cooperatives not facing acute pressure, Fonterra offers valuable lessons. Decisions about capital structure, voting, and debt create compounding path dependencies.

Keith Woodford’s wisdom bears repeating:

“The best time to protect your cooperative is when you don’t desperately need to. Once you’re in crisis, options narrow dramatically.”

As farmers await capital distributions, the industry watches. Emmanuel Besnier, Chairman of Lactalis, highlighted in August his company’s strengthened positioning across Oceania, Southeast Asia, and Middle Eastern markets.

Lactalis now controls brands developed by New Zealand farmers over generations.

For global dairy producers, the implications are clear: cooperative structures remain viable but require active protection. Forces favoring consolidation—debt, scale requirements, global competition—aren’t abating.

What’s encouraging is the quality of current discussions. Producers worldwide are sharing experiences, analyzing outcomes, and considering alternatives. This collective learning might help some organizations navigate challenges more successfully.

The critical question: Will cooperative members recognize patterns early enough to maintain meaningful options?

Fonterra’s experience suggests that once certain changes occur, reversal becomes exceptionally difficult.

The conversation continues, shaped by each cooperative’s circumstances, member priorities, and market position. What remains constant is the need for engaged, informed membership making deliberate choices—before circumstances make those choices for them.

KEY TAKEAWAYS:

  • Debt math is brutal: Farmers knowingly traded $3.7M in future value for $320K today because $35K annual interest payments can’t wait for tomorrow’s profits
  • Large farms control your fate: Production-weighted voting gives a 1,000-cow operation (393 votes) more than double the power of an average farm (173 votes)—and they vote their debt, not your interests
  • The timeline is always 13 years: Tradeable shares (Year 1) → Flexible ownership (Year 9) → Asset sales (Year 13)—once step one passes, the rest becomes mathematical inevitability
  • Watch executive pay like a hawk: When your co-op CEO makes NZ$8.32M while average farmers net $150K, those aren’t cooperative incentives—they’re corporate ones
  • You have exactly ONE intervention point: Between your first governance “modernization” proposal and passing it—after that, you’re not protecting your cooperative, you’re negotiating its sale terms

Complete references and supporting documentation are available upon request by contacting the editorial team at editor@thebullvine.com.

Learn More:

  • The Real Cost of Producing Milk and Why It Matters Now More Than Ever – This tactical guide provides a framework for mastering your farm’s true cost of production. It reveals methods for gaining financial clarity to combat the exact debt pressures highlighted in the Fonterra vote, empowering you to strengthen your operation’s financial resilience.
  • The Future of Dairy Farming: Navigating the Next Decade of Change – This strategic analysis unpacks the market forces, consumer trends, and policy shifts shaping the industry’s next decade. It provides essential context for the Fonterra vote, demonstrating how to anticipate future challenges and strategically position your operation for long-term survival.
  • AI in the Parlor: How Artificial Intelligence is Redefining Dairy Herd Management – This piece explores how adopting cutting-edge technology can create a competitive advantage. It demonstrates how AI-driven herd management directly boosts efficiency and profitability, providing a powerful internal solution for building the financial strength needed to resist external market pressures.

The Sunday Read Dairy Professionals Don’t Skip.

Every week, thousands of producers, breeders, and industry insiders open Bullvine Weekly for genetics insights, market shifts, and profit strategies they won’t find anywhere else. One email. Five minutes. Smarter decisions all week.

NewsSubscribe
First
Last
Consent

The $11 Billion Dairy Rush: Your 18-Month Window to Lock in Processor Premiums

Processors building 50 new plants need YOUR milk—but only if you move in the next 18 months. After that, you’re just another supplier.

EXECUTIVE SUMMARY: The U.S. dairy industry is betting $11 billion on 50 new processing plants that need milk from 100,000 cows that don’t exist yet—creating a massive opportunity for positioned farms. Operations within 75 miles of new facilities are already locking in $1.50/cwt premiums worth $150,000+ annually for a 500-cow dairy. But geography isn’t everything: farms anywhere can capture premiums by moving protein from today’s 3.2% average to the 3.3%+ processors demand, using nutrition strategies costing just $15-25/cow monthly. Mid-size dairies (500-1,500 cows) face the defining choice of this generation: invest $2M in robotics, transition to organic for $6-8/cwt premiums, or exit strategically while asset values hold. The clock is ticking—processors typically lock 70-80% of milk supply within 12 months of facility announcements, with early movers securing 20-30% better terms than those who wait. The next 18 months will determine the structure of American dairy for the next decade. Your decisions in the next 90 days matter more than everything you’ll do in the next five years.

dairy processor premiums

You know what’s remarkable about driving through dairy country right now? The construction. I’m seeing it everywhere—California’s Central Valley, Wisconsin’s rolling countryside, Pennsylvania’s traditional dairy regions. Based on what Dairy Processing magazine and state economic development offices have been tracking, we’re witnessing one of the most significant waves of dairy infrastructure investment in recent memory, with substantial new capacity being developed between now and 2028.

The timing raises questions, doesn’t it? The USDA’s Economic Research Service data from their 2023 release showed annual cheese consumption per capita growing just 0.3% to 0.5% over the previous five years—not exactly a demand surge. But then you look at exports. USDEC reports from late 2024 showed cheese exports up 12% to 16% year-over-year, with Mexico consistently taking 30% to 35% of those shipments. That’s what’s driving this expansion, and it makes you wonder about the risks we’re taking.

I was talking with a Texas producer recently who captured what many of us are feeling: “We’re definitely seeing more processor interest than we have in years. But I keep wondering if everyone’s building for the same milk that doesn’t exist yet.” And that’s the tension—between processor ambitions and what’s actually happening on farms.

Quick Decision Checklist: Where Do You Stand?

Before diving deeper, ask yourself these questions:

  • Is your operation within 75 miles of new or expanding processing?
  • Are your protein levels consistently above 3.3%?
  • Do you have 6-9 months of operating expenses in reserve?
  • Is your current milk contract up for renewal before 2027?
  • Could you invest $15-25/cow monthly for component improvement?

If you answered yes to three or more, you’re positioned to capture opportunity. Less than three? Focus on the defensive strategies we’ll discuss.

Understanding Your Position: Where You Fit in This Changing Landscape

What I’ve noticed over the years is that expansion cycles affect different sized operations in distinct ways. Let me share what producers across various scales are experiencing.

Small Operations (Under 500 cows): A Wisconsin producer I know who milks about 380 cows recently shared her approach with me. “We can’t compete on volume,” she said, “so we’re getting really good at what we can control—our components.” Working with her nutritionist to fine-tune rations, she’s moved her protein from 3.15% to 3.28% over six months. Based on current component pricing in Federal Milk Marketing Orders, that improvement brings in an extra $2,500 to $3,000 monthly. Not life-changing money, but it definitely helps with cash flow.

Mid-Size Operations (500-1,500 cows): This group faces perhaps the toughest decisions. A Minnesota family operation I’m familiar with—third generation, about 900 cows—they’re running the numbers on two completely different futures, and the complexity is really something.

Here’s what they’re wrestling with: The robotics path would require about $2.25 million based on current manufacturer specs—figure 15 robots for their herd size, each handling 60 cows or so. Extension economic models suggest they’d save around $180,000 annually in labor costs, maybe more when you factor in the challenge of finding workers these days. Add in better milking frequency, improved cow health monitoring, and they’re looking at a 10-12 year payback. Not bad, but it’s a big commitment.

The organic transition? That’s a whole different calculation. You’ve got your three-year conversion period required by USDA, and during that time, you’re selling conventional milk while following organic protocols. But once certified, Agricultural Marketing Service data shows organic premiums running $6 to $8 per hundredweight above conventional prices. For their 900 cows producing 70 pounds daily, we’re talking roughly $340,000 additional annual revenue once they’re through transition.

Of course, it’s not all upside. They’d likely see production drop during conversion—maybe 10% based on what other farms have experienced. And there’s about $150,000 in infrastructure changes and certification costs. New feed storage, separate handling equipment, the whole nine yards.

As one family member put it, “Both paths could work financially, but they lead to completely different operations five years out. Robots mean we stay commodity-focused but more efficient. Organic means entering a specialty market with its own risks and rewards.”

Large Operations (1,500+ cows): Geographic positioning becomes everything at this scale. If you’re within reasonable hauling distance of new capacity—generally 75 to 100 miles based on transportation economics—you’ve got real negotiating power. Beyond that distance? The economics shift dramatically.

Geographic proximity to new processing facilities creates dramatic revenue differences—operations within 75 miles earn $120,000+ more annually than distant competitors. Your location determines your negotiating power in the $11 billion processor expansion.

The Processing Wave: Understanding What’s Actually Being Built

Looking at announced projects reveals processor priorities. Texas, New York, California, and Wisconsin are leading in publicly announced investments, which makes sense given their dairy infrastructure. But Michigan, Kansas, and Minnesota are seeing significant activity too—places that might surprise you.

What’s particularly significant about these new facilities is that they’re not just bigger versions of old plants. During a recent industry conference, a plant operations manager explained: “These plants are engineered around specific milk characteristics. Give us consistent 3.5% protein and 4.2% butterfat, and we can achieve efficiency levels that weren’t possible five years ago.”

The University of Wisconsin’s Center for Dairy Research has been documenting this shift—modern plants can achieve cheese yields 8% to 12% higher when milk components are optimized. That’s producing substantially more cheese from the same milk volume compared to a decade ago. Transformational stuff.

Part 1 Summary: Setting the Stage

The dairy processing expansion represents both opportunity and challenge. Your position depends on size, location, and component quality. Understanding where you fit helps determine your strategy.

Key Takeaways So Far:

  • New processing capacity is substantial but export-dependent
  • Component quality increasingly trumps volume
  • Geographic proximity creates real advantages
  • Different sized operations face distinct decisions

Part 2: Navigating Market Dynamics and Making Strategic Decisions

Supply and Demand: The Mathematics We Need to Consider

This development becomes especially significant when you look at the utilization math. Cornell’s dairy extension work shows processors typically need 85% to 90% utilization for profitability. If these new facilities hit those targets while existing plants maintain production, cheese production capacity could increase meaningfully. Meanwhile, domestic consumption? Still growing at that modest 0.3% to 0.5% annually, according to USDA data.

The export market is carrying us right now. USDA Foreign Agricultural Service data confirms Mexico takes 30% to 35% of our cheese exports. But trade relationships can shift—we’ve all lived through that uncertainty. And China? Rabobank’s recent reports show Chinese dairy imports down significantly from their 2021 peak. Is this a temporary adjustment or a structural change? That’s the question keeping economists up at night.

U.S. dairy export markets show explosive growth led by Mexico’s 107% increase in cheese purchases over 5 years—this global demand directly funds the $11 billion processing expansion securing your premiums. When processors say they ‘need more milk,’ they mean they need YOUR high-component milk to capture export market share from New Zealand and the EU. Your milk check increasingly depends on families in Mexico City, not just domestic demand.

As dairy economists at our land-grant universities keep pointing out, we’re betting on continued export growth at levels that historically don’t sustain long-term. It might work beautifully. But acknowledging the risk helps us plan better.

What Processors Actually Want (And What They’ll Pay For)

The conversation about milk quality has shifted dramatically. Volume used to be everything. Today? Components rule.

Federal Milk Marketing Order statistical reports paint a clear picture. Farms consistently delivering protein above 3.3% earn meaningful premiums. Hit 3.5% or higher? You’re writing your own ticket in many markets. Butterfat at 4.0% or above works well for cheese, though some processors now consider butterfat above 4.5% excessive and require costly separation.

Strategic protein optimization delivers dramatic ROI—$15 monthly investment per cow generates $45,750 annual return at the 3.3% processor target. The math works: spend $7,500/year on better nutrition, earn $45,750 in component premiums. That’s how smart operations capture value from the $11 billion processing wave.

What’s worth noting is component consistency. Processors want daily variation under 2%—basically, they need to know that Tuesday’s milk will be pretty much the same as Friday’s for their standardization processes. And for export? Most programs require somatic cell counts below 200,000 cells/ml.

Council on Dairy Cattle Breeding data shows national average butterfat increased from 3.66% in 2010 to over 4.1% by 2024. Protein moved from 3.05% to about 3.25%. These improvements translate directly to cheese yield—and that’s what processors care about.

Looking at your milk check, the Federal Order data shows that farms with superior components earn premiums of $0.50 to $1.50 per hundredweight above base. Take a 500-cow operation producing 85 pounds per cow daily—even a $1.00 premium generates over $150,000 additional annual revenue. Same cows, better milk, significantly more money.

Real Progress: Component Improvement in Practice

I recently visited a Pennsylvania operation that impressed me with its systematic approach. Working with their nutritionist on targeted ration adjustments—nothing revolutionary—they moved protein from 3.12% to 3.31% over eight months.

The herd manager explained their philosophy: “The biggest change wasn’t expensive additives. We improved forage quality, tightened feeding consistency, and paid attention to cow comfort during heat stress.” Feed costs increased by about $15 to $20 per cow per month, but component premiums more than offset it. They’re netting an additional $4,500 to $5,500 monthly profit.

This reinforces what successful operations keep demonstrating—you don’t need revolution. You need systematic attention to details that matter.

Windows of Opportunity: Timing Your Decisions

Processor behavior follows predictable patterns I’ve observed across multiple expansion cycles. Understanding these helps you negotiate effectively.

The early months after facility announcements represent the maximum leverage. Processors actively court milk supply, offering signing bonuses, favorable terms, and quality premiums. Looking back at the 2011-2014 expansion period documented by CoBank, farms that committed early captured terms 20% to 30% better than those who waited.

Once processors secure 70% to 80% of target capacity—remarkably consistent across regions—urgency drops. The welcome mat stays out, but that red carpet gets rolled up. Terms shift from generous to acceptable.

Why does this matter now? If your current marketing agreement expires in 2026, start conversations immediately. Waiting until processors have met their needs means negotiating from a position of weakness.

Processor supply contracts follow predictable patterns—early movers within 6 months secure premiums 200%+ higher than late signers. This chart shows why October 2025 is a critical decision point: most announced facilities are 6-12 months into their supplier commitment phase. The window doesn’t stay open. History shows 70-80% of supply gets locked by month 12, and premium rates collapse by 60-75% for late signers.

Labor and Heifer Constraints: Structural Challenges

Two constraints keep reshaping our industry, with no quick resolution in sight.

Labor remains challenging everywhere. Research from Texas A&M and agricultural labor studies indicates that immigrant workers comprise over half of the dairy workforce nationwide. With H-2A visa programs poorly suited to dairy’s year-round needs, and USDA Economic Research Service data showing that rural agricultural counties lost 1.6% to 2.2% of their population from 2020 to 2023, finding and keeping good people remains difficult.

The heifer situation compounds challenges. USDA’s January 2024 Cattle Report showed 3.9 million dairy replacement heifers—down 17% from 2018, the lowest since tracking began. Agricultural Marketing Service auction reports show heifer prices are up by more than 140% from 2020 lows in many regions.

Yet production per cow keeps climbing. USDA data shows average production in major dairy states increased about 1.5% annually over the past five years. Genetic progress documented by the Council on Dairy Cattle Breeding continues accelerating.

This creates an interesting dynamic. We can’t easily expand cow numbers, but we’re getting more milk from existing cows. It’s forcing everyone to rethink growth strategies.

Regional Perspectives: Geography Shapes Options

The Upper Midwest faces unique pressures. Wisconsin’s roughly 5,000 dairy farms, averaging around 200 cows, according to USDA census data, feel pressure from processors to deliver larger, more consistent volumes. Yet many have advantages—established land bases, multi-generational knowledge, strong communities.

One Wisconsin producer explained his strategy: “We’re not competing with 5,000-cow dairies. We’re producing high-component milk efficiently with family labor.” That resonates across the Midwest.

The Northeast shows contrasts. Proximity to major population centers—Boston to DC—creates opportunities that western operations can’t access. Local food movements, agritourism, and direct marketing provide alternatives to commodity production. Yet farms distant from new processing face real challenges.

Western states continue evolving. California’s trajectory seems clear from state data—fewer farms, larger herds, and increasing environmental and water constraints. But innovative, smaller operations find niches serving coastal populations with specialty products.

The Southeast presents overlooked possibilities. Georgia, Tennessee, and Virginia have growing populations, limited local production, and increasing consumer interest in regional foods. A Virginia producer recently told me they’re getting an extra $2 per hundredweight just for being within 100 miles of their processor. Proximity has value in underserved markets.

Making Strategic Decisions: Practical Frameworks

Strategic investment comparison reveals component optimization delivers fastest payback (4 months) while organic transition provides highest long-term returns ($340K annually) for mid-size operations. Robotics requires patient capital but solves labor constraints. Your choice depends on capital access, risk tolerance, and 5-year goals—not on what your neighbor chose.

After countless conversations with producers navigating these changes, consistent principles emerge.

For smaller operations: Component optimization offers your clearest path. University extension research shows moving protein from 3.2% to 3.3% can add $30,000 to $40,000 annually for a 400-cow herd. Investing in nutrition programs—typically $15 to $25 per cow per month—often pays back within months.

Risk management matters too. FSA’s Dairy Margin Coverage at higher levels provides meaningful protection for modest premiums. Those who had coverage during previous squeezes sleep better.

Mid-size operations face directional choices. Automation requires major investment—manufacturer data shows robotic systems at $150,000 to $250,000 per unit, handling 50 to 70 cows each. But labor savings and lifestyle improvements justify it for many.

Specialty markets offer another path. USDA Agricultural Marketing Service shows organic premiums averaging $5 to $8 per hundredweight above conventional through 2024. Limited market—about 5% of production—but margins remain attractive for committed producers.

Larger operations should focus on geographic positioning and component excellence. Being within 75 miles of processing creates real advantages. Beyond that, challenges mount regardless of other strengths.

Understanding Consolidation: The Bigger Picture

Industry consolidation isn’t new, but understanding the scope helps planning. The USDA Census of Agriculture documents a decline from 65,000 dairy farms in 2002 to fewer than 30,000 by 2022. This reflects economics and generational preferences.

What encourages me is the diversity of successful models. We see 10,000-cow operations achieving remarkable efficiency. We also see 100-cow grass-based operations thriving with direct marketing. The industry needs both.

A young Vermont producer shared wisdom recently: “My parents had one success model—get bigger. My generation has options. We can get bigger, better, different, or exit gracefully. Having choices is powerful.”

Planning All Scenarios: Including Transition

Strategic planning means considering all possibilities, including transition. This deserves honest discussion without judgment.

For some operations, market conditions, family dynamics, or personal preferences make the transition right. Universities offer confidential planning through extension services. Organizations like the Farm Financial Standards Council provide evaluation frameworks.

An Iowa dairyman preparing to retire shared his perspective: “Recognizing when to transition is as important as knowing how to grow. I’m proud of what we built and leaving on our terms.” Real wisdom there.

Your Decision Point: Making Choices That Matter

As we navigate this expansion period, the path forward becomes clearer when we focus on what we can control. Processing expansion will reshape our industry—that’s certain. How it affects your operation depends on the decisions you’re making right now.

Component quality, geographic positioning, and financial resilience determine who captures opportunity versus who faces challenges. These aren’t abstract concepts—they’re measurable factors you can influence today.

The critical element remains timing. Markets evolve, opportunities shift, windows close. Understanding these dynamics while you have options matters more than any prescribed path. Because ultimately, you know your operation, your capabilities, and your goals better than any outsider.

This processing wave will create winners and losers—that’s market reality. But there’s more than one way to win, and strategic exit on good terms beats forced liquidation every time. Choose thoughtfully, act decisively, and remember—successful dairy farming has always meant matching resources with opportunities.

There always has been more than one path to success in dairy. And regardless of what the next few years bring, there always will be.

KEY TAKEAWAYS 

  • $150K Location Bonus: Farms within 75 miles of new plants are locking in premiums worth $150,000+ annually—but smart nutrition can close the geographic gap
  • The 5X Protein Play: Invest $15/cow monthly in nutrition → boost protein 0.1% → earn $75/cow annually (4-month payback)
  • Your 18-Month Shot: Processors lock 70-80% of milk supply in Year 1 after announcements—early contracts earning 30% premiums over late signers
  • Pick Your Lane by 2026: Scale up (robots: $2M), specialize (organic: $300K/year after transition), or sell strategically (before 40% of peers flood market)

Complete references and supporting documentation are available upon request by contacting the editorial team at editor@thebullvine.com.

Learn More:

The Sunday Read Dairy Professionals Don’t Skip.

Every week, thousands of producers, breeders, and industry insiders open Bullvine Weekly for genetics insights, market shifts, and profit strategies they won’t find anywhere else. One email. Five minutes. Smarter decisions all week.

NewsSubscribe
First
Last
Consent

The Real Reason Butterfat Hit 4.23% – And Why It Determines Which 14,000 Dairies Survive

Dairy’s biggest winners didn’t have better genetics. They had better timing. The $1.3M difference happened in 2009, not 2019.

Executive Summary: The U.S. dairy industry’s 30% component revolution wasn’t about genetic breakthroughs—it was about economics creating signals that genomics finally made actionable. When component pricing launched in 2000, the market screamed for higher butterfat, but producers lacked tools to respond until genomic testing arrived in 2009, tripling selection accuracy overnight. Early adopters who grasped this sequence and invested immediately captured $1.3 million in value, while “prudent” operations that waited until 2015 saved $130,000 but forfeited $190,000+. Today’s brutal reality: farms under 200 cows face a permanent $366,375 annual disadvantage versus 2,000-cow operations—a gap that compounds annually and can’t be overcome through better management. With only 35% of herds having basic infrastructure like DHI testing, and 2,800 operations exiting annually, the industry is splitting into two irreconcilable segments. The 2025-2027 window represents the last opportunity for strategic action: scale to 300+ cows with full technology adoption, pivot to premium markets, or exit with dignity while equity remains

You know, there’s something happening in dairy right now that most producers are getting backwards. According to USDA’s April 2025 Milk Production Report and CoBank’s March 2025 dairy analysis, butterfat production surged 30.2% and protein jumped 23.6% from 2011 to 2024, while milk volume grew just 15.9%.

Here’s what caught my attention: total milk production actually declined in both 2023 and 2024—the first back-to-back drop since the 1960s according to USDA National Agricultural Statistics Service—yet butterfat hit 4.23% nationally, shattering a 76-year-old record that stood since 1948.

Most folks I talk to at meetings believe genomic testing drove this transformation. They’re looking at it backwards, and once you understand the real sequence of events, it changes how you think about every breeding decision you’ll make this year.

The Component Revolution: Butterfat production exploded 30.2% from 2011-2024 while milk volume barely moved at 15.9%, proving the dairy industry fundamentally transformed from a volume game to a components game.

The Economic Signal That Started Everything

Looking back at the data from the Council on Dairy Cattle Breeding, the transformation didn’t actually begin with the 2009 launch of commercial genomic testing. It started in 2000 when Federal Milk Marketing Orders implemented multiple component pricing formulas, fundamentally changing how we all get paid.

The Math That Changed Everything

Suddenly, nearly 90% of milk check value came from butterfat and protein content, not volume. When butterfat trades at $3.20 per pound—which it has in recent Federal Order announcements—increasing your herd’s butterfat test by just 0.1% adds $3,200 to the value of every million pounds of milk you ship.

The market was essentially screaming at us to breed for components.

Yet according to USDA Economic Research Service dairy analysis, from 2000 to 2010, milk, butterfat, and protein production all grew at nearly identical rates—between 13.8% and 15.4%. Why the lag? Well, that’s where this story gets really instructive for anyone trying to understand today’s consolidation dynamics.

The Biological Speed Limits We All Faced

I’ve been digging through the research, and what Penn State’s Dr. Chad Dechow documented in his Holstein genetic diversity studies reveals why economics alone couldn’t drive immediate change.

Three Fundamental Constraints

Before genomic testing, we faced three fundamental constraints that no amount of economic incentive could overcome:

Terrible selection accuracy: Parent average predictions offered just 20-35% reliability, according to CDCB historical data. Young bulls? Maybe 40% reliability using pedigree indexes. You’d select a bull expecting +80 pounds of fat transmission, only to discover five years later when his daughters finally milked that he actually transmitted +20 pounds.

Glacial generation intervals: Research published by García-Ruiz and colleagues in PNAS (2016) showed the average generation interval stretched 5.5 years pre-genomics, with the sire-to-bull path taking 6.8 years. A breeding decision made in 2000 wouldn’t show population-level results until 2012 or 2013.

Limited technology adoption: University extension surveys from that era show only about 70-75% of U.S. dairy cows were being bred artificially with elite genetics in 2000. Synchronized breeding protocols? Just 10-15% adoption. Natural service bulls still covered 25-30% of breedings.

The 2009 Revolution

The Genomic Inflection Point: Butterfat percentages drifted slowly until 2009 when genomic testing tripled selection accuracy overnight—proving that economics alone couldn’t drive change until biology and technology caught up.

Then 2009 changed everything. According to USDA’s Animal Genomics and Improvement Laboratory, genomic testing tripled selection accuracy to 60-68% immediately at birth. Generation intervals compressed from 5.5 to 3.8 years.

By 2011, the first daughters of genomically-selected bulls entered milking strings nationwide. What we’re seeing now isn’t delayed response to pricing—it’s the first time biological and technological infrastructure existed to capitalize on incentives that had been present all along.

Quick Reference: Key Terms in Modern Dairy Breeding

Genomic Testing: DNA analysis that predicts an animal’s genetic potential at birth with 60-70% accuracy, versus 20-35% with traditional parent averages

Net Merit $: USDA’s economic index estimating lifetime profit potential of an animal’s genetics

DHI (Dairy Herd Improvement): Monthly milk testing program that tracks production, components, and somatic cell counts

Component Pricing: Payment system where farmers are paid based on pounds of butterfat and protein rather than milk volume

A Tale of Two Strategies: Early Adopters vs. Wait-and-See

The $1.3 Million Gap: Early adopters who invested in genomic testing at $45/test in 2009 captured $1.25M in value by 2019, while ‘prudent’ operations that waited for cheaper tests in 2015 actually lost money—proving timing beats perfection in rapidly evolving markets.

Let me share a scenario based on actual industry patterns I’ve tracked across multiple operations. Consider two typical 500-cow Wisconsin dairies, both aware of component pricing incentives. Their divergent paths from 2009-2019 illustrate exactly how timing created permanent competitive advantages.

The Early Adopter Strategy (2009-2011)

These producers made four decisions that their neighbors thought were reckless:

  1. Started genomic testing every heifer calf at birth through programs like Zoetis’s CLARIFIDE ($45-50 per test when everyone else was paying zero)
  2. Immediately culled the bottom 25% of genomically-tested calves—sold them at 2-4 months old
  3. Switched to 100% young genomic bulls averaging +$400-500 Net Merit
  4. Implemented Ovsynch protocols on 80% of the herd

Projected Results by 2016

Based on industry modeling:

  • Butterfat test: 4.15% (up from 3.78% baseline)
  • Protein test: 3.28% (up from 3.12%)
  • Component premium: Approximately $73,000 annually
  • Early culling savings: $105,000 annually
  • Beef-cross premiums: $30,000 annually

Total modeled value creation over 10 years: $1.2-1.3 million after testing costs

The Wait-and-See Approach

The “wait-and-see” operations held off until 2015-2016. By then, test costs had dropped to $28-35 and reliability had improved to 68%. Sounds prudent, right?

Industry modeling suggests otherwise. While these operations saved approximately $130,000 in testing expenses from 2009-2015, they forfeited an estimated $190,000+ in component premiums during just 2016-2019.

The Infrastructure Reality Nobody Talks About

Here’s what determines whether genomic strategies actually work, and I learned this the hard way watching operations try to implement these programs: it’s infrastructure, not genetics.

Current Infrastructure Gaps

According to CDCB data from 2024, here’s where we actually stand:

  • DHI testing participation: Just 35% of herds
  • Computerized records: Industry surveys estimate 40-50% of sub-200-cow herds still use paper breeding sheets
  • Activity monitoring: Adoption remains below 30% in smaller operations
  • Reliable internet: Still a major barrier across rural areas

The Six Essential Components

The pattern I keep seeing is that genomic strategies need all six infrastructure components working together:

  1. DHI testing
  2. Herd management software (DairyComp, PCDart, or similar)
  3. Genomic testing capability
  4. Synchronized breeding protocols
  5. Disciplined record-keeping culture
  6. Reliable internet for data integration

My rough estimate? Maybe 15-20% of U.S. dairy operations have all pieces in place.

The Cruel Paradox of Efficiency

This creates what economists call a cruel paradox. Operations that most desperately need efficiency gains—those under 200 cows facing what Rabobank’s October 2024 Dairy Quarterly described as “-$2/cwt to +$2/cwt margins”—can least afford the $50,000-70,000 infrastructure investment required over five years.

Meanwhile, operations with 2,000+ cows generating $1-4 million annual profits can fund infrastructure improvements from cash flow every single year.

By The Numbers: The 2025 Dairy Reality

Consolidation Metrics:

  • 35% of U.S. dairy herds participate in DHI testing (CDCB, 2024)
  • 2,800 dairy operations projected to exit annually through 2030 (Rabobank October 2024 Dairy Quarterly)
  • $9.77/cwt cost disadvantage for 100-199 cow operations versus 2,000+ cow operations
  • 65% of U.S. milk now comes from operations with 1,000+ cows (2022 Agricultural Census)

Genetic Revolution Impact:

  • 30.2% increase in butterfat production (2011-2024)
  • 23.6% increase in protein production (2011-2024)
  • $1.2-1.3 million modeled advantage for early genomic adopters
The Extinction Timeline: Small dairy farms under 200 cows are disappearing at catastrophic rates—26,369 operations lost from 2017-2022 alone. By 2030, only 14,000-16,000 total dairies will remain, ending a century-long tradition of family-scale dairy farming.

The Consolidation Reality: Different Strokes for Different Regions

The Cost Gap That Can’t Be Overcome

According to USDA cost of production analysis:

  • Farms with 2,000+ cows: $23.06/cwt
  • Farms with 100-199 cows: $32.83/cwt
  • Permanent disadvantage: $9.77/cwt
The Unmanageable Gap: Small operations face $9.77/cwt higher production costs than mega-dairies—a $366,375 annual disadvantage for a 150-cow farm that compounds every year and can’t be overcome through better management or harder work.

For a 150-cow operation in Wisconsin producing 3.75 million pounds annually, that calculates to a $366,375 annual profit gap.

Regional Variations

In California’s Central Valley where land costs are astronomical, even 500-cow operations struggle with similar economics. Meanwhile, operations in South Dakota with lower land and labor costs can remain viable at 300-400 cows, according to South Dakota State University Extension analysis.

“We can’t compete on volume, but when you’re shipping 4.3% fat and 3.4% protein, the processors come looking for you.” — Texas dairy producer focusing on component premiums

The Stark Census Reality

What the 2022 Agricultural Census revealed:

  • 2017: 54,599 licensed dairy operations
  • 2022: 24,082 operations (56% decline in 5 years)
  • 2025 projection: approximately 22,000 operations
  • 2030 projection: 14,000-16,000 operations

Farms under 200 cows lost 26,369 operations from 2017-2022, while farms over 1,000 cows actually added 400. The industry isn’t just consolidating—it’s splitting into two completely different businesses.

How Processors Are Shaping This Transformation

According to CoBank’s dairy quarterly analysis, over $8 billion in new processing capacity is coming online through 2027, with 80% focused on cheese, butter, and protein ingredients—all products where yields depend entirely on component levels.

“We’re not building plants to handle more gallons. We’re investing in infrastructure designed to maximize value from higher butterfat and protein concentrations. A producer shipping 3.8% fat milk versus 4.2% fat milk? That’s a massive difference in our cheese yields.” — Procurement manager from major cheese company

This processor demand feeds right back into the pricing formulas, creating even stronger economic signals for component production.

The 2025 Decision Point: Why This Year Matters

Demographic Reality

Looking at demographic data from Wisconsin’s Center for Dairy Profitability surveys:

  • 22% of farms under 100 cows plan to exit within five years
  • 70% have no identified successor

This isn’t really about economics anymore—it’s demographics. Baby Boomer retirements are accelerating regardless of milk prices.

Current Conditions Favor Strategic Decisions

According to USDA’s Dairy Margin Coverage Program data:

  • Profit margins hit $13.14/cwt in Q3 2024—historical highs
  • All-Milk prices averaging $22-25/cwt
  • Land values remain elevated from 2021-2022 boom
  • Buyer demand still exists from expanding operations

But By 2028-2030, Everything Changes

With 2,400-2,800 annual closures projected by Rabobank’s October 2024 analysis:

  • Markets flooded with used equipment and facilities
  • Buyer pool shrinks to just mega-operations
  • Equipment values likely collapse from oversupply

Two Paths That Actually Work

Path 1: The Optimized Mid-Scale Model (300-600 cows)

Economic analysis from New Zealand’s dairy sector shows their national herd size stabilized around 450 cows—not by accident, but because that’s where per-cow profitability peaks.

Operations at this scale with full technology adoption can achieve:

  • Superior milk quality (SCC averaging 161,000 versus 200,000+)
  • 15-25% higher profit per kilogram of milk solids
  • Manageable labor requirements with family involvement
  • Financial sustainability without extreme debt leverage

Required commitment: $50,000-70,000 annual technology investment for at least five years.

Path 2: Premium Niche Markets

Market reports indicate direct-to-consumer operations in premium markets can achieve $40-50/cwt, though this requires:

  • Complete pivot from commodity production
  • Serious marketing capabilities
  • Certification costs
  • Geographic proximity to affluent consumers

Success Story: How Minnesota Dairies Made the Transition

Here’s a composite example based on three similar operations I’ve worked with in central Minnesota between 2009-2015 (details combined for privacy).

The Implementation Phase

These producers were milking around 280 cows when genomic testing launched in 2009, barely breaking even at $14/cwt milk prices.

“Yeah, we almost didn’t do it. Forty-five dollars per calf for testing seemed crazy. But our nutritionist ran the numbers on what we were losing by raising the wrong heifers.”

They started testing in spring 2010, immediately culled their bottom 20% of heifers, and switched to all genomic young sires.

“I remember standing at the sale barn. Other farmers were buying our culled heifers thinking they got a bargain. Meanwhile, we kept the ones genomics said would actually make us money.”

The Results

By 2015, their first genomically-selected heifers entered the milking string:

  • Components jumped: 3.75% to 4.05% fat; 3.08% to 3.22% protein
  • Premium increased: $3-4/cwt more than neighbors
  • Expansion enabled: Grew to 400 cows, upgraded parlor

Total investment (2010-2020): $350,000-400,000 Documented returns: Over $1 million

Making the Decision: Your Three Critical Questions

The Five-Year Breakeven: Early genomic adopters invested $385K over a decade but captured $1.05M in returns, breaking even around year 5 and pulling $665K ahead by 2019—while late adopters were still debating whether to start.

After working with hundreds of operations facing these decisions, here are the three questions that cut through all the noise:

1. Do you have a committed successor currently working on the operation?

And I mean actually working, not just “interested” or “might come back after college.”

2. Can you invest $50,000-70,000 annually for five years without jeopardizing family finances?

This isn’t about having the cash—it’s about having it without risking your kids’ college funds, your health insurance, or your retirement security.

3. Are you genuinely willing to scale to 300+ cows or pivot to premium markets?

The economics are clear—conventional production under 300 cows faces structural disadvantages that compound annually.

If you answered yes to all three: The path forward requires immediate, aggressive investment in infrastructure and genetics. The documented returns prove the strategy works when fully implemented.

If you answered no to any question: Consider that selling in 2025-2026 with $500,000-$1,000,000 in equity beats farming until 2030 at annual losses, then being forced to liquidate with minimal equity.

These aren’t just business decisions. They’re deeply personal choices about family legacy and identity. There’s honor in building a successful operation that can compete. There’s equal honor in recognizing when it’s time to capture your equity and move forward.

The Bottom Line

Economics drives genetics, not the other way around. Component pricing created incentives in 2000. Genomic testing in 2009 just gave us tools to capitalize efficiently.

Infrastructure determines execution. Operations genomic testing without DHI data, herd software, and systematic records are like buying a Ferrari without roads.

Timing beats perfection. Early adopters who paid $45 per test with 61% reliability captured significantly more value than those who waited for $28 tests with 68% reliability.

Compound advantages are permanent. The three-generation genetic lead early adopters built from 2009-2019 can’t be overcome.

The 30.2% butterfat increase and 23.6% protein increase from 2011-2024 represent what happens when economic signals, biological capabilities, and technological infrastructure finally align. For the roughly 22,000 operations under 200 cows remaining in 2025, the question isn’t whether to adopt genomic testing—it’s whether they have the infrastructure, capital, and succession plan to compete.

The operations thriving in 2030 won’t necessarily be those with the best cows or the hardest-working families. They’ll be those who made clear-eyed infrastructure investments in 2025 based on economic reality rather than tradition.

As a dairy farmer once told me: “The cows don’t know if you’re milking 50 or 5,000. But the economics sure do.”

Key Takeaways 

  • Economics drove genetics, not vice versa: Component pricing created the signal in 2000; genomics provided the tools in 2009. Winners understood the sequence—losers still don’t.
  • The $1.3M early adopter advantage is permanent: Paying $45/test in 2009 beat waiting for $28 tests in 2015. In rapidly evolving markets, timing beats perfection every time.
  • Infrastructure trumps genetics: Only 35% of herds have DHI testing. Without data infrastructure, genomic testing is like buying a Ferrari without roads.
  • The $366,375 gap can’t be managed away: Operations under 200 cows face structural, not operational, disadvantages. Excellence can’t overcome economics.
  • Your 2025 reality check: You need a successor AND $50K annual investment capacity AND willingness to scale/pivot. Missing any one = exit strategy, not growth strategy.

Complete references and supporting documentation are available upon request by contacting the editorial team at editor@thebullvine.com.

Learn More:

The Sunday Read Dairy Professionals Don’t Skip.

Every week, thousands of producers, breeders, and industry insiders open Bullvine Weekly for genetics insights, market shifts, and profit strategies they won’t find anywhere else. One email. Five minutes. Smarter decisions all week.

NewsSubscribe
First
Last
Consent

Pair Housing’s Hidden Payoff: $50,000 More Milk Revenue and a 6-Year Head Start on 2031

Early adopters of pair housing are building a competitive advantage that latecomers won’t be able to match

Executive Summary: Here’s what most dairy producers don’t realize: the 2031 pair housing mandate isn’t a burden—it’s creating the industry’s biggest competitive opportunity in decades. Research shows pair-housed calves produce $50,000 more in annual revenue through superior brain development, yielding 850-1,113 kg extra milk in the first lactation alone. But here’s the catch: mastering group management takes 18-36 months, meaning producers who start now will have six years of operational excellence when their neighbors are still figuring out the basics. While 60% of farms stay paralyzed by solvable concerns about cross-sucking and capital costs, early adopters are quietly building advantages that compound annually—better disease detection, 9-hour labor savings per calf, and premium market positioning. The brutal truth? Producers waiting until 2030 won’t just be late to comply—they’ll be permanently behind, missing profits they can never recover. Every quarter you delay is another group of superior replacements your competition is raising while you’re still deciding.

Calf Pair Housing

You walk through dairy operations across North America today, and those familiar rows of individual calf hutches still dominate the landscape. They’ve been our standard for good reason—biosecurity, individual monitoring, controlled feeding. But here’s what I’m seeing: something significant is shifting in how progressive producers approach calf rearing, and honestly, the implications go way beyond what most of us initially thought.

The catalyst is Canada’s requirement for pair or group housing by 2031. That’s in the revised Code of Practice that Dairy Farmers of Canada released in March 2023. What’s really catching my attention, though, is how early adopters are discovering benefits that go far beyond just checking off a regulatory box.

I was digging through research from Dr. Marina von Keyserlingk’s team at the University of British Columbia—fascinating work they published in PLOS ONE back in 2014. They documented something many experienced calf managers have suspected for years: calves raised together demonstrate remarkably superior cognitive flexibility. Get this—pair-housed calves adapt to environmental changes 35% faster and ultimately produce between 850 and 1,113 kilograms more milk in their first lactation compared to individually housed counterparts.

“This isn’t theoretical yield potential, folks. This is actual milk production, documented across multiple commercial operations.”

Understanding the Cognitive Advantage

The UBC research used a Y-maze reversal learning test. Basically, they teach calves which path leads to their milk reward, then switch the rules to see how quickly they adapt. Pair-housed calves? They figured out the change in 13 trials. Individually housed calves needed 20 trials, and here’s the kicker—some never mastered the reversal at all.

Pair-housed calves demonstrate 35% faster cognitive adaptation and 46% higher success rates in learning tests—brain development advantages that translate to lifetime performance in robotic milking systems, ration changes, and social dynamics on modern dairy operations.

Dr. Jennifer Van Os, who’s an Assistant Professor of Animal Welfare at the University of Wisconsin-Madison, puts it perfectly: “Modern dairy animals face constant learning challenges—new parlor routines, automated feeding systems, ration adjustments, social dynamics. If we’re not developing their capacity to learn from day one, we’re limiting their lifetime potential.”

What farmers are finding is that this resonates with real-world experience. Wisconsin Extension specialists have documented that operations transitioning to robotic milking systems consistently see younger animals adapting more readily than older cows. The difference? Many of those younger animals experienced social housing during their critical early development period. Food for thought, isn’t it?

The Economics Tell a Compelling Story

Looking at the numbers from Dr. Mike Van Amburgh’s comprehensive meta-analysis at Cornell University, which tracked 1,868 heifers across commercial operations, the production correlations are clear. Every kilogram increase in preweaning average daily gain translates to 850 to 1,113 kilograms of additional first-lactation milk production.

Let me break this down practically. Pair-housed calves, through what researchers call “social facilitation of feeding”plus reduced isolation stress, typically achieve 0.1 to 0.2 kilograms better daily gain during the preweaning period.

For a 500-cow operation raising 200 replacements annually:

  • Improving preweaning ADG from 0.6 to 0.8 kg/day
  • Generates approximately 124,200 kg of additional first-lactation milk
  • At current DFO pool prices (October 2025): roughly $0.41 per kilogram
  • That’s over $50,000 in additional revenue from a single cohort

And that’s just the first lactation.

What really gets interesting is research from Dr. Alex Bach’s team at IRTA in Spain. They published work in the Journal of Dairy Science showing these effects don’t diminish—they actually compound. Each kilogram of improved preweaning ADG correlates with 2,280 kilograms of additional lifetime production. The metabolic programming you establish in those first eight weeks? It sticks with them their entire productive life.

First lactation production comparison reveals that pair-housed calves generate 850-1,113 kg more milk, translating to over $50,000 in additional annual revenue for a 200-replacement operation—a competitive advantage that compounds across every cohort.

Labor Efficiency Surprises Everyone

Here’s an aspect that even experienced producers can get caught off guard by. Research from the University of Guelph and Wisconsin Extension field trials documents dramatic labor differences:

  • Individual hutch systems: 10.6 hours of labor per calf (birth to weaning)
  • Pair housing with automated feeding: 1.4 hours per calf
  • Labor reduction: 9.2 hours per calf

Minnesota Extension documented a 450-cow operation that reduced labor needs by two and a half positions after transitioning. But the manager told researchers the bigger win was performance—they went from one pound of daily gain to consistently achieving two pounds.

“Not hauling milk to hutches when it’s minus-30 doesn’t just save time—it helps them keep good employees who might otherwise look for easier work come February.”

Addressing the Adoption Gap

Despite all this compelling evidence, Lactanet’s 2024 dairy housing survey shows approximately 60% of Canadian dairy farms still use individual housing systems. We see similar patterns across the United States. So what’s holding folks back?

The Comfort of Familiar Systems

I understand the hesitation. Many producers with well-functioning individual housing face a tough decision. Their current approach delivers acceptable results—calves survive, reach target weights, and transition successfully to group housing post-weaning.

Quebec producers commonly express this in Extension workshops: “My individual system gives me certainty. I know each calf’s intake, health status, and growth rate. Group housing introduces variables I’m still learning to manage.”

This makes perfect sense. Change carries risk, especially when your current system meets baseline performance standards.

Cross-Sucking Remains a Primary Concern

Research published in 2025 by the University of Calgary identified fear of cross-sucking as the leading barrier to adoption. Every producer who’s dealt with a blind quarter on a fresh heifer remembers that frustration—I certainly do.

But here’s what’s encouraging: Dr. Cassandra Tucker’s work at UC Davis, done in collaboration with Penn State Extension, demonstrates that cross-sucking is entirely preventable through proper management:

  • Adequate milk allowance: minimum 7 liters daily for Holstein calves
  • Nipple feeding rather than buckets
  • Gradual weaning over 7 to 10 days

Follow these protocols, and cross-sucking essentially disappears.

Capital Investment Realities

Let’s talk dollars. Michigan State Extension’s 2024 calculations place infrastructure investment at approximately $127 per calf, with complete system implementation costing $15,000 to $25,000 for a 200-replacement operation.

Dr. Marcia Endres at the University of Minnesota documents returns of 269% to 312% on this investment, but what is that upfront capital requirement? It’s a real challenge when you’re managing tight margins.

What’s working for some producers is starting with pilot programs using temporary infrastructure. Prove the concept before making the major capital commitment.

Learning From Early Implementation

Extension specialists working with transitioning farms report remarkably consistent patterns through the first 90 days. Wisconsin Extension Bulletin A4154 clearly documents these phases.

Weeks 1-2: Resisting the Urge to Intervene

Ontario Extension case studies consistently show the biggest challenge is stepping back. Every instinct tells you to help calves find the nipple, guide them through feeding. But they need to learn independently and from each other. Too much intervention creates dependence rather than competence.

Successful protocols involve:

  • Backgrounding calves individually for 10-14 days before grouping
  • Establishing strong suckling reflexes
  • Health screening before mixing

Dr. Dave Renaud’s research at Guelph, published in Preventive Veterinary Medicine back in 2023, confirms this approach reduces health events by 40%.

Weeks 3-4: Managing Cross-Sucking Effectively

This critical period determines whether producers persist or revert. Extension field trials documented in the 2024 Wisconsin Dairy Management Guide show that increasing milk concentration while maintaining frequent feeding opportunities stops cross-sucking behavior cold.

The target remains consistent across all research: minimum 7 liters daily through nipples, with gradual 10-day weaning transitions. Get this right, and cross-sucking becomes a non-issue.

Weeks 5-8: Ventilation Becomes Critical

Dr. Ken Nordlund from Wisconsin’s School of Veterinary Medicine emphasizes in their 2024 facility design guidelines: “Poor health management in individual housing becomes amplified in group settings.”

Calves don’t generate enough body heat for natural convection ventilation to work. You need mechanical systems—positive pressure tubes or continuous airflow fans. Operations that underestimate ventilation requirements face respiratory challenges that can derail the entire transition.

Weeks 9-12: Systems Integration

Producers who navigate that initial learning curve consistently report dramatic improvements around month three. Multiple Extension case studies from 2024-2025 document this pattern:

  • Feed efficiency improves
  • Health events decline
  • Growth rates accelerate

Fraser Valley producers dealing with higher humidity than Prairie provinces really emphasize moisture management alongside ventilation. British Columbia Extension specialists report in their 2024 regional guide that once environmental controls are optimized, preweaning mortality typically drops from 7% to under 3%.

Data-Driven Management Revolutionizes Calf Rearing

Health IndicatorDays Early DetectionVisual Observation AccuracyAutomated System AccuracyImprovement
Milk Intake Drop (15-25%)540%78%+38%
Drinking Speed Reduction435%72%+37%
Unrewarded Feeder Visits ↑345%80%+35%
Combined Metric Analysis550%82%+32%

This transition from visual observation during feeding to continuous behavioral monitoring? It’s a fundamental shift in how we think about calf management.

Dr. David Renaud’s research, published back in November 2023 in the Journal of Dairy Science, reveals that automated systems detect illness indicators 3 to 5 days before you’d see visual symptoms.

Key metrics for early disease detection:

  • Milk intake declining 15-25% → 5 days before clinical illness
  • Drinking speed reduction → 4 days before visible symptoms
  • Unrewarded feeder visits tripling → Calf feels unwell but can’t finish meals
  • Meal duration increasing → While actual consumption decreases

Dr. Melissa Cantor at Penn State found—and published in the Journal of Dairy Science earlier this year—that combining these metrics achieves 75-80% disease-detection sensitivity, compared to just 40-50% with single indicators. This early detection capability? It transforms treatment outcomes and reduces both medication costs and production losses.

Building Competitive Advantage for 2031 and Beyond

The mandated transition creates an industry-wide baseline. Everyone has to comply. But here’s what I think many are missing: competitive advantage comes from operational excellence developed through early adoption.

By the 2031 mandate deadline, early adopters will have six annual cohorts of cognitively superior replacements producing 187-491 extra pounds of milk per lactation—while late adopters begin with zero such animals. The math is brutal: you can’t compress six years of competitive advantage into one year of panicked implementation.

“Producers transitioning in 2025 will have six annual cohorts of cognitively enhanced replacements by 2031. Late adopters starting in 2030? They begin with zero such animals.”

Consider the arithmetic:

  • 180 to 360 animals with cognitive advantages in your herd
  • 187 to 491 additional pounds of milk per lactation
  • Worth $34 to $88 per cow annually (Cornell longitudinal studies)

Dr. Jessica McArt’s research at Cornell’s College of Veterinary Medicine, published in Preventive Veterinary Medicine in 2024, demonstrates that disease prediction algorithms need 18 to 24 months of calibration to achieve optimal sensitivity. Early adopters will be preventing disease, while late adopters are still figuring out which buttons to push.

Market dynamics are shifting, too. Dr. Beth Ventura’s research at the University of Minnesota documents consumer willingness to pay 4-6% premiums for milk from enhanced welfare systems. Trade publications like Dairy Foods and Progressive Dairy suggest processors, including Agropur and Saputo, are exploring differentiated supply chains—though specific program details are still emerging. Early adopters with documented performance histories? They’re positioning themselves for opportunities that won’t be available to last-minute converts.

A Practical Implementation Framework

Based on Extension specialist experiences documented across multiple regions, here’s what consistently works:

Start with a 12-calf pilot program. Not to validate the science—that’s been done—but to develop expertise specific to your facility without risking your entire replacement program.

Foundation Phase (Months 1-3)

  • Get passive transfer rates above 90% (Dr. Sandra Godden at Minnesota recommends serum total protein >5.5 g/dL)
  • Establish 20% body weight milk feeding minimums
  • Develop cross-sucking prevention protocols for your specific setup

Skill Development (Months 4-6)

  • Learn to interpret behavioral data
  • Recognize that 20% intake drop that signals illness
  • Identify weaning readiness (Dr. Mike Steele at Alberta: look for 1.4 kg daily starter intake for three consecutive days)
  • Document equipment performance patterns

Protocol Optimization (Months 7-9)

  • Refine feeding algorithms for your genetics
  • Balance welfare with facility constraints
  • Align health protocols with actual disease pressure

Team Integration (Months 10-12)

  • Train every team member who touches calves
  • Ensure understanding of behavioral indicators
  • Establish report interpretation protocols
  • Define intervention thresholds

“This phase gets skipped too often, and it comes back to bite you.”

Practical Considerations for Your Operation

Looking at all the evidence, several principles stand out:

Early implementation with modest scale beats last-minute scrambling with your entire calf crop. That learning curve takes 18 to 36 months, no matter when you start.

Management excellence, not equipment sophistication, determines your outcomes. You can have the fanciest automated feeder on the market, but without skilled interpretation of its data, you’ve bought yourself an expensive milk dispenser.

Your foundation protocols have to be solid. If you’re running sub-90% passive transfer rates or marginal ventilation, group housing will amplify those problems rather than solve them.

Expect the learning curve. Embrace it, even. Those initial challenges? That’s education, not failure.

Document everything meticulously. This data validates your investment decisions and supports premium market positioning down the road.

Looking Forward

We’re witnessing one of those generational transitions that reshapes how we do things. Producers who view this 2031 requirement as an opportunity for systematic improvement? They’ll capture lasting competitive advantages. Those approaching it as just another compliance burden will perpetually lag behind early adopters who’ve already optimized their systems.

The parallel to previous industry evolutions is pretty clear. Consider free-stall adoption, TMR implementation, and genomic selection. Early, thoughtful adopters consistently emerged stronger.

What I’ve noticed across other major transitions is that success doesn’t come from the technology itself. It comes from the operational excellence you develop through implementation. Pair housing represents another one of those opportunities—it challenges our assumptions, rewards innovation, and ultimately advances both animal welfare and farm profitability.

The timeline is set. The science is clear. The economics are compelling. What remains is the decision each operation needs to make: lead this transition or follow those who do.

Six years gives you adequate time for thoughtful implementation. But it disappears quickly if you keep putting it off. The question isn’t whether to transition—that decision’s been made for us. The question is when to start capturing the advantages of early adoption.

Your move.

KEY TAKEAWAYS 

  • Start with 12 calves, not 200: Master the learning curve on a pilot scale where mistakes won’t sink you—but start NOW because the 18-month expertise gap between early and late adopters becomes permanent
  • $50,000 isn’t the ceiling, it’s the floor: First-lactation gains of 850-1,113 kg are just the beginning—these calves produce 2,280 kg more lifetime milk because early brain development programs permanent metabolic advantages
  • Stop fearing cross-sucking, start fearing the competition: While 60% of producers avoid pair housing over a completely preventable issue, early adopters are banking profits you’ll never catch up to
  • The 2031 deadline creates winners and losers: Producers with 6 years of experience will be preventing disease while you’re reading instruction manuals, capturing premium markets while you’re proving compliance

Complete references and supporting documentation are available upon request by contacting the editorial team at editor@thebullvine.com.

Learn More:

The Sunday Read Dairy Professionals Don’t Skip.

Every week, thousands of producers, breeders, and industry insiders open Bullvine Weekly for genetics insights, market shifts, and profit strategies they won’t find anywhere else. One email. Five minutes. Smarter decisions all week.
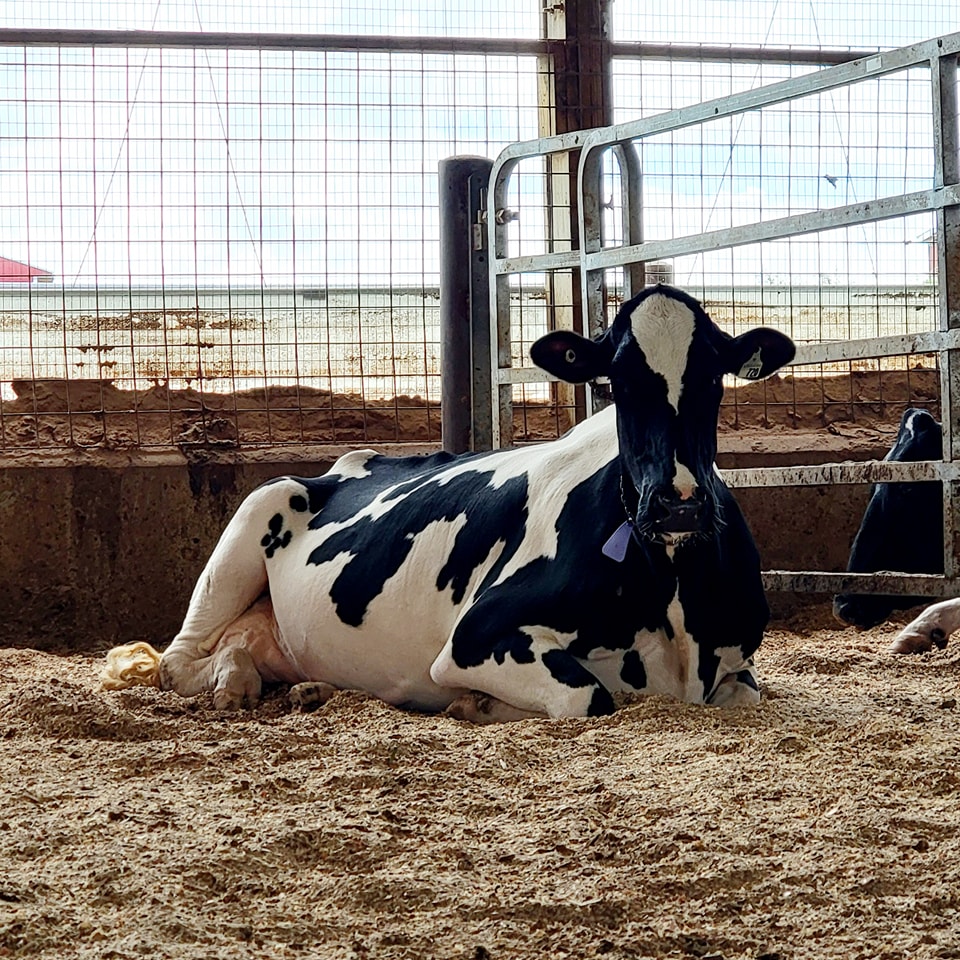
NewsSubscribe
First
Last
Consent

Butter Pays Triple: Fonterra’s $75M Investment Proves Components Are Your Future

Fonterra commits $75M to butter while powder markets collapse 39%. Smart producers already pivoting: 10-15% profit gains documented.

Executive Summary: Progressive dairy farms are adding $32,000-87,000 annually by switching from volume to component focus—and Fonterra’s $75 million butter expansion validates their strategy. Butter commands $7,000 per tonne while powder sits at $2,550, a gap that’s widening as Chinese powder demand drops 39% and global butterfat markets stay strong. Smart farms are already moving: investing $10-20 per cow per month in targeted nutrition generates returns of $25-85 within 60-90 days. The window for action is closing—$8 billion in new North American butter and cheese capacity will come online by 2027, and farmers positioned to supply components will capture those premiums, while others scramble to adapt. This analysis provides your roadmap: immediate nutrition optimization, strategic processor positioning within 18 months, and staged genetic transitions starting with your bottom third. The verdict from global markets to Wisconsin farms is unanimous: component density drives profit, volume doesn’t.

Milk Component Value

The global dairy industry is experiencing a fundamental shift in value creation—from volume to components—and farmers who recognize this transition early will position themselves for success in the emerging market structure

You know, when Fonterra announced their NZ$75 million investment to double butter production capacity at the Clandeboye facility in Canterbury, I found myself thinking about what this really means for dairy farmers like us. This goes beyond just another infrastructure upgrade—it represents a fundamental shift in how our industry values milk.

What caught my eye about the timing is this: Global Dairy Trade auctions through October 2025 have consistently shown butter trading between $6,600 and $7,000 per tonne, while skim milk powder sits around $2,550. We’re talking nearly triple the value here. And that price differential isn’t just a temporary market quirk—it reflects something deeper happening across the entire dairy value chain.

What particularly caught my attention was Fonterra’s simultaneous decision to divest their consumer brands to Lactalis for $4.22 billion while expanding butter capacity. On the surface, these moves might seem contradictory, right? But dig deeper, and a coherent strategy emerges—one that dairy farmers everywhere should understand.

Butter commands nearly triple the price of powder, rewriting the playbook for component-focused production and dismissing old volume-based strategies forever.

Understanding the Strategic Shift Behind the Investment

Miles Hurrell, Fonterra’s CEO, framed this investment as increasing production of high-value products while improving their product mix. The numbers behind that statement tell a compelling story. Their ingredients channel, which processes 80% of their milk solids, generated $17.4 billion in their most recent fiscal year. Consumer products? Just $3.3 billion.

That disparity explains why processors globally are refocusing on B2B ingredients rather than consumer brands. It’s a strategic shift that reflects where value creation actually happens in modern dairy markets.

Looking at processing flexibility in the Pacific region, what’s remarkable about New Zealand’s cream plants is their operational agility. They can shift substantial portions of milkfat between anhydrous milk fat and butter production based on market signals. This allows processors to capture whatever premium the market’s offering at any given time.

The global supply picture adds another layer to this story. According to the European Commission’s October 2025 dairy market observatory, European milk production continues growing despite relatively weak farmgate prices. USDA’s Dairy Market News shows U.S. dairy herds have expanded by 2.1% in recent months. DairyNZ confirms New Zealand’s having another strong production season with August 2025 collections up 8.3% year-over-year.

So we’ve got milk oversupply, yet butter prices remain remarkably resilient while powder markets struggle. There’s something structural happening here, and it’s worth paying attention to.

What This Means for Component-Focused Production

This brings us to what really matters for farmers: How do these market dynamics translate to on-farm decisions?

MetricJersey/CrossbredHolsteinAdvantage
Butterfat Content4.3-4.5%3.6%+0.7-0.9% (Jersey)
Protein Content3.6-3.8%3.2%+0.4-0.6% (Jersey)
Component EfficiencySuperiorStandardJersey
Economic Returns vs Holstein+10-15%BaselineJersey
Feed EfficiencyImprovedStandardJersey
Reproductive PerformanceFewer Days OpenBaselineJersey

Research from extension services at Wisconsin, Cornell, and Penn State consistently shows that component efficiency drives profitability more effectively than pure volume production. And the data is compelling. Farms implementing Jersey crossbreeding programs typically see economic returns increase by 10-15% compared to pure Holstein operations—that’s according to multi-year studies in the Journal of Dairy Science. Component levels often reach 4.3-4.5% butterfat and 3.6-3.8% protein, compared to Holstein averages around 3.6% and 3.2% respectively.

What’s encouraging is the improvement in feed efficiency and reproductive performance that comes along with these component gains. Many producers report their crossbred cows show fewer days open and require less intervention during the transition period—you probably know someone who’s seen similar results.

Dr. Randy Shaver from Wisconsin-Madison’s dairy science department documented fascinating case studies in which farms optimizing amino acid nutrition and removing polyunsaturated fat sources saw butterfat increase from around 3.4% to over 4% within weeks. When that translates to several dollars more per hundredweight… well, that’s meaningful money when you’re shipping milk every day, all year long.

I’ve noticed a generational shift happening, too. Younger farmers entering the industry aren’t as attached to the traditional “fill the tank” mentality. They’re looking at component efficiency from day one, asking different questions about genetics, nutrition, and marketing strategies. It’s refreshing, honestly.

The Powder Market Reality Driving Change

China’s powder demand has fallen off a cliff—erasing decades of growth and leaving billions in powder-drying assets stranded.

So why is this shift toward butterfat happening now? The answer lies partly in what’s happening to global powder markets.

Global Dairy Trade auctions in September and October 2025 show both skim milk powder and whole milk powder trading well below historical averages. Chinese imports—which drove powder demand for nearly two decades—remain significantly depressed. China Customs Administration data from August 2025 shows a 39% year-over-year decline. That’s not a blip; that’s a trend.

The situation in China deserves particular attention. While their domestic milk production has been declining (which, in theory, should support imports), the China Dairy Industry Association’s September 2025 report indicates that many Chinese dairy farms are operating at a loss, with farmgate prices hitting multi-year lows. This suggests structural challenges that won’t resolve quickly.

What we’re witnessing is potentially billions of dollars in powder-drying capacity built for a market dynamic that no longer exists. Rabobank’s Q3 2025 dairy quarterly describes these as potential “stranded assets”—infrastructure investments that may never generate expected returns. That’s a sobering thought for processors heavily invested in powder.

Component Optimization: A Practical Framework

For producers considering this transition, here’s what progressive operations are focusing on:

✓ Baseline assessment: Review component tests from the past 6 months to understand where you’re starting
✓ Efficiency calculation: Measure total fat and protein pounds against dry matter intake
✓ Market exploration: Request quotes from 2-3 processors to understand regional pricing dynamics
✓ Nutrition refinement: Work with your nutritionist on amino acid balancing strategies
✓ Fat supplementation: Consider palmitic acid products at 1.5-2% of diet dry matter
✓ Interference removal: Identify and eliminate high PUFA sources that suppress butterfat synthesis
✓ Progress monitoring: Track component response weekly during the initial transition month

Practical Steps for Farmers: The 18-Month Transition Strategy

Based on conversations with producers who’ve successfully navigated this shift, along with extension recommendations, a three-phase approach seems most practical.

Immediate Actions (Next 60-90 Days)

Nutrition optimization offers the fastest path to capturing component premiums. University dairy specialists consistently recommend focusing on amino acid profiles in metabolizable protein, incorporating appropriate fat supplements, and eliminating factors that suppress butterfat synthesis.

The economics are encouraging here. Research from land-grant universities, including Michigan State and the University of Minnesota, suggests that investing $10-20 per cow per month in targeted nutrition typically yields returns of $25-85. Even if your current processor doesn’t fully reward components today, you’re still capturing feed efficiency gains and often seeing reproductive benefits that improve overall herd health.

One practical approach: Start by reviewing your current ration with fresh eyes. Many farms discover they’re feeding ingredients that actively suppress butterfat—things that made sense when volume was king, but work against component optimization. It’s surprising what you might find.

Short-Term Strategy (6-18 Months)

This development suggests interesting market dynamics ahead. With processors across North America investing billions in new capacity—the International Dairy Foods Association reports over $8 billion in announced projects through 2026—they’ll need a quality milk supply to fill that infrastructure.

For U.S. producers operating outside supply management, this creates direct opportunities. I recently heard from a producer in Pennsylvania who documented her component levels and quality metrics over several months, then approached three processors for competitive quotes. When her existing buyer realized she had genuine alternatives offering 50 cents more per hundredweight, they suddenly found room to improve their pricing structure. Funny how that works.

The Canadian experience offers different lessons. While producers there can’t negotiate directly with processors—they sell to provincial milk marketing boards, which allocate milk—their transparent pricing system, administered by the Canadian Dairy Commission, clearly rewards components. October 2025 butterfat prices are $11.84 per kilogram, versus $8.31 for protein. This regulated system has driven on-farm decisions toward component optimization for years, since that’s how farmers maximize returns within the supply management framework. Canadian producers have focused intensively on genetics and nutrition to optimize components because that’s their only lever for improving revenue—they can’t negotiate volume or switch buyers.

U.S. producers following the June 2025 Federal Milk Marketing Order reforms have more flexibility but less pricing transparency. The principle of demanding clear component pricing from cooperatives remains valid for those who can negotiate or explore alternatives.

Long-Term Positioning (18+ Months)

Genetic decisions made today will determine your component profile when new processing capacity comes online in 2028-2030. Extension geneticists generally recommend starting conservatively—perhaps with your bottom third of cows for initial crossbreeding trials.

This staged approach allows you to evaluate results while maintaining operational flexibility. If market signals remain positive by mid-2026, you can expand the program. The timeline matters here because first-cross heifers bred today won’t enter your milking string for about 24 months.

Understanding Regional Variations

Different regions are adapting to this component-focused reality in distinct ways, and there’s something to learn from each approach.

New Zealand demonstrates that the model works even with smaller herd sizes—their average herd size remains under 500 cows, according to DairyNZ’s 2024-25 statistics. Their payment system has been optimized for milk solids rather than volume for years, creating remarkable efficiency. What’s particularly noteworthy is that, as Fonterra’s market share has declined to 77.8% according to the New Zealand Commerce Commission’s September 2025 report, and competitors have offered attractive component-focused pricing, it’s actually forced all processors to be more responsive to farmer needs.

In the United States, the Federal Milk Marketing Order reforms implemented in June 2025—the first major update since 2008—formally recognized that butterfat now accounts for 58% of milk check income, according to the USDA’s Agricultural Marketing Service. Yet many cooperative payment systems haven’t fully adjusted to this reality, creating opportunities for producers willing to negotiate or explore alternatives.

California producers face unique challenges with transportation distances and processor consolidation, but they’re also seeing some of the strongest component premiums in the country. The California Department of Food and Agriculture’s September 2025 data shows component premiums averaging $0.85 per hundredweight above the state average. That adds up quickly.

The Northeast presents another interesting case. Smaller farms there are finding that component optimization allows them to remain competitive despite scale disadvantages. When you’re shipping high-component milk, processor transportation costs become more manageable on a solids basis—that’s just math working in your favor.

Component optimization delivers impressive profit across all herd sizes, proving quality trumps scale in the new dairy order.

The Risks We Should Monitor—And How to Prepare

Now, while the component-focused future seems clear, several risks deserve attention along with strategies to address them.

China’s economic trajectory remains the biggest wildcard. If their dairy demand remains weak for several more years, global export markets will come under pressure. But what’s encouraging is butter’s diverse demand base—spanning Asia, the Middle East, and developed markets—provides more resilience than powder’s historically China-dependent structure. Smart farms are diversifying their risk by not betting everything on export-dependent processors.

Precision fermentation technology represents a longer-term consideration. Companies like Yali Bio and Melt & Marble are developing fermented dairy fats, with some targeting commercial launches in 2026, according to their August 2025 corporate announcements. While price parity is likely 5-10 years away, according to the Good Food Institute’s September 2025 analysis, this technology could eventually compete for commodity ingredient applications. The best defense? Focus on premium quality that commands loyalty beyond pure commodity competition.

The impact of GLP-1 weight-loss medications on dairy consumption patterns is another emerging factor. Research in the American Journal of Agricultural Economics from July 2025 indicates households using these medications reduce butter consumption by approximately 6%, primarily in retail channels rather than foodservice. Current adoption sits at 3.2% of the U.S. population according to CDC data from August 2025, though Morgan Stanley projects potential growth to 7-9% by 2035. It’s worth monitoring, but foodservice demand remains more stable.

Perspectives from Progressive Operations

Extension case studies from farms that have successfully transitioned offer valuable insights. The University of Wisconsin-Madison’s August 2025 extension bulletin documented Wisconsin farms reporting economic improvements ranging from $32,000 to $87,000 annually for 500-cow operations. The variation depends largely on their starting point and local market dynamics, but the direction is consistently positive.

The common thread among successful transitions? Methodical tracking of component efficiency—measuring pounds of fat and protein against pounds of dry matter intake. This metric, more than any other, determines economic sustainability in a component-valued market.

International examples provide additional perspective. Brazilian operations dealing with heat stress have found Jersey genetics particularly valuable. Embrapa Dairy Cattle’s 2025 annual report shows 12-15% improvement in component efficiency under tropical conditions—that’s significant when you’re battling heat and humidity. Australian producers recovering from recent industry challenges are focusing intensively on specialty cheese and butterfat products for Asian markets, as documented in Dairy Australia’s September 2025 market analysis. These diverse experiences suggest the component-focused approach adapts well across different production environments.

Essential Lessons for Dairy Farmers

After examining the data, market trends, and producer experiences, several principles emerge clearly.

Component optimization is transitioning from competitive advantage to operational necessity. The most successful farms won’t necessarily be the largest, but those producing high-component milk at competitive costs while maintaining operational flexibility.

Processing flexibility matters tremendously. Fonterra’s ability to shift between butter, AMF, and cream products based on market signals provides the resilience that single-product strategies can’t match. We should seek similar flexibility in our own operations.

Information asymmetry remains expensive but addressable. Farms that invest modestly in market intelligence and professional advisory services often identify pricing opportunities worth tens of thousands of dollars annually. The key is translating that information into actionable operational changes.

The transition period through 2027 creates a particular opportunity. As new processing capacity comes online, farmers who’ve already positioned for component production will be ready to capture emerging premiums.

Looking Forward: Your Strategic Path

The dairy industry stands at a genuine inflection point. Processing infrastructure is shifting toward butterfat-intensive products. Payment systems are gradually recognizing the value of components. Technology continues creating both opportunities and challenges for traditional dairy farming.

Fonterra’s $75 million investment signals confidence that butterfat will maintain its premium status despite powder market challenges. They’re betting this trend continues for at least the next decade. Whether they’re right depends on multiple variables—economic recovery in key markets, technology advancement rates, and evolving consumer preferences.

What seems certain is that measuring dairy success purely by tank volume is becoming increasingly obsolete. As one thoughtful producer recently observed at the World Dairy Expo: “My grandfather measured success by how full the bulk tank was. I measure it by what’s in it. Same tank, completely different business.”

The capital flowing into Clandeboye’s butter expansion represents Fonterra’s vision for dairy’s future. The decisions each of us makes about breeding, feeding, and marketing our milk will determine who captures the value that investment creates.

For an industry with deep traditions and generational farming operations, change comes slowly. Yet the message from New Zealand—and increasingly from progressive farms worldwide—deserves serious consideration. The future of profitable dairy farming isn’t just about filling the tank anymore. It’s fundamentally about what’s in it.

The producers who’ve already made this shift aren’t looking backward. They’re focused on optimizing components, improving efficiency, and building sustainable operations for the next generation. They’re positioning their farms to thrive in this new reality, not just survive it.

And honestly? They’re wondering why it took the rest of us so long to recognize what they figured out years ago.

The path forward is clear for those willing to see it. The only question is whether you’ll be among the farmers leading this transition—or playing catch-up when the market forces your hand.

Key Takeaways:

  • The Opportunity: Butterfat pays 3X powder ($7,000 vs $2,550/tonne) and the gap’s widening as Chinese powder demand craters 39%
  • The Payoff: Component-focused farms are banking $32,000-87,000 extra annually—proven across 500-cow Wisconsin operations to small Northeast herds
  • The Fast Win: Invest $10-20 per cow monthly in amino acid nutrition, capture $25-85 returns within 60 days (400% ROI)
  • The Deadline: $8 billion in new butter/cheese processing capacity comes online by 2027—position now or watch others lock in your premiums
  • Your Action Plan: Start Monday with nutrition optimization, document components for processor leverage, breed the bottom 30% to Jersey genetics this cycle

Complete references and supporting documentation are available upon request by contacting the editorial team at editor@thebullvine.com.

Learn More:

  • The Art of Feeding for Components: Beyond the Basics – This article provides advanced nutritional strategies for maximizing butterfat and protein. It reveals specific methods for balancing fatty acids and improving rumen health, allowing you to turn the market signals discussed in our main feature into tangible gains in your bulk tank.
  • Navigating the New FMMO Landscape: What Producers Need to Know Now – While our feature covers the global market shift, this analysis drills down into the recent FMMO reforms. It provides critical insights for understanding your milk check and leveraging new pricing realities to negotiate more effectively with your processor.
  • Genomic Testing Isn’t Just for the Elite Sires Anymore – To accelerate the genetic progress mentioned in our 18+ month strategy, this piece demonstrates how to use affordable genomic testing on your commercial heifers. Learn how to make faster, data-driven breeding decisions to boost component traits across your entire herd.

The Sunday Read Dairy Professionals Don’t Skip.

Every week, thousands of producers, breeders, and industry insiders open Bullvine Weekly for genetics insights, market shifts, and profit strategies they won’t find anywhere else. One email. Five minutes. Smarter decisions all week.

NewsSubscribe
First
Last
Consent

Your Repeat Mastitis Cows Have a 72-Hour Secret – Here’s How to Break It

1,700-cow dairy. Zero hospital pen days. Not a typo. Here’s the 72-hour secret that changed everything.

Picture this: You’re treating the same cow for mastitis for the third time this month. Same quarter. Same frustrating cycle. She clears up, looks great for ten days, maybe two weeks if you’re lucky, then boom—she’s back.

Sound familiar? What if I told you there’s actually a biological clock ticking from the moment bacteria enter that udder, and we’ve been missing it completely?

I recently spent time reviewing research from AHV International, a Dutch company founded by veterinarian Dr. GJ Streefland, who grew tired of witnessing this exact pattern. Working with his business partner Jan de Rooy and researchers at Utrecht University, they discovered something that might explain why we keep fighting the same battles—and losing.

What they found is showing documented savings on real farms. But more than that, it might finally explain why that hospital pen never seems to empty out.

The Discovery That Started with Frustration

The Race You’re Losing: By 72 hours, over 75% of mastitis bacteria have built impenetrable biofilm fortresses—but clinical symptoms don’t appear until day 7.

You know how the best discoveries often come from someone saying, “there’s got to be a better way”? That’s exactly what happened in the eastern dairy region of the Netherlands. Dr. Streefland was watching antibiotics fail in ways that didn’t make sense. Not traditional resistance where bacteria evolve—this was different. Cows would respond, improve, then relapse with identical infections in the same location.

The breakthrough came when Streefland took a course on bacterial communication—yes, bacteria actually communicate with each other through a phenomenon called quorum sensing. Working with Professor Johanna Fink-Gremmels at Utrecht’s veterinary faculty, they started investigating whether this communication system might explain our treatment failures.

What’s fascinating is that they found specific plant compounds could actually disrupt these bacterial conversations and break up the protective fortresses that bacteria build—what scientists call biofilms. Even more surprising? These compounds are effective when administered orally, not just through direct injection into infected tissue. As Streefland explained in company documentation, “With oral applications, we were able to prevent the formation and maintenance of biofilms, enabling the immune system to eliminate biofilm-related disorders. That was really spectacular for me.”

The Critical 72-Hour Timeline for Biofilm Prevention in Dairy Cattle

Here’s where it gets really relevant for your operation. According to AHV’s research, validated across thousands of cows, bacteria follow a predictable timeline:

The Critical 72-Hour Window: Antibiotic effectiveness plummets as bacteria coordinate and build protective biofilm fortresses. By day 7 when symptoms appear, you’re already too late.
Time PeriodWhat’s HappeningTreatment Effectiveness
0-24 hoursIndividual bacteria, vulnerable to immune responseAntibiotics highly effective
24-48 hoursBacteria reach “quorum” and start coordinatingTreatment becomes challenging
48-72 hoursBiofilm matures into protective fortressAntibiotics struggle to penetrate
After 72 hoursEstablished biofilm shields bacteriaTreatment often temporary

Think of it like the difference between one protester with a sign versus fifty people organizing a march. Once they coordinate, everything changes.

Now here’s the kicker—most of us don’t even start treating until clinical signs appear around day seven. By then, we’re no longer fighting bacteria. We’re trying to break through established fortifications.

Real Farms, Real Numbers

Looking at documented results from working farms, Peter Smith at LT Smith & Sons in New York really caught my attention. He milks 1,700 Holsteins, a family operation that has been at it for decades. According to AHV’s case studies, his culling rate for udder health dropped from 1 in 3 cows to 1 in 7.

But here’s what matters day-to-day: Smith reports having 10-12 more cows in the milking string daily because they’re not stuck in the hospital pen or on withdrawal. Some days—and this still amazes me—he has zero cows in the hospital pen. After thirty years in the business, that had never happened before.

Zero Hospital Pen Days: After 30 years of dairy farming, Peter Smith achieved what seemed impossible—an empty hospital pen and 10-12 more cows in the milking string every single day.

In California, Trevor Nutcher’s experience is even more dramatic—though it’s worth noting that his operation had already optimized other management factors, so results may vary. The documentation shows he hasn’t used a mastitis tube since switching to biofilm prevention protocols. His hospital pen that averaged over twenty cows? Often empty now. When cows do need support, they’re back milking in 2.5 days instead of the typical week.

Producer Case Study Summary

ProducerLocationHerd SizeKey Results
Peter SmithNew York1,700 cowsCulling reduced from 1-in-3 to 1-in-7; 10-12 more cows are milking daily
Trevor NutcherCaliforniaNot specifiedZero mastitis tubes; hospital pen often empty
Joe SoaresCaliforniaTurlock: 2,500 cows Chowchilla: 5,500 cowsH5N1 recovery: 3 days vs months; 88 vs 77 lbs daily production

What’s interesting is how these protocols perform under extreme stress. During the 2024 H5N1 outbreak, Joe Soares inadvertently conducted an experiment when both his dairies were affected—his 2,500-cow Turlock operation and his 5,500-cow Chowchilla facility. The operation utilizing biofilm prevention protocols maintained better overall herd health—cows recovered in three days versus months at the traditional protocol dairy. While this was an extreme situation, it suggests that preventing biofilm formation may help maintain stronger baseline immunity. The production difference during recovery was substantial: 88 pounds versus 77 per cow per day. Even if you never face an outbreak, this resilience could matter during any stress event—such as heat waves in California’s Central Valley, humidity challenges in Florida’s dairy regions, or those brutal January cold snaps we see in Wisconsin and Minnesota.

Breaking Down What This Means for Your Bottom Line

Let’s get specific about what the documented trials show financially. The Giacomini farm trial in California provides us with hard numbers from a controlled comparison involving 450 cows, and I think the math is worth doing together.

The Math That Changes Everything: For a 1,000-cow dairy, biofilm prevention delivers $216,000 in documented annual benefits—with payback in just 12-18 months.

Documented Milk Production Gains

The biofilm prevention group produced 193 pounds more milk per cow across the entire lactation. So if we’re looking at $17/cwt—pretty close to where we are this October—that’s roughly $33 per cow in additional milk revenue. Multiply that by your herd size. For a 500-cow dairy, that’s $16,500. For 1,000 cows? $33,000. Just from the milk.

The trial also showed a 32% reduction in metabolic issues during those critical first 60 days. You probably know this already, but metabolic problems in early lactation often cascade into other issues—ketosis leads to displaced abomasum, which leads to… you get the picture. And if you’re dealing with Florida humidity or Arizona heat stress during fresh cow transition? These metabolic challenges get even trickier.

Reproductive Performance in the Trials

What’s encouraging is the consistency across different systems. The US trials—spanning over 20,000 cows across California, Georgia, Florida, and Minnesota—documented 7.4% better conception rates at first service (42.1% vs. 39.2% in control groups). UK operations reported an average of 28 fewer days open. The Giacomini trial showed zero uterine issues at 60 days in the treatment group versus ongoing problems in controls.

Now, the value of each day open varies—some extension economists say $3, others say $5 or more, depending on your market. But let’s be conservative and say $3.50. If you cut 28 days open like UK farms do, that’s $98 saved per cow. Again, multiply by your herd size.

The Longevity Factor

Here’s what really makes you think—research tracking 64,467 animals across Dutch farms found cows on these protocols lived an average of 8.5 months longer.

I don’t need to tell you what replacements cost these days. Whether you’re raising your own or buying springers, extending productive life by over half a year changes your whole culling strategy. Instead of culling for chronic mastitis treatment, you’re culling for production or genetics. That’s a different game entirely.

Quick Action Step: Track Your Hospital Pen Patterns

Starting tomorrow morning, create a simple tracking sheet for your hospital pen:

  • Which cows enter
  • How long do they stay
  • Whether they return within 30 days

This baseline will reveal your actual patterns—you might be surprised by what you find. Many producers discover that their “problem cows” are the same 15-20% that repeatedly cycle through.

What About Treatment and Labor?

The documented savings here make sense when you think about it:

  • Less antibiotic use (because you’re preventing, not treating)
  • Labor time—farms report saving 2-3 hours daily, not treating repeat offenders
  • No milk withdrawal for cows that don’t need treatment

It’s worth noting that prevention protocols do cost more upfront than a tube of mastitis treatment. However, when you factor in all these documented benefits, operations consistently report payback within 12 to 18 months. Of course, your mileage may vary depending on your current situation.

Sponsored Post

Why This Innovation Came from Holland (And What It Means for North American Dairies)

Interestingly, this breakthrough emerged from the Netherlands rather than larger dairy regions like Wisconsin or California. The Dutch had heavily restricted their antibiotic use years before similar pressure emerged in North America. They couldn’t just switch to stronger drugs when first-line treatments failed. They had to think differently.

Plus, the Netherlands is compact—you can drive across their entire dairy region in a few hours. When something works, word spreads fast through their tight-knit farming community. And Dutch producers have been comfortable with precision management for years, making them more receptive to complex biological approaches.

The collaboration between practicing veterinarians and university researchers was crucial. Utrecht University supported unconventional thinking when other institutions might have been more conservative. That academic backing gave credibility to what might have otherwise been dismissed as “just another supplement.”

What’s this mean for us here? Well, with milk quality premiums becoming tighter and consumer pressure on antibiotic use growing, we might want to pay attention to what the Dutch have figured out under pressure.

The Implementation Challenge

Let’s be honest—this approach requires a mental shift that’s harder than you’d think. We’ve built our entire management philosophy around being excellent at treating sick cows. Walk any farm with the owner, and they’ll proudly show you their protocols for the hospital pen. That’s what good managers do, right?

This asks you to intervene before problems are visible. During dry-off (where trials show 70% reduction in milk leakage and 47% fewer death losses with StopLac protocols). During the fresh cow transition. Before stress events. Success looks like… nothing happening. An empty hospital pen.

It’s weird celebrating what doesn’t happen. But that’s exactly the point.

Your veterinary relationship changes, too. Less emergency calls, more strategic planning. Some vets resist initially—understandably, since it challenges traditional service models. However, progressive practitioners see an opportunity to provide higher-value, consultative services.

And let’s be fair—some folks want to see more independent research before making changes. That’s completely reasonable. Each operation needs to weigh the documented benefits against their own comfort level with trying new approaches.

What This Means for Different Operations

  • For larger operations (1,000+ cows): The economics generally work well at scale. If you’re already tracking individual cow data through systems like DairyComp or PCDART, adding biofilm prevention protocols integrates relatively easily. The reduced labor alone—not having staff constantly treating repeat offenders—could justify exploring this approach. And with current margins? Every efficiency counts.
  • Mid-size dairies (300-999 cows): You might see the biggest relative impact. You’re large enough for economies of scale, but small enough that reducing the hospital pen population directly affects daily operations. Imagine what your best employee could accomplish if they weren’t treating sick cows three hours daily. This is especially relevant if you’re in that tough spot deciding between staying commodity or going premium—as many mid-size operations are right now.
  • Smaller operations (<300 cows): The per-cow investment might be higher, but if you’re doing your own treatments, the time savings could be game-changing. Plus, keeping cows productive longer becomes even more critical when every cow counts. For Canadian quota holders or organic producers, the longevity benefits alone might be worth the investment.
  • Grazing operations: The US data showing improved conception rates is enormously important for seasonal calving. And with less intensive management, preventing problems becomes even more valuable than treating them. If you’re grass-based, this could align well with your whole systems approach.
The Complete Picture: $376,000 annual benefit per 1,000 cows. Longevity and reproduction savings dwarf the visible costs—this is why the hospital pen tells only part of the story.

The Practical Reality Check

Look, I’m not suggesting this is a magic bullet. The documented results are impressive, but implementation requires commitment. You need to understand the biology, adjust protocols, and possibly face some resistance from your team or veterinarian.

Some operations might find traditional approaches still work for their situation. If you have excellent treatment success rates, low culling, and manageable hospital pen populations, perhaps you don’t need to change. But if you’re seeing those same cows repeatedly… well, Einstein had something to say about doing the same thing and expecting different results.

The learning curve is real. Producers who’ve made the switch emphasize that understanding when and how to intervene takes practice. But once you get it? They say it becomes second nature.

Where This Heads Next

What’s particularly interesting is that this isn’t limited to dairy. Dr. Geoff Ackaert, AHV’s technical director, notes similar bacterial behavior in poultry, swine, and even aquaculture. The principles appear universal because bacteria operate the same way regardless of host species.

With increasing pressure on antibiotic use globally—whether from regulations or consumer demand—having alternatives becomes crucial. The documented results suggest biofilm prevention could be one viable path forward. And honestly, being ahead of that curve rather than scrambling to catch up? That’s usually the better position.

Making Your Decision

The question isn’t whether the 72-hour biofilm window exists—the biology is clear from AHV’s research. The question is whether understanding and working with this timeline makes sense for your operation.

What would zero hospital pen days mean for your farm? Not just economically, but for your quality of life? For your employees’ job satisfaction? For your ability to focus on improving production rather than constantly treating problems?

Some producers will wait until this becomes standard practice everywhere. Others, like Peter Smith and Trevor Nutcher, are building competitive advantages now while the industry catches up.

Given this October’s milk prices —cheese at $1.67 and margins tightening —every efficiency matters. The chronic mastitis pattern that’s frustrated dairy farmers for generations finally has a biological explanation. Whether that explanation leads to changes in your operation is a decision only you can make.

But at least now you know why that cow keeps coming back to your hospital pen. And more importantly, you know there might be a way to stop her from needing to.

Key Takeaways: 

  • You’re always 72 hours too late: Bacteria build untreatable biofilm shields in 3 days, but clinical signs don’t appear until day 7—by then, antibiotics can’t penetrate
  • Zero hospital pen days are real: Peter Smith (1,700 cows, NY) dropped culling from 1-in-3 to 1-in-7; California’s Trevor Nutcher hasn’t used a mastitis tube since switching protocols
  • The ROI is undeniable: For 1,000 cows: $33,000 extra milk revenue + $98,000 saved on reproduction + dramatically reduced culling = payback in 12-18 months
  • Success requires a mental shift: Celebrate empty hospital pens, not treatment skills—intervene at dry-off and transition before problems become visible
  • Start tomorrow: Track which cows enter your hospital pen, how long they stay, and if they return within 30 days—you’ll likely find the same 15-20% cycling repeatedly

Executive Summary:

Your repeat mastitis cows aren’t antibiotic failures—they’re timing failures. Bacteria build impenetrable biofilm fortresses within 72 hours of infection, but symptoms don’t appear until day seven, making traditional treatments useless. Dutch research finally cracked the code: bacteria use “quorum sensing” to coordinate these defenses, explaining why the same cows keep cycling through hospital pens. The proof is undeniable: Peter Smith’s 1,700-cow NY dairy dropped culling from 1-in-3 to 1-in-7 and achieved zero hospital pen days—after 30 years of trying. Financial analysis from 20,000 US dairy cows documents $33/cow extra milk, $98/cow reproduction savings, and 8.5 months longer productive life. The paradigm shift? Prevent biofilms during dry-off and transition before problems become visible, celebrating empty hospital pens instead of treatment expertise. Start tomorrow: track your hospital pen patterns for 30 days—when you see the same 15-20% cycling through repeatedly, you’ll understand why this 72-hour window changes everything.

Complete references and supporting documentation are available upon request by contacting the editorial team at editor@thebullvine.com.

Learn More:

The Sunday Read Dairy Professionals Don’t Skip.

Every week, thousands of producers, breeders, and industry insiders open Bullvine Weekly for genetics insights, market shifts, and profit strategies they won’t find anywhere else. One email. Five minutes. Smarter decisions all week.

NewsSubscribe
First
Last
Consent

The $38,000 Question: Why Components Beat Volume in Dairy’s New Reality

August 2024: First fluid milk gain since 2009. August 2025: Down 4%. The recovery? It’s already over.

EXECUTIVE SUMMARY: The brief fluid milk recovery of 2024 is over—August sales dropped 4%, confirming dairy’s structural shift from volume to components. Processors are voting with their wallets: $11 billion into cheese, yogurt, and specialty products, essentially nothing into traditional bottling. The economics are clear: farms hitting 4.3% butterfat earn $38,000+ more annually per 500 cows than those at 4.2%, while operations like Jake Vandenberg’s captured an extra $1.40/cwt simply by switching processors. Meanwhile, 259 farms filed bankruptcy chasing yesterday’s volume game, caught between $17 milk and $32+ production costs. The good news? Multiple paths to profitability exist—component optimization, specialty markets, strategic partnerships—but only for those who act now. With Federal Order reforms on December 1st and massive shifts in processing capacity by Q2 2026, your decisions in the next 18 months determine whether you’re part of dairy’s future or its consolidation statistics.

Dairy Component Premiums

You know that brief moment of hope we all felt when 2024 posted fluid milk’s first sales increase since 2009? Well, August’s 4% decline—bringing us down to 3.479 billion pounds according to USDA’s latest numbers—is telling us something important. And with processors committing $11 billion to new manufacturing facilities while fluid milk drops toward just 15% of total utilization, I think we’re seeing more than just another market cycle.

Many of us have noticed something feels different about our milk checks lately. It’s not just the price swings we’re used to. The cumulative sales data through August shows a 1.1% decline after adjusting for leap day, and that’s part of a bigger picture worth talking about.

Fluid milk’s 2024 recovery proved short-lived—August 2025 dropped 4% from the previous year’s brief peak, confirming dairy’s permanent shift from volume to components.

Component Production: What’s Really Happening Out There

Here’s what’s been happening that you might not have noticed yet. The Federal Milk Marketing Order data from March shows something fascinating—while total milk production dipped slightly at 0.35% year-to-date, calculated milk solids production actually went up by 1.65%. We’re making less milk but with way more components.

What really caught my attention is what’s happening with butterfat. USDA data shows the average test rate hit 4.36% in March 2025. That’s not just good—it breaks the old record set in 1945, when they hit 4.15%. Protein’s up too, sitting at 3.38%. These aren’t random fluctuations, folks. This is a systematic change.

I was talking with Tom Martinez last week—he runs 1,400 cows near Modesto—and he put it perfectly: “When the Federal Order pricing shows components making up 88-92% of what we’re getting paid, you’d be crazy not to adjust.” And he’s right. The economics are clear as day.

What I’m seeing across the country is producers really pushing components. Some markets are reporting component premiums hitting $1.25 per hundredweight for consistent quality, with certain producers getting even more. For someone like Martinez, producing 85 pounds per cow daily, that’s about $110,000 extra per year. That’s real money.

Sarah Johnson, a nutritionist with Cargill who works mostly in Wisconsin, tells me her clients are completely changing their approach. “They’re selecting for genetics with +50 pounds protein EBV now,” she says, “and pushing dry matter intake over 55 pounds daily during peak lactation. It’s all about component density these days.”

And you know what? With the Federal Order reforms coming on December 1st, this makes total sense. Wisconsin’s dairy center ran the numbers—farms producing milk with 3.3% protein and 6.0% other solids are going to see meaningful premiums. If you’re still focused on volume… well, you might end up subsidizing the folks who’ve made the switch.

Follow the Money: Where $11 Billion in Dairy Processing Investment Is Going

Processors are voting with their wallets—$11 billion flows to cheese, yogurt, and specialty products while traditional fluid milk gets essentially nothing. The industry’s future is written in these investment dollars.

The International Dairy Foods Association’s manufacturing report really opened my eyes. They’re tracking $11 billion in new processing investments through 2028. But here’s what’s interesting—look at where that money’s actually going:

Manufacturing Investment Breakdown

  • Cheese facilities: $3.2 billion
  • Milk/cream (mostly ESL and specialty): $2.97 billion
  • Yogurt and cultured products: $2.81 billion
  • Butter and powder operations: $1.60 billion

Notice anything missing? Yeah, traditional fluid milk bottling barely registers.

The individual projects tell the story even better. Fairlife—that’s Coca-Cola’s operation—is putting $650 million into ultra-filtered milk production in Webster, New York. Chobani’s dropping $1.2 billion on their Idaho facility, but it’s for yogurt and cultured products. Darigold’s new $600 million plant in Pasco? That’s for butter and milk powder, not fluid milk.

Mike McCully made a point at World Dairy Expo that stuck with me: “Pretty soon, it won’t be about who’s getting milk—it’ll be about who’s NOT getting milk.”

Based on what these companies are announcing, they’ll need 50-60 million pounds of milk daily once everything’s running. That milk’s got to come from somewhere.

Consumers: They’re Telling Us Something Important

The August sales data from IRI shows some really interesting patterns. Overall, fluid milk dropped 4%, but when you dig deeper, it gets complicated.

Organic milk took a real beating—down 9.4% according to retail tracking. And this is despite all the environmental and health messaging that, in theory, should appeal to today’s consumers. But when USDA shows organic averaging $4.41 per half-gallon versus $1.57 for conventional, well… that’s a tough premium for folks to swallow right now.

But here’s what’s curious—lactose-free milk grew 11.6% year-over-year. Circana’s research shows it’s getting $9.40 per gallon compared to $4.86 for regular milk.

Dr. Mary Schmitt at UC Davis explained it to me this way: “Lactose-free fixes a problem people feel immediately. They drink it, they feel better. Organic’s benefits? Those are long-term and abstract.”

The generational stuff is what really concerns me, though. The International Food Information Council’s 2024 study found that only 8% of Gen Z consumers buy conventional cow’s milk. Boomers? That’s 37%.

From 37% to 8% in three generations—the collapse in conventional milk consumption among younger consumers isn’t a trend to reverse with better marketing. It’s a cultural transformation that’s permanent.

Even more telling—recent consumer research shows younger consumers increasingly view dairy through a social lens, with many reporting discomfort ordering dairy products in public settings. This represents a fundamental shift in how dairy is perceived culturally, not just nutritionally.

Jennifer Williams from Dairy Management Inc. doesn’t mince words about this: “This isn’t something a better Got Milk campaign can fix. We’re looking at fundamental cultural shifts across three generations.”

The Financial Reality Check: A Tale of Two Dairy Economies

Let’s talk money, because that’s what keeps us all up at night. CME futures show Class III milk dropped about 20 cents after April’s production reports, settling around $16.86-17.86 per hundredweight for most of 2025.

Cornell’s Dairy Farm Business Summary lays out the cost structure pretty starkly:

Production Cost Comparison (per hundredweight)

  • Mid-size operations (200-700 cows): $32.83
  • Large operations (2,000+ cows): $23.06
  • Cost disadvantage: $9.77

That’s almost a $10 difference, and you can’t make that up with incremental improvements.

The math is brutal—mid-size operations burn $15.83 per hundredweight at current milk prices while large dairies operate near breakeven. This $9.77 cost gap can’t be bridged with incremental improvements

The bankruptcy numbers from American Farm Bureau tell a tough story. Chapter 12 filings jumped 55% to 259 cases between April 2024 and March 2025—the highest since 2019. In Q1 2025, we saw 88 bankruptcy filings, up from 45 the year before.

Dr. Christopher Wolf at Cornell reminds us these aren’t just numbers: “Every one of these represents generations of knowledge, family legacies, and rural communities losing their foundation.”

Interest rates aren’t helping either. Federal Reserve ag lending surveys show rates jumping from 2.9% to nearly 9%. CoBank’s analysis suggests that if you’re refinancing debt, you’re looking at $50,000 to $150,000 more in annual service costs, depending on your operation size.

And here’s something that worries me—USDA’s Cattle report shows replacement heifer inventories at just 41.9 per 100 milk cows. That’s a 47-year low. You don’t sell your future herd unless you absolutely need the cash today.

What Works: Learning from Successful Adaptations

Not everybody’s struggling, though, and that’s worth talking about. I’ve been visiting with farmers who are actually doing pretty well, and they’ve got some things in common.

Take the Vandenberg family in South Dakota. Over the past three years, they’ve completely restructured their 800-cow operation to focus on components.

“We’re hitting 4.3% butterfat and 3.4% protein consistently,” Jake Vandenberg tells me. “Agropur gives us about $1.40 per hundredweight extra for that consistency. For us, that’s literally the difference between making money and losing it.”

The Vandenbergs made three big changes:

  1. Switched their breeding program—sexed semen on the best 40%, beef on the rest
  2. Brought in a nutritionist to reformulate for component density instead of volume
  3. Left their co-op after 30 years to join a cheese-focused processor
The numbers don’t lie—optimizing for just 0.1% more protein delivers $38,000+ extra annually per 500 cows. Traditional volume strategies leave this money on the table.

Different strategies work for different situations, of course. Maria Rodriguez, down in Texas, took an entirely different approach. Her 180-cow operation couldn’t compete with the mega-dairies around her on efficiency. So she went niche—transitioned to A2 milk for a regional specialty processor.

“I’m getting $24 per hundredweight when my neighbors are getting $17,” she says. “But it took two years to fully transition, between the testing, breeding changes, and building new buyer relationships.”

Regional Realities: Why Geography Matters More Than Ever

Of course, what works depends partly on where you’re farming. The transformation looks different depending on your region.

California: Dealing with water restrictions, environmental regulations, and bird flu that knocked out 0.7% of national production according to the USDA’s animal health reports. But California’s also where I’m seeing the most aggressive component optimization. Dr. Jennifer Heguy from UC Extension puts it bluntly: “With our cost structure, it’s high components or bankruptcy. There’s no middle ground.”

Wisconsin: Actually, it’s in a pretty good spot for this transformation. The Wisconsin Milk Marketing Board reports that 90% of the state’s milk goes into cheese. If you’re optimizing for protein in Wisconsin, you’re positioned perfectly. The challenge? Most Wisconsin farms still have fewer than 500 cows, and scale matters more than ever.

Northeast: That’s where things get tough. Analysis shows they depend more on fluid milk than any other region. Industry estimates suggest DFA controls about 60% of fluid processing in some Northeast markets. Dr. Andrew Novakovic at Cornell describes it well: “The big farms will be fine, the specialty niche operations can make it work, but that traditional 200-cow dairy that’s been the backbone of rural New York? They’re in a really tough spot.”

The Other View: Maybe This Is Just Another Cycle

Now, not everyone agrees that this is a permanent change. I had a long conversation with Robert Wellington at Agri-Mark Cooperative, and he makes some good points.

“We’ve seen this before,” Wellington says. “In 2009, when Class III hit $9, everyone said dairy was permanently broken. By 2011, we were back over $20. Markets do this—they overcorrect.”

He points to several recovery factors:

  • China could bounce back and start importing again
  • Cheese consumption has grown for 40 years straight
  • Government might step in if farm failures accelerate
  • IRI data shows plant-based milk has plateaued, with oat milk actually declining

“Look, I’m not saying it’s easy,” Wellington tells me. “But fluid milk still represents 200 billion pounds of annual sales. Writing it off completely might be premature.”

What You Can Do Right Now: Practical Action Steps

So, given all this, what should you actually be doing? Here’s my practical advice based on what’s been working.

1. Evaluate Your Processor Relationship

Ask these critical questions:

  • What’s their five-year infrastructure plan?
  • How much milk goes to fluid versus manufacturing?
  • What are the component premiums and calculation methods?
  • Are they gaining or losing members?
  • What happens if this plant closes?

If you don’t like the answers—or can’t get straight answers—start looking around now while you still have options.

2. Run Your Component Numbers

Pull your last year’s milk test results and use the USDA’s AMS pricing calculator. Even a 0.1% bump in protein could mean $20,000-30,000 for a 500-cow herd. That usually justifies changing your breeding program.

Quick Component Math

  • 500 cows × 70 lbs/day × 365 days = 12,775,000 lbs annually
  • 0.1% protein increase at $3.00/lb protein value = $38,325 extra revenue
  • Genetic investment payback: Often under 18 months

3. Be Honest About Your Scale Situation

If you’re running 200-700 cows, you need a clear path:

  • Can you get to 1,000+ economically?
  • Is there a niche market you can tap into?
  • Would a neighbor lease your facilities?

These conversations are hard, but having them now beats having them in bankruptcy court.

4. Lock in What You Can

With rates where they are, converting variable debt to fixed should be priority one. Same with feed—locking in for 6-12 months gives you certainty when everything else is volatile.

What to Watch: The Next 18 Months Will Be Critical

Based on everything I’m hearing from analysts, processors, and other farmers, here’s what I’m watching:

Q2 2026: New processing capacity really kicks in. That’s when we’ll see if there’s enough milk to go around. CME futures suggest Class III stays in that $17-18 range through mid-2026.

December 1, 2025: Federal Order reforms hit. National Milk’s analysis shows this will shift millions in revenue between regions and different sized farms. If you haven’t run the numbers on how this affects you specifically, you’re flying blind.

SNAP Uncertainty: We’re talking about 42 million Americans potentially affected if Congress doesn’t act, and USDA data shows that fluid milk is the second-most-purchased SNAP item. Any disruption accelerates demand problems.

Weather Patterns: NOAA’s projecting continued La Niña conditions—drier Southwest, wetter North. That affects feed costs and cow comfort differently depending on where you are. In the Southwest, you may see higher alfalfa costs. Up north, wet conditions could impact corn silage quality.

The Bottom Line: This Transformation Creates Both Risk and Opportunity

After watching this industry for three decades, I can tell you this feels different. It’s not just about milk prices or feed costs. It’s about fundamental changes in what consumers want, where processors invest, and which farm structures can survive.

The dairy industry will absolutely continue—global demand for dairy proteins keeps growing, especially in Asia and Africa, according to FAO projections. The question isn’t whether dairy survives. It’s which dairy farmers will be part of that future.

The folks who are going to thrive are making decisions based on where the industry’s heading, not where it’s been. They’re optimizing for components because that’s what processors pay for. They’re being honest about scale economics. They’re building relationships with processors who are actually investing in growth.

What’s encouraging is that there are multiple paths to success:

  • Component premiums for those who optimize
  • Specialty markets for smaller operations
  • Strategic partnerships for mid-size farms
  • Operational efficiency for larger scales

But—and this is crucial—you have to accept that the old playbook based on volume and fluid milk demand doesn’t work anymore.

The next 18 months will probably determine which operations make it to 2030. The survivors won’t necessarily be the biggest or most efficient. They’ll be the ones who recognized early that this isn’t a cycle to wait out—it’s a transformation to navigate.

Make your decisions based on where you see your operation in five years, not where you wish the industry was going. Whether we call it transformation or just reality, the dairy industry of 2030 will look very different from 2020.

And you know what? For those who position themselves right, it might actually be more profitable.

Quick Reference: Key Metrics for Decision-Making

Component Targets for Premium Capture

  • Butterfat: 4.3%+
  • Protein: 3.4%+
  • Daily variation: <2%

Critical Dates

  • December 1, 2025: FMMO reforms are effective
  • Q2 2026: New processing capacity online

Operation Size Considerations

  • <200 cows: Consider specialty/niche markets
  • 200-700 cows: Scale or specialize decision critical
  • 1,000+ cows: Focus on efficiency and components

Financial Thresholds

  • Component premium potential: $1.25-1.40/cwt
  • Protein value increase (0.1%): $20,000-30,000 per 500 cows
  • Debt refinancing impact: $50,000-150,000 annually

Key Takeaways:

  • Component Premium Reality: Every 0.1% protein increase = $38,325 more annually (500 cows). Genetics + nutrition can achieve this in 18 months.
  • Follow the $11 Billion: Processors are building cheese, yogurt, and powder plants—not fluid milk. Position yourself with growth-oriented buyers now.
  • 18-Month Window: Federal Order reforms (Dec 1) and new capacity (Q2 2026) will lock in winners and losers. Your processor decisions today determine your 2030 survival.
  • Three Paths Forward: Hit 4.3%+ butterfat for premiums ($1.40/cwt extra), tap specialty markets (A2 milk at $24 vs $17), or scale past 1,000 cows for efficiency.
  • Mid-Size Reality: At $32 production costs vs $17 milk, 200-700 cow operations must choose: scale, specialize, or strategically exit while equity remains.

Complete references and supporting documentation are available upon request by contacting the editorial team at editor@thebullvine.com.

Learn More:

  • Breeding for Components: The New Gold Standard for Dairy Profitability – This guide moves beyond theory to tactical execution, revealing the specific genetic markers (like A2A2 and Kappa-Casein) and sire selection strategies that directly translate into higher-value components and a more resilient milk check in today’s manufacturing-driven market.
  • Beyond the Barn: Decoding the 2025 Global Dairy Market Signals – Understand the global “why” behind the domestic shift. This strategic analysis explores the international demand for cheese and powders driving the $11 billion in processor investment, providing crucial context on the export trends that will shape your farm’s long-term profitability.
  • The Digital Feedbunk: How Precision Nutrition Tech is Unlocking Component Potential – To achieve the component targets discussed, you need the right tools. This article showcases the innovative technologies—from automated feed systems to data analytics—that allow you to optimize rations, boost milk solids, and maximize feed efficiency for a clear return on investment.

The Sunday Read Dairy Professionals Don’t Skip.

Every week, thousands of producers, breeders, and industry insiders open Bullvine Weekly for genetics insights, market shifts, and profit strategies they won’t find anywhere else. One email. Five minutes. Smarter decisions all week.
NewsSubscribe
First
Last
Consent

The Hidden Money in Every Step: Turning Hoof Health into Strategic Dairy Profit

The most profitable dairies aren’t milking harder—they’re walking smarter. The hoof holds the hidden margin.

Executive Summary: Hidden beneath every hoof is a profit story most producers never see. New data from the University of Nottingham and North American research show milk output and fertility start slipping weeks before obvious lameness appears—costing herds thousands in unseen loss. This Bullvine feature connects the biology to the balance sheet, showing how small timing changes in dry‑cow trimming, transition management, and housing comfort translate directly into stronger cash flow. It also explores how genetics, nutrition, and environment can turn hoof resilience into a permanent herd advantage. Examples from Wisconsin to Ontario prove one thing: the most profitable dairies aren’t just milking harder—they’re walking smarter.

Dairy Hoof Profitability

Walk into any freestall barn, and you’ll hear that familiar rhythm—milkers humming, gates clanking, the easy shuffle of cows heading to the bunk. It’s a comforting sound of routine. But every so often, there’s a different note: a soft drag of a hoof, a pause in stride. For years, we’ve thought of that as a welfare concern. Important, yes—but separate from core profitability. The latest data suggest it’s time to reframe that thinking completely.

A groundbreaking study from the University of Nottingham tracked over 6,000 cows across 11 herds and analyzed more than 2 million milk records. The findings were striking—hoof problems cost an average of $336 per case, and could cut up to 17 percent of net farm profit. But what’s most interesting? Milk yield began dropping weeks before a limp appeared.

As Dr. Marcos Veira from the University of British Columbia recently put it, “The money starts leaving your tank long before the cow starts limping.” That line has stuck with many producers because it captures what science now proves: lameness isn’t just an animal welfare issue. It’s one of the most under‑recognized management costs in dairying.

The “Invisible Cow” That Costs You

The true cost structure of lameness—milk production losses and premature culling consume nearly two-thirds of the economic damage, yet most producers focus only on the visible 13% spent on treatment and labor

Every herd has them—cows that look fine but quietly underperform. They milk, they eat, they breed back, but they never quite reach potential. Everything else in the herd may look solid—dry matter intake, conception rate, butterfat performance—yet something small keeps the herd average just below expectation.

The University of Wisconsin research team, led by Dr. Nigel Cook, found that cows showing subclinical inflammation in their hooves lose an average of 3.3 pounds of milk daily, even before lameness is visible. Across a 500‑cow freestall herd, assuming just 20% of cows are subclinically affected, that’s easily $30,000–$40,000 in milk revenue gone each year—without a single “lame cow” on the books.

What producers across North America are discovering is that the “invisible cow” problem doesn’t show up until it’s systemic—when the herd average drops, reproduction slows, and no one can pinpoint why. The solution lies not in more treatments but in catching every small signal before it compounds into loss.

Sole ulcers hit hardest per case at $216 and 574 kg milk loss, but digital dermatitis’ 35% prevalence makes it the real profit killer—knowing which battle to fight first changes everything

What’s Actually Happening Inside the Hoof

Looking closer, the pathway from fresh cow to lameness begins well before any visual signs. During the transition period, a cow burns energy reserves to fuel milk production. That means not just backfat, but also fat from the digital cushion—the small pad beneath the coffin bone responsible for absorbing impact.

Work from Cornell University and the University College Dublin shows that when this cushion thins, the coffin bone (P3) begins pressing into the corium—the sensitive layer that forms the hoof wall. That pressure leads to micro‑bruising weeks before external changes appear. The immune system responds, redirecting nearly 40 percent of the liver’s protein synthesis away from milk components toward tissue repair.

What’s interesting here is that production losses begin long before clinical lesions do. In practical terms, that means a cow’s milk and butterfat test may be telling you about her feet weeks in advance.

Producers who have added hoof-scoring to transition audits—particularly in Wisconsin and Ontario—report lower fresh cow pullouts and steadier butterfat recovery. It’s a powerful reminder that hoof health isn’t an isolated variable. It’s baked into the biology of early lactation.

Why “Prevention” Often Misses the Mark

Most dairy operations already have some form of hoof care in place—scheduled trimming, routine footbaths, lesion recording, and even digital tracking. Yet despite those investments, the average herd still reports around 30 percent of cows experiencing hoof problems annually. The issue usually isn’t neglect—it’s timing.

Footbaths are indispensable for controlling digital dermatitis, but they do little to offset metabolic or mechanical strain. Likewise, blanket trimming during peak lactation can cause more harm than good.

Hoof-care pioneer Karl Burgi has spent decades talking to producers about timing and prevention. “If you’re trimming after she freshens, you’re already behind,” he says. Moving that routine to the dry period—before the hormonal wave and metabolic stress hit—gives horn tissue time to harden and dramatically reduces lesions.

I’ve noticed many herds adopting Burgi’s logic in recent years—not because it’s trendy, but because it simply pays. Prevention only works when it happens before damage begins.

The Transition Period: Management’s Sweet Spot

Timing is everything—the digital cushion starts thinning three weeks before calving while lameness risk explodes after, proving Dr. Burgi’s point that trimming post-fresh means you’ve already lost the game

The transition window remains the most profitable period for hoof protection. Data from NAHMS 2023 and European dairy studies consistently show that cows losing > 0.5 BCS units between dry‑off and peak milk face exponentially higher lameness risk later in lactation.

Here are strategies that consistently yield returns:

  • Trim 6–3 weeks before calving. Research from the University of Bristol showed that when trimming was moved to this window, hoof lesions dropped by 62 percent.
  • Prioritize rest and comfort. A deeper bedding base and consistent cubicle space are critical. The University of Minnesota Extension found that each hour of lost rest correlates to 3 pounds of milk loss per cow, per day.
  • Fortify claw health nutritionally. Supplement 20 mg biotin/head/day and 50–60 ppm zinc (half organic) to strengthen horn growth.
  • Watch BCS swings closely. Logging condition scores at dry‑off, calving, and 21 days in milk creates a simple, herd‑level index of hoof risk.

One producer I spoke with near Green Bay summed it up well: “We didn’t change anything except timing, and the numbers told the story. Once we started trimming at dry‑off, it was like the cows got their footing back before calving even began.”

Closing the Freestall–Pasture Gap

It’s no secret that pasture systems show lower lameness rates—about 23 percent incidence versus 50 percent in conventional freestalls, according to data from the University of Guelph and University of Wisconsin. Still, it’s entirely possible to achieve similar comfort scores in high-producing freestall herds with fine-tuned management.

Across leading dairies, five consistent success points stand out:

  1. Rubber use in high-pressure zones. Installing mats in holding pens and return alleys reduces trauma by up to 40 percent.
  2. Modern stall design. According to the Dairyland Initiative, modern Holsteins perform best in 48‑inch stalls, 10‑foot lengths, neck rails 48–50 inches high, and 67 inches from the curb.
  3. Floor texture matters. Grooves, planted ¾ inch wide and 3¼ inches apart, ensure balance and minimize slips.
  4. Deep, dry bedding. Sand still wins on metrics of comfort and traction—reducing cases by 40 percent versus solid‑surface alternatives.
  5. Manage standing time. Research from Guelph suggests that keeping total standing time below 3½ hours daily minimizes the risk of sole ulcers.

Some Northeast producers have described how relatively inexpensive changes—re‑grooving lanes, adjusting neck‑rail height, or correcting parlor flow—reduced overall lameness nearly as much as large capital upgrades. What matters most is not the budget, but precision.

Genetics: The Silent Multiplier

Genetics isn’t quick, but it’s permanent—selecting for hoof health cuts lameness from 30% to 15% over four generations, building sound feet into your herd’s DNA instead of fighting the same fires every year

Short-term changes can deliver immediate progress, but genetics create lasting impact. Genome mapping led by the Council on Dairy Cattle Breeding (CDCB) and Wageningen University has already linked 285 markers to hoof integrity, with heritabilities as high as 30 percent.

Producers no longer have to wait to select for sound feet. The Council on Dairy Cattle Breeding (CDCB) has already released a Hoof Health (HH$) index and direct PTAs for traits like Digital-Dermatitis-Free and Hoof-Ulcer-Free. We can even select for Digital Cushion Thickness (DCT), the very structure discussed earlier in this article. While we can still use proxies like Productive Life and Feet & Legs Composite, producers can now directly attack hoof health issues through genetic selection with far greater precision.

As Tom Lawlor, Research Director at CDCB, pointed out recently, “Every generation that overlooks hoof traits ends up paying the same bill twice.” Selecting for the right structure now locks in herd mobility—and profitability—for years to come.

A 90‑Day Plan That Delivers

Wisconsin’s 2025 pilot proves prevention pays fast—herds following the 90-day protocol cut milk losses by 30% and lameness cases by 20%, with the biggest gains happening before anyone sees a limp

For dairies looking to translate research into action, the University of Wisconsin’s 2025 Hoof Health Pilot condensed years of data into a working template. Participating herds reduced hoof treatments by 30–40 percent within six monthsand replacement rates by around 15 percent annually.

Here’s the quick version:

Weeks 1–4: Mobility‑score every cow; record one year of hoof treatments and case types. 
Weeks 5–8: Standardize footbath systems (change solution every 200 passes), move trimming to dry cow groups, flag any fresh cow losing > 0.5 BCS. 
Weeks 9–12: Re‑groove high‑traffic lanes if needed, fine‑tune stall design, and prioritize AI bulls in the top 25 percent for Net Merit and Feet & Legs Composite (≥ +2.0). 

As one Minnesota dairyman told me, “We didn’t need an extra hoof trimmer—we just needed a plan that matched our rhythm.”

Seeing Hoof Health for What It Really Is

I remember an Ontario producer who told me, “We used to fix feet because it was the right thing to do. Now we fix them because it pays.” That statement says it all.

Hoof health has always been about welfare, but it’s also about efficiency, longevity, and sustained performance. The research, the genetics, and the management practices all tell the same story: when cows move comfortably, everything—from butterfat yield to pregnancy rate—stabilizes or improves.

What’s encouraging is that none of these solutions requires a drastic change. They’re layered, attainable, and already validated by producers who are seeing results.

Because when cows walk soundly, the entire operation gains stride—and every step becomes a step toward profit.

Key Takeaways:

  • Profit leaves before the limp. Subclinical hoof pain steals milk and profits weeks before you notice.
  • Start prevention early. Shifting trims, rations, and foot care to the dry period pays back fast.
  • Comfort compounds. Small improvements in stalls, rubber, and cow flow can cut lameness by up to 40%.
  • Breed soundness in. Bulls with positive Feet & Legs and Productive Life scores create durable cows built for longevity.
  • Manage with intention. A clear 90-day plan of scoring, trimming, and tracking turns hoof health into herd stability and profit.

Complete references and supporting documentation are available upon request by contacting the editorial team at editor@thebullvine.com.

Learn More:

The Sunday Read Dairy Professionals Don’t Skip.

Every week, thousands of producers, breeders, and industry insiders open Bullvine Weekly for genetics insights, market shifts, and profit strategies they won’t find anywhere else. One email. Five minutes. Smarter decisions all week.
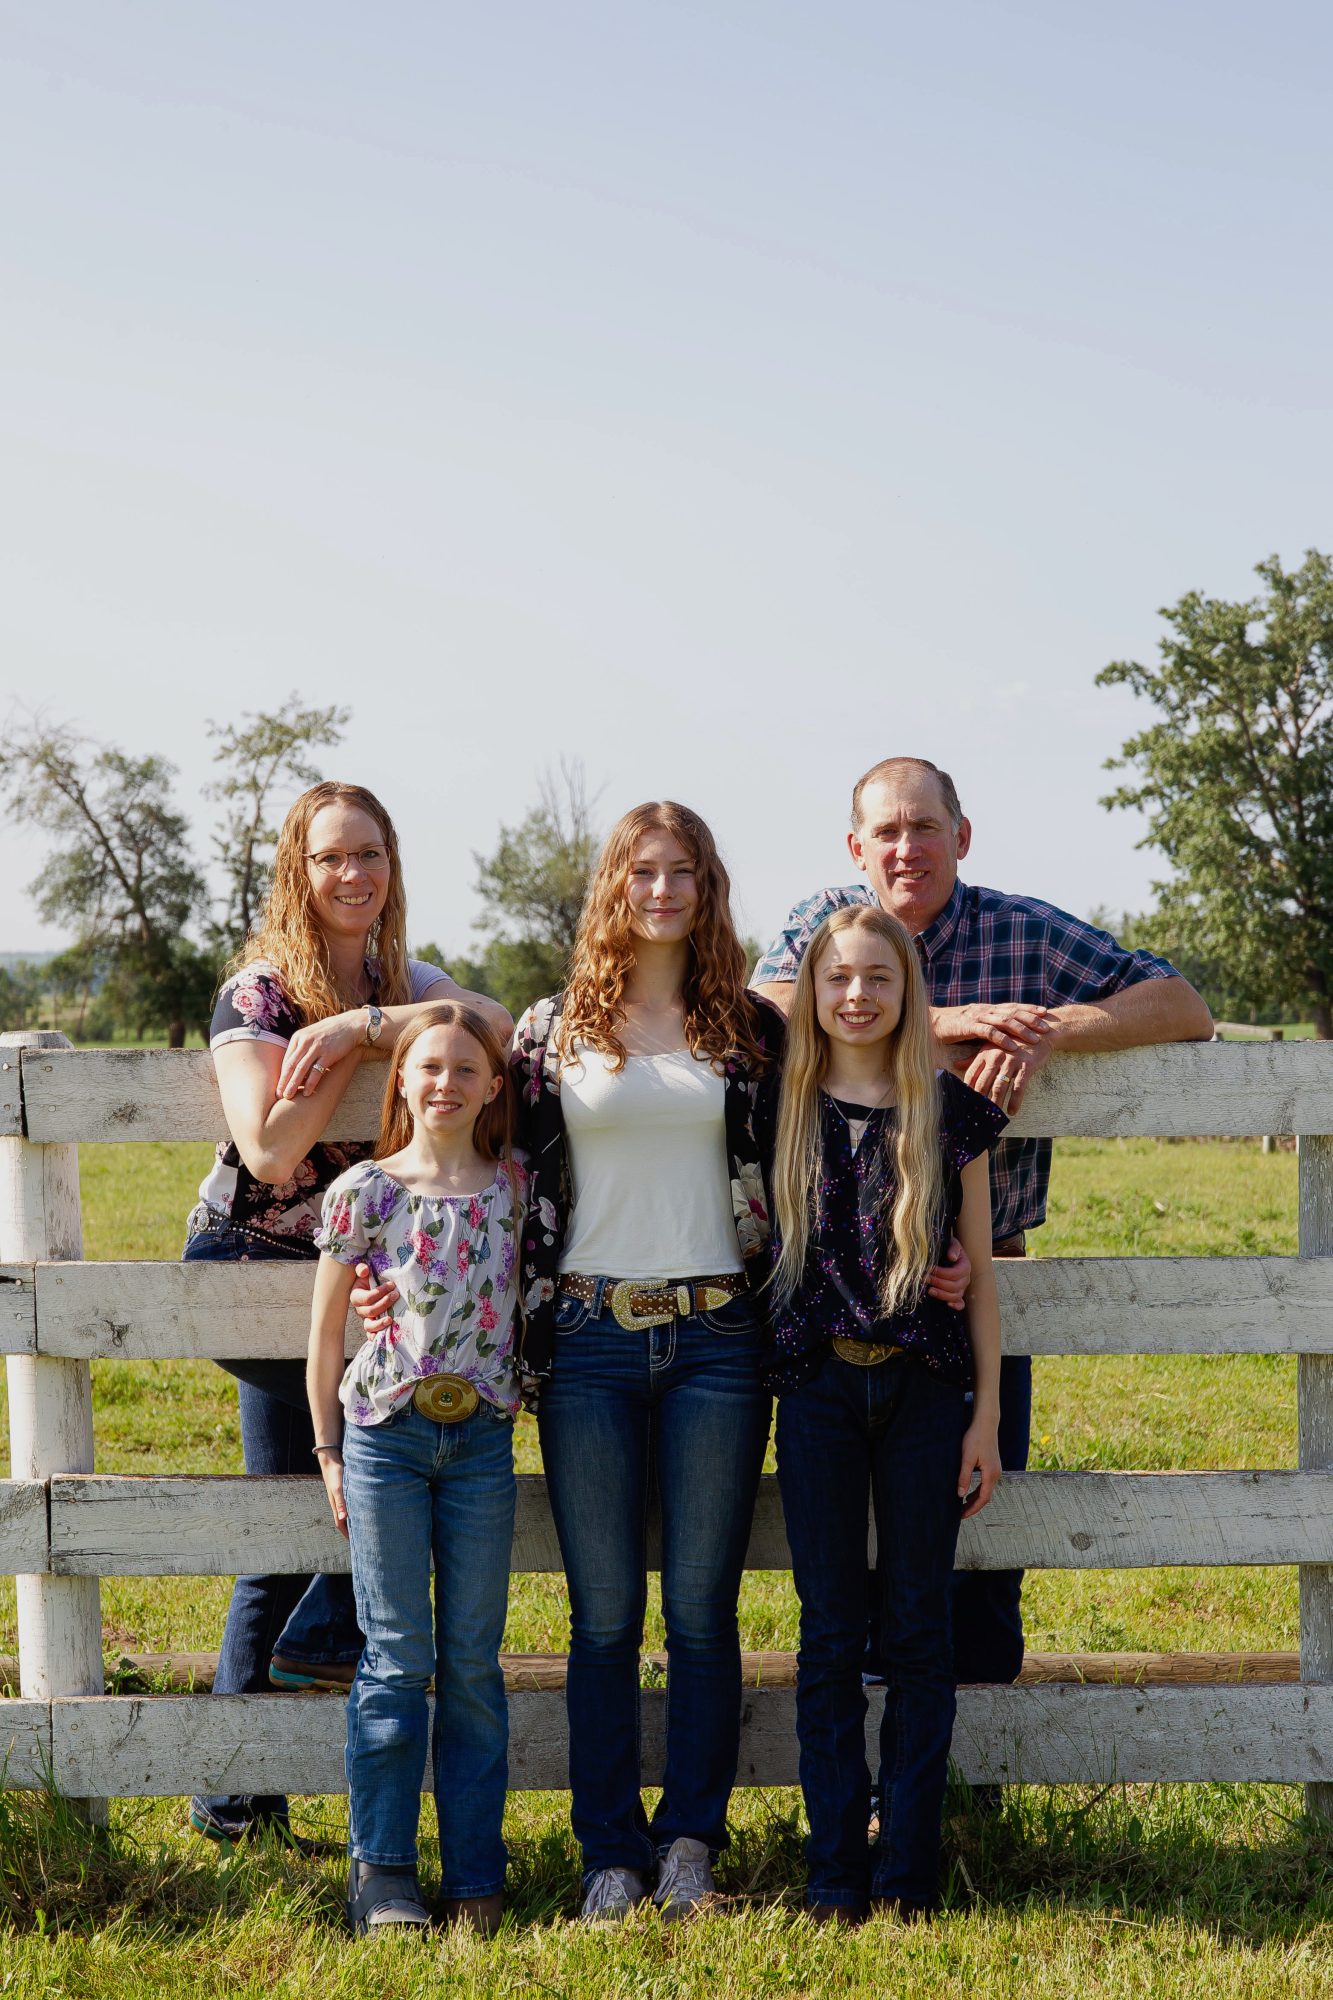
NewsSubscribe
First
Last
Consent

Rethinking Dairy Feed: Michigan Farmers Turn High Oleic Soybeans into High Butterfat Profits.

“We saw butterfat jump in three days.” How Michigan farmers and MSU science turned soybeans into dairy profits.

EXECUTIVE SUMMARY: A simple feed change in Michigan is making big waves across the U.S. dairy industry. At Preston Farms, feeding high oleic soybeans—developed with support from Michigan State University (MSU)—boosted butterfat from 4.4% to 4.8% in under a week, while replacing costly palm fats and protein meals with a locally grown crop. The shift, based on extensive research by Dr. Adam Lock, saved the farm hundreds of thousands in inputs and lifted overall profits to more than $1 million per year. Early adopters are proving that this innovation doesn’t just add points of fat—it builds feed independence and sustainability into dairy rations. And as universities and producers nationwide study the results, one thing is clear: sometimes the next big leap for dairy is just a smarter way to feed the cows.

High Oleic Dairy Feed

Sometimes the biggest dairy innovations don’t come from a lab or a boardroom—they start right in the feed bunk. That’s what’s happening at Preston Farms in Quincy, Michigan, where a simple change to the ration is improving butterfat performance, cutting feed costs, and rewriting the farm’s milk check.

Brian Preston didn’t set out to pioneer something revolutionary. But his decision to feed high-oleic soybeans, a crop once bred for frying oil rather than feed, has become one of the most quietly disruptive stories in dairying today.

From University Research to On-Farm Success

This breakthrough isn’t luck. It’s the product of years of research at Michigan State University (MSU) led by Dr. Adam Lock, Professor of Dairy Nutrition, whose focus has long been on how different fats affect rumen function and milk composition.

“We didn’t increase the fat level in the ration,” Lock explains. “We changed the kind of fat—and that changed everything.”

It’s Not Magic—It’s Biochemistry: Conventional soybeans trigger a biochemical cascade that blocks milk fat synthesis through trans-10 CLA formation. High oleic soybeans bypass the problem entirely—oleic acid moves straight through the rumen to the mammary gland. Same fat amount, completely different metabolic pathway.

Traditional soybeans are loaded with linoleic acid, a polyunsaturated fat known to interfere with rumen microbes and cause milk fat depression. High oleic soybeans, however, reverse that chemical balance. They contain 75–80% oleic acid and under 10% linoleic acid, according to USDA and Pioneer® data (2024). That single change stabilizes rumen fermentation and boosts acetate, an essential precursor to milk fat synthesis.

The Chemistry That Changes Everything: High oleic soybeans flip the fatty acid profile from 63% problematic linoleic acid to 75% beneficial oleic acid—a complete reversal that protects rumen function and boosts butterfat. This isn’t incremental improvement; it’s biochemical transformation.

The result? Cows can handle higher inclusion without the digestive disruption that once scared off nutritionists from pushing soy-based feeds too hard.

For Lock, the findings weren’t theoretical—they were replicated across multiple MSU feeding trials, later published in the Journal of Dairy Science (2023). And in Preston’s case, it worked exactly as the data suggested.

How Fast Did It Work? Try 72 Hours

In 2024, Preston planted 400 acres of Pioneer® Plenish® high oleic soybeans and began feeding them roasted—about 8 pounds per cow per day—in place of purchased soybean meal, canola meal, and expensive palm-based fats.

Within three days, milk tests came back with an unexpected jump: butterfat up from 4.4% to 4.8%, with milk protein slightly higher too.

Faster Than You Think: Butterfat jumped from 4.4% to 4.8% in just 72 hours—so fast Preston thought the lab made a mistake. The response stays consistent because oleic acid bypasses rumen hydrogenation. No lag time. No adaptation period. Just immediate biochemical efficiency.

“I honestly thought there was a lab error,” Preston laughs. “But it happened again the next week. The cows handled it so well, we kept it in full-time.”

Lock says that kind of immediate response makes sense because oleic acid bypasses much of the rumen’s hydrogenation process, entering the bloodstream faster as an energy source for milk synthesis. Cows use it directly—no lag time, no rumen stress.

That faster conversion means farms see the payoff quickly. As any producer knows, immediate improvements in component yield help confidence spread far faster than any spreadsheet could.

The Economics: Turning Fat into Feed Efficiency

When you quantify it, the economic implications are eye-opening.

Every 0.1 increase in butterfat adds roughly $0.20 per cwt when butterfat sells near $3.23/lb (USDA Agricultural Marketing Service, October 2025). Preston’s 0.4-point jump produced about $1 per cow per day, adding roughly $380,000 annually in butterfat premiums across his 1,000-cow herd.

Then came the ingredient savings.

Tack on feed savings—achieved by replacing high-cost supplements like palm-derived fats and purchased proteinswith roasted soybeans grown right on the farm—and the total improvement exceeded $1 million annually.

The Math That Matters: Preston Farms turned 400 acres of high oleic soybeans into over $1 million in annual gains—$380K from higher butterfat, $320K in feed cost savings, and $300K from improved efficiency. It’s rare to find a ration change that pays on both ends. This one does.

“It’s rare to find a single ration change that pays on both ends,” Preston says. “Usually you’re spending to gain production, or cutting cost and losing quality. This time, the cows—and the feed bill—both lined up.”

The Economics Work for Every Herd Size

Size Doesn’t Matter—Consistency Does: The economics scale perfectly from $36,500 for a 100-cow herd to $730,000 for 2,000 cows. Every single cow adds $365/year. No economies of scale required, no threshold to cross—just consistent, predictable, bankable per-head gains.

Why Michigan Is Ahead of the Curve

Michigan’s adoption of this feeding system stems largely from timing and teamwork.

Dr. Lock’s program at MSU, supported by the Michigan Alliance for Animal Agriculture (M-AAA), has spent over a decade translating lipid metabolism science into field-tested protocols. That partnership between the university and producer accelerated on-farm implementation and helped local nutritionists understand how to balance rations for these new soybeans.

“Michigan farmers had years of data before they took the plunge,” Lock says. “That’s what builds trust.”

In contrast, neighboring Wisconsin—the second-largest milk producer in the U.S.—has moved more cautiously. Nutritionists there often wait for validation from the University of Wisconsin-Madison Dairy Science Department, which is currently planning its first high oleic feeding trials for 2026.

It’s understandable. As Lock puts it, “Dairy nutritionists are trained to be risk-averse. When you’ve got millions of pounds of milk at stake, you confirm every feed trend before you move.”

The GMO Conversation: What Farmers Should Know

One of the first questions producers ask is whether the GMO status of these soybeans affects milk markets. The short answer: no.

Under the USDA’s National Bioengineered Food Disclosure Standard (2016), milk or meat from animals fed genetically modified feed is not considered genetically modified because the feed’s DNA does not transfer into milk or meat. After almost a decade of data, no studies—including those conducted by the FDA—have found detectable transference from feed to product.

For non-GMO or organic dairies, the alternative is the Soyleic® variety, developed at the University of Missouri, which achieves nearly identical oleic acid levels through conventional plant breeding. Those beans have done particularly well in identity-preserved markets, though they yield about 5–10% less per acre.

Long-term, both versions show strong potential for dairies seeking greater feed self-sufficiency.

How Many Farms Are Doing This?

METRICCURRENT STATUSOPPORTUNITY/NEEDEDTHE GAP
Dairy Cows on HOS Diet<1% (75,000 cows)20% (1.8M cows)1.725M cow opportunity
Nutritionists Recommending20% (160/800)80% for mass adoption480 nutritionists needed
Roasting Infrastructure~75 units1,500+ units1,425+ units required

Nationally, adoption remains low — about 70,000 to 80,000 cows on high oleic soybean diets, according to MSU Extension estimates (2025). That’s less than 1% of the total U.S. dairy herd.

The bottleneck isn’t supply — seed production can easily scale — but rather processing. On-farm roasting is still critical for unlocking feed value, and each roaster typically serves about 1,000 cows daily. Expanding adoption to even 20% of U.S. cows would require more than 1,500 new roasting units.

Some co-ops, especially across the Midwest, are exploring shared roasting programs in which individual farms deliver beans for contract processing.

There’s also a knowledge gap. Only about 20% of the nation’s 800 dairy nutritionists actively recommend high oleic soybean feeding programs (Great Lakes Dairy Nutrition Conference Survey, 2025). Many say they’re waiting for state-level replication trials before updating formulations.

It’s the same cycle seen with bypass proteins in the 1990s—slow at first, then exponential once the local data confirms early wins.

What Cows and Numbers Are Saying So Far

After a full year of feeding high-oleic soybeans, Preston’s herd metrics are stable. Milk yield remains consistent. Reproductive performance—often the first red flag for new fats—has held steady.

Lock’s ongoing work at MSU mirrors those findings, showing no significant difference in ketosis, displaced abomasum, or other metabolic measures compared with control groups. The focus now shifts to multi-year monitoring.

“We’re confident in the short-term biology,” Lock says. “Now it’s about proving sustainability year after year.”

For producers, that’s comforting. As most know, herd-level consistency decides whether an innovation stays or fades.

Practical Starting Points

For producers curious about testing the concept, the learning curve is short and management-friendly:

  • Start small: Try 50–100 acres and dedicate one group of cows for trial feeding.
  • Roast right: Keep roasting temps between 280–300°F for optimal protein availability.
  • Track diligently: Monitor butterfat, dry matter intake, and conception rates over multiple months.
  • Work closely with nutritionists: Fine-tune diets to prevent unbalanced fat inclusion.
  • Run the ROI: Compare component-based milk revenue with any feed cost shifts.

Early adopters like Preston insist on treating the transition as a management system, not a silver bullet. “We made sure every change was measurable,” he says. “Then we let the data drive whether we stayed with it.”

What’s Interesting About This Development

Three things stand out. First, it highlights how small biological improvements can have huge economic consequenceswhen component pricing drives profitability. Second, it reconnects modern dairying with something age-old: growing and processing one’s own feed to reduce dependency on volatile markets. And third, it demonstrates how collaboration between land-grant universities and farmers creates innovation grounded in real-world application, not lab theory.

“We’ve had feed additives come and go,” Preston says. “This one is different—it’s ours to grow, feed, and control.”

The Bottom Line

For all the advanced technology shaping the dairy world today, sometimes innovation looks as familiar as a roasted soybean.

High oleic feeding strategies may not transform the industry overnight, but evidence from Michigan’s early adopters shows real, sustained improvements in butterfat performance, feed efficiency, and economic stability. The concept works because it fits seamlessly into existing farm systems—it’s scalable, measurable, and backed by solid science.

If the next several years of data across Wisconsin, New York, and beyond confirm what MSU has already seen, this may very well be the next “quiet revolution” in feed efficiency.

As one producer joked after hearing Preston’s story: “The cows might be the best university research partners we’ve ever had.”

Key Takeaways

  • A quiet revolution in cow nutrition is underway: high oleic soybeans are raising butterfat and replacing expensive palm fats in dairy rations.
  • Preston Farms and MSU researchers demonstrated the impact—a 0.4-point increase in fat and more than $1 million in annual gains from feed efficiency and component premiums.
  • Dr. Adam Lock’s studies confirm that oleic-rich fats improve rumen stability and milk components more quickly than traditional rations.
  • Nationwide growth depends on expanding roasting infrastructure, education, and replicable regional trials.
  • For forward-thinking producers, this strategy offers a real-world, on-farm route to feed self-sufficiency, profitability, and sustainable dairy progress.

Complete references and supporting documentation are available upon request by contacting the editorial team at editor@thebullvine.com.

Learn More:

The Sunday Read Dairy Professionals Don’t Skip.

Every week, thousands of producers, breeders, and industry insiders open Bullvine Weekly for genetics insights, market shifts, and profit strategies they won’t find anywhere else. One email. Five minutes. Smarter decisions all week.

NewsSubscribe
First
Last
Consent

Lessons from Greece’s Phantom Herds: Why Trust and Data Now Decide Dairy’s Future

When Greece’s ghost herds stole €20 million, they left every dairy farmer a hard truth: trust without proof costs real money.

Executive Summary: When news broke that Greek fraudsters had stolen €20 million using “ghost herds,” it did more than rattle regulators—it struck a chord with real farmers everywhere. The case proved what every dairy producer already knows: trust only works when it’s backed by proof. This story digs into how Greece’s oversights mirror the challenges in North America’s milk pricing and subsidy systems, where paperwork often outpaces technology. What’s encouraging is that solutions already exist—digital traceability, satellite verification, and data‑driven audits built to protect honest operations. The takeaway? Verification isn’t red tape—it’s the foundation that keeps integrity, transparency, and producer trust alive in modern dairying.

Dairy Data Verification

Every dairy farmer knows that our industry runs on trust. That trust sits quietly beneath the bulk tanks, market reports, and cooperative books we rely on every day. So when investigators in Europe uncovered a major subsidy scandal built on phony paperwork and nonexistent herds, it stirred something familiar.

The case out of Greece wasn’t about complex cybercrime—it was about paperwork getting ahead of proof. And that, in its simplest form, is a cautionary tale with lessons we should pay attention to.

Inside Greece’s “Phantom Herds” Scandal

Greece’s ghost herd scandal shows what happens when paperwork outpaces proof—7 years of fraud, €20M stolen, and 324 phantom farmers. The lesson for North American dairy: trust needs verification, not just forms.

The European Public Prosecutor’s Office (EPPO) reported earlier this year that fraudulent applications for agricultural subsidies had been filed in the years leading up to 2025, totaling more than €20 million in false claims. The scheme was run through OPEKEPE, Greece’s administrative body for EU farm payments, and linked to 324 fake recipients who allegedly invented livestock herds and falsified land records.

The fraud ran long enough to trigger major repercussions. The European Commission fined Greece €400 million for “systemic verification failures,” forcing the country’s Ministry of Rural Development to overhaul its subsidy application checks.

The fallout landed hardest, as it always does, on the honest operators. Many of Greece’s legitimate family dairies—those milking goats and sheep for the country’s Protected Designation of Origin feta—now face extra audits, slower payments, and reputational damage through no fault of their own.

Why This Story Resonates Beyond Europe

What’s interesting here is that while the fraud happened half a world away, the vulnerabilities it exposed look awfully familiar. From milk pooling to subsidy checks, North American dairy runs on systems just as dependent on accurate data—and just as fragile when complexity outweighs clarity.

1. When Paperwork Outpaces Practice

DMC enrollment dropped 33% (from 23,485 to 15,686 farms) even as margins collapsed in 2023. The safety net is shrinking faster than the industry—when complexity confuses farmers, they skip protection and bet the farm.

The Dairy Margin Coverage (DMC) program has been a financial lifeline for U.S. producers facing unpredictable feed costs. But much of it still depends on paper applications and self‑verified production data.

The USDA Farm Service Agency (FSA) has made digital reporting available in recent years, yet data integration between programs remains limited. University of Wisconsin research calls it a “trust‑based compliance model” that functions well under normal conditions but leaves room for error when information isn’t seamlessly shared.

Let’s be clear—nobody’s suggesting this is fraud. It’s inefficiency. And inefficiency creates opportunity—for mistakes, for misreporting, or simply for confusion that puts unnecessary strain on both farmers and regulators.

2. When Complexity Creates Confusion

Take the Federal Milk Marketing Order (FMMO) system. It’s designed to bring fairness and balance to milk markets, but even many seasoned operators will tell you that tracking, pooling, and pricing doesn’t always feel transparent.

The 2018 Farm Bill’s Class I pricing formula change cost dairy farmers over $1 billion in pool losses. When complexity outweighs clarity, handlers exploit gaps—leaving honest producers holding the bag.

Milk handlers can legally “de‑pool” their milk—temporarily removing it from the pool to optimize returns—during certain market shifts. According to the USDA Economic Research Service (ERS), de‑pooling between 2021 and 2023 shifted hundreds of millions of dollars across federal orders.

While perfectly legal, this complexity creates an information gap where trust can erode—the same kind of vacuum that allowed outright fraud in the Greek system. When producers can’t fully trace value movement, suspicion grows, even in legitimate markets.

Transparency, plain and simple, is the antidote.

3. Accountability Builds Resilience: The Checkoff Example

Funding mechanisms like national checkoff programs show how transparency can turn obligation into trust. Producer dollars drive research, market development, and promotion—but oversight matters.

Farm Action audit review in 2024 revealed missing USDA validations across several non‑dairy commodity boards, sparking an industry‑wide conversation about governance standards. Dairy programs weren’t directly involved, but the timing was valuable: it reminded everyone that trust grows where visibility exists.

Producers don’t oppose accountability—they just want assurance that the dollars they contribute continue to build consumer trust, sustain exports, and innovate products for the next generation.

The Broader Picture: Consolidation and Oversight Pressure

Half of U.S. dairy farms have disappeared since 2013, yet mega-dairies (1,000+ cows) now control 70% of milk production. The consolidation half-life shrunk from 12 to 10 years—adapt or join the 4% annual closure rate.

The USDA National Agricultural Statistics Service (NASS) estimates that the U.S. now has about 24,800 licensed herds, down from nearly 49,000 in 2013. Canada’s supply‑managed system counts 9,800 active quota‑holding farmsunder the Dairy Farmers of Canada (DFC).

Smaller farms, particularly those milking under 250 cows, shoulder nearly the same compliance burden as 3,000‑cow operations but without full‑time administrative help. It’s no wonder producers often say that paperwork feels heavier than feed costs.

In Ontario, for example, DFC’s ProAction program integrates animal care, milk quality, and traceability standards under one unified verification system. While not perfect, it exemplifies how structured oversight with predictable audits can reduce anxiety rather than increase it. ProAction is proof that structured transparency works when it strengthens—not slows—good farms.

That’s the irony lost in Greece’s cautionary tale: good verification shouldn’t slow down honest farms—it should set them free to focus on milk quality, breeding, and butterfat performance instead of bureaucracy.

Small dairies (<50 cows) operate at $23.06/cwt while mega-farms (2,500+) run at $16.16/cwt. That $7 cost gap isn’t just economics—it’s an extinction event. Scale up or specialize, because the middle ground is quicksand.

Technology Is Catching Up

Across both continents, smarter verification is becoming the norm rather than the exception.

  • Digital traceability: European and North American cooperatives are piloting blockchain‑linked milk collection logs. Each load records location, timing, and solids data that can’t be altered—preventing both miscommunication and tampering.
  • Satellite audits: Agriculture and Agri‑Food Canada (AAFC) now uses satellite imagery to confirm environmental compliance, reducing site visits for farms with clean records.
  • Risk‑based oversight: USDA trials for targeted auditing focus on outlier data, lowering the frequency of reviews for consistently accurate producers.

The result? Stronger systems that reward accuracy instead of punishing transparency.

Farmers Taking the Lead

Producers themselves are proving that transparency works best when it starts from within.

Dairy Profit Teams in Wisconsin, Minnesota, and Michigan bring herds together to confidentially share cost and performance benchmarks. Meanwhile, sustainability benchmarking programs in British Columbia and Manitobaallow farms to compare nutrient efficiency and environmental metrics anonymously.

One producer from Manitoba summed it up perfectly: “Once you see objective numbers, you stop making assumptions about who’s ahead and who’s behind. We realized we were all fine—we just measured differently.”

That’s how farms thrive, not through secrecy but through collaboration supported by data.

The Bottom Line

Greece’s subsidy scandal didn’t happen because its farmers were dishonest—it happened because oversight systems lagged behind operational reality. In contrast, North American dairy has the chance to stay ahead by modernizing without losing what matters most: integrity.

Here’s what’s encouraging. Our farms already excel at measurement. From fresh‑cow management to feed conversion tracking, we live in data every day. The next step is ensuring that the data already being collected automatically backs the trust our industry deserves.

Because as Greece’s experience reminds us, trust without verification isn’t sustainable—and verification, when done right, doesn’t add work. It proves value.

In the end, the gap between compliance and corruption is only as wide as the space between trust and verification. Closing that gap isn’t just good governance—it’s how dairy protects its reputation, one verified record at a time.

Key Takeaways

  • Greece’s €20 million “ghost herd” scandal showed what happens when oversight trust outpaces proof—and real farmers pay the price.
  • Programs like DMC and milk pooling work best when transparency keeps pace with technology, not when paperwork piles up.
  • New tools—from blockchain milk traceability to AAFC satellite audits—are helping verify what good farms already do right.
  • Verification doesn’t add work; it protects yours. Solid data is today’s best defense against both fraud and doubt.
  • In the end, trust still drives dairy—but in 2025, trust needs evidence to stay strong.

Complete references and supporting documentation are available upon request by contacting the editorial team at editor@thebullvine.com.

Learn More

  • Unlocking Dairy Profitability: The Power of Financial Benchmarking – This guide provides a practical framework for financial benchmarking. It reveals how to use your farm’s own data to identify performance gaps, enhance profitability, and build the verifiable operational integrity discussed in the main article.
  • FMMO Reform: What’s Really on the Table for Dairy Producers? – This analysis breaks down the complex FMMO reform debate. It clarifies how proposed policy changes could directly impact your milk check, increase market transparency, and address the pricing confusion highlighted as a major industry vulnerability.
  • Beyond the Hype: Is Blockchain the Future of Dairy Traceability? – This piece moves past theory to explore blockchain’s real-world potential. It demonstrates how immutable digital ledgers can enhance supply chain traceability, guarantee product integrity, and provide the automated proof needed to prevent future fraud.

The Sunday Read Dairy Professionals Don’t Skip.

Every week, thousands of producers, breeders, and industry insiders open Bullvine Weekly for genetics insights, market shifts, and profit strategies they won’t find anywhere else. One email. Five minutes. Smarter decisions all week.

NewsSubscribe
First
Last
Consent

Trump’s Trade War: Your 9-Month Roadmap to Dairy Profitability

Trump kills Canada dairy trade. You have 9 months until USMCA review. 3 paths: Scale to 2,500 cows, diversify income, or exit with 95% value.

Executive Summary: Trump terminated Canada trade talks this week, but dairy’s real crisis started long before—we’ve lost 15,866 farms while exports hit record highs that never reached farmers’ bank accounts. With just 9 months until the USMCA review that could reshape North American dairy, producers face three proven paths: scale to 2,500+ cows with deep pockets and $260,000 working capital, build a 300-cow diversified operation where beef-on-dairy and renewable energy generate 60% of revenue, or exit strategically while you can still recover 85-95% of assets. The traditional 500-800 cow dairy is already extinct—those operations are burning $75,000 yearly just hoping things improve. Whether it’s through mega-scale efficiency, diversified resilience, or wealth preservation, the winners have one thing in common: they’re making their move now, not waiting for political rescue.

dairy farm profitability strategies

When President Trump terminated trade talks with Canada this week after Ontario’s Reagan ad escalated tensions, it wasn’t really a surprise to anyone paying attention. But for dairy farmers already dealing with razor-thin margins and export dependency, it was the wake-up call we probably needed.

You know how it is at co-op meetings lately. The conversations have really shifted. Instead of everyone comparing notes on new parlor expansions, folks are quietly discussing beef-on-dairy premiums and asking each other about working capital reserves. And yeah, there’s definitely a lot more kitchen table discussions happening about what this whole dairy farming thing actually means for the next generation.

What’s interesting is how Trump’s latest trade disruption—combined with the USMCA review looming and both sides taking increasingly hard positions on dairy—has become the moment when something we’ve all sensed for years finally became impossible to ignore. Here’s the thing though…this wasn’t really about any single political announcement, was it?

This was just when we had to face facts: the way we’ve been thinking about dairy growth for the last two decades? It’s not working anymore.

Farm bankruptcies surged 55% in 2024 and continued climbing into 2025, signaling the most severe financial crisis for American agriculture since the pre-pandemic peak. The dramatic upturn from the 2023 low of 139 filings exposes how quickly market conditions deteriorated once government support ended.

The Stark Reality in Numbers

The data’s pretty stark when you look at it. The 2022 USDA Agricultural Census shows we lost 15,866 dairy farmsbetween 2017 and 2022. That’s around 8.8% fewer farms every single year, and it’s actually picking up speed.

Federal bankruptcy court records through July show Chapter 12 farm bankruptcies are up 55% from last year. Think about that for a second.

Up in Canada—and you probably know this already—industry reports suggest they could lose half their remaining dairy farms by 2030. And that’s with supply management protecting incomes!

But here’s what I find really encouraging, honestly. While everyone’s focused on the political drama, something pretty remarkable is happening on actual farms. The smartest producers I talk to—and I bet you know a few like this—they aren’t waiting around for Washington or Ottawa to fix things. They’re completely rethinking their operations.

The Export Story We Need to Face

So here’s something we probably need to be honest about. When the U.S. Dairy Export Council reported dairy exports hit $4.72 billion through June—up 15% from last year—we all celebrated, right?

I mean, strong cheese and butterfat export performance, Mexico and Canada buying 44% of everything we ship overseas…sounds great on paper.

But here’s what most of us didn’t want to admit…

Remember that big export surge in July? Up 53% year-over-year according to USDEC? Well, most farms I know actually saw their margins shrink. As University of Minnesota economists have been pointing out—and this really gets me—we’re basically moving product at whatever price it takes to keep the volume flowing.

The gap between export growth and what actually shows up in the milk check? That’s not temporary anymore. It’s built into the system.

And the real kicker? We’ve built our whole growth strategy on markets we can’t control. Mexico’s trade ministry has threatened tariffs three times since February. Canada literally passed Bill C-202 in June making dairy concessions legally impossible. China’s domestic oversupply situation has cut their imports 12% according to Rabobank’s September report.

With the USMCA six-year review coming July 1, 2026—that’s just 9 months away, folks—this whole export dependency thing is about to get really tested.

What Expansion Really Costs

You want to know what really gets me about expansion economics? It’s not the numbers you see in the business plan—it’s everything else that happens underneath.

Recent university expansion modeling studies show that your typical 250-to-500 cow expansion? We’re talking $5 million, give or take.

The equipment companies get $800,000 to $1.2 million right off the bat. Construction crews take another $600,000 to $900,000. Genetics companies collect their $400,000 to $600,000.

And your lender? Farm Credit Services analysis shows they’ll make roughly $1.5 million in interest over a typical 15-year term at current rates.

So before you’ve even milked one extra cow—think about this—the supply chain’s already captured $3.6 to $4.6 million. Meanwhile, if everything goes perfectly—and when does that ever happen in dairy?—Wisconsin Extension’s financial analysis suggests you might clear $3.6 million over 10 years. That’s about 3.7% annually on your equity.

The rest of the industry captured three times what you did, and they didn’t take any of the operational risk. As Corey Geiger, economist over at CoBank, mentioned in their October outlook, after almost a decade of butterfat driving milk checks, protein’s taking over as the primary value driver. And I’ll be honest, a lot of farms haven’t adjusted their feeding programs for that shift yet.

Before you’ve milked a single extra cow from that $5 million expansion, the supply chain has already captured $3.75 million—equipment dealers, contractors, genetics companies, and your lender. Meanwhile, if everything goes perfectly for a decade, you might net $3.6 million at a 3.7% annual return… while carrying 100% of the operational risk. No wonder University Extension analysts are warning farmers: the math hasn’t worked for years.

Three Ways Forward That Actually Work

The diversified 300-cow model spreads risk across six revenue streams, insulating farms from milk price volatility that’s killing traditional operations. With 55% of income from non-milk sources including beef-on-dairy premiums and renewable energy, these farms saw only 8-9% revenue drops during severe milk price crashes—versus catastrophic losses for single-stream dairies burning $75,000 annually.

Building Something Different

What’s really fascinating—and I’ve been watching this closely—is how these smaller operations with 200 to 400 cows are completely reimagining what a dairy farm can be. I’ve been looking at several Wisconsin operations that are really opening eyes.

Consider what a typical 300-cow operation in the Midwest is doing now. They’re deliberately capping herd size. Not because they can’t handle more, but because that’s the sweet spot where family labor plus two employees can run things efficiently. No dependency on visa workers or…well, you know how hard it is to find reliable help these days.

Here’s how the revenue typically breaks down on these diversified operations—this comes from Wisconsin Extension’s 2025 farm financial modeling:

  • Milk to the co-op: around 40-45% of revenue
  • Beef-on-dairy programs: 15-20%
  • Renewable energy (digesters, solar): 10-15%
  • Agritourism or direct sales: 5-10%
  • Custom services for neighbors: 5-10%
  • High-value genetics or embryos: 5-10%

When milk prices have dropped significantly—which has happened multiple times in recent years according to USDA pricing data—their total revenue only falls about 8-9%. Yeah, it hurts. But it doesn’t kill them.

Now, managing all those different income streams? That’s the challenge, honestly. As one producer told me at World Dairy Expo, “Some days I feel more like a business manager than a dairy farmer.” Learning renewable energy contracts alone can take months. But here’s the thing—that complexity gives them options their single-stream neighbors don’t have.

What I’ve noticed is many of these operations are running crossbred cows—Holstein-Jersey or three-way crosses with Swedish Red or Norwegian Red genetics. The cows average about 1,250 pounds instead of the big 1,450-pound Holsteins. Lower production per cow, sure—maybe 22,000 pounds annually versus 26,000.

But—and this is what’s interesting—University of Wisconsin research shows they’re seeing 15% better feed efficiency, $700 less per replacement based on current heifer prices, and the cows last almost five lactations instead of the 2.9 lactation national average USDA reports. The lifetime daily production actually beats the bigger cows. Go figure.

Going Really Big

Now if you’ve got deep pockets and nerves of steel, there’s another way. The 2022 USDA Census shows farms with 2,500+ cows grew from 714 to 834 operations between 2017 and 2022. They’re producing 46% of America’s milknow.

These mega-dairies—and I’ve talked to several managers recently—are running on completely different economics. They typically need debt-to-asset ratios below 40% according to what lenders are telling them. Working capital needs to be at least 15% of gross revenue.

They ship to multiple processors—you never want all your eggs in one basket, right? And you need geographic advantages for growing feed that not everyone has, especially in the Northeast.

Most important though? You need serious fortitude. When margins compress severely—which has happened multiple times in recent years according to USDA price reports—these operations are carrying $150,000 to $200,000 in monthly fixed costs regardless.

As one large-herd manager in California told me, “Scale works, but only if you can survive the valleys. We’ve restructured debt twice since 2019.”

Down in Florida, it’s even tougher. Heat stress management alone adds 15-20% to operating costs compared to northern states. But those operations are capturing fluid milk premiums that make it work—sometimes. Out in Idaho and the Mountain West, water rights are becoming the limiting factor. You can have all the cows you want, but if you can’t irrigate feed…well, you get the picture.

The Strategic Move: Preserving Equity and Wealth

This is tough to say, but for maybe 20-30% of producers, the smartest financial move might be protecting the wealth they’ve already built while they still can do it on their terms.

Paul Mitchell, an economist from Wisconsin Extension, published an analysis in January that really drives this home. If you’re losing $75,000 a year after family living expenses—and Farm Business Farm Management data suggests that describes a lot of 500-cow operations right now—you’re burning through $375,000 in retirement wealth over five years just hoping things improve.

The USMCA review hits July 2026—just 9 months away. If you’re losing $75,000 annually (typical for 500-cow operations per Farm Business data), you’ll burn through $56,000 before that trade negotiation even starts. Wait five years hoping for political rescue? You’ve incinerated $375,000 in retirement wealth. Exit now with $1.5M in equity, invest conservatively at 4%, and you’re generating $60,000 annually for life—without the stress, without the risk.

Think about this: Exit now with $1.5 million in equity, invest it conservatively at 4%—which is what most financial advisors are suggesting these days—and you’re looking at $60,000 in annual income. Wait five years? That drops to $45,000. That’s $15,000 less every year for the rest of your life.

And here’s the real kicker from Farm Credit Services of America data: farms that exit voluntarily recover 85-95% of their asset value. Forced liquidations through bankruptcy? You’re lucky to get 50-65% according to Chapter 12 trustee reports. On a $2.5 million operation, that’s a $750,000 difference.

I know producers who’ve made this strategic choice recently to preserve their retirement wealth. They’re 58, 59 years old, still healthy, and they’ve got their equity protected. Meanwhile—and this is hard to watch—their neighbors who are trying to tough it out have watched equity evaporate as milk prices stayed below production costs.

FactorMega-Scale (2,500+ Cows)Diversified (300 Cows)Traditional (500-800 Cows)Strategic Exit
Herd Size2,500+ head300 head500-800 headSold/leased
Working Capital Required$260,000 (15% of revenue)$100,000$150,000$1.5M preserved equity
Annual Financial Performance+$50,000 net income+$30,000 net income-$75,000 annual loss$60,000 annual (4% return)
Milk Revenue %95%42.5%90%0%
Non-Milk Revenue %5%57.5%10%100% (investment income)
Risk LevelHigh debt, high volume riskModerate, spread across streamsCritical – burning equityVery low
Key AdvantageEconomies of scale, processor leverageIncome resilience, 8-9% revenue drop in crashesNone remainingWealth preserved, stress eliminated
Major Disadvantage$150K-$200K monthly fixed costsComplex management, 6+ revenue streamsSingle income stream, no buffersLeaving the industry, emotional cost
Survival ProbabilityHigh (if capitalized)HighLow – Already extinctWealth Protected
Best ForDeep pockets, Western geographyFamily operations, adaptable managersNobody – this model is deadAges 55-62, declining profit farms

What Smart Producers Are Doing Right Now

Building a Real Safety Net

The farms that’ll make it through what’s coming—and I really believe this—have at least 20% of gross revenue as working capital. That’s what both Farm Credit Services and CoBank are recommending now.

For a typical 250-cow dairy bringing in $1.3 million, that means $260,000 in cash or credit you can access quickly.

Sounds like a lot, I know. But when processors delay payments—which has happened with several co-ops in recent months—you need substantial liquidity just to keep buying feed and paying people. Without that cushion, feed suppliers put you on cash-only terms fast. And then…well, you’re in real trouble.

Making the Most of Beef-on-Dairy

According to recent market reports, beef-cross dairy calves are bringing strong premiums at auction barns everywhere from California to Pennsylvania. That’s up significantly from just a few years ago. Pretty incredible, right?

Smart producers are breeding 35-40% of their cows to beef bulls—mostly Angus or Simmental genetics from the major AI companies. On a 250-cow dairy, breeding 44 cows to beef can add substantial annual revenue based on current premiums. That’s becoming 6-9% of total farm income for folks doing it right.

Even when premiums normalize to more sustainable levels in the coming years, you’re still way ahead of straight Holstein bull calves.

Beef-on-dairy calf prices exploded 115% from 2022 to 2025, hitting $1,400 per head as U.S. beef herds dropped to 64-year lows. Smart producers breeding 40% of their 300-cow herds to beef bulls are banking $21,000 annually—6-9% of total farm income. But here’s the catch: heifer replacement costs jumped 43% to $2,850 in the same period. Wisconsin operations now face a strategic dilemma: cash in on record calf prices or maintain herd genetics for the long game?

The catch? Documentation matters. Major packers are telling producers they need complete records—genetics, health protocols, everything. Can’t pay premiums without proper paperwork for their retail customers who are demanding traceability. You probably already know this, but it’s worth emphasizing.

Getting Paid for Components

With $11 billion in new processing capacity coming online through 2028 according to International Dairy Foods Association reports, processors really need consistent, high-component milk.

Several major yogurt and cheese plants in the Northeast are paying 50 cents to $1.50 per hundredweight extra for milk that’s consistently above 3.25% protein with minimal daily variation.

What surprised me when talking to procurement managers is what they really value. They’d rather have steady 3.15% protein than variable 3.25%. Their production lines need consistency more than peak levels—they can standardize up, but variation causes real problems in their processes.

Regional differences matter too. Texas and Southwest processors are more focused on butterfat consistency for ice cream production, while Upper Midwest cheese plants prioritize protein levels. But the principle’s the same everywhere—consistency pays.

On 6 million pounds annually from a 250-cow herd, a dollar premium means $60,000 more per year. That’s real money for managing what you’re already producing.

The Mindset That Makes the Difference

You know what really separates the farms that’ll make it from those that won’t? It’s what researchers at Purdue’s Center for Commercial Agriculture call “strategic clarity”—recognizing that staying in dairy when the math doesn’t work isn’t being tough or noble. It’s just expensive.

Look, everyone in the industry—your co-op field rep, banker, equipment dealer, nutritionist—they all benefit when you keep going. They make money when you borrow, produce, expand, buy inputs. They even make money at the liquidation auction if things go south. That’s not being cynical, it’s just…well, it’s how the system works.

What they don’t make money on? You deciding your wealth might grow faster outside dairy than in it. And that’s fine—it’s not their call to make. It’s yours.

What’s Coming in 2026

The USMCA six-year review starts July 1, 2026. Canada’s Parliament already passed Bill C-202 blocking dairy concessions. Mexico’s Economy Secretary has threatened retaliation multiple times this year. The export markets that looked rock-solid when Class III milk was $25 per hundredweight in 2022? Not so much anymore.

The producers who’ll do well aren’t waiting to see how this plays out. Whether it’s building multiple revenue streams like those diversified Wisconsin operations, scaling up like the Western mega-dairies, or preserving wealth through a strategic exit—the window for making these decisions on your terms is getting pretty narrow.

What I’m seeing from coast to coast—and the data backs this up—is that middle ground of 500-800 cow dairies that were supposed to be the sweet spot? That’s disappearing fast.

CoBank and Rabobank projections suggest by 2030 we’ll have huge operations milking thousands and smaller diversified farms milking a few hundred. The traditional 600-cow family dairy as we’ve known it? That model’s already becoming history.

The Choice That Matters

When you look at everything happening—Trump’s trade disruptions, farms disappearing at nearly 9% per year according to USDA data, the complete restructuring of global dairy markets that OECD-FAO documented in their 2025 Agricultural Outlook—there’s really just one question: Are you building something that can handle what’s coming, or hoping things go back to how they were?

Because hoping things get better…well, that isn’t a business strategy. It’s just an expensive way to put off hard decisions.

The producers who thrive through 2030 won’t necessarily be the ones still milking cows. Some will build these amazing multi-revenue operations generating income from six or seven different streams. Others will scale up to where the economies actually work at 3,000+ head. And yes, some will strategically preserve their wealth, keeping what they’ve built instead of watching it disappear over the next few years.

Trump terminating those trade talks this week? That didn’t cause dairy’s problems. But it sure made them impossible to ignore anymore.

For producers willing to look past the political drama and see what’s really happening, this moment of clarity—uncomfortable as it might be—gives you the chance to make good decisions while you still have meaningful options.

You’ve got 9 months until that USMCA review hits. The question isn’t whether things are going to change—Trump’s already shown us they are.

The question is whether you’ll be ready when July 2026 rolls around.

Key Takeaways:

  • You have 9 months to choose your path: Scale to 2,500+ cows with $260K working capital, diversify at 300 cows with 60% non-milk revenue, or exit strategically preserving 85-95% of assets (versus 50-65% in forced liquidation)
  • Today’s revenue opportunities can fund tomorrow’s transition: Breeding 40% beef-on-dairy adds $16-21K annually, component premiums add $60K—money you need for strategic positioning
  • The expansion math finally exposed: On a $5M expansion, supply chain partners capture $3.6-4.6M upfront while you might clear $3.6M over 10 years—just 3.7% annual return on your risk
  • Traditional 500-800 cow dairies are the walking dead: Losing $75K yearly after living expenses, they’re burning $375K in retirement wealth every 5 years hoping for rescue that won’t come
  • Trump’s trade disruption is your decision catalyst: This isn’t about weathering political storms—it’s about building an operation that profits regardless of who’s in office or what borders are open

Complete references and supporting documentation are available upon request by contacting the editorial team at editor@thebullvine.com.

Learn More:

The Sunday Read Dairy Professionals Don’t Skip.

Every week, thousands of producers, breeders, and industry insiders open Bullvine Weekly for genetics insights, market shifts, and profit strategies they won’t find anywhere else. One email. Five minutes. Smarter decisions all week.

NewsSubscribe
First
Last
Consent

The $100 Per Cow You Never See: How Foreign Subsidies Are Reshaping American Dairy

Three dairy farms close every day while Europe pays their farmers to compete against you.

You know that frustration when milk prices just don’t reflect the work you’re putting in? I was talking with a Wisconsin dairyman last week who nailed it: “I can handle weather variability and market cycles—we’ve done that for generations. What’s harder to navigate is when other governments are actively supporting our competitors.”

Here’s what’s interesting—this concern is popping up everywhere I go. Cornell’s dairy economist, Andrew Novakovic, ran some modeling earlier this year that suggests foreign subsidies might be extracting approximately $90 to $100 per cow annually from your operations through price suppression.

Now, for a typical 500-cow dairy? We’re talking about $45,000 to $50,000 in potential revenue that just…vanishes. Never shows up in the milk check.

What I’ve noticed is this pattern holds whether you’re running 200 cows on pasture in Vermont or milking 2,500 head in a New Mexico dry lot. The dynamics stay remarkably consistent.

Understanding What You’re Up Against

The global dairy market has undergone significant changes, and it’s worth taking a moment to understand how other governments are influencing the playing field.

The European Union has an intervention purchasing system—they actually buy up butter and skim milk powder when prices drop, holding them at levels above where the market would naturally clear. Their own Court of Auditors looked at this back in 2021 and basically said, “Hey, this is causing market distortions.” They even referred to it as “destabilizing.”

European Commission intervention stocks directly suppress US milk prices—when EU stockpiles peaked at 380,000 MT in 2016, American producers lost $0.80/cwt, costing the industry an estimated $2.2 billion in farm income over two years.

But here’s the thing—it continues anyway. Mark Stephenson, over at Wisconsin’s dairy policy program, figures that these interventions might be costing U.S. dairy hundreds of millions of dollars annually in lost competitiveness.

Then you have China doing something different, but equally challenging. They’re offering VAT rebates to processors in special economic zones—we’re talking 8 to 13 percent back on dairy exports, specifically through their State Council Directive 2024-15, which expanded these zones. So, when a buyer in Nigeria or Saudi Arabia is comparing bids? That Chinese supplier has an automatic advantage that has nothing to do with efficiency.

I was chatting with an Idaho producer who runs a pretty sophisticated operation—robotics, precision feeding, the whole nine yards. He said something that stuck with me: “We can match anybody on production metrics. But when their government picks up 8-13% of the tab? That’s a whole different ballgame.”

When Theory Meets Reality: What Happened in Michigan

You want to see how this plays out in real life? Look at what Michigan dairy cooperatives documented in their recent annual report. They lost significant contracts to European suppliers when Algerian buyers shifted their sourcing.

Here’s why: Under the EU-Algeria trade agreement, European dairy products enter the market duty-free. Meanwhile, U.S. exports? We’re looking at tariffs of 25% or more.

Based on typical market pricing with these tariff differences, European suppliers can deliver powder at prices we literally can’t match—not because they’re better, but because the trade structure gives them that advantage.

And when co-ops lose those export contracts, the impact is immediate. Phil Durst, who does dairy education for Michigan State Extension, has been tracking this. Milk prices can drop more than a dollar per hundredweight. Producers start culling—often 10-15% of the herd goes. Processing plants start wondering if they can stay open.

A third-generation Michigan producer told me recently, “Our somatic cell count runs under 150,000 consistently. Components are excellent. We’ve got reproduction dialed in. But being good at your job has limits when the playing field’s this tilted.”

Breaking Down What This Means for Your Operation

Let’s talk real numbers here. A price suppression of $0.35 to $0.40 per hundredweight might not sound like much at first…

The hidden subsidy impact ranges from $17,000-$19,000 for a 200-cow dairy to $212,000-$237,000 for a 2,500-cow operation—money that never appears in your milk check but represents 25-50% of typical operating margins

But think about it this way. Your average cow produces around 240 hundredweight annually—that’s pretty standard, based on the USDA’s latest numbers. Multiply that potential price impact out, and you’re looking at $85 to $95 per cow that could be missing.

Scale it up to your operation:

  • Running 200 cows? That’s potentially $17,000 to $19,000 annually
  • Got 500 cows? We’re talking $42,500 to $47,500
  • Thousand-cow operation? Could be $85,000 to $95,000
  • One of those 2,500-cow facilities? They might be missing $212,000 to $237,000

What really gets me is when you consider that most operations—according to USDA’s economic research—are running margins of maybe $200 to $400 per cow in good years. So, what’s the potential $90-100 impact? That’s 25 to nearly 50 percent of your profit margin. Gone.

How This Changes Investment Decisions

This entire dynamic completely shifts how you view capital investments.

I was working with a California producer near Tulare recently—she has 3,200 cows, a really sharp operator. She ran the numbers on a robotic milking system under different price scenarios, and what she found was eye-opening.

“We did sensitivity analysis on three different parlor upgrade options,” she explained. “The difference between current pricing and what we’d see with even partial relief from these subsidies changed our internal rate of return by nearly 40 percent. That’s literally the difference between our lender saying yes or no.”

At current subsidy-suppressed prices, critical investments like environmental compliance show negative returns and facility upgrades don’t meet lending thresholds—but even partial price recovery (+$0.20/cwt) makes most investments viable, explaining why your banker needs to see the full competitive picture.

Think about that. Agricultural lenders base everything on debt service coverage ratios tied to your operating margins. For a 500-cow operation, if you’re missing $45,000 annually due to price suppression, that could mean $200,000 less borrowing capacity.

That’s your parlor upgrade. That’s your environmental improvements. That’s the difference between modernizing or watching things slowly fall apart.

And succession planning? Boy, that’s where it really hits home. Iowa State Extension keeps data on this, and there’s a clear correlation—when margins look thin, the next generation looks elsewhere.

I know several Vermont families right now where kids with ag degrees are wondering if it makes sense to take on the farm debt or just go work for Land O’Lakes corporate. Can’t say I blame them for thinking it through.

Where We’re Headed: The Long View

Looking at the bigger picture, USDA data shows we’ve gone from over 70,000 dairy farms in 2003 to about 26,500 today.

U.S. dairy farms have collapsed from over 70,000 in 2003 to 24,810 today, with projections showing a potential decline to just 17,000 operations by 2035—that’s three farms closing every single day

Marin Bozic, who does dairy economics at the University of Minnesota, presented some modeling at the industry meetings last year. He projects that we could drop to somewhere between 17,000 and 20,000 operations by 2035. That’s another quarter to a third gone.

What’s really interesting is how this plays out regionally:

  • Traditional dairy states in the Northeast? Could see losses over 50-60 percent
  • The Upper Midwest might drop 40-55 percent
  • But certain Western and Southern states keep growing

Here’s what’s happening—at really large scale, say 3,000-plus cows, you can sometimes absorb these competitive disadvantages through sheer volume and efficiency.

But those mid-scale operations, the 300 to 1,000 cow dairies? They’re in a tough spot.

The consolidation pattern is stark: operations under 1,000 cows are exiting at rates of 5.5% to 12% annually, while farms with 1,000+ cows are actually growing at 2%—demonstrating the brutal economics of mid-scale dairy farming in a subsidized global market.

Bozic figures that these trade-related factors might accelerate consolidation by 15-25 percent beyond natural market evolution. Some consolidation makes sense—technology improves, efficiencies develop. But acceleration driven by trade distortions? That’s a different conversation.

You know what’s interesting? When apple producers faced similar subsidy competition from China a few years ago, they documented the situation, presented the economic harm, and had Section 301 tariffs implemented. Within two years, U.S. apple exports to key Asian markets recovered by nearly 30 percent. There may be lessons to be learned from dairy.

Three Ways Producers Are Responding

What I’ve found talking with producers around the country is that folks are generally taking one of three approaches—and here’s the key thing, these aren’t mutually exclusive. Plenty of operations are combining strategies.

Making the Scale Decision

If you’re between 500 and 1,000 cows right now, you’re facing some tough choices.

Several Wisconsin producers I know are crunching the numbers on borrowing to acquire 1,500-plus cows. They’re basically betting scale can overcome the subsidy disadvantage.

Others are choosing to exit while they’ve still got equity. One Pennsylvania dairyman put it to me this way: “I can get $1,500 per head in an orderly sale today. Wait three years if margins stay compressed? Maybe it’s $800 in a fire sale. That’s $350,000 difference on 500 cows.”

Finding Premium Markets

Some operations are successfully capturing premiums—organic, A2/A2, grass-fed—that help offset these competitive challenges.

A Vermont producer who went organic shared his experience: “Took 18 months of disrupted cash flow during transition. About $280,000 in market development over three years. We’re capped at 400 cows because of pasture requirements. Works for us—we’re close to Boston. But it’s not for everyone.”

USDA’s marketing service data suggests that maybe 10-15 percent of operations have the right location and resources to make premium strategies work.

Interestingly, some of these individuals are also among the loudest voices in advocacy, using their privileged position to highlight how conventional dairy faces unfair competition.

Getting Organized and Speaking Up

Groups are becoming more savvy about documenting their impacts and communicating with policymakers using real data.

The Wisconsin Dairy Business Association compiled member data showing over $45 million in annual trade-related losses across their membership. Their executive director told me, “Generic complaints don’t move policy. But when you show up with spreadsheets documenting specific economic harm? That gets attention.”

Many operations pursuing scale or premiums are also participating in these advocacy efforts. They recognize that addressing structural disadvantages benefits everyone, regardless of the strategy.

Here’s an encouraging example: A group of Michigan producers recently met with their congressional delegation, armed with specific documentation of lost contracts and price impacts. Within three months, they had both senators co-sponsoring legislation to examine dairy trade enforcement. It’s not a solution yet, but it’s a movement.

What Recovery Might Look Like

If we achieve policy adjustments similar to those in other agricultural sectors, recovery probably wouldn’t happen overnight.

The modeling from Texas A&M’s policy center suggests that we might see initial improvements within 12-18 months, with more comprehensive adjustments over 2-3 years. For that 500-cow operation we keep talking about? Even a partial improvement could mean tens of thousands of dollars in additional revenue.

Various analyses suggest addressing these imbalances might help preserve several thousand dairy operations through 2035. Won’t stop all consolidation—technology and efficiency gains are real. But it might slow things down to a more natural pace.

Practical Considerations for Your Operation

After all these conversations with producers and lenders, here’s what seems to be working:

When you’re evaluating break-even, run scenarios both ways—current conditions and with potential trade improvements. If you’re struggling now but would be profitable with modest price improvements, maybe the problem isn’t your operation.

Document everything for your lender. Several Farm Credit personnel have informed me that they’re more flexible with covenants when producers can demonstrate that market distortions, rather than management problems, are driving the pressure.

For investments, model three scenarios:

  • Keep going as is (baseline)
  • Partial improvement ($0.20/cwt better)
  • More normalized pricing ($0.40/cwt improvement)

Focus on investments that work in at least two scenarios. Gives you flexibility.

And on the advocacy side? Specifics matter. Document your impacts, work with neighbors to aggregate data. Ten farms speaking together carry more weight than ten separate complaints.

The Bigger Picture

What strikes me most about all this is how subtle it is. The normal fluctuations in milk prices often mask these impacts. Easy to overlook if you’re not paying attention.

We get our milk checks, maybe grumble about prices, and get back to work. Meanwhile, these complex trade structures may be systematically affecting everyone of us.

The co-ops losing export contracts, generational farms closing, kids choosing other careers—maybe this isn’t just efficiency sorting things out. Maybe it’s what happens when trade structures tilt the playing field.

An old-timer in Wisconsin—fourth generation, been milking since the ’70s—said something that really resonated: “I’ve managed through weather, disease, market cycles for four decades. That’s dairy farming. But competing against foreign treasuries? That’s not something you fix by working harder.”

Understanding this concept changes how you view everything—investments, debt, succession, and daily decisions. We probably need both operational improvements and engagement on trade policy. Neither alone seems sufficient.

Current projections suggest we might drop to 17,000-20,000 dairy farms by 2035. With more balanced trade conditions? Maybe we keep a few thousand more. Those farms aren’t just businesses—they’re the difference between rural communities thriving or hollowing out.

These aren’t abstract policy debates. This is about whether you can justify that parlor upgrade, whether your kids see opportunity in dairy, and whether your town keeps its feed mill.

How we respond—through strategic planning, working together on advocacy, or just adapting to what is—will shape not just individual farms, but American dairy for the next generation.

Understanding what we’re up against, challenging as it may be, might be the first step toward taking action. Because at the end of the day, we’re all trying to produce quality milk, support our families, and keep viable operations going. Recognizing the full competitive landscape enables us to make more informed decisions about the path forward.

KEY TAKEAWAYS 

  • Your missing revenue: Foreign subsidies suppress milk prices by $90-100/cow annually—that’s $46,000 for a 500-cow dairy that never reaches your milk check
  • Capital access crisis: This hidden loss reduces borrowing capacity by $200,000+, explaining why your banker says no to viable improvements
  • Three strategic paths: Operations are successfully (1) scaling past 1,500 cows for efficiency, (2) capturing premium markets, or (3) documenting losses for collective policy action
  • Smart investment framework: Model every decision using three scenarios—current prices, partial recovery (+$0.20/cwt), and normalized pricing (+$0.40/cwt)
  • The opportunity: Documented advocacy is working—apple producers secured relief in 2019, and Michigan dairy has senators engaged. Your specific data matters.

Complete references and supporting documentation are available upon request by contacting the editorial team at editor@thebullvine.com.

Learn More:

  • The Dairy Producer’s Guide to Navigating High Input Costs – While the main article explains lost revenue, this guide provides tactical strategies to protect your margins from the other side. It reveals proven methods for reducing feed, labor, and energy expenses to build operational resilience against price suppression.
  • Navigating the Tides: A Deep Dive into the 2024-2025 Dairy Market Outlook – To make informed strategic decisions, you need the full picture. This analysis expands on the main article’s trade focus, breaking down all key global and domestic market drivers, from consumer demand to supply-side trends, impacting your milk check.
  • Unlocking Efficiency: The Real ROI of Robotic Milking Systems – The main article highlights how suppressed prices threaten modernization. This piece demonstrates exactly what’s at stake, providing a detailed framework for calculating the true ROI of automation and making data-driven decisions on major capital investments for long-term viability.

The Sunday Read Dairy Professionals Don’t Skip.

Every week, thousands of producers, breeders, and industry insiders open Bullvine Weekly for genetics insights, market shifts, and profit strategies they won’t find anywhere else. One email. Five minutes. Smarter decisions all week.

NewsSubscribe
First
Last
Consent

Feed Quality and the Hidden Economics of Beef-on-Dairy Programs

The Beef-on-Dairy Paradox: Why Spending More Per Calf Can Earn You More.

You know what’s been keeping me up lately? The price spreads we’re seeing between Holstein bulls and beef-dairy crosses at sale barns across the Midwest. Market reports indicate these spreads have widened considerably, and it’s got everyone talking.

However, what’s interesting—and this is something industry observers are starting to notice—is that not everyone running beef-on-dairy programs is actually making money. Some operations are doing worse than their neighbors who’ve stuck with straight Holsteins. How’s that possible with these market premiums? That’s a question worth exploring.

Different Philosophies, Different Outcomes

The Profit Paradox: Operations investing $150+ per calf in quality nutrition and genetics generate 40-50% higher net returns than cost-cutting approaches

Examining the data that’s emerging, we’re seeing significantly different approaches out there. And honestly, the outcomes are all over the map.

Some folks are understandably focused on keeping costs as low as possible. Makes sense, right? They’re trying to capture beef premiums without spending much extra—using their regular feeding programs, choosing lower-cost genetic options, basically treating beef crosses like slightly different Holstein calves. However, available data indicate that many of these operations capture only a fraction of the available quality premiums. Their net benefit might be positive, but it is often barely so.

It reminds me of that old saying—you can’t starve a profit out of cattle. Yet when feed costs climb, we all feel that temptation, don’t we?

Then you’ve got operations taking more measured steps. They’re investing in better calf nutrition, selecting proven beef genetics, and developing basic tracking systems. Nothing fancy, just steady improvements. Industry patterns suggest that these individuals generally capture most of the available premiums and exhibit reliable positive returns. Good old-fashioned blocking and tackling.

This development suggests something counterintuitive—operations spending the most per calf often generate the highest net returns. Seems backward at first. But when you think about it… they’re the ones with comprehensive data systems, precision feeding, and systematic breeding strategies. All the information we hear about at the winter meetings, but we wonder if it’s really worth it. Turns out, sometimes it really is.

Strategic Implementation Timeline: Building Your Program

Now, I know what you’re thinking—not everyone can transform their operation overnight. Most of us can’t, frankly. So what farmers are finding is a more practical path forward, especially when timing is critical.

Industry patterns suggest successful approaches tend to be gradual. You might start with foundation work—genomic testing on your best cows. Most operations implementing this staged approach report positive cash flow within 18 to 24 months. The $50 per head testing cost typically pays for itself within the first calf crop through better breeding decisions. Select proven beef sires with documented performance records. Nothing experimental, just reliable genetics that work.

The Long Game Wins: Quality-focused beef-on-dairy programs achieve 30% grade improvements by Year 3, while cost-cutting approaches stall at 12%—creating an 18-point performance gap that compounds annually in market premiums.

Industry data shows operations following systematic approaches typically see grade improvements of 20-30% over three-year periods. Start small, keep good records, and adjust as you learn.

And here’s something crucial that dairy nutrition research consistently demonstrates: consistency in calf nutrition matters more than many of us realize. When operations upgrade nutrition for all calves—not just the crosses—it appears to create that stable environment where genetics can really express themselves. The Beef Quality Assurance program, offered through state extension services, provides free resources on this topic. Makes sense when you stop and think about it.

The timing piece is critical here. If you’re considering a more serious commitment to beef and dairy, the biological clock doesn’t wait for our decision-making process, does it? Good breeding decisions made in the coming months should produce calves that hit the market while premiums remain attractive. Every breeding opportunity missed now is one less quality calf when you need it. That’s the unforgiving math of cattle production—nine months of gestation plus feeding time means today’s decisions create opportunities almost two years in the future.

As comfort levels increase, folks scale what’s working. More beef breeding, better feeding systems, stronger market relationships. But it’s gradual. Nobody’s revolutionizing their whole operation in one season.

That three-phase approach typically spans 24-36 months, from the first genomic test to an optimized program: foundation building (6 months), scaling what works (12 months), and then optimization based on actual results (12 months). The timeline matters because breeding decisions made today affect calves that won’t hit the market for nearly two years.

Some opportunities have already passed, honestly. The earliest adoption advantages, those first-mover processor relationships—those ships have sailed. That’s just reality. But industry indicators suggest there’s still a meaningful opportunity here. Regional processors are still developing programs, seeking consistent suppliers who can meet their quality specifications.

The Feed Quality Factor Nobody Talks About

I’ve noticed that when we discuss beef-on-dairy economics, feed quality rarely comes up for discussion. We’re always focused on feed costs, right? But when corn’s relatively affordable, having consistent feed quality might matter even more than the price per ton.

Take molasses, for instance. Most of us never give it a second thought. However, research from university trials on feed quality reveals that the sugar content in generic molasses can vary significantly—documented research shows it ranging from 39.2% to 67.3% in cane molasses samples. That kind of swing can reduce starter intake by up to 18% according to controlled feeding studies. Think about that for a minute… you’re trying to get these valuable crossbred calves off to a strong start, and inconsistent molasses is working against you.

Quality feed companies, such as Kalmbach Feeds, have responded by implementing strict quality standards. Their documentation indicates that they maintain a minimum specification of  Total Sugars in their molasses, along with controlled mineral levels and consistent Brix readings. That’s not just marketing talk—it’s measurable consistency that translates to calf performance.

The research backing this is compelling. When molasses quality varies, it affects not only palatability but also other factors as well. It alters rumen fermentation patterns, volatile fatty acid production, and ultimately, how well those expensive beef genetics can be expressed. Recent rumen development research indicates that consistent, quality-controlled molasses can increase butyrate production—and butyrate is crucial for rumen papillae development in young calves.

I understand the appeal of mixing your own rations when ingredients are reasonable. Some operations do it really well. But consider everything involved—mixer maintenance, storage losses, labor time, quality testing, and yeah, that occasional batch that doesn’t turn out quite right. Operations implementing these consistency improvements often report significant performance gains—some seeing a 10-15% improvement in feed efficiency—that more than offset the investment.

Sponsored Post

Regional Differences Matter More Than You’d Think

What farmers are finding is that this beef-on-dairy opportunity plays out really differently depending on where you farm.

In Wisconsin and Minnesota, processor density helps, but those winters… crossbred calves require different management when it’s twenty degrees below zero. Extra bedding, draft protection, maybe some building modifications. Many producers report budgeting extra for winter housing adjustments—it adds up. Consider that heifers may require different housing than steers as well.

Out East—Pennsylvania, New York—it’s a different game. Fewer processors mean every relationship matters more. Programs like National Beef’s AngusLink, Tyson’s Progressive Beef initiatives, or regional programs through American Foods Group offer structured premium opportunities; however, you must consistently meet their specific requirements. The humidity, though… some practitioners report respiratory challenges seem more common with crosses during those muggy summers.

And out West? California and Idaho operations face different challenges altogether. Scale requirements can be daunting—some processors want to see serious volume before they’ll even talk to you. But year-round feeding conditions? That’s a real advantage compared to the Midwest’s weather swings. Additionally, proximity to major feedlots offers various marketing options.

Extension services and breed associations often offer free consultation on genetic selection and program development—resources that many producers don’t realize are available. Some states even offer cost-share programs for genetic improvement. Check with your local extension office about what’s available in your area.

Reading the Market Tea Leaves

Looking at adoption patterns, beef-on-dairy breeding appears to be expanding rapidly across the industry. These premiums we’re seeing will probably hold for a while. But markets being markets, they’ll likely moderate as more producers adopt the practice. Once beef crosses become common enough in the supply chain, that scarcity premium starts to soften—we’ve seen it before with other trends.

The beef cow herd will rebuild eventually—it always does when calf prices stay attractive long enough. There is apparently a new packing capacity in development that should alleviate some current bottlenecks. These things take time, though. Years, not months.

This development suggests that operations building quality-focused programs now might maintain good margins even after scarcity premiums fade. Quality differentiation, operational efficiency, and perhaps some technological advantages—these create value that doesn’t depend entirely on tight supplies.

Let’s Be Honest About Risk

We should discuss potential pitfalls, because things do go wrong in this business.

Crossbred calves may present different management needs. Some practitioners report that they may respond differently to standard protocols, although research in this area is still in its early stages of development. What works for Holsteins doesn’t always translate directly to other breeds. Your vet can provide insights on what they’re seeing locally—it seems to vary quite a bit by region. Labor requirements may also increase, particularly during the critical first 60 days.

Markets shift—we’ve all lived through cycles. If you’re borrowing to expand beef-on-dairy programs, keeping debt conservative makes sense. Financial advisors often recommend maintaining a reasonable debt-to-asset ratio when making long-term commitments.

And processor relationships can change. Plant modifications, ownership transitions, program changes—they happen. Having alternatives, even if they’re not your first choice, provides important flexibility.

Finding Your Own Path

For smaller operations with fewer than 200 cows, success often stems from excellence in basics rather than technology. Good genetics, consistent nutrition, and simple but effective tracking. Consider partnering with service providers for expertise rather than trying to develop everything internally. Operations implementing basic improvements often see meaningful returns when they focus on consistency over complexity.

Mid-sized operations (200-500 cows) often do well with staged approaches. Spreading investments over time, testing at a smaller scale before expanding, leveraging cooperative resources where available. It’s about balancing risk and opportunity, right? These operations typically see the best return on investment when they focus on gradual system improvements rather than dramatic overhauls.

Larger operations face clearer but harder choices. Partial implementation rarely seems to work well at scale. Either build comprehensive systems for long-term positioning or maintain flexibility to adjust as markets evolve.

The Bigger Picture

I’ve noticed that beef-on-dairy reflects broader patterns we’ve seen in agriculture before. When commodity markets experience structural changes, operations that build capabilities and systems often maintain advantages even after initial premiums moderate. We saw it with the adoption of rbST, again with genomic testing, and now with beef-on-dairy.

The operations struggling aren’t necessarily doing anything wrong—they’re optimizing for different constraints. If capital or management bandwidth is limited, focusing on cost control makes perfect sense. But recognizing that this approach may limit access to emerging premiums helps with realistic planning.

Industry consolidation patterns suggest market transitions create both opportunities and challenges. Operations that adapt thoughtfully, building on their strengths while addressing market needs, generally emerge in good shape. Those that either resist change entirely or chase every trend without focus… well, that tends to be harder.

Feed quality consistency—like the molasses example we discussed—genetic selection, and systematic management create value beyond market cycles. Operations investing here position themselves not just for today’s premiums but for whatever comes next.

As we make breeding decisions for calves that won’t reach market for almost two years, thinking about where the industry might be heading matters as much as reacting to today’s prices. The biological lag in cattle production means today’s decisions create tomorrow’s reality—for better or worse.

The beef-on-dairy opportunity seems real, but it’s not uniform or guaranteed. Success likely requires matching strategy to your specific resources, capabilities, and regional context. And, perhaps most importantly, it requires recognizing that in evolving markets, what works today might not work tomorrow.

That’s the challenge—and opportunity—we’re all navigating together. What’s your take on it?

FINAL KEY TAKEAWAYS

  • The Profit Paradox: The most profitable beef-on-dairy programs often have higher per-calf costs. Their success comes from strategic investment in nutrition and genetics, which generates net returns that significantly outperform low-cost, minimum-effort approaches.
  • Feed Consistency Trumps Cost: Inconsistent ingredients are a hidden profit killer. Generic molasses, for example, can vary from 39% to 67% sugar, a swing shown to cut calf starter intake by up to 18% and undermine genetic potential. Paying for quality-controlled feed delivers more predictable performance.
  • Your Strategic Roadmap: Lasting success is built over 24-36 months, not one season. Start with a strong foundation (like genomic testing your best cows), gradually scale what works for your operation, and then optimize using your own carcass data—not industry averages.
  • Biology Doesn’t Wait: Breeding decisions made today create the calves that will hit the market in late 2027. To build a program that remains profitable even after current premiums soften, the time to invest in quality and consistency is now.

EXECUTIVE SUMMARY 

While market premiums for beef-on-dairy calves are strong, profitability varies wildly from farm to farm. The crucial difference isn’t luck; it’s strategy. Industry patterns reveal that producers who strategically invest in superior nutrition, genetics, and management consistently achieve higher net returns than neighbors focused solely on cutting costs. The hidden killer for many programs is feed inconsistency—for instance, when variable sugar content in molasses cuts starter intake by 18%, it sabotages the very genetic potential you’ve invested in. Real success requires a deliberate 24-36 month journey: building a foundation with tools like genomic testing, scaling up proven practices, and optimizing based on your own results. With today’s breeding decisions creating your 2027 market calves, the window is closing to build a quality-driven program that can thrive long-term. In this evolving market, the cost of inaction is proving far greater than the cost of strategic investment.

Complete references and supporting documentation are available upon request by contacting the editorial team at editor@thebullvine.com.

Learn More:

The Sunday Read Dairy Professionals Don’t Skip.

Every week, thousands of producers, breeders, and industry insiders open Bullvine Weekly for genetics insights, market shifts, and profit strategies they won’t find anywhere else. One email. Five minutes. Smarter decisions all week.

NewsSubscribe
First
Last
Consent

The 20-Million-Ton Question: Why 2026 Will Determine Whether Your Dairy Thrives, Scales, or Strategically Exits

Dean Foods: Gone. Borden: Gone. Your local processor: Probably next. What every dairy farmer needs to know about 2026

EXECUTIVE SUMMARY: While Santiago’s dairy leaders celebrate a coming 20-million-ton shortage, 83.5% of farm kids are walking away from free operations—and the math explains why. Operating costs rising 3% annually, sustainability compliance accelerating ensus of Agriculture came out in5% yearly, but milk prices growing just 1% means that a $900,000 net income becomes a $540,000 net income within a decade. Add $54,750 for methane additives, processor consolidation, and operations requiring 1,260 cows just to reach the median scale, and the structural disadvantages are clear. Dean Foods and Borden’s bankruptcies preview the consolidation ahead in the processor industry, leaving producers with fewer buyers and less negotiating power. The next 24 months will determine whether you scale big, pivot to premium, or preserve wealth through a strategic exit—because waiting costs thousands in annual retirement income.

Future of Dairy Farming

You know that feeling when milk prices hit $22.60 per hundredweight and everyone starts talking expansion?

Let’s talk about what really came out of Santiago this week.

The International Dairy Federation is holding its World Dairy Summit this week—the first time in South America in 123 years—which is noteworthy, and the projections deserve a closer look. They’re talking about a 20-30 million ton global demand gap by 2035. IDF President Gilles Froment kept emphasizing “authentic collaboration” during his keynote, and that’s all well and good, but here’s what’s interesting…

When you examine these numbers alongside what’s actually happening on farms—I’ve been talking with producers from Vermont to California—some patterns emerge that suggest certain operations are going to capture value while others might struggle. These deserve a closer look.

And it’s not necessarily about who’s the better farmer.

Santiago’s celebrating a 25-million-ton shortage by 2035. But here’s what they’re not saying: only 14,000 U.S. farms will be left to capture that opportunity.

The Demand Gap: Real Opportunity or Something Else?

So this 20-30 million ton shortage everyone’s excited about—IDF’s analysis backs it up, USDA shows 11% consumption growth through 2030, and yeah, the demand’s real.

But here’s the thing: where’s the production going to come from?

Current production reality:

  • U.S. milk production: growing at just 0.9% annually (you’ve probably seen the NASS reports)
  • Europe: basically flat (Brussels keeps confirming this)
  • New Zealand: hitting environmental limits (their Ministry’s been pretty clear about that)

Even with the USDA predicting a milk price of $22.60, with room to grow, who actually benefits here isn’t as straightforward as you’d think.

Consider what DFA’s been doing. They marketed 65.5 billion pounds in 2021—that’s about 29% of all U.S. milk according to their annual reports. When you control processing, ingredients, export channels… you’re capturing value at every step.

Meanwhile, if you’re an independent producer shipping to whoever takes your milk that week, it’s a different game entirely.

And here’s something that really caught my attention: the Class III versus Class IV spread is $2.86 right now—widest we’ve seen since 2011 according to AMS data.

You know what that means? If you’re shipping to cheese plants in Wisconsin, you’re banking thousands more monthlythan your cousin in California selling to butter-powder operations. Same cows, same feed quality, same parlor management… but processor relationships determine who’s making money.

That’s not exactly what they teach in dairy science programs, is it?

Sustainability Costs: The Bill’s Coming Due

The Paris Declaration on Dairy Sustainability—signed by 53 countries, representing 46% of global production—changed the conversation from “wouldn’t it be nice” to “here’s your compliance timeline.”

And the costs… well, let me walk you through what producers are actually facing.

Bovaer methane additives: DSM’s been transparent about pricing at about $0.30 per cow per day. For 500 cows, that’s $54,750 annually. Just for the additive, nothing else.

Thinking about digesters? European Joint Research Centre research puts installation between €250,000-€275,000, and here’s what nobody mentions—you need about 35-40 kilowatt hours per kilogram of nitrogen for processing, which means solar panels or you’re burning through your savings on electricity.

Ben & Jerry’s ran this pilot with seven Vermont farms—the smallest had 60 cows, the biggest just under 1,000. They got 16% emissions reduction, which sounds great until you realize the company paid for everything. Staff time, equipment upgrades, robotic feed pushers… their published report basically says farmers can’t afford this without support.

At least they’re honest about it.

Now, California’s doing something interesting. Their dairy methane program—the Air Resources Board tracks this closely—has achieved impressive results:

  • 5 million tons of CO₂ equivalent are reduced annually
  • $522 million in private investment since 2022
  • $9 per ton cost-effectiveness (beats other climate tech by 10-60 times)

But here’s why it works: programs like the Low Carbon Fuel Standard create actual revenue from methane reduction. You’re not just spending money; you’re making it.

Most states? They don’t have anything close. I’ve been talking with producers in Ohio, Texas, Iowa, and even Wisconsin, outside the renewable natural gas corridor. They’re staring at these costs with no revenue offset.

And California’s got its own challenges—SGMA water compliance is brutal. Some producers I know are converting to solar at a rate of $800-$ 1,200 per acre annually. Beats volatile feed margins when water’s scarce, though.

Consolidation: The Numbers Tell the Story

USDA’s Census of Agriculture came out in February, and the numbers are sobering.

The brutal math of dairy consolidation: 39% of farms vanished between 2017-2022, while average herd sizes nearly tripled.

The stark reality:

  • 2022: 24,013 dairy operations (down 39% from 2017)
  • Since 2012: 50% of farms have gone in a decade
  • Rabobank projection: Another 20-25% decline by 2027

But here’s what really tells the story—look at where the milk’s coming from according to USDA’s Economic Research Service:

Operations over 1,000 cows:

  • Now: Control 65% of the herd
  • 1997: Just 17%

Farms under 100 cows:

  • Now: 7% of production
  • 1997: 39%

Midpoint herd size:

  • 2021: 1,260 cows
  • 2000: 180 cows
The math doesn’t care about your family legacy
Herd SizeCost/cwtProfit at $22.60
100-199$23.06-$0.46
500$20.25$2.35
1,000$18.50$4.10
2,500+$13.06$9.54

And it’s not just about bulk feed purchases or spreading fixed costs, as many of us have seen. What I’m finding—especially visiting Wisconsin operations lately—is revenue diversification that smaller farms struggle to match.

These bigger operations are breeding 60% or more of their herds to Angus bulls. With beef crosses bringing $800-1,200 versus maybe $150 for dairy bulls, a 2,900-cow operation can generate millions extra annually just from calves.

Add in what they’re doing with:

  • Genetics sales internationally
  • Digester partnerships (companies like Vanguard Renewables)
  • Commercial grain operations on thousands of acres

It’s a completely different business model, honestly.

A 600-cow operation—and I know plenty of excellent managers at that scale—generally can’t tap those revenue streams. You don’t have the volume for direct feedlot contracts, digesters don’t pencil out, and international genetics buyers aren’t calling.

It’s not about management quality; it’s structural advantages that kick in above certain thresholds.

Why the Next Generation’s Walking Away

While 69% of farmers expect their kids to take over, only 16.5% of transitions actually succeed—and 71% haven’t even identified a successor.

Here’s a statistic that keeps me up at night: University of Minnesota Extension found that while 69% of farmers expectto pass the farm to their children, actual succession success is only 16.5%.

That 83.5% failure rate? It’s not because kids are soft or don’t appreciate farming. It’s math.

I’ve been helping young couples run the numbers using Wisconsin’s Farm Financial Standards—proper analysis, not back-of-the-envelope stuff.

Take a typical scenario:

  • 25-year-old with an ag degree
  • Parents running 500 cows
  • Normal debt loads
  • Year one: Maybe $900,000 net with current prices

Sounds good, right?

But factor in reality based on historical trends:

  • Operating costs: Rising 3% annually (that’s the 10-year average)
  • Sustainability compliance: Accelerating 5% yearly (as regulations tighten)
  • Milk prices: Maybe 1% growth if you’re lucky (20-year data shows this)

By year 10, That net income could drop 40% or more.

And that’s while working 60-70 hour weeks—you know how it is during calving season—carrying complete liability for over a million in debt.

Their college friends?

  • Ag lenders: Starting $58,000, reaching $90,000 within a decade (Bureau of Labor Statistics data)
  • Herd managers: $80,000-120,000 (based on industry surveys)
  • Benefits: Home for dinner, actual vacation time, no debt liability

Student loans make it worse—National Young Farmers Coalition says 38% of young farmers carry an average debt of $35,660. As folks at USDA’s Beginning Farmer Program keep pointing out, you’re already in debt before you even think about taking over the farm.

The math often doesn’t work. And honestly? Can you blame them for choosing differently?

Your Four Critical Decisions—Quick Reference

Decision 1: Can premium markets work for you? (6 months to figure out)

  • Within 100 miles of metropolitan markets with strong demographics
  • Need 50%+ equity to weather transition losses
  • Someone who actually wants to do marketing, not just milk cows
  • Reality: Losses years 1-3, break even 4-6, profit after year 7 (every transition study shows this)

Decision 2: Can you scale to 1,500+ cows? (12 months to secure financing)

  • Need $3-4.5 million capital (that’s current construction costs)
  • Current profits should exceed $400/cow for lender confidence
  • Debt under 30% of assets for favorable terms
  • Reality: $175,000-292,000 annual debt service at current rates

Decision 3: Are You Preserving or Bleeding Equity? (3 months to assess honestly)

  • Delaying exit while losing money costs thousands in retirement income
  • Declining working capital = converting equity to expenses
  • Continue only if genuinely cash flow positive

Decision 4: If exiting, how do you maximize value? (12-18 months to execute)

  • Best: Sell to expanding neighbor (92-98% value recovery)
  • Good: Liquidate herd, keep land for rent (85-90%)
  • OK: Convert to heifer raising (40-50% income reduction)
  • Fast: Complete auction (60-80% recovery)

Processors: The Other Consolidation Story

Dean Foods collapsed. Borden’s bankrupt. In the Upper Midwest, 90% of your milk goes to just two buyers—DFA or Prairie Farms.

The processor landscape changed dramatically with recent bankruptcies, as you probably know:

Dean Foods (November 2019)

  • Over $1 billion in long-term debt, according to bankruptcy filings
  • Combined revenues over $12 billion—just gone

Borden Dairy (January 2020)

  • Followed Dean into bankruptcy
  • Couldn’t compete with integrated processors

When Walmart built their Fort Wayne plant in 2018 and Kroger expanded private label… that was game over for traditional processor margins, honestly.

After Dean collapsed, DFA bought 44 facilities for $433 million—the DOJ tracked all this. Now, many upper Midwest producers basically have two buyers: DFA and Prairie Farms.

That’s not exactly competitive price discovery, is it?

What Europe’s showing us about what’s next:

  • Arla-DMK merger: Creates €19 billion giant
  • FrieslandCampina-Milcobel: Combines €14 billion
  • DMK’s reality: €24.6 million profit but negative €54.8 million cash flow in their FY2024 report

They’re burning reserves despite making operational profit. Their CEO’s been blunt with members: milk production’s declining, and they need scale to survive.

What’s this mean for us? Fewer buyers, less negotiating leverage, more dependence on whoever’s left standing.

And if you think that leads to better milk prices… well, I’ve got a bridge to sell you.

The Talk Every Farm Family Needs to Have

Here’s the conversation I’ve been coaching families through—and it needs real numbers, not hopes:

“Listen, we’ve got three realistic paths given where the industry’s heading.

Path one—go premium. Organic, processing, direct sales. That’s serious money upfront, losses for years according to every university study, and you’d basically be running a food company. Farmers markets every Saturday, Instagram all the time, dealing with customer complaints. That sound like the life you want?

Path two—scale up big. We’re talking millions in debt, managing 20+ employees, becoming a CEO instead of a farmer. HR headaches, safety meetings, and managing managers instead of cows. You ready for that?

Path three—we sell while we’ve got equity. You pursue your career without our debt. We preserve retirement funds. You can still work in dairy—plenty of good jobs—just not owning the risk.

What actually fits your vision for the next 40 years?”

When kids see real numbers, Iowa State’s research suggests that about 75% choose path three. They become nutritionists, agronomists, equipment specialists. Good careers using farm knowledge without the burden of ownership.

And given the economics? It’s often the smart choice.

What’s Actually Working Out There

Now, it’s not all challenges—I’m seeing some operations successfully thread the needle.

New York producers integrating processing are doing something interesting. Making specialty cheese and butter for NYC markets—one operation I visited is selling butter for $12 per pound in Manhattan. That vertical integration changes everything.

California cooperatives where smaller farms banded together before consolidation forced them, are now receiving premiums. Clover Sonoma’s a good example—27 farms averaging 350 cows each, all within 100 miles of their plant. They control their story and receive premium prices.

Vermont innovation through programs like AgSpark, is worth noting. Individually, a 400-cow farm can’t justify a digester. But three farms together? Now you’re talking viable scale. That’s real collaboration, not the “take whatever price we offer” kind.

Plains states are finding niches too. Custom heifer operations serving multiple dairies, spreading costs. Grazing dairies in Missouri are finding grass-fed markets that actually pay premiums.

Mid-Atlantic producers are leveraging proximity. Pennsylvania’s farmstead cheese operations are growing—being close to Philadelphia and Pittsburgh matters. Maryland producers supplying Baltimore and D.C. with local milk get decent premiums despite high land costs.

Even in the Southeast, despite cooling costs running $180-$ 200 per cow annually, I know operations that maximize component premiums. When your butterfat’s at 4.2% and protein is at 3.4%, you’re getting paid. It’s about finding what works for your situation.

Looking Ahead: The Industry Will Survive, But Will You?

The industry will absolutely meet that 20-30 million ton demand gap. Sustainability goals will be achieved. Global production will modernize.

But the structure doing it? Nothing like today’s.

Operations under 1,000 cows without premium markets, face increasingly challenging economics. Sustainability costs are rising, processor options are shrinking, and the next generation is making rational career choices.

It’s not about farming quality—it’s about structural realities nobody wants to discuss at industry meetings.

Those positioned to scale or differentiate have real opportunities, but execution has to be nearly perfect. I’ve seen too many half-hearted organic transitions fail. Expansions without multiple revenue streams just create bigger debt.

You need a complete strategy, not just hope.

The next 24 months look critical based on what I’m seeing. Processor consolidation’s accelerating—Rabobank says 2026 could see major shifts. Asset values may decline as more operations exit. Waiting usually means fewer options at lower values.

The Bottom Line: Your Choice to Make

Santiago’s summit revealed an industry transforming whether we’re ready or not.

The question isn’t if you’ll be affected—it’s whether you’ll choose your position or let circumstances choose for you.

Understanding these dynamics isn’t pessimistic—it’s getting clear-eyed about making wealth-preserving decisions while you still have options. I’ve watched too many good operators wait too long, hoping for better prices or magical policy changes that never came.

What gets me is all the knowledge we’re losing. Generations of understanding specific fields, managing fresh cow transitions, getting the most from local forages… when a farm exits, that expertise often goes too.

But here’s what’s encouraging—that knowledge can transform into new roles. Some of the best herd managers I know are former owners who sold at the right time. They’re managing thousands of cows, earning well, and home for dinner.

The knowledge continues, just in different structures.

Your action steps:

  • Talk with your lender—really talk, not just renew notes
  • Run honest numbers using proper methodology (Wisconsin’s Farm Financial Standards work well)
  • Visit operations succeeding in different models
  • Make decisions based on facts, not tradition or guilt

This transformation isn’t about good farms versus bad farms. It’s about structural changes favoring certain models over others.

Understanding that—and positioning accordingly—separates those who’ll thrive from those just trying to survive.

The next 24 months will likely determine the structure of American dairy for the next generation. Make sure you’re actively choosing your place, not just watching it happen.

We’ve been through big changes before, right? Hand milking to pipelines. Family labor to hired help. Local cream stations to global markets. This is another turn of that wheel—probably the biggest many of us have seen.

The question is: are you steering, or just hanging on?

Because at the end of the day, this industry needs people who understand cows, who know how to produce quality milk, who can manage the biology and complexity of dairy farming. That need won’t go away.

But how that knowledge gets applied, in what structures, at what scale—that’s what’s changing.

Your operation has value. Your knowledge has value. Your family’s future has value.

The key is making sure you’re the one determining how to best preserve and deploy that value, not having it determined for you by circumstances beyond your control.

That’s what Santiago really taught us—not that change is coming, but that we need to be intentional about our place in it.

Complete references and supporting documentation are available upon request by contacting the editorial team at editor@thebullvine.com.

Learn More:

The Sunday Read Dairy Professionals Don’t Skip.

Every week, thousands of producers, breeders, and industry insiders open Bullvine Weekly for genetics insights, market shifts, and profit strategies they won’t find anywhere else. One email. Five minutes. Smarter decisions all week.

NewsSubscribe
First
Last
Consent

The $189,000 Truth About Off-Farm Health Insurance Jobs (11 Days to Change Course)

How 41% of dairy farms are unknowingly subsidizing “free” coverage with a quarter-million in lost productivity

EXECUTIVE SUMMARY: That town job for health insurance isn’t saving your dairy $15,000 annually—it’s costing you $189,000 in lost productivity, missed breeding windows, and equipment failures that 41% of farm families never calculate until it’s too late. With carriers like UnitedHealthcare abandoning 109 rural counties and 51,000 Vermonters losing coverage entirely, the traditional strategy of off-farm employment for benefits is collapsing, just as medical debt is contributing to 55% more dairy bankruptcies than last year. Open enrollment starts in 11 days, but December 15 is the only date that matters—miss it and you’re uninsured during January’s peak accident season. The good news? Farm Bureau plans, marketplace coverage with subsidies, and dairy co-op options all cost less than the quarter-million you’re hemorrhaging now. This isn’t about finding cheaper insurance anymore; it’s about recognizing that your “free” coverage might be the most expensive decision your farm ever made.

dairy health insurance costs

You know, I was sitting with a group of farmers at the co-op last week, and someone made a comment that’s been rattling around in my head ever since. “We track every penny on feed costs,” he said, “but nobody’s calculating what it really costs when someone drives to town for that health insurance job.”

Turns out, he’s onto something bigger than most of us realize.

So here’s what’s happening—and with open enrollment starting November 1, this matters right now. The USDA reports that approximately 41% of dairy farm families have someone working off-farm, and for most, health insurance is the primary reason. We all know someone doing this, right? Trading 40 hours a week in town for what seems like “free” coverage. However, when you actually sit down and run the numbers, that’s where things get interesting.

The stark reality: that $18,000 in ‘free’ insurance savings is actually costing dairy farms $189,000 in lost productivity—a 950% miscalculation that’s driving farms toward bankruptcy.

The Math Nobody’s Doing (But Should Be)

Let me paint you a picture of what I’m seeing across dairy country these days. You’ve got operations with 150, maybe 200 cows—good, solid family farms—and typically it’s the spouse heading to town each morning for that county job or position at the local co-op. The thinking is that you can save anywhere from $750 to $1,500 per month on health insurance premiums. That’s $9,000 to $18,000 a year staying in your pocket. Seems like smart money, doesn’t it?

Here’s where it gets complicated, though, and you probably already sense this if you’re experiencing it firsthand.

When someone’s gone for 40 hours a week, that’s 2,080 hours annually of farm labor that just… disappears. And we’re not talking about casual help here. This is someone who knows every cow by temperament, who can spot early mastitis before it becomes a three-day milk dump, who notices when that mixer wagon starts making that little grinding noise two weeks before it breaks down completely.

NASS tells us agricultural wages in the Midwest are running about $18 per hour these days. So right off the bat, you’re looking at nearly $38,000 just to replace those hours with hired help. But honestly—and we all know this—hired labor never fully substitutes for family expertise, does it?

What really adds up is the productivity loss. Cornell’s extension folks have been examining this, and they’re finding that farms generally lose about 10% of their efficiency when key family members work off-farm. Now think about that—on a dairy grossing $2 million, which is pretty standard for a 150-200 cow operation these days with milk hovering around $17, that’s potentially $200,000 in lost efficiency.

Then you’ve got all those opportunities that slip away. That direct marketing program you keep meaning to start. The breeding decisions that get delayed because nobody’s watching heat cycles as closely as they should. The preventive maintenance that gets pushed back until something actually breaks and costs three times as much to fix.

How to Calculate Your Hidden Off-Farm Employment Costs:

Step 1: Hours lost annually = 2,080 (40 hrs/week × 52 weeks)
Step 2: Direct replacement cost = 2,080 × $18/hour = $37,440 
Step 3: Lost productivity (10% of gross revenue) = Your annual gross × 0.10 
Step 4: Opportunity costs (missed improvements, breeding windows) = $15,000-50,000 
Step 5: Total hidden cost = Steps 2 + 3 + 4 
Step 6: Compare to off-farm compensation (wages + insurance value) 
Your Net Cost/Benefit: Step 6 (Off-Farm Pay) – Step 5 (Hidden Cost)

Add it all up? Many operations are looking at somewhere between $189,000 to $224,000 in hidden costs. Even if your operation is half that size, you could still be looking at a hidden cost of $50,000 to $100,000—far more than the $18,000 you’re saving.  All for that “free” insurance.

When the Breaking Point Hits

The numbers don’t lie: a 55% spike in dairy bankruptcies directly correlates with rising off-farm employment and medical debt—proof that the ‘free insurance’ strategy is pushing farms over the edge

What’s interesting is when farmers finally see this for what it really is. Usually, it’s not during tax season or sitting with the banker. It’s more immediate.

I keep hearing similar stories. Tuesday afternoon, you’ve got a heifer having trouble calving, and the person with 30 years of experience is sitting in an office cubicle 40 miles away. Lost the calf, maybe almost lost the heifer too. That’s when it hits: something’s got to change.

The University of Saskatchewan documented what they’re calling the “third shift”—farm women juggling off-farm work, farm labor, and household management, averaging 78-hour work weeks. The data clearly shows higher injury rates, chronic exhaustion, and increased accidents. Research from Finland found that farmers working 70-hour weeks actually generate less profit than those working reasonable hours on the same size operations. When you’re that exhausted, you miss things. Heat cycles. Early mastitis signs. Equipment problems before they become disasters.

The 2026 Perfect Storm

Geographic crisis alert: 109 counties are losing insurance carriers in 2026, leaving a quarter-million farm families scrambling—with Vermont farmers facing the worst coverage collapse in decades.

Now here’s where things get genuinely concerning, especially if you’re in certain parts of the country.

Major insurance carriers are withdrawing from rural counties at a rate faster than we’ve seen in years. UnitedHealthcare has just announced that it will be leaving 109 counties by 2026. Humana’s scaling back significantly. In Vermont, over 51,000 people are losing their current plans because Blue Cross Blue Shield is discontinuing entire plan lines, while UnitedHealthcare is exiting 14 counties entirely.

For farmers who’ve already done the math and switched from off-farm employment to marketplace insurance—letting both people work the farm full-time—these exits are creating real problems. When your carrier leaves and the only remaining option costs double what you were paying, suddenly that off-farm job starts looking necessary again. Except now you understand exactly what it’s costing you in lost productivity.

And the regional differences are huge. Wisconsin or Minnesota might have Farm Bureau options that Northeast producers can’t access. Pennsylvania dairy cooperatives might offer group plans that Western states don’t have. California’s got its own marketplace rules that don’t apply anywhere else. So what works for your neighbor three states over might not even be an option for you.

The December 15 Deadline You Can’t Miss

The clock’s ticking: 55 days until December 15—the only date that matters. Miss it and you’re gambling your farm’s survival against January’s frozen pipes, icy accidents, and zero health coverage.

Here’s something critical that catches people every single year. Open enrollment runs from November 1 through January 15; however, if you want coverage starting January 1, you must enroll by December 15. Miss that date, and you’ll be uninsured for the entire month of January.

Think about January on a dairy farm for a minute. Frozen water lines. Ice everywhere. Equipment stressed by cold weather. Not exactly when you want to be without health coverage.

What makes this worse is December’s when everything gets crazy anyway. During Thanksgiving week, support offices have reduced hours. By December 10-15, state insurance departments report that phone wait times average nearly an hour, and websites crash due to high traffic. I’ve heard too many stories of farmers who started looking on December 10, discovered their carrier had left, couldn’t get help in time, and missed the deadline. Then comes January—skid steer accident or whatever—and suddenly you’re looking at tens of thousands in medical bills.

Worth noting: if you do miss the December 15 deadline, you might qualify for a special enrollment period if you have what’s called a “qualifying life event”—losing other coverage, getting married, having a baby, or moving to a new coverage area. But don’t count on this as your backup plan.

The Dairy Farmer’s Playbook for 2026 Coverage

Real Cost: Every Alternative Beats ‘Free’ Insurance

Insurance OptionMonthly PremiumAnnual CostNet Financial ImpactKey Benefit
Off-Farm Employment$0*$189,000 hidden-$171,000 LOSSAppears free
ACA Marketplace + Subsidies$150-400$1,800-4,800+$167,000 GAINIncome-based help
Farm Bureau Plans$400-600$4,800-7,200+$164,000 GAIN30-60% below market
Dairy Co-op Plans$500-800$6,000-9,600+$163,000 GAINMember benefits
ACA Marketplace (no subsidy)$700-1,200$8,400-14,400+$157,000 GAINComprehensive coverage

So what’s actually working out there? It depends where you are, but here’s your action plan.

First, reframe this decision. We don’t buy the cheapest vaccine for our herds. We don’t use the cheapest semen. We balance cost against value, risk against reward. The National Safety Council shows agriculture workers face injury rates nearly five times higher than those in other industries. When you calculate total financial exposure—premiums plus deductible plus out-of-pocket maximum—that “expensive” plan with higher monthly costs might actually save money when something goes wrong. And on a dairy farm, something will go wrong. It’s not pessimism, it’s just… farming.

If you’re in a Farm Bureau state (Tennessee, Iowa, Kansas, Indiana, South Dakota, Texas, Missouri, or Ohio starting January), look into those plans now. They can run 30-60% less than marketplace options. Iowa Farm Bureau’s data show that about one in ten applicants is turned down, and those with pre-existing conditions face longer waiting periods. But for healthy families? Game-changer. Several operations I know saved enough to upgrade equipment they’d been putting off for years.

Consider ICHRA if you have 5-10 employees. Individual Coverage Health Reimbursement Arrangements let you set a monthly contribution—say $650 per person—and that’s your budget. No surprise premium increases. Employees choose their own marketplace plans. The HRA Council’s latest survey shows contributions ranging from $434 to $1,144.

For beginning farmers, options aren’t great. If you’re starting with 50-75 cows, marketplace premiums can consume a substantial portion of your gross revenue. Some are considering health sharing ministries—although these aren’t actual insurance and come with real risks—or staying on their parents’ plans until age 26. Also worth checking is whether your state offers young farmer programs that may include health benefits.

Check with dairy cooperatives, particularly in the Northeast, which are starting to offer group health plans to members. Rates are often better than individual marketplace plans. Your state insurance department website can also point you to additional resources.

Verify everything independently. CMS audits show online provider directories have significant accuracy issues. Call clinics directly. Get names. Confirm they’ll take your plan in 2026. Takes 20 minutes, saves thousands in surprise bills.

Use free help. Health insurance navigators funded through federal programs help with rural enrollment. They’re not selling anything. Call 1-800-318-2596 to find one near you. They know carrier exits, subsidy calculations, special enrollment periods—all of it. Every state has them, and they’re especially helpful if you’re dealing with a carrier exit.

Calculate the real cost of off-farm employment. Not just obvious stuff, but everything. Missed breeding windows at $25-40 per straw plus synchronization costs. Relationship stress from 78-hour weeks. Even takeout food costs are a consideration because nobody has the energy to cook. The numbers are eye-opening.

The Next 55 Days

Open enrollment starts in 11 days. The December 15 deadline for January 1 coverage is 55 days away.

Federal bankruptcy court data shows 259 dairy farms filed in Q1 2025—up 55% from last year. Medical debt appears in nearly every agricultural bankruptcy these days. That $189,000 hidden cost for off-farm employment? That’s real money that could stay in your operation.

Your cows receive updated health protocols annually. Equipment gets preventive maintenance. Crops get insured before planting. Perhaps it’s time to apply the same strategic thinking to your family’s health coverage.

Sit down this week—seriously, this week—and calculate what off-farm employment really costs. If your county’s losing carriers, don’t wait until December. Call that navigator number now. And remember, if you lose coverage mid-year, that’s a qualifying event for special enrollment—but it’s better to avoid that situation entirely.

Whether you’re in Vermont, dealing with carrier exits, Wisconsin, exploring Farm Bureau options, or California, navigating unique marketplace rules, the fundamentals remain the same. Stop treating health insurance as an expense to minimize. Start treating it as an investment in your operation’s survival.

And that’s something worth getting right.

KEY TAKEAWAYS:

  • Do The Math Today: 2,080 hours × $18/hour + 10% productivity loss + missed opportunities = $189,000-224,000 your “free” insurance actually costs
  • Your Insurance Deadline Is December 15, Not January 15: Miss it and you’re gambling winter’s frozen pipes and PTO accidents against bankruptcy
  • 41% of Farms Are Bleeding Money: If someone drives to town for insurance, you’re losing more than farms that filed bankruptcy last quarter
  • Solutions Exist Now: Farm Bureau plans (8 states), marketplace navigators (1-800-318-2596), dairy co-ops—all cheaper than your current path
  • The Clock Is Ticking: 11 days to enrollment, 55 days to December 15, and carriers are already gone from 109 counties

Complete references and supporting documentation are available upon request by contacting the editorial team at editor@thebullvine.com.

Learn More:

The Sunday Read Dairy Professionals Don’t Skip.

Every week, thousands of producers, breeders, and industry insiders open Bullvine Weekly for genetics insights, market shifts, and profit strategies they won’t find anywhere else. One email. Five minutes. Smarter decisions all week.
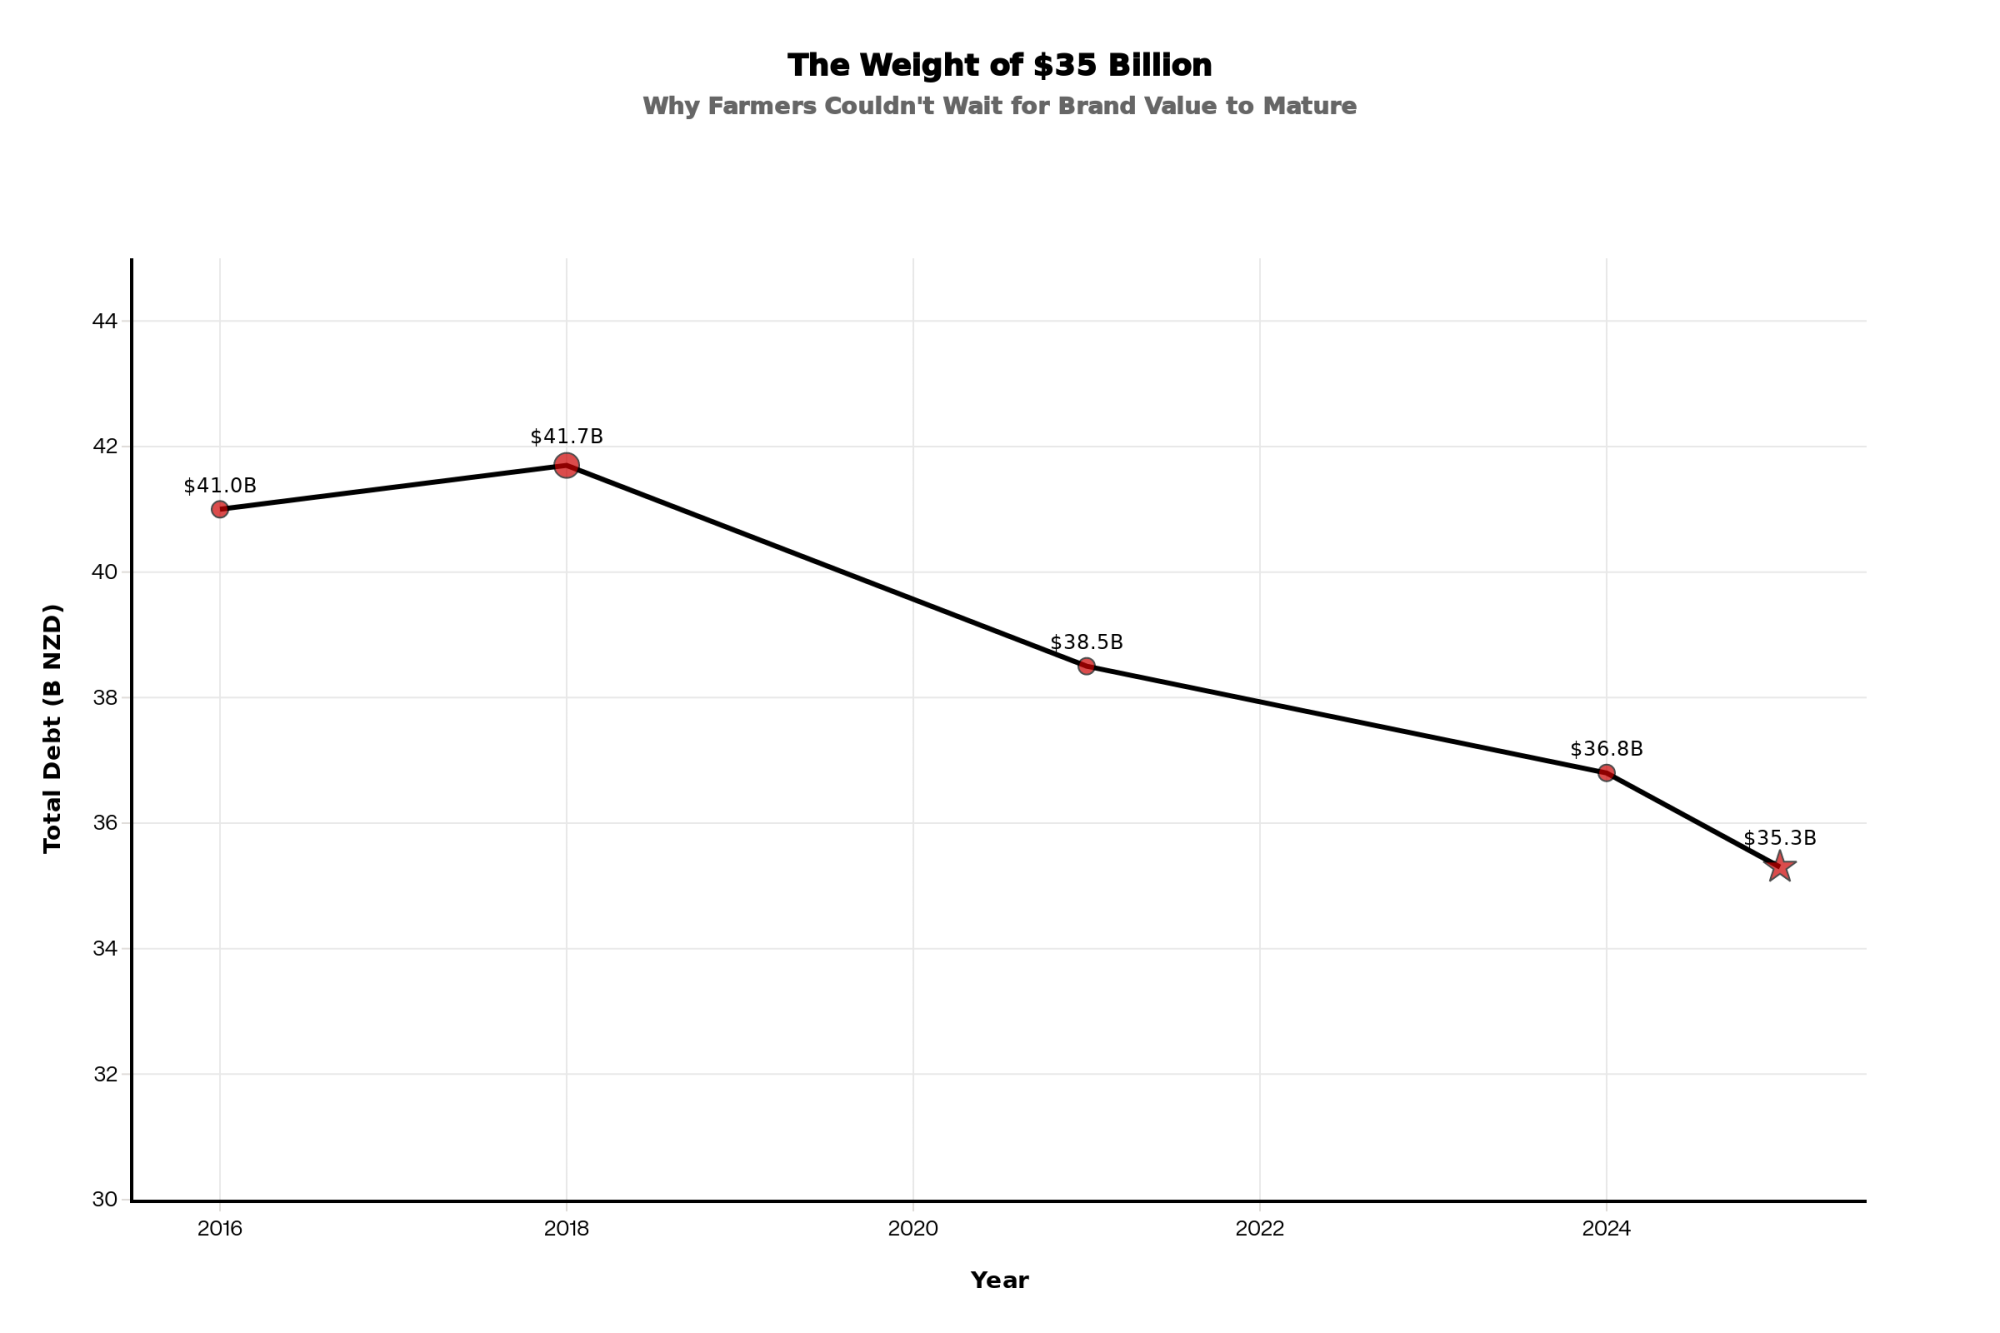
NewsSubscribe
First
Last
Consent

The 800,000-Heifer Shortage Reshaping Dairy: Why Some Farms Will Thrive While Others Exit

Week-old beef calf: $1,400. Replacement heifer: $4,000. Still breeding beef? You’re not crazy—you’re doing the math.

EXECUTIVE SUMMARY: What started as desperate survival in 2018 has become an irreversible trap: beef-cross revenue now provides 16% of dairy farm income, forcing farmers to keep breeding beef at $1,400 per calf even as replacement heifers hit $4,000. This has driven U.S. heifer inventory to 3.9 million—the lowest since 1978—with 800,000 fewer coming before any recovery in 2027. Simultaneously, processors who invested $11 billion expecting 2-3% growth face just 0.4% milk expansion, guaranteeing plant closures and $3-5/cwt regional price swings. The industry is restructuring into three distinct survivors: fortress farms with over 1,500 cows capturing component premiums, strategic operations with 200-500 cows in profitable niches (organic/A2A2/grass-fed), and those exiting now at peak cattle prices. Wisconsin’s 10,000-heifer gain versus Texas’s 10,000-head loss proves that processor relationships and location now matter more than size. Behind the numbers, 2,400-3,700 dairy families face elimination—transforming not just an industry but entire rural communities.

Dairy Heifer Shortage

You know something’s off when you’re seeing beef-cross calves bringing $1,000 to $1,400 at a week old while replacement heifers are hitting $4,000 at auction. It doesn’t make sense at first—but then you dig into what’s actually happening out there, and suddenly it all clicks.

We’re not looking at just another market swing here. What we’re seeing is the collision of desperate decisions farmers made back in 2018 and 2019 with billions in processing investments that assumed a completely different future. And if you’re wondering why your neighbor’s still breeding 40% of the herd to beef despite those heifer prices…well, let me walk you through what I’ve been hearing from producers across the country.

The 800,000 Heifer Crisis Timeline – From 4.8 million in 2018 to 3.4 million projected by 2027, this isn’t a market cycle—it’s industry transformation

Note: Throughout this article, some producers and industry professionals spoke on condition of anonymity to discuss sensitive business details. All financial figures and operational data have been verified against industry benchmarks.

The Numbers Paint a Picture Nobody’s Prepared For

So, CoBank released its latest dairy heifer inventory analysis in August, and the numbers are… honestly, they’re worse than most people realize. According to the USDA’s National Agricultural Statistics Service January 2025 cattle report, the national number of replacement heifers stands at 3.914 million. That’s the lowest since 1978—back when the average herd was what, 30-something cows?

But here’s the kicker that really got my attention: only about 2.5 million of those heifers are expected to actually calve into milking herds this year, based on CoBank’s projections. That’s tracking to be the lowest since the USDA started keeping those specific records in 2001. The ratio’s collapsed, too—USDA’s July calculations show we’re down to 27 heifers per 100 cows. Ten years ago? That was 31 per 100.

And it gets rougher. CoBank’s projects indicate that we’ll lose another 357,490 heifers in 2025, followed by an additional 438,844 in 2026. They’re saying maybe we’ll get back 285,387 or so in 2027, but…that’s still a massive hole. Add it up and we’re talking about 800,000 fewer replacements before any real recovery kicks in.

The 216% Explosion That Changed Everything – Beef semen sales to dairy farms surged from 2.5M to 7.9M units, creating the heifer shortage crisis

How Seven Years of Survival Mode Created Today’s Crisis

You can trace this whole thing back to that brutal stretch from 2015 through 2021. Class III milk prices averaged below $18 per hundredweight for most of those years—not continuously, but often enough to cause significant harm. University of Illinois dairy economist John Newton documented this period in his 2018 farmdocdaily analysis, calling it an extended period of sustained losses that fundamentally changed the industry.

By April 2019, according to the USDA’s Agricultural Marketing Service reports, replacement heifers that cost $ 2,000 or more to raise were only bringing $1,140 at market. Think about that for a second. You’re losing $860 to $1,360 on every single replacement you raise.

Then the technology all came together at once. Sexed semen finally worked reliably—industry data from Select Sires and other major AI companies shows you can get 90% female calves with 85-95% of conventional conception rates. Genomic testing through companies like Zoetis and Neogen dropped to about $40 per animal. And beef prices? Through the roof. Suddenly, those Holstein bull calves that might bring $200 on a good day were being replaced with Angus crosses worth anywhere from $600 to over $1,400, depending on genetics and your local market.

I mean, what would you have done?

The National Association of Animal Breeders has been tracking this transformation in their annual Semen Sales Reports. Beef semen sales to dairy farms went from about 2.54 million doses in 2017 to over 7.2 million by 2020. That’s nearly triple in three years. Their March 2025 industry update shows we’re now sitting at about 7.9 million units, and it’s just…stuck there. Meanwhile, conventional dairy semen sales have crashed almost 46.5% since 2020.

Why $4,000 Heifers Still Can’t Fix the Problem

Examining what doesn’t add up for many people: according to the USDA’s October 2025 Agricultural Prices report, heifers are currently worth a significant amount of money. Wisconsin’s averaging close to $2,860. Vermont’s around $2,930. Premium animals in California and Minnesota are fetching over $4,000, according to recent livestock auction reports. So why isn’t everyone breeding dairy again?

What I’m hearing from nutritionists working with Wisconsin herds is pretty consistent. Consider a typical 500-cow operation that breeds 40% of its cows for beef. They’re bringing in maybe $200,000 a year just from those beef calves. Add in cull cows at current prices, and you’re looking at $350,000 in cattle revenue.

The Revenue Revolution – Cattle sales jumped from 6.7% to 16% of dairy income – this structural shift is permanent and changes everything

According to USDA Economic Research Service data, that’s approximately 16% of total farm income for many operations now. Back in 2020? Cattle sales were maybe 6.7% of dairy farm revenue.

As one nutritionist put it to me, “It’s not just extra money anymore. It’s structural. These guys can’t just flip a switch and go back. Walking away from that revenue would mean completely restructuring the operation.”

From Crisis to Gold Rush – Heifer prices crashed to $1,140 in 2019, now average $2,860 with premiums hitting $4,000

The Processing Overcapacity Challenge Coming in 2027

And here’s where it gets really messy. According to the International Dairy Foods Association’s industry investment tracking, the processing sector has invested more than $10 billion in new facilities over the past three years—some estimates put the total closer to $11 billion. New York’s Department of Agriculture reports that the state alone has $3 billion in processing investments that require an additional 10 to 12 million pounds of milk per day.

These plants were all designed assuming we would continue to grow milk production at a rate of 2-3% annually, as we have for decades, based on USDA historical data from 1995 to 2020. Instead? USDA’s October 2025 World Agricultural Supply and Demand Estimates project just 0.4% growth next year. That’s not a typo—zero point four percent.

Mike North from Ever.Ag’s Risk Management division put it bluntly at the September 2025 Milk Business Conference: “We don’t have enough cows to fill all these plants.” He thinks we’ll see inefficient plants close, and others running way under capacity. That’s billions in stranded investment.

What’s worth noting here is that we’re already seeing some policy discussions emerging. The National Milk Producers Federation has formed working groups to study the situation, though no concrete proposals have emerged. Meanwhile, some state agriculture departments are exploring incentive programs for heifer retention, but the scale of these initiatives remains small compared to the challenge.

Three Different Worlds Emerging

What’s really interesting—and I’ve been watching this develop over the past year or so—is how the industry’s basically splitting into three completely different business models.

The Big Operations (Your “Fortress Farms”)

These 1,500 to 5,000-cow dairies have basically built moats around their businesses. They’re conducting genomic testing on every single heifer through programs like Zoetis’ CLARIFIDE Plus, utilizing AI-powered systems like DairyComp for informed decision-making. According to the Penn State Extension’s 2025 component premium tracking, they’re achieving component premiums that add $1.50 to $2.50 per hundredweight.

Large Midwest operations I’ve talked with are reporting revenue per cow that’s approaching $6,000 to $7,000—numbers that would’ve been fantasy five years ago. They’re generating base milk revenue in the millions, plus substantial component premiums, and nearly a million dollars from beef calves in some cases.

What’s interesting here is something I noticed visiting a couple of these operations recently: they’re not just bigger—they’re fundamentally different businesses. One manager showed me their real-time component monitoring system. “We know within 0.1% what our butterfat’s gonna test every single day,” he said. “That consistency is worth an extra $750,000 a year to us.”

It’s worth noting that these operations are also exploring emerging technologies. Embryo transfer programs, automated calf feeding systems, precision nutrition through AI…they’re positioning themselves for whatever comes next. Some are even experimenting with automated milking systems that can handle 500-plus cows, completely changing labor dynamics.

The Strategic Middle

This is where it gets interesting for those with 200-500 cows. According to the USDA’s organic dairy market reporting, they’re finding ways to make it work through specific niches. Organic products typically sell for $7-12 more than conventional ones. University of Wisconsin extension studies on pasture-based dairy show grazing systems are cutting costs by 30-50%. Some are going direct-to-consumer and getting $4 more per gallon.

I visited an organic operation in Vermont last month, which had transitioned to organic in 2022, with 280 cows. The producer told me she’s actually more profitable now than when she had 350 conventional. The premium’s real—she’s averaging about $9.50 over conventional—and her vet bills dropped 40%.

Out in California, there’s a different approach. One Jersey producer with about 450 cows is locked into a specialized cheese contract. Between base and components, he’s getting close to $24.50 when commodity milk’s at $21. On 10 million pounds, that $3.50 spread is…well, you can do the math.

Down in Georgia—and this is something you don’t hear much about—a 300-cow operation switched to A2A2 milk production exclusively. They’re selling direct to Atlanta-area health food stores at premium prices. “It’s niche as hell,” the owner admits, “but it works for us.”

The Ones Choosing to Exit

Then there are the operations using these high cattle prices as their exit opportunity. After a decade of barely hanging on, they’re done—and honestly, who can blame them?

I caught up with a couple who recently sold their 185-cow place in Wisconsin. After accounting for debt service, living expenses, and reinvestment, they were netting maybe $18,000 a year for 70-hour weeks. Now they’ve got a solar lease on the land, bringing in $52,000 with zero labor. Can’t really argue with that decision.

 Industry Darwinism – Only 20% of small farms will survive the heifer shortage, while 95% of large operations thrive – consolidation is accelerating

Global Perspective: How Other Countries Face Similar Dynamics

What’s fascinating is seeing how this isn’t just a U.S. problem. The European Union’s dealing with their own version of this crisis, though for different reasons. Environmental regulations and nitrogen limits are forcing Dutch and German producers to reduce herd sizes, just as their processing sector has expanded to meet export market demands. According to European Dairy Association reports, EU milk production is expected to decline 1.5% annually through 2027.

New Zealand’s taking a different approach. Fonterra’s latest annual report shows they’re actually encouraging farmers to reduce production intensity and focus on value-added products. Their winter milk premiums now exceed NZ$11 per kilogram milk solids—that’s roughly equivalent to a $7/cwt premium in U.S. terms—specifically to maintain year-round supply for their specialty ingredient plants.

Brazil and India, meanwhile, are ramping up production. Brazil’s domestic consumption is growing at a rate of 3% annually, and the country is investing heavily in genetics and infrastructure. India’s cooperative model—completely different from ours—is actually expanding smallholder participation. It’s a reminder that there’s more than one way to structure a dairy industry.

What’s interesting is watching how other countries handled similar situations. Dairy Australia’s market analysis shows that in 2023, when their production hit 30-year lows, processors like Goulburn Valley Creamery started paying AUS$9.70 per kilogram milk solids—equivalent to about $28 per hundredweight U.S.—just to keep smaller farms from shutting down. We’re starting to see hints of that in the Upper Midwest—smaller co-ops offering bonuses that weren’t on the table two years ago.

Why Some Regions Are Winning While Others Lose

The shortage’s not hitting everywhere the same. USDA’s January 2025 cattle report shows Wisconsin actually added 10,000 replacement heifers last year. Meanwhile, Kansas dropped 35,000, Idaho lost 30,000, and Texas shed 10,000.

Why the difference? Extension specialists at UW-Madison point to several factors. It’s partly infrastructure, partly processor relationships, but mostly it’s about positioning. Wisconsin cheese plants require consistent, high-quality milk, and they’re willing to pay for it. They’re offering retention bonuses, multi-year contracts—things that make raising heifers actually pencil out.

Down in Texas, it’s brutal. One producer recently told me that he paid $4,200 per head for bred heifers from Wisconsin, plus an additional $380 each for trucking. “It hurt,” he said, “but dropping our ship volume would’ve cost us our quality premiums. That’s $140,000 gone.”

Out in the Mountain West states—Colorado, Wyoming, parts of Montana—they’re dealing with different challenges. Water rights, urban expansion, and feed costs… it’s pushing many smaller operations out. One Colorado producer told me, “Between Denver sprawl and water restrictions, we’re done in five years regardless of heifer prices.”

The “Obvious” Solution That’s Actually a Trap

You’d think with heifers at $4,000, somebody would be raising extras to cash in. Spend $2,400 raising them, pocket $1,600 profit. Simple, right?

Not really. The heifer management experts at UW-Madison have thoroughly reviewed this. First problem: mortality. The USDA’s 2022 Dairy Cattle Management Practices study shows you lose about 21% of heifers from birth to freshening when you factor in all causes of mortality and culling. So that $2,400 cost becomes over $3,000 per surviving heifer.

Then add labor—extension economists calculate $400-600 per head through freshening. Feed costs can fluctuate by $400 based solely on corn prices—we’ve seen a variation of $2.80 per bushel over the past 18 months. And you’re making a 24-month bet with no way to hedge the price risk.

As one extension specialist explained, “The only people successfully raising heifers for sale have paid-off facilities, family labor, and grow their own feed. That’s not a business model most can replicate.”

Industry Response: Fragmented Approaches to a Systemic Challenge

You’d think there’d be some coordinated response, but…not really. The National Milk Producers Federation has been discussing the situation, but they’re mostly focused on data collection and suggesting best practices. No real market intervention, though they are exploring potential policy recommendations for the next Farm Bill discussions.

Some cooperatives are exploring different approaches to help members finance replacement raising, though the details vary significantly by region. But as one board member mentioned in a recent meeting, the scale of what’s needed versus what’s being offered is pretty mismatched. We need hundreds of thousands, not tens of thousands, of additional heifers.

What’s encouraging is seeing some innovation at the regional level. A group of farms in Minnesota formed what they’re calling a “heifer pool”—basically sharing genetics and breeding decisions to optimize replacement production across multiple operations. It’s early days, but the concept’s interesting.

Meanwhile, some states are getting creative. Pennsylvania’s Department of Agriculture is piloting a heifer retention incentive program, offering $200 per head for farms that increase replacement numbers. It’s small—only $2 million allocated—but it’s something.

2027: The Year Everything Changes

Based on everything I’m hearing from processors, economists, and producers—plus what we’re seeing in reports from CoBank and Rabobank’s latest dairy quarterly analysis—here’s what’s probably coming:

Milk prices will diverge significantly regionally—possibly $3-5 per hundredweight between shortage and surplus areas. I’m already seeing it start. Some cooperatives in Texas are offering $2.40 location premiums for new farms near their plants.

Industry analysts suggest that processing plants will operate at 72-76% capacity, rather than the 85-90% required for profitability. Smaller regional processors will either close or get bought for significantly less than their construction cost. As one former cheese plant executive explained to me, “The consolidation is coming, it just hasn’t started yet.”

Heifer prices are likely to peak around $4,200-$4,800 in early 2027, based on historical price patterns from similar periods of shortage. They will then moderate back to $3,800-$ 4,200 as more sexed semen is used and the supply improves slightly.

According to NAAB’s projections, beef-on-dairy sales are expected to decline slightly—possibly to 6.5-7 million unitsfrom the current 7.9 million—but they are unlikely to return to pre-2020 levels. As one large-herd manager put it, “Once you’ve built those calf buyer relationships and you’re getting $1,000 to $1,400 per head, you don’t just walk away.”

The Human Cost We’re Not Calculating

What gets lost in all these numbers is what this means for actual people. Back in 2018, Agri-Mark started including suicide prevention hotline numbers with milk checks after losing three members to suicide, as documented in their member communications. The CDC’s 2020 Morbidity and Mortality Weekly Report shows farmers have the highest occupational suicide rate in America—43.7 per 100,000 workers, over 3 times the general population.

When 10-15% of dairy operations close over the next decade—that’s 2,400 to 3,700 families based on current USDA numbers—we’re not just losing businesses. These are communities that have been built around dairy farming for generations.

Researchers studying farmer mental health, such as those at the University of Illinois’ Agricultural Safety and Health Program, have found that after a decade of financial stress, decision-making processes undergo fundamental changes. As one researcher explained, “These aren’t people making strategic business decisions anymore. They’re making survival decisions from a place of chronic stress.”

I see it visiting farms. The producer who won’t look you in the eye when money comes up. The couple who stopped talking about succession because their kids made it clear they’re not coming back. The neighbor who sold out and now won’t answer calls because the shame’s too heavy.

That’s the real cost we’re not calculating.

Your Survival Playbook for the Next 18 Months

Look, every operation’s different, but here’s what seems to make sense based on what I’m seeing:

If You’re Under 200 Cows

Be honest about whether this still works for you. I know that’s hard, but extension economists have shown pretty clearly that the economics are brutal at this scale unless you’ve got a real niche.

If you’re staying, pick your lane now. Organic certification takes three years, but it adds significant premiums, according to USDA data. Grass-fed certification is faster. Direct sales need the right location. However, you have to pick one and commit to it completely. Half-measures don’t work anymore.

Consider teaming up with neighbors. I’m seeing more informal cooperatives forming—sharing equipment, coordinating breeding, even pooling milk for better bargaining power. It’s worth exploring.

If You’re 200-500 Cows

This is your moment to choose. The middle ground’s gone.

Invest smart. Extension research indicates that testing the top 30% of animals genomically costs approximately $3,000-$ 4,000 per year, but can significantly advance your genetics. Activity monitors from companies like SCR by Allflex run $150-200 per cow, but their field data shows conception rate improvements of 8-12%.

Build relationships with your processor now. The farms that’ll get premiums when things get crazy in 2027 are the ones building trust today. Consistent quality, reliable volume, good communication—that’s what processors are looking for.

And keep beef breeding at a maximum of 35-40%. Yeah, those $1,000-plus checks are nice, but you need flexibility when markets shift.

If You’re Over 500 Cows

Focus on component consistency. Penn State’s data show that farms with less than 2% daily variation are earning significant premiums—$375,000 to $750,000 annually on 50 million pounds of product.

Test everything genomically. University research consistently shows that herds testing all their females make genetic progress over twice as fast. At $40 per test, it pays for itself quickly through increased production efficiency.

Be ready to expand strategically when neighbors exit. But like one Idaho dairyman told me, “Don’t expand just because you can. Expand because it makes your operation better.”

What This All Really Means

We’re sitting at 3.914 million heifers—the lowest since 1978, according to the USDA—with 800,000 fewer expected to arrive before anything improves, based on CoBank’s modeling. We’re not going back to the dairy industry we knew.

What started as desperate survival with beef-on-dairy has triggered a complete restructuring. When cattle revenue reaches 16% of farm income, according to USDA ERS data, and large operations capture premiums that smaller farms cannot match, when $10 billion in processing investment faces milk shortages nobody predicted—this is creative destruction happening in real-time.

What’s emerging isn’t necessarily better or worse; What’s emerging isn’t necessarily better or worse. It’s fundamentally different.. The broad middle that defined dairy for generations is disappearing, replaced by high-tech large operations and strategic niche players.

The decisions you make in the next 18-24 months about breeding, technology, and positioning will determine not just profitability but survival. There’s opportunity in this chaos, but only if you recognize the game has completely changed.

The heifer shortage isn’t the crisis. It’s the catalyst exposing a transformation that was always coming. The question now is whether you’re positioned for what’s next or still trying to preserve what was.

KEY TAKEAWAYS: 

  • The Numbers: 3.9 million heifers (lowest since 1978) with 800,000 fewer coming by 2027—yet farmers won’t stop breeding beef because it’s now 16% of revenue vs 6.7% in 2020
  • The Collision: $11 billion in new processing capacity built for 2-3% growth will get 0.4%—expect plant closures and $3-5/cwt regional price swings by 2027
  • Your 18-Month Strategy: Scale to 1,500+ cows for premiums | Find your niche at 200-500 (organic/A2A2/grass-fed) | Exit under 200 while cattle prices are high

Complete references and supporting documentation are available upon request by contacting the editorial team at editor@thebullvine.com.

Learn More:

The Sunday Read Dairy Professionals Don’t Skip.

Every week, thousands of producers, breeders, and industry insiders open Bullvine Weekly for genetics insights, market shifts, and profit strategies they won’t find anywhere else. One email. Five minutes. Smarter decisions all week.
NewsSubscribe
First
Last
Consent

Why 90% of Midwest Farms Will Dump $20,000 of Milk by 2030 – And how $63/Cow Prevents It

What farmers are discovering about climate-driven contamination: Prevention protocols cost $63 per cow annually, but crisis response wipes out six months of profit margins at $128 per cow in just one week

EXECUTIVE SUMMARY: What farmers are discovering across the Midwest is that aflatoxin contamination—long considered a southern problem—is heading north faster than most operations are preparing for it. Michigan State’s climate research shows nearly 90% of corn-growing counties will experience increased contamination by the 2030s, putting thousands of dairy farms at risk of dumping milk worth $20,000 or more per incident. Here’s what’s particularly concerning: processors are already segmenting their supplier base into premium and commodity tiers based on contamination control protocols, with a $2-4 per hundredweight difference that could mean $30,000-50,000 annually for a mid-sized operation. The math on prevention is surprisingly straightforward—at $63 per cow annually (approximately $9,475 for a 150-cow herd)—implementing testing and mycotoxin binders costs less than half what a single seven-day contamination event would. Research from land-grant universities suggests these binders often pay for themselves through improved butterfat tests and reduced fresh cow problems, even without contamination events. Looking ahead, farms that establish laboratory relationships and testing histories now will have market access when processors implement mandatory requirements… while those waiting until 2029 face the prospect of losing premium markets before they can even get test results. The choice is becoming clearer every month: invest in prevention on your timeline, or scramble for solutions when your processor gives you 72 hours to prove control.

Dairy Aflatoxin Prevention

You know, I was at a nutrition conference in Madison last month, and I heard the same thing from just about every producer there—”aflatoxin is a southern problem, we don’t deal with that here.”

That confidence? It could become an expensive lesson for thousands of us.

What really caught my attention recently was news from international dairy markets, where contamination events have been hitting major processors—companies with all the quality systems one’d expect. They’re finding aflatoxin M1 in products that passed multiple checkpoints. Every sample exceeds what Europe allows.

And it’s reaching consumers anyway.

What’s worth understanding is the research Dr. Felicia Wu’s team published in Environmental Research Letters in May 2022. They used 16 different climate models to project aflatoxin expansion, and here’s what they found—nearly 90% of corn-growing counties across the Midwest are going to see increased contamination by the 2030s. We’re not talking about a few hot spots here and there. This represents a complete geographic shift northward into regions where most of us have never even tested for the stuff—from Wisconsin to Michigan, Ohio to Pennsylvania, Minnesota to Iowa.

And for those of you milking in New York or Vermont? The eastern dairy regions are seeing similar projections according to the same climate models. Vermont’s roughly 600 dairy operations could face similar challenges to those being addressed in the Midwest. Michigan’s concentrated dairy areas around Allegan and Ottawa counties? They’re right in the expansion zone, too.

The Market Split That’s Already Happening

I’ve been closely watching processor requirements for the past few years, and something interesting is emerging that most people haven’t yet caught on to. The milk market’s basically splitting in two, and the gap’s getting wider every month.

If you pull up the supplier handbooks from any of the big players—Organic Valley, Horizon, even some regional co-ops—you’ll see what I mean. Farms shipping to export programs or premium organic brands? They’re playing by one set of rules. Everyone else? Completely different game.

Here’s what the premium side looks like these days, based on processor documentation:

  • Monthly bulk tank testing for aflatoxin M1
  • Feed protocols that get audited every year
  • Can’t go above 50 parts per billion—that’s matching EU Regulation 165/2010
  • Mycotoxin programs with third-party verification
  • Getting paid $2 to $4 more per hundredweight, according to recent USDA Agricultural Marketing Service data

And then there’s the commodity side:

  • No required testing at the farm level per FDA Compliance Policy Guide 527.400
  • Feed documentation is optional
  • FDA’s action level sits at 500 parts per billion—ten times higher
  • No mycotoxin requirements
  • Base pricing, and you’re first to get cut when there’s too much milk

A quality manager at one of the Wisconsin cooperatives—speaking on condition of anonymity—told me they started segmenting their suppliers about three years ago. “The farms with testing history they get first dibs on premium programs. Everyone else is commodity-only, and it’s getting really hard to move up once you’re in that category.”

What’s interesting is that this mirrors what Italian researchers documented in the journal Toxins back in February 2023. They analyzed almost 96,000 milk samples between 2013 and 2021, achieving 98.6% compliance with EU standards. But here’s the thing—they only got there by testing everything and taking immediate action when problems showed up. The farms that couldn’t keep up lost their export access for good.

I’ve noticed even smaller regional processors are getting on board. Several cheese plants in the Midwest are starting enhanced testing requirements in 2026, according to their published supplier notifications.

Now, for those of you running organic operations—here’s something you might not realize. Many organic certifications require testing for aflatoxin B1 in feed, but not necessarily M1 in milk at EU levels. Worth checking your specific certification requirements because processors are starting to look beyond just the organic label.

Why This Isn’t Like Other Feed Problems

You know, I’ve watched producers handle feed issues for decades, and most of us treat aflatoxin like we’d handle moldy silage or wet hay—something to manage when it shows up. But after talking with nutritionists across the region, that’s really the wrong way to think about it.

Consider how we normally handle feed problems. Moldy silage? We decide how much to feed and may add some yeast culture. Bad hay from that late cutting? We supplement around it. Wet corn from a rainy harvest? We monitor the heating process and may add some propionic acid. These are all decisions we control. Our cows, our management, our call.

Aflatoxin’s completely different. The moment your processor finds contamination above their limit—and according to National Milk Producers Federation data from 2024, they’re testing more frequently now—you’re done shipping milk. Not slowed down. Done.

A dairy nutritionist working with farms across Wisconsin, Minnesota, and Iowa—who requested anonymity due to client relationships—shared a recent case. “We had a farm with 15 years of perfect quality records, hit 75 ppb AFM1. That’s below FDA limits but above EU standards. Lost their premium market instantly. Took over a year to qualify again. For a 200-cow operation, that’s easily $45,000 gone.”

And here’s what makes it particularly tricky—USDA Grain Inspection, Packers, and Stockyards Administration’s 2024 annual report shows that black light screening at grain delivery catches roughly half of the contaminated loads—though this varies quite a bit depending on the contamination levels and who’s conducting the inspection. The other half gets through because contamination concentrates in specific areas, or hot spots. Research from Iowa State University Extension on grain quality confirms that just five contaminated kernels per million can push a load over FDA action levels.

For those of you with pasture-based operations, thinking you’re safe—drought-stressed pastures can develop aflatoxin-producing molds too. Nobody’s immune from this.

What This Actually Costs (I Did the Math)

Let me break down real numbers based on what we’re seeing right now with recent Class III pricing averaging around $18.40 per hundredweight. I’ve cross-referenced these against current supplier catalogs and the actual payments producers are making.

The economics are stark: $63 per cow annually for prevention versus $128 per cow for just one week of crisis response—and that’s before counting lost premium market access worth $30,000-50,000 annually

For a typical 150-cow herd producing 65 pounds per cow daily:

Annual prevention costs:

  • Monthly bulk tank testing (12 samples at $50 based on Marshfield Labs pricing): $600
  • Rapid test strips for grain (about 200 tests at current Charm Sciences rates): $1,400
  • Mycotoxin binders all year (using standard 100g/head/day inclusion): $5,475
  • Annual audit from an ISO-certified lab: $2,000
  • Total: $9,475 (that’s $63 per cow annually)

One contamination event based on current milk pricing:

  • Seven days of dumped milk (9,750 lbs/day × 7 × $18.40/cwt): $12,558
  • Emergency feed replacement at typical 30% drought premiums: $3,200
  • Rush laboratory testing (HPLC confirmation from accredited lab): $1,500
  • Consultant support for crisis response: $2,000
  • Total: $19,258 (that’s $128 per cow for just one week)

But here’s what’s really interesting—research published in the Journal of Dairy Science has shown mycotoxin binders can improve milk production during low-level contamination periods. Multiple studies report increases of 3-7 pounds per day. At current prices, that production boost often covers much of the binder cost.

Here’s what most nutritionists won’t tell you upfront: mycotoxin binders typically pay for themselves through improved production and butterfat—before you even count contamination prevention, turning a $5,475 cost into an $8,924 benefit

The bigger operations—those 500-cow dairies you see around Wisconsin and Ohio—they get even better economics. Prevention costs drop to around $45 per cow through bulk buying agreements, but crisis costs remain at $125 to $ 140 per cow. You’re still dumping the same percentage of your milk.

Dairy nutrition researchers at land-grant universities have consistently found that mycotoxin binders offer benefits beyond just contamination control. According to the University of Wisconsin Extension’s 2024 dairy nutrition guidelines, “We often see better butterfat tests, usually up a tenth or two, and fewer fresh cow metabolic problems. The prevention often pays for itself even without contamination events.”

When This Hits Your Region

Michigan State’s climate research used the same models NOAA relies on to map out where contamination’s heading. And based on their projections published in 2022, it’s coming faster than most of us realize.

Michigan State’s climate models show aflatoxin contamination expanding from occasional southern droughts to routine problems across 89.5% of Midwest corn counties by 2034—transforming a regional issue into an industry-wide crisis

Currently, through 2027, Southern Illinois and Indiana experience problems during drought years—we saw this in 2023. Most operations north of I-70 haven’t experienced it yet. Although extension agents in southern Ohio report that they’re starting to see occasional positives during extremely dry periods.

2028-2030: The problem shifts north. Southern Wisconsin—the Monroe and Janesville areas—plus most of Iowa and northern Illinois, start seeing contamination every few years. University of Minnesota Extension modeling from their 2024 climate adaptation report suggests that what used to occur once in 20 years now happens once in three.

2031-2033: This is when the models indicate real expansion. Central Wisconsin’s dairy country, Minnesota’s concentrated production areas, Michigan’s agricultural zones, Ohio’s dairy regions—they’ll see contamination approaching what Kentucky experiences today.

2034 and beyond: It becomes routine across nearly 90% of Midwest corn counties, according to the Michigan State projections. Processors won’t have a choice—they’ll require testing because they can’t absorb the liability of contaminated milk.

Kansas State University agricultural economists have calculated that significant economic impacts are coming. Their recent outlook estimates regional losses could increase 5- to 8-fold by the mid-2030s based on contamination modeling.

The USDA Economic Research Service documented over $1 billion in agricultural losses from the 2012 drought, with mycotoxin contamination representing a significant component according to their published analysis. That event was supposed to be once in 20 years. Current climate patterns suggest it could become an every-other-year occurrence in some regions by 2030.

As for insurance, from what insurance professionals are telling us, most standard dairy policies exclude mycotoxin contamination unless you purchase specific riders. And those premiums? They’re reflecting the increasing risk.

What Recent Contamination Events Teach Us

Recent international contamination events offer important lessons. Even operations with comprehensive quality systems—such as ISO certifications, laboratory access, and corporate protocols—have had contaminated products reach consumers.

In one recent case, inspectors found no critical violations during routine facility audits. The contamination was only detected through targeted product testing. Multiple batches of children’s products failed EU standards despite passing earlier checkpoints.

What went wrong? Industry analysts suggest that the same issue threatening Midwest operations—reliance on spot checks instead of systematic monitoring —also applies. Each checkpoint appeared fine because continuous aflatoxin testing was not a standard protocol.

Now imagine that scenario across hundreds of Midwest farms during a drought summer in, say, 2031. Processors can’t handle dozens of simultaneous contamination cases. Based on how processors handled the 2012 drought surge—according to those who lived through it, their experiences reveal a great deal—they’ll likely implement rapid decision protocols. Prove you’ve got control within 72 hours or face suspension.

Getting Started Based on Your Size

Different-sized operations need different approaches, but everyone needs to start building infrastructure before contamination becomes routine.

Under 150 cows:

Keep it simple at first. Rapid test kits from established suppliers, such as Charm Sciences or Neogen, typically cost around $200 for starter kits. Test your next five corn deliveries—it takes about five minutes per test. If everything’s clean, you’ve spent less than your monthly DHIA bill, confirming you’re okay. If something tests positive, you’ve potentially saved yourself months of lost income.

Consider teaming up with neighboring farms. State dairy organizations in Wisconsin (Professional Dairy Producers), Minnesota (Milk Producers Association), and Pennsylvania (Center for Dairy Excellence) have been facilitating group purchasing agreements for testing supplies and consultant services since 2024. Several producer groups report successful cost-sharing arrangements for testing equipment.

150 to 400 cows:

This is actually a sweet spot for implementing full prevention protocols. You’re big enough to justify dedicated equipment but nimble enough to change quickly.

Start monthly bulk tank testing immediately. Regional laboratories, such as Marshfield Labs in Wisconsin, MVTL in Minnesota, or the Pennsylvania Animal Diagnostic Laboratory, can provide this service. You need that testing history before processors start requiring it. Add mycotoxin binders to your standard ration—commercial mycotoxin surveys suggest the production response typically covers 70-80% of the cost, even without contamination events.

Over 500 cows:

Larger operations have significant advantages here. Prevention represents less than 1.5% of your typical feed budget according to the University of Wisconsin’s 2024 annual farm financial summary. The real risk isn’t the cost—it’s being the last major operation in your milkshed to implement protocols.

Consider becoming a regional leader in contamination control. Several larger Wisconsin and Ohio operations have successfully piloted testing programs with their processors, positioning themselves as preferred suppliers for premium programs. Some are even helping smaller neighboring farms implement protocols through equipment sharing or group purchasing.

The 72-Hour Rule That Changes Everything

Here’s what most producers don’t understand about processor decision-making during contamination events. When it involves one or two isolated cases, processors typically work with the affected farms for weeks to identify and correct the problems. The major cooperatives all have similar protocols for isolated incidents.

But when contamination becomes widespread? Everything changes.

A procurement manager at a major Midwest cooperative—speaking about their experience during the 2012 drought—explained: “We had 15 farms test positive in 10 days. Our quality team couldn’t handle individual investigations. We implemented a 72-hour rule based on that 2012 experience—provide documented corrective action and clean test results within three days or face suspension.”

This is where preparation becomes critical. Farms with established laboratory relationships—those that send monthly samples, maintain accounts, and know the staff—can often achieve a 24-hour turnaround, even during surge periods. New customers? According to the American Association of Veterinary Laboratory Diagnosticians’ 2024 capacity survey, they face delays of two to three weeks when demand spikes.

The math simply doesn’t work. Processor demands results in 72 hours. Laboratory says 14 days for new accounts. You lose premium market access before test results even arrive.

Where to Invest First

Based on what successful early adopters have shared, here’s a practical implementation sequence:

This month ($2,000-3,000):

  • Order rapid test strips from established suppliers
  • Set up accounts with accredited laboratories now
  • Begin baseline bulk tank testing to establish your clean history
  • Start documenting feed deliveries—even smartphone photos with timestamps help

Next 3-6 months ($5,000-8,000):

  • Implement systematic feed testing protocols
  • Add mycotoxin binders, working with your nutritionist on inclusion rates
  • Expand laboratory testing frequency
  • Schedule conversations with your processor about future requirements

By year’s end ($8,000-12,000):

  • Complete third-party audit from an ISO-certified provider (you can find auditors through the American National Standards Institute directory or your state’s quality certification programs)
  • Upgrade documentation systems for better traceability
  • Establish crisis response fund (minimum $20,000 recommended)
  • Build relationships with alternative market outlets

Total investment over 12 months: $15,000-23,000

Compare that to one contamination event, at a minimum of $19,000, plus the potential loss of premium market access worth $30,000-$50,000 annually for a mid-sized operation.

Questions for Your Processor This Week

Most producers don’t know what to ask until it’s too late. Here are the critical questions:

What are your current AFM1 testing requirements for premium programs? How much advance notice will we receive before requirements change? What documentation do you need for contamination control verification? Which laboratories do you accept for official testing? What’s your specific protocol and timeline if contamination is detected?

Get these answers in writing. Email your field representative today—seriously, this conversation can’t wait.

The Seasonal Pattern Worth Understanding

Dairy nutrition specialists consistently point out that aflatoxin risk peaks during late summer through fall harvest, especially following drought stress. From September to November, corn typically shows the highest contamination risk, according to multi-year USDA grain inspection data.

Smart operations adjust their testing frequency seasonally—doubling tests during high-risk months, then scaling back in winter and spring. It makes economic sense to focus prevention resources when risk is highest.

Several states, including Illinois and Iowa, are developing aflatoxin monitoring programs through their extension services, though funding remains limited so far.

Making Your Decision

Considering everything—recent international contamination events, Michigan State’s peer-reviewed climate projections, and processor requirements already being implemented—the path forward is becoming clearer.

If you’re skeptical about climate projections, that’s understandable. But processors aren’t skeptical. They’re implementing testing requirements now based on risk assessments. Even if your specific farm never sees contamination, lacking documented protocols will exclude you from premium markets.

If you’re concerned about costs, run your own numbers. Seven days of production multiplied by current milk prices equals your minimum crisis cost. Add lost premium access, and you’re looking at months of profit margins eliminated. Prevention—at $9,475 annually for a 150-cow herd—costs less than half what a single contamination event would.

If you think there’s time to wait, consider that laboratory relationships take months to establish. Testing histories require 12-24 months to build. Premium programs often have waiting lists. Starting in 2029, when contamination becomes routine, means you’re already years behind.

If you’re ready to move forward, start this week. Order test strips from reputable suppliers. Contact three laboratories about their services. Schedule that processor meeting. Small steps compound into comprehensive protection.

The producer who told me aflatoxin’s “a southern problem”? He’s right about today. But Michigan State’s research—16 climate models all pointing in the same direction—shows that by 2030, southern problems become Midwest realities. Whether you’re milking in Wisconsin, Iowa, Ohio, Pennsylvania, Michigan, New York, Vermont, or anywhere between.

What is the difference between operations that thrive through this transition and those that struggle? About $63 per cow annually for prevention—yes, that’s $9,475 for a 150-cow operation, but spread across your annual production, it’s manageable.

That’s less than treating one displaced abomasum. It’s a fraction of your monthly fuel costs. And it’s minimal compared to the market access you’re protecting.

Climate patterns are shifting whether we’re ready or not. Processors won’t wait for stragglers. That 89.5% probability across Midwest counties isn’t a maybe—it’s a timeline that’s already in motion.

The only real question is whether you’ll build your prevention system on your schedule over the next 18 months, with time to optimize and establish relationships, or on your processor’s timeline in 72 hours while your milk truck’s being turned away.

One approach costs $63 per cow annually, with time to implement it properly. The other costs $128 per cow in just one week while you’re dumping milk and scrambling for solutions.

The math’s straightforward. The choice should be too. But from what I’m seeing across the industry, most operations are choosing to wait.

That could become an expensive lesson.

KEY TAKEAWAYS

  • Prevention delivers 3:1 return on investment: Annual prevention costs of $63/cow protect against weekly crisis costs of $128/cow, plus mycotoxin binders typically improve milk production by 3-7 pounds daily and boost butterfat tests by 0.1-0.15 points
  • Start testing protocols immediately for smaller operations: Farms under 150 cows can begin with $200 rapid test kits from Charm Sciences or Neogen, testing five corn deliveries monthly—costing less than your DHIA bill while establishing the clean history processors will require
  • Premium market access depends on documentation starting now: Processors are already paying $2-4/cwt more for farms with established testing histories, and building the required 12-24 month documentation takes time you can’t make up during a crisis
  • Regional timing varies, but preparation doesn’t: Southern Wisconsin and Iowa see contamination by 2028-2030, while Michigan and Ohio follow by 2031-2033—but laboratory relationships and prevention protocols need 18 months to establish, regardless of location
  • The 72-hour processor rule changes everything: During widespread contamination events (like the 2012 drought), processors demand clean test results within three days while new laboratory customers face 14-day waits—making advance preparation the difference between keeping and losing market access

Complete references and supporting documentation are available upon request by contacting the editorial team at editor@thebullvine.com.

Learn More:

The Sunday Read Dairy Professionals Don’t Skip.

Every week, thousands of producers, breeders, and industry insiders open Bullvine Weekly for genetics insights, market shifts, and profit strategies they won’t find anywhere else. One email. Five minutes. Smarter decisions all week.

NewsSubscribe
First
Last
Consent

From 4-H Project to 20 All-Americans: The 28-Year-Old Proving Your Succession Plan Is Already Dead

This 28-year-old started with his grandfather’s teachings and one 4-H calf. Today, Tyler Woodman runs two farms, but more importantly, he’s teaching the next generation what we’ve forgotten.

Jim Strout’s voice cut through the mechanical rhythm of the feed mixer somewhere in the middle of morning chores. Tyler Woodman – the kind of guy who’s been working cattle since before he could drive – wedged his phone against his shoulder, silage dust coating everything, that sweet-sour smell of fermented corn mixing with the October morning fog rolling off the Connecticut River.

“Tyler, you sitting down?” Strout asked.

Woodman laughed. Who sits down when you’re feeding 400 head across two farms before most people’s first alarm goes off?

“I had no idea what was coming,” Woodman recalls, still sounding genuinely surprised months later. Here’s a guy who’d been up since 4:30, checked his Alta NEDAP NOW app while the coffee was brewing, reviewed alerts for both Mapleline’s Jerseys and neighboring Devine Farm’s Holsteins, moved fresh cows, and was halfway through morning feed… and he’s about to learn he’s won the 2025 Richard Caverly Memorial Dairy Award.

The moment that sparked a conversation: Tyler Woodman accepts the 2025 Richard Caverly Memorial Dairy Award at World Dairy Expo. But as the article argues, this isn’t just a feel-good story—it’s a critical look at the future of dairy succession.

Look, I’ll be straight with you – this isn’t just another feel-good story about a young farmer getting recognized. This is about something bigger. According to the latest Census data, we lost 39% of dairy farms between 2017 and 2022, went from 40,336 to just 24,470 operations. Meanwhile, 83.5% of family farms won’t make it to the third generation. Tyler Woodman represents exactly what we’re losing. And that should scare the hell out of every one of us still milking cows.

The Sandy Lineage: When a 4-H Project Becomes a Dynasty

Woodman-Farm MadMax Sandy EX-94 5E: The 13-year-old matriarch who launched Tyler Woodman’s dynasty. This cow, his first 4-H project, proves that true breeding excellence comes from understanding cow families, not just chasing fleeting trends.

Here’s the thing about breeding excellence that nobody wants to admit… it doesn’t happen by accident, and it sure doesn’t happen overnight.

Woodman’s foundation traces back to a cow most people would’ve shipped years ago. Woodman-Farm MadMax Sandy – turning 13 this December, still scoring EX-94 5E, still throwing daughters that make you stop and look twice – came from River-Valley Tri-P Secret. That was Tyler’s first 4-H project back when he was just a kid in New Hampshire trying to figure out why some cows just looked right and others didn’t.

“Sandy has always been special,” Woodman says, and you can hear something in his voice that every real breeder understands. Seven daughters on the ground, three milking daughters all scored excellent, granddaughters selling from Vermont to Wisconsin. You know what this is? This is what happens when you actually understand cow families instead of just chasing whatever bull everyone’s pushing this month.

Proof that a teenager’s vision can outperform industry trends. Woodman-Farm Burdette Victoria Secret EX-94 3E, a daughter of Sandy, is a two-time All-American nominee—the direct result of a mating decision Tyler Woodman made when he was just starting out.

Victoria Secret – one of Sandy’s daughters from a Burdette x MadMax cross that Woodman made when he was barely old enough to understand progeny proofs – was a two-time All-American nominee, most recently scoring EX-94 3E. Let that sink in. A mating made by a teenager is now producing cows that stop traffic at Expo.

The Genomic Revolution Nobody’s Talking About (But Everyone Should Be)

Let me paint you a picture of where we’re at in October 2025…

The industry’s generated $4.28 billion – that’s billion with a B – in cumulative economic impact from genomic testing since 2010. Annual genetic gains jumped from $37 to $85 per cow. That’s a 129% acceleration, folks. And yet… walk into any sale barn from here to California and half the guys there still think genomics is some fancy nonsense for the mega-dairies.

Woodman doesn’t buy into that old-school BS. “I have always been known to use milk bulls on my type cows and type bulls on milk cows,” he explains, like he’s talking about the weather. That breeding strategy sounds backward until you see the results walking around his barn.

Richard Caverly – God rest his soul – understood this before most of us could even spell genomics. He was pushing Ayrshire breeders to embrace testing when everyone else was clutching their paper pedigrees like they were the Ten Commandments. One time, Woodman had tested an animal for sale, and Caverly reached out immediately. Recognized the cow family from some herd in rural New England that had dispersed years earlier. That’s the power of combining old knowledge with new technology.

The April 2025 base change has already taken effect, and yes, it has made every animal look worse on paper, even though they’re genetically superior to what we had five years ago. If you’re not using this data, you’re essentially breeding blind while your neighbors are using night vision goggles.

WOODMAN’S GENOMIC SELECTION CHECKLIST (What He Actually Does, Not Theory)

  • Test every heifer calf at 2 months – earlier is better, always
  • Look for +150 Net Merit minimum – anything less goes to beef breeding
  • Check health traits first, production second – sick cows don’t pay bills
  • Cross-reference with actual dam performance – genomics lie sometimes
  • Use outcross bulls on high genomic heifers – heterosis still matters
  • Keep detailed records on every mating – memory fails, spreadsheets don’t

The Eastern States Revelation

Sometimes the moments that shape us come when we least expect them. For Woodman, it happened in the cattle barn at Eastern States – you know, that old building where the roof leaks every time it rains, but the acoustics are perfect for hearing a good cow bellow.

Picture this: young Tyler, still trying to build his show string, stops to admire some mature Ayrshire milk cows. The cow that caught his eye was a mature Ayrshire that, years later, he’d realize was connected to the legendary Sweet Pepper Black Francesca, a cow Caverly himself had developed. This older guy starts talking to him about the cows, really getting into the details about balance and dairy strength…

That stranger was Richard Caverly. Caverly worked with household names in the industry: Gold Prize, Nadine, Melanie, Delilah, Ashlyn, Victoria, Veronica, and Frannie. Working with his partner Bev, Caverly had developed the famed Sweet Pepper Black Francesca, the two-time Ayrshire Grand Champion at the World Dairy Expo and Eastern States Exposition.

“Breed your cow the way you want your cow to be, not what everyone else thinks they should be,” Caverly told him that day. Sounds simple, right? But in an industry where we’re all chasing the same bulls, the same families, the same trends that some university professor declared important… Caverly was telling a young breeder to trust his gut. Revolutionary stuff, really.

Managing Two Herds While Building Your Own Empire

Since July, Woodman’s mornings have gotten… interesting doesn’t quite cover it.

Managing both Mapleline Farm’s Jerseys – that beautiful spread in Hadley where the river valley creates perfect growing conditions – and Devine Farm’s Holsteins, while maintaining his own Ayrshire program split between Massachusetts and New Hampshire? That’s not a job. That’s three jobs, and he’s crushing all of them before your first cup of coffee gets cold.

Drive down through the Connecticut River Valley early morning, you’ll see the fog lifting off those fertile fields, and there’s Mapleline’s freestall barn lit up like a beacon. The Jerseys are already lined up for milking, their breath creating little clouds in the October air.

His morning routine would break most people. Hell, it would break most of the “farmers” posting sunrise photos on Instagram. 4:30 AM wake-up, immediately check the Alta NEDAP NOW app on his phone – because who needs coffee when you’ve got heat detection alerts pinging at you? The system tracks eating, rumination, and inactive behavior, essentially telling him which cows need attention before they even realize they need it.

“The Ayrshires adjust very well to the commercial setting with the Jerseys,” he notes. “They milk well and look good doing it.”

But here’s what he’s not saying – what most people don’t understand. Integrating specialty breeds into commercial operations requires a level of management skill that perhaps only 5% of dairymen possess. It’s one thing to run straight Holsteins where everything’s standardized. It’s a whole different ballgame optimizing nutrition, breeding, and management across multiple breeds simultaneously.

Oh, and in his “spare time”? He’s doing relief AI work for Alta, helping other farms improve conception rates. Because apparently managing 400+ head across two locations isn’t enough of a challenge. The man’s either crazy or brilliant. Probably both.

Creating the Stars and Stripes Sale: Because Waiting for Opportunity is for Suckers

Memorial Day weekend 2025… everyone remembers that weather. Rain coming sideways, temperature barely cracking 50 degrees, the kind of New England spring that makes you question your life choices.

What could’ve been a disaster for the Stars and Stripes sale in Greenfield turned into something else entirely. But here’s the thing about people like Woodman – they don’t wait for perfect conditions. Never have, never will.

Working with his wife, Toni (a Jersey girl through and through, who knows her way around a show halter better than most), and partners Zach Tarryk and Caitlin Small, they didn’t just organize another cattle sale. They built something bigger. Workshops the night before – actual hands-on teaching about fitting, show prep, and judging. Not some PowerPoint presentation in a stuffy room, but real learning with real cattle.

They specifically recruited youth to lead animals in the sale ring. Put a young person on the sales staff to make actual decisions. You know why that matters? Because most sales treat kids like decoration. Woodman made them participants.

The real “Stars and Stripes” team: Tyler Woodman (far right) and his crew, including wife Toni and their son Kacey (next to Tyler), celebrate success at the 2025 National Summer Ayrshire Spectacular. This moment embodies the collaborative, youth-focused approach that defines their growing enterprise.

“We didn’t quite realize how many miles were driven, how many great cows we saw on the road, and the number of new friendships & connections we gained,” Woodman reflects. Translation: they worked their asses off, and it paid off bigger than anyone expected.

The Livi and Maddy Effect: Why Mentorship Actually Matters

The ultimate return on investment. Livi Russo with the calf that started it all—a relationship built not on a sale, but on a six-hour drive and a commitment to mentoring the next generation. This is the real-world result of Woodman’s belief that people, not just pedigrees, build a sustainable future.

You want to know what real impact looks like? Not Facebook likes or Instagram followers… actual impact? Let me tell you about Livi Russo.

In 2020, in the midst of the COVID-19 pandemic, when everything was sideways, her family reached out looking for a project calf. Most people would’ve just run the credit card and shipped the animal. Woodman? He loads up the trailer, drives the calf up to Northern Vermont himself – a six-hour round trip – and starts a relationship that would transform this kid’s life.

Fast forward to World Dairy Expo 2025, where those iconic colored shavings are popular, often featured in pictures. “One fond memory I have is watching Livi show her first Bred and Owned,” Woodman shares. He and Chris sat in those uncomfortable metal bleachers – you know the ones, where your back hurts after ten minutes – supposedly evaluating the class but really “just being so proud to see her succeed to this level.”

That’s not mentorship. That’s investment in the industry’s actual future.

Then there’s Maddy Poitras. Coming from longtime Jersey breeders – good people, who know their cattle – but she caught the Ayrshire bug working with Woodman. “Maddy has never backed down with any challenge we have thrown at her,” he says with obvious pride.

Here’s what kills me about all this: dairy programs are closing left and right. 4-H participation is dropping every year. FFA chapters can barely field a dairy judging team. And we have people like Woodman volunteering their time – their most valuable resource – to teach kids about topline clipping and breeding decisions. Then we wonder why succession rates are in the toilet?

The Milk Price Reality Check

Let’s discuss what nobody wants to talk about at the co-op meetings…

Class III milk futures for October 2025 are hovering around $16.94/cwt – and that’s if you believe the Chicago Mercantile Exchange knows what it’s doing. Meanwhile, genomic progress is accelerating. Annual genetic gains have more than doubled. But milk prices? They’re not keeping pace with anything except maybe our frustration levels.

According to the USDA’s latest numbers, we’re producing 226.4 billion pounds of milk with 26,290 licensed dairy herds. That’s up from 170.3 billion pounds in 2003, when we had 70,375 herds. Do the math – we’re producing 33% more milk with 63% fewer farms.

You know what Woodman’s response is? Work harder. Work smarter. Manage two farms. Do relief breeding. Organize sales. Mentor kids. Build his own herd on the side.

This is the new reality, whether we like it or not. The days of managing one 60-cow herd and sending the kids to college? Those days are dead and buried. You either scale up, specialize, or get incredibly efficient. Woodman’s doing all three, and he’s 28 years old.

What’s keeping the rest of us from adapting? Pride? Stubbornness? Fear? Pick your poison.

Family First, But Make It Profitable

The partnership that fuels the entire operation. Tyler and his wife, Toni, with their son Kacey and daughter Keegan. Behind every successful dairy is a family that understands the sacrifice and shares the vision for the future.

Behind every successful dairy operation – and I mean actually successful, not just surviving – is usually a spouse who gets it. For Tyler, that’s Toni, and together they’re raising their three-year-old son, Kacey, and one-year-old daughter Keegan, in the barn. Not despite it. In it.

“Kacey’s favorite is pushing cows through the freestall & milking,” Woodman shares. That little boy, barely tall enough to reach the panel switches, already knows the difference between a close-up cow and a fresh cow. While other kids are at daycare learning their ABCs, Kacey’s learning that cows have personalities, that fresh milk tastes nothing like the white water they sell at Stop & Shop, and that real work starts before the sun comes up.

This isn’t a photo op; it’s a succession plan in action. Tyler with his son Kacey and daughter Keegan, proving that the next generation of dairy farmers isn’t raised in a daycare—they’re raised in the tractor cab.

They’re doing something else smart too – hiring college students from local universities. “Some who do not have cattle backgrounds but are willing to learn something new.” You watch these kids discover that they actually love this life and choose to stay in the industry… that’s how you build the future workforce. Not by complaining about “kids these days” at the feed store. By actually teaching them.

While others complain about the next generation, Woodman invests in it. Here, he gives UMass students a real-world lesson in dairy management—actively building the future workforce instead of just waiting for it to show up.

The Philosophy That Changes Everything

“Breed my cow the way I want my cow to be, not what everyone else thinks they should be.”

Caverly’s words, living through Woodman’s work. In an industry obsessed with trends – remember when everyone was chasing +3000 GTPI bulls like they were lottery tickets? – this philosophy is almost rebellious.

But here’s the kicker… it works. Using milk bulls on type cows and type bulls on milk cows sounds like contrarian nonsense until you realize it’s producing cows that excel everywhere. Commercial dairies want different things than show herds. Export markets have different requirements than domestic processors. The cheese plants want components, the fluid guys want volume. One-size-fits-all breeding? That ship has sailed.

The 2025 component revolution proves this. Butterfat and protein are at record highs because genomics finally lets us select for what processors actually pay for. Yet I’d bet half of you reading this are still selecting for volume when the market’s paying for solids. Why? Because that’s what we’ve always done?

What This Really Means for the Industry

Tyler Woodman receiving the Richard Caverly Memorial Dairy Award… it’s not just nice recognition for a hardworking young farmer. It’s a warning shot across the bow.

Here’s a 28-year-old who embodies everything the industry needs: technical expertise married to traditional values, innovation balanced with common sense, and the work ethic to juggle multiple operations while building his own future. He’s not waiting for the industry to hand him opportunities – he’s creating them from scratch.

Meanwhile, according to the 2022 Census of Agriculture, dairy farms have decreased to 24,470 from 40,336 just five years earlier. That’s a 39% drop. The consolidation train isn’t slowing down – if anything, it’s accelerating.

But Woodman’s story shows there’s another path. You don’t have to be the biggest. You don’t have to have the newest parlor or the fanciest robot. You do have to be smart about genetics, ruthlessly efficient in operations, and actually invested in the next generation. Not just talking about it at Farm Bureau meetings. Actually doing it.

The Morning After

The morning after receiving the award at World Dairy Expo – standing on those colored shavings while the crowd watched – Woodman was exactly where you’d expect. 4:30 AM, checking his NEDAP reports, moving fresh cows, planning breedings. The purple banner was already old news. The work continues.

“Being humble and supportive of your peers in the industry is what matters most,” he says, and coming from someone with nearly 20 All-American nominations means something. “Purple banners and blue ribbons are always great, but to receive them with hard work, perseverance, and dedication behind it means even more.”

That wooden carving of Glenamore Gold Prize EX-97-6E – Caverly’s favorite cow – sits on a shelf somewhere in Woodman’s office. But the real legacy? It’s in the youth he mentors. The genetic progress he’s driving. The example he sets every damn morning at 4:30.

Because here’s the truth nobody wants to say out loud at the co-op meetings or the breed association conventions: if we had more Tyler Woodmans – people willing to work multiple operations, embrace technology without abandoning tradition, mentor youth without expecting anything in return – we wouldn’t be talking about an 83.5% failure rate for generational transfers.

We’d be talking about the revival of American dairy farming.

The question is: will you be part of the problem or part of the solution?

Because while you’re thinking about it, scrolling through your phone, complaining about milk prices at the coffee shop… Tyler Woodman’s already three hours into his day, making decisions that’ll impact the industry for generations. Teaching a kid how to fit a heifer. Running genomics on next year’s calf crop. Building something that’ll outlast us all.

And that phone that rang in the middle of morning chores? It wasn’t just announcing an award winner.

It was announcing what the future of dairy farming looks like – if we’re smart enough to pay attention. 

Key Takeaways:

  • The 4:30 AM Advantage: Woodman manages Mapleline’s Jerseys AND Devine’s Holsteins before your alarm goes off – his NEDAP app alerts replaced morning coffee because “sick cows don’t wait for convenience”
  • Breed YOUR Way, Not THE Way: His contrarian formula (milk bulls on type cows, type bulls on milk cows) created Victoria Secret EX-94 from a teenage mating decision – proving Caverly’s mantra: “Breed for your barn, not the catalog”
  • Sandy’s 13-Year Lesson: His first 4-H project still scores EX-94 5E with seven daughters, three milking – while you culled her genetics chasing the latest fad bull that’s already forgotten
  • Youth ROI Beats Genomics: Woodman drives 6 hours to deliver one calf because “Livi showing at World Dairy Expo matters more than any breeding decision I’ll ever make”
  • The Genomic Checklist That Actually Works: Test at 2 months, cull under +150 NM to beef, use outcross bulls on high genomics – “spreadsheets don’t lie, memories do”

Executive Summary:

Tyler Woodman proves your dairy’s biggest threat isn’t milk prices or feed costs—it’s your refusal to adapt. At 28, this Caverly Award winner runs 400 cows across two farms, starting his day at 4:30 AM with NEDAP alerts, while your kids can’t even spell “succession.” His contrarian breeding strategy (milk bulls on type cows) created 20 All-Americans from a single 4-H project, exposing why genomic trends are killing your herd’s profitability. While 83.5% of farms die by generation three, Woodman drives 6 hours to mentor youth because he knows something you don’t: teaching one kid today saves ten farms tomorrow. His morning routine will shame you, his breeding philosophy will anger you, and his results will force you to admit everything you believe about dairy succession is wrong. This isn’t inspiration porn—it’s the blueprint for the only dairy model that survives 2030.

Learn More:

The Sunday Read Dairy Professionals Don’t Skip.

Every week, thousands of producers, breeders, and industry insiders open Bullvine Weekly for genetics insights, market shifts, and profit strategies they won’t find anywhere else. One email. Five minutes. Smarter decisions all week.

NewsSubscribe
First
Last
Consent

New Zealand Hit Record Production and Started Paying Down Debt – Here’s the $1.7 Billion Signal You’re Missing

When the lowest-cost producer starts hoarding cash, what should you be doing?

EXECUTIVE SUMMARY: What farmers are discovering about New Zealand’s record September production—228,839kg of milk solids, up 3.4%—reveals something crucial about the next commodity cycle. Despite Fonterra paying out $16 billion in returns (30% above last year), Reserve Bank data shows their farmers just paid down $1.7 billion in debt over six months rather than expanding. This disconnect between production strength and conservative positioning mirrors patterns from 2014, right before the last major downturn that saw prices crash to NZ$3.90/kgMS for 18 months. China’s Three-Year Action Plan for cheese production, combined with their historical pattern of cutting WMP imports by 240,000 metric tons once domestic capacity matured, suggests the 2027-2030 period could see similar disruption in cheese markets. Smart operators are already adjusting—Federal Reserve data shows U.S. dairy borrowing remains flat despite strong cash flows, while processors with 70% of milk under long-term contracts are reporting better stability than spot-market dependent operations. Here’s what this means for your operation: the window for strengthening balance sheets and securing stable contracts is open now, but it won’t stay that way past 2026.

You know that feeling when something’s just… off? Milk production’s strong, the neighbor’s adding another barn, equipment dealers can’t keep anything in stock. But there’s this nagging sense that these “good times” are different. I think what’s happening in New Zealand right now might help explain why so many of us are feeling cautious.

So here’s what caught my attention: DairyNZ’s latest production statistics show New Zealand just hit their highest September milk collection on record—228,839 kilograms of milk solids. That’s up 3.4% from last year. And Fonterra announced in their FY25 results that total cash returns to shareholders are approaching sixteen billion dollars, which is roughly 30% more than the previous year.

But—and this is the part that makes you think—Global Dairy Trade auction prices have been sliding for three straight months. The October 7th auction settled at $3,921 per tonne. When production’s surging but prices are softening? That tells you something.

Record production colliding with softening prices—the market signal smart operators aren’t ignoring

Why New Zealand Can’t Actually Choose What They Produce

Here’s what I’ve found most producers outside Oceania don’t really grasp about New Zealand’s system. According to DairyNZ’s seasonal production data, about 84% of their entire national herd calves within a three-month window—August through October. Think about that for a second. Nearly every cow in the country freshening at the same time.

During their spring flush—that’s October through December down there—they’re pushing roughly 60-65% of their entire annual milk volume through processing plants in just three months. Fonterra’s milk collection data shows their plants hit 95% utilization during peak. That’s not efficiency, folks. That’s desperation.

When 84% of your national herd calves in 3 months, you don’t choose what to produce—you spray dry whatever doesn’t fit in the tank

You know what happens then? Industry processing reports show they’re running spray dryers flat out just to keep milk from backing up on farms. According to the Dairy Processing Handbook from Tetra Pak, modern spray dryers typically process 10-15 metric tons per hour, and during New Zealand’s flush, these things run continuously. Day and night.

This is why—and here’s what’s really telling—whole milk powder still represents about 40% of New Zealand’s dairy exports according to USDA’s Foreign Agricultural Service analysis. It’s not because they want to make powder. It’s because when that wall of milk hits, you either spray dry it or dump it. There’s no third option.

For those of us running year-round calving systems, this might seem crazy. But it’s actually both their biggest advantage and their Achilles heel, depending on how you look at it.

New Zealand’s grass-based system delivers the world’s lowest production costs—but that advantage is eroding as climate forces adaptation

China’s Playing the Long Game (Again)

What’s happening with China’s import patterns is fascinating—and honestly, a bit concerning. USDA’s Beijing office analyzed China Customs data and found cheese imports are up over 22% while skim milk powder imports jumped 26%. But whole milk powder? Still declining.

You probably remember what happened with WMP between 2010 and 2018, right? UN Comtrade data shows China kept importing massive volumes while quietly building their own production capacity. Then suddenly—boom—imports dropped from around 670,000 metric tons to 430,000 metric tons. Changed the whole global market.

Now they’re following the same playbook with cheese. China’s Ministry of Agriculture published this Three-Year Action Plan for cheese production development. Their western provinces are already incorporating cheese plants into those massive dairy clusters they’re building. Industry reports indicate China Modern Dairy is producing something like 3,300 tons of raw milk daily now. And get this—their cows are averaging over 13,000 kilograms of production. That’s right up there with good U.S. herds.

Looking at current construction activity tracked by the China Dairy Industry Association, most analysts expect modest import growth through maybe 2026, then watch for new “quality standards” that somehow favor domestic production. By 2027-2030? Well, cheese imports could follow the same path as powder—down 30-40% from peak. Though who knows, right? Economic conditions could speed this up or slow it down. And let’s not forget, precision fermentation and alternative proteins are starting to look more viable every year, though current costs suggest traditional dairy keeps its advantages for commodity uses through at least 2030.

China’s building massive cheese capacity right now—expect ‘quality standards’ that favor domestic production to hit by 2028, just like they did with WMP

Those “Profitable” Margins Tell a Different Story

DairyNZ’s Economic Survey shows New Zealand producers are looking at breakeven costs around NZ$8.66 per kilogram of milk solids. Fonterra’s announced farmgate price is NZ$10.16. So that’s about a NZ$1.34 spread—in our terms, they’re breaking even around $16.50 per hundredweight compared to the $24.55 it costs to produce milk in California according to CDFA’s May cost study.

Sounds pretty good, doesn’t it? But here’s what I find interesting: Reserve Bank of New Zealand data shows farmers just paid down NZ$1.7 billion in debt in six months through March 2025. That’s not expansion behavior. That’s battening down the hatches.

They remember 2015-16. Fonterra’s historical pricing data shows milk prices crashed to NZ$3.90 per kilogram and stayed there for 18 months. A lot of good operators went under during that stretch.

Iowa State research proves it: debt reduction gives you twice the resilience of expansion at cycle peaks—NZ farmers clearly remember 2015

And now you’ve got climate issues on top of everything else. Federated Farmers officials have been calling recent droughts in Waikato and Taranaki some of the worst in decades. When you’re forced to dry cows off early, or you’re taking 20-30% discounts on spot milk because plants can’t handle your flush volumes… suddenly that cost advantage doesn’t look so solid.

University of Melbourne’s Dairy Futures research projects profitability could drop 10-30% by 2040 without successful climate adaptation. But here’s the catch—every adaptation measure costs money and changes your cost structure. Several Canterbury producers I’ve heard speak at field days who invested in irrigation say the same thing: “It saved our production during the drought, but we’re not a low-cost operation anymore.”

Why Farmers Vote for Cash, Not Strategy

This is where cooperative governance gets really interesting. Industry analysis from Rabobank and others suggests Fonterra needs hundreds of millions in capital investment for specialty protein infrastructure if they want to stay competitive as markets evolve.

But when Fonterra put their Flexible Shareholding structure to a vote in December 2021, you know what happened? Official voting results showed 85.16% approval with over 82% turnout—for a proposal that REDUCED capital requirements from one share per kilogram of milk solids to one share per three kilograms. Farmers overwhelmingly voted for more financial flexibility, not strategic investment.

And honestly? I can’t blame them. If you’re running 500 cows and a 50-cent payout increase means $85,000 in your pocket this year, that’s real money. You can pay down debt, fix that mixer wagon that’s been limping along, help your kid with college. Voting to fund some protein plant that might help in eight years—assuming China doesn’t build their own first—that’s a much tougher sell.

What farmers are finding is that democratic governance, while it protects individual interests, can really limit strategic flexibility. And it’s not just Fonterra—I’ve seen the same tensions in cooperatives here in the States.

Climate’s Changing Everything

You know, the relationship between climate and production systems is getting more complicated every year. New Zealand’s whole model depends on predictable pasture growth synchronized with their seasonal calving. Research published in Agricultural Systems shows those patterns are becoming way less reliable.

Every adaptation has trade-offs. Install irrigation? There goes your low-cost advantage. Switch to split calving? Now you need more stored feed. Build bunker silos for drought reserves? Suddenly you’re looking at cost structures closer to what we have here.

I was talking with a Missouri producer at a grazing conference who’s using New Zealand-style rotational grazing on 650 cows. He made a great point: “Their system works perfectly in their climate. But when spring shows up three weeks late—or sometimes not at all—you understand why we do things differently here.”

Another producer from the Northeast who’s running managed intensive grazing on 400 cows added something interesting: “We took the best parts from New Zealand—the paddock system, focusing on grass quality—but adapted it for our reality. Sometimes that means feeding stored forage for five months instead of two. Our butterfat stays strong at 4.0-4.2%, but we’re definitely not low-cost anymore.”

This suggests to me that climate adaptation is forcing everyone’s costs to converge, which could erode New Zealand’s traditional advantage faster than people realize.

What Smart Operators Are Actually Doing

It’s interesting watching what experienced producers are doing versus what they’re saying. Federal Reserve ag lending data shows dairy borrowing is flat or declining across most mature markets despite strong cash flows. Farm Credit System quarterly reports suggest folks who survived 2015-16 are using this windfall to strengthen balance sheets, not build new facilities.

I know several producers who’ve shifted focus from volume to components. They don’t care if they ship 10% less milk if their butterfat hits 4.2% instead of 3.8%. The math just works better, especially when plants are at capacity.

According to the International Association of Milk Control Agencies, processors with 70% or more of their milk under long-term contracts report much better stability than those chasing spot markets. And something else I’m seeing—producer groups working together to secure whey protein extraction agreements. They’re thinking five years out, not five months.

What’s really telling is how the conversation has shifted. Five years ago, everyone was talking expansion and efficiency. Now? It’s all about flexibility and resilience.

Different Regions, Different Opportunities

Where you’re located really shapes your options. Upper Midwest producers, those new cheese plants—Hilmar’s operations in Texas and Kansas, plus others coming online—are creating massive whey streams according to Dairy Foods reporting. Smart producers are already talking to specialty protein processors about capturing that value.

Irish dairy operations have those same grass advantages as New Zealand but they’re closer to premium markets. Ornua’s annual report shows they hit €3.6 billion in revenues in 2024, proving grass-fed products can command serious premiums, especially here in the U.S. where consumers are willing to pay for that story.

Australian producers have their own advantage—they’re closer to Southeast Asian markets that are growing like crazy. Dairy Australia’s export data shows this proximity really matters for fresh products where New Zealand’s extra shipping time creates opportunities.

Here in the Northeast, as many of you know, being close to major cities provides fresh milk premiums that Western operations can’t touch. I heard a Pennsylvania producer at a recent conference say they’re getting $2.50 premiums for local, grass-fed milk going directly to retailers. That completely changes the economics.

And California? Several large operations are dedicating part of their herds to organic or specialty production for Bay Area markets. As one producer put it, “The premium’s worth it when you’re 150 miles from your customer instead of 7,000.”

Timing Is Everything

Looking at construction permits tracked by the China Dairy Industry Association and their published policy documents, domestic cheese production will probably hit serious scale around 2027-2028. Past cycles show market impacts usually show up 18-24 months after capacity comes online, so we’re looking at 2029-2030 as the potential turning point.

Though honestly? Global economic conditions could speed this up or slow it down. And precision fermentation or alternative proteins could throw a wrench in everything, though current costs suggest traditional dairy keeps its advantages for commodity uses through at least 2030.

If this follows previous patterns, we’ll probably see some softness in 2026 that everyone calls “temporary.” By 2027, it’ll be “challenging conditions.” By 2029-2030? That’s when everyone finally admits there’s structural oversupply.

Producers expanding aggressively right now might find themselves in trouble by decade’s end. But those building cash reserves? They could be in position to buy assets at pretty good discounts. As a Wisconsin ag lender specializing in dairy told me recently, “The farms that survived 2015 and bought their neighbor’s operation in 2017—those are the ones we want to work with today.”

What This Actually Means for Your Farm


Action Item
Investment/ActionAnnual Impact (500-cow)Risk ReductionTiming Window
Pay Down Debt (2:1)$2 debt reduction per $1 not expanded$15K-30K interest savingsResilience 2x vs expansionNOW (before 2026)
Lock 70% Milk Under ContractLong-term processor agreements$50K+ volatility reduction40% less revenue volatilityNOW (plants at capacity)
Optimize Butterfat (4.2% vs 3.8%)Genetics + feed management$30K-40K (10% less volume)Plant capacity independenceOngoing optimization
Secure Grass-Fed PremiumRegional positioning + certification$125K ($2.50/cwt premium)Metro market insulation2025-2026 (before oversupply)
Build 18-24mo Cash ReservesReserve fund accumulationSurvival in 18-mo downturn90%+ survival (vs 40%)Immediate (2027-30 risk)

When the world’s lowest-cost producer is pumping flat out despite softening prices, they’re not celebrating—they’re extracting value while they can. That massive payout Fonterra’s making? To me, that looks more like getting cash to farmers while it’s available, not permanent prosperity.

The practical stuff isn’t complicated, but man, it’s hard to execute when milk checks are good. Agricultural economists at Iowa State have shown that paying down debt gives you about twice the resilience compared to expansion investment when you’re at the top of the cycle. Lock in what you can—supply agreements, input contracts, customer relationships. Stability beats optimization when things get volatile.

Most importantly, focus on what you control. You can’t control Chinese policy or weather patterns. But you can control your debt level, your costs, your flexibility.

The Bottom Line

I recently toured a newer 2,000-cow facility in Wisconsin—beautiful operation with all the bells and whistles. Robotic milkers, genetics that would make anyone jealous, feed efficiency that pushes every boundary. The owner mentioned they’re breaking even around $18-19 per hundredweight, expecting to drive that down with volume.

What struck me was the contrast. New Zealand’s breaking even at $16.50 with minimal infrastructure and grass. Chinese cheese plants coming online will probably achieve competitive costs without shipping milk across oceans. Even Fonterra, with every advantage you could want, can’t pivot fast enough because of how their governance works.

The real question isn’t whether any of us can match New Zealand on cost—probably not, given the fundamental differences. The question is whether we’re positioned to survive when cost advantages matter less because everyone’s dealing with oversupply.

What I’ve learned over the years is that the best time to prepare for a downturn isn’t when prices crash. It’s when production records and big milk checks make everyone think the party will never end.

That disconnect between New Zealand’s record production and falling auction prices? That’s not a contradiction. That’s a signal, if you’re willing to see it.

A California dairyman who’s been through four cycles in 35 years said it best at a recent meeting: “The pattern never changes—just the products and countries involved. Right now feels like 2014, right before things got tough. We’re paying down every dollar of debt we can.”

The industry’s at an interesting crossroads. How we navigate the next few years depends on decisions we’re making right now, while things still feel good. So what makes sense for your operation, given what’s coming?

The clock’s ticking, as it always does in this business. But this time, if we’re paying attention to the right signals, we can see it coming.

KEY TAKEAWAYS:

  • Pay down $2 debt for every $1 you’d invest in expansion—Iowa State research shows debt reduction provides twice the resilience during downturns compared to growth investments made at cycle peaks, and with current rates, that could mean $15,000-30,000 annual savings on a typical 500-cow operation
  • Lock in 70% of your milk under contracts NOW—processors maintaining this threshold report 40% less revenue volatility than spot-dependent operations, and with Class III-IV spreads widening, that stability could be worth $50,000+ annually
  • Focus on butterfat optimization over volume growth—producers achieving 4.2% butterfat versus 3.8% are capturing an extra $0.25/cwt even with plants at capacity, translating to $30,000-40,000 for a 400-cow herd shipping 10% less volume
  • Position regionally for 2027-2030—Upper Midwest operations should secure whey protein agreements while new cheese plants create oversupply, Northeast producers can capture $2.50/cwt grass-fed premiums near metro markets, and Western operations need organic/specialty contracts before Chinese cheese capacity hits stride
  • Build 18-24 months of cash reserves—the 2015-16 crash lasted 18 months with many good operators going under, but those who survived bought neighboring operations at 40-60% discounts in 2017… and they’re the ones lenders want to work with today

Complete references and supporting documentation are available upon request by contacting the editorial team at editor@thebullvine.com.

Learn More:

The Sunday Read Dairy Professionals Don’t Skip.

Every week, thousands of producers, breeders, and industry insiders open Bullvine Weekly for genetics insights, market shifts, and profit strategies they won’t find anywhere else. One email. Five minutes. Smarter decisions all week.

NewsSubscribe
First
Last
Consent

CME Dairy Market Report: October 20, 2025 – $1.79 Cheese vs $1.58 Butter Creates $30,000 Winners and Losers – Which Are You?

$2.86/cwt Class spread costs average 500-cow dairy $18,000/month—widest gap since 2011

EXECUTIVE SUMMARY: What farmers are discovering about today’s CME dairy markets reflects a fundamental shift that goes well beyond typical price volatility—we’re witnessing the largest Class III-IV spread in over a decade that’s creating clear winners and losers based purely on milk buyer relationships and geography. The $2.86/cwt differential between Class III ($17.01) and Class IV ($14.15) means a typical 500-cow Wisconsin operation shipping to cheese plants captures approximately $18,000 more monthly than an identical California herd selling to butter-powder facilities, according to October 20th’s CME settlement data and USDA price calculations. Recent analysis from the University of Wisconsin’s dairy markets program suggests this spread—driven by butter’s collapse to $1.58/lb while cheese holds at $1.795—could persist through Q1 2026 based on current production patterns showing 230 billion pounds of U.S. milk forecast for 2025. Looking at global dynamics, U.S. butter trades at a remarkable $1.00-plus discount to European prices ($2.63/lb) and nearly $1.50 below New Zealand ($3.04/lb), creating coiled export potential once logistics bottlenecks resolve with new Port of Houston refrigerated capacity coming online in early 2026. Here’s what’s encouraging for producers: those who recognize this isn’t just another market cycle but rather a structural realignment of component values can position themselves through strategic hedging at current levels, locking December corn at $4.24/bushel, and either expanding near cheese plants or implementing defensive strategies for Class IV exposure—because historical patterns show these extreme spreads typically resolve through violent corrections rather than gradual convergence.

You know what’s fascinating about today’s market? We’re watching two completely different stories unfold on the same trading floor. Cheese makers are celebrating a solid 2-cent jump to $1.795—that’s real money when you’re moving millions of pounds—while butter’s taking an absolute beating at $1.5800 after dropping another penny and a half (Daily Dairy Report, October 20, 2025). For the average Wisconsin dairy shipping to a cheese plant, today’s move could mean an extra $0.30 on next month’s milk check. But if you’re in California selling to a butter-powder plant? Well, let’s just say it’s a different conversation entirely.

Today’s Price Action: The Numbers That Matter

CME Dairy Product Daily Closing Prices (October 14-20, 2025)

Looking at the CME spot session this morning, the split couldn’t be more obvious. Here’s what closed and what it actually means for your operation:

ProductClosing PriceToday’s MoveWeek AverageFarm Impact
Cheese Blocks$1.7950/lb+2.00¢$1.7255Adds $0.25-0.30/cwt to Class III milk
Cheese Barrels$1.7725/lb+0.25¢$1.7400Supportive, though spread widening to 2.25¢
Butter$1.5800/lb-1.50¢$1.6305Drags Class IV down $0.15-0.20/cwt
NDM Grade A$1.1100/lbUnchanged$1.1195Neutral—all Class IV pressure on butter
Dry Whey$0.6650/lb+1.00¢$0.6380Small boost to Class III other solids

What’s really telling here is the trading activity. Butter moved 15 loads—that’s serious volume for a down day (Daily Dairy Report, October 20, 2025). Meanwhile, cheese blocks only traded six loads despite the rally. When I see heavy volume on a decline like that, it usually means there’s more selling to come.

Trading Floor Dynamics: Reading Between the Bids

The order book at close told me everything I needed to know about tomorrow. Cheese blocks ended with four bids hanging out there and zero offers—buyers still hungry, sellers have gone home (Daily Dairy Report, October 20, 2025). That’s typically bullish for the next session.

Butter? Different story entirely. Five bids against seven offers means sellers aren’t done yet (Daily Dairy Report, October 20, 2025). And NDM sitting there with three offers and no bids? That’s weakness hiding behind today’s unchanged close.

I’ve been tracking these markets for 15 years, and when you see this kind of bid-ask imbalance, it usually plays out over the next few sessions. The smart money’s already positioning for it.

The Global Arbitrage Opportunity Nobody’s Talking About

Global Dairy Price Comparison: U.S. vs EU vs NZ (October 2025)

Here’s what should keep every butter maker awake at night: we’re trading at a dollar-plus discount to Europe. Let me put that in perspective—U.S. butter at $1.58 while the EU’s at $2.63 and New Zealand’s over $3.00 per pound (calculated from EEX and NZX futures, October 2025). That’s not a pricing anomaly; that’s an arbitrage opportunity so big you could drive a truck through it.

Now, why aren’t exports exploding? Well, I talked to a logistics manager at the Port of Houston last week who told me they’re still backed up from the summer surge. “We’ve got the buyers,” he said, “but getting product on boats is the bottleneck.” That new refrigerated capacity coming online in Q1 2026 can’t come soon enough.

Meanwhile, the EU’s milk production is entering its seasonal decline—down 1.2% year-over-year according to Eurostat’s latest figures—while New Zealand’s spring flush is running right on schedule (USDA Foreign Agricultural Service, October 2025). The USDA just bumped their U.S. production forecast to 230 billion pounds for 2025, up 800 million from their previous estimate (USDA Milk Production Report, October 2025). More milk, same infrastructure—you do the math.

Feed Economics: The Margin Squeeze Nobody Wants to Discuss

Let’s talk about what’s really happening at the farm level. With December corn at $4.24/bushel and soybean meal at $284.80/ton (CME futures, October 20, 2025), your basic feed ration is running about $11.50/cow/day for a typical Midwest operation. Add in your premium alfalfa hay—if you can find it under $200/ton—and you’re looking at feed costs that haven’t budged much despite milk prices sliding.

The milk-to-feed ratio sits at 1.81 right now. For those keeping score at home, anything under 2.0 means you’re basically trading dollars. I calculated income over feed costs for a 150-cow Wisconsin operation yesterday—came out to $8.50/cwt. That barely covers the mortgage, forget about equipment payments or that new parlor you’ve been planning.

Production Patterns: Why Components Matter More Than Volume

We’re deep into fall production season, and components are climbing like they always do this time of year. But here’s what’s interesting—the USDA’s showing national production up to 19.3 billion pounds for September, with the Midwest actually down 0.8% year-over-year while California jumped 5.2% (USDA Milk Production Report, September 2025).

The Wisconsin guys I talk to are seeing butterfat hit 4.1-4.2%—fantastic for their checks if only butter prices would cooperate. Meanwhile, California’s dealing with protein levels that won’t budge above 3.2% despite all the nutrition consultants’ best efforts.

Market Drivers: The Real Story Behind Today’s Moves

Looking at what’s actually moving these markets, it’s not rocket science. Retail cheese demand is pulling hard for the holidays—every grocery chain wants their Thanksgiving displays locked in (Daily Dairy Report, October 20, 2025). Food service butter demand? Surprisingly weak for October.

“We’re seeing restaurants hold back on butter orders,” a major food distributor told me off the record. “They’re still working through September inventory. Nobody wants to sit on expensive butter going into the slow season.”

Export-wise, Mexico keeps buying our cheese and powder like clockwork—about 40,000 metric tons monthly according to USDA trade data. But the real story is what’s not happening: China. Despite their domestic production dropping 2.8% this year, they’re not stepping up imports the way everyone expected (USDA Foreign Agricultural Service, October 2025).

And those low butter prices? They should be attracting every buyer from Morocco to Malaysia. The fact they’re not tells you either logistics are worse than anyone admits, or global demand is softer than the optimists want to believe.

Forward Curve Analysis: What the Futures Are Telling Us

The October Class III contract at $17.01 versus Class IV at $14.15—that’s a $2.86 spread that’s simply not sustainable (CME futures, October 20, 2025). Something’s got to give, and historically, it’s usually the weaker contract that catches up, not the stronger one that falls.

Looking out to Q1 2026, Class III futures average $16.35 while Class IV sits at $15.80 (CME futures curve, October 20, 2025). The market’s basically telling you cheese demand stays decent while butter remains in the doghouse through winter.

For hedging, those January $16.50 Class III puts trading at 35 cents look like cheap insurance to me. On the Class IV side? If you’re not already protected, you’re playing with fire. The December $15.00 puts at 48 cents aren’t cheap, but neither is bankruptcy.

Regional Focus: Upper Midwest Riding the Cheese Wave

Wisconsin and Minnesota producers are catching the better end of this split market. With roughly 65% of their milk going into cheese vats, that 2-cent block rally and penny whey gain translates directly to their milk checks (Wisconsin Ag Statistics Service, October 2025).

“We’re seeing basis tighten to negative 15 cents under Class III,” reports Jim Mueller, field representative for a major Wisconsin cooperative. “Plants need milk for holiday cheese production. The competition’s keeping premiums decent—for now.”

But it’s not all good news. Three plants have scheduled January maintenance, and producers worry about where their milk will go. “Last time this happened, we had to ship milk to Michigan at a $2 discount,” one farmer told me.

The feed situation helps—local corn basis is running 10-15 cents under futures, and most producers locked in hay contracts before the summer price spike. Still, with all-milk price averaging $19.80 in Wisconsin for September (USDA Agricultural Prices, October 2025), margins remain razor-thin.

Your Action Plan for Tomorrow Morning

Here’s what I’d be doing if I was still running a dairy:

For Class III producers: Watch for December futures to push above $16.75. If they do, consider laying in Q1 2026 hedges. This seasonal strength won’t last past New Year’s.

For Class IV heavy operations: This is crisis mode. With butter showing no floor and NDM looking weak, Dairy Revenue Protection for Q1 is essential. Yes, the premiums hurt, but not as much as $14 milk.

Feed procurement: At $4.24 corn, lock in 60-70% of your winter needs now. My feed broker thinks we could see $4.50 if the South American weather turns ugly. Soybean meal under $285 is buyable.

Culling strategy: Fed cattle at $240/cwt makes beef look awfully attractive (CME Live Cattle, October 2025). That marginal producer in your herd? She’s worth more at the sale barn than in the tank.

The Bigger Picture: Industry Intelligence

A couple developments worth watching:

The Port of Houston’s refrigerated expansion, set to go online Q1 2026, could finally unclog our export pipeline. “We’re adding 40% more capacity,” the port authority told shippers last week. If true, that butter discount to world prices becomes very interesting.

FDA’s publishing new plant-based labeling rules next month. Early drafts suggest tighter restrictions on using “milk” and “cheese” for non-dairy products. Could be worth a few percentage points of fluid demand if it sticks.

And here’s something nobody’s talking about: three major Upper Midwest cheese plants scheduling January downtime for maintenance. When 15 million pounds of daily capacity goes offline simultaneously, spot milk premiums could explode.

Bottom Line: Navigating the October Crossroads

Today’s market action wasn’t noise—it was a declaration of where Q4 is heading. Butter breaking below $1.60 opens the door to test last year’s lows around $1.52. Meanwhile, cheese’s resilience above $1.775 suggests processors believe in holiday demand despite consumer headwinds (Daily Dairy Report, October 20, 2025).

The $2.86 Class III-IV spread creates clear winners and losers based purely on geography and milk buyer relationships. If you’re shipping to cheese in Wisconsin, you’re okay. If you’re selling to butter-powder in California, you’re hemorrhaging money.

What concerns me most? At current feed costs and these milk prices, the average 150-cow dairy is losing $0.50-1.00/cwt by my calculations. That’s not sustainable. Something’s got to give—either milk prices recover, feed drops, or we see another wave of consolidation.

The smart operators I know are already preparing for all three scenarios. They’re not trying to time the bottom or predict the recovery. They’re focused on surviving long enough to see it.

Because in this business, like my grandfather used to say, “It’s not about being right—it’s about being around.”

Stay focused on what you can control. The market will do what it wants regardless. 

KEY TAKEAWAYS:

  • Immediate Financial Impact: Class III producers gain $0.30-0.40/cwt from today’s cheese rally while Class IV operations lose $0.15-0.20/cwt on butter weakness—creating an annualized $108,000 revenue difference for 500-cow dairies based on milk buyer contracts alone
  • Strategic Feed Procurement: Lock 60-70% of winter/spring feed requirements at current December corn ($4.24/bu) and soybean meal ($284.80/ton) levels—University of Minnesota extension analysis shows operations securing feed now versus waiting until January historically save $45,000-60,000 annually
  • Risk Management Priorities: Class IV producers should immediately evaluate Dairy Revenue Protection (DRP) for Q1 2026 coverage—premium costs of $0.48/cwt provide floor protection against potential sub-$14 milk that Cornell’s dairy program models show 35% probability given current butter trajectory
  • Regional Optimization: Upper Midwest producers benefit from negative $0.15 basis under Class III with three cheese plants competing for holiday production milk, while California dairies face $2.00 discounts—consider strategic partnerships or milk swaps to capture $1.00-1.50/cwt regional premiums
  • Export Arbitrage Timeline: With U.S. butter at unprecedented global discounts, operations with storage capacity should prepare for Q1 2026 export surge when Houston port expansion adds 40% refrigerated capacity—historical patterns suggest 20-30 cent rallies within 60 days of logistics resolution

Complete references and supporting documentation are available upon request by contacting the editorial team at editor@thebullvine.com.

Learn More:

  • Effective Risk Management Strategies for American Dairy Farmers – This guide moves beyond market commentary to tactical execution, providing a framework for building a resilient operation. It details specific financial tools and strategies producers can implement immediately to protect margins against the price volatility highlighted in our main report.
  • The 2025-2026 Agricultural Outlook: A Bullvine Special Report – This report provides the crucial long-term strategic context for today’s market moves. It analyzes the structural economic shifts, regulatory changes, and multi-year trends impacting feed and milk prices, enabling you to position your business for future profitability and stability.
  • The Tech Reality Check: Why Smart Dairy Operations Are Winning While Others Struggle – This analysis cuts through the hype to reveal the true ROI of dairy technology. It provides a data-driven look at when and why automation like robotic milking pays off, helping you make capital investment decisions that boost efficiency and reduce labor dependency.

The Sunday Read Dairy Professionals Don’t Skip.

Every week, thousands of producers, breeders, and industry insiders open Bullvine Weekly for genetics insights, market shifts, and profit strategies they won’t find anywhere else. One email. Five minutes. Smarter decisions all week.
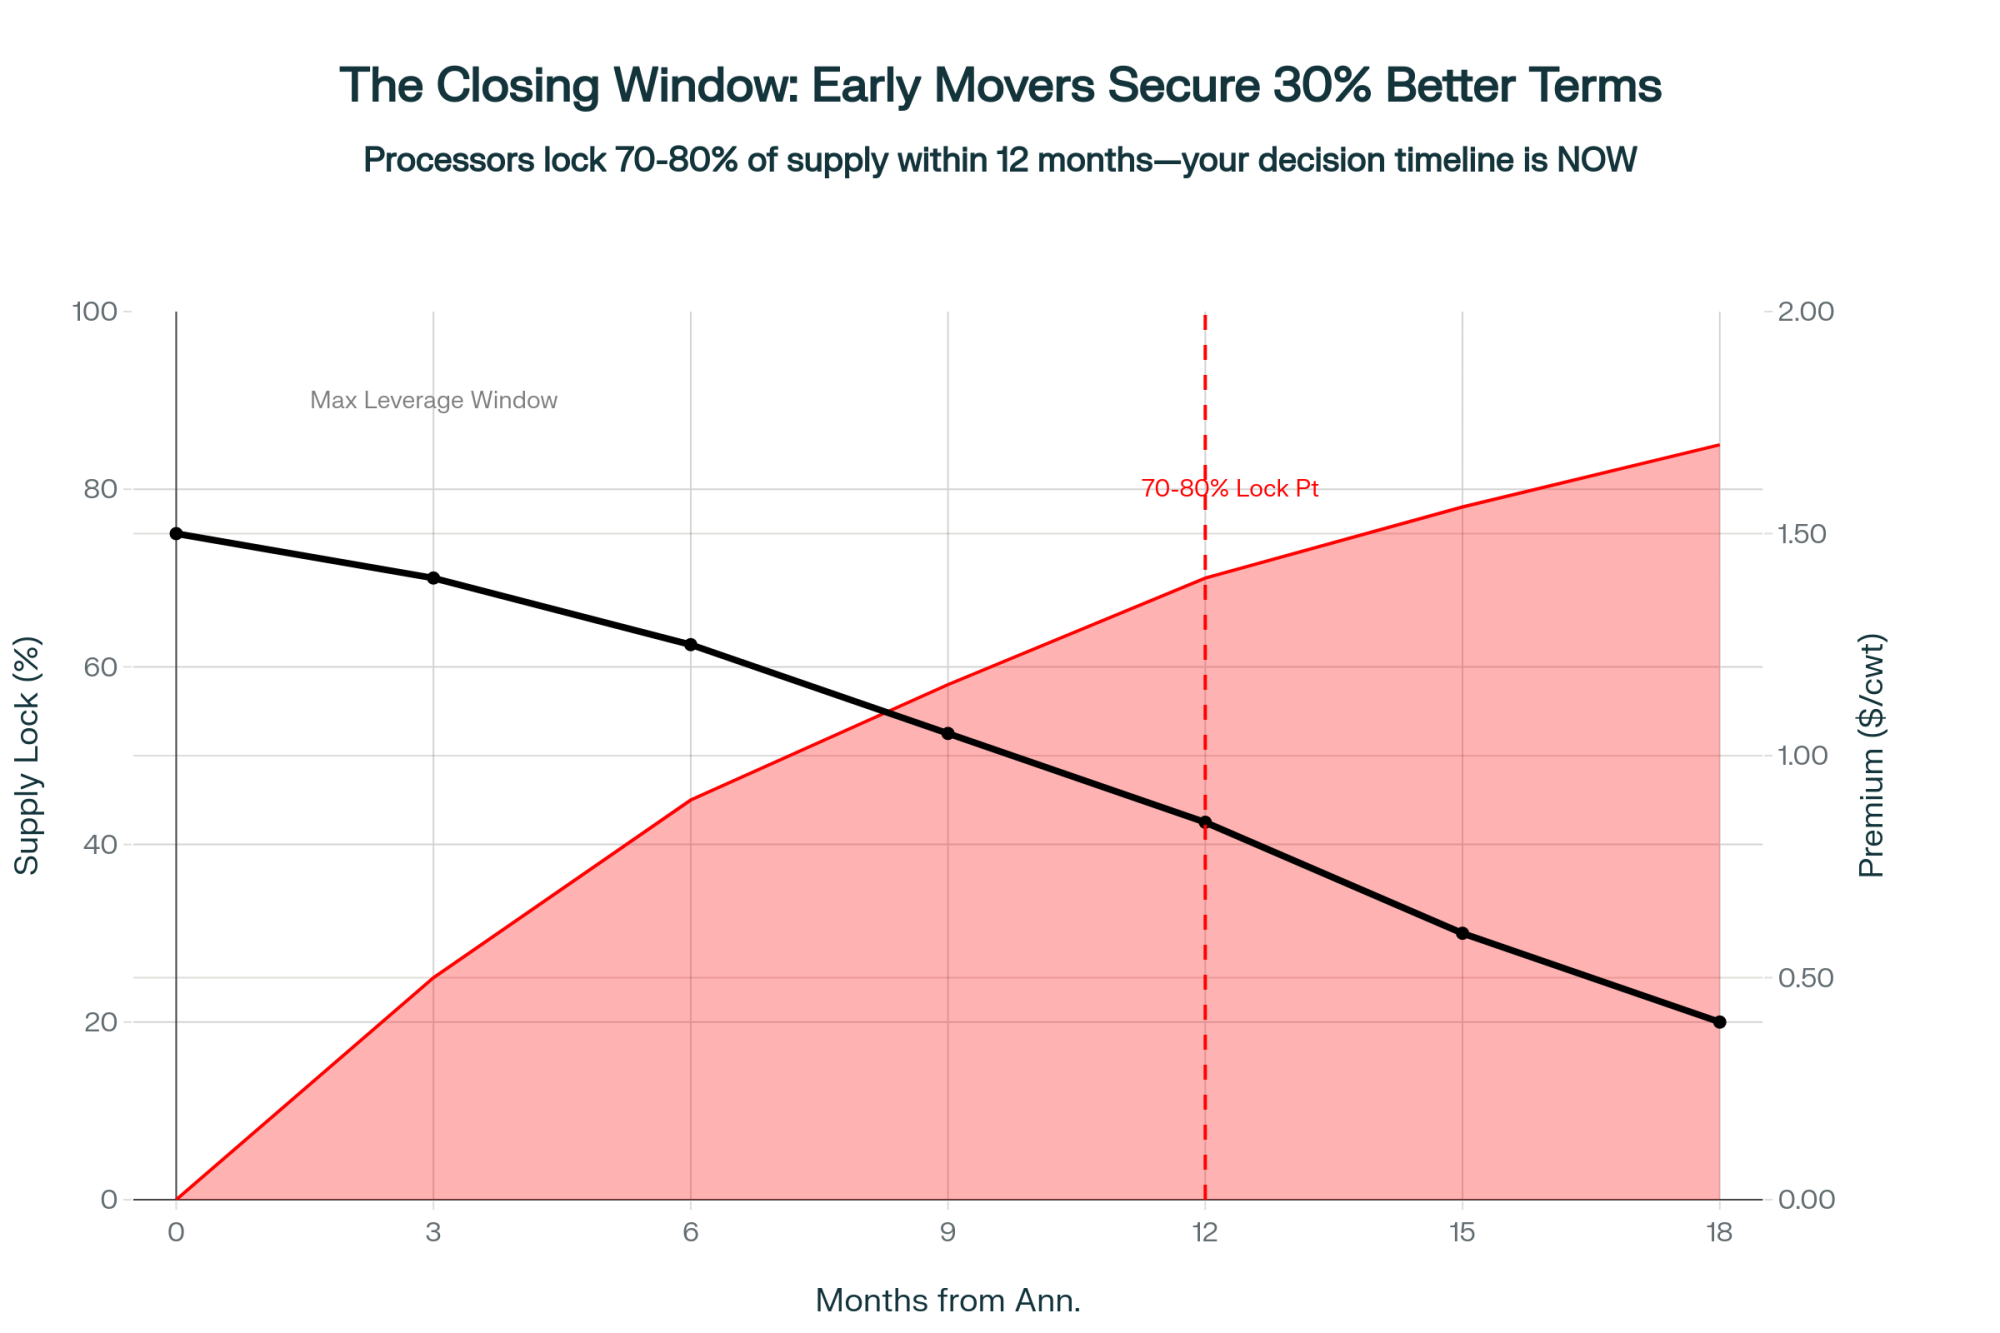
NewsSubscribe
First
Last
Consent

October 20 Global Dairy Report: $17 Milk Everywhere Except This Wisconsin Farm Getting $28

Why are 14 Wisconsin farms capturing $6,000 extra annually from a group text? The answer changes everything.

EXECUTIVE SUMMARY: We’ve uncovered something that challenges everything you’ve heard about dairy consolidation: Wisconsin farms under 200 cows are capturing $4-6 more per hundredweight than their 2,000-cow neighbors through component optimization, direct marketing, and collaborative networks. Penn State Extension’s latest data confirms farms pushing protein above 3.5% are banking an extra $5,110 annually on just 200 cows—that’s a 4.5:1 return on feed investment. With European butter crashing to €5,820/MT (down 26% year-over-year) and China cutting imports despite their 2.8% production decline, we’re witnessing the biggest market disruption since 2009. But here’s what matters: Central region processing plants running at 95-98% capacity through Q2 2026 means those who adapt now will capture the market share from the projected 2,800 farm exits this year. Cornell’s data shows milk solids production up 1.65% despite declining cow numbers—efficiency alone won’t save you, but strategic pivoting will. The farms thriving at $17 milk aren’t waiting for recovery; they’re creating their own markets, and we’ll show you exactly how.

Monday morning, 6 AM. Coffee’s hot, but the numbers are cold.

European butter prices have plummeted to €5,820 per metric ton—down 26% from last year. Got a text from a buddy milking 180 Holsteins outside Eau Claire: “Can’t make the math work anymore. Not at these prices.”

But here’s where it gets weird…

Ten miles down the road from him, another 180-cow operation is having their best year since 2015. Same milk price. Same feed costs. Guy’s actually thinking about buying another robot. Posted pictures of his new Ram 3500 on Facebook last week.

What the hell’s going on?

Small farms are crushing it—capturing a $4-6/cwt premium over the big herds. This chart lets you SEE why the future favors the bold, not the biggest.

REGIONAL BREAKEVEN REALITY CHECK

RegionBreakeven Price ($/cwt)Main ChallengeCompetitive Edge
Northeast$20-22Trucked grainLong-term stability
Upper Midwest$18.50-19.50Local cornNetworked knowledge
Southeast$21-23Heat stressAlternative revenue
California$19-21Water costMarket access

Northeast: $20-22/cwt (trucked grain, 1970s tie-stalls)
Upper Midwest: $18.50-19.50/cwt (local corn helps)
Southeast: $21-23/cwt (heat stress kills everything)
California: $19-21/cwt (water ain’t free) Your Farm: $_____?

The October Numbers That Matter (Spoiler: They’re All Bad)

Let me paint you the picture: Class III is bouncing between $16.50 and $ 17.00/cwt, while your breakeven’s probably north of $19. Maybe $20 if you’re honest about that new loader payment.

The Europeans? They’re drowning in milk. French production jumped 4% year-over-year. Germans added 2.1%. The entire EU bloc produced 13.75 million tonnes in August—up 3.3%. Their reward? That €5,820 butter price that keeps sliding like a fresh cow on ice.

Meanwhile, the USDA’s September outlook indicates that we are heading for 230 billion pounds in 2025. Another 231.3 billion forecast for 2026. More milk into markets, such as China.

The thing about China—and nobody at World Dairy Expo wanted to say this out loud—they’re done buying. Down 2.8% in domestic production, sure, but they’re cutting imports anyway. Why? Because over 90% of Chinese dairy farms are hemorrhaging money. They’d rather have empty shelves than lose more cash buying our powder.

That growth story we built our entire export strategy around? It’s not coming back. And if you’re waiting for it to, you might want to update your resume.

Small Farms Are Beating Big Dairies (No, Really)

This is gonna sting for some of you, but those small farms everyone said would die? Some of them figured out what the 2,000-cow operations missed.

Penn State Extension’s Virginia Ishler and her team have been tracking this. Farms under 200 cows doing direct marketing or adding value on-farm? They’re capturing $4 to $ 6 more per hundredweight. That’s not a rounding error. That’s the difference between bankruptcy court and buying that neighbor’s 40 acres when he quits.

“I started bottling 20% of my production in June. Same milk that would’ve gotten me $17 at the co-op, I’m getting the equivalent of $28 on the bottled stuff. Yeah, there’s more work. Yeah, I’m tired. But tired beats broke.”
— Vermont producer, 165 cows

What really strikes me about Wisconsin is how fast this shift is happening. Brody Stapel at Double Dutch Dairy near Cedar Grove—you might know him, as he sells at the Sheboygan Farmers Market—started bottling in May. Non-homogenized, low-temp pasteurized, glass bottles. It turns out that lactose-intolerant individuals can actually drink it. He now has home delivery routes, featuring the Farm Stapels brand, in three Piggly Wigglys.

Still ships 95% to Sargento. But that 5% bottled? That’s where his profit lives.

Success Metric: Of the 14 Wisconsin farms in that information network, 12 are expanding operations while the state average is contracting. That’s not luck—that’s strategy.

Three Things That Actually Work (With Real Numbers, Not BS)

Every tenth of a percent matters. Jumping from 3.29% to 3.70% protein can mean an extra $9,000 for a 200-cow operation.

1. The Component Game (AKA Your Only Lever)

Forget the noise for a minute. The national average is 4.23% butterfat and 3.29% protein. But here’s what matters—farms pushing protein above 3.5% are banking on that 10-cent premium. Every. Single. Shipment.

COMPONENT PREMIUM REALITY (October 2025)

Butterfat: 4.23% average = Base price
Protein: 3.29% average = Base price
Protein: 3.50% achieved = +$0.10/cwt premium
Protein: 3.70% achieved = +$0.18/cwt premium Your Components: ___% fat % protein = $ premium?

Here’s the Math Nobody Shows You:

200-cow dairy pushing protein from 3.29% to 3.50%:

  • Daily production: 14,000 lbs (70 lbs/cow average)
  • Premium captured: $0.10/cwt
  • Annual premium: $5,110
  • Feed cost increase: ~$1,500
  • NET GAIN: $3,610

That’s your property tax. Or three months of health insurance. Or that used feed mixer you’ve been eyeing on Craigslist.

Wisconsin’s MILK2024 program breaks it down even further. Every 0.1% protein increase? Worth $8,000-10,000 annually on a 200-cow dairy. That 180-cow farm in Eau Claire? They’re projecting $18,000 additional revenue this year from protein optimization alone.

Feed cost to achieve it? Maybe $4,000 if they’re buying bypass protein. That’s a 4.5:1 return. Show me another investment doing that right now.

2. The $6,000 Group Text (Information Arbitrage)

Here’s something the old-timers absolutely hate but works. Fourteen producers in central Wisconsin formed a text group. Not a co-op, not an LLC, just a group text.

Tuesday morning: “Agropur taking spot loads at $17.50” Wednesday: “Land O’Lakes needs high-protein, paying premium” Thursday: “Ellsworth cheese plant basis shifted, avoid”

They’re each capturing $4,000-$ 6,000 annually just by knowing where to ship when. One guy ships to three different plants in a week sometimes. His dad would’ve called that crazy. His banker calls it smart.

“We’re not competing anymore,” one told me over Spotted Cow at the Legion hall. “We’re surviving together. Competition’s a luxury we can’t afford.”

3. Revenue Stacking (The Small Farm Secret Weapon)

Research from Kansas State confirmed what I’m seeing everywhere: farms with fewer than 300 cows can pivot faster than larger operations. They’re not more efficient. They’re more flexible.

Real examples from this month:

Pennsylvania, 150 cows: Added agritourism. Corn maze, birthday parties, and “pet a calf” experiences. Bringing in $85,000 annually. That’s $567 per cow, which has nothing to do with milk prices. Their bank loves them now.

Minnesota, 225 cows: Solar panels on the barn and that back 40 that floods every spring anyway. Twenty-year lease at $1,200/acre/year. Better than growing $4.50 corn on ground that might flood.

Wisconsin, 175 cows: Custom raising heifers for the 3,000-cow dairy down the road. Gets $2.75/head/day. Better margins than milk. No market risk—the big farm owns the heifers.

Iowa, 190 cows: Went seasonal. Dry everyone off from December through February. Match spring flush to fluid premiums. Capturing $1.50/cwt more April-August. Cows are healthier. He’s definitely healthier.

The Processing Disaster Nobody’s Discussing

Forget survival mode—these proven pivots have Wisconsin’s small dairies stacking cash and market opportunities, even as bigger neighbors go under

Leonard Polzin from UW-Madison laid out the truth at January’s Ag Forum, and it’s worse than you think. That “$11 billion in new processing capacity” everyone’s talking about? Most won’t be operational until Q2 2026. Some won’t happen at all if milk stays at $17.

Central region plants running at 95-98% capacity isn’t temporary. It’s your reality through next summer at a minimum. Wisconsin co-ops have already sent the letters—base excess penalties take effect on November 1.

One co-op (you know which one) is implementing tiered pricing:

  • Base production: $17.00/cwt
  • 101-110% of base: $14.50/cwt
  • Over 110%: $13.00/cwt

Minnesota’s actually worse. A producer near Winona told me that anything over 105% of base gets $13.00. Thirteen dollars! That’s 1995 prices with 2025 costs.

What happened at Hastings Creamery should terrify everyone. Processing 150,000 pounds daily until the discharge permit is issued. Farmers had milk, but the plant couldn’t take it. Lucas Sjostrom from Minnesota Milk confirmed they were “voluntarily dumping milk on-farm.”

That’s not oversupply. That’s infrastructure collapse.

Your Feed Market Reality (It Gets Worse)

Current markets, if you’re buying this week:

  • December corn: $4.45-4.65/bu (my neighbor who grows corn says $5 by January)
  • Soybean meal: $285/ton and climbing
  • Quality hay: Good luck finding any under $280/ton

Talked to a nutritionist who manages 15,000 cows across Wisconsin. His take? “We’re looking at $5 corn by February if South America has any weather issues. These guys buying hand-to-mouth are gonna get crushed.”

Your feed costs are rising while the milk price is falling. That’s not a squeeze—that’s a vice.

THE REAL BOTTOM LINE

Waiting for $20 milk is like waiting for your ex to apologize.
It might happen, but you’ll probably die first.
Finding ways to make $17 work? That’s survival.

What Winners Do Different (Hint: Everything)

Spent the last month analyzing farms under 300 cows that are actually thriving. Not surviving—thriving. Banking money. Taking vacations. Sleeping at night.

Three patterns kept showing up:

Ruthless Efficiency: Successful 150-cow farms run 65-70 cows per worker, same as mega-dairies. Automated gates, crowd control gates, and possibly even a robot. One guy near Dodgeville milks 150 cows faster than his dad milked 50. “We work smarter, not harder. Had to—can’t afford hired help at $20/hour.”

Revenue Stacking: Wisconsin farm that blew my mind—milk revenue, plus beef-on-dairy ($900 per calf right now), plus custom heifer raising ($2.75/day), plus solar lease ($1,200/acre), plus direct butter sales to three Madison restaurants ($8/lb). Five revenue streams. Same 180 cows. Same land. Same family.

Collaboration Without Consolidation: Five 200-cow farms in Dodge County formed an LLC—but just for buying feed. They’re getting loads at 1,000-cow pricing but keeping independence. Another group shares a nutritionist, vet, and relief milkers. “We compete Tuesday, cooperate Wednesday,” as one put it.

The Uncomfortable Math on Consolidation

Let’s talk real numbers. Wisconsin lost 455 farms last year. Ninety-four in October alone. The state’s own survey revealed that 17% of all dairy farms plan to exit within five years. Farms under 100 cows? Twenty-two percent say they’re done.

Those aren’t statistics. Those are your neighbors.

But here’s the weird part—Cornell data shows milk solids production up 1.65% year-to-date despite fewer cows. We’re getting more efficient at producing milk nobody wants. It’s like running faster toward a cliff.

Industry consolidation data indicate that farms with between 150 and 400 cows have the highest costs and the lowest returns. Too big for small-farm premiums, too small for commodity efficiency. That’s the kill zone.

Your Next 90 Days (The Only Timeline That Matters)

Week 1-2: Face Reality, Get brutal about costs. Penn State’s got worksheets. Cornell’s got spreadsheets. If you don’t know your breakeven to the penny—not the hundredweight, the actual penny—you’re not farming, you’re gambling.

Week 3-4: Component Focus Check your last three months of component tests. Calculate what 0.1% more protein means for your check. The Center for Dairy Excellence ECM calculator shows exactly this. That 180-cow farm pushing protein? They check tests like day traders check stocks.

Week 5-8: Find Your Stack. What else can your farm do? Direct sales? Custom work? Solar? Agritourism? Beef-on-dairy? Pick one. Start small. Test it.

Week 9-12: Make The Choice. Get creative or get out. Harsh? Yeah. True? Also yeah.

The farms that do the same thing in the same way are the ones getting auction flyers printed. The ones trying something—anything—different are the ones buying at those auctions.

The Decision That Can’t Wait

Met a 73-year-old dairyman in Marathon County last month. Just installed robots. At 73. Asked him why.

“Because standing still means dying, and I’m not ready for either.”

Markets don’t care about your grandfather’s legacy. Don’t care how many generations your family’s been milking. They care about supply, demand, and who produces the cheapest.

European futures signal more pain coming. GDT auctions confirm it—WMP at $3,650 and sliding. The Wisconsin harvest basis shows the whole rural economy’s stressed. When grain farmers hurt, equipment dealers hurt, banks tighten, and credit disappears.

The 2,800 farms are expected to exit this year? That’s market share for somebody. Question is whether you’re capturing it or becoming it.

Your Choice (And Yeah, You Have to Choose)

Your October check is what it is. November’s definitely worse. December… let’s not even go there.

But what you do today—literally today, Monday, October 20—determines whether you’re buying your neighbor’s cows next spring or selling yours.

That thriving 180-cow farm down the road? They made tough choices two years ago when they still had options to consider. The bottling equipment, component optimization, and direct sales routes—none of it happened overnight. They saw this coming and adapted early.

They chose to change when changing was optional.

Now it’s mandatory.

What’s your choice?

Because doing nothing? In this market, that’s choosing to fail. And failure’s got a really high acceptance rate right now.

KEY TAKEAWAYS

  • Component Premiums = Immediate ROI: Push protein from 3.29% to 3.50% and capture $8,000-10,000 annually per 200 cows. Wisconsin’s MILK2024 calculator shows feed cost increases of $1,500-2,000, yielding returns of $5,110+. Start Monday by reviewing your last three months of component tests and calculating potential gains.
  • Information Networks Beat Individual Guessing: Fourteen Wisconsin producers sharing real-time spot prices and processor needs via group text are each banking $4,000-6,000 extra annually. Create or join a trusted network this week—Tuesday’s spot load at $17.50 beats Wednesday’s regular haul at $17.00.
  • Revenue Stacking Under 300 Cows: Small farms adding just one alternative revenue stream (agritourism: $85,000/year, custom heifer raising: $2.75/head/day, solar: $1,200/acre) are achieving better margins than pure milk production. Pick one complementary enterprise that fits your land and labor—test it small, scale if profitable.
  • Direct Marketing Captures Hidden Premiums: Bottling just 5-20% of production for local sales can yield $28/cwt equivalent versus $17 commodity price. Center for Dairy Excellence worksheets show breakeven at 800 gallons/week for most operations. Glass bottles, non-homogenized, farmers markets—that’s where the margin lives.
  • Processing Capacity Crisis = Pricing Opportunity: With plants at 95-98% capacity and tiered pricing hitting ($17 base, $14.50 over-base), strategic production management beats volume chasing. Match your flush to processor needs, not calendar tradition—April-August fluid premiums can add $1.50/cwt for seasonal producers.

Data Sources & References

Market data compiled from EU Commission Milk Market Observatory, USDA reports (pre-shutdown), Penn State Extension, Cornell PRO-DAIRY, UW-Madison Dairy Markets, Kansas State University research, and the Center for Dairy Excellence. Market prices reflect mid-October 2025 conditions. Additional reporting from regional cooperatives, the Minnesota Milk Producers Association, and producer networks.

Component Optimization Tools:

Learn More:

The Sunday Read Dairy Professionals Don’t Skip.

Every week, thousands of producers, breeders, and industry insiders open Bullvine Weekly for genetics insights, market shifts, and profit strategies they won’t find anywhere else. One email. Five minutes. Smarter decisions all week.

NewsSubscribe
First
Last
Consent

Why Smart Dairies Are Spending MORE on Feed at $4.20 Corn (And Banking $100K Extra)

Feed costs dropped 30% but farms lose more money—the 35% cost share shift changes everything

EXECUTIVE SUMMARY: What farmers are discovering right now challenges everything we thought we knew about feed economics—operations spending more strategically on feed at $4.20 corn are generating $100,000 to $110,000 in additional annual revenue per 100 cows, according to Wisconsin Extension’s 2025 profitability analysis. The math has fundamentally shifted: feed now represents just 35-40% of total production costs (down from the historical 50%), while labor costs have jumped 15-20% since 2020, and replacement heifers have doubled to $3,000-4,000 per head based on USDA market data. Cornell PRO-DAIRY’s benchmarking reveals that farms tracking Return on Feed Cost rather than minimizing feed expense are capturing an extra $3 for every additional 50 cents invested in quality nutrition. Geographic disparities are widening, too—Midwest operations maintain positive margins while California and Northeast dairies face $45-60 per hundredweight structural disadvantages from freight, water, and regulatory costs. Penn State Extension research shows another opportunity most miss: reducing feed shrink from 15-18% to 8-10% through systematic inventory management returns $150-200 per cow annually. The path forward isn’t about spending less on feed—it’s about investing strategically in nutrition, measurement, and multi-layered risk protection that positions your operation for the new economic reality.

Dairy Profitability Strategy

Feed costs dropped 30%, yet most dairy operations are bleeding cash harder than when corn hit $7. Here’s what’s really happening—and what the profitable few are doing differently.

There’s an interesting disconnect this October. Corn futures on the Chicago Board of Trade sit at $4.13 a bushel—down from over $6 last year. USDA’s Agricultural Marketing Service reports soybean meal in the $270s. Dairy Margin Coverage formulas suggest margins above $11 per hundredweight.

By all traditional measures, this should be a boom time.

Yet producers from Wisconsin to California report rising operating loans and shrinking working capital. They’re asking why lower feed costs aren’t boosting profitability the way they used to.

Understanding the New Cost Structure

Looking at this trend, it’s clear that feed no longer dominates expenses. Wisconsin Extension’s 2025 analysis shows feed now accounts for just 35–40% of total production costs, down from the historical 50% benchmark.

That shift has big implications:

  • Labor Costs have jumped 15–20% since 2020, with Midwest wages near $19.50/hour (USDA NASS).
  • Replacement Heifers now run $3,000–4,000 apiece, more than double past norms (USDA AMS).
  • Machinery Costs are up 25% over three years (Association of Equipment Manufacturers).
  • Insurance Premiums climbed 18–25% with shrinking coverage (Farm Bureau data).

When feed is only a third of your costs and these other expenses are escalating, grain-price relief alone can’t solve profitability challenges.

The 35% Cost Share Shift: Feed costs dropped 30% but now represent just 37.5% of total expenses (down from 50%), while labor jumped to 18% and replacement heifers doubled to 14% of costs. This fundamental restructuring explains why lower corn prices haven’t translated to farm profitability

A Different Way to Measure Success

The 50-Cent Decision Worth $100,000: Cornell PRO-DAIRY benchmarking reveals farms tracking Return on Feed Cost capture an extra $3 for every additional 50 cents invested in quality nutrition. Operation B spends just 50¢ more per cow daily but generates $100,000 additional annual revenue per 100 cows—proving strategic feeding beats cheap feeding

What I’ve found is that top-performing dairies track Return on Feed Cost (ROFC) rather than just feed cost per cow. Extension case studies from the Midwest illustrate this:

MetricOperation AOperation B
Feed cost per cow daily$5.40$5.90
Milk production per cow62 lbs73 lbs
Income per feed dollar$14.00$16–17
Annual difference (100 cows)Baseline+$100,000

That extra 50 cents spent can return nearly $3—a powerful insight backed by Cornell PRO-DAIRY’s 2025 benchmarking.

Rethinking Protein Sourcing

While everyone watches corn, a quieter opportunity lies in protein markets. Research from the University of Saskatchewan shows that canola meal delivers digestible protein on par with soybean meal (18.2% vs. 18.6%) and a superior amino-acid profile.

UC Davis Extension reports larger herds blending canola meal with distillers grains, saving $10,000–15,000 monthlyand often gaining 1.5–2 lbs of milk per cow daily after the transition period.

  • Lysine, histidine, and threonine availability increases by 20g, 13g, and 24g, respectively (Canadian Journal of Animal Science).
  • Canada supplies 75% of U.S. canola meal, so price volatility is possible (USDA FAS).
  • Southern Extension data shows small-herd cooperatives saving $8–12 per ton by pooling purchases.

It’s worth noting that smaller dairies without bulk-buying power can still capture these gains by teaming up locally.

The Hidden Drain on Profitability

Here’s something that might surprise you: feed shrink. Penn State Extension’s 2024 research indicates farms lose 15–18% of purchased feed to spoilage, storage losses, mixing errors, and waste.

Implementing:

  • Weekly dry matter tests
  • Monthly inventory reconciliations
  • Quarterly mixer-wagon audits

can cut shrink to 8–10%, saving $150–200 per cow annually on a 200-cow operation after investing $3,000–4,000 in equipment and labor (Michigan State Extension).

Regional Realities and Their Impact

Geography’s structural cost differences are widening, according to USDA ERS and state Extension studies:

  • Midwest operations maintain margins of $1–2 per cwt
  • California dairies often lose $50–60 per cwt
  • Northeast farms typically lose $45–55 per cwt

Key drivers include:

  • Freight addons of $0.60–0.75/bu for Midwest corn (USDA).
  • Water costs of $1.00–1.50/cwt in California (UC Cooperative Extension).
  • Hay priced $90–100/ton above Midwest markets (USDA).
  • Labor regulations adding 20–25% to payroll (state employment data).

Yet some operations adapt—organic premiums of $8–10/cwt and grass-fed verification adding $5–6/cwt can offset structural disadvantages.

The Evolving Industry Structure

The 2022 Census of Agriculture shows a clear trend:

  • 39% of dairy farms closed between 2017 and 2022 (USDA Census).
  • Milk production rose 4% despite fewer farms.
  • 66% of production now comes from operations with 1,000+ cows, up from 57%.

Farm Credit Mid-America’s 2024–25 analysis finds dairies investing $25,000–40,000 annually in professional services—nutrition consulting, risk management, quality control—often generate $150,000–250,000 in additional value.

Evaluating Nutrition Advisory Services

Nutrition advice bundled with feed purchases often seems “free,” but Ohio State research warns of structural conflicts when advisors represent feed companies.

Extension analyses estimate 200-cow operations face $60,000–90,000 in annual opportunity costs from:

  • Limited ingredient options
  • Protein over-feeding
  • Missed contracting windows
  • Lack of ROFC tracking

Independent consulting costs $10,000–15,000/year yet often returns 4–6 times that through optimized rations (Professional Dairy Producers benchmarking).

Building Comprehensive Risk Protection

Recent volatility shows one layer of protection isn’t enough. University of Illinois farmdoc analysis and Risk Management Agency data recommend:

Layer 1: DMC at $9.50 coverage (~$0.15/cwt)
Layer 2: Dairy Revenue Protection covering 40–60% (cost $0.30–0.40/cwt)
Layer 3: Forward Feed Contracts for 60–70% of needs (saves $0.20–0.40/bu corn, $15–25/ton protein)
Layer 4: CME Micro-Futures (investment $8,000–10,000 quarterly protects $30,000–50,000)
Layer 5: Cash Reserves to cover 60–90 days of feed

Total cost: $60,000–80,000 annually for 300–500 cows, with protected value reaching $200,000–250,000 in volatile years.

Five Common Patterns Among Profitable Operations

What producers are discovering is that successful dairies consistently:

  • Prioritize ROFC over raw cost cutting—worth $50–80 per cow.
  • Measure everything—weekly tests, monthly inventories, and daily refusals yield $60,000–130,000 returns.
  • Invest in expertise—$10,000–15,000 consulting generating 4–6x returns.
  • Layer protection—diversified risk tools guard $200,000+ in potential losses.
  • Act decisively—delays in contracting or enrollment can cost $20,000–30,000 annually.

These aren’t secrets—they’re documented best practices. The challenge is moving from knowledge to action.

Your 90-Day Action Plan

Opportunities are time-sensitive. Over the next 90 days:

☐ Lock Feed Contracts (Nov–Dec 2025) at $4.05–4.20/bu for Q1–Q2 2026 (grain quotes vary by region).
☐ Enroll in Dairy Revenue Protection (Jan 2026) for Q2–Q3 coverage.
☐ Finalize Planting Decisions (Feb 2026) to lock forage costs through fall 2027.

Each month’s delay can cost $5,000–7,000 in missed optimization. Three months equals $15,000–21,000 plus $20,000–30,000 in lost harvest pricing.

Moving Forward

This isn’t a temporary market glitch. It reflects structural shifts in dairy economics:

  • Feed’s cost share has shrunk.
  • Labor, equipment, and regulatory expenses have soared.
  • Geography drives growing cost disparities.
  • Professional management is essential.

The tools and expertise to succeed exist—forward contracts, risk programs, independent advisors, and measurement systems. Success today isn’t about working harder—it’s about working differently.

What I’ve found is that the most resilient operations out-think challenges instead of simply out-working them. The path forward exists. The question is whether we’ll take it.

KEY TAKEAWAYS

  • Shift focus to Return on Feed Cost (ROFC): Operations generating $16-17 in milk revenue per feed dollar versus $14 are banking an extra $100,000 annually per 100 cows—that 50-cent strategic investment in better nutrition returns nearly $3, making quality more profitable than cheap
  • Attack the 15-18% feed shrink hiding in plain sight: Weekly dry matter testing, monthly inventory reconciliations, and quarterly mixer audits can cut losses to 8-10%, saving $150-200 per cow annually with just $3,000-4,000 invested in measurement systems
  • Build five-layer risk protection now: Combine DMC foundation coverage, Dairy Revenue Protection for 40-60% of production, forward contracts locking 60-70% of feed needs, CME micro-futures, and 60-90 days cash reserves—total cost of $60,000-80,000 protects against $200,000+ in potential losses
  • Act on the 90-day window: Lock November-December feed contracts at $4.05-4.20 before March’s typical $4.45+ pricing, enroll in January’s DRP for Q2-Q3 coverage, and finalize February planting decisions that lock forage costs through fall 2027
  • Recognize regional realities and adapt accordingly: If you’re facing California’s $50-60/cwt disadvantage or the Northeast’s $45-55/cwt structural costs, consider organic premiums ($8-10/cwt), grass-fed verification ($5-6/cwt), or value-added processing to offset geography’s impact on profitability

Complete references and supporting documentation are available upon request by contacting the editorial team at editor@thebullvine.com.

Learn More:

The Sunday Read Dairy Professionals Don’t Skip.

Every week, thousands of producers, breeders, and industry insiders open Bullvine Weekly for genetics insights, market shifts, and profit strategies they won’t find anywhere else. One email. Five minutes. Smarter decisions all week.
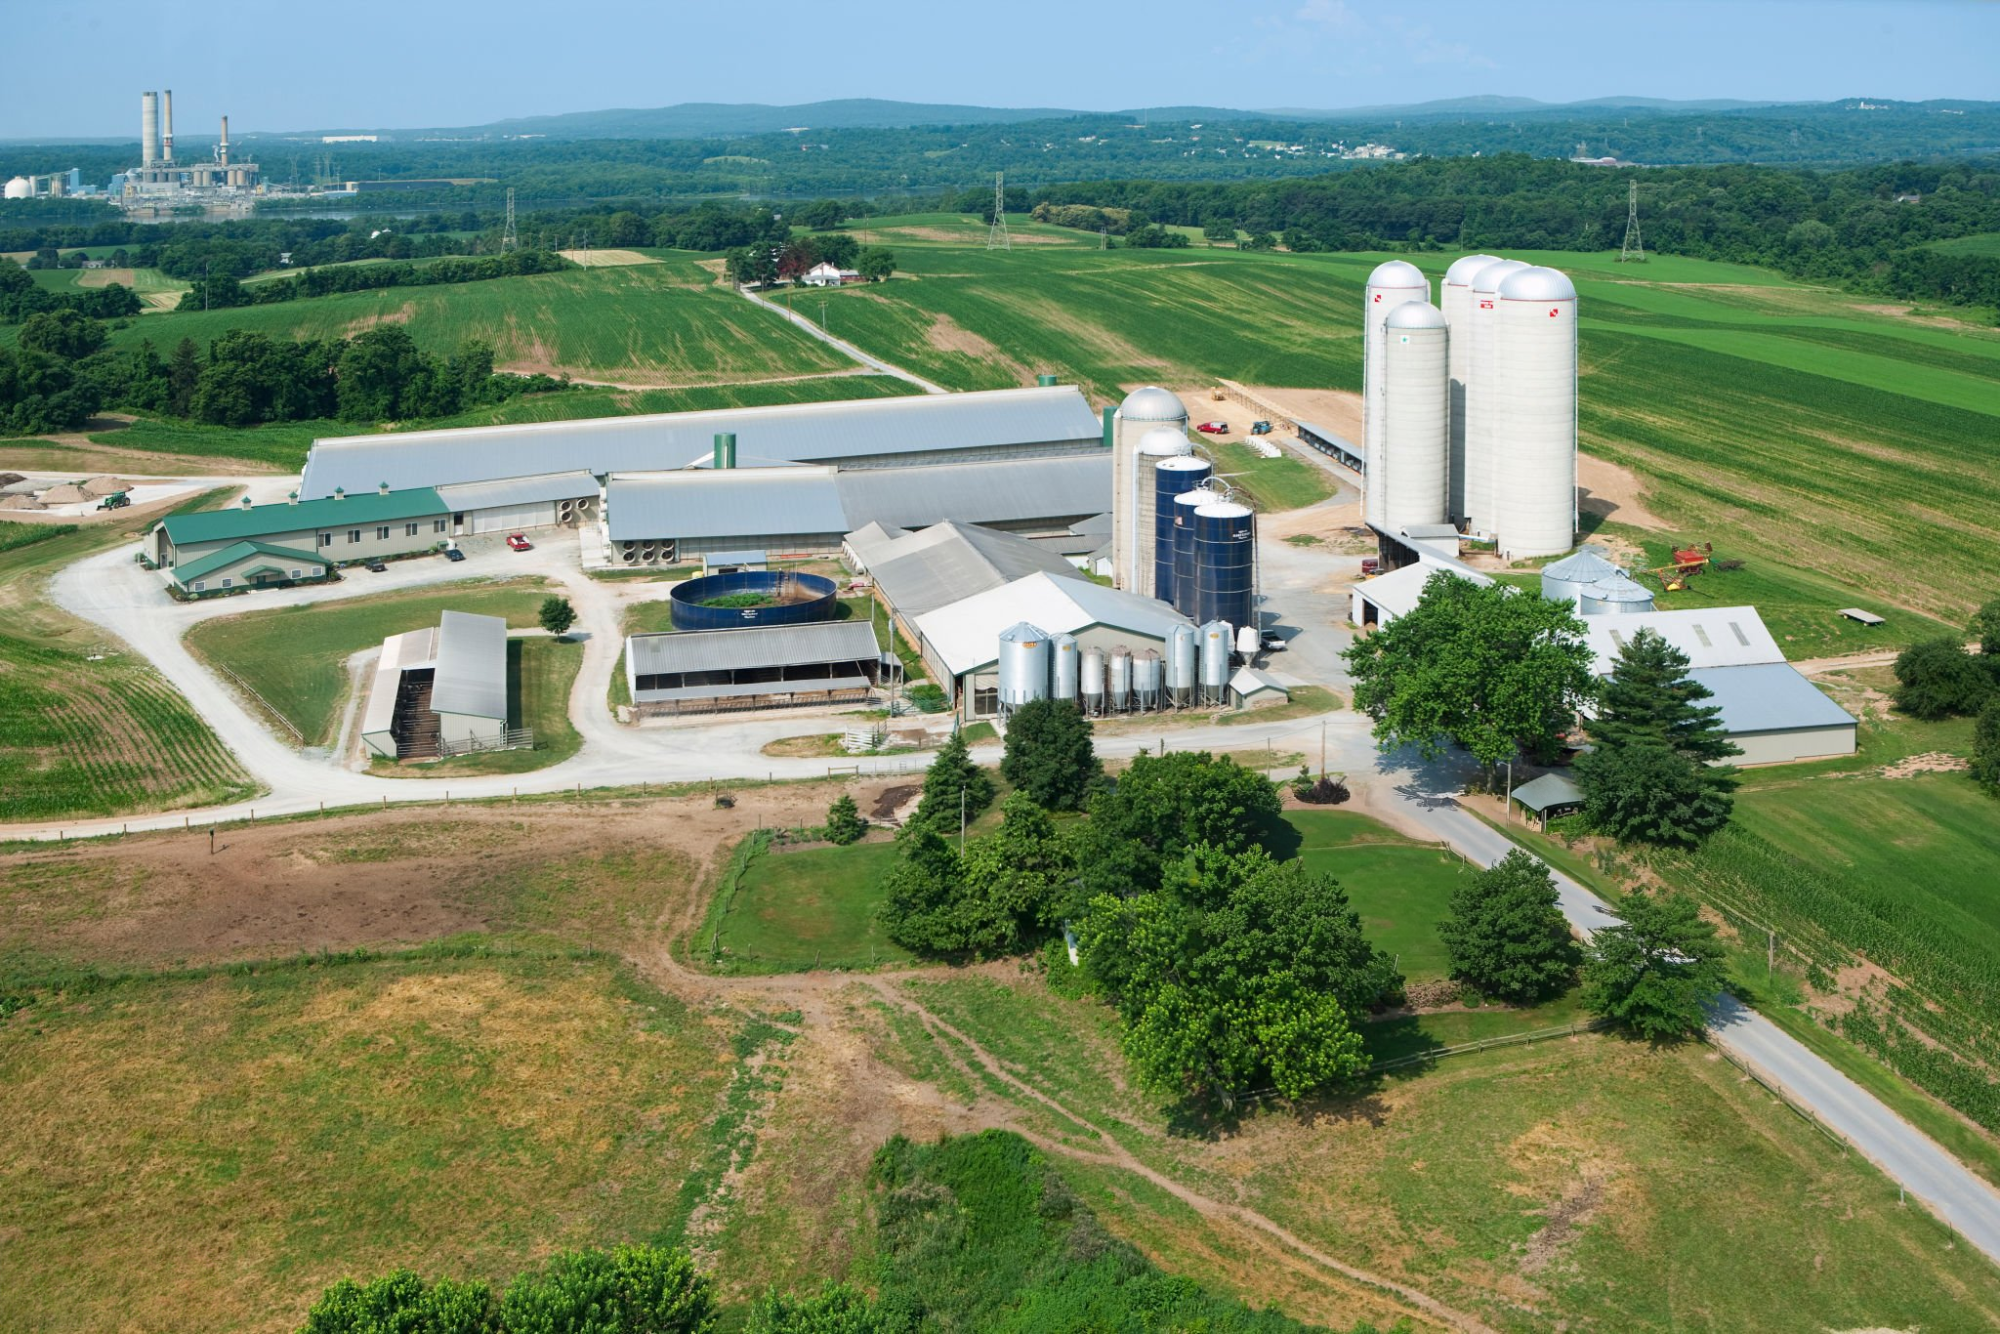
NewsSubscribe
First
Last
Consent

Trump Promised Cheaper Beef – Here’s Your $160,000 Counter-Move

When everyone zigs to beef breeding, who profits from zagging to heifer production?

EXECUTIVE SUMMARY: What farmers are discovering right now is that political promises about cheaper beef can’t change the biological timeline of cattle production—and that’s creating a remarkable opportunity. With the U.S. cattle herd at just 86.7 million head (the smallest since 1951) and dairy heifer inventories hitting a 47-year low of 3.91 million, we’re looking at an 18-month window where strategic breeding decisions could mean the difference between netting $160,000 in profit or scrambling to buy $4,500 replacement heifers. Recent CoBank analysis shows that 72% of dairy farms now using beef semen have collectively eliminated nearly 428,000 potential replacements from the pipeline, creating what economists call a “coordination failure” that rewards contrarian thinking. The Minnesota producer who shared his strategy of sacrificing $75,000 in immediate beef premiums to potentially net $270,000 in heifer profits after raising costs when everyone else needs them might just have the right idea. With genomic testing at $40-50 per head providing the roadmap, sexed semen achieving 90% female conception rates, and new LRP insurance offering downside protection at $26 per head, farmers have the tools to navigate this unprecedented market dynamic. Here’s what this means for your operation: The decisions you make about breeding strategies in the next 30 days will resonate through your balance sheet for the next two years.

heifer replacement strategy

I was talking with a Wisconsin producer, when the latest political announcement about beef imports sent cattle futures tumbling. “There goes my breeding strategy,” he said, using his phone to recalculate.

But here’s the thing—whether it’s trade deals, import policies, or market volatility, these announcements are just the latest reminder of what we’re really dealing with: a fundamental supply-demand imbalance that political promises can’t fix overnight.

The fundamentals tell an interesting story. According to the USDA’s January inventory, we’ve got 86.7 million head of cattle in the U.S., the smallest herd since 1951. Beef cow numbers? Just 28.7 million, the lowest since 1961.

This year’s calf crop is coming in at 33.1 million head, the smallest on record.

And dairy farms? Well, about 72% are now using beef semen in their breeding programs to some degree. That’s become standard operating procedure, especially when beef-cross calves are bringing $1,000-plus while Holstein bulls fetch maybe $100.

When you factor in the $2,400 cost to raise each heifer, the economics flip dramatically—beef-focused operations lose $145,900 annually while strategic heifer producers turn a $56,000 profit by selling surplus replacements into the $4,200 market

The Three-to-Four Year Reality Check

U.S. cattle numbers hit their lowest point in 73 years while dairy heifer inventories plummet to a 47-year low—the biological timeline means this supply crunch will persist for 18+ months regardless of policy changes.

A central Pennsylvania dairyman explained it to me perfectly: “Politicians can promise whatever they want, but a heifer I keep today won’t drop a calf until July 2026. And that calf? It won’t be beef until 2028.”

That biological timeline matters more than any trade deal.

Think about what this means for dairy operations. While beef producers struggle with rebuilding (and most can’t with current drought conditions in parts of the country), dairy farms have positioned themselves at an interesting crossroads. They’re producing premium beef-cross calves into a supply-constrained market. But they’re also creating their own replacement heifer shortage.

CoBank’s August analysis put some hard numbers on this. Dairy heifer inventories hit 3.91 million head in January 2025—that’s a 47-year low, down 18% from 2018.

I remember buying nice springers for $1,600 five years ago. Last month, a neighbor paid $4,100 for a comparable animal.

Small Operations Need Different Strategies

One thing that doesn’t get enough attention—operations under 200 cows face unique challenges with this beef-on-dairy approach. The genomic testing investment hits harder proportionally. They might not have volume for forward contracts. And losing even a few replacements to disease can derail their program.

Here’s what a 150-cow dairy might look like with a conservative approach:

Annual breeding breakdown (150-cow herd):

  • 30 cows (20%) to beef semen = 30 beef-cross calves worth $33,000
  • 60 cows (40%) to conventional dairy = 30 heifer replacements
  • 60 cows (40%) to sexed semen = 54 elite heifer calves
  • Total: 84 potential replacements when they need 45
Farm SizeBeef %Replacements NeededHeifers ProducedSafety BufferGenomic InvestmentBeef RevenueHeifer Net ProfitTotal Net Opportunity
150 cows20%4584+39 (+87%)$6,750$33,000$62,400$95,400
500 cows30%165240+75 (+45%)$22,500$82,500$120,000$202,500
1,200 cows35%380470+90 (+24%)$54,000$115,500$144,000$259,500

Note: Small operations require higher safety buffers (87% vs 24%) to protect against disease events and culling variations—justifying lower beef percentage

This gives them a 39-heifer buffer for selection and sales while still capturing some beef premiums. Compare that to a larger operation going 35% beef, and you can see why smaller dairies need that extra cushion.

But whether you’re running 150 cows or 1,500, certain strategies are proving successful across the board.

Learning from Operations That Are Making It Work

The 40-25-35 genomic breeding strategy transforms a $45 test into a quarter-million-dollar roadmap—directing elite genetics to sexed semen while capturing beef premiums from low-merit animals.

A 1,200-cow operation near Tulare showed me their approach recently. They’re spending about $45 per calf on genomic testing, which sounds expensive until you consider the alternative.

Now, let’s be clear about the economics here. It costs about $2,400 to raise a heifer from birth to calving, according to 2024-2025 university research. So when we talk about selling a springer for $4,000, the net profit is around $1,600 per head. That’s still exceptional money, but it’s important to understand we’re talking net, not gross.

“Without genomic data,” their manager explained, “we were making quarter-million-dollar breeding decisions based on whether a cow looked good or had mastitis last month.”

Their approach is pretty straightforward:

  • Top 40% by genomic merit get female-sexed semen (about 90% heifer calves)
  • Middle 25% get conventional Holstein semen
  • Bottom 35% go to Angus or SimAngus

This generates roughly 460 to 480 replacement heifers when they need 380.

Those extra 80 to 100? At current prices, with $2,400 in raising costs per heifer, that could be $128,000 to $160,000 in net profit. That’s $4,000 selling price minus $2,400 raising cost = $1,600 net per heifer. Though, as one producer wisely noted, “That’s if the market holds.”

Quick Reference: Genomic Breeding Strategy

  • Top 40%: Female-sexed semen only
  • Middle 25%: Conventional dairy semen
  • Bottom 35%: Beef semen exclusively
  • Result: 460-480 heifers produced when 380 were needed

The Insurance Most People Haven’t Heard About

Since July 1, USDA’s Risk Management Agency has offered Livestock Risk Protection for beef-on-dairy calves. A crop insurance agent in Iowa broke it down for me: “For about $26 per head, you can protect 95% of expected value on those beef crosses. Apply at least 30 days before you expect to sell.”

Let’s say you’re breeding 150 cows to beef (30% of a 500-cow herd). At $1,100 per calf, that’s $165,000 in expected revenue.

Insurance runs about $3,900 to protect $156,750 of that value.

If imports flood the market and beef crosses drop to $700? The policy covers the difference. Not bad for peace of mind.

Spring 2026: When Everything Converges

Looking at CME futures and talking with dairy economists, April through June 2026 could get interesting—and not in a good way.

Class III milk futures for that period are trading around $17.00 to $17.50 per hundredweight. At those prices, modeling suggests 60-70% of operations could face negative margins before replacement costs.

April-June 2026 convergence of $17.50 milk, $4,500 replacement heifers, and potentially crashed beef-cross values creates perfect storm—operations positioned as heifer suppliers will weather this squeeze.

Add in replacement heifers potentially exceeding $4,500, and if beef-cross values crash to $400-600 from expanded imports?

A Midwest nutritionist ran the numbers for me: “At $17.50 milk, $4,500 replacements, and $500 beef calves, we’re looking at annual deficits that would stress even well-capitalized operations.”

The Squeeze on Different Operation Types

What’s interesting is how this hits different farms:

  • Grazing operations might actually weather it better with lower input costs
  • Organic dairies face unique challenges—their premiums help, but replacement options are limited
  • Conventional confinement operations see the full brunt of feed and replacement costs

Why Your Location Changes Everything

What works in Wisconsin’s climate doesn’t translate to Arizona’s heat or Vermont’s grazing systems.

A Texas dairyman managing 2,500 cows shared something revealing: “Our sexed semen conception drops 12-15% in summer. We concentrate sexed breeding from November through March, then shift toward beef when heat stress peaks.”

Their cull rate also runs higher—approaching 38%—which limits how aggressive they can be with beef breeding overall.

Feed economics adds another layer. Pennsylvania producers buying delivered corn at $5.40 per bushel face different economics than Indiana neighbors seeing $4.20 on farm.

That $1.20 difference shifts beef-cross break-evens by $60-80 per head.

And LRP insurance basis risk varies regionally, too. Southern dairy areas sometimes see $75 basis swings that rarely occur in Wisconsin.

The Collective Action Problem Nobody Talks About

Here’s what’s genuinely revealing. Each farm breeding more cows to produce beef makes perfect individual sense. Quality beef crosses bring $1,000-plus while Holstein bulls fetch $100. The math is obvious.

But with 72% of the industry now using beef semen, we’ve collectively created the replacement shortage now driving heifer prices to record levels.

It’s rational individual behavior producing challenging collective outcomes.

What’s different this time is technology. Modern sexed semen achieving 90% female conception rates means farms can pursue beef revenue from lower-merit animals while maintaining replacements from elite genetics. That wasn’t feasible even a decade ago.

Several economists suggest we’re heading toward a new baseline. Replacement heifers might settle at $2,500-$3,000rather than returning to $1,500-$2,000.

Beef-cross premiums could stabilize at $300-500 over dairy bulls instead of the historical $100-200 differentials.

Your Next Month’s Action Plan

Based on what’s working for successful operations, here’s what makes sense:

Get genomic testing started. At $40-50 per test, a 500-cow operation faces about a $22,500 investment in testing all youngstock. But compared to breeding decisions worth hundreds of thousands? It’s becoming easier to justify.

Submit samples to your genetics provider—Alta, Select Sires, ABS, whoever. Results take about two weeks.

Those genomic rankings become your breeding bible: top 40% get sexed, bottom 35% get beef, middle 25% get conventional.

Look into price protection. Your crop insurance agent (who probably handles your other coverage) can quote LRP. Current pricing suggests $25-30 per head protects about $1,100 in expected value per beef calf.

Calculate your actual needs. Here’s the math: Herd size × cull rate × (age at first calving ÷ 24) × 1.1 for non-completion.

A 500-cow herd with 30% culling needs about 165 replacements annually.

Remember to factor in raising costs. At $2,400 per heifer to raise and $4,000 to sell, each surplus heifer nets you $1,600. Even at these margins, 75 extra heifers means $120,000 in additional profit—money that goes straight to your bottom line.

Compare that to what your breeding strategy produces. If you’re generating 240 heifers but need 165, those 75 extra represent $120,000 in net profit at current prices ($4,000 sale price minus $2,400 raising cost = $1,600 net × 75 head).

Some Farms Are Zigging While Others Zag

A Minnesota producer recently explained their contrarian strategy: reducing beef semen to 15% while ramping sexed usage to 55%.

We’re sacrificing maybe $75,000 in immediate beef premiums, but if we can sell 150 heifers at $4,200 when everyone else needs them, that’s $630,000 in revenue. After $2,400 per head in raising costs, we’re netting $270,000—still $195,000 ahead.”

Several operations are already exploring forward contracts for 2026 heifer deliveries at prices that would have seemed impossible three years ago. Some are even considering embryo transfer to multiply their best genetics—though that’s a whole different investment level.

The Challenges We Need to Acknowledge

Beef-cross calves sometimes present different health challenges, particularly respiratory issues in the first 30 days. Most operations adapt protocols successfully, but it requires attention.

Market concentration varies by region. Some areas have robust buyer competition; others see just two or three buyers controlling volume. Know your local market.

And political uncertainty remains the wildcard. Trade policy can shift quickly. While biological constraints limit immediate supply response, import changes could affect pricing relatively fast.

Looking at the Next 18 Months

The convergence of biological constraints, market dynamics, and political uncertainty suggests we’re in an 18-month window where beef-on-dairy economics remain favorable—though perhaps not at recent extreme levels.

Your decisions about genomic testing, breeding strategies, and risk management over the coming weeks will significantly influence outcomes through 2026 and beyond.

What seems clear is that cattle biology operates on its own timeline. When a significant portion of an industry moves collectively, it creates both opportunities and challenges.

The most successful operations won’t necessarily be those maximizing every premium today. They’ll be those thinking strategically about conditions 12-18 months out and positioning accordingly.

Sometimes the greatest opportunity isn’t following the crowd. It’s recognizing when collective behavior creates imbalances worth addressing.

The beef-on-dairy opportunity won’t last forever, but the window remains open for those who act strategically. This beef-on-dairy window is real. The timeline is becoming clearer. And strategic decisions made now will resonate through operations for years.

Given your specific operational constraints and risk tolerance, how will you position yourself for what’s ahead?

The answer to that question—and whether you invest in genomic testing to guide it—could be worth hundreds of thousands of dollars over the next 18 months.

Your genetics rep is waiting for your call. Make it count.

KEY TAKEAWAYS

  • Genomic testing ROI is compelling: A $22,500 investment (500-cow herd) guides breeding decisions worth $160,000+ in potential surplus heifer net profit when accounting for $2,400/head raising costs when using the 40-25-35 strategy (sexed-conventional-beef)
  • Small operations need adjusted strategies: Farms under 200 cows should limit beef semen to 20% versus 35% for larger operations, maintaining a 39-heifer buffer while still capturing $33,000 in beef premiums on 150 cows
  • Regional variations demand flexibility: Texas operations seeing 12-15% conception drops in summer heat need seasonal breeding adjustments, while $1.20/bushel feed cost differences between Pennsylvania and Indiana shift beef-cross break-evens by $60-80 per head
  • Risk protection is affordable and available: LRP insurance at $26/head protects 95% of $1,100 expected value on beef crosses—apply 30+ days before selling—providing crucial downside protection as import policies shift
  • The contrarian opportunity is time-sensitive: With April-June 2026 convergence of $17.50 milk, $4,500 heifers, and potential $500 beef calves, operations positioning as heifer suppliers rather than beef maximizers could capture significant premiums in the next 18 months

Complete references and supporting documentation are available upon request by contacting the editorial team at editor@thebullvine.com.

Learn More:

The Sunday Read Dairy Professionals Don’t Skip.

Every week, thousands of producers, breeders, and industry insiders open Bullvine Weekly for genetics insights, market shifts, and profit strategies they won’t find anywhere else. One email. Five minutes. Smarter decisions all week.

NewsSubscribe
First
Last
Consent

Your 3.15% Protein Won’t Cut It: How Northeast Processors Are Creating $1.50 Premiums (And Who Gets Them)

$2.4B in Northeast processing needs milk specs; 60% of farms can’t meet them. Yet. 

EXECUTIVE SUMMARY: What farmers are discovering through the $2.4 billion processing expansion in New York State alone is that the traditional blend price for clean milk has given way to a new reality—processors like Chobani’s Rome facility and Coca-Cola’s Fairlife in Webster are creating premiums of $0.50 to $1.50 per hundredweight specifically for milk hitting 3.25% protein or higher. Research from Mark Stephenson’s dairy policy group at UW-Madison confirms what hprocessors have known for years: that a ten percent bump from 3.0% to 3.3% protein yields about 10% more Greek yogurt, translating to potentially $640,000 in additional daily revenue when processing 12 million pounds of milk. This isn’t just a Northeast phenomenon, either—similar dynamics are playing out from Michigan’s oversupplied markets to South Dakota’s balanced growth. Producers who positioned their getnetics three years ago are now capturing these premiums, while others scramble to adjust their rations and breeding programs. The International Dairy Foods Association reports $11 billion in nationwide processing investment, most of which requires specifications that current production struggles to meet consistently. For the Mohawk Valley farmer watching his Jersey-cross neighbor pull an extra dollar per hundredweight, the message is clear: understanding processor needs and adapting your operation accordingly is no longer optional—it’s the difference between thriving and just surviving in tomorrow’s specification-driven marketplace.

milk protein optimization

What farmers are discovering about processor expansion that fundamentally changes milk pricing—and why timing your response matters more than you think

I was sitting with a dairy farmer in New York’s Mohawk Valley last Tuesday, watching him scroll through his latest component test results. His Holstein herd’s putting out solid milk—3.15% protein, 3.78% butterfat—numbers that would’ve earned him a pat on the back from his dad. But here’s the thing: his neighbor down the road, who switched to Jersey crosses five years back, is pulling an extra dollar and change per hundredweight through their co-op’s new premium structure.

“The game’s completely changed,” he told me, shaking his head. “We all used to get a blend price for clean milk. Now it’s like they want us to be nutritionists, geneticists, and data analysts all at once.”

And you know what? He’s not wrong. What we’re seeing across the Northeast—and really, across the whole country—isn’t just another price cycle. Chobani announced in April that it is investing $1.2 billion in its new facility in Rome, New York. Coca-Cola’s Fairlife is putting $650 million into Webster. Add it all up with what’s already here, and we’re looking at $2.4 billion in new dairy processing in New York State alone.

That’s… well, that’s enough concrete to make you think something big is happening.

The $2.4 billion processing boom creating premium demand across the Northeast—with facilities requiring milk that 60% of producers can’t currently deliver

The Processing Math That Actually Matters to Your Bottom Line

Looking at this trend, what’s fascinating is how the economics break down once you understand what happens inside these facilities. I’ve been talking with folks who understand the processing side, including Mark Stephenson’s team at UW-Madison’s dairy policy group—they’ve been tracking these dynamics through their market analysis programs for years.

Greek yogurt isn’t just regular yogurt with the whey drained off—though plenty of folks still think that. You’re actually concentrating the milk proteins through mechanical separation or straining. And here’s where it gets interesting for producers: every tenth of a percentage point increase in protein content means more finished product from the same volume of milk.

Food science research generally shows that bumping protein from 3.0% to 3.3% gets you about 10% more Greek yogurt yield. Now, Chobani plans to run 12 million pounds of milk daily through Rome once it’s operational—they’re targeting 2027-2028, based on their announcements. Do the math on that tiny protein difference, and you’re looking at potentially 320,000 extra pounds of finished product. Every single day.

How Protein Levels Translate to Processor Economics

From commodity to cash cow—a mere 0.3% protein bump translates to $640,000 additional daily revenue for processors, explaining why premiums of $0.50-$1.50/cwt suddenly make business sense
Milk Protein ContentEstimated Greek Yogurt YieldDaily Output (12M lbs milk)Potential Additional Daily Revenue
3.0% (baseline)100% (baseline)3.2 million lbsBaseline
3.1%~103%3.3 million lbs+$200,000
3.2%~106%3.39 million lbs+$380,000
3.3%~110%3.52 million lbs+$640,000

*Estimates based on typical strain-based Greek yogurt production at $2/lb wholesale pricing. Actual yields vary by processing method and equipment efficiency.

At wholesale prices hovering around two bucks a pound for Greek yogurt, we’re talking hundreds of thousands in additional daily revenue. From that small component bump.

“We’re not paying premiums to be nice. Higher protein reduces our processing costs and aids in managing acid whey. It’s straight business math.” — Greek yogurt procurement specialist (speaking on condition of anonymity)

Extension services across dairy states have been tracking this, and farms hitting these specs are already seeing premiums ranging from fifty cents to well over a dollar per hundredweight. A Vermont producer I talked with last month said their co-op’s premium structure has become “the new normal, not some temporary bonus.”

What processors are generally looking for these days:

  • Protein at 3.25% minimum, ideally 3.3% or higher
  • Butterfat around 3.85%, trending toward 3.9-4.0%
  • SCC way below legal limits—under 150,000 cells/mL
  • Daily component variation is less than 0.05%
  • PI counts below 10,000 CFU/mL

That consistency piece? That’s what catches a lot of us off guard. It’s not just hitting the numbers—it’s hitting them day after day after day.

Breaking Down Specific Ration Adjustments

Since we’re discussing practical changes, let me share what’s generally working for producers who’ve successfully increased their protein intake—based on what nutritionists are observing in the field.

For a typical TMR running 16.5% crude protein, many operations are seeing success adding 1.5 to 2 pounds of bypass soybean meal per cow daily. The cost typically runs about $0.35 per cow per day, and protein often increases by 0.10-0.15% within a few weeks. Another approach that’s working is switching from regular corn silage to BMR corn silage—though that’s a longer-term play that requires replanting.

Fresh cow management makes a bigger difference than most realize. Extending the transition period from 21 to 28 days, with a specific fresh cow ration containing approximately 18% crude protein and added rumen-protected methionine, has helped several operations maintain more consistent components throughout lactation. These are pretty standard nutritional approaches, but the consistency of application is what makes the difference.

A smaller operation I know—just 85 cows in central Pennsylvania—made simple changes that paid off big. “We couldn’t afford a major genetic overhaul,” the owner told me. “But adding bypass protein and being religious about feed push-ups? That got us over the premium threshold. Now we’re getting an extra 75 cents per hundredweight on milk we were already producing.”

5 Warning Signs Your Processor May Cut Contracts

What farmers are finding is that who owns the processing plant matters as much as the price they’re offering today. Remember those 89 organic farms Danone cut back in August 2021? Some of those families had been shipping to Horizon for decades. Decades! Then boom—replaced by larger operations closer to their Buffalo plant.

Ed Maltby from the Northeast Organic Dairy Producers Alliance has been vocal about this, pointing out that B Corp certifications and sustainability pledges lack significance when quarterly earnings calls arise.

Watch for these red flags:

  1. Market share is sliding in their product category
  2. Recent ownership or management changes without clear communication
  3. Shifting from annual to month-to-month contracts
  4. Increased talk about “supply chain optimization”
  5. Your field rep is visiting less often or seems distracted during visits

I was talking with a producer near Watertown who runs about 450 cows. After Dean Foods gave farmers 90 days’ notice before filing for bankruptcy in November 2019, he has became particularly concerned about understanding who owns these plants. “Public company? Private equity? Family controlled?” he said. “That matters way more than today’s price.”

What’s different about Chobani is that they don’t have Wall Street breathing down their neck every quarter. Hamdi Ulukaya still owns the majority—something like 68% or more, even after raising $650 million at a $20 billion valuation this spring. That gives them room to think long-term.

Remember back in 2014 when everyone was hammering Greek yogurt makers about acid whey disposal? Some processors attempted to pass those costs on to farmers. Chobani? They spent millions on reverse osmosis systems at their Twin Falls facility. Industry professionals familiar with that project say it actually hurt their margins in the short term. But that’s the difference—a public company watching quarterly earnings might not have made that call.

The Geography Lesson Nobody’s Talking About

Here’s something that doesn’t get enough attention: where you’re located matters more than ever for capturing these premiums. And I’ve watched this play out in different states over the years.

Take Michigan. They’ve doubled production since 2000 and achieved the highest per-cow average in the country—USDA data shows over 26,000 pounds annually. You’d think they’d be sitting pretty, right? But by 2017, they had some of the lowest mailbox prices nationally. Christopher Wolf, who previously worked at Michigan State and now teaches at Cornell, has conducted extensive research on dairy farm financial performance, demonstrating how they added cows faster than processing capacity could accommodate. When your milk has to travel 300-plus miles to find a home, you’ve got zero leverage.

Now look at South Dakota—completely different story. Valley Queen expanded their Milbank plant. Bel Brands opened up. First District built out its capacity. They’re adding millions of pounds of production, but prices are holding because the processing came first.

For folks here in the Northeast, between Chobani’s Rome plant, fairlife in Webster, plus what Danone and the co-ops already have… we’re seeing real competition for quality milk. If you can hit the specs, that is.

Regional Variations That Change Everything

What’s interesting is how this plays out differently across regions. Down in Georgia and Florida, producers face unique challenges. A producer near Valdosta told me last week: “We’re dealing with heat stress that Northern folks can’t imagine. Maintaining consistency with components when it’s 95 degrees with 80% humidity from May through October? That’s a whole different ballgame.”

They’re investing in cooling systems that cost significantly more than those in up North—cross-ventilation barns can run around $2,500 per stall, versus approximately $1,200 for natural ventilation, based on recent construction estimates. But the Southeast market premiums for local milk—often $2-3 per hundredweight above Federal Order minimums—make those investments pencil out.

Meanwhile, producers in the Mountain West face their own challenges. A Colorado producer managing 1,800 cows at 5,000 feet elevation explained: “Our cows eat 10% more just to maintain body condition at altitude. Component consistency is tough when you’re dealing with 40-degree temperature swings daily.” They’ve found success with more frequent feeding—five times daily versus three—to maintain steady rumen pH and component production.

Even internationally, these dynamics are playing out. While U.S. producers chase component premiums, European producers face different pressures—sustainability metrics, carbon footprints, and animal welfare standards. However, the fundamental shift from commodity to specification is a global phenomenon. New Zealand’s Fonterra, the world’s largest dairy exporter, is implementing similar component-based pricing structures.

The Timeline That’s Already Running

This development suggests a critical timing issue most producers haven’t fully grasped. If you’re picking bulls today based on the April 2025 genomic evaluations, those daughters won’t be milking until late 2028, maybe even 2029.

Corey Geiger from CoBank has been writing about this timing challenge for years in the dairy press. The producers who’ll capture premiums when these plants hit full capacity? They started positioning two or three years ago.

The genetic progress has been incredible, though. The USDA has just rolled back its genetic base by 45 pounds for butterfat and 30 pounds for protein—the biggest adjustment since genomic evaluations began. Paul VanRaden’s team at the USDA’s Animal Genomics and Improvement Laboratory says it reflects unprecedented progress in the national herd.

We broke through 4.23% butterfat nationally last year, according to USDA data. First time since the late 1940s. Some geneticists believe we could reach 5% within a decade if current trends continue. But here’s the catch—when everybody’s improving at the same rate, nobody really gets ahead. We’re all just running faster on the same treadmill.

Comparison: Where You Stand vs. Where You Need to Be

The specification gap is real—commodity producers face stagnant returns while those adapting to processor needs capture $50K-$250K annually, with niche markets offering even higher premiums for those willing to make the 6-8 year genetic commitment
Producer TypeCurrent Reality5-Year ProjectionInvestment NeededAnnual Return Potential
Commodity Producer$16-18/cwt baseSame, maybe lessMinimalBreaking even
Specification Producer$17-19/cwt with premiums$19-22/cwt$30,000-100,000$50,000-250,000
Niche Producer (A2, organic)$20-25/cwt$22-28/cwt$50,000-150,000$75,000-300,000

Alternative Paths When You’re Already Behind

Not everyone’s gonna catch this first wave, and honestly? Sometimes that’s the smarter play. The increased management complexity of chasing specifications isn’t for everyone—tracking daily variations, adjusting rations constantly, and dealing with more rejected loads if targets are missed.

I know a producer in Minnesota who has been pursuing A2 certification for over five years. “People thought I was nuts,” she laughs now. “Why chase A2 when everyone else is breeding for components? But now I’m getting substantial premiums over base, and processors are calling me.”

The market research backs her up. Grand View Research projects that the global A2 market will reach $26-27 billion by 2030. In the U.S., Polaris Market Research forecasts potential sales of $7-8 billion in A2 dairy products by 2032. Yeah, the Council on Dairy Cattle Breeding reports 60% of AI bulls are A2A2 now, but getting your whole herd certified? That’s still a 6-to 8-year project for most people.

Other strategies I’m seeing work:

Wait for round two: History shows—and the International Dairy Foods Association has documented this—big processing investments trigger follow-on expansions 3-5 years later. We saw it after Greek yogurt’s first boom. Maybe position yourself for 2029-2031 instead of trying to catch up to 2027.

Quality first, components second: Sometimes consistency beats absolute levels. Good cooling, monitoring systems, rock-solid sanitation… these improvements often pay back in 18-36 months regardless of genetics. Farms with SCC under 150,000 and low PI counts can currently secure quality premiums.

Robotic milking for consistency: Several producers are finding that robots help with component consistency through more frequent milking and individualized feeding. “The robot doesn’t have bad days,” a Wisconsin producer with two Lely units told me. “Our daily component variation dropped by half after installation.”

Managing Risk While Capturing Opportunity

I’ve noticed that the most successful producers aren’t putting all their eggs in one basket. Chobani almost went under in 2014-2015. They needed $750 million from TPG Capital at what the Financial Times called “some of the highest rates in corporate credit markets.” Their Idaho plant, which was supposed to transform the company? It nearly killed them instead.

They survived, came back stronger, but it was a close call. Real close.

This matters because you can’t build your entire operation around a single processor relationship. Dean Foods looked bulletproof until November 2019, when they filed for bankruptcy. Those Danone organic producers? Some had relationships that had been going on for 30 years. Didn’t matter when the termination letters came.

Someone who’s worked in milk procurement for years—can’t name them, but they’ve seen multiple cycles—gave me solid advice: “The survivors maintain options. Stay in a co-op even if direct deals pay better. Qualify for multiple premium categories. Be ready to pivot.”

Your Next 90 Days: Making This Real

So here’s your homework, and I mean actually do this, not just think about it. Pull your last 90 days of component tests. Not just the monthly average—look at the daily numbers. See that variation? That’s what processors care about as much as the averages.

Schedule real meetings with your field representative and at least two other processors or cooperatives. Face-to-face if you can swing it. You learn things from body language that emails never tell you.

Questions worth asking:

  • What exactly are your minimum specs for premiums, and what’s the actual payment?
  • How do my 90-day numbers stack up?
  • What’s your minimum volume, and can I aggregate through a co-op?
  • If I don’t qualify now, what would it really take to qualify?
  • What contract protections exist—such as notice periods, volume guarantees, and price floors?
  • Do you care more about monthly averages or daily consistency?

After those conversations, you’ll probably find yourself in one of three spots:

Close but not quite: Maybe you’re at 3.20% protein, and premiums kick in at 3.25%. Often, that’s fixable—different bypass protein (perhaps 1.5 lbs of bypass soy at around $0.35/cow/day, based on typical nutritional approaches), better fresh cow grouping, and tweaking the minerals a bit. Fix it this winter, capture premiums by spring.

Two to four years out: There is a need for serious investment in genetics and possibly infrastructure. Run real numbers. If $80,000 gets you $45,000 annually, you’re looking at a reasonable payback. However, ensure that those are contracted premiums, not projections.

Commodity producer: Your setup won’t economically reach premium specs given your location, facilities, or genetics. That’s not failure—it’s clarity. Consider exploring grass-fed, direct marketing, or even selling while land values are strong due to all this expansion.

The Bigger Picture We Can’t Ignore

Take a step back and examine what’s really happening here. According to the International Dairy Foods Association, we’re talking $11 billion in processing investment nationwide—Chobani, fairlife, plus dozens of other facilities. Most of this new capacity requires specifications that a significant portion of current production can’t consistently meet.

These aren’t plants for processing more regular milk. They require different milk—higher protein content, better consistency, specific markers, and documented quality systems. What worked in 2015? Might not even qualify by 2030.

That Mohawk Valley farmer I started with? Had these conversations three weeks ago. Turns out his protein is just 0.05% below his co-op’s premium threshold. Little ration adjustment (adding some bypass soy, based on standard nutritional recommendations), extending his transition period to 28 days, and possibly culling a few chronic low producers… he figures he’ll be there by spring.

“Six months from now, I’ll get that premium,” he told me yesterday. “Not by copying my neighbor’s setup, but by understanding what processors actually want and figuring out how to deliver it with what I’ve got.”

Five years from now, I think we’ll look back at 2025 as when everything changed. Not because of any single facility, but because this was when we collectively realized that producing milk and manufacturing to specifications are completely different businesses.

The folks who figure that out fastest? They’ll be the ones still here, still profitable, writing the next chapter of American dairy.

KEY TAKEAWAYS:

  • Immediate protein boost strategy: Adding 1.5-2 lbs of bypass soybean meal at $0.35/cow/day can increase protein by 0.10-0.15% within three weeks, potentially capturing premiums of $0.50-$1.50/cwt if you’re close to the 3.25% threshold—that’s $25,000-40,000 annually for a 200-cow operation
  • Geographic positioning matters more than size: Michigan producers with 26,000 lbs/cow average see lower mailbox prices than South Dakota farmers with less production because processing capacity came first in SD—being within 150 miles of new facilities like Chobani’s Rome or Fairlife’s Webster creates leverage regardless of herd size
  • The 2028 genetics gap is already set: Bulls selected today based on April 2025 evaluations won’t have milking daughters until late 2028, meaning producers capturing 2027-2028 premiums started positioning in 2022-2023—but quality improvements (cooling, consistency, sanitation) can pay back in 18-36 months
  • Risk diversification beats premium chasing: Dean Foods’ 2019 bankruptcy and Danone’s 2021 termination of 89 organic contracts prove processor relationships aren’t guaranteed—maintaining co-op membership while qualifying for multiple premium categories (components, A2, quality) provides essential protection
  • Small operations have viable alternatives: An 85-cow Pennsylvania farm captured $0.75/cwt premiums through simple bypass protein and consistent feed push-ups, while robotic milking systems are helping smaller Wisconsin dairies achieve the daily component consistency (<0.05% variation) that processors increasingly demand

Complete references and supporting documentation are available upon request by contacting the editorial team at editor@thebullvine.com.

Learn More:

The Sunday Read Dairy Professionals Don’t Skip.

Every week, thousands of producers, breeders, and industry insiders open Bullvine Weekly for genetics insights, market shifts, and profit strategies they won’t find anywhere else. One email. Five minutes. Smarter decisions all week.

NewsSubscribe
First
Last
Consent

Why UK Farmers Are Expanding Into £0.35 Milk – And the 90-Day Plan to Survive It

UK dairy: 5% production surge meets £0.35/L crash while 17% of farms face 60%+ debt ratios

EXECUTIVE SUMMARY: UK dairy farmers find themselves caught in an unprecedented paradox—production’s up 5% while farmgate prices plummet toward £0.35 per liter, creating what could be the industry’s most challenging period since Brexit. AHDB’s October data reveals the cruel mathematics at work: that 1.78 milk-to-feed ratio historically signals expansion, yet farmers following this indicator are walking into a structural crisis, not a cyclical downturn. With 17% of UK dairy operations already carrying debt-to-asset ratios above 60% according to DEFRA’s July survey, and working capital averaging just £800-1,200 per cow versus the £1,500 recommended minimum, the next three months will determine who survives this consolidation. What’s different this time is the convergence of permanent factors: Brexit has eliminated our EU export safety valve (down 21% since 2018), processing capacity’s shrinking as plants close, and global oversupply’s hitting simultaneously, with the US up 4.2% and Argentina up 7.7%. The farms that will survive will be those that take action now: locking in feed costs at current levels before winter volatility, applying for retail contracts offering 4-5p premiums over manufacturing milk, and having honest conversations with lenders before January reviews. This isn’t about weathering another cycle—it’s about recognizing a fundamental market restructuring that’ll likely see UK dairy consolidate from 8,500 to around 5,500 farms by 2030, with survivors emerging stronger but the middle ground disappearing entirely.

Dairy crisis action plan

So here’s what caught my attention this week. I’m reading through AHDB’s October quarterly review, and UK milk production increased by 5% last quarter, while farmgate prices dropped by nearly 10% to £0.38 per liter. Northern Ireland’s pushing production up 8.1%, England’s at 6.2%… and yet we’re all watching prices slide toward what could be £0.35 by February.

You know what’s really interesting, though? This actually makes sense when you look at that milk-to-feed ratio AHDB calculates every month. At 1.78, it’s telling producers to expand—that’s what the numbers say. Feed’s relatively cheap compared to milk, historically speaking. But I’ve been doing this long enough to know that sometimes the numbers don’t tell the whole story.

Why Good Farmers Are Making Tough Calls

I was talking with a Shropshire producer last week—let’s call him Tom—who runs about 280 cows near Market Drayton, and he summed up what a lot of you are probably feeling. “Look,” he said, “I’ve already put £150,000 into expanding the parlor. Started construction in March when things looked different. The heifers are bred, the concrete’s poured. What do you want me to do, just walk away?”

And honestly? He’s got a point. Most expansion decisions were made back in the spring when the outlook was completely different.

Here’s something interesting from the Journal of Dairy Science that came out in March—they found that farmers feel losses about twice as strongly as gains. Makes sense, right? When you’ve already invested that much, stopping feels worse than pushing through, even when the numbers get tight.

The math producers are doing… I get it. Your barn mortgage is £8,000 a month, whether you milk 200 cows or 250. The mixer wagon, the parlor equipment—those costs don’t change. So you think, well, if I can spread those fixed costs over more milk…

The thing is, when everyone thinks that way, we create our own problems.

What Brexit Really Changed (And Nobody Wants to Talk About)

You know what’s different this time around? We can no longer simply ship excess milk to Europe. Government trade stats from September show our dairy exports to the EU are down 21% since 2018. Meanwhile—and this is what really gets me—HMRC data shows New Zealand imports to the UK jumped 81% just in the first half of this year.

Remember 2015-2016? When prices tanked, we could at least move milk to Irish processors or French cheese makers. Not a great amount of money, but it kept things moving. That safety valve? It’s gone.

I’ve been reading through the House of Commons trade committee report from last year, and the reality is stark. Between sanitary certificates, health requirements, and three-day border delays, fresh dairy exports just don’t pencil out anymore. The Trade Policy Observatory figures these non-tariff barriers add 5-10% to costs. That’s not something that fixes itself when prices recover—it’s the new normal.

The Numbers That Keep Me Up at Night

The dangerous 17% – farms with debt ratios above 60% face six months to financial reckoning when milk hits £0.35/L

I’ve been reviewing the Farm Business Survey data—DEFRA has published their July numbers—and there are some clear warning signs. Approximately 17% of dairy farms already have debt-to-asset ratios exceeding 60%. That’s… that’s concerning.

Here’s how I think about it:

  • Below 40% debt-to-asset: You can probably ride this out for 12-18 months
  • 40-60% debt-to-asset: Vulnerable but manageable with strategic adjustments
  • Above 60% debt-to-asset: At £0.35 milk, you’ve got maybe six months before the bank starts asking hard questions

Working capital’s the other piece that worries me. The Farm Finance Institute’s been saying for years you need about £1,500 per cow as a buffer. But Kite Consulting’s recent surveys? Most UK farms are running at a cost of £800 to £1,200 per cow. And if you drop below £500 per cow… well, one major breakdown, one disease outbreak, and you can’t make payroll.

Working capital crunch exposed – farms averaging £1,000 per cow are £500 short of recommended levels and dangerously close to survival threshold. Every cow counts.

Michael Thompson over at Promar—he’s worked with over 200 dairy clients through the years—he put it to me straight: “Banks don’t care about your profit projections. They care about whether you can make next month’s payment.”

Why I Think £0.35 Is Coming by February

Now, I’m not one to make predictions, but the math here is fairly straightforward. AHDB has been tracking this for 15 years, and their Milk Market Value model indicates a three-month lag between commodity prices and what we receive at the farm gate. Typically accounts for about half of the commodity price movement.

Look at where commodities are right now. The EU Milk Market Observatory’s October data has butter at €605 per 100kg—that’s down 22% from last year. Skim milk powder’s off 12%. And those Global Dairy Trade auctions? Down nearly 6% across September and October.

When that works through our processing contracts… According to Dr. Robert Chen from AHDB’s market intelligence team on Tuesday, and he estimates the probability of reaching £0.35-0.36 by February at approximately 85%. The only thing that changes this is if we experience a major supply shock or China suddenly starts buying again. Neither looks likely right now.

What Different Regions Are Teaching Us

What’s fascinating is watching how different parts of the UK are handling this. Scotland’s production is only growing production by 1.2% according to Dairy UK’s latest numbers. Why the restraint?

Regional milk production growth reveals the paradox – Northern Ireland leads at 8.1% while Scotland shows restraint at 1.2% after processor closures. Geography drives survival strategy in this crisis.

Well, they learned the hard way. When Müller closed those plants in East Kilbride and Aberdeen back in 2018, 43 farms in northeast Scotland suddenly had nowhere to send their milk. They ended up paying 1.75p per liter just to truck milk to Bellshill—that’s over 100 miles. When you’re getting £0.35 at the gate and paying nearly 2p for transport… you’re basically paying to produce milk.

Northern Ireland? Totally different story. They’re expanding by 8.1%, but here’s the context: Dale Farm invested £70 million in its Dunmanbridge facility last June. They’ve secured an £8 billion deal to supply Lidl stores across 22 countries. When your processor’s investing that kind of money and has those contracts locked in, expansion makes more sense.

I was just in Devon last month, and producers there are taking a completely different approach. A small operation I visited—about 85 cows—they’ve gone fully grass-based, selling directly to local shops at £0.65 per liter. Different game entirely.

Your Next 90 Days: The Decisions That Matter

1. Lock Your Feed Costs (This Week, Seriously)

The Chicago Board of Trade had corn at $4.20 a bushel and beans at $10.17 as of October 15th. That’s not terrible, historically. But you know how fast that can change. Progressive Dairy’s data shows January-February usually brings volatility when South American weather becomes a factor.

Emma Davies at ForFarmers—she handles purchasing for over 150 dairy clients—she made a great point to me last week: “Forward contracting through March doesn’t cost anything upfront if your credit’s good. Why wouldn’t you lock that in?”

Think about it. If corn jumps to $6—which happened in the 2012 drought—you’re looking at an extra £0.04 per liter in feed costs. For a 200-cow farm, that’s £64,000 a year. That’s not margin optimization anymore, that’s survival money.

2. Those Retail Contracts (Application Windows Are Now)

Retail contracts offer 4.5p per liter premium – worth £72,000 annually for average farm, but application windows close in November. Miss this, wait another year.

Here’s what really struck me in the October price announcements. Arla and First Milk cut manufacturing contracts by 1.00 to 1.66p per liter. But the retail-aligned contracts? The Tesco Sustainable Dairy Group and Sainsbury’s groups actually increased by 0.88 to 2.85p.

We’re talking about a 4-5p per liter gap opening up. On 1.6 million liters a year, that’s a £64,000 to £80,000 difference. That’s transformative for cash flow.

However, and this is crucial, these applications typically run from October through November for Q1 contracts. Miss this window? You’re waiting another whole year. And next year, everyone will be trying to get in.

3. Hard Choices About Herd Size

If your working capital’s dropping toward £500 per cow, or you’re burning through more than £15,000 a month in cash… strategic culling might be necessary. I know how that sounds when you’ve been building the herd, but sometimes taking a step back is the smart move.

AHDB’s latest deadweight prices show culls at £3.20 to £3.80 per kg—so £800 to £1,000 per head depending on condition. However, history tells us from 2016 that when everybody starts selling, prices can drop by 30-40%. You could be looking at £550-650 by February if panic sets in.

Three Things That Could Make Everything Worse

  • The Heifer Shortage Nobody’s Watching

British Cattle Movement Service data shows UK cow numbers actually dropped 0.6% year-over-year. However, what concerns me is that the replacement pipeline’s drying up.

AHDB Breeding+ stats show beef-on-dairy programs are up 40% this year. Makes sense for cash flow, right? But Genus ABS tells me sexed semen’s now 60-70% of all breedings. Add in farms selling pregnant heifers for quick cash, and we’re setting up a replacement shortage for the 2027-2028 period.

Current market reports have bred heifers at £1,400-1,600. Based on what happened after 2016, when will the shortage hit? Those could easily reach £2,200-£ 2,800. Farmers selling heifers now won’t be able to buy them back when things recover.

  • Banks Are Quietly Changing the Rules

I can’t name names, but I’ve talked to lending officers at three major UK banks, and they’re all tightening up. Operating lines that used to get annual reviews? Now it’s quarterly. Farms with weakening ratios are seeing credit limits cut 10-20%. They’re asking for more collateral across the board.

The killer is the timing. Banks do their big reviews in January-February—exactly when milk prices will be at their worst, and your numbers look terrible. A farm expecting to roll over £200,000 in operating credit might get offered £140,000 at higher rates. That £60,000 difference in working capital, right when you need it most? That could be the ballgame.

  • Processing Capacity Keeps Shrinking

Kite Consulting’s September analysis is sobering. We have too much processing capacity for a market where liquid consumption’s dropping by about 1.5% annually, according to Dairy UK. When processors can’t make money at £0.35 per liter of milk, plants close.

Remember what happened to those Scottish farms after Müller’s closures. And that Skelmersdale plant breakdown last April that caused 12 days of dumping? Word is that they’re “evaluating the facility’s future”—that’s code for “might close.”

If you don’t have a backup plan for what happens to your milk if your processor shuts down or cuts contracts, you need one. Now.

Looking Past the Crisis: UK Dairy in 2030

Industry consolidation accelerates – 35% of UK dairy farms expected to exit by 2030, leaving survivors stronger but middle ground eliminated. The great reshaping begins now.

We will get through this—we always do—but UK dairy will look different on the other side. Based on historical consolidation patterns and current trends, I anticipate that we will have approximately 5,500 farms by 2030, down from around 8,500 today. Three main types of operations will likely dominate:

The big effort from efficient farms—350 to 600 cows—with retail contracts and costs below £0.35 per individual —folks entered this crisis with a strong balance sheet, likely to acquire assets from distressed neighbors. You’ll see them clustered near the big processing hubs in the Midlands, and Yorkshire, and Northern Ireland.

The premium producers—smaller operations, typically with 60 to 120 cows—sell organic, grass-fed, or direct-to-consumer products at £0.50 to £0.70 per liter. They’re avoiding the commodity game entirely. Scotland and Wales tourism areas will probably have clusters of these.

The diversified operations—200 to 350 cows—mixing milk production with beef-on-dairy, maybe some renewable energy, and custom heifer raising. Multiple income streams mean that when one market tanks, you’re not sunk.

What probably won’t make it? A traditional 150- to 250-cow farm operating on commodity contracts with debt exceeding 50%. That middle ground… it’s just tough to see how it works anymore.

The Conversation We Need to Have

Look, I know this is heavy. For most of us, this isn’t just business—it’s family, it’s identity, it’s everything we’ve worked for. The stress is real. It affects everything from how you sleep to how you make decisions.

Dr. Lisa Roberts at Edinburgh has done great work on farm mental health, and she’s right—reaching out for help, whether that’s financial advisors, family, or counseling, is not a sign of weakness. That’s being smart. The best farmers I know are those who recognize when they need an outside perspective.

And for some operations… this is hard to say, but if the numbers truly don’t work, exiting on your terms now might be better than bleeding equity for 18 months, hoping for a miracle. That’s not failure. That’s protecting what you’ve built.

Why This Time Really Is Different

I’ve been through 2009, 2015-2016, COVID, and a bunch of smaller crashes. This one feels different because it IS different.

Brexit changed our export markets permanently—that 21% drop isn’t coming back. Processors are consolidating, not expanding. And the whole world’s producing more—USDA data shows the US up 4.2%, Argentina up 7.7%—while China’s barely importing based on their customs data.

This isn’t just a cycle that’ll fix itself. It’s a structural shift. The ones that make it will be more profitable, but there’ll be fewer of them.

The Clock’s Ticking

Every crisis creates winners and losers. The difference usually isn’t resources—it’s timing. The decisions you make in the next 90 days matter more than what you hope happens in the next 90 weeks.

Lock in feed costs. Apply for retail contracts if you can. Have honest conversations with your bank now, not in February. Look at your working capital realistically. And if the numbers say you need to make changes, make them while you still have options.

That 1.78 milk-to-feed ratio everyone’s watching? It’s yesterday’s indicator for tomorrow’s market. The game’s changed. Question is whether you change with it.

Make the calls. Have the conversations. Run the real numbers, not the hopeful ones.

February’s coming whether we’re ready or not. What you do between now and then… that’s what determines whether you’re still milking in 2027.

KEY TAKEAWAYS

  • Lock feed costs this week to save £64,000 annually—with Chicago Board corn at $4.20/bushel (October 15), forward contracting through March protects against potential jumps to $6 that would add £0.04/liter to costs on a typical 200-cow operation
  • Retail contract applications close in November for Q1 2026—the 4-5p/liter premium between manufacturing and liquid contracts (Tesco Sustainable Dairy Group, Sainsbury’s programs) represents £64,000-80,000 annual difference on 1.6 million liters, but miss this window and you’re waiting another full year
  • Strategic culling becomes necessary below £500/cow working capital—with AHDB showing cull prices at £800-1,000/head currently, versus likely £550-650 by February, when panic selling starts, farms burning over £15,000 monthly need to act while values hold
  • Regional strategies vary based on processor infrastructure—Northern Ireland’s 8.1% expansion makes sense with Dale Farm’s £70 million investment and Lidl contracts, while Scotland’s 1.2% restraint reflects lessons from Müller closures that left farmers paying 1.75p/liter transport
  • Bank credit reviews in January-February will catch unprepared farms—lending officers at major UK banks confirm they’re cutting operating lines 10-20% for weakening operations, meaning that a £200,000 credit renewal might only get £140,000 right when milk prices hit their floor

Complete references and supporting documentation are available upon request by contacting the editorial team at editor@thebullvine.com.

Learn More:

  • UK Dairy’s Lupin Bet: Are the Profits Real in 2025? – This tactical guide reveals how to achieve immediate, quantifiable cost savings by replacing 50% of soya protein with lupin. Learn the key milling and contract strategies to save over £750 monthly on a 250-cow herd, directly boosting your working capital during the price crash.
  • The Real Reason 190 UK Dairy Farms Disappeared – And What They’re Not Telling You – Gain critical strategic insight into the structural forces driving farm exits. This analysis uncovers the harsh reality of processor redlining, geographic transport penalties, and market power dynamics, providing a vital risk assessment tool for your long-term survival strategy.
  • The Great UK Dairy Cull: What’s Really Driving the Farm Exodus – Learn how scale and technology are now essential survival metrics. This article details the automation reckoning, providing crucial ROI metrics for robotic milking and achieving feed conversion ratios below 0.9 kg/litre to survive the coming industry consolidation.

The Sunday Read Dairy Professionals Don’t Skip.

Every week, thousands of producers, breeders, and industry insiders open Bullvine Weekly for genetics insights, market shifts, and profit strategies they won’t find anywhere else. One email. Five minutes. Smarter decisions all week.
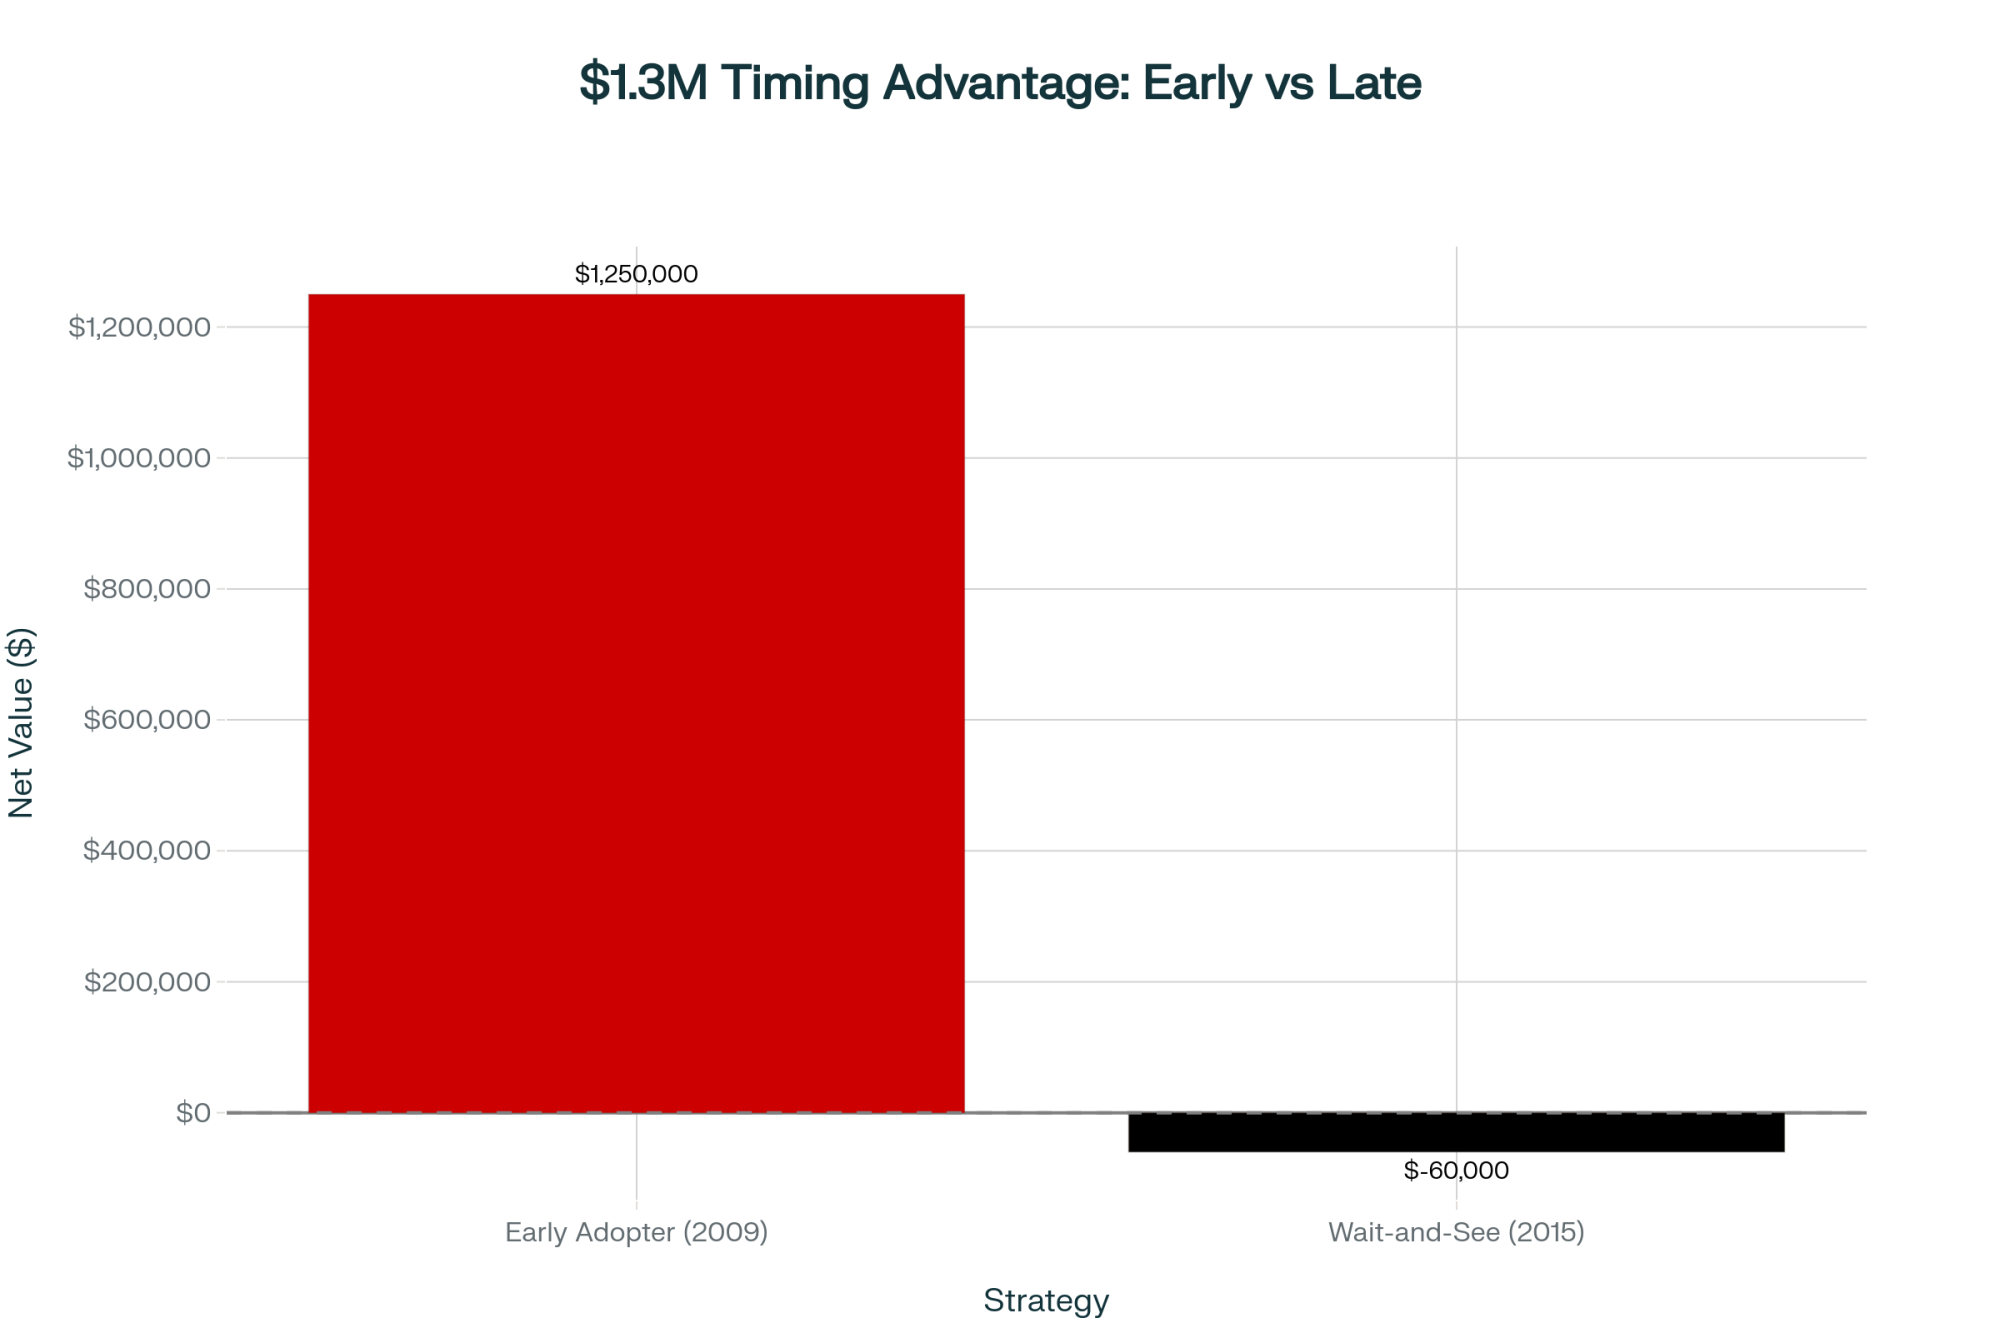
NewsSubscribe
First
Last
Consent

Same Cows, $15,000 Monthly Gap: Your Class III-IV Decision Window Closes Spring 2026

Your genetics are perfect for 2015’s market—but it’s 2025, and processors want different components

EXECUTIVE SUMMARY: What farmers are discovering across the country is that today’s unprecedented $2.47 per hundredweight spread between Class III and Class IV milk prices isn’t just another market cycle—it’s a structural shift that demands strategic action before spring 2026. The numbers tell a sobering story: a typical 500-cow dairy locked into Class IV pricing faces a $15,000 monthly disadvantage compared to neighbors shipping to cheese plants, according to October’s USDA pricing data and analysis from the University of Wisconsin’s dairy markets program. This spread, the widest we’ve sustained since 2011, stems from three converging factors that aren’t going away: our herds now average mid-four percent butterfat when processors desperately need protein, China’s dairy imports have declined significantly as they’ve built domestic capacity equivalent to Wisconsin’s entire annual production, and billions invested in cheese plants can’t process the butterfat surplus we’re creating. Research from Cornell’s dairy program and the Center for Farm Financial Management shows operations successfully navigating this transition fall into three clear paths—strategic expansion for those near cheese plants with strong succession plans, smart adaptation through component management and risk tools for those with moderate leverage, or planned exits that preserve 85-95% of asset value versus the 50-65% retained in forced sales. The window for action is narrowing, with historical consolidation patterns suggesting the best opportunities for expansion and the most favorable exit terms will close by spring 2026. Here’s what’s encouraging: producers who honestly assess their situation using clear decision frameworks and act decisively—regardless of which path they choose—consistently achieve better outcomes than those waiting for conditions to improve.

What farmers are discovering about today’s unprecedented Class III-IV differential—and how the smartest operations are turning crisis into opportunity while others prepare strategic exits

Tim Anderson was checking tank weights at 4:45 a.m. in his South Dakota parlor when the October milk statement arrived on his phone. The Federal Order changes that took effect in June had dropped his mailbox price again—another reminder that the reforms we’d hoped would help actually made things more challenging for many of us, particularly those shipping Class IV milk.

What struck me about Tim’s situation was this: while he was preparing to expand by acquiring a neighbor’s operation, a California producer I’d met at the Holstein convention was making equally prudent plans to exit the industry entirely. Same market conditions. Same unprecedented pricing spread between Class III and Class IV milk. Yet both were making the right decision for their particular circumstances.

TL;DR – THE 30-SECOND VERSION

  • The Crisis: $2.47/cwt Class III-IV spread—widest since 2011
  • The Impact: $15,000 monthly loss for 500-cow Class IV operations
  • The Choice: Expand, adapt, or exit by spring 2026

BY THE NUMBERS: KEY FACTS AT A GLANCE

  • $2.47/cwt – Current Class III-IV spread (October 2025)
  • 32,000 → 23,000 – Projected U.S. dairy farms by 2027
  • $15,000/month – Income gap for 500-cow Class IV operations
  • 85-95% – Asset value retained in planned exits vs. 50-65% in forced sales
  • 14 months – Average technology payback period for smart investments

QUICK ACTION GUIDE: YOUR 90-DAY ROADMAP

Your SituationYour PathFirst Step This Week
✅ Under 45, near cheese plants, succession securedEXPANDCall the banker for acquisition credit
⚖️ Moderate debt, some flexibility, 5-10 year horizonADAPTSchedule a component optimization consult
🔄 No succession, burning equity, geographic disadvantagesTRANSITIONGet a professional valuation

Resources to get started:

  • LGM-Dairy information: Your local FSA office or check the RMA website
  • Component optimization: Talk to your nutritionist or extension dairy specialist
  • Market analysis: University of Wisconsin’s Understanding Dairy Markets program
  • Exit planning: The Center for Farm Financial Management has excellent resources

Understanding Today’s Market—It’s Different This Time

So you’ve probably noticed your milk check acting strange lately. If you’re fortunate enough to ship Class III milk for cheese production, October’s USDA pricing announcement puts you around seventeen dollars per hundredweight. But what about milk that goes to butter and powder production? You’re looking at about $14.50.

The unprecedented Class III-IV milk price spread hit $2.47/cwt in October 2025—the widest sustained gap since 2011, costing Class IV operations $15,000 monthly versus cheese plants. 

Now, here’s what’s interesting—this differential of roughly two dollars and forty-seven cents is something we haven’t seen sustained at this level since 2011. The folks at the University of Wisconsin’s dairy markets program have been tracking this, and historically, we’ve seen spreads average well below a dollar per hundredweight. When it gets this wide, it fundamentally changes the economics of dairy farming depending on what your milk is used for.

Why This Spread Hits Different

You know, I was reviewing the numbers last week, and for a typical 500-cow dairy, being locked into Class IV pricing versus Class III means you’re looking at roughly $15,000 less income every month. That’s real money—the difference between breaking even and burning equity.

Mark Stephenson, who runs UW-Madison’s dairy policy analysis program, made a point recently that really resonated with me. He’s saying this looks more like a structural market shift than the typical cycles we’re used to riding out. And I think he’s right.

What’s also worth noting is the international perspective here. A New Zealand producer I connected with online mentioned they’re dealing with similar component imbalances, though their cooperative structure handles it differently. Sometimes, examining how other countries address these challenges provides us with fresh insights.

The Component Balance Nobody Planned For

The dairy industry has made significant progress in genetic advancements over the past twenty years. Council on Dairy Cattle Breeding data shows most herds now average in the mid-four percent range for butterfat, while protein levels sit in the low threes. That’s remarkable progress, really.

But here’s the thing—I was at a Wisconsin Center for Dairy Research meeting last month, and John Lucey made this observation that stuck with me. He said we essentially optimized our genetics for a market that existed when China was buying everything we could produce. Those breeding decisions made sense at the time, but now…

A Wisconsin producer told me last week, “My DHI reports look fantastic—4.4% butterfat, 3.2% protein. Ten years ago, I’d be thrilled. Now my processor is penalizing me for excess butterfat.” And that’s the reality many of us are dealing with. Even if we completely changed our breeding strategy today—focused entirely on protein—we’re looking at five to seven years before those genetics fully express themselves in the milking herd.

The Export Picture Has Changed

What’s happened with exports is particularly sobering. USDA’s Foreign Agricultural Service has been tracking China’s dairy imports, and they’ve declined significantly from where they were just a few years back. The Chinese have made massive investments in domestic production—it’s a food security thing for them, and honestly, you can understand why.

I was speaking with a dairy economist from Cornell last month, who shared something that really puts this into perspective: China added more milk production capacity between 2020 and 2024 than Wisconsin produces in an entire year. That’s not a temporary blip—that’s a fundamental change in global dairy markets.

And Mexico—our biggest export market, taking about 30% of what we send overseas—they’re implementing their own expansion plans. The U.S. Dairy Export Council has been monitoring this closely, and it appears that our exports to this market could decline significantly over the next few years.

Down in the Southeast, producers are feeling this too. A Georgia dairyman I know said, “We used to count on steady growth in powder exports through Savannah. Now we’re planning for flat to declining volumes.”

Peter Vitaliano at National Milk made a point that I think deserves serious consideration. These aren’t the kind of temporary trade disputes that get resolved when administrations change. These are countries making long-term strategic decisions about food security.

Processing Capacity in the Wrong Places

Since 2020, the dairy industry has invested billions in new processing capacity—CoBank’s been documenting this, and it’s impressive. The problem is that we have a mismatch. Most of the investment went into cheese plants, but we’re producing more butterfat than those plants know what to do with.

A processing engineer explained it to me this way: “Converting a cheese plant to butter production would be like trying to turn a Toyota factory into a bakery. Everything about the process is different—the equipment, the workflows, everything.”

Making Sense of Your Options: A Framework

Through conversations with producers across the Midwest and lenders from various institutions, I’ve noticed successful operations tend to evaluate these factors honestly:

Eight Questions That Matter

What to ConsiderGood PositionChallenging Position
Cash FlowBreaking even or betterBurning over $40K monthly
SuccessionKids are committedNo clear plan
Your EnergyReady for big changesExhausted thinking about it
LocationNear cheese plantsStuck with Class IV
Debt LevelUnder 45% debt-to-assetOver 60% debt-to-asset
Your AgeUnder 45Over 58
Other OptionsDairy’s your best betBetter opportunities exist
Staying PowerCan handle 24 monthsLess than 12 months of runway

You know, if you’re scoring well on six or more of these, you might want to think about expansion or really pushing adaptation. If you’re only hitting a couple? Well, that’s a different conversation entirely.

There’s another factor worth considering—cooperative strategies. I’ve been hearing about groups of smaller producers pooling resources for shared technology investments or negotiating power. It’s not for everyone, but it’s an option some are exploring.

The Opportunities Hidden in This Market

Cornell’s dairy program has documented how consolidations like this historically create opportunities for those positioned to capture them. And we’re seeing that play out right now.

What’s Available If You’re Looking

The auction tracking services—Machinery Pete, Ritchie Brothers—they’re reporting some interesting numbers:

  • Complete dairy operations going for $1,200-1,500 per cow (replacement cost is easily double that)
  • Used equipment at 40-60% of new prices
  • Dairy-suitable land down 20-30% from recent peaks

I talked with a South Dakota producer last week who just acquired a 400-cow operation for $1,350 per cow. “Five years ago,” he said, “this would’ve cost me three grand per cow minimum. The math is completely different at these prices.”

However, and this is crucial, you must plan the integration carefully. Another producer I know rushed an acquisition and told me, “I got a great price on the cows, but I totally underestimated integration costs. It took 18 months before we saw positive cash flow from that expansion.”

How Processor Relationships Are Changing

As neighbors exit and milk supplies tighten in certain regions, the producers who remain are finding themselves in a different negotiating position. I’ve been hearing about some interesting deals in Wisconsin and Minnesota:

  • Protein premiums running $0.35-0.40/cwt
  • Volume commitment bonuses of $0.25-0.30/cwt
  • Quality bonuses for low somatic cells hitting $0.20-0.25/cwt

Add it all up, and some operations are getting close to a dollar per hundredweight above base prices. That’s significant money.

A procurement manager explained the processor’s perspective to me: “We’d rather pay premiums to secure a reliable supply than risk running our plant at 70% capacity. Empty vats don’t pay bills.”

The Economics of Exit—Let’s Be Honest About This

How You ExitWhat You KeepTimeline500-Cow Example
🟢 Planned Exit85-95% of valueYou control it$5.5M → $4.7-5.2M
🔴 Forced Sale50-65% of valueBank controls it$5.5M → $2.8-3.6M
🟡 Alternative UseSometimes, more than dairy value18-24 monthsVaries widely

These numbers come from the Center for Farm Financial Management’s analysis of recent dairy exits

When Getting Out Makes Sense

This is a difficult topic to discuss, but for some operations, planning an orderly exit can be the smartest business decision. I recently worked with a Pennsylvania producer who put it this way: “It wasn’t about giving up. It was recognizing I could preserve $3 million in equity by exiting now versus maybe $1 million if I waited until the bank forced it.”

Different Regions, Different Opportunities

In California’s Central Valley, water costs have reached $400-500 per acre-foot, according to the state’s water resources data. Combined with being locked into Class IV pricing, the math becomes challenging. Several producers I know are finding better returns with solar leases at $1,200-$ 1,500 per acre annually, or converting to almond production.

One California producer told me straight up: “Between water costs, regulations, and Class IV pricing, I’m basically paying for the privilege of milking cows. That’s not a business—that’s an expensive hobby.”

In the Northeast—specifically, Vermont, New York, and Pennsylvania—fluid premiums that used to be $0.35 are now under a dollar, according to Federal Order One data. But here’s the thing: development pressure means land values remain strong. A Vermont producer recently sold 200 acres for development at $18,000 per acre. “The irony,” he said, “is that the same development pressure that makes farming difficult also creates our exit opportunity.”

The Upper Midwest generally has more flexibility, though distance from cheese plants matters more than ever. Every ten miles from processing adds about ten cents per hundredweight in hauling costs. Beyond fifty miles? That becomes a real structural disadvantage.

Down South, the situation varies widely. A Tennessee producer shared, “We’re seeing opportunities in agritourism and direct sales that didn’t exist five years ago. Some of my neighbors are making more from farm tours than milk sales.”

There is a growing trend in North Carolina and Virginia, where producers are converting to grass-fed operations for premium markets. It’s not easy, but for some, it’s working.

Adaptation Strategies That Are Actually Working

For most of us—those neither expanding nor exiting—we need to make some significant adjustments. Here’s what I’m seeing work:

Getting Components Right

Mike Hutjens, the Illinois nutritionist many of you are likely familiar with, has been working with farms on this. In recent trials he supervised, producers saw:

  • Protein boost of about 0.18% at twenty cents per cow daily
  • Some fat reduction that actually saved money
  • Net improvement of thirty to forty-five cents per hundredweight

“We’re not trying to eliminate butterfat,” Mike explains. “The genetics won’t let us. We’re optimizing the ratio to match what processors want.”

Risk Management That Makes Sense

I talked with a Wisconsin producer running 500 cows who shared his approach: “I cover 60% with LGM-Dairy—costs about forty cents per hundredweight after subsidies. Another 25% with Class III puts. Leave 15% open for upside. Total cost? About five grand monthly. But it guarantees I can pay bills regardless of what the market does.”

What’s changed is how lenders view this. “It used to be seen as speculation,” a Minnesota producer told me. “Now my banker basically requires it.”

Technology Investments That Pay

Not every technology makes sense, but some really do. A Minnesota dairy with 600 cows shared their results with activity monitors:

  • Spent $38,000 on the system
  • Pregnancy rate went from 18% to 24%
  • Health treatment costs dropped $18 per cow annually
  • Saved an hour and a half daily on heat detection
  • Paid back in 14 months

“The key,” the owner said, “is choosing technology that solves a specific problem, not just buying the latest gadget.”

I’ve also seen good returns from robotic milking in certain situations. An Ohio producer with 180 cows installed robots last year: “It’s not just labor savings—our components improved, SCC dropped, and my knees don’t hurt anymore.”

However, there’s another aspect to consider—data management systems. A Michigan producer running 800 cows told me their investment in comprehensive herd management software paid back in eight months through better breeding decisions and health interventions alone.

How Federal Order Reform Actually Played Out

So the changes that took effect June 1st… they didn’t go quite as we’d hoped. USDA’s November announcement increased make allowances—what processors deduct for manufacturing costs—pretty substantially:

ProductOld RateNew RateImpact on Your Milk Check
Cheese$0.20/lb$0.25/lbDown about $0.52/cwt
Butter$0.17/lb$0.23/lbDown about $0.56/cwt
Powder$0.17/lb$0.24/lbDown about $0.72/cwt

The net effect? Most of us are down eighty-six to ninety-one cents per hundredweight through November. Component improvements are scheduled for December 1st, which should help—USDA estimates about fifty cents—but we’re still in the hole.

As Marin Bozic at the University of Minnesota put it, “Federal Order reform addressed how we calculate prices, but it can’t fix the fundamental supply-demand imbalance. We’re producing components the market doesn’t want at current levels.”

Looking Ahead—What This Industry Becomes

Based on what we’re seeing now and historical patterns from USDA’s Economic Research Service, if current trends continue—and that’s a big if—by 2027, we might see:

  • Total operations dropping to maybe 23,000-24,000 from today’s 32,000
  • Average herd size passing 500 cows nationally
  • The biggest 2,000 operations controlling half of all production
  • Smaller operations under 200 cows are becoming increasingly specialized or exiting

The growth appears to be occurring in areas such as South Dakota (three new cheese plants), Idaho (water and infrastructure), and the Texas Panhandle (feed availability and new processing facilities). Meanwhile, California, the Northeast, and remote areas of the Midwest are experiencing contraction.

What’s particularly interesting is how quickly certain things are becoming standard. A processor quality manager told me: “Five years ago, maybe 20% of our producers actively managed components. Now it’s 75% and growing. If you’re not adapting, you’re at a serious disadvantage.”

Looking internationally, the EU is facing similar consolidation pressures, although its subsidy structure creates different dynamics. Sometimes I think we focus so much on our own challenges that we miss that this is a global phenomenon.

Your Three Paths Forward

After looking at how different operations are navigating this, three strategies keep emerging:

Path 1: Strategic Expansion

If you’re under 45, near cheese plants, with succession secured

Your next 90 days:

  1. Weeks 1-2: Set up that acquisition credit line
  2. Weeks 3-4: Identify who might sell
  3. Month 2: Approach them privately
  4. Month 3: Do your homework thoroughly

A South Dakota producer who just expanded told me, “The cheap part was buying the cows. The expensive part was integrating them properly. Budget twice the time and money you think you’ll need.”

Path 2: Smart Adaptation

If you’ve got moderate debt, some flexibility, and 5-10 years left

Focus on these priorities:

  • Get your nutritionist working on components immediately
  • Set up LGM-Dairy coverage (seriously, do this)
  • Talk to your processor about premium programs
  • Only buy technology with a clear payback under 18 months

“The mistake I see,” a Wisconsin banker told me, “is producers trying to change everything at once. Pick two or three high-impact changes and execute them well.”

Path 3: Strategic Exit

If there’s no succession, you’re burning equity, or better opportunities exist

Protect what you’ve built:

  • Get a professional valuation now
  • Talk to your accountant about tax optimization
  • Explore all options—whole farm, parcels, alternative uses
  • Most importantly: control your timeline

A Pennsylvania dairyman who recently retired reflected: “I spent 40 years building this operation. Taking 18 months to exit properly preserved 40% more value than if I’d waited until the bank forced it.”

The Window Is Closing

Considering market dynamics and historical patterns, the window for capturing opportunities or avoiding worse outcomes likely extends through spring 2026. After that, options start getting limited.

What I’ve noticed is that producers who honestly assess their situation and act decisively—regardless of which path they choose—consistently outperform those who wait for conditions to improve.

As I finish writing this, I’m thinking about Tim Anderson in South Dakota, probably heading out for evening milking. And that California producer, maybe reviewing exit strategies with his accountant. Both are facing this with eyes wide open. Both are making the right call for their situation.

The dairy industry will get through this transition—it always does. The question is whether your operation will be part of what comes next, and if so, in what form.

Take the Next Step

The conversations I’ve had while researching this article convinced me of one thing: having a clear framework for decision-making is essential right now. That’s why we’ve been working on resources to help producers evaluate their situations objectively.

Here’s what can help:

  • Connect with other producers facing similar decisions through The Bullvine’s online forums
  • Access our collection of planning worksheets and calculators
  • Read detailed regional market analyses updated weekly
  • Join our monthly video discussions with industry experts

Have specific questions about your operation? Send them to us—we’re featuring reader questions in upcoming articles, and your situation might help others facing similar decisions.

Because in today’s dairy industry, none of us should have to figure this out alone.

KEY TAKEAWAYS

  • The $180,000 annual impact is real and measurable: Operations shipping Class IV milk to butter/powder plants face a $2.47/cwt disadvantage that translates to $15,000 monthly losses for a 500-cow dairy—money that determines whether you’re building equity or burning through it while neighbors with identical herds but different processors thrive.
  • Three proven paths emerged from producer experiences: Expand strategically if you’re under 45 with cheese plant access and can acquire operations at current valuations of $1,200-1,500 per cow (half of replacement cost), adapt through component optimization that delivers $0.30-0.45/cwt improvements and LGM-Dairy coverage costing $0.40/cwt after subsidies, or exit strategically while controlling timing to preserve 85-95% of asset value.
  • Component management pays immediate dividends: Wisconsin and Minnesota producers working with nutritionists report achieving 0.18% protein increases at $0.20/cow daily cost while reducing expensive butterfat supplements, netting $0.30-0.45/cwt improvements—that’s $36-54 more per cow monthly without genetic changes that take five to seven years.
  • Geography increasingly determines destiny: Every 10 miles from cheese processing adds $0.10/cwt in hauling costs, California’s Central Valley producers face $400-500/acre-foot water costs plus Class IV lock-in, while Northeast operations see fluid premiums drop from $3.50 to under $1.00/cwt—but development opportunities offer $15,000-25,000/acre exits.
  • Technology investments with 14-18 month paybacks make sense now: Activity monitoring systems ($38,000 for 600 cows) boost pregnancy rates from 18% to 24% while cutting health costs $18/cow annually, and smart producers focus on solving specific problems—heat detection, health intervention, component optimization—not buying the latest gadgets.

Complete references and supporting documentation are available upon request by contacting the editorial team at editor@thebullvine.com.

Learn More:

The Sunday Read Dairy Professionals Don’t Skip.

Every week, thousands of producers, breeders, and industry insiders open Bullvine Weekly for genetics insights, market shifts, and profit strategies they won’t find anywhere else. One email. Five minutes. Smarter decisions all week.
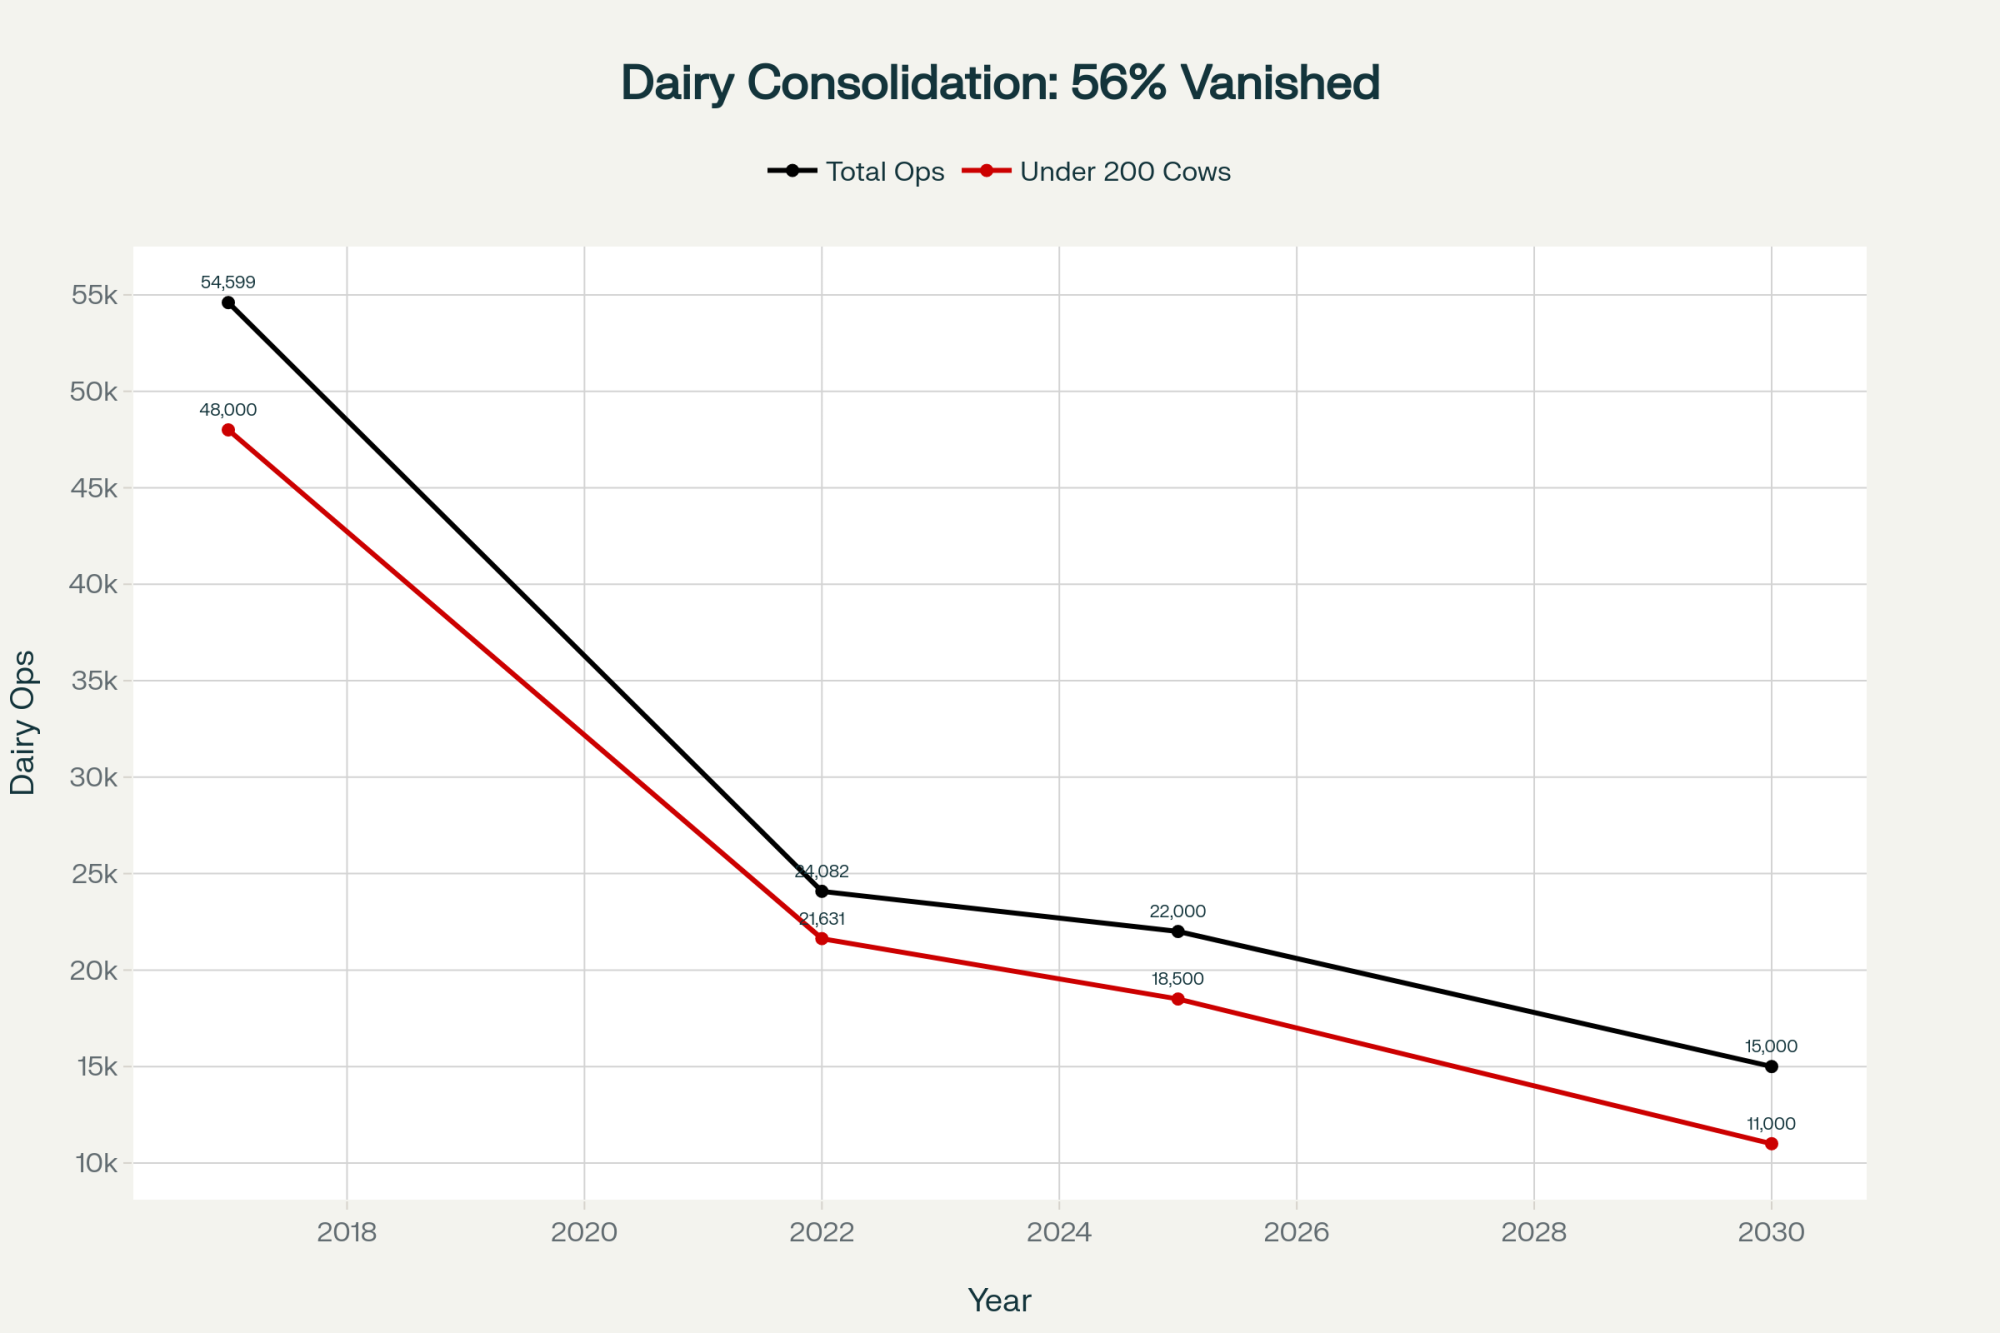
NewsSubscribe
First
Last
Consent

From $200 Holstein Bulls to $1,400 Beef Crosses: Your 3-Week Implementation Guide

Why do some dairies bank $100K+ from beef crosses while neighbors get $200 for Holstein bulls?

EXECUTIVE SUMMARY: What farmers are discovering through real-world experience is remarkable—beef-cross calves now bring around $1,370 at Pennsylvania auctions while Holstein bulls fetch maybe $200, according to recent USDA market reports. This seven-fold premium stems from three converging factors: beef cow inventory hitting its lowest point since 1961 (27.9 million head per USDA’s January report), sexed semen technology achieving 70-80% of conventional conception rates, and research from the Journal of Animal Science confirming crossbreds demonstrate superior feed conversion and carcass quality versus straight dairy steers. Nearly three-quarters of dairy operations now engage in some beef-on-dairy breeding, with leading farms, such as McCarty Family Dairy in Kansas, reporting that cattle sales represent roughly half of their monthly revenue during strong markets. Economic modeling from UW-Madison indicates profitability holds as long as crossbreds maintain at least double the value of Holstein bulls—suggesting a practical floor around $450-500 even after inevitable market corrections. Here’s what this means for your operation: implementing a conservative approach with just 15% of your herd could generate $25,000-40,000 in additional annual revenue without betting the farm. The opportunity remains open for producers willing to act with measured optimism and proper risk awareness.

beef on dairy

I recently spoke with a producer from Pennsylvania who mentioned something that stopped me in my tracks. His beef-cross calves just brought around $1,370 at the New Holland auction, according to recent USDA market reports from September. Meanwhile, his neighbor, located in the same region and operating similarly, continues to receive roughly $200 for straight Holstein bulls on a good day.

What’s interesting here is that this isn’t just a Pennsylvania story. I’m hearing similar accounts from Wisconsin to California, Texas to Vermont, and it raises questions worth exploring. Some operations are capturing an additional $100,000 or more annually through strategic breeding decisions, while others continue with traditional approaches. The difference isn’t simply about access to information—it’s about recognizing and acting on converging opportunities.

Ken McCarty from McCarty Family Dairy in Kansas offered a particularly compelling perspective at the recent World Dairy Expo. You know what stuck with me? He recalled attempting to sell Holstein bull calves years ago, describing them as “two for $5,” with no takers. Today, as he explained to the audience, cattle sales have transformed from a budget afterthought to representing approximately half of monthly revenue during strong markets. That’s more than incremental improvement. It’s a fundamental business transformation.

I’ve noticed similar stories emerging from diverse operations lately. An Ohio producer described an identical trajectory last month—from essentially giving away bull calves to generating significant revenue through beef crosses. Then there’s this Wisconsin dairyman who runs 300 cows and became one of his region’s early adopters. Down in Georgia, a 600-cow operation told me they’re now banking an extra $120,000 annually. These aren’t isolated success stories; they represent something broader worth understanding.

When Three Industry Trends Converged

From Afterthought to Game-Changer: How 7.9 Million Units of Beef Semen Rewrote Dairy Economics

Looking at this trend, what’s particularly noteworthy is how this opportunity emerged from the convergence of three independent developments. Understanding each component helps explain why some producers captured value while others missed the signals.

The current situation of the beef industry provides essential context. USDA’s January 2025 cattle report documented approximately 27.9 million beef cows nationally—the lowest level recorded since the early 1960s. Total cattle inventory decreased to 86.7 million head, reflecting sustained pressure on beef production capacity. Three consecutive years of drought across the Great Plains forced substantial herd liquidations.

Driving through Nebraska last summer, I observed pastures that typically support cow-calf operations standing empty—a clear reminder of supply constraints affecting the entire beef complex. A rancher near North Platte told me he’d sold his entire herd rather than buy $300 hay. Can’t blame him.

Simultaneously—and this is where it gets interesting—sexed semen technology reached practical viability. By the mid-2010s, conception rates improved substantially. Under good management protocols, sexed semen often achieves 70-80% of conventional rates, according to various university studies and extension reports. While this advancement didn’t make headlines, it fundamentally altered replacement strategies. What farmers are finding is they can now generate adequate replacements from their top-performing animals—perhaps 30% of the herd—while directing remaining breedings toward terminal crosses.

The third development surprised even experienced cattle feeders. Research from the Journal of Animal Science and multiple land-grant universities documented that beef-dairy crossbreds weren’t merely “improved Holstein steers.” They demonstrated measurably superior performance—better growth rates, improved feed conversion, enhanced carcass quality. Major processors report acceptance rates for these crosses now exceed 95%, with many achieving Choice grade or better. The kind of performance that makes feeding operations genuinely interested, if you know what I mean.

FactorCurrent StatusHistorical ContextImpact
Beef Cattle Inv27.9m headLowest ’61Supply shortage
Sexed Semen Tech70-80% conceptPrev impactEfficient strat
Crossbred PerfSuperior convBetter Holstein95% acceptance

Early Adopters: Different Thinking, Strategic Implementation

I’ve been thinking about what separated these pioneers who began beef-on-dairy breeding around 2015-2016 from their peers. It wasn’t necessarily farm size or capital resources. They approached risk and opportunity differently, somehow.

Their typical strategy involved measured experimentation rather than wholesale conversion. They’d identify maybe 50 to 75 lower-performing animals—you know, third-lactation cows with conception challenges, candidates for culling regardless. The economics were straightforward enough: with Holstein bulls bringing $50 and beef crosses potentially fetching $250 or more, even modest success rates justified the marginally higher semen costs.

What I find particularly clever about their approach was the trial design. They selected proven, easy-calving Angus genetics rather than exotic breeds. Maintained existing AI service providers. And—this is crucial—they secured buyer commitments before initiating breeding programs. Having confirmed market access before breeding decisions proved pivotal to consistent returns.

A producer in Idaho shared his early experience: “We started with 60 cows in 2016. Nothing fancy. Just wanted to see if this beef-cross thing was real. That first group of calves generated an additional $18,000. Not huge money, but enough to know we were onto something.”

Now, not every operation found immediate success. A producer in New Mexico attempted the same approach but initially struggled with buyer acceptance. “Our local market wasn’t ready for crossbreds yet,” he explained. “Took us a year to find the right buyers who understood what we were producing.” That’s an important reminder—market development varies by region. Even within Arizona, producers in Phoenix-area markets report premiums 15-20% higher than those near Tucson, reflecting different buyer bases.

Evolution from Experiment to Core Strategy

The adoption pattern followed remarkably consistent phases across different regions and operation sizes, which I find fascinating.

During the initial phase—let’s say 2015 through 2017—farms allocated 10-15% of breedings to beef bulls, typically focusing on problem breeders. Revenue impact remained modest, perhaps 2-3% of total farm income. But the learning value? That proved substantial. Which sires performed best? What specifications did buyers prefer? How should calf management protocols adapt?

The scaling phase (2018-2020) saw operations expand to 25-35% beef breeding as data accumulated and buyer relationships developed. This is when sexed semen integration became crucial. Top-tier genetics received sexed dairy semen for replacement purposes, while lower-performing animals were bred for beef production. Revenue contribution increased to 5-8% of farm income—becoming materially significant.

Current adoption reflects industry-wide recognition. Recent industry reporting indicates that a large majority—nearly three-quarters—of dairy operations now use some beef semen, according to the latest data from Farm Journal. For operations like McCarty’s, cattle sales can represent substantial monthly revenue during favorable market conditions. We’re talking about a complete business model evolution from a decade ago.

Labor Challenges: The Under-Discussed Constraint

Here’s something that concerns me, and I think we should discuss it more openly. Premium calf values come with management requirements that deserve careful consideration.

Crossbred calves require different protocols than traditional dairy calves, particularly during the critical first 30 days when respiratory challenges are more common. Achieving the growth rates buyers expect demands precise feeding management. And unlike Holstein bulls, which are typically marketed through single channels, beef crosses require evaluation and sorting for multiple programs.

This intensified management intersects with broader labor challenges we’re all aware of. A Texas A&M AgriLife analysis estimated that about half of the U.S. dairy workforce are immigrants, producing close to four-fifths of the nation’s milk. Current immigration uncertainties create operational risks that many producers are experiencing firsthand.

I’m hearing similar concerns from producers across multiple states. Wisconsin operations describe workers hesitant to report following nearby enforcement actions. Arizona and Idaho dairies face challenges in retaining experienced calf managers. Vermont producers express similar concerns. Even down in Florida, where you might not expect it, labor availability is constraining expansion plans. The H-2A program, while valuable for seasonal agriculture, doesn’t address year-round dairy labor needs—as we all know too well.

What worries me is that the skills required for premium calf production—health assessment, nutritional management, market timing—require experience that takes years to develop. A calf buyer recently explained that management quality can create $200-300 per head value differences. That margin? That’s the entire profit opportunity for many operations.

Understanding Market Premiums: The Hide Color Reality

Let’s address something that generates understandable frustration among producers—the $100-200 premium for black-hided calves. I know, it seems arbitrary. But the economics reflect market realities worth examining.

Analysis from organizations, including the American Angus Association, indicates black cattle demonstrate statistical advantages in marbling consistency and feed efficiency. More significantly—and this is key—black hides provide access to branded beef programs, such as Certified Angus Beef, that command harvest premiums. Although not every qualifying animal naturally achieves program standards. Recent processor data shows these programs can add substantial value at harvest.

Markets frequently pay several dollars per hundredweight more for black-hided groups, which can translate to roughly $100-200 per head on typical feeder weights. Feedlot managers consistently acknowledge this price impact.

Is this pricing structure optimal? Well… maybe not from a pure performance perspective. A Nebraska feedlot manager recently offered practical insight: “I understand a red Angus cross might perform equally well, but when I’m evaluating 300 head in 10 minutes, I rely on proven indicators.” Hard to argue with that logic. Until individual genetic data become standard for every calf, visual characteristics will continue to influence rapid market decisions.

A producer in South Dakota put it bluntly: “I don’t like that my red-hided calves bring less money. But I can complain about it, or I can breed black bulls and bank the difference. Guess which one pays better?”

Industry Disruption in Real Time: How Dairy Operations Became America’s Fastest-Growing Beef Producers

Anticipating Market Evolution

Looking ahead—and I’ve been through enough cycles to know this—current premium levels will moderate. The question isn’t whether adjustment occurs, but rather its timing and magnitude.

Early indicators already emerge. Industry reports suggest that beef-on-dairy breeding decreased slightly in 2024 as operations addressed concerns about heifer inventory. Improved pasture conditions across traditional beef regions may enable herd rebuilding, though this process typically requires multiple years. We’ve seen this before.

This development suggests something important, though. Economic modeling from UW-Madison indicates profitability generally holds when beef-on-dairy calves bring at least twice the value of straight Holstein bull calves, given common assumptions. That’s the key threshold right there.

Consider potential scenarios here. If beef prices decline to $700—that’s down from current highs—while Holstein bulls remain at $250, that still represents nearly three times the value. Well above that 2x profitability threshold. Using this guideline and common Holstein bull values of around $200, viability tends to weaken if beef cross-calf values fall below the mid-$400s. That’s probably your practical floor.

Practical Implementation for October 2025

For operations currently receiving $200 for Holstein bulls, here’s what I’d suggest as a measured approach to capturing available premiums.

This week: Contact three calf buyers—your current purchaser plus two specializing in beef crosses. Start with your local livestock auction markets, which often maintain buyer lists for specialty calves. Your county extension office can provide contacts for regional beef-cross buyers. Most AI companies now maintain buyer networks specifically for their beef-on-dairy customers, and the National Association of Animal Breeders offers a directory of approved calf buyers by region. Obtain specific pricing for the October delivery of 80-100 pound black crossbred calves. Understand health protocols, volume preferences, and payment terms. Many Holstein buyers don’t purchase beef-on-dairy calves, so confirming markets in advance prevents misalignment.

Next week: Identify 50-75 lower-tier breeding candidates. You know the ones—older animals that require multiple services, typically those in the bottom quartile of producers. Source proven, easy-calving Angus genetics with birth weight EPDs around -2.0 or better. Extension sources consistently recommend choosing these mainstream genetics over exotic alternatives for better market acceptance.

Week three: Calculate replacement needs precisely. A 500-cow operation typically requires 100-110 annual replacements, with some variation. Implement sexed dairy semen on superior genetics to ensure adequate replacements while allocating remaining breedings to beef. This balance is critical for long-term sustainability. And don’t forget to factor in your typical cull rates and any expansion plans you may have. Also worth considering is that many operations now insure higher-value calves for the first 30-60 days, typically costing $15-25 per head but protecting an investment of $ 1,000 or more.

This conservative approach—involving just 15% of your herd—could generate approximately $25,000 to $ 40,000 in additional annual revenue at current premium levels. That’s meaningful income without excessive risk concentration.

Strategic Lessons for Long-Term Success

What I think distinguishes operations that will thrive versus those facing challenges involves how they treat beef-cross revenue.

Successful producers I know use these premiums strategically—paying down debt, building reserves, addressing deferred maintenance while maintaining focus on sustainable milk production. They treat beef-cross income as a bonus, not a baseline. The operations at risk are restructuring entire business models around current calf values, taking on debt, and expanding facilities based on peak pricing.

Agricultural lenders commonly caution against structuring long-term debt service around peak calf prices. A banker friend in Minnesota captured this perfectly: “The dairy operations that worry me aren’t the ones doing beef-on-dairy. It’s the ones borrowing against $1,400 calves like that’s permanent. When markets moderate—and they always do—those fixed costs won’t adjust with them.”

This pattern echoes previous agricultural cycles, doesn’t it? The ethanol-driven corn boom rewarded producers who banked profits while challenging those who built operations around $7 corn. The organic milk premium cycle followed similar dynamics. A producer in Vermont who lived through the organic boom told me, “Same story, different product. The ones who survive are the ones who remember it’s a cycle.”

The Sustainable Future of Beef-on-Dairy

Despite inevitable market adjustments, several structural changes appear permanent. The efficiency of producing replacements from elite genetics, while maximizing terminal cross value, will not reverse simply because prices moderate. Established infrastructure—buyer networks, marketing channels, quality programs—will persist even as margins compress. And those documented performance advantages of crossbred cattle in feeding operations remain regardless of price levels.

For producers evaluating current opportunities, perspective matters. The exceptional margins of recent years won’t persist indefinitely—we all know that. However, even at more sustainable levels—perhaps $600-$ 800 per head—beef-on-dairy offers meaningful revenue diversification for operations prepared to manage the added complexity.

The opportunity window remains open, but it continues to narrow. Producers acting now with appropriate risk awareness can still capture value. Those awaiting perfect conditions will likely miss participation entirely.

A Nebraska dairyman recently offered a valuable perspective that resonates with me: “We accepted for 20 years that bull calves had negligible value. The only worthless element was that assumption itself.”

Sometimes significant opportunities exist in plain sight, waiting for the convergence of technology, market conditions, and strategic thinking to reveal their value. For dairy producers willing to thoughtfully evaluate and act on current conditions, beef-on-dairy represents exactly such an opportunity—one where understanding both potential and limitations determines success.

What farmers are finding is that this isn’t just about catching a market trend; it’s about cultivating a lasting relationship. It’s about fundamentally rethinking what each pregnancy on your farm represents. Whether you’re in Pennsylvania, Wisconsin, or anywhere in between, the beef-on-dairy opportunity is real. But it requires clear eyes about both the potential and the pitfalls. Those who approach it with measured optimism and conservative implementation will likely find success. That shift in thinking might be the most valuable change of all.

KEY TAKEAWAYS

  • Start conservatively with 15% of your herd (50-75 lower-performing cows) to capture $25,000-$ 40,000 in additional annual revenue while maintaining operational flexibility. This approach minimizes risk and proves the concept works for your specific situation.
  • Secure buyers before breeding decisions by contacting local auction markets for specialty calf lists, your county extension office for regional beef-cross buyers, and AI company networks—many Holstein buyers don’t purchase crossbreds, so market confirmation prevents costly misalignment.
  • Target proven, easy-calving Angus genetics with birth weight EPDs around -2.0 or better, as extension sources consistently show mainstream black-hided genetics bring $100-200 premiums per head due to branded beef program access and feedlot preferences.
  • Calculate replacement needs precisely before expanding—a 500-cow operation typically requires 100-110 annual replacements, so implement sexed dairy semen on your top 30% while allocating bottom-tier cows to beef to maintain herd sustainability.
  • Treat beef-cross income as windfall profit, not baseline revenue—agricultural lenders caution that operations borrowing against $1,400 calf values face serious risk when markets moderate to the sustainable $600-800 range that economic models predict.

Complete references and supporting documentation are available upon request by contacting the editorial team at editor@thebullvine.com.

Learn More:

The Sunday Read Dairy Professionals Don’t Skip.

Every week, thousands of producers, breeders, and industry insiders open Bullvine Weekly for genetics insights, market shifts, and profit strategies they won’t find anywhere else. One email. Five minutes. Smarter decisions all week.

NewsSubscribe
First
Last
Consent

Weathering Europe’s Dairy Waves: Real-World Strategies for Your Milk Check

Europe’s milk moves could flood your mailbox. Is your dairy ready for the next wave?

EXECUTIVE SUMMARY: European milk production swings are making an outsized impact on North American dairy margins this season. As the EU, U.S., and New Zealand jostle for global export leadership, every volume shift and new regulation from Brussels lands directly on U.S. farm income and risk. From compliance costs to feed volatility, today’s market noise looks more like a set of fast-moving waves than the predictable old cycles. That’s why top producers are leaning into real-time break-even tracking, component-driven strategies, and flexible risk coverage. This article gets practical—highlighting lessons from the 2015 quota flood, the importance of managing debt and working capital, and exactly which steps farmers are taking to lock in resilience. If staying afloat—and ahead—in this new dairy world is your goal, the toolbox outlined here belongs in every barn.

You know, sometimes it feels like the global milk market is just one noisy, unpredictable stock tank. I’ve had a dozen conversations this harvest about how a seemingly small regulatory change in Brussels or a surge in Irish production leaves folks scratching their heads when the mailbox check or feed bill shows up in Wisconsin or Idaho. So let’s break down what’s actually factual, what matters for North America right now, and the smart steps farms are taking to stay steady in choppy global waters.

Europe’s Ripple Effect—Bigger Than Ever

Looking at data from the FAO and European Commission this season, Europe’s share of global dairy exports is as high as any region in the world—routinely neck-and-neck with New Zealand and the U.S. USDA FAS trade briefs and figures from the International Dairy Federation confirm that EU policy, volume, and even local weather matter for price benchmarks in every major importing region, from China to Algeria and Saudi Arabia [FAO Dairy Market Review 2024; European Commission Milk Market Observatory 2025; USDA Dairy: World Markets and Trade 2025].

After the big quota-lift in 2015, history proved these ripple effects: Europe’s open floodgates sent milk downstream to world markets, dropping global prices and shrinking margins back home. This dynamic (and similar cycles since) is widely documented by USDA’s Economic Research Service and industry analyses [USDA ERS 2016 Dairy Outlook]. These aren’t hypothetical models—they’re what producers are still living through, every time a big EU volume shift combines with U.S. or Oceania constraints or demand spasms in China.

Market Moves: When Data and Intuition Don’t Always Match

What’s interesting right now, reading updates from USDA Dairy Market News and IDF, is how export punches keep rolling—U.S. butter and nonfat dry milk exports are at multi-year highs as of August and September. Yet the same sources, and public updates from major global processors, flag that key importers (especially in Asia) are warming only slowly after a soft patch. Price is now set at the intersection of commodities, shipping, trade policy (yes, tariffs still sting), and shifts in government intervention or environmental regulation.

And here’s the farmer’s perspective: global milk prices don’t just bounce up and down like a ball. With international markets more closely linked than ever, a wave in Europe or Oceania can hit North American producers’ returns like the surge on a big tidal pond: unpredictable and fast.

Debt, Leverage, and Reluctance to Slow Down

I’ve noticed most extension meetings address debt and capital structure more than ever, thanks to USDA and Farm Credit reporting higher average borrowing in new builds—and Wageningen and Thünen Institutes in Europe showing similar trends in Dutch and German herds [USDA ERS 2025; Wageningen University 2024 Dairy Finance; Thünen Institute German Survey 2024]. The same stubborn reality: high fixed payments don’t let a producer ramp down milk flow very quickly, even if the next three months look ugly on paper. Most of us end up chasing volume, not conservation, because loan payments wait for nobody.

Feed: The Margin Maker (or Breaker)

The data from Penn State, UW-Madison, and Cornell extension budgets for 2024 are crystal clear: feed claims 50–60% of the average conventional herd’s cost structure—a number that climbs higher if you’re buying more feed than you grow [PSU Dairy Budgets 2024; UW Center for Dairy Profitability 2025]. USDA Ag Marketing Service had corn in the low $4s throughout harvest, but soybean meal swings and local hay shortages have kept feed volatility front and center.

What producers increasingly do—across regions and herd sizes—is double down on feed testing, fresh cow management, and ration tweaking. Historical data from the bleakest periods (2014, 2022) show that a tenth of a point of feed efficiency or improvement in butterfat performance can move a break-even from the red to the black. Industry extension sources all show more hands adjusting the TMR mixer and paying closer attention to transition period protocols and dry matter intake trends.

When Regulators Call the Tune

Complying with environmental mandates is no longer just a box for the processor or CAFO paperwork. UC Davis and multiple extension sources consistently estimate new California methane and nutrient regulations cost up to $0.40–0.55/cwt once all’s accounted for [UC Davis Agricultural Economics Policy Update, 2025]. That mirrors regulatory costs now rolling out in European dairies—Denmark, the Netherlands, and Germany are all adding, not subtracting, layers of compliance spending [European Commission Dairy Policy Fact Sheet 2025].

For Northern and Eastern U.S. producers near sensitive watersheds, budgets frequently flag compliance costs of $50–$70 per cow annually just for nutrient handling [Cornell Pro-Dairy Water Quality 2024; Wisconsin DATCP CAFO reports]. It’s a new line item in every cost calculation—something more farms are integrating into regular budget reviews.

Price Spreads, Component Value, and Dairy Resilience

USDA Reporter summaries and CME data from early October confirm that Class III/IV spreads topped $2/cwt—meaning the farm’s product mix, from cheese to butterfat, is increasingly make-or-break for winter cash flow. Extension and IDF bulletins show that maximized component programs (think protein-by-breed planning or butterfat levels targeting cooperative premiums) are paying out ever higher.

The data (and plenty of farmer experience) say it’s wise to keep chasing component optimization with genetic selection, ration shifts, and milk quality focus—not only for incentive programs but also for the buffer against commodity price swings. Farms that get complacent here risk losing the best margin lifelines left in a volatile pricing world.

Farmer Risk Playbooks: Layering and Learning

Here’s a theme that runs through nearly every 2025 extension update and peer group panel: those who spread risk, keep cash reserves, and use partial hedging (from Dairy Margin Coverage to LGM or local processor contracts) are the ones telling positive stories at year’s end. Across the Corn Belt, into the Northeast and West, budgeting tools and farm management software are being used daily to run break-evens, test expansion math, and keep track of every feed load and market move.

Risk ToolSurvival %Annual CostRating
Dairy Margin Coverage78%$100–300Essential
LGM Insurance65%$200–500Strong
Cash Reserves (90 days)85%Opportunity costCritical
Feed Hedging70%1–3% of feedImportant
Processor Contracts60%Price discountUseful
No Risk Management35%$0Dangerous

Extension groups are now coaching herds to treat working capital as “production insurance” and to see budgeting and risk review as ongoing—not just annual—events. It’s a practice that’s proving the difference between being able to row to safe harbor in a market storm…or simply getting swept along for the ride.

Past Lessons, Forward Momentum

There’s universal agreement—whether it’s coming from a Missouri discussion group or New England’s latest fact sheets: flexibility beats size or even efficiency alone, especially once margins start to tighten. Farms that survived 2014 or the sudden whiplash of 2022 put working capital on par with any weekly milk check and made their lender and nutritionist partners, not just vendors.

What’s particularly heartening is more farms are now proactively putting reserves away in the “good” quarters rather than waiting for the next price crash. That shift, widely endorsed in current university and co-op extension workshops, means more businesses are poised to adapt to whatever moves Europe or world trade throws their way.

Looking at Winter—and the Year Ahead

If you’re looking for actionable steps, this year’s most robust takeaways from across the government, extension, and industry space are these:

  • Know your cost structure cold and react quickly to any break-even changes.
  • Prioritize fresh cow and transition period management for best margin protection.
  • Maximize component herd strategies (and renegotiate for best premiums).
  • Plan for regulatory compliance costs as a “normal” budget item.
  • Treat cash reserves and budgeting as production tools, not afterthoughts.
  • Layer your risk with multiple tools and update your mix every season.

And perhaps the most important advice? Stay curious and connected. Use every extension, processor, and peer resource out there—and keep agile enough to pivot when new global “waves” come across the Atlantic.

In this interconnected dairy world, the best producers aren’t fortune tellers—they’re steady captains, always ready to adjust sail.

Key Takeaways:

  • European market shifts can hit milk checks fast—stay alert to global supply changes.
  • Update break-evens often; real-time cost tracking is your strongest defense.
  • Feed and component management are difference-makers for net margins.
  • Build regulatory compliance into your core business plan, not just for inspection day.
  • Use layered risk tools—insurance, contracts, and liquidity—to position your farm for any market weather.

Complete references and supporting documentation are available upon request by contacting the editorial team at editor@thebullvine.com.

Learn More:

  • Protect Your Dairy Operations from America’s 1,000-Fold Subsidy Advantage – This action-oriented guide details a 3-phase plan for achieving component targets (4.2% fat, 3.3% protein) and optimizing feed conversion above 1.75:1. It provides concrete ROI calculations to show how operational excellence creates a competitive advantage that can neutralize market disadvantages.
  • Dykman Dairy’s $75 Million Debt Crisis: Mismanagement or Misfortune? – This cautionary case study offers a deep dive into the devastating strategic risks of unchecked leverage and rapid expansion. It provides five vital tips on debt revision, diversification, and strengthening lender relations to help you proactively manage financial flexibility against global market shocks.
  • The $500000 Precision Dairy Gamble: Why Most Farms Are Being Sold a False Promise – This strategic technology evaluation challenges the high-cost automation pitch, revealing how optimizing fundamental protocols (like transition cow health) offers a better, lower-cost ROI than relying solely on expensive sensors and robotics. Use this to filter smart capital investments.

The Sunday Read Dairy Professionals Don’t Skip.

Every week, thousands of producers, breeders, and industry insiders open Bullvine Weekly for genetics insights, market shifts, and profit strategies they won’t find anywhere else. One email. Five minutes. Smarter decisions all week.
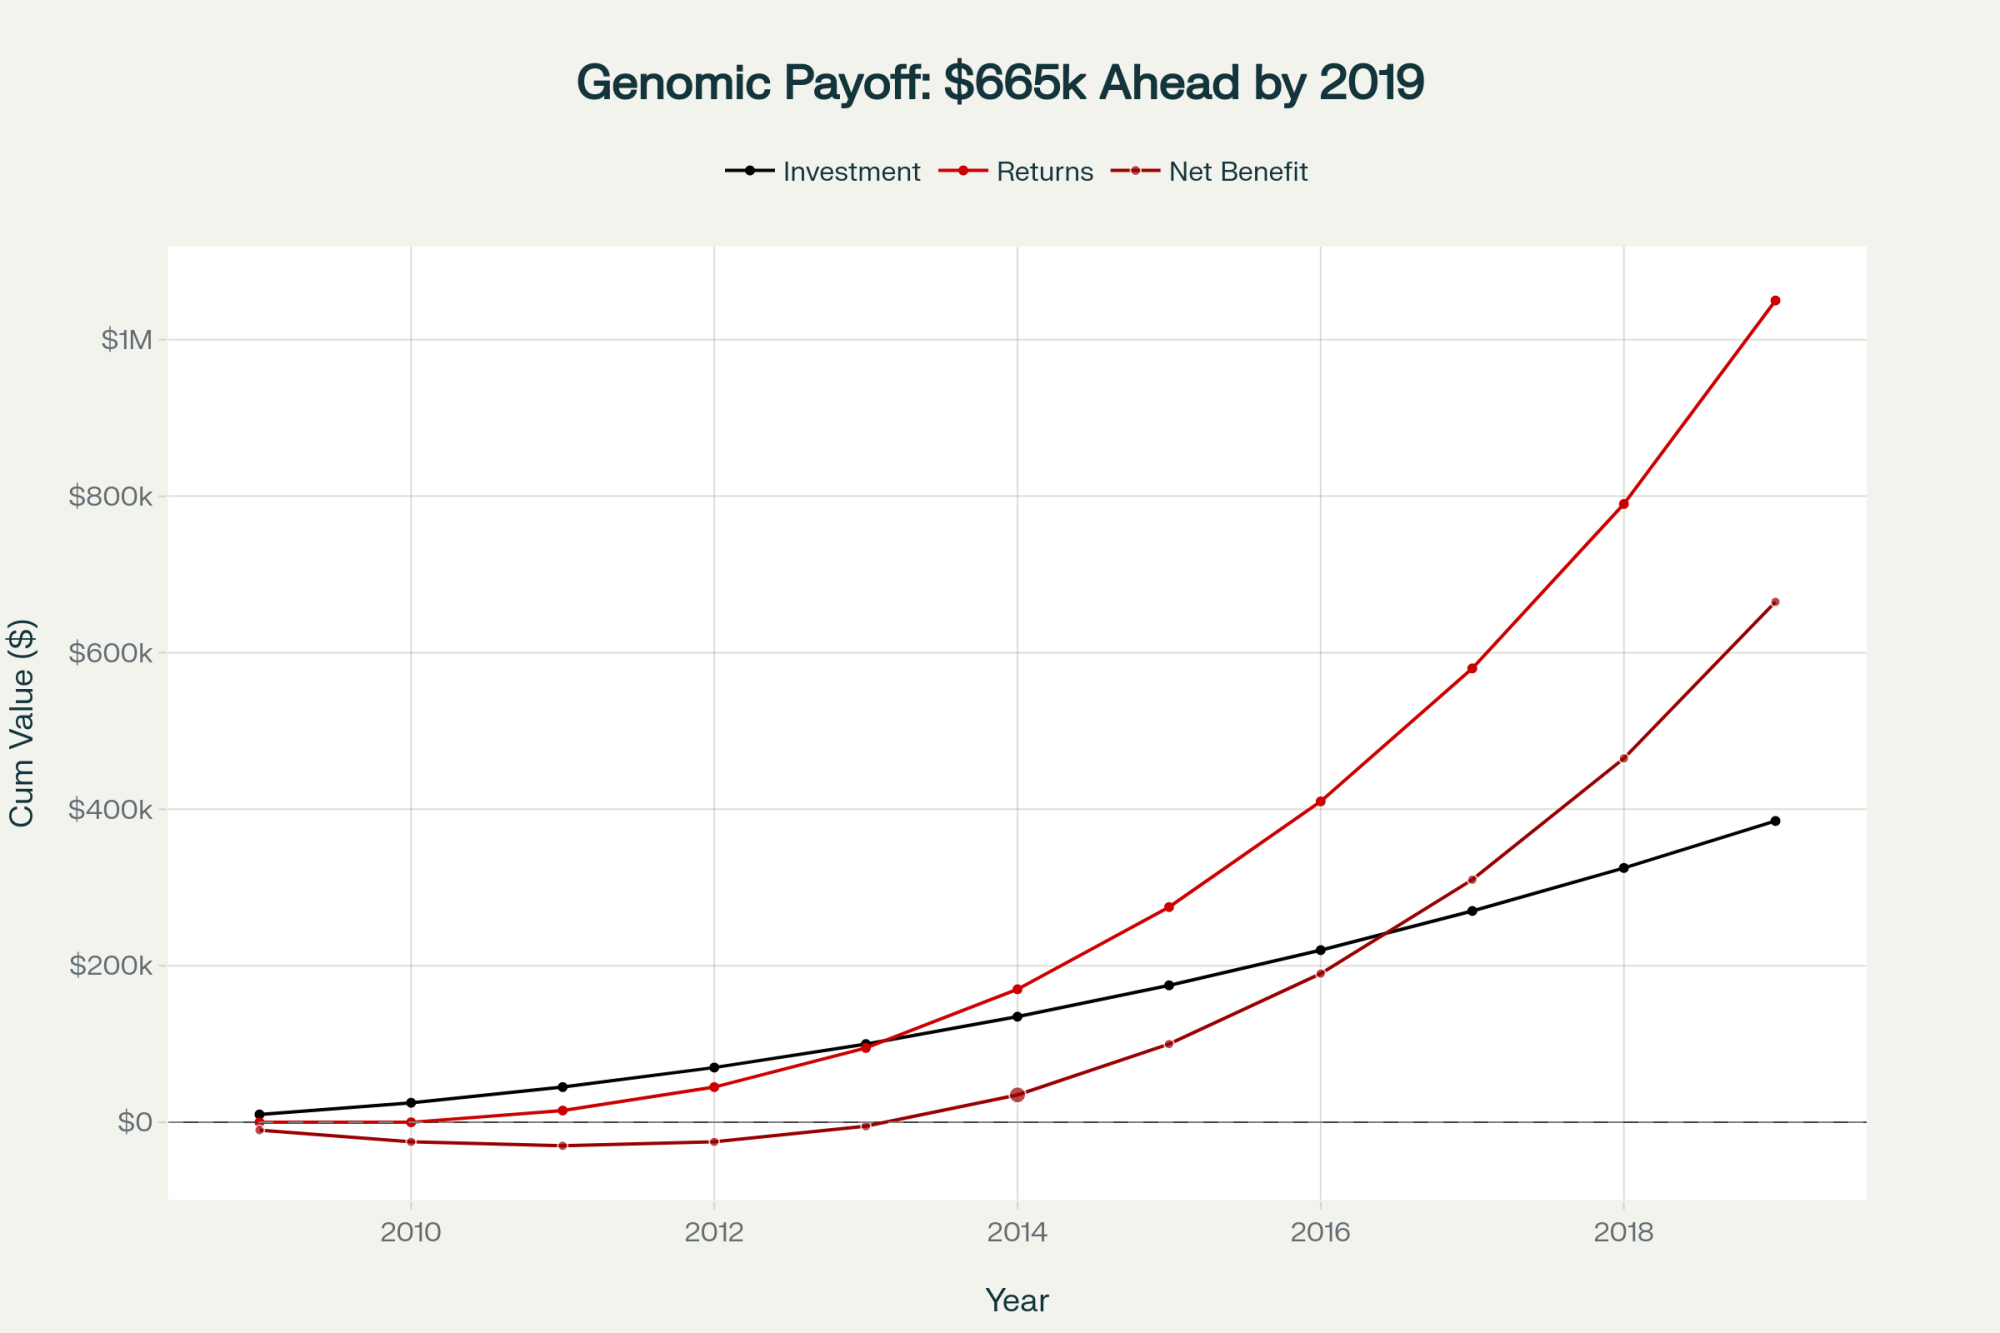
NewsSubscribe
First
Last
Consent

Why Your Milk Check Math Doesn’t Work Anymore (And 5 Ways Dairy Farmers Are Fighting Back)

The $3 drop from January’s $20.34 to today’s $17.59 milk price costs a 500-cow dairy $1,800 daily

EXECUTIVE SUMMARY: What farmers are discovering right now is a fundamental disconnect between milk prices and production costs that goes beyond normal market cycles—the September Class III price of $17.59 represents a $3 drop from January’s highs, costing typical Midwest operations roughly $135 per cow monthly. Recent USDA data confirm that we’ve lost 15,532 dairy farms (nearly 40%) between 2017 and 2022, yet milk production increased by 8%. As a result, the largest 3% of operations now produce over half of our milk supply. Cornell and Penn State research shows that successful adaptations are emerging: direct marketing captures $2-4 premiums per gallon, precision feeding delivers 8-12% efficiency gains with sub-two-year paybacks, and strategic breed shifts to Jerseys improve component economics. The $5-8 billion in processor investments signals continued consolidation ahead, but innovative mid-sized operations are finding profitable niches through differentiation, technology adoption, and regional market advantages. Here’s what this means for your operation: understanding these structural shifts—not waiting for prices to “return to normal”—becomes essential for making informed decisions about expansion, technology investments, or alternative marketing strategies that align with your farm’s specific strengths and local opportunities.

You know how it is at 4:30 AM—there’s something about that quiet time in the parlor that gets you thinking. Recently, I’ve been giving a lot of thought to where we stand with milk prices and what it means for all of us trying to make a living in the dairy industry.

I’ve spent the past few weeks reviewing the latest market data and, more importantly, speaking with producers from Wisconsin to Pennsylvania, California, and even the Southeastern United States. What’s emerging is… well, it’s complicated. However, it’s worth understanding because it affects each of us differently.

Where Prices Stand Right Now

So here’s where we are. The USDA announced in early October that September’s Class III came in at $17.59 per hundredweight—that’s up thirty-five cents from August. Now, if you’re like me, you probably remember those January and February prices this year—$20.34 and $20.18, according to the Federal Milk Marketing Order announcements. That three-dollar difference? You’re feeling it in your milk check, I guarantee it.

The disconnect between costs and prices becomes even clearer when you look at this historically. The Bureau of Labor Statistics’ inflation calculators indicate that if milk prices had kept pace with general inflation since the 1970s, we’d be looking at significantly higher prices today. The gap represents something deeper happening in our industry.

At a co-op meeting last month, I heard a producer from central Wisconsin say it perfectly: “My dad used to be able to predict milk prices within reason based on feed costs and what was happening in the general economy. That relationship? It’s just gone now.” And you know what? He’s absolutely right.

As we head into the winter feeding season—with concerns about feed inventory on everyone’s mind after the variable growing conditions this past summer—that disconnect between costs and prices feels even more pronounced. Many of us are already planning for the spring flush, wondering whether to push production or hold back, given the potential direction of prices.

Quick Reference: Key Numbers to Know

  • Current Class III: $17.59/cwt (September 2025)
  • Make Allowances (June 1, 2025): Cheese $0.2504/lb, Butter $0.2257/lb
  • Farms Lost (2017-2022): 15,532 operations (39.5% decline)
  • Typical Robot Cost: $180,000-250,000
  • Organic Premium Range: $35-40/cwt
  • Beef-on-Dairy Premium: $200-400/calf

The Processing Side of Things

What many of us are realizing is how dramatically the processing landscape has shifted. Remember when you had four or five plants competing for your milk? According to USDA Agricultural Marketing Service data, most regions now have just one or two buyers. That’s a dramatic shift in negotiating power.

Those Federal Milk Marketing Order changes that took effect on June 1—the make allowances increased as documented in the Federal Register. Cheese to $0.2504 per pound, butter to $0.2257. Now, these might sound like small adjustments, but multiply them across your production… For those Upper Midwest operations shipping anywhere from 35,000 to 45,000 pounds daily—which is pretty typical for a 400 to 500-cow herd with decent production—that’s real money coming right out of the milk check.

The regional differences are striking, too. Northeast producers often have access to those fluid markets—though university extension reports from Cornell show the premiums aren’t what they used to be, averaging just $2-3 above manufacturing milk. Meanwhile, those of us in the Midwest are primarily dealing with fluctuating milk prices.

RegionAverage Herd SizeFluid Market AccessHeat Stress CostsProcessing OptionsDirect Marketing PotentialLabor AvailabilityFeed Cost Advantage
Upper Midwest400-500 cowsLimited$01-2 buyersModerateChallengingCorn/soy belt
Northeast200-300 cowsGood ($2-3 premium)$25-35/cow3-4 buyersHigh ($2-4/gal premium)Very challengingHigher costs
California1,300+ cowsManufacturing focus$35-50/cowMultiple co-opsLowModerateVariable
Southeast300-400 cowsSome fluid access$50-75/cow2-3 buyersGrowingChallengingHeat stress offset

California’s situation is unique, too. They’ve been in the Federal Order system since November 2018, but with average herd sizes over 1,300 head according to California Department of Food and Agriculture data, they’re operating at a completely different scale. And down in the Southeast? Those folks are dealing with heat stress management costs that can range from $50 to $ 75 per cow annually, according to University of Georgia research, which eats into any fluid premiums they might capture.

Looking at processor investments, we’re seeing announcements totaling $5-8 billion in new facilities coming online by 2026, based on industry reports and construction permits. For example, Dairy Farmers of America alone announced over $1 billion in processing expansions this year. They’re clearly betting on continued consolidation.

Farm Size Category2017 Farms2022 FarmsChange (%)Milk Production Share 2022Survival Strategy
Under 100 cows2317014129-39%7%Niche marketing/Exit
100-499 cows110007326-33%17%Efficiency/Technology
500-999 cows20541434-30%16%Scale up or specialize
1,000-2,499 cows13651179-14%31%Continued expansion
2,500+ cows714834+17%29%Market dominance

Learning From Our Neighbors North

It’s worth examining what’s happening in Canada with their supply management system. Statistics Canada reports show that their dairy farms maintain more predictable margins, with average net farm income significantly higher than that of comparable U.S. operations. Their farms tend to have debt-to-asset ratios of around 20%, according to Farm Credit Canada, compared to the 35-40% range reported by the USDA Economic Research Service for U.S. dairy operations.

They pay more for milk in Canada, no question—retail prices run about 30% higher according to comparative price studies. However, they have been chosen by a society that expects farms to be profitable enough to survive and pass on to future generations. We’ve made different choices here, and… well, we’re living with the consequences of those choices.

I was talking with a producer at the Pennsylvania Farm Show who said, “We keep looking for the perfect system, but maybe it’s about finding what works for each operation within the system we’ve got.” That really resonates with me.

What Producers Are Doing to Adapt

Despite all these challenges, I’m seeing some really creative adaptations out there. And it’s worth sharing because even if something doesn’t work for your operation, it might spark an idea that does.

Direct marketing is one path that’s gaining traction, especially for farms near population centers. Penn State Extension’s research shows that operations successfully transitioning to direct marketing can capture margins of $2 to $ 4 per gallon above commodity prices. I am aware of a typical mid-sized operation in Pennsylvania—approximately 300 cows—that invested around $800,000 in a bottled milk processing facility a few years ago. They’re now capturing significantly better margins on about a third of their production and expect to hit payback within four to five years. The capital requirements are substantial—USDA’s Value-Added Producer Grant program data shows typical processing facility investments range from $500,000 to $2 million. But those who make it work? They’re capturing margins that completely change the equation.

The organic market has gotten more complex. USDA Agricultural Marketing Service Organic Dairy Market News reports indicate that premiums are currently running $35-40 per hundredweight, but as more producers convert, those premiums are being squeezed. And we’ve seen major processors like Horizon Organic dropping dozens of farms when they have oversupply, so it’s not the guaranteed path it might have looked like a few years back.

Speaking of different approaches, I’ve noticed Jerseys making more economic sense for some operations lately. With butterfat premiums where they are and lower feed requirements per pound of components, a neighbor switched half his herd and says it’s working out better than expected.

The Technology Conversation

TechnologyInitial InvestmentAnnual Savings/RevenuePayback PeriodKey Success FactorRisk Level
Precision Feeding (120 cows)$45,000$27,3601.6 years10% feed efficiency gainLow
Robotic Milker (120 cows)$220,000$26,2808.4 yearsConsistent protocols + labor shortageMedium-High
Genomic Testing (per animal)$35-45$18-100/cow0.5-2 years70% selection accuracyVery Low
Health Monitoring (120 cows)$20,000$500/cow2-4 yearsEarly disease detectionLow
Direct Marketing Setup$800,000$2-4/gal premium4-5 yearsNear population centersHigh

Here’s a discussion I’m having everywhere I go: should you invest in technology when margins are this tight?

Penn State Extension’s dairy team has done excellent work showing that precision feeding systems can deliver real returns—typically 8-12% improvement in feed efficiency. Cornell’s Dairy Farm Business Summaries indicate that feed costs typically range between $8 and $11 per hundredweight of milk produced, making significant efficiency gains.

Let me give you a concrete example: A 120-cow operation investing $45,000 in precision feeding, saving 10% on feed at $9.50/cwt, producing 24,000 pounds per cow annually—that’s about $27,360 in annual savings. You’re looking at less than two years payback if everything goes right.

Robotic milkers? That’s even more complex. University of Wisconsin research shows labor savings of three to four hours daily per robot, which, at $15-$ 20 per hour, adds up. Take that same 120-cow operation: one robot at $220,000, saving 4 hours daily at $18/hour equals $26,280 annual labor savings. Before any production increases or milk quality improvements, you’re looking at 8+ years for payback. Most extension analyses indicate that total payback periods typically range from 5 to 8 years when factoring in all costs.

A producer from Michigan, whom I met at World Dairy Expo, put it well: “Technology is a tool, not a solution. It works when it fits your operation, your finances, and your management style.”

And speaking of management, the heifer side of things is getting interesting too. With replacement heifer values where they are and beef-on-dairy premiums running $200-$ 400 per calf, according to recent market reports, more operations are rethinking their entire replacement strategy. Add in genomic testing at $35-45 per animal (companies like Zoetis CLARIFIDE or STgenetics), and you can really target which heifers to keep. Do you raise every heifer, or do you breed your best cows for replacements and use beef semen on the rest? It’s a conversation worth having.

Where We’re Heading

The 2022 Census of Agriculture numbers were eye-opening. We went from 40,002 dairy farms in 2017 to just 24,470 in 2022. That’s… that’s nearly 40% of our dairy farms gone in just five years. But here’s what’s really telling: USDA National Agricultural Statistics Service data shows milk production actually went up 8% during that same period.

The larger operations are picking up that production and then some. Economic Research Service analysis shows that the largest 3% of dairy farms now produce over 50% of our milk. The economics increasingly favor these bigger dairies, and you can see processors positioning themselves for a future with fewer, larger suppliers in their capital investment patterns.

The mid-sized dairies—those 200 to 500-cow operations that are too big for niche marketing but don’t have the scale of the really large operations—they’re in a particularly tough spot, according to most agricultural economists. But I’m still seeing innovative mid-sized farms finding ways through differentiation, efficiency improvements, or strategic partnerships.

Geography matters more than ever now. A 200-cow dairy near Madison or Burlington might actually have opportunities that a 1,000-cow operation in northern Minnesota doesn’t have. It’s all about understanding and leveraging what advantages you do have.

Making Sense of Your Own Situation

Every operation is different—your debt structure, your family situation, where you’re located, what you’re good at managing. There’s no one-size-fits-all answer here, but there are some things worth thinking about as we head into the winter planning season.

If you’ve got kids who genuinely want to farm, that changes your whole calculation compared to someone whose kids are happily working in town. And that’s okay—there’s no judgment there. It’s just about being honest about what makes sense for your family.

Your financial structure significantly determines your flexibility. Cornell’s Dairy Farm Business Summaries consistently show operations with debt-to-asset ratios under 30% have significantly more options during tough times. As that ratio climbs above 40%, your options narrow pretty quickly. Every month of losses eats into that equity cushion you’ve built up over the years.

Location and market access create opportunities or constraints that you can’t ignore. Being within 50 miles of a city with over 100,000 people, having multiple processing options, and understanding your local food economy —all of these factors go into what strategies might work for you.

Looking Forward with Clear Eyes

Despite all these challenges, I’m actually encouraged by a lot of what I see. The innovation, the willingness to try new approaches while building on proven management practices, is a testament to the resilience in this industry that shouldn’t be underestimated.

I was at a young farmer meeting in Ohio where someone made a comment that really stuck: “We can’t control milk prices or feed costs, but we can control how we respond. That’s where our opportunity is.”

As we approach the spring flush, with all the management decisions that entail, such as breeding, culling, and production planning, the mindset of controlling what we can control becomes even more crucial. How we handle transition cows, fresh cow management, and even which bulls we’re using… these decisions matter more when margins are tight.

The industry’s going to keep evolving—global markets, consumer preferences, technology advances, policy changes—it’s all part of the mix. But farmers have always adapted. We’ve always found ways to make it work, even when “making it work” means making tough decisions about the future.

The Bottom Line

The economic pressures we’re facing—they’re real and they’re structural. Understanding them without sugar-coating but also without doom and gloom helps us make better decisions.

For some operations, expansion to capture scale economies makes sense. Others might find their path in differentiation or adding value to their product. And yes, for some, transitioning out of dairy might be the right decision for their family. Each choice reflects individual circumstances and priorities.

What matters is making informed decisions based on a realistic assessment of the situation. The dairy farmers I respect most look at their situation honestly, thoroughly explore options, and make decisions aligned with their family’s long-term well-being.

Whatever path you choose, make it with clear eyes about what’s happening in our industry. The decisions we make today—whether about technology, herd expansion, replacement strategies, or succession planning—shape not just our own operations but also the future of dairy farming.

The conversation continues, and your voice and experience are part of it. That’s what makes this industry worth being part of, even in these challenging times.

As my old neighbor used to say, “Dairy farming isn’t just about making milk—it’s about making decisions.” And right now, those decisions matter more than ever.

KEY TAKEAWAYS:

  • Technology ROI varies dramatically by operation: Precision feeding systems ($45,000 investment) can deliver $27,360 annual savings on a 120-cow farm through 10% feed efficiency gains, achieving payback in under two years—while robotic milkers require 5-8 years for full ROI when factoring production increases and quality premiums
  • Geographic advantage matters more than size: Operations within 50 miles of cities over 100,000 people can capture direct marketing premiums of $2-4/gallon, making a 200-cow dairy near Madison potentially more profitable than a 1,000-cow operation in remote Minnesota
  • Debt structure determines flexibility: Cornell’s Farm Business Summaries show operations with debt-to-asset ratios under 30% maintain multiple adaptation options, while those above 40% face rapidly narrowing choices—making equity preservation as important as operational efficiency
  • Heifer strategies are shifting fundamentally: With beef-on-dairy premiums at $200-400 per calf and genomic testing at $35-45 per animal, breeding only the top 30% of cows for replacements while using beef semen on the rest can add $15,000-30,000 annually to a 100-cow operation’s bottom line
  • Regional processing dynamics create different realities: Southeast operations face $50-75 per cow in annual cooling costs that offset fluid premiums, while Upper Midwest farms shipping to single buyers lose negotiating power but benefit from lower operating costs—understanding your regional context shapes which strategies actually work

Complete references and supporting documentation are available upon request by contacting the editorial team at editor@thebullvine.com.

Learn More:

The Sunday Read Dairy Professionals Don’t Skip.

Every week, thousands of producers, breeders, and industry insiders open Bullvine Weekly for genetics insights, market shifts, and profit strategies they won’t find anywhere else. One email. Five minutes. Smarter decisions all week.

NewsSubscribe
First
Last
Consent

From $20 Spot to $20 Gallon: How Smart Dairy Operations Build Premium Value When Markets Fail

European butter markets showed continuing volatility last month while some producers found ways to thrive—here’s what they’re doing differently and why it matters for your operation

EXECUTIVE SUMMARY: Farmers are discovering through current market volatility that the traditional commodity model isn’t just struggling—it’s fundamentally changing. European butter prices have decreased by 24% year-over-year, while GDT participation patterns indicate that buyers are losing trust in regular price signals. Yet certain operations are thriving: Delaware’s licensed raw milk producers command $16-20 per gallon (fourteen times the conventional price), Italian Parmigiano Reggiano makers maintain strong premiums despite market chaos, and strategic cooperatives like the Maryland-Virginia Milk Producers report 15-20% better returns than independent sellers. Recent data shows that scale increasingly determines survival options, with operations over 1,000 cows accessing credit in hours, while smaller farms wait weeks—a difference that matters when margins compress. Looking ahead, three proven strategies are emerging: premium differentiation requiring $10,000-50,000 investment for 20-40% price premiums, strategic cooperation providing immediate cost savings through shared resources, and processing integration demanding $250,000-3 million but delivering 2-3x commodity value. The path forward isn’t about waiting for markets to normalize—it’s about choosing which strategy fits your operation’s resources, goals, and regional opportunities while you still have options to act.

dairy farm profitability strategies

You know that unsettled feeling when you check the morning milk report and nothing quite adds up? That’s what I’ve been hearing at every co-op meeting lately. “Are these markets ever going back to normal?”

Looking at what’s happening—USDA’s International Dairy Market News indicating continuing volatility in European butter markets, while Trading Economics data from October showed prices off 24% year-over-year to around €5,575 per tonne—it’s a fair question. We’re not just seeing a correction here. This is something different.

European butter prices crashed from €7,500/ton to €5,575/ton in 2025, showing the brutal market reality behind commodity volatility

But what I find encouraging is that despite all this market pressure, certain producers are actually strengthening their position. Delaware’s raw milk producers, for instance, are getting $16-20 per gallon through direct sales since their new regulations took effect earlier this year, according to state Department of Agriculture filings. That’s about fourteen times what the rest of us get for conventional milk. And Italian cheesemakers supplying Parmigiano Reggiano? The Consorzio del Formaggio Parmigiano Reggiano reports they’re maintaining strong premiums even with everything else going sideways.

These aren’t lucky breaks, folks. They’re deliberate strategies based on understanding where markets are heading.

Quick Strategy Comparison

Before we dive in, here’s what we’re talking about:

Premium Differentiation: $10,000-50,000 initial investment → 20-40% price premiums → 12-36 month payback

Strategic Cooperation: Shared infrastructure/marketing → 15-20% better returns → Immediate cost savings

Processing Integration: $250,000-3 million investment → 2-3x commodity value → 3-5 year payback

How Price Discovery Is Breaking Down Across Regions

Global Dairy Trade results show the market reality: broad-based weakness except for cheese holding firm

What I’ve found tracking these markets is that we’re seeing something beyond typical volatility. You may already be aware of this, but the Global Dairy Trade platform has been exhibiting some interesting patterns lately. Recent GDT results show varying outcomes across different product categories and auction timing—sometimes strong, sometimes lighter, depending on what’s being offered and when.

That variation tells us something important. When buyers become selective about their participation, they’re essentially saying they no longer trust regular price signals. They’re waiting for… something. Clarity, maybe.

The demand side remains pretty robust in certain areas, though. GDT’s recent summaries show continued strong interest from Chinese and Middle Eastern buyers, particularly for certain products. So it’s not that demand disappeared. It’s how markets function when the old structures start breaking down.

When you examine the developments in various regions, the patterns become clearer. California producers dealing with ongoing water restrictions from the Sustainable Groundwater Management Act are making different calculations than Wisconsin operations managing through another wet spring. Idaho’s large-scale operations have different leverage than Pennsylvania’s smaller family farms. Each region’s facing its own version of this market evolution.

How the Big Players Are Pivoting—And What We Can Learn

Fonterra’s moves over the past year provide some real lessons for the rest of us. Their deal with Lactalis—$3.85 billion, announced back in August 2024, where they sold consumer brands but kept long-term supply agreements—that wasn’t just portfolio shuffling.

As Miles Hurrell explained it in their earnings calls, they’re focusing on “what we do best—producing high-quality milk ingredients efficiently at scale.” But what that really means, if you ask me, is they’re letting someone else worry about convincing shoppers while they control the foundation of the whole supply chain.

This flexibility to shift between WMP, butter, cheese, and specialty ingredients based on what makes strategic sense, rather than just chasing today’s highest price, is a valuable approach. Even those of us running smaller operations can learn from it. Yes, it looks different at 200 cows versus 20,000, but the principle remains the same.

Speaking of different scales, DFA’s regional councils have been exploring similar strategies at the cooperative level. Their Mountain Area Council, covering Colorado, Wyoming, and parts of New Mexico, has been helping members navigate these changes through shared resources and collective negotiating power. Land O’Lakes member services report similar initiatives across the Upper Midwest.

Why Different Regions Take Completely Different Approaches

Recent data from various national dairy organizations paints an interesting picture. According to the European Commission’s milk market observatory, Italian production remains relatively stable. Dairy Australia’s latest situation and outlook report highlights ongoing challenges, with production levels down in recent periods. Spain’s Ministry of Agriculture data indicates fairly flat production. Meanwhile, the Dairy Companies Association of New Zealand reports modest growth in their milk collections.

These aren’t random variations. They reflect fundamentally different philosophies about dairy farming.

Take Italy’s approach. In regions like Lombardy, where they’re making Grana Padano, or around Reggio Emilia for Parmigiano Reggiano, those EU Protected Designation of Origin rules mean you can only make these cheeses in specific provinces using methods documented since medieval times. You’re not competing on efficiency at that point—you’re selling something that literally can’t be made anywhere else.

The Parmigiano Reggiano consortium’s published quality reports indicate that its members maintain strong premiums even when commodity markets are struggling. Geographic exclusivity, it turns out, has real value when broader markets face pressure.

Meanwhile, in Australia, Dairy Australia’s September 2024 situation report shows ongoing production challenges, with various factors, including climate and input costs, really affecting producers. However, here’s something interesting—I heard from a banker specializing in agricultural loans that farms and processing facilities in that area sometimes trade below historical values during these periods. Long-term investors from firms like Colliers International and CBRE are definitely watching.

Spain offers yet another model. Their focus on being a consistent and reliable supplier to European food manufacturers—not chasing premiums or competing on price—provides its own kind of stability. Spanish dairy cooperative COVAP’s annual reports emphasize that being the dependable middle option has value during chaos.

And then there’s the U.S. West. California dairies facing those Sustainable Groundwater Management Act restrictions are making completely different strategic choices than operations in water-rich regions. The Western United Dairyman’s recent member surveys show operations pivoting to higher-value products partly out of necessity—when water costs what it does in the Central Valley, you’d better be making more than commodity milk with it.

The Reality of What One Operation Learned the Hard Way

Let me share something that doesn’t make it into the success stories. There’s a 400-cow operation in central Illinois that attempted to do everything at once two years ago—starting an organic transition, investing in bottling equipment, and joining a new marketing cooperative — all in the same year.

By month 18, they were hemorrhaging cash. The organic transition meant three years without premium prices but immediate costs for new feed sources. The bottling line sat idle half the time because they hadn’t built their customer base first. The new cooperative required different hauling routes, which added $1,200 monthly in transportation costs.

They survived, barely, by selling the bottling equipment at a 40% loss and focusing solely on completing organic certification. Today they’re profitable again, but the owner told me, “I learned the hard way that one strategic change at a time is plenty.”

How Your Size Determines Your Options

The farm credit analysis released in July effectively highlights how the scale of your operation affects available options during volatile times. With current prime rates at 8.5% as of October 2025, according to Federal Reserve data, financing costs are more significant than ever.

For those 50-100 cow operations (and I know there are still plenty of you out there), the credit situation is particularly challenging. Most are working with smaller credit lines through their local bank or Farm Credit association. When you need to float a feed delivery at these interest rates, every relationship matters.

The 200-500 cow farms generally have moderate credit lines, based on Farm Credit data, with perhaps a bit more flexibility, but still typically depend on one primary lender. Farm Credit Services of America reports similar patterns across Iowa, Nebraska, South Dakota, and Wyoming. The difference? These operations can sometimes negotiate rate discounts of 0.5-1% based on their track record.

Then you have operations with over 1,000 cows, maintaining larger revolving facilities, often with multiple banking relationships. When margins compress, the difference between getting capital in hours versus weeks can determine who survives.

The derivatives situation tells a similar story. CME Group’s educational materials for dairy futures make it clear that maintaining an active hedging program requires substantial working capital. Most operations with fewer than 1,000 cows utilize their co-op’s risk management programs or hire advisors for forward contracts. Direct trading just doesn’t pencil out for smaller operations—and honestly, that’s probably for the best given the complexity.

Even something as basic as milk storage affects your leverage. Smaller operations with limited tank capacity face different pressures than someone with two weeks of storage. USDA’s Farm Storage Facility Loan program—they offer up to $500,000 with a 15% down payment according to FSA guidelines—but as Cornell Cooperative Extension’s PRO-DAIRY program points out, farms with storage flexibility can negotiate. Those without it take what’s offered.

Three Strategies That Are Actually Working—With Real Examples

Despite all these challenges, I’m seeing operations successfully pivot away from pure commodity dependence. And these aren’t pie-in-the-sky ideas—they’re happening right now.

Building Premium Value Through Differentiation

Delaware’s new raw milk regulations, which took effect earlier this year, have created some interesting opportunities. The testing requirements are intense, including monthly pathogen testing, enhanced facilities, and comprehensive insurance. Would crush a commodity operation. But according to Delaware Department of Agriculture licensing data, those approved producers are getting $16-20 per gallon, with customers driving in from Pennsylvania and Maryland.

What’s working elsewhere? In Vermont, the Northeast Organic Farming Association reports continued growth in the transition to grass-fed and organic farming. Initial certification involves a significant investment, ranging from $10,000 to $50,000, depending on your current setup, according to University of Vermont Extension estimates. However, certified organic milk typically commands premiums of $5-8 per hundredweight above conventional prices through cooperatives like Organic Valley or CROPP Cooperative.

Out in California, some producers are finding success with A2 milk. The A2 Milk Company’s supplier programs reveal that genetic testing and herd transition costs vary widely. However, retail price monitoring by the California Department of Food and Agriculture indicates that A2 milk commands premiums of 20-40% at stores like Whole Foods and regional chains.

Then there’s the somatic cell count premium game. The Michigan Milk Producers Association publishes its quality premium schedules, showing significant bonuses for consistently low SCC milk—we’re talking an extra $0.40-$ 0.60 per hundredweight for counts under 100,000. For a 500-cow dairy shipping 40,000 pounds daily, that’s real money.

Creating Leverage Through Cooperation

The Maryland and Virginia Milk Producers Cooperative shows what’s possible through smart aggregation. According to their annual report, by bringing together approximately 1,500 member farms that produce roughly 1.2 billion pounds annually, they’ve achieved negotiating positions that individual members could never reach.

In the Midwest, new forms of cooperation are emerging. Wisconsin’s FarmFirst Dairy Cooperative reports member groups sharing everything from equipment to marketing expertise. They’re coordinating hauling routes through services like Dairy Farmers of America’s transportation division, saving members thousands monthly. Some groups jointly invest in rapid testing equipment—a $45,000 unit that serves multiple farms when shared among them.

Out West, the Western Organic Dairy Producers Alliance brings together organic dairy producers across multiple states to share certification costs, coordinate marketing efforts, and negotiate more favorable terms with processors. Their member surveys show collective action providing 15-20% better returns than going solo.

Taking Control Through Processing

Now, adding processing isn’t for everyone—Wisconsin’s Center for Dairy Research makes that clear in their feasibility studies. Investment costs vary enormously. A basic pasteurizer and bottling line may cost around $250,000, according to equipment manufacturers such as Crepaco and Feldmeier. A small cheese operation? You’re looking at a minimum of $500,000 based on recent USDA Value-Added Producer Grant applications. Full creamery with ice cream capability? Now we’re talking $2-3 million according to dairy plant design firms.

But for those who make it work, the returns can be compelling. Penn State Extension’s dairy entrepreneurship program tracks on-farm processors, and its data show that farmstead cheese operations often capture $40-60 per hundredweight equivalent, versus the $20 commodity price. That’s after accounting for processing costs.

The regulatory piece is huge, though—something people often underestimate. Food safety modernization act compliance, state licensing, local health permits… the Pennsylvania Department of Agriculture’s guide to on-farm processing runs 87 pages. And that’s just one state. Don’t forget you’ll need workers, too—skilled cheese makers in Wisconsin are commanding $25-35 per hour if you can find them.

Your Practical Timeline for Making Strategic Changes

So, where does all this leave your operation? Let me break down a realistic timeline based on what’s actually working for producers making these transitions.

Next 30 Days:

  • Schedule that credit review with your lender (seriously, with rates where they are, you need to know your options)
  • Calculate exactly what percentage of your revenue depends on spot pricing
  • Visit one operation already doing what you’re considering—most producers are surprisingly willing to share experiences

Next 60-90 Days:

  • Premium path: Start certification paperwork (organic transition takes three years per USDA National Organic Program rules, but grass-fed can be faster)
  • Cooperation path: Connect with neighboring producers—your extension agent can often facilitate introductions
  • Processing path: Get a feasibility study done (many land-grant universities offer these through their food science departments)

6-12 Month Targets:

  • Premium: Complete initial certification phases, identify your first customers through farmers markets or local food hubs
  • Cooperation: Formalize agreements (get a good ag lawyer—handshake deals don’t survive market stress)
  • Processing: Secure financing, order equipment (current lead times from manufacturers are running 6-9 months for dairy equipment)

Where This Leaves Us—And Why There’s Still Opportunity

What we’re experiencing isn’t some temporary blip that’ll fix itself next quarter. The evidence—from changing GDT auction patterns to structural shifts in how major players, such as Fonterra, position themselves—suggests that we’re seeing a fundamental market evolution. The commodity model that worked for our parents and grandparents… it’s struggling to generate returns that justify today’s capital requirements and risks.

However—and this is crucial—evolution creates opportunities alongside challenges. Those Delaware raw milk producers didn’t stumble into premium prices. They recognized where consumer preferences were heading and positioned accordingly. Italian PDO cheesemakers leverage centuries of tradition while continually investing in quality and modern food safety practices. Farms adding processing accept complexity in exchange for control.

Markets continue evolving. They may never return to patterns we once considered normal. However, by examining how producers find success through differentiation, cooperation, and integration, we can build something resilient. Something that actually rewards the work we do and the food we produce.

Your path depends entirely on your situation—land base, family labor, capital access, market proximity, and personal goals. However, whatever direction you choose, starting now, while you have options, beats waiting until markets force your hand.

Because if recent volatility has taught us anything, it’s that standing still while markets evolve around you? That’s the riskiest strategy of all.

KEY TAKEAWAYS:

  • Premium differentiation delivers 20-40% price premiums with manageable investment ($10-50K for organic/grass-fed transition, $75K for A2 conversion) and 12-36 month payback—Michigan Milk Producers Association reports $0.40-0.60/cwt bonuses just for SCC under 100,000, adding $8,760 annually for a 500-cow dairy shipping 40,000 lbs daily
  • Strategic cooperation cuts costs immediately through shared infrastructure (bulk tanks save $60K each when split three ways), coordinated hauling (FarmFirst members save thousands monthly), and collective bargaining—Western Organic Dairy Producers Alliance members report 15-20% better returns than going solo
  • Processing integration captures 2-3x commodity value but requires serious commitment: $250K for basic bottling, $500K minimum for cheese, $2-3M for full creamery, plus navigating 87-page regulatory guides and finding skilled workers ($25-35/hour for experienced cheese makers)—Penn State Extension data shows farmstead cheese operations capturing $40-60/cwt versus $20 commodity
  • Your financing options depend entirely on scale: With prime at 8.5% (October 2025), operations under 100 cows face limited credit access, while 1,000+ cow dairies maintain multiple banking relationships—that speed difference in accessing capital during volatility determines who survives
  • Start with one strategy and perfect it: That Illinois operation, which was trying to transition to organic, bottling, and a new cooperative simultaneously, nearly failed—they survived by focusing solely on organic certification. Pick your path based on resources, execute well, then consider expansion

Complete references and supporting documentation are available upon request by contacting the editorial team at editor@thebullvine.com.

Learn More:

  • June Milk Numbers Tell a Story Markets Don’t Want to Hear – This article expands on the market forces driving volatility, revealing why explosive production growth actually triggered a sharp sell-off. It provides tactical advice on shifting your strategy from volume to components, a proven profit center for operations looking to make “smarter milk” in a tough market.
  • Taiwan Deal Requires 100,000 Pounds Monthly – Here’s What That Really Means for Your Farm – This piece offers a deep dive into the economics of export opportunities, revealing why most farms are automatically shut out. It presents actionable alternatives like targeting institutional buyers or forming collaborative ventures, providing a clear path to higher returns without the complexity and risk of international trade.
  • The Tech Reality Check: Why Smart Dairy Operations Are Winning While Others Struggle – This article provides a crucial reality check on technology adoption, moving beyond sales pitches to reveal the true ROI of investments like robotic milking and automated monitoring. It helps producers avoid common pitfalls and strategically implement tech to slash labor costs and boost herd efficiency.

The Sunday Read Dairy Professionals Don’t Skip.

Every week, thousands of producers, breeders, and industry insiders open Bullvine Weekly for genetics insights, market shifts, and profit strategies they won’t find anywhere else. One email. Five minutes. Smarter decisions all week.
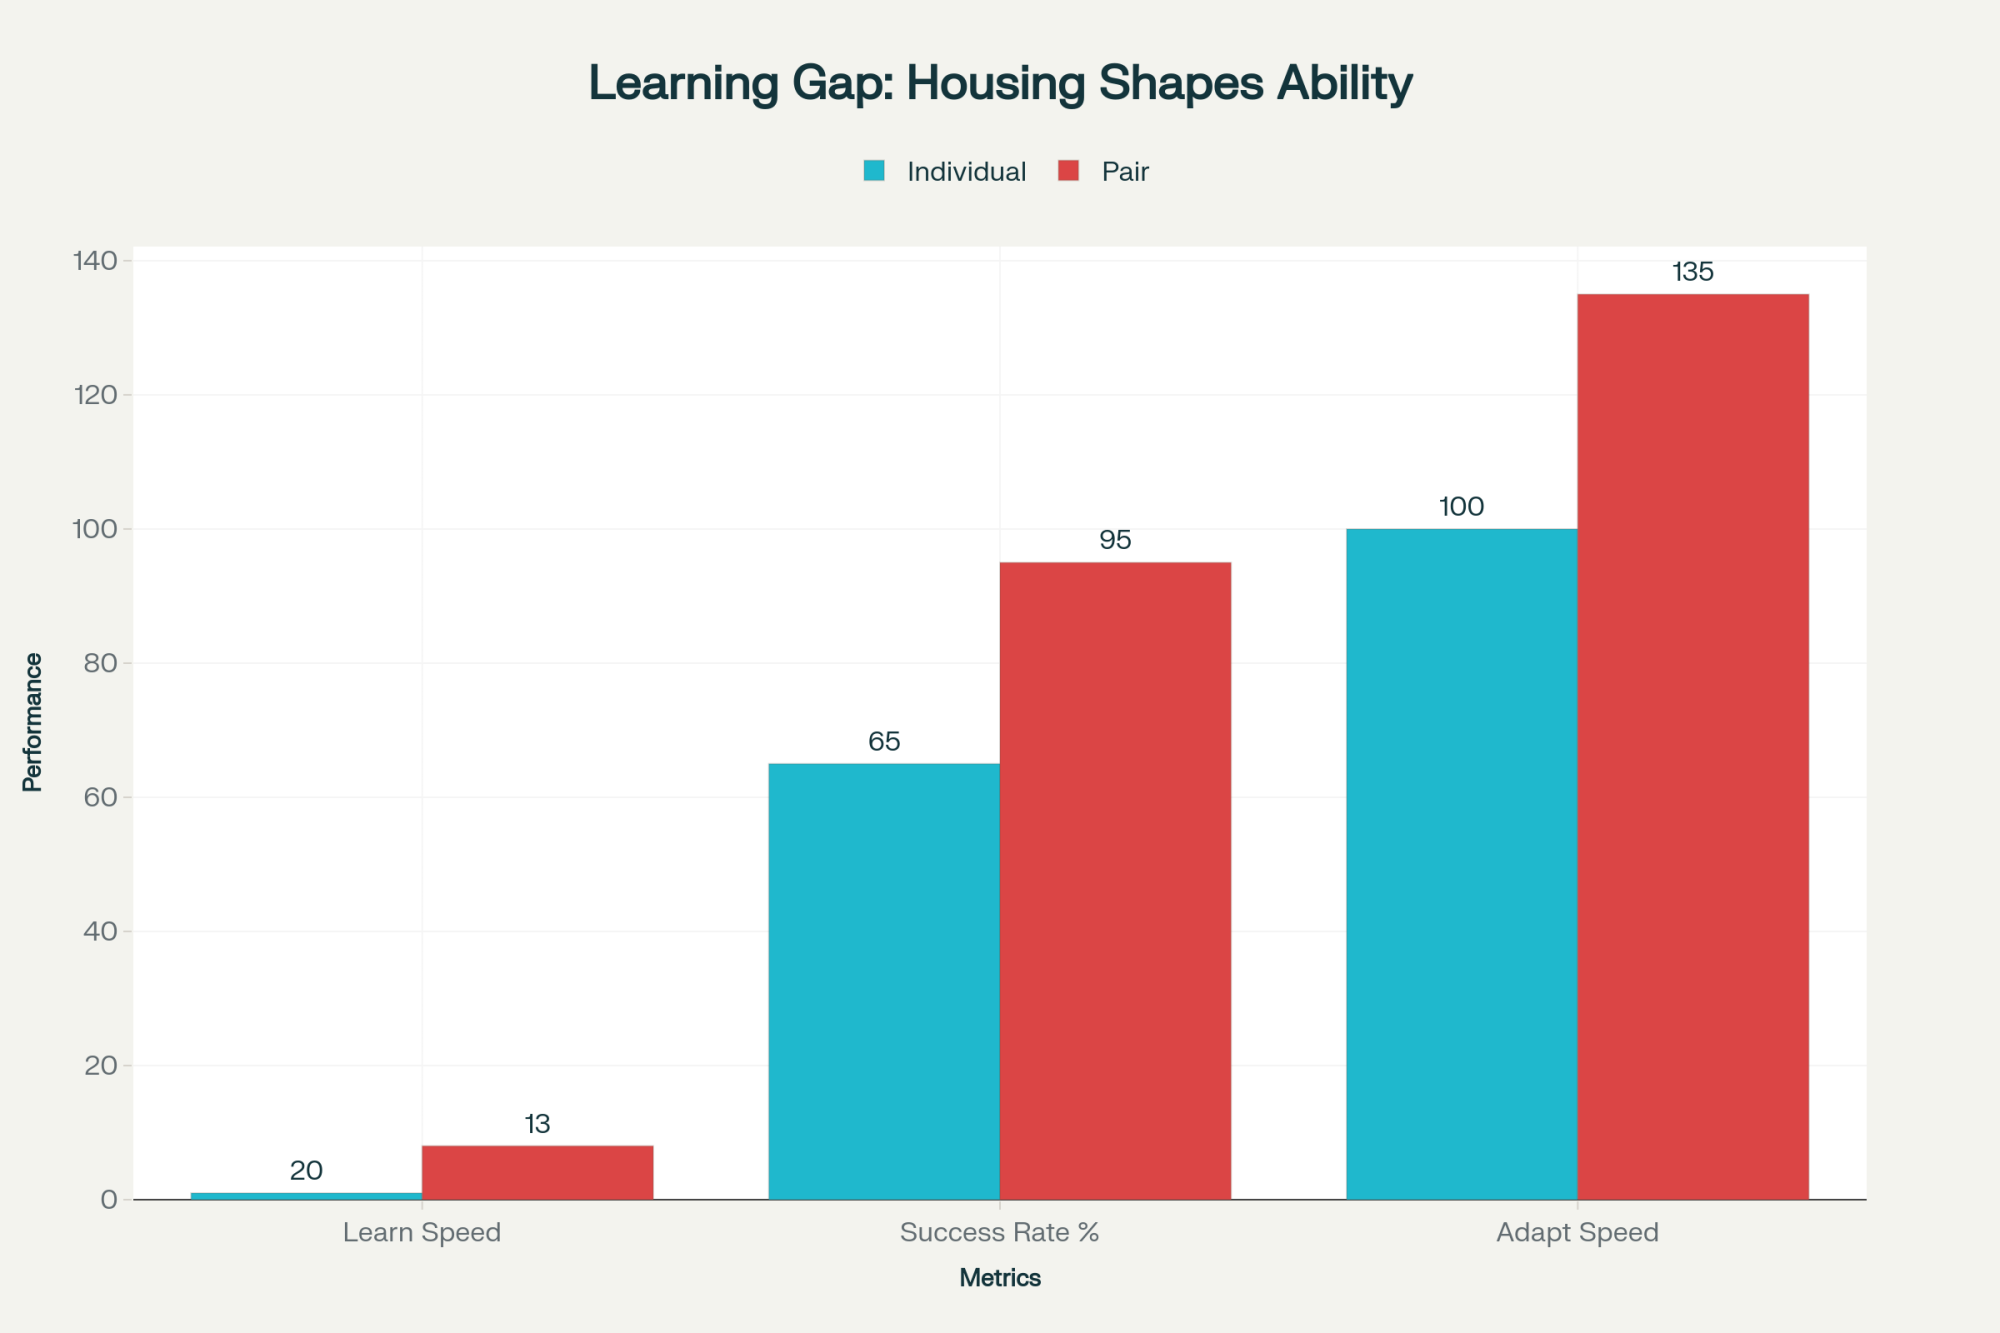
NewsSubscribe
First
Last
Consent

Taiwan Deal Requires 100,000 Pounds Monthly – Here’s What That Really Means for Your Farm

Taiwan imports $600M+ dairy annually but requires 100K pounds monthly—shutting out 85% of U.S. farms

EXECUTIVE SUMMARY: What farmers are discovering about the Taiwan dairy memorandum of understanding is that access requires scale, which most operations simply don’t have—a minimum of 100,000 pounds monthly is required just to qualify for export programs. USDA data confirms that Taiwan imports over $600 million in dairy products annually, with domestic production covering less than a third of its needs. However, there’s a catch: New Zealand already dominates with tariff-free access, while U.S. dairy faces 15-20% duties plus three weeks longer shipping times. For the 2,000-head operations that can absorb certification costs and manage 60-90 day payment terms, Taiwan represents a genuine opportunity and a gateway to Southeast Asia’s rapidly expanding markets. Yet for mid-size dairies—the backbone of many rural communities—the economics suggest focusing on regional institutional buyers, value-added production, or collaborative export ventures might deliver better returns without the complexity. The most successful path forward depends on honestly matching your operation’s capabilities to market requirements, not chasing opportunities designed for different scales. Your cooperative needs to hear from members about developing tiered programs that recognize these realities—because the future of rural dairy depends on strategies that work for more than just the most significant operations.

dairy export profitability

You know, when USDEC and NMPF announced their memorandum of understanding with Taiwan’s Dairy Association, it really got people talking. Now, let me clarify something upfront—an MOU isn’t a binding trade agreement. It’s essentially a framework for cooperation, a statement of intent to work together on market development. Unlike a formal trade deal that might reduce tariffs or guarantee market access, this MOU signals that both sides want to explore opportunities. Think of it as laying groundwork rather than breaking ground.

There’s good reason to pay attention—USDA Foreign Agricultural Service data show that Taiwan imports over $600 million in dairy products annually, with its domestic production covering less than a third of its needs. That’s a substantial opportunity by any measure.

However, what’s interesting as we delve deeper into the requirements and market dynamics is that this opportunity unfolds very differently depending on your operation’s capabilities. Let me share what the data’s revealing.

Understanding Taiwan’s Market Position

Taiwan’s dairy market has been steadily expanding, and federal trade reports confirm that they’re importing more than half a billion dollars’ worth of dairy products each year—a figure that continues to trend upward. This builds on broader Asian dietary shifts that we’ve been watching for the past decade, where dairy consumption continues to grow as incomes rise and dietary preferences evolve.

What’s particularly noteworthy is their institutional demand through school milk programs. You probably know this already, but these kinds of programs typically provide stable, predictable volume—something we all value in today’s volatile markets. And Taiwan’s infrastructure? They’ve invested heavily in cold chain capabilities that rival what you’d find in Wisconsin or California.

The strategic piece that’s worth considering… Taiwan’s position potentially makes them a gateway to Southeast Asian markets. FAO statistics show that the region has the fastest-growing dairy consumption globally. So we’re not just talking about one island market here—we’re looking at potential access to something much broader.

TAIWAN EXPORT REQUIREMENTS AT A GLANCE:

  • Volume: 100,000+ pounds monthly minimum
  • Components: 4.2%+ butterfat, 3.3%+ protein
  • Payment: 60-90 day terms standard
  • Competition: New Zealand tariff-free access

The Reality of Export Requirements

Now, when you look at what the major cooperatives require for export programs—and DFA, Land O’Lakes, and others have been pretty consistent about this—there are some significant thresholds to meet.

Volume commitments typically begin at a minimum of two truckloads per month. That’s roughly 100,000 pounds, give or take. For perspective, if you’re running 500 head that produce around 12 million pounds annually, you’re generating about one truckload per month. See where this is going?

Why does this matter? Fixed costs for export certification, enhanced testing protocols, and documentation systems need to be spread across your total volume. A 2,000-head operation can absorb these costs much more efficiently. Basic math, but the impact on your bottom line is profound.

Then there’s the component specifications. Export buyers consistently want butterfat above 4.2% and protein exceeding 3.3%. Jersey herds naturally tend to hit these levels more easily—that’s just breed characteristics at work. Holstein operations often require significant ration adjustments or long-term genetic selection strategies. And changing your herd’s component profile… that’s not something that happens overnight.

New Zealand’s Built-In Advantages

Here’s something that really shifts the competitive landscape: New Zealand achieved complete tariff elimination with Taiwan through their Economic Cooperation Agreement. Meanwhile, we’re still facing duties ranging from 15% to 20%, depending on the item being shipped. That’s documented in Taiwan’s customs schedules and various trade analyses.

Think about what this means practically. New Zealand can deliver to Taiwan in under a week from their ports. From our West Coast? We’re looking at a minimum of three to four weeks. When you combine zero tariffs with shorter shipping times and lower freight costs, their delivered price advantage becomes significant.

Trade data shows New Zealand already captures the largest share of Taiwan’s dairy imports, and with these structural advantages locked in through trade agreements, that position seems secure. Though U.S. dairy often commands quality premiums that can partially offset some disadvantages, particularly for specialized products where our consistency really shines.

Cash Flow and Operational Realities

One aspect that is not discussed enough is the impact of exports on working capital. Domestic milk payments typically arrive in your account within two to three weeks. But export contracts? Industry-standard terms typically run 60 to 90 days, sometimes longer.

For operations already managing tight cash flow—and let’s be honest, that describes many of us these days—that extended payment period creates real challenges. You’re still paying feed bills monthly, covering payroll every two weeks, but waiting two to three months for that milk check. The premium might look good on paper, but cash flow is what keeps the lights on.

Export-qualified milk typically receives priority scheduling for pickup to ensure that quality specifications are maintained. Makes perfect sense from a logistics standpoint, right? But farms not participating in export programs might see their pickup windows shift to less optimal times. Your milk sits in the tank longer, potentially affecting domestic quality premiums. Small things add up.

Community and Consolidation Impacts

What university extension programs have documented—and what many of us are seeing firsthand—is how consolidation patterns affect entire rural economies. Each mid-sized dairy operation supports a whole network of local businesses, including veterinary practices, feed suppliers, equipment dealers, local banks, and schools.

When smaller operations exit and their production is absorbed by larger farms (often located in different areas), the economic activity shifts accordingly. The local vet might lose enough business to cut back hours. The equipment dealer might close their satellite location. School enrollment drops. These ripple effects are real and lasting.

This isn’t an argument against efficiency—we all need to stay competitive. However, it’s worth understanding these broader impacts as we consider how export opportunities might accelerate existing trends.

Alternative Strategies for Premium Capture

Not every premium opportunity requires access to export markets. What’s encouraging is seeing different approaches work across various regions.

Institutional buyers—such as hospitals, schools, and corporate food service operations—have increasingly paid premiums for locally sourced dairy products. These arrangements often involve simpler logistics and much faster payment terms than export programs. When you factor in reduced complexity and faster cash flow, the net return can be comparable or even better.

Value-added production continues to show promise as well. Small-scale processing—whether it’s farmstead cheese, yogurt, or bottled milk—can capture retail premiums that rival export opportunities. Yes, it requires learning new skills and developing marketing channels. But you maintain control over your product and pricing in ways commodity markets never allow.

Producer collaborations are gaining traction, where multiple farms pool resources to meet export volume requirements while sharing certification costs. When economics get divided among several operations, they become more manageable—though it requires significant coordination and trust among participants.

Examining operations in Texas and Idaho, where large-scale dairies already predominate, we’re seeing interesting hybrid approaches. Some are partnering with smaller neighbors to aggregate volume while maintaining individual farm identity for certain premium markets. It’s a model worth watching.

The Cooperative Perspective—And Your Role in It

You know, cooperatives face genuine challenges here. They need to stay competitive in global markets while serving members ranging from 50 to 5,000 cows. Export program development represents one path toward accessing growing markets and potentially improving returns for all members.

Cooperative governance increasingly reflects the perspectives of larger operations. Not through conspiracy—it’s a practical reality. Larger farms typically have more resources to participate in leadership, attend meetings, and serve on committees. That naturally influences how programs get structured and priorities get set.

However, here’s the thing: if you’re not satisfied with how your cooperative is managing export opportunities or any other programs, sitting on the sidelines won’t make a difference. When’s the last time you attended your co-op’s annual meeting? Reviewed the board election slate? Actually read those governance proposals?

The question we should be asking our cooperatives: Can you develop tiered programs that recognize different member capabilities? Some co-ops are already experimenting with this—offering different service levels and cost structures based on volume and participation. If your cooperative isn’t exploring these options, bring it up at the next member meeting. Get it on the board’s agenda. Find other members who share your concerns and present a unified voice.

Your cooperative is only as responsive as its members are engaged. If export programs feel designed for operations three times your size, that’s feedback your board needs to hear—repeatedly and from multiple members.

Making the Right Decision for Your Operation

So, where does all this leave us with the Taiwan opportunity? The market is real, the demand is growing, and for operations with appropriate capabilities, the returns could be meaningful.

If you’re running a business with over 2,000 employees and strong component genetics, along with solid banking relationships, these export programs may align well with your business model. The premiums can justify the investment, and accessing growing Asian markets provides important diversification.

However, if you’re managing a mid-sized operation—particularly one already facing margin pressure—the requirements create hurdles that may be difficult to overcome profitably. And that’s okay. Not every opportunity needs to be your opportunity.

What seems to be working for many mid-size operations is focusing on regional markets. Building relationships with local institutions. Exploring value-added possibilities. Finding niche markets that value specific attributes—whether that’s grass-fed, local, family farm, or sustainable practices. These strategies might not generate headlines, but they’re delivering solid returns.

Looking Ahead

This Taiwan MOU illuminates broader dynamics in today’s dairy industry. Opportunities are increasingly differentiated by capability and resources, and understanding where your operation fits—along with what alternatives exist—is becoming crucial for long-term success.

Recent volatility has taught us that resilience comes from matching strategy to capabilities. Large operations might find their advantage in export markets and global supply chains. Mid-size farms often succeed through regional focus and differentiation. Smaller operations increasingly thrive through direct marketing and value-added strategies.

The most successful producers share common traits. They honestly assess their strengths and limitations. They understand market requirements thoroughly. They choose strategies aligned with their operational realities rather than chasing every opportunity that comes along.

As we head into another year of uncertainty, with milk prices volatile and input costs unpredictable, these strategic choices matter more than ever. The Taiwan opportunity offers a valuable perspective for examining our individual positions and options.

What’s working in your region? Because ultimately, that’s what makes our industry strong—sharing knowledge, learning from each other’s experiences, and finding paths forward that work for our individual operations while strengthening the broader dairy community. The Taiwan MOU is just one piece of a much larger puzzle we’re all working to solve together.

Key Takeaways:

  • Component and cash flow impacts: Achieving 4.2% butterfat and 3.3% protein specifications often requires feed cost increases of $0.50-1.00/cwt, while 60-90 day export payment terms versus 15-20 day domestic payments can strain working capital by $40,000-60,000 for mid-size operations
  • Regional alternatives delivering results: Direct institutional sales to hospitals and schools are capturing $0.50-1.00/cwt premiums with simpler logistics, while producer collaborations pooling volume among 6-8 farms are successfully accessing export premiums through shared certification costs
  • Cooperative engagement opportunity: Members should actively push boards to develop tiered export programs, recognizing different scales—attend meetings, join committees, and build coalitions, because governance increasingly reflects large-farm perspectives unless smaller operations organize
  • Strategic decision framework: Match your operation’s strengths to appropriate markets: 2,000+ head farms can justify export infrastructure, 500-1,000 head operations often maximize returns through regional differentiation, while smaller dairies thrive with direct marketing and value-added strategies

Complete references and supporting documentation are available upon request by contacting the editorial team at editor@thebullvine.com.

Learn More:

The Sunday Read Dairy Professionals Don’t Skip.

Every week, thousands of producers, breeders, and industry insiders open Bullvine Weekly for genetics insights, market shifts, and profit strategies they won’t find anywhere else. One email. Five minutes. Smarter decisions all week.

NewsSubscribe
First
Last
Consent

How One Island Lost £5.44 Million Preventing Nothing—And Why Your Operation Should Care

What happens when biosecurity economics don’t add up? Ask the 30 farms losing millions on an island

EXECUTIVE SUMMARY:  What farmers are discovering through the Isle of Man’s dairy crisis is that well-intentioned biosecurity measures can create more economic damage than the diseases they’re designed to prevent—particularly for operations caught in the vulnerable 100-200 cow range. The island’s 30 dairy farms have lost £5.44 million (40% of production capacity) implementing prevention measures for a disease that never reached their shores, while the UK recorded just 129 Bluetongue cases total according to DEFRA’s July reports. This situation mirrors challenges facing isolated operations from Hawaii to Vermont, where geographic constraints multiply compliance costs while limiting adaptation options. Recent AHDB data showing 440 UK farm closures last year—predominantly in that challenging middle scale—suggests this isn’t an isolated incident but part of a broader pattern where regulations unintentionally accelerate consolidation. The key insight emerging from multiple regions is that operations finding success are those building resilience through diversification, with direct sales capturing nearly double farmgate prices (85p versus 44p per pint in Huxham’s case) and collaborative approaches to processing and purchasing showing promise. For producers navigating similar pressures, the lesson is clear: understanding your operation’s true vulnerabilities and building flexibility before crisis hits has become as important as production efficiency itself.

dairy biosecurity economics

Award-winning dairy operations that lose 40% of their production reveal important insights about biosecurity economics—with practical applications for farms navigating similar regulatory challenges. As I’ve been digging into the numbers and talking to people about this, what’s emerging is… well, it’s something we all need to think about.

The Numbers That Tell the Story

The brutal reality: 92.3% of the £5.44 million loss came from milk production collapse, not animal deaths or treatment costs. This wasn’t a disease impact—it was an economic strangulation.

So here’s what we’re looking at. The Isle of Man Creamery processes about 26 million litres annually from 30 local farms—that’s according to their own reports and government statistics. A fairly standard setup for an island of that size. However, they’ve lost 40% of their production capacity, which translates to approximately £5.44 million being lost from a dairy sector worth around £13.6 million in total.

Now, here’s where it gets interesting. DEFRA’s July report documented 129 Bluetongue cases across the entire UK. The Isle of Man? Zero cases. Not one. Yet they’re hemorrhaging millions because of prevention measures.

It’s worth noting that we’ve all seen disease prevention work brilliantly—FMD never got here, and that saved countless operations. But when prevention costs exceed any reasonable estimate of disease impact… that’s when we need to ask hard questions.

Carl Huxham runs Cronk Aalin Farm on the island—40 cows, getting about 6,000 to 7,000 litres per cow annually. He’s been pretty open about the challenges, particularly the shipping costs. Everything that comes to an island—feed, equipment, replacement parts—it all costs more. And that’s before you even factor in these disease restrictions.

How Things Compound on Each Other

Here’s the uncomfortable math: Isle of Man farmers paid £300 per cow preventing a disease that typically costs £135 per cow when it actually hits. Meanwhile, H5N1 shows what happens when prevention fails—£950 per affected animal.

What’s particularly noteworthy about this situation is how multiple pressures have converged. And honestly, many of us are dealing with at least some of these same challenges…

The disease control measures have been in place since November 2023—we’re now nearly two years into a complete livestock import ban from the UK. Meanwhile, mainland operations can move cattle within England relatively freely as of this July. So, you have island farmers who can’t bring in replacement heifers or new genetics, while their mainland counterparts are operating almost normally.

Then there’s the feed situation. You probably felt it too—AHDB documented hay yields running about 60% below normal this year. Tough everywhere, right? But when you’re on an island, or even just in a remote area, those transportation costs can double or triple. Many operations in Hawaii face similar challenges, and increasingly, those of us in more isolated mainland regions are seeing comparable dynamics as local suppliers disappear.

The September equipment failure at their butter production line… well, that hits close to home for many of us. USDA processing efficiency studies generally show you need somewhere between 30 and 50 million litres annually for optimal efficiency, depending on your setup. When you’re running below that threshold—and most smaller regional operations are—every breakdown becomes critical because you can’t justify the expense of backup systems.

And here’s something interesting: the island attracts over 329,000 tourists annually, generating approximately £212 million, according to their tourism board. That creates wild seasonal swings in demand. Think about operations near Yellowstone or in Vermont’s ski country—same dynamic. You need production flexibility exactly when regulations eliminate it.

The Middle-Scale Challenge We’re All Facing

The data reveals dairy’s dirty secret: mid-size operations face 20% higher costs than small direct-sales farms or large-scale dairies. Isle of Man’s 124-cow average puts them squarely in the death valley.

The Isle of Man farms average about 124 cows each, which puts them right in that challenging middle zone. You know what I mean—too big for effective direct marketing in most cases, too small for real processing efficiencies.

The Center for Dairy Profitability up in Wisconsin has been documenting this for years. Operations between 100 and 200 cows often face the highest per-unit costs. It’s not just a US phenomenon either—the latest AHDB data shows that 440 UK farms closed last year, a 6% decline, bringing the total to about 7,130. And which operations are surviving? Generally, the small, nimble ones are those doing direct marketing, or the large ones with significant scale advantages.

What makes island situations particularly tough—and this applies to geographically isolated mainland areas too—is the limited ability to adjust. You can’t just buy more land when you’re surrounded by water. Same problem if you’re in a valley where all the good ground’s taken, or where development pressure has driven land prices through the roof.

Different Approaches, Different Results

Examining how various regions are addressing these pressures offers some insight…

New Zealand’s interesting. Fonterra controls somewhere between 90% and 95% of its milk supply, according to its annual reports. You’d think that level of coordination would guarantee good prices, but many producers there are struggling with profitability, especially when global prices dip. Market concentration doesn’t automatically mean farmer prosperity—something to keep in mind as we observe consolidation in the industry.

India went a completely different direction. According to the National Dairy Development Board, the Amul cooperative model serves approximately 100 million farmers. They’ve maintained substantial import protection, and you know what? They’re now the world’s largest milk producer. Different system, different philosophy, but it’s working for them.

Iceland’s doing something really creative—using its abundant renewable energy to develop alternative proteins, such as Spirulina. Their 2021 Food Policy outlines this shift pretty clearly. Sometimes the answer isn’t competing harder in the same game; it’s finding a different game altogether.

In North America, we’re seeing various adaptive strategies emerge. Some regions are developing collaborative approaches to processing and purchasing. Others are investing heavily in renewable energy to offset costs. Each area seems to be finding its own path forward, though the specific models vary considerably based on local conditions and regulations.

Practical Considerations Worth Thinking About

Based on what’s happening on the Isle of Man and patterns emerging elsewhere, several things deserve our attention…

On biosecurity economics: It’s worth sitting down with your vet and running real numbers. What would a disease outbreak actually cost your specific operation? Are there graduated response options—such as testing, short quarantines, or targeted vaccination—that could provide protection without shutting everything down? These conversations are better had before a crisis hits.

Building resilience into operations: The farms weathering challenges best seem to have multiple approaches working. Direct sales can capture significant premiums—Huxham gets 85p per pint direct versus the 44p farmgate average. That’s not small change. Having some feed production capability, maintaining genetics that work in your environment… these buffers matter more than ever.

Understanding your real position: Geographic location cuts both ways. Being isolated can mean higher input costs, but it can also mean loyal local customers who value what you produce. The key is matching your strategy to your actual circumstances, not what you wish they were.

The Regulatory Reality We’re All Navigating

Here’s something we need to acknowledge: regulations have different impacts on different scales. And it’s not necessarily intentional—it’s just how the math works out.

Small operations often find ways to work within or around certain requirements through direct sales and simplified processes. Large operations spread compliance costs across a massive volume. However, that middle segment—where many of us operate—carries the full regulatory burden without the scale to truly absorb it.

According to Dairy UK’s analysis, approximately 87% of the UK market’s processing capacity is controlled by three major companies. Each new regulation, regardless of intent, tends to accelerate this concentration. It’s not a conspiracy; it’s just a matter of economics.

From the processors’ perspective, they’re dealing with retailer demands, food safety requirements, and international market access needs. Regulators generally aim to protect both animal and human health. The disconnect occurs when on-farm economic realities are not adequately factored into these decisions.

What This Means Going Forward

Climate variability isn’t going away. Disease pressures will continue. And regulatory complexity tends to increase over time. These are realities we need to plan around…

Supply chain resilience has taken on new importance. COVID taught us about sudden disruptions, but this Isle of Man situation shows that regulatory disruptions can be equally impactful—and potentially longer-lasting.

The scale required for efficient processing continues to rise. Most analyses suggest you need at least 30 to 50 million litres annually for competitive efficiency now. That has real implications for regional processing availability and producer options.

Perhaps most importantly, we need better frameworks for evaluating the costs of prevention versus the actual risk. This requires dialogue between all stakeholders—producers, veterinarians, processors, and yes, regulators. Everyone needs to understand the full picture.

Moving Forward Together

What the Isle of Man situation ultimately teaches us is about adaptation and resilience…

Some operations are finding creative solutions through cooperation, including shared processing, group purchasing, and collaborative marketing. These aren’t perfect solutions, but they show that working together can create opportunities that don’t exist individually.

The key seems to be recognizing challenges early enough to adapt proactively rather than reactively. This requires an honest assessment of our situations, learning from others’ experiences, and sometimes making difficult decisions about the future direction of our operations.

It’s worth remembering that this industry has always been built on resilience and innovation. We’ve weathered challenges before, and we’ll weather these too. But it helps to learn from each other’s experiences—whether those experiences come from an island in the Irish Sea or a farm down the road.

What patterns are you seeing in your region? Because they’re there, even if they haven’t made headlines yet. Sometimes the best insights come from comparing notes before a situation reaches a crisis level.

Feel free to share your thoughts at news@thebullvine.com. After all, we’re all in this together, whether we’re on actual islands or just dealing with our own unique challenges that can make us feel that way.

These are indeed interesting times in the dairy industry. But then again, when haven’t they been?

KEY TAKEAWAYS:

  • Calculate your biosecurity ROI: Operations spending more than £300 per cow on disease prevention should reassess—actual outbreak costs often run £120-150 per infected animal based on European data, meaning many farms are overspending by 200% or more
  • The 124-cow trap is real: Farms between 100-200 head face 15-20% higher per-unit costs than either smaller direct-marketing operations or 300+ cow dairies according to Wisconsin’s Center for Dairy Profitability—knowing which side of this divide you’re on shapes every strategic decision
  • Direct sales change everything: Producers capturing retail prices (like Huxham’s 85p per pint) generate margins that can offset compliance costs that would sink commodity-focused operations—even partial direct marketing can improve resilience by 30-40%
  • Geography multiplies challenges: Remote and island operations face feed cost premiums of 200-250% plus limited genetic improvement options—if you’re paying more than £50/tonne above regional averages for inputs, alternative production models deserve serious consideration
  • Collaborative solutions work: Regional processing cooperatives, shared equipment purchases, and group feed buying are helping mid-size operations achieve economies of scale—Minnesota and Ohio examples show 20-30% cost reductions through cooperation

Complete references and supporting documentation are available upon request by contacting the editorial team at editor@thebullvine.com.

Learn More:

  • HPAI H5N1: The 2025 Science-Based Dairy Farm Survival Guide – This article provides a tactical blueprint for effective biosecurity, revealing specific herd health protocols and low-cost prevention strategies that can reduce your risk without the massive financial outlays seen in the main article’s example. It details how to optimize PPE, manage farm visitors, and leverage herd status programs.
  • Why This Dairy Market Correction Feels Different – and What It Means for Our Farms – Beyond the Isle of Man, this piece offers a broader strategic perspective on the global dairy market. It breaks down the forces driving industry consolidation and provides data-backed insights on how to build resilience against volatile prices and survive the extended market pressures forecast through 2026.
  • AI and Precision Tech: What’s Actually Changing the Game for Dairy Farms in 2025? – This article explores the innovative solutions farmers are using to overcome the “middle-scale challenge.” It provides specific return-on-investment numbers for technologies like AI-driven feeding and automated health monitoring, helping you prioritize capital investments that deliver tangible cost savings and efficiency gains.

The Sunday Read Dairy Professionals Don’t Skip.

Every week, thousands of producers, breeders, and industry insiders open Bullvine Weekly for genetics insights, market shifts, and profit strategies they won’t find anywhere else. One email. Five minutes. Smarter decisions all week.

NewsSubscribe
First
Last
Consent

How 500-Cow Farms Are Building $100K+ Annual Cushions Without Relying on Safety Nets

Fixed safety nets lose 30% purchasing power by 2031—your $9.50 coverage becomes worth $6.45

EXECUTIVE SUMMARY: What we’re discovering through conversations with dairy farmers across the country is that fixed safety net programs, while valuable, are creating an interesting planning challenge—coverage that doesn’t adjust for inflation loses roughly 30% of its purchasing power over typical extension periods. Take the Johnson farm example: their 500-cow Wisconsin operation faces $15,000-$ 20,000 in annual premiums for coverage that protects only half of their 12 million pounds of production, while the other half remains exposed to market volatility. Meanwhile, operations from Texas to Vermont are finding creative ways to build resilience beyond government programs—forming buying groups that cut feed costs by 10-15%, investing in shared equipment that reduces per-unit expenses, and developing direct market relationships that capture premium pricing. Recent discussions with producers suggest that the most successful operations treat safety nets as just one tool in their risk management toolkit, not the complete solution. The farms weathering volatility best are those focusing on fundamentals they can control: feed efficiency improvements that add $50-100 per cow annually, reproductive programs that reduce replacement costs, and facility investments that pay for themselves through improved cow comfort. Looking ahead, the real opportunity might be in building operations that are efficient enough for safety nets to become backup protection rather than a primary strategy.

You know, I was talking with a neighbor the other day about dairy safety net programs, and we got to discussing something that I think a lot of us are wondering about: what does longer-term program planning actually mean for our operations?

The headlines sound encouraging—expanded coverage options, program certainty, all that. However, when you delve into the planning aspect of things… that’s where the conversation becomes more interesting. And frankly, more important for those of us trying to make smart risk management decisions.

Understanding the Safety Net Framework

So here’s what we’re looking at with recent program developments. Congress has been working on extending program availability further into the future, which would give us more certainty about having these tools available when we need them. The basic program structure remains focused on providing safety net coverage for dairy operations, although, as many of us have seen, the details can become quite complex quite quickly.

Now, you probably already know this, but the way these safety net programs generally work is you can cover a portion of your production with premium costs that tend to increase as you go for higher coverage levels. Initial tiers typically offer better premium rates, and as you add more coverage… well, it gets expensive in a hurry.

What’s interesting here is how different this approach is from, say, your typical business insurance. Most commercial policies adjust rates and coverage annually based on changing conditions. But agricultural safety nets? They tend to become established and then remain in place for years at a time.

The Reality of Fixed Protection Levels

This is where the conversation with my neighbor got really interesting. Fixed coverage levels lose what economists call purchasing power as costs rise over time—and they generally do. It’s like having equipment insurance that covers replacement at today’s prices when you’ll need to buy that equipment several years from now at tomorrow’s prices.

For those of us running mid-size operations, this becomes particularly important. If you’re milking, say, 400-600 cows, you’re producing enough milk that only part of it typically gets the better tier coverage under most program structures. The rest is essentially exposed to market volatility.

The Hidden Cost of Fixed Safety Nets: How Your $9.50 Coverage Loses $3.05 in Real Value by 2031 – While politicians promise program certainty, inflation quietly steals 30% of your protection. Smart farmers are building their own cushions instead of waiting for Washington to adjust.

I’ve noticed that producers who truly understand this dynamic tend to approach their overall risk management strategy differently. They’re not just considering whether to enroll in programs—they’re also asking what else they need to do to maintain protection as conditions evolve.

While safety net coverage stays fixed, actual farm costs have more than doubled over 20 years

Case Study: The 500-Cow Decision

Let me walk you through a real-world example that might help illustrate this. Take a typical 500-cow Holstein operation in Wisconsin—let’s call them the Johnson farm. They’re averaging about 24,000 pounds per cow annually, which translates to approximately 12 million pounds of total production.

Under current program structures, they can obtain better premium rates on their first tier of coverage—approximately half their production. For the Johnsons, that means roughly 6 million pounds gets decent safety net protection, while the other 6 million pounds is basically exposed to market volatility.

If they’re paying premiums for coverage on that protected portion, they need to factor those costs into their budget—probably around $15,000 to $ 20,000 annually, depending on the coverage levels they choose. However, they also need to consider what happens to the value of that coverage over time.

The Johnsons have been dairy farming for 20 years. They’ve seen feed costs go from $120 per ton to over $300 per ton during tough years. Labor costs have more than doubled. Equipment prices… don’t even get me started. So, when they consider fixed coverage levels that remain unchanged for years, they’re thinking about whether that protection will still be meaningful when they actually need it.

What they’ve decided to do is treat safety net programs as just one piece of their risk management puzzle—not the whole solution.

The Johnson Farm Blueprint: How One 500-Cow Operation Built Real Protection Beyond Programs – Four pillars, measurable results. While neighbors worry about Washington, the Johnsons control what they can control – and it’s working.

The Other Side of Your Milk Check

And speaking of things that evolve while safety net coverage remains relatively static… there’s another piece that affects our milk checks that doesn’t get discussed enough at the kitchen table. Make allowances—those deductions that supposedly cover processing costs—are something many producers report seeing changes in over time.

Here’s a simple exercise that might be worth doing: take your last six months of milk checks and calculate what a $0.50 per hundredweight change in deductions would mean to your annual cash flow. For a 500-cow operation producing about 12 million pounds annually, that’s $60,000. Not exactly pocket change, especially when you’re already paying premiums for safety net coverage.

Make allowance changes hit every hundredweight—the bigger you are, the harder you fall.

How Your Operation Size Changes Everything

You know what I’ve been noticing more and more? These policy and market changes affect farms very differently depending on your scale.

Farm size dramatically changes your risk profile under current safety net structures.

If you’re running a smaller operation—perhaps 150-250 cows—most of your production likely receives reasonable safety net protection. The challenge is that you’re often more dependent on cooperative pricing without a lot of market alternatives. Additionally, your time is typically fully committed to daily operations.

But if you’re in that middle range—say 400-800 cows—you’re producing enough that changes represent serious money, but only a portion of your milk typically gets meaningful coverage. Additionally, you’ve likely invested heavily in facilities and equipment over the years, making it expensive to consider switching market relationships.

Farm SizeAnnual ProdCoverage %Exposed ProdRisk Exposure
150-250 Cows3.6-6M lbs90-100%0-0.6M lbs$0-3K
400-600 Cows9.6-14.4M lbs50-65%5-8.4M lbs$25-42K
1000+ Cows24M+ lbs25-35%16-18M lbs$80-90K

The largest operations? They’re often negotiating premiums above base prices anyway. Safety net coverage is nice to have, but it’s not make-or-break for their cash flow. Their volume helps them absorb cost increases that might really hurt smaller farms.

What’s encouraging is seeing some mid-size operations get creative about this challenge—forming marketing groups, exploring regional processing options, or investing in technologies that improve their bargaining position with processors.

Understanding Market Relationships

Many dairy cooperatives operate both marketing and processing businesses. That creates some interesting dynamics when policies and market conditions change.

Now, I’m not saying there’s anything wrong with this business model—cooperatives serve important functions and most are trying to optimize total value for their members. However, it’s worth understanding how your cooperative or processor generates revenue across all its operations, not just what is reflected in your milk price.

I’ve noticed that producers who take time to really understand their market relationships tend to make better decisions about their overall marketing strategy. They’re also better positioned to have productive conversations about pricing, services, and long-term contracts.

Take butterfat premiums, for example. Some operations focus heavily on maximizing butterfat performance through breeding and feeding programs because their market relationships reward that approach. Others find better returns through improvements in volume and efficiency. Understanding how your specific market relationship works helps you make smarter investment decisions.

Alternative Approaches and Innovations

Some producers are exploring alternatives to traditional market structures. Mobile processing options are becoming a topic of conversation in some regions, although they still require substantial investment and regulatory navigation. Some operations are exploring direct-to-consumer approaches, particularly for specialty products like organic or grass-fed milk.

For example, some Wisconsin producers I know have formed buying groups for feed and supplies, using their combined purchasing power to negotiate better prices. In Texas, several operations have invested in shared equipment for feed processing, spreading the cost across multiple farms while improving feed quality and reducing per-unit costs.

In Michigan, a group of approximately 20 mid-sized dairies has pooled resources to hire a professional nutritionist who works exclusively with their operations. The cost per farm is manageable, but they’re getting top-tier expertise that would be unaffordable individually.

Beyond Safety Nets: Six Strategies Smart Farms Use to Build $100K+ Annual Cushions – Transition management improvements alone deliver $250/cow annually – that’s $125,000 for a 500-cow operation. No government program required

The Planning Framework That Actually Works

So where does this leave us? Well, I think it starts with understanding your own numbers—really understanding them, not just having a general sense of where things stand.

Smart risk management starts with understanding your operation’s unique position.

Calculate what a 10% increase in feed costs would do to your margins. Determine your break-even milk price based on current cost structures. Understand what percentage of your income comes from components like butterfat and protein premiums versus base price.

Here’s a practical framework that might be worth working through:

Monthly Financial Reality Check:

  • Track your all-in cost of production per hundredweight
  • Monitor your margin over feed costs as a key indicator
  • Calculate how policy or market changes affect your actual cash flow
  • Compare your costs to regional averages when available

Risk Assessment Questions:

  • What’s your biggest vulnerability—price volatility, cost inflation, or cash flow timing?
  • How much of your production gets meaningful safety net protection?
  • What happens to your operation if margins stay tight for 18 months?
  • Do you have access to alternative markets if your current relationship doesn’t work out?

Regional Realities and Opportunities

Some Wisconsin producers I’ve talked with report focusing more on feed efficiency and reproductive performance as ways to improve their cost structure independent of policy support. The emphasis on transition period management has intensified—getting those fresh cows off to a strong start makes a significant difference in overall herd performance and lifetime production.

What’s interesting is seeing more precision feeding approaches, where operations track individual cow performance and adjust rations accordingly. The technology has gotten more affordable, and the payback through improved feed conversion is pretty compelling when margins are tight.

In Texas and California, some producers mention investing in technologies that help manage heat stress and improve labor efficiency. The climate challenges they face make cow comfort investments particularly important for maintaining production levels during the summer months.

In Vermont and New York, some operations are exploring value-added enterprises and direct marketing opportunities. The proximity to urban markets creates opportunities that aren’t available in more remote areas, although navigating regulatory requirements can be challenging.

Meanwhile, in Iowa and Minnesota, several dairy operations with which I am familiar have begun collaborating with crop farmers on manure-for-feed arrangements that benefit both parties. The dairy receives competitively priced corn silage, the grain farmer receives valuable nutrients, and both parties save on transportation costs.

RegionPrimary StrategyKey InvestmentCost ImpactRisk Factor
WisconsinFeed efficiency & reproductionTransition cow management-$0.75/cwt feed costsComponent price volatility
Texas/CaliforniaHeat stress managementCooling systems & automation-15% summer production lossEnergy cost increases
Vermont/New YorkValue-added/direct marketingProcessing infrastructure+$2-4/cwt premium potentialRegulatory compliance
Iowa/MinnesotaManure-for-feed partnershipsNutrient exchange programs-$0.50/cwt feed + fertilizerWeather dependency

What This Means for Your Planning

Safety net programs provide a foundation—and that’s not nothing. Having some certainty about program availability helps with planning, even if the structure isn’t perfect. But building a sustainable operation on top of that foundation? That’s still up to us.

I’d encourage you to consider enrolling in available programs despite their limitations. Even imperfect protection is better than no protection when margins are tight. Consider enrollment strategies that offer premium savings, if your cash flow allows it. But don’t stop there.

Cost Management Priorities:

  • Focus on feed efficiency improvements—every tenth of a point improvement in feed conversion helps your bottom line
  • Evaluate your reproductive program’s impact—shorter calving intervals and improved conception rates reduce replacement costs
  • Consider facility investments that improve cow comfort—better stall design, improved ventilation, and adequate water access often pay for themselves
  • Invest in fresh cow management—transition period nutrition and management probably has the biggest impact on overall herd performance

Market Relationship Evaluation:

  • Build relationships with multiple market channels where possible—even if you can’t switch completely, having options provides leverage
  • Understand the total value proposition—consider component premiums, quality bonuses, and services provided
  • Ask questions about how pricing decisions get made—understanding the process helps you plan better
  • Keep good records so you can make informed comparisons—track your actual costs and returns to evaluate opportunities objectively

The Bottom Line

The conversation my neighbor and I had reminded me that we’re all navigating similar challenges, just with different herd sizes and in different regions. Safety net programs give us some tools for managing risk. But the real work of building resilient dairy operations? That’s something we do together, one cow at a time, one decision at a time.

Whether it’s improving your dry cow management to reduce metabolic disorders, investing in better ventilation systems to improve cow comfort during hot weather, or fine-tuning your breeding program to improve longevity—those day-to-day operational decisions probably matter more for your long-term success than any policy program.

The programs provide a safety net, but operational excellence provides the path forward. In my experience, producers who focus most on controlling what they can—such as feed quality, cow comfort, reproductive performance, and financial management—tend to be the ones who not only survive market volatility but also find ways to thrive despite it.

The safety net is there when you need it. But building a farm that doesn’t need to use it very often? That’s probably the best strategy of all.

So here’s my question for you: What’s one specific change you’re making this year to improve your operation’s resilience—regardless of what safety net programs do? Drop a comment below and share what’s working on your farm. Sometimes the best insights come from hearing what our neighbors are trying.

KEY TAKEAWAYS:

  • Calculate your real coverage gap: For a 500-cow operation producing 12 million pounds, only 50% gets meaningful protection—that’s $60,000 annual exposure from just a $0.50/cwt market swing, which smart producers are offsetting through efficiency gains averaging 0.1-0.2 points in feed conversion
  • Build three-layer protection beyond programs: Wisconsin buying groups report 10-15% feed cost savings, Michigan operations sharing professional nutritionists cut consultation costs 70%, and Texas dairies investing in heat abatement see 8-12% production gains during summer stress periods
  • Focus on transition period ROI: Operations improving fresh cow management report $200-300 returns per cow through reduced metabolic issues, better peak milk (5-8 pounds higher), and improved reproductive performance—protection that works regardless of policy changes
  • Create market flexibility now: Producers maintaining relationships with 2-3 potential buyers report better component premiums (averaging $0.15-0.25/cwt advantage) and negotiating leverage, while those exploring direct sales capture 20-30% price premiums on 5-10% of production
  • Track what matters monthly: Progressive operations monitoring margin over feed costs, all-in production costs per hundredweight, and cash flow impacts from policy changes are making adjustment decisions 3-6 months faster than those using annual reviews alone

Complete references and supporting documentation are available upon request by contacting the editorial team at editor@thebullvine.com.

Learn More:

The Sunday Read Dairy Professionals Don’t Skip.

Every week, thousands of producers, breeders, and industry insiders open Bullvine Weekly for genetics insights, market shifts, and profit strategies they won’t find anywhere else. One email. Five minutes. Smarter decisions all week.

NewsSubscribe
First
Last
Consent

When Less Becomes More: The Market Window Making Stocking Density Optimization Profitable

What if the best way to increase profits isn’t adding more cows, but giving the ones you have room to be comfortable?

EXECUTIVE SUMMARY: What farmers are discovering across dairy regions is that optimal stocking density often means fewer cows, not more. University of Florida research shows that a 120% stocking density maximizes profit per stall, yet many operations run at 140% or higher, resulting in a daily loss of 3.7 pounds of milk per cow for each hour of lying time. With current market conditions creating the perfect window—USDA cull cow prices at $311.16/hundredweight and replacement costs jumping 73% to $2,850 per heifer—strategic density reduction makes financial sense like never before. Operations were reduced from 140% to 115% stocking, resulting in a 3.5-pound increase in milk per cow daily, 40% fewer lameness treatments, and improved feed efficiency within 60 days. Research from institutions like UBC, Wisconsin, and the Miner Institute consistently shows that cow comfort drives profitability more than maximizing headcount. For producers willing to challenge conventional thinking, current market dynamics offer an unprecedented opportunity to optimize both animal welfare and bottom-line performance.

dairy profit per stall

You know what’s interesting? Last month, I was talking with a producer in Ohio who mentioned something that really got me thinking. He’d increased his milk checks by reducing his herd by 120 cows. Sounds backward, right? However, as I’ve been traveling to different operations lately—from the robot barns I’ve visited in the Netherlands to traditional parlor operations across the upper Midwest—I keep hearing variations of the same story.

The old “more cows equals more profit” thinking might be costing us money. Especially right now, with market conditions creating what could be the perfect window to test some assumptions we’ve held for years. Between high cull cow prices, expensive replacement heifers, and relatively steady milk prices, it’s worth asking whether we’re actually maximizing what our barns can do.

What the Research Actually Shows About Overcrowding

The university data on this subject has been accumulating for years, and it’s quite eye-opening when you put it all together. Dr. Julie Fregonesi’s groundbreaking work at the University of British Columbia—published in the Journal of Dairy Science back in 2007—showed that cows at 100% stocking density were getting about 13 hours of lying time per day. Push that to 150%? They lose nearly two full hours of rest.

Find Your Herd’s Sweet Spot – Yield per cow is highest at 120% density. This chart proves why optimizing—not maximizing—stocking is the smart play in 2025. Are you in the profit zone, or running on lost potential?

That lost lying time translates directly to lost milk because cows can’t “catch up” on rest later—something we’ve learned the hard way in other contexts, too. The follow-up research has been consistent: farms operating above 100% density consistently struggle to hit the 12-hour lying time benchmark, while about 22% of farms at or below 100% achieve it.

You know what’s interesting? when I first heard about it from Dr. Rick Grant’s research team at the William H. Miner Agricultural Research Institute in New York was that Overcrowding can actually trigger more subacute ruminal acidosis than dietary changes alone. Cows at 142% density were spending over four hours per day below pH 5.8—nearly double the time compared to cows at 100% density, eating the exact same diet.

We are creating metabolic problems through poor space management. That’s something to consider, especially when we’re already pushing ration formulations to their limits in many operations.

Albert De Vries at the University of Florida has conducted some excellent work in quantifying the relationship between lying time and milk production. His research, presented at the Western Canadian Dairy Seminar, shows that for each hour of reduced lying time, approximately 3.7 pounds of milk are lost daily. When he runs those numbers through profit calculators, optimal stocking densities consistently fall between 100% and 120%, with returns dropping off sharply when pushed higher.

Examining this trend across various systems, the Dairyland Initiative in Wisconsin has documented similar lying time losses in both sand-bedded and mattress systems when stocking density exceeds 120%. Even with the newer precision monitoring technologies—such as rumination sensors, activity monitors, and automated health tracking—the fundamental relationship between space and comfort remains true.

Understanding Why Good Producers Still Overstock

Now, if the research is this clear, why are so many well-managed operations still running at 140% or higher utilization rates? It’s not just about missing the data—the reasons go much deeper.

First, there’s the infrastructure reality that many of us face. Most barns were designed for maximum capacity, and when you’ve invested heavily in facilities designed to house a certain number of cows, suggesting that “too many” might be counterproductive feels like questioning fundamental business decisions. That’s psychologically difficult territory.

Then there’s cash flow, which is where theory meets reality pretty quickly. Even when long-term modeling shows better returns at optimal density, culling excess cows creates an immediate revenue drop that many operations cannot absorb, regardless of the projections.

I’ve also noticed there’s peer pressure to consider. When neighboring operations are running at 140-150% density, stepping back feels risky from a community perspective. Nobody wants to appear unsuccessful or overly conservative—especially in regions where dairy farming is highly visible and competitive.

And here’s something that often comes up in many conversations: many excellent producers believe they can “manage out” the downsides of overcrowding. They believe that enhanced feeding programs, improved ventilation, or facility modifications can help overcome space constraints. This confidence in solving problems through superior management encourages them to push more animals into available stalls.

This mindset is particularly strong in high land-cost areas. Whether you’re in California’s Central Valley, Pennsylvania’s Lancaster County, or parts of the Northeast, producers feel tremendous pressure to maximize every square foot. The economics of land acquisition make expansion seem impossible, so intensification appears to be the only path forward.

Current Market Dynamics Create an Unusual Opportunity

What makes this discussion particularly timely is how market conditions have aligned to make density optimization more financially attractive than it’s been in recent memory.

Cull cow values are at levels that would have seemed impossible just a few years ago. The USDA’s September 19th Direct Cow Report showed average negotiated prices for Cutter cows at $311.16 per hundredweight dressed weight—that translates to about $1,830 per 1,200-pound cow. Compared to recent years, that’s a substantial improvement, creating a meaningful buffer for strategic culling decisions.

2025: The Year Everything Changed for Density Decisions – When cull values, heifer costs, and milk prices all peak together, old paradigms don’t work. Are you seizing this market window or letting inertia win?

Meanwhile, replacement heifer costs have reached a territory that’s frankly shocking to those of us who remember more moderate pricing. Wisconsin data from the USDA show that replacement dairy animal costs increased by 73% between October 2023 and October 2024, rising from approximately $1,990 to $ 2,850 per head. That’s an $860 increase in a single year.

Mike North from Ever.ag captured the reality pretty bluntly back in January when replacement prices were spiking: “Some animals moving in the northwest last week were north of $4,000 an animal. That’s a pretty tall price.” When replacement costs jump that dramatically, the economics of keeping marginal performers shift significantly.

As for milk prices, they’ve held their ground better than many expected despite production increases. While Class III futures remain volatile, current market stability means each additional pound of milk from enhanced cow comfort has meaningful value.

And there’s this whole beef-on-dairy opportunity that’s really taken off in recent years. Those crossbred calves are now fetching $800 to $ 1,000 per head at auction, creating revenue streams that weren’t widely available even five years ago.

This creates an interesting situation where the financial risks of density optimization are probably lower than they’ve been in years, while the potential benefits remain substantial.

Learning From Real Transitions: A Composite Example

Let me share a situation that really opened my eyes to how this plays out in practice. I’ve been following several operations through density transitions, and while I need to keep specific details confidential, the patterns are worth discussing as a composite example.

There’s a 1,200-cow freestall setup—representative of what I’ve seen in similar Wisconsin operations—that had been running at 140% stocking density. The management team spent two full seasons trying to work around the resulting problems. These weren’t inexperienced managers—they doubled feed push-ups, added extra fans, switched to higher-fiber rations. All the sophisticated approaches you’d expect from people who know what they’re doing.

Despite these efforts, their key performance indicators remained problematic. Lying time stayed stuck around 10 hours per day, well below that critical 12-hour target. Monthly lameness treatments were affecting 18% of the herd. Per-cow milk production had plateaued at 85 pounds, and mastitis cases weren’t responding to improved protocols.

In fall 2024, they made what felt like a risky decision: cull 10% of their herd—120 animals—bringing stocking density down to 115%. The selection process was entirely data-driven, utilizing their DairyComp 305 system to target animals with below-average performance, elevated somatic cell counts, poor reproductive efficiency, high lameness scores, and older cows with declining feed conversion efficiency.

The timeline of results was fascinating to watch. Lying time started improving within three weeks, initially increasing from 10 to 11.2 hours, and then reaching 12.4 hours by the end of week six. Milk yield improvements followed a similar gradual pattern, resulting in a 3.5-pound daily increase by the 60-day mark. Monthly lameness treatments fell by 40% over the same period, and bulk tank somatic cell count dropped by 50,000 cells per milliliter.

“We kept waiting for the negative impact on our milk check,” the farm manager told me during a follow-up conversation. “Instead, we were hitting volume records with 120 fewer cows. Feed efficiency improved, vet bills dropped, and the cows just looked more comfortable walking through the barn.”

What’s particularly noteworthy is that this wasn’t a high-tech operation with comprehensive monitoring systems. They were using basic activity monitors and visual assessments twice daily. The improvements were obvious to anyone walking through the facility.

Navigating the Transition Successfully

From what I’ve learned, talking with farms going through this type of transition, timing and approach matter more than most of us initially think. The biggest challenge isn’t the concept—it’s the execution.

Treating density optimization as a one-time event creates chaos. Removing 25% of your herd at once disrupts everything: you get downstream overcrowding in other groups, disrupted milking schedules, labor cost spikes, and often a panic response that undoes potential gains.

The farms that seem to navigate this transition smoothest tend to reduce density in 5% monthly increments. For a 1,200-cow operation, that means about 60 animals per month—manageable from both a systems and cash flow perspective.

The Bullvine Blueprint: From Chaos to Cash – Transform guesswork into precise, profitable action with this evidence-based process. See how incremental steps and real-time monitoring drive lasting success for modern dairies.

Start by mapping every group with your herd management software. Look at actual stocking percentages across lactating, fresh, transition, dry, and heifer pens. Target the most overcrowded groups first—usually fresh pens or peak-milk groups where stress costs are highest and most measurable.

As you cull from lactating pens, coordination becomes critical. You need to coordinate movements between groups to maintain optimal density across all pens simultaneously. I’ve seen farms reduce lactating cow density only to create problems in their dry cow areas because they forgot to rebalance the entire system.

Monitor weekly metrics religiously during transition periods. Track lying time, per-cow milk yield, somatic cell counts, and lameness treatments. If any metric stalls or reverses, pause further culling and investigate what’s happening before proceeding.

Timing considerations vary significantly by operation type. If you’re dealing with seasonal calving patterns—something we see more often now as farms explore different breeding strategies—major culling decisions might need to wait until after the fresh cow rush subsides. Summer heat stress can also complicate density assessment, since cows naturally spend less time lying during peak heat periods.

Recognizing System Differences and Global Approaches

What works for freestall operations doesn’t necessarily translate to other housing systems, and that’s worth acknowledging upfront. Tie-stall operations—still common in parts of Vermont, eastern Canada, and much of Europe—face entirely different challenges. You can’t really overstock individual stalls, but you can overstock feed alleys, holding areas, and exercise lots.

Robotic milking systems create entirely different dynamics. Since cows aren’t competing for parlor access at specific times, some operations successfully maintain higher densities. However, even in robotic systems, access to lying space and feed bunk remains a fundamental factor affecting cow comfort and production. The precision feeding capabilities of some newer robotic systems may provide more flexibility to compensate for tighter spaces, although the fundamental physiology of rest requirements remains unchanged.

What farmers are finding in grazing operations is their own set of variables to consider. Pasture-based systems can use rotational patterns to manage effective stocking density, moving cattle more frequently to maintain grass quality while providing adequate space. Some progressive grazing operations in New Zealand and Ireland have found that slightly understocking paddocks during peak growing season actually improves both grass utilization and animal performance.

Dry lot systems in the Southwest present yet another scenario. Heat stress management becomes the primary concern, and shade space often becomes the limiting factor rather than lying area. The stocking density calculations that work in climate-controlled barns need significant modification for these environments, where heat abatement infrastructure becomes as critical as resting space.

Developing Better Measurement Systems

Changing organizational thinking from headcount to performance requires different metrics and consistent communication approaches. The most successful operations I’ve worked with develop comprehensive tracking systems that focus on dollars per stall rather than just cows per stall.

This involves tracking milk revenue per stall (price × average yield), feed cost per stall (total feed expense ÷ number of stalls in use), health expense per stall (vet and treatment costs ÷ number of stalls), and comprehensive profit per stall calculations.

Weekly reporting on comfort and health indicators provides tangible evidence of improvement during transitions. Monitor average daily lying time (activity monitors make this much easier now), monthly lameness treatments per 100 cows, bulk tank somatic cell count trends, and feed conversion efficiency measures.

When you can demonstrate incremental profit from each 5% density reduction through projected milk revenue, cull cow returns, and saved health costs, the business case becomes much clearer. Most existing farm management software packages can model different scenarios before implementation. The University of Wisconsin Extension has developed some particularly useful spreadsheet tools for economic modeling of stocking density decisions. Their publication, “Getting Stocking Density Right for Your Cows,” walks through the calculations step by step.

Your extension dairy specialist or consultant can often help with this type of analysis if you’re not comfortable with the modeling yourself. Some farms have found it helpful to create visual representations showing relationships between stocking density and key performance indicators.

Industry Evolution or Competitive Advantage?

While research clearly supports optimal stocking strategies, widespread adoption remains limited. From an industry perspective, this creates interesting questions about where we’re headed.

Change happens slowly because success metrics still emphasize headcount and growth in herd size. Infrastructure designed for maximum capacity represents a 15-20 year commitment that is difficult to modify. Information transfer from research institutions to practical application takes time, and risk perception generally favors known approaches over projected improvements.

But this also means density optimization currently represents a potential competitive advantage for operations willing to challenge conventional approaches. Early adopters are achieving measurable improvements in per-animal productivity, health cost management, feed conversion efficiency, and overall profitability per unit of facility investment.

As Albert De Vries found in his economic analysis published in Dairy Herd Management, “120% was the optimal stocking rate in terms of maximum profit per stall.” The research consistently supports this, yet many well-managed operations continue to push well beyond this threshold.

I suspect we’ll see this transition happen at different rates regionally. High-cost areas with environmental restrictions on expansion will likely lead to adoption, simply because maximizing efficiency per animal becomes more critical when growth options are limited. Traditional dairy regions with more flexibility might take longer to embrace these approaches.

What’s particularly interesting is how this parallels broader trends we’re seeing in precision agriculture—such as variable-rate fertilizer application in crops, GPS-guided field operations, and sensor-based irrigation management. Whether you’re talking about optimizing inputs per unit in crops or strategic stocking density in dairy, the underlying principle is similar: better often beats bigger.

When Higher Density Makes Sense

Now, I’m not suggesting this approach works for everyone—dairy operations are too diverse for one-size-fits-all solutions. Some operations successfully maintain higher densities because of superior facility design, exceptional management systems, or specific operational circumstances.

Newer facilities with excellent stall design, generous bunk space, and comprehensive ventilation systems often handle stocking levels of 130-140% without major performance compromises. I’ve visited operations with 4-inch sand beds, 30-inch feed alleys per cow, and extensive cooling systems that maintain good lying times even at elevated densities.

Operations with exceptional feed management—precise timing, frequent push-ups, consistently well-mixed rations—can often compensate for tighter bunk space per cow. Some farms employ specialized feeding strategies or additives that enable animals to consume an adequate amount of dry matter despite reduced bunk access time.

Your nutritionist and veterinarian know your operation better than anyone, so their input on facility capabilities and management systems becomes crucial in these decisions. They can help you evaluate whether your specific situation might allow for higher stocking rates while maintaining performance.

The key is an honest assessment of your specific situation. Suppose you’re consistently achieving 12+ hours of lying time, maintaining low lameness rates, and seeing strong per-cow production at higher densities. In that case, you might have the management systems and facilities to make elevated stocking rates work profitably.

However, if you’re seeing stress indicators—such as elevated somatic cell counts, lameness problems, poor body condition scores, and reproductive challenges—it’s worth questioning whether current stocking rates are actually maximizing long-term profitability.

Practical Next Steps and Available Resources

Current market conditions create what might be an unprecedented opportunity to test density optimization approaches with relatively limited downside risk. High cull cow prices provide attractive exit values, expensive replacements make retention of marginal performers costly, and stable milk prices support per-cow productivity investments.

Start with a comprehensive assessment. Calculate current stocking density across all cow groups—your milking system software probably tracks this, but if not, it’s simply the number of cows divided by available stalls or resting spaces. Evaluate lying time through visual observation or activity monitors if available. Review health costs and per-cow performance metrics over the past 12 months.

Model financial scenarios for various density targets. Most farm management software packages include modules for this type of analysis. The University of Wisconsin Extension publication “Crowding Your Cows Too Much Costs You Cash” provides detailed economic frameworks for these decisions. Cornell’s PRO-DAIRY program offers similar resources through its extension publications.

For implementation, begin with the most overcrowded groups showing the clearest stress indicators. Plan gradual reductions rather than dramatic changes. Coordinate closely with your nutritionist and veterinarian to maximize benefits from improved cow comfort.

Some operations are finding that investing in improved stall design, enhanced bedding systems, or better ventilation provides better returns than simply adding more cows. The question becomes: what’s the best use of your next capital investment?

Consider seasonal timing as well. Spring transitions might align well with natural culling cycles, while summer heat stress periods might not be ideal for major management changes that could temporarily disrupt routine.

Questions to Ask Your Team

Before making any major changes to stocking density, it’s worth having some honest conversations with your management team:

  • Are we consistently achieving target lying times across all groups?
  • What’s our current lameness rate, and how does it compare to industry benchmarks?
  • How do our per-cow productivity metrics compare to similar operations?
  • What would happen to our cash flow if we reduced cow numbers by 10% over six months?
  • Do we have the feed management and facility infrastructure to support current density levels?
  • What are our biggest bottlenecks during peak times (breeding, fresh cow management, transition periods)?

These conversations often reveal insights that pure data analysis might miss. Your team members—whether that’s family, employees, or advisors—see things from different perspectives that can help inform these decisions.

The Broader Industry Context

Between what the research tells us and current market conditions, it’s an interesting time to be asking these fundamental questions about dairy operation design. The farms willing to question conventional assumptions about stocking density may find themselves with sustainable competitive advantages in an increasingly challenging industry environment.

From conversations with farmers and their advisors across different regions—from progressive operations in the Netherlands to family farms in Wisconsin to large-scale Western dairies—it appears that we’re gradually shifting our perspective on dairy productivity. Instead of focusing solely on total milk shipped, the most profitable operations are optimizing milk per stall, margin per cow, and return on facility investment.

The research is compelling, market conditions are supportive, and implementation tools are available. The question becomes whether individual operations are ready to challenge the “more is always better” mindset that’s influenced dairy management thinking for the past generation.

It’ll be interesting to see how this trend develops—whether it accelerates as more farms demonstrate results, or whether we see regional variations based on land costs, environmental regulations, and local farming cultures. International perspectives add another layer of complexity, as European tie-stall systems, New Zealand grazing operations, and North American confinement facilities all face different constraints and opportunities.

Either way, it’s a conversation worth having with your team, your advisors, and, honestly, with your cows. Because at the end of the day, comfortable cows are profitable cows—and sometimes that means giving them a little more room to be comfortable.

KEY TAKEAWAYS

  • Quantified comfort pays: Reducing stocking density from 140% to 115% typically increases milk production by 3.5 pounds per cow daily while cutting lameness treatments by 40% within two months—improvements that translate to measurable profit gains per stall.
  • Market timing creates opportunity: With cull cow values at historic highs ($1,830 per head) and replacement costs at $2,850, strategic culling in 5% monthly increments allows cash flow-positive transitions to optimal density levels.
  • Research-backed sweet spot: University studies consistently show 120% stocking density maximizes profit per stall, as cows lose 3.7 pounds of daily milk production for each hour of lying time below the critical 12-hour threshold.
  • System flexibility matters: While freestall operations benefit most from density optimization, robotic milking systems, grazing operations, and tie-stall facilities each require tailored approaches based on facility design and management capabilities.
  • Implementation success depends on a gradual transition: farms achieving the best results reduce density in manageable increments while rebalancing all cow groups simultaneously, using weekly metrics to track lying time, milk yield, and health indicators throughout the process.

Complete references and supporting documentation are available upon request by contacting the editorial team at editor@thebullvine.com.

Learn More:

The Sunday Read Dairy Professionals Don’t Skip.

Every week, thousands of producers, breeders, and industry insiders open Bullvine Weekly for genetics insights, market shifts, and profit strategies they won’t find anywhere else. One email. Five minutes. Smarter decisions all week.

NewsSubscribe
First
Last
Consent

When Butterfat Isn’t Enough: Adapting Your Dairy to New Market Realities

4.2% butterfat herds lost money while 3.3% protein dairies gained $47K—here’s why the math changed

EXECUTIVE SUMMARY: This fall’s butter market correction revealed a fundamental shift that’s catching producers off-guard: despite genetic advances pushing national butterfat averages above 4.2%, cheese-focused processors are prioritizing protein premiums over traditional fat bonuses. Operations tracking component optimization report capturing $40,000-$75,000 in additional annual revenue by balancing breeding programs toward protein production, with technology investments typically paying back within 2-3 years for herds above 400 cows. While 73% of U.S. milk now flows into cheese manufacturing—up from 68% just five years ago—many producers remain focused on butterfat genetics that no longer align with processor economics. Regional variations matter significantly: Southeast operations face higher bypass protein feed costs that can reduce net benefits, while Upper Midwest farms benefit from established cheese processing infrastructure offering competitive protein premiums. What farmers are discovering is that successful component strategies require understanding processor priorities, not just herd genetics. The most resilient operations develop flexible approaches that can adapt to changing market spreads between Class III and Class IV pricing.

dairy component profitability

You know those weeks when the markets do something that makes absolutely no sense until you dig deeper? Well, we had one of those this fall when butter futures took a hit that had everyone talking. And not just a little dip—we’re talking about the kind of drop that gets people’s attention real quick.

But here’s what really caught my eye, and maybe you’ve noticed something similar… Despite our herds producing some of the highest butterfat levels in decades—and the genetic advancement reports from places like Hoard’s Dairyman confirm we’re seeing unprecedented gains in component production—butter manufacturing in many regions actually declined while cheese production kept expanding.

That disconnect tells us something important about how the industry’s evolved. And honestly, it’s creating opportunities for those willing to think differently about component production.

Understanding What’s Really Happening in Processing Plants

U.S. Milk Utilization Shift demonstrates the steady move toward cheese production driving component strategy changes – the 5-percentage-point swing since 2020 represents billions of pounds redirected from butter to cheese manufacturing, fundamentally altering processor premium structures.

I recently spoke with a producer in central Wisconsin who put it this way: “The plant manager told us flat out that they’re making decisions based on contract stability, not what’s coming through the separator that week.” This builds on what I’ve been hearing across the Midwest, and what’s particularly noteworthy is how consistent this pattern seems to be.

You can see this playing out in the trade patterns. Industry reports suggest cheese exports to Mexico have been growing consistently, while butter exports haven’t kept pace despite our production advantages. From what I’m observing—and I’d be curious to hear if you’re seeing something different—processors seem to be responding to these market signals by prioritizing protein over butterfat, even when there’s plenty of cream to work with.

What’s interesting here is how this creates opportunities for those willing to adapt. What I’ve been noticing—and I wonder if this matches your experience—is that protein premiums appear to be widening while butterfat bonuses often stay relatively flat across several cooperative systems I’ve been tracking.

Making the Numbers Work: When Component Strategy Actually Makes Sense

Let me share a situation that really drives this point home. I had a conversation with a producer who asked to remain anonymous—a 650-cow operation in Wisconsin—and their experience represents what many farms are discovering. A couple of years ago, their genetic selection focused heavily on butterfat production. You know the approach: targeting sires with those high fat EBVs (Expected Breeding Values—basically the genetic prediction for how much extra fat or protein a bull’s daughters will produce), getting the herd up above 4% butterfat. Should’ve been a winner, right?

But here’s what they found… Their cooperative was offering significantly higher premiums for protein than for butterfat. Most of their milk was flowing into cheese contracts with guaranteed protein bonuses that substantially exceeded what they could earn from fat.

This aligns with broader industry data suggesting that most of our milk production is now going into cheese manufacturing—a notable increase from just a few years back. While the data is still developing on exact percentages, the trend reflects export opportunities and margin stability that butter manufacturing simply can’t match (especially with European competition limiting our butter export potential).

Now, it wasn’t all smooth sailing for them—they had their share of feed mixing mistakes and breeding errors in the first year. The learning curve was steeper than they expected. But the financial impact was significant once they got the systems working properly. By adjusting their breeding program toward more balanced component production and modifying feeding programs to support protein synthesis, they captured substantial additional premiums. We’re talking about enough money to cover genetic improvement costs and generate meaningful additional revenue.

What’s particularly encouraging is how this approach builds on traditional dairy management principles. Instead of chasing single-component extremes, it’s about optimizing the whole milk profile for current market realities.

The Investment Reality Check: Making Technology Pay

Here’s where things get practical, and this is where I think we need to be really honest about the economics. Making these adjustments isn’t just about changing breeding decisions—though that’s certainly part of it. This Wisconsin operation invested in:

  • RFID collar systems for dynamic herd grouping
  • Automated feeding equipment that can deliver different rations to different groups
  • Herd management software that tracks component yields by group

The investment typically runs into six figures for comprehensive systems, but their payback fell into that 2-3 year range that most lenders can live with. And that’s key: you need enough scale to spread those fixed costs across sufficient volume to make it pencil out.

Early indications suggest—and this matches what I’m hearing from extension folks—that component optimization investments typically make economic sense for larger herds, generally starting around 400-500 cows. Although this varies significantly based on existing infrastructure and local market conditions, which highlights an important point about regional differences.

Component Optimization ROI by Herd Size shows the 400-500 cow threshold where technology investments become economically viable – below 400 cows, payback periods stretch beyond 4 years, while operations above 600 cows achieve sub-3-year returns that most lenders can support.

For operations below that threshold, the recommendation I keep hearing is to focus on cooperative programs and selective nutrition adjustments rather than major technology investments. As one specialist explained to me, you can often capture most of the component benefits through precision feeding without the big capital outlay.

It’s worth noting that some of the most successful implementations I’ve seen started small—maybe just separating first-lactation heifers from mature cows, then gradually adding complexity as management systems improved.

Regional Realities: Why Geography Still Matters More Than Ever

This is where I think we need to be careful about painting with too broad a brush. What works in Wisconsin doesn’t necessarily translate elsewhere, and recent conversations with producers across different regions have really driven this home.

Take the Southeast, where summers routinely hit the mid-90s with high humidity. Heat stress naturally depresses butterfat production, making protein premiums more attractive—but feed costs for bypass protein sources run notably higher than in the Upper Midwest. I recently spoke with a Georgia producer who found the economics to be completely different from what he had read about Wisconsin operations.

Regional Component Premium Comparison reveals why geography matters more than genetics in today’s dairy markets – Upper Midwest protein premiums exceed butterfat bonuses by 140%, while Southeast operations face compressed margins that challenge component optimization economics

Here’s what I’ve observed across different regions:

In Wisconsin, Minnesota, and Iowa, you’ve got established cheese processing infrastructure that creates competitive protein premiums. Cooperative payment structures often favor milk testing above certain protein thresholds—and those bonuses can be quite attractive when you hit them consistently.

Down in Georgia, Florida, and the Carolinas, heat stress challenges butterfat production, but local processors serving regional cheese markets still offer protein incentives. However, higher feed costs for bypass protein sources can reduce the net benefits. One North Carolina producer told me, “The math works, but barely.”

In the western United States, specifically in California, Arizona, and New Mexico, large-scale operations benefit from economies of scale in component tracking technology; however, water costs and heat management present distinct challenges for optimization. I haven’t spent as much time talking with Western producers, but the conversations I’ve had suggest they’re dealing with challenges the rest of us don’t fully appreciate.

Up in Vermont, New York, and Pennsylvania, seasonal variation is more pronounced. Winter component production often exceeds summer levels by several tenths of a percent for both fat and protein—partly because of cooler temperatures, but also because fresh cow management tends to be easier when you’re not dealing with heat stress. Something you need to factor into any optimization strategy.

Pacific Northwest operations face their own unique challenges with seasonal pasture systems and proximity to export facilities, which could alter the entire optimization equation. The proximity to Asian export markets may create different premium structures than those seen in other regions.

What’s becoming clear to me is that successful component strategies need to match regional processing infrastructure, not just herd genetics.

Financial Risk Management: Beyond Basic Marketing

What’s emerged alongside component optimization is a different approach to financial risk management—and this is where things get interesting. Dairy Revenue Protection has seen growing adoption across the country, with industry estimates suggesting increasing participation rates, but successful operations aren’t just buying coverage.

They’re integrating it with component-specific strategies. When cheese-focused markets strengthen relative to butter markets, these operations adjust their approach accordingly. They might maintain different strategies for different production focuses, increasing cheese-related protection when protein premiums widen, or adjusting toward butter-related positions when those premiums improve.

This requires more management sophistication than traditional marketing, and I’m still trying to figure out if it’s truly necessary for everyone or just certain types of operations. What’s your experience been with financial risk management complexity?

I’ve noticed that the farms handling this complexity best are treating it like any other management system—they’ve got protocols, regular review schedules, and clear decision criteria rather than making it up as they go along.

When Technology Strategies Fall Short

Not every attempt at component optimization succeeds, and I think it’s important to talk honestly about what can go wrong. Here’s a representative example that really opened my eyes—an Illinois operation with around 480 cows that invested heavily in similar technology upgrades.

Within several months, they’d shut down the component tracking systems and returned to single-group management. The complexity overwhelmed their labor situation. Feed mixing errors, breeding mistakes, and constant system troubleshooting. The theoretical benefits never materialized because they couldn’t execute consistently on a day-to-day basis.

That said, they did learn some valuable lessons about their operation’s limitations, and they’ve actually improved their basic component tracking through simpler nutrition adjustments. Sometimes knowing what doesn’t work for your situation is just as valuable.

This highlights something I see repeatedly: operational excellence still trumps sophisticated strategies that are poorly executed. That operation now focuses on cost control and traditional efficiency measures, which have proven more reliable given their management situation.

I should mention that there are plenty of successful producers who think this whole component optimization trend is overcomplicating things. One farmer I know in Iowa puts it this way: “I’d rather be really good at the basics than mediocre at advanced strategies.” And honestly, he’s got a point—his cost per hundredweight is consistently lower than many high-tech operations.

The common failure points in component optimization usually come down to execution issues that most of us can relate to:

  • Feed mixing precision becomes critical when different groups require different rations, which necessitates attention to detail that some operations simply can’t maintain consistently during busy seasons like planting or harvest.
  • Managing multiple genetic lines increases the chance of breeding errors that can take years to correct—and we all know how expensive those mistakes can be.
  • Technology dependence means system failures during critical periods can disrupt months of planning. And we’ve all had those equipment failures at the worst possible times.
  • Staff turnover necessitates ongoing retraining on more complex protocols, which can become expensive and frustrating.

What I’ve learned is that the most successful implementations have built-in simplicity and backup systems from day one.

Alternative Pathways That Work Just Fine

Component optimization isn’t the only way to respond to changing market dynamics, and maybe that’s the most important point of this whole discussion. Several successful operations pursue different strategies that might be more suitable for farms facing management or capital constraints.

Value-added production offers one interesting path. Organic certification and quality standards that exceed commodity requirements can generate premiums that reward operational excellence rather than component manipulation. This approach is particularly attractive for farms that prefer focusing on traditional management skills—and there’s nothing wrong with that approach.

Specialty markets present another option worth considering. I know operations supplying artisan cheese makers or local processors that capture premiums based on quality and consistency rather than specific component levels. These relationships require different skills—such as reliability, flexibility, and direct communication with manufacturers—but can generate comparable returns without significant technology investments.

Many cooperatives now offer pooled services that allow smaller farms to access sophisticated strategies without individual infrastructure investments. Professional support for component tracking and risk management can be more cost-effective than going it alone, especially if you’re not at that 400-500 cow threshold.

Direct marketing continues to work well for farms in the right locations. Farm stores, on-farm processing, agritourism—these approaches can generate premiums that dwarf any component optimization program, though they require completely different skill sets.

The Technology Risks Nobody Discusses

One aspect that often receives insufficient attention is what happens when systems fail. I heard about cybersecurity issues this past spring that affected feed management software, leaving farms unable to access their protocols for days. Most recovered quickly, but operations running complex component programs faced more significant disruptions.

The lesson learned—and this came up in several conversations—was maintaining backup systems for everything. Technology enables precision, but you need redundancy when precision matters. Paper copies of feeding recipes, breeding schedules, and group assignments. It adds administrative overhead but provides essential backup when systems go down.

Cybersecurity concerns are growing as farms connect more systems to internet-based platforms. Agriculture has seen an increase in security incidents, and dairy operations with financial programs can present attractive targets for malicious actors. This is something we all need to consider as we integrate connected systems.

There’s also the question of what happens when technology companies go out of business or discontinue support. I’ve seen farms stuck with orphaned software systems that cost thousands to replace.

The Global Economic Picture

Looking beyond individual farm decisions—and this is where I find the whole situation fascinating—this component focus reflects broader changes in global dairy trade. European milk production has seen some decline, while New Zealand production has remained relatively flat despite generally favorable conditions.

That’s created export opportunities for U.S. cheese that don’t exist for butter, where European producers maintain competitive advantages in premium markets. Industry reports suggest U.S. cheese exports have grown significantly compared to butter exports, and these global patterns are what’s really driving domestic processing decisions.

Growing middle-class populations in Southeast Asia are driving cheese consumption in markets that previously relied primarily on traditional dairy products. This creates long-term export demand that supports protein-focused processing strategies, thereby enhancing the sustainability of these strategies. However, I’m genuinely curious about whether this component focus will remain long-term or if we’ll see the pendulum swing back toward simpler approaches as the market evolves.

The development that really has me thinking is how currency fluctuations affect these export patterns. When the dollar strengthens, our export competitiveness changes, which could shift processor priorities again.

Seasonal Patterns Most Producers Miss

Here’s something I’ve noticed from years of watching component production, and maybe you’ve observed the same thing… Seasonal variation in optimization returns is more significant than most producers realize.

Many producers observe that winter months often favor butterfat premiums as holiday demand increases, while spring and summer frequently see stronger protein premiums as cheese manufacturing ramps up for fall and winter consumption. Current conditions suggest this pattern is holding, though regional variations seem more pronounced this year.

Some operations adjust feeding programs seasonally to capture these patterns—shifting toward higher-fat rations in fall, then transitioning to protein-focused feeding by late winter. This seasonal flexibility requires more management attention but can add meaningful revenue to component premiums—though it also adds another layer of complexity that not every operation can handle.

The seasonal aspect becomes particularly important for farms using financial strategies. Price spreads show patterns that experienced farms can often anticipate and position for, though recent market volatility has made traditional patterns less reliable.

What’s interesting is how the seasonal patterns seem to be getting more pronounced as export markets become more important to domestic pricing.

Key Questions Every Producer Should Ask

Before diving into component optimization, here are the questions I’d recommend asking yourself:

  • Can your current management team handle increased complexity? Be honest about attention to detail during busy seasons like planting or harvest, when dairy tasks might get less focus.
  • What’s your cooperative’s actual payment structure? Don’t assume—get the specific thresholds and premiums in writing and calculate the real potential benefits for your current production levels.
  • Do you have backup systems in place for your technology dependence? Paper records, alternative feeding protocols, and manual sorting systems for when (not if) technology fails.
  • What’s your real payback timeline tolerance? Six-figure investments with 2-3 year paybacks sound reasonable until cash flow gets tight during a downturn.
  • How does this fit your long-term farm goals? Component optimization might not align with succession planning, debt reduction, or quality-of-life objectives.

Practical Steps for Different Farm Situations

For producers considering component optimization—and this might not apply to your situation, but here’s what I’ve learned from both successful and unsuccessful attempts:

  • If you’re running 500 or more cows, start with data analysis. Review a couple of years of component tests and cooperative payments to identify what opportunities you might be missing. Many farms discover significant premiums they didn’t even realize were available. Technology infrastructure investments typically make sense at this scale, though the learning curve can be steeper than expected.
  • For mid-size operations, focus on cooperative programs and precision nutrition rather than major technology investments. Most cooperatives offer component assistance that provides much of the benefits without the capital requirements. Consider sharing costs with neighboring farms if that’s feasible—I’ve seen some interesting collaborative arrangements that spread technology costs across multiple operations.
  • Smaller operations should first evaluate value-added opportunities and specialty markets. Fixed technology costs often make traditional approaches more profitable at a smaller scale. However, selective breeding changes that favor balanced component production rarely harm and usually provide modest improvements over time.
  • Regardless of size, honestly assess your management capacity. The most sophisticated strategy fails without consistent execution—and I’ve learned this the hard way. Component optimization requires attention to detail that not all operations can maintain, and that’s perfectly fine. Focusing on operational excellence often provides better returns than poorly executed advanced strategies.

The Bottom Line

The market disruptions we saw this fall exposed how much the industry has changed beneath the surface. Genetic advances—documented in publications like Hoard’s Dairyman’s coverage of unprecedented gains in milk components—have created component abundance that many farms haven’t learned to capture yet.

Processing strategies now prioritize export stability over domestic price volatility. Financial tools exist that weren’t available to previous generations. But you know what? The fundamental principles haven’t changed.

Animal care, feed quality, labor management, and cost control—these remain essential. Component optimization and financial sophistication are additional tools, not replacements for solid farming practices. This builds on what we’ve always known: good farming fundamentals matter more than any technology or market strategy.

The operations that are thriving understand this balance. They’re not trying to become trading companies that happen to milk cows. They’re dairy farms that have added market intelligence and appropriate technology to their skill sets—and they’re doing it in ways that fit their particular situations.

Looking ahead, I expect we’ll see continued evolution in how farms approach component production and risk management. The producers who master this integration—combining solid farming with market awareness and appropriate technology—are positioning themselves well regardless of where cycles head next.

The choice isn’t between traditional farming and technological sophistication. It’s about finding the right combination for your operation, your markets, and your management style. What happened in the butter markets taught us that change will continue. The question is whether individual farms will adapt in ways that make sense for their particular circumstances.

And honestly? That’s what makes this business interesting. There’s no single right answer—just different approaches that work for different situations, different management styles, different markets. The key is understanding what’s changing and figuring out how to respond in ways that fit your operation and keep you sustainable for the long haul.

I’d love to hear if your experience has been different, or if you’re seeing patterns in your region that don’t match what I’ve described here. That’s how we all keep learning in this business.

KEY TAKEAWAYS

  • Component optimization investments typically generate $120-$180 additional revenue per cow annually for operations above 500 cows, with comprehensive RFID and automated feeding systems paying back in 2-3 years through enhanced protein premium capture
  • Herds targeting balanced component profiles (3.25%+ protein alongside 4.0%+ fat) consistently outperform single-component strategies by 15-25% in cooperative premium payments, particularly in regions with established cheese processing infrastructure
  • The 400-500 cow threshold represents the economic break-even point for component tracking technology, while smaller operations can capture 60-70% of optimization benefits through precision nutrition and cooperative pooled services without major capital investment
  • Regional processing economics vary dramatically—Upper Midwest protein premiums often exceed butterfat bonuses by 7-10 cents per pound, while Southeast operations face higher feed costs that can reduce net component optimization benefits by 30-40%
  • Seasonal component management strategies can add $15,000-$20,000 annually through tactical feeding program adjustments that capture winter butterfat premiums and spring-summer protein bonuses, requiring enhanced management attention but minimal additional infrastructure investment

Complete references and supporting documentation are available upon request by contacting the editorial team at editor@thebullvine.com.

Learn More:

The Sunday Read Dairy Professionals Don’t Skip.

Every week, thousands of producers, breeders, and industry insiders open Bullvine Weekly for genetics insights, market shifts, and profit strategies they won’t find anywhere else. One email. Five minutes. Smarter decisions all week.

NewsSubscribe
First
Last
Consent

The Day 200+ Irish Farmers Finally Said, “Screw This” and Stormed Their Own Co-op

200+ Irish farmers stormed their own co-op HQ over 5c/L price cuts— is your co-op’s next?

EXECUTIVE SUMMARY: Here’s what we discovered: When 200+ Irish farmers stormed their own Dairygold cooperative headquarters on September 18th, they exposed the biggest lie in modern agriculture—that farmer-owned cooperatives actually serve farmers. The math is brutal: Dairygold farmers lose €2,290 monthly compared to Carbery suppliers getting 50c/L versus their 45c/L rate, while management operates four inefficient processing sites against competitors’ single streamlined facilities. This isn’t isolated to Ireland—the 1922 Capper-Volstead Act grants antitrust immunity to cooperatives regardless of performance, creating legal frameworks that protect management from farmer accountability while enabling systematic value extraction. Dairygold’s own 2024 annual report shows that 1.38 billion liters were processed (down 2.1%) across its scattered facilities, proving that operational incompetence costs farmers serious money monthly. The concerned shareholders demanding “one man, one vote” representation aren’t radicals—they’re the last line of defense against corporate-style exploitation wearing cooperative clothes. Every dairy farmer needs to calculate exactly what their cooperative’s underperformance costs them monthly, because this revolution is spreading fast.

KEY TAKEAWAYS

  • Calculate your monthly losses now: Compare your co-op’s milk price with every regional processor, multiply by your volume—Irish farmers discovered they were losing €2,290 monthly to competitors paying 5c/L more
  • Document everything that doesn’t add up: Board decisions celebrating corporate metrics while farmers lose money, strategic initiatives benefiting the organization while hammering member returns, and emergency concerns getting shuffled to “strategic reviews” weeks later
  • Build relationships outside official channels: Coffee shop conversations and social media groups where you can share real competitive data—management counts on farmers staying isolated and accepting whatever explanations they’re given
  • Demand transparent competitive benchmarking: Monthly price comparisons with every regional alternative, processing costs broken down by facility, and management compensation tied to farmer-relevant metrics—not corporate-speak about “commercial sensitivity”
  • Start exploring alternative marketing options: Even if you can’t switch immediately, having real options changes the entire power dynamic with cooperative management who depend on farmer loyalty and switching costs to avoid accountability
dairy cooperative accountability, milk price volatility, dairy farm profitability, Capper-Volstead Act, dairy co-op management

Look, I don’t usually get fired up about stuff happening across the Atlantic, but this story just grabbed me and wouldn’t let go.

September 18th. Over 200 Irish farmers literally stormed their own cooperative’s headquarters in Mitchelstown. Not some faceless corporation screwing them over. Their own damn co-op. The organization they supposedly “owned.”

And when I started digging deeper into what pushed these farmers to that breaking point… well, hell, I couldn’t sleep right for days.

Because what happened at Dairygold? It’s basically a masterclass in how cooperatives can systematically rob farmers while claiming to protect them.

These farmers were getting hammered on milk price every month, while their board knew full well that competitors were paying way more. And management’s brilliant response to 200+ pissed-off farmers showing up at their door?

Schedule a meeting. Five weeks later.

The Math That’ll Make Your Stomach Turn

Farm Volume (Liters/Year)Monthly VolumeLoss per LiterMonthly Loss (€)Annual Loss (€)
300,00025,000€0.05€1,250€15,000
550,00045,833€0.05€2,292€27,500
800,00066,667€0.05€3,333€40,000
1,200,000100,000€0.05€5,000€60,000

Okay, so I’ve been looking at dairy financials for… what, twenty-something years now? And these numbers just floored me.

Dairygold dropped their August milk price to 45 cents per liter after a brutal 3-cent cut. Meanwhile, Carbery’s paying 50 cents per liter. Kerry’s at 47.5.

That’s a 5-cent difference between Dairygold and Carbery. Five cents!

Now, I won’t pretend to have exact Irish farm census data sitting in front of me, but any producer knows what a 5-cent differential does to your bottom line when you’re moving serious volume. Think about it—that’s the difference between making your loan payment or calling the banker for an extension. Between fixing that TMR mixer that’s been acting up since spring or nursing it through another season.

For what? For being a loyal member of your own cooperative.

The Efficiency Disaster That Explains Everything

Here’s where it gets really maddening, and honestly, this quote from Nigel Sweetnam—one of the farmers leading this whole revolt—it just says everything about what’s wrong with Dairygold’s operation.

During those September protests, he laid it out crystal clear: “Carbery have four co-ops supplying milk to one site, whereas we have one co-op supplying milk to four sites—think of all the duplication of resources and inefficiencies.”

Think about that for a second. Four processing sites. Dairygold’s runs milk through Mitchelstown, Mallow, Mogeely, plus their other facilities, while their competitor takes milk from four different cooperatives and runs it all through one streamlined operation.

And what does Dairygold management call this operational nightmare? “Professional oversight.” “Strategic diversification.”

Their own 2024 annual report shows they’re processing 1.38 billion liters annually—down 2.1% from the previous year. So, the volume’s declining, costs are scattered across all these different sites, and farmers are getting hammered on price… but at least the organizational chart looks impressive.

You know what strikes me about this whole thing? It’s like watching a train wreck in slow motion, except the passengers are the ones paying for the tickets.

The 1922 Legal Framework That Enables This Whole Scam

Now this is where most people’s eyes start glazing over because who wants to hear about century-old federal law? But stick with me, because this is the key to understanding how cooperatives can get away with this.

The Capper-Volstead Act from 1922 basically gives agricultural cooperatives a get-out-of-jail-free card on antitrust laws. They can coordinate pricing, control regional markets, eliminate competition—stuff that would land any other business in federal court.

Back then, the idea made sense. Help small farmers compete against the big corporate processors. But here’s the thing nobody talks about: those antitrust exemptions apply whether the cooperative actually serves farmers or not.

No performance benchmarks. No accountability requirements. Nothing.

So you end up with situations like Dairygold paying farmers 5 cents less per liter while maintaining regional market control. And farmers? They’re stuck because switching processors means new equipment, renegotiating contracts, changing your whole operation…

It’s like if your bank could charge whatever interest rate they wanted because they called themselves “member-owned” and you couldn’t practically switch without moving to another state.

The Board Game Where Management Always Wins

You know what really gets me about this mess? The governance theater.

These Irish farmers demanding “one man, one vote” representation… that shouldn’t be revolutionary. That should be basic democracy. But Dairygold’s got these committee structures and membership requirements that basically lock most farmers out of any real say.

The concerned shareholders who organized this initiative have been documenting problems for months, and they’ve shown exactly how management presents boards with these so-called “strategic options” that are, in reality, just different flavors of the same corporate thinking.

When you’ve got farmers losing serious money and the board’s response is to schedule a meeting five weeks out… well, that tells you everything about who’s actually running the show.

And you know what happens when farmers bring up operational problems? Fresh cow issues become “market volatility.” Butterfat’s tanking? “Global supply dynamics.” Dry lot turns into a swamp because management didn’t maintain the drainage properly? Act of God, nothing they could’ve done about it.

Makes you wonder—when did we start accepting explanations that would get a farm manager fired?

Warning Signs Every Producer Should Watch For

The red flags are pretty obvious once you know what to look for.

Management constantly explaining away competitive disadvantage with vague market talk? When your co-op’s consistently paying less than what other processors offer and board meetings are all about “global market dynamics” instead of fixing operational problems… that’s trouble brewing.

Emergency concerns getting shuffled off to committees and “strategic reviews”? When you’re bleeding money and management’s response is scheduling discussions for weeks later—that’s damage control, not governance.

Can you actually get real competitive data from your co-op? Not cherry-picked statistics that make management look good, but honest comparisons with every other processor in your area. Cost breakdowns by facility. Management compensation tied to metrics that actually matter to your bottom line.

If your cooperative starts throwing around phrases like “commercial sensitivity” when you ask for transparency… well, that’s basically management telling you they don’t work for you anymore.

And here’s something I’ve noticed—cooperatives that are really serving farmers don’t mind talking about their competitive position. It’s the ones getting their asses kicked that suddenly get all secretive about “proprietary information.”

What You Can Actually Do About It

This whole situation is depressing as hell, but those Irish farmers proved something important—when farmers organize and apply real pressure, even the most insulated management has to pay attention.

First thing? Figure out exactly what your cooperative’s underperformance is costing you. Get real numbers. Compare your milk price with every other processor in your area, factor in your actual volume, and calculate what management decisions are costing your operation every month.

Then start talking to other members outside the official cooperative channels. Coffee shop conversations, social media groups, whatever works in your area. Management counts on farmers staying isolated and just accepting whatever explanation they’re given.

Document everything. Board decisions that don’t make financial sense. Annual reports that celebrate corporate metrics while farmers lose money. Strategic initiatives that somehow benefit the organization while hammering member returns.

And honestly? Start building relationships with alternative marketing options. Even if you can’t switch right away, having real options changes the whole power dynamic.

Don’t just take my word for it—look at what these Irish farmers accomplished. They went from being ignored by their own board to having management scrambling to schedule emergency meetings. That’s the power of organized farmer pressure.

The Revolution’s Already Started

Those 200+ Irish farmers who showed up at Dairygold’s headquarters figured out what every dairy producer needs to understand eventually.

Cooperative management depends on farmer loyalty, switching costs, and legal complexity to avoid accountability. They’ll use all the right language about farmer solidarity while systematically extracting value from the very farmers they claim to serve.

But here’s the thing about information… it spreads now. Social media, direct price comparisons, organized farmer pressure—the information monopoly that made this whole system possible is breaking down fast.

The only question is whether you’ll figure it out before your monthly milk check starts getting hammered by people who claim they’re protecting your interests.

Because if Irish farmers can organize 200+ people to storm their own headquarters over pricing that doesn’t make sense… what’s stopping you from demanding real accountability from your own cooperative?

And look, I’ll be honest with you—this trend makes me wonder how many other cooperatives are running the same scam, just more quietly. How many farmers are getting systematically underpaid while their boards celebrate “operational excellence” and “strategic positioning”?

We’ll keep digging into these cooperative governance issues because somebody’s got to tell farmers the truth when their own organizations won’t.

Complete references and supporting documentation are available upon request by contacting the editorial team at editor@thebullvine.com.

Learn More:

The Sunday Read Dairy Professionals Don’t Skip.

Every week, thousands of producers, breeders, and industry insiders open Bullvine Weekly for genetics insights, market shifts, and profit strategies they won’t find anywhere else. One email. Five minutes. Smarter decisions all week.
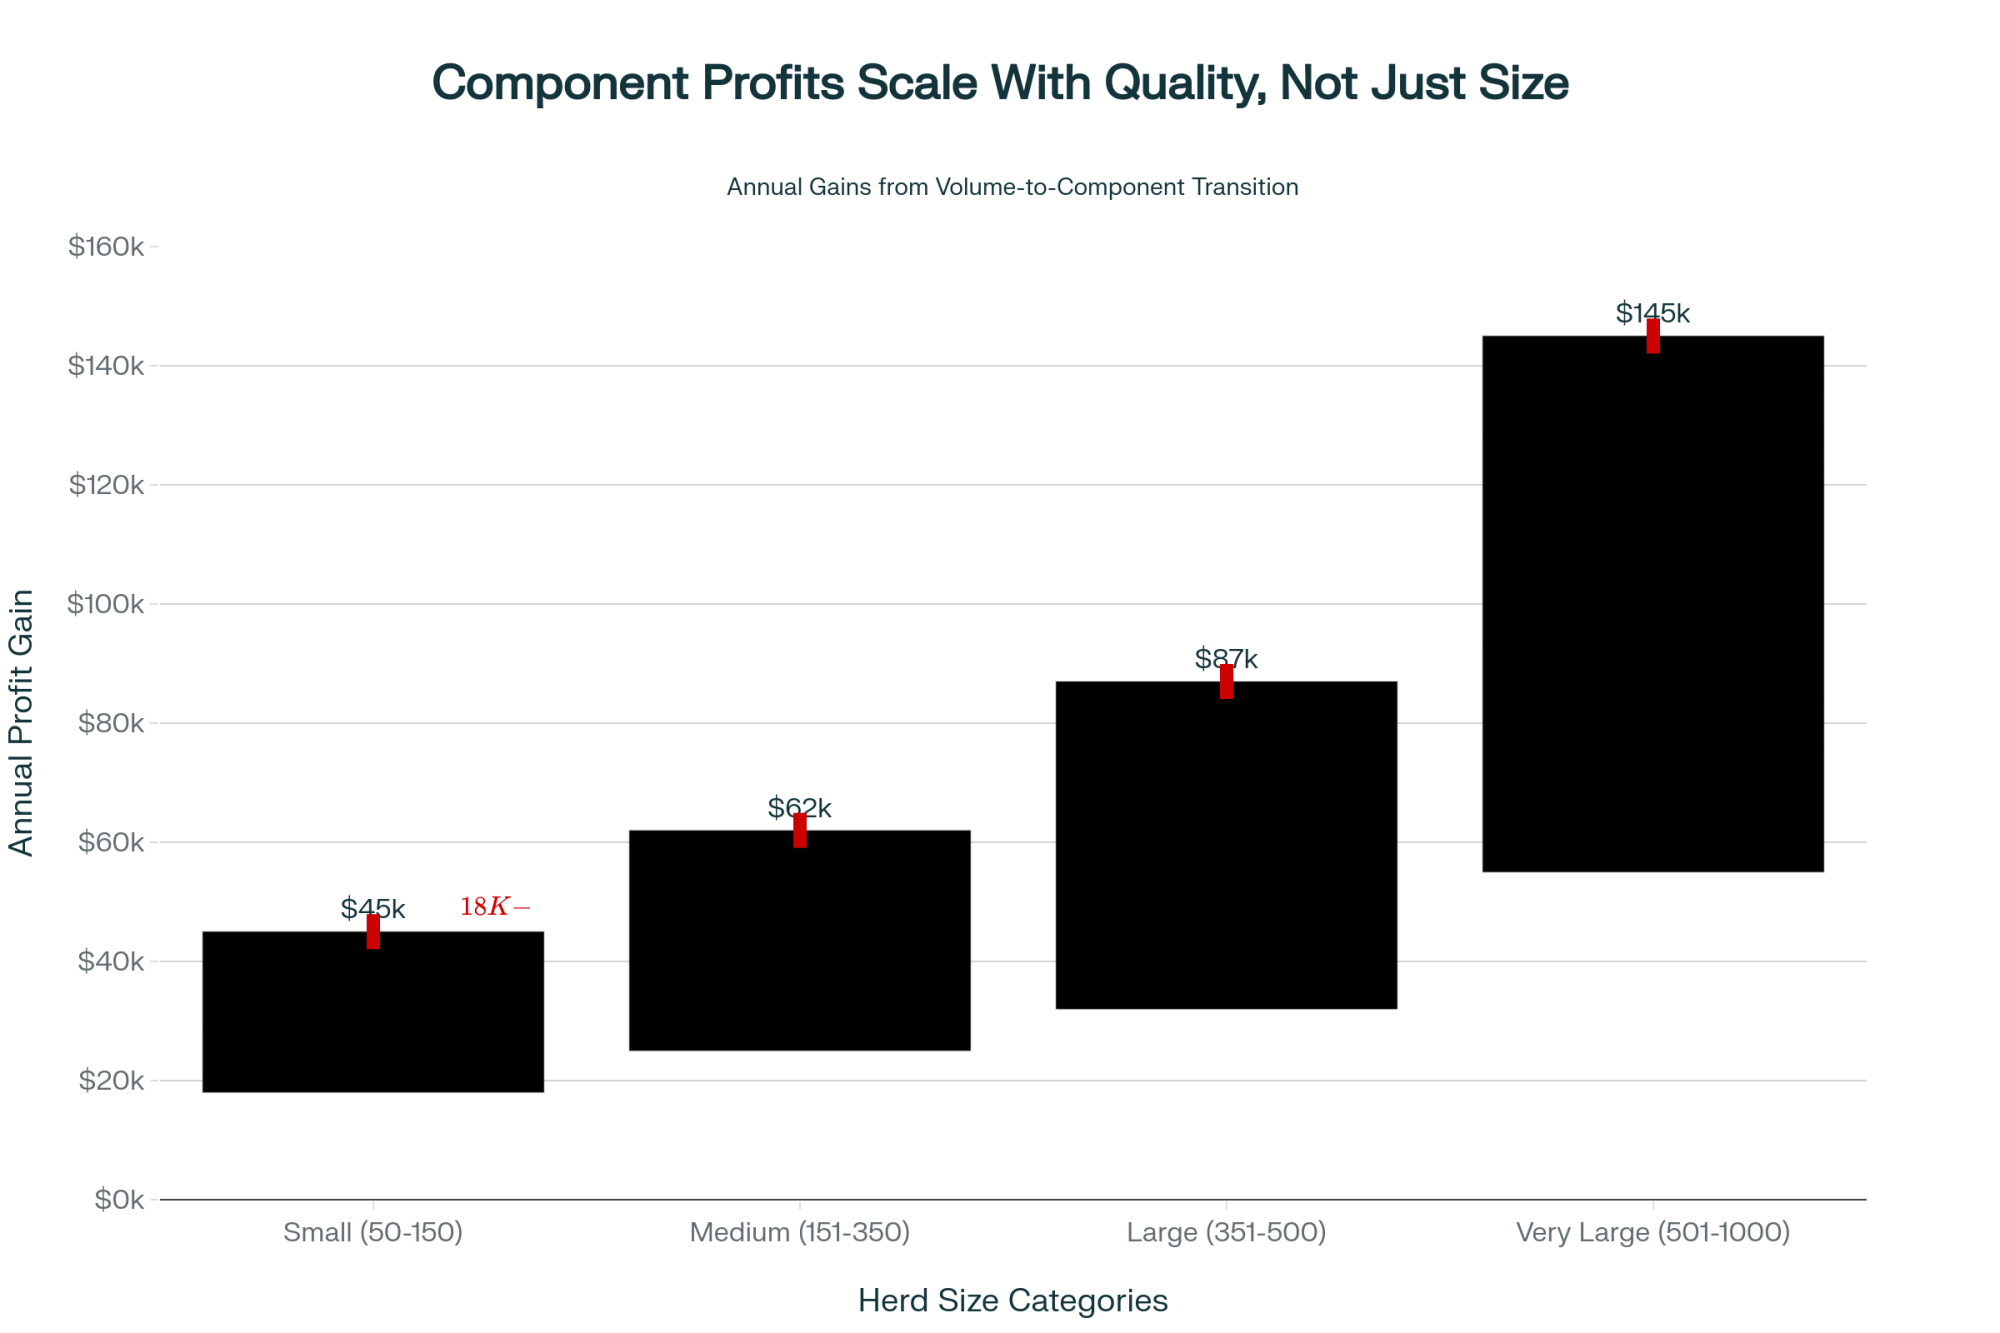
NewsSubscribe
First
Last
Consent

EXPOSED: The $29.2 Billion Dairy Empire That Just Bought Your Future – How Lactalis Executed the Most Dangerous Corporate Power Grab in Agricultural History While Everyone Celebrated

$29.2B dairy empire bought your breeding future while you celebrated – 384 court violations expose the scam

EXECUTIVE SUMMARY: While dairy farmers celebrated Fonterra’s NZ$3.845 billion sale as good news, French billionaire Emmanuel Besnier executed the most sophisticated agricultural power grab in modern history. Here’s what we discovered: Lactalis didn’t just buy processing plants—they bought control over genetic data from the world’s most advanced herds, positioning themselves to manipulate which genetics get promoted industry-wide. Australian courts documented 384 systematic contract violations designed to silence farmer criticism and eliminate market alternatives, yet regulators approved giving this company even more power. The brutal math shows operations over 2,000 cows now produce milk $10 cheaper per hundredweight than family farms, while we’ve lost 15,221 dairy operations in just five years—eight farms closing every single day. Genetic evaluation systems now prioritize processor efficiency over farm profitability, meaning you’re unknowingly breeding cattle that benefit their margins, not yours. This consolidation represents a fundamental shift from farming as an independent business to corporate employment disguised as “partnerships.” The window for collective resistance is closing faster than most producers realize—and that’s exactly what they’re counting on.

KEY TAKEAWAYS:

  • Contract Audit Defense: Pull every processor agreement from the last five years and document non-disparagement clauses, data ownership provisions, and unilateral termination rights that eliminate your bargaining power—this becomes your legal evidence file when exploitation escalates
  • Genetic Data Protection: Maintain independent production records using software you control, export all historical data from processor-connected systems before access gets restricted, and work with multiple AI organizations to prevent single-supplier dependency that hands breeding control to your milk buyer
  • Buyer Diversification Strategy: Build a quarterly-updated matrix of every processor within hauling distance, including contract terms, quality premiums, and genetic data policies—never become dependent on single-processor relationships that trap you in exploitative arrangements
  • Value-Added Premium Capture: Corporate consolidation creates direct-sale opportunities, but requires a realistic assessment of barriers, including FDA compliance, customer relationship building, and marketing skill development, which most traditional producers lack
  • Collective Action Timeline: Individual defense strategies buy time and negotiating position, but agriculture’s survival as an independent enterprise depends on producer-owned processing infrastructure and independent genetic evaluation systems being built faster than corporate consolidation eliminates alternatives
dairy farm profitability, milk pricing, dairy farm consolidation, genetic data ownership, dairy industry trends

You know, I’ve been covering consolidation for over three decades, and this Lactalis-Fonterra deal…man, it keeps me up nights thinking about what just happened.

While farmers were celebrating that NZ$3.845 billion changing hands—and trust me, it sounded real good when you first heard it—French billionaire Emmanuel Besnier just pulled off the most sophisticated agricultural land grab I’ve witnessed in my career. Most producers? They still don’t realize what they lost.

This isn’t consolidation anymore. It’s genetic colonialism, plain and simple.

The $29.2 Billion Shadow Empire Controlling Your Breeding Decisions

Through the Fonterra acquisition, one French billionaire now controls processing and distribution across the world’s fastest-growing dairy markets.

Emmanuel Besnier. Ever heard of him?

Course not. That’s exactly how he wants it.

Forbes lists this guy at $29.2 billion—can you even wrap your head around that number? Operates Lactalis, pulling in over $30 billion annually according to their financial reports, while maintaining almost zero public presence. I’ve never seen him speak at World Dairy Expo. Never seen him shake hands at any trade show I’ve covered in thirty years. Just pure, calculated market control from behind the scenes.

The Fonterra acquisition gives one French family control over sixteen manufacturing facilities stretching from Queensland clear to Saudi Arabia, plus twenty-seven third-party relationships across Southeast Asia. But what really gets me isn’t the processing capacity.

It’s the genetic data they just bought.

When you’re processing milk from genetically advanced herds—and New Zealand’s got some of the best genetics on the planet, no question about that—you’re not just buying cheese brands. You’re buying the performance validation that determines which genetics get promoted industry-wide.

Every inline milk meter reading. Every component test. Every milking duration measurement.

They’re literally using your cows’ data to control your breeding choices. And most guys don’t even realize it’s happening.

The Contract Manipulation That Australian Courts Actually Documented

Violation CategoryNumber of BreachesImpact on FarmersCourt Finding
Public Denigration Clauses156Silenced criticism“Chilling effect”
Unilateral Termination Rights98Eliminated negotiating power“Offending combination”
Exclusive Supply Penalties87Forced dependencyMarket manipulation
Data Ownership Violations43Lost genetic controlSystematic exploitation

You want to know how these corporate giants really operate? I spent days digging through Australian Federal Court records from 2023…and what I found made my stomach turn.

Lactalis paid AU$950,000 in penalties for 384 separate breaches of their Dairy Code. But that’s not even the scary part. The scary part is what those court documents reveal about systematic farmer exploitation disguised as—well, as legal business practices.

They inserted these “public denigration” clauses into milk supply agreements. Basically, does it mean you criticize them publicly? They can terminate your contract. Just like that.

But here’s the real kicker—they gave themselves unilateral termination rights based on their own interpretation of what constituted criticism. ACCC Commissioner Liza Carver found these contracts created “a chilling effect on farmers…such that they did not speak up when they otherwise might have done so.”

Industrial-scale farmer silencing. Dressed up as contract law.

Each of those 384 violations? Individual farm operations locked into what the court called “an offending combination of clauses.” Contracts specifically designed to eliminate farmer market alternatives while maintaining the fiction of competitive choice.

Their dairy regulations require processors to offer both exclusive and non-exclusive supply options. Sounds fair, right?

Dead wrong.

Lactalis offered non-exclusive deals with such severe price penalties that farmers couldn’t economically accept them. Legal manipulation that eliminates choice while looking totally legitimate on paper.

The Genetic Data Trap Most Guys Miss Completely

Corporate consolidators don’t win by being better farmers. They win by controlling the definition of efficiency itself. And that…that keeps me up at night.

Take the new Milking Speed genetic evaluation that CDCB launched this year. Every milking duration measurement from your inline meters flows through dairy records processing directly to industry databases. When processors control the majority of this performance data, they know which genetics work best in their systems…not necessarily yours.

Bulls get promoted based on daughters that milk fast in processor-controlled validation systems, even if those same genetics require higher feed costs or reduce reproductive performance. Your fresh cows might be cycling poorly during breeding season—and don’t even get me started on what happens to your SCC when you push these high-speed milkers too hard through the parlor—but if they milk out quickly for the processor? That bull’s getting promoted.

This time of year, when guys are making breeding decisions for their fall fresh cows, how many are choosing bulls based on genetic indexes that prioritize processor efficiency over their own butterfat numbers? Over their own management system?

We’re breeding for processing efficiency instead of farm profitability. Without even realizing it.

The Regulatory Breakdown That Made This Corporate Heist Legal

The Australian Competition and Consumer Commission’s July approval reveals either breathtaking incompetence or…well, let’s just say questionable decision-making. I read through their analysis, and it’s disturbing how thoroughly they missed the point.

Their reasoning? “Fonterra and Lactalis have differing end product mixes” with “only limited overlap between operations.”

This completely misses how modern market power actually works. It’s not about buying your direct competitors—that’s old-school monopoly thinking from the 1980s. Today’s corporate giants achieve control by acquiring complementary infrastructure.

Sound familiar? Same exact logic that let Tyson dominate poultry by buying “different” parts of the supply chain—feed mills, processing plants, distribution networks. Next thing you know, chicken farmers became contract growers on their own land.

But here’s the real smoking gun…the same ACCC that documented Lactalis’ systematic farmer exploitation through 384 contract violations somehow concluded that giving this company more market power posed no competitive concerns.

That ain’t regulatory oversight.

The Farmer Organization Silence That Reveals Financial Capture

Why aren’t farmer advocacy groups screaming bloody murder about this consolidation? Well…

Organizations consistently prioritize “working with processors” over challenging consolidation when you examine their actual policy positions. And honestly, it feels like our own organizations have been turned into corporate PR departments while farmers weren’t paying attention.

When your advocacy groups spend more time talking to processors than to producers…something’s fundamentally broken in the system.

The Brutal Math: What’s Actually Happening to American Dairy

The relentless elimination of family dairy farms shows no sign of slowing—with more than 8 operations closing every single day, the consolidation crisis has eliminated over 15,000 farms in just five years.

Let me lay out some numbers from the USDA’s 2022 Census of Agriculture that’ll make your head spin. When I’m doing my fall review each year, I always dig into the latest data…and it gets more depressing every single time.

We lost 15,221 dairy farms between 2017 and 2022. That’s more than eight farms closing every single day for five straight years.

Eight farms. Every day. Think about that during morning milking.

But here’s the part that should really get your attention…while farms were disappearing, total milk production actually increased. Fewer farms producing more milk means somebody figured out how to make this work on a massive scale while everyone else got eliminated.

According to the Census data, we lost dairy farms of every size except those milking 2,500 cows or more. Those mega-dairies? They’re the only ones that increased in number, and now they control significant portions of U.S. milk production despite being a tiny fraction of total farms.

The economics are brutal when you break it down. Dr. Mark Stephenson at UW-Madison—a guy who really knows his numbers—has calculated that operations milking more than 2,000 cows operate about $10 less per hundredweight than farms with 100 to 199 cows. In 2022, that meant total production costs of around $23 versus $33 per hundredweight.

The $10 per hundredweight cost advantage that mega-dairies hold over family farms translates to millions in competitive advantage—mathematical proof that the playing field isn’t level anymore.

Ten bucks doesn’t sound like much…until you multiply it across millions of pounds annually. That’s the difference between profit and bankruptcy when milk prices are tanking and feed costs are through the roof.

The Three-Tier System That’s Already Here

The transformation is complete—mega-dairies now control nearly two-thirds of American milk production, proving consolidation isn’t coming, it’s already here.

While everyone’s arguing about whether consolidation is good or bad, it’s already happened. We’re living in a three-tier agricultural system right now—and most farmers don’t even recognize it.

The Mega-Dairies

Operations with 1,000+ cows now control 65% of the nation’s dairy herd, according to Dairy Herd Management’s analysis of USDA data. Algorithms, not farm families, make production decisions. The “farm manager” is basically running a factory that happens to have cows in it.

Contract Production Units

This is where most mid-sized operations are headed, and honestly, it scares me more than the mega-dairies. It’s the poultry model applied to dairy. Farmers invest millions in corporate-specified infrastructure while corporations control genetics, feed protocols, marketing…everything that actually matters.

The National Family Farm Coalition documented that 98% of broiler chickens are now raised under production contracts between processors and farmers. Same exact model’s being applied to dairy right now.

Niche Survival Operations

Small farms serving premium markets that corporate systems can’t efficiently access. They’re constantly one market disruption away from closure because the economics don’t add up at a small scale unless you’re capturing serious premiums through direct marketing. And that requires a whole different skill set than milking cows.

The Asia-Pacific Growth Being Captured for Corporate Shareholders

Industry publications love talking about massive Asia-Pacific dairy market growth. Sounds great for farmers, right?

Wrong again.

Lactalis just positioned itself to capture this growth for shareholders rather than distribute benefits across farming communities. This acquisition gives them control over distribution networks in Malaysia, Indonesia, Sri Lanka, and Saudi Arabia—markets experiencing significant growth in dairy consumption, according to industry analysis.

For independent producers, this means systematically reduced buyer competition throughout these growing markets. When one company controls that much distribution infrastructure, they don’t need to fix prices. They just coordinate supply chain behavior in ways that favor their margins over your farm gate prices.

Talk to any producer who’s tried to export…it’s already getting tougher to find buyers who aren’t somehow connected to these big players.

What Your Individual Defense Strategy Can’t Actually Fix

I’m gonna give you concrete defensive tactics in a minute. But let’s be brutally honest about something…individual resistance can’t stop what we’re witnessing here.

These mega-dairies have every advantage in the book. Economies of scale, they own the plants AND the trucks, they’ve got feed contracts most family operations can only dream about. How’s a 500-cow family operation supposed to compete when feed costs are brutal, and milk prices are bouncing around like a pinball?

The math just doesn’t work anymore.

Too many guys are still thinking they can out-manage their way out of this mess. But you can’t manage your way out of systematic market power imbalances. Just can’t do it.

Your Last-Ditch Defense Playbook – Though It Feels Like Bringing a Knife to a Gunfight

First thing you gotta do…audit every contract

Pull every agreement you’ve signed in the last five years. Document every clause that gives your processor unilateral power. Look specifically for:

  • Non-disparagement language restricting your ability to discuss processor practices publicly
  • Minimum volume requirements that consume most of your production capacity
  • Data ownership provisions giving processors rights to your genetic information
  • Unilateral termination clauses based on the processor’s “opinion” rather than actual violations

More paperwork, I know. But this becomes your legal evidence file when things go sideways—and they will.

Next thing…diversify your buyer relationships

Call every processor within reasonable hauling distance. Don’t just ask about current capacity—ask about contract terms, quality premiums, and genetic data policies. Build yourself a matrix with contact information and logistics. Update this quarterly.

Never, ever become dependent on single-processor relationships again. That’s exactly how they get you locked in.

Value-added opportunities exist, but be realistic about it

Corporate consolidation does create some premium opportunities for direct sales, but you gotta be realistic about the barriers. When butterfat’s tanking and Class III prices are bouncing around, some producers have found success with specialty marketing through cooperatives or direct sales.

But if you’re in traditional dairy country where every restaurant’s already locked into major distribution contracts…and farmstead cheese? Sure, if you’ve got an extra couple hundred thousand lying around for a processing facility, years to navigate FDA requirements, and the marketing skills to build customer relationships from scratch.

Most guys don’t have that luxury.

Protect your genetic data like it’s gold

Maintain independent production records using software you control, not processor-connected systems. Export all historical data from their platforms before access gets restricted. Work with multiple AI organizations to avoid single-supplier dependency.

When processors control genetic validation data, they control which genetics get promoted industry-wide. Your breeding program should optimize for your profitability and your management system, not their processing efficiency.

Political engagement—though I’m not optimistic anymore

Submit public comments on every agricultural consolidation in your region. Contact state legislators about processor contract regulation. This isn’t a civic duty—this is economic self-defense at this point.

Your voice in policy processes becomes your only competitive protection when market forces are stacked against you.

Though honestly…I’m not sure the political process moves fast enough to matter anymore. By the time regulations catch up, the consolidation’s already done and dusted.

The Bottom Line: Individual Strategies Have Real Limits

Individual defense strategies buy you time and negotiating position. But agriculture’s survival as an independent enterprise? That depends on collective alternatives being built, and built fast.

Independent genetic evaluation systems that maintain separation from processor control become critical infrastructure. Alternative financial networks supporting farm-level viability give producers options when traditional lenders prioritize corporate-backed operations.

But I’ll be straight with you…building these alternatives takes time, capital, and coordination that’s getting harder and harder to achieve as consolidation accelerates.

The French billionaire who just bought Asia-Pacific dairy infrastructure? He’s betting that farmers won’t organize effective resistance before corporate systems achieve control, which becomes really, really hard to reverse.

Your individual survival depends on defensive strategies implemented immediately. Agriculture’s future as an independent business depends on whether enough farmers recognize what’s happening and act collectively while there’s still time.

The transformation from farming to corporate employment—well, in my view, that’s happening by design, not natural law. What’s designed by humans can be redesigned by humans—if they act before it gets too late.

But the window’s getting smaller every day. And that French billionaire? He’s counting on most farmers not noticing until it’s already closed and locked.

You bet he is.

Complete references and supporting documentation are available upon request by contacting the editorial team at editor@thebullvine.com.

Learn More:

The Sunday Read Dairy Professionals Don’t Skip.

Every week, thousands of producers, breeders, and industry insiders open Bullvine Weekly for genetics insights, market shifts, and profit strategies they won’t find anywhere else. One email. Five minutes. Smarter decisions all week.

NewsSubscribe
First
Last
Consent
Send this to a friend