Archive for dairy profitability – Page 2

$8.2B Exports, $2,500 Heifers: Why Your Milk Check Is Stuck – and the Beef‑on‑Dairy and Genetics Decisions You Can’t Duck in 2026

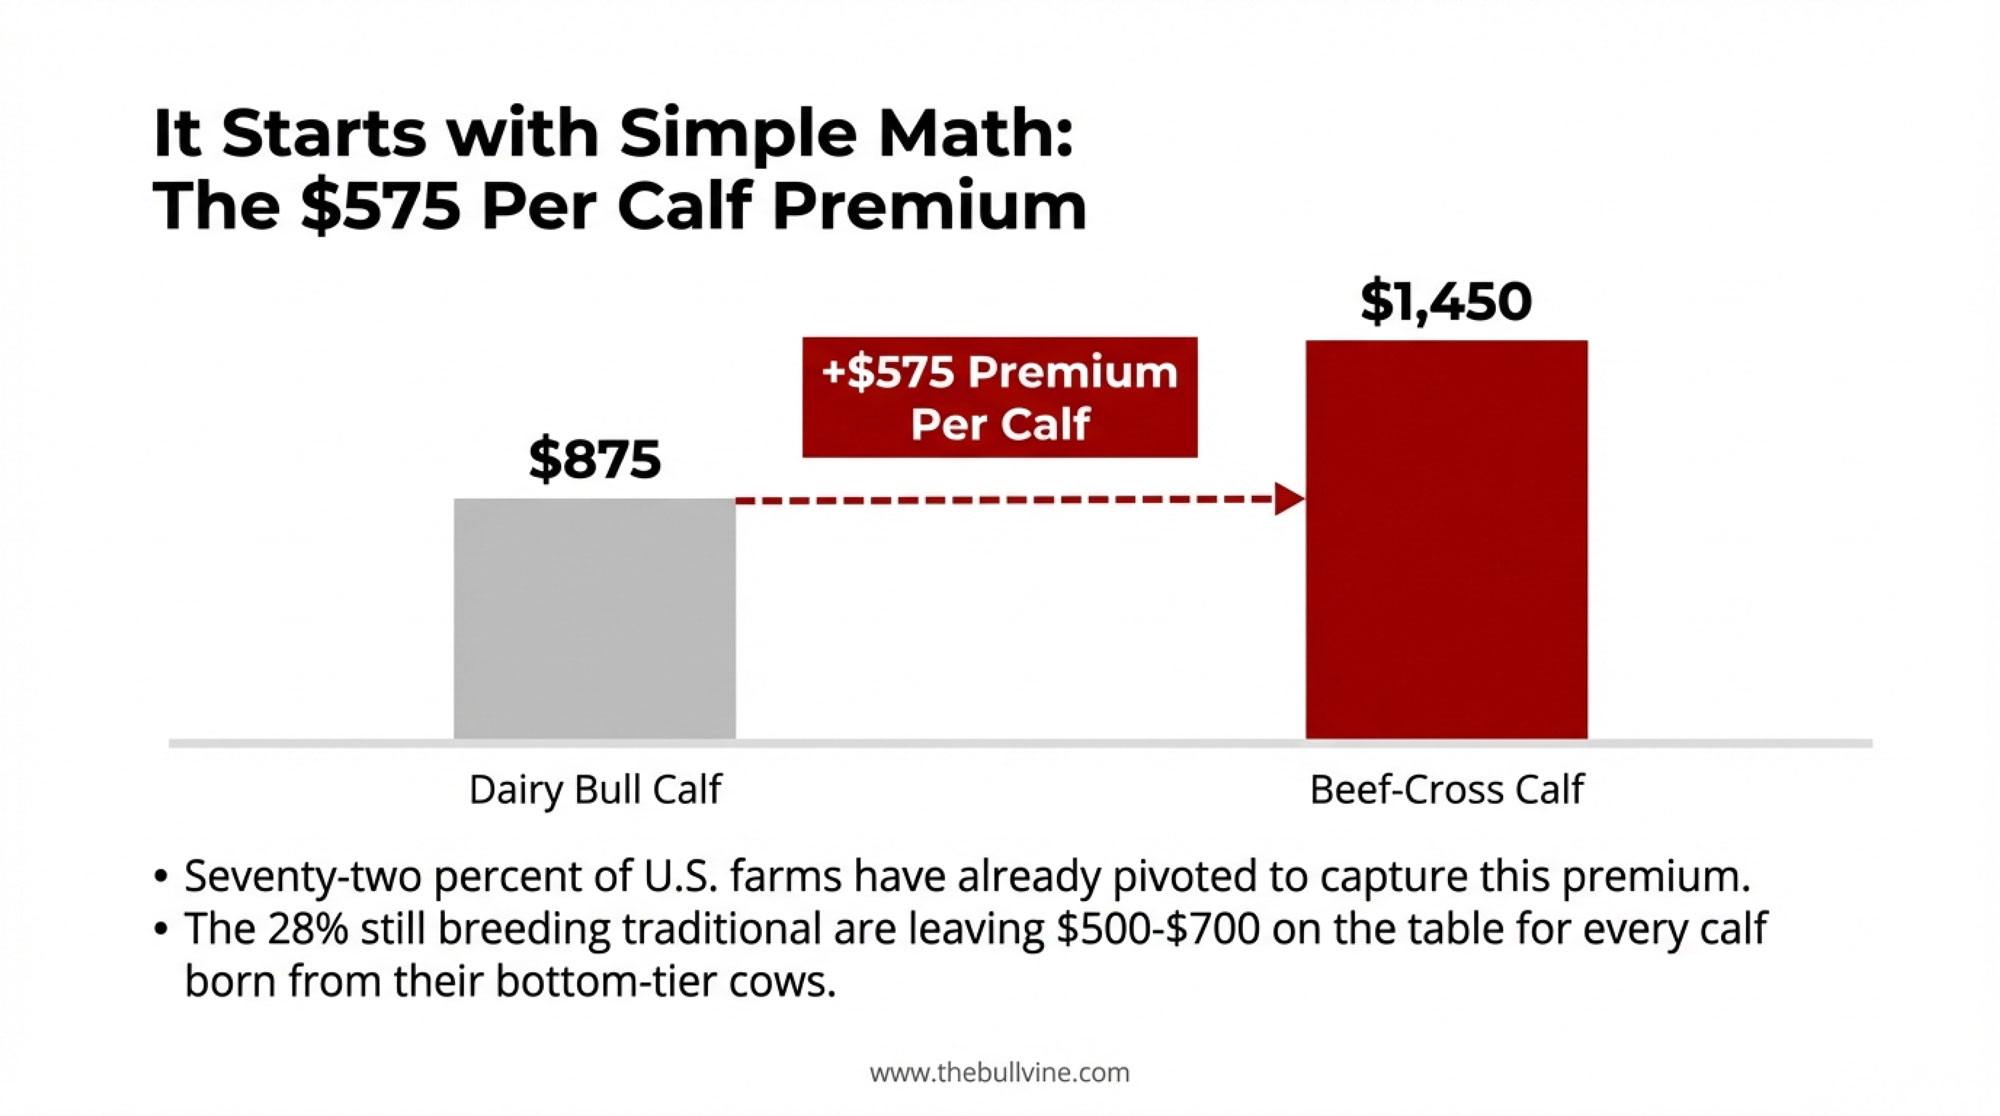
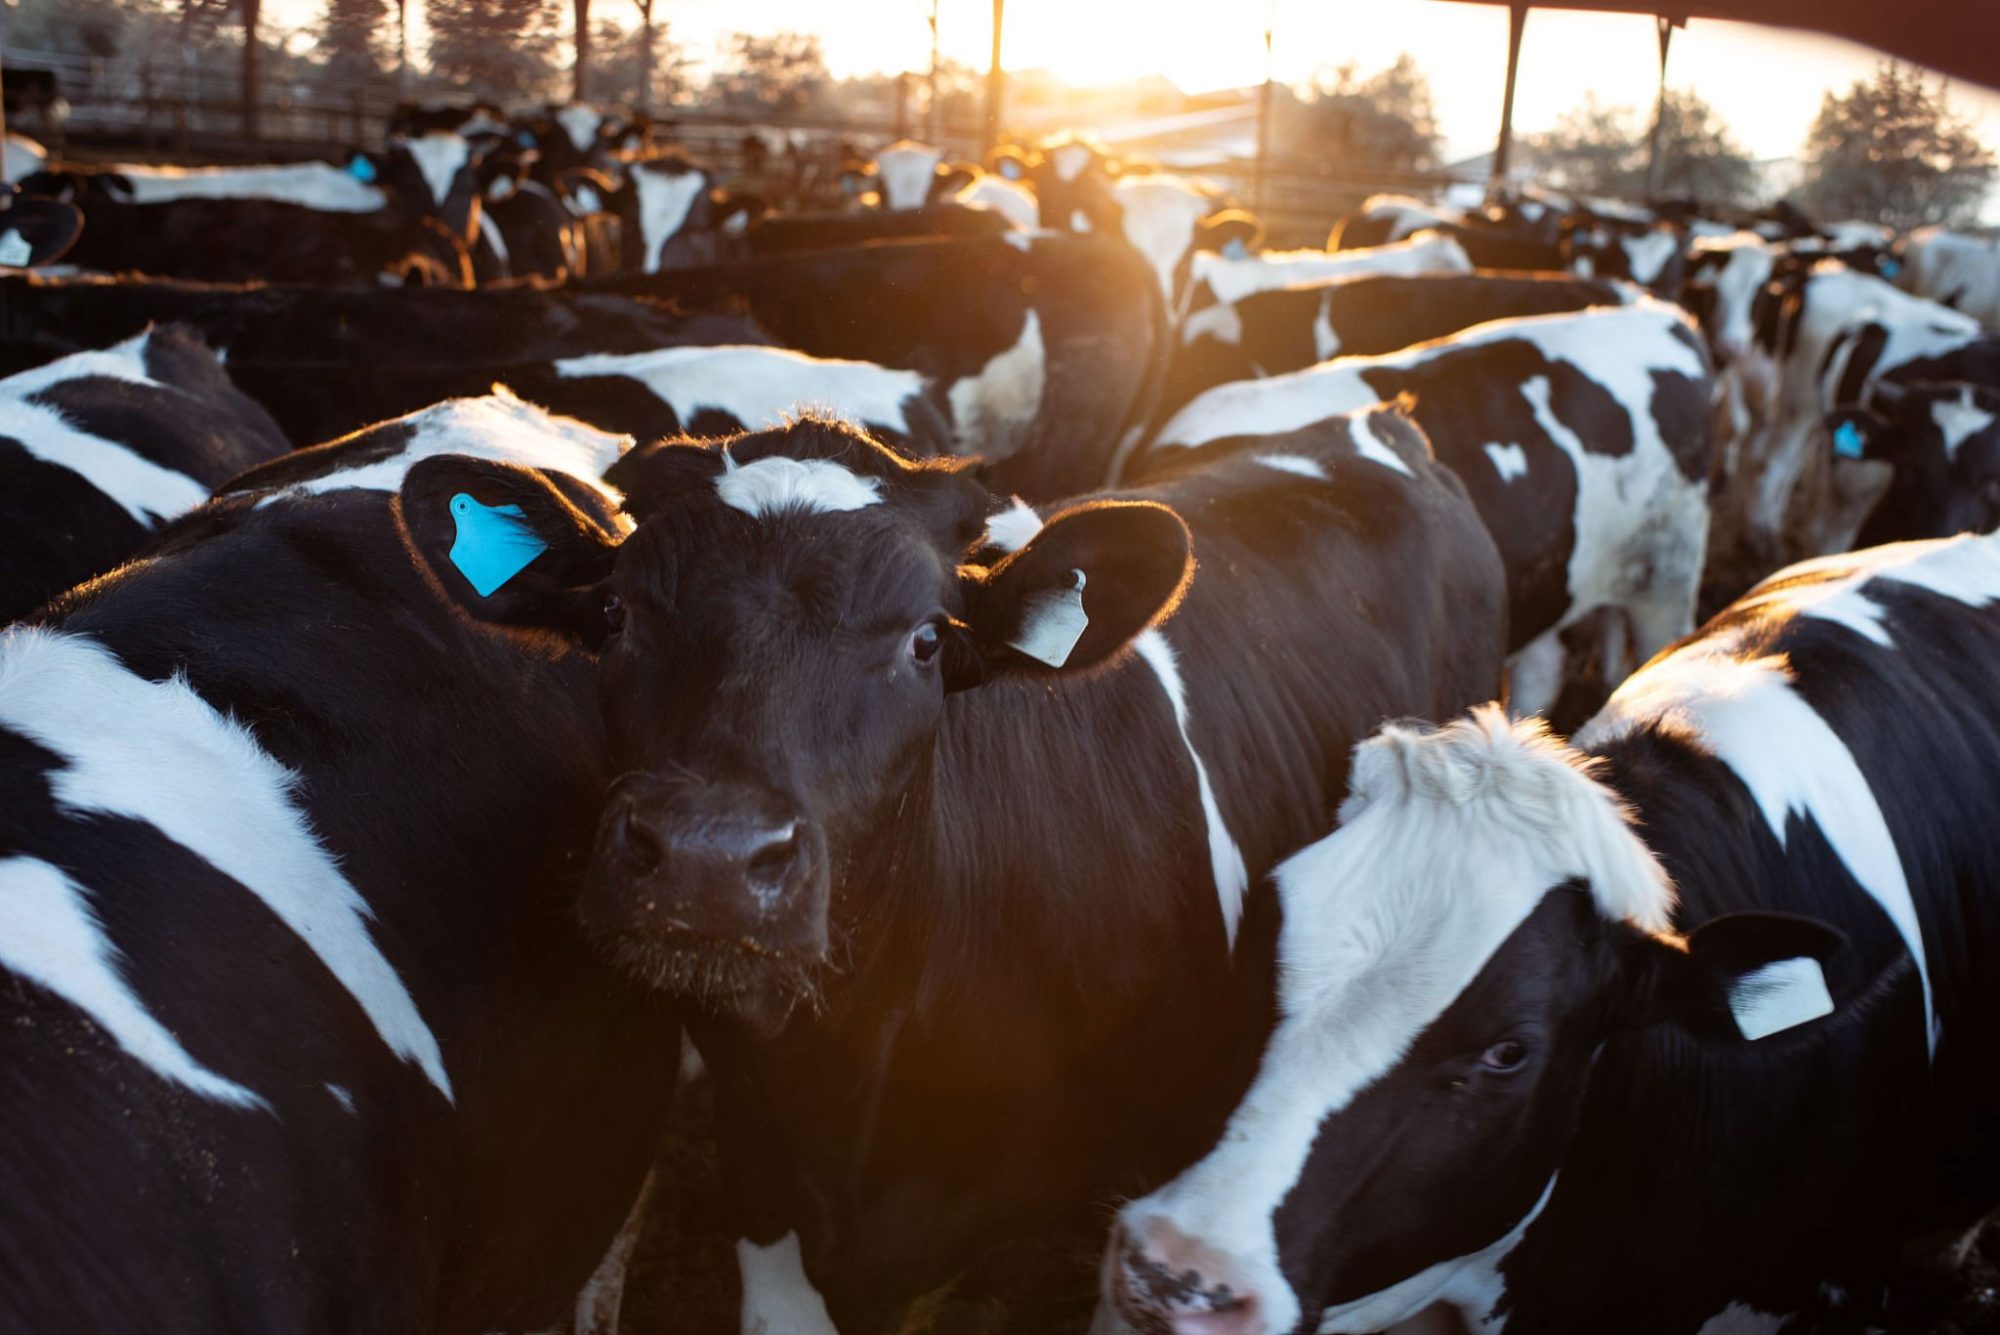
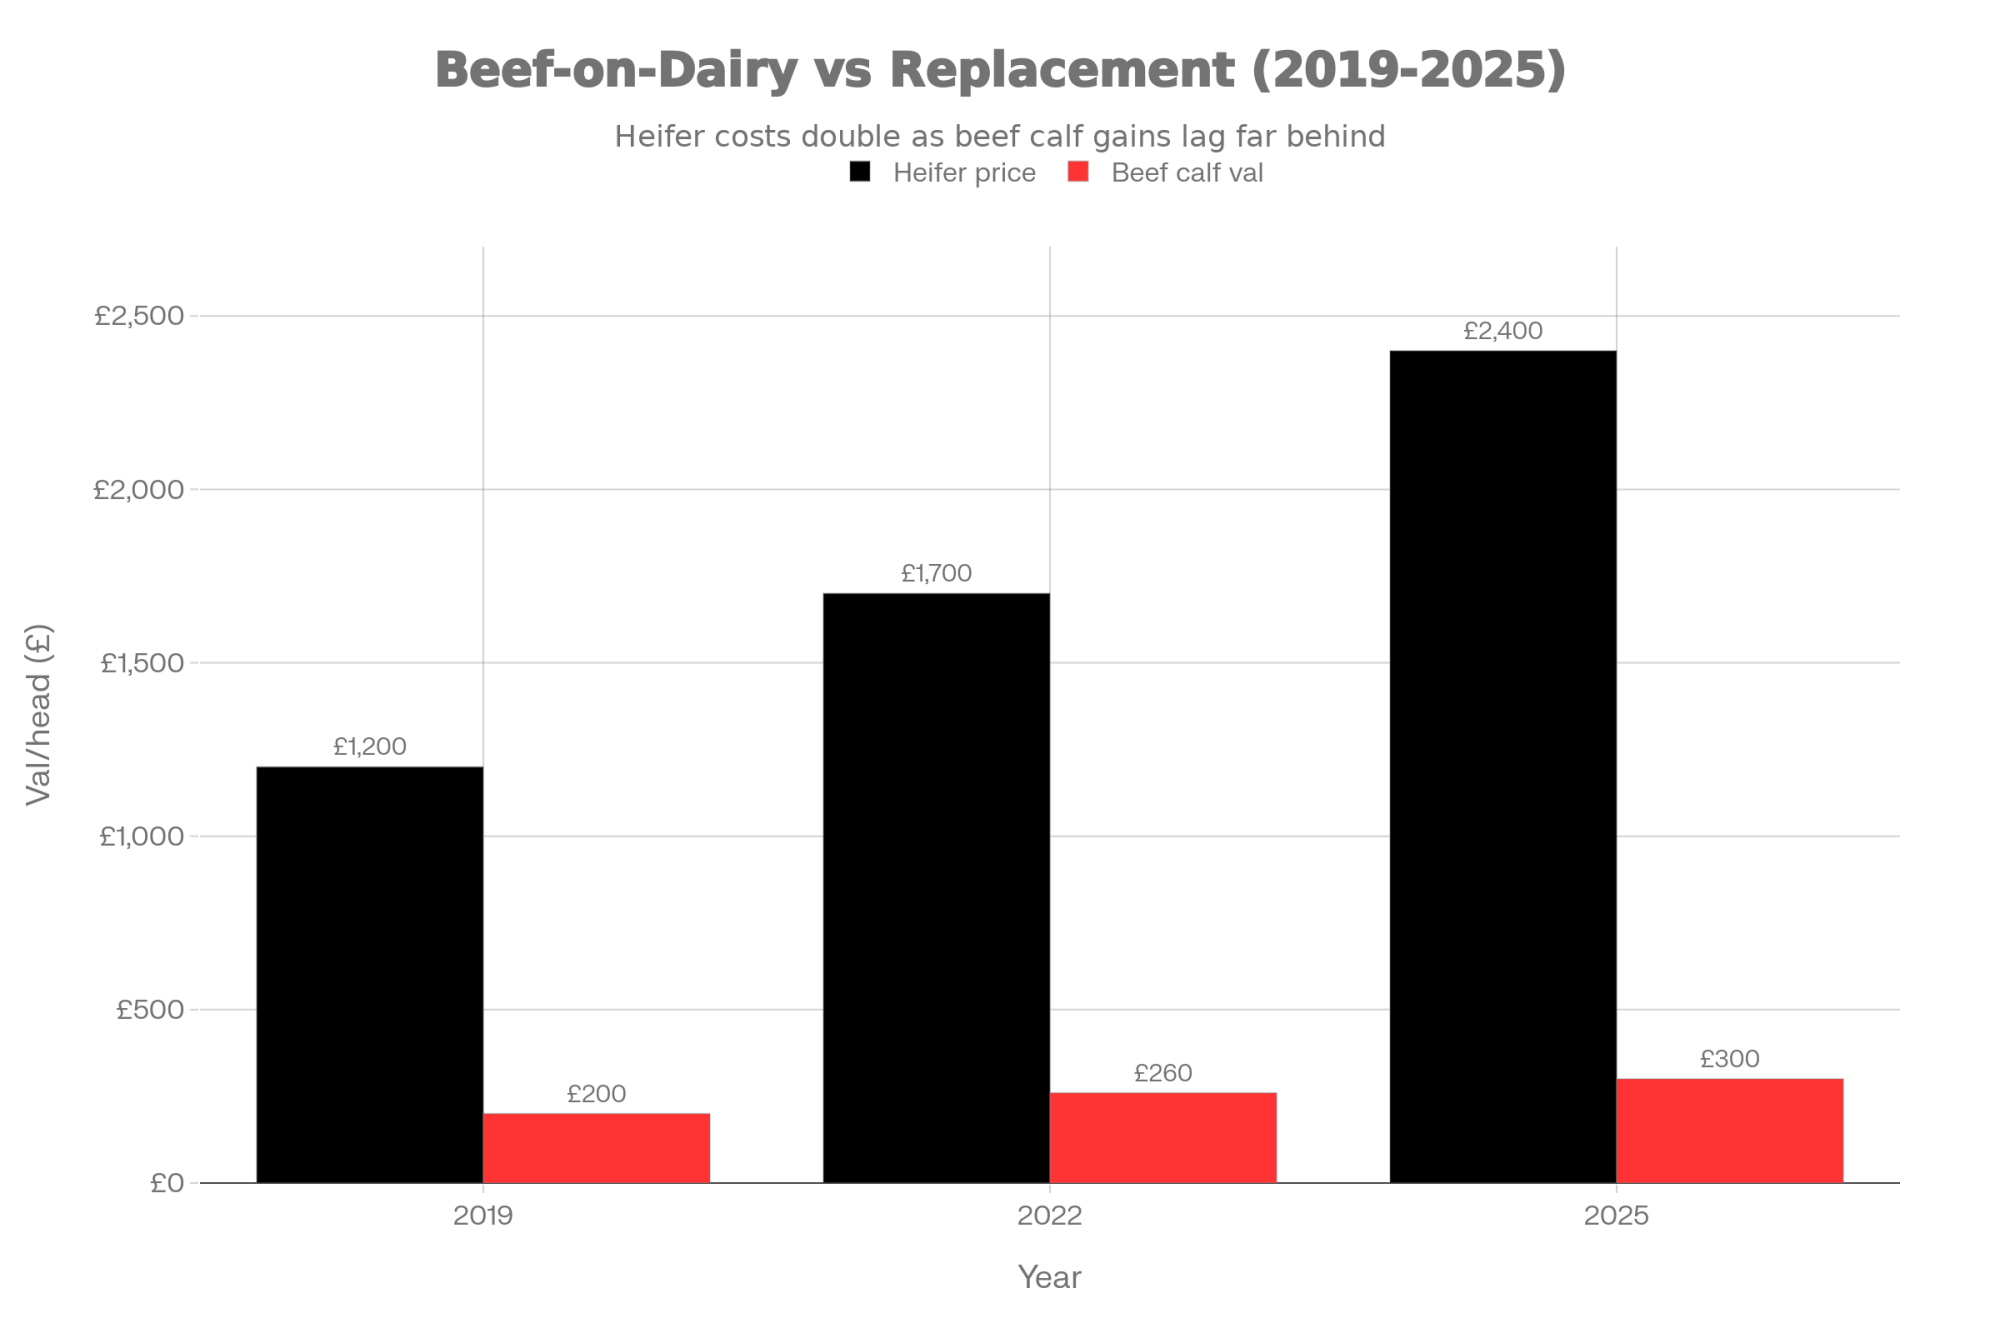
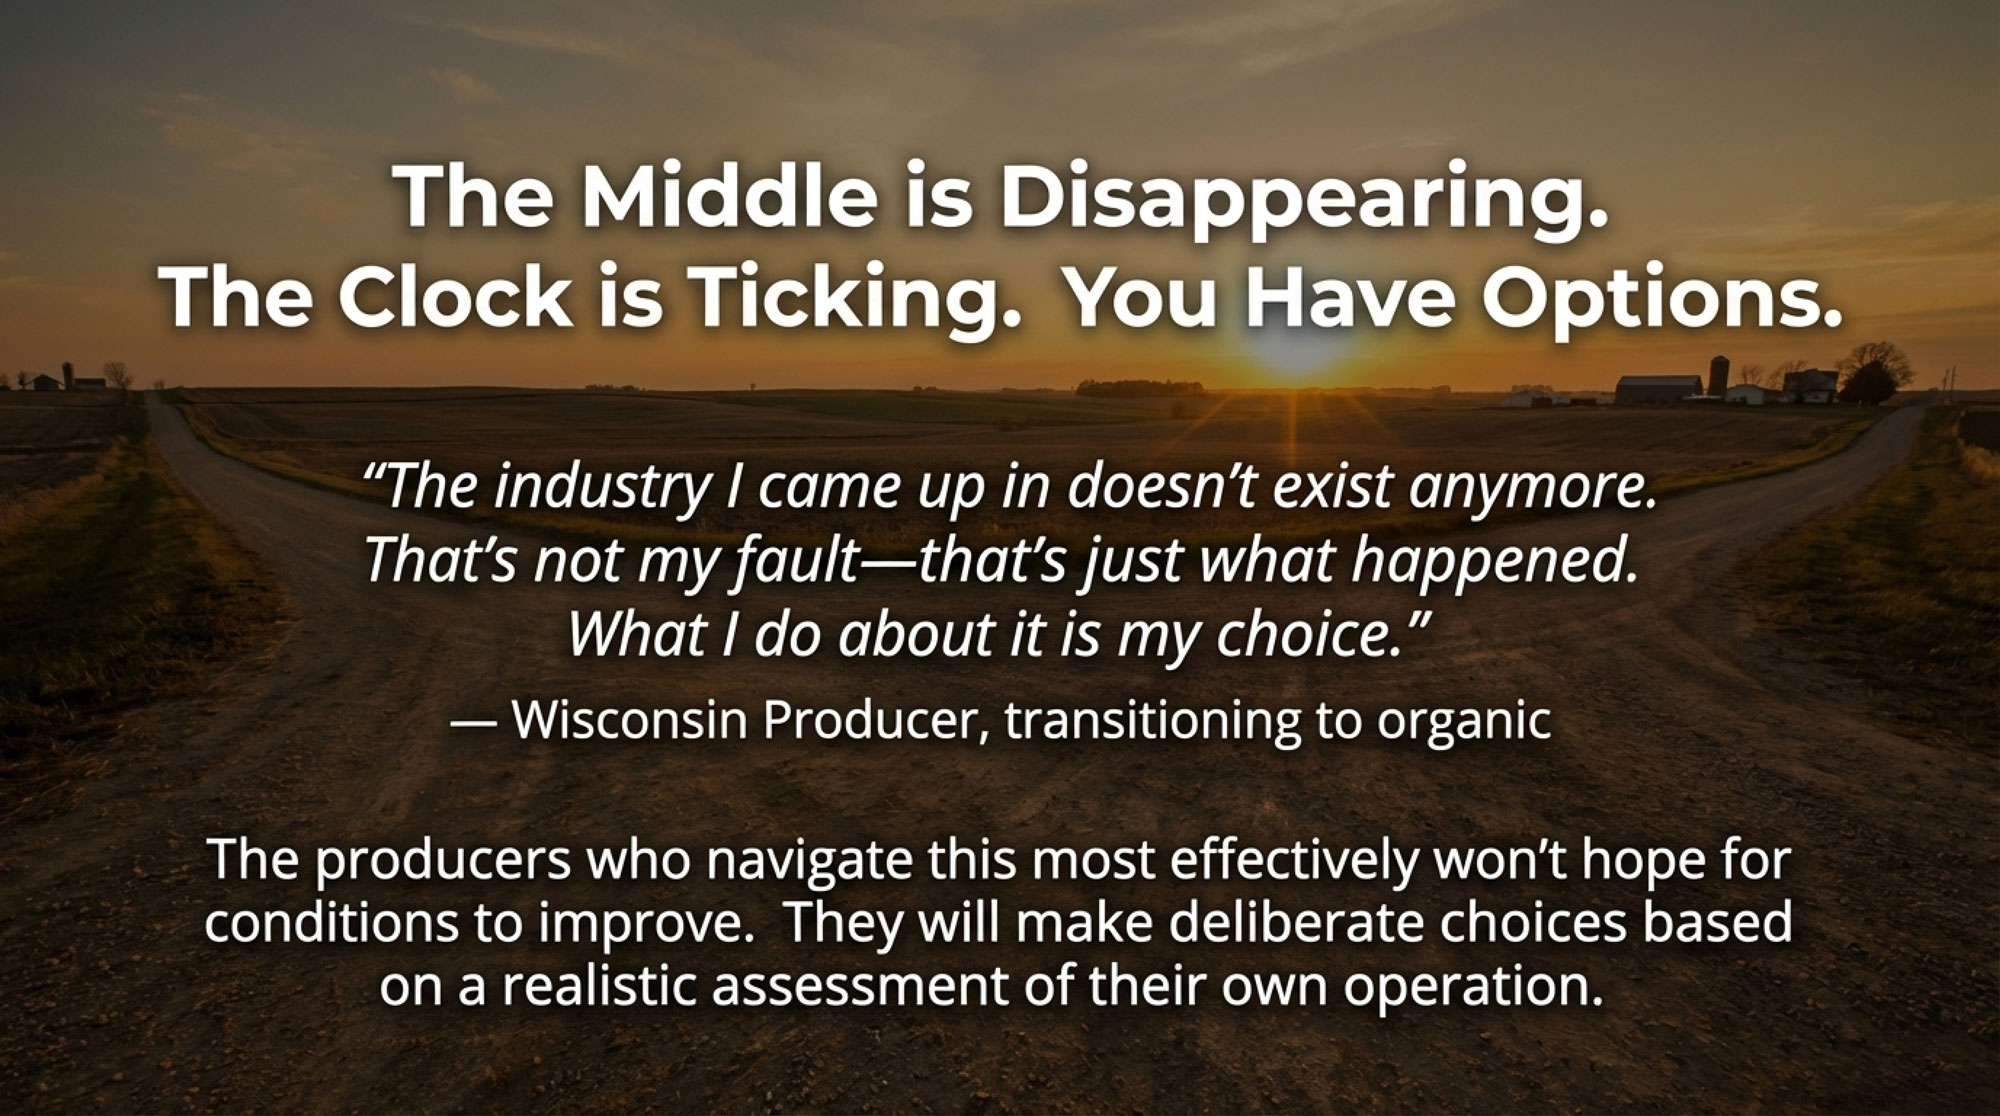
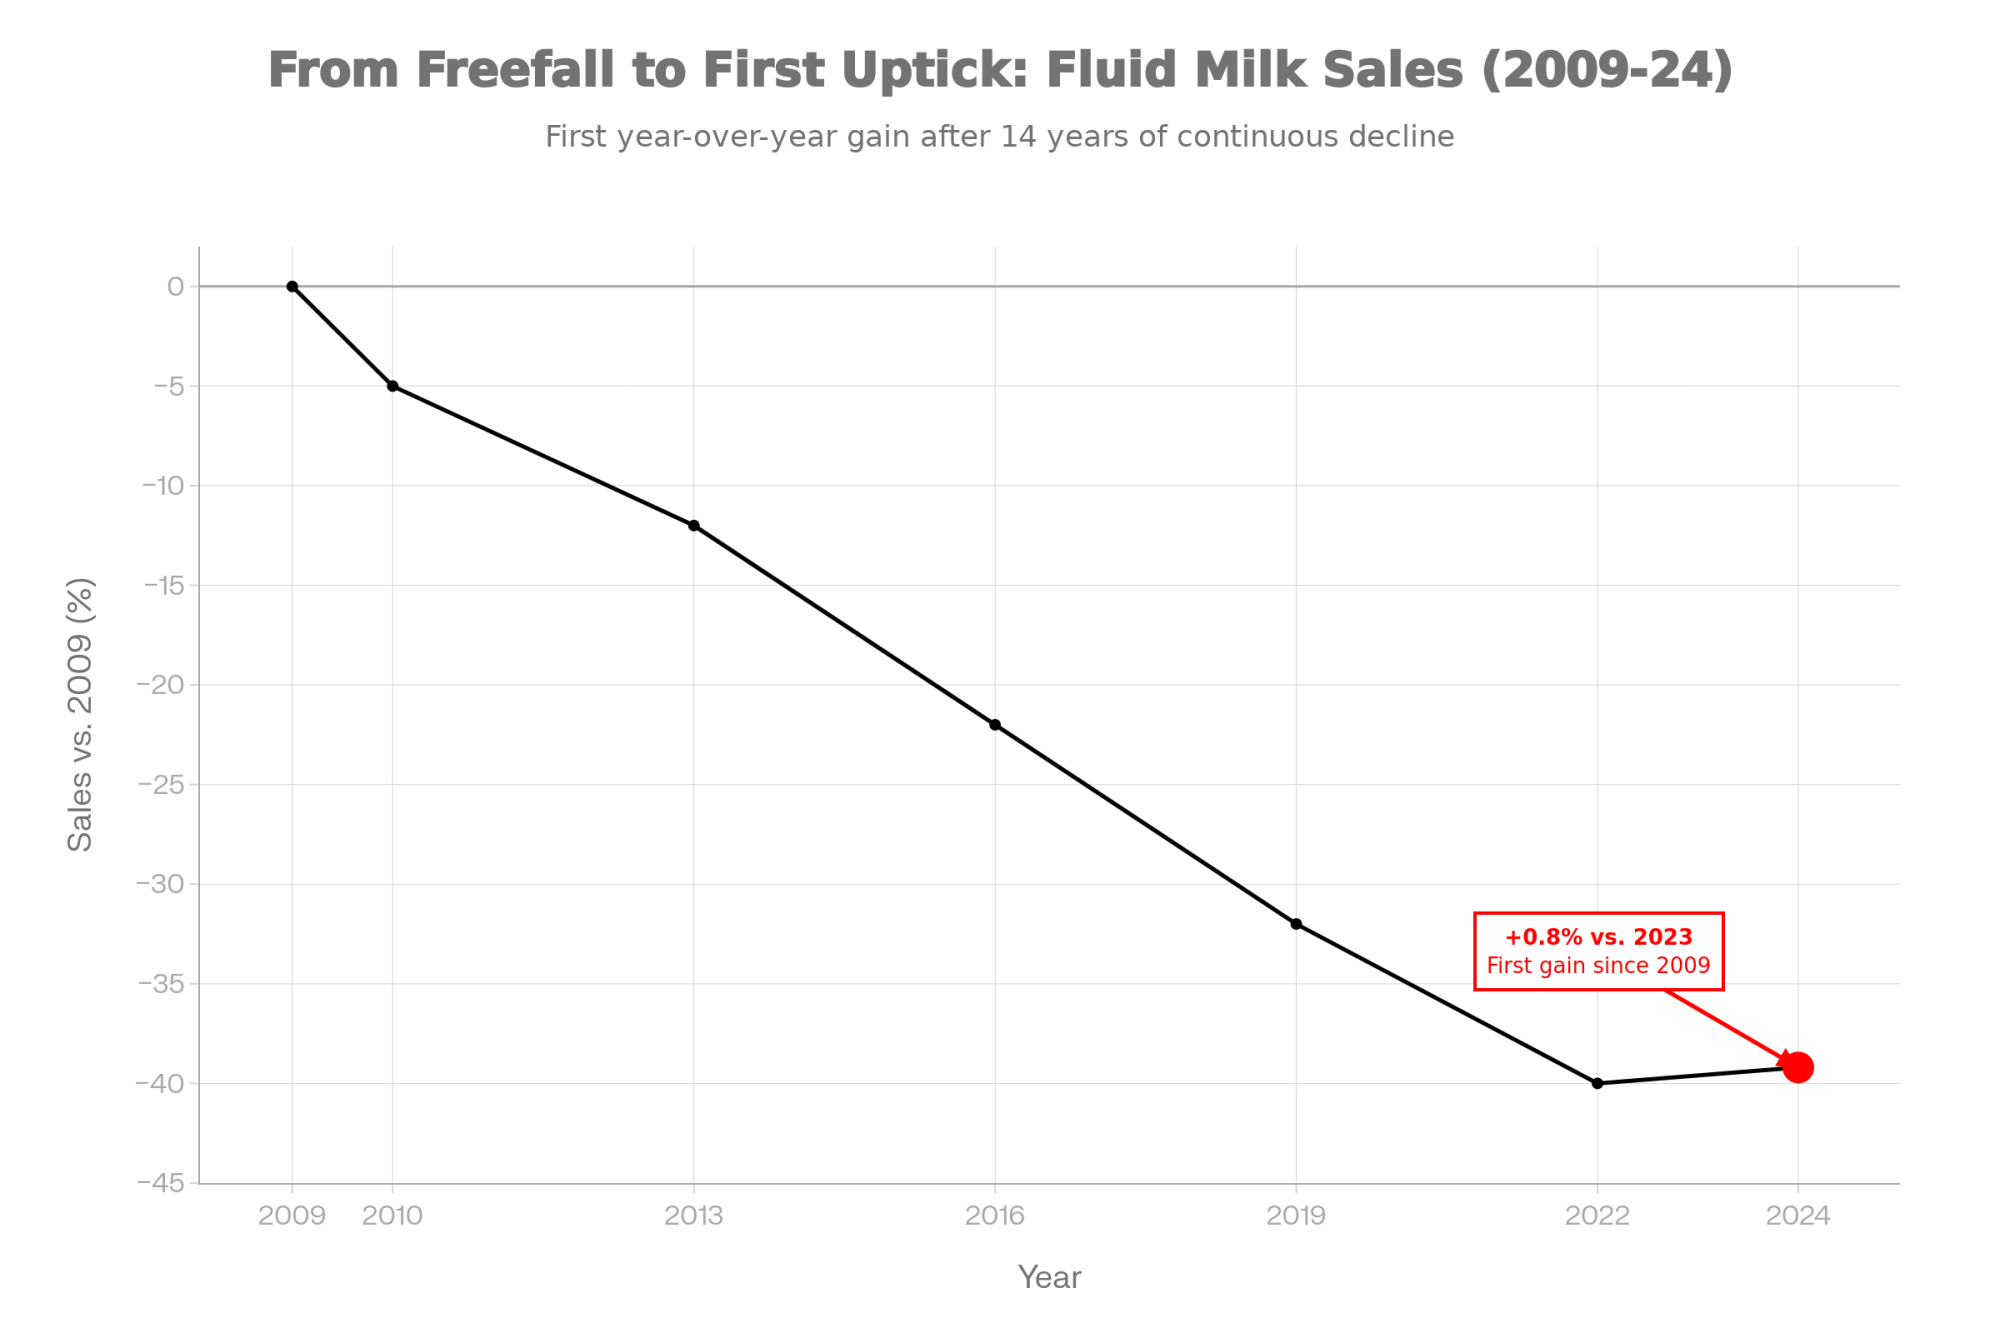
$600 beef calf or $2,500 heifer? The farms still standing in 2026 didn’t trade their future for today’s calf check.

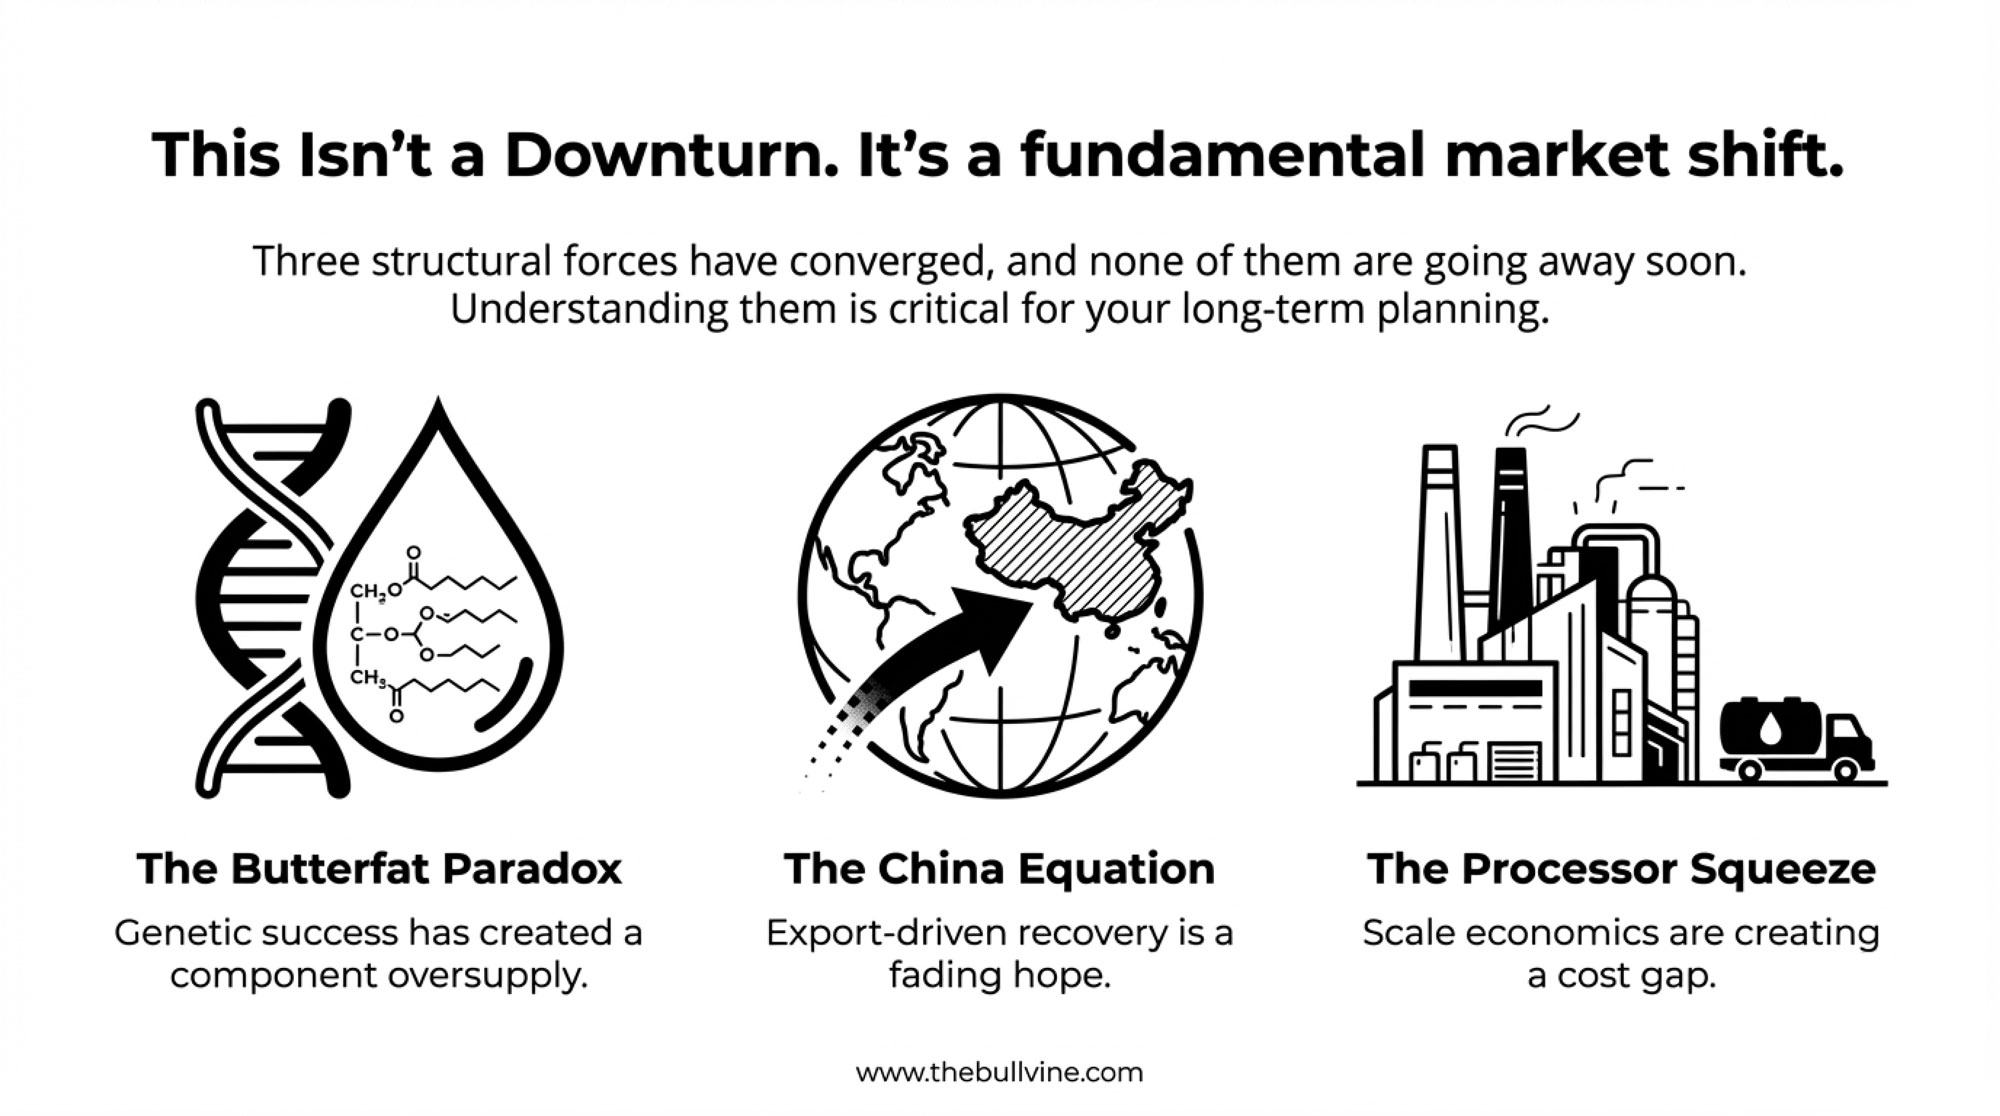
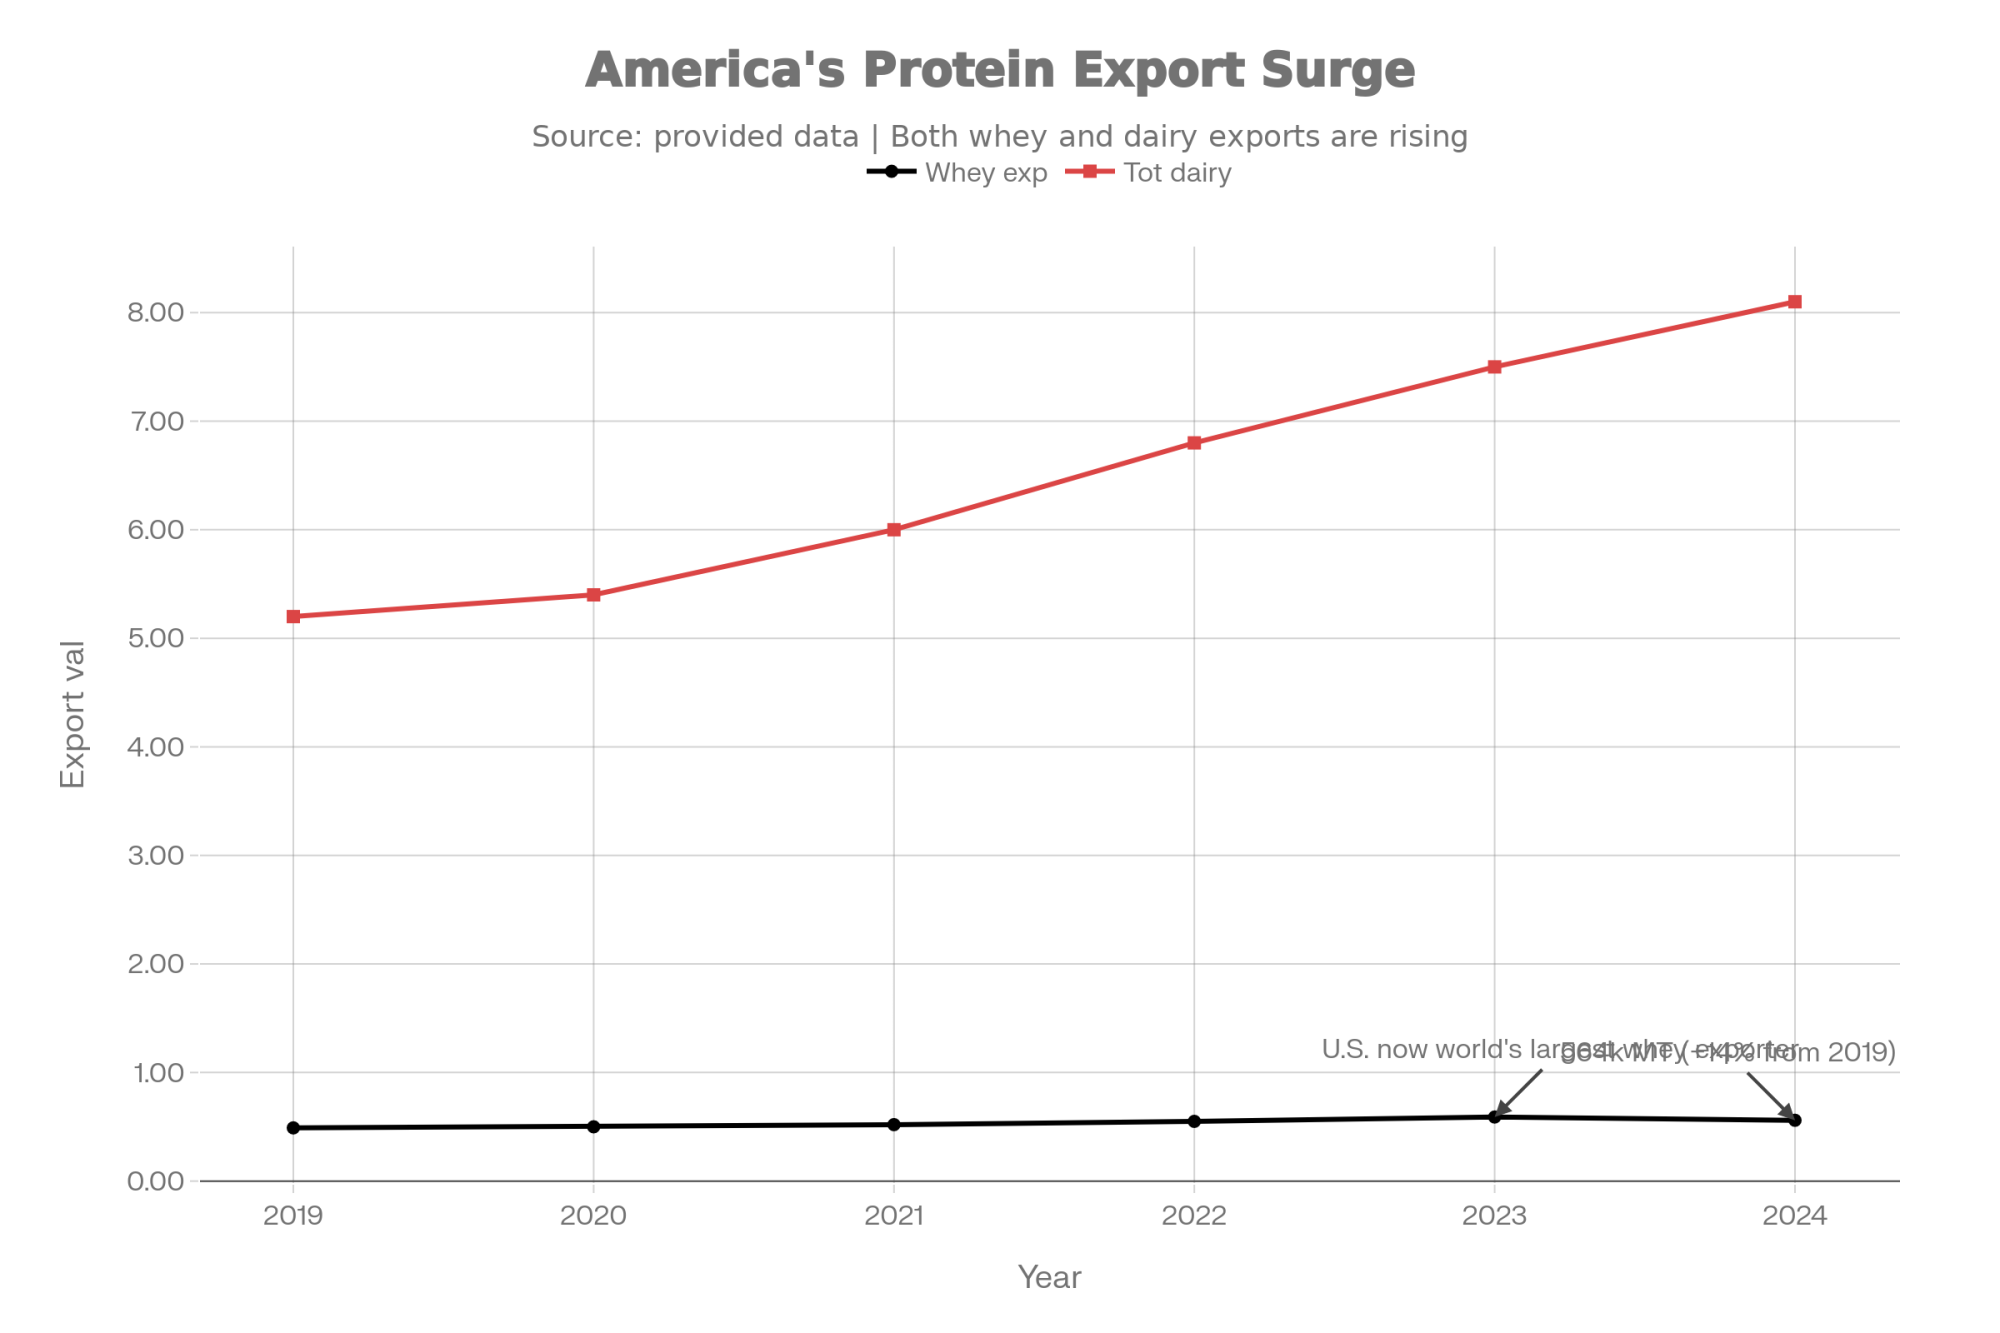
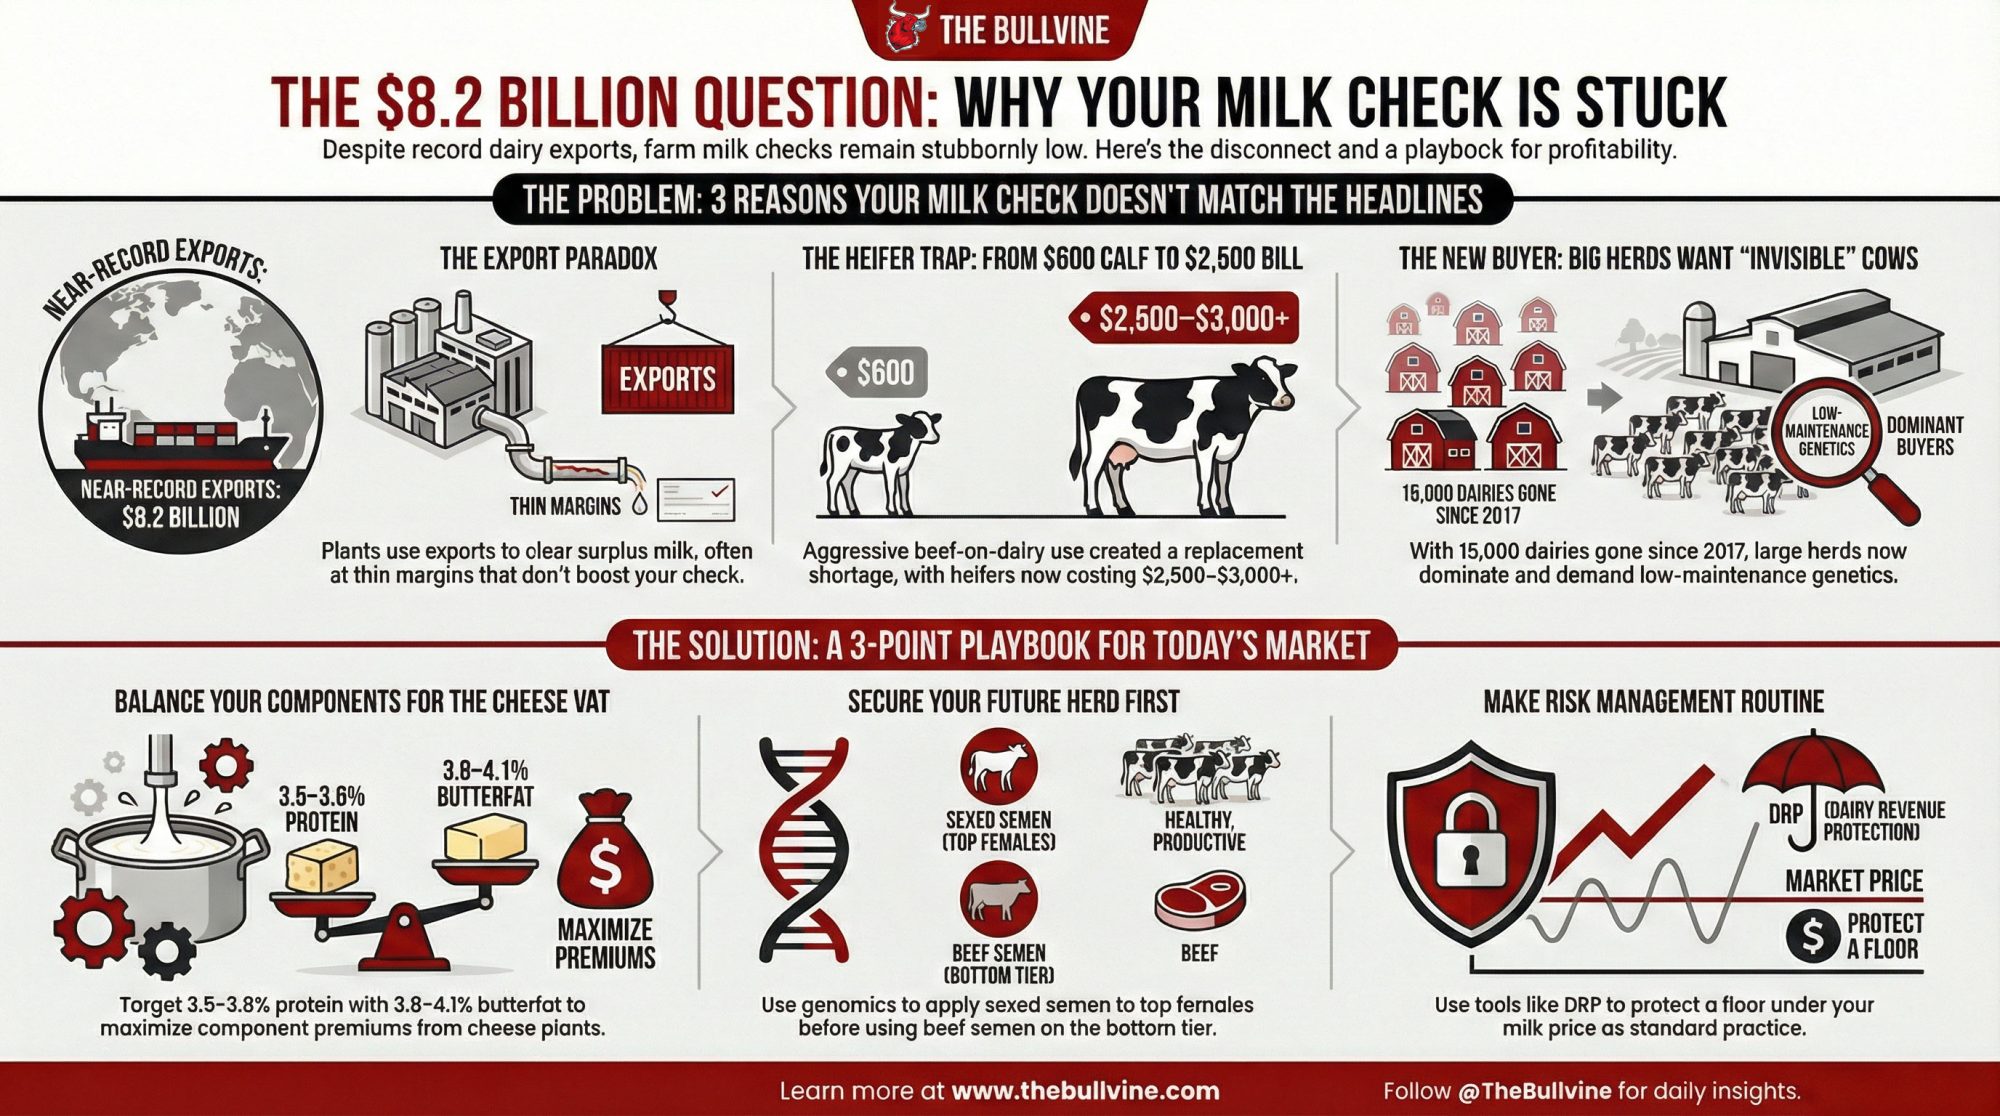
Executive Summary: U.S. dairy exports hit $8.2 billion in 2024, yet milk checks stayed stubbornly flat—and understanding why matters for your next move. The gap comes down to three forces: processing overcapacity that needs export markets to clear marginal pounds, a component shift in which cheese plants now reward protein over extreme butterfat, and a heifer shortage, many herds created by chasing $600 beef calf checks instead of protecting replacements. Today, quality heifers command $2,500–$3,000+, and the math has flipped. Consolidation has reshaped the landscape, too—15,000 dairies exited between 2017 and 2022, with 1,000+ cow herds now producing two-thirds of U.S. milk and demanding “invisible” cows that stay off the treatment list. The operations thriving in this environment share a playbook: components tuned to their plant’s grid, genomics and beef-on-dairy strategies that secure the replacement pipeline, and risk management treated as routine—not a crisis response. The next 12–24 months will separate the farms that planned from the farms that hoped.

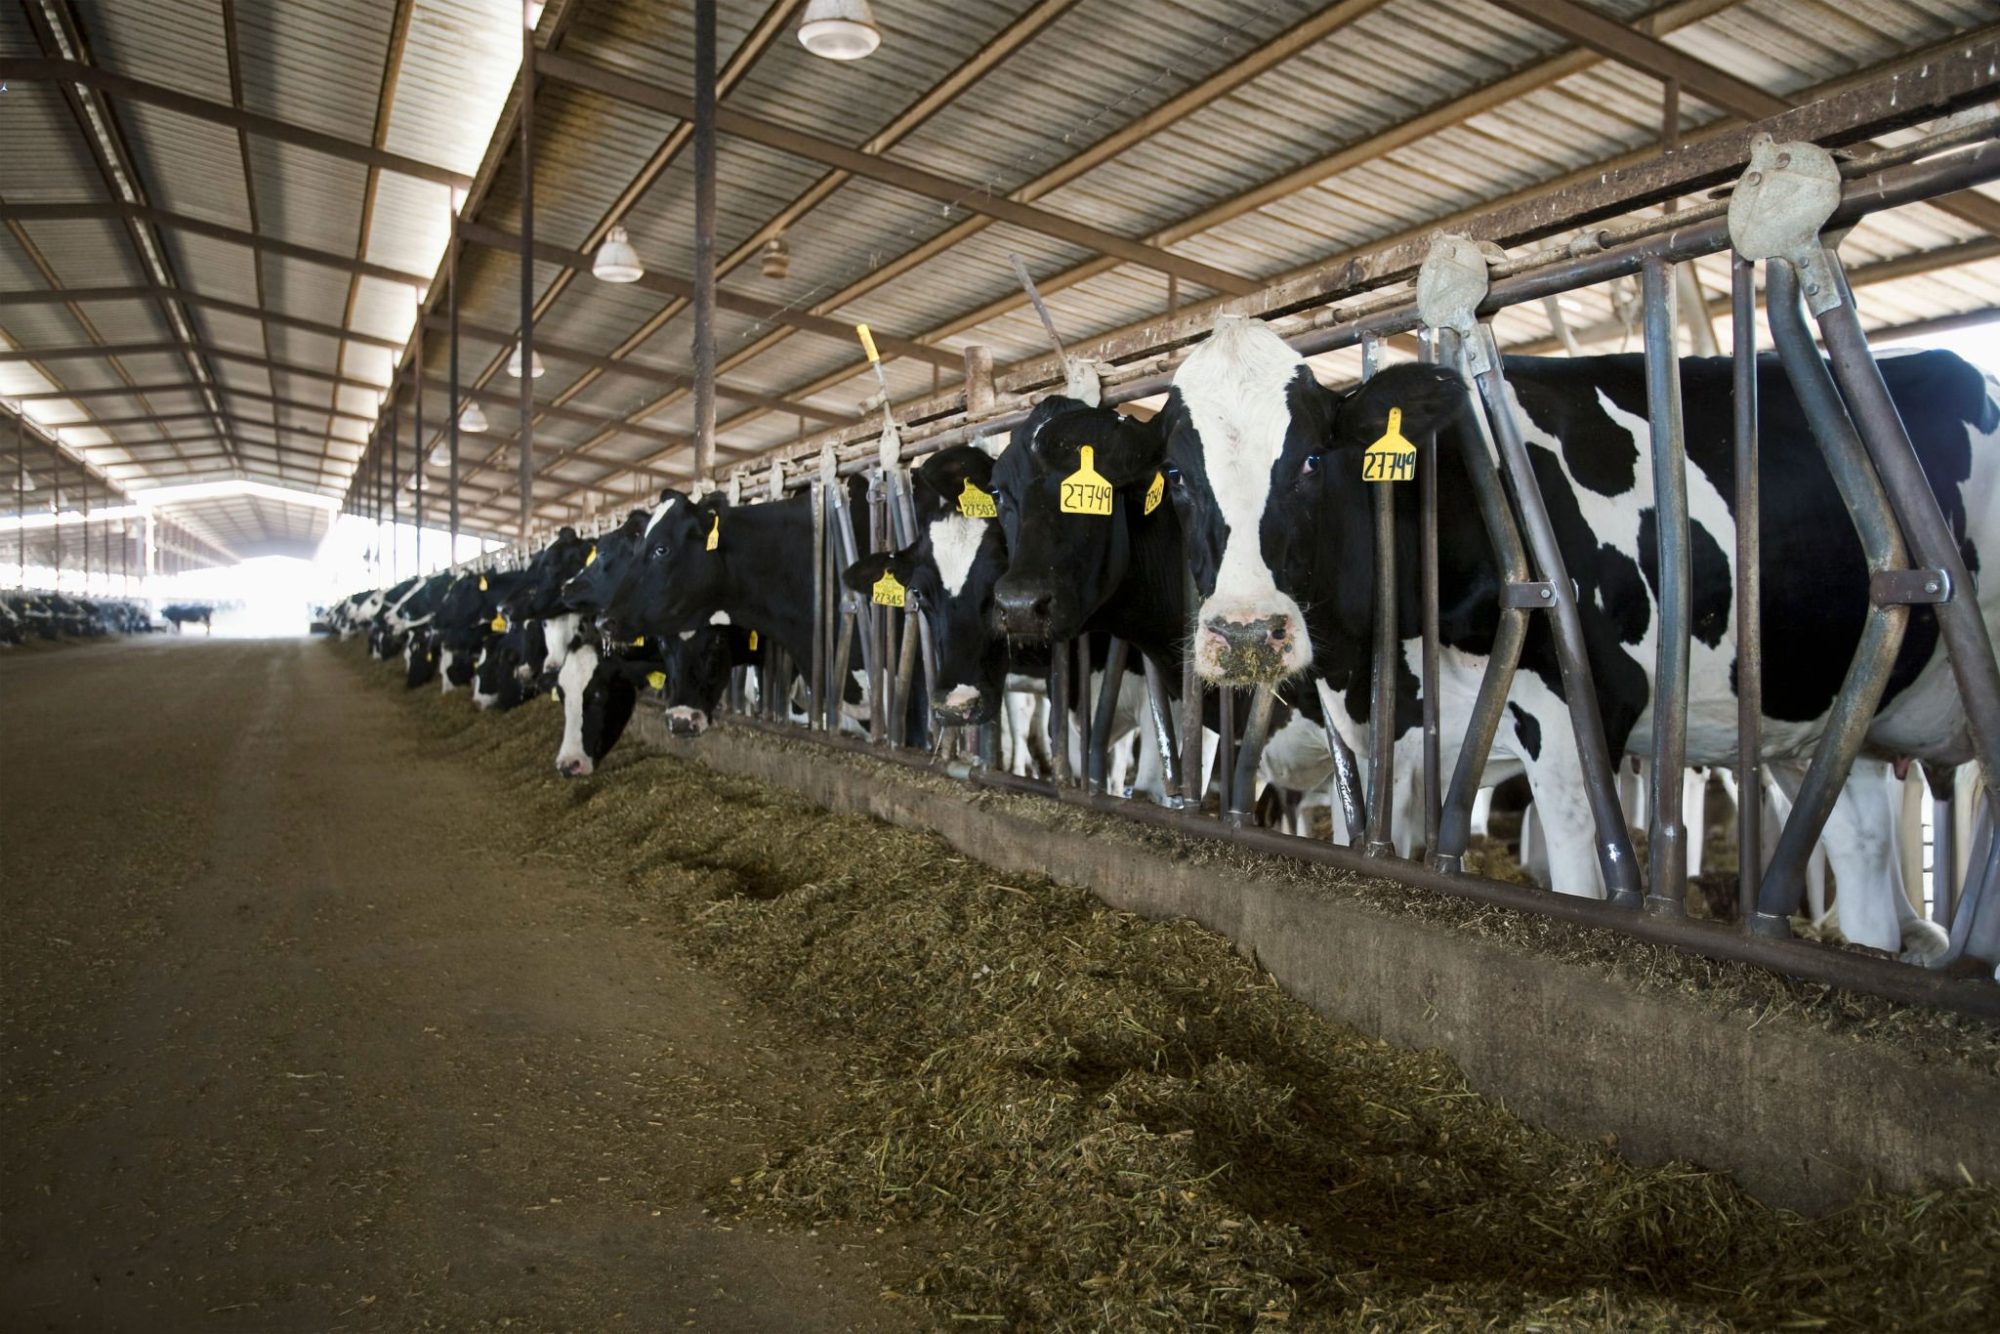
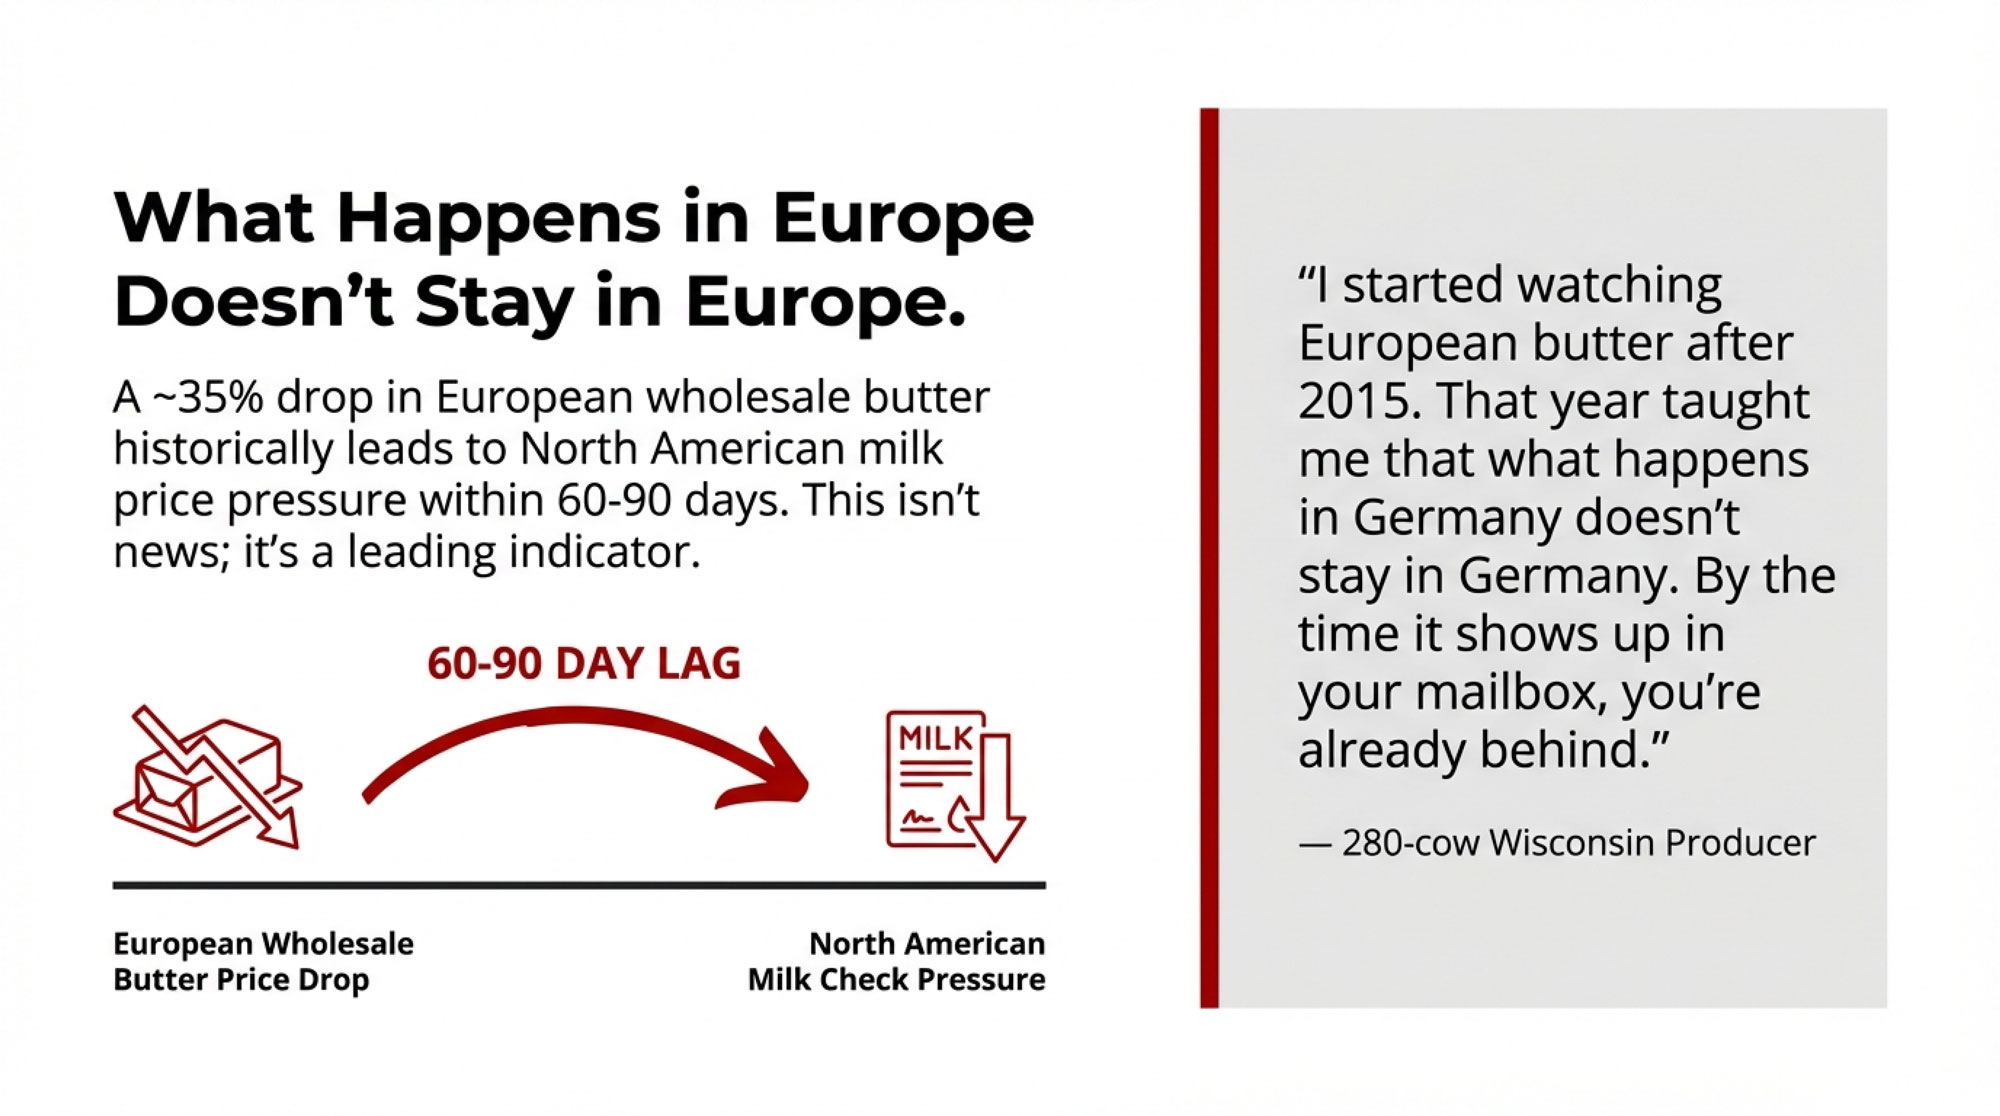
You’ve probably lived this. You sit through a winter meeting where someone from the co‑op says, “Exports are strong, global demand looks good, U.S. dairy is well‑positioned.” The slides are full of big numbers. Then you get home, sit down at the kitchen table, open your milk check… and it feels like you’re farming in a different industry than the one they just described.

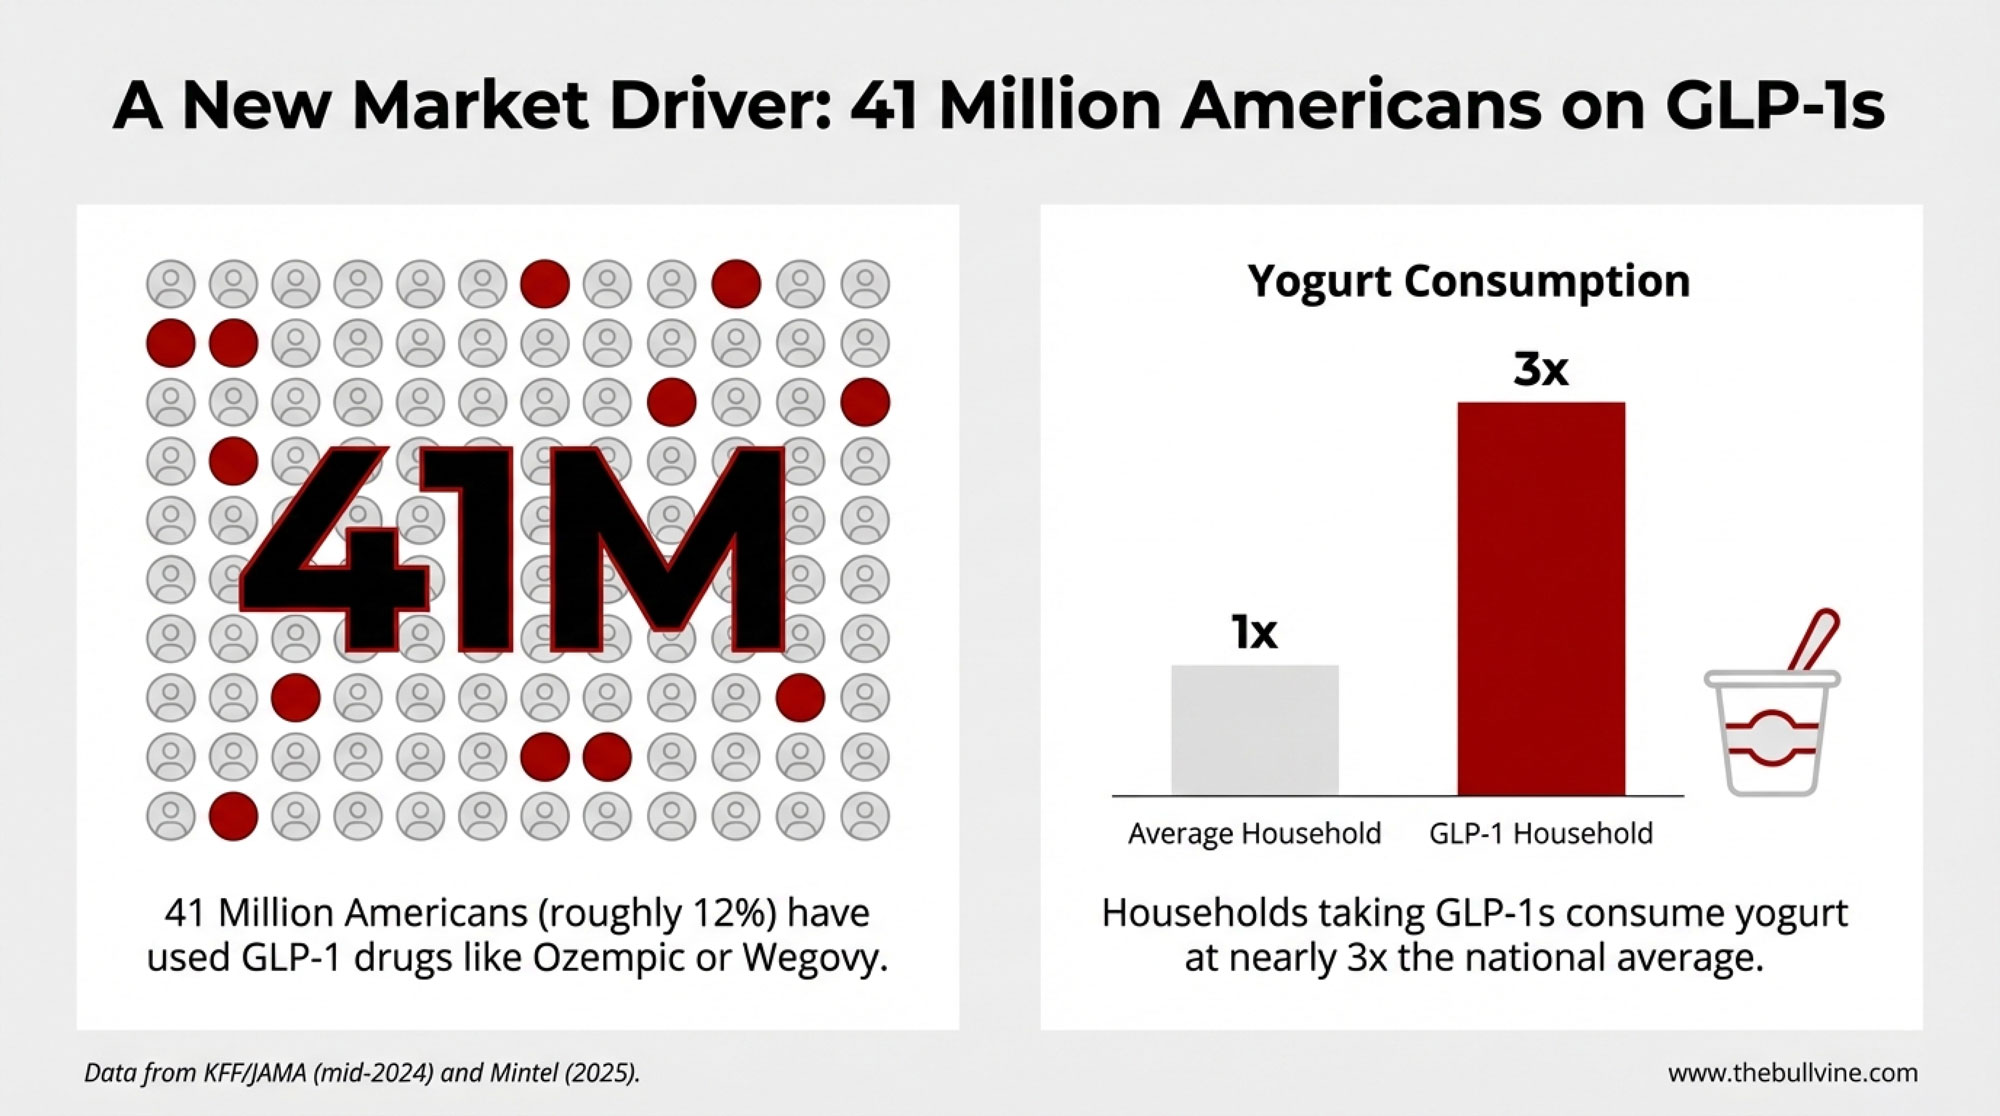
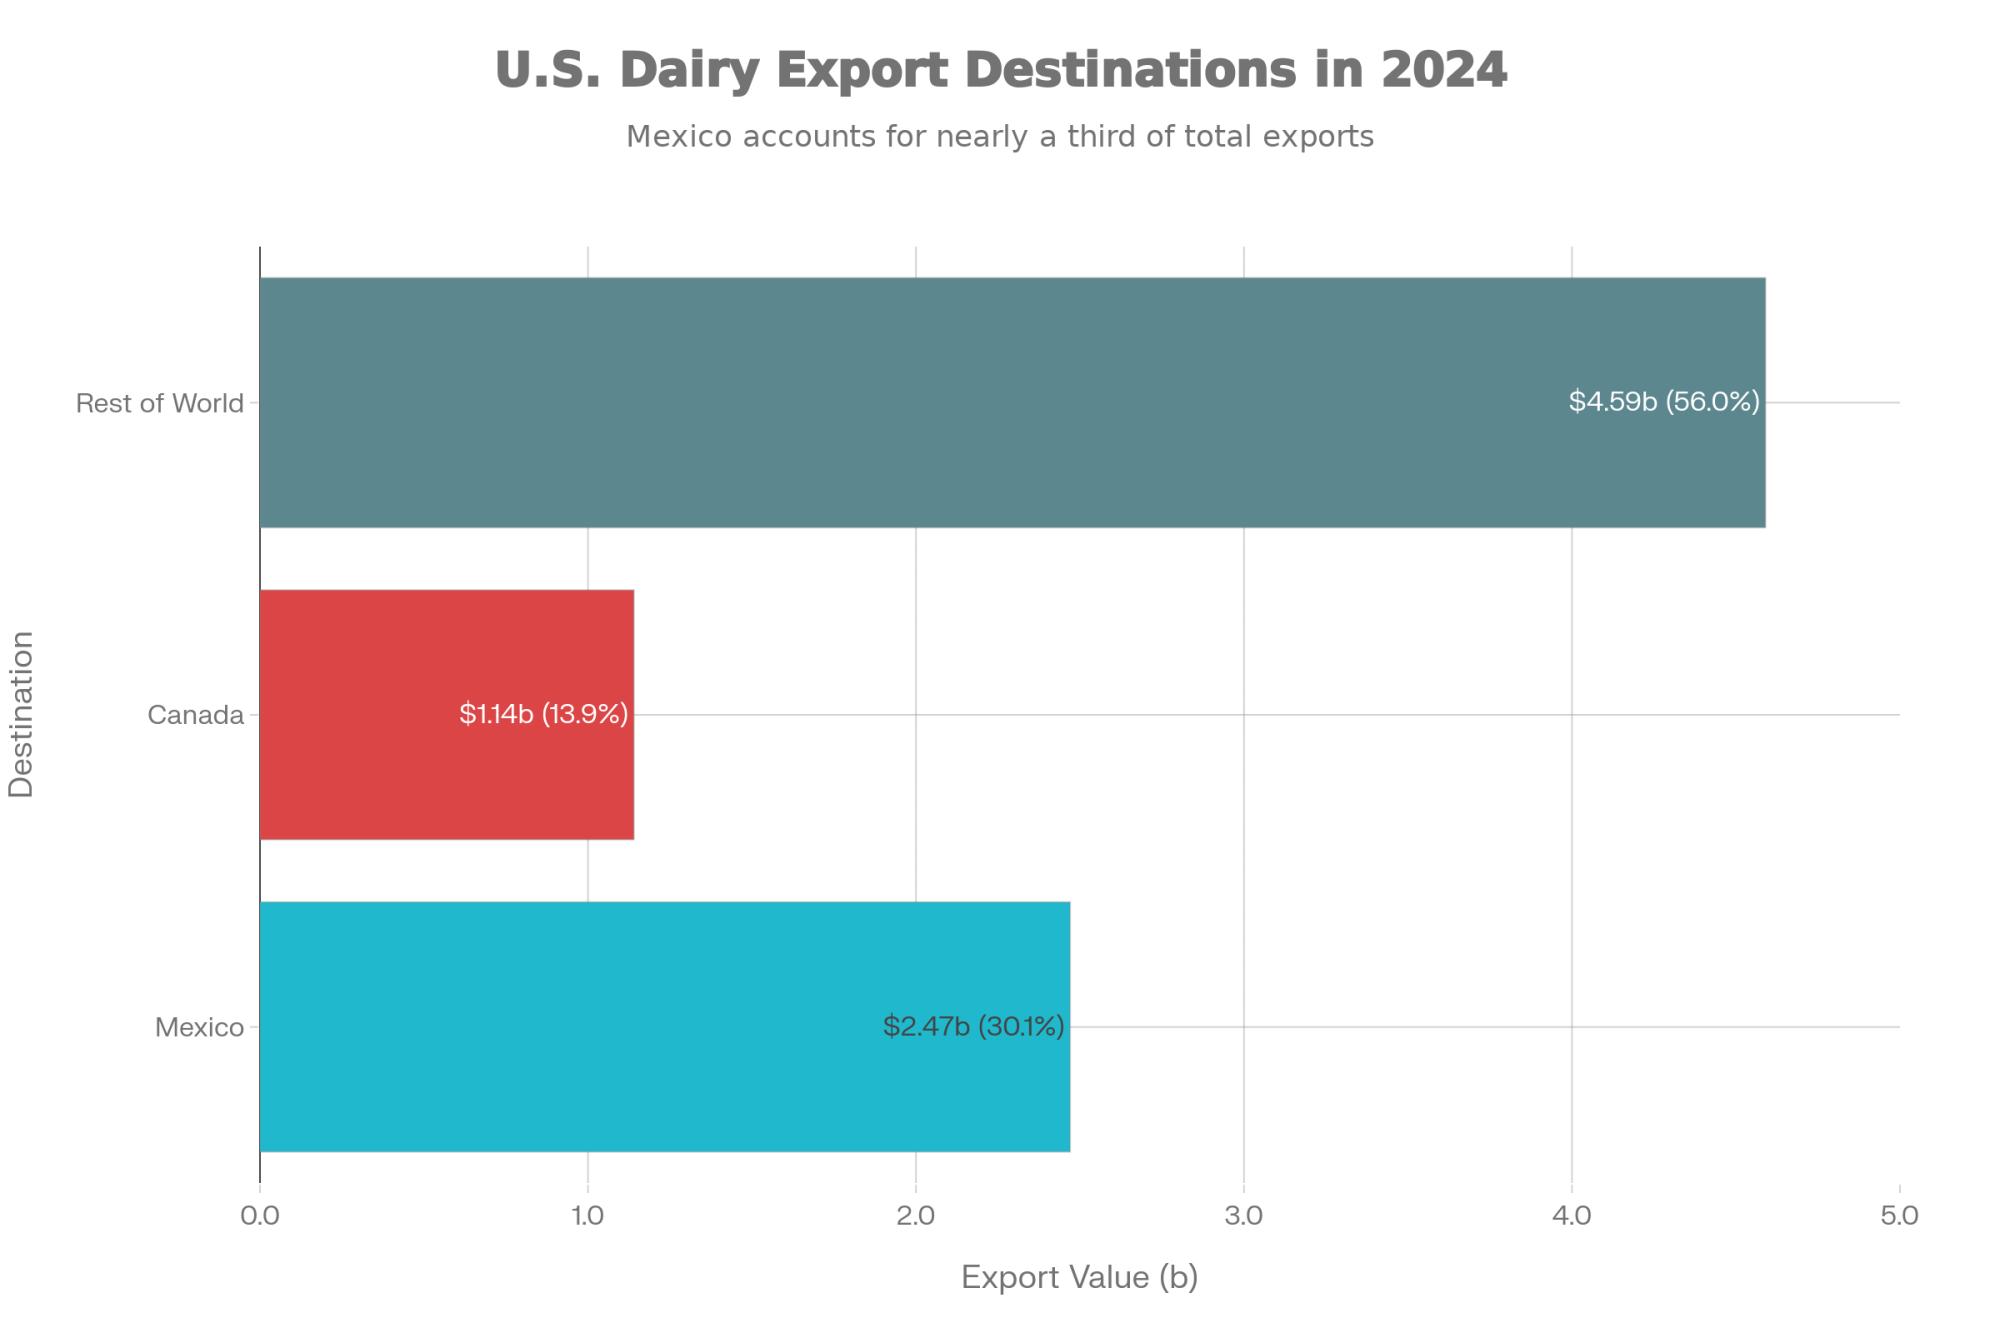
What’s interesting here is that those export numbers really are big. USDA’s Foreign Agricultural Service, in numbers summarized by IDFA, Dairy Processing, Dairy Foods, and Progressive Dairy, put 2024 U.S. dairy exports at about 8.2 billion dollars, the second‑highest export value on record after the 9.5‑billion‑dollar peak in 2022. Mexico took roughly 2.47 billion dollars of that total, and Canada about 1.14 billion, so together those two neighbors account for just over 40 percent of everything the U.S. ships overseas by value. Export coverage from USDEC highlights that Mexico is consistently the top buyer of U.S. cheese and skim milk powder.

Early 2025 commentary from market analysts suggests exports have generally held up reasonably well compared to 2024, with cheese shipments in particular staying firm in several key months. So that “exports are strong” line on the slides isn’t spin.

The question you and a lot of producers are asking is simple: if exports look that good, why doesn’t the milk check feel the same? To get at that, let’s walk through what’s happening at the plant, what’s changed with butterfat performance and protein, why geography still matters, what’s going on in Mexico—and then bring it right back to genetics, beef‑on‑dairy, fresh cow management, and risk decisions on your own farm.

Looking at This Trend from the Plant Side

Looking at this trend from the processor’s side is where the fog starts to clear a bit.

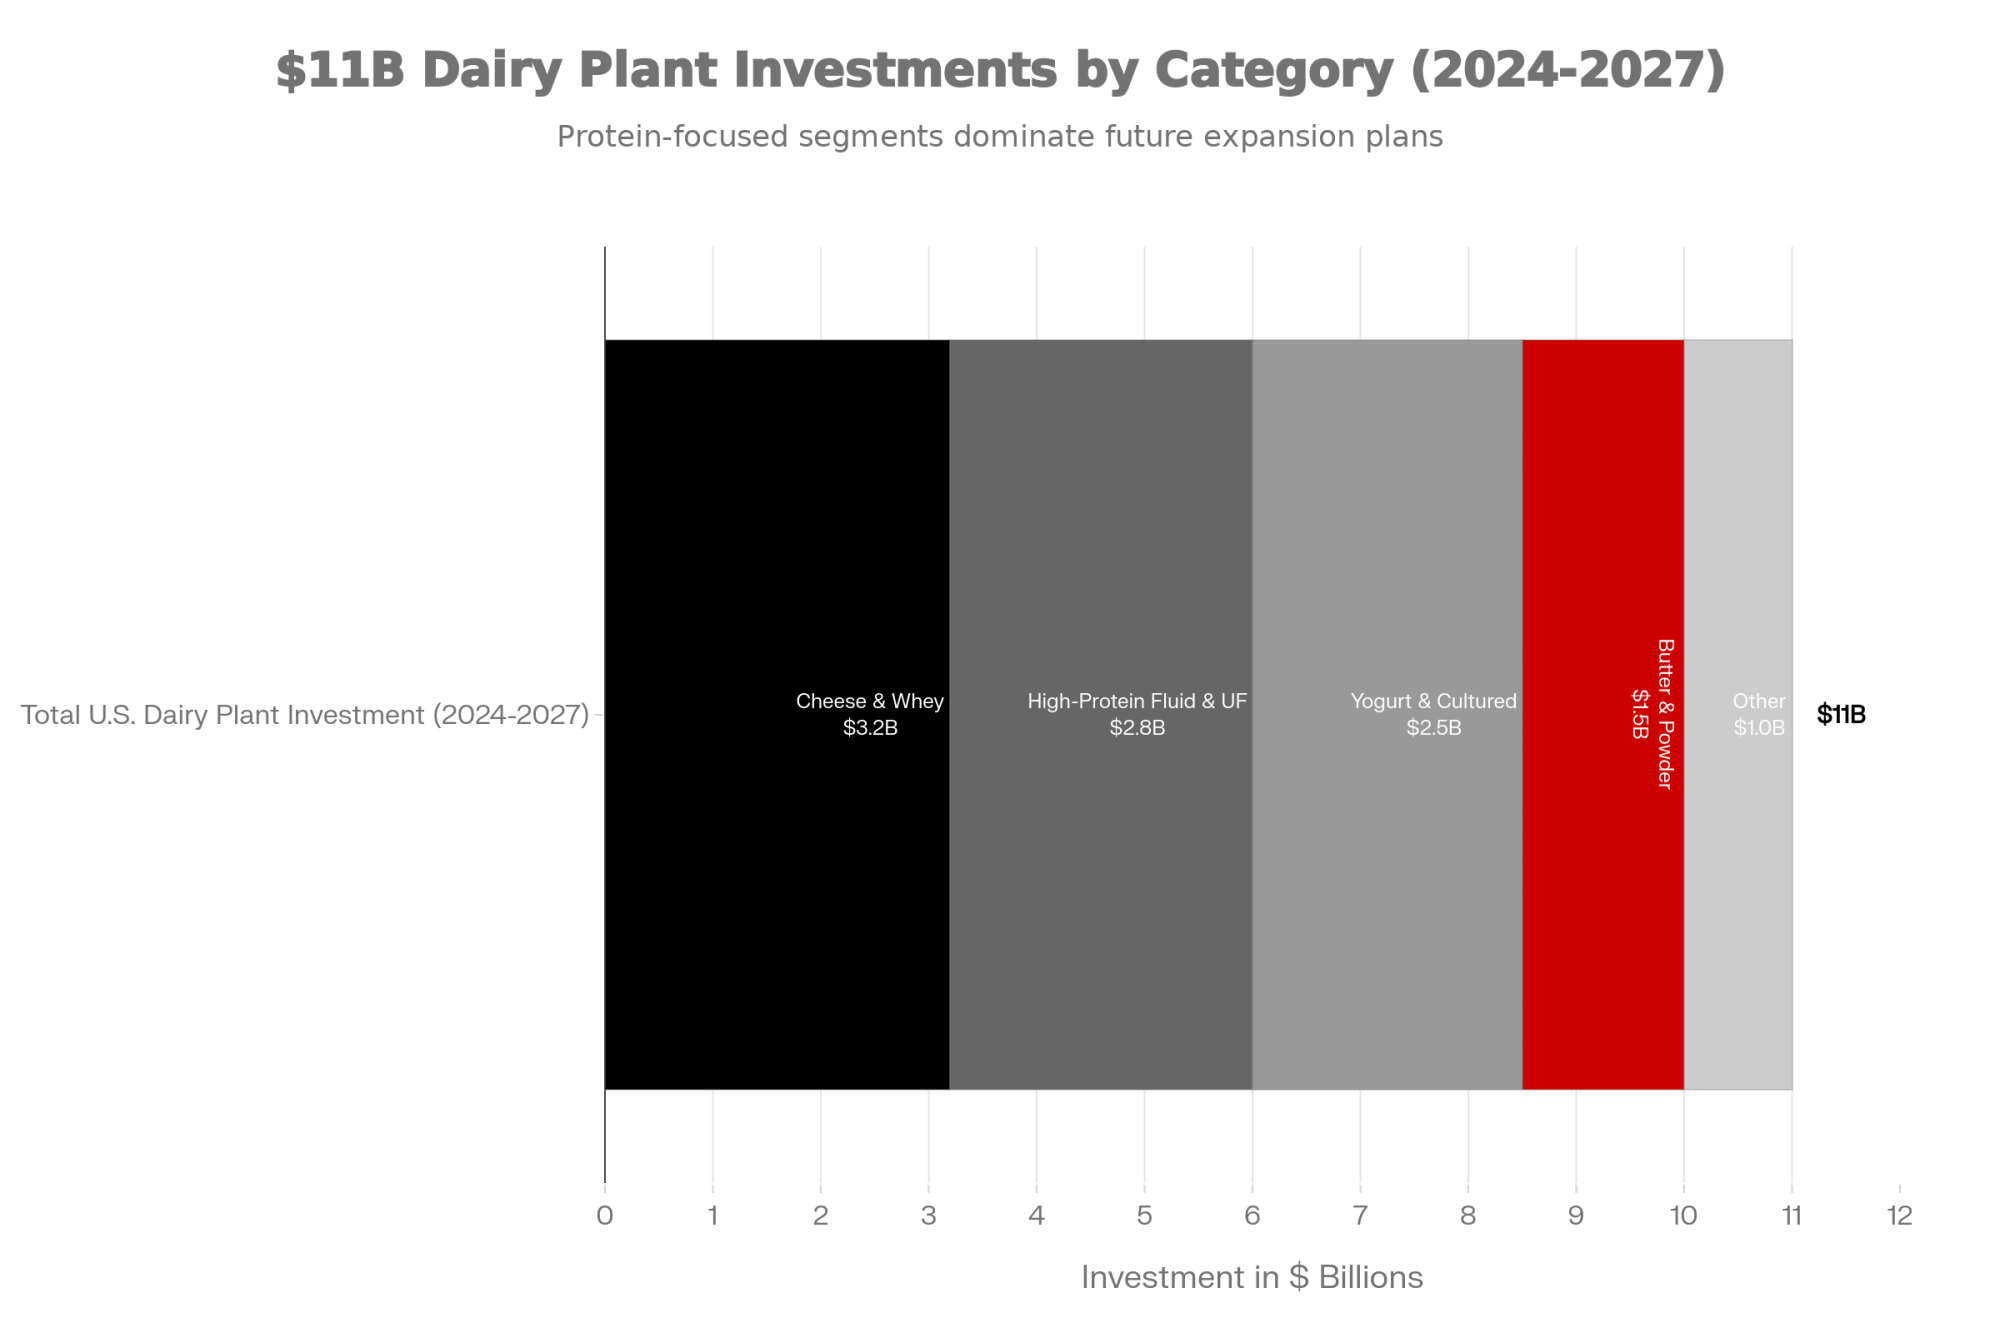
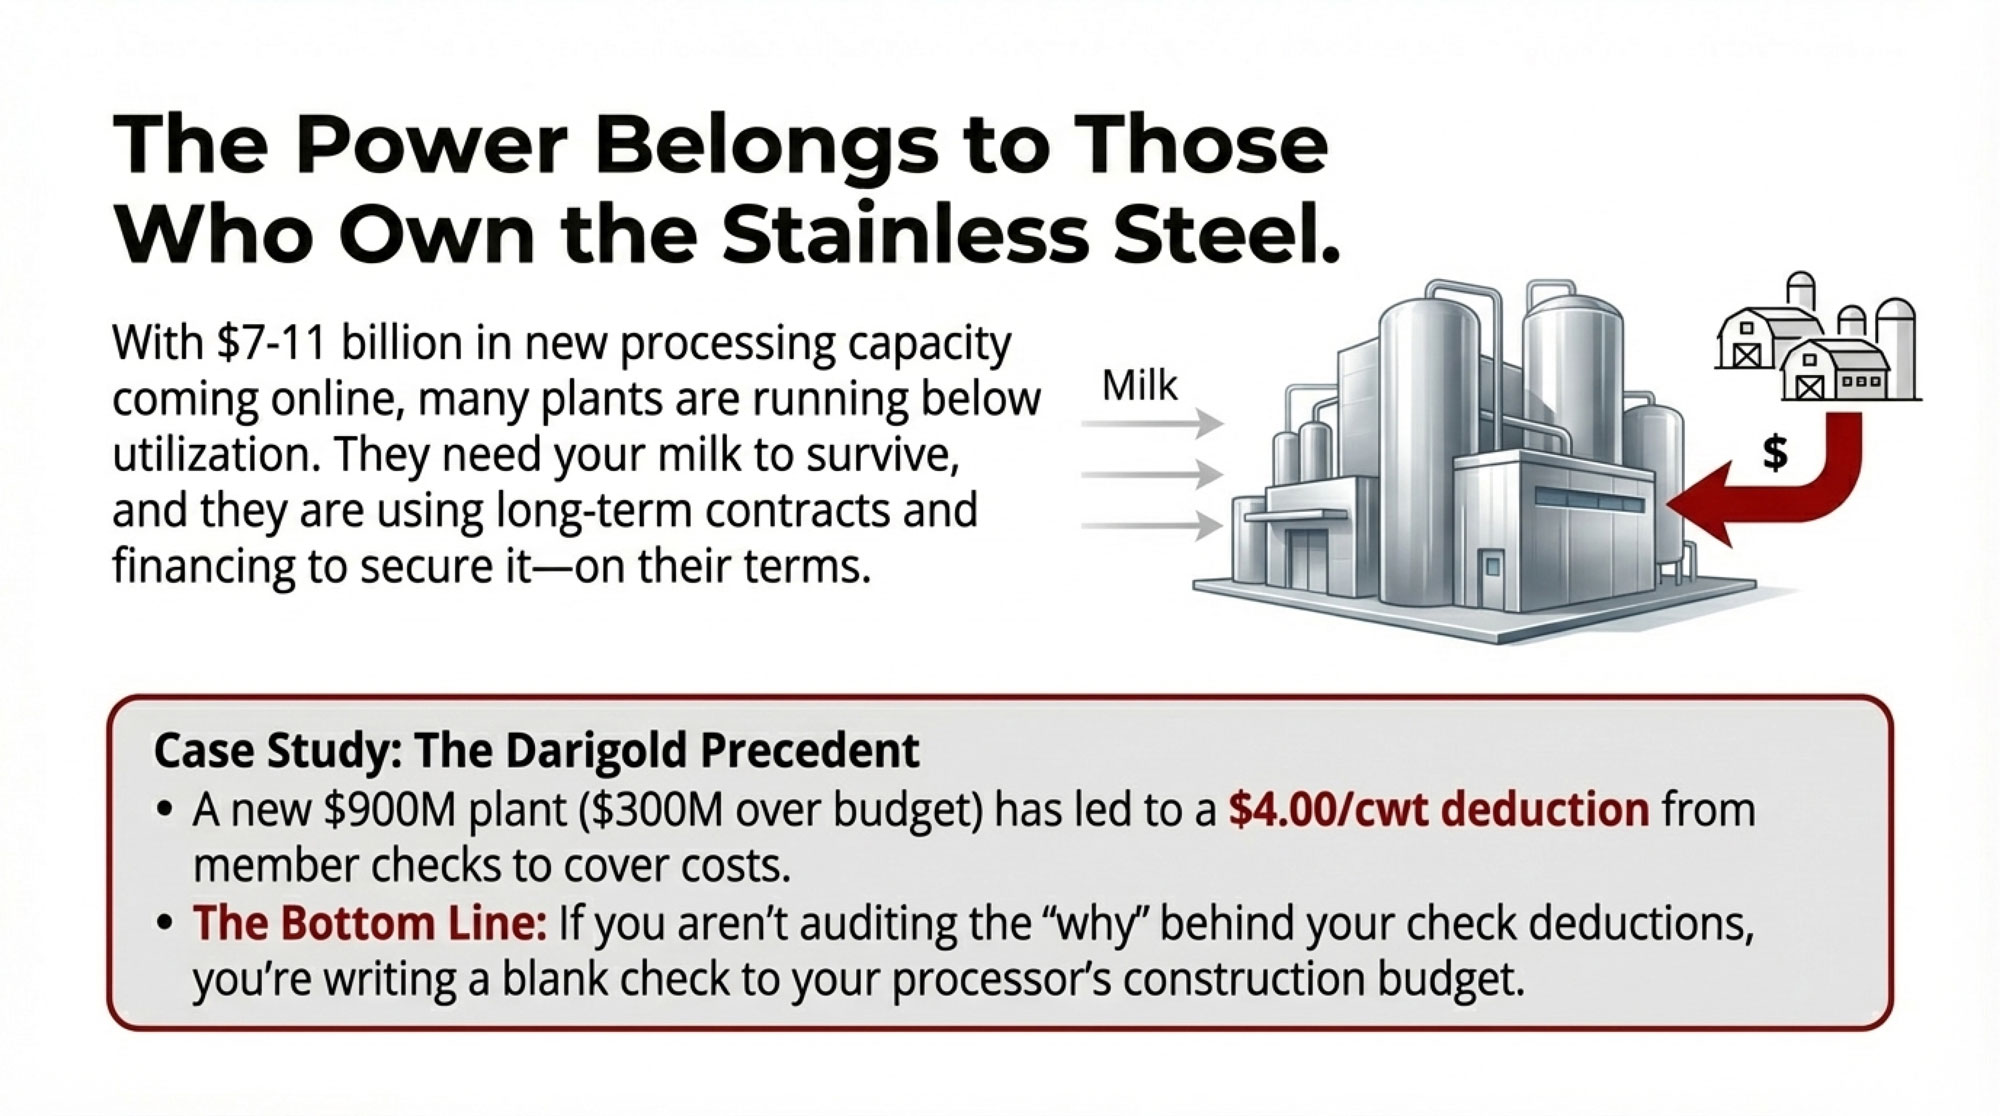
Over the last several years, processors have poured serious money into stainless steel. IDFA and industry analysts have talked about “historic levels” of processing investment, and Hoard’s Dairyman reported that roughly 8 billion dollarsworth of dairy processing projects—new cheese plants, powder facilities, and ingredient expansions—are in the works across the Upper Midwest, Plains, and Southwest. Brownfield Ag News and Dairy Herd have described “widespread growth underway,” citing new or expanded plants in South Dakota, Kansas, Texas, Idaho, and New York.

You see it most clearly along the I‑29 corridor. South Dakota has become one of the fastest‑growing dairy regions in the U.S., as new cheese capacity along I‑29 pulled in cows and capital. Kansas appears in USDA Milk Production reports and Progressive Dairy summaries as another state with steady multi‑year growth, driven by large freestall herds and added processing capacity. In New York, big yogurt and cheese plants—including Chobani’s facility at New Berlin—are regularly flagged in state and federal reports as major buyers anchoring regional milk sheds.

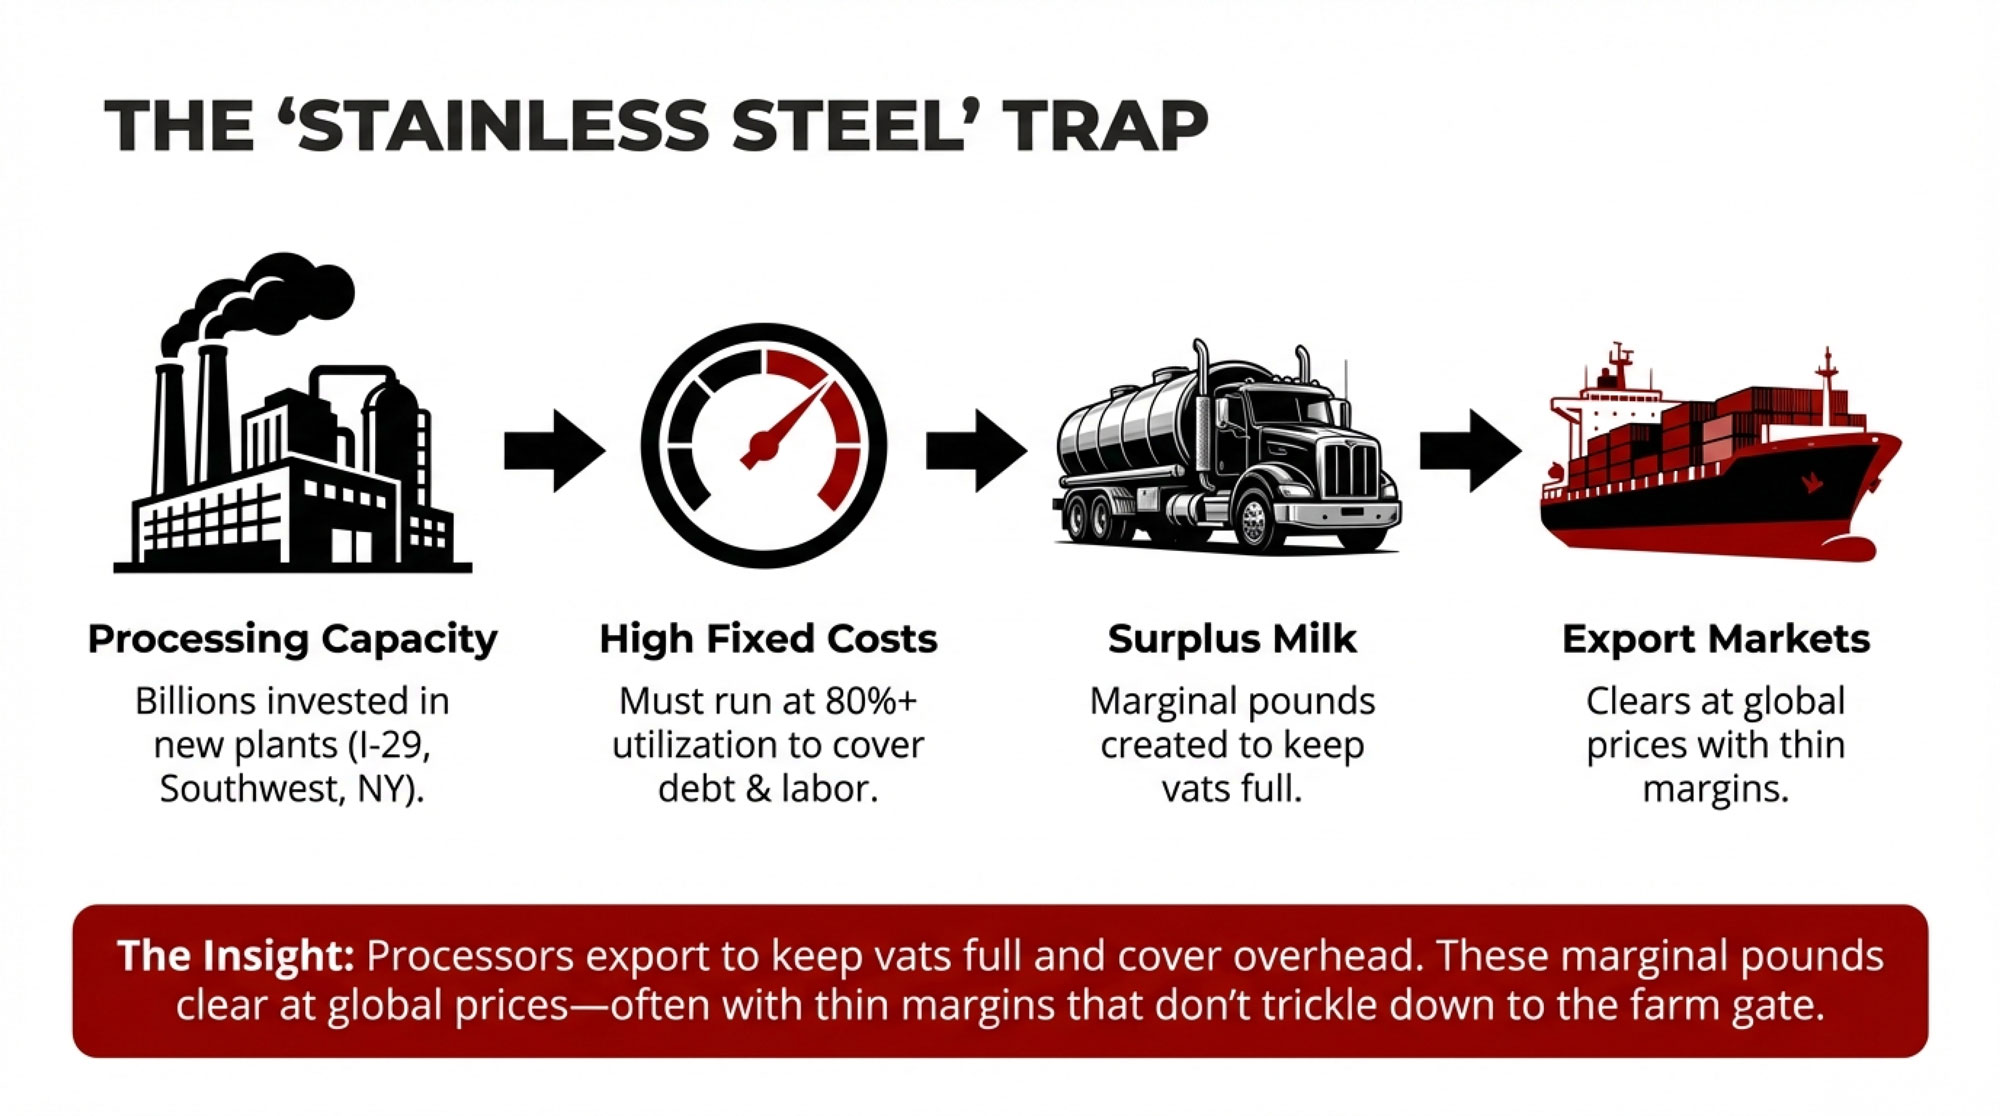
Here’s where the math gets real. Large cheese and powder plants are incredibly capital‑intensive. Dairy economists and plant managers consistently note that these facilities are built to run at high utilization—typically targeting 80 percent or higher—to spread fixed costs over as many cwt as possible. If you build a plant to handle 7 million pounds of milk a day and it only runs at 4 million, your cost per cwt jumps because the debt, labor, utilities, and maintenance don’t shrink just because the milk flow does.

So if the domestic market can only comfortably absorb, say, two‑thirds of what this whole system could produce at profitable prices, the rest has to move somewhere. That “somewhere” is export markets. USDEC summaries show that in 2024, the U.S. shipped record or near‑record volumes of cheese to destinations such as Mexico, South Korea, and Central America, and moved significant quantities of skim milk powder and whey to Asia and Latin America.

From the plant’s point of view, moving that extra product overseas at thin margins is often better than leaving vats idle. From your side of the milk check, those marginal export pounds don’t always create enough added value per cwt—after you factor in global competition, freight, and currency—to show up as a big jump. The plant can spread its fixed costs over a larger volume. You might see a bit better basis at times, but not the windfall “8.2 billion dollars” sounds like on a slide.

That’s the first piece of the export paradox: big export dollars and stubborn milk checks can absolutely coexist.

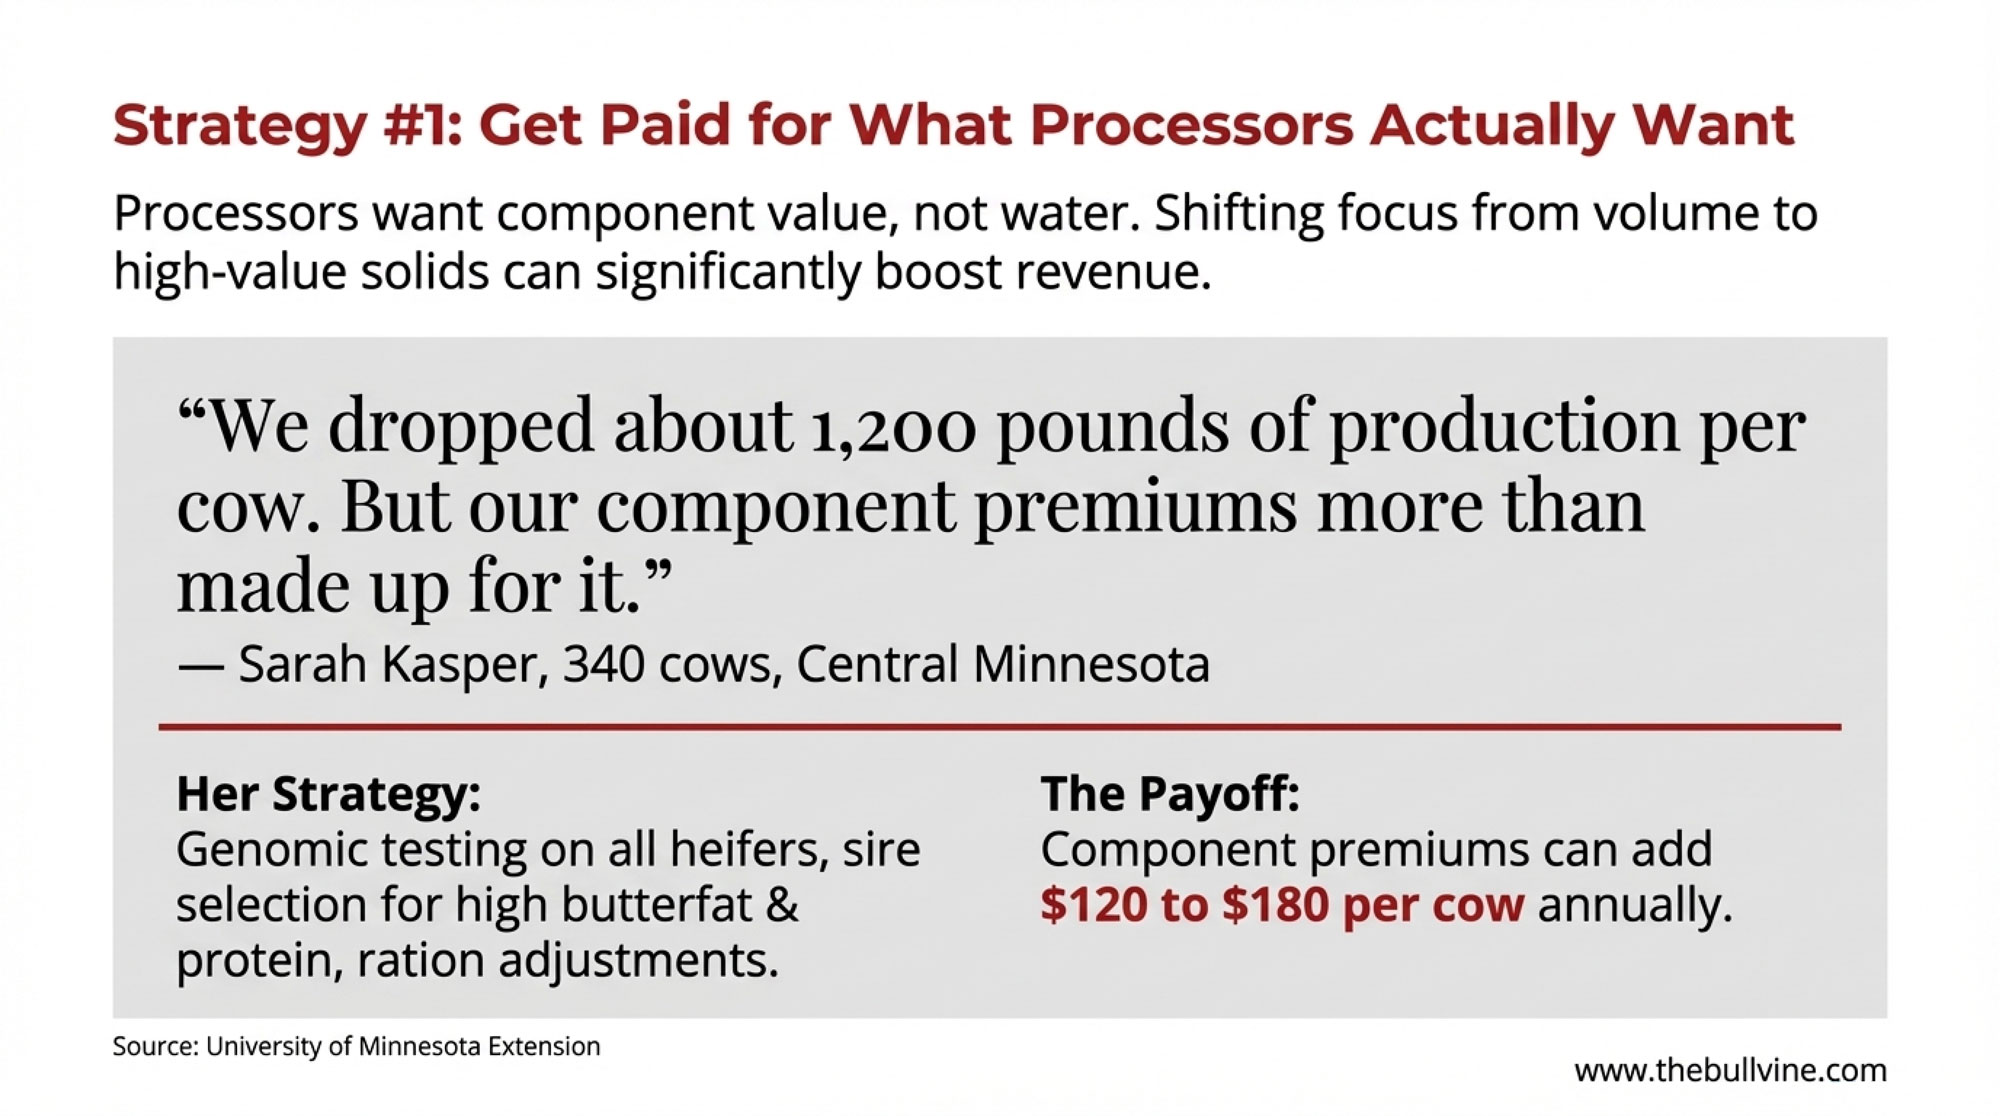
What Farmers Are Finding About Components

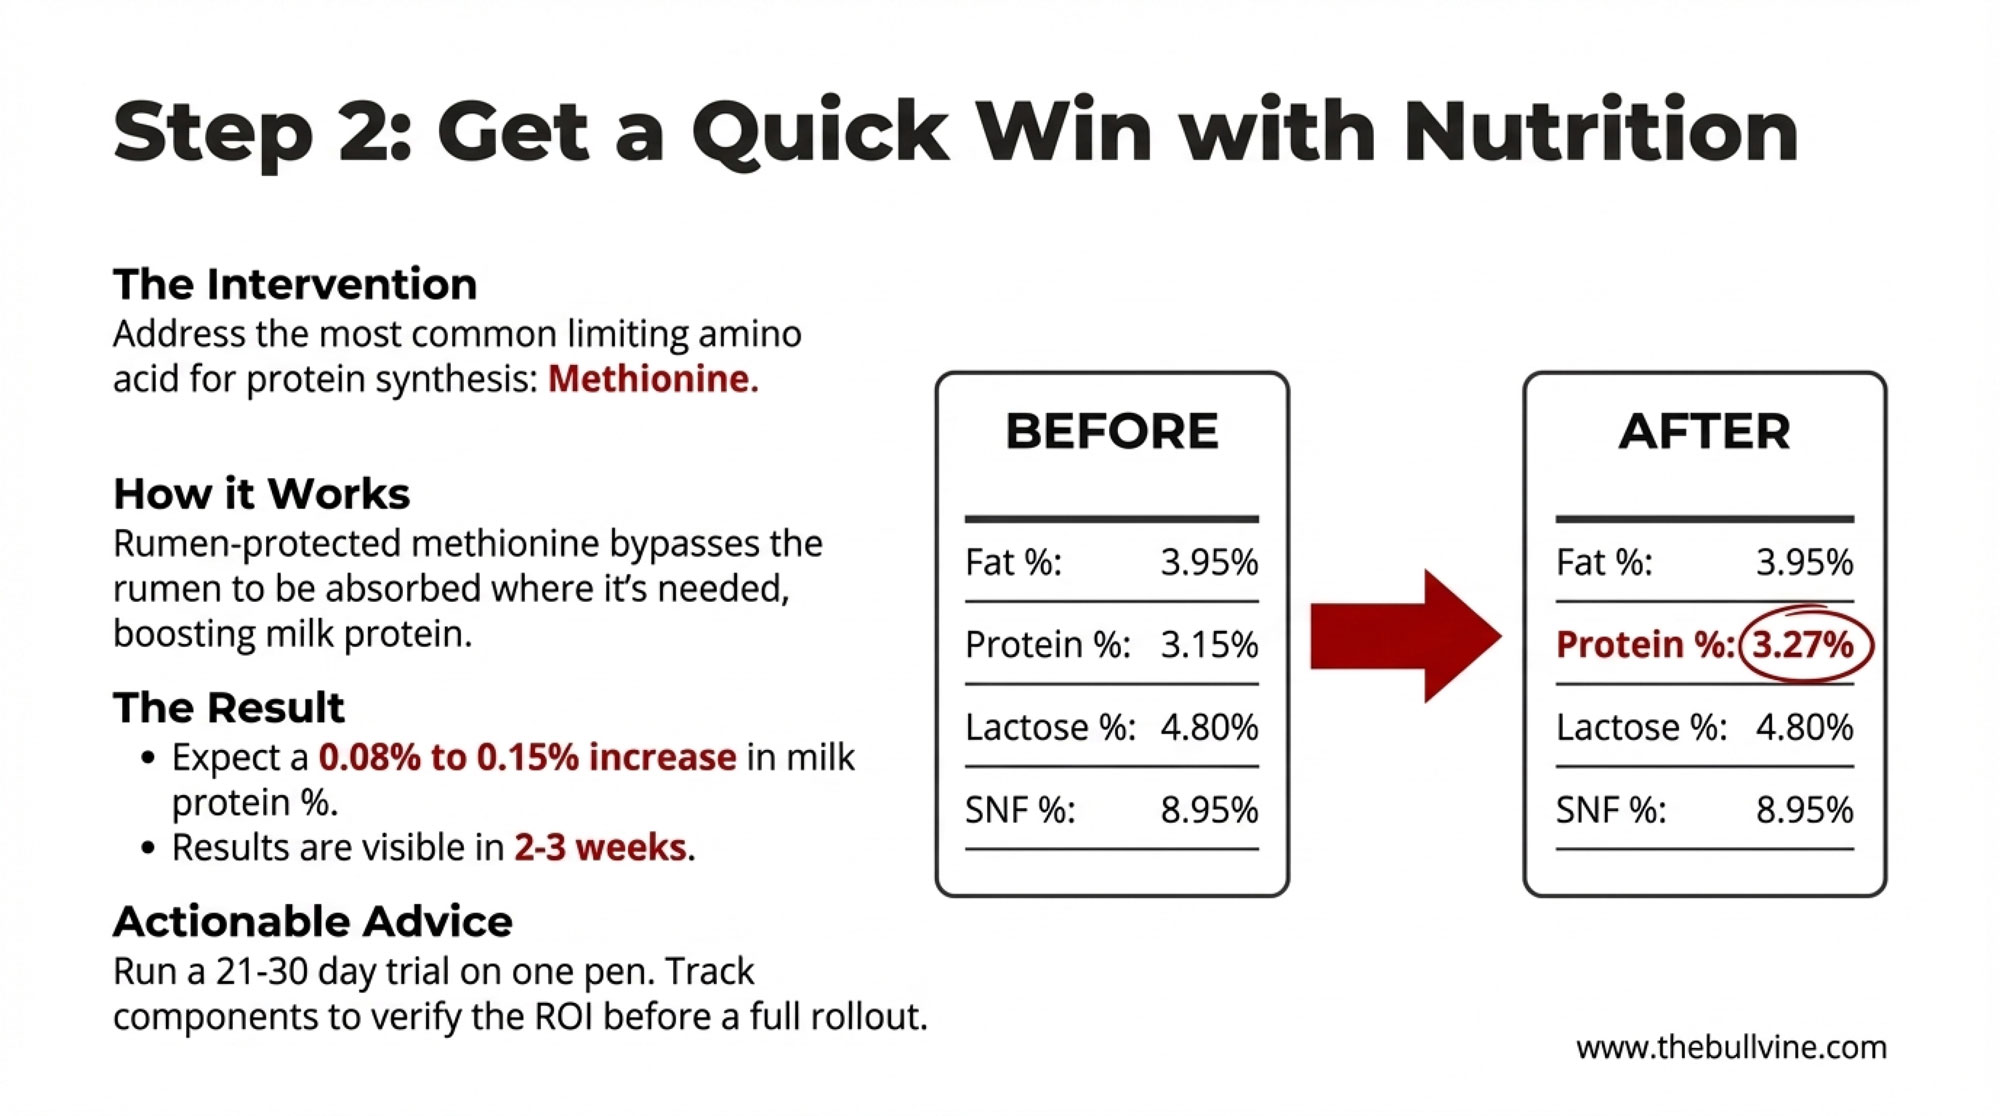
Now let’s bring this back into the parlor, because butterfat levels and protein are doing more of the talking on your milk check than many of us expected a few years ago.

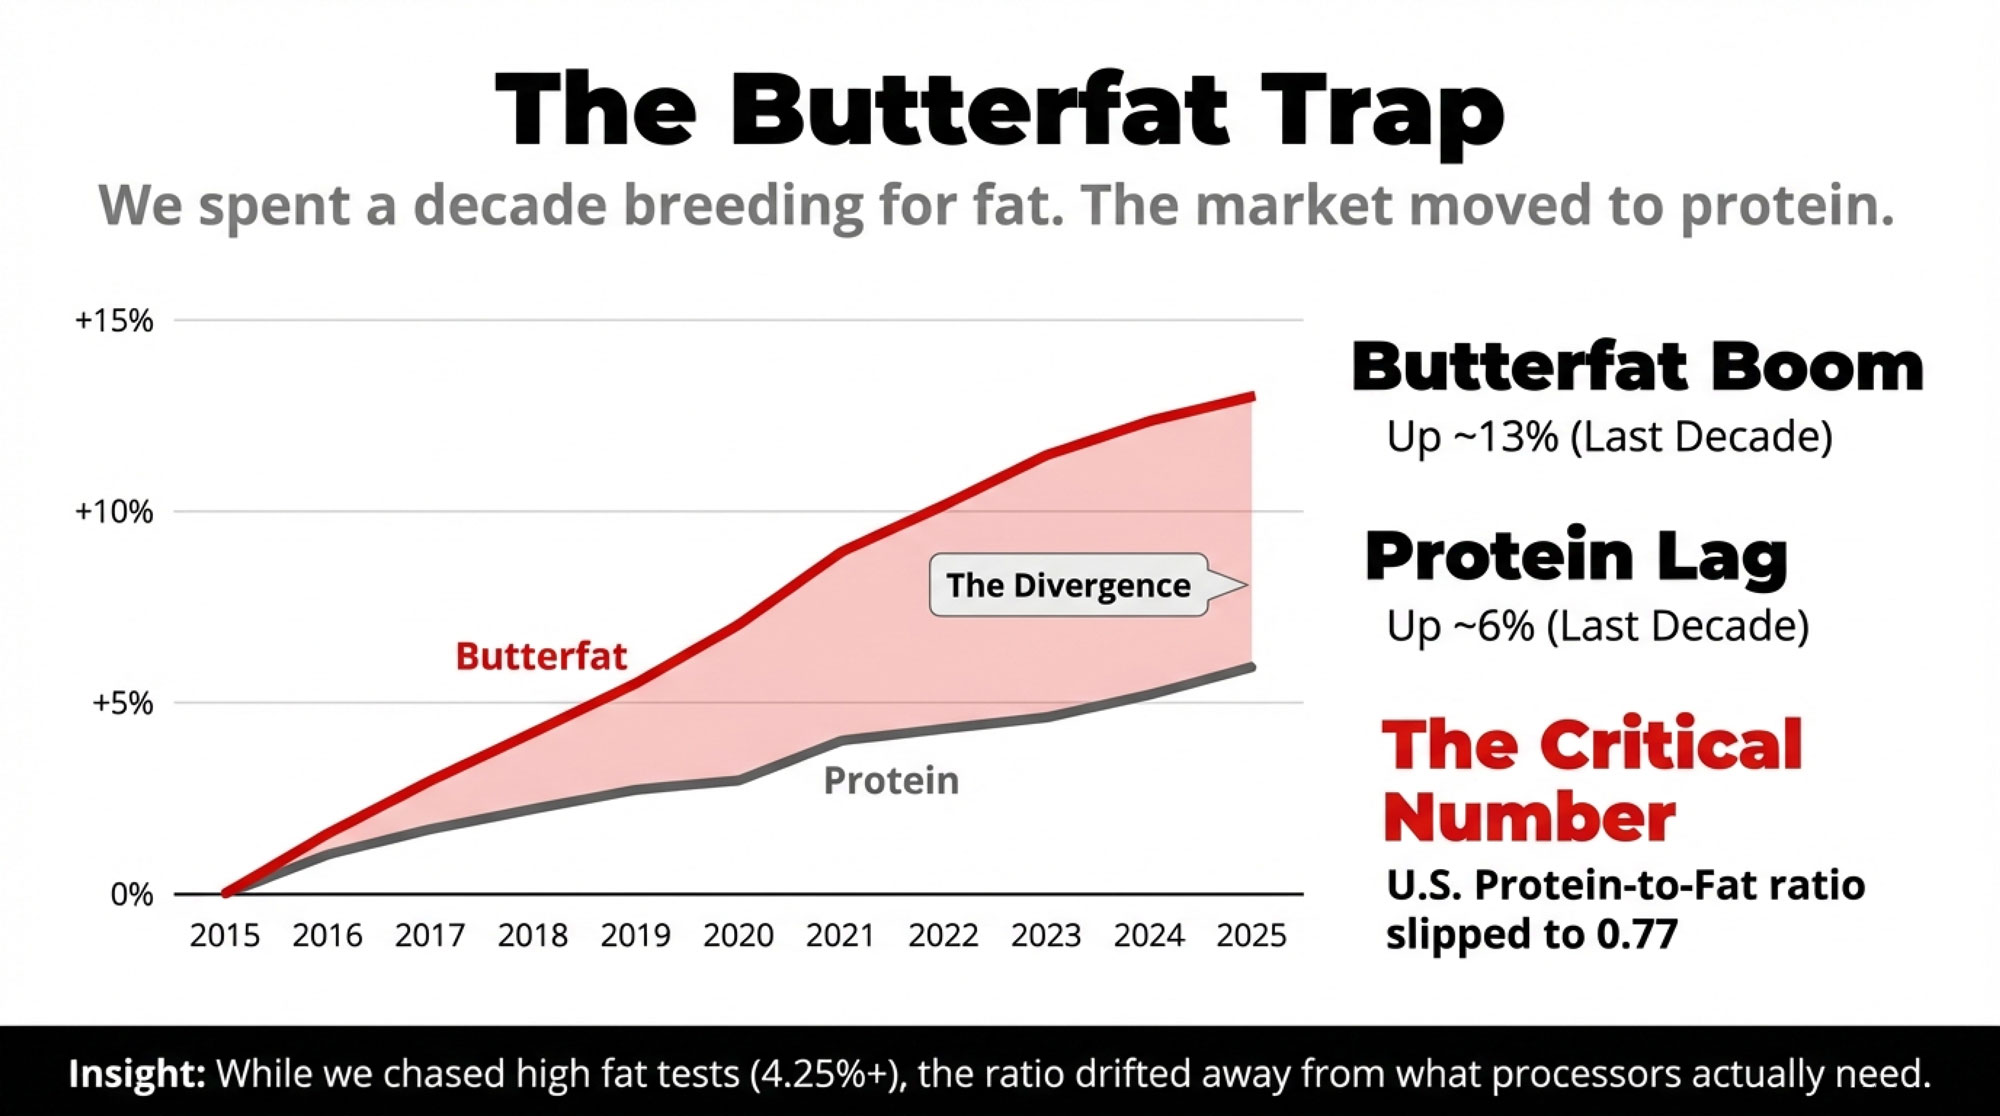
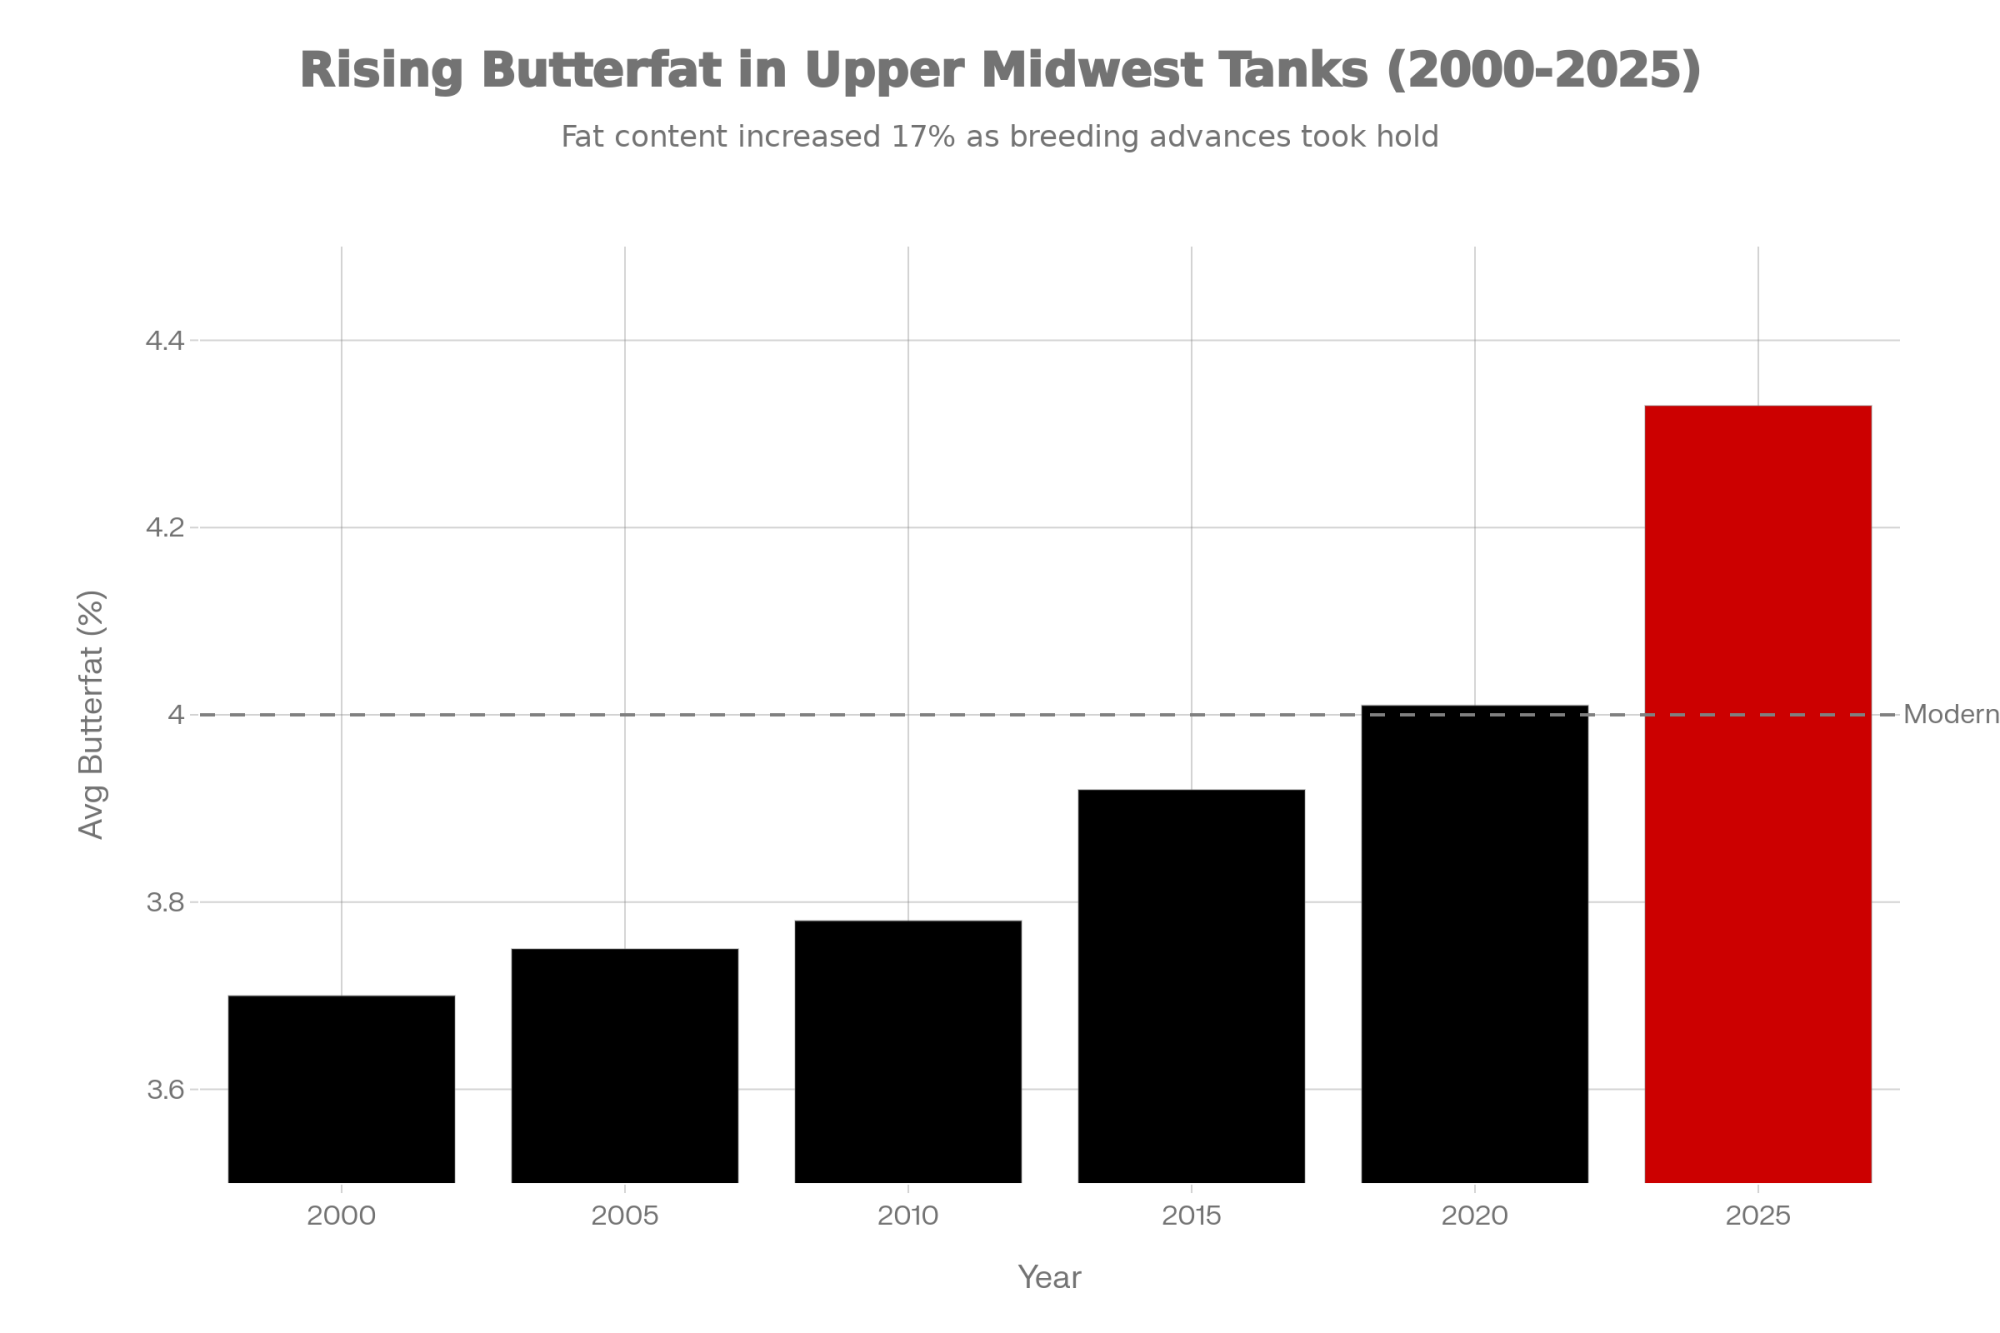
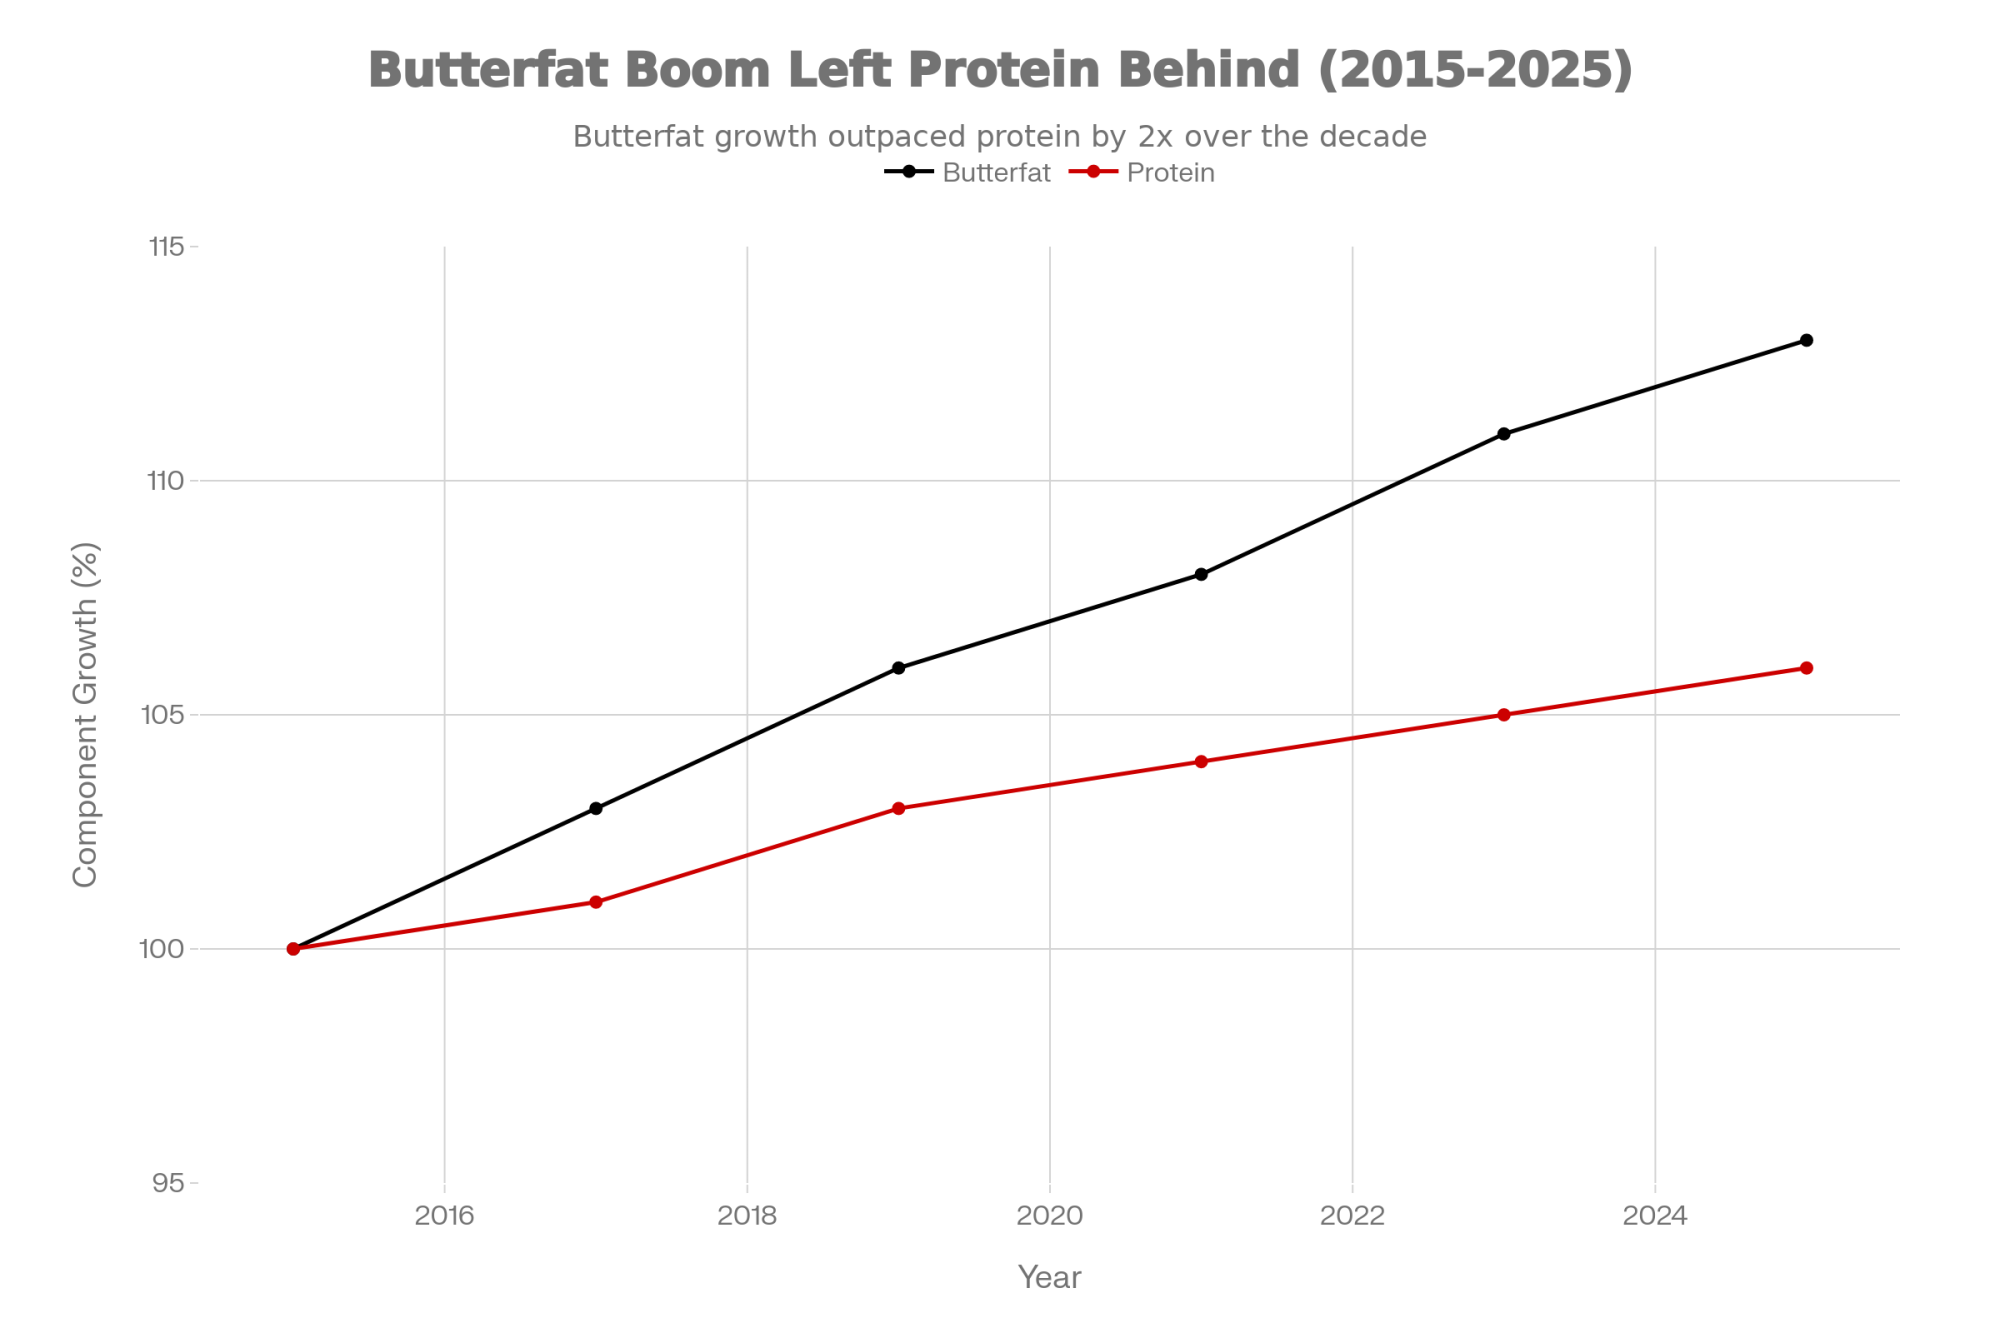
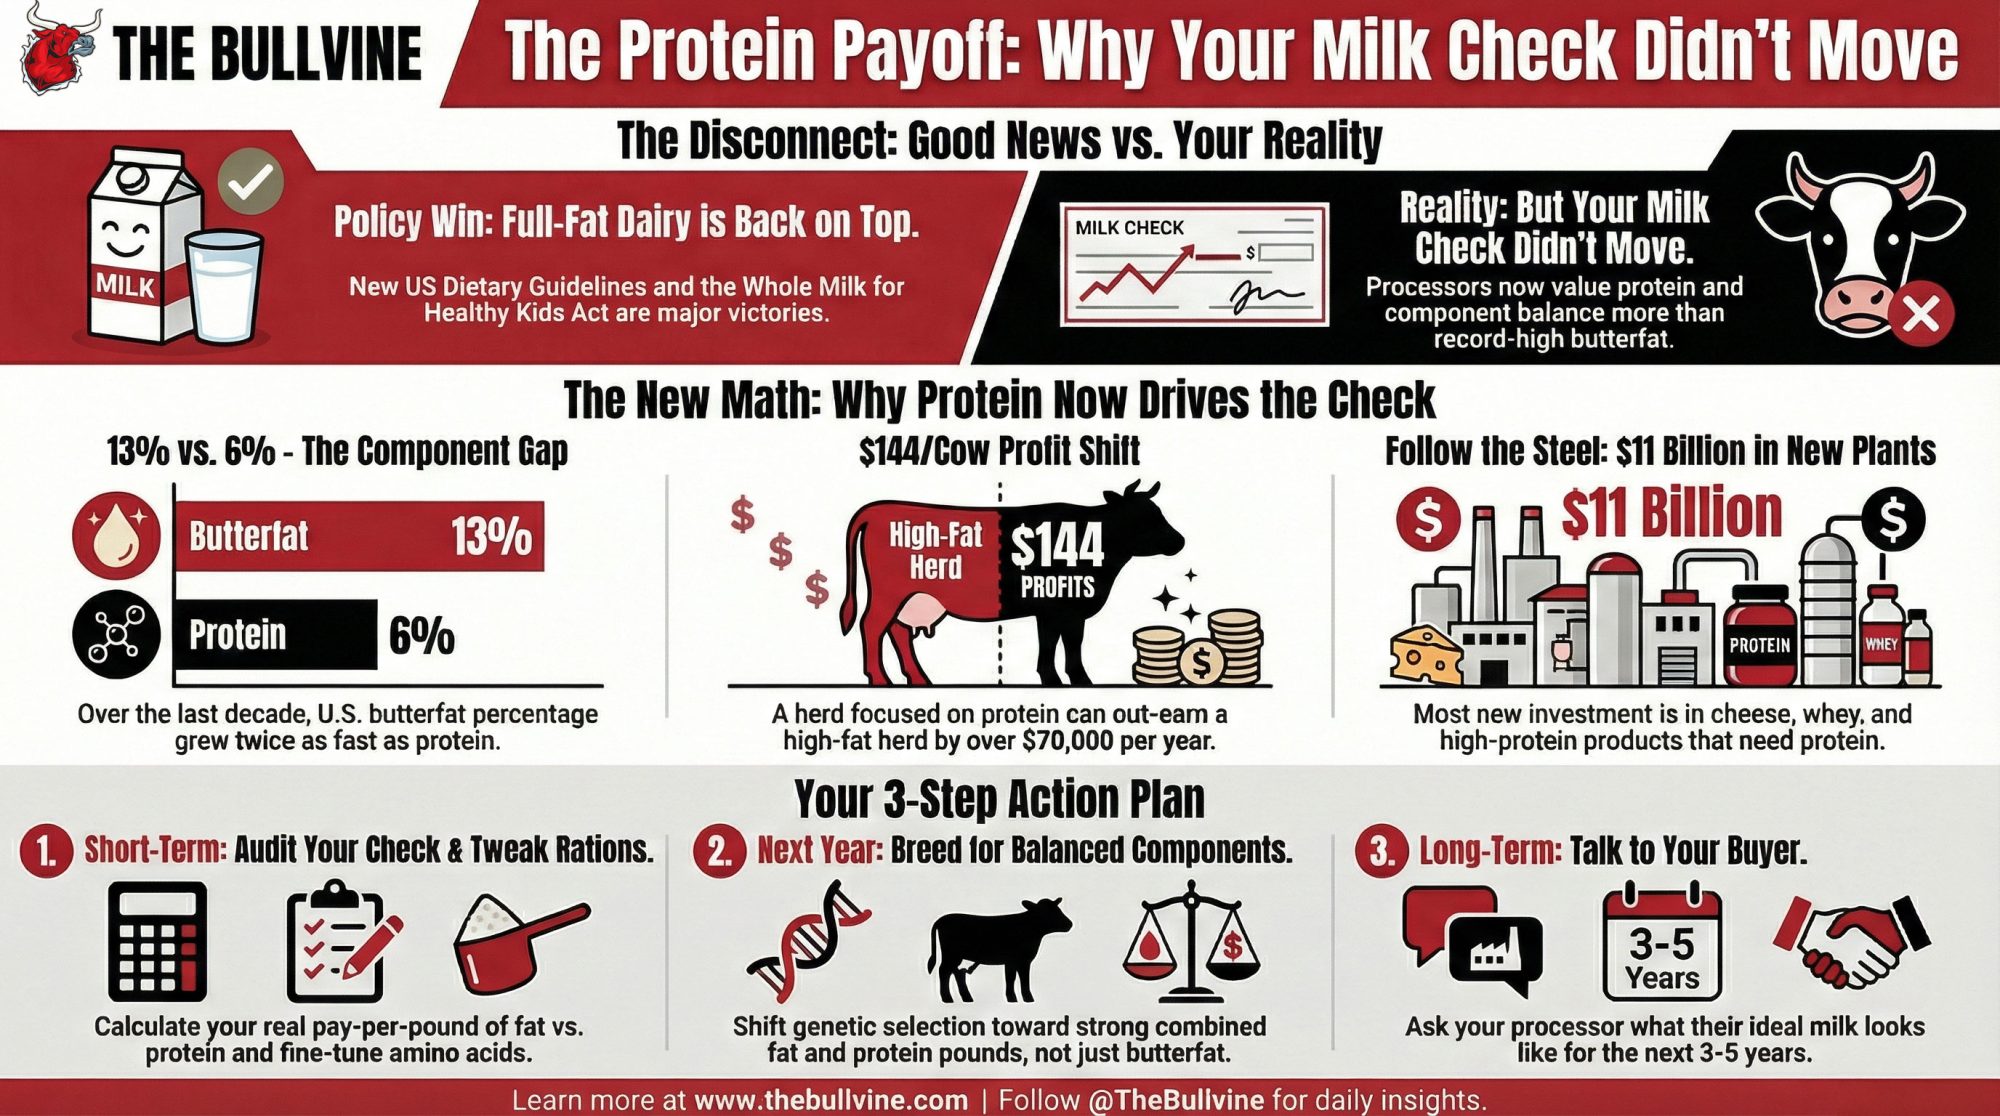
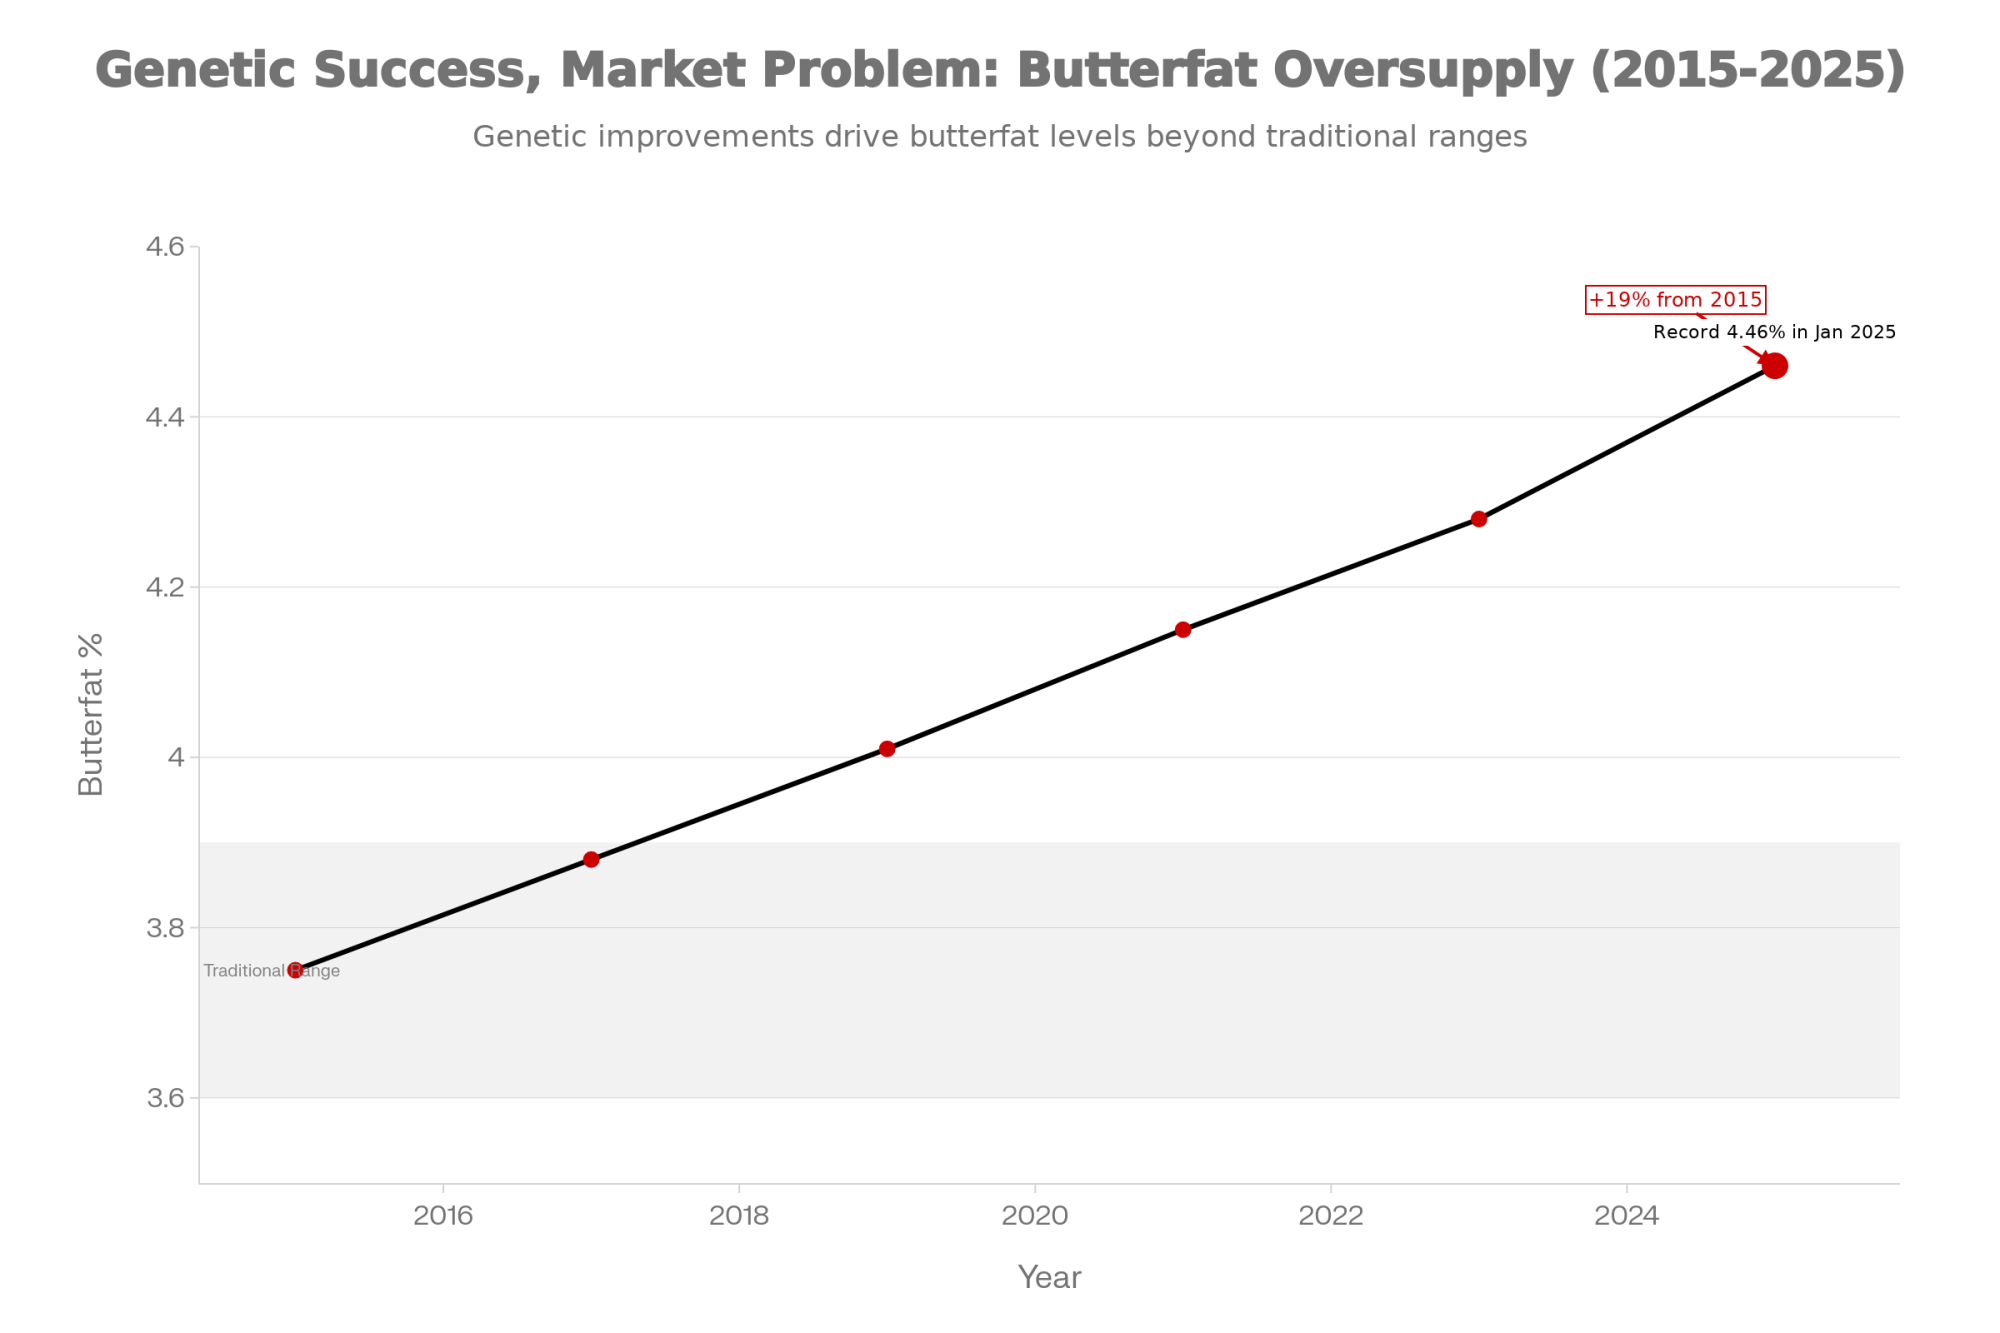
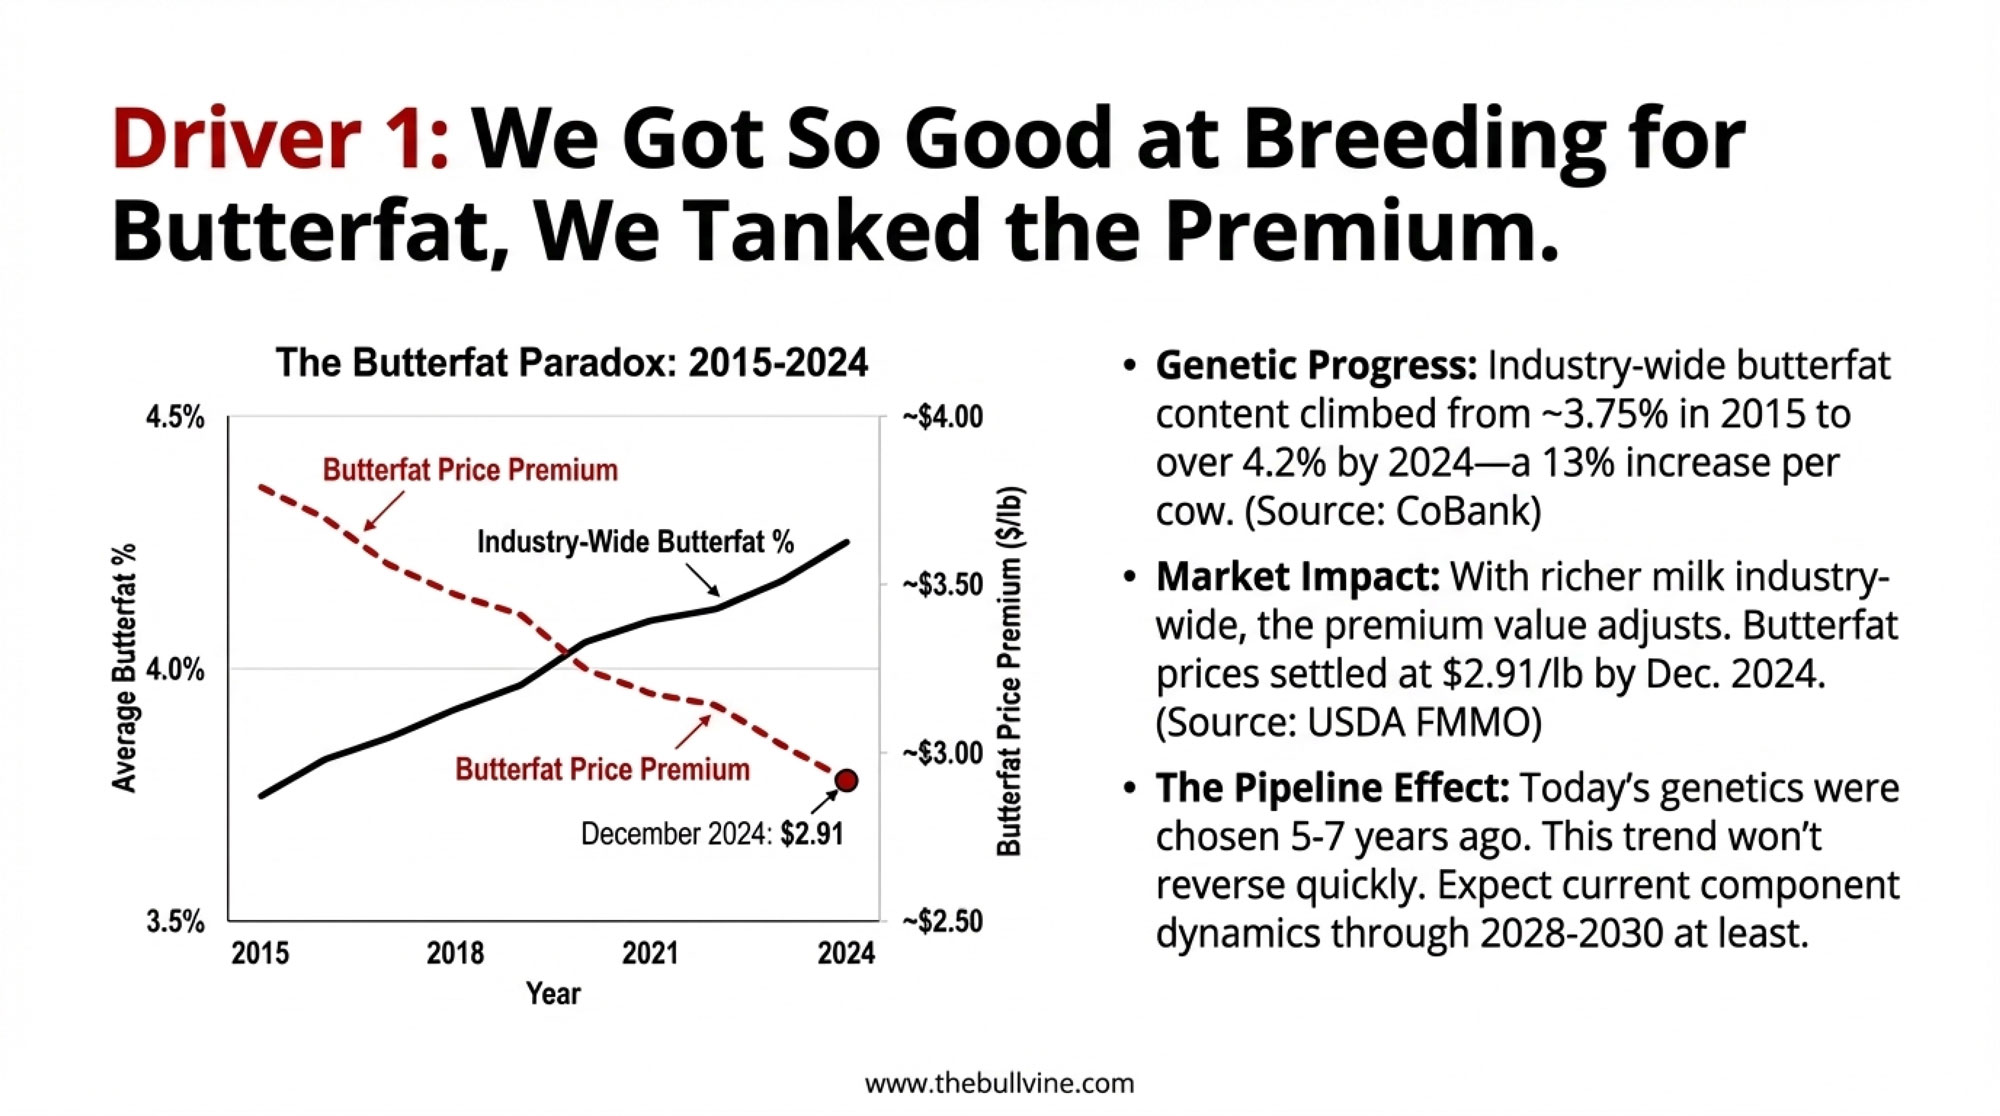
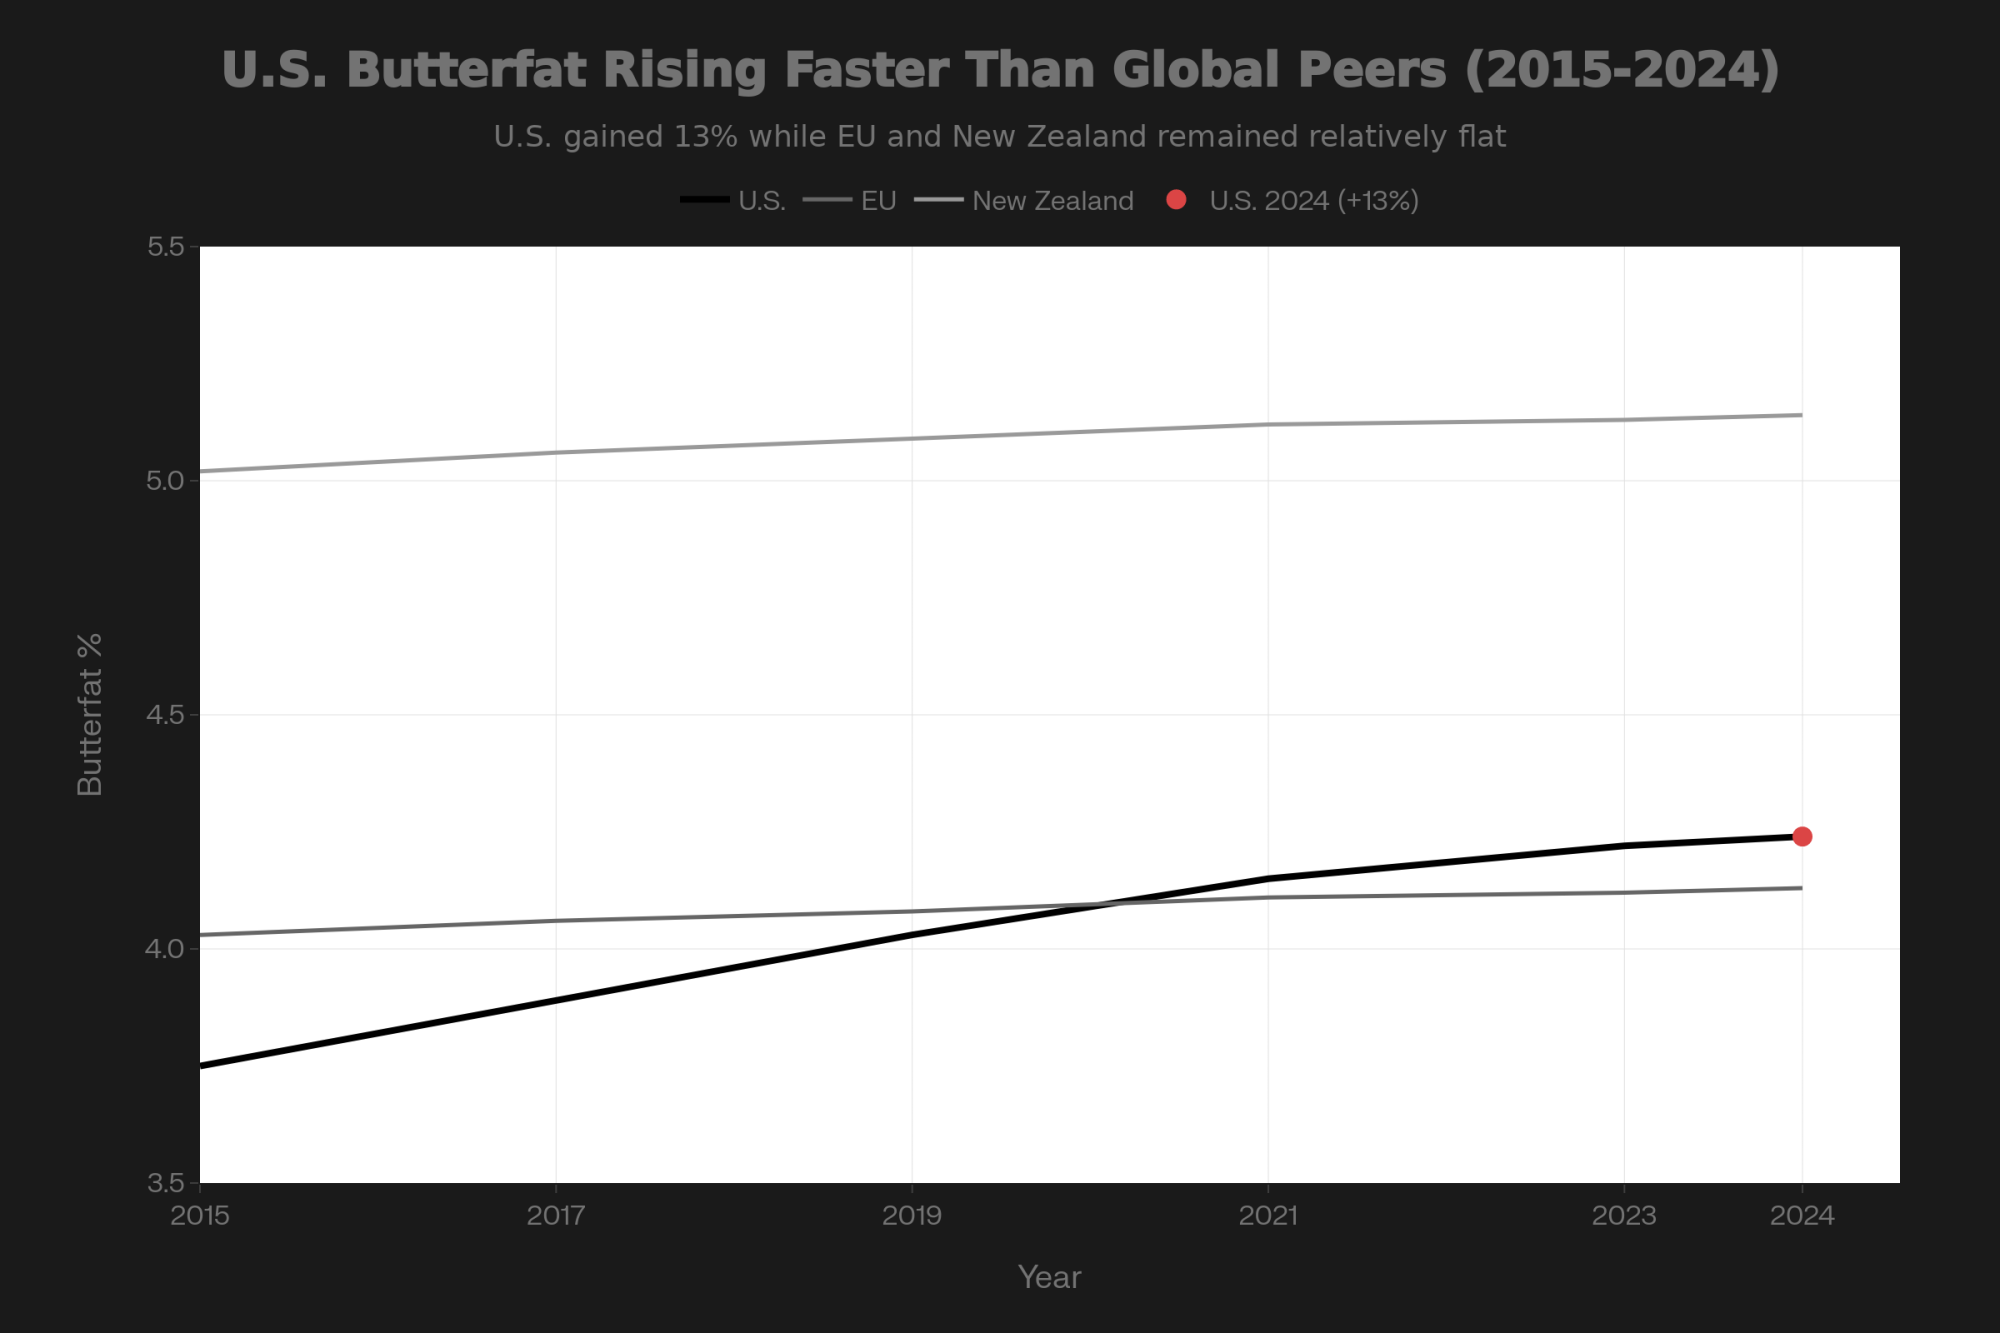
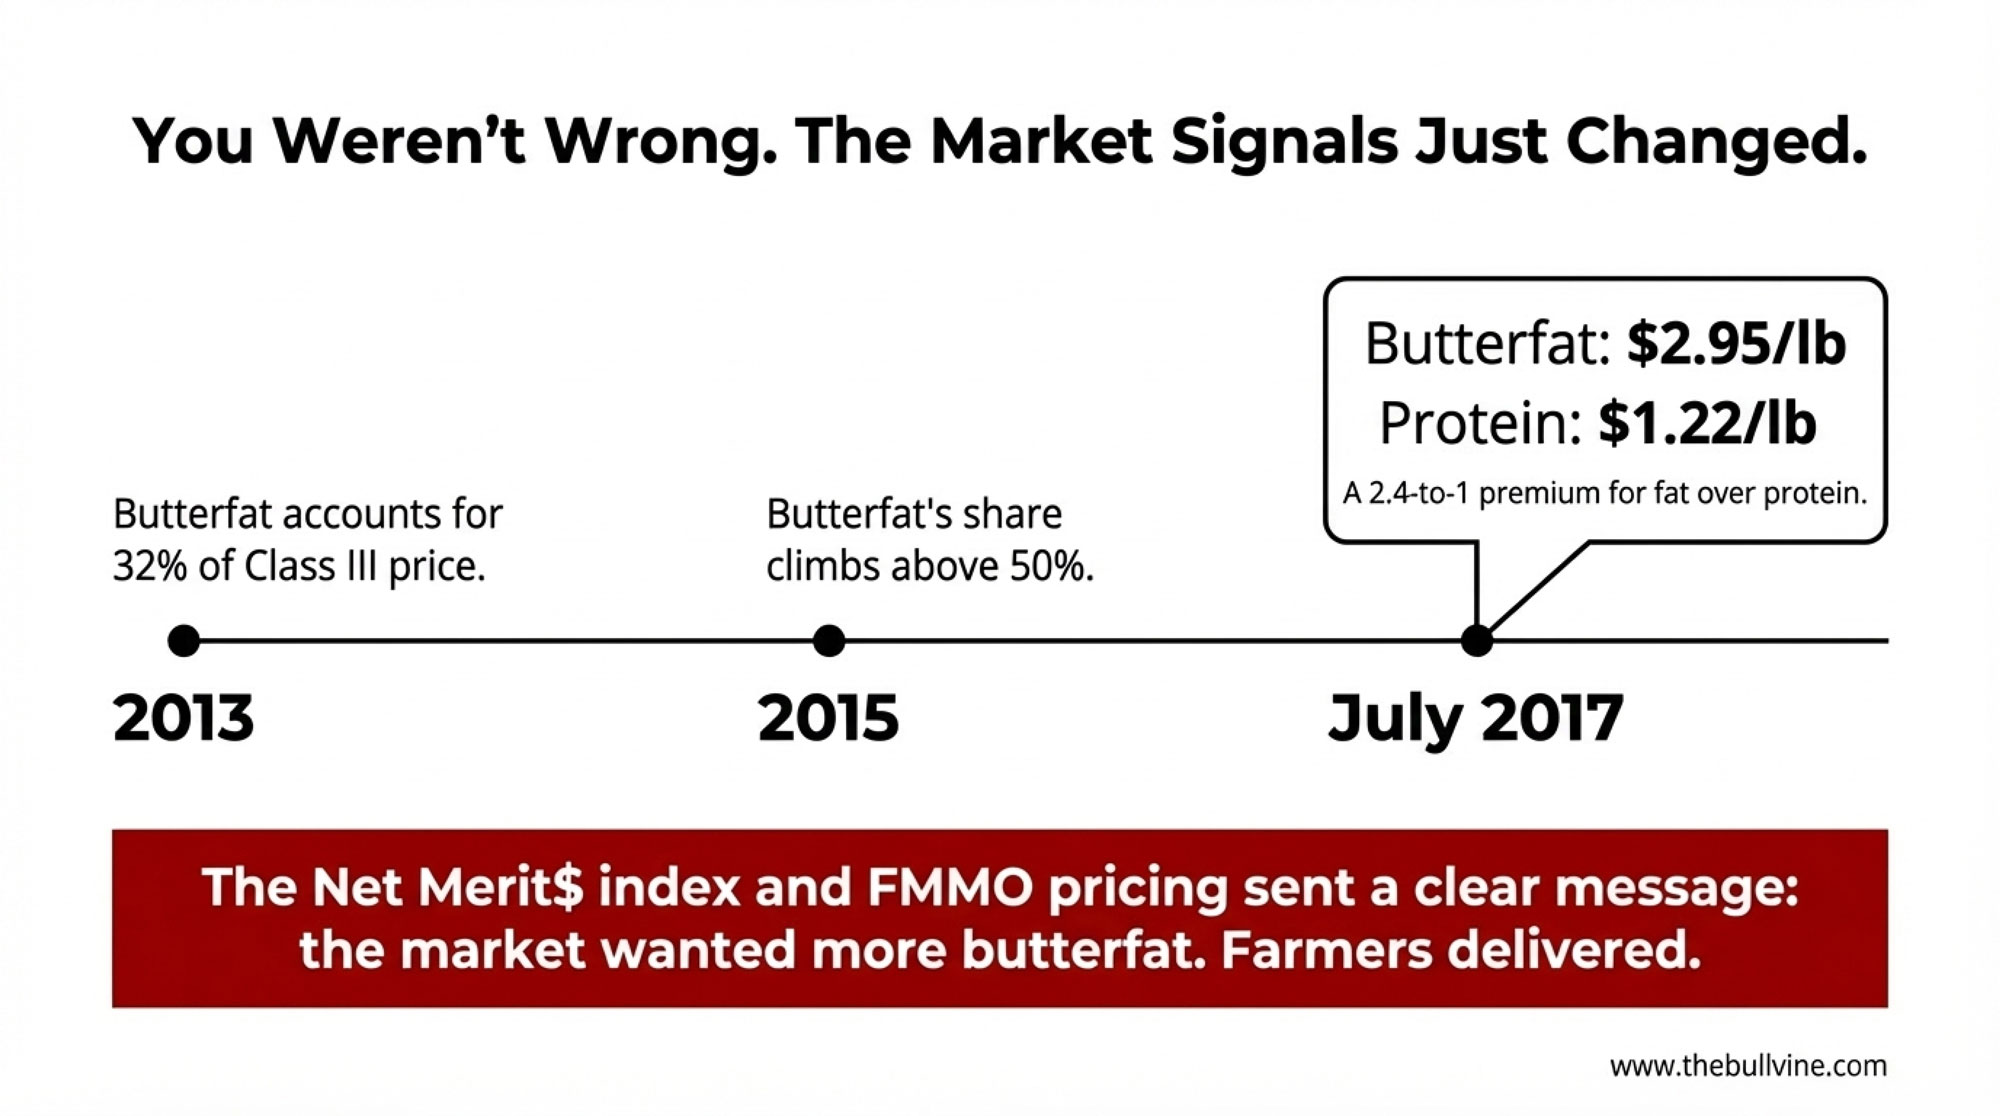
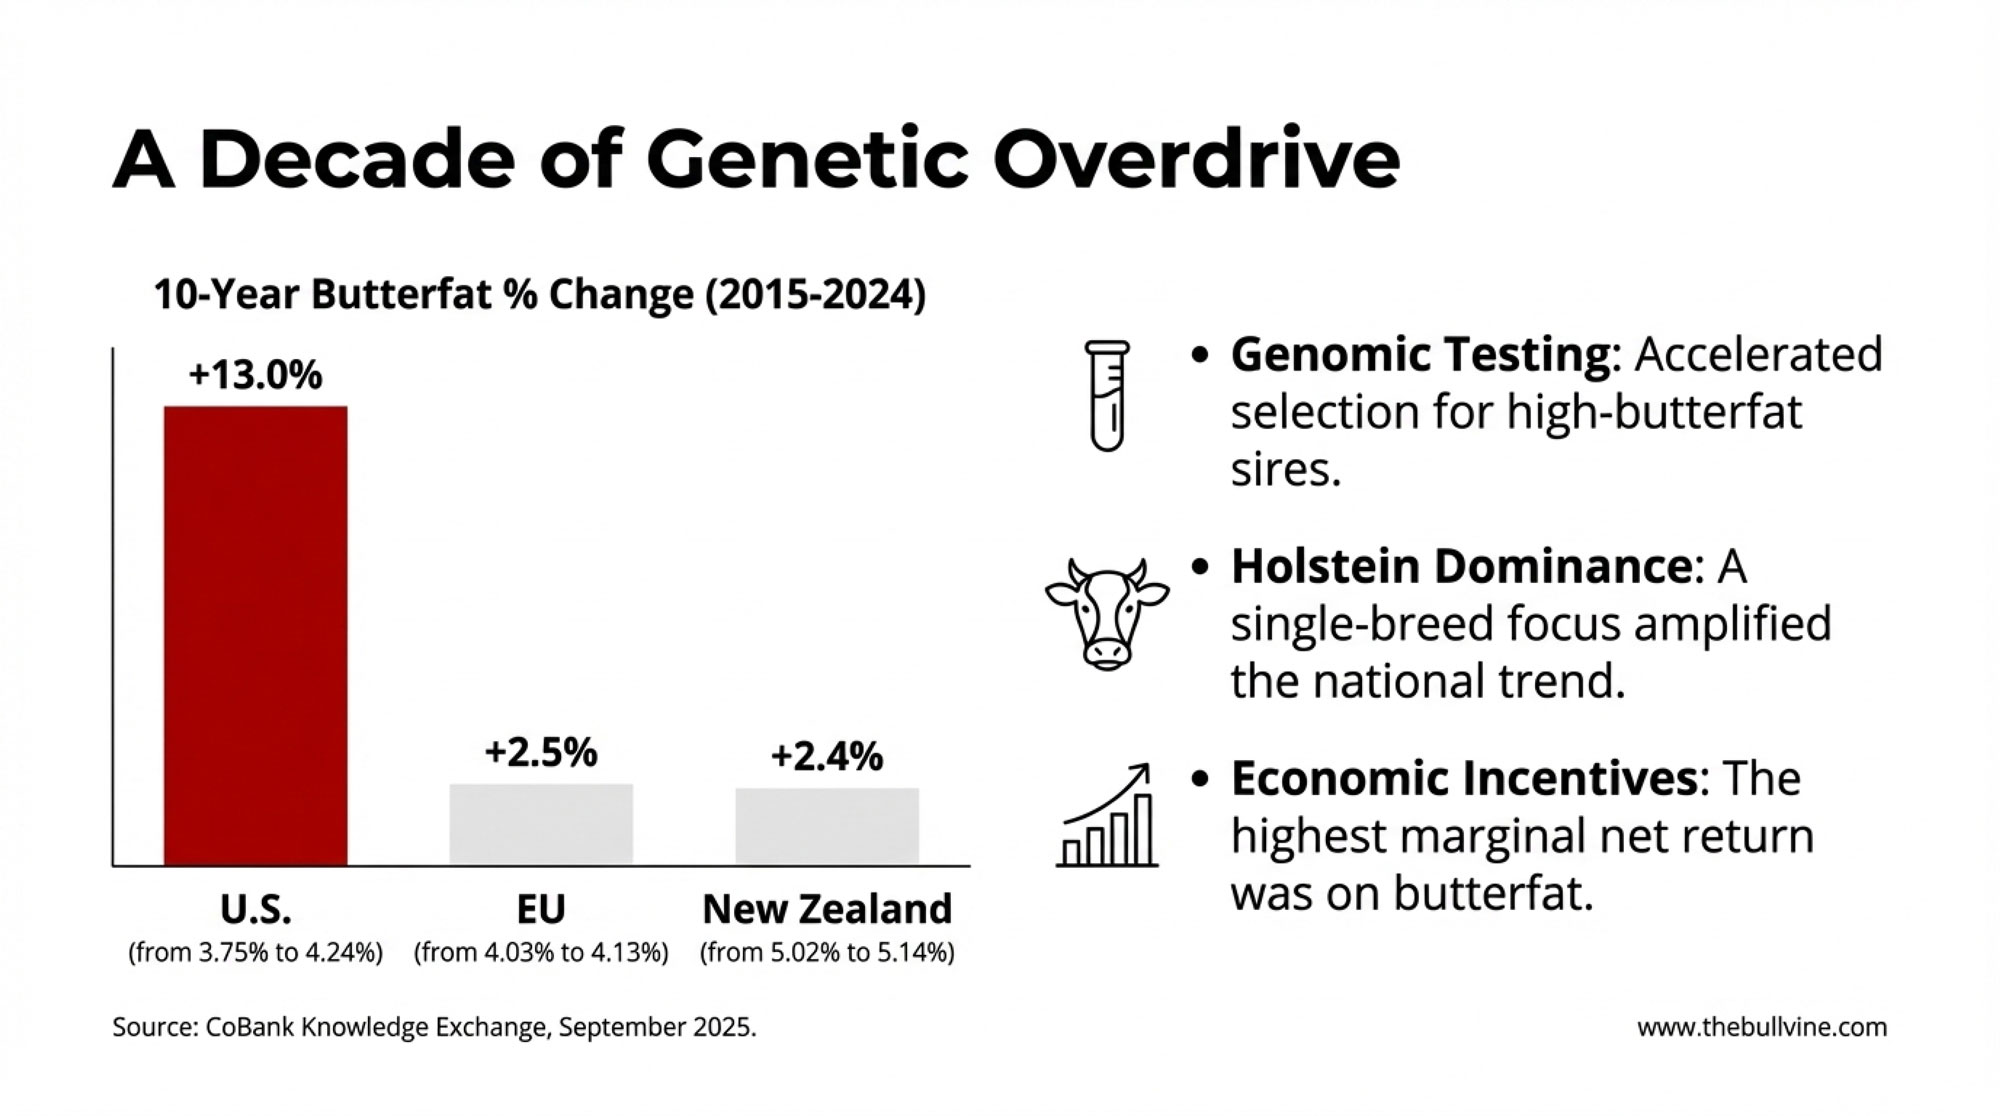
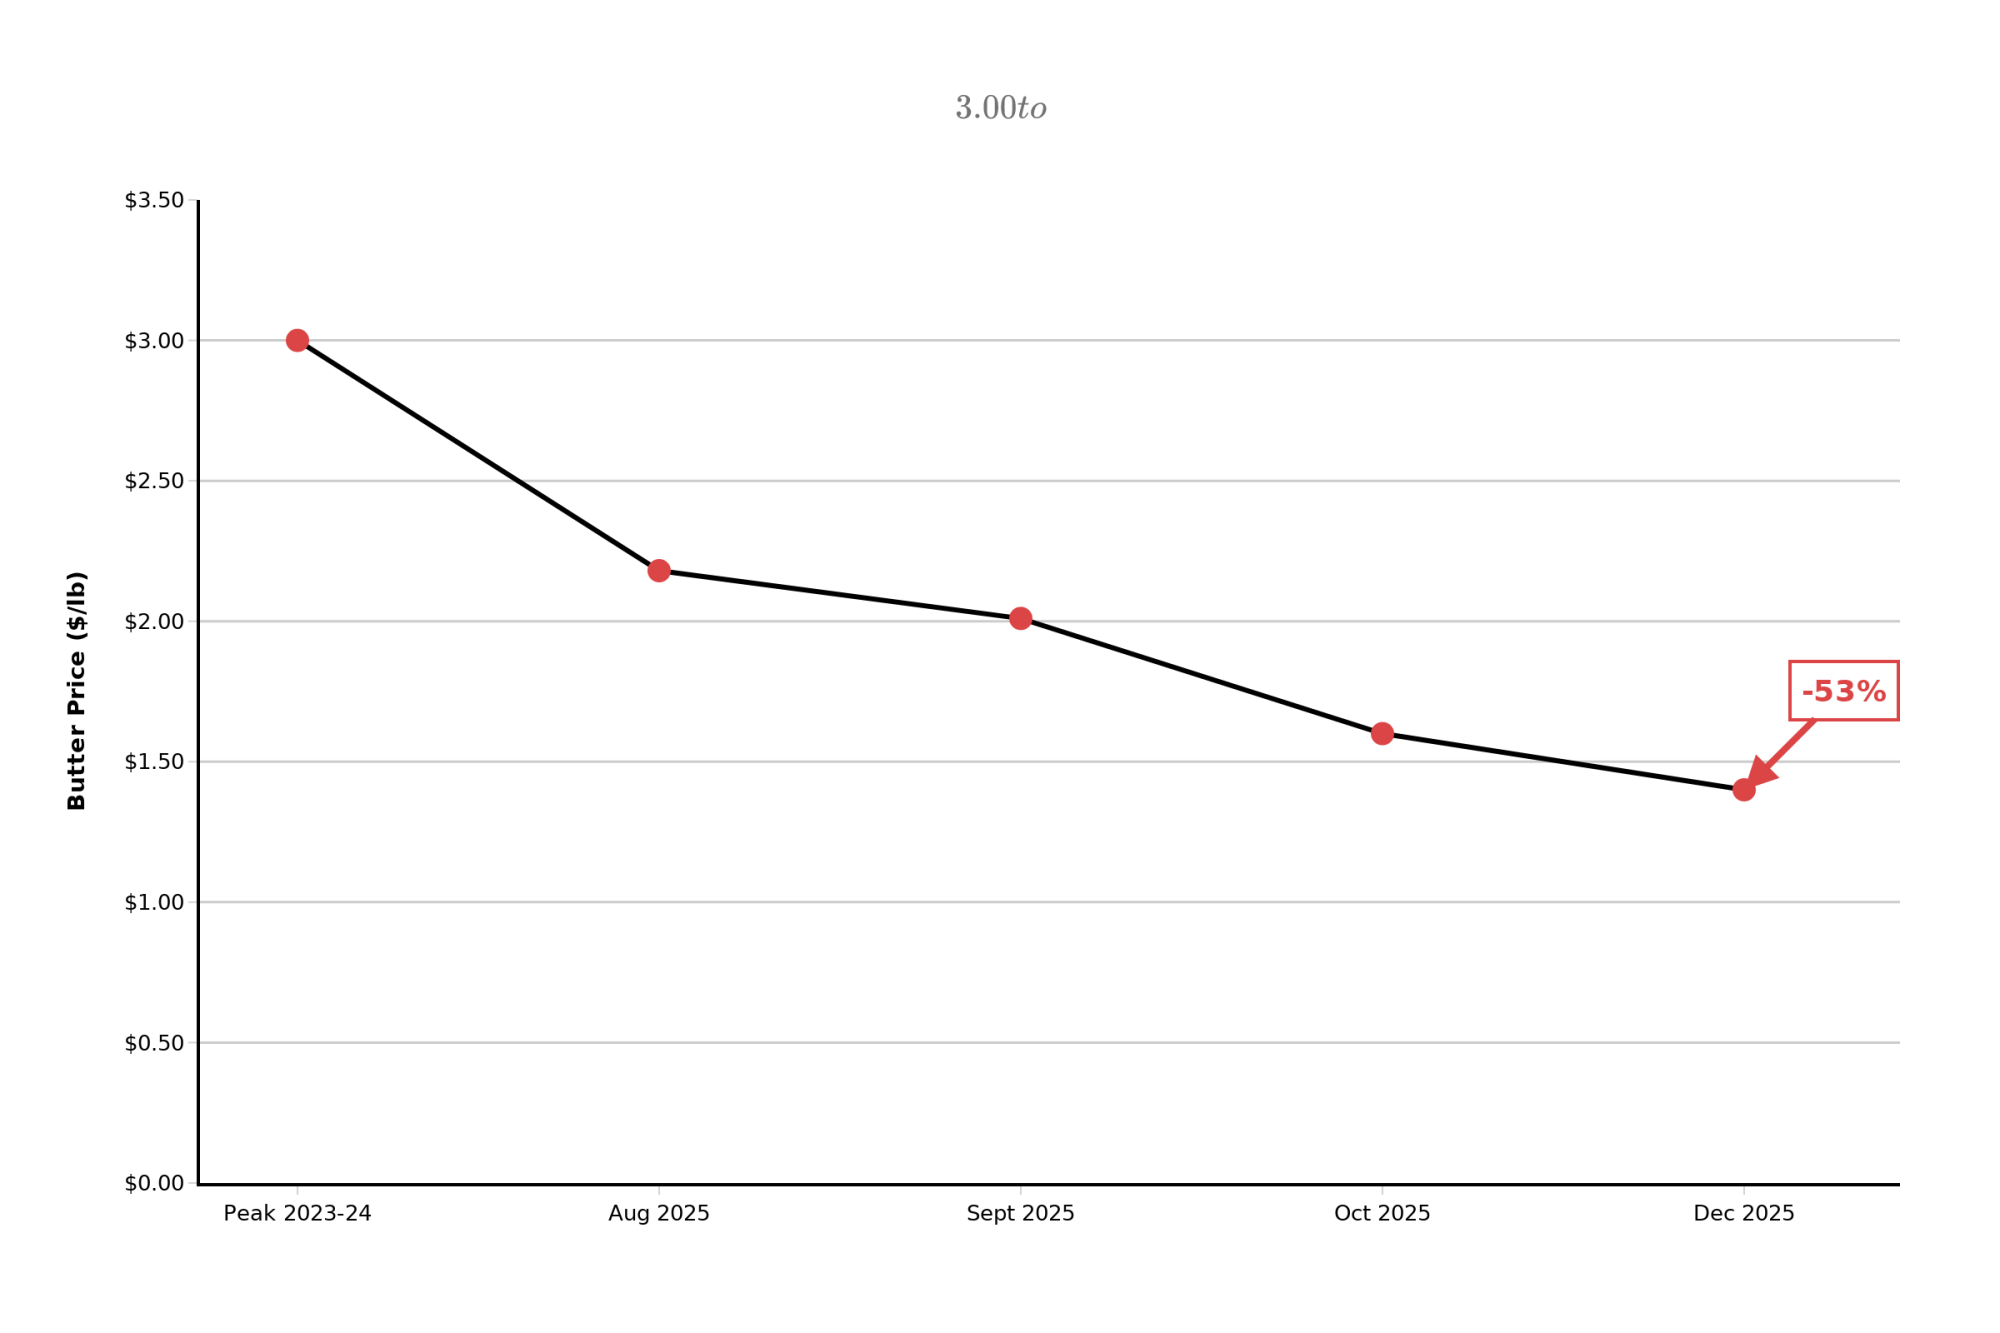
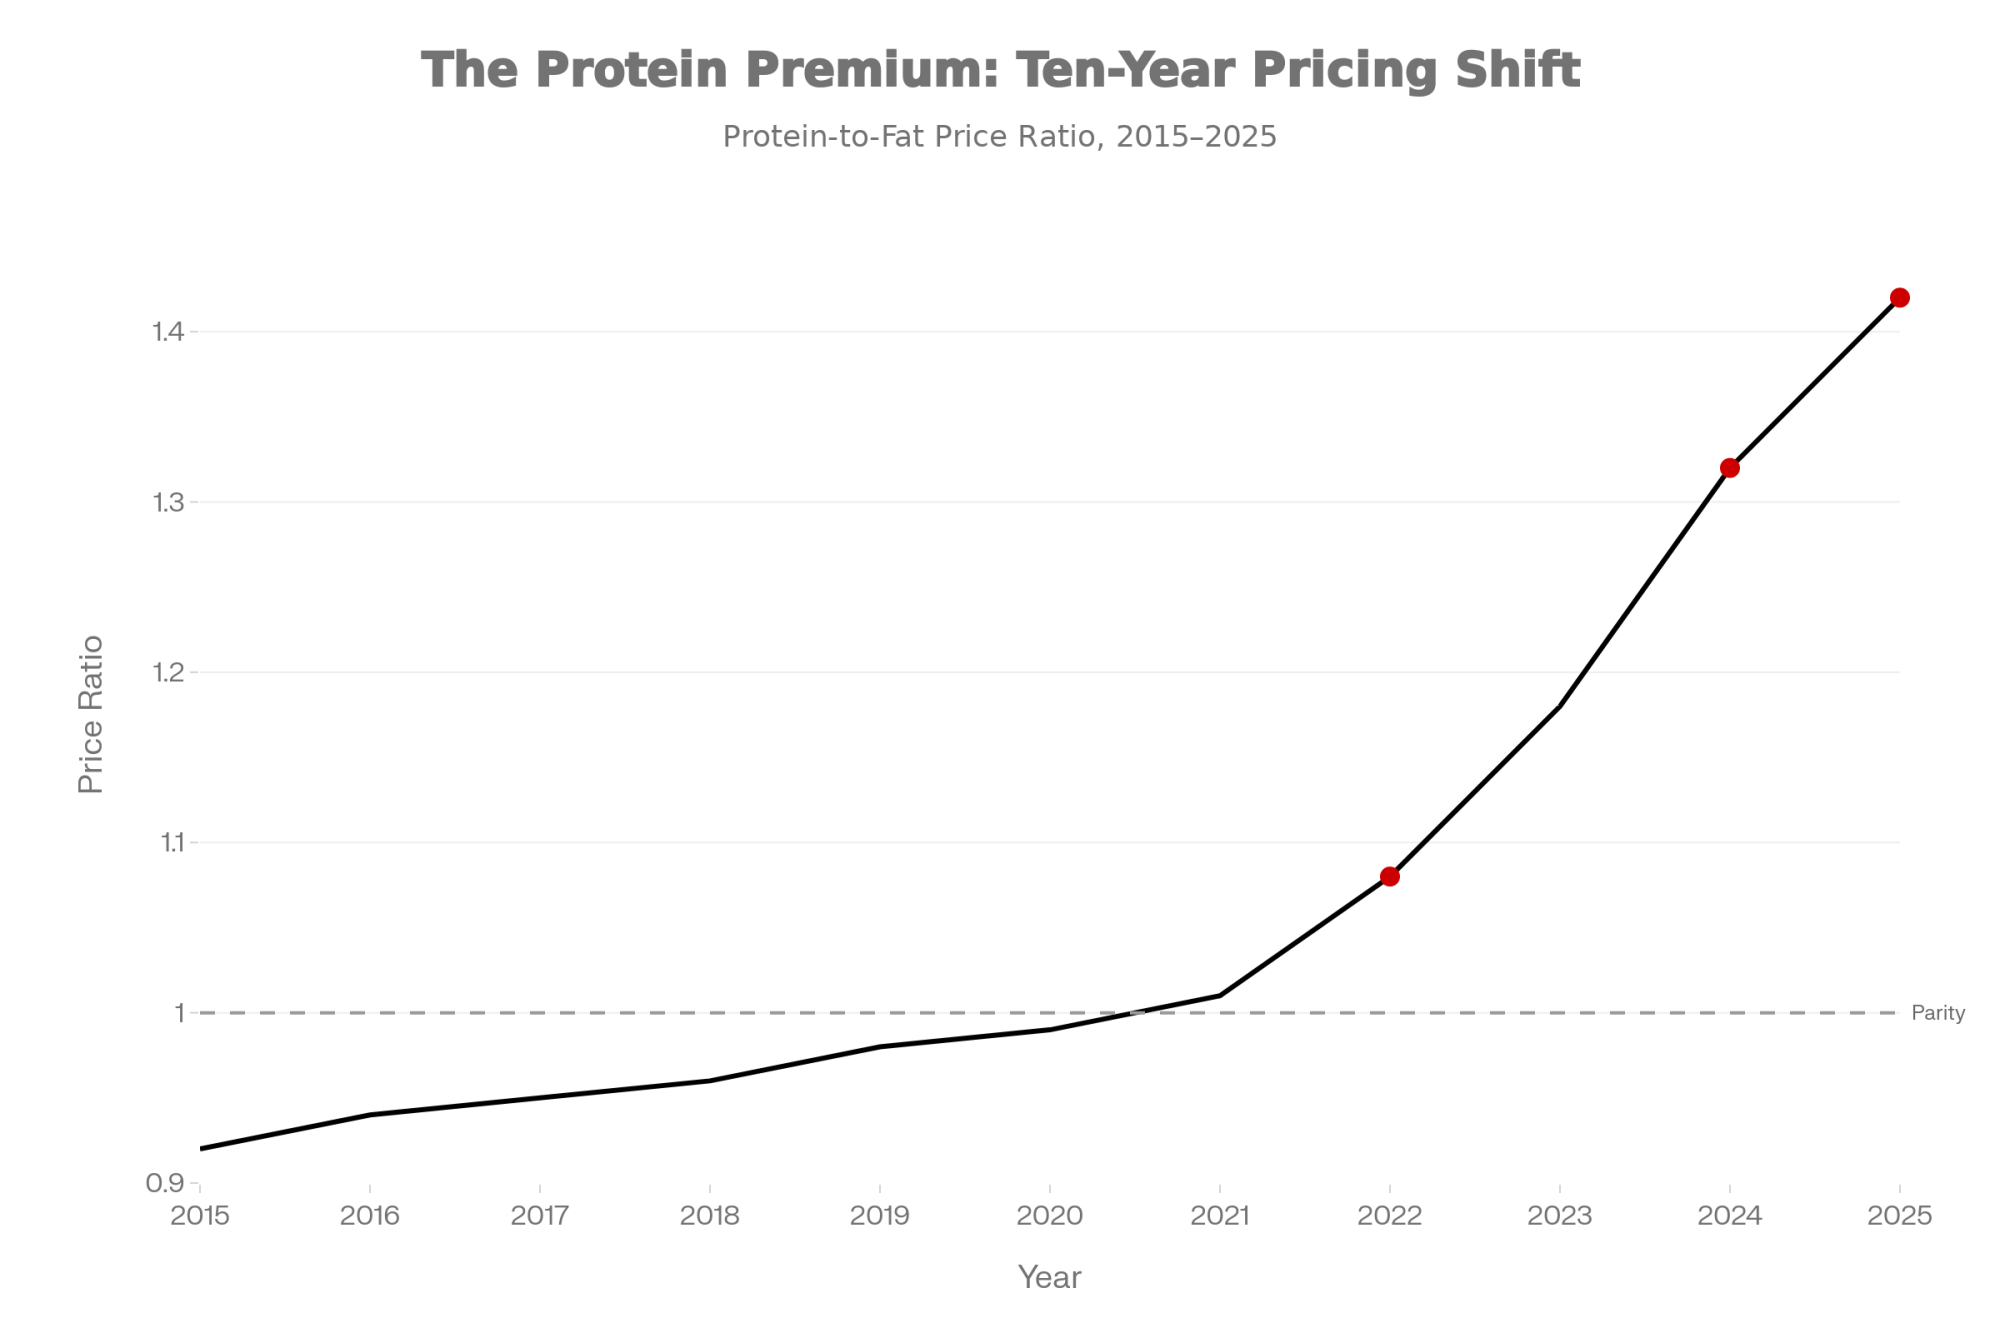
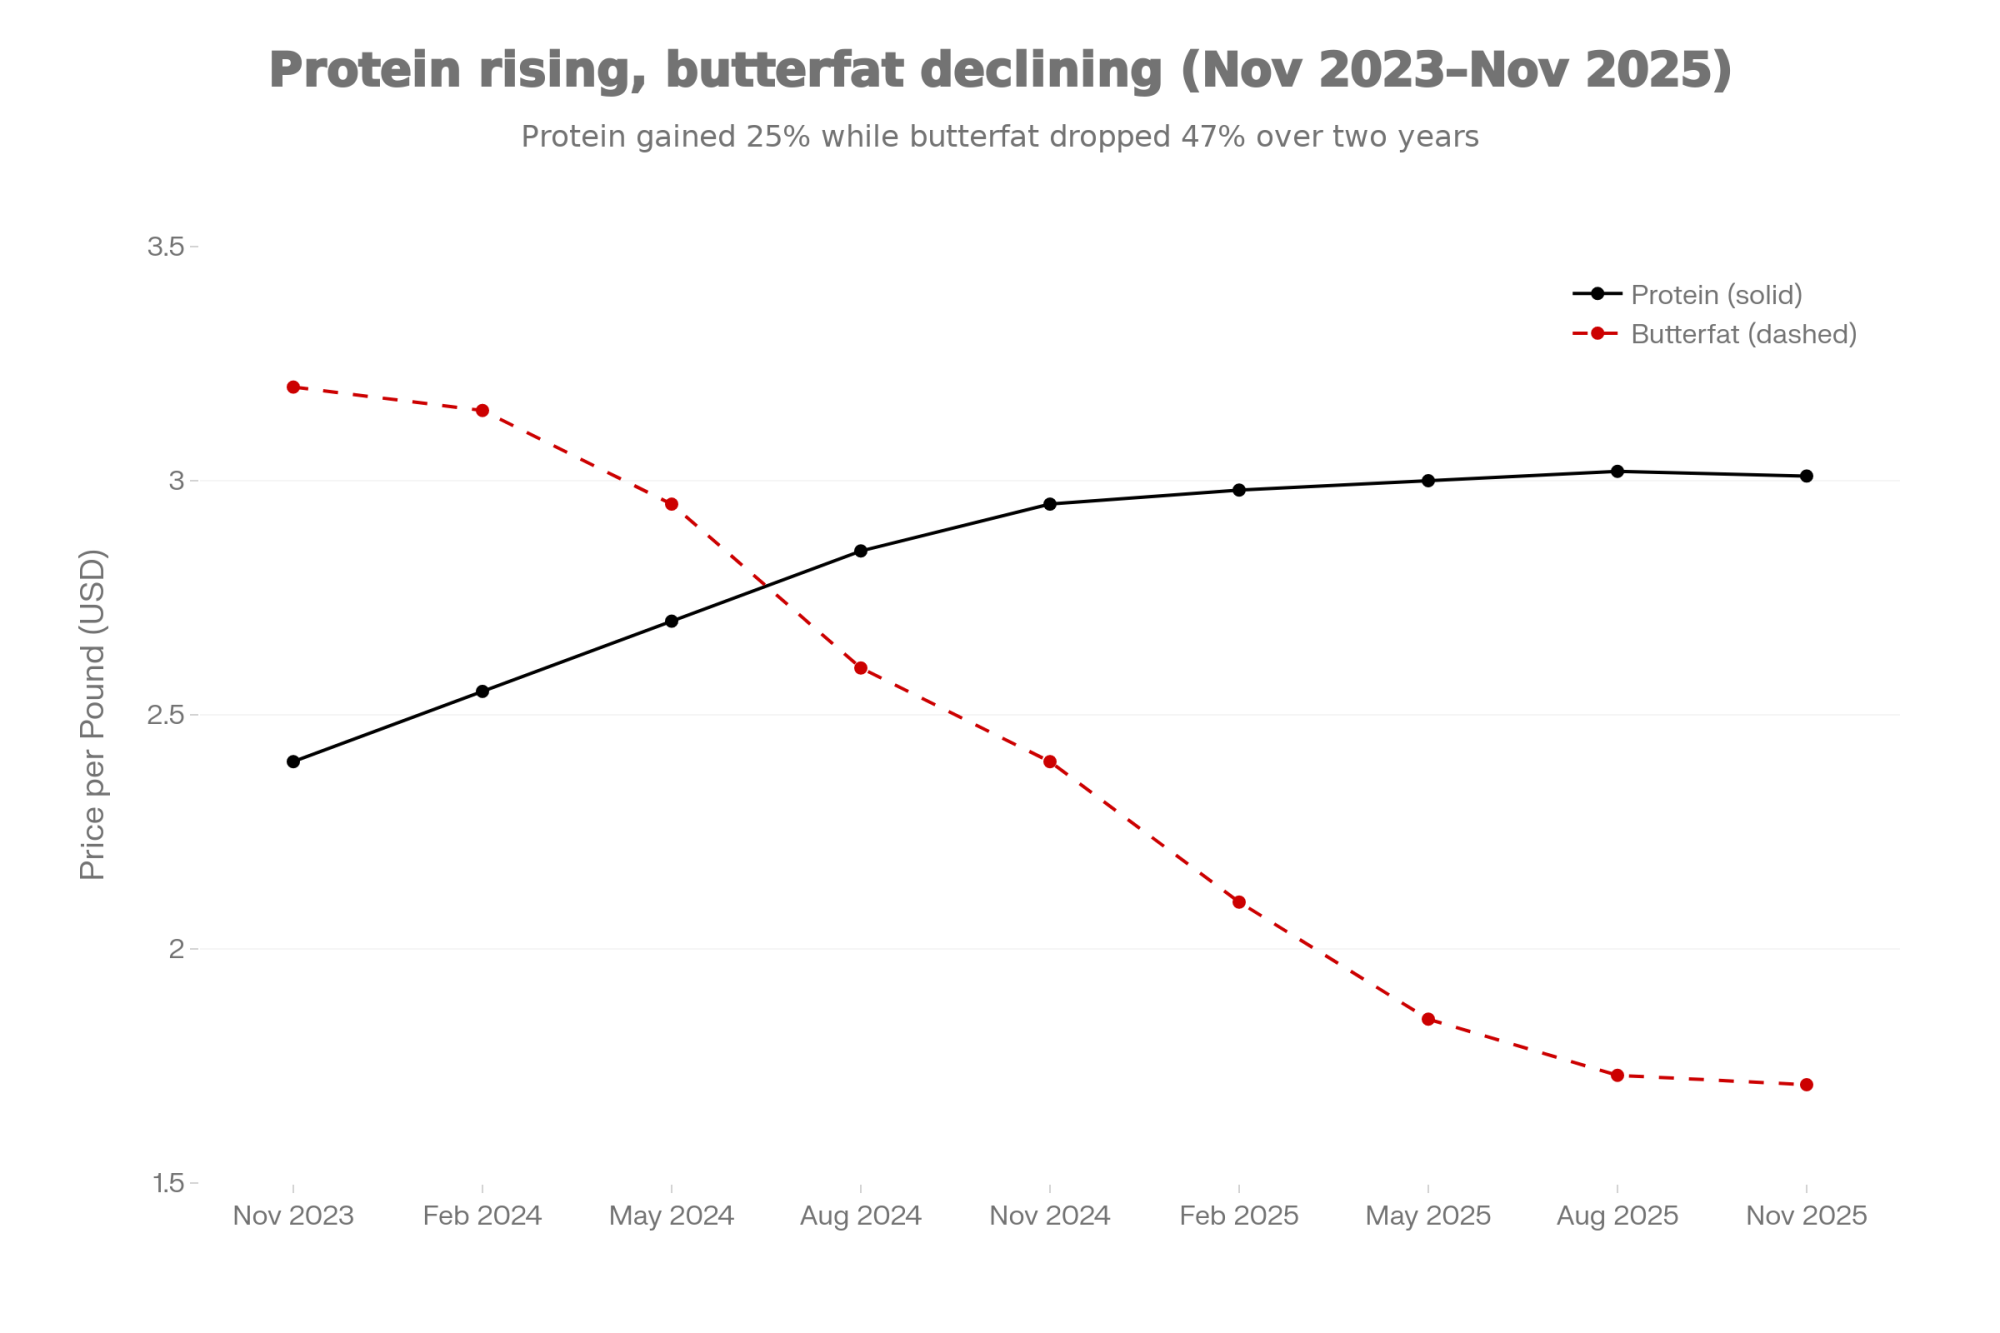
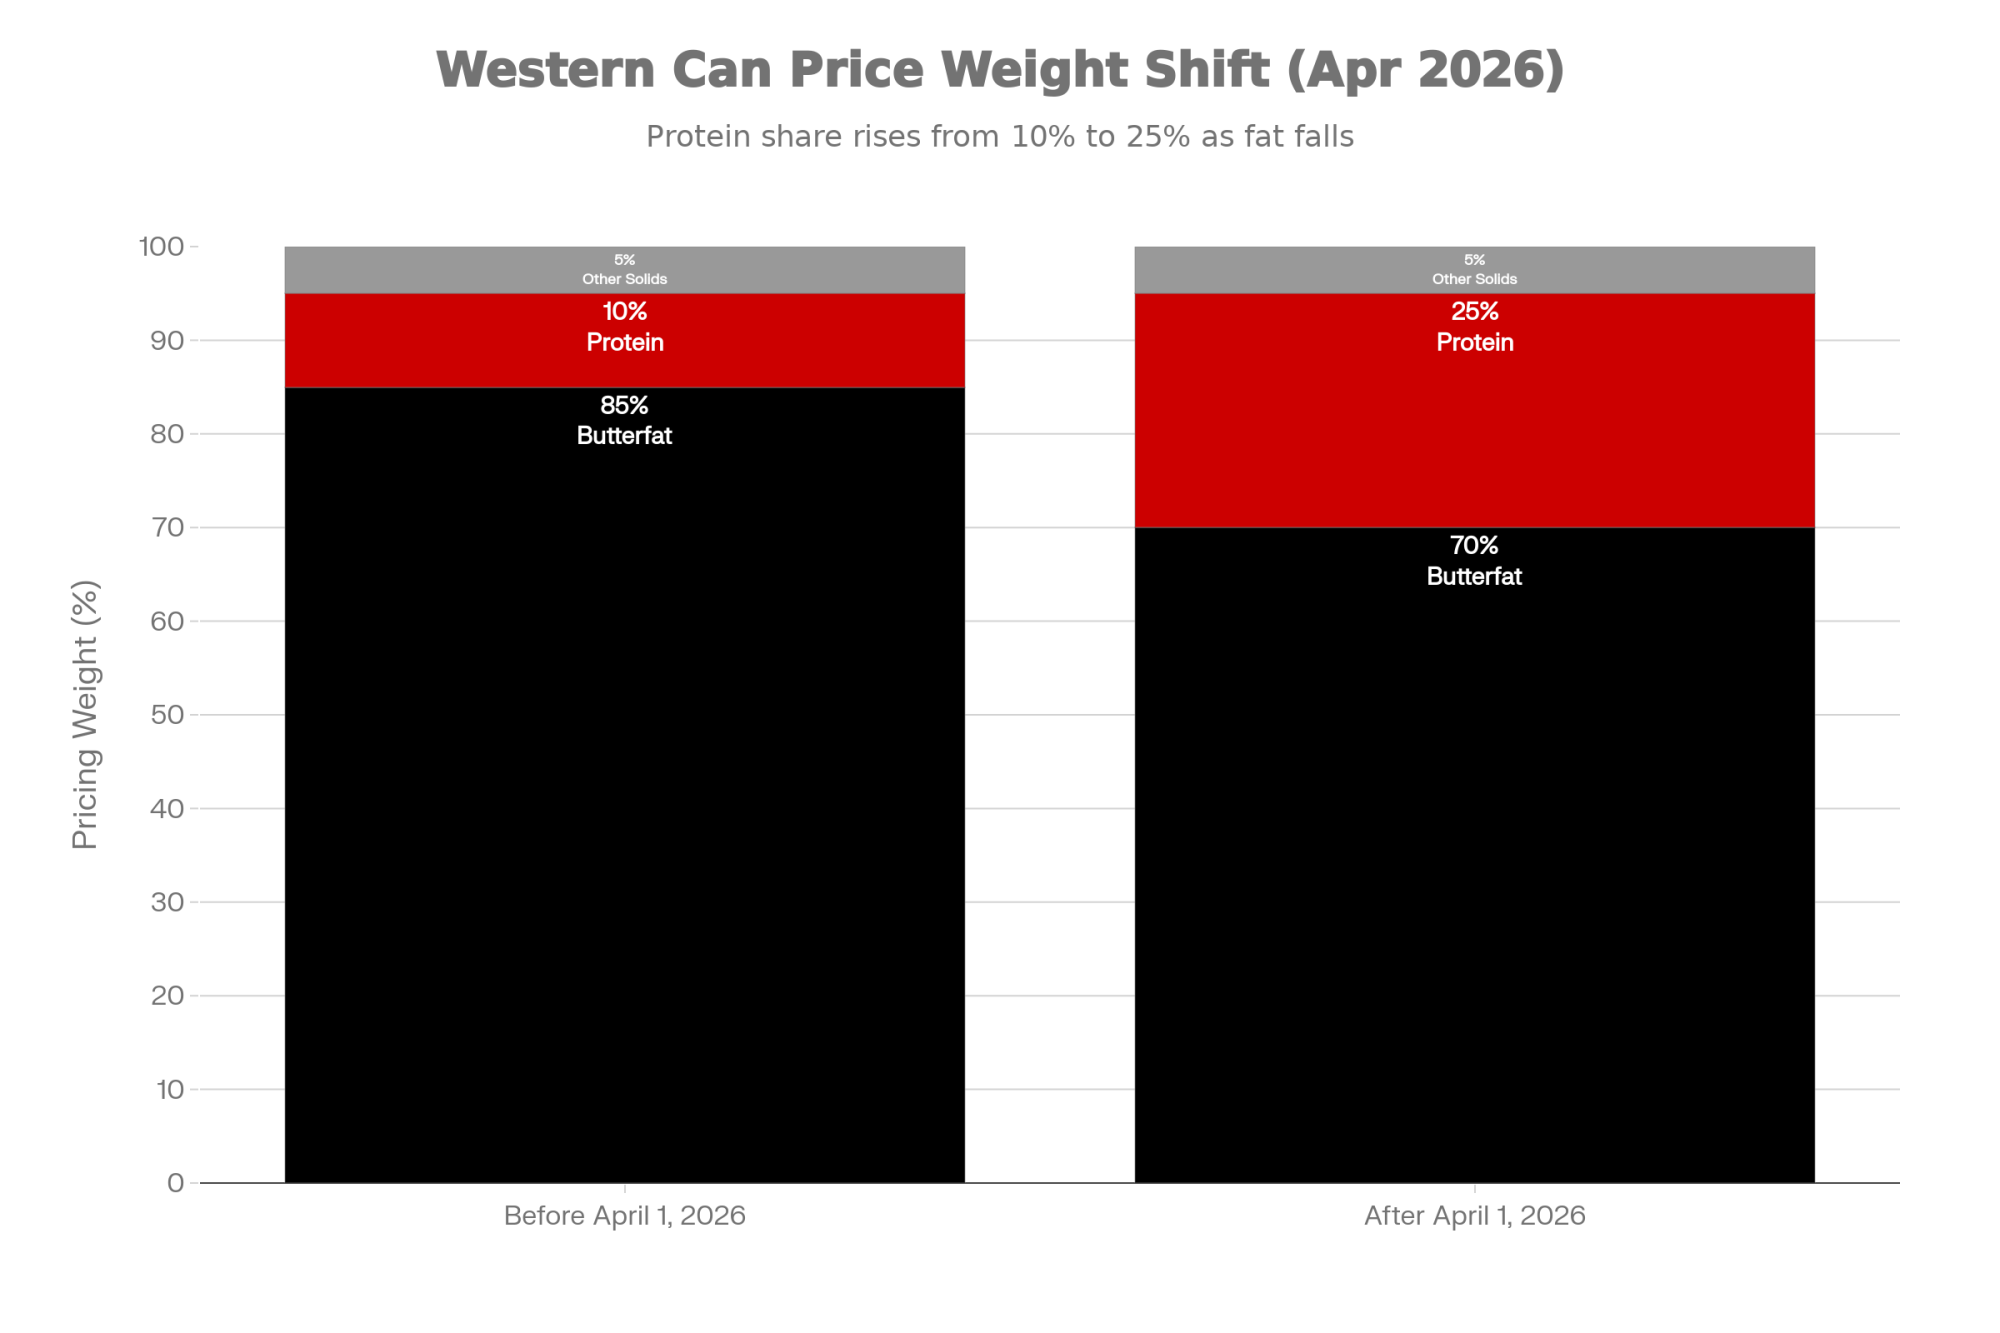
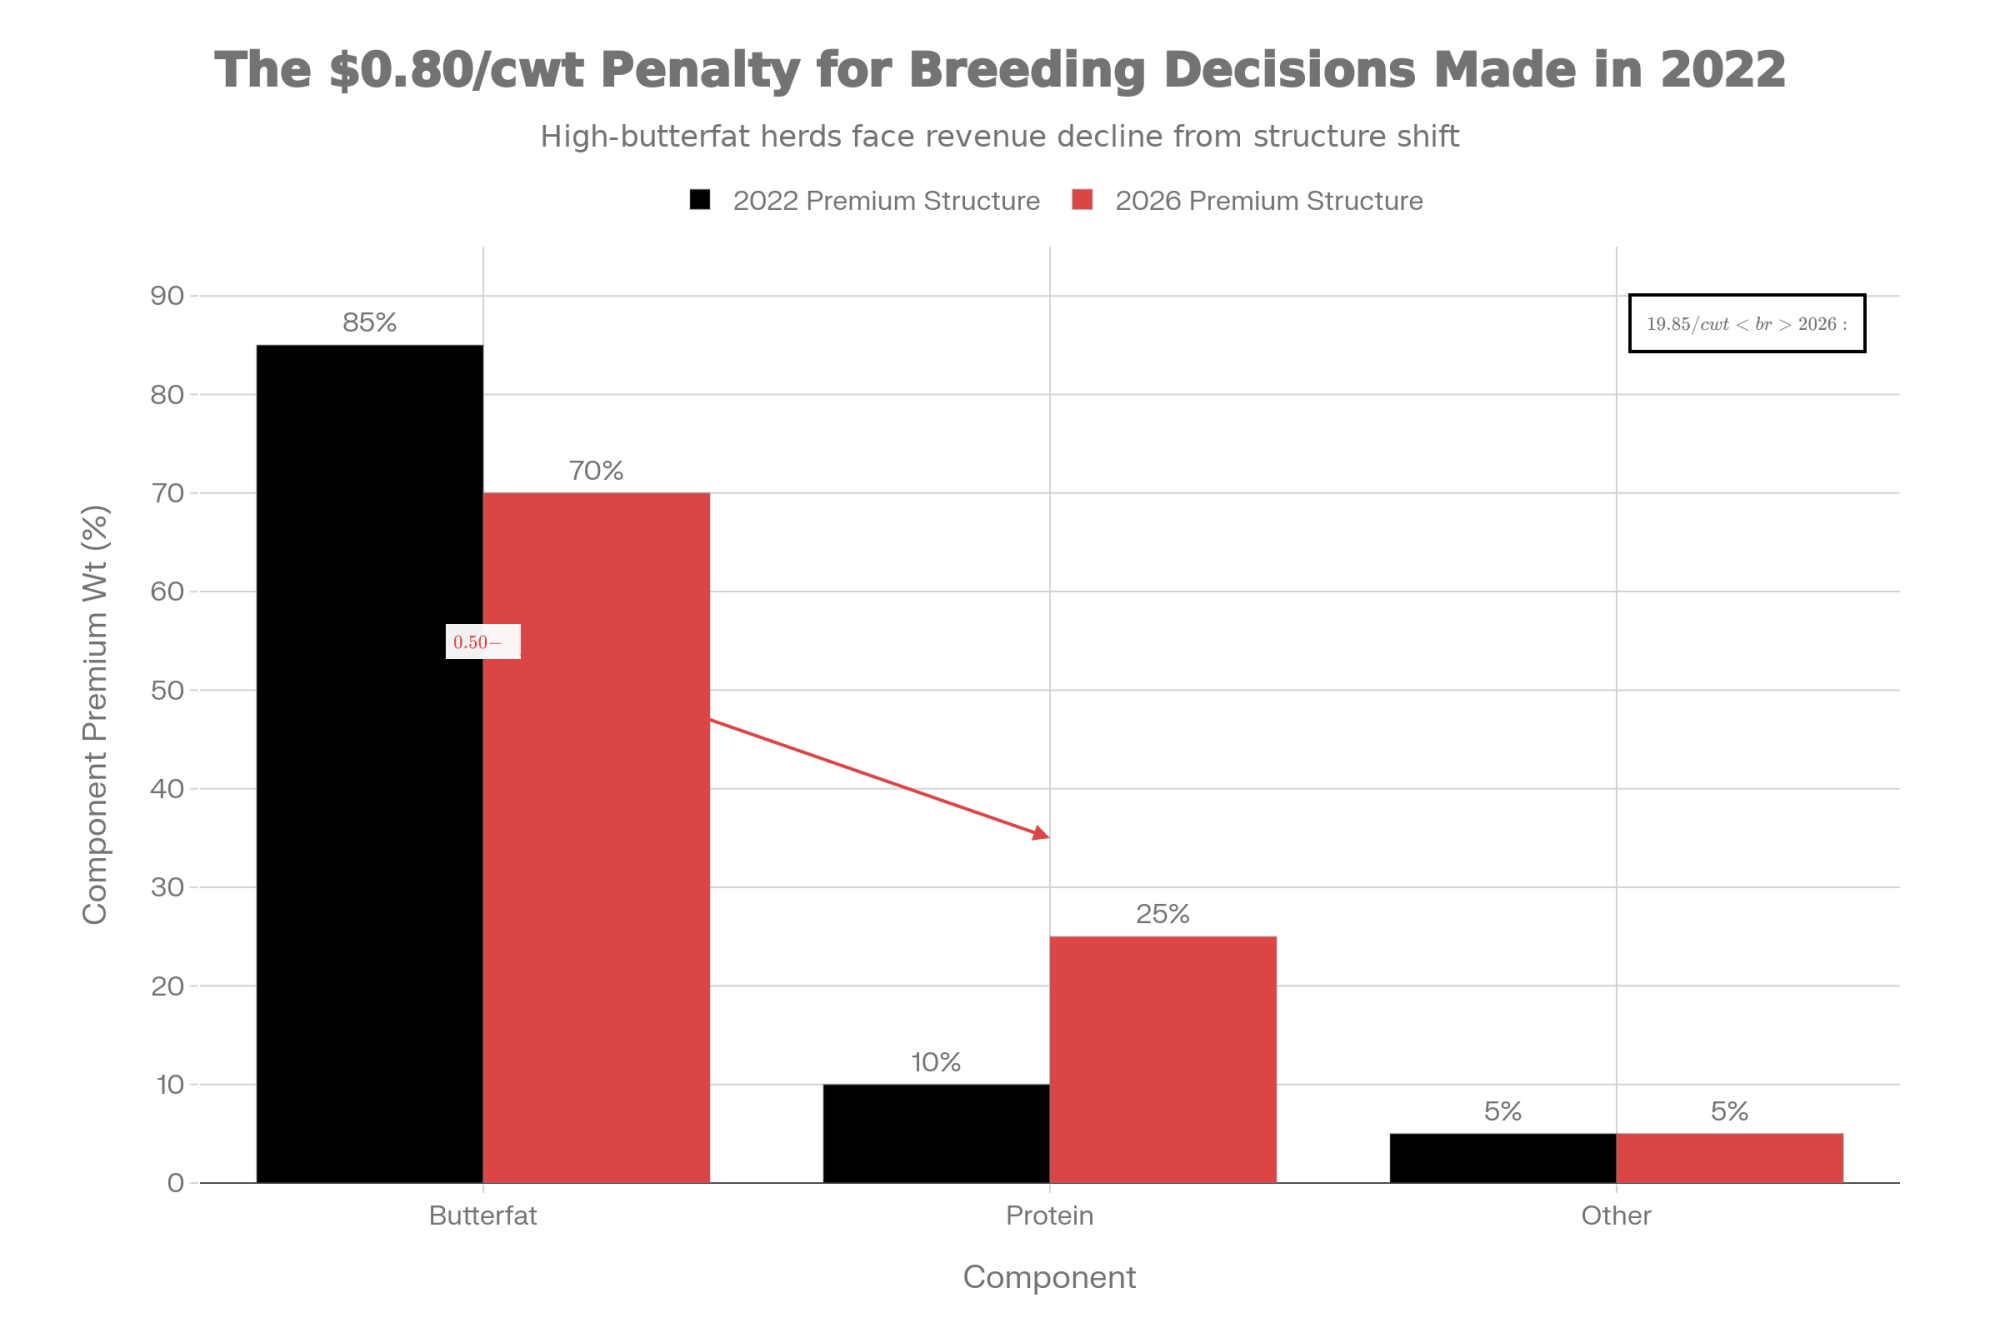
For much of the last decade, butterfat looked like the star. USDA and CME data show U.S. butter prices and per‑capita butter consumption rising, and for many years, Class III and IV values put butterfat at a clear premium over protein on a solids basis. So a lot of us leaned into butterfat—through breeding, rations, and fresh cow management—to capture those butterfat premiums.

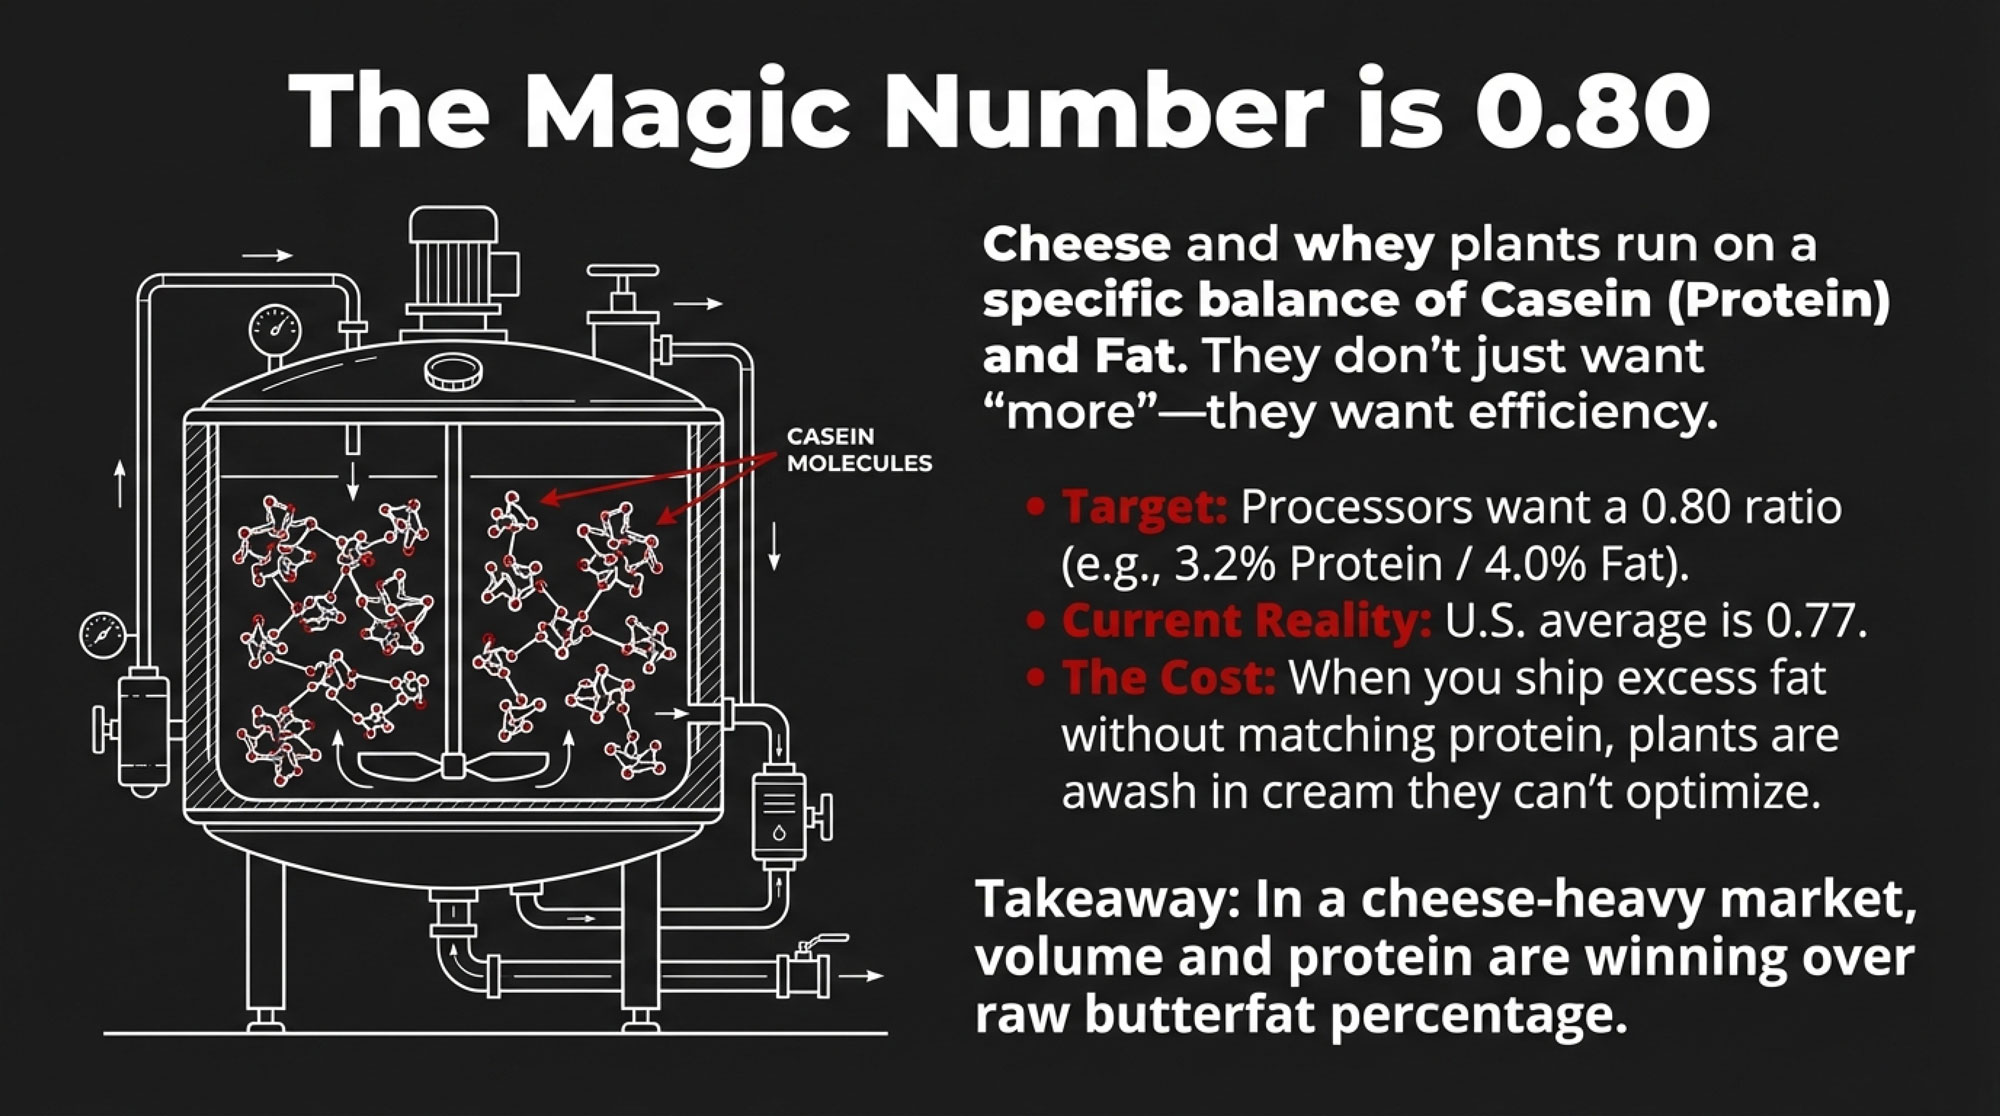
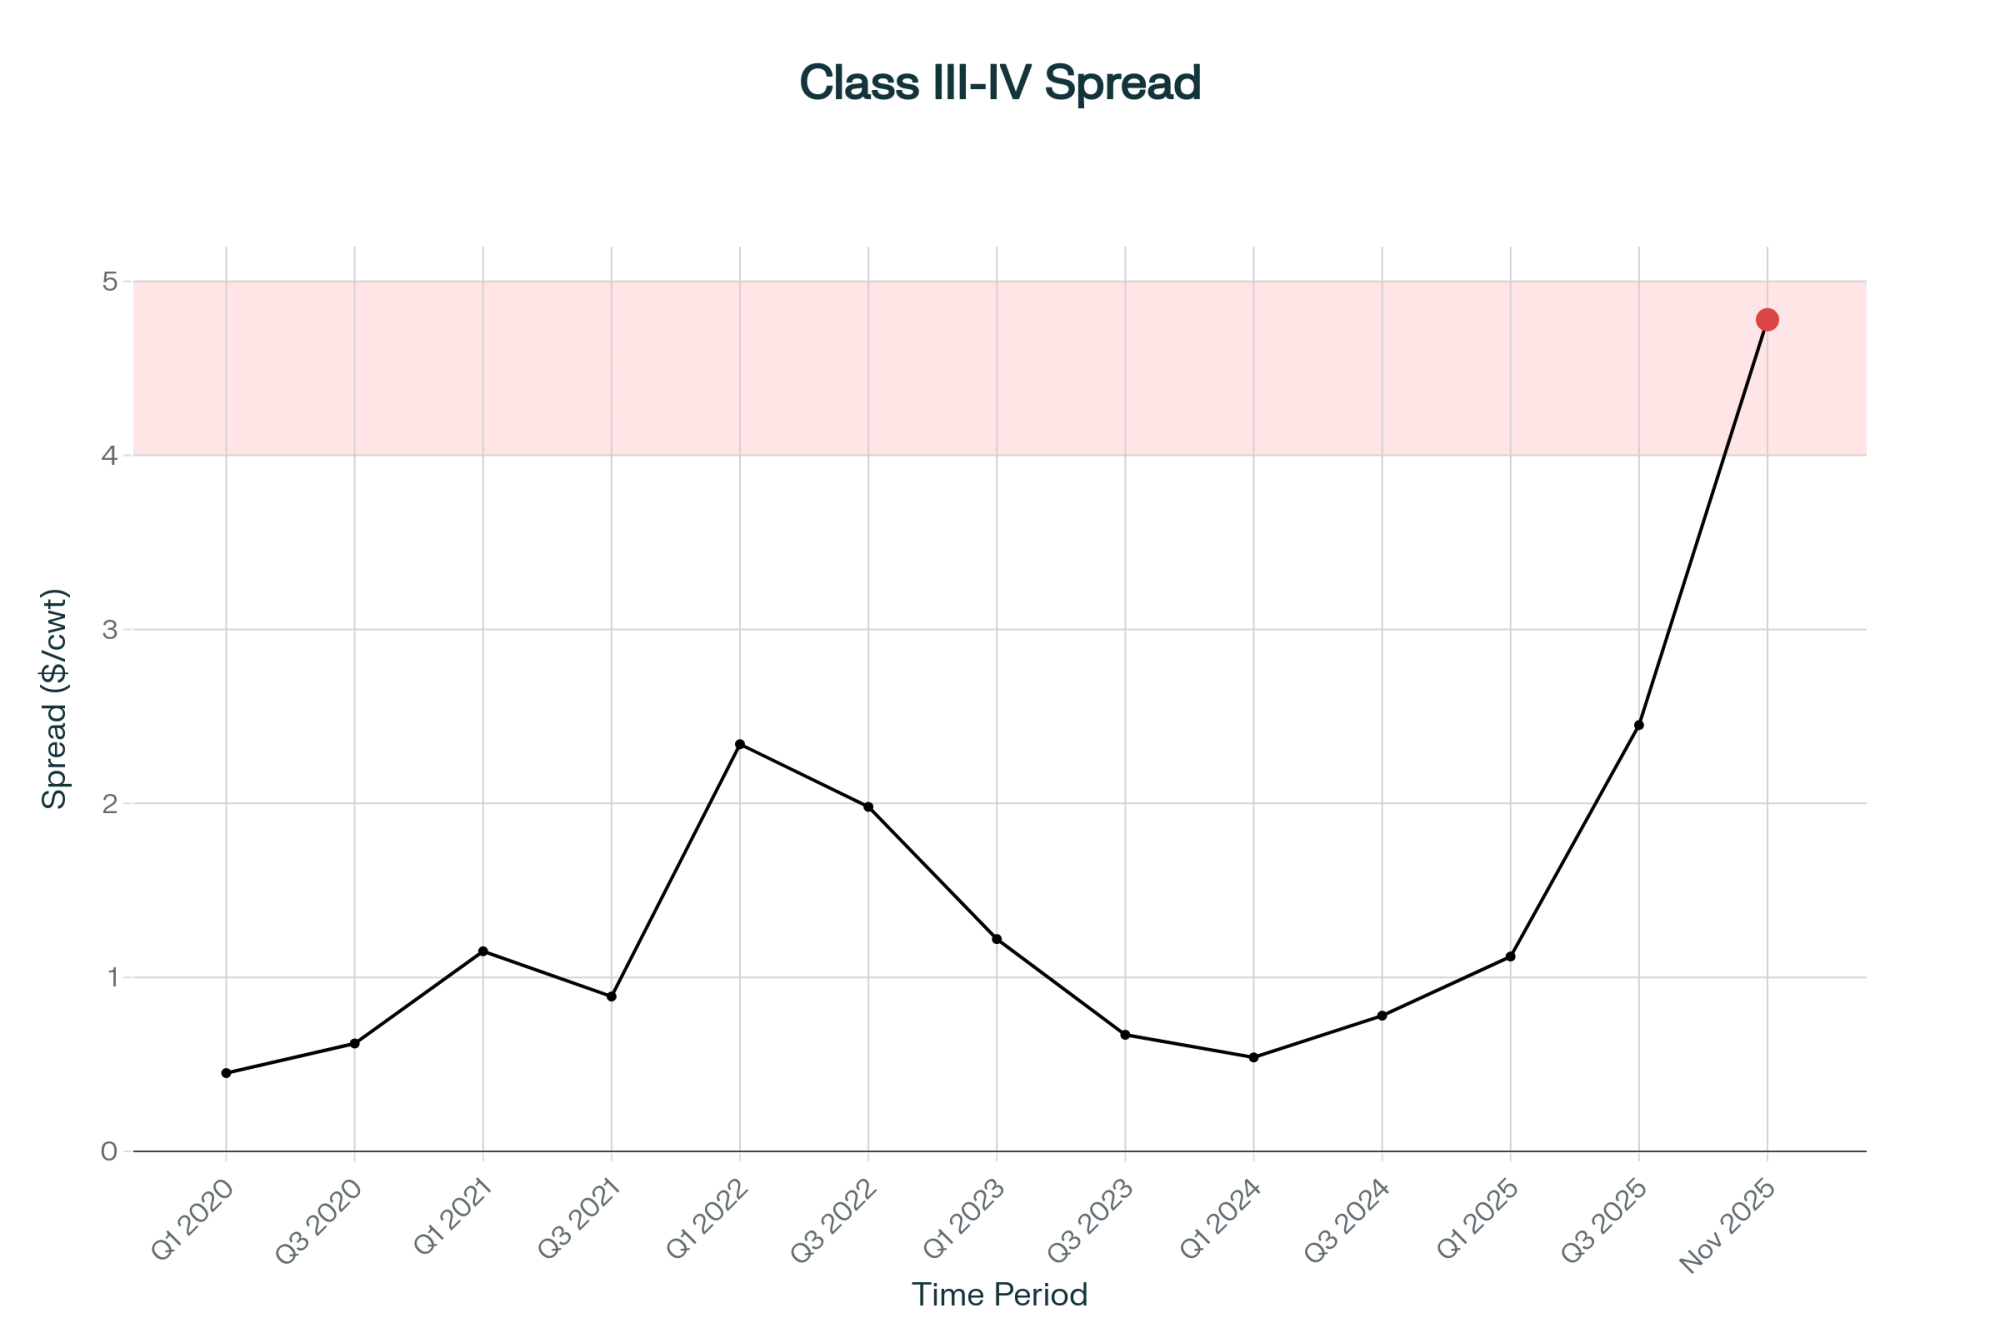
As more milk has flowed into cheese vats, though, the balance has shifted. Cheesemakers live on protein. That’s what builds curd. The Federal Milk Marketing Order Class III formulas use cheese, whey, and butter prices to calculate fat and protein values using specific yield factors. The way those formulas are structured creates a kind of see‑saw: when butterfat prices move sharply higher, the implied value of protein tends to get pulled down, and when butterfat softens, protein can carry more of the pay pool.

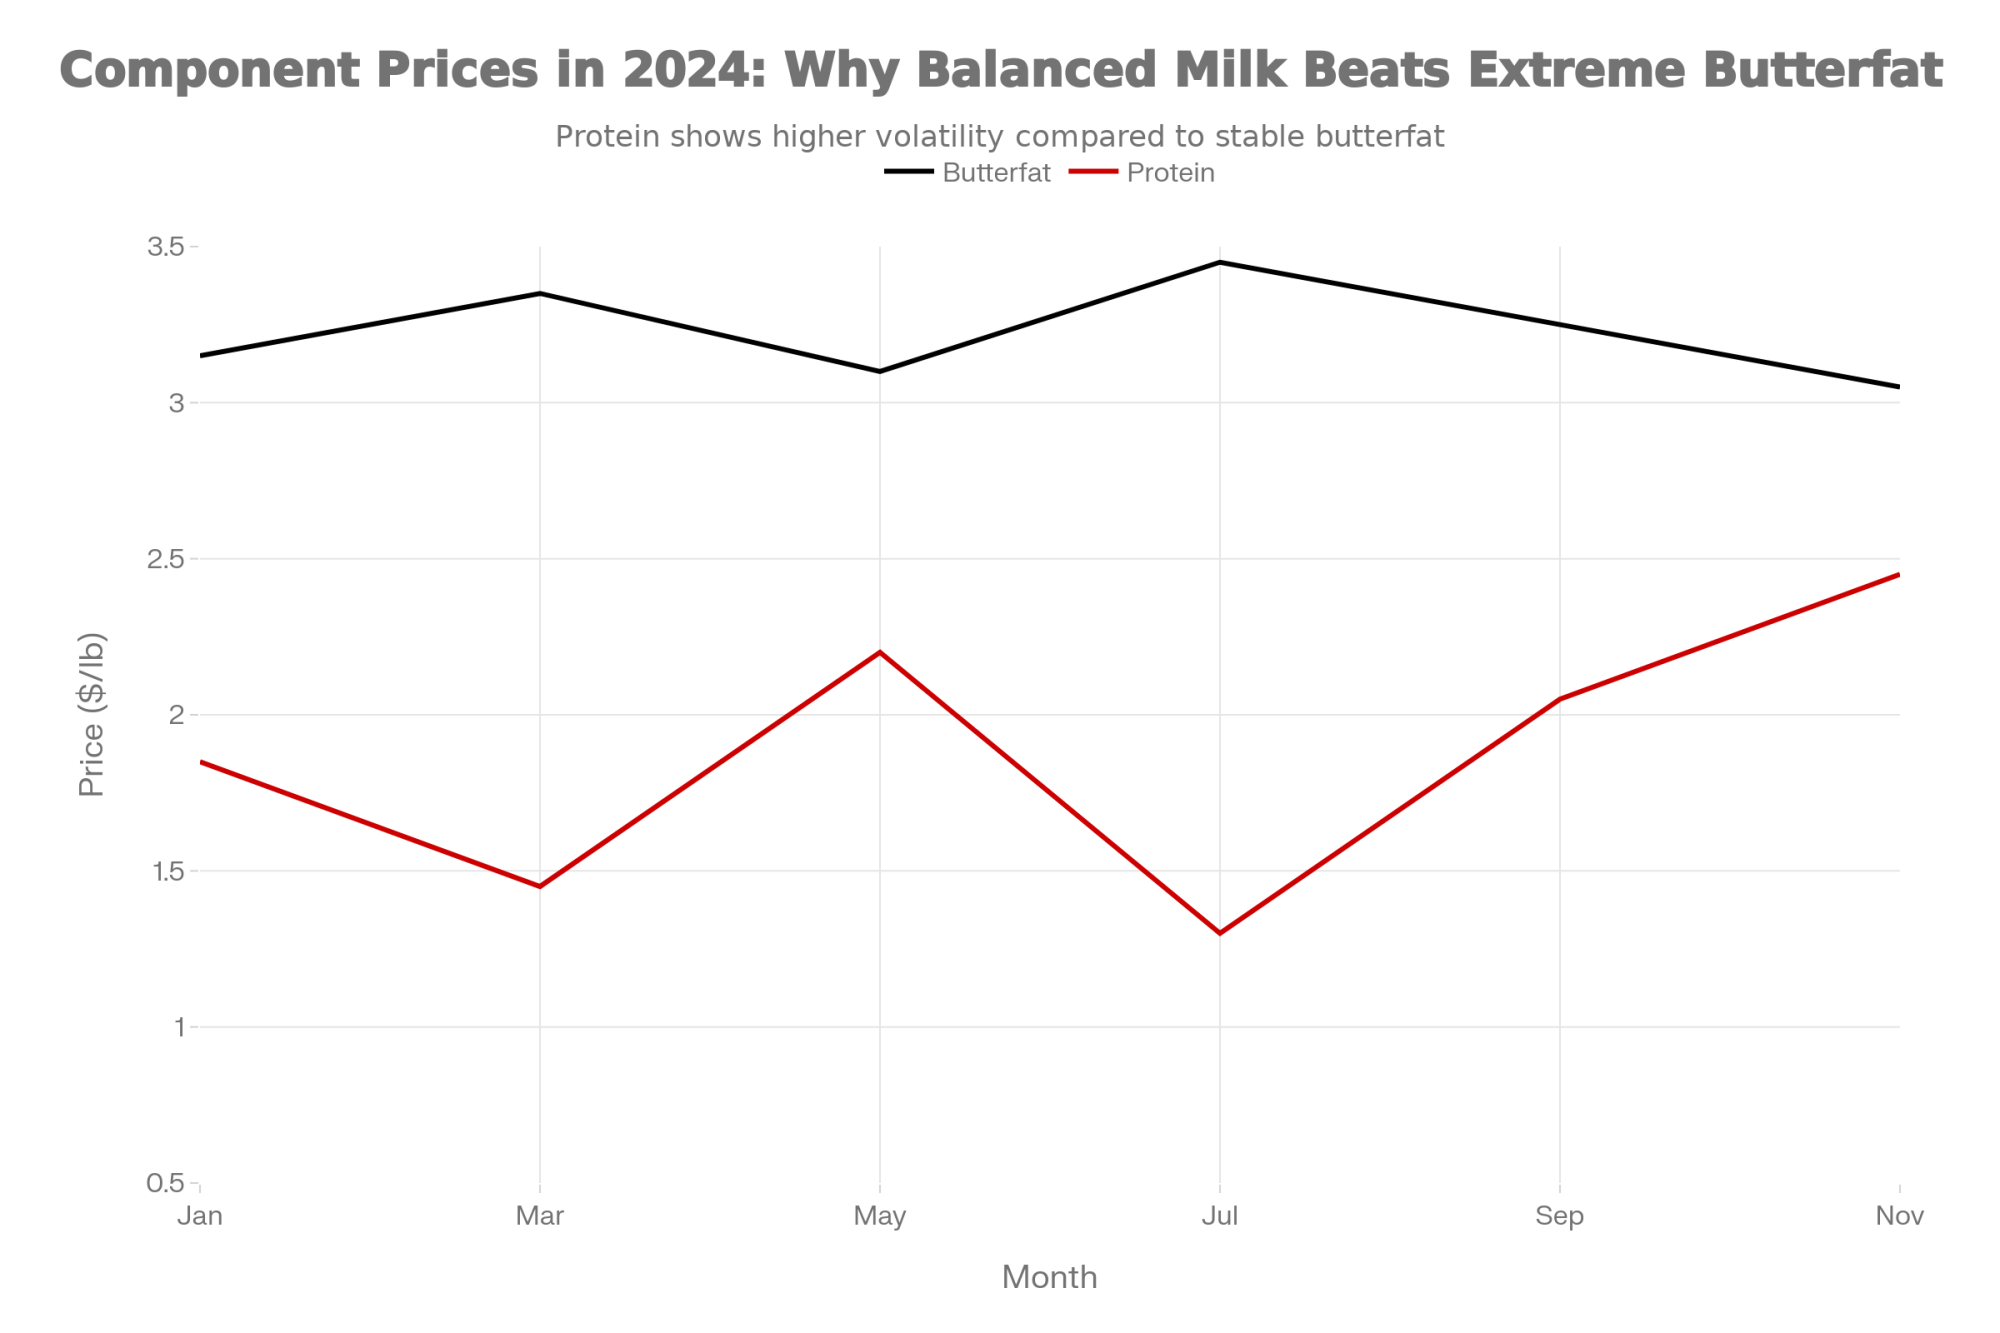
If you look at USDA component price reports across 2024, butterfat values often ran in the 3.00 to 3.50 dollars per pound range, while Class III protein values showed significant volatility—bouncing from around 1.10 to over 2.50 dollars per pound depending on the month. Dairy market updates from MCT Dairies and federal order bulletins highlighted several months where fat was historically strong while protein sagged, reflecting that cheese‑heavy product mix. Analysts like Sarina Sharp with the Daily Dairy Report have talked about co‑ops finding themselves “long on cream” at times, which makes it hard to fully reward sky‑high butterfat tests when protein and cheese demand are really driving the bus.

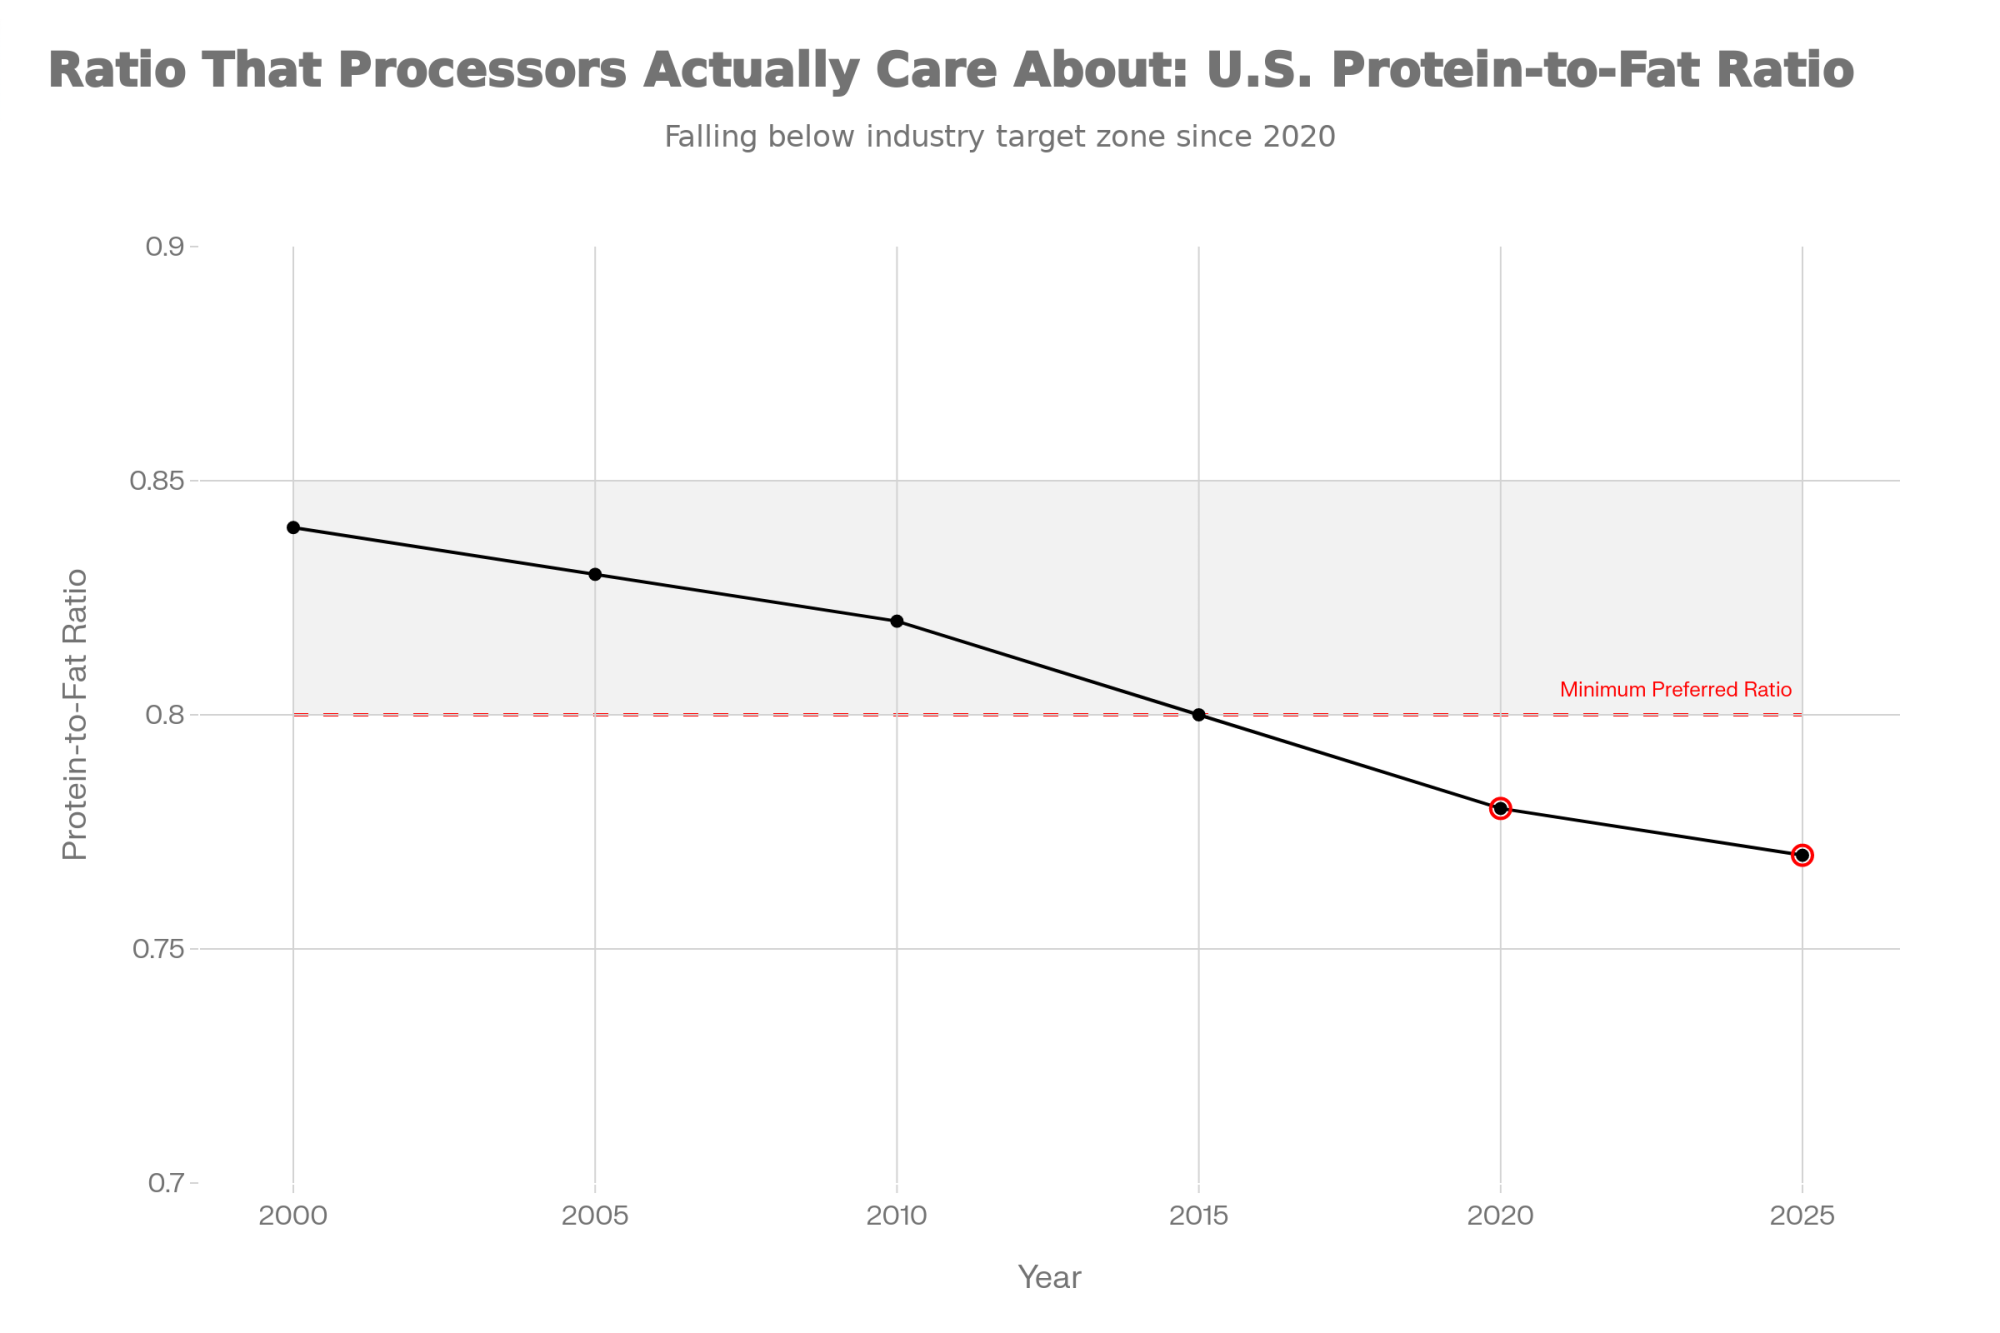
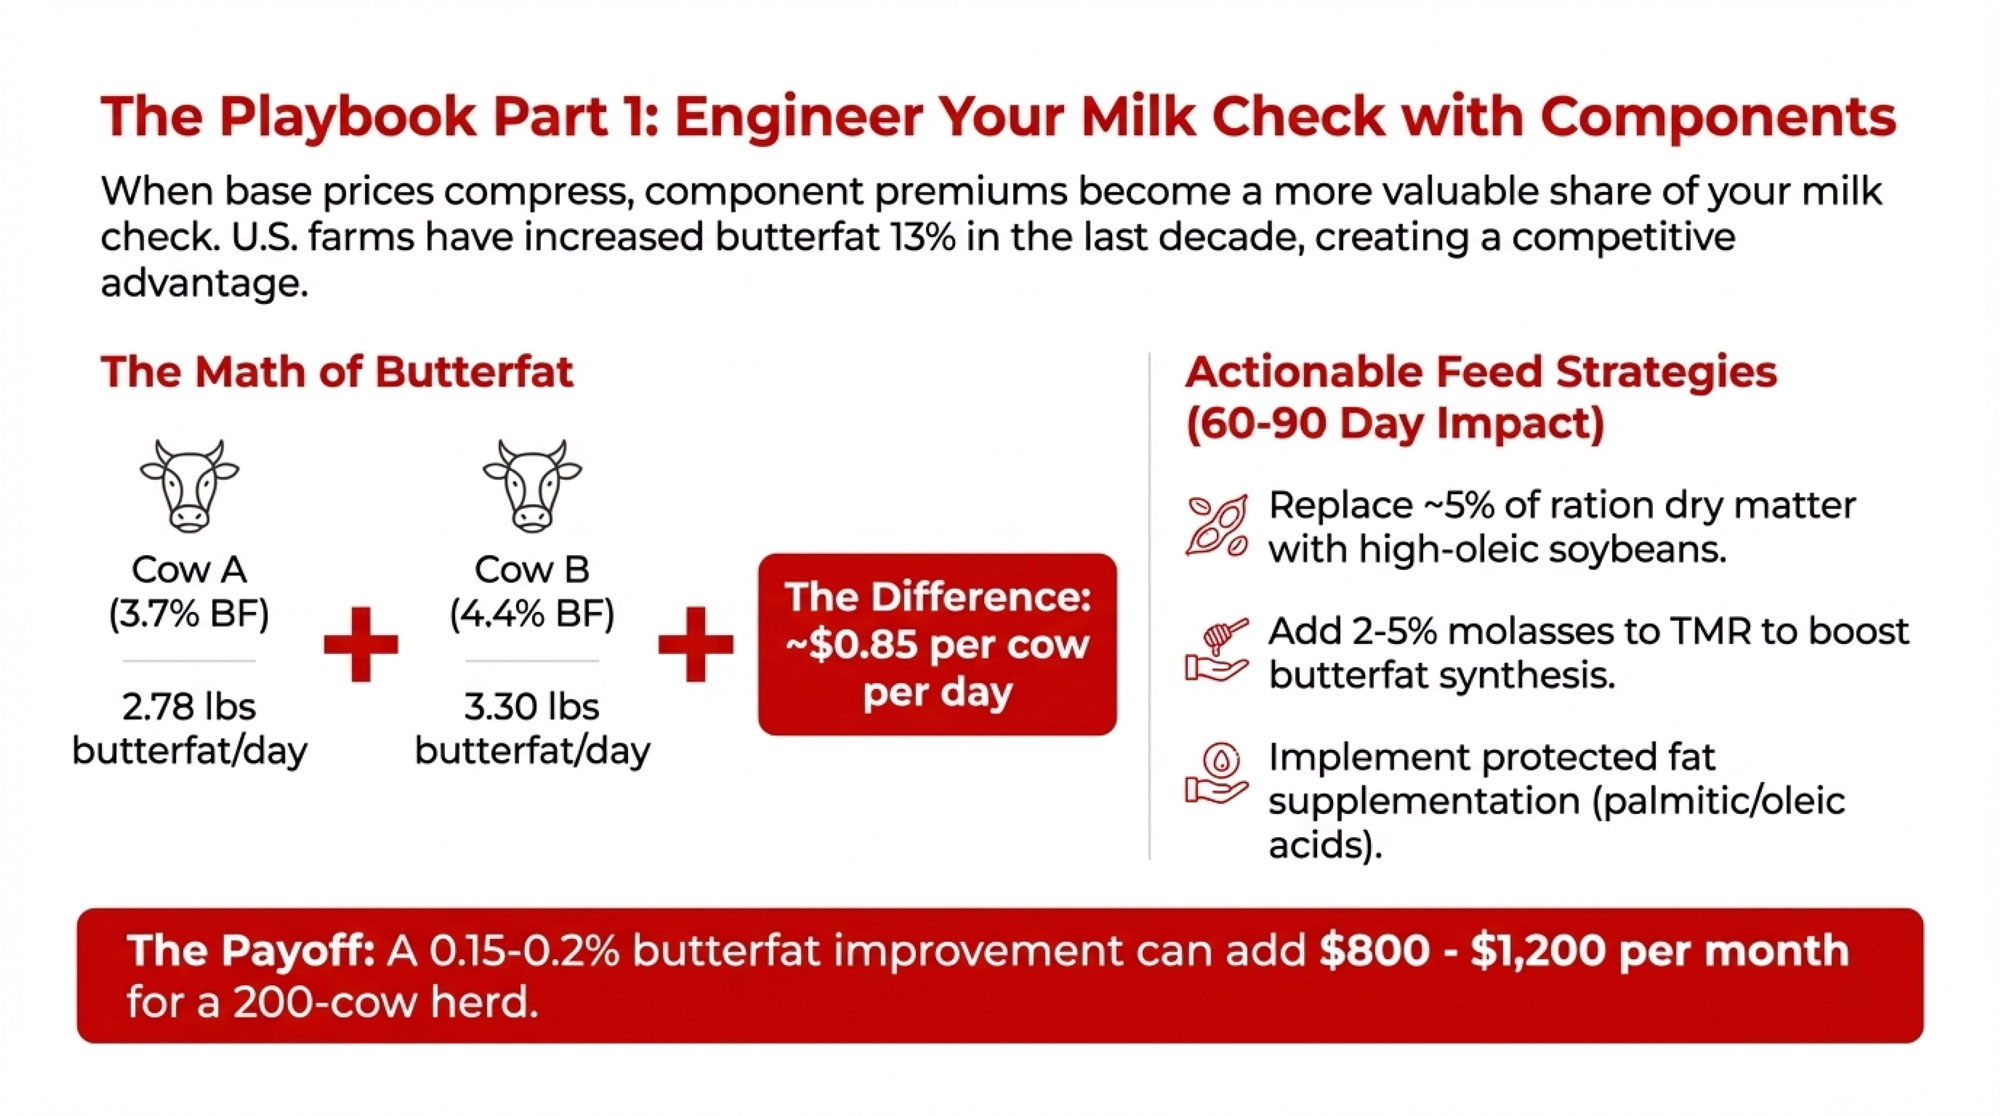
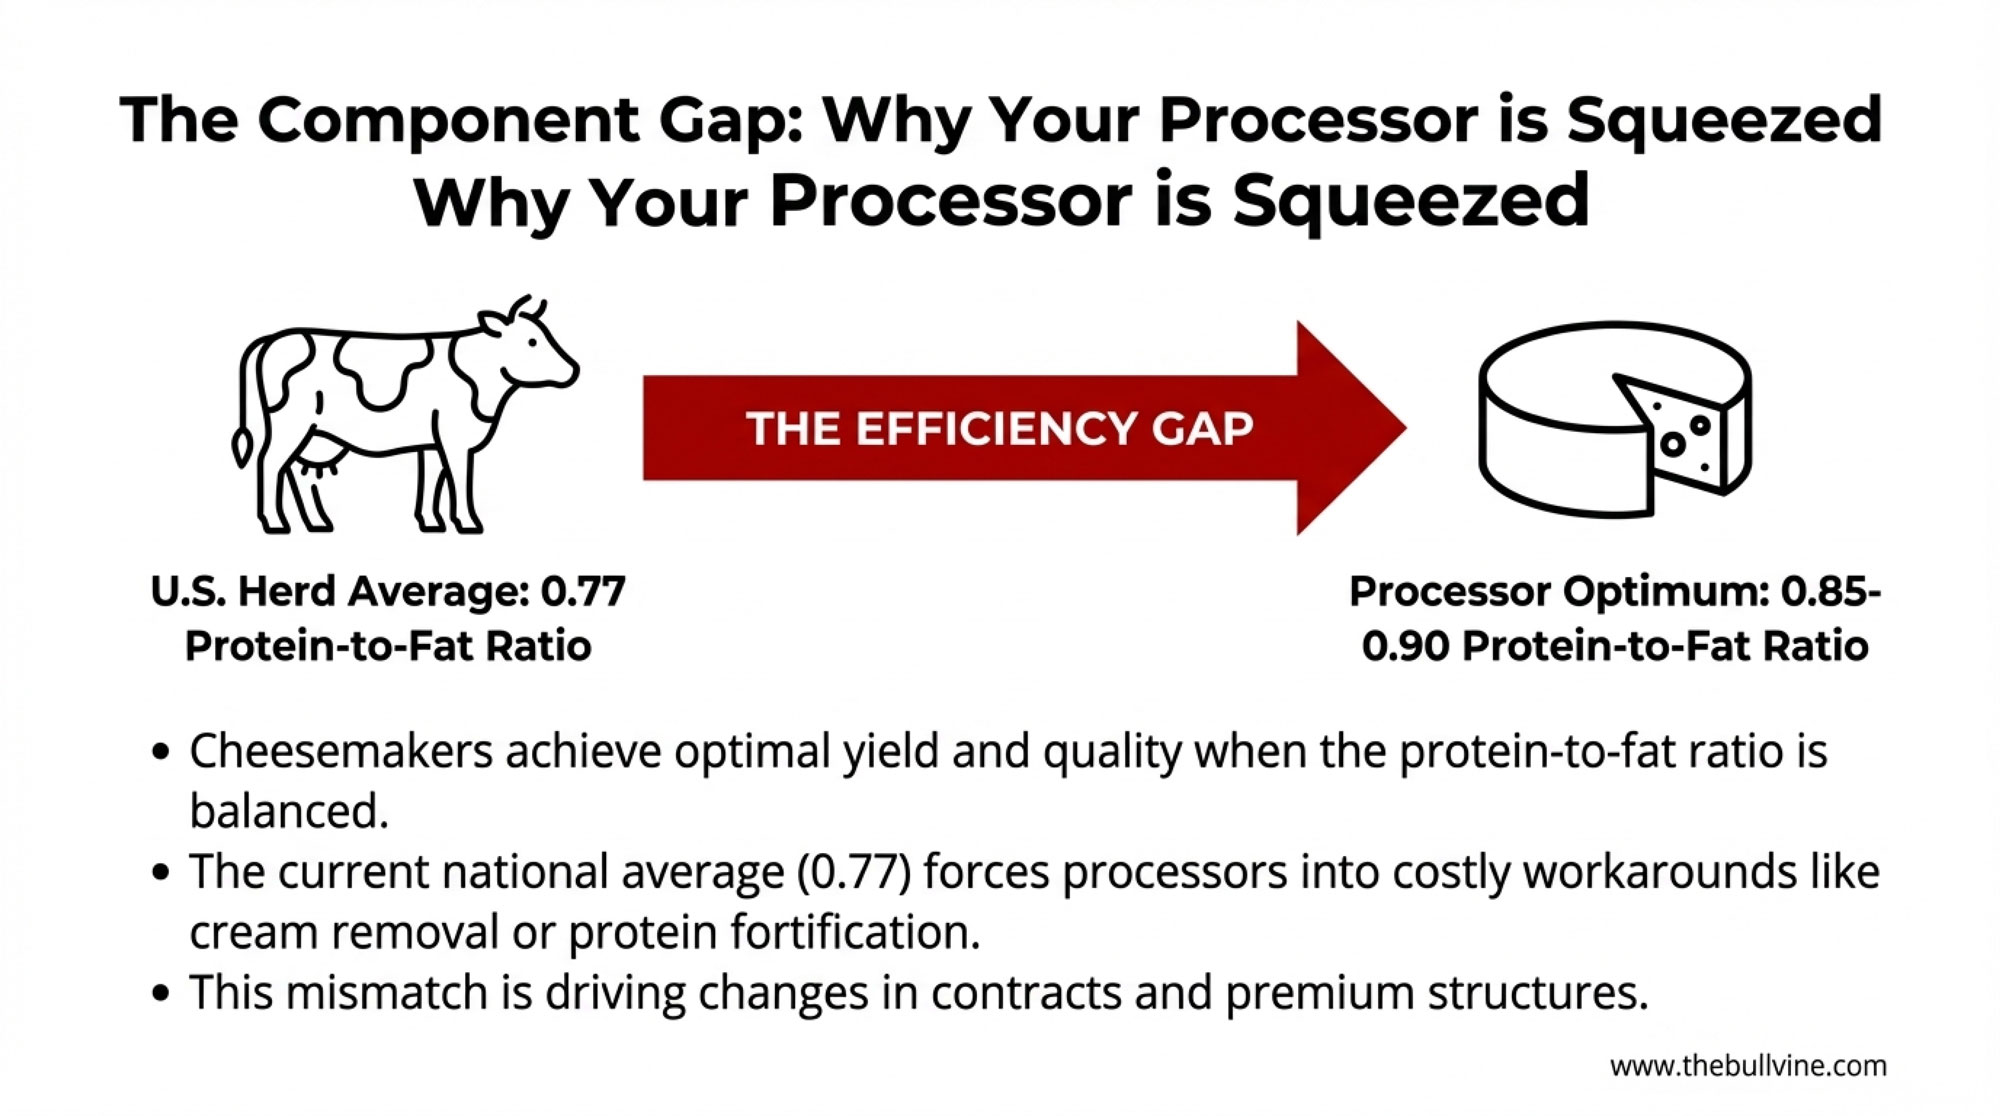
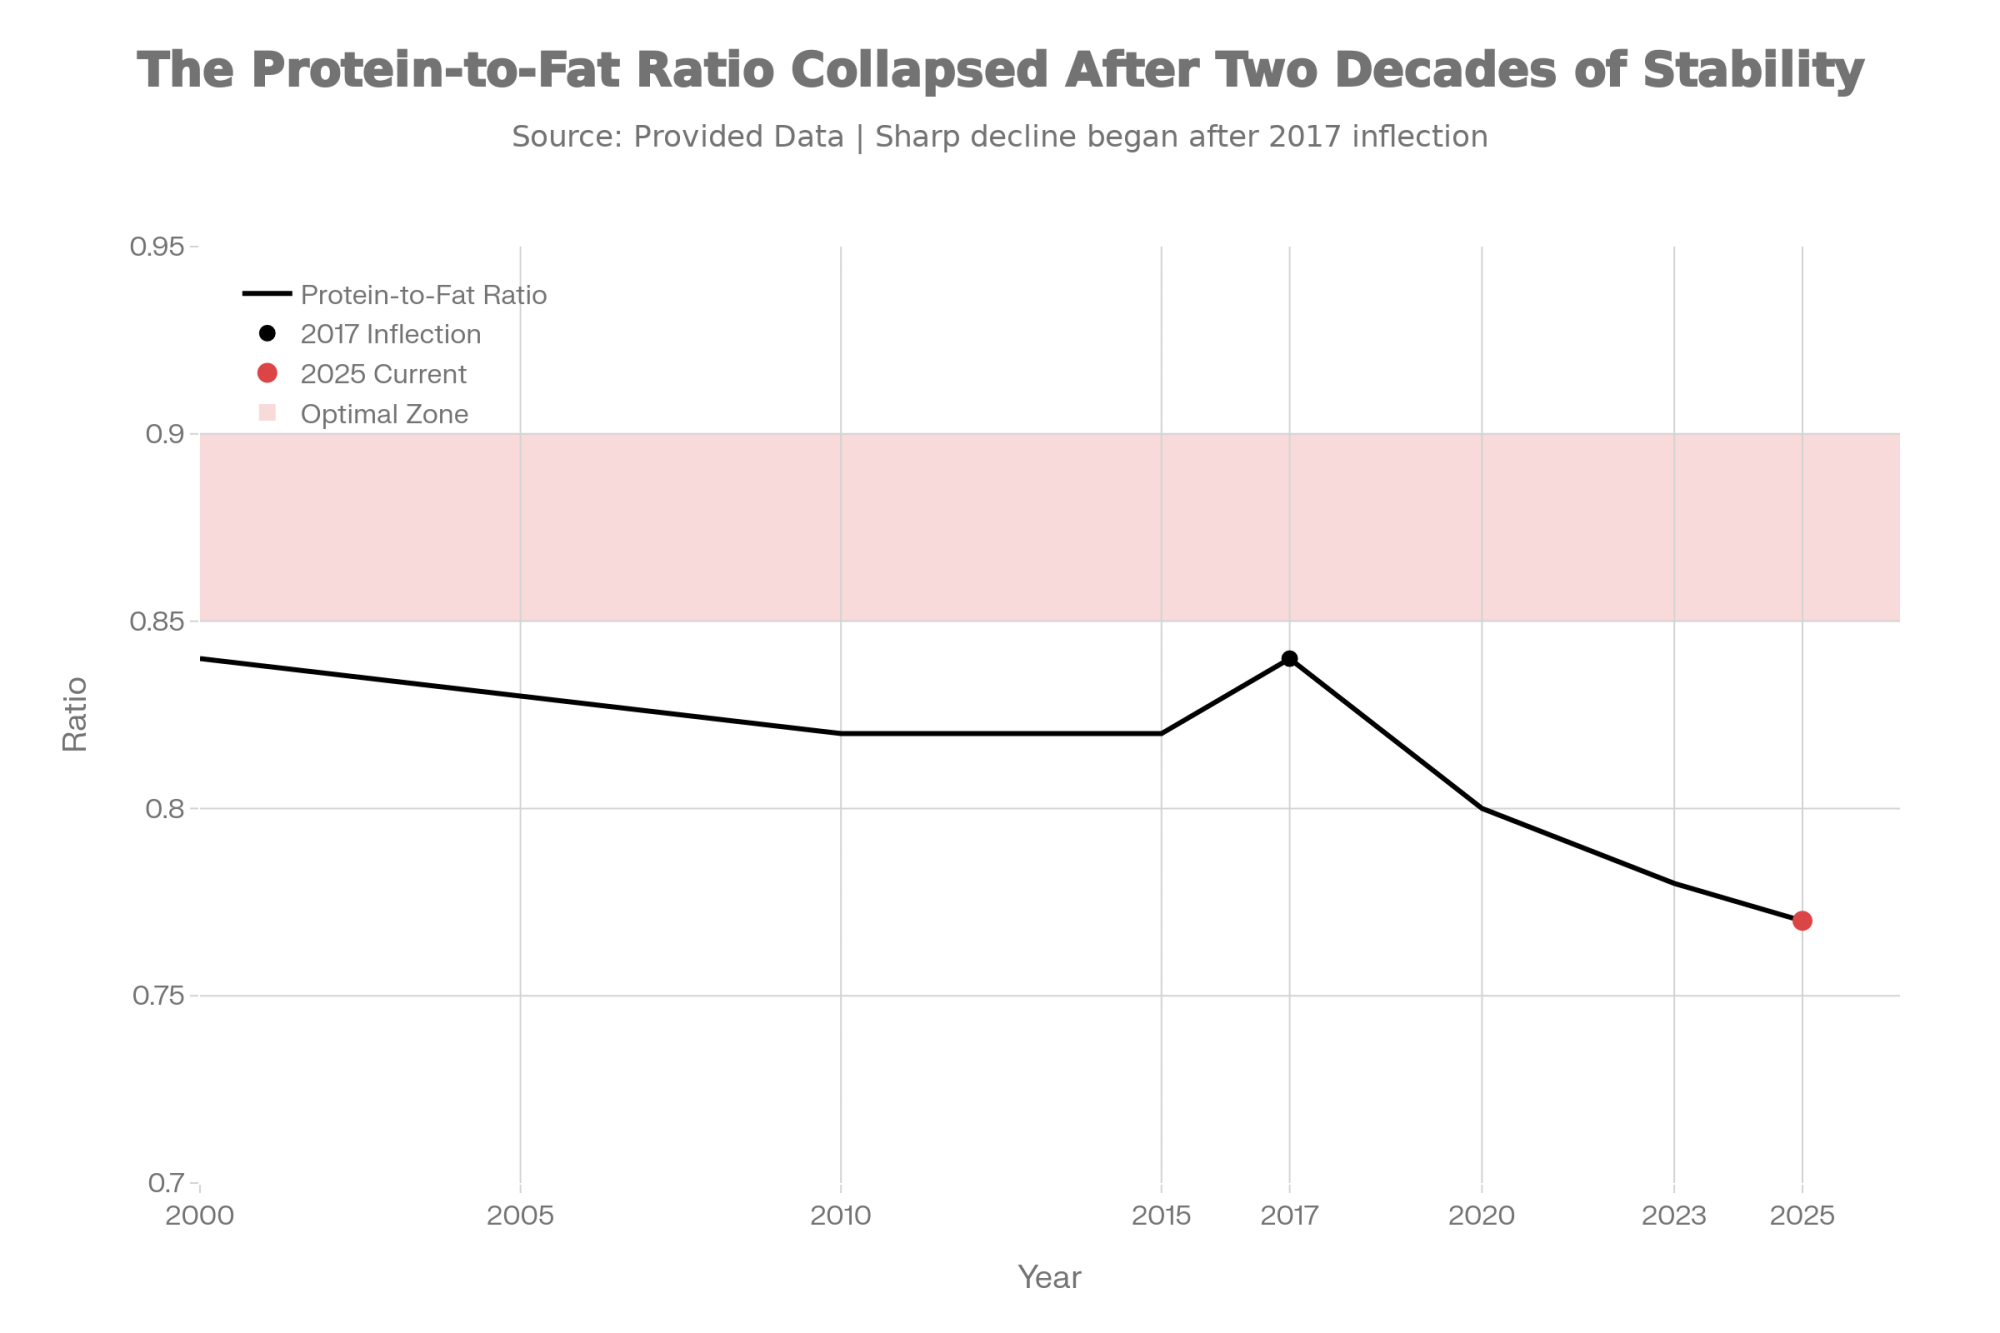
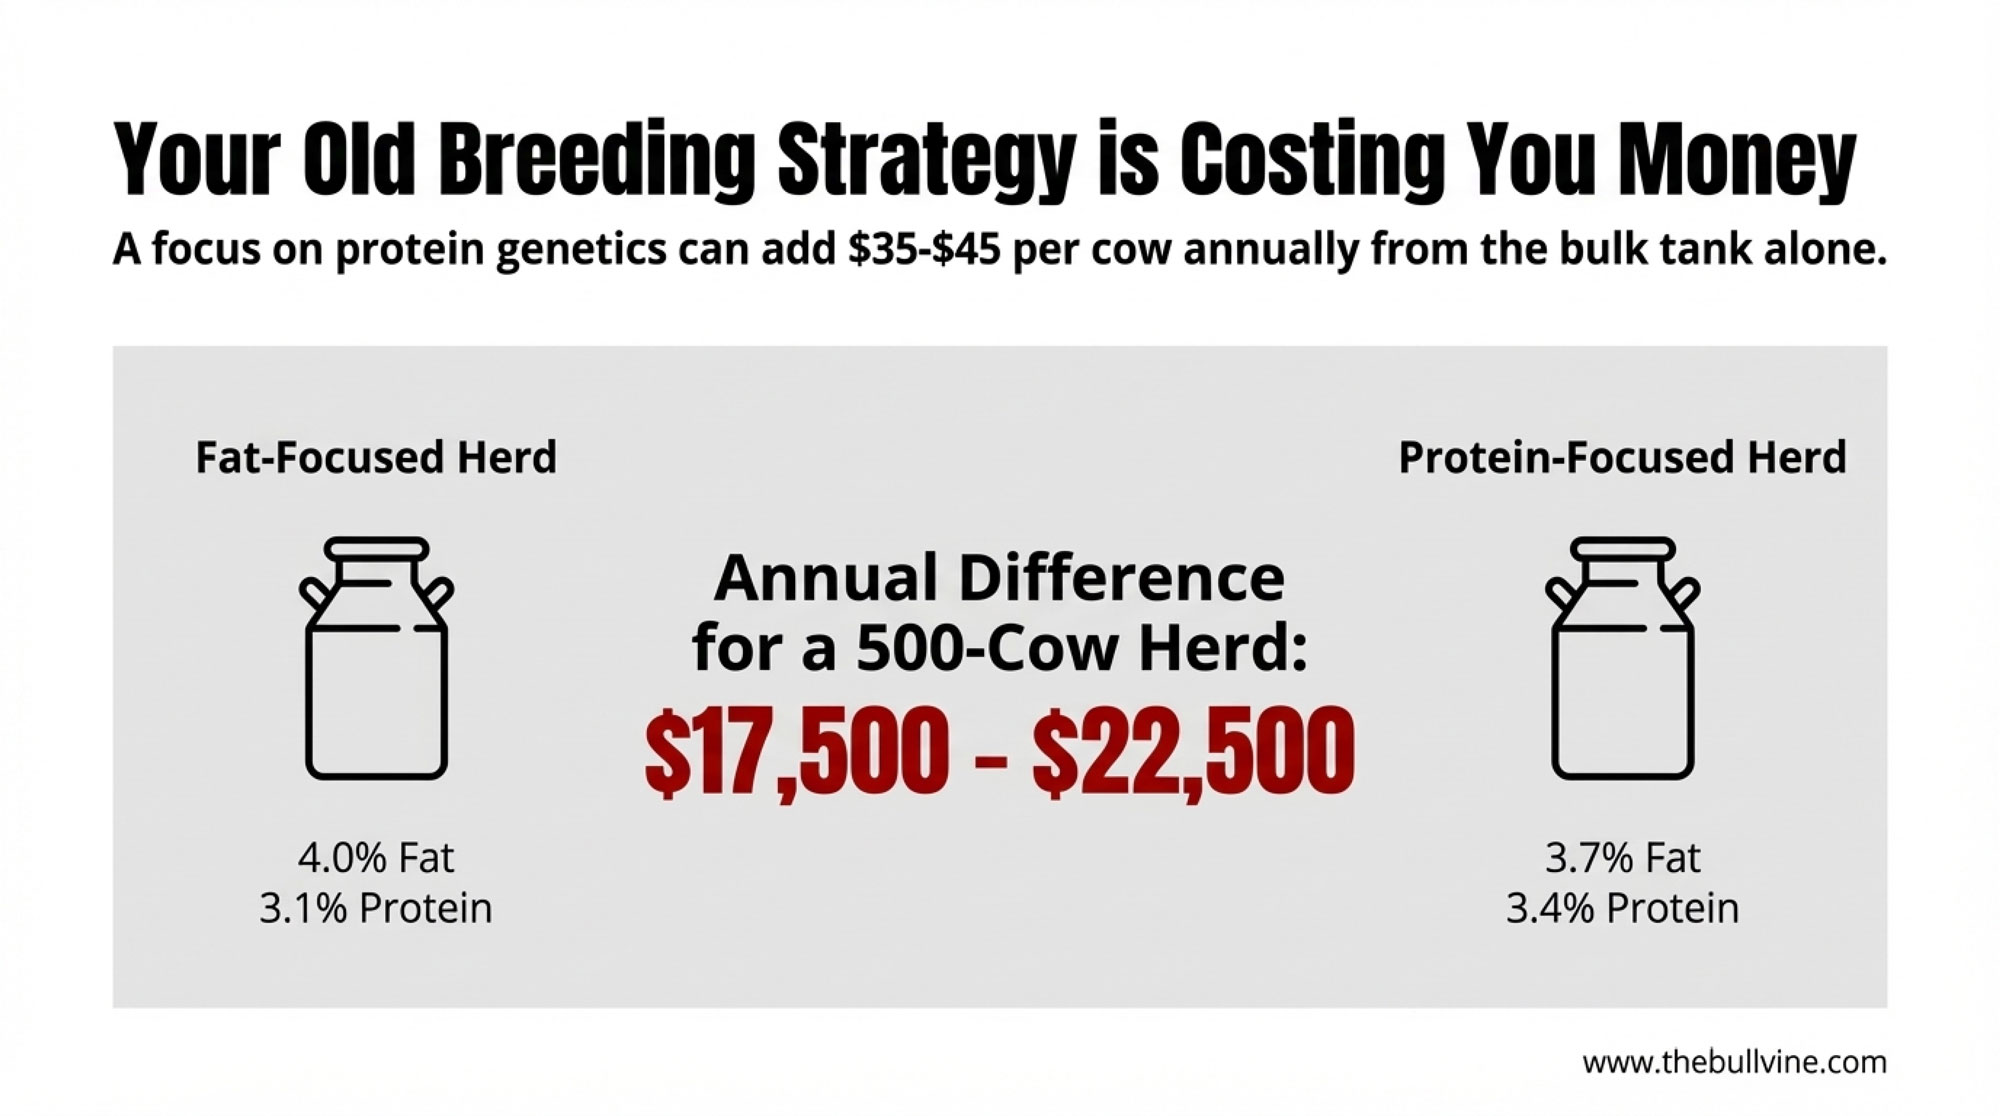
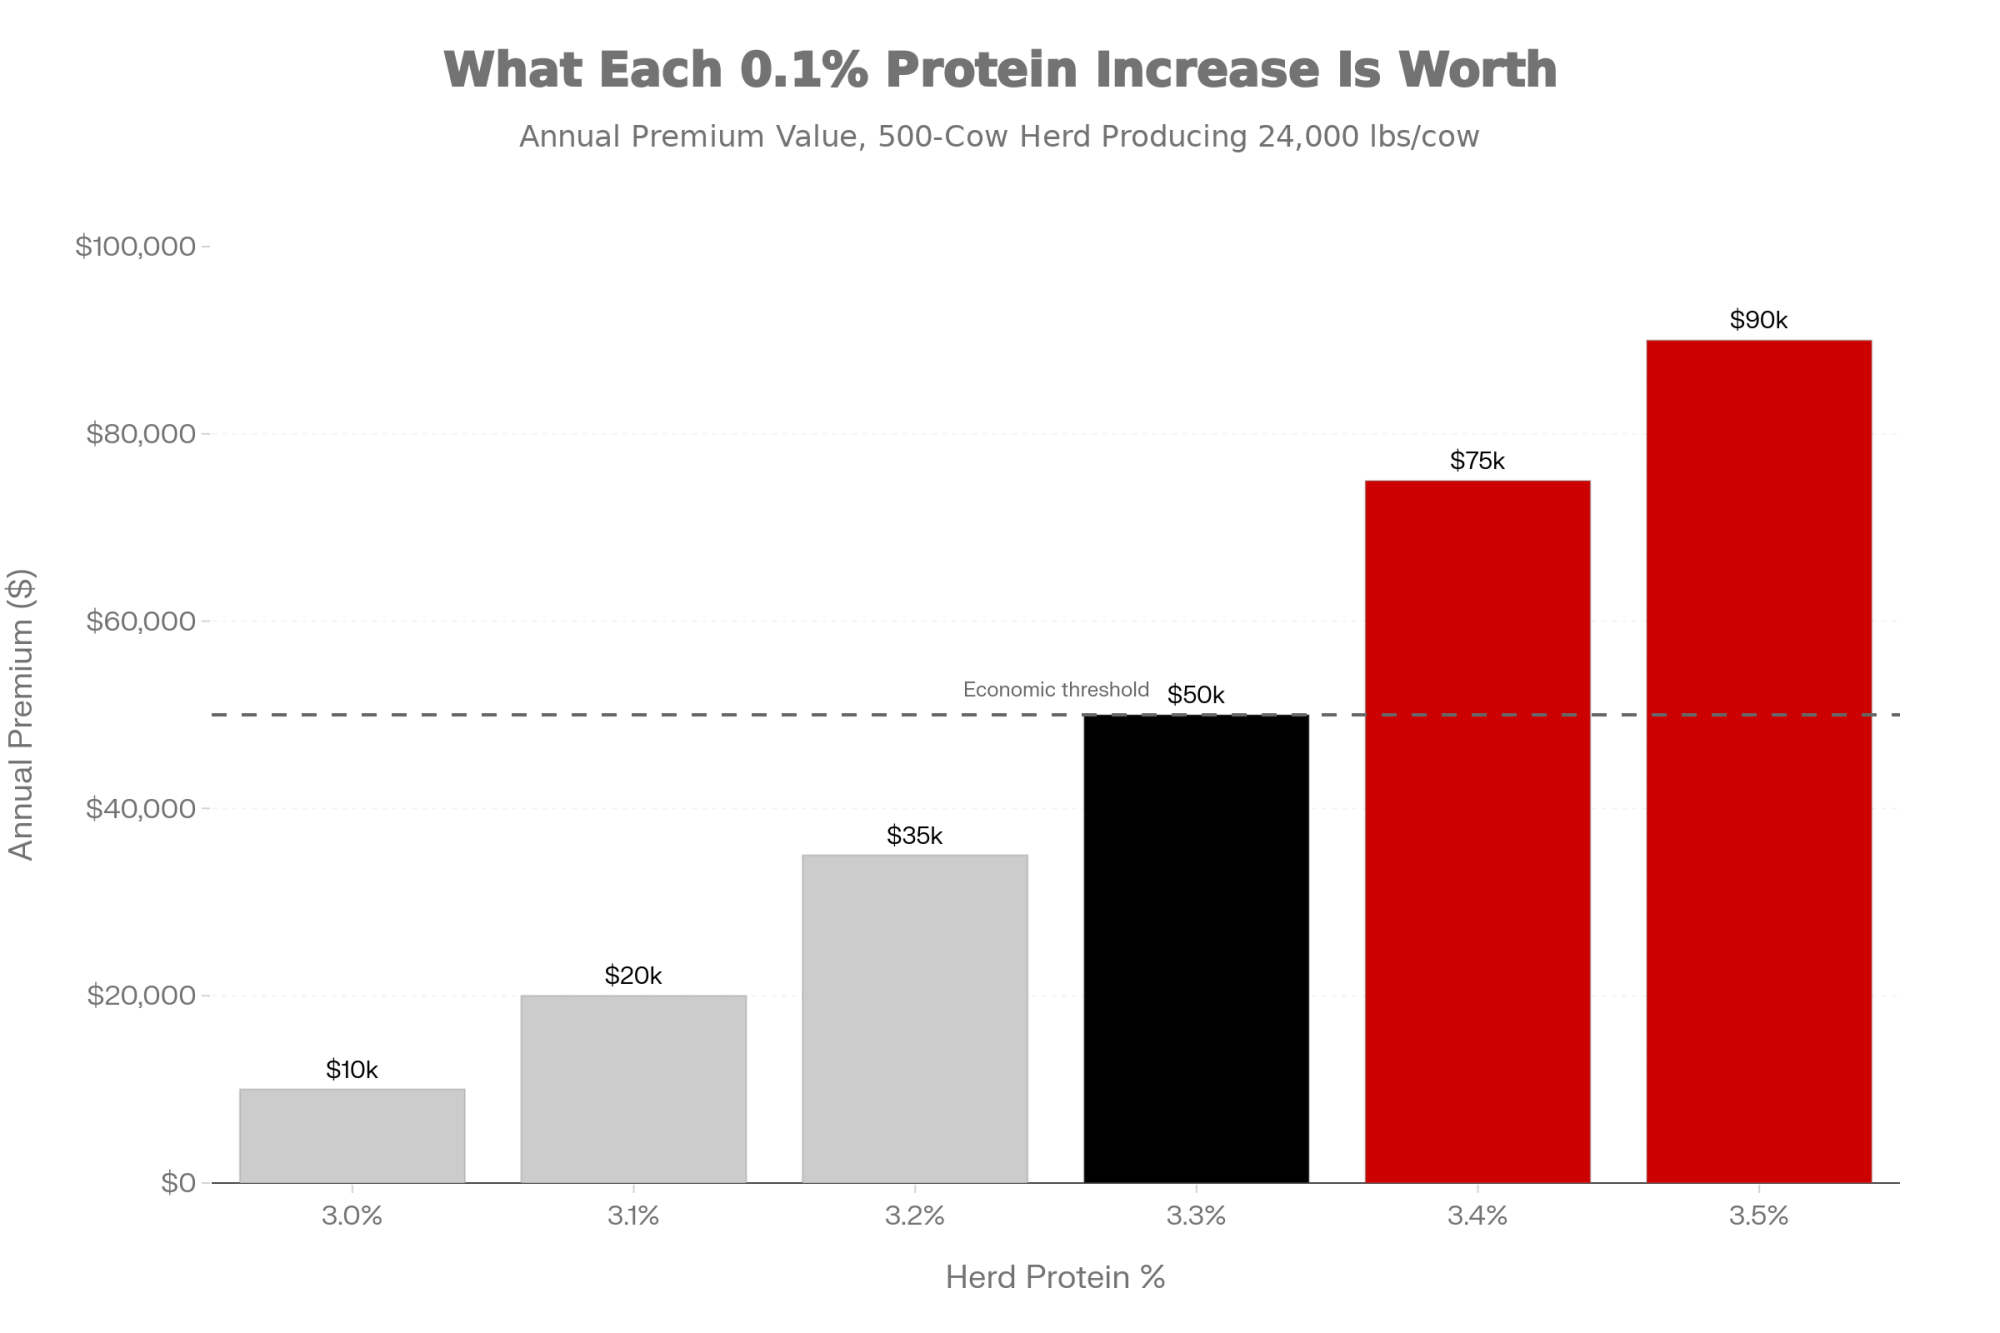
What farmers are finding—and what a lot of field nutritionists and independent advisers will tell you—is that balancedmilk tends to pay better than extreme milk in this environment. Herds averaging around 3.5–3.8 percent protein and 3.8–4.1 percent butterfat, with solid fresh cow management and a smooth transition period, often see more stable component checks than herds that push butterfat into the mid‑4s while letting protein linger around 3.0–3.1 percent. That profile matches what many cheese plants say they want: strong pounds of solids, but in a ratio that actually fits their vats.

MonthButterfat ($/lb)Protein ($/lb)
Jan3.151.85
Mar3.351.45
May3.102.20
Jul3.451.30
Sep3.252.05
Nov3.052.45

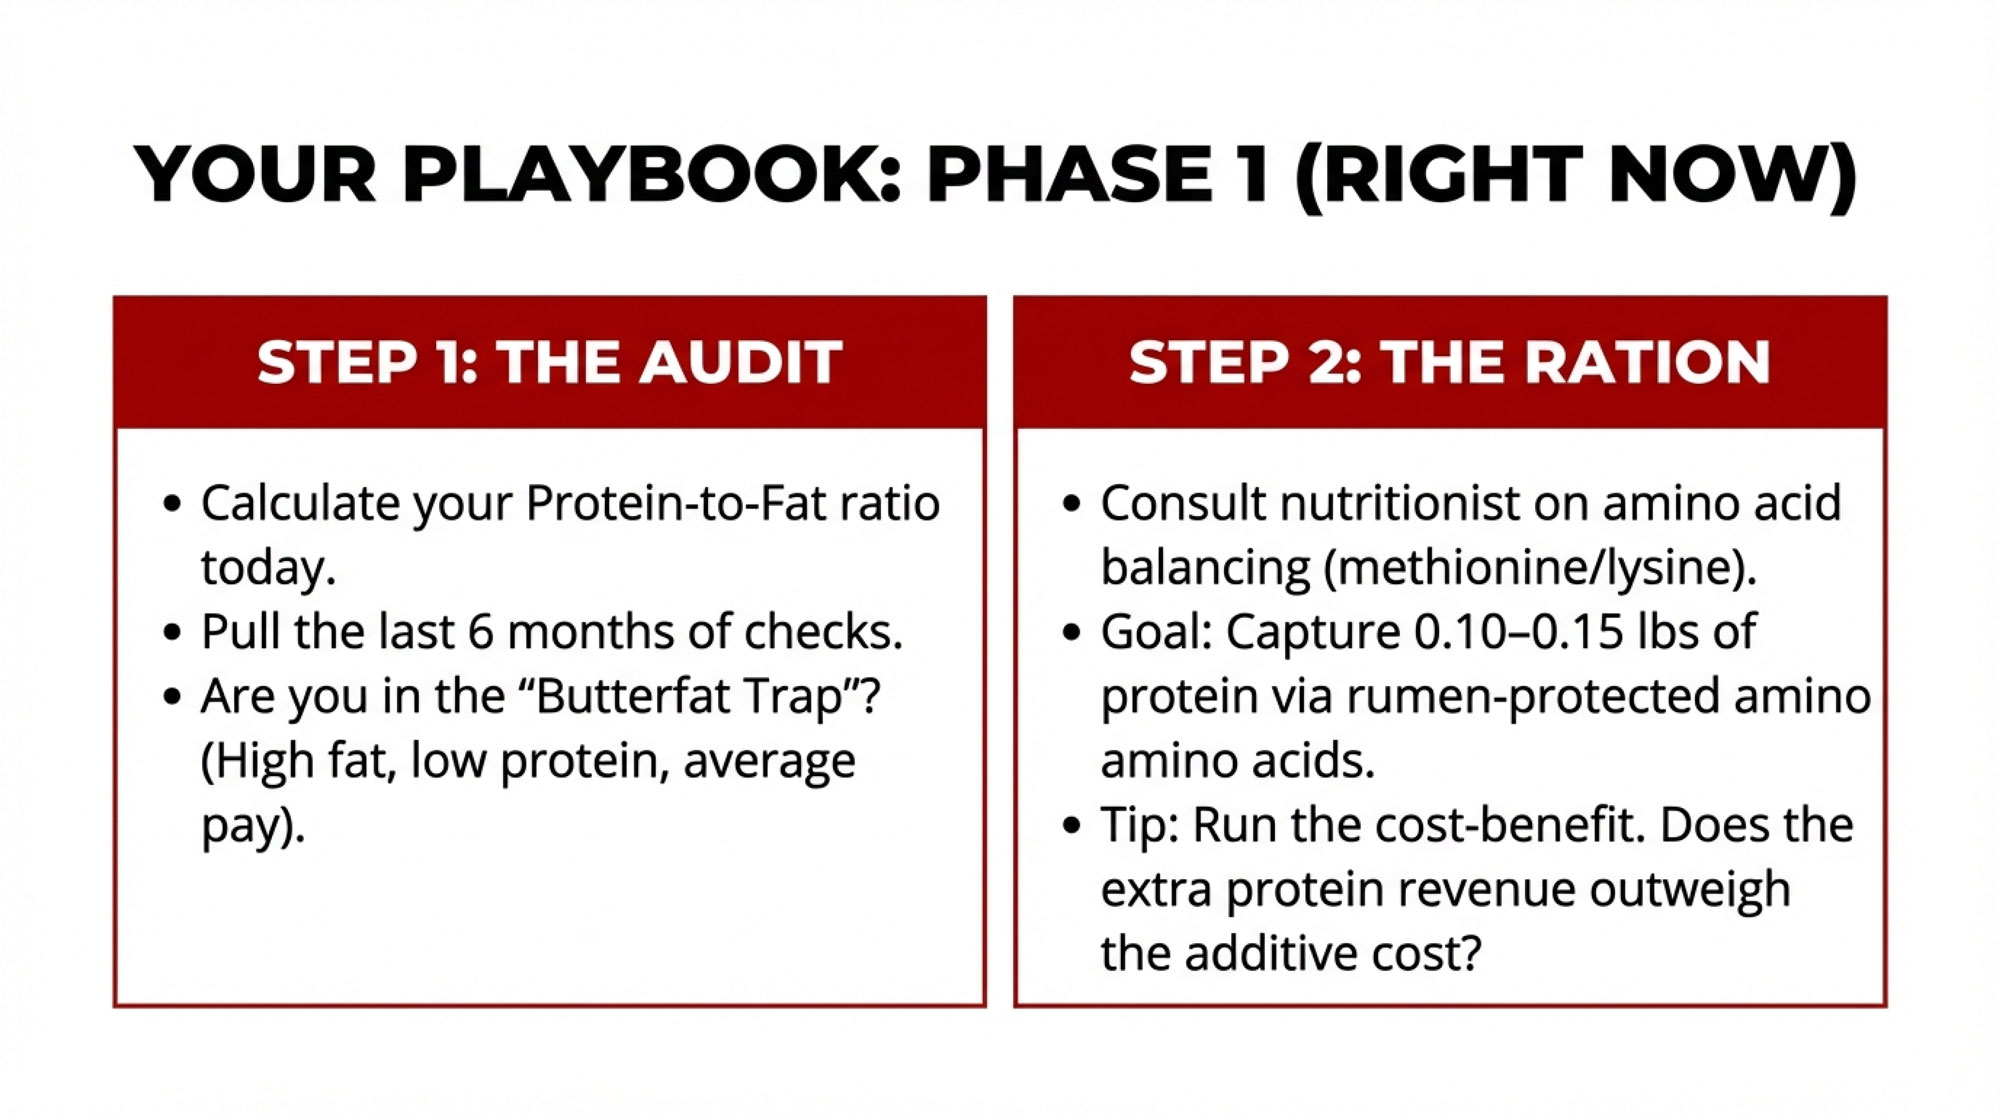
If you haven’t done it recently, it’s worth a quick kitchen‑table exercise:

  • Take a month’s milk statement and write down the total pounds of fat shipped and total pounds of protein shipped.
  • Divide each by the total pounds of milk shipped to confirm your average butterfat and protein tests.
  • Then look up that month’s USDA or co‑op Class III/IV component values and see how many dollars per cwt those pounds are really generating.

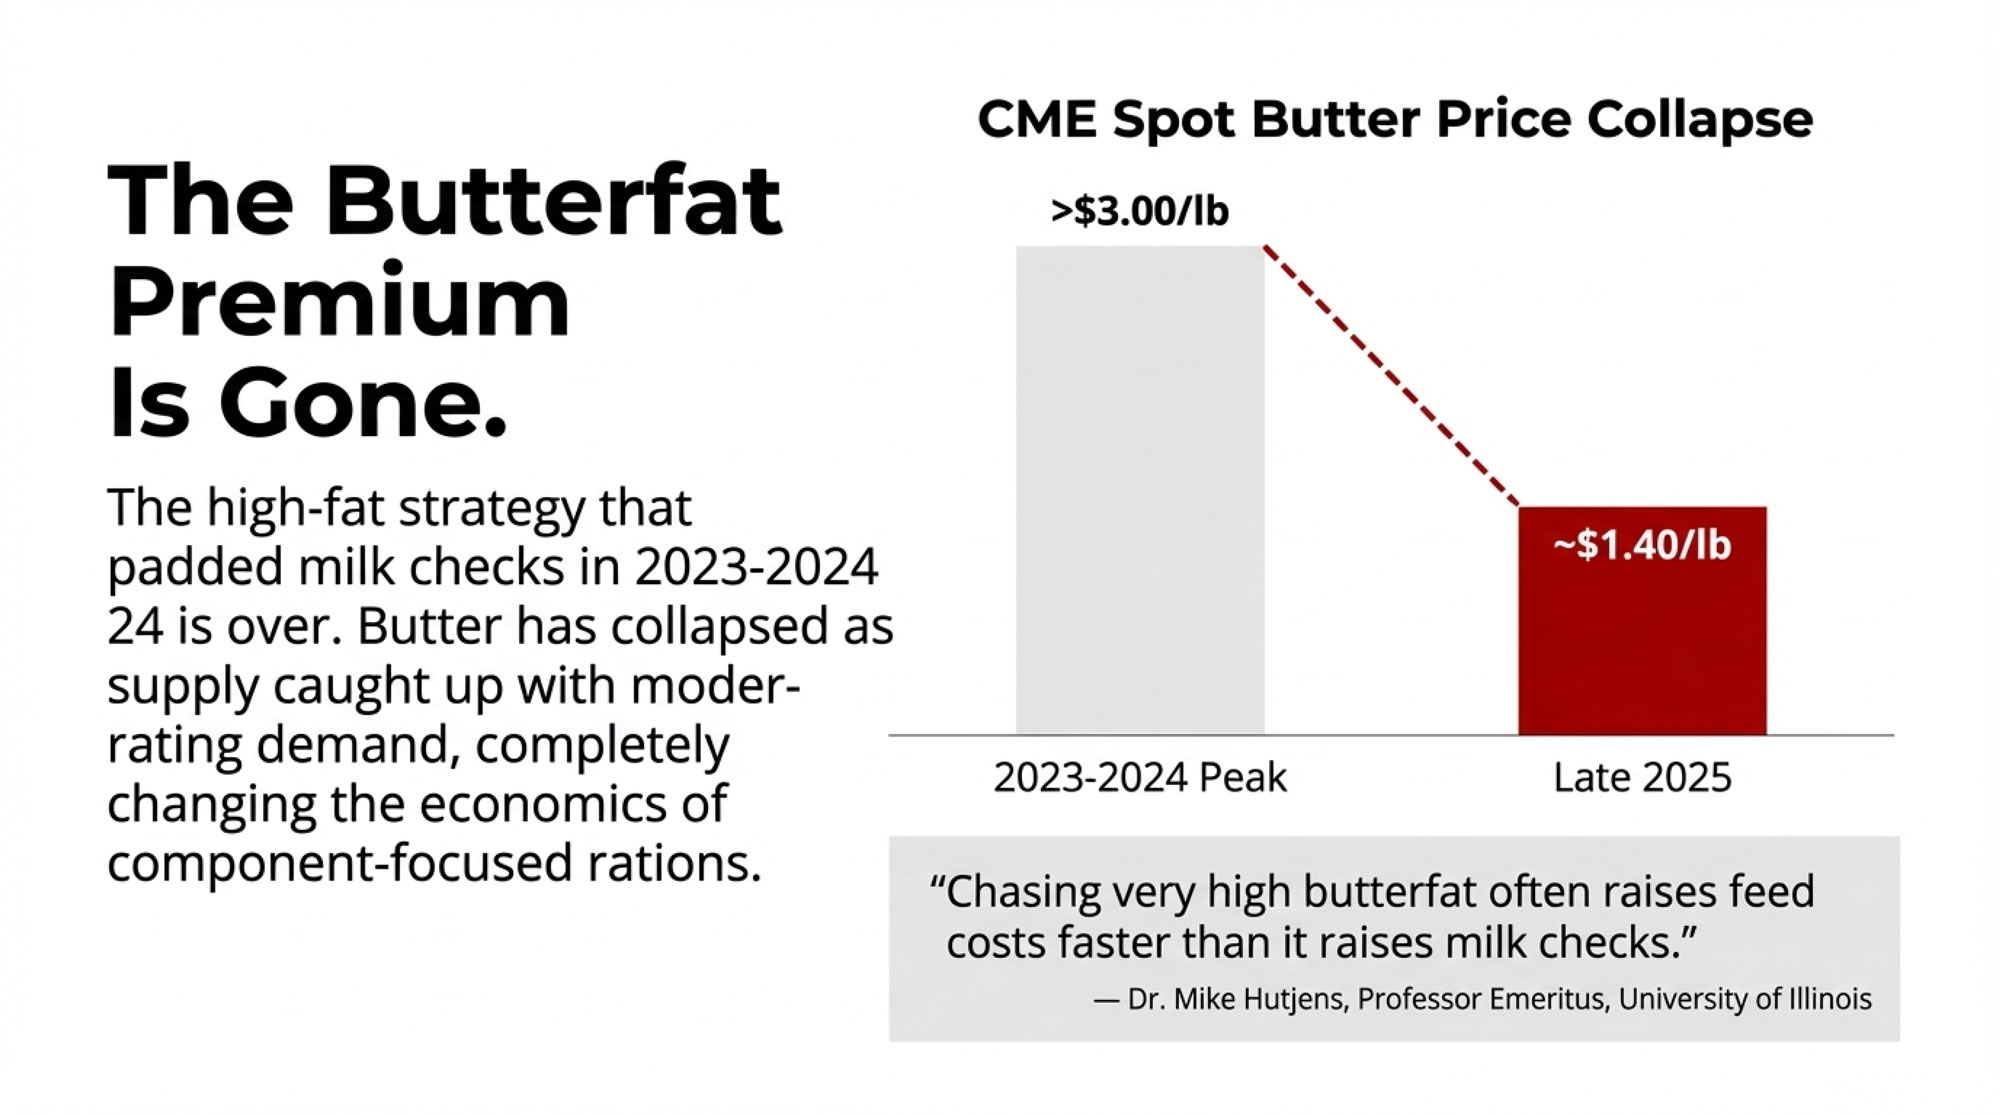
A recent review on milk quality and economic sustainability points out that herds with better component performance and milk quality tend to show stronger economic sustainability—so long as they aren’t trading away health and fertility to get there. And Mike Hutjens, Professor Emeritus and extension dairy specialist at the University of Illinois, has hammered the same point for years: it’s pounds of fat and protein shipped per cow and per cwt that drive income, not just pretty percentages on the DHI sheet.

This development suggests something important: chasing maximum butterfat at the expense of protein and cow health doesn’t pay the way it once might have. The money today is in a balanced component profile, backed by good transition‑period management and consistent TMRs.

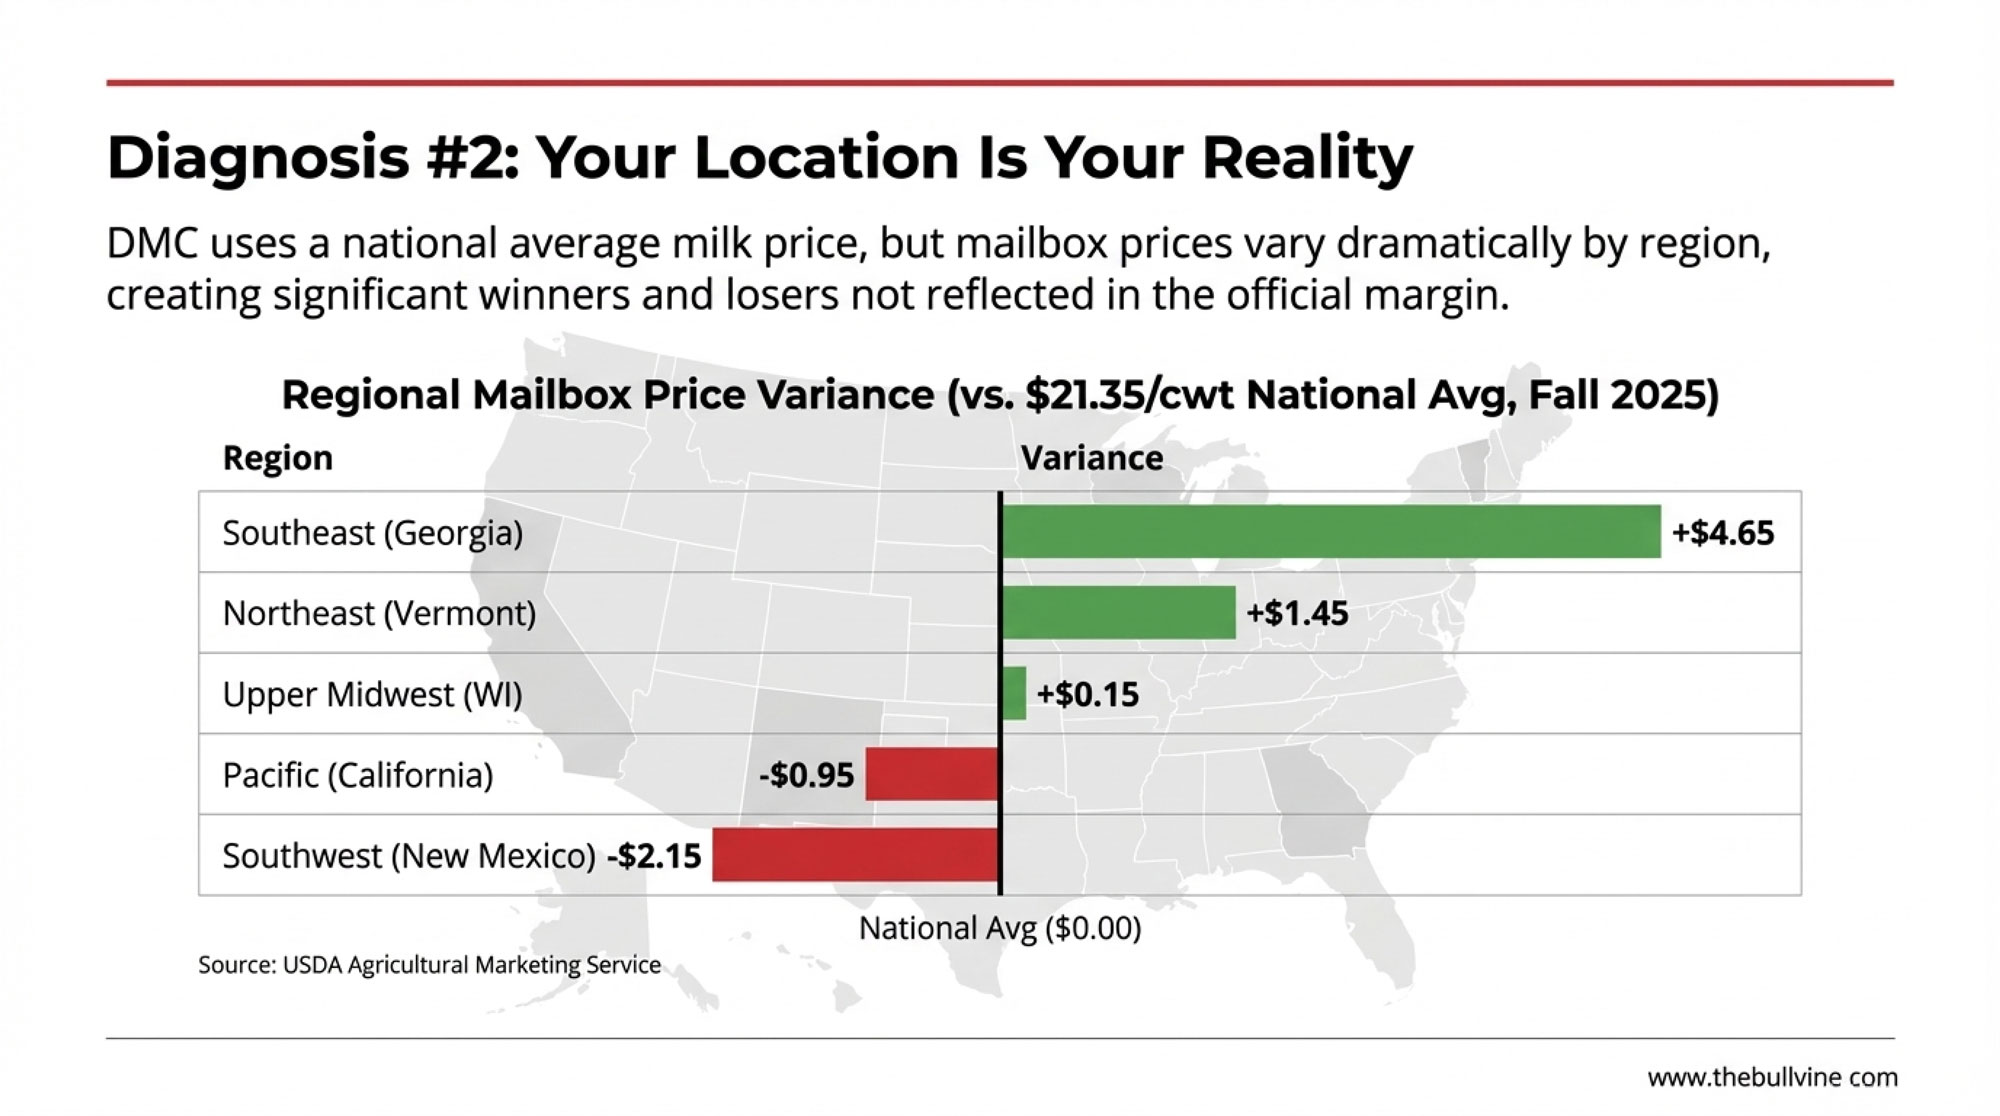
Why Your ZIP Code Still Matters More Than You’d Like

Looking at this trend across regions, it’s hard to ignore how much your postal code still shapes your milk check.

USDA Milk Production reports make it pretty clear that cows and milk have been shifting into certain regions, especially the interior. South Dakota is one of the clearest examples. The state has become a major growth engine as the I‑29 corridor cheese plants and expansions pulled in herds and investment. Kansas appears in USDA and Progressive Dairy statistics as another state with consistent year‑over‑year growth, driven by large freestall operations and added plant capacity. At the same time, USDA/NASS and state reports often rank Michigan near the top for milk per cow, thanks to strong forage programs, cow comfort, and efficient parlors.

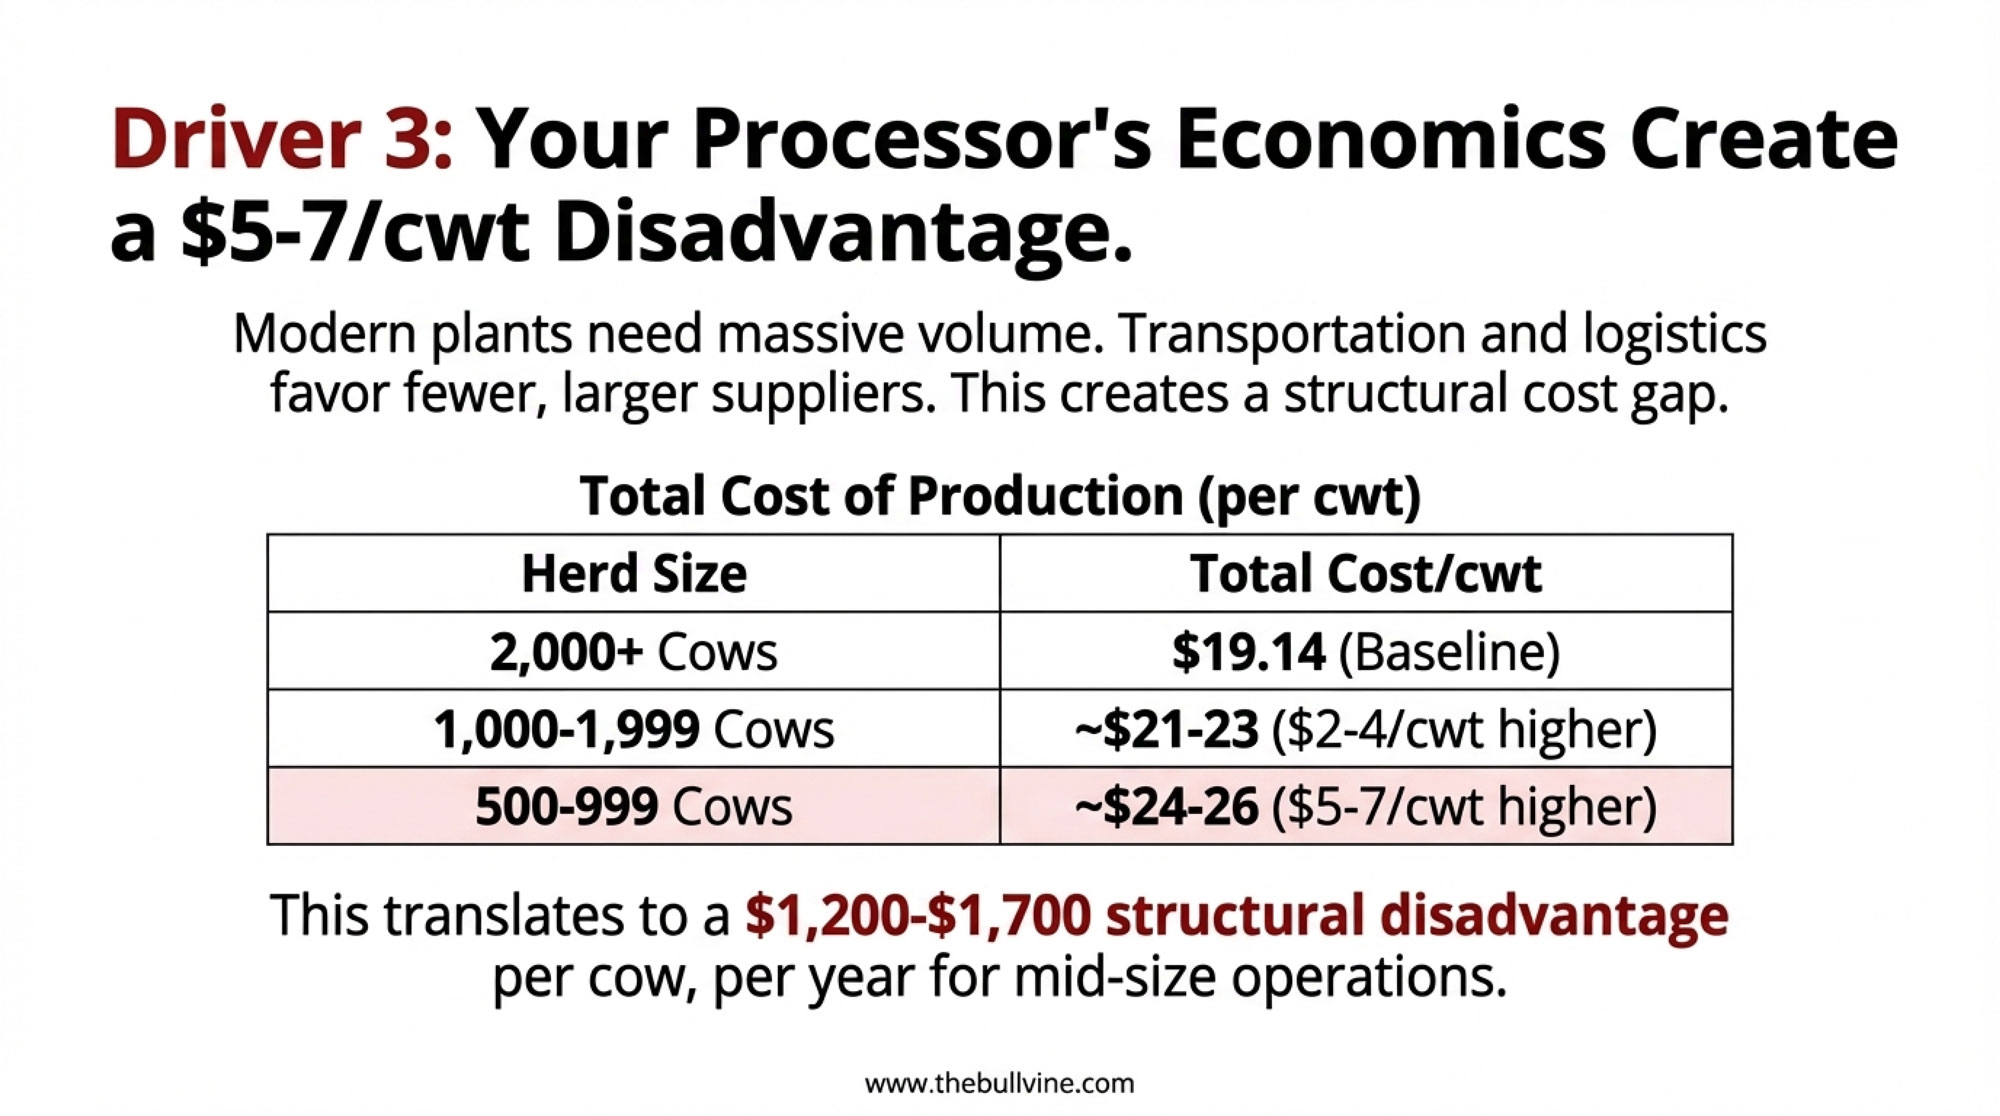
What I’ve noticed, looking at those numbers and listening to producers, is that geography flows directly into basis and hauling. A 1,500‑cow freestall in eastern South Dakota, 20 or 30 miles from a modern cheese plant, is playing a different game than a 200‑cow tie‑stall in a New England valley where there’s limited processing and plants are already full. The close‑in herd may save 30–50 cents per cwt on hauling and pick up stronger over‑order premiums and quality incentives because the plant really needs their milk. The more remote herd often pays more just to get milk to town and has fewer realistic buyers if contracts change.

To put some rough numbers on it, imagine a herd shipping 20,000 cwt per month. If better basis and lower hauling together net 0.75 dollars per cwt more than a herd in a less favored location, that’s 15,000 dollars per month, or roughly 180,000 dollars per year. That’s just an example based on USDA and regional data; every farm will have its own version of that spread. But it shows why two herds can read the same export headlines and feel completely different realities when the milk checks arrive.

FactorHerd A: Close to Growing Plant (SD, KS, TX)Herd B: Remote or Declining Region (VT, Upstate NY, Rural West)
Distance to Plant20–30 miles80–150+ miles
Hauling Cost$0.25–$0.40/cwt$0.60–$1.00/cwt
Over-Order Premium/Basis$0.50–$1.25/cwt$0.00–$0.50/cwt
Quality/Volume IncentivesStrong (plant needs milk)Weak (plant at capacity or shrinking)
Monthly Advantage (20,000 cwt)Baseline−$15,000
Annual ImpactBaseline−$180,000

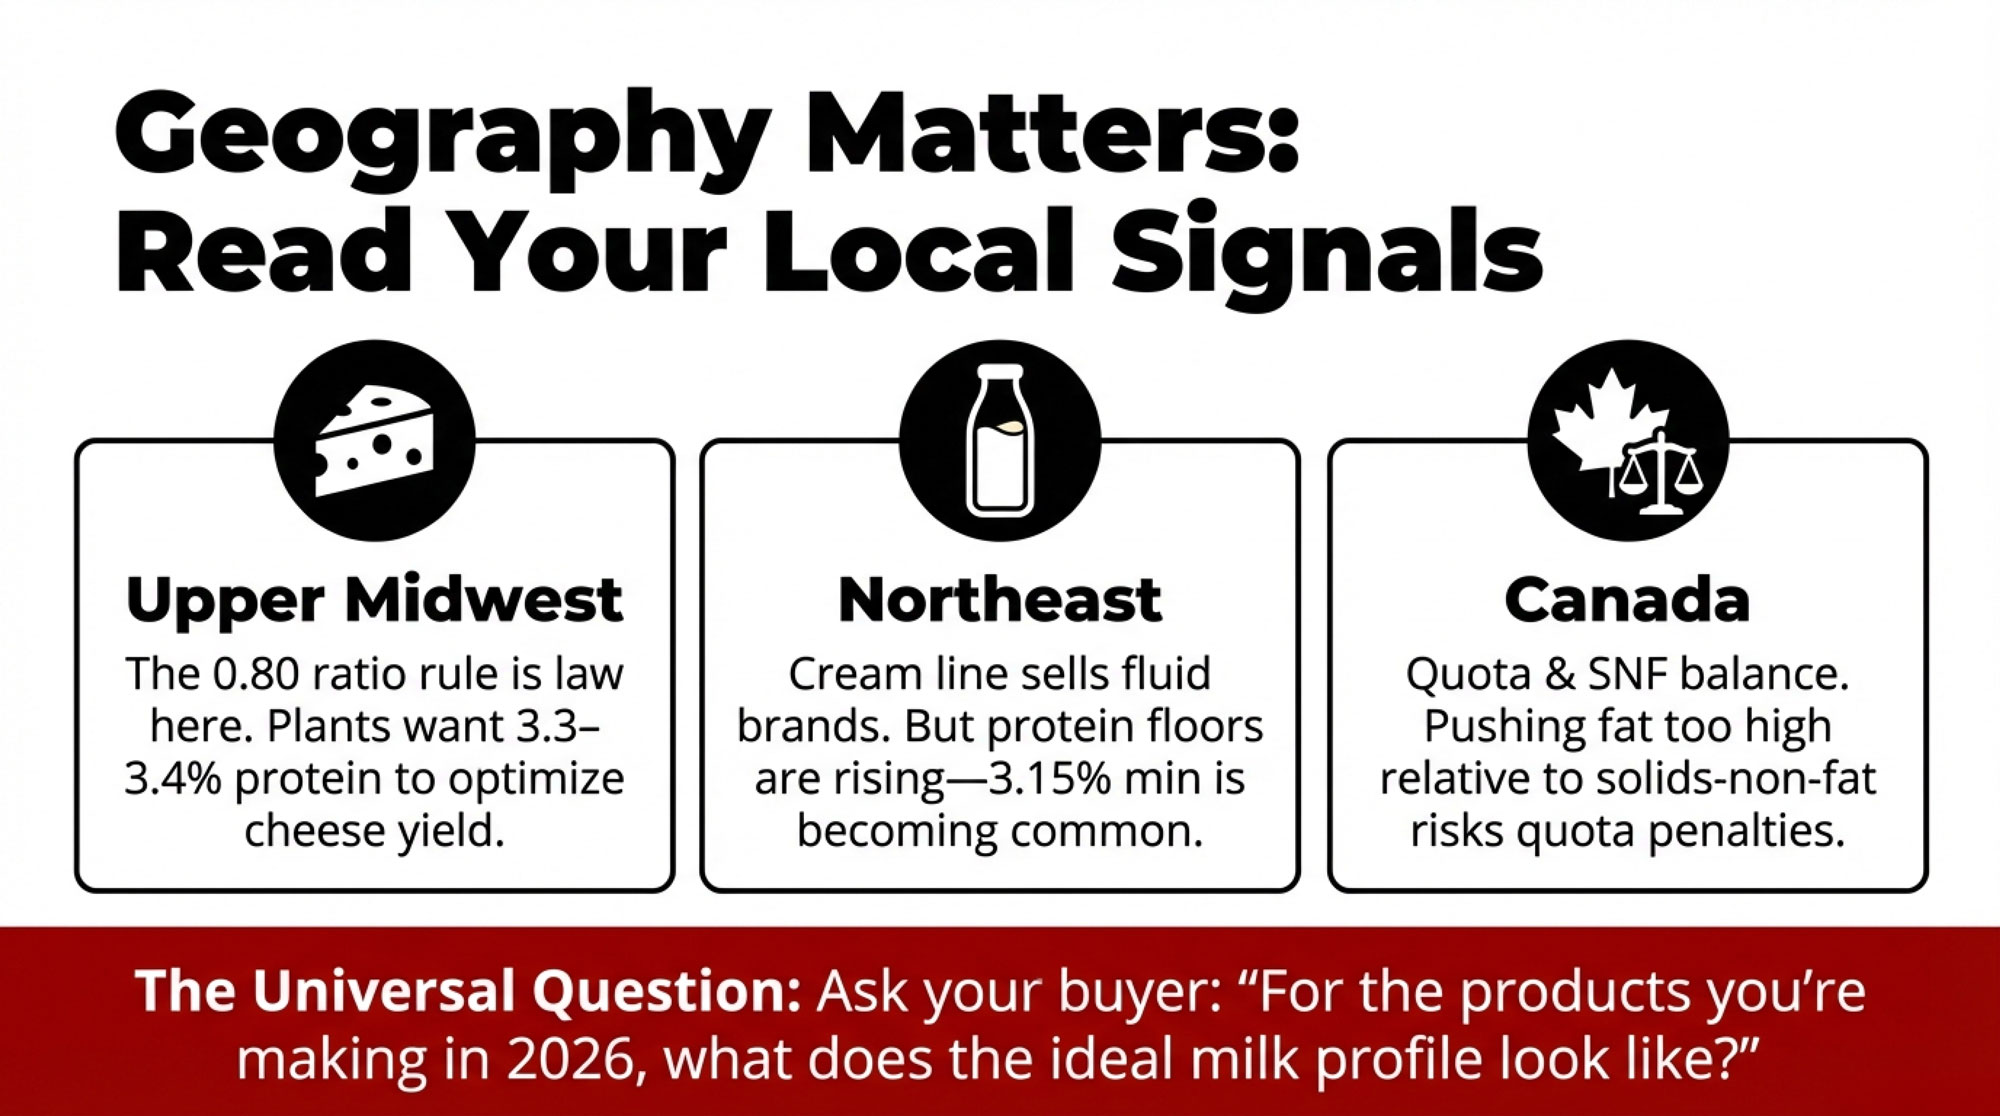
It’s not about “good” or “bad” states. It’s about plant geography, infrastructure, and policy. Many producers in the Midwest and Plains will tell you their biggest advantage right now is simply being inside the pull radius of expanding cheese plants. Producers in some Northeast or Mountain West pockets, or even parts of Canada, may have very competitive herds but face higher freight and less processor competition, even while exports are booming.

Mexico: Our Best Customer—and a Big Exposure

Now let’s talk about where a lot of those extra cheese and powder pounds actually end up: Mexico.

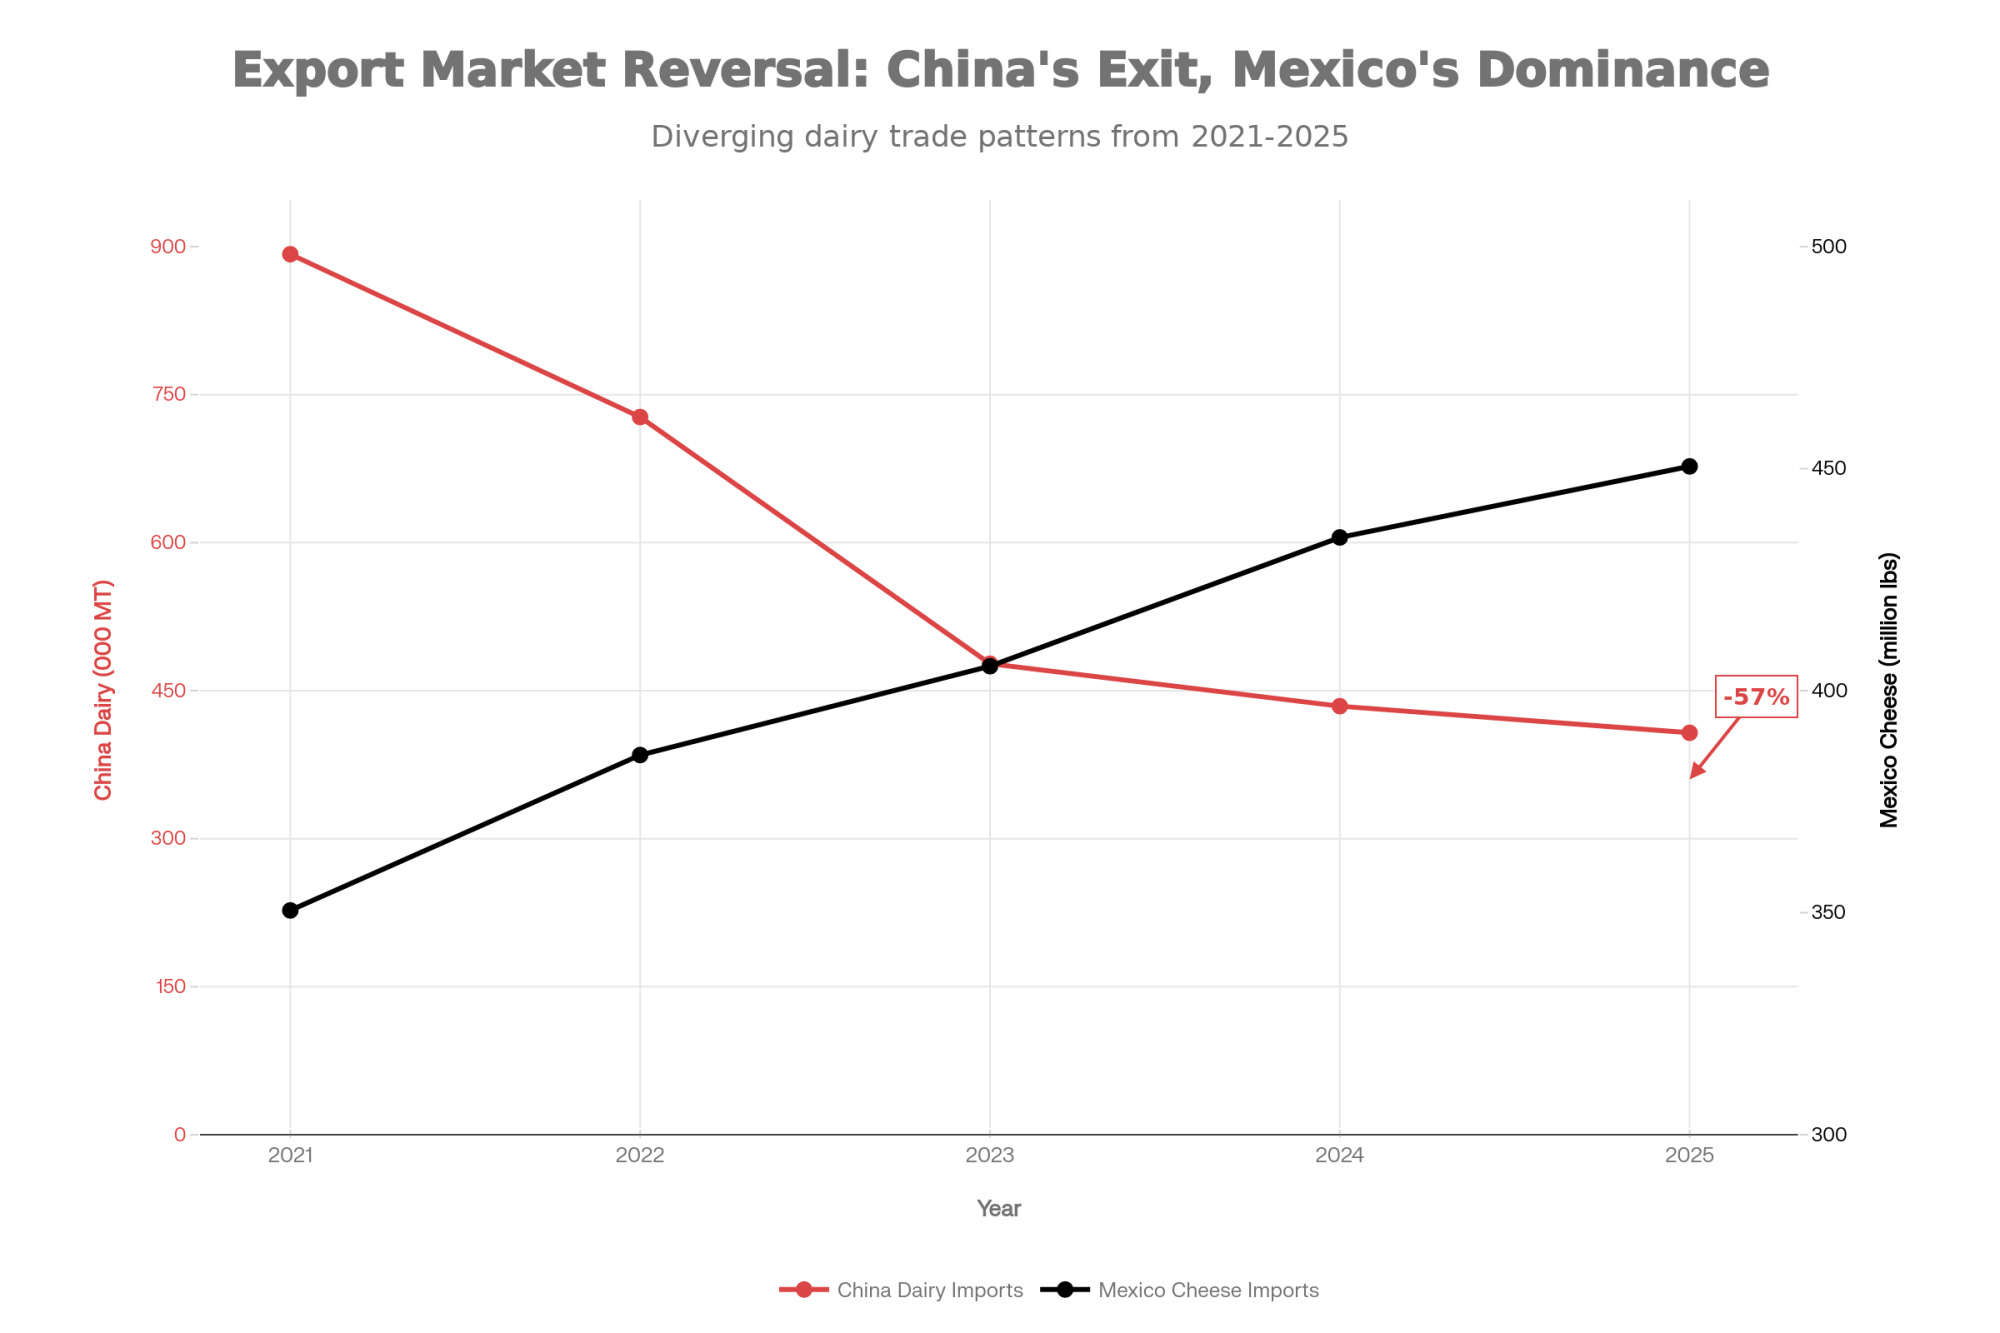
USDA FAS, IDFA, USDEC, and trade outlets like Dairy Processing are all on the same page here: Mexico is the single largest foreign market for U.S. dairy by value. In 2024, the U.S. shipped roughly $2.47 billion in dairy products to Mexico and about $1.14 billion to Canada. Together, Mexico and Canada account for more than 40 percent of U.S. dairy export value, with Mexico consistently the top buyer for U.S. cheese and skim milk powder.

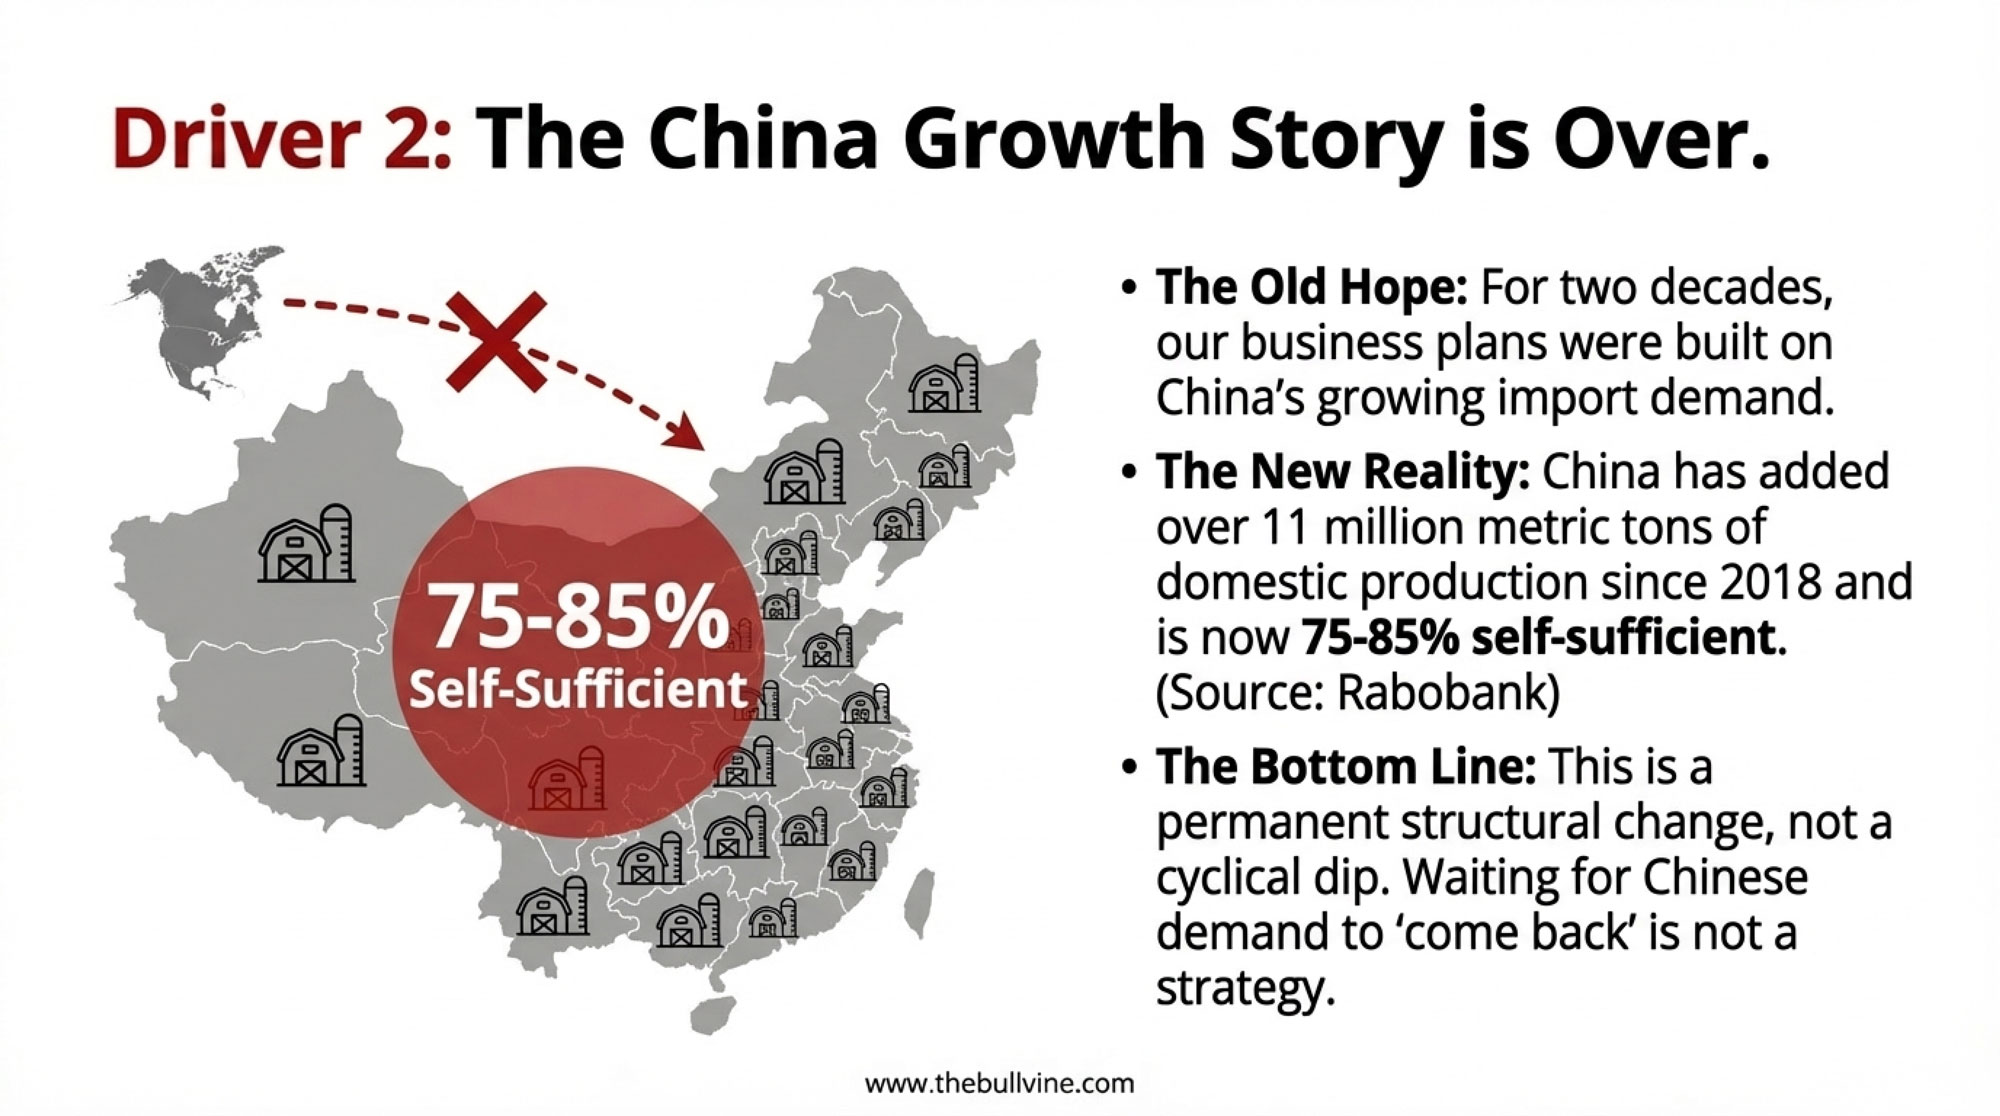
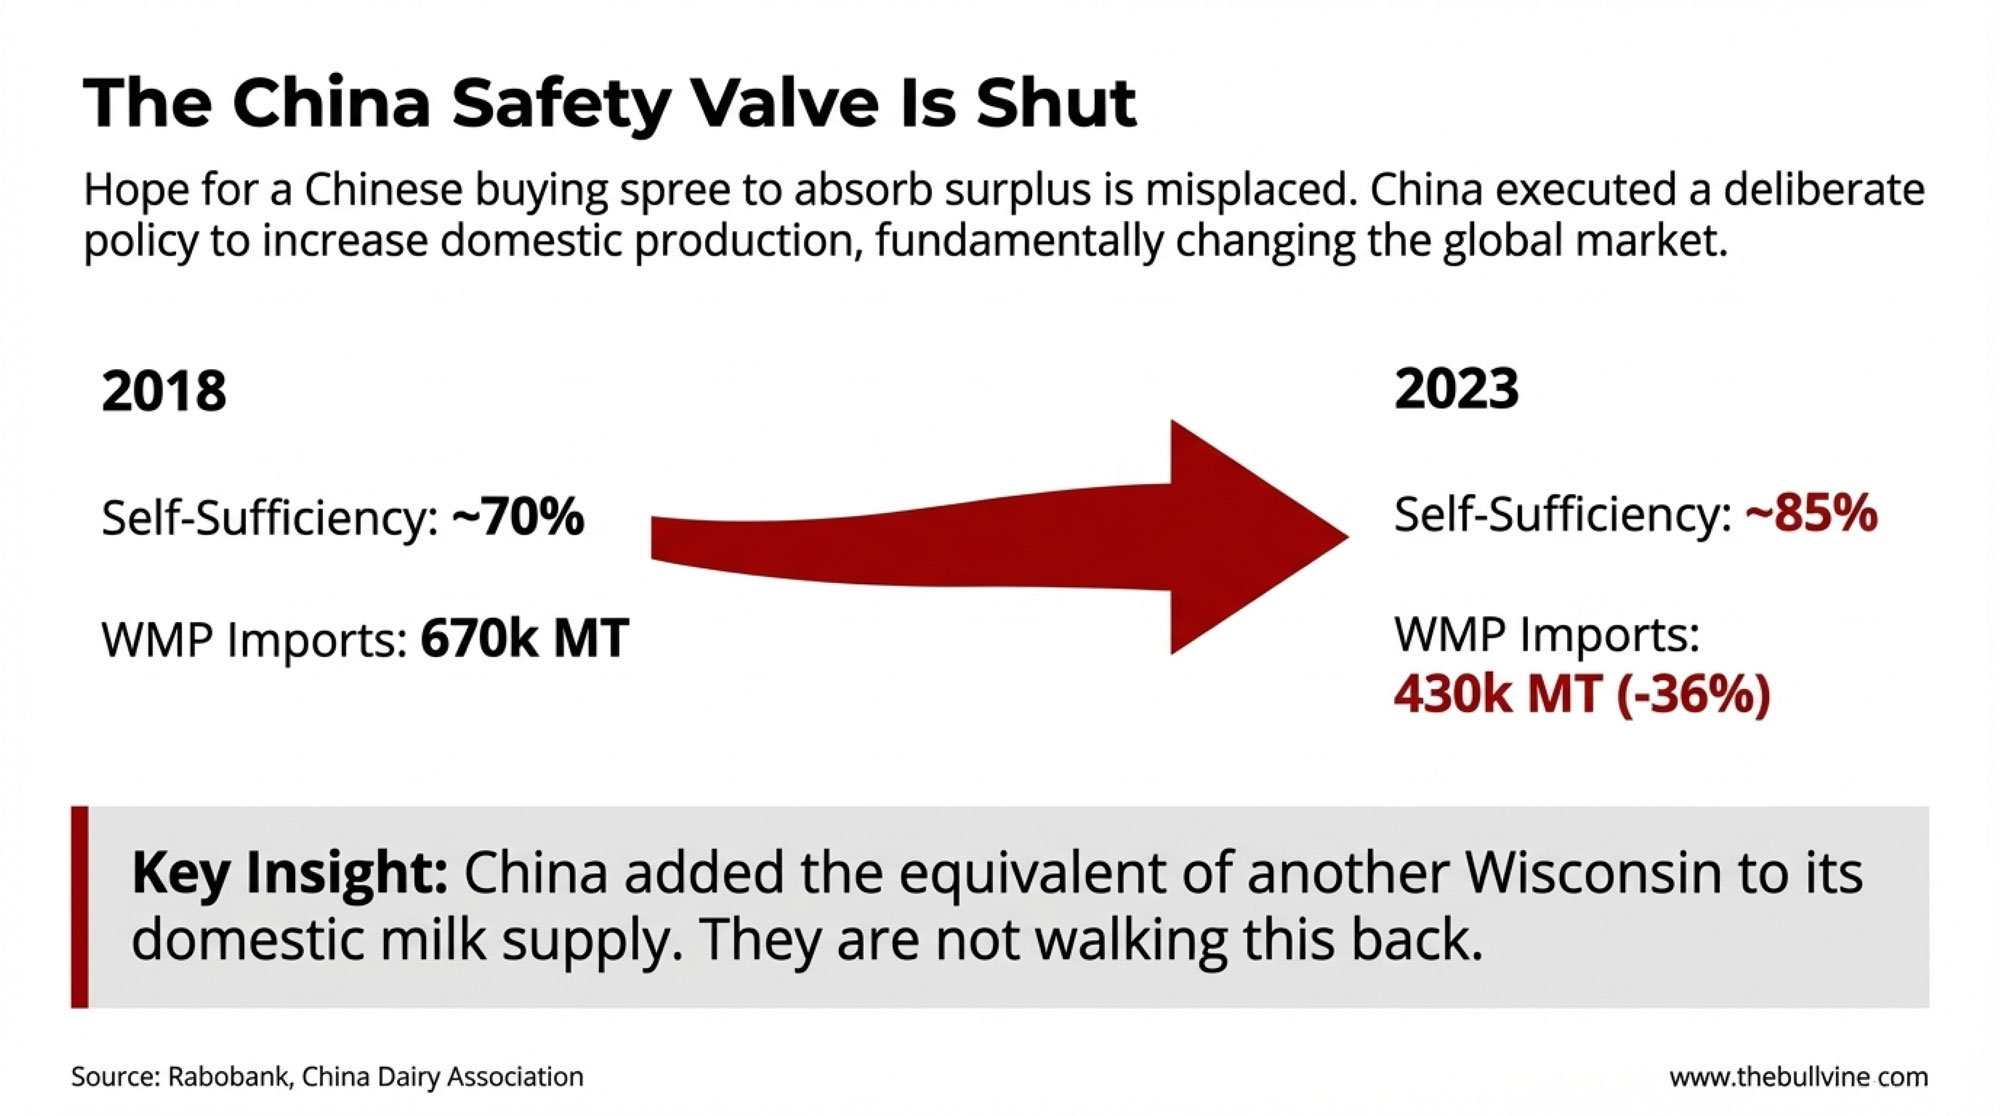
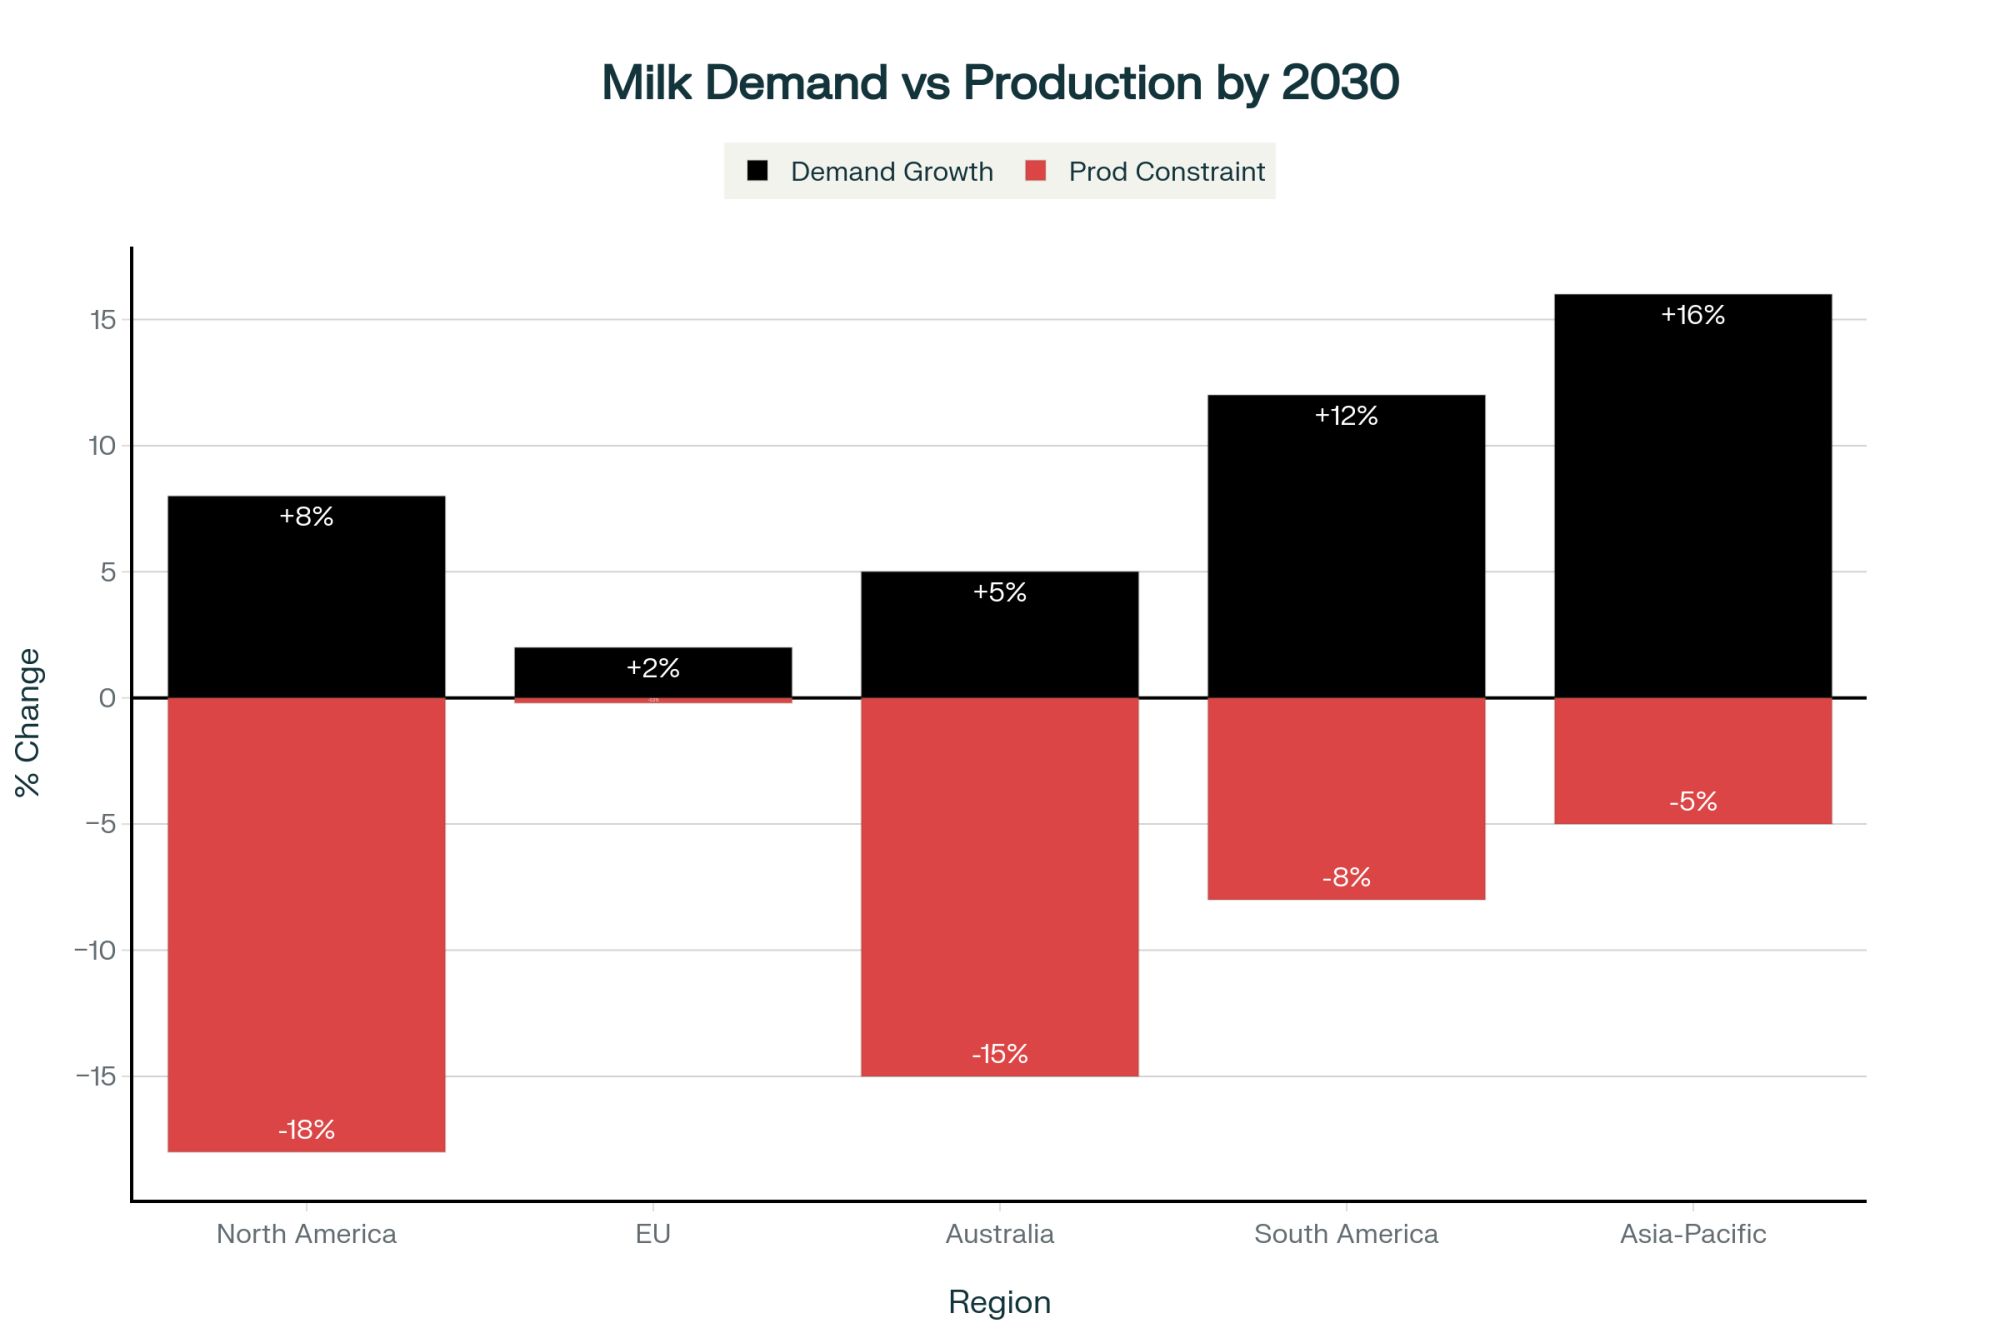
What’s encouraging in the near term is that Mexico is structurally short on milk. CoBank’s export analysis and USDA FAS reports describe a situation where Mexican dairy demand has outpaced domestic production, leaving a persistent gap that imports—mostly from the U.S.—fill. Per‑capita dairy consumption in Mexico is still lower than in the U.S., which gives some headroom for growth as incomes rise. That combination—structural deficit plus room for per‑capita growth—is a big part of why analysts see Mexico as critical to U.S. dairy’s near‑term export outlook.

But there’s another side that matters for your risk. FAS and industry coverage point out that Mexico is investing in its dairy sector, particularly in northern states, where newer farms are increasingly resembling large freestall and dry-lot systems in the U.S. Southwest, with upgraded genetics, improved feed efficiency, and better milk-handling infrastructure. The goal is to trim back some of that import dependence over time.

So what farmers are finding is that Mexico is both a tremendous asset and a concentration point. Over the next one to three years, it’s hard to imagine a strong U.S. export story that doesn’t lean heavily on Mexico. Over a three‑to‑ten‑year window, if Mexico succeeds in significantly boosting its own production, the growth rate of U.S. exports there could slow, or the mix of products could shift—even if the trading relationship remains strong.

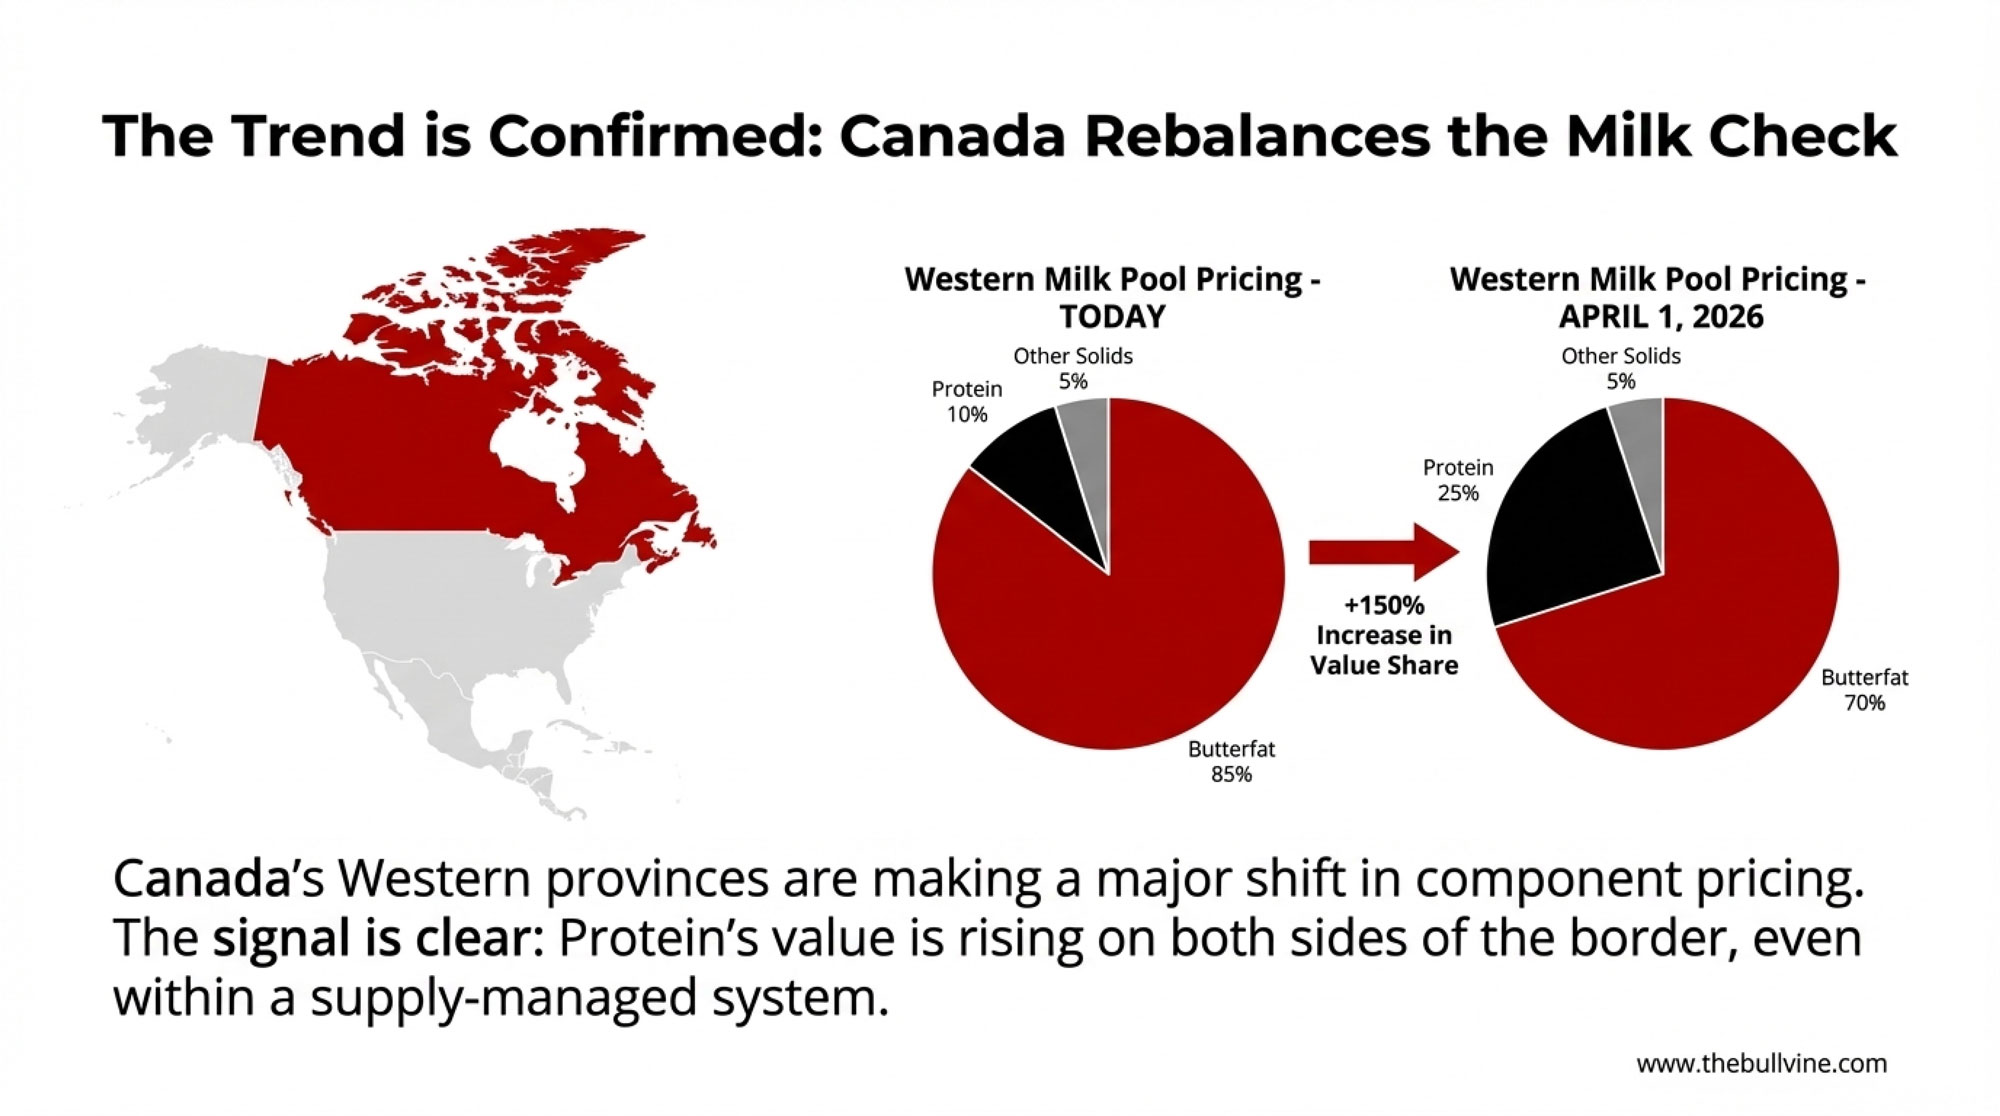
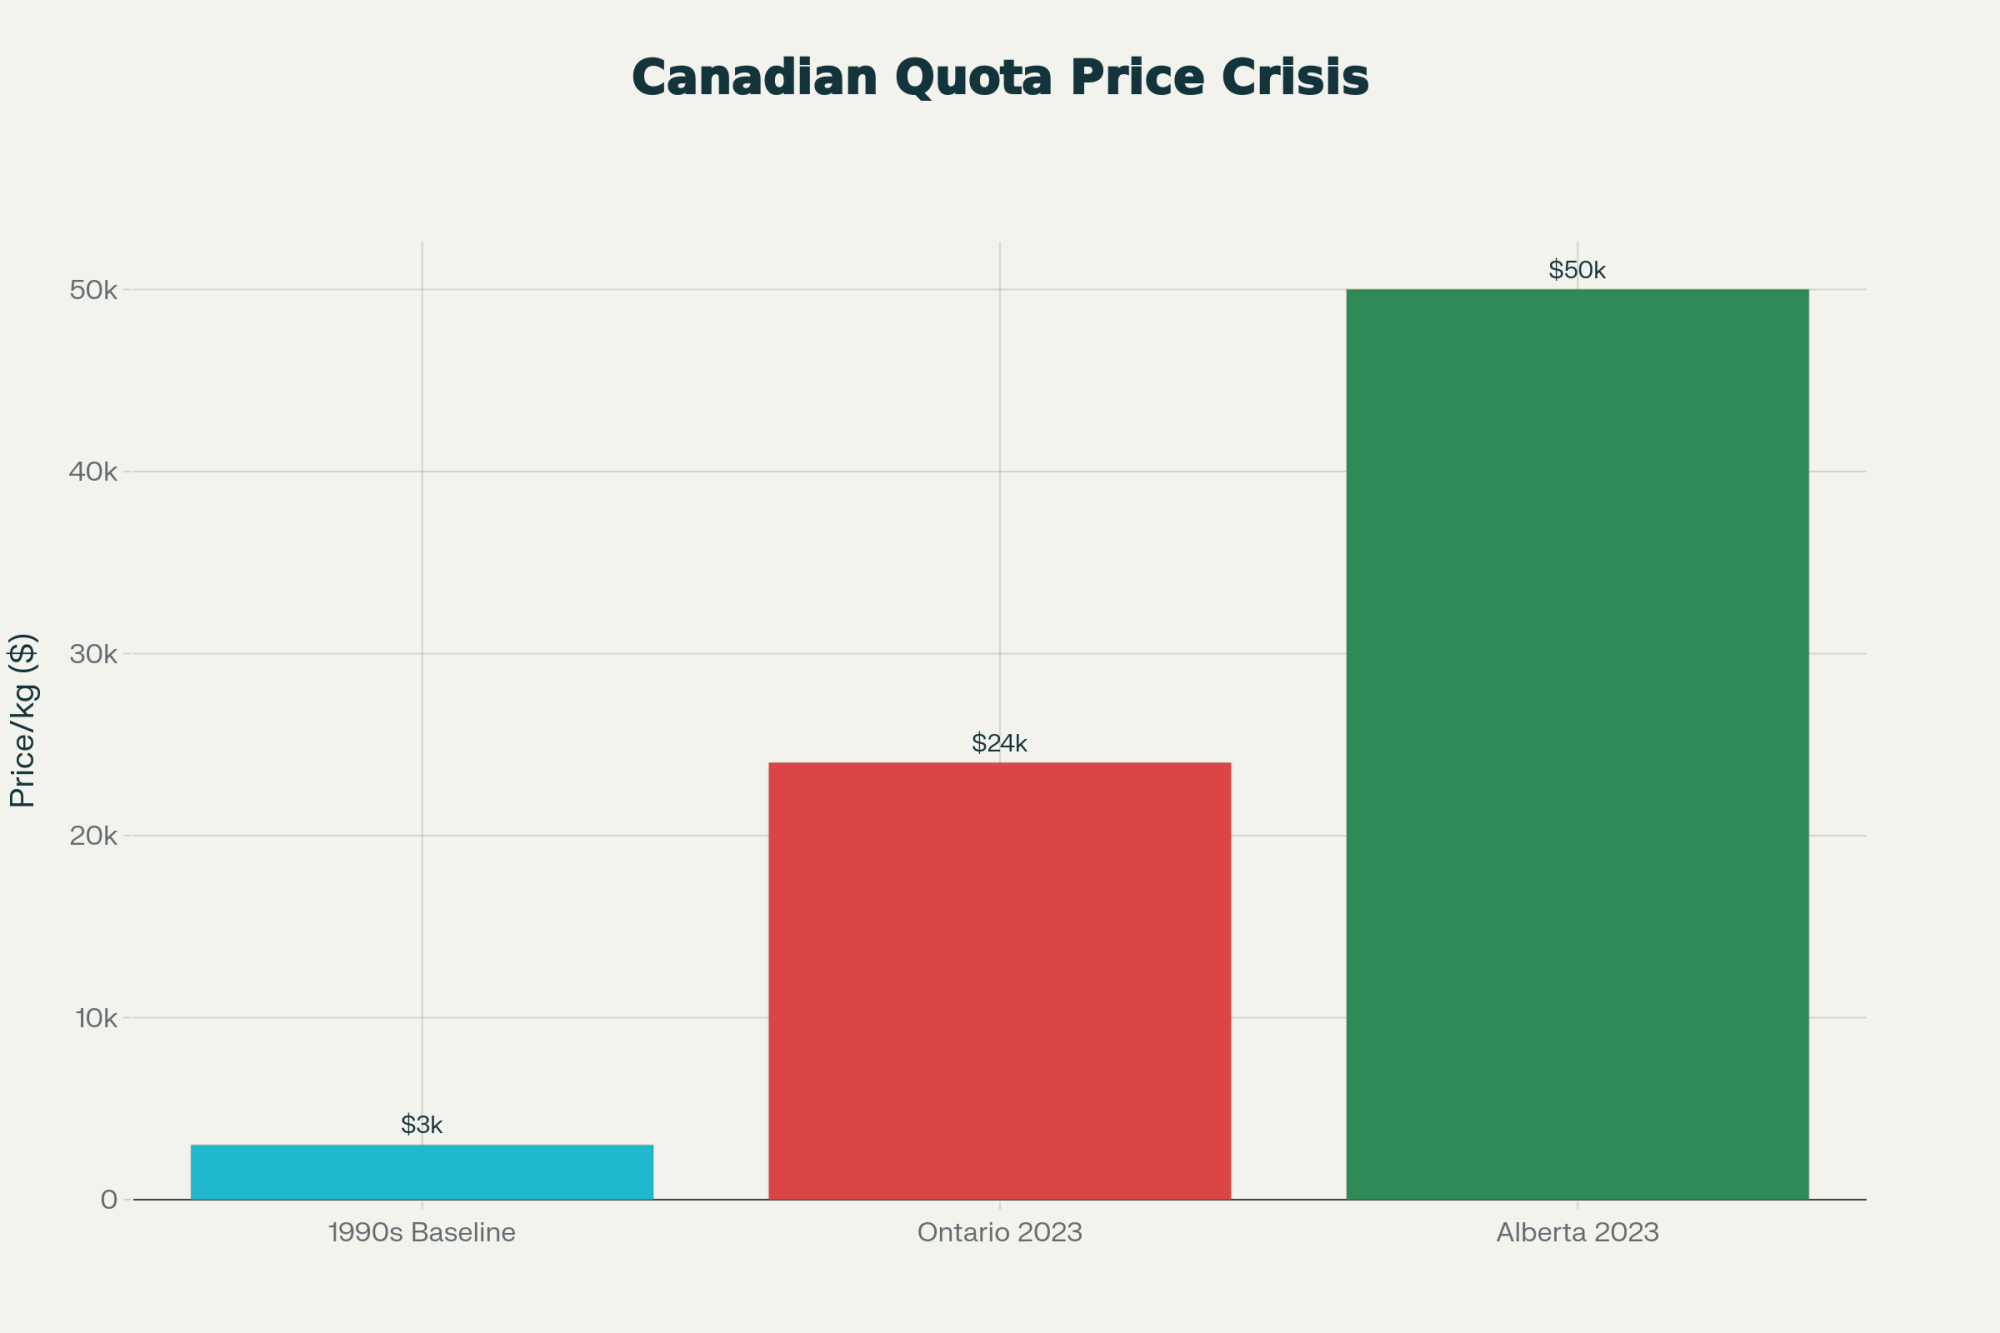
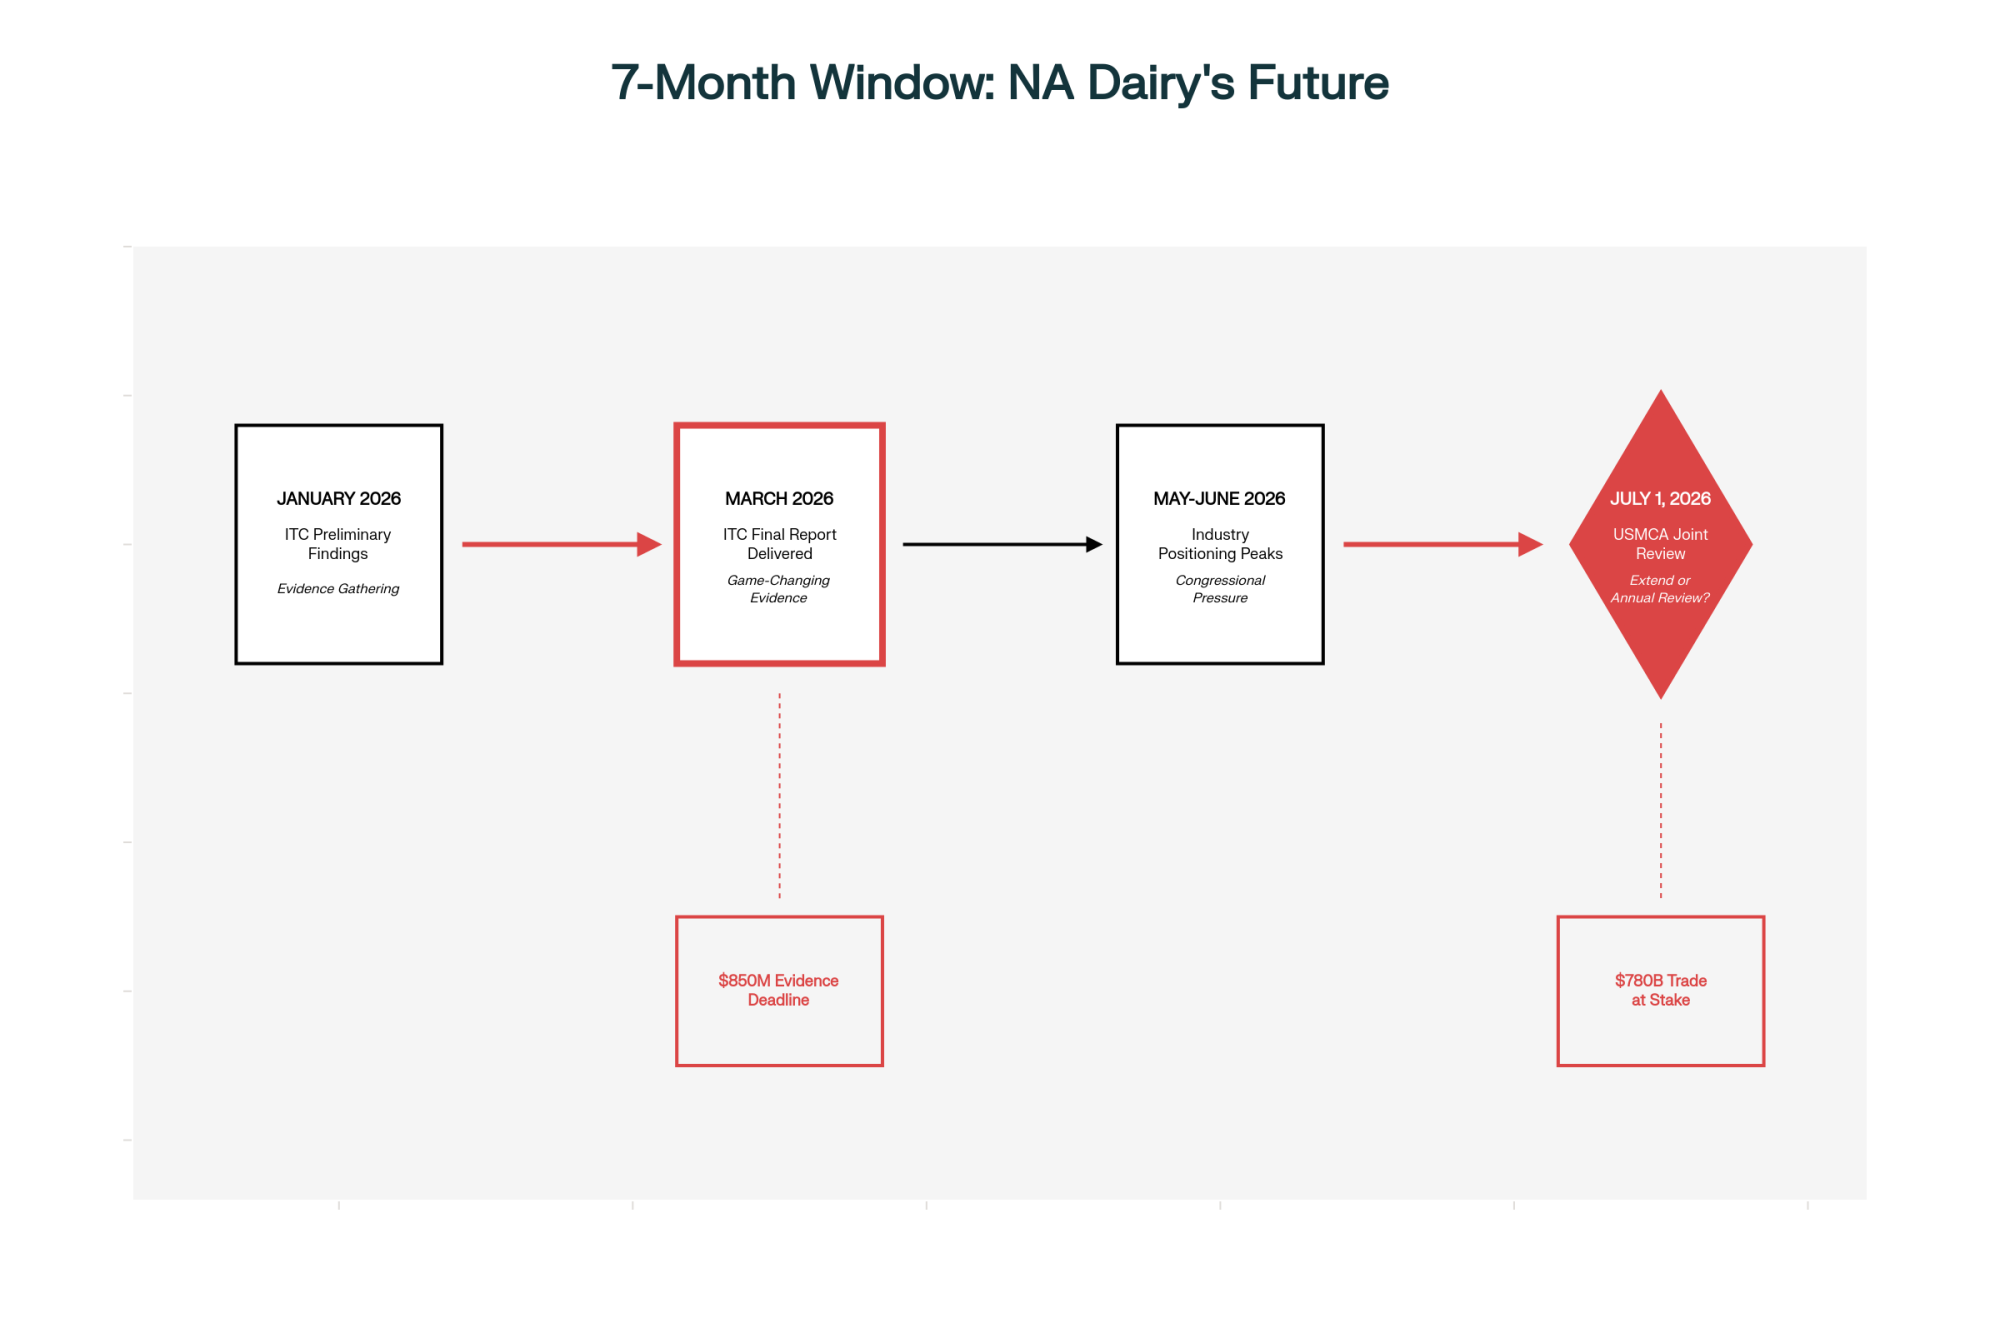
For Canadian readers in Ontario and Quebec, supply management and quota systems buffer your farm‑gate price from a lot of these swings, as multiple analyses of the 2022 Census and Canadian policy have noted. But U.S. export performance and Mexico’s appetite still shape the broader North American environment you’re operating in—especially for processors, trade negotiations, and on‑going USMCA disputes.

One Herd That Fits Today’s Market

Sometimes these big forces are easier to digest when you see how they play out in a real barn.

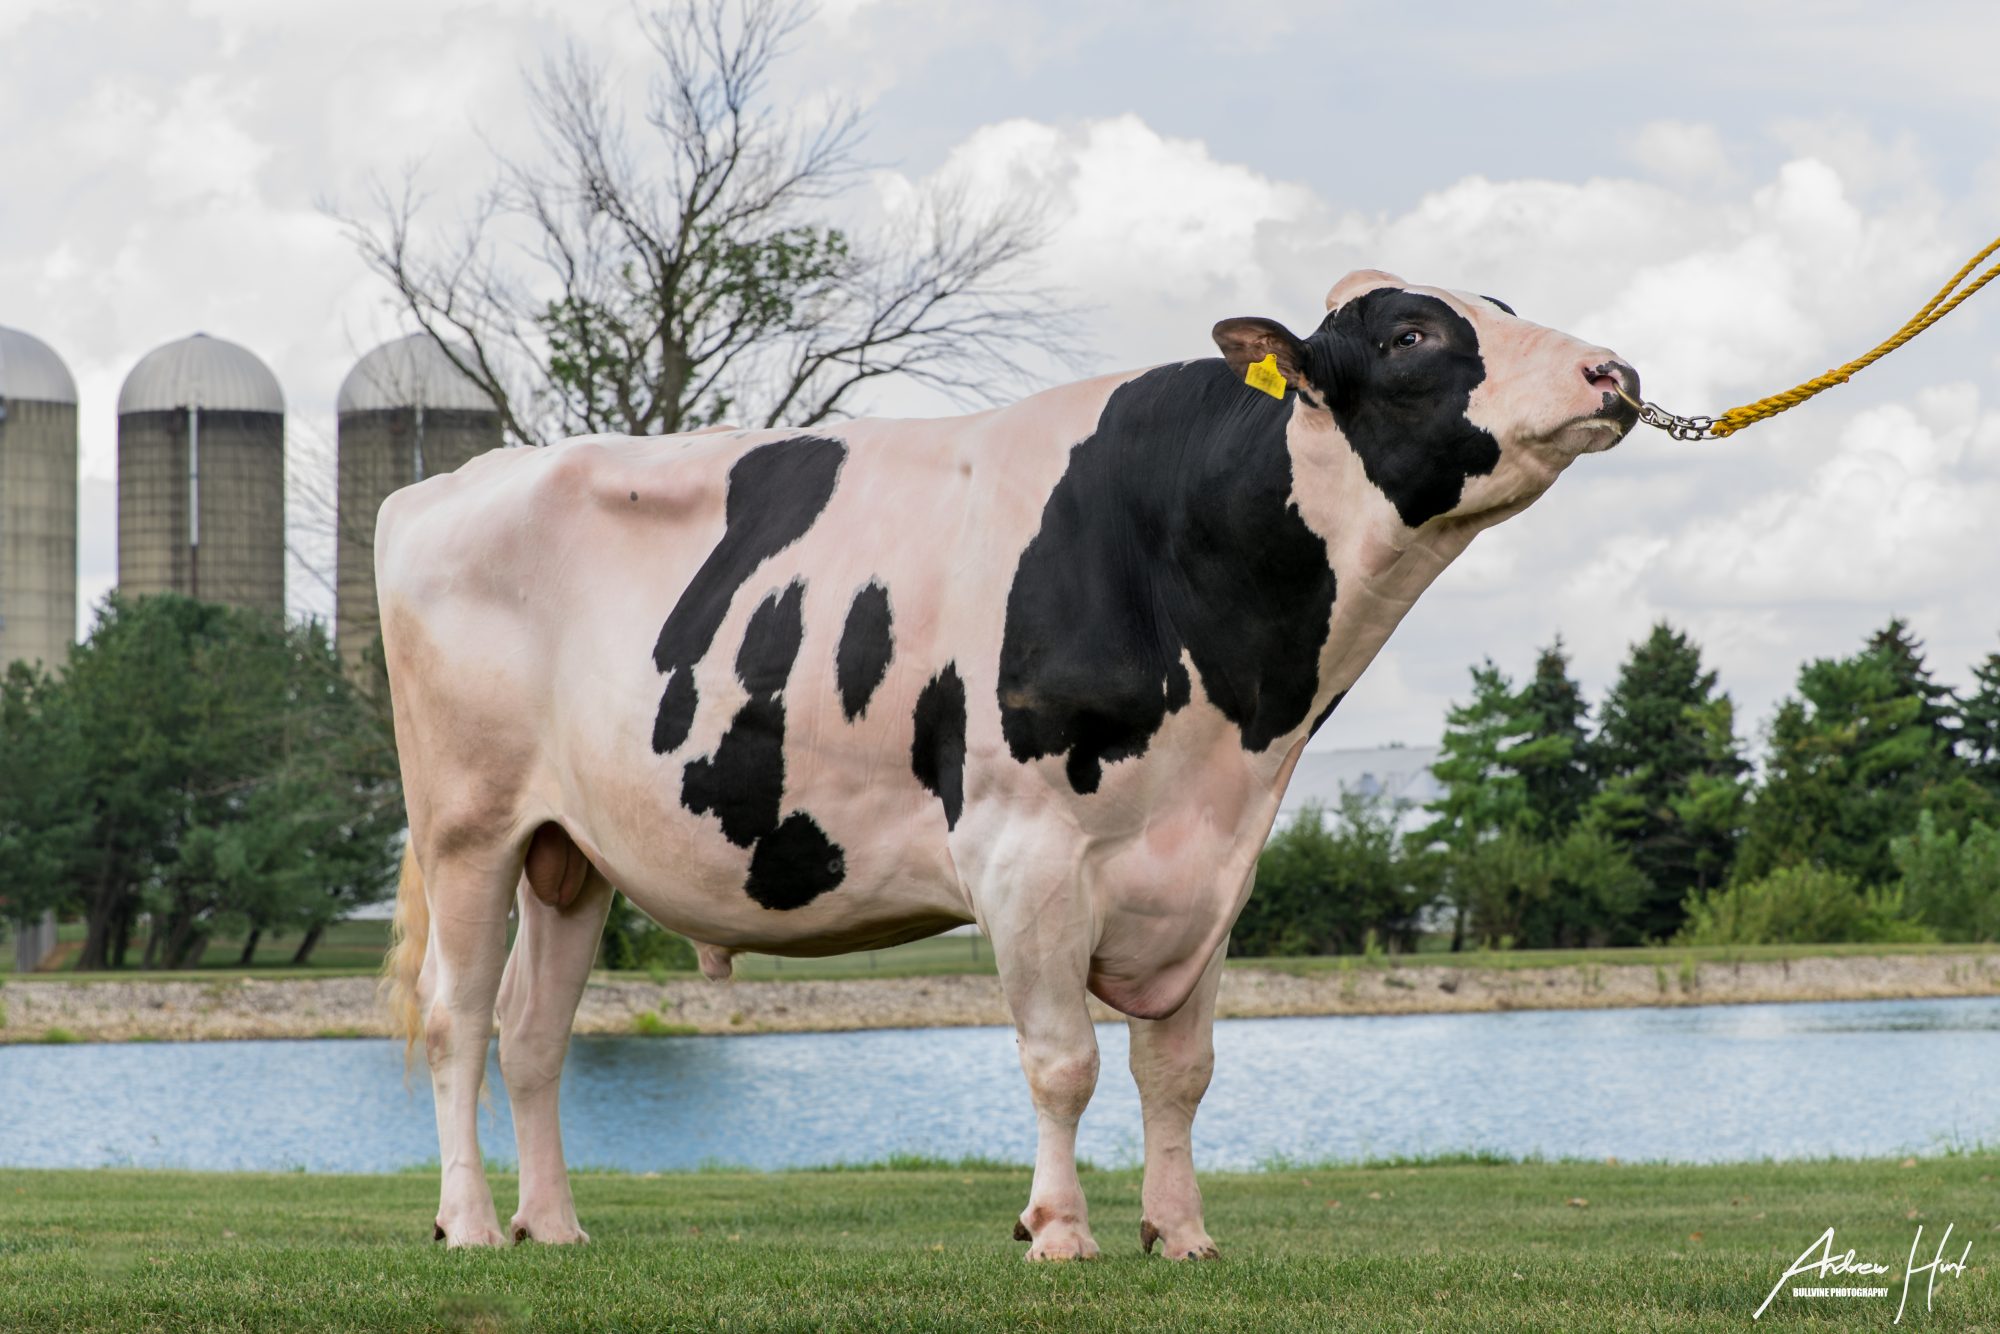
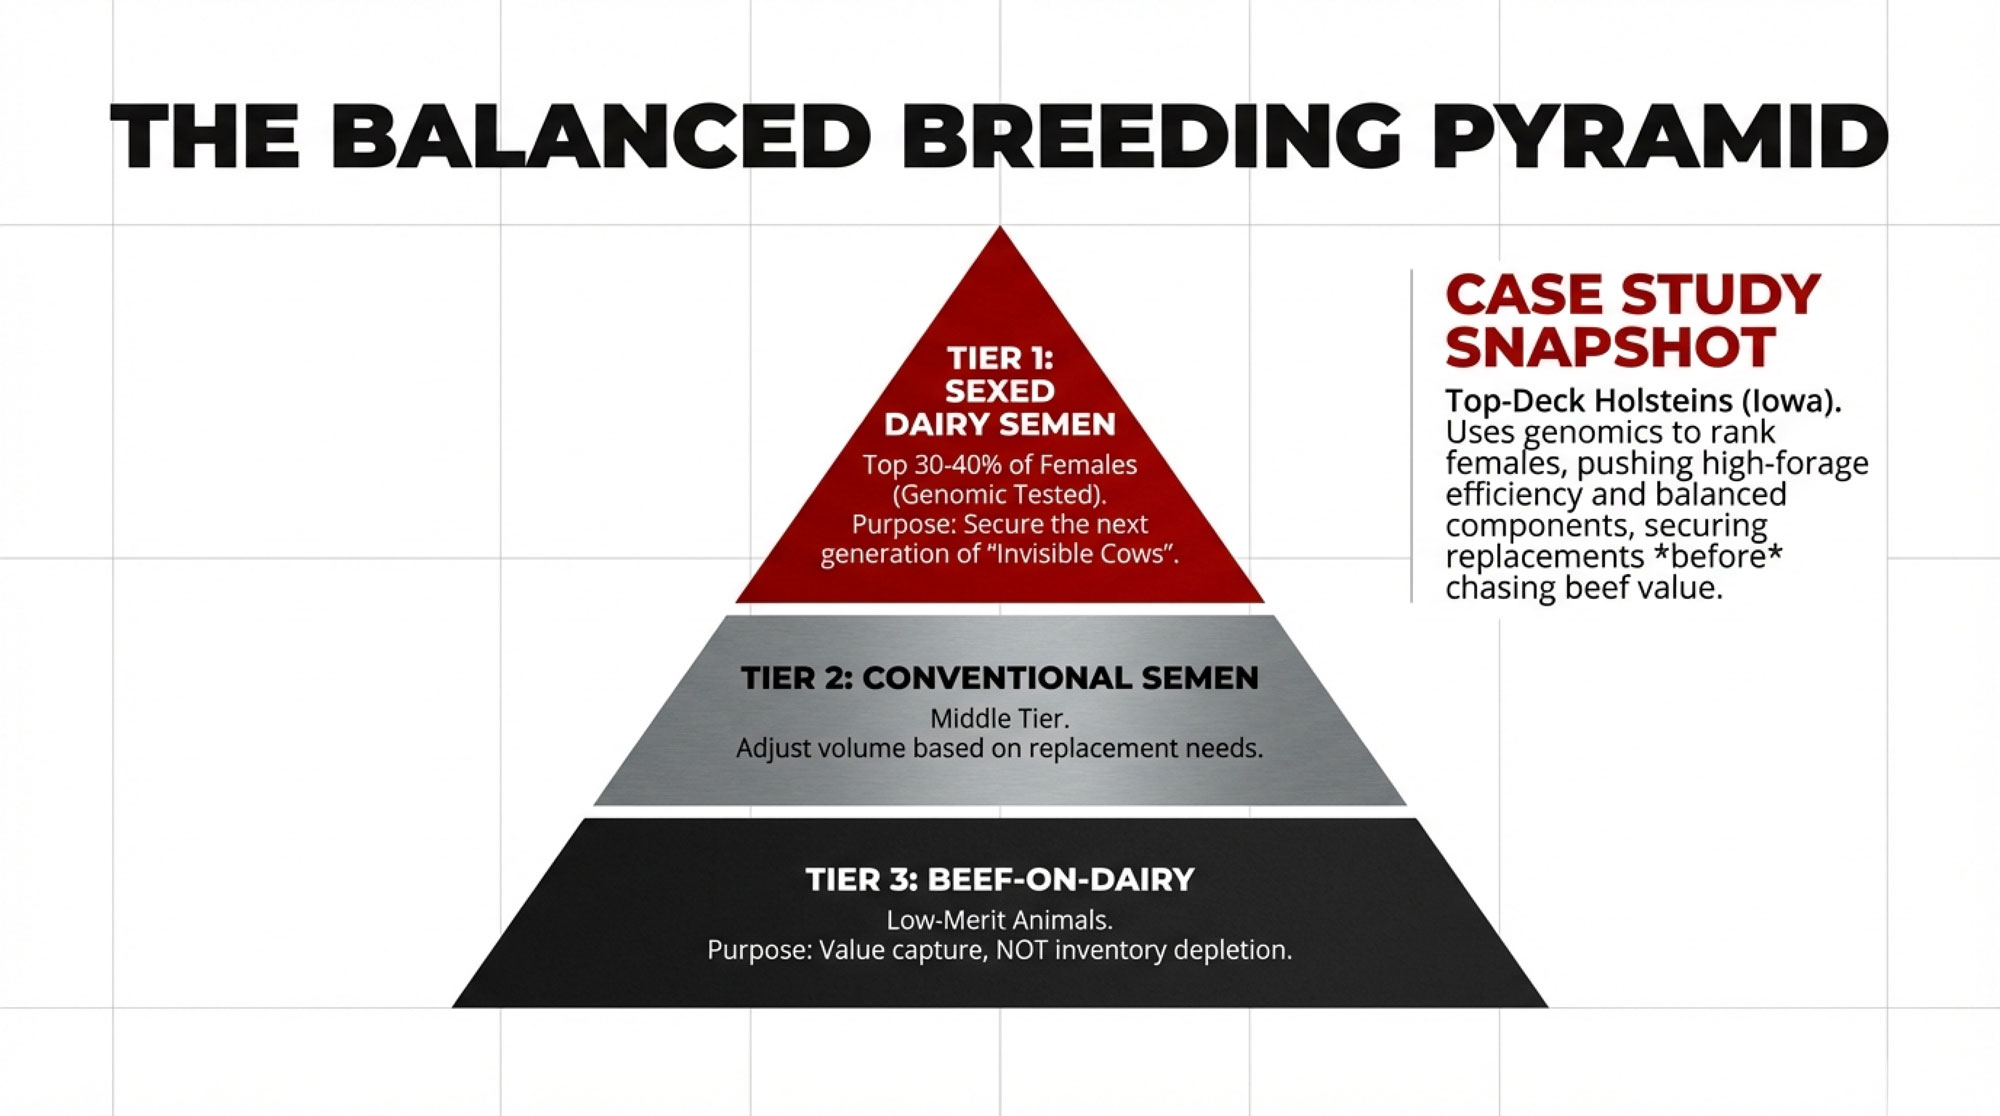
Top‑Deck Holsteins, a roughly 700‑cow Holstein herd in Iowa, is one of those examples. A recent profile describes Top‑Deck as a freestall operation shipping milk with a rolling herd average around 33,500 pounds per cow per year, built on intentional management and breeding decisions. The exact numbers can move with feed and weather, but the pattern is what matters.

On the cow side, that profile explains that Top‑Deck:

  • Pushes forage quality and ration balance hard to drive dry matter intake and feed efficiency.
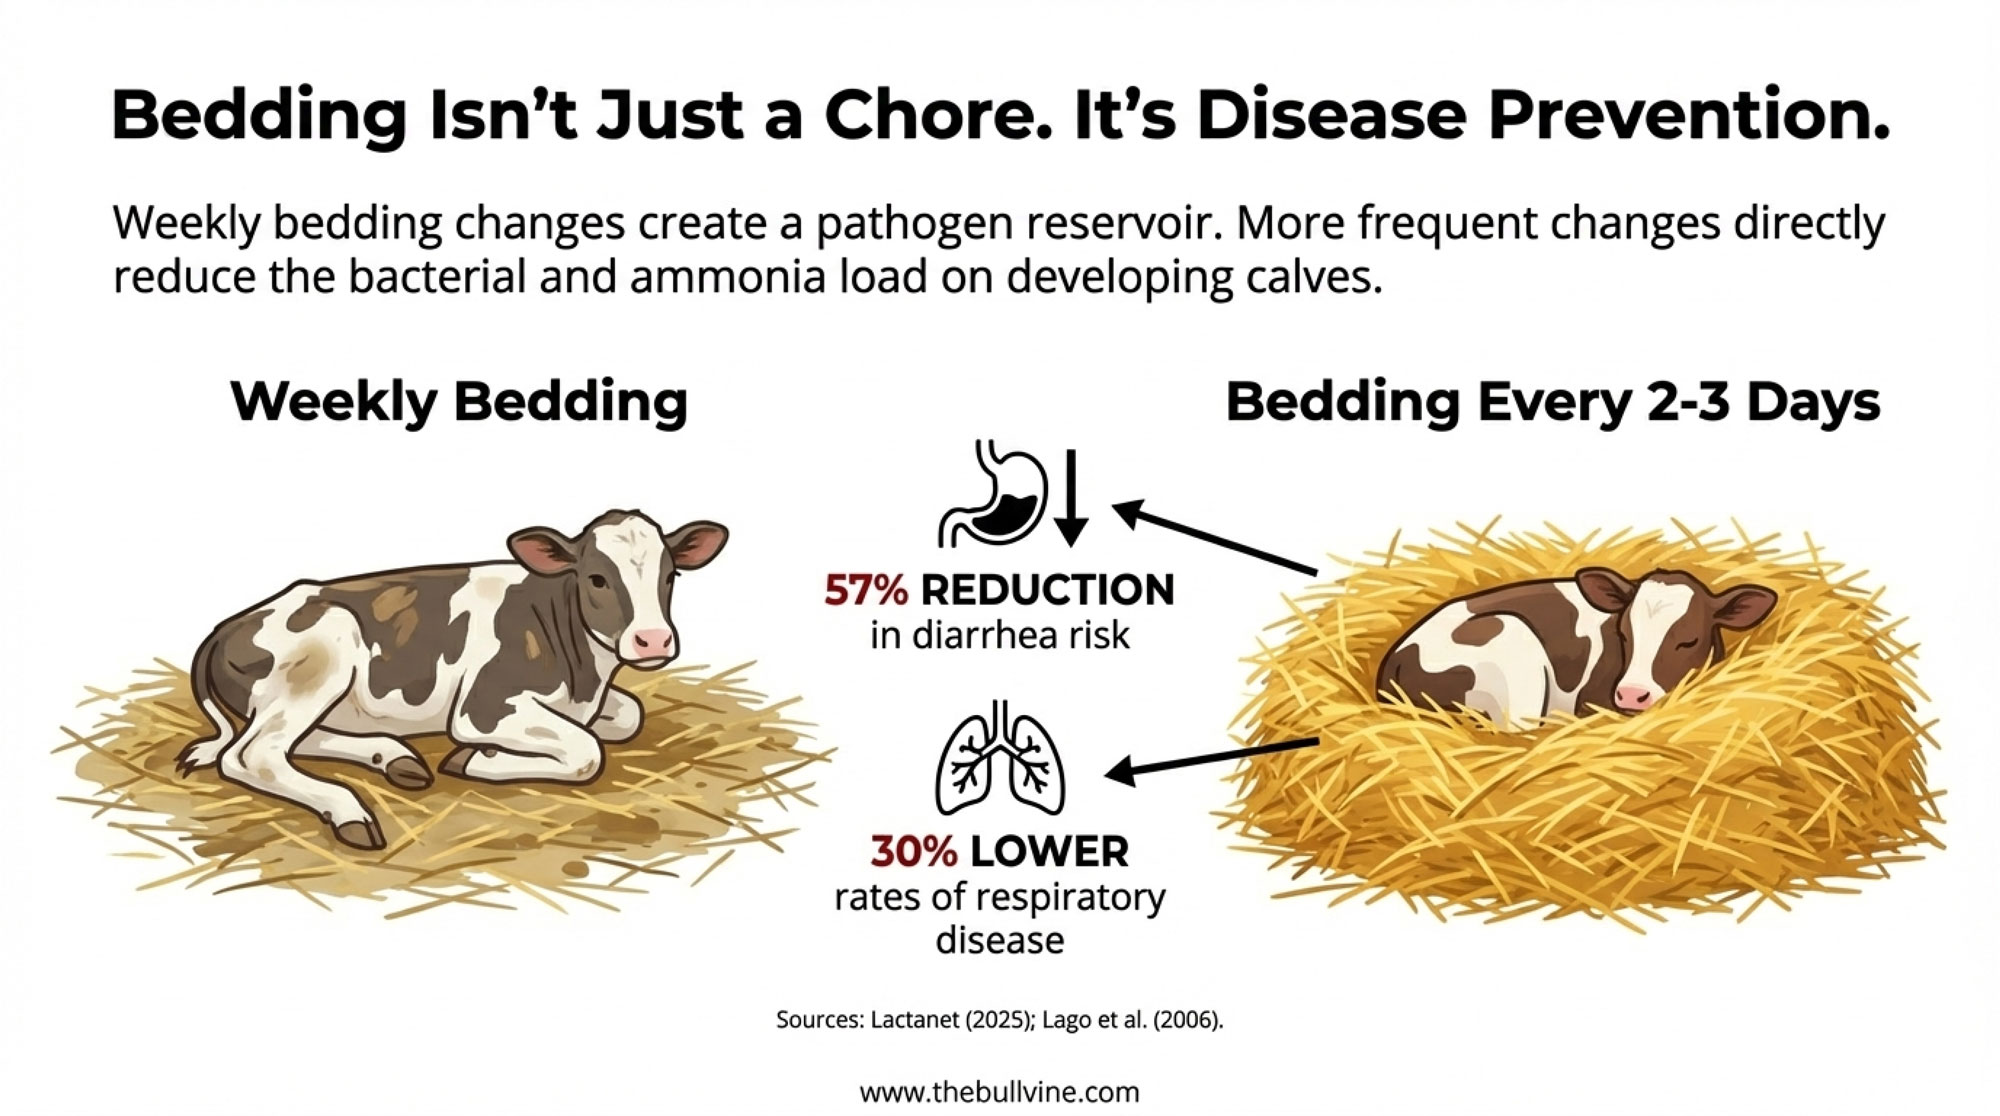
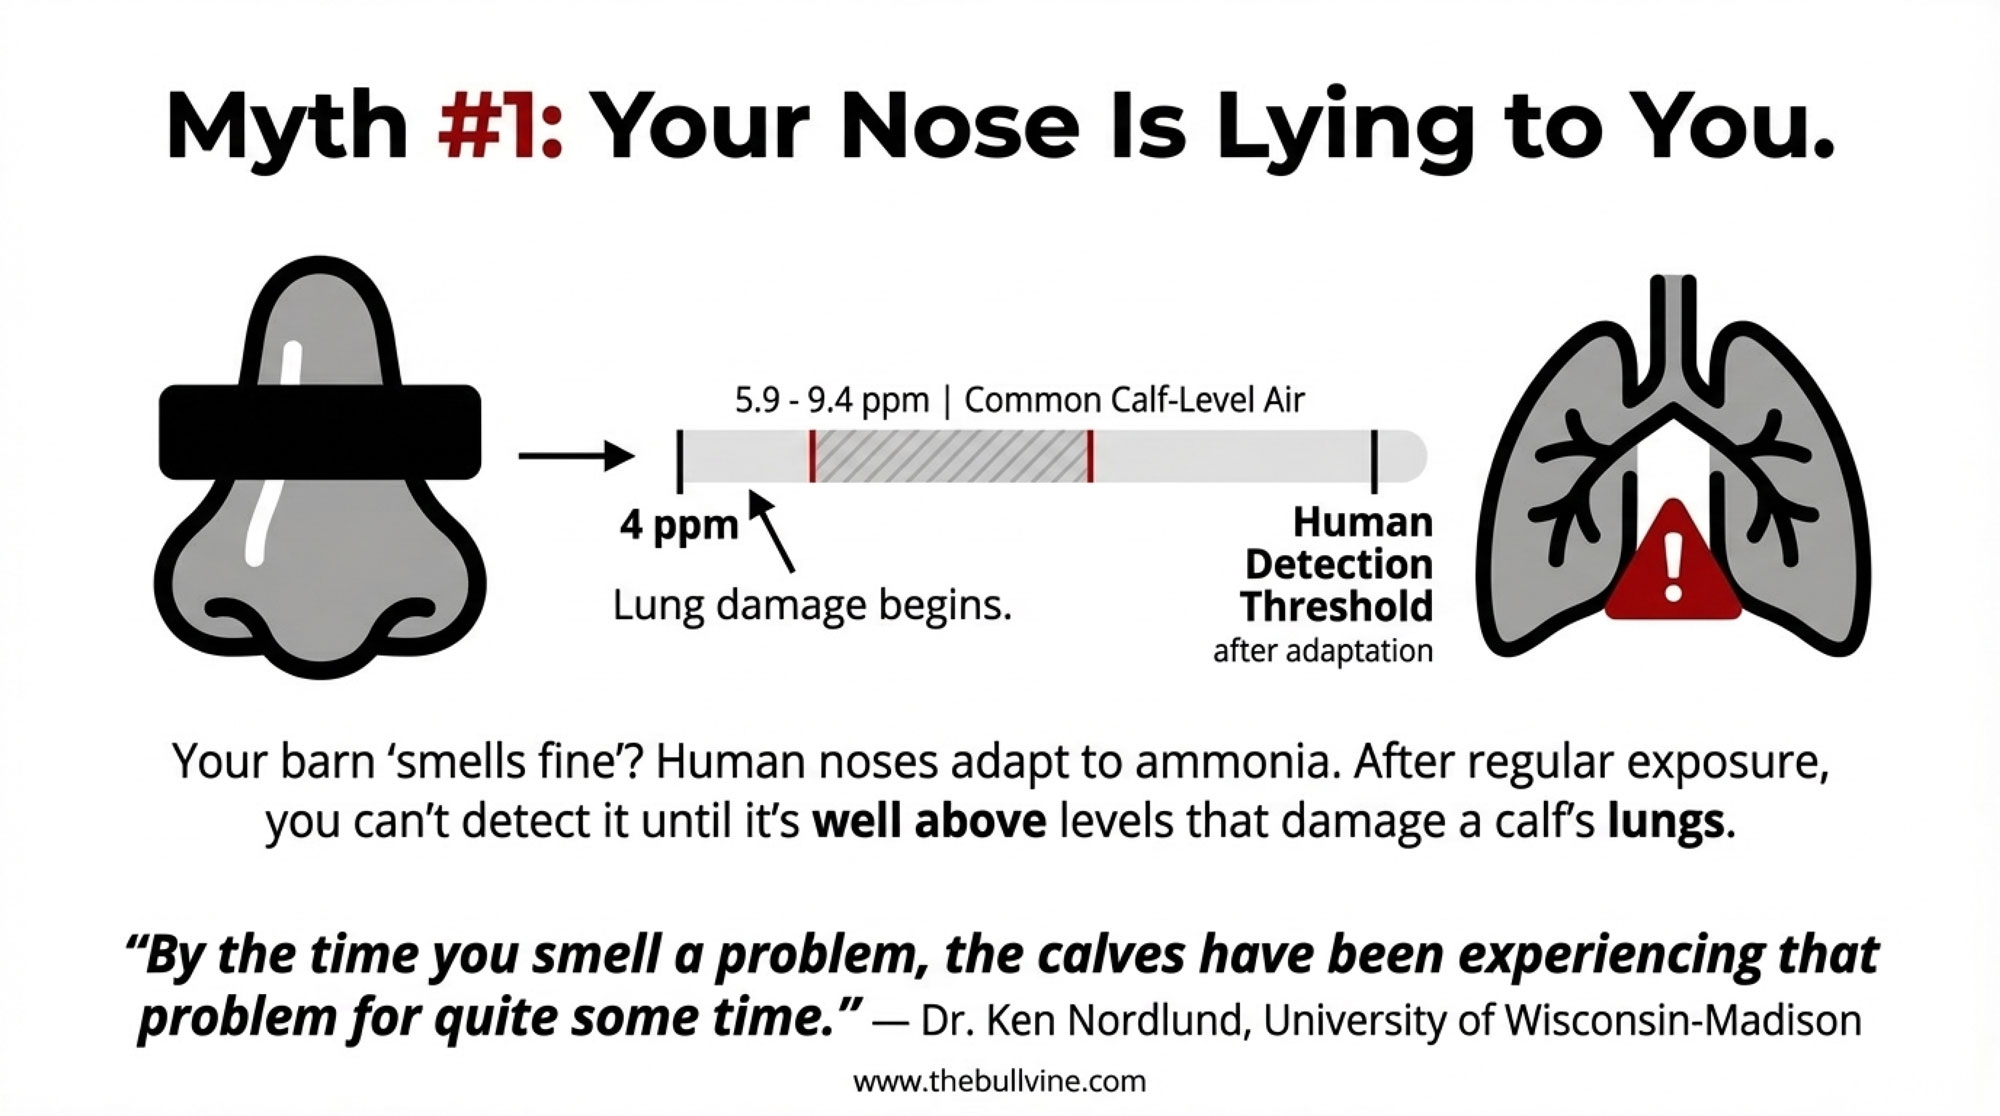
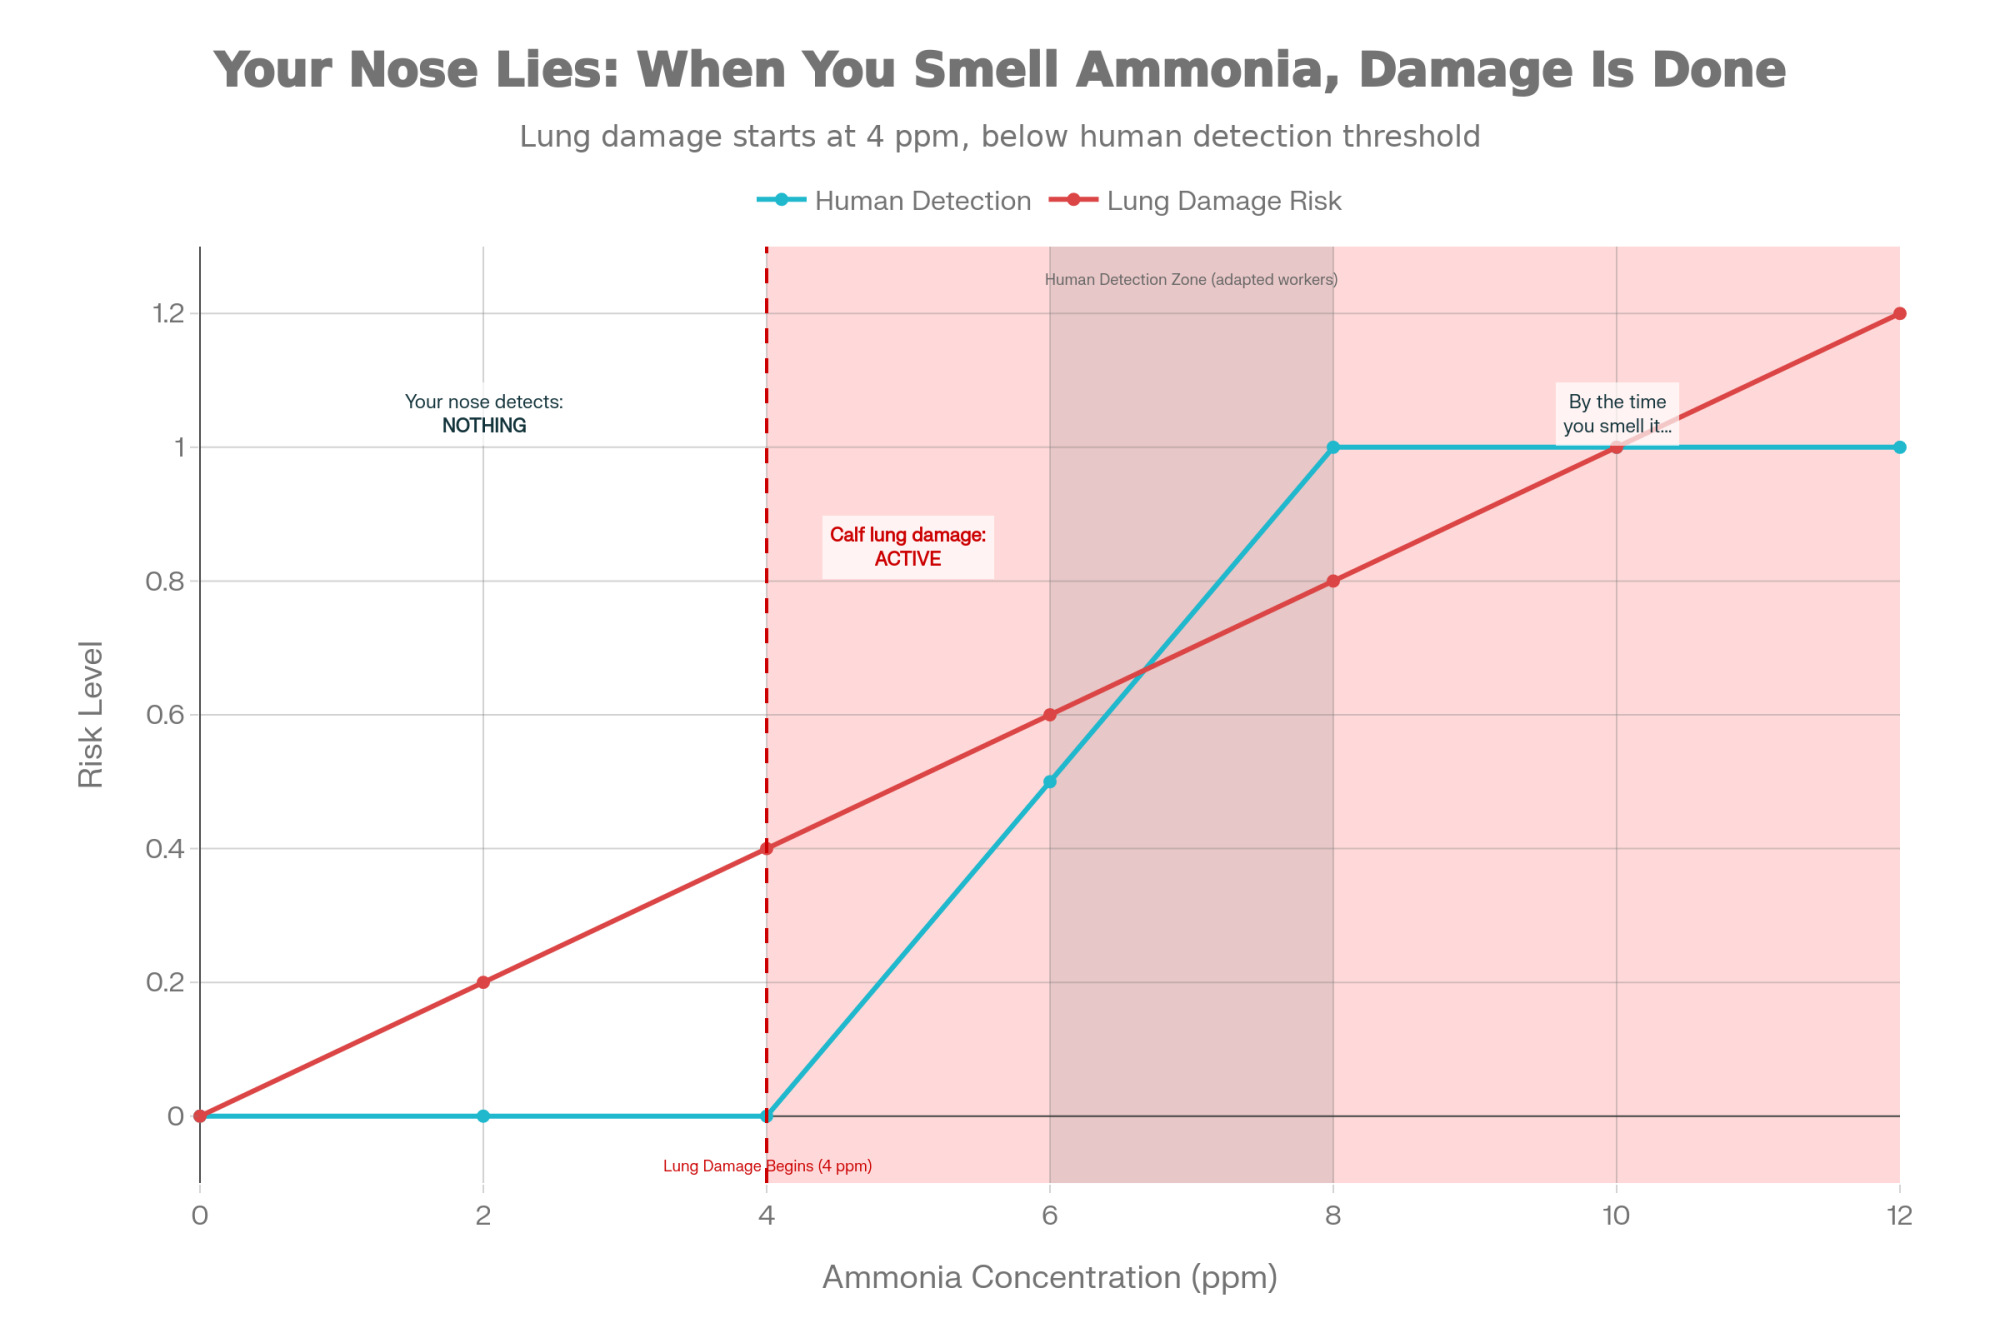
  • Treats cow comfort as a core investment—stall design, bedding, ventilation, and milking routines are all tuned for long lying times and low stress.
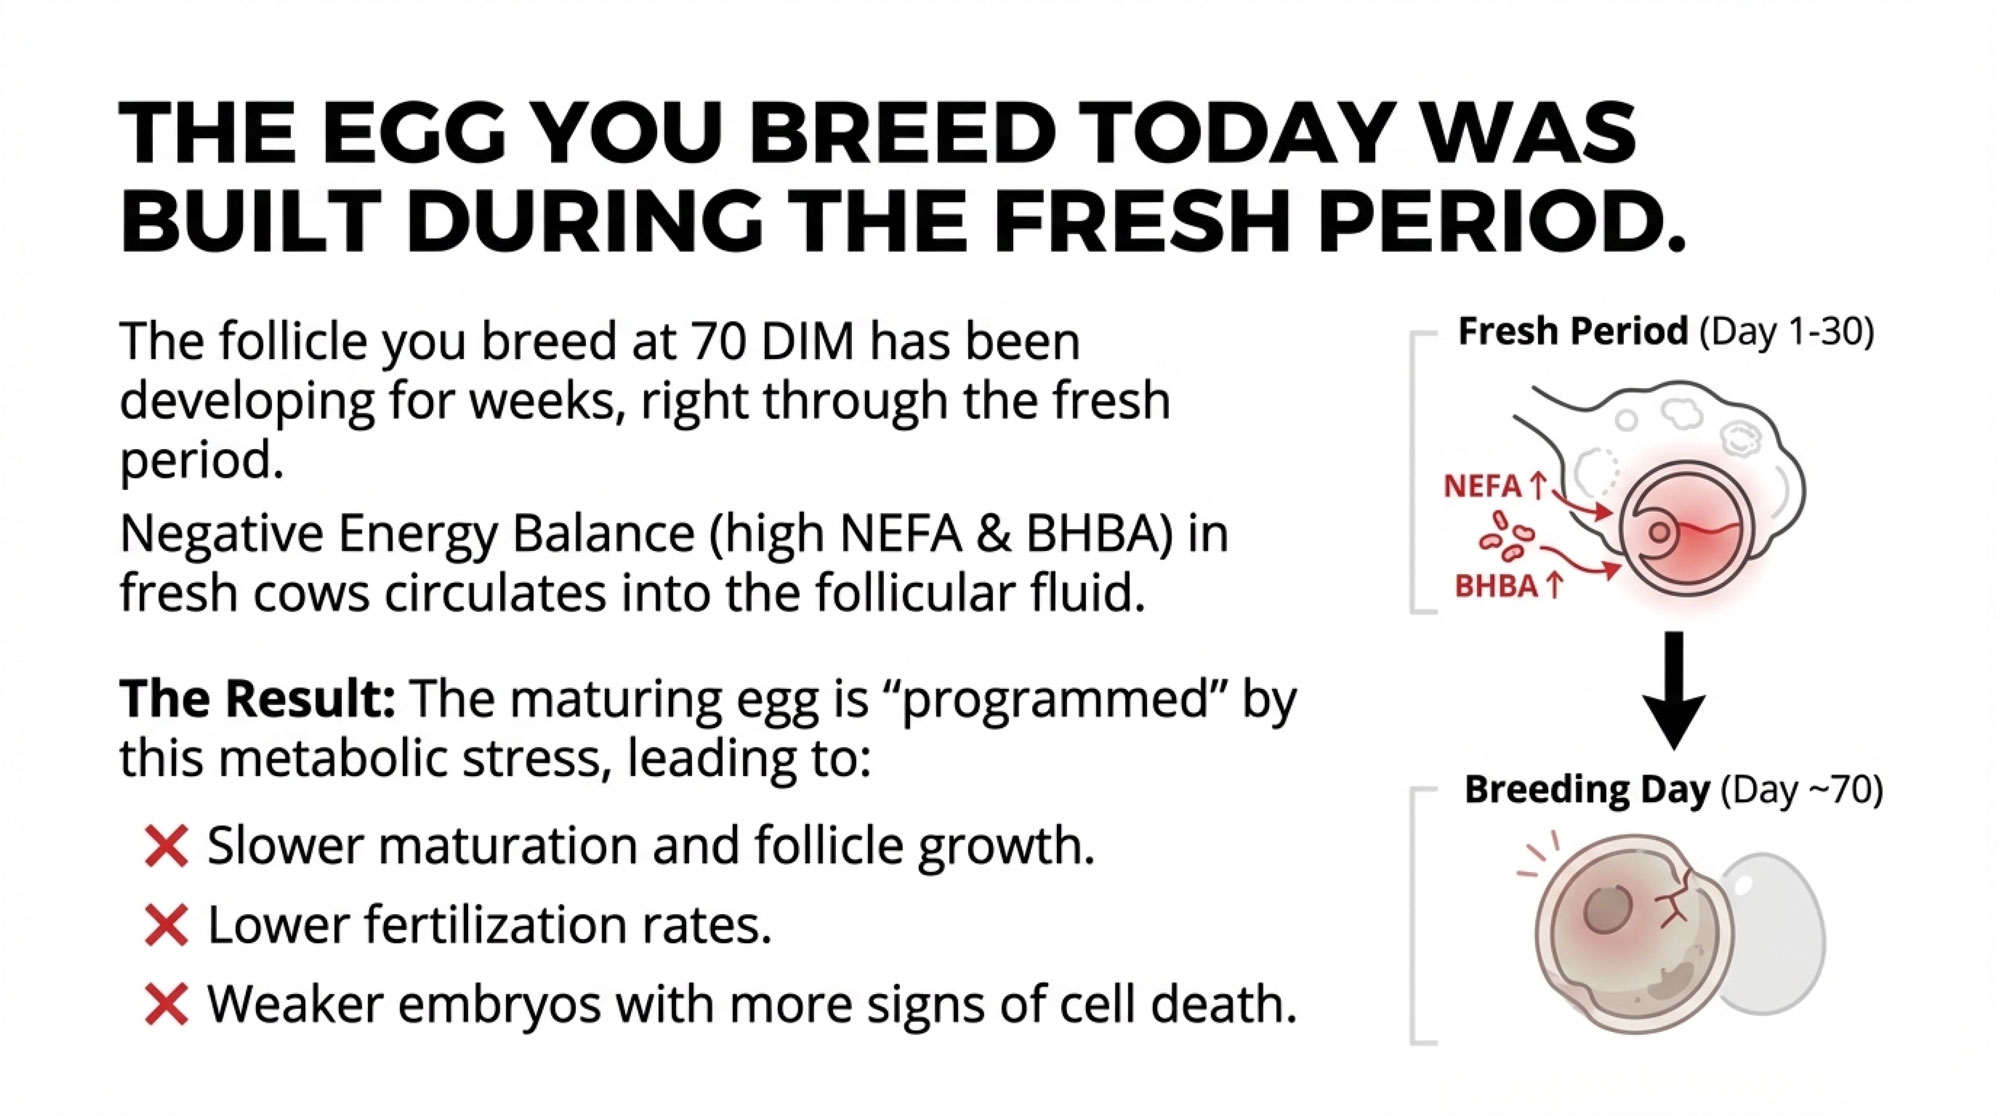
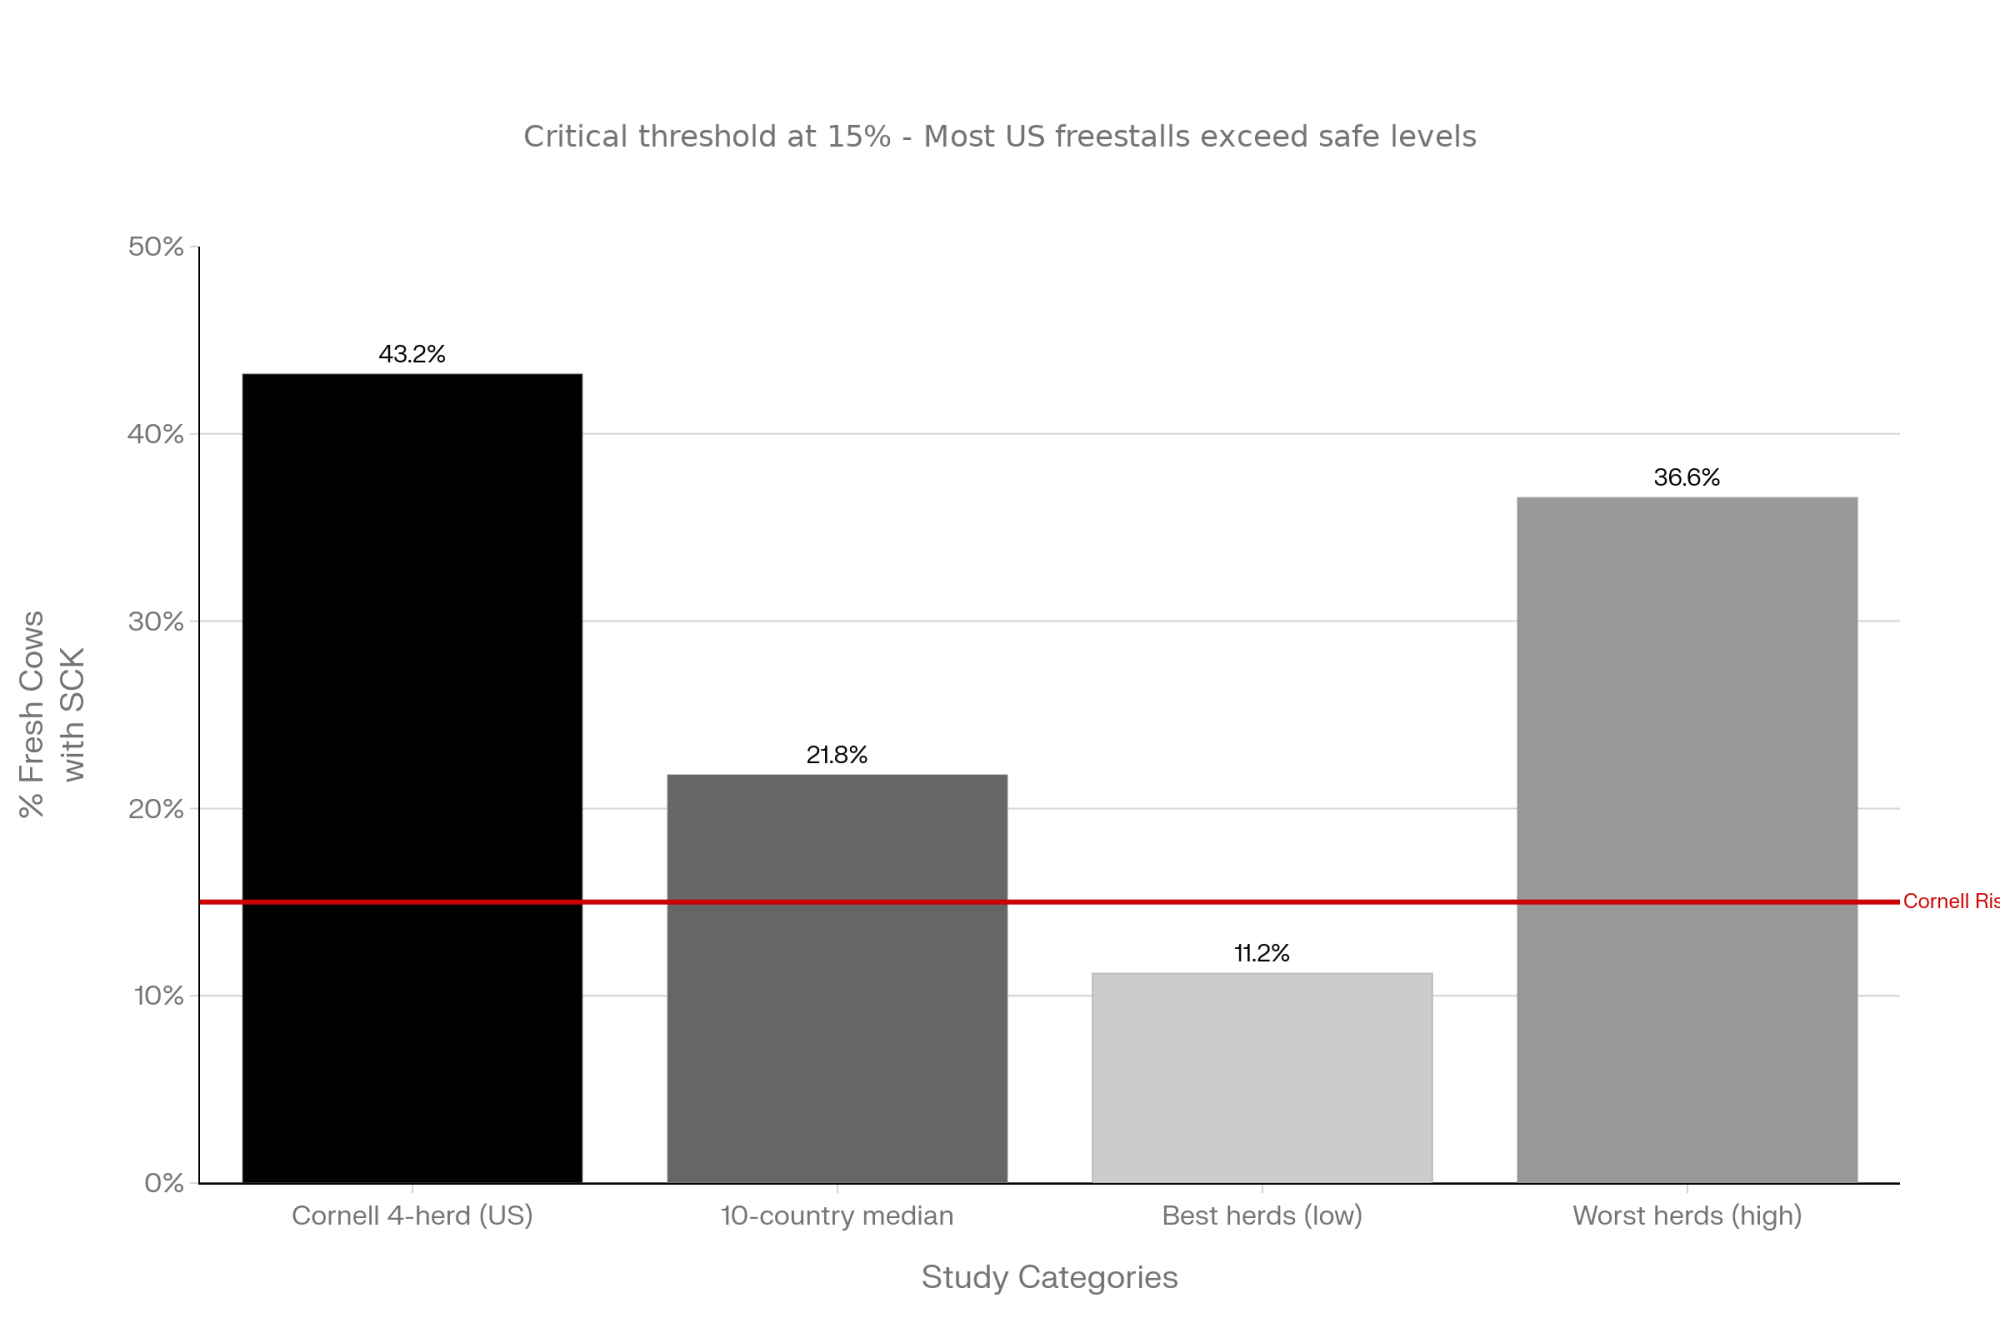
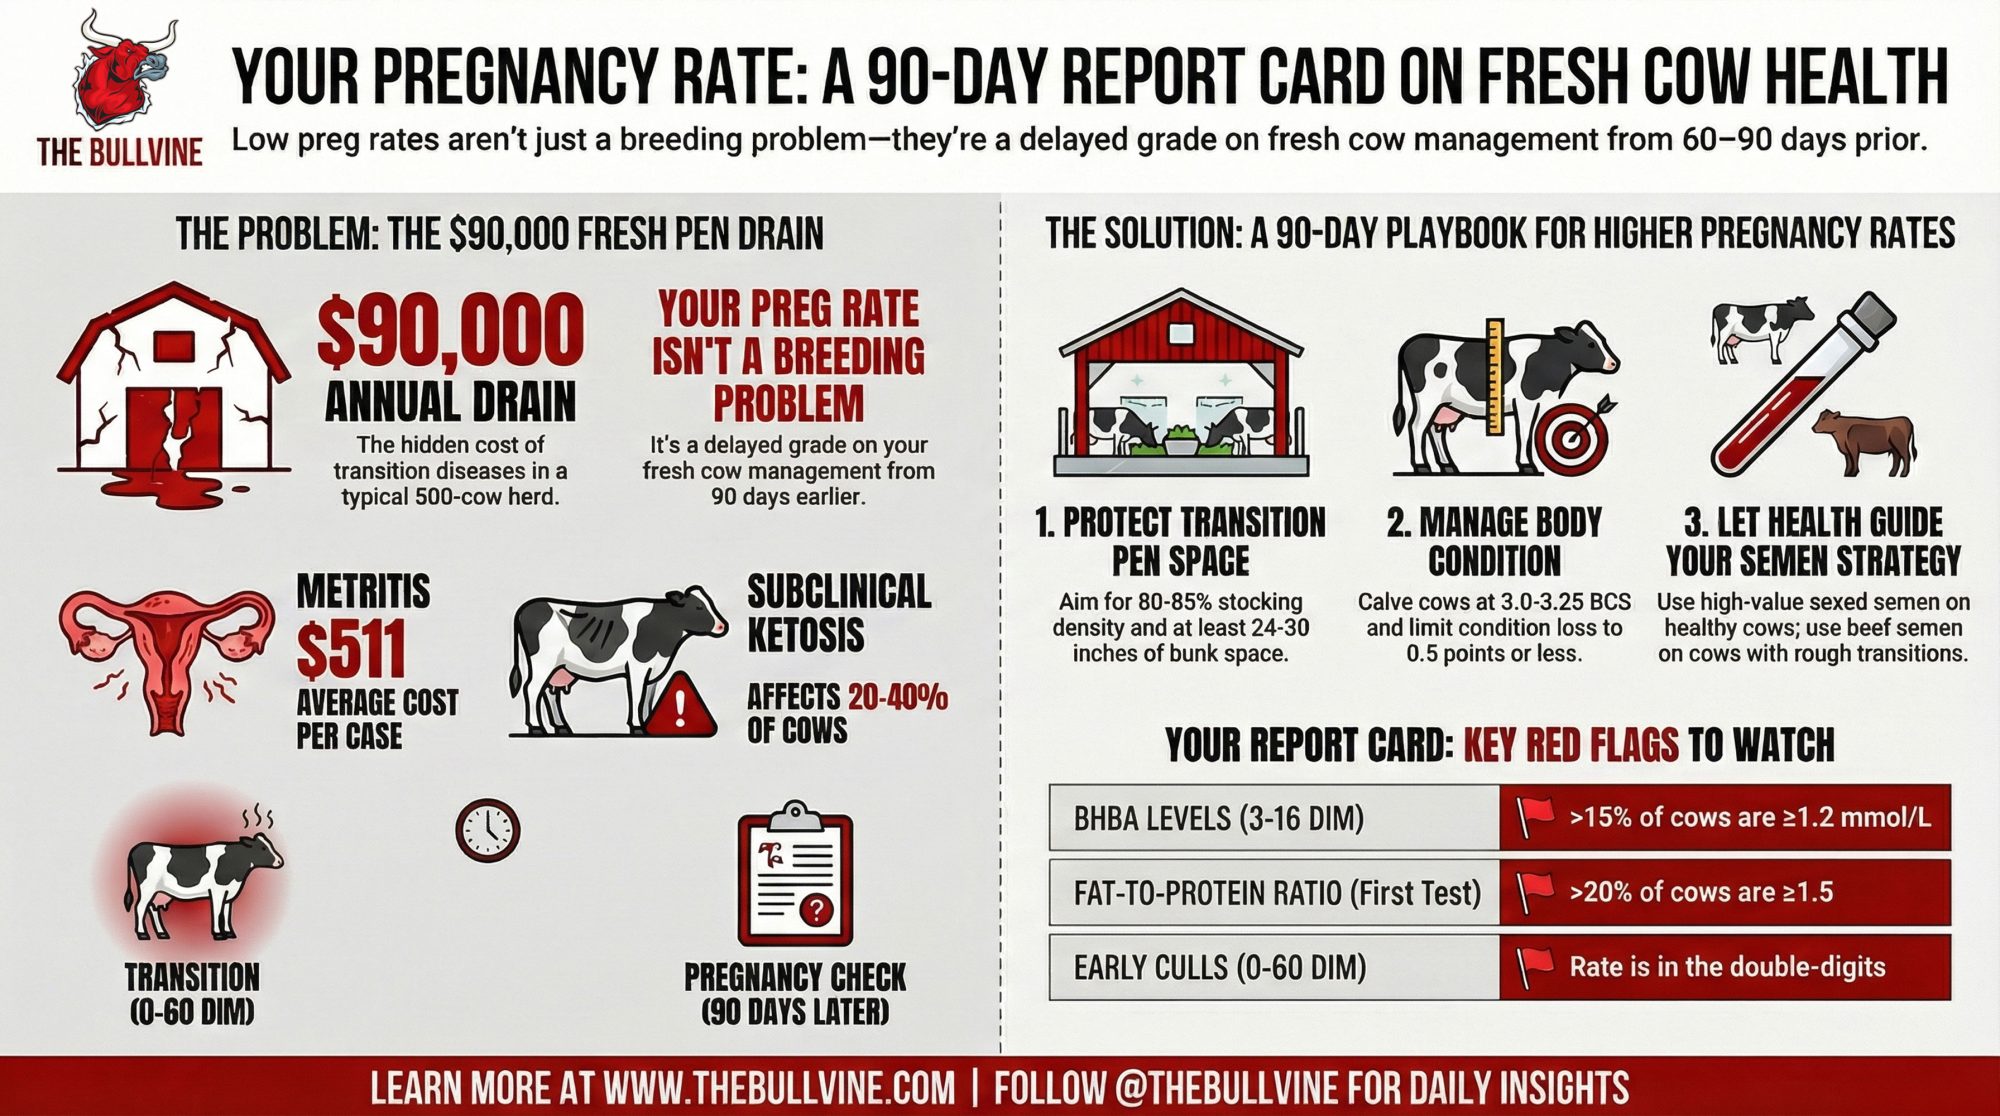
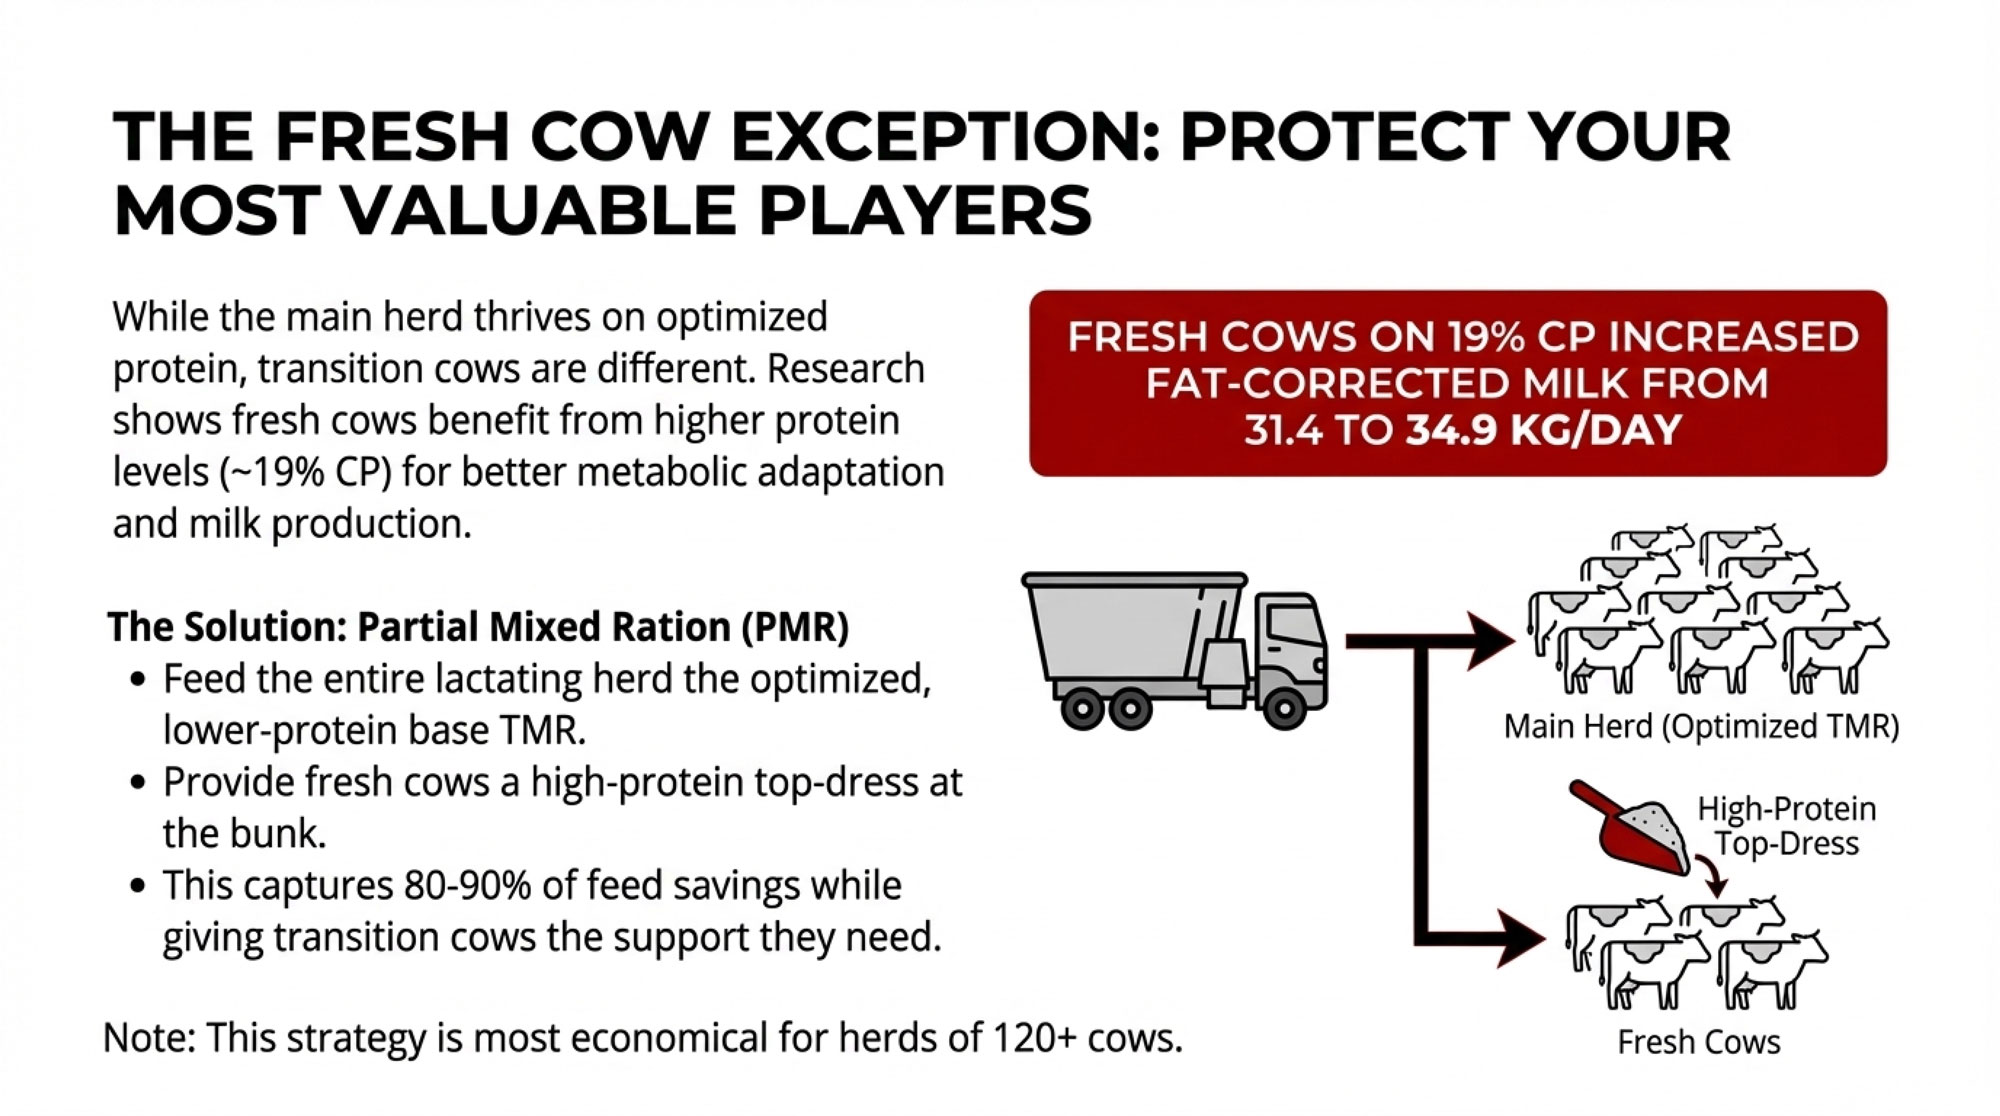
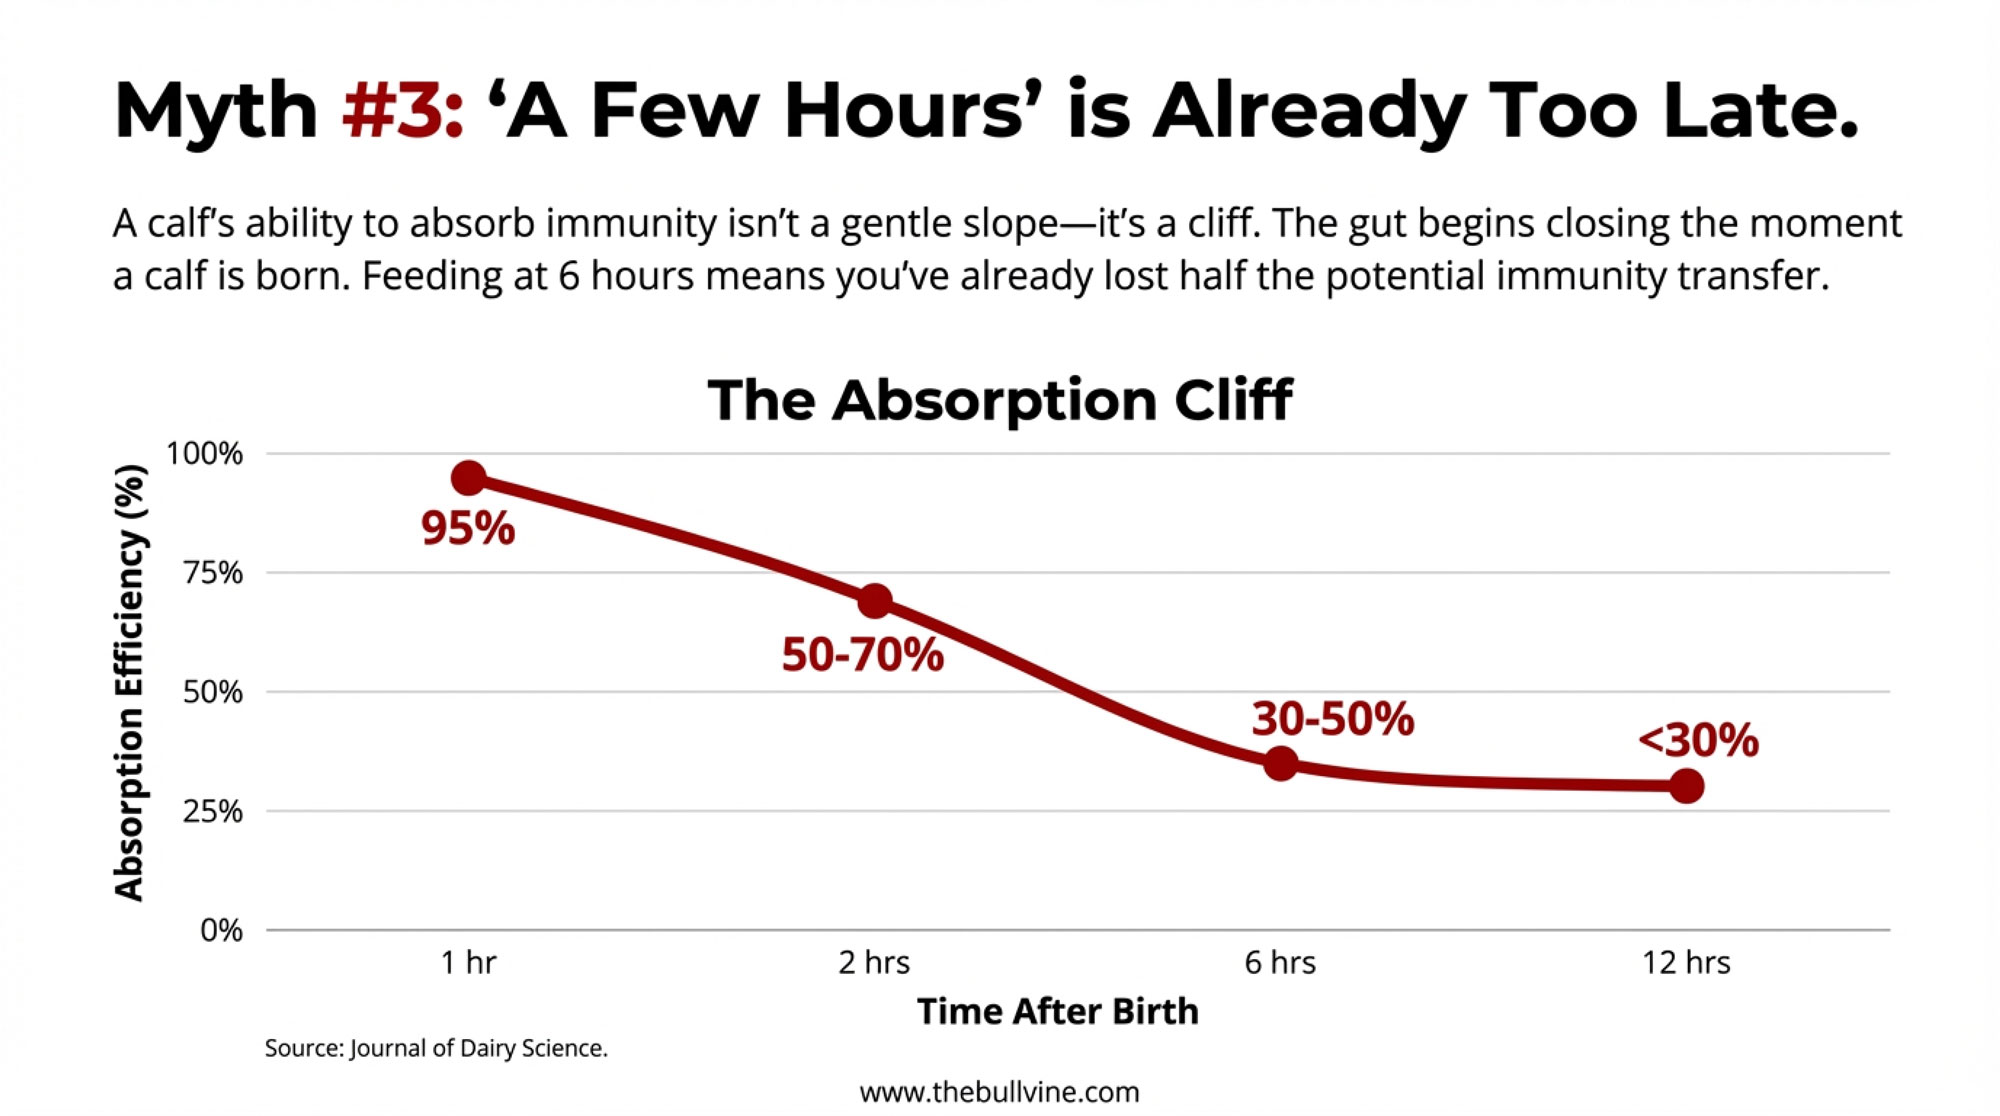
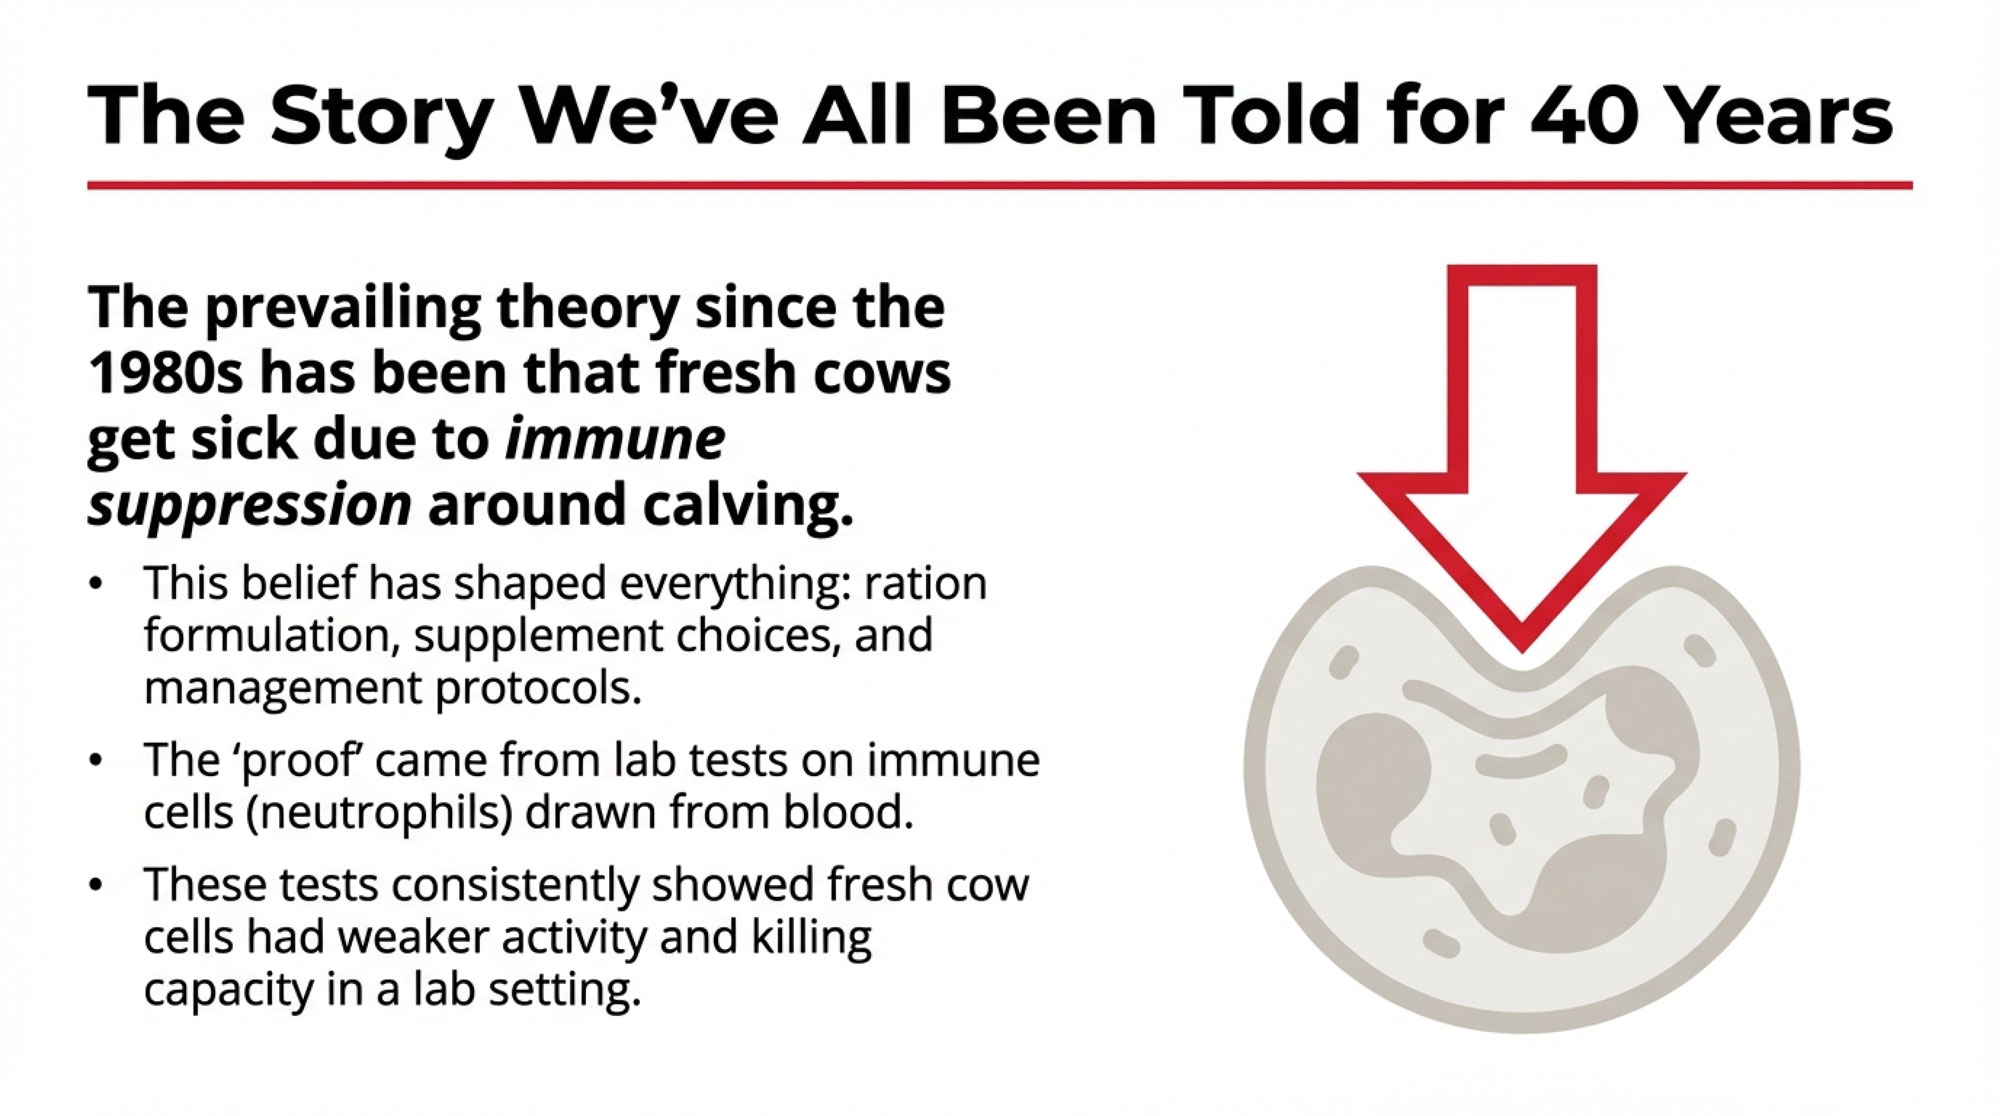
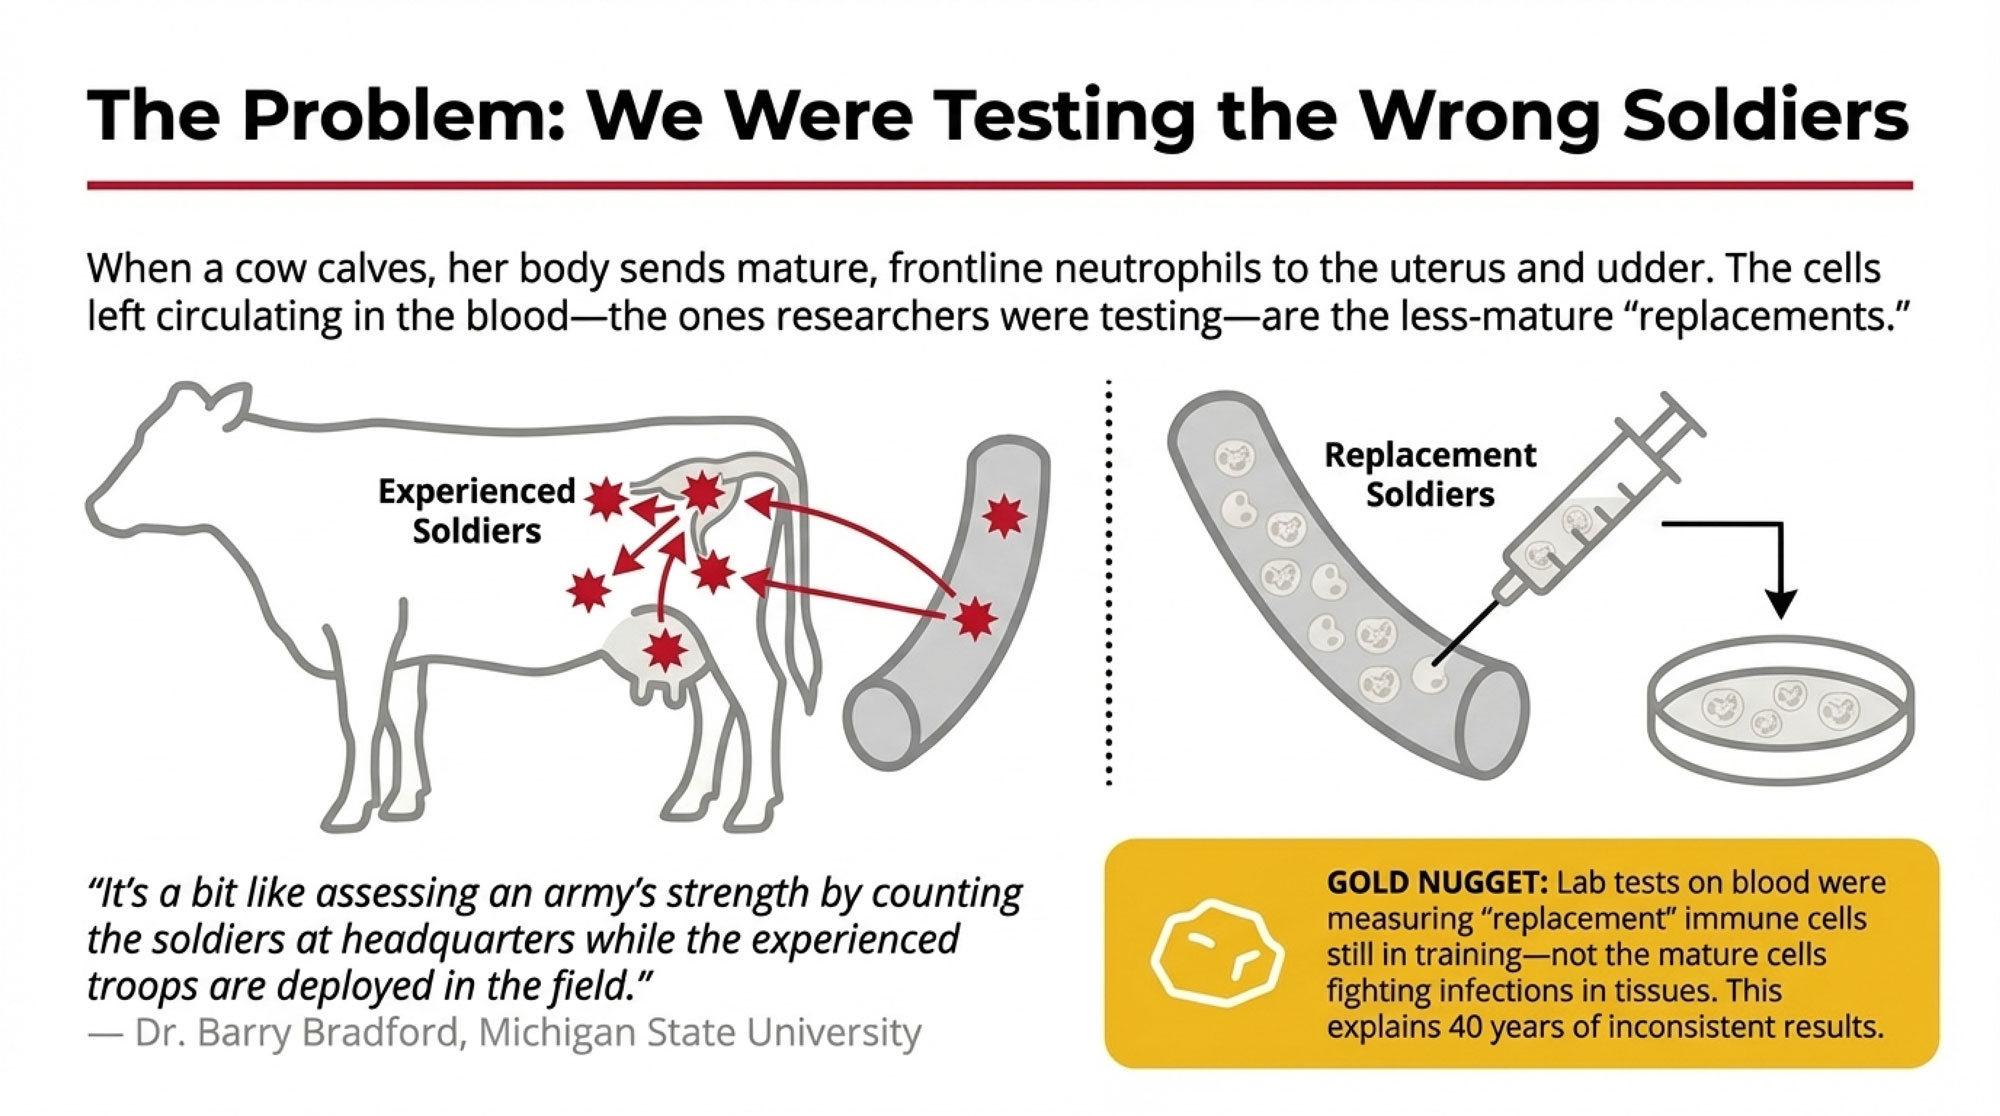
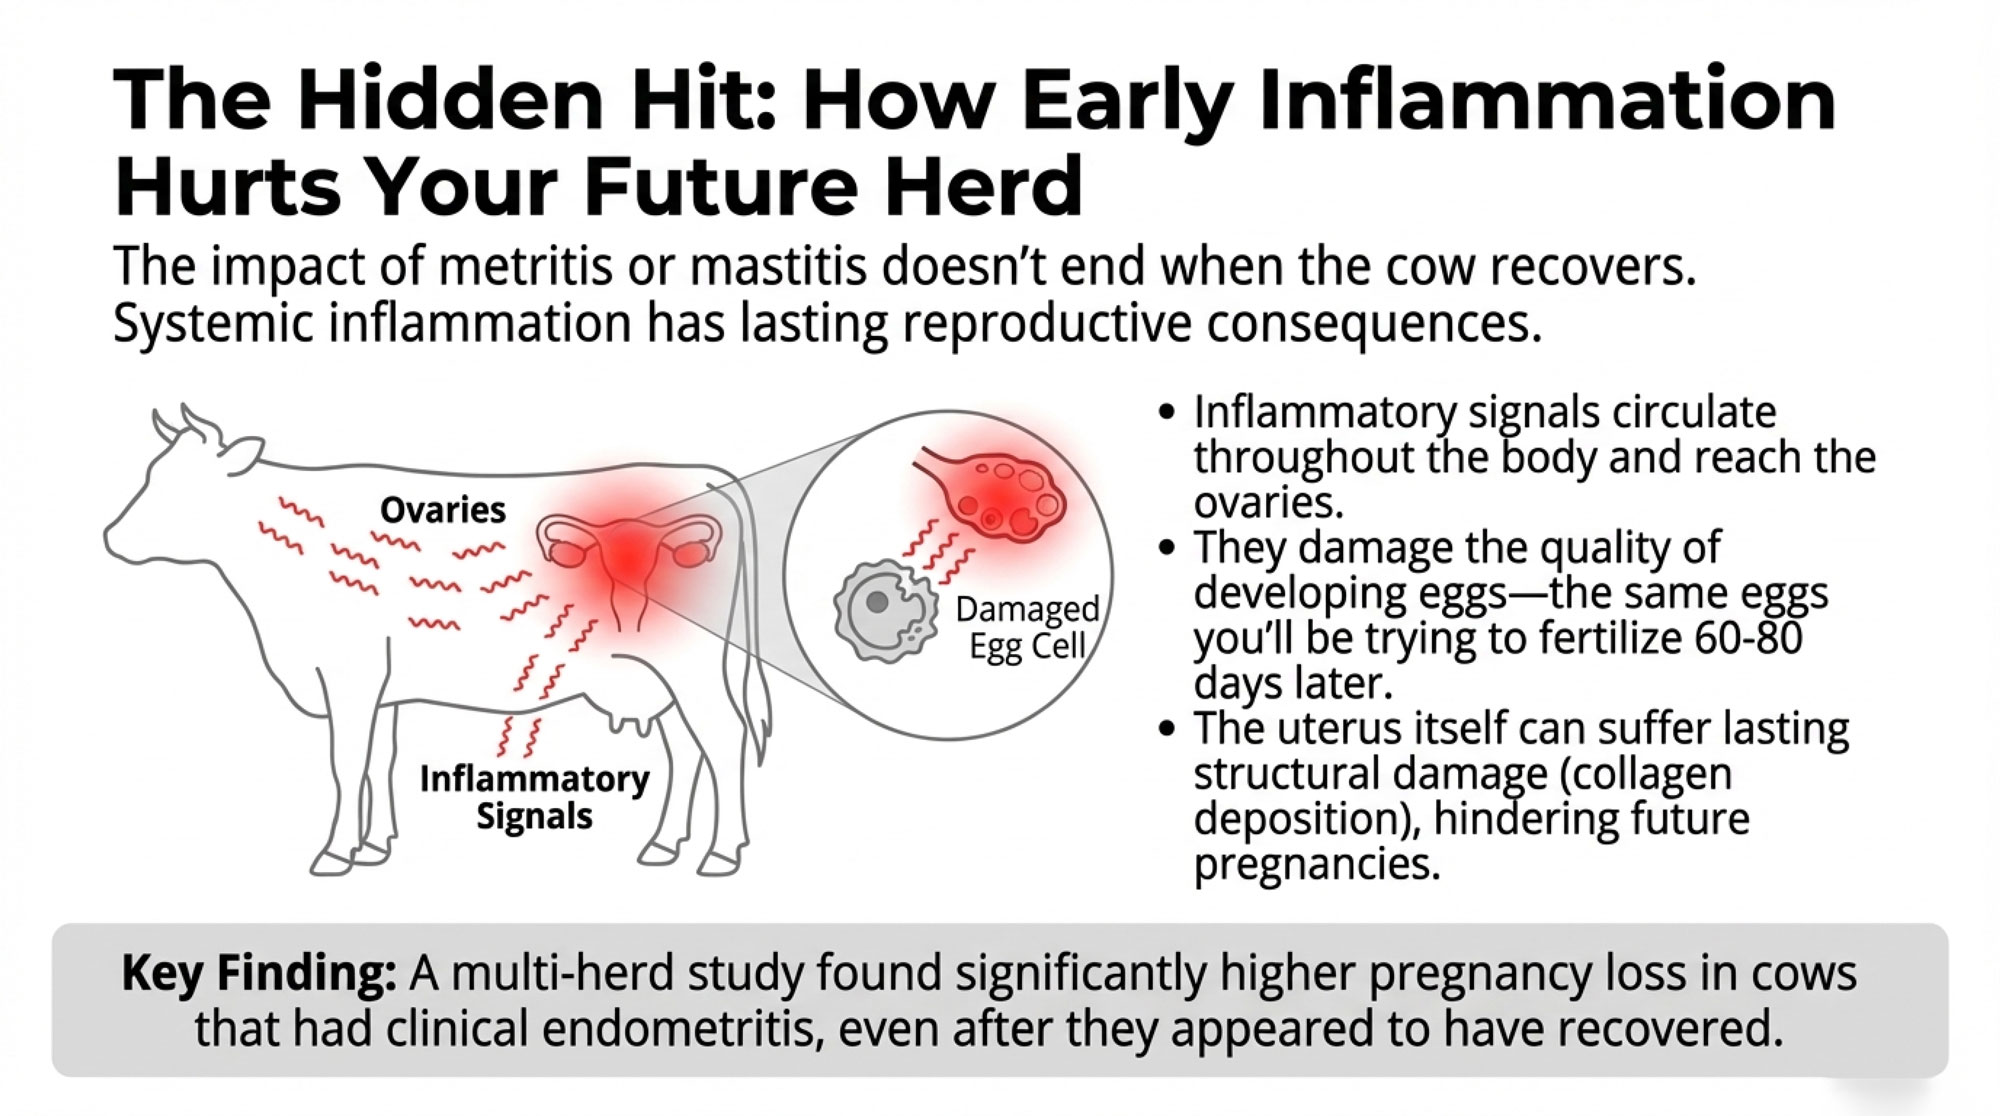
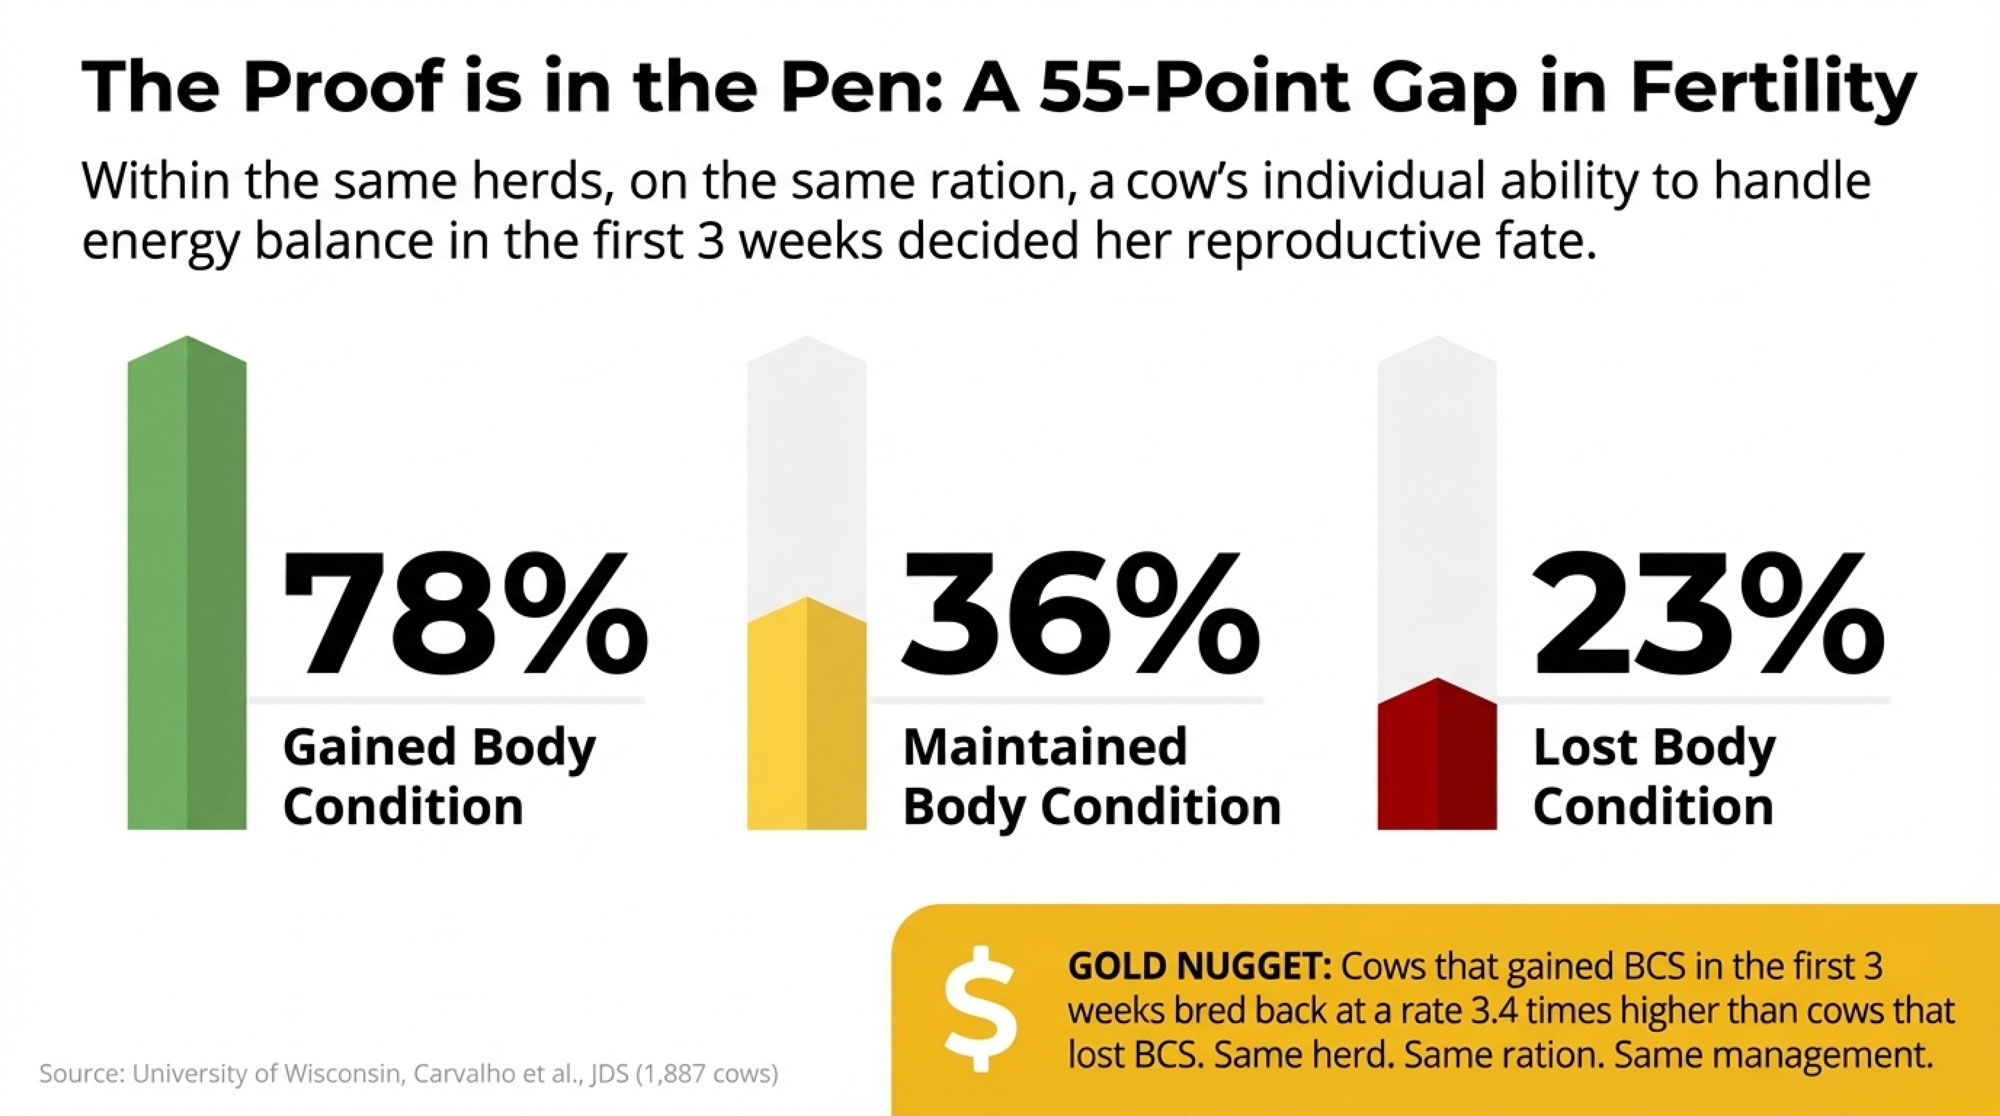
  • Watches fresh cow management and the transition period closely, with protocols aimed at catching issues early and supporting strong peaks without burning cows out at 30–60 days in milk.

Genetically, Top‑Deck uses genomic testing to rank heifers and cow families, then:

  • Uses sexed Holstein semen on top‑merit animals to generate replacements with strong production, components, fertility, and health traits.
  • Uses beef semen—often Angus—on lower‑merit animals to produce calves that bring better beef value than traditional Holstein bull calves.

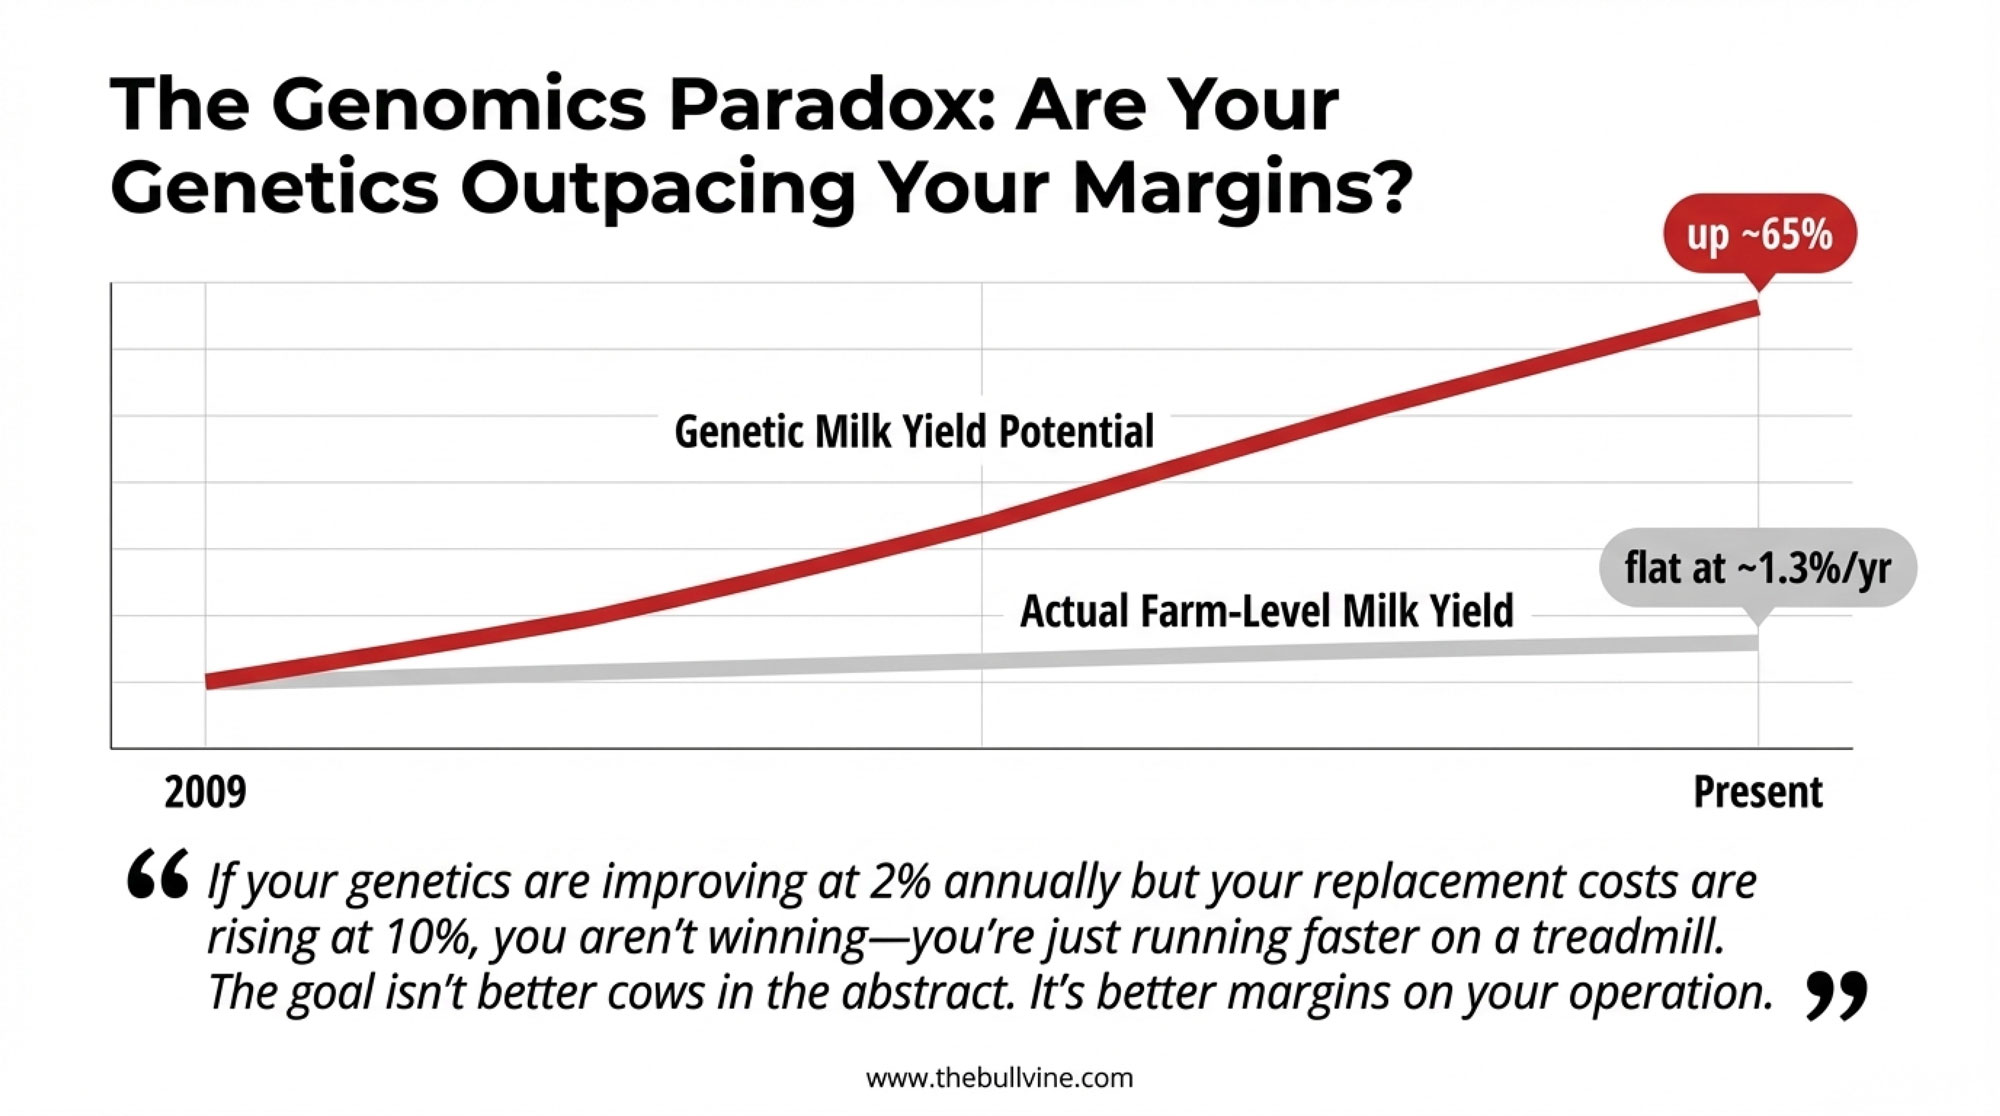
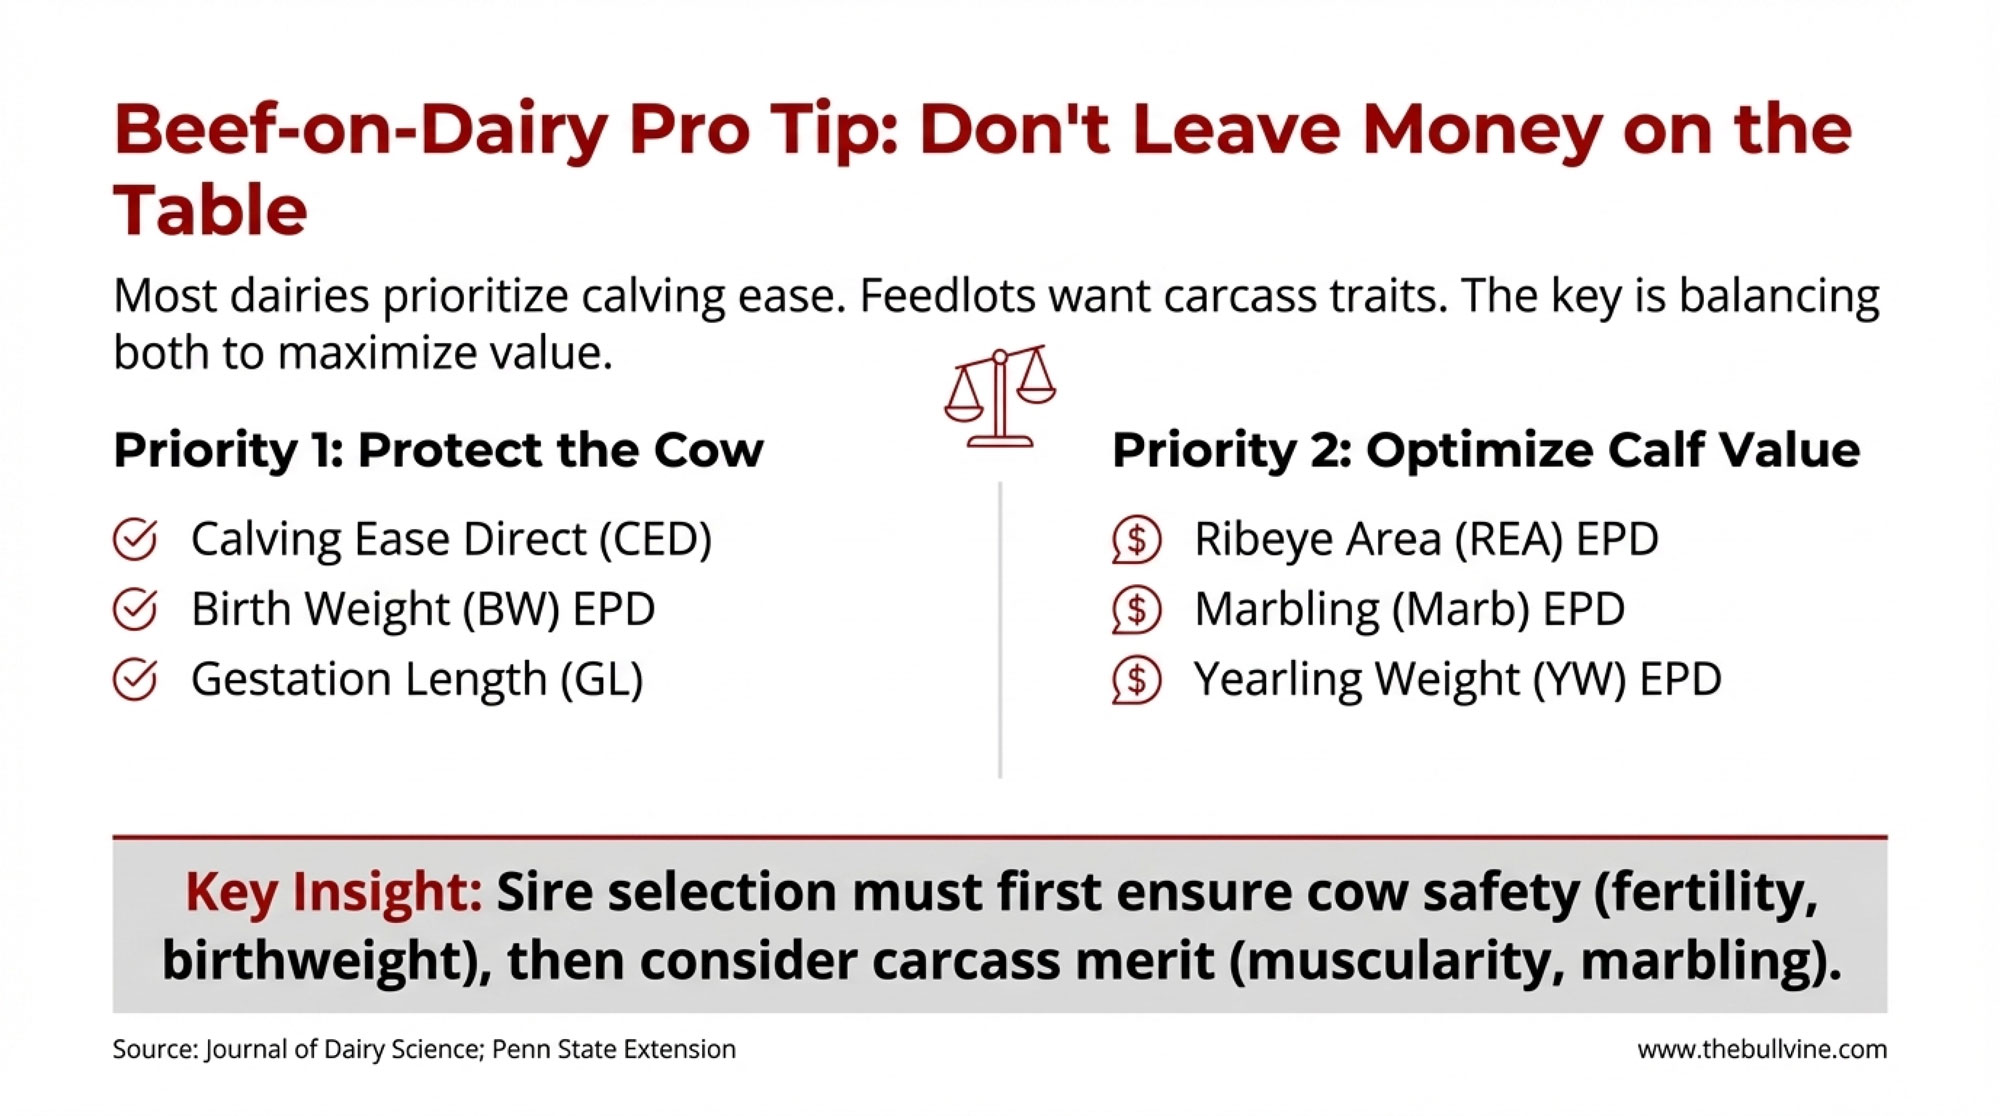
Recent genomic and evaluation‑system reviews in the Journal of Dairy Science and related outlets note that millions of dairy animals worldwide have been genotyped, and that using genomic evaluations with economic indexes has significantly improved progress in production, fertility, and health compared with relying on parent averages. Work from the University of Guelph’s “beef on dairy” research program—funded through the Ontario Agri‑Food Innovation Alliance and national beef research groups—shows that beef‑sired dairy calves, when managed and marketed correctly, can deliver clearly higher prices than straight Holstein bull calves, and that optimizing their early‑life management is key to maximizing value.

What’s interesting here is that Top‑Deck’s approach isn’t about chasing one extreme number. It’s about building cows that quietly ship a lot of pounds of fat and protein, stay healthy and fertile, and leave behind replacements that can do the same—while using beef‑on‑dairy to lift calf revenue. That’s exactly the kind of herd that fits a cheese‑heavy, component‑sensitive, export‑connected world.

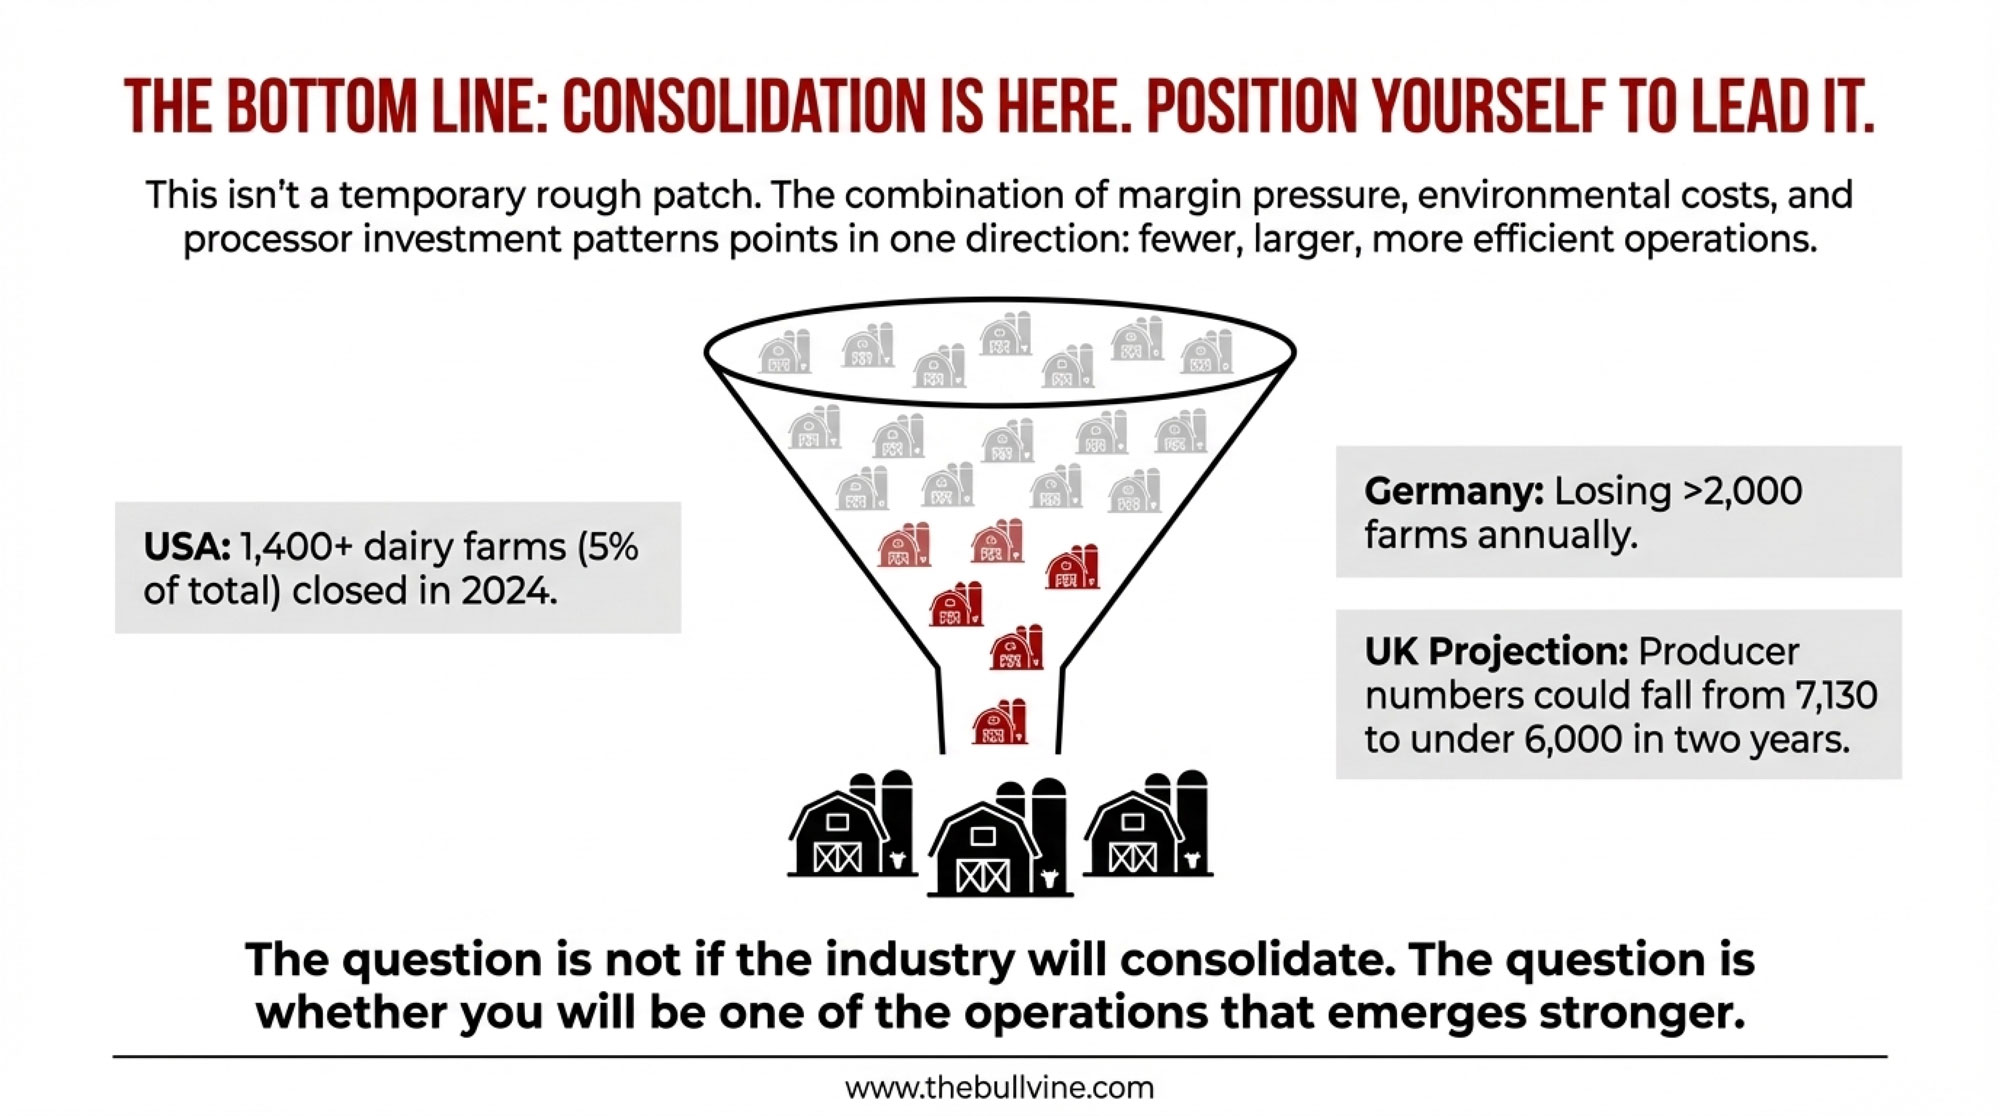
The Consolidation Reality—and What It Means for Genetics

Now let’s punch in the consolidation piece, because this really matters for breeders and for anyone thinking about where their herd fits.

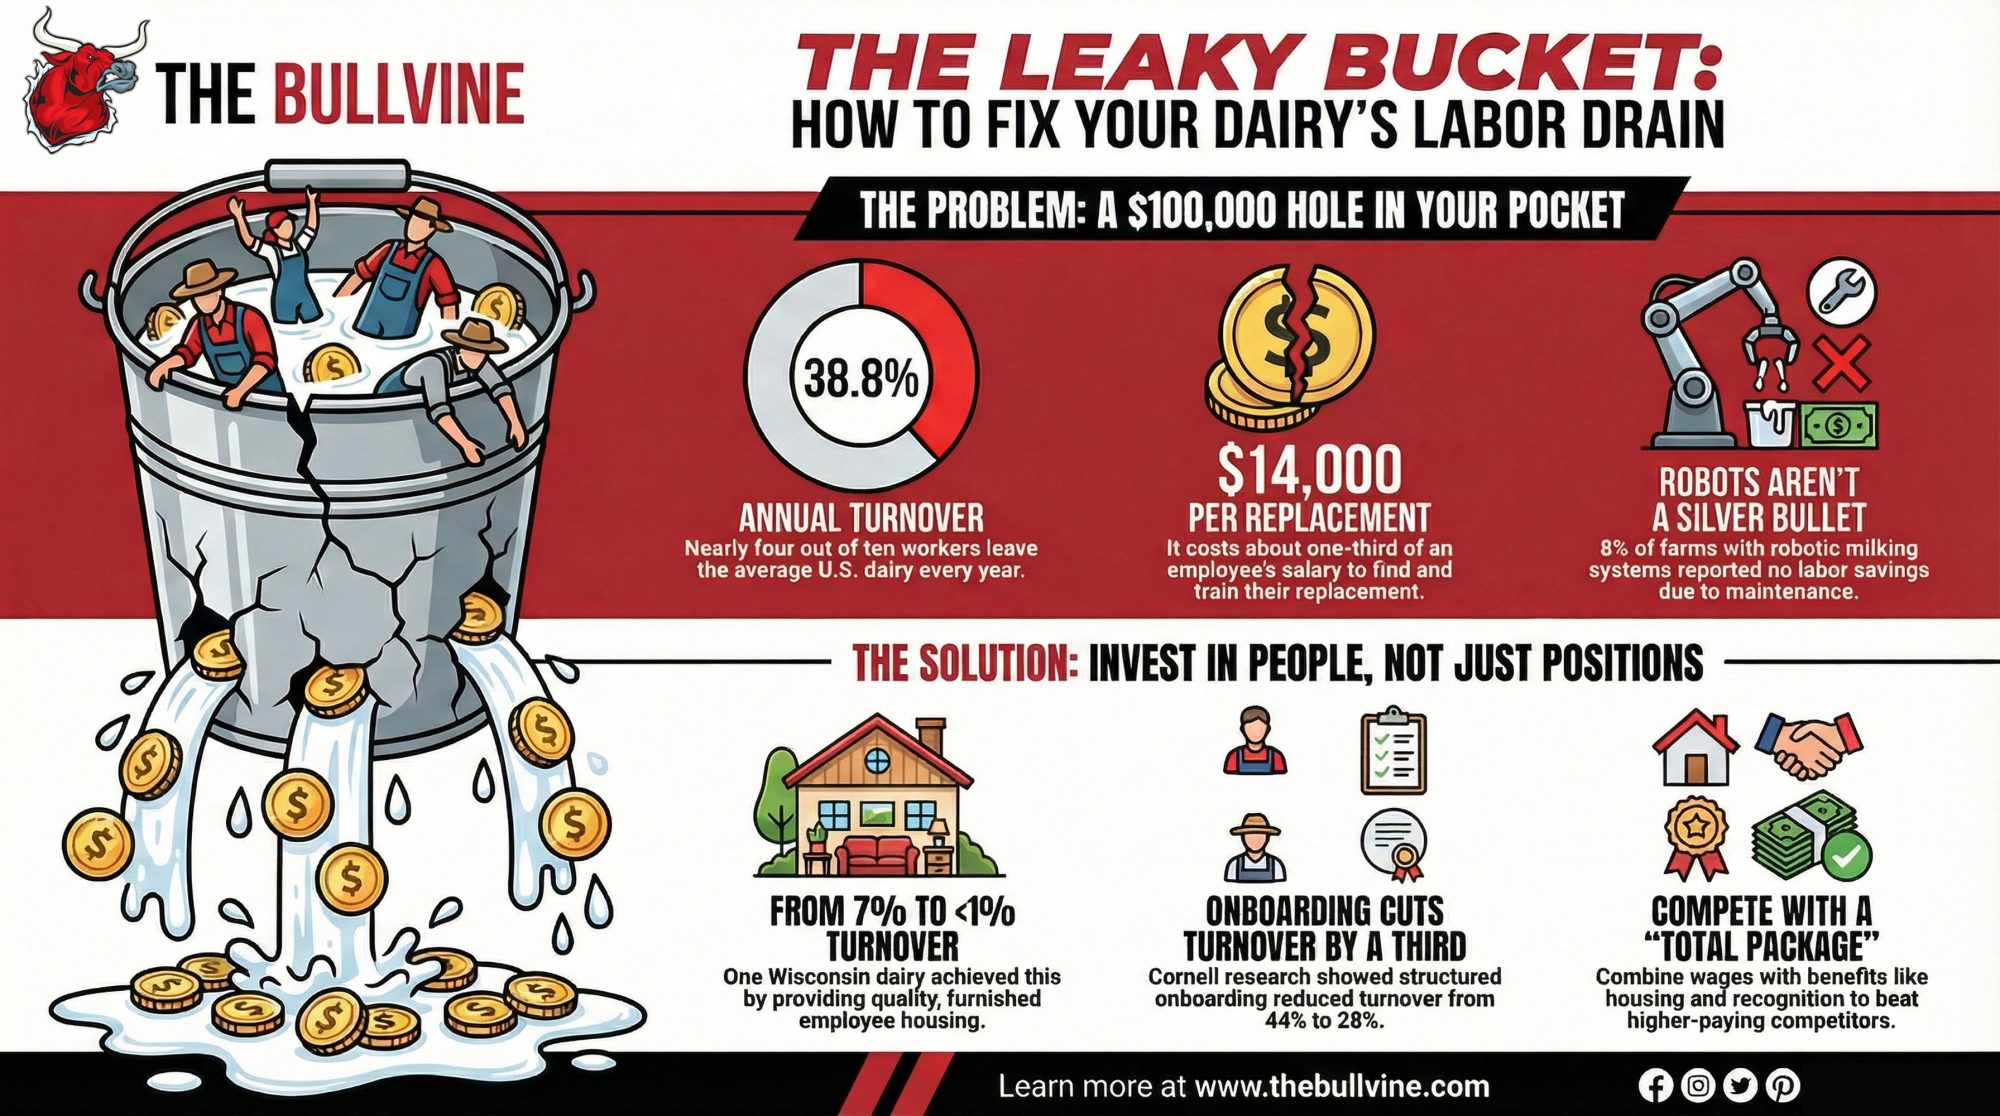
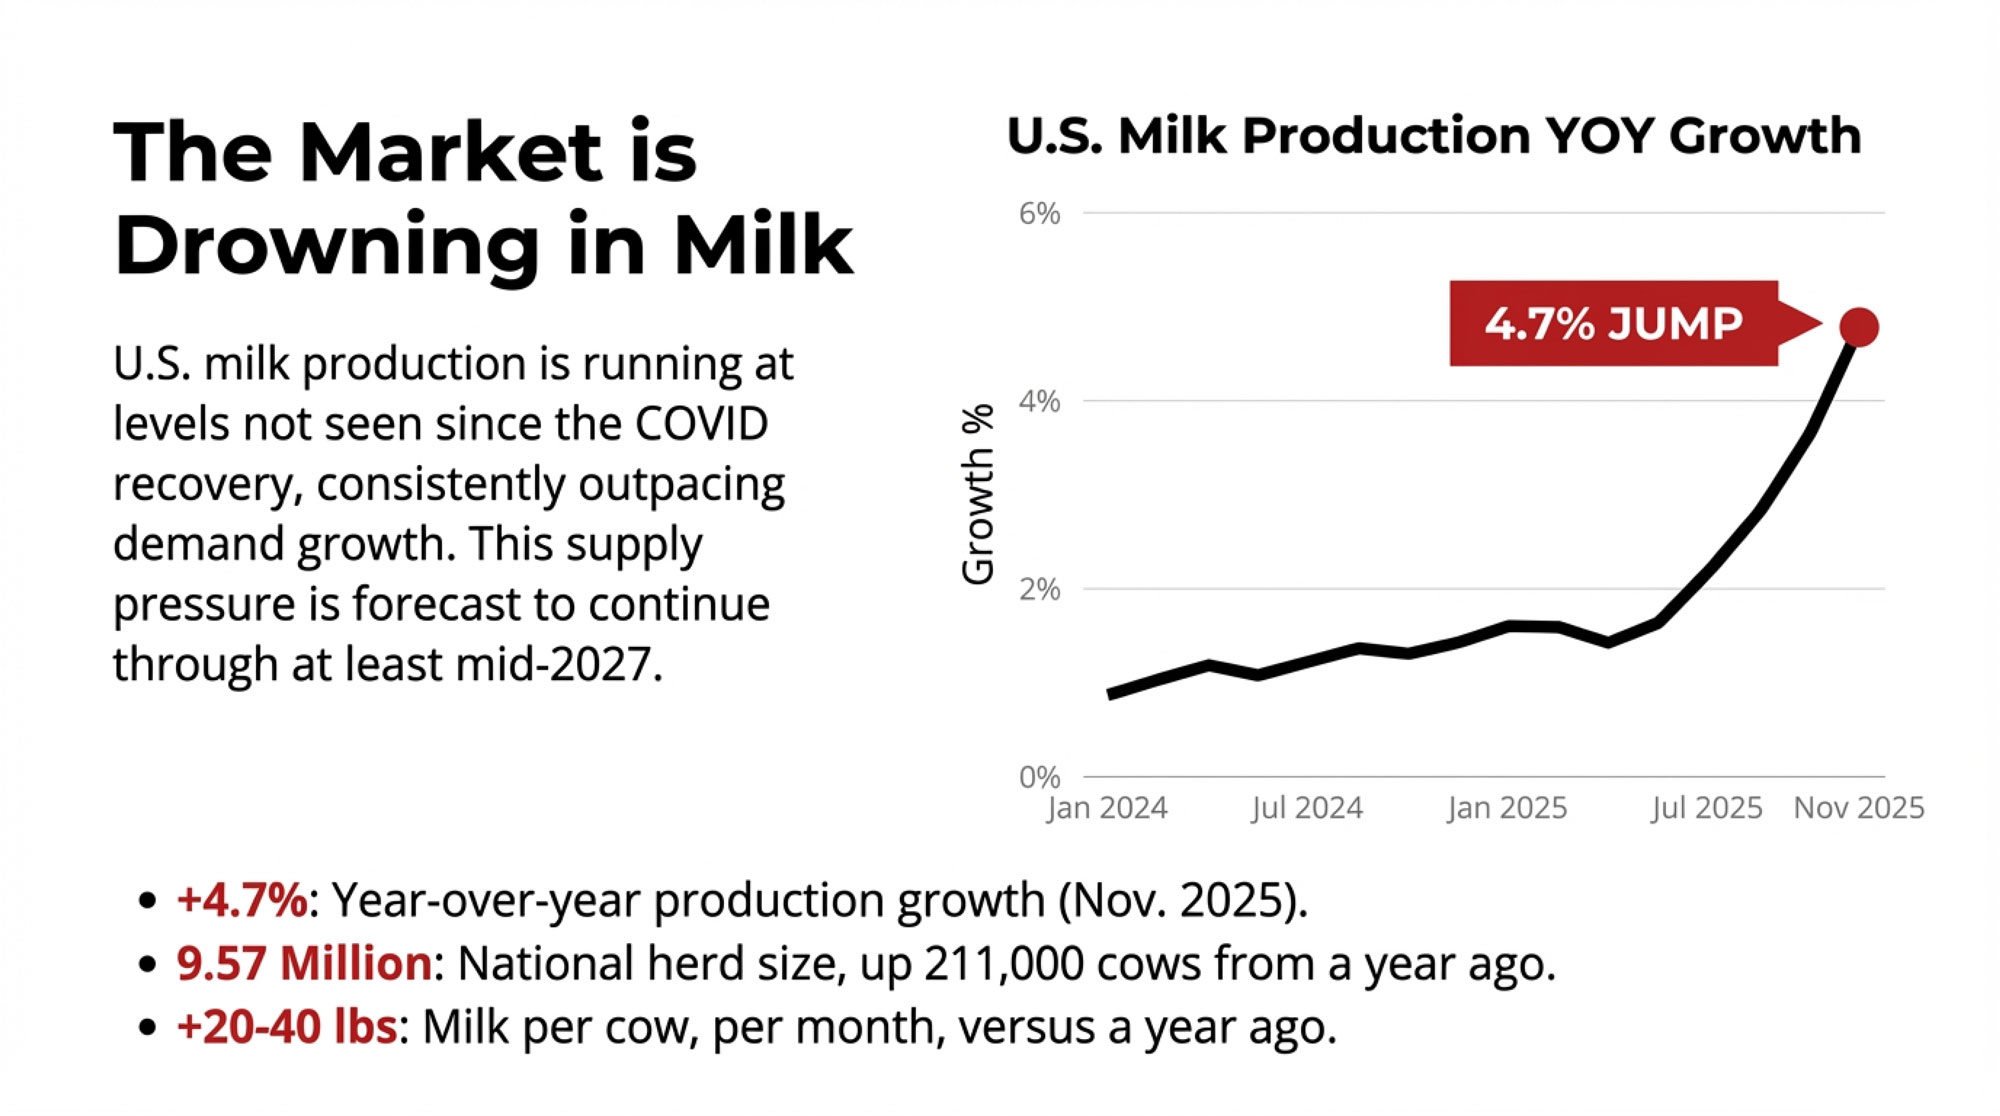
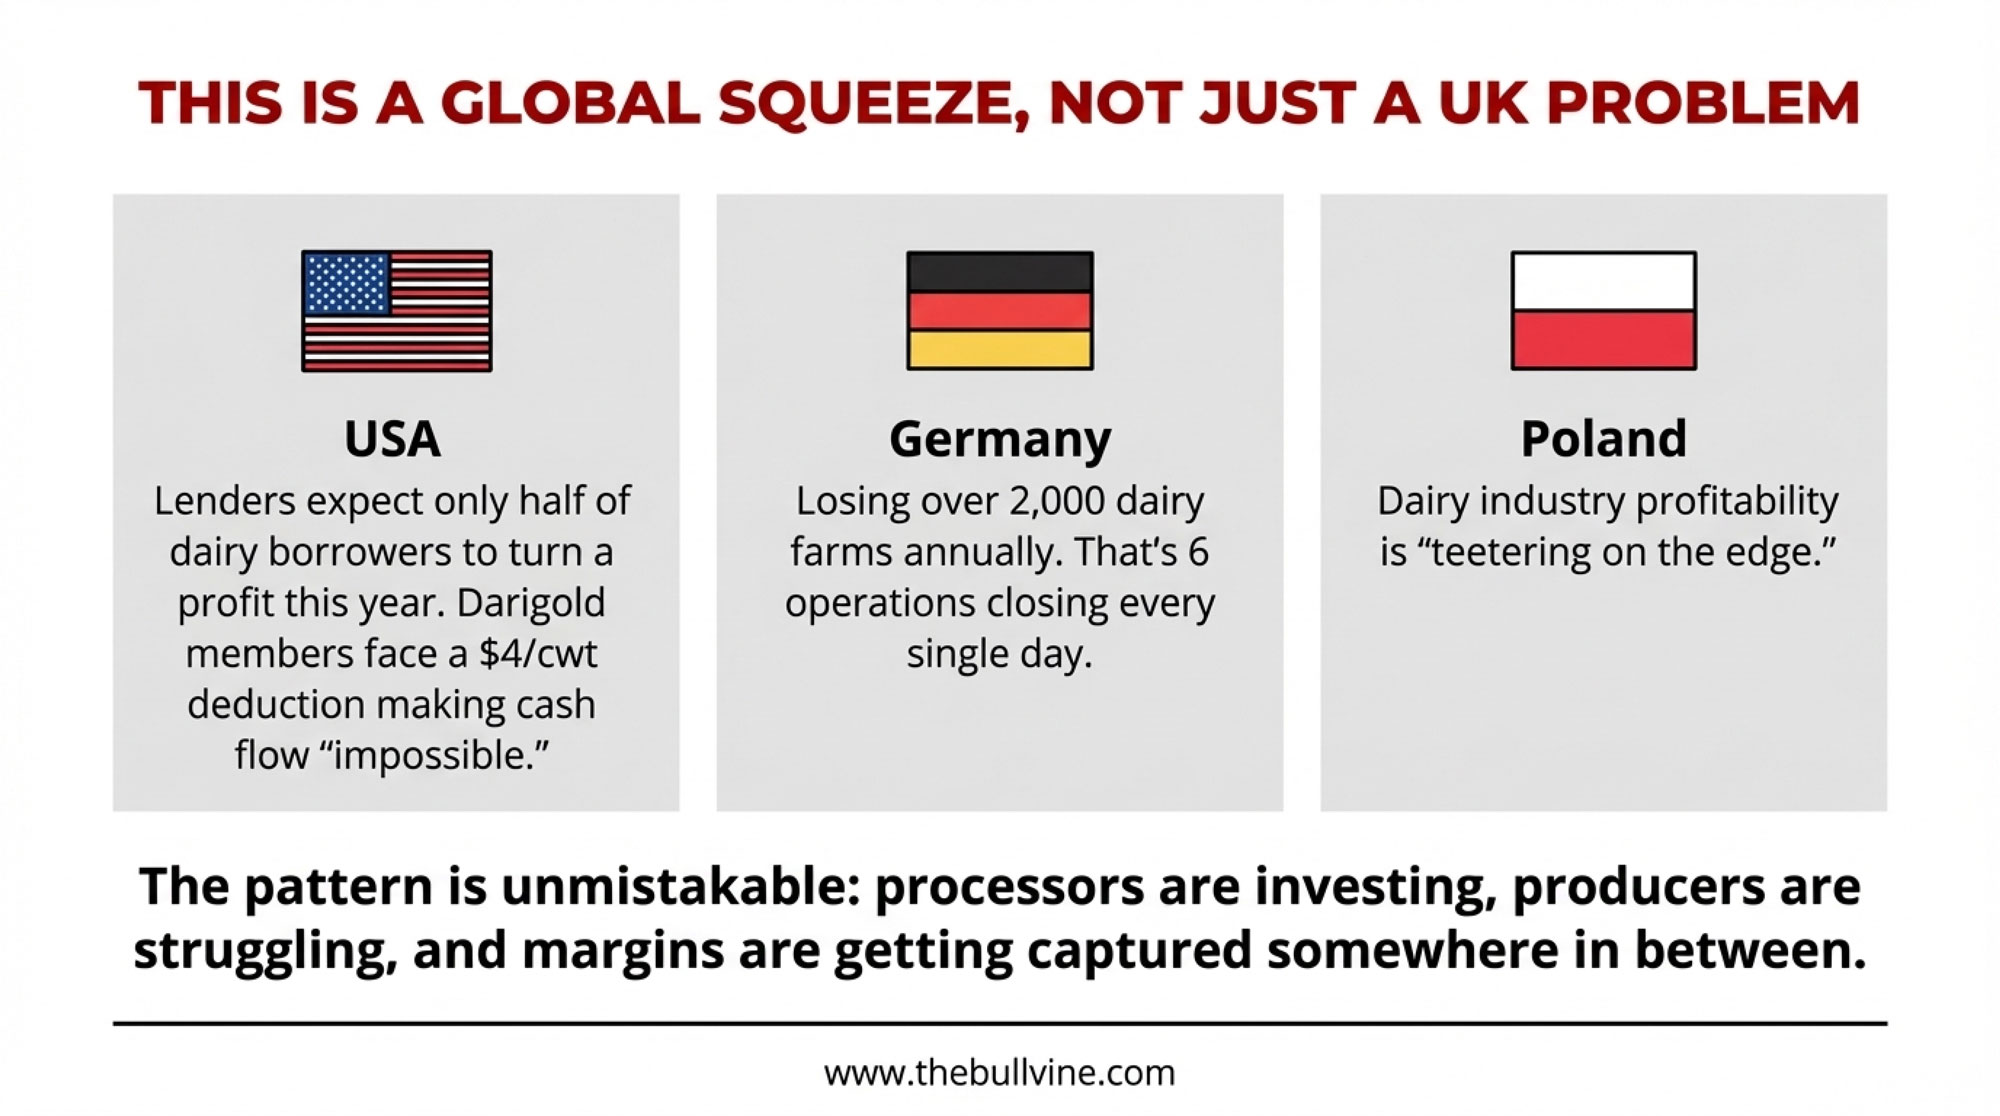
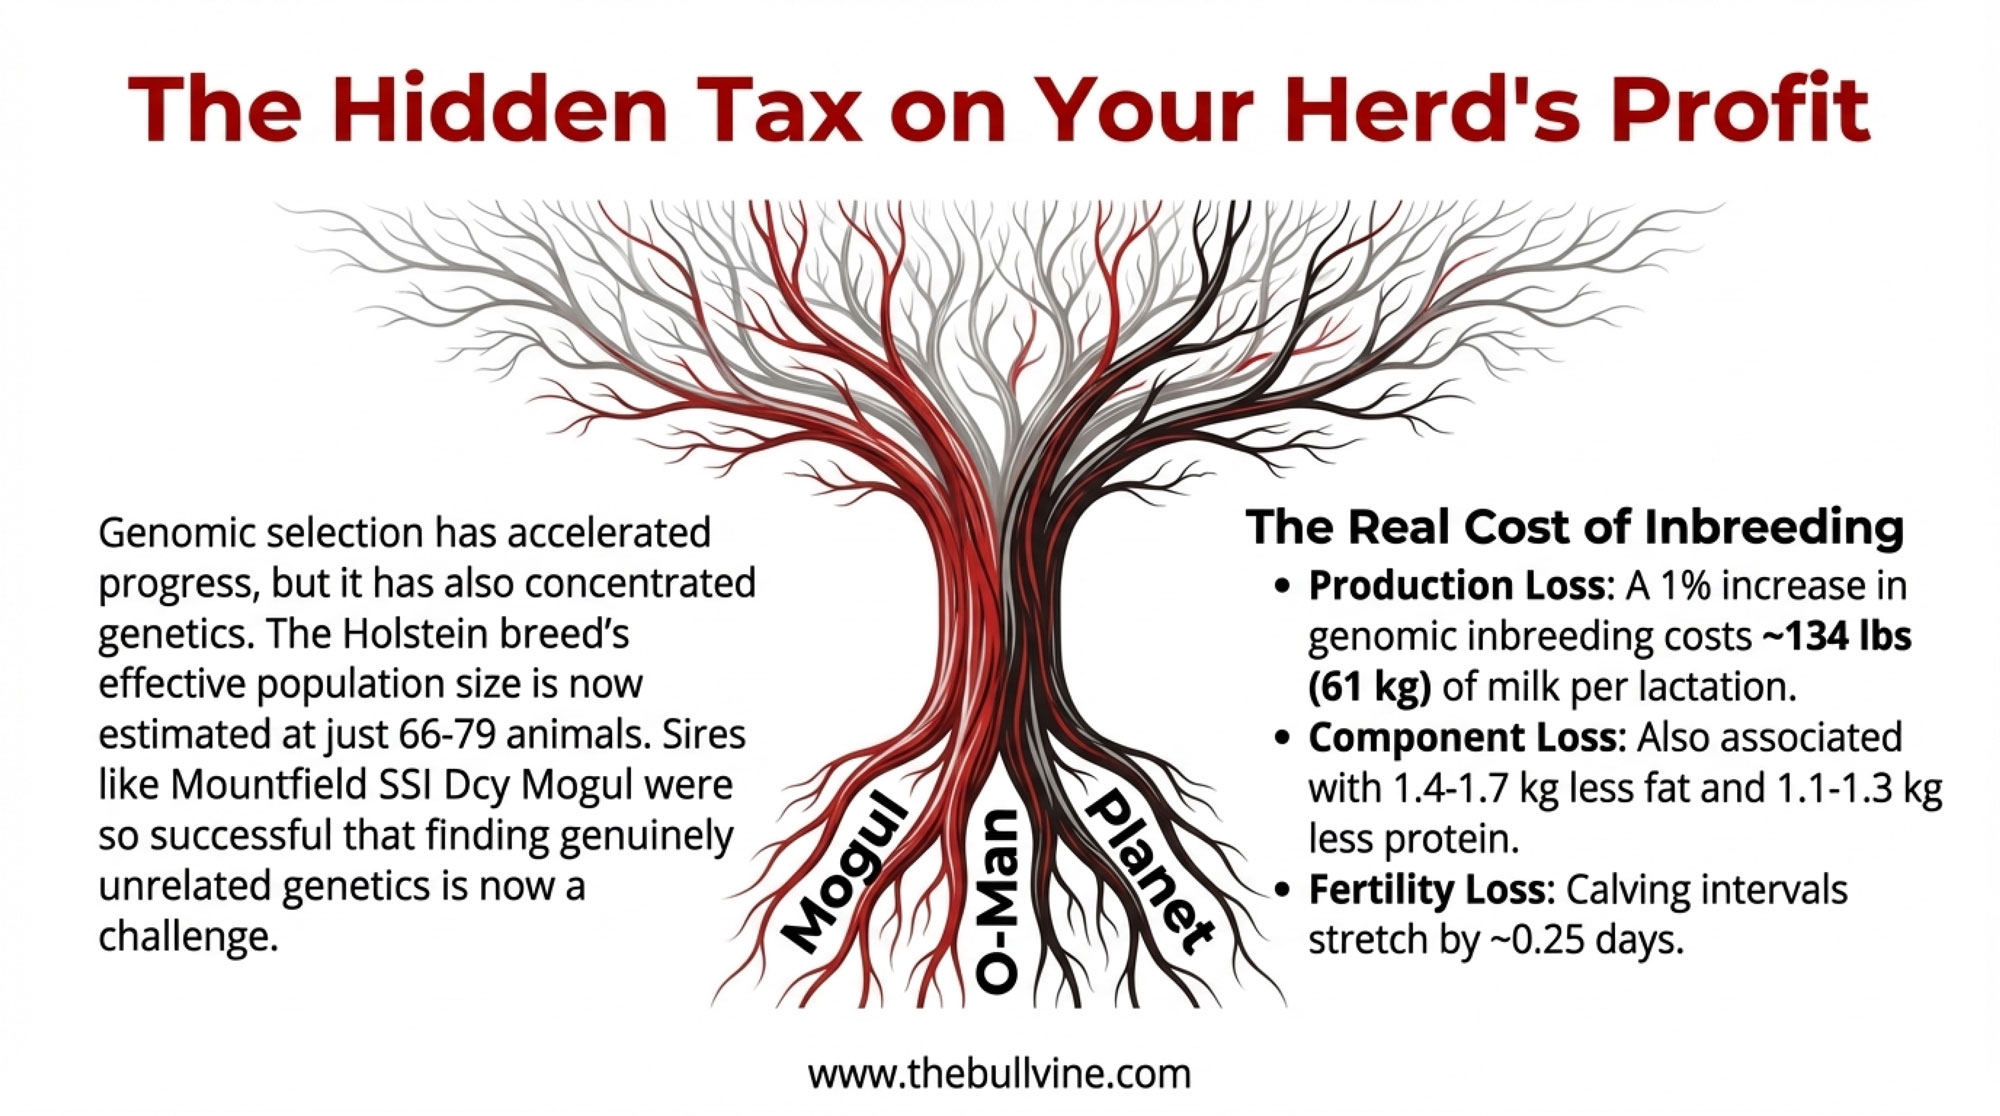
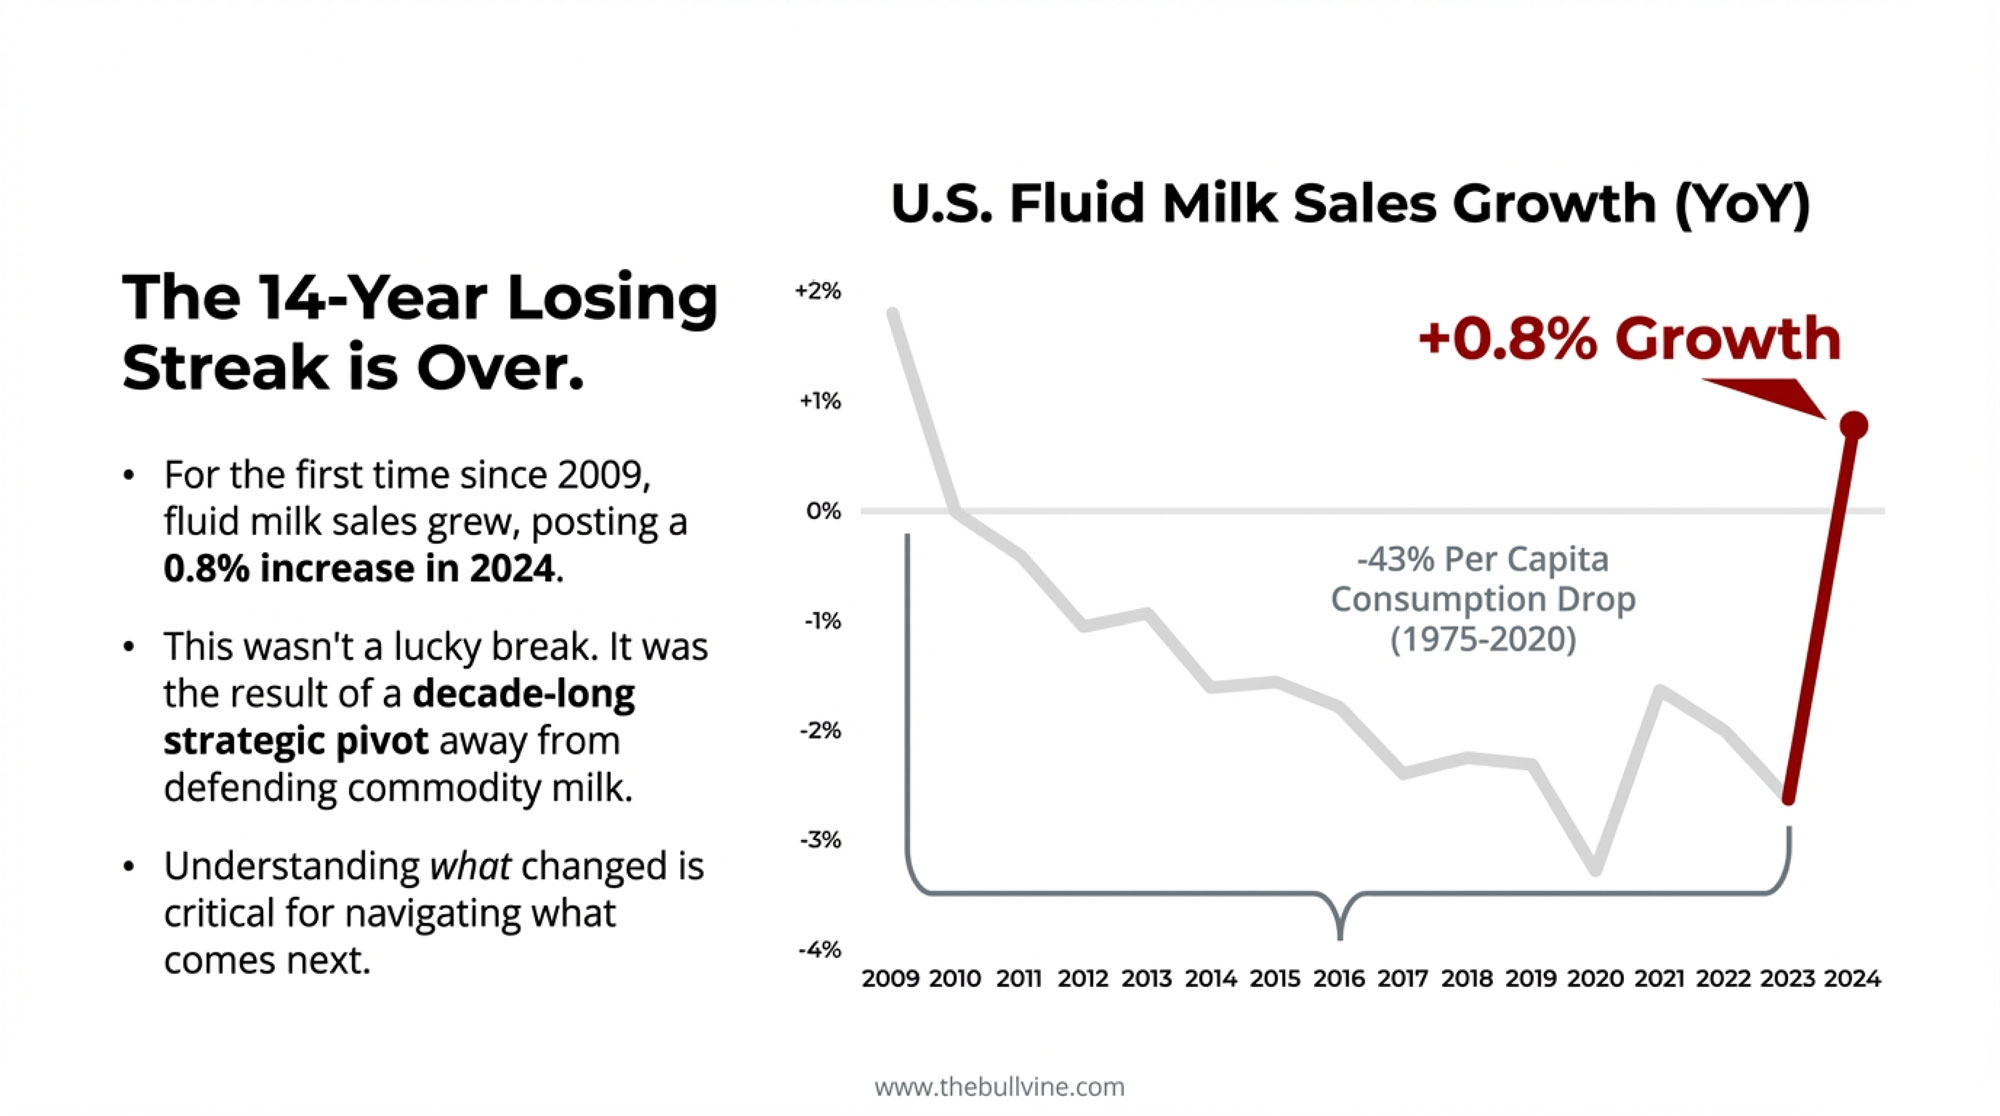
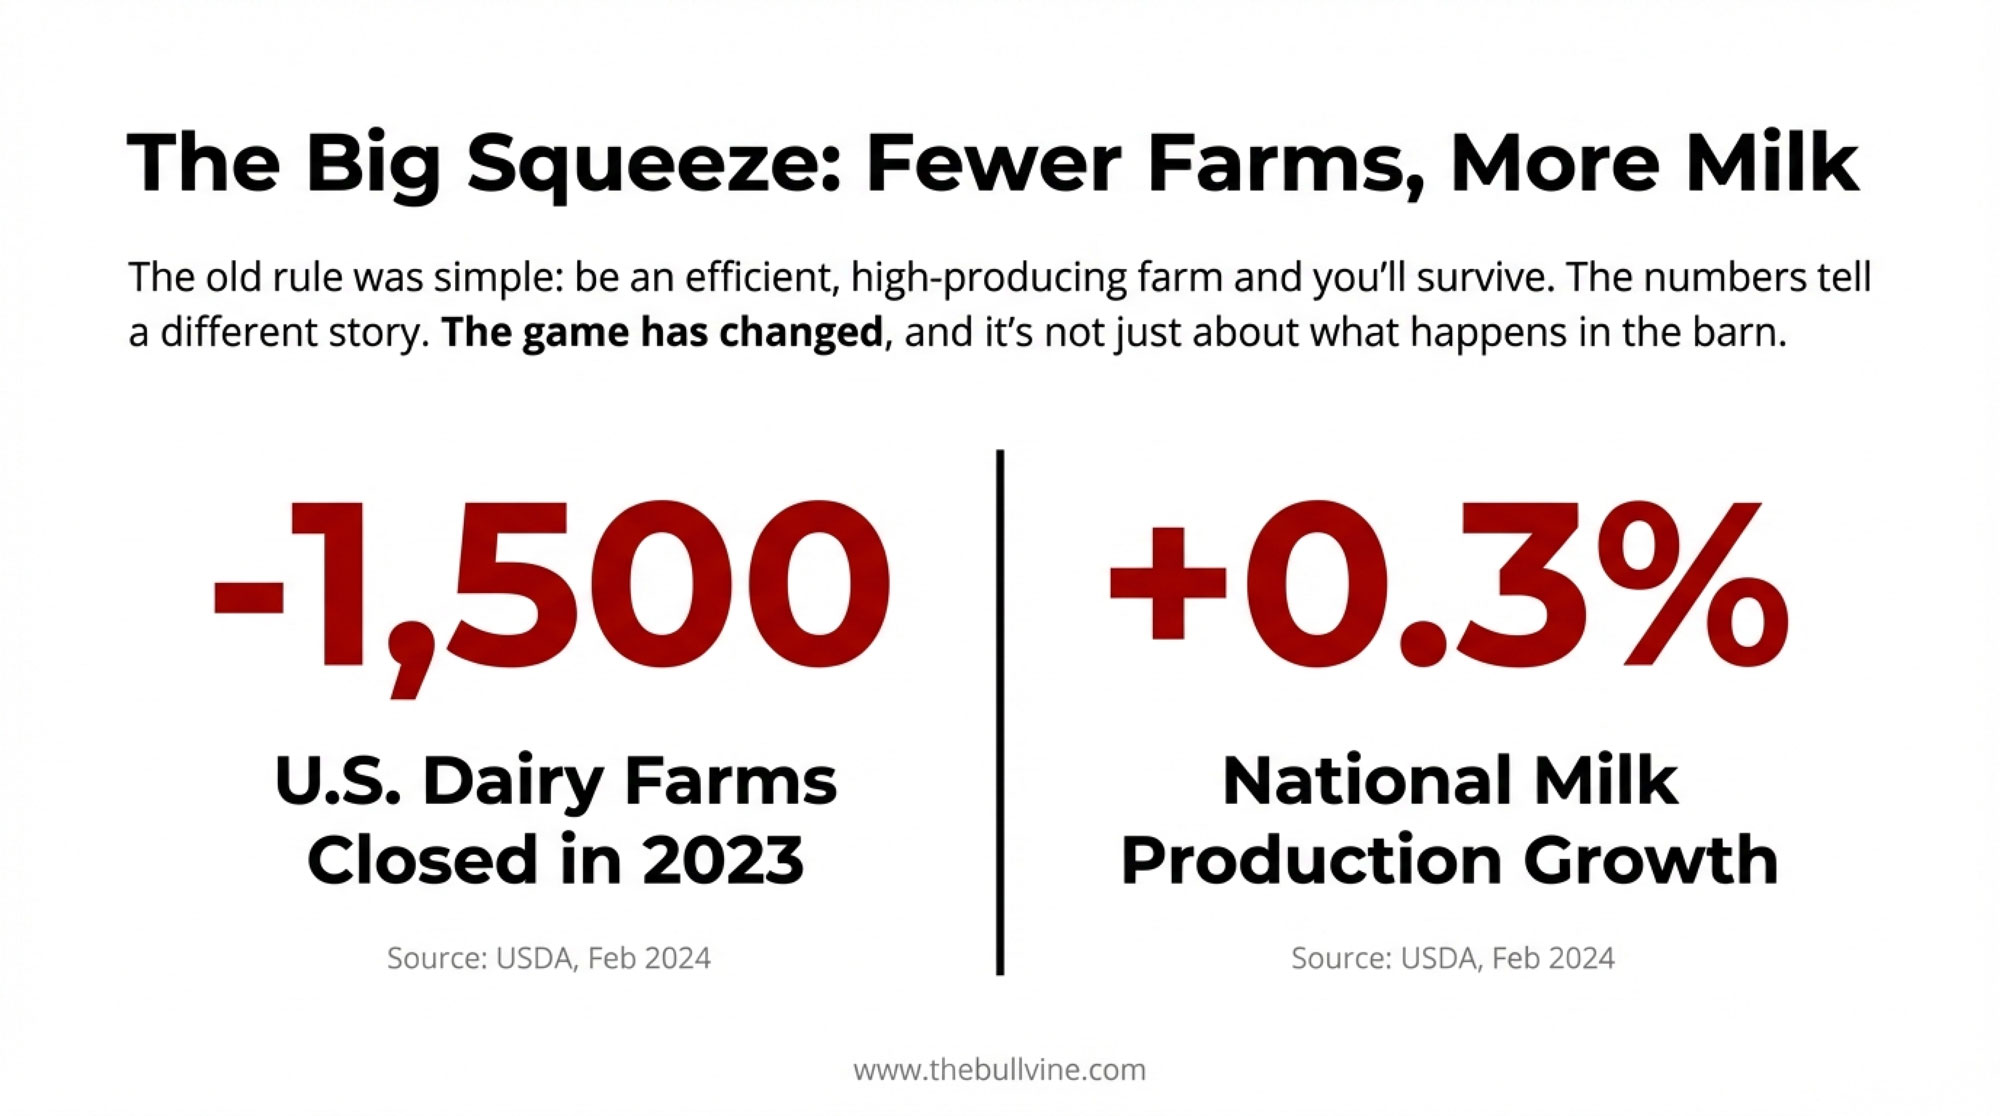
The 2022 Census of Agriculture shows U.S. dairy farm numbers dropping from 39,303 in 2017 to 24,082 in 2022. That’s roughly a 39 percent decline—about 15,000 dairies gone in five years—even as total U.S. milk production climbed roughly 5 percent, on about 9.4 million milk cows. Rabobank analysis cited in those same reports estimates that herds with more than 1,000 cows now produce around two‑thirds of U.S. milk by value, up from around 60 percent in 2017.

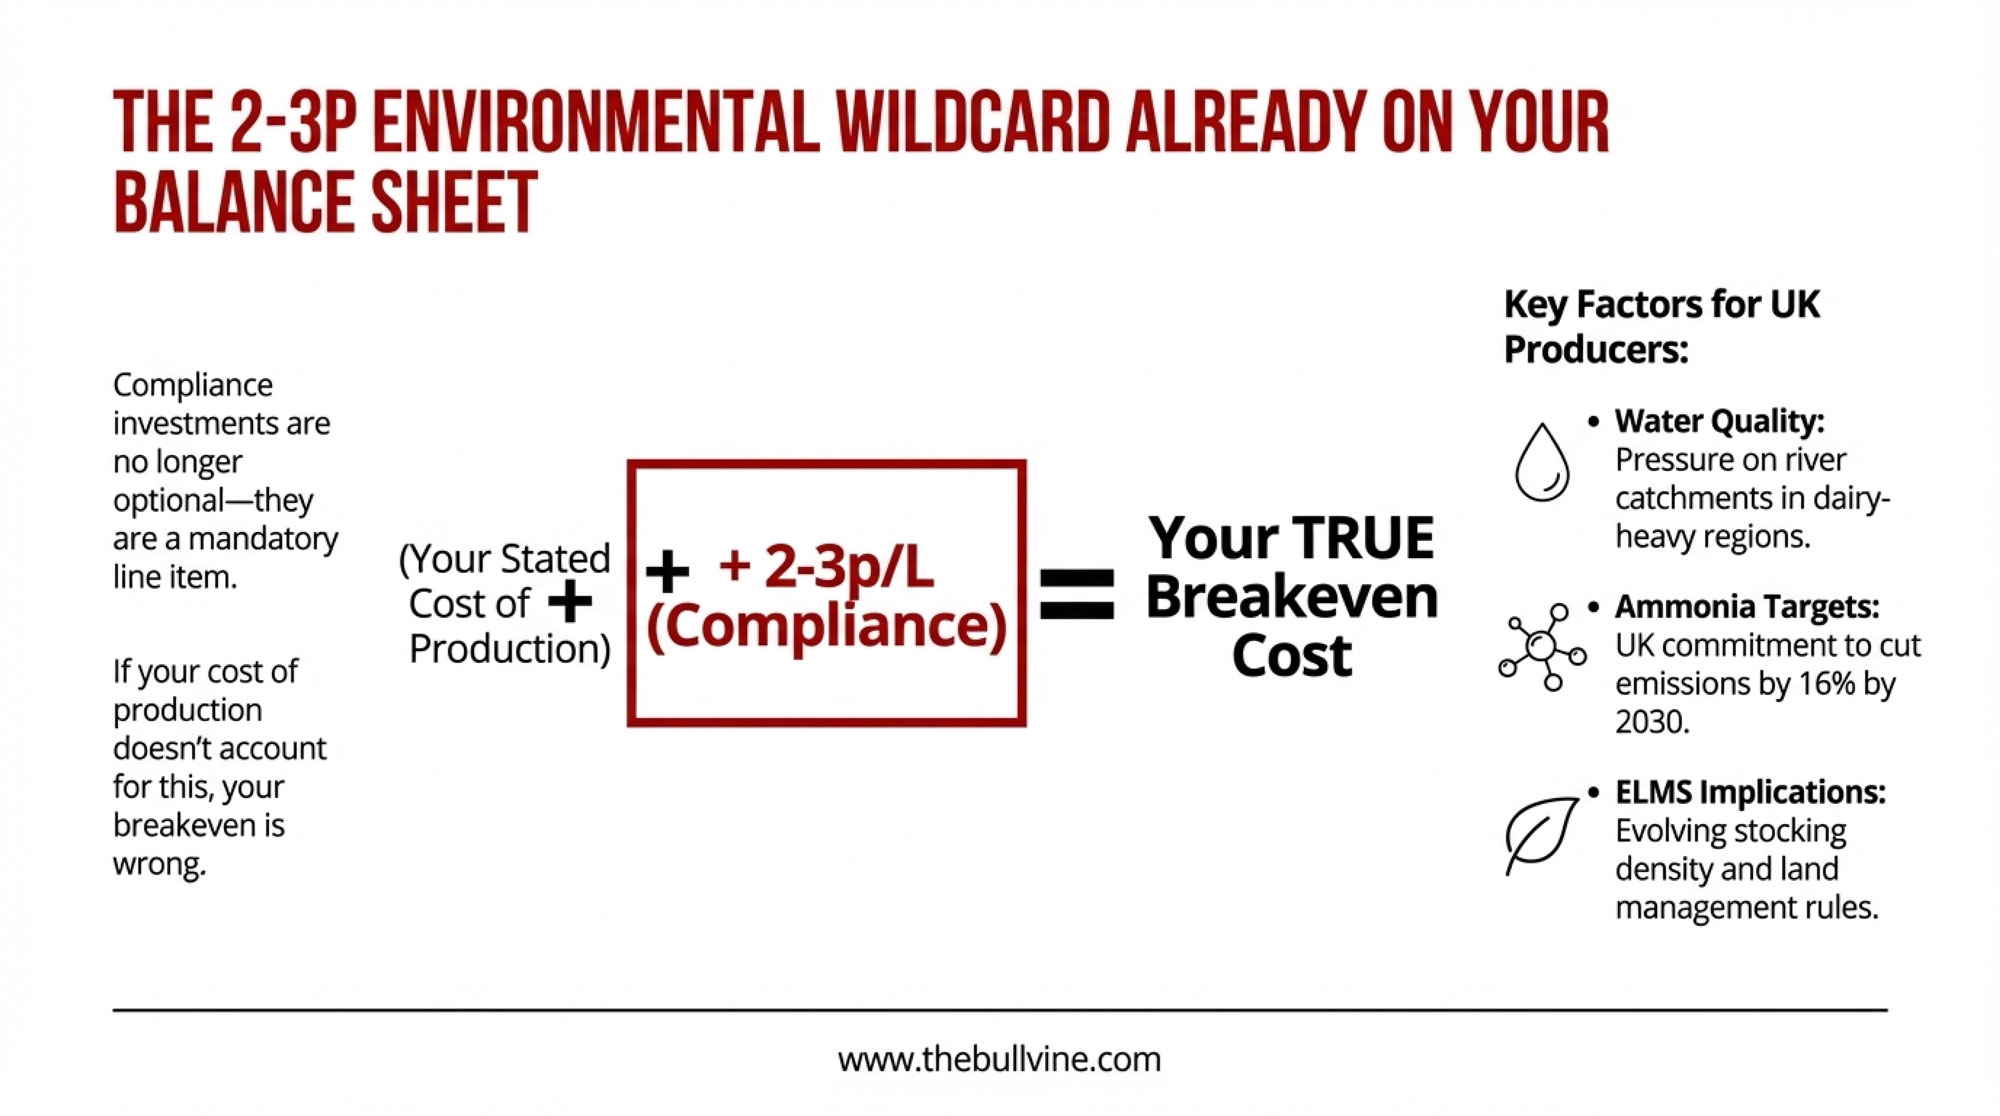
On top of elemental market forces, environmental and labor policies are nudging in the same direction. California, Washington, and other states have tightened manure, water, and methane rules, pushing dairies toward digesters, lagoon covers, and more sophisticated nutrient management systems—investments that are easier to justify on a 2,000‑cow dairy than on an 80‑cow tie‑stall. Labor and immigration constraints also tend to hit smaller farms harder, while larger operations often have more tools to recruit, pay, and house workers.

So the center of gravity has shifted. The buyers of genetics and semen are increasingly large freestall and dry-lot herds milking 1,000, 3,000, or 10,000 cows, not just smaller family herds picking bulls at a local sale. And those large herds are demanding a specific type of cow.

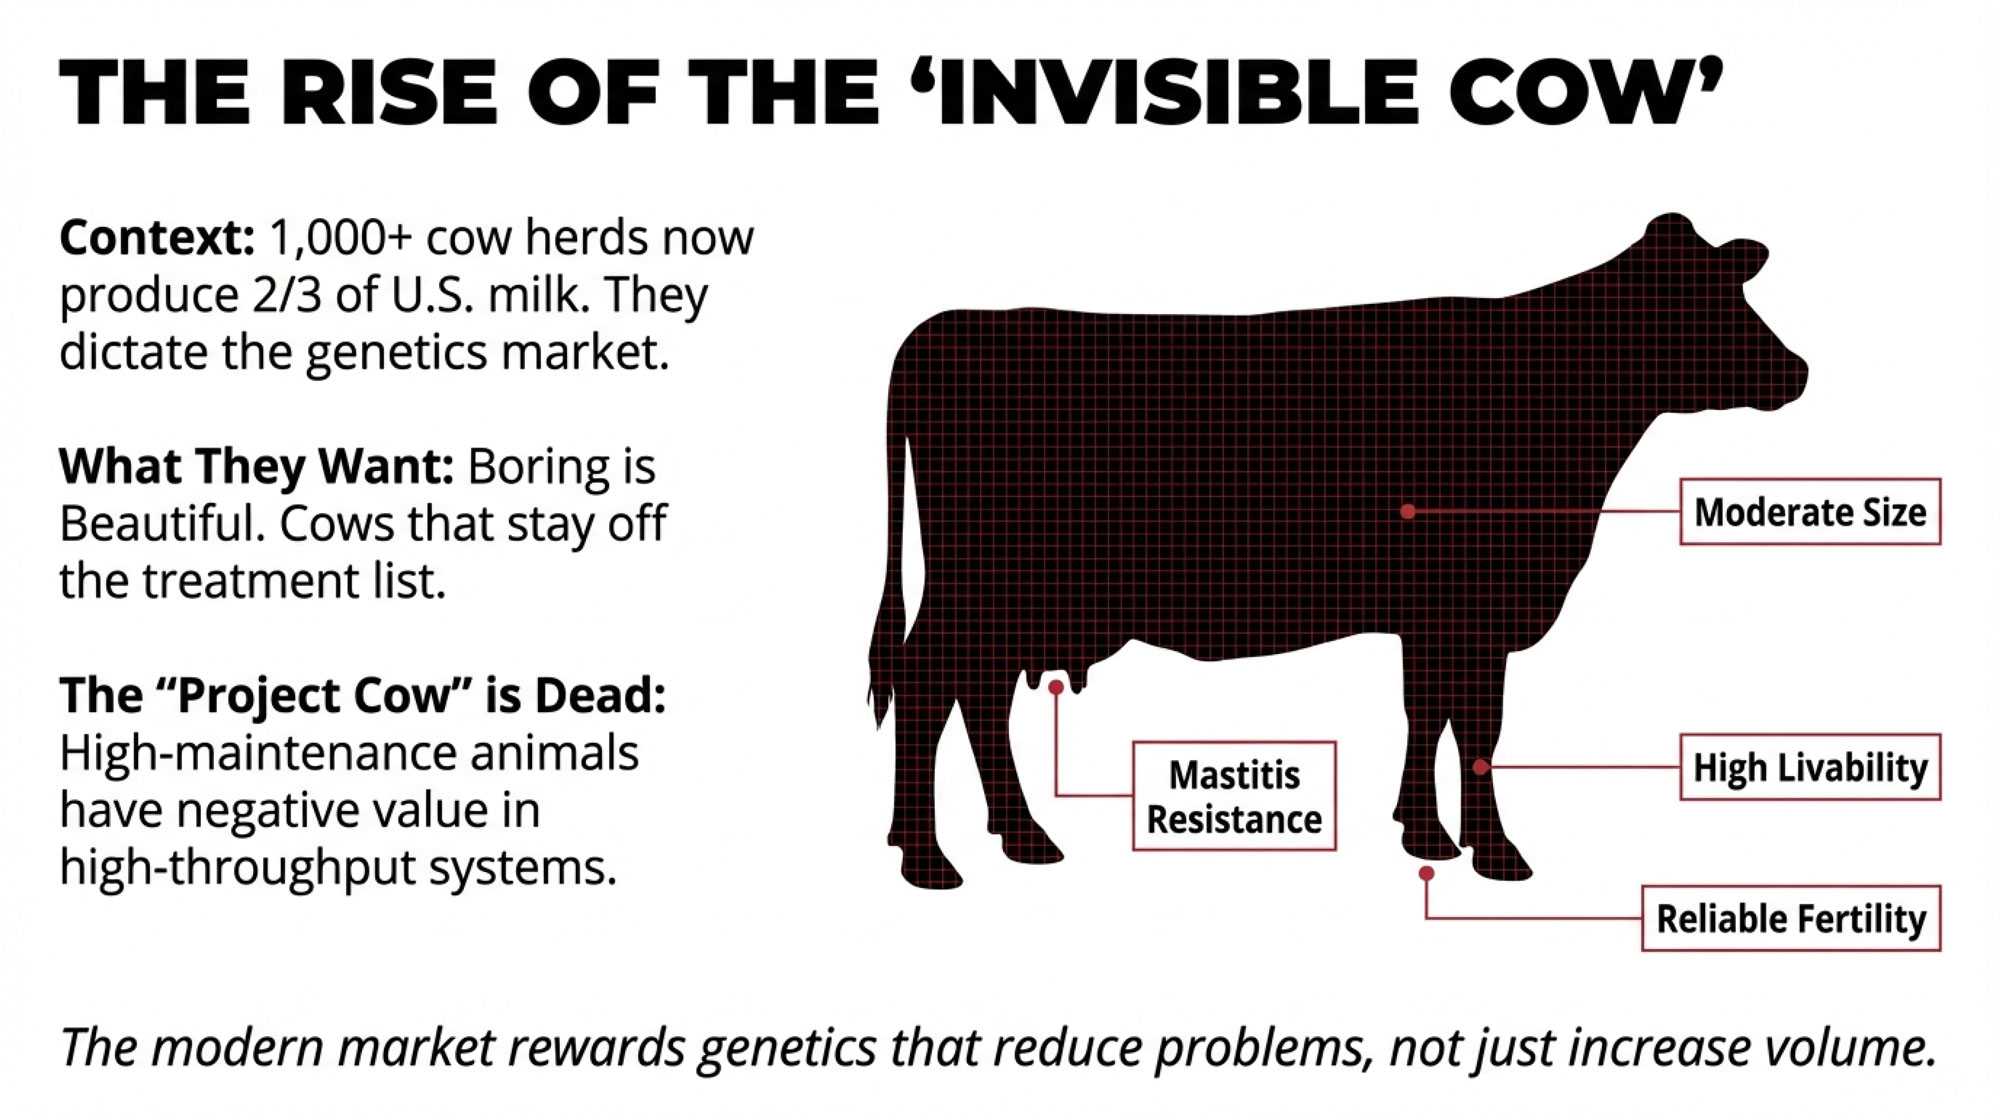
European and Scandinavian research has started using the phrase “invisible cows” to describe the ideal animal in large, modern dairy systems: basically trouble‑free, almost boring cows that don’t show up on the treatment list, have few metabolic or hoof problems, calve easily, breed back reliably, and quietly ship components that fit the plant’s grid. U.S. management and genetics advisers are framing similar ideas—focusing on cows that minimize disruptions in high‑throughput, labor‑tight environments.

What I’ve noticed, talking with large‑herd managers and AI folks, is that this is changing the genetic marketplace. Big herds don’t want “project cows” that constantly need special attention. They want cows that are almost invisible day‑to‑day:

  • Strong on productive life and livability.
  • Good mastitis resistance and udder health.
  • Sound feet and legs that keep them moving to the bunk and parlor.
  • Fertility and calving traits that keep fresh cow problems to a minimum.
  • Moderate size with solid feed efficiency.
Trait CategoryOld Priority (Show Ring / Single Trait)2025 Large-Herd Priority (“Invisible Cow”)
ProductionMax milk volume or max butterfat %Balanced pounds of fat + protein shipped per cow/year
HealthTreat problems as they comeMastitis resistance, low SCC, minimal treatments
FertilitySecondary concernStrong heat detection, conception rate, calving interval
CalvingSome assistance acceptableCalving ease (sire & maternal), low stillbirths
LongevityCull and replace as neededProductive life, low cull rate, multiple lactations
StructureExtreme dairy form, show-ring styleSound feet/legs, good locomotion, moderate frame
TemperamentNot formally selectedCalm, easy to handle in high-throughput parlors
Feed EfficiencyRarely consideredModerate intake, strong component output per lb DMI

For breeders, that has two big implications. First, there’s an opportunity for those who can breed and market families that consistently deliver these trouble‑free, “invisible” cows and back it up with real herd performance. Second, there’s risk if a herd or breeding program stays focused only on show‑ring traits or single‑trait extremes without a clear economic story tied to big‑herd, high‑throughput systems.

As herds get larger, the market is slowly but surely rewarding genetics that reduce problems rather than create them.

Beef‑on‑Dairy: Cash Cow or Heifer Trap?

Now let’s lean into beef‑on‑dairy and replacements, because this is where a lot of operations are feeling both opportunity and pain.

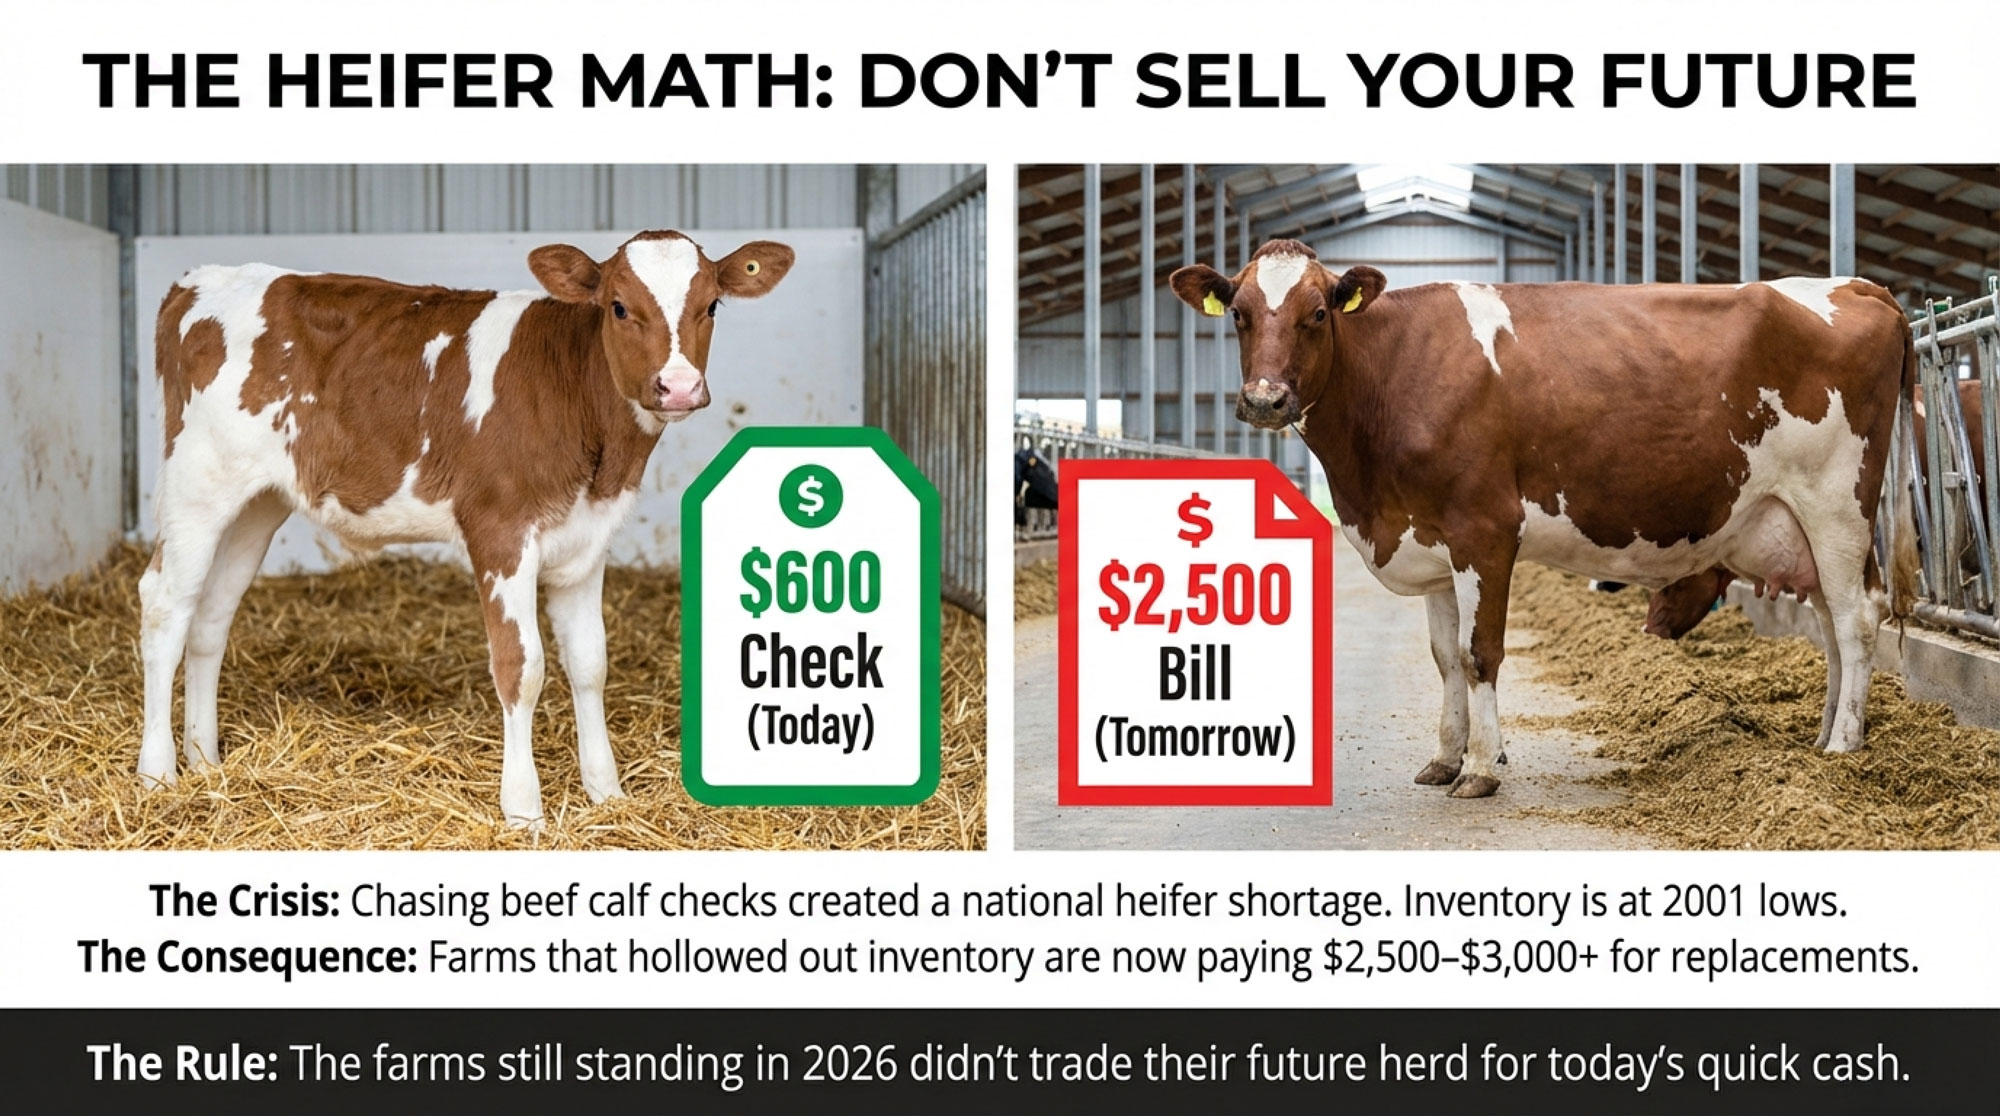
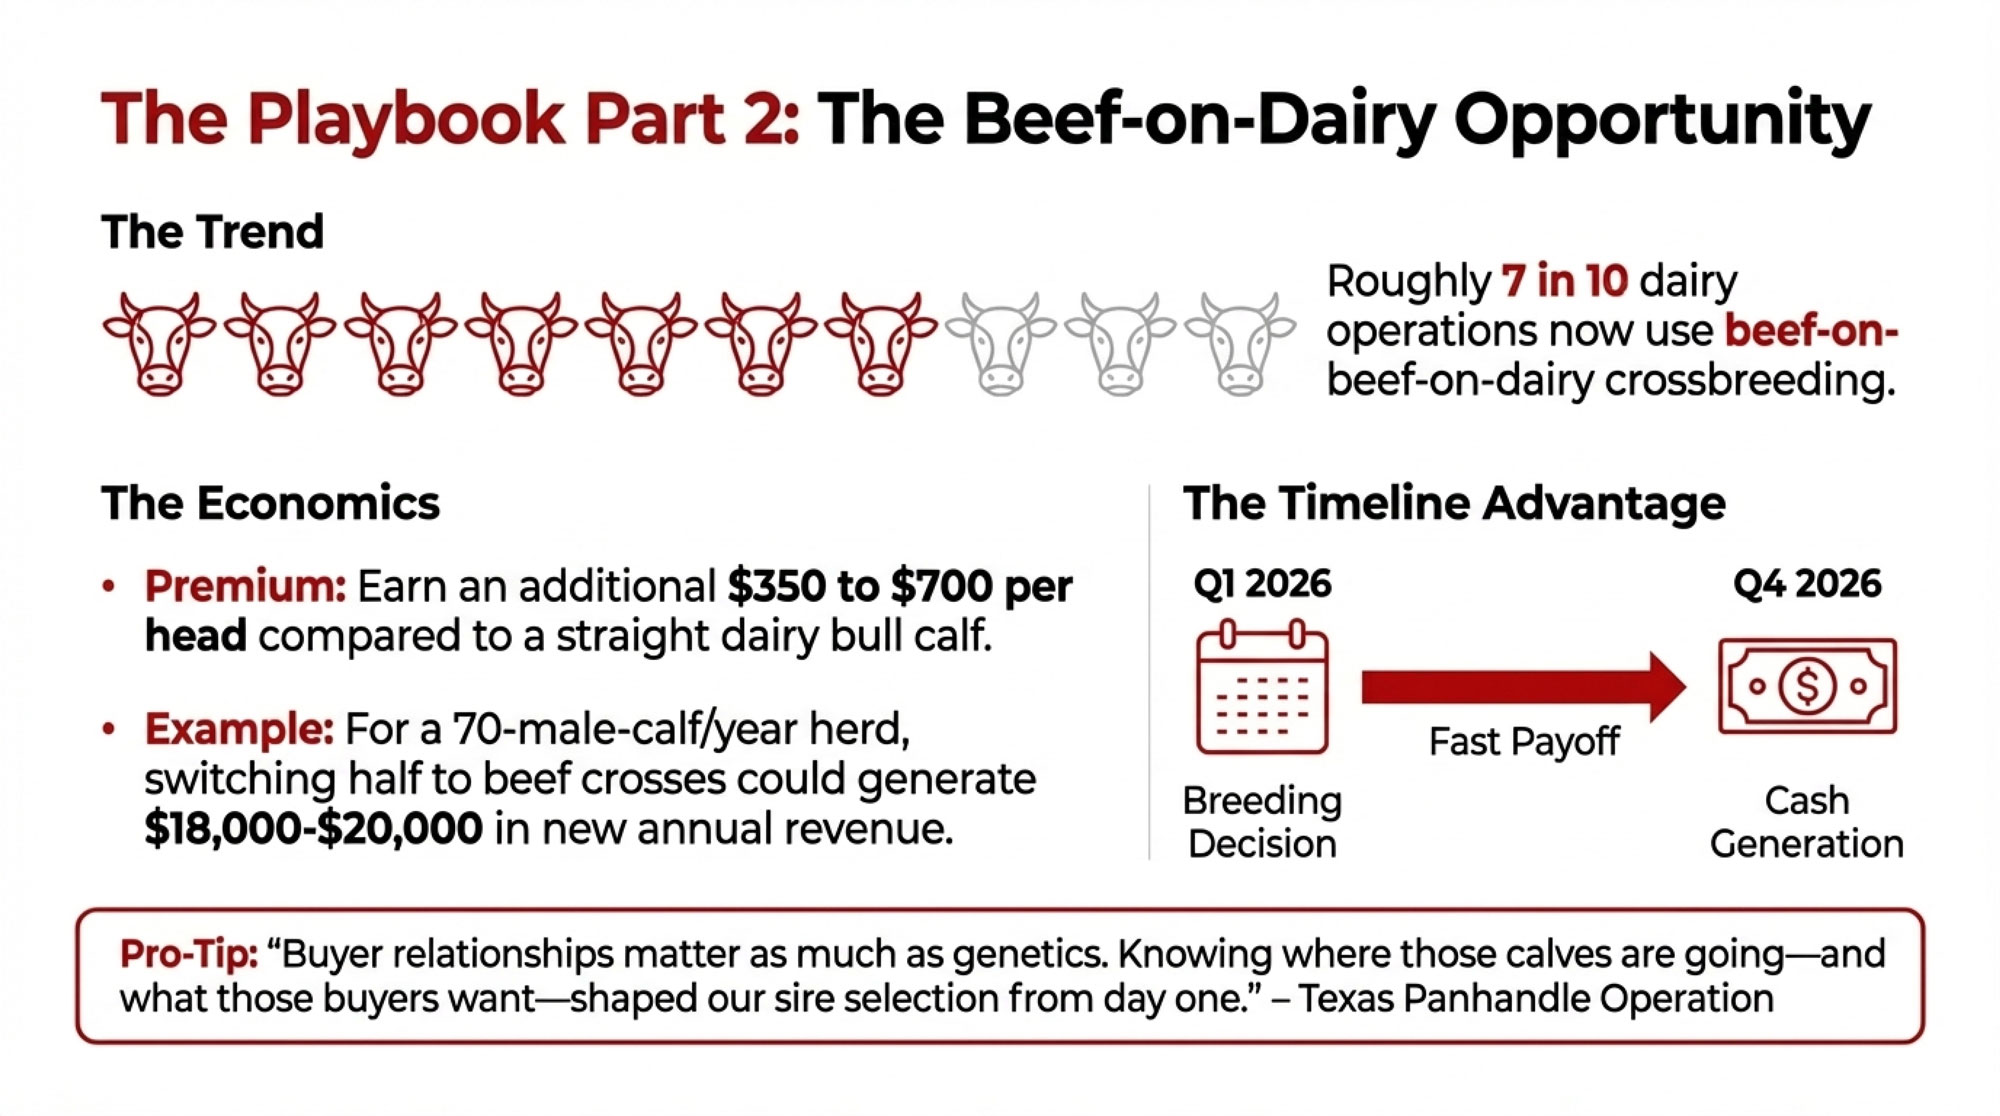
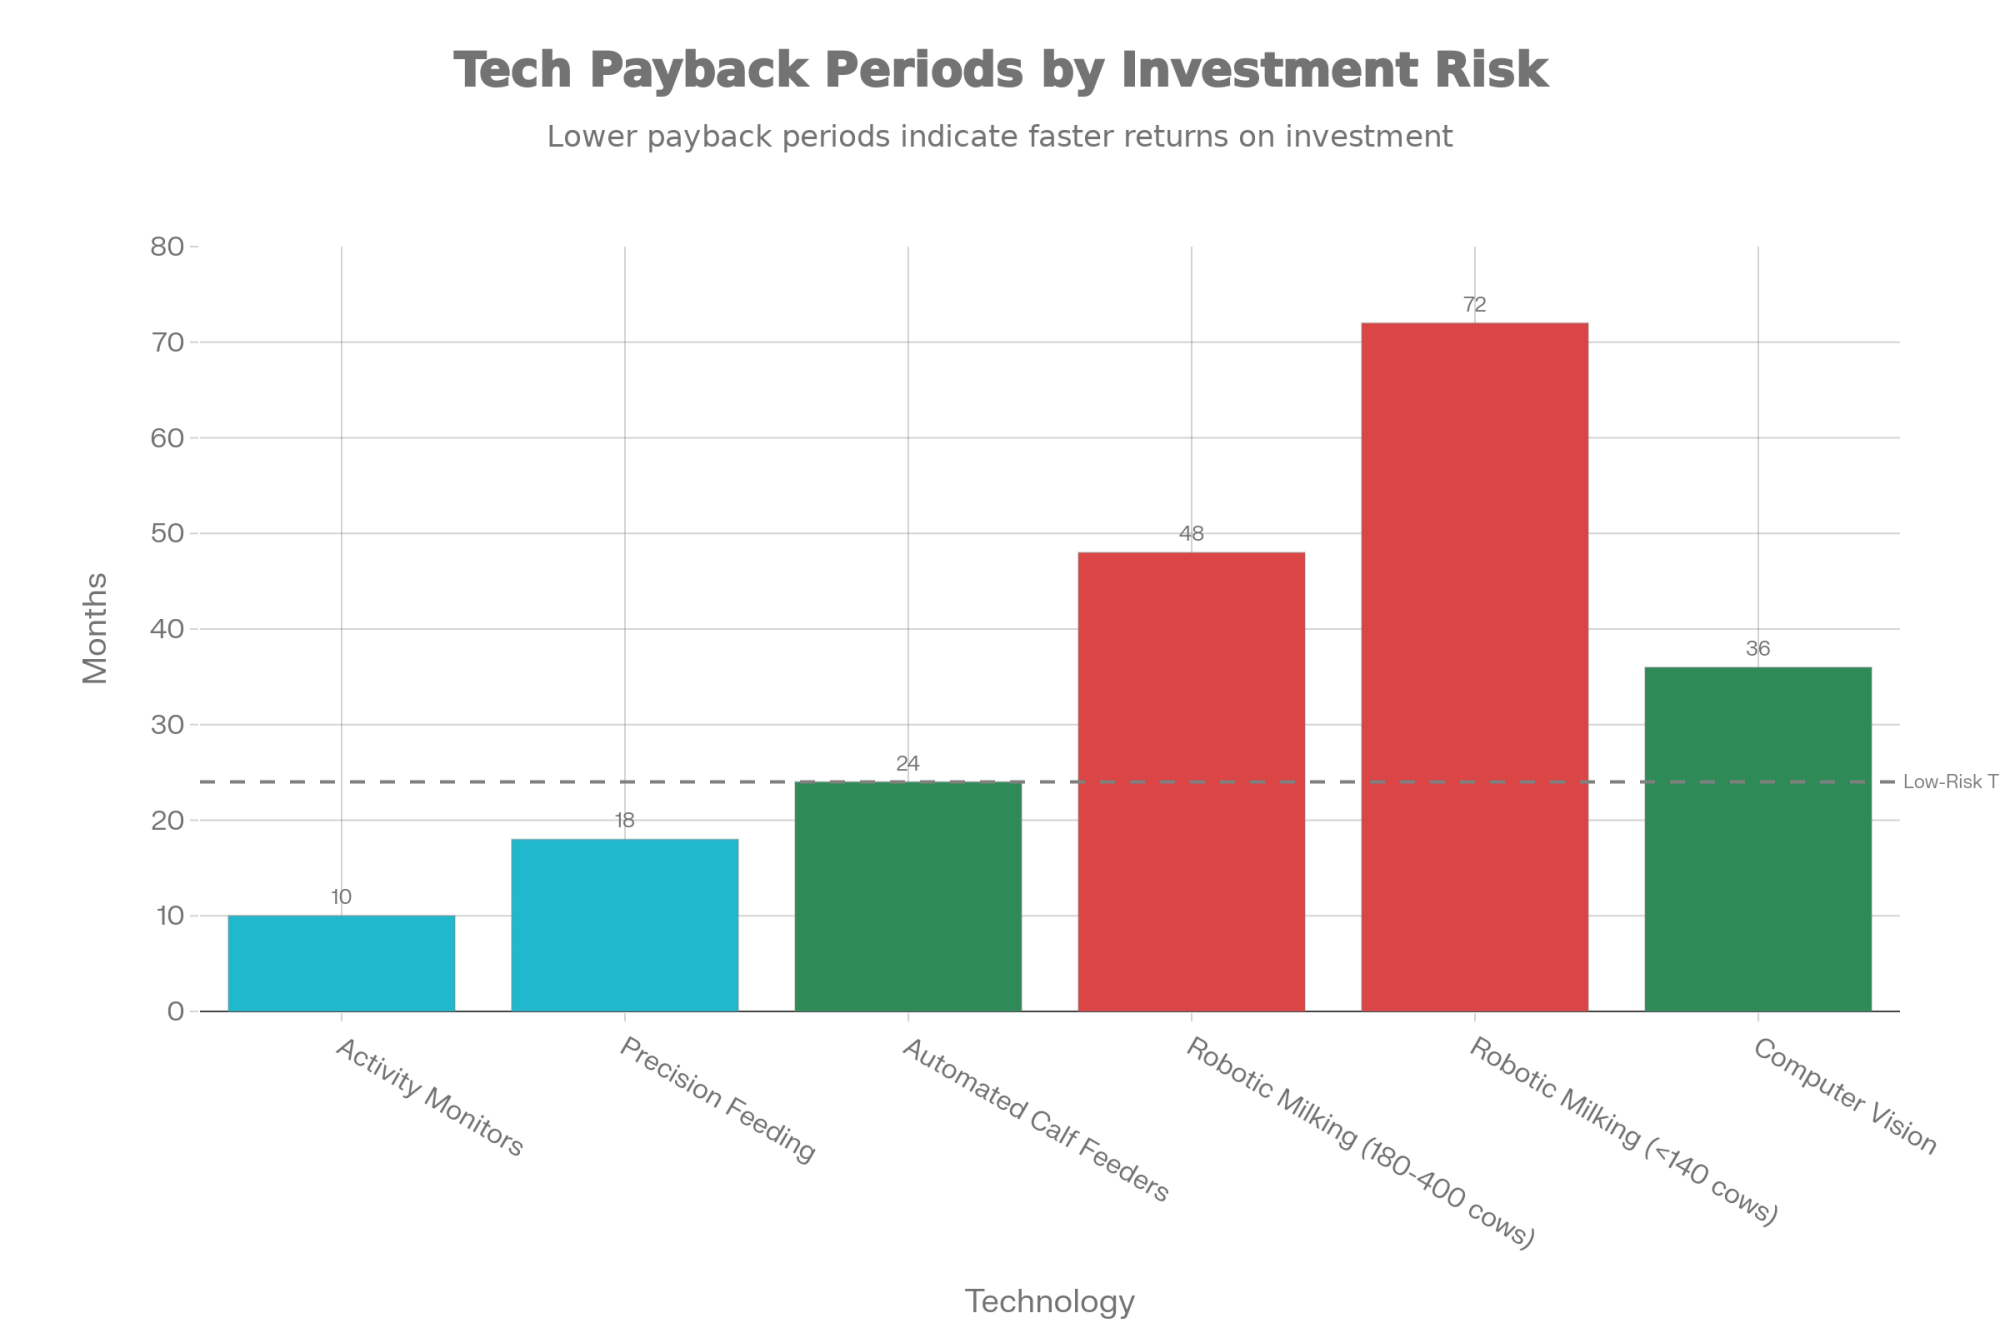
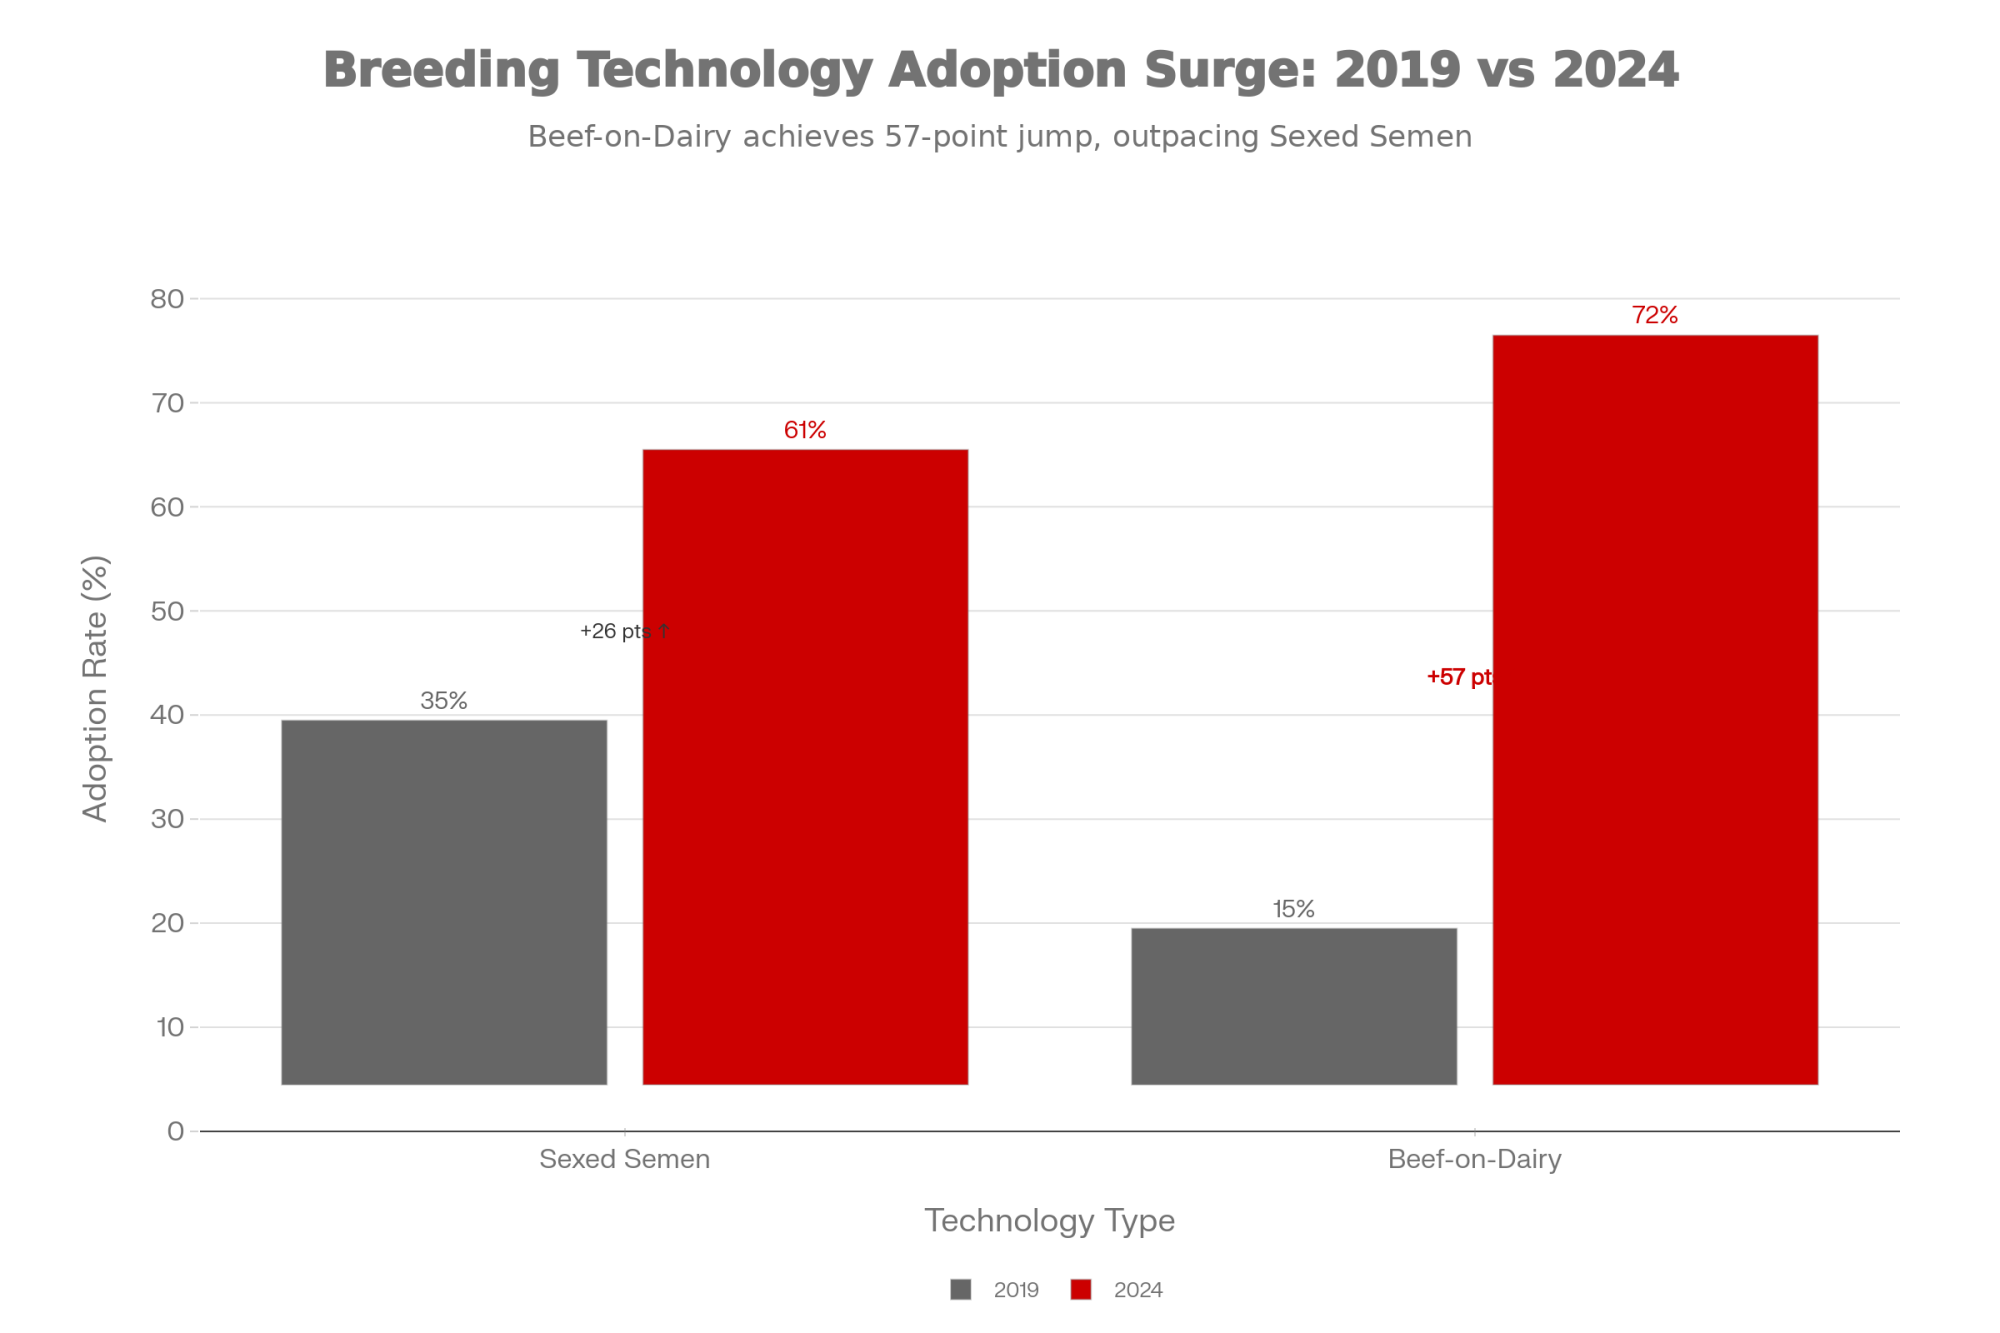
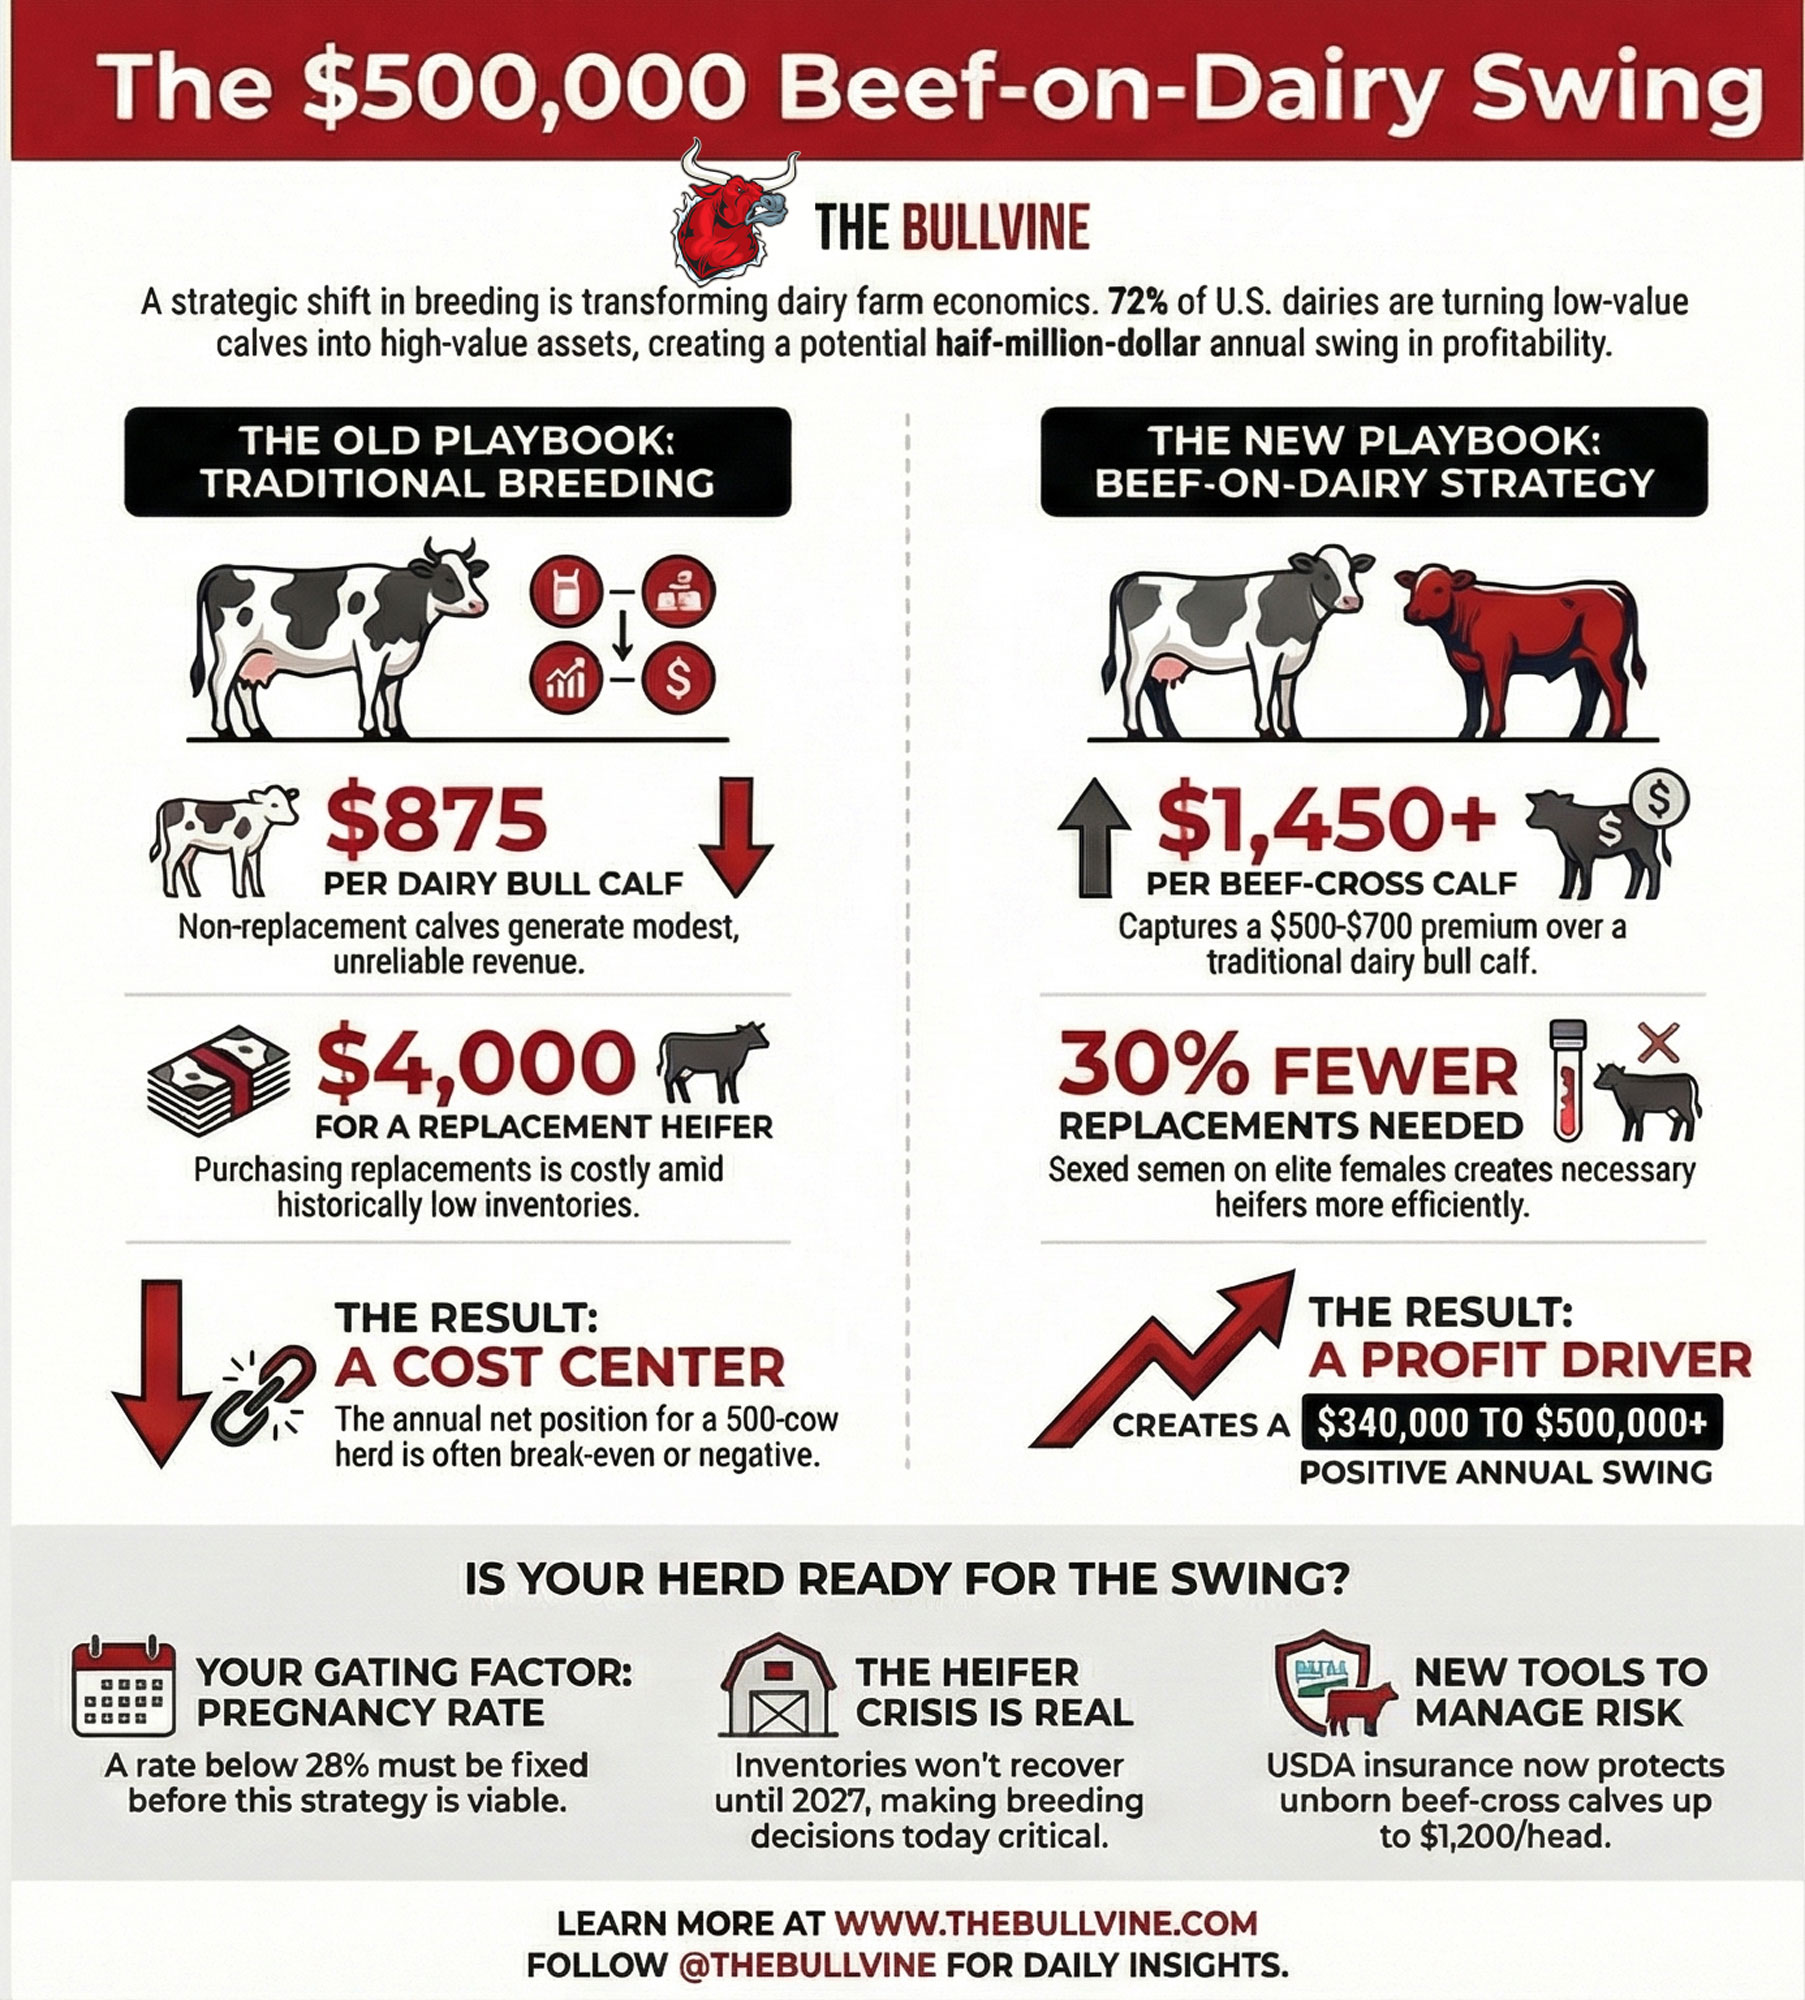
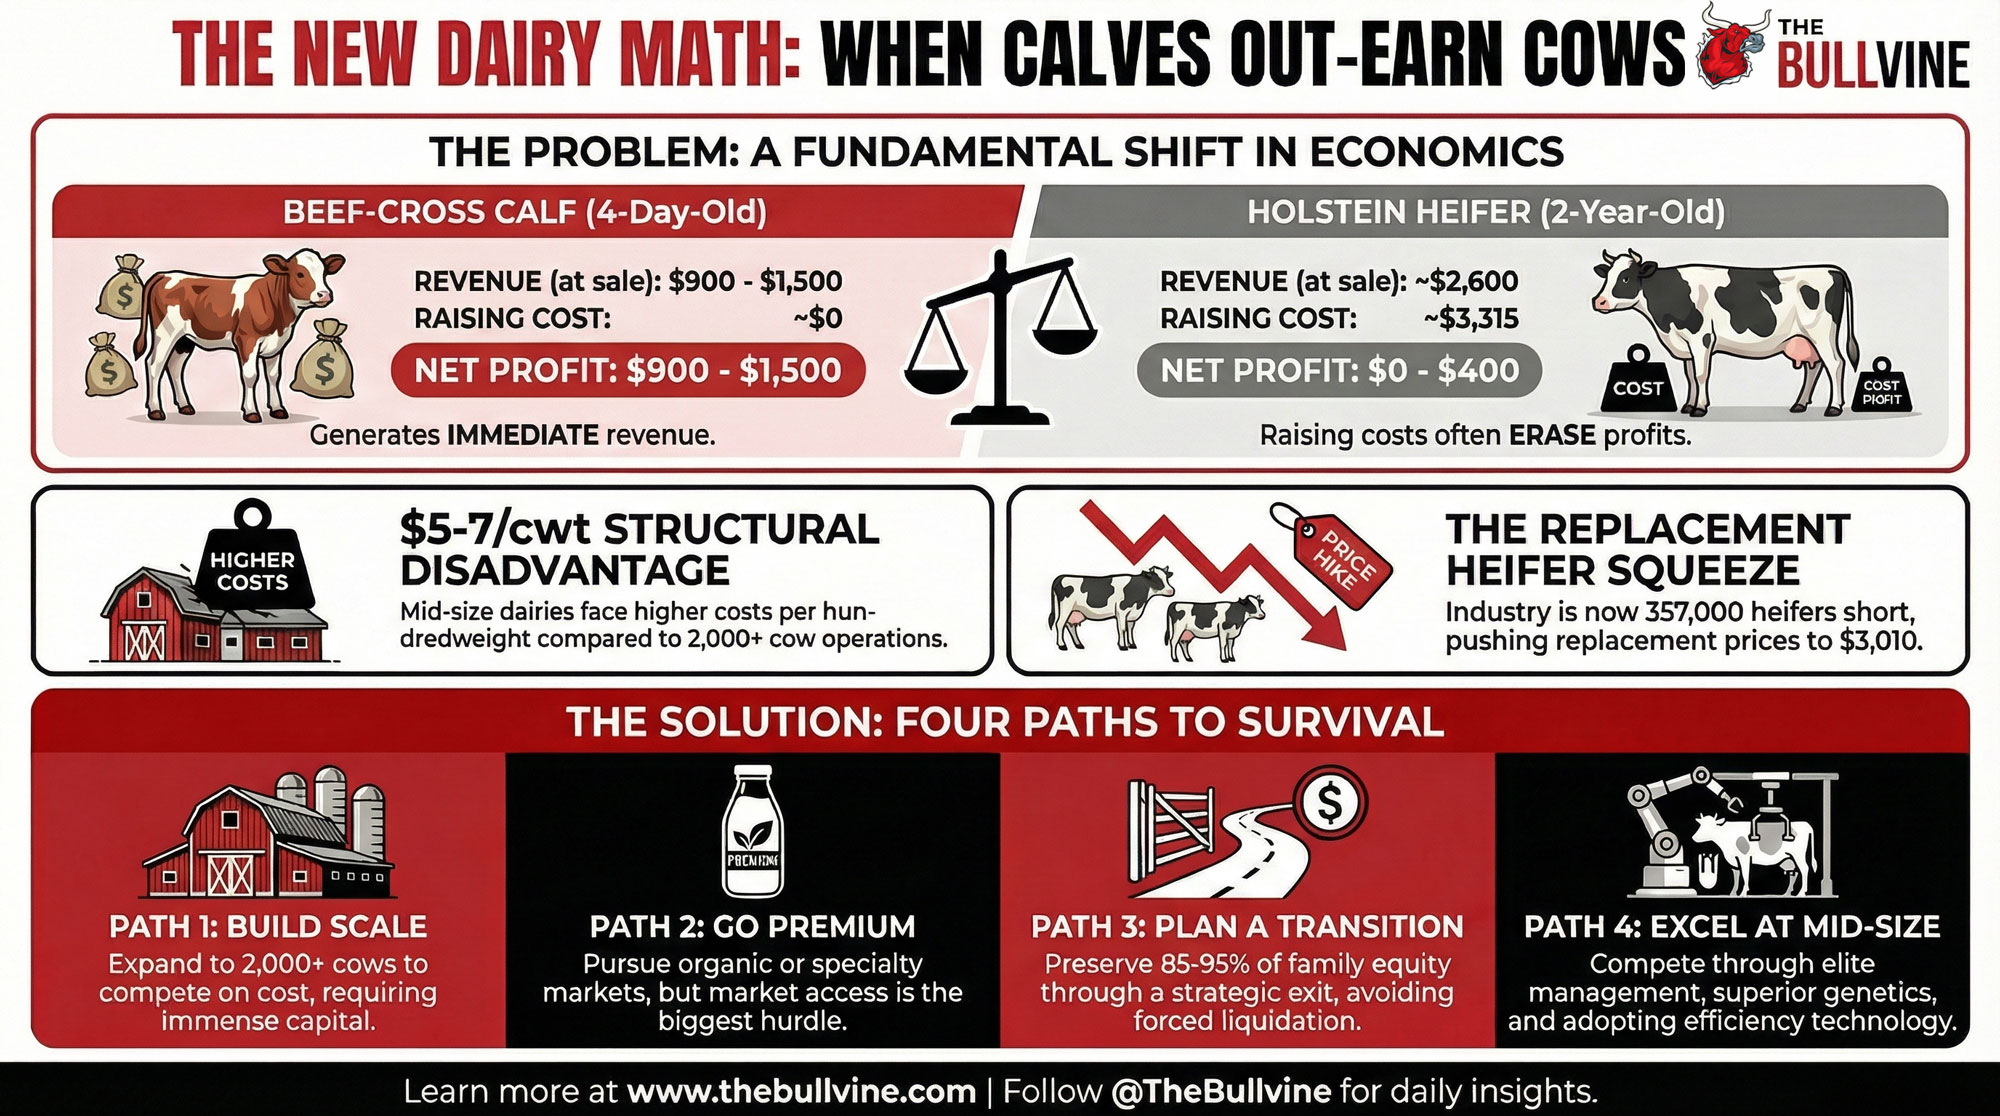
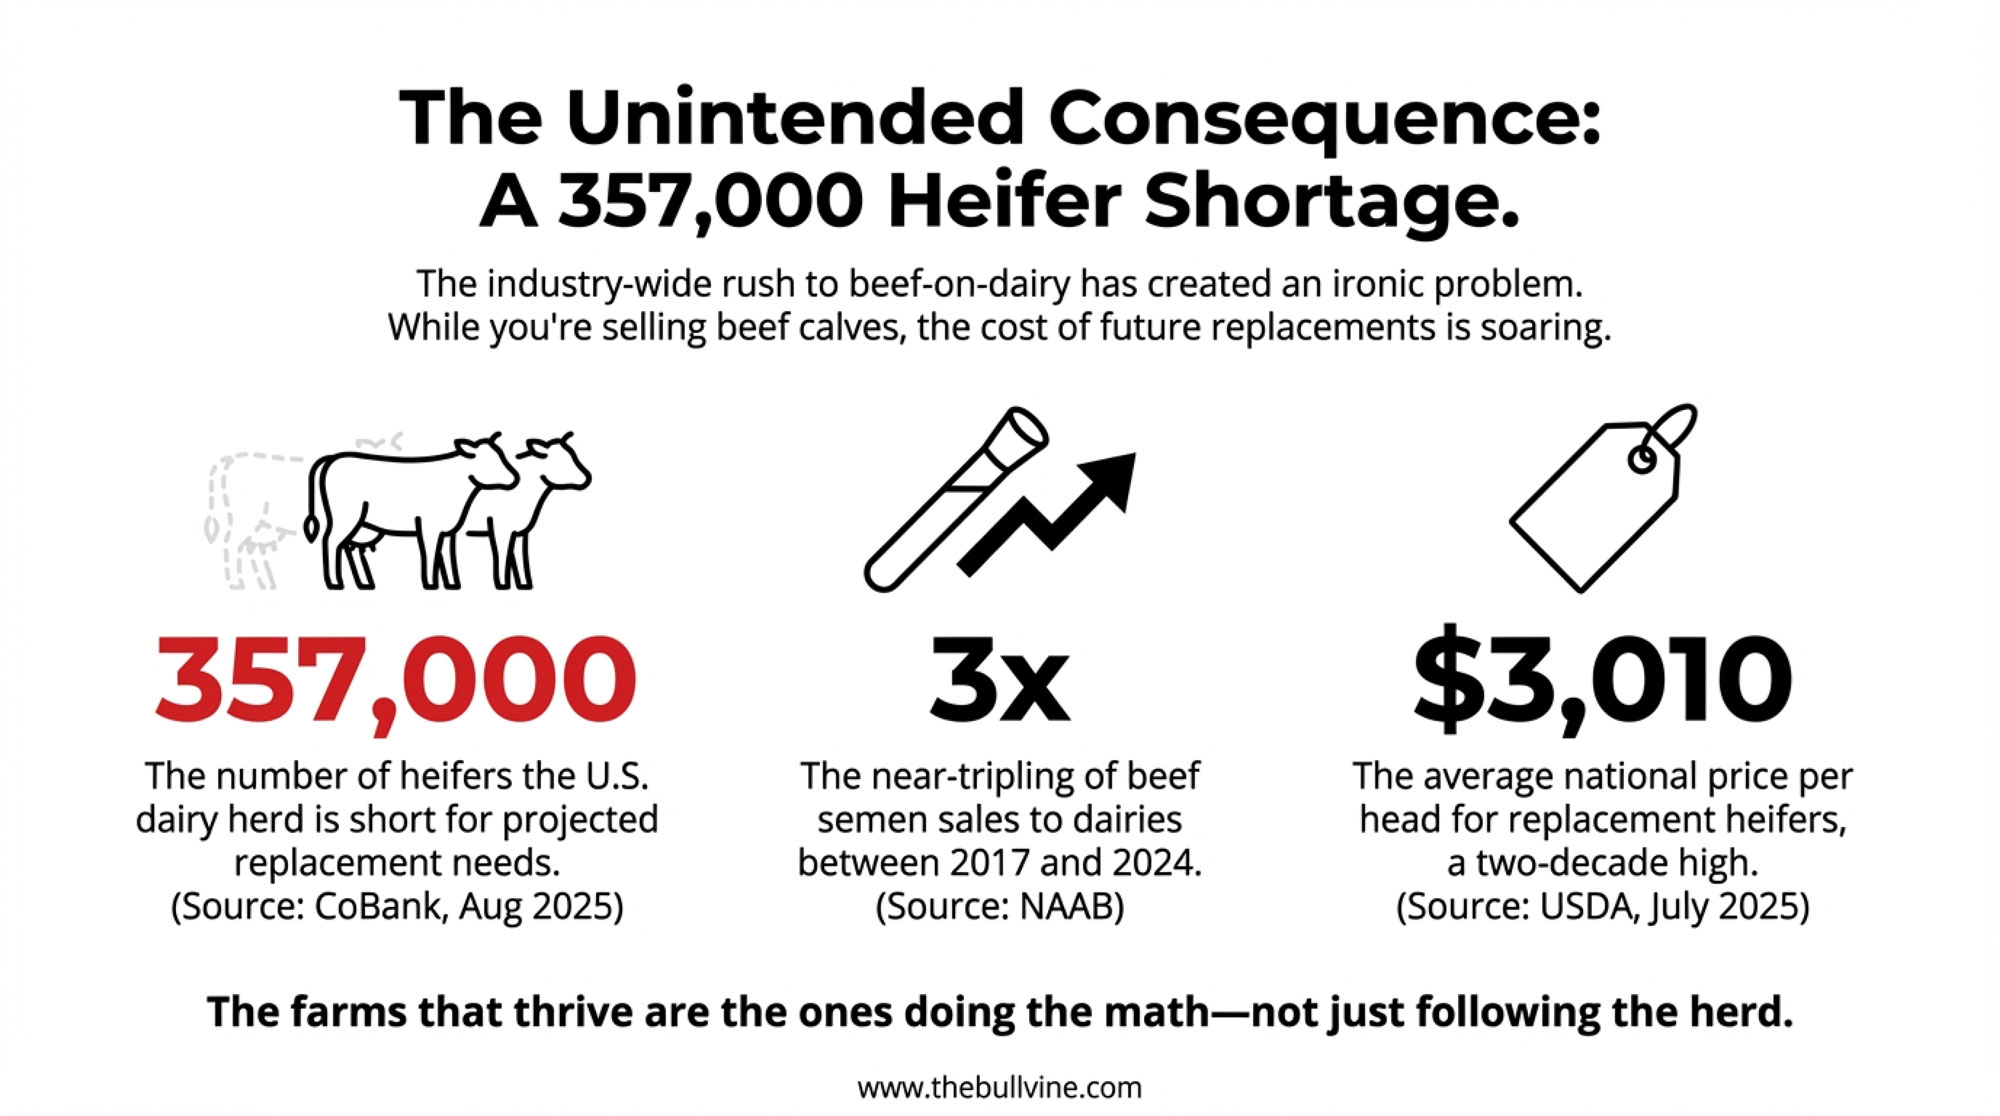
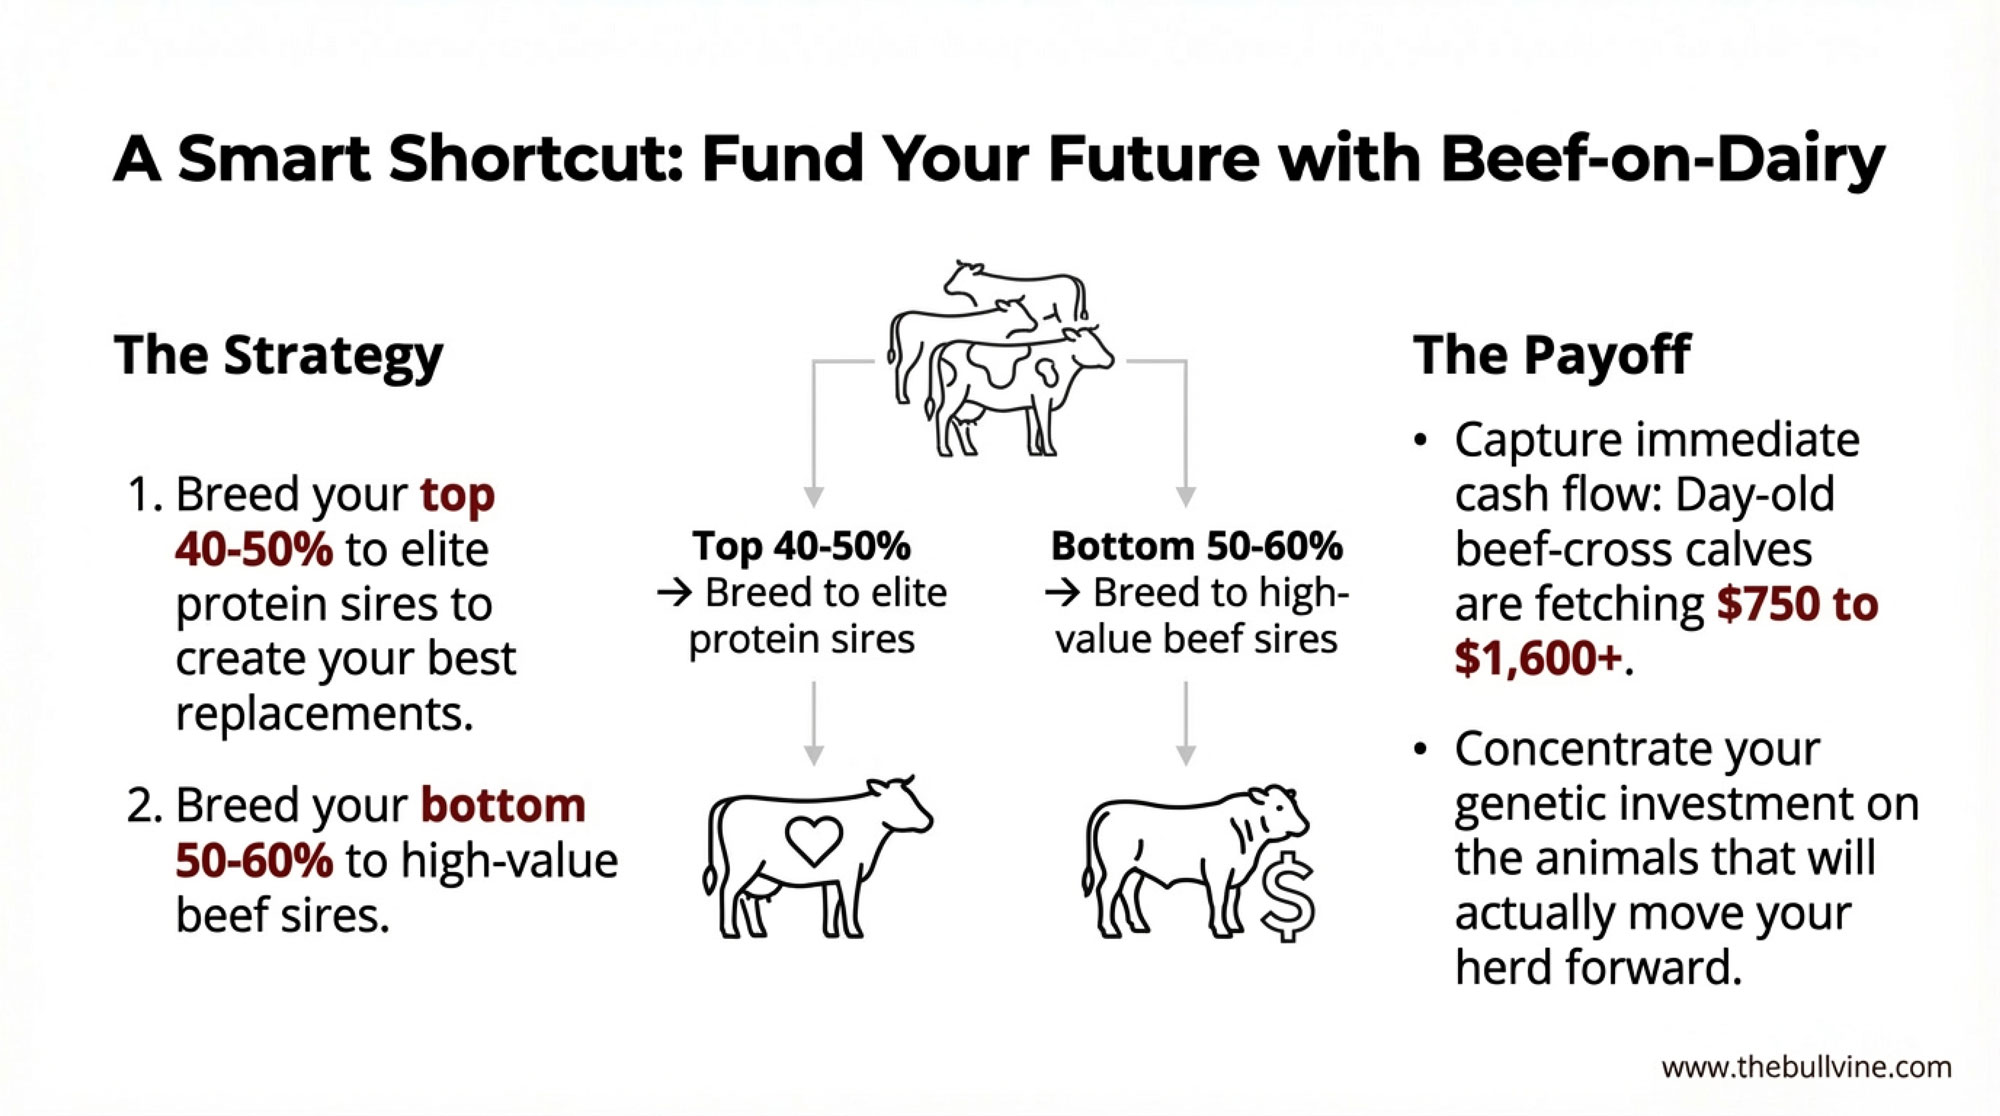
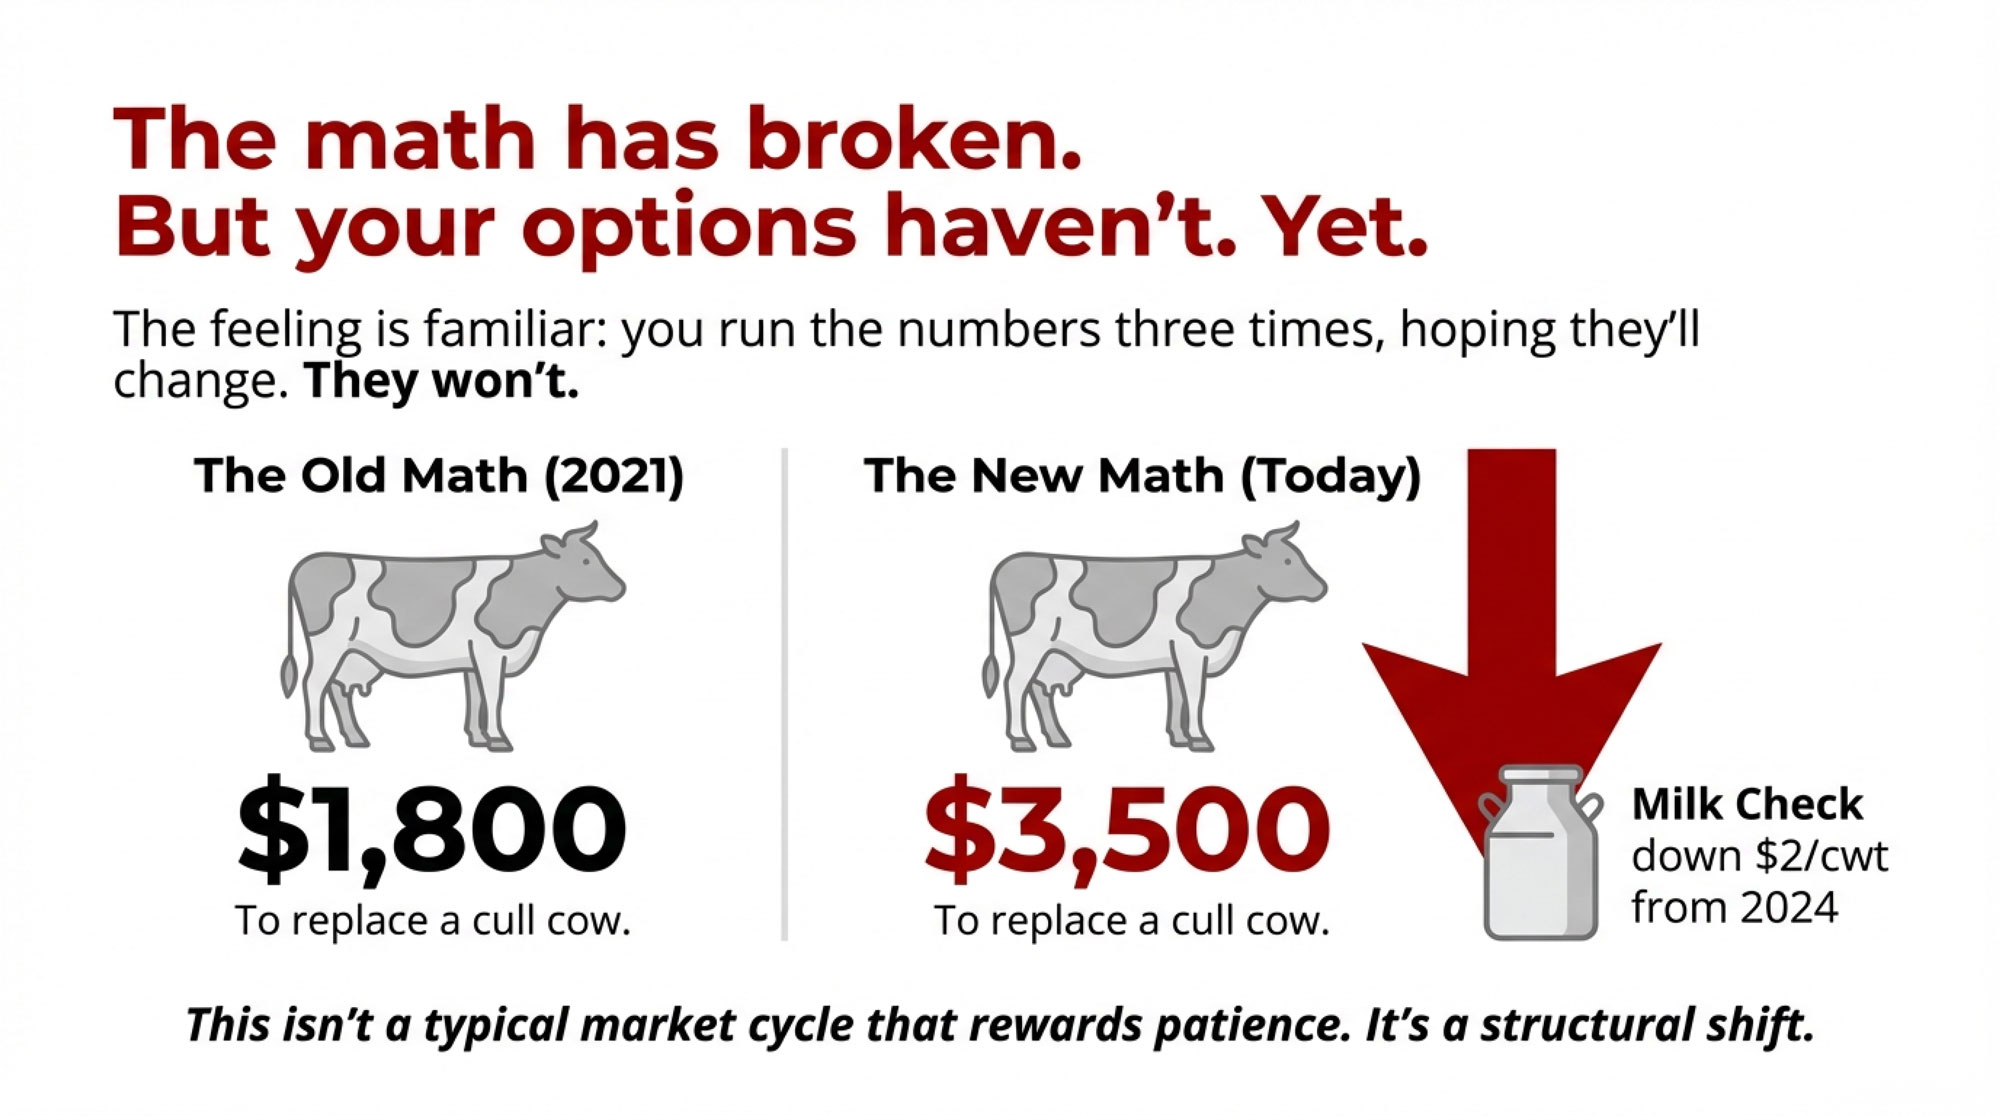
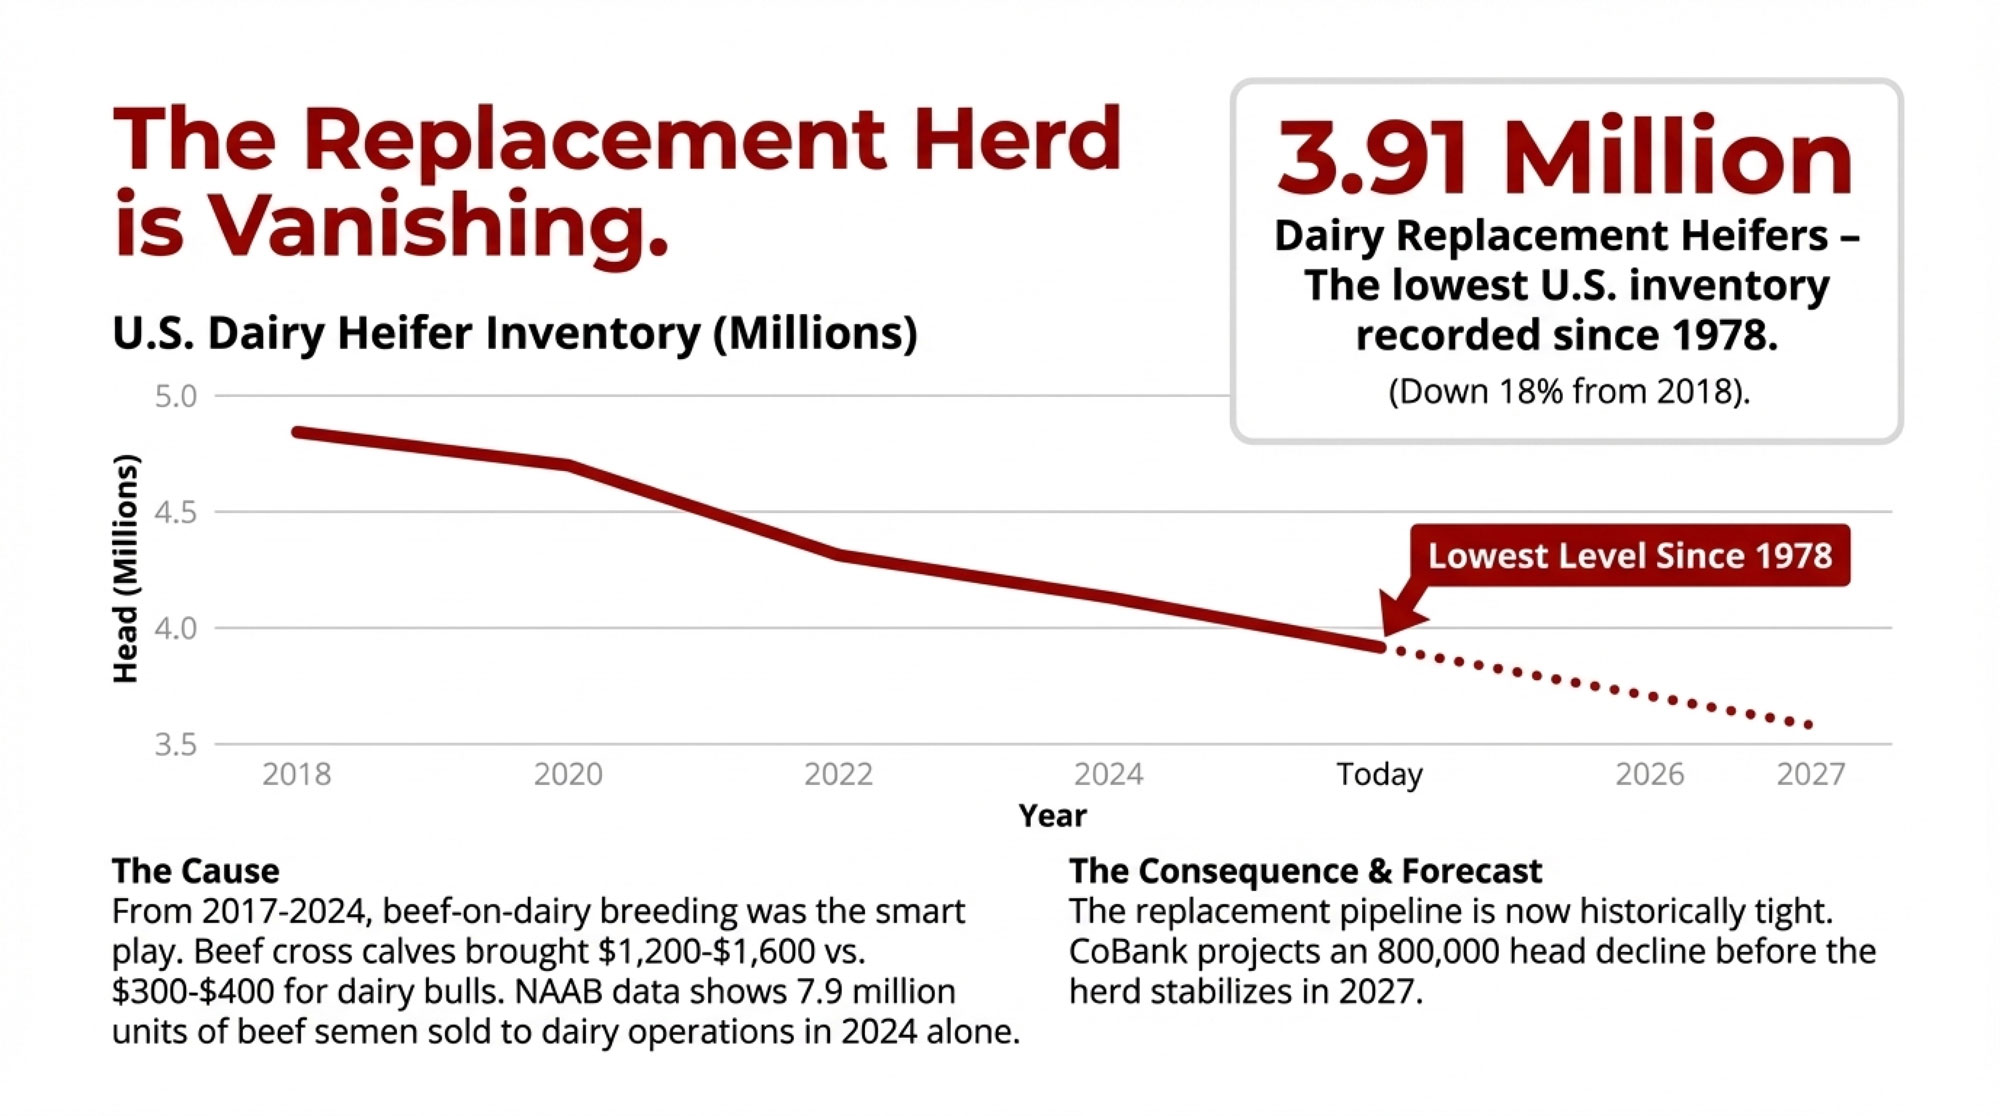
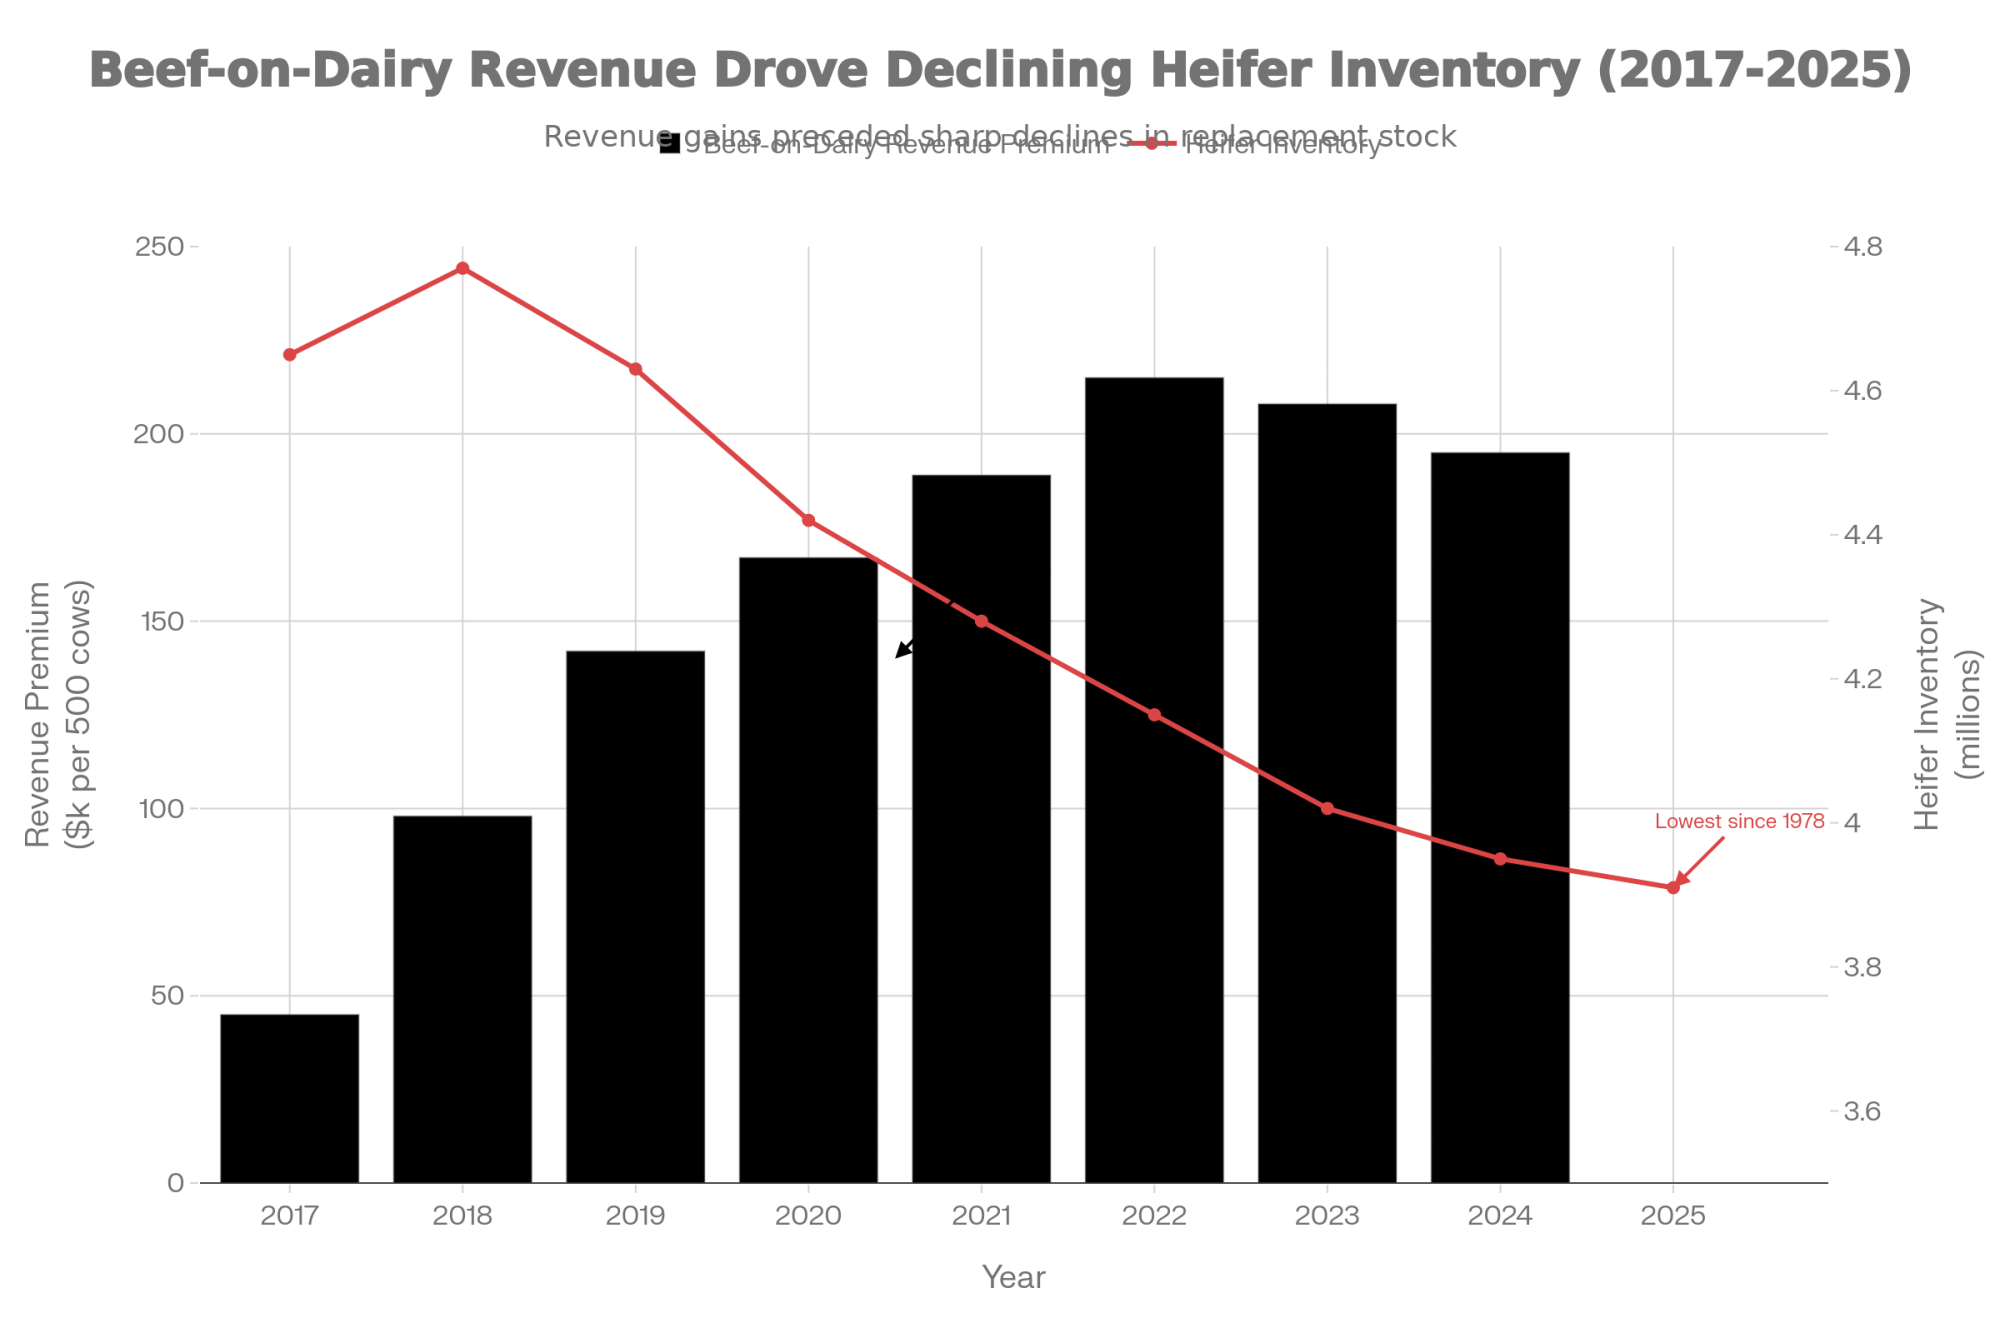
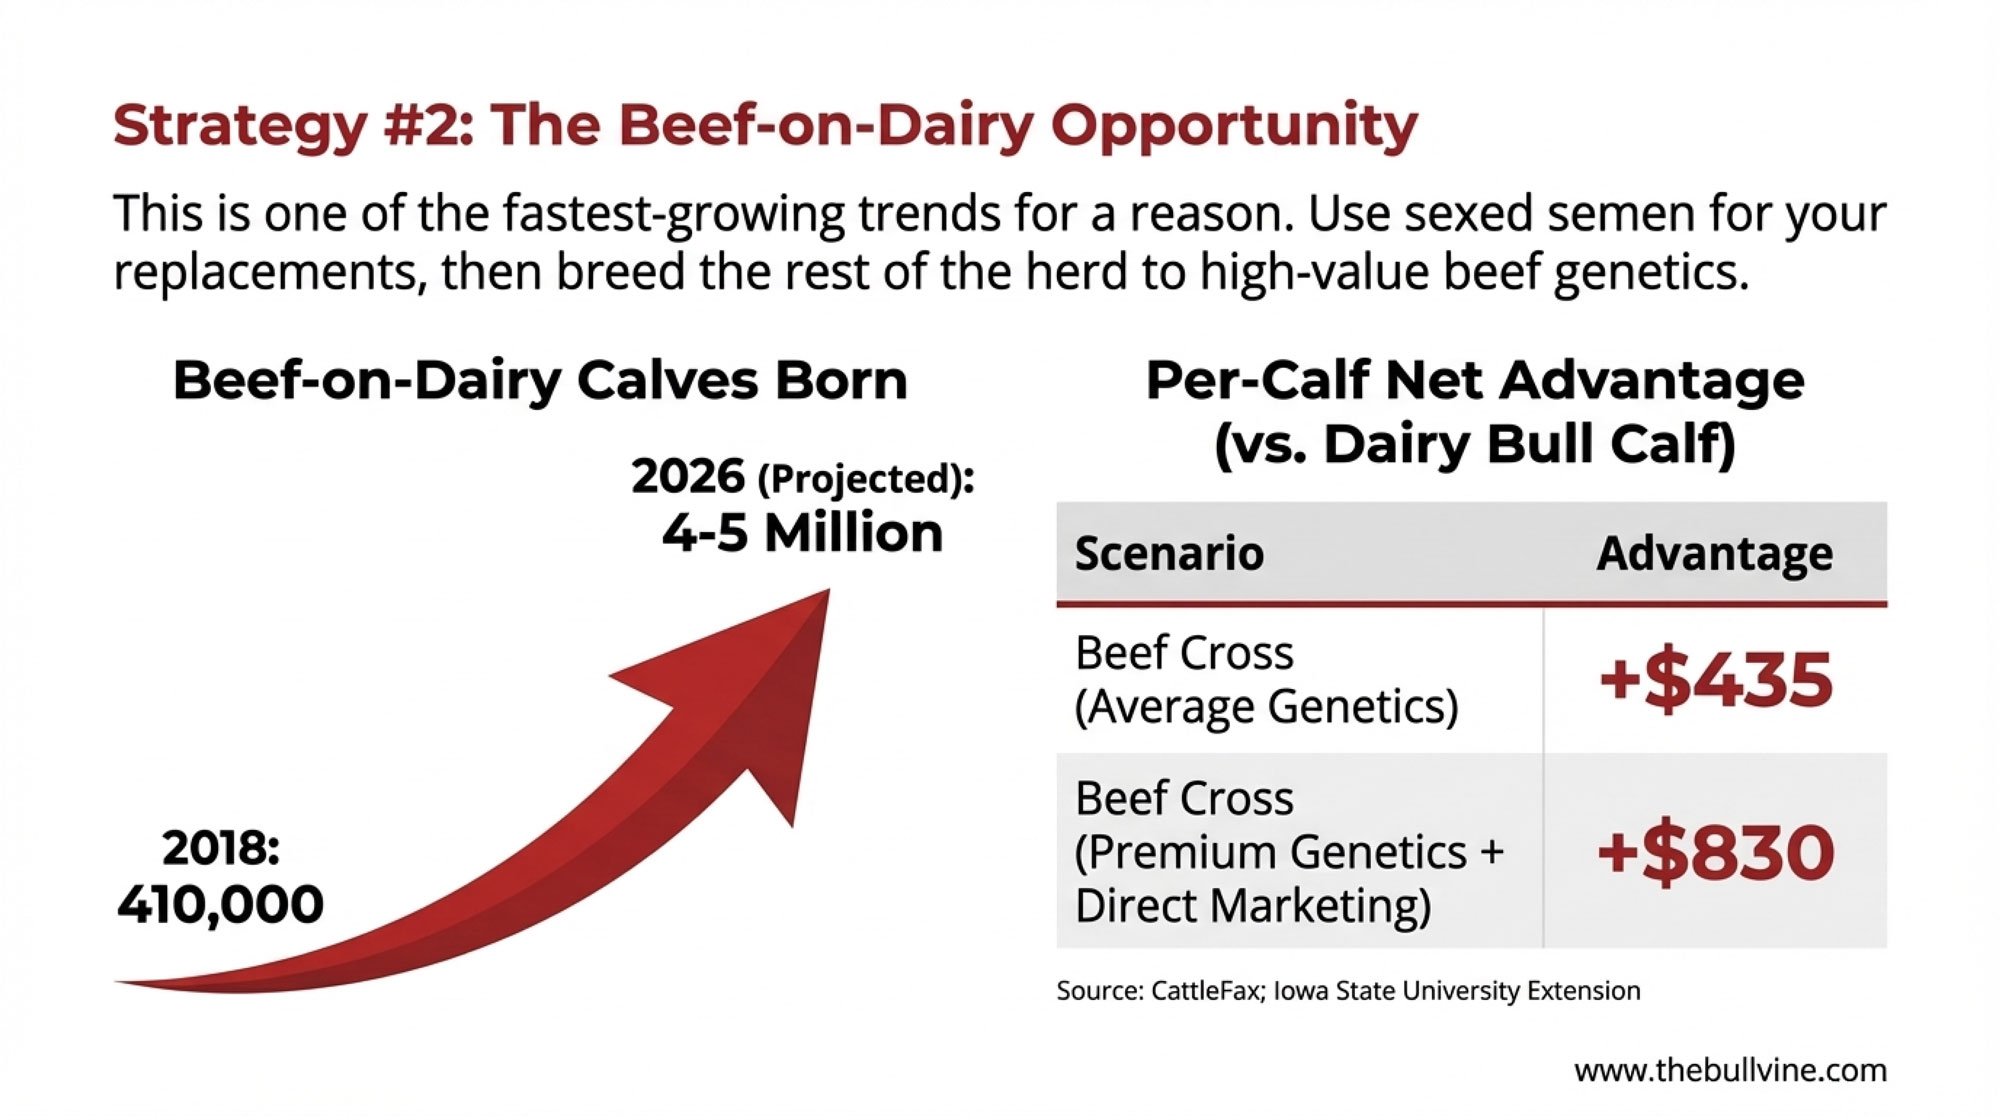
Over the last several years, beef semen sales into dairy herds have surged. CoBank analysts and semen company data indicate that beef semen units going into dairy cows have roughly tripled compared to the late 2010s, with estimates that 7–8 million beef units were sold into U.S. dairies in 2024 alone. The attraction is obvious: in many markets, newborn beef‑on‑dairy calves can bring 600 to 900 dollars per head in the first week, while Holstein bull calves often lag well behind that.

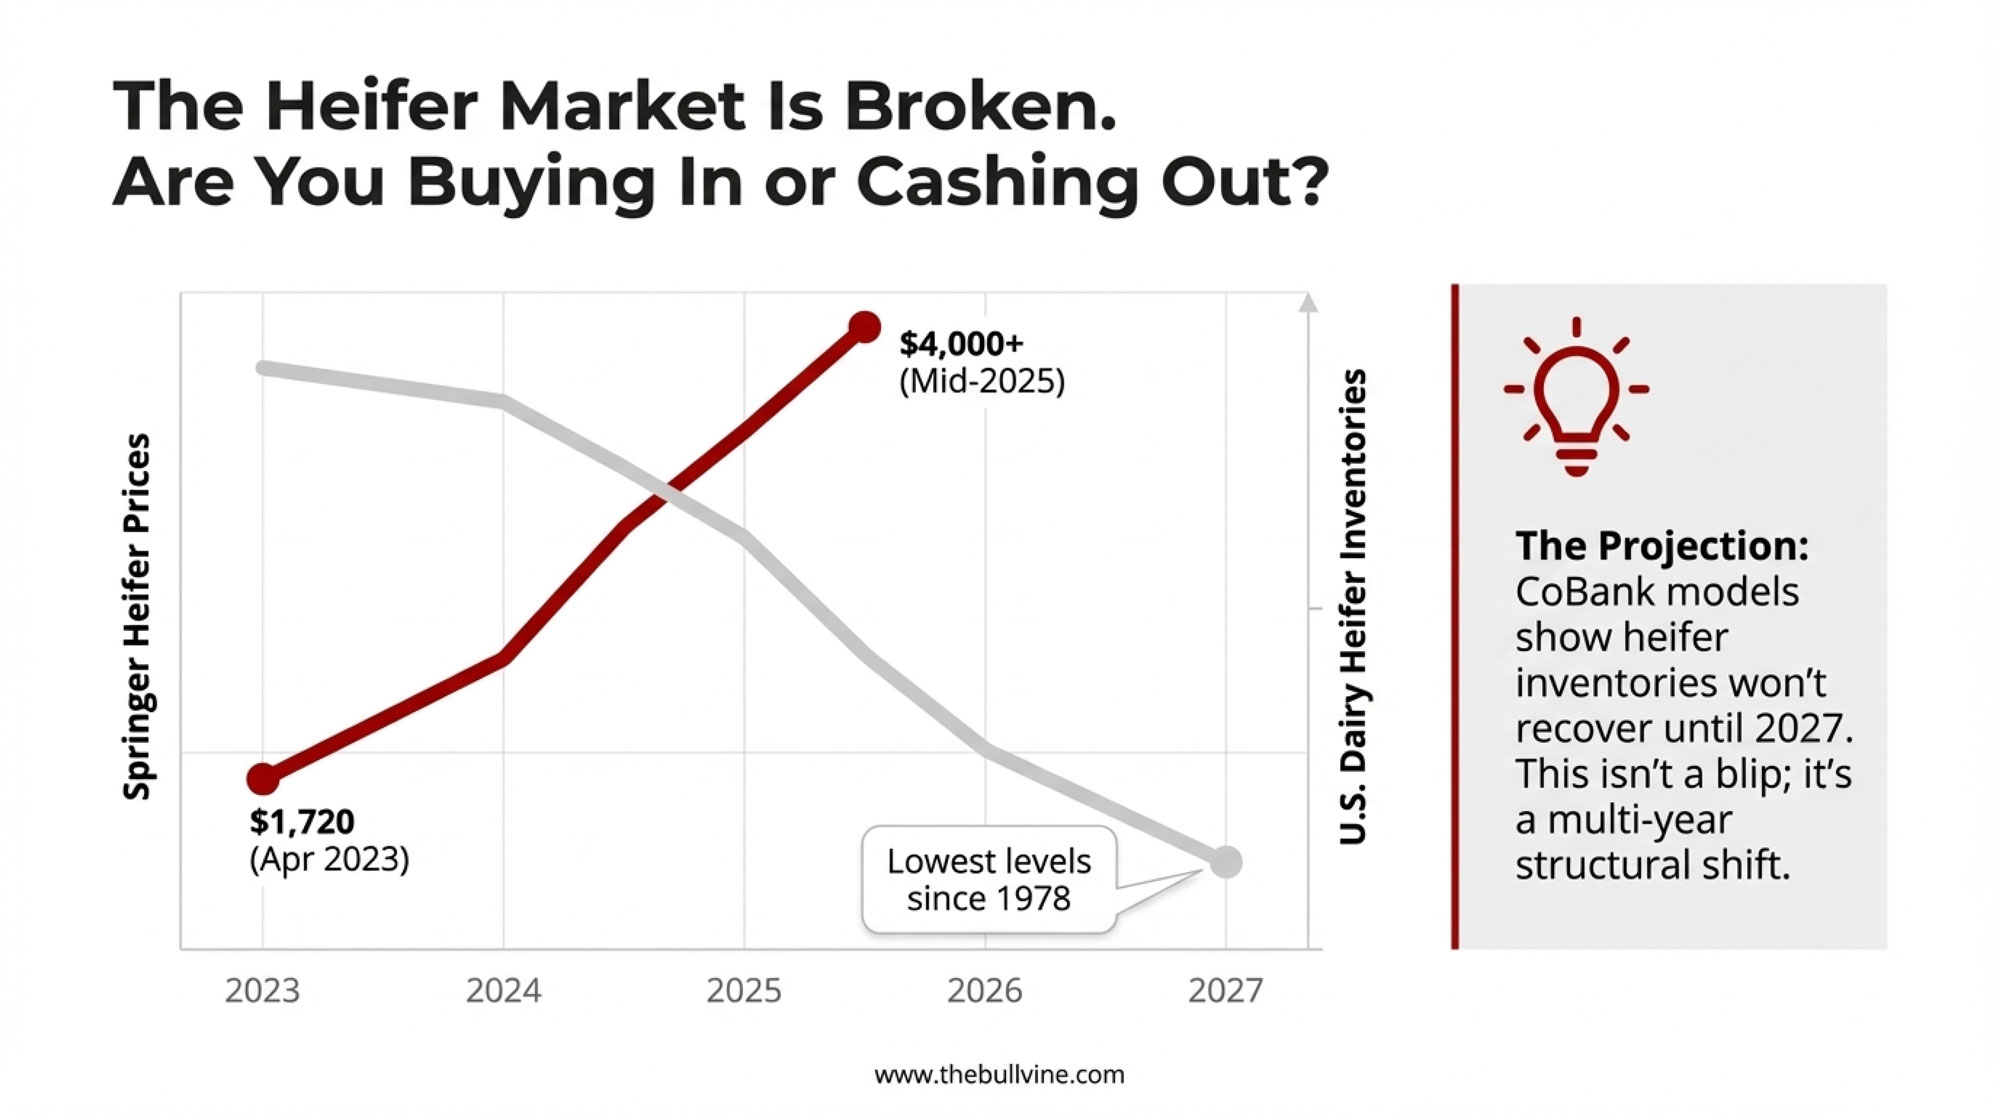
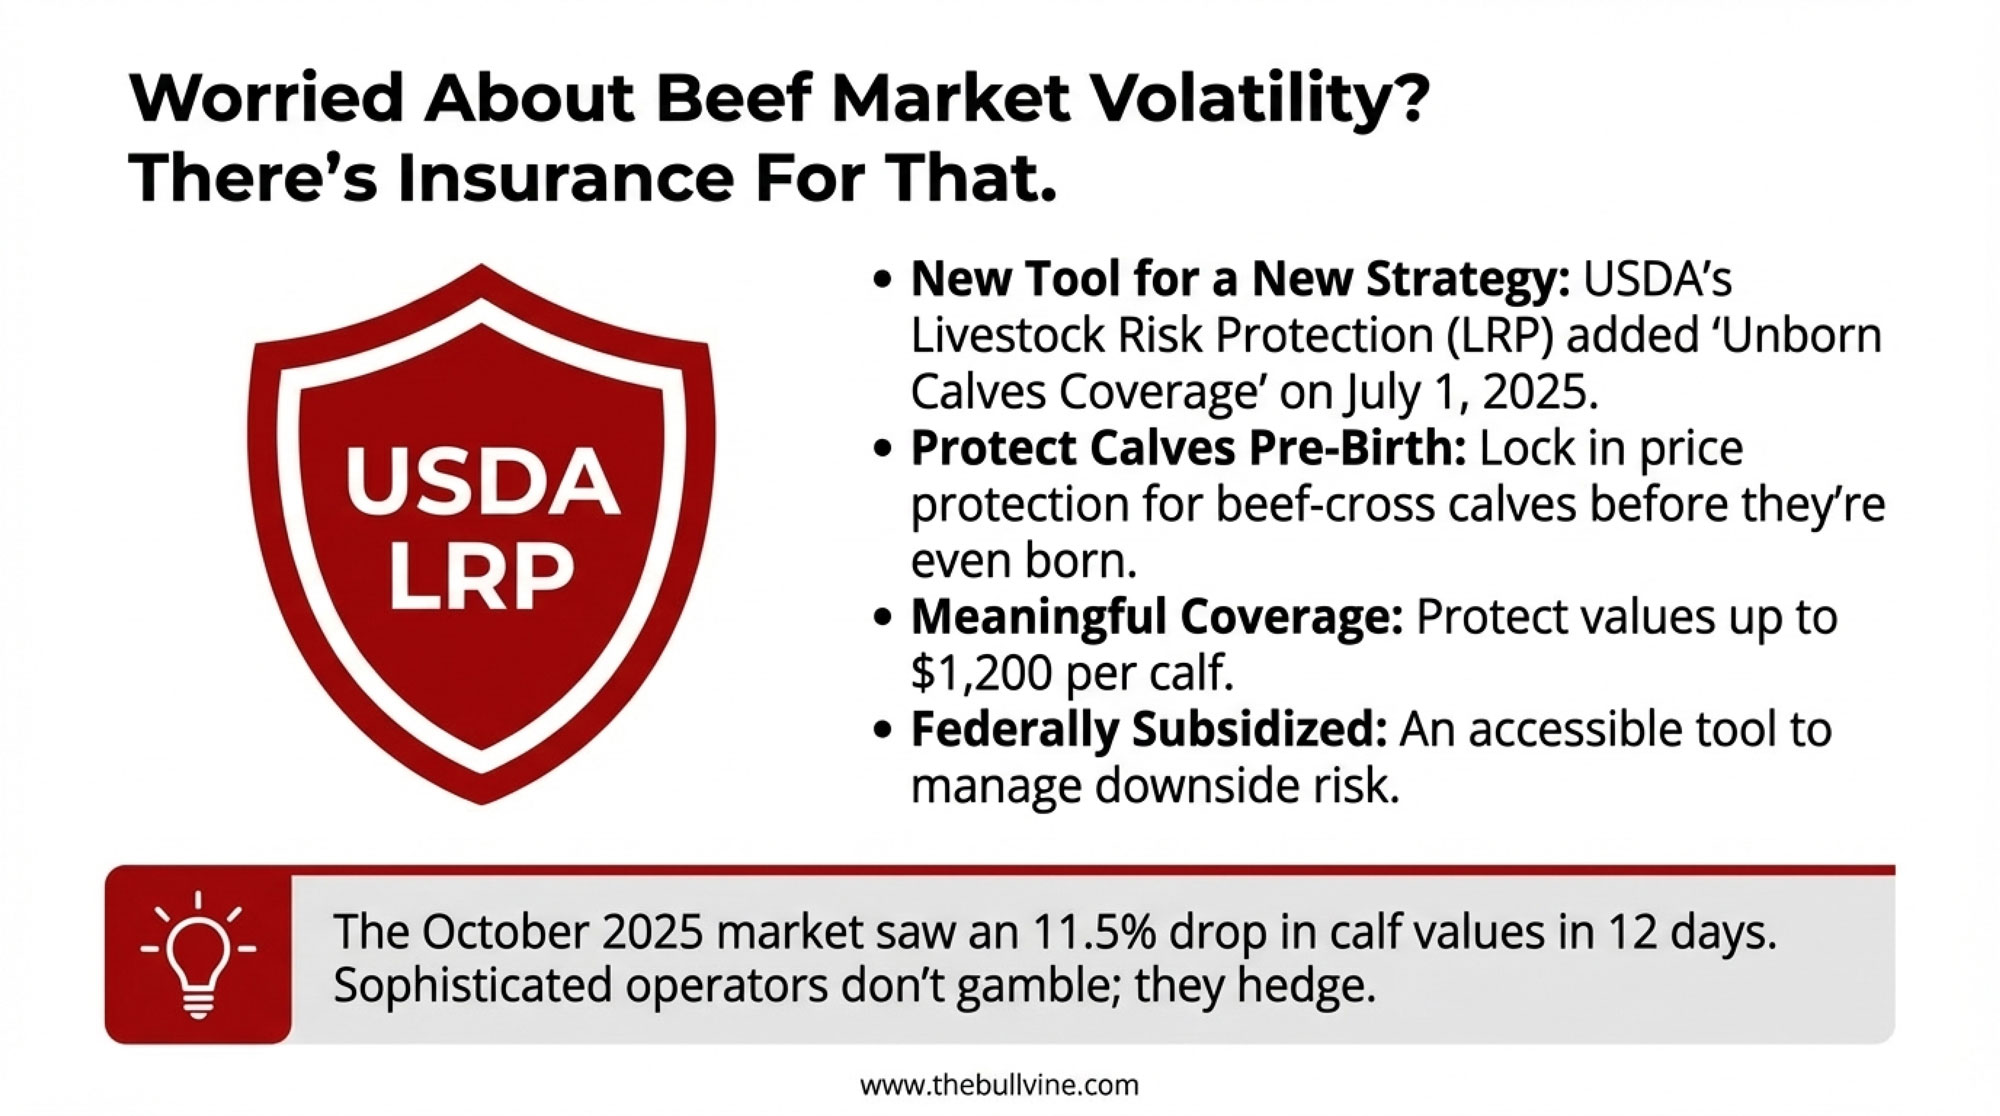
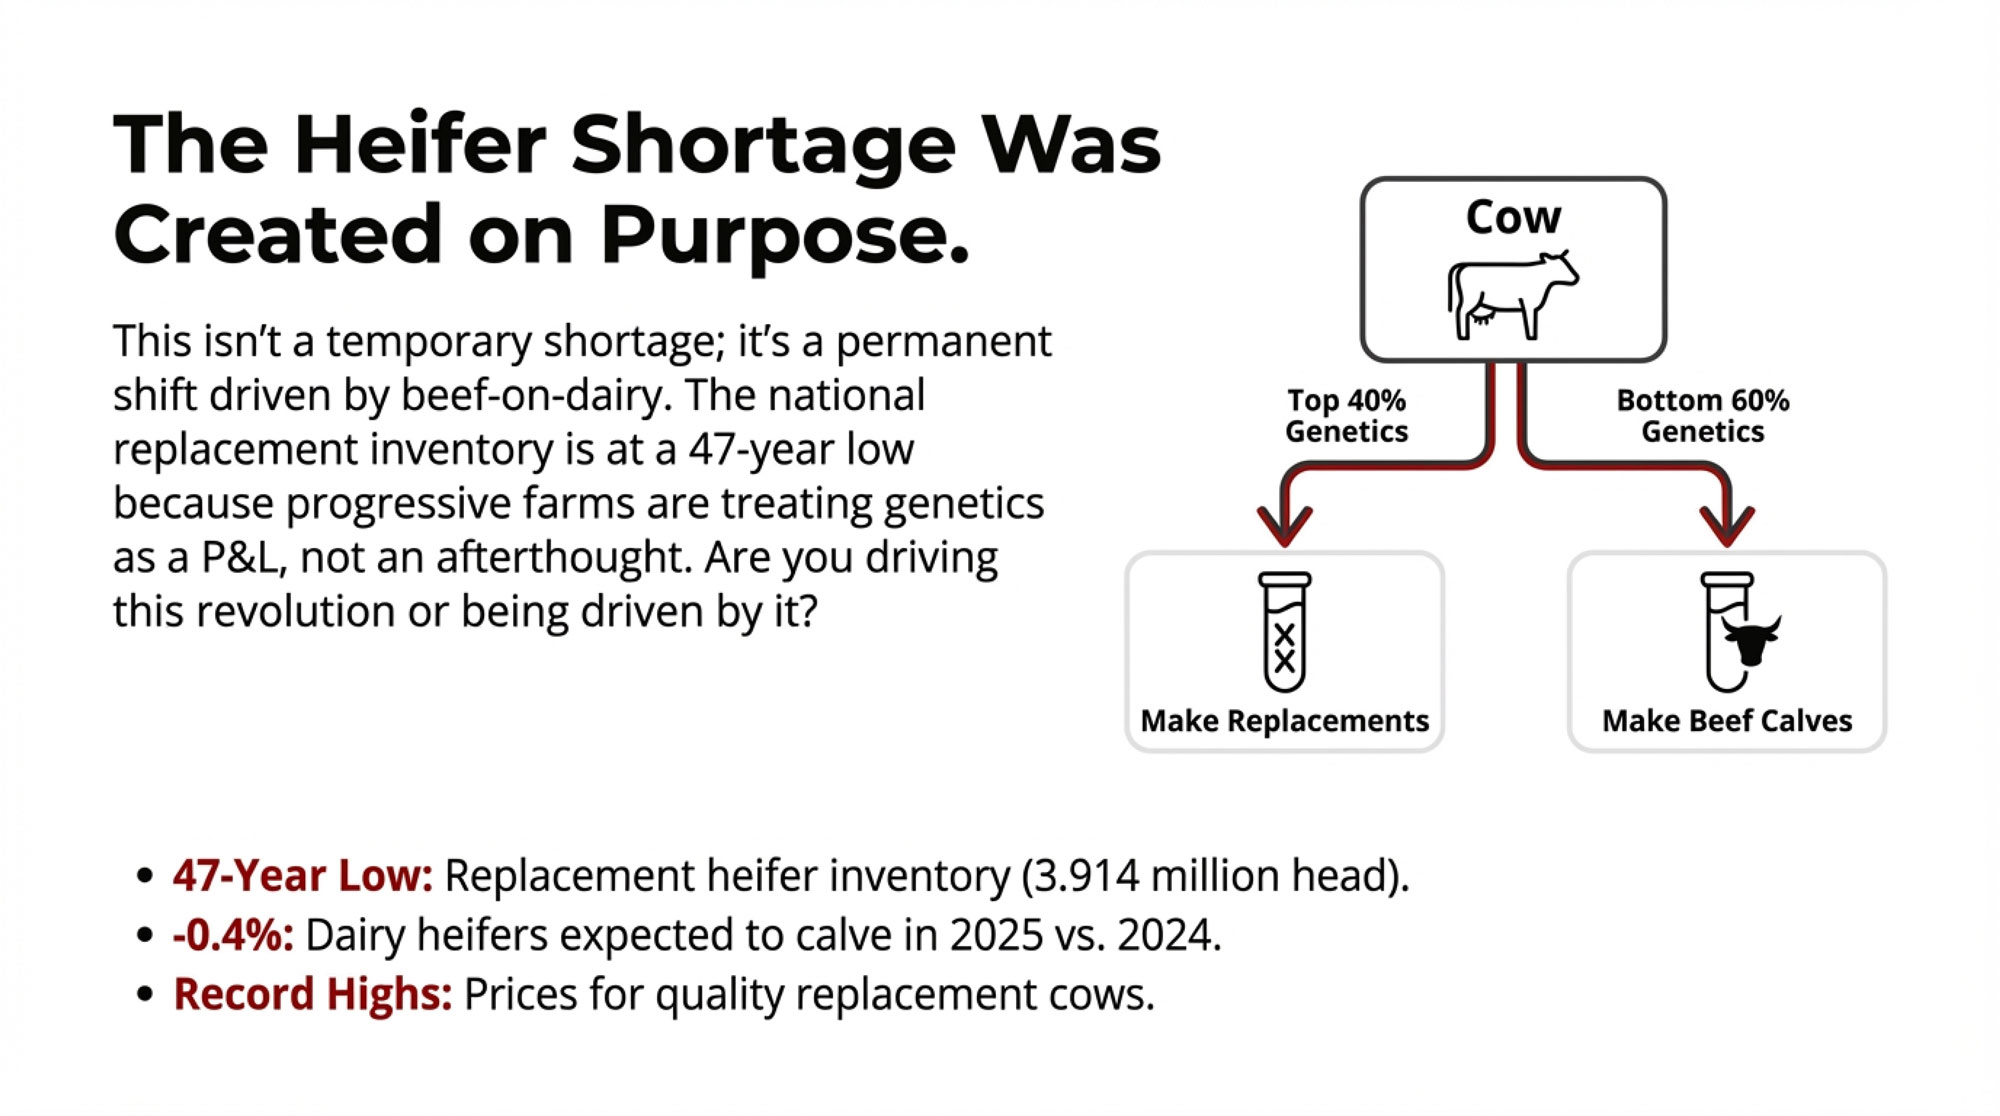
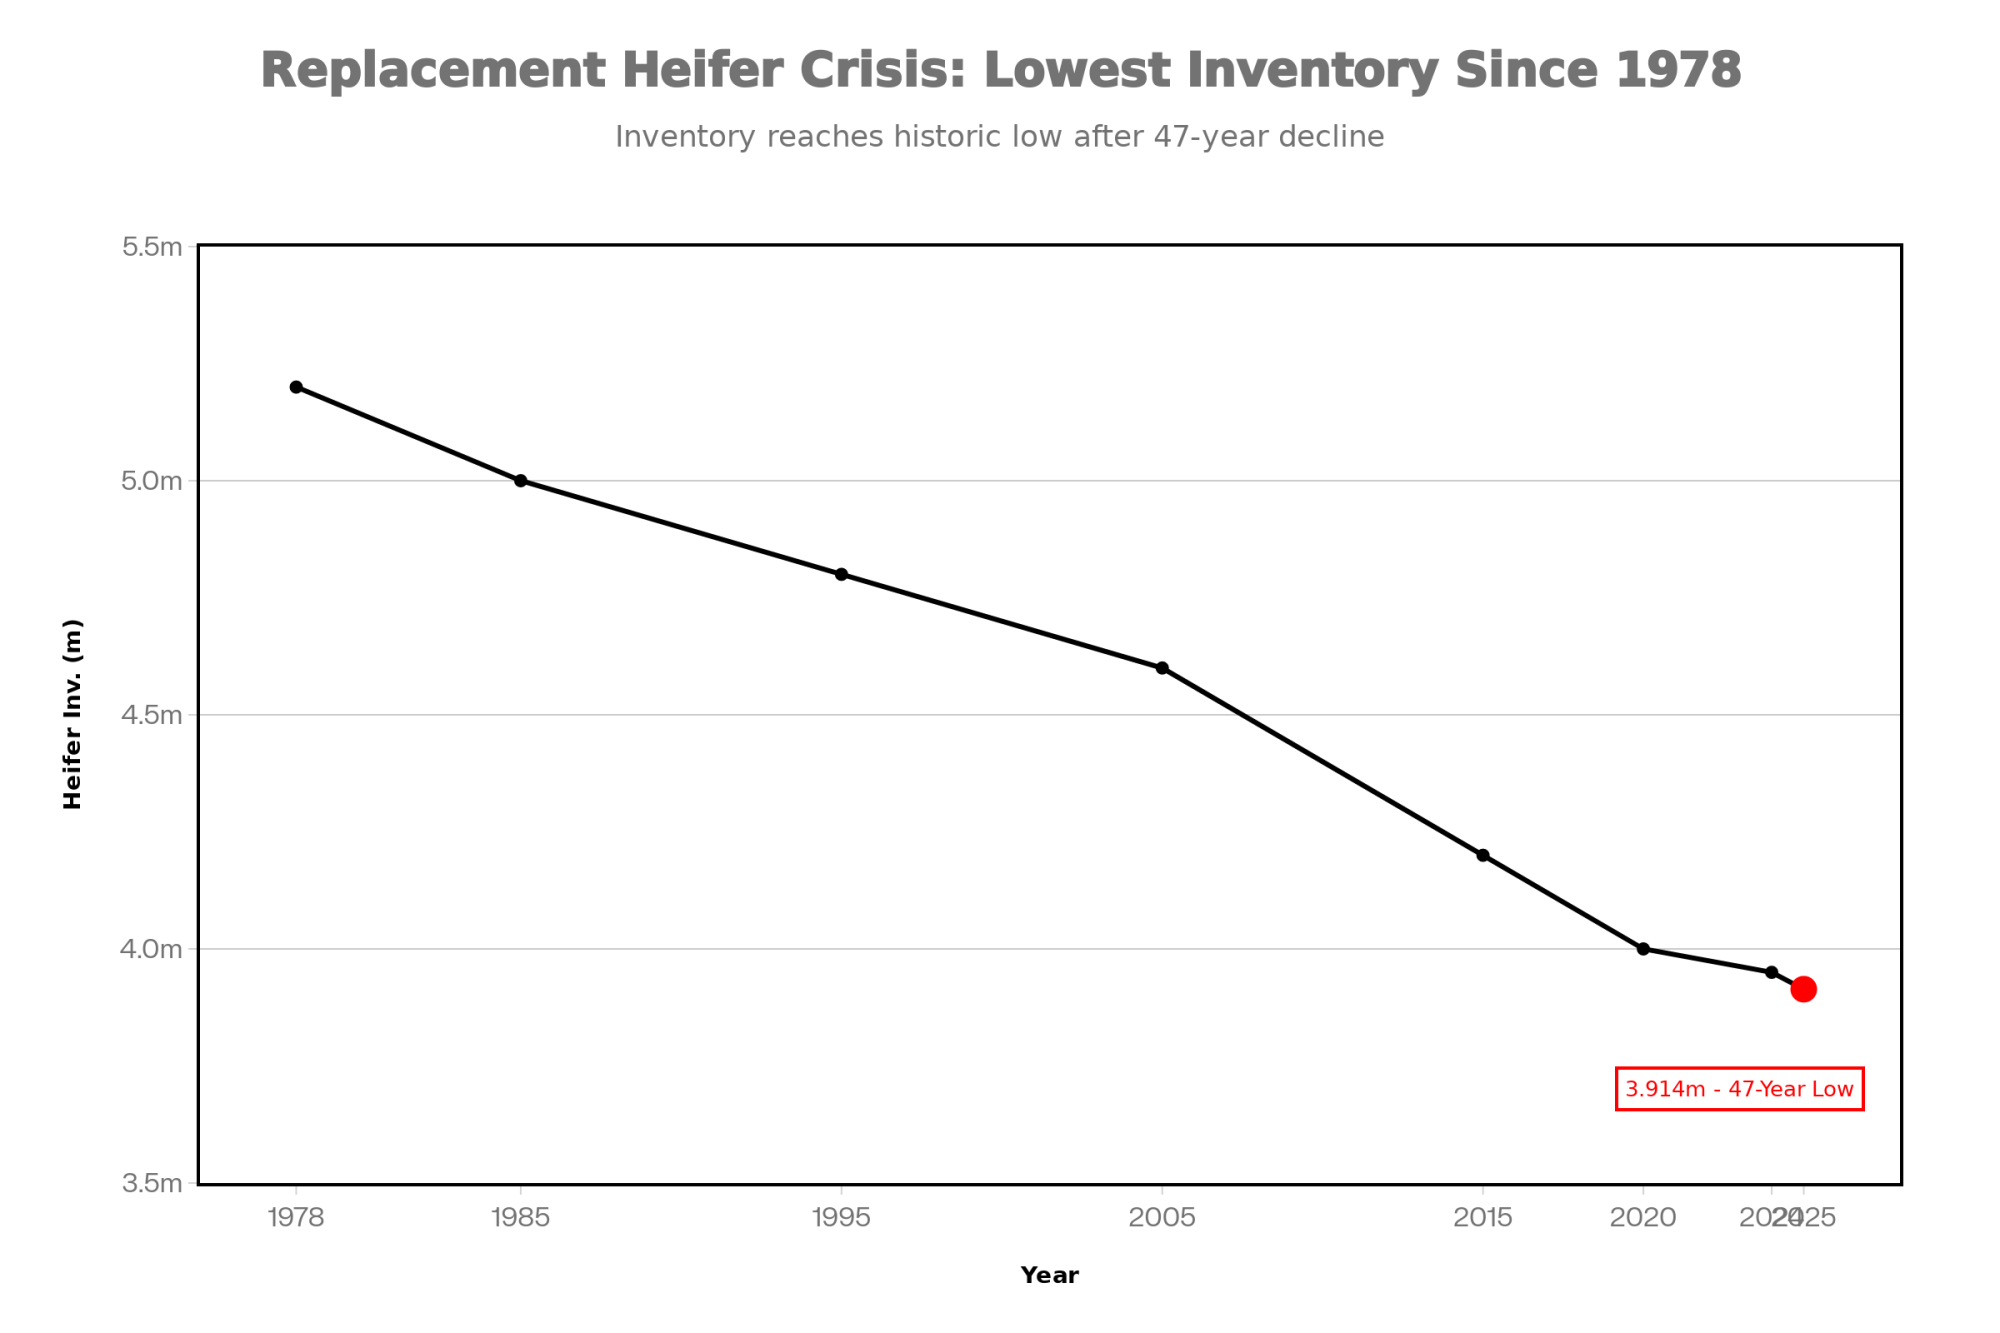
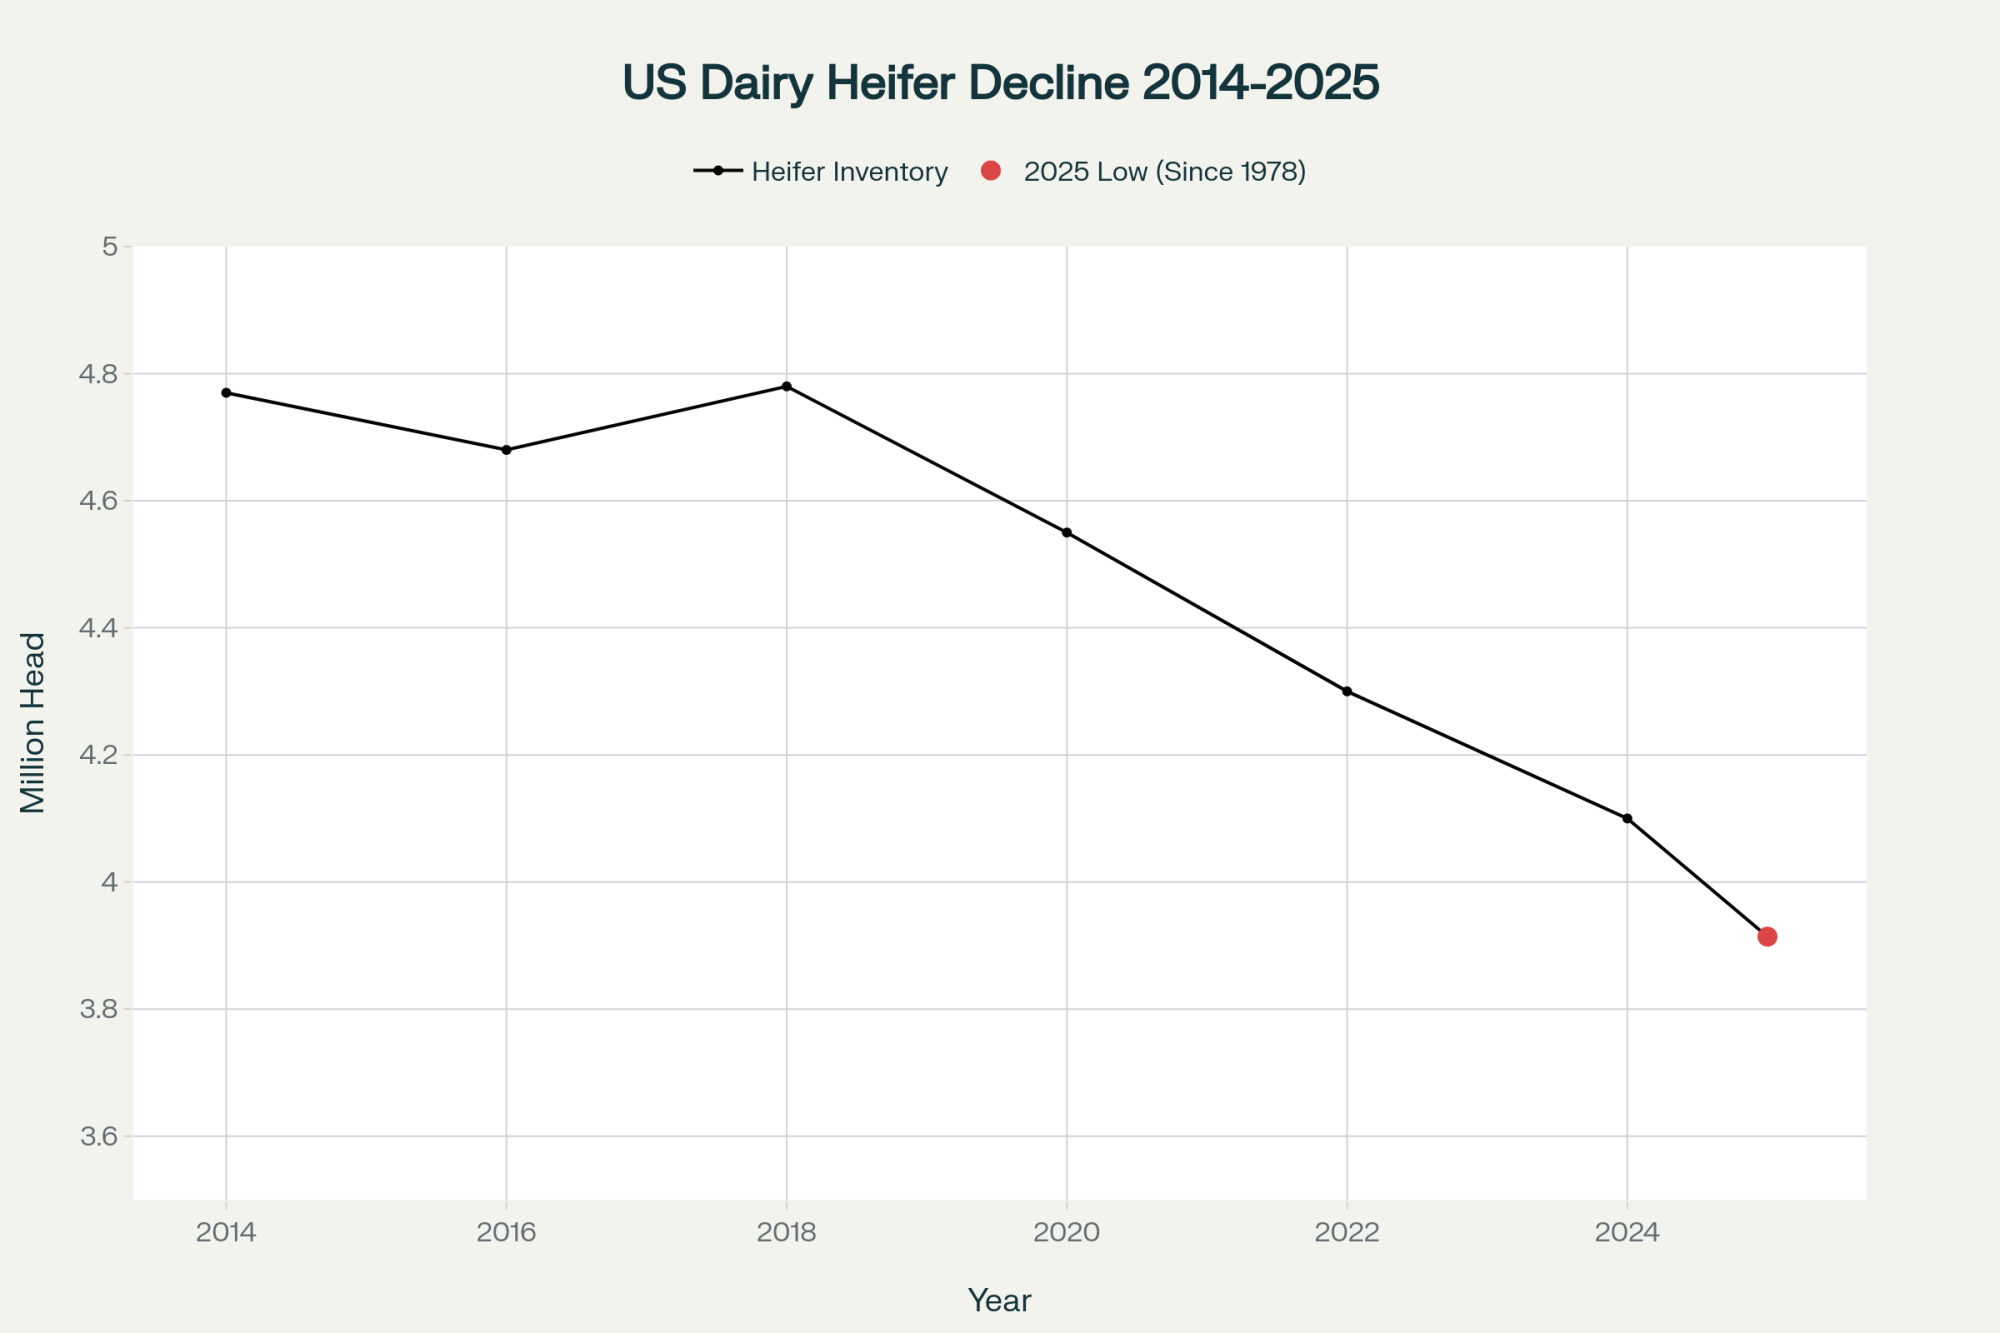
At the same time, USDA’s annual Cattle reports and independent analyses have been ringing the bell on dairy replacement inventories. A 2024 Farmdoc Daily review noted that just 2.59 million dairy heifers were expected to calve and enter the herd that year—the lowest since USDA began tracking that series in 2001. More recent updates and CoBank commentary suggest replacement inventories have been revised downward multiple times and remain historically tight.

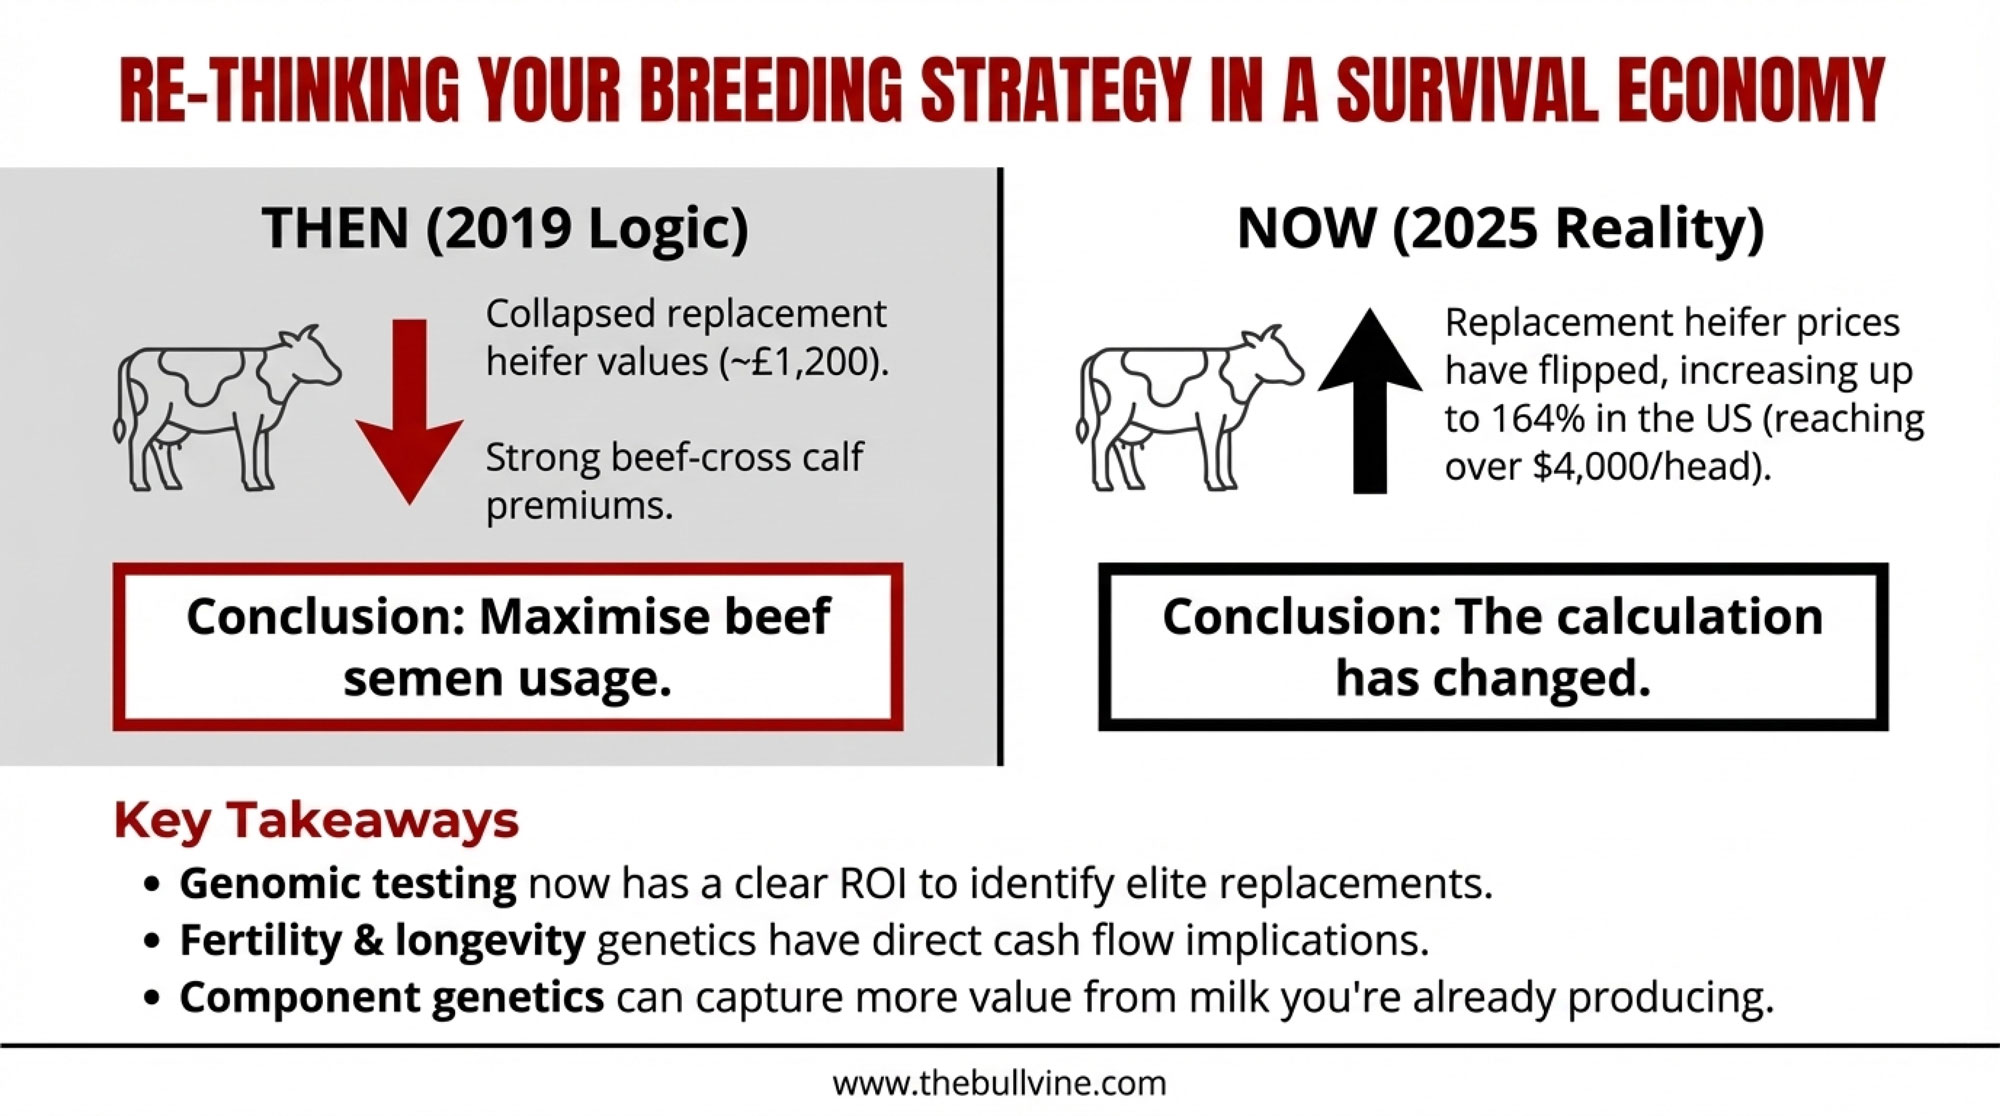
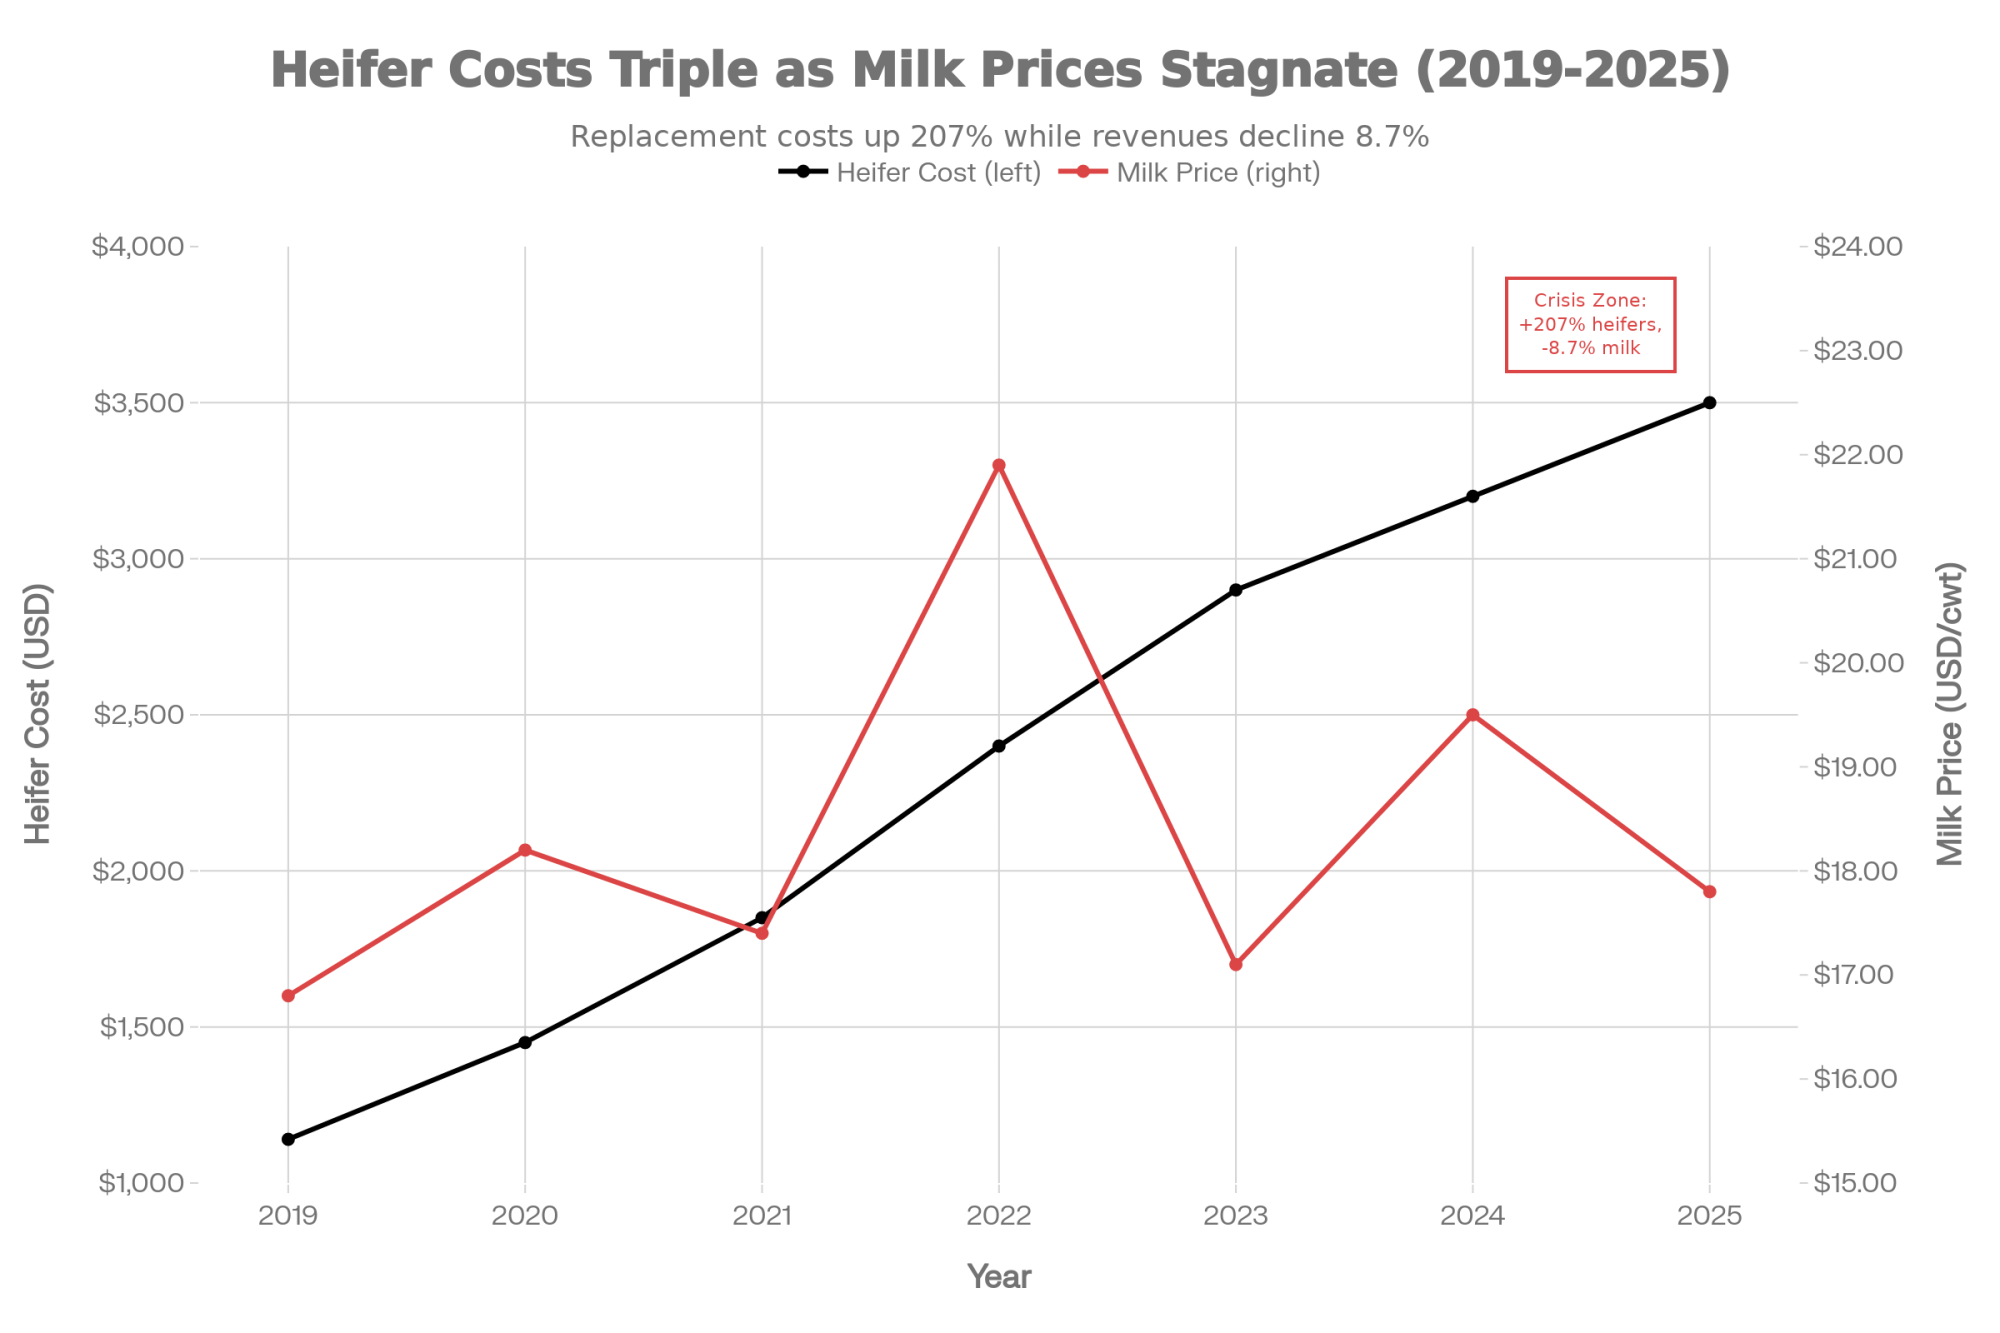
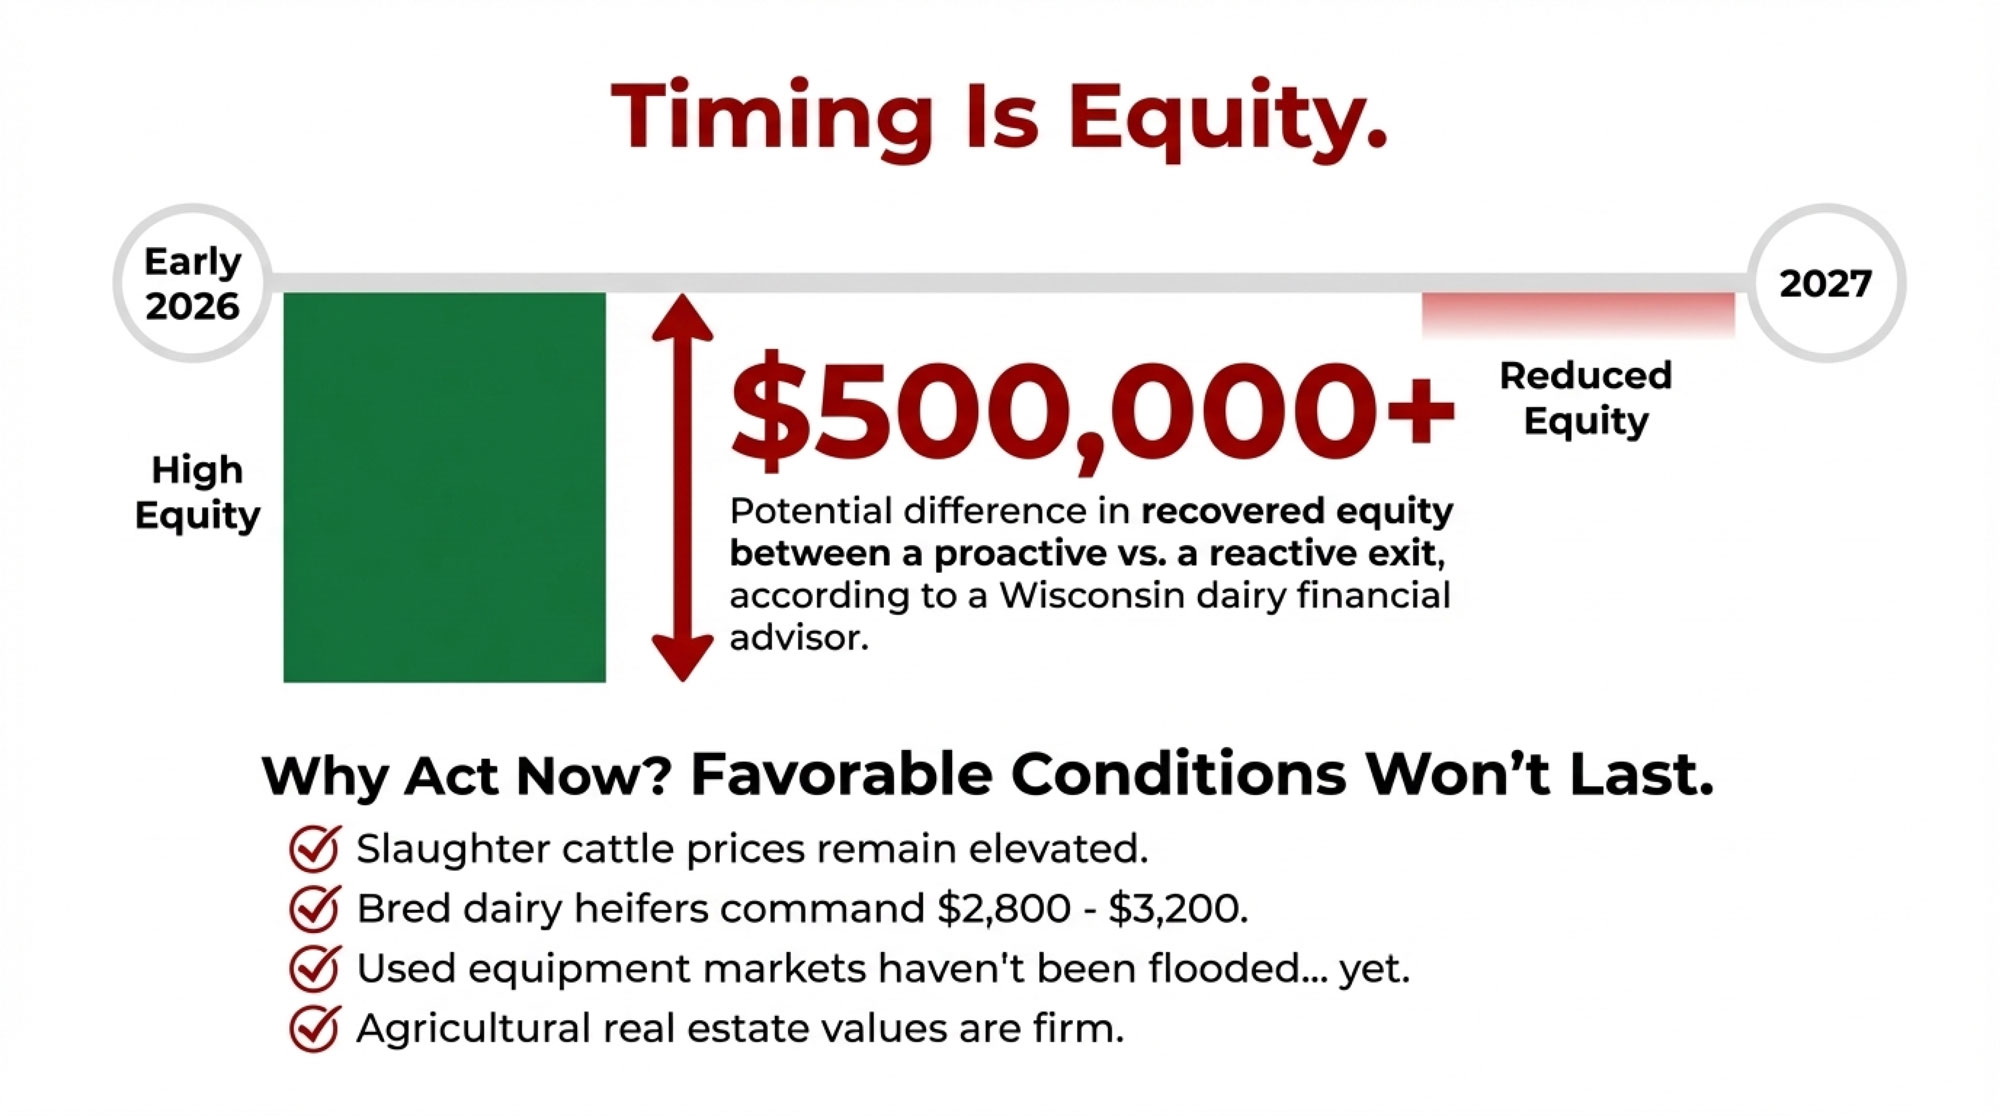
On the price side, USDA’s Agricultural Prices reports show average dairy replacement heifer values moving into the 2,200 to 2,700 dollar range in many regions over 2023–2024, with springing heifers at auctions commonly bringing 2,500 to 3,000 dollars, and top lots in some Midwest and Western states touching 3,600 to 4,000 dollars. Several economic studies and extension bulletins peg the cost of raising a replacement heifer from birth to calving around 1,700 to 2,400 dollars, depending on the system—confinement, dry lot, or pasture.

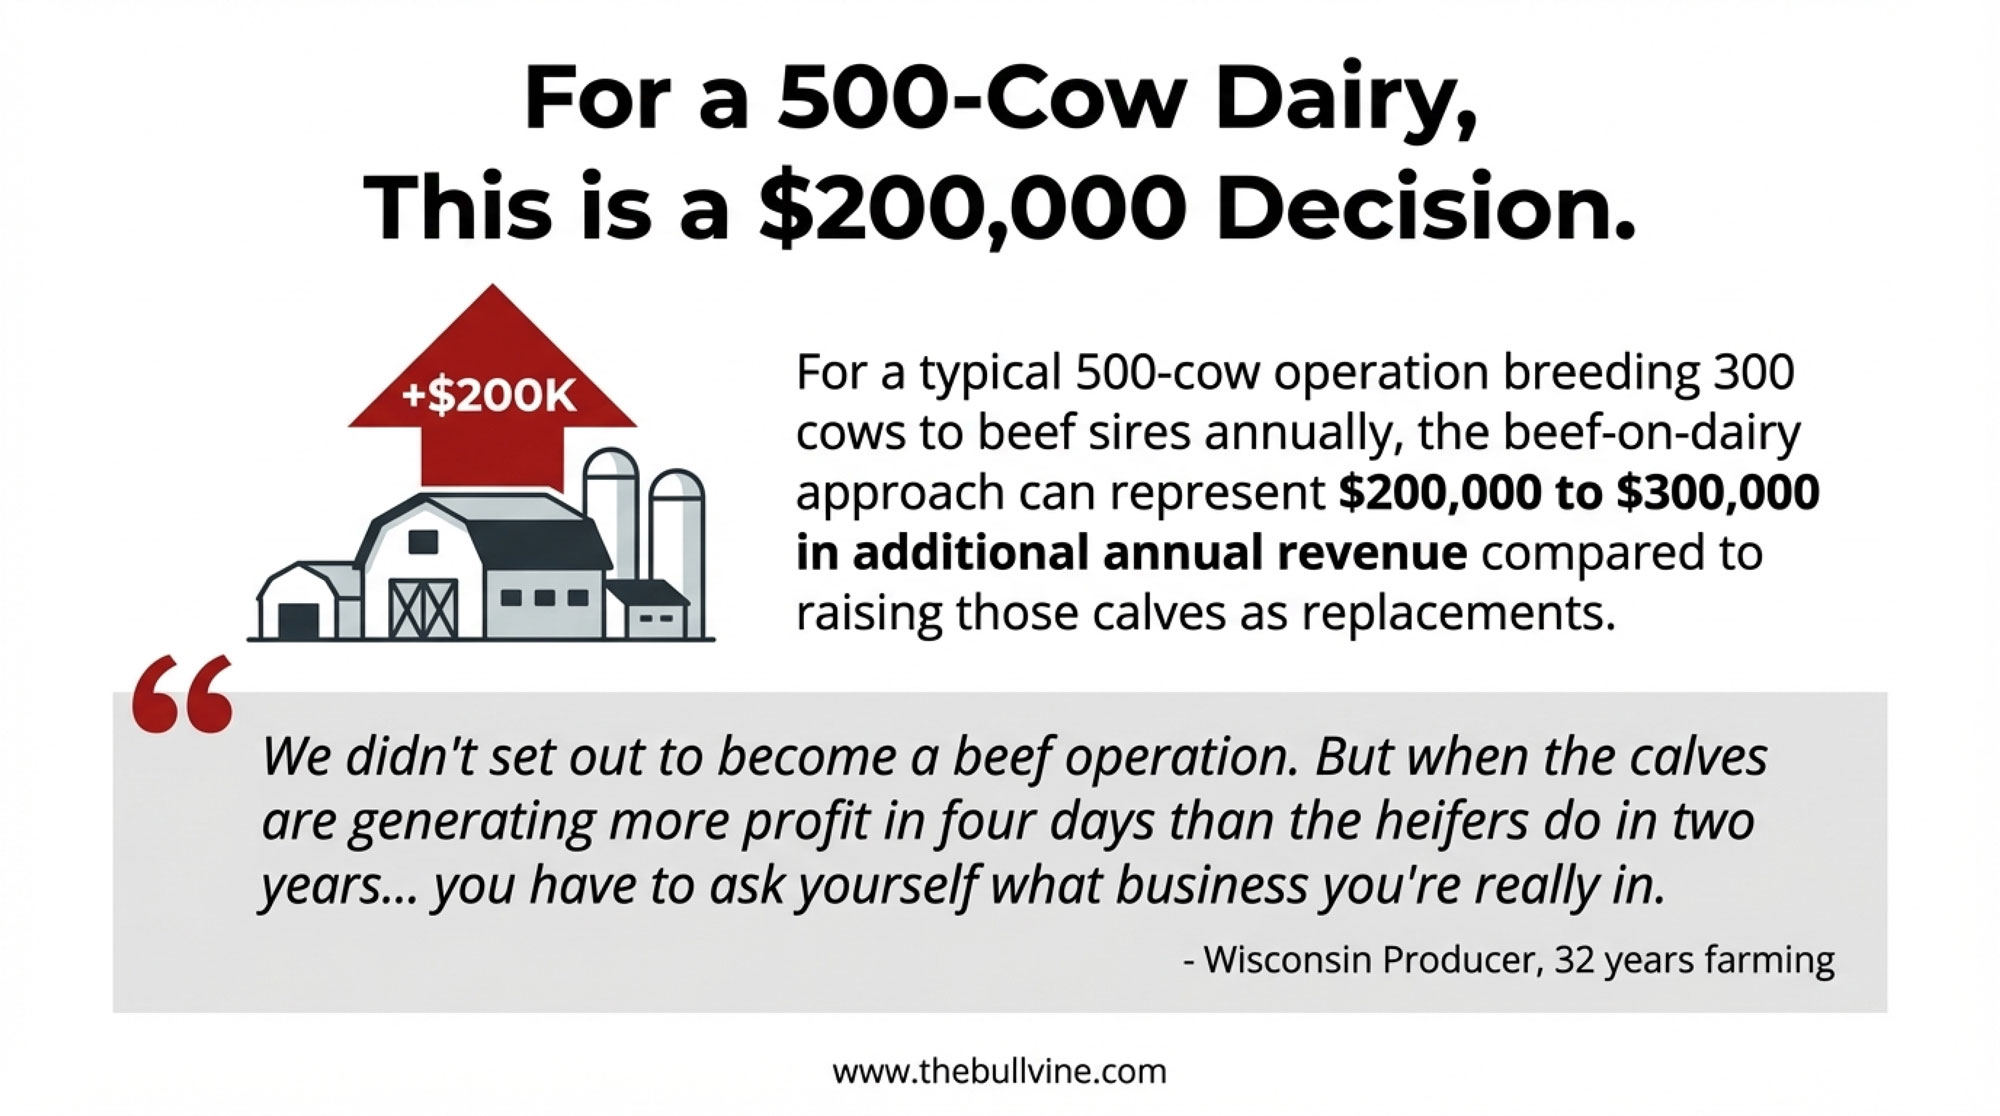
So here’s the hard truth many of us are dealing with: a lot of farms leaned into beef‑on‑dairy so aggressively—because that 600–900 dollar beef calf check looked awfully good—that they’re now staring at 2,500‑plus replacement heifer prices when they want to expand or even just maintain herd size. Analysts in Dairy Herd have gone so far as to say that America’s heifer shortage is actively limiting expansion and that the “big money in beef‑on‑dairy” is one of the key drivers.

For a Bullvine reader, the warning needs to be crystal clear:

Don’t sell your future for a 300‑dollar calf check today.

Decision PointToday’s CashCost to RaiseMarket PriceReal Economics
Beef-on-Dairy Calf$600–$900$0 (buyer’s problem)N/AImmediate income, no future cow
Holstein Bull Calf$150–$250$0 (buyer’s problem)N/AMinimal income, no future cow
Keep & Raise Heifer$0 today$1,700–$2,400$2,500–$3,60024-month investment, future production
Annual Impact (100 beef calves)+$60,000–$90,000Clear−$250,000–$360,000 in replacement costsNet position depends on replacement needs

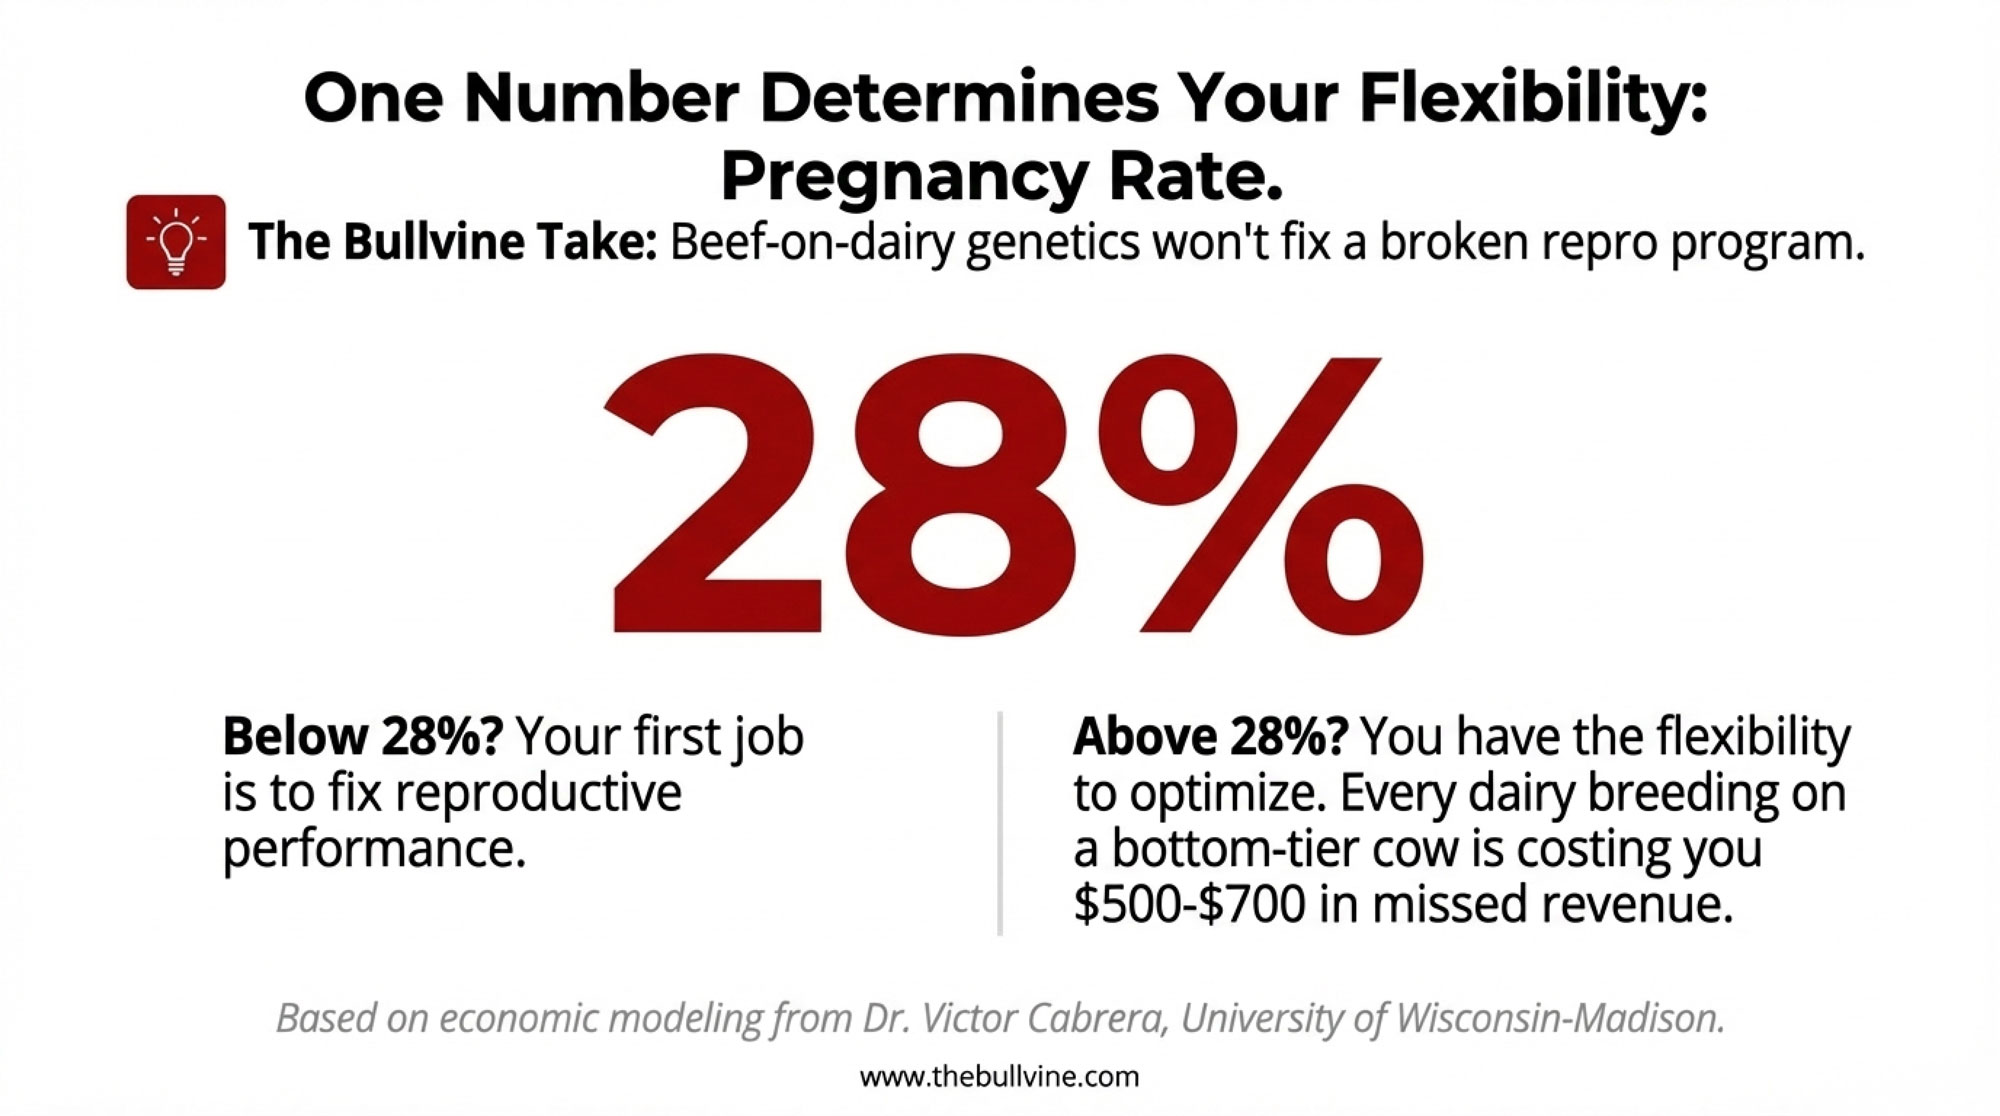
In some markets, the calf check is 600 or 800 dollars, not 300, but the principle is the same. Beef‑on‑dairy is a powerful tool when it’s aimed at the bottom of the herd with a clear replacement plan. Used without a plan, it can hollow out your future cow herd and leave you paying top-of-the-market prices to fill stalls.

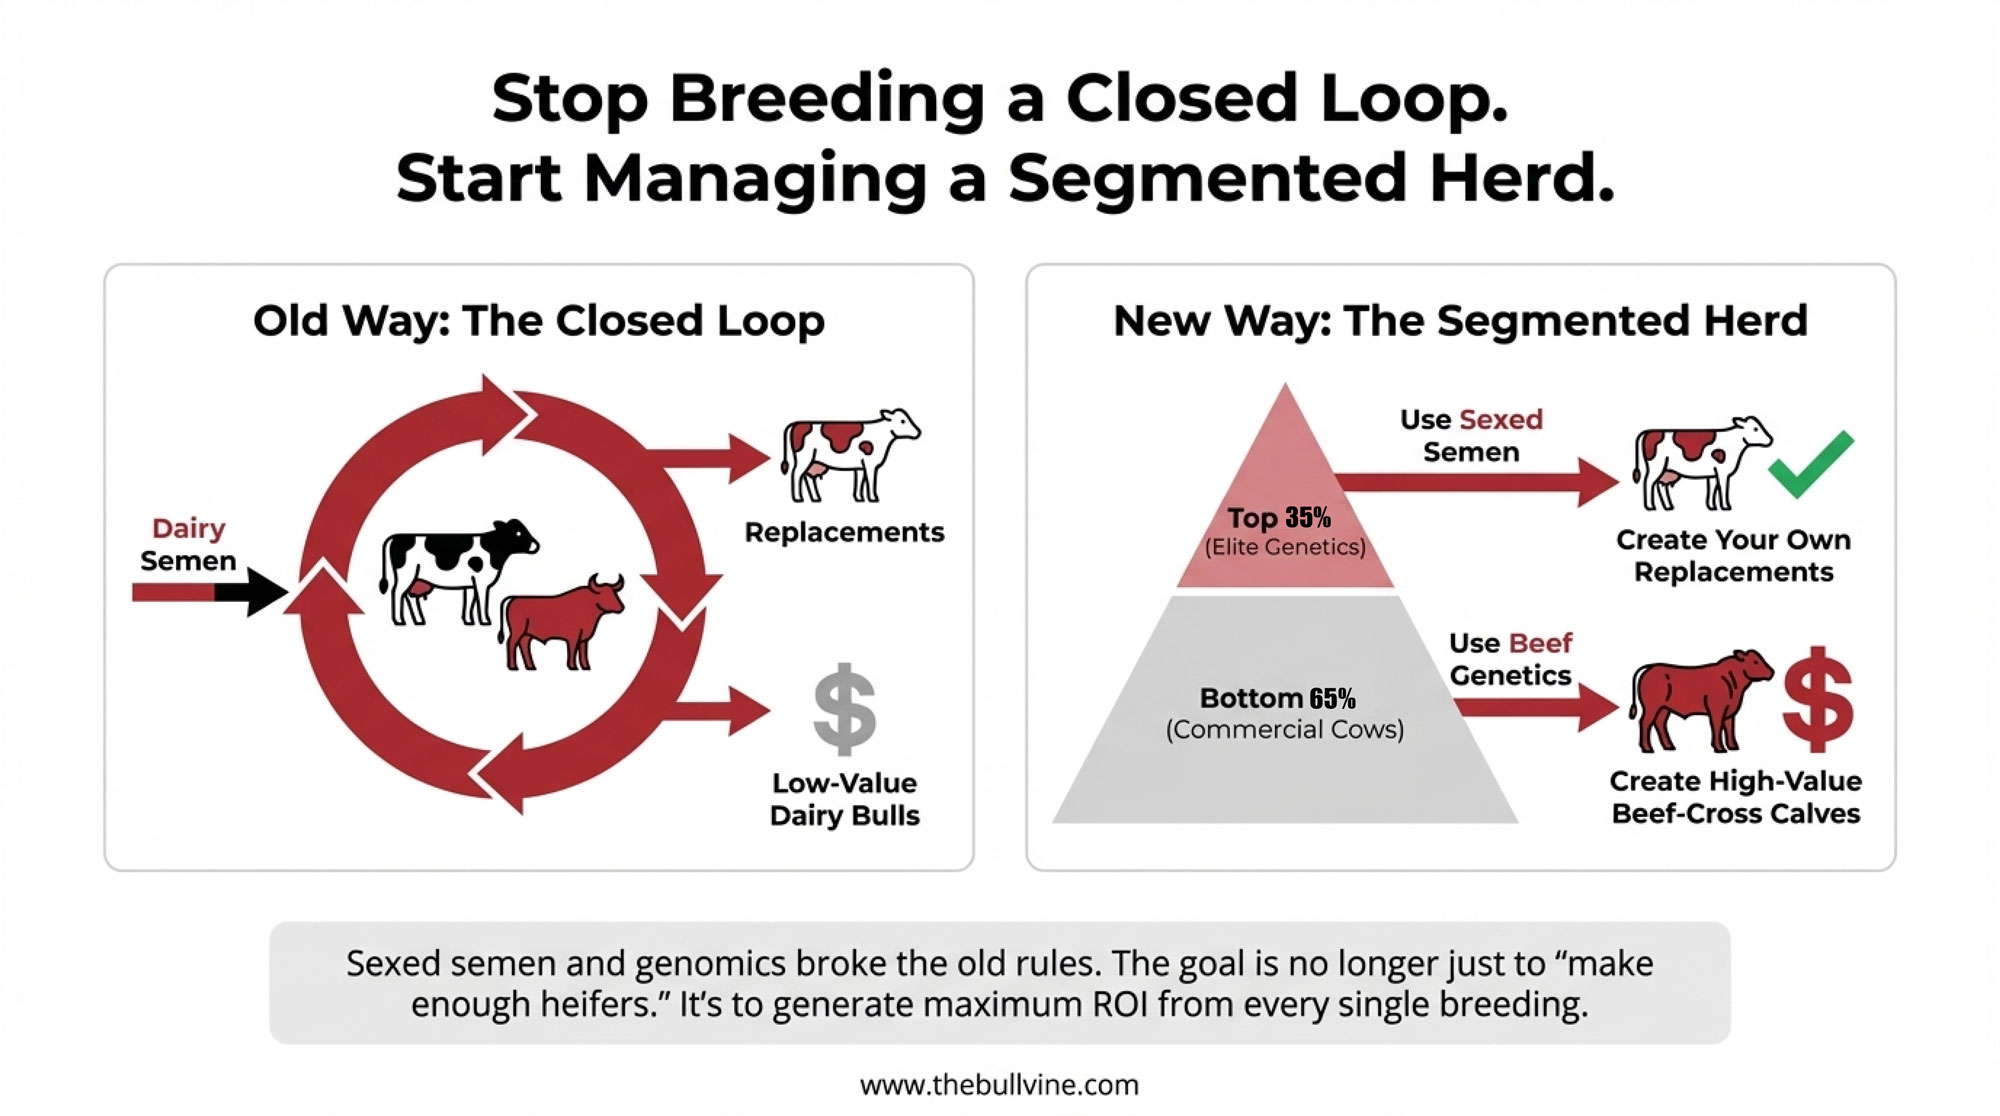
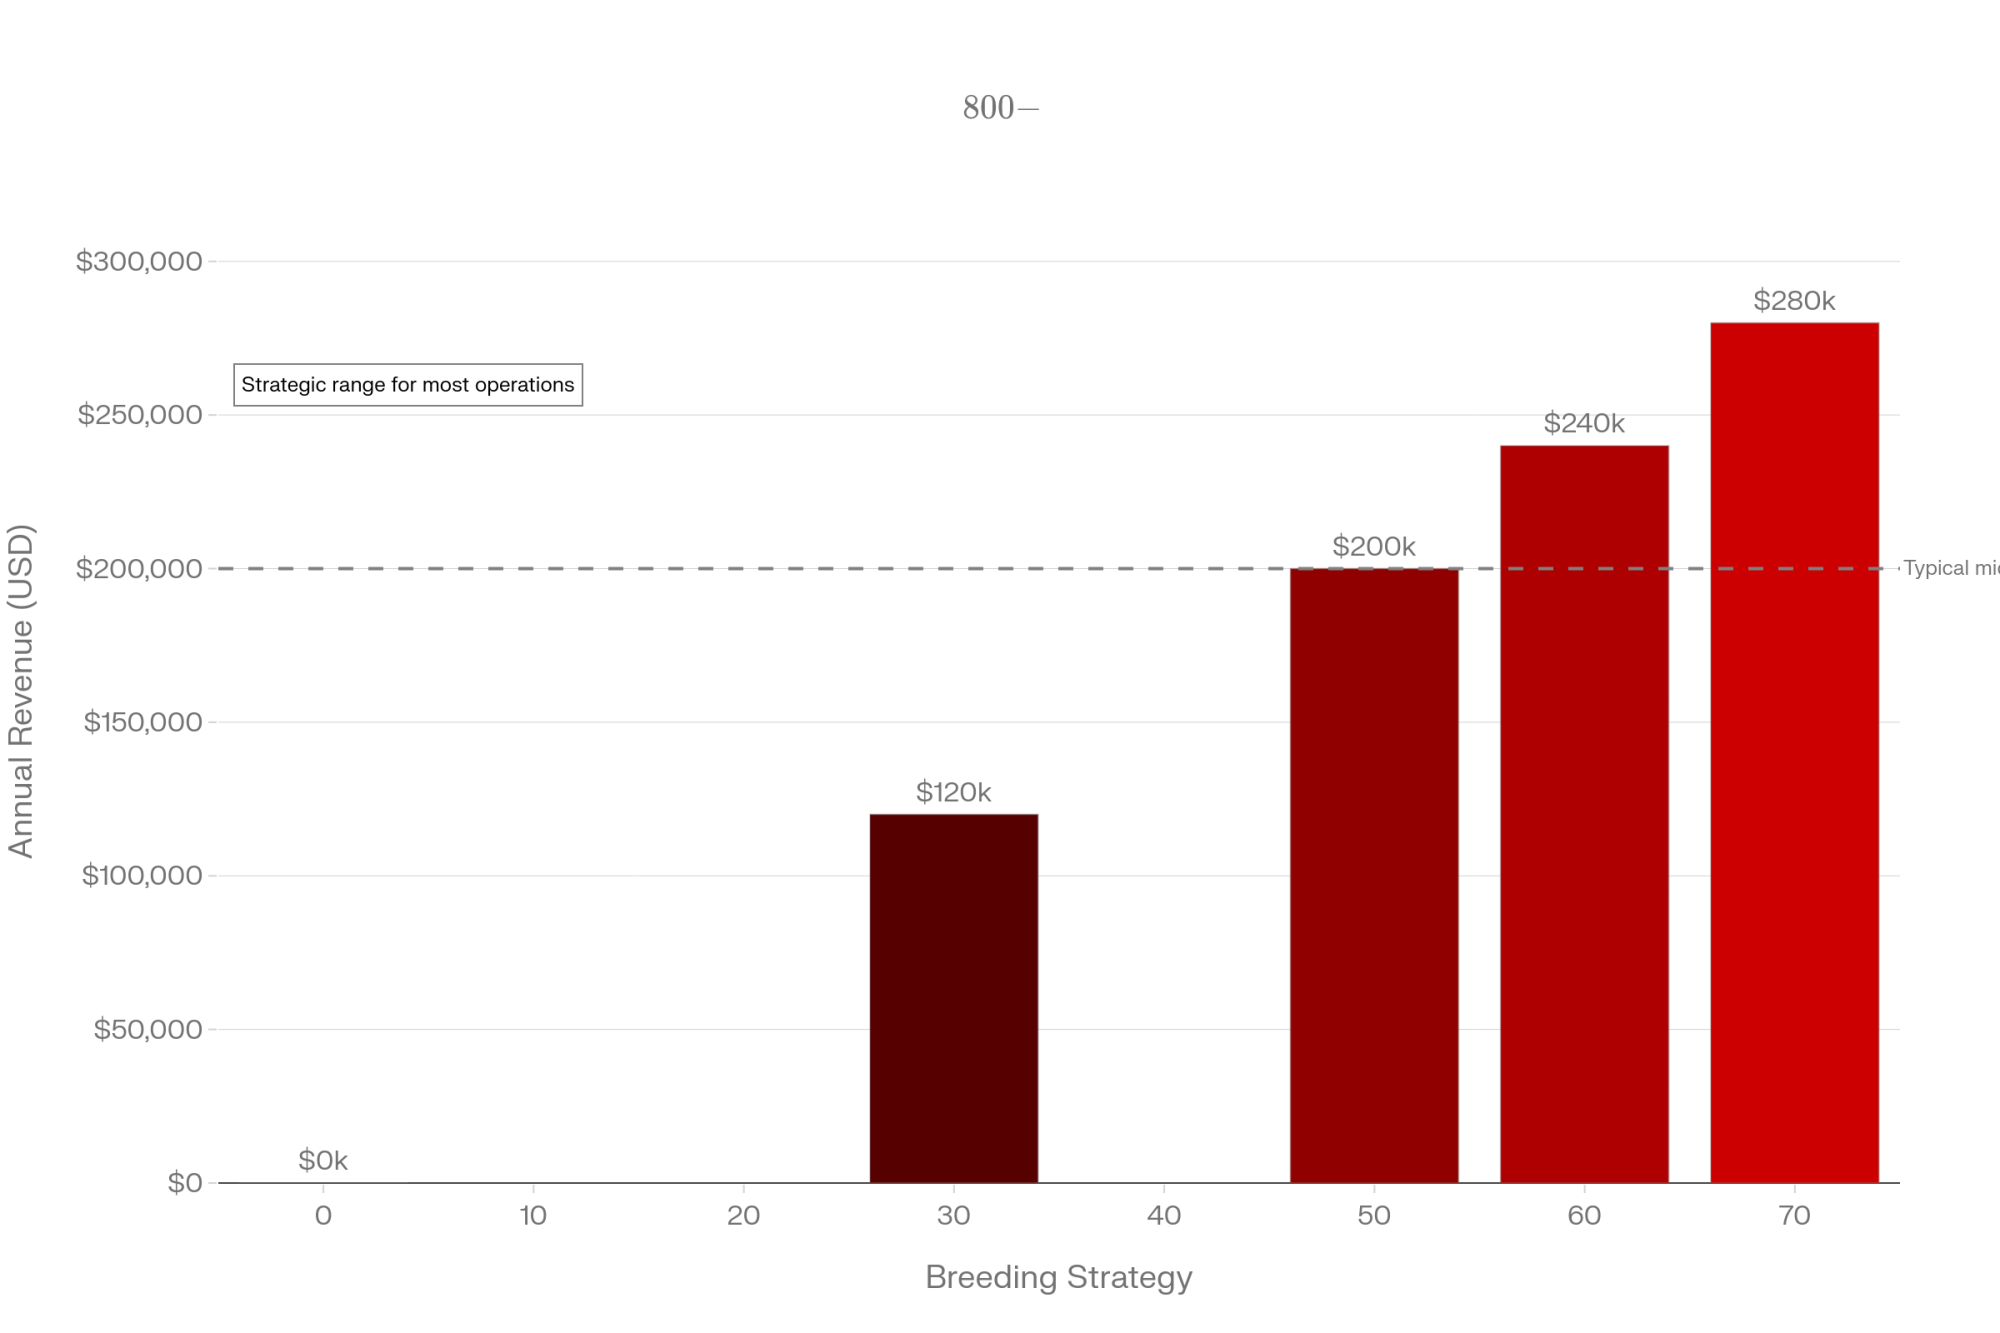
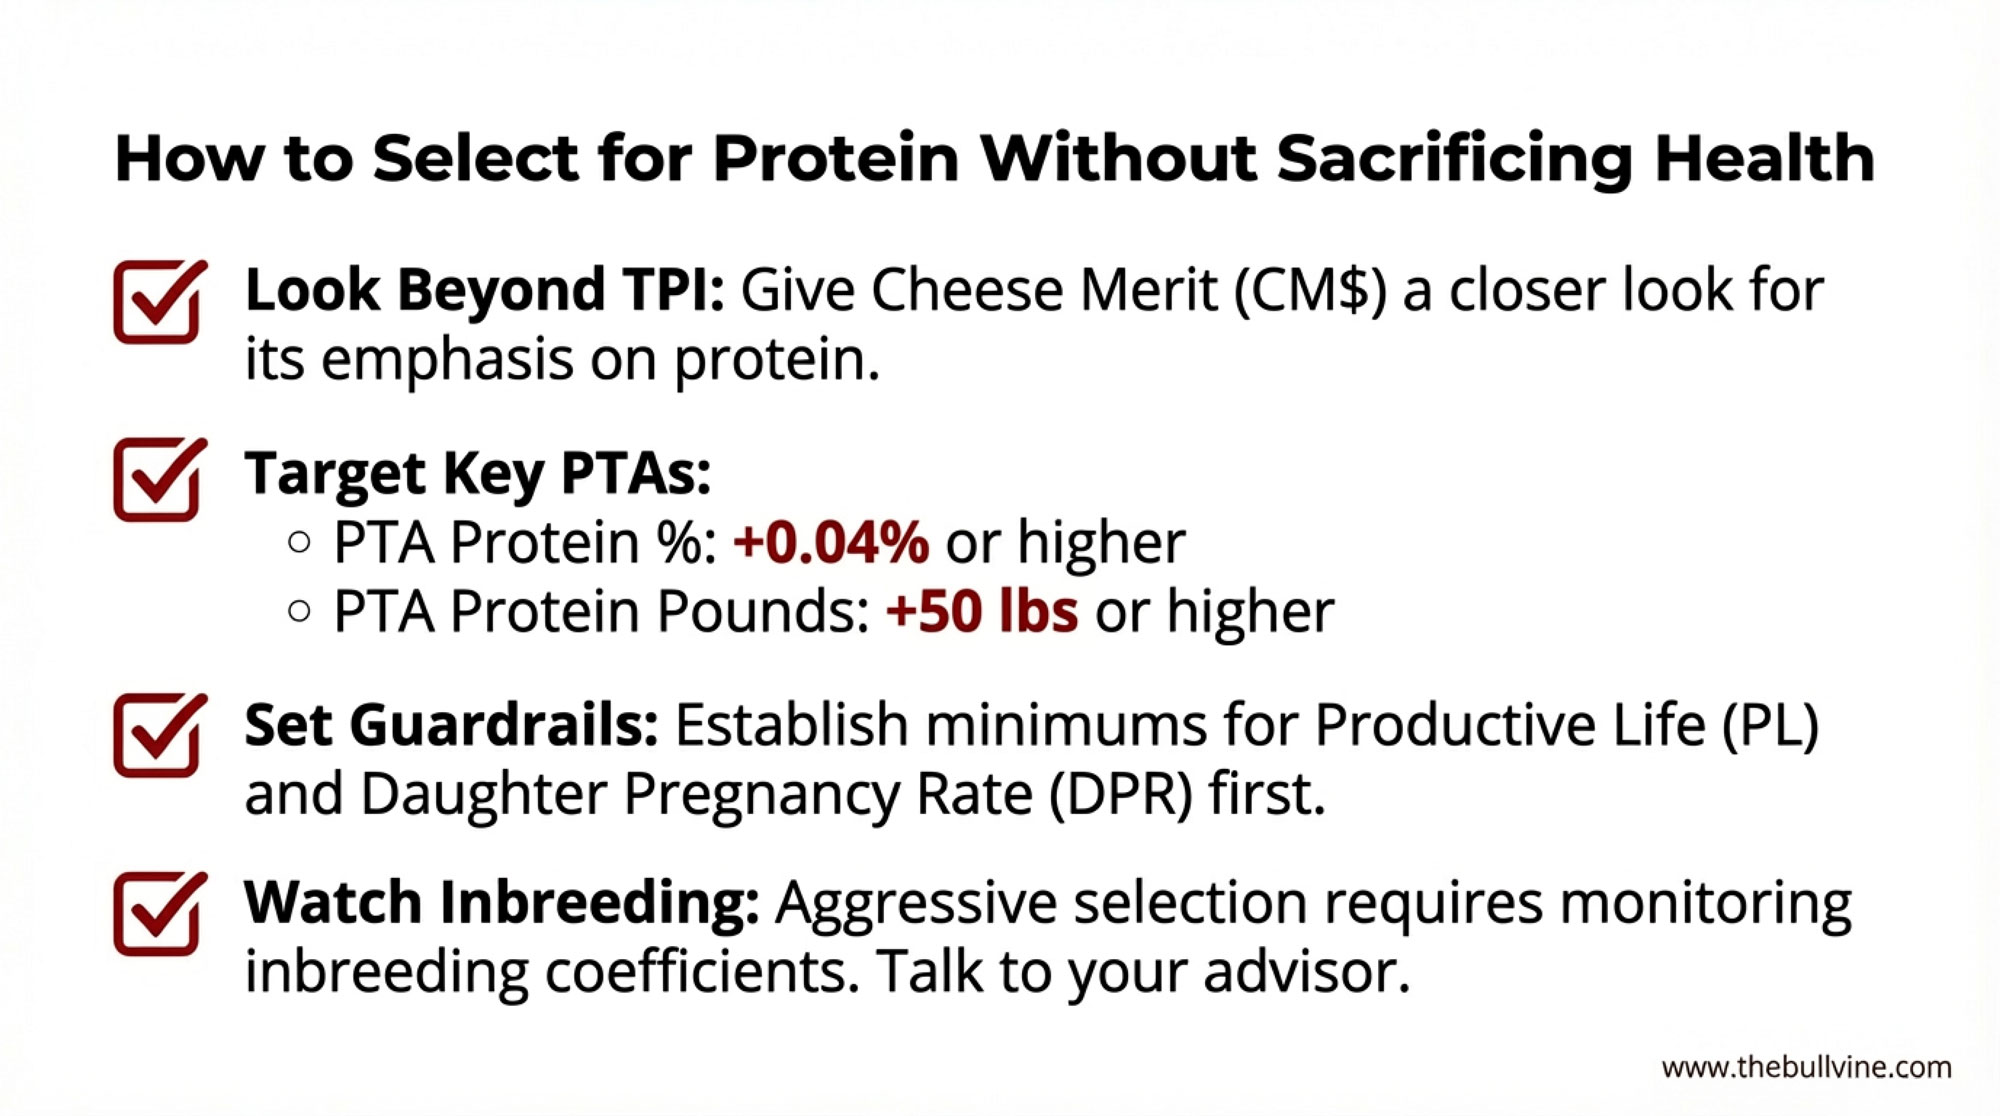
The sweet spot, based on both research and what well‑run farms are doing, looks something like this:

  • Top 30–40 percent of females: Genomic‑tested and top‑merit cows and heifers get sexed dairy semen to generate replacements.
  • Middle group: Conventional dairy semen, adjusted up or down depending on your replacement needs.
  • Bottom end: Clearly identified low‑merit cows and heifers get beef‑on‑dairy semen to turn them into higher‑value calves.

And that plan isn’t static. It gets revisited each year as calf, beef, and replacement markets change. But the order of operations doesn’t change: protect your future herd first; chase beef calf checks second.

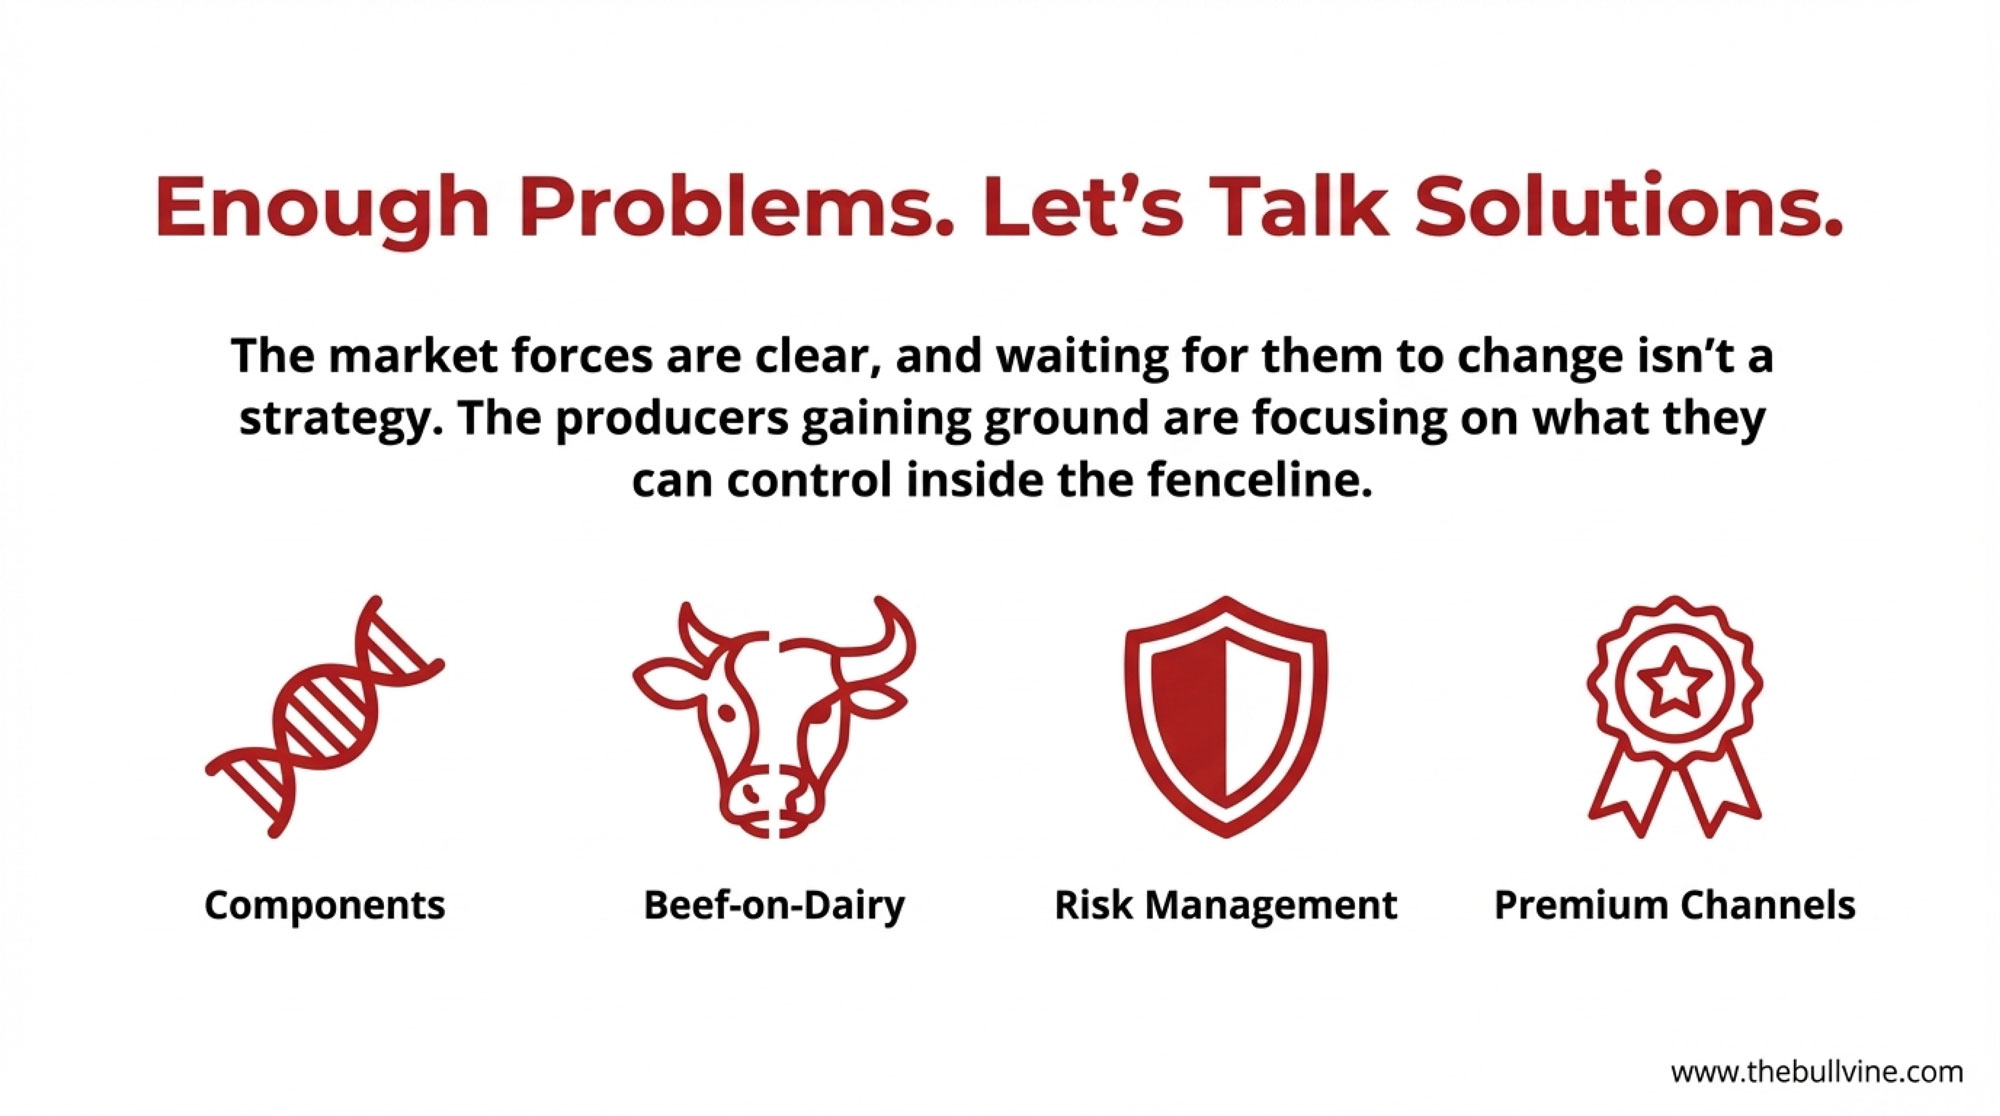
What Farmers Are Finding Works Right Now

Talking with producers from Wisconsin to South Dakota, from Idaho to Ontario, three themes keep showing up on farms that seem to be navigating all this better than most.

Breeding for Profit and “Invisible” Cows

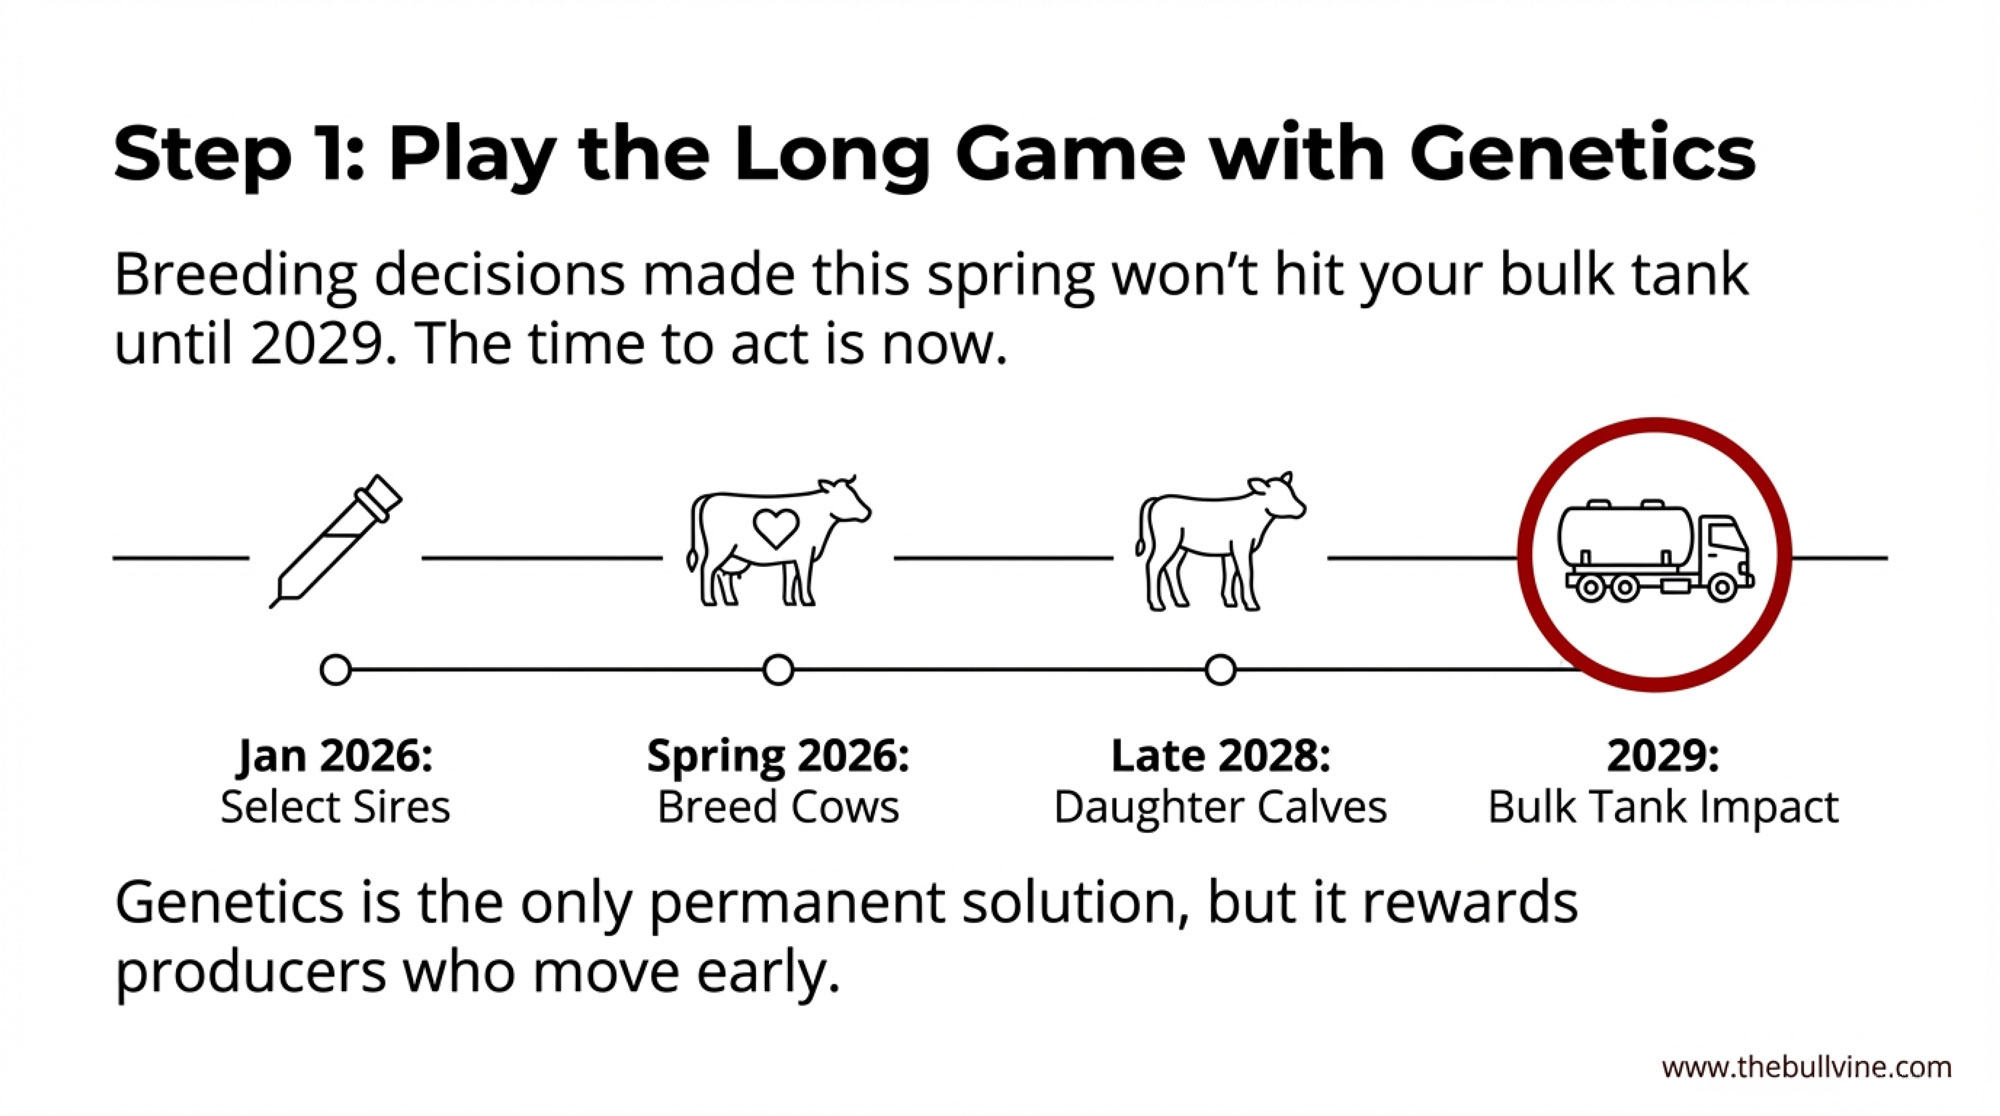
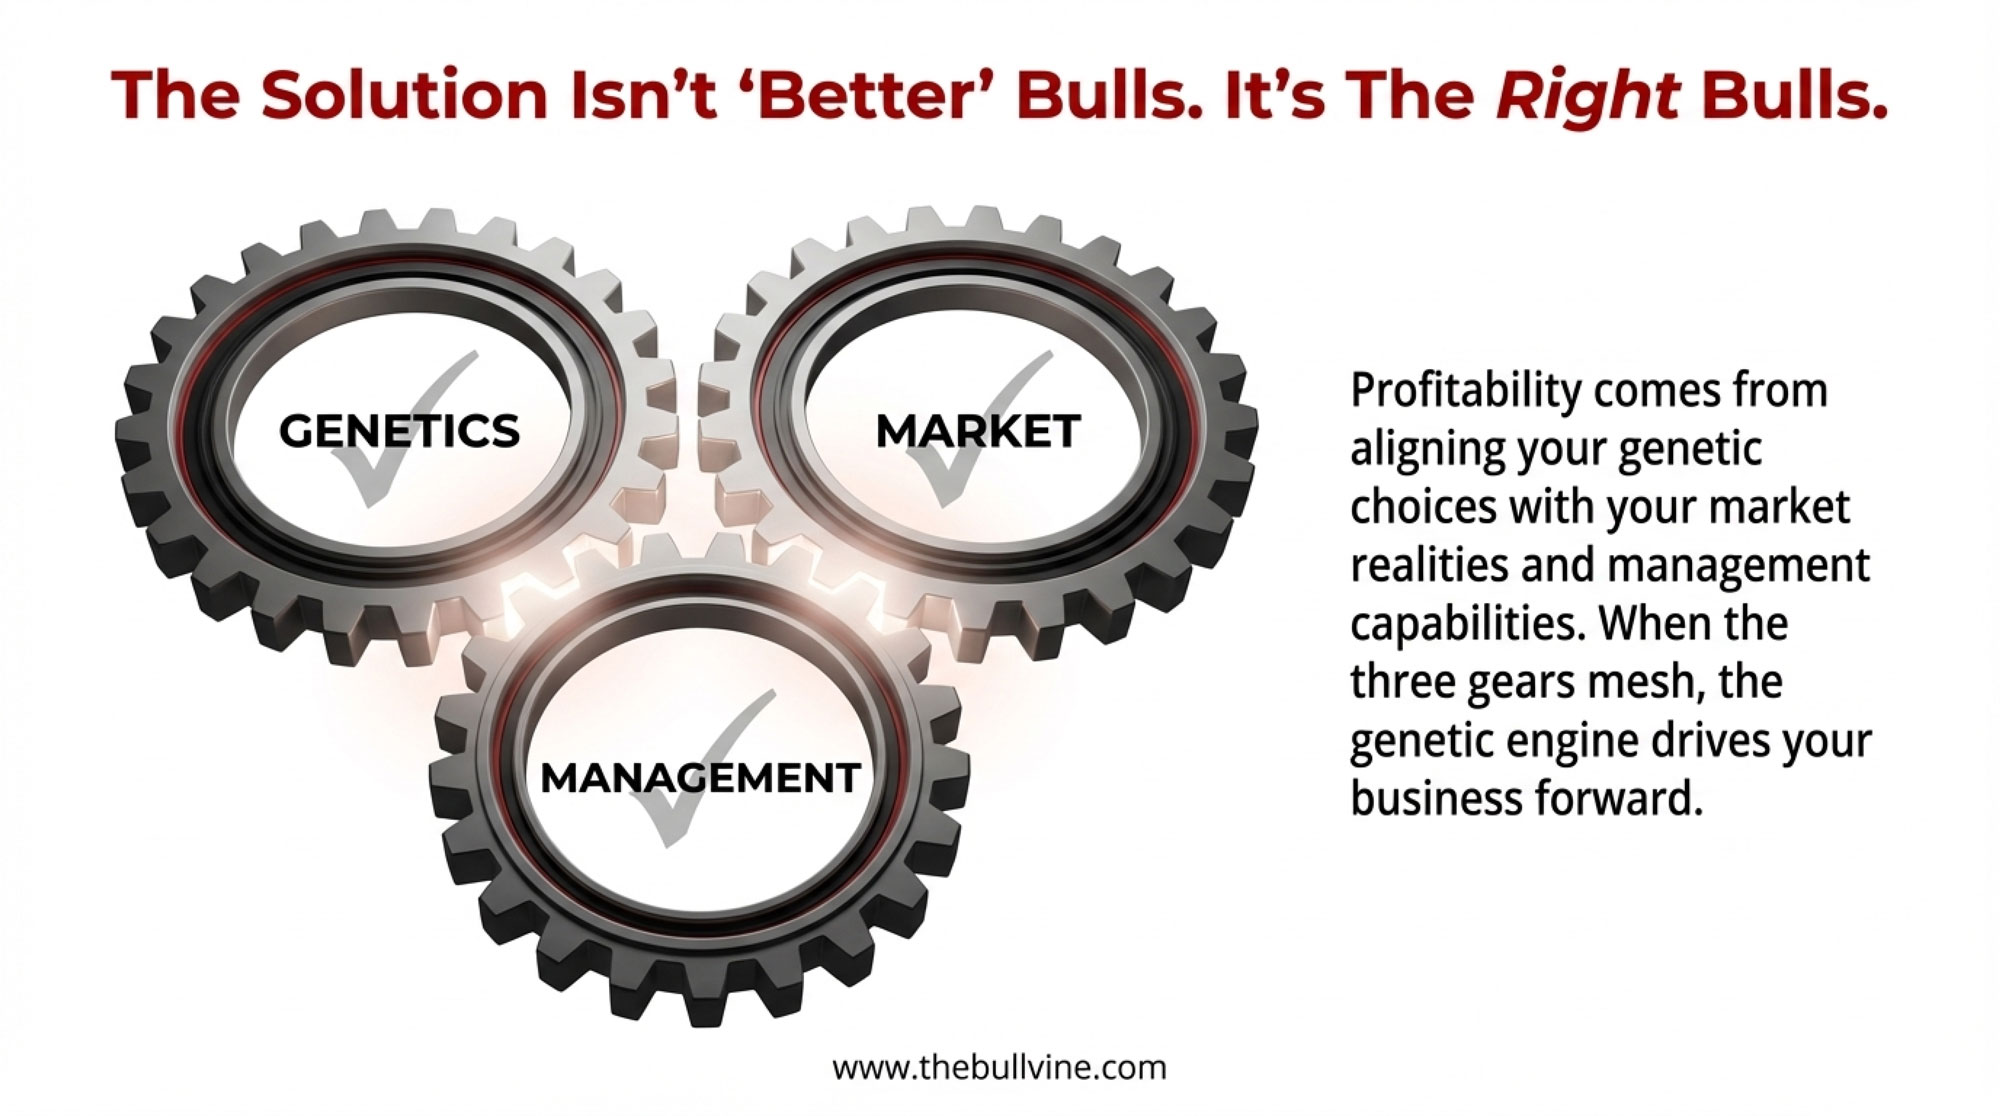
Looking at this trend in breeding decisions, the herds that look most resilient aren’t chasing a single extreme trait. They’re using tools like genomic selection, economic indexes, and on‑farm records to build cows that are profitable and low‑drama.

Peer‑reviewed work on dairy genetics and national evaluation systems, summarized by the Council on Dairy Cattle Breeding and others, shows that genomic selection combined with economic indexes like Net Merit (U.S.) and Pro$ or LPI (Canada) can significantly improve progress in production, fertility, and health traits compared to traditional selection. That’s the backbone of how most major AI studs and progressive herds are making mating decisions today.

On the farms I’ve seen, a practical genetics plan often looks like this:

  • Use a profit index (Net Merit, Pro$, LPI) as the main filter rather than picking bulls off a single trait like butterfat or total milk.
  • Inside that pool, favor bulls that nudge both fat and protein percentages modestly upward while maintaining or improving fertility, udder health, and productive life.
  • Put real weight on traits that keep cows in the herd: mastitis resistance, hoof health and locomotion, calving ease, and overall robustness.

In that context, many commodity‑oriented herds are targeting cows with butterfat around 3.8–4.0 percent, protein in the mid‑3s, and reproduction performance that aligns with their culling and replacement plans. That doesn’t win you banners at a show, but it tends to win you more predictable component checks, fewer headaches, and a cow that’s “invisible” in the best way—just quietly doing her job.

Turning Genomics and Beef‑on‑Dairy into Everyday Tools

Genomics and beef‑on‑dairy aren’t fringe ideas anymore—they’re everyday tools for a growing number of herds.

Recent genomic reviews indicate that genomic evaluations can roughly double the accuracy of selecting young animals compared to using parent averages alone, especially for complex traits such as fertility and health. Breeding programs that use sexed semen on the top tier of females and beef semen on the bottom tier to accelerate dairy genetic gain while also lifting calf value.

On many commercial farms, that has turned into a straightforward three‑tier system like the one above. The key shift on farms that are doing it well is that they’ve stopped guessing:

  • They genomic‑test at least a subset of heifers to identify which families deserve replacements.
  • They run replacement‑need projections based on real cull rates, expansion plans, and age at first calving.
  • They adjust the proportion of sexed, conventional, and beef semen to hit those replacement targets rather than just chasing what the calf market looks like this month.

University of Guelph research and beef‑on‑dairy extension materials emphasize that dairy‑beef cross calves can command solid premiums over straight Holstein bull calves when marketed correctly, but they also warn that early‑life management and health are critical to capturing that value. The farms that treat beef‑on‑dairy as a strategic tool—not just a quick cash grab—are the ones turning it into a durable advantage.

Making Risk Management Routine Instead of a Panic Button

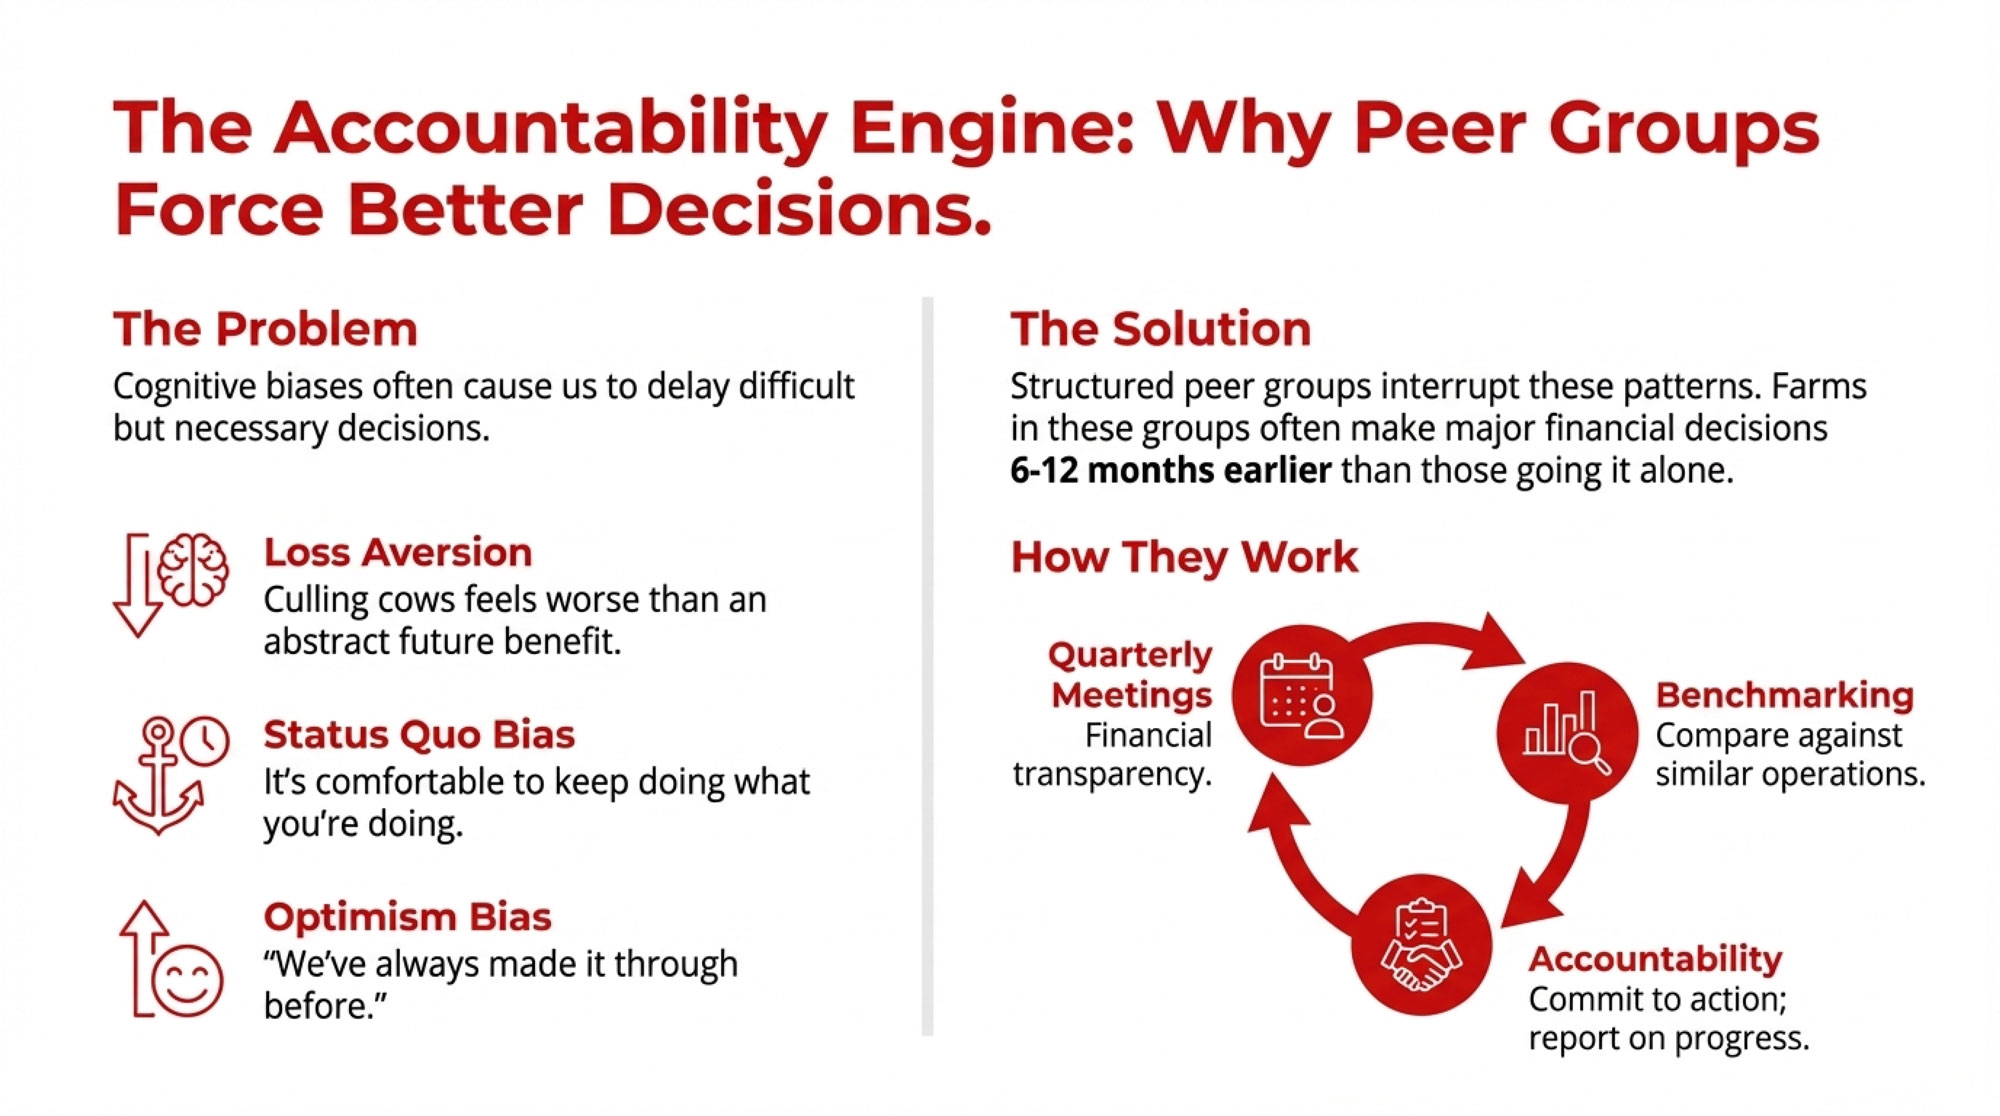
The third big shift isn’t genetic or nutritional—it’s in how farms treat price risk.

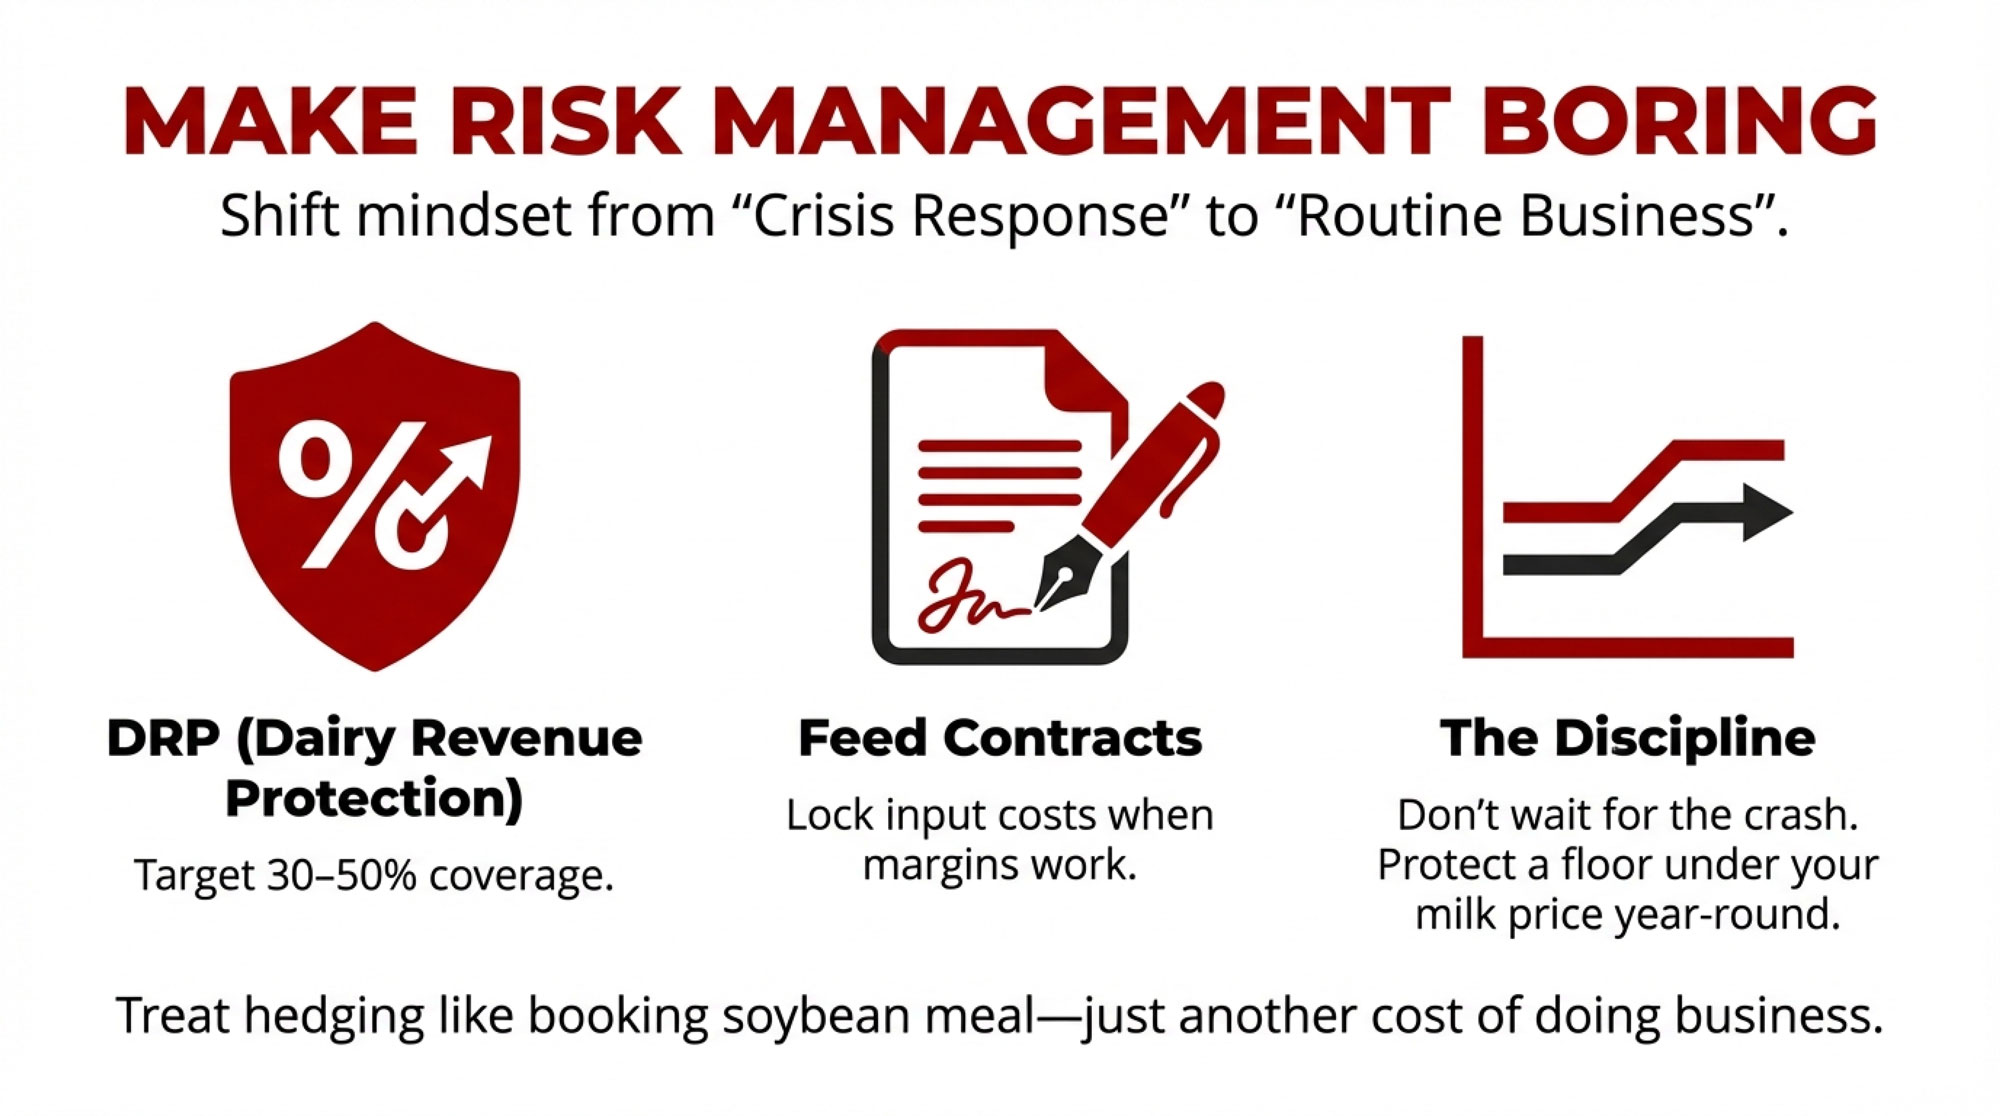
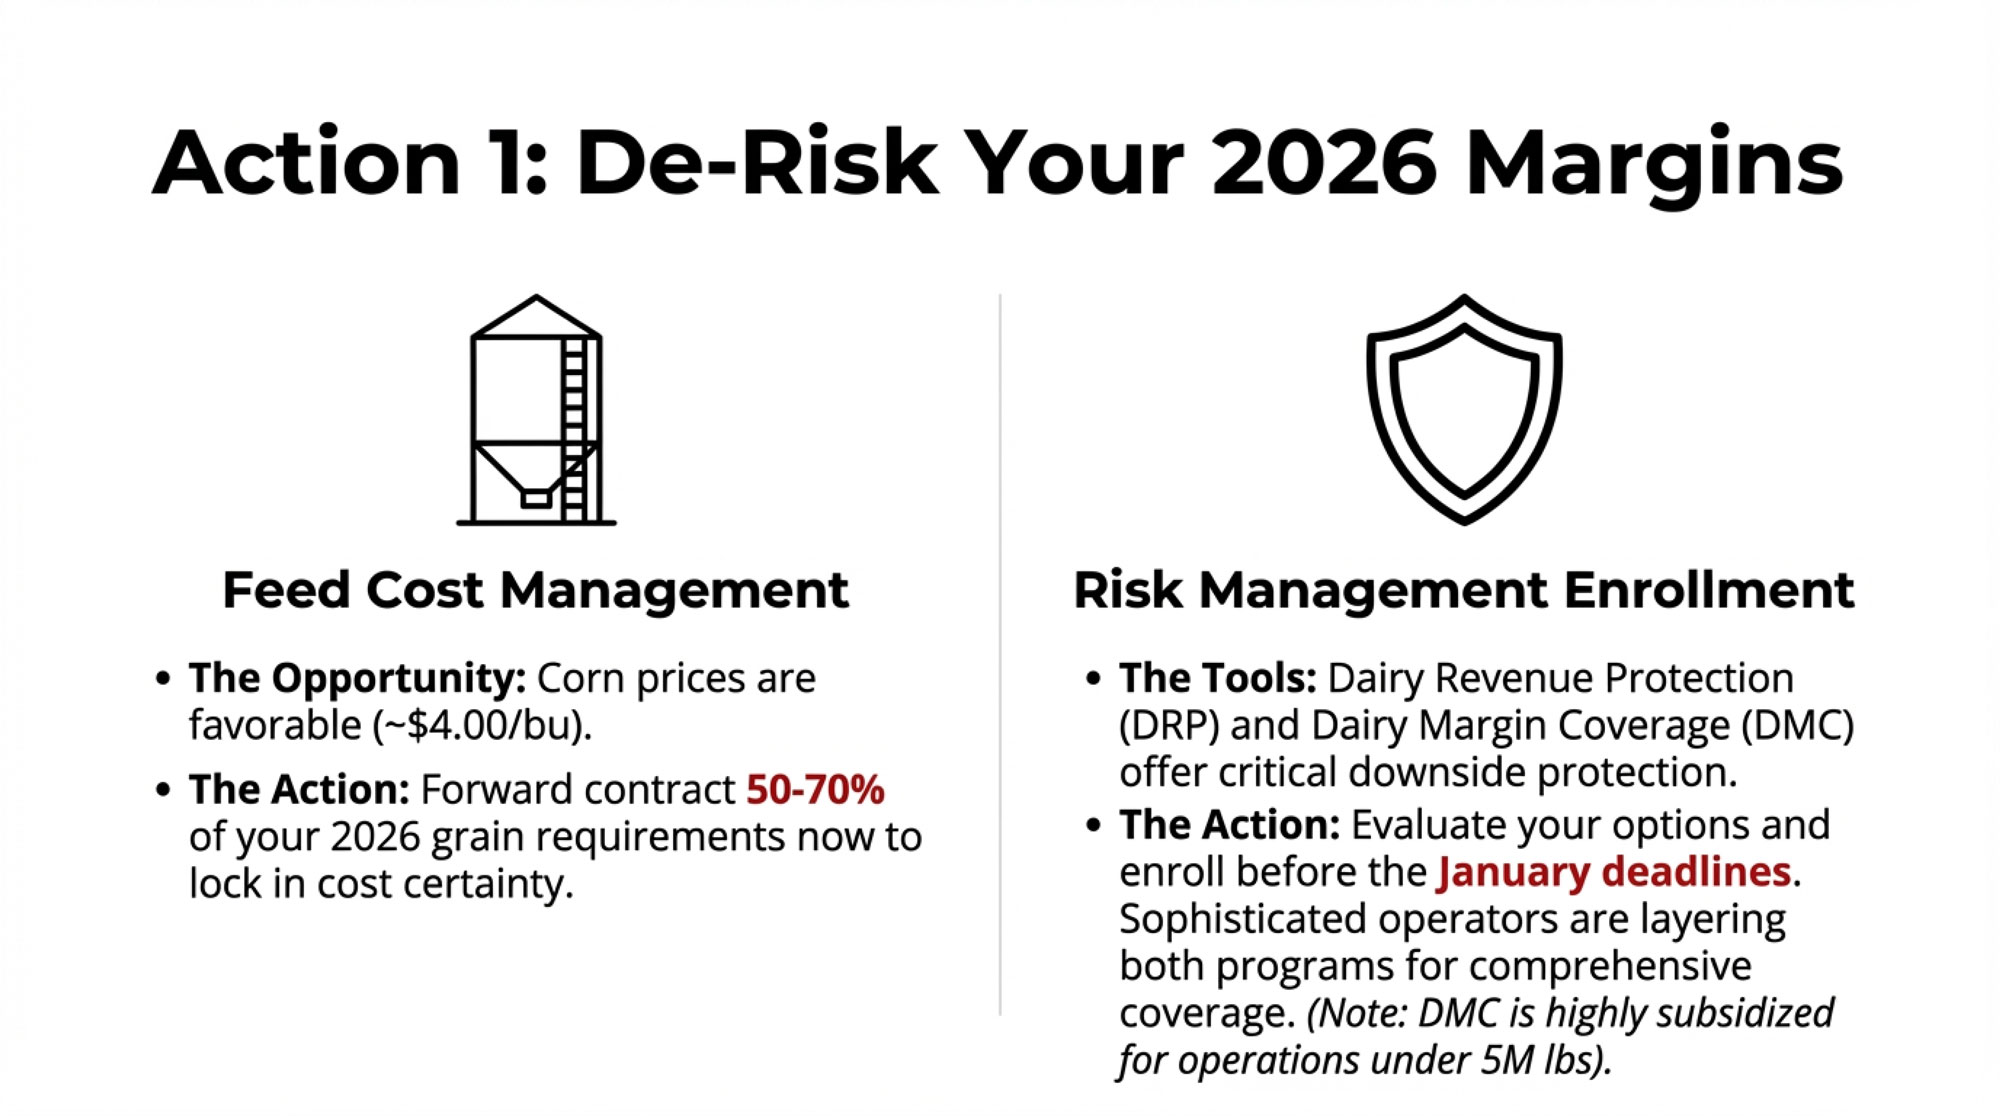
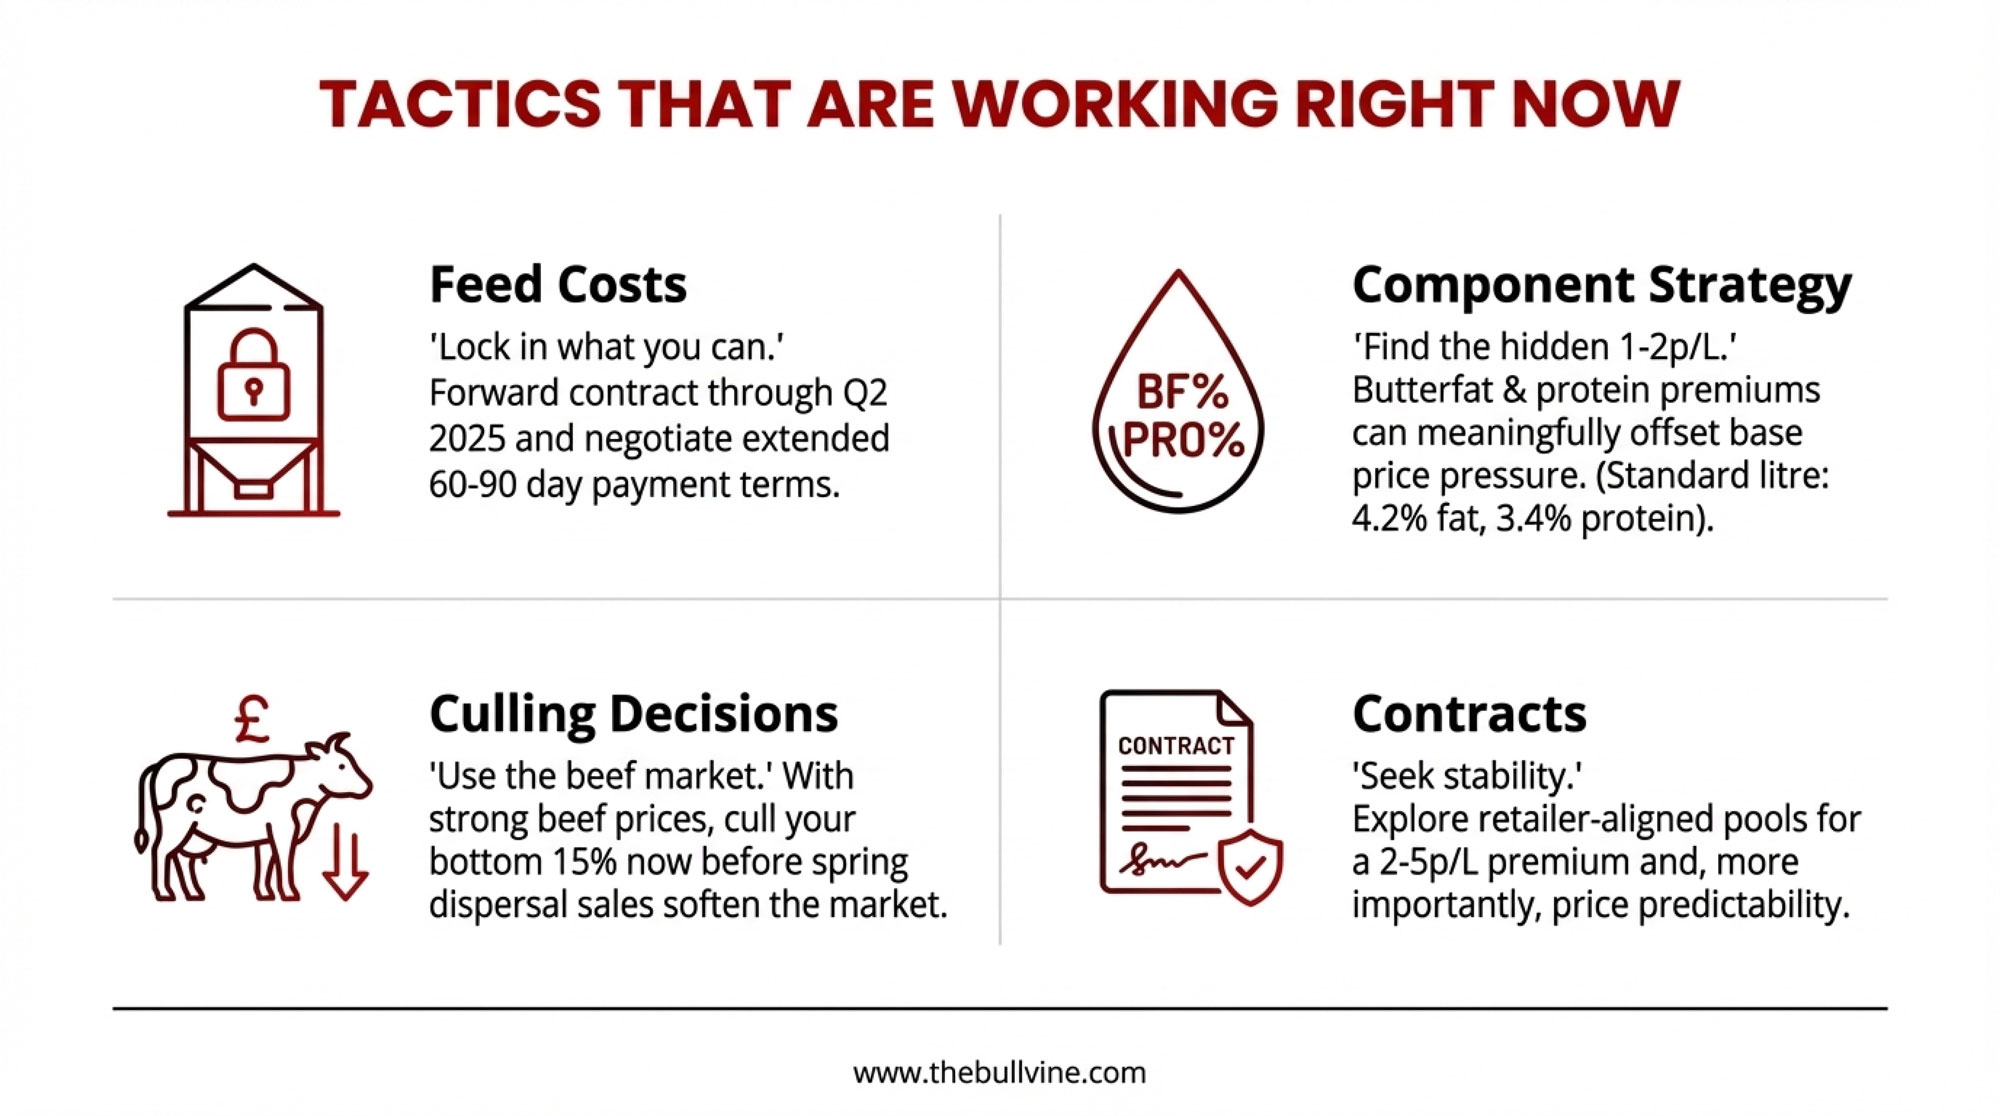
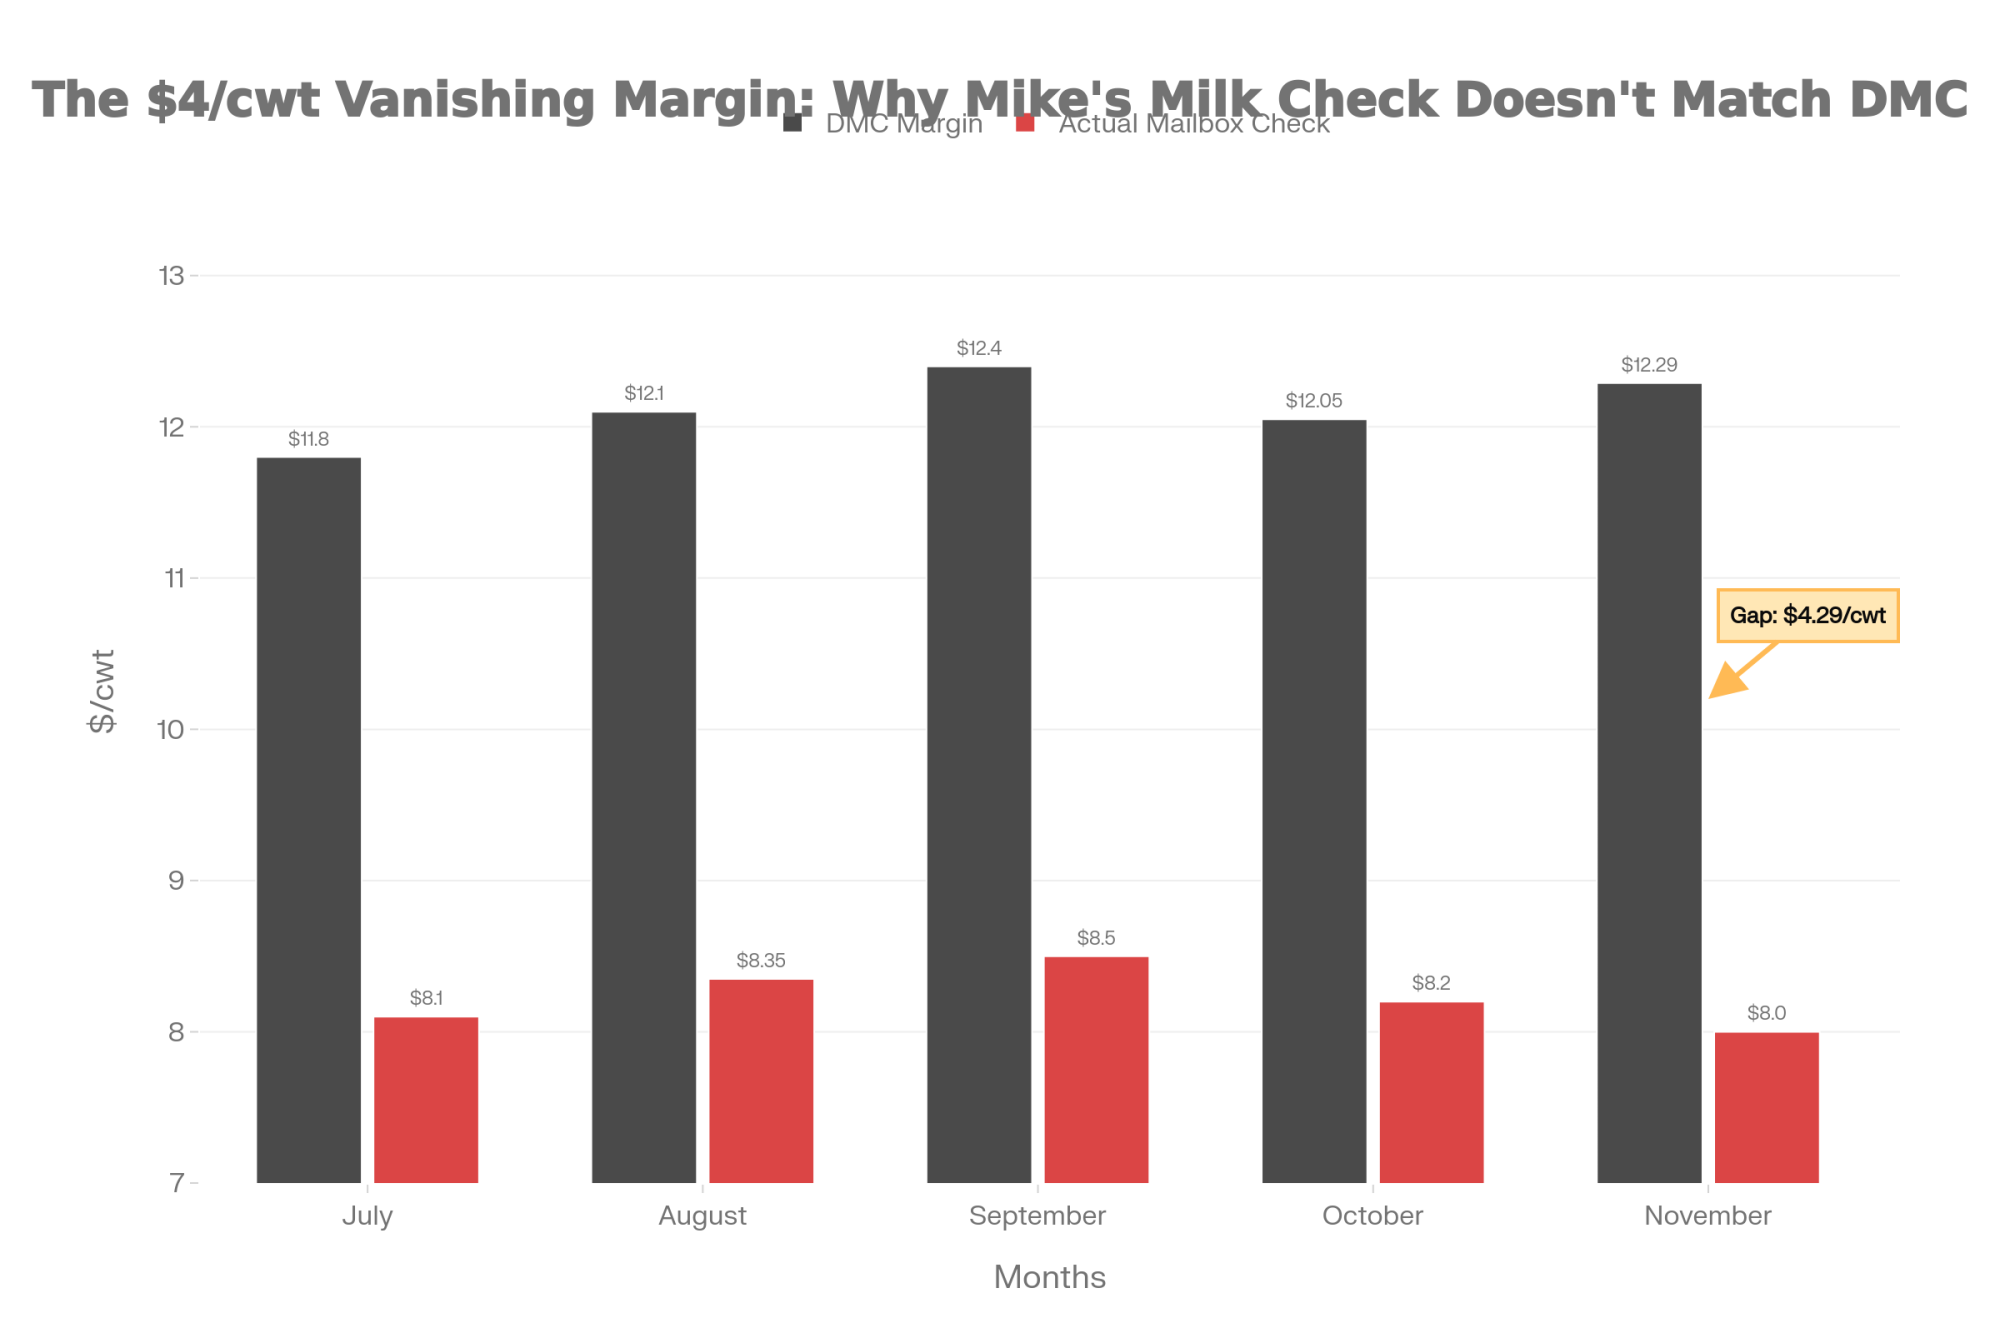
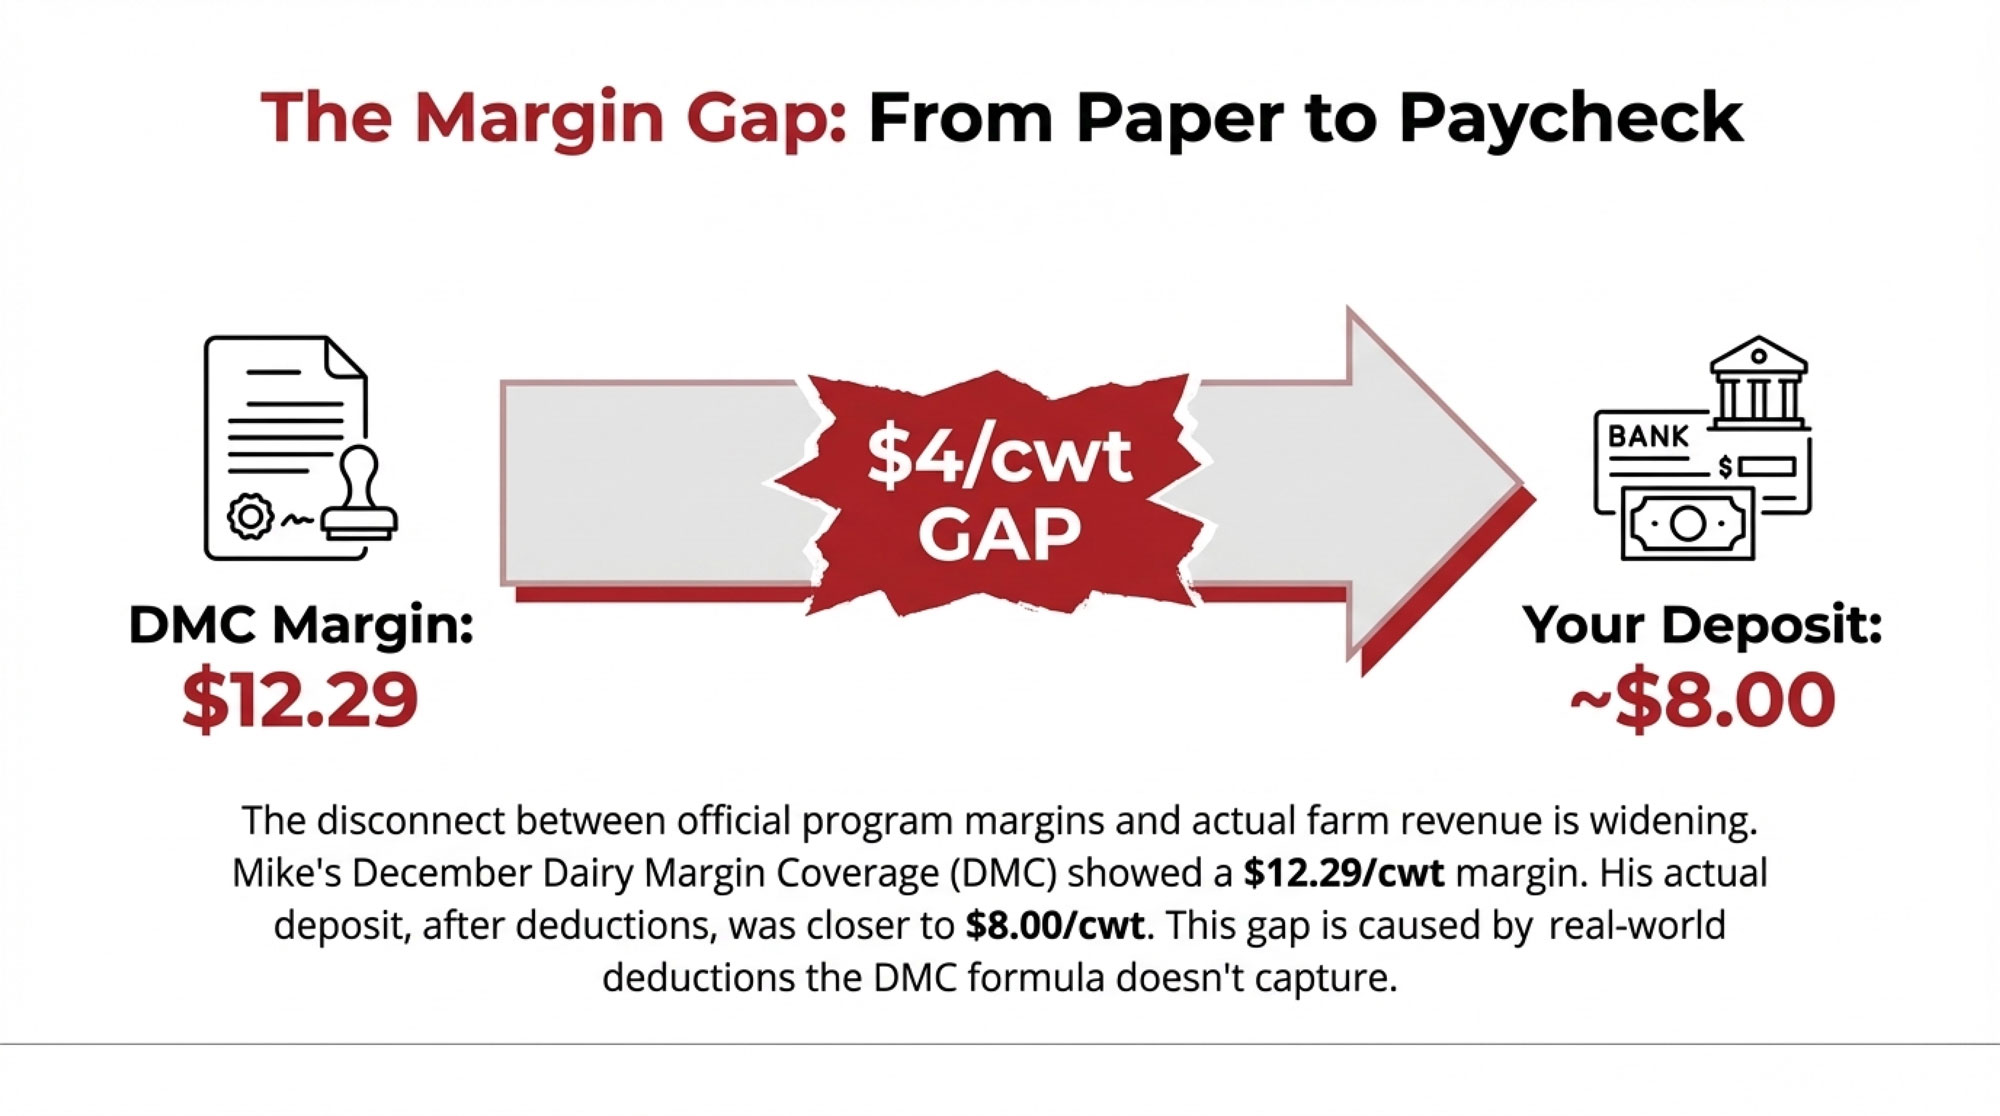
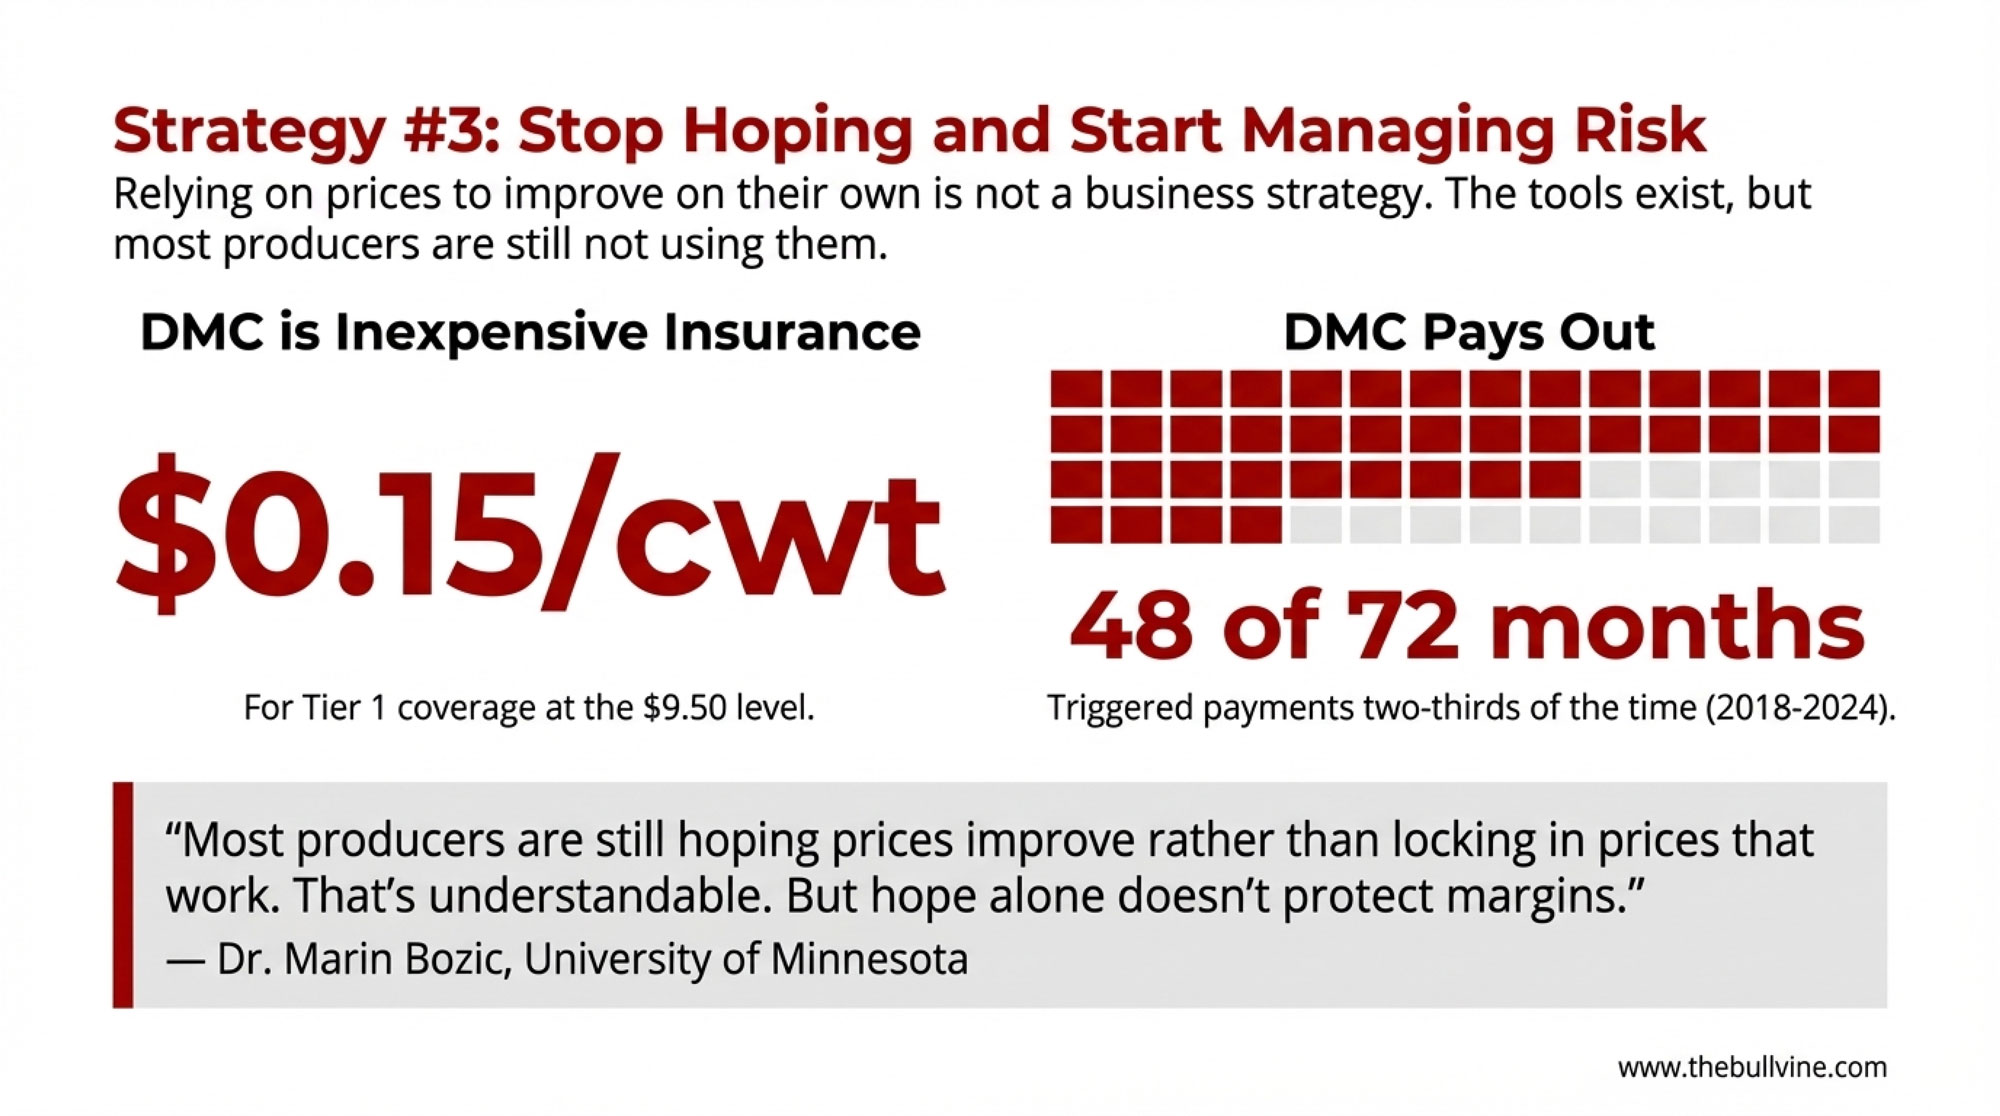
Extension economists and dairy market advisers have been pushing for years now that tools like Dairy Margin Coverage and Dairy Revenue Protection should be part of a routine risk plan, not just something you sign up for when prices crash.  Herds that quietly use DRP or basic options strategies year after year to put a floor under part of their milk price while leaving some upside open.

What many advisers suggest, as a starting point, is that producers consider protecting something like 30–50 percent of their expected milk production with DRP, options, or fixed‑price contracts when forward prices cover their cost of production and debt needs. It’s not a rule; it’s a range that seems to work for a lot of operations. Some herds are comfortable covering more, while others are less comfortable, depending on their balance sheets and risk tolerance.

A simple example might look like this:

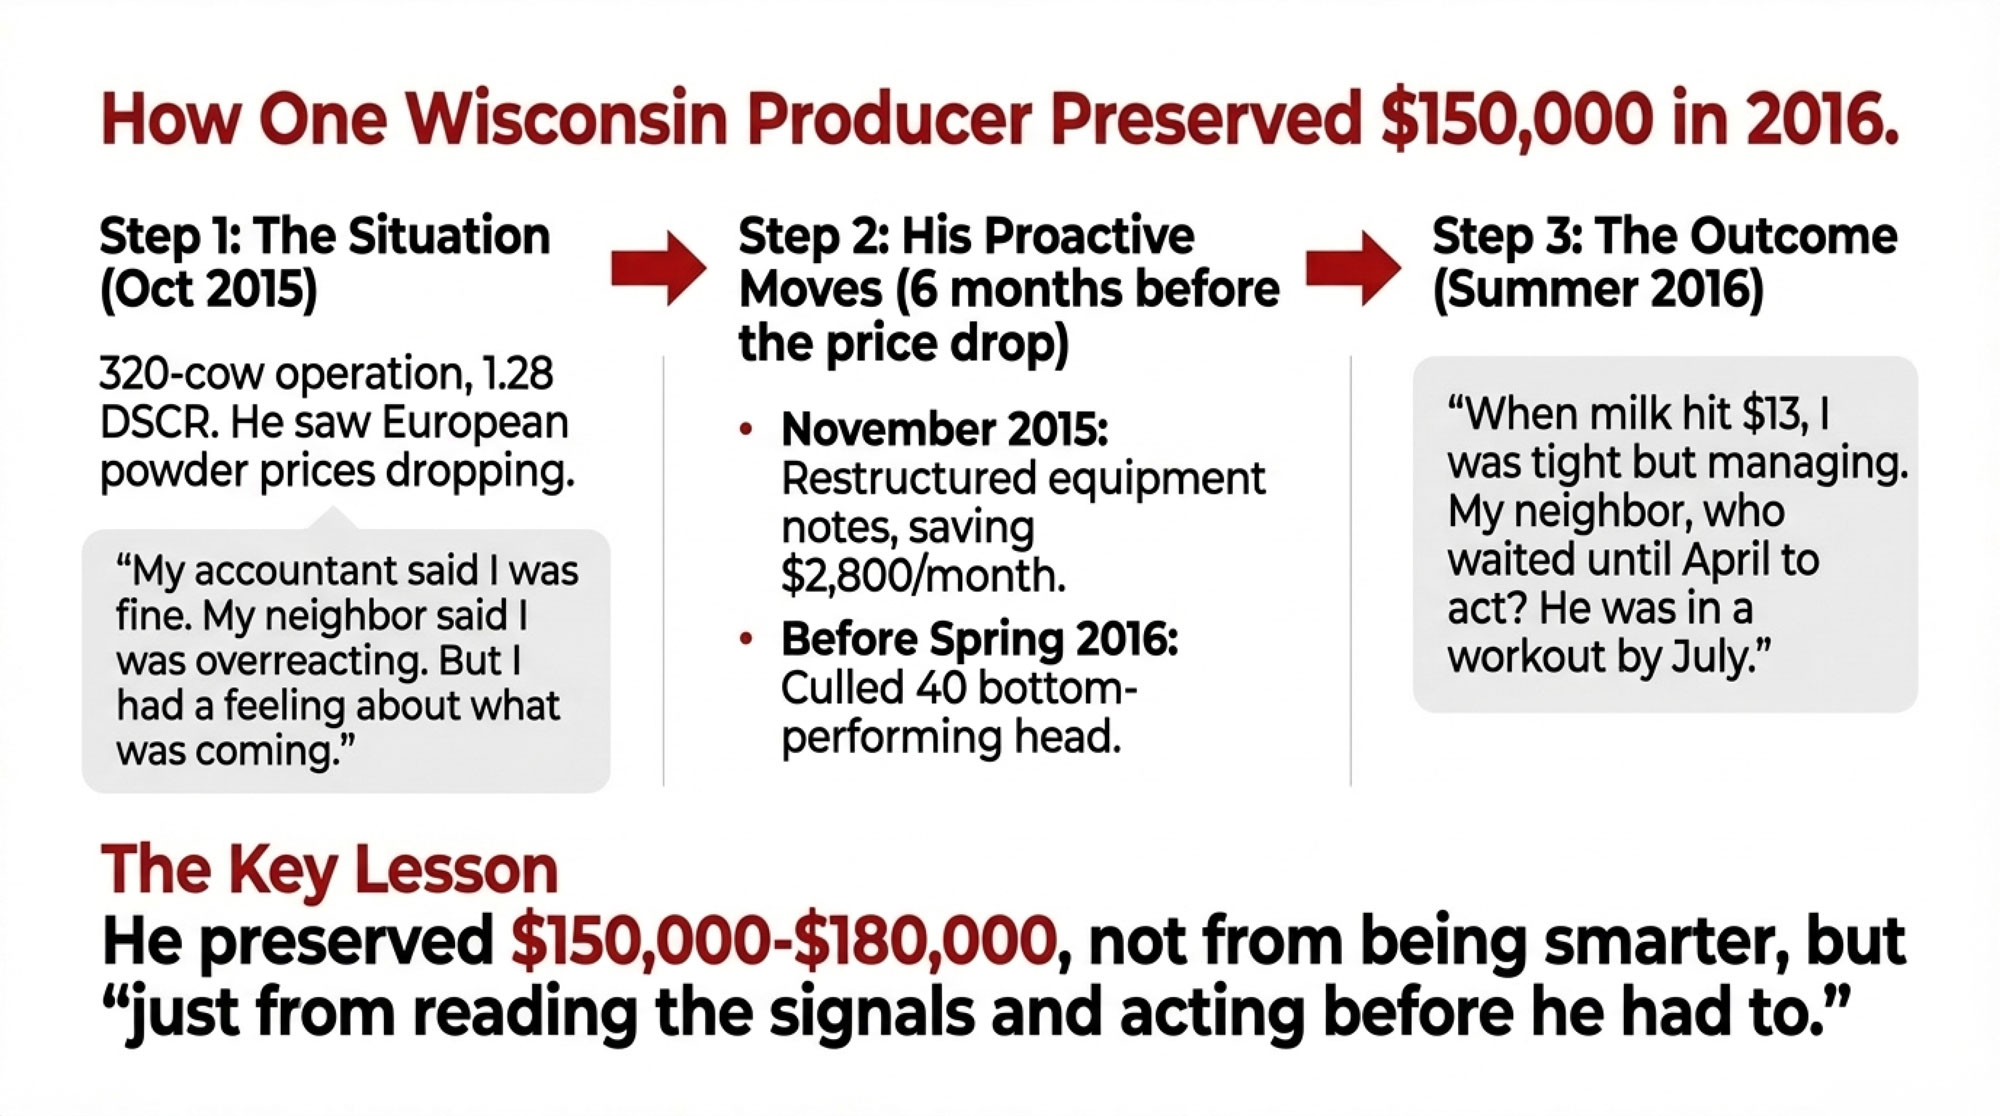
  • A 900‑cow herd in Wisconsin, selling mainly into Class III, uses DRP to set a revenue floor under part of its projected spring and summer milk based on its typical butterfat and protein tests and the markets it ships into.
  • At the same time, the herd forward‑contracts a portion of its corn and soybean meal when futures plus local basis give them a feed cost that supports a margin they can live with.

The rest of the milk and feed stays unhedged, leaving room to benefit if markets move higher. The point isn’t that 900 cows in Wisconsin need this exact plan. The point is that treating risk tools as normal business practice—as much a part of the job as booking soybean meal—can turn wild swings into manageable bumps.

From conversations with producers who’ve made that shift, the hardest step usually wasn’t understanding the math. It was deciding to stop waiting for the next crisis to start learning.

Different Starting Points, Different Options

Given all this, the logical question is: “So what does this mean for my farm?” The honest answer depends on your size, your location, and your timeline. But some patterns show up pretty consistently.

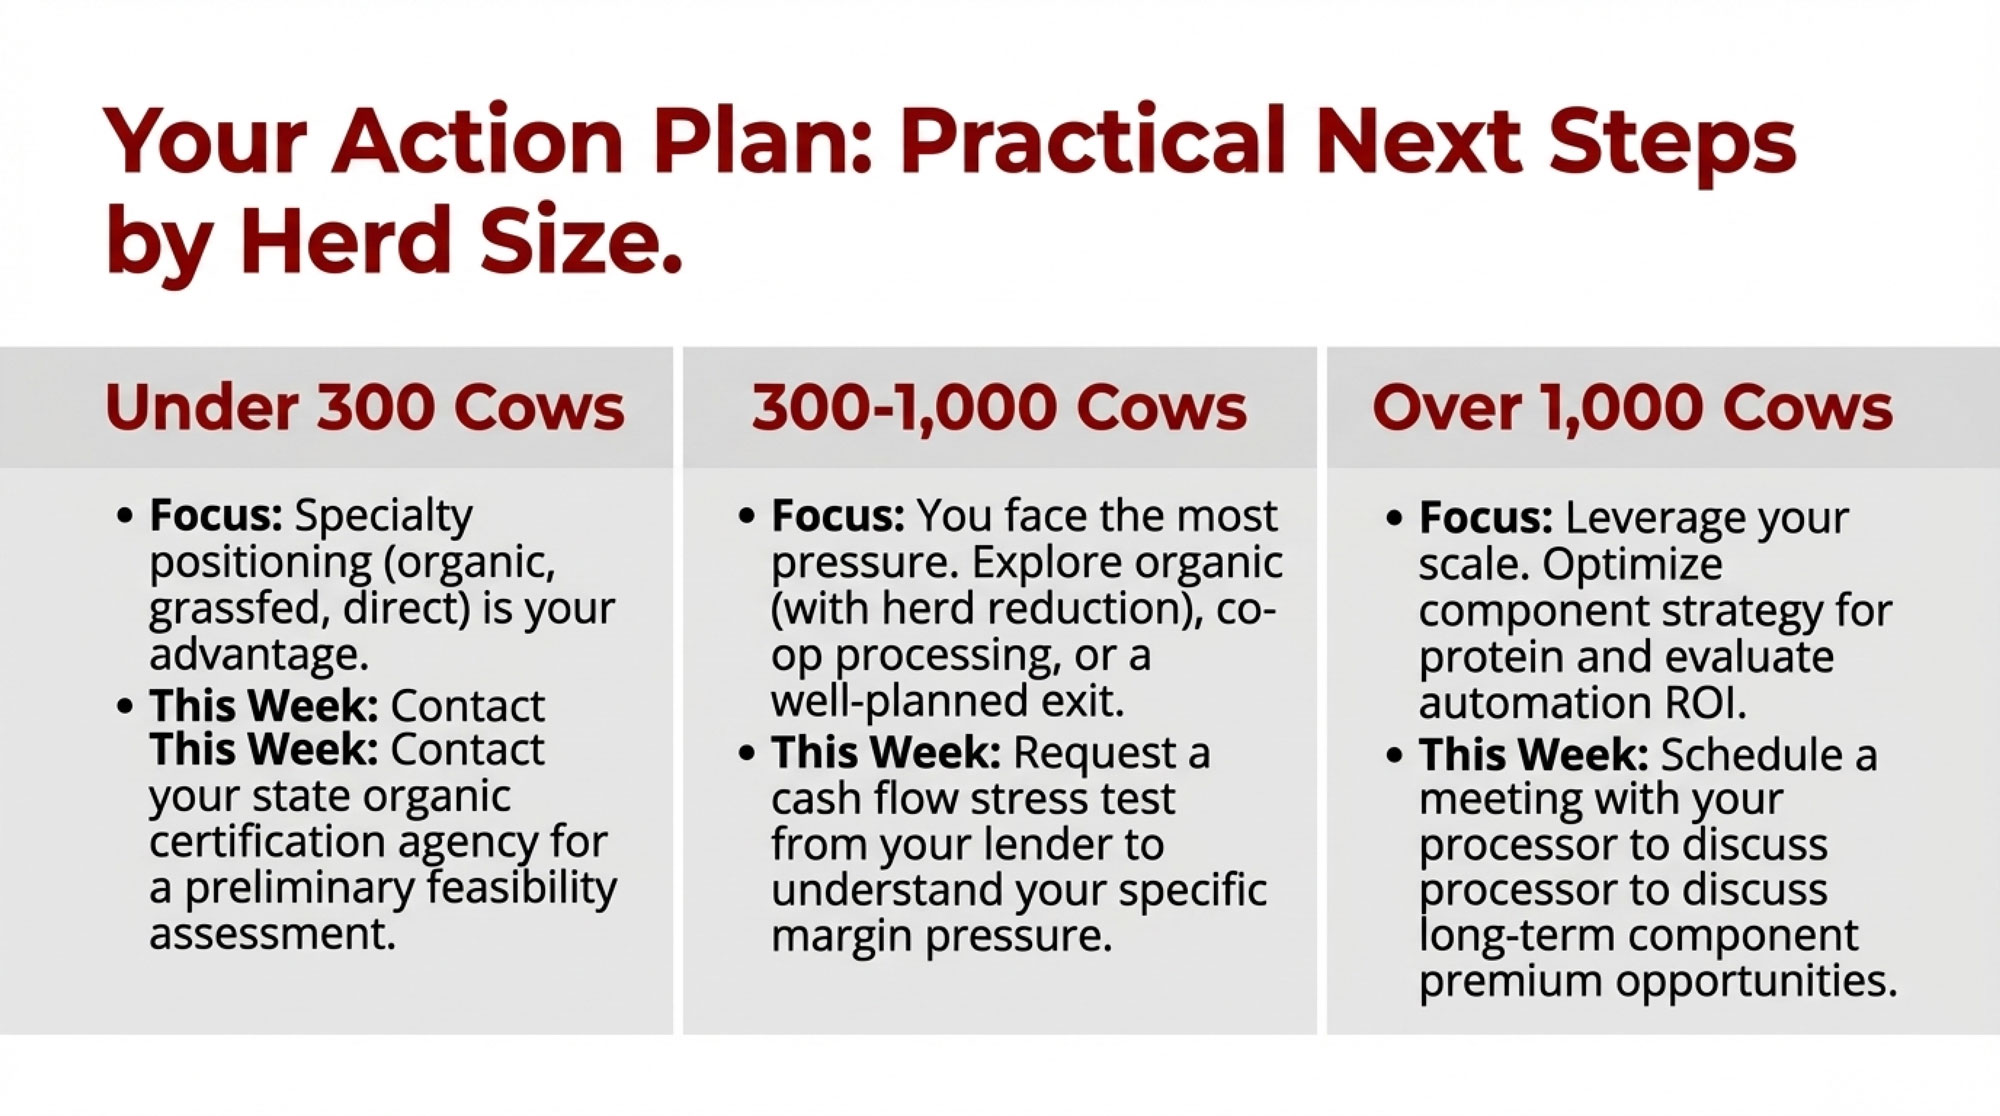
Larger Herds Close to Growing Plants

If you’re milking 800–3,000 cows in eastern South Dakota, western Kansas, the Texas Panhandle, southern Idaho, or near growing plants in Wisconsin or New York, you’re in a spot where processors need your milk. That doesn’t solve everything, but it’s a real advantage.

On farms like yours that seem to be in decent shape, you usually see:

  • Sharp focus on components and cow flow. Butterfat and protein targets are tuned to what nearby cheese and ingredient plants actually pay for, and fresh cow management during the transition period is geared to support strong peaks without wrecking cows.
  • Structured breeding and replacement plans. Genomics and sexed semen build replacements from the top of the herd; beef‑on‑dairy is used thoughtfully on the bottom end to boost calf revenue without starving replacements.
  • Habitual risk management. DRP, DMC, options, and feed contracts are used when the math works, not just when the market is already in free fall.
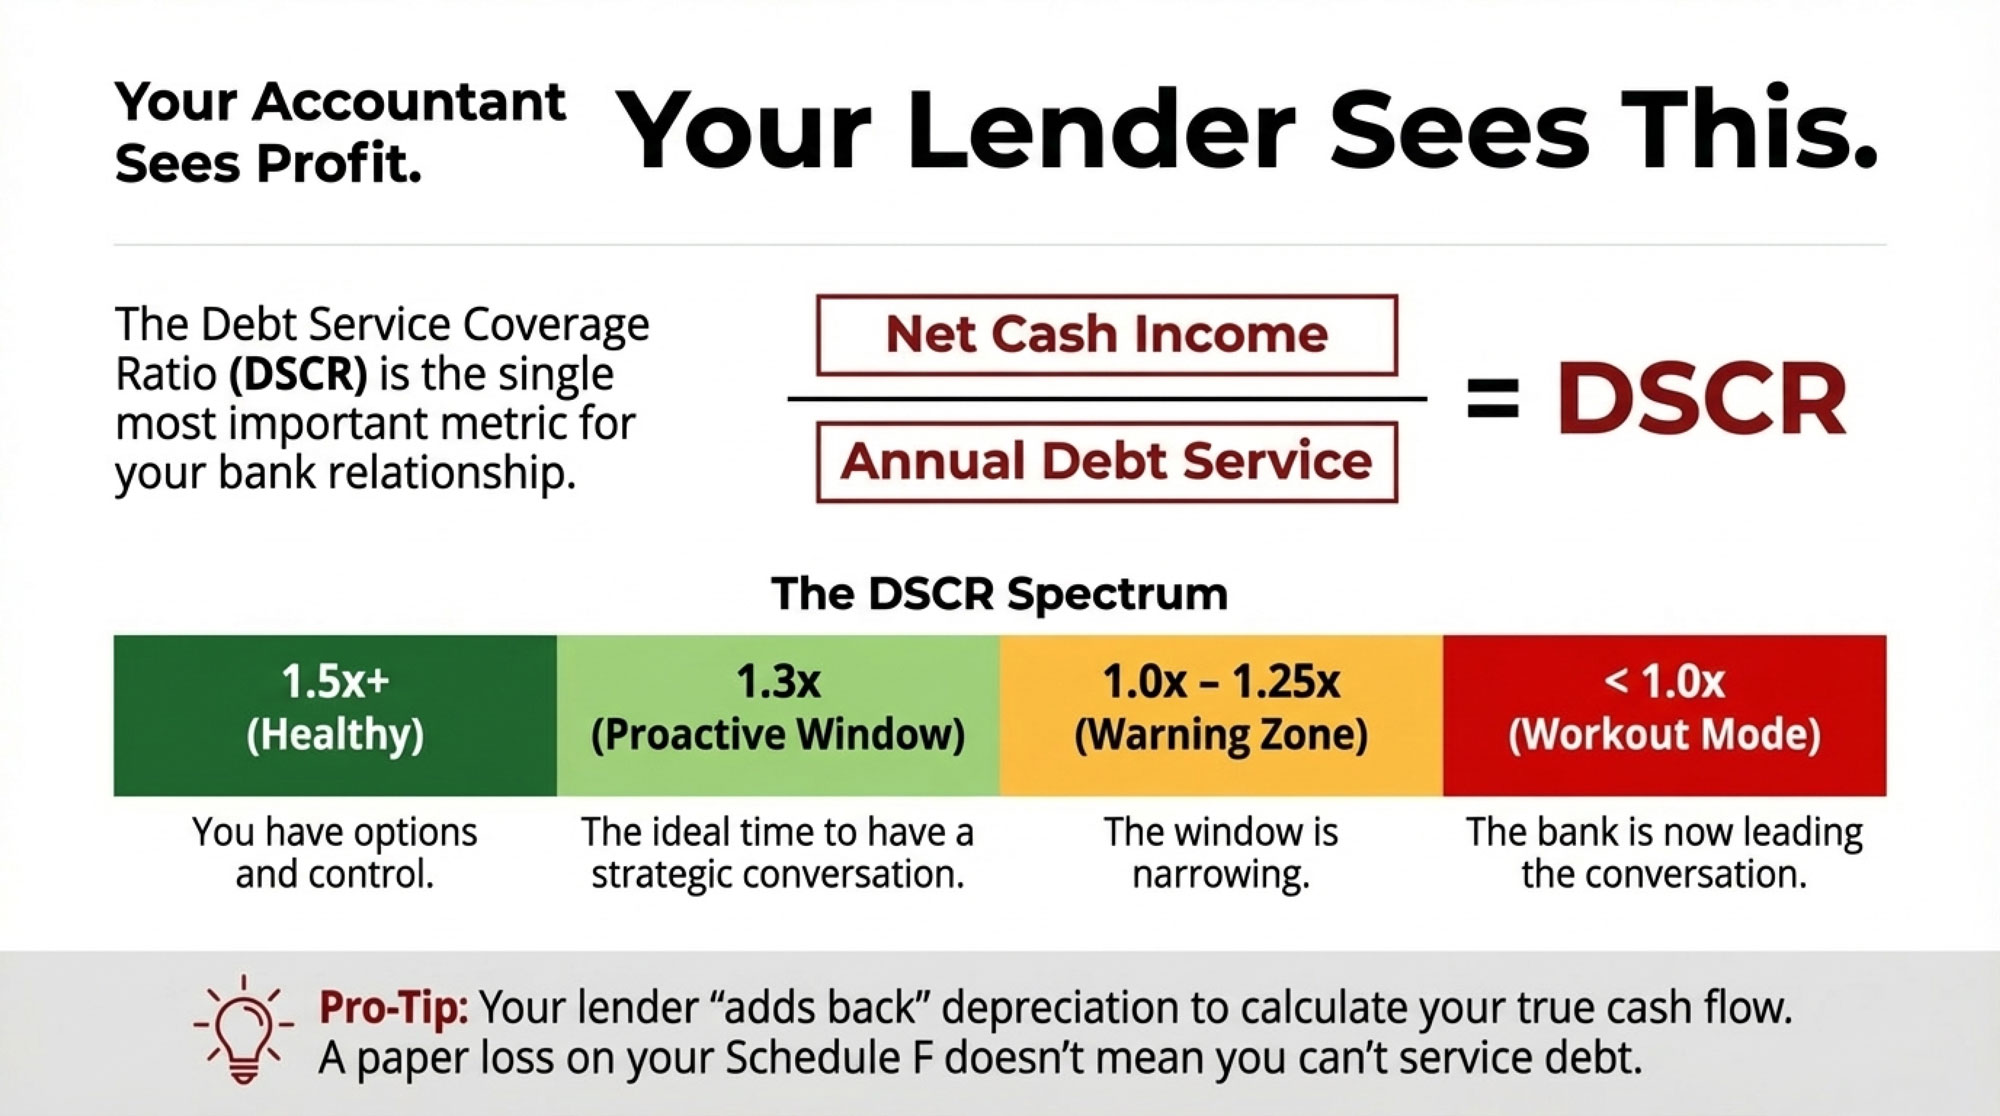
  • Cautious growth decisions. Expansion plans are stress‑tested against lower milk prices and higher costs, often with lender and adviser input, not just modeled on today’s strong basis.

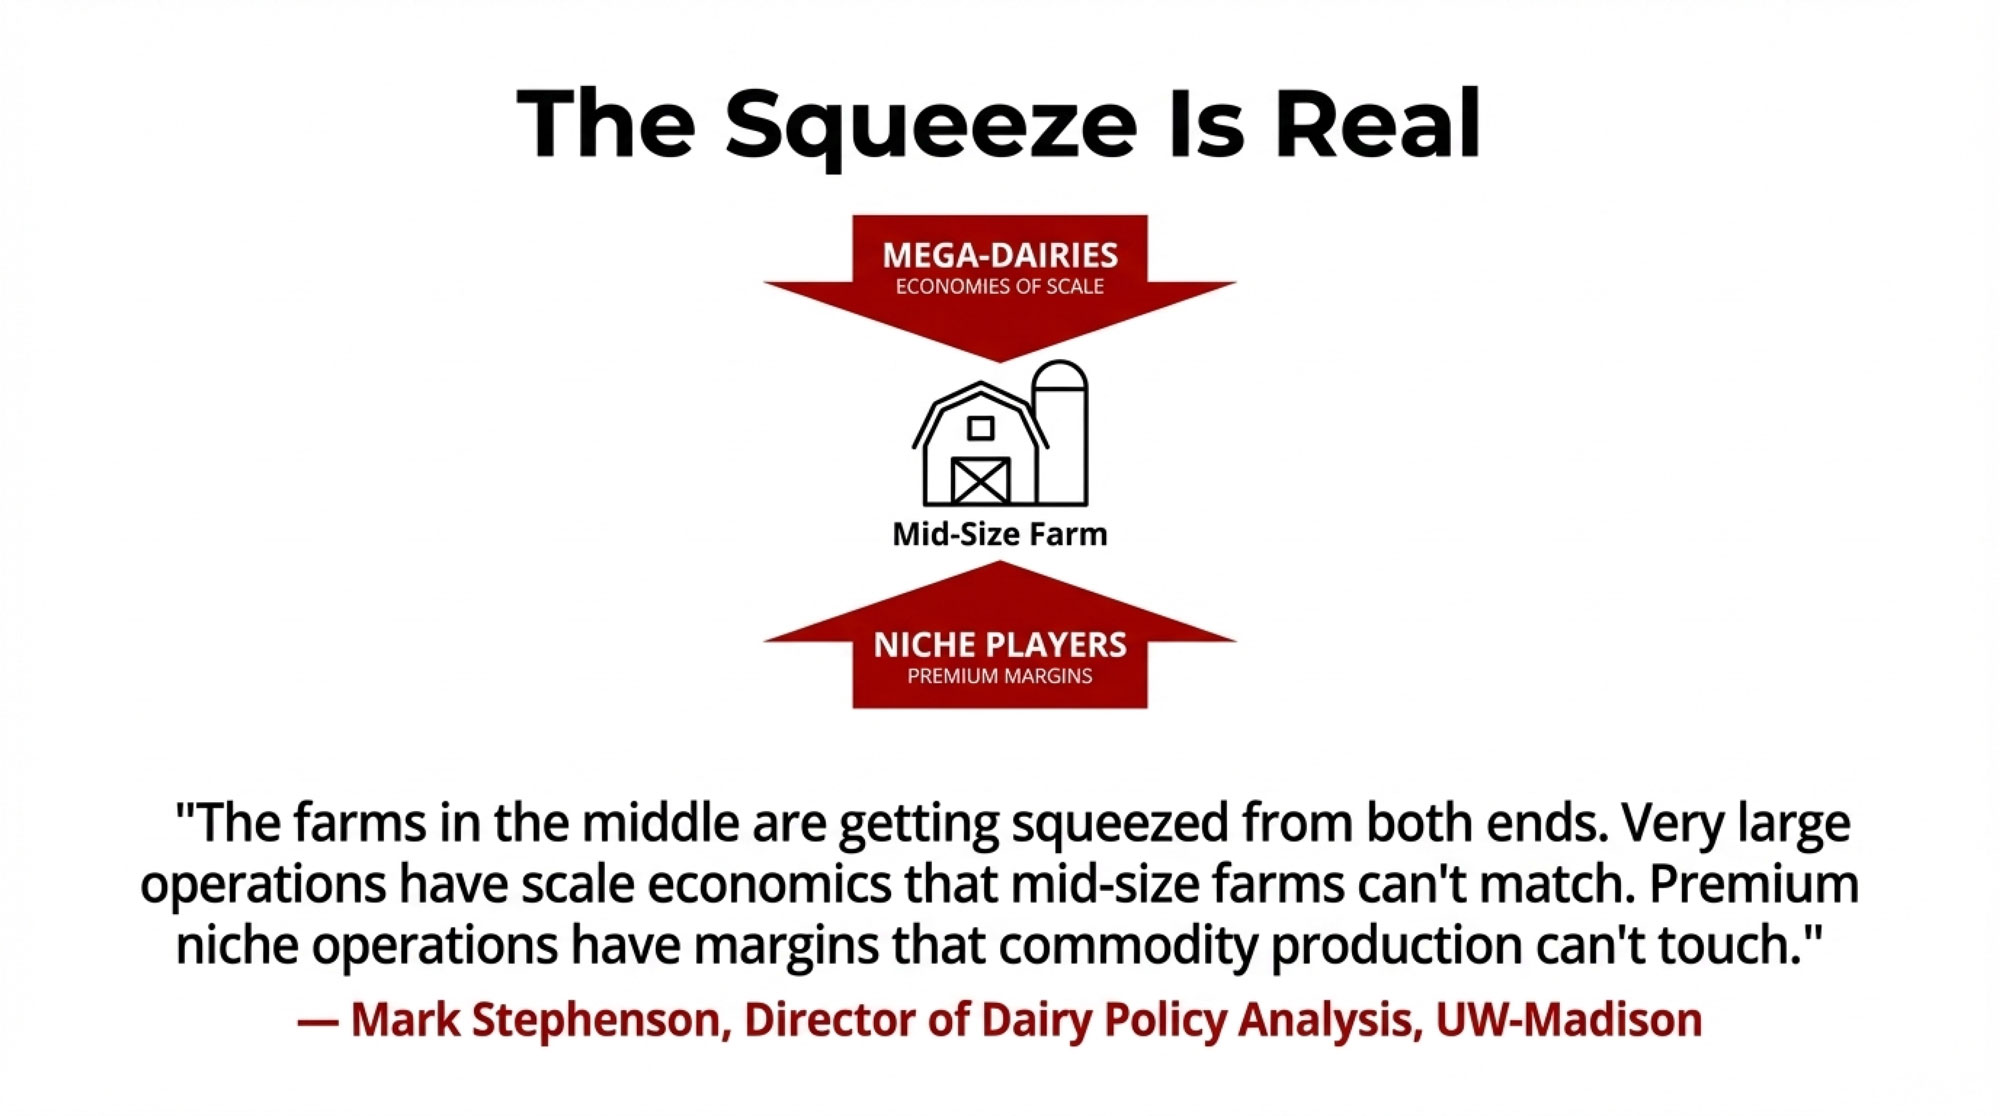
Mid‑Size Herds in Stable Regions

If you’re running 400–800 cows in places like Wisconsin, Michigan, Pennsylvania, Vermont, or Southern Ontario, you’re big enough to feel serious capital pressure but not always big enough to be your plant’s top priority.

Mid‑size herds that look resilient tend to:

  • Drive the cost of production hard. They lean into cow comfort, parlor throughput, and ration consistency to get into the top third of their region’s cost curve, using benchmarks from lenders, extension, and trade media.
  • Make themselves “must‑keep” suppliers. Plants know they can count on them for consistent volume, strong quality, and components that fit the product mix.
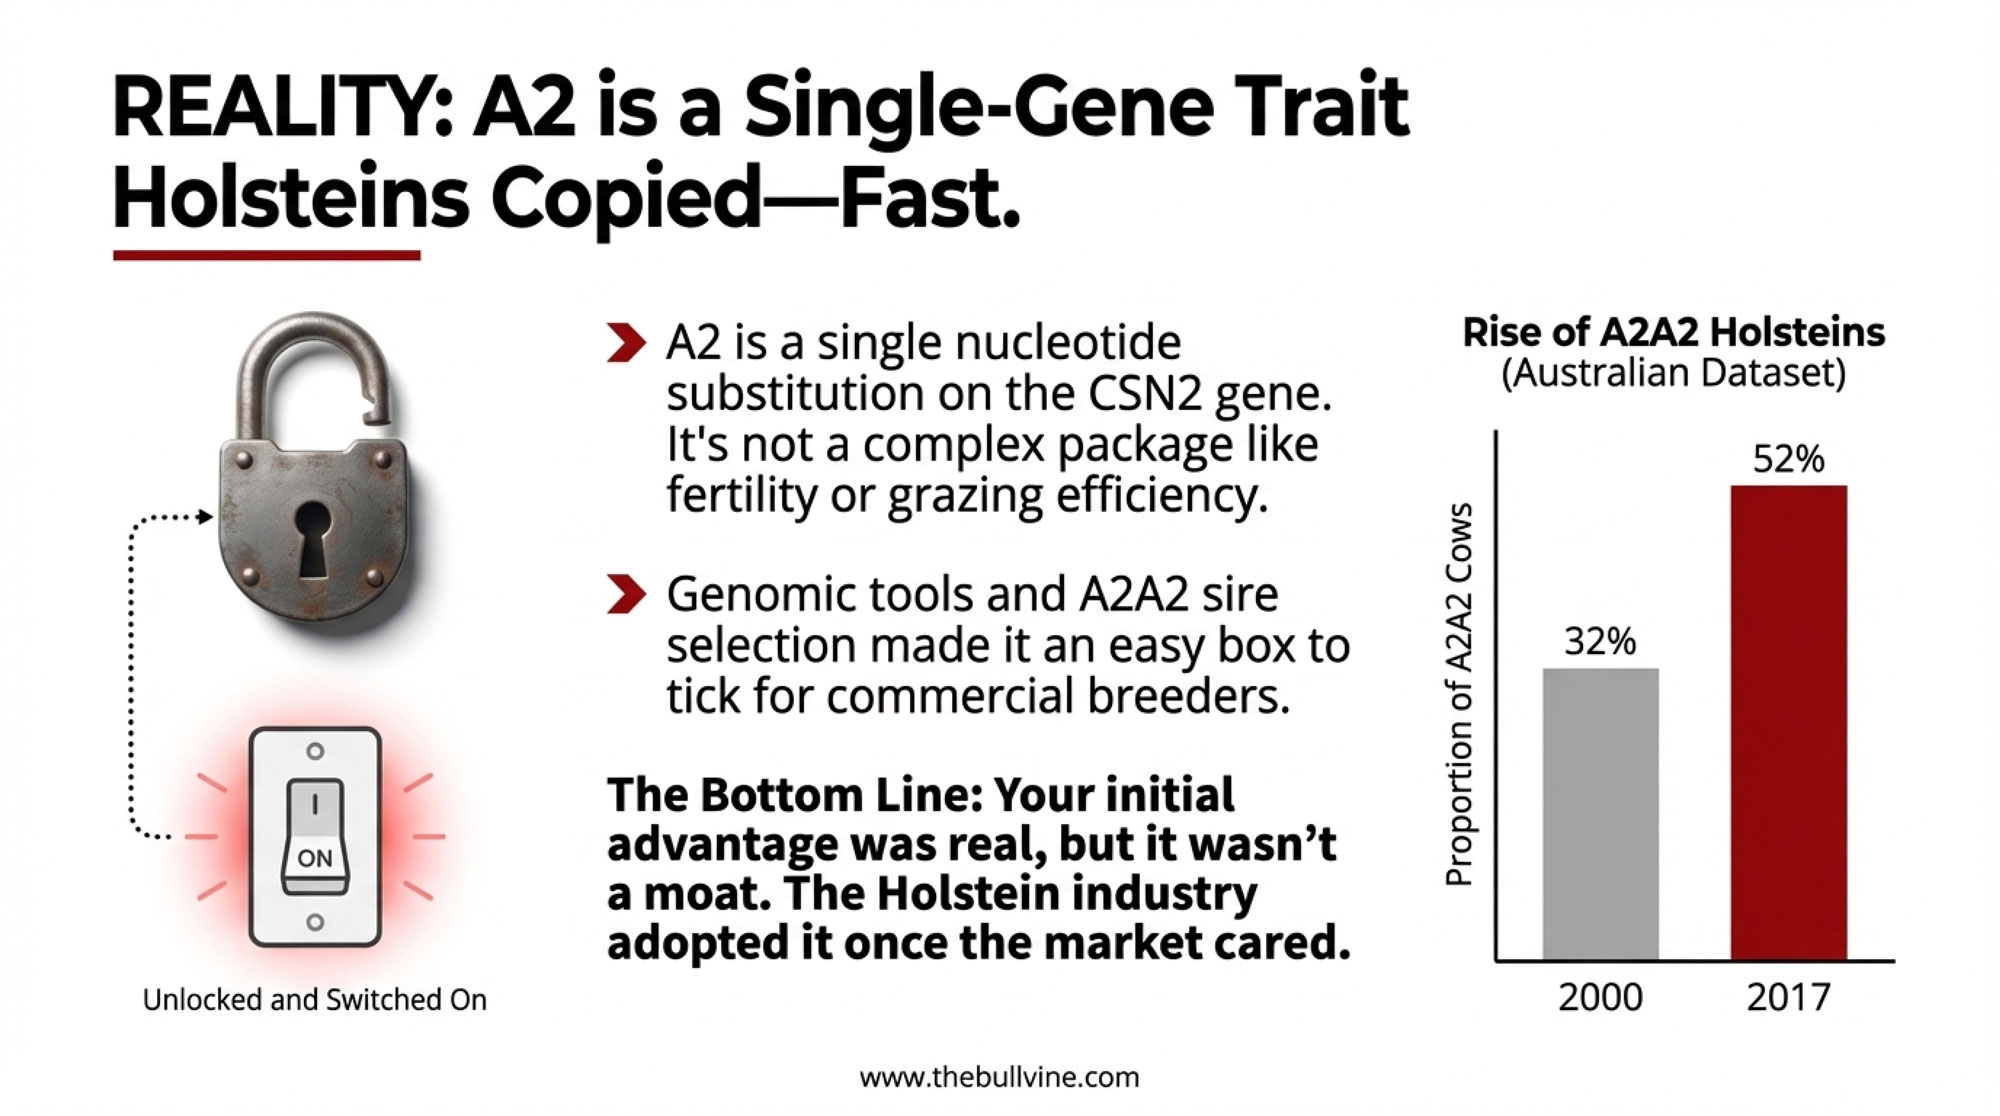
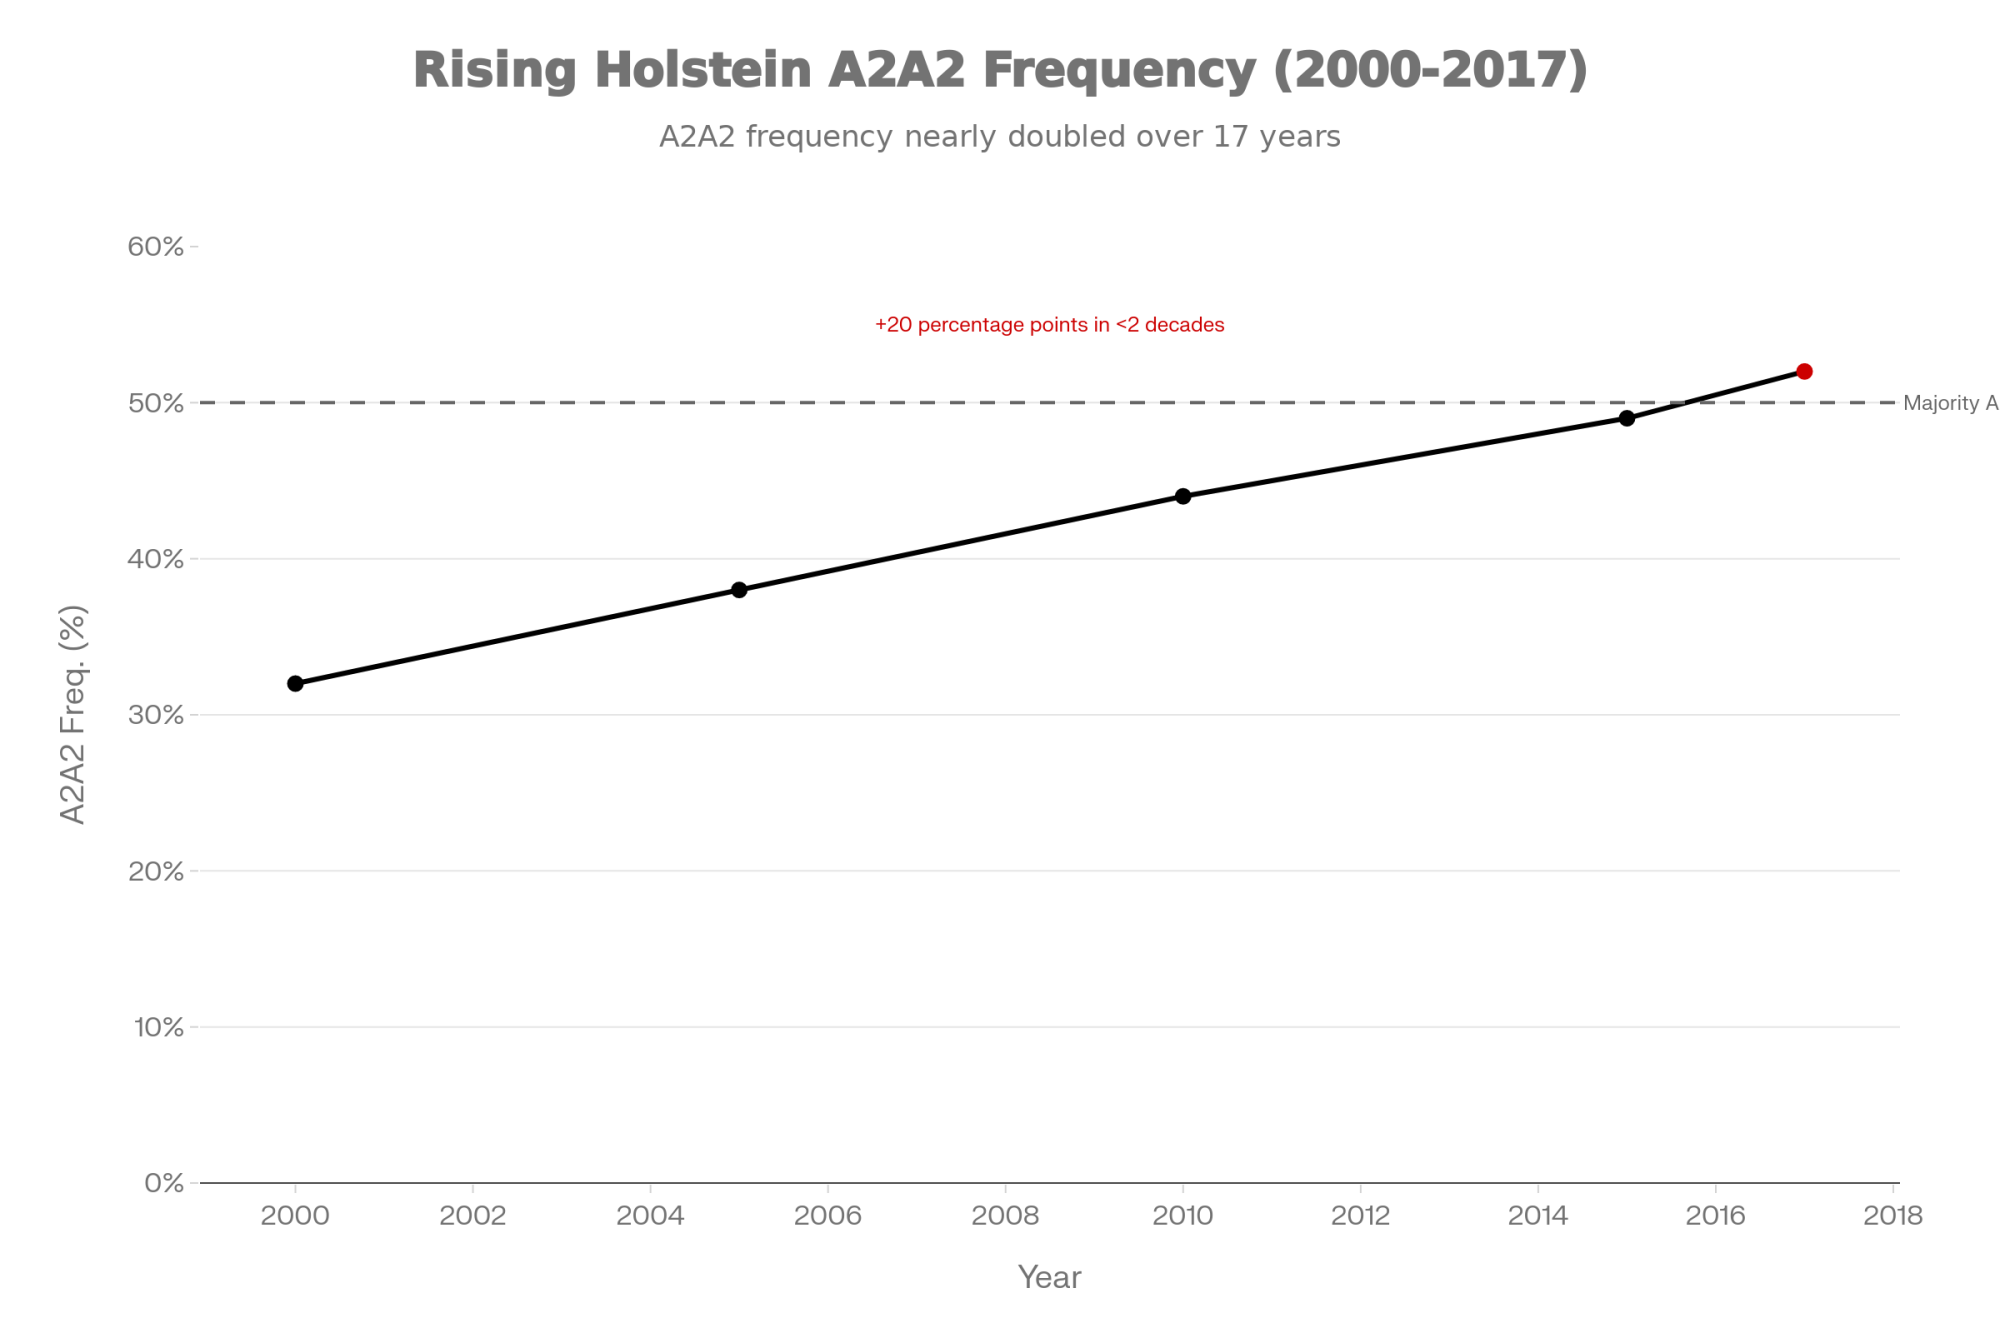
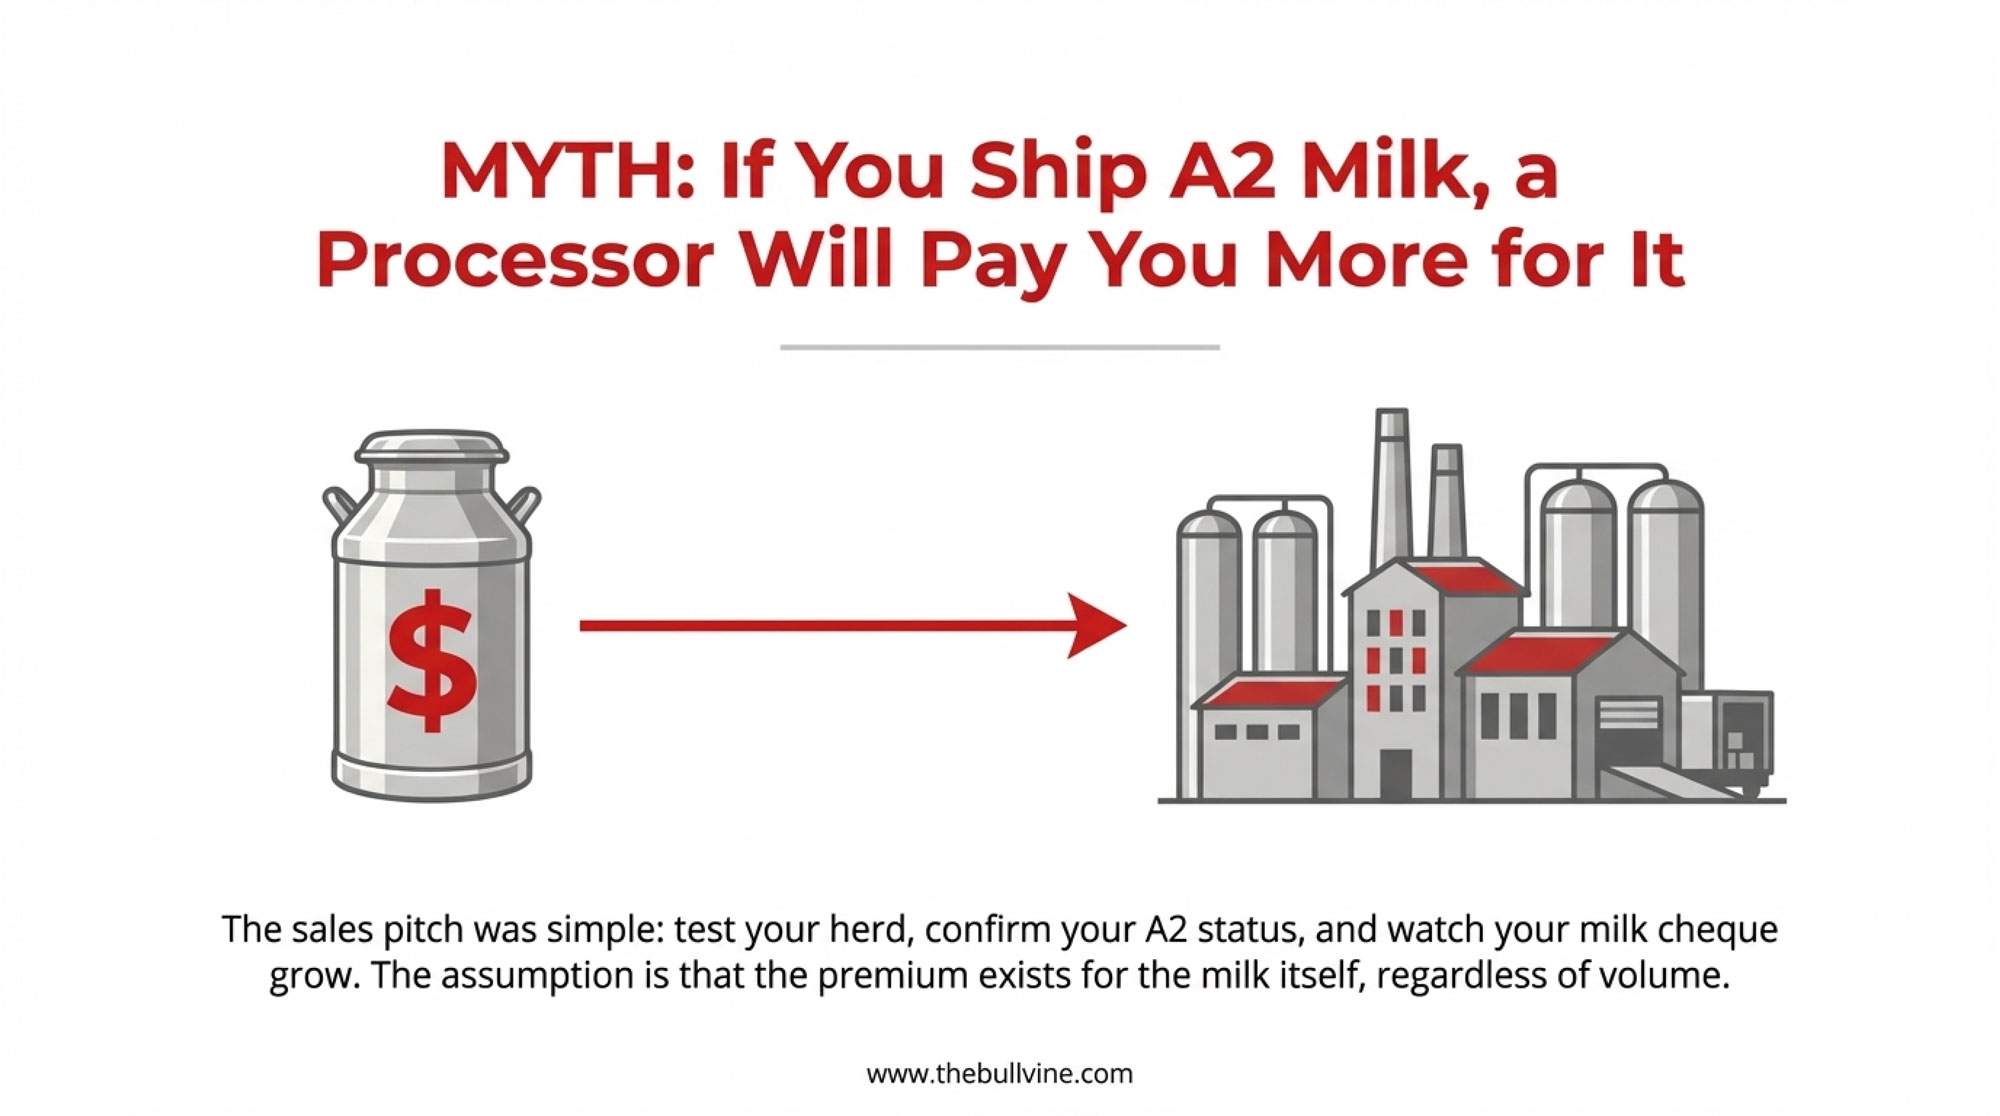
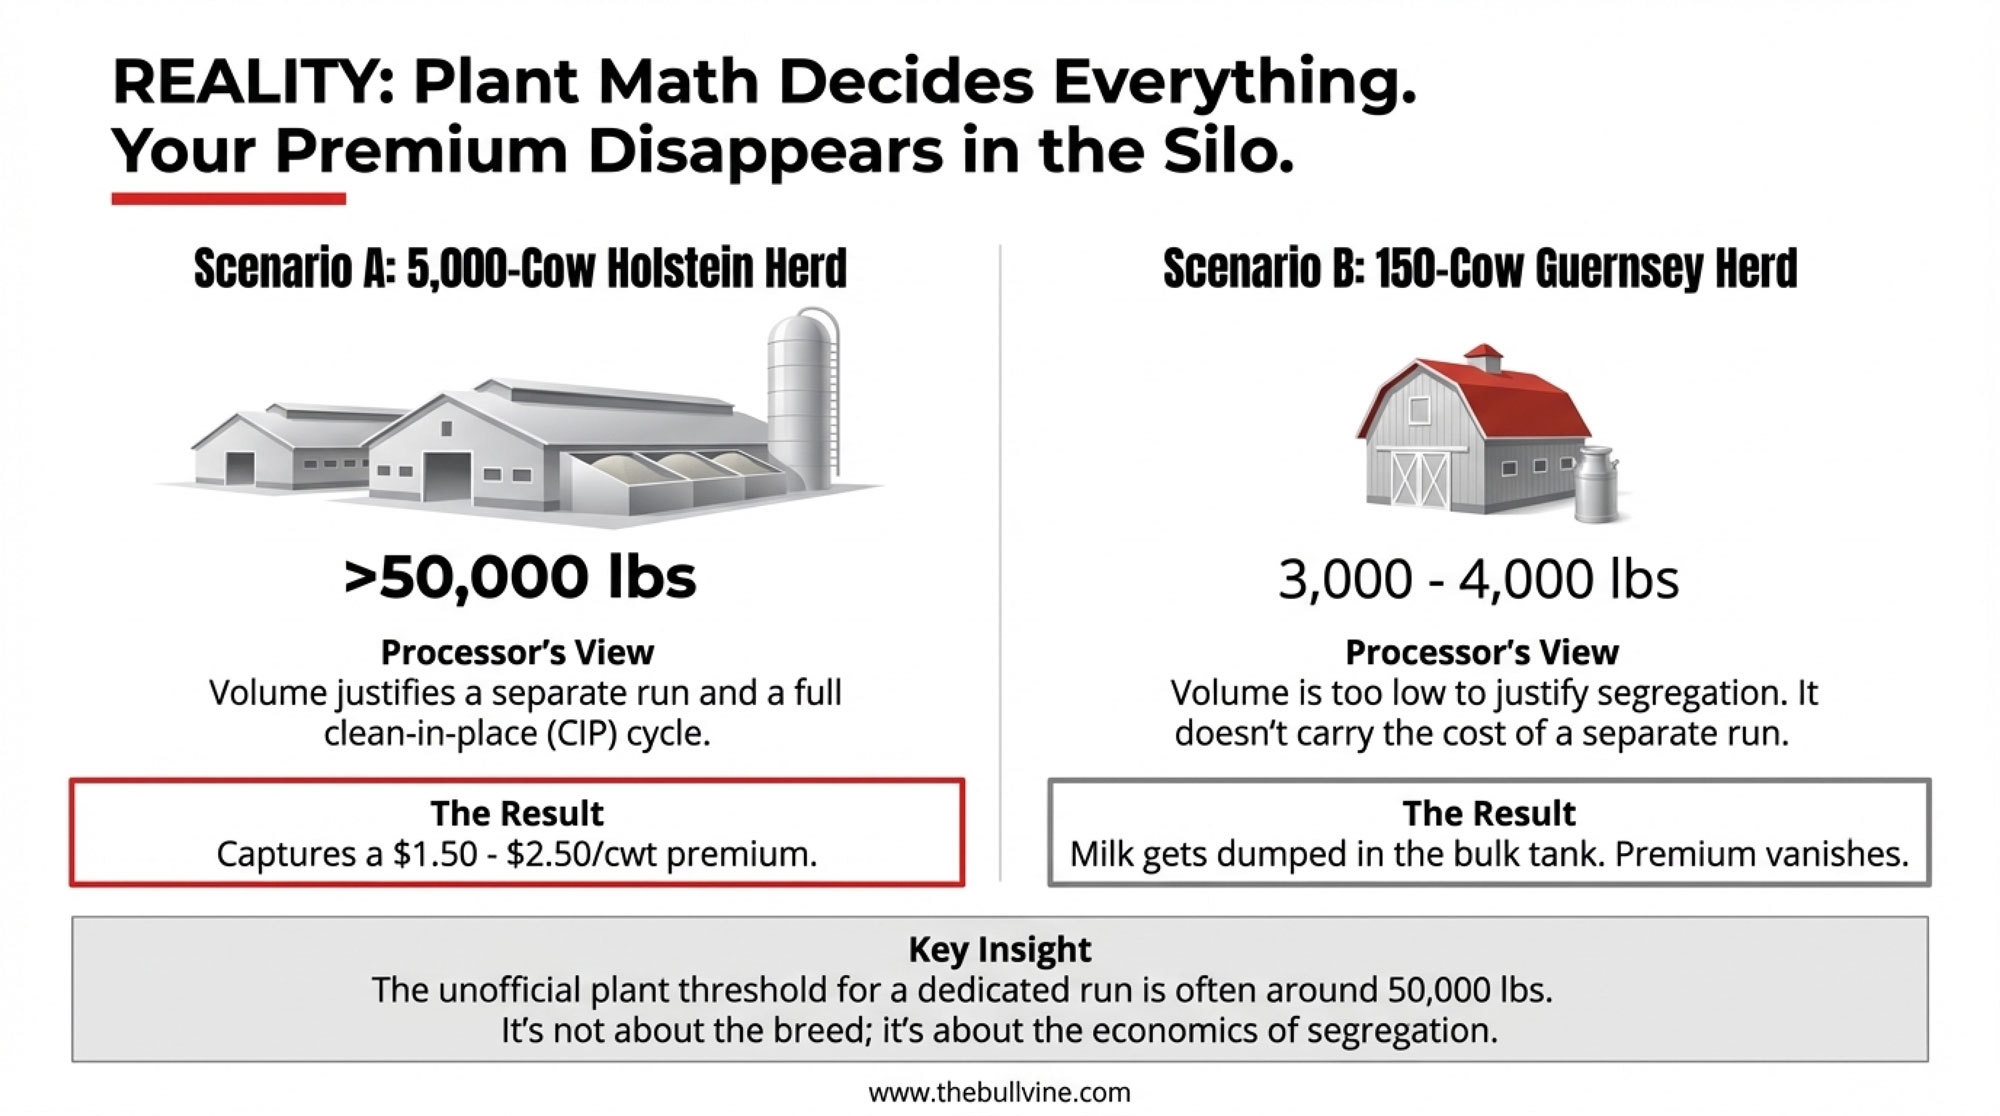
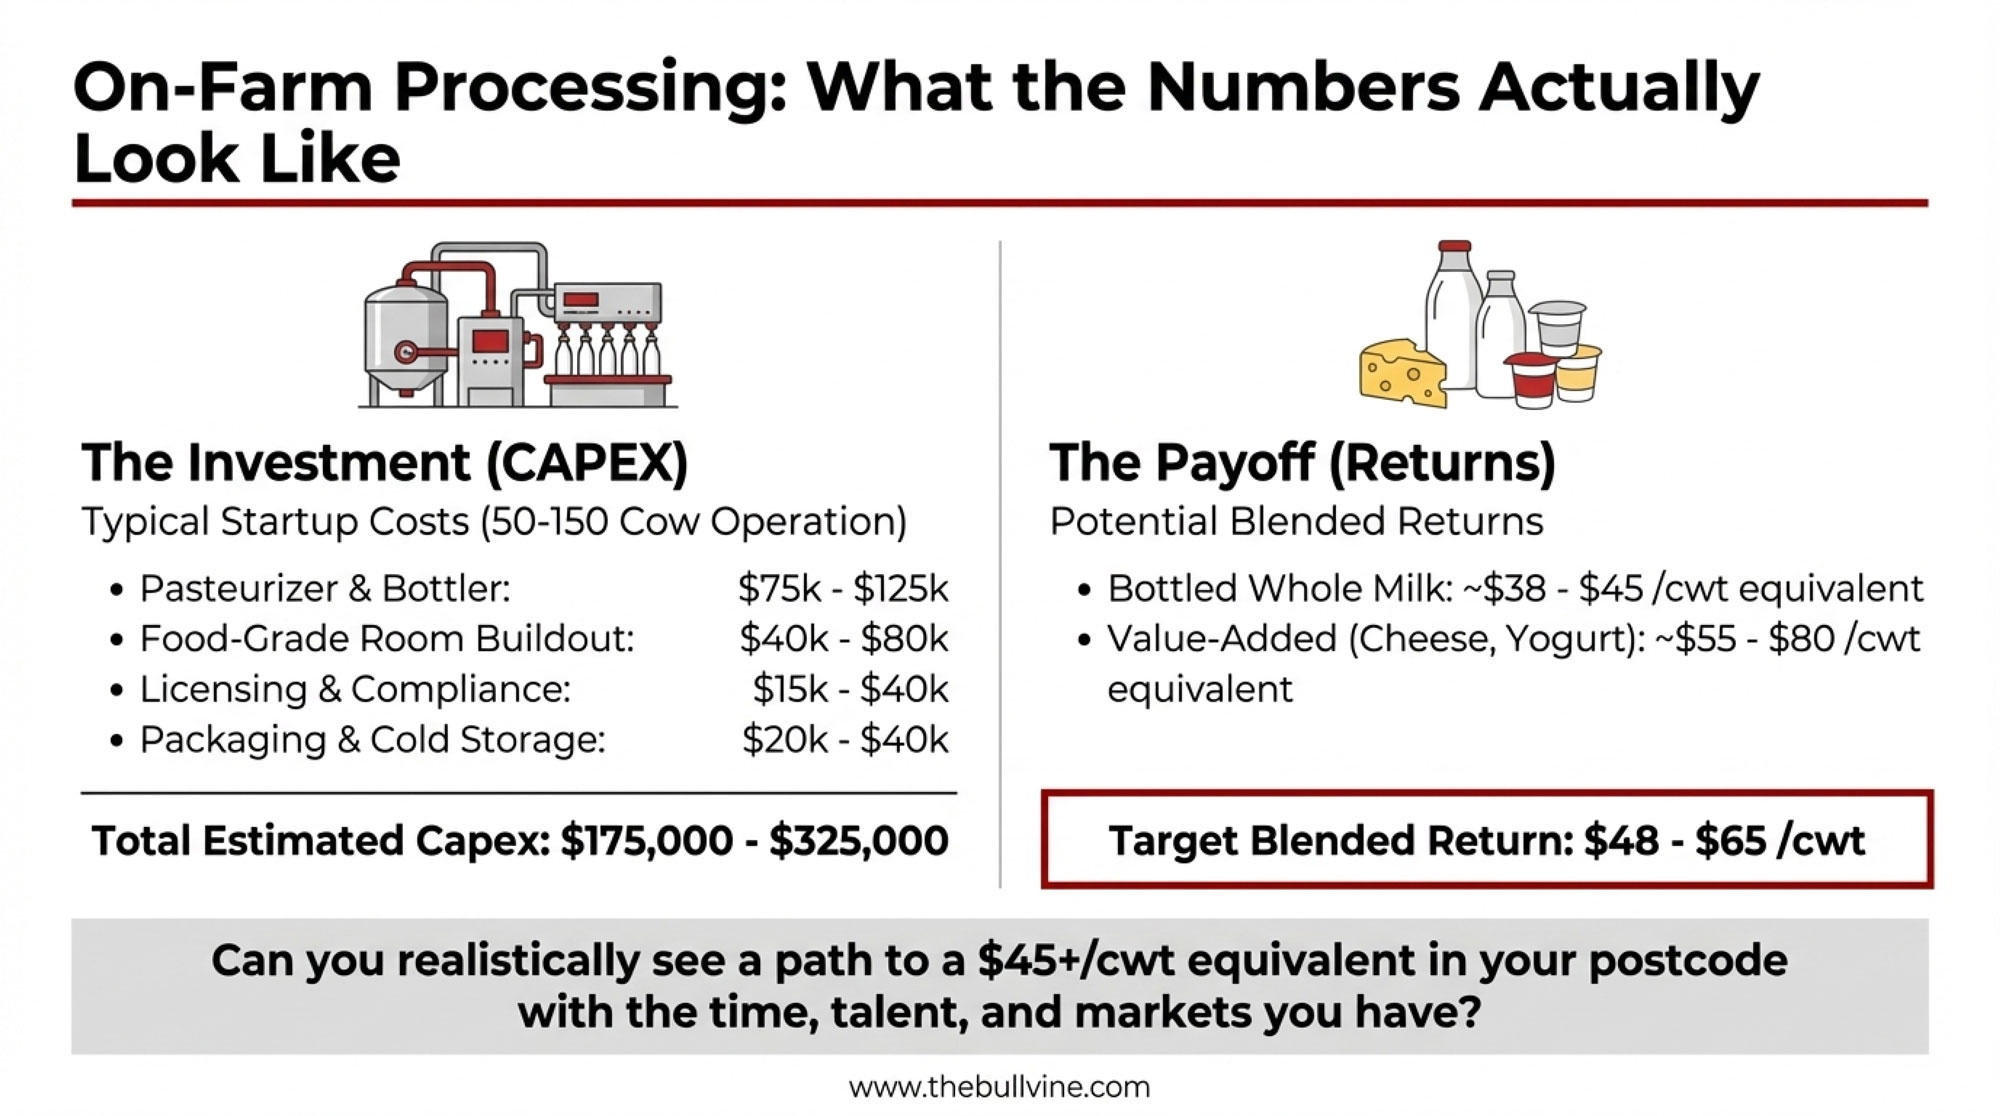
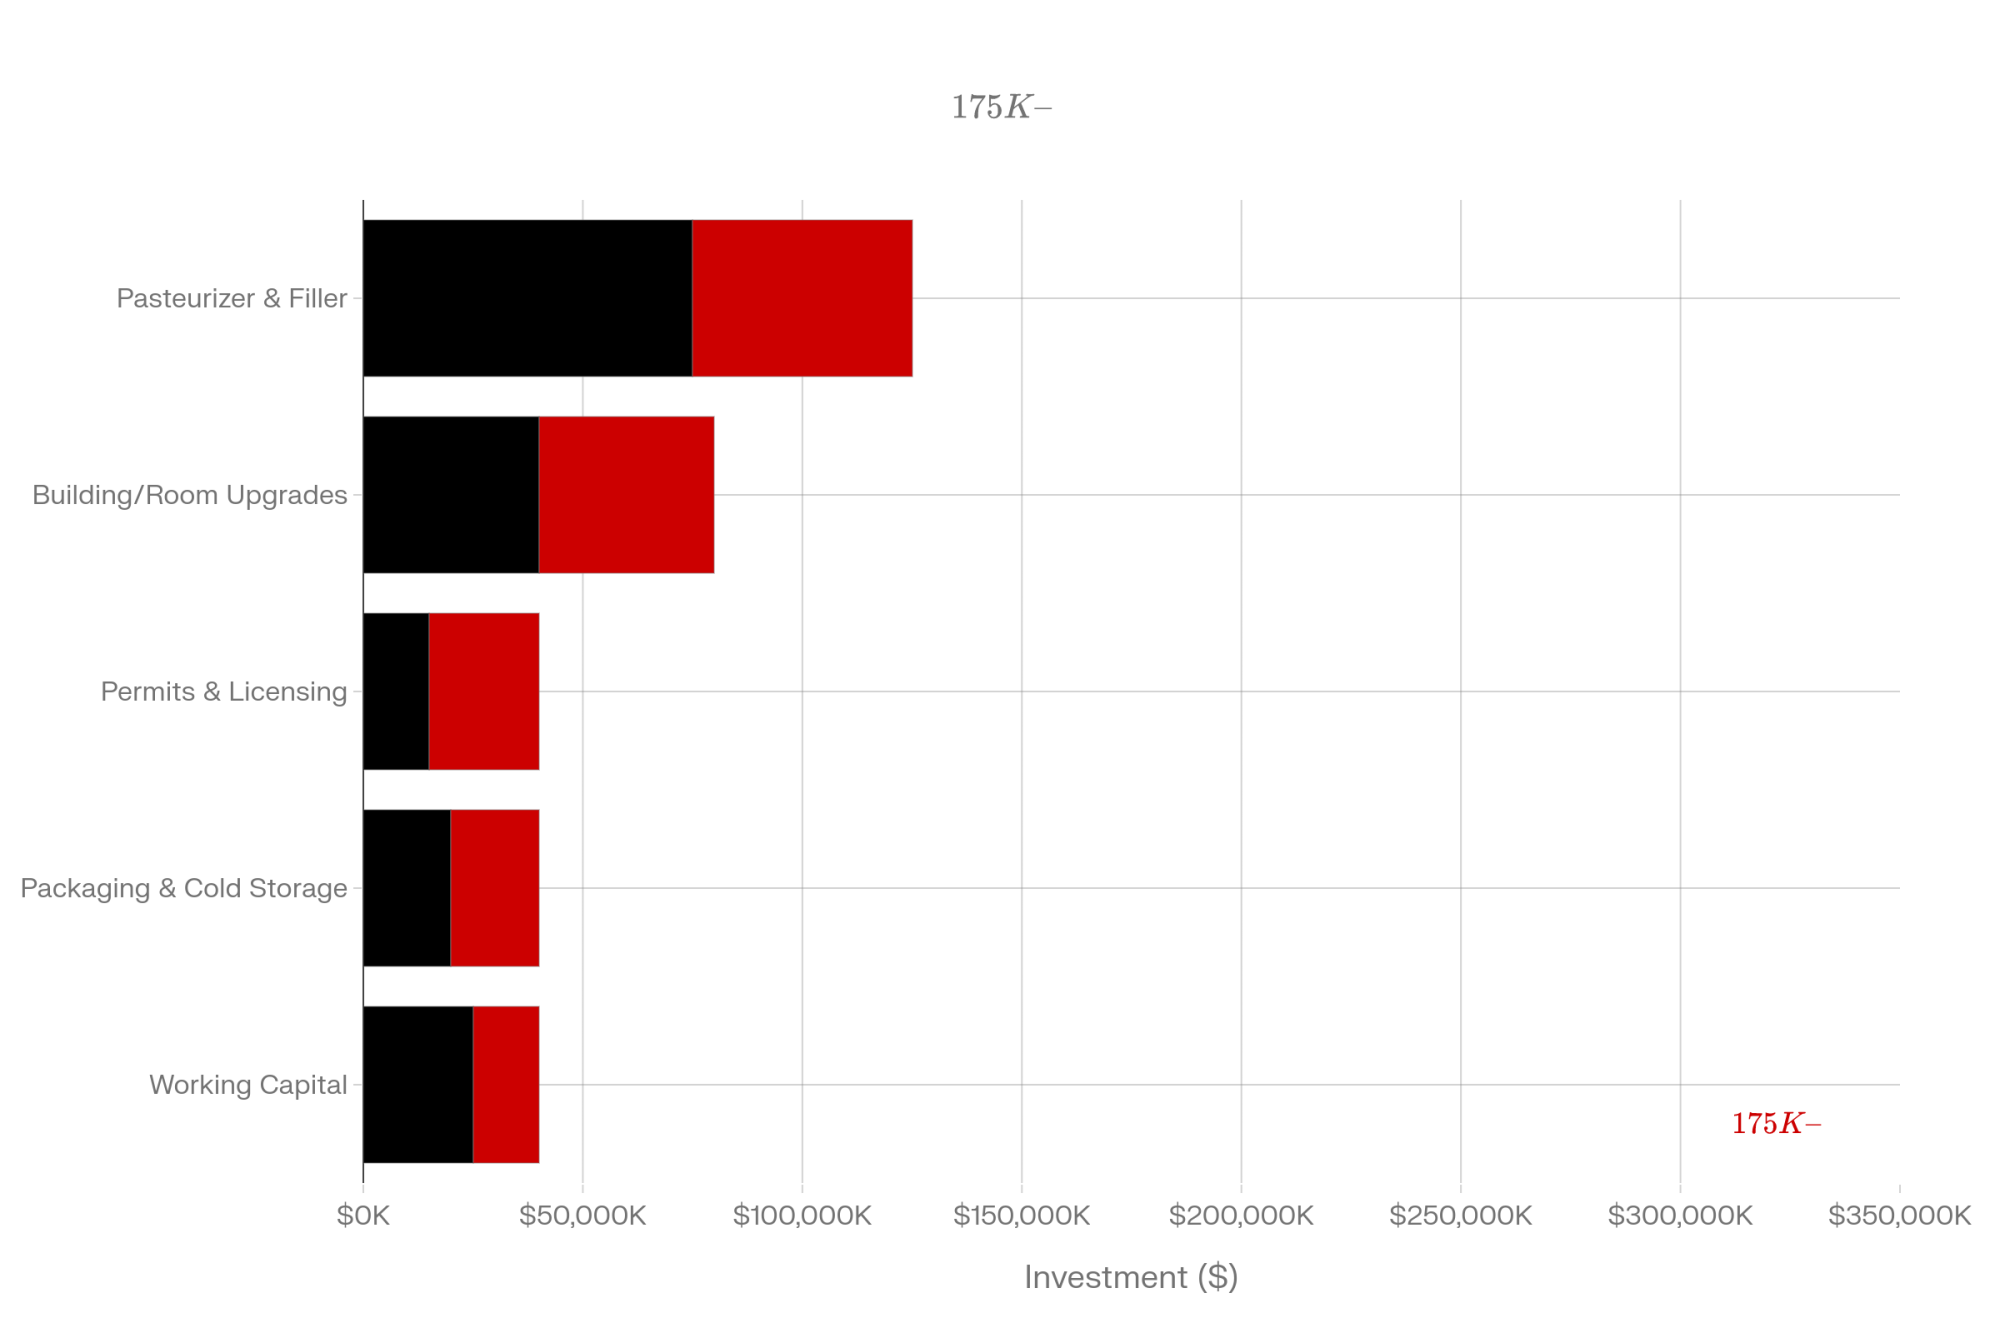
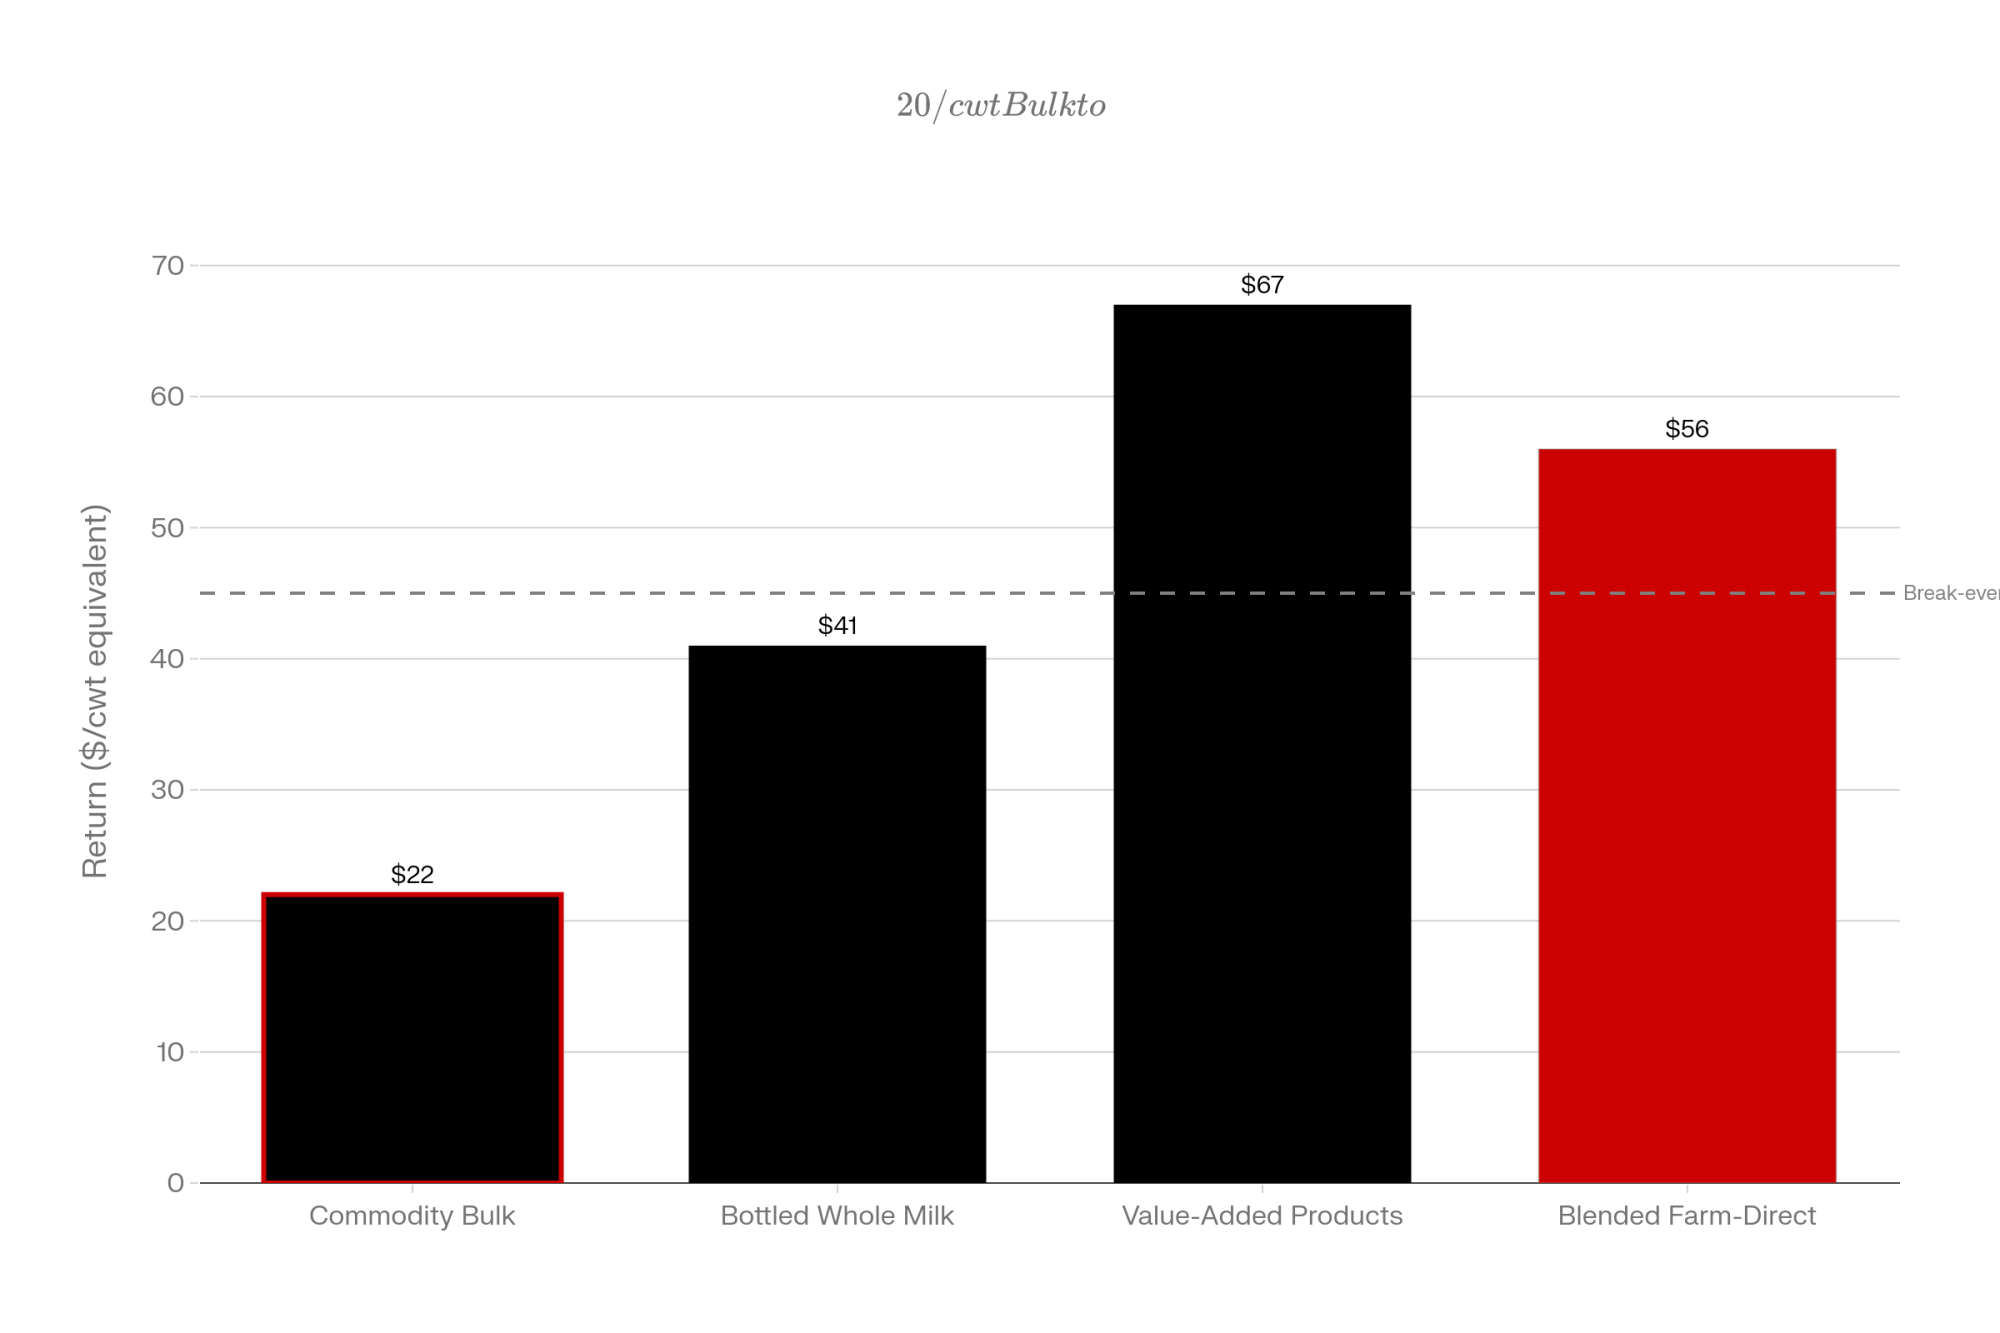
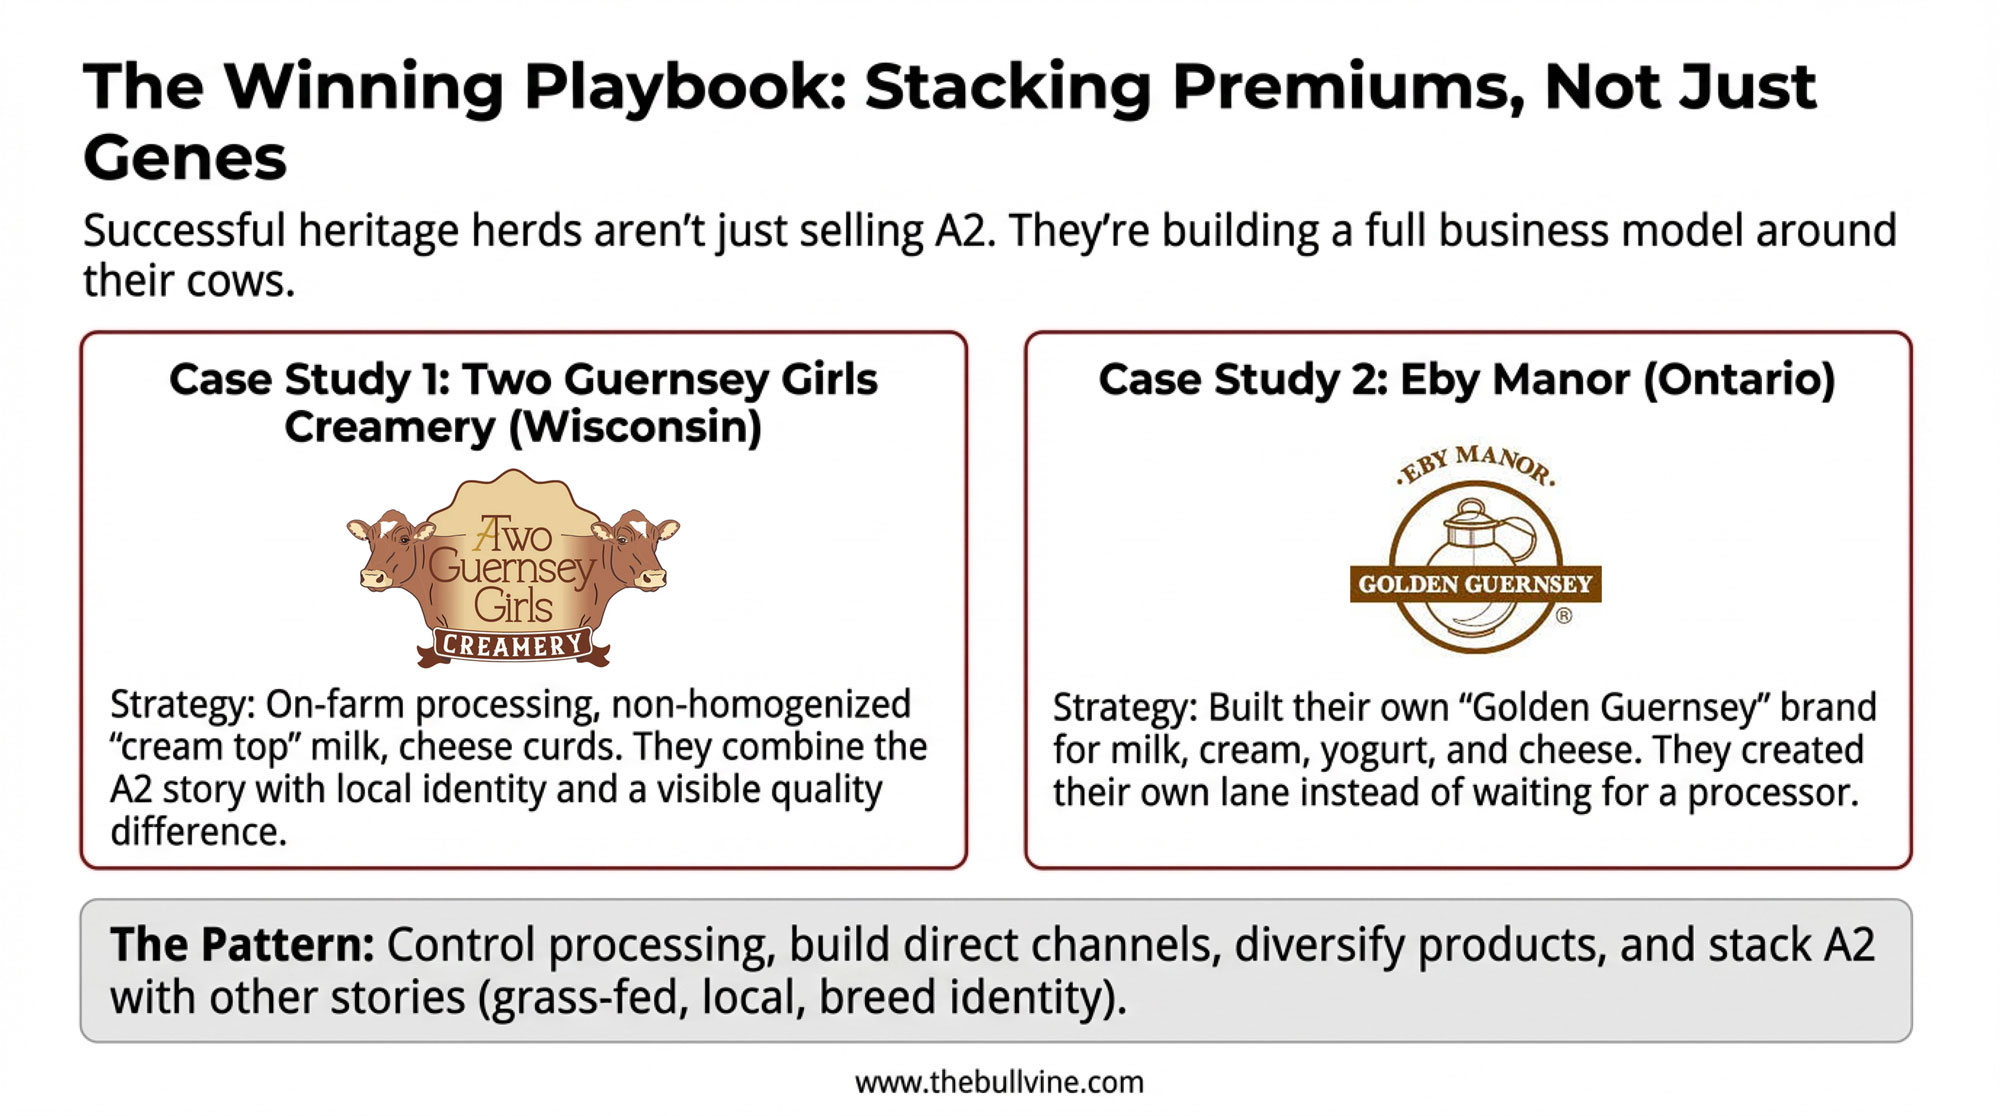
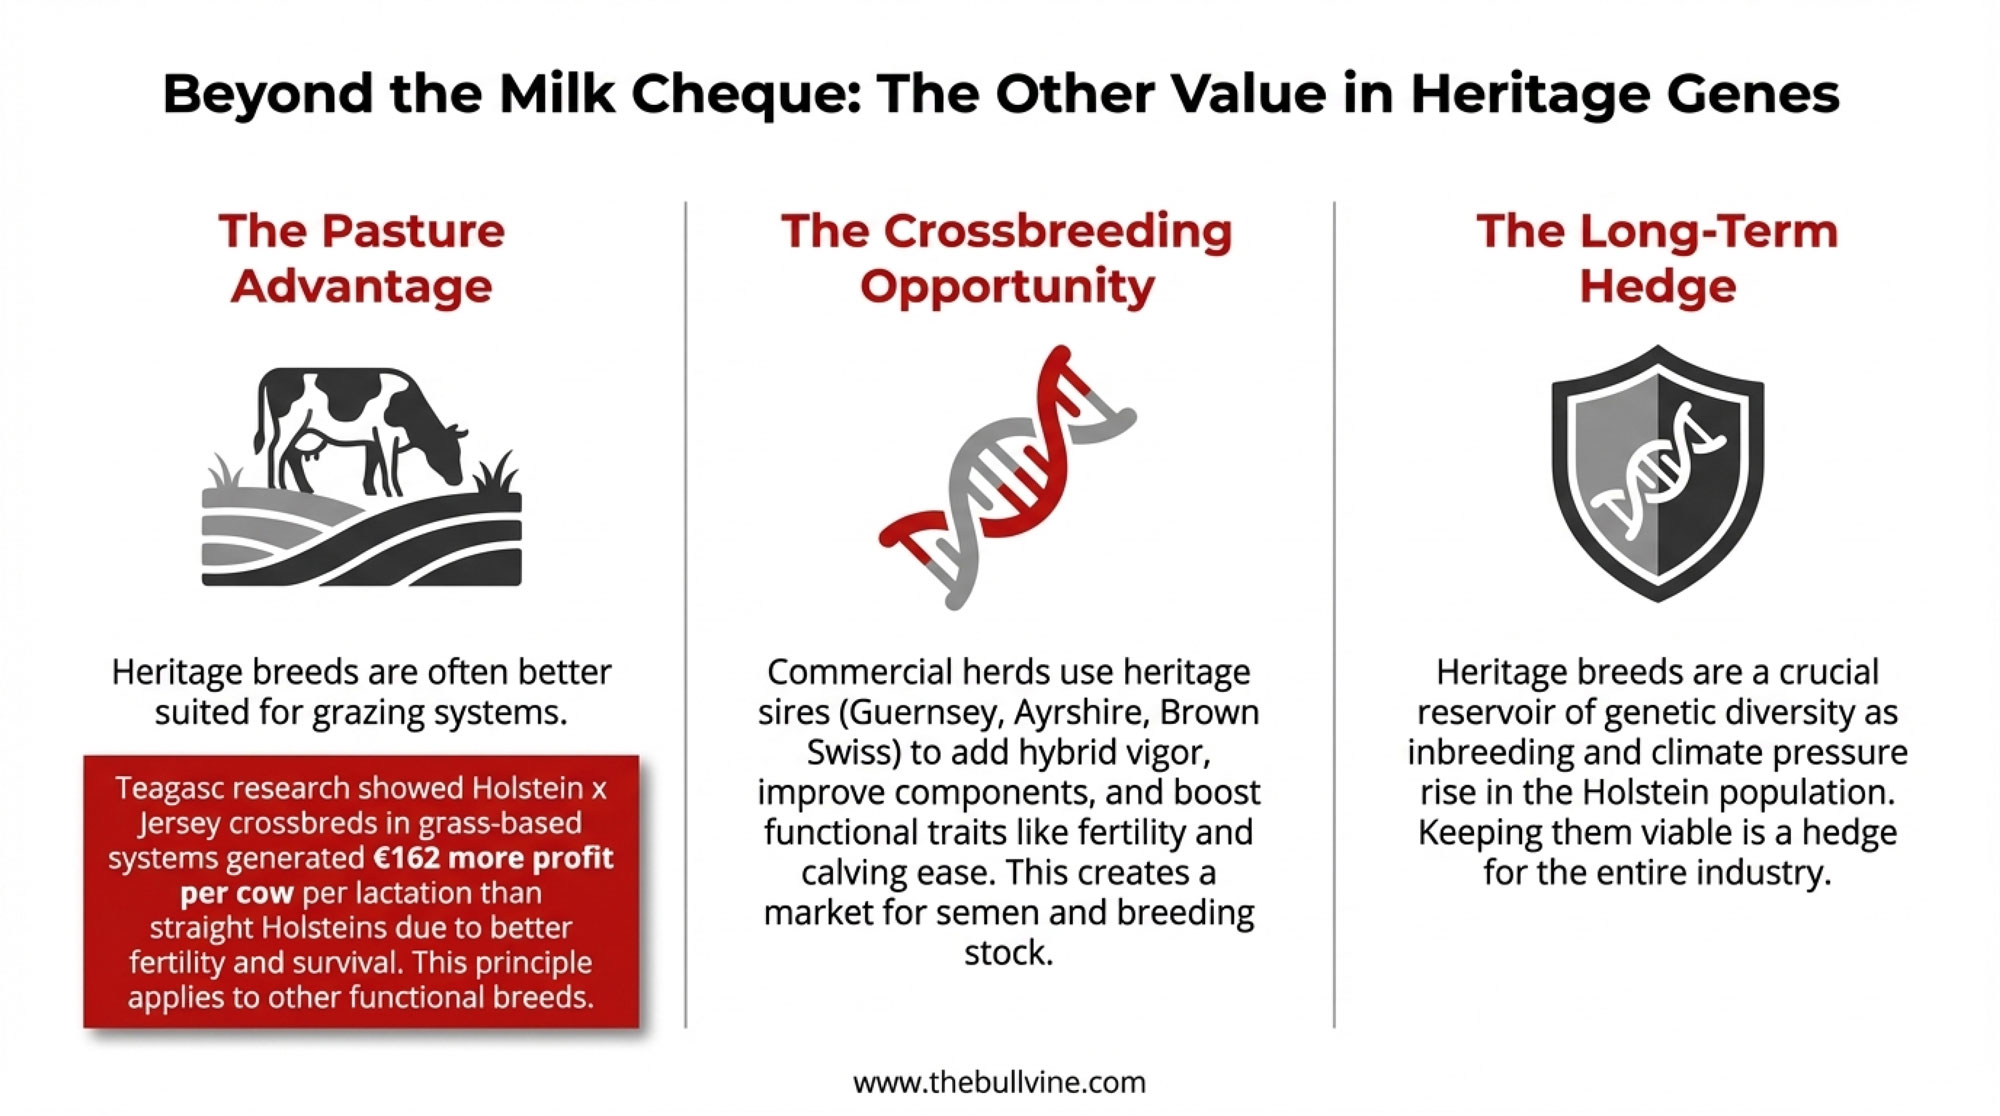
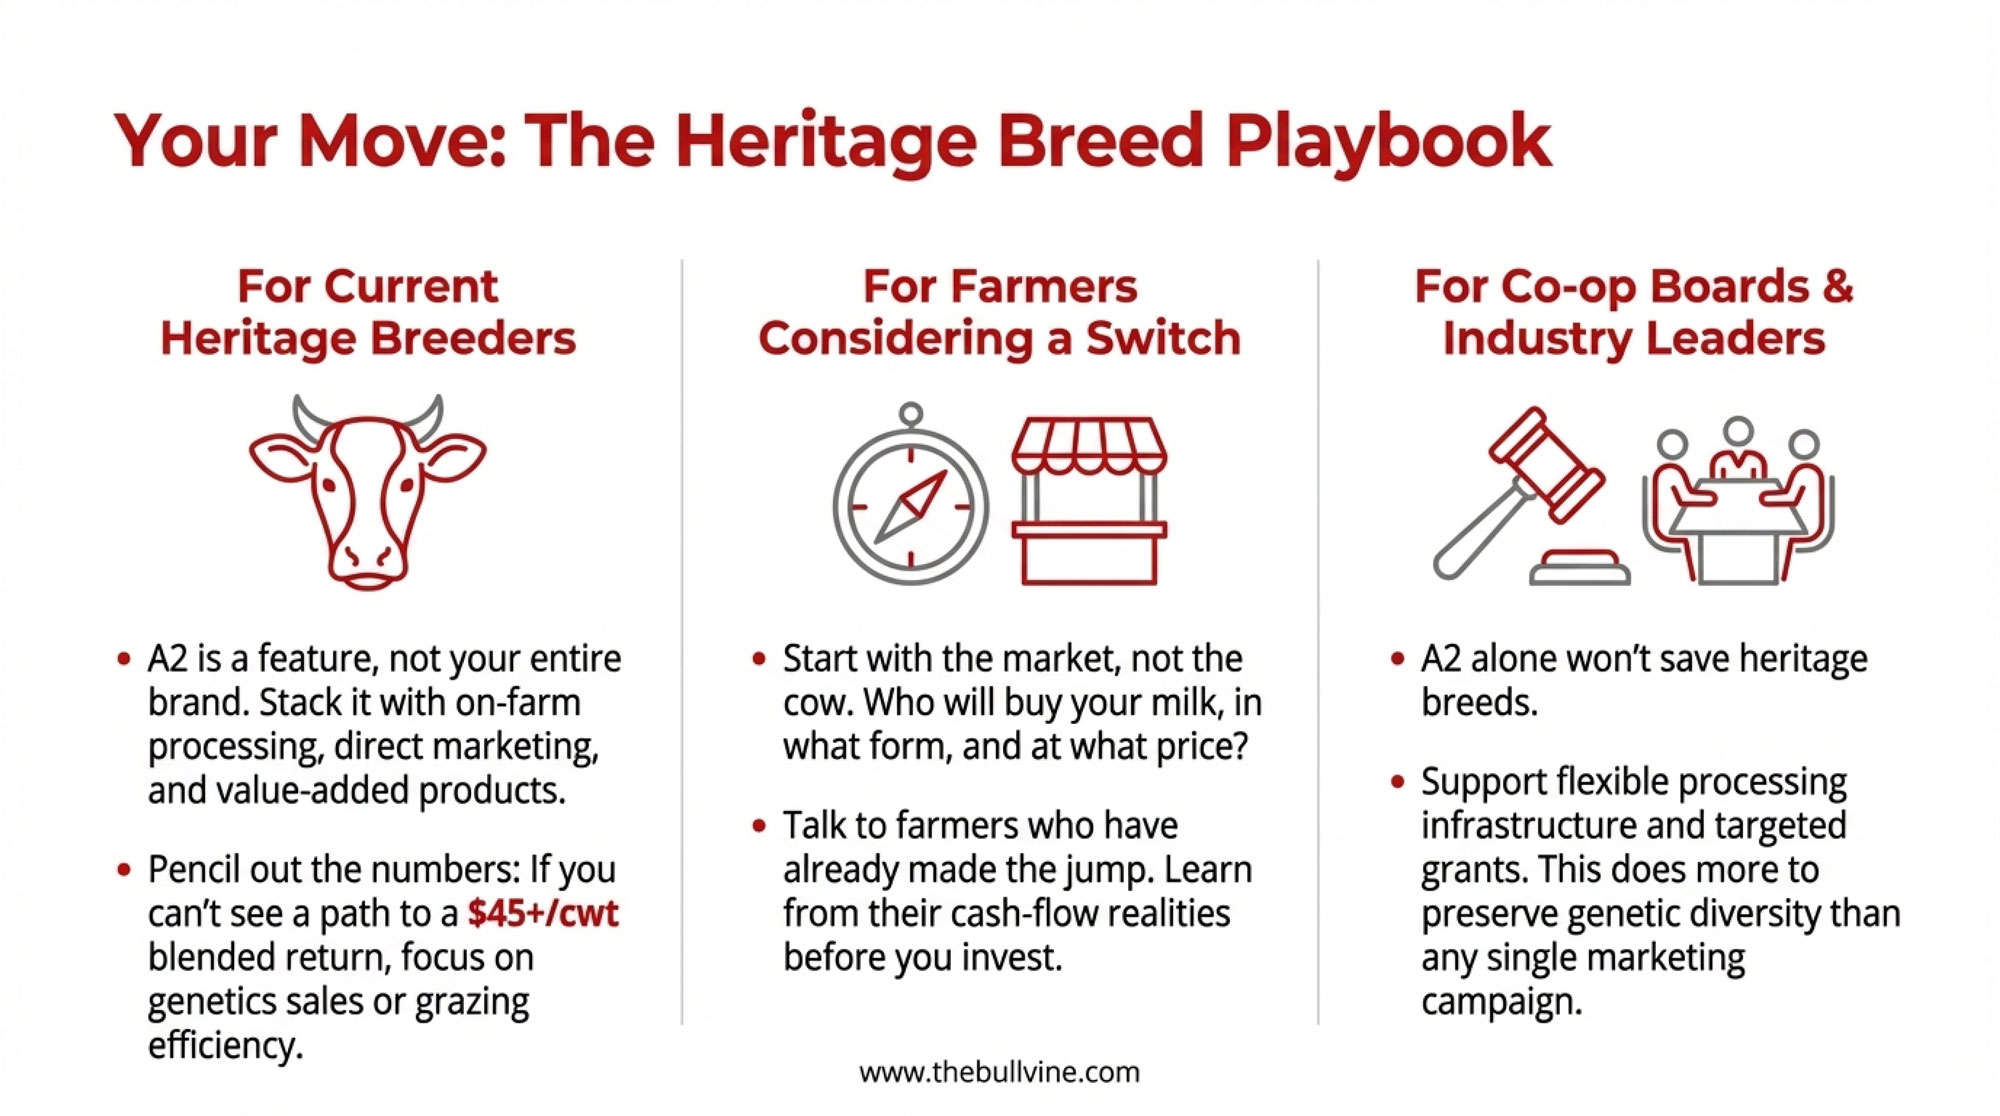
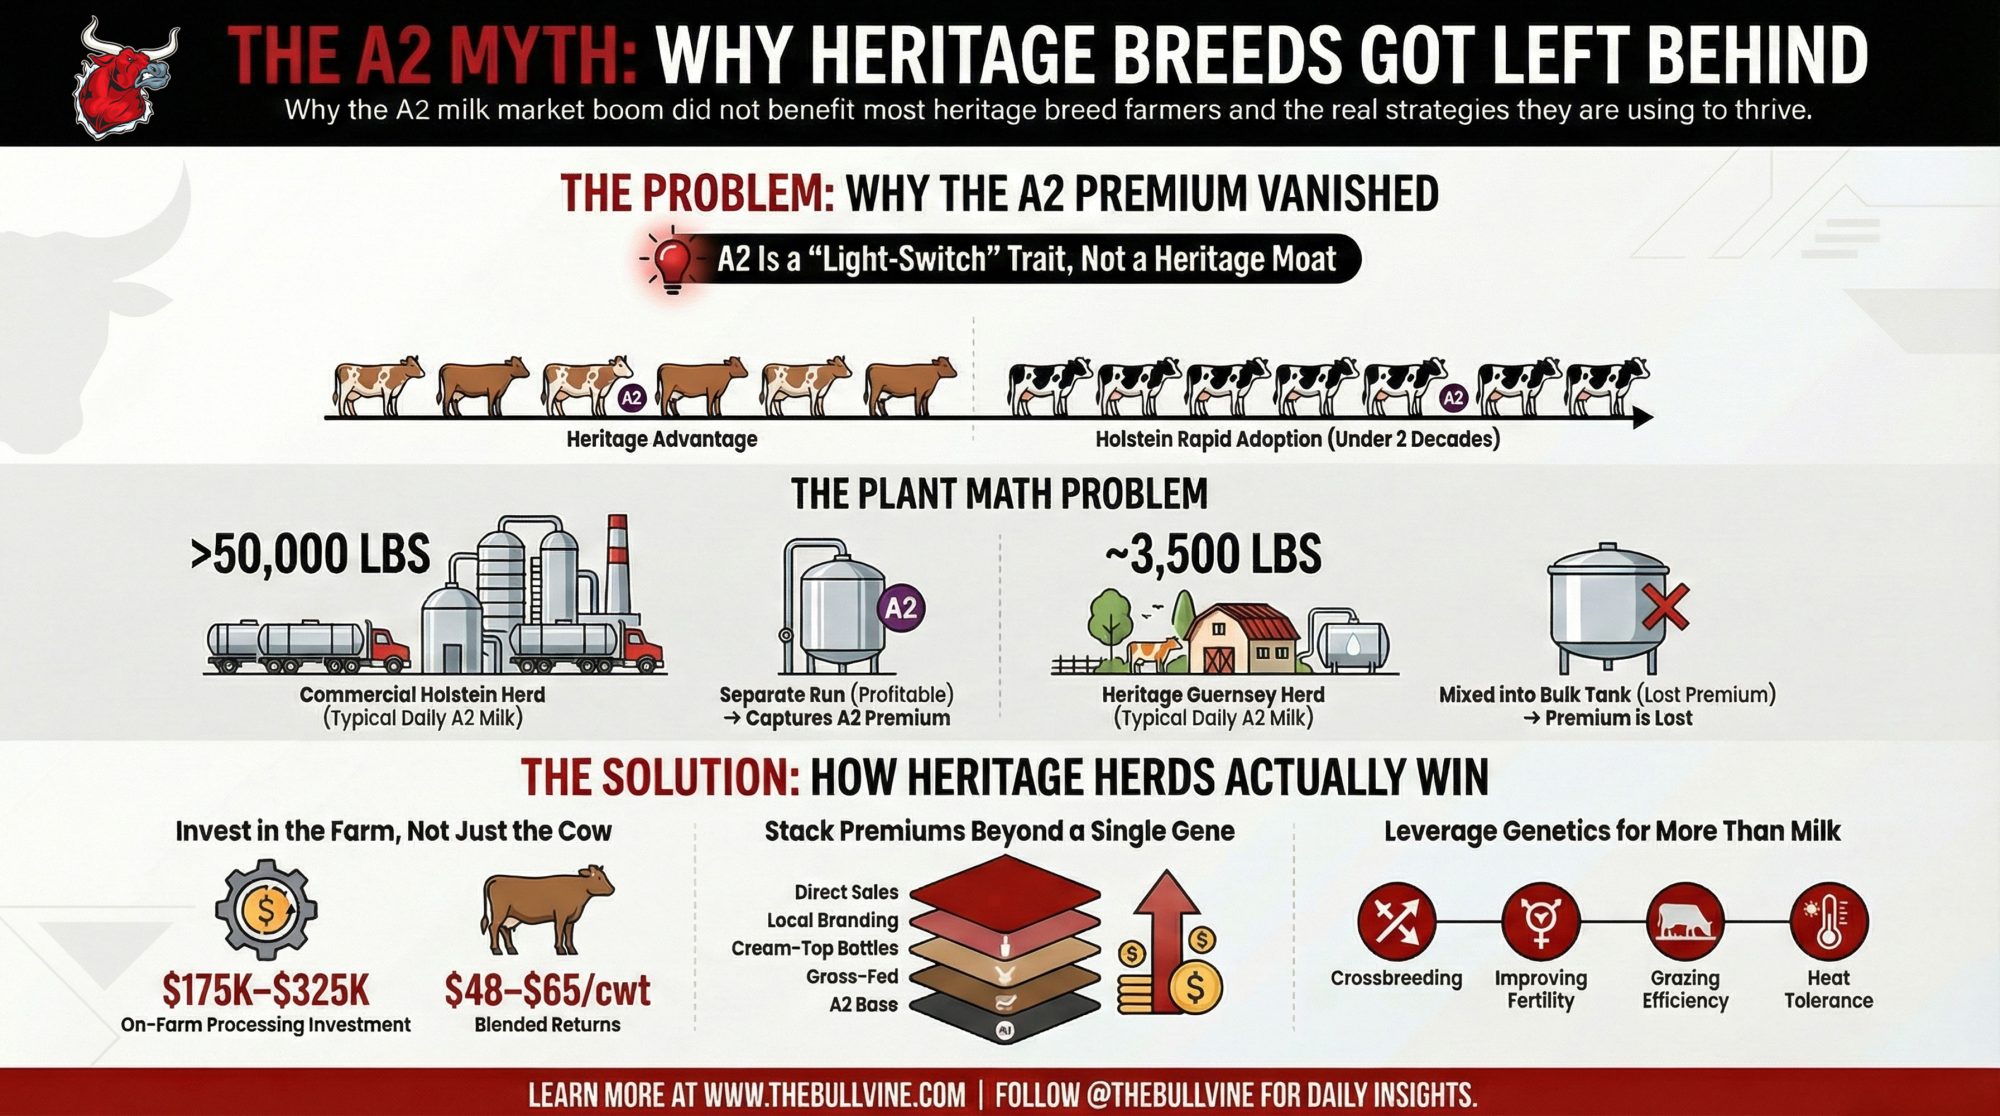
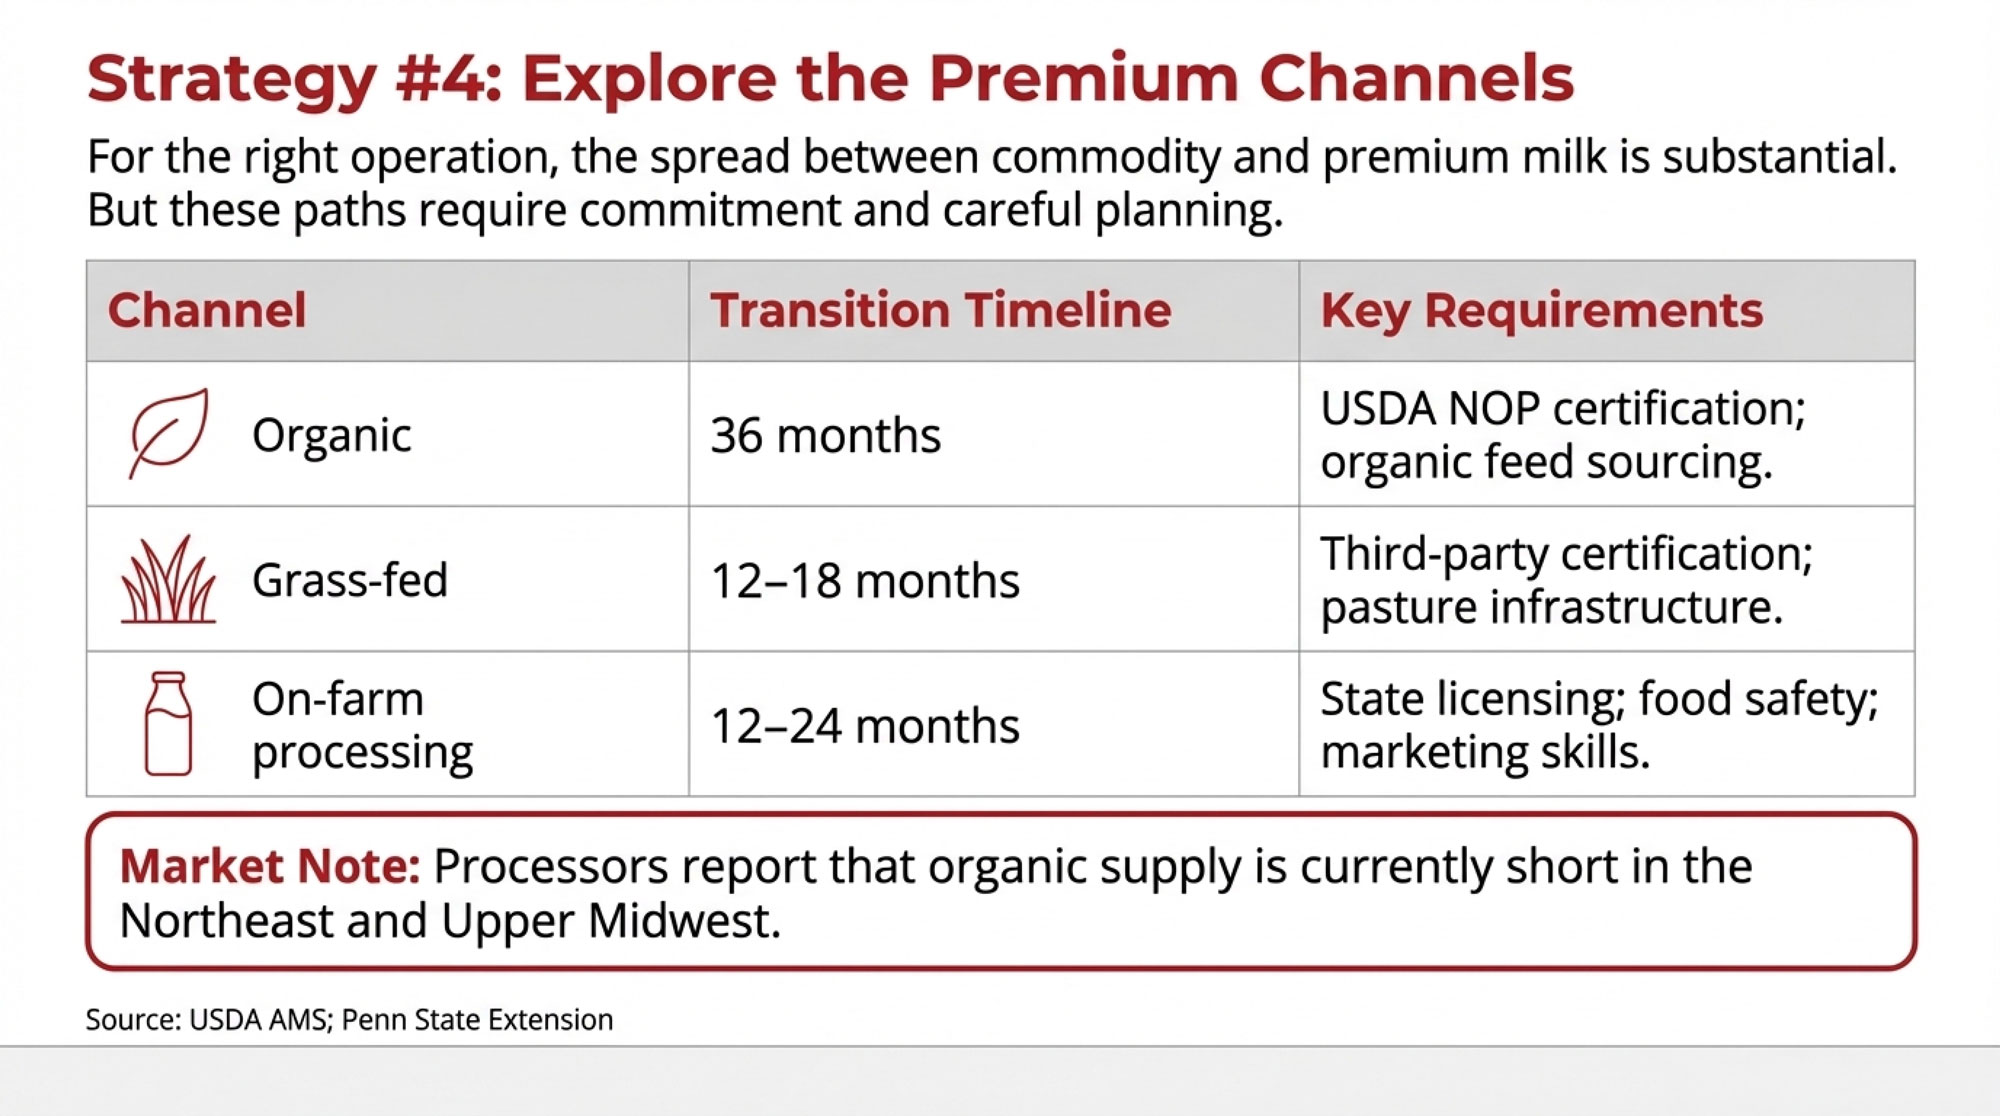
  • Explore niches where they truly fit. Some find success with organic, grass‑fed, A2A2, on‑farm processing, or regional branding—especially in the Northeast and Upper Midwest—but only when local demand and the family’s temperament for marketing line up.
  • Treat succession and timing as strategic variables. Major upgrades or expansions are tied to clear family plans for who wants to be there in 5–10 years, not just to what the bank will finance.

Smaller or More Isolated Herds

If you’re milking 50–200 cows in a rural pocket far from growing plants, or in a region losing processing, the export‑driven, capacity‑heavy system frankly isn’t built with you in mind.

Smaller herds in that position that manage to stay in the driver’s seat often:

  • Get brutally honest about cost and equity trends. They know, in numbers, whether they’re gaining ground, treading water, or slowly slipping.
  • Decide what role the dairy plays. For some, the dairy is still the primary economic engine. For others, it’s part of a mix with off‑farm jobs, cash crops, custom work, or direct‑marketing businesses. That choice shapes everything else.
  • Explore niches carefully, not desperately. On‑farm processing, direct‑to‑consumer sales, or agritourism can work—especially near population centers—but only when location, market, and family skills align. They’re not automatic lifelines.
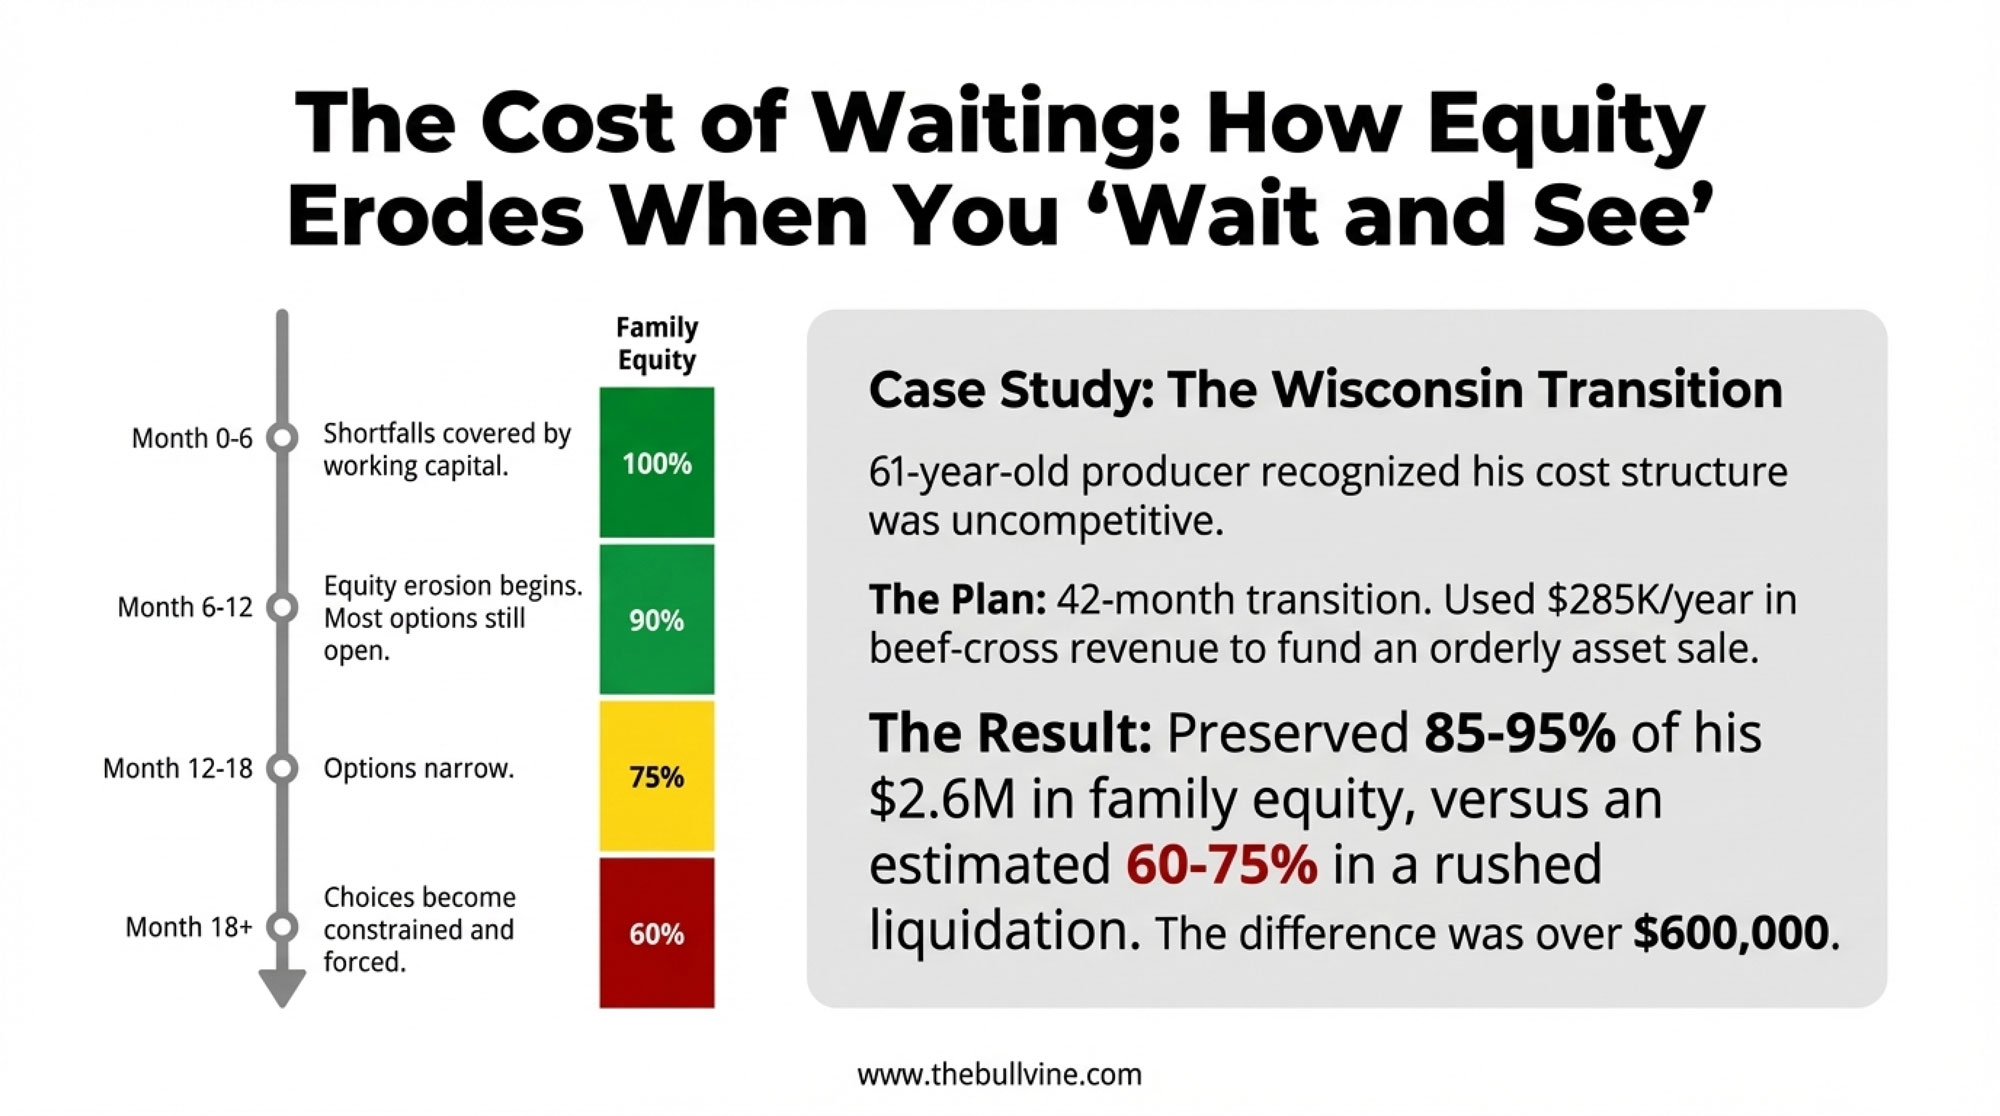
  • Plan early for transitions. The most successful exits or step‑downs start with early, candid conversations with family, lenders, and advisers—before external forces make the decision for them.

A Few Practical First Steps

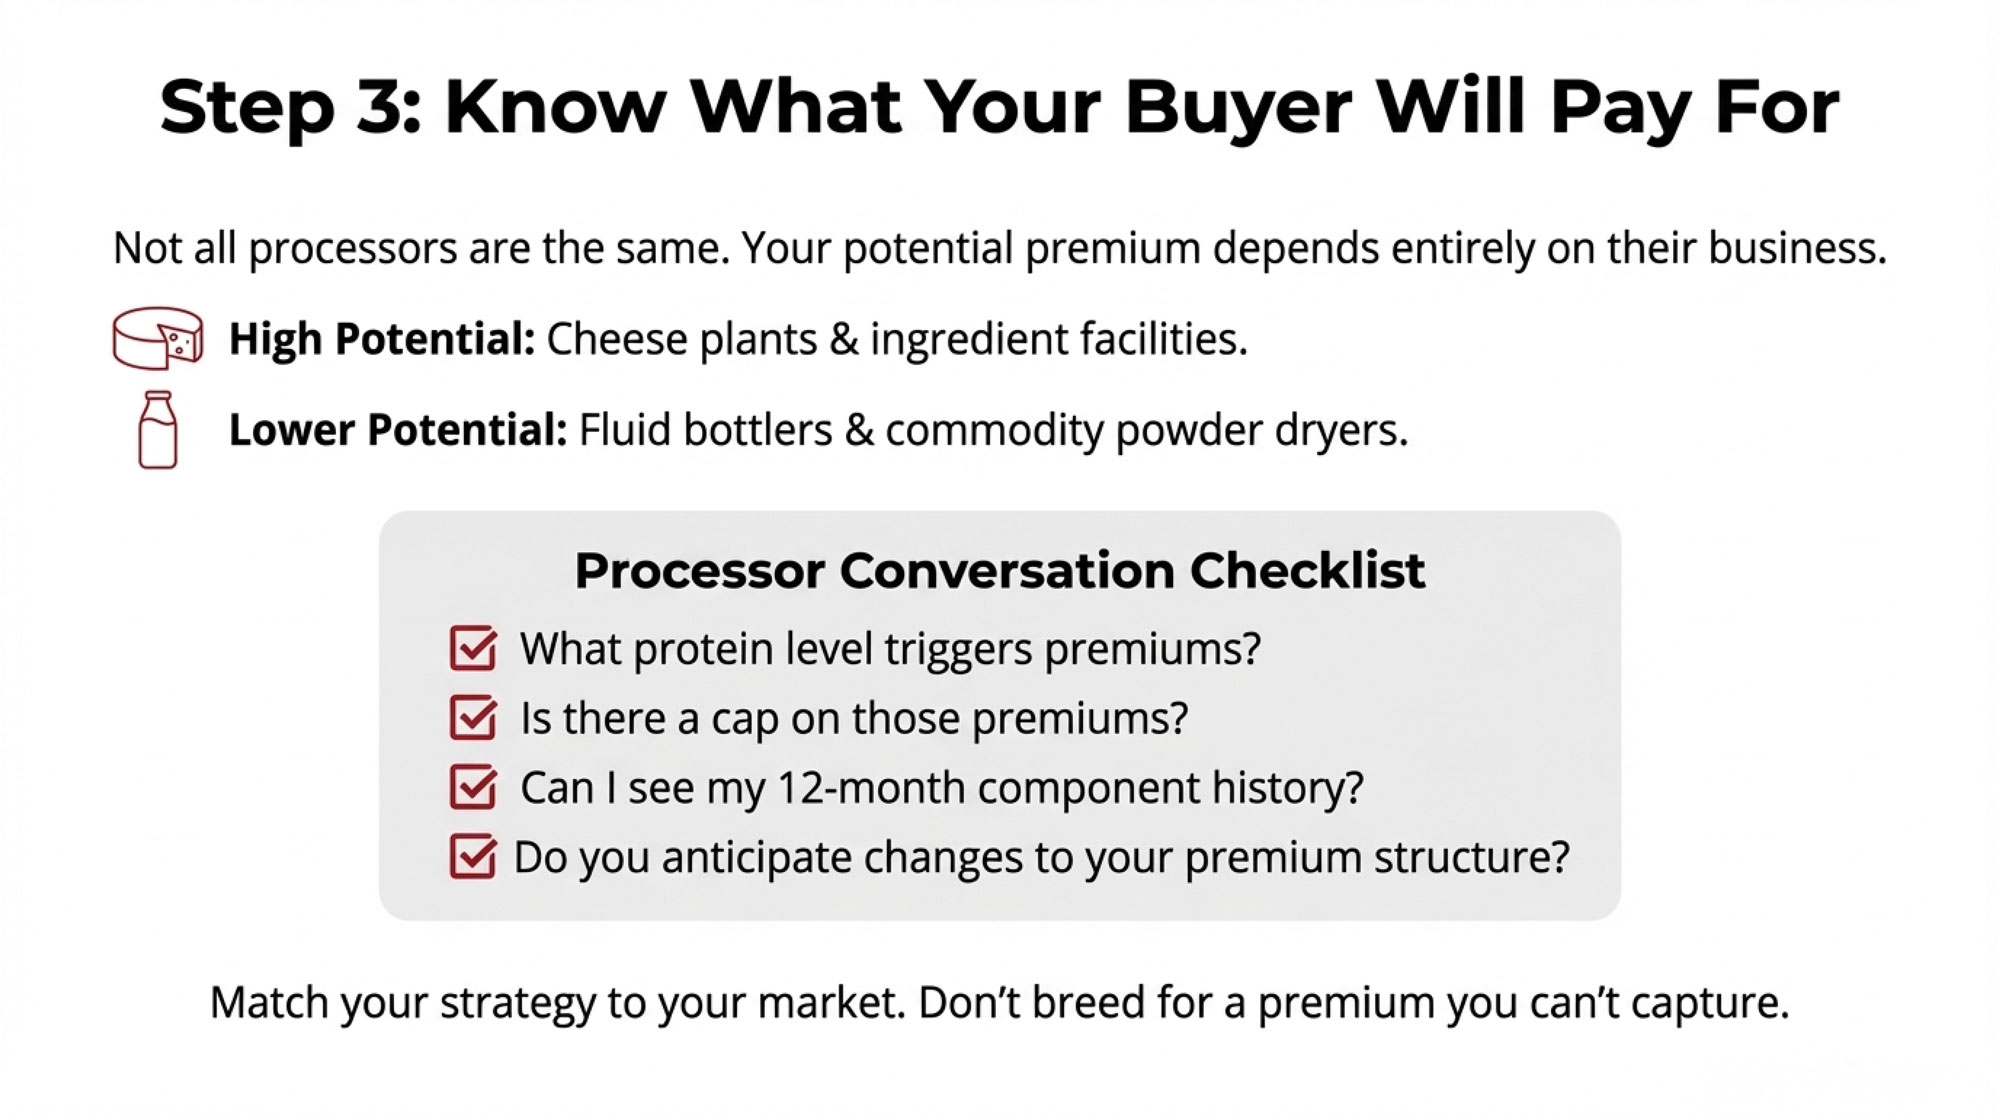
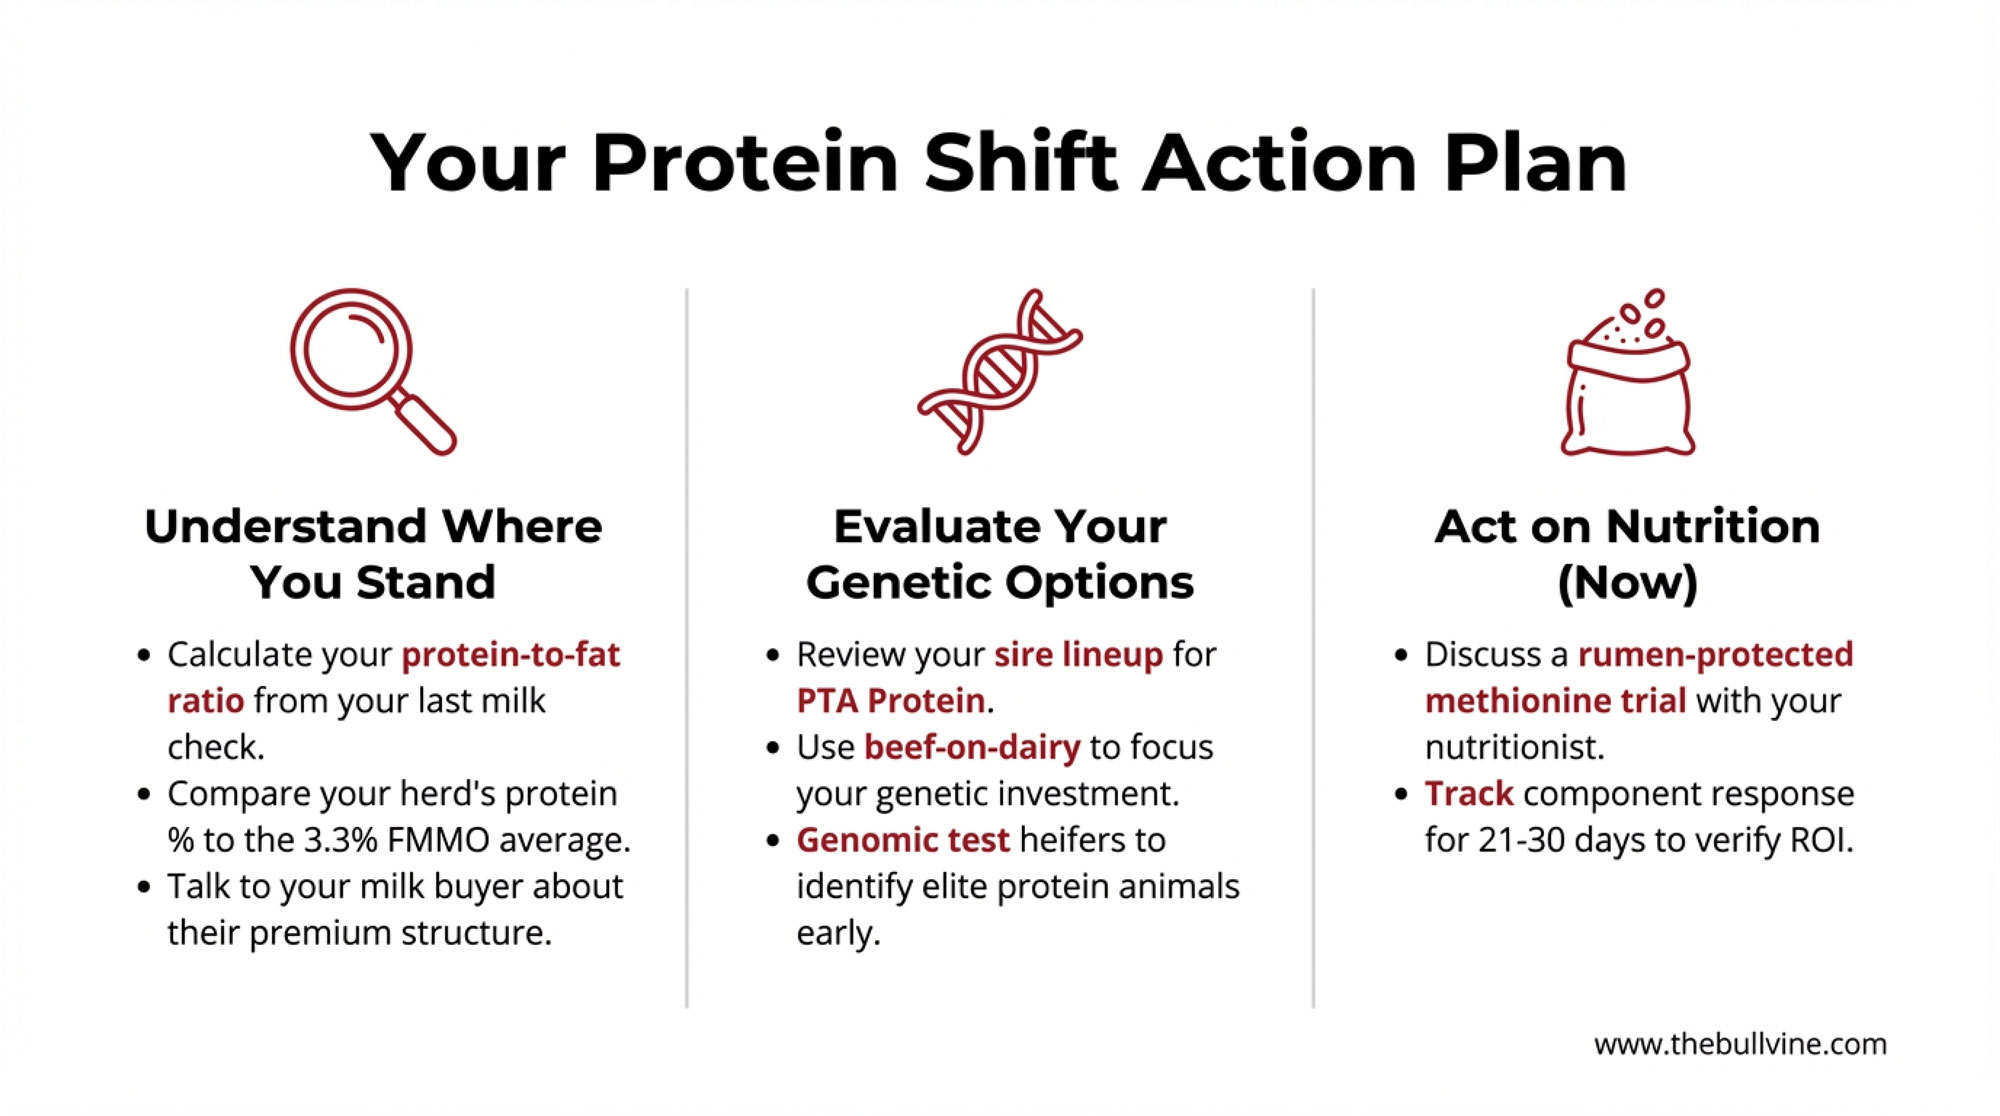
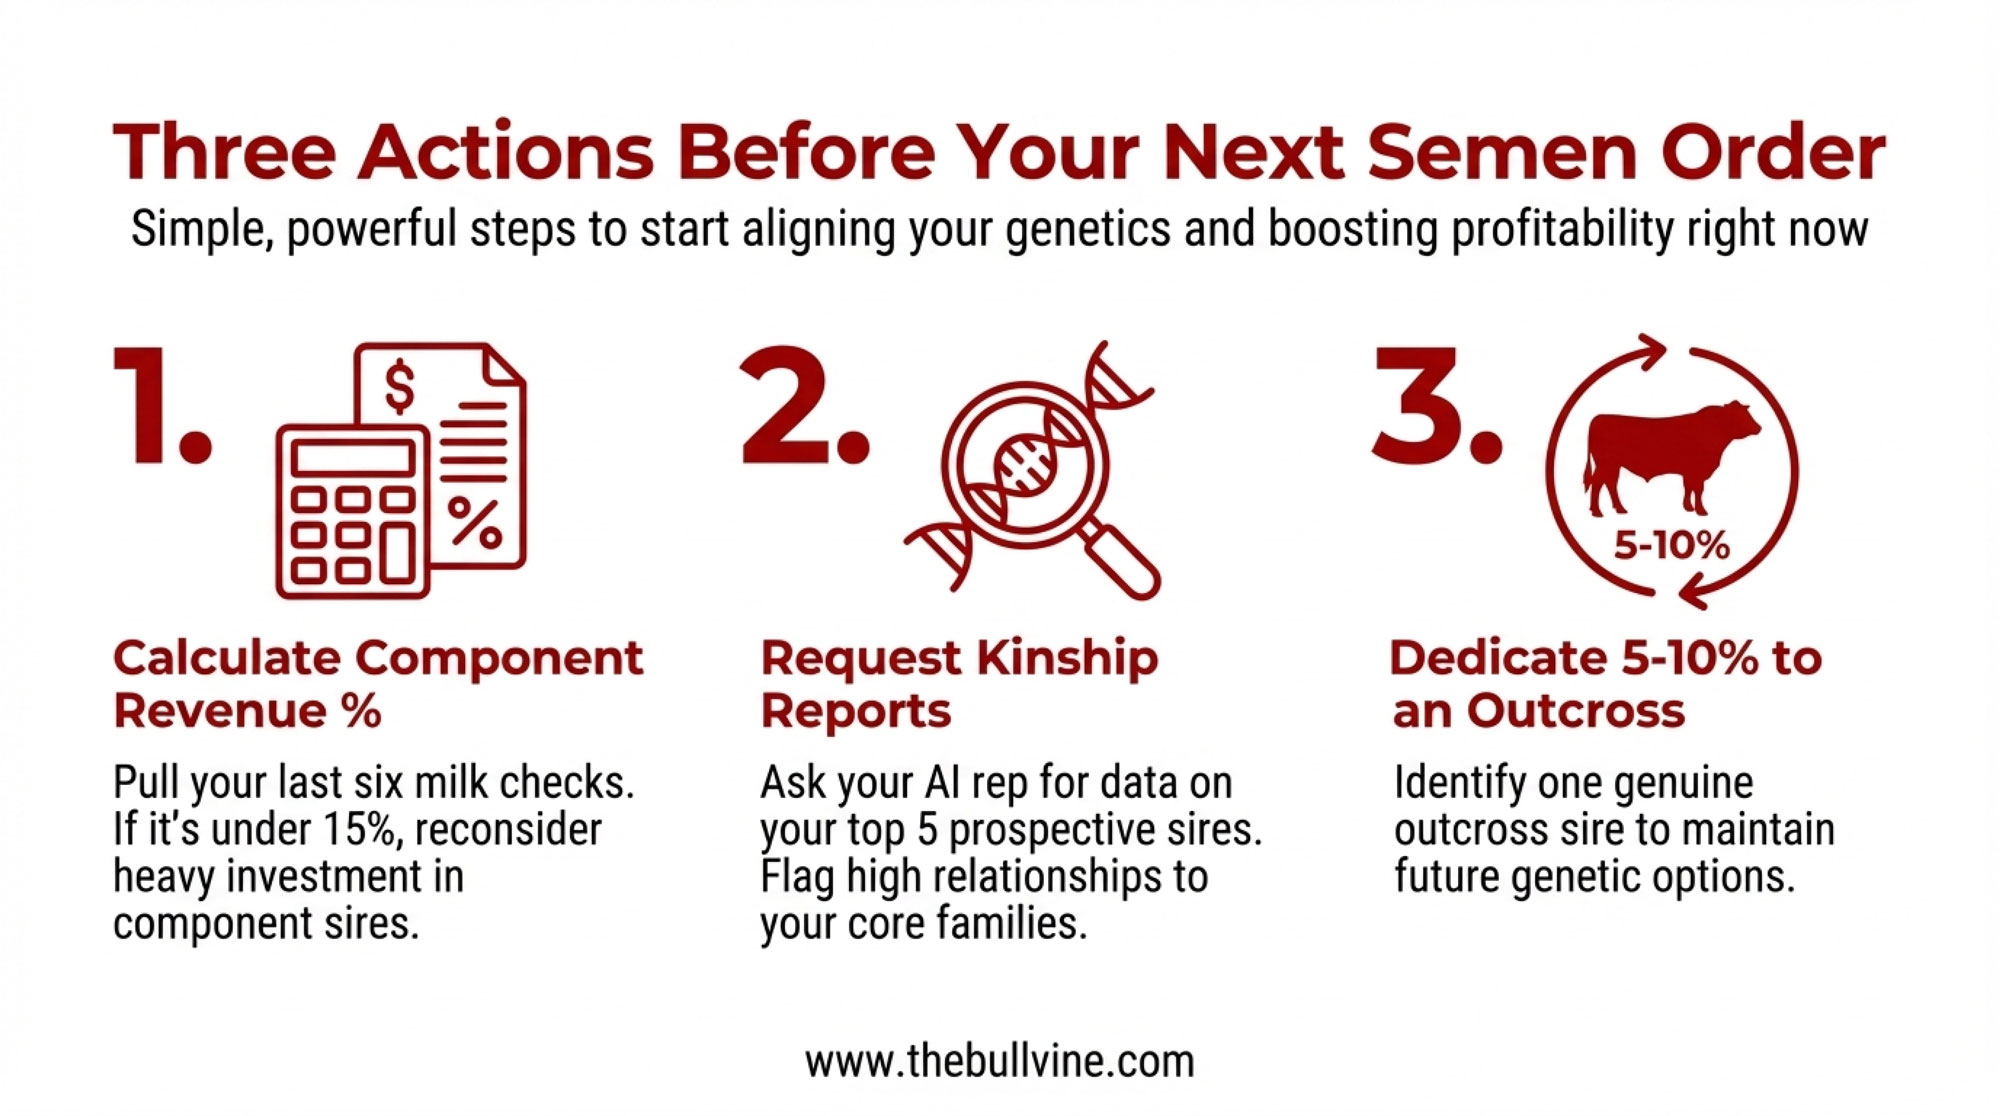
If you’re looking at your own numbers and wondering where to start, here are a few simple, concrete steps that many producers have found useful:

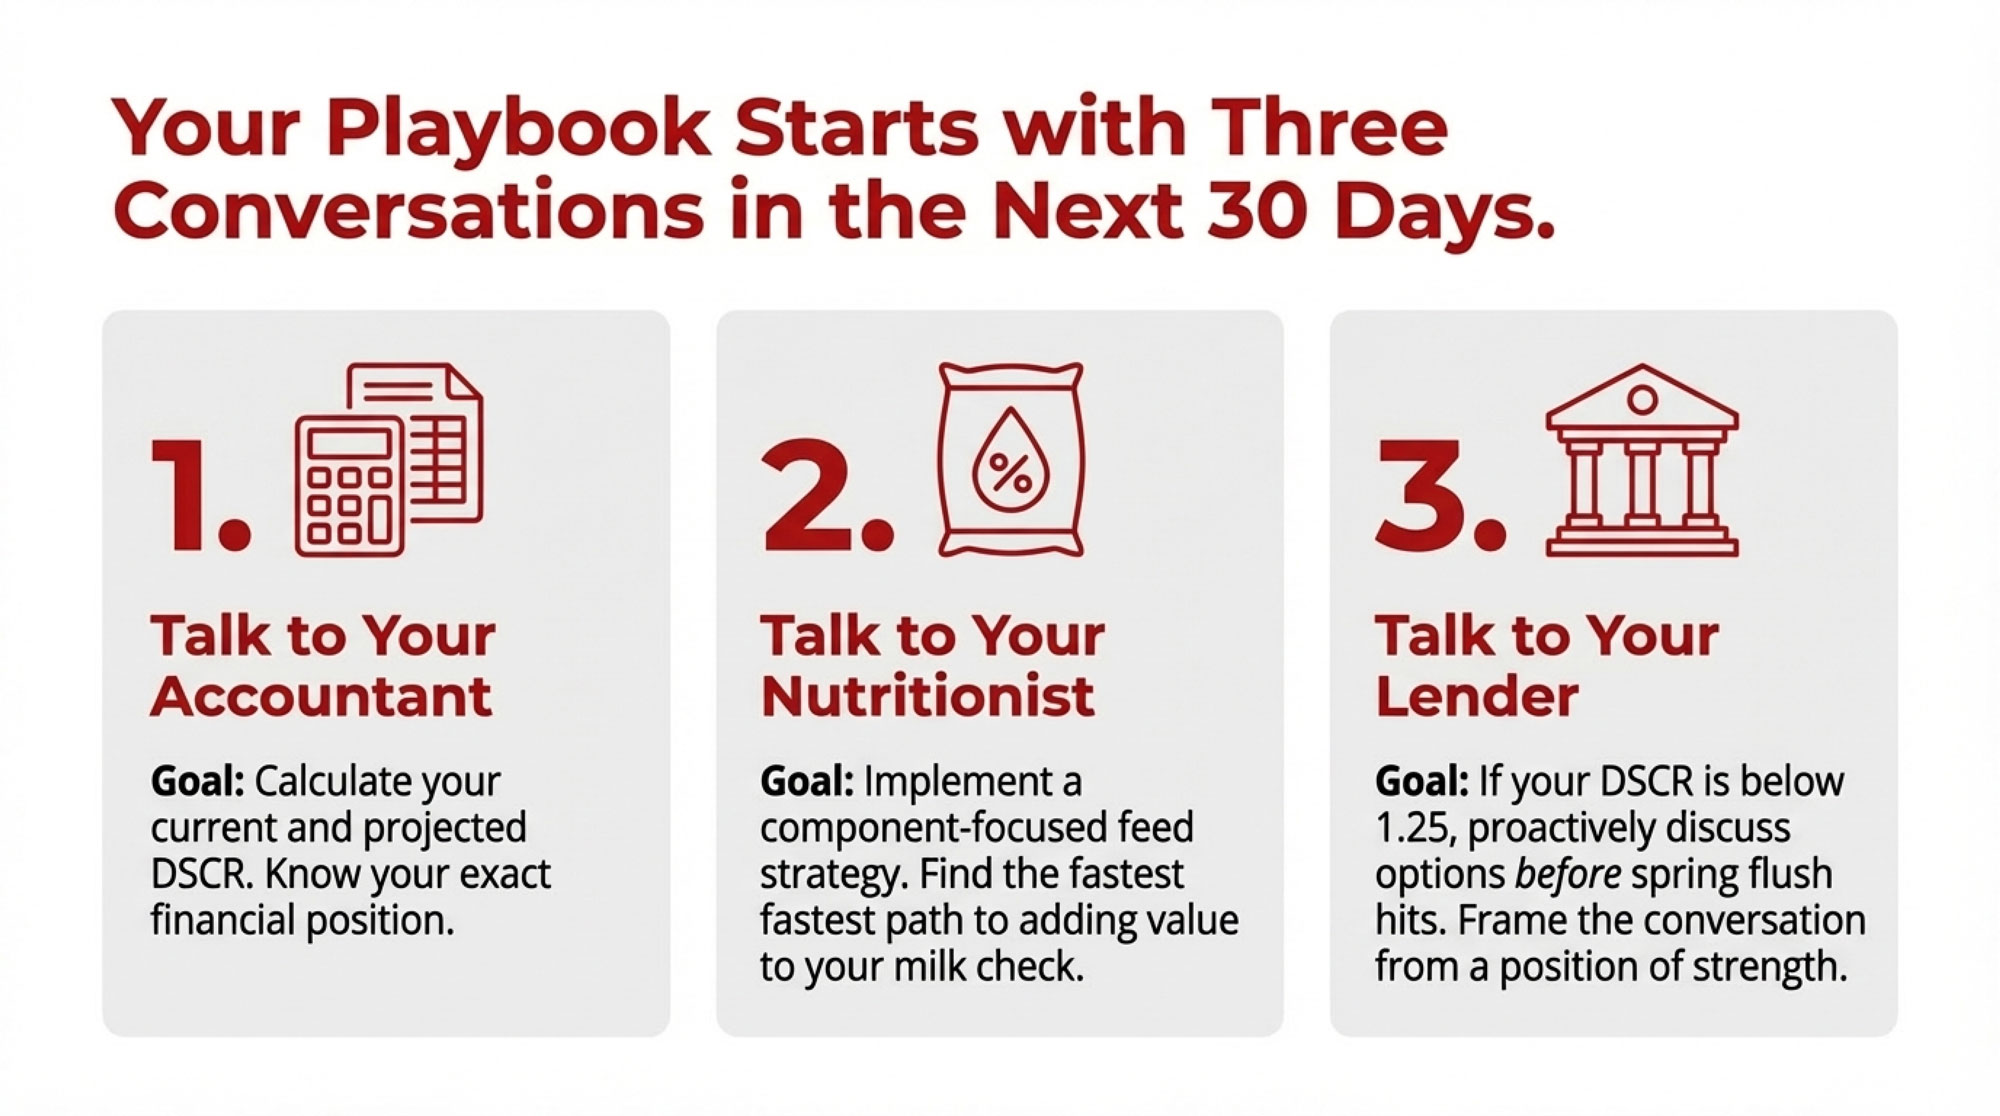
  • Pull a year’s worth of milk checks and component reports.
    Work out your true average butterfat and protein tests, and—more importantly—your pounds of fat and protein shipped per cow and per cwt. Then talk with your field rep or plant contact about how that profile lines up with what your leading buyer wants and pays best for.
  • Map your replacement needs before you map beef‑on‑dairy.
    Sit down with your records and figure out your real replacement rate and any expansion plans. Estimate how many quality dairy heifers you’ll need calving in over the next two to three years. Use that number to double-check how much beef‑on‑dairy your breeding program can truly support without putting you in the heifer penalty box.
  • Pilot genomic testing on a subset of heifers.
    Work with your AI rep or herd vet to test a group, rank them, and use that ranking to decide who gets sexed dairy semen and who gets beef. Treat this as a learning process, not a one‑off experiment.
  • Schedule an hour with a risk adviser.
    Sit down with someone from your co‑op, a dairy‑focused broker, or an extension economist and ask them to walk you through what it would look like to protect roughly 30–50 percent of your expected milk and some of your feed at prices that cover your costs and debt needs. Then adjust that percentage based on your own risk tolerance and lender expectations.
  • Run a stress‑test budget.
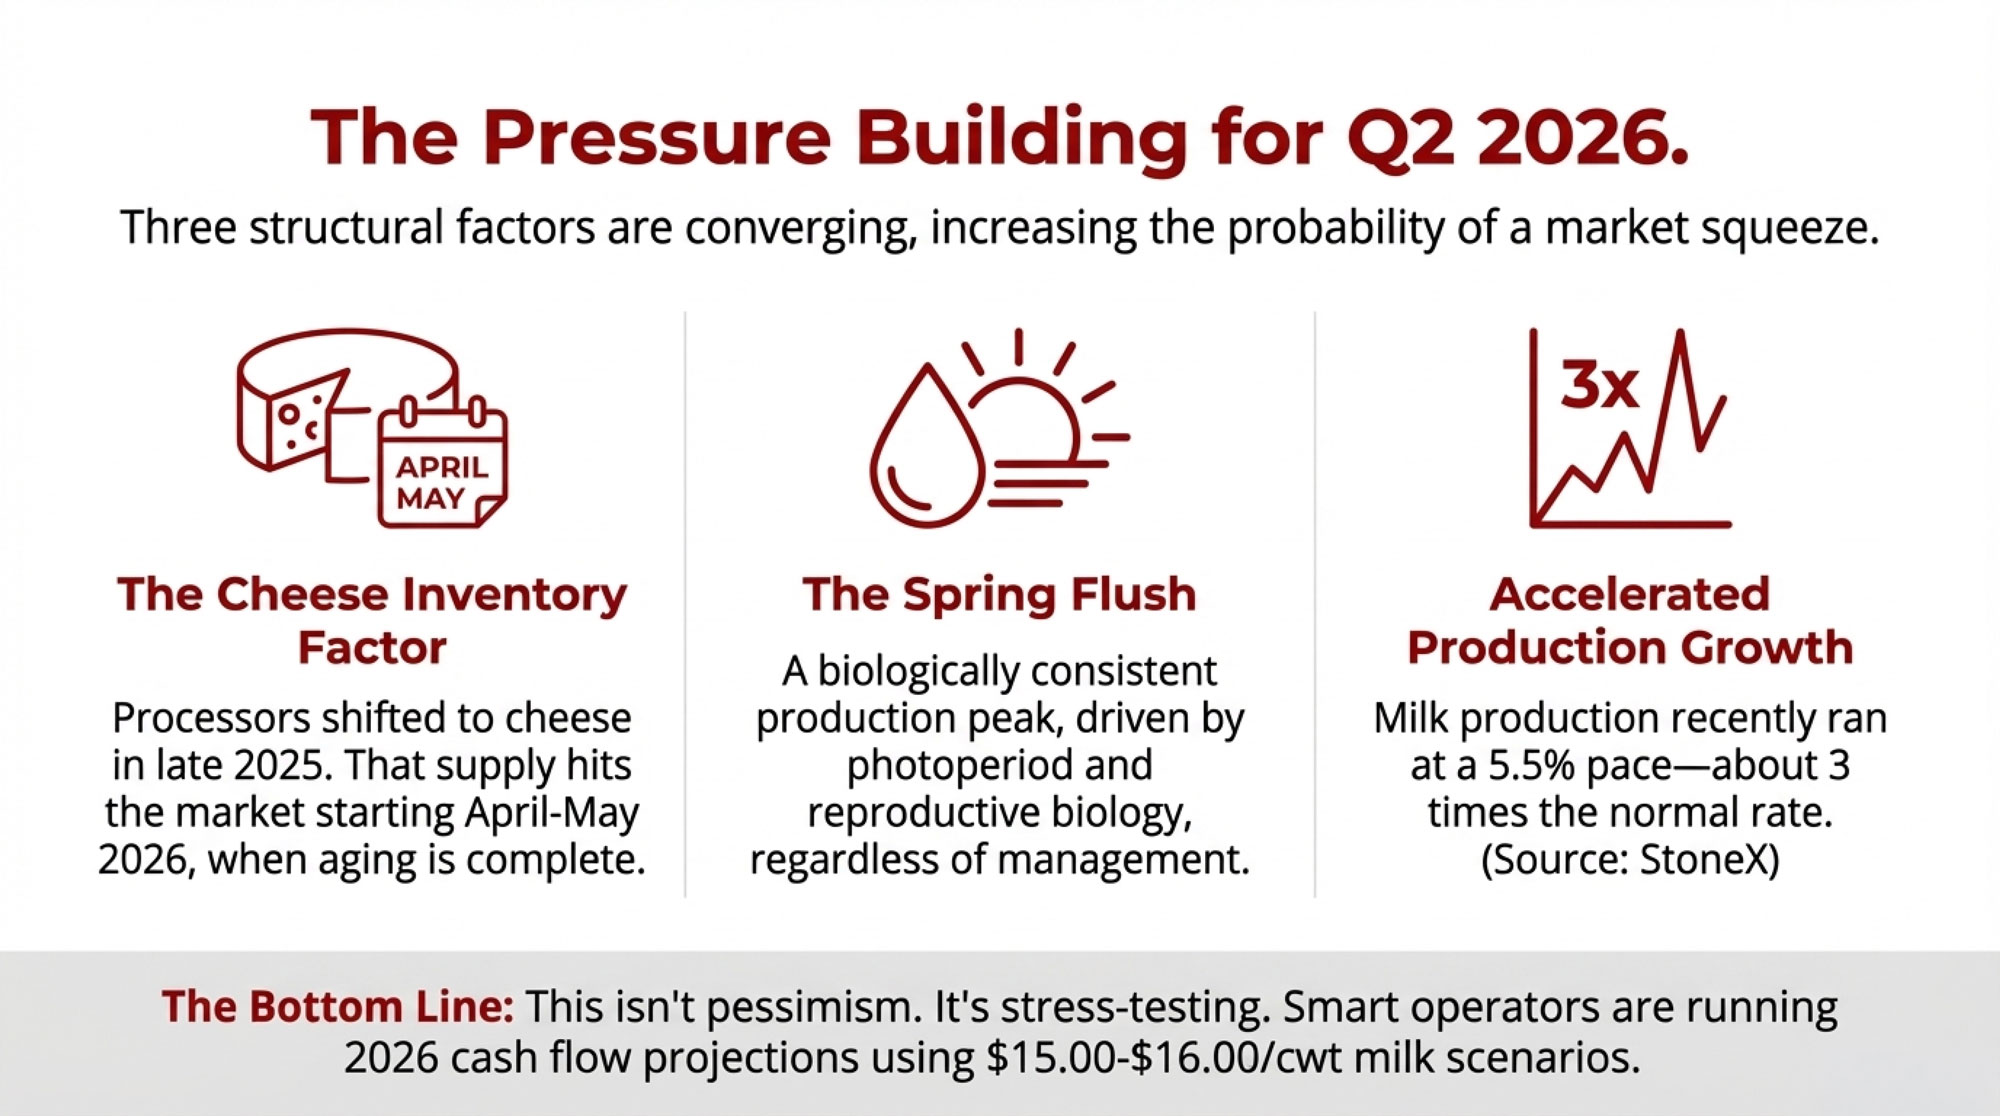
    Put together a simple cash‑flow scenario at a lower milk price—say 13–14 dollars Class III—and slightly higher feed costs. See where the pinch points are. Use that information to decide whether your next move should be to tighten costs, adjust debt, lock in some margins, pursue measured growth, or plan a gradual pivot.

Three Questions Worth Asking Yourself

As you work through all that, three blunt questions keep coming up in good kitchen‑table conversations:

  • Do my components actually fit my buyer’s product mix and pricing grid—or am I leaving money on the table chasing the wrong butterfat/protein profile?
  • Am I using genomic tools and beef‑on‑dairy with a clear replacement strategy—or am I selling my future herd for today’s calf checks?
  • Do I have even a basic risk plan for the next 12–24 months, or am I still gambling that spot markets will treat me kindly?

The Bottom Line

At the end of the day, the export headlines and your milk check are telling different parts of the same story. The export dollars keep plants running and markets open. The milk check reflects how that big system—stainless steel, global competition, butterfat and protein pricing, consolidation, geography, heifer supply, and policy—lines up with your cows, your barn, and your ZIP code.

What I’ve noticed, sitting at a lot of kitchen tables and in a lot of barn offices, is that once you really understand those connections, the whole situation feels a little less random. You won’t control the world price of cheese. But you can control how your herd is bred, how your fresh cows come through the transition period, what your cost of production looks like, and whether you use the genetics, beef‑on‑dairy, and risk tools that are already on the table.

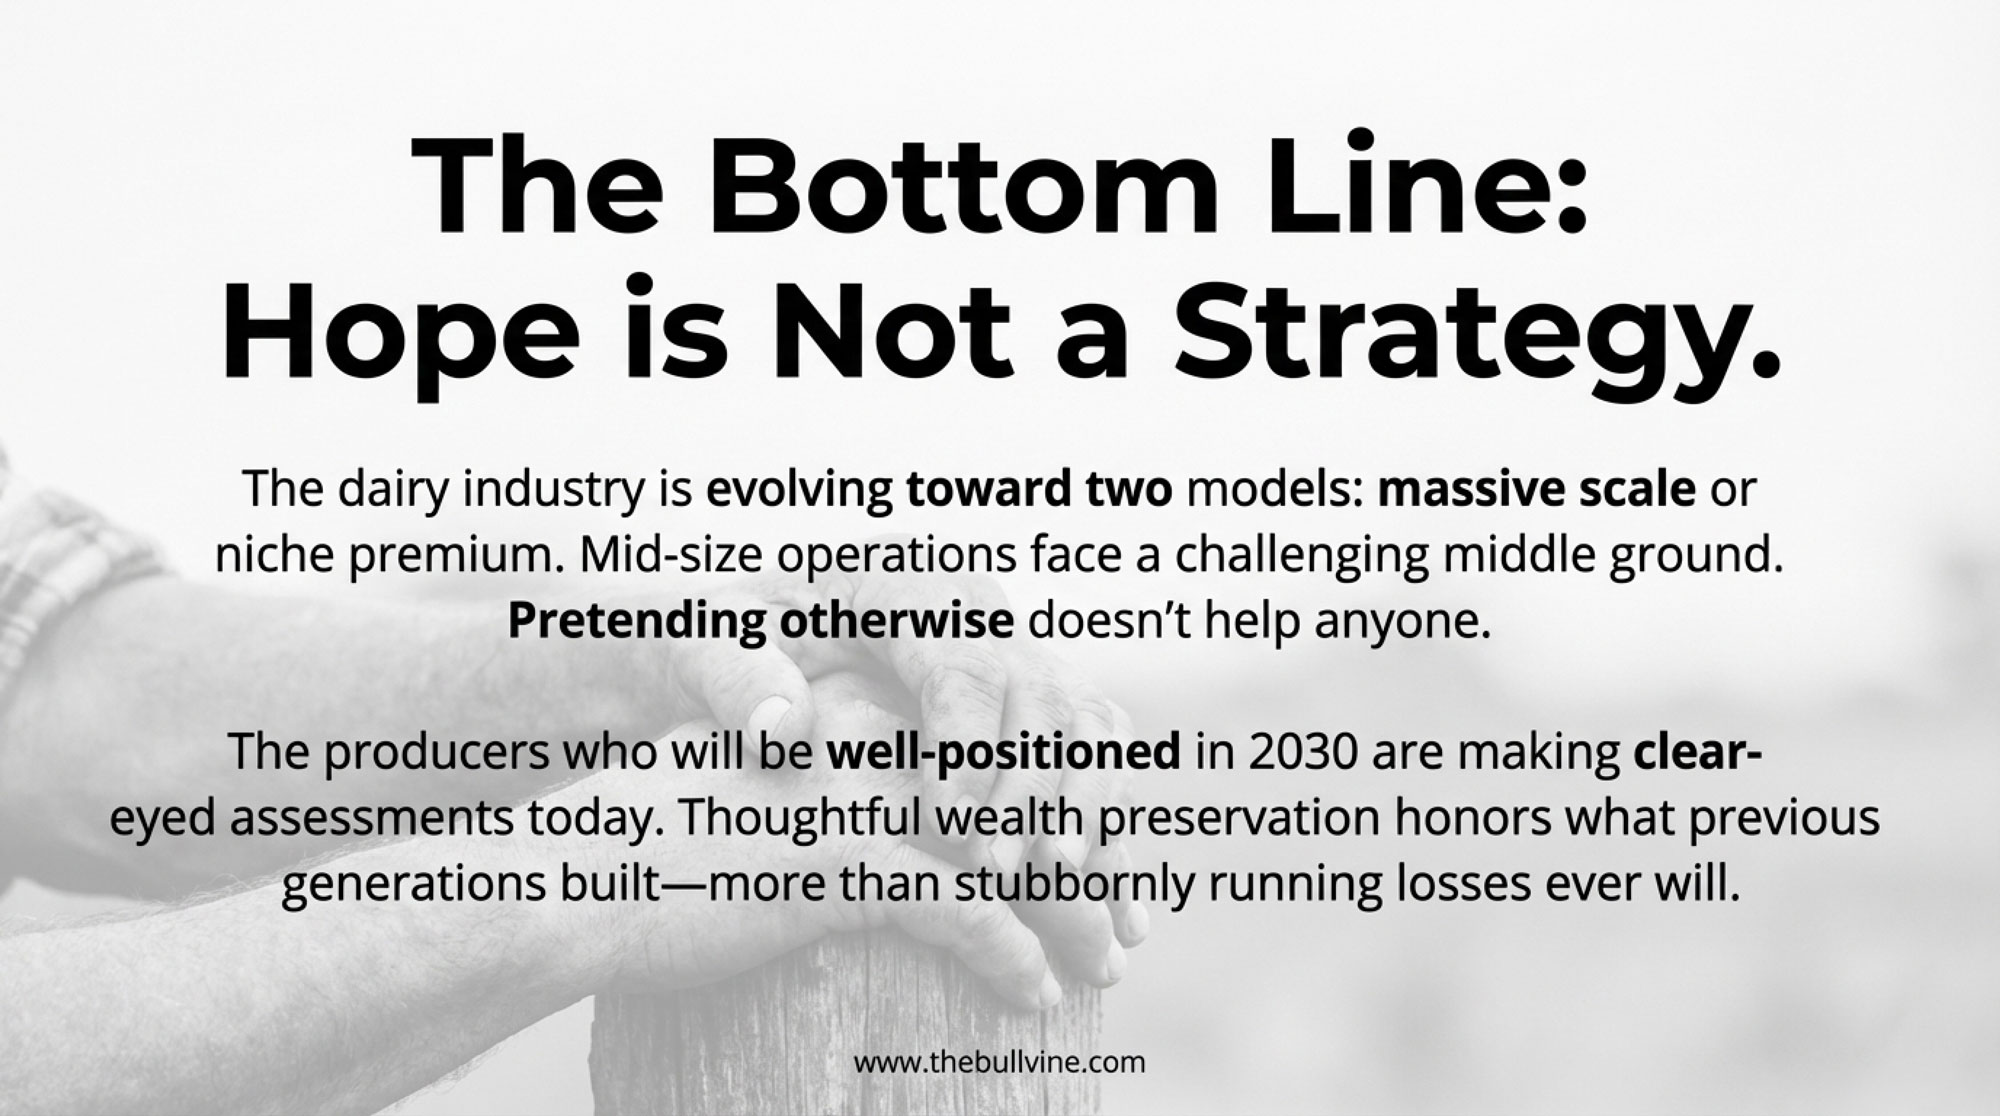
There isn’t one right answer. For some operations, the smart play will be to lean in and grow with the local plant. For others, it’ll be carving out a well‑defined niche that truly fits their region and family. And for some, the bravest and best decision will be planning a thoughtful transition that protects family, equity, and sanity. The key is making that call with clear eyes, honest numbers, and a solid grasp of the forces that are shaping all of us—whether we like them or not.

Key Takeaways 

  • $8.2B exports, stubborn checks: Record dairy shipments didn’t lift every milk check because expanded plant capacity needs export markets to clear marginal pounds—at margins that rarely flow back to producers.
  • Protein now drives the pay grid: Cheese plants reward curd yield, not extreme butterfat. Herds balancing 3.5–3.8% protein with 3.8–4.1% fat are capturing more consistent component premiums than single-trait chasers.
  • Beef-on-dairy created a heifer crisis: Replacement inventories fell to their lowest since 2001. Farms that grabbed $600 beef calf checks now face $2,500–$3,000+ heifer bills—proof that short-term cash can cost long-term cows.
  • Big herds are buying “invisible” cows: 15,000 dairies exited in five years; 1,000+ cow operations now ship two-thirds of U.S. milk. They’re paying for genetics that deliver fertility, health, and components—not project cows that hit the treatment list.
  • Three moves that separate planners from hopers: Tune your component profile to your plant’s grid, use genomics and beef-on-dairy with a locked-in replacement plan, and treat DRP and feed hedges as standard practice—not emergency measures.

Complete references and supporting documentation are available upon request by contacting the editorial team at editor@thebullvine.com.

Learn More

The Sunday Read Dairy Professionals Don’t Skip.

Every week, thousands of producers, breeders, and industry insiders open Bullvine Weekly for genetics insights, market shifts, and profit strategies they won’t find anywhere else. One email. Five minutes. Smarter decisions all week.

NewsSubscribe
First
Last
Consent

You Won the Whole Milk Fight. Here’s Why Your Milk Check Didn’t Move.

Whole milk finally won. Your check didn’t move. The $140/cow answer is in your protein-to-fat ratio.

Executive Summary: This feature digs into why, even after full‑fat dairy won big in the 2025–2030 Dietary Guidelines and whole milk returned to U.S. schools, many producers aren’t seeing bigger milk checks. It shows how years of chasing butterfat performance left U.S. herds slightly out of step with cheese and whey plants that now pay more attention to protein and protein‑to‑fat ratio than to record fat tests. Using current data from CoBank, Federal Orders, and major plant investments, the article walks through real numbers—including a two‑herd example with a $70,000‑per‑year difference in component revenue—to prove how protein is quietly becoming the main driver of milk value in cheese‑heavy markets. Regional sections help producers in the Upper Midwest, California, the Northeast, and Canada see how these shifts look under their own pricing and quota systems. The core takeaway is simple: if you want to stay ahead, you need to manage for protein at least as actively as you manage for butterfat. A three‑stage playbook then outlines what to do next—short‑term component audits and ration tweaks, one‑year genetics and genomics choices, and three‑year positioning around new cheese, whey, and sustainability‑linked programs—delivered in a practical, farmer‑to‑farmer tone that respects both the win for whole milk and the new math on the milk check.

milk protein-to-fat ratio

If you just skimmed the headlines this year, you’d swear dairy finally got everything it’s been asking for.

In early January, the U.S. Department of Agriculture and the Department of Health and Human Services rolled out the new 2025–2030 Dietary Guidelines for Americans under the “Eat Real Food” banner at realfood.gov, and dairy is right in the middle of that plate. The guidelines lay out a 2,000‑calorie pattern that includes three daily servings of dairy and spell out that when people consume dairy, they can choose full‑fat dairy with no added sugars as part of a healthy eating pattern, describing dairy as an excellent source of protein, healthy fats, vitamins, and minerals. USDA and HHS press materials even call this a historic reset of nutrition policy that puts real, minimally processed foods—meat, eggs, full‑fat milk, fruits, vegetables—front and center while urging people to prioritize protein and cut back on added sugars and highly processed foods.

On the industry side, the International Dairy Foods Association jumped in with both boots. In a January 6, 2026 statement, Michael Dykes, D.V.M., president and CEO of IDFA, said these guidelines “send a clear and powerful message to Americans: dairy foods belong at the center of a healthy diet,” and he highlighted that the document recommends dairy products “at all fat levels,” including whole and full‑fat milk, yogurt, and cheese. That’s a long way from the older “choose low‑fat or fat‑free dairy most often” messaging many of you have been pushing back against for years.

At the same time, Congress finally moved on to something dairy has chased for more than a decade: getting whole milk back into schools. The Whole Milk for Healthy Kids Act of 2025—H.R. 649—updates National School Lunch and School Breakfast rules so schools can serve whole, 2%, 1%, and fat‑free milk, flavored and unflavored, and it excludes milk’s saturated fat from the weekly saturated‑fat limits used to score school menus. Coverage from Dairy Reporter and farm policy outlets notes that the law also tightens rules for what counts as a nutritionally equivalent non‑dairy beverage, and both dairy and plant‑based groups weighed in heavily as the bill advanced. USJersey organizations formally backed the legislation, arguing that it restores whole- and reduced‑fat milk options in cafeterias and better reflects what families actually drink at home.

On paper, that’s full vindication for how a lot of you have been feeding your own kids for decades.

Then the milk check lands on the table… and the numbers don’t exactly say, “You’re finally getting paid for this,” do they?

So let’s walk through why that is, and what it really means for your butterfat performance, your protein, and your next moves.

Looking at This Trend: What Really Changed in the Guidelines

Looking at this trend, here’s what’s interesting: it’s not just that dairy survived another guideline cycle. It’s that full‑fat dairy stepped out of the penalty box.

The new guidelines on realfood.gov lay out a 2,000‑calorie pattern with three servings of dairy and clearly state that when people consume dairy, they can choose full‑fat dairy with no added sugars as part of a healthy eating pattern. The text calls dairy an excellent source of protein, healthy fats, vitamins, and minerals, and it emphasizes that Americans should prioritize protein-rich foods at every meal, including dairy. USDA and HHS fact sheets describe the package as ending the “war on healthy fats,” encouraging more dairy and other whole‑food fat sources, while still stating that saturated fat should remain below 10% of total calories.

Harvard’s T.H. Chan School of Public Health weighed in with a JAMA Viewpoint in January 2025 that’s worth noting. The authors point out that the numeric saturated‑fat cap stayed at 10% of calories, but the visuals and examples in the new guidelines now prominently feature steak, butter, and full‑fat milk, which could easily make people think the cap has quietly loosened. They argue that the “eat real food” emphasis reflects justified worry about ultra‑processed diets, yet also raises fair questions about whether the 10% cap will be applied consistently in practice.

On the research side, more nutrition scientists have been questioning the old blanket advice always to pick low‑fat dairy. A 2021 review in Nutrients concluded that the evidence supporting a strict saturated‑fat cap is more nuanced than many past guidelines suggested and that saturated fat in whole foods such as full‑fat dairy may not carry the same risk profile as saturated fat in ultra‑processed snacks. A 2024 analysis of U.S. diets found that a large share of saturated fat and added sugar comes from processed meats, desserts, and snack foods, rather than just milk and cheese, which supports a more targeted approach to “bad actors” in the diet.

Now fold in the Whole Milk for Healthy Kids Act. The Congress.gov summary of H.R. 649 spells out that schools in the National School Lunch and School Breakfast Programs can once again offer whole and reduced‑fat milks, both flavored and unflavored, and that fluid milk’s saturated fat is excluded from the weekly saturated‑fat calculation used to judge school menus. Dairy Reporter’s coverage shows dairy groups praising the bill for restoring taste and choice, while public‑health advocates worry it could raise saturated‑fat intake among kids who already overshoot recommended levels.

So nutritionally and politically, the wind is finally at dairy’s back. Full‑fat milk, cheese, and yogurt are back in government advice and school cafeterias.

But as many of you have already noticed, that doesn’t automatically change what your processor pays the most for in each hundredweight of milk.

What Farmers Are Seeing: Butterfat Performance and the Protein Gap

What I’ve seen, looking at the data and listening to producers, is that U.S. herds have done an outstanding job at one thing: butterfat.

University of Minnesota’s Isaac Salfer, assistant professor of dairy nutrition, has tracked bulk tank fat tests in the Upper Midwest in work shared through Dairy Herd Management and extension channels. He showed that from roughly 2000 through 2012, average bulk tank butterfat in that region floated around 3.7 to 3.8 percent. By 2021, the regional average climbed above 4.0 percent, and in January 2022, the average fat test for Upper Midwest herds came in around 4.25 percent. Salfer has even commented that a 3.75% fat test—once considered high for Holsteins—now looks more like the low end of what he expects from well‑managed herds with modern genetics and feeding.

From “pretty good” to “best in the neighborhood” in 25 years: Upper Midwest herds pushed butterfat from 3.7% to 4.33%—hitting that target right when mozzarella plants decided they didn’t need any more cream

National numbers line up with that story. The average U.S. butterfat climbed from about 3.8% in 2015 to 3.94% in 2020, then 4.01% in 2021, and hit 4.33% by March 2025, based on Federal Milk Marketing Order data. CoBank’s 2025 analysis on components goes a step further and notes that butterfat percentage in U.S. milk has risen about 13% over the last decade, compared to only 2–3% growth in places like the European Union and New Zealand.

The gap tells the story: U.S. dairy pushed butterfat 13% higher in a decade while protein crawled ahead just 6%—leaving many herds fat-rich and protein-poor exactly when cheese plants started begging for the opposite

Protein has been moving too, but not nearly as fast. That same CoBank work points out that the average true protein in U.S. milk has increased roughly 6% over the decade, from about 3.1% to around 3.3%. Solid progress, but the gap between fat gains and protein gains is exactly where the trouble starts for processors.

None of this happened by accident. A lot of you have deliberately pushed butterfat performance:

  • Picking sires with strong butterfat PTAs, including some Jersey influence in Holstein herds to boost fat and total component yields, as reflected in both CoBank’s commentary.
  • Improving forage quality—more digestible fiber, better harvest timing—and ration balance so cows can produce more milk fat without getting knocked off balance energy‑wise.
  • Tightening up fresh cow management through the transition period—watching negative energy balance, ketosis risk, rumen function—so higher butterfat doesn’t come with more displaced abomasums or down cows.

For several years, that was exactly what the market seemed to want. CoBank notes that butterfat pay prices led protein in eight of the ten years heading into the mid‑2020s, fueling what its analysts call a butterfat boom. Butter prices ran strong, cream multiples were attractive, and churns running hard while cream supplies periodically looked for a home.

The hitch is that protein hasn’t kept up, and processors—especially the cheese and whey plants—are showing more and more concern about that imbalance.

CoBank’s component work shows that from 2000 to 2014, protein prices exceeded butterfat every year, which encouraged a pretty balanced growth in both components and kept the national protein‑to‑fat ratio in the 0.82–0.84 range. As butterfat advanced in both genetics and pricing, the ratio slipped to roughly 0.77. For plants that need a tight balance of casein and fat to fill cheese vats and whey dryers efficiently, that shift matters a lot.

The number your co-op watches closer than you do: the U.S. protein-to-fat ratio slid from 0.84 to 0.77 over 25 years—meaning more cream to manage, less protein for cheese, and higher costs. Cheese plants want you back above 0.80

Why Processors Care So Much About the Protein‑to‑Fat Ratio

Looking at this trend from the plant’s side of the road, you start to see why they keep talking about protein‑to‑fat ratios instead of just “more components is better.”

Cheese makers design their yields around a specific relationship between casein and fat. Many plants like their incoming milk somewhere around 3.2% protein and 4.0% fat, giving a protein‑to‑fat ratio near 0.80—not because they’re fussy, but because that ratio makes their cheese vats and whey systems run efficiently. When milk rolls in at, say, 4.2% fat and 3.1% protein, a few things happen:

  • There’s more cream than they can easily use in the products they’re making today.
  • There are fewer pounds of protein per hundredweight to turn into cheese and high‑value whey proteins.
  • They have to spend extra time and money standardizing milk just to hit the specs their equipment and contracts are built around.

CoBank lays that trajectory out clearly. For years, fat and protein grew in step, and protein generally sat ahead of butterfat on the price sheet, so plants got a nicely balanced stream of components. Then, as butterfat stayed “the money maker” in many markets, genetics and feeding strategies pushed fat faster than protein, leaving cheese‑oriented plants awash in cream but relatively short on protein.

At the same time, USDA Class and component price announcements show that butterfat and protein often trade closer together than many folks expect. For example, March 2025 Federal Order component prices reported butterfat near the mid‑$2.60s per pound and protein in the mid‑$2.40s, with month‑to‑month swings moving those numbers back and forth. In some 2025 months and orders, protein has led fat; in others, fat has led protein. Either way, the gap isn’t always as wide as “butterfat always wins” would suggest.

Corey Geiger, CoBank’s lead dairy economist, has been pretty frank about it. In an October 2025 interview, he pointed out that U.S. butterfat percent is up about 13% over the past decade, while New Zealand and the EU sit closer to 2%, and that U.S. true protein is up around 6%. His takeaway was that U.S. producers in many markets should start shifting some focus from butterfat toward producing more protein, especially as cheese and whey plants expand and protein “takes over the pole position on milk checks” in those regions.

So if it feels like you spent ten years building the butterfat levels the market seemed to want, just in time for the same market to start telling you it’s short on protein, you’re not imagining it.

What Producers See in Their Checks: A Simple Milk Check Example

You know how sometimes the only way to really feel a change is to run the math on two herds that look a lot like what you see in your area? Let’s do that.

Picture two 500‑cow herds shipping to the same cheese‑and‑whey plant in a Midwestern Federal Order:

  • Herd A (Holstein‑Jersey cross): 75 lb of milk per cow per day, 4.2% butterfat, 3.1% protein.
  • Herd B (Holstein): 78 lb of milk per cow per day, 3.8% butterfat, 3.35% protein.

Now layer on representative 2025 component values from Federal Order announcements where both butterfat and protein are in play—think butterfat somewhere in the mid‑$2.60s per pound and protein in the mid‑$2.40s to low‑$2.50s, depending on the month. In some recent orders, protein has nudged above fat; in others, fat has had the edge. But they’re in roughly the same ballpark.

Under those kinds of prices:

  • Herd A clearly “wins” on butterfat performance and ships more pounds of fat per cow.
  • Herd B gives up some fat, but pushes more protein pounds and a bit more milk.

When you crank those numbers through an actual component pay sheet—with each herd’s fat and protein production multiplied by their respective prices, plus a bit of milk yield difference—it’s easy to reach a scenario where Herd B’s milk brings in tens of thousands of dollars more per year in component revenue than Herd A, despite Herd A’s better fat test. CoBank’s modeling and case examples bear this out in a variety of cheese‑heavy markets: modestly lower fat with noticeably higher protein and milk volume often wins the total component dollar race when protein prices are competitive.

MetricHerd A (Fat Focus)Herd B (Protein Balance)DifferenceWinner
Herd Size500 cows500 cows
Milk Yield (lb/cow/day)7578+3 lbHerd B
Butterfat %4.20%3.80%-0.40%Herd A
Protein %3.10%3.35%+0.25%Herd B
Protein:Fat Ratio0.740.88+0.14Herd B
Total Daily Milk (lb)37,50039,000+1,500 lbHerd B
Est. Annual Revenue AdvantageBaseline+$72,400+$144/cow/yearHerd B

Your exact math will depend on your local component values, premiums, solids‑non‑fat rules, quality bonuses, and hauling costs. But that basic story—that very high butterfat can be outgunned financially by strong protein plus solid fat in a cheese‑oriented market—is showing up again and again when producers, nutritionists, and farm business advisors sit down and run 6–12 months of milk checks through real pay grids.

Regional Reality Check: It Doesn’t Look the Same Everywhere

It’s worth saying out loud here that the “right” butterfat‑to‑protein balance isn’t identical in every region or every plant.

In Wisconsin and the broader Upper Midwest, Federal Order 30 and neighboring areas send a large share of milk into cheddar, mozzarella, and other cheeses, with modern whey protein recovery. CoBank has noted that these plants tend to be especially sensitive to the protein-to-fat ratio and overall component balance because both cheese and whey yields depend heavily on those ratios. It’s not unusual to hear co‑op reps there say they’re comfortable around 4.0% fat, but they get more excited when they see protein closer to 3.3–3.4%.

In California, the picture is more mixed. Since joining the Federal Order system in late 2018, California milk has flowed into a blend of Class I fluid products, Class III cheese, and Class IV butter and powder. State and federal data make clear that nonfat dry milk and skim powder still matter a lot for that market, which means solids‑non‑fat, class utilization, and balancing costs share the stage with component pricing. A large dry lot herd near Tulare shipping to a plant making both cheddar and powder is playing a slightly different game than a freestall herd in central Wisconsin shipping primarily to a mozzarella‑plus‑whey facility.

In the Northeast, Orders 1 and 33 still lean more heavily on Class I fluid, with strong branded players in whole milk, flavored milk, and ice cream. Those brands often pay healthy butterfat premiums because they’re selling the “cream line” and indulgence story, even while yogurt, cheese, and ultra‑filtered milk plants in the region are watching protein very closely. That’s why you’ll see some Northeast‑targeted analysis—including Bullvine pieces—warning that a 3.15% protein test doesn’t cut it anymore if you want to land in the top tier of certain processor grids.

Then there’s Canada, where the entire structure is different. Under supply management and the Canadian Dairy Commission’s component pricing, producers are paid based on a national grid that’s designed to match butterfat and solids‑non‑fat production with domestic demand for different milk classes. A Holstein herd in Quebec or Ontario that pushes fat too high relative to SNF can quickly bump into quota over‑production penalties or create an SNF surplus, even if the component test looks impressive on paper. That’s a very different optimization problem than a U.S. herd chasing Federal Order component prices and cheese‑plant premiums.

So while the national numbers say butterfat is up double digits, and protein is up single digits, your local reality might be:

  • “Our mozzarella plant really wants more protein and doesn’t pay much once we’re above 4.0% fat.”
  • Or, “Our regional fluid brand still rewards butterfat heavily because most of our milk ends up in bottles and ice cream.”
  • Or, “Our quota system is about staying in tight butterfat and SNF bands, not maxing out a single component.”

In that context, one of the most useful questions you can ask your buyer is very simple: “For the products you’re actually making, what does ideal milk look like for you over the next five years?” It sounds basic, but many of us don’t ask it directly enough.

Region / MarketPrimary ProductsPreferred Butterfat %Preferred Protein %Target RatioKey Notes
Upper Midwest (WI, MN)Cheddar, mozzarella, whey3.9–4.1%3.3–3.4%0.80–0.85Cheese-focused; protein drives value; above 4.2% fat adds cost
CaliforniaCheese, powder, fluid mix3.8–4.0%3.2–3.3%0.80–0.83SNF matters for powder; Class IV still significant; balancing act
Northeast (NY, PA, VT)Fluid milk, yogurt, ice cream4.0–4.3%3.2–3.4%0.75–0.85Fluid brands reward fat; UF/Greek yogurt wants protein; mixed signals
Canada (Supply Mgmt.)Quota-based mix3.9–4.1%3.3–3.4%0.80–0.85Exceeding quota in any component triggers penalties; balance is mandatory

Where School Milk Fits: Stabilizer, Not Silver Bullet

Looking at this trend, you know, it’s tempting to think, “Great—whole milk is back in schools, so butterfat is king again, and we’re saved.”

From a nutrition and category‑health standpoint, the Whole Milk for Healthy Kids Act really is a big win for dairy. The law lets cafeterias put whole and reduced‑fat milk back on the line by exempting milk’s saturated‑fat content from the weekly limit used in menu scoring, and it clarifies what counts as a nutritionally equivalent non‑dairy alternative. Dairy groups have highlighted better taste, greater acceptance, and improved nutrition for kids, while public‑health advocates worry this adds saturated fat back into diets that already exceed recommended levels.

From a volume and pricing standpoint, though, the impact is more modest. Federal Order utilization data and CoBank’s broader market analysis both show that beverage milk is now a minority of total U.S. milk disappearance, and school milk is just one piece of that Class I segment. CoBank economists describe school milk policy changes as important stabilizers: they support butterfat demand, likely raise the floor under fat pricing a bit, and help defend dairy’s relevance with younger consumers. But they’re not big enough to re‑balance a national milk supply that’s become very efficient at producing cream in a system where new stainless steel is increasingly pointed at protein.

So yes, whole milk in schools is a long‑overdue positive. It’s just not a magic lever that can rescue butterfat pricing in markets where everything else is screaming for more protein.

What Producers Are Learning: Reading the Signals That Matter

What I’ve noticed, listening to producers from larger freestall setups in Wisconsin to big dry lot systems in Idaho to smaller tie‑stall herds in the Northeast, is that the folks who seem a little calmer right now aren’t necessarily the ones who guessed every move right. They’re the ones who have been quietly watching a few key signals and adjusting as they go.

First, they’ve watched where the stainless steel is going. CoBank’s late‑2025 work on “Protein will drive milk checks for the foreseeable future” highlights roughly $11 billion in new and expanded dairy plant investments across the U.S., with cheese projects leading the way at about $3.2 billion and significant additional investment in high‑protein fluid and yogurt/cultured dairies. That’s a huge bet on turning milk into cheese, whey, protein‑forward beverages, and cultured products—categories where protein drives a lot of the value.

Hilmar Cheese’s Dodge City, Kansas, facility is a good real‑world example. Company announcements and state economic‑development releases describe an investment north of $600 million, roughly 250 new jobs, and a new cheese and whey production plant designed to handle a substantial stream of milk in southwest Kansas. The message around that project is all about cheese and whey—no one is building a plant like that just to chase cream.

On the cultured side, expansions at places like Chobani’s Twin Falls, Idaho complex have turned it into one of the world’s largest yogurt operations, with multiple rounds of investment in Greek‑style yogurt and other high‑protein cultured products. Those lines rely heavily on ultrafiltration and protein concentration. Butterfat still matters for flavor and mouthfeel, but protein is very much in the lead role in the business model.

Second, some herds have quietly fine‑tuned how they look at genetics. Land‑grant extension specialists and geneticists have been pointing out that composite indexes like Net Merit are built around assumptions about component prices and milk usage that get updated in stages. When butterfat enjoyed a long run of leading the milk check, those indexes reflected that. As protein becomes more valuable in cheese‑heavy markets, there can be a lag before the standard indexes fully adjust. That’s why you see some progressive herds—especially larger ones with more replacements and genomic budgets—using custom indexes that put extra weight on protein PTA, total pounds of fat plus protein, and cheese‑specific traits alongside fertility, health, and feed efficiency.

Third, these operations talk with their processors in pretty practical terms. In some cheese‑heavy areas, field reps have told producers, “We’re fine around 4.0% fat, but what we really want is 3.3–3.4% protein.” That kind of specific feedback has a way of influencing ration design, bull selection, and even which cows get sexed semen versus beef semen when replacement numbers aren’t the bottleneck.

None of this guarantees big margins. But it does show how paying attention to where plants are investing, where component prices actually sit on your milk check, and what your buyer says they need can help you tune your herd toward where the market is going, not just where it’s been.

So What Can You Do? A Time‑Framed, Practical Look

So, given all that, the real question is: given your herd, your market, and your resources, what can you realistically do from here?

I’ve found it helps to think in three timeframes: the next few months, the next year, and the next three years.

In the Next Few Months: Low‑Cost Levers and Better Information

In the short term, you’re not going to rewrite your genetics. But you can sharpen your picture of where the money’s really coming from and see if your ration is leaving easy protein dollars on the table.

A good first step is a simple component value audit. Sit down with your nutritionist, accountant, or farm business advisor and pull out the last 6–12 months of milk checks. Using the USDA’s component price announcements alongside your plant’s pay sheet, calculate what you effectively received per pound of butterfat and per pound of protein once you factor in quality bonuses, premiums, and any penalties. In conversations with extension folks from Minnesota, Wisconsin, and New York, many producers say that once they see those numbers in black and white, they’re surprised at how much work protein is doing in their own pricing grid.

Once you know your real numbers, ask your nutritionist whether small ration changes could nudge protein up while keeping butterfat performance and cow health solid. That might mean:

  • Fine‑tuning amino acid balance—through rumen‑protected methionine and lysine, for example—so the cows have what they need to add 0.10–0.15 point of protein and potentially a bit more milk, which recent nutrition research suggests is feasible when correctly balanced.
  • Re‑evaluating bypass fat or specialty fat products to make sure you’re truly getting paid enough for those extra butterfat pounds to justify the cost and any impact on intakes or rumen function.
  • Double‑checking fiber digestibility and effective fiber so any push toward higher protein doesn’t trigger butterfat drops or more fresh cow problems during the transition period.

These tweaks might add a few cents per cow per day to your feed cost, depending on products and inclusion rates. Before you spend the money, it’s worth running the full cost‑benefit: if you add X cents per cow per day in amino acid products and get Y more pounds of protein and milk, how does that compare to your actual protein prices and margins?

To keep things manageable, there are three numbers worth tracking closely this month:

  • Your average butterfat percent.
  • Your average protein percent.
  • Your herd’s protein‑to‑fat ratio.

Those three alone will tell you if you’re in the ballpark for your market or if you’ve drifted into very high‑fat, modest‑protein territory that might not fit where your milk is going.

Over the Next Year: Genetics and Relationships

Over the next year, the biggest levers you’ll pull are about genetics and relationships.

On the genetics side, it’s a good time to ask whether your bull selection has leaned too hard toward fat at the expense of protein. CoBank’s work on protein‑driven milk checks, combined with the component gains we’re already seeing, suggests that in many cheese‑oriented markets, protein is poised to do more of the heavy lifting in the milk check, even as butterfat stays important. That doesn’t mean abandoning butterfat—it means looking for bulls that deliver strong combined fat and protein, with a bit more emphasis on protein PTA and total component pounds than you might have used five or ten years ago, especially if your milk is headed primarily into cheese and whey plants.

Many studs now offer custom or cheese‑oriented indexes, and university geneticists and extension specialists have shown how to build your own in‑house index that weights fat, protein, fertility, health traits, and feed efficiency according to your actual pay program and costs. For large freestall or dry‑lot herds shipping primarily into cheese and whey plants, those tools can make a noticeable difference in total component yield and income over a few calf crops.

Genomics fits into this picture differently depending on herd size and replacement pressure. For a 2,000‑cow herd, targeted genomic testing can help identify families that reliably deliver higher components and feed efficiency, and that information can shape both culling and mating plans; extension work in states like Wisconsin and California suggests that this kind of targeted approach tends to pencil out better than testing every heifer. For a 120‑cow tie‑stall herd, it often makes more sense to limit genomics to a handful of top heifers each year, lean on proven sires with strong component proofs, and focus more attention on fresh cow management, forage quality, and reproduction.

On the relationship side, this is a very good year to have a plain‑language component conversation with your co‑op or plant. Some questions worth asking directly:

  • “Given what you’re making now, what butterfat and protein levels would you most like to see from us?”
  • “Are there specific protein thresholds where you start paying more, or fat levels where it doesn’t really pay for us to push higher?”
  • “As new plants or product lines come online, do you expect your component pricing or premiums to shift in the next few years?”

You won’t get a perfect forecast, but even a rough answer can tell you whether chasing another 0.05 point of butterfat is really the smartest use of your dollars, or whether leaning into protein, overall component balance, or even sustainability metrics might be a better focus for your market.

Over the Next Three Years: Positioning Around Protein and New Trends

Once you stretch the horizon out to three years, you’re really deciding what sort of milk you want to produce and where you want it to end up.

On the traditional processing side, CoBank’s December 2025 analysis and related industry reporting highlight that processors have made about an $11 billion bet on protein‑oriented capacity—cheese and whey plants at the front, followed by high‑protein fluid and yogurt/cultured investments. Cheese projects alone account for roughly $3.2 billion of that investment, with the rest spread across fluid and cultured plants that are often geared toward ultra‑filtered and high‑protein products. The message for many U.S. regions is pretty clear: protein is becoming the main driver of value at the plant level, even as butterfat remains vital.

On the emerging technology side, precision‑fermented dairy proteins have moved from PowerPoints into actual steel tanks. Perfect Day’s acquisition of Sterling Biotech in India and the build‑out of a whey‑protein facility in Gujarat—with commercial production targeted for 2026 and scale‑up into 2027—is one example of how non‑farm protein production is stepping into markets like sports nutrition powders, ready‑to‑drink protein beverages, and specialized foods. At the same time, companies like Bel Group are working on precision‑fermented casein and on turning acid whey from cheese and yogurt plants into higher‑value ingredients instead of a disposal headache.

What’s encouraging, even if it’s complicated, is that analysts are still divided on how big a bite precision‑fermented proteins will take out of traditional dairy. Some see them as a growing but niche ingredient stream; others think they’ll capture a meaningful share of specific protein ingredient markets over the next decade. Either way, they’re unlikely to replace the bulk of conventional cheese and milk anytime soon, but they will complicate pricing and positioning for certain whey and casein markets.

Layered on top of that, global buyers like Nestlé and Arla are steadily tightening their climate and sustainability expectations. Nestlé has piloted net‑zero and low‑carbon dairy farms, including projects highlighted in Dairy Global, and Arla’s Climate Check program has been paying its farmers a sustainability incentive tied to farm‑level climate performance while building a massive dataset on emissions per kilo of milk. Those programs aren’t identical to U.S. efforts, but they give a good sense of where large buyers and brands are aiming.

For small and mid‑sized farms in regions like the Northeast, Upper Midwest, and certain Western milksheds, that means the long‑term strategy conversation now includes questions like:

  • “Do we want to position ourselves for a low‑carbon or regenerative milk program if our buyer offers one?”
  • “Are there animal‑welfare or environmental certifications that could stack on top of our component premiums?”
  • “Does it make more sense for us to stay a pure commodity shipper, or to direct a portion of our milk into a program that pays for attributes beyond components?”

Those are big questions, and they won’t have the same answers in every region. But they’re increasingly part of the same conversation as butterfat, protein, and where your milk actually ends up.

The Part We Don’t Put in Charts: Being “Right” at the Wrong Time

There’s one more piece here that doesn’t show up in the spreadsheets, and that’s how this all feels.

A lot of farm families have spent decades defending whole milk—at school board meetings, in conversations with dietitians, even in the grocery aisle—while official advice kept pushing low‑fat and fat‑free dairy. Over those same years, many of you re‑tooled your herds and feeding programs to take butterfat performance from “good enough” to “best in the neighborhood,” while steadily improving forage quality, TMR consistency, and transition‑cow programs so those high components didn’t wreck your fresh pens.

Now the federal government finally turns around and says, “Full‑fat dairy belongs in a healthy diet, and we’re putting whole milk back in schools,” at almost the exact moment your processor is telling you, “We really need more protein in your tank.”

I’ve heard more than one producer say some version of, “My dad argued for whole milk in schools his whole life. He’d love to see this—but it’s crazy it took this long, and it’s not what’s moving our check now.” That kind of bittersweet feeling is real. It deserves to sit right alongside any butterfat or protein chart in this discussion.

What’s interesting is that the farms that tend to ride these swings better over time usually aren’t the ones that predicted every move. They’re the ones that treat each new policy change, plant announcement, and component price sheet as more information—not as a verdict on past decisions. They ask, “Given what we know now, what’s the next smart adjustment for our herd, our market, and our family?” and they keep doing that year after year.

That doesn’t make the frustration go away—especially when you feel like you were “right” about whole milk nutritionally for decades and still aren’t getting rewarded the way you’d hoped. But it does give you a way to respond with intention instead of just reacting.

The Bottom Line

So, you’re sitting at the kitchen table with your milk checks, ration sheets, and breeding list. Where does all this leave you?

A few things feel pretty solid:

  • The new Dietary Guidelines and the Whole Milk for Healthy Kids Act are real wins for dairy’s image and full‑fat milk’s place in U.S. nutrition policy. They reflect updated nutrition science and finally line up a bit better with what many of us have believed and practiced on our own farms since the early 2010s.
  • At the same time, CoBank’s component work, USDA price announcements, and billions of dollars in cheese, whey, and high‑protein dairy plant investments all point to protein being a major driver of milk value in many U.S. markets over the next several years, especially where most of the milk ends up in manufactured products.
  • U.S. herds have done an exceptional job with butterfat performance. The next big opportunity is to balance that fat with stronger protein so your component profile lines up with what your plant can actually use and pay for most profitably—not just with what a genetic index favored during the butterfat boom years.
  • You still have practical levers: short‑term ration tweaks that respect cow health and the transition period, medium‑term breeding and genomic choices that nudge your herd toward better component balance, and longer‑term positioning around where your milk goes—cheese, fluid, powders, or value‑added and sustainability‑linked programs.

You don’t have to fix everything this season. You don’t have to stop being proud of the butterfat performance you’ve built. But given where the money and the stainless steel are moving—from Washington’s “Eat Real Food” rollout to Hilmar’s cheese and whey lines in Kansas, from high‑protein yogurt lines in Idaho to new whey‑protein tanks in Gujarat—it’s worth asking yourself a simple question:

What’s one step I can take this season, and one step over the next year, that nudges our herd a little closer to where our milk, our component pricing, and our margins are actually headed?

Because the rules around components and milk pricing have changed before, and they’ll change again. The farms that tend to stay in the game are the ones that keep reading the signals, keep asking good questions, and keep making those small, smart adjustments—without losing who they are in the process. 

Key Takeaways

  • Policy wins ≠ bigger milk checks. Full-fat dairy in the Dietary Guidelines and whole milk back in schools are image wins—but your processor still pays on components, not nutrition headlines.
  • Butterfat boomed; protein lagged. U.S. butterfat jumped ~13% over the past decade while protein rose only ~6%, pushing the national protein-to-fat ratio to 0.77—below the ~0.80 cheese plants need.
  • Protein now drives the check in cheese markets. A 500-cow herd shipping 3.35% protein and 3.8% fat can out-earn a 4.2% fat, 3.1% protein herd by $70,000+ per year at the same plant.
  • Know your three numbers. Track butterfat %, protein %, and protein-to-fat ratio monthly. These reveal whether your component profile matches what your market actually rewards.
  • Act across three timeframes. Now: audit components and adjust rations. This year: shift genetics toward balanced fat + protein. Next three years: align your herd with new cheese, whey, and high-protein plant investments.

Complete references and supporting documentation are available upon request by contacting the editorial team at editor@thebullvine.com.

Learn More

The Sunday Read Dairy Professionals Don’t Skip.

Every week, thousands of producers, breeders, and industry insiders open Bullvine Weekly for genetics insights, market shifts, and profit strategies they won’t find anywhere else. One email. Five minutes. Smarter decisions all week.

NewsSubscribe
First
Last
Consent

European Butter Down 35%: The 90-Day Playbook That’s Helping Dairy Farmers Protect $150,000+

European butter crashed 35%. History shows your milk check is due in 90 days. The farmers protecting six figures right now aren’t smarter. They’re just 90 days earlier.

Executive Summary: European butter crashed 35%—your milk check follows in 60-90 days. With Class III at $17-18/cwt, production growth running three times normal pace, and spring flush weeks away, the proactive window is narrowing. The wealth gap between acting at 1.3 DSCR versus waiting until 1.0 typically exceeds $150,000—not because one group is smarter, but because they moved earlier. This framework covers the metric your lender is watching, component strategies adding $800-1,200/month, and beef-on-dairy premiums hitting $350-700/head. The playbook mirrors 2015-16: three conversations before pressure hits—accountant, nutritionist, lender.

You know, German retail butter dropped to €0.77 per pack in late December 2025. That’s down from nearly €2.00 just a few months earlier—a correction that barely registered in most North American dairy publications. But here’s what caught my attention: for farmers who’ve learned to read global dairy signals, that price move wasn’t just European grocery news. It might be a 60-90 day advance signal for what’s heading toward our milk checks.

I spoke with a Wisconsin producer running about 280 cows near Fond du Lac recently. He put it simply: “I started watching European butter after 2015. That year taught me that what happens in Germany doesn’t stay in Germany. By the time it shows up in your mailbox, you’re already behind.”

The 60-90 Day Warning System: When European butter dropped 35% from €7,200 to €4,400 between early 2024 and late 2025, it preceded U.S. Class III pressure by roughly 75 days. The Wisconsin producer who learned this pattern in 2015 gained a $150,000+ advantage over his neighbor who ignored these global signals 

And he’s not wrong. Understanding these global connections—and knowing when they might warrant action—is becoming increasingly valuable for dairy operations navigating interconnected markets. So let me walk you through what farmers across North America are learning about price signals, financial positioning, and the strategic decisions that can make the difference between weathering market pressure and getting caught flat-footed.

AT A GLANCE: Key Insights

  • The Signal: European wholesale butter down ~35% year-over-year; historically correlates to North American price pressure within 60-90 days
  • The Metric That Matters: Know your Debt Service Coverage Ratio—acting at 1.3x versus waiting until 1.0x can mean a six-figure difference in preserved wealth
  • Near-Term Strategies: Feed-based butterfat improvements can add $800-1,200/month within 60-90 days; beef-on-dairy premiums running $350-700/head
  • The Framework: Proactive positioning beats reactive response—farmers who move early consistently outperform those who wait
  • The Bottom Line: Markets may surprise either direction, but stress-testing your operation at $15-16/cwt scenarios is sound management

How European Butter Prices Connect to Your Milk Check

The relationship between European dairy commodities and North American milk prices follows a transmission path that agricultural economists have tracked for over a decade now. It typically unfolds across 60-90 days, which—when the signals are reliable—gives observant farmers a meaningful window to prepare.

Dr. Mark Stephenson, who served as Director of Dairy Policy Analysis at the University of Wisconsin-Madison before his recent retirement, studied this lag extensively throughout his career. His research shows that when European wholesale butter drops significantly, the effects tend to ripple through Global Dairy Trade auctions in New Zealand within 2-3 auction cycles, then influence contract negotiations across Oceania before reaching North American processor discussions.

What’s happening right now appears to fit that pattern. European wholesale butter fell from over €7,200 per tonne in early 2024 to the €4,000-5,000 range by late 2025, according to AHDB’s EU wholesale tracking—that’s roughly a 35% year-over-year decline. Class III futures for Q1-Q2 2026 are currently trading in the $17.00-18.00/cwt range on CME, which is actually better than some analysts projected a few months back, but still tight for operations with higher cost structures.

Industry estimates suggest that breakeven for mid-size Wisconsin dairies typically runs $18-19/cwt when all costs, including family living and debt service, are accounted for. Operations in California’s Central Valley often see higher numbers due to feed costs and regulatory compliance, while Northeast operations face their own regional dynamics. Western operations dealing with water constraints and Southeast dairies facing heat stress economics have their own cost pressures layered on top. Canadian producers navigate a different reality entirely—quota values and supply management provide price stability but bring their own capital and cash flow considerations. The specific math varies by region and management, but the directional pressure applies when Class III hovers near or below regional breakevens.

RegionTypical All-In Breakeven ($/cwt)Primary Cost DriversCurrent Margin @ $17.50 Class IIIProjected Margin @ $15.50 ScenarioRisk Level Q2 2026
Wisconsin$18.00 – $19.00Feed, labor, debt service-$0.50 to -$1.50-$2.50 to -$3.50Moderate-High
California Central Valley$20.00 – $22.00Feed costs, water, regulatory compliance-$2.50 to -$4.50-$4.50 to -$6.50High
Northeast (NY, PA, VT)$19.00 – $21.00Labor, fuel, regional feed premiums-$1.50 to -$3.50-$3.50 to -$5.50Moderate-High
Texas/New Mexico$17.50 – $19.50Water constraints, heat stress mitigation, feed$0.00 to -$2.00-$2.00 to -$4.00Moderate
Southeast (GA, FL)$19.50 – $21.50Heat stress, humidity management, feed transport-$2.00 to -$4.00-$4.00 to -$6.00High
Canada (Quota Systems)Quota value amortized variesQuota costs, supply management compliancePrice stability via quota systemPrice stability via quota systemLow (different market structure)

Now, I want to be clear about something. Markets can and do surprise us. Futures have been wrong before—2022 comes to mind, when projections sat around $18, and actual prices hit $23 on unexpectedly strong export demand. Some analysts I’ve spoken with remain cautiously optimistic that domestic demand strength could offset some of the pressure we’re discussing. But what’s different about the current setup is the structural inventory situation, which has its own timeline regardless of demand fluctuations.

The Financial Metric Your Lender Is Already Watching

If there’s one number that shapes the conversation you’ll have with your bank—whether it’s a proactive discussion or a reactive one—it’s your Debt Service Coverage Ratio. DSCR tells you whether your operation generates enough cash to cover debt obligations with breathing room… or whether you’re running closer to the edge than you might realize.

Farm Credit Canada’s educational materials lay out the basics pretty clearly. A DSCR of 1.5 is generally considered healthy—it means you’ve got 1.5 times more cash available than your debt obligations require. Drop below 1.0, and you’re looking at difficulty servicing debt without off-farm income or other support. Most agricultural lenders use similar thresholds, though the specific trigger points for increased monitoring or restructuring conversations vary by institution.

DSCR RatioFinancial PositionWho Controls the ConversationRestructuring Options AvailableTypical Cost of Restructuring
1.5x or higherHealthy, strong cushionYou lead; bank followsFull menu: extend terms, consolidate, refinance at competitive ratesStandard processing fees (~$500-1,500)
1.25x – 1.49xAdequate but tighteningPartnership discussionMost options available; minor rate premiums possibleStandard to slight premium (~$1,000-3,000)
1.0x – 1.24xOperating in yellow zoneShared control; bank monitoring increasesLimited options; rate premiums likelyModerate premium (~$3,000-8,000 + 50-100 bps higher interest)
0.85x – 0.99xDistressed territoryBank controls termsRestricted; workout scenarios$8,000-15,000 + 100-150 bps higher interest
Below 0.85xCrisis modeBank workout team drivesForced asset sales likely$15,000+ legal/processing + distressed sale losses

Here’s what farmers are discovering—sometimes later than they’d prefer—the difference between acting at 1.3x DSCR and waiting until you hit 1.0x isn’t just about the numbers themselves. It’s about who’s leading the conversation and who’s following.

I spoke with a senior agricultural lender at a Midwest Farm Credit association who asked to remain anonymous but offered this perspective: “When a producer comes to us at 1.3 with a plan, we’re partners working on optimization. When they come at 0.95 because their operating line is maxed, we’re in workout mode. Same bank, same farmer, completely different dynamic.”

Why does this matter so much? Industry data on distressed agricultural loans shows some significant cost differences. Farms entering workout typically pay 100-150 basis points higher on restructured debt and face substantially higher legal and processing fees. Proactive restructuring—the kind you initiate while your ratios still look reasonable—generally costs a fraction of what a reactive workout costs. And perhaps more importantly, you’re often selling assets into stable markets rather than whatever conditions happen to exist when you’re forced to act.

Agricultural lenders like AgAmerica have documented case studies showing the financial benefits of proactive restructuring. In their published examples, operations that restructured early reported significant annual savings through debt consolidation and strategic use of bridge financing during capital-intensive phases. These options existed because producers initiated conversations while their ratios still demonstrated operational viability.

Here’s a calculation worth doing this week:

Pull your most recent income statement and loan documents. You need three numbers:

  1. Net cash income (gross revenue minus operating expenses—but don’t subtract interest, depreciation, or principal payments)
  2. Annual debt service (all monthly loan payments × 12)
  3. Divide the first by the second

Pro-tip: Remember that while your tax preparer uses depreciation to lower your tax bill, your lender “adds it back” to your net income to determine your actual cash flow capacity. Don’t let a “paper loss” scare you away from a proactive lender meeting. That $80,000 depreciation expense on your Schedule F doesn’t mean you’re $80,000 poorer in cash—it’s an accounting entry, not money leaving your checking account. Lenders understand this, and you should too when evaluating your real financial position.

If you’re above 1.3, you likely have options and time to be strategic. Between 1.0 and 1.25, the window for proactive decisions may be narrowing. Below 1.0, that conversation with your lender probably needs to happen soon—and having a professional guide you in is worth considering.

RED FLAGS: Signs You May Already Be Past Proactive Positioning

  • Operating line balance is climbing more than $5,000/month for three consecutive months
  • Deferred maintenance backlog growing—you’re skipping repairs you’d normally make
  • Breeding decisions driven by cash flow rather than genetic strategy
  • Accounts payable stretching beyond normal terms with key suppliers
  • Finding yourself calculating “which bills can wait” rather than “which investments make sense.”

If three or more of these apply, the proactive window may be closing. That doesn’t mean it’s too late—but it does mean the conversation with your lender needs to happen this month, not next quarter.

What’s Building Toward Q2 2026

Several market forces appear to be converging, potentially creating price pressure this spring. I want to be thoughtful here—market projections are exactly that, projections—but the structural setup is worth understanding so you can make your own assessment.

The cheese inventory factor: When butter prices declined through late 2025, processors across the U.S., UK, and EU made a logical shift. Butter had compressed margins and ongoing storage costs. Cheese—particularly aged cheddar—can sit in inventory for months as it matures, serving as a financial buffer during uncertain times.

You probably already know the aging timelines: mild cheddar reaches market readiness in 2-3 months, medium in 4-9 months, and sharp in 9-12 months. The cheese made in December 2025 and January 2026 will mature and need to be moved to market starting around April-May 2026. That’s not speculation about demand—that’s just aging biology meeting calendar math.

The spring flush timing: Every dairy farmer knows spring flush, but the research on its consistency is worth noting. Studies published in the Journal of Dairy Science on annual rhythms in U.S. dairy cattle show that the spring production peak is remarkably consistent across regions, parities, and management systems—driven more by photoperiod and reproductive biology than management decisions.

USDA’s December 2025 forecast projects U.S. milk production for 2026 at 106.2 million metric tons, up 1.2% from 2025. StoneX Director of Dairy Market Insight Nate Donnay noted in late December that milk production growth was running at an estimated 5.5% pace in September and October—about three times the normal rate. That’s notable context heading into the new year.

The export question: Here’s what’s been encouraging—September 2025 U.S. cheese exports hit 116.5 million pounds, up about 35% year-over-year, according to USDA Foreign Agricultural Service data. That was a remarkable achievement for the industry. The question some analysts are asking is whether markets that absorbed those record volumes will have the same appetite just as domestic production peaks.

None of this means $13 milk is coming. Markets find equilibriums, demand can surprise to the upside, and spring flush intensity varies year to year. But farmers projecting cash flow for Q2 2026 might consider running scenarios at $15.00-16.00/cwt alongside their base case assumptions. That’s not pessimism—it’s the kind of stress-testing that helps operations stay resilient when surprises happen.

Why Component Performance Is Becoming a Competitive Advantage

One of the most significant structural shifts in U.S. dairy over the past decade has been the steady improvement in milk components. And the numbers here are pretty remarkable. CoBank’s Knowledge Exchange published an analysis in September 2025 showing that U.S. butterfat levels increased approximately 13% over the past decade—from about 3.75% in 2015 to 4.24% by 2024. That’s roughly six times the improvement rate seen in the EU and New Zealand.

What’s particularly noteworthy is how this shifts farm-level economics during price compression. Class III and Class IV pricing formulas reward butterfat and protein by the pound rather than by volume. When base prices compress, the premium for higher components becomes proportionally more valuable as a share of the milk check.

Let me walk through some rough math on two cows producing identical volume but different components:

Cow A at 3.7% butterfat: 75 lbs/day = 2.78 lbs butterfat daily
Cow B at 4.4% butterfat: 75 lbs/day = 3.30 lbs butterfat daily

At current butterfat component pricing—which has been running in the $1.55-1.75/lb range in recent months according to USDA announcements—that 0.52-pound daily difference represents roughly $0.80-0.90 per cow per day. Scale that across a 200-cow herd over a year, and we’re talking meaningful revenue differences.

Now, genetic improvement takes 2-3 years to show up meaningfully in the bulk tank. But feed ration adjustments can produce measurable butterfat improvements within 60-90 days—which matters for operations looking at near-term margin pressure.

A Penn State study published in the Journal of Dairy Science in June 2024 found that replacing about 5% of ration dry matter with whole high-oleic soybeans improved income over feed cost by approximately $0.27/cow/day—roughly $99/cow annually. The research synthesized results from multiple feeding trials, so the findings are pretty robust.

Dairy nutritionists generally recommend adding 2-5% molasses to TMR to stimulate fiber-digesting bacteria and boost acetate production, which supports butterfat synthesis. Many farms report butterfat increases of 0.10-0.15 percentage points from this relatively simple adjustment. Protected fat supplementation—combinations of palmitic and oleic acids—can increase milk fat yields within 30-45 days of implementation.

For farms facing compressed margins, even a 0.15-0.2% butterfat improvement translates to meaningful revenue—potentially $800-1,200 monthly for a 200-cow operation at current component pricing. It’s not a complete solution to price pressure, but it’s real money that shows up in the tank relatively quickly.

The ration adjustment that pays for itself in monthly milk checks: Feed-based butterfat improvements show up in the tank within 60-90 days—potentially adding $800-1,200 monthly for a 200-cow operation. Penn State research found protected fat and molasses additions can boost butterfat 0.10-0.15 percentage points within 30-45 days

The Beef-on-Dairy Opportunity

One revenue diversification strategy that’s gained remarkable traction is beef-on-dairy crossbreeding. Industry surveys, including data from the American Farm Bureau Federation, based on Purina’s 2024 producer research, indicate that roughly seven in ten dairy operations are now actively implementing crossbreeding programs. That’s a significant shift from even five years ago.

The economics are fairly straightforward. Industry analysis shows that the majority of dairy farmers participating in these programs receive meaningful premiums for beef-on-dairy calves, with reports of additional revenues ranging from $350 to $700 per head compared to straight dairy bull calves. For an operation producing 70 male calves annually, switching half to beef crosses could generate $18,000-$20,000 in additional annual revenue.

What stands out to me about this trend is the timeline. Beef-on-dairy calves sell at 6-9 months, meaning breeding decisions made in Q1 2026 generate cash in Q4 2026. That’s a faster payoff than almost any other diversification strategy available to dairy producers—which matters when you’re managing through uncertain price periods.

Penn State Extension research on beef×Holstein crosses shows these animals have greater potential to put on muscle than purebred Holstein steers and generally show improved feedlot performance. The carcass quality has proven competitive, and the market infrastructure has developed rapidly to accommodate increased supply. One California producer I spoke with mentioned that his local auction now has specific beef-on-dairy sales days—something that would have seemed unlikely five years ago.

A Texas Panhandle operation I connected with recently shared a different angle on this. They’ve been running beef-on-dairy for three years now and emphasized that buyer relationships matter as much as genetics. “We spent six months building connections with regional feedlots before we started,” the manager told me. “Knowing where those calves are going—and what those buyers want—shaped our sire selection from day one.”

Implementation is fairly straightforward for most operations: genomic testing identifies which cows should continue breeding to elite dairy genetics (typically top 50% by genomic merit) versus which shift to beef sires—Angus, Simmental, or Charolais being common choices depending on regional buyer preferences.

WHAT ONE PRODUCER LEARNED FROM 2015

A 320-cow operation in Dodge County, Wisconsin, offers a useful case study. The producer—who asked that I not use his real name but was willing to share his experience—was running at about 1.28 DSCR in October 2015 when he started noticing warning signs.

“My accountant said I was fine. My neighbor said I was overreacting. But I’d been watching powder prices in Europe drop for months, and I had a feeling about what was coming.”

He restructured his equipment notes that November, extending terms and reducing his monthly obligation by $2,800. He culled 40 head—his bottom performers on both production and components—before spring 2016.

“When milk hit $13 that summer, I was tight but managing. My neighbor, who waited until April to act? He was in a workout by July. Similar starting points, different decisions, very different outcomes.”

His estimate of the wealth difference: around $150,000-$180,000 preserved by moving about six months earlier. Not from being smarter, he emphasized—just from reading the signals and acting before he had to.

What Peer Accountability Groups Are Teaching Farmers

There’s growing evidence suggesting that farms participating in structured peer groups make major financial decisions 6-12 months earlier than farms relying solely on individual analysis. And the mechanisms behind this are fascinating—rooted in behavioral economics as much as farm management principles.

Research on structured farm management groups has consistently shown meaningful financial advantages for participants. Studies tracking farms in peer advisory programs have found notable improvements in operating profit and return on assets compared to non-participants—though the specific magnitude varies by region, group structure, and management intensity.

The Ohio State University Extension put together a helpful fact sheet on peer group value that explains part of the mechanism. As they describe it, “With trusting relationships, members can share their farm’s production data such as yield, inputs, labor, and equipment, along with core financial ratios. Peers then act as an informal board of directors by identifying the strengths and areas for improvement.”

Here’s something I’ve noticed over the years: most dairy farmers don’t actually know their neighbor’s DSCR. They might know what kind of tractor he bought or roughly what he’s feeding, but the real financial picture? That stays behind closed doors. And that isolation can be expensive.

Having sat in on several of these groups over the years, I’ve observed something important about what actually happens in those rooms. The groups seem to override the cognitive biases that can cause all of us—not just farmers—to delay difficult decisions. Loss aversion makes culling cows feel worse than the abstract benefit of “preserving financial flexibility.” Status quo bias creates comfort with continuing current practices even when data suggests change might be warranted. Optimism bias whispers, “we’ve always made it through before.”

The farmers losing the most money right now aren’t necessarily the ones with the worst operations. They’re often the ones who calculated correctly but couldn’t pull the trigger—who knew what they should do but found reasons to wait another month, another quarter, another year.

Peer groups interrupt these patterns through straightforward mechanics: quarterly meetings with financial transparency, benchmarking against similar operations, and accountability for stated commitments. When you tell five other farmers in January that you’re going to restructure your equipment debt and cull your bottom 15%—and they’re going to ask you about it in April—it changes the calculus.

Kim Gerencser, a Saskatchewan-based farm business and management consultant who has been facilitating peer groups for well over a decade, has written and spoken extensively about the value of accountability structures. In interviews with Country Guide, he’s emphasized that the groups that sustain themselves over many years do so because participants find genuine value in the structure. The accountability piece, he’s noted, is what really matters.

For farmers who haven’t participated in this kind of group, options include Cornell’s Dairy Profit Discussion Groups, various state extension programs, cooperative-facilitated groups, and private consultant-led formations. The common elements that seem to make groups effective: quarterly meetings, financial transparency among members, neutral facilitation, and strong confidentiality agreements.

A Practical Six-Month Framework

For farmers who’ve assessed their position and decided proactive action makes sense, here’s what a practical timeline might look like. I want to emphasize that this isn’t the only approach, and every operation’s circumstances differ. A 500-cow California dairy faces different cost structures and cooperative relationships than a 150-cow Vermont operation or a 2,000-cow Texas facility.

But the underlying framework—financial clarity first, then cost structure adjustment, then ongoing accountability—seems to apply broadly based on what I’ve seen work across different regions and operation sizes.

Month 1 (January): Financial Clarity

The starting point is knowing exactly where you stand. Complete the DSCR calculation using both historical and projected prices. Pull your operating line balance trend over the past six months—if it’s been climbing $3,000-8,000 monthly, you may already be running negative cash flow, regardless of what last year’s financial statement showed.

Review your DHIA reports to identify the bottom 15-20% of your herd by combined production and components. These become your first-look candidates if cash flow requires culling decisions.

And if you’re considering a lender conversation, schedule it now while you’re initiating from a position of relative strength. The framing matters. Something like: “I’ve run forward projections based on current futures. I’d like to discuss options while we’re still well above your monitoring threshold” positions you as a proactive manager rather than a distressed borrower.

Month 2 (February): Cost Structure Adjustment

If culling decisions make sense for your operation, executing them while cattle prices remain stable preserves value. Current market prices for cull cows typically range from $1,200-1,800/head, depending on region and market conditions; distressed selling in a soft spring market could mean $800-1,100. That difference across 35 cows adds up quickly—real money for most operations.

Implement any feed ration adjustments to improve butterfat. The 60-90 day timeline for feed-based component gains means February changes can show up in April milk checks.

If beef-on-dairy makes sense for your operation, begin that breeding protocol on lower genomic performers. Revenue arrives in Q4 2026.

Month 3 (March): Risk Management and Accountability

Evaluate hedging options based on your operation’s risk tolerance and expertise. Dairy Revenue Protection and Class III options are available for farms that want price-floor protection, though they come with costs and basis risk that warrant careful evaluation—ideally with someone who understands these tools well.

Consider joining or establishing a peer accountability group. The first meeting should present your current position and action plan. Having external accountability through the spring flush period can be valuable.

Months 4-5 (April-May): Monitor and Maintain Discipline

Track actual versus projected cash flow weekly. This is where discipline matters—there can be temptation to reverse culling decisions or restructuring if short-term prices tick up.

If you’re in a peer group, the meeting during this period provides external validation. Present your January baseline, your April position, and your variance analysis. Let the group help you assess whether you’re on track.

Month 6 (June): Assessment and Forward Planning

Compare actual DSCR to January projections. Evaluate what worked, what didn’t, and what you’ve learned. Develop your Q3-Q4 plan incorporating any beef-on-dairy calf revenue and continued component focus.

What success might look like: A farm that entered January at 1.3x DSCR with $18.50/cwt breakeven, facing uncertain milk prices, emerges in June at 1.15-1.18x DSCR with $16.80/cwt breakeven—having maintained position above the critical 1.0x threshold even through potential price pressure. That’s not a dramatic turnaround story. It’s just solid management under challenging conditions.

The Conversation That Matters Most

Perhaps the hardest part of proactive financial management isn’t the calculations or even the lender meetings. It’s the kitchen table conversation about making significant changes before a crisis becomes undeniable.

What farmers who act early seem to be deciding is whether the discomfort of acknowledging vulnerability now is worth the financial protection it might provide later. And honestly, that’s not an easy trade-off. Culling cows you’ve raised can feel like a retreat. Calling your lender proactively can feel like admitting weakness. Joining a peer group and sharing your financials can feel uncomfortable.

But the alternative—waiting until circumstances force the same decisions from a weaker position—tends to cost real money, according to the research and case studies I’ve reviewed. The wealth difference between proactive and reactive positioning can range from $150,000 to $300,000 or more over a 2-3-year market cycle, depending on the operation’s size and the severity of the downturn.

That’s what tends to happen when operations restructure at penalty rates rather than market rates, sell cattle into distressed markets rather than stable ones, pay workout fees rather than standard processing fees, and navigate restricted credit access for years rather than maintaining banking relationships.

Key Takeaways

On global market signals:

  • European butter prices and Global Dairy Trade auction results can provide 60-90 days of advance indication for U.S. milk price direction
  • Current signals suggest potential price pressure in Q2 2026, though markets can surprise, and projections always carry uncertainty
  • Worth monitoring: GDT auction results at globaldairytrade.info, AHDB EU wholesale prices, and CLAL’s international databases

On financial positioning:

  • DSCR is the metric lenders watch most closely—knowing yours and projecting it forward matters
  • The wealth difference between acting proactively versus reactively can be substantial over a market cycle
  • Proactive restructuring conversations tend to yield significantly better terms than reactive conversations during distress

On operational strategies:

  • Component improvement through feed rations can generate meaningful monthly revenue within 60-90 days
  • Beef-on-dairy crossbreeding offers $18,000-$20,000 potential annual revenue diversification with a  6-9 month payoff timeline
  • Culling decisions reduce cost structure but require careful analysis of volume versus efficiency trade-offs specific to each operation

On decision-making:

  • Peer accountability groups appear to help farmers make structural decisions earlier than solo analysis
  • The psychological barriers to early action—loss aversion, status quo bias, optimism bias—are normal human tendencies
  • The farms that navigate market pressure most successfully seem to share a common trait: they made uncomfortable decisions while they still had meaningful control over terms and timing

The Bottom Line

The European butter correction of 2024-2025 wasn’t just a European story. It appears to be an early chapter in a global market adjustment that’s still developing. For dairy farmers willing to monitor these signals, clearly understand their financial position, and make proactive decisions, it may also represent an opportunity to strengthen operations before market pressures fully test them.

The question isn’t whether to prepare—smart operators are always preparing. The question is whether you’ll do it on your terms or the bank’s.

For producers reading this in January 2026, that means three conversations in the next 30 days: one with your accountant to calculate your current DSCR, one with your nutritionist about component-focused ration adjustments, and—if your number is below 1.25—one with your lender before spring flush hits. The farmers who preserved six figures in 2015-2016 didn’t have better operations. They had better timing.

For dairy producers seeking resources: University extension dairy programs in most states offer farm financial analysis services. The Center for Dairy Profitability at UW-Madison publishes annual benchmarking data. Regional cooperatives increasingly offer member financial planning support. Farm Credit institutions provide forward-looking cash flow analysis. The key is engaging these resources while your financial position still allows flexibility to act thoughtfully on what you learn.

Note: Market projections are inherently uncertain. This article provides educational framework, not financial advice. Consult qualified professionals for operation-specific decisions.

Complete references and supporting documentation are available upon request by contacting the editorial team at editor@thebullvine.com.

Learn More

The Sunday Read Dairy Professionals Don’t Skip.

Every week, thousands of producers, breeders, and industry insiders open Bullvine Weekly for genetics insights, market shifts, and profit strategies they won’t find anywhere else. One email. Five minutes. Smarter decisions all week.

NewsSubscribe
First
Last
Consent

The Hidden Equipment Failure Costing Dairy Farms $100,000 Annually – And Why Most Farmers Don’t Know They Have It

The dairy industry’s toughness culture kept farms alive for generations. Now it’s quietly costing them six figures a year.

EXECUTIVE SUMMARY: If 60% of milking robots were glitching, you’d have dealers on farm by Tuesday. When 60% of farmers are burning out, we shrug and call it “part of the job.” But the research says otherwise: University of Guelph data shows 34% of farmers meet criteria for depression and 76% report moderate to high stress—and it’s showing up in bulk tanks, lameness scores, and breeding records. Canadian mastitis modeling puts subclinical cases alone at $34,344 per 100 cows annually, losses driven by the exact tasks that slip when mental bandwidth runs low: CMT testing, fresh cow checks, structured repro reviews. Farms that deliberately protect headspace are seeing results—ELBI Dairy in Manitoba cut SCC by 52% after rebuilding with robots and tighter routines. What works isn’t telling farmers to “just get help”; it’s written plans, peer groups that talk numbers and stress, and coaching designed around calving schedules. The brain making your herd decisions is equipment, too—and right now, on many operations, it’s running without a maintenance plan.

If 60% of our milking robots were glitching, you know exactly what would happen. There’d be emergency calls to the dealer, reps on the farm, and probably industry meetings asking what went wrong. When a similar share of farmers themselves are running mentally on “low‑battery,” we tend to shrug and call it “just part of the job.”

What’s interesting here is that newer research is showing this isn’t just a human‑interest story. It’s a herd‑health and profitability story. And it’s showing up in somatic cell counts, fresh cow management, reproduction, and culling decisions in ways a lot of us never fully connect back to the person in the parlor or in front of the robot screen.

Let’s walk through what the data actually says—and what it means for SCC, butterfat performance, and your bottom line in today’s cost structure.

Looking at This Mental Health Trend in Dairy

Looking at this trend over the last decade, one thing is clear: people have finally begun measuring farmer stress seriously.

In Canada, Dr. Andria Jones‑Bitton, DVM, PhD, an epidemiologist at the University of Guelph, led a national online survey of 1,132 farmers between 2015 and 2016 using validated scales for stress, anxiety, depression, and resilience. The results were stark:

  • About 34% of farmers met the criteria for depression.
  • Roughly 57% and 33% met criteria for possible and probable anxiety, respectively.

Farmers scored significantly worse than normative Canadian population values across stress, anxiety, depression, and resilience, confirming what many of us have felt anecdotally for years.

Later, the same research team examined farm families, including both parents and adolescents. Follow‑up work on farm families and youth in agriculture reported that around 60% of adults and teens in farm households were experiencing at least mild symptoms of depression, raising concern that stress is impacting the whole family, not just the primary operator.

Then COVID hit. A national follow‑up survey of Canadian farmers conducted in 2021 and published in 2022 found that 76% of farmers reported moderate to high perceived stress, and suicidal ideation was about twice as common as in the general Canadian population.

University of Guelph summarized that work by noting that roughly one in four farmers had experienced suicidal thoughts in the previous 12 months.

And it’s not just a Canadian story. A 2022 HillNotes analysis and coverage in Hoard’s Dairyman highlight that farmers in several U.S. regions are also at greater risk of mental‑health challenges and suicide than many other occupations, with financial stress and fear of losing the farm topping their list of stressors. In Pennsylvania and across the Upper Midwest, extension and farm bureau surveys have flagged similar patterns. Recent European research has found comparable trends, with farmers scoring higher on stress and burnout measures than general working populations.

What I’ve noticed, and what the qualitative work confirms, is a consistent pattern in how farmers talk about this. In interviews with Ontario producers, Jones‑Bitton’s team heard farmers say things like “farmers aren’t into the emotions and things” and describe mental‑health struggles as “just part of farming,” while still labelling their own mental health as “good” or “fine” even when they screened as depressed or anxious.

That toughness has kept a lot of farms alive through years that would have sunk other businesses. But this development suggests that early warning signs are often normalized rather than treated as something that deserves a plan, just like any other high‑risk area of the operation.

What Depression Really Changes in Day‑to‑Day Dairy Management

So what’s actually going on in the brain when chronic stress or depression sets in?

Modern psychology research shows that depression changes how people evaluate mental effort: planning, concentrating, and making decisions feel more costly, even when your body is still capable of hard physical work. Farmers in Canadian and international studies describe low energy, difficulty focusing, trouble making decisions, and feeling “foggy” or “overloaded.”

On a dairy, you can see that pattern pretty clearly.

You can still:

  • Milk two or three times a day.
  • Push feed, scrape alleys, and keep the dry lot reasonably in shape.
  • Fix the broken gate or that leaky waterer in the holding area.

But the “thinking jobs” start to slide:

  • “I’ll pull those SCC reports tomorrow.”
  • “I should CMT those fresh cows, but I’ll get to it later this week.”
  • “I’ll sit down with the breeding and culling records when things slow down.”
Task CategoryWhat Still Happens (Physical/Routine)What Quietly Slips (Cognitive/Planning)
Milking & FeedingMilk 2-3x daily, push feed, scrape alleysStructured SCC trend analysis, CMT testing on fresh cows
FacilitiesFix broken gates, leaky waterersLameness scoring on schedule, body condition scoring
ReproductionAI techs still show upHeat detection without activity monitors, structured repro reviews
Fresh CowsFresh cows still get fed and milkedSubclinical ketosis checks, rumination monitoring, “just off” cow follow-up
Culling & EconomicsObviously sick cows still leaveData-driven cull reviews, borderline cow decisions, cost-benefit modeling

What’s interesting is that we now have herd‑level data to back up what many of us have seen. An exploratory study on Ontario dairy farms using robotic milking systems measured farmers’ mental health using validated scales and then linked those scores with cow health and welfare indicators.

The researchers found that:

  • Higher farmer stress scores were associated with a higher prevalence of severe lameness.
  • Anxiety and depression scores were higher among farmers who worked mostly alone, fed manually, or had lower milk protein percentages.
  • Resilience scores were higher on farms using automated feeding systems, suggesting potential benefits in terms of mental bandwidth and consistency.

Dairy Global summarized the work, stating that farmer and cow well-being are clearly connected, and that automation and better support can reduce stress and improve both lameness and overall performance.

On farm, as many of us have seen across Ontario free‑stalls, Wisconsin parlors, Quebec tie‑stalls, and Western dry lot systems, the same vulnerable tasks tend to pop up:

  • Subclinical mastitis detection: routine CMT testing on fresh cows, tracking SCC trends, and acting on borderline cows.
  • Heat detection and recording, especially in non‑robot herds without activity monitors.
  • Fresh cow management in the transition period: spotting subclinical ketosis, watching intakes and rumination, and checking cows that are just “off.”
  • Lameness and body condition scoring are done on a schedule, not just when a cow is obviously sore.
  • Structured repro and cull reviews with numbers on the table instead of relying only on gut feel.

Those jobs are exactly where the money is quietly made—or quietly lost.

The Math of Mental Load: Where the Money Disappears

Farmers tend to ask, “What’s this really worth?” So let’s talk big math using actual research and common economic assumptions for today’s input and replacement costs.

A Canadian team led by Dr. Ebrahim Aghamohammadi modeled herd‑level mastitis‑associated costs on Canadian dairy farms using detailed production and health data combined with economic modeling. They estimated that:

  • Median total mastitis cost was 662 CAD per milking cow per year.
  • About 48% of mastitis costs were due to subclinical mastitis (SCM)—cases that often only show up on SCC reports or CMT testing.
  • In their model, SCM cost around 34,344 CAD per 100 cow‑years, compared with about 13,487 CAD per 100 cow‑years for clinical mastitis.

They also showed that milk yield reduction was the largest single cost component, especially in subclinical cases. Most of the cost is in lost production, not just treatment and discarded milk.

Now, stack reproduction on top. Many dairy economists and extension bulletins peg the cost of an extra day open at several dollars per cow per day, once you factor in delayed calving, reduced lifetime milk production, and higher culling risk. Depending on milk price and stage of lactation, missing a heat on one cow can easily represent tens of dollars per 21‑day cycle, especially when it repeats or involves multiple cows.

Subclinical ketosis is another slow drain. Transition‑cow economic work commonly estimates the cost of each subclinical ketosis case at around the low hundreds of dollars, once early‑lactation milk loss, a higher risk of displaced abomasum and metritis, and poorer fertility are included.

Then there’s premature culling. With 2024–2025 feed, labor, and construction costs where they are, it’s increasingly common to see full replacement heifer rearing costs in the 3,000–4,000 dollar range per heifer by first calving, depending on region and system. Every cow that leaves the herd early because her issues weren’t caught and resolved is a partial or complete write‑off of that investment.

So on a 100‑cow herd, even at conservative assumptions for:

  • Subclinical mastitis losses (~34,000 CAD per year),
  • Extra days open from missed heats,
  • A handful of subclinical ketosis cases, and
  • A few premature culls,

It’s realistic to expect preventable losses in the neighbourhood of 100,000 CAD per year due to the inconsistent execution of these management tasks.

That’s not a single study’s number; it’s a composite built from peer‑reviewed mastitis data, typical reproduction and transition‑disease economics, and current replacement values.

What I’ve noticed on real farms is that the tasks that control those costs—structured SCC work, tight fresh cow management, disciplined repro and culling reviews—are exactly the jobs that require the most sustained mental effortfrom the key decision‑maker.

That’s where mental overload stops being a personal issue and becomes a line item.

What Happens When You Free Up Headspace: A Manitoba Example

It’s one thing to lay out models and surveys. It hits differently when you watch a real farm go through the change.

ELBI Dairy in La Broquerie, Manitoba, is a family‑run operation milking roughly 900 cows, and they’ve become a bit of a case study in how automation and mental bandwidth can interact. After a barn fire, the de Jong family rebuilt with robotic milking systems and a barn designed for labor efficiency and cow comfort. Their journey has been featured in the Lely case material.

Performance MetricBefore Robots (Conventional)After Robots + Optimized RoutinesChange
Bulk Tank SCC183,000 cells/mL88,000 cells/mL-52%
Milk Yield per Cow per Day~32 L/day (~70 lb/day)~40 L/day (~87 lb/day)+25%
Hoof Health & LamenessConventional levels (moderate issues)Substantially improved, lower hoof costsMajor improvement
Farmer Mental BandwidthHigh stress, long hours, physically demandingMore time for data review, fresh cow management, strategic decisionsFreed up

Before robots, ELBI was milking conventionally and reported:

  • Bulk tank SCC around 183,000 cells/mL.

After they transitioned to robots and settled into the new routines:

  • SCC dropped to around 88,000 cells/mL—about a 52% reduction.
  • Milk yield increased by around 7–8 litres per cow per day (roughly 15–17 lb/cow/day).
  • They saw large improvements in hoof health and substantially reduced hoof‑related costs once they optimized manure handling, cow flow, and stall use.

In interviews, the de Jongs don’t talk like robots magically cured their mastitis and lameness. They talk about improved cow flow, more consistent routines, and the ability to devote more attention to fresh cow management, preventive care, and data‑driven decision‑making because the daily milking grind was less physically and mentally draining.

That fits almost exactly with the Ontario robotic‑milking research: lower stress and higher resilience on farms with more automation and support, and better lameness and welfare outcomes when farmers are in a better mental place.

Now, full automation isn’t going to pencil out for every farm. A 70‑cow tie‑stall in Quebec, a 300‑cow sand‑bedded freestall in Wisconsin, and a 1,500‑cow dry lot in California are all playing different capital and labor games.

But I’ve seen similar patterns when farms:

  • Hire or grow a herdsman/assistant manager role.
  • Lean into herd management software and actually use the reports.
  • Reorganize chores so the primary decision‑maker isn’t also doing every repetitive task.

The theme is the same: when you deliberately free up mental bandwidth for the people steering the ship, the herd typically responds, and so does the milk cheque.

Why “Just Get Help” Doesn’t Really Move the Needle

With numbers like these, it’s fair to ask: if the stakes are this high, why don’t more farmers just reach out and say, “I need help”?

A Texas‑based study tackled that question. Researchers surveyed 429 agricultural producers and looked at factors that influenced whether they said they’d seek help for mental‑health concerns. One of the strongest predictors was self‑stigma—the belief that needing help means you’re weak or a failure.

Producers with higher self‑stigma were significantly less likely to say they’d seek help, even when their symptom scores were high.

Qualitative work with Canadian farmers turned up similar themes. In interviews, farmers talked about not wanting to be seen as weak, about feeling they “should be able to handle it,” and about worrying what neighbours or lenders might think if they sought professional help.

Hoard’s Dairyman reported that in one survey, nearly 70% of farmers said mental health was very important to them, but still preferred to talk first to family, friends, vets, or agribusiness professionals rather than to therapists or doctors.

That’s a big clue. It suggests that simply telling farmers “you should prioritize your mental health” doesn’t land because it clashes with identity and habit.

From an economic standpoint, that reluctance becomes a risk factor. When self‑stigma stops people from using tools that would protect their cognitive capacity, it’s not just their mood that takes a hit—it’s mastitis control, transition performance, reproduction, and culling decisions that suffer along with it.

So if “just get help” doesn’t fit how many farmers see themselves, what does?

What Farmers Are Finding Actually Works

What farmers are finding, across different regions and systems, is that the approaches that gain traction don’t start with mental‑health labels. They start with better management, reduced risk, and clearer plans—and mental‑health improvements show up as part of that package.

Intervention TypeSpecific Tool/ApproachResearch-Backed OutcomeImplementation Barrier
Business PlanningWritten business plan, reviewed quarterly88% report reduced stress & peace of mind (Farm Management Canada)Only 21% currently use one
Peer SupportDairy discussion groups (benchmarking + candid talk)96% discuss safety/health; normalize challenges (Irish study)Requires regular time commitment
Flexible CoachingPhone-based coaching around farm scheduleSignificant reduction in depression & stress scores (German RCT)Low—phone-based, no clinic visit
Financial LiteracyUnderstanding disaster assistance, government programsReduces feeling trapped; improves decision confidence (U. Georgia)Requires trusted advisor to explain
Automation/SupportHire herdsman, use herd software, automate feedingHigher resilience, lower stress, better lameness scores (Ontario study)Capital or labor cost

1. Business Planning as Headspace Protection

Farm Management Canada’s “Exploring the Connection between Mental Health and Farm Business Management” project looked squarely at how business practices and mental health interact. One key finding:

  • Only about 21% of farmers reported regularly using a written business plan.
  • Among those, 88% said the plan contributed to peace of mind and reduced stress.

Canadian Cattlemen’s summary of that work highlighted that farmers with business plans were more likely to review financial statements regularly, work with advisory teams, and take at least some time away from the farm.

The data suggests that planning doesn’t magically eliminate stress, but it reduces background chaos, freeing up mental energy for fresh cow checks, repro and culling decisions, and watching component performance rather than just reacting to emergencies.

On mid‑size Ontario and Prairie farms I’ve talked with, I often hear: “I still worry. But I’m not worrying in the dark anymore.”

2. Peer Groups That Talk Numbers—and What’s Behind the Numbers

In Ireland, dairy discussion groups are a backbone of extension. Studies of those groups found that around 96% of them discuss occupational safety and health, and about 89% have participants share personal accident or illness experiences.

The official agenda is grazing, breeding, milk contracts, and policy. The reality is that they also become spaces where someone says, “Last spring nearly finished me,” and people around the table understand exactly what that means economically and emotionally.

In the U.S. Midwest and across Canadian provinces, dairy benchmarking and discussion groups run by extension, co‑ops, and private consultants play a similar role. Farmers come to compare SCC, butterfat, days in milk, pregnancy rate, and transition metrics.

Over time, those meetings often become places where it’s acceptable to talk about both performance and pressure.

These groups don’t require anyone to say, “I’m here for mental‑health support.” They simply normalize honest conversation about what it takes to keep a herd and a family going.

3. Coaching Designed Around Real Farm Schedules

A randomized controlled trial in Germany tested telephone‑based coaching for farmers and foresters. Over six months, the group receiving structured coaching calls—focused on coping strategies, problem‑solving, and planning—saw significantly larger reductions in depression and stress scores compared with the control group.

The format is tailor‑made for agriculture:

  • Calls happen by phone.
  • Sessions are scheduled around farm work.
  • The service is framed as coaching rather than traditional therapy.

An evidence‑based guide for delivering mental‑healthcare services in farming communities, published in 2024, emphasized that flexible, phone‑ or online‑based services that respect farm schedules and culture are more likely to succeed than clinic‑only models.

We’re starting to see that in practice in places like Canada, where agricultural organizations and the Canadian Centre for Agricultural Wellbeing are rolling out farm‑specific support lines and coaching‑style services.

4. Financial Literacy as a Pressure Relief Valve

At the University of Georgia, extension staff surveyed 310 farmers about which financial education topics would most help reduce their stress. The top priorities weren’t exotic hedging strategies; they were very practical:

  • Understanding disaster assistance programs.
  • Knowing what government financial support options exist and how to access them.

Social worker and agricultural educator Dr. Anna Scheyett, who has been a key voice in this work, has argued that solid financial literacy and access to trustworthy information are themselves mental‑health tools for farmers.

They don’t fix milk price or weather—2024–2025 is still volatile on both fronts—but they keep producers from feeling trapped or blindsided.

Who’s Actually in the Best Position to Start the Conversation?

These kinds of changes don’t just appear out of thin air on a farm. Someone has to open the door. And as many of us have seen, it makes a huge difference who that person is.

The Front Line: Vets and Nutritionists

Your veterinarian and your nutritionist probably know more about your cows and your numbers than anyone outside the family. They also see you regularly.

A Canadian review on mental‑health supports for farmers noted that vets and other ag professionals are often the first to notice when a farmer is struggling, and that equipping them with basic knowledge and referral pathways is a practical way to get help started.

Some vet practices and feed companies are now giving their teams simple tools and phrases, like:

  • “We’ve built a good plan to get this mastitis flare‑up under control. How are you doing with everything else on your plate right now?”
  • “Between herd health, markets, and family, you’re carrying a lot. Would it help if we brought your accountant or lender into this conversation so we can put a full plan on paper?”

Because that comes from someone you already trust with your herd’s health and ration, it often opens the door more effectively than a generic “take care of yourself” message.

Spouses and Family

On family farms, spouses, parents, and older kids often see the changes first—late‑night screen time, staying in the barn longer than usual, snapping over little things.

Research on farmer burnout and stress highlights spousal and family support as one of the strongest protective factors. The conversations that work best usually start from what’s been noticed:

  • “I’ve noticed you’re really quiet lately.”
  • “You’re up late every night looking at the books, and I’m worried about how much you’re carrying.”

That’s not a weakness. That’s good family‑level management of a high‑risk business.

Lenders and Advisors

In both Canada and the U.S., some ag lenders and advisory firms have taken training on farm stress and mental‑health awareness. It makes sense: they’re in the room when some of the hardest decisions get made—refinancing, expansion, downsizing, or succession.

A good lender or advisor can say, “We’ve seen other farms face this kind of squeeze. There are financial tools we can look at. And if the stress side of this is starting to get heavy, there are people we can connect you with who understand agriculture.”

Given the evidence that chronic stress undermines decision quality and increases risk, that’s not overstepping. It’s risk management for both the farm and the lender.

Building a “Transition Protocol” for Farmers, Not Just Cows

Most of us already treat the transition period for cows as a high‑risk window that deserves its own protocol: close‑up and fresh cow rations, stocking density targets, bedding management, and daily fresh cow checks.

It’s worth asking: what’s the equivalent for the people?

In northern regions like Ontario, the Prairies, and the Upper Midwest, farmer “transition risk” often runs from late fall through winter:

  • Short days and limited sunlight.
  • Long stretches inside barns and shops.
  • Cold stress on cows and humans.
  • Year‑end bills, tax planning, and sometimes weaker milk prices.

On pasture‑based, spring‑calving herds in places like Ireland or New Zealand, the crunch might be calving plus breeding. In large Western dry lot systems, it can be summer heat and water uncertainty. Every region has its own hot zone.

What I’ve noticed is that more operations are starting to deliberately build farmer‑focused steps into their seasonal management plan, right alongside herd protocols:

Light and sleep routines: In higher‑latitude regions, using a 10,000‑lux light box at breakfast for 20–30 minutes, combined with making a point of getting outside in real daylight, aligns with clinical guidance for seasonal mood support. Canadian farmer research has found that coping strategies, including getting outside and staying physically active, are commonly used and can help manage stress.

Written winter game plan: Sitting down in October or November with your accountant, nutritionist, or business advisor to map out winter cash flow, feed inventory, and “if this, then that” scenarios helps turn vague dread into specific, manageable decisions.

One trusted peer: Picking one other producer—a neighbour, co‑op contact, or discussion‑group colleague—and agreeing to a weekly check‑in with one win, one frustration, and one thing you’re watching. It doesn’t take long, but it keeps isolation from sneaking up on you.

Pre‑booked off‑farm touchpoints: Registering ahead for winter workshops, show‑season meetings, or benchmarking sessions makes it more likely you’ll actually get off the farm at least occasionally. Surveys and commentary from extension and industry consistently show that farmers who engage in these events feel more supported and more confident in their decisions.

Checklist‑style management tasks: Turning “stay on top of herd health” into specific, visible tasks—”Monday: CMT fresh cows; Wednesday: lameness score high group; Friday: review repro and cull list”—and putting them on a whiteboard or in your phone takes some load off your memory on the rough days.

None of this requires anyone to say, “I’m depressed.” It just treats your attention and decision‑making capacity as another critical resource, right alongside cow comfort, forage quality, and parlor performance.

Where Farmers Can Turn: Practical Resources

Looking at this trend, one encouraging development is the growth of farm‑specific support programs that understand both the business and the culture.

In Canada, the Canadian Centre for Agricultural Wellbeing has been involved in launching the National Farmer Wellness Network, a crisis‑line‑style resource that connects farmers with trained agricultural responders. Programs like “In the Know,” a mental‑health literacy workshop designed specifically for farmers and farm advisors, are offered by universities and ag organizations to give people a common language and basic tools to support one another.

In the United States, several states have farm‑stress hotlines and online resources housed in departments of agriculture, extension services, and farm bureaus. Farmers are more likely to engage with resources promoted through trusted ag channels that respect farm schedules and realities.

Internationally, programs like Farmstrong in New Zealand and resources from the National Centre for Farmer Health in Australia combine practical farm management content with wellbeing tools, using farmer stories, videos, and events to make the topic relatable.

The common thread is that these supports are built around how farms actually operate—early mornings, long days, seasonal crunches, family involvement—not around generic 9‑to‑5 models.

The Bottom Line

At this point, it’s hard to argue that farmer mental health is just a “soft” issue. The evidence is pretty clear:

  • Farmers are carrying higher loads of stress, anxiety, depression, and burnout than the general population.
  • Poor mental health can negatively affect decision‑making, cow health, productivity, and overall farm performance.

That means this isn’t just a wellness story. It’s a story about dairy herd management and profitability.

If you’re looking at your own operation and wondering what to actually do, here are a few concrete next moves that many progressive herds are finding helpful:

  1. Put a simple, written plan in place. Even a basic winter business plan and a short list of key herd‑health tasks on a whiteboard can take a surprising amount of weight off your mind.
  2. Turn key health and repro jobs into checklists. Don’t leave CMT testing, lameness scoring, and cull reviews to “when I get time.” Make them scheduled, visible jobs.
  3. Find or build a peer group that talks about both numbers and stress. Whether it’s an extension discussion group, a virtual benchmarking circle, or a coffee‑shop crew, having at least one space where you can talk honestly about both performance and pressure pays dividends.
  4. Identify one trusted professional you’d talk to if the load gets too heavy. That might be your vet, nutritionist, lender, or advisor. Decide ahead of time whom you’d call, just like you know whom you’d call if a main line in the parlor blew out.
  5. Explore the resources available in your region. That might be a farmer wellness line, an “In the Know” workshop, a state farm‑stress program, or a coaching service that understands agriculture.

The culture of toughness has a proud place in dairy’s history. It’s part of why this industry is still standing after price crashes, policy shocks, and brutal weather years. But when that same toughness keeps us from using tools that protect our ability to think clearly and manage well, it’s quietly expensive.

If 60% of the milking systems in Wisconsin, Quebec, or California were underperforming because of a design flaw, the industry would throw everything it had at the problem—service, training, support, maybe even recalls. When a similar share of the people running those systems are stretched past their limits, and we know that’s affecting mastitis control, fresh cow management, repro, and culling decisions, it deserves the same level of attention.

The good news is we don’t have to choose between being tough and being smart. We can keep the grit this business demands and still take care of the one piece of equipment no dairy can afford to burn out:

The brain that decides when to test that fresh cow, when to call the vet, when to tweak that ration, when to cull, when to invest—and, just as importantly, when to rest.

If you’d overhaul your robot or your parlor for a 10% SCC reduction, it might be time to give the same attention to the operator between your ears.

From what I’ve seen—and what the data backs up—when farms start treating that as part of their herd management plan, the cows notice. The milk cheque notices. And the people around your kitchen table notice too.

KEY TAKEAWAYS 

  • Mental load is a profit issue, not a wellness issue: 34% of farmers meet depression criteria and 76% report high stress—and it’s showing up in bulk tanks, lameness scores, and breeding records
  • The six-figure math hiding in plain sight: Subclinical mastitis alone costs ~$34,000 per 100 cows annually. Stack reproduction losses, transition disease, and premature culls, and you’re looking at $100,000/year in preventable drag on a 100-cow herd
  • Freeing up headspace delivers measurable ROI: ELBI Dairy cut SCC by 52% after rebuilding with robots. No robot budget? Farms see similar gains from hiring a herdsman, actually using herd software, or reorganizing who handles the “thinking jobs.”
  • Forget “just get help”—meet farmers where they are: 70% would rather talk to a vet, nutritionist, or lender than a therapist. The real play is equipping those trusted advisors to open the door
  • Your playbook: Write a winter business plan. Turn fresh cow checks into visible checklists. Find one peer for weekly check-ins. Decide now who you’d call before you need to

Complete references and supporting documentation are available upon request by contacting the editorial team at editor@thebullvine.com.

Learn More

The Sunday Read Dairy Professionals Don’t Skip.

Every week, thousands of producers, breeders, and industry insiders open Bullvine Weekly for genetics insights, market shifts, and profit strategies they won’t find anywhere else. One email. Five minutes. Smarter decisions all week.

NewsSubscribe
First
Last
Consent

Is Your Fresh Pen Costing You $90,000? The 90-Day Transition Fix for Pregnancy Rate

Metritis + SCK can quietly drain US$90,000 from a 500‑cow herd. The fix starts 90 days before you ever thaw a straw.

Executive Summary: Most of us still reach for semen, protocols, or the AI tech when pregnancy rate flattens, but what’s interesting is how often the real damage was done 60–90 days earlier in the fresh pen. A 2023 study on 15,041 Holsteins bred on Double‑Ovsynch found that cows with transition diseases in the first 30 DIM had clearly lower pregnancy per AI and more pregnancies lost by 60 days, even under excellent repro management. At the same time, economic work shows metritis averaging about US$511 per case and subclinical ketosis hitting 20–40% of cows in many herds, together easily stripping around US$90,000 a year from a 500‑cow operation once milk loss, disease, extra days open, and early culls are added up. This article treats pregnancy rate as a “90‑day transition report card” and walks through simple tools—NEFA/BHBA thresholds, fat‑to‑protein ratios, peak curves, and early‑lactation culls—that make that connection visible in your own data. From there, it lays out a clear playbook: a BHBA testing routine you can run on Mondays, realistic stocking and bunk space targets, BCS and F:P benchmarks, and a health‑based plan for where to use sexed dairy semen versus beef‑on‑dairy. Whether you’re in a Wisconsin freestall, a Western dry lot system, a Canadian quota barn, or a seasonal grazing herd, the goal is the same—tighten up fresh cow management so the next three preg checks feel a lot less like a guessing game and a lot more like a controlled business decision.            

When a herd’s pregnancy rate gets stuck in the low‑to‑mid‑20s, the conversation still usually starts in the breeding pen. You know how it goes: semen choices, heat detection, synchronization tweaks, maybe a quiet question about the AI tech. That’s where the problem shows up in your software, so that’s where everyone looks first.

What’s interesting now is that newer work is making a pretty strong case that your pregnancy rate is really grading your fresh cow management from 60 to 90 days earlier, not just what happened on breeding day. A 2023 study in JDS Communications followed 15,041 Holstein cows in a high‑producing German herd where every first service was done on a Double‑Ovsynch program. Cows that had transition problems—milk fever, retained fetal membranes, metritis, ketosis, left displaced abomasum, or mastitis—in the first 30 days in milk had lower pregnancy per AI at 32 days and, in several of those categories, more pregnancies lost by 60 days than cows that stayed healthy, even though they all followed the same repro protocol.

So the old idea that “I’ll fix my preg rate with better semen and tighter protocols” is really only half the story. The other half is, “What were these cows living through in those first few weeks fresh?”

Looking at This Trend: Biology Keeps Pointing Back 90 Days

Let’s walk through the biology the way we’d talk it through over coffee. Once you see the timing inside the cow, this 90‑day connection stops feeling like a theory and starts looking like common sense.

The Egg You Breed Was Built During the Fresh Period

You probably know this already, but we all forget it sometimes: the follicle you breed at 60–80 days in milk didn’t show up last week. It’s been developing for weeks in the ovary. The “high fertility cycle” idea, outlined in a 2020 review, showed that cows that become pregnant around 130 DIM tend to lose less body condition after calving, experience fewer health events, have better fertility at first insemination, and have lower pregnancy loss. That pattern tells us fertility is strongly tied to what happened during the dry period and the early fresh period.

During that stretch, most cows slide into negative energy balance. Milk is ramping up, but dry matter intake hasn’t caught up yet. So the cow pulls more energy from body fat, which pushes non‑esterified fatty acids (NEFA) up in the blood and, if the liver gets overloaded, beta‑hydroxybutyrate (BHBA) as well. Cornell work and follow‑up studies have shown that when too many cows run with high NEFA and BHBA around calving, the herd sees more transition disease and weaker reproductive performance.

In an epidemiology study many of you will have heard about by now, Jessica McArt, DVM, PhD (Cornell University), and colleagues followed 1,717 cows in four New York and Wisconsin freestall herds. They tested blood BHBA between 3 and 16 days in milk and used 1.2 mmol/L as the cutoff for subclinical ketosis (SCK). In that dataset, 43.2% of cows had at least one BHBA reading at or above 1.2 mmol/L, with risk peaking around day five fresh. A larger study in 10 countries found a median SCK prevalence of 21.8% between 2 and 15 DIM at the same cut point, with herds ranging from 11.2% to 36.6%.

So in many herds, somewhere between one in five and almost half of the fresh cows are running with elevated ketones in that first couple of weeks. That’s a lot of cows quietly working too hard metabolically before we ever talk about breeding.

Now, here’s where it gets uncomfortable biologically. Several studies on negative energy balance and reproduction have shown that elevated NEFA and BHBA don’t just circulate in the blood—they show up in follicular fluid, right where the next oocytes are maturing. Under those conditions, oocytes tend to mature more slowly, fertilization rates are lower, and the embryos that do develop have fewer cells and more signs of stress and cell death in culture. Work examining genetically divergent fertility lines has also shown that cows in deeper negative energy balance after calving can exhibit slower follicle growth and altered ovarian activity compared with cows in better energy status.

In other words, the egg you’re hoping to get pregnant at 70 DIM has already been “programmed” by whatever energy and health storms the cow went through in those first three or four weeks fresh. If she was deep in negative energy balance and battling disease, that egg is starting behind.

The Uterus Doesn’t Forget a Rough Start

Then there’s the uterus, which is often harder to see from the alley. A metritis cow can look “fixed” pretty quickly: smell is gone, discharge looks cleaner, she’s eating again. It’s easy to mentally tick that box and move on.

But research and field experience say the uterus remembers that rough start longer than we’d like. A Hoard’s Dairyman article that drew on transition cow research described a “hangover effect” of uterine disease—cows that had metritis or retained fetal membranes early on often had slower uterine involution or subclinical inflammation later, even when they looked normal from a distance. That lingering inflammation can delay the return to normal cycles and make it harder for early pregnancies to survive.

The 2023 Double‑Ovsynch study we started with backs up what a lot of vets see in practice. Cows that had transition health events—retained fetal membranes, metritis, mastitis, ketosis, left displaced abomasum—in the first 30 DIM had lower pregnancy per AI and more pregnancies lost between 32 and 60 days, across first‑, second‑, and older‑lactation cows, despite a very standardized repro program.

Transition Health StatusPregnancy/AI at 32dPregnancy Loss by 60dNet Impact
Healthy (no disease)42.3%8.2%Baseline
Metritis36.1%11.8%-6.2% P/AI, +3.6% loss
Retained placenta37.4%10.9%-4.9% P/AI, +2.7% loss
Ketosis (clinical)34.8%12.4%-7.5% P/AI, +4.2% loss
Displaced abomasum31.2%14.1%-11.1% P/AI, +5.9% loss
Mastitis (0-30 DIM)38.9%9.7%-3.4% P/AI, +1.5% loss

On top of that, work on postpartum inflammatory conditions has shown that cows dealing with disease during this period can develop smaller or less functional corpora lutea and produce less progesterone, which is not the kind of environment a young embryo wants to live in.

A large retrospective study in intensive Holstein herds in Spain estimated that about 12.2% of pregnancies were lost between 28 and 110 days of gestation. Put that next to the transition‑health and hormone data, and it’s not hard to see how a cow can be “pregnant at 32 days, open at 60,” without anything obvious happening in between.

So, between eggs that were built in a high‑NEFA, high‑BHBA environment and a uterus that may still be recovering from a transition “hangover,” biology keeps pointing back to what happens in those first 30 days fresh.

The Big Dollars: Metritis, SCK, and the Quiet Six‑Figure Drag

The biology matters, but at the end of the month, you’re still staring at a milk cheque, a vet bill, and a loan statement. So let’s put some realistic dollars to these transition issues.

Metritis: A US$511 Per‑Cow Problem

A 2021 paper in the Journal of Dairy Science analyzed 11,733 cows in 16 herds across four U.S. regions and estimated the full economic cost of metritis. Using farm records and simulation, the authors found:

  • Mean cost per case: US$511
  • Median: US$398
  • Simulated mean: US$513, with 95% of scenarios between roughly US$240 and US$884

Those dollars include lost 305‑day milk, lower gross margin per cow, extra reproductive costs, and higher replacement costs because affected cows left the herd sooner. Hoard’s Dairyman, using herd‑level modeling on a large U.S. dairy, landed on metritis costs in the mid‑US$300 range for that specific scenario, which falls within the general range and shows how market conditions and farm structure can tweak the final number.

Now take a 500‑cow herd with a 20% metritis rate among fresh cows—a number that wouldn’t shock many vets in freestall herds. That’s roughly 100 cases of metritis per year. At US$511 per case, you’re into about US$51,000 in metritis‑related costs per year. That’s not just one bad month; that’s a steady leak.

Those costs don’t just sit in the “vet” column, either. A sizable chunk of that US$511 is hidden in longer days open, more services per pregnancy, lower milk, and cows that drift out of the herd earlier than they should.

Subclinical Ketosis: Common, Quiet, Costly

Subclinical ketosis doesn’t show up like a twisted stomach or a downer cow, but it quietly hits a lot more animals.

In McArt’s four‑herd study, 43.2% of cows hit SCK—BHBA ≥1.2 mmol/L—at least once between 3 and 16 DIM. In the 10‑country data set, the median herd‑level SCK prevalence was 21.8% between 2 and 15 DIM at the same cut point, with a broad range across herds. Cows with high BHBA were more likely to develop displaced abomasum, clinical ketosis, and metritis, and were more likely to leave the herd earlier.

The Subclinical Ketosis Reality: Between 1 in 5 and nearly half of fresh cows run dangerously high ketones. Cornell’s four-herd study found 43.2% SCK prevalence, while even the 10-country median (21.8%) sits well above the 15% risk threshold where reproductive and health problems accelerate

Economic analyses that bundle milk loss, disease risk, extra days open, and culling generally land in the low‑to‑mid hundreds of dollars per SCK case. The exact number depends on milk prices, feed costs, and replacement values, but it’s not pocket change.

So if around 40% of a 500‑cow herd—about 200 cows—experience SCK in early lactation, even a conservative estimate of US$200 per case means you’re looking at about US$40,000 per year in lost opportunity tied to SCK alone. When you stack that next to the metritis math, it’s easy to see how transition disease can quietly push the total into serious money for a 500‑cow operation.

The Hidden $90,000 Drain: How Transition Disease Costs Stack Up in a 500-Cow Herd. Metritis and subclinical ketosis together strip over $91,000 annually from a typical herd—with most costs hidden in lost milk, reproduction failures, and early culls rather than visible vet bills 

In Canadian quota systems, there’s another angle. Canadian Dairy Commission figures show that average butterfat tests on Canadian farms have been creeping up—around 4.3% in 2024—helping reduce structural surplus and improve returns per litre. When fresh cows crash, both milk yield and butterfat performance in early lactation tend to suffer. That means quota isn’t being used as efficiently, and you may be under‑delivering butterfat against the quota you paid a lot of money for. Dairy Global has reported that producers in Eastern Canada continue to battle for relatively small amounts of new quota at high butterfat prices per kilogram, reinforcing how valuable every kilogram of component really is. A fresh cow crash is a component crash—and in a quota system, components are your currency.

So these early diseases aren’t just a health story; they’re a transition‑to‑cheque story.

What Farmers Are Finding: NEFA, BHBA, and That Post‑Calving Crash

So how do you tell whether NEB and transition problems are really a big driver on your farm, beyond the feeling that you’re treating too many fresh cows?

Cornell work has given us some very practical markers. In a series of projects summarized by Tom Overton, PhD (Cornell University), and detailed in work by Ospina and colleagues, three key thresholds emerged when predicting disease and performance:

  • Pre‑calving NEFA: When more than about 15% of close‑up cows tested ≥0.30 mEq/L NEFA in the week before calving, the herd saw a higher risk of displaced abomasum, retained placenta, metritis, and poorer reproduction after calving.
  • Post‑calving NEFA: When more than about 15% of fresh cows had NEFA ≥0.60–0.70 mEq/L in the first two weeks after calving, early‑lactation disease risks and performance losses increased.
  • Post‑calving BHBA: When more than about 15% of cows had BHBA ≥10–12 mg/dL (≈1.0–1.2 mmol/L) in the first couple of weeks, the herd had more DAs, clinical disease, and lower 305‑day mature‑equivalent milk.

Overton and others have translated this into a simple herd‑level rule of thumb: if more than 15% of sampled cows are over those NEFA or BHBA thresholds, there’s likely “room for improvement” in transition energy balance and management.

So, a practical way to use NEFA/BHBA looks like this:

  • A few times a year, pull blood on 12–15 close‑up cows and 12–15 fresh cows with your vet.
  • See what percentage of each group is over those 0.30 / 0.60–0.70 NEFA levels and ~1.0–1.2 mmol/L BHBA equivalents.
  • If that percentage is under about 15%, you’re probably in decent shape. If it’s above 15–20% consistently, it’s a strong signal your transition program is leaving money and pregnancies on the table.

You don’t have to turn your herd into a research trial. A small, well‑chosen sample, taken a few times a year, gives you a pretty honest “weather report” on how tough that transition window really is for your cows.

What Farmers Are Doing: Three Management Levers That Actually Move the Needle

So, where are the herds that are doing well on this 90‑day connection, actually putting their time and money? Across extension meetings, Dairyland Initiative resources, and producer discussions, three levers keep coming up.

1. Protecting Space and Comfort in Transition Pens

Looking at this trend across herds, the first word that comes up is space. The University of Wisconsin’s Dairyland Initiative has been very clear: overstocking freestall pens increases competition at the bunk, reduces lying time, keeps cows on concrete longer, and leads to more lameness and lower milk yield. Those effects are especially problematic in close‑up and fresh pens.

Their recommendations—and those of other researchers—generally look like this:

  • Aim for about 80–85% stocking density in close‑up and fresh pens, not 100–120%.
  • Give at least 24–30 inches of bunk space per cow in these pens to reduce bunk competition.

Penn State Extension has also emphasized that overstocking at the bunk raises risk for SCK, displaced abomasum, and hypocalcemia because lower‑ranking cows end up eating less of the intended ration and at less‑ideal times.

In Wisconsin freestall herds, I’ve noticed that when producers finally protect those transition groups—sometimes at the cost of a tighter late‑lactation pen—fresh cow problems start to ease. Fewer DAs, fewer metritis cases, fewer slow‑starting cows. In Western dry lot systems in California or Idaho, the details change—shade, mud, and feedlane design matter more than stalls—but the principle is the same: if transition cows can’t eat and rest without fighting for it, you’ll pay for it in the breeding pen.

2. Keeping Body Condition in the Sweet Spot

Body condition management isn’t new, but the research has sharpened the targets.

The high fertility cycle paper and postpartum BCS studies suggest that Holsteins do best for health and fertility when they calve around 3.0–3.25 on a 5‑point scale. Cows calving at 3.5 or higher have a higher risk of metabolic problems—SCK, DA, metritis—and more reproductive trouble. On top of that, cows that lose more than about 0.5 BCS points between calving and first breeding tend to have poorer reproductive performance than cows that hold condition or lose only a little.

So a realistic set of targets looks something like:

  • Calve the bulk of the herd at 3.0–3.25 BCS.
  • Keep BCS loss from calving to first breeding to 0.5 points or less whenever possible.

In a lot of Midwest freestall herds, the big improvements came not from exotic feed additives but from tightening late‑lactation diets, grouping over‑conditioned cows more thoughtfully, and making sure transition rations support steady intakes before and after calving.

In Canadian quota herds, it has a direct butterfat angle as well. When fresh cows calve too heavy and crash in condition, you often see depressed butterfat performance right when you’re trying to maximize component yield against quota, this is critical to improving farm margins in a supply‑managed environment.

3. Making Sure the Ration on Paper Matches the Ration at the Bunk

The third lever is deceptively simple: cows don’t eat the ration in the nutritionist’s software, they eat what’s in front of them.

Penn State and other extension teams keep coming back to a few basics that are easy to slip on when days get long:

  • Feed at consistent times so cows know when to expect feed.
  • Push up often enough that there’s always feed in reach, especially for timid cows.
  • Watch refusals and particle size so you catch sorting before it becomes a habit.

Overstocking the feed bunk makes all three much harder, and that’s a big reason why crowded transition pens and higher SCK/DA/metritis risk so often travel together.

In the herds that really excel at fresh cow management, someone clearly “owns the bunk.” That person is watching how the ration looks in the wagon, how it looks in front of the cows, how cows are eating it, and how much is left—and they’re talking regularly with the feeder and nutritionist about what they see.

What I’ve noticed is that when this bunk piece is tight, you feel it everywhere: smoother fresh cow management, more consistent butterfat performance, fewer surprise DAs, and fewer cows that arrive at first service already behind.

Simple Data Tools That Make the 90‑Day Connection Visible

You don’t need a new monitoring system or a consultant parked at your farm to start connecting transition and reproduction. Three data points most herds already have—or can get easily—can take you a long way: early fat‑to‑protein ratio, peak milk patterns, and early cull rates.

Fat‑to‑Protein Ratio: A Metabolic Weather Report

A 2021 paper revisiting the link between fat‑to‑protein ratio (F:P) and energy balance found that early‑lactation F:P ratios of 1.5 or higher tended to reflect deeper negative energy balance—more body weight loss, higher NEFA, and more metabolic strain. That’s consistent with what a lot of nutritionists already treat as a warning sign.

So, practically:

  • If only a small slice of early‑lactation cows have an F:P ≥1.5 on the first test after calving, you’re likely okay.
  • If 20% or more of those cows have F:P ≥1.5 on that first test, it’s a good reason to dig into energy balance and SCK risk.

It won’t diagnose the problem for you, but it tells you there’s likely a problem to solve.

Peak Milk Curves: How Fast and How High

In well‑managed Holstein herds on TMR, mature cows often peak around 60–75 DIM, depending on genetics and ration strategy. When transition disease is common, those peaks tend to be lower and show up later in lactation.

Several studies and field analyses have shown that cows with clean transitions tend to have faster‑rising, higher peaks, while cows that battled SCK, metritis, or DA have flatter, delayed peaks and lower overall production. If your software will let you, plotting separate curves for “healthy through 30 DIM” cows and “at least one transition disease” cows can be an eye‑opening exercise in a herd meeting. In many herds, seeing those two curves side‑by‑side does more to justify investing in transition than any lecture.

Early‑Lactation Culls: When Do Cows Leave?

Most herds track the total cull rate. Fewer herds break out 0–60 DIM removals in a way that gets discussed regularly.

Disease‑costing and herd analyses repeatedly show that early culls are among the most expensive, because you’ve carried that cow through a previous lactation and the dry period and then gotten very little milk out of the current one. Herds with strong transition programs often keep early removals in the low single digits as a percentage of calvings, while herds where transition disease is a bigger issue can see early culls drift into double‑digit percentages.

Once you start tagging early culls with clear reasons and comparing them against fresh cow records and BHBA/NEFA test results, a pattern usually emerges: many of those cows never really recovered from the transition period. It’s a tough conversation, but it’s one of the most useful ones you can have.

What Farmers Are Doing: A BHBA Routine That Fits Real Herds

Subclinical ketosis is one of those areas where a simple routine can give you a lot of control without turning your farm into a research station.

Building on McArt’s SCK work and field protocols shared by practitioners like Jerry Gaska, DVM (Wisconsin), the routine many herds are adopting looks like this:

  • Pick one or two mornings each week.
  • On those days, test a group of cows between 3 and 9 DIM using a validated handheld BHBA meter.
  • Use 1.2 mmol/L as the cutoff for subclinical ketosis—the same line used in Cornell’s epidemiology work and in many extension programs.

Gaska described a Wisconsin farm where they treat their BHBA results like a herd‑level dashboard:

  • If ≤15% of tested cows are at or above 1.2 mmol/L, they just keep monitoring.
  • If 15–40% are positive, they test all cows 3–9 DIM and treat the positives.
  • If ≥40% are positive, they treat every fresh cow in that DIM range.
The Monday-Morning BHBA Dashboard: Turn your weekly testing into a transition health report card. When more than 15% of fresh cows test above 1.2 mmol/L BHBA, Cornell research shows you’ll see more disease, lower milk, and weaker reproduction 60 days later. This simple metric predicts your pregnancy rate before you ever pull the breeding gun

Their standard treatment is 300 cc of propylene glycol once daily for 5 days, which is consistent with recommendations from many vets and extension resources. The goal isn’t to drive SCK to zero—it’s to keep the percentage reasonable and to use that weekly number as an early warning system for when transition is slipping.

If you imagine a 500‑cow herd trimming SCK prevalence from 40% down toward 20% over a season or two, using this type of monitoring and better transition management, and you assume each SCK case costs in the low hundreds of dollars, the potential savings add up quickly. And what farmers are finding is that when that BHBA dashboard number improves, DA numbers, metritis cases, and repro results tend to look better a few months later.

What Farmers Are Finding: Letting Transition Health Steer Semen Use

Now let’s talk about where this transition health story meets some of the hottest decisions on many farms: how to use sexed dairy semen, conventional semen, and beef‑on‑dairy.

Beef‑on‑dairy has moved from “interesting idea” to everyday practice on a lot of operations. Industry reporting and national evaluation data show more herds using sexed dairy semen on a limited top tier and beef semen on lower‑priority cows to capture calf value. At the same time, reproduction leaders like Paul Fricke, PhD (University of Wisconsin–Madison), have been talking about a “reproduction revolution” centered on precision timed‑AI, early pregnancy diagnosis, and targeted use of sexed and beef semen.

What’s encouraging is that more producers are folding transition health into that conversation, not just parity and genetic index.

A Simple Health‑Based Semen Strategy You Can Actually Use

Here’s one way to structure it that fits real herds:

1. Clean Transition Cows

These cows:

  • Had no recorded transition disease in the first 30 DIM (no milk fever, metritis, DA, clinical ketosis, retained fetal membranes).
  • Stayed below 1.2 mmol/L BHBA on any early‑lactation testing, if you test.
  • Lost 0.5 BCS points or less from calving to first breeding.
  • Showed a first‑test F:P ratio comfortably under 1.5.

They’re prime candidates for high‑index sexed dairy semen, especially if their genetic merit fits your replacement goals. That’s where you want to invest in future daughters.

2. Minor Transition Bumps

These cows might have:

  • A single BHBA reading just over 1.2 mmol/L that responded to propylene glycol.
  • A mild metritis case that resolved quickly.
  • Slightly more BCS loss than ideal, but nothing dramatic.

They’re often solid cows, just not quite in the “best bets” class. Many herds here lean toward conventional dairy semen, reserving sexed semen for cows that are both genetically strong and biologically set up for success.

3. Major Transition Events

These cows tend to be the ones that:

  • Had metritis and a DA or stacked multiple transition diseases.
  • Showed consistently high BHBA readings or obvious SCK that lingered.
  • Dropped more than a full BCS point between calving and breeding.

A growing number of herds put these cows in the beef‑on‑dairy or “do not breed” category, depending on age, production, and pregnancy status. In Western dry lot systems where beef‑cross calves often have a ready market and good value, managers talk about this as a way to turn a cow with higher reproductive risk into a short‑term calf revenue opportunity instead of betting your future replacements on her.

In Canadian quota herds, where quota additions can be limited and expensive, many producers are using a similar idea: they focus sexed dairy semen on cows that are most likely to be long‑term, high‑component producers under their system, and use beef on cows where the odds of a trouble‑free, high‑butterfat lifetime are lower.

The big shift is that the first 30 days in milk are now part of the semen decision, not just age, production, or genomic index. That’s a very “2020s” way of thinking about reproduction that lines up biology, genetics, and cash flow.

Transition Health TierHealth Markers (0-30 DIM)Semen StrategyWhy This WorksExpected Outcome
Tier 1: Clean Transition– No disease events
– BHBA <1.2 mmol/L
– BCS loss ≤0.5 points
– F:P <1.5
High-index sexed dairy semenHealthy metabolism during follicle development; strong oocyte quality; optimal uterine environmentHigh P/AI (40%+); low preg loss; valuable replacement heifers
Tier 2: Minor Bumps– Single mild SCK event (responded to treatment)
– Mild metritis (quick resolution)
– BCS loss 0.5-0.75 points
Conventional dairy semenModerate metabolic challenge; good recovery; acceptable but not optimal fertilityModerate P/AI (30-38%); acceptable preg loss; solid replacements
Tier 3: Major Events– Metritis + DA
– Multiple disease events
– Persistent high BHBA
– BCS loss >1.0 point
Beef-on-dairy or Do Not BreedSevere metabolic/uterine damage; compromised oocyte quality; high preg loss risk; poor lifetime potentialCapture calf value; avoid wasting high-value dairy genetics on low-fertility cow

Nuances That Matter: Heifers, Pregnancy Loss, and Seasonal Herds

There are a few wrinkles worth mentioning, because not every group of cows—or every system—behaves the same.

One nuance that came out of the Cornell NEFA/BHBA work, and was highlighted in Hoard’s Dairyman, is that heifers and older cows don’t always show the same performance patterns at similar NEFA and BHBA levels. In those data, heifers with higher postpartum NEFA (≥0.60 mEq/L) and BHBA (≥9 mg/dL) sometimes produced more milk than heifers with lower levels, while multiparous cows with NEFA ≥0.70 mEq/L and BHBA ≥10 mg/dL produced less and had more disease. That doesn’t mean high ketones are ever “good,” but it does suggest that if time and budget are tight, focusing your most intensive monitoring on older cows may give you more bang for your buck.

On pregnancy loss, the Spanish Holstein work put numbers around something many of us feel: about 12.2% of pregnancies were lost between 28 and 110 days of gestation in intensive systems. Articles in Hoard’s Dairyman and Dairy Global have described pregnancy loss as a major ongoing puzzle in modern dairies, with uterine health and metabolic stress as key suspects. That’s one more reminder that “pregnant at 32 days” isn’t mission accomplished if the transition period was rough.

Seasonal and block‑calving herds—whether in New Zealand, Ireland, or pasture‑based pockets of North America—live and die by this 90‑day connection even more. Research on grazing herds with different fertility breeding values has shown that cows with better transition metabolism and shorter postpartum anestrus intervals are far more likely to conceive in the first 3–6 weeks of mating, which pushes up six‑week in‑calf rates and tightens the calving spread. When transition management has holes, those herds feel it almost immediately in more late‑calvers and a stretched season. When they improve energy balance, BCS management, and fresh cow monitoring, many see their fertility and calving patterns tighten within a couple of seasons.

The biology doesn’t care if you’re on pasture or TMR, quota or open market—the transition pen is still writing a big chunk of the repro story.

Bringing It Home: Benchmarks and Monday‑Morning Moves

If you’re thinking, “This all makes sense, but where do we start without turning the place upside‑down?”, here are some concrete benchmarks and a realistic plan.

Benchmarks to Check Your Own Herd Against

From the work and examples we’ve talked about, here are some practical “sanity check” targets:

  • BHBA in early lactation:
    If more than 15–20% of sampled cows 3–16 DIM test at or above 1.2 mmol/L, your transition energy balance likely needs work.
  • NEFA pre‑ and postpartum:
    If more than about 15% of close‑up cows have NEFA ≥0.30 mEq/L, or more than 15% of early‑lactation cows have NEFA ≥0.60–0.70 mEq/L postpartum, you’re in a higher‑risk zone for disease and weaker repro.
  • Body condition:
    Calving most Holsteins with BCS 3.0–3.25 and keeping BCS loss from calving to first breeding at ≤0.5 pointssupports better health and fertility.
  • Fat‑to‑protein ratio:
    If roughly 20% or more of early‑lactation cows have an F:P ≥1.5 on their first test after calving, it’s a good sign you should dig into energy balance and SCK.
  • 0–60 DIM culls:
    If early‑lactation culls are creeping into double‑digit percentages of calvings, transition disease is almost certainly playing a major role.

You don’t have to fix every metric at once. The power is in watching them over time and seeing whether changes in your transition program move those numbers in the right direction.

MetricTarget (Green Zone)Acceptable (Yellow Zone)Fix This Now (Red Zone)
BHBA Prevalence (3-16 DIM, ≥1.2 mmol/L)<15% of tested cows15-20% of tested cows>20% of tested cows
Postpartum NEFA (0-14 DIM, ≥0.60 mEq/L)<15% of tested cows15-20% of tested cows>20% of tested cows
Calving BCS & LossCalve at 3.0-3.25; lose ≤0.5 points to 1st breedingCalve at 3.25-3.5; lose 0.5-0.75 pointsCalve at >3.5 or lose >0.75 points
Fat-to-Protein Ratio (1st test postpartum)<20% of cows with F:P ≥1.520-30% of cows with F:P ≥1.5>30% of cows with F:P ≥1.5
Transition Pen Stocking(close-up & fresh)75-85% stocking; 24-30″ bunk/cow85-95% stocking; 22-24″ bunk/cow>95% stocking or <22″ bunk/cow
Early Culls (0-60 DIM)<5% of calvings5-8% of calvings>8% of calvings

A Realistic Plan for the Next Six Months

If you want to put this 90‑day lens to work without overwhelming the team, a simple roadmap could look like this:

  1. Start a BHBA Snapshot.
    Once or twice a week, test a small group of cows 3–9 DIM (maybe 6–8 cows in a 100‑cow herd, 10–15 in a 500‑cow herd) using a handheld meter. Track the percentage at or above 1.2 mmol/L, treat positives with a propylene glycol protocol that your vet is comfortable with, and write that weekly percentage where everyone can see it.
  2. Walk Your Transition Pens with a Tape Measure.
    Count stalls, count cows, and measure bunk space in your close‑up and fresh pens. If you’re regularly at or above 100% stocking or bunk space is under 24 inches per cow, sit down with your nutritionist and vet to talk through options for regrouping, overflow pens, or small facility tweaks that protect those high‑risk groups.
  3. Bring Transition Health Into the Semen Discussion.
    At your next breeding strategy meeting, take along a simple list of fresh cow diseases and BHBA results by cow, plus BCS scores on cows coming up for first service. Sort cows into “clean,” “minor bump,” and “rough transition,” and make deliberate decisions about where sexed dairy semen, conventional semen, and beef‑on‑dairy semen really belong.

The Bottom Line

If there’s one big idea to tuck in your pocket, it’s this: your pregnancy rate isn’t just a breeding‑pen number. It’s a delayed grade on your fresh cow management. The more we treat those first 30 days in milk as the front end of our repro program, not a separate chapter, the more room we give ourselves to improve both the biology and the bottom line.

What’s encouraging is that you don’t need a brand‑new barn or a shiny gadget to get started. Same cows, same buildings, same people—just looked at through a 90‑day lens that connects what happens in the transition pen to what shows up at preg check and, ultimately, on your milk statement. 

Key Takeaways:

  • Pregnancy rate is really a 90‑day transition report card. Cows with metritis, SCK, or DA in the first 30 DIM have lower pregnancy per AI and more pregnancy loss—even on excellent timed‑AI programs. ​
  • The math adds up fast. Metritis costs about US$511/case; SCK hits 20–40% of fresh cows. Together, they can quietly drain around US$90,000 a year from a 500‑cow herd. ​
  • Simple flags make it visible. BHBA ≥1.2 mmol/L in >15–20% of fresh cows, F:P ≥1.5 in >20% on first test, or 0–60 DIM culls in double digits all signal transition trouble. ​
  • Three levers matter most. Protect stocking (80–85%) and bunk space (24–30″) in transition pens; calve cows at BCS 3.0–3.25 and limit loss to ≤0.5 points; make sure the ration at the bunk matches the ration on paper. ​
  • Use transition health to guide semen decisions. Clean‑transition cows are prime for sexed dairy semen; cows with rough transitions often belong in the beef‑on‑dairy column.

Complete references and supporting documentation are available upon request by contacting the editorial team at editor@thebullvine.com.

Learn More

The Sunday Read Dairy Professionals Don’t Skip.

Every week, thousands of producers, breeders, and industry insiders open Bullvine Weekly for genetics insights, market shifts, and profit strategies they won’t find anywhere else. One email. Five minutes. Smarter decisions all week.

NewsSubscribe
First
Last
Consent

When Land Is Worth More Than Milk in California’s Lost Dairy Valley

400 dairies became 3,176 warehouses. Before you face that math, see how one California dairy valley made its hardest choice.

Executive Summary: At its peak in the late 1980s, California’s San Bernardino County Dairy Preserve around Chino and Ontario covered roughly 17,000 acres, with over 400 dairies and 350,000 cows producing most of Southern California’s milk. By 2021, logistics growth had turned much of that “dairy valley” into an industrial landscape, as San Bernardino County’s warehouses expanded from 24 in 1975 to 3,176, covering about 23 square miles—including former preserve land. This article traces how families like the Van Leeuwens, Alta Dena’s founders, and Geoffrey and Darlene Vanden Heuvel of J & D Star Dairy navigated that shift, balancing regulatory pressure and neighbor conflicts against rapidly rising land values and multimillion‑dollar buyout opportunities. It follows the northward move of many herds to Central Valley counties such as Tulare and Merced, now among California’s leading dairy counties by cow inventory and milk sales, and shows how the region’s milk production footprint changed without the people or their values simply disappearing. For today’s producers facing their own land‑value wake‑up calls, the piece offers a practical kitchen‑table framework: put your equity on paper, sketch three realistic paths (stay and reinvest, stay and scale back, or plan an exit), and ask which choice your family will be most at peace with five years from now. Above all, it argues that legacy in dairy isn’t defined only by keeping a specific farm operating, but by the courage to protect your family and carry forward the values you built in the barn—whether that’s on the same acres, in a new county, or in a different role in the industry. ​

Land Worth More Than Milk

I still remember the first time I watched her hesitate at that kitchen table.

The documentary about the San Bernardino County Dairy Preserve had just started. On paper, it was a history lesson: roughly 17,000 acres brought under California’s Williamson Act in 1967, more than 400 dairies and about 350,000 cows at the peak, supplying most of Southern California’s milk. The numbers lined up neatly on the screen.

But the moment that changed everything for me wasn’t a statistic. It was one daughter trying to talk about her dad.

She’s sitting at a table that looks like it’s hosted more milk checks, arguments, and late‑night coffees than anyone could count. In the film—shared by her family so people could understand what the preserve meant—she explains that her father grew up on São Jorge in the Azores. Out there, it was all pastures and cattle. Milking and raising animals were what he knew, so when he came to California, that’s what he did.

“It’s all pastures,” she says quietly, “so that’s what my father grew up doing—was milking the cows, raising cattle.”

And then she stops.

It’s barely half a second. Her eyes drift down, her fingers tighten a little on the mug, and there’s this small, fragile silence you can feel right through the screen. What moved me most was that silence. In that breath, you can hear everything her father carried: a young immigrant stepping into a strange country, barns rising on leased land, cows that paid the bills and anchored the family, a valley that once smelled like silage and warm milk—and the slow realization that the world around those barns had changed.

If you’ve ever looked across your own yard and wondered what happens if the land under your freestalls becomes worth more to somebody else than your milk will ever justify, you already know this story is closer to home than any map shows.

No One Thought This Dirt Would Be a Dairy Giant

No one driving past that dusty patch of southern California in the 1940s would’ve guessed it would become one of the most intense dairy regions in the country.

After World War II, waves of farm families came into places like Chino and Ontario. Dutch and Portuguese names began appearing on mailboxes and milk tankers. Historical accounts show Azorean Portuguese immigrants climbing the ladder one step at a time: first as hired hands, then as herdsmen, then as partners, and finally as owners. There were no consultants or five‑year plans—just people who knew cows and were willing to work.

They built more than rows of stalls.

Community histories describe how those families rooted D.E.S. halls and Holy Ghost festas across California’s dairy regions. You can almost smell the smoke from the churrasqueira and hear the clatter of plates as you read them: tents sagging over rough tables, kids in red sashes weaving between chairs, elders arguing in Portuguese about which donated animal was the best offering that year. No one’s marketing budget sponsored those gatherings. They were paid for out of parlors up and down the valley.

Then there were families like the Van Leeuwens. A Los Angeles Times feature tells how Bill Van Leeuwen’s grandfather left the Netherlands in the 1920s and started a dairy in Paramount with about 60 cows, all milked by hand. Later, Bill’s father bought a 17‑acre dairy in Norwalk in 1945, grew it to roughly 180 cows with mechanical milking, and watched houses press in tighter every year. When the city got too close, they sold that Norwalk farm in 1957 for about $17,000 and moved again—this time to Chino, where the land was cheaper and zoned for dairies.

On a timeline, that looks straightforward: buy, build, sell, move. On the ground, it’s a lot messier. It’s loading your best cows onto someone else’s trailer at an auction you never wanted to hold. It’s kids landing in new schools and trying to explain why their boots smell the way they do. It’s lying awake at night, wondering if uprooting everyone—again—was a brave move or a terrible mistake.

Against all odds, families kept choosing to move when staying put stopped making sense. Not because they weren’t scared. Because they were, and they did it anyway.

The Preserve That Was Supposed to Keep Them Safe

The preserve was supposed to be the part of the story where the pressure finally eased.

In 1967, under California’s Williamson Act, San Bernardino County created what became known as the San Bernardino County Dairy Preserve. Owners who agreed to keep their land in agriculture for ten‑year stretches got a tax break. About 17,000 acres around Ontario and Chino were drawn into a zone where dairies were not just tolerated—they were officially wanted.

For a while, that line on the map did exactly what it was meant to do.

By the late 1980s, that preserve held more than 400 dairies and around 350,000 cows, widely described as the largest single dairy concentration in the United States and the source of most of Southern California’s milk. A University of California report at the time described roughly 280,000 cows in about 300 herds across 20 square miles, with average herd sizes over 900 and nearly all of them family‑owned and managed.

Then the world outside the fence changed faster than the rules inside it.

PBS SoCal’s Earth Focus reporting and county data show how, starting in the 1970s and accelerating through the 1990s and 2000s, San Bernardino County became a logistics hotspot. In 1975, there were just 24 warehouses. By 2021, there were 3,176, covering about 23 square miles of what had once been open land. More and more of those roofs went up on former dairy ground, including pieces of the preserve.

Cities like Ontario and Chino annexed big chunks of that rural area as they expanded, pulling dairy land into city limits and long‑range development plans. At the same time, dairies in the preserve were wrestling with environmental rules, odor and dust complaints, rising costs, and the same milk price volatility everyone else knows.

On the surface, some of those operations looked stronger than ever: bigger herds, better parlors, more milk shipped. Underneath, the math was bending. The ground under those freestalls suddenly carried a price tag driven more by warehouse demand than by milk checks, and the contracts that had once offered protection were now one more factor to navigate before a family could even think about selling.

The fence that was drawn to keep the bulldozers out had quietly become part of the puzzle families had to solve just to protect themselves.

Standing in the Barn When It Starts to Feel Smaller

The call that changes everything doesn’t always come from a lawyer or a city planner. Sometimes it comes while you’re just standing in your own parlor.

Producers interviewed in planning documents and local reporting talk about that moment without always naming it. They had moved when the cities pushed in. They had signed onto the preserve. They had doubled down and built bigger. They had done everything they were told “serious” dairies had to do.

In 1993, San Bernardino County began formally phasing out the agricultural preserve. Over the years that followed, planning reports show that at least half of the roughly 400 dairies moved out, many heading for Central Valley counties like Tulare and Merced, where land was cheaper and zoning still openly welcomed cows. Others tried to hang on as long as they could.

Some of those who stayed told county officials and reporters something very simple: they didn’t want special treatment; they wanted the same right as any other landowner to sell their land at its true value when that was what their family needed.

Imagine finishing cleanup, leaning your arms on the pit rail, and realizing that on paper, your entire life’s work sits on land that’s suddenly worth more to a trucking company than your milk will ever justify—and knowing that the system built to protect you now plays a big role in how easily you can step away. That’s not just a business problem. That’s something that gets into your bones.

When your whole sense of self starts with “I’m a dairyman” or “I’m a dairywoman,” even letting the thought “Maybe we should sell” float across your mind for more than a second can feel like treason. Not against the land. Against who you’ve always believed you are.

When Neighbors You Trust Suddenly See Different Futures

The deepest cracks didn’t only come from policy or developers. They also ran right between neighbors who had once stood shoulder to shoulder.

As the county moved to unwind the preserve and cities annexed more land, dairy families found themselves standing on opposite sides of a line no one had deliberately drawn. In broad strokes, many older or smaller operations, worn down and boxed in, wanted the option to sell to developers at full value. Larger, heavily invested herds with newer facilities wanted the land to stay agricultural and the cluster intact.

Planning reports describe how some producers saw the preserve as some of the best dairy ground anywhere, and grieved the idea of losing it under concrete. Others looked at appraisals and felt that not being able to sell freely at those prices effectively pinned their families in a corner they hadn’t chosen.

Nobody in those meetings loved cows less than anyone else. They were just looking at the same valley from different kitchen tables.

“We Weren’t Forced Out. We Were Enticed.”

One line in this story still hits like a punch.

In a Los Angeles Times piece about the area’s dairies leaving, Bill Van Leeuwen said:

“Dairy farmers will say they were forced out by urbanization, but really, we were enticed to leave.”

He could have just said “forced out” and left it there. Urbanization, annexations, and changing rules absolutely pushed. But Bill knew there was another side to the ledger.

PBS SoCal and county documents spell out what was happening: as warehouse demand surged and land prices climbed, developers offered high purchase prices for dairy parcels. At the same time, San Bernardino County created mechanisms for early withdrawal from Williamson Act contracts and began auctioning county‑owned parcels, like the land under J & D Star Dairy. In 2014, that auction drew more than $65 million from warehouse and logistics buyers.

On one side: long days, regulatory pressure, neighbor complaints, aging bodies, and kids whose attachment to the cows may not look the same as yours. On the other: a cheque big enough to pay off debt, help children into their own futures, and maybe ease some of the strain.

Bill’s sentence doesn’t try to make anyone a hero or a victim. It simply admits that families were pushed and pulled at the same time. That honesty is part of what makes this whole valley’s story so powerful.

“Once the Dairies Leave, What Do You Do?”

Sometimes the most important question gets asked long before anyone’s ready to answer it.

In archival footage tied to the recent documentary about the San Bernardino Dairy Preserve, Geoffrey Vanden Heuvel stands in front of J & D Star Dairy in Chino. He and his wife, Darlene, had built that dairy, on land leased from the county, into a notable family operation in the preserve.

Looking into the camera, Geoffrey says, “Once the dairies leave, what do you do? You ought to have a plan in place.”

At the time, that must’ve felt like talking about a storm still sitting on the far horizon. The preserve was still in place on paper. A lot of people didn’t want to imagine a valley without dairy barns.

But the record shows how accurate he was. San Bernardino County began phasing out the preserve in 1993. As years passed, many of the preserve dairies moved to Central Valley counties like Tulare and Merced, which have consistently ranked among California’s top dairy counties for cow numbers and milk sales over the past decade.

J & D Star stayed longer than most. Then, in 2014, the county auctioned the land it was leasing, and developers bought it as part of a package worth over $65 million. By 2018, PBS SoCal reports that a FedEx warehouse and a large parking lot sat at Merrill and Flight avenues, where J & D Star’s corrals and barns had stood.

Geoffrey didn’t simply disappear from the industry when the dairy closed. Today, he serves as Director of Regulatory and Economic Affairs for the Milk Producers Council, working on policy and economic issues that shape the future for other dairy families across California. The same man who said, “You ought to have a plan in place,” now spends his days helping others think ahead.

When a Founder Admits Grit Isn’t Always Enough

If you zoom out beyond the Chino preserve, another name keeps showing up in California’s dairy story: Harold Stueve.

The Los Angeles Times recounts how he and his brother Edgar founded Alta Dena Dairy in Monrovia in 1945 with 61 cows and a milk wagon. By the 1960s, they had grown it into one of the largest dairies in the world. When the family sold a majority interest in 1989, Alta Dena had annual sales of more than $125 million and over 70 family members working in the business.

Later, as legal battles over raw milk, regulatory scrutiny, and urban growth intensified around their operations, Alta Dena sold most of its Chino-area dairy land. On paper, it reads like just another corporate transition. When you look closer, you see decades of pushing, innovating, and eventually hitting constraints you can’t simply outwork.

Over the years, Harold acknowledged that there comes a point where you can’t keep a large dairy going if houses and schools completely hem you in. You need open ground, a supportive community, and workable rules. If those disappear, even the toughest operator runs into walls that grit alone can’t knock down.

Sometimes courage is setting your alarm for 3:30 AM for the thousandth day in a row. Sometimes courage is admitting that the rules have changed enough that the old plan can’t get you where you hoped to go.

The Questions That Decide Everything (and They Don’t Show Up on a Spreadsheet)

The biggest turning points in this story didn’t happen at county hearings or in courtrooms. They happened at kitchen tables like yours.

The kids finally fall asleep. The second milking is done. The only sounds are the fridge humming and someone turning pages in a stack of bills. Maybe there’s an appraisal in there. Maybe a letter from the lender. Maybe just your own notes with numbers you’ve run three times and still don’t like.

Somebody stares at the paper. Somebody else stares at the wall. Someone says, “We’re okay,” but nobody really believes it.

The details are different from farm to farm, but the same questions keep trying to surface—even if they first show up as half sentences and long pauses instead of clean bullet points.

What are we actually protecting here?

Not “the family farm” as an idea. This exact operation. These cows. This land. These loans. This level of stress on your body. These kids are watching you, trying to decide if this is a life they can see themselves in.

Sometimes the moment that changes everything isn’t when some letter shows up in the mailbox. It’s when someone finally whispers, “Are we protecting the farm, or are we protecting our family?” and nobody rushes to shut it down.

Five years from now, what decision will we be most at peace with?

Nobody typically says it that neatly across the table. It comes out as, “I can’t keep this up forever,” or “If we walk away, who am I?”

But underneath, that’s the question. If you could look back from five years ahead, what would you be most grateful you did now? Pushed through one more round of changes? Took a serious offer while it was on the table? At least they laid every option out honestly and listened to each other?

There’s no path with zero regret. The real choice is which regret you can live with.

What does legacy really mean to us?

Is legacy only an unbroken line of your farm name on this specific piece of land?

Or is legacy your kids carrying your values—work ethic, care for animals, honesty—in whatever work actually lets them build a life? The historical record from the Chino milk shed shows families moving their herds to Tulare or Merced to keep milking, while others stepped into different roles within the industry. The barns changed. The values didn’t.

Are we still running this farm, or are we just holding a very expensive ticket in a game we no longer control?

When you sketch out your net worth and realize most of it is tied up in land whose price swings more with zoning decisions, warehouse demand, or policy than with what you ship in the tank, that’s a different kind of risk. For some families, that risk still feels worth it. For others, it feels like a clock ticking in the background.

There’s no single right answer baked into these questions. The only real mistake is refusing to ask them because you’re afraid of where the conversation might go.

A Kitchen‑Table Playbook You Can Actually Use

This isn’t a mastitis protocol or a robot ROI spreadsheet. It’s simpler and, in some ways, harder. But if anything in the Chino story hits you in the gut, here’s a framework you can adapt to your own table.

1. Put your equity on paper—for yourselves.

Not a formal statement. Just an honest sketch. How much of your net worth is in cows, machinery, and working capital versus land and buildings? It doesn’t have to be down to the dollar. It just has to be real enough that everyone around the table can see its shape.

2. Sketch three paths, even if you hate all of them at first.

  • One where you stay and reinvest: what would you actually change—facilities, herd size, contracts?
  • One where you stay but intentionally scale back or shift direction.
  • One where you sell or transition over a defined timeline—maybe to family, maybe not.

You’re not signing anything. You’re just admitting that these are the real options, not the ones you wish you had.

3. Ask the five‑year question out loud.

“If we look back from five years out, which of these paths will we be most at peace with—even if it’s hard in the short term?”

Let everyone answer from where they sit—owner, spouse, next generation. Don’t rush to smooth it over. Let there be a few uncomfortable silences. Sometimes that’s where the truth finally slips out.

You don’t owe social media or the neighbors a tidy narrative. You owe the people at that table your best effort at the truth.

What’s Left When the Barns Are Gone

If you drive through that valley today with no idea what it used to be, you’ll mostly see concrete and loading bays.

PBS SoCal shows how the J & D Star Dairy land, once home to corrals, lagoons, and barns, is now a FedEx warehouse and a large parking lot at Merrill and Flight avenues. The same reporting and county data map out thousands of warehouse roofs across roughly 23 square miles of what was some of the most productive dairy ground anywhere in the state.

In some of those industrial parks, bronze cow statues are standing in front of office doors—a nod to the cows that once lived there. To someone just passing through, it might look like a quirky design choice. To someone who grew up milking there, it probably feels more like walking into an empty barn and hearing phantom pulsators.

The cows didn’t all vanish; they moved. Industry data and USDA Census snapshots over the past decade consistently place Tulare and Merced among California’s top dairy counties for cow numbers and milk sales, reflecting the shift of herd concentration into the Central Valley.

Holy Ghost festas still pack D.E.S. halls in Portuguese communities, including in places tied back to the preserve story. The names on some of those banners are the same names that once hung over dairy lanes near Chino. Some of those families are still milking, just in different counties. Others are working in roles that keep them connected to cows and producers in new ways.

The valley’s role in the dairy map changed. The people who built it didn’t just evaporate.

If You’re Standing on That Edge Yourself

You might be nowhere near California. Your pressure might come from quota rules, a processor that’s gotten too big, labor you can’t find, interest rates that keep you up at night, or climate policy that makes your head spin. The details are different, but that feeling in your gut can be exactly the same.

If you’ve ever sat at your own kitchen table with a stack of envelopes, your stomach in a knot, and that little voice saying, “We can’t keep doing it like this forever,” then you are closer to those San Bernardino families than you might want to admit.

This story isn’t here to talk you into staying or to talk you into leaving. That’s not anyone else’s job.

What it can do is give you a few things their journeys made painfully clear:

  • You’re not weak for questioning whether the current path still makes sense.
  • You’re not a failure if, in your situation, protecting your family means exiting an operation your grandparents poured their lives into.
  • You’re not alone if, some nights, the place that once held all your dreams now feels like it’s squeezing them.

The strength that comes through the Chino story isn’t just the toughness it took to build those dairies in the first place. It’s the quiet courage it took to keep going while the landscape and the rules shifted underneath them—and then, when the time came, to admit that the bravest move for their family might be a different one than they expected.

The Part of Your Legacy No One Can Pave Over

I keep going back to that woman at the kitchen table and that half‑second pause before she could talk about her dad.

He didn’t leave São Jorge, cross an ocean, and put his whole life into cows and concrete barns so his name would stay attached to one particular parcel of land forever. He did it to give his family a chance—to keep them secure and part of a community that knew their name.

For a long time, dairy was the best way he knew to do that. The barns, the cows, the milk checks—they mattered. They helped hold households and community institutions together in that valley.

But the legacy he left her didn’t live in a legal description on a deed. It lives in the way she carries his story, in the values and work ethic he passed on, and in her willingness to share that story so other families can see themselves in it.

Your legacy isn’t only the cows you milk or the acres that carry your name.

Your legacy is the courage to do what it takes to give the people you love a future they can live with—whether that means staying and reinventing your operation, moving and rebuilding somewhere that fits better, or blessing the next generation as they carry your values into a different part of the dairy chain or into something else entirely.

Sometimes that’ll mean doubling down: investing in cow comfort, air, and shade; tightening up decisions; bringing your kids into the real conversations instead of just handing them a pitchfork. Sometimes it’ll mean cheering them on as they walk into a feed lab, a vet clinic, or another barn with your lessons in their back pocket, not your name on their pay stub.

And sometimes, it might mean sitting at that same table that’s seen more milk checks than you can count and finally saying, with your voice catching just a bit:

“We can’t carry on this business the way it is, not here. And that’s okay. We’ll find another way.”

If you’re anywhere on that edge right now—half anchored in the life you’ve always known, half staring into a fog of what‑ifs—this story isn’t here to push you in either direction.

It’s here to give you permission to ask the hard questions, to listen to each other without flinching, and to remember something the Chino valley proved in its own hard way:

The barns may change. The land may change. The way we milk and get paid will keep changing, just like it did there.

But that quiet, stubborn determination at the core of this way of life—the part that keeps you getting up on the mornings when nothing on the ledger looks pretty—that’s yours. No auction, no zoning vote, no warehouse, and no milk price can ever take that from you. 

Key Takeaways

  • The numbers tell the story: At its peak, California’s Chino–Ontario dairy preserve held 400+ dairies and ~350,000 cows on 17,000 acres; by 2021, San Bernardino County’s warehouses had grown from 24 (1975) to 3,176, paving roughly 23 square miles—including much of that preserve. ​
  • Pushed and pulled at once: As one longtime dairyman said, families weren’t simply “forced out by urbanization”—they were “enticed to leave” by land values that dwarfed what milk checks could ever justify. ​
  • The herds moved, they didn’t vanish: At least half the preserve’s dairies relocated to Central Valley counties like Tulare and Merced, which now rank among California’s top dairy counties by cow inventory and sales. ​
  • A kitchen-table playbook for today: If you’re facing land-pressure decisions, start here—put your equity on paper, map three paths (reinvest, scale back, or exit), and ask which choice your family will be most at peace with five years from now.
  • Legacy isn’t acreage—it’s values: The Chino story proves that what you pass on isn’t a deed or a barn; it’s the courage to protect your family and carry forward what you built, wherever that takes you. ​

Complete references and supporting documentation are available upon request by contacting the editorial team at editor@thebullvine.com.

Learn More

The Sunday Read Dairy Professionals Don’t Skip.

Every week, thousands of producers, breeders, and industry insiders open Bullvine Weekly for genetics insights, market shifts, and profit strategies they won’t find anywhere else. One email. Five minutes. Smarter decisions all week.

NewsSubscribe
First
Last
Consent

Why the A2 Boom Bypassed Heritage Breeds – And What’s Actually Working

Your Guernseys might be naturally A2—but if you’re not hitting 50,000 lb per run, your premium is probably disappearing in someone else’s silo.

U.S. Guernsey cattle are now officially sitting in the “Watch” category on The Livestock Conservancy’s Conservation Priority List, which is the tier reserved for breeds with fewer than 2,500 annual U.S. registrations and an estimated global population under 10,000 registered animals according to the Conservancy’s parameters.  The latest list still places Guernseys in that Watch bracket, which gives you a pretty clear sense of how small the registered population has become compared with where it once was in North America.

Over roughly the same period, the business around A2 milk has gone from a niche curiosity to serious money. Precedence Research pegs the global A2 milk market at about 2.86 billion U.S. dollars in 2025 and projects it out to around 7.62 billion by 2034 if current demand growth holds, which works out to roughly an 11‑plus percent annual growth rate over that stretch.  So you’ve got a rapidly growing premium segment on one hand, and on the other, you’ve got heritage breeds like Guernsey that, based on both breed descriptions and on‑farm A2 testing results, tend to show a very high frequency of the A2 β‑casein variant when samples are sent in.

The global A2 milk market is projected to nearly triple from $2.86B in 2025 to $7.62B by 2034—an 11%+ annual growth rate that explains why heritage breed owners thought they had a goldmine

On paper, you’d think those two things would line up a lot better than they have. As many of us have seen over coffee at meetings or in the bleachers at shows, they mostly haven’t.

What’s interesting here is that once you strip this back to what’s actually in the genes, how plants are built, and where the dollars really move, the answer is pretty straightforward… and a bit uncomfortable.

Looking at the genetics, not the sales pitch

Looking at this trend from the genetics side first, A2 isn’t some magical “heritage package.” It’s one specific change in the β‑casein protein coded by the CSN2 gene—a single nucleotide substitution that flips one amino acid at position 67 from histidine (A1) to proline (A2).  Reviews on A2 milk from food science and nutrition researchers keep coming back to the same point: the distinction between A1 and A2 β‑casein is that single amino acid difference, not a wholesale change in the cow or in other milk proteins.

That’s very different from things like butterfat performance, fertility, or how a cow holds up through the transition period in a grazing system, which all involve many genes and years of selection pressure. A2 is more like a light‑switch trait. If you’ve got genomic tools and access to semen catalogues that clearly label A2A2 sires, you can shift the A2 status of a Holstein herd pretty quickly.

A group led by B.A. Scott in Australia pulled together Holstein genomic data and published it in 2023 in Frontiers in Animal Science. They showed that the proportion of A2A2 Holstein cows in their dataset rose from about 32 percent in 2000 to roughly 52 percent in 2017 as selection for the A2 allele increased in the population.  That’s a big shift in less than two decades, driven mainly by AI studs and breeders nudging A2 sires up their lists once the trait started to matter commercially.

Holstein herds went from 32% A2A2 in 2000 to 52% by 2017 through simple genomic selection—proving that the “heritage A2 advantage” was never a sustainable moat 

Once brands like The a2 Milk Company started talking about A2 in grocery aisles, studs did what they always do: they flagged A2A2 sires clearly in proofs and catalogs and, where feasible, folded A2 into their mating tools and marketing.  If a bull was already strong on production, health traits, and type, A2 became one more box that was easy to tick when planning matings.

You can see how fast this can move when you look at operations like Sheldon Creek Dairy in Ontario. Their own story describes how they used Holstein genetics and careful sire selection to transition their herd to produce only A2 β‑casein, then built a bottled milk brand around that.  They didn’t need to change breeds to do it.

So if you’ve been told that Guernseys or other heritage breeds had a “baked‑in A2 advantage” that nobody else could catch, the genetics really don’t support that. The initial advantage was real—many Guernsey herds do test very high for A2—but it was easy for Holstein programs to copy once there was a commercial reason to do so.

The plant math that quietly decided everything

Now, genetics is only half the story. The other half is the part that doesn’t show up in glossy brochures: how milk actually moves through a plant, and what it costs to treat a stream as “special.”

Let’s walk through two real‑world scenarios the way you’d probably talk them through around a table with a pencil and a notepad. The numbers themselves will feel familiar if you’ve ever sat down with an extension engineer or a processing consultant.

In Scenario A, imagine a 5,000‑cow Holstein herd. If you decide to test all those cows for A2 using a typical genomic panel that includes β‑casein, you’re probably looking at something in the $45–50 per head range based on current commercial lab pricing in North America. Call it roughly $225,000 to test the whole string.

If around 45 percent of those cows test A2A2—which lines up with where a lot of Holstein herds land once A2 has been on the radar for a while—that’s about 2,250 cows. If those cows are averaging roughly 70 pounds of milk per day, that subset alone is producing around 157,000 pounds of A2 milk per day. Even if a processor only pulls part of that into a dedicated stream, you’re still comfortably over the 50,000‑pound volume that makes a separate A2 run realistic.

Most large plants can justify a separate A2 run at that kind of volume, including a full clean‑in‑place cycle between the A2 product and regular milk. Processors running A2 programs in markets like the U.S., Australia, and New Zealand report premiums of $1.50 to $2.50 per hundredweight over conventional pay prices, depending on contract structure and the products they’re making.  Stack that over a month, and you’re talking tens of thousands of dollars in extra revenue, without changing barns, freestall layout, dry lot systems, or core fresh cow management—just sorting cows, managing groups, and scheduling dedicated loads.

Daily production from that herd might be in the 7,500 to 9,000 pound range if cows are giving 50–60 pounds apiece, depending on components, fresh‑cow management, and days in milk. And that’s where the problem starts. In many Guernsey herds that have actually done the testing, a very high proportion of cows do come back A2A2, which matches what breed descriptions and breeders report, even though there isn’t a single global genomic survey that pins down one exact percentage.

Daily production from that herd might be in the 3,000 to 4,000 pound range, depending on butterfat performance, fresh cow management, and days in milk. And that’s where the problem starts. The same plants that are happy to schedule a special A2 run at 50,000 pounds in Scenario A can’t justify a completely separate run for 7–9,000 pounds a day from one small herd. By the time you factor in hauling logistics, testing, and the time and chemicals for a full CIP, that small stream just doesn’t carry its weight in a conventional plant.

Unless you and several neighbours can pool your milk into a unified, A2‑only stream that gets into the tens of thousands of pounds per week, your A2 milk is simply going to disappear into the regular tank. The premium doesn’t vanish because anyone dislikes Guernseys; it vanishes because the plant can’t afford to treat that small volume as a separate product under its current design.

In the Upper Midwest, for example, plant managers will tell you candidly that every new product run means lining up dedicated loads, testing them, possibly tweaking process settings, and then doing a full CIP before switching back. For many plants, a rough threshold where that becomes feasible is somewhere around 50,000 pounds per run, not as a hard rule but as the point where per‑unit costs start to look sensible.

So a lot of heritage herds find themselves at a three‑way fork:

  • One path is to invest in some level of on‑farm processing. When you talk to extension specialists and farmstead processors, a modest 50–150 cow setup—pasteurizer, bottling line, food‑grade processing room, cold storage, licensing, and working capital—often lands in the $175,000 to $325,000 range once everything’s on paper.
  • Another path is to organize a serious pooled stream with like‑minded neighbours so you can show up at the plant door with enough volume and consistency to justify a separate A2 or heritage run.
  • The third path, which many people end up on by default, is to accept that as long as you’re shipping into a conventional pool, A2 alone won’t change your milk cheque much, if at all.

A Vermont producer who priced all this out with advisors summed it up bluntly in a regional article: the A2 premium at the plant is real, he said, but they couldn’t see how to capture it “without becoming a completely different kind of business.”  That’s a pretty honest read on the gap between the A2 sales pitch and plant‑level infrastructure.

What on‑farm processing really looks like when you sharpen the pencil

If you’re seriously kicking the tires on processing your own milk—even just part of it—those big ballpark numbers start to look a lot more real once you break them down into line items.

Extension publications and small dairy plant consultants tend to put the major capital costs into a few familiar buckets. A decent-sized batch or HTST pasteurizer, plus a filler and basic controls, might run in the $75,000–$125,000 range, depending on whether you’re buying new or reconditioned equipment.  Building out or upgrading a room to meet food‑grade standards—floors, walls, floor drains, CIP‑friendly design, HVAC, and electrical—can easily add another $40,000–$80,000.

Then there’s the regulatory and compliance side. Between design review, permits, inspections, and initial lab work, many farms end up in the $15,000–$40,000 range just to get through licensing.  Add in $20,000–$40,000 for packaging and cold storage—bottles, caps, labels, cases, coolers, or a small walk‑in—and whatever you’re comfortable holding as working capital for a few months of payroll and utilities, which might be another $25,000–$40,000.

Put all of that together, and that’s how so many farmstead dairies land in that $175,000–$325,000 startup range for a 50–150 cow operation.  It’s a big step, especially when you’re still milking mornings and evenings and trying to keep cows moving cleanly through the transition period.

So what does that investment actually buy you on a per‑hundredweight basis?

When you talk to direct‑market farms that are selling whole milk under their own label and turning some of the tank into cheese, yogurt, or ice cream, you hear similar patterns in their back‑of‑the‑envelope math. Once they reverse‑engineer their retail sales back to the farm gate, many find that bottled whole milk is effectively returning somewhere in the high‑30s to mid‑40s per hundredweight equivalent.  Value‑added products like cheese or yogurt often come out in the mid‑50s to maybe around $80/cwt equivalent in some markets, especially near cities with strong local‑food demand.

Nobody is suggesting that every farm will hit those exact numbers; it depends heavily on your location, customer base, product mix, and ability to manage both the plant and the cows. But when you blend it all together—a portion of the milk as bottled whole, some as chocolate, some as yogurt or cheese—a lot of these operations report blended returns in the roughly $48–$65/cwt equivalent range.

Compare that to a commodity price in the low‑20s per hundredweight in many recent U.S. mailbox averages, and you start to see why some heritage herds are making that jump, even if it means learning to run a pasteurizer in the afternoon instead of heading straight from the parlor to the shop.

Heritage herds that successfully process on-farm report blended returns of $48–$65/cwt versus low-$20s in bulk pools—a 2–3× multiplier that justifies the capex if you can realistically climb this ladder in your market 

The real question for your yard isn’t “Is on‑farm processing a good idea?” It’s “Can I realistically see a path to that blended $45+/cwt equivalent in my own postcode with the time, talent, and markets I have—or can build?”

Who’s actually making heritage genetics pay?

What farmers are finding is that the heritage herds that are growing or at least holding steady aren’t hanging their hats on A2 alone. They’re building full business models around their cows.

Two Guernsey Girls Creamery in Wisconsin is a good example. Owner Tammy Fritsch runs a state‑licensed micro‑dairy near Freedom, milking a small Guernsey herd and processing the milk right there on the farm.  The idea didn’t start with spreadsheets; it started with years of showing Guernseys at the Wisconsin State Fair and hearing visitors ask where they could still buy Golden Guernsey milk like they remembered.

Today, that operation tests cows to confirm A2 status, pasteurizes milk on‑farm, and bottles non‑homogenized milk so the cream rises in the bottle—something customers notice right away.  They also make Guernsey cheese curds and other products, selling through farm pickup, local stores, and outlets that want something distinct and local.  A2 is part of the story, but it sits alongside breed identity, the visible cream line, and a direct relationship between the family and their customers.

In Ontario, Eby Manor near Waterloo has done something similar with its Golden Guernsey label. Their own materials describe their Guernsey milk as naturally rich and A2, and they bottle that into milk, chocolate milk, cream, yogurt, and cheeses under their family brand.  They’re working inside a quota system, but the basic approach is similar: don’t wait for a processor to create a Guernsey A2 silo—build your own lane and brand.

When you lay these examples side by side, the pattern is fairly consistent. The heritage herds that are really making it work often share a few traits:

  • They’ve taken control of at least some processing and packaging under their own roof.
  • They’ve built direct‑to‑consumer channels—farm stores, markets, local grocers, cafés, and delivery.
  • They’ve diversified beyond fluid milk into at least one or two value‑added products, often including cheese or yogurt.
  • They’re stacking A2 with other premiums like grass‑based feeding, local identity, sometimes organic certification, and the heritage angle itself.
  • They’ve built a community of customers who know the farm and the cows by sight.

For heritage herds that are still shipping everything into a single tanker and hoping a processor will someday decide to pay more just because the milk is A2, that’s the real gap.

The consumer confusion that muddies the water

There’s another piece here that’s easy to underestimate when you’re living in the barn: what’s going on in the consumer’s mind.

You probably know this already, but a lot of people use “lactose intolerance” as a catch‑all label for any discomfort they feel after drinking milk, even though true lactose intolerance is about low lactase enzyme levels and not about casein proteins. Reviews that look over the A2 literature point out that many consumers don’t clearly distinguish between issues with lactose and possible differences in how they respond to A1 versus A2 β‑casein.

So someone who’s genuinely lactose intolerant sees A2 milk on the shelf, hears that it’s “easier to digest,” and decides to give it a try. Since A2 milk still contains essentially the same lactose content as regular milk, that person may not feel any better. They walk away thinking, “That was just expensive milk that didn’t help me.”

At the same time, some people do report feeling better on A2 milk in controlled digestion studies, especially in terms of bloating or GI discomfort, but those are often individuals whose issues weren’t driven purely by lactose in the first place.  That nuance is tough to convey in three lines on a label or in a 15‑second ad.

For small heritage herds trying to build a local A2 niche, that confusion creates headwinds. The big A2 brands have done a lot to get the term “A2” into consumer vocabulary, which helps.  But they haven’t always helped shoppers understand why a local Guernsey A2 milk, sold in glass with a visible cream line and a pasture story, is another step different again.

So what stands out in conversations with farmers here is that A2 can be a door‑opener. It might be the reason someone tries your milk for the first time. But the reasons they keep coming back—flavour, mouthfeel, how they feel after they drink it, the kids’ reactions, what they see when they visit the farm—go way beyond that one gene marker.

What processors are really up against

As many of us have seen, it’s tempting to chalk all this up to processors “not getting it.” But when you actually sit in a plant office and ask how they’d make a heritage A2 run work, the answer often comes down to mechanics: plant design, labour, and scheduling.

In many Midwest plants, managers will tell you that every new product run means lining up dedicated loads, verifying composition, possibly adjusting process settings, and then performing a full CIP before switching back. That’s a lot of labour and downtime for a small stream. For many plants, the rough threshold at which this becomes feasible is around 50,000 pounds per run; below that, the extra cost per unit can erode the premium quickly.

There have been attempts in states like Wisconsin and Vermont to set up specialty pools—grass‑based pools, local pools, sometimes A2 pools. Some of those have made progress; others have run into predictable problems: not enough consistent volume, too much compositional variation, too much scheduling complexity relative to plant capacity.  In California’s Central Valley, where a lot of milk moves through very large, highly optimized plants tied to big Holstein herds in freestalls or dry lot systems, there’s even less room to carve out tiny lanes for heritage milk.

So if your business plan is built on a conventional plant paying a stable, meaningful premium just because your milk is both A2 and heritage, at a relatively small volume, you’re basically betting against the way most plants are currently engineered. That doesn’t make processors villains; it just means the system wasn’t built to do what we now wish it could do.

The pasture angle we don’t want to lose sight of

It’s also worth stepping back from the plant for a minute and looking at where these cows actually earn their keep: on the ground.

Teagasc, the Irish agriculture research and advisory organization, has done a lot of work comparing straight Holstein‑Friesian cows with Holstein‑Friesian × Jersey crossbreds in grass‑based, seasonal systems. In several of those multi‑year pasture studies, the crossbreds have come out ahead on profit per cow and per hectare, mainly because of better fertility, survival, and components, even when straight Friesians had an edge on pure volume.  An analysis highlighted by Agriland reported that crossbred cows at Teagasc’s Clonakilty research farm were generating around €162 more profit per cow per lactation than straight Holsteins in that grass‑based system.

Those aren’t Guernseys, but they do back up what many graziers in the Northeast and Upper Midwest have already noticed on their own farms: the cow that’s a star on a high‑input TMR in a big freestall isn’t always the cow that makes you the most money when you’re walking to the back paddock in April, dealing with wet springs, and trying to get an efficient bite off grass.

Heritage breeds like Guernsey, Ayrshire, and Brown Swiss, evolved in environments closer to those of grazing systems. The Livestock Conservancy, breed associations, and extension sources describe Guernseys as good grazers that can do well on quality pasture, hardy across a range of climates, and relatively easy to manage.  Ayrshires have long been known for strong feet and legs and good performance on rougher ground.  Brown Swiss carry a reputation for longevity and for producing milk with protein and casein profiles that work well for cheesemaking, especially in alpine‑style cheeses.

So if you’re in a pasture‑heavy system—think New York’s hill farms, Vermont and Quebec grazing herds, Wisconsin seasonal dairies, or coastal British Columbia—chasing A2 might be less important than asking, “Which genetics give me the best lifetime production and profit per acre on this land base?” A2 can still be part of that picture, but fertility, days in milk, hoof health, and how well a cow converts your grass into fat and protein are often the real levers.

Crossbreeding: where heritage genes quietly move into big herds

There’s also a quieter trend that doesn’t show up in breed registration numbers: heritage genetics getting into commercial herds through deliberate crossbreeding.

Many larger Holstein herds frustrated by fertility, lameness, and short productive lifespans have already considered crossbreeding with Jerseys, Montbéliardes, or Scandinavian Reds, and the literature on crossbred systems consistently shows heterosis benefits for functional traits such as fertility and survival.  Adding Guernsey, Ayrshire, or Brown Swiss sires into that mix—especially sires that are A2A2—is another way to bring in hybrid vigor and some of those pasture or functional traits without flipping the whole herd overnight.

Guernsey breeders like Tom Ripley, who has worked extensively with the American Guernsey Association, have shared field reports from producers who use Guernsey sires on Holstein cows and report improvements in calving ease, component levels, and, sometimes, fertility in the resulting crossbreds.  These aren’t controlled university trials, and they’re not going to show up in Journal of Dairy Science the same way Teagasc’s work does, but they do line up with the broader crossbreeding literature from New Zealand and Ireland that shows heterosis boosting “functional” traits in many three‑breed systems.

What’s encouraging about that is it opens up revenue beyond the milk cheque for heritage breeders who are paying attention. If you’ve got a Guernsey, Ayrshire, or Brown Swiss family with real performance behind it—good components, sound udders, durable feet and legs—you may have an opportunity to sell semen or breeding stock into commercial herds that want those traits, even if your own milk still goes into a conventional pool.

The bigger genetic picture and why it matters

One more piece that matters more in the long run than in any given month’s milk statement is genetic diversity.

Geneticists working on dairy cattle have been pointing out for years that the effective population size of Holsteins—the number of unrelated founders you’d need to reproduce the existing genetic variation—is relatively small compared with the actual number of Holsteins in barns. That’s what happens when you run intense selection on a fairly narrow group of elite sires for multiple generations.  It’s been great for yield and components, but it has nudged inbreeding steadily upward.

Scott’s 2023 analysis of selecting for A2 in the Australian Holstein population went a step further and showed that selecting for the A2 allele alone, without careful management of relationships, could increase both regional and genome‑wide inbreeding, because it narrows the sire pool even more.  That’s not a reason to avoid A2 completely, but it’s a reminder that stacking too many selection criteria on top of each other in a single breed can have side effects you don’t fully feel until years down the road.

Heritage breeds like Guernsey, Ayrshire, and Brown Swiss carry trait combinations that aren’t easy to rebuild if we lose them—heat tolerance paired with decent components, strong grazing instincts with solid structure, and cheese‑friendly casein variants, just to name a few.  The fact that Guernseys sit in that Watch category, with thresholds of fewer than 2,500 annual U.S. registrations and fewer than 10,000 registered animals globally, is a quiet alarm bell that those options are not endless.

BreedAnnual U.S. RegistrationsEst. Global PopulationConservation Status
Holstein>200,000>10 millionNot at risk
Jersey~40,000~1 millionNot at risk
Guernsey<2,500<10,000Watch
Ayrshire<1,000<5,000Threatened
Brown Swiss~5,000~50,000Watch
Milking Shorthorn<500<3,000Critical

Source: The Livestock Conservancy Conservation Priority List; breed association estimates

It doesn’t mean every commercial herd needs to go buy a string of Guernseys tomorrow. But it does mean that breed associations, co‑ops, and policy folks should be thinking consciously about whether they want those tools still available when our kids and grandkids are the ones making the breeding decisions.

So, where does this leave you in 2026?

Looking at this trend as a progressive producer, you start to see where the real decision points sit once the dust from the A2 hype settles.

A few things stand out:

  • Consumer preferences around A2, local, grass‑based, and heritage products are real in certain markets, especially urban and higher‑income areas, but they’re patchy. Survey‑based work on A2 consumer preferences in Europe and Oceania shows that some shoppers will pay a noticeable premium for A2 milk, while others don’t see enough perceived benefit to justify switching from conventional milk, which mirrors what many of us see in farm stores and markets.
  • Heat stress and climate volatility are already costing the dairy sector serious money in lost production and fertility, and those costs are expected to grow rather than shrink. Economic analyses of heat stress in U.S. dairy herds estimate total losses in the billion‑dollar range annually, once you add up milk yield, reproduction, and health impacts.  Cows that handle heat and weather swings better are going to become more valuable in most regions.
  • Infrastructure support for new models is becoming increasingly flexible. Vermont’s Working Lands Enterprise Initiative, Wisconsin’s Dairy Innovation Hub, and similar programs are investing public funds in on-farm processing, small regional plants, and broader dairy innovation projects.  That doesn’t guarantee success, but it does mean there’s some help out there if you want to test a new model rather than go it completely alone.
  • Genetic diversification remains an under‑valued hedge. Whether it’s crossbreeding, bringing in some heritage lines, or just broadening your selection goals beyond the next hundred pounds of milk, diversifying your genetics can give you more room to manoeuvre when markets, policies, or weather patterns shift.

Coffee‑table takeaways, now that the mugs are half empty

If you’re already milking heritage cows, the big takeaway is that A2 is a nice card to have, but it’s not the ace by itself. The herds that are winning with heritage breeds right now are stacking A2 on top of strong butterfat performance, good grazing fit, on‑farm processing, and deep customer relationships.  Before you spend a couple of hundred thousand dollars on stainless and concrete, it’s worth asking yourself whether you can realistically see a blended return in that $45+/cwt equivalent range through bottled milk and value‑added products in your area.  If you can’t, you may find that your energy is better spent tightening your grazing, strengthening your direct‑to‑consumer channels, or positioning your herd as a source of genetics for crossbreeding and semen sales.

If you’re thinking about moving into heritage breeds, it’s worth starting not with the cow but with the market. Who exactly would buy this milk? In which form? At what price? Is there a realistic path to processing either on‑farm or through a small creamery that’s willing to build a heritage or A2 brand with you? Spending a day or two with people who already made that jump—walking their plant, talking about their transition period, and listening to their cash‑flow stories—is probably one of the best investments you can make before you call a Guernsey breeder.  And don’t forget to think about genetic revenue: semen, embryos, and breeding stock can all sit alongside the milk cheque if you build the reputation and the data.

If you’re looking at things more from the 30,000‑foot view—maybe you’re involved in a co‑op board, a breed organization, or a policy group—then the message is that heritage breeds aren’t going to be “saved” by the A2 boom alone. But they still have important roles to play in crossbreeding programs, in pasture‑based systems, and as a reservoir of traits we may need badly in years to come.  Supporting more flexible processing infrastructure, targeted grants, and thoughtful breeding work may do more to keep those options alive than any single A2 marketing campaign.

In the end, the A2 boom didn’t so much ignore heritage breeds as flow into the channels that were already built: big Holstein herds, big plants, big distribution. That’s frustrating if you’ve been sitting on a naturally A2 herd for decades. But once you see it clearly, it also frees you up.

Instead of waiting for the system to notice and reward you, you can decide whether you want to build a different kind of business around your cows, or whether you’re better off using their genetics as one tool in a broader, more diversified strategy. It’s more work either way, no doubt about it. But as many of us have seen on farms that have made these choices with clear eyes and solid numbers, that’s also where the real, lasting opportunities tend to live. 

Key Takeaways:

  • A2 isn’t a heritage lock‑in. It’s a single‑gene trait Holsteins copied fast once the market cared—Guernseys’ natural head start didn’t last.
  • Plant math decides who gets the premium. Most processors need ~50,000 lb A2 runs to justify segregation; a 150‑cow Guernsey herd’s 3–4,000 lb/day just disappears into the bulk tank.
  • On‑farm processing can pay, but know your numbers. Expect $175K–$325K capex and aim for $45+/cwt blended returns—if you can’t see that path in your market, stainless may not be your move.
  • Winning heritage herds stack premiums, not just genes. A2 opens doors, but repeat customers come back for cream‑top bottles, local identity, pasture stories, and real relationships.
  • Heritage genetics still matter—for crossbreeding, grazing, and the long game. Functional traits, heat tolerance, and diversity are worth more as inbreeding and climate pressure keep rising.

Executive Summary: 

This feature digs into a simple question a lot of producers are asking: if A2 milk is headed toward a $7.6 billion global market, why are Guernseys still on the Watch list instead of cashing in? It shows that A2 is just a single‑gene switch Holsteins adopted quickly, while the real gatekeeper is plant design—big processors need 50,000‑lb A2 runs from 5,000‑cow herds, not 3–4,000 lb/day from 150‑cow heritage barns. You’ll see the hard numbers on on‑farm processing—typical $175,000–$325,000 capex and blended $48–$65/cwt returns—so you can tell if a bottling room pencils out for your postcode or just steals sleep and cashflow. The article profiles Two Guernsey Girls in Wisconsin and Eby Manor in Ontario to show how some herds are actually making heritage genetics pay by stacking A2 with grass‑based stories, cream‑top bottles, and value‑added products. It also walks through where heritage genes fit into crossbreeding, pasture‑based systems, and long‑term genetic diversity, especially as heat stress and inbreeding pressure keep rising. The piece ends with clear, coffee‑table style takeaways that help you decide whether your best move is chasing A2 contracts, investing in stainless, leaning into crossbreeding, or staying bulk and focusing on the cows and markets you already do best.

Complete references and supporting documentation are available upon request by contacting the editorial team at editor@thebullvine.com.

Learn More

The Sunday Read Dairy Professionals Don’t Skip.

Every week, thousands of producers, breeders, and industry insiders open Bullvine Weekly for genetics insights, market shifts, and profit strategies they won’t find anywhere else. One email. Five minutes. Smarter decisions all week.

NewsSubscribe
First
Last
Consent

Dairy Tech ROI: The Questions That Separate $50K Wins from $200K Mistakes

180 cows. The threshold that separates dairy tech wins from expensive regrets. Here’s what actually works on each side—and why infrastructure matters more than equipment.

EXECUTIVE SUMMARY: The math on dairy technology is simpler than vendors suggest—and more unforgiving than most producers expect. University of Minnesota research shows robotic milking breaks even only when labor costs reach $27.05 per hour, with optimal utilization at 55 cows per robot, according to the University of Wisconsin’s Dairyland Initiative. That reality puts the automation sweet spot squarely between 180 and 400 cows. Below that threshold, activity monitors (7-14 month payback) and precision feeding (7-12% feed savings) consistently deliver stronger returns than robots that can’t justify their capital cost at smaller scales. But infrastructure failures sink more technology investments than poor purchasing decisions ever will—62% of automated milking difficulties trace to electrical inadequacy, and half of US farms lack the connectivity modern systems demand. The producers winning with technology aren’t buying the flashiest equipment; they’re matching capability to scale, fixing infrastructure first, and planning for 50-60% of marketed benefits rather than trade-show promises.

When Mike Vanbeek installed activity monitors on his Wisconsin dairy, he wasn’t chasing the latest trend. He was solving a specific problem – missed heats were eating into his bottom line, and he knew it. Within months, his 21-day pregnancy rate climbed from 25% to 35%, and he’d cut his synchronization protocol costs by more than half.

That’s a technology success story worth examining. But here’s what makes it interesting: Vanbeek didn’t buy robots. He didn’t automate his milking. He invested in collars and sensors—relatively modest technology that delivered returns he could actually measure against his milk check.

His experience reflects something dairy farmers across North America are discovering as they navigate the flood of precision agriculture tools now available. The question isn’t really “Should I adopt technology?” It’s more nuanced than that: “Which technology fits my operation, my scale, and my specific constraints?”

After Agritechnica 2025 showcased everything from AI-powered weed detection promising 90% herbicide savings to autonomous equipment that seemed lifted from science fiction, that question has become more urgent—and honestly, more complicated—than ever.

The ROI Benchmark That Changes Everything

Let’s start with something practical. Gary Sipiorski, a dairy financial consultant who works with producers across the Midwest, offers a useful framework: compare any technology investment to what you’d earn parking that money in a certificate of deposit. With current CD rates running in the 4-5% range, technology investments should target at least 15% ROI to justify the additional risk and management complexity.

That’s a cold shower for anyone standing in a flashy trade show booth. And it’s where the conversation gets interesting.

Research on automated milking systems illustrates the challenge nicely. A peer-reviewed study reports that robotic milking has “potential to increase milk production by up to 12%.” By the time that finding works its way through marketing materials, it often becomes “robots increase milk 10-12%.” But the documented average on working farms? Closer to 4%.

This isn’t vendor deception. It reflects how many variables influence outcomes—management practices, facility design, cow genetics, transition period protocols, and even how consistently someone responds to system alerts at 2 AM. The farms hitting those top-end numbers are doing a lot of things right simultaneously. They’ve got their fresh cow management dialed in, their nutritionist is optimizing rations for the system, and they’ve committed the time to really learn the technology.

The takeaway for anyone evaluating technology: trade show projections represent best-case scenarios achieved under optimal conditions. Planning around 50-60% of the marketed benefits yields more realistic financial projections. Not pessimistic—just grounded in what the data actually shows.

Comparison of marketed maximum benefits versus documented average farm performance across five major dairy technology categories, showing the consistent 40-60% reality gap

Where Scale Changes the Math

This is where the research gets genuinely useful for decision-making. University of Wisconsin’s Dairyland Initiative has established a practical guideline that’s reshaping how farmers think about robotic milking: plan for 55 cows per robot for optimal performance.

Vendors might suggest higher numbers—theoretical capacity calculations can make 70 or even 78 cows per robot sound feasible. But cows aren’t machines. They have circadian rhythms. They prefer milking at certain times. Peak voluntary attendance happens around dawn and dusk, with quieter periods in between. Push too many cows through a robot, and milking frequency drops, udder health issues start appearing, and those production gains you were counting on evaporate.

Some producers have learned this the hard way—pushing cow numbers beyond optimal levels, watching bulk tank SCC climb, then scaling back to more manageable ratios. The theoretical capacity on paper doesn’t account for real-world cow behavior.

Finding Your Technology Sweet Spot

Here’s how the scale economics break down based on current research:

Herd SizeOptimal Technology InvestmentTarget ROI TimelinePrimary BarrierCapital Investment Range
Under 140 cowsActivity monitors, precision feeding, automated calf feeders7-14 monthsHigh capital cost per cow; labor savings can’t offset robot investment$10,500 – $35,000
140-180 cowsActivity monitors, precision feeding, computer vision (emerging)12-24 monthsRobot ROI marginal; requires $27+ per hour labor costs to break even$35,000 – $75,000
180-400 cowsRobotic milking systems (3-4 units), activity monitors36-60 monthsElectrical capacity, internet latency, training commitment$600,000 – $1,200,000
400-500+ cowsAutomated parlors, rotary systems with robotic attachments48-72 monthsManagement complexity of multiple individual robot units$1,200,000 – $2,500,000

Under 140 cows: The economics of robotic milking get ugly fast. Fixed costs spread across fewer animals, and while labor savings matter, they can’t offset the capital investment. University of Minnesota research found that breaking even on robots requires paying milking labor around $27.05 per hour. If your labor costs are significantly below that, the math doesn’t work.

180-400 cows: This is the sweet spot. With 3-4 robots, farms can eliminate meaningful labor positions while maintaining efficient robot utilization. Research from Australian operations confirms it—farms that pushed their cow-to-robot ratio toward 70 cows (while still managing cow flow effectively) saw measurable profit improvements.

400-500+ cows: Here’s where it gets counterintuitive. Conventional parlor systems with robotic attachment technology may actually outperform multiple individual robot units. DeLaval’s solution managers acknowledge that automated carousel systems become “financially viable for farms with a minimum of 400-500 cows.”

These thresholds shift based on local labor markets and regional conditions. Operations in California’s Central Valley or across the Northeast, where agricultural wages run higher, and labor availability stays tight, may see robots pencil out at smaller scales. Vermont and New York dairies often face economic conditions different from those in the Upper Midwest. Pacific Northwest producers deal with their own labor dynamics, while Texas and Southwest operations factor heat-stress management differently into the equation.

For Canadian producers, the calculation carries an additional wrinkle. Quota value affects how you think about capital allocation—when quota represents a significant asset on your balance sheet, the decision to invest $600,000 in robots versus additional quota becomes a strategic choice about where your capital works hardest. The labor-savings argument still applies, but it competes with a different set of alternatives than US producers face.

Your specific labor market and regional context matter more than any trade show pitch.

What’s Actually Working for Smaller Herds

If robots don’t pencil out at your scale, what does? Turns out, quite a bit. And most of it won’t win any innovation awards—which is exactly why it works.

Activity Monitoring: The Quiet Winner

At $75-150 per cow, activity monitors deliver some of the highest returns available to smaller operations. The documented results are consistent: 30-34% improvement in first-service conception rates, meaningful reductions in days open, and earlier illness detection during that critical fresh cow period.

Carlson Dairy’s numbers tell the story. After implementing monitoring, their conception rates rose from 38% to 52%, and pregnancy rates jumped from 25% to 40%. When a single missed heat costs roughly $42 in extended days open—and that compounds across a breeding season—those improvements hit the milk check directly.

Typical payback: 7-14 months. That’s real money, real fast.

Precision Feeding: Where the Real Dollars Hide

Feed represents 50-60% of operating costs on most dairies. Even modest efficiency improvements translate directly to margin—often more directly than technologies that generate more excitement at industry events.

University of Wisconsin research demonstrates what’s possible. Through differentiated concentrate feeding during milking—supplementing high producers with additional concentrates while feeding a more moderate TMR to everyone—farms can achieve 7-12% reductions in feed costs without requiring separate mixer wagons or multiple cow groups.

One study documented a 120-cow group achieving 32% feed cost savings. The principle is simple: feed expensive nutrients to cows that can convert them to milk, not to animals that will deposit them as body condition. We’ve all seen those over-conditioned dry cows heading into calving. This approach prevents that while improving margins.

Payback typically runs one to two years, with returns that continue indefinitely.

Automated Calf Feeders: Investing in Your Future Herd

For operations raising replacement heifers, automated calf feeding offers compelling returns that get overlooked in conversations dominated by milking technology.

The headline number: 40% reduction in calf mortality. But there’s more. These systems detect illness 48 hours before you’d notice visible symptoms during morning chores. With young calves vulnerable to scours and respiratory challenges in their first weeks, catching problems early means the difference between a $50 treatment and a $2,000 dead replacement.

Add 1-2 hours of daily labor savings and improved first-lactation performance from better early nutrition, and the investment typically pays for itself within two years.

One thing worth noting here: if you’re running a beef-on-dairy program with a significant portion of your cows bred to beef sires, the calf feeder ROI calculation shifts. Fewer dairy replacements means fewer calves running through that system, which extends your payback period. It doesn’t kill the investment case, but it changes the math enough that you should run the numbers based on your actual replacement strategy rather than industry averages.

Computer Vision: Promising but Not Proven

You’ll hear buzz about camera-based monitoring as a low-cost alternative to wearable sensors. University research shows a camera setup monitoring a 21-cow pen costs approximately $400 total, compared to $4,200 for wearable sensors covering the same animals.

But let’s be honest about where this technology stands: it’s promising, not proven. The data analysis capabilities are still maturing, accuracy varies significantly across systems, and most commercial offerings aren’t yet delivering the reliability to justify betting your management decisions on them. The technology needs more development before it can match the reliability of proven monitoring systems. Keep watching, but don’t bet your operation on it yet.

Technology payback periods ranked from shortest to longest, with black columns indicating lower-risk investments (under 24 months) and red columns indicating higher-risk long-term bets

The Infrastructure Reality That Kills Technology Dreams

What trade shows won’t tell you: infrastructure readiness determines success more than the technology itself. I’ve seen promising installations fail not because the equipment was flawed, but because the foundation wasn’t ready.

Connectivity: The Deal-Breaker Nobody Discusses

Lely specifies minimum internet requirements for their robotic systems: 20 Mbps download, 5 Mbps upload, less than 100ms latency, and 99%+ uptime. Those are firm requirements, not suggestions.

The hard truth? Half of you are trying to run 21st-century tech on a dial-up-era backbone. Research indicates that over 50% of US farmers lack adequate internet service on their farms. And the critical issue isn’t your farmhouse connection—it’s connectivity in the barn, often hundreds of feet from your router through metal buildings and concrete walls.

One farmer put it bluntly: “One of the biggest problems I see is issues with rural internet… If you aren’t able to access the data and actually utilize it, then it’s a waste.”

Before signing any contract for cloud-dependent technology, test your internet speed in the barn during peak household usage—evening hours when everyone’s streaming. That’s your real-world number, not the speed test you run at 2 PM.

Electrical Capacity: The 62% Factor

Here’s a stat that should stop you cold: 62% of automated milking system difficulties trace back to inadequate electrical infrastructure. Not software. Not mechanical failures. Power problems.

The consequences play out predictably. Farms that install robots before addressing electrical capacity often spend months chasing intermittent shutdowns and control board errors that nobody can diagnose. When they finally upgrade—typically $15,000-$25,000 for adequate service—the problems disappear almost overnight. That’s an expensive lesson in doing the infrastructure assessment first.

Most farms operate on 400-amp single-phase service. Robotic operations often require a minimum of 600-800 amps. And keep in mind that these requirements intensify during peak demand periods—summer heat events when cooling systems, ventilation, and robots all run simultaneously, or winter months in northern regions when heating elements and lighting add to the load. Get an electrician who understands agricultural loads to assess your capacity before you commit to anything.

Infrastructure CategoryMinimum RequirementAssessment MethodConsequence of Failure
Internet Connectivity20 Mbps download, 5 Mbps upload, <100ms latency, 99%+ uptimeTest speed in barn during peak household usage (7-9 PM)System can’t access cloud data, alerts fail, remote monitoring impossible
Electrical Capacity600-800 amp service (minimum) for robotic systemsProfessional agricultural electrician assessment of total farm load62% of AMS difficulties trace here: intermittent shutdowns, control board failures, months of troubleshooting
Facility Layout55 cows per robot maximum; clear cow traffic flow pathsMap cow movement patterns; measure fetch distancesReduced milking frequency, elevated SCC, production gains evaporate
Technical Personnel2 trained staff members capable of system troubleshootingIdentify backup coverage for vacations, illness, turnoverSystem underutilized, alerts ignored, data not leveraged for decisions
Service SupportCertified technician within 2-hour response radiusMap dealer locations; ask for average response time during peak seasonExtended downtime during breakdowns, milk quality issues, lost production

The Training Gap Nobody Mentions

Vendors typically provide 1-3 days of training for systems that take 6-12 months to master.

One farmer described it honestly: “The robot trainer was here for 3 days… but it took us 6 months to really understand the system.”

Successful adoption requires someone—ideally two people for backup—who can commit to learning the system thoroughly and troubleshooting daily issues. If that person doesn’t exist on your operation, address that before the equipment arrives.

A Framework for Cutting Through Vendor Noise

When evaluating any major technology investment, three questions cut through the sales pitch:

  • On support: How many certified technicians are within two hours of your farm? What are the response times when multiple farms need help simultaneously? Agricultural dealerships report they’d hire three to five mechanics immediately if they could find them. Understanding actual support capacity in your region sets realistic expectations.
  • On true costs: Request itemized quotes including facility modifications, electrical upgrades, installation, and first-year operating costs. The gap between the quoted price and the all-in cost can reach 50% or more. Better to know upfront than discover it during installation.
  • On realistic performance: What percentage of installations achieve the marketed performance? What separates high performers from those that struggle? Any vendor confident in their product can answer this honestly.

For Those Already Invested

Already bought the technology and working to maximize returns? Different conversation, but equally important.

  • First 90 days: Expect a learning curve for you and the cows. Production fluctuations during transition are normal. Watch whether production returns to baseline by day 60-90 and whether system issues decrease over time. Trend lines matter more than daily numbers.
  • Document everything. Production logs, downtime, service calls, and actual labor hours. You can’t manage what you don’t measure—especially with complex technology where multiple variables interact.
  • Focus on controllables. Cow traffic management, feed incentives at the robot, and alert response protocols. These often explain performance gaps between farms running identical equipment. Sometimes it’s not the technology—it’s how you’re managing around it.
  • Get outside eyes. Consultants not affiliated with the vendor can spot bottlenecks you’ve stopped noticing after months of daily involvement.

By six months, you’ll have enough data to know if optimization is working or if it’s time to try something different. Trust what the numbers tell you.

Quick Reference: The Numbers That Matter

Critical BenchmarkNumberDecision Application
Robot viability threshold180 cows minimumBelow this, activity monitors + precision feeding deliver better risk-adjusted returns
Optimal cows per robot55 cowsPush toward 65-70 only with excellent cow traffic; vendor claims of 78 ignore cow behavior
Labor cost breakeven$27.05/hourIf your milking labor costs less, robots won’t generate positive ROI at typical scales
Minimum ROI target15% annuallyTechnology must beat low-risk alternatives (5% CD rate) by 3x to justify complexity and risk
Realistic benefit planning50-60% of marketed claimsVendors quote best-case scenarios; farm averages run half that across all technology categories
Infrastructure failure rate62% of AMS problemsMost difficulties trace to electrical/connectivity, not equipment—audit before purchase
Electrical requirement600-800 amps minimumMost farms operate on 400-amp service; upgrade costs $15K-$25K but prevents months of issues
Internet minimum20 Mbps down / 5 Mbps upTest in barn during peak usage, not farmhouse during off-hours—real-world connectivity matters
Activity monitor payback7-14 monthsFastest proven ROI in dairy technology; $75-$150 per cow consistently delivers
Automated parlor threshold400-500+ cowsAbove this scale, consider automated parlors vs. multiple robot units for reduced complexity

Before your next technology conversation, know these benchmarks:

  • 55 cows per robot — Optimal utilization target (University of Wisconsin)
  • $27.05/hour — Breakeven labor cost for robot ROI (University of Minnesota)
  • 15% ROI — Minimum target to justify technology risk over safer investments
  • 50-60% — Realistic benefit assumption vs. marketed claims
  • 62% — AMS difficulties traced to electrical infrastructure
  • 600-800 amps — Typical electrical requirement for robotic operations
  • 20 Mbps download — Minimum internet for cloud-dependent systems
  • 7-14 months — Typical activity monitor payback period
  • $15,000-$25,000 — Common electrical upgrade cost range

The Bottom Line

The technology landscape in dairy keeps evolving, and the opportunities are real for operations positioned to capture them. But success depends less on buying the most advanced equipment and more on matching the right technology to your scale, infrastructure, and management capacity.

For smaller herds, that usually means activity monitors and precision feeding—technologies that deliver strong returns without massive capital or infrastructure overhaul. For mid-sized operations in that 180-400 cow range, robotic milking can transform profitability—if the foundation supports it. For larger operations, automated parlors might actually outperform multiple robot units while reducing complexity.

The farmers navigating this best share a common approach: they evaluate innovations based on fit rather than flash, and they’re brutally honest about their infrastructure, skills, and scale before signing anything.

As one industry advisor put it: “Think from the farm’s needs backward, rather than picking a technology and projecting it onto the farm.”

So here’s the question you need to answer before your next equipment conversation: Is your barn actually ready for the technology you’re considering, or are you just buying a shiny ornament for an outdated foundation?

The math doesn’t care about your enthusiasm. It only cares whether the numbers work.

Keep in mind that technology economics shift over time as equipment costs change and labor markets evolve. These frameworks should guide your thinking, but revisit the calculations periodically—what didn’t pencil out three years ago might look different today, and vice versa.

Key Takeaways

  • Match technology to scale. Activity monitors and precision feeding often deliver stronger returns for smaller operations than robots. Sometimes the unglamorous stuff pays best.
  • The 180-400 cow range is the robotic sweet spot. Below 140 cows, the math rarely works. Above 500, automated parlors deserve serious consideration.
  • Infrastructure comes first. Test barn internet, assess electrical capacity, identify dedicated personnel—before signing anything. Expensive technology on inadequate infrastructure is a recipe for frustration.
  • Plan around 50-60% of the marketed benefits and target 15% ROI to justify the risk.
  • Already invested? The first 90 days are a learning curve. By six months, trust what the data tells you—not what you hoped would happen.

We’d love to hear how these frameworks apply to your operation. Share your technology experiences—successes and struggles alike—in the comments below or reach out directly. Your real-world insights help the entire dairy community make better decisions.  Which of these numbers surprised you most? Or better yet, which one have you proven wrong on your own farm?

Complete references and supporting documentation are available upon request by contacting the editorial team at editor@thebullvine.com.

Learn More

The Sunday Read Dairy Professionals Don’t Skip.

Every week, thousands of producers, breeders, and industry insiders open Bullvine Weekly for genetics insights, market shifts, and profit strategies they won’t find anywhere else. One email. Five minutes. Smarter decisions all week.

NewsSubscribe
First
Last
Consent

Beef-on-Dairy’s $500,000 Swing: What 72% of Farms Know That’s Costing You $1,000/Cow Every Year

$4,000 for a replacement heifer. $875 for a dairy bull calf. But 72% of farms get up to $1,450 for beef-cross calves, AND cut replacement needs by 30%. The $500K swing isn’t theory—it’s math.

Last spring, I was talking with a Wisconsin dairy producer who described a moment that’s becoming increasingly common across the industry. He’d just finished reviewing his 2024 breeding costs—nearly $38,000 between sexed semen, genomic testing, and beef genetics—and realized he was spending six times what his father had budgeted for the same line item in 2018. The question that kept him up that night wasn’t whether the investment was worthwhile. It was whether he was even measuring the right outcomes anymore.

You know, that producer’s experience captures something significant happening across North American dairy right now. For generations, farmers identified themselves by the breed they milked. Holstein operators pointed to volume records and global market dominance. Jersey advocates countered with components, feed efficiency, and longevity. These conversations shaped industry gatherings, show ring rivalries, and breeding decisions for the better part of a century.

But something’s shifted over the past decade. While traditionalists continued debating which breed was superior, many producers started asking a different question entirely: “What combination of genetics—regardless of color—maximizes my return on investment?”

The answers to that question are reshaping dairy genetics in ways that would have seemed unlikely just 15 years ago.

The Numbers Behind the Shift

The breeding landscape has changed dramatically in just five years, and the National Association of Animal Breeders’ 2024 year-end report tells the story pretty clearly. Gender-selected semen now accounts for 61% of all dairy breeding decisions in the United States—that’s 9.9 million units out of 16.1 million total domestic dairy units sold. We’ve come a long way from roughly 35% back in 2019.

Technology2019 Rate2024 RateGrowth
Sexed Semen35%61%+26 pts
Beef-on-Dairy15%72%+57 pts

And beef-on-dairy? Those crosses have surged to 7.9 million units annually, making beef genetics the fastest-growing category in dairy barns across the country. According to American Farm Bureau analysis, 72% of dairy farms are now using beef genetics to boost the value of calves from lower-performing cows—a remarkable adoption rate for a strategy that barely existed a decade ago.

Meanwhile, USDA data confirms that replacement heifer inventories have dropped to historic lows. The January 2025 Cattle report shows heifers expected to calve this year at roughly 2.5 million head—the lowest since USDA started tracking this series back in 2001. Total dairy heifers are sitting at levels we haven’t seen since 1978.

YearHeifer Shortage (thousands)Springer Price ($)
202301,720
2024-2002,400
2025-4003,010
2026-4383,800
2027-1534,500

These trends connect in important ways, reshaping how dairy operations think about genetic investment, replacement economics, and long-term profitability.

How Technology Changed the Breeding Playbook

Understanding today’s genetics landscape means recognizing how fundamentally the rules have changed since 2010.

The traditional purebred breeding model rested on a straightforward biological constraint: farmers needed to produce enough replacement heifers from their own herds to maintain herd size. This meant breeding most cows to bulls of their chosen breed, creating an inherent link between breed loyalty and operational necessity.

Gender-selected semen technology changed that equation entirely.

Here’s how to think about it: The old model was essentially a closed loop—every cow bred to a dairy bull, every heifer raised as a potential replacement, every bull calf sold for whatever the market offered. Today’s model is more of a segmented herd approach. Your top 15-20% of cows get sexed dairy semen to produce your replacements. Your bottom tier gets beef genetics to produce premium calves. And your middle tier? That’s where the economic optimization happens—balancing replacement needs against beef calf revenue based on your pregnancy rate and market conditions.

This shift from “closed loop” to “segmented herd” represents a fundamental change in how dairy barns function economically.

When farmers can achieve 90%+ heifer conception rates with sexed semen—something that’s become routine with modern sorting technology—they no longer need to breed their entire herd for replacements. A 500-cow operation that needs 110 replacement heifers annually can now direct its top genetics to dairy sires and point the remaining breedings elsewhere.

For most operations, “elsewhere” increasingly means beef genetics. Research by Dr. Victor Cabrera and his team at the University of Wisconsin-Madison has documented that beef-cross calves command substantial premiums over pure dairy bull calves at auction. Current market data shows beef-cross calves bringing $1,250-$1,700 per head compared to$750-$1,000 for dairy bull calves—a premium of $500-$700 per calf that adds up fast across a herd.

Pregnancy RateBreeding StrategyBeef Breeding %Risk Level
Below 25%FIX REPRODUCTION FIRST0-10%N/A – Focus on fertility
25-28%Limited beef breeding15-25%Moderate
28-30%Balanced approach40-50%Low
Above 30%Aggressive beef program60-70%Very Low

That revenue shift matters. On a 500-cow operation producing 350+ calves from non-replacement breedings, the difference between $875 average for dairy bulls and $1,450 average for beef-crosses represents over $200,000 in additional annual revenue—before you even factor in the replacement heifer math.

The Quiet Crisis at Breed Associations

Here’s where we need to have an honest conversation about what’s happening to breed associations—and whether the current model can adapt.

Holstein Association USA CEO Lindsey Worden acknowledged the situation directly in her 2024 State of the Association address: registrations decreased 8% from 2023, and participation in core programs like Herd Complete dropped 4% in both animals and herds. What’s notable is that Worden attributed the decline directly to fewer Holstein heifers being born as more dairies breed cows to beef.

Industry data shows Holstein’s share of the U.S. dairy herd has declined from around 90% in the early 2010s. Meanwhile, crossbred dairy animals have grown significantly—Council on Dairy Cattle Breeding data shows their numbers increased from fewer than 3,000 in 1990 to over 207,000 by 2018, with continued growth since as crossbreeding programs have expanded.

Budget CategoryAnnual Cost% of Total
Genomic Testing$24,00063.2%
Sexed Dairy Semen$7,50019.7%
Data Analytics/Consulting$4,25011.2%
Beef-on-Dairy Semen$2,8507.5%
Breed Association Services$3000.8%

Breed association fees now represent less than 1% of what commercial operations spend on genetics. When registrations, classification, and breed services capture such a tiny slice of the breeding dollar, you have to ask: Is the current association model serving today’s commercial dairy industry, or is it serving a shrinking segment that values pedigree for its own sake?

The Bullvine has been asking this question for years. As we noted in our analysis, “Are Dairy Cattle Breed Associations Nearing Extinction?” Breed associations face mounting pressure from technological advancements, shifting market demands, and environmental concerns—all while struggling with leadership transitions and declining relevance to commercial producers.

The Case for Associations: A Different Perspective

To be fair, association leaders push back on the “declining relevance” narrative—and they have some data to support their position.

Worden, in a recent interview, offered a direct counter-argument: “Animal identification is the foundation to any genetic program, and that’s our core business. From there, the goal is to make it easy for every herd, large or small, to capture value with the Holstein cow.”

She points to growth in other metrics even as registrations decline. In 2024, Holstein USA officially identified 544,438 Holsteins in the herdbook—up 16% from the prior year. The Basic ID program, which provides official ear tags, sire/dam identification, and birthdate recording at a lower cost than full registration, grew 10%.

“Basic ID is an inexpensive way for herds to get involved,” Worden explained. “With an official ear tag, sire, dam, and birthdate, plus genomic testing, we can start showing the value of having data in the national database, not just in Dairy Comp on the farm.”

She also highlighted breed performance gains: In 2024, Holstein USA’s TriStar 305-day mature equivalent averages surpassed 1,200 pounds of fat for the first time, protein topped 900 pounds, and milk hit 28,443 pounds.

“We still offer all the same programs our longtime members value,” Worden commented in a recent interview. “If someone wants to register a calf with a photo and a paper application, we’ll do that. But we’ve also streamlined programs, invested in I.T., and created automated processes for large herds. We have herds milking 10,000 cows or more, so we’ve made it as efficient and seamless as possible.”

The question isn’t whether breed associations will survive. Some will. The question is whether they can evolve from membership organizations selling breed identity to service organizations selling genetic value—and do so fast enough to remain relevant when the value proposition has fundamentally shifted.

What Crossbreeding Adopters Are Experiencing

The documented results from systematic crossbreeding programs offer useful data points for producers evaluating their options.

The ProCROSS system—a structured rotation of Holstein, VikingRed, and Montbéliarde genetics developed through collaboration between Coopex Montbéliarde in France, VikingGenetics in Scandinavia, and CRV in the Netherlands—has accumulated over a decade of commercial data across multiple countries.

A University of Minnesota study led by Dr. Amy Hazel, Dr. Brad Heins, and Dr. Les Hansen tracked 3,550 cows across seven commercial dairies from first calving through multiple lactations. Their findings, published in the Journal of Dairy Science in 2017, showed ProCROSS crossbreds produced at least as much milk solids, gave birth to more live calves, were more fertile, and returned to peak production sooner than their pure Holstein herdmates.

The economics are worth examining closely. Research published in the Journal of Dairy Science by Clasen and colleagues in 2020 calculated crossbreeding advantages, including:

  • €20-59 higher contribution margin per cow per year compared to pure Holsteins
  • 30.1% replacement rate versus 39.3% for pure Holsteins—roughly 45 fewer replacements needed annually on a 500-cow dairy
  • Improved fertility is driving most of the economic gain, with health cost reductions adding further margin

Ongoing research at the University of Minnesota’s West Central Research and Outreach Center in Morris continues to track these outcomes. According to recent NIMSS project reports, crossbred cows in their studies show daily profit 13% higher for two-breed crossbreds and 9% higher for three-breed crossbreds compared to their Holstein herdmates, with lifetime death loss 4% lower for both crossbred groups.

From Wisconsin to California: U.S. Operations Are Implementing at Scale

It’s one thing to see research data. It’s another to see it work on commercial farms across different scales and regions.

Dornacker Prairies is a 360-cow dairy in Wisconsin run by fifth-generation farmer Allen Dornacker and his wife Nancy, in partnership with Allen’s parents Ralph and Arlene. According to VikingGenetics case study materials, the farm has embraced both crossbreeding and robotic milking as part of their strategy to future-proof the operation.

The Dornackers transitioned to robotic milking in 2018, installing Lely A5 robots, and have built their ProCROSS program alongside the technology investment. Their production runs around 9,200 kg per year, with 4.6% fat and 3.6% protein—strong component levels that align with research findings on crossbred performance. They also rear dairy-cross beef calves, capturing value on both sides of the breeding decision.

What’s notable about the Dornacker operation is how it represents a typical Wisconsin dairy in scale—the state averages around 350 cows per farm—while implementing progressive breeding and technology strategies. They’re 90% self-sufficient in feed, growing their own soybeans, alfalfa, corn, and winter wheat across 405 hectares.

But crossbreeding isn’t just for medium-scale family operations. In California—the nation’s largest milk-producing state—approximately 81% of dairy operations reported using beef semen in a 2020 survey cited in Choices Magazine research by Latack and Carvalho. These include many of the state’s large-scale operations, which run 2,000-5,000+ cows.

The scale of adoption is remarkable. According to The Bullvine’s market analysis, nearly 4 million crossbred calves were born nationally in 2024, with forecasts projecting that number could reach 6 million by 2026. Texas alone saw herd counts increase by 50,000 cows in 2024, complemented by a production spike of over 10% per cow—with beef-on-dairy breeding playing a significant role in the economics.

Tom and Karen Halton converted their 500-cow UK operation to ProCROSS roughly fifteen years ago. According to ProCROSS case study materials, Tom offered a candid perspective: “Without these cows doing what they have done, we wouldn’t still be farming.”

These results are encouraging, though it’s worth noting that crossbreeding success depends heavily on consistent implementation and appropriate genetic selection within the rotation.

When Master Breeders Face Commercial Realities

What’s particularly telling is how even elite breeders—those who’ve achieved the industry’s highest recognition—are adapting to commercial pressures.

Take Cherry Crest Holsteins in Ontario. Don Johnston and Nancy Beerwort, along with their son Kevin and wife Tammy, secured their third Master Breeder shield in 2024—a remarkable achievement made more impressive by the fact that the farm has undergone three complete herd dispersals in its history. Their philosophy prioritizes animal well-being, balanced breeding, and practical, economically sound decisions.

“The Master Breeder shield gives you the satisfaction that you’ve been making some of the right decisions,” Johnston said in an interview.

The ability to achieve elite breeding recognition despite multiple dispersals demonstrates an important point: successful breeding today requires adaptability and economic pragmatism, not just genetic idealism. The Johnstons rebuilt their program three times by consistently applying sound principles—identifying superior genetics, making economically rational decisions, and staying focused on what actually works.

This pragmatic approach is increasingly common among recognized breeders. The 2024 Holstein Canada Master Breeder class included operations running robots alongside tie-stalls, farms that started from scratch and achieved recognition in less than two decades, and multi-generational operations that have evolved their programs significantly to remain competitive.

The message from these elite breeders is clear: genetic excellence and commercial viability aren’t opposing forces. The best breeders find ways to achieve both.

The Case for Focused Purebred Programs

Crossbreeding isn’t the right answer for every operation, and some producers are achieving excellent results with focused purebred programs. This deserves equal attention.

The approach relies on intensive genomic testing of every heifer calf, strategic culling of bottom-tier genetics, and careful bull selection emphasizing productive life and fertility alongside traditional production traits. Producers with strong management systems, good facilities, and the discipline to cull strategically can build highly profitable purebred herds averaging 32,000+ pounds per cow with solid pregnancy rates.

Here’s what’s worth recognizing: the genetic tools that enable crossbreeding—genomic testing, sexed semen, data-driven selection—also enable more sophisticated purebred programs. The key consideration isn’t which approach is universally “better,” but whether a breeding program aligns with an operation’s management capacity, market access, and operational goals.

Jersey producers have seen particularly strong results in recent years. The US Jersey Journal reported in March 2025 that the breed achieved record production levels in 2024: 20,719 lbs milk with 5.08% fat and 3.77% protein on a mature equivalent basis—numbers that would have seemed ambitious a generation ago. For operations selling to processors with strong component premiums, Jersey genetics continue delivering compelling economics.

Why Components Are Driving Breeding Decisions

And those component premiums matter more than ever. According to CoBank’s lead dairy economist, Corey Geiger, multiple component pricing programs now allocate nearly 90% of the milk check value to butterfat and protein.

Here’s what that looks like in practice: Under Federal Milk Marketing Order pricing for December 2025, butterfat is valued at $1.7061 per pound according to the USDA’s Announcement of Class and Component Prices. For a producer shipping 100 pounds of milk, the difference between 3.5% and 4.5% butterfat represents roughly $1.70 per hundredweight—over $17,000 annually on a 1,000-cow dairy shipping 80 pounds per cow per day.

Real dollars at the farm level: According to MilkPay’s June 2025 component analysis, with butterfat valued at $2.66 per pound and protein at $2.48 per pound, increasing butterfat from 3.90% to 4.25% adds $0.93 per hundredweight. Increasing protein from 3.16% to 3.32% adds another $0.40 per hundredweight. Combined, that’s $1.33 per hundredweight of additional revenue—roughly $13,300 annually on a 1,000-cow operation.

Some cooperatives go further with quality incentives. Curtis Gerrits, senior dairy lending specialist at Compeer Financial, noted that Upper Midwest processors work with farmers who consistently deliver high-quality milk, offering approximately $0.85 per hundredweight in quality premiums for consistent volume and good components. That’s enough to make a real difference in margin.

The University of Wisconsin Extension’s February 2025 Dairy Market Update confirmed that U.S. butterfat tests hit 4.218% as of November 2024—up 0.088 percentage points from the prior year. Protein reached 3.29%. Both represent continued genetic progress, and both reward producers who’ve selected for components.

The message is clear: genetics that deliver components are genetics that deliver revenue. Whether that’s Jerseys, crossbreds emphasizing Montbéliarde or VikingRed, or Holsteins selected for component indexes—breeding decisions that ignore component trends are leaving money on the table.

The Genomics Paradox: Worth Understanding

This next point challenges some assumptions about genetic investment.

Genomic selection, introduced commercially in 2008-2009, promised to accelerate dairy breeding by nearly halving generation intervals. And genetic progress on paper has accelerated substantially—bulls are improving at rates that would have seemed unlikely under the old progeny-testing system.

Yet a peer-reviewed analysis by the Agricultural & Applied Economics Association in late 2024 found something worth noting: while genetic milk yield potential increased approximately 60-70% following genomic selection implementation, actual farm-level milk yield growth remained essentially unchanged at approximately 1.3% annually—the same rate as before genomics arrived.

“If your genetics are improving at 2% annually but your replacement costs are rising at 10%, you aren’t winning—you’re just running faster on a treadmill. The goal isn’t better cows in the abstract. It’s better margins on your operation.”

Why the disconnect? Management constraints often matter more than genetics—facilities, nutrition, and labor frequently limit genetic expression. Feed economics have shifted, meaning that higher production doesn’t always translate into higher profit. And inbreeding is accumulating faster under intensive genomic selection, with measurable implications for fertility and health traits.

Recent Canadian research adds another dimension. A study published in the Canadian Journal of Animal Science in December 2025 found that “While milk yield had improved, profitability had shown a negative genetic trend, which means that an exclusive focus on higher milk production is detrimental to long-term economic efficiency.”

This doesn’t mean genomic testing lacks value—for parentage verification, genetic defect screening, and informed culling decisions, it remains genuinely useful. But evaluate genomic investments against realistic expectations rather than theoretical maximums.

What Could Go Wrong: Risks Worth Understanding

Before diving into the economics comparison, let’s be honest about what could derail these strategies. No breeding approach is risk-free.

Beef market volatility is real—and it can move fast. In October 2025, cattle markets experienced a sharp correction. According to The Bullvine’s market analysis, crossbred calf values dropped significantly—an 11.5% decline in just twelve days. Drovers magazine noted that “tight supplies and strong demand could push cattle prices to even higher highs in 2025, but uncertainty is infusing more risk and volatility into the markets.”

Sexed semen isn’t foolproof. While the technology has improved dramatically, conception rates still run below those of conventional semen. According to ICBF data, the relative performance of sexed semen compared to conventional semen is about 92%. Industry data from British Dairying suggests that the current 4M technology achieves roughly 82-84% of conventional conception rates in well-managed herds. Herds that tried sexed semen and stopped reported much lower results—averaging just 37% conception with sexed versus 58% with conventional. Management and timing matter enormously.

Crossbreeding implementation failures happen. Research reviews have documented that crossbreeding programs can fail due to “insufficient funding, low return on investment in biotechnology, poor monitoring and evaluation of breeding programs.” Operations with excellent Holstein management may see less benefit from switching than operations struggling with purebred health and fertility issues.

Managing Beef Market Risk: New Tools Available

The good news? Risk management options have expanded significantly.

As of July 1, 2025, the USDA’s Livestock Risk Protection (LRP) program added a game-changing option: Unborn Calves Coverage specifically designed for beef and beef-on-dairy crossbred calves. According to Farm Credit East, this federally subsidized insurance program now allows dairy producers to lock in price protection for calves before they’re even born.

Here’s how it works: producers can protect calves intended for sale within 14 days of birth, with coverage levels allowing protection of up to $1,200 per calf. The program uses a price adjustment factor (multiplier) so producers can protect values closer to what they’re actually receiving at market.

Other risk mitigation strategies:

  • Forward contracting with calf buyers when prices are favorable
  • Diversifying beef sire selection across multiple breeds (Angus, Limousin, Simmental)
  • Maintaining breeding flexibility by keeping pregnancy rates high enough to shift back toward dairy replacements if beef markets weaken
  • Staggering calf sales throughout the year, rather than selling in large batches

What This Looks Like in Practice

CategoryTraditional ApproachSexed + Beef-on-Dairy
Annual Breeding Budget$12,000$38,000
Calf Revenue (200-350 calves)$150,000 – $200,000$437,500 – $595,000
Replacement Purchases Needed($120,000 – $160,000)($40,000 – $60,000)
Net Annual Position($12,000) to +$28,000+$340,000 to +$495,000
THE SWINGBASELINE+$340K to +$500K

THE ECONOMICS THAT MATTER: A 500-COW COMPARISON

This is the calculation every dairy should run with their own numbers.

Traditional Approach (Conventional + Some Sexed Dairy Semen):

  • Breeding budget: ~$12,000 annually
  • Dairy bull calf value: ~$750-1,000/head × ~200 calves = $150,000-$200,000
  • Replacement heifer purchases needed: 30-40 head at $4,000 = $120,000-$160,000
  • Net breeding/replacement position: -$12,000 to +$28,000

Optimized Sexed + Beef-on-Dairy Approach:

  • Breeding budget: ~$38,000 annually (sexed dairy on top 20%, beef on remainder)
  • Beef-cross calf value: ~$1,250-1,700/head × 350 calves = $437,500-$595,000
  • Replacement heifer purchases needed: 10-15 head at $4,000 = $40,000-$60,000
  • Net breeding/replacement position: +$340,000 to +$495,000

The Swing: $340,000 to $500,000+ difference in annual economics

Here’s the key insight: Dairy bull calves are finally worth real money—$750-$1,000 is nothing to dismiss. But beef-cross calves at $1,250-$1,700 are worth 50-70% MORE. That $500-$700 premium per calf, multiplied across 350 calves, is where the swing comes from.

RUN YOUR OWN NUMBERS

Plug in your operation’s actual figures to see where you stand:

Your VariableYour NumberIndustry Benchmark
Current pregnancy rate___%28-30% minimum for flexibility
Annual replacement rate___%30-35% typical, 25% achievable
Cost to raise a heifer$___$2,800-3,500
Current springer purchase price$___$3,800-4,200 (projected $4,500+ by 2027)
Dairy bull calf sale value$___$750-1,000
Beef-cross calf value (local market)$___$1,250-1,700
Sexed semen conception rate___%82-92% of conventional
Current butterfat test___%4.22% national average
Current protein test___%3.29% national average
Processor component premium$___/cwt$0.85-1.33/cwt typical

If your pregnancy rate is below 28%, focus there first. The best breeding strategy won’t overcome poor reproductive performance.

The Replacement Heifer Challenge Ahead: 2026-2027 Projections

One consequence of widespread beef-on-dairy adoption deserves attention for anyone planning breeding programs through 2027—and the projections are sobering.

With heifer inventories at multi-decade lows and springer prices reaching $4,000 or more in major dairy markets—CoBank reported top dairy heifers in California and Minnesota auction barns bringing upwards of $4,000 per head by mid-2025—replacement economics have fundamentally shifted.

But here’s what’s coming: According to CoBank’s modeling published in August 2025, dairy replacement inventories will not rebound until 2027. The numbers are stark:

  • 2025 and 2026 combined: Nearly 800,000 fewer dairy replacements than needed
  • 2026 specifically: The model predicts 438,844 fewer dairy heifers compared to 2025
  • 2027 outlook: A potential net gain of 285,387 dairy heifers available for replacements compared to 2026—the first positive turn in years

The price trajectory tells the story. According to the USDA’s July 2025 Agricultural Prices report, dairy replacement prices have jumped from $1,720 per head in April 2023 to $3,010 per head—a 75% increase in just over two years.

University of Illinois dairy economist Mike Hutjens, in his 2026 Feed and Forage Outlook, summarized the situation: “The critical heifer shortage is expected to persist, with replacement heifer inventories projected to shrink further before a potential rebound in 2027. Farmers are already ‘hoarding’ older cows and adopting gender-sorted semen to maintain herd sizes.”

What this means for your 2025-2026 breeding decisions: Every heifer you breed to beef today affects your replacement availability in 2028-2029. The 30-month biology of dairy cattle doesn’t negotiate.

Dr. Victor Cabrera at the University of Wisconsin-Madison has modeled this extensively. His research suggests that operations need pregnancy rates of 28-30% to achieve meaningful flexibility in beef-on-dairy programs without compromising replacement availability. Herds below that threshold face harder tradeoffs.

Farmers navigating this environment are employing several strategies:

  • Extended productive life focus: Keeping healthy cows in the herd through 4-5 lactations reduces replacement needs by 20-30%
  • Precision replacement breeding: Using genomic testing to identify the top 15-20% of genetics for heifer production
  • Earlier breeding programs: Achieving first calving at 22-23 months rather than 24-26 months
  • Custom heifer partnerships: Contracting heifer development to manage capital constraints

Regional Realities: Context Matters

Optimal breeding strategies vary significantly by region, scale, and market access. There’s no universal answer.

  • Western mega-dairies in California, Idaho, Texas, and New Mexico, operating 3,000+ cows, often have dedicated reproduction teams and processor relationships that reward consistent volume. With 81% of California dairies already using beef semen and Texas adding 50,000 cows in 2024 alone, the Western region has embraced this shift at scale.
  • Midwest family operations in Wisconsin, Minnesota, Michigan, and Iowa, averaging 200-500 cows, face different considerations. Tighter labor availability and the need for management simplicity often make single-breed programs more practical. Operations like the Dornackers show that medium-scale farms can successfully implement crossbreeding—but it requires commitment and consistent execution.
  • Northeast and Mid-Atlantic producers contend with higher land costs and often-limited expansion options. For these farms, maximizing income per cow frequently drives breeding decisions toward higher-component breeds or crossbreeding systems emphasizing longevity.
  • Grazing-based operations prioritize different traits—moderate body size, strong feet and legs, and fertility under seasonal breeding pressure. These systems have long embraced crossbreeding or alternative breeds that don’t appear prominently in conventional AI catalogs.

The principle that emerges: matching genetic strategy to operational reality matters more than following any single approach.

Your Next 90 Days: Practical Steps

For farmers evaluating breeding strategies heading into 2025-2026, here are specific actions:

In the next 30 days:

  • Calculate your actual cost per replacement heifer—including all raising costs, not just purchase price. Many operations underestimate this by $500-800 per head.
  • Pull your pregnancy rate trend for the last 12 months. Is it above 28%? This single number determines how much flexibility you have.

In the next 60 days:

  • Get current beef-cross calf quotes from your local auction or buyer. Prices vary significantly by region and genetics—current ranges are $1,250- $1,700 for quality beef crosses.
  • Review what your processor is actually paying for. Check your milk statement for actual dollars per pound of butterfat and protein.

In the next 90 days:

  • Run the 500-cow comparison with your own numbers. See where your operation actually stands.
  • Talk to your AI rep about a pilot program. Start with 20% of breedings rather than a wholesale shift.
  • Contact your crop insurance agent about LRP Unborn Calves Coverage. The new coverage could protect up to $1,200 per calf against market downturns.

Questions to discuss with your advisors:

  • Can my management system capture the genetic potential I’m paying for?
  • Do I have the reproductive performance to support aggressive beef-on-dairy programs?
  • What’s my contingency if beef markets drop 15-20%?
  • Given CoBank’s projections of continued heifer tightness through 2026, should I be more conservative on beef breeding this year?

Looking Forward

The breed wars, as traditionally understood, may be evolving into something different. What’s emerging is a dairy genetics landscape where farmers can select from an expanding toolkit of genetic resources—purebred, crossbred, and integrated beef programs—based on what delivers sustainable profit for their specific operation.

This doesn’t mean breed identity disappears. Holstein, Jersey, and other purebred programs will continue serving producers who find success with focused genetic selection. Show rings will still draw interest. Elite breeders will still command premium prices for exceptional genetics. And as Lindsey Worden’s data shows, breed associations are finding new ways to deliver value—even if registrations decline, services like Basic ID and genomic integration are growing.

But for the commercial dairy industry—the operations producing the majority of North America’s milk supply—breeding decisions increasingly follow economic logic rather than breed loyalty alone.

The Bottom Line

That $340,000 to $500,000+ annual swing in breeding economics is real. Dairy bull calves at $750-$1,000 are finally worth something—but beef-crosses at $1,250-$1,700 are worth substantially more. The $500-$700 premium per calf, multiplied across hundreds of breedings, is where fortunes are being made or missed.

Whether that swing works in your favor depends on running the numbers—your numbers, not industry averages—and on making decisions that align with your management capacity, your market access, and your operation’s specific goals.

For producers willing to evaluate their options thoughtfully, that half-million-dollar swing represents a genuine opportunity.

KEY TAKEAWAYS:

  • The $500,000 breeding flip. Optimized operations capture $1,450 beef-cross calves instead of $875 dairy bulls—a $575 premium per head. Traditional approach: Still selling $875 calves when you could be netting $1,700. The annual swing on 500 cows: $340,000-$500,000+.
  • 72% already pivoted. The 28% are leaving money on the table. Three-quarters of U.S. dairies use beef genetics. Haven’t switched? You’re missing $500-$700 per calf while competitors capture it.
  • Pregnancy rate is the gating factor. Below 28%? Fix reproduction—beef-on-dairy won’t save a broken repro program. Above 30%? Every dairy-bred bottom-tier cow costs $500-700 in missed calf premium per year.
  • Today’s breeding decision locks in 2028 economics. CoBank: heifer inventories won’t recover until 2027. Springers: $4,000+. The 30-month biology of cattle means this quarter’s breedings set replacement costs for three years.
  • New hedging tools match the strategy. USDA’s LRP Unborn Calves Coverage (launched July 2025) protects beef-cross calves up to $1,200/head—critical after October 2025’s 11.5% market correction.

EXECUTIVE SUMMARY: 

The $500,000 question every dairy faces: Are you capturing the beef-on-dairy swing, or funding your competitors’ replacement heifers? Seventy-two percent of U.S. farms have already pivoted—using sexed semen on top genetics for replacements while turning bottom-tier breedings into $1,250-$1,700 beef-cross calves instead of $750-$1,000 dairy bull calves. The result: an annual economics flip of $340,000 to $500,000+, transforming breeding from modest revenue to a major profit driver. But timing matters—CoBank projects heifer inventories won’t recover until 2027, springer prices have hit $4,000, and every beef breeding today locks in your 2028 replacement position. This analysis delivers the complete breakdown: the threshold pregnancy rates that determine if beef-on-dairy works for you (hint: below 28%, fix that first), the October 2025 market correction that exposed downside risk, and a concrete 90-day action sequence. The 28% of operations still breeding traditional aren’t just missing upside—they’re leaving $500-$700 per calf on the table while subsidizing the heifer market for everyone else.

Complete references and supporting documentation are available upon request by contacting the editorial team at editor@thebullvine.com.

Learn More

The Sunday Read Dairy Professionals Don’t Skip.

Every week, thousands of producers, breeders, and industry insiders open Bullvine Weekly for genetics insights, market shifts, and profit strategies they won’t find anywhere else. One email. Five minutes. Smarter decisions all week.

NewsSubscribe
First
Last
Consent

When Your Calves Outearn Your Cows: The 357,000-Heifer Shortage and the $200K Math Reshaping Dairy Survival

Hope is not a strategy. Nostalgia is not a business plan. Three hundred fifty-seven thousand heifers short and $200K on the line—here’s the math dairies need now.

Beef-on-dairy math

EXECUTIVE SUMMARY: A beef-cross calf at four days old now generates more profit than a Holstein heifer does after two years—and for mid-size dairies, that shift represents $200,000-$300,000 in annual revenue sitting on breeding decisions. Beef-cross calves fetch $900-$1,500 while heifer-raising nets $0-400 after $3,315 in average costs. Three structural forces have converged: butterfat oversupply from genetic progress, China’s 75-85% self-sufficiency killing export recovery hopes, and processor consolidation creating $5-7/cwt disadvantages for mid-size suppliers. The industry is now 357,000 heifers short with replacements at $3,010 nationally, per CoBank’s August 2025 analysis. Four paths remain for mid-size operations—scale aggressively, pursue premium markets, execute planned transitions that preserve 85-95% of equity, or achieve the operational excellence that makes mid-size sustainable. Hope is not a strategy; families preserving wealth are deciding in months 6-10, during margin pressure, not in month 18, when options have narrowed, and equity has eroded.

Something worth paying attention to is happening on dairy operations across North America, and honestly, I don’t think it’s getting the discussion it deserves. A beef-cross calf sold at four days old now generates somewhere between $900 and $1,500 in revenue, depending on your market and genetics. Meanwhile, a Holstein heifer calf—after 24 months of feeding, housing, breeding, and veterinary care—often produces milk worth roughly the same in annual margin contribution.

I know. It sounds backwards. But the numbers are real.

Here’s the uncomfortable question nobody wants to ask at the coffee shop: Why are so many operations still raising every heifer calf like it’s 2015? The answer usually has more to do with tradition than spreadsheets—and that’s a problem when margins are this tight.

What we’re looking at is a meaningful shift in how successful operations are thinking about revenue streams, genetic decisions, and the fundamental question of where their margins actually come from. For mid-size operations—those running 300 to 1,000 cows—understanding this shift matters a great deal for long-term planning.

The Revenue Picture Has Changed

Here’s what’s interesting about the current market. Premium beef-cross calves from Angus, Limousin, or Belgian Blue sires bred to dairy cows are commanding prices that would have raised eyebrows five years ago. USDA Agricultural Marketing Service data from late 2025 shows auction prices for quality dairy-beef crosses consistently exceeding $1,200 at major livestock markets in the East, with premium genetics pushing above $1,400 in strong markets.

Now, those numbers vary quite a bit by region—and that matters for your planning. The Bullvine’s market tracking shows beef-cross calves in the 60-100 pound range fetching $931-$1,075 per head at New Holland in Pennsylvania, while Wisconsin markets run $690-$945, and Minnesota comes in around $700-$985. California operations often see stronger prices due to proximity to feedlot demand, while Canadian producers face different dynamics under supply management. So your results will depend significantly on where you’re selling and what genetics you’re putting into those calves.

Meanwhile, the traditional replacement heifer model—which made solid economic sense when Holstein heifers sold for $2,800 and milk margins were healthier—now requires some careful penciling. And by “careful penciling,” I mean actually doing the math rather than assuming heifer-raising still works because your dad did it.

Here’s the practical math many operations are working through:

  • Beef-cross calf at 4 days: $900-$1,300 average revenue, depending on market and genetics
  • Holstein heifer at 24 months: $2,600 sale value minus roughly $2,500-$3,000 raising cost = $0-$400 net in many cases
  • Difference: Often $700+ per animal favoring beef-on-dairy

That heifer raising cost deserves a moment here. Canfax’s 2024 analysis of 64 benchmark farms found average costs of about $3,315 per heifer, and Beef Research Canada’s 2023 work showed a range of $2,904 to $3,806, depending on the operation. Your costs might be lower if you’ve got cheap home-raised feed and efficient facilities—but they might also be higher than you think when you pencil in everything honestly.

And that’s the thing. In my experience, many operations haven’t honestly factored heifer-raising costs into their budgets in years, if ever. They keep doing it because they’ve always done it. That’s not a strategy—it’s a habit.

For a 500-cow operation breeding 300 cows to beef annually, the beef-on-dairy approach can represent $200,000 to $300,000 in additional revenue compared to raising all those calves as replacements. That’s meaningful money for operations working on tight margins.

For a 500-cow operation, shifting 60-70% of breeding to beef genetics generates $240,000-$280,000 in annual revenue—enough to offset much of the structural cost disadvantage mid-size dairies face. This isn’t a sideline business; it’s the difference between survival and slow equity erosion 

I spoke with a Wisconsin producer recently who’s been farming for 32 years about this shift. “We didn’t set out to become a beef operation,” he told me. “But when the calves are generating more profit in four days than the heifers do in two years of work, you have to ask yourself what business you’re really in.”

Now, I want to be clear—beef-on-dairy isn’t right for every operation. Farms with genuinely superior heifer genetics, established replacement programs that actually pencil out, or specific breeding objectives may find the traditional model still makes sense for their situation. The key word there is “genuinely.” Too many operations claim their heifer program is profitable without ever running the real numbers. The key is running the actual math for your specific circumstances rather than assuming what worked in 2015 still pencils today.

Understanding What’s Driving These Changes

Three factors have converged to create the current environment. And what’s notable is that each one looks more structural than cyclical, which matters for planning purposes. This isn’t a two-year downturn you can wait out.

The Butterfat Genetics Story

North American dairy genetics programs spent 15 years successfully breeding for higher butterfat content. By most measures, they achieved exactly what they set out to do. CoBank’s analysis shows butterfat percentages climbed from around 3.75% in 2015 to over 4.2% by 2024—a 13% increase in component production per cow. Butterfat levels in January 2025 hit a record 4.46% in some markets.

North American dairy genetics achieved exactly what they set out to do—boosting butterfat from 3.75% to 4.46%, a 19% increase in a decade. The unintended consequence: when everyone’s milk is richer, component premiums collapse, and the genetic pipeline means this won’t reverse until 2028-2030 at the earliest

That’s genuinely impressive genetic progress. Here’s where it gets complicated from a market perspective, though.

These genetic improvements are now hitting markets simultaneously across much of the industry. When a large portion of cows produce richer milk, the premium value of those components naturally adjusts. We saw butterfat prices decline significantly through 2024, with USDA Federal Milk Marketing Order data showing butterfat settling at $2.91 per pound by December 2024—down from stronger premiums earlier in the year.

The genetic pipeline creates a timing consideration that I don’t think gets enough attention in these conversations. Bulls used today were evaluated 5-7 years ago, when butterfat premiums were steadily climbing. The market environment has evolved, but genetic decisions made years ago are still working through the system. Operations probably won’t see meaningful adjustment in their milking strings until 2028-2030 at the earliest.

This isn’t anyone’s fault—it’s simply how long-term genetic selection interacts with shorter-term market cycles. But it does mean the component dynamics we’re seeing won’t reverse quickly.

Global Demand Patterns Have Shifted

For two decades, China’s growing middle class drove global dairy demand projections. You know the story—expansion plans, processor investments, and price forecasts often included Chinese import growth as a key assumption. Many of us built business plans around that expectation.

That picture has evolved considerably. According to Rabobank’s Global Dairy Quarterly analysis, China has added over 11 million metric tons of domestic production capacity since 2018 and has moved toward approximately 75-85% self-sufficiency in dairy. That’s a dramatic shift from where they were a decade ago.

Rabobank’s analysts suggest this represents a more permanent structural change rather than a cyclical dip. The infrastructure investments China has made in domestic production indicate that it’s building for long-term self-sufficiency, not for temporary import substitution.

For North American producers, this means export-driven price recovery depends on developing other markets, which is certainly possible, but represents a different timeline and strategy than waiting for Chinese demand to return to previous growth patterns. Mexico has become an increasingly important market, as CoBank has noted, but it’s a different dynamic than the rapid growth we saw from China in the 2010s.

If your business plan depends on “prices have to come back eventually,” it might be time for a new business plan.

Processor Economics Are Evolving

Modern dairy processing plants need substantial daily volume to operate efficiently—we’re talking several million pounds daily for competitive economics. This reality naturally favors fewer, larger suppliers from an operational standpoint.

A 500-cow operation producing 33,000 pounds daily represents a relatively small portion of a major processor’s intake needs. And when processors are investing billions in new capacity—industry reports show over $10 billion in dairy processing infrastructure investment through 2028—they’re designing facilities around large-volume supplier relationships.

Transportation economics factor in as well. Consolidated pickup routes to larger operations create real cost savings for processors, savings that either flow to large farms through better contract pricing or improve processor margins. Either way, that dynamic doesn’t particularly benefit mid-size suppliers trying to maintain competitive market access.

For cooperative members, these dynamics create additional considerations. Voting power in many cooperatives correlates with volume, which can affect how mid-size operations see their interests represented in cooperative decision-making. A 500-cow operation and a 5,000-cow operation technically have equal membership status, but their influence on cooperative strategy often differs considerably. I’ve watched cooperative boards approve hauling route consolidations and component pricing structures that made sense for their largest members while quietly disadvantaging the mid-size operations that historically formed their base.

That’s not a blanket criticism of cooperatives—some have adopted modified voting structures or regional representation models that give individual producers more proportional voice, and the cooperative model still provides genuine value for many operations. But the governance dynamics are worth understanding as you think about your market position and long-term relationships.

The Mid-Size Cost Picture

USDA Economic Research Service cost-of-production data reveals patterns worth understanding for operations in the 300-1,000 cow range. And I’ll be honest—these numbers can be sobering, but they’re important to face clearly.

Mid-size operations face a structural disadvantage of $5-7 per hundredweight—translating to $1,200-$1,700 in higher costs per cow annually compared to operations with 2,000+ cows. This cost gap persists regardless of management quality and explains why scale has become survival in commodity dairy
Herd SizeTotal Cost/CWTDifference vs. 2,000+ Cows
500-999 cows~$24-26$5-7/cwt higher
1,000-1,999~$21-23$2-4/cwt higher
2,000+ cows$19.14Baseline

Based on USDA ERS Milk Cost of Production Estimates, 2021 data—the most recent comprehensive survey available

That cost gap of roughly $5-7 per hundredweight translates to approximately $1,200-$1,700 in structural disadvantage per cow annually. Those are significant numbers that affect long-term competitiveness regardless of how well you manage day-to-day operations.

Where does this cost difference come from? It’s distributed across several areas that you probably recognize intuitively:

  • Labor efficiency: Larger operations typically spread management and specialized labor across more production, achieving better output per worker
  • Feed procurement: Volume buyers often negotiate 10-15% lower prices on concentrates through direct mill contracts
  • Capital costs: Facility and equipment depreciation spreads across more production units
  • Professional services: Veterinary, nutrition, and accounting fees get divided by more cows

Now, these figures represent national averages, and your situation may differ significantly. Regional variations matter quite a bit. California operations face environmental compliance costs that Midwest farms largely don’t carry. Wisconsin and Pennsylvania operations deal with different land costs and climate considerations than Texas dairies. Your specific costs depend on your specific circumstances—which is why it’s worth penciling your actual numbers rather than assuming you match the averages.

Beef-on-dairy revenue helps offset these structural differences. Based on current calf prices, it might cover roughly 40-50% of that gap for many operations. That’s meaningful, though it doesn’t eliminate the underlying economics entirely.

The Replacement Heifer Squeeze

There’s another dimension to this that complicates the picture—and frankly, reveals the consequences of industry-wide groupthink. The widespread adoption of beef-on-dairy breeding has created something of a heifer shortage across the industry. CoBank’s August 2025 dairy analysis indicates the U.S. dairy herd is running approximately 357,000 heifers short of projected replacement needs—a direct consequence of so many operations shifting breeding priorities toward beef genetics.

This shortage has pushed replacement heifer prices to levels we haven’t seen in two decades. USDA’s July 2025 Agricultural Prices report showed replacement heifers averaging $3,010 per head nationally, with top genetics commanding $4,000 or more at California and Minnesota auction barns.

The irony isn’t lost on me: an industry that spent decades telling farmers to “raise your own replacements no matter what” has now swung to an equally thoughtless extreme of “breed everything to beef.” Beef semen sales to dairies nearly tripled between 2017 and 2020, reaching 7.9 million units by 2024, according to NAAB data. Neither the old approach nor the new one involves actually analyzing what makes sense for your specific operation. The farms that will thrive are the ones doing the math—not following the herd in either direction.

But here’s the catch—and it’s worth thinking about carefully. If you’re planning to exit the industry in 3-5 years, the beef-on-dairy math works fine. If you’re planning to operate for another 20 years, you’re eventually going to need those replacements—and they may be harder and more expensive to find.

Four Paths Worth Considering

Producers working through margin challenges generally have four strategic directions available. The key—and I can’t emphasize this enough—is to assess which path fits your specific situation honestly, rather than pursuing the one that sounds best, feels most comfortable, or lets you avoid difficult conversations with family.

Path 1: Building Scale

This tends to work for: Operations with strong debt service coverage—generally above 2.0-2.5—manageable debt-to-asset ratios below 40-45%, clear succession plans, and confident processor relationships.

Scaling from 500 to 2,000+ cows represents a significant undertaking. We’re talking substantial capital—often $10-15 million or more, depending on your starting point and approach—plus considerable additional land to meet nutrient management compliance requirements. The financial and management prerequisites are demanding.

Based on what I’ve observed over the years, a relatively small percentage of mid-size operations are genuinely positioned to pursue this path successfully. That’s not a criticism—it’s just an acknowledgment of the financial realities involved. The problem is that too many operations pursue expansion because it feels like “doing something” rather than because the fundamentals actually support it. Expanding into a cost structure you still can’t compete in just means losing money faster.

What successful scaling typically involves:

  • Multi-year timeline from decision to full operation—often 5-7 years
  • Major milking infrastructure investment for robotics or rotary systems
  • Management systems that can function without daily owner involvement in routine decisions
  • Strong processor relationships with confirmed market access at expanded volume

Penn State Extension has noted that operations seeking expansion financing typically need to demonstrate sustained positive cash flow history and strong management capacity before lenders will seriously consider major facility loans. That generally means having your current operation running well before taking on expansion debt.

I should mention that scaling does work for some operations. A central Indiana dairy I’ve followed grew from 600 to 2,400 cows over eight years by acquiring a neighboring operation, investing heavily in robotics, and securing a long-term processor contract before breaking ground. But they started with a debt-to-asset ratio under 30% and two generations actively involved in management. The prerequisites were there before the expansion began. They didn’t expand, hoping to fix their problems—they expanded because they’d already solved them.

Path 2: Premium Market Positioning

This tends to work for: Smaller operations—often under 200-250 cows—with strong balance sheets, secured processor contracts for specialty milk, and a willingness to fundamentally change their operational approach.

The challenge for mid-size operations pursuing this path is significant. Organic certification requires extensive pasture access—typically several hundred acres of quality grazing land for a larger herd. Feed costs increase 30-80% with organic inputs, and production often dips 10-15% during the transition period.

Perhaps most critically, organic processors in several major dairy regions report adequate or surplus supply and aren’t actively seeking new large-volume suppliers. The premium is attractive on paper, but market access is often the limiting factor in practice. You can get certified, but that doesn’t guarantee someone wants to buy your organic milk at organic prices. I’ve watched operations spend 18 months and significant capital to achieve organic certification, only to discover there’s no market for their milk at organic premiums. That’s an expensive lesson in checking market access before making production changes.

A2 milk and other specialty designations present similar market access considerations. These segments remain relatively small portions of total fluid milk sales, and most specialty processors have established supplier relationships they’re not looking to expand significantly.

One exception worth noting: Direct-to-consumer models with on-farm processing can work quite well at 50-150 cow scale, potentially capturing 60-80% of retail margin rather than commodity pricing. This does require significant processing infrastructure investment—$250,000-$600,000 isn’t unusual—and fundamentally different business skills. You’re essentially building a retail and marketing business that happens to have cows. Different game entirely, but it works for some folks with the right location, skills, and appetite for that kind of venture.

Path 3: Planned Transition

This may make sense for Operations where the primary operator is approaching retirement age without a clear succession plan, where debt service is consuming too much cash flow, where breakeven costs significantly exceed market prices, or where the operation has experienced extended periods of negative cash flow.

And here’s something I want to say directly: suggesting that some operations should consider transition isn’t a criticism of those farms or their management. Markets change. Cost structures evolve. Making a thoughtful decision to preserve family wealth is good business management, not failure.

What I will criticize is the stubborn refusal to consider transition when the numbers clearly indicate it’s time. I’ve seen too many families lose $500,000 or more in equity by waiting too long, hoping things would turn around, and being unwilling to have honest conversations about the future. That’s not perseverance—it’s denial dressed up as virtue. And it devastates families financially.

What makes planned transition more viable today than in previous challenging periods is that beef-on-dairy revenue can maintain positive cash flow during a drawdown. That $200,000-$300,000 in annual beef-cross revenue provides working capital for orderly asset sales at reasonable market value rather than distressed pricing.

The equity preservation difference can be substantial:

  • Planned transition over 36-48 months: Families typically preserve 85-95% of asset value
  • Rushed liquidation after extended losses: Families often preserve 60-75% of asset value

For an operation with $3 million in net worth, that difference can exceed $600,000 in actual preserved family equity. That represents real money for retirement, for the next generation’s opportunities, or for whatever comes next.

Path 4: Making Mid-Size Work

I’d be doing you a disservice if I didn’t mention that some mid-size operations are genuinely finding ways to compete—and the research backs this up. University of Vermont Extension’s 2024 dairy economics analysis found that operations in the 400-600 cow range implementing robotic milking systems achieved labor cost reductions averaging 15-18%, which began to close the efficiency gap with larger operations meaningfully.

A 650-cow Vermont operation I’ve followed has carved out a sustainable position by combining aggressive robotic milking efficiency with a local processor relationship that values consistent quality and year-round supply stability over raw volume—and they’ve kept heifer-raising in-house because their genetics actually command premium replacement prices that make the math work. Their fresh cow protocols and transition period management have pushed their rolling herd average well above regional benchmarks, which gives them leverage in processor negotiations that most mid-size operations don’t have.

It’s not easy, and it requires exceptional management in multiple dimensions simultaneously. But it’s worth noting that “mid-size is doomed” isn’t universally true. It’s just that this path requires you to be genuinely excellent at several things at once, not just average at everything. If you’ve got superior genetics, strong local processor relationships, and the management capacity to optimize every efficiency lever available—robotics, feed management, reproduction, cow comfort—mid-size can still work. You just can’t afford to be mediocre at any of it.

A Framework for Decision-Making

When producers work through these decisions with their CPA and agricultural lender, several metrics typically guide the conversation. Understanding these ahead of time can make those discussions more productive.

Debt Service Coverage Ratio (DSCR)

This ratio measures the cushion between income and debt payments. Lenders watch this number closely—it’s often the first thing they calculate.

  • Formula: Net operating income ÷ Total annual debt service
  • Above 2.0: Generally solid position for considering strategic investments
  • 1.5-2.0: Optimization makes sense; expansion capacity may be limited
  • Below 1.25: Transition planning deserves serious consideration

True Cost Analysis

One pattern I’ve noticed over the years: producers often underestimate their actual breakeven by not accounting for costs that don’t show up as monthly payments but are economically real:

  • Operator labor at what you’d pay a hired manager—$65,000-$95,000 annually isn’t unreasonable in many markets
  • Return on your equity could earn in alternative investments—typically 4-6%
  • Deferred maintenance is accumulating on facilities

When these factors are honestly included, some operations discover that their true economic breakeven point significantly exceeds current milk prices. That’s uncomfortable to realize, but better to know it than not. And frankly, if you’re not willing to calculate your true breakeven because you’re afraid of what you’ll find, that tells you something important right there.

Stress Testing

Experienced lenders evaluate what happens to your DSCR if milk drops $2 per hundredweight while feed costs rise 10%. It’s worth doing that calculation yourself before you’re sitting in the loan officer’s office. Operations that look marginal under that scenario typically face limited options for expansion financing.

Five Questions for Your Next Lender Meeting

Before you sit down with your agricultural lender or CPA, work through these honestly:

  1. What’s your true all-in breakeven? Include operator labor at replacement cost, opportunity cost on equity, and deferred maintenance. If this number scares you, that’s information.
  2. What happens to your DSCR if milk drops $2/cwt and feed rises 10%? If you go below 1.25 under that scenario, your strategic options are already narrowing.
  3. Are you strategic to your processor, or easily replaced? If your milk disappeared tomorrow, would they notice—or just shift a route?
  4. What’s your succession plan—documented, not assumed? Verbal family interest isn’t the same as committed next-generation involvement with financial analysis.
  5. If you’re considering expansion, are you doing so because the fundamentals support it, or because it feels better than the alternatives? Be honest with yourself here.

Timing Considerations

What I’ve observed over the years is a fairly consistent pattern once operations enter challenging cash flow territory:

  • Months 0-6: Operating shortfalls often get covered by savings and working capital
  • Months 6-12: Equity erosion becomes more noticeable; most strategic options remain available
  • Months 12-18: The situation typically demands more immediate attention; options narrow
  • Month 18+: Choices become more constrained

The practical insight here is that decisions made earlier in this timeline—during months 6-10, say—tend to preserve more options and more equity than decisions made later. Waiting and hoping for market improvement is completely understandable… but it has real costs. Every month of delay is a decision—it’s just a decision not to decide, which is often the most expensive choice of all.

Beef-on-dairy revenue can extend these timelines somewhat, providing breathing room that previous generations of struggling dairy farms didn’t have. But it doesn’t change the underlying economics. An operation generating $300,000 in beef-cross revenue while facing $500,000 in other losses is still experiencing $200,000 in annual equity erosion. The beef revenue buys time for better decisions—not infinite time.

What Successful Transitions Look Like

A Wisconsin Example

A 61-year-old producer I’ve followed over the past few years recognized, around month 7, that his cost structure wouldn’t allow him to compete effectively long-term at his current scale. Rather than waiting indefinitely—or worse, doubling down on a strategy that wasn’t working—he implemented a 42-month planned transition:

  • Increased beef breeding to 70% of the herd for revenue optimization
  • Generated approximately $285,000 annually in beef-cross calf sales
  • Reduced herd size gradually while maintaining processor relationships and milk quality
  • Marketed real estate with an 18-month timeline, allowing proper buyer qualification rather than a rushed 60-day distressed sale

Result: Preserved $2.6 million in family equity—substantially more than a rushed liquidation would have yielded.

He now manages cropland for neighboring operations at around $55,000 annually while drawing income from invested assets. His total annual income actually increased, and his working hours dropped considerably. Not the outcome he’d imagined when he started farming, but a genuinely good outcome for his family.

“The hardest part wasn’t seeing the numbers—those were clear enough. The hardest part was accepting that the market had changed in ways I couldn’t control or wait out. Once I made peace with that, the decisions got a lot simpler.”

— Wisconsin dairy producer, 32 years in operation

His son, who had considered returning to the family operation, used his share of the preserved assets to start a successful trucking business. Different path, but solid financial foundation—which was really the goal all along.

Practical Takeaways

Assessing your current position:

  • Calculate the true all-in breakeven, including the opportunity costs that are easy to overlook
  • Run stress-test scenarios—milk down $2, feed up 10%—before your lender does
  • Evaluate succession plans honestly. Verbal family interest isn’t the same as documented commitment with financial analysis
  • Assess your processor relationship realistically. Are you strategic to them, or easily replaced?

If considering growth:

  • Verify you meet financial thresholds before investing in detailed planning
  • Secure processor commitment for expanded volume before major capital decisions
  • Document succession planning with realistic financial projections
  • Plan for multi-year implementation with regular evaluation points
  • Be honest: Are you expanding because the fundamentals support it, or because it feels better than the alternatives?

If considering premium markets:

  • Confirm market access before beginning any conversion—certification without a buyer isn’t worth much
  • Recognize that finding a processor often matters more than achieving certification
  • Evaluate direct-to-consumer models if scale and location support them
  • Budget realistically for transition periods with uncertain cash flow

If pursuing mid-size excellence:

  • Identify your genuine competitive advantages—don’t assume you have them
  • Invest in efficiency technology where ROI is demonstrable
  • Build processor relationships based on quality, consistency, and reliability
  • Evaluate whether your genetics actually justify keeping heifer-raising in-house
  • Accept that this path requires excellence across multiple dimensions simultaneously

If considering transition:

  • Make decisions while meaningful options remain available
  • Use beef-on-dairy revenue to maintain positive cash flow during the process
  • Engage qualified professionals—CPA, agricultural attorney—early rather than late
  • Explore all available tools, including Chapter 12 provisions where applicable. Section 1232 can provide meaningful tax advantages in farm bankruptcy situations

For all operations:

  • Beef-on-dairy provides valuable revenue flexibility, though it’s one tool among several
  • Cost differences between herd sizes reflect structural economics that tend to persist
  • Earlier decisions typically preserve more options than later ones
  • Thoughtful wealth preservation honors what previous generations built—more than stubbornly running losses ever will

The Bottom Line

The North American dairy industry continues to evolve toward two primary models: larger-scale commodity production, where cost structures provide a competitive advantage, and smaller-scale operations, where premium positioning or direct consumer relationships create different economics.

Operations in the 300-1,000 cow range face a challenging middle position. Beef-on-dairy revenue helps considerably, but doesn’t fully resolve the underlying cost dynamics. Some operations will find ways to make mid-size work through exceptional execution on multiple fronts simultaneously—but that’s a narrow path that requires genuine excellence, not just determination.

That observation isn’t a criticism of mid-size operations or the people who run them. Many excellent managers operate in this range. But market structures have evolved in ways that create real challenges regardless of management quality. Pretending otherwise—or blaming the challenges on things you can’t control while ignoring the decisions you can make—doesn’t help anyone.

The producers who will be well-positioned in 2030 are the ones making clear-eyed assessments today: pursuing growth where the prerequisites genuinely exist, pivoting toward premium markets where access is available, finding the operational excellence to make mid-size sustainable where the skills and circumstances align, and transitioning thoughtfully where the underlying economics have shifted.

Each of these paths can lead to good outcomes for families. The path that tends to work poorly is waiting indefinitely for conditions to change while equity gradually erodes. Hope is not a strategy. Nostalgia is not a business plan.

Previous generations built these operations by adapting to market realities, not by ignoring them. That same practical wisdom—applied to today’s circumstances—will preserve these operations for the families who depend on them.

For operations working through these decisions, conversations with your agricultural lender and CPA provide a good starting point. The numbers for your specific situation may look quite different from industry averages—and understanding your actual position is the first step toward making good decisions.

Complete references and supporting documentation are available upon request by contacting the editorial team at editor@thebullvine.com.

Learn More

The Sunday Read Dairy Professionals Don’t Skip.

Every week, thousands of producers, breeders, and industry insiders open Bullvine Weekly for genetics insights, market shifts, and profit strategies they won’t find anywhere else. One email. Five minutes. Smarter decisions all week.

NewsSubscribe
First
Last
Consent

38% Turnover Is Bleeding You Dry. One Wisconsin Dairy Got It Under 1% – With a Waiting List.

Your workers are leaving. Theirs are lining up. The difference between 38% turnover and under 1% isn’t money—it’s a $5,000 decision you haven’t made yet

EXECUTIVE SUMMARY: The average dairy loses 38% of its workers every year—and at $15,000 a head, that’s $100,000+ walking out your driveway. Money that never produces a single pound of milk. Sandy Larson was trapped in the same cycle until she made a decision most owners won’t: she became a landlord. Her Wisconsin operation went from 7% turnover to under 1%. Now there’s a waiting list to work there. Cornell research confirms it—structured onboarding alone cuts turnover nearly in half. The fix isn’t higher wages. It’s treating labor like the capital investment it actually is. Here’s the math, the proof, and the playbook.

Let’s be blunt: The average U.S. dairy loses nearly four out of ten workers every single year. According to the FARM Program and Texas A&M, that 38.8% turnover rate isn’t just a “headache”—it’s a financial hemorrhage.

If you’re running a 20-employee operation, you aren’t just losing people; you’re watching $100,000 walk out the driveway annually in replacement costs. That’s money that doesn’t produce a single pound of milk. With Class III milk hovering in the high teens and component premiums tightening margins across most regions, every operational efficiency matters more than it did five years ago. It’s time we stop treating labor as a “cost to be minimized” and start treating it like the high-stakes capital investment it actually is.

Operation SizeAverage Turnover RateWorkers Lost AnnuallyAnnual Turnover Cost
Small (10 employees)38%3.8 workers$52,000
Medium (20 employees)38%7.6 workers$104,000
Large (50 employees)38%19 workers$260,000
Experienced Worker Loss38%Per worker$20,000+
Industry Best (Larson Acres)<1%0.5 workers (50 employees)$7,000

The FARM Program’s nationwide survey—conducted by Texas A&M’s Center for North American Studies with over 630 dairy farms participating—found that replacing a worker typically costs about one-third of their annual salary. With average dairy compensation running around $42,000, you’re looking at $13,000 to $14,000 per departure. For experienced hands who know your herd, your protocols, your fresh cow management inside and out? That number climbs past $20,000.

So what separates the farms drowning in turnover from the ones that have essentially solved it? It’s not geography. It’s not wage rates. It’s not luck. It’s how they think about their people.

How Employee Housing Transformed One Wisconsin Dairy

When Sandy Larson, general manager at Larson Acres near Evansville, Wisconsin, started hearing employees mention housing as a reason for choosing other employers back in 2019, she made a decision that seemed counterintuitive at the time: she’d take on the responsibility of becoming a landlord.

“That was the one thing that I thought I could change that would help the culture and keep our employees wanting to be at Larson Acres every day,” Larson shared on the Uplevel Dairy Podcast a few years back.

You know how it goes—you identify a problem, and you find a way to address it. Today, nearly half of her 75 employees live in housing provided by the farm. Some of it’s farm-owned, some are rentals where Larson Acres holds the leases. Either way, the results speak for themselves.

“Our turnover rate has dropped from 7% to under 1%,” Larson says. “We have a waiting list of people that want to work here because we’re taking care of the employees.”

What she’s discovered is that housing isn’t just a benefit—it creates a genuine competitive advantage. And the practical details matter here. Furnishing units completely so workers can walk into a home that’s ready to be lived in. Handling seasonal needs like A/C units come summer and salt and shovels before winter hits. Covering wireless internet as part of the rent. Grouping employees by shift compatibility to avoid disrupting each other’s sleep schedules.

It’s work—Larson visits homes monthly and manages relationships with multiple landlords. But the return on that effort shows up across the operation.

“The culture at the farm, the cow care, the somatic cell count, the milk production… it’s all clicking,” she explains. “And it’s all tied in together with a good working environment and a good home.”

The True Cost of Dairy Employee Turnover

What makes turnover expensive isn’t just the obvious stuff—posting job ads, interviewing candidates, sorting paperwork. It’s everything that happens after someone new walks through the door. As many of us have seen, the new hire spends their first few weeks learning the ropes, while your experienced people spend their time teaching rather than doing their actual jobs.

Richard Stup, who leads the Agricultural Workforce Development program at Cornell, has spent years studying what actually happens when farms bring on new people. His team’s research, published in the Journal of Dairy Science earlier this year, found that structured onboarding programs reduced turnover from 44% to 28% among participating farms. Now, the sample size meant this wasn’t statistically significant, but the direction is encouraging—and worth watching as more data comes in.

More importantly, farms that implemented formal onboarding saw real improvements in how they do things day to day. Of 23 recommended onboarding practices, participating farms tripled their adoption of mission statements, first-day safety training, and written job descriptions. Five other practices more than doubled.

What that tells us is pretty straightforward: most farms aren’t doing the basics yet. And when you’re not doing the basics, you’re essentially running a perpetual training operation.

Beyond those direct replacement costs, the connection between workforce stability and production outcomes is consistently evident across industry research. While specific figures vary depending on how you measure things, the pattern is clear: operations with high turnover generally see lower milk production, higher calf mortality, and higher cow mortality than operations that keep their people around.

And here’s something that doesn’t always make it into the turnover conversation: inconsistent milking routines from constant staff changes can show up in bulk tank SCC swings and butterfat variation—subtle hits to your milk check that don’t always get traced back to staffing issues. When your milking crew changes every few months, those cows know it. Consistency in stockmanship, feeding protocols, and fresh-cow management. New people, no matter how capable, need time to develop those instincts.

Understanding Today’s Dairy Workforce

Any honest conversation about dairy labor has to acknowledge who’s actually doing this work. The most comprehensive assessment we have comes from a 2015 National Milk Producers Federation survey, which found that 51% of dairy workers are immigrants. According to that same research, those workers are responsible for 79% of U.S. milk production.

Now, I want to be straight with you—that data is a decade old. Comprehensive updated surveys simply haven’t been conducted, which is a gap in our understanding that deserves attention. That said, most industry observers suggest immigrant workforce percentages have remained stable or increased slightly since then.

Let’s stop pretending we don’t know who is milking the cows. The data is a decade old because the industry is too timid to look the labor reality in the eye. Whether it’s 2015 or 2026, the immigrant workforce is the backbone of the American bulk tank.

Jaime Castaneda, who serves as executive vice president for policy and strategy at NMPF, spoke earlier this year about the industry’s ongoing efforts to improve access to the H-2A visa program. The challenge, as he explained it, is that the year-round nature of dairy work doesn’t fit a visa system designed for seasonal agriculture.

“We have written to the Department of Labor a number of different times and actually even pointed to the fact that the sheep herding industry has access to H-2A, and it’s a very similar industry to dairy,” Castaneda noted.

This creates real operational vulnerability for farms across the country. What I’ve noticed is that farms with the strongest retention practices tend to have somewhat more resilience here. Workers who’ve been somewhere for years, who have housing, whose kids attend local schools—they’re more embedded in the community. Operations with high turnover and no housing or community ties face a very different situation.

Why Robotic Milking Systems Aren’t the Complete Labor Solution

I’ve watched many farms invest in robotic milking systems, expecting significant reductions in labor costs. And look, automation absolutely has its place. But the reality has been more nuanced than the sales presentations often suggest.

Research from the University of Wisconsin Extension tells an interesting story. They surveyed 50 dairy producers who’d adopted automated milking systems, and while the average labor-saving was about 38% per cow, there was enormous variation in outcomes. At the lower end, 8% of respondents reported no labor savings at all, citing maintenance and repair issues as their primary concern.

Retention StrategyImplementation CostTurnover ReductionPayback PeriodExample
Structured Onboarding$5,000-8,00016 points (44%→28%)<1 yearCornell study
Employee Housing (Owned)$75K-150K/unit6+ points (7%→1%)2-3 yearsLarson Acres
Housing (Rental Subsidy)$500-800/mo/worker4-6 points1-2 yearsRegional
Recognition Programs$2K-3K/year2-4 pointsImmediateVir-Clar Farms
Transportation Support$3K-5K/year1-3 points<1 yearVir-Clar Farms
Referral Bonuses$500-1K/hire1-2 pointsImmediateVir-Clar Farms
Do Nothing (Baseline)$00 points (38.8% avg)N/AIndustry avg

One producer comment from that survey captured it well: “Anyone considering robotics should understand that there is still plenty of daily work involved in milking, robots just give you more flexibility with your time.”

Another was more direct: “Still need experienced labor to keep robots running.”

Dr. Trevor DeVries, who holds the Canada Research Chair in Dairy Cattle Behaviour and Welfare at the University of Guelph, has extensively researched robotic milking systems. His work highlights an important point: the technology doesn’t eliminate the need for skilled workers—it transforms the skills needed.

“Automated milking systems allow dairy cows to choose when and how often they want to be milked, which may increase production and help reduce stress,” DeVries has explained. “These systems also record data that farmers can use to improve management efficiency.”

That data management piece deserves attention. Robots generate substantial information about individual cow behavior, milk production, and health indicators. Getting value from that data requires people who can interpret it and act accordingly—a different skill set than conventional milking and often a higher-paid one.

The farms succeeding with automation tend to be those that invested in workforce development alongside technology investment. Technology and human capital work together, not as substitutes.

Low-Cost Retention Strategies That Deliver Results

But technology investments aside, some operations are finding retention success through approaches that cost almost nothing in capital—just consistent attention and follow-through.

Katie Grinstead, who owns Vir-Clar Farms in Fond du Lac, Wisconsin, has built loyalty through a combination of smaller but steady practices. She’s talked about how tracking vacation accrual has become a useful proxy for workforce stability at her operation—employees have to put a year in before they earn vacation hours, and watching how many people hit that milestone tells you something about how you’re doing.

Her employee Joaquin Vasquez, who’s been with the farm for more than 14 years, received recognition from Farm Journal’s Milk Business program in 2024. That kind of tenure doesn’t happen by accident—it’s built through deliberate effort.

What Vir-Clar does includes a ride-share program for employees without transportation (something Grinstead started after seeing another farmer do it successfully), birthday celebrations for all team members, holiday gatherings with bonuses, summer picnics, referral bonuses that recognize both the referrer and newcomer if they stay past 30 days, and internal promotion priority before outside hiring.

“If you can get employees to stay, they get to see all of the benefits we offer,” Grinstead explains. “We couldn’t do what we do every day without our team. To be successful, we need a group of people committed to our vision. Building this doesn’t happen overnight; it’s cultivated through intentional actions every single day.”

That phrase—intentional actions every single day—is worth sitting with. It’s not a program you implement once and move on from. It’s a way of operating.

And it’s not just a Midwest phenomenon. I’ve seen similar commitment paying off on operations from California’s Central Valley to Arizona’s dry lot dairies to smaller family operations in Vermont and upstate New York—the specific tactics vary based on regional labor markets and housing costs, but the underlying commitment to treating workers as long-term investments rather than interchangeable costs shows up wherever retention is working.

What Dairy Workers Actually Want

Here’s something that might shift how you think about this: industry surveys increasingly show that employee retention has become a top human resource concern for agriculture and food employers, in many cases, overtaking talent acquisition as the primary focus. That’s a meaningful shift from where things stood just a few years ago.

It makes sense when you consider what we’re learning about worker preferences. Multiple surveys have found that benefits often matter more than wage increases alone—which helps explain why some lower-paying operations retain workers while competitors paying more can’t seem to keep anyone. It’s a counterintuitive finding, but one worth considering.

For dairy specifically, the Canadian Agricultural Human Resource Council’s research indicates that dairy operations experience lower voluntary turnover than the broader agriculture sector. That relative stability suggests our industry has some structural advantages—year-round employment, potential for skill development, and often closer relationships between employers and employees on smaller operations.

The question is whether individual farms can capitalize on those structural advantages through deliberate retention practices, or whether we’ll lose that potential through inattention.

Competing With Processing Plants for Workers

There’s another dimension to this challenge that’s easy to overlook: you’re not just competing with other farms for workers—you’re competing with processing plants, manufacturing, construction, and retail.

Processing facilities often offer entry-level wages of $22-23/hour with full benefits and climate-controlled work environments. For workers comparing that to farm positions with irregular hours, weather exposure, and physical animal handling requirements… well, the calculation isn’t always in our favor.

Compensation ComponentProcessing PlantFarm (No Housing)Farm (With Housing)Competitive Gap
Base Hourly Wage$22.50$18.00$18.00-$4.50/hr
Annual Base (2,080 hrs)$46,800$37,440$37,440-$9,360
Housing Value$0$0$12,000+$12,000
Work EnvironmentClimate-controlledWeather-exposedWeather-exposedVariable
Shift FlexibilityFixed scheduleSome flexibilitySome flexibilityModerate +
Skill DevelopmentRepetitive tasksLivestock mgmtLivestock mgmtHigh +
Community/CultureIndustrialRelationship-basedRelationship-basedHigh +
Total Annual Value$46,800$37,440$49,440+$2,640

This creates a frustrating dynamic. You invest in developing workers, building dairy knowledge over months or years, then watch those trained employees get recruited by processors offering better compensation—without having invested in that development themselves.

The farms that successfully retain workers despite this competition typically offer something processors can’t easily match: total employment value that includes housing, advancement opportunities, work variety, and a relationship-based culture. When you factor in housing worth $10,000-15,000 annually, an $18/hour farm position starts looking genuinely competitive with a $23/hour processing job. It’s about the complete package.

Building Your Retention Program: A First-Year Roadmap

For operations ready to improve workforce outcomes, the research and case studies suggest a phased approach works better than trying to change everything at once.

Start with the fundamentals. The Cornell research found that farms implementing structured onboarding saw the biggest gains in practices that cost almost nothing: sharing your mission and values with new hires, providing first-day safety training, and giving workers written job descriptions. These are standard practices in most industries that agriculture has largely overlooked.

You’re probably looking at $5,000-8,000 for template development and mentor training—real money, but not prohibitive.

Recognition programs similarly require minimal cash—maybe $2,000-3,000 annually for birthday acknowledgments, referral bonuses, team meals—but they signal to workers that they’re valued as individuals rather than interchangeable positions.

Then measure what’s happening. Track time-to-productivity for new hires. Survey existing employees anonymously about their satisfaction and opportunities for improvement. Calculate your actual turnover costs so you know whether your interventions are working.

The Stup research is instructive here: farms that implemented structured practices saw turnover drop from 44% to 28%. That 16-percentage-point improvement, on a 20-employee operation at $15,000 per departure, represents roughly $48,000 in annual savings. That’s meaningful money.

If early changes show improvement, consider strategic investment. Housing investment will compound those gains if you’ve got the cultural foundation in place. The math varies by region and approach—purchased mobile homes, new construction, and rental partnerships all have different cost structures. What works in rural Wisconsin at $75,000 per unit might cost $150,000 or more in California dairy regions, so local housing markets matter when you’re penciling out the numbers.

Larson’s experience suggests payback periods of 2-3 years are achievable in many situations. For operations that can’t access capital for housing, rental subsidies offer a middle path—guarantee leases, subsidize rent, and provide the stability benefits without full ownership.

Tailoring Your Approach by Operation Size

What works for a 75-employee dairy in Wisconsin isn’t necessarily appropriate for a 200-cow family operation in Vermont or a 5,000-head facility in Idaho. Similar retention approaches have shown results across operations from the Pacific Northwest to the Northeast, though specific implementations vary by regional labor markets and operational context.

Smaller operations—say, under 50 cows with primarily family labor—often face challenges in transition planning and family dynamics rather than employee retention. But even operations with minimal hired labor benefit from documenting protocols and creating clear expectations. If nothing else, it makes eventual expansion or transition more manageable.

Mid-size operations—somewhere in the 100-500 cow range with mixed family and hired labor—this is where retention investments often deliver the strongest return. You’re large enough that turnover costs really add up, but small enough that culture changes can happen relatively quickly. Housing investment becomes feasible, structured onboarding makes sense, and career pathways can be meaningful even with a modest organizational structure.

Large operations—500-plus cows with primarily hired labor—scale creates both opportunities and challenges. You can potentially offer better benefits packages and more formal advancement structures. But you’re also competing more directly with processors and other large employers, making it harder to maintain culture across shifts and locations.

The Bottom Line

The dairy operations figuring out workforce stability aren’t doing anything magical. They’re treating human capital as actual capital—investing in it strategically, tracking returns on that investment, and adjusting based on results.

Sandy Larson didn’t have special advantages when she started managing housing. She had a hypothesis that taking care of employees would pay returns, a willingness to test it, and the discipline to execute consistently. Three years later, she has a waiting list of applicants while competitors struggle to staff basic positions.

Katie Grinstead at Vir-Clar doesn’t have a massive budget for employee programs. She has a commitment to “intentional actions every single day”—small practices that add up over time into a culture where someone stays for 14 years and earns recognition for it.

Research from Cornell, Wisconsin Extension, the University of Guelph, and others isn’t prescriptive about exactly what every farm should do. It’s descriptive about what tends to work and what doesn’t. The common thread: operations that invest deliberately in their people—through housing, training, recognition, advancement opportunity, or some combination—generally outperform those that treat labor primarily as a cost to minimize.

That’s not a revelation. It’s a reminder that what’s obvious in principle requires actual execution in practice. The farms winning the labor war aren’t smarter than everyone else. They’re just more consistent about doing what they know works.

The question isn’t whether you can afford to invest in your workforce. It’s whether you can afford not to.

Key Takeaways

What the research tells us:

  • Average dairy turnover runs 38.8% annually, according to the FARM Program nationwide survey
  • Replacement costs typically run about one-third of annual salary—roughly $13,000-$14,000 for most positions, higher for experienced workers
  • Workforce instability correlates with production challenges, increased mortality, and subtle milk quality issues like SCC swings and component variation

What’s working:

  • Housing investment at Larson Acres dropped turnover from 7% to under 1%
  • Structured onboarding in the Cornell study reduced turnover from 44% to 28%
  • Recognition programs at Vir-Clar helped retain an employee for 14+ years
  • Total employment value—wages plus housing plus benefits plus culture—competes effectively against higher-wage alternatives

Practical starting points:

  • Calculate your actual turnover cost—most of us significantly underestimate it
  • Implement documented onboarding covering mission, safety training, and job descriptions
  • Survey current employees anonymously about what would make them more likely to stay
  • Track the basics monthly: time-to-productivity, turnover rate, satisfaction indicators

On technology:

  • About 8% of robotic milking adopters report zero labor savings due to maintenance demands
  • Robots transform labor needs rather than eliminating them
  • If you buy a Ferrari but don’t know how to shift gears, don’t blame the car when you’re stuck in the driveway. Robotics require a higher-caliber human, not just a higher-caliber technician.

Complete references and supporting documentation are available upon request by contacting the editorial team at editor@thebullvine.com.

Learn More

The Sunday Read Dairy Professionals Don’t Skip.

Every week, thousands of producers, breeders, and industry insiders open Bullvine Weekly for genetics insights, market shifts, and profit strategies they won’t find anywhere else. One email. Five minutes. Smarter decisions all week.

NewsSubscribe
First
Last
Consent

Editor’s Choice 2025: 10 Articles Your Competitors Already Read Twice

Every breeding decision you’ll make next year connects to lessons buried in this year’s best journalism. A $260,000 gamble from 1926 that critics called insanity. A bankruptcy that produced three generations of World Dairy Expo champions. A bull whose daughters added $6,500 per head in today’s dollars, while his modern genomic evaluation shows negative Net Merit—a $2,117 swing from December 2025’s top bull. These aren’t just stories – they’re the strategic frameworks top breeders reference when everyone else is guessing.

Look, we published over 300 feature articles this year. Breeder profiles, sire spotlights, donor stories, industry investigations. When our editorial team sat down to identify which ones actually mattered—not which got the most clicks, but which ones readers bookmarked, shared with their herd managers, or referenced in breeding meetings—ten articles kept coming up.

These pieces combined a strong readership with lasting impact. Our Elevation story generated over 340 comments and was shared more than 2,800 times across platforms. The Blackrose piece prompted eight separate emails from readers who’d reconsidered their approach to dispersal auctions. The “Death of Get Big” article? At least a dozen producers told us they’d shared it with their lenders.

That’s the standard we used. Months after publication, readers were still emailing about these stories, arguing about them, applying them.

If you’re planning your 2026 breeding strategy, reviewing dispersal auction opportunities, or just trying to understand why certain genetic decisions matter more than others, these articles deserve your attention. Your competitors have probably already read them twice.

Four Bets, Five Legends: The Holstein Visionaries Who Built Everything You’re Breeding Today

Here’s the thing about Holstein history—most of us think we know it. We can name the big bulls, recite a few famous prefixes. But this article did something different. It traced four distinct breeding philosophies through five legendary figures and showed how each remains valid today.

Take T.B. Macaulay’s gamble on Johanna Rag Apple Pabst in 1926. According to Bank of Canada inflation calculations, that $15,000 purchase represents roughly $260,000 in today’s dollars—for one animal, in a post-WWI economy when farmers were still digging out from agricultural depression. The critics thought he’d lost his mind.

And here’s what makes this relevant to your operation right now: Holstein Canada pedigree records confirm that virtually every registered Holstein walking the planet today carries that bull’s blood.

Why Macaulay’s Math Still Works

What made Macaulay different? He came from actuarial science, not cattle breeding. He was doing progeny testing—evaluating bulls by their daughters’ actual performance—decades before Holstein Association formalized the practice in the 1930s. The man treated genetic improvement like a math problem while everyone else bred on gut instinct and show-ring appearance.

The article pairs Macaulay’s data-driven approach against Stephen Roman’s empire-building through marketing muscle, Roy Ormiston’s patient cow-family development, and Heffering and Trevena’s paradigm-shifting partnership at Hanover Hill.

The question worth asking yourself: Are you breeding like Macaulay (data-first), Roman (marketing-first), Ormiston (cow-family-first), or some combination? Your answer shapes every semen purchase you’ll make in 2026. Knowing your bias reveals your blind spots.

Round Oak Rag Apple Elevation: The Bull That Changed Everything

You can’t have a serious conversation about Holstein breeding without talking about Elevation. But this article went beyond the usual tribute piece—it interrogated his legacy while respecting it. That tension is exactly what makes it Editor’s Choice material.

Born in 1965 on a modest Virginia farm from what the article calls “a questionable mating,” this unassuming black-and-white calf became the most significant genetic influencer Holstein breeding has ever seen. His bloodline now runs through nearly 9 million descendants. Almost every glass of milk you’ve ever enjoyed likely came from a cow with some connection to this sire.

His numbers were off the charts for the era: daughters averaging 29,500 pounds of milk during their first lactations—beating their peers by 15%—while sporting picture-perfect udders described by Charlie Will of Select Sires as having “high and wide rear udders with exceptional shape and symmetry”.

Here’s where it gets interesting for your bottom line. Those udders stayed attached for 2-3 lactations longer than average, translating into an extra $1,200 in profit per cow in 1970s dollars. Adjusted for inflation, that’s roughly $6,500 per cow today—the difference between a profitable and breakeven herd on longevity alone.

The Paradox Every Breeder Should Understand

What sets this piece apart is how it handles the tension between Elevation’s historical importance and his modern genomic evaluation. His current CDCB summary shows a Net Merit of -$821. Compare that to December 2025’s #1 Net Merit bull, Genosource Retrospect-ET, sitting at +$1,296 NM. That’s a $2,117 swing—representing six decades of genetic progress built on Elevation’s foundation.

That seems damning until you understand—as the article carefully explains—that these numbers compare him to a modern Holstein population he helped create. As Will put it: “Elevation’s genes form the baseline against which we measure progress—you can’t delete the foundation of a skyscraper and expect it to stand”.

Six decades after his birth, his DNA still runs through 14.5% of active proven Holstein sires. Understanding why matters when your genetics rep is pushing the latest trendy lineup. Foundation sires created the genetic architecture you’re building on. Ignoring that context leads to concentration mistakes.

READER ACTION: Before your next mating batch, review CDCB’s relationship tools to understand how heavily your current herd relies on Elevation and Chief genetics. Concentration you don’t see is concentration you can’t manage.

When Financial Disaster Breeds Genetic Gold: The Blackrose Story

This is the kind of story conventional dairy media won’t touch—financial ruin, bankruptcy, bull calves sent to slaughter just to keep the electricity on. But it’s also a story about vision, opportunity recognition, and the staying power of superior genetics.

Picture it: mid-80s, brutal January morning. Jack Stookey—once a larger-than-life figure who owned some of North America’s most elite cattle—can’t scrape together payroll. Decades of careful breeding sitting in legal limbo. And Louis Prange looks at that situation and sees a buying opportunity where everyone else sees disaster.

Prange worked out a deal with the bankruptcy trustee: lease the best cows, flush embryos, split proceeds three ways. His vision was what breeders call a “corrective cross”—mating two animals whose strengths perfectly complement each other’s weaknesses. He wanted to breed the red-and-white champion Nandette TT Speckle to To-Mar Blackstar, a production powerhouse who needed help on the structural side.

On March 24, 1990, Stookey Elm Park Blackrose came into this world.

From $4,500 Purchase to Dynasty

Sold as an 18-month-old for $4,500—about $10,400 in today’s money—she grew into a commanding presence that dominated wherever she went. Her numbers: 42,229 pounds of milk at five years old, 4.6% butterfat, 3.4% protein, EX-96 classification. She won All-American honors as both a junior two-year-old and a junior three-year-old, then captured the Grand Champion title at the Royal Winter Fair in 1995, joining an exclusive club of U.S. cows to win Canada’s most prestigious show.

But what really earns this story Editor’s Choice status is tracing Blackrose’s influence forward. Her descendants include Lavender Ruby Redrose-Red, who in 2005 became the first and only Red & White cow ever named Supreme Champion over all breeds at World Dairy Expo. And Ladyrose Caught Your Eye—a Unix daughter born in 2019 who’s won World Dairy Expo three consecutive years (2021-2023) with 16 milking daughters classified VG-87 or higher.

Financial disaster. Genetic gold. Same story, same cow family. If you’re not looking at dispersal auctions and bankruptcy sales as potential genetic opportunities, this article might change your mind.

READER ACTION: Before your next dispersal auction, ask: what second-chance genetics might be available that well-funded operations are overlooking? The Blackrose story suggests financial distress creates buying opportunities—if you know what you’re looking for.

When Giants Fall Silent: The Shore Dynasty’s Century of Excellence

“Have you ever gotten one of those calls that just stops you cold? Mine came the day after Christmas, 2013. Hardy Shore Jr. was gone.”

That opening line sets the tone for something different—not just a breeder profile, but a meditation on legacy, creative genius, and the personal costs of relentless pursuit of excellence.

The Shore story spans four generations, from William H. Shore’s leap into purebreds in 1910 (when most thought he’d lost his mind) to Hardy Jr.’s embryo exports in the genomic era. It’s a century of dairy evolution through one family’s decisions.

Why This History Matters Right Now

What really struck me, rereading this article, is how it mirrors challenges producers face today. Consider William’s decision to buy those first purebred Holsteins from Herman Bollert when mixed farming was safe, predictable, and profitable. Sound familiar? How many of us are weighing similar pivots right now with robotic milking systems, precision nutrition protocols, or carbon-neutral initiatives?

The genetic throughline is extraordinary. Follow it from Hardy Sr.’s twin bulls Rockwood Rag Apple Romulus and Remus, through Shore Royal Duke, to Fairlea Royal Mark—described as “possibly the best bull to come out of Western Ontario”—and you’ll find it leads directly to Braedale Goldwyn. Breeding decisions made in the 1940s shaped the breed through to the 2000s and beyond.

The article doesn’t shy away from Hardy Jr.’s personal struggles either. “The same creative fire that produced breakthrough genetics also fueled personal demons that few understood”. The industry’s response—celebrating his contributions while acknowledging his difficulties—showed the best of our community.

That’s nuanced, human storytelling. The dairy industry deserves more of it.

The $4,300 Gamble That Reshaped Global Dairy: The Pawnee Farm Arlinda Chief Story

If Elevation changed everything, Chief changed it alongside him. According to CDCB data cited in this article, up to 99% of AI bulls born after 2010 can be traced back to either Round Oak Rag Apple Elevation or Pawnee Farm Arlinda Chief. That’s not influence—that’s near-total genetic dominance of the modern Holstein population.

This piece opens with a pregnant cow traveling 1,152 miles by train from Nebraska to California in 1962, then traces how her calf would revolutionize milk production worldwide. Chief contributed nearly 15% to the entire Holstein genome—a level of genetic concentration unprecedented in livestock breeding.

The Question That Makes This Essential Reading

What earns this story Editor’s Choice status isn’t just the historical account—though that’s compelling. It’s the article’s willingness to honestly interrogate the legacy.

Chief transmitted tremendous production, yes. But he also passed along udder conformation challenges that breeders spent decades managing. The piece asks a provocative question: would Chief still have become the most influential Holstein sire in history if today’s genomic tools had been available? Would we have managed his genetics differently if we’d known what we know now from the start?

That’s not second-guessing history. That’s learning from it. And it’s exactly the kind of uncomfortable question we exist to ask.

READER ACTION: Run your herd through CDCB’s haplotype and relationship tools. Understanding your concentration on foundation sires like Chief helps you make smarter outcross decisions—and avoid repeating mistakes the breed made when we couldn’t see what we were building.

Death of ‘Get Big or Get Out’: Why Tech-Savvy 500-Cow Dairies Are Outperforming Mega-Farms

For years, the industry’s biggest voices told mid-size dairies to expand or exit. This article asked: what if that conventional wisdom was incomplete—and what if the data revealed something more nuanced?

Every decade has its orthodoxy. For the past fifty years, dairy’s orthodoxy has been scale. This piece challenged it directly, examining how mid-size operations leveraging precision technology achieve profitability metrics that compete with operations several times their size in specific market conditions.

Now, to be clear: scale advantages are real. Recent USDA data shows larger operations generally achieve lower per-unit costs, and the correlation between size and overall profitability remains strong in aggregate. The article didn’t dispute that.

What the Article Actually Found

What it documented was more specific: certain 500-cow operations in the Upper Midwest using robotic milking, precision feeding, and intensive management protocols were achieving component yields and margin-per-cwt figures that challenged the assumption that they were simply waiting to be consolidated out of existence.

The key variable wasn’t size—it was technology adoption intensity and management focus. Operations that couldn’t compete on scale were competing on precision.

That’s a different argument than “small is better.” It’s an argument that technology can substitute for some—not all—of the scale advantages when management intensity matches the investment.

The response from readers was telling. At least a dozen producers emailed us about sharing this article with their lenders when justifying technology investments over expansion. One Wisconsin producer credited the piece with helping secure $180,000 in automation financing instead of a $2.4M expansion loan that would have stretched his operation thin.

If you’re running a mid-size operation and feeling pressure to “grow or go,” this article offers a more nuanced framework for evaluating your options.

The Human Stories: Hearts, Tragedy, and Triumph

Not every Editor’s Choice selection centers on breeding decisions and production records. Two articles this year reminded us why the human element matters—and earned their place through reader impact rather than genetic analysis.

Hearts of the Heartland

This Youth Profile documented young dairy farm girls battling extraordinary health challenges while their families remained committed to dairying. What struck readers wasn’t just the adversity—it was the community response. The article traced how neighboring operations stepped in during medical crises, how 4-H networks mobilized support, and how the fabric of rural dairy communities showed its strength when tested.

The piece generated more reader emails than any other youth profile we’ve published. Several readers mentioned sharing it with family members who questioned why they stayed in dairy when the economics got tough. It captured something data can’t measure—the emotional core of agricultural life, the values that keep operations running when spreadsheets say they shouldn’t.

From Tragedy to Triumph: Nico Bons

This profile showed how setbacks can catalyze the kind of focused intensity that produces greatness. Bons’s trajectory—tragedy, rebuilding, excellence—provided both inspiration and a practical framework for breeders facing their own obstacles.

The article documented specific decisions Bons made during his lowest points that positioned him for later success: doubling down on cow families he believed in when others suggested selling, maintaining classification standards when cutting corners would have been easier, and building relationships that paid dividends years later.

For anyone dealing with challenges right now—and honestly, between labor pressures, feed costs, and processor consolidation, who isn’t?—this piece offers more than motivation. It offers a model.

The Holstein Genetics War: What Every Producer Needs to Know

Some topics require going beyond surface-level reporting. The competing visions for Holstein breeding’s direction—the economic forces, policy implications, and philosophical tensions shaping the breed’s future—demanded exactly that treatment.

This article examined the battle lines between different approaches to genetic improvement: index-driven selection versus holistic breeding programs; concentration of elite genetics versus diversity; and short-term gains versus long-term sustainability. It named the tensions other publications dance around—including specific industry voices pushing concentration and the researchers warning against it.

Whether you’re navigating US component pricing shifts, EU Green Deal compliance costs, Canadian quota considerations, or NZ emissions regulations, the strategic questions this article raises apply across markets. The breed’s direction isn’t being set in a vacuum. Policy, economics, and genetic decisions interact in ways this piece helped readers understand.

The article generated exactly the kind of productive disagreement we aim for—readers with strong opinions engaging substantively rather than nodding along. When industry professionals argue thoughtfully about something we’ve written, that tells us we hit a nerve worth hitting.

If your genetics rep is pushing hard for one approach, this article gives you a framework for asking better questions and evaluating whether their recommendations align with your operation’s long-term interests.

The Controversial Canadian System That Could Save American Dairy

Trade policy isn’t sexy. We made it essential reading anyway.

By connecting Canada’s supply management debate to real-world implications for American producers, this article transformed dry policy discussion into a story about survival, fairness, and the future of family farming. It examined the evidence honestly—acknowledging both legitimate criticisms of supply management and the genuine problems it addresses that free-market systems struggle with.

The response was polarized. Some readers sent passionate disagreements, arguing that any government intervention distorts markets and punishes efficiency. Others thanked us for finally explaining a system they’d heard criticized but never understood—and pointed to the stability Canadian producers enjoy while American operations ride brutal price cycles.

Both responses tell us the same thing: this was journalism that mattered to people trying to understand their competitive environment.

Whether you think Canadian dairy policy is a model worth studying or a cautionary tale about protectionism, understanding how it actually works—rather than relying on political talking points from either side—makes you a better-informed decision maker.

Articles That Almost Made the List

A few pieces came close and deserve mention for readers looking to go deeper:

Bell’s Paradox: The Worst Best Bull in Holstein History examined a bull who excelled in production traits while transmitting significant type faults—challenging comfortable assumptions about what “best” even means in genetic evaluation. Strong engagement, genuine controversy, but slightly narrower application than our final selections.

The Robot Truth: 86% Satisfaction, 28% Profitability—Who’s Really Winning? found that robotic milking adopters reported high satisfaction rates, but far fewer achieved projected profitability targets within expected timeframes. If you’re considering automation investments, add this to your reading list before signing anything.

The Silent Genetic Squeeze documented inbreeding coefficients in the Holstein population rising steadily over recent decades, with specific data on haplotype frequency changes that affect fertility and calf survival. Important reading for anyone concerned about where genomic selection’s concentration is taking the breed.

The Bottom Line: Your 2026 Reading List

Looking at this collection, patterns emerge. We gravitate toward stories that challenge assumptions rather than reinforce them, connect historical decisions to present-day implications, humanize the industry without losing analytical rigor, and tackle uncomfortable topics when the evidence demands it.

You can read publications that confirm what you already believe, or you can read the ones that make you uncomfortable enough to improve. These ten articles fall in the second category. That’s why they earned Editor’s Choice.

The conversations these articles started aren’t finished. Genomic selection keeps evolving—as the December 2025 proofs showed, with Genosource capturing 22 of the top 30 Net Merit positions and reshaping the competitive landscape overnight. The tension between consolidation and resilience intensifies. Component pricing shifts and processor relationships tighten. And the human stories—the triumphs, the setbacks, the stubborn persistence of people who believe in this industry—keep unfolding.

We’ll be here to cover them. Starting in January with our deep-dive into what the December 2025 proof run means for your spring matings—and why three bulls everyone’s talking about might not deserve the hype.

With data. With nuance. And with the same commitment to making you think rather than just nod along.

That’s what these ten articles delivered in 2025. That’s what we’re aiming for in 2026.

EXECUTIVE SUMMARY: 

‘We published 300 articles in 2025—these ten are the ones readers bookmarked, argued about, and shared with lenders and genetics reps months later. Inside: the $260,000 gamble that put one bull’s blood in every registered Holstein alive today, a bankruptcy that spawned three consecutive World Dairy Expo champions, and data showing tech-savvy 500-cow dairies beating mega-farms on margin-per-cwt. You’ll find Elevation’s $6,500/cow longevity advantage explained against his -$821 Net Merit—a $2,117 swing from today’s #1 bull representing sixty years of progress built on his foundation. Each piece delivers actionable breeding frameworks for 2026, not just history. One Wisconsin producer used our scale article to secure $180,000 in automation financing instead of a $2.4M expansion loan. Your competitors already read these twice—have you?

The Sunday Read Dairy Professionals Don’t Skip.

Every week, thousands of producers, breeders, and industry insiders open Bullvine Weekly for genetics insights, market shifts, and profit strategies they won’t find anywhere else. One email. Five minutes. Smarter decisions all week.

NewsSubscribe
First
Last
Consent

83% of Dairies Overtreat Mastitis – That’s $6,500/Year Walking Out the Door

Michigan State researchers found treatment costs varying threefold across similar operations. The difference wasn’t the antibiotics. It was the decisions.

EXECUTIVE SUMMARY: With Class III averaging $17-18 and margins under pressure, there’s $30,000-50,000 per year hiding in your mastitis protocols—and Michigan State research shows exactly where to find it. Dr. Pamela Ruegg’s team tracked 37 commercial dairies and found treatment costs varying threefold ($120 to $330 per case) for identical infections, with the gap driven entirely by decisions, not antibiotics. The core issue: 83% of producers treat longer than label minimum, adding $65/day in unnecessary milk discard because we treat until milk looks normal—even though bacterial cure precedes visual cure by 24-48 hours. On-farm culture cuts antibiotic use in half while maintaining outcomes, with typical payback under 90 days. The hardest part isn’t the protocol change; it’s trusting the science when you’re staring at off-looking milk on day three. But the economics don’t lie—and in today’s market, leaving $30K on the table isn’t something most operations can afford.

mastitis treatment costs

You know, when Dr. Pamela Ruegg’s team at Michigan State University started digging into mastitis economics across 37 commercial dairies—operations averaging around 1,300 cows each—they found something that really made me sit up and take notice. Out-of-pocket treatment costs for cases that were essentially identical ranged from $120 to $330 per farm. Same antibiotics. Same case severity. Nearly three times the cost difference.

That finding deserves some thought because it points to something a lot of us have probably sensed over the years but rarely put numbers to. We’ve accepted for a long time that mastitis runs about $250 per case and somewhere around $2 billion annually across U.S. operations—figures the National Mastitis Council has been citing for years now. Those numbers get repeated so often they’ve almost become white noise at conferences and in the trade publications. But here’s what the Michigan State work actually shows: those averages hide enormous variation in real-world outcomes. Some operations are spending well under $250 per case while getting solid results. Others are spending considerably more and still can’t seem to get ahead of their udder health challenges.

The difference, as Dr. Ruegg’s research suggests, comes down to decisions we can control: treatment duration, pathogen identification, prevention investment, and culling calculations. None of this requires fancy new technology or major capital investment. It does require taking a fresh look at some practices we might not have questioned in a while. And with 2024-25 margins under pressure—Class III averaging in the $17-18 range, feed costs still elevated—the buffer that used to absorb inefficiency just isn’t there anymore.

The Math Most of Us Have Been Using—And What the Research Actually Shows

Here’s where things get interesting. The way most of us have been calculating mastitis costs doesn’t capture what’s actually happening economically. Take a look at how traditional thinking stacks up against what the research reveals:

FactorTraditional MathThe Real MathAnnual Impact (500-cow herd)
Treatment DurationTreat until milk looks normal (5+ days)Label minimum often sufficient (2-3 days)$6,500+ in unnecessary discard
Days in Milk ImpactAll cases cost ~$250Early lactation: $444; Late lactation: ~$120Varies 3-4x based on timing
Subclinical Loss“Not a problem if the bulk tank is fine.”Accounts for 48% of total mastitis costs$33,000+ in hidden losses
Culling DecisionsHeifer cost minus cull valueFuture profit potential over the planning horizonCulling = 48% of clinical mastitis costs

Sources: Michigan State University (Ruegg, 2021); Canadian Bovine Mastitis Research Network (Aghamohammadi et al., 2018)

Understanding Where Cost Variability Comes From

Dr. Ruegg’s work at Michigan State, published in the Journal of Dairy Science back in 2021, breaks down exactly where this variation originates—and honestly, the findings offer some pretty clear direction for anyone willing to act on them.

Subclinical mastitis and culling decisions (shown in red) account for 96% of total mastitis costs—yet most operations only track clinical treatment and discarded milk 

Timing matters more than most of us probably realize. A case hitting a cow in her first 30 days fresh averages around $444 in total impact because that production hit follows her through the entire lactation. That same infection at 200 days in milk? You’re looking at something closer to $120, simply because there’s less lactation left to affect. Makes sense when you think about it, but how often do we actually factor timing into our treatment intensity decisions? In my experience, not often enough.

A mastitis case in the first 30 days costs $444 vs. $120 in late lactation—yet most operations apply identical treatment intensity regardless of timing

What’s causing the infection matters quite a bit, too. Your gram-negative cases—E. coliKlebsiella—tend toward more dramatic presentation but often resolve without intervention. Meanwhile, gram-positive infections generally respond well to appropriate treatment but won’t clear up on their own. The research consistently shows that gram-negative infections incur higher total costs due to their severity, even though many will self-cure if given time.

And then there’s treatment duration. This is where the Michigan State findings become immediately useful. Their data showed that each additional treatment day beyond label minimum costs approximately $65 in discarded milk and extended withdrawal. Think about what that actually means on your operation: an 80-pound cow at $18 per hundredweight generates $14.40 in daily milk value. Extend treatment for three days beyond what’s actually necessary? That’s $43 in direct milk loss right there, plus your antibiotic costs, plus labor time. It adds up faster than most of us realize.

The Hidden Economics Most of Us Miss

What I’ve come to appreciate over years of following this research—and talking with producers who’ve really dug into their numbers—is that our standard accounting does a surprisingly poor job capturing actual mastitis costs. We track what shows up on invoices. We miss what accumulates quietly in the background.

A study published in Frontiers in Veterinary Science back in 2018 really quantified this gap in a way that hit home for a lot of folks I’ve discussed it with. Researchers from the University of Montreal and the Canadian Bovine Mastitis Research Network tracked 145 commercial operations and calculated total mastitis costs at CAD $662 per cow annually across the herd. Now, that’s not per case—that’s per cow in the milking string, whether she had clinical mastitis or not. And here’s the kicker: subclinical mastitis accounted for nearly half of those costs, with milk yield reduction being the biggest hidden driver.

Think about what typically shows up on your books: antibiotic purchases, discarded milk during withdrawal, vet visits for the severe cases, and labor during treatment. Now think about what usually doesn’t show up anywhere: the production drop that persists after an early-lactation infection clears, the extra days open that subclinically infected cows tend to accumulate, the culling decisions made without complete economic analysis, the bulk tank SCC that hovers just under penalty thresholds but quietly costs you quality premiums month after month.

I’m not pointing fingers here—the economic feedback most operations receive is simply incomplete. But that incomplete picture can lead us to underinvest in prevention and make treatment decisions that don’t really optimize for what matters most to the bottom line.

Reconsidering How Long We Treat

This is where the research translates most directly into money you can actually keep.

That same Canadian study found something really interesting about how producers actually handle treatment. Among farmers using a single protocol for mild or moderate cases, 83% were treating for longer than the labeled regimen—averaging about two extra days beyond the protocol’s duration. Only 17% were following the label duration exactly. If you think about your own habits or watch what happens in your parlor, those numbers probably ring true.

And look, the tendency to keep treating when milk still looks abnormal makes complete sense. You’re looking at clumpy milk on day three, and every instinct you’ve developed over years of working with cows tells you “she’s not better yet.” That’s a reasonable instinct. I get it.

But here’s what the biology actually shows, and this is worth really understanding: clinical cure—milk appearance returning to normal—lags biological cure by 24-48 hours. The bacteria can be cleared while the inflammation is still resolving. The udder is healing, even though the milk still doesn’t look quite right. Treating through visual normalization often means you’re medicating a cow whose infection has already resolved. As Dr. Ruegg puts it, the abnormal milk appearance is due to inflammation, and it’s not predictive of whether bacteria are still present.

Research from California, published in the Journal of Dairy Science, tracked non-severe gram-negative cases across different treatment protocols and found that a 2-day treatment achieved equivalent clinical outcomes to a 5-day treatment—at meaningfully lower cost. For operations running a typical mastitis incidence, those savings compound pretty quickly over a year.

I talked with a Wisconsin herd manager not long ago who shared his experience implementing shorter protocols: “First month was brutal,” he told me. “My lead milker was absolutely convinced I was going to kill cows by stopping treatment at two days. Milk still looked off in a couple of them. I had to stand between him and the treatment box physically. Three days later? Milk was normal. He’s a believer now, but we had to get through that crisis of faith first.”

83% of producers extend treatment beyond label minimum, adding $65 per day in unnecessary milk discard—even though bacterial cure precedes visual cure by 24-48 hours 

That psychological barrier—trusting the biology over what your eyes are telling you—seems to be the hardest part of making this change. The research supports shorter treatment for non-severe cases. The economics favor it clearly. But in the moment, standing in front of a cow showing abnormal milk… it takes real discipline to trust the science over your instincts.

Why Some Infections Just Won’t Clear—The Biology Most of Us Never Learned

Here’s something that wasn’t in the textbooks when most of us were coming up: bacteria talk to each other. And that communication—scientists call it quorum sensing—might explain why that chronic mastitis case keeps coming back no matter what you throw at it.

The basic concept is this: bacteria aren’t just mindless individual cells floating around waiting to be killed by antibiotics. They’re sophisticated communicators. Through quorum sensing, they release signal molecules to detect how many similar bacteria are nearby. When the population reaches a critical mass, they undergo what researchers describe as a phenotypic shift—essentially flipping a switch that triggers coordinated group behavior.

And one of the most important things that switch turns on? Biofilm formation.

You’ve probably seen biofilm in your water troughs or pipeline—that slimy layer that builds up over time. The same thing happens inside the udder. Research published in Frontiers in Veterinary Science in 2021 confirms that Staphylococcus aureus, one of our most problematic mastitis pathogens, forms biofilm communities inside udder tissue. Once established, these bacterial fortresses become remarkably difficult to eliminate.

Here’s why that matters for treatment: bacteria within a biofilm can be up to 1,000 times more resistant to antibiotics than the same bacteria floating freely. It’s not that the antibiotic doesn’t work—it’s that the biofilm creates a physical barrier AND, perhaps more importantly, bacteria inside biofilms actually change their gene expression. They essentially turn off the cellular processes that antibiotics are designed to target.

Dr. Johanna Fink-Gremmels, a veterinary pharmacology specialist, puts it this way: “Bacteria within a biofilm change their gene expression. They may turn down protein or membrane synthesis, which are common antibiotic targets, making the antibiotics ineffective because their target is gone.”

That’s a fundamentally different problem than what we typically think about with treatment failure. We’re not just dealing with resistant bacteria—we’re dealing with bacteria that have essentially hidden themselves and gone dormant until the threat passes.

This helps explain some patterns we’ve all probably noticed. That quarter that clears up after treatment but flares again three weeks later? Likely a biofilm reservoir that was never eliminated. The chronic subclinical case that never quite gets below 400,000 SCC no matter what you do? Same story.

What’s particularly interesting—and honestly, a bit concerning—is that sub-therapeutic antibiotic exposure can actually trigger biofilm formation. The bacteria sense a threat that isn’t quite strong enough to kill them, and they respond by building more protection. It’s a reminder that partial treatment or insufficient duration can sometimes make things worse rather than better.

The emerging research is exploring ways to disrupt quorum sensing itself—blocking the bacterial communication that coordinates biofilm formation in the first place. Some plant-derived compounds show promise for jamming these bacterial signals. A study from Texas A&M found that certain phytogenic compounds can reduce biofilm formation by 60-88% by interfering with quorum sensing pathways.

Now, I want to be careful here—this is still relatively emerging science, and I’m not suggesting everyone should abandon proven protocols for the latest thing. But understanding these mechanisms helps explain why:

  • Chronic S. aureus infections are so difficult to cure (biofilm formation is particularly strong)
  • Early-lactation infections can establish persistent problems (bacteria have time to form biofilms before immune function fully recovers)
  • Prevention consistently outperforms treatment economically (avoiding biofilm establishment is far easier than eliminating it)
  • On-farm culture matters more than we might think (knowing you’re dealing with a biofilm-prone pathogen changes the calculus)

For practical purposes, this biology reinforces what the economics already tell us: preventing infections from establishing is worth far more than treating them after the fact. And when you do have persistent problems, understanding that you may be dealing with protected bacterial communities—not just stubborn individual cells—changes how you think about the challenge.

It’s also worth noting that biofilm can form in your equipment, not just in udders. That slimy layer in water troughs or pipeline? Research from the University of Wisconsin suggests it can reduce water palatability enough to cut intake—and every pound of reduced water consumption costs you roughly a pound of milk. Keeping equipment truly clean, not just visibly clean, matters more than most of us probably realize.

The Value of Actually Knowing What You’re Treating

If treatment duration is probably the most accessible economic lever, bacterial identification might be the most impactful one over the long haul. The value of knowing what you’re actually dealing with becomes pretty obvious when you look at pathogen-specific outcomes.

Penn State extension has documented this stuff for years now. Here’s what systematic culturing typically reveals—and what it means for your treatment decisions:

Culture ResultFrequencyRecommended ActionEconomic Impact
No Growth10-40%Do not treatSaves antibiotics + 2-5 days milk discard
Gram-Negative25-35%Supportive care; short duration if treatedPrevents 2-3 days of unnecessary discard
Gram-Positive30-50%Targeted antibiotic therapyHigher cure rate with appropriate treatment

Source: Penn State Extension; Journal of Dairy Science

Farms implementing on-farm culture consistently report around 50% reductions in antibiotic use while maintaining or even improving cure rates. They’re using half the antibiotic and achieving comparable or better outcomes because they’re matching treatment to what’s actually happening in that quarter.

Operations implementing culture-guided protocols cut antibiotic use by 50%, reduce costs by 40%, and eliminate 80% of unnecessary treatments—all while maintaining or improving cure rates

The economics pencil out for most operations:

  • System cost: $2,500-3,000 for a quad-plate setup
  • Per-case culture cost: ~$10-15, including supplies and labor
  • Typical payback: 60-90 days for operations running industry-average mastitis incidence

Penn State’s extension materials emphasize that trained producers can achieve high accuracy in decisions that actually matter—distinguishing gram-positive from gram-negative from no growth. You don’t need laboratory-level precision here. You need enough accuracy to guide treatment decisions, and that’s absolutely achievable with proper training and consistent technique.

Culture ResultFrequencyRecommended ActionEconomic Impact Per Case
No Bacterial Growth10-40% of casesNO treatment neededSave $130-195
Gram-Negative
(E. coli, Klebsiella)
25-35% of casesSupportive care; short duration if treatedSave $65-130
Gram-Positive
(Staph, Strep)
30-50% of casesTargeted antibiotic therapy (2-3 days)Optimize drug selection
Contaminated Sample5-15%
(poor technique)
Re-sample with better aseptic techniqueWaste $10-15

Prevention Economics – Where the Real Returns Hide

There’s a tendency in our industry to view prevention as an expense category and treatment as the necessary response to problems that inevitably arise. The research suggests we might have that framing exactly backwards.

Post-milking teat disinfection emerges across virtually every study as the highest-ROI intervention. That Canadian study I mentioned earlier found 97% of participating farms were already using post-milking teat dipping—it’s become nearly universal because the returns are so clear and immediate. For any operation that isn’t doing this consistently, it’s probably the clearest opportunity out there.

Selective dry cow therapy is another area where research increasingly supports approaches different from the traditional blanket treatment most of us grew up with. Dr. Ruegg’s team at Michigan State examined what happens when farms move from blanket treatment to selective protocols—treating only infected or high-risk cows based on SCC history while applying internal teat sealants universally. They found potential for about 50% reduction in antibiotic use and estimated savings of roughly $5.37 per cow with equivalent or superior early-lactation udder health outcomes.

Now, this approach does require more management intensity and solid record-keeping, so it won’t fit every operation equally well. But for farms with the systems to implement it properly, the economics look pretty favorable.

InterventionInitial InvestmentPayback PeriodAnnual Savings (500-cow herd)Antibiotic Use Impact
On-Farm Culture System$2,500-3,00060-90 days$6,500+-50%
Post-Milking Teat Dip$800-1,200/yearImmediate$8,000-12,000Prevents infections
Selective Dry Cow Therapy$1,500-2,000 setup4-6 months$2,685-50%
Extended Treatment (Beyond Label)$0Loses $6,500/year-$6,500+35% (wasted)

The Norwegian dairy industry offers what might be the most comprehensive example of what prevention-focused economics can achieve at a whole-industry scale. Their systematic implementation of prevention priorities, mandatory health recording, and selective treatment protocols reduced national mastitis costs from 9.2% to 1.7% of milk pricebetween 1994 and 2007. They now report the lowest antibiotic use per kilogram of livestock biomass among all the European countries being tracked.

That kind of transformation didn’t happen overnight or by accident—it required infrastructure investment, aligned incentives across the supply chain, and genuine cultural change throughout their industry. But it demonstrates what becomes possible when prevention rather than treatment becomes the default mindset.

The Culling Calculation Worth Revisiting

Here’s a calculation I think a lot of farms are getting wrong, and it’s costing real money in both directions—keeping cows too long and culling too soon.

The common approach most of us use: replacement heifer cost minus cull cow sale value. With heifers running $3,000-4,000 and cull cows bringing $1,800-2,300 these days—those cull values are at historic highs, by the way—that math suggests a $1,200-2,200 replacement cost from culling. The narrowed gap might make culling seem more attractive on paper, but that simple calculation still misses what actually matters.

What’s the difference in future profit potential between keeping this specific cow versus replacing her with a specific heifer?

Think through a practical example. A second-lactation cow at 150 days in milk develops mastitis. Production drops from 75 to 68 pounds daily. She’s open but otherwise healthy.

  • Simple transaction math says culling costs around $1,500 (heifer price minus elevated cull value).
  • A complete economic analysis considers her remaining profit potential—finishing this lactation, completing a third lactation at mature-cow production levels, and eventual cull value—compared with what a replacement heifer would generate over the same timeframe.

That fuller analysis often favors keeping her despite the mastitis episode. The infection dropped her production, sure, but she may still be worth more than her replacement over the relevant planning horizon.

What’s particularly telling: that Canadian study found culling represented the largest single cost component for both clinical and subclinical mastitis—accounting for about 48% of clinical mastitis costs. That magnitude suggests these decisions deserve more systematic analysis than they typically get.

Even with today’s elevated cull values narrowing the replacement cost gap, the fundamental point remains: cows that would have been clear culling candidates when heifers cost $1,800 now have positive retention value at $3,500 heifers. The economic decision point has shifted. The question is whether our decision frameworks have shifted along with it.

The Subclinical Challenge That Keeps Nagging

Bulk tank SCC shows up on every pickup report. It’s probably the most frequently measured metric we have in dairy. Yet subclinical mastitis continues to cause estimated annual U.S. losses of $1 billion+, according to the National Mastitis Council. Why does that gap between measurement and management persist?

The limitation is that bulk tank SCC only tells you the aggregate average. It doesn’t tell you which cows are infected, how long they’ve been dealing with it, or whether the situation is trending better or worse.

A reading of 185,000 cells/mL could represent a herd with 85% healthy cows and 15% chronic infections. Or it could mean widespread low-grade infection that’s building toward clinical outbreaks. Same number, completely different situations requiring completely different responses.

A Pennsylvania producer shared a story with me that illustrates this really well: “We were running 178,000 bulk tank, feeling pretty good about ourselves,” he said. “Then we actually pulled the DHI data and found 14 cows averaging over 400,000 that weren’t showing any clinical signs. Given the production losses those cows were experiencing, we were bleeding money on milk that never even made it to the tank. The bulk tank number had us thinking everything was fine when it really wasn’t.”

Farms that manage subclinical mastitis effectively tend to have systematic protocols that convert data into specific, actionable decisions. They set clear thresholds: culture any cow over 200,000 on consecutive tests; immediate intervention at 400,000; and specific action plans at each level. They review watchlists weekly rather than just filing the DHI report and moving on to the next thing.

Regional and Seasonal Context

These economics aren’t uniform everywhere, and that’s worth acknowledging directly. The figures I’ve been citing primarily reflect Upper Midwest, Northeast, and Canadian commercial operations—the regions where most of this research has been conducted.

Southeast dairies deal with different realities. Heat stress and humidity create environmental mastitis challenges that shift the pathogen mix considerably. Summer months typically see more E. coli and Klebsiella from bedding contamination, while contagious pathogens spread more readily in winter housing. California’s large dry lot operations have different exposure patterns than Wisconsin freestalls. Organic operations face additional considerations regarding treatment options that significantly affect the calculations.

Smaller operations may find some interventions don’t quite pencil out at their scale—the fixed costs of on-farm culture systems require sufficient case volume to justify the investment.

The principles apply broadly: know your pathogens, match treatment to actual need, invest in prevention, and make culling decisions based on complete economics. But the specific numbers need local calibration.

The Implementation Reality

It’s worth being direct about why more farms haven’t adopted practices the research so clearly supports. The economics favor on-farm culture and selective treatment. Payback periods are short. Returns are well-documented. And yet adoption remains pretty modest across the industry.

Part of it is the psychology I already mentioned—trusting biology over visual appearance, accepting that abnormal-looking milk doesn’t always mean more treatment is needed. That runs against instincts we’ve built over entire careers.

Part of it is implementation discipline. The farms that succeed with culture-based protocols treat them like any other systematic management approach: written protocols everyone follows, trained staff at every level, and regular review of outcomes. The farms that struggle tend to treat it more casually—doing it when convenient, following culture results except when it doesn’t feel right. That second approach rarely holds up over time.

Sample contamination is another common practical failure point. Without solid aseptic technique, you get plates showing multiple bacterial species that can’t actually guide treatment decisions. When contamination rates run too high, farms often conclude the whole system doesn’t work—when really their collection technique just needs some refinement.

A veterinarian who consults with a lot of Upper Midwest operations framed it this way when I talked with him: “The farms that succeed have written protocols, trained staff, and monthly review meetings where we examine outcomes together. The farms that struggle treat it like a suggestion. That second approach just doesn’t hold up.”

Looking Ahead

Several forces seem likely to shape mastitis economics over the coming years.

Processor requirements are evolving beyond simple SCC penalties toward documentation of antimicrobial stewardship practices. Export markets and retail buyers increasingly demand verification of responsible antibiotic use, pushing processors to ask more of their suppliers. This trend isn’t going away—and producers who wait for processors to mandate culture-based protocols will find themselves implementing under pressure rather than capturing savings on their own timeline.

Technology keeps making selective treatment more practical. Activity monitoring systems from companies like SCR, Afimilk, and others increasingly incorporate udder health alerts that flag quarters before clinical signs appear. Inline sensors that measure conductivity and other milk parameters can detect problems earlier than visual observation alone. As these systems become more prevalent and affordable, the practical obstacles to selective treatment continue to diminish.

And economic pressure keeps forcing optimization throughout the industry. At current input costs and milk prices, the margins that once absorbed some inefficiency just don’t do that as comfortably anymore. Avoidable mastitis costs that might have been tolerable at better margins become harder to carry when overall profitability is tight.

Key Takeaways

On treatment economics:

  • Research supports label-minimum treatment durations for non-severe cases
  • Each extra treatment day costs approximately $65 in discarded milk
  • Biological cure precedes visual normalization by 24-48 hours—milk can look abnormal even after the infection has cleared

On bacterial identification:

  • On-farm culture systems typically achieve a 60-90 day payback
  • 10-40% of clinical cases show no bacterial growth—treating these provides zero benefit
  • Knowing the pathogen enables targeted therapy with better economic outcomes

On prevention investment:

  • Post-milking teat disinfection consistently shows the highest returns
  • Selective dry cow therapy can reduce antibiotic use by approximately 50% while maintaining udder health
  • Subclinical mastitis accounts for nearly half of the total mastitis costs in most studies

On culling decisions:

  • Simple transaction math (heifer cost minus cull value) still misses future profit potential—even with today’s elevated cull prices
  • At current heifer prices, many cows previously culled now have positive retention value
  • Culling accounts for 48% of clinical mastitis costs—these decisions matter

On implementation:

  • Written protocols consistently outperform verbal agreements
  • Cross-training multiple staff members prevents knowledge loss when people move on
  • Regular reviews make ROI visible and maintain protocol adherence
  • Veterinary partnership provides valuable expertise for protocol development and troubleshooting

Resources for Further Reading

For producers interested in exploring these approaches further, several university extension programs offer detailed implementation guidance:

  • Penn State Extension: On-farm culture training materials and mastitis treatment protocols at extension.psu.edu
  • University of Wisconsin Milk Quality Program: Decision support tools and economic calculators at milkquality.wisc.edu
  • Michigan State University Extension: Mastitis economics research and practical recommendations at canr.msu.edu/dairy
  • National Mastitis Council: Industry guidelines and research summaries at nmconline.org

The Bottom Line

The research points toward real opportunities for operations willing to examine their protocols against current evidence. The changes involved aren’t revolutionary—optimized treatment duration, bacterial identification, systematic prevention, more complete culling calculations—but the cumulative impact on farm economics can be pretty substantial. For a 500-cow herd running industry-average mastitis rates, the difference between optimized and traditional protocols could mean $30,000-50,000 in annual margin. That’s real money sitting in decisions you make every day.

For operations considering these approaches, documenting your current costs as a baseline, followed by a veterinary consultation on protocol options, provides a sensible starting point. The economics appear favorable for most situations. Implementation requires discipline and systematic follow-through. Whether that fits your operation’s circumstances, capabilities, and management style is ultimately a judgment only you can make—but at least now you’ve got solid numbers to inform that decision.

Next time you’re standing in the parlor on Day 3 of a treatment, put the tube back in the box and trust the biology. Your bottom line will thank you.

Complete references and supporting documentation are available upon request by contacting the editorial team at editor@thebullvine.com.

Learn More

The Sunday Read Dairy Professionals Don’t Skip.

Every week, thousands of producers, breeders, and industry insiders open Bullvine Weekly for genetics insights, market shifts, and profit strategies they won’t find anywhere else. One email. Five minutes. Smarter decisions all week.

NewsSubscribe
First
Last
Consent

Farmers Think 60% Reject Gene Editing. Research Says 18%. Here’s What That Gap Costs You.

Three years ago, the FDA cleared gene-edited cattle. Today, early adopters have data. Late adopters have… assumptions. Which are you betting your genetics program on?

EXECUTIVE SUMMARY: Dairy farmers estimate 60% of consumers reject gene-edited products. Research shows only 18% are firmly opposed. That perception gap may be the most expensive blind spot in your genetics program. Three years after the FDA cleared SLICK heat-tolerant cattle, early adopters have data—late adopters have assumptions. For heat-stressed herds, the cost of waiting runs $200-250/cow annually, with genetic improvements compounding each generation you delay. But the math isn’t universal: California operations losing $275/cow face a different decision than Wisconsin herds at $75-80. Meanwhile, Indonesia and Pakistan are now importing heat-tolerant genetics—positioning matters. This analysis delivers the research, the regional economics, and a threshold framework to help you decide: adopt, wait, or pass. Your answer depends on your numbers, not industry noise.

Three years and potentially $200-250/cow in heat-stress savings later, North American dairy producers are weighing a decision that’s less about the science itself and more about competitive timing. Here’s what the emerging data suggests—and why the assumptions driving most producers’ hesitation may be years out of date.

Mark Thompson (name changed at his request) runs 650 Holsteins outside Fresno, California, where summer temperatures routinely top 105°F. Last July, he watched his herd’s conception rates drop to 18%—down from 42% in the cooler months. His cooling infrastructure costs nearly $85,000 in electricity alone annually.

“I’ve been following the SLICK genetics conversation for two years now,” Thompson told me when we spoke in early December. “My AI rep keeps bringing it up. But every time I think about pulling the trigger, something holds me back. It still feels like we’re early on this.”

You know, Thompson’s hesitation reflects what I’m hearing from producers across the country—a reasonable caution about adopting new technology balanced against growing questions about what waiting might cost. That push-and-pull is worth unpacking.

Quick Math: Thompson’s Operation

  • Estimated heat stress losses: ~$275/cow × 650 cows = ~$179,000/year
  • Semen premium at current pricing: ~$60/breeding × 200 breedings = ~$12,000/year
  • Net potential benefit: ~$167,000/year (before accounting for multi-year genetic lag)

Your numbers will be different. That’s exactly the point.

RegionAnnual Heat Stress Cost per CowTypical THI Days >72SLICK Break-Even at $60 Semen PremiumAdoption Priority
California (Central Valley)$250-27590-120Year 1High
Texas (South)$220-24085-110Year 1High
Arizona$260-28095-125Year 1High
Wisconsin$75-8025-35MarginalEvaluate
Minnesota$60-7020-30NoLow
Pacific Northwest$50-6515-25NoLow

What European Regulatory Shifts Signal for You

European regulatory shifts on gene-edited crops signal where livestock rules may eventually head—but if you’re tracking this space, don’t expect quick clarity. The EU has been moving toward a more permissive framework for new plant genomic techniques, though several member states, including Germany and Austria, remain cautious. Livestock-specific regulations are still being worked out, and Germany’s retail sector may create de facto barriers regardless of what Brussels decides.

Here’s what matters for your planning: A 2024 survey commissioned by the German Association for Food without Genetic Engineering (VLOG) and conducted by the Civey polling institute with over 5,000 respondents found that 84% of German voters want mandatory labeling for new genetic engineering in food. That’s a significant number, and it creates real tension between regulatory permission and actual market acceptance.

German retailers have shown they’re willing to go beyond what regulations require. Back in 2022, ALDI’s German chains committed to shifting their private-label fresh milk to higher Haltungsform animal welfare tiers, and since then, they’ve steadily moved away from lower-tier sourcing—using welfare labeling as a competitive signal to consumers. Industry observers expect similar dynamics could develop around gene-edited dairy, where regulation might eventually permit it, but major retailers will continue to differentiate based on production methods.

In practice, this probably means Europe’s gene-edited dairy market—whenever it materializes—will develop as a two-speed structure. Denmark, the Netherlands, and parts of France appear more receptive to the technology. Germany and Austria may maintain de facto barriers through retail positioning, regardless of what Brussels ultimately permits. For North American producers thinking about export opportunities down the road, this regional variation matters.

Canadian producers face additional considerations given Health Canada’s separate regulatory process for novel foods and animal products—another variable for cross-border operations to track.

The Performance Data That’s Accumulating

While European regulators deliberate, North American genetics companies have been building a meaningful head start. SLICK genetics—the naturally occurring mutation in the prolactin receptor gene that produces a shorter, slicker coat for better heat dissipation—have been commercially available in beef cattle since the FDA issued its low-risk determination and chose enforcement discretion in March 2022. That’s three years of real-world performance data.

Dr. Raluca Mateescu, professor of quantitative genetics at the University of Florida and one of the lead researchers on SLICK cattle, has documented the performance differences in studies published in the Journal of Dairy Science and Journal of Heredity. Research from her team and collaborators in Puerto Rico has shown that slick Holsteins hold milk production better during hot months and demonstrate shorter calving intervals under tropical conditions compared with their herd-mates—indicating measurable advantages for both production and fertility in heat-stress environments.

I spoke with a producer in south Texas who adopted SLICK genetics two years ago. “The first summer, I wasn’t sure I was seeing much difference,” he told me. “The second summer, when we had that brutal August, my SLICK-sired heifers held production while everything else dropped. That’s when it clicked for me.” His experience isn’t universal—results vary by operation and climate—but it reflects the pattern researchers are documenting.

What’s particularly worth considering is how genetic advantages compound over generations. Producers implementing SLICK genetics in 2026 will have daughters producing by 2028. Those daughters provide lactation data that refines selection for subsequent generations. A producer starting in 2030 enters four years behind operations that have already completed multiple breeding cycles.

Dr. Mateescu framed it this way: “The genetics that go into your herd this year produce daughters that lactate in 2027-2028. Every year you wait, you’re a year behind the producers who didn’t wait. And unlike other management decisions, you can’t accelerate genetics. Biology sets the timeline.”

That’s a consideration worth weighing—though it needs to be balanced against the legitimate questions some producers have about technology maturity and market acceptance.

The Case for Deliberate Waiting

Not everyone is convinced the timing pressure is as urgent as some suggest, and those perspectives deserve serious consideration.

I spoke with a third-generation dairy operator in central Wisconsin who has deliberately decided to hold off. “My heat stress losses run maybe $75-80 per cow in a bad year,” he told me. “Most years it’s less. At current semen premiums, the math just doesn’t work for my operation. I’m not opposed to the technology—I’m just not going to pay a premium for a problem I don’t really have.”

His point is worth sitting with. A Wisconsin producer at $80/cow heat losses and a Fresno producer at $280/cow are facing fundamentally different math. For Upper Midwest, Northeast, and Pacific Northwest operations, where heat-stress events are less frequent and less severe, the economic case looks fundamentally different.

There’s also a reasonable argument for letting early adopters work through the learning curve. “Someone has to be first,” another producer in Minnesota mentioned. “But that doesn’t have to be me. I’d rather see three or four more years of commercial data before I commit my breeding program.”

That’s not resistance to technology—it’s rational risk management.

Beyond Heat Stress: The Broader Genetic Shift Coming

Heat tolerance represents the first commercially available application of gene editing in cattle, but it’s not the only trait in development. The same precision editing techniques are being applied experimentally to other welfare-relevant traits—and this broader shift may reshape how consumers and producers think about genetic technology altogether.

Gene editing has already been used experimentally to produce polled dairy calves—born without horn buds—which, if commercialized at scale, could eliminate the need for traditional dehorning. According to USDA’s 2014 NAHMS Dairy study and related welfare research, roughly 94% of U.S. dairy operations disbud or dehorn heifer calves. No commercial timeline for polled gene-edited dairy cattle has been announced, but the research is progressing.

As these alternatives approach availability, an interesting question arises: How will consumers view operations that continue traditional procedures when genetic alternatives exist? I don’t think anyone knows the answer yet, but it’s worth considering.

Work from Dr. Candace Croney’s team at Purdue University’s Center for Animal Welfare Science suggests that when gene editing is explicitly tied to animal welfare benefits—such as reduced pain or better heat comfort—consumer acceptance rises noticeably, and a substantial share of consumers report they’d be willing to pay more for those products.

Consumer SegmentNo Context (%)Heat Comfort Benefit (%)Polled Benefit (%)
Firmly Opposed22%18%15%
Skeptical but Persuadable28%20%18%
Neutral30%25%22%
Supportive15%24%28%
Strong Supporters5%13%17%

The Perception Gap You Should Know About

This brings me to something genuinely surprising from the research—and it’s worth paying attention to.

European consumer research, including work from the University of Copenhagen published in peer-reviewed journals, has found that when benefits are clearly explained, only about one in five consumers express firm opposition to gene-edited dairy products—substantially lower than most farmers estimate.

When farmers in those same studies estimated consumer response to gene-edited dairy, most thought only 30-40% would accept it. The research suggests acceptance runs considerably higher than that.

Think about that: most of us have been making breeding decisions based on consumer resistance assumptions that the research says are roughly twice the actual level. That’s a meaningful blind spot.

Why might this be? Anti-GMO messaging is organized, visible, and gets significant media coverage. But across multiple consumer studies on GM and gene-edited foods, researchers commonly find a relatively small but vocal minority who are strongly opposed, while a much larger middle group is either neutral or open to these technologies once they understand the benefits—particularly when those benefits relate to animal welfare.

There’s also loss aversion to consider. Behavioral economics research consistently finds people weight perceived losses roughly twice as heavily as perceived gains when evaluating new decisions—a pattern that applies to technology adoption in agriculture. The immediate $50-75 premium for gene-edited semen feels more significant than a delayed annual benefit per cow—even when the math clearly favors adoption over time.

Dr. Nicole Olynk Widmar at Purdue, who’s done extensive published work on agricultural technology perceptions, put it to me this way: “Producers are making rational decisions based on the information environment they’re in. But that information environment is heavily weighted toward vocal opposition. The silent majority of consumers who are neutral or positive just don’t show up in the same way.”

Consumer attitudes can shift, and survey responses don’t always predict purchasing behavior. But the size of this perception gap suggests many producers may be working with assumptions that are years out of date.

The Global Picture—And Why It Matters for Your Genetics

For those of you tracking export genetics opportunities, here’s the global context in brief.

Indonesia has set a target of importing around 1 million dairy cattle by 2029 under their Fresh Milk Supply Road Map, according to Agung Suganda, director general of livestock and animal health at Indonesia’s Ministry of Agriculture. The opportunity isn’t selling commodity milk—it’s supplying heat-tolerant genetics that make tropical dairy production viable.

In May 2025, University of Florida researchers shipped the first SLICK Holstein genetics to Pakistan, working with a commercial operation called DayZee Farms in Bahawalpur, Punjab province, where temperatures routinely exceed 115°F in summer. Traditional Holstein genetics struggle in those conditions—this is exactly the kind of market where heat-adapted genetics could become essential.

China is building domestic breeding capabilities rather than remaining dependent on Western genetics. And recent trade actions—China imposed provisional duties of up to 42.7% on EU dairy products effective December 23, 2025, according to multiple news sources, including Reuters and ABC News—suggest the country views dairy increasingly through a strategic lens.

Operations building heat-adapted genetics now are positioning for export markets that may become significant—but that window may not stay open indefinitely.

Running Your Numbers: A Decision Framework

So what does this mean for your operation? Here’s how to think through it:

  • As a rough threshold: Operations seeing heat-stress losses above $150/cow annually in an average year are likely candidates for serious evaluation. Those below $75/cow may find the current semen premium harder to justify. Between those numbers? That’s where your specific circumstances—facilities, climate trajectory, breeding goals—really matter.
  • Understand your actual heat stress economics. Pull DHI records from the last three summers. Identify days when your Temperature-Humidity Index exceeded 68-72. Calculate the production drop compared to your spring and fall baseline. When Thompson dug into his records, he estimated that heat stress was costing him about $250-300 per cow annually. The Wisconsin producer pegged his at $75-80. Those aren’t national benchmarks—they’re individual calculations that show how sharply the economics diverge by region.
  • Have the availability conversation. SLICK genetics are commercially available through university programs and select AI providers, with availability expanding. Ask your rep about current sire offerings and pricing in your market, and whether they can connect you with producers in your region who’ve made the switch.
  • Factor genetics into infrastructure decisions. If you’re planning significant upgrades to cooling infrastructure, consider model genetics as a partial alternative. SLICK genetics won’t eliminate cooling needs in serious heat-stress environments, but they may deliver a meaningful portion of the benefit at lower cost.
  • Document your baseline. Whatever you decide, keep detailed records. If you adopt, you’ll want data showing improvement. If you wait, you’ll want to understand what that decision cost—or saved—you.
Heat Stress Loss ($/cow/year)Years to Break EvenAnnual ROIEconomic VerdictTypical Regions
$50-755-7 yearsLow (10-15%)Hold – Wait for cost declinePNW, Upper Midwest
$75-1253-4 yearsModerate (20-30%)Marginal – Evaluate closelyWisconsin, N. Minnesota
$125-1752-3 yearsStrong (35-50%)Favorable – Consider adoptionIowa, S. Wisconsin, N.Y.
$175-2501-2 yearsVery Strong (60-80%)Strong – Adopt strategicallyMissouri, S. Texas
$250+<1 yearExceptional (90%+)Compelling – Delay costs moneyCA, AZ, S. TX

Your Next 30 Days

  1. Pull DHI records for the last three summers—calculate your actual heat stress cost per cow
  2. Call your AI rep and ask specifically about SLICK sire availability and current pricing
  3. If cooling infrastructure investment is on your horizon, model genetics as a partial alternative
  4. Watch for processor/retailer sustainability messaging shifts in your market
  5. Document your 2025 baseline so you can measure whatever you decide

Finding the Right Path for Your Operation

The gene-editing question isn’t really about whether the science works—the accumulating data from the University of Florida and commercial operations suggest it does. And it’s increasingly less about whether consumers will accept it—the research shows most will when benefits are explained, though some uncertainty remains.

The question is about timing, risk tolerance, and competitive positioning. And reasonable people can reach different conclusions.

Thompson called me last week with an update. He’s planning to breed 30% of his heifers to SLICK sires starting this spring. “I’m not going all-in,” he said. “But I’m done waiting for perfect certainty. The cost of being wrong looks a lot smaller than the cost of being late.”

That’s one framework—partial adoption that builds experience while maintaining flexibility. The Wisconsin producer is taking a different approach, deliberately waiting until the economics make more sense for his climate. The Minnesota dairyman wants more commercial data before committing.

Each of these can be the right decision depending on circumstances.

What’s clear is this decision deserves fresh evaluation—not because adoption is right for everyone, but because the assumptions driving most producers’ hesitation may be three years out of date. The landscape has evolved. In a global market, you’re either the one setting the pace or the one wondering where the margin went. Your 2026 breeding list is the first signal of which one you intend to be. Choose based on your math, not your neighbor’s comfort zone.

Key Considerations for Your Decision

  • Your heat stress threshold matters most. Above $150/cow in annual heat losses? Serious evaluation warranted. Below $75/cow? Current premiums may not pencil. Know your number before deciding.
  • Consumer resistance is lower than you probably think. European research consistently shows that only about one in five consumers firmly oppose gene-edited dairy when benefits are explained. Most farmers estimate roughly half that acceptance level—a meaningful blind spot worth correcting.
  • The welfare narrative is shifting. When gene editing is framed around animal welfare benefits, consumer acceptance increases substantially. Watch for shifts in processor messaging in your market.
  • Genetic improvement compounds. Decisions made in 2026 produce results in 2028; subsequent generations build on that. Biology sets the timeline—you can’t accelerate later.
  • European markets are fragmenting. German retail dynamics may create barriers even with EU regulations in place. Factor this into export genetics calculations.
  • Deliberate waiting can be rational. For cooler climates with minimal heat stress, or operations wanting more commercial data, waiting may be appropriate. The right answer depends on your math, not industry hype.

The Bottom Line

Here’s my take: Gene editing in dairy isn’t a question of if anymore—it’s a question of when and whether it fits your operation. The producers I respect most aren’t rushing in or digging in their heels; they’re running their own numbers, watching the early data, and making decisions based on their specific circumstances rather than industry hype or outdated fears. 

KEY TAKEAWAYS 

  • You’re likely 3X wrong on consumer rejection. Farmers estimate 60% oppose gene editing. European research shows 18%. That gap may be the most expensive assumption in your genetics program.
  • Your threshold: $150/cow in heat-stress losses. Above that annually? Gene editing math likely works. Below $75? It probably doesn’t. In between? Your specific numbers decide.
  • Genetics compound. Delay doesn’t. 2026 semen → 2028 daughters → 2030 granddaughters. Wait until 2030 to start, and you’re four years behind the herds that moved now.
  • Same technology, 4X different economics. A Fresno operation losing $275/cow and a Wisconsin herd at $75/cow aren’t facing the same decision—even when the pitch sounds identical.
  • Deliberate waiting is thoughtful. Defaulting to “not yet” isn’t. If you’re holding off based on your climate and math, that’s a strategy. If you’re holding off based on 2019 assumptions, that’s a blind spot.

Complete references and supporting documentation are available upon request by contacting the editorial team at editor@thebullvine.com.

Learn More

The Sunday Read Dairy Professionals Don’t Skip.

Every week, thousands of producers, breeders, and industry insiders open Bullvine Weekly for genetics insights, market shifts, and profit strategies they won’t find anywhere else. One email. Five minutes. Smarter decisions all week.

NewsSubscribe
First
Last
Consent

The 2% Protein Mistake: How One Feed Change Is Saving Dairies $40,000 a Year

The diagnostic protocol and implementation timeline that’s turning wasted nitrogen into profit

Executive Summary: That extra 2% crude protein in your ration isn’t insurance—it’s a $40,000 annual drain on a 300-cow dairy. Research from Penn State, Cornell, and USDA confirms that properly balanced 15-16.5% protein diets match production while eliminating wasted nitrogen that hits your feed bill and your conception rates. Stack protein optimization with zero-cost heifer separation and proper silage timing, and the combined opportunity reaches $130,000-$160,000 per year. The risk: cutting protein without proper diagnostics can trigger intake depression and lost milk. This guide delivers the 4-step diagnostic protocol that’s working on progressive operations—plus an 18-month implementation timeline, fresh cow exceptions, and clear guidance on when to hold back. The goal isn’t minimum protein. It’s the maximum profit per cow.

What if I told you that 2% of your crude protein is actually a $40,000 hidden tax on your 300-cow herd? That’s the conversation I keep having with producers across North America, and it’s worth exploring carefully.

The central issue comes down to protein. Specifically, the long-standing practice of feeding more than cows can efficiently utilize.

When Applied Animal Science published a survey of U.S. dairy nutritionists in 2021, the findings confirmed what most of us suspected—the majority still formulate lactating cow rations at 17-18% crude protein. There are solid historical reasons for that approach. Protein has always been viewed as insurance against production losses.

But here’s where the conversation gets interesting. Foundational research from scientists like Glen Broderick at USDA’s Agricultural Research Service has consistently demonstrated that well-formulated diets in the 15-16.5% crude protein range can deliver equivalent performance—when amino acid nutrition is properly addressed. That qualifier matters.

The economics become clearer once you work through the numbers. Protein remains one of the most expensive components of the ration. When cows receive more than their metabolism can utilize, the liver converts that surplus nitrogen to urea—an energy-intensive process that diverts calories away from productive purposes. That urea shows up in three places: elevated Milk Urea Nitrogen readings, increased nitrogen loading in the manure lagoon, and higher numbers on the feed bill.

Understanding the Financial Picture

For a 300-cow operation—and I’ve worked through these calculations with producers in several regions—the potential impact deserves attention. Current feed prices vary considerably by geography, but overfeeding crude protein by two percentage points typically costs $0.30-0.45 per cow per day in direct feed expenses.

Annually, that represents roughly $33,000 to $49,000 in potential savings from optimization alone. Whether those savings are fully achievable depends on your specific situation, which is why working with a qualified nutritionist matters so much.

And that’s before considering the reproductive implications.

Research from Cornell University and the University of Wisconsin has established connections between elevated MUN levels and reduced fertility. Studies published in Animal Reproduction Science found that cows with MUN concentrations above 16 mg/dL showed notably lower pregnancy rates—approximately 14% reduction in some trials. That’s meaningful when you’re working to maintain reproductive efficiency.

The biology here is reasonably well understood. Elevated circulating ammonia and urea can alter the uterine environment, compromising embryo development. Penn State’s extension service recommends targeting MUN in the 10-14 mg/dL range, and research suggests approximately a 10% reduction in conception odds for each 1 mg/dL increase above that target.

What does that mean practically? A 300-cow operation seeing even modest conception rate improvements—say 5-6 percentage points—could realize $15,000-$25,000 annually in reduced days open, lower breeding costs, and fewer replacement purchases. The exact figures depend heavily on your replacement costs and current reproductive performance.

Why the Transition Takes Careful Thought

Given the potential economics, it’s fair to ask why more operations haven’t pursued protein optimization. The nutritionists I’ve spoken with offer thoughtful perspectives.

The Applied Animal Science survey identified “fear of decreased dry matter intake” as the primary concern when formulating lower-protein diets. And honestly, that concern has merit.

Dr. Alex Hristov’s research group at Penn State has done extensive work in this area, and their findings confirm there’s a real threshold below which performance suffers. In long-term trials, diets containing approximately 14% or less crude protein resulted in decreased intake, even when amino acid balance was addressed. At the 2024 Florida Ruminant Nutrition Symposium, their work highlighted that supplementation with rumen-protected histidine improved performance on low-protein diets—underscoring the amino acid’s critical role.

I recently spoke with an Ontario nutritionist who put it this way: “I’ve seen operations run successfully at 15% crude protein, and I’ve also seen farms struggle at 16% because their forage base couldn’t support it. The tipping point varies by herd.”

That variability is exactly why blanket recommendations can be problematic. Every operation has different forages, different genetics, and different management systems.

There’s another consideration worth acknowledging. Dr. Chuck Schwab, Professor Emeritus at the University of New Hampshire and a leading voice on amino acid nutrition, has been appropriately cautious about some rumen-protected amino acid products. Not all have been rigorously evaluated for bioavailability using in vivo methods, which means nutritionists sometimes formulate without complete confidence in how much amino acid is actually being absorbed. That uncertainty makes some advisors understandably careful.

A Measured Approach That’s Working

The operations successfully navigating this aren’t making dramatic overnight changes. They’re following methodical processes that identify their specific herd’s optimal range before making adjustments that could affect production.

What does that look like in practice? I walked through the process recently with a California producer running 400 cows who’s been fine-tuning his approach over the past 18 months.

  • Establish your baseline first. Before any dietary changes, examine individual MUN records from DHI testing. Cornell’s PRO-DAIRY program suggests that 75% or more of cows should fall within ±4 mg/dL of the herd average. Wide variation—some cows at 8 mg/dL while others hit 22 mg/dL on the same ration—usually indicates mixing or sorting issues to address first. “We discovered our TMR wasn’t as consistent as we thought,” that California producer told me. “Had to fix that before anything else made sense.”
  • Move gradually. Reduce dietary crude protein by 0.5 percentage points while maintaining amino acid levels. Monitor manure consistency and milk protein percentage carefully. Slightly firmer manure often indicates less nitrogen waste. But if the milk protein percentage drops by more than 0.05% in the first week, you may have reduced rumen-degradable protein too aggressively.
  • Address amino acid nutrition simultaneously. When dropping crude protein further, consider introducing or increasing rumen-protected methionine and lysine. Published research suggests targeting a ratio of approximately  for Lysine to Methionine, with roughly 7.2% lysine and 2.4-3.2% methionine as a percentage of metabolizable protein. Your nutritionist can help fine-tune these targets.
  • Find your floor carefully. Continue modest reductions—perhaps 0.25% increments every three weeks—while watching fresh cow peak milk as a key indicator. Fresh cows have the highest amino acid requirements. When peaks plateau or decline, you’ve found your floor. Add back half a percentage point immediately.
Diet TypeCrude Protein (%)Risk ProfileAnnual Cost (300-cow herd)
Traditional Industry Standard17-18%Low risk, high nitrogen wasteBaseline + $40,000
Aggressive Low (Risky)14% or lessHigh risk—intake depression likelyMay lose production
Optimized Target Range15-16.5%Balanced—when amino acids addressedSaves $33,000-$49,000
Fresh Cow Exception19%Supports metabolic transitionWorth the premium

Most operations following this approach discover their sustainable range is 1.5 to 2.0 percentage points below their starting point. But the key word is “sustainable”—the goal isn’t to reach the lowest possible number; it’s to find where your specific herd performs optimally.

Fresh Cows Require Different Thinking

Here’s where the conversation takes an important turn. While mid-lactation cows may thrive on optimized protein levels, transition cows appear to benefit from more generous protein nutrition.

Recent research found that fresh cows receiving approximately 19% crude protein increased fat-corrected milk substantially—from 31.4 to 34.9 kg/day in one study. Those same animals showed reduced body condition loss and improved metabolic markers (lower NEFA and BHB concentrations), suggesting better adaptation to the demands of early lactation.

Dr. Masahito Oba’s work at the University of Alberta supports this general pattern, though he notes that research on rumen-protected amino acid supplementation during transition has yielded inconsistent results. The physiology of transition cows is complex, and we’re still learning how best to support them nutritionally.

So how do you capture efficiency gains on the main herd while protecting vulnerable fresh cows?

Many operations are finding success with a Partial Mixed Ration approach. Rather than preparing completely separate batches—which creates logistical headaches and often exceeds mixer capacity for small fresh pen loads—they feed the entire lactating herd a base ration at the optimized protein level. Fresh cows then receive a high-protein top-dress at the bunk.

This captures most of the potential savings (since 80-90% of cows consume the efficient ration) while providing transition animals the metabolic support they need.

The economics suggest that somewhere around 120 lactating cows represents a rough threshold where the management complexity pays for itself. Smaller operations may find the labor hard to justify. Larger herds—150 cows and above—that remain on a single high-protein ration may be leaving meaningful money on the table.

A High-Return Strategy That Requires No Ration Changes

One finding that consistently surprises producers: one of the most impactful changes doesn’t involve the feed sheet at all.

Separating first-lactation animals into their own group—even on identical nutrition—regularly delivers measurable production improvements. Research from multiple university programs, including work highlighted in Hoard’s Dairyman, has confirmed that first-lactation heifers housed apart from mature cows show reduced competitive stress and improved feeding patterns.

European researchers documented that heifers housed separately for just one month after calving increased milk yield by 506 pounds across the lactation. Classic studies suggest farms may sacrifice close to 10% of potential production when parities are commingled—a substantial penalty for something that costs nothing to address.

The mechanism is behavioral, and as many of us have seen watching bunk activity, first-lactation animals naturally prefer smaller, more frequent meals. Mature cows tend toward larger, less frequent consumption. When housed together, dominant animals control access to the bunk during the critical period after fresh feed delivery. Younger cows respond by eating faster (which destabilizes rumen pH) and resting less (which reduces rumination time).

For a 300-cow dairy with roughly 110 first-lactation animals, even a 6% production improvement translates to approximately $32,500 in additional annual revenue at $18 milk. No equipment investment, no ration reformulation—just a management decision about pen assignments.

Management SystemLactation Yield ImpactAnnual Value (300-cow herd)Additional Cost
Mixed Parity HousingBaseline (100%)$0None
Heifers Separated (1 month)+506 lbs/lactation$16,000-$20,000Zero
Heifers Separated (Full lactation)+800-1,000 lbs/lactation (est)$25,000-$32,500Zero
European Research Average+506 lbs/lactation$16,000-$20,000Zero

A Wisconsin producer I spoke with made this change two years ago. “We were skeptical at first,” he told me. “Same feed, same barn, just different pens. But we saw results in the bulk tank within six weeks. The heifers settled into a better routine once they weren’t competing with older cows.”

I’ve heard similar stories from Northeast operations and California dairies. The specifics vary, but the pattern holds.

The Annual Decision That Creates Outsized Impact

While protein optimization and grouping strategies operate throughout the year, one seasonal decision carries disproportionate financial weight: corn silage harvest timing.

The Bottom Line on Harvest Timing: “Losing 11 points of NDF digestibility from delayed harvest costs more than $52,000 annually for a 300-cow dairy. That’s money lost in a few autumn days that you can never recover.”

Research published in Translational Animal Science quantified what many producers have observed. As harvest gets pushed from 37% to 43% dry matter, NDF digestibility declined from 64.4% to 53.4%. That’s roughly 11 percentage points of fiber digestibility compromised by delayed harvest.

Why does that matter so much? Work from Michigan State—specifically, Drs. Mike Oba and Mike Allen—established that each percentage point of NDF digestibility improvement corresponds to about 0.40 pounds more daily dry matter intake and 0.55 pounds more 4% fat-corrected milk. When you’re losing 11 points of digestibility, the math gets uncomfortable quickly.

The challenge is practical. Corn typically dries at 0.5-0.75% per day during fall conditions (though weather obviously affects this). An operation with 10 days of chopping capacity that waits for an ideal 35% dry matter may finish well above 40%.

For a 300-cow dairy feeding late-harvest silage, the consequences compound:

  • Additional corn grain needed to replace lost energy: roughly $17,500 annually
  • Higher shrink losses from compromised packing and aerobic stability: approximately $15,000 annually
  • Unrecoverable milk from reduced intake: around $19,700 annually

That’s more than $52,000 in annual impact from decisions made in a few autumn days. This is one area where even experienced operations sometimes get caught by weather or competing priorities.

When Caution Is Warranted

Any honest discussion of these strategies must acknowledge situations in which aggressive implementation can backfire.

  • Variable forage quality presents real challenges. Operations dealing with inconsistent harvest conditions, limited storage infrastructure, or purchased feeds with uncertain history face genuine risk when tightening protein margins. The traditional safety cushion exists for good reason.
  • Existing rumen health issues complicate the picture. Herds already managing subclinical acidosis have compromised rumen function. Reducing protein on top of SARA often makes things worse. Address rumen health first.
  • Monitoring limitations matter. Operations relying primarily on bulk tank MUN and monthly DHI tests may not detect problems quickly enough. More frequent observation—at minimum, close attention to milk protein percentage and manure consistency—becomes essential when operating near the efficiency frontier.
  • Regional and system differences affect optimal approaches. Southwest operations managing heat stress face different metabolic pressures than those in the Upper Midwest. Farms built around byproduct feeds have different amino acid profiles than corn silage-alfalfa operations. And for pasture-based systems—whether in Ireland, New Zealand, or parts of Australia—these TMR-focused strategies require significant adaptation for grazing contexts where lush pasture protein creates entirely different management challenges.

And some nutritionists raise reasonable questions about whether current amino acid models are precise enough to support aggressive protein reduction across all scenarios. “The science is clearly trending this direction,” one told me, “but I’m not convinced we have the precision yet for every situation.” That perspective deserves respect.

How the Strategies Work Together

What makes these approaches compelling is how they interact. Operations implementing multiple strategies often see returns exceeding the simple sum of individual improvements.

StrategyPer Cow Annual Value ($)300-Cow Herd Impact ($)
Protein Optimization$110-165$33,000-49,000
Reproductive Improvement (Lower MUN)$50-85$15,000-25,000
Parity Grouping (Zero-Cost)$108$32,500
Optimal Harvest Timing$174$52,000
Total Annual Opportunity$442-532$130,000-$160,000

Quality forage creates a safety margin for lower-protein diets—rumen microbes need readily available energy to utilize limited nitrogen efficiently. Reduced social stress from proper grouping improves nutrient utilization. Better body condition from appropriate MUN levels supports reproduction, gradually improving herd structure over time.

Here’s how the numbers add up when you put these pieces together for a 300-cow operation:

StrategyEst. Annual Value (Per Cow)Primary Driver
Protein Optimization$110-165Reduced nitrogen waste & feed cost
Reproductive Improvement$50-85Lower MUN / higher pregnancy rates
Parity Grouping$108Reduced social stress in heifers
Harvest Timing$174Improved NDF digestibility
Combined Potential$442-532Combined management impact

That suggests an annual improvement potential of $130,000 to $160,000 for a 300-cow dairy. Your specific numbers will shift based on milk price, regional feed costs, current practices, and implementation success—but the general magnitude tends to hold. You can adjust these figures for your own milk price and feed costs to get a better sense of what applies to your operation.

Your 30-Day Quick Start

  1. Pull DHI MUN records—check variation across your herd
  2. Separate first-lactation heifers into their own group (zero cost, immediate impact)
  3. Schedule a nutritionist review for the amino acid balancing feasibility
  4. Mark the corn silage target harvest date on the calendar now

The Component Pricing Connection

One additional factor worth considering: current component pricing structures can amplify or dampen the returns from these strategies, depending on your market.

In regions where protein premiums remain strong relative to butterfat, the milk protein percentage improvements from proper amino acid balancing deliver direct check impact beyond feed savings. Conversely, in markets where butterfat premiums dominate (as they have in many U.S. Federal Orders through 2024-2025), the reproductive and efficiency gains matter more than component shifts.

The point is that these strategies aren’t one-size-fits-all economically any more than they are nutritionally. Understanding your specific market’s component structure helps prioritize which elements to implement first.

Realistic Expectations for the Timeline

Operations considering this path should understand what a realistic timeline looks like.

TimelineWhat’s Actually HappeningMonthly Cash Impact
Month 1Feed cost reduction appears immediately+$1,500-$2,000
Months 2-3Amino acid costs peak, milk check looks same—patience required+$500-$1,000
Months 4-6Heifer grouping benefits measurable, component premiums visible+$2,500-$3,500
Month 6+New crop forage (optimal harvest) creates largest single cash gain+$4,500-$6,000
Months 12-18Full reproductive cycle improvement compounds into herd demographics+$10,000-$13,000

What’s Coming Next

Looking ahead, several developments may make precision protein feeding more accessible and reliable.

Real-time MUN monitoring through inline milk analyzers is becoming more practical, potentially allowing daily or even milking-by-milking adjustments rather than waiting for monthly DHI results. Precision feeding systems that deliver individualized rations based on production stage, body condition, and metabolic status are moving from research herds to commercial application. And genomic selection for feed efficiency traits—still in early stages—may eventually allow producers to select animals that convert feed more efficiently at the genetic level.

These technologies won’t replace good nutritional management, but they may provide better tools for finding and maintaining optimal protein levels for individual animals rather than group averages. Worth watching as these systems mature.

Practical Guidance by Operation Size

  • For herds with fewer than 100 cows, the management complexity of multi-group feeding may not justify the labor investment. Focus on forage quality and gradual protein optimization first. The diagnostic approach still applies—just proceed more slowly and acknowledge real constraints on management time.
  • For herds of 120-300 cows: The economic case for fresh cow differentiation and heifer separation becomes quite compelling. Consider starting with parity grouping (requiring no ration changes) to build confidence in nutritional optimization. This range represents something of a sweet spot for these strategies.
  • For herds with more than 300 cows, full implementation represents a substantial annual opportunity. The 18-month timeline means changes initiated now affect profitability through 2027 and beyond. At this scale, the question shifts from “whether” to “how well and how quickly.”
  • For all operations: Perhaps the most common mistake is confusing high feed efficiency numbers with genuinely profitable efficiency. A cow showing 1.8 pounds of milk per pound of dry matter intake while losing body condition isn’t efficient—she’s depleting reserves that will be repaid through reproductive failure, health challenges, or premature culling. Sustainable efficiency means strong production supported by adequate intake and stable body condition.

Your Next 3 Moves

  1. Review the last 6 months of DHI MUN data—calculate your herd’s variation and identify outliers
  2. Walk your fresh pen and first-lactation group this week—observe feeding behavior during and after TMR delivery
  3. Block 30 minutes with your nutritionist—discuss amino acid balancing feasibility for your specific forage base

The Bottom Line

The opportunity exists for many operations. Whether to pursue it—and how aggressively—depends on management capacity, forage infrastructure, current practices, and appropriate risk tolerance. But the underlying economics, for those positioned to capture them, continue to look favorable.

Key Takeaways:

  • Cut 2% protein, bank $40,000: Balanced 15-16.5% CP diets match 17-18% production—saving $33,000-$49,000/year on a 300-cow herd
  • Fix MUN, fix fertility: Every 1 mg/dL above 14 costs ~10% conception odds. Target 10-14 mg/dL for $15,000-$25,000 in annual reproductive savings
  • Separate heifers today—it costs nothing: First-lactation cows in their own pen gain 506 lbs/lactation. That’s $32,500/year at zero feed cost
  • Miss harvest timing, lose $52,000: Late-chopped silage drops NDF digestibility 11 points. That milk loss can’t be bought back
  • Stack all four for $130K-$160K/year: But first—pull MUN records. Variation over ±4 mg/dL means TMR problems to fix before touching protein

Complete references and supporting documentation are available upon request by contacting the editorial team at editor@thebullvine.com.

Learn More

The Sunday Read Dairy Professionals Don’t Skip.

Every week, thousands of producers, breeders, and industry insiders open Bullvine Weekly for genetics insights, market shifts, and profit strategies they won’t find anywhere else. One email. Five minutes. Smarter decisions all week.

NewsSubscribe
First
Last
Consent

You’ll Spend $200K on a Robot But Not $100 on This – It’s Costing You 1,200 lbs of Milk

Your barn ‘smells fine’? At 8 ppm ammonia, you can’t detect it—but your calves’ lungs can. You’re not managing. You’re hoping. And it’s costing you.

Executive Summary: The dairy industry finances $200,000 robots without blinking but ignores $100 interventions that cost 1,200 pounds of milk per heifer over a lifetime. Research from UC Davis, UW-Madison, and Lactanet (2019-2025) shows lung damage begins at 4 ppm ammonia—a level humans can’t detect after regular barn exposure—while colostrum absorption crashes from 95% at hour one to 50% by hour six. One-quarter of colostrum samples fail quality thresholds, and visual assessment is unreliable: thick golden colostrum sometimes tests worse than thin watery batches. The fixes cost almost nothing: a Brix refractometer runs under $100, bedding every 2-3 days cuts diarrhea risk 57%, and tightening colostrum timing requires only protocol discipline. With multiple component pricing placing nearly 90% of milk check value on butterfat and protein, early-life calf health compounds directly into first-lactation revenue. The math is brutal: maternity pen protocols pay back in weeks while that robot takes seven years.

Maternity pen management

Walk into any progressive dairy operation these days, and you’ll find precision feeding systems calibrated to the gram, genomic testing that predicts lifetime production potential, and automated milking technology that would have seemed like science fiction a generation ago. According to USDA data and industry reports—a single robotic milking unit now runs $150,000-$230,000, and farms are installing them by the thousands. We’ve embraced data-driven decision-making in remarkable ways.

Investment DecisionUpfront CostAnnual Debt Service (7 years)Calf Health ImpactFirst-Use Payback
Robotic milking unit$150,000-$230,000$21,000-$33,000/yearNone7 years
Brix refractometer + protocol<$100$0Saves 1,200 lbs/heifer × heifers bornImmediate

But here’s what’s been catching my attention lately. A conversation has been building among veterinarians, extension specialists, and forward-thinking producers over the past few years. The question: What if the biggest opportunity for improvement isn’t in the milking string at all—but in the first 24 hours of a calf’s life?

The emerging data from the University of California, the University of Wisconsin-Madison, and on-farm trials across North America reveals something worth considering. The maternity pen—often treated as a simple pass-through area where calves arrive and cows transition—may actually be one of the most underutilized profit centers on many farms. And the interventions that seem to move the needle most don’t require six-figure investments. They require attention, protocol, and a shift in how we think about foundational management.

The Colostrum Absorption Cliff: Every Hour Costs You Immunity” – This line chart shows the dramatic decline in colostrum absorption efficiency after birth, illustrating why feeding within 1 hour achieves 95% efficiency while waiting 6 hours drops to just 25%

The Lifetime Value Calculation Worth Revisiting

When producers think about calf losses, they typically calculate the immediate cost: the value of a dead calf, maybe $150-200, depending on the market. But that calculation, it turns out, may significantly underestimate what’s really at stake.

Dr. Sheila McGuirk, Professor Emerita at the University of Wisconsin-Madison School of Veterinary Medicine, has spent decades researching calf health outcomes. Her work, along with research from UC Davis and other land-grant universities, points to a more complete economic picture that extends well beyond immediate mortality.

Consider a thought experiment with two genetically identical heifer calves born on the same farm, same day:

Calf A is born in a maternity pen with adequate but not optimal conditions—bedding changed weekly, moderate ammonia levels that nobody really notices, colostrum delivered within “a few hours” of birth.

Calf B is born in a well-managed environment—fresh bedding, clean air, and colostrum within 90 minutes of hitting the ground.

Both calves survive. Both eventually enter the milking string. But their lifetime trajectories can diverge in ways that compound over the years.

Research published in the Journal of Dairy Science and documented through USDA NAHMS surveys suggests that Calf A faces a series of potential disadvantages:

The growth consideration. Multiple studies show that calves with poor passive transfer or early respiratory disease tend to have lower average daily gain and reach breeding size later, adding weeks to the rearing period and increasing feed and housing costs. Penn State Extension’s 2023 summary of the research found clear links between passive transfer categories and growth outcomes—calves in lower categories simply don’t grow as efficiently.

The lung capacity question. This one particularly caught my attention. Research from Dr. Theresa Ollivett at UW-Madison using thoracic ultrasound has documented that calves with lung consolidation—even those never treated for clinical pneumonia—often produce less milk in their first lactation.

The Hidden Milk Loss

A 2018 cohort study by Dunn and colleagues presented at ADSA found that heifers with at least 3 cm of lung consolidation as calves produced about 525 kg (1,150 lbs) less milk in their first 305-day lactation. Dr. Ollivett has noted in extension presentations that any heifer calf with a history of pneumonia tends to produce about 1,200 pounds less milk in her first lactation.

The longevity factor. NAHMS data and follow-up studies indicate that calves experiencing early health challenges have a higher risk of leaving the herd before completing their second lactation. They may be more likely to struggle with metabolic issues at first calving and less likely to breed back efficiently.

The component connection. Here’s something that doesn’t get discussed enough in the calf barn: early-life nutrition and health also affect component production. A 2024 study published in BMC Veterinary Research, tracking 220 heifer calves from eight herds, found that colostrum management and preweaning health measures significantly impacted not only total milk yield but also protein and fat yields in first lactation. Penn State Extension’s review of calf feeding research found that calves fed higher planes of nutrition produced more fat and protein on a daily basis and had higher 3.5% fat-corrected milk in first lactation. With multiple component pricing placing nearly 90% of the milk check value on butterfat and protein, according to CoBank’s 2025 analysis, those early-life investments compound directly into revenue.

When you add these factors together—the extended rearing costs, the potential first-lactation milk loss, the component production impact, the increased culling probability—the lifetime economic impact can reach several hundred dollars per heifer, and in some scenarios more. A 2016 meta-analysis by Raboisson and colleagues, frequently cited by Dr. Sandra Godden at the University of Minnesota, estimated that failure of passive transfer alone costs at least $70 per calf in direct effects.

The Hidden Tax: Lifetime Cost of Poor Colostrum Management” – Every heifer with suboptimal passive transfer carries a $610 lifetime penalty. The red segment shows first-lactation milk loss alone costs $240—more than twice what you paid for that refractometer you don’t own 

Worth considering as you evaluate where to focus improvement efforts.

The Bedding Research That’s Getting Attention

Perhaps no finding has generated more discussion among dairy consultants than what’s emerged about bedding management in recent years.

The BRD 10K study, published in the Journal of Dairy Science in 2019 by Dubrovsky and colleagues at UC Davis—including epidemiologist Dr. Sharif Aly—tracked 11,470 calves across six California dairies over a full year. The study examined dozens of management variables to identify which practices correlated with respiratory disease outcomes. What they found reinforced something that’s been gaining traction in calf housing guidance: cleaner, drier environments appear to matter considerably.

The Bedding Frequency Finding

A February 2025 calf housing fact sheet from Lactanet, drawing on research by Medrano-Galarza and colleagues published in Journal of Dairy Science, found that adding fresh bedding every 2 to 3 days, compared with every 7 days or longer, was associated with a 57% reduction in diarrhea risk.

The same Lactanet summary, citing work by Lago and colleagues from 2006, found that calves fully nested in deep straw bedding had 30% lower rates of respiratory disease compared to those with legs visible while lying down.

More Straw, Less Scours: The Bedding Frequency Trade-off” – Bedding every 2-3 days cuts diarrhea risk by 57% and costs $4 per calf per week. Compare that to treating scours or losing 1,200 lbs of milk in first lactation

I recently spoke with a Wisconsin producer who implemented more frequent bedding changes last fall. His observation: the mindset shifted from reactive to preventive. They’re changing bedding before it becomes a problem rather than after noticing one. Within three weeks, he said, respiratory rates in his calf barn had dropped noticeably. Now, that’s one farm’s experience—but it aligns with what the research suggests.

The mechanism makes intuitive sense when you think about it. When bedding sits undisturbed for extended periods, bacterial populations grow in the moist environment. Ammonia accumulates from decomposing organic matter. By the end of a week, the bedding can become a pathogen reservoir—and every breath the calf takes delivers that load to developing lung tissue.

The economics vary by operation, of course. More frequent bedding changes mean more straw and more labor. Those aren’t trivial considerations, especially for operations already stretched thin. But on farms that have carefully tracked outcomes, the returns from reduced treatment costs, improved growth rates, and lower mortality have often exceeded the investment.

I want to be clear: these figures come from specific studies in specific contexts. Operations in the Upper Midwest face conditions different from those in California’s Central Valley or the humid Southeast. Pasture-based systems have their own considerations entirely. The principle seems sound—cleaner environments generally mean healthier calves—but the specific economics will vary based on your starting point, labor costs, and regional factors.

What the “Smell Test” Might Be Missing

Most dairy producers believe they can assess air quality by smell. If the barn doesn’t reek of ammonia, ventilation must be adequate. It’s a reasonable assumption, and I’ve relied on it myself over the years.

But the biology may tell a different story.

Research from Penn State Extension, corroborated by work at multiple land-grant universities, has documented that humans typically detect ammonia at fairly low concentrations—but here’s the thing: regular exposure creates what researchers call olfactory adaptation. Those of us who work in barns daily often don’t consciously register ammonia until concentrations are well above levels that may affect calves.

The four ppm Threshold

FindingSource
Ammonia exposure above four parts per million is significantly associated with lung consolidation (odds ratio 1.73)Van Leenen et al., 2020, Preventive Veterinary Medicine
Four-hour maximum ammonia levels are commonly 5.9-9.4 ppm at calf levelAnimals journal, 2024 (Swiss calf housing study)
Human nose adapts; calves’ lungs don’tMultiple land-grant university extension publications

Dr. Ken Nordlund, who co-authored foundational calf housing recommendations now used through the Dairyland Initiative at UW-Madison, put it plainly:

“By the time you smell a problem, the calves have been experiencing that problem for quite some time.”

— Dr. Ken Nordlund, DVM, University of Wisconsin-Madison

Your Nose Lies: When You Smell Ammonia, the Damage Is Already Done” – The critical 4 ppm threshold where lung damage begins is invisible to workers with adapted noses. By the time you smell ammonia, your calves have been breathing damage for weeks

That’s worth thinking about. We walk through and think everything is fine. The calves may be experiencing something different.

Visual Checks That Can Help

What some farmers are discovering is that while human noses adapt, visual and behavioral indicators don’t. Several zero-cost assessments can reveal ventilation concerns before they show up in treatment records:

  • The eye check. Fresh cows and young calves with visible tearing, red or watery eyes, are showing mucosal irritation—potentially from ammonia exposure. The eyes don’t adapt the way noses do.
  • The bedding moisture test. In winter, if bedding shows heavy condensation or frost at calf nose height in the early morning, moisture may not be adequately exhausted from the barn. That trapped moisture creates favorable conditions for both pathogen growth and ammonia accumulation.
  • The breathing observation. This one takes a little practice, but it’s useful. Healthy calves at rest breathe effortlessly from the belly—what veterinarians call diaphragmatic breathing—at 20-30 breaths per minute. If you’re seeing visible flank movement, shoulders working, or labored breathing in resting calves, that’s worth investigating.
  • The rafter inspection. Water droplets forming on the underside of the barn roof indicate moisture is condensing rather than being ventilated out.
  • The 5-degree rule. According to Cobb et al. (2016), cited in The Dairy Site’s ventilation guidance, when the temperature difference between inside a calf shelter and outside exceeds 5°F, that’s indicative of a ventilation problem—the barn is too closed up.

These assessments take minutes and require no equipment. Just attention and a willingness to look.

The Colostrum Conversation

If there’s one area where the gap between “doing something” and “doing it optimally” is most evident, it’s colostrum management. You probably know most of this already—but the details matter, and I’ve found the research worth revisiting.

Most dairy operations believe they’re handling colostrum adequately because they feed it “within a few hours” of birth. The intention is right. But research from multiple institutions reveals several common gaps that can undermine even well-meaning protocols.

Why Timing Matters More Than We Thought

The calf’s ability to absorb immunoglobulin G from colostrum begins declining immediately after birth. This is intestinal physiology documented extensively in peer-reviewed research. The gut epithelium that allows large antibody molecules to pass into the bloodstream begins closing from the moment the calf is born.

The Absorption Clock

Time After BirthAbsorption Efficiency
Less than 1 hour90-100%
1-2 hours70-90%
2-6 hours50-70%
6-12 hours30-50%
Beyond 12 hoursBelow 30%

Source: Journal of Dairy Science and multiple university extension summaries

What this means practically: every hour of delay has a cost. A farm that believes it’s feeding “within a few hours” but is actually reaching calves at 5-6 hours has already lost a substantial portion of potential immunity transfer.

Dr. Sandra Godden at the University of Minnesota has published extensively on colostrum management protocols. Her research suggests that “within a few hours” is too vague a target—specific timing protocols that ensure feeding within two hours, and ideally within one hour, tend to produce meaningfully different outcomes.

The Visual Assessment Question

One of the more interesting findings I’ve encountered comes from colostrum quality research conducted across multiple U.S. dairy operations.

When researchers asked farmers to visually rank colostrum quality—thick and golden versus thin and watery—and then tested with a Brix refractometer, the results challenged conventional wisdom. As Hanne Skovsgaard Pedersen demonstrated, the first three first-milking colostrum batches harvested the same morning showed surprising results:

  • The thick, bright golden yellow batch: Brix reading of 18 (below threshold)
  • The intermediate-appearing batch: Brix reading of 21
  • The thin, nearly white batch: Brix reading of 27 (excellent quality)

True quality was the direct inverse of perceived quality based on visual assessment alone.

Yet walk through most dairy operations, and you’ll find colostrum assessment still relies primarily on appearance. And here’s the challenge—summaries of NAHMS data and herd-level testing cited in Hoard’s Dairyman suggest that around one-quarter of colostrum samples fall below the commonly used 50 g/L IgG cutoff. That’s approximately 22% on a Brix refractometer, according to the Dairy Calf and Heifer Association Gold Standards. Without testing, farms have limited ways of knowing which batches might be setting calves up for challenges.

Your Eyes Lie: Visual Assessment vs. Actual Colostrum Quality” – This chart exposes the dangerous disconnect between what farmers see and reality. The thick golden batch failed at Brix 18, while the thin watery sample tested excellent at 27
Visual AppearanceWhat You ThinkActual Brix ReadingReality
Thick, bright golden yellow“Excellent quality”18FAILED (below 22% threshold)
Intermediate color“Probably OK”21Borderline
Thin, nearly white“Poor quality”27EXCELLENT

The Affordable Solution

Penn State Extension confirms that a Brix refractometer costs between $100 and several hundred dollars, with many farm-suitable options at the low end of that range. Takes 30 seconds per batch. Compare that to $150,000-$230,000 for a milking robot—and ask yourself which investment has the faster payback.

The Contamination Variable

Even high-quality colostrum can be undermined by bacterial contamination—something that doesn’t always get the attention it deserves.

Research published in the Journal of Dairy Science and reviewed in Canadian Veterinary Journal articles demonstrates that heavy bacterial loads in colostrum can interfere with IgG absorption. The mechanism involves bacterial binding to antibodies, thereby reducing the amount available for uptake. High pathogen exposure may also trigger accelerated gut closure.

The practical result: a calf can receive colostrum with excellent Brix readings and still experience suboptimal passive transfer because contamination compromised absorption.

Sources of contamination include dirty teats at harvest, inadequately cleaned collection equipment, storage in contaminated containers, and direct pathogen shedding from infected mammary glands.

Research on colostrum pasteurization, including work from the University of Minnesota, has found higher serum IgG concentrations and fewer bacterial contaminants in calves receiving pasteurized versus raw colostrum. The heat treatment eliminates pathogens while preserving antibody function.

For operations with persistent passive transfer challenges despite good Brix scores, pasteurization may be worth investigating.

Putting This in Context: When Does This Apply?

I want to address something directly, because useful analysis requires acknowledging that not every farm faces the same situation.

  • Operations are already achieving strong outcomes. If your calf mortality is consistently below 3%, your serum total protein testing shows excellent passive transfer rates, and respiratory disease is minimal—your current protocols are working well. The improvements discussed here offer diminishing returns when baseline performance is already strong. Your resources may be better invested elsewhere.
  • Pasture-based and seasonal calving systems. The bedding and ventilation research cited here comes primarily from confined housing systems. Operations calving on pasture face different challenges—weather exposure, predation risk, monitoring difficulty—but also different advantages in terms of air quality and pathogen load. The colostrum timing principles apply broadly, but housing-specific recommendations need thoughtful adaptation.
  • Small-scale operations. The labor economics of twice-weekly bedding changes look different on a 50-cow dairy than on a 500-cow operation. The principles remain valid, but the implementation needs to align with your operation’s labor availability and management capacity. Sometimes “better” is more achievable than “optimal.”
  • Regional and seasonal variation. A barn in Wisconsin during February faces different ventilation dynamics than one in California in July. Humidity, temperature extremes, and baseline pathogen pressure all affect how these recommendations translate to specific operations.
  • International considerations. For producers in Canada, Europe, Australia, New Zealand, and elsewhere—regulatory environments, housing norms, and climate conditions vary considerably. The biological principles apply broadly, but specific protocols and cost structures need local adaptation.

“The research provides direction. Local adaptation provides results.”

Regional Protocol Adjustments: What the Research Says

RegionPrimary ChallengeCritical AdjustmentTarget Metric
Upper Midwest (WI, MN, MI)Winter cold + moistureMinimum 4 air changes/hour even in winter<5°F temp difference inside vs outside
California / WesternSummer heat + dust40-60 air changes/hour in summerShade + evaporative cooling
Southeast (GA, FL, TX Gulf)High humidityMoisture control paramountDew point management

Because ventilation and environment management looks different depending on where you farm, here’s what the research suggests for key regions:

Upper Midwest (Wisconsin, Minnesota, Michigan) — Winter Focus

The challenge in cold-climate barns is balancing fresh air with avoiding drafts. According to Dairy Global and extension guidance:

  • Minimum four air changes per hour, even in winter—closing up the barn completely is worse than cold
  • Target barn temperature of 40-50°F (4-10°C) in heated facilities; use heat as a ventilation tool to dry air, not primarily for warmth
  • Calves are comfortable down to 50°F with adequate nutrition and deep bedding; below that, they start using energy for warmth instead of growth
  • Positive pressure ventilation tubes are particularly valuable in winter—a system for a 40×100-foot calf barn costs approximately $1,500-2,000 to install, according to extension estimates
  • Watch for the 5°F rule: if the inside temperature exceeds the outside by more than 5 degrees, ventilation is inadequate

California & Western Dry Lot Systems — Summer Focus

Heat stress and dust present different challenges:

  • 40-60 air changes per hour are needed in summer conditions
  • Shade and water access become critical; evaporative cooling, where feasible
  • Dry lot systems have natural ventilation advantages, but require careful attention to dust and bedding moisture management
  • Morning and evening feeding may help calves consume adequate nutrition during heat

Southeast (Georgia, Florida, Texas Gulf) — Humidity Focus

High humidity creates unique pathogen pressure:

  • Moisture control is paramount—humidity promotes bacterial and fungal growth in bedding
  • More frequent bedding changes may be necessary than in drier climates
  • Ventilation must address both temperature and humidity; dew point management matters
  • According to Dairy Herd Management, keeping dew points lower than external ambient temperature helps prevent condensation

What Getting Started Might Look Like

For farms considering improvements, the question of where to begin can feel daunting. Address bedding, ventilation, and colostrum simultaneously? That approach sometimes leads to implementation challenges—too many changes, unclear attribution of results, and staff feeling overwhelmed.

What seems to work better for many operations is a sequenced approach that builds confidence through visible progress.

PhaseActionTimelineExpected OutcomeCost
Phase 1Increase bedding frequency to every 2-3 daysWeeks 1-457% diarrhea reduction, visible calf health improvement$4/calf/week
Phase 2Add Brix testing to every colostrum batchWeeks 5-6Identify failing batches, improve protocol<$100 one-time
Phase 3Assess and upgrade ventilationMonths 3-6Reduced ammonia, better lung health$1,500-$2,000 for tube system
PaybackMeasure first-lactation milk from improved cohort24-30 months+1,200 lbs milk per heiferRevenue gain

Consider starting with the bedding protocol.

This isn’t necessarily the highest-impact intervention, but it’s often the most immediately visible. Move to more frequent bedding changes—every 2-3 days rather than weekly. Track two simple metrics: navel scores on a 1-3 scale and respiratory rates on a sample of 10 calves weekly.

Within a few weeks, many operations see measurable improvement. Navel scores drop. Respiratory rates normalize. The barn smells different. Staff notices calves seem healthier.

That visible progress builds confidence that change matters—and creates momentum for the next step.

Then consider adding colostrum testing.

Once bedding improvements show results, adding Brix testing feels like a natural progression. Invest in a refractometer. Test every batch for two weeks.

Many farms discover something uncomfortable: a meaningful percentage of batches fall below quality thresholds. This revelation typically triggers improvements to the protocol organically. Farmers want to address problems they can now see.

Then evaluate ventilation.

With foundational improvements in place, farms are better positioned to assess ventilation investments. Initial improvements—such as fan repositioning and curtain management adjustments—may be relatively modest. More substantial upgrades—such as positive-pressure tube systems and structural modifications—require a greater investment.

The timeline for seeing returns is longer here. But farms that have already experienced benefits from bedding and colostrum work are often more willing to make the investment and allow time for results.

The pattern I’ve observed: farms that sequence improvements tend to sustain them. Farms that attempt comprehensive change all at once sometimes abandon the effort when results are hard to attribute, and staff feels stretched.

The Bottom Line

Let’s be honest here.

Bedding calves every two to three days is a pain. It’s labor-intensive, and straw isn’t getting any cheaper. Testing every batch of colostrum adds another task to an already packed calving routine. And convincing your team that the barn “smells fine” isn’t actually fine? That’s a tough conversation.

InvestmentTypical CostPayback TimelineImpact on Milk Production
Robotic milking unit$150,000-$230,0005-7 yearsLong-term efficiency
Positive pressure tube system$1,500-$2,0001-2 seasonsRespiratory health
Brix refractometerUnder $100First use1,200 lbs saved per heifer
More frequent beddingLabor + materialsWeeks to months57% diarrhea reduction

But here’s what I keep coming back to:

If you’re ignoring the 1,200 lbs of milk you’re leaving on the table because you wanted to save an hour of labor on a Tuesday, you aren’t managing a dairy—you’re managing a decline.

We’ll finance a $200,000 robot over seven years without hesitation. We’ll invest in automated feeding because it saves labor. We’ll pay for genomic testing to find the cows with the best production potential.

But then we’ll feed those genetically superior animals compromised colostrum because we didn’t want to spend $100 on a refractometer. We’ll house them in bedding that’s growing bacteria for a week because changing it more often “costs too much.” We’ll let them breathe eight ppm ammonia because we can’t smell it anymore.

The math doesn’t lie. The research is clear. The interventions are cheap compared to almost everything else we invest in.

InvestmentTypical CostPayback Timeline
Robotic milking unit$150,000-$230,0005-7 years
Positive pressure tube system$1,500-$2,0001-2 seasons
Brix refractometerUnder $100 to several hundredFirst use
More frequent beddingLabor + materialsWeeks to months

The question isn’t whether you can afford to implement better maternity protocols. The question is whether you can afford not to.

Every calf born on your operation is either starting her career with a solid foundation—or starting it with a handicap she’ll carry to the bulk tank for years. The decisions you make in those first 24 hours echo through every lactation that follows.

This isn’t complicated. It’s not sexy. It won’t win you any awards at the equipment dealer’s open house.

But it might be the best return on investment you’ll make all year.

Quick Reference: The Three Thresholds That Matter

ParameterTargetWhy It Matters
Colostrum timingWithin 1 hour of birthAbsorption efficiency drops from 90-100% to below 70% after 2 hours
Colostrum qualityBrix ≥22% (50 g/L IgG)~25% of samples fail this threshold; visual assessment unreliable
Ammonia levelsBelow four ppmLung damage begins at levels humans can’t detect; your nose lies

Print this. Post it in the maternity area. Make it non-negotiable.

Key Takeaways:

  • $100 beats $200,000: A Brix refractometer (under $100) catches colostrum failures costing 1,200 lbs of milk per heifer. That robot takes seven years to pay back. This pays back on first use.
  • Your nose lies: Lung damage starts at 4 ppm ammonia—below human detection after regular barn exposure. By the time you smell it, your calves have been breathing damage for weeks.
  • Your eyes lie too: Thick golden colostrum: Brix 18, FAILED. Thin watery batch: Brix 27, EXCELLENT. 25% of samples fail thresholds you cannot see.
  • The absorption cliff: Hour 1 = 95%. Hour 6 = 50%. Hour 12 = 30%. Every hour you delay colostrum is immunity that never comes back—and milk that never hits the tank.
  • Cheap fixes, lifetime returns: Bedding every 2-3 days cuts diarrhea 57%. Colostrum within one hour costs only protocol discipline. With 90% of your milk check now riding on components, early-life health is first-lactation revenue.

For more information on maternity management protocols and calf health research, consult your herd veterinarian or regional extension dairy specialist. Resources are available through the Dairyland Initiative at the University of Wisconsin-Madison School of Veterinary Medicine, Cornell PRO-DAIRY, UC Davis Dairy Extension, and Lactanet in Canada.

Complete references and supporting documentation are available upon request by contacting the editorial team at editor@thebullvine.com.

Learn More

The Sunday Read Dairy Professionals Don’t Skip.

Every week, thousands of producers, breeders, and industry insiders open Bullvine Weekly for genetics insights, market shifts, and profit strategies they won’t find anywhere else. One email. Five minutes. Smarter decisions all week.

NewsSubscribe
First
Last
Consent

The Butterfat Reckoning: $337 Million Lost in 90 Days – And Your Herd’s Best Trait May Be Next

You bred for butterfat. You won. Now $337M is gone in 90 days—and processors want less of what made your herd profitable. The math changed. Did anyone tell you?

EXECUTIVE SUMMARY: U.S. dairy farmers lost $337 million in 90 days under new FMMO rules—and the genetics they spent a decade perfecting are now working against them. Butterfat climbed 13% since 2015, but protein didn’t keep pace: the average protein-to-fat ratio is 0.77, well below the 0.85-0.90 range processors need for efficient cheesemaking. Some plants have restructured contracts, paying reduced premiums for butterfat above threshold levels, while AFBF analysis shows Class price cuts of 85-93 cents per hundredweight. Canadian producers face parallel pressure—Western provinces shift from 85% butterfat pricing to 70% in April 2026. The playbook for 2026: get your contract terms in writing this week, calculate your herd’s ratio today, and select genetics for component balance rather than butterfat alone. The producers navigating this best understood their contracts before the rules changed.

When a 550-cow operator in east-central Wisconsin reviews his numbers these days, the economics look different than they did a few years back. His herd tests 4.58% butterfat—a genetic achievement that would have earned solid premium dollars not long ago. Today, his processor’s payment structure means production above a certain threshold earns reduced premiums.

“We did exactly what we were told to do for years,” he explained in a conversation for this article, asking that his name be withheld due to ongoing contract negotiations. “Now I’ve got daughters in the milking string from bulls I selected back in 2019, and I can’t change that overnight.”

He isn’t alone in this. Not by a long shot. For the past decade, U.S. dairy farmers responded to clear market signals. They bred for butterfat. They optimized rations for components. They invested in genetics that pushed Holstein herds from 3.75% butterfat in 2015 to 4.24% by 2024—a 13% increase in just ten years, according to USDA milk production data and Council on Dairy Cattle Breeding records. The CoBank Knowledge Exchange reported in September 2025 that this growth rate is roughly six times faster than that of the European Union or New Zealand over the same period.

Now, producers across the country are navigating a market where some of those premium structures are changing. Certain processors have adjusted how they value components above certain thresholds. Export markets that absorbed excess butterfat face trade policy questions. The situation keeps evolving, and thoughtful producers are adapting their strategies accordingly.

This isn’t a story about mistakes—farmers or otherwise. It’s a story about how pricing signals, genetic acceleration, and processor economics can create dynamics that shift over time. Understanding these forces helps us make better decisions going forward.

The Logic Behind Butterfat Focus

To understand the current landscape, it helps to revisit the reasoning that drove butterfat optimization. And honestly? The logic was sound based on the information and incentives available at the time.

Back in 2013, butterfat accounted for about 32% of the Class III milk price, according to Federal Milk Marketing Order data. By 2015, that figure had climbed above 50%. Then by July 2017—and those of you watching milk checks closely will remember this—butterfat was trading at $2.95 per pound while protein sat at $1.22. Nearly a 2.4:1 premium for fat over protein. Progressive Dairy documented this shift extensively, and it naturally influenced breeding priorities across the industry.

The genetic selection tools aligned with these market signals. Leadership at the Council on Dairy Cattle Breeding has explained that Net Merit$ weightings reflect what the market signals to producers—in this case, more fat and more components. The pricing system was essentially communicating: we value more butterfat.

The farm-level economics were compelling. According to analysis from June 2025, producing one pound of strategic butterfat over the past decade generated an average of $2.54 in gross income while requiring only about 52 cents in nutrient costs—a marginal net return of roughly $2.02 per pound. With numbers like that, breeding for fat made clear economic sense.

Key factors driving butterfat selection from 2014 to 2020:

  • Federal Milk Marketing Order pricing that rewarded components
  • Consumer demand is shifting toward butter, whole milk, and premium cheese
  • Genomic testing (available since 2009) enabling rapid genetic acceleration
  • Net Merit$ index weighting butterfat at historic highs
  • COVID-era quota systems that encouraged component density over volume

Genomic testing particularly accelerated the pace of change. Before 2009, genetic progress moved more gradually—farmers waited years for bull daughters to prove a sire’s value. After genomic testing became available, breeders could predict about 70% of a young bull’s genetic potential immediately, deploying high-butterfat genetics across the national herd within a few breeding cycles.

The April 2025 genetic base change illustrates this progress pretty clearly. Butterfat shifted by 45 pounds for Holsteins—an 87.5% larger adjustment than the 24-pound change in 2020, according to CDCB. That represents the fastest butterfat genetic gain in Holstein breed history.

Kevin Jorgensen, senior Holstein sire analyst at Select Sires, noted the continuing trajectory in January 2025: “Absolutely, we’re going to see additional gains. The emphasis placed upon this is not waning.”

So the genetics kept pushing forward even as some market dynamics began shifting underneath.

Understanding the Processor Side

This is where things get technical, but stick with me—it’s worth understanding because it explains what’s driving some of these contract changes.

Cheesemakers generally achieve better efficiency with milk at a protein-to-fat ratio roughly in the mid-0.80s to 0.90 range, though this varies somewhat by cheese type. At ratios in that range, fat and protein transfer into the cheese curd efficiently, waste is minimized, and yields are optimized. The American Dairy Products Institute has emphasized that standardizing the fat-to-protein ratio is one of the most important factors in ensuring optimal cheese quality and quantity.

Here’s the challenge. Current U.S. milk averages a ratio of about 0.77—down from the 0.82-0.84 range that held fairly steady from 2000 to 2017. The CoBank Knowledge Exchange reported in September 2025 that butterfat has been growing at roughly twice the pace of protein, which has driven the decline in that ratio. Both Feedstuffs and Hoard’s Dairyman covered this imbalance in their fall 2025 coverage.

MetricProtein-to-Fat Ratio
Current U.S. Average0.77
Processor Optimal Range (Low)0.85
Processor Optimal Range (High)0.90
Gap from Optimal-0.08 to -0.13

Research published in Frontiers in Veterinary Science has demonstrated that milk composition significantly affects cheese-making efficiency, with the protein-to-fat ratio playing a central role in determining both fresh and ripened cheese yields. When milk composition deviates from optimal ranges, processors can experience reductions in cheese output and higher nutrient losses in the whey stream.

Why does this matter to farmers? Because processors have costs they need to manage, and those costs ultimately affect what they can pay for milk.

Common processor approaches to managing composition:

  • Cream removal: Separating excess butterfat before cheesemaking, then selling that cream separately—sometimes at different margins than cheese
  • Protein fortification: Adding nonfat dry milk, condensed skim, or ultrafiltered milk to rebalance the ratio before processing
  • Ultrafiltration investment: Installing membrane technology to concentrate proteins and adjust composition

Each approach involves expense. From the processor’s perspective, they’re managing milk composition to optimize their operations. Understanding this helps explain why some contract structures are evolving.

What Farmers Are Experiencing

The picture became clearer for many producers in late 2025 when component premiums stopped scaling as they had previously. Reports from multiple regions indicate that some processors have introduced payment structures where the incremental value of butterfat above certain thresholds is reduced. While individual levels vary by contract, producers in several areas report that additional butterfat above their processor’s preferred range no longer receives full premiums.

In October 2025, cheese processors reported milk is too high in fat relative to milk protein. Some cheese plants were essentially saying, “Don’t send me more butterfat.” By December, industry analysis indicated that premiums for higher butterfat had diminished for production above certain thresholds. What we saw is, the milk check, it got way too heavy in components.

To illustrate how this might affect an operation:

For a 600-cow herd shipping about 13.8 million pounds of milk annually at 4.6% fat, if the payment structure recognized full premiums only up to a certain point—say around 4.5%—the 0.1-point difference would represent roughly 13,800 pounds of butterfat that might earn a reduced premium. At even $0.50 per pound reduction in premium value, that’s approximately $6,900 in foregone annual income—or roughly $11.50 per cow per year left on the table. The actual impact varies considerably by contract, but the math helps illustrate why this matters.

One aspect that keeps coming up in conversations is that these details weren’t always clearly communicated upfront. A central Wisconsin producer described his experience: “I had to sit down with three months of milk checks and back-calculate before I understood what was happening. Nobody had really walked me through how the payment structure worked at higher test levels.”

I heard something similar from a California producer in the San Joaquin Valley who’s been running the same analysis. “We’re at 4.4% fat and thought we were in good shape,” he shared. “Then I realized our processor changed how they calculate premiums above 4.2%. Different market out here, but same basic dynamic.”

This points to an opportunity—and one of the most practical recommendations we can make: understanding your specific contract terms in detail.

How Other Regions Approached Component Growth

An interesting comparison emerges when we look at how other major dairy regions experienced this same period. Why did European and New Zealand farmers see different outcomes?

The differences trace back to structural factors rather than farmer decision-making.

Breed composition plays a significant role. The U.S. dairy herd is predominantly Holstein—a single breed that responded uniformly to genomic selection pressure. When U.S. farmers bred for butterfat, the national herd moved in that direction together. New Zealand’s herd is about 60% Holstein-Friesian/Jersey crossbreeds—the “KiwiCross”—with the remainder split among various breeds. The EU has significant breed diversity across countries. Different breed mixes respond differently to selection pressure.

Jersey crosses naturally produce higher protein-to-fat ratios. When New Zealand farmers selected for components, they achieved more balanced improvements in both fat and protein.

Pricing structures created different incentives. U.S. Federal Milk Marketing Orders explicitly reward individual components—which is why U.S. farmers responded so directly to component signals. EU milk pricing is largely based on intervention prices for butter and skim milk powder rather than on component premiums paid directly to farmers, according to the European Commission DG AGRI Dashboard. Different incentive structures led to different breeding emphases.

Here’s how the numbers compare:

RegionButterfat 2015Butterfat 202410-Year Change
U.S.3.75%4.24%+13.0%
EU4.03%4.13%+2.5%
New Zealand5.02%5.14%+2.4%

Source: CoBank Knowledge Exchange analysis (September 2025) reporting actual 2024 calendar year data; CLAL international dairy statistics

New Zealand already had higher butterfat than the U.S. Their breeding programs emphasized maintaining ratio balance while improving overall efficiency. Neither approach is inherently superior—they reflect different market structures and breeding objectives. But understanding these differences helps contextualize the U.S. experience.

But the international comparison isn’t just academic—because those other regions are also our customers.

The Export Market Factor

During early to mid-2025, U.S. butterfat exports frequently ran more than 140% above year-earlier levels, with some months nearly tripling prior-year volumes, according to USDA Foreign Agricultural Service data. Brownfield Ag News reported in November 2025 that butterfat exports to Canada alone were up 73%, with butter exports climbing 190%.

That export growth absorbed domestic production and supported prices. But it also created dependencies worth monitoring.

Current export market concentration:

  • Mexico: More than 25% of all U.S. dairy exports—our largest and most consistent customer. CoBank’s December 2024 analysis noted that Mexico’s share of U.S. dairy product exports had grown to about 29% by late 2024.
  • Canada: Second-largest market by value at $1.14 billion in 2024
  • China: A key market for whey and specialty products, though exports have declined since 2022
Export MarketShare of U.S. Dairy Exports2026 Trade Risk
Mexico~29%USMCA renegotiation
Canada~18%Supply management tensions
China~12%Trade policy uncertainty
Other Markets~41%Mixed/regional

These three markets account for a substantial share of U.S. dairy export volume. All three face some degree of trade policy uncertainty heading into 2026, with USMCA renegotiation on the calendar and China trade dynamics continuing to evolve.

The American Farm Bureau Federation has described the U.S. dairy’s trade outlook as requiring careful navigation. CoBank’s lead dairy economist, Corey Geiger, has emphasized in multiple analyses that trade relationships—particularly with Mexico—are increasingly important to domestic market stability and that disruptions could pose significant challenges.

For producers focused primarily on their milk checks, trade policy can seem distant. But export market access affects domestic supply-demand balances, which ultimately influences what processors can pay.

What Canadian Producers Should Know

For our Canadian readers, the dynamics play out differently under supply management—but the underlying tension between fat and protein is creating similar conversations north of the border.

Canada’s Western Milk Pool is making a significant shift. The BC Milk Marketing Board announced in October 2025 that, effective April 1, 2026, Western Canadian provinces (British Columbia, Alberta, Saskatchewan, and Manitoba) will change their component pricing allocation from 85% butterfat / 10% protein / 5% other solids to 70% butterfat / 25% protein / 5% other solids. That’s a major rebalancing—protein’s share of producer payments will more than double.

ComponentCurrent (Pre-April 2026)New (April 1, 2026)Change
Butterfat85%70%-15 pts
Protein10%25%+15 pts
Other Solids5%5%

The signal is clear: even in a quota system that’s historically emphasized butterfat, there’s growing recognition that protein deserves more weight in producer payments. Canadian producers selecting genetics today should factor this shift into their breeding decisions. The April 2025 Canadian genetic evaluations highlighted sires like FRAHOLME VEC TRITON-PP, ranking 30th on GLPI with +940 kg Milk, +105 kg Fat, and +63 kg Protein—the kind of balanced production profile that may become increasingly valuable under the new payment structure.

Practical Approaches Farmers Are Taking

Producers who recognized these dynamics early have been adapting their strategies. Their approaches offer useful frameworks to consider—whether you’re running a 200-cow family operation in Vermont, a 2,000-cow dairy in the Central Valley, or something in between. Specific processor options and contract structures vary by location, but the underlying principles apply broadly.

Contract clarity has become a priority. The question on a lot of minds right now: “At what point does my component premium structure change, and how?” Getting this in writing enables informed decision-making about ration and genetic investments.

An eastern Wisconsin producer described his experience after getting clearer on his contract terms in fall 2025: “Once I understood exactly how the payment structure worked at different test levels, I could actually plan around it. Before that, I was working with incomplete information.”

Ration adjustments are becoming more common. Nutritionists report increased interest in shifting from maximum-butterfat rations toward balanced-component approaches. Typical adjustments include:

  • Reducing rumen-protected fat supplementation from 1.5% to 0.5% of dry matter
  • Increasing alfalfa hay/haylage proportion for protein support
  • Adding rumen-protected amino acids (lysine, methionine) to maintain protein while moderating fat

University of Minnesota dairy nutrition work led by Isaac Salfer, assistant professor of dairy nutrition, suggests that in many herds, component changes begin to show within roughly 4-6 weeks of a ration adjustment, with new steady-state levels often reached by 8-12 weeks—though actual timelines can vary by herd and ration specifics. These aren’t overnight changes, but they’re not multi-year horizons either.

  • Exploring processor options makes sense. Farmers with competitive alternatives are obtaining quotes from multiple processors before contract renewals. Even without switching, documented alternatives provide useful context for conversations with current partners.
  • Revenue diversification continues expanding. The beef-on-dairy approach has gained significant traction, with Holstein/Angus and Jersey/Angus cross calves commanding premium prices at weaning, according to recent USDA livestock market reports. Breeding a portion of the herd to beef genetics generates meaningful calf revenue—diversification that reduces dependence on any single revenue stream. Several producers I’ve spoken with describe this as one of their more impactful recent decisions.
  • Genetic planning is evolving. While existing genetics represent previous decisions—those daughters are already producing—future breeding choices can emphasize a balance between protein and fat alongside other traits. Sire catalogs still feature many high-butterfat genetics. Dairy Global reported in January 2025 that among the top 100 Holstein sires, only six were negative for the fat test. But balanced-ratio options exist. The April 2025 evaluations identified sires showing strong component balance—bulls transmitting positive deviations for both fat percentage and protein percentage, rather than fat alone. When reviewing sire summaries, look beyond total pounds to the percentage deviations and the fat-to-protein relationship in the proof.

What’s Likely to Change

Now, I know federal order math isn’t anyone’s favorite topic, but the numbers here matter because they’re already hitting milk checks.

The 2025 FMMO reform isn’t just a policy update—it’s a fundamental reset of the American milk check. After a record 49-day national hearing that concluded in January 2024, USDA released its final decision on November 12, 2024. Producers in all 11 federal orders voted to approve the changes, and the new pricing formulas took effect June 1, 2025, according to USDA’s Agricultural Marketing Service.

Product CategoryMake Allowance Increase (¢/lb)
Cheese5.0
Butter5.4
Nonfat Dry Milk5.9
Dry Whey6.6

The changes are substantial. Make allowances increased by 5 to 7 cents per pound across cheese, butter, nonfat dry milk, and dry whey—representing a larger share of wholesale value going to processors. Farm Credit East documented the specific increases: cheese up 5 cents, butter up 5.4 cents, nonfat dry milk up 5.9 cents, and dry whey up 6.6 cents per pound.

The financial impact has been significant. Danny Munch, economist with the American Farm Bureau Federation, told Brownfield Ag News in June 2025 that once you net the negative make allowances against the benefits from updated Class I differentials and the return to the “higher of” Class I mover, dairy farmers still face meaningful losses. By September 2025, AFBF’s detailed analysis showed farmers had lost more than $337 million in combined pool value in just the first three months under the new rules, with Class price reductions ranging from 85 to 93 cents per hundredweight depending on the order.

The composition factor changes—updating baseline assumptions to 3.3% protein, 6% other solids, and 9.3% nonfat solids—took effect December 1, 2025, according to USDA’s final rule. These updated factors finally acknowledge what’s actually in today’s milk rather than formulas designed when milk tested around 3.5-3.6% fat and 3.1% protein.

Between processor payment restructuring and FMMO reform impacts, high-butterfat herds face a potential double squeeze heading into 2026. The producers navigating this best are those who understood their contracts before the rules changed—and who are now positioning their herds for what processors actually need, not what the old incentives rewarded.

Processor consolidation continues. The Arla Foods/DMK Group merger, expected to complete in 2026, will create a cooperative of more than 12,000 member farms processing approximately 19 billion kilograms of milk annually—the largest dairy company in Europe, according to Dairy Reporter’s April 2025 coverage. Similar consolidation dynamics exist in other regions. Larger processors typically have greater standardization capacity and different economics for managing milk composition.

Component evaluation discussions are evolving. CoBank economists suggested in their September 2025 analysis that protein may increasingly drive breeding decisions as market conditions evolve. Industry discussions increasingly focus on developing selection tools that emphasize component ratio balance rather than maximizing individual components—a recognition that what processors need and what the genetic indexes have been rewarding may not always align perfectly.

Industry leaders continue pushing for mandatory processor cost surveys to inform future make allowance discussions. NMPF CEO Jim Mulhern emphasized in October 2025 comments to Brownfield Ag News that ongoing reform is necessary for the federal order system to remain effective. The conversations are happening at every level, from cooperative boardrooms to Capitol Hill.

Your Monday Morning Checklist

  1. Get your contract in writing—this week. Call your processor or co-op field rep and request complete written documentation of how component payments work at different test levels. Don’t accept verbal explanations. You need the actual payment schedule showing where premiums flatten or decline.
  2. Calculate your herd’s protein-to-fat ratio today. Pull your last DHI test or bulk tank analysis. Divide protein percentage by fat percentage. If you’re below 0.80, you’re producing milk that costs your processor money to rebalance. That matters for your next contract conversation.
  3. Review one month of ration costs against component returns. Sit down with your nutritionist this month and calculate the actual ROI on your rumen-protected fat supplementation. At current component values, is that investment still paying?
  4. Get a competitive quote before your next contract renewal. Even if you have no intention of switching processors, having documented alternatives strengthens your position. Make three calls.
  5. Flag three sires in your tank for ratio review. Look at your current AI lineup. For each sire, check whether the fat percentage deviation significantly exceeds the protein percentage deviation. Consider whether that balance still serves your operation’s future.
  6. Set a calendar reminder for trade and policy news. Block 15 minutes monthly to scan USDA export reports and FMMO announcements. What happens in Washington and at the border affects your milk check more than most producers realize.

The Bottom Line

The butterfat gains achieved between 2015 and 2024 represent remarkable genetic progress. U.S. farmers responded effectively to market signals and improved their components, while their global counterparts didn’t. The current situation isn’t about those decisions being wrong—it’s about market conditions evolving and creating opportunities for strategic adjustment.

What producers across the Midwest and beyond are experiencing is a transition period. The signals were real, the decisions were rational, and the current landscape calls for thoughtful adaptation. The opportunity now lies in applying the same analytical approach that drove butterfat gains toward more balanced outcomes: genetics aligned with processor requirements, contracts with clear terms, and diversified revenue that provides flexibility.

The question every producer should be asking their co-op board right now: When did you know component pricing was shifting, and why didn’t you tell us?

“I’m not upset about it,” the east-central Wisconsin producer reflected. “I’m just adjusting. That’s what we do. But I wish somebody had laid out the whole picture five years ago instead of just highlighting the premium check.”

Farmers who recognized these dynamics and began adapting in 2025 will likely view this period as a recalibration rather than a setback. The question for every operation is whether current decisions account for where markets are heading—not just where they’ve been.

Additional Resources

For those interested in exploring these topics further:

  • Council on Dairy Cattle Breeding (CDCB): Genetic evaluation tools and Net Merit$ component weightings at uscdcb.com
  • University of Minnesota Extension Dairy: Research on component management through nutrition at extension.umn.edu/dairy
  • CoBank Knowledge Exchange: Quarterly dairy economic analyses, including component and trade reports at cobank.com
  • USDA Agricultural Marketing Service: Federal Order pricing data and component values at ams.usda.gov/market-news/dairy

In upcoming coverage, The Bullvine will examine specific breeding strategies for optimizing the protein-to-fat ratio over a five-year genetic plan—including which sire lines are showing promising balance characteristics for evolving market conditions.

KEY TAKEAWAYS 

  • $337 million gone in 90 days — FMMO reforms cut Class prices 85-93¢/cwt. This isn’t projection—it’s already hitting milk checks.
  • The ratio gap is driving it — U.S. milk averages 0.77 protein-to-fat. Processors need 0.85-0.90. That mismatch explains why contracts are changing.
  • Premium structures are shifting — Some plants now cap full butterfat premiums at threshold levels. Most producers haven’t seen their actual payment schedule. Have you?
  • Canada confirms the trend — Western provinces shift from 85% butterfat pricing to 70% in April 2026. Protein’s value is rising on both sides of the border.
  • Three moves to make this week: (1) Get your contract payment terms in writing. (2) Calculate your herd’s protein-to-fat ratio. (3) Review your sire lineup for component balance.

Complete references and supporting documentation are available upon request by contacting the editorial team at editor@thebullvine.com.

Learn More

The Sunday Read Dairy Professionals Don’t Skip.

Every week, thousands of producers, breeders, and industry insiders open Bullvine Weekly for genetics insights, market shifts, and profit strategies they won’t find anywhere else. One email. Five minutes. Smarter decisions all week.

NewsSubscribe
First
Last
Consent

Stop Tightening Your Belt: Dairy’s $6.35/cwt Gap and Your 90-Day Window to Close It

90 days to reposition before 2026 hits. The top 25% of dairy operations already moved. This is the playbook they’re using.

EXECUTIVE SUMMARY: Tightening your belt won’t save you this time. The shifts hitting dairy in 2025-2026—production running 4.7% above year-ago levels, replacement heifers at a 47-year low, butterfat collapsed from $3.00 to $1.40/lb, processors leveraging billions in new capacity—aren’t cyclical headwinds that reverse when prices recover. They’re structural changes to how this industry operates. Cornell Pro-Dairy data makes the stakes clear: a $6.35/cwt efficiency gap separates top-quartile from bottom-quartile farms, a difference exceeding $100,000 annually between similar-sized operations. The producers repositioning now—locking in feed costs, enrolling in risk management before January deadlines, recalibrating breeding programs for the beef-on-dairy era—will be the ones thriving in 2028. You have a 90-day window. This is the playbook.

Dairy Market Shift 2026

You’ve probably seen the headlines by now. U.S. milk production has been running hot—really hot—through the back half of 2025. We’re talking 3.7 to 4.2 percent above year-ago levels in September and October, and then November came in at 4.7 percent higher than the same month in 2024, according to USDA’s latest milk production reports and Cheese Reporter’s analysis of the data. That’s the kind of year-over-year growth we haven’t seen since the COVID recovery period.

And the industry is still figuring out where all that extra milk should go.

USDA’s November estimates show the national dairy herd has grown to approximately 9.57 million head—up 211,000 cows from a year ago. Per-cow productivity keeps climbing, too. USDA data shows milk per cow running 20 to 40 pounds higher per month than a year earlier across the major dairy states.

When you multiply those gains across millions of cows, you end up with substantial incremental production that needs to find a home.

I’ve been tracking dairy markets for a long time, and this moment feels genuinely different. Not catastrophically so—dairy will remain viable, and there are real opportunities for well-positioned operations—but different enough that the playbook from 2016 or 2020 may need some adjustment in 2026.

Let me walk through what’s actually happening and what it might mean for your operation.

The Production Picture That’s Emerging

The supply situation requires some unpacking because it’s not just about one factor. It’s several forces converging at once.

Herd numbers have expanded meaningfully after years of modest growth, and productivity gains keep compounding. Modern genetics and management practices—better transition cow protocols, improved fresh cow management, tighter reproduction programs—keep pushing output higher. That additional 20-40 pounds per cow per month doesn’t sound dramatic until you’re looking at the national numbers.

The regional story has gotten interesting, too. Some areas hit by HPAI and weather challenges in 2024 saw temporary production setbacks, but by late 2025, USDA data show California’s milk output actually rising sharply—up about 6.9 percent year-over-year in October—as both cow numbers and per-cow production recovered.

Meanwhile, expansion in Texas, parts of the Upper Midwest, and states like South Dakota continues to reshape the geography of the U.S. milk supply.

I recently spoke with a producer in the Texas Panhandle who has been farming for 30 years. He noted that five years ago, he could count the large dairies in his county on one hand. Now there are several major operations within a reasonable drive, all competing for the same labor pool and feed resources. That kind of regional shift creates both opportunities and new competitive pressures.

What economists like Dr. Marin Bozic at the University of Minnesota have been tracking is a fundamental geographic redistribution of U.S. milk production. The industry is less concentrated in traditional dairy regions, which has real implications for processor logistics and regional pricing.

For our Canadian readers, the contrast is striking—while U.S. producers navigate oversupply pressure, Canada’s supply management system, with quota prices ranging from CAD $24,000 to over $56,000 per kilogram of butterfat per day, depending on province (according to Agriculture Canada’s 2025 data) and tariffs of 200-300% on imports creates an entirely different market reality. That protection comes with its own trade-offs, but it insulates Canadian producers from the volatility American farmers are facing.

So what does this mean practically? USDA forecasts indicate domestic production will likely continue exceeding consumption growth through at least mid-2027. That suggests continued pressure on milk prices—though as always, unexpected developments could change the trajectory.

What’s Actually Happening to Component Premiums

For a lot of operations, component pricing—particularly butterfat premiums—has been a crucial margin driver over the past several years. That dynamic is shifting in ways worth understanding.

Butterfat values have come down significantly from their recent peaks. CME spot butter prices, which topped $3.00 per pound at various points in 2023-2024, have declined through 2025. By August, prices had dropped to around $2.18 per pound according to market tracking. September brought a new year-to-date low of around $2.01.

And by October, butter had fallen to $1.60 per pound. As of late December, we’re looking at butter trading in the $1.40 range—a meaningful change in butterfat economics that affects the math for many feeding strategies.

What’s driving this? A combination of factors. Farmers responded to high premiums by selecting for higher-fat genetics and adjusting rations—exactly what economic incentives encourage. At the same time, retail demand for butter and full-fat products has moderated somewhat. Supply caught up with demand, and premiums softened accordingly.

As Dr. Mike Hutjens, Professor Emeritus of Animal Sciences at the University of Illinois, has emphasized in his extension work over the years, chasing very high butterfat often raises feed costs faster than it raises milk checks. Many herds find better margins around moderate butterfat—say, 3.8 to 4.0 percent—with solid protein performance, rather than pushing fat above 4.2 percent and paying for the extra inputs.

That guidance feels particularly relevant given where butter is now.

Of course, every operation is different. Farms with cost-effective access to high-fat supplements may still find the economics work. The key is running the numbers for your specific situation rather than assuming what worked in 2023 still pencils out today.

It’s also worth noting that Federal Milk Marketing Order modernization proposals released by USDA in late 2024 are expected to adjust how components are valued over time. How butterfat and protein strategies pay going forward may look quite different than what we’ve seen in the past few years.

The Genetic Revolution That’s Rewriting Replacement Math

Let’s be direct about something: What’s happening with replacement heifers isn’t just a market trend or a temporary shortage. It’s a genetic revolution that has fundamentally altered how dairy farmers must think about herd replacement—and most operations haven’t yet fully grasped the implications.

USDA’s January 1, 2025, Cattle Inventory report shows 3.914 million dairy heifers 500 pounds and over. That’s the smallest number since 1978, as Dairy Reporter and multiple other outlets have noted. We’re at a 47-year low for replacement inventory.

The data from USDA and HighGround Dairy shows just 2.5 million dairy heifers expected to calve in 2025—the lowest level since that dataset began in 2001. That’s a drop of 0.4 percent compared to 2024, and industry analysts suggest tight replacement numbers will keep heifer availability constrained for several years.

Here’s what makes this different from previous heifer shortages: this one was deliberately created through breeding decisions.

The beef-on-dairy movement isn’t some accident of market forces—it represents a fundamental shift in how progressive dairy operations view their genetic programs. Every breeding decision is now a strategic choice about whether you’re in the business of making milk, making beef, or both.

The old mental model—breed everything dairy, cull what doesn’t work—is obsolete. The new reality requires treating your replacement pipeline as a distinct enterprise with its own P&L, not an afterthought of your breeding program.

The economic forces driving this shift were compelling. When beef calves were bringing $750 more than they had been two years prior, concentrating dairy genetics on your best animals while capturing beef premiums on the rest made perfect sense. USDA and industry commentary explicitly connect lower replacement inventories to increased use of beef semen on dairy cows.

But here’s what the numbers don’t always show: The farms that executed this strategy well didn’t just chase beef premiums—they simultaneously intensified their genetic selection on the dairy side. They used genomic testing to identify the top 30-40% of females, bred them aggressively with sexed dairy semen, and captured beef value on the rest.

The April 2025 CDCB genetic base change—moving the reference population from cows born in 2015 to cows born in 2020, with updated Net Merit formula weights—gives producers better tools for these decisions. The December 2025 evaluation updates added further refinements to health and type trait data, according to CDCB. Farms making breeding decisions without current genomic information are essentially flying blind in this new environment.

The farms that got caught were the ones who saw beef-on-dairy as a revenue grab rather than a genetic strategy. They reduced dairy breedings without upgrading the genetic intensity of the ones they kept.

Consider a scenario many Midwest operations have navigated: A 600-cow Wisconsin dairy that shifted from 70 percent gender-sorted dairy semen to 40 percent in 2024 might have captured an additional $300,000 in beef calf revenue that year. But that same operation now faces needing 75-100 more replacement heifers than their breeding program will produce—a gap that requires careful planning to address at current prices.

The gain was immediate and visible. The cost is delayed and often larger.

“We got caught up in the beef premium along with everyone else,” one 700-cow operator in central Wisconsin told me. He asked to stay anonymous, which is understandable. “The checks were great in 2024. Now I’m looking at replacement costs that eat into those gains significantly. Looking back, I might have maintained a higher percentage of dairy breedings. But the economics at the time pointed toward beef.”

Recent reports show that U.S. replacement dairy cow prices are reaching record highs in late 2025, with many quality cows and bred heifers trading well above earlier levels of $2,000-$2,200. At those prices, buying your way out of a heifer deficit isn’t just expensive—it may not be possible at scale.

The strategic question every operation needs to answer: What percentage of your herd represents your genetic future, and are you breeding them accordingly?

The good news is that farmers are recalibrating. The National Association of Animal Breeders reports gender-sorted dairy semen sales grew by 1.5 million units in 2024—a 17.9 percent growth rate in just one year—as producers adjust their programs.

The farms that will thrive in this new environment aren’t abandoning beef-on-dairy—they’re getting smarter about it. They’re using genomics to make precise decisions about which animals deserve dairy genetics and which should produce beef calves. They’re treating replacement inventory as a strategic asset, not a byproduct.

This is the genetic revolution in action. The question is whether you’re driving it or being driven by it.

The Power Shift to Those Who Own the Stainless Steel

Let’s talk plainly about something the industry doesn’t always acknowledge directly: The power dynamic between dairy farmers and processors has fundamentally shifted. The leverage now belongs to those who own the stainless steel.

Significant processing capacity has come online over the past several years. Industry reports from Cheese Reporter, CoBank, and others tally multi-billion-dollar investments in new cheese, butter, and specialty dairy plants in the U.S.—with estimates ranging from $7 billion to $11 billion in committed or recent capacity additions, depending on the source and timeframe.

Major projects from Hilmar, Bel Brands, Leprino, and others were predicated on expectations of continued milk supply growth and strong export demand. These processors made massive bets on dairy’s future—and now they need milk to justify those investments.

Here’s where it gets uncomfortable: Analysts and trade publications report that several recently commissioned cheese and powder plants are running below their designed capacity.

That creates enormous pressure for processors carrying major capital investments. And that pressure flows directly to farmers in the form of supply commitments, pricing structures, and partnership terms that increasingly favor the processor’s position.

Run the numbers from their side. A $500 million cheese plant sitting at 70 percent utilization is bleeding money. The incentive to lock up milk supply through multi-year agreements, financing arrangements, and expansion partnerships isn’t altruism—it’s survival.

The Darigold situation in the Pacific Northwest illustrates this dynamic clearly. Local reports indicate their new Pasco, Washington plant has seen its price tag rise from initial estimates of $600 million to over $900 million—approximately $300 million over budget. As a result, the cooperative has implemented a $4 deduction per hundredweight from member milk checks, with $2.50 allocated explicitly to construction costs.

Even in a cooperative structure—where farmers theoretically own the processing—the capital requirements of modern dairy manufacturing mean producers are effectively captive to infrastructure decisions made on their behalf. For a farm shipping 5 million pounds monthly, that $4 deduction represents $200,000 annually coming out of your check. Whether you are in a co-op or independent, if you aren’t auditing the ‘why’ behind your check deductions in 2026, you’re essentially writing a blank check to your processor’s construction budget.

When processors offer financing for heifer purchases, equipment upgrades, or expansion projects in exchange for multi-year milk supply commitments, understand what’s really happening: They’re converting your flexibility into their supply security. That’s not necessarily bad—capital access and price stability have genuine value—but you need to recognize the trade.

Economists like Mark Stephenson, Director of Dairy Policy Analysis at the University of Wisconsin-Madison, have observed that processors who invested billions in new capacity now face utilization challenges.

When evaluating these arrangements, consider them with clear eyes:

  • Who benefits more from the locked-in supply? In a rising market, fixed pricing hurts you. In a falling market, it helps. But the processor gets supply certainty regardless.
  • What are the exit provisions? If your situation changes, what does it cost to get out?
  • Are you financing their utilization problem? Expansion commitments that serve processor capacity needs may or may not align with your operation’s optimal scale.
  • What’s the opportunity cost of reduced flexibility? Five-year agreements made in 2025 lock you into a world that might look very different by 2028.

None of this means you shouldn’t engage with processors or consider partnership structures. It means you should engage as a businessperson who understands that the party with the capital makes the rules. Get independent financial advice. Model the downside scenarios. Understand what you’re giving up, not just what you’re getting.

The Export Picture: Opportunity and Uncertainty

Exports have absorbed substantial U.S. dairy production in recent years, with 2024 reaching $8.2 billion—the second-highest export value ever, according to USDEC and IDFA reporting. Understanding the current export environment helps put domestic market dynamics in context.

Mexico remains the dominant destination—and deserves close attention. USDA Foreign Agricultural Service data and USDEC reporting show Mexico accounts for more than a third of all U.S. cheese export volume—by far the largest single destination. Mexico purchased 37 percent of all U.S. cheese sold to international customers through September 2024, and Cheese Reporter confirms 424 million pounds of cheese were exported to Mexico in 2024.

This concentration creates both opportunity and exposure. Mexican economic conditions—including inflation pressures and remittance flows—directly influence demand. The relationship has been remarkably durable, but it’s worth monitoring.

The China situation represents a more structural shift. USDA and Rabobank analysis show Chinese dairy imports dropping from a peak of nearly 845,000 metric tons in 2021 to about 430,000 metric tons in 2023—a decline of nearly 50 percent in just two years, as Dairy Reporter and Capital Press have documented.

USDA GAIN reports and Rabobank describe China’s strategy to boost domestic raw milk production and reduce import dependence. Chinese dairy imports were down roughly 10-14 percent in early 2024, with forecasts suggesting continued pressure.

The consensus among economists studying global dairy trade is that China deliberately increased self-sufficiency. That suggests planning for Chinese demand to return to 2021 levels may not be realistic—though trade relationships can shift in unexpected ways.

On a more positive note, other markets continue developing. Southeast Asia, the Middle East, and parts of Latin America offer growth potential. And USDEC confirms U.S. dairy export volume was up 1.7 percent through the first three quarters of 2025, indicating continued demand despite the China headwinds.

Global competition remains a factor. EU milk production is forecast to decline modestly in 2025, according to European Commission data—about 0.2 percent—as environmental regulations and cost pressures affect European producers. New Zealand, Australia, and South American producers continue competing in key markets.

Building business plans that work at realistic domestic price levels, while remaining positioned to benefit from export opportunities, seems like a prudent approach.

What Could Change This Outlook

Markets regularly surprise us, and it’s worth considering scenarios where conditions might improve faster than current projections suggest.

Weather or disease events could tighten global supply. A significant drought in New Zealand or production challenges in European herds would reduce global competition. U.S. dairy would benefit from being a reliable supplier in that environment.

China’s approach could evolve. Economic pressures, food security priorities, or trade negotiations could reopen Chinese import demand. It’s not the base case, but it’s possible.

Domestic demand could strengthen. Cheese consumption has grown modestly but consistently. A shift in consumer preferences or successful product innovation could accelerate demand. The foodservice recovery post-COVID continues developing.

Trade policy could create openings. New trade agreements or the resolution of existing disputes could improve access to markets that are currently restricted.

I wouldn’t build a business plan assuming these developments, but they’re worth monitoring. They’re also reasons for measured optimism rather than pessimism about dairy’s long-term prospects.

Practical Steps for the Months Ahead

For dairy operators assessing their position, several action areas warrant attention in the near term. These aren’t theoretical—they’re decisions with specific windows. And while the priorities may vary based on your operation’s size and situation, the core principles apply broadly.

Feed Cost Management

With corn prices running around $4.00-4.05 per bushel in late December—down from $4.20-plus earlier in the fall and well below the $5-plus levels of 2023—this represents a genuine opportunity, according to USDA and CME data.

Forward contracting 50-70 percent of the anticipated 2026 grain requirements provides cost certainty regardless of how commodity markets move. For a 600-cow operation, that’s roughly 1,200-1,800 tons of corn equivalent. If prices move higher by spring, you’ve protected yourself.

Smaller operations—say, 100-200 cows—might target the lower end of that range to preserve cash flexibility, while larger commercial dairies with dedicated nutritionists and storage capacity might push toward 70 percent or higher.

I spoke with a nutritionist in the Northeast who mentioned that several of her clients locked in corn in October and are already seeing the benefit as prices have firmed. “It’s not about timing the absolute bottom,” she noted. “It’s about knowing your costs and removing uncertainty.”

The window for favorable pricing exists now, though markets can always move in either direction.

Risk Management Tools

Both the Dairy Revenue Protection and Dairy Margin Coverage programs offer downside protection worth evaluating. Each works differently:

DRP protects revenue and allows customizable coverage levels. Recent quotes in the Upper Midwest have shown producers can often secure Class III price floors in the high-$17 to low-$19 range, with premiums typically running a few dozen cents per hundredweight, depending on coverage level and quarter. These numbers move with the market, so working with your agent on current pricing makes sense.

DMC protects margins—milk price minus feed costs—and offers subsidized rates for smaller operations. As Wisconsin Extension and Ohio State confirm, Tier 1 coverage at $9.50 margin costs just $0.15 per hundredweight for qualifying operations—genuinely affordable protection for smaller producers.

Dr. John Newton, Vice President of Public Policy and Economic Analysis at the American Farm Bureau Federation, has noted that more sophisticated operators are layering both programs. DMC provides base margin protection; DRP covers revenue risk on top of that. The combination requires some investment, but it’s comprehensive.

A note on operation size: DMC’s Tier 1 subsidized rates make it particularly attractive for smaller operations with a production history of under 5 million pounds production history. Larger operations may find DRP more cost-effective on a per-hundredweight basis.

Insurance enrollment deadlines typically fall in mid-to-late January. This is an immediate decision point worth prioritizing.

ProgramWhat It ProtectsCoverage Cost ($/cwt)Best ForEnrollment Deadline
Dairy Revenue Protection (DRP)Milk revenue (price × volume)$0.30 – $0.70 (varies)Larger operations, revenue focusMid-January (quarterly)
Dairy Margin Coverage (DMC) Tier 1Margin (milk price – feed costs)$0.15 (subsidized)Small farms (<5M lbs history)Mid-January (annual)
DMC Tier 2Margin (milk price – feed costs)$1.11 – $1.53Mid-size operationsMid-January (annual)
No Coverage (Exposed)Nothing$0High-risk strategyN/A

Balance Sheet Assessment

Operations carrying significant debt—particularly debt originated at lower interest rates that’s now repricing—benefit from proactive lender conversations.

The math matters. A $4.5 million debt portfolio repricing from 3.5 to 7.5 percent adds roughly $180,000 in annual interest expense. On a typical-size operation, that extra interest alone can add $1.00-1.50 per hundredweight to your cost of production—money that comes straight off your margin.

Options worth discussing with your lender:

  • Amortization extensions that reduce annual payments by stretching repayment
  • Refinancing into FSA programs—USDA’s December 2025 announcement confirms current rates at 4.625 percent for direct farm operating loans and 5.75 percent for farm ownership loans
  • Covenant modifications that provide flexibility during market transitions

A lender I know in the Upper Midwest told me that producers who come in early with clear projections and a realistic plan typically achieve the best outcomes. “It’s the ones who wait until they’re already stressed who have fewer options,” he observed.

Initiating these conversations proactively, with clear financial projections showing you understand market conditions, typically produces better results than waiting.

Herd Composition Review

Evaluating whether lower-producing animals justify their feed and labor costs becomes more important as margins compress.

The efficiency gap between top and bottom performers in most herds is larger than many farmers realize. Cornell Pro-Dairy data shows the lowest quartile of farms averaging operating costs of $22.32 per hundredweight, while the highest quartile averages just $15.79—a difference of $6.35 per hundredweight that translates to performance gaps exceeding $100,000 between similarly-sized operations.

The math often favors addressing the bottom 10 percent of producers rather than carrying them through a soft market. For a 600-cow herd, that’s 60 animals consuming feed, requiring labor, and potentially affecting rolling herd average.

This doesn’t necessarily mean culling aggressively—it might mean more intensive management of problem cows, faster culling decisions on chronic cases, or adjusting breeding priorities. The right approach depends on your specific situation.

Regional Considerations

These strategies apply broadly, but regional variations matter.

Operations in Texas and the expanding Southwest face different labor markets and heat stress considerations than Wisconsin or Michigan dairies. California operations navigating recovery from recent challenges have unique constraints. Farms in traditional dairy regions may have more processor options and competitive milk pricing than those in emerging areas.

Working with your local extension specialists and financial advisors to calibrate these recommendations to your specific situation makes sense. Generic advice only goes so far.

The Efficiency Conversation—What It Actually Means

“Get more efficient” has become standard advice. But what does meaningful efficiency improvement actually involve at a practical level?

Milk quality management delivers measurable returns. Operations maintaining somatic cell counts below 200,000 capture quality premiums while avoiding the production losses, treatment costs, and discarded milk associated with elevated SCC.

Extension economists at Cornell, Penn State, and elsewhere estimate that reducing bulk tank SCC from the 400,000 range to under 200,000 can improve returns by several hundred dollars per cow per year, including quality premiums, reduced discarded milk, and lower treatment costs.

I visited a 400-cow operation in Pennsylvania last spring that had invested significantly in parlor upgrades and milking protocols. Their SCC dropped from 280,000 to 140,000 over eighteen months. The owner estimated the combination of premium capture and reduced mastitis treatment was worth about $350 per cow annually. “It wasn’t cheap to get there,” he acknowledged, “but the payback has been solid.”

For operations considering larger capital investments, robotic milking systems are showing compelling economics for the right situations—studies cited by Progressive Dairy and industry analysts show payback periods of 5-7 years when labor savings, production increases, and improved herd health detection are factored together, though ROI varies significantly based on herd size, labor costs, and management intensity.

Feed efficiency metrics matter more than ever. Tracking pounds of milk produced per pound of dry matter intake reveals opportunities many operations overlook.

Research documented in the Journal of Dairy Science and confirmed by Michigan State’s extension work shows each 1 percent improvement in forage NDF digestibility translates to approximately 0.55 pounds additional milk per cow per day and about 0.38 pounds more dry matter intake, according to a summary of the research.

On a 600-cow herd, that 0.55 pounds daily adds up to 330 pounds across the herd, or roughly 120,000 pounds annually. At $16 milk, you’re looking at around $19,000 in additional revenue from a single percentage point improvement in forage quality. That’s why forage testing and harvest timing decisions carry such significant economic weight.

Labor productivity varies widely across operations, too. Farms running 120-140 cows per full-time equivalent generally outperform those at 80-100 cows per FTE on a cost-per-hundredweight basis. This doesn’t mean minimizing staff—it means ensuring labor investments produce proportional output through good systems, appropriate automation, and reduced turnover.

The farms navigating current conditions most successfully tend to excel across multiple efficiency dimensions simultaneously rather than focusing narrowly on any single metric. It’s the combination that creates a durable competitive advantage.

Why ‘Tightening Your Belt’ Won’t Save You This Time

Here’s what I keep coming back to when I look at all of this: The biggest risk for dairy farmers right now isn’t any single market factor. It’s the assumption that this is just another cycle that will correct itself if you tighten your belt and wait it out.

Dairy farmers are extraordinarily resilient. You’ve navigated 2008-2009, 2015-2016, 2020, and everything in between. Every time you cut costs, got more efficient, and made it through to better prices.

That resilience has been your greatest asset. But in this environment, the traditional playbook has limits.

The structural changes we’re seeing—the genetic revolution reshaping replacement dynamics, the power shift toward processors, the permanent loss of Chinese import demand, the capital intensity that favors scale—these aren’t cyclical headwinds that will reverse when milk prices recover. They’re fundamental changes in how the industry operates.

Tightening your belt works when you’re waiting out a temporary downturn. It doesn’t work when the game itself has changed.

The farms that will emerge strongest from 2026-2028 aren’t necessarily the biggest. They’re the ones that recognized early that some operating conditions have shifted permanently and adjusted their approaches accordingly.

That means:

  • Building cost structures that work at $16-18 milk, while remaining positioned to benefit if prices improve
  • Managing debt proactively rather than assuming refinancing will always be available on favorable terms
  • Making breeding decisions that balance near-term revenue with longer-term replacement needs—and treating your genetic program as a strategic asset
  • Evaluating processor partnerships with clear eyes about who holds the leverage
  • Focusing on profitability at the current size rather than assuming growth solves margin challenges

The Bottom Line

The dairy industry has weathered difficult periods before, and it will navigate this one as well. Domestic and global demand for quality dairy products remains substantial. Well-managed operations will continue finding paths to profitability.

The question is which operations will position themselves to thrive in the industry’s next chapter. And that positioning is happening now, in the decisions being made over the next 90 days.

The farmers who approach this moment with clear-eyed realism—neither panic nor complacency—and take deliberate action to strengthen their operations will look back in 2028 with satisfaction at the choices they made.

That outcome is available to you. That window closes faster than you think.

Key Takeaways

The market reality:

  • U.S. milk production running 3.7-4.7 percent above year-ago levels through fall 2025—the strongest growth since the COVID recovery
  • National herd at 9.57 million head, up 211,000 from a year ago
  • Domestic supply projected to exceed demand growth through at least mid-2027
  • China’s import decline—from 845,000 to 430,000 metric tons—represents a structural policy shift
  • Mexico accounts for more than a third of U.S. cheese exports

The structural shifts:

  • Beef-on-dairy isn’t a trend—it’s a genetic revolution requiring new replacement math
  • Power has shifted to processors who control the stainless steel and need milk to justify their investments
  • Butterfat premiums have collapsed—butter from over $3.00/lb to around $1.40/lb
  • Replacement heifer inventory at 47-year lows (3.914 million head); record prices

Action items for the next 90 days:

  • Evaluate forward contracting 50-70 percent of the 2026 feed needs
  • Review DRP and DMC options before January enrollment deadlines
  • Initiate lender conversations—FSA operating loans at 4.625%
  • Reassess breeding strategy: What percentage of your herd represents your genetic future?
  • Model breakeven at $16-18 milk and identify improvement areas

The mindset shift:

  • “Tightening your belt” is a failing strategy when the game has changed
  • Resilience means proactive adaptation, not passive endurance
  • Q1 2026 decisions will significantly influence outcomes through 2028

Complete references and supporting documentation are available upon request by contacting the editorial team at editor@thebullvine.com.

Learn More

The Sunday Read Dairy Professionals Don’t Skip.

Every week, thousands of producers, breeders, and industry insiders open Bullvine Weekly for genetics insights, market shifts, and profit strategies they won’t find anywhere else. One email. Five minutes. Smarter decisions all week.

NewsSubscribe
First
Last
Consent

The $97,500 Protein Shift: How Weight-Loss Drug Users Are Rewriting Your Breeding Strategy

$97,500. That’s what weight-loss drugs are worth to a 500-cow dairy. Here’s how to capture it.

milk protein premiums

Executive Summary: $97,500 annually. That’s what a 500-cow dairy can capture by responding to the protein shift—a market realignment most producers haven’t traced to its source. GLP-1 weight-loss drugs have reached 41 million Americans who now consume high-protein dairy at triple the normal rate, reshaping what your milk is worth. Protein premiums have hit $5/cwt at cheese facilities, and December’s Federal Order update raised baseline protein to 3.3%—meaning below-average herds now subsidize neighbors who ship higher components. The opportunity stacks three ways: nutrition optimization ($8,750-$15,000), protein-focused genetics ($17,500-$22,500), and processor premiums ($24,000-$60,000). The catch: breeding decisions this spring won’t reach your bulk tank until 2029, rewarding producers who move early. The math is clear, the window is open, and this analysis shows exactly how to capture it.

A number worth sitting with: households taking GLP-1 weight-loss medications are consuming yogurt at nearly three times the national average. Not 20% more. Not double. Three times.

That data point comes from Mintel’s 2025 consumer tracking. It tells you something important about where dairy demand is heading—and raises questions worth considering if your breeding program has been focused primarily on butterfat.

Something meaningful is shifting in how the market values what comes out of your bulk tank. This isn’t a temporary blip or a pricing anomaly. What we’re seeing appears to be a structural change driven by forces that weren’t on most of our radars even five years ago—pharmaceutical trends, aging demographics, and global nutrition demands all converging at once.

This creates opportunities for producers positioned to respond. It also creates challenges for those caught off guard. The difference often comes down to understanding what’s actually driving these changes.

THE QUICK MATH: What’s This Worth?

For a 500-cow herd positioned to capture the protein shift:

OpportunityAnnual Value
Nutrition optimization (amino acid balancing)$8,750 – $15,000
Genetic improvement (protein-focused selection)$17,500 – $22,500
Processor premiums (above-baseline protein)$24,000 – $60,000
Combined Annual Opportunity$50,000 – $97,500

These figures assume: 500 cows, 24,000 lbs/cow annually, current component price relationships, and access to a processor paying protein premiums. Individual results vary based on current herd genetics, ration, and market access.

The Pharmaceutical Connection

When GLP-1 drugs first hit the market, I didn’t give much thought to dairy implications. Weight-loss medications seemed pretty far removed from breeding decisions and component pricing.

That thinking needed updating.

As of late 2025, roughly 12% of Americans—about 41 million people—have used GLP-1 medications like Ozempic, Wegovy, or Mounjaro. That figure comes from a KFF poll reported in JAMA in mid-2024, with subsequent tracking by RAND and others confirming the trend has held. Market projections for these drugs range from $157 billion to $324 billion by 2035, depending on which analyst you ask. This isn’t a niche trend anymore. It’s a mainstream pharmaceutical category reshaping eating behavior at a population level.

What makes this relevant to your operation is how these medications change consumption patterns. GLP-1 drugs work by slowing gastric emptying—patients feel full faster and eat much less. But their protein requirements don’t drop. If anything, clinical guidance suggests they increase.

Obesity medicine specialists now recommend GLP-1 users consume 1.2 to 1.6 grams of protein per kilogram of body weight daily—backed by research in the Journal of the International Society of Sports Nutrition and clinical practice guidelines from multiple medical organizations. That’s substantially higher than typical recommendations. The reasoning? Rapid weight loss without adequate protein intake leads to significant muscle wasting.

And this is where it gets clinically important: studies published in peer-reviewed journals indicate that between 25% and 40% of weight lost on these medications can come from lean body mass rather than fat. A 2025 analysis in BMJ Nutrition, Prevention & Health quantified this at “about 25%–40%” as a proportion of total weight loss. That’s a real concern for patients and their physicians—and it’s driving specific dietary recommendations.

So you have millions of people who can only eat small portions but genuinely need concentrated protein sources. What foods fit that profile?

High-protein dairy fits it remarkably well.

The consumption data supports this. According to Mintel’s tracking, Greek yogurt and cottage cheese consumption has increased significantly among GLP-1 users, while higher-fat dairy categories have moved in the opposite direction. Reports in June 2025 showed that “plain dairy and protein powders hold steady” while “processed goods are taking the biggest hit.” The exact percentages vary by study, but the directional trend is consistent.

There’s also a bioavailability dimension worth understanding. The DIAAS score—Digestible Indispensable Amino Acid Score, the FAO-recommended measurement method—indicates how efficiently the body uses different protein sources. According to research by the International Dairy Federation and the Global Dairy Platform, whole milk powder scores around 1.22 on DIAAS, while other dairy proteins consistently score 1.0 or higher. Compare that to soy at roughly 0.75-0.90, depending on processing, and pea protein at 0.62-0.64. For someone eating limited quantities, that efficiency difference matters considerably.

What does this means practically? This isn’t just a preference shift—there’s a physiological basis driving these patients toward nutrient-dense protein sources. Dairy happens to fit that need particularly well.

Reading Your Milk Check Differently

So consumer preferences are shifting. What does that actually mean for component pricing?

The answer depends partly on your market, but broad trends are worth understanding.

Looking at USDA component price announcements over recent months, protein has traded at a meaningful premium over butterfat. Through late 2025, the protein-to-fat price ratio has been running in the range of 1.3 to 1.4—a notable departure from historical norms. For much of the past two decades, these components traded closer to parity, with fat often commanding a slight premium.

I recently spoke with a Wisconsin producer who’d been closely tracking this shift. “I started paying attention about two years ago,” he told me. “Once I saw the ratio consistently above 1.25, I went back and looked at my sire selection. Realized I’d been leaving money on the table.”

That experience isn’t unusual. Many producers look at their check, review the component breakdowns, and maybe note whether fat or protein prices have changed from last month. But they’re not calculating what the spread actually means for breeding strategy over time.

Let me put some illustrative numbers on it, using late 2025 component price relationships as a guide.

Consider a 500-cow operation producing 24,000 pounds per cow annually. If you compare a fat-focused breeding approach averaging 4.0% fat and 3.1% protein against a protein-focused approach averaging 3.7% fat and 3.4% protein, the difference in total component value can run $35 to $45 per cow annually from the bulk tank alone (these figures shift as component prices move, but the general principle holds when protein maintains its current premium over fat). For that 500-cow herd, you’re looking at roughly $17,500 to $22,500 in annual difference from genetics alone.

That’s before considering processor premiums that cheese and ingredient plants often pay for high-protein milk. Factor those in, and the opportunity can be larger still.

I want to be measured here. I’m not suggesting everyone immediately overhaul their breeding strategy. What I am suggesting is that this ratio deserves more attention than most producers have been giving it.

The Federal Order Update

Another dimension affects how money flows through the pricing system.

The June 2025 updates to Federal Milk Marketing Order formulas—finalized by USDA in January 2025 after the producer referendum—adjusted baseline composition factors to reflect current herd averages. According to the USDA Agricultural Marketing Service final rule, protein moved from 3.1% to 3.3%, other solids from 5.9% to 6.0%, and nonfat solids from 9.0% to 9.3%. The composition factor updates became effective December 1, 2025.

Why does this matter practically? Processors now assume your milk contains 3.3% protein as the baseline. If you’re consistently shipping 3.0% or 3.1%, you’re not just missing premiums—you may be contributing to the pool that pays premiums to higher-component herds.

I’ve spoken with producers who didn’t fully grasp this dynamic at first. They knew their components were “a little below average” but figured it wasn’t significant. When we worked through their position relative to the pool, they were surprised to see how much value was being transferred out of their operation each month.

The system isn’t unfair—it’s designed to reward quality. But you need to understand where you stand within it.

Genetic Strategies Worth Considering

For operations looking to improve protein production, genetic selection offers the most durable path forward. The challenge, as we all know, is that results take time to show up in the bulk tank.

The timeline reality looks something like this:

From Breeding Decision to Bulk Tank Impact

  • Select high-protein sires (January 2026) → Semen in tank
  • Breed cows (Spring 2026) → Conception
  • Gestation (Spring 2026 – Winter 2027) → Calf born
  • Heifer development (2027 – 2028) → Growing replacement
  • First calving (Late 2028) → Enters milking string
  • First full lactation data (2029) → Bulk tank impact measurable
PhaseTimingMonths from Decision
Sire SelectionJanuary 20260
Breeding/ConceptionSpring 20263–6
GestationSpring 2026 – Winter 202712–15
Heifer Development2027 – 202824–30
First CalvingLate 202833–36
Measurable Bulk Tank Impact202936–48

If you breed a cow this spring, her daughter won’t enter the milking string until late 2028 at the earliest. That’s just the biology. So breeding decisions you make in the next few months will shape your herd’s component profile three to five years from now.

MetricFat-Focused StrategyProtein-Focused Strategy
Avg Fat %4.0%3.7%
Avg Protein %3.1%3.4%
Component Value/Cow/Year$1,245$1,290
Processor Premium/Cow/Year$0$120
Total Annual Herd Revenue (500 cows)$622,500$705,000
Revenue Advantage+$82,500

This is why genetics is a long game—but it’s also the only permanent solution. Nutrition can help capture more of your genetic potential today, but it can’t exceed what the genetics allow.

One development that’s accelerating this timeline for some operations: genomic testing. If you’re testing heifers at a few months of age, you can identify your high-protein genetics earlier and make culling decisions before investing in two years of development costs. It doesn’t change the biological timeline, but it does let you be more selective about which animals you’re developing in the first place.

Selection Index Considerations

Most producers default to Total Performance Index (TPI) when evaluating Holstein sires, and it remains useful for balanced selection. But if protein improvement is a specific priority, Cheese Merit (CM$) rankings warrant closer scrutiny.

Trait CategoryMinimum ThresholdProtein-Focused TargetWhy It Matters
PTA Protein %+0.03%+0.04% to +0.06%Improves concentration—the key to premiums
PTA Protein Pounds+40 lbs+50 lbs or higherEnsures volume doesn’t drop as % increases
PTA Fat %No minimum+0.01% to +0.03%Hedges against protein premium narrowing
Productive Life (PL)+2.0+3.0 or higherCows must last long enough to justify investment
Daughter Pregnancy Rate (DPR)+0.5+1.0 or higherPoor fertility destroys genetic progress
Somatic Cell Score (SCS)2.90 or lower2.85 or lowerHigh SCC kills premiums faster than low protein
Inbreeding CoefficientMonitor: keep below 6.25%Aggressive protein selection can concentrate genes
Selection IndexUse CM$ or updated NM$Better protein weighting than traditional TPI

CM$ places greater emphasis on protein per pound and protein percentage than TPI does. It was designed for operations shipping to cheese plants, where protein drives vat yield. The updated Net Merit (NM$) formula has also adjusted component weightings in recent years to reflect market realities.

General Thresholds to Consider

When evaluating individual sires for protein improvement, what many nutritionists and AI representatives suggest—keeping in mind these are general guidelines, not hard rules:

  • PTA Protein %: Bulls at +0.04% or higher are generally considered strong for protein concentration. Bulls above +0.06% are moving the needle meaningfully.
  • PTA Protein Pounds: Targeting +50 lbs or higher helps maintain total protein production while improving percentage.
  • Combined approach: The ideal sires show positive values in both categories. Bulls that improve percentage by diluting volume aren’t actually helping you.

One important caution: don’t chase protein so aggressively that you sacrifice health and fertility traits. A cow that burns out after 1.8 lactations isn’t profitable regardless of her component profile. Setting minimum thresholds for Productive Life and Daughter Pregnancy Rate before optimizing for components makes sense. Talk with your AI rep about what fits your specific situation.

Intervention StrategyLow EstimateHigh EstimateTimeline to Impact
Nutrition Optimization (amino acid balancing)$8,750$15,0002–4 weeks
Genetic Improvement (protein-focused sires)$17,500$22,5003–5 years
Processor Premiums (high-protein milk)$24,000$60,000Immediate (if available)
TOTAL ANNUAL OPPORTUNITY$50,250$97,500Varies by strategy

A Note on Inbreeding

Another consideration doesn’t get discussed enough: selecting heavily for narrow trait clusters can accelerate inbreeding. Pennsylvania State University’s Dr. Chad Dechow, who has extensively studied genetic diversity in Holsteins, notes that intense selection for specific traits can accelerate genetic concentration faster than many producers realize—as he’s put it, “if it works, it’s line breeding; if it doesn’t, it’s inbreeding.” Research published in Frontiers in Animal Science found that selection for homozygosity at specific loci (like A2 protein) significantly increased inbreeding both across the genome and regionally. The takeaway: if you’re selecting aggressively for protein traits, monitor inbreeding coefficients and work with your genetic advisor to maintain adequate diversity in your sire lineup.

The Beef-on-Dairy Angle

There’s strategic flexibility that comes with the current beef market. Beef-on-dairy calves have been commanding strong prices—industry reports from late 2025 show day-old beef-cross calves going for $750 to over $1,000 in many markets, with well-bred calves sometimes topping $1,600 depending on genetics and condition. Dairy Herd Management reported in August 2025 that Jersey beef-on-dairy calves were fetching $750 to $900 at day of birth, with the market remaining robust through the fall.

Some producers are using this strategically: breed your top 40-50% of the herd to high-protein dairy sires for replacements, and use beef semen on the bottom half. You capture immediate cash flow from beef calves while concentrating genetic improvement on animals that will actually move the herd forward.

A California producer I spoke with recently has been doing exactly this for three years. “It changed my whole approach to replacement decisions,” she said. “I’m more selective about which genetics I’m actually keeping in the herd, and the beef calves are paying their own way.”

It’s not the right approach for every operation, but it’s worth thinking through.

The Nutrition Bridge

Genetics determine the ceiling for what your cows can produce. Nutrition determines how close you get to that ceiling. And unlike genetics, nutrition interventions can show results within weeks.

The most targeted intervention for protein production involves amino acid supplementation—specifically rumen-protected methionine.

The background: in typical U.S. dairy diets built around corn silage and soybean meal, methionine often becomes the limiting amino acid for milk protein synthesis. You can feed all the crude protein you want, but if the cow runs short on methionine, she can’t efficiently convert it to milk protein. The excess nitrogen gets excreted.

Rumen-protected forms of methionine—coated to survive rumen degradation—allow the amino acid to reach the small intestine, where absorption actually happens.

What the Research Shows

University trials—including work from Cornell, Penn State, and Wisconsin dairy extension programs—have demonstrated that rumen-protected methionine can boost milk protein percentage, often by 0.08% to 0.15% within 2 to 3 weeks of implementation. Results vary by herd and baseline diet, so verifying response on your own operation before committing fully makes sense.

Run a trial with one pen of mid-lactation cows for 21-30 days. Compare their component tests to a control group or their own pre-trial baseline. Work with your nutritionist on the economics—supplement costs, expected response, and whether it pencils at current protein prices. If you’re seeing the expected response, roll it out more broadly. If not, you haven’t invested much to find out.

One thing I’ve noticed, talking with nutritionists across the Midwest and Northeast, is that the response tends to be most consistent in herds that haven’t previously optimized their amino acid balance. If you’ve already been balancing for methionine and lysine, the incremental gain may be smaller. Fresh cows and early-lactation groups often show the most dramatic response, since that’s when protein synthesis is competing most with other metabolic demands during the critical transition period.

For a 500-cow herd seeing a 0.10-0.12% protein increase, that can translate to $8,750 to $15,000 annually in additional component value at current prices—often exceeding the supplement cost by a meaningful margin.

An additional benefit: because you’ve addressed the limiting amino acid, you may be able to reduce total ration crude protein slightly without sacrificing production. That can offset some or all of the supplement cost.

Processor Relationships

This dimension deserves more attention than it typically gets.

Not all processing facilities are equally equipped to capture the value of high-protein milk. Before making significant changes to your breeding program, it’s essential to understand what your buyer can actually afford.

Cheese plants—particularly the large cooperative facilities across Wisconsin’s cheese belt and specialty operations in California’s Central Valley—are generally the most straightforward. Higher protein concentration means more cheese per gallon processed. A plant can increase output without expanding capacity simply by sourcing higher-protein milk. Clear economic incentive exists to pay for it.

Processor TypeProtein ThresholdPremium per CWTAnnual Value (500 cows)
Commodity Powder PlantNo premium$0.00$0
Regional Cheese Co-op3.3%$0.50–$0.75$60,000–$90,000
Large Cheese Facility (WI)3.3%$1.00–$1.50$120,000–$180,000
Specialty Protein Plant3.35%$2.00–$3.00$240,000–$360,000
Direct Contract (High-volume)3.4%$3.00–$5.00$360,000–$600,000

Cheese plant managers I’ve spoken with confirm they’re actively seeking higher-protein milk supplies. One plant manager in central Wisconsin told me their facility has increased protein premiums twice in the past eighteen months, specifically to attract higher-component milk. “We’re competing for that milk now,” he said. “Five years ago, we weren’t having that conversation.”

What Premiums Actually Look Like

Processor premiums vary considerably by region and facility, but here’s what the market data shows: USDA Dairy Market News reports the average protein premium is around $1.25 per hundredweight above baseline. Some producers shipping to cheese-focused cooperatives report premiums in the $0.50 to $0.75/cwt range for modest improvements, while direct contracts with protein-hungry facilities can reach $3.00 to $5.00/cwt for milk consistently testing above 3.35% protein—though these premium contracts typically require volume commitments and consistent quality.

For a 500-cow herd producing 120,000 cwt annually, even a $0.50/cwt premium adds $60,000 to the annual milk check. At $1.00/cwt, that’s $120,000. The math quickly draws producers’ attention.

Ingredient and filtration plants making whey protein concentrates, milk protein isolates, and similar products also value protein highly. Operations in Idaho and across the West are specifically tooled to extract and monetize protein fractions. These facilities serve the growing functional nutrition market, including products for GLP-1 users.

Fluid milk bottlers and commodity powder dryers may have less ability to monetize elevated protein. If a bottler standardizing for the Southeast fluid market is already adjusting milk to regulatory specifications, excess protein beyond those specs doesn’t necessarily yield premium returns.

PROCESSOR CONVERSATION CHECKLIST

Download and bring to your next meeting with your milk buyer:

☐ Premium Structure

  • “What protein threshold triggers premium payments?”
  • “Is there a cap on protein premiums, or do they scale continuously?”
  • “How is the premium calculated—per point above threshold, or tiered brackets?”

☐ Testing & Verification

  • “How frequently is my milk tested for components?”
  • “Can I access my component test history for the past 12 months?”

☐ Plant Capabilities

  • “Does your plant have protein standardization capability?”
  • “What’s your target protein level for incoming milk?”

☐ Market Trends

  • “Are you seeing increased demand for high-protein products from your customers?”
  • “Do you anticipate changes to your premium structure in the next 12-24 months?”

☐ Contract Options

  • “Are direct premium contracts available for consistent high-protein suppliers?”
  • “What volume and consistency requirements would apply?”

Keep notes from this conversation—the answers should inform your breeding and nutrition decisions.

The answers might influence how aggressively you pursue protein genetics. If your buyer caps premiums at 3.3%, there is less incentive to push for 3.5%. If they’re paying meaningful premiums with no cap because they’re expanding ingredient production, that’s entirely different information.

A Decision Framework

Given this complexity, a framework for thinking through whether an aggressive protein pivot makes sense:

Consider aggressive protein focus if:

  • You ship to a cheese plant or ingredient facility
  • Your current herd averages below 3.25% protein
  • Your buyer explicitly pays protein premiums without caps
  • You have flexibility in your replacement strategy
  • Your herd health metrics are already solid

Consider a balanced approach if:

  • You ship to a fluid bottler or a diversified cooperative
  • Your herd already averages 3.3%+ protein
  • Your buyer caps protein premiums at a specific threshold
  • You’re still working on fertility or longevity genetics
  • You operate in a region with limited processor options

Consider maintaining the current strategy if:

  • Your processor has no protein premium structure
  • Switching buyers isn’t practical for your location
  • Your herd has significant health or fertility challenges to address first
  • You’re already at or above pool averages for both components

There’s no single right answer here. The key is matching your genetic strategy to your actual market circumstances.

Your Current SituationAggressive Protein FocusBalanced ApproachMaintain Current Strategy
Processor pays protein premiums?Yes, uncapped or high capYes, but capped at 3.3–3.4%No premium structure
Current herd protein averageBelow 3.25%3.25–3.35%Above 3.35%
Milk buyer typeCheese/protein plantDiversified co-opFluid bottler/powder plant
Herd health & fertility statusAlready solid (DPR >20%)Some challengesSignificant problems to fix first
Ability to switch processorsYes, within 50 milesLimited optionsLocked into current contract
Replacement strategy flexibilityCan use beef-on-dairyRaising most replacementsMust raise 100% replacements
Risk toleranceWilling to commit 3+ yearsModerateConservative
RECOMMENDATIONGo aggressive: aim for 3.4–3.5% proteinIncremental improvement: target 3.3–3.4%Focus on other profit drivers first

Regional Considerations

This analysis doesn’t apply uniformly across all operations and regions—something worth acknowledging.

Upper Midwest herds shipping to Wisconsin cheese plants are positioned differently than Southeast operations serving fluid markets. A 3,000-cow operation in the San Joaquin Valley faces different economics than a 100-cow farm in Vermont or a grazing dairy in Missouri.

Those shipping to cheese-focused cooperatives in Wisconsin and Minnesota have generally been tracking protein-to-fat ratios more closely—some for several years—and have adjusted breeding programs accordingly. In conversations with producers in these areas, I’ve repeatedly heard that neighbors who were initially skeptical are now asking about sire selections.

But producers in fluid-heavy markets often take a more measured approach. If your buyer can’t pay for high protein, breeding for a premium you can’t capture doesn’t make economic sense. Watching trends while maintaining flexibility is entirely reasonable.

Both perspectives make sense given their circumstances.

The fundamental trends—GLP-1 adoption, component pricing shifts, global protein demand—are real regardless of location. But how you respond depends on your specific situation: current herd genetics, processor relationship, cash flow position, and risk tolerance.

The Global Context: America’s Protein Export Opportunity

What’s happening domestically aligns with broader international patterns—and positions the U.S. dairy industry for a significant strategic shift.

New Zealand’s dairy industry—historically the world’s dominant dairy exporter—has hit production constraints. Environmental regulations capping nitrogen runoff have effectively frozen their national herd. Rather than competing for market share in commodity whole milk powder, they’ve pivoted toward high-value protein products.

According to a 2023 report from DCANZ and Sense Partners, protein products rose from 8.6% to 13.2% of New Zealand’s export mix between 2019 and 2023. DairyNZ reported that protein product exports increased 120% over that period, reaching $3.4 billion. That’s a deliberate strategic shift, not an accident.

Here’s what’s interesting for U.S. producers: we’re no longer just a dairy exporter—we’re increasingly becoming a protein exporter. According to the International Dairy Foods Association, U.S. dairy exports reached $8.2 billion in 2024, the second-highest level ever recorded. That’s a remarkable transformation. As IDFA noted in their February 2025 analysis, “After being a net importer of dairy products a decade ago, the United States now exports $8 billion worth of dairy products to 145 countries.”

The composition of those exports is shifting in telling ways. Brownfield Ag News reported in November 2025 that high-protein whey exports rose nine percent, led by sales to Japan. Farm Progress confirmed in July 2025 that “high-end whey exports continue to grow both in volume and value,” specifically noting that whey protein concentrates and isolates with 80% or more protein are driving the growth. According to the U.S. Dairy Export Council’s reference materials, the United States is now the largest single-country producer and exporter of whey ingredients in the world, with total whey exports reaching 564,000 metric tons in 2023—up 14% from 2019.

The industry is investing, and strong growth prospects have led to $8 billion in new processing plant investments set to increase production over the next two years. By mid-2025, nearly 20 million additional pounds of milk were flowing through new facilities, with much of that capacity focused on cheese—and the whey protein streams that come with it.

This matters for producers because U.S. dairy protein must increasingly meet global specifications. The U.S. Dairy Export Council has been working with the American Dairy Products Institute to develop industry standards for U.S. products and with the International Dairy Federation to develop worldwide technical standards. The National Milk Producers Federation prompted an investigation in 2025—through the U.S. International Trade Commission—into global competitiveness for nonfat milk solids, including milk protein concentrates and isolates.

Why does this matter at the farm level? Asian markets have evolved. China’s domestic milk production has grown, reducing the need for basic powder imports. What they’re purchasing now are specialized high-protein ingredients: lactoferrin for infant formula, protein isolates for clinical nutrition, functional ingredients for the growing urban fitness market.

With New Zealand capacity-constrained and the U.S. investing heavily in protein-processing infrastructure, there’s a genuine opportunity—but only if we’re producing what global buyers want. They’re not paying premium freight costs to import commodity milk. They want protein density that meets international quality standards. The farms supplying that milk are part of an increasingly export-oriented value chain, whether they realize it or not.

Balancing Opportunity and Risk

Any time someone presents a market opportunity, you should ask: “What if the assumptions don’t hold?”

Fair question.

What if the protein premium narrows?

It could happen. Processor capacity might expand. Consumer trends might shift. The protein-to-fat ratio could drift toward historical norms.

My thinking: even if protein premiums moderate, protein is unlikely to become less valuable than fat on a sustained basis. The fundamentals—bioavailability advantages, consumer demand for functional nutrition, processing economics—support continued protein value.

More importantly, breeding for combined solids rather than protein alone provides insurance. Bulls that improve both fat and protein percentages protect against shifts in the ratio. The market has never penalized producers for shipping high total solids. The risk is in low-component production, not in being wrong about which component the market favors most.

What if GLP-1 adoption plateaus?

Possible, but current trajectory suggests otherwise. These medications are being prescribed not just for weight loss but for diabetes management and cardiovascular protection. Insurance coverage is expanding. Pill formulations are entering the market. The user base appears to be institutionalizing rather than peaking.

But even setting GLP-1 aside, other demand drivers—aging populations seeking muscle preservation, fitness culture emphasizing protein intake, Asian markets wanting protein imports—remain intact.

Practical risk management approaches:

  • Use Net Merit (NM$) rather than extreme protein indexes for a balanced hedge
  • Maintain health and longevity trait minimums regardless of component goals
  • Keep some flexibility through beef-on-dairy rather than raising 100% of replacement heifers
  • Consider nutrition interventions (reversible) before genetic changes (permanent)
  • Monitor inbreeding coefficients when selecting heavily for protein traits

Practical Takeaways

Bringing this together into actionable items:

Understanding Where You Stand

  • Calculate the protein-to-fat price ratio from your last few milk checks
  • Compare your herd’s protein percentage to the Federal Order pool average (now 3.3%)
  • Have an explicit conversation with your milk buyer about protein premiums and thresholds

Evaluating Genetic Options

  • Review your current sire lineup for protein trait emphasis
  • Consider CM$ or updated NM$ rankings alongside traditional TPI
  • Set minimum thresholds for health and fertility traits before optimizing for components
  • Look for bulls positive in both protein percentage and protein pounds
  • Work with your AI rep on what makes sense for your herd
  • If you’re genomic testing heifers, use protein traits in your retention decisions
  • Monitor inbreeding levels when concentrating selection on protein traits

Near-Term Nutrition Interventions

  • Discuss rumen-protected methionine with your nutritionist
  • Consider a 21-30 day pen trial before full implementation
  • Track component response carefully to verify ROI on your operation
  • Pay particular attention to fresh cow and early lactation response

Timeline Expectations

  • Nutrition changes: visible results in 2-4 weeks
  • Genetic changes: first daughters milking in 3+ years
  • Spring 2026 breeding decisions will shape your 2029 bulk tank

Questions to Keep Asking

  • Does my processor have the infrastructure to pay for high-protein milk?
  • Am I positioned above or below the pool average for components?
  • What’s my risk tolerance for genetic strategy changes?
  • Am I tracking the protein-to-fat ratio, or just looking at absolute prices?

The Bottom Line

The dairy industry has navigated plenty of transitions over the decades. What makes this moment noteworthy is the convergence of forces—pharmaceutical, demographic, and economic—pointing in a consistent direction.

I’m not predicting that butterfat will become worthless or that every operation needs to overhaul its breeding program immediately. What I am suggesting is that assumptions many of us have operated under for the past decade deserve fresh examination.

The market is sending signals. Processors are paying premiums for protein that would have seemed unusual five years ago. Consumer demand is shifting in ways that favor nutrient density over volume. Global buyers are seeking protein ingredients, not commodity powder. And American dairy is increasingly positioned as a global protein exporter, not just a domestic commodity producer.

The combined opportunity is real. For a 500-cow herd that optimizes nutrition, adjusts genetic selection, and captures processor premiums—we’re talking $50,000 to $97,500 annually in additional value. That’s not theoretical. It’s math based on current market conditions and achievable improvements.

Producers who take time to understand these dynamics—and thoughtfully evaluate what they mean for their specific operations—are well positioned. Those who assume the old rules still apply may find themselves wondering why neighbors’ milk checks look different.

This isn’t about chasing trends. It’s about recognizing when fundamental market structures are shifting and responding accordingly. For some operations, that response might be modest adjustments. For others, more significant changes might make sense. Either way, understanding what’s actually happening is the essential first step.

That protein-to-fat ratio on your milk check? It’s telling you something. 

Complete references and supporting documentation are available upon request by contacting the editorial team at editor@thebullvine.com.

Learn More

The Sunday Read Dairy Professionals Don’t Skip.

Every week, thousands of producers, breeders, and industry insiders open Bullvine Weekly for genetics insights, market shifts, and profit strategies they won’t find anywhere else. One email. Five minutes. Smarter decisions all week.

NewsSubscribe
First
Last
Consent

28p vs. £300 Million: The 2025 Milk Price Gap Nobody’s Explaining

Asked Arla and Müller how £300M in expansions aligns with 28p milk. No response. Their annual reports answered anyway: €401M profit, margins tripled.

EXECUTIVE SUMMARY: Lakeland’s November 2025 price of 28.8p per litre—the first below 30p in over a year—means the average farm loses 15p on every litre produced. Processor economics tell a different story: Arla netted €401 million profit, Müller tripled operating margins to £39.6 million, and the sector poured £300 million into new capacity. This pattern extends globally. US lenders expect only half of dairy borrowers to profit this year; Germany loses 6 farms a day; Darigold members describe $4/cwt deductions making cash flow “impossible.” Factor in 2-3p/L in looming environmental compliance costs, and margins compress further still. Farms positioned to navigate this share clearly have the following characteristics: debt below 50% of assets, production costs under 38p, and component or contract strategies that capture value beyond the base price. The global dairy industry is consolidating faster than at any point since 2015. What you decide in the next 90 days shapes whether your operation leads that consolidation or gets swept up in it.

Milk Price Gap

The text came through just after 6 AM on a wet December morning in County Fermanagh. Lakeland Dairies had announced November’s price: 28.8 pence per litre. The Irish Farmers Journal confirmed it was the first time we’d seen prices dip below 30p since November 2023.

For the farmer who shared it with me—180 cows, third-generation operation, silage already put up for winter—the math took about thirty seconds. At 28.8p against his actual production cost of roughly 44p, he’s losing just over 15p on every litre his cows produce. That works out to around £2,500 a month in the red, assuming nothing else goes sideways between now and spring.

“Dairy farming is not sustainable for families at the minute,” is how he put it when we spoke later that week. “They talk about it coming back at the second half of next year—the second half of next year could be December.”

You know what struck me about that conversation? It wasn’t the frustration. Every dairy farmer I’ve talked to lately has plenty of that. It was the clarity. He’d already run his numbers. He knew exactly how many months of working capital he had left, what land he could move if it came to that, and at what price point he’d need to start having some hard conversations about the herd’s future.

That kind of clear-eyed planning is becoming more common across dairy operations worldwide right now. And given where things stand, that’s probably smart.

The 70p Gap: Where Your Milk Money Actually Goes

So let’s dig into what we actually know about where the money flows in late 2024.

The headline numbers tell a pretty stark story. Lakeland’s 28.8p base price for Northern Ireland suppliers is the first time we’ve breached that 30p floor in over a year. Meanwhile, you walk into any Tesco Express or Sainsbury’s Local, and you’re looking at somewhere between £1.00 and £1.50 for a litre of milk.

That’s a gap of 70p to 120p per litre between what we’re getting at the farm gate and what consumers pay at checkout.

Now here’s the thing—and you probably know this already—a good chunk of that gap is completely legitimate. Processing costs real money. So does transport, packaging, refrigeration, retail labour, and the considerable energy costs of keeping those dairy cases cold around the clock. A reasonable industry estimate for post-farm costs is 25-35p, depending on the product and supply chain.

But even accounting for all those real costs, there’s still a meaningful portion—perhaps 40p or more—being captured at various points along the supply chain between the bulk tank and the checkout. Understanding where that value ends up, and why, helps when you’re trying to make sense of your own situation.

SegmentTypical revenue per litre (p/L)Approximate cost per litre (p/L)Approximate margin per litre (p/L)
Dairy farm28.844.0-15.2
Processor45.035.010.0
Retailer110.070.040.0
Whole chain110.0149.0*

Here’s what gets interesting when you look at the regional breakdown. According to AHDB data from October 2025, the UK average farmgate price is 46.56p per litre, with Great Britain at 47.99p. Northern Ireland? Just 39.09p—and remember, that’s the average, which includes farms on better contracts. The 28.8p base price we’re talking about sits well below even that regional figure.

I was chatting with a Devon producer last month who put it pretty plainly:

“We’re getting 38p on a standard liquid contract, which isn’t great, but it’s survivable if you’re careful. When I hear what lads in Fermanagh are getting, I honestly wonder how they’re managing it.”

So why such a big difference across regions? Some structural factors help explain it.

The Export Trap: Why Northern Ireland is the Canary in the Coal Mine

Here’s the key thing about Northern Ireland that shapes everything else: roughly 80% of NI milk production—that’s from AHDB’s latest figures—heads straight for export markets. Cheese, butter, powder destined for Europe, Africa, and beyond. That’s a fundamentally different setup from Great Britain, where more milk stays domestic and flows through liquid contracts with the major retailers.

What that export focus means—and this is really the central point—is that pricing works on completely different terms. When you’re selling mozzarella into European food service or milk powder into global commodity markets, you’re competing against New Zealand, Ireland, and every other major exporter out there. Your price gets driven by the Global Dairy Trade index, not by whether Tesco needs to keep shelves stocked.

And there’s a geographic reality that also constrains options. You can’t economically truck raw milk across the Irish Sea to chase a buyer in Liverpool. The collection infrastructure, the processing capacity, the contractual relationships—they’re all concentrated within Northern Ireland. That creates a different competitive environment than what a Cheshire farmer might have with potentially more buyers nearby.

Why does this matter for producers elsewhere? Because what’s happening in Northern Ireland is a preview of what export-dependent regions face globally when commodity markets soften. The same dynamics are playing out in New Zealand right now, where Fonterra is facing pressure on its farmgate milk price forecast amid supply outpacing global demand. Australia’s southern export regions have seen similar pressure on milk prices compared to last season, according to recent Rabobank analysis.

Cyril Orr, the Ulster Farmers’ Union Dairy Chairman, has been pushing hard on the transparency issue through all of this. “As dairy farmers, we are entering a challenging period marked by significant market uncertainty and pressure on farm gate prices,” he said in a December statement. “It is more vital than ever that farmers can place trust in their processors. We need to see greater openness, transparency, and genuine collaboration within milk pools.”

That call for transparency reflects something I’ve heard from producers across the UK, Ireland, and frankly, the US too: there’s a real desire for clearer information about how product values actually translate into what shows up on our milk checks.

The £300 Million Question: What Processor Investments Really Tell Us

Here’s where things get more nuanced—and it’s worth thinking through carefully.

If the dairy sector were struggling across the board, you’d typically expect processors to pull back on capital spending, maybe close some facilities, and issue profit warnings. That’s what we saw during the 2015-2016 downturn, as many of us remember.

But that’s not what’s happening now.

Over the past 18 months, UK and Ireland-based processors have committed nearly £300 million to capacity expansion:

  • Arla Foods: £179 million for Taw Valley mozzarella capacity, announced July 2024
  • Müller: £45 million at Skelmersdale for powder and ingredients
  • Dale Farm: £70 million for the Dunmanbridge cheddar facility in Northern Ireland, plus a major long-term supply deal with Lidl covering 8,000 stores across 22 countries

You don’t commit nearly £300 million to capacity expansion unless you’re confident about future milk availability and market demand. That’s just business sense.

It’s worth looking at the processor financials, too. Arla Foods group-wide posted €401 million in net profit for 2024—up from €380 million the year before—on revenues of €13.8 billion, according to their February annual report. Müller UK, according to The Grocer’s September coverage, nearly tripled its operating profit to £39.6 million after turning a profit again.

What does all this suggest? Well, one way to read it is that while farm-level economics are under real pressure, other parts of the supply chain have found ways to maintain or even improve their positions. Whether that’s a temporary rebalancing or something more structural… honestly, reasonable people can look at these numbers differently. The situation is complex.

I reached out to both Arla and Müller for comment on how their investment plans align with current farmgate pricing. Neither responded. And you know, that silence tells you something too.

A Global Squeeze: This Isn’t Just a UK Problem

Before we go further, it’s worth zooming out—because this margin pressure isn’t unique to the UK. Not by a long shot.

In the US, agricultural lenders now expect only about half of farm borrowers to turn a profit this year. That’s a marked decline from previous expectations. Out in the Pacific Northwest, Darigold—a cooperative serving around 250 member farms across Washington, Oregon, Idaho, and Montana—announced a $ 4-per-hundredweight deduction earlier this year to cover construction cost overruns at its new Pasco facility. As Capital Press reported in May, one farmer bluntly described the situation: “The $4.00 deduct, combined with all the other standard deductions, has made it impossible for us to cash flow.”

The EU picture isn’t any rosier. A December 2024 USDA GAIN report forecast that EU milk production would decline in 2025 due to declining cow numbers, tight dairy farmer margins, and environmental regulations. Germany has been losing over 2,000 dairy farms annually—that’s roughly six operations closing every single day, according to analysis of federal statistics. Poland’s dairy industry profitability is “teetering on the edge,” per a recent Wielkopolska Chamber of Agriculture report. And across Eastern Europe, thousands of farms have exited in recent years amid what industry leaders describe as significant crisis conditions.

The pattern is unmistakable: processors investing, producers struggling, margins getting captured somewhere in between.

What’s interesting is how different regions are responding. And one of the more instructive comparisons—with lessons worth considering—is how Irish farmers handled similar pressure.

When Farmers Fought Back: The Irish Playbook

When Irish processors announced cuts in late 2024, the response was notably coordinated. Over 200 farmers gathered outside Dairygold’s headquarters in Mitchelstown on September 19th—Agriland covered it extensively—and many of them brought printed copies of their milk statements. A broader group eventually mobilised roughly 600 suppliers to raise specific questions about pricing formulas and the calculation of value-added returns.

What made this different was the specificity of it. Rather than general complaints about “unfair prices,” farmers showed up with documented questions: How does the Ornua PPI relate to what’s actually showing up in our milk checks? How are value-added premiums being allocated? What are the real margins on different product categories?

Pat McCormack, the ICMSA President, was pretty direct in his assessment—he suggested processors were using milk prices to absorb volatility that might otherwise hit other parts of the chain. The IFA raised concerns about what continued cuts might mean for production levels.

Within a few weeks, several cooperatives did adjust their pricing. The movement wasn’t dramatic, but it showed that organised, data-driven engagement could influence outcomes.

Here in the UK, the farming unions—NFU, NFU Scotland, NFU Cymru, and UFU—took a different approach, issuing a joint letter calling for “responsible conduct” across the supply chain. Professional and measured.

I’m not saying one approach is inherently better than another—different markets and structures call for different strategies. But the contrast raises some interesting questions about which kinds of engagement actually move the needle. Something to think about.

The Environmental Wildcard: Already on Your Balance Sheet

Here’s a factor that’s reshaping farm economics right now—not someday, but today: environmental regulation. And honestly, it probably deserves more attention than most of us are giving it.

What happened in the Netherlands—where nitrogen limits led to mandatory herd reductions—shows how fast the regulatory picture can shift. Irish farmers have already felt it from nitrate derogation adjustments. Ireland’s water quality issues prompted the EU to reduce the limit to 220kg/ha in some areas starting January 2024, forcing affected farmers to cut stock or find more land.

For UK producers, several things are worth watching:

  • Water quality pressure: Defra’s getting pushed to address agricultural contributions to river catchment issues. Dairy-heavy areas in the South West and North West could face new requirements as review cycles progress.
  • Ammonia targets: The Clean Air Strategy includes a UK commitment to cut ammonia emissions by 16% by 2030 compared to 2005—that’s according to official government reporting. Housing and slurry management are big focus areas.
  • ELMS implications: How dairy operations fit into the Environmental Land Management scheme’s eligibility—and whether future support involves stocking density requirements—are still evolving questions with real implications.

Why does this matter for your cost of production calculation? Because compliance investments aren’t optional anymore—they’re line items. If you’re running your numbers at 44p and not factoring in upcoming environmental requirements, you might be underestimating your true breakeven by 2-3p per litre. That’s the difference between surviving and not in a sub-30p market.

If UK policy moves toward firmer livestock limits, the ripple effects would run right through the supply chain. Processing infrastructure designed for current volumes faces different economics if milk availability shifts through regulation rather than markets.

The Numbers That Actually Matter for Your Operation

If you’re milking cows right now and trying to figure out where you stand, all this industry analysis provides useful context. But your specific numbers are what really matter. Here’s a framework several farm business consultants have been using—not hard rules, but useful reference points:

What to TrackGenerally ComfortableWorth Watching⚠️ Needs Attention
Debt-to-Asset RatioBelow 50%50-60%Above 60%
Working Capital Runway12+ months6-12 monthsUnder 6 months
True Cost of ProductionUnder 38p/L38-42p/LAbove 42p/L
Annual Volume2M+ litres1.5-2M litresUnder 1.5M litres

The debt-to-asset calculation you probably know—total liabilities divided by total asset value. What matters about that 60% threshold is that above it, your ability to absorb an extended low-price period gets pretty limited. You might find yourself servicing debt out of equity rather than cash flow, and any softening in land or livestock values creates additional pressure you don’t need.

Working capital runway—current assets minus current liabilities, divided by your monthly cash burn—tells you how long you can keep going if nothing changes. Dairy pricing cycles generally take 6-18 months to shift meaningfully, so shorter runways don’t leave much room to wait things out.

And the cost of production number? That’s where honest self-assessment really matters. Include everything: variable inputs, fixed overhead, family labour at what you’d actually have to pay someone else, full finance charges—and now, factor in those environmental compliance costs we just discussed. If that figure’s above 42p and there’s no clear path to getting it under 38p in the next 90 days… that’s a structural challenge that better markets alone probably won’t fix.

Three Questions Worth Asking Your Processor This Week

  1. What’s the current Ornua PPI or equivalent product return index, and how does my price track against it?
  2. What market factors might support a price adjustment in Q1 2025?
  3. Are there aligned contract opportunities available, and what would I need to qualify?

You might not get detailed answers. But asking demonstrates you’re engaged, and it creates a record of the conversation.

What’s Working for Producers Who’ve Been Here Before

In conversations with farmers who’ve navigated previous cycles, several themes consistently emerge. Here’s what seems to be helping.

On feed costs: “Lock what you can while grain markets are favourable” was something I heard over and over. Feed generally runs over 40% of variable costs for most of us, so it’s one of the bigger levers you can actually pull. Forward contracting through Q2 2025 won’t entirely offset a 15p/litre shortfall, but it removes one variable from the equation. Several farmers mentioned negotiating extended payment terms—60-90 days—in exchange for volume commitments. Worth exploring.

On component strategy: Here’s something that doesn’t get enough attention in these pricing discussions: butterfat and protein premiums can meaningfully offset base price pressure for operations set up to capture them. UK butterfat levels averaged 4.44% in October 2025 according to Defra statistics—but there’s wide variation between herds. First Milk’s Mike Smith noted in their June 2025 announcement that component payments directly affect their manufacturing litre price, with the standard calculated at 4.2% butterfat and 3.4% protein. Farms consistently running above those benchmarks are realizing additional value that doesn’t show in base-price comparisons. If your herd genetics and nutrition programme support higher components, that’s real money—potentially 1-2p/L or more depending on your processor’s payment structure.

On culling decisions: With beef prices relatively strong right now, the math on marginal cows looks different than it might in other years. The general guidance is to look hard at your bottom 15% by productivity—but timing matters too. Cull values tend to be better now than they might be if spring brings a wave of dispersal sales from farms exiting. One Cumbrian producer told me he’d moved 20 cows in November specifically because he expected prices to soften by February. Smart thinking.

On contracts: Farmers with competitive cost structures and solid compliance credentials may benefit from exploring retailer-aligned pools. The premium over standard contracts—typically 2-5p per litre—can add up to £35,000-£90,000 annually on a million-litre operation. Application windows for Q1 usually run in autumn, so timing for 2025 might be tight, but it’s worth a conversation.

And here’s something that doesn’t get talked about enough: farmers on well-structured, aligned contracts often say it’s the stability, not just the premium, that makes the real difference during volatile times. Knowing your price three months out changes how you plan, how you manage cash flow, and, honestly, how those conversations with your bank manager go.

On sharing information: Producer Organisations provide a framework for collective engagement that individual suppliers just don’t have. The Fair Dealing regulations have given these structures more teeth. Several farmers mentioned that even informal setups—WhatsApp groups where neighbours compare milk checks and input costs—have been really valuable for understanding whether their situation reflects broader patterns or something specific. Shared information helps everyone.

Breeding Decisions in a Survival Economy

Here’s something worth thinking through carefully if you’re making genetic decisions right now: the beef-on-dairy question has gotten a lot more complicated.

The numbers tell part of the story. According to AHDB’s December 2025 analysis, dairy beef now makes up 37% of GB prime cattle supply—up from 28% in 2019. Dairy-beef calf registrations increased another 6% in the first half of 2025 compared to the same period in 2024. That’s a significant shift in how our industry contributes to the broader meat supply.

What’s driven it? Pretty straightforward economics, really. When beef-cross calves were bringing strong premiums and replacement heifer values had collapsed to around £1,200 back in 2019, the maths pushed many operations toward more beef semen at the bottom end of the herd. Made perfect sense at the time.

But here’s what’s changed: replacement heifer economics have flipped dramatically. In the US, USDA data shows replacement dairy heifer prices jumped 69% year-over-year in Wisconsin—from $1,990 to $2,850 by October 2024. CoBank’s August 2025 analysis reported prices reaching $3,010 per head nationally, with top heifers in California and Minnesota auctions fetching over $4,000. That’s a 164% increase from the 2019 lows.

The UK hasn’t seen quite the same spike, but the trend is similar: quality replacement heifers are getting harder to source and more expensive when you find them.

So what does this mean for breeding decisions right now? A few things worth considering:

  • Genomic testing economics have shifted. When heifers were cheap, testing your youngstock and culling aggressively on genomics felt like a luxury. Now, with replacement costs significantly higher, knowing which animals are worth developing and which should go to beef makes real financial sense.
  • The fertility-longevity trade-off matters more. Every open cow or early cull represents a replacement purchase in a tight heifer market. Genetic selection for fertility and productive life has direct cash flow implications that weren’t as acute three years ago.
  • Component genetics intersect with pricing strategy. If your processor pays meaningful butterfat and protein premiums, breeding decisions that move those numbers aren’t just about future herd composition—they’re about capturing more value from the milk you’re already producing.

I’m not suggesting everyone should immediately pivot away from beef-on-dairy—the calf values are still there, and for many operations the economics still work. But the calculation has changed enough that it’s worth running the numbers fresh rather than assuming what worked in 2021 still makes sense in 2025.

The Bottom Line: Consolidation is Coming—Position Yourself Now

Let me be direct about what I see happening.

The UK dairy industry isn’t just going through a temporary rough patch. It’s consolidating. The combination of margin pressure, environmental compliance costs, and processor investment patterns all point in the same direction: fewer, larger operations capturing a greater share of production. USDA data shows more than 1,400 US dairy farms closed in 2024—that’s 5% of all operations in a single year. Germany is losing over 2,000 dairy farms annually. The Andersons Outlook report projects GB dairy producers could fall to between 5,000 and 6,000 within the next two years, down from 7,130 in April 2024. The pattern is global, and it’s accelerating.

That’s neither good nor bad—it’s just reality. The question is whether you’re positioned to be one of the operations that emerges stronger, or whether the current squeeze catches you unprepared.

The farms that will thrive through this cycle share some common characteristics: debt loads below 50%, production costs under 38p, component levels capturing premium payments, breeding programmes balancing replacement needs against beef income, and the willingness to explore non-traditional arrangements—whether that’s aligned contracts, on-farm processing, or strategic partnerships.

The current environment is genuinely challenging, but it’s not the same for everyone. Some farms will work through this and find opportunities on the other side. Others face situations where operational improvements alone may not be enough.

Figuring out which category your operation falls into is the essential first step. Run your numbers honestly. Have proactive conversations with your lender—before they’re calling you. Think through the full range of options, including the possibility of stepping away with equity intact rather than waiting until choices narrow.

If it’s been more than a couple of months since you’ve really dug into your financial position, this might be a good week for that work. The decisions made now—with complete information and realistic expectations—are usually the ones that still look sound eighteen months down the road, whatever direction ends up making sense for your situation.

The processors are betting on continued milk availability. The question is: at what price, and from whom?

KEY TAKEAWAYS

  • You’re Losing 15p on Every Litre: 28.8p farmgate vs. 44p production cost = £2,500/month loss for average herds. First sub-30p price in over a year.
  • Processors Are Expanding While Farms Contract: €401M Arla profit. Müller margins tripled to £39.6M. £300M in new capacity committed. The pain isn’t distributed equally.
  • This Is Global Restructuring, Not a Local Dip: Half of US dairy borrowers expected to be unprofitable in 2025. Germany loses six farms daily. Same pattern, different currencies.
  • Your True Breakeven Is 2-3p/L Higher: Environmental compliance—ammonia targets, water-quality regs—is now a line item. Update your numbers before your lender does.
  • The 90-Day Survival Test: Debt below 50%? Costs under 38p/L? Strategy capturing value beyond base price? Farms passing all three will shape the consolidation. The rest will be shaped by it.

Complete references and supporting documentation are available upon request by contacting the editorial team at editor@thebullvine.com.

Learn More

The Sunday Read Dairy Professionals Don’t Skip.

Every week, thousands of producers, breeders, and industry insiders open Bullvine Weekly for genetics insights, market shifts, and profit strategies they won’t find anywhere else. One email. Five minutes. Smarter decisions all week.

NewsSubscribe
First
Last
Consent

Does Your Breeding Program Fit Your Milk Market?

The same genetics cost one farm $190,000/year and make another farm $57,000. The difference? Market alignment.

Here’s something I’ve been thinking about quite a bit lately. After spending time reviewing proof sheets and talking with dairy farmers from Wisconsin to California, I keep coming back to the same observation: there’s a growing gap between what the catalogs celebrate and what actually drives profitability on individual farms.

Don’t get me wrong—the numbers look impressive. Genetic progress is accelerating. Index values keep climbing. But sit down with producers who’ve been making these decisions for two or three decades, and they’ll share something the marketing materials tend to leave out: genetics that work beautifully on one operation can quietly underperform on another.

What’s interesting here isn’t that some bulls are better than others. It’s that every elite sire represents a specific vision of where dairy is headed—and whether that vision aligns with your milk market, your management approach, and your economic reality is really the question worth exploring.

The Three Gears That Must Mesh

Think of profitable breeding decisions as three interlocking gears: GeneticsMarket, and Management. When these gears mesh smoothly, genetic investments translate into income over feed cost and long-term herd health. When they don’t—when you’re selecting for traits your market doesn’t reward or your management can’t support—you’re essentially paying for genetic potential you can’t capture.

As many of us have seen, that’s how you end up with cows that look great on paper but don’t quite pay their way in your specific system.

The visual is simple enough to sketch on a napkin: three gears touching. Genetics turns Market turns Management. If one gear is spinning in the wrong direction—or sized wrong for the others—you get grinding instead of progress.

Gear Misalignment Example

Midwest Freestall — Class III Cheese Plant Contract — Volume-Focused Genetics

Picture a 600-cow Midwest freestall operation shipping exclusively to a cheese plant on a Class III contract. The processor pays heavily on components—protein especially, since that’s what drives cheese yield. At current prices, protein is worth $3.01 per pound and butterfat $1.71 per pound.

The breeding program, though, has been chasing milk volume for years. High-production sires. Big milk numbers. The tank is full, but the tests are running 3.6% fat and 2.95% protein—below the current Holstein breed average of 4.15% fat and 3.36% protein, according to the Canadian Dairy Information Centre’s 2024 data.

Where money leaks out:

Lost protein premium: At 2.95% protein instead of 3.2–3.3%, this herd leaves roughly $0.75–$0.90 per cwt on the table compared to a component-focused herd at similar production levels. On 60 lbs/cow/day, that’s $140–$195 per cow per lactation in foregone protein revenue alone.

Butterfat gap: The 0.3–0.4% fat test difference adds another $95–$125 per cow per year in missed premiums.

Feed efficiency drag: High-volume, low-component cows often require more DMI per pound of milk solids produced. Using USDA’s NM$ 2025 values, moving that extra water through the system costs feed dollars without generating proportional component revenue.

Estimated annual cost for this 600-cow herd: Approximately $150,000–$190,000 in component revenue the cheese plant would have paid—if the genetics matched the market.

The cows aren’t “bad.” The bulk tank isn’t empty. But the breeding program was optimized for a fluid milk check that no longer exists. The Genetics gear is turning toward volume. The Market gear is turning toward components. They’re grinding against each other instead of working together.

Understanding What You’re Actually Buying

Looking at three sires that represent distinctly different breeding philosophies helps make this concrete.

Denovo 2776 Leeds from ABS is built on a premise that resonates with many operations right now: labor is expensive and increasingly difficult to find, so invest in genetics that reduce calving interventions. His pedigree runs through Sandy-Valley Laker back to the De-Su Frazzled 6984 cow family—the same family that gave us Gateway, Hercules, Ajax, and Skeet, according to ABS pedigree records. With essentially flat components, Leeds isn’t designed to transform your butterfat levels. His value proposition centers on strong calving-ease and a solid productive life from a family known for commercial functionality.

Denovo 6856 Hotshot takes a completely different approach. His pedigree traces through Pine-Tree Shadow to the Bomaz Perfect-P line—part of what ABS describes as “one of the premier cow families of the breed for longevity.” Hotshot isn’t positioned as a production leader. He’s built around health, livability, and keeping cows productive through the transition period and beyond.

Urzokari from Synetics represents yet another direction—explicit optimization for robotic milking systems. Emphasizing teat position, udder balance, and locomotion traits that influence whether cows visit the robot voluntarily or need fetching.

Producers are discovering that none of these bulls represents a universally optimal choice. Each makes excellent sense for some operations and may quietly cost money on others. The question isn’t which bull is “best,” but which breeding philosophy fits your particular three gears.

Where NM$ and TPI Fit—And Where They Don’t

Before we go further, it’s worth talking about how this framework relates to Net Merit and TPI, since that’s how most of us were taught to think about genetics.

The April 2025 NM$ revision—documented in detail by Paul VanRaden and colleagues at USDA’s Animal Genomics and Improvement Laboratory—now places 31.8% emphasis on butterfat13% on protein, and a combined 17.8% on Feed Saved, which includes body weight composite and residual feed intake. The remaining emphasis spreads across productive life, health, fertility, calving, and conformation traits.

Here’s what’s important to understand: NM$ is designed to maximize lifetime profit for an average U.S. Holstein herd selling into average market conditions. It’s a remarkably well-constructed tool for that purpose. Canadian producers working with LPI or Pro$ face similar considerations—different weightings, different assumptions, same fundamental question of whether those assumptions match your operation.

How the Major Indexes Compare

The differences between selection indexes reflect different market realities and breeding priorities:

  • NM$ (U.S.) places heavy emphasis on components—31.8% on butterfat alone in the 2025 revision—reflecting the cheese-heavy U.S. processing sector. Feed efficiency gets significant weight at 17.8% combined.
  • TPI (U.S.) weights production, type, and health traits differently, placing greater emphasis on conformation. Operations selling breeding stock or show cattle often weight TPI more heavily.
  • Pro$ (Canada) incorporates Canadian market conditions and pricing structures. The formula accounts for Canadian component pricing ratios, which—as we’ll see—are shifting significantly.
  • LPI (Canada) takes a different approach to balancing production, durability, and health traits within the Canadian context.

The point isn’t that one index is “right,” and others are wrong. It’s that each embeds assumptions about markets, management, and priorities that may or may not match your operation.

A Global Trend, Not Just a North American One

This isn’t just a North American consideration. Globally, component emphasis is intensifying—and the herds that have been selecting for it are pulling ahead.

In Ireland, milk fat content reached 4.51% and protein hit 3.58% in January 2025, according to the Central Statistics Office—both up from the prior year. New Zealand’s Fonterra bases its milk price calculations on standardized 4.2% fat and 3.4% protein, as documented in the Commerce Commission’s September 2025 review—benchmarks that reflect decades of component-focused breeding in pasture-based systems. And across the EU, butter prices hit record highs in early 2025, reaching €7,422 per metric ton in January according to CLAL data—a 36.5% increase over the same month in 2024. Industry analysts describe the fat premium as becoming “structural, not some temporary blip.”

The takeaway? Market alignment isn’t a U.S. phenomenon. It’s a global reality that’s reshaping which genetics deliver returns, regardless of where you farm.

When “Average” Doesn’t Describe Your Situation

But “average” may not describe your situation. If you’re shipping Class III milk to a cheese plant with strong component premiums, NM$ may actually underweight the traits driving your revenue. If you’re in a fluid market with minimal component pay, the 31.8% butterfat emphasis in NM$ could be steering you toward genetics that don’t match your milk check.

The framework in this article doesn’t replace NM$ or TPI—it complements them by asking: Does this index’s assumptions match my actual market, management, and constraints?

Think of NM$ as an excellent starting filter. But the final selection—especially for your top sires getting heavy use—benefits from the three-gear alignment check.

The Concentration Question Worth Understanding

Looking at this trend at the breed level, something jumps out that doesn’t get nearly enough airtime.

Multiple studies have estimated the effective population size of Holsteins—a measure of genetic diversity based on how animals are actually related—at 66-79 animals, despite millions of Holstein cows walking into parlors around the world. Geneticists generally view an effective population size below 50 as the line where long-term adaptability becomes a serious concern, so we’re not over that cliff—but we’re closer than many would guess.

Dr. Chad Dechow, Associate Professor of Dairy Cattle Genetics at Penn State University, has been writing and speaking about this for years. His work shows that genomic selection—for all its tremendous benefits in accelerating genetic improvement—has also sped up how quickly we concentrate genetics in fewer lines.

Why does this matter for your next semen order?

Because the bulls marketed as “outcrosses” today often trace back to the same handful of influential sires, once you unfold the pedigree far enough. And the economic bite of that concentration isn’t theoretical—it’s been quantified.

The Mogul Example: When Success Creates Its Own Risk

Mountfield SSI Dcy Mogul—the youngest Holstein sire to exceed one million units sold. His daughters delivered. His influence now appears throughout the breed’s pedigree, making genuine outcrosses increasingly difficult to find.

Mountfield SSI Dcy Mogul is one of the most influential Holstein sires in breed history. Select Sires announced in September 2017 that he’d exceeded 1 million units sold at just seven years of age, making him the youngest bull to reach that milestone. His impact as a foundation sire for subsequent generations has been enormous.

That success wasn’t accidental. Mogul daughters delivered. But the sheer scale of his use means his genetics now appear in a substantial percentage of the breed’s pedigrees—often multiple times per animal when you trace back six or seven generations.

The concern isn’t that Mogul was a poor bull. He wasn’t. The concern is that when any sire achieves that level of market penetration, finding genuinely unrelated genetics becomes progressively harder. Research by Doublet and colleagues, published in 2019, documented annual inbreeding rates rising to 0.55% per year in the genomic era—roughly double the rate considered sustainable in the long term.

For individual herds, this means that selecting a “new” high-ranking bull may actually be deepening your connection to Mogul, O-Man, Planet, or Supersire rather than diversifying away from them. Checking kinship data isn’t paranoia—it’s due diligence.

What Inbreeding Actually Costs

Italian research from Ablondi and colleagues, published in the Journal of Animal Science in 2023, found that a 1% increase in genomic inbreeding—specifically measured via runs of homozygosity (FROH), which captures actual stretches of identical DNA—is associated with about 134 pounds (61 kg) less milk over a 305-day lactation, along with lower fat and protein yields.

German work from Mugambe and colleagues in the Journal of Dairy Science in 2024 found similar patterns:

  • 32–41 kg less milk per 1% increase
  • 1.4–1.7 kg less fat
  • 1.1–1.3 kg less protein
  • Calving intervals stretched by roughly a quarter-day per 1% increase

I recently talked with a Wisconsin producer milking about 400 cows who’s been tracking inbreeding and performance for a decade. His take was pretty straightforward: “The daughters are producing more milk than their dams, so the genetic progress is real. But conception rates and feet-and-leg issues have gotten harder to manage. I’m not sure the net gain is as large as the proof sheets suggest.”

The Component Premium Question

The shift toward component-focused genetics has really picked up speed in recent years, especially with the 2025 NM$ revision, which placed 31.8% emphasis on butterfat alone. On paper, that makes a lot of sense given recent price trends. In practice, it depends heavily on where your milk check comes from.

The November 2025 USDA Agricultural Marketing Service announcement showed protein at $3.0143 per pound and butterfat at $1.7061 per pound—a very different picture from a year earlier, when butterfat was over $3.00 a pound. Class III settled at $17.18 per hundredweight. Those relationships move, sometimes dramatically.

Processor Contracts Are Tightening

And processor expectations are tightening—that’s something worth paying attention to. Western Canadian provinces—British Columbia, Alberta, Saskatchewan, and Manitoba—announced through the BC Milk Marketing Board a major component pricing ratio shift effective April 1, 2026, moving from 85% butterfat / 10% protein / 5% other solids to 70% butterfat / 25% protein / 5% other solids. That’s a significant rebalancing toward protein that will reward herds already selecting for it and penalize those who aren’t.

In the U.S., the story is similar. New processing capacity often comes with stricter contract requirements. Today’s direct contracts increasingly expect consistent volume, protein tests above 3.2%, and premium somatic cell counts. If your genetics have been drifting away from protein while you’ve been chasing other traits, the next contract renewal window may deliver an unwelcome surprise.

Quick Math Check: What’s Your Component Revenue Share?

Pull your last six milk checks. Add up the component premiums (fat + protein payments above base). Divide by total milk revenue.

  • Above 25%: Component genetics is likely paying well for you. The 2025 NM$ emphasis on butterfat aligns with your market.
  • 15–25%: Mixed picture. Component genetics help, but don’t over-rotate away from production.
  • Below 15%: You may be over-investing in component genetics. Consider whether volume-focused or balanced sires deliver better returns in your specific market.

This 5-minute exercise can save thousands in misaligned genetic decisions.

Red Flag Checklist: 5 Warning Signs Your Genetics Don’t Match Your Market

  1. Your fat or protein test has dropped 0.2%+ over 3 years while selecting high-NM$ bulls. NM$ emphasizes components, so if your tests are declining despite following index rankings, something in your selection isn’t translating to your tank.
  2. Your component revenue share (from the Quick Math Check) is under 20%, but you’re heavily using component-focused sires. You may be paying for genetic potential your market doesn’t reward.
  3. You can’t find a prospective sire with less than 8% relationship to your herd. Genetic concentration has narrowed your options more than you realize—time to seek outcross genetics actively.
  4. Your processor has mentioned tightening component thresholds or premium structures in recent communications. With Western Canadian provinces shifting to 70/25/5 (fat/protein/other) pricing in April 2026 and U.S. processors increasingly requiring 3.2%+ protein for premium contracts, genetic decisions made today need to anticipate tomorrow’s standards.
  5. You’re using beef genetics on more than 40% of your herd but haven’t genomic-tested to identify your true top-tier replacements. With dairy heifer inventories at 20-year lows—2.5 million head as of January 2025, according to HighGround Dairy—the cows you keep replacements from matter more than ever.

If you checked two or more: Your three gears may be grinding. Consider a formal review of your breeding program’s alignment with your current market before your next semen order.

The Feed Efficiency Factor

There’s another dimension to this calculation that’s getting more attention in 2025: feed efficiency. The April 2025 NM$ revision now includes 17.8% combined emphasis on Feed Saved, which incorporates both body weight composite and residual feed intake—a significant increase from previous versions.

Here’s what the research tells us: residual feed intake has moderate heritability, typically estimated between 0.15-0.25 in Holstein populations, making it a meaningful selection target over time. And USDA research used in the NM$ calculations shows that feed costs average about 58% of milk income, broken down into 39% for production costs and 19% for maintenance. That’s not “a big part” of the budget; it’s often the biggest lever you have.

Detailed Per-Cow, Per-Lactation Example

Let’s put real numbers to a side-by-side comparison using November 2025 Class III prices and the economic values from the 2025 NM$ revision.

Scenario: Two cows in the same 500-cow Midwest Class III herd

FactorCow A (Volume-Focused)Cow B (Component-Aligned)
Daily milk62 lbs56 lbs
Fat test3.7%4.2%
Protein test3.0%3.3%
305-day milk18,910 lbs17,080 lbs
305-day fat700 lbs717 lbs
305-day protein567 lbs564 lbs

Revenue calculation (Class III component pricing):

  • Cow A: Fat (700 × $1.71) + Protein (567 × $3.01) + Other solids ≈ $2,904
  • Cow B: Fat (717 × $1.71) + Protein (564 × $3.01) + Other solids ≈ $2,927

Component advantage for Cow B: ~$23/lactation

Feed cost calculation (using USDA’s NM$ 2025 values of $0.13/lb DMI and requirements of 0.10 lbs DMI per pound of milk, 8.0 lbs per pound of fat, and 6.5 lbs per pound of protein):

  • Cow A DMI: (18,910 × 0.10) + (700 × 8.0) + (567 × 6.5) = 11,185 lbs
  • Cow B DMI: (17,080 × 0.10) + (717 × 8.0) + (564 × 6.5) = 10,810 lbs

Feed cost difference: 375 lbs × $0.13 = $49/lactation advantage for Cow B

If Cow B also has 3% better residual feed intake (genetic feed efficiency): Additional savings: ~325 lbs DMI × $0.13 = $42/lactation

Total advantage for component-aligned Cow B in Class III market: $23 (components) + $49 (baseline feed) + $42 (RFI) = ~$114/lactation

Over a 500-cow herd: That’s roughly $57,000/year in additional margin from aligned genetics—not from buying “better” bulls, but from buying bulls that fit the operation’s market and management.

In a fluid market with minimal component premiums, this math reverses. Cow A’s extra 1,830 lbs of milk volume generates more revenue, and the feed efficiency advantage shrinks because you’re not capturing the component value. The same genetics, completely different financial outcome.

What Specialization Actually Costs

Every specialized sire carries trade-offs embedded in his genetic package. The proof sheet highlights the specialization; it doesn’t spell out what you’re giving up.

Leeds’ calving-ease strength comes from specific physical characteristics—smaller, finer skeletal structure, lower birth weight calves, and reduced pelvic dimensions. For operations genuinely struggling with calving difficulty—assisted births over 18–20%—the trade-off often pencils out. For herds where calving assistance is already well-managed, the structural compromise might cost more than the calving-ease saves.

Hotshot’s emphasis on longevity reveals a different dynamic. His moderate milk proof looks more like a genetic ceiling than a starting point. When bred heifers bring $4,000 or more at auction, and raising costs run around $1,700–$2,400 per head, keeping cows in the herd for more lactations makes sense on paper. But if those cows are giving 6–8 lbs/day less than alternatives, whether longevity genetics pay off depends on your culling rate, replacement strategy, and feed costs.

A Northeast grazing operation I spent time with last spring leaned into longevity-focused genetics five years earlier and were genuinely happy with the outcome. “The per-cow production dropped some,” the producer told me, “but with lower replacement costs and better cow health, we’re actually keeping more of what we make.”

Sire TypeIntended BenefitHidden Trade-OffBest FitExpensive Misfit
Calving-Ease (e.g., Leeds)Lower assisted births, reduced labor during calving, fewer injury lossesSmaller frame, reduced mature size, often comes with 6-8 lbs/day lower lifetime productionFirst-calf heifers; herds with assisted calvings >18%; operations with limited labor for calving supervisionWell-managed herds with <10% assisted births; operations where replacement heifers cost $4,000+ and production matters more than calving ease
Longevity-Focused (e.g., Hotshot)Extended productive life, lower replacement costs, better transition cow healthModerate milk proofs often represent genetic ceiling, not starting point; slower genetic progress on production traitsHigh replacement costs ($2,200+ per heifer); grazing operations; herds targeting 3.5+ lactations; limited heifer inventoryOperations with strong cull cow markets; herds breeding beef-on-dairy on bottom 40%; processors paying volume bonuses; low feed costs favoring higher production
Robotic-Optimized (e.g., Urzokari)Improved voluntary robot visits, better teat positioning, reduced fetch timeEmphasis on udder/teat traits may sacrifice component genetics or production potential; value only captured if robots utilized efficientlyRobotic dairies; operations struggling with fetch rates >15%; herds prioritizing labor efficiency over per-cow productionConventional parlor operations; herds with no robot plans; component-paying markets where udder traits matter less than tests

When Realignment Pays Off: A Recovery Story

What happens when a producer recognizes the mismatch and corrects course? I talked with a 550-cow operation in central Minnesota that went through exactly that process.

“We’d been chasing TPI for about eight years,” the herd manager explained. “Good bulls, good genomics, no complaints about the genetics themselves. But we were shipping to a cheese plant, and our protein test just kept sliding—went from 3.25% down to 3.05% over that stretch. Meanwhile, the premiums for protein kept going up.”

When they ran the numbers in 2022, they realized they were leaving close to $180 per cow in component revenue on the table annually. “That’s when it clicked. We weren’t using bad genetics. We were using the wrong genetics for our market.”

They shifted their sire selection criteria—still using high-ranking bulls, but filtering hard for positive protein deviation and component balance. Three years later, their protein test is back to 3.22% and climbing.

“The genetic progress feels slower on paper,” he admitted. “But the milk check is bigger. That’s the number that actually matters.”

Regional Considerations

Where you farm changes these calculations more than most proof sheets acknowledge.

In the Southeast and Southwest, producers dealing with persistent heat stress often find that moderate production with stronger health and fertility traits out-earns elite production genetics that struggle through extended summers. In the Upper Midwest and Northeast, grazing-heavy systems face different realities—a cow built for a California dry lot isn’t always the cow you want walking hillsides in Vermont.

The Beef-on-Dairy Connection

The three-gear framework applies to more than just which dairy sires you’re using—it also shapes your beef-on-dairy strategy.

The 2024 NAAB semen sales report shows 7.9 million beef semen units flowing into U.S. dairy operations, representing over 80% of all beef semen sales. Meanwhile, dairy heifer inventories expected to calve dropped to 2.5 million head as of January 2025—the lowest level since USDA began tracking this data, according to HighGround Dairy analysis. CoBank research projects 357,490 fewer dairy heifers for 2025 compared to the prior year, driven largely by beef-on-dairy breeding decisions.

Here’s where the gears mesh—or grind: If you’re using beef genetics on your bottom-tier cows, you’ve already made a three-gear decision. You’re saying those animals don’t fit your Genetics goals (not worth keeping daughters from), don’t justify the Management investment of raising replacements, and the Market for beef calves currently rewards that choice.

But the framework cuts both ways. With heifer supplies this tight, the cows you do keep replacements from matter more than ever. Beef Magazine’s November 2025 report notes that beef-on-dairy cattle now represent 12–15% of all fed slaughter—the crossbreds have become an indispensable part of the beef supply chain. That’s fine, as long as your top-end genetics are truly aligned with your dairy operation’s market and management. Using beef on low-merit cows makes sense; accidentally breeding beef on cows that should be producing your next generation of high-component replacements is a costly mistake that compounds over time.

Finding Genuine Genetic Diversity

While genetic gains have more than doubled in the genomic era, breeding for diversity inside Holsteins now takes real effort.

For Purebred Holstein Operations

Seek out niche Holstein lines. Legacy maternal lines like Hanover-Hill, Landmark, Meteor, Durham, or Elegant, which were prominent 20–30 years ago but don’t dominate today’s rankings, can bring different genetics to the table.

Request genomic kinship data. Most major AI companies can show you how closely a prospective sire is related to your herd’s core cow families. CDCB offers inbreeding tools as well. For operations that haven’t genomic-tested their cows yet, current testing runs around $40–50 per head—a worthwhile investment if you’re serious about managing inbreeding across your herd.

Unfold pedigrees further back. Many so-called outcross sires look different in the first three generations, then converge on Mogul, O-Man, Planet, or Supersire once you get back to generation six or eight.

Consider the National Animal Germplasm Program. USDA’s germplasm program maintains semen and embryos from older, less-represented lines to preserve genetic diversity for long-term breed health.

“I’ve stopped looking at the top 10 TPI list entirely. If a bull doesn’t have positive deviation for protein and decent feet-and-legs, he doesn’t enter my tank, regardless of his rank. The proof sheets tell you what a bull can do genetically. They don’t tell you whether those genetics fit your parlor, your market, or your management. That’s the part you have to figure out yourself.”

— Wisconsin producer, 650-cow operation

A Framework for Matching Genetics to Your Operation

Five Questions Before You Pick a Bull

1. What’s my actual milk market? How much of your check comes from components versus volume?

2. What’s my primary constraint? Is involuntary culling above 25%? Are assisted calvings over 18%? Is production lagging?

3. Does this sire truly address that constraint? If calving isn’t a major issue, calving-ease sires might just be giving away production.

4. How closely is this bull related to my herd? Check genomic kinship or pedigree overlap.

5. What does the five-year math look like? Account for production, components, feed costs, replacements, and health.

The Larger Perspective

When you put all of this together, what’s interesting is how much breeding has shifted from “Which bull is best?” to “Which bull best fits what I’m actually trying to do here?”

The Holsteins that maximize returns on a 3,000-cow California dry lot shipping Class III milk are not the same Holsteins that fit a 200-cow Wisconsin grazing herd shipping mostly fluid milk. Both operations might reasonably use bulls like Leeds or Hotshot—but in very different proportions, for very different reasons, and with very different expectations.

Three Actions Before Your Next Semen Order

  • Calculate your component revenue percentage from your last six milk checks. If it’s under 15%, reconsider heavy use of component-focused sires.
  • Request kinship reports on your top 5 prospective sires from your AI representative. Flag any showing an elevated relationship to your existing cow families or heavy Mogul/O-Man/Planet ancestry.
  • Identify one genuine outcross sire from an underrepresented maternal line for 5–10% of your matings—not to chase diversity for its own sake, but to maintain options as the breed continues to concentrate.

The tools to make smarter, more aligned decisions exist—genomic kinship, feed efficiency data, inbreeding metrics, and diverse sire options. The challenge, and the opportunity, is taking the time to line those tools up with the reality of your own farm.

The Bottom Line

What’s been your experience with specialized genetics? Have calving-ease, longevity-focused, or component-heavy sires delivered the returns their proofs suggested under your conditions? The most useful lessons often come from comparing what the proofs promised with what actually showed up in the bulk tank and the balance sheet.

Key Takeaways

  • Fit beats rank. The same genetics can cost one farm $190,000/year and add $57,000 to another—the difference is market alignment, not genetic quality.
  • Misalignment drains profit quietly. Volume genetics in a cheese market can leave $150,000–$190,000 annually on the table, even when production looks strong.
  • NM$ is designed for the average herd. The 2025 revision puts 31.8% emphasis on butterfat. If your market doesn’t reward components, you’re paying for genetic potential you can’t capture.
  • Inbreeding costs compound. Each 1% increase means ~134 lbs less milk plus weaker fertility—and at 0.55% annually, the breed is accumulating it faster than ever.
  • Before your next semen order: Calculate your component revenue share (5 minutes), request kinship data on prospective sires, and reserve 5–10% of matings for genuine outcrosses.

EXECUTIVE SUMMARY: 

The same genetics can cost one operation $190,000 a year and add $57,000 to another. The difference isn’t genetic quality—it’s market alignment. This article introduces a three-gear framework (Genetics, Market, Management) that helps producers evaluate whether their breeding program actually fits their milk check. Drawing on USDA’s April 2025 NM$ revision and peer-reviewed research, it demonstrates how misaligned genetics can quietly drain profitability even when production looks strong. Practical tools include a 5-minute component revenue analysis, five questions to ask before selecting any sire, and strategies for finding genuine diversity as the breed concentrates. The goal isn’t finding “better” bulls—it’s finding bulls that fit your operation.

Complete references and supporting documentation are available upon request by contacting the editorial team at editor@thebullvine.com.

Learn More

The Sunday Read Dairy Professionals Don’t Skip.

Every week, thousands of producers, breeders, and industry insiders open Bullvine Weekly for genetics insights, market shifts, and profit strategies they won’t find anywhere else. One email. Five minutes. Smarter decisions all week.

NewsSubscribe
First
Last
Consent

The $23,000 Mistake: Why ‘Immune Support’ Isn’t Fixing Your Fresh Cow Problems

78% conception rate vs 23%. Same herd. Same feed. Same genetics. The difference? How cows handled the first 3 weeks. New research says we’ve been focused on the wrong thing.

EXECUTIVE SUMMARY: For 40 years, we’ve assumed fresh cows get sick because their immune systems fail at calving. Iowa State research published in the Journal of Dairy Science (2024) says we’ve had it backwards—early lactation cows actually mount stronger inflammatory responses than mid-lactation animals. They’re not failing; they’re firefighting against bacterial overload when physical barriers are down. The numbers make this personal: metritis costs $511 per case ($23,000 annually on a 300-cow herd at 15% incidence), and University of Wisconsin data reveals a 55-percentage-point fertility gap—78% conception for cows gaining condition in the first three weeks versus 23% for those losing it, same herds, same ration. If the science is shifting, maybe the priorities in the barn should too. Calving hygiene and metabolic support may outperform immune boosters, and the ROI math increasingly favors operations willing to rethink their protocols.

There’s a conversation happening in transition cow circles that I think deserves more attention from producers.

It started for me when I was visiting a 650-cow freestall operation in central Wisconsin last spring. Good herd, solid management team, well-designed protocols. They had quality minerals dialed in, yeast culture in their close-up ration, and attentive fresh cow monitoring. Yet their metritis rates wouldn’t budge below 17–18%.

“We’re doing everything right,” the herd manager told me, genuinely puzzled. “At least everything we’ve been taught.”

That conversation stuck with me because it echoes what I’ve heard from producers across the Midwest and Northeast over the past couple of years. And it turns out, researchers have been wrestling with similar questions—except they’ve been digging into some foundational assumptions that have shaped transition cow thinking for decades.

💡 THE BOTTOM LINE: New whole-animal research suggests fresh cows mount stronger immune responses than mid-lactation cows—not weaker ones. The diseases we see may result from pathogen exposure overwhelming the system, not immune failure.

The Framework We’ve All Learned

If you’ve been in the dairy business for any length of time, you know the standard story about fresh cows: they experience immune suppression around calving, leaving them vulnerable to mastitis, metritis, and metabolic challenges. This framework has shaped ration formulation, supplement choices, and management protocols across the industry since the 1980s.

The science behind it seemed solid. Researchers would draw blood from transition cows, isolate immune cells—particularly neutrophils—and test how those cells performed in laboratory settings. Fresh cow cells consistently showed reduced activity: weaker oxidative burst, fewer surface markers, diminished killing capacity.

But here’s where it gets interesting.

When Dr. Lance Baumgard’s team at Iowa State decided to test immune function differently, they got a very different picture. Baumgard—he holds the Norman Jacobson Professorship in Nutritional Physiology there—challenged whole cows with lipopolysaccharide (a bacterial component that triggers systemic immune response) and compared early lactation animals to mid-lactation animals.

The results, published in the Journal of Dairy Science in 2024, raised some eyebrows.

In a study of 23 multiparous Holsteins, early lactation cows mounted significantly stronger inflammatory responses across virtually every measure:

Immune ParameterEarly LactationMid-LactationDifference
Fever Response+2.3°C+1.3°C+1.0°C higher
TNF-α (inflammatory marker)6.3× elevatedbaseline6.3-fold higher
IL-6 (inflammatory marker)4.8× elevatedbaseline4.8-fold higher
Haptoglobinelevatedbaseline79% higher
LPS-binding proteinelevatedbaseline85% higher

Those aren’t the signatures of a suppressed immune system. If anything, they suggest early lactation cows are running hotter immunologically, not cooler.

“Early lactation cows mounted significantly more robust inflammatory responses than mid-lactation cows across virtually every parameter we measured.” — Dr. Lance Baumgard, Norman Jacobson Professor of Nutritional Physiology, Iowa State University

Understanding the Discrepancy

So why did decades of lab studies show one thing while whole-animal challenges show something different? This is worth understanding because it shapes how we think about intervention strategies.

When a cow calves, her body mobilizes mature, fully-equipped neutrophils to the sites that need them most—the uterus recovering from calving, the mammary gland transitioning into lactation. These experienced immune cells deploy to the tissues where pathogens are most likely to gain entry.

To replace them in circulation, the bone marrow releases newer neutrophils that are still maturing. When researchers drew blood and tested circulating cells, they were essentially evaluating replacements rather than frontline defenders.

Dr. Barry Bradford at Michigan State has pointed out that ex vivo testing captures what’s circulating in the bloodstream rather than what’s happening at actual infection sites. It’s a bit like assessing an army’s strength by counting the soldiers at headquarters while the experienced troops are deployed in the field.

💡 GOLD NUGGET: Lab tests on blood samples were measuring “replacement” immune cells still in training—not the mature cells actually fighting infections in tissues. That’s why results were so inconsistent for 40 years.

If Not Immune Suppression, Then What?

This is the practical question, and I think the answer has real implications for how we approach fresh cow management.

The research points to three factors that drive early lactation disease—none of which involve a weakened immune system.

Physical Barriers Are Compromised

Calving opens the reproductive tract, creating opportunities for bacterial invasion. The cervix dilates, tissues experience trauma, and in retained placenta cases, damaged membranes remain attached to the uterine wall. Meanwhile, the mammary gland relaxes its tight junctions to allow immunoglobulins to enter colostrum.

Work from the University of Florida has documented that bacterial contamination of the uterus occurs in the vast majority of postpartum cows—90% or higher, within the first two weeks. Most cows clear this contamination without developing clinical disease. The difference between cows that stay healthy and those that develop metritis often comes down to bacterial load exceeding the clearing capacity, not immune failure.

The Barrier You Don’t See—Gut Integrity 

While we often focus on the reproductive tract and the udder, there’s a third barrier that can fail during transition: the intestinal lining.

Several research groups have shown that high-grain diets, transition-period stress, and reduced feed intake can disrupt the “tight junctions” in a cow’s gut. When those junctions loosen, lipopolysaccharides (LPS) and other bacterial toxins leak from the digestive tract directly into the bloodstream. If you’ve ever dealt with subacute ruminal acidosis, rapid ration changes, or slug feeding in your close-up or fresh pens, you’ve likely seen some version of this—cows that look “off” without an obvious infection, running low-grade fevers, or just not transitioning the way they should.

Why this matters: This creates a secondary inflammatory response on top of whatever’s happening in the uterus or udder. The cow’s immune system is now firefighting toxins entering through her gut and dealing with bacterial challenges at calving. That dual burden consumes enormous amounts of glucose—energy that should be going toward milk production and tissue repair—further deepening her metabolic deficit and extending her negative energy balance.

Pathogen Dynamics Work Against Us

The math here is sobering. E. coli can double its population roughly every 20 minutes under favorable conditions. A small initial contamination can reach tens of millions of colony-forming units within 48 hours. Even a robust immune response is racing against exponential bacterial growth.

Virulence factors matter too. Research has identified specific gene combinations in E. coli—particularly kpsMTII and fimH—that correlate with more severe clinical outcomes. It’s not just bacterial numbers; it’s which strains gain entry.

Timing Creates a Gap

Mounting a full inflammatory response takes hours to reach peak intensity. During that ramp-up, bacteria multiply and establish themselves. By the time the immune system hits full stride, significant tissue damage may already have occurred.

Time (hours)E. coli Population (million CFU)Immune Response Intensity (% max)
00.0010
10.0085
20.06415
30.51230
44.150
66675
81,05090
12270,00095
24>1,000,000100

This timing mismatch explains why early lactation infections often present with greater clinical severity. The immune response isn’t weaker—it’s just working from behind the scenes.

💡 THE BOTTOM LINE: Fresh cow disease isn’t about weak immunity. It’s about: (1) physical barriers being down, (2) bacteria multiplying faster than the immune response can ramp up, and (3) which bacterial strains get in.

The Reproductive Connection

What’s received less attention, but may matter more economically, is how early lactation inflammation affects fertility weeks or months down the road.

When mastitis or metritis triggers systemic inflammation, those inflammatory mediators circulate throughout the body—including to the ovaries. Research has shown that pro-inflammatory cytokines alter gene expression in granulosa cells, the supportive cells surrounding developing oocytes.

Here’s what that means practically: the eggs you’re targeting at breeding time (60-80 days in milk) began their final development phase weeks earlier. If they developed during a period of systemic inflammation, their quality may be compromised before you ever breed that cow.

A multi-herd study from Argentina tracking over 1,300 lactations found significantly higher pregnancy loss rates in cows that experienced clinical endometritis—even after apparent recovery. These animals conceived but couldn’t maintain pregnancies at normal rates.

Work by researchers at Ghent University in Belgium has documented lasting structural changes in the uterus following metritis—increased collagen deposition and altered tissue architecture—that persist long after clinical signs resolve. This helps explain why treating acute disease doesn’t always translate to improved reproductive outcomes. Antibiotics can clear the infection, but they can’t reverse cellular-level changes that have already occurred.

The Data That Should Change How You Think About Transition Cows

One of the more striking findings I’ve come across involves how differently individual cows handle the transition period—even within the same herd, on the same ration, under identical management.

Research from the University of Wisconsin, published by Carvalho and colleagues in the Journal of Dairy Science, tracked body condition changes in 1,887 early-lactation cows. The fertility differences based on energy balance in those first three weeks were staggering:

Body Condition Change vs. Conception Rate (n=1,887 cows)

BCS Change (First 3 Weeks)Number of CowsConception RateRelative Performance
Gained condition42378%Baseline
Maintained condition67536%-54% vs. gainers
Lost condition78923%-70% vs. gainers

Read that again. Same herds. Same management. Same genetics, largely. Same nutrition program. But individual metabolic capacity varied so dramatically that fertility outcomes ranged from 23% to 78%—a 55-percentage-point gap based on how cows handled energy balance in the first three weeks.

💡 GOLD NUGGET: Cows that gained BCS in the first 3 weeks bred back at 78%. Cows that lost BCS? Just 23%. That’s a 3.4× difference in fertility—from the same herd, same ration, same management.

What strikes me about this data is what it suggests about blanket protocols. If some of your cows are cruising through transition while others are metabolically struggling, uniform interventions are going to miss in both directions.

This is where precision monitoring technologies—rumination collars, activity sensors, temperature monitoring—start to make more sense. Cornell University research has demonstrated that automated systems can flag at-risk cows several days before clinical signs appear. Healthy cows typically ruminate 460-520 minutes daily, and meaningful deviations from that baseline often signal trouble before visual observation catches it.

Regional and Seasonal Considerations

It’s worth noting that these dynamics may play out differently depending on where you’re farming and what time of year your cows are calving.

For operations in the Southeast, Southwest, or anywhere summer heat is a significant factor, heat stress during the dry period and early lactation compounds the metabolic challenges fresh cows already face. The same barrier vulnerabilities exist, but cows dealing with heat stress are simultaneously managing additional metabolic strain—which may explain why some operations see seasonal spikes in transition problems that don’t respond to the same interventions that work in cooler months.

Production system matters too. Confinement operations with higher cow density face different pathogen pressure dynamics than seasonal grazing systems where cows calve on pasture. The barrier vulnerability is identical, but exposure levels and bacterial populations differ. A protocol that works beautifully on a Wisconsin freestall dairy may need adjustment for a grass-based operation in Vermont or a large dry-lot facility in California’s Central Valley.

Production SystemPrimary Risk FactorMetritis IncidencePeak Risk PeriodPriority Intervention
Confinement/FreestallHigh pathogen pressure (cow density)12-18%Year-round (worse summer)Bedding hygiene + individual calving pens
Tie-stallModerate pressure, close monitoring8-14%Winter (footing issues)Foothold safety + rapid detection
Seasonal grazingLow pressure, clean pasture calving5-10%Spring (mud/weather)Pasture rotation + shelter
Heat stress regions (SE/SW)Metabolic + immune compromise15-22%May-SeptemberCooling systems + dry period heat abatement

What This Means for Your Operation

So where does this leave us? A few priorities emerge from the research, though I’d be the first to acknowledge that implementation looks different in a 200-cow tie-stall operation in Pennsylvania than in a 5,000-cow facility in the Central Valley.

Calving Hygiene: The ROI Is Better Than You Think

If disease susceptibility stems from pathogen exposure during barrier vulnerability rather than immune suppression, then reducing bacterial load at calving becomes paramount.

The practices themselves aren’t new: individual calving spaces where feasible, fresh bedding for each cow, rigorous equipment sanitation, and adequate rest time between animals using the same pen. The research sharpens the economic justification for these investments.

A 2021 analysis by Pérez-Báez and colleagues, published in the Journal of Dairy Science, examined metritis costs across 16 U.S. dairy herds:

Metritis Cost FactorFinding
Mean cost per case$511
Cost range (95% of cases)$240 – $884
IncludesMilk loss, treatment, reproduction, and culling risk

On a 300-cow herd running 15% metritis incidence, you’re looking at 45 cases annually—somewhere in the neighborhood of $23,000 in direct costs before accounting for the fertility tail.

💡 THE BOTTOM LINE: At $511 per case average, metritis is costing a 300-cow herd with 15% incidence roughly $23,000/year. Cutting that rate in half through better calving hygiene pays for itself fast.

Metabolic Support May Matter More Than Immune Boosting

This is where some of the research becomes practically relevant. If the issue isn’t immune suppression, then products marketed primarily for “immune support” may be addressing the wrong problem.

I want to be careful here, because I know plenty of operations report good results with their current transition protocols, including various immune-targeted supplements. Individual variation means some interventions may genuinely help certain cows even if the mechanism isn’t exactly what we thought. And controlled research doesn’t always capture the complexity of commercial conditions.

When we talk about metabolic support, we aren’t just talking about energy—we’re talking about barrier integrity. Some research groups are testing gut-focused tools to help stabilize that intestinal lining during transition. For example, work on Saccharomyces cerevisiae fermentation products (SCFP)—the yeast-based additives many producers already use—suggests they may help maintain tight junction integrity and reduce the inflammatory load from gut-derived endotoxins. Other trials are looking at specific trace mineral forms (like organic zinc or chromium) that support both gut barrier function and glucose metabolism during immune challenges.

These are still being tested and tuned on real farms, but the logic behind them fits what we’re seeing: if you can reduce the “noise” from gut-derived inflammation, the cow’s immune system can focus its resources where they’re needed most—the mammary gland and uterus.

That said, what the research points to is that interventions supporting metabolic function—maintaining feed intake, managing body condition loss, and smoothing dietary transitions—address what the data actually shows is happening.

Intervention StrategyTarget MechanismResearch SupportCost per CowExpected ROIPriority Tier
Calving hygiene upgradeReduces bacterial exposureStrong (observational)$8-153-5× returnTier 1: Essential
Automated health monitoringEarly detection (rumination/activity)Strong (controlled)$150-200/yr2-4× returnTier 1: Essential (>200 cows)
Metabolic support protocolsMaintains intake, reduces BCS lossStrong (mechanistic)$25-402-3× returnTier 1: Essential
Omega-3 (EPA/DHA)Inflammation resolutionModerate (variable)$35-601.5-2× returnTier 2: Consider (high inflammation)
Generic immune boostersUncertain—wrong problem?Weak (conflicting)$40-800.5-1.2× (uncertain)Tier 3: Reevaluate

Dr. Tom Overton at Cornell has emphasized for years that the transition period is fundamentally about managing competing demands for nutrients. The cow is simultaneously supporting immune function, ramping up milk production, and attempting tissue repair—all while she can’t eat enough to cover the energy requirements. Anything that improves intake or metabolic efficiency during this window has cascading benefits.

Inflammation Resolution Is Worth Watching

This is still an emerging area, but early results are worth watching. Omega-3 fatty acids—EPA and DHA from fish oil or algae sources—serve as precursors for what researchers call specialized pro-resolving mediators. These molecules don’t suppress inflammation; they help complete the inflammatory process efficiently, signaling the body to transition from active response into tissue repair.

Earlier work from the University of Florida documented reduced systemic inflammation and modest improvements in reproduction in cows receiving omega-3 supplementation during the periparturient period. Results across subsequent studies have varied with product and dosing, but the biological rationale is sound.

Keeping Perspective

I should acknowledge that this isn’t a settled conversation. Some nutritionists and veterinarians I respect point out that their transition protocols—including products I’ve just suggested—produce consistently good outcomes in client herds. They’re not wrong to trust their experience.

Science advances incrementally. There’s often a gap between what controlled research demonstrates and what works in the messy reality of commercial dairy production. Individual farms vary in pathogen pressure, facility design, genetic base, and management execution. What struggles on one operation may succeed on another for reasons that aren’t immediately apparent.

The value of the emerging research isn’t that it invalidates decades of transition cow wisdom. It’s that it offers a more refined framework for understanding why things work when they do—and for asking better questions when outcomes don’t match expectations.

💡 GOLD NUGGET: The goal isn’t to throw out what’s working. It’s to understand why it works—so you can troubleshoot when it doesn’t.

Three Questions to Ask Your Advisory Team

1. What’s the mechanism? When evaluating any product or protocol, understanding how it’s supposed to work—and whether that mechanism aligns with current understanding—helps separate substance from marketing.

2. How will we measure it? Peer-reviewed research is valuable, but on-farm data from your own herd is more valuable still. If you’re implementing changes, rigorously tracking outcomes actually to know whether they’re helping makes the investment worthwhile.

3. What’s our baseline? Improvement requires knowing where you started. What’s your current metritis rate? Retained placenta incidence? First-service conception rate? These benchmarks make evaluation possible.

The Bottom Line

That Wisconsin freestall operation I mentioned at the start? They eventually brought metritis rates down to single digits—roughly half of where they’d been. The changes that moved the needle weren’t primarily nutritional. They redesigned their calving area, got more rigorous about bedding management, and started using rumination monitoring to flag individual cows showing early warning signs.

Their experience won’t map directly onto every operation. But the underlying approach—reduce exposure, support metabolism, monitor individuals—aligns with where the science seems to be heading.

The conversation around transition cow immunity will continue to evolve. What seems increasingly clear is that the “immune suppression” framework doesn’t fully capture what’s happening. Fresh cows aren’t defenseless; they’re mounting robust inflammatory responses while simultaneously managing enormous metabolic demands. The diseases we see are more likely to result from overwhelming pathogen exposure during barrier vulnerability than from an immune system that’s shut down.

For producers, that shifts focus toward controllable factors: calving environment hygiene, metabolic support strategies, and individual animal monitoring. These aren’t dramatic interventions. They don’t come with splashy marketing. But they address the mechanisms that current research actually supports.

And sometimes, that’s exactly what progress looks like.

Key Takeaways

The emerging picture:

  • Early lactation cows mount robust—even heightened—immune responses, not suppressed ones
  • Fresh cow disease results from overwhelming pathogen exposure during barrier vulnerability, combined with metabolic stress
  • Early lactation inflammation creates downstream reproductive effects that persist for months
  • Individual variation is massive: BCS gainers bred at 78%, BCS losers at just 23%

Practical priorities:

  • Calving hygiene delivers serious ROI—metritis costs average $511/case
  • Metabolic support (feed intake, BCS management) addresses mechanisms that the research supports
  • Individual cow monitoring catches problems before clinical signs appear
  • Regional factors influence how these principles apply on your operation

Questions for your team:

  • What mechanism does this intervention actually address?
  • How will we track whether changes are improving outcomes?
  • Are we capturing enough individual cow data to spot the variation in our herd?

Complete references and supporting documentation are available upon request by contacting the editorial team at editor@thebullvine.com.

Learn More

  • The First 48 Hours: A Manager’s Guide to Fresh Cow Success – Reveals a streamlined management audit to sharpen your fresh cow checks. You’ll gain a high-impact strategy for prioritizing labor where it generates the most ROI, drastically reducing the clinical metritis cases that drain your bottom line.
  • Dairy Economics 2025: The Hidden Cost of Inflammation – Exposes the massive financial drag caused by sub-clinical inflammation. This analysis arms you with the long-term economic strategy needed to shift your focus from treatment to prevention, securing a competitive advantage and a more resilient balance sheet.
  • Genetic Selection for Resilience: Breeding the Cow of the Future – Breaks down how to leverage the newest genetic health traits to bake-in resilience from day one. You’ll gain the insight needed to stop breeding for “milk-only” and start creating a self-sufficient herd that naturally handles the metabolic stress of transition.

The Sunday Read Dairy Professionals Don’t Skip.

Every week, thousands of producers, breeders, and industry insiders open Bullvine Weekly for genetics insights, market shifts, and profit strategies they won’t find anywhere else. One email. Five minutes. Smarter decisions all week.

NewsSubscribe
First
Last
Consent

The Robot Metric Dealers Don’t Emphasize – And Why It Predicts Your Payback

A cow making 85 lbs is costing you money. A cow making 75 lbs is driving profit. Robot economics don’t work like you think.

Executive Summary: The metric you were sold on—milking frequency—has surprisingly little to do with whether your robots actually pay off. Six years of industry data points to a different number: efficiency, measured as kilograms of milk per minute of robot time. ICAR research benchmarks profitable operations at 1.86 kg/min, and farms falling short struggle regardless of strong bulk tank numbers. Here’s the uncomfortable math: an 85-lb producer hogging 45 minutes of box time costs you money, while a 75-lb cow with 25-minute turnover drives real profit. This analysis delivers five metrics worth tracking daily, a 90-day turnaround protocol, and an honest framework for determining whether your struggles are management problems you can fix—or structural and economic realities that require harder decisions.

Robotic Milking Efficiency

You know that conversation that happens at coffee shops near dairy country? The one where a producer leans in and says something like, “They told me three to four years to payback. I’m at year six, and I’m still waiting.”

I’ve been hearing variations of this for the past eighteen months. What strikes me isn’t the frustration—that’s understandable when you’ve invested somewhere between $150,000 and $275,000 per unit in technology that hasn’t delivered on the sales projections. What’s interesting is what separates the producers who’ve turned things around from those still treading water.

It comes down to a single insight, and it’s surprisingly counterintuitive: the farms thriving with automation have largely stopped obsessing over milking frequency.

The Sales Pitch vs. The Reality

Let’s be direct about this. For years, the robotic milking industry pushed frequency as the golden metric. Get your cows visiting 2.9 times daily. Push for 3.0 if you can manage it. The reasoning seems solid enough—more milkings should translate to more milk.

Here’s what the early sales conversations often missed: the correlation between frequency and profitability is far weaker than the pitch implied.

Efficiency (kg/min)Net margin (USD/cow/day)Frequency (visits/day)
1.20-1.502.9
1.40-0.753.0
1.600.252.8
1.861.502.9
2.002.102.7
2.203.002.8

What actually correlates with making money? Something called milking efficiency—the kilograms of milk harvested per minute of robot time. Dr. Débora Santschi, who directs Lactanet Canada’s R&D team and has been working with dairy data since 2010, has been central to tracking these patterns. Research presented through ICAR’s technical series in Montreal shows that average milking efficiency runs around 1.86 kg milk per minute of box time—but the variation between high and low performers is where fortunes are made or lost.

To be fair, the conversation is evolving. I’ve spoken with several Midwest dealers who now lead with efficiency metrics rather than frequency targets—a welcome shift that suggests the industry is catching up to what producers have learned the hard way. But if you bought your system five or six years ago, you probably got the older playbook.

The bottom line: When consultants work with producers to improve robot economics, frequency is rarely the limiting factor. It’s almost always about capacity utilization.

Think about it. A robotic milking system only has so many minutes of available milking capacity per day. That number doesn’t expand based on how hard you push—it’s the fixed resource that every management decision operates within. Whether you’re running a 120-cow operation in Wisconsin or a 300-cow herd in California, the math is unforgiving.

What Efficient Operations Actually Look Like

I’ve spent time visiting farms in Ontario, Wisconsin, and the Central Valley that have figured this out. The differences are more subtle than you might expect—and they have nothing to do with hitting frequency targets.

Here’s a pattern I’ve seen repeatedly: A mid-sized operation installs robots, focuses intently on increasing frequency, and hits that 2.9 visits per day target within the first year. The bulk tank looks good. But payback doesn’t materialize.

What changes things? Shifting attention to box time—the total minutes each cow spends in the robot per visit.

Once farms start tracking this metric, they discover enormous variation within their herds. Some cows are in and out in five minutes flat. Others are taking 9, 10, sometimes 11 minutes for essentially the same milk yield.

I recently spoke with an Ontario producer who put it this way: they had maybe 15 cows using 20% of their robot capacity while contributing maybe 8% of their milk.

“Once you see that math, you can’t unsee it.”

A Wisconsin producer I visited last fall told me something similar. He’d been chasing 3.0 visits per day for two years before his nutritionist suggested looking at individual cow efficiency. “I had cows I was proud of—good production, no health issues—that were killing my robot economics. That was a hard conversation with myself.”

The University of Wisconsin’s Dairy Brain initiative has been systematically documenting these patterns. Their work integrating AI and real-time sensor data suggests that systematic attention to individual cow efficiency metrics—rather than herd-average frequency—may be among the stronger predictors of robot profitability.

The Five Numbers That Actually Predict Profitability

Dr. Marcia Endres at the University of Minnesota makes a point that cuts through the noise: milk yield tells you what happened yesterday. The metrics that matter tell you what’s about to happen.

Here’s what the most profitable robot farms are watching daily:

MetricTargetWhy It Matters
Milking EfficiencyAbove 1.86 kg/minFarms below this threshold struggle financially regardless of production numbers
Incomplete Milking RateBelow 5%Above 8-10%, cascading effects on udder health and capacity compound rapidly
Fetch RateBelow 5-8%Lame cows are 2.2x more likely to need fetching—this is your lameness early warning
Individual Cow SCC TrendsStable or decliningThree consecutive rising tests signals trouble before production drops
Frequency by Lactation Stage3.0-3.2 (fresh) / 2.4 (late)Blanket targets waste capacity on cows that don’t need it

Key insight on regional economics: Operations in California or the Northeast may need to hit the upper end of efficiency targets to achieve margins similar to those of Midwest producers. Labor costs and milk prices shift the math significantly.

Software note: Lely Horizon, DeLaval HerdNav, and GEA DairyPlan can all generate efficiency reports, but you may need to set up custom calculations to track kg/minute specifically.

The Efficiency Gap: A Tale of Two Cows

This is where robot economics get uncomfortable—and where the biggest opportunities hide.

Traditional culling focuses on production. A cow making 85 pounds daily seems like a keeper. A cow making 75 pounds seems like a candidate for the truck.

Robot economics flip this completely.

MetricCow A: “The Capacity Thief”Cow B: “The Profit Driver”
Daily Yield85 lbs75 lbs
Total Daily Box Time45 minutes25 minutes
Efficiency0.85 kg/min1.36 kg/min
Robot Capacity Used3.1% of daily capacity1.7% of daily capacity
VerdictLooks good on paper, costing you moneyLower production, stronger profit

The math that changes everything: Cow A consumes robot capacity that could support an additional partial cow’s production. Multiply this across your herd’s bottom 10-15% of efficiency performers, and you’re looking at 5-6 additional efficient animals you could be milking.

Research documented in ICAR’s technical series confirms this variation is “very high” across and within lactations. Some animals take twice as long as others for similar yields.

The hard truth: These aren’t sick cows. They’d do fine in a conventional parlor. They’re just not suited for robots—usually due to teat placement, milking speed, genetics, or temperament. Some producers find alternative markets rather than processing them. But keeping them is costing you money every day.

The Hidden Cost of Incomplete Milkings

A failed attachment or mid-milking kickoff doesn’t just cost you that session’s milk. Research from the Swedish University of Agricultural Sciences found effects lasting up to ten days:

  • Elevated SCC for several days following incomplete milking
  • Reduced voluntary returns from stress response
  • Cascading capacity loss as problem cows consume more management time

The annual cost difference between 5% and 15% incomplete rates can reach tens of thousands per robot when you factor in production loss, health effects, and labor.

What the top farms discovered: Stop treating failures as random events. Track them by individual cow—same as you’d track breeding outcomes or health events. Patterns emerge fast. A handful of animals typically cause the majority of incidents.

Common CauseRoot IssueSolution Path
Failed attachmentsTeat placement/udder conformationGenetic selection over time; culling chronic offenders
KickoffsLiner/vacuum issues OR painEquipment check first, then lameness/teat-end evaluation
Early exitsInterval settings mismatchAdjust individual cow permissions

The 90-Day Turnaround Protocol

For farms recognizing they’ve been chasing the wrong metrics, here’s the focused improvement pathway that’s working:

Month 1: Diagnosis

  • Pull historical efficiency data
  • Rank every cow by efficiency ratio
  • Identify your worst capacity thieves
  • Document incomplete milking patterns by individual animal

Month 2: Execution

  • Cull or beef-breed the bottom 10-15% efficiency performers
  • Aggressive lameness intervention (watch fetch rate drop)
  • Adjust milking permissions by lactation stage
  • Address equipment issues causing incomplete milkings

Month 3: Systematization

  • Write protocols that survive staff turnover
  • Establish weekly efficiency review routines
  • Create accountability for the metrics that matter

Realistic expectations: Meaningful efficiency gains within the quarter. Full payback recovery typically takes another 12-18 months of sustained attention. This isn’t a quick fix—but it’s a proven path.

When the Robot Isn’t the Problem

Here’s what doesn’t get discussed enough: not every struggling operation can be fixed solely through management.

The Australian dairy industry’s Milking Edge project—a four-year initiative through NSW Department of Primary Industries—tracked commercial installations and found success depends heavily on factors beyond equipment:

  • Facility design limitations (retrofit constraints that can’t be managed away)
  • Herd genetics (some populations aren’t well-suited for robots)
  • Unrealistic initial expectations set during the sales process
  • Management capacity for data-driven decision making

Equipment failure was rarely the primary cause of struggling operations.

Dairy facility specialists have long observed: the robot doesn’t create your management system—it reveals the one you already have.

For producers underwater for multiple years despite genuine effort, honest assessment matters:

Challenge typeTypical symptomsDiagnostic questionPath forward
ManagementWide cow-to-cow efficiency spread, high fetch & incomplete ratesHave we ever run a focused 90-day efficiency protocol?Tighten protocols, cull bottom 10–15%, own the data
StructuralChronic traffic jams, awkward retrofits, robots boxed in by layoutWould a blank-sheet design ever choose this traffic pattern?Cost out redesign vs. living with permanent bottlenecks
EconomicDecent efficiency but margins still thin or negative year after yearIf this herd were in the Midwest, would it be profitable?Rethink long-term viability and regional strategy

The Industry Is Getting More Honest

The robotic milking conversation is maturing. I’m seeing more nuanced guidance from universities—less “robots will transform your operation” and more practical discussion of which farms are positioned for success.

And credit where it’s due: equipment dealers are increasingly part of this honest conversation. The best ones now discuss efficiency economics before the sale, help producers assess facility fit, and set realistic payback expectations. If your dealer isn’t having these conversations, that tells you something, too.

For producers considering robots:

  • Understand efficiency economics before you buy
  • Evaluate facility design with someone who doesn’t profit from the sale
  • Assess herd genetics: teat placement, milking speed, temperament

For current robot operators:

  • The metrics from your initial training may not be the metrics that matter
  • Efficiency-focused management requires seeing data differently
  • Culling decisions that feel wrong on paper may be right for your robot

For struggling operations:

  • Honest assessment beats hopeful persistence
  • Know whether you’re facing management, structural, or economic challenges
  • The pathway forward depends entirely on which category you’re in

Quick Reference: Robot Success Metrics

MetricTargetRed Flag
Milking Efficiency>1.86 kg/min<1.4 kg/min
Incomplete Rate<5%>10%
Fetch Rate<5%>8%
Fresh Cow Frequency3.0-3.2x/day<2.8x/day
Late Lactation Frequency2.4x/dayForcing higher visits

Key Takeaways:

  • Stop chasing frequency. The metric that actually predicts payback is efficiency—kg of milk per minute of robot time. Farms above 1.86 kg/min profit; those below 1.4 kg/min struggle regardless of bulk tank numbers.
  • Your top producer might be your biggest liability. An 85-lb cow hogging 45 minutes of daily box time bleeds capacity. A 75-lb cow finishing in 25 minutes drives real profit. Robot economics run backward from everything you learned in a parlor.
  • Fetch rate reveals lameness before production drops. Research shows lame cows are 2.2x more likely to need fetching. If you’re retrieving more than 5-8% of your herd daily, you’ve got a systemic problem brewing.
  • The 90-day turnaround protocol: Month 1—rank every cow by efficiency ratio. Month 2—cull your bottom 10-15% and attack lameness aggressively. Month 3—build systems that survive staff turnover.
  • Not every struggle is fixable with management. Structural limitations and regional economics don’t respond to harder work. Honest diagnosis matters: know whether you’re facing a solvable problem or a reality that requires different decisions.

The Bullvine provides independent analysis for dairy producers navigating industry change. This article draws on published research from ICAR, the Swedish University of Agricultural Sciences, the University of Wisconsin, the University of Minnesota, and the NSW Department of Primary Industries, along with producer conversations from 2024-2025. For farm-specific guidance, consult your local extension specialists.

Complete references and supporting documentation are available upon request by contacting the editorial team at editor@thebullvine.com.

Learn More

The Sunday Read Dairy Professionals Don’t Skip.

Every week, thousands of producers, breeders, and industry insiders open Bullvine Weekly for genetics insights, market shifts, and profit strategies they won’t find anywhere else. One email. Five minutes. Smarter decisions all week.

NewsSubscribe
First
Last
Consent

Why Camel Dairy Gets $35/Liter, and You’re Stuck at Blend Price

His camels make 6 liters/day at $35 each. Your Holsteins make 50 liters/day at blend price. You’re outproducing him 8-to-1. He’s out-earning you. Why?

Executive Summary: You outproduce camel dairies 8-to-1. They out-earn you. That’s not genetics—it’s market structure. Three walls lock conventional dairy into commodity pricing: FMMO pooling eliminates farm-level quality premiums, processor contracts surrender your pricing power, and debt loads punish transition attempts. But walls can be climbed. UW-Madison, Iowa State, and Virginia Tech research reveals specific paths: validate customers before capital investment, test demand through co-packing, and choose positioning that competitors can’t easily copy. What follows covers the economics, the barriers, and the practical playbook—plus one question mid-size operations can’t ignore. Can you survive on efficiency gains alone when mega-dairies have scale and niche players have margins you’ll never touch?

When Sam Hostetler got a phone call from a doctor asking if he could supply camel milk for patients with digestive issues, he didn’t see dollar signs. He saw a problem he could solve.

Hostetler had spent four decades working with exotic animals at his operation in Miller, Missouri. Camels weren’t new to him. But milking them commercially? Different story.

“Twelve years ago, I was contacted by a doctor to see if I would consider milking camels,” Hostetler shared in a recent interview. “I said, ‘Milking a camel? I didn’t know they milked camels in this country.’ Then she said, ‘They don’t, but I need milk for a patient.’ To which I replied, ‘Well, I’ve been known to do some crazy things. One more won’t hurt me.'”

That conversation launched Humpback Dairy—now home to about 200 camels, including roughly 100 breeding-age females.

Camel dairies generate roughly ten times more daily revenue per animal than Holstein herds despite producing a tiny fraction of the milk. This visual makes it painfully clear that genetics and feed efficiency aren’t the problem—pricing power and market structure are. For family‑scale dairies, it reframes strategy away from “more liters” toward “better positioned liters” that actually move the milk check.

Here’s the number that should get your attention: Hostetler sells milk at around $26 per liter. Meanwhile, conventional dairy farmers—managing far more animals with far more infrastructure—fight for margins at $19-21 per hundredweight.

THE BOTTOM LINE: The U.S. camel dairy market hit $1.37 billion in 2024 and is projected to reach $3.16 billion by 2034, according to Research and Markets. But this isn’t about competition. It’s about understanding where premium value goes—and why you can’t access it.

Let’s Talk Scale First

Camel dairy is tiny. We’re talking 3,000-5,000 camels across the entire country. According to CBS4, Camelot Camel Dairy in Wray, Colorado, is one of only two fully licensed camel dairies in the United States.

Compare that to 9.35 million dairy cows tracked by USDA NASS for 2024.

Production per animal? Not even close. Camels produce 1-6 liters daily according to FAO research. Your Holsteins? 30-40 liters daily for typical operations, with top herds pushing 50+ liters in well-managed TMR systems.

So why does this matter?

The Price Gap Is Staggering

  • Camel milk: $25-35 per liter retail. Desert Farms charges $35 per liter, according to SkyQuest market research.
  • Your milk: $4.39 per gallon average in 2024, per USDA AMS data. That’s regional variation from $3.29 in Louisville to $5.92 in Kansas City.
  • The margin story: Camel operators report 40-60% gross margins. Conventional dairy? 15-25% based on USDA ERS cost-of-production tracking.

A Wisconsin producer told me last month: “It’s not that I want to milk camels. But when I see someone getting $35 a liter, and I’m getting paid commodity price for milk that took three generations of genetic work to produce… you start asking questions.”

He’s asking the right questions.

ModelMilk price received (USD/cwt)Net margin per cwt (USD)Net margin per cow per year (USD)
Commodity Holstein herd20.03.0900
Premium-positioned Holstein26.07.02,100
Difference (premium – comm.)6.04.01,200
% Advantage of premium herd+30%+133%+133%

KEY INSIGHT: The gap isn’t about production. Holstein genetics have never been better. The gap is about market positioning and who captures the margin between your farm gate and the consumer’s refrigerator.

ProductFarm value (USD)Processing/packaging (USD)Marketing/DTC operations (USD)Distribution/retail profit (USD)Total retail price (USD)
Holstein milk – 1 gallon1.001.1002.304.40
Camel milk – 1 liter14.007.006.008.0035.00

This Isn’t Disruption. It’s Segmentation.

When investors see camel dairy’s growth, they think tech-style disruption. New thing kills old thing.

That’s not what’s happening here.

Mark Stephenson, Director of Dairy Policy Analysis at the University of Wisconsin-Madison, has studied dairy markets for over two decades. The distinction he draws matters: disruption makes the old model obsolete. Segmentation splits the market into different value tiers.

Camel dairy isn’t replacing anything. Even at $3.16 billion by 2034, it’s a rounding error on total dairy volume.

What it IS doing: capturing margin-rich slices of the market that conventional dairy structurally abandoned.

Premium Segments Punch Above Their Weight

Look at how premium dairy has evolved:

  • Organic: ~7% of fluid milk volume (RaboResearch), commanding 25-30% premiums
  • A2 genetics: 2-3% of volume, 50-100% premiums (a2 Milk Company data)
  • Grass-fed: 1-2% of volume, premiums often exceeding 100% (American Grassfed Association)
  • Specialty products: Under 1% of volume, 300-1000%+ premiums

Conventional dairy controls most of the volume but captures a shrinking share of total market value.

That gap? It’s billions in premium revenue that most of us can’t touch.

Why You Can’t Access Those Premiums

Here’s where it gets uncomfortable.

What actually stops a well-managed operation with excellent genetics and superior milk quality from capturing premium prices?

I’ve talked to producers who tried. I’ve reviewed extension research on premium transitions. The barriers aren’t operational. They’re structural.

Structural barrierPremium blocked (USD/cwt)
FMMO pooling2.0
Exclusive processor contracts2.0
High leverage/debt load1.5

A California producer put it bluntly: “My SCC runs under 80,000, my butterfat is consistently above 4.2%, and my protein is top-tier for the region. But I get paid the same blend price as everyone else in the pool.”

Let’s break down the three walls standing between you and premium margins.

Wall #1: The Pooling System

Under the Federal Milk Marketing Order system, your milk is pooled with other milk in regional pools. Prices get set by commodity markets—cheese, butter, and powder trading on the CME.

Everyone in the pool gets essentially the same blend price. Your superior milk—better components, cleaner production, stronger genetics—earns the same per hundredweight as lower-quality milk.

The system was designed to stabilize prices. It’s done that. But the tradeoff? It eliminates individual quality premiums at the farm level.

Yes, component premiums exist for butterfat and protein. Upper Midwest operations have benefited. But there’s no mechanism to capture extra value for A2/A2 genetics, exceptional SCC, or other differentiators.

The processor captures brand premium. You get blend price.

REALITY CHECK: The FMMO system isn’t broken—it’s working exactly as designed. The question is whether that design serves your operation’s future.

Wall #2: Contract Lock-In

Over 90% of conventional operations work under exclusive supply contracts with processors. These provide real benefits: guaranteed market access, predictable pickups, and reduced marketing burden.

Tom Kriegl, who spent years as a farm financial analyst at the University of Wisconsin Extension’s Center for Dairy Profitability, has written extensively about these economics. The tradeoff is clear: you gain stability but surrender pricing flexibility.

Processors aren’t villains here—they face their own margin pressure from retailers and foodservice. But the structure concentrates pricing power away from farms.

Wall #3: Your Debt Load

This is the one nobody talks about enough.

A typical 500-cow dairy carries $3-4 million in debt, based on USDA ERS data. That debt is collateralized against assets and depends on consistent cash flow from commodity milk sales.

Want to transition to premium positioning? You’ll need capital for processing, branding, and marketing infrastructure. You’ll face production disruptions. Revenue won’t stabilize for 12-24 months.

David Kohl, Professor Emeritus of Agricultural Finance at Virginia Tech, has studied this for decades. The dynamic he describes: lenders want stable, predictable revenue. Transition uncertainty makes them nervous.

A Northeast producer told me about approaching his lender: “They said they’d need 18 months of premium sales revenue before restructuring our terms. But I couldn’t build that history without capital to get started.”

Classic chicken-and-egg. And it keeps a lot of good farmers locked into commodity production.

“The farms in the middle are getting squeezed from both ends. Very large operations have scale economics that mid-size farms can’t match. Premium niche operations have margins that commodity production can’t touch.”

— Mark Stephenson, UW-Madison

What Actually Works for Premium Positioning

Not everyone should chase premium markets. But if you’re considering it, here’s what the research shows about operations that succeed.

Get This Backwards, and You’ll Fail

Most farms considering premium positioning do it this way:

  1. Decide to transition
  2. Invest in infrastructure
  3. Convert production
  4. Search for buyers

That’s backwards.

Larry Tranel, dairy field specialist at Iowa State University Extension, has watched this play out with dozens of farms. The operations that succeed flip the sequence:

  1. Identify customers
  2. Validate willingness to pay
  3. Secure commitments
  4. THEN invest in production changes

Research in the Journal of Dairy Science found the same pattern. Farms with existing customer relationships experienced minimal disruption during organic conversion. Farms that converted first and sought markets later? Profitability problems that lasted years.

THE RULE: If you can’t get 30-50 people to put down deposits before you spend anything on infrastructure, you don’t have a market. Better to learn that early.

Why Camel Dairy Has Natural Protection

When someone pays $35/liter for camel milk, they’re not comparing it to your milk price. They’re asking if this specific product meets their specific needs.

The scarcity of camels—13-month gestation periods, two-year calving intervals, limited U.S. population, only a handful of licensed dairies—creates natural barriers to competition.

Compare that to A2 positioning. Any farm can test genetics and claim A2 certification. As more enter, premiums compress.

Durable premiums combine:

  • Verifiable attributes
  • Relationship-based customer loyalty
  • Some barrier to easy replication

Pure attribute claims (“my milk is A2” or “my cows are grass-fed”) get competed away faster than relationship positioning, where customers connect with YOUR specific operation.

The Customer Service Reality Nobody Mentions

Premium operations accept that customer relationship management IS the product. Not overhead. Not a distraction. The actual product.

Direct-to-consumer dairy means substantial time on order management, delivery logistics, emails, complaints, and retention.

Tranel sees this all the time: producers try direct sales for 6 months and quit. Not because the economics don’t work. Because they’re spending 15 hours a week on customer service instead of their animals.

That’s not failure. That’s recognizing that premium positioning requires different skills than production excellence. Both paths are legitimate. They’re just different paths.

Lower-Risk Ways to Test Premium Markets

If you want to explore premium positioning without betting the farm, here are approaches extension specialists recommend.

The Co-Packing Model

Skip the $30,000-50,000+ for on-farm pasteurization. Many states let you produce Grade A raw milk and contract with a licensed processor for pasteurization and bottling under YOUR brand.

ModelStartup capital required (USD)Additional net income per year (USD)Estimated payback period (years)Extra weekly marketing time (hours)
Status quo commodity-only000
On-farm processing/brand build-out40,00060,0000.720
Co-packed, branded fluid milk pilot12,00035,0000.315
Co-packed + subscription delivery tier15,00050,0000.318

Startup cost: $6,500-15,000 for branding, packaging, cold storage, and delivery setup (extension estimates)

Timeline: 8-10 weeks to first sales in states with straightforward pathways

Find a processor willing to do small runs—usually smaller regional plants with excess capacity. State dairy associations can point you in the right direction.

This lets you test demand before committing major capital.

The Validation Sequence

Months 1-2: Research customer segments. Test messaging at farmers markets, social media, and community groups. Collect contacts. Don’t sell yet—gauge interest.

Month 3: Survey interested people. What volumes? What prices? What delivery preferences? Separate real purchase intent from casual curiosity.

Months 4-5: Request deposits. A $50 commitment separates talkers from buyers.

Months 6+: With 30-50 committed customers, consider minimal infrastructure investment.

Positioning Options Compared

PositioningPremiumProtectionTimeline
Organic25-30%Medium5-7 years to saturation
A2 genetics30-50%Low2-3 years
Grass-fed50-100%Medium3-5 years
Regenerative30-50%Medium-High5-10 years
Hyper-local branded40-80%HighOngoing investment

The pattern: Premiums last longer when you combine verifiable attributes with relationships and real barriers to replication.

Regulations: Check Before You Build

State rules on on-farm processing and direct sales vary wildly. This trips up a lot of producers.

Raw milk examples:

  • Wisconsin: Prohibits retail sales; gray areas around farm-gate transfers
  • Vermont: Permits sales with minimal licensing
  • California: Requires extensive testing and licensing
  • Pennsylvania: Allows sales with appropriate permits

On-farm pasteurization pathways exist in some states (New York and California have processes) but not in others. Co-packing rules depend on location and whether products cross state lines.

Before spending anything: Contact your state Department of Agriculture’s dairy division. Ask specifically about raw milk regulations, on-farm processing licenses, and co-packing arrangements. Get it in writing.

State inspectors are more helpful when you ask before building than after.

While we’ve highlighted US examples, the trend of margin-capture vs. commodity-volume is playing out across Canada, the UK, and Australia in similar ways.

Honest Questions Before You Decide

Does customer interaction energize or drain you? Premium positioning means hours of emails, delivery coordination, and complaint handling. If that sounds exhausting, this isn’t your path.

Can you handle 12-24 months of uncertainty? Premium revenue takes time. Do you have reserves or off-farm income to bridge gaps?

Is your positioning defensible? What makes your story compelling AND hard to copy?

Is your family aligned? This changes daily work patterns. Everyone affected needs to understand and support it.

If these questions raise concerns, that’s not failure. That’s valuable information for better decisions.

The Bigger Picture

Camel dairy’s success reflects something larger: dairy markets are stratifying into distinct value tiers where margins concentrate among operations that control their positioning, customer relationships, and narrative.

The Trends Reinforcing This

Vertical integration: Fairlife (Coca-Cola-owned), a2 Milk Company, major organic cooperatives—they capture production AND brand premiums by controlling the whole chain.

Consumer willingness to pay: IFIC Foundation research consistently shows that substantial segments are willing to pay premiums for health, environmental, or local-sourcing stories. This preference has stayed stable for years.

Technology lowering barriers: Online ordering, subscription management, delivery logistics—tools that once required custom development now cost $50/month.

THE STRATEGIC QUESTION: Is efficiency-focused commodity production, competing against ever-larger operations with superior scale economics, a viable long-term path for family-scale farms?

Key Takeaways

Premium markets are real. They capture disproportionate revenue despite modest volume.

Barriers exist, but aren’t absolute. Co-packing, graduated transitions, and customer-first approaches can manage risk.

Sequencing is everything. Build a customer base before investing capital.

Customer work is core. If you hate it, premium positioning isn’t for you.

Defensibility determines durability. Attributes get copied. Relationships and complexity hold value.

Question your assumptions. “Better genetics + lower costs = eventual reward” faces structural headwinds. Operations capturing premium value succeed through positioning, not just production.

The Bottom Line

Camel dairy at $35/liter isn’t a threat. It’s a signal.

Dairy markets have stratified. Commodity production remains essential—it serves the majority of consumption. The infrastructure, genetics, and management expertise we’ve developed over generations matter.

But the assumption that production excellence alone generates adequate returns—especially for mid-size operations squeezed between large-scale efficiency and premium margins—deserves hard examination.

The question isn’t whether to milk camels. It’s whether some version of premium positioning might complement commodity production as markets continue to evolve.

The operations best positioned over the next decade will figure out how to produce excellent milk AND capture value that currently flows elsewhere.

That’s what camel dairy’s unlikely success actually demonstrates. The animal matters far less than the market structure lessons embedded in those $35-per-liter prices.

Whether the industry is ready to learn those lessons… that’s the open question.

Complete references and supporting documentation are available upon request by contacting the editorial team at editor@thebullvine.com.

Learn More

  • Dairy Farm Profitability: It’s Not Just About More Milk – Stop chasing pounds and start chasing profit with this operational overhaul. It delivers the specific cost-analysis tools you need to identify hidden leaks in your system, ensuring every management decision on Monday morning directly improves your bottom line.
  • The Future of the Family Farm: Strategy Over Scale – Position your operation for the next decade by understanding the inevitable stratification of the global milk supply. This strategic guide exposes why the “get big or get out” mantra is failing and reveals how mid-size farms can reclaim their competitive advantage.
  • A2 Milk and Beyond: The Real ROI of Niche Markets – Evaluate the genuine ROI of emerging premium tiers before you commit your herd’s genetics. This analysis strips away the marketing hype around niche attributes, delivering the data-backed reality of which certifications actually hold their value against future market saturation.

The Sunday Read Dairy Professionals Don’t Skip.

Every week, thousands of producers, breeders, and industry insiders open Bullvine Weekly for genetics insights, market shifts, and profit strategies they won’t find anywhere else. One email. Five minutes. Smarter decisions all week.

NewsSubscribe
First
Last
Consent

Squeezed Out? A 12-Month Decision Guide for 300-1,000 Cow Dairies

You’ve run the numbers three times, hoping they’d change. They won’t. For 300-1,000 cow dairies, the math has broken—but your options haven’t. Yet.

Executive Summary: The economics that sustained mid-size dairy farming are disappearing faster than most producers realize. Heifer prices have tripled since 2019, milk is down $2/cwt from 2024, and component pricing is shifting from butterfat to protein—meaning genetics selected two years ago are now optimized for a vanishing market. For 300-1,000 cow operations, this creates a structural squeeze: too large for specialty positioning, too small for automation to be economically viable. With USDA reporting the lowest heifer inventory since 1978 and Rabobank projecting 2,800 farm closures this year, the pressure is real and accelerating. The paths forward—organic transition, cooperative processing, strategic scaling, or well-timed exit—all require decisions within 12 months. Here’s the verified data, honest analysis, and practical framework you need to choose your path while options remain open.

Dairy Structural Shift 2025

You know that feeling when you run the numbers three times, hoping they’ll come out different? I was sitting with a third-generation Wisconsin dairy farmer last month, and he did exactly that—pulled out his calculator, punched in the same figures again, shook his head.

“Three years ago, I could replace a cull cow for eighteen hundred dollars and still make it work,” he told me. “Now I’m looking at thirty-five hundred, and my milk check is down almost two dollars from where it was. Something fundamental has shifted.”

He’s right. And here’s what I’ve been seeing across the industry this year: what’s happening right now isn’t a typical market cycle that rewards patience. Several structural forces are converging at once, creating conditions that favor operations at the extreme ends of the scale spectrum—the very large and the strategically small—while putting real pressure on the traditional middle that’s defined family dairy farming for generations.

I share that not to be pessimistic, but because I think you deserve honest information while meaningful options are still available. And frankly, there are options worth exploring.

What’s Actually Going On

Let me walk through what the data shows, because the way these factors connect matters as much as any single one.

The heifer situation is tighter than most folks realize. USDA’s January 2025 cattle inventory came in at 3.91 million dairy replacement heifers—that’s the lowest level we’ve recorded since 1978. We’re down 18% from 2018 levels. CoBank’s August analysis suggests we’ll see another 800,000 head decline over the next couple of years before things stabilize, probably sometime in 2027.

Now, here’s what’s interesting about how we got here. Between 2017 and 2024, beef-on-dairy breeding took off because the math was genuinely compelling—you probably saw this in your own operation or talked with neighbors who did. Dairy bull calves were bringing $300-$400 at auction, while those beef crossbreds commanded $1,200-$1,600. For a 500-cow operation, that difference meant an extra $200,000 or more in annual calf revenue. Hard to argue with those economics at the time. The National Association of Animal Breeders reported 7.9 million units of beef semen sold to dairy operations in 2024 alone.

The consequence of those decisions—rational as they were—is now arriving. Heifer prices have climbed from roughly $1,140 back in 2019 to $3,000-$4,000 at current auctions. For operations trying to maintain herd size through normal culling cycles, the replacement math looks very different from what it was even two years ago.

Milk pricing has found a new range. Class III has been trading in that $17-20/cwt corridor through 2025—some months dipping toward the lower end, others pushing higher, but the overall pattern sits $1.50-$2.50 below where we were in 2024. What I find myself thinking about isn’t the decline itself—we’ve all weathered price cycles. It’s the structural factors that suggest this might be more of a new baseline than a temporary dip.

China’s domestic dairy production has expanded significantly, reaching roughly 85% self-sufficiency according to the USDA Foreign Agricultural Service tracking. That compresses what had been a growing export opportunity for U.S. producers. Meanwhile, domestic production continues to expand even as farm numbers decline—larger operations are adding capacity faster than smaller ones are exiting.

Component economics are shifting in ways that matter. This one’s been on my radar because it affects breeding decisions many of us made years ago. Western Canada’s milk marketing boards announced in October that, effective April 1, 2026, component pricing will move from roughly 85% butterfat emphasis to a 70/25/5 split that weights protein significantly higher than historical norms. You can find the details on the BC Milk Marketing Board’s website.

American processors are beginning to explore similar adjustments. Producers in Wisconsin and Minnesota have mentioned contract offers with $0.30-$0.50/cwt premiums tied to protein content above 3.4%—something that would have seemed unusual three years ago when butterfat commanded all the attention.

Why does this matter right now? Those genetic decisions we made in 2022-2023 are entering the milking herd. They were overwhelmingly butterfat-focused because that’s what the market rewarded at the time. If your tank average is still chasing butterfat because of the bulls you picked in 2022, you’re optimizing for a market that is rapidly evaporating. The premium is moving to protein.

The biological reality of a 24-36 month lag between breeding decisions and production outcomes means some operations may find themselves locked into yesterday’s pricing signals for another full cycle. It’s worth reviewing your current breeding program with this shift in mind—not panic, but awareness and action.

The GLP-1 Factor: A Genuine Shift in Consumer Behavior

Here’s something genuinely interesting from the demand side that I think deserves thoughtful attention.

A collaborative research effort between Cornell University and Numerator, which tracks household purchasing data across more than 100,000 households, published findings analyzing how consumers using GLP-1 weight-loss medications are changing their eating habits. The patterns were notable:

  • Cheese spending down 7.2%
  • Butter down 5.8%
  • Ice cream down 5.5%
  • High-protein yogurt up nearly triple
  • Cottage cheese purchases up 280%

As of mid-2025, IQVIA data shows approximately 11 million Americans are actively using GLP-1 medications, with that number steadily increasing. Now, there’s been confusion about Medicare coverage—let me clarify what actually happened. The Trump administration declined to extend Medicare coverage for weight-loss-only indications back in April 2025. But commercial coverage continues expanding, costs are moderating, and most healthcare analysts expect the user base to keep growing through 2026.

What makes this different from typical diet trends is the underlying mechanism. These medications don’t just suppress appetite temporarily—they appear to shift food preferences by affecting dopamine pathways.

“Users report that high-fat foods simply become less appealing. That’s a different kind of demand pattern.”

We’re not talking about willpower or temporary restriction. We’re talking about neurochemical changes that persist as long as patients remain on medication—and many of these drugs are prescribed long-term.

The demographic profile matters too. According to the Numerator data, 71% of GLP-1 users taking these drugs for weight loss are Millennials or Gen X—the same consumer groups that drove premium dairy category growth over the past fifteen years.

What’s encouraging is the flip side of this data: protein-focused dairy is growing dramatically. Operations positioned to serve that demand—high-protein yogurt, cottage cheese, protein-enhanced products—are seeing real opportunity. The question becomes whether your operation can participate in that shift.

Labor Economics: A Threshold Worth Understanding

Farms have always dealt with labor challenges—that’s nothing new. But the current cost structure warrants careful examination.

The H-2A program restructuring established tiered wage requirements. In Michigan—a reasonable proxy for Midwest dairy regions—the Adverse Effect Wage Rate for experienced agricultural workers is $18.15/hour, according to Department of Labor data. But that base wage significantly understates actual costs.

Once you factor in employer-provided housing (required under H-2A), transportation, insurance, payroll taxes, and turnover replacement costs… many operations I’ve talked with are seeing all-in costs of $19-$21/hour. A 600-cow dairy requiring 2.5 full-time-equivalent milking positions now faces annual labor costs exceeding $140,000 just for parlor staffing.

What’s interesting is how this interacts with scale. Larger operations spread specialized positions across more cows, reducing per-unit labor cost. They can also more readily justify automation investments—which brings me to a topic that deserves nuanced discussion.

The Automation Question at Different Scales

The numbers here tell a more complicated story than equipment marketing materials often suggest.

For a 100-130 cow operation, a two-robot system (Lely, DeLaval, or comparable) plus barn modifications, feed integration, and installation runs somewhere in the $430,000-$740,000 range based on late 2025 dealer quotes. That’s getting fully operational with adequate support infrastructure.

For a 600-cow dairy, you’re looking at 8-10 robots minimum—now we’re talking $1.5-$2.5 million in total investment. The per-cow economics shift dramatically depending on how that fixed cost gets distributed.

Industry research and extension analyses suggest payback periods vary significantly with herd size. Smaller operations often face 15-20+ year payback at current financing rates, while larger operations with 2,000+ cows may achieve returns in under 10 years. These aren’t hard rules—individual circumstances matter enormously—but the pattern is worth understanding.

And there’s the financing dimension. A dairy lender I spoke with (he asked to remain anonymous, given client relationships) put it directly: “We’re looking at debt service coverage ratios very carefully. A producer comes in wanting financing for robotics, but their margins have compressed significantly over the past two years. That’s a challenging loan to structure, even when the long-term investment thesis makes sense.”

This isn’t to say automation is wrong for mid-size operations—some are making it work beautifully. But the economics require an honest assessment of your specific situation.

What Processors Are Building Toward

The processing side of this equation often gets discussed abstractly. Let me make it more concrete.

The International Dairy Foods Association released October data showing that between 2024 and 2027, U.S. dairy processing capacity expansion totals more than $11 billion in announced investments across 19 states. New cheese plants, expanded fluid milk processing, protein isolation facilities—substantial infrastructure.

What’s particularly noteworthy isn’t the investment volume alone. It’s the supply relationship structure underlying it. Major facility expansions—Hilmar in Kansas, Valley Queen in South Dakota, Glanbia and Leprino projects—are largely being built around long-term supply agreements with operations milking 2,000 cows or more.

A dairy cooperative field representative in the Upper Midwest explained the underlying economics: “A 600-cow operation represents maybe 60,000 pounds of milk daily. For a plant processing 8 million pounds, that’s less than 1% of the supply. The transaction costs of managing that relationship—quality monitoring, logistics, payment processing—are roughly the same whether it’s 60,000 pounds or 600,000 pounds.”

He was careful to add that cooperatives remain committed to their member base. “But producers need to understand the economics their buyers are navigating. The pressure toward consolidation has structural roots.”

So What Does “Viable” Actually Mean Right Now?

This is where I want to be careful to distinguish between what the data clearly show and what represents my analytical interpretation.

Operation SizePer-Cow Labor CostAutomation ROI PaybackProcessor LeveragePremium Access2025 Viability Status
<100 cows$520/cow/year20+ years (not viable)MinimalDirect-to-consumer, organicViable if specialty
100-300 cows$465/cow/year15-20 yearsLowOrganic, grassfed possibleTransition required
300-600 cows$410/cow/year12-18 yearsModerateLimited at current scale⚠️ High pressure zone
600-1,000 cows$385/cow/year10-15 yearsModerateScale too large for specialty⚠️ Severe structural squeeze
1,000-2,500 cows$315/cow/year8-12 yearsStrongComponent optimization focusStructurally advantaged
2,500+ cows$245/cow/year6-10 yearsPreferred supplierContract leverageDominant position

The data shows that operations above 1,000 cows have structural advantages in the current environment—lower per-unit fixed costs, automation ROI that pencils out more readily, processor leverage, and stronger capital access. The data also shows that specialty operations under 300 cows can achieve premium pricing that fundamentally changes the economics—several dollars per hundredweight above conventional for organic, significantly more for direct-to-consumer channels.

What I can’t tell you with precision is exactly how many operations will exit or consolidate, or over what timeline. When I suggest that traditional 400-1,000 cow conventional commodity operations face structural rather than cyclical challenges, that’s my analytical conclusion from watching these forces converge—not an official forecast from USDA or university research.

The trajectory raises legitimate questions. Rabobank’s analysis projects that approximately 2,800 dairy operations will close in 2025. If structural factors continue operating as they have—and I don’t see any obvious near-term reversal mechanisms—exit rates could remain elevated.

Dairy CategoryGLP-1 User Consumption ChangeCurrent U.S. GLP-1 UsersProjected Annual Market ImpactStrategic Implication
Cheese-7.2% ⚠️11 million-$840M category pressureDeclining demand for commodity cheese milk
Butter-5.8% ⚠️11 million-$320M category pressureButterfat premium erosion accelerating
Ice Cream-5.5% ⚠️11 million-$675M category pressureHigh-fat dessert categories vulnerable
Fluid Milk (whole)-3.1% ⚠️11 million-$180M category pressureCommodity fluid milk continues secular decline
Greek Yogurt+185% ✓11 million+$920M category opportunityProtein-focused growth accelerating
Cottage Cheese+280% ✓11 million+$450M category opportunityDramatic protein-demand spike
High-Protein Beverages+195% ✓11 million+$615M category opportunityEmerging premium protein channel
Skyr / Icelandic Yogurt+220% ✓11 million+$285M category opportunityUltra-high protein positioning working

The dynamics play out somewhat differently across regions. California operations face additional water cost and regulatory pressures that compound the structural challenges we’ve discussed. Idaho’s rapid consolidation has created different competitive patterns, with fewer mid-size operations surviving the squeeze. Texas and New Mexico dairies navigate the economic impacts of heat stress, which affect both production and labor. But the underlying forces—hierarchal costs, component shifts, processor consolidation, labor thresholds—are similar across geographies.

Here’s what’s equally important to acknowledge: different producers in different circumstances will navigate this very differently. I’ve talked with 800-cow conventional operations in Wisconsin, genuinely optimistic about their positioning—strong processor relationships, manageable debt, recent automation investment. I’ve talked with 500-cow operations in the same region that see no viable path forward without fundamental restructuring. Context matters enormously.

Paths That Are Working

Let me share what I’m observing in operations as they find viable paths forward, because genuine success stories exist alongside the challenges.

The organic transition continues to offer meaningful premium for operations willing to commit to production system changes. Operating margins for organic dairy typically exceed conventional operations substantially—though specific returns vary considerably by region, market relationships, and transition management. Several producers who converted from larger conventional operations emphasized that they had to reduce herd size significantly to make organic economics work long-term.

One Vermont organic producer—she runs about 200 cows and has been active in regional organic dairy advocacy—described her experience: “We ran 450 conventional cows for fifteen years. When we converted in 2019, we dropped to 200 and actually increased net income. The gross revenue decline was scary initially, but the margin improvement proved real.”

The transition period requires careful planning and an adequate financial runway. It’s not a quick fix, but it’s working for operations that approach it strategically.

Cooperative processing models are emerging in several regions and merit attention. The concept: multiple mid-size operations collectively invest in processing capacity—typically Greek yogurt, high-protein products, or specialty cheese—to capture value-added margins on a portion of their milk.

One Minnesota cooperative involving four farms with a combined 1,800 cows reports routing 25% of collective production through a small processing facility they financed together. That portion generates roughly twice the commodity price. The remaining 75% continues through traditional channels.

“We didn’t have the scale individually to make processing investment work,” one participating farmer explained. “Together we did.”

This model won’t fit every situation, but it represents creative thinking worth exploring.

Strategic positioning toward protein-focused products is another path to gaining traction. Some operations are pivoting toward products that align with GLP-1-influenced consumption patterns—high-protein yogurt, cottage cheese, protein-enhanced beverages. Rather than resisting the demand shift, they’re moving with it.

Strategic PathCapital RequiredTimeline to ViabilityPrimary Risk FactorIdeal Candidate ProfileAction This Week
Organic Transition$50,000-$150,000 (certification, transition feed)18-24 months (transition period)⚠️ Market access / buyer contracts<300 cows, manageable debt, pasture access, 12-month cash runwayContact state organic certification agency for feasibility assessment
Cooperative Processing$200,000-$500,000 (shared facility investment)24-36 months (facility build-out)⚠️ Partner alignment / governance structure3-5 operations, 250-600 cows each, geographic proximity, complementary goalsInitiate conversation with neighboring operations about joint feasibility study
Strategic Scaling$2M-$5M+ (automation, expansion, acquisition)12-24 months (installation, ramp-up)⚠️ Debt service in compressed margin environment>800 cows, strong processor relationship, expansion capacity, lender supportRequest processor meeting on long-term supply agreement; lender pre-qualification
Strategic Exit$25,000-$75,000 (professional planning, legal, transition)6-18 months (orderly liquidation)⚠️⚠️ Asset value erosion if market floods300-1,000 cows, elevated debt, no succession plan, limited specialty pivot options→ Confidential consultation with ag financial advisor and equipment appraiser

A Necessary Conversation About Timing

I want to address something directly that industry coverage sometimes avoids.

For some operations facing the structural challenges discussed here—compressed margins, elevated replacement costs, processor relationship pressure, automation economics that don’t pencil out, no clear specialty pivot—strategic exit while asset values remain elevated may represent the soundest financial decision available.

Choosing to exit under these circumstances isn’t failure. It’s asset management.

It’s recognition that structural economics have shifted in ways that particular operational configurations can’t accommodate. The industry changing isn’t any individual producer’s fault.

Current asset values remain relatively favorable. USDA market data shows slaughter cattle prices elevated, with bred dairy heifers commanding $2,800-$3,200 at many auctions. Used equipment markets haven’t yet flooded with liquidation inventory. Agricultural real estate values in productive regions remain firm.

These conditions won’t persist indefinitely if exit rates accelerate as structural pressures suggest they might.

A financial advisor working exclusively with Wisconsin dairy operations framed it this way: “The difference between a proactive exit in early 2026 and a reactive exit in 2027 can exceed half a million dollars in recovered equity for a mid-size operation. That’s not about farming ability—it’s about timing.”

What I’d Tell Someone Navigating This

If I were sitting across from you working through these realities—and I’ve had many such conversations this year—here’s what I’d want you to understand:

The structural forces are real, but they’re not uniform. Your specific circumstances—debt levels, processor relationships, facility condition, labor situation, geographic positioning, family involvement, personal goals—matter enormously. There’s no single right answer that applies universally.

The timeline for proactive decision-making appears compressed. Whether you’re considering specialty transition, cooperative participation, strategic investment, or planned exit, the window for making deliberate choices rather than reacting to crisis seems to be the next six to twelve months. Asset values, credit access, and market options tend to deteriorate once financial stress becomes externally visible.

Professional guidance matters more than usual. This isn’t a moment for figuring everything out alone. State agricultural extension services offer transition planning resources—Wisconsin’s Center for Dairy Profitability and Cornell’s PRO-DAIRY program have developed tools specifically for this environment. The Farm Financial Standards Council maintains directories of qualified agricultural financial consultants. USDA’s Farm Service Agency administers loan programs supporting organic transition or operational restructuring.

Consider what you actually want. Beyond financial analysis lies a personal question: What do you want your life to look like in three years? Five years? Sometimes the right answer is to continue farming dairy under restructured circumstances. Sometimes it means preserving the equity you’ve built and redirecting it elsewhere. Both can represent good decisions depending on your situation and values.

A producer working through organic transition planning after thirty years in conventional dairy offered a perspective that’s stayed with me: “The industry I came up in doesn’t exist anymore. That’s not my fault—that’s just what happened. What I do about it is my choice.”

Practical Considerations by Operation Size

For operations under 300 cows:

  • Specialty positioning—organic, grassfed, direct-to-consumer—offers economics that commodity production increasingly struggles to match
  • Your scale disadvantage in commodity markets can become an advantage where authenticity and direct relationships matter
  • Organic certification typically requires 18-24 months of transition planning; raw milk licensing varies significantly by state
  • State organic certification agencies and NODPA offer valuable transition guidance
  • This week: Contact your state organic certification agency to request a preliminary feasibility assessment for your operation

For operations of 300-1,000 cows:

  • This scale faces the most significant structural pressure—large enough that specialty positioning at current capacity is difficult, but not large enough for automation economics to work straightforwardly
  • Viable paths worth exploring: organic conversion with strategic herd reduction, cooperative processing partnerships, or well-planned exit
  • Timeline for decision-making matters; consultation with dairy financial specialists before mid-2026 seems prudent
  • Conversations with neighboring operations about cooperative arrangements may reveal unexpected opportunities
  • This week: Request a cash flow stress test from your lender or farm financial consultant to understand your specific margin pressure under various price scenarios

For operations above 1,000 cows:

  • Automation ROI becomes more favorable at this scale; systematic robotics evaluation is appropriate if not already undertaken
  • Processor relationships and component optimization—particularly protein—represent strategic priorities worth attention
  • Structural advantages in labor efficiency, purchasing leverage, and capital access provide meaningful flexibility
  • Expansion through the acquisition of exiting operations may warrant consideration depending on circumstances
  • This week: Schedule a meeting with your processor contact to discuss long-term supply relationship options and component premium opportunities

For all operations regardless of size:

  • Breeding program review with attention to emerging component economics favoring protein
  • Forward projections incorporating $3,000+ heifer replacement costs
  • Recognition that GLP-1 demand impacts appear structural rather than cyclical
  • Early lender conversations if refinancing or restructuring might become necessary

The dairy industry has weathered profound changes before and will continue producing the milk, cheese, and products consumers depend on. What’s shifting is who produces them and at what scale—and that transition is happening faster than many anticipated.

For individual producers, the essential insight is this: the forces reshaping dairy economics appear structural rather than cyclical. Making strategic decisions—whether restructuring toward specialty production, joining cooperative arrangements, investing in scale and automation, or executing an orderly exit—tends to preserve options and equity that waiting erodes.

The producers who navigate this most effectively share a common characteristic: they make deliberate choices based on a realistic assessment of their specific circumstances rather than hoping that general conditions will improve on their own.

The choice belongs to each of you. The information needed to make it wisely is increasingly available.

Key Takeaways:

  • Heifer economics have flipped: Prices tripled ($1,140 → $3,500+), and inventory is at its lowest since 1978. Every replacement costs $2,000+ more than it did three years ago.
  • Protein is overtaking butterfat: Component premiums are shifting. Review your breeding program now—genetics from 2022 may be optimized for a vanishing market.
  • The middle is disappearing: 300-1,000 cow operations face a structural squeeze—too large for specialty pivots, too small for automation ROI to work.
  • Four paths, one timeline: Organic transition, cooperative processing, strategic scaling, or planned exit. All require action before mid-2026.
  • Timing is equity: Asset values favor decisions made now. The difference between proactive and reactive exit can exceed $500,000 in recovered value.

Complete references and supporting documentation are available upon request by contacting the editorial team at editor@thebullvine.com.

Learn More:

The Sunday Read Dairy Professionals Don’t Skip.

Every week, thousands of producers, breeders, and industry insiders open Bullvine Weekly for genetics insights, market shifts, and profit strategies they won’t find anywhere else. One email. Five minutes. Smarter decisions all week.

NewsSubscribe
First
Last
Consent

From -43% to +0.8%: The Genetic Shift Powering Dairy’s First Fluid Milk Growth Since 2009

How Net Merit changes, fairlife’s $7.4 billion success, and the premium pivot are reshaping what your genetics are worth.

Dairy Genetic Shift

Executive Summary:  For the first time since 2009, fluid milk sales grew in 2024—up 0.8%, ending a 14-year decline. The turnaround didn’t come from better marketing of commodity milk; it came from building what consumers actually wanted: lactose-free, high-protein, premium products that command real price premiums. fairlife proved the model works spectacularly, generating $7.4 billion in total value for Coca-Cola and reshaping the value of dairy genetics. The April 2025 Net Merit revision tells the story: butterfat emphasis jumps to 31.8% while protein drops to 13.0%—volume-only genetics are losing economic ground. But here’s the hard truth: 40% of U.S. dairy farms exited between 2017 and 2022, and premium market access isn’t equally distributed. The strategic question for every producer is no longer whether this shift is real—it clearly is—but whether your operation’s genetics, scale, and processor relationships position you to capture value from it.

After decades of falling fluid milk sales, the industry posted growth in 2024 for the first time since 2009. The story behind that turnaround holds lessons for every farmer making decisions today.

By the Numbers: Dairy’s Turnaround at a Glance

MetricThenNow
Per capita fluid milk consumption247 lbs (1975)141 lbs (2020)
2024 fluid milk sales vs. 202314-year decline+0.8% growth
U.S. dairy farms39,303 (2017)24,082 (2022)
Milk from farms with 1,000+ cows60% (2017)68% (2022)
Holstein butterfat average3.9% (2019)4.23% (2024)
fairlife annual retail sales$90M (2015)$1B+ (2022)
Net Merit protein emphasis19.6% (2021)13.0% (April 2025)
Net Merit butterfat emphasis28.6% (2021)31.8% (April 2025)

Here’s something that caught a lot of people off guard last year. Fluid milk sales actually grew in 2024—not just stabilized, but genuinely increased. USDA data show total U.S. fluid milk sales were up about 0.8% from 2023, ending a 14-year streak of annual declines. The National Milk Producers Federation called it the first year-over-year gain since 2009.

That’s worth sitting with for a moment.

What’s interesting here isn’t just the number itself. It’s what had to happen to get there. This wasn’t a lucky break or some temporary consumer fad. The growth came after roughly a decade of strategic decisions that ran counter to almost everything the dairy industry had believed about competition and survival.

I’ve been watching this unfold for years now. The more you dig into what actually changed, the more you realize there’s a playbook here that matters to producers navigating what comes next.

Understanding How Deep the Decline Really Was

To make sense of the comeback, you need to understand how challenging things had gotten. Not just the headlines—the structural shift that was reshaping the entire category.

Between 1975 and 2020, per capita fluid milk consumption in the United States dropped by nearly 43%, according to Federal Milk Market Administrator data. We went from around 247 pounds annually down to about 141 pounds per person. Penn State Extension’s dairy trends research shows similar figures—they tracked a decline from 247 pounds in 1975 to 134 pounds by 2021. That’s not a temporary dip. That’s a generational shift away from a product that used to be on every breakfast table in America.

The reasons were accumulating, as many of us observed firsthand. Beverage options multiplied—sports drinks, bottled water, energy drinks, and the expanding coffee culture. Plant-based alternatives began to claim serious shelf space in the mid-2010s. Younger consumers, especially, seemed to be reconsidering whether dairy belonged in their daily routine.

And the financial pressure kept building. Class III prices dropped below $14 per hundredweight multiple times during 2018 and 2019. The Class III average for 2018 was just $14.61, the lowest in years. If you were shipping milk during those months, you remember.

Then came Dean Foods. The largest fluid milk processor in the country filed for Chapter 11 bankruptcy on November 12, 2019, in the Southern District of Texas—USDA’s Agricultural Marketing Service confirmed the filing date in subsequent proceedings. When a company of that size goes down, it sends a signal about industry direction. Or at least, that’s what everyone assumed at the time.

The Strategic Pivot: Asking a Different Question

The turning point, looking back, came when industry leadership started asking a fundamentally different question.

Instead of “How do we convince people to drink more regular milk?”—which promotion campaigns had been attempting for years—they asked: “What do modern consumers actually want that dairy could provide better than alternatives?”

Why does that distinction matter? Because it shifts the entire strategic framework.

Dairy Management Inc., the organization that manages the national dairy checkoff, commissioned extensive consumer research starting around 2014-2015. According to DMI’s published partnership reports, what they found reshaped the entire strategic approach.

Here’s what the research revealed: consumers weren’t rejecting dairy’s core benefits—protein, nutrition, taste. They were rejecting the format and the limitations. The National Institutes of Health estimates that somewhere between 30 and 50 million American adults are lactose intolerant—MedlinePlus and federal health resources have consistently cited this range. Many of those people wanted dairy’s nutritional benefits but couldn’t tolerate conventional milk. Others wanted higher protein for fitness goals, lower sugar for health reasons, or longer shelf life for convenience.

This consumer insight work became the foundation for everything that followed. DMI announced more than $500 million in fluid milk partnerships with seven major companies—Dairy Herd and other industry publications covered the announcement extensively. What’s particularly noteworthy is the leverage structure: most of that investment came from partners putting money into processing plants and infrastructure, while the checkoff’s direct commitment was about $30 million. That ratio—partners investing roughly $15 for every checkoff dollar—represents a fundamental strategic pivot from defending commodity milk to building new categories where dairy had natural advantages.

The fairlife Case Study

No single product illustrates the transformation better than fairlife, which has become Coca-Cola’s fastest-growing brand acquisition. The timeline is worth examining because it shows what patient long-term investment actually looks like in practice.

fairlife launched as a joint venture in 2012 between Select Milk Producers—a Texas-based dairy cooperative with just 99 member farms, as confirmed by multiple industry sources, including the Texas Agricultural Council and the University of Guelph—and Coca-Cola, which took an initial 42.5% ownership stake. The product uses ultrafiltration technology (not new technology exactly, but newly commercialized at scale) to concentrate protein, remove lactose, and reduce sugar while maintaining dairy’s nutritional profile.

National rollout came in late 2014, after test markets in Denver showed something remarkable. Coca-Cola’s Mike Saint John, speaking to industry groups, noted that the Denver test showed fairlife driving a 4% increase in fluid milk sales—not just capturing share from other brands, but actually growing the category. That distinction matters considerably when you’re trying to reverse a multi-decade decline.

The growth trajectory tells the story. By the mid-2010s, fairlife had reached about $90 million in annual sales. Industry estimates put 2019 sales at around $500 million. In January 2020, Coca-Cola acquired the remaining 57.5% stake for $979 million, according to SEC filings.

Here’s where the economics get striking. fairlife surpassed $1 billion in annual retail sales by 2021-2022, as Dairy Reporter and Coca-Cola’s earnings communications confirmed. The company’s SEC filings now show that total payments for fairlife—including the original acquisition plus performance-based earnouts—have reached approximately $7.4 billion. That earnout structure meant Coca-Cola paid more because fairlife exceeded financial targets.

YearRetail sales (USD billions)Cumulative value/investment (USD billions)
20150.090.50
20190.501.50
20221.005.00
20241.207.40

Today, fairlife sells at a clear premium to conventional milk in most retailers. High Ground Dairy’s analysis highlights these strong price premiums, while USDA retail price tracking shows conventional milk averaging about $4.39 per gallon in 2024. Consumers are paying meaningful premiums for a product delivering 50% more protein, 50% less sugar, no lactose, and a longer shelf life.

But Can Other Cooperatives Replicate This?

Here’s the question many producers are asking: Is the fairlife playbook actually replicable, or do you need Coca-Cola’s balance sheet to make it work?

The honest answer is complicated.

fairlife didn’t just have good milk—it had a partner with essentially unlimited capital, global distribution networks, and decades of beverage marketing expertise. Select Milk Producers brought the supply chain and dairy knowledge; Coca-Cola brought everything else. That’s not a model most regional cooperatives can simply copy.

fairlife’s own FAQ clarifies the supply structure: “As a milk processor, fairlife does not own farms or cows. We partner with dairy co-ops in geographies where we have plant locations to source milk.” All supplying farms must meet fairlife’s specific animal care requirements and maintain both FARM and Validus third-party certifications. That creates a meaningful barrier for farms not already connected to fairlife’s supply network.

Consider this: Select Milk Producers has just 99 member farms. That’s a deliberately small, carefully managed supplier base—not an open door for any operation wanting premium market access. And when Organic Valley, the largest organic dairy cooperative in the country, added new farms in 2023, they brought on just 84 operations, according to Dairy Herd reporting. Premium market access is growing, but it’s not unlimited.

For mid-sized cooperatives exploring this space, the entry barriers are substantial: processing infrastructure for ultrafiltration runs into the tens of millions; third-party certification programs require ongoing investment; and finding a retail or foodservice partner willing to commit long-term distribution adds another layer of complexity.

That said, some regional cooperatives are finding their own paths. Cobblestone Milk Cooperative in Virginia built its model around exceptionally high-quality standards—bacteria and somatic cell counts far below industry norms, as Dairy Herd has documented—creating differentiation without the use of ultrafiltration technology. The approach requires different capabilities than the fairlife model, but it shows there’s more than one route to premium positioning.

The key insight: fairlife’s success proves the premium fluid milk market exists and can grow. Replicating it requires either a massive corporate partnership or finding alternative differentiation strategies appropriate to your cooperative’s scale and capabilities.

The Genetics Angle: Why “Volume-Only” Selection Is Losing Ground

For Bullvine readers, here’s where the story gets especially relevant. The shift toward premium, composition-focused products isn’t just changing processor strategies—it’s fundamentally reshaping what genetics are worth money.

The April 2025 Net Merit revision from CDCB clearly tells the story. According to the official USDA-AGIL research document “Net merit as a measure of lifetime profit: 2025 revision,” the updated NM$ formula shifts emphasis significantly:

Trait2021 NM$ WeightApril 2025 NM$ WeightDirection
Protein19.6%13.0%↓ Decreased
Fat28.6%31.8%↑ Increased
Feed Saved12.0%17.8%↑ Increased
Productive Life11.0%8.0%↓ Decreased

Why the shift? Dr. Paul VanRaden, Research Geneticist at USDA and lead author of the Net Merit revision, describes NM$ 2025 as “a strategic response to the evolving dairy industry,” integrating recent economic data and market signals. Butterfat emphasis increased because consumer demand for butter and high-fat dairy products has strengthened. Protein emphasis decreased partly because the cheese market has matured, and premium fluid products like fairlife actually remove some protein during ultrafiltration.

The real-world expression of these genetic shifts is already visible. Corey Geiger with CoBank told Brownfield Ag News that Holstein butterfat levels reached a record 4.23% in 2024, while protein levels were 3.29%. The April 2025 genetic base change reflects this: Holsteins saw a 45-pound rollback on butterfat—that’s 87.5% higher than the 24-pound adjustment in 2020, and the largest base change in the breed’s genetic history. Protein rolled back 30 pounds.

Geiger’s projection is striking: he told Brownfield he believes butterfat levels “could pass five percent in the next decade” based on current consumer demand and genetic momentum.

What this means practically: bulls selected purely for milk volume without strong component percentages are becoming less valuable relative to high-component, high-health-trait sires. TPI formula adjustments reflect similar trends—Holstein Association USA has been increasing emphasis on fat and protein pounds while rebalancing type traits.

For breeding decisions today, the implications are clear:

  • Component percentages matter more than ever. A sire with +0.10% Protein and +0.35% Fat commands attention in ways volume-only genetics don’t.
  • Feed efficiency is gaining weight. The Feed Saved emphasis increase from 12% to 17.8% in NM$ reflects tighter margins and environmental pressure.
  • Health and longevity traits remain important but are being rebalanced against productivity gains.

The premium pivot isn’t just about finding a processor who’ll pay more for your milk. It’s about recognizing that the entire genetic selection framework is shifting toward what those premium products require.

The Two-Tiered Reality: Who Actually Benefits?

This brings us to what might be the most uncomfortable part of the story. The premium pivot and genetic evolution I’ve been describing don’t affect all operations equally. In fact, there’s a reasonable argument that these trends are accelerating the exit of smaller producers who can’t afford the entry costs.

The numbers are sobering. The 2022 USDA Census of Agriculture found just 24,082 U.S. dairy farms—down from 39,303 in 2017. That’s nearly a 40% decline in five years, as Brownfield Ag News and Dairy Reporter both reported. Lucas Fuess, senior dairy analyst at Rabobank, points out that 68% of U.S. milk now comes from farms with 1,000 or more cows—operations that represent only 8% of total farms.

Category20172022
Number of U.S. dairy farms39,30324,082
Share of milk from farms with 1,000+ cows60%68%
Estimated share of farms with 1,000+ cows6%8%
Cost advantage of >2,000-cow farms vs. 100–199$8/cwt cheaper$10/cwt cheaper

The cost dynamics are stark. USDA data show farms milking more than 2,000 cows can operate roughly $10 per hundredweight cheaper than farms with 100-199 cows. That’s not a small gap—it’s the difference between profitability and struggling to break even.

Meanwhile, the 50-99 cow category—traditionally the heart of family dairy—has seen dramatic declines according to USDA census data, with the segment nearly halving between 2017 and 2022. Dr. Frank Mitloehner at UC Davis has noted that one of the main reasons smaller dairy farms are disappearing is “ever-tightening profit margins,”—and larger farms’ cost advantages enable them to “achieve much higher net returns,” as Dairy Global reported.

Peter Vitaliano, economist for the National Milk Producers Federation, told Brownfield that 2023 saw nearly 6% of licensed dairy farms exit, and he expected “an even higher rate of dairy farm closures” in 2024. Industry analysts project that this consolidation trend will continue, with production increasingly concentrated on the largest operations.

So when we talk about genomic testing at $25-50 per head, third-party certification programs, and processor relationships that require data transparency and infrastructure investment—who can actually afford that?

For a 2,000-cow California operation, genomic testing the replacement heifer crop might run $50,000-100,000 annually—a meaningful but manageable investment against a multi-million dollar revenue base. The same testing for a 150-cow Vermont farm costs $3,750-7,500—proportionally similar, but coming out of a much tighter margin with far less negotiating leverage on the premium side.

The infrastructure requirements for premium programs add another layer. FARM certification, video monitoring at handling points, sustainability documentation, and unannounced audit preparation—these require administrative capacity that larger operations can absorb more easily than smaller ones running lean.

Does “Collaborative Competition” Help the Small Producer?

The DMI partnership model—where checkoff dollars leverage private investment—has clearly grown the premium category. But does that growth help the 150-cow operation, or does it primarily benefit the large farms and cooperatives already positioned to capture that value?

The evidence is mixed.

On one hand, composition-based pricing tiers are expanding across cooperatives of various sizes. FarmFirst, Foremost Farms, and DFA all have programs that, in theory, reward any member farm that ships high-component milk. Genetic improvement is available to everyone who chooses to pursue it.

On the other hand, premium market access often requires scale. fairlife’s supplier base is deliberately limited to 99 member farms in Select Milk Producers. Organic Valley added just 84 farms in 2023 despite significant producer interest. The infrastructure investments driving premium product growth—like fairlife’s $650 million Webster, New York facility—create jobs and markets, but they don’t automatically open doors for every nearby farm.

The most honest assessment: the premium pivot has created new opportunities, but those opportunities aren’t equally accessible. Farms with existing cooperative relationships, geographic proximity to premium processors, capital for certification and genetic investment, and administrative capacity for compliance requirements are better positioned than those without. The “collaborative competition” model has grown the pie, but the slices aren’t being distributed equally.

For smaller operations, the strategic question becomes: what premium pathways are actually accessible given your scale, location, and cooperative membership? Direct-to-consumer sales, farmstead processing, local food networks, and quality-differentiated regional cooperatives like Cobblestone may offer more realistic paths than trying to break into fairlife’s supply chain.

Navigating the Fair Oaks Crisis

Every turnaround has a moment where the whole thing nearly falls apart. For dairy’s innovation strategy, that moment came in June 2019.

The Animal Recovery Mission, an animal welfare organization, released undercover footage from Fair Oaks Farms—one of fairlife’s primary milk suppliers in Indiana. The footage showed systematic mistreatment of calves, and Dairy Reporter, along with other trade publications, covered the story extensively.

The response from retailers was immediate. Industry reporting confirmed that major chains, including Jewel-Osco, Tony’s Fresh Market, and several others, pulled fairlife from shelves within days. Consumer boycotts gained momentum. Class action lawsuits were filed alleging deceptive marketing around animal welfare claims.

What happened next offers lessons for crisis management across the industry.

Rather than minimize the situation or deflect blame, fairlife and Coca-Cola chose transparency. They immediately suspended all milk deliveries from Fair Oaks Farms. Dairy Reporter confirmed they increased unannounced audits at supplier farms from once annually to 24 times per year—a dramatic escalation in oversight. They installed video monitoring systems at animal handling points and commissioned independent investigations of all supplying farms.

fairlife’s 2024 Animal Stewardship Report, as covered by Food Dive, notes the company has invested, along with its suppliers, nearly $30 million in its animal welfare program since the crisis. The company eventually paid $21 million to settle related litigation—Food Dive called it one of the largest settlements ever in an animal welfare labeling case.

It was expensive. It was risky—admitting failure often accelerates brand damage in the short term. But the approach preserved something more valuable: trust in the brand and in the category. By 2020-2021, fairlife had returned to most retail shelves. By 2022, it reached $1 billion in sales.

Practical Implications for Producers

So that’s the industry-level narrative. But what does it mean for someone actually running a dairy operation? That’s the question that matters most.

The shift affecting producers most directly is the changing economics around milk composition. The traditional model rewarded volume—more pounds shipped meant more revenue. The emerging model increasingly rewards components and quality characteristics that premium products require.

I’ve talked with several Upper Midwest producers who are seeing this play out in real time. Farms focusing on protein percentage and butterfat rather than volume alone are reporting meaningful improvements in their milk checks—even when shipping slightly less total volume. It requires a different way of thinking about what you’re actually producing.

Here’s the practical reality. Current Class III prices have been running in the mid-to-upper teens per hundredweight according to USDA milk pricing data, with month-to-month variation. Farms meeting premium composition targets through preferred supplier programs can access additional premiums, though specific rates vary considerably by processor and region.

MetricHerd A – Volume FocusHerd B – Premium Components
Avg. milk shipped/cow/day90 lb82 lb
Butterfat / Protein test3.7% F / 3.05% P4.2% F / 3.25% P
Base milk price$18.00/cwt$18.00/cwt
Component & quality premiums$0.40/cwt$1.30/cwt
Net mailbox price$18.40/cwt$19.30/cwt

Regional dynamics matter here. Upper Midwest cooperatives like FarmFirst and Foremost Farms have been building out composition-based pricing tiers, according to their published producer communications. California’s larger operations often negotiate directly with processors. Southeastern producers working through DFA have seen new preferred supplier programs emerge over the past couple of years. Pacific Northwest operations shipping to Darigold have their own regional dynamics. The opportunity exists, but access varies.

What many producers are discovering is that capturing these premiums requires intentional decisions rather than hoping the bulk tank tests well:

Genomic testing is typically the starting point. Testing replacement heifers for protein traits, A2 beta-casein status, and kappa-casein genotype generally runs in the $25-50 range per animal through commercial services, though prices vary by service level and volume. University extension dairy genetics research confirms these trait associations translate to real composition differences in the bulk tank over time. For a 100-heifer crop, you’re looking at a few thousand dollars—an investment that can return value within the first year of improved milk checks if you’re making culling and breeding decisions based on the results.

Sire selection follows from testing—and this is where the Net Merit shifts become directly actionable. Bulls ranking high on protein percentage, fat percentage, A2A2 genetics, and kappa-casein BB genotypes are increasingly valuable. A2A2 milk commands premiums in some markets because consumers perceive it as easier to digest. Research published in the Journal of Dairy Science confirms that kappa-casein BB genetics improve the processing characteristics of milk for ultra-filtered products.

Given the April 2025 NM$ revision, which emphasizes butterfat (+31.8% weight) and feed efficiency (+17.8% weight) while de-emphasizing protein pounds, sire selection strategies should reflect these economic realities. Volume-only genetics—high milk pounds without strong component percentages—are losing ground in the index and in the marketplace.

It’s worth noting that these genetic shifts take time. We’re talking about a 3-5 year timeline before you see the full expression in your herd. Decisions made today won’t show up meaningfully in bulk tank averages until 2028-2030. That’s the reality of cattle genetics—no shortcuts available.

Processor relationships are becoming strategic rather than purely transactional. I’d encourage any producer reading this to contact your processor’s sourcing or sustainability department and ask directly: What composition targets are you looking for? What premiums do you offer for hitting them? Do you have a preferred supplier program?

Some processors—DFA, Darigold, Land O’Lakes, and others—have formal programs that offer price premiums, contract stability, and technical support to farms that commit to composition targets and data transparency. These programs aren’t always well-publicized, but they exist.

Certification requirements are expanding as well. fairlife, Horizon Organic, and other premium brands increasingly require third-party sustainability verification from their suppliers. FARM certification, DHI participation, and documented environmental practices are becoming baseline expectations rather than differentiators.

Challenges and Uncertainties Ahead

It would be incomplete to discuss this turnaround without acknowledging the challenges that remain. Success creates its own vulnerabilities.

  • Capacity constraints are affecting the market right now. fairlife is production-limited, according to Coca-Cola’s Q3 2024 earnings commentary. CEO James Quincey explicitly stated they couldn’t meet demand until new capacity comes online. Cowsmo reported on a 745,000-square-foot, $650 million facility under construction in Webster, New York, that should help, but it’s been a bottleneck.
  • Policy changes create uncertainty. The Federal Milk Marketing Order reform, taking effect in 2025, is expected to affect milk pricing in various ways. The exact impact depends on your region and class utilization, so it’s worth checking with your cooperative or university extension for current projections specific to your situation.
  • Plant-based competition continues. The category keeps growing, with various market research firms projecting continued expansion through the early 2030s. Growth has moderated from the rapid 2018-2020 period, but oat milk in particular continues gaining ground with younger consumers.
  • Consolidation pressure isn’t easing. The trajectory from the 2022 census—40% fewer farms in five years—continues to pressure mid-size operations caught between the flexibility of small farms and the cost advantages of large ones.
  • Complacency may be the biggest risk. The discipline that built the turnaround—long-term research investment, consumer-centric product development, collaborative strategy—is exactly what successful industries tend to abandon once growth returns. If checkoff boards redirect funding from innovation to short-term promotion, or if processors reduce R&D as margins improve, the momentum could stall.

The Underlying Lesson

Looking at this entire arc, there’s a counterintuitive insight that applies beyond dairy.

The instinct when an industry faces decline is to work harder at the existing business. Cut costs. Improve efficiency. Fight for market share. Promote more aggressively.

Dairy tried all of that for years. It wasn’t sufficient—because when the market itself is shifting away from your core product, being better at the old thing only delays the inevitable.

What changed around 2014-2015 was a fundamental acceptance that commodity fluid milk, as traditionally sold, was unlikely to return to growth. Instead of fighting that reality, industry leaders asked what they could build that consumers actually wanted, using the infrastructure and supply chain already in place.

Same farms. Same cows. Same processing facilities. But instead of trying to sell more commodity milk at mid-teens per hundredweight, the focus shifted to creating categories where dairy had genuine advantages: ultra-filtered, lactose-free, high-protein, composition-specific products commanding meaningful premiums.

Volume is flat or slightly declining. Revenue per farm is higher. Margin per cow improved. Farm sustainability is better—for those who can access the premium markets.

That last qualifier matters. The turnaround is real, but its benefits aren’t flowing equally to all producers. The strategic question for any individual operation isn’t whether the premium pivot worked at the industry level—it clearly did—but whether and how you can position to capture some of that value given your specific scale, location, genetics, and cooperative relationships.

The Bottom Line

The dairy industry in late 2025 sits at an interesting inflection point. The turnaround appears real—2024’s growth wasn’t an anomaly, and analysis suggests the trajectory is continuing. Premium categories are expanding. Consumer perceptions of dairy are improving among key demographics. Genetic selection is evolving to support composition-focused production.

But the foundational work isn’t complete. New processing capacity is still coming online. Composition-focused genetics will take another 3-5 years to express in herds that are now fully selecting. Policy and trade uncertainty could affect even well-planned operations. And the consolidation pressure that’s eliminated 40% of U.S. dairy farms since 2017 shows no sign of reversing.

For producers, the practical implications come down to several key considerations:

  • Assess your herd’s genetic profile if you haven’t already. The information shapes every breeding decision going forward. With NM$ now emphasizing butterfat and feed efficiency more heavily, your selection criteria may need updating.
  • Initiate conversations with your processor about composition premiums. Programs exist but aren’t always well-publicized. Ask specifically what they’re seeking and what they offer for hitting targets.
  • Be realistic about premium market access. Not every farm can break into fairlife’s supply chain or join Organic Valley. Understand which premium pathways are actually accessible given your scale and cooperative membership—and consider alternatives, such as quality-focused regional cooperatives or direct marketing—if the major premium programs aren’t realistic options.
  • Plan for the 2028-2030 timeframe, not just next year’s milk check. Genetic decisions compound over time. Processor relationships require time to develop. The farms positioned well three years from now are making those decisions today.
  • Watch the consolidation dynamics. If you’re a mid-size operation, clearly understand whether your cost structure and market access can remain competitive as larger operations continue to gain share.

The turnaround didn’t happen because someone discovered a compelling marketing message that made consumers embrace commodity milk again. It happened because the industry stopped trying to preserve something consumers had moved past and started building what they actually wanted.

That’s perhaps the most transferable insight here. Not the specific technology or product. The willingness to accept that what worked for 50 years may not work for the next 20—and to build something new while there’s still time.

Key Takeaways

  • The 15-year decline is over. Fluid milk sales grew 0.8% in 2024—driven by premium products like fairlife, not commodity milk marketing.
  • Your genetics are being repriced. April 2025 Net Merit boosts butterfat to 31.8% and cuts protein to 13.0%. Volume-only bulls are losing economic ground.
  • $7.4 billion proves the premium model. Coca-Cola’s total fairlife investment shows the upside is real—but capturing it requires scale, certifications, and cooperative positioning most farms don’t have.
  • 40% of U.S. dairy farms are already gone. Operations dropped from 39,303 (2017) to 24,082 (2022). Premium market benefits are concentrating in larger herds.
  • The question has changed. It’s no longer whether this shift is real—it’s whether your operation’s genetics, processor relationships, and market access position you to benefit from it. The farms winning in 2028 are making those decisions now.

Complete references and supporting documentation are available upon request by contacting the editorial team at editor@thebullvine.com.

Learn More:

The Sunday Read Dairy Professionals Don’t Skip.

Every week, thousands of producers, breeders, and industry insiders open Bullvine Weekly for genetics insights, market shifts, and profit strategies they won’t find anywhere else. One email. Five minutes. Smarter decisions all week.

NewsSubscribe
First
Last
Consent

The $4/cwt Your Milk Check Is Missing – And What’s Actually Working to Get It Back

You know that moment—scrolling to the bottom of your milk statement, already doing the math in your head? Mike Boesch’s DMC said $12.29. His deposit said $8.

Executive Summary: Dairy producers everywhere are doing the math twice lately—and they’re not wrong. There’s a $4/cwt gap between what DMC margins show on paper and what’s actually hitting farm accounts. The causes stack up fast: make allowance increases that cost farmers $337 million in just three months, regional price spreads running nearly $7/cwt, and component formula changes that blindsided many operations. Milk keeps flowing despite the pressure—expansion debt doesn’t pause for soft markets, and the lowest heifer inventory since 1978 makes strategic culling nearly impossible. With USDA projecting $18.75/cwt All-Milk prices for 2026, margin relief likely won’t arrive until late 2027. The producers gaining ground are focusing on what they can control: component-focused genetics, beef-on-dairy programs built on smart sire selection, and risk management tools that most operations still aren’t using.

Dairy profitability strategies

You know that feeling when the numbers on paper don’t quite match what’s hitting your bank account? Mike Boesch, who runs a 280-cow operation outside Green Bay, Wisconsin, put it well when we talked last month. He pulled up his December milk statement, scrolled straight to the bottom—like we all do—and there it was. His Dairy Margin Coverage paperwork showed a comfortable $12.29/cwt margin. His actual deposit? After cooperative deductions, component adjustments, and those make allowance changes that kicked in last June, he was looking at something closer to $8/cwt.

“I keep two sets of numbers in my head now. The one the government says I’m making, and the one my checkbook says I’m making. They’re not the same number.” — Mike Boesch, Green Bay, Wisconsin (280 cows)

He’s far from alone in this experience. I’ve been talking with producers from California’s Central Valley to Vermont’s Northeast Kingdom over the past few months, and I keep hearing variations of the same observation. There’s a growing disconnect between what the formulas say margins should be and what’s actually landing in farm accounts. Understanding why that gap exists—and what you can do about it—has become one of the more pressing questions heading into 2026.

The Math That Isn’t Adding Up

YearCorn ($/bu)Soymeal ($/ton)All‑Milk ($/cwt)
20236.5443022.50
20245.1038021.80
20254.0030021.35

Here’s what makes this situation so frustrating for many of us. Feed costs dropped meaningfully through 2025. Corn’s been trading in the low $4s per bushel—USDA’s November World Agricultural Supply and Demand Estimates report projected $4.00 for 2025-26—down considerably from that $6.54 peak we saw in 2023. Soybean meal’s been running in the high $200s to low $300s per ton through fall. For most operations, that translates to real savings on the feed side.

But milk revenue softened faster. USDA National Agricultural Statistics Service data shows September’s All-Milk price came in at $21.35/cwt, with Class III at $18.20. That’s below what many of us were hoping for at this point in the year.

What I’ve found talking to producers and running through numbers with nutritionists and farm business consultants: even with clearly lower feed costs, the decline in milk revenue has offset—and in many cases more than offset—those feed savings. The specifics vary by operation. Your ration, your components, and your cooperative’s pricing structure all matter. But the pattern holds across a lot of different farm types.

Mike’s take stuck with me: “I saved money on feed. But I lost more on milk. The feed savings felt like winning a $20 scratch ticket after your truck got totaled.”

Where Your Money Is Actually Going

So what’s creating that $4/cwt gap between calculated margins and received margins? It comes down to several deductions that the DMC formula doesn’t capture.

The Make Allowance Shift

When the Federal Milk Marketing Order updates took effect on June 1, processors received larger deductions for manufacturing costs. American Farm Bureau Federation economist Danny Munch analyzed the impact, and his findings show the higher make allowances reduced farmer checks by roughly $0.85-0.93/cwt across the four main milk classes.

Key Finding: $337 Million Impact

Farm Bureau’s Market Intel analysis found that farmers saw more than $337 million less in combined pool value during the first three months under the new rules—that’s June through August alone.

ScenarioPool Value ($ billions)
Without new make allowance6.00
With new make allowance5.66

Source: American Farm Bureau Federation, September 2025

I talked with a Midwest cooperative field rep who asked to stay anonymous, given how sensitive pricing discussions can be. His perspective added some nuance worth considering: “Nobody wanted to make allowances to go up. But processing costs genuinely increased—energy, labor, transportation. The alternative was plant closures, and that would have helped nobody. It’s a situation where producers and processors both feel squeezed.”

He raises a fair point. The processing sector faced real cost pressures, and there’s a legitimate argument that updated make allowances were overdue. That said, the timing has been difficult for producers already navigating softer milk prices.

What’s worth understanding here is that the DMC formula uses pre-deduction prices. So your calculated margin looks healthy, while your actual check reflects those higher processor allowances.

Regional Pricing Reality

DMC uses national average milk prices, but anyone who’s compared notes with producers in other states knows the spread can be significant.

The Regional Price Gap: Same Month, Different Reality

RegionApproximate Mailbox PriceVariance
Southeast (Georgia)~$26.00/cwt+$4.65
Northeast (Vermont)~$22.80/cwt+$1.45
Upper Midwest (Wisconsin)~$21.50/cwt+$0.15
Pacific (California)~$20.40/cwt-$0.95
Southwest (New Mexico)~$19.20/cwt-$2.15

Source: USDA Agricultural Marketing Service Federal Order mailbox prices, Fall 2025

The regional story plays out differently depending on where you’re milking cows. Upper Midwest producers deal with cooperative basis adjustments and seasonal hauling challenges. California’s Central Valley operations face water costs that have fundamentally changed their cost structure—some producers there tell me water now rivals feed as their biggest variable expense. Southwest operations running large dry-lot systems have entirely different economics.

The Component Pricing Shuffle

Here’s one that caught a lot of producers off guard: the June 2025 FMMO changes removed 500-pound barrel cheddar from Class III pricing calculations. Now, only 40-pound block cheddar prices determine protein valuations—the USDA Agricultural Marketing Service confirmed this in their final rule.

Sounds technical, I know. But when barrels were trading higher than blocks—which they were in early summer—that switch affected producer checks. The rationale was to reduce price volatility and better reflect actual cheese market conditions, though the timing meant lower payments for many during that transition period.

Stack all of these together, and you get that $4-5/cwt gap between what DMC says you’re earning and what you’re actually receiving.

The Production Paradox

One thing that keeps coming up in conversations: if margins are this tight, why does milk keep flowing?

USDA NASS data shows national production running 1-4% above year-earlier levels in many recent months. July 2025 came in 3.4% higher than July 2024, totaling 19.6 billion pounds nationally.

At the same time, we’re watching a steady structural decline in dairy farm numbers. USDA has documented this trend for years—thousands of farms exiting nationally over the past decade, with several hundred closing each year just in heavily dairy states like Wisconsin.

Expert Insight: Leonard Polzin, Ph.D. Dairy Economist, University of Wisconsin-Madison Extension

“What we’re seeing is expansion commitments made in 2022-2023 when margins looked completely different. That debt doesn’t care about today’s milk prices. Producers have to keep milking to service those loans.”

There’s also the heifer situation. Replacement heifer inventory has dropped to 3.914 million head—the lowest level since 1978, according to USDA cattle inventory reports and confirmed by Dairy Herd Management coverage. Producers who might otherwise strategically cull their way to a smaller herd can’t easily replace the animals they’d be selling.

And then there’s processing. Since 2023, substantial new cheese processing capacity has come online—much of it financed through long-term USDA Rural Development loans requiring consistent milk intake. Those plants need milk regardless of farmgate prices.

For your operation: the supply response to low prices is likely to be slower than historical patterns suggest. If you’re planning around industry-wide production cuts that are expected to boost prices by late 2026, a longer timeline may be more realistic.

Why the Export Safety Valve Is Stuck

I’ve had producers ask when China might start buying again. Honestly? That valve is essentially closed for the foreseeable future.

Between 2018 and 2023, China added roughly 10-11 million metric tons of domestic milk production—equivalent to around 24-25 billion pounds. Rabobank senior dairy analyst Mary Ledman noted that’s almost like adding another Wisconsin to their domestic supply. The result? Self-sufficiency jumped from about 70% to 85% during this period.

China’s Dairy Transformation: The Numbers

MetricBefore (2018)After (2023)Change
Self-sufficiency~70%~85%+15 pts
WMP imports670,000 MT/yr avg430,000 MT-36%
Impact on competitors7% of NZ production was displaced

Sources: Rabobank/Brownfield Ag News

This wasn’t market fluctuation—it was deliberate government policy. And they’re not walking it back. In July 2025, China’s Dairy Association announced plans to maintain at least 70% self-sufficiency through 2030.

For U.S. producers, this represents a structural shift. Other markets—Southeast Asia, Mexico, and parts of the Middle East—continue to show growth potential. But that traditional “surplus absorption” mechanism that China provided? It’s significantly smaller than it used to be.

What’s Actually Working: Four Strategies From the Field

Enough about challenges. Let’s talk about what’s actually moving the needle on margins.

Getting Paid for Components

Sarah Kasper runs a 340-cow operation in central Minnesota that she transitioned to component-focused management three years ago. Her approach: genomic testing on every replacement heifer, sire selection emphasizing butterfat and protein over milk volume, and ration adjustments optimizing for component production rather than peak pounds.

“We dropped about 1,200 pounds of production per cow. But our component premiums more than made up for it. We’re getting paid for what processors actually want.” — Sarah Kasper, Central Minnesota (340 cows)

University of Minnesota Extension dairy economic analyses document component premiums ranging from $120 to $ 180 per cow annually for operations achieving above-average butterfat and protein levels. With genomic testing running $30-50 per animal, the return on investment can be meaningful—especially compounded over multiple generations.

What processors increasingly want is component value, not volume. April 2025 USDA data showed cheese production up 0.9% year-over-year while butter production fell 1.8%—processors are routing high-component milk toward their highest-margin products.

The Beef-on-Dairy Opportunity

This strategy has seen remarkable adoption. CattleFax data reported by Hoard’s Dairyman shows there were about 2.6 million beef-on-dairy calves born in 2022, up from just 410,000 in 2018. CattleFax projects that it could grow to 4-5 million head by 2026.

The economics are fairly straightforward. Use sexed dairy semen on your top-performing cows to secure replacements, then breed the remaining 60-70% of your herd to beef genetics. A dairy bull calf might bring $200-400. A well-managed beef cross with the right genetics and colostrum management can fetch $900-1,250 through direct feedlot relationships, according to Iowa State University Extension beef-dairy market reports.

Beef-on-Dairy Economics: Per-Calf Comparison

ScenarioCalf ValueSemen CostNet Advantage
Dairy bull calf$250$8-15Baseline
Beef cross (average genetics)$700$15-25+$435
Beef cross (premium genetics + direct marketing)$1,100$20-35+$830

Note: Values vary significantly by region, genetics quality, and buyer relationships Sources: Iowa State Extension; Hoard’s Dairyman market reports

But here’s where genetics selection really matters—and where I see a lot of operations leaving money on the table.

Research published in the Journal of Dairy Science in 2025 found the average incidence of difficult calving in beef-on-dairy crosses runs around 15%. But breed selection makes a significant difference: data from the Journal of Breeding and Genetics shows Angus-sired calves had only 7% calving difficulty compared to 13% for Limousin when looking at male calves.

Beef Sire Selection: The Calving Ease vs. Carcass Quality Tradeoff

Here’s the tension every producer needs to understand: beef sires selected for ease of calving and short gestation are often antagonistically correlated with carcass weight and conformation, according to research in Translational Animal Science.

Priority 1 — Protect the Cow:

  • Calving Ease Direct (CED): Select from the top 25% of beef sires
  • Birth Weight EPD: Lower is generally safer for dairy dams
  • Gestation Length: Angus adds ~1 day vs. Holstein; Limousin adds 5 days; Wagyu adds 8 days

Priority 2 — Optimize Calf Value:

  • Frame Size: Moderate-framed bulls generally produce more feed-efficient animals
  • Ribeye Area (REA) EPD: Higher values improve carcass muscling
  • Marbling EPD: Targets quality grade premiums
  • Yearling Weight EPD: Predicts growth performance

Sources: Journal of Dairy Science (2025); Penn State Extension; Michigan State Extension; Translational Animal Science

A Hoard’s Dairyman survey found that most dairies currently prioritize conception rate, calving ease, and cost when selecting beef sires—but feedlot and carcass performance traits aren’t priorities for most farms yet. Michigan State Extension notes this is a missed opportunity: selecting for terminal traits that improve growth rate and increase muscling should be a priority.

The bottom line from peer-reviewed research: sire selection for beef-on-dairy should firstly emphasize acceptable fertility and birthweight because of their influence on cow performance at the dairy; secondarily, carcass merit for both muscularity and marbling should receive consideration.

Tom and Linda Verschoor, who run 1,200 cows near Sioux Center, Iowa, started their beef-on-dairy program in 2022 with this balanced approach. “We figured out we only need about 35% of our herd for replacements,” Tom explained.

They report that in 2024, they generated roughly $185,000 more revenue from beef-cross calves than they would have from traditional dairy bull calves. Results will vary depending on genetics quality, calf care, and buyer relationships. But the opportunity is real for operations set up to capture it.

Actually Using the Risk Management Tools

This is where I see one of the biggest gaps between what’s available and what producers actually use.

DMC Tier 1 coverage costs $0.15/cwt, with a $9.50/cwt margin protection on the first 5 million pounds. University of Wisconsin-Extension analysis shows that from 2018-2024, DMC triggered payments in 48 of 72 months—about two-thirds of the time. Average net indemnity ran $1.35/cwt during payment months. It’s essentially catastrophic margin insurance at minimal cost.

ScenarioCovered Milk (million lbs/year)Net Avg Indemnity ($/cwt in pay months)Approx. Extra Margin per Year ($)
No DMC enrollment00.000
DMC Tier 1 at $9.50 margin51.3545,000

Beyond DMC, Class III futures and options let you establish price floors. If your break-even is $16/cwt and you can lock $17/cwt through futures, you’ve reduced margin uncertainty—even if it means giving up potential upside.

Expert Insight: Marin Bozic, Ph.D. Dairy Economist, University of Minnesota

Bozic often reminds producers at risk-management meetings that relying on prices to improve on their own simply isn’t really a strategy. Most producers are still hoping prices improve rather than locking in prices that work. That’s understandable. But hope alone doesn’t protect margins.

Finding Premium Channels

The spread between commodity milk and premium markets continues widening:

  • Organic certified: $33-50/cwt depending on region and buyer (USDA National Organic Dairy Report)
  • Grass-fed certified: $36-50/cwt with current supply shortages (Northeast Organic Dairy Producers Alliance)
  • Value-added processing: On-farm yogurt or cheese production can generate meaningful additional margin, though capital requirements are real

I’m hearing from processors that organic supply is currently short in the Northeast and Upper Midwest—there’s genuine demand if you can make the transition work.

Premium Channel Pathways: What’s Actually Involved

ChannelTransition TimelineKey RequirementsRegional Considerations
Organic36 monthsUSDA NOP certification; organic feed sourcing; no prohibited substancesStrong processor demand in the Northeast, Upper Midwest; fewer options in the Southwest
Grass-fed12-18 monthsThird-party certification (AWA, PCO, or equivalent); pasture infrastructureWorks best with existing grazing infrastructure; limited in western dry lot operations
On-farm processing12-24 monthsState licensing; food safety compliance; marketing/distribution capabilityStrong local food demand helps; it requires entrepreneurial capacity beyond milk production

Sources: USDA Agricultural Marketing Service; Northeast Organic Dairy Producers Alliance; Penn State Extension

The transition timeline matters. Organic requires three years of certified organic land management before you can sell organic milk—and you’ll need reliable organic feed sourcing, which can be challenging and expensive depending on your region. Grass-fed certification moves faster but requires pasture infrastructure that not every operation has. On-farm processing offers the highest margin potential but demands skills well beyond dairy farming.

Whether these channels make sense depends on your land base, labor situation, existing infrastructure, and appetite for marketing complexity. They’re not right for every operation, but for those with the right setup, the premium differential is substantial.

What the Analysts Are Actually Saying About 2026

Let me share what the forecasts show, because realistic timeline expectations matter.

Producer conversations often reference recovery by “late 2026.” The analyst forecasts suggest a more gradual path.

2026 Price Outlook: Key Forecasts

Source2026 All-Milk ForecastAssessment
USDA December WASDE$18.75/cwtDown from $20.40 (Nov)
2025 Actual$21.35/cwtBaseline comparison
Rabobank“Prolonged soft pricing through mid-to-late 2026” 
StoneXProduction slowdown not until Q2-Q3 2026 

Here’s the key difference: analysts are describing prices “bottoming out” in early to mid-2026. That means the decline stabilizes—not that prices bounce back to 2024 levels. Most forecasts suggest meaningful margin recovery is more likely a late-2027 development.

This isn’t cause for panic. Markets are cyclical, and conditions will eventually improve. But it does suggest planning for an extended timeline.

The Conversation Worth Having

For producers with potential successors, this margin environment brings important conversations into focus. University of Illinois Extension notes that less than one in five farm owners has an estate plan in place. The Canadian Bar Association found 88% of farm families lack written succession plans.

Expert Insight: David Kohl, Ph.D. Professor Emeritus, Virginia Tech

Kohl emphasizes that families starting succession talks early navigate transitions more smoothly than those who wait until circumstances force the conversation.

His framework:

  1. Know your actual numbers — true break-even, debt maturity, realistic equity position
  2. Find out what your kids actually want — not what you assume
  3. Lay out options honestly — status quo, restructuring, strategic exit, or succession

You’re not solving everything in one meeting. You’re getting information on the table.

The Bottom Line

“I’m not pretending the math is good right now. But I’ve stopped waiting for someone else to fix it. We enrolled in DMC at the $9.50 level, we’re breeding 60% of our herd to Angus, and we had that kitchen table conversation with our son over Thanksgiving. First real talk about whether he wants this place.”

He paused. “I’d rather know where we stand than keep guessing. At least now we’re making decisions instead of just hoping.” — Mike Boesch

That’s really the choice in front of all of us right now. The margin environment is challenging—that’s just the reality for the foreseeable future. But producers who understand the dynamics, assess their positions honestly, and implement available strategies aren’t just getting through this period; they’re succeeding. Some are building advantages that will serve them well when conditions improve.

The math is difficult. It’s not impossible. The difference comes down to whether you’re making decisions based on information or just waiting to see what happens.

Key Takeaways

  • The $4/cwt gap is real—and it’s not your math. Make allowances, regional spreads, and formula changes explain why your milk check doesn’t match your margins.
  • $337 million left producer pockets in 90 days. June’s make allowance increases pulled that from the pool values before summer ended.
  • Plan for a long haul. USDA projects $18.75/cwt for 2026—a meaningful margin recovery likely won’t show up until late 2027.
  • Don’t count on production cuts to save prices. Expansion debt keeps cows milking, and the lowest heifer inventory since 1978 limits strategic culling.
  • The wins are in the details. Component premiums, smart beef sire selection, and actually enrolling in DMC at $9.50—that’s where producers are finding margin.

Complete references and supporting documentation are available upon request by contacting the editorial team at editor@thebullvine.com.

Learn More:

The Sunday Read Dairy Professionals Don’t Skip.

Every week, thousands of producers, breeders, and industry insiders open Bullvine Weekly for genetics insights, market shifts, and profit strategies they won’t find anywhere else. One email. Five minutes. Smarter decisions all week.

NewsSubscribe
First
Last
Consent

The $16/CWT Reality: Why Mid-Size Dairies Can’t Out-Work Structural Economics – And What Actually Works

Mid-size dairies face a $16/cwt cost gap against mega-operations. You can’t out-work structural economics. But you might out-think them.

Executive Summary: The gap between thriving dairies and struggling ones isn’t about who works harder—it’s structural. Mid-size operations (250-1,000 cows) face a cost disadvantage of up to $16 per hundredweight compared to mega-dairies, driven by differences in labor efficiency, purchasing power, and organizational capacity that longer hours alone can’t bridge. These aren’t cyclical pressures waiting to pass; USDA data shows 40% of dairy farms exited between 2017 and 2022, while operations with 1,000+ cows now produce 68% of U.S. milk. Three strategies are helping producers navigate this divide: beef-on-dairy breeding programs capturing significant calf revenue, component-driven culling aligned with today’s pricing, and precision feeding that compounds efficiency gains over time. For farms facing margin pressure, timing proves critical—acting early preserves substantially more equity than waiting for conditions that may not improve. Understanding these dynamics won’t guarantee any particular outcome, but it enables clearer decisions while meaningful options still exist.

dairy profitability strategies

There’s a number from the latest Zisk Report that’s worth pausing on. Looking at their 2025 profitability projections, operations milking more than 5,000 cows were expected to earn around $1,640 per cow. Smaller herds under 250 cows in the Southeast? Roughly $531 per cow. That’s not just a performance gap you can chalk up to management differences. It reflects fundamentally different economic realities.

What makes this moment feel different from the cyclical downturns we’ve weathered before is that this gap isn’t closing. The farms caught in the middle—those 250- to 1,000-cow operations that have traditionally formed the backbone of American dairy—face a structural squeeze that traditional approaches alone may not address.

I want to be clear about something upfront. This isn’t a story about who deserves what outcome. It’s about understanding what’s actually driving profitability, why certain strategic moves create compounding advantages, and what realistic options exist for operations navigating an increasingly challenging landscape.

The Scale of Change Already Underway

Before digging into strategy, it’s worth sitting with how much has already shifted. USDA’s 2022 Census of Agriculture shows licensed dairy farms with off-farm milk sales declining from 39,303 in 2017 to 24,082 in 2022—a reduction of almost 40%. University of Illinois economists at Farmdoc Daily noted that it was the largest decline between adjacent Census periods since 1982.

The consolidation squeeze: Total dairy farms dropped 59% between 2012-2022, while mega-operations now control 68% of U.S. milk production—up from 52% a decade ago

Here’s the part that surprises people: total milk production actually increased slightly during that same period.

Why? Because remaining farms are larger, more productive, and increasingly concentrated. Rabobank’s analysis of the Census data estimates that farms with 1,000 or more cows—roughly 2,000 operations—now produce about 68% of U.S. milk, up from 60% in 2017. Meanwhile, farms with fewer than 500 cows account for about 86% of all operations but contribute only about 22% of total production.

The profitability chasm: Large dairies earn triple what mid-size operations make per cow, driven by structural cost advantages rather than management quality

The profitability breakdown by herd size tells the story. According to Zisk’s 2025 projections, those massive 5,000+ cow herds were looking at $1,640 per cow, with profitability declining steadily as herd size decreased. Their 2026 projections suggest smaller herds will continue to lag, with sub-250-cow farms hovering near break-even and mid-size herds projected somewhere in the low hundreds per cow.

These aren’t random variations. They reflect structural cost advantages that compound at scale—advantages in labor efficiency, feed purchasing, risk management infrastructure, and capital access that mid-size operations struggle to replicate, regardless of management quality.

The “No-Man’s Land” Problem: Why 750 Cows Is the New 100

Here’s something I’ve been thinking about a lot lately. Back when I started paying attention to this industry, a 100-cow operation was considered the minimum viable scale for a full-time dairy. Based on current cost structures and margin realities, that threshold has shifted dramatically upward.

Mid-size operations—those running roughly 250 to 1,000 cows—find themselves stuck in what I’d call economic no-man’s land. They’re too big to run primarily on family labor, the way smaller operations can. But they’re not big enough to justify the specialized management teams, dedicated risk managers, and infrastructure investments that large operations deploy.

Consider what a 300-cow operation still needs:

  • Full-time hired labor (family alone can’t handle 24/7 milking schedules)
  • Modern parlor equipment and maintenance
  • Compliance infrastructure for environmental and labor regulations
  • Professional nutritional consulting
  • Financial management beyond basic bookkeeping

But that same 300-cow operation typically can’t afford:

  • A dedicated herd manager separate from the owner
  • Full-time HR staff to handle employee recruitment and retention
  • A risk management specialist monitoring DRP enrollment and forward contracts
  • The volume discounts in feed purchasing that large operations secure

University of Minnesota Extension data in FINBIN show the math clearly: herds with up to 50 cows face costs of around $20.22 per cwt, compared to $16.70 for herds over 500 cows. That gap of several dollars per hundredweight? It often represents the entire margin at current milk prices.

At stressed margins, a mid-size operation can lose approximately $15,000-$20,000 per month, according to industry analysis. That’s not a sustainable position, and no amount of 80-hour weeks changes the structural economics.

Reality Check: The Cost of Waiting

The hardest conversation I have with producers involves timing. Industry analysis from agricultural lenders suggests that farms making strategic decisions during months 8-10 of financial stress preserve significantly more equity—often hundreds of thousands of dollars more—than those waiting until months 16-18.

The cost of waiting: Farms that delay strategic decisions until month 18 preserve half the equity of those acting at month 12—a difference often exceeding $200,000 in lost family wealth

Every month of delayed decision-making at stressed margins burns equity that families will never recover. The pattern is consistent across regions: waiting for conditions to improve when structural forces are at work rarely improves outcomes.

The difficult truth is that the only wrong choice is often no choice at all.

Understanding What Creates the Cost Gap

When we talk about economies of scale, it can sound abstract. On working farms, though, this shows up in tangible ways.

Structural Cost Comparison: Mid-Size vs. Large Operations

Cost FactorMid-Size Operation (250-1,000 cows)Large Scale (5,000+ cows)
Total Cost per CWT$19-22 (University of Minnesota FINBIN)$16-18 (USDA ERS, Cornell data)
Labor StructureOwner + generalist hired workersSpecialized department managers
Risk ManagementOwner-operated, part-time attentionDedicated full-time staff
Feed SourcingMarket price/spot purchasesContracted volume discounts
Genomic TestingSelective/occasional useUniversal/systematic across the herd
Equipment Cost per CowHigher (fixed costs spread across fewer animals)Lower (fixed costs spread across more animals)

Sources: University of Minnesota FINBIN, USDA ERS milk cost studies, Cornell

Where the Differences Come From

Cost ComponentMid-Size Operations (250-1,000 cows)Large Scale (5,000+ cows)Gap Impact
Labor Cost per CWT$4.50$2.80$1.70 disadvantage
Feed Cost per CWT$11.20$9.90$1.30 disadvantage
Equipment Cost per CWT$3.50$2.00$1.50 disadvantage
Total Operating Cost per CWT$20.22$16.70$3.52 total gap
Net Cost Disadvantage+$3.52BASELINE21% higher costs

Labor efficiency represents the most significant structural gap. MSU Extension research found labor costs ranging from less than $3 per cwt on well-organized, larger farms to more than $4.50 per cwt on operations averaging around 258 cows. University benchmarking consistently shows large herds support substantially more cows per full-time worker—often roughly double the cows per FTE compared to smaller family operations.

Think about what this means practically. A 500-cow farm requiring 10 employees at an average cost of $45,000 runs $450,000 in labor annually. A 3,000-cow operation with better labor efficiency spends significantly less per cow. And there’s only so much you can do about this—someone still needs to be monitoring fresh cows at 2 AM, whether you’re milking 400 or 4,000.

Feed purchasing power compounds the advantage. What I’ve found, talking with nutritionists and lenders, is that larger dairies consistently secure meaningful volume discounts on purchased feed compared to smaller buyers who purchase at spot prices. With feed typically accounting for the majority of operating costs, even modest percentage savings translate into real-dollar advantages.

Capital costs follow similar patterns. Equipment amortization illustrates this well: the same piece of equipment costs more per cow annually when spread across 350 animals than when spread across 3,000. That’s not about management quality—it’s pure math. And it affects everything from parlor systems to feed storage to manure handling.

When you stack these factors together, USDA ERS research found that dairy farms with fewer than 50 cows had total economic costs of $33.54 per cwt while herds of 2,500+ cows achieved costs of $17.54 per cwt. That’s a $16 difference—nearly the entire milk price in some months.

The Organizational Capacity Challenge

Here’s something that doesn’t get discussed enough, and honestly, it’s an aspect I didn’t fully appreciate until digging into this data: organizational infrastructure may matter as much as any single cost factor.

Organizational Comparison: Who’s Managing What?

Critical FunctionMid-Size (250-1,000 cows)Large Scale (5,000+ cows)Impact
Risk ManagementOwner part-timeDedicated marketing staffLower DRP enrollment
Genetic Program StrategyAI tech recommendationsIn-house geneticistReactive vs. systematic
Nutritional ManagementConsultant quarterly visitsFull-time on-staff nutritionistSlower optimization
Employee Recruitment & TrainingOwner handlesHR departmentHigher turnover costs
Financial Planning & AnalysisAnnual lender meetingCFO with monthly analysisDelayed interventions
Regulatory ComplianceOwner learns as neededCompliance officerViolation risk

Consider risk management specifically. Large dairy operations increasingly employ dedicated staff for milk marketing, futures hedging, and Dairy Revenue Protection enrollment. A much higher share of large operations actively use DRP and forward contracting than mid-size farms do. What’s interesting is that the tools themselves are identical—DRP costs the same per hundredweight regardless of herd size.

So why the adoption gap?

The answer comes down to organizational capacity. Effective risk management requires:

  • Accurate cost-of-production projections 6-12 months forward
  • Quarterly decision-making discipline for DRP enrollment
  • Understanding of basis risk and Class III correlations
  • Coordination between the lender, the nutritionist, and the marketing decisions

Large operations have staff dedicated to these functions. Mid-size farms have owner-operators trying to manage risk alongside daily operations, employee supervision, equipment maintenance, and family responsibilities. As extension economists often note, it’s not that mid-size farms can’t afford the premiums—they don’t have the bandwidth to execute consistently. And inconsistent execution often performs worse than no strategy at all.

From the Field: A Wisconsin Operation’s Strategic Pivot

I recently spoke with operators running a 480-cow dairy in Dane County, Wisconsin, who implemented beef-on-dairy breeding starting in early 2024. They moved from modest bull calf revenue to well over $200,000 in beef-cross calf sales within 18 months. The key was starting with genomic testing to identify which cows warranted investment in sexed semen. “Once we knew our top 35% genetically, the breeding decisions got clearer. We’re not guessing anymore.” They acknowledged that the transition took about two complete breeding cycles before they felt the system was truly optimized.

Three Strategic Moves Separating Top Performers

What are genuinely successful operations doing differently? Three specific strategies keep appearing among farms outperforming their peer groups. These aren’t theoretical—they’re moves I’m seeing executed on working dairies right now.

Beef-on-Dairy as a Revenue Strategy

The shift toward beef-on-dairy breeding represents one of the most significant strategic pivots in dairy today. American Farm Bureau analysis describes beef-on-dairy crossbreeding as one of the fastest-growing trends in dairy genetics, with a substantial share of commercial herds now breeding part of the milking string to beef sires.

The traditional approach—breeding all cows to dairy sires and selling bull calves for whatever the market offers—often yields disappointing returns. Top performers instead use genomic testing to identify their top 35-40% of cows genetically, breed those with sexed semen for replacement heifers, and breed the remainder to beef sires.

USDA Agricultural Marketing Service reports show that well-grown beef-cross calves bring several hundred dollars more than straight dairy bull calves at auction. Recent sale barn data often shows beef-on-dairy calves trading in the low four figures while dairy bull calves bring a fraction of that (depending on weight and region).

Based on current price differentials, that gap can translate into substantial additional annual calf revenue—potentially six figures for a 500-cow herd, depending on local market conditions.

The beef-on-dairy revenue multiplier: A 500-cow herd switching to strategic beef breeding can add $225,000 in annual calf revenue—enough to cover several full-time employees

Execution requires infrastructure that many mid-size farms lack, though:

  • Genomic testing: $35-55 per head, depending on test panel (one producer reported average costs around $38)
  • Breeding discipline: Consistent heat detection and sexed semen protocols
  • Market development: Building feedlot relationships that value beef-on-dairy genetics
  • Timeline: 2-3 years to fully optimize the program

Component-Driven Culling Decisions

Traditional culling logic focuses on milk volume: keep high producers and cull low producers. What I’m seeing among top performers is a shift to income-over-feed-cost analysis that accounts for component value—and it’s changing which cows stay and which go.

Why does this matter more now than it did five years ago? Federal order component pricing in 2025 has rewarded solids heavily, with butterfat prices often in the $2.50-2.70 per pound range and protein in the low-to-mid $2.00s per pound. It’s worth noting there’s been significant month-to-month volatility—August 2025 saw butterfat above $2.70, while October dropped closer to $1.80. That kind of swing matters for planning.

This pricing structure means a cow producing 60 pounds daily with average components generates different revenue than one producing 48 pounds at notably higher butterfat and protein tests. In many cases, that “lower-producing” high-component cow delivers more monthly value than her high-volume counterpart.

Recent USDA/NAHMS-based summaries indicate the typical overall cull rate runs about 37% of the lactating herd annually, with roughly 73% of those culls classified as involuntary in Northeast datasets—driven by reproductive failure, mastitis, and lameness. Penn State Extension reported similar figures. Extension specialists emphasize that moving more culling into the voluntary category (strategically removing low-IOFC cows rather than reacting to health breakdowns) improves long-term herd economics.

Here’s a number worth sitting with: it takes more than three lactations to recoup the cost of raising a replacement heifer—about $2,000 per head—but average productive life currently runs about 2.7 lactations. That gap between investment and return is where considerable money quietly disappears.

Precision Feeding Implementation

Emerging technology enables individual-cow nutritional optimization rather than pen-based feeding. While still early in adoption, farms implementing precision feeding systems report meaningful gains in milk income minus feed costs, with results varying by implementation quality and starting-point efficiency.

Systems like Nedap or SCR by Allflex integrate with automated milking and grain dispensers, continuously analyzing individual cow data to optimize nutrient delivery. Initial investment varies significantly by herd size and configuration, representing a substantial capital commitment for mid-size operations.

Early adopters are building optimization data that compounds into structural advantages as the technology matures. This isn’t something you implement overnight—farms report 12-18 months before fully realizing efficiency gains.

The Premium Market Reality

For struggling mid-size operations, “go premium” often sounds like an obvious solution. Organic, grass-fed, and A2 milk command notable premiums. So why not transition?

The economics prove more complicated than they appear.

Organic transition requires 2-3 years of certification, during which farms follow organic protocols while selling at conventional prices. Case studies and extension reports note that transition periods typically involve lower yields, higher purchased-feed costs, and additional capital investments. Producers and lenders describe the certification window as a period of thinner or negative margins, with favorable returns often appearing only after full certification and stable market access.

That’s a considerable risk for farms already under financial pressure.

Market access presents additional challenges. Organic Valley, the largest organic dairy cooperative, added 84 farms to its membership in 2023—meaningful, but limited given interest levels. What’s encouraging for the broader market: USDA AMS data show organic fluid milk accounting for around 7.1% of total U.S. fluid milk sales by early 2024-2025, up from 3.3% in 2010. The market continues growing, but processor capacity limits how quickly supply can expand.

Regional dynamics matter considerably. Premium markets concentrate near urban population centers. A farm in central Wisconsin faces different market access than one in Pennsylvania’s Lehigh Valley or New York’s Hudson Valley. Transportation costs for specialty products often determine viability as much as production capability.

Regional Realities: How Geography Shapes Options

The geographic dimension of this profitability divide deserves more attention than it typically receives. Recent USDA data shows milk production expanding in parts of the High Plains—Texas reached 699,000 head of dairy cows this year, the most in the state since 1958, according to the USDA. Production in Texas has increased approximately 8-10% year-over-year.

Meanwhile, California output has flattened under higher costs, water constraints, and tightening environmental regulations. I recently spoke with a Central Valley producer running 1,200 cows who noted their cost structure has shifted dramatically—water costs alone have nearly doubled over five years, and labor competition keeps pushing wages higher.

Mid-size operations in expanding regions face structural disadvantages when competing with neighbors that are rapidly adding scale. Your region shapes strategic options more than generic industry advice typically acknowledges.

Understanding Decision Timelines

For operations facing compressed margins without premium market access or scale advantages, understanding realistic timelines becomes essential. This is difficult territory, I know. For families who’ve farmed for generations, these calculations extend beyond spreadsheets to identity, legacy, and community.

Industry data from Farm Credit Services and agricultural lenders suggests the progression from sustained negative margins to necessary transition decisions typically spans 18-36 months, depending on starting financial position.

Months 1-6: Working capital reserves absorb losses. Operators often don’t recognize the structural nature of the challenge—it feels like a temporary downturn, another cycle to ride out.

Months 6-12: Operating lines get drawn, and lenders request more frequent reporting. Equity erosion accelerates in ways that become clear on balance sheets.

Months 12-18: The decision window opens. Farms acting during this period typically preserve substantially more equity through planned transitions—strategic sales to neighboring operations, partnership restructuring, or managed wind-downs.

After month 18: Options narrow significantly. Crisis liquidation scenarios preserve far less—often a difference of hundreds of thousands of dollars.

What economists and lenders consistently emphasize: timing matters as much as the decisions themselves. Farms that recognize structural challenges early and act decisively preserve substantially more equity than those that wait for conditions to improve.

The Labor Factor Reshaping Everything

Beyond financial metrics, labor availability increasingly shapes farm viability in ways that profitability data doesn’t fully capture. This is something I’ve been watching closely, and the implications concern me.

National Milk Producers Federation research (conducted by Texas A&M) found that immigrant employees make up about 51% of the U.S. dairy workforce, with farms employing immigrant labor contributing roughly 79% of the nation’s milk supply. UW-Extension confirmed these figures remain current in their 2024 workforce research. Unlike seasonal crop agriculture, dairy can’t access H-2A visa programs—the program specifically excludes year-round operations. This leaves the industry uniquely exposed to changes in immigration policy.

What I’m noticing among top-performing operations is aggressive automation investment—not primarily for current efficiency gains, but as hedges against labor volatility. Automated milking systems, robotic feeders, and activity monitoring reduce labor dependency while maintaining or improving productivity.

For mid-size operations, meaningful automation investments require careful analysis. But farms that view automation solely through current efficiency metrics may be underweighting the risk-management dimension.

Practical Guidance Based on Where You Stand

Understanding these dynamics creates opportunities for informed decision-making. Here’s how I’d think about next steps based on the current situation.

For operations with 18+ months of financial runway:

  • Take beef-on-dairy seriously as a revenue strategy—budget $35-55 per head for genomic testing and expect 2-3 breeding cycles before full optimization
  • Know your actual cost-of-production within a dollar per hundredweight
  • Consider organizational partnerships—shared services, consulting relationships, and peer learning groups provide capacity that individual operations struggle to build alone
  • Evaluate automation economics as risk management, not just efficiency

For operations facing immediate financial pressure:

  • Act earlier rather than later—the equity preservation difference between early and delayed decisions often runs hundreds of thousands of dollars
  • Understand your full range of options—strategic sales, partnership structures, and planned transitions typically preserve more value than crisis liquidations
  • Engage advisors before crisis mode, not during
  • Look at succession realistically—if it’s uncertain, that should factor into timing decisions

For operations positioned for growth:

  • The acquisition environment favors prepared buyers with capital access and clear expansion plans
  • Infrastructure quality matters more than simple herd additions
  • Acquiring cows from liquidating operations while building modern infrastructure often outperforms acquiring aging facilities

Questions Worth Discussing With Your Advisor

  • What’s our precise break-even milk price, and how does it compare to current projections?
  • Are we capturing full value from our genetic program through beef-on-dairy or other strategies?
  • What’s our debt service coverage ratio, and what milk price would put us below 1.0?
  • Do we have a written plan for labor disruption scenarios?
  • If we needed to transition the operation in 18 months, what would that look like?

The Bottom Line

The profitability divide reshaping American dairy isn’t primarily about who works hardest or cares most about their cows. It’s about structural economics, organizational capacity, and strategic positioning in a rapidly evolving industry.

Understanding these dynamics won’t guarantee any particular outcome—but it helps you make decisions with a clear vision. And in an industry where timing and positioning increasingly determine outcomes, that understanding may be the most valuable asset available.

Key Takeaways:

  • The gap is structural, not cyclical. Mid-size dairies face up to $16/cwt in cost disadvantages that longer hours can’t close—driven by differences in labor efficiency, purchasing power, and organizational capacity.
  • 750 cows is the new 100. Operations running 250-1,000 cows are caught in economic no-man’s land: too large to run on family labor, too small to support specialized management teams.
  • Three strategies are creating real separation: Beef-on-dairy breeding, adding significant calf revenue, component-driven culling optimized for current pricing, and precision feeding that compounds gains over time.
  • Timing matters more than optimism. Farms acting early in financial stress preserve substantially more equity than those waiting for conditions to improve—often by hundreds of thousands of dollars.
  • Labor is the underpriced risk. With immigrant workers comprising 51% of dairy labor and producing 79% of U.S. milk, workforce disruption could reshape the industry faster than consolidation.

Complete references and supporting documentation are available upon request by contacting the editorial team at editor@thebullvine.com.

Learn More:

The Sunday Read Dairy Professionals Don’t Skip.

Every week, thousands of producers, breeders, and industry insiders open Bullvine Weekly for genetics insights, market shifts, and profit strategies they won’t find anywhere else. One email. Five minutes. Smarter decisions all week.

NewsSubscribe
First
Last
Consent

They Called Him the Three-Legged Bull. He Created the Modern Red Holstein: The Untold Story of Hanover-Hill Triple Threat-Red

53 years ago, a man bet his career on a red calf everyone else called a defect. He was right

Hanover-Hill Triple Threat, the bull they once called a “defect.” He overcame initial rejection and later challenges to become a legend, reshaping the modern Red Holstein breed with his resilience and elite genetics.

Picture this. It’s October 1972, upstate New York. The sale barn at Hanover Hill Holsteins is packed—the kind of crowd that shows up when they know something historic might happen. That electric tension you only get when serious money is about to change hands.

In the ring stands a six-month-old calf. Vibrant red coat. Good on his feet. And by every measure of conventional wisdom in that era? A genetic liability.

See, for most of the 20th century, red and white on a Holstein wasn’t just unfashionable—it was treated as a defect. Something you culled. Something that barred your animal from the prestigious main herdbook. The industry elite wanted nothing to do with it.

But by 1972, something was shifting. All over the world—especially in Europe—people were looking for Red Holstein blood with good conformation. The market was starved for elite red genetics. And when this particular calf stepped into the ring, breeders recognized they were looking at something the industry had never seen before: a red Telstar son from the iconic Barb family.

So when the auctioneer started climbing past $40,000… then $50,000… the tension in that room was palpable.

Ken Young of American Breeders Service had already blown past his authorized limit. His bosses back in DeForest, Wisconsin, hadn’t signed off on anything close to this. But Young kept his paddle in the air.

$60,000. The gavel fell. World record for a Red & White Holstein. And in that moment, the trajectory of an entire breed pivoted on its axis.

When Young’s superiors demanded an explanation, he reportedly offered a reply that’s echoed through the halls of dairy breeding lore ever since: “It was easier to ask for forgiveness than to ask for permission.”

That calf was Hanover-Hill Triple Threat-Red. And here’s the thing—fifty-three years later, if you’re running red genetics in your herd, if you’ve ever admired Apple-Red or watched a Rubels-Red daughter walk into the ring… you’re looking at his legacy.

The World That Existed Before

To really understand what happened in that sale barn, you’ve got to understand the historical context.

For most of the 20th century, the Red Factor gene wasn’t treated as a variation. It was treated as a mistake. A genetic blemish to be erased. Elite North American breeders had systematically selected against red animals for generations. The main herdbooks slammed their doors shut. And the reasoning became self-reinforcing—because all the best genetics for milk and type were being developed exclusively in Black & White bloodlines, the Red & White population kept falling further behind.

It was a vicious cycle. Red cattle needed access to elite genetics to improve. But elite genetics wanted nothing to do with red cattle.

By the early 1970s, however, European demand was changing the equation. Farmers across Switzerland, France, and Germany were actively seeking red genetics with a modern dairy type. The question that haunted every breeder who loved that red coat was deceptively simple: How do you improve a population when the very best bloodlines refuse to acknowledge you exist?

The answer, it turned out, would come from an unexpected place—not the heartland of North American dairying, but the green valleys of Switzerland.

The Swiss Visionary Who Wouldn’t Take No for an Answer

The story of Triple Threat’s creation starts with a young Swiss agricultural graduate named Jean-Louis Schrago. In 1968, Schrago arrived in North America with a mandate that would’ve seemed absurd to most American breeders: find the world’s best red genetics and bring them back to Europe.

His search led him to Hanover Hill Holsteins in New York—the breeding epicenter managed by the legendary R. Peter Heffering. And Schrago walked right in and made an audacious proposal: breed your finest cow, the iconic matriarch Johns Lucky Barb, to a red-factor bull.

Heffering, pragmatic and focused on the lucrative Black & White market, shut him down flat. “There’s no Red & White market,” he told the young Swiss visitor.

But Schrago wasn’t a man who accepted dismissal easily.

He came back in 1971. This time, he brought a delegation of European farmers with him—visible proof of growing demand. And over lunch, Heffering finally asked the question that would change everything: “Alright then. Who would you recommend?”

Schrago’s answer was specific, unconventional, and—looking back—borderline miraculous: Roybrook Telstar.

Now, Telstar was a titan of the Canadian breed. A superstar celebrated for transmitting refinement, dairy character, and exceptional udders. His daughters were known as “show ring prima donnas.” But here’s what most North American breeders didn’t know: Telstar carried a rare genetic variant called the Black-Red gene—a peculiar trait that caused red-born animals to darken as they matured, a phenomenon that would later become known simply as “Telstar Red.”

Schrago knew. And he wasn’t telling everyone.

The logistics alone were insane. Telstar had been exported to Japan in 1967—at the highest price ever paid by Japanese buyers for a Canadian bull at that time. Schrago located two precious units of semen on the other side of the Pacific and arranged their importation for $2,500. A substantial sum at the time—enough to make most breeders think twice.

Then came his final stroke of genius. Rather than using the aging Johns Lucky Barb herself, he advised Heffering to use her greatest daughter—Tara-Hills Pride Lucky Barb EX-94—a formidable cow in her prime who carried the true recessive red gene.

The genetic math was elegant. Telstar contributes the rare Black-Red gene. The dam contributes the true recessive red gene. Together? Something the breed had never seen: an elite red calf carrying the accumulated genetic wealth of Holstein royalty.

Heffering agreed. The mating was made. And on April 24, 1972, the gamble paid off.

When Schrago heard the news, he drove non-stop from Wisconsin just to see the animal he’d dreamed into existence. He later described the calf as “looking like a small deer”—delicate, alert, unmistakably special.

That deer would prove anything but delicate.

Where the Power Came From

To understand why Triple Threat could stamp his offspring with such consistency—why his prepotency became legendary—you’ve got to look at what collided in his pedigree. This wasn’t just good genetics meeting good genetics. This was the deliberate convergence of the most dominant forces in the Holstein universe.

The Sire: Roybrook Telstar EX-Extra. The Canadian superstar whose semen Schrago imported from Japan for the historic mating. While famous for his “show ring prima donna” daughters, Telstar secretly carried the rare Black-Red gene—the source of the unique “chameleon” coat color he passed to his son.

His sire, Roybrook Telstar EX-Extra, was line-bred to the famous “White Cow” family of F. Roy Ormiston in Brooklin, Ontario. His dam, Roybrook Model Lass EX-15, accumulated lifetime credits of 218,814 pounds of milk and 9,018 pounds of fat—numbers that still command respect today. Telstar’s gift to his offspring was unmistakable: style, dairy character, and udders of exceptional texture. He added what breeders called “silkiness” to the hide. But his most unique contribution was the rare Black-Red gene—the genetic trait that would become the visual trademark of the Triple Threat lineage, causing red-born animals to darken progressively with age.

Tara-Hills Pride Lucky Barb *RC (EX-94). The formidable dam of Triple Threat. She was the crucial piece of the genetic puzzle, providing the true recessive red gene from the iconic Barb family. At the same 1972 sale where her son made history, she set her own world record, selling for $122,000.

His dam, Tara-Hills Pride Lucky Barb EX-94, was a force of nature in her own right. Sired by the strength specialist Ellbank Admiral Ormsby Pride, she combined power, width, and constitution with refined dairy character. Lifetime production: 147,756 pounds of milk with 6,264 pounds of fat. And her value showed up in the sale ring—at the same 1972 Hanover Hill Sale where her son commanded $60,000, Pride Lucky Barb herself sold for $122,000. World record for a dairy female. Mother and son shattered two global price records in a single afternoon.

The Matriarch: Johns Lucky Barb EX-97. Triple Threat’s legendary maternal granddam. Known as a “money tree” for shattering price records, she was the crucial, silent carrier of the red gene that made the historic Triple Threat mating possible.

The maternal granddam—Johns Lucky Barb EX-97-4E-GMD-5—was one of the pillars of the Holstein breed. The 1967 All-American aged cow. One of the very first cows in history to achieve EX-97. Her highest record at eight years: 29,052 pounds of milk at 4.7% fat with 1,372 pounds of fat. Lifetime total: 166,311 pounds of milk and 7,582 pounds of fat.

Industry observers called her a “money tree,”—and they weren’t exaggerating. Her progeny consistently shattered price records. Crucially, she was the original source of the red factor in the maternal line—a trait she passed silently down the generations.

Here’s what made the Triple Threat mating so special: it combined two different types of red genes. The rare Black-Red gene from Telstar’s side, and the true recessive red gene from the Barb maternal line. That unique combination gave Triple Threat his special ability to reliably produce red offspring while passing on world-class type and components.

The Chameleon Who Wouldn’t Quit

Triple Threat’s story could’ve ended with that record-breaking sale. Instead, it was only beginning—and the chapters that followed would test his resilience in ways nobody predicted.

True to his Telstar Red genetics, Triple Threat was born a vibrant red—the kind of color that stood out immediately. But within months, something strange began happening. His coat started darkening. You’d visit him one week, and he’d look a shade deeper. By six months, the transformation was visible to anyone paying attention. By nine months, he was almost completely black—often retaining only a few reddish hairs in his ears and the switch of his tail.

The Chameleon Effect. Pictured here at just six months old, Triple Threat had already transformed from a vibrant red calf to nearly all black—a trademark of the “Telstar Red” gene. Despite this confusing visual trait, which appeared in about half his red offspring, his popularity never wavered among breeders of both colors.

This was the famous “Telstar Red” phenomenon in action—a genetic trait inherited directly from his sire. For breeders unfamiliar with the trait, it caused real confusion. Some questioned whether he could even transmit red genetics at all. But verification came quickly: despite his chameleon appearance, Triple Threat consistently passed the red gene to his offspring. About half of his red-born progeny exhibited the same darkening phenomenon—turning what might’ve been a liability into a recognized trademark.

But it was a later chapter that cemented his legend among breeders who valued toughness as much as type.

According to industry accounts, Triple Threat suffered a significant leg injury in his mature years at ABS. The damage was reportedly permanent and debilitating—serious enough that he became known among breeders as “the three-legged bull.” By conventional measures, an animal in that condition should’ve been retired. Should’ve been done.

He wasn’t done.

His libido remained strong. His seminal quality stayed high. He continued to work, continued to breed, continued to stamp his excellence on thousands of daughters. For breeders, this physical resilience became more than an anecdote. It was living proof of constitutional vigor—a will to live that he passed to his progeny. His daughters became renowned not just for their beauty but for their durability. Long-lasting cows who stayed productive from lactation after lactation.

Whether the “three-legged bull” story is the literal truth or an industry legend grown tall over fifty years, the underlying message resonated: this was a bull—and a bloodline—that refused to quit.

A Threat in Three Dimensions

His name proved prophetic. Hanover-Hill Triple Threat-Red posed a genuine challenge to the competition in three distinct ways—a combination that made him one of the most sought-after sires of his generation.

First, type transformation. At a time when many Red & White cattle lacked the scale and refinement of their Black & White counterparts, Triple Threat injected the elite “Hanover Hill look” into the red population. He consistently sired daughters who were tall, long-necked, angular—animals with mammary systems showing exceptional texture and strong suspensory ligaments. His impact on feet and legs was equally dramatic. Flat bone. Correct set to the hock. Traits that contributed directly to the longevity his daughters became famous for.

One European observer summarized it best: “He probably improved conformation more in one generation than any bull ever used in Europe.”

Second, components. While contemporaries like Round Oak Rag Apple Elevation were chasing sheer milk volume, Triple Threat offered something different. High butterfat percentage—inherited from both sides of his pedigree. In today’s component-heavy pricing environment, we’d call that money in the tank. Back then, it made his daughters highly profitable in markets that paid on solids. And it made him a perfect complement to high-volume bloodlines that often tested lower for fat.

Third—and this is the big one—maternal transmission. Triple Threat was what breeders call a “daughters bull.” He produced great daughters but no legacy sons. That’s not a flaw; it’s a pattern you see when a sire’s maternal line is exceptionally dominant. He was a conduit for one of the breed’s most powerful dynasties—the Barbs. His ability to sire what observers called “outsize brood cows”—noted for correct conformation, style, pretty udders, high butterfat, and longevity—was legendary.

His daughters weren’t merely productive. They were matriarchs capable of founding dynasties.

So he had the genetics. He had the resilience. But the proof? That came through his progeny—both daughters and sons who carried his influence forward in ways nobody anticipated.

The Dynasty That Changed Everything

Here’s where the story gets really interesting—and really relevant to anyone running red genetics today.

The crown jewel of Triple Threat’s legacy? The connection to KHW Regiment Apple-Red EX-96 – “The Million Dollar Cow” and arguably the most influential Red Holstein of the 21st century.

The Dynasty Builder: KHW Regiment Apple-Red EX-96. The “Million Dollar Cow” and the most famous Red Holstein of the modern era. Her existence is the direct result of Triple Threat’s legacy: she would not be red without the red factor passed down through her grandsire, Meadolake Jubilant—Triple Threat’s most influential son.

Meadolake Jubilant-RC EX—the vital bridge to the Apple family—and E-D Thor-Red were Triple Threat’s two highest sons. While both were widely used across Canada, the US, and Europe, it was Jubilant who reinforced the classic Triple Threat profile: frame, strength, high components. He sired tens of thousands of daughters, making him one of the most widely used RC sires of his era. But his most important contribution? He carried the red factor forward. One of Jubilant’s significant daughters was Clover-Mist Augy Star EX-94, who became the granddam of Kamps-Hollow Altitude-RC EX-95—the 2009 Red Impact Winner. Altitude produced Advent-Red, Acme-RC, and the famous Apple herself.

That entire Apple family—unparalleled in Red Holstein circles—would never have been red and white if Jubilant hadn’t passed along the red factor. If you’ve used Apple genetics in the last decade, you’re tapping into a lineage that started with that “genetic defect” of a red calf back in 1972.

But the daughters built empires too.

The Showstopper: Nandette T.T. Speckle-Red EX-93-DOM. A two-time All-American who proved Triple Threat daughters could dominate the show ring. She wasn’t just a pretty face; her descendants include the millionaire sire Ladino-Park Talent-RC, further cementing Triple Threat’s influence on the modern breed.

Nandette T.T. Speckle-Red EX-93-DOM was a two-time All-American Red & White in 1981 and 1984—25,290 pounds of milk at 4.7% fat as a four-year-old. Beautiful and productive. Her daughter, Stookey Elm Park Blackrose-ET EX-96, became an All-American in ’92 and ’93, accumulating 149,880 pounds in four lactations while mothering eight Excellent offspring. That line produced Ladino-Park Talent-RC—the world’s only RC millionaire sire. Talent sired Ms Delicious Apple-Red EX-94, who carries double Triple Threat blood and is the dam of Diamondback with over 22,000 daughters.

The Black & White Influence: Tora Triple Threat Lulu EX-96-GMD. While Triple Threat is famous for his red offspring, his influence transcended color lines. Lulu, a Reserve Grand Champion at the Royal Winter Fair, became the dam of the millionaire sire Hanover-Hill Inspiration—proving that Triple Threat’s genetics were powerful enough to shape the mainstream Black & White population just as heavily as the Red.

Tora Triple Threat Lulu EX-96-GMD earned Reserve Grand at the Royal Winter Fair in 1981 and became the dam of Hanover-Hill Inspiration EX-Extra—another millionaire sire used heavily in Black & White populations worldwide. Through Inspiration, Triple Threat’s genetics permeated the mainstream breed, reaching herds that never explicitly sought red genetics.

Hanoverhill TT Roxette-ET EX-94-2E-GMD-DOM introduced the red gene into the legendary Roxy family—widely considered the greatest cow family in Holstein history. The 2012 Red Impact winner, Golden-Oaks Perk Rae-Red, traces back to Roxette—and carries double Triple Threat blood through Jubilant on her dam’s side.

The Polled Pioneer: Golden-Oaks Perk Rae P Red EX-90. A granddaughter of the legendary Roxette, Perk Rae P Red didn’t just carry the Triple Threat legacy of elite type—she pushed the frontier of polled genetics. As a pioneer brood cow, she proved that breeders didn’t have to sacrifice conformation to get the polled gene, laying the groundwork for the modern polled Red market we see today.

And then there’s Sellcrest T Roseanne-Red EX-93-2E-GMD-DOM—40,340 pounds of milk at 4.7% fat with 1,880 pounds of fat. She shattered the stereotype that Red & White cows couldn’t compete on production. When Holstein International ran its 2012 Red Impact Competition—forty years after Triple Threat’s birth—Roseanne still finished sixth. Four decades of relevance.

The reach extended beyond red breeding. Scientific Debutante Rae EX-92—carrying double Triple Threat blood through both Jubilant and the Roxette line—became the dam of Destry-RC, one of the most influential sires in mainstream Black & White populations. Meanwhile, Lulu’s son Hanover-Hill Inspiration achieved millionaire status and was used heavily across the breed worldwide. Triple Threat’s genetics didn’t just build the Red Holstein—they infiltrated the entire Holstein population.

From New York to the World

The impact wasn’t confined to North America. Triple Threat’s genetics became the primary vehicle for “Holsteinization” across Europe—transforming traditional dual-purpose red breeds into specialized dairy cattle.

Schrago Triple Ortensia Red. The proof in the pail. In 1977, ABS Director Dr. Robert Walton (second from right) traveled to Switzerland to see the first milking Triple Threat daughter firsthand—validating the “rogue” purchase made five years earlier. Also pictured with breeder André Schrago are industry leaders from France (Alain Du Colombier) and Germany (Dr. Otto Dramm), marking the start of the European Red revolution.

The Swiss daughter Guex Triple Tulippe-Red achieved something almost unprecedented: EX-98. Nearly perfect. When a disease outbreak at the 1979 Paris Agriculture Show infected her and three other Triple Threat daughters with IBR, Swiss authorities—whose country was free of the disease—demanded immediate slaughter upon their return. Three went to the abattoir. But Tulippe’s genetics were considered too precious to lose. Jean-Louis Schrago arranged for her transfer to Holland, where breeder Anton Van Nieuwenhuize saved her. She lived to age 15—a living advertisement across Europe for the durability and elite type of the Triple Threat bloodline.

The Survivor: Guex Triple Tulippe-Red EX-98. Pictured here upon her arrival in Holland in 1979 with Anton Van Nieuwenhuize (pouring champagne). After contracting IBR at the Paris show, Tulippe was barred from returning to Switzerland and faced immediate slaughter. Instead, she was spirited away to the Netherlands, where she lived to age 15 and became a key figure in convincing Dutch breeders to embrace the Red Holstein crossing program.

But the show ring dominance stretched far beyond Switzerland. Hepp-Haven Lisa of Pinehurst EX-96 earned Reserve Grand Champion at World Dairy Expo in 1986—competing against all colors and holding her own on the biggest stage in the industry. In France, he established the Uzes EX-96 and Rolls EX-96 families—both national champions, with Uzes winning not just the red and white division but the overall national championship against Black & White competition. In Germany, his genetics accelerated the evolution of the German Red Pied into the modern Red Holstein.

The list of remarkable Triple Threat daughters scoring EX-96 or higher across three continents is extraordinary. It’s a testament to how consistently he transmitted elite type regardless of where his genetics landed.

Jean-Louis Schrago’s vision, dismissed by Heffering in 1968, had reshaped an entire continent. But the story doesn’t end with history—it’s still being written today.

What This Means for Your Herd in 2025

Walk through Madison during World Dairy Expo or watch the results coming out of the recent National Red & White Show—Golden-Oaks Temptres-Red taking Grand Champion this year—and you’ll see Triple Threat’s fingerprint everywhere. That’s not nostalgia talking—it’s genetics.

This is Golden-Oaks Temptress-Red-ET—the 2024 World Dairy Expo Supreme Champion who just dethroned a three-time reigning queen. Fifty-two years after Ken Young bet his career on a red calf nobody wanted, a Red & White Holstein stood at the pinnacle of the most prestigious show on earth. That’s the arc of Triple Threat’s legacy. From $60,000 gamble to Supreme Champion crowns. From “cull her, she’s red” to the kind of type that makes judges stop and stare.

Fifty-three years after his birth, his influence isn’t just historical. It’s actively shaping the breed’s future. Modern genomic giants like Hoogerhorst DG OH Rubels-Red carry the Triple Threat bloodline no less than three times in their pedigrees. The Ranger-Red lineage connects directly back. Influential sires like Gywer-RC and Lawn Boy-Red all carry Triple Threat genes. If you’ve been watching the red leaderboards lately, you’re seeing his genetic fingerprint everywhere.

So what’s the lesson here? What should today’s breeders take from Schrago’s vision and Young’s rogue bid?

It’s this: the genetics everyone dismisses today might be the genetics everyone needs tomorrow.

In 1968, Heffering told Schrago there was no market for red cattle. The industry consensus was clear: red was a defect. The smart money said cull those animals and move on. But Schrago saw something different. He saw value where others saw liability. And he was willing to wait—to import semen from Japan, to return year after year, to make the case until the market caught up with his vision.

We’re seeing similar dynamics right now. Breeders banking embryos from A2A2 cows when the premium’s only a nickel. Breeders prioritizing polled genetics when the market hasn’t fully caught up. Breeders maintaining cow families that don’t top the genomic charts but produce consistently year after year—cows that stay in the herd five, six, seven lactations. With feed costs where they are and labor harder to find than ever, that kind of durability isn’t just nice to have; it’s what makes this business sustainable when margins get tight.

Triple Threat proved that patience and conviction, backed by genuine genetic quality, can reshape an entire breed. His daughters weren’t just show winners—they were durable, profitable, long-lasting cows that worked in commercial settings. That combination of type and function, beauty and durability, is exactly what the industry needs now as we balance genomic potential against real-world cow performance.

The Bottom Line

Hanover-Hill Triple Threat-Red was an anomaly who became an archetype. Born from a speculative mating that defied the commercial logic of his time. Purchased for a record price through a rogue bid that could’ve ended Ken Young’s career. Physically compromised for much of his productive life, if the old-timers’ stories are to be believed. Yet he overcame every barrier to reshape an entire breed.

He didn’t merely improve the Red & White cow—he essentially created its modern iteration. By combining the potent Black-Red gene from Telstar with the true recessive red gene and elite type from the Lucky Barb family, he elevated the Red Holstein from a genetic curiosity to a global commercial powerhouse.

His legacy lives in the Speckles and Lulus and Roxettes who dominated their eras. It lives in Tulippe, the Swiss survivor who carried his banner to EX-98. It lives in the Jubilant line that made Apple possible—and in Apple herself, the Million Dollar Cow who would never have been red and white without Triple Threat’s genes flowing through her pedigree. It lives in Destry-RC, carrying his genetics into the mainstream Black & White population. And it lives in breeding programs worldwide, where his genetic fingerprint continues to shape decisions made today.

Every modern Red & White that commands a high price, wins a championship, or tops a genomic index owes a genetic debt to the bull breeders still call “three-legged”—the resilient legend from Hanover Hill.

In the end, Young was right to take the risk. It was easier to ask for forgiveness than to ask for permission. And fifty-three years later, the breed is still thanking him—and Schrago, the Swiss visionary who wouldn’t take no for an answer—for having the courage to see what others couldn’t.

If you’re running red genetics in your herd—or considering adding them—take a minute to trace those pedigrees back. Chances are, you’ll find Triple Threat waiting there. The bull who changed a color. The chameleon who wouldn’t quit. The legend from Hanover Hill who proved that resilience, vision, and elite genetics can rewrite the destiny of an entire breed.

KEY TAKEAWAYS

  • The Rogue Bid: Ken Young exceeded his authorization to buy a red calf that the industry dismissed as a defect. His reported justification—”Easier to ask forgiveness than permission”—became breeding lore. That calf built the modern Red Holstein.
  • Two Genes, One Revolution: Triple Threat uniquely combined Telstar’s Black-Red gene with the Barb family’s true recessive red. For the first time, elite Black & White genetics could reliably produce red offspring.
  • A Daughters Bull: No legacy sons—but his daughters (Speckle, Lulu, Roxette, Roseanne) founded every major Red Holstein dynasty. Apple-Red, Destry-RC, and Rubels-Red all trace back to him.
  • Longevity Is the Legacy: His daughters didn’t just win shows—they lasted 5, 6, 7 lactations. In 2025, with labor tight and turnover costly, that durability is worth more than genomic flash.
  • The Breeder’s Takeaway: The genetics everyone dismisses today might be the genetics everyone needs tomorrow. Schrago waited three years. Young bet his career. Patience plus conviction can reshape an industry.

The Sunday Read Dairy Professionals Don’t Skip.

Every week, thousands of producers, breeders, and industry insiders open Bullvine Weekly for genetics insights, market shifts, and profit strategies they won’t find anywhere else. One email. Five minutes. Smarter decisions all week.

NewsSubscribe
First
Last
Consent

The Real Reason Dairy Farms Are Disappearing (Hint: It’s Not About Better Farming)

Dairy success isn’t about better farming anymore—here’s the real force changing who survives and who sells out.

The February 2024 USDA report had a number that’s stuck with me: about 1,500 U.S. dairy farms closed in 2023, yet national milk production ticked higher. That’s not just abstract data—it’s what drives our conversations at kitchen tables and farm meetings across the country. Let’s talk through what’s really happening and what it means for the future.

U.S. dairy farming faces an existential consolidation crisis, with farm numbers plummeting from 39,300 operations in 2017 to a projected 10,500 by 2040—a 73% reduction driven by systematic structural advantages favoring mega-operations over traditional family farms, with 1,420 farms disappearing annually as of 2024.

Looking at How the Structure Has Shifted

Start with the numbers, because they’re telling: The 2022 Census of Agriculture shows about 65% of American milk now comes from just 8% of herds—those with over 1,000 cows. Meanwhile, nearly 9 out of 10 farms (the 100–500 cow group) account for only 22% of the supply. In the Northeast and Midwest, that’s still the “standard” size, but the playing field keeps tilting.

As one third-generation Wisconsin farmer shared, “I remember 13 dairies on our road, but now it’s just us. Plenty of the folks who exited were younger managers, not retirees. They just couldn’t get the numbers to work.”

Cost of production varies dramatically by herd size, with the smallest operations facing a devastating $9/cwt disadvantage that translates to $250,000 in annual losses for a typical 600-cow farm—a gap driven by scale advantages in feed purchasing, financing, and regulatory compliance rather than management quality.

Cornell’s Dairy Farm Business Summary for 2022 has it in black and white: the biggest herds report $22–$24/cwt cost of production. For 100–199 cow operations, the range is $31–$33/cwt. In a market where the base price is set by regional blend or federal order, that gap eats margin and equity fast.

Beyond Raw Efficiency: What’s Really Behind Cost Gaps

What’s interesting here is how much of the “efficiency” story isn’t really about cow management or even genetics anymore. I talked to a Central Valley manager running 5,000 cows who summed it up: “We buy grain by the unit train—110 railcars. Our delivered price is CBOT minus basis, sometimes 15 cents lower. My neighbor with 300 cows pays elevator price, plus haul; that’s 40, 50 cents more per bushel.”

It’s not just West Coast operations seeing this. In the Upper Midwest, neighbors share similar experiences. Volume buyers get priority and save dollars, not because they feed cows better, but because they can buy enough at once to command a discount.

Bring in finance, and the gap widens. Published rates show 2,000-cow herds receiving prime plus 0.5%. A 200-cow farm might see prime plus two. On a $1 million note, that’s more than $15,000 a year in extra interest just for being smaller.

Then consider environmental compliance. The latest Wisconsin Department of Ag reports—which many of us turned to during the farm planning season—show the cost of nutrient management, methane compliance, and water permits comes out to 50 cents/cwt for the largest herds, but easily $15/cwt or more for the smallest. It’s the same paperwork, same inspector fee—just spread over far fewer cows and pounds.

The scale advantage isn’t about better farming—it’s about systematic structural advantages that give large operations a $4/cwt cost edge through volume discounts on feed, preferential financing rates, amortized regulatory compliance costs, and labor efficiency, creating a $100,000 annual penalty for a 500-cow farm that has nothing to do with management quality.

The Co-op/Processor Crossover: Facing Up to the Math

Now, here’s where a lot of dinner-table talk turns pointed. Vertical integration with co-ops, especially after big moves like DFA’s $425 million purchase of Dean Foods’ 44 plants, changes the dynamic. Industry estimates now indicate that more than half of DFA members’ milk flows through DFA plants.

There’s no way around it: when your co-op is both your “agent” and your buyer, it faces a built-in conflict. The original co-op job—fight for a fair farm price—collides with the processor’s goal: keep input costs as low and steady as possible.

A Cornell ag econ professor put it bluntly at last year’s co-op leadership workshop: “Co-ops owning plants face incentives that are tough to align. You can’t maximize both farmer pay price and processing margin.” And I’ve seen the evidence myself; the research shows co-ops often have lower stated deductions, but within the co-op group, “other deductions” can vary wildly. As one board member told us, “Transparency on this stuff is hard for everyone, even when we want it.”

Think about it: if your co-op owns the plant, is the negotiation about pay price truly across the table or just across the hallway?

Canadian Lessons: Costs and the Future

Now, Canadian friends watching these trends aren’t immune either. The Canadian Dairy Information Centre’s latest data puts the last decade’s dairy farm reduction at over 2,700, even under supply management. And quota levels are a choke point: In Ontario, with a strict cap, quota changes hands around $24,000 per kilo of butterfat; Alberta’s uncapped market runs up past $50,000.

A young producer near Guelph explained it best: “We want to keep the farm in the family, but the math now is about buying quota at market rate from Dad—he paid $3,000/kilo in the ’90s. I pay $24,000/kilo or more, and start so far behind on cash flow it feels impossible.”

Canadian dairy quota prices have exploded from $3,000 per kilogram in the 1990s to $24,000 in Ontario and $50,000 in Alberta by 2023—a 1,567% increase that creates an impossible generational wealth transfer barrier, forcing young farmers to begin their careers hundreds of thousands of dollars in debt simply to acquire the right to produce milk their parents obtained for a fraction of the cost.

Producers Team Up—and Win

We should all pay attention to how producers abroad have responded. In Ireland, Dairygold tried to drop prices, but farmers quickly networked on WhatsApp. Once they started comparing pay stubs, they discovered inconsistencies—same pickup, same composition, different pay. They organized: “If 200 show up with real data, will you join?” The answer was yes. Six weeks, 600 farmers, and the transparency improved, the price cut was rescinded.

That lesson isn’t just for Ireland. That’s modern farm business—facts and solidarity over rumors and grumbling.

U.S. Adaptation Tactics: What’s Working

Across the U.S., I’ve watched farmers embrace savvy but straightforward approaches. Central Valley producers doubled back to their milk checks and truck bills and found that some paid 20 cents/cwt more for identical hauls. As a group, they pressed for change—and got it.

Midwesterners have started bottling their own milk—Wisconsin’s extension reports show farmgate price benefits of $2 to $4 a gallon, though yeah, getting there takes $75,000 to $100,000 and some serious compliance stamina.

Debt is a fresh challenge in its own right in cow management. Now’s the time to renegotiate any credit above prime plus one. Dropping even one percent on a $2 million note brings $20,000–$25,000 savings straight to the P&L.

Environmental Law: A Sea Change

California’s methane digester rules, fully phased in over the past two years, are a classic case of “scale wins again.” For big operations, $4 million-plus digesters can become a profit center—especially if you trade renewable natural gas credits north of $1 million a year. Small farms? They can’t justify the capital, so the compliance cost splits unevenly—UC Davis economists show $2/cwt for small farms, under 50 cents for the largest.

It’s not about better manure management; it’s about who can amortize the cost.

The Path Ahead: What’s Next in Dairy Consolidation

The USDA’s Economic Research Service expects U.S. dairy farm numbers to dip below 10,000 by the mid-2030s, with Canadian farm numbers also dropping to around 4,000–5,000. That’s the math if nobody changes the model or the market.

But honestly, what gives me hope are examples of when perseverance, innovation, and strategic shifts pay off. In Wisconsin, several smaller herds now sell directly into grass-fed cheese contracts, pulling in a $4/cwt premium (more than make-allotment size, less fight for line space). “We stopped competing with 5,000-cow barns by beating them at their game,” one farmer told me. “We get paid for our story and our butterfat.”

Where To Focus Now

  • Calculate Your Position Honestly. Know your true cost—family living included—against hard local benchmarks. If the numbers don’t lie, accept what you see and plan accordingly.
  • Don’t Go It Alone. From paycheck audits to volume negotiations, the farms that win increasingly do so together.
  • Strategic Awareness Beats Production Alone. The future belongs to those who know how pricing, processing, and consumer trends intersect—and find their “crack” in the system instead of just producing more.

As Tom Vilsack put it at a dairy business roundtable: “We love to say we’re saving family farms, but policy and business choices keep rewarding bigness and consistency.” No matter your model—organic, conventional, something in between—the goal is to find your margin, your allies, and your leverage.

The numbers will keep changing, but one reality holds—those who adapt, share, and innovate stand the best chance. Old rules are being rewritten, and it’s worth being part of that conversation. For deep dives on industry economics, co-op strategy, and farm resilience, visit www.thebullvine.com.

KEY TAKEAWAYS

  • Butterfat numbers and raw efficiency don’t guarantee survival—market scale, price leverage, and transparency do.
  • Question every deduction and demand clarity from your co-op or processor—internal conflicts don’t have to shortchange you.
  • Benchmark your costs with neighboring farms and negotiate together—solo producers rarely win against consolidated buyers.
  • The farms thriving today are adapting: going direct-to-consumer, value-adding, or finding specialized markets to earn more per cwt.
  • Success in modern dairy comes from forward planning, embracing new models, and building your own leverage—not waiting for the system to “fix itself.”

EXECUTIVE SUMMARY:

Dairy’s old rules—“be efficient and you survive”—no longer hold. Drawing on real farm stories and national data, this investigation exposes why scale, access, and co-op consolidation matter more than top cow performance. You’ll see how market power and processor influence—not just farm management—decide who survives and who sells out. With insights from producers challenging these trends, along with practical strategies and benchmarks, this article is a must-read for anyone rewriting their playbook. Get the facts, the framework, and a clear-eyed look at what real success in dairy now demands.

Complete references and supporting documentation are available upon request by contacting the editorial team at editor@thebullvine.com.

Learn More:

The Sunday Read Dairy Professionals Don’t Skip.

Every week, thousands of producers, breeders, and industry insiders open Bullvine Weekly for genetics insights, market shifts, and profit strategies they won’t find anywhere else. One email. Five minutes. Smarter decisions all week.

NewsSubscribe
First
Last
Consent

Feed as Science: How the Penn State Particle Separator Turns TMR Consistency into Butterfat and Profit

Feed as Science: How the Penn State Box Turns TMR Consistency into Butterfat and Profit

I was in a feed room on a Wisconsin dairy not long ago when I noticed something familiar—a brand-new Penn State Particle Separator, still in the box and tucked behind a stack of feed samples. The herd manager laughed when he saw me notice it. “We bought it last winter,” he admitted, “but we’ve been too busy to get into the routine.”

You know, that exchange says a lot about where we are as an industry. We’ve got tools that can unlock thousands of dollars in performance, but in the rush of day-to-day dairy life, the simplest ones often get sidelined. What’s interesting here is that this little plastic box—the Penn State Separator—is turning out to be one of the best pay-per-minute management tools we have.

Why Particle Size Still Deserves Attention

In recent years, research from Penn State Extension and the University of Wisconsin–Madison Department of Dairy Science has made one thing clear: physical feed structure drives both nutrition and profit. When TMR particle size drifts off target—either too fine or too coarse—milk output routinely dips 3–8 pounds (1.4–3.6 kg) per cow per day. Butterfat often falls 0.3–0.6 percentage points, especially when rumen function gets disrupted.

Those numbers add up quickly. For a 600-cow herd, that could easily amount to five figures in monthly component revenue left on the table.

Dr. Mike Hutjens, Professor Emeritus at the University of Illinois, puts it plainly: “Feed uniformity is your daily quality control system. Without it, you’re guessing.” And that’s the truth—consistency isn’t a luxury metric; it’s how high-performing dairies stay profitable year-round.

The Science Inside the Box

If you’ve handled a Penn State Particle Separator, you know it’s simple: four sieve trays stacked by particle size that literally show what cows are eating—not just what’s printed on the ration sheet.

For most lactating cows, Penn State guidelines suggest:

  • 2–8% retained on the top (>19 mm) sieve
  • 30–50% on the next (8–19 mm)
  • 20–30% on the third (4–8 mm)
  • Under 20% in the bottom pan (<4 mm)

What’s really fascinating is how this simple distribution tells us everything about the efficiency of rumen function. Too much fine material, and pH typically plummets below 5.8, kicking off subacute ruminal acidosis (SARA) (Krause & Oetzel, J. Dairy Sci., 2006). Too much long material, and cows start sorting, which restricts intake and upsets the delicate microbial balance that drives butterfat production.

Essentially, the Separator is a truth serum for TMR management—turning impressions into data.

When Feed Gets Too Fine – The Hidden Efficiency Leak

Overmixing is easy, especially in winter when forages dry out and mixing times stretch. The problem is subtle: rations start looking “fluffy,” but excessive blending breaks down fiber particles that cows need for natural buffering.

Mixing Time: The Goldilocks Zone for Particle Size – Seven to nine minutes hits the sweet spot for most operations: enough to blend thoroughly, not enough to pulverize fiber. Beyond 11 minutes, physically effective NDF drops below 60%, and fine particles spike—setting up acidosis risk. 

Research from Penn State (2023) and Dairyland Laboratories (2024) shows a consistent relationship—each 1% increase in fecal starch above 3% equals roughly 0.7 pounds (0.3 kg) of lost milk per cow per day. That drop traces directly back to reduced particle size and faster rumen passage.

Fecal Starch: The 3% Rule That Costs Real Money – Every 1% above 3% fecal starch equals 0.7 lbs lost milk per cow daily. At 5%, a 600-cow herd loses $30,660 annually.

Once the feed texture is corrected, cows respond fast. Intake climbs within a few days, and butterfat tends to normalize within 10–14 days. That’s the rumen re-establishing equilibrium, and it happens predictably if consistency holds.

It’s worth noting that recovery isn’t instant because microbial populations need a full cycle—about three weeks—to rebuild. But when farms stick with the plan, the results speak for themselves.

When Feed Gets Too Long – Why “More Fiber” Can Backfire

Across the Midwest, it’s common to see the opposite: rations that are too coarse. Sometimes it’s due to harvest conditions, sometimes prolonged knife wear, or wet forages. But even 10–15% material on the top sieve can drop dry matter intake by 3.3–4.4 pounds (1.5–2 kg) per cow per day, according to Cornell Cooperative Extension (2023)and Kononoff et al. (J. Dairy Sci., 2003).

It’s easy to spot. Bunks show long refusals, feed sorting increases, and milk solids vary from cow to cow. That imbalance also stresses the fresh cow group, where consistent energy delivery is critical during the transition period.

The fix is often small—a sharper chop or added moisture—but the payoff is large. One Northeast producer told me, “We didn’t change the ration at all, just the chop setting—and our intakes stabilized in a week.”

Connecting Particle Size and Fecal Starch

Here’s where modern precision feeding really shines. When farms combine physical evaluation (via the separator) with digestion analytics (via fecal starch testing), they close the loop on total feed efficiency.

Research at the University of Guelph (2024) found that herds maintaining a balanced TMR structure consistently achieved fecal starch levels below 3%, aligning with about 96% total-tract starch digestibility. Anything over 5% points to feed passing too quickly—often because TMR is too fine, not because kernels are underprocessed.

Or, as Hutjens says in his workshops, “If the rumen can’t hold feed long enough, microbes can’t finish their job.” That line always sticks because it’s a simple truth: the rumen’s efficiency relies on physical structure first, chemistry second.

What Improvement Looks Like – The 21-Day Timeline

Now, many producers ask: once we fix it, how quickly do the cows show results? Based on consistent findings from Penn State, UW–Madison, and the Miner Institute, here’s what usually happens:

  • Days 1–2: Feed sorting drops; bunk refusals even out.
  • Days 3–5: DMI increases 2–4 pounds (0.9–1.8 kg) per cow.
  • Days 5–7: Milk production rises 3–5 pounds (1.4–2.3 kg) per cow.
  • Days 10–14: Butterfat lifts 0.2–0.3 points.
  • By Day 21: Rumen and microbial stability return to optimal levels.

What’s interesting here is just how predictable the recovery is when particle size and feeding routine stay on target. Results don’t happen overnight—but give it three weeks, and the cows will show you why it’s worth sticking to the plan.

21-Day Recovery: From Feed Fix to Full Profit – Cows respond predictably when particle size is corrected. Milk rises within a week, butterfat follows by week two, and rumen stability locks in by day 21. 

Turning the Separator into a Habit

Producers who’ve made this work treat the Separator as part of weekly herd management, not a special task. I like to call it “Feed Quality Friday”—a fifteen-minute ritual where the feeder runs one test, records the numbers, and shares them with the nutritionist.

The payback for that small amount of time is remarkable. Field results from Penn State Extension (2024) show that farms that regularly monitor particle size reduced component volatility by nearly 30% across seasons, saving $50,000–$60,000 annually on a 500-cow herd.

But more importantly, it changes culture. Feeders begin catching drift before it shows up in milk tests. They start asking better questions about forage moisture, mixing time, and loading sequences. And that’s how farms shift from reactive to proactive management.

Building a Culture of Consistency

What’s encouraging is that this approach works everywhere—from 120-cow tiestalls in Ontario to 2,000-cow dry lot systems in California. The herds that succeed treat feed measurement with the same precision as fresh cow management or breeding records.

Across operations big and small, I’ve noticed that testing isn’t just about data—it builds accountability. Posting results weekly in the feed room, laminating target charts next to the mixer, or even color-coding sieves can transform an abstract concept into a visible, shared goal.

As Hutjens likes to emphasize, “Technology gives you options, but discipline delivers results.” That sentiment captures the heart of this discussion.

The Takeaway

Here’s what it all comes down to: the Penn State Separator isn’t flashy, and it doesn’t plug into an app—but it represents precision in its purest form. Measure, monitor, adjust, repeat. That process costs almost nothing and protects everything that matters: milk yield, butterfat performance, and cow health.

So if your separator is sitting in a corner, unopened, dust it off this week. Shake out one sample. It might just be the five most profitable minutes you’ll spend all month.

This feature draws on research and field data from Penn State Extension, University of Wisconsin–Madison, University of Guelph, Cornell Cooperative Extension, Dairyland Laboratories, and the William H. Miner Agricultural Research Institute, with expert perspective from Dr. Mike Hutjens, University of Illinois Professor Emeritus.

Key Takeaways:

  • The Penn State Particle Separator turns feed analysis into a five‑minute habit that can unlock five‑figure profits.
  • A simple metric—fecal starch over 3%—signals lost milk and missed feed efficiency worth hundreds daily.
  • “Feed Quality Fridays” pay off: just 15 minutes a week can protect up to $60,000 a year in butterfat returns.
  • Within 21 days of adjusting the feed structure, rumen health steadies, and milk fat rebounds naturally.
  • Across every region and herd size, the best dairies win on one thing: disciplined consistency—not fancy tools.

Executive Summary

Ask any successful dairy manager, and they’ll tell you—precision starts with the basics. This article reveals how the humble Penn State Particle Separator has become one of the most cost-effective tools for improving butterfat and overall feed efficiency. Backed by university and field research, it shows how something as simple as a five-minute TMR check can prevent $50,000 or more in yearly losses from feed inconsistency and poor fiber balance. Each 1% rise in fecal starch above 3% translates directly to milk left on the table, and yet, herds that make testing routine see full recovery in yield and butterfat within just 21 days. What’s interesting here is that the wins don’t come from expensive equipment—they come from habit, focus, and follow-through. It’s proof that on the best dairies, measurement has become a mindset, not just a task.

Complete references and supporting documentation are available upon request by contacting the editorial team at editor@thebullvine.com.

Learn More:

The Sunday Read Dairy Professionals Don’t Skip.

Every week, thousands of producers, breeders, and industry insiders open Bullvine Weekly for genetics insights, market shifts, and profit strategies they won’t find anywhere else. One email. Five minutes. Smarter decisions all week.

NewsSubscribe
First
Last
Consent

The $300 Million Overrun You’re Paying For: Inside Dairy’s $11 Billion Labor Crisis

What farmers are discovering about the gap between processing expansion and workforce reality—and the practical lessons emerging from projects like Darigold’s Pasco plant

EXECUTIVE SUMMARY: The U.S. dairy industry is pouring $11 billion into processing plants it can’t staff—and farmers are paying for this disconnect through devastating milk check deductions. Darigold’s Pasco facility exemplifies the crisis: costs exploded from $600 million to over $900 million, forcing 300 member farms to cover the overrun at $4 per hundredweight, slashing their income by 20-25%. This infrastructure boom collides with an existential workforce crisis where immigrant workers, who produce 79% of America’s milk, face deportation while dairy remains locked out of legal visa programs that other agricultural sectors freely use. Farmers had no vote on these massive expansions, yet cooperative governance ensures they absorb all losses while contractors pocket overrun profits and board members face zero consequences. Some producers are finding lifelines through direct-to-consumer sales (commanding 400-600% premiums), smaller regional cooperatives, and strategic production management, but these are individual escapes from a systemic failure. Without fundamental reforms in cooperative governance and immigration policy, the industry will complete these factories just in time to discover there’s nobody left to run them—or milk the cows.

dairy governance risk
The largest ever investment in Darigold’s 100-year history, the Pasco plant stands to solidify the Northwest region among dairy producing regions for generations to come.

You know that feeling when you watch a neighbor build a massive new freestall barn, and you can’t help but wonder—who exactly is going to milk all those cows?

That’s not just a neighborhood curiosity anymore. It is the $11 billion question hanging over the entire dairy industry. Except we aren’t talking about barns; we’re talking about processing plants. And the answer is costing you $4.00 per hundredweight.

[IMAGE TAG: Wide shot of massive dairy processing plant under construction with empty parking lots]

So here’s what’s happening. When Darigold opened its new Pasco, Washington processing facility this past June, they had every reason to celebrate. The 500,000-square-foot facility can handle 8 million pounds of milk daily—that’s enough capacity to churn out 280 million pounds of powdered milk and 175 million pounds of butter annually. The technology really is impressive—state-of-the-art dryers, low-emission burners, the whole nine yards.

But here’s where it gets complicated, and you probably know where I’m going with this. That shiny new plant ended up costing over $900 million, even though the original budget was $600 million. That’s a 50% overrun, and if you’re shipping to Darigold, you already know who’s paying for it—their 300 member farms are covering it through that $4 per hundredweight deduction from milk checks.

Darigold’s Pasco plant overran by $300M—and 300 member farms absorbed it all through $4/cwt deductions

I’ve been talking with producers who say it accounts for 20-25% of their payments. Think about that for a minute. You’re already juggling feed costs that won’t quit, trying to find workers who’ll actually show up, dealing with market swings that’d make your head spin, and suddenly a quarter of your milk check disappears to cover someone else’s construction overrun.

“A quarter of your milk check disappears to cover someone else’s construction overrun while you struggle with feed costs, labor shortages, and market volatility.”

What’s interesting is that Pasco isn’t some weird outlier. The International Dairy Foods Association released their October report showing we’re looking at over $11 billion in new processing capacity coming online between now and 2028. We’re talking over 50 major projects here—it’s the largest infrastructure expansion I’ve seen in… well, honestly, ever.

And yet—and this is the kicker—this massive bet on processing capacity is running headfirst into a reality that anyone who’s tried to hire a milker recently knows all too well. We simply can’t find enough workers to operate the facilities we’ve already got, let alone staff new ones.

Quick Facts: The $11 Billion Reality Check

  • Total Infrastructure Investment: $11+ billion (2025-2028)
  • Major Projects: 50+ processing facilities announced or under construction
  • Darigold Overrun: $300 million (50% over budget)
  • Farmer Impact: $4/cwt deduction = 20-25% payment reduction
  • Farms Closing in 2025: 2,800 operations
  • Workforce Reality: 51% immigrant workers producing 79% of the U.S. milk

Understanding the Infrastructure Surge

Let me walk you through what’s actually being built out there, because the scale really is something else.

Chobani broke ground on a $1.2 billion facility in Rome, New York, back in April. Governor Hochul’s office is promising 1,000+ jobs and the capacity to process 12 million pounds of milk daily. Now, I’ve driven through that region recently—beautiful country, no doubt about it. But here’s what’s nagging at me: New York lost more than half its dairy farms between 2009 and 2022. The Census of Agriculture data doesn’t lie. So where exactly is all that milk going to come from?

Then you’ve got Hilmar Cheese Company’s operation in Dodge City, Kansas. It’s a $600+ million plant that started running this past March. They designed it to process 8 million pounds of milk daily, supposedly creating 250 jobs. But here’s what’s interesting—and this is November, mind you—they’re still scrambling to fill critical positions. Maintenance mechanics, facilitators, and milk receivers for night shifts. These aren’t entry-level gigs where you can train someone up in a week. These are technical roles that require people who know what they’re doing.

Fairlife—you know, the Coca-Cola folks—they’re building a $650 million ultra-filtration facility in Webster, New York. It’s part of what the state’s calling a $2.8 billion surge in dairy processing investments. Largest state investment in the nation, they say.

Michael Dykes, over at the International Dairy Foods Association, he’s confident about all this expansion. In their October industry report, he said: “Don’t fret for one moment—dairy farmers hear the market calling for milk. Milk will come.”

I appreciate the optimism, I really do. And on paper, it makes sense. Global dairy demand is growing, especially in Southeast Asia. Export opportunities are expanding. Processing innovation is creating new product categories we couldn’t have imagined ten years ago.

What could go wrong, right?

Well, let me tell you what’s already going wrong.

The Labor Reality Check

[IMAGE TAG: Split screen showing empty milking parlor positions vs. ICE raid at dairy farm]

Here’s the number that should keep every processor awake at night—and probably keeps many of you awake too. Texas A&M did a study in 2023, and the National Milk Producers Federation confirmed it: 51% of the dairy workforce consists of immigrant workers who produce 79% of America’s milk supply. I’ve cross-checked these numbers with multiple sources. If anything, they might be conservative.

Meanwhile—and this is where it gets frustrating—the H-2A temporary agricultural worker program has grown from about 48,000 certified positions back in 2005 to nearly 380,000 in fiscal 2024. Department of Labor tracks all this. But dairy? We’re completely locked out. Why? Because their regulations say work has to be “seasonal or temporary.”

Last I checked, cows need milking 365 days a year. They don’t take vacations.

“51% of the dairy workforce consists of immigrant workers who produce 79% of America’s milk. Yet dairy is locked out of H-2A visas because cows don’t take vacations.”

51% of dairy workers produce 79% of U.S. milk—the uncomfortable truth about American agriculture

What really gets me is that sheep herding operations—sheep herding!—have H-2A access, even though that’s year-round work too. It’s right there in the H-2A Herder Final Rule if you want to look it up. Jaime Castaneda, who handles policy for the National Milk Producers Federation, he’s been beating this drum for years. As he told me, “We have written to the Department of Labor a number of different times and actually even pointed to the fact that the sheep herding industry has access to H-2A, and it’s a very similar industry to dairy.”

But nothing changes.

And it’s not just dairy facing this squeeze. The Associated Builders and Contractors released its 2025 workforce report: the construction industry needs 439,000 additional workers this year just to meet demand. This labor shortage is exactly what’s driving delays and cost overruns on these dairy processing projects. Darigold learned that the hard way.

Workforce Crisis by the Numbers

Let me give you the regional breakdown, because it varies depending on where you’re farming:

  • Wisconsin: The University of Wisconsin School for Workers did a survey in 2023. Found that 70% of dairy workers are undocumented. Seven out of ten.
  • South Dakota: The Bureau of Labor Statistics shows unemployment under 2%. You literally cannot find local workers.
  • Looking ahead, USDA’s Economic Research Service forecasts 5,000 unfilled dairy jobs by 2030.
  • Worst-case scenario: Cornell’s research suggests that if we saw full deportation, milk prices could rise by 90% and we’d lose 2.1 million cows from the national herd.

Lessons from the Darigold Experience

So let me dig into what actually happened with Darigold, because if you’re in a co-op—and most of us are—there are some important lessons here.

What Went Wrong

Back in September 2024, Darigold sent out an update to members trying to explain the delays and cost overruns. I’ve reviewed their communications and spoken with affected producers. Here’s what really happened.

First off, supply chain disruptions hit way harder than anyone expected. And I’m not talking about generic delays here. The specialized dairy processing equipment—most of it comes from Europe—faced 12-18 month lead times instead of the usual 6-9 months. When you’re building something this complex, one delayed component throws everything off. It’s like dominoes.

Second, building regulations changed mid-construction. The Port of Pasco confirmed this in their regulatory filings. These weren’t just minor tweaks either. We’re talking structural changes that required completely new engineering calculations, new permits, and the works.

Third—and this is what really killed them—labor shortages in construction trades meant paying absolutely premium rates for skilled workers. You need specialized stainless steel welders who can work to food-grade standards? You can’t just grab someone off the street. Local construction sources tell me these folks were commanding $45-50 per hour plus benefits. And honestly? They were worth it because you couldn’t get the job done without them.

The plant was originally supposed to open in early 2024. It didn’t actually start operations until mid-2025. By September 2024, Stan Ryan, Darigold’s CEO, had to admit to the Tri-City Herald that it was only 60% complete, with costs already over $900 million.

How Farmers Are Paying the Price

This is where it gets personal for a lot of us. To cover the overrun, Darigold implemented what they’re calling a “temporary” deduction structure. I’ve seen the letters they sent to members. The language is… well, it’s stark.

Jason Vander Kooy runs Harmony Dairy near Mount Vernon, Washington—about 1,400 cows with his brother Eric. What he told Capital Press in May really stuck with me:

“There are a lot of guys who don’t want to quit farming, but can’t keep farming if this continues. The problem is we don’t have any other options. We just can’t leave the plant half constructed and walk away.”

Dan DeRuyter’s operation in Yakima County? They lost almost $5 million over 2 years due to these deductions. Five million. He told Capital Press, “It’s awful. I can’t go on much longer. I don’t think producers will be able to stay in business.”

“Dan DeRuyter’s dairy lost almost $5 million over two years from deductions to cover Darigold’s construction overruns. ‘I don’t think producers will be able to stay in business.'”

What strikes me about these stories—and maybe you’re feeling this too—is that these aren’t struggling operations. These are successful, multi-generational farms that suddenly find themselves cash-flow negative because of decisions they had no real say in making.

John DeJong’s family has been shipping to Darigold for 75 years. Seventy-five years! He put it pretty bluntly: “The deduction has eliminated investment. We’re more in survival mode. This is not a sustainable position—to dip into producers’ pockets.”

The Governance Question

Now, this is where things get interesting—and maybe a little uncomfortable—from a cooperative governance perspective.

Darigold said in their June announcement that “farmer-owners approved the Pasco project in 2021.” But when you dig into what that actually means… well, it’s not what most folks would consider democratic approval.

Based on how cooperative governance typically works—and on the extensive research by agricultural law experts at the University of Wisconsin—the approval probably came through board representatives rather than a direct member vote. Think about it. When was the last time your co-op asked you to vote on specific project budgets? On contractor selections? On who bears the risk if things go sideways?

Cornell’s cooperative research program has documented this pattern. Major capital investments often proceed based on board decisions, with members learning about cost overruns only when the deductions appear on milk checks.

I should mention that when I reached out, Darigold declined to provide specific details about their member approval process. They cited confidentiality of internal governance procedures. Make of that what you will.

The Immigration Policy Disconnect

You can’t talk about dairy labor without addressing the elephant in the barn—immigration policy. And boy, is this getting complicated.

Farmers Caught in Political Contradictions

I’ve spent a lot of time talking with farmers about this lately, and the cognitive dissonance is real.

Take Greg Moes. He manages a four-generation dairy operation near Goodwin, South Dakota, with 40 workers—half of them foreign-born. There was this CNN interview back in December that’s been making the rounds. Moes said: “We will not have food… grocery store shelves could be emptied within two days if the labor force disappears.”

Then there’s John Rosenow, who runs Roseholm-Wolfe Dairy up in Buffalo County, Wisconsin. Eighteen workers, half foreign-born. He told PBS Wisconsin this past October: “I’m out of business. And it wouldn’t take long.”

“We’re voting against our own workforce. I’m not making a political statement here, just observing the contradiction that’s tearing rural communities apart.”

What’s fascinating—and frankly, a bit troubling—is how many of these same farmers vote for politicians promising strict immigration enforcement. It’s like we’re voting against our own workforce. I’m not making a political statement here, just observing the contradiction that’s tearing rural communities apart.

Real-World Impact of Enforcement

And this isn’t theoretical anymore.

This past June, Homeland Security Investigations raided Isaak Bos’s dairy in Lovington, New Mexico. Multiple news outlets covered it. The operation lost 35 out of 55 workers in a single day. Milk production basically stopped. Bos had to scramble—brought in family members, high school students on summer break, anybody who could help keep the livestock alive.

Nicole Elliott’s Drumgoon Dairy in South Dakota went through an I-9 audit. The Argus Leader reported she went from over 50 employees down to just 16. As she told reporters, “We’ve effectively turned off the tap, yet we have not made any efforts to establish a solution for acquiring employees in the dairy sector.”

What I’ve noticed—and maybe you’ve seen this too—is that after these raids, remaining workers often self-deport out of fear. It creates this cascade effect that ripples through entire dairy regions. One raid, and suddenly everybody’s looking over their shoulder.

Understanding the Financial Flow

[IMAGE TAG: Infographic showing money flow – $300M overrun split between contractors, designers, vendors vs farmers]

When we talk about a $300 million cost overrun, it’s worth understanding where that money actually goes—and who absorbs the losses. This isn’t abstract accounting. It’s real money from real farms.

Who Profits from Overruns

So I’ve been looking into this based on construction industry analysis and Engineering News-Record’s contractor rankings.

Construction contractors like Miron Construction—they had $1.74 billion in revenue in 2024, according to ENR’s Top 400 list—typically operate under cost-plus contracts. Their fees increase in proportion to project costs. When projects run over? Their percentage-based fees go up, too. It’s built into the system.

Design firms like E.A. Bonelli & Associates, who designed Darigold’s facility, typically charge 6-12% of total construction costs. That’s standard according to the American Institute of Architects. So a $300 million overrun? That can mean millions more in design fees. Not a bad day at the office.

Equipment vendors benefit from supply chain premiums and change orders. When specialized European equipment is scarce—and it has been—vendors can command premium prices. I’ve seen quotes for processing equipment jump 30-40% during the pandemic supply crunch. Supply and demand, right?

Public entities, such as the Port of Pasco, invested $25+ million in infrastructure to support the project, according to port commission records. They get the economic development win, the ribbon-cutting photo ops, regardless of whether farmers can afford the milk check deductions.

The Processor’s Perspective

Now, to be fair, I did reach out to several processor representatives to get their side of the story. Darigold declined specific comment, but an IDFA spokesperson—speaking on background—made some points worth considering:

“Processors are caught between rising global demand and workforce constraints just like farmers. These investments are made with 20-30 year horizons. Yes, there are challenges today, but we believe in the long-term future of American dairy. The alternative—not investing in capacity—means losing market share to international competitors.”

That’s a reasonable position. It really is. Even if it doesn’t help farmers paying today’s deductions for tomorrow’s theoretical benefits.

Who Bears the Cost

But at the end of the day, it comes down to this: the financial burden falls squarely on cooperative members. The 300 Darigold farms absorbed every penny of that overrun through milk check deductions. They had no direct vote on contractor selection. No control over budget management. No recourse when costs exploded.

“300 Darigold farms absorbed every penny of a $300 million overrun. No vote on contractors. No control over budgets. No recourse when costs exploded.”

Practical Paths Forward for Farmers

Given all these structural challenges, what realistic options do we actually have? I’ve been tracking several strategies that producers are using to create some alternatives.

1. Diversification Beyond Cooperatives

Direct-to-consumer sales are providing some farmers with genuine pricing power. The Farm-to-Consumer Legal Defense Fund tracks this—28 states now allow raw milk sales in some form. Farmers I’ve talked with are getting $8-12 per gallon. That’s a 400-600% premium over conventional farmgate prices.

Direct-to-consumer sales command 400-600% premiums over commodity milk—a viable escape route from cooperative dependency

Cost Comparison Reality Check: Let me break down the numbers:

  • Conventional milk price: $18-20/cwt (works out to roughly $1.55-1.72/gallon)
  • Direct raw milk sales: $8-12/gallon
  • Investment needed: $50,000-150,000 for on-farm processing setup
  • Payback period: Generally 18-36 months if you shift 20% of production to direct sales

Even moving 20% of your production to direct sales can fundamentally change your negotiating position. You’re no longer completely dependent on that co-op milk check.

Dan Stauffer, a California dairy farmer I know, started an on-farm creamery specifically because—as she put it—”the $4.00 deduct combined with all the other standard deductions has made it impossible for us to cash flow.” She didn’t wait for reform. She built an alternative.

One important note, though: regulations vary significantly by state. What works in Pennsylvania won’t necessarily fly in Wisconsin. Always check with your state department of agriculture before making any moves.

2. Regional Cooperative Alternatives

Some farmers are successfully exploring smaller, regional cooperatives with more transparent governance. Research from the University of Wisconsin Center for Cooperatives shows these smaller co-ops often feature:

  • Direct member voting on major investments (imagine that!)
  • Transparent pricing tied to actual costs
  • Limited or no speculative facility construction
  • Focus on value-added products rather than commodity volume

The challenge? Leaving a major cooperative often involves exit fees, equity complications. But here’s what I’m seeing—when groups of farmers coordinate their intentions (legally, of course), cooperatives sometimes become more flexible on governance reforms. Funny how that works.

3. Advocacy for Practical Reforms

Rather than waiting for comprehensive federal legislation—which, let’s be honest, probably isn’t coming anytime soon—farmers are pursuing achievable state-level reforms.

In Wisconsin, a group of farmers filed formal complaints with the state Department of Agriculture regarding violations of cooperative governance. Outcomes are still pending, but it’s gotten attention.

Similarly, farmers in New York are working with their state attorney general’s office on transparency requirements for agricultural cooperatives. These aren’t radical demands. Just basic stuff like seeing the actual construction contracts before being asked to pay for overruns.

4. Strategic Production Management

This one’s delicate, but some farmers are discovering they can influence cooperative behavior through coordinated (but legal) production decisions. If enough members strategically manage production volumes, it creates leverage for governance reforms.

I’m not talking about illegal collusion here. Just individual business decisions that happen to align. When cooperatives see milk volumes dropping, board meetings suddenly become much more interesting.

Key Industry Trends to Watch

Based on conversations I’ve had with industry analysts and extension economists, here’s what I’m tracking:

Processing capacity utilization: Multiple sources suggest plants will operate at 65-75% capacity through 2026 due to milk supply constraints from labor shortages. That’s going to create margin pressure throughout the system. No way around it.

Consolidation acceleration: USDA data shows 2,800 farms closed in 2025. And that’s not the peak—it’s the baseline. Mid-size operations (500-1,500 cows) are facing the greatest pressure. I’m particularly worried about dairies in that sweet spot—too big to go niche but too small to achieve mega-dairy economies of scale.

2,800 dairy farms closed in 2025 alone—nearly double the baseline. The consolidation accelerates while processors invest $11 billion

Immigration policy evolution: Watch for potential executive orders creating temporary pathways for dairy workers. Congressional solutions remain blocked, but I’m hearing administrative workarounds are being discussed at USDA. Sources familiar with the discussions say something might be coming, but I’ll believe it when I see it.

Cooperative governance pressure: The Darigold situation has awakened member interest in governance reform across multiple cooperatives. I’m hearing rumblings from DFA and Land O’ Lakes members about demanding more transparency. About time, if you ask me.

Alternative marketing growth: Direct sales, regional brands, on-farm processing—all continuing to expand. The economics are compelling. Capturing even a portion of that processor-to-retail margin changes everything.

Practical Takeaways for Dairy Farmers

After researching this issue and talking with dozens of farmers, here’s my best advice:

1. Understand your cooperative’s governance structure. Get copies of the bylaws. Read them. Actually read them. Request documentation of how major capital decisions are made. Know your rights—you might have more than you think.

2. Evaluate diversification options. Run the numbers on direct sales or value-added processing. Even if you don’t pull the trigger, knowing your alternatives strengthens your position.

3. Document workforce challenges. Keep detailed records of recruitment efforts, wage offers, and position vacancies. This data matters for policy advocacy and might be required for future visa programs.

4. Build regional alliances. There’s strength in numbers. Coordinated action among neighboring farms—whether for governance reform, marketing alternatives, or workforce solutions—multiplies individual leverage.

5. Monitor capacity developments. Understanding regional processing capacity and utilization rates helps inform production and marketing decisions. If your processor is running at 60% capacity, that affects your negotiating position.

6. Prepare for workforce disruption. Develop contingency plans now. Cross-train employees, investigate automation options where feasible, and build relationships with temporary labor providers. Hope for the best, plan for the worst.

The Road Ahead

Looking at this $11 billion infrastructure investment, I see both dairy’s ambition and its fundamental challenge. We’re building world-class processing capacity while the workforce foundation—both on farms and in plants—is crumbling beneath us.

The Darigold experience isn’t just a cautionary tale. It’s a preview of what happens when expansion proceeds without addressing underlying structural issues. Farmers pay the price while contractors, consultants, and executives move on to the next project.

What’s become clear to me is that the disconnect between processing infrastructure and workforce reality isn’t just a temporary mismatch. It’s a structural crisis that requires fundamental reforms in how cooperatives govern themselves, how immigration policy treats agricultural workers, and how the industry plans for the future.

For dairy farmers navigating this environment, waiting for top-down solutions while writing checks for bottom-up failures isn’t sustainable. The operations that survive and thrive will be those that recognize the current system’s limitations and actively build alternatives—whether through direct marketing, governance reform, or strategic cooperation with like-minded producers.

The infrastructure bet has been placed. The steel is welded, and the dryers are installed. Now we need to ensure farmers aren’t the only ones covering the spread when the dice don’t roll our way.

Because at the end of the day, all those shiny new plants don’t mean a damn thing if there’s nobody left to milk the cows—or if the farmers have gone broke paying for the factory’s cost overruns.

KEY TAKEAWAYS

  • Check your cooperative governance NOW: If your board can approve $50M+ projects without direct member vote, you’re one announcement away from a $4/cwt deduction. Demand to see construction contracts, board votes, and risk allocation before the next expansion—farmers discovering they have legal recourse for unapproved overruns.
  • Build your escape route before you need it: Direct-to-consumer sales command $8-12/gallon (vs. $1.72 conventional) with $50-150K setup costs and 18-36 month payback. Moving just 20% of production creates leverage and covers deduction losses—28 states allow it, but check regulations first.
  • Document everything related to the workforce crisis: keep detailed records of every recruitment attempt, wage offers ($45-50/hr for skilled positions), and unfilled positions. You’ll need this evidence when immigration reform finally comes or when explaining why you can’t meet production contracts after raids.
  • Power comes from numbers, not hoping: Cooperative boards ignore individual complaints but panic when 10+ farms coordinate action. Whether demanding governance reforms, exploring alternative cooperatives, or strategic production management—allied farmers are getting results while solo operators just get bills.

Learn More: 

The Sunday Read Dairy Professionals Don’t Skip.

Every week, thousands of producers, breeders, and industry insiders open Bullvine Weekly for genetics insights, market shifts, and profit strategies they won’t find anywhere else. One email. Five minutes. Smarter decisions all week.

NewsSubscribe
First
Last
Consent

The $3 Million Question: Why Dairy’s 18-Month Window Demands Your Decision Now

Three dairy producers. One expanded. One optimized. One sold. All three are winning. Here’s why your path matters more than your size.

EXECUTIVE SUMMARY: A perfect storm is reshaping dairy: heifer inventory at historic lows (3.9M—lowest since 1978), processors desperately seeking milk with $150K+ annual premiums, and global production hitting environmental and biological walls. This convergence creates an 18-month window in which your decision determines whether you thrive, survive, or exit by 2030. Three proven paths exist: strategic expansion ($3.5-4M investment yielding up to $731K annually), optimization without debt ($200-300K profit improvements), or planned exit (preserving $400-680K more wealth than distressed sales). The window is real—processor premiums evaporate after 18 months, and with heifers requiring 30 months from birth to production, today’s decisions lock in your 2027-2028 position. Your farm’s future isn’t determined by size or history, but by making the right choice for YOUR situation in the next 90 days.

You know that feeling when you’re at the co-op meeting and everyone’s dancing around the same question? “Is something big happening here, or is this just another cycle?” Well, here’s what’s interesting—I think we’re all sensing the same thing because this time actually is different.

What I’ve found in the data lately is that we’re not seeing the typical supply hiccup or price swing. The International Farm Comparison Network released its projection last October, showing a 6 million tonne global milk shortage by 2030. Now, the International Dairy Federation? They’re suggesting it could hit 30 million tonnes. Even if we land somewhere in the middle… well, that’s not just a shortage. That’s a structural shift.

What’s Actually Driving This Supply Crunch

So here’s where it gets really interesting, and it’s the combination that matters.

The FAO and OECD put out their Agricultural Outlook last July—2024, not this year—showing global milk demand climbing by 140 to 208 million tonnes by 2030. We’re adding another 1.5 billion people to the planet, but what caught my attention is this: per capita consumption is jumping by 16% as developing regions gain purchasing power. Southeast Asia alone—according to IFCN’s April analysis—will command 37% of total global milk demand. I mean, think about that for a minute.

But production? That’s where things get complicated.

I was talking with a Wisconsin extension specialist last week, and she nailed it: “We’re watching three major dairy regions hit walls at the same time, and they’re different walls.” She’s absolutely right. DairyNZ’s latest statistics show New Zealand’s dairy cattle numbers dropped from 5.02 million back in 2014/15 to 4.70 million last year. The EU Commission’s December forecast? Milk production is declining by 0.2% this year, with growth capped at just 0.5% annually through 2031. That’s their greenhouse gas reduction targets at work, and those aren’t going away.

And then there’s our heifer situation here in North America—honestly, this one really concerns me.

The Heifer Shortage That’s Reshaping Everything

The USDA’s January Cattle report came out showing U.S. dairy heifer inventory at 3.914 million head. You know what that is? The lowest since 1978. We’re down 18% from 2018 levels.

CoBank’s research team published some sobering analysis in August—they’re projecting we’ll lose another 800,000 head over the next two years before we see any recovery. Think about that. We’re already at historic lows, and we’re going lower.

What’s driving this? Well, the National Association of Animal Breeders’ data shows beef-on-dairy breeding hit 7.9 million units in 2024. That trend alone—just that one factor—created nearly 400,000 fewer dairy heifers in 2025. Every beef-on-dairy calf born today is a heifer that won’t be entering your neighbor’s milking string in 30 months.

Dr. Jeffrey Bewley from Kentucky’s dairy extension program explained it perfectly when we talked last month: “The pipeline is essentially fixed for the next 30 months. It takes 24-30 months from birth to first lactation. The calves being born today won’t produce milk until 2027-2028, and we’re simply not producing enough of them.”

You’re probably already seeing this in heifer prices. The USDA’s Agricultural Marketing Service data from February showed prices running $2,660 to $3,640 per head—up 29% year-over-year. A Vermont producer told me last week he’s paying $4,000 for quality bred heifers… when he can find them. California operations? Some out there can’t source adequate replacements at any price. This dairy heifer shortage in 2025 is fundamentally different from past cycles.

Processing Expansion Creates Time-Limited Opportunities

Here’s a development that’s really worth watching, especially if you’re within reasonable hauling distance of new facilities.

The dairy processing sector is investing billions—we’re talking serious money—in dozens of new and expanded plants across the country. The International Dairy Foods Association has been tracking these milk processing expansion opportunities, and what fascinates me is how predictable processor behavior has become.

The University of Wisconsin’s Center for Dairy Profitability documented this pattern, and it’s remarkably consistent. In that first year after a facility announces expansion? They’re hungry for milk—offering premiums of $1.50 to $2.50 per hundredweight. But here’s what happens: by months 13 through 18, when they’ve locked in about 60-70% of what they need, those premiums drop to maybe $0.75 to $1.25. After 18 months? Standard market pricing.

Mark Stephenson from UW-Madison’s Dairy Policy Analysis program put it well: “We’re seeing farms within 75 miles of new facilities locking in bonuses worth $150,000 or more annually for a 500-cow dairy. But that opportunity has an expiration date. Once processors hit about 70-80% of their target volume, the welcome mat stays out, but the red carpet gets rolled up.”

I’ve seen this play out in Wisconsin, Pennsylvania, Idaho… same pattern everywhere. And what’s happening in Europe and Australia right now? Similar dynamics—processors scrambling for supply in tight markets, then becoming selective once they’ve secured their base needs.

Three Strategic Paths Forward

What’s fascinating to me—and I’ve been talking to producers all over—is how clearly folks are sorting themselves into three camps. Each one makes sense depending on where you’re at.

Strategic Expansion for Positioned Operations

Operations taking this route generally have strong balance sheets—we’re talking debt-to-equity ratios under 0.50. They’ve got established management systems, often with a clear succession plan in place.

Current construction costs? You’re looking at $3.5 to $4.0 million for a 500-to-1,000 cow expansion, based on what I’m hearing from contractors and extension budgets. Freestall construction alone runs $3,000 to $3,500 per stall. And financing… well, at 7-8% interest, that changes everything compared to three years ago.

A Pennsylvania producer expanding from 450 to 900 cows walked me through his thinking: “With milk projected at $21-23 per hundredweight through next year and geographic premiums adding another buck-fifty, we’re looking at $731,250 in additional annual income. Yeah, the interest rates hurt—we’re paying $840,000 more over the loan term than we would’ve three years ago. But we think the opportunity justifies it.”

Benchmarking suggests you need breakevens below $18 per hundredweight to weather potential downturns. That’s a narrow margin for error.

But here’s something worth noting—smaller operations aren’t necessarily excluded from expansion opportunities. I know a 150-cow operation in Ohio that’s adding just 50 cows, focusing on maximizing components and securing a local processor contract. Sometimes expansion doesn’t mean going big—it means going strategic.

Optimization Without Expansion of Debt

Now, this is where things get interesting for many operations. Dr. Mike Hutjens—he’s emeritus from Illinois but still consulting—has been documenting some impressive results.

Component optimization through precision nutrition, which typically costs $15-25 per cow per month, can generate $75 per cow annually just by improving butterfat and protein levels. Reproductive efficiency improvements? Those are yielding $150 in annual benefits per cow. And here’s one that surprised me: extending average lactations from 2.8 to 3.4 adds about $300 per cow in lifetime value.

“We’re documenting operations improving net income by $200,000 to $300,000 annually through systematic optimization,” Hutjens comments. “For producers who don’t want additional debt or can’t expand due to land constraints, this approach offers substantial returns.”

I’m seeing this work particularly well for operations in areas where expansion just isn’t feasible—whether due to land prices, environmental regulations, or personal preference. With this summer’s heat-stress issues reminding us of the importance of cow comfort and fresh cow management, there’s real money in getting the basics right.

For smaller herds—say, under 200 cows—optimization might be your best bet. Focus on what you control: breeding decisions, feed quality, cow comfort. One 120-cow operation in Vermont improved their net income by $85,000 annually just through better reproduction and component management. No debt, no expansion stress, just better management of what they already had.

Strategic Transition While Values Hold

This is the conversation nobody wants to have at the coffee shop, but it needs to be part of the discussion.

Cornell’s Dyson School research shows that well-planned transitions preserve $400,000 to $680,000 more wealth compared to distressed sales. That’s real money—generational wealth we’re talking about.

A farm transition specialist I know in Wisconsin—he’s been doing this for 30 years—shared something that stuck with me: “Strategic transition isn’t giving up. It’s maximizing value for the family’s future. I’m working with a 62-year-old producer right now, with no identified successor. If he transitions in 2026, he preserves about $2.1 million in equity. If he waits, hopes things improve, maybe faces forced liquidation in 2028? We’re looking at maybe $1.2 million.”

For our Canadian friends, it’s a different calculation. Ontario’s quota exchange is showing values around $24,000 per kilogram of butterfat. That’s substantial equity tied up in quota that needs careful planning to preserve.

The Human Side We Can’t Ignore

I need to bring up something we don’t talk about enough—the mental and emotional toll of these decisions.

A University of Guelph study from last year found that 76% of farmers experienced moderate to high stress levels. Dairy producers? We’re showing some of the highest rates. This isn’t just about personal wellbeing—though that matters enormously. Research in agricultural safety journals shows that chronic stress directly impacts decision-making quality. Poor decisions made under stress can affect operations for years.

A Minnesota producer was remarkably honest with me recently: “The weight of these decisions—expansion, optimization, or transition—it affects the whole family. Having someone to talk to, someone outside the immediate situation, has been invaluable.”

The Iowa Concern Line—that’s 1-800-447-1985—expanded nationally this year. Organizations like Farm State of Mind provide crucial support. Using these resources isn’t a weakness—it’s smart business. You wouldn’t run a tractor with a blown hydraulic line, right? Why run your operation when your decision-making capacity is compromised?

Risk Management in Uncertain Times

Now, I’d be doing you a disservice if I didn’t acknowledge what could go wrong with this thesis.

A severe recession? It’s possible, though the Federal Reserve currently puts the probability of a 2008-level event pretty low—less than 15%. Technology breakthroughs in genetics or reproduction could accelerate supply response, but biological systems don’t change overnight. We’ve been improving sexed semen for 15 years—sudden miraculous breakthroughs seem unlikely. Environmental policy reversals? Given current trajectories in the EU and New Zealand, I wouldn’t count on it.

And here’s something we haven’t talked about enough—feed price volatility. As many of you know, grain markets have been all over the map lately. USDA projections show significant price variability ahead for both corn and soybean meal over the next 18 months. These aren’t small moves. A dollar change in corn prices can shift your cost of production by $1.50 to $2.00 per hundredweight, depending on your feeding program. That’s why managing feed costs remains critical to any strategy you choose.

Smart producers are hedging their bets. The Dairy Margin Coverage program lets you lock in $9.50 or higher income-over-feed-cost margins for most of your production—and that “feed cost” component is key here. When feed prices spike, DMC payments help offset the pain. University of Minnesota Extension shows diversifying through beef-on-dairy programs adds $4-5 per hundredweight in supplemental revenue. These aren’t huge numbers individually, but together they provide meaningful buffers against both milk price drops and feed cost spikes.

And let’s not forget weather impacts—the drought conditions we’ve seen in parts of the Midwest and the heat-stress challenges—are adding another layer of complexity to these decisions. Climate variability isn’t going away, and it directly affects both production and feed costs.

Your 90-Day Action Framework

After talking with dozens of producers and advisors, here’s the framework that seems to resonate:

Weeks 1-2: Pull your real numbers. Not what you think they are—what they actually are. Calculate your true production costs, debt ratios, and stress-test at $16 milk for 18 months. If your breakeven’s above $20 or debt-to-equity exceeds 0.80, expansion probably isn’t your path.

Weeks 3-4: Map your market position. Meet with every processor within 150 miles. Understand which contracts are available and which premiums exist. Geography matters more than ever in this market.

Weeks 5-6: Have the succession conversation. I know—it’s uncomfortable. But if you’re over 50 without a clear successor, a strategic transition might preserve more wealth than holding on indefinitely.

Weeks 7-8: Determine actual borrowing capacity. Today’s 7-8% rates are a world apart from those of three years ago. Know your real numbers before making commitments.

Weeks 9-10: Make your choice—expansion, optimization, or transition—based on data, not emotion or tradition. This is where the rubber meets the road.

Weeks 11-12: Start executing. Delays mean missing opportunities and facing higher costs down the line.

The Global Context and What’s Ahead

What strikes me most is how this moment accelerates trends we’ve been watching for years. Industry consolidation? That’s mathematical reality. Hoard’s Dairyman’s October analysis suggests 25-40% of current operations will transition by 2030. That’s sobering… but it also creates opportunities for those positioned to capture them.

Looking globally, we’re seeing similar patterns in Australia with their drought recovery challenges, in Europe with environmental constraints, and in South America with infrastructure limitations. This isn’t just a North American phenomenon—it’s a global realignment of dairy production and consumption patterns.

A colleague at Penn State Extension said something that resonates: “Success won’t necessarily correlate with size or history. It’ll favor those who accurately assess their position and act decisively within this window.”

The 18-month timeframe isn’t arbitrary—it reflects the convergence of heifer biology, processor contracting patterns, and construction cost trajectories already in motion. While heifer availability remains fixed for 30 months ahead, the processor premium window closes in 18 months, making that the more urgent decision-making timeline. Multiple paths can succeed, but each requires honest assessment and willingness to act on that understanding.

For an industry built on multi-generational commitment and remarkable resilience, this period calls for something additional: recognizing when adaptation is necessary and positioning thoughtfully for what comes next.

Whether through expansion, optimization, or transition, the key is making intentional choices aligned with your operational realities and family goals. The decisions ahead aren’t easy—they never are. But as we’ve seen throughout dairy’s history, producers who engage thoughtfully with change, rather than hoping it passes, tend to find sustainable paths forward.

And that, ultimately, is what this is all about—finding your path forward in a changing landscape. The opportunity is real, the challenges are significant, and the window for decisive action is open… but not indefinitely.

KEY TAKEAWAYS:

  •  The 18-month window is biology meeting economics: Heifers at 3.9M (lowest since ’78) + 30-month production lag + processors desperately needing milk NOW = your decision window
  • Three strategies, all winners: Expand if you’re positioned ($3.5M investment → $731K annual returns) | Optimize what you have ($200-300K profit, no debt) | Exit strategically ($680K more than waiting)
  • Your report card determines your path: Breakeven under $18/cwt ✓ | Debt-to-equity under 0.50 ✓ | Clear succession ✓ = expand. Missing any? Optimize or exit.
  • Location drives premiums: New processing within 75 miles = $150K+ annual bonus, but these premiums evaporate after 18 months—first come, first served
  • The 90-day sprint: Weeks 1-2: Pull real numbers | Weeks 3-4: Map processor contracts | Weeks 5-6: Succession reality check | Weeks 7-12: Commit and execute

Complete references and supporting documentation are available upon request by contacting the editorial team at editor@thebullvine.com.

Learn More:

The Sunday Read Dairy Professionals Don’t Skip.

Every week, thousands of producers, breeders, and industry insiders open Bullvine Weekly for genetics insights, market shifts, and profit strategies they won’t find anywhere else. One email. Five minutes. Smarter decisions all week.

NewsSubscribe
First
Last
Consent

The $4.78 Spread: Why Protein Premiums Won’t Last Past 2027

4.2 million on GLP-1 drugs just shifted dairy demand. Yogurt up 3x. Cheese down 7%. Your protein premiums won’t last past 2027.

EXECUTIVE SUMMARY: Right now, the same tanker of milk earns $10,755 more monthly at a cheese plant than a butter plant—that’s the historic $4.78 Class III-IV spread talking. Here’s why it matters: processors invested $10 billion in capacity designed for 3.35% protein milk, but they’re getting 3.25%, forcing them to import protein at $6.50/lb while offering domestic producers $3-5/cwt premiums. Smart farms are already cashing in through amino acid programs (paying back in 60 days), beef-on-dairy breeding ($950 extra per calf), and direct processor contracts. Add 4.2 million new GLP-1 patients needing triple the yogurt, and this protein shortage has legs through 2026. But genetics will catch up by 2027, making this an 18-month window. Your first move: enroll in DMC by December 20th—$7,500 buys up to $50,000 in margin protection when Class III corrects.

Milk Protein Premiums

Monday morning’s USDA Milk Production Report delivered some surprising news that I think reveals one of the most significant opportunities we’ve seen in years. You know how September production hit 18.99 billion pounds—up 4.2% from last year? Well, our national herd expanded by 235,000 head to reach 9.58 million cows, which is the largest we’ve had since 1993.

And here’s what caught my attention: within 48 hours of that report, December through February Class III contracts on the CME dropped toward $16 flat, yet whey protein concentrate is holding steady at $3.85 per pound according to the latest Dairy Market News.

What I’ve found, analyzing these component value spreads and the processing capacity situation, is that we’re looking at opportunities worth hundreds of millions of dollars across the industry. The farms recognizing these signals over the next year and a half… well, they could find themselves in much stronger positions than those who don’t.

When Component Values Don’t Make Sense Anymore

Let me share what’s happening with the Class III-IV spread—it hit $4.78 per hundredweight this week. That’s the widest gap we’ve ever had in Federal Order history, based on the CME futures data from November 13th.

You probably already know this, but for a 1,000-cow operation averaging 75 pounds daily, that’s a $10,755 monthly difference in revenue. Just depends on whether your milk heads to cheese or butter-powder processing. We’re talking real money here.

What’s even more dramatic is the component breakdown. USDA’s weekly report from November 13th shows whey protein concentrate at 34% protein trading at $3.85 per pound. But WPC80 instant? That’s commanding $6.35 per pound, and whey protein isolate reaches $10.70. Meanwhile—and this is what gets me—CME spot butter closed Friday at just $1.58 per pound.

I’ve been around long enough to remember when these components traded pretty much at parity. This protein-to-fat value ratio of about 2.44:1… that’s not your normal market fluctuation. It’s fundamentally different.

Here’s what the dairy market’s showing us right now:

  • Class III futures sitting at $16.07-16.84/cwt through Q1 2026
  • Class IV futures stuck in the mid-$14s
  • That record $4.78/cwt Class III-IV spread
  • Whey products are at historically high premiums
  • Butter near multi-year lows, even with strong exports

The Processing Puzzle: Creating Opportunities

What’s interesting here is that between 2023 and 2025, processors committed somewhere around $10-11 billion to new milk processing capacity across the country—the International Dairy Foods Association has been tracking all this. We’re seeing major investments: Leprino Foods and Hilmar Cheese each building facilities to handle 8 million pounds daily, Chobani’s $1.2 billion Rome, NY plant, which they announced in 2023, plus that $650 million ultrafiltered dairy beverage facility Fairlife and Coca-Cola broke ground on in Webster, NY, last year.

Now, these plants were all engineered with specific assumptions about milk composition. The equipment manufacturers—Tetra Pak, GEA, those folks—they design systems expecting milk with 3.8-4.0% butterfat and 3.3-3.5% protein. That’s what everything was sized for.

But what’s actually showing up at the dock? Federal Order test data from September shows milk testing 4.40% butterfat but only 3.25% protein. That 17% deviation from design specs creates all sorts of operational headaches.

You see, cheese yields suffer because the casein networks can’t trap all that excess butterfat during coagulation—there’s been good research on this in the dairy science journals. One Midwest plant manager I spoke with—he couldn’t go on record, company policy—but he mentioned they’re dealing with reprocessing costs running $150,000-200,000 monthly, depending on facility size.

The result? According to USDA Foreign Agricultural Service trade data from July, U.S. imports of skim milk powder jumped 419% year-over-year through the first seven months of 2025. Processors are literally importing milk protein concentrate at $4.50-6.50 per pound—paying premium prices for components that domestic milk isn’t providing in the right concentrations.

The GLP-1 Factor Nobody Saw Coming

Looking at Medicare’s new GLP-1 coverage expansion, they enrolled 4.2 million patients in just two weeks after announcing medication prices would drop from around $1,000 monthly to $245 for Medicare Part D participants. The Centers for Medicare & Medicaid Services released those enrollment numbers on November 14th.

These medications—Ozempic, Wegovy—they dramatically change what people can tolerate eating. Consumer tracking research shows cheese consumption drops around 7% in GLP-1 households, butter falls nearly 6%, but yogurt consumption? It runs three times higher than the typical American rate. These patients, they can’t physically handle high-fat foods the way they used to.

The nutritional requirements are pretty specific, too. Bariatric surgery guidelines recommend patients get 1.0-1.5 grams of protein per kilogram of body weight daily to preserve muscle mass during weight loss. For someone weighing 200 pounds, that’s 91-136 grams of protein every day.

With potentially 6.7 million Medicare beneficiaries eligible, according to Congressional Budget Office projections, we’re looking at roughly 38 million pounds of additional whey protein demand annually. And that’s just from this one demographic.

What’s Working for Farms Right Now

Quick Wins (Next 60 Days)

What I’m seeing with precision amino acid balancing is really encouraging. Dr. Charles Schwab from the University of New Hampshire has been recommending targeting lysine at 7.2-7.5% of metabolizable protein and methionine at 2.4-2.5%. Farms implementing this are seeing 0.10-0.15% protein gains within 60-75 days—that’s based on DHI testing data from operations in Wisconsin and New York.

For your typical 200-cow herd in the Upper Midwest or Northeast, that translates to about $2,618-3,435 monthly in improved component values at current Federal Order prices. Plus, you avoid those Federal Order deductions when the 3.3% protein minimum kicks in on December 1st.

The cost? It costs about $900-1,500 per month for rumen-protected amino acids from suppliers like Kemin, Adisseo, or Evonik. Pretty straightforward return on investment if you ask me.

On the calf side, beef-on-dairy’s generating immediate cash. The Agricultural Marketing Service reported on November 11th that crossbred calves are averaging $1,400 at auction while Holstein bulls bring $350-450. So a 200-cow operation breeding their bottom 35%—that’s 70 cows—captures an additional $70,000 annually.

Several producers I know in Kansas and Texas are forward-selling spring 2026 calves at $1,150-$1,200, with locked prices. That provides working capital for other investments, which is crucial right now.

Strategic Medium-Term Moves

What’s proving interesting is how some farms approach processors directly rather than waiting for co-op negotiations. I know several operations in Vermont and upstate New York that secured $18.50-20.00/cwt contracts for milk testing above 3.35% protein. That’s a $3.00-5.50 premium over standard Federal Order pricing.

The genetics side is evolving quickly, too. Select Sires’ August proof run data shows that farms using sexed semen from A2A2 bulls with strong protein profiles—+0.08 to +0.12%—are well positioned for the late-2027 market when these animals enter production. Bulls like 7HO14158 BRASS and 7HO14229 TAHITI combine A2A2 status with solid protein transmission according to Holstein Association genomic evaluations.

Out in New Mexico, one producer working with a regional yogurt processor mentioned they’re getting similar premiums for consistent 3.4% protein milk. “The processor needs reliability more than volume,” she told me. “They’re willing to pay for it.” That Southwest perspective shows these opportunities aren’t just limited to traditional dairy regions.

The Jersey Question

Now, I realize suggesting Jersey cattle to Holstein producers usually gets some eye rolls. But here’s what successful operations are doing—they’re not converting whole herds. They’re introducing 25-50 Jersey or Jersey-Holstein crosses as test groups.

One Vermont producer I talked with added 40 Jerseys last year and is seeing interesting results. These animals naturally produce 3.8-4.0% protein milk and carry 60-92% A2A2 beta-casein genetics according to Jersey breed association data.

Yes, Jerseys produce 20-25% less volume. But they also eat 25-30% less feed based on university feeding trials. When you run the full economic analysis—feed costs, milk volume, component premiums—several farms report net advantages of $1.90-3.30 per cow daily.

Of course, results vary by region. What works in Vermont might not pencil out in California’s Central Valley or Idaho. You’ve got to run your own numbers.

A central Wisconsin producer running 600 Holsteins told me last week: “I’ve got too much invested in facilities and equipment sized for Holsteins to start mixing in Jerseys. For my operation, focusing on amino acids and genetics within my Holstein herd makes more sense.” And that’s a valid perspective—it really does depend on your specific situation.

Down in Georgia, another producer with 350 cows mentioned they’re seeing entirely different dynamics. “Our heat stress issues mean Jerseys actually perform better than Holsteins during summer months,” she said. “The component premiums plus heat tolerance make them work for us.” Regional differences matter.

Timing the Market: When Windows Close

Beef-on-Dairy Reality Check

Here’s something to watch carefully. Patrick Linnell at CattleFax shared projections at their October outlook conference showing beef-on-dairy calf numbers reaching 5-6 million by 2026. That would be 15% of the entire fed cattle market, up from essentially zero in 2014.

October already gave us a warning when USDA-AMS reported that prices had dropped from $1,400 to $1,204 per head in just a few weeks. Linnell tells me the premium, averaging $1,050 per calf, will likely shrink significantly as supply increases. His advice? Lock forward contracts now at $1,150-1,200 for 2026 calf crops. Once the market gets oversupplied, we could see prices settling at $900-1,050 by late 2026. Still better than Holstein bull prices, but not today’s windfall.

The Heifer Shortage Nobody’s Prepared For

Ben Laine, CoBank’s dairy economist, published some concerning modeling in their August 27th outlook. We’re looking at 796,334 fewer dairy replacement heifers through 2026 before any recovery begins in 2027.

This creates an interesting dynamic in which beef calves might be worth $900-1,050, while replacement heifers cost $3,500-4,000 or more. For a 200-cow operation needing 40 replacements annually, that’s $150,000 for heifers, while your beef calf revenue only brings in $136,500. That’s a $13,500 gap that really squeezes cash flow.

Farms implementing sexed semen programs now can produce their own replacements for $45,000-60,000 in raising costs, according to University of Wisconsin dairy management budgets. Those still buying heifers in 2027? They’ll be paying premium prices that could strain even healthy operations.

Why European Competition Isn’t the Threat

With European butter storage at 94% capacity according to EU Commission data from November, and global production up 3.8% per Rabobank’s Q4 report, you might wonder—why won’t cheap imports flood our market?

Well, USDA’s Foreign Agricultural Service analysis from October shows U.S. dairy tariffs add 10-15% to European MPC landed costs. Container freight from Europe runs $800-1,200 per 20-foot unit—that’s roughly $0.04-0.06 per pound based on the Freightos Baltic Index from November. When you add it up, European MPC lands here at $4.74-5.33 per pound. Not really undercutting domestic prices.

Plus, companies like Fonterra and Arla are pivoting toward Asian markets where they get better prices without tariff hassles. Fonterra announced in August that it’s selling its global consumer business to Lactalis for NZ$4.22 billion ($2.44 billion USD) to focus on B2B ingredients for Asian and Middle Eastern markets.

Though I should mention, one California dairyman running 800 cows pointed out that trade dynamics can shift quickly. What protects us today might not tomorrow. That’s a fair perspective worth monitoring.

Surviving the Next 90 Days

With Class III futures at $16.07-16.84 according to CME closing prices from November 15th, and many operations facing breakeven costs of $13.50-15.00 based on October profitability analysis, margins are tight. Really tight.

Creative Financing That Works

FBN announced in November that they’re offering 0% interest through September 2026 on qualifying purchases—that includes amino acids and nutrition products. No cash upfront, payments due next March after your protein improvements show in milk checks. Farm Credit Canada offers similar programs with terms of 12-18 months, according to its 2025 program guidelines.

For beef-on-dairy, several feedlots are doing interesting things with forward contracts. One Kansas feedlot operator pre-sells 40-50 spring calves at $1,300 with a 50% advance payment. That generates $26,000-$32,500 in January working capital—enough for Jersey purchases or to cover operating expenses during tight months.

Some processors are even offering advances against future protein premiums. I’ve heard of deals—companies prefer not to be named—where they’ll provide $15,000-20,000 upfront against a 24-36 month high-protein supply agreement. The advance recovers through small deductions from premium payments.

Critical December Dates

Here’s what you need on your calendar:

December 1st: Federal Order 3.3% minimum protein requirement takes effect. If you’re testing below that, deductions start immediately.

December 20th: DMC enrollment deadline for 2026 coverage. Some states have earlier deadlines—check with your local FSA office this week.

December 31st: Last day to lock beef-on-dairy forward contracts for Q1 2026 delivery at most feedlots.

The One Decision That Can’t Wait: DMC Enrollment

If you take nothing else from this discussion, please hear this: enroll in Dairy Margin Coverage at $9.50/cwt before December 20th.

At $7,500 for 5 million pounds of Tier 1 coverage, DMC provides crucial protection. Mark Stephenson from the University of Wisconsin found that 13 of the last 15 years delivered positive net benefits at $9.50 coverage. With margins at $5.07-6.34/cwt based on current milk and feed prices, and production growing 4.2%, the odds of needing this protection in early 2026 are pretty high.

Think about it—if margins drop to $9.00/cwt with Class III at $15.50, you’d receive $25,000. Drop to $8.50/cwt? That generates a $50,000 payment according to the DMC calculator. When’s the last time $7,500 bought you that kind of downside protection?

Looking at the Bigger Picture

What we’re seeing here isn’t just another market cycle. Dr. Marin Bozic at the University of Minnesota characterizes these conditions as a significant structural shift—the kind that happens maybe once in a generation. You’ve got mismatched processing capacity, changing consumer preferences accelerated by weight-loss drugs, and genetics still catching up to new realities, all converging at once.

The arbitrage opportunities won’t last forever—that’s just how markets work. Current trajectories suggest beef-on-dairy saturates by mid-2026, protein premiums moderate by 2027, and heifer shortages resolve by 2028. But for producers acting strategically over the next 18-24 months, there’s a real opportunity to strengthen operations.

The November 10th production report showing 4.2% growth might seem like bad news at first glance. But understanding component economics and arbitrage opportunities actually illuminates a path forward. The math is compelling—it’s really about positioning yourself to take advantage.

Key Actions This Week

Looking at everything we’ve discussed, here’s what I’d prioritize:

This Week’s Must-Do List:

  • Call your FSA office about DMC enrollment—deadline’s December 20th, but varies by state
  • Get quotes on rumen-protected amino acids and ask about input financing terms
  • Contact at least three feedlot buyers about spring 2026 calf contracts
  • Schedule meetings with specialty processors within 50 miles

Planning Through 2026:

  • Target 3.35-3.40% protein through nutrition management
  • Consider sexed semen on your top 40% for A2A2 and protein traits
  • Evaluate a small Jersey trial group if facilities and regional economics align
  • Keep an eye on protein contract opportunities above $2.50/cwt

Risk Management Priorities:

  • Watch beef calf forward pricing—below $1,150 means reassessing your breeding program
  • Monitor heifer prices in your area—over $3,200 signals a serious shortage ahead
  • Track processor premium offers—lock anything over $2.50/cwt
  • Review component tests monthly and adjust accordingly

What other producers are telling me is that the farms coming out ahead won’t necessarily have perfect strategies. They’ll be the ones bridging the next 90 days through smart financing and risk management while these component markets sort themselves out.

DMC enrollment alone could make the difference between staying in business and having difficult conversations with your lender come February.

You know, this opportunity window is real, but it won’t stay open indefinitely. The clock’s ticking—DMC enrollment ends December 20th, and every day you wait on strategic decisions is a day your competition might be moving ahead. The question isn’t whether these opportunities exist… it’s whether you’re positioned to capture them.

And that’s something worth thinking about over your next cup of coffee.

KEY TAKEAWAYS 

  • DMC by Dec 20 (Non-Negotiable): $7,500 premium buys $25,000-50,000 protection when Class III corrects—enrollment closes in 33 days
  • Protein Boost Pays Fast: Amino acids cost $1,200/month, deliver 0.15% protein gain in 60 days, return $3,000+ monthly for 200 cows
  • Beef-on-Dairy Has 12-Month Window: Today’s $1,400 calves drop to $900-1,050 by late 2026—lock $1,150+ contracts now
  • Chase Processor Premiums: Direct contracts pay $3-5/cwt for 3.35%+ protein milk, but only through 2027 as capacity fills
  • The Math Is Clear: $4.78 Class III-IV spread = $10,755/month extra at cheese plants. This historic gap closes within 18-24 months.

Complete references and supporting documentation are available upon request by contacting the editorial team at editor@thebullvine.com.

Learn More:

The Sunday Read Dairy Professionals Don’t Skip.

Every week, thousands of producers, breeders, and industry insiders open Bullvine Weekly for genetics insights, market shifts, and profit strategies they won’t find anywhere else. One email. Five minutes. Smarter decisions all week.

NewsSubscribe
First
Last
Consent

From Shutdown to Showdown: How Dairy’s 2026 Wake-Up Call Is Redefining Survival

What the End of Government Relief Really Meant—and How Smart Farms Are Turning Uncertainty Into Opportunity

EXECUTIVE SUMMARY: From Shutdown to Showdown: How Dairy’s 2026 Wake-Up Call Is Redefining Survival” details how the end of the government shutdown set the stage for a year of unprecedented challenge—and opportunity—in the dairy sector. Instead of relief marking the finish line, the reopening exposed new processor contract demands, profit headwinds from make allowance adjustments, and a high-stakes shift to protein-centric pricing, all verified through university extension findings and current market data. The article demonstrates how farms that capitalize on narrow timing windows, lean into peer networks, and embrace collaborative learning are gaining margin and flexibility amidst change. Practical checklists, region-specific examples, and expert-backed insights make it useful at the barn and the boardroom table alike. By weaving in both the pressures and pathways open to all sizes of operation, the story embodies The Bullvine’s commitment to presenting real decisions, not just headlines. In the end, it shows that survival—and success—are less about official relief and more about being prepared to adapt, connect, and strategize for what 2026 brings next.

Dairy Profit Strategy

You know, as much as we all soaked in the relief of those USDA payments and the delayed Milk Production reports this past fall, the lesson of the moment is clearer than ever: what matters most heading into 2026 is how quickly and thoughtfully we respond to the challenges—not just what help the government sends. What I’ve noticed—confirmed by producers in Wisconsin, Florida, and even out west—is that “relief” doesn’t make the difference for your bottom line. It’s how you move with the changing facts, the shifting contracts, and the farm realities in front of you.

Pull up a stool. Here’s how that’s actually playing out in barns, co-op meetings, and balance sheets, with credible trail markers for farms of all sizes.

Speed Kills (Complacency): Margins in the Data Gaps

What farmers are finding is that, in this climate, the winners are the ones ready to act. When the USDA’s October Milk Production report was missing for weeks, extension specialists and loan officers across the Midwest were fielding anxious calls. Herds that moved quickly—hedged milk at $17.35/cwt right after the report, or locked in feed at $4.10—wound up with $2,000-$2,500 more on every 500 cows compared to those who waited. CME and Wisconsin extension data both show how waiting for “certainty” can shrink margins before you even see the warning.

It’s not luck. It’s keeping your strategy loose, your phone handy, and your local data bookmarked. Fresh cow management, feed contracts, and market windows—they all demand being both alert and decisive, especially as 2026 approaches.

Make Allowance Leaks: When Efficiency Quietly Costs You

The Allowance Shift: June 2025 Make Allowance Increase Transfers ~$0.50/cwt from Producer Milk Checks to Processor Margins

Let’s lay out the dollars and cents. Thanks to FMMO make allowance changes last summer, about $82 million annually has shifted from producer checks into processor cost recovery, according to the American Farm Bureau and university research. That hits particularly hard for 400-600 cow herds in the Midwest, where $8,000-$15,000 in value quietly vaporized from family budgets in 2025 alone. While vertically integrated co-ops sometimes recoup some through patronage, for most, these quieter cost shifts are exactly what force new choices—do we hold, reinvest, cut inputs, or consider transitioning out?

The lesson? It’s time to double down on IOFC, watch every transition group closely, and look at every feed and labor line as a matter of survival, not just habit.

Premium Contracts: New Growth, New Hurdles

The Processor Divide: Expanded Capacity and Premium Contracts Favor Large Operations—Small Farms Face Component Quality Barriers Worth $4.40/cwt

Let’s get real about processor expansion. Yes, IDFA and DFO confirm $11 billion in new milk-processing capacity, but the “growth” headlines come with some fine print. Today’s direct contracts expect you to consistently deliver volume (often 1,000+ cows), protein over 3.2%, and sub-Grade A somatic cell counts.

Why the clampdown? Processors need stable, high-quality components to secure export and retail channels, invest in automation, and deliver on food safety for globally diverse buyers. UW reports and field officers say this shift is now woven into most new plant supplier specs.

It’s not all doom. Farms who began investing in butterfat genetics, precision feed systems, and herd data management years ago are fielding more calls, not fewer. Those focusing just on short-term barn expansion are finding that you can’t rush a protein curve or a culture of quality management. Extension and Minnesota case studies show that slow, steady moves—targeting milk components and recordkeeping upgrades first—put herds in the fast track for premium deals.

December’s 3.3% Rule: Protein as the Baseline

Speed Kills Complacency: How Quick Response to Market Data Translates to $1,400+ More Per 500 Cows

Here’s what’s interesting: this year’s biggest structural shift might be USDA’s new baseline for protein—up from 3.1% to 3.3% (USDA Final Rule). It’s been a long time coming, and peer-reviewed research had foreshadowed the change for several years. Genetics, feeding, and savvy fresh cow management have all nudged national averages upward. But it’s the local impacts—from blend checks to contract premiums—that hit home.

What does that mean practically? A 0.2% difference in protein, per 100 cows, adds up to $400-800 in annual check value, per the latest Midwest and Ontario extension data. Above 3.3%? You’re in the bonus column. Below? Now’s the time to pull out the ration notes and see where you can tweak, swap, or invest before the next round of pricing hits.

More importantly, more farms are opening up the books—digitizing records, crowdsourcing advice in peer groups, and trading input strategy tips without fear of “giving away secrets.” As more transition into 2026, collaborative learning is proving, in the field and in extension trials, to be a margin driver as real as any piece of steel.

Transition Planning: The Strongest Exit Isn’t Running—It’s Timing

One of the biggest takeaways this year is that transition can be a strength, not a sign of retreat. USDA NASS land reports peg the Midwest ground firmly above $25K/acre; extension planners increasingly help herds time “retirement” or partner transitions before the next storm hits. The real win? Leaving with financial options and the pride of calling the shot on your terms.

Herds still thinking big? UW and DFO studies show that the best results come when expansion is built on several years of component improvement and a fresh-cow strategy—not as a panic reaction to price. Dry lot and fresh group upgrades, pooled input efforts, and peer feedback show up again and again in success stories.

And for those holding steady, including herds in the 200-700 cow bracket, “optimization” is earning a new respect. Peer networks and beef-on-dairy strategies (with calves bringing $400-600, latest UMN data) are now front-line tools, and regular peer benchmarking is ensuring that the smartest changes don’t just sit on paper—they get put into practice.

Are You Fast Enough for 2026?

Pulling together farmer panels and co-op roundtables, it’s clear: being nimble, not just knowledgeable, is the new shield against margin loss. Extension economic analysis calls it “window management”—profits are made in these small, rapid openings, not in broad trends or after-the-fact decision meetings.

Facing Protein Gaps? Your Action Checklist

  • Bring three years of production and component records to a dairy-literate advisor. 
  • Model the value and cost of boosting protein (and the status quo if you don’t). 
  • Sit down with a local extension or farm business group—where are your best, region-specific levers hiding?
  • Use your peer network: tested approaches and hard-learned lessons are worth more than a new gadget.

So if there’s one sure thing heading into our “2026 wake-up call,” it’s that resources, relationships, and rapid response matter. Let’s keep those mugs full and the learning real—together, we’ll keep setting the pace for the next curve in dairy.

KEY TAKEAWAYS:

  • Farms that respond swiftly to new information—securing prices or input deals as data shifts—routinely outperform those waiting for a “clear signal.”
  • The new normal: Processor contracts and milk pricing now demand higher protein, stricter quality, and more documentation, making management upgrades and peer collaboration must-haves.
  • Smart transition planning—whether exiting, scaling, or realigning—can be a competitive edge, helping farm families lock in value rather than react to crises.
  • Operational resilience is increasingly about connecting with peer networks, bulk-buying alliances, and benchmarking tools—not just individual innovation.
  • For 2026, the most resilient farms will be those that adapt fastest to changing rules, seize learning opportunities, and stay proactive in their markets.

Complete references and supporting documentation are available upon request by contacting the editorial team at editor@thebullvine.com.

Learn More:

The Sunday Read Dairy Professionals Don’t Skip.

Every week, thousands of producers, breeders, and industry insiders open Bullvine Weekly for genetics insights, market shifts, and profit strategies they won’t find anywhere else. One email. Five minutes. Smarter decisions all week.

NewsSubscribe
First
Last
Consent

The 15:1 ROI Protocol: How Anti-Inflammatory Treatment is Cutting Transition Disease in Half

11 pounds more milk daily. 50% less disease. All from one dose of meloxicam 14 days before calving. Penn State proved it.

EXECUTIVE SUMMARY: Your transition cow problems have been starting 21 days before calving—you just didn’t know it. Revolutionary research from Penn State and Iowa State proves inflammation, not energy balance, drives fresh cow disease by hijacking glucose worth 68 pounds of milk daily. The solution is surprisingly simple: targeted anti-inflammatory treatment that costs $10 per cow but delivers 15:1 returns. Progressive farms using these protocols are cutting disease rates in half (from 25% to 12%) while increasing milk production by 3-11 pounds per day. First-calf heifers get meloxicam prepartum, overconditioned cows get aspirin, and normal cows get treated postpartum—timing is everything. Even farms that can’t use medications are seeing 60% of the benefits through management changes alone. This isn’t incremental improvement—it’s a paradigm shift that’s redefining what’s possible in transition cow performance.

Transition Cow Protocol

You know, there’s a pattern I’ve been noticing in fresh cow pens across the country—something that’s probably been bothering you too. Some cows sail through transition while others struggle, even when they’re getting identical feed and care. For years, we’ve all just accepted that 20-30% of our fresh cows will develop some kind of metabolic or infectious disease in early lactation. Cost of doing business, right? The price of pushing biology to produce 100+ pounds of milk daily.

But here’s what’s interesting… recent research from Iowa State, Penn State, and the University of Alberta is turning this thinking on its head. What I’ve found is that many transition cow problems aren’t coming from where we thought they were. And the solutions emerging from this research? They’re both simpler and way more profitable than any of us expected.

The whole thing centers on inflammation—though not the kind you can see. Research teams have identified an inflammatory cascade that starts — get this — 14 to 21 days before calving. It’s essentially programming your cows for success or failure before they even hit the maternity pen.

What’s encouraging is that forward-thinking operations—and I’ve talked with quite a few lately—are already putting this knowledge to work. They’re cutting fresh cow disease rates by 40-50% while bumping milk production by anywhere from 3 to 11 pounds per day. Real milk in the tank, not theoretical gains.

Understanding What’s Really Going On

So Barry Bradford—he was at Kansas State, now he’s up at Michigan State—and Lance Baumgard at Iowa State discovered something that seemed impossible at first. When a dairy cow’s immune system really kicks into gear, it burns through 2 to 3 kilograms of glucose daily. Think about that for a second. That’s enough glucose to produce 44 to 68 pounds of milk. Just gone. Hijacked by the immune system.

The Iowa State team demonstrated this with elegant work published in the Journal of Dairy Science in 2017. They challenged cows with lipopolysaccharide—basically a bacterial toxin—while infusing glucose to keep blood glucose levels normal. And even with all that extra glucose… milk production still crashed by 42% on day one. The immune system was outcompeting the mammary gland for glucose, despite plenty being available in the bloodstream.

This flipped everything we thought we knew. For decades, right? We’ve blamed negative energy balance for problems during transition. Cow doesn’t eat enough; it mobilizes body fat; metabolic problems follow. Simple story. But Baumgard’s comprehensive review in 2021 suggested something completely different—that inflammation might be causing both the reduced intake and the metabolic dysfunction. Cart before the horse, so to speak.

Meanwhile—and this is where it gets really interesting—Elda Dervishi’s team was tracking inflammatory markers in transition cows. What they found back in 2016 was that cows destined to develop retained placenta, metritis, or ketosis showed elevated inflammation markers starting 14 to 21 days before calving. Way before any clinical signs. The inflammation came first.

And here’s the kicker… Burim Ametaj’s team at Alberta just published work showing that hypocalcemia—which we’ve always treated as a simple calcium deficiency—might actually be the body’s intelligent response to control inflammation. Pro-inflammatory cytokines upregulate calcium-sensing receptors, actively lowering blood calcium as a protective mechanism. That’s why some cows don’t respond to calcium supplementation, no matter how much you give them. Their inflammatory state won’t let calcium normalize.

What Progressive Farms Are Actually Doing

I’ve been talking with producers who aren’t waiting for this to become mainstream. They’re implementing targeted anti-inflammatory protocols based on individual cow risk, and the results… honestly, they’re pretty compelling.

Adrian Barragan’s team at Penn State developed these risk-based protocols—just published this year—that have been validated across commercial dairies in Pennsylvania and Ohio. What they’re finding is that precision targeting beats blanket treatment every time:

First-calf heifers receiving meloxicam 2 weeks before expected calving are producing an extra 11 pounds of milk per day during the first 150 days. At current milk prices—anywhere from $0.14 to $0.22 per pound, depending on your market—that’s substantial money.

For overconditioned cows (body condition score 3.75 or higher), prepartum aspirin treatment has reduced disease rates from around 38-46% to 21%. Makes sense when you think about it—Michigan State research shows these heavier cows experience enhanced inflammatory stress from all that adipose tissue metabolism.

Normal-condition multiparous cows do best with postpartum treatment. Aspirin given 12 to 36 hours after calving—and this is critical, after the placenta passes—yields about 3.6 pounds more milk daily for over 60 days. Penn State documented what happens if you give NSAIDs too early: stillbirths increase fivefold. So timing really matters here.

A California producer who shared their experience (requesting anonymity due to ongoing research participation) is milking about 1,800 Holsteins near Turlock. After tracking haptoglobin levels following a Michigan State extension workshop, they found their fresh cow average was running 0.9 grams per liter—way above the 0.5 target. Six months after implementing targeted protocols and improving their heifer housing, they’re down to 0.6 and still dropping. Michigan State data shows that improvement correlates with about 1,000 pounds of additional milk per lactation. That’s real money.

Now, different systems face different challenges. A Vermont producer managing 450 Jerseys in tie-stalls (who asked to be identified only by state) told me, “We can’t easily separate heifers, and we’re dealing with humidity rather than dry heat. But focusing on bunk space, ventilation, and treating our at-risk cows has still cut fresh cow problems by 40%.” You work with what you’ve got, right?

Managing the Triggers You Can Control

What’s empowering about all this is learning how much inflammation we can actually control through management. Research has identified several key areas where relatively simple changes yield big results.

Heat stress during the dry period… this one’s huge, and I think we’ve all been underestimating it. Geoffrey Dahl’s extensive work at the University of Florida shows that cows experiencing THI values above 72 during the final three weeks before calving produce 5 to 16 pounds less milk daily throughout the next lactation. The damage persists for months.

Now, investing in cooling for dry cows—you’re looking at $2,000 to $5,000 depending on your setup—can return $60 to $160 per cow in additional milk revenue. I’ve seen operations in Arizona and New Mexico where dry cow cooling pays for itself in under a year.

Stocking density in closeup pens is another big one. Wisconsin research by Cook and Nordlund consistently shows that keeping close-up pens below 80% capacity improves dry matter intake, reduces cortisol levels, and cuts fresh cow disease rates. Many farms could achieve this tomorrow just by adjusting group movements or repurposing existing space. I know it’s tempting to pack that closeup pen when you’re tight on space, but the data is crystal clear on this.

Dietary transitions cost nothing to improve but pay huge dividends. Limiting starch increases to less than five percentage points when moving to lactation rations helps prevent what Baumgard’s team calls “leaky gut,”—where bacterial endotoxins flood into circulation and trigger systemic inflammation. Pure management discipline, no capital required.

Social dynamics… this one surprises people. Mixing first-lactation heifers with mature cows exposes them to about twice the inflammatory stress. An Idaho producer (name withheld at their request) invested $45,000 in separate heifer facilities and watched fresh cow disease rates drop from 35% to 18%.

But you don’t need $45,000. A Georgia dairyman with 2,200 Holsteins shared an innovative approach: they achieved meaningful improvements just using portable gates to create separate feeding areas within existing pens. Cut competitive displacements by 60%. Sometimes the simple solutions work best.

Treatment Protocols That Actually Work

Quick Protocol Reference

Prepartum Treatment (14 days before expected calving):

  • First-calf heifers: Meloxicam (1 mg/kg) or Aspirin (125g)
  • Overconditioned cows (BCS ≥3.75): Aspirin (125g)
  • Previous problem cows: Aspirin (125g)

Postpartum Treatment (12-36 hours after calving, placenta must be expelled):

  • Normal multiparous cows: Aspirin (4 boluses)
  • Never give before the placenta passes—can increase stillbirths 5x

Note: Meloxicam requires a veterinary prescription in most jurisdictions. These protocols are based on North American research and regulations—international producers should consult local veterinary guidelines. Aspirin boluses are available through most veterinary suppliers.

The Economics Make This a No-Brainer

Let’s talk money. Consider a typical 500-cow dairy implementing basic protocols:

Investment runs about $3,250 annually. That’s assuming 25% first-calf heifers at $10 each for meloxicam, 10% overconditioned cows at $8 for aspirin, and treating 40% of your multiparous cows at $8 each.

Returns? Based on documented improvements, you’re looking at around $52,400. That breaks down to $37,125 from heifer milk increases, $7,500 in disease-reduction savings, and $7,776 in multiparous production gains.

That’s better than a 15-to-1 return at $0.18 per pound of milk. Even at $0.14 milk, you’re still over 11-to-1. And if you’re getting $0.22 with premiums? The numbers get even better.

For organic operations or those choosing to minimize pharmaceutical use, just implementing the management changes—cooling, stocking density, dietary transitions—captures about 60% of the total benefit. Tie-stall operations might see slightly different results than freestalls, but the principles hold. Spring-calving herds might implement differently than year-round operations, but the biology remains consistent.

Want to track your own results? Most dairy management software systems can help monitor the key metrics: disease incidence, milk production by treatment group, and actual ROI based on your specific costs and milk price.

Spotting Hidden Inflammation

What farmers are finding is that several subtle signs suggest excessive inflammation before obvious disease appears:

  • Daily rumination below 500 minutes that first week fresh—if you’re tracking this
  • More than 15% of fresh cows with any disease event within 30 days
  • Butterfat dropping below 3.2% in Holsteins, 3.8% in Jerseys
  • Wide swings in peak milk between seemingly similar cows
  • Discharge hanging around beyond 21 days postpartum

These metrics give you an early warning that inflammation’s impacting performance.

Getting Your Team on Board

The biggest challenge isn’t technical—it’s cultural. Most vets and nutritionists were trained when metabolic theories dominated. Jessica McArt from Cornell’s College of Veterinary Medicine suggests approaching advisors as partners in exploration rather than challenging their expertise.

A Wisconsin producer near Shawano (requesting anonymity) shared their approach: “We presented the research to our vet and suggested testing protocols on half our fresh cows for 90 days. When the disease dropped from 31% to 18% in the treatment group, everyone became believers.”

A practical trial might run like this: Two weeks of collecting baseline data. Ten weeks with half your cows on treatment, half as controls. One week to analyze and discuss results with your team.

The key is establishing clear baseline metrics first. Without knowing current disease rates and production patterns, you can’t convincingly demonstrate improvement.

Where This is All Heading

The inflammation paradigm is just the beginning. Three areas show particular promise:

Microbiome analysis is getting close to commercial reality. Garret Suen’s team at Wisconsin has identified specific bacterial changes that precede ketosis. While full profiling services are probably still 3-5 years out, some probiotic companies are already developing targeted products based on this research. Current options include various yeast products and bacterial probiotics that support gut health during transition—ask your nutritionist about what’s available in your area.

Specialized pro-resolving mediators—compounds that actively turn off inflammation rather than just suppressing it—are showing promise. Lorraine Sordillo at Michigan State has been pioneering this work. Human medicine’s already using these successfully; dairy applications are coming.

AI integration with monitoring systems shows immediate potential. Companies like CowManager are testing systems that predict disease 5-7 days before clinical signs with accuracy approaching 85%, though these are still early-stage claims needing field validation.

For producers looking to stay current, the annual conferences at Penn State and Iowa State, as well as the American Dairy Science Association meetings, are excellent sources of the latest transition cow research.

Making This Work on Your Farm

After talking with dozens of early adopters, several principles keep coming up:

Start with a simple risk assessment. Score body condition at closeup entry—shoot for 90% of cows between 3.0 and 3.5. Separate heifers from mature cows when possible. Flag cows with previous transition problems.

Target your interventions rather than treating everyone. Focus prepartum treatments on heifers and high-risk cows. Save postpartum for normal multiparous animals. And never, ever give NSAIDs before that placenta passes.

Fix the management basics alongside any pharmaceutical approach. If dry cows are panting, they need cooling. Keep stocking densities reasonable. Make dietary changes gradually. These management factors contribute as much as the medications.

Track everything. Disease rates, milk differences, and actual ROI based on your milk price. This data becomes invaluable for refining protocols and convincing skeptics.

Most importantly, shift your thinking from treatment to prevention. We’re not trying to manage sick cows better—we’re creating conditions where fewer cows get sick in the first place.

The Bigger Picture

This isn’t just incremental improvement—it’s a fundamental shift in how we think about transition biology. Operations implementing comprehensive inflammation management report not just better numbers but cultural changes in how teams approach fresh cows.

An Idaho dairyman running 2,000 cows near Twin Falls (who shared their story on condition of anonymity) put it perfectly: “We used to budget for 25% morbidity. Now we’re under 12% and still improving. But the bigger change? Our team focuses on creating optimal conditions rather than preparing for problems. That mindset shift changes everything.”

Success factors vary by region and system. Grazing operations face different triggers than confinement dairies. Humid climates present different challenges than arid regions. But that’s the beauty—you can identify and address your specific inflammatory triggers.

The evidence keeps strengthening. Peer-reviewed research confirms the biology. Field implementation proves it’s practical. Economic analysis shows compelling returns across all pricing scenarios.

For progressive producers, the question isn’t whether to consider inflammation management—it’s how quickly to adapt it to your operation. This evolution in understanding might well define the difference between thriving and just surviving in today’s competitive environment.

The transition period will always be dairy’s greatest metabolic challenge. But we’re learning it doesn’t have to be our greatest source of loss. By understanding and managing inflammatory processes, we can help cows navigate this critical period more successfully than ever.

And that’s what this is really about, isn’t it? Not just the science or the economics, but giving our cows the best chance to do what they do best—make milk efficiently and stay healthy doing it.

KEY TAKEAWAYS

  • The game-changer: Inflammation starts 21 days before calving—treat it then, not after
  • ROI that matters: Spend $10 per cow, get $150 back in milk and health
  • Know your protocol: Heifers = meloxicam prepartum | Fat cows = aspirin prepartum | Normal cows = aspirin postpartum
  • Management alone works: Can’t use NSAIDs? Fix cooling, crowding, and feed changes for 60% of benefits
  • Field-proven: 50% less disease, 11 extra pounds of milk in heifers, under 12% morbidity achievable

Producers interested in implementing these approaches should work with dairy veterinarians familiar with current transition cow research. Key resources include Baumgard’s 2021 comprehensive review “The influence of immune activation on transition cow health and performance” and Barragan’s 2024 work on targeted protocols, both published in the Journal of Dairy Science. Extension specialists at Penn State, Iowa State, Michigan State, and Cornell offer excellent implementation guidance tailored to regional conditions. The principles discussed here are based primarily on North American research—international producers should consult local experts for region-specific adaptations.

Learn More:

The Sunday Read Dairy Professionals Don’t Skip.

Every week, thousands of producers, breeders, and industry insiders open Bullvine Weekly for genetics insights, market shifts, and profit strategies they won’t find anywhere else. One email. Five minutes. Smarter decisions all week.

NewsSubscribe
First
Last
Consent

November 12 Market Shock: Cheese Crashes to $1.55 as Milk Heads for $16 – Your Action Plan Inside

Warning: Today’s cheese collapse confirms what smart money already knows – milk’s heading for $16. Action plan inside.

Executive Summary: Today’s 8-cent cheese collapse to $1.5525 sent an unmistakable message: the U.S. dairy industry has entered a margin crisis that smart money says could stretch into 2027. With Europe undercutting our prices by 10 cents, Mexico pulling back orders, and domestic production inexplicably up 4.2%, we’re producing into a black hole. The numbers are sobering – Class III milk heading for $16.50 means your January check drops $3/cwt, translating to $7,500 less monthly revenue for a typical 300-cow operation. At these prices, even well-run dairies lose $1,500 daily. But here’s what 30 years in this industry has taught me: the operations that act decisively in the first 90 days of a crisis are the ones that survive. Those waiting for markets to ‘come back’ typically don’t make it. Your December milk check isn’t just a number anymore—it’s a referendum on whether your operation has what it takes to weather the storm ahead.

Dairy Margin Management

Today’s Market Summary Table

ProductCloseChangeTrading Activity
Cheese Blocks$1.5525/lb↓ $0.084 trades ($1.5775-$1.6275)
Cheese Barrels$1.6450/lb↓ $0.03No trades
Butter$1.5000/lbUnchanged3 trades ($1.49-$1.50)
NDM$1.1575/lb↑ $0.0025No trades
Dry Whey$0.7500/lbUnchangedNo trades

You know that sinking feeling when you check the CME report and see red numbers everywhere? That’s exactly what happened today. Block cheese crashed 8 cents to close at $1.5525 per pound—and here’s what’s interesting, it happened on relatively heavy trading with four separate transactions recorded by the Chicago Mercantile Exchange spanning from $1.5775 to $1.6275, according to today’s CME cash market report. Barrels weren’t far behind, falling 3 cents to $1.6450, though notably without any recorded trades.

What I’ve found particularly telling is how butter stayed frozen at $1.50 with three trades in a tight range, while nonfat dry milk barely budged, climbing just a quarter-cent to $1.1575 with zero trading activity. Days like this tell us something important about where we’re headed. And honestly? It’s time we had a serious conversation about what this means for your December milk check.

Reading the Tea Leaves in Today’s Trading Patterns

Here’s something many of us miss when we just glance at the closing prices—the bid-ask spreads are telling a much bigger story. You probably know this already, but when the gap between what buyers are willing to pay and what sellers are asking widens dramatically, it usually means traders can’t agree on where prices should settle.

Today’s cheese block market saw those four trades bouncing between $1.5775 and $1.6275, but—and this is crucial—CME floor sources report that we had only one bid against one offer at the close. That’s not healthy price discovery; that’s a market running on uncertainty. In my experience working with Chicago traders, when you see heavy block volume with falling prices but no barrel activity, it often means processors are dumping inventory before year-end accounting.

The 8-Cent Collapse Captured: From $1.64 trading range into $1.55 settlement across four institutional block trades. This waterfall pattern signals that major traders are repricing dairy fundamentals downward—the classic setup for extended weakness.

The weekly totals back this up dramatically: 14 block trades this week versus zero for barrels, according to CME weekly volume data. You know what really concerns me? The order book shows just one bid each for blocks and barrels, creating virtually no floor under this market. Compare that to butter, where we’re seeing four offers—sellers everywhere, but buyers have vanished. It’s worth noting that this setup typically precedes another leg lower, especially when remaining buyers finally capitulate.

How Global Markets Are Boxing Us In

So here’s where things get complicated—and you’ve probably noticed this in your own export conversations if you’re dealing with cooperatives. European butter futures trading at €5,070 per metric ton on the European Energy Exchange work out to about $2.29 per pound at current exchange rates. That’s now competitive with our prices, and according to USDA Foreign Agricultural Service data, they’re capturing business we desperately need.

What I find particularly troubling is New Zealand’s positioning on the NZX futures exchange. Their whole milk powder at $3,440 per metric ton signals aggressive pricing to capture Asian market share, based on Global Dairy Trade auction results. And with EU skim milk powder at €2,075 per metric ton—that’s about $1.04 per pound—they’re undercutting our NDM by over 10 cents. In many cases, that’s enough to make a U.S. product completely uncompetitive globally.

Now, Mexico has traditionally been our safety net. USDA trade data shows they account for about 25% of U.S. dairy exports. But here’s what’s changed: the peso weakened by 8% against the dollar this quarter, and according to Conasupo (Mexico’s national food agency), domestic production is ramping up. Several processors I’ve talked with in Wisconsin report Mexican buyers are pulling back on November purchases.

Southeast Asia was supposed to pick up that slack, but USDA attaché reports from Vietnam and Indonesia indicate those markets are currently oversupplied with cheaper product from New Zealand and Europe. And the dollar… well, that’s another story entirely. Federal Reserve data shows it’s near 52-week highs, and research from the International Dairy Federation shows that every 1% rise in the dollar index typically drops our dairy exports by 2-3%.

Feed Markets: The Silver Lining Gets Thinner

Here’s one bright spot, though it’s getting dimmer by the day. According to CME futures settlements, December corn closed at $4.3550 per bushel, with March futures at $4.49. That’s manageable. Soybean meal’s recovery to $322 per ton from Monday’s $316.80 keeps feed costs somewhat reasonable, based on CBOT trading data.

But—and this is a big but—the milk-to-feed ratio is deteriorating fast. Cornell’s Dairy Markets and Policy program calculates that at current prices, income over feed costs could drop below $8 per hundredweight by January. University of Wisconsin Extension analysis confirms that for most operations, that’s below breakeven.

The regional differences are striking, too. USDA Agricultural Marketing Service basis reports show Midwest producers near corn country seeing sub-$4 local cash prices. Meanwhile, California Department of Food and Agriculture data indicates that West Coast producers are facing $5-plus delivered corn. For hay, USDA’s Agricultural Prices report puts the national average at $222 per ton, but Western Premium Alfalfa runs $280 and up according to the latest USDA hay market news.

Production Growth: The Numbers We Can’t Ignore

USDA’s National Agricultural Statistics Service finally released that delayed September milk production report on November 10th, and the numbers are… well, they’re sobering. Twenty-four state production hit 18.3 billion pounds, up 4.2% year-over-year. The national herd added 235,000 cows over the past year, while production per cow jumped 30 pounds to 1,999 pounds per month.

What’s really eye-opening is where this growth is concentrated. Kansas leads with 21.1% growth, South Dakota’s up 9.4%—those new processing plants that Dairy Foods magazine has been covering are pulling massive expansion. Looking at efficiency gains, Michigan State University Extension reports their state’s cows are averaging 2,260 pounds per month. That’s 260 pounds above the national average.

The 261-Pound Survival Gap: Michigan’s elite herds average 2,260 lbs/month while national average sits at 1,999. That efficiency gap translates to $15/day cost per marginal cow. When Class III drops to $16.50, every pound counts—operations with production per cow below 1,950 face economic extinction.

The combination of improved genetics—documented in Journal of Dairy Science studies—optimized nutrition protocols from land-grant university research, and modernized facilities, as tracked by Progressive Dairy, has pushed biological limits higher than we thought possible. Here’s the reality check from talking with nutritionists: when your neighbors are achieving these yields, you either match them or risk getting priced out.

Remember all those cheese plants that broke ground in 2023? Kansas Department of Agriculture confirms three major facilities, Texas Department of Agriculture lists two, and South Dakota’s Governor’s Office announced another two. We’ve added 10 billion pounds of annual processing capacity since 2023, according to estimates from the International Dairy Foods Association. These plants have 20-year USDA Rural Development financing that requires running near capacity—this structural oversupply won’t resolve quickly.

The Structural Trap: Four new cheese plants in 2023 plus six more in 2024-2025 added 10 billion pounds of capacity. These debt-financed facilities must operate near 95% utilization to service 20-year USDA Rural Development loans. Current market demand: 46 billion pounds. Result: 5+ billion pounds annual oversupply locked in through 2030. Price recovery impossible without facility closures—and that doesn’t happen voluntarily.

What This Means for Your December Check

Let’s talk straight about where Class III milk is headed. With November futures already at $17.16 on the CME and December futures implying further weakness according to today’s settlements, several dairy economists I respect are projecting $16.50 or lower by January.

December Check Reckoning: A 300-cow operation at $16.50 Class III faces $7,500 monthly revenue loss. That’s $900 daily. January will be worse.

At $16.50 Class III with current feed costs, the University of Minnesota’s dairy profitability calculator shows the average 100-cow dairy loses about $1,500 per day. If we hit spring flush with these prices… well, that’s going to force some tough culling decisions. Today’s spot prices, when run through USDA’s Federal Milk Marketing Order formulas, translate to January milk checks down $2.50 to $3.00 per hundredweight from October.

For a 300-cow dairy shipping 65,000 pounds daily, that’s $7,500 less monthly revenue. Farm Credit Services reports from the Midwest indicate banks are already tightening credit as dairy loan portfolios deteriorate. The Federal Reserve’s October Agricultural Credit Survey shows agricultural loan demand rising while repayment rates fall—if you haven’t locked in operating lines for 2026, today’s price action just made that conversation much harder.

What’s particularly concerning is that our traditional escape route isn’t available. USDA Foreign Agricultural Service data shows China’s imports down 18% year-over-year, Mexico’s pulling back, as I mentioned, and Southeast Asian markets are oversupplied. Without export demand absorbing 15-20% of production—which has been the historical average according to U.S. Dairy Export Council analysis—domestic markets face crushing oversupply through 2026.

Tomorrow Morning’s Practical Action Plan

So what do we do about all this? Here’s my thinking on practical steps based on conversations with risk management specialists and successful producers who’ve weathered previous downturns.

On the hedging front, if we get any bounce above $17.00 for Q1 2026 Class III, I’d seriously consider locking it in. Several commodity brokers I trust are recommending ratio spreads—selling two February $16 puts to buy one February $18 call, which limits your downside while maintaining upside potential. For feed, the consensus among grain merchandisers is to buy March corn under $4.40 and meal under $320 while you can.

Operationally, extension dairy specialists are unanimous: it’s time for aggressive culling. Penn State’s dairy management tools show that every marginal cow below 60 pounds per day is costing you money at these prices. Push breeding decisions to maximize beef-on-dairy premiums while they last—Superior Livestock Auction data shows those crossbred calves bringing $200 to $300 premiums.

Review every feed ingredient for substitution opportunities. University of Wisconsin research demonstrates that optimizing your grain mix can save $5 per ton without sacrificing production—that equals $50,000 annually for a 500-cow dairy. And here’s something many producers hesitate to do but really should: schedule that lender meeting now, before year-end financials force their hand.

Prepare cash flow projections showing survival through $16 milk—Farm Financial Standards Council guidelines suggest they need to see that you’ve faced reality. Several ag finance specialists recommend considering sale-leaseback arrangements on equipment to generate working capital before values drop further.

The 90-Day Reckoning: From November 12 market shock through February 10, every day counts. The red danger zone shows when critical decisions must occur. Operations that delay past December 15 face compromised options by January spring flush. Historical dairy downturns show: decisive action in days 1-90 determines survival probability. The clock started November 12.

The Bottom Line

You know, I’ve been through the 2009 crisis, the 2015-2016 downturn, and 2020’s volatility. What we’re seeing today isn’t just another cycle. Today’s 8-cent cheese collapse, combined with global oversupply data and production growth trends, confirms the U.S. dairy industry faces what could be a two-year margin squeeze.

Looking at the fundamentals—global markets oversupplied according to Rabobank’s latest dairy quarterly, domestic demand softening per USDA disappearance data, and production still growing at 3-4% annually—prices have further to fall before this corrects. The harsh reality, according to agricultural economists at several land-grant universities, is that we could see 5-10% of operations exit by the end of 2026.

Your December milk check has become more than a financial report—it’s a survival test. But here’s what’s encouraging from studying previous downturns: operations that adapt quickly, that make hard decisions now rather than hoping for recovery, those are the ones that emerge stronger. The question facing every producer tonight is simple but profound: will your operation be among the survivors?

What I’ve learned from 30 years of watching these cycles is that the difference between those who make it and those who don’t often comes down to acting decisively in moments like this. Tomorrow morning, when you’re doing chores, think about which camp you want to be in. Then act accordingly.

Key Takeaways

  • This isn’t a blip—it’s a reckoning: Today’s 8-cent cheese crash to $1.5525 with only one bid standing confirms we’re entering a 2-year margin squeeze. Class III hits $16.50 by January.
  • The world has turned against U.S. dairy: Europe’s 10 cents cheaper, Mexico’s pulling back, and our 4.2% production growth is flooding a shrinking market. Exports can’t save us this time.
  • Efficiency gaps will force consolidation: When Michigan averages 2,260 lbs/cow and you’re at 1,900, the math is fatal—every marginal cow costs you $15 daily at these prices.
  • Your banker already knows: Today’s CME report just flagged every dairy loan in America. Schedule that meeting now with realistic projections, not wishful thinking.
  • History’s lesson is clear: In 2009 and 2015, farms that acted decisively in the first 90 days survived. Those that waited for “normal” to return didn’t make it. Which will you be? 

Learn More:

The Sunday Read Dairy Professionals Don’t Skip.

Every week, thousands of producers, breeders, and industry insiders open Bullvine Weekly for genetics insights, market shifts, and profit strategies they won’t find anywhere else. One email. Five minutes. Smarter decisions all week.

NewsSubscribe
First
Last
Consent

$850 Million Dairy Standoff: What U.S. and Canadian Farmers Need to Know Before July 2026

Canada won the trade panel. The U.S. has the sunset clause. July 2026 decides who blinks first in the $850M dairy standoff.

EXECUTIVE SUMMARY: Wisconsin dairy farmers are asking a simple question: Where’s the Canadian market access USMCA promised five years ago? The U.S. industry says Canada blocked $850 million in opportunities by allocating import quotas to processors who won’t use them, keeping fill rates at just 42%. Canada counters they’re following the rules—winning a November 2023 panel to prove it—and argues American dairy simply isn’t competitive in their market. With 1,420 U.S. farms closing last year while Canadian producers protect quota investments worth $30,000 per cow, both sides face existential stakes. July 2026 changes everything: the USMCA sunset clause means all three countries must actively agree to continue, or $780 billion in annual trade enters dangerous uncertainty. This analysis presents both perspectives fairly and provides specific strategies based on your farm size—because regardless of who “wins,” every North American dairy operation needs to prepare for what comes next.

USMCA dairy review

As we approach the July 2026 USMCA review, the U.S. dairy industry is building their case while Canada defends its position. Here’s what both sides are saying—and why it matters for dairy farmers across North America.

You know what’s interesting? When you talk to Wisconsin producers these days, there’s this deep frustration that just keeps coming up. Five years after the USMCA promised meaningful Canadian market access, they’re still waiting. And it’s not just Wisconsin—this sentiment’s spreading across the entire U.S. dairy belt, setting up what could be quite a showdown come July 2026.

So here’s what’s happening. The International Dairy Foods Association filed this formal complaint in October to the Trade Representative, and when you combine that with five years of trade data from both USDA and Canada’s Global Affairs department… well, the U.S. industry’s making a pretty specific case. They’re talking about roughly $850 million in export opportunities that haven’t materialized, all while 1,420 American dairy operations shut down last year, according to the USDA’s count.

But here’s the thing—and this is important—Canada sees this completely differently. They won that November 2023 dispute panel, and they’re saying they’re following the agreement just fine. Understanding both perspectives has become essential for anyone trying to make sense of what’s coming.

What the U.S. Industry Says Was Promised vs. What They Got

Let me walk you through the American dairy sector’s position. It starts with the International Trade Commission’s 2019 assessment, which projected we’d see about $227 million in additional annual exports under USMCA’s dairy provisions.

The way U.S. producers see it, they were expecting:

  • Access to 3.6% of Canada’s dairy market through 14 different quota categories
  • Complete elimination of those Class 6 and 7 pricing schemes within six months
  • Export caps keeping Canadian skim milk powder and milk protein concentrates at 35,000 metric tons annually
  • Import quotas going to actual importers, not Canadian processors

Now, according to Canada’s own Global Affairs data and those USMCA panel findings, what actually happened looks quite different.

What were the average quota fill rates from 2022 to 2023? Just 42% across all categories. Nine of those 14 categories never even hit 50% utilization. And that January 2022 USMCA panel—they found that Canada had allocated between 85% and 100% of its quota shares to Canadian processors. American farmers argue these processors have about as much incentive to import competing U.S. products as… well, let’s just say not much.

Here’s what really gets American producers going—this Class 7 pricing business. Sure, Canada technically eliminated it like they promised. But then—and the University of Wisconsin’s dairy economists have documented this—similar pricing dynamics popped up under Class 4a. The U.S. sees that as a way to get around its USMCA commitments.

“You get on a phone conversation with some of these folks that have been farming for five and six generations. How do you say I can’t help you? That becomes very tough.” – Bill Mullins, Mullins Cheese

Quick Reference: Understanding Key Trade Terms

TRQ (Tariff Rate Quota): Think of it as a two-tier system. A certain amount gets in at low or zero tariffs. Above that? You’re looking at 200-315% tariffs for Canadian dairy.

Supply Management: Canada’s comprehensive dairy system since 1972—combines production quotas, price supports, and import controls.

Class Pricing: Canada’s milk classification system that sets different prices based on how the milk’s used—and this is where things get contentious.

Why Canada Defends Supply Management So Fiercely

You know, when you really look at Canada’s dairy system, you start to understand why they’re so protective of it. Agricultural economists at Université Laval have documented how it works through three integrated pieces:

First, there’s production quotas that limit what each farmer can produce. Then you’ve got price supports keeping farmgate values at about 1.5 to 2 times what we see in the U.S. And finally, those import barriers—we’re talking 200% to 315% on anything over quota.

This whole framework’s supporting about 9,000 Canadian dairy operations that generate close to CA$20 billion in annual economic activity, according to Dairy Farmers of Canada’s latest report.

Mark Stephenson over at UW-Madison’s dairy policy program explains it well: “The fundamental incompatibility is that supply management requires import control to function. Asking Canada to provide meaningful market access is essentially asking them to dismantle the system piece by piece. From their perspective, that’s existential.”

And here’s something to consider—Canadian producers have invested around CA$30,000 per cow in quota value according to their provincial milk boards. That’s not just an operating expense. That’s retirement savings, succession planning, and their kids’ inheritance. No wonder they defend it so fiercely.

How American Farmers See the Economic Stakes

For U.S. producers, the Grassland Dairy situation from 2017 is still a really raw issue. It kind of exemplifies their broader concerns about Canadian trade practices.

When Canada introduced that Class 7 pricing targeting ultra-filtered milk, Grassland Dairy had to terminate contracts affecting about a million pounds of daily production across 75 Wisconsin farms. Bill Mullins from Mullins Cheese—he took on eight of those displaced operations even though his plants were already near capacity. His words still resonate.

Here’s what keeps U.S. producers up at night:

Wisconsin Center for Dairy Profitability data shows your average 200-cow operation generates about $87,000 in annual net income. If you lost $56,000 in potential export revenue—that’d be each farm’s theoretical share of that $850 million—you’re looking at a 64% income hit.

The numbers that really worry them:

  • Chapter 12 farm bankruptcies jumped 55% in 2024, hitting 259 filings
  • Wisconsin dairy operations averaged just $0.87 per hundredweight in net margins during 2023
  • At those margins, farms facing reduced market access could hit insolvency within 30 months

New York dairy producers have been pretty vocal about their frustration, arguing they’re seeking the market access they were promised, not handouts. One Cayuga County operator mentioned how expansion decisions are basically on hold until there’s clarity about Canadian market availability.

Canada’s Counter-Argument: Why They Say They’re Complying

Now here’s where it gets really interesting—Canada’s perspective on USMCA compliance is fundamentally different from the U.S.’s.

First off, Canada won that November 2023 USMCA dispute panel ruling. The panel found 2-1 that Canada’s revised allocation methods based on market share didn’t violate USMCA provisions. That’s a big deal—it validated Canada’s position that their implementation, while maybe not what the U.S. expected, technically complies with the agreement.

The way Canadian officials see it, several key points counter U.S. arguments:

On those low quota fill rates, they argue this reflects market conditions and U.S. producers’ inability to meet Canadian market requirements, not administrative barriers. They say importers are free to source from the U.S. if the products are competitive.

On processor allocations: Canada maintains that allocating quotas based on historical market activity is legitimate and non-discriminatory. It doesn’t explicitly exclude any type of importer.

On Bill C-202: Rather than overplaying their hand, Canada sees that June 2025 legislation—where 262 of 313 MPs voted to prohibit dairy concessions—as a democratic expression of national consensus. All parties supported it. From their perspective, that’s sovereign policy choice, not a negotiating tactic.

Dairy Farmers of Canada has consistently maintained that supply management represents more than just an economic system—they see it as ensuring food security and stable farm incomes across rural Canada. Pierre Lampron, who served as DFC president through 2024, expressed confidence at their annual meeting that the government understands this broader context.

Timeline: Key Dates Leading to July 2026 Review

January 2026: Monitor for ITC preliminary findings on protein dumping investigation

March 2026: ITC final report delivers—this could be game-changing evidence

May-June 2026: Industry positioning intensifies, Congressional pressure peaks

July 1, 2026: USMCA joint review—decision on extension or annual review mode

Here is the data from the image converted into a table:

Two Countries, Two Systems

AspectU.S. SystemCanadian System
Farm Closures (2024)1,420 operations (5% decline)Stable/protected
Quota Investment per Cow$0$30,000
Price StabilityVolatile (market-based)Guaranteed (1.5-2x U.S. prices)
Market Access BarriersNone domesticallyHigh tariffs (200-315%)
Export OpportunitiesGrowing but constrained by CanadaLimited by supply management

The Political Leverage Game for 2026

Both sides are positioning themselves for July 2026 with some distinct strategic advantages.

What the U.S. Industry Has Going For It

The timing of the ITC investigation is no accident. The International Trade Commission investigation into Canadian dairy protein dumping delivers findings in March 2026. That’s just four months before the review—giving U.S. negotiators the federal agency documentation they need right when they need it.

The sunset clause creates real pressure. USMCA requires all three countries to actively confirm they want to extend the agreement in July 2026. If they don’t, we’re looking at uncertainty over $780 billion in annual bilateral trade.

Congressional backing matters. Bipartisan pressure from dairy-state legislators provides the U.S. industry with political support to push enforcement demands.

Canada’s Strategic Position

Legal victories count. That November 2023 panel ruling provides Canada with legal cover for its current practices. They can say, “Look, we went through dispute settlement and won.”

Political unity is powerful. Bill C-202’s overwhelming parliamentary support shows that protecting supply management goes beyond party politics in Canada.

The broader relationship provides leverage. Canada can point to integrated North American supply chains—especially in automotive and energy—to resist dairy-specific pressure.

Three Scenarios and What They Mean for Different Farm Sizes

Supply management has survived 30+ years of trade fights. Betting the farm on a breakthrough? That’s a 30% probability play. Smart money plans for the 45% scenario: more paperwork, same barriers, modest improvements at best

Looking at how things are shaping up, here’s what seems most likely and what it means for your operation:

Scenario 1: More Incremental Changes (45% probability, if you ask me)

Canada agrees to better reporting and maybe some monitoring mechanisms, but keeps its fundamental allocation approaches. The U.S. claims progress, Canada keeps supply management intact. Quota fill rates? They probably stay about the same.

What this means by farm size:

Under 100 cows: Focus on local markets and direct sales. Canadian access won’t materialize in meaningful ways for you anyway. Consider value-added products where you control the whole chain.

100-500 cows: Keep flexibility for quick pivots. Maybe maintain current production, but don’t expand based on export hopes. Watch Southeast Asian opportunities instead.

500+ cows: You’ve got scale to weather this, but don’t count on Canadian markets in your five-year plans. Consider leading industry advocacy efforts—you’ve got the most to gain if something breaks loose.

Scenario 2: Real Enforcement Mechanisms (30% probability)

If those ITC findings are compelling and U.S. negotiators credibly threaten not to renew, Canada might accept automatic penalties for under-utilization or mandatory non-processor allocations. That could deliver partial yet meaningful improvements in access.

Preparation steps if this happens:

  • Get your export documentation systems ready now
  • Build relationships with potential Canadian buyers
  • Understand Canadian labeling and standards requirements
  • Consider partnerships with existing exporters to learn the ropes

Scenario 3: A Standoff (25% probability)

Neither side budges much. The agreement goes into annual review mode, creating ongoing uncertainty but avoiding immediate disruption. Both industries operate under this cloud of potential future changes.

Risk management if we hit a standoff:

  • Maximum Dairy Margin Coverage enrollment becomes essential
  • Lock in feed costs wherever possible
  • Diversify buyer relationships domestically
  • Don’t make major capital investments based on export assumptions

Who’s Pushing for What: The Players Making Things Happen

Let me tell you about the organizations driving this whole thing, because understanding who’s involved helps make sense of the dynamics.

On the U.S. side, you’ve got some heavy hitters:

The International Dairy Foods Association—they’re the ones who filed that October 2025 complaint. They represent processors, and they’re pushing hard for what they call an end to protectionist measures. They want binding enforcement, and they want it now.

National Milk Producers Federation lobbied hard for that ITC investigation. They’re your farmer cooperatives, and they keep hammering on automatic penalties for non-compliance. They’ve got members losing money, and they’re not shy about saying so.

The U.S. Dairy Export Council is more technical—they document barriers, provide negotiating support, and help with the nuts and bolts. Edge Dairy Farmer Cooperative represents those Midwest producers, and they’re great at putting farm-level impacts front and center.

On Canada’s side, it’s equally organized:

Dairy Farmers of Canada maintains they’re fully complying with USMCA. They’ve got a consistent message: supply management is legitimate policy, and they’re following the rules.

Les Producteurs de lait du Québec—now these folks have serious clout. They represent Quebec’s 4,877 dairy farms, and in Canadian federal elections, Quebec matters. A lot.

Provincial marketing boards coordinate the defense while implementing those quota allocation systems that the U.S. finds so frustrating.

Market Alternatives: What Some Smart Operators Are Doing

While this U.S.-Canada dispute dominates headlines, some American producers are zigging, while others are zagging. Take this example—a California operation recently told me they doubled their Vietnam exports in 18 months. “The middle class there is exploding,” they said. “They want quality dairy, and there’s no quota games to navigate.”

Industry data from USDEC backs this up—U.S. dairy exports to Vietnam and other Southeast Asian countries keep climbing year over year. Vietnam, Thailand, and the Philippines—they’re importing more dairy each year. No supply management system to work around. Just straightforward business based on quality and price.

You know what’s interesting about these markets? They’re growing fast enough that even mid-size operations can find niches. Specialty cheeses, high-quality milk powders, and even fluid milk in some cases. The logistics are getting better every year, too.

Seven months. Four critical milestones. $780 billion in annual trade hanging in the balance. This is how the March 2026 ITC report becomes the leverage point that forces Canada’s hand—or blows up USMCA

The Bottom Line: No Easy Resolution in Sight

That $850 million figure the U.S. dairy industry keeps citing? That’s their calculation of lost opportunities. Canada disputes both the number and the whole premise. Five years of USMCA implementation have revealed fundamental disagreements about what the agreement actually requires and what compliance entails.

Canada’s supply management system has survived more than 30 years of trade negotiations. Honestly? It’ll probably survive this challenge too. The question isn’t whether USMCA will fully open Canadian dairy markets—nobody really expects that. It’s whether the 2026 review might produce some incremental changes that partially address U.S. concerns while keeping Canada’s core system intact.

The way American producers see it, success means binding enforcement mechanisms with automatic penalties. The way Canada sees it, success is maintaining supply management’s essential structure while offering enough procedural adjustments to avoid a broader trade confrontation.

Come July 2026, we’ll see whether these positions can be reconciled—or whether North American dairy trade stays defined by promises unfulfilled and expectations unmet. Either way, it’s going to be interesting to watch. And whatever happens, we’ll all need to adapt our operations accordingly.

One thing’s for sure—whether you’re milking 50 cows or 5,000, whether you’re in Wisconsin or Quebec, this dispute affects the entire North American dairy landscape. Understanding both sides helps us all prepare for whatever comes next.

Resources for Following This Issue:

Trade Documentation:

Research Centers:

The Bullvine continues tracking developments from both perspectives as we approach the July 2026 USMCA review. For ongoing analysis, visit www.thebullvine.com.

KEY TAKEAWAYS

  • Both sides have valid arguments: U.S. proves Canada allocates 85% of quotas to processors who won’t import (42% fill rate); Canada’s November 2023 panel win says that’s technically legal
  • Real farms, real consequences: 1,420 U.S. operations closed waiting for promised access, while Canadian farmers defend $30,000/cow quota investments—everyone has skin in this game
  • July 2026 is unprecedented leverage: The sunset clause means all three countries must actively agree, or $780B in trade enters chaos—first time the U.S. can credibly threaten the whole relationship
  • History suggests incremental change: Supply management survived 30+ years of trade fights; expect minor adjustments, not market revolution
  • Your operation, your strategy: Under 100 cows = stay local; 100-500 = maintain flexibility; 500+ = lead advocacy while developing Asian markets where actual growth exists

Complete references and supporting documentation are available upon request by contacting the editorial team at editor@thebullvine.com.

Learn More:

The Sunday Read Dairy Professionals Don’t Skip.

Every week, thousands of producers, breeders, and industry insiders open Bullvine Weekly for genetics insights, market shifts, and profit strategies they won’t find anywhere else. One email. Five minutes. Smarter decisions all week.

NewsSubscribe
First
Last
Consent

Concrete, Air, and Shade: The Real Drivers Behind Milk Yield

Your biggest ROI isn’t in feed—it’s in airflow, space, and shade. Comfort is still the cheapest form of nutrition.

You know, it’s easy to see why so many of us start with feed when we think about performance. Feed costs take up the biggest line in most of our budgets — and it’s the part of management we can see, mix, and adjust every day. But what I’ve found, after years of walking barns across Wisconsin and talking with producers from Ontario to Idaho, is that sometimes the problem isn’t in the ration. It’s in the roof, the floor, and the airflow.

You can’t fix nutrition in a broken barn. And once you understand the biology behind that statement, it changes everything about how you think about profitability.

The Rest-Revenue Multiplier: Every additional hour of cow rest time generates 2-3 lbs more milk daily, translating to $4,380+ annual revenue per cow—making comfort your highest-ROI investment

The $50 Fix That Unlocks 3.5 Pounds of Milk

Research is clear on this one — comfort is milk in the tank. The University of Wisconsin’s Dairyland Initiative and William H. Miner Agricultural Research Institute have both documented that every additional hour a cow spends lying down yields 1.7 to 3.5 pounds more milk each day (UW Dairyland Initiative and Miner Institute Cow Comfort Resources).

Here’s what’s interesting: the fix for poor comfort isn’t always expensive. I visited a mid-sized herd near Ripon, Wisconsin, that simply raised neck rails by four inches and deepened bedding. The cows immediately started using the stalls properly, adding almost 2.5 hours of rest per day. “Same cows, same feed,” the producer told me. “We gained six pounds of milk just by fixing the structure.”

It makes sense when you look at history. Freestall dimensions built before 2010 were designed for smaller Holsteins, around 1,100–1,300 pounds. Modern cows average closer to 1,500–1,600 pounds, which means their natural movement is restricted in older stalls. Adjusting neck rails to 48–52 inches high and 68–70 inches from the curb better fits today’s herds.

Investment TypeCost Per StallPayback PeriodMilk Gain (lbs/day)Annual ROI
Neck Rail Adjustment$503 months2.0-3.5360%
Bedding Deepening$754 months1.7-3.0280%
Fan Repositioning$0-251-2 months2.5-4.0450%
Stall Width Increase$1506 months3.0-4.5320%

Cornell Pro‑Dairy economic modeling shows that small structural corrections like these deliver consistent three‑month paybacks with average returns of 360%. The investment? About $50 per stall, mostly in tools and labor (Cornell Stall Design & Economics Tools).

Heat Stress Isn’t Just a Southern Problem

Heat Stress Strikes at 68°F: Most producers think heat stress begins at 80°F, but research proves milk loss, fertility decline, and reduced feed intake start at just 68 THI—a game-changing revelation for northern dairies

A lot of northern producers still assume heat stress doesn’t affect them — but science and data say otherwise. Dr. Geoff Dahl, professor of animal sciences at the University of Florida, has shown that cows begin to decline in performance when the Temperature‑Humidity Index (THI) exceeds 68, roughly 70°F with 60% humidity (University of Florida – Heat Stress Research).

The Silent Inheritance: One summer without cooling dry cows costs $1,200-1,800 per animal across multiple generations—proving that heat stress during the dry period is the most expensive 46 days on your dairy

What’s really eye‑opening is that heat stress during the dry period doesn’t just affect current milk yield. It alters calf development in utero, setting those heifers up for life‑long performance losses. Dahl’s studies have shown that heifers born from heat‑stressed dry cows produce 5‑11 pounds less milk during their first lactation — a penalty that carries on through adulthood.

Even in the Upper Midwest and Ontario, weather-tracking from UW‑Extension shows that cows experience that threshold for 50–90 days per year, depending on ventilation and humidity. The solution doesn’t always mean a major retrofit — just adjusting fan direction or installation height to maintain 300‑400 feet per minute of airflow at cow levelcan significantly change outcomes.

At one Ontario farm, redirecting fans over feed alleys rather than back walls completely flattened milk yield swings. The owner laughed when he said, “We didn’t add fans — just turned them the right way.” That small shift eliminated bunching, improved feed intake, and kept butterfat performance steady all summer.

When Infrastructure Outperforms Feed

Investment CategoryTypical CostPayback TimeMilk ResponseWorks 24/7Risk Level
Stall Modification$50-150/stall3-6 months2-4 lbs/dayYesLow
Cooling System$200-500/cow6-12 months3-5 lbs/dayYesLow
Nutrition Additive$0.20-0.50/dayContinuous0.5-2 lbs/dayNoMedium
Premium Feed$50-100/tonContinuous1-3 lbs/dayNoMedium

Let’s talk numbers, because that’s where the case for infrastructure gets serious. Studies from Cornell Pro‑DairyUniversity of Wisconsin, and Kansas State University show the ROI on barn improvements consistently competes with — and often beats — nutrition investments.

One 450‑cow herd in western New York implemented these upgrades and dropped its cull rate by 10% while cutting hoof‑trimming costs by a quarter. Herd average climbed five pounds — all from removing the bottlenecks stalls created. The farm’s owner summed it up well: “I used to buy almost every nutrition additive out there. Now my barn does most of the work.”

Why Improvements Still Lag

If the data is so compelling, what holds farms back? Psychologists — and farm economists like Dr. Cameron King of the University of Guelph — believe it’s about visibility. As King puts it: “Producers invest where they can see results fast. Feed changes give immediate feedback. Infrastructure improvements return slower, even though the payoff is bigger.”

That rings true. With a slight tweak to the ration, you can check the milk weights the next morning. But it’s harder to measure peace, comfort, and stability — the quiet gains of removing friction from cow behavior. What’s encouraging is that the operations making these investments are often the same ones noticing calmer cows, fewer metabolic issues, and a stronger transition period before any milk data even comes in.

From Managing to Designing Systems

There’s a shift happening that’s worth watching. Instead of “managing stress,” many top herds are designing barns so that stress never builds in the first place. In a series of case studies, Cornell Pro‑Dairy and Kansas State Universityfound that herds that improved stall space, bedding, and airflow gained 2 hours of rest per cow daily, resulting in 8–9 pounds more milk per cow without changing feed.

Cows weren’t “pushed” to perform; their biology was finally allowed to express what the ration and genetics were already capable of. Transition cows handled fresh periods more smoothly, fertility improved, and energy balance stabilized.

One Minnesota dairy manager put it perfectly during a University of Minnesota Extension discussion: “We quit trying to ‘manage’ around cow comfort. Now, the management kind of takes care of itself.”

Five Quick Ways to Gauge Comfort

Your Monday Morning Diagnostic: This simple decision tree helps producers systematically identify barn comfort bottlenecks before spending another dollar on feed—potentially unlocking 2-3.5 lbs more milk per cow daily

If you want to know where your barn performance really stands, start with these simple checks:

  1. Monitor THI at the cow level. Anything above 68 calls for immediate cooling actions.
  2. Try the 25‑second knee test. Kneel in a stall for half a minute. If it’s painful or wet, it’s failing your cows.
  3. Look mid‑day. At least 80–85% of your cows should be lying down comfortably after feeding.
  4. Start small. Neck rails, fans, and bedding deliver immediate ROI—and can fund larger phases later.
  5. Recalibrate your ration. Once comfort improves, cows eat differently — work with your nutritionist to reflect that change.

The Foundation That Never Takes a Day Off

I remember something Dr. Mike Hutjens once told a group of producers: “Infrastructure never takes a day off.” And it stuck with me. A properly fitted stall or well‑placed fan doesn’t clock out when you do; it’s the one system on the farm that works 24/7 without supervision or overtime.

What’s important—and, frankly, encouraging —is that comfort strategies aren’t limited to freestall setups. Tie‑stall and dry lot systems achieve similar returns when cow biology drives design rather than human habit. Sand or dry bedding, airflow direction, and clean water space work for dairies of every scale and layout.

If there’s a single takeaway here, it’s this: foundation before feed. The barn sets the biological ceiling, and the feed fills the space below it. Get that order right, and suddenly everything else — the ration, the reproduction, the milk components — starts falling into place naturally.

Further Reading and Resources

Key Takeaways:

  • Every extra hour cows rest can earn roughly 3.5 lbs of milk—comfort converts directly into production.
  • Feed can’t fix a poorly built barn. Airflow, shade, and stall comfort determine how well the feed performs.
  • Simple $50 stall fixes often deliver a 300% ROI—before your next feed bill even prints.
  • Heat stress begins at a THI of 68 °F, not 80. Early cooling preserves milk yield and fertility.
  • Infrastructure pays you every day—it never takes a day off.

Executive Summary

Most producers focus on feed when milk performance stalls — but new research shows the real ceiling may be in the barn, not the bunk. Studies from Wisconsin, Florida, and Cornell link each extra hour of cow rest to 1.7–3.5 lbs of milk per day, with simple $50 comfort fixes delivering triple‑digit ROI. Heat stress starts earlier than we think — at just 68 °F THI — quietly costing milk, fertility, and even the next generation’s output. What’s encouraging is how quickly these investments pay back, often inside one season. Across freestalls, tie‑stalls, and dry lots, the takeaway is the same: infrastructure is the quiet partner that lets nutrition, genetics, and management finally show their full potential.

Complete references and supporting documentation are available upon request by contacting the editorial team at editor@thebullvine.com.

Learn More:

The Sunday Read Dairy Professionals Don’t Skip.

Every week, thousands of producers, breeders, and industry insiders open Bullvine Weekly for genetics insights, market shifts, and profit strategies they won’t find anywhere else. One email. Five minutes. Smarter decisions all week.

NewsSubscribe
First
Last
Consent

Is Stray Voltage Stealing 20 Pounds Per Cow from Your Dairy?

Cows avoiding water? Nervous in the parlor? Production dropping? You’re not imagining it—20% of dairies have stray voltage that utilities can’t detect.

You know, I spoke with a producer from Minnesota who shared something that many of us might recognize: her best cow had died unexpectedly after a completely normal 70-pound milking. Every consultant she’d brought in confirmed her management was exemplary. Yet cows kept declining, and nobody could explain why.

This was Jill Nelson from Olmar Farms in Sleepy Eye, and her eight-year journey to discover what was affecting her elite registered Holstein herd reveals an issue that—honestly—deserves more attention than it gets. After installing an isolated transformer to separate her farm from utility electrical infrastructure (we’re talking about an investment approaching $100,000 here), production increased by nearly 20 pounds per cow per day. And this happened during summer 2017, when most of us are just trying to maintain production through heat stress.

What’s particularly noteworthy is that Nelson’s experience aligns with estimates from that old USDA Agriculture Handbook 696—you might have seen it referenced—suggesting that up to 20% of dairy operations may encounter some level of stray voltage issues. While the data is still developing on the exact prevalence, this potential scope… well, it merits serious consideration as we evaluate those unexplained herd health and production challenges we all see from time to time.

Here’s what’s interesting from an economics standpoint: With a 20-pound daily increase on 150 cows at current milk prices, Nelson’s investment paid for itself in approximately six months. Not many farm improvements deliver that kind of return, right?

Understanding the Technical Challenge

So here’s where things get a bit complicated—but stick with me because this matters.

The complexity of stray-voltage diagnosis begins with how we measure it. Standard utility testing protocols use a 500-ohm resistor to simulate your cow’s electrical resistance. This standard, believe it or not, was established in that 1991 USDA handbook I mentioned. And it’s still what utilities use when they come out to test your farm today.

The Testing Gap reveals why 20% of dairies struggle with hidden electrical issues—utilities test at 500 ohms, but real cows measure 109-400 ohms, experiencing double to quadruple the current that standard tests report as “safe.”

What makes this significant? Well, field research from agricultural electrical consultants has documented dairy cattle with actual body resistance ranging from approximately 100 to 400 ohms—substantially lower than what the testing standard assumes. Dr. Richard Norell, who’s the Extension dairy specialist up at the University of Idaho, has examined electrical resistance in dairy cattle as part of broader agricultural electrical research, and his work contributes to our understanding of this variation.

The practical implications… they deserve consideration. You probably remember Ohm’s Law from somewhere—current equals voltage divided by resistance, right? Well, if the testing equipment assumes 500 ohms but the actual cow resistance is closer to 200 ohms, the measured current significantly underestimates what your animals actually experience. It’s somewhat like calibrating feed measurements with equipment that doesn’t account for actual dry matter intake—the numbers look fine, but reality’s telling a different story.

When utilities measure, say, 1.0 volts using standard protocols, they calculate approximately two milliamperes of current flow—within accepted guidelines, according to veterinary references such as the Merck Manual. But here’s the thing: cattle with lower resistance are experiencing higher current levels proportionally. Norell’s research and data collected at UW–Madison showed cows reacted to current at the lowest tested levels—just 0.25 milliAmps, which is eight times lower than the standard utilities use to define possible harm to cattle. In fact, 25% of cows in those studies showed behavioral responses at only 0.25 mA, much lower than the traditional 2 mA threshold long reported in the industry.You can see the problem here.

Learning from Progressive Operations

What I find valuable about the Olmar Farms case is that they followed best management practices—and still got hammered.

Their operation, which received Holstein Association USA’s Elite Breeder Award in 2017, maintained a rolling herd average of 26,192 pounds before encountering these challenges. They’d invested in modern facilities, including equipotential planes (you know, those conductive grid systems designed to prevent electrical differentials), tunnel ventilation, sand-bedded freestalls—basically everything we’re told makes a difference.

Nelson brought in respected consultants. Dr. Tom Oldberg analyzed nutrition. Dr. Reid evaluated the milking systems. Dr. Gary Neubauer, a well-known dairy veterinarian, was also part of the diagnostic team. Each one confirmed management met or exceeded industry standards. As many of us have experienced, sometimes you can do everything right and still have problems.

Yet the herd exhibited concerning behavioral changes. Previously calm animals became difficult to handle during milking. Some cows required leg restraints for safe milking—and that’s unusual for well-managed herds, wouldn’t you say? Mastitis incidence increased despite proper protocols. Water consumption patterns changed dramatically, with cows hesitating at troughs or displaying unusual lapping behaviors rather than normal drinking.

⚠️ Warning Signs We Should All Watch For:

  • Cows hesitating or “dancing” at water troughs
  • Unusual lapping instead of normal drinking
  • Parlor nervousness is developing in previously calm animals
  • Drinking from puddles while avoiding standard waterers
  • Multiple health issues appearing simultaneously without a clear cause
  • High producers are dying unexpectedly without an obvious illness

Standard utility testing repeatedly showed “acceptable” voltage levels. The graphs looked normal, measurements within guidelines. This continued for eight years—eight years!—until 2016, when Nelson connected with an electrical specialist with specific experience in agricultural applications. Using equipment capable of millisecond-resolution recording (typically from manufacturers such as Fluke or Dranetz) and testing with more representative resistance values, this specialist documented electrical issues throughout the facility, including outdoor water systems.

Olmar Farms’ dramatic recovery after resolving stray voltage—production crashed 978 pounds during their 8-year battle, then surged 3,295 pounds above baseline after a $100,000 isolated transformer installation that paid for itself in just six months

Court records from July 2019 confirm the operation converted to three-phase power with an isolated transformer installation on May 1, 2017. There was a reported an 18-pound increase in production during the subsequent summer months, with current production exceeding 30,318 pounds rolling herd average as of March 2025. That’s quite a turnaround.

The Biological Response to Chronic Electrical Exposure

Here’s something that really fascinates me about this whole issue—the biology behind it.

Research from institutions like the University of Wisconsin-Madison helps explain what’s happening at the biological level. Doug Reinemann and co-researcher Dr. Louis Sheffield, both with Wisconsin’s biological systems engineering department, have published on how electrical stress affects dairy cattle biology. And what he’s found… it’s eye-opening.

This research shows that repeated low-level electrical exposure triggers cortisol release—the primary stress hormone. While acute stress responses serve important biological functions (we’ve all seen how a fresh cow reacts to a single stressor during transition), chronic exposure can maintain elevated baseline cortisol levels, which can affect multiple body systems. This builds on what we’ve learned about other chronic stressors in dairy production.

The cascade effects are fascinating… and concerning. We’re talking suppressed immune function, with reduced T-cell production and weakened antibody responses. This explains the varied symptoms Nelson observed: treatment-resistant mastitis in some cows, reproductive failures in others, sudden production crashes or unexpected mortality in high producers.

As Nelson put it—and I think this really captures the frustration—”It looked like we were failing at everything simultaneously. Nutrition problems AND health problems AND reproduction problems AND behavior problems all at once.” Makes perfect sense when you understand it’s all coming from the same electrical source, doesn’t it?

Research in veterinary literature also documents transgenerational effects, with calves from electrically stressed dams showing reduced immune competence, impaired vaccine responses, and various developmental issues. Nelson reported observing congenital disabilities and cardiac abnormalities during the most challenging period. That’s something that really makes you think about the long-term implications for your replacement program.

Distinguishing Source and Responsibility

Alright, so here’s where things get complicated—and expensive. The source of electrical issues fundamentally determines resolution approaches and costs.

On-farm sources (damaged motor insulation, corroded connections, inadequate grounding) typically cost between $800 and $10,000 to address, depending on scope. Any qualified agricultural electrician can handle these repairs. That’s manageable for most operations.

But utility-source issues? That’s a different story altogether.

Every North American farm connects to multi-grounded neutral systems—the National Electrical Safety Code requires it. The utility-neutral conductor is repeatedly grounded between the substation and your farm, with your farm’s electrical systems bonded to this neutral at the transformer. You probably know this already, but it’s worth reviewing.

Under ideal conditions, this system works well. But when utility neutrals can’t adequately carry return current—maybe due to undersized conductors for modern loads, deteriorated connections from age, or phase imbalances—that current seeks alternate paths through earth ground. And since your farm’s grounding system is bonded to theirs… well, that current can flow right through your agricultural facilities.

The primary solution is to install isolated transformers to create electrical separation between the farm and utility systems. Based on documented cases, these installations can cost $50,000 to $100,000 or more. The Nelson operation’s investment approached $100,000, including a three-phase power installation located more than 100 yards from the buildings. And despite the problem originating from utility infrastructure, farms often bear these costs themselves. That still frustrates me when I think about it.

The financial fork in the road—on-farm electrical issues cost under $10K and resolve quickly, while utility-source stray voltage demands $50-100K investments that take months but pay back in 6-12 months through production recovery

What about insurance? Most standard farm policies generally don’t specifically address stray voltage losses, though some carriers now offer specialized riders. I always tell producers: verify coverage with your agent rather than assuming protection exists. Better to know before you need it.

Best Practices from Affected Operations

Looking at successful resolutions, I’m seeing consistent patterns that are worth sharing.

Documentation proves crucial. Producers who achieve resolution create comprehensive evidence before engaging utilities or consultants. This includes video documentation of behavioral changes—hesitation at water sources, unusual drinking patterns, and parlor nervousness. They maintain detailed production records showing systematic changes despite consistent management. Health events, treatments, mortality patterns—it all merits careful tracking.

Paul Halderson’s Wisconsin operation, which prevailed in litigation against Xcel Energy, maintained decades of documentation. This record proved invaluable when addressing utility claims about management deficiencies. The lesson here is clear: document everything, even if it seems minor at the time.

Independent testing before utility engagement often proves worthwhile. Specialists familiar with agricultural electrical systems, using appropriate protocols and resistance values, typically charge $3,000 to $5,000 for a comprehensive assessment. While that’s significant, this investment can prove valuable if negotiation or—God forbid—litigation becomes necessary.

Understanding state-specific standards helps producers navigate the system. Wisconsin and Minnesota use 1-volt or 2-milliamp action thresholds. Knowing these standards—and their basis in that 500-ohm testing protocol we discussed—helps you advocate for appropriate testing when utilities respond.

Regional Variations and Current Context

The 2025 dairy economy makes hidden production losses particularly challenging, doesn’t it? While feed costs have moderated from recent peaks (thankfully), maintaining production efficiency remains crucial for profitability. A 15% production loss from undiagnosed electrical issues—not uncommon based on documented cases—that can determine operational viability.

I’ve noticed regional patterns emerging from infrastructure age and agricultural practices. Wisconsin and Minnesota operations, particularly those served by infrastructure dating back 40-50 years, report more utility-source issues as equipment struggles with modern electrical loads. Similar patterns appear in Vermont and upstate New York, especially where utility consolidation has deferred infrastructure updates.

Newer dairy regions present different challenges. Texas and Idaho operations may have more modern infrastructure, but they face issues stemming from shared distribution lines used by center pivot irrigation systems. Seasonal voltage fluctuations during peak irrigation can affect nearby dairy facilities. And Southeastern operations? They contend with how seasonal variations in ground moisture affect current flow through the soil—I heard about this recently from a Georgia producer dealing with mysterious summer production drops.

California’s large-scale operations, with their substantial electrical loads for cooling and milk processing, sometimes encounter unique challenges when utility infrastructure hasn’t kept pace with dairy consolidation and expansion. It’s a different set of problems, but the underlying issue remains the same.

Recognition and Response Strategies

Based on documented cases and producer experiences, if you’re seeing behavioral changes at water sources—hesitation, unusual lapping behaviors, complete avoidance despite obvious thirst—that’s particularly telling. Same with parlor nervousness that develops in previously calm animals, especially during milking preparation.

For producers observing these patterns, here’s what works: Begin with thorough documentation using available technology—smartphones can capture behavioral evidence effectively these days. Engage independent testing through specialists who understand agricultural applications. Eliminate on-farm sources by systematically evaluating motors, connections, and grounding systems. Only then engage utilities, preferably in writing, with documentation already assembled.

Budget considerations should include $3,000-$5,000 for comprehensive independent testing. If utility infrastructure proves problematic, resolution costs can reach $50,000 to $100,000 or more for isolated transformer installation. Yes, that’s significant. But remember Nelson’s six-month payback period. Sometimes the investment, painful as it is, makes sense.

Industry Evolution and Future Considerations

Recent legal precedents suggest evolving recognition of these challenges. The Iowa Supreme Court’s June 2024 decision upholding Vagts Dairy’s verdict against Northern Natural Gas for pipeline-related electrical issues establishes important precedent for infrastructure liability. That’s encouraging, at least.

Most producers won’t pursue lengthy litigation—and shouldn’t have to. Practical solutions matter more than legal victories. That’s why farmers like Jill Nelson are developing resources to share knowledge. Her website, strayvoltagefacts.com, provides research and guidance based on her direct experience. It’s worth checking out if you’re dealing with unexplained issues.

What’s encouraging is how the industry conversation has evolved. A decade ago, debates centered on whether stray voltage even existed. Today’s discussions focus on identification and mitigation strategies. This represents meaningful progress, even if implementation remains inconsistent.

Nelson’s operation now maintains a rolling herd average of over 30,318 pounds on twice-daily milking, according to March 2025 data. While genetics were damaged during the affected period, the operation survived and recovered. As Nelson has shared in various forums, early recognition of testing limitations and documentation requirements might have shortened their eight-year challenge considerably.

Given the substantial number of operations potentially experiencing some level of electrical issues, it is important to acknowledge that “acceptable” testing results may not ensure the safety of sensitive animals. Just as we’ve embraced precision management for nutrition and reproduction, electrical safety may require similar individualized approaches.

Dairy farmers are winning big in court—$32+ million awarded across four major cases from 2010-2024, with the June 2024 Iowa Supreme Court ruling establishing critical precedent that negligence isn’t required to prove nuisance from stray voltage

This builds on what we’ve learned about variation in biological systems—what works for the average may not protect the sensitive. Until testing protocols better reflect this reality, those of us who combine careful observation with independent verification will be best positioned to protect our herds.

The Bottom Line

You know, the difference between management challenges and electrical issues can be subtle but significant. Understanding this distinction—and knowing how to investigate it properly—that’s valuable knowledge for any operation experiencing unexplained herd challenges.

Sometimes what appears to be a management problem stems from infrastructure issues that standard testing protocols weren’t designed to detect. And that’s not a failure of management—it’s a limitation of how we’ve been measuring things.

What’s your experience been with unexplained herd health or production challenges? Have you noticed behavioral changes that didn’t quite fit typical patterns? The conversation continues as we work together to understand and address the complex interactions between modern dairy operations and aging electrical infrastructure.

For more resources and to share experiences, visit strayvoltagefacts.com or reach out through The Bullvine’s producer network. Because sometimes the best solutions come from farmers sharing what they’ve learned the hard way. And that’s how we all get better at this business we’re in.

KEY TAKEAWAYS:

  • If cows are hesitating at water or dying unexpectedly, it’s likely stray voltage—affecting 1 in 5 dairy farms, not management failure
  • Standard utility testing misses the problem: They test at 500 ohms resistance when actual cow resistance is 200-400 ohms, underreporting exposure by half
  • Your documentation strategy determines your outcome: Video behavior changes, track production/health data, get independent testing ($3-5K) BEFORE calling utilities
  • Resolution costs vary wildly: On-farm electrical fixes are manageable (under $10K), but utility-source problems requiring isolated transformers can hit $100K—though payback can be swift (20 lbs/cow/day gains)
  • You’re not imagining it: Courts are awarding millions in stray voltage cases, proving this hidden problem is real and fixable when properly diagnosed

EXECUTIVE SUMMARY: 

Your cows avoiding water troughs and dying after perfect production days might not be a management problem—it’s likely stray voltage, a hidden electrical issue affecting up to 20% of dairy operations nationwide. The crisis stems from a fundamental testing flaw: utilities measure using 500-ohm resistance standards established in 1991, but research shows dairy cattle actually average 200-400 ohms, meaning your animals experience double the electrical current that standard tests report as “safe.” Jill Nelson’s award-winning Minnesota Holstein operation suffered eight years of mysterious losses before discovering this truth—her $100,000 investment in an isolated transformer delivered 20 pounds of milk per cow per day, paying for itself in six months. The difference between financial recovery and bankruptcy often comes down to recognizing symptoms early (behavioral changes at water sources, parlor nervousness, unexplained deaths) and getting independent testing with proper equipment. While on-farm electrical fixes typically cost under $10,000, utility-source problems can exceed $100,000, making documentation and proper diagnosis critical before accepting utility test results that miss what’s really happening to your herd.

Complete references and supporting documentation are available upon request by contacting the editorial team at editor@thebullvine.com.

Learn More:

The Sunday Read Dairy Professionals Don’t Skip.

Every week, thousands of producers, breeders, and industry insiders open Bullvine Weekly for genetics insights, market shifts, and profit strategies they won’t find anywhere else. One email. Five minutes. Smarter decisions all week.

NewsSubscribe
First
Last
Consent
Send this to a friend