






National on-highway diesel was $2.634 a gallon higher year over year on Oct. 26 (EIA). USDA’s Title I relief pays on planted acres, not gallons. Here’s how to work out what your acres could cover.
Information checked as of October 31, 2026.
A dairy’s fuel bill doesn’t stop when harvest does. The mixer runs and the milk truck comes all year. The Title I formula USDA has announced for its $8 billion Harvest Fuel Relief program doesn’t pay on gallons burned or hundredweights shipped. It pays Title I crop producers through commodity-specific rates on FSA-reported planted acres.
That formula is built on a modeled national average of 2026 crop losses, not on any one dairy’s fuel-and-hauling increase. Whether a payment offsets that increase depends on the final rates and on each farm’s eligible acres and costs.
This piece covers the announced Title I approach only; USDA says the method for other commodities comes later. Until the November rates post, the useful work is sorting which acres could count and what a payment on them would have to cover.
What’s confirmed, what’s pending
| Confirmed by USDA (Oct. 19, 2026) | Still pending |
| $8 billion in one-time payments, Commodity Credit Corporation Charter Act, administered by FSA | Commodity-specific Title I rates (“in November”) |
| Formula uses FSA planted acres, ERS cost of production, WASDE yields and prices | Corn-silage treatment |
| No crop-insurance linkage required | Producer-share rules, limits and other adjustments |
| Pre-filled online applications for producers with a USDA-linked Login.gov account | Application dates |
| Non-Title I producers can submit fuel-cost data to HarvestFuel@usda.gov | Methodology for non-Title I commodities |
Source: USDA Release 0137.26, October 19, 2026.
Silage acres and the FBA precedent
USDA’s October 19 announcement doesn’t say whether corn-silage acres qualify.
The 2025 Farmer Bridge Assistance program counted them. FSA included acres planted for “harvest, haying, silage, or other similar purposes,” listed eligible corn intended uses and calculated each applicant’s acreage from reported shares (1-FBA Handbook, ¶25A, ¶25B, ¶41F). FBA paid $44.36 per corn acre.
HFR is a separate 2026 program. USDA called it “similar to” FBA, but the October 19 release doesn’t adopt FBA’s silage language, intended-use table or share rules. That $44.36 is history, not an HFR forecast.
A hypothetical 600-acre dairy
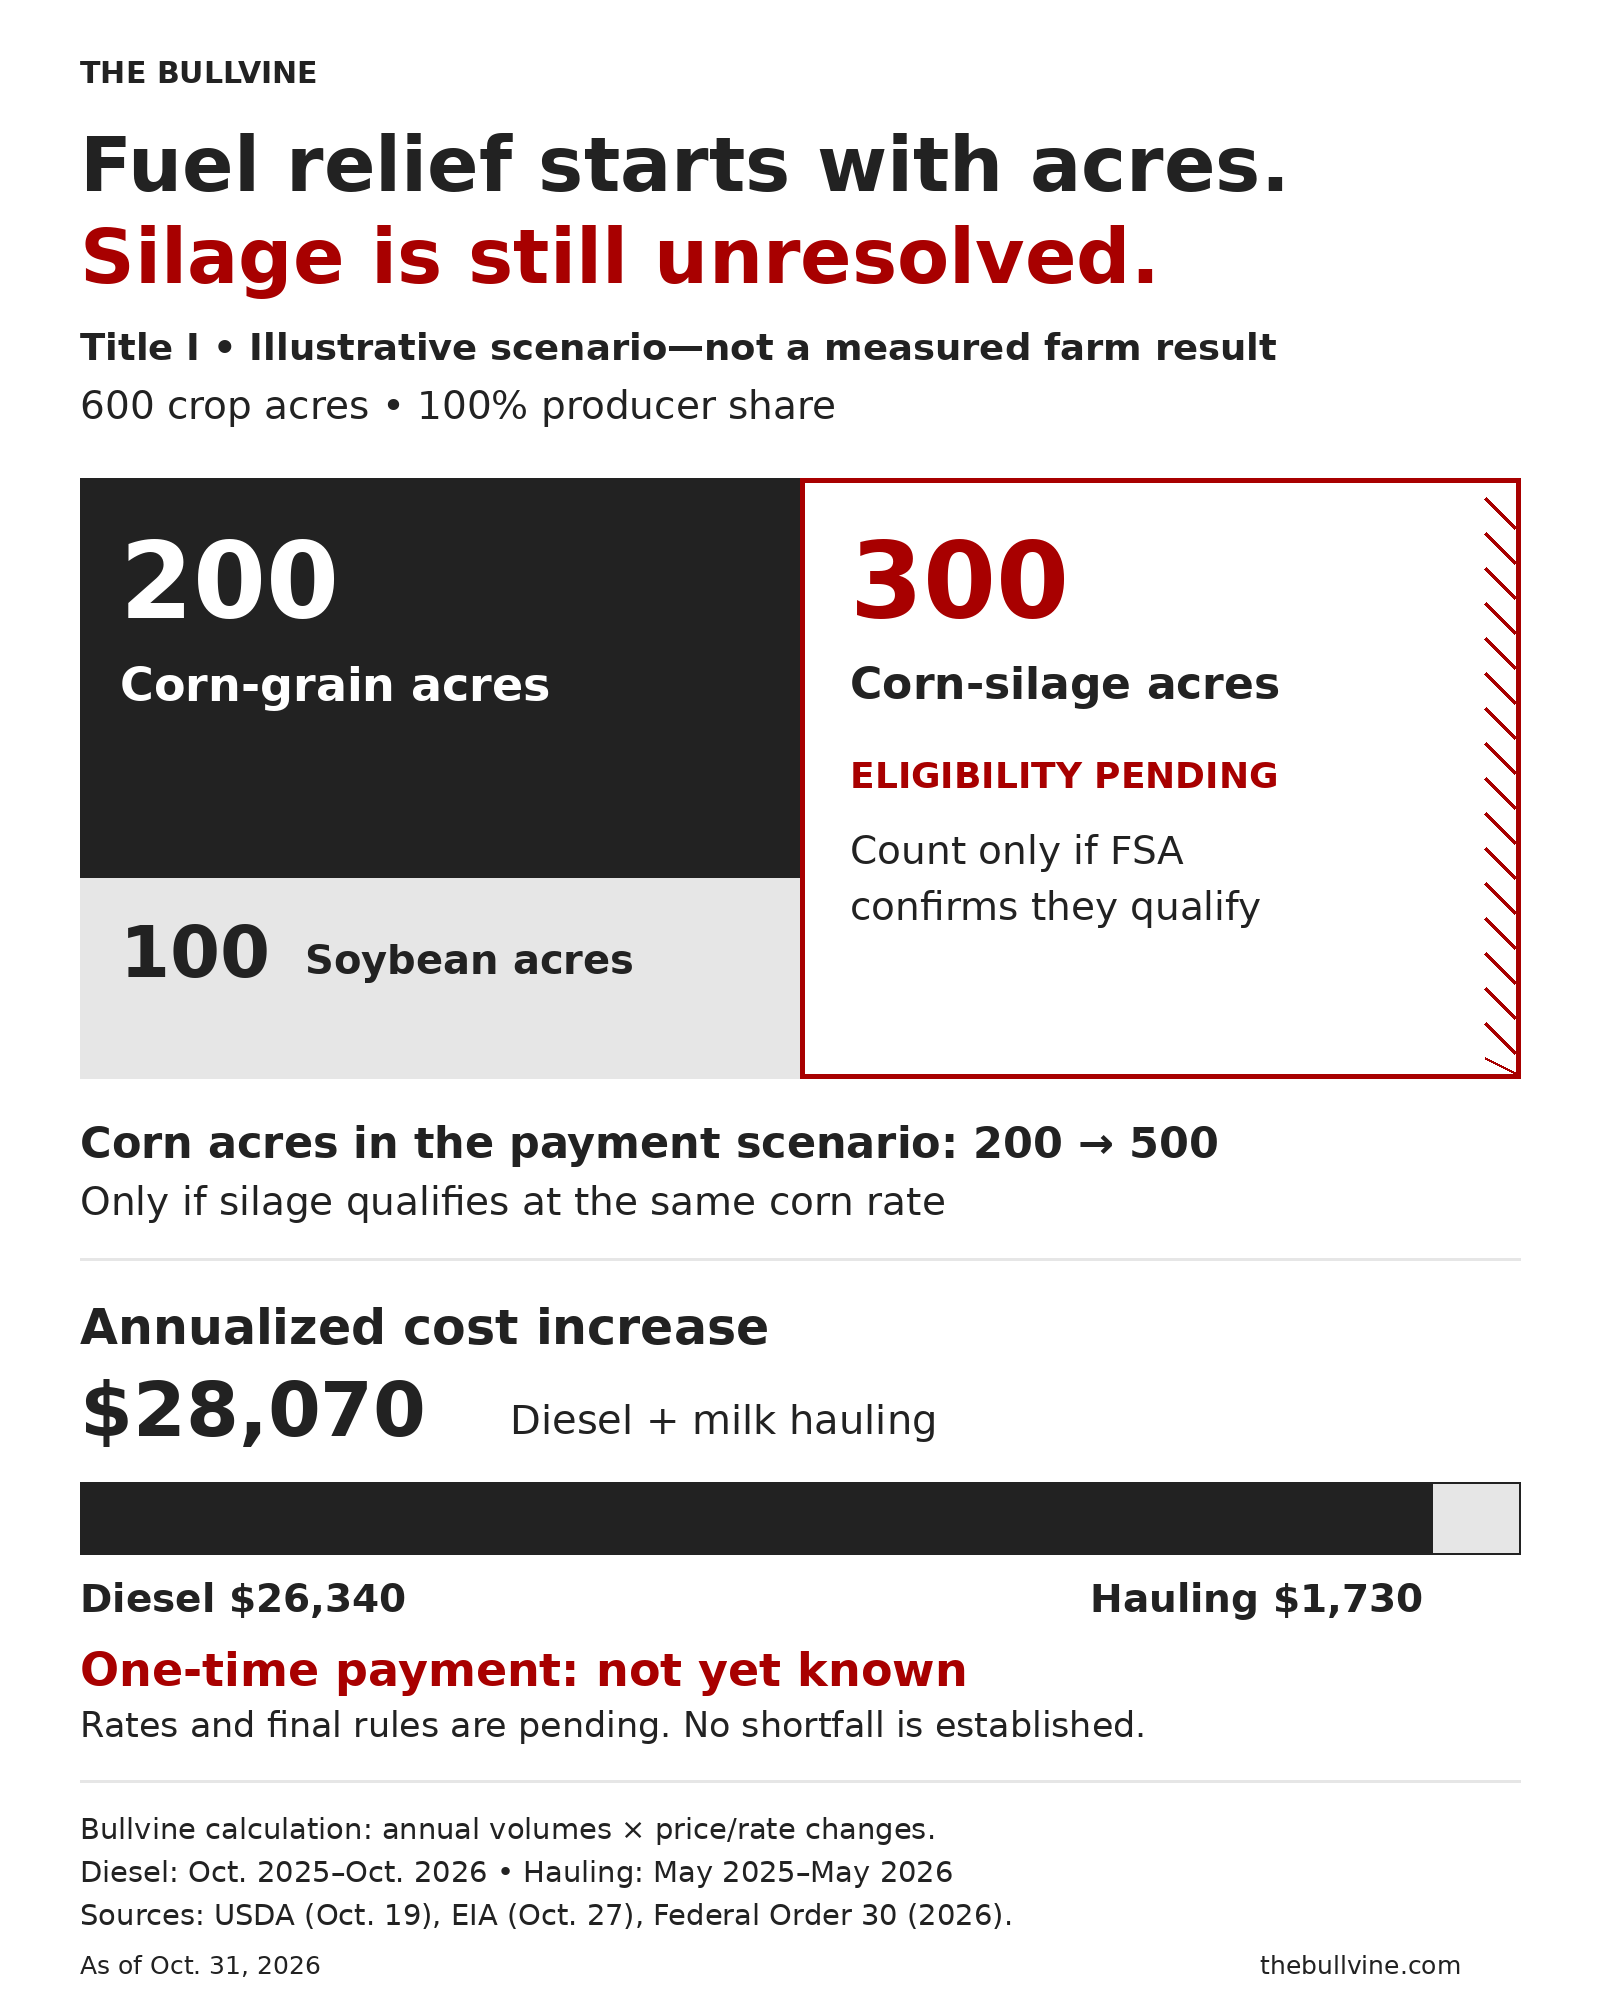
The farm below isn’t real, and the calculations are Bullvine’s. It holds a 100% share of the crop on all 600 acres; actual payment acres will follow HFR’s final eligibility and share rules.
| Illustrative inputs | Value |
| Corn-grain acres | 200 |
| Soybean acres | 100 |
| Corn-silage acres (awaiting HFR guidance) | 300 |
| Annual diesel | 10,000 gallons |
| Annual milk shipped | 100,000 cwt |
These figures are a planning scenario, not an audit of 2026 spending. They apply one diesel-price change (October to October) and one hauling-rate change (May to May) to a full year’s volume. What the farm actually paid depends on when it bought fuel, when its hauling rate changed and how much it used or shipped.
Annualized exposure
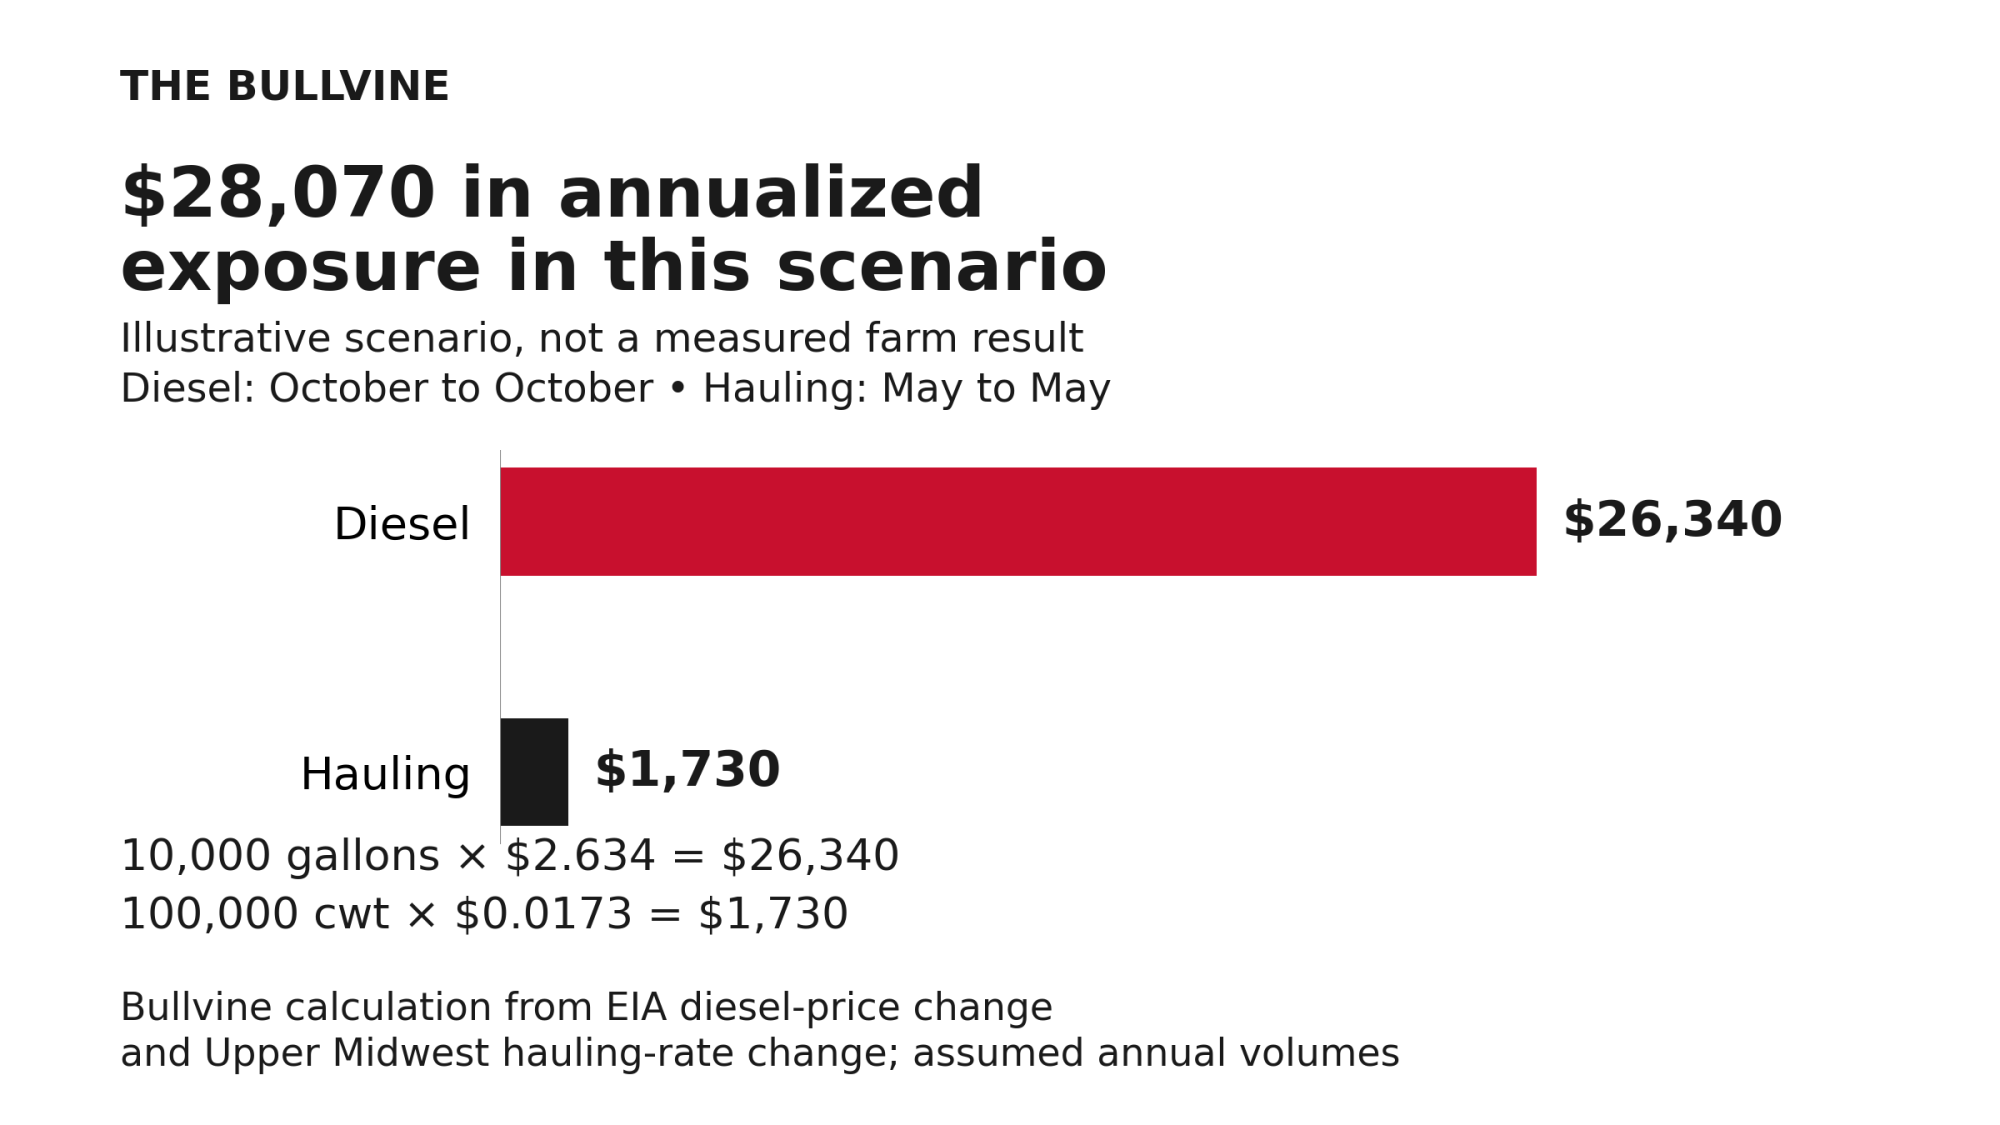
- Diesel: 10,000 gal × $2.634 = $26,340
- Hauling: 100,000 cwt × $0.0173 (Upper Midwest order-wide change, May to May) = $1,730
- Combined annualized exposure: $28,070
Potential acreage payment
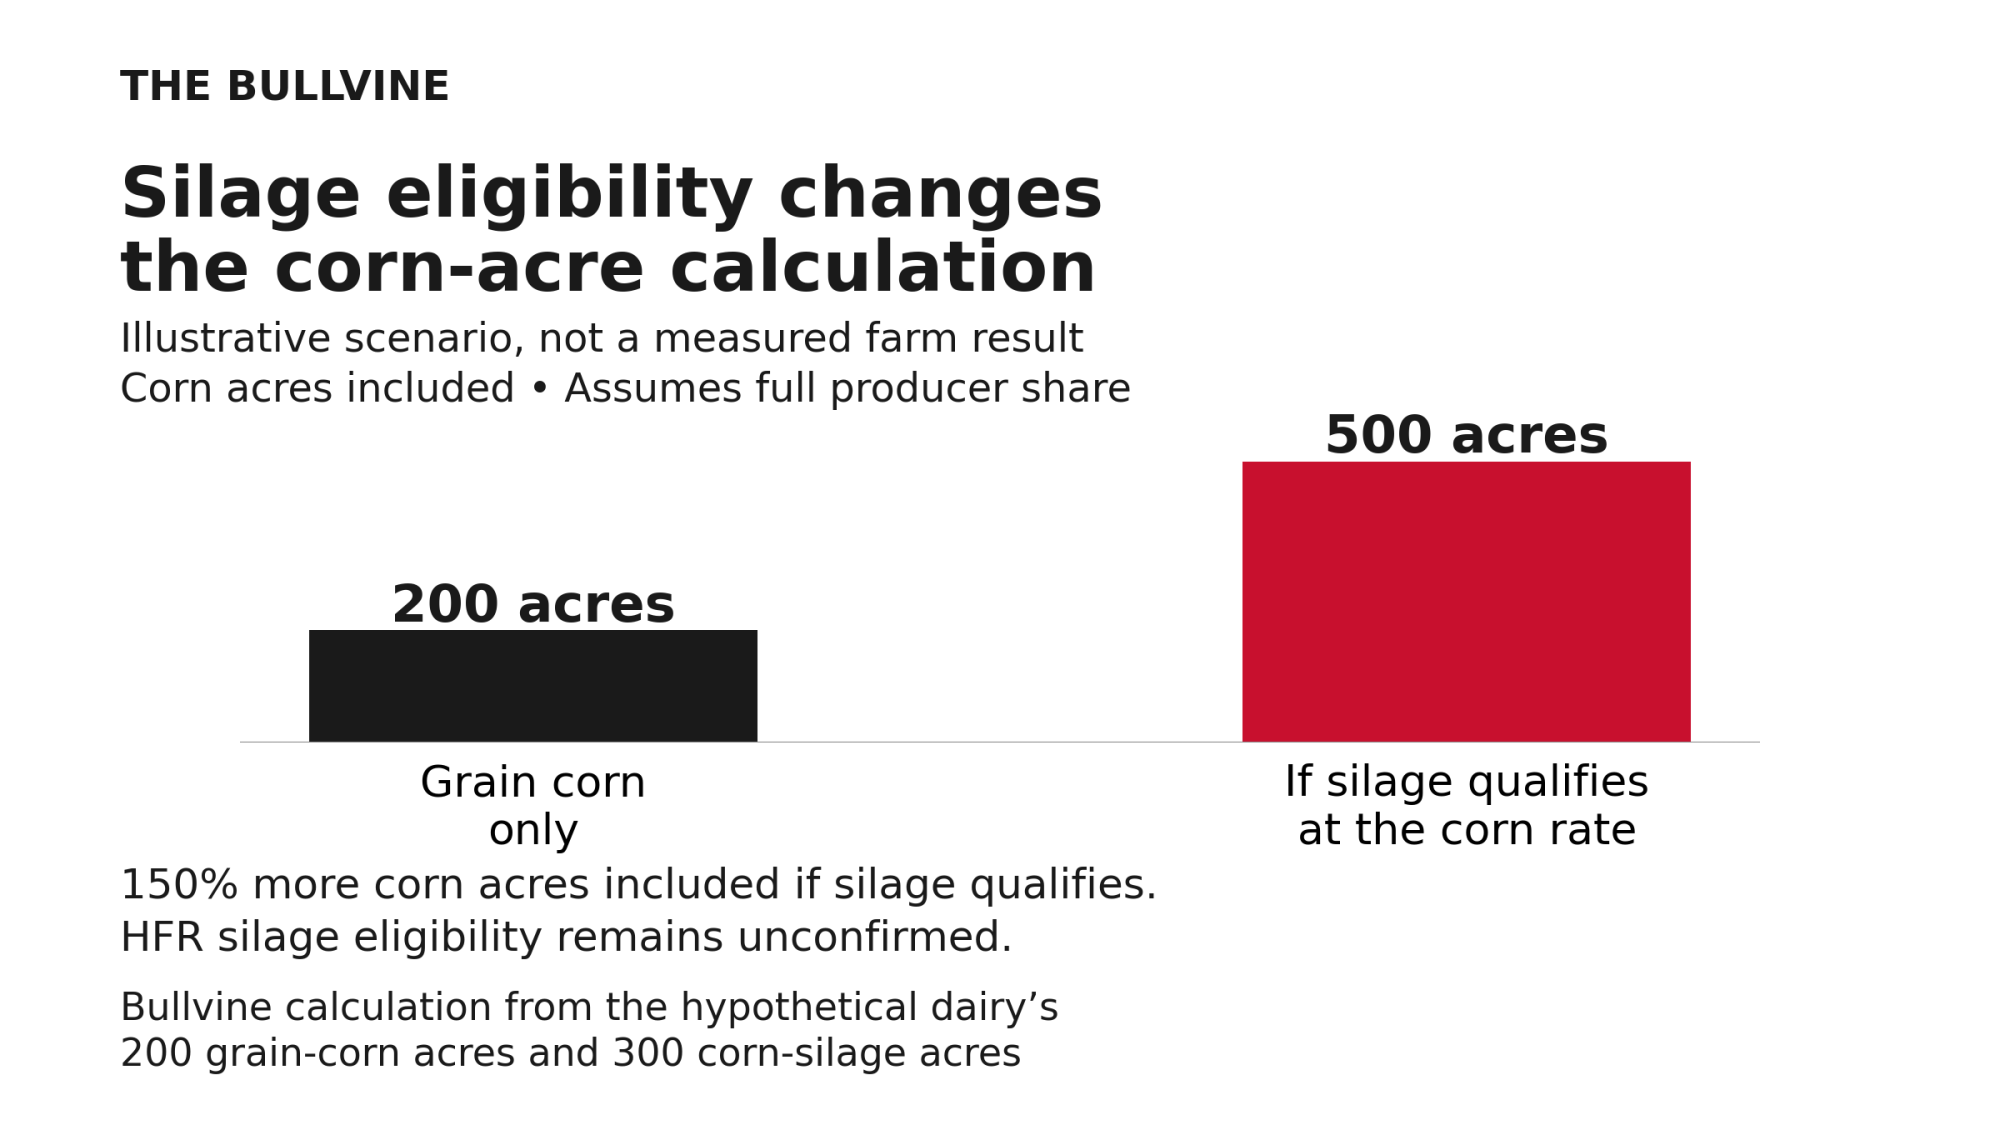
- If only grain corn and soybeans qualify: (200 acres × corn rate) + (100 acres × soybean rate)
- If silage also qualifies at the corn rate: (500 acres × corn rate) + (100 acres × soybean rate)
If silage qualifies at the same corn rate, the corn acres in this example rise from 200 to 500, a 150% increase. The silage acres sit in a separate column until FSA rules.
Illustrative: a hypothetical 600-acre dairy. FSA hasn’t confirmed how HFR treats silage acres.
Both lines are gross. The actual payment could be smaller once FSA applies its final eligibility, producer-share and any payment-limit rules.
Exposure against payment
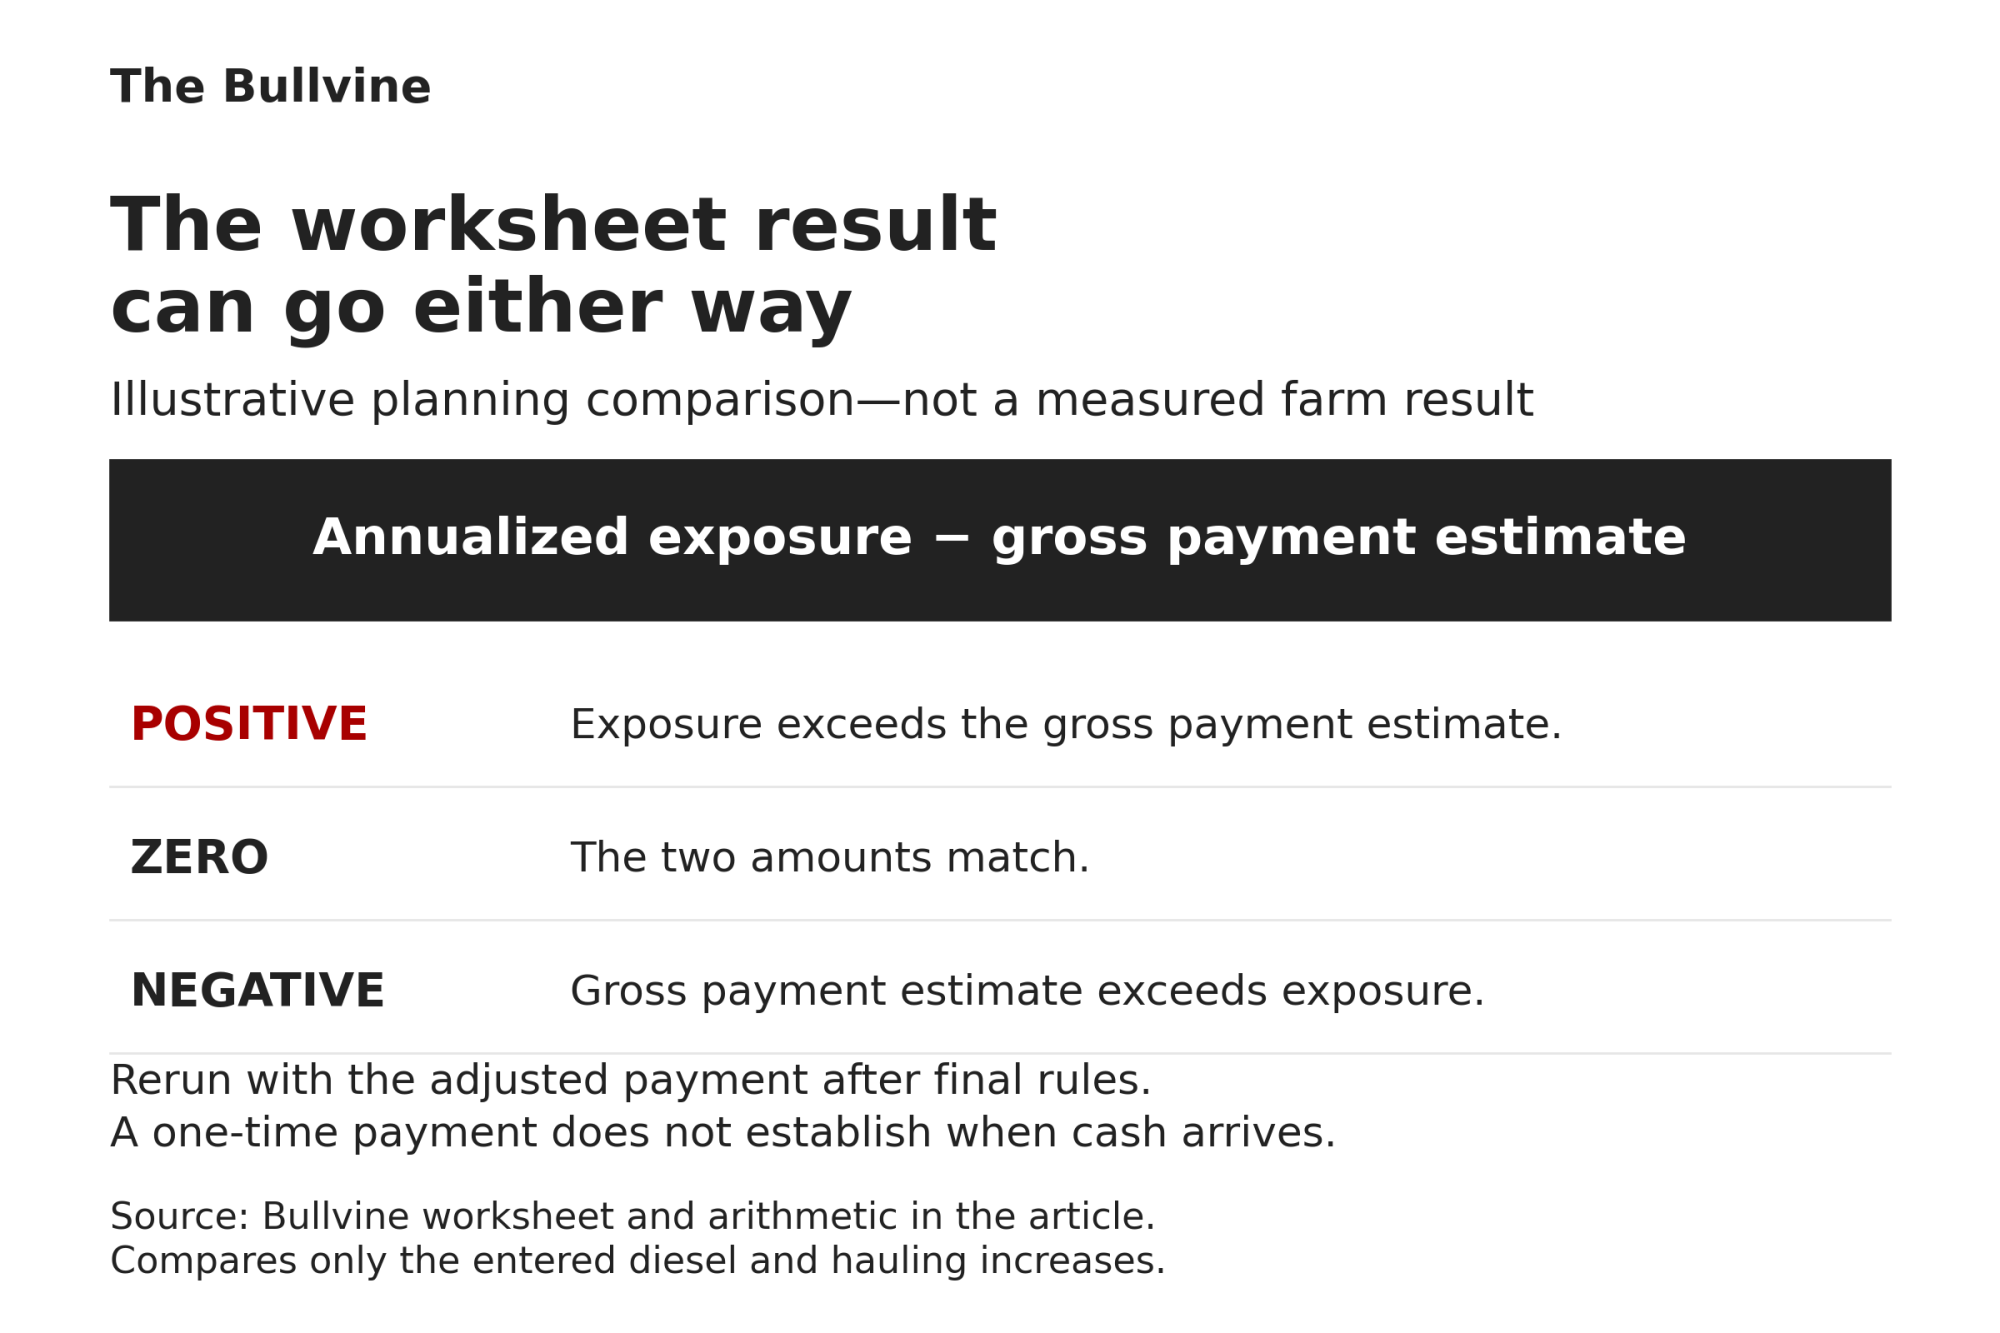
- Exposure minus gross payment estimate = $28,070 − gross payment scenario
Once rates post, a positive result is the part of the diesel and hauling increase the acreage payment doesn’t reach. A negative result means the gross payment tops it, before FSA’s final adjustments.
The comparison covers only the diesel and hauling increases entered. It doesn’t capture every higher cost on the farm or everything HFR might help offset, and the farm should rerun it with the adjusted payment once final rules are out. It also says nothing about when the check arrives. The worksheet sets a one-time payment against a year of assumed cost increases.
Each crop is calculated separately first. A single summary rate has to be weighted by confirmed eligible acres; a simple average of rates, or a blend done before eligibility is known, can misstate the payment.
Diesel and hauling numbers
EIA’s national on-highway diesel price was $6.352 a gallon on October 26, 2026, $2.634 above a year earlier. That’s about 71% by Bullvine’s math (EIA Gasoline and Diesel Fuel Update, October 27, 2026). The series tracks pump prices, not dyed-diesel invoices. The worksheet input is the difference between comparable fuel prices in the farm’s own records, not the full current price per gallon.
Federal Order 30’s May 2026 study of 7,526 Upper Midwest producers found volume-weighted hauling charges up roughly 1.7 cents per cwt from May 2025 (Staff Paper 26-02; 2025 paper). The paper’s author concludes that handlers passed little of the recent fuel-cost change through to farmers’ hauling deductions in May. October milk checks fall outside that study.
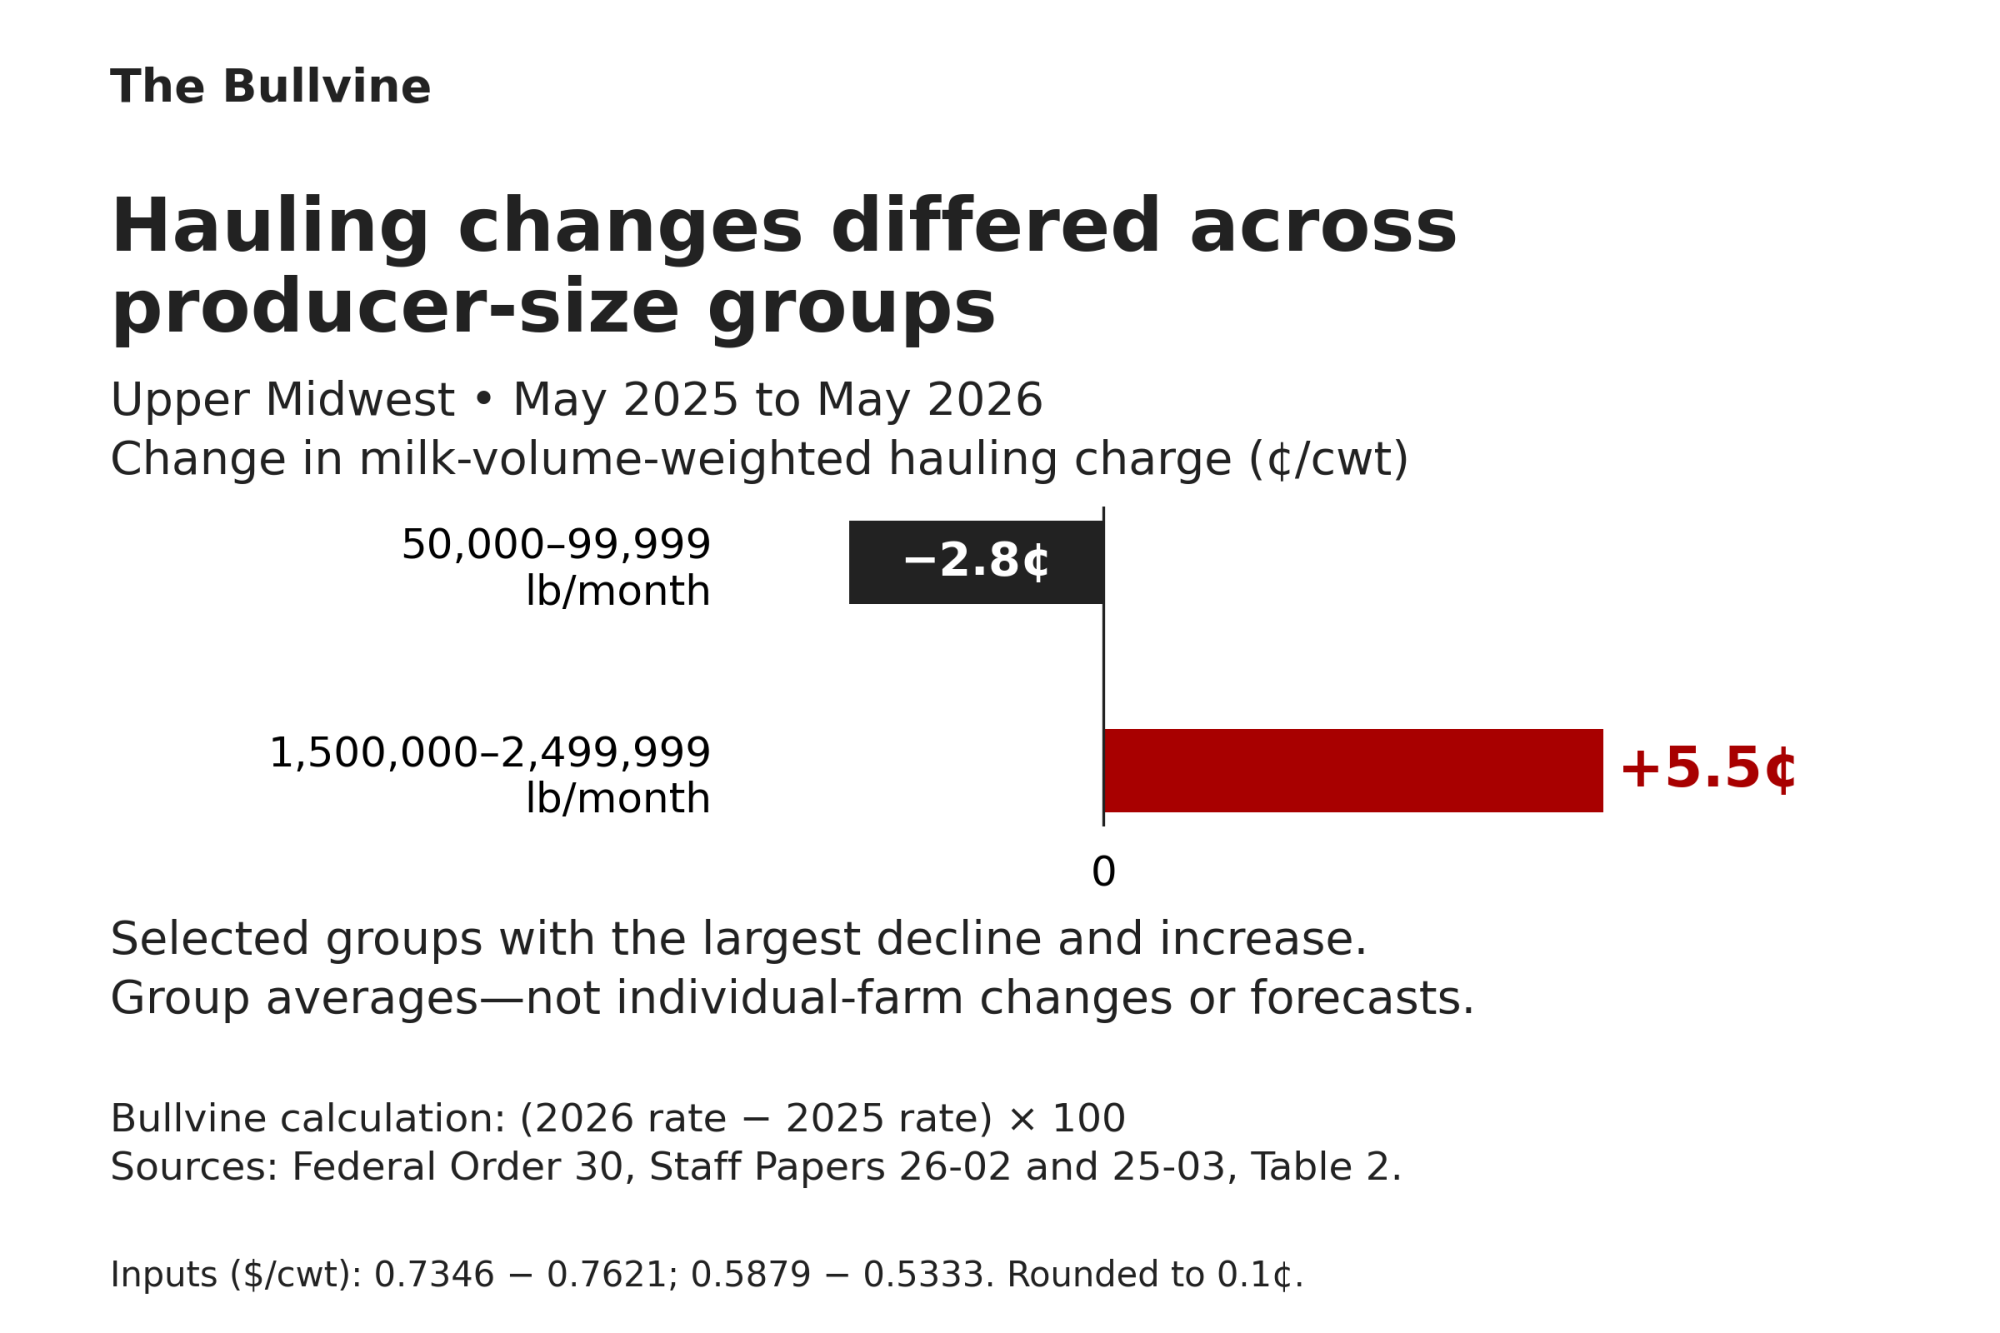
Hauling by monthly milk volume, Upper Midwest, May 2025 to May 2026
The 50,000–99,999 lb/month group saw charges fall about 2.8¢/cwt. The 1.5–2.5 million lb/month group saw them rise about 5.5¢/cwt. Those were the biggest drop and the biggest jump among the 10 size groups. They are group averages, not a forecast for any one farm.
Hauling paid directly to a third-party hauler won’t show up as a payroll deduction on the milk check. The worksheet takes the change in that bill, not the whole bill. Each cost counts once, so a farm hauling its own milk shouldn’t enter the same diesel increase in both the fuel and hauling lines.
What this means for your operation
- Pull the 2026 FSA acreage report and check crop types, intended uses, producer shares and planted acres.
- Keep silage acres in a separate column until FSA confirms they count.
- Link a Login.gov account to USDA. The agency says linked accounts will get pre-filled applications, and it hasn’t announced the application window.
- Gather the latest 12 months of fuel volumes and milk shipments, plus comparable earlier invoices and statements to set the price and hauling-rate changes. A forward budget uses expected volumes for one defined 12-month period, with the price assumptions written down.
- Keep unconfirmed HFR assistance out of committed cash-flow assumptions until the rates, eligibility rules and share calculation are published.
Fuel Relief & Exposure Calculator
Run your own numbers to see what USDA’s acreage-based relief actually covers on your dairy.
(Default based on ’25 FBA)
USDA has said Title I rates will come in November. In this example, the silage ruling decides whether 300 of the 500 possible corn acres count.
Complete references and supporting documentation are available upon request by contacting the editorial team at editor@thebullvine.com.
Learn More
- Three Feed Inputs Set the DMC Margin. Diesel Isn’t One, and It Rose 65%. — Behind the federal safety net lies a $31,980 blind spot. Exposes why government margin payouts systematically ignore fuel inflation, arming you with the exact math needed to restructure your operational risk plan today.
- A CA$686M Co-op Just Sent Maritime Farmers the Hauling Bill — Your exposure to hidden freight shifts becomes visible when tracing a CA$686 million plant closure. Follows the money to deliver a blueprint for calculating the multi-year cost when profitable processors offload consolidation onto producers.
- Iran War and Hormuz: How $4.16 Diesel Masks a $1.5M Fertilizer Hit on Your Dairy’s Bottom Line — Protect your equity from a devastating $1.5 million fertilizer shock by looking past pump prices. Dismantles the industry fixation on diesel alone, proving why tunnel vision on fuel costs leaves your bottom line completely exposed.
The Sunday Read Dairy Professionals Don’t Skip.

Every week, thousands of producers, breeders, and industry insiders open Bullvine Weekly for genetics insights, market shifts, and profit strategies they won’t find anywhere else. One email. Five minutes. Smarter decisions all week.