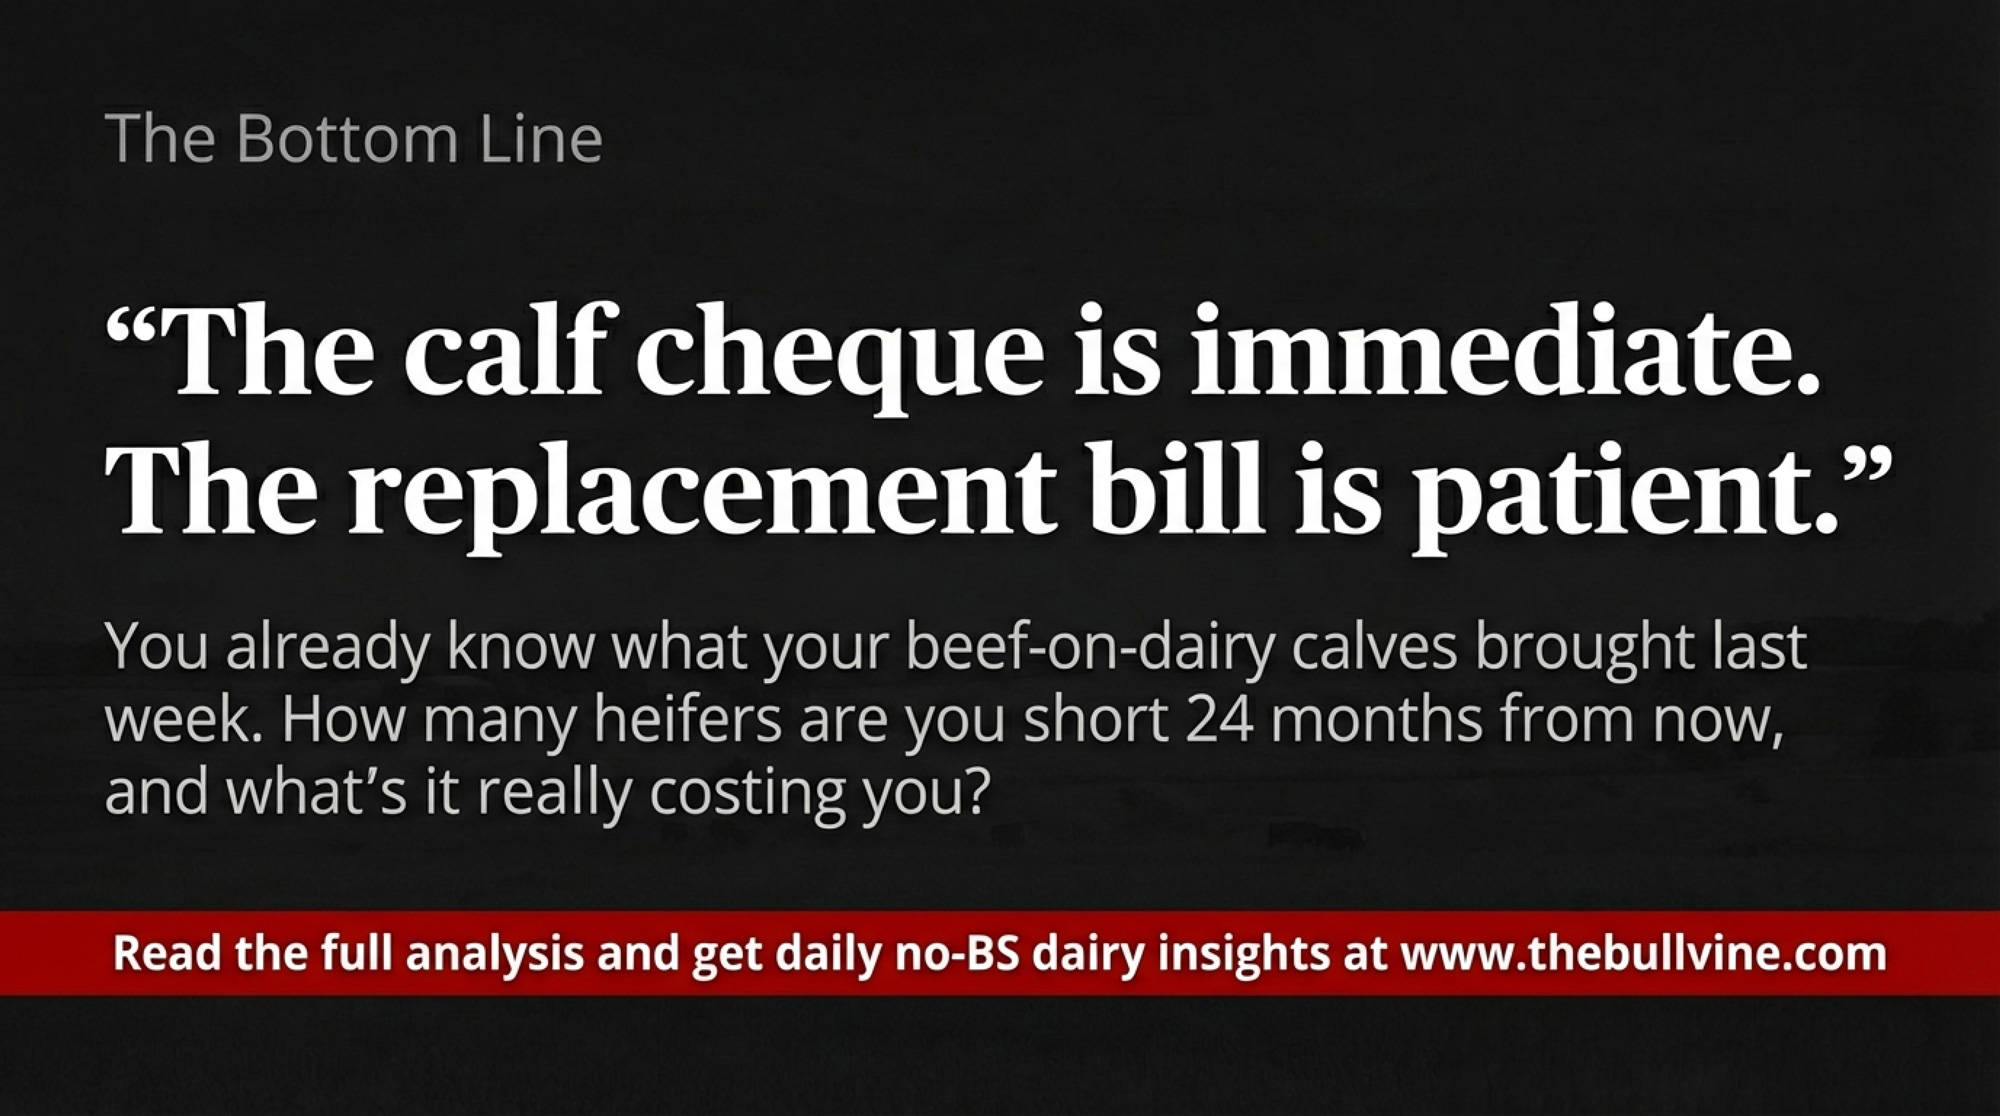
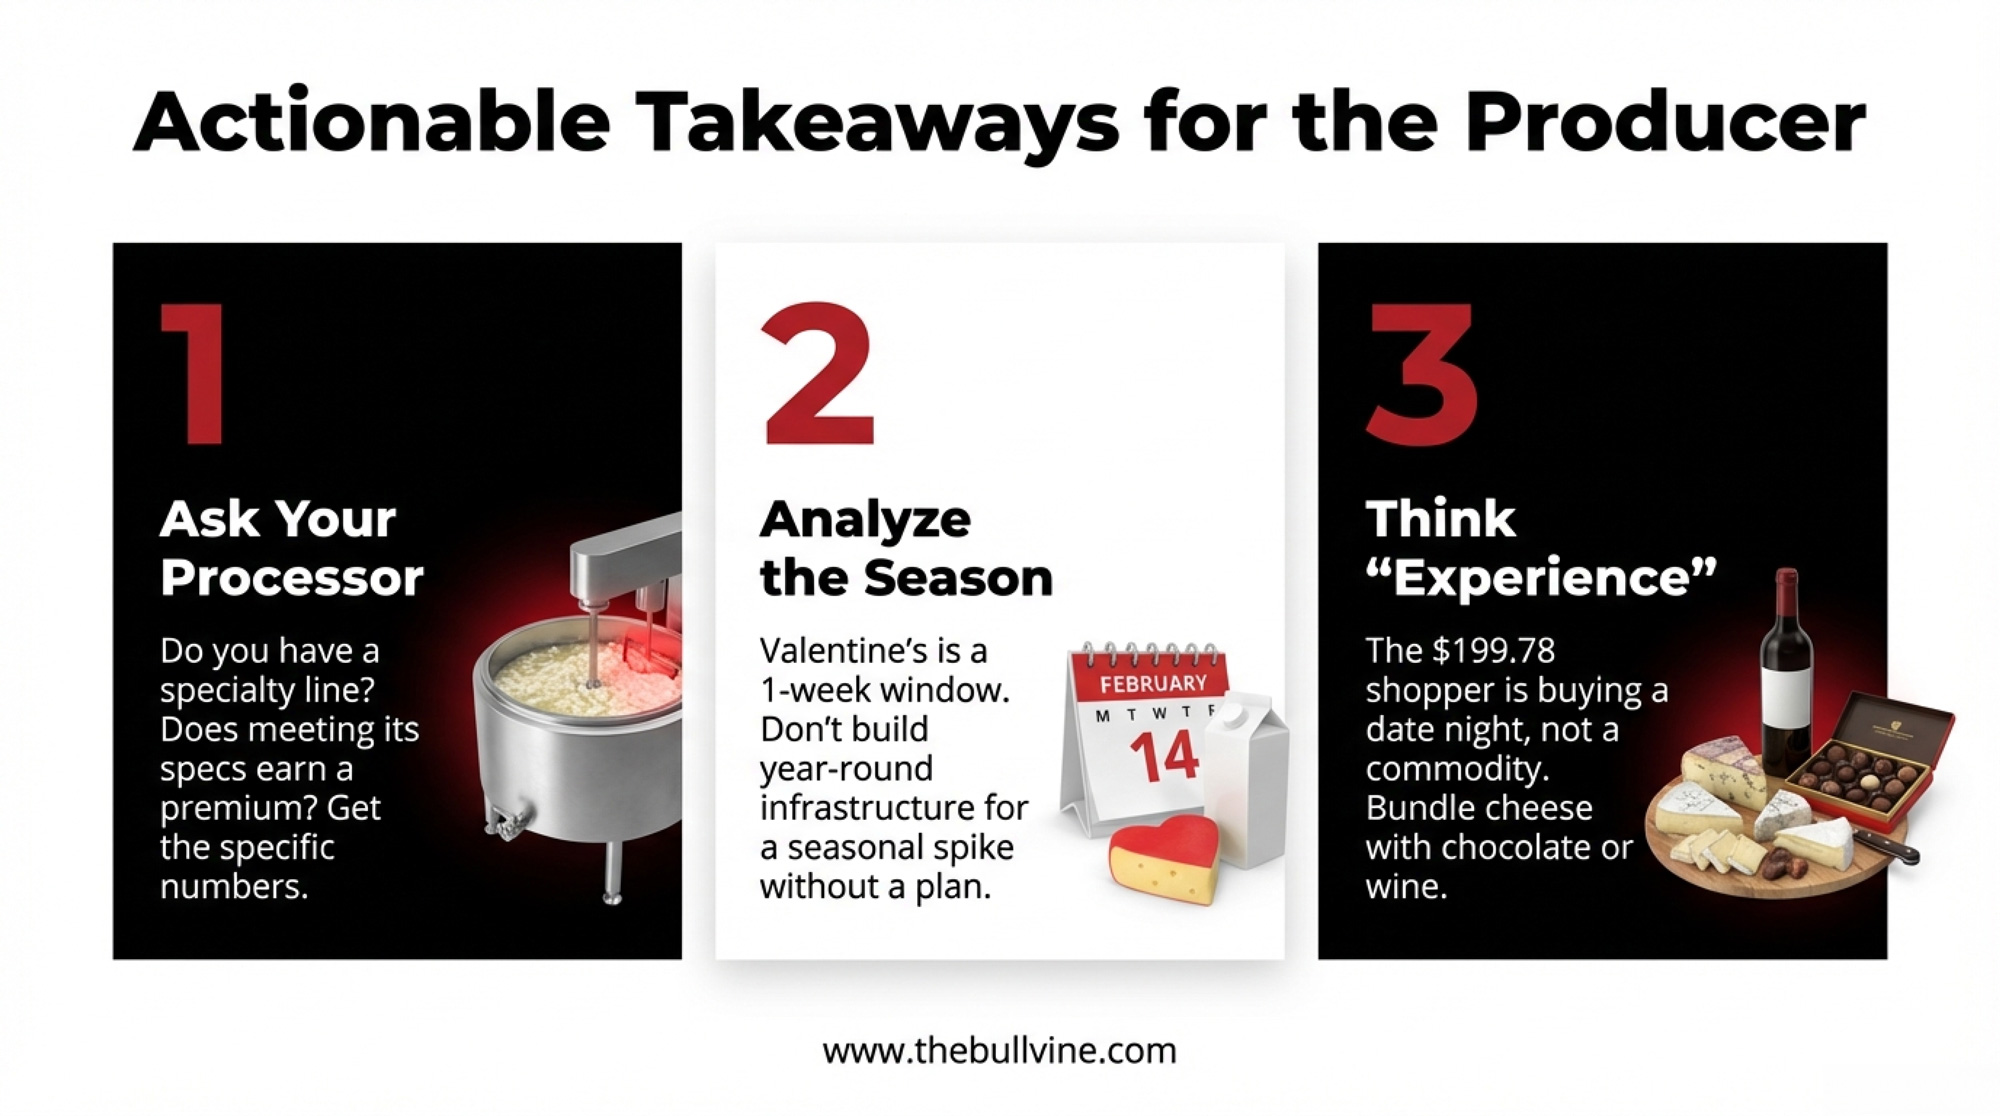
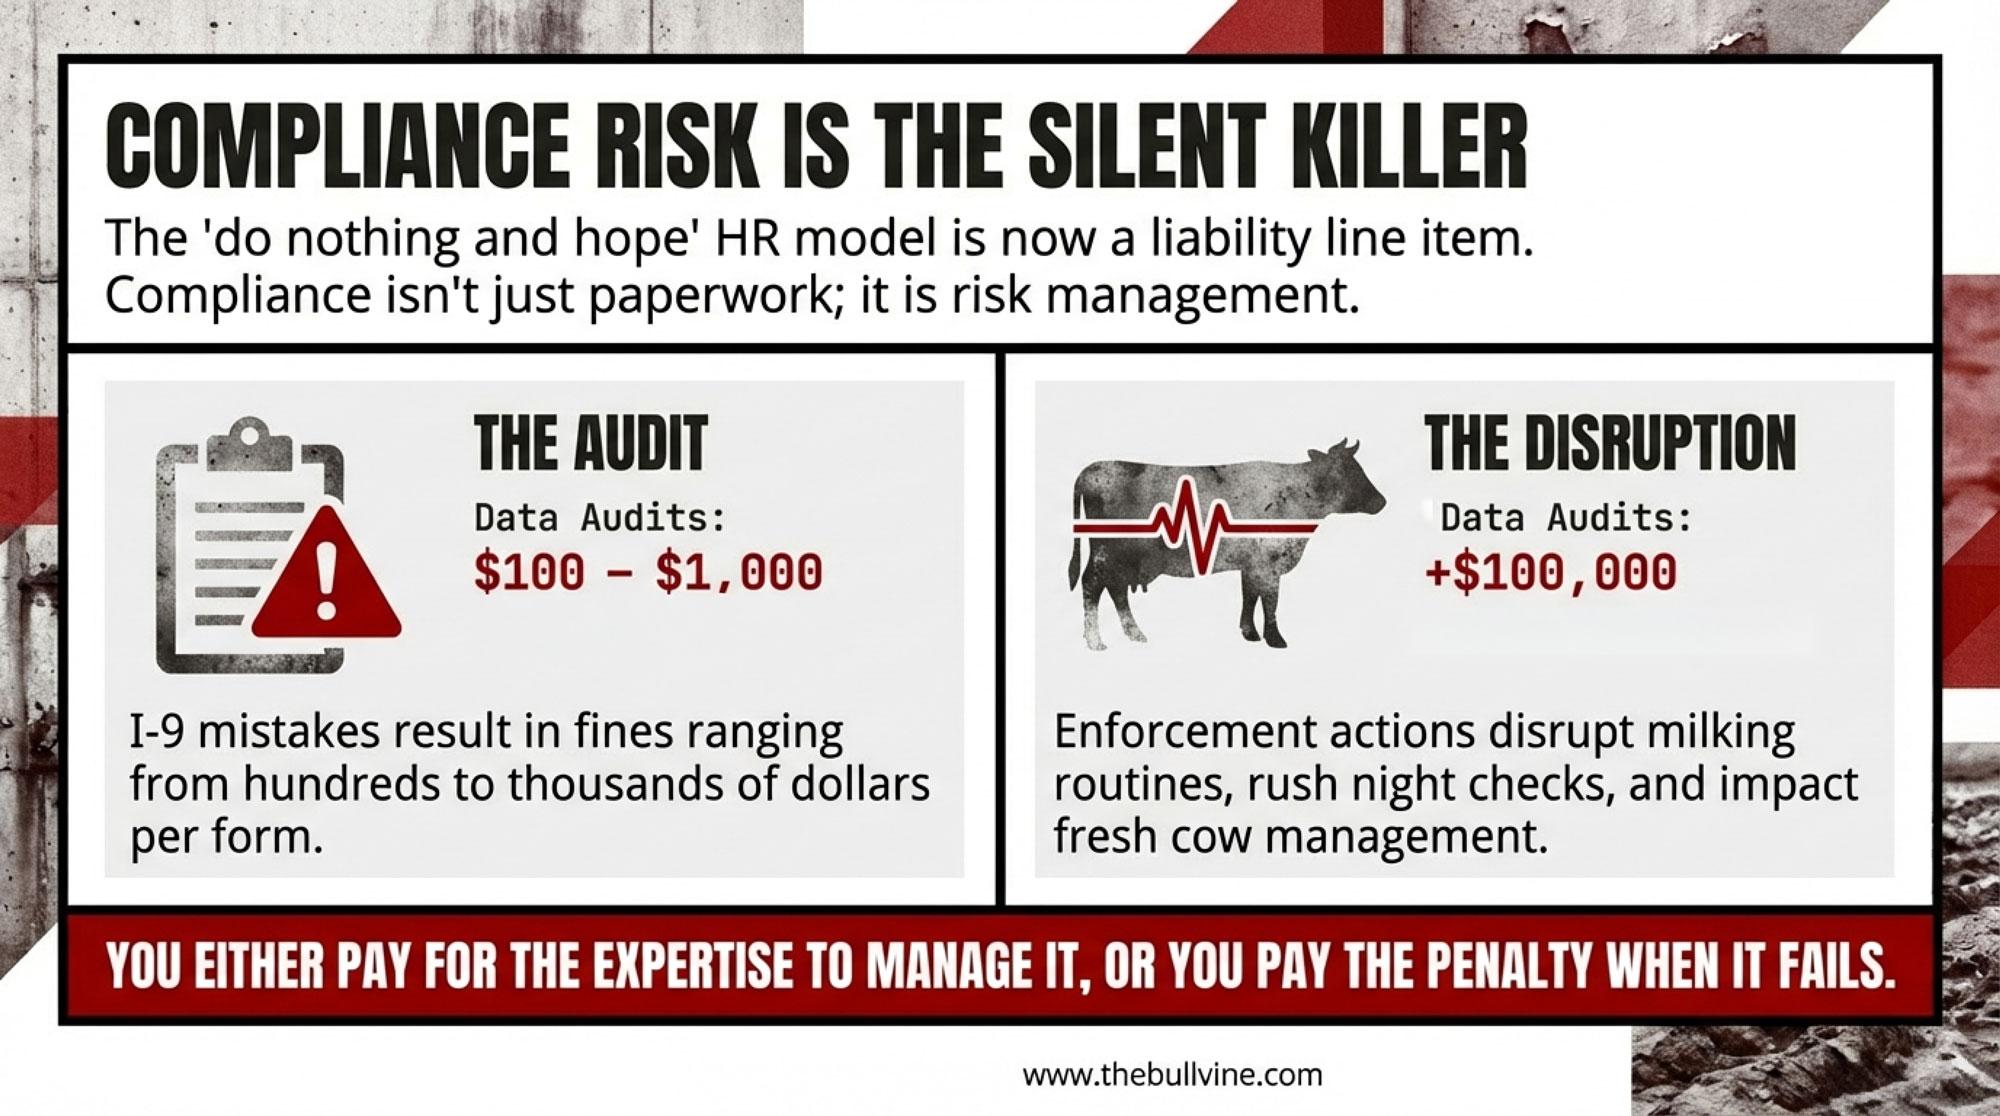
Your plant may be modeling a $100K recall risk. The real odds point to $800K — and roughly $2,000 per cow quietly baked into your milk check.
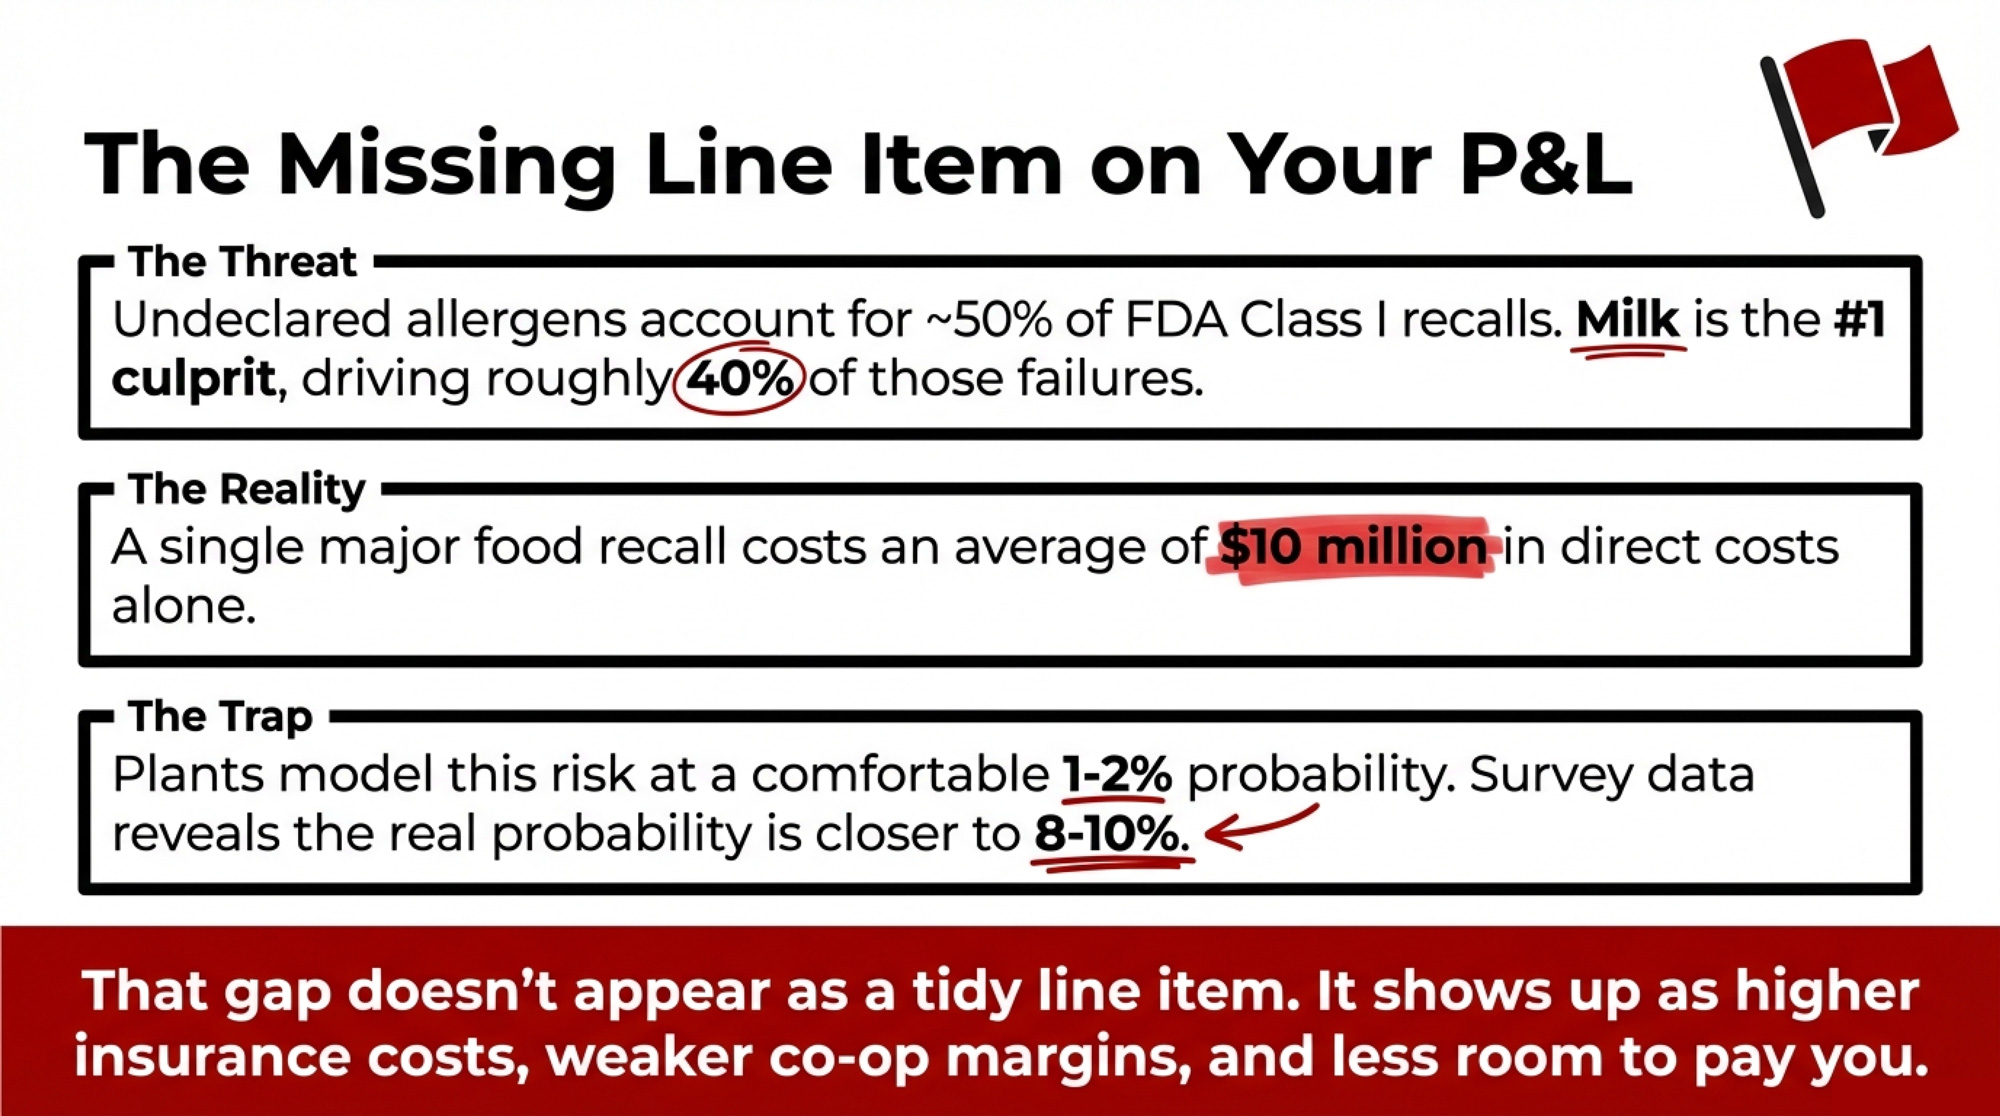
Executive Summary: Dairy’s allergen recall problem isn’t just a QA issue — it’s an invisible $2,000‑per‑cow risk that can end up baked into your milk check. Industry data puts the average direct cost of a food recall near $10 million, and undeclared allergens now account for almost half or more of FDA Class I recalls, with milk the single most commonly undeclared allergen. Many plants still model recall probability at 1–2%, but survey‑based numbers point closer to 8–10%, turning what looks like a $100,000 exposure into an $800,000 hit on a single high‑mix line supplied by about 400 cows. That gap doesn’t appear as a tidy line item; it shows up as higher insurance costs, weaker co‑op margins, and less room to pay you on components or volume. The story follows Ontario processor Mark Leduc and co‑op director Janet as they confront this math, run a targeted cleaning‑validation pilot on one yogurt line, and use real near‑miss data to renegotiate with insurers, customers, and their own board. You finish with a 30/90/365‑day playbook and specific questions to ask your plant and co‑op — from “What recall probability are we actually modeling?” to “Who pays if an in‑plant allergen failure triggers a $10 million recall?”

A single undeclared milk recall at Mark’s processor plant could cost more than $10 million in direct expenses — and there still isn’t a clear line on his P&L for allergen recall risk.
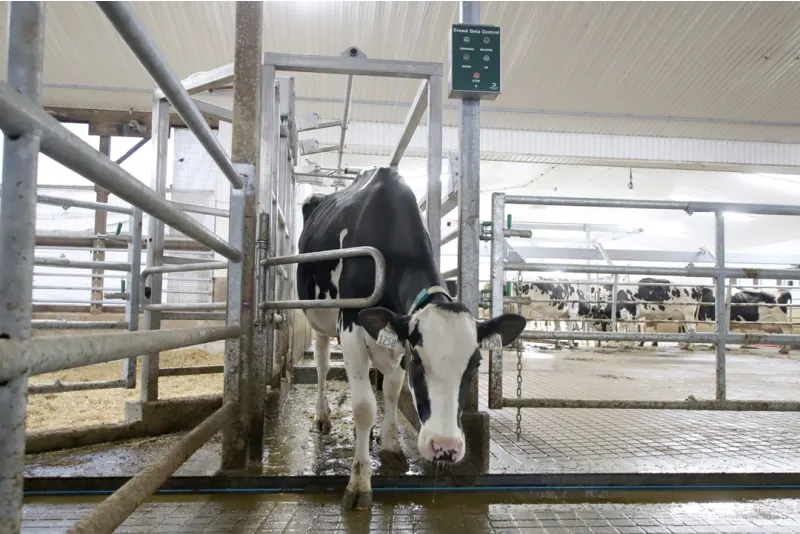
On paper, Mark’s 500‑cow supply base looks solid heading into 2026. Volumes are steady, co‑op contracts are locked, and the private‑label yogurt and ice cream runs are full. The allergen recall risk sits off to the side — until it doesn’t.
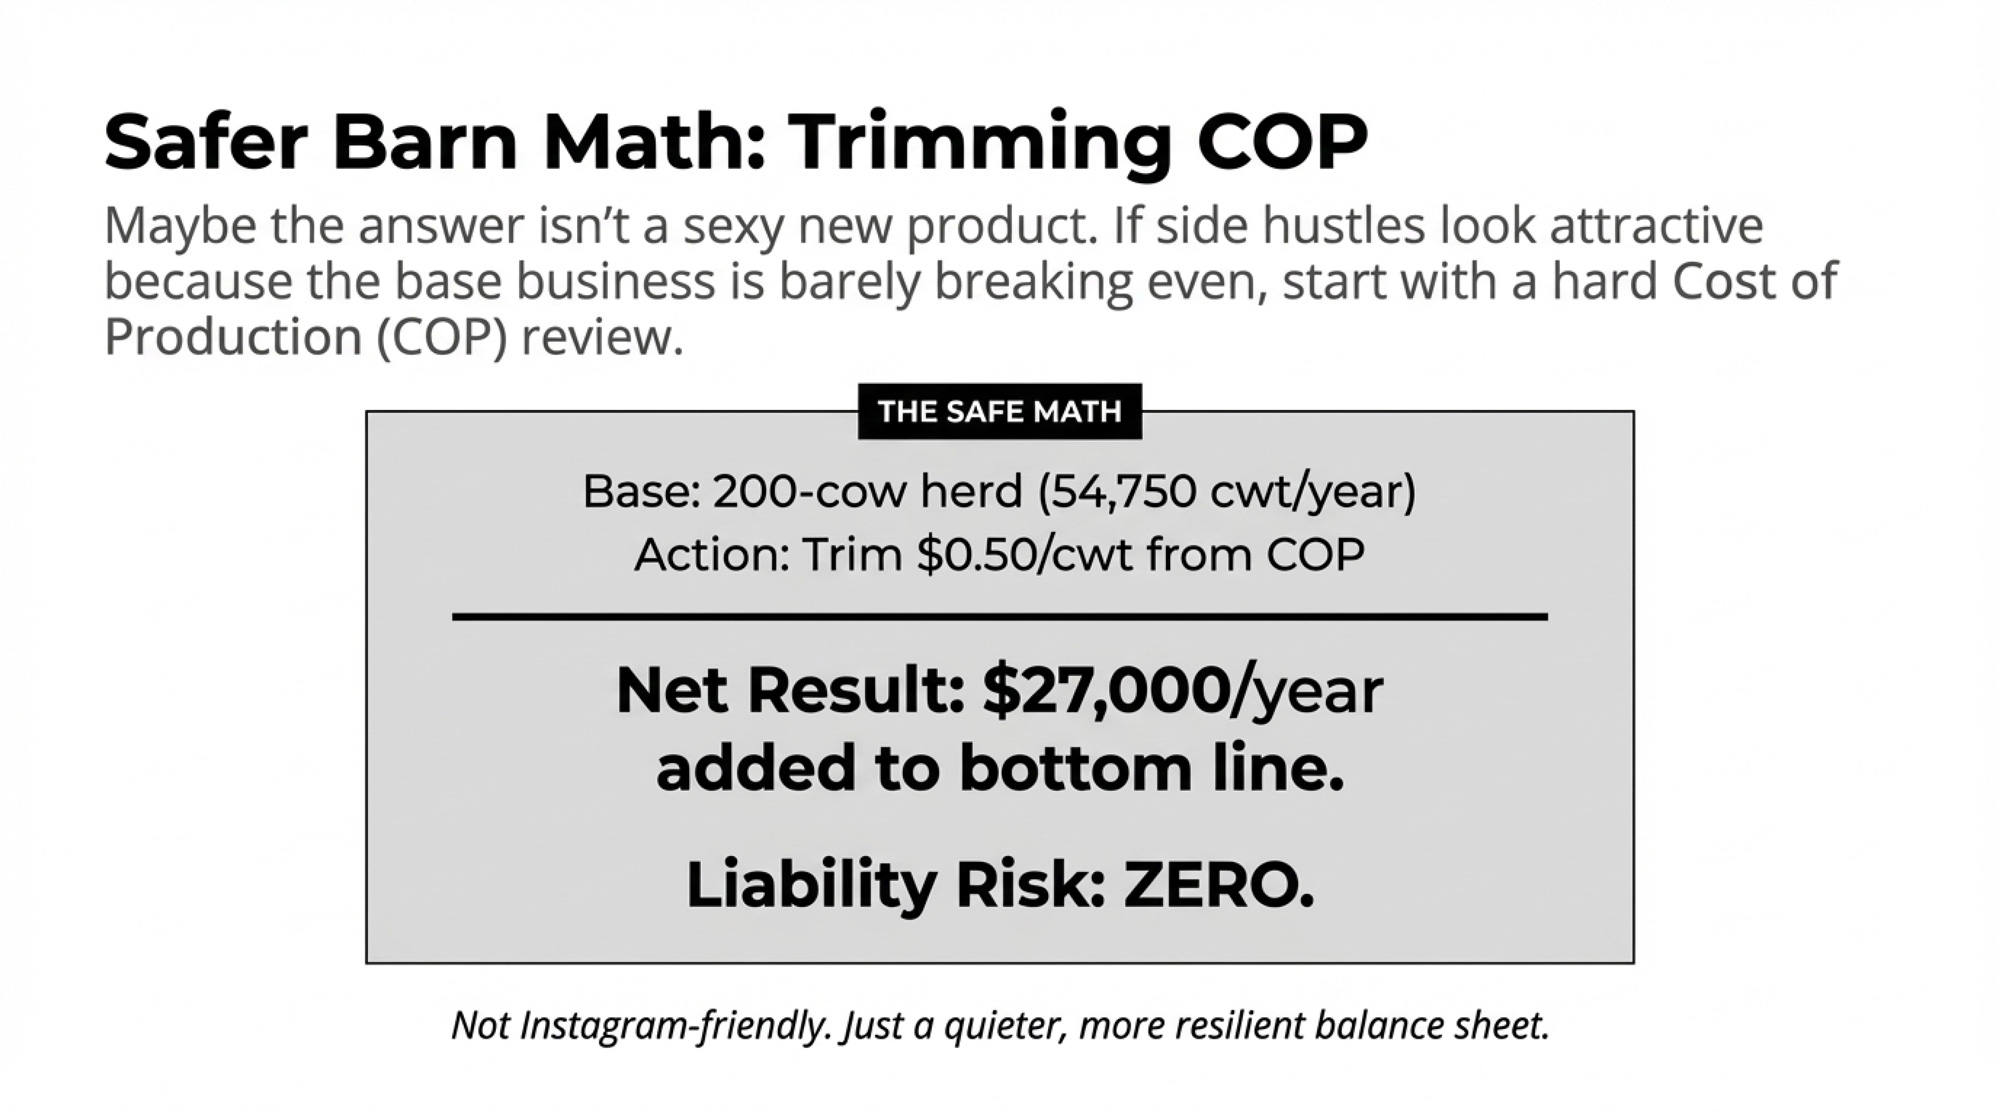
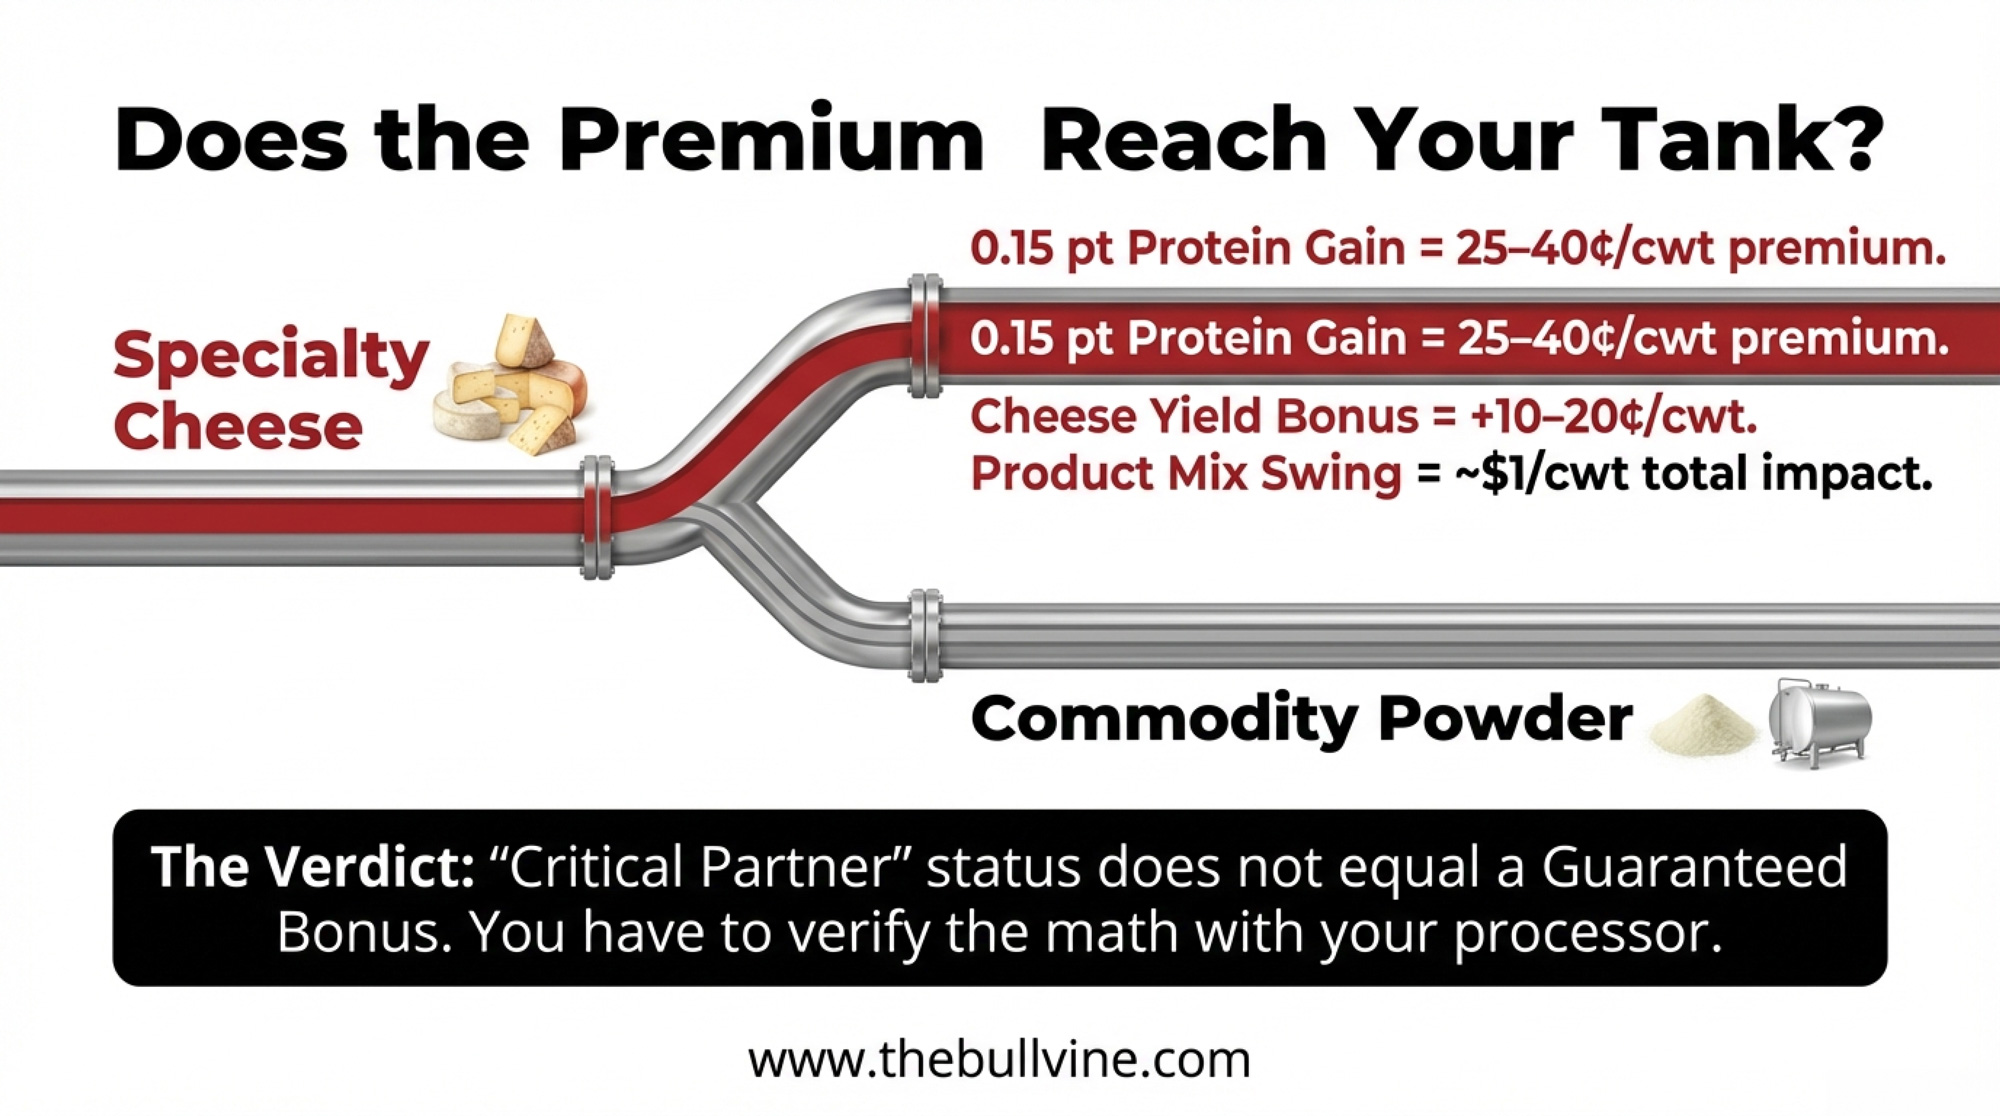
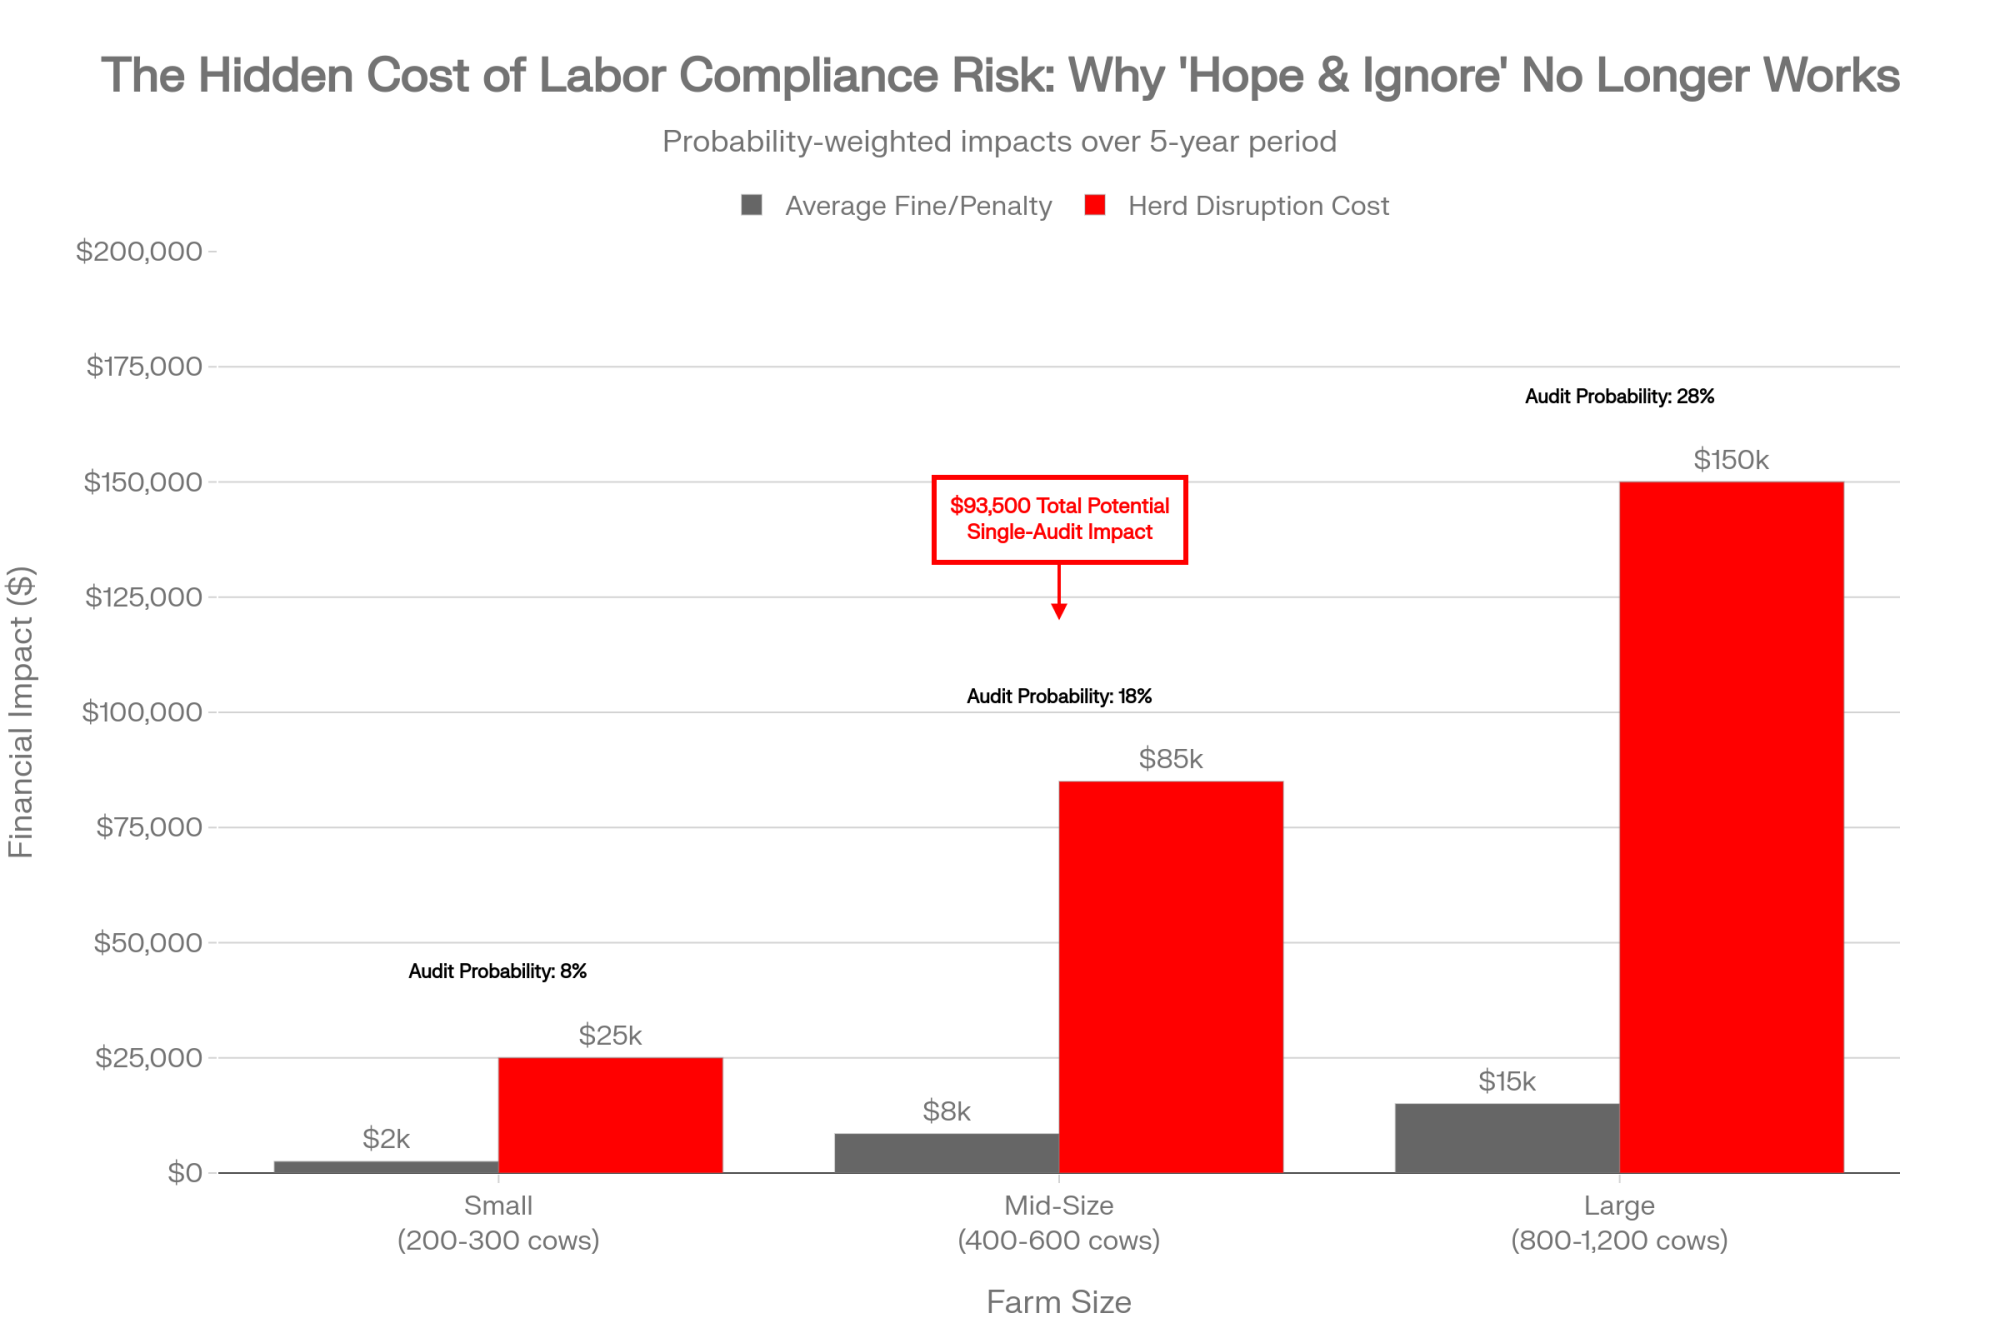
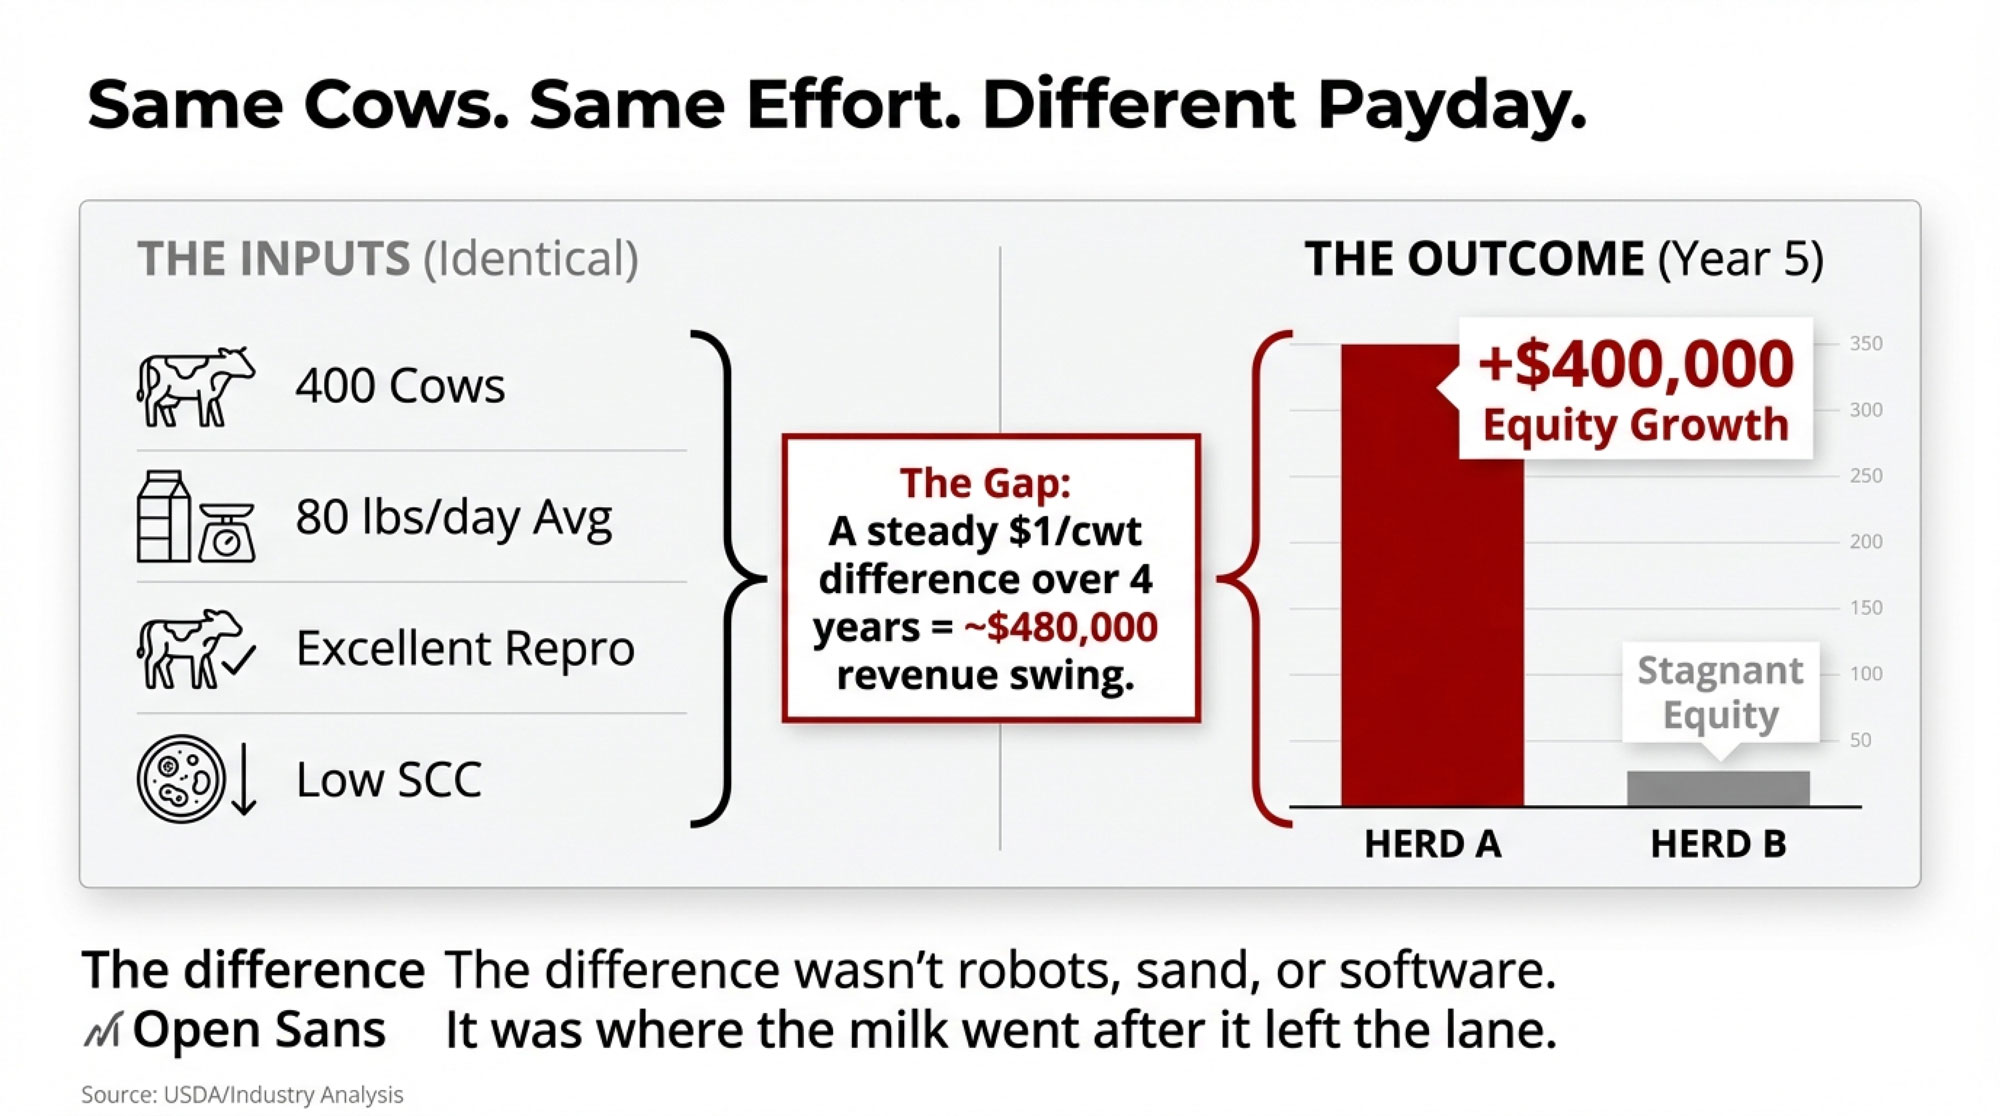
The $250 vs. $2,000 Per Cow Recall Gap
Before you get lost in SOPs and swab types, it helps to see the recall gap at a glance. This is the difference between the old “1–2% recall” rule of thumb and what more recent recall and survey data actually suggest for complex, multi‑allergen plants.
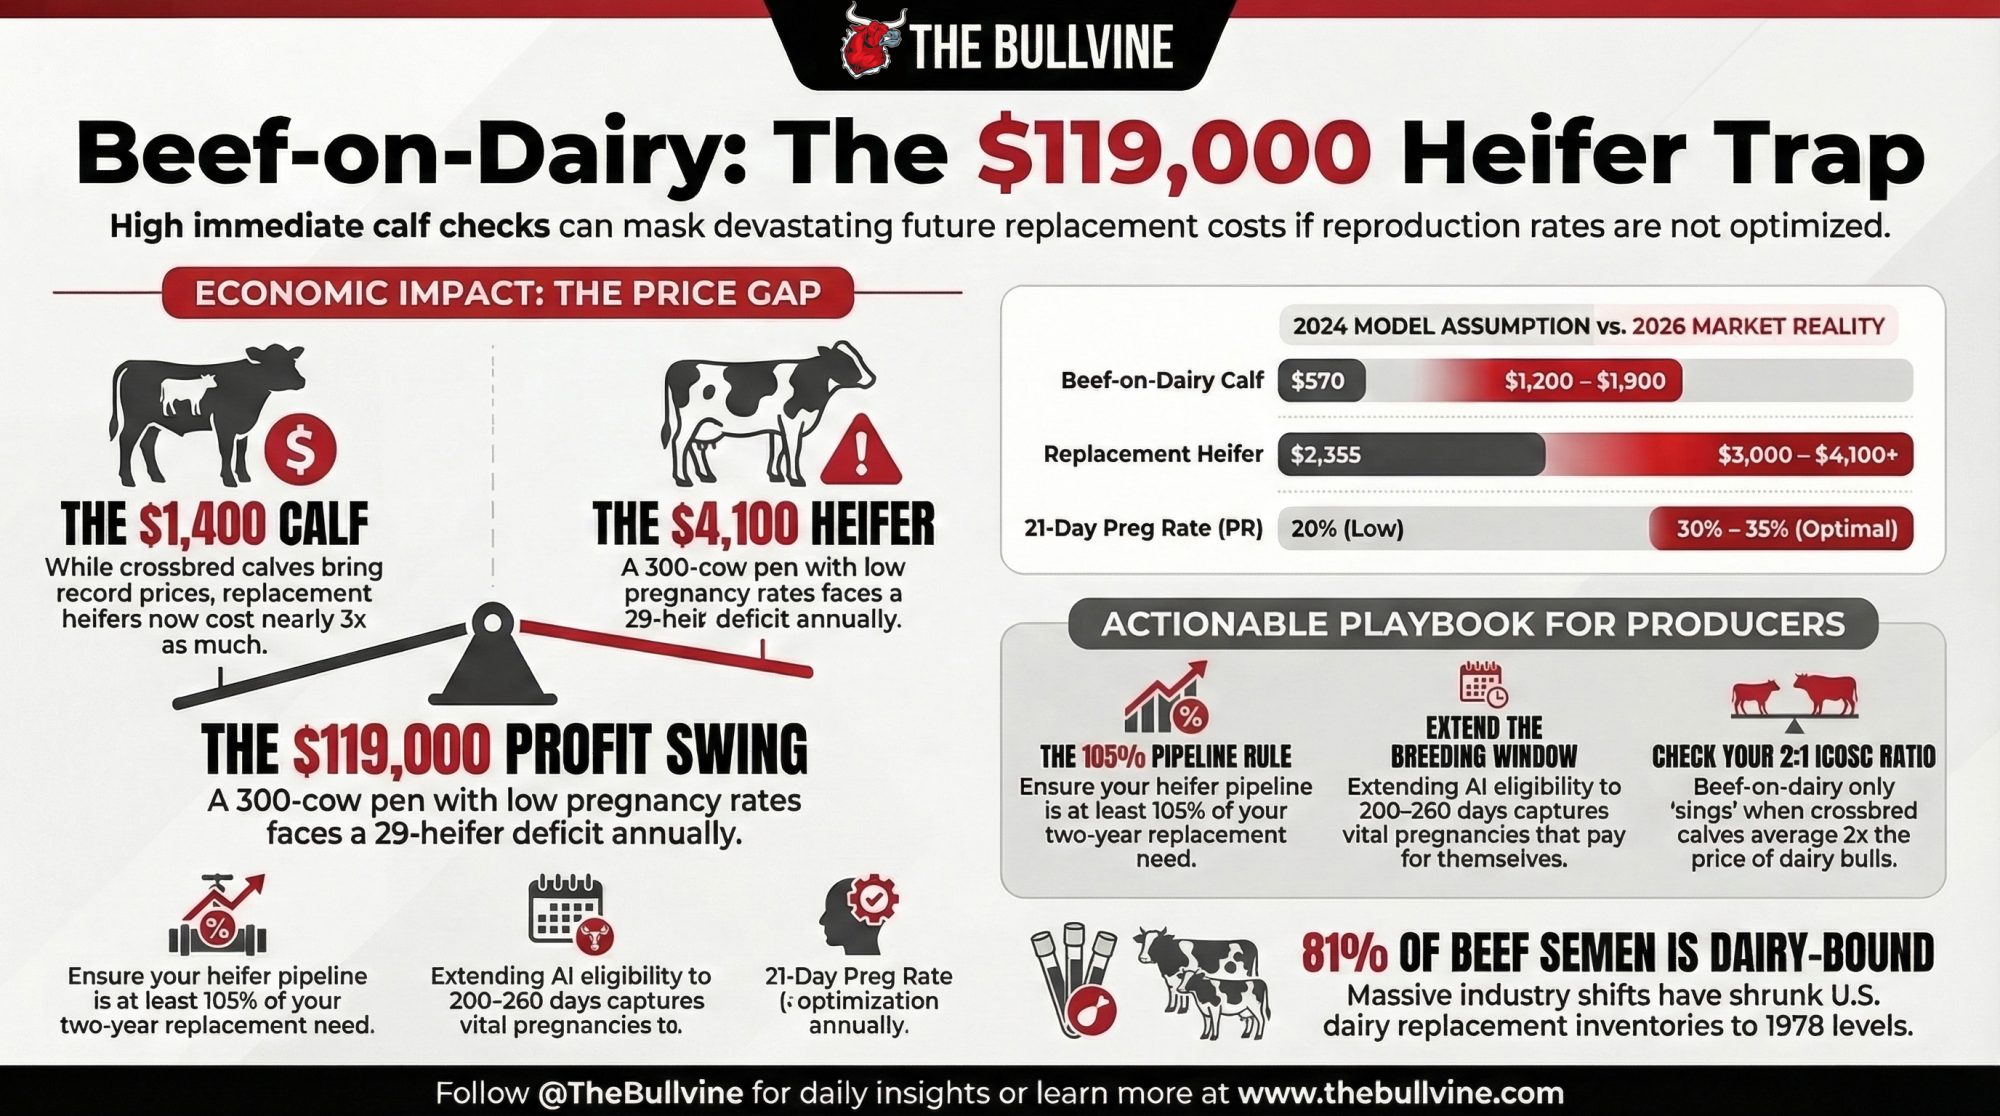
Industry and trade‑group analyses built on work from the Grocery Manufacturers Association and Food Marketing Institute often peg the average direct cost of a food recall around $10 million per event. At the same time, one published survey of food businesses with allergen plans reported that, while almost all respondents said they had a plan, roughly two in five still had at least one allergen‑related recall in five years. That works out closer to a high single‑digit annual probability than a comfortable 1–2%.
Here’s what that means for a 400‑cow supply block feeding a single high‑risk line:
| Scenario | Annual Recall Probability | Average Recall Cost | Expected Annual Loss | Cost Per Cow (400-cow block) | Who’s Paying the Gap |
| “Rule of Thumb” (Plant Model) | 1–2% | $10,000,000 | $100,000–$200,000 | $250–$500 | Insurance premiums (manageable) |
| Survey Reality (Multi-Allergen Plants) | 8–10% | $10,000,000 | $800,000–$1,000,000 | $2,000–$2,500 | Your milk check |
| The Gap | 6–8 percentage points | — | $600,000–$800,000 | $1,500–$2,000 | Underwritten by co-op members |
Those numbers are simple math:
- At 1% recall probability, expected annual cost = 0.01 × $10M = $100,000 → $250 per cow across 400 cows.
- At 8% recall probability, expected annual cost = 0.08 × $10M = $800,000 → $2,000 per cow across the same 400 cows.
The plant’s profit‑and‑loss statement doesn’t show “$2,000 per cow allergen risk.” It shows higher insurance premiums, occasional big hits when things go wrong, and thinner margins for the co‑op and its members. If your co‑op owns or supplies that plant, you’re underwriting the difference, whether anyone has written it down or not.
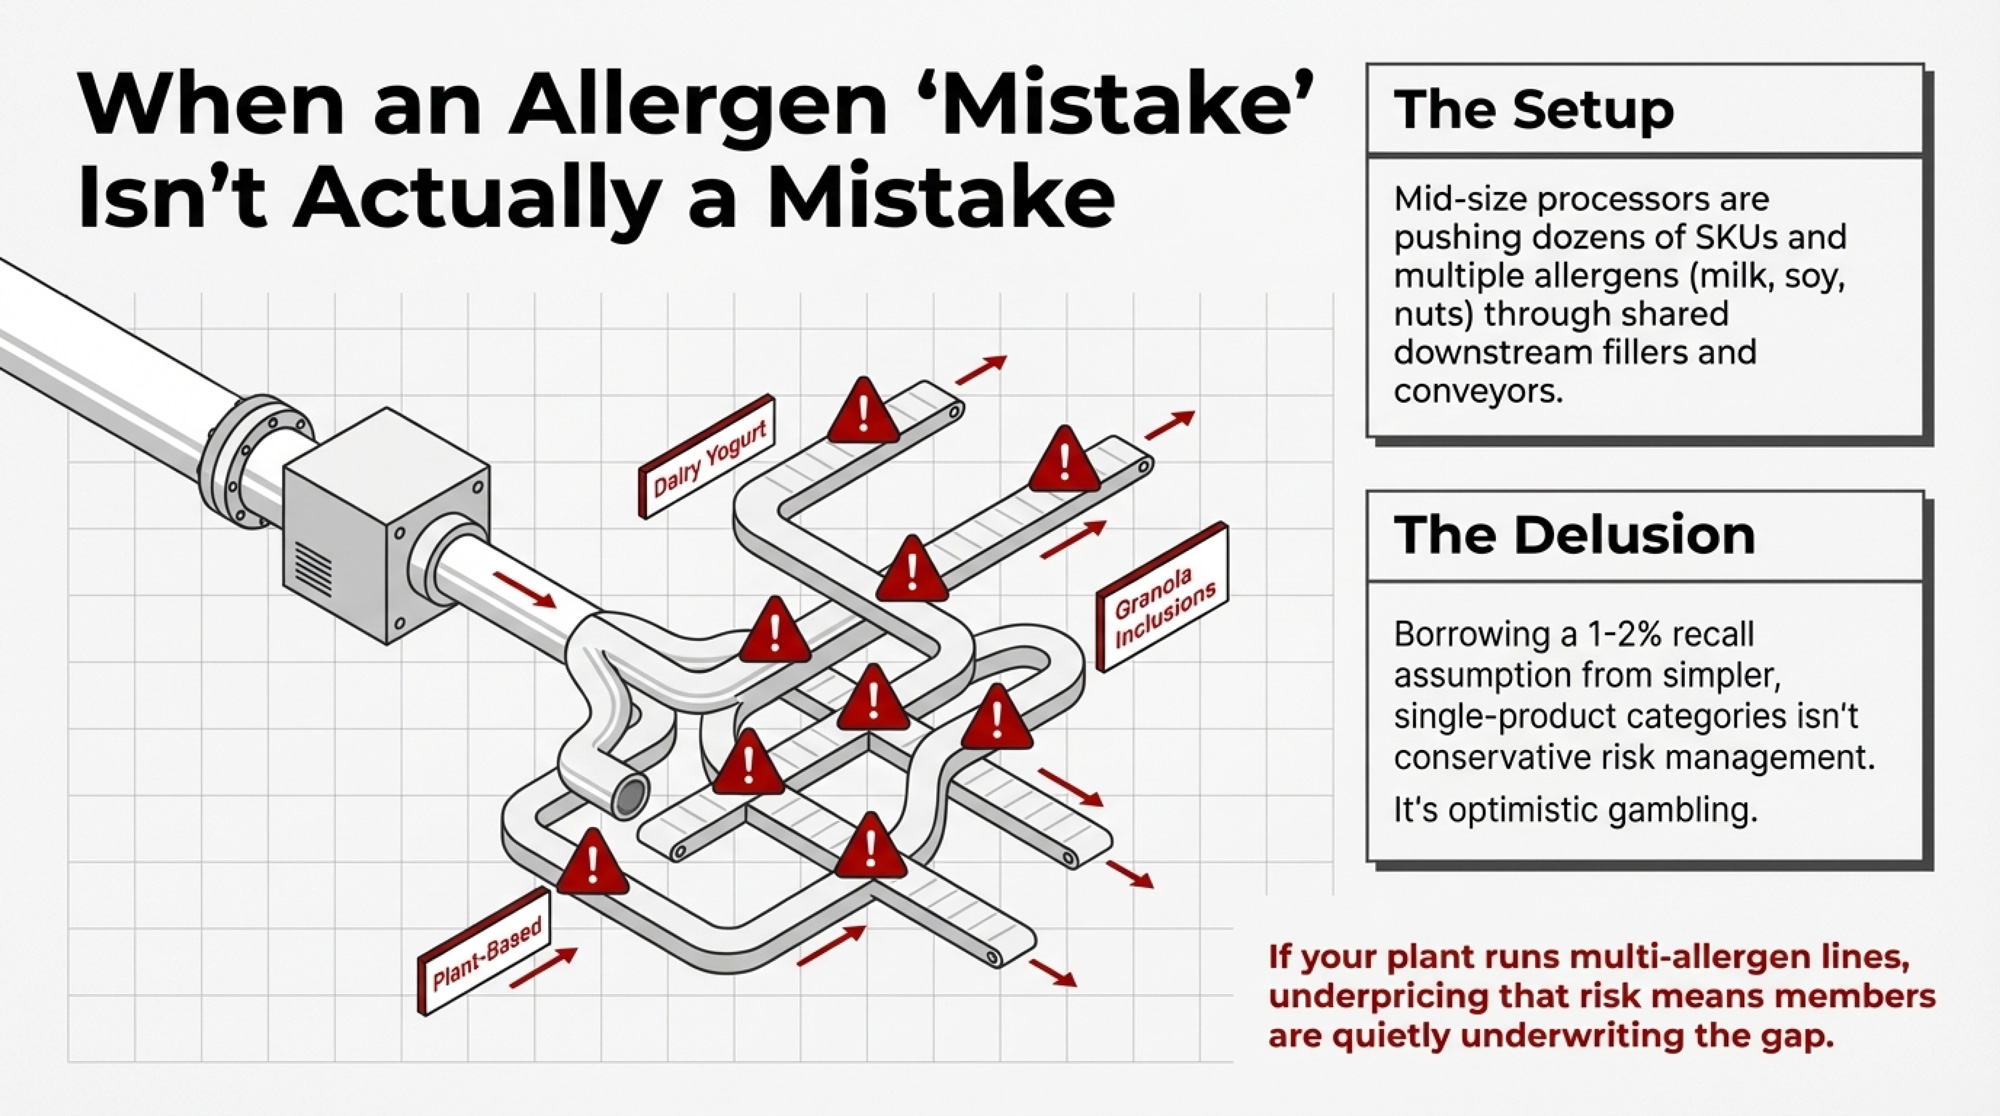
When the Dairy Allergen “Mistake” Isn’t Really a Mistake
Mark did what a lot of mid‑size processors have done over the past decade: he tried to push more SKUs through the same stainless. His highest‑risk yogurt line has all the classic features:
- Dozens of SKUs — plain, fruit‑on‑the‑bottom, granola‑topped, high‑protein, kids’ flavors.
- Multiple allergens — milk, soy from inclusions, sometimes nuts.
- Shared downstream equipment — fillers, conveyors, packaging, and labels touching everything from whole‑milk Greek to “plant‑based” cups.
On the QA whiteboard, the plan looks fine: visual checks, routine cleaning, periodic swabs. On the risk model, the assumption is simple: if the chance of a major allergen recall is 1–2% per year and the average direct cost is about $10 million, the expected annual hit is $100,000–$200,000 — uncomfortable but “manageable” with insurance and standard controls.
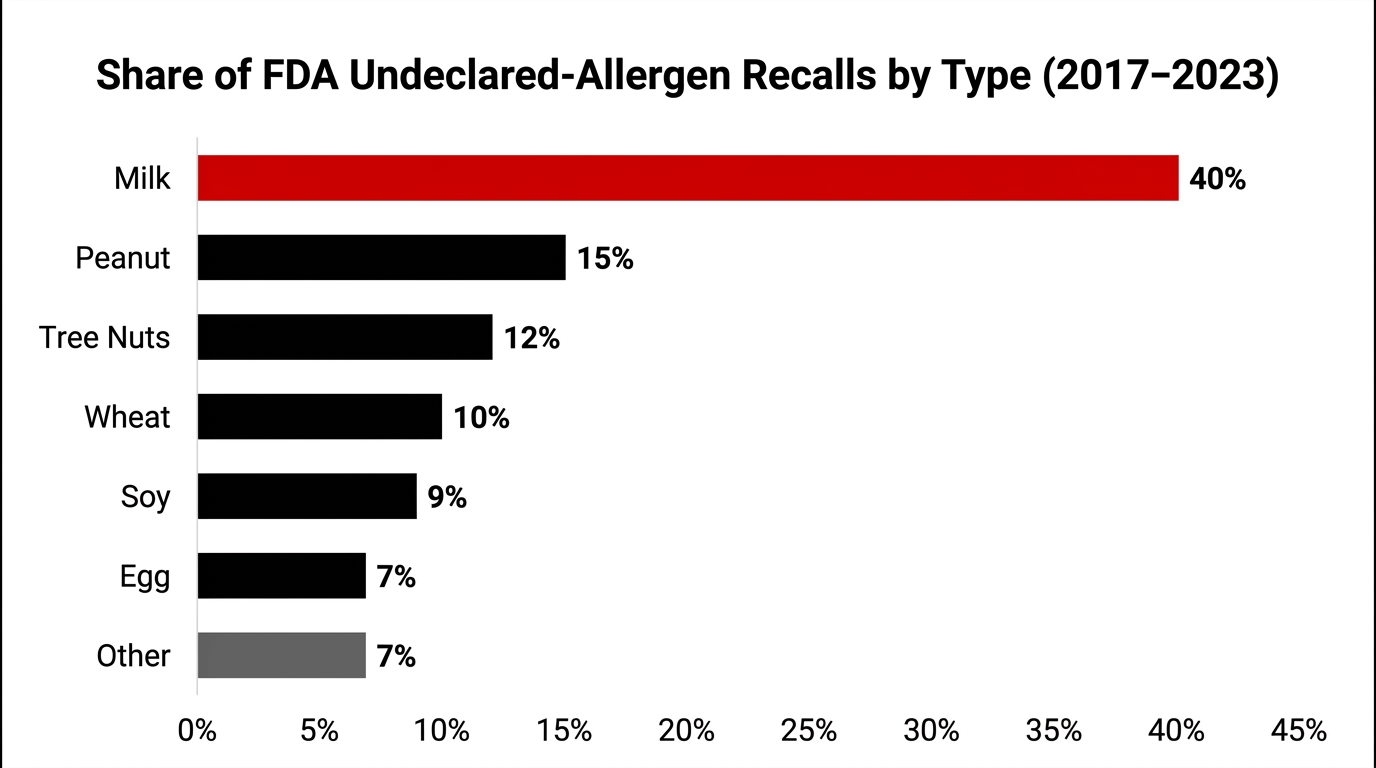
The reality is harsher. Undeclared allergens have become the leading cause of U.S. food recalls. One Trustwell analysis found that undeclared allergens accounted for 47% of all FDA Class I recalls in 2022 and 63% from January to August 2023. A 2024 review of U.S. recall patterns reported that undeclared allergens helped push total recall counts to a post‑pandemic high, with losses in the billions once direct and indirect costs are included.
Milk is at the center of that. An analysis of more than 620 FDA undeclared‑allergen recalls since 2017 found that around 40% were due to undeclared milk, making milk the single most commonly undeclared allergen.
So if your plant is built on milk and runs multi‑allergen, high‑mix lines, borrowing a 1–2% recall assumption from simpler categories isn’t conservative. It’s optimistic. And in a co‑op or supply‑based system, underpricing that risk is another way of saying your members are quietly underwriting the gap.
What Does a $10M Allergen Recall Really Mean for 400 Cows?
Mark’s highest‑risk yogurt line pulls milk from a group of farms totaling roughly 400 cows’ worth of production. Think of that as one 400‑cow block whose fortunes are tied to that line’s allergen performance.
From the available data:
- The average direct recall costs $10 million per major event.
- “Rule‑of‑thumb” recall probability: 1–2% per year.
- Survey‑based probability for companies with allergen plans: roughly 8–10% per year over a five‑year window.
Step through the math so you can plug in your own numbers later.
How the $10M Recall Risk Lands on a 400‑Cow Block
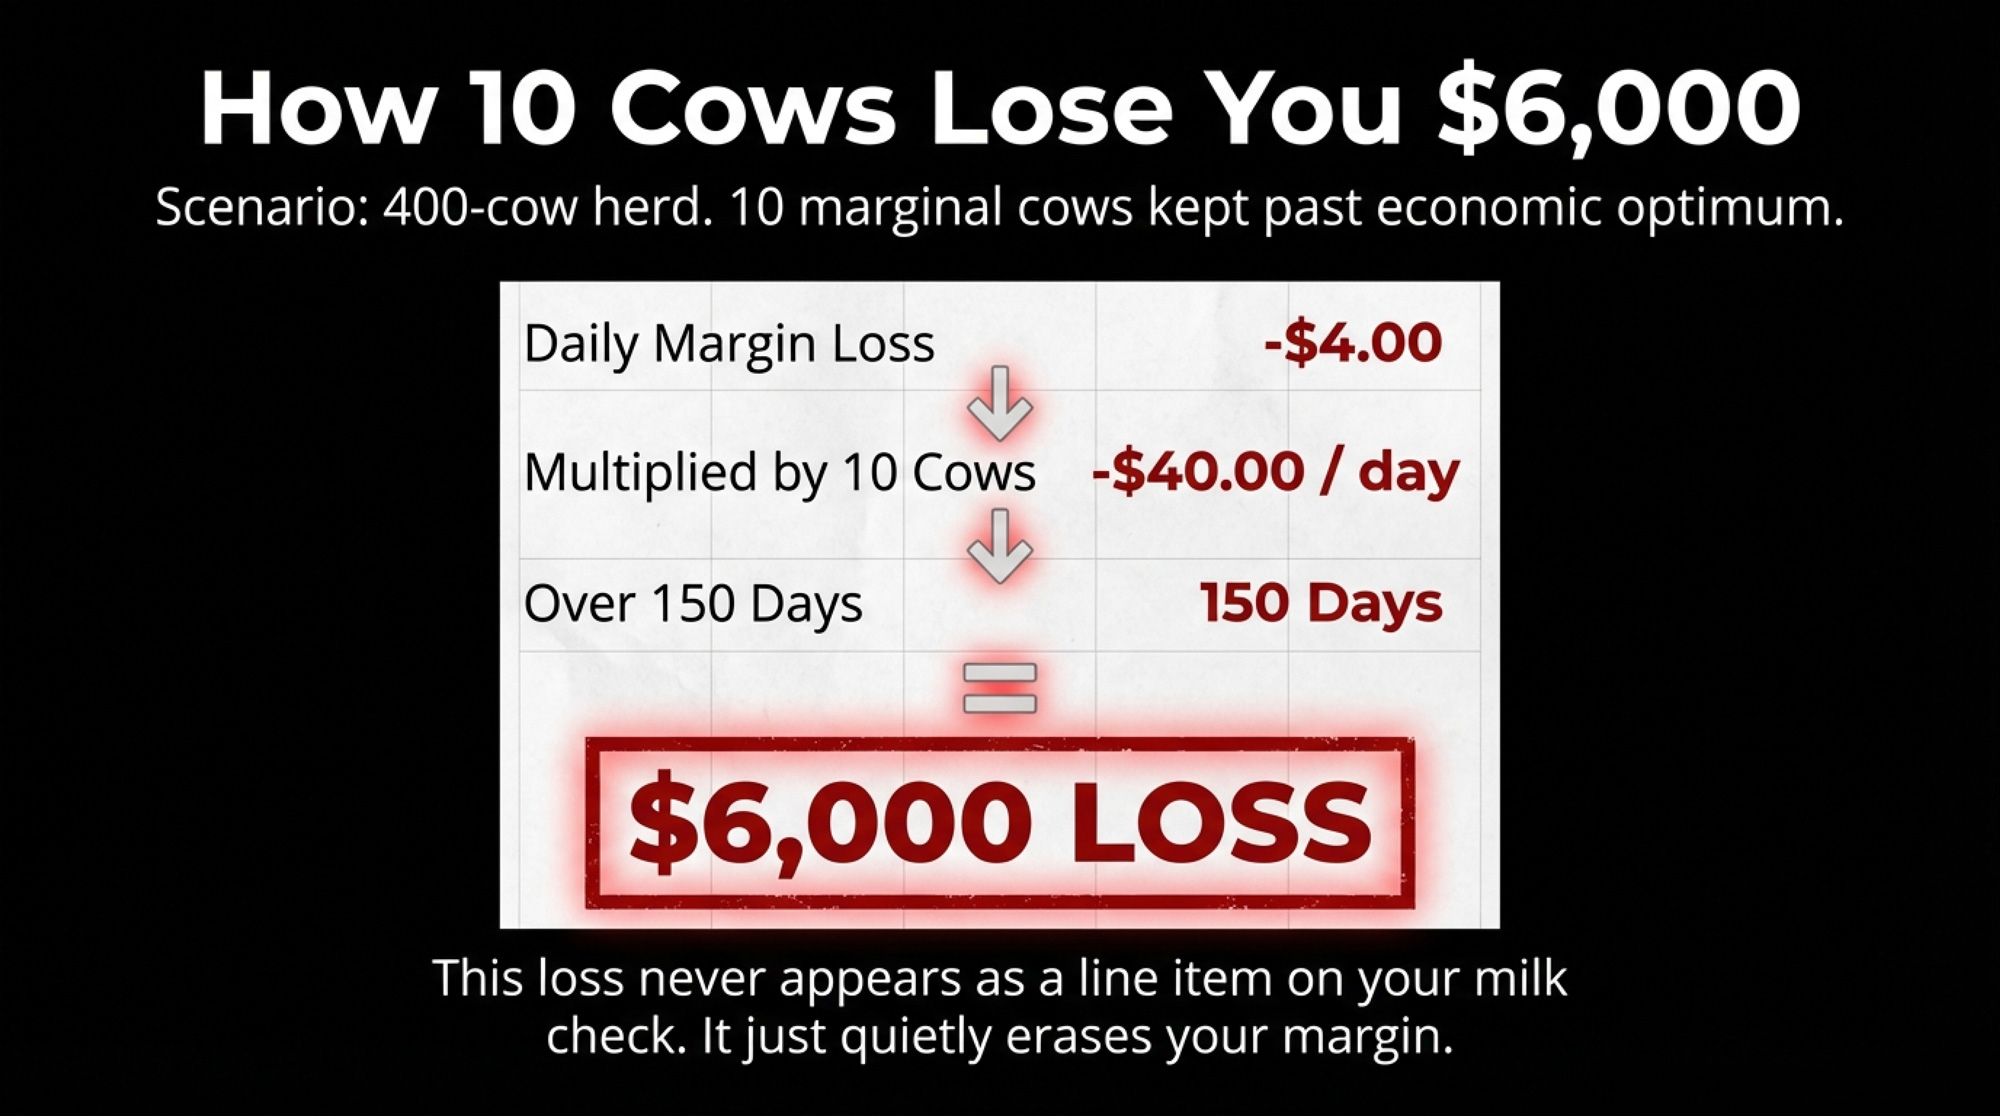
Scenario A – Underpriced Risk (1% modeled annual probability)
- Expected annual recall cost = 0.01 × $10,000,000 = $100,000.
- Spread over 400 cows, that’s $250 per cow per year.
If you model the plant like this, it’s easy to say, “We’ll carry it with insurance, keep premiums where they are, and move on.”
Scenario B – Reality‑Based Risk (8% annual probability)
- Expected annual recall cost = 0.08 × $10,000,000 = $800,000.
- Over the same 400 cows, that’s $2,000 per cow per year.
Now you’re not talking about a rounding error. You’re talking about a material drain on what that plant can afford to pay for milk, especially when margins are already tight from 2024–26 feed, labor, and energy costs.
The plant’s P&L doesn’t show “$2,000 per cow in allergen recall exposure.” It shows:
- Higher recall and contamination insurance premiums.
- Occasional large costs when the product is pulled and destroyed.
- Less margin left for co‑op dividends, capital projects, and milk premiums.
If you sit on a board, the question isn’t, “Do we have an allergen control plan?” It’s, “Are we modeling recall probability at 1–2% when our own near‑miss data — and broader survey and recall stats — point much higher?”
The Boardroom Questions You Aren’t Asking Yet
Janet sits on the co‑op board and ships from a 350‑cow herd into Mark’s plant. She’s not just looking at somatic cell counts and butterfat anymore. She’s looking at who’s underwriting the plant’s allergen gamble.
| The Question | Why It Matters | If You Can’t Answer This… |
| “Where exactly is the line between farm-origin hazards and plant-origin failures in our contracts?” | Residues at intake ≠ allergen cross-contact after the plant owns the milk. If contracts blur this line, your herd backs plant QA failures. | Your members may be underwriting recall costs they can’t control — and won’t know until the invoice arrives. |
| “How many allergen near-misses and label errors occurred on our highest-risk lines in the last 12–24 months?” | “We’re fine” isn’t data. Near-miss counts show whether your plant catches problems before they ship — or relies on luck and insurance. | You’re guessing at recall probability, not managing it. |
| “If there’s a $10M plant-origin allergen recall tomorrow, what indemnity rights do we have against members?” | Plant-side allergen failures can trigger member clawbacks if contracts aren’t clear. Know the split before the lawyer does. | You’ll find out during the recall — when it’s too late to negotiate. |
If you’re in her chair — board member, delegate, advisory council — these are three questions that belong on your next agenda:
- “Where exactly is the line between farm‑origin hazards and plant‑origin failures in our contracts?”
Ask counsel and management to point to the clauses that separate residues or pathogens at intake from allergen cross‑contact and mislabeling that happen after the plant owns the milk. If they can’t show you that line in writing, your members may be underwriting risks they can’t control. - “In the last 12–24 months, how many allergen‑related near‑misses and label errors occurred on our highest‑risk lines — and who would pay if one of those shipped?”
“We’re fine” isn’t an answer. You want a count of near‑misses, how they were caught, and how a miss would flow through your recall insurance, the co‑op’s balance sheet, and member returns. - “If there’s a $10 million plant‑origin allergen recall tomorrow, what specific indemnity or clawback rights do we have against members — and does that match our intent?”
This isn’t about letting sloppy farms off the hook. It’s about making sure plant‑side allergen failures aren’t being patched with member‑funded indemnity language by default.
Once those questions hit the minutes, allergen control stops being just a QA metric. It becomes a risk‑underwriting decision, which is where it belongs for a co‑op.
Sesame’s Shortcut: When Labels Beat Cleaning
If you want to see how regulators behave when cleaning and labels collide, look at sesame.
The Food Allergy Safety, Treatment, Education, and Research (FASTER) Act made sesame the ninth major U.S. food allergen, with mandatory labeling and allergen‑control requirements taking effect January 1, 2023. After that date:
- Allergy advocates and consumer groups documented cases where bakers and restaurants intentionally added sesame to products and updated labels rather than paying for full cleaning between runs.
- The FDA said it was concerned about impacts on sesame‑allergic consumers but acknowledged that adding sesame and labeling it doesn’t automatically violate the law, as long as the label is accurate.
The message is uncomfortable: regulators were willing to accept cost‑saving allergen strategies as long as the label stayed accurate, even when those choices hurt allergic consumers. In practice, regulators have focused more on what’s on the label than what’s left on the stainless — at least so far.
If your plant runs “dairy‑free” or alt‑dairy products on shared equipment, that should get your attention. You can solve a milk‑protein problem on paper with wording, but if buyers and consumers lose confidence in “dairy‑free” claims coming out of your plant, that premium evaporates — and so does the extra value flowing back to your herd.
“May Contain Milk”: Precaution or Crutch?
Dairy doesn’t just live with milk as a top allergen. It also lives with a labelling tool that makes it easy to hedge liability in a grey zone: precautionary allergen labelling (PAL) — all the “may contain” and “processed in a facility” statements.

The research keeps pointing to the same problem:
- PAL is often used inconsistently and, in many markets, without a specific regulatory framework, which reduces its value for people with food allergies.
- Analytical surveys have found products with PAL that contained no detectable allergen, and products without PAL that did contain measurable allergens.
- The 2024 paper “Time to ACT‑UP: Update on precautionary allergen labelling (PAL)” describes current PAL use as problematic and pushes for a risk‑based, regulated system tied to agreed reference doses and contamination data.
Regulators are tightening expectations:
- FDA’s draft Compliance Policy Guide on major food allergen labeling and cross‑contact makes it clear that advisory statements can’t substitute for adequate cross‑contact controls and must be truthful and not misleading under the Federal Food, Drug, and Cosmetic Act.
- Health Canada and CFIA guidance say PAL must be truthful and clear and “not be a substitute for Good Manufacturing Practices,” and should only be used where inadvertent presence of an allergen is unavoidable.
- EU and UK guidance on “free‑from” claims increasingly expects “dairy‑free” to mean essentially no detectable milk protein, backed by documented risk assessments and agreed reference doses.
That leaves your plant or co‑op with two real PAL strategies:
- PAL as a blanket shield. You put “may contain milk” on entire product lines to protect the lawyer, even when your own validation data shows very low actual risk.
- PAL as a last resort. You reserve it for scenarios where documented risk assessments show you can’t get risk below a defined threshold despite fully applied controls.
If your own cleaning and testing suggest low milk‑protein risk but your labels still blanket “may contain milk,” you’re writing the plaintiff’s opening argument for them: you had enough information to do better and chose not to. And if a “dairy‑free” product tests positive for milk under that setup, PAL will look more like evidence of a business choice than a shield.
PAL isn’t going to carry this forever. As more regulators and retailers move toward risk‑based allergen labelling, plants that use “may contain” instead of validation will have a much weaker story to tell.
What Mark and His Co‑op Actually Did With One Yogurt Line
Once the recall math and near‑miss history were on the same page, Janet pushed for something simple: evidence instead of assumptions.
When QA first pitched a full allergen validation, Mark wanted more than theory before tying up his busiest line. The external numbers were ugly:
- Validation for that filler and conveyor system sat in the five‑figure range per phase, with phases between $5,000 and $80,000 depending on scope and sample size.
- The bigger fear was lost throughput — repeated clean–swab–reclean cycles on a line already overbooked with private‑label and alt‑dairy contracts.
Janet cut through the noise with one question:
“What’s actually cheaper for our members — validating one line properly, or living with the real recall odds on that filler and hoping our insurance and contracts keep us whole?”
Mark didn’t have an immediate answer. But he agreed to a focused first step: a pilot allergen cleaning validation on a single high‑risk yogurt line.
Over roughly a month, his team:
- Picked the line with the widest allergen mix and the most sensitive customer contracts.
- Left the core cleaning SOP in place but added high‑sensitivity ATP swabs on specific “worst‑case” surfaces after each changeover.
- Used protein swabs where ATP passed, then ran milk allergen tests once ATP and protein were consistently passing.
The early results were uncomfortable:
- Several “visually clean” changeovers failed ATP or protein — exactly the kind of runs that would have gone into production before.
- After changing tools, chemistry, and a few SOP steps, first‑pass cleaning success climbed; once ATP and protein were reliably passing, milk allergen tests came back clean.
The pilot cost real money — test kits, labor, and some lost line time. But it bought three assets Mark and Janet had never had:
- A measured first‑pass cleaning rate on their riskiest line.
- A count of near‑misses that would have shipped under the old system.
- A one‑pager that they could show their insurer, their biggest retail customer, and their members when they talked about risk and premiums.
Janet’s line at the next board meeting was blunt:
“I’d rather see us spend five figures hunting our own near‑misses than watch eight figures disappear from the milk check because we never bothered to look.”
That was the turn. Not a new law. Not a hardware upgrade. Just one pilot on one line and a decision to move allergen recall risk out of the shadows and into the budget.
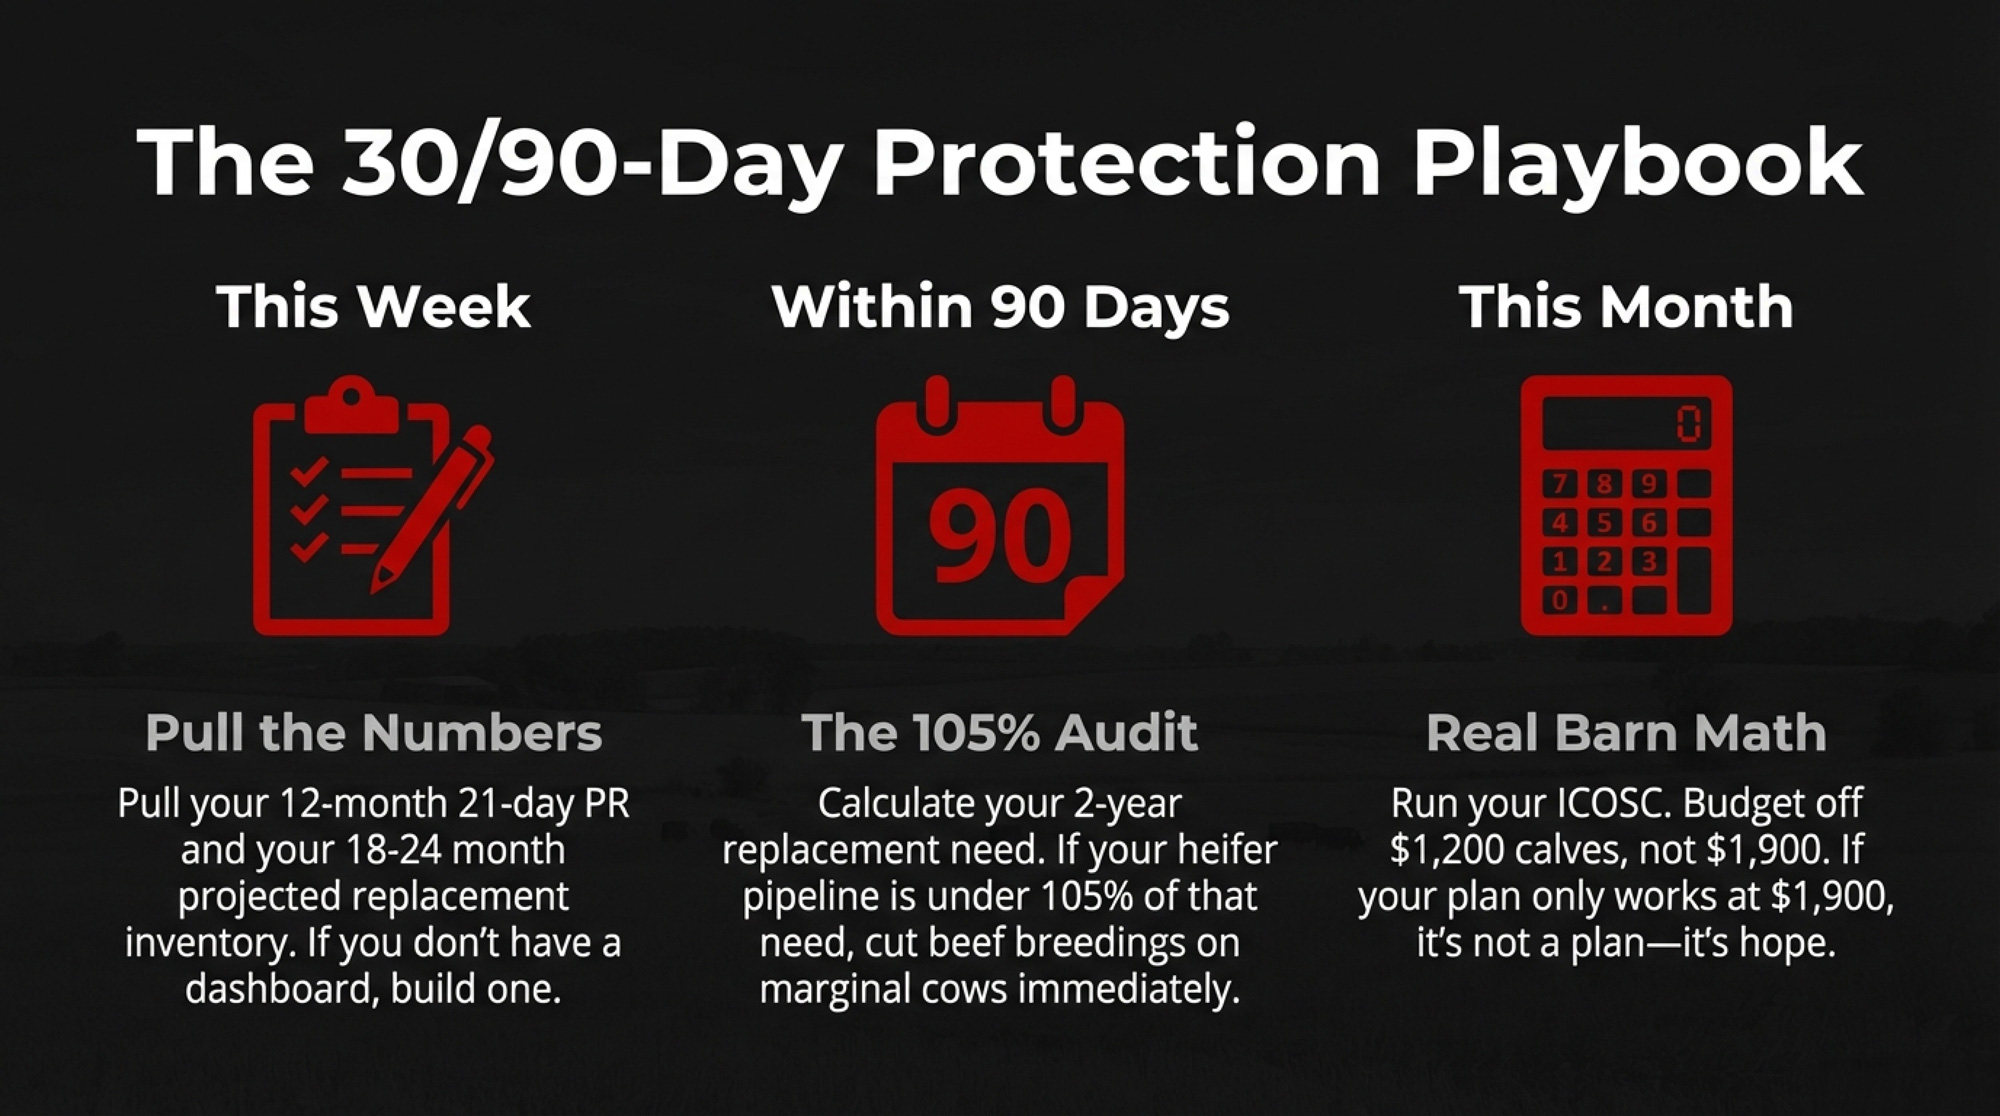
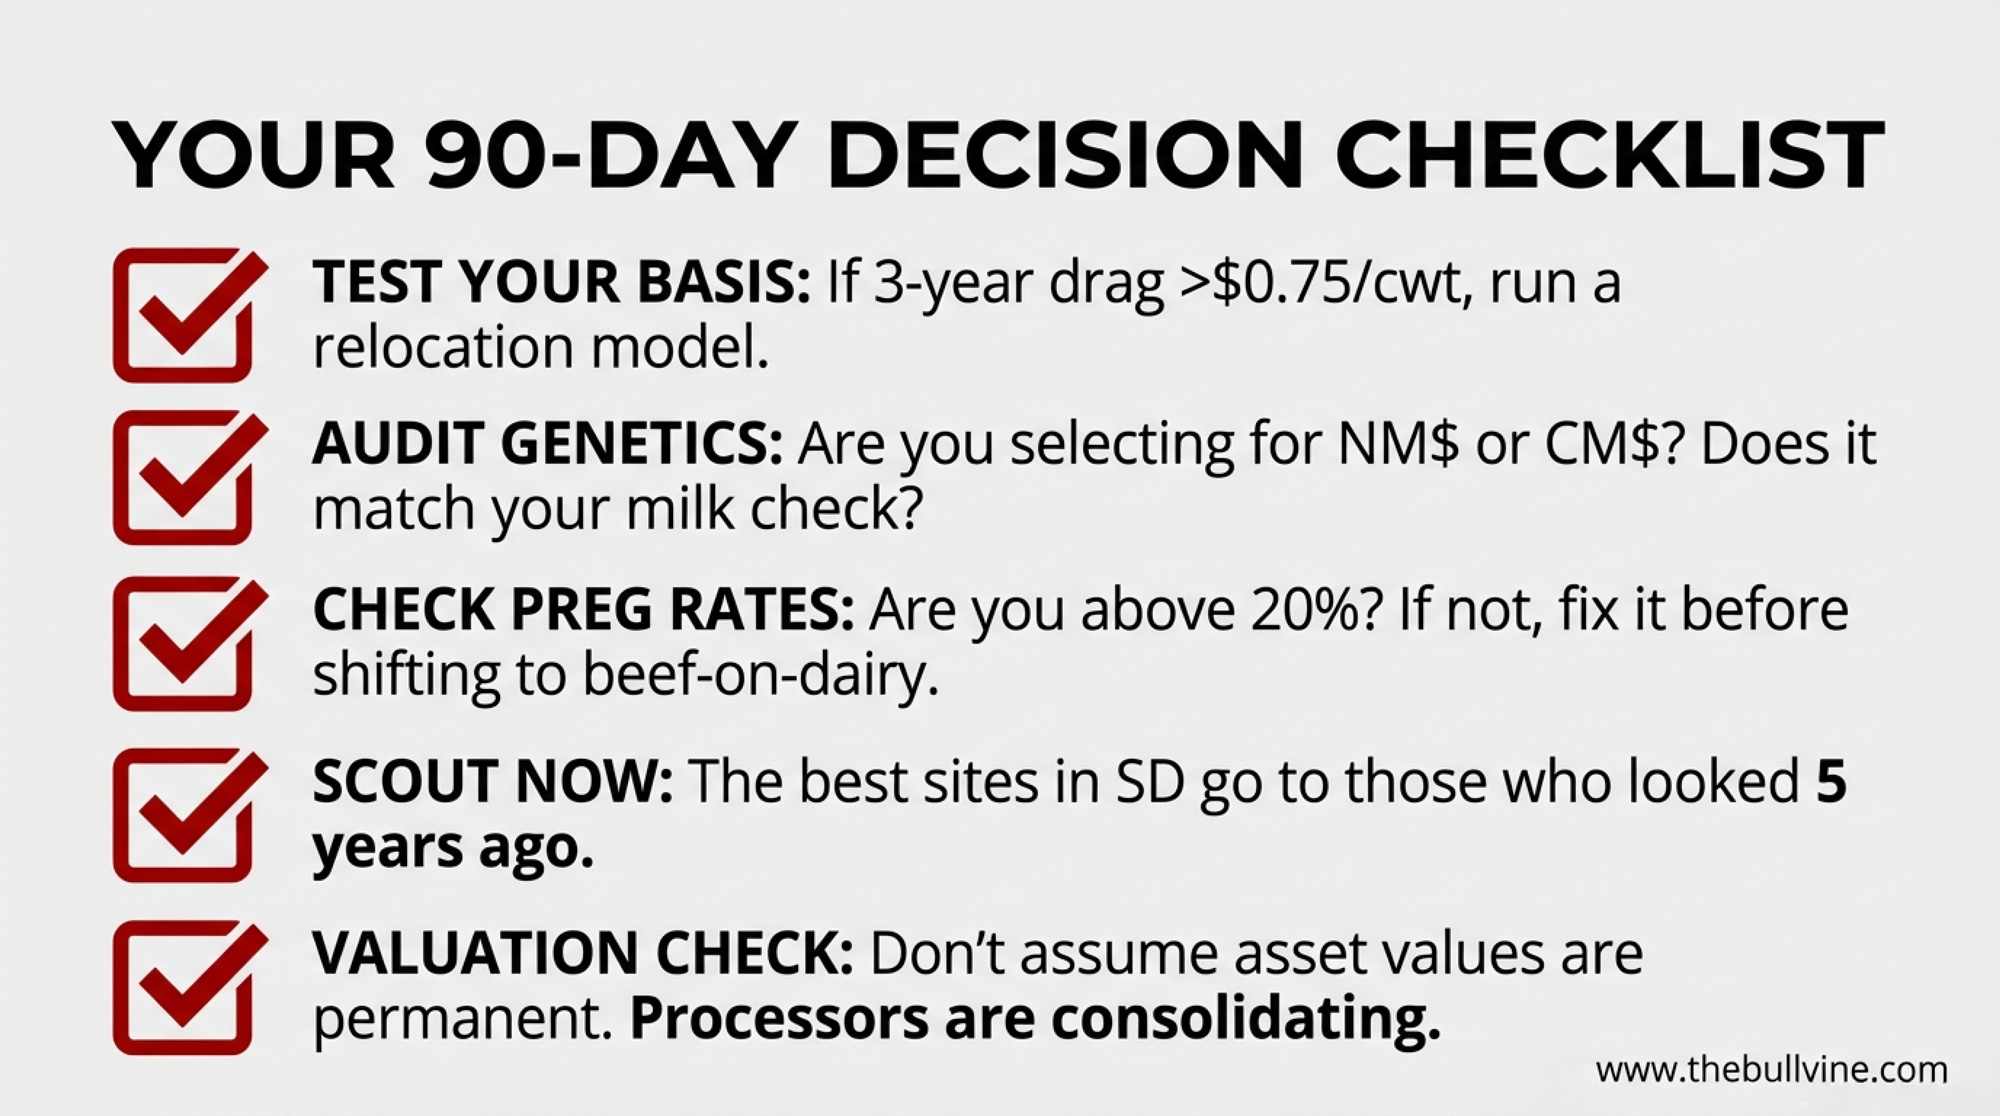
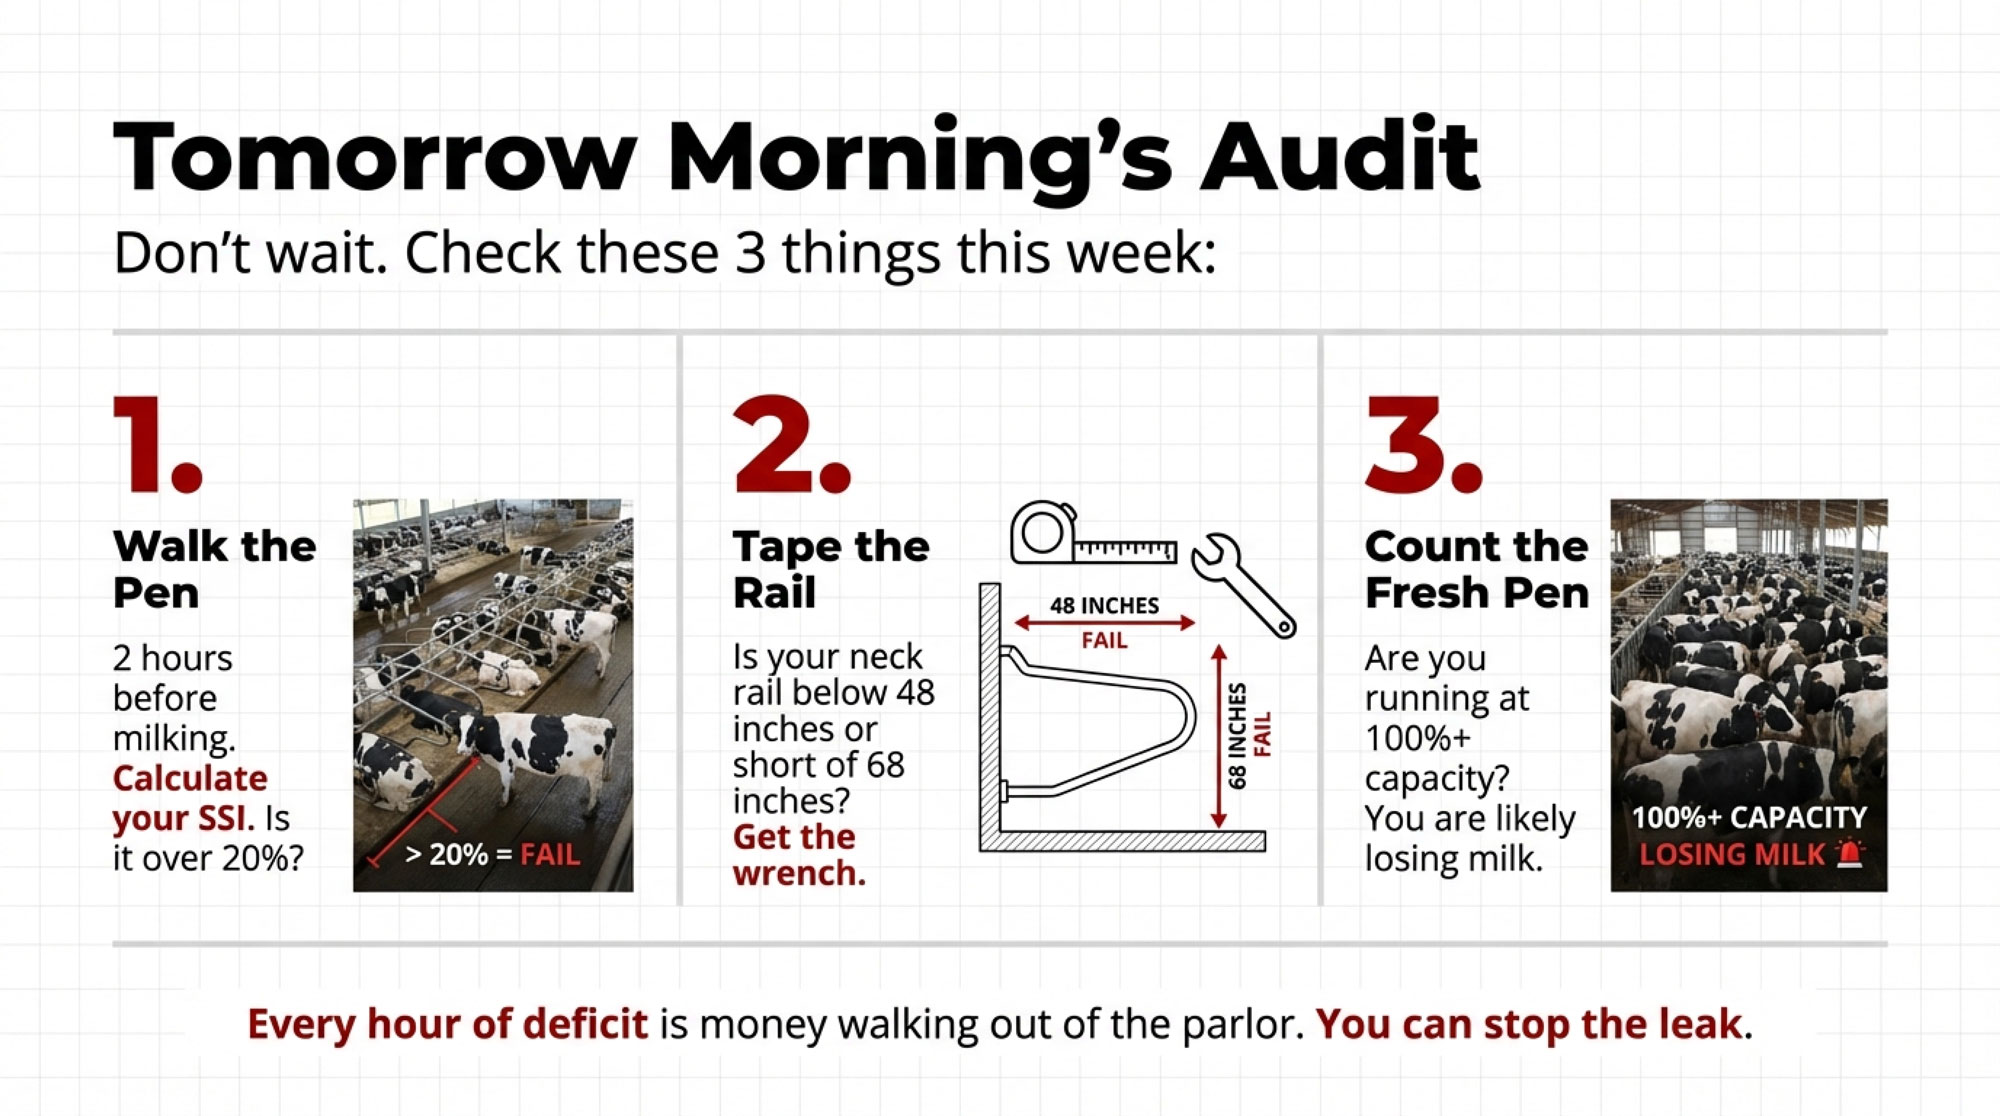
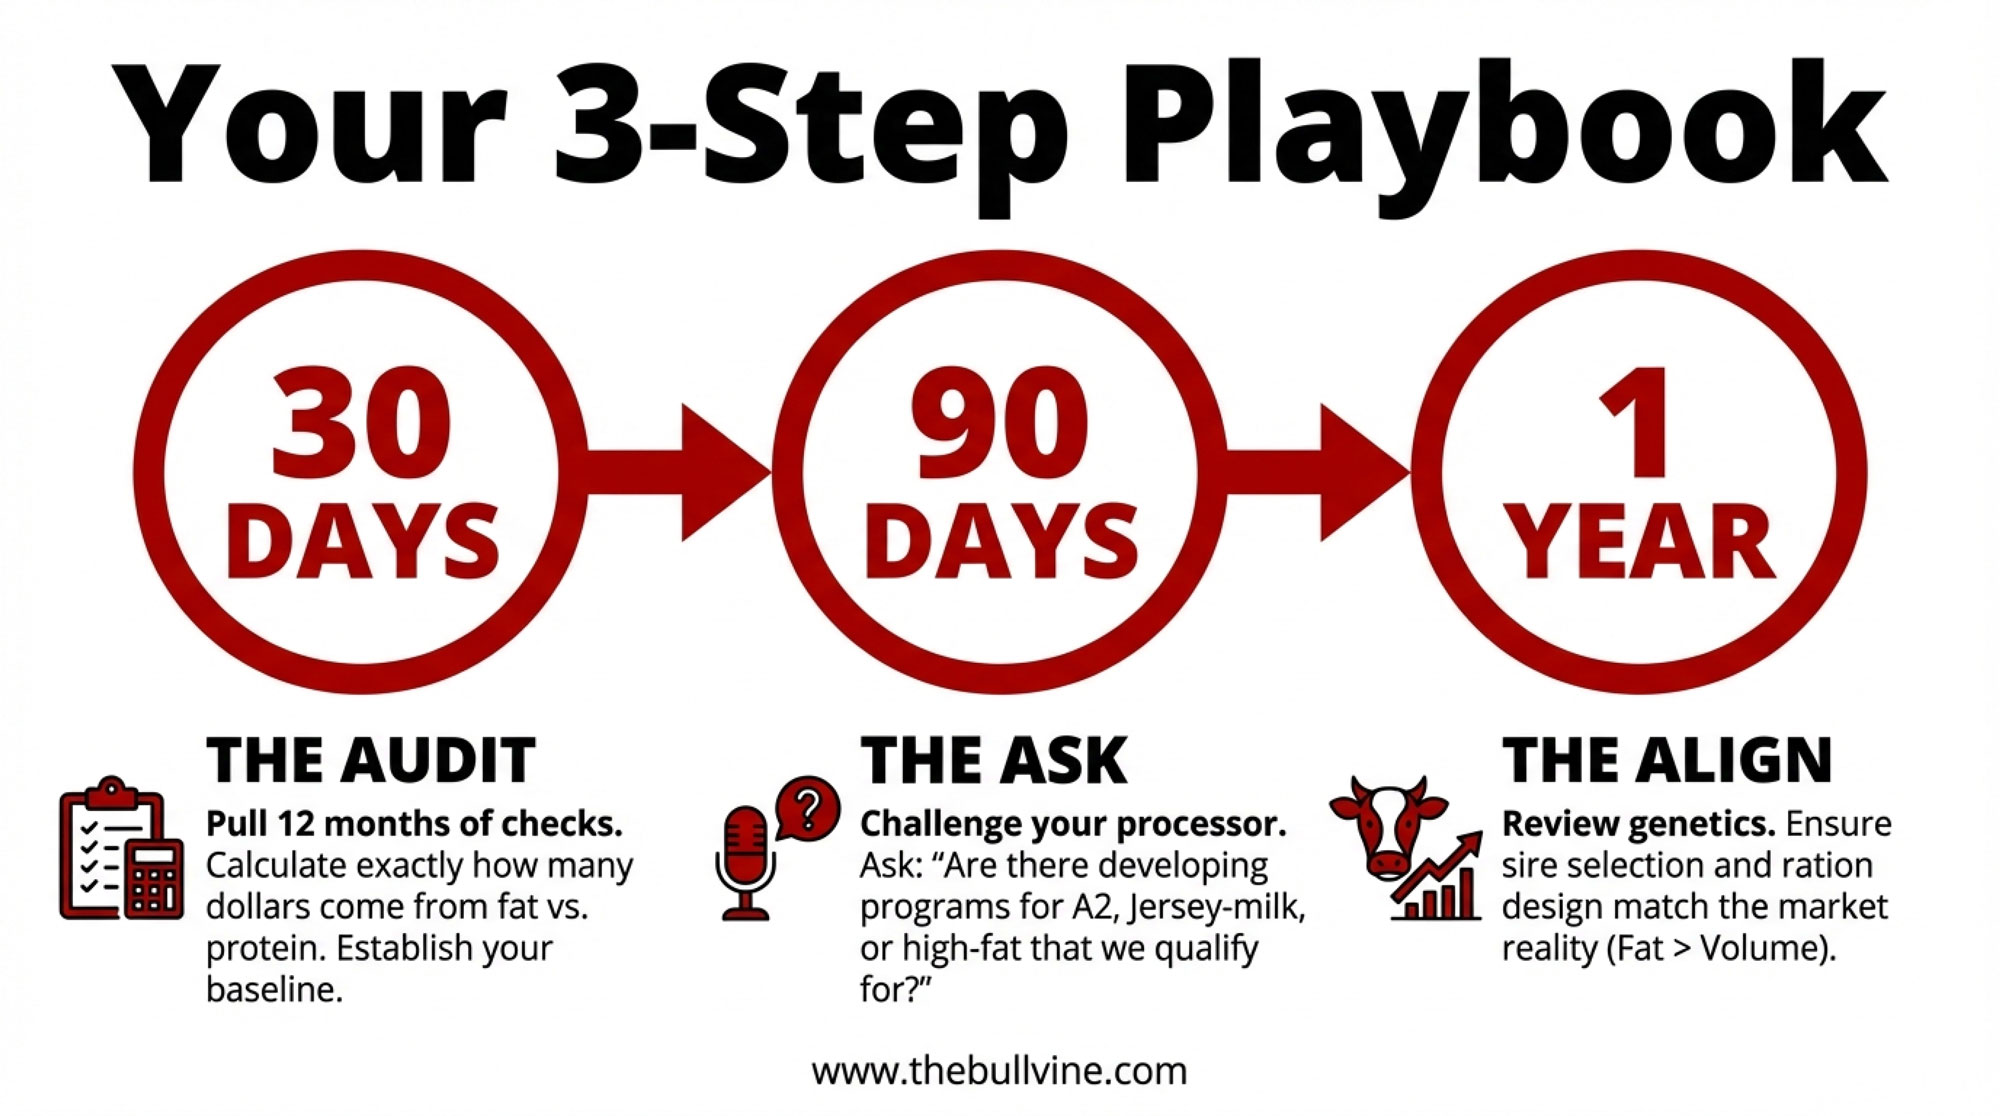
The 90‑Day Allergen Recall Risk Playbook for Mid‑Size Dairy Plants
You don’t have to rebuild your whole plant to change your allergen recall risk profile. You need 90 days of disciplined work that puts real numbers next to your milk check.
In the Next 30 Days: Name Your Riskiest Line and Your Blind Spots
1. Pick your highest‑risk line on purpose.
Ask:
- Which line runs the most SKUs and allergen combinations (milk plus soy, nuts, eggs)?
- Which line has the tightest changeover windows?
- Which line touches your “dairy‑free,” “non‑dairy,” or premium private‑label contracts?
That’s your pilot line. Don’t overthink it.
2. Pull a 12–24‑month allergen and label‑error history for that line.
With your QA team, pull:
- All failed ATP, protein, and allergen swabs on that line.
- All label or packaging deviations involving milk or other allergens.
- Any incidents where the wrong product or label was caught before shipping.
If you can’t generate that report in a clean, credible way, you’re not managing recall risk. You’re gambling.
30‑Day Check:
By your next board or advisory meeting, you should be able to say:
“In the last 12 months, our riskiest line had [X] allergen‑related near‑misses, and here’s how we caught them.”
If you don’t know X, the recall model you’re using on your P&L isn’t reality.
Over the Next 90 Days: Run the Pilot and Put a Price Tag on Prevention
3. Run a 2–4 week cleaning validation pilot on that line.
You’re not trying to build a PhD thesis. You’re trying to establish a baseline:
- Start from your existing cleaning SOP.
- Add ATP swabs on 5–10 “worst‑case” surfaces after cleaning.
- Add protein swabs where ATP passes.
- Once ATP and protein are consistently passing, run milk allergen tests at agreed intervals (end of selected changeovers, high‑risk product switches).
Track:
- How many first‑round cleans fail ATP or protein?
- How many re‑cleans are needed to pass?
- How many allergen tests do you run, and what are their results?
The goal isn’t zero failures in week one. The goal is a baseline you can act on.
4. Track pilot costs and compare them to your modeled recall risk.
During that pilot:
- Log extra minutes or hours per changeover.
- Log overtime or schedule shifts caused by re‑cleans.
- Log the cost of ATP, protein, and allergen kits plus any lab fees.
At the end, stack those numbers against your recall risk math:
- A low‑thousands‑of‑dollars pilot is realistic on a line like this over a month.
- At an 8% annual recall probability and a $10M recall cost, your expected annual exposure is $800,000 on that line — or $2,000 per cow on a 400‑cow block.
That’s a conversation your insurer, your retailer, and your members all understand: pay a known amount now to reduce the odds of an eight‑figure hit later.
Over the Next 365 Days: Move Recall Risk into Governance and Contracts
5. Put allergen recall risk in front of your board and members once, in writing.
At your next major meeting:
- Share a one‑page pilot summary: cost, failures caught, changes made.
- Walk through the recall math at 1–2% and 8–10% probabilities, using your own line as the example.
- Ask in plain language:
“Are we comfortable modeling recall risk at 1–2% per year when our own near‑miss data — and broader survey and recall data — point much higher?”
Once that question is in the minutes, allergen recall risk becomes a governance item, not just a QA report.
6. Take your data to your insurer and your biggest retail or brand customer.
Use the pilot numbers:
- With your insurer: “Here’s our high‑risk line and the validation data. How does this impact recall coverage and premiums at renewal?”
- With your largest customer: “We’ve validated cleaning and reduced allergen risk on your line. Can we talk about longer terms, preferred status, or modest premiums tied to this control?”
You’re not asking for charity. You’re negotiating with evidence.
7. Rewrite one clause at renewal so producers aren’t underwriting plant‑side failures.
At the next contract renewal:
- Make sure raw milk supply agreements clearly separate farm‑origin hazards (residues, pathogens at intake) from plant‑origin allergen and labeling failures (cross‑contact, mislabeling, wrong packaging) that occur after milk crosses the hose.
If you’re a producer, ask your co‑op or plant rep:
“If there’s an allergen recall caused by cross‑contact or mislabeling in the plant, how much of that cost can be pushed back onto members under our current wording?”
If plant‑origin failures can be pushed back on your herd, you’re underwriting risks you can’t directly control.

What This Means for Your Operation
You don’t need to own a plant to be tied to this. If your milk goes into a high‑mix facility, allergen recall risk is already baked into your milk check.
- If your milk feeds a plant running yogurt, ice cream, cheese blends, or alt‑dairy on shared lines, assume your recall exposure looks more like an 8–10% scenario than a safe 1–2% — unless someone shows you data that says otherwise.
- In the next 30 days, ask your plant or co‑op for a simple allergen near‑miss and label‑error report for their riskiest line.
If they can’t pull it, you know they’re leaning harder on recall insurance and “may contain” labels than on validated allergen control. - If you sit on a board, push to have allergen recall risk discussed once a year alongside milk price, capital spending, and debt coverage.
That discussion should include near‑miss counts, cleaning validation pass rates, and recall history on products made with your milk. - Before you sign your next supply agreement, read the indemnity and contamination clauses with allergens in mind.
If in‑plant failures can be pushed back onto members, your herd is backing liabilities you never meant to underwrite. - If you ship into “dairy‑free” or alt‑dairy contracts, treat PAL as a last resort, not a business model.
Premiums in that space exist because consumers trust the label; once that trust cracks, the premium disappears. - Use the $250 vs. $2,000 per cow math as a sanity check.
If you can spend a low‑thousands‑of‑dollars pilot to materially reduce an $800,000 expected recall exposure on a single line, that’s not just QA spend. That’s risk management.

Key Takeaways
- If your plant models allergen recall risk at 1–2% per year while survey data show roughly two in five companies with allergen plans still had a recall over five years, you’re probably underpricing that risk by a factor of four.
- A focused cleaning‑validation pilot on your riskiest line is a realistic 90‑day project that can turn “we think we’re fine” into numbers your board, insurer, retailer, and members can actually use.
- “May contain milk” is not a long‑term strategy. As regulators and retailers move toward risk‑based allergen labelling and tighter “dairy‑free” claims, plants that leaned on PAL instead of validation will have the weakest story to tell.
- If your co‑op or plant contracts don’t clearly separate farm‑origin hazards from plant‑origin allergen and labeling failures, your herd may be backing liabilities you never agreed to carry.
The Bottom Line
Mark and Janet now expect one simple answer every year:
“On our highest‑risk line, what’s our real cleaning pass rate, what did it cost us to prove it, and how much of that recall risk is already baked into our milk check?”
Don’t wait for a $10 million mistake to discover who’s actually liable. Send this article to your co‑op field rep or plant contact and ask: “Where is our allergen validation data — and what recall probability are we really modeling?”
Complete references and supporting documentation are available upon request by contacting the editorial team at editor@thebullvine.com.
Learn More
- The Hidden Contract Clause That Could Cost Your Dairy $55,000 in 2026 – This tactical guide arms you with a 30-day action plan to dodge the massive liability shifts appearing in new milk contracts. It exposes how processor-level failures are being legally offloaded onto farms and delivers the leverage needed to protect your profit.
- The $11 Billion Reality Check: Why Dairy Processors Are Banking on Fewer, Bigger Farms – This strategic deep dive reveals the $11 billion processing wave reshaping the industry through 2028. It breaks down why processors are locking in supply with mega-dairies, allowing you to position your operation before regional consolidation closes your window to negotiate.
- More Milk, Fewer Farms, $250K at Risk: The 2026 Numbers Every Dairy Needs to Run – This disruptive analysis exposes the brutal “more milk, fewer farms” era and the $250,000 margin gap facing mid-size dairies in 2026. It delivers the precise math required to choose between scaling, specializing, or exiting while you still own your equity.
 The Sunday Read Dairy Professionals Don’t Skip.
 The Sunday Read Dairy Professionals Don’t Skip.
Every week, thousands of producers, breeders, and industry insiders open Bullvine Weekly for genetics insights, market shifts, and profit strategies they won’t find anywhere else. One email. Five minutes. Smarter decisions all week.