






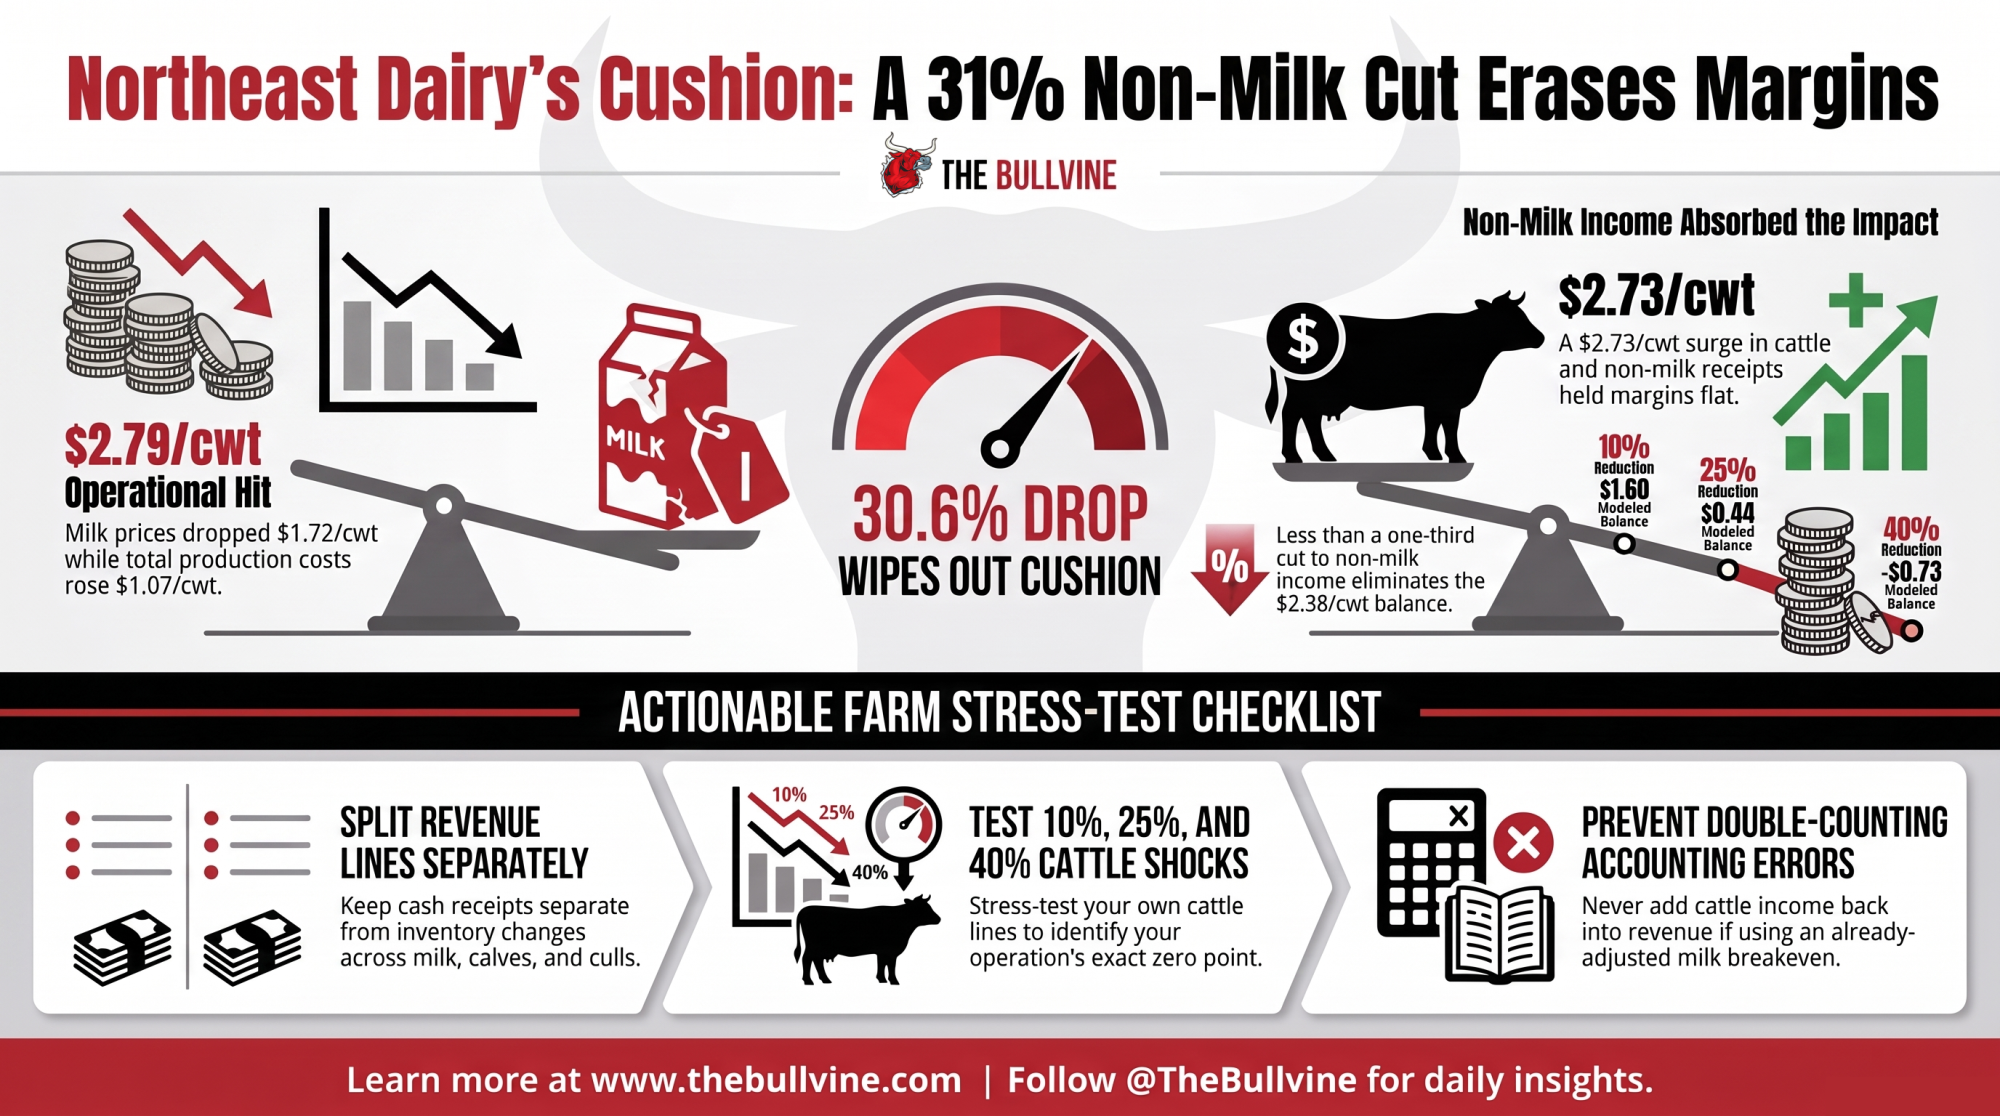
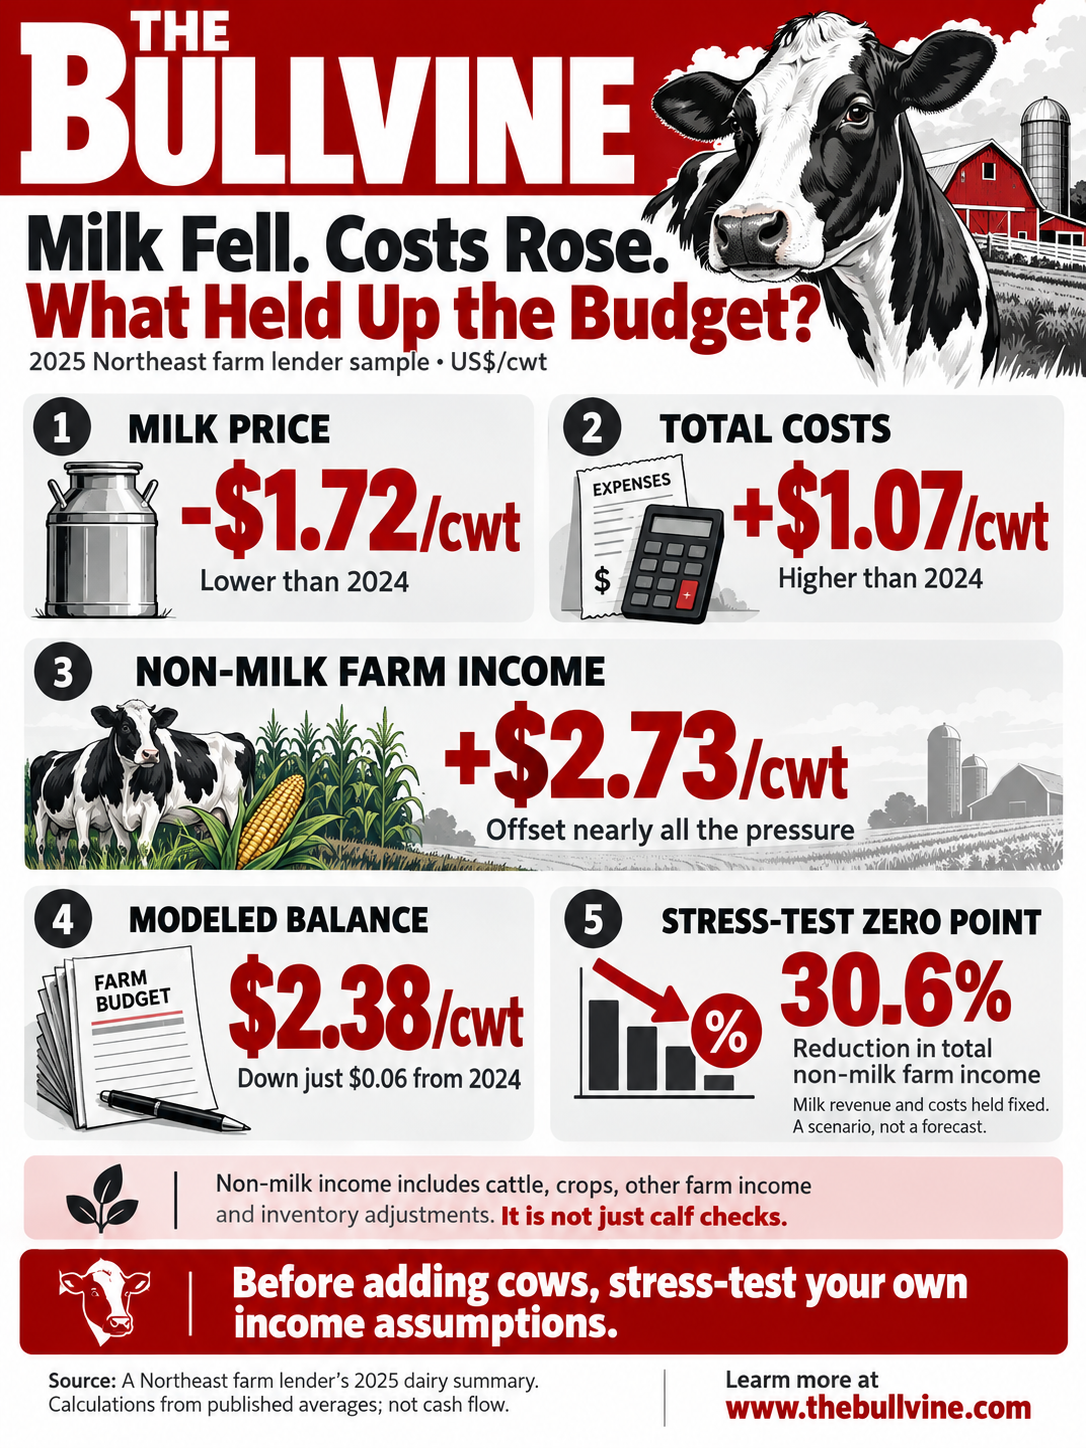
Milk fell $1.72/cwt and costs rose $1.07, yet the Northeast average moved six cents. On Bullvine’s math, a 31% cut in cattle, crop and other income erases that cushion. For 300–699-cow herds, 7.4% does.
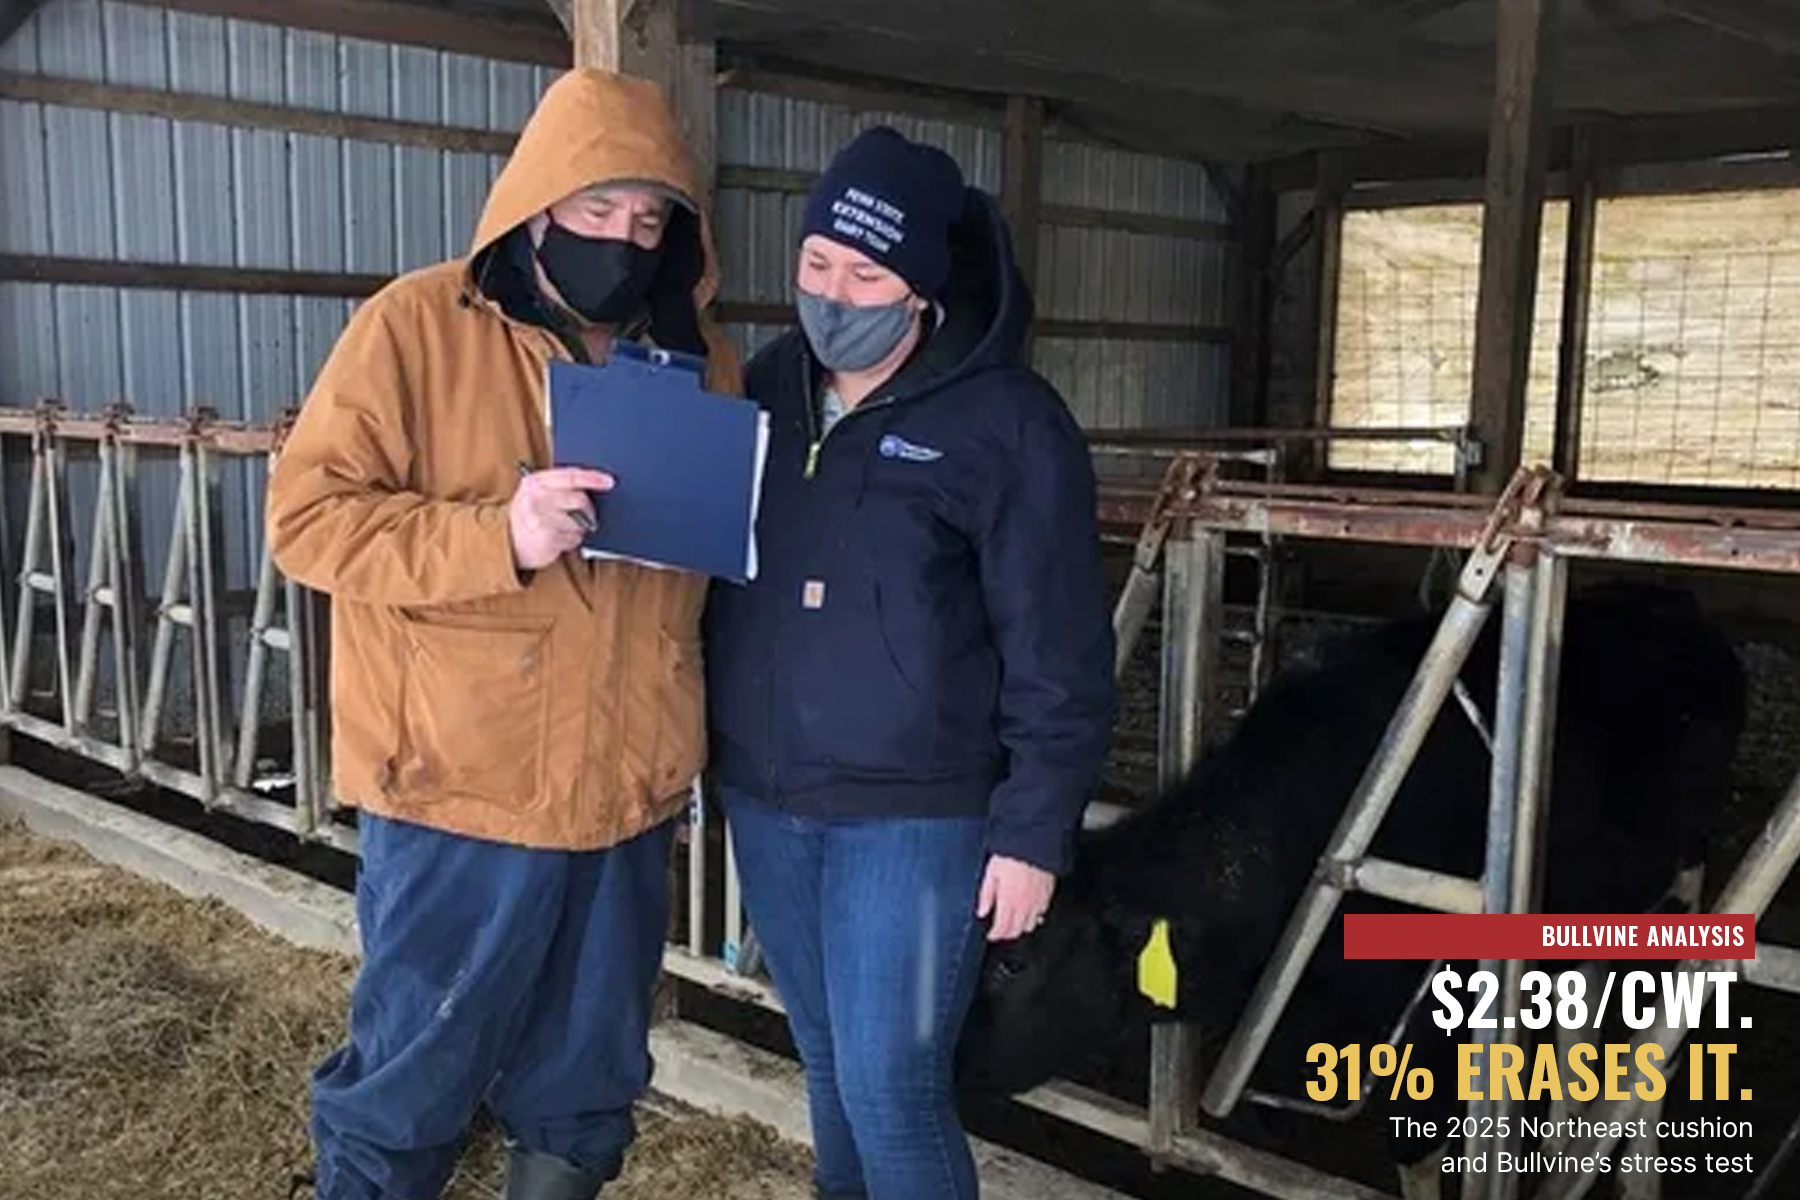
The 2025 Northeast Dairy Farm Summary shows Northeast milk receipts dropped $1.72/cwt in 2025 while total costs climbed $1.07/cwt. On paper, margins got $2.79 worse. Yet the modeled balance barely flinched, slipping six cents from $2.44 to $2.38. One revenue stream absorbed the blow: cattle and other non-milk income surged $2.73/cwt. Shrink that stream 31% (Bullvine’s math) and the cushion is gone.
That’s not a story about cattle revenue being suspicious. It’s a story about what’s doing the load-bearing work, and how much of it a 2027 expansion budget can afford to lose.
The $0.06 that explains 2025
The summary covers 136 Northeast farms, from 70 to more than 5,000 milking cows. Because the sample skews large, the report weights its three herd-size groups equally, so a group averaging 181 cows counts as much as one averaging 2,136. In barn terms, the $7.78/cwt the accountants call “non-milk farm income” is the cull cow check, the calf check (beef-cross and dairy), crop sales and the change in raised-livestock inventory, all rolled together. The report is direct about what moved: “Increased value of cattle sales was the main contributor to this.” It adds that larger farms “had more income from beef-on-dairy and cull cow sales.”
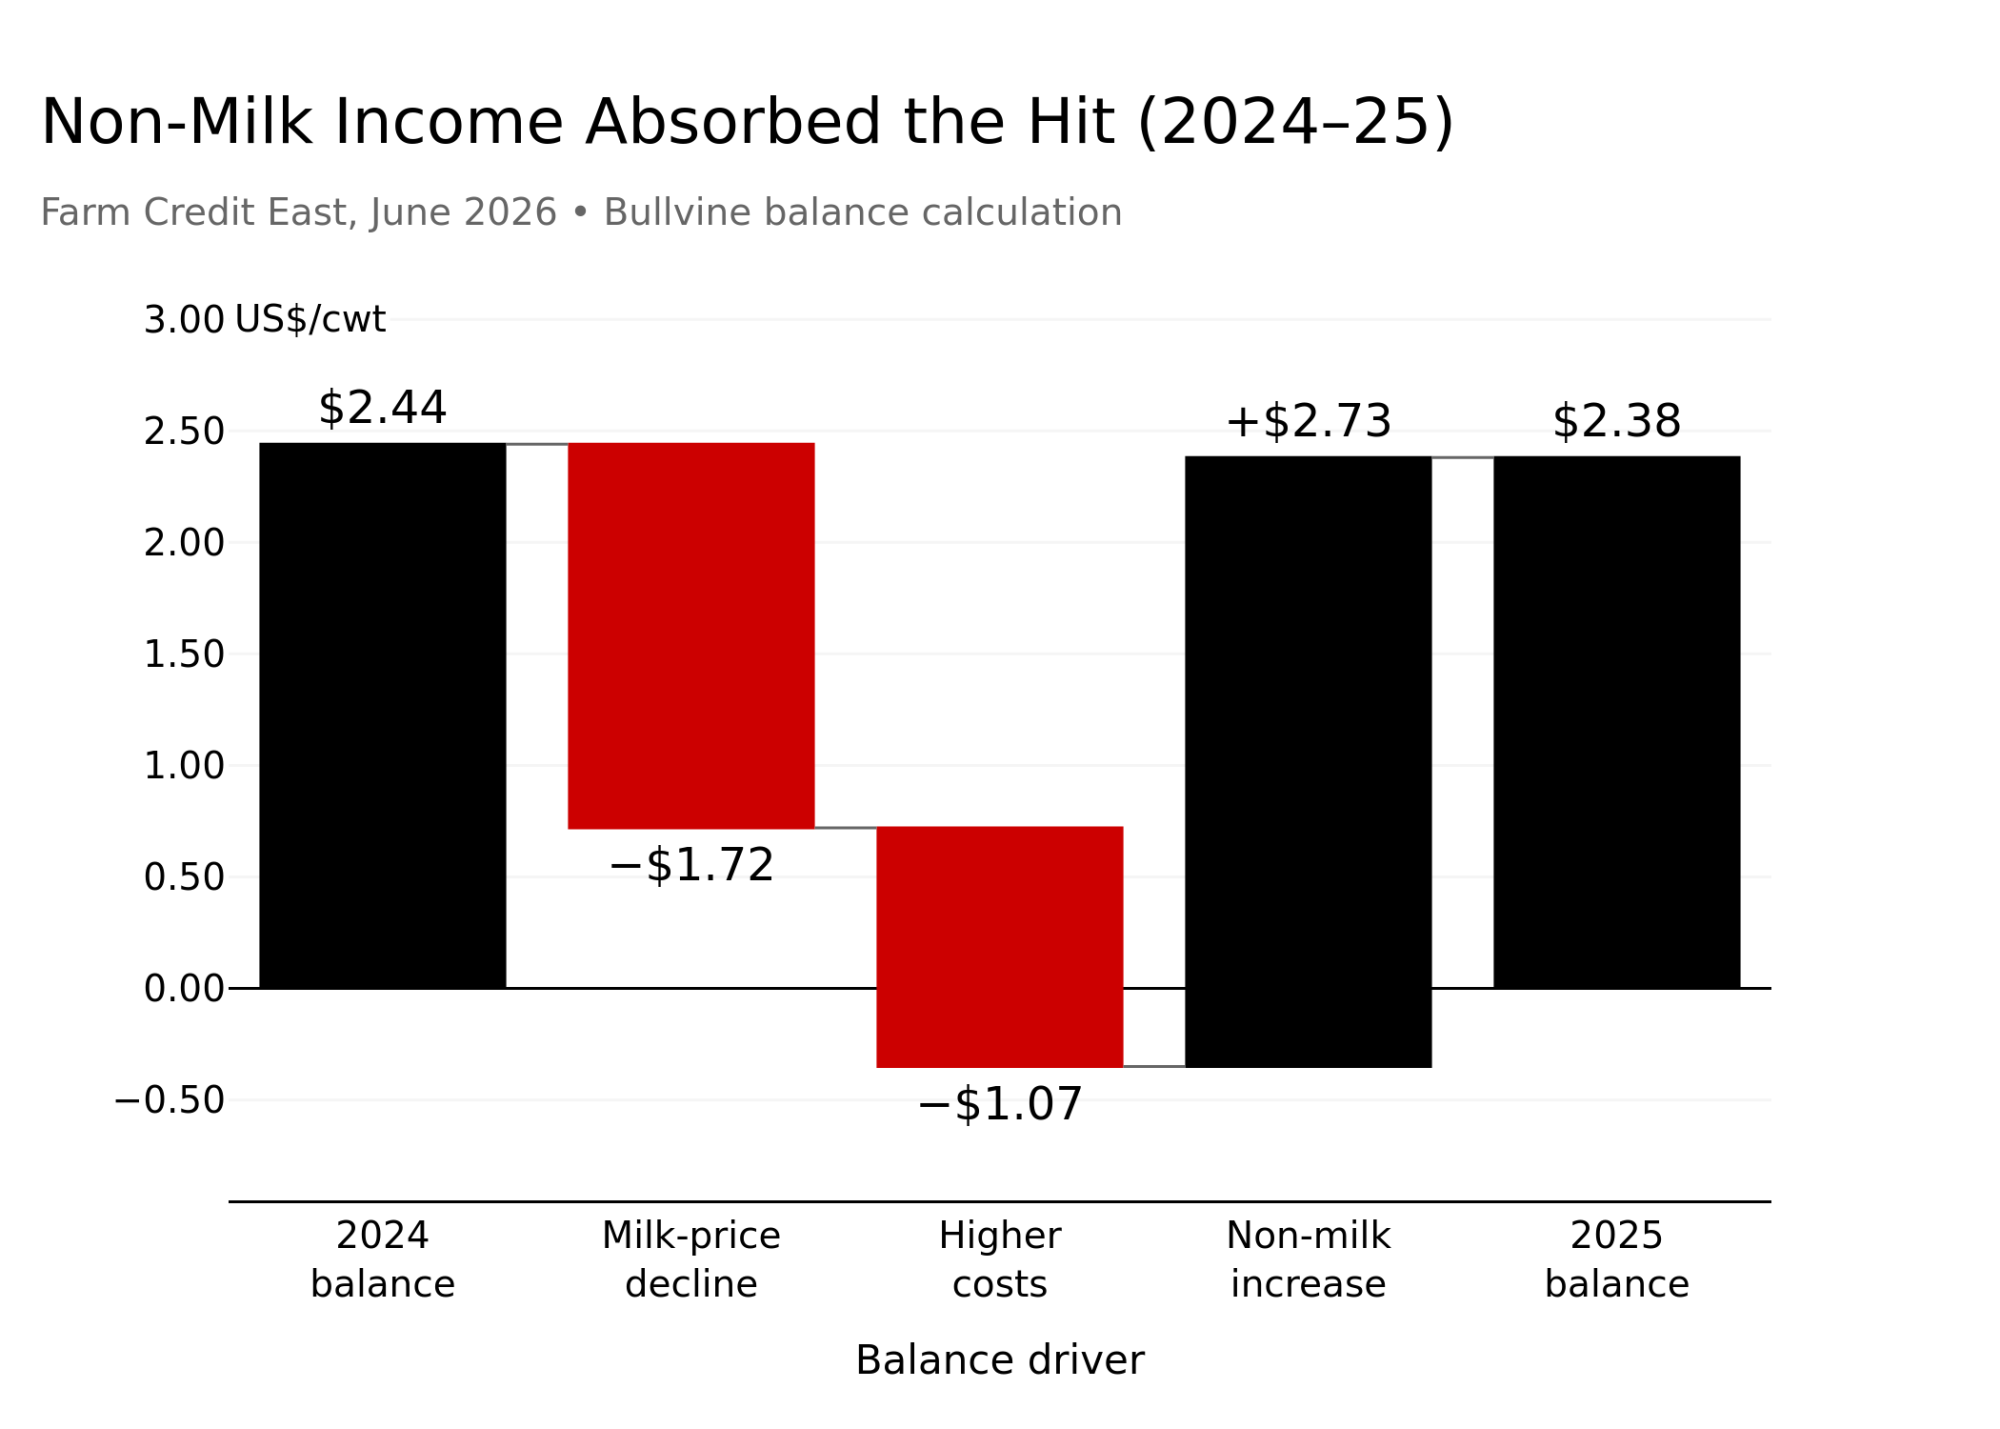
| Input, US$/cwt | 2024 | 2025 | Change | % |
| Milk price | $23.93 | $22.21 | −$1.72 | −7.2% |
| Total costs (incl. depr., living & tax) | $26.54 | $27.61 | +$1.07 | +4.0% |
| Non-milk income (cattle, crop, other) | $5.05 | $7.78 | +$2.73 | +54.1% |
| Modeled balance (Bullvine math) | $2.44 | $2.38 | −$0.06 |
Inputs: 2025 Northeast Dairy Farm Summary, Figure 6 and reported milk prices. Changes and balances are Bullvine calculations from published averages, not the report’s net-earnings or cash-margin measures.
The cash-receipts worksheet shows where the money came from. Cattle sales more than doubled, from $2.57 to $5.39/cwt, while crop sales slipped from $0.80 to $0.54. For a sense of the market behind that line, CoBank’s lead dairy economist, writing in the summary’s outlook section, put beef-on-dairy calves at a record $2,013 a head in mid-April 2026. One caution: these aren’t the same farms both years. The sample went from 122 farms averaging 820 cows to 136 averaging 941, so the bridge compares two samples, not one set of farms over time.
The report’s net cost of production fell from $21.49 to $19.83/cwt. Producing milk didn’t get cheaper. More of the cost got covered by cattle, crop and other income. A lower milk breakeven and a lower cost of running the business are different things.
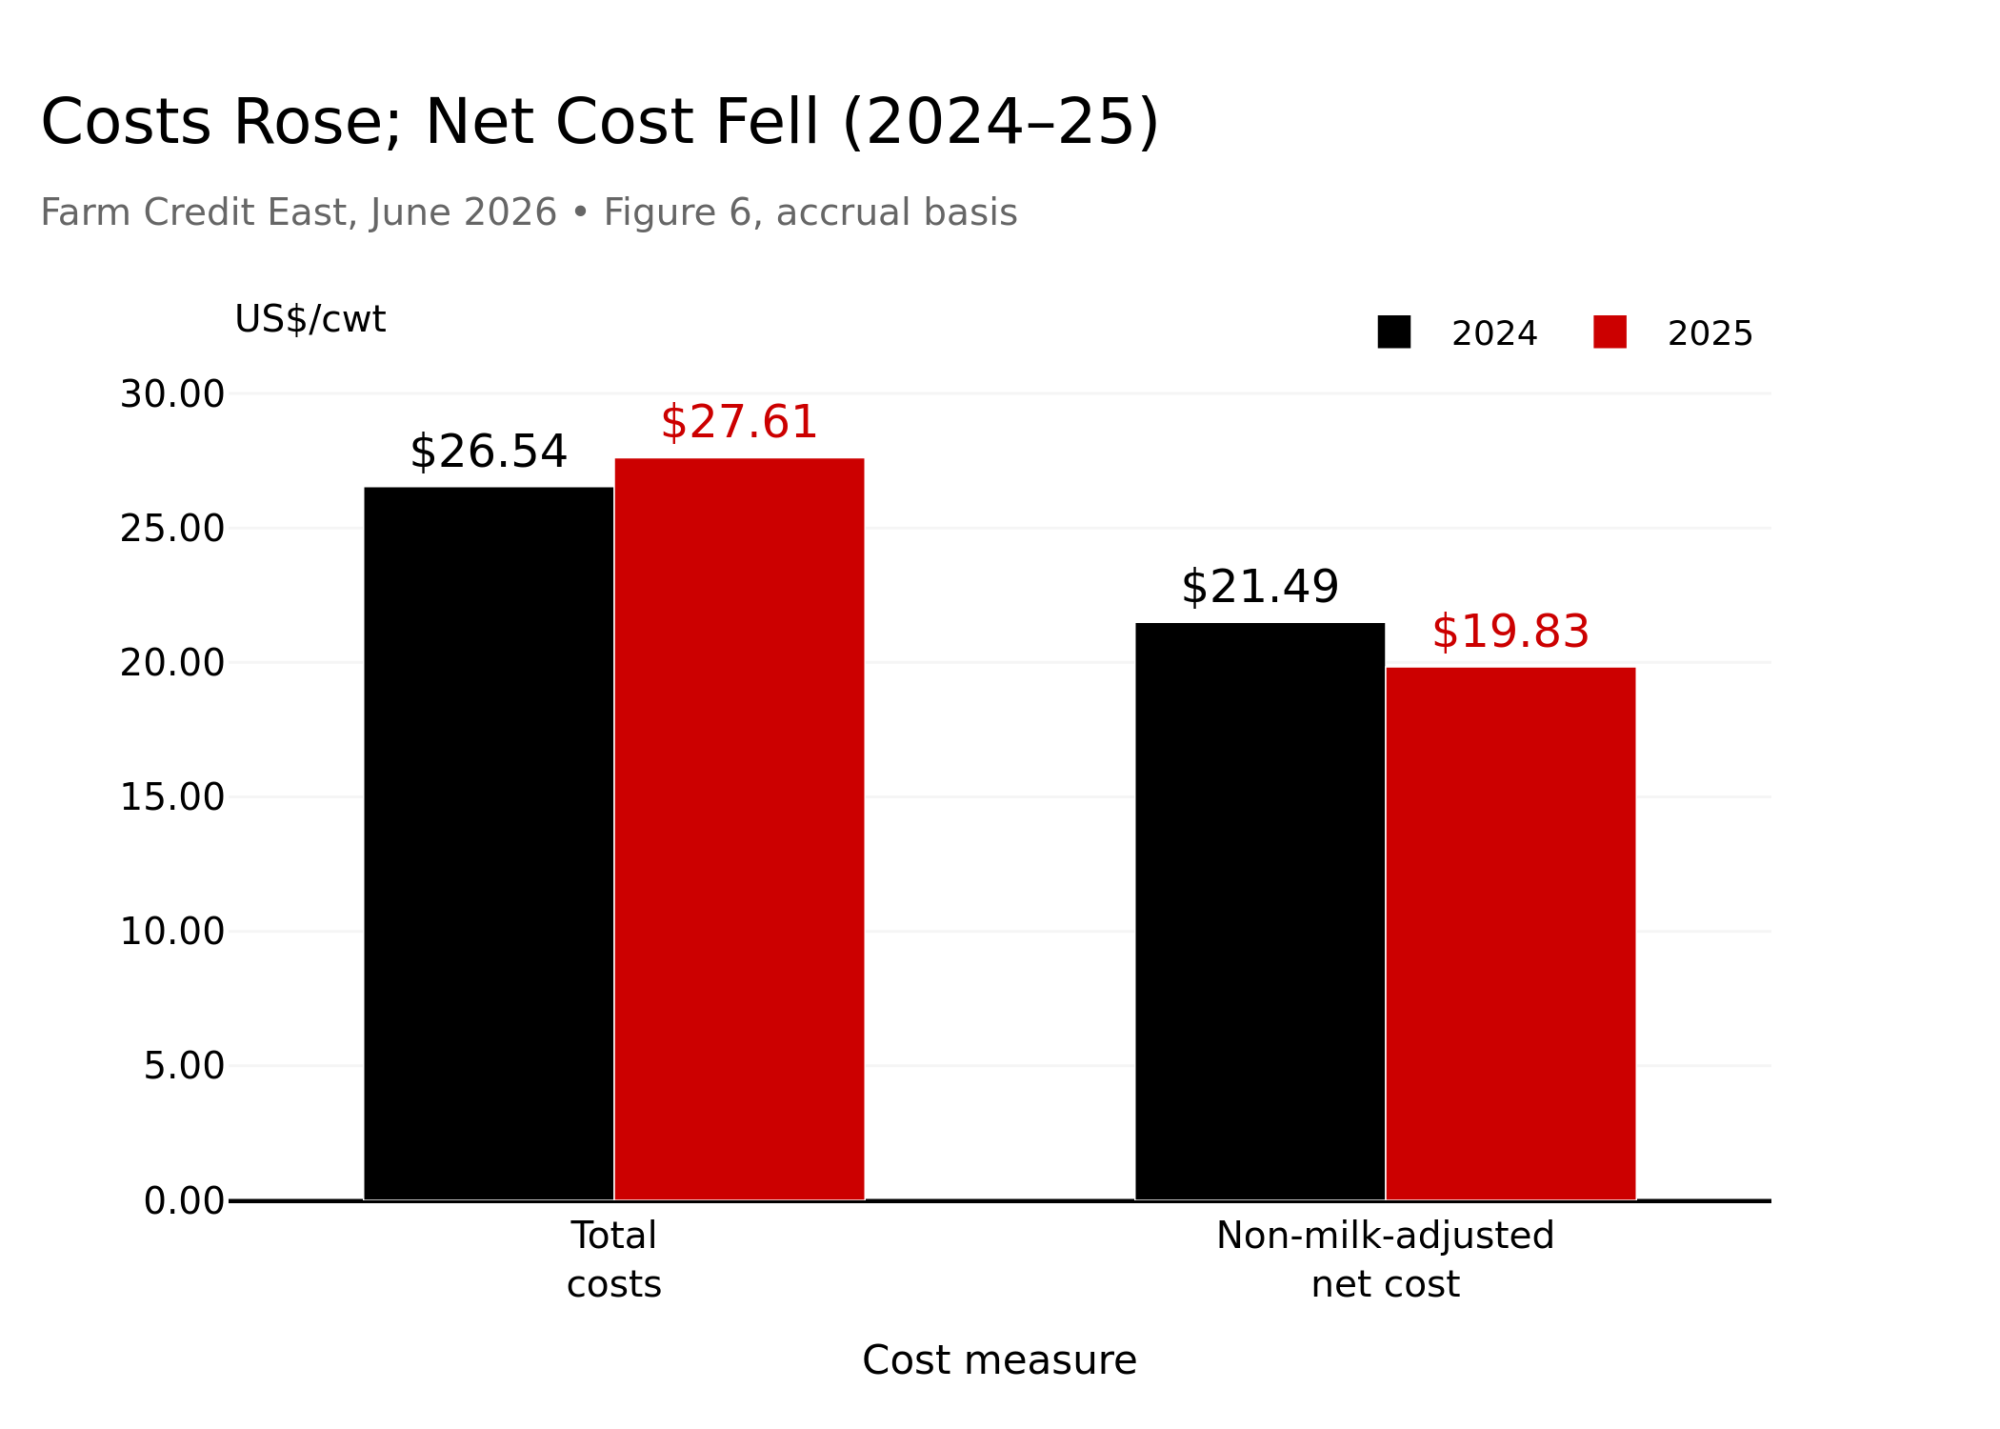
The expansion trap. A $19.83/cwt breakeven doesn’t mean it costs less than $20 to make milk. It means cattle, crop and other income covered $7.78 of a $27.61 cost. If the calf and cull checks shrink, the milk check carries more of that full $27.61.
More cows, not stronger margins
As of USDA’s October 16 outlook, the dairy herd stood at 9.710 million cows in August 2026, up 167,000 head on the year. Milk production rose 1.7%, but output per cow slipped one pound. The herd grew; the cow didn’t. Dairy-cow slaughter through 39 weeks ran above 2025 but below the 2023–25 average.
None of that is a price signal to expand. USDA’s October forecast puts the 2026 all-milk price at $19.90/cwt, Class III at $15.80 and Class IV at $18.90. The same outlook projects the 2027 herd averaging 9.710 million: flat, not 10 million. A monthly head count and an annual-average forecast are different numbers.
The farm-level decision isn’t whether the national herd is growing. It’s whether the next cow earns her place under your milk contract, your calf and cull market, and your replacement budget.
The Bullvine Non-Milk Dependence Test
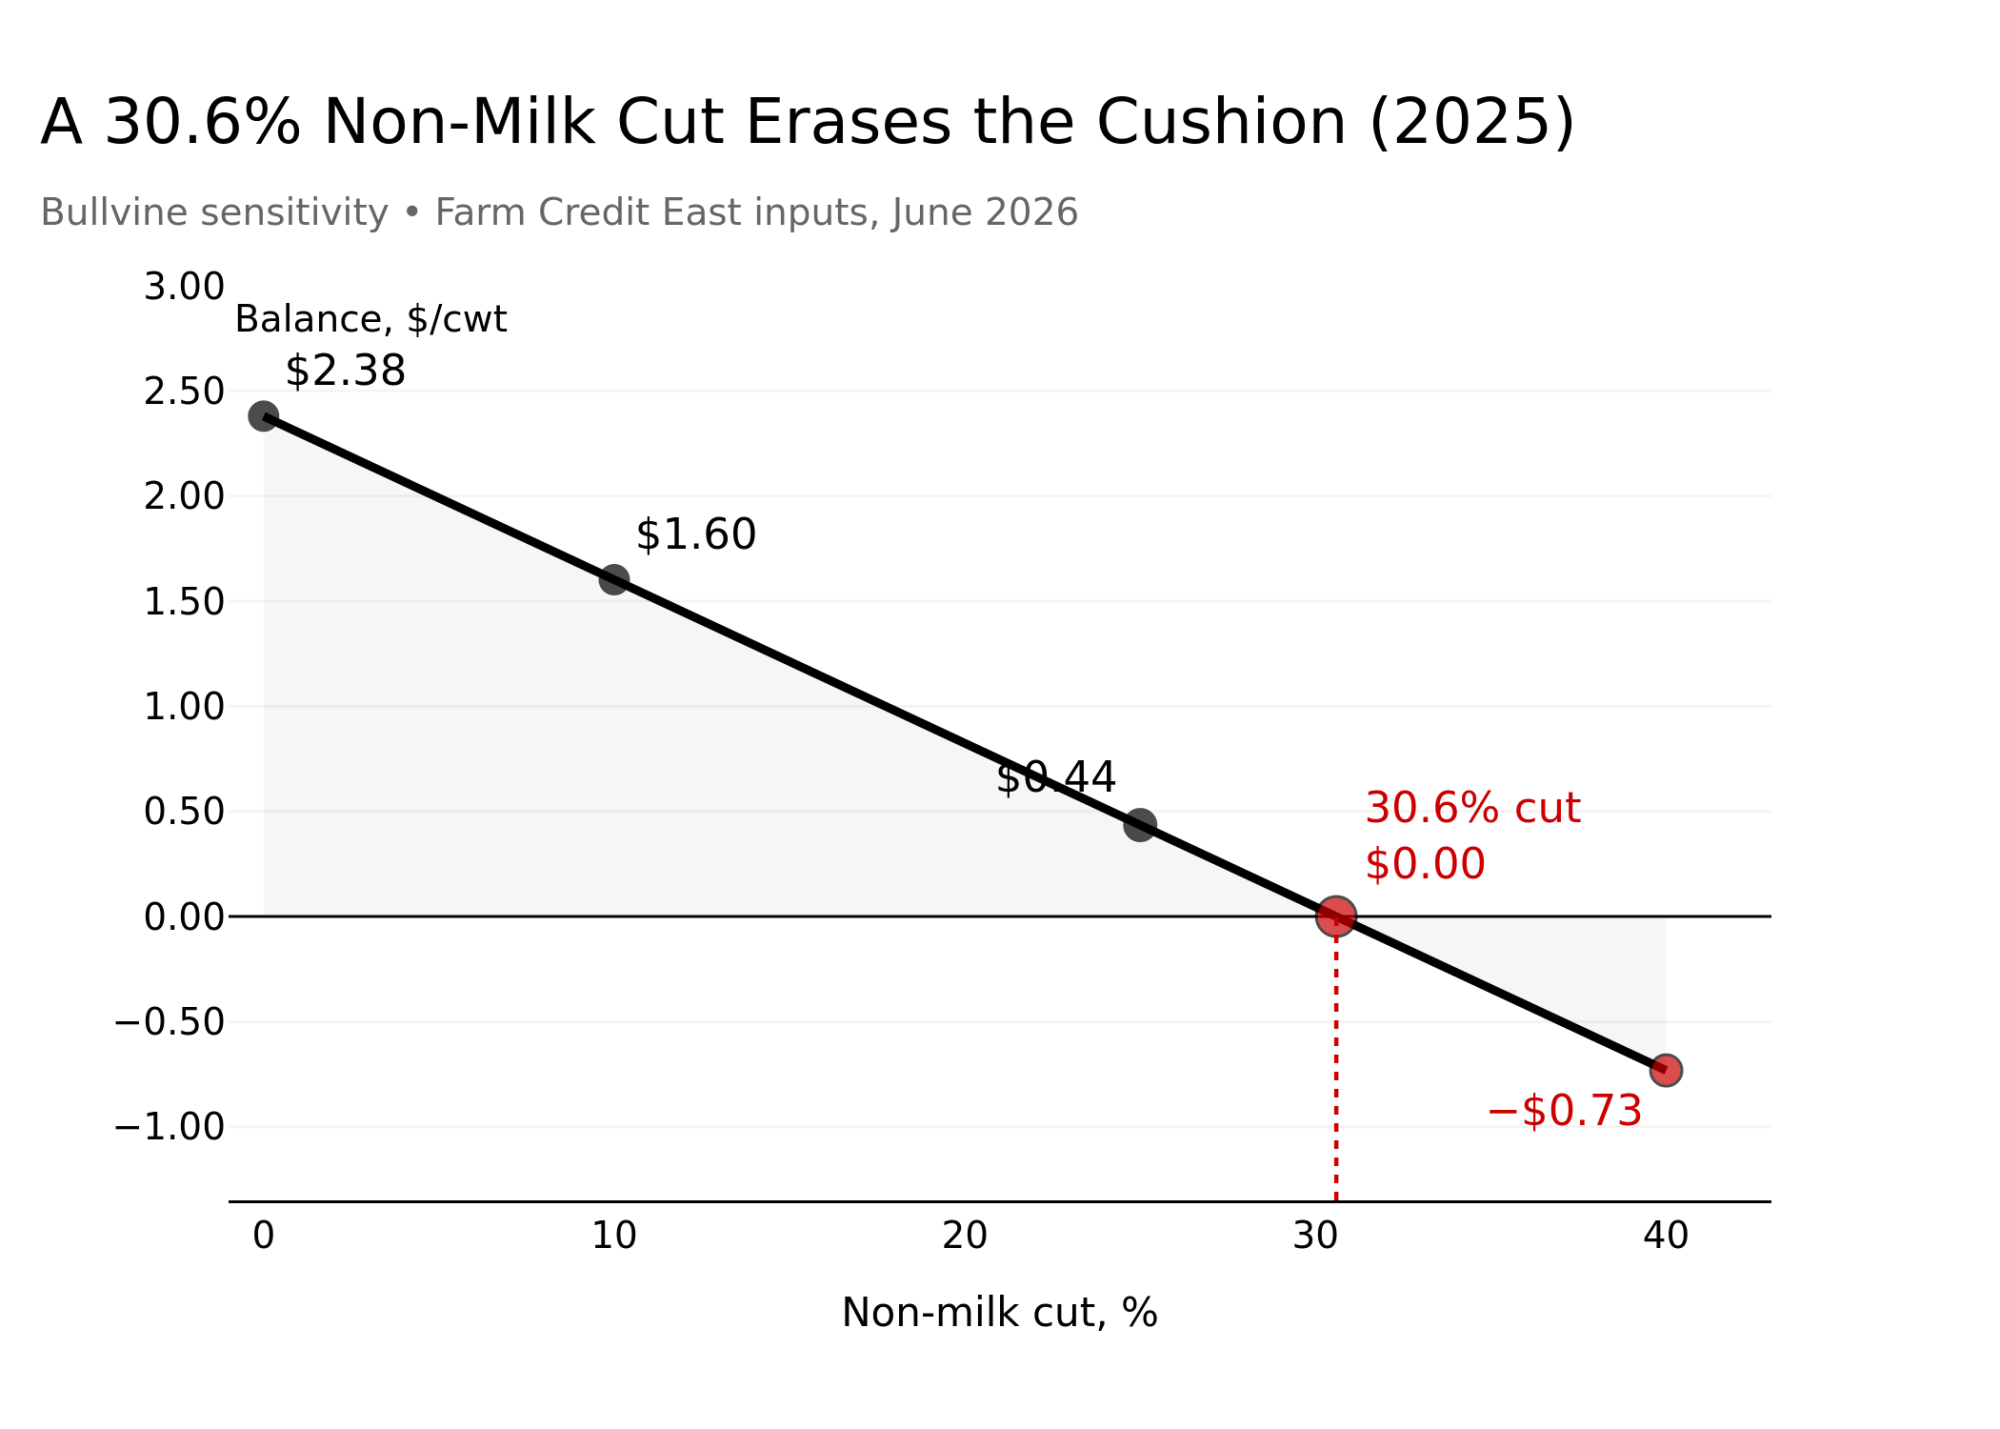
Start with three published 2025 averages: $22.21 milk, $7.78 cattle-and-other income, $27.61 total costs. The modeled balance is $2.38/cwt. Hold milk price, milk volume and costs fixed, and shrink only the cattle-and-other line.
| Scenario | Removed | Remaining | Balance |
| Published baseline | — | $7.78 | $2.38 |
| Illustrative 10% cut | $0.78 | $7.00 | $1.60 |
| Illustrative 25% cut | $1.95 | $5.84 | $0.44 |
| Illustrative 40% cut | $3.11 | $4.67 | −$0.73 |
Bullvine calculations from the summary’s 2025 inputs, computed before rounding. All figures US$/cwt.
The three percentages are markers, not forecasts. We didn’t calibrate them to calf-price history or lender stress tests. The number that does the work is the zero point: divide the $2.38 balance by the $7.78 input and you get 30.6%, the cut that exhausts this cushion with everything else unchanged.
One boundary. Because the stressed line is the whole category, a 25% cut here is not a 25% drop in calf prices. Splitting calf checks from cull checks from crop sales is the operator’s job, using their own records.
The average hides three different herds
Run the same arithmetic by herd size and the $2.38 comes apart. Milk price barely differed across the groups. Costs and cattle income didn’t.
| Herd group | Avg cows | Non-milk | Balance | Zero point |
| 1–299 cows | 181 | $6.02 | −$0.74 | negative before cut |
| 300–699 cows | 507 | $7.26 | $0.54 | 7.4% |
| 700+ cows | 2,136 | $9.91 | $7.03 | 70.9% |
| All farms | 941 | $7.78 | $2.38 | 30.6% |
Inputs: summary Figures 9 and 14 (milk price, total costs and non-milk income by group). Balances and zero points are Bullvine math, US$/cwt.
The 1–299-cow group average was under water on this measure before any cut. The 300–699-cow group average loses its cushion at a 7.4% drop in cattle-and-other income. Only the 700+ group, which also had the most cattle income per cwt, holds up through a deep cut. Individual results spread wider still: net earnings ran from more than $3,000 a cow to losses of more than $2,000, and nearly one-third of the farms lost money on an accrual basis. A regional average can’t decide an individual expansion.
What 44 cents tells you, and what it doesn’t
The 25% scenario leaves $0.435/cwt for the all-farm average, rounded to 44 cents. It looks like a margin, and margins invite decisions. The summary’s total-cost line already includes interest, depreciation, and a $0.60/cwt family-living-and-income-tax line. It does not include scheduled loan principal, a return on equity or new capital. By the report’s own figure, each 1% of return on equity adds $0.49/cwt.
| If you’re asking… | What 44 cents supports |
| Is that cash in the account? | No. It’s an accrual-adjusted balance that includes depreciation and inventory changes. |
| Does it cover the loan payment? | Interest is already in the costs. Principal is not. |
| Does it pay the family? | $0.60/cwt for family living and income tax is already deducted. Whether that matches your household is another question. |
| Is the investment earning a return? | Not established. No equity return is in the benchmark. |
| Will the next cow earn 44 cents? | No. There’s no replacement purchase, construction, financing or production response in an averages-based number. |
Principal is where this bites, and the report measures it. Its cash-flow analysis counts operating expenses, family living, income tax and scheduled principal payments: $27.84/cwt in cash required. Against that, the average farm had $22.21 of milk and $7.11 of cattle, crop, capital and other income, leaving a cash margin of $1.48/cwt. The report’s highlights page lists $2.12; its body text and cash-flow table show $1.48. We use the table. On Bullvine math, a 20.8% cut in that other income erases the cash margin. At the 25% marker, the average farm is 30 cents short on cash after debt service. That’s before any capital replenishment, and it’s the arithmetic a lender will run.
Don’t count the cattle check twice
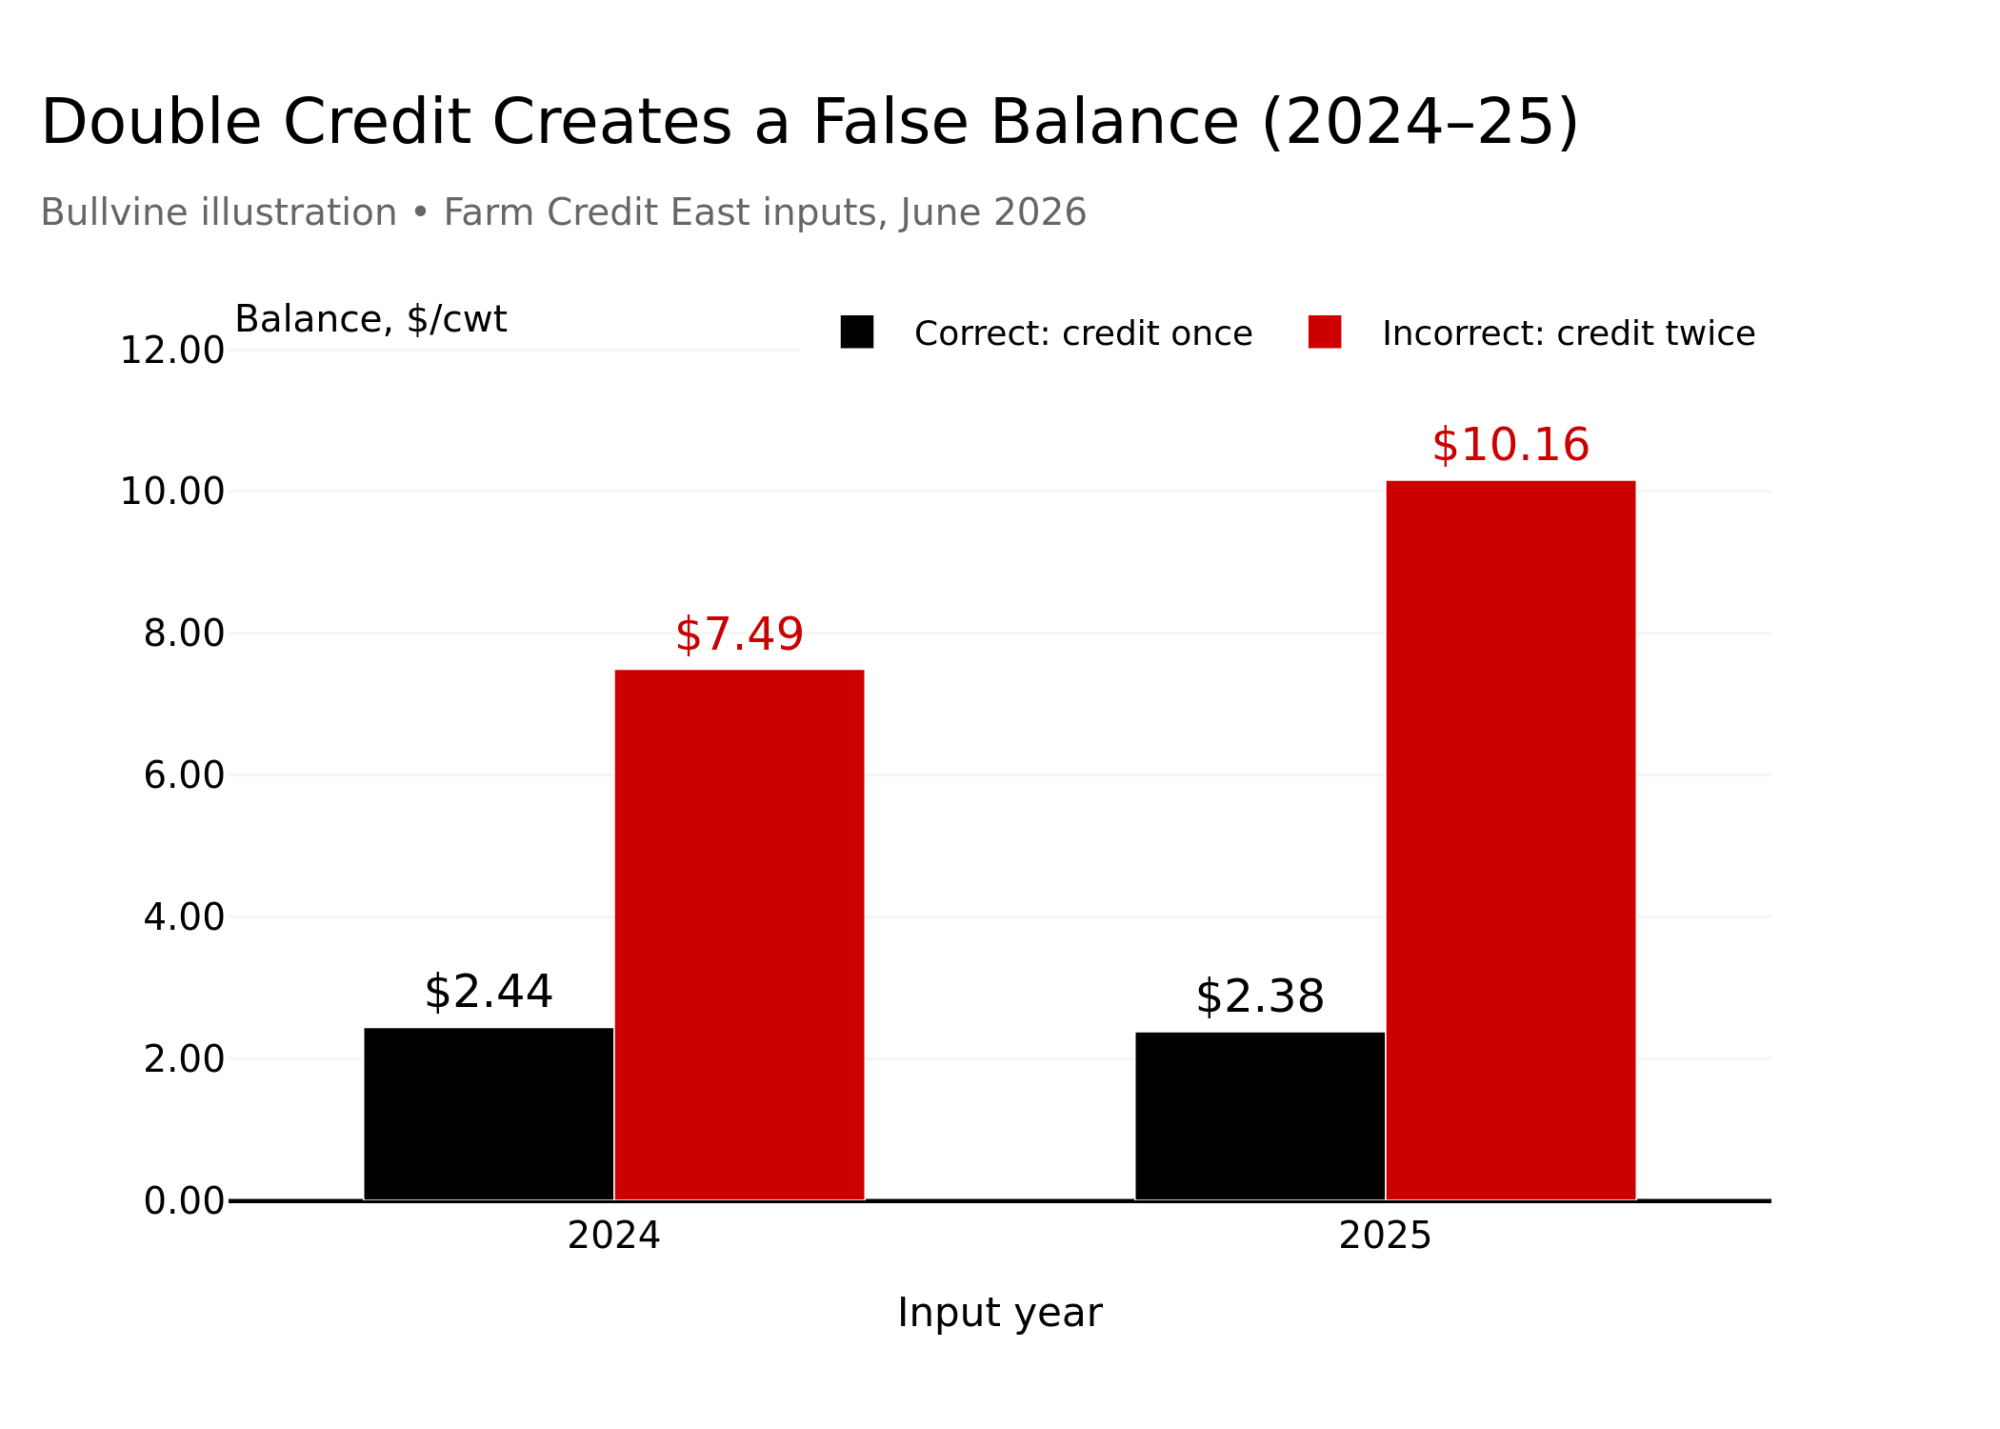
There are two correct ways to lay out this worksheet. The first adds cattle-and-other income to revenue and subtracts total costs. The second subtracts that income from costs first (that’s how the summary gets $19.83) and compares the net cost with milk revenue alone. Both land on $2.38. The error is mixing them: using the already-adjusted $19.83 andadding the $7.78 to revenue again.
| Line, US$/cwt | Route A: full revenue | Route B: milk vs. net cost | Fatal error: double-credited |
| Milk revenue | $22.21 | $22.21 | $22.21 |
| Cattle-and-other income | +$7.78 | already in cost line | +$7.78 again |
| Cost subtracted | −$27.61 total | −$19.83 net | −$19.83 net |
| Balance (Bullvine math) | $2.38 | $2.38 | $10.16 — wrong |
The overstatement is exactly $7.78/cwt. Both cells look right in isolation; it only shows when you reconcile the two routes. This is an illustration from published averages, not a documented error at any farm or in the source report. Five checks:
- Trace what the cost cell has already subtracted.
- Trace whether any income line appears twice.
- Match period, denominator and accounting basis.
- Confirm both routes reconcile.
- When you stress the cattle line, update the adjusted breakeven too.
Does the expansion create the exposure?
The test shows exposure. The next question is whose: does the expansion create it, or is the existing herd already underwater without this year’s calf and cull checks? For the 1–299-cow group average, the answer was already yes. Run both cases under the same weaker-income assumption. That’s partial budgeting as Penn State Extension lays it out: count only what the decision changes.
| Market assumption | Don’t expand | Expand |
| This year’s cattle income | Existing herd, projected | Expanded herd, projected |
| Weaker cattle income | Existing herd under the shock | Expanded herd under the shock |
Read across to judge the expansion. Read down to judge the exposure. If both columns fail under the shock, the expansion didn’t create the problem; the base herd has it already. If the expanded herd stays cash-positive but the new capital earns nothing, that’s a different problem.
What this means for your operation
The one thing to take into the next expansion meeting: run this test while you can still change the commitment, and put the review date in writing. Penn State’s guidance is to test uncertain assumptions until the preferred decision switches. It also says to look at both this year’s and next year’s cash flow, because a move that helps one can hurt the other. The Bullvine addition is to tie that to the project calendar.
- By November 20, 2026, split the revenue lines. Trailing 12 months: milk, beef-cross calves, dairy calves, culls, other livestock, crops, other income. Keep cash receipts separate from inventory changes.
- Stress calf and cull checks, not “non-milk.” Run 10%, 25% and 40% on your own cattle lines, then find your own zero point on both an accrual and a cash basis. The benchmark’s 30.6% is not yours, and neither is its 20.8%.
- Name what fails first. A scheduled principal payment, a minimum cash balance, a lender covenant or a return target, chosen before you see the result.
- Run expand vs. don’t-expand under the same shock. If the 25% case flips the answer, that’s a redesign trigger: fewer cows, staged construction, less debt, a stronger milk agreement or a larger reserve.
- Check the breakeven definition. If the worksheet starts from a cattle-adjusted milk breakeven, the cattle check doesn’t go back in as revenue.
- Write the checkpoint. Next commitment, its date, the options still open on that date, the threshold, and who signs off. “Not yet paid” and “not yet committed” aren’t the same thing, so read the agreements.
The biggest cattle check in this five-year series is real income. The expansion question is whether the next cow still earns her place when that check gets smaller, and whether you’ll find out while you can still do something about it.
Non-Milk Income Dependence & Breakeven Stress Tester
Test how vulnerable your operating cushion is to a correction in beef-cross calves, cull cow checks, and secondary farm revenue.
Review The Math: Avoiding The \$7.78 Double-Counting Error
Lenders and farm managers frequently commit the catastrophic double-counting trap when reviewing net cost of production. Here is how your active numbers reconcile:
| Method | Calculation Flow | Result |
|---|---|---|
| Full Revenue vs Full Cost | \$22.21 milk + \$7.78 non-milk − \$27.61 total | +\$2.38/cwt |
| Milk vs Adjusted Breakeven | \$22.21 milk − \$19.83 net cost | +\$2.38/cwt |
| Fatal Accounting Error | Crediting non-milk to revenue AND subtracting it from costs | +\$10.16 (+\$7.78 Error) |
*Depreciation and family living allowances are included. Scheduled debt principal, equity return targets, and income taxes are not.
Complete references and supporting documentation are available upon request by contacting the editorial team at editor@thebullvine.com.
Learn More
- USDA Raised Class I $1.84. Upper Midwest Gets 10 Cents, the Northeast 48. Runs October’s $18.88 base Class I through August pool use; the Northeast blend picks up about 48 cents.
- USDA’s 3.905 Million-Heifer Paradox: A 500-Cow Dairy Can Sell 291 Beef Calves and Still Come Up 28 Replacements Short At $3,260 a replacement, each beef calf has to bring about $310 more than a dairy calf just to cover the gap.
- New Holland’s Beef-Cross Calves Topped UW–Madison’s $1,125 Test—at a $260 Premium Two Pennsylvania sales put No. 1 beef-cross bulls above $1,230, but only $260–$303 over Holsteins.
The Sunday Read Dairy Professionals Don’t Skip.

Every week, thousands of producers, breeders, and industry insiders open Bullvine Weekly for genetics insights, market shifts, and profit strategies they won’t find anywhere else. One email. Five minutes. Smarter decisions all week.