




The U.S. 10-year Treasury yield hit 5.365% on October 7, 2026, its highest level in 24 years, according to Tradeweb data reported by Dow Jones. It had eased to about 4.99% by October 26.
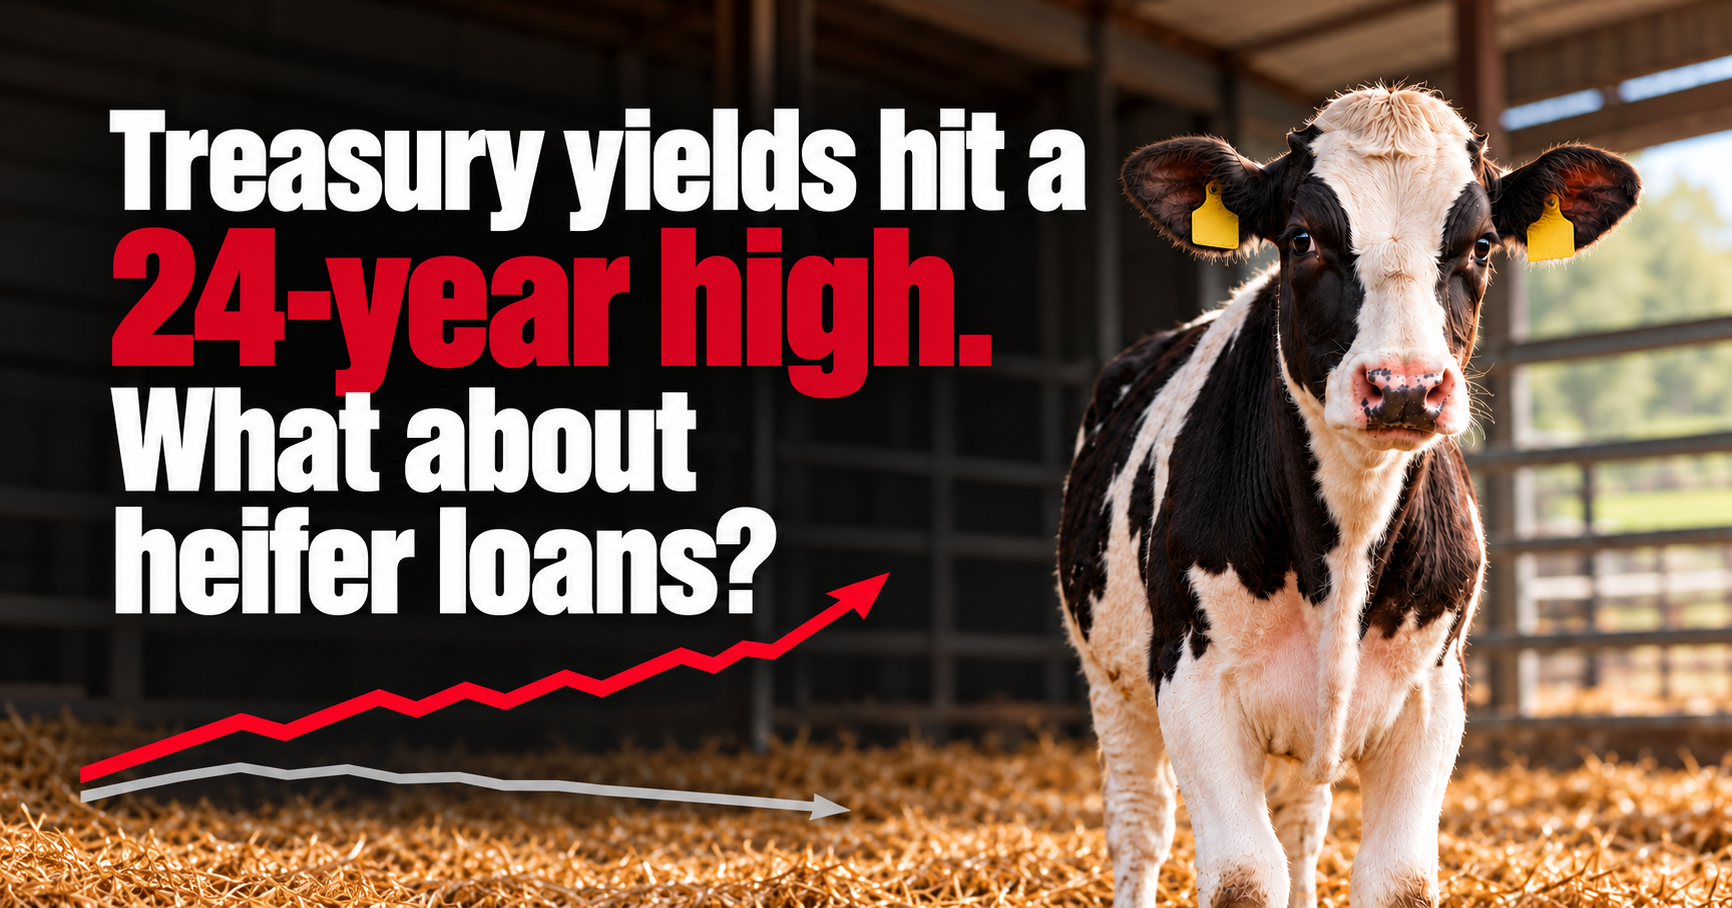
For a dairy deciding which heifers to raise, the relevant question is what its lender charges on the money it borrows to raise her.
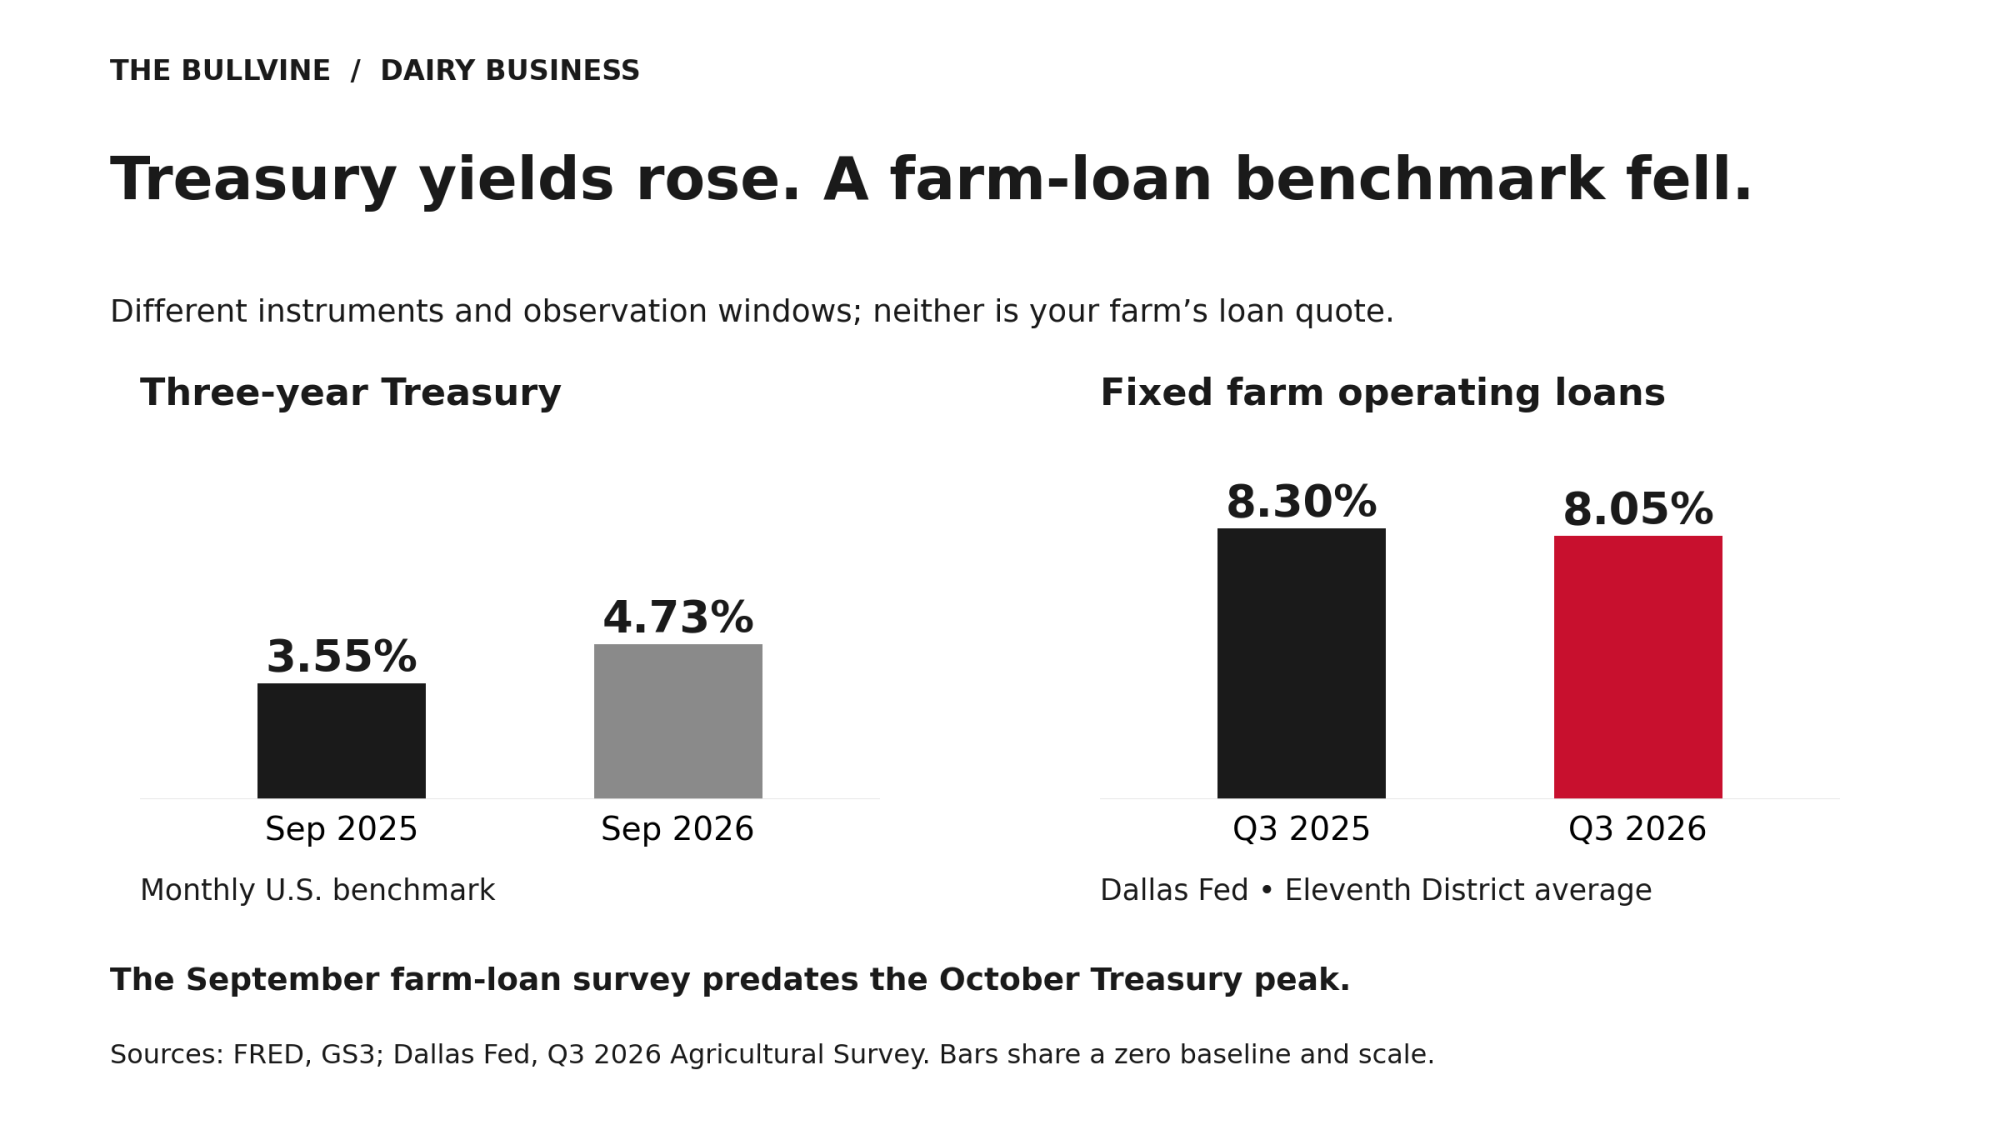
The Dallas Fed’s September survey offers a different year-over-year picture. It polled 50 Eleventh District agricultural bankers from September 1 to 9, who put the average fixed rate on other farm operating loans at 8.05% for the third quarter. That’s down from 8.30% a year earlier and up from 7.78% in the second quarter. The survey predates the October peak, so it can’t show how lenders responded afterward.
One Heifer, Two Rates
Bullvine ran both Dallas Fed rates through a selected slice of Iowa State Extension’s 2024 heifer budget for a conventional 26,000-pound herd. The slice is $1,429 in feed plus $227 in livestock costs such as veterinary care, breeding and bedding. That $227 is after removing a $12 budget line that mixes operating interest with phone costs. Together, that’s $1,656 over 24 months. The illustration excludes facilities and equipment allocations, labor and initial calf value to isolate interest on selected feed and livestock expenses. A farm’s financing budget should include any additional cash costs it must fund.
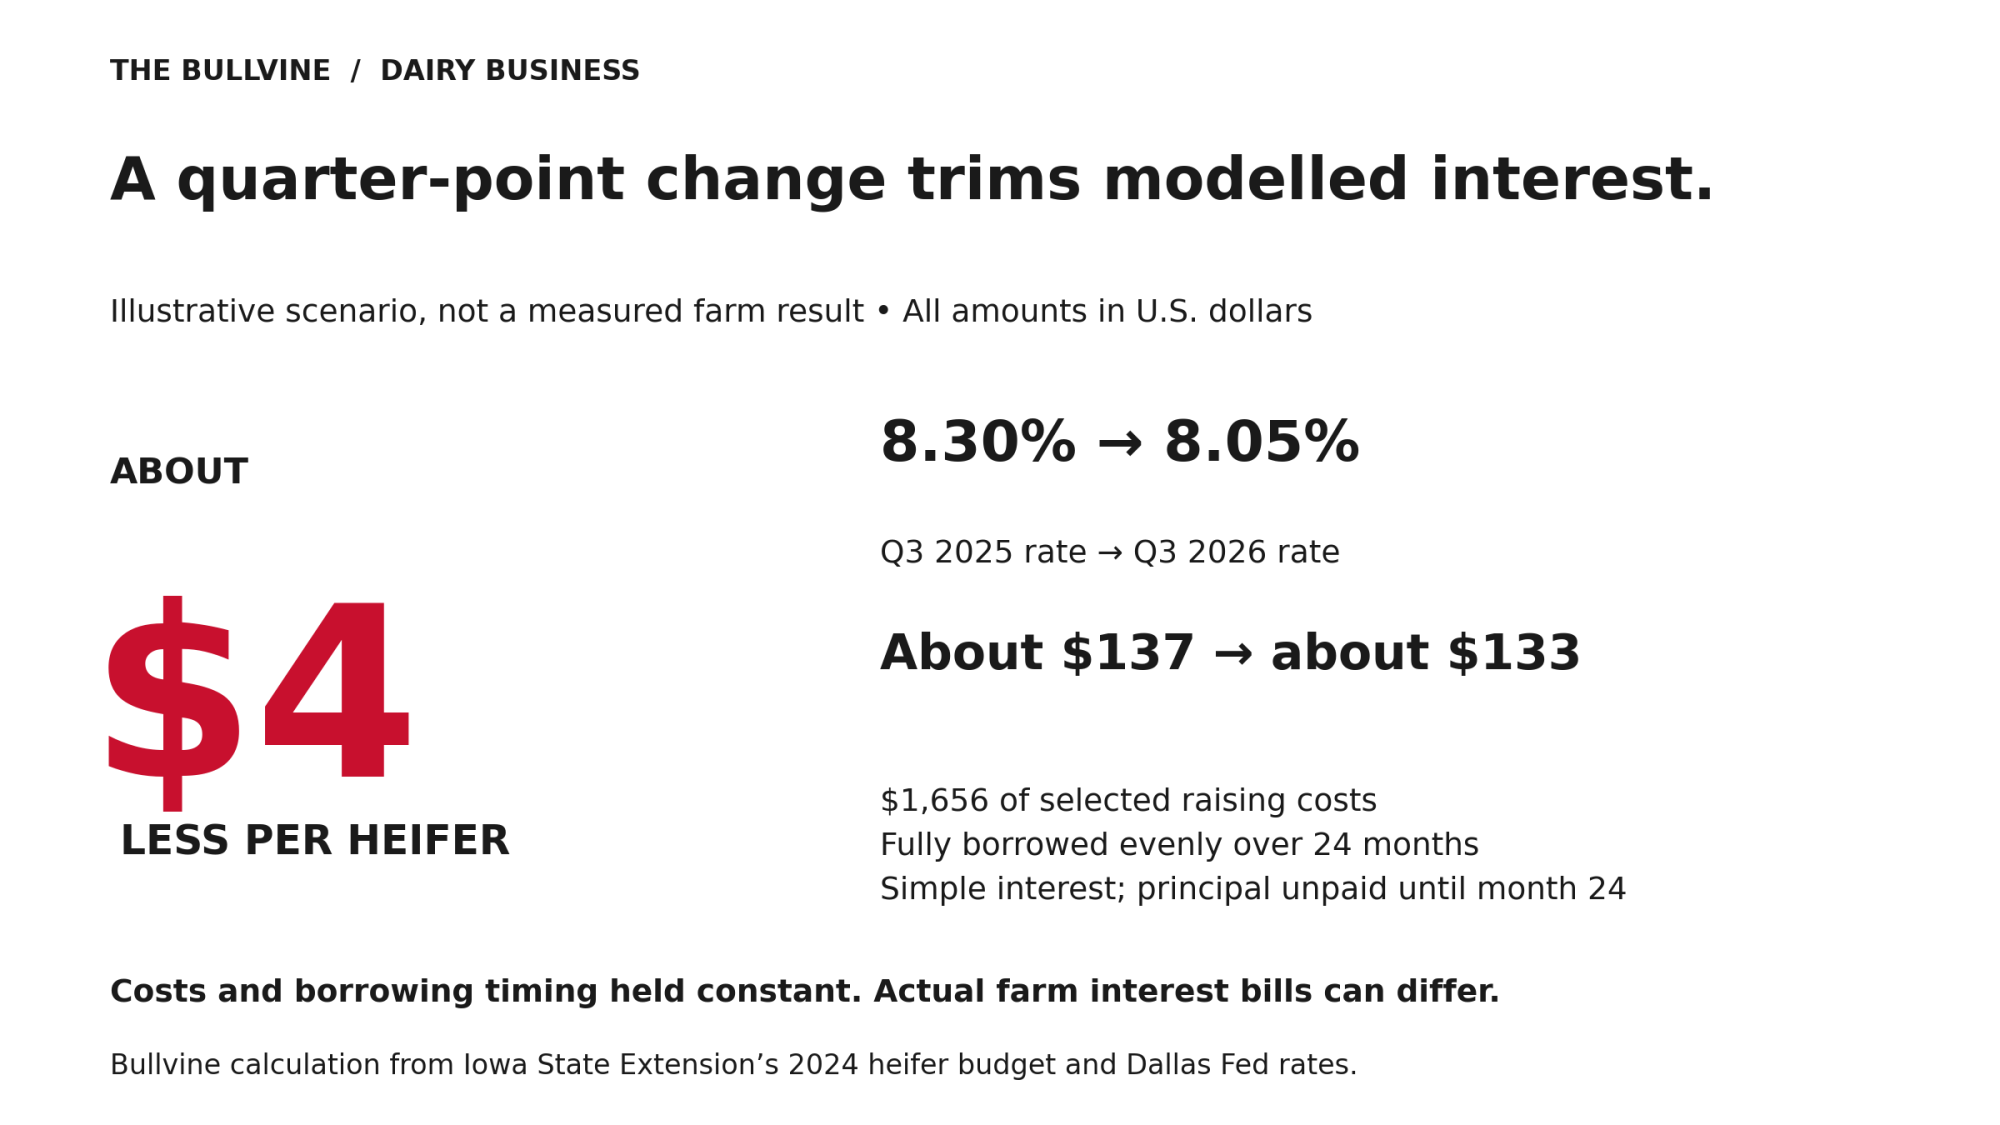
| Bullvine heifer model | Q3 2025 rate (8.30%) | Q3 2026 rate (8.05%) |
| Interest on $1,656 of selected raising costs | about $137 | about $133 |
Holding costs and borrowing timing constant, estimated interest falls by about $4. At the Q2 2026 rate of 7.78%, the same model gives about $129, so the third-quarter uptick adds roughly $4 back.
Model assumptions: Selected expenses from Iowa State’s 2024 budget are fully borrowed, accumulate evenly over 24 months and remain unpaid until month 24. Interest is simple. The regional survey rates are illustrative, not heifer-specific loan quotes. This is not a full raising-cost or financing budget.
What the Model Shows and What It Doesn’t
The model measures the size of the rate effect. On this cost base, a quarter-point move in the operating rate is worth about $4 a head over 24 months. By Bullvine’s math, under this same evenly borrowed, 24-month model, each one-percentage-point rate change adds or subtracts $10 for every $1,000 of selected costs financed. It doesn’t show that actual heifer interest bills fell. On a real farm, raising costs, debt balances, loan terms and development periods all move at once.
Treasury yields send a different signal. FRED’s three-year Treasury series, a low-default-risk nominal benchmark, averaged 3.55% in September 2025 and 4.73% in September 2026. Using annual compounding, Bullvine’s math puts a hypothetical $1,000 receipt due in three years at about $901 at 3.55% and $871 at 4.73%. The amount and payment date are unchanged. This illustrates sensitivity to a benchmark rate, not a valuation of a dairy heifer.
In these year-over-year comparisons, the regional borrowing benchmark fell and the Treasury benchmark rose. Neither number tells a dairy what its own financing costs. Cash not spent on a heifer could instead repay debt, fund working capital, buy feed or finance another investment. Each farm has to price its own loan terms against its own alternative uses for cash.
Required, Surplus or Raised for Sale
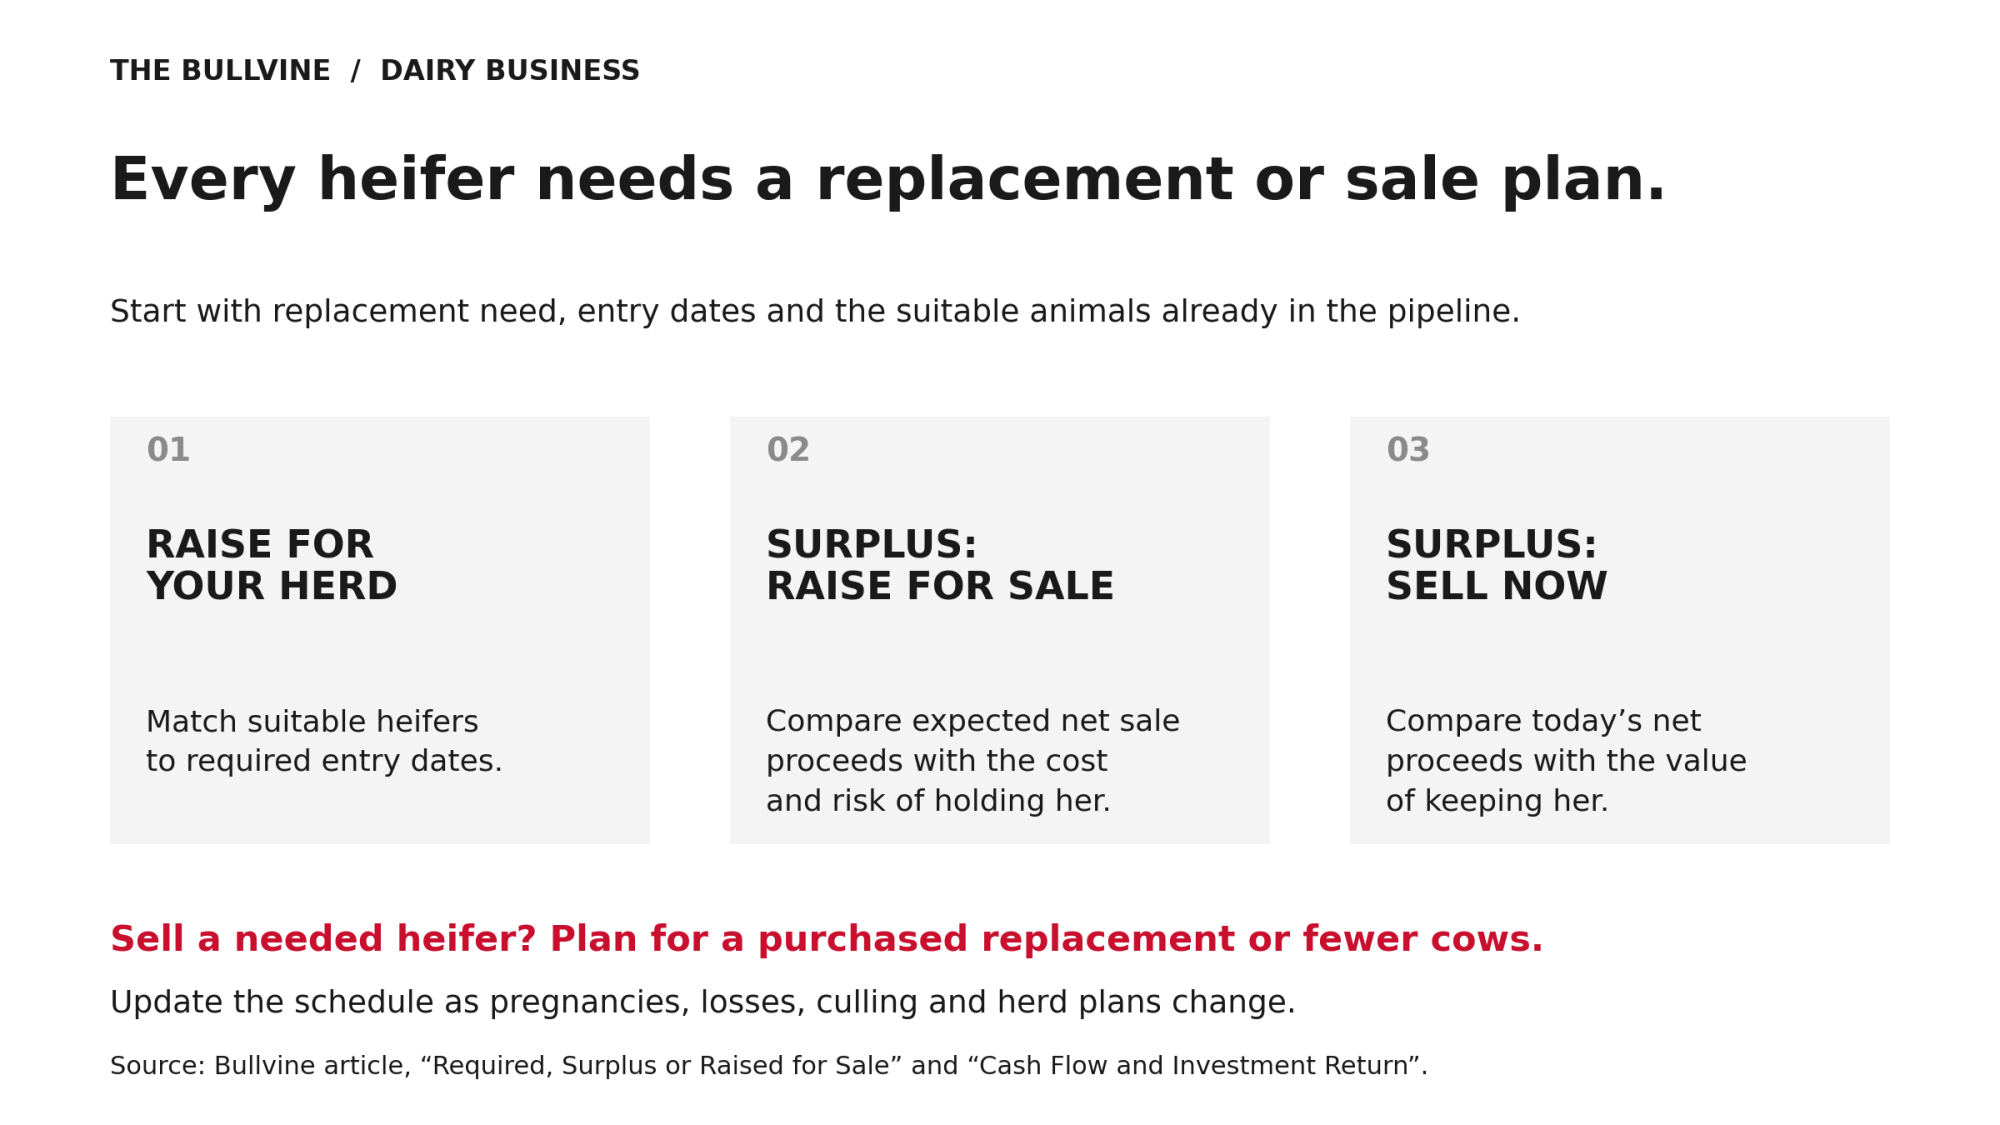
Three numbers decide where a calf fits:
- the herd’s replacement count
- when those animals must enter the milking string
- how many suitable animals are already in the pipeline
A required heifer is raised for the farm’s own herd. A surplus heifer can still be raised for sale, or sold now. Selling one the herd needs opens another decision: buy a springer later or milk fewer cows.
The labels move. Pregnancies, losses, culling and herd plans change the count, so the replacement schedule needs updating as they happen. Milk receipts start at the herd’s expected age at first calving. UW–Madison Extension gives the traditional rule of thumb as 22 to 24 months but stresses breeding by size and growth rather than the calendar. The remaining development period runs from her current age to expected calving. Borrowing may continue after freshening, so the cash budget must also show when milk receipts can support repayment.
Related: Dairy replacement heifer coverage by state
Cash Flow and Investment Return
The cash budget shows whether the operation can make its payments while she grows. Actual interest and scheduled principal belong there, alongside borrowing needs, development costs and the timing of receipts.
The investment test sets the paths against each other: raise her for the herd, raise her for sale, or sell now and then replace her another way or milk fewer cows. Only the costs and returns that change between those paths count. A heifer that enters a full barn and pushes out another cow doesn’t add her whole milk check to farm revenue.
For a heifer raised for sale, use expected net sale proceeds at the planned sale date. For one entering the herd, use the incremental milk, calf and eventual cull returns after accounting for any cow she replaces. Either path’s returns, less the cost of raising and keeping her, are weighed against the net proceeds from selling her today. Those returns are probability-weighted, because some heifers never calve, calving dates slip, and productive lives run shorter or longer than planned.
Interest should be counted once. If the cash-flow projection already includes the actual loan payments, a discount rate that also builds in the cost of borrowing can count that cost twice. For an enterprise analysis, exclude loan proceeds and debt service and use an appropriate cost-of-capital discount rate. For an equity analysis, include financing flows and discount the remaining cash flows at the required equity return. Keep the method consistent.
What This Means
- Count required replacements. Build a replacement schedule based on age or calving date, and flag each calf as required, surplus to raise for sale, or surplus to sell now. Optional: the Bullvine Pipeline Index Calculator adds a broader screening score from inventory, culling, price and breeding inputs.
- Obtain actual terms. Ask the lender for the rate formula and spread, reset frequency, maturity, fees and renewal terms, and whether the figure is a quote or a commitment. Where land secures the line, ask whether the collateral valuation has changed. A Fed rate decision does not automatically change a farm’s loan rate. Before the operating line renews, get the indicative renewal terms in writing and apply them to the farm’s projected borrowing balances and repayment schedule.
- Project borrowing. Price heifer interest on the farm’s own costs, borrowing and loan rate. As a quick check under Bullvine’s model, each percentage point moves interest by about $10 per $1,000 of selected costs financed over 24 months.
- Compare alternatives. Run both tests.
| Financial test | The question it answers | The numbers needed |
| Cash-flow test | Can the farm make its payments while she grows, and after she freshens? | Loan terms, monthly expenses, current debt service, timing of receipts |
| Investment test | Which feasible replacement or sale strategy offers the best expected value? | Net proceeds from selling today, expected net sale proceeds at a planned sale date, incremental milk, calf and cull returns, replacement costs, a discount rate matched to the method used |
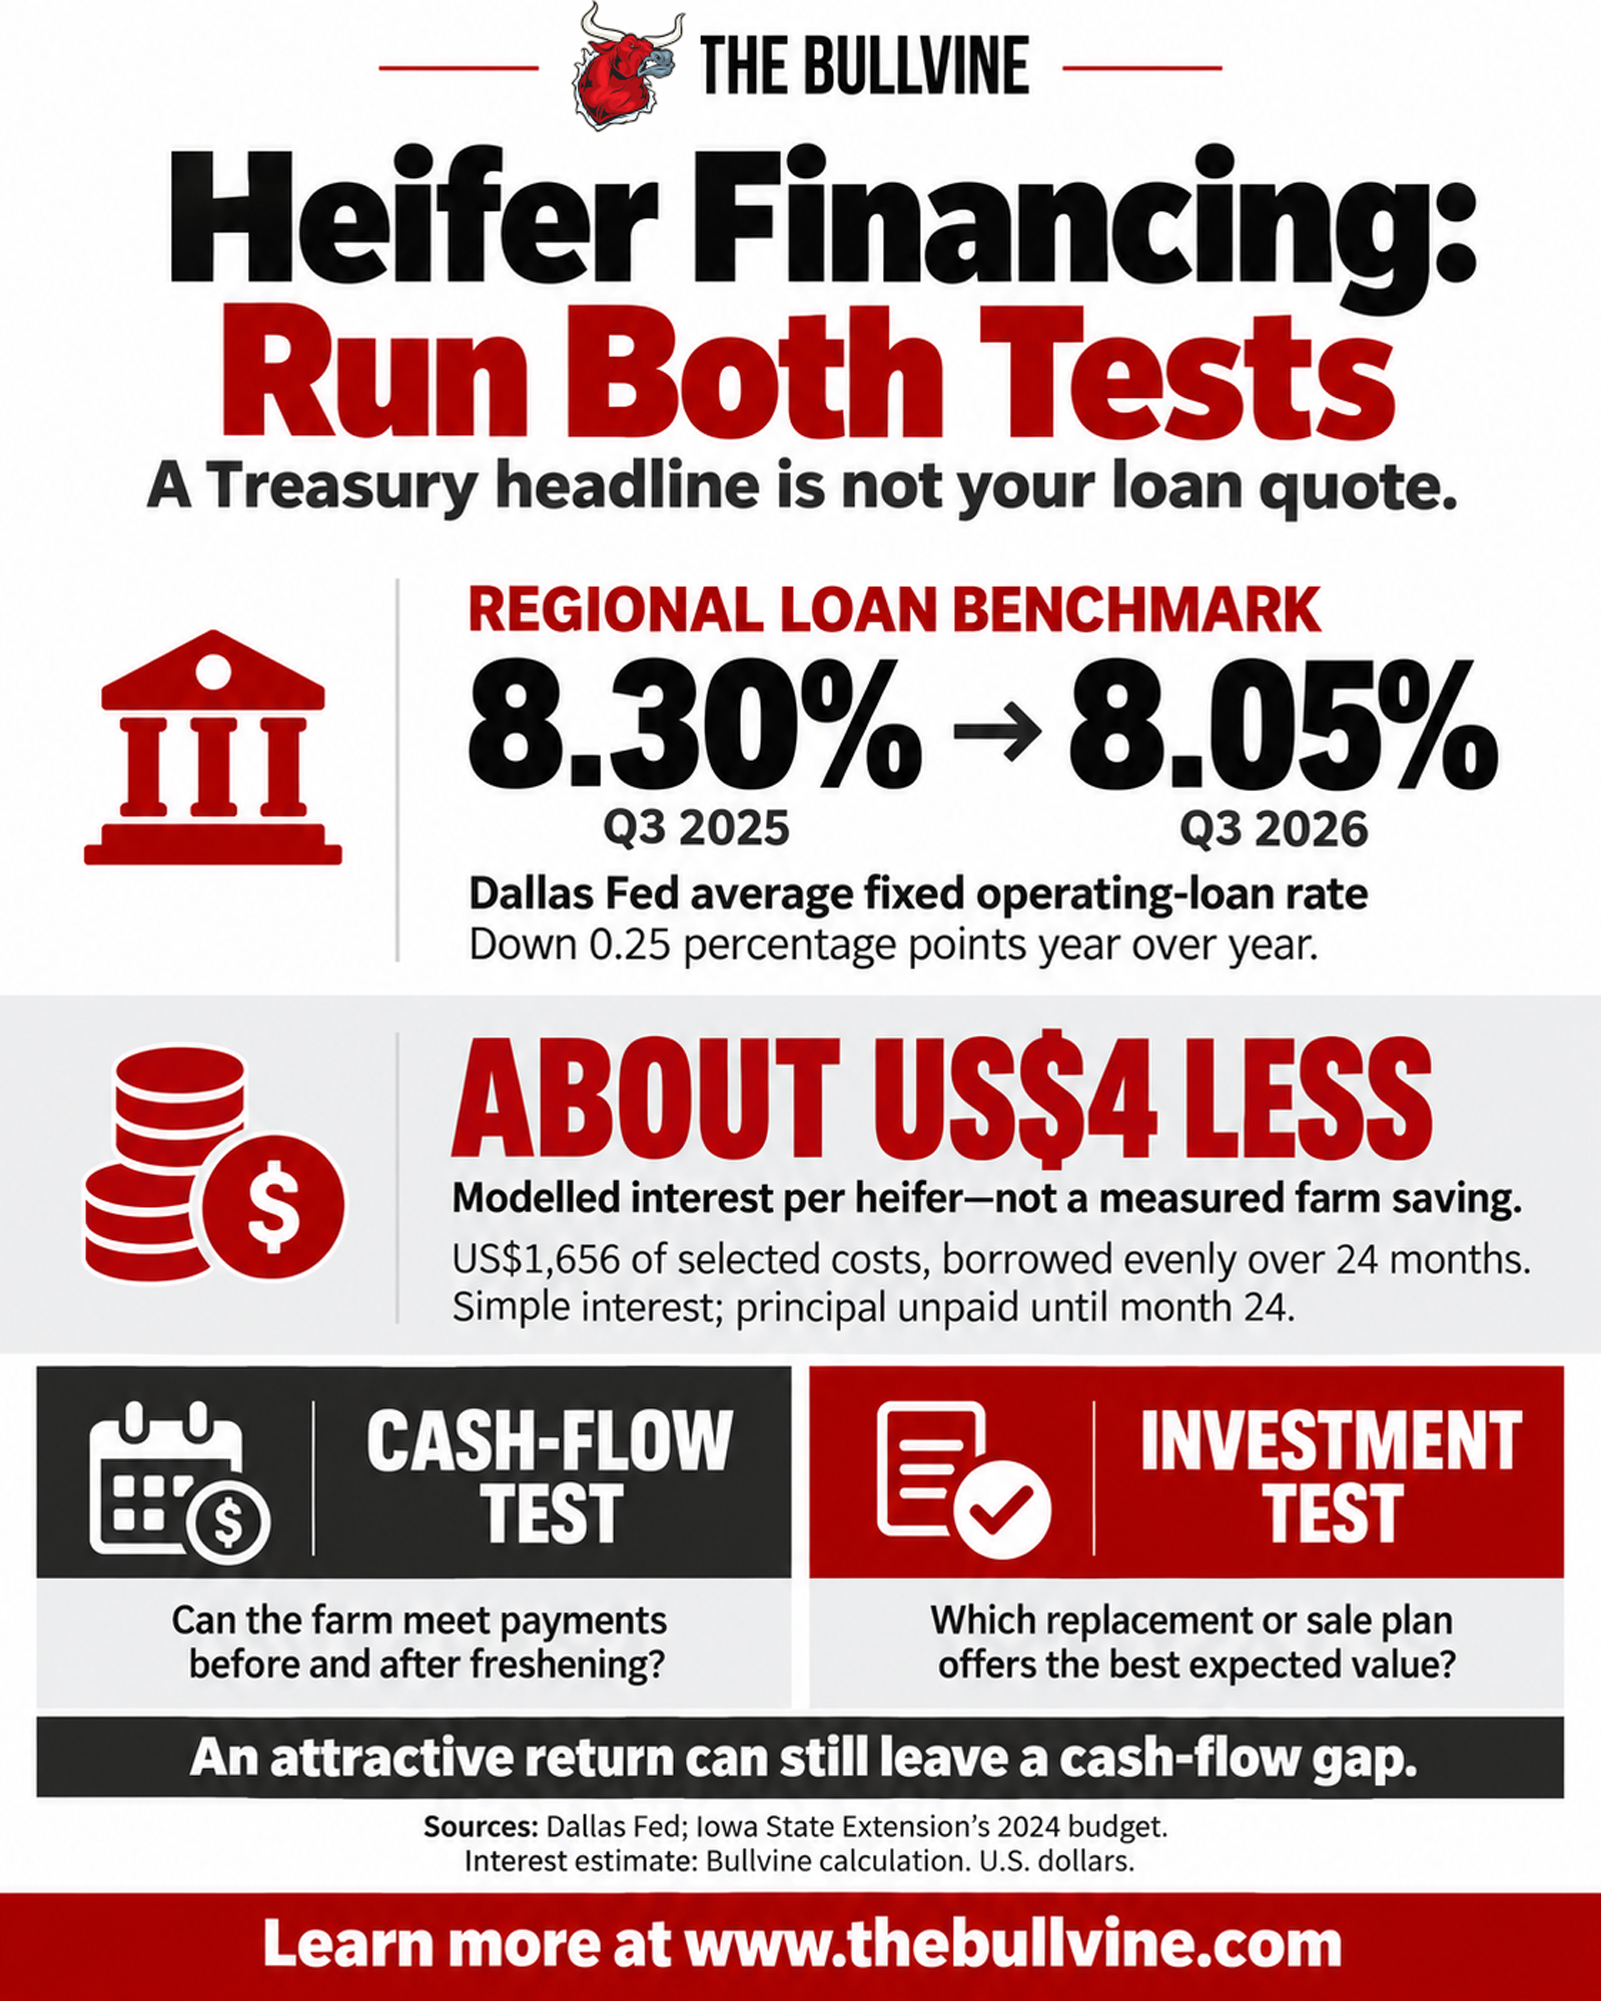
A heifer can show an attractive expected return and still open a cash-flow gap before she freshens. Both tests have to pass.
The Heifer Pipeline Check in The Bullvine’s Farm Benchmark Snap Check estimates what a replacement program costs per milking cow.
Learn More
- Beef-on-Dairy’s $6215 Secret: Why 72% of Herds Are Playing It Wrong — Mastering your exact 21-day pregnancy rate thresholds makes or breaks your beef-calf income. This operational breakdown delivers a performance-tiered roadmap, ensuring your breeding mix adds up to $6,215 monthly without starving the future replacement pipeline.
- The Heifer Crisis Hiding in Plain Sight: Why Your Next 90 Days Determine Your 2028 Herd — Biological leakage and a 300,000-head national shortage threaten the industry’s replacement inventory. Exposing these hidden traps arms you with the leverage to align your next 90 days of breeding decisions with peak 2028 herd equity.
- Dairy Farm Economics 2026: Milk Pricing, Margins & Risk Playbook — Arm your balance sheet against the 2026 structural reset. The following playbook dismantles FMMO modernization and component ratio shifts, calculating precisely how rising make-allowances will slash your regulated milk check by up to $1.03/cwt.
The Sunday Read Dairy Professionals Don’t Skip.

Every week, thousands of producers, breeders, and industry insiders open Bullvine Weekly for genetics insights, market shifts, and profit strategies they won’t find anywhere else. One email. Five minutes. Smarter decisions all week.