






The Canadian Dairy Commission suspended its 3.5548% formula result after requests its notice didn’t identify. Its decision lands Friday at 1 p.m. Here’s how to budget until then.
Current as of October 29, 2026.
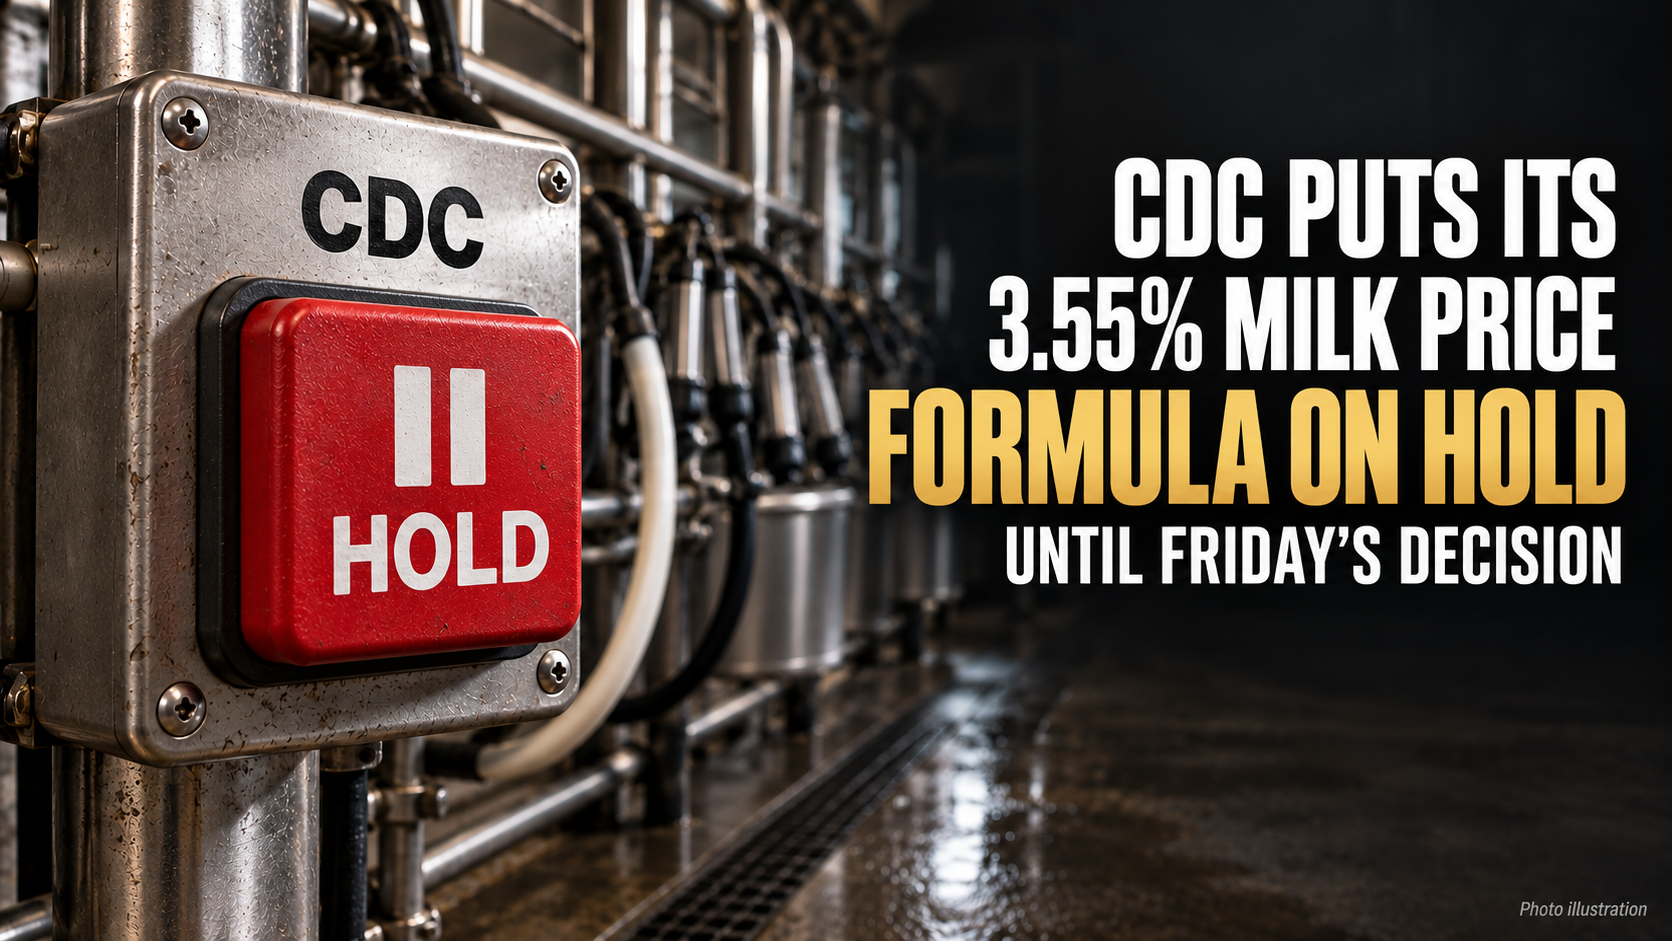
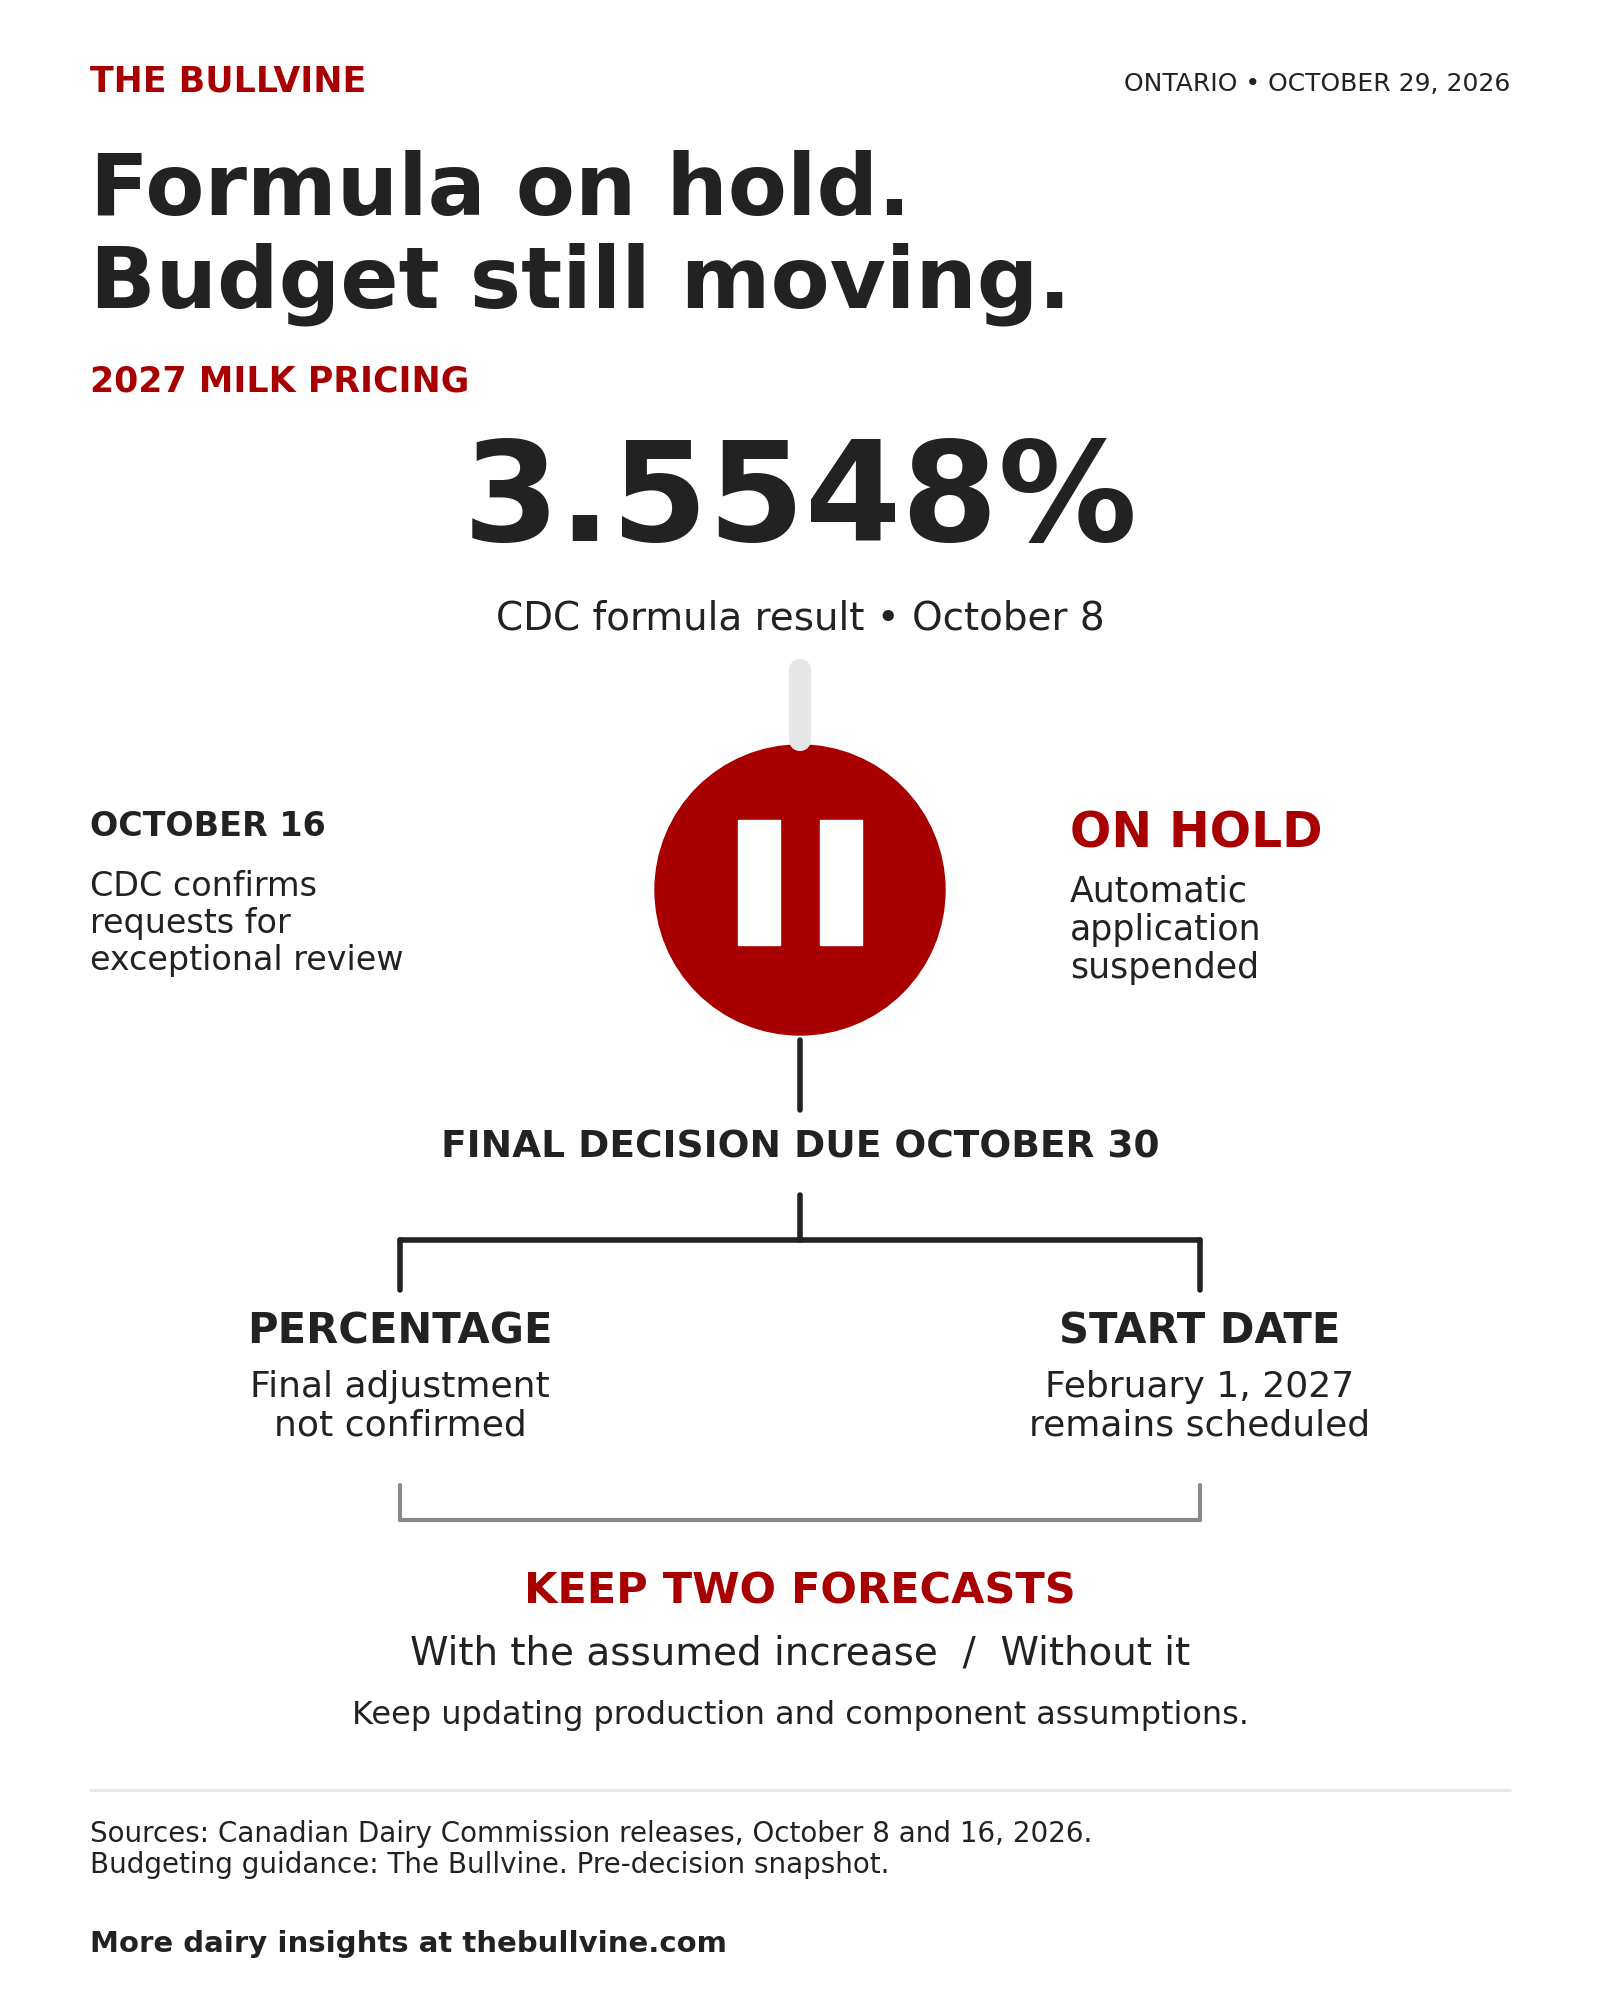
The Canadian Dairy Commission (CDC) has suspended automatic application of its 3.5548% formula result after receiving exceptional-circumstances requests. A 2027 cash-flow forecast that already assumes a 3.55% February increase should carry that increase as unconfirmed, alongside a second version without it. A CDC media advisory dated October 28 says the news release announcing the 2027 farmgate milk price adjustment will be published at 1 p.m. on Friday, October 30.
CDC’s October 8 release published the 3.5548% formula result and said it “will not necessarily translate into the next price adjustment.” The same release says requests under Criterion #1 must be justified by the organizations making them. Invoking the process triggers consultations on a potential price adjustment and the butter support price.
On October 16, CDC said Criteria #2 and #3 weren’t met. That left Criterion #1, which covers an unexpected event not accounted for in the latest cost-of-production data. CDC confirmed it had received requests to invoke the process.
The October 16 notice didn’t identify who made the requests, what event they cited or what evidence they supplied. It gives producers no basis to assess the arguments behind them. The notice lists the farmgate and butter support-price adjustments as scheduled for February 1, 2027, and announces no later start date.
What Should a 2027 Milk Budget Assume Today?
- The unconfirmed 3.5548% belongs in the forecast as a labelled assumption, with a second version that leaves it out.
- Production, component and market-related assumptions can keep moving while CDC decides.
- The announcement needs to supply two numbers before the forecast changes: the percentage and the effective date.
- In this comparison, a zero adjustment means no additional CDC increase. Total revenue and other milk prices can still move.
What the Scenarios Show at 100 kg/Day
Bullvine used two inputs from Dairy Farmers of Ontario (DFO), Ontario’s milk-marketing regulator. The first is the July 2026 producer average gross blend price of $95.47/hL. The second is that month’s average composition of 4.1471 kg butterfat/hL. Both come from DFO’s September 2026 Dairynomics report, p. 33. This illustration applies the adjustment to the entire gross blend, so it doesn’t forecast the change in an Ontario milk cheque.
Illustration: 100 kg/day butterfat quota; CAD
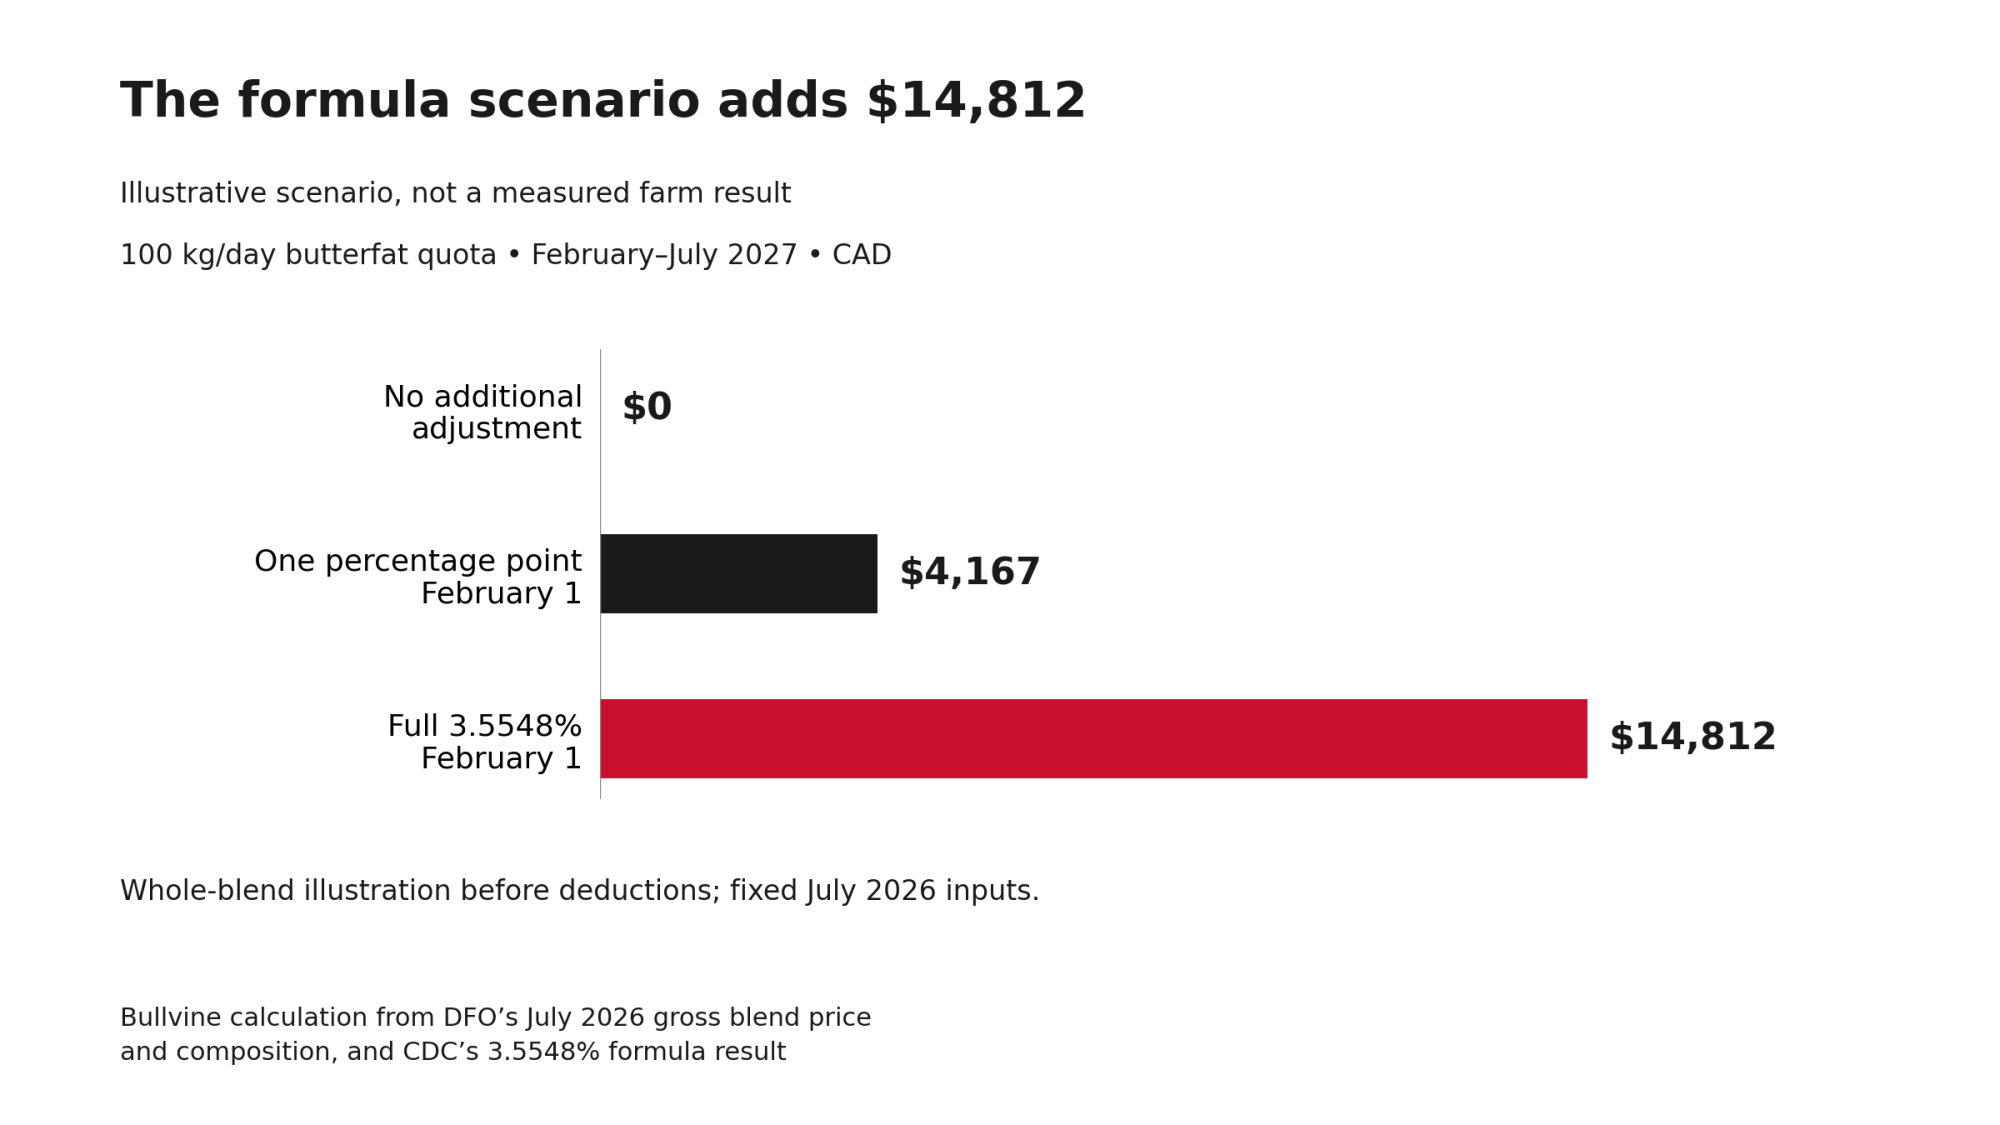
| Scenario | Start Date | Modelled Added Gross Revenue (Feb–July 2027) |
| No additional adjustment | None | $0 |
| One-percentage-point adjustment | February 1 | $4,167 |
| Full 3.5548% formula result | February 1 | $14,812 |
| Same formula result, later start | May 1 | $7,529 |
These are Bullvine calculations. They assume full quota production at July’s average composition, with the adjustment applied before deductions. To scale the illustration to another farm, multiply each dollar figure by that farm’s daily butterfat quota divided by 100. The six-month calculation stops at July 31.
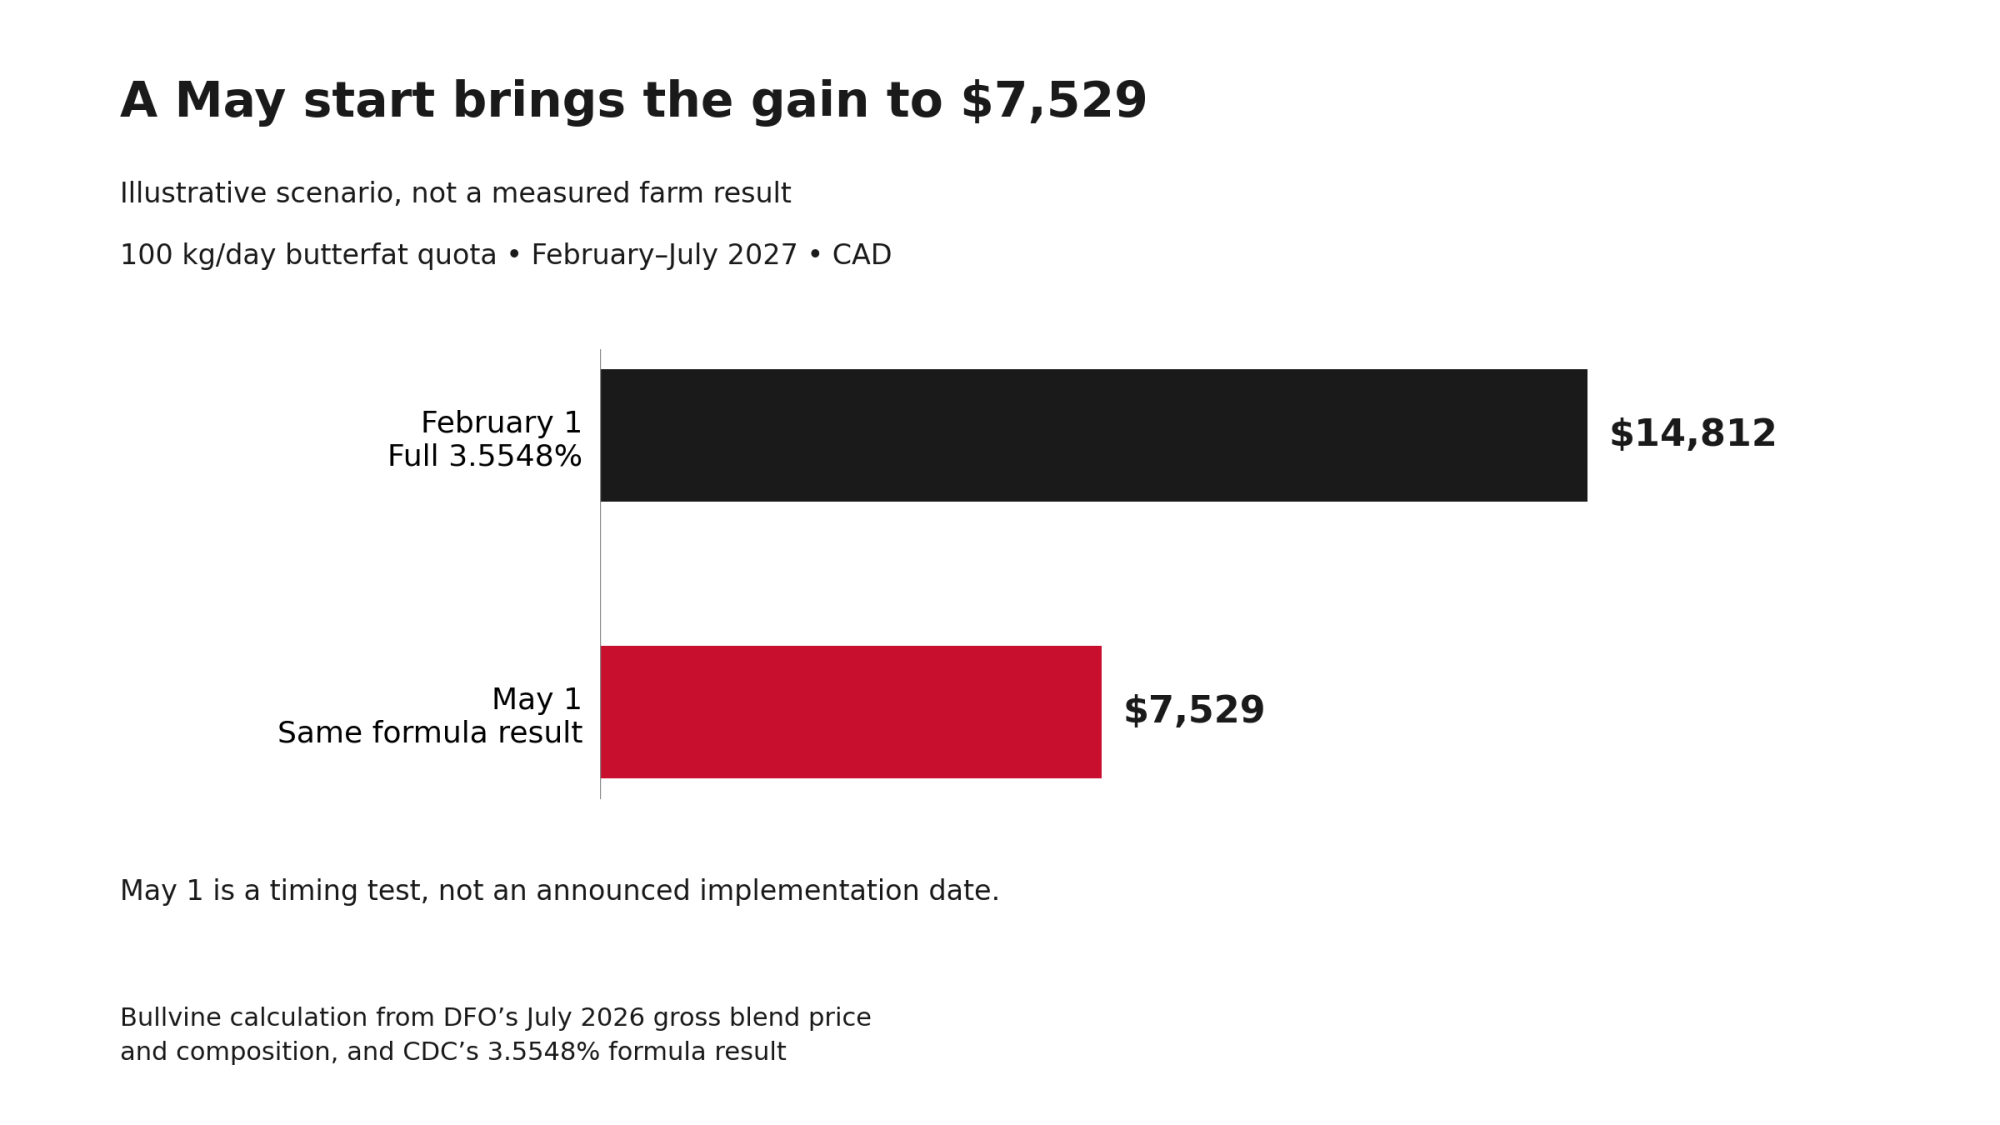
If implementation moves to May. In this model, at the full 3.5548% rate, a May 1 start instead of February 1 cuts the February–July gain for a 100 kg/day farm by roughly $7,300.
Same 3.5548% formula result, different start date. Bullvine model, 100 kg/day quota, fixed July 2026 DFO inputs. Whole-blend illustration, not a milk-cheque forecast.
CDC hasn’t announced May 1 as a 2027 date; it’s a sensitivity scenario. Bullvine tested it because of a documented precedent: for 2024, CDC kept its 1.77% formula result but moved implementation from February 1 to May 1 (CDC, November 1, 2023).
Why Won’t 3.55% Show Up Dollar-for-Dollar on a Milk Cheque?
CDC’s pricing methodology, p. 8 applies annual adjustments to specified component prices in Classes 1–4. It excludes Class 4(m) and solids-not-fat in Class 4(a). Class 5 sits outside that scope. A whole-blend illustration therefore runs higher than a payment estimate built on those classes would. When CDC announces, the producer-pricing adjustment needs to be read separately from the butter support price.
What This Means for an Ontario Operation
A 2027 operating line still being finalized should go to the lender or accountant in two versions: with and without an assumed CDC adjustment. The illustration above covers scale and timing. Farm-specific figures come from expected shipments, components and applicable payment rules.
Once CDC announces, the confirmed percentage and start date replace the scenario inputs. The payment estimate firms up when DFO publishes Ontario payment information, and the first affected statement is the check against it.
The figures cover milk produced from February through July. When payments arrive depends on the payment schedule. A planning budget shows revenue in the production months and cash receipts in the months payment is expected.
Methodology
Inputs and equation
Bullvine used DFO’s July 2026 Ontario producer average gross blend price ($95.47/hL), its average composition (4.1471 kg butterfat/hL) and CDC’s 3.5548% formula result. All amounts are in Canadian dollars.
Modelled gross increase = daily quota in kg butterfat/day × affected days ÷ 4.1471 kg butterfat/hL × $95.47/hL × adjustment rate, entered as a decimal (3.5548% is 0.035548).
Days and production assumptions
February 1 to July 31, 2027 contains 181 days. May 1 to July 31 contains 92. The model assumes exact quota fill, no incentive days, fixed July 2026 prices and composition, and no deductions.
Rounding note
CDC reported a 4.57% change in indexed production costs and a 2.54% change in the Consumer Price Index. At that rounding, the two average 3.5550%. The article uses CDC’s published 3.5548% result (CDC, October 8, 2026).
Learn More
- The $900/Cow Hit You Can’t Outbreed by April: Western Canada’s 70/25/5 Reckoning — Arms you with an immediate triage plan to survive shifting component payment ratios. Breaks down why high-butterfat herds face massive revenue drops and delivers exact margin adjustments needed before bulk-tank genetics can catch up.
- The $8 Billion Infrastructure Trap: Why America’s Dairy Boom Could Become Its Biggest Bust — Exposing the financial risk behind the recent processing buildout, this breakdown maps a severe market threat. You gain critical visibility into the 12-to-24-month gap where regional supply outpaces demand, threatening to crush long-term class prices.
- Dairy Technology 2026: Robotics, Sensors, AI and Real-World ROI — Hard data on capital requirements and seven-year payback windows dismantles the hype around automated systems. Deploying these real-world metrics ensures your next computer vision or robotics investment actually protects your operating margins.
The Sunday Read Dairy Professionals Don’t Skip.

Every week, thousands of producers, breeders, and industry insiders open Bullvine Weekly for genetics insights, market shifts, and profit strategies they won’t find anywhere else. One email. Five minutes. Smarter decisions all week.