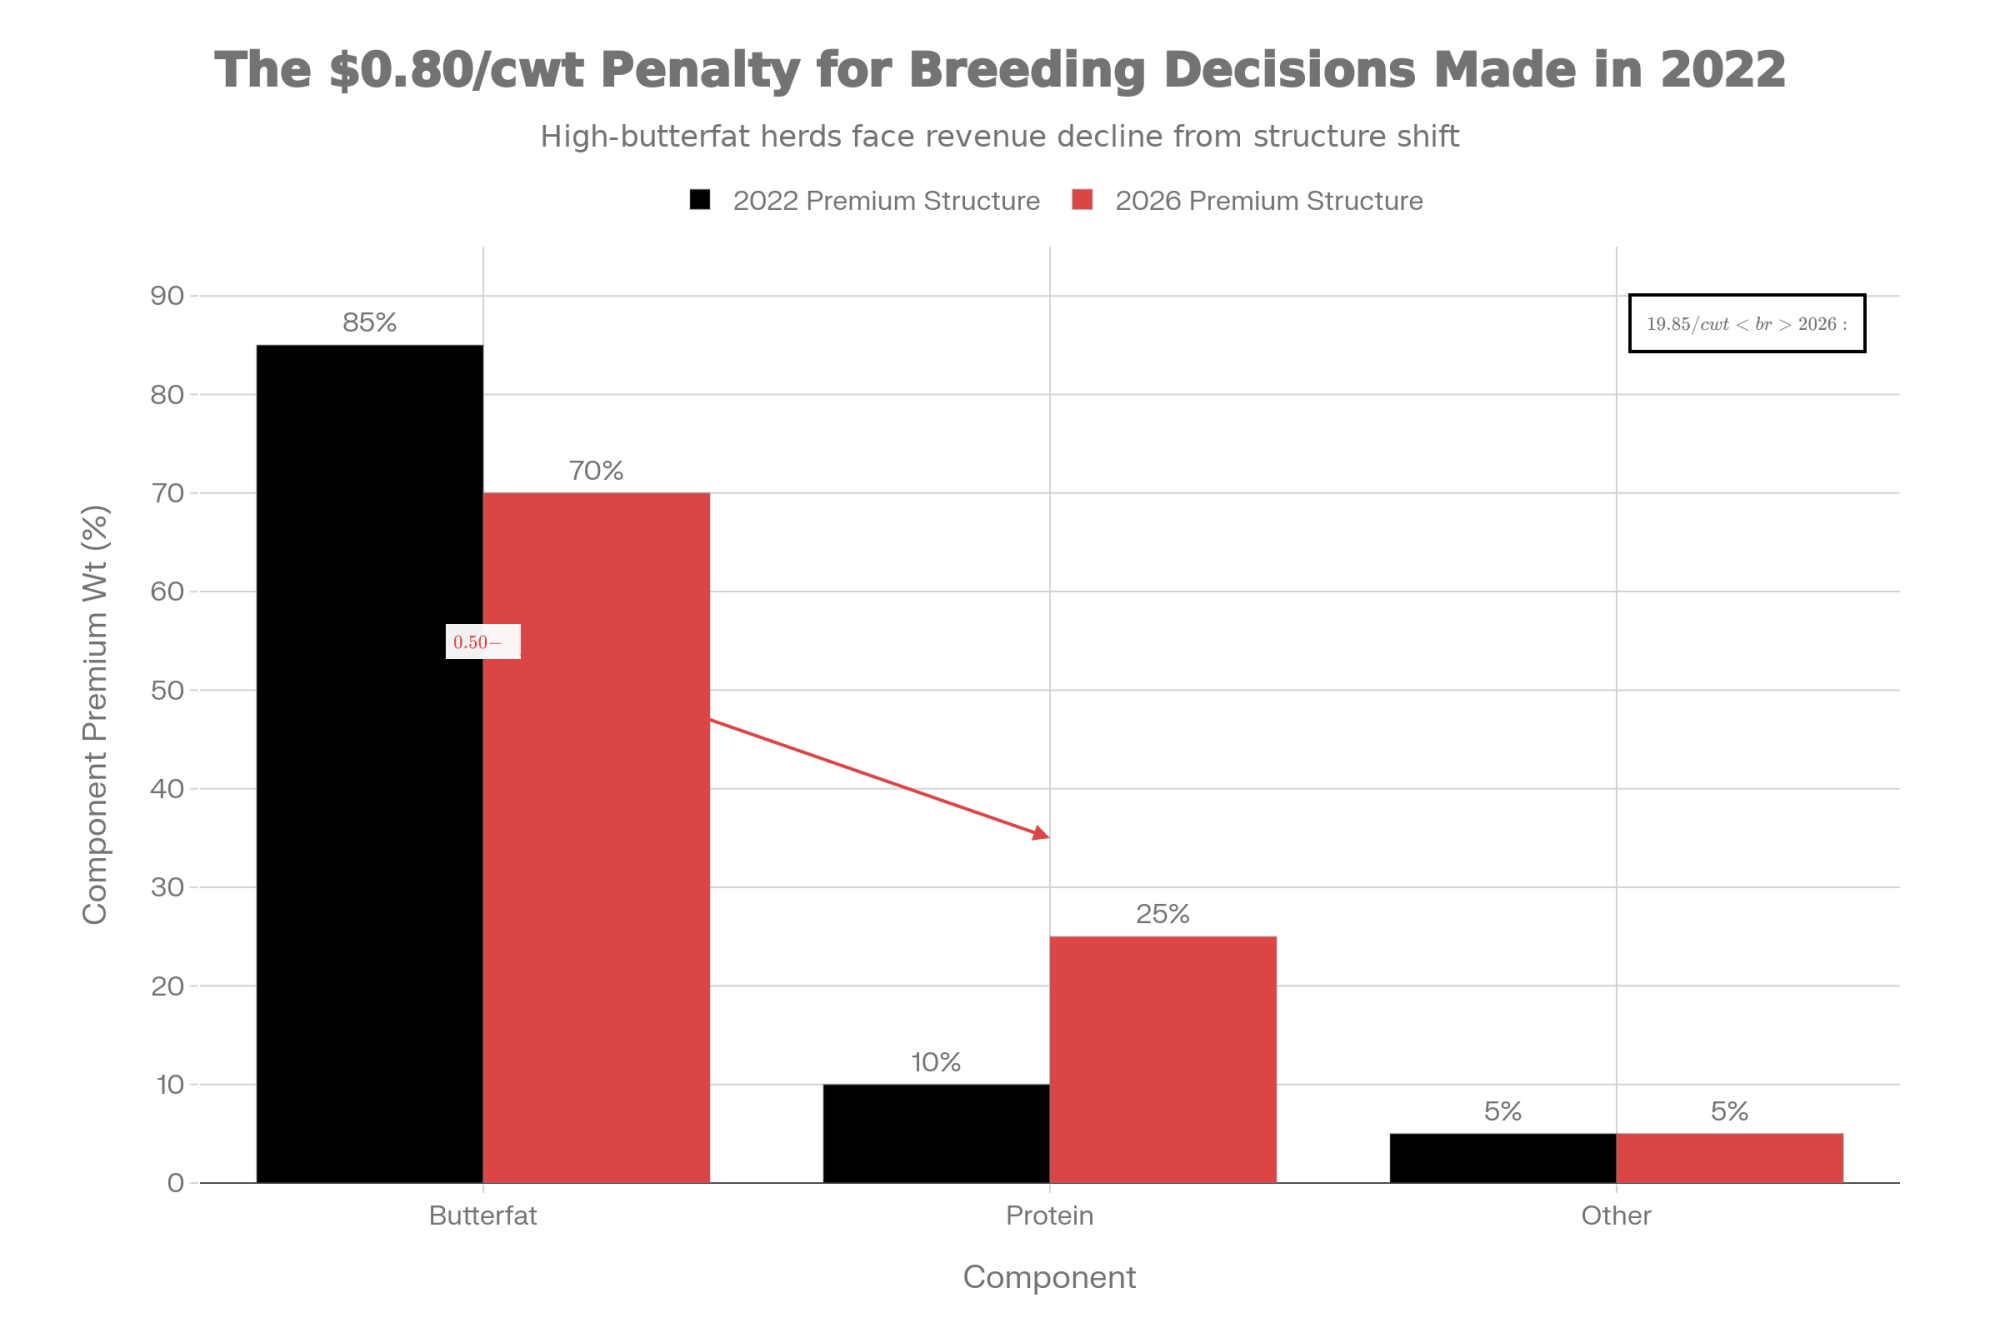
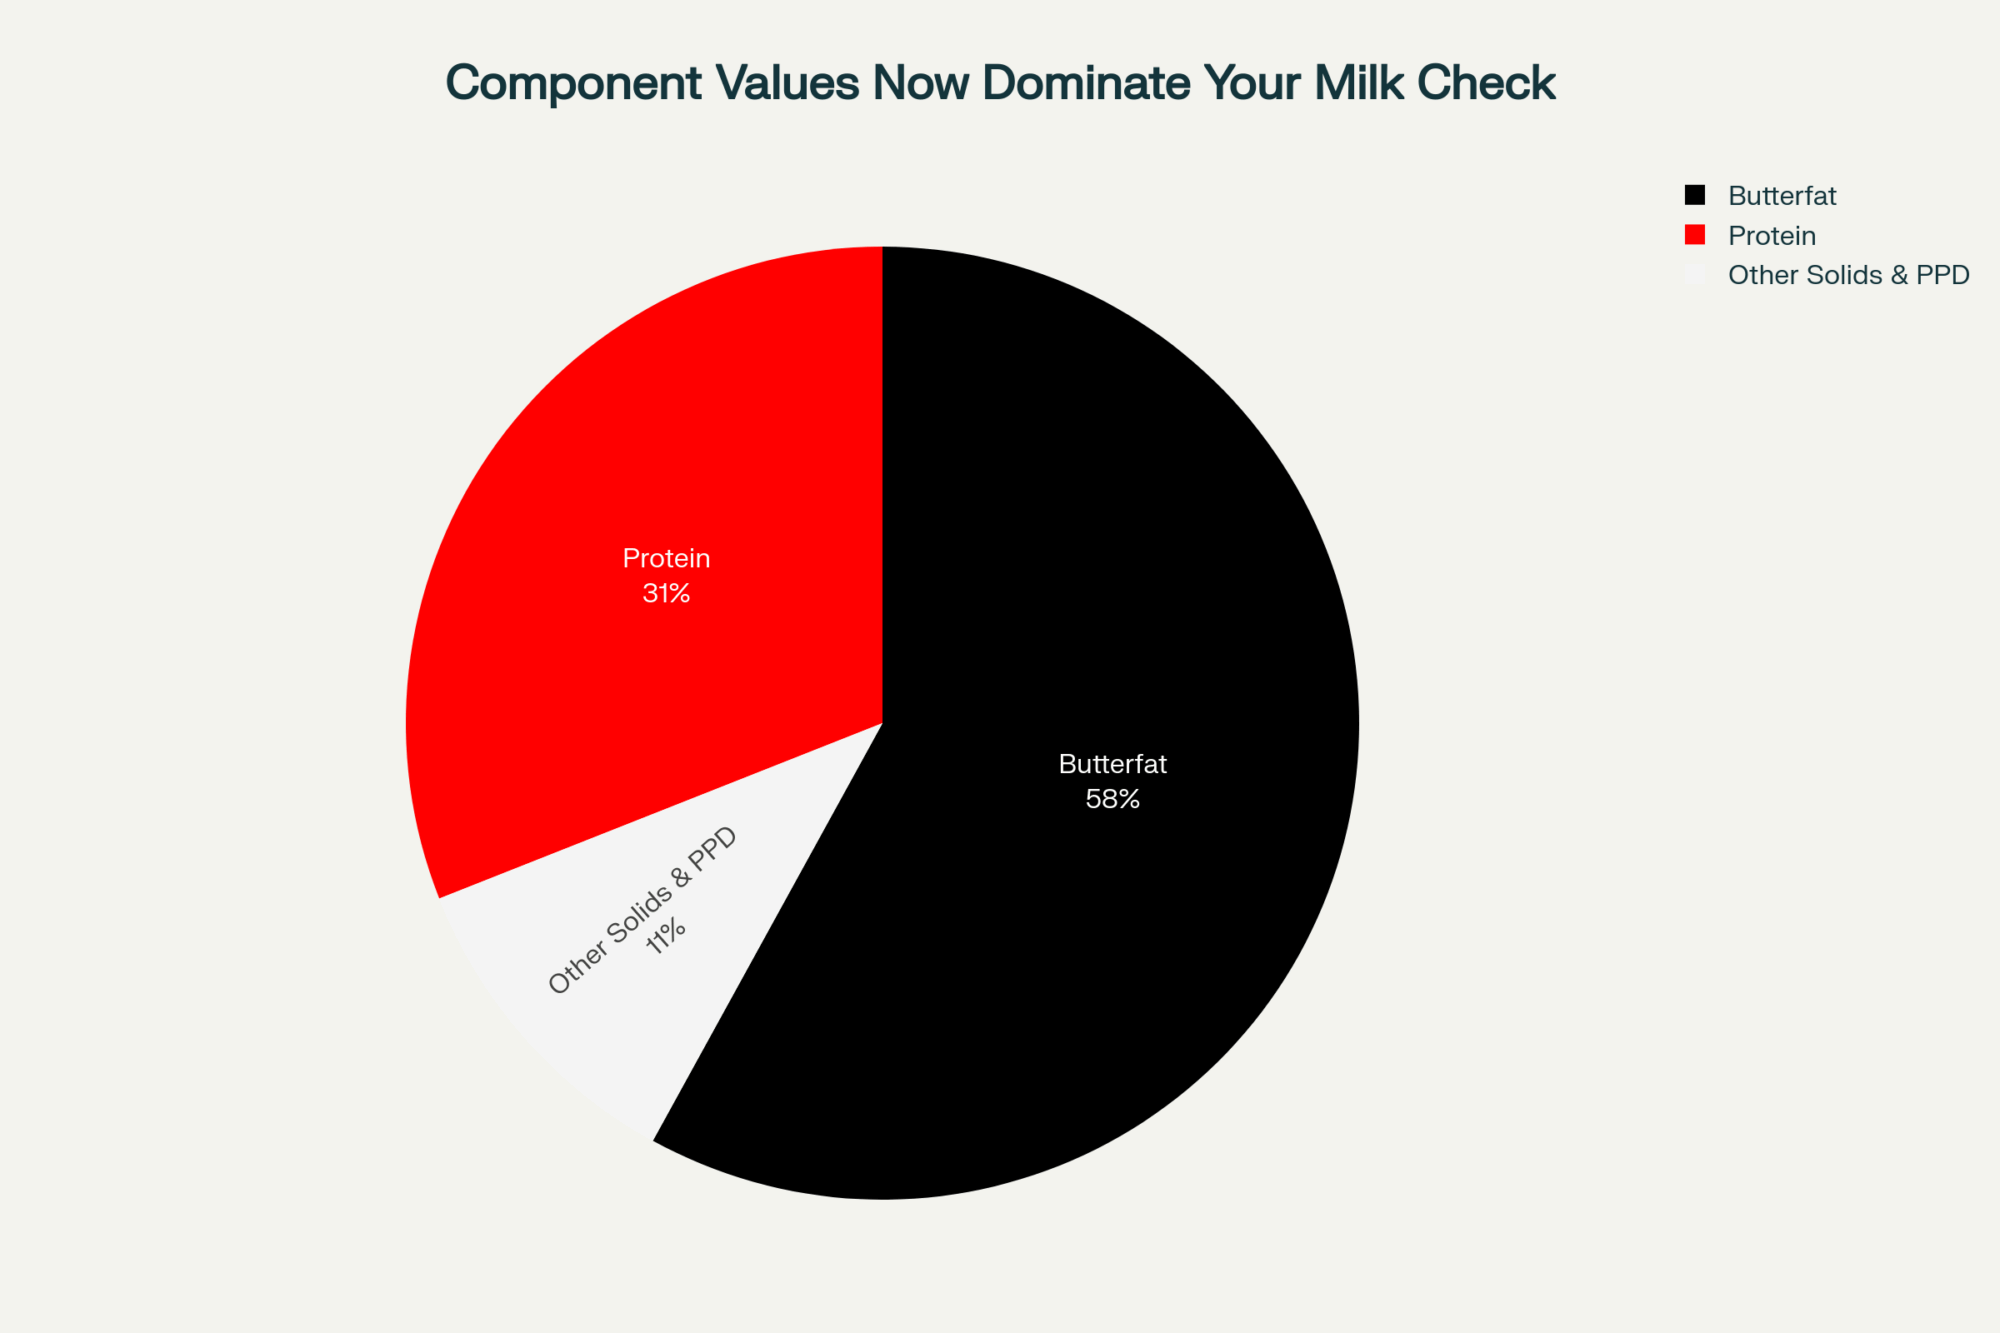
You’re 19¢/cwt underwater on 2026 milk — and still leaving $20,000–$45,000 of dairy tech ROI sitting in the barn. The fix isn’t new gadgets. It’s how you use what you own.
Executive Summary: USDA’s 2026 numbers say it all: $18.95/cwt milk against $19.14/cwt costs leaves most U.S. dairies roughly 19¢/cwt underwater before they do anything about technology. At the same time, The Cow Tech Report shows that foundational tools like electronic ID, ration software, cloud herd management, collars, and sort gates are now in majority adoption in progressive herds, yet vets and consultants estimate that most farms use only 10–50% of those systems’ capabilities. That underutilization shows up in three quiet leaks — collars stuck on heat detection instead of health, herd software as a filing cabinet instead of a task engine, and sort gates that still run on sticky notes. Pulling more value out of existing systems through better alerts, automation, and repro protocols can realistically add about $20,000–$45,000 a year on a 400‑cow herd, especially where fresh‑cow disease and manual sorting are still common. This feature lays out a 30‑day “tech tune‑up” — audit what you own, integrate the systems that should talk, then train people in the language they work in — so those majority‑adoption tools finally show up in your cash flow instead of just your asset list. In a year when Rabobank still expects roughly 2,800 U.S. dairies to close, the real competitive edge may not be new gadgets at all, but how relentlessly you manage the people and processes behind the tech you already own.
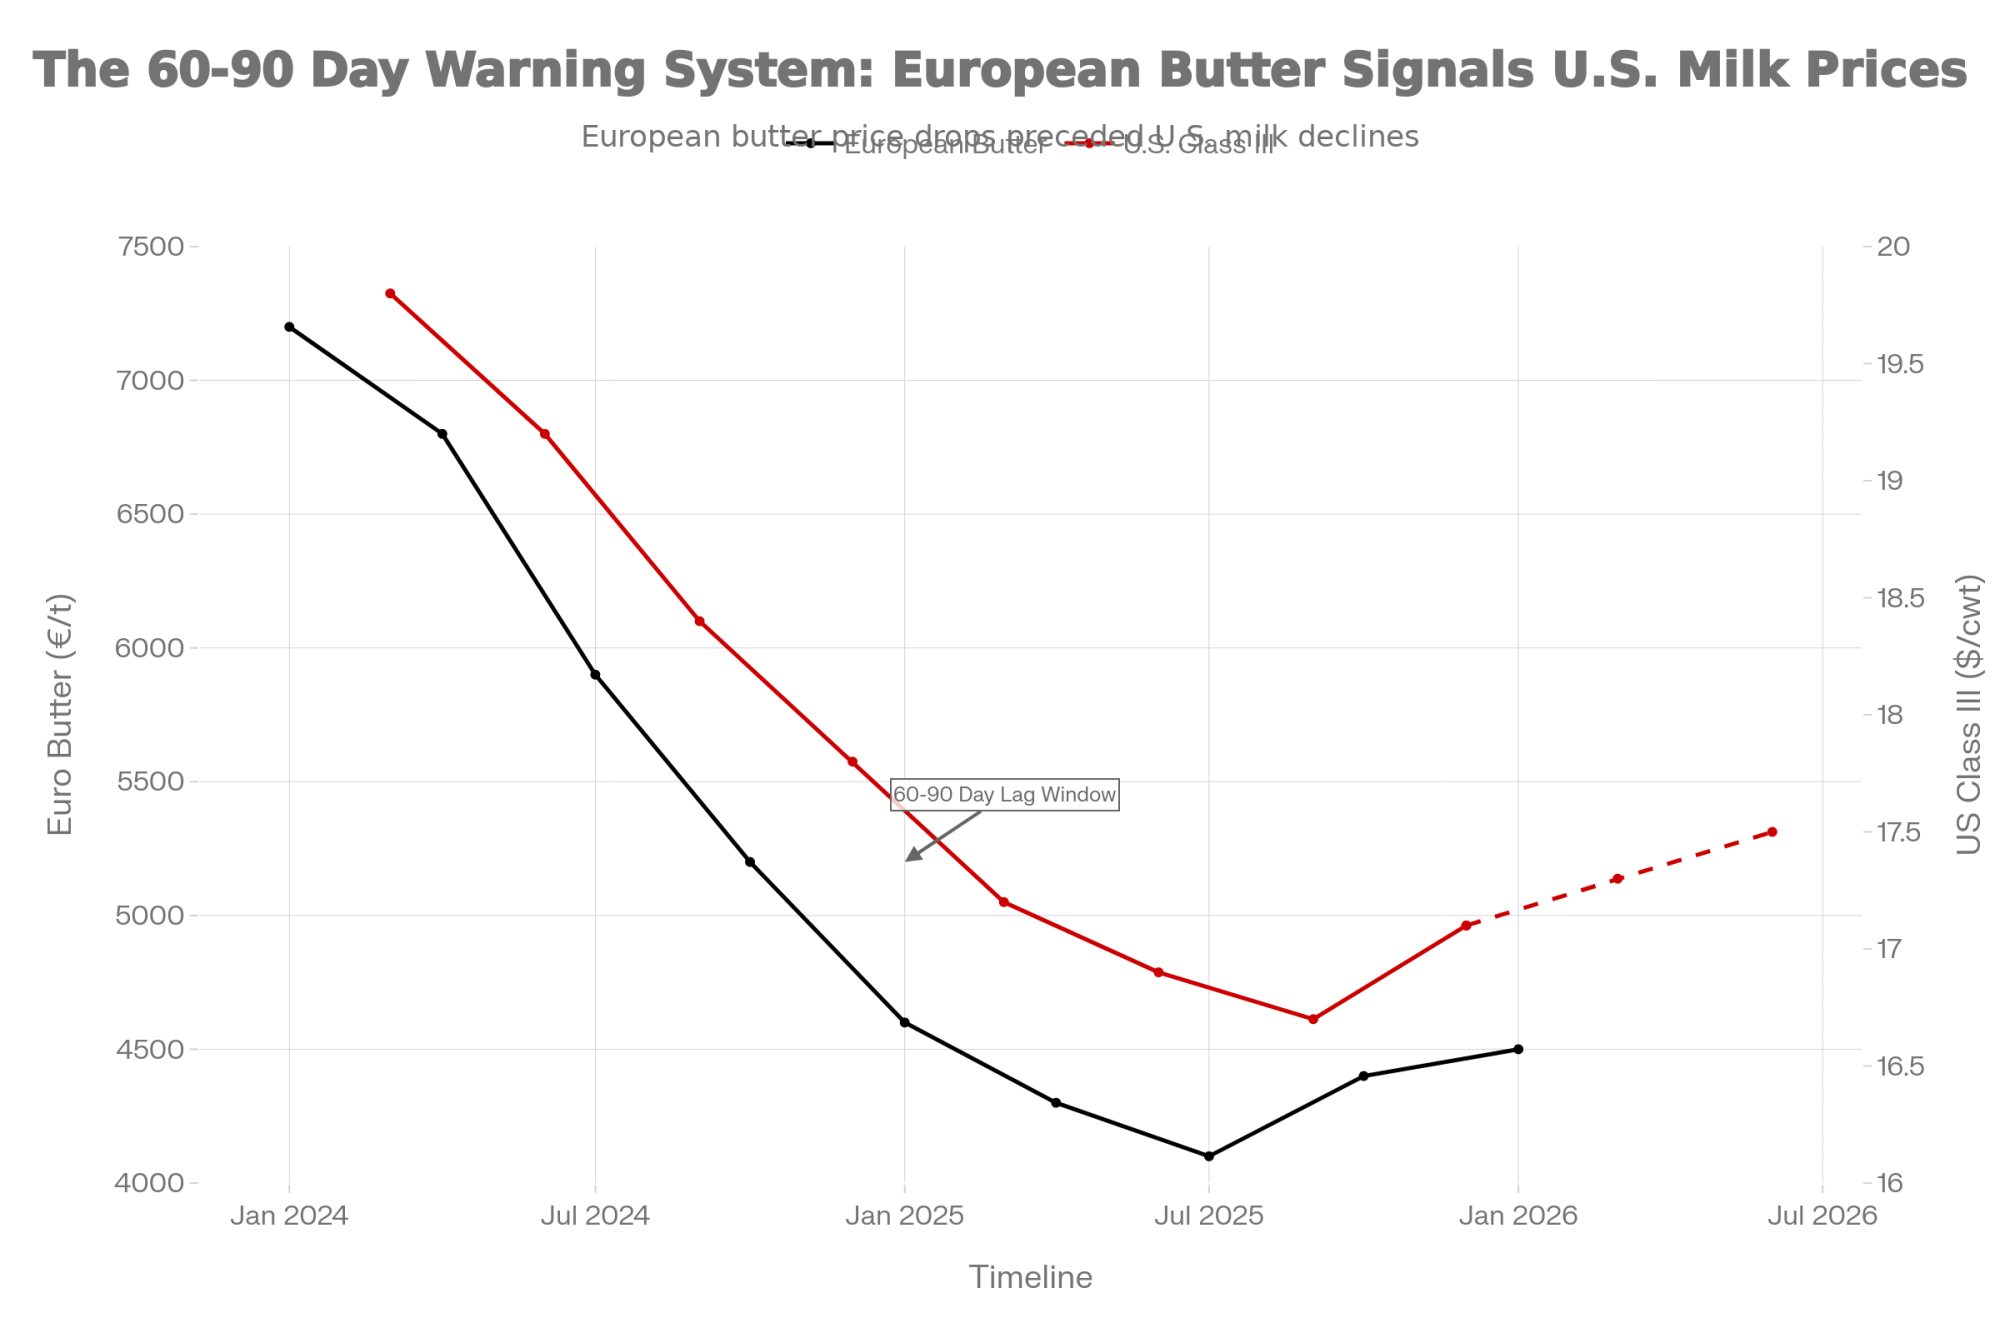
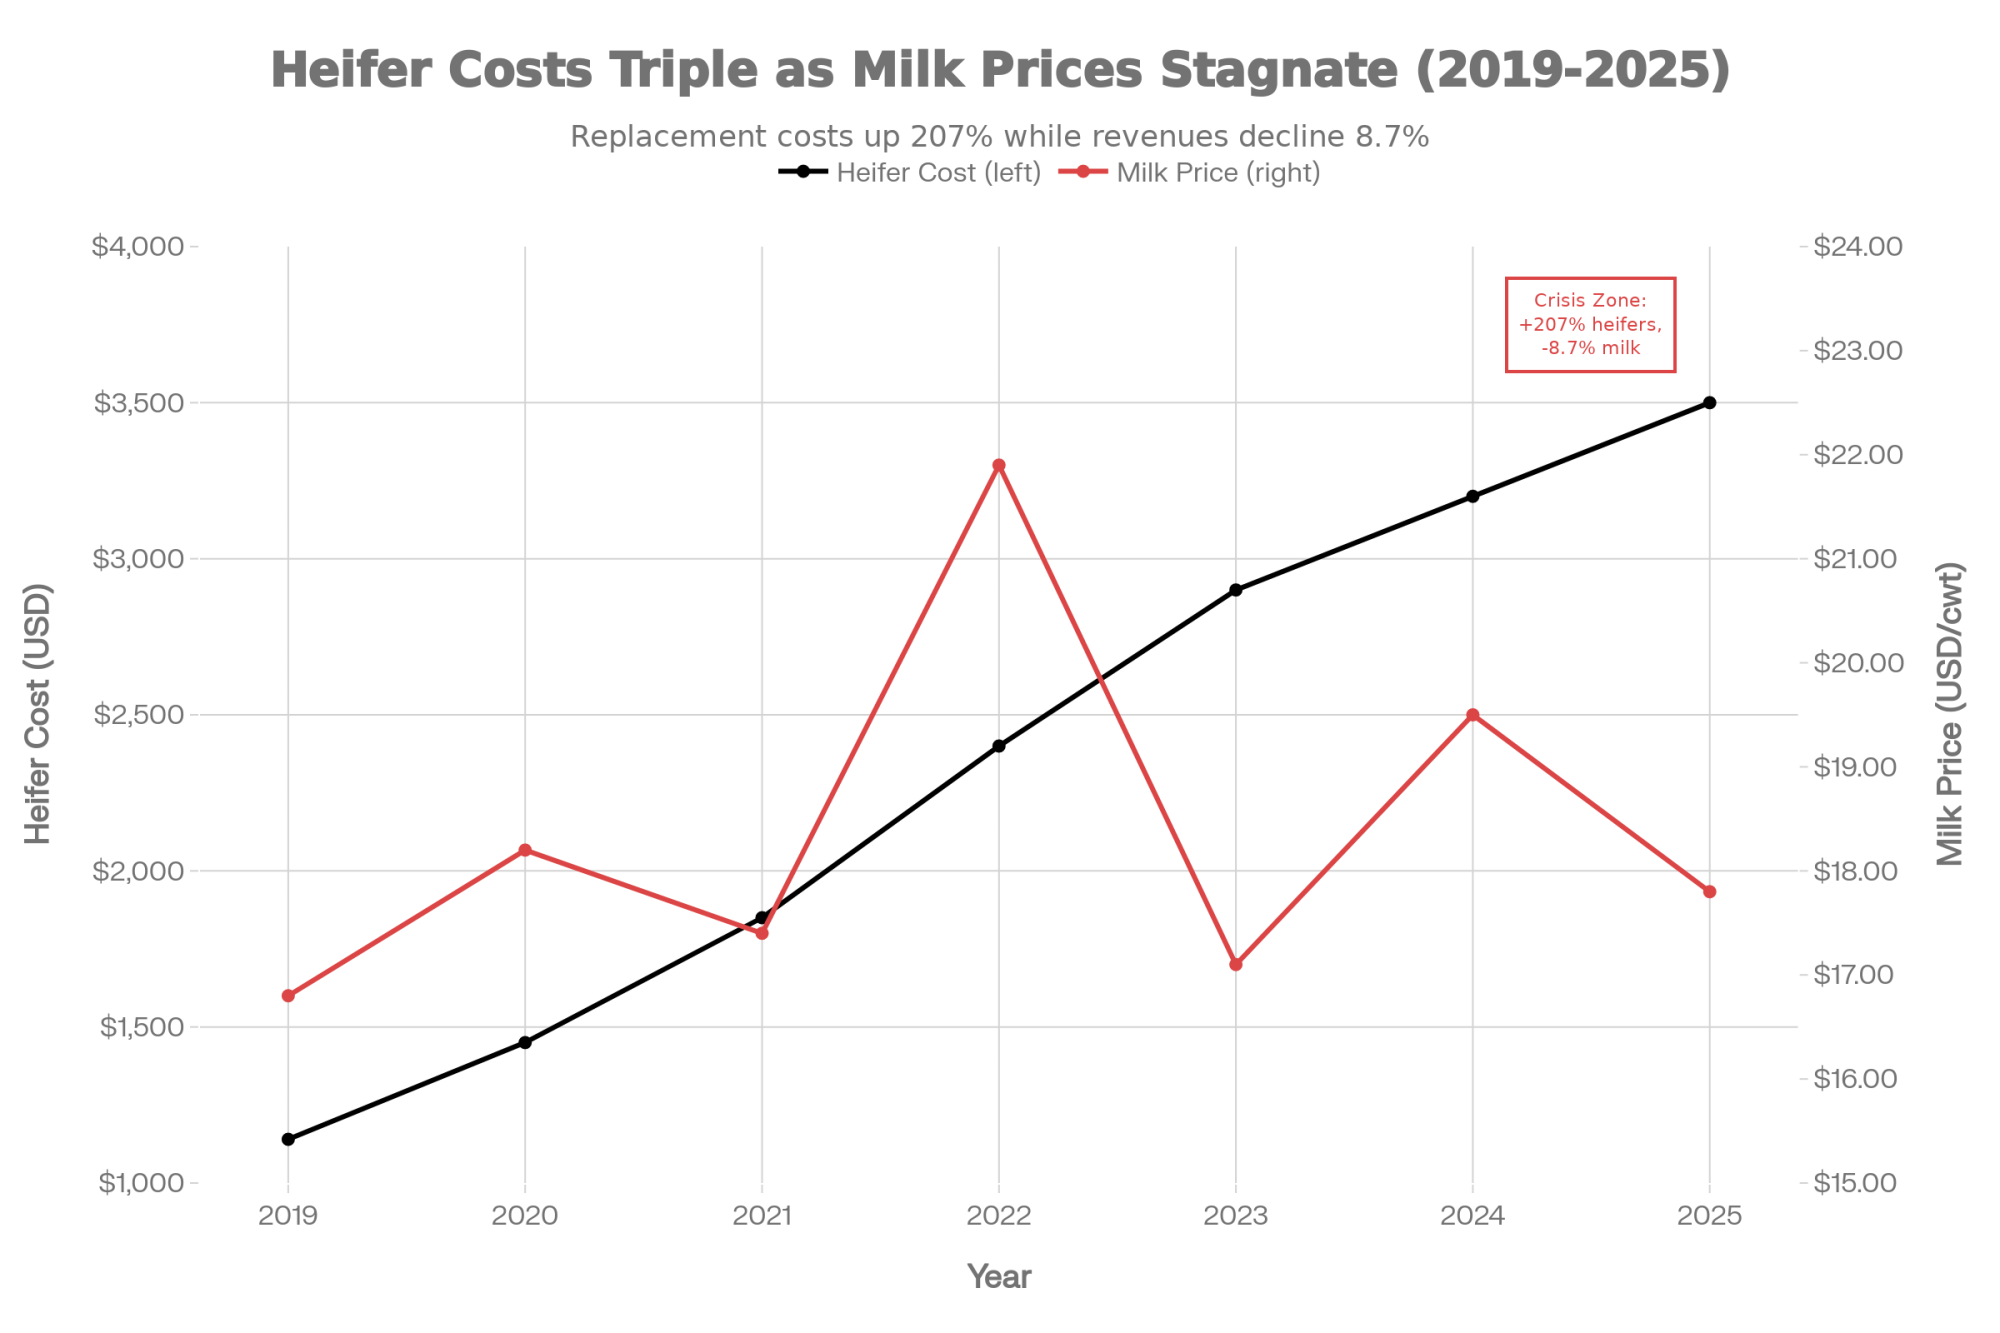
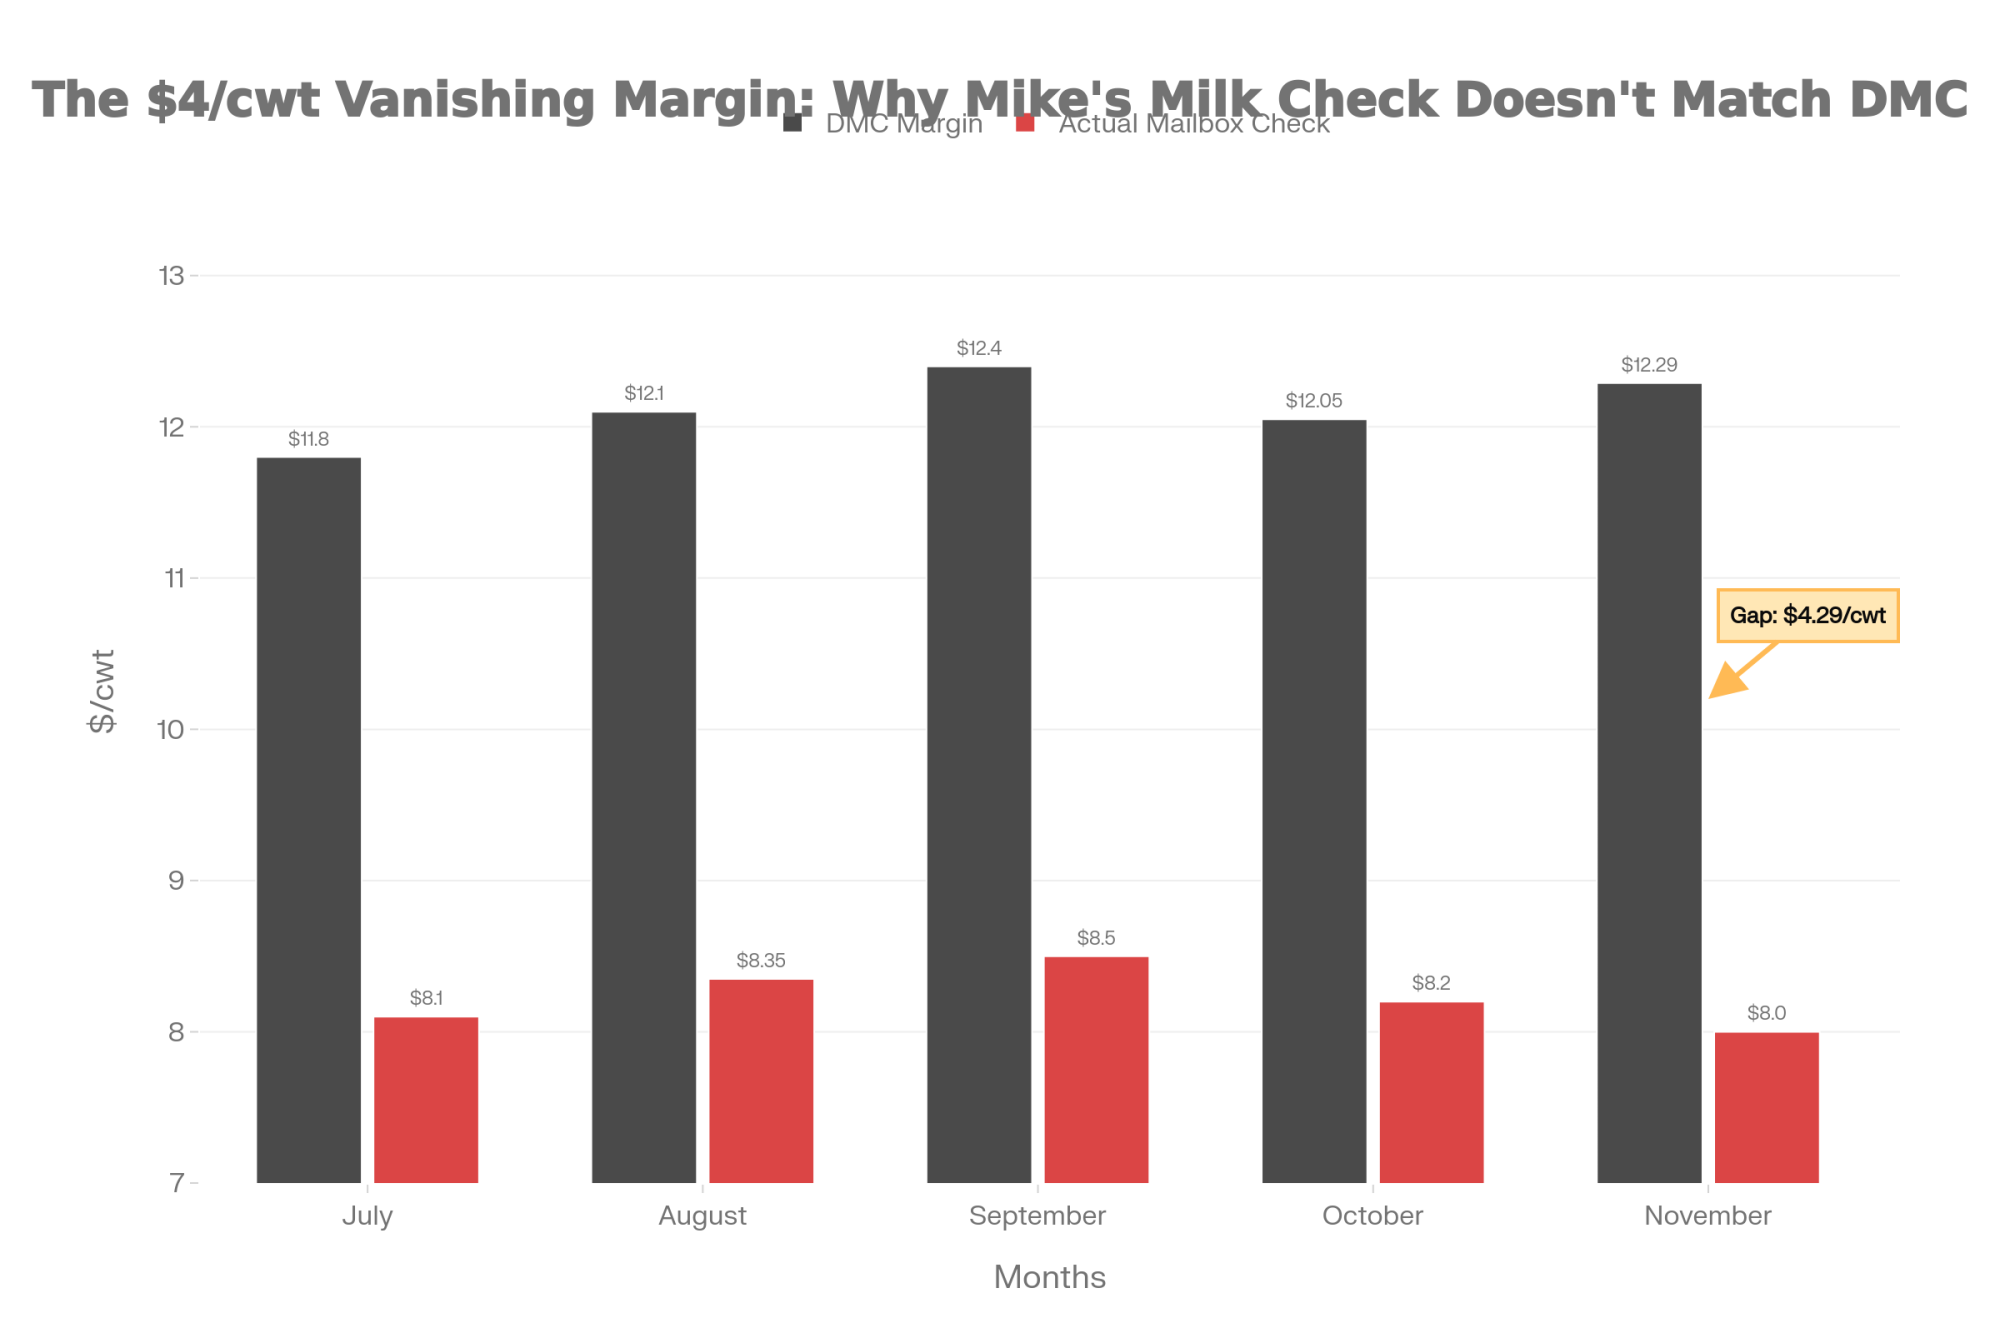
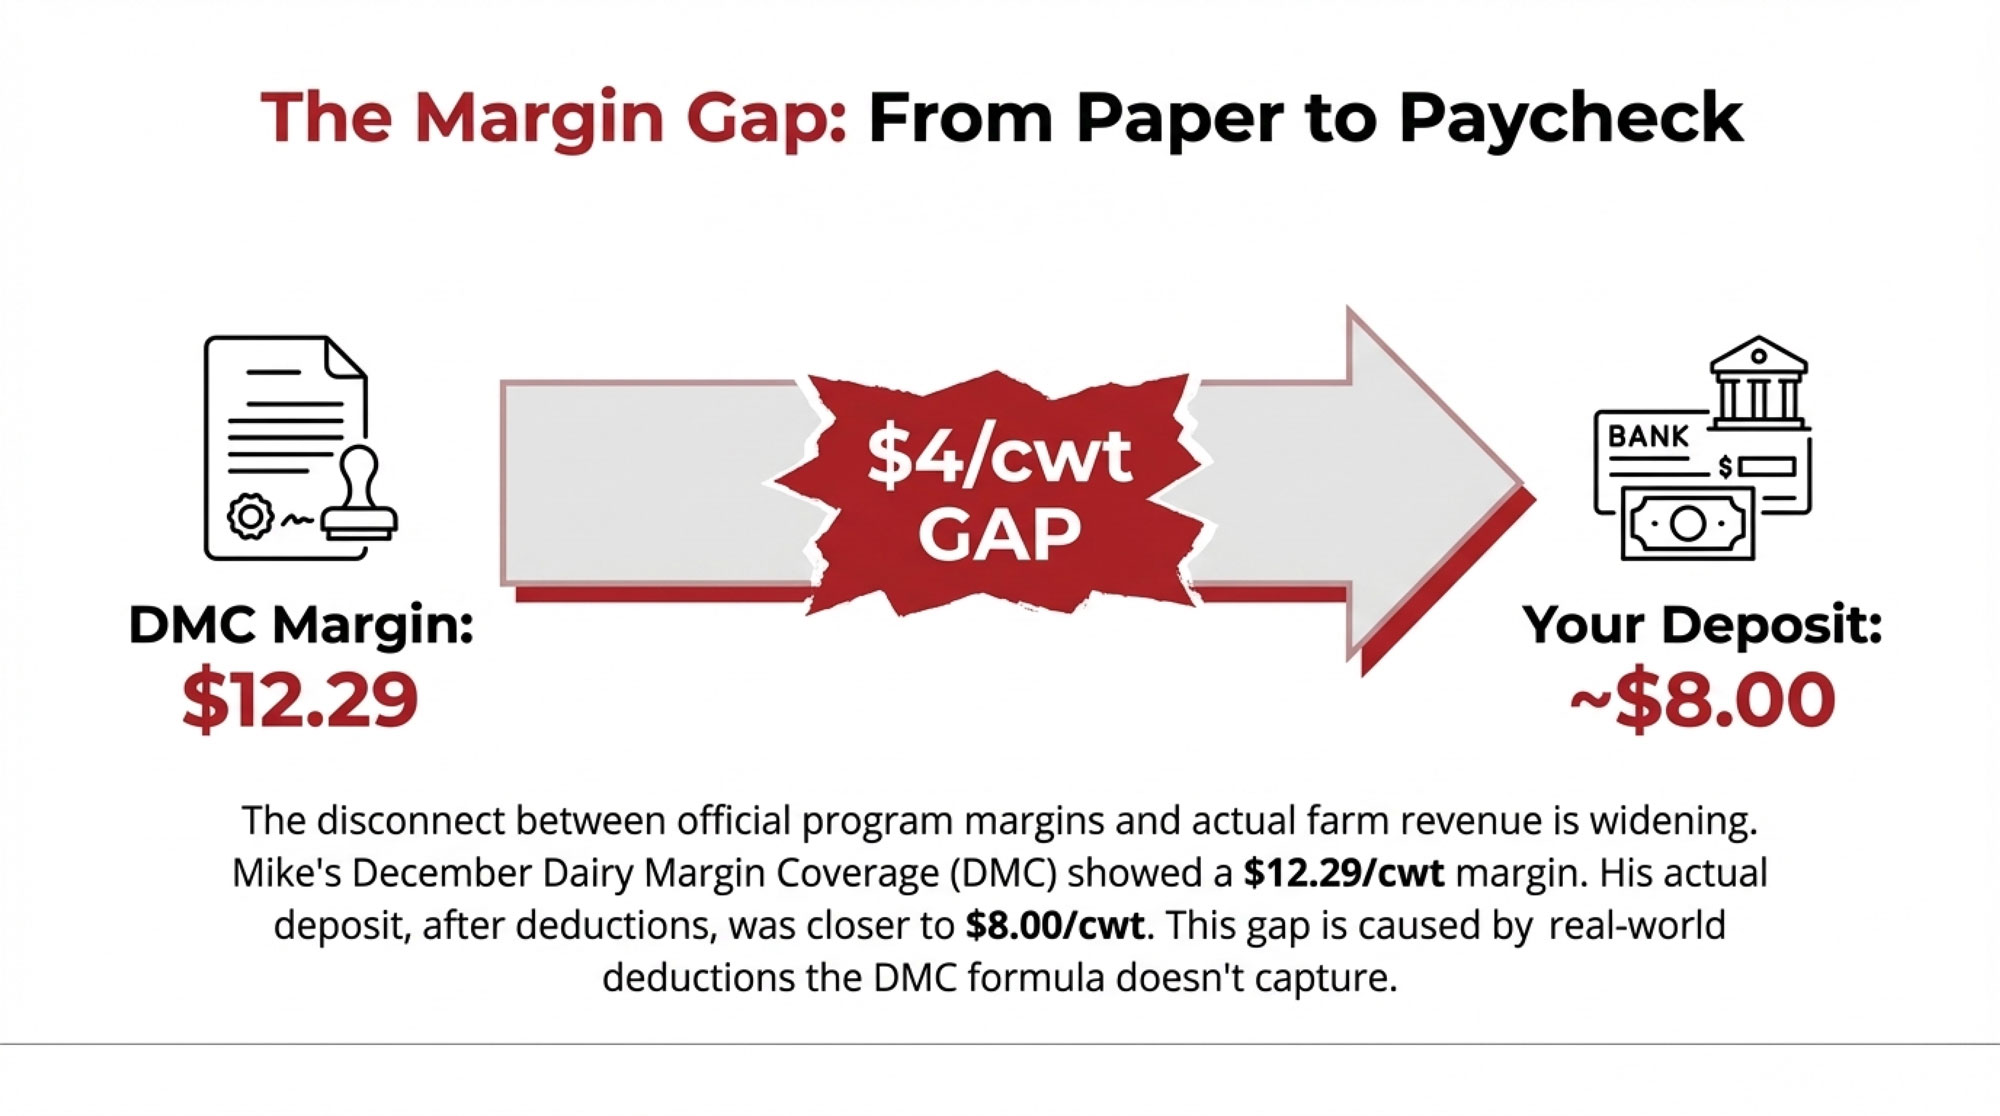
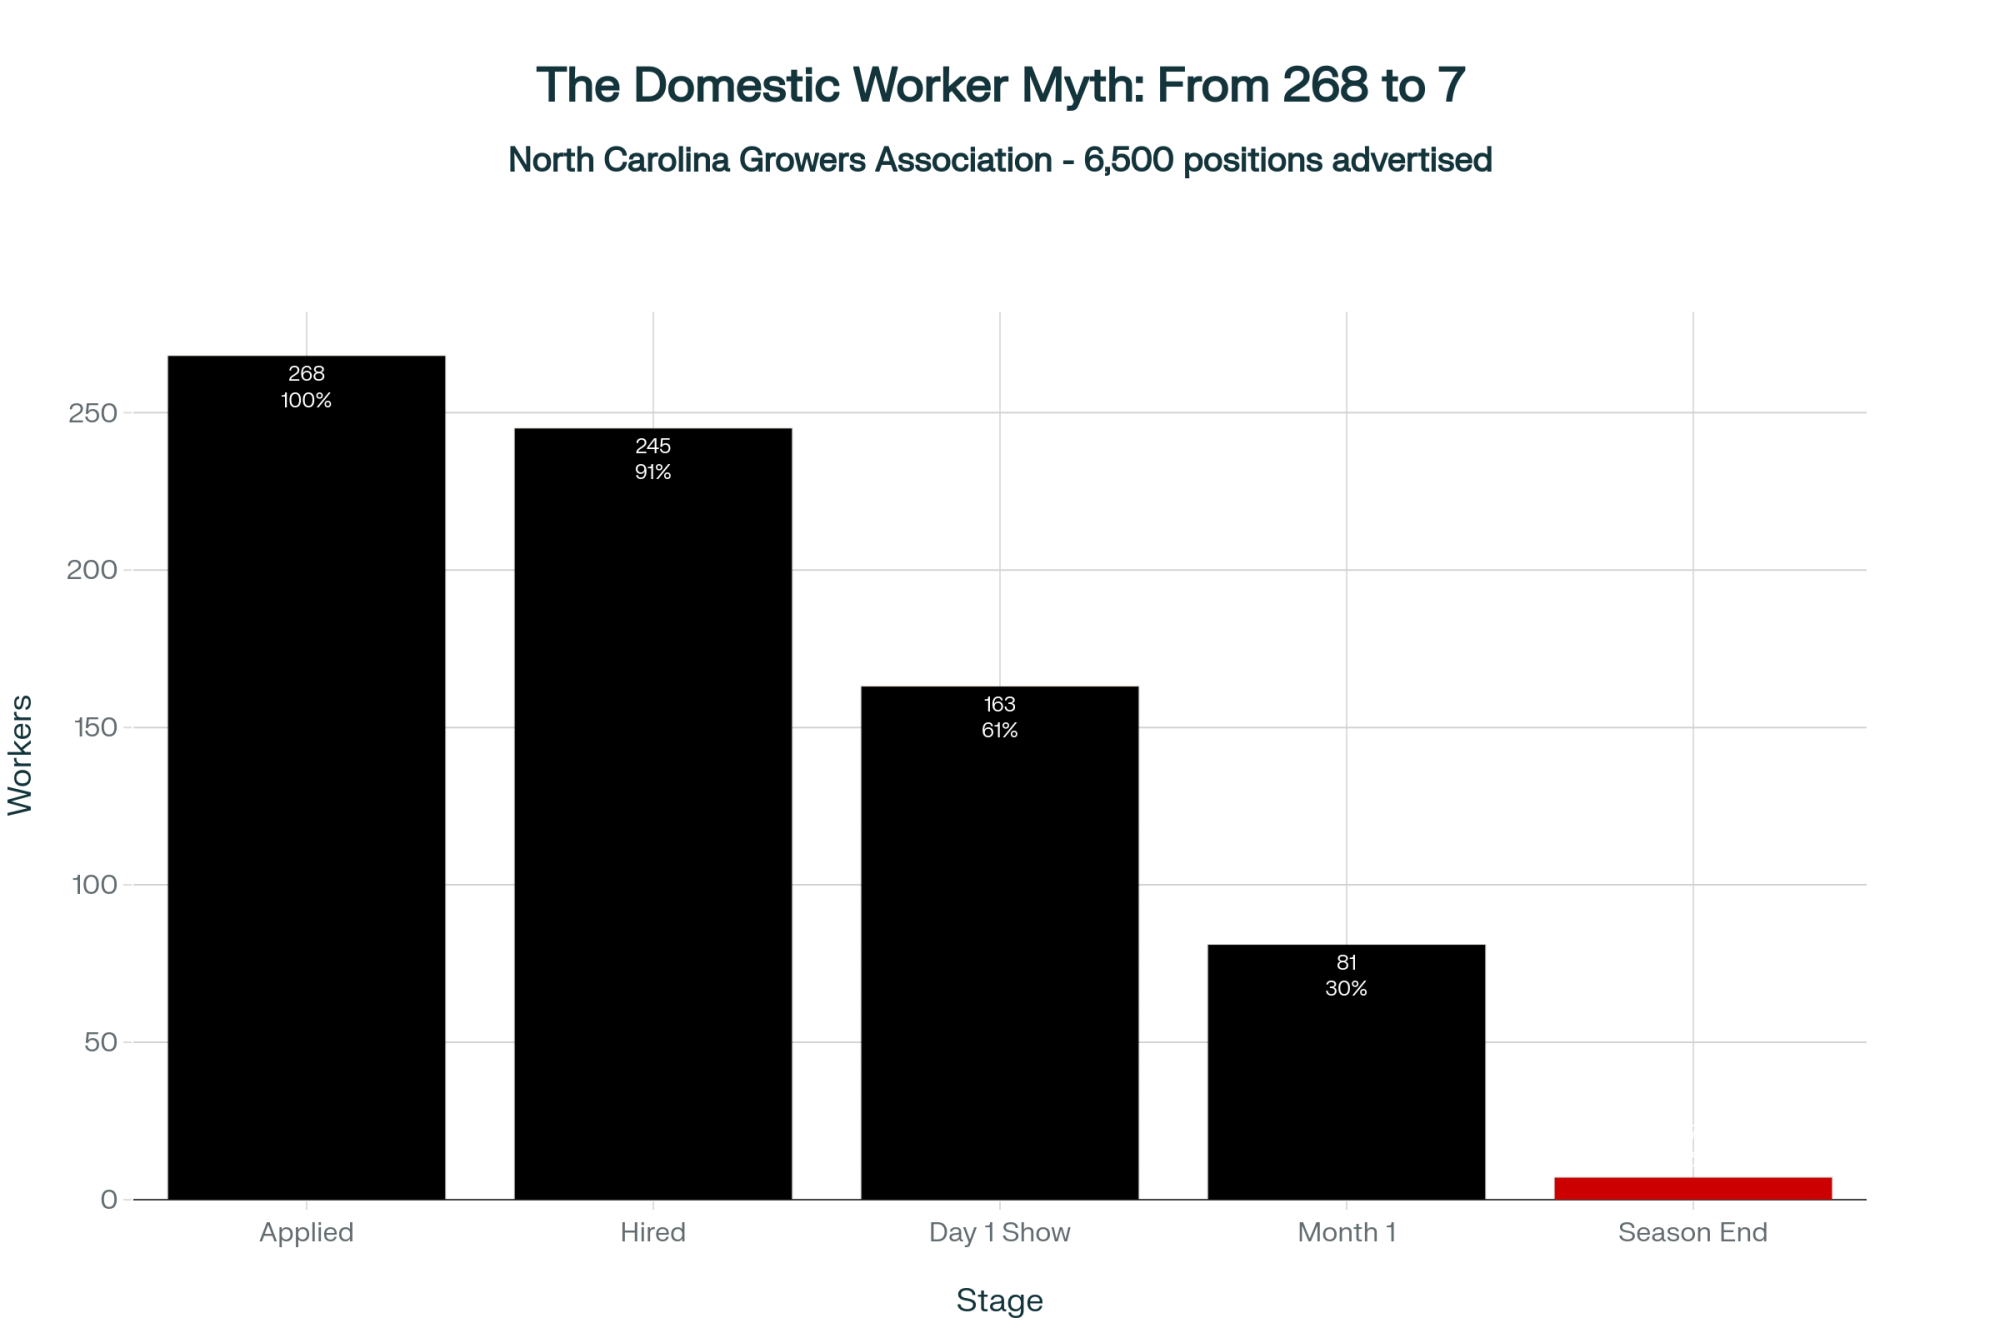
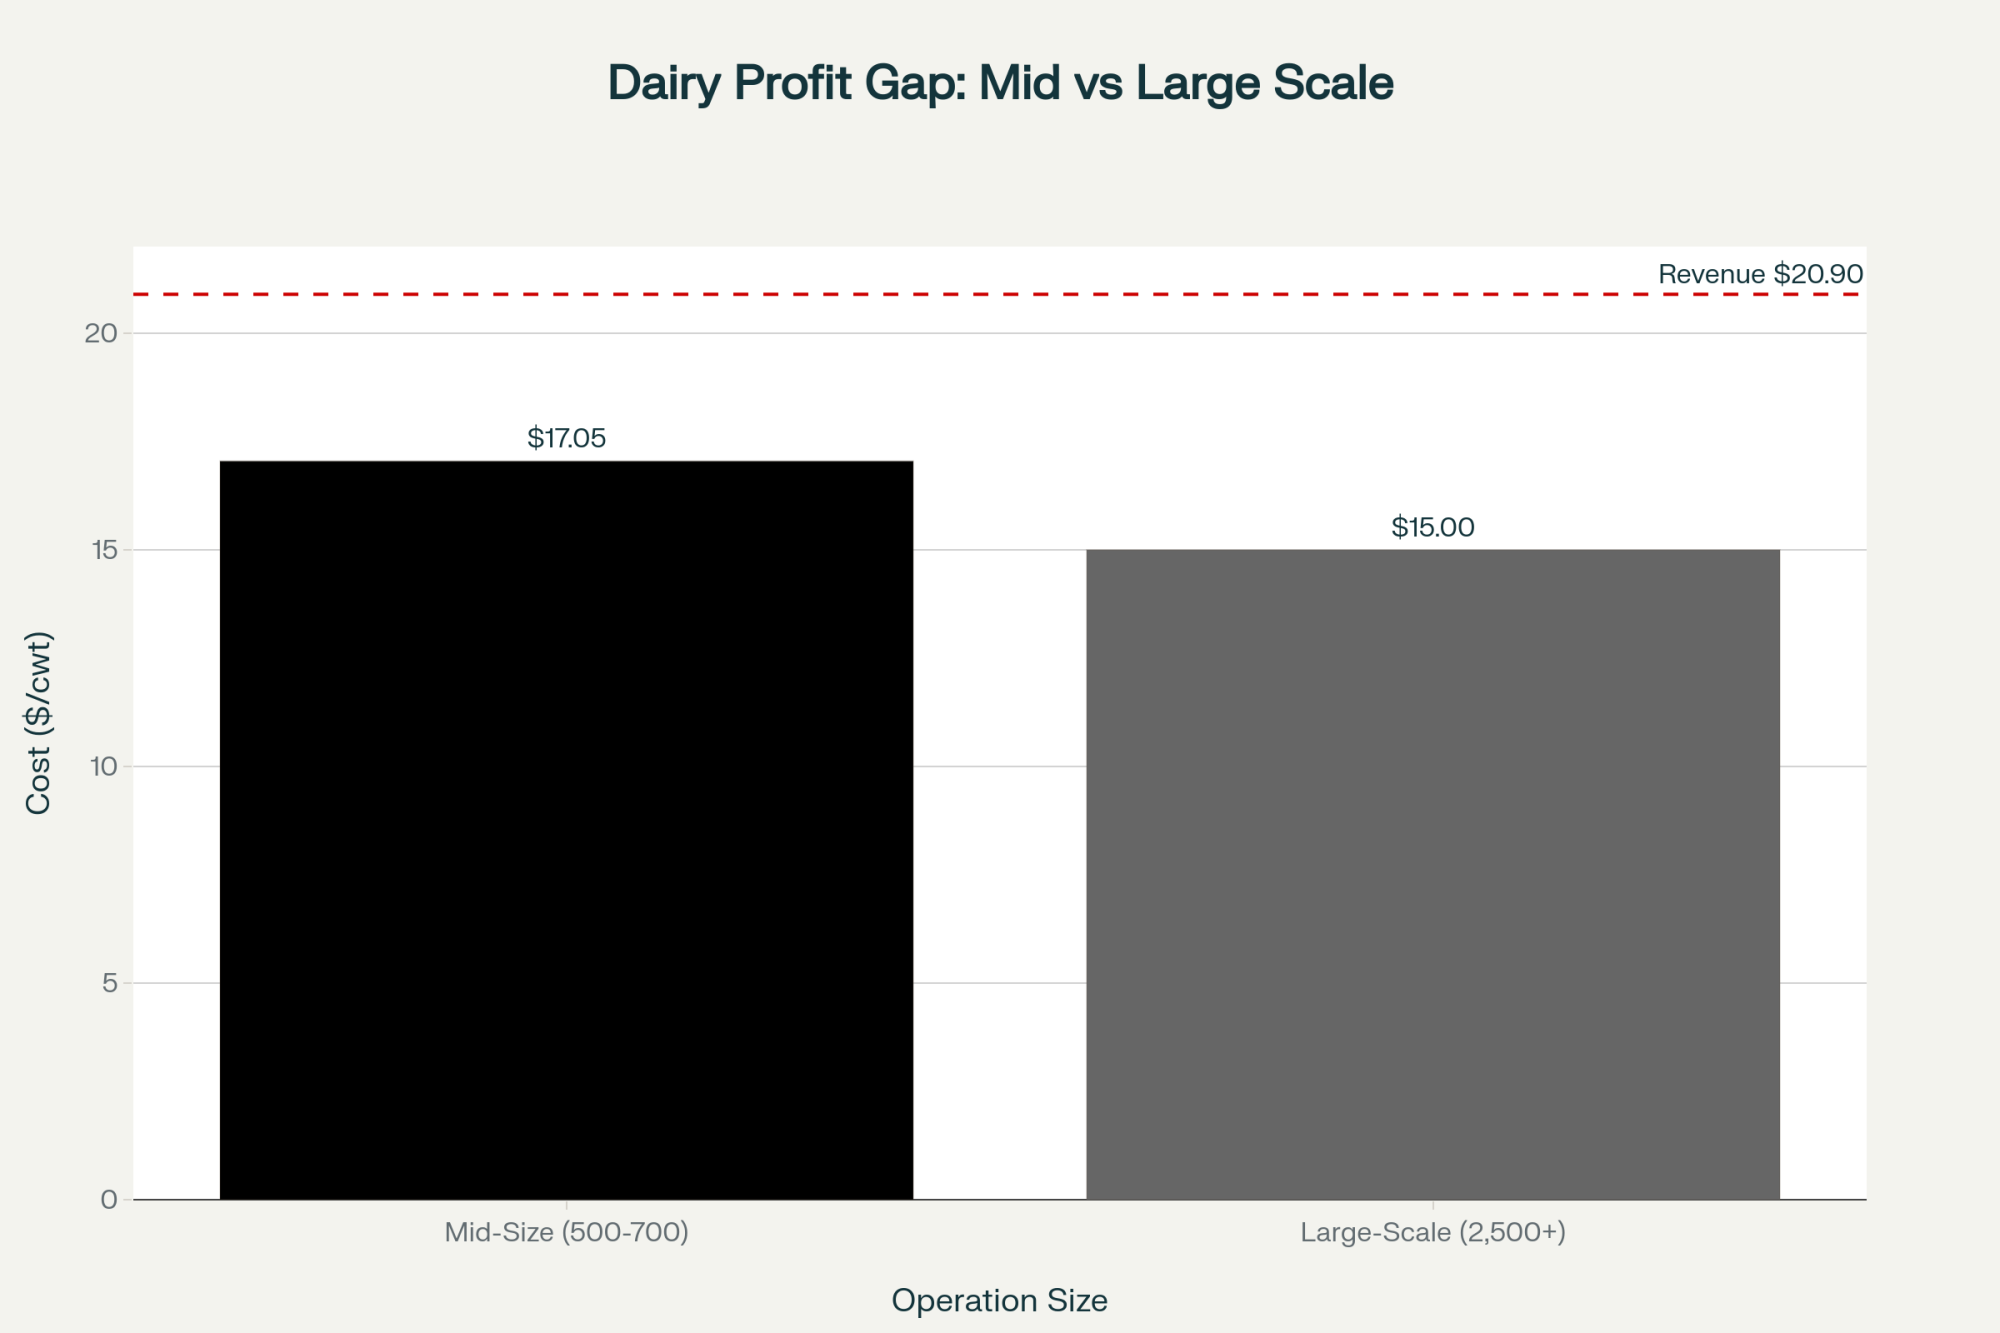
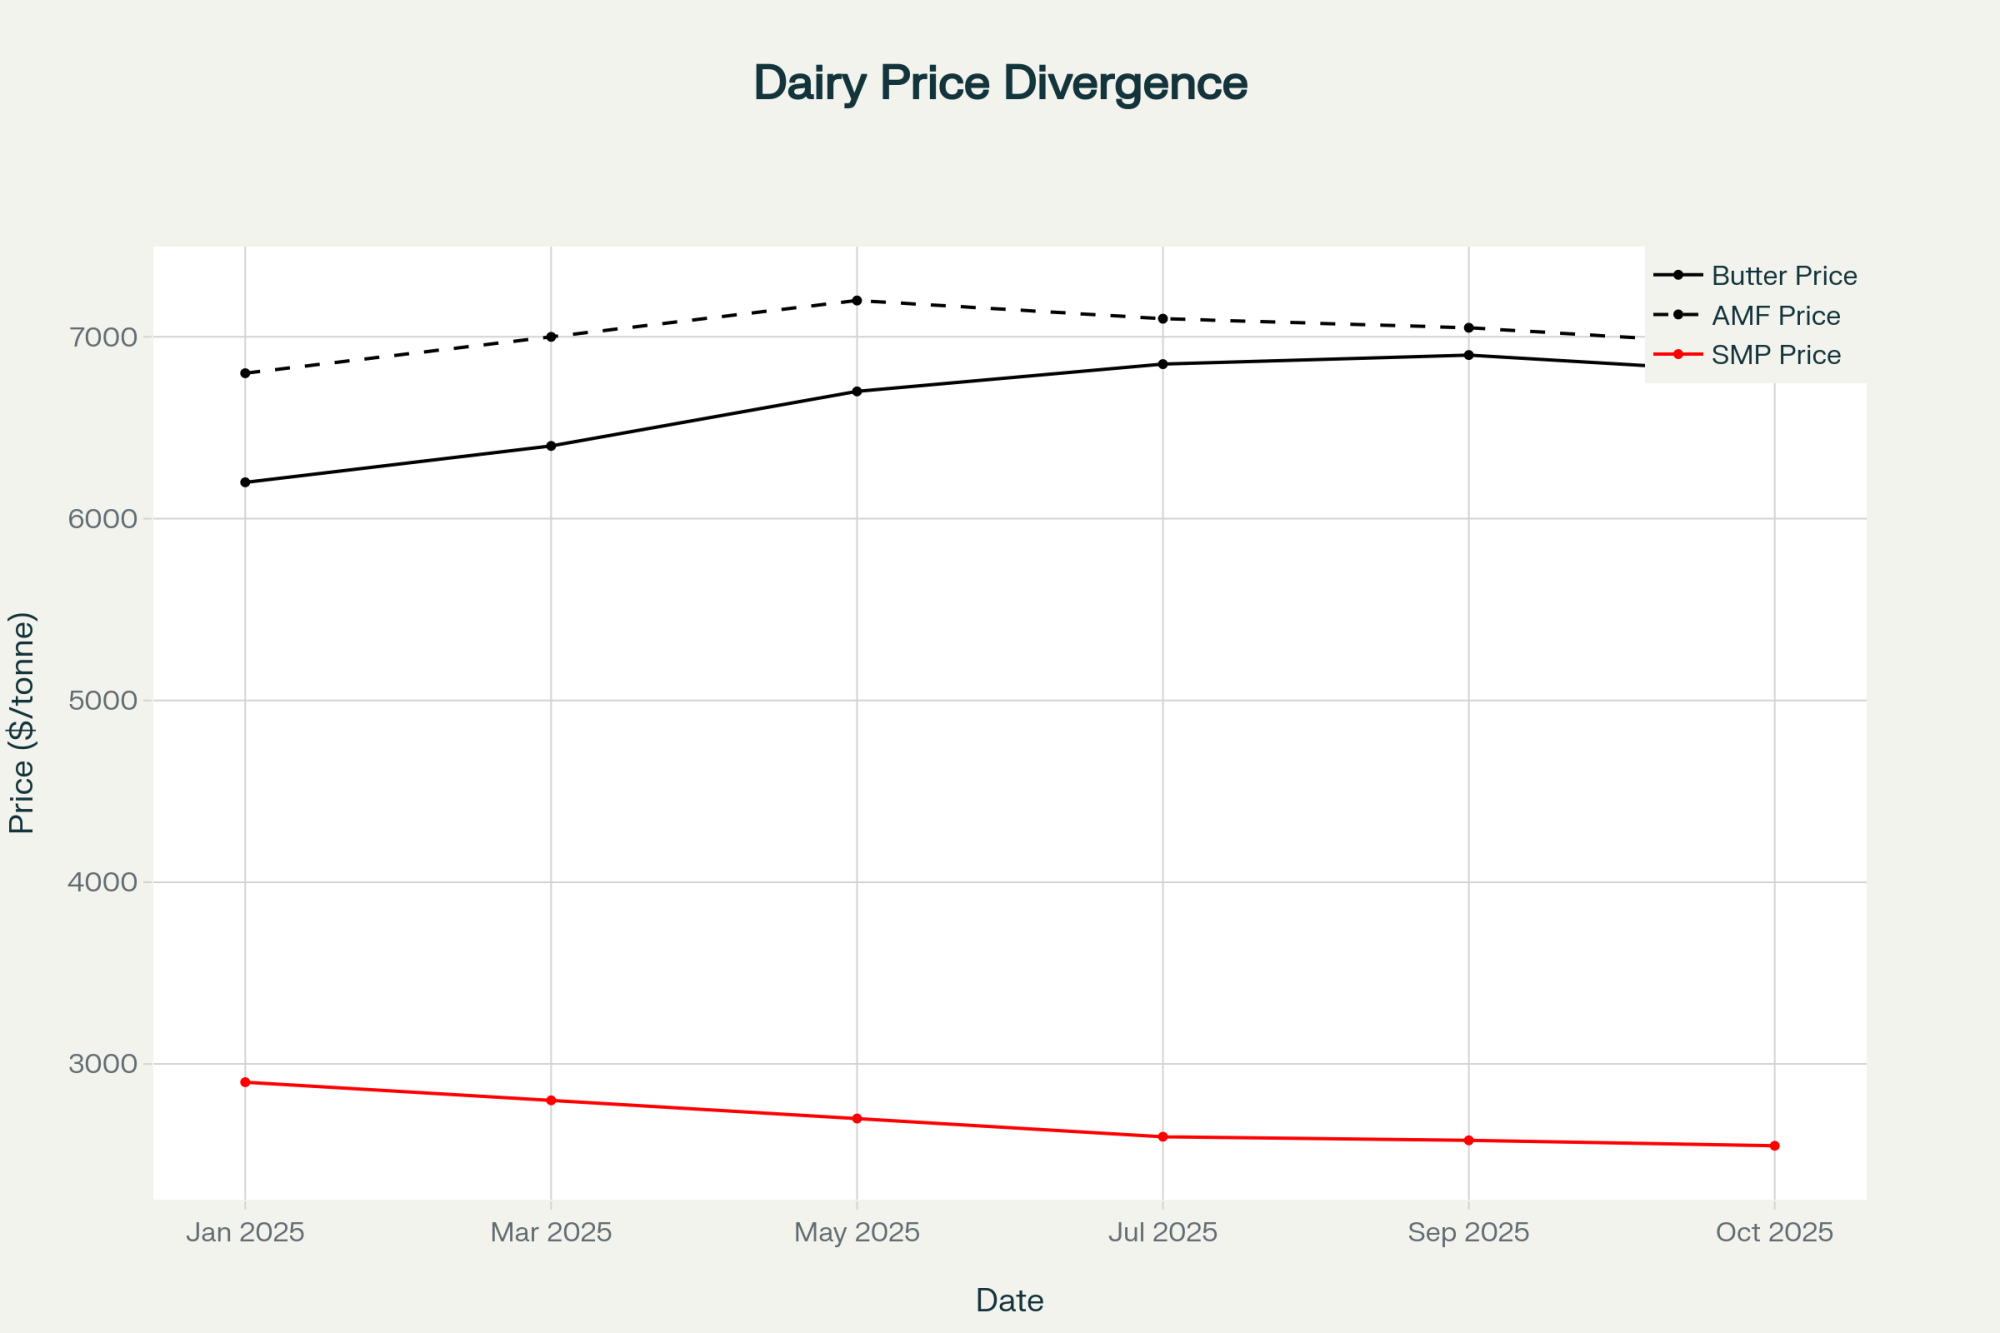
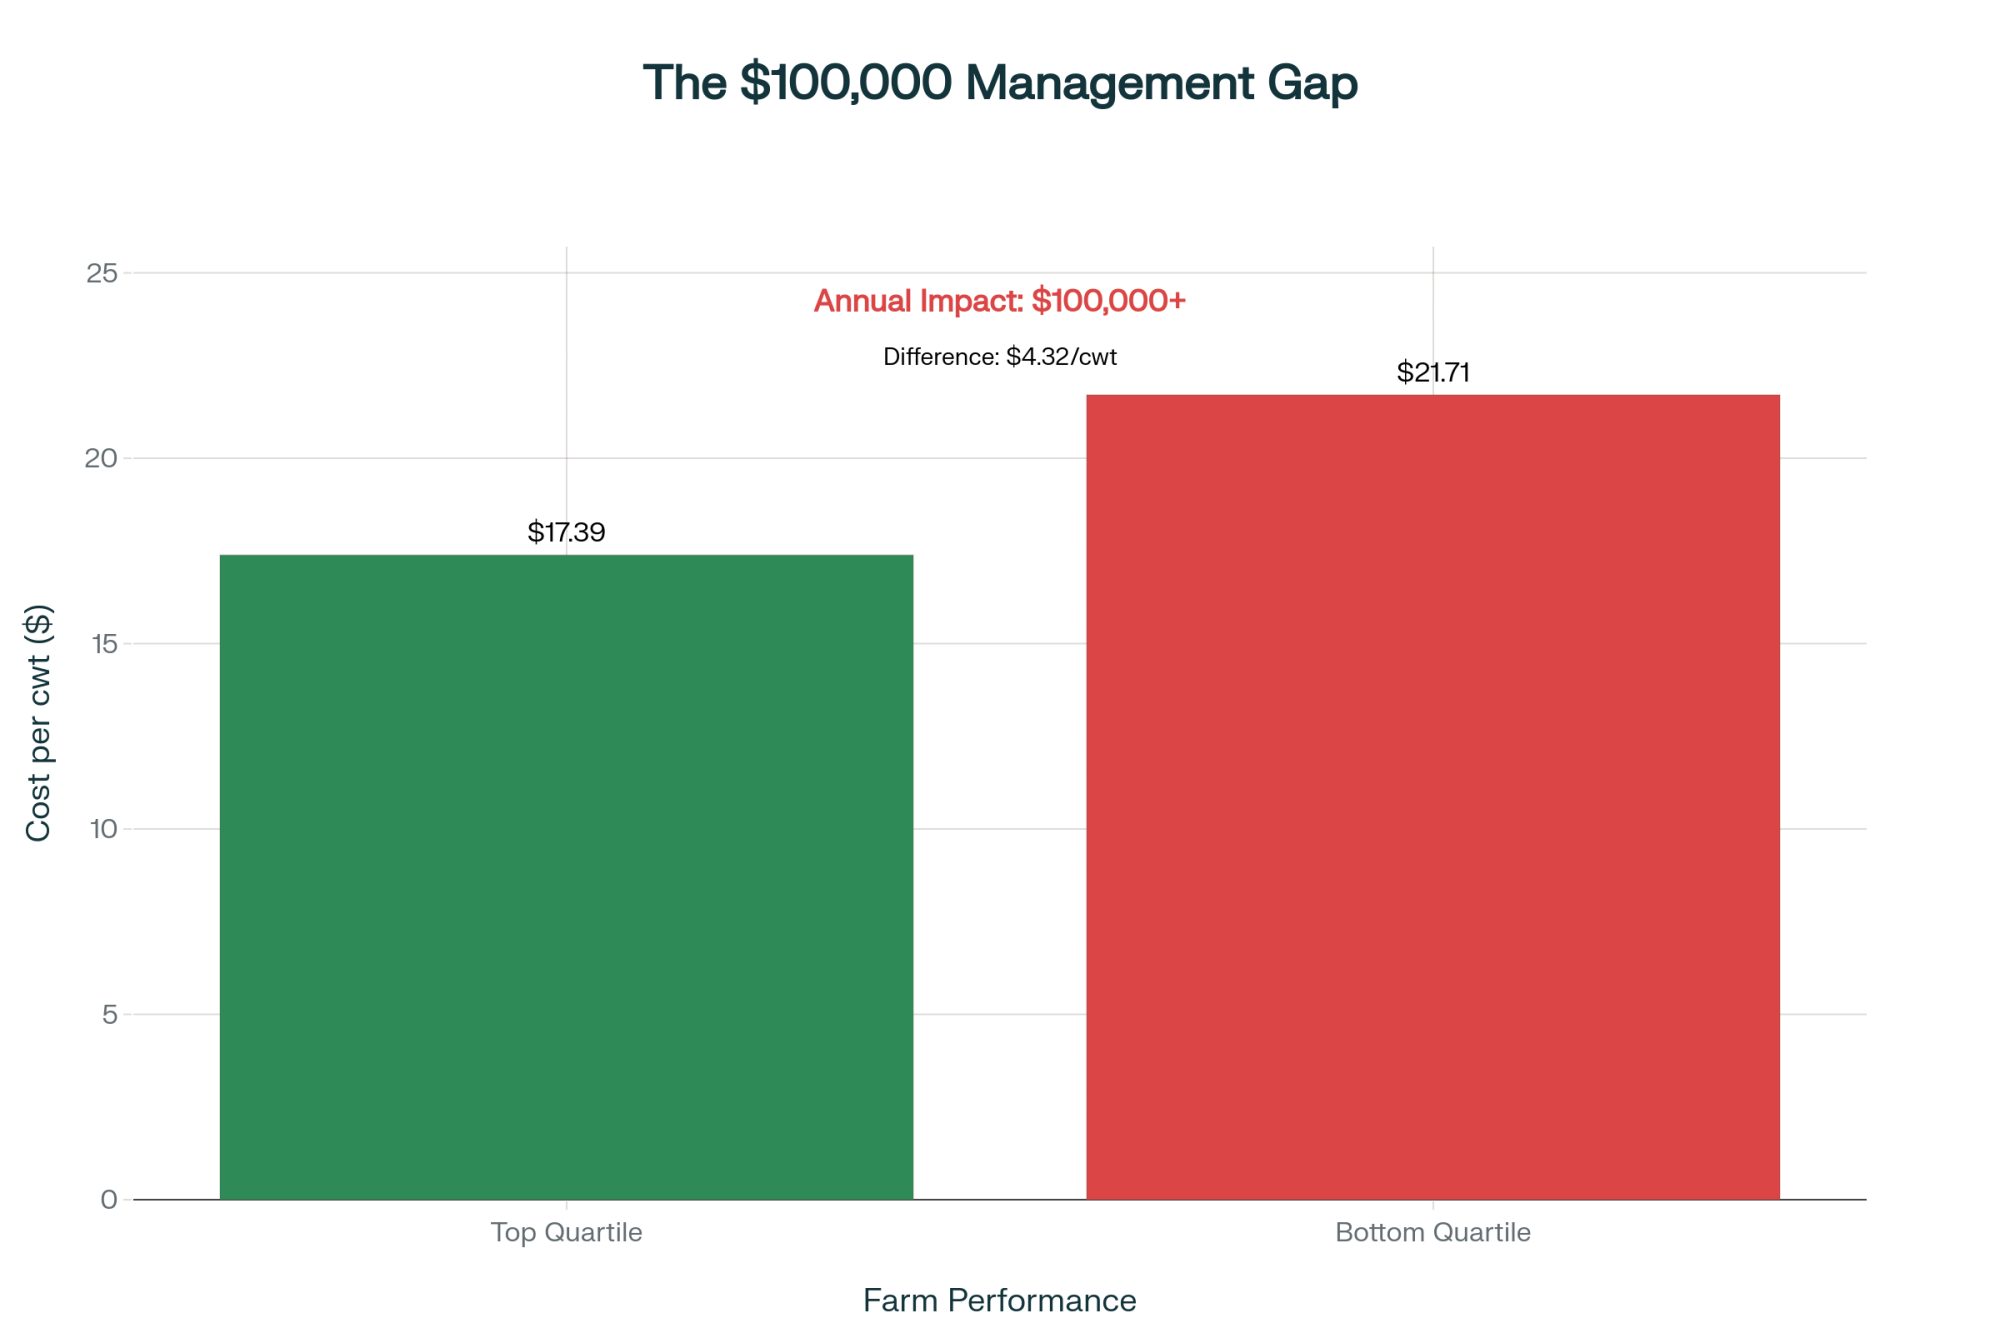
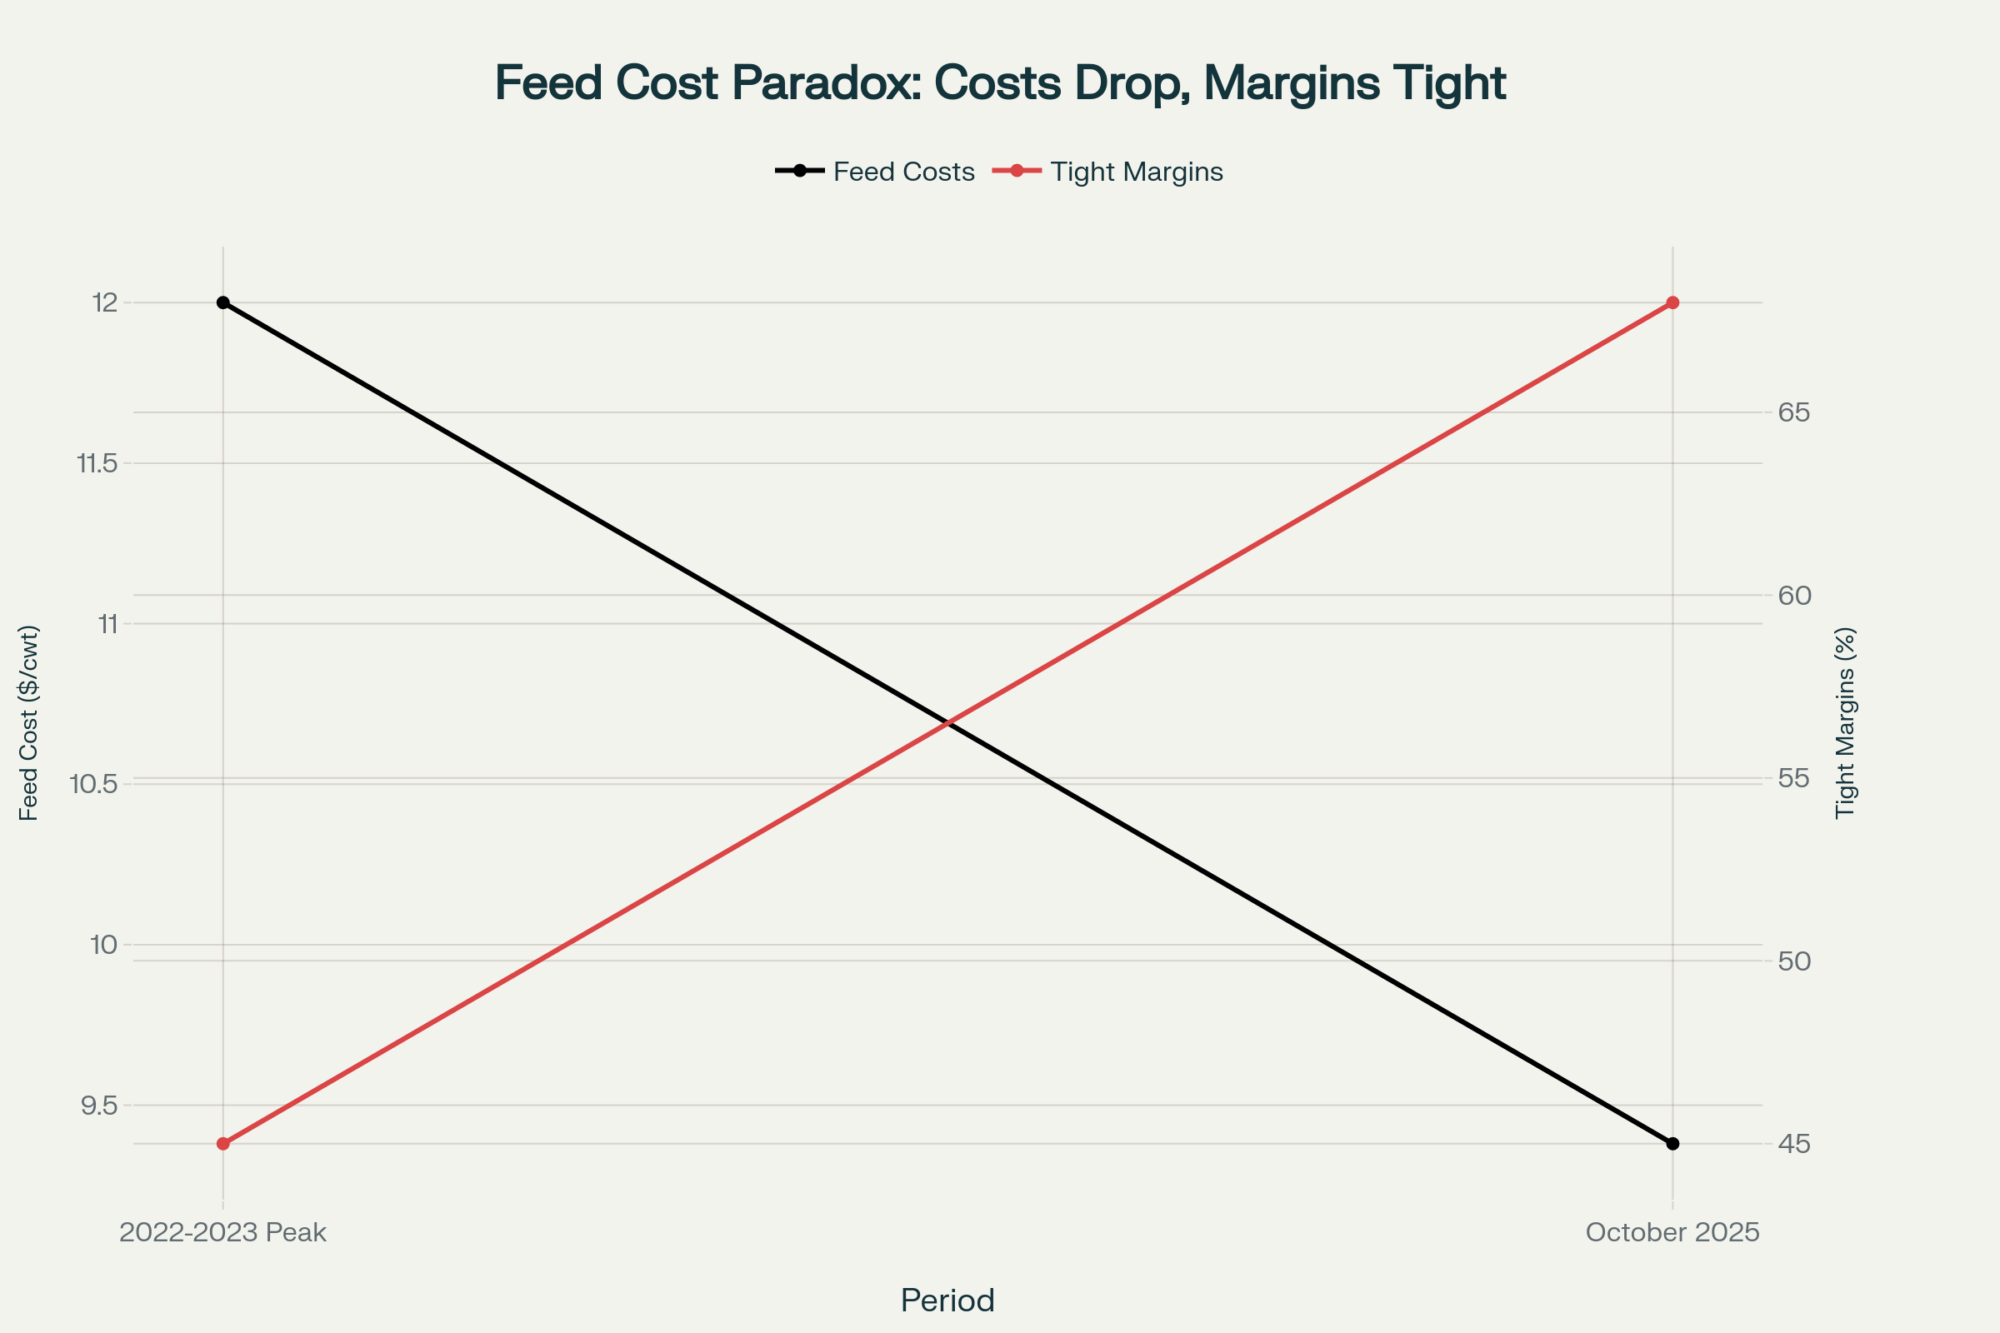
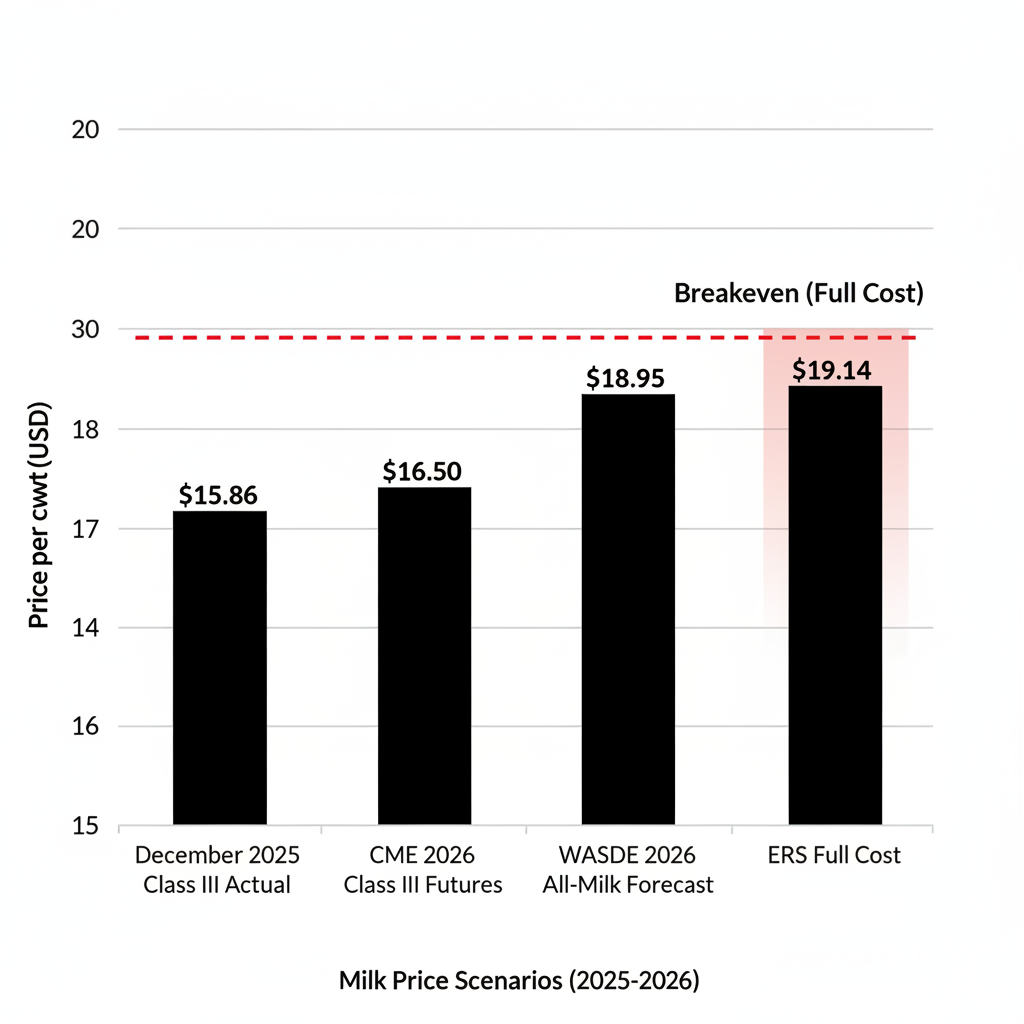
USDA’s February 10 WASDE projects 2026 all-milk at $18.95/cwt. ERS pegs average costs for 2,000-plus cow herds at $19.14/cwt. That’s 19 cents underwater on a full-cost basis before you factor in that December 2025 Class III finished at $15.86/cwt — the lowest since April 2024’s $15.50 — and CME Class III futures for 2026 are stuck in the mid-$16s, with the February WASDE raising the full-year forecast to just $16.65. For a 300-cow herd shipping about 75,000 cwt, the gap between USDA’s all-milk forecast and what Class III futures actually pay represents a $150,000 to $225,000 swing in annual revenue.
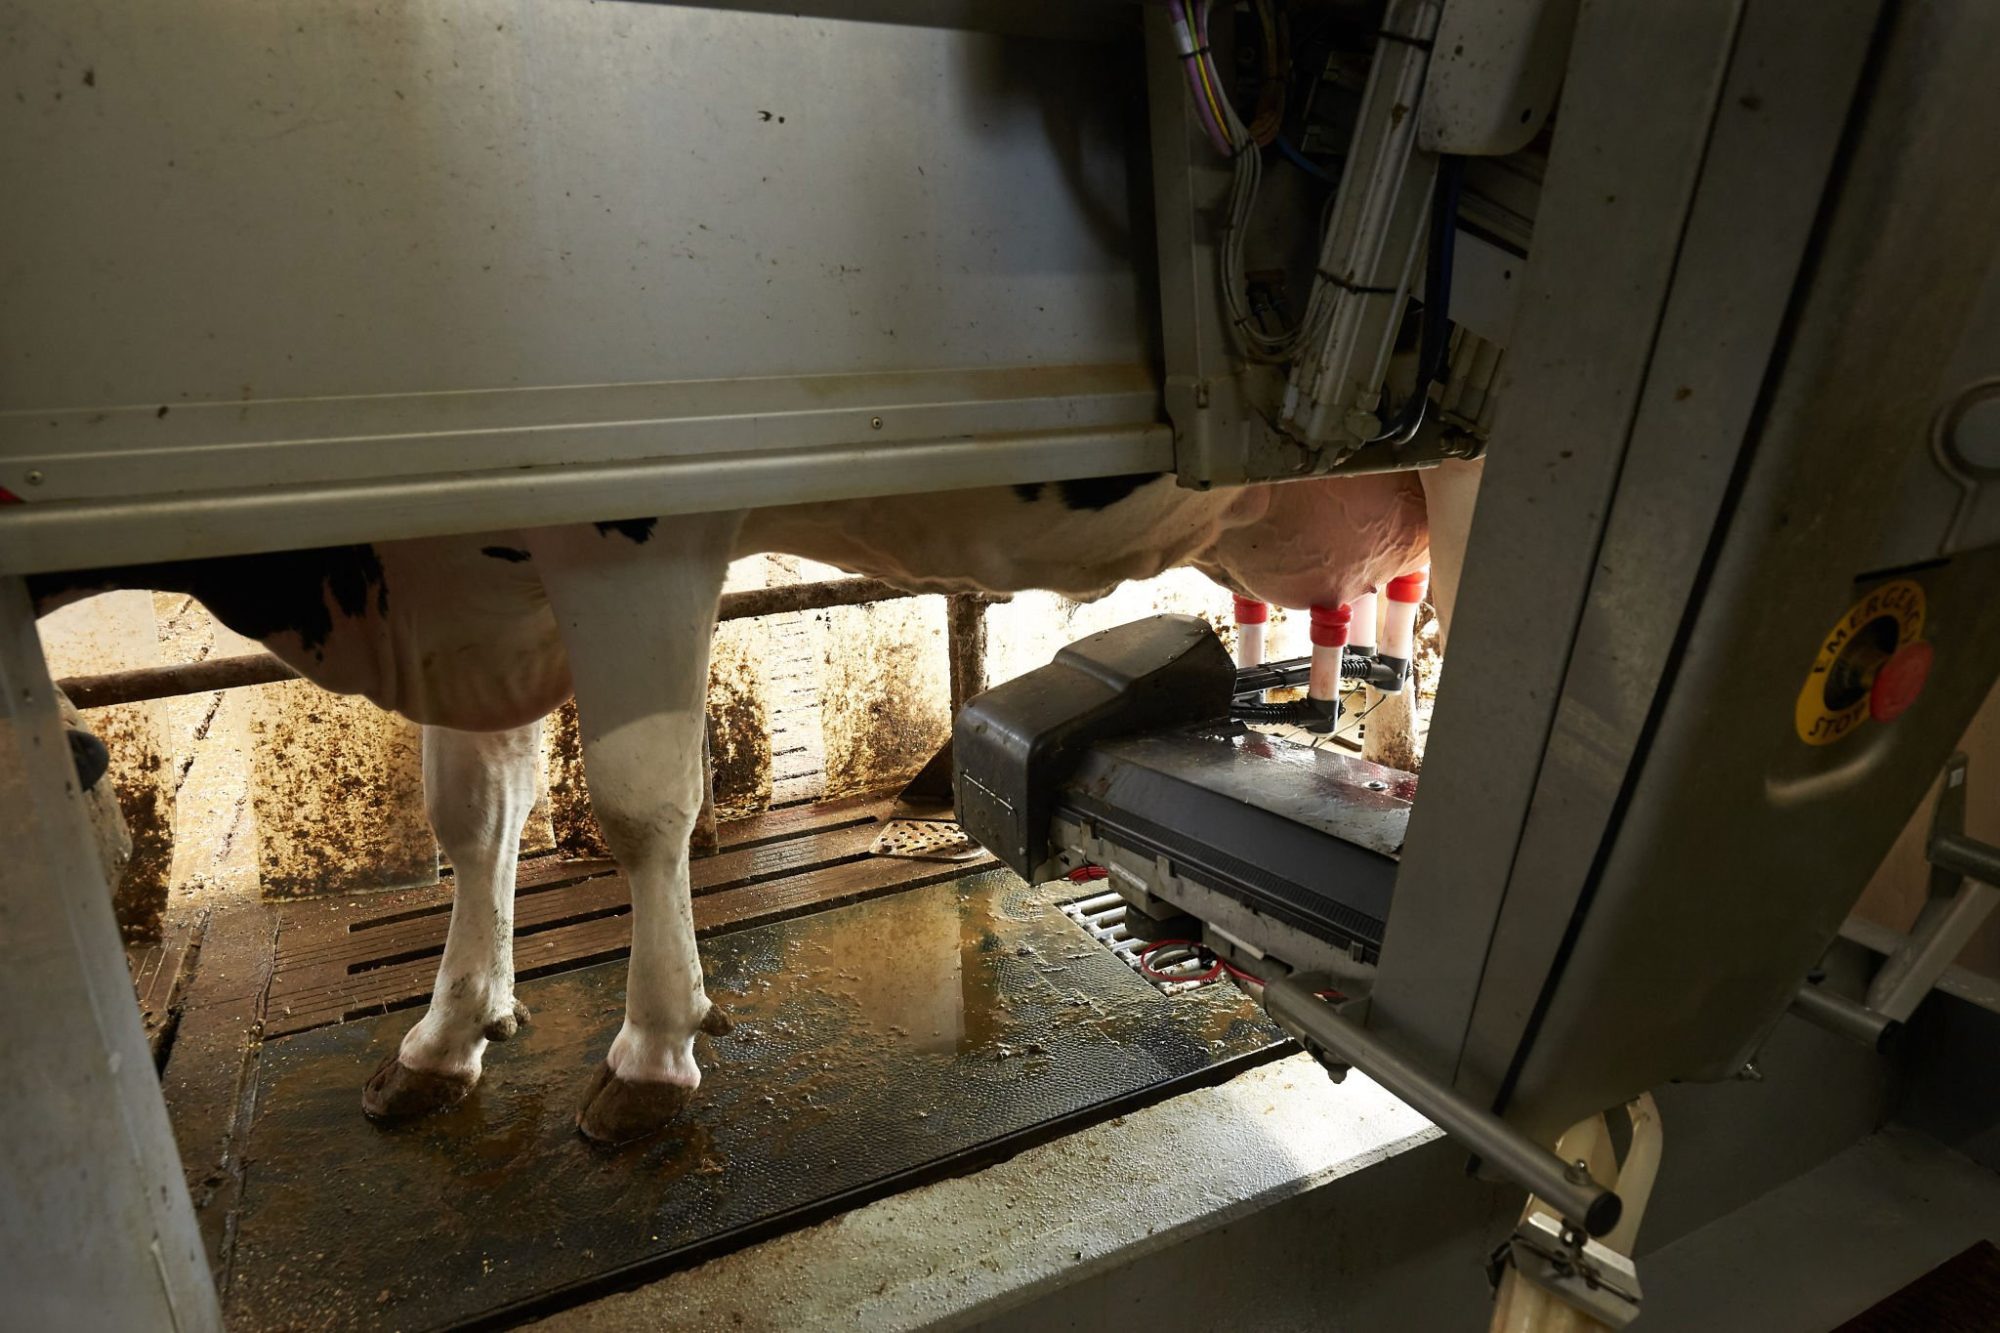
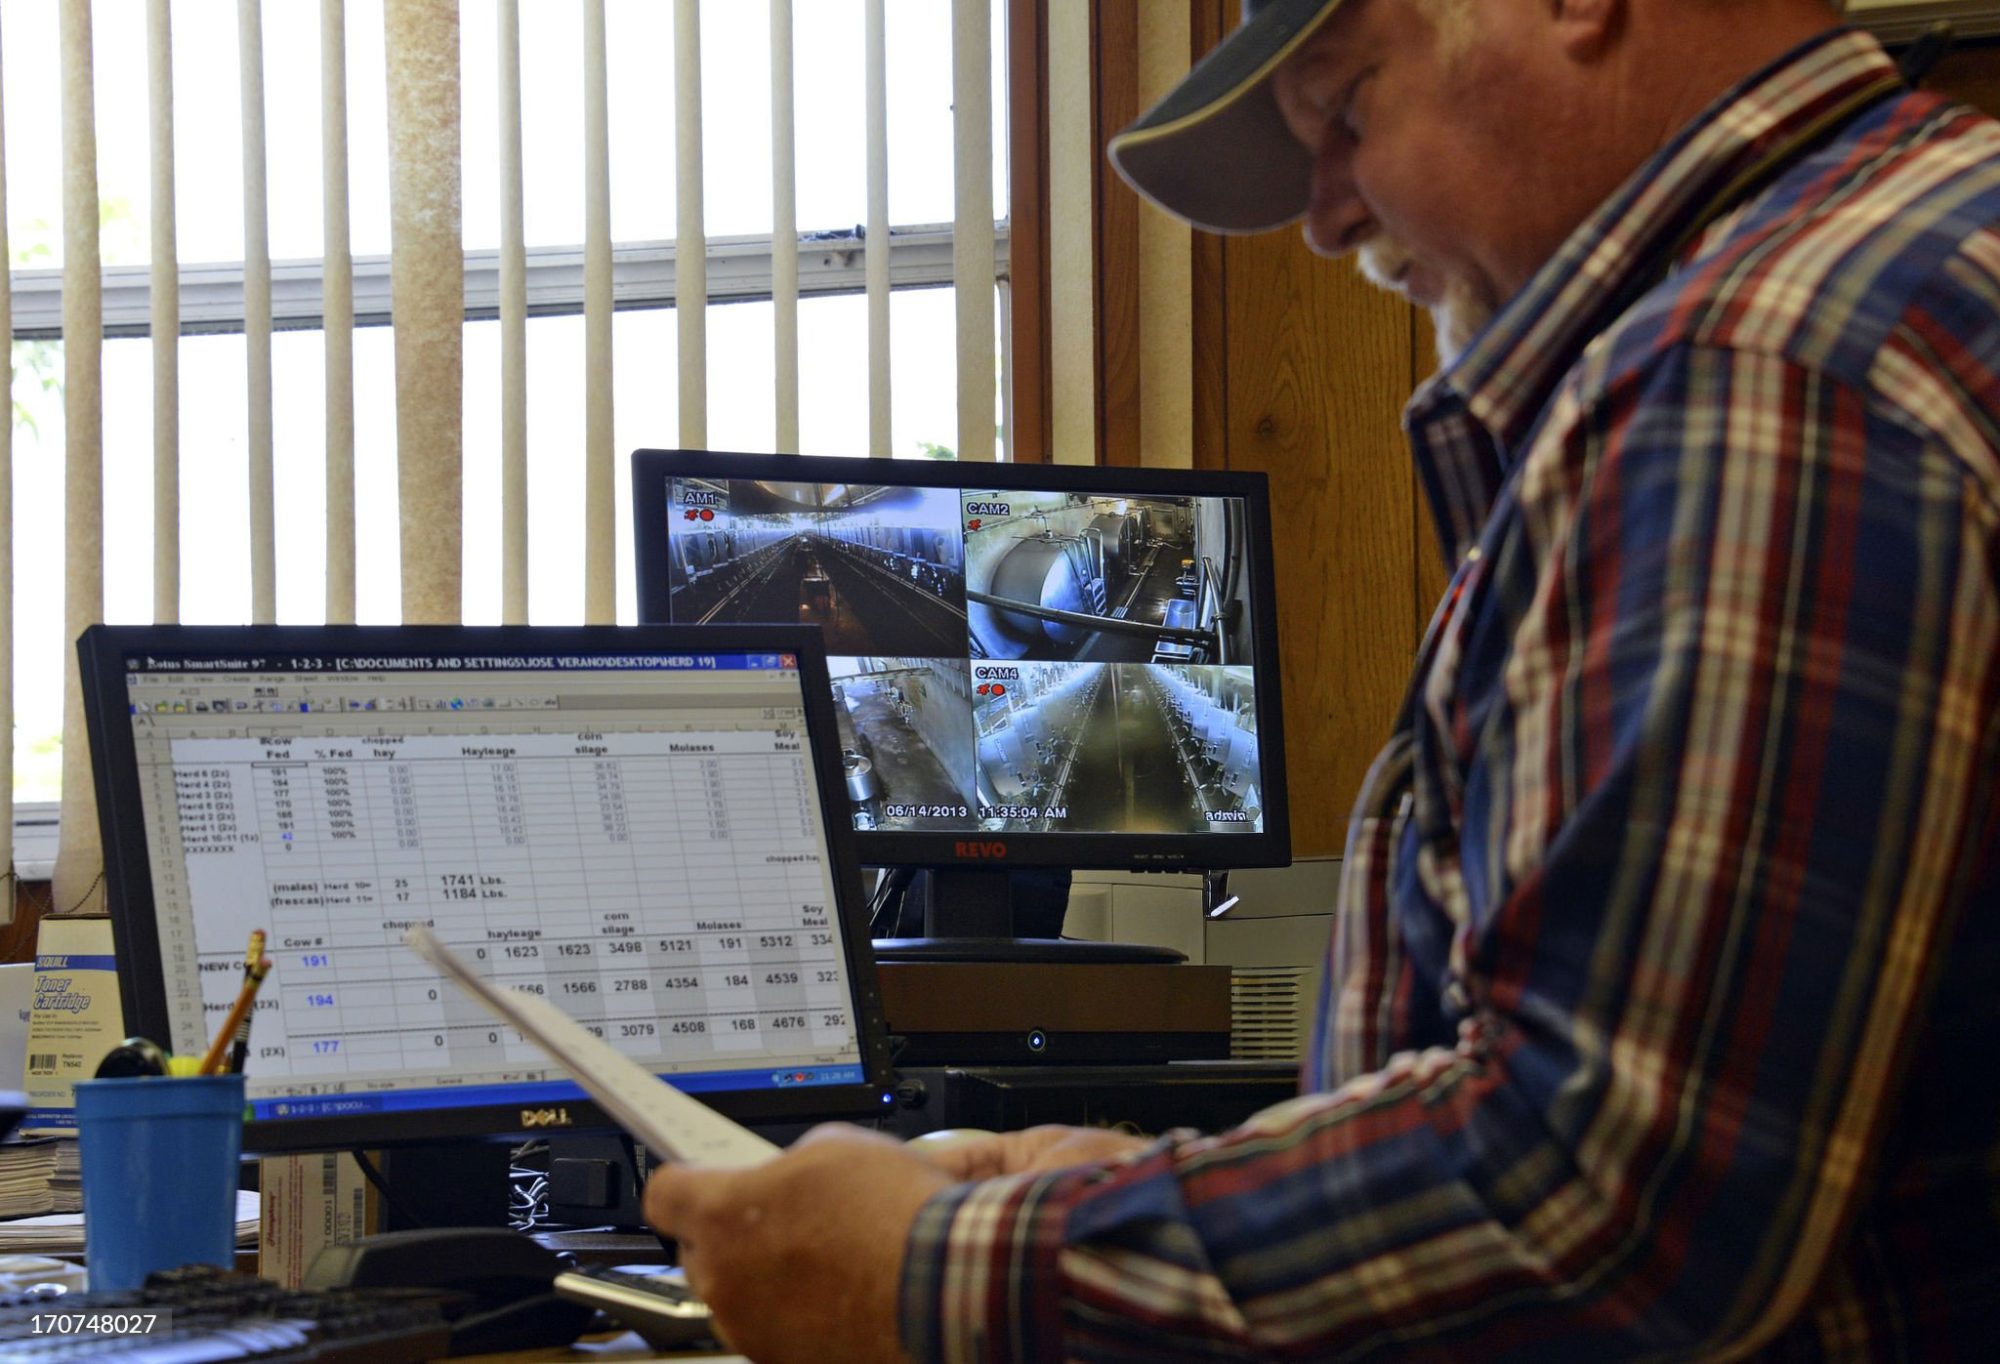
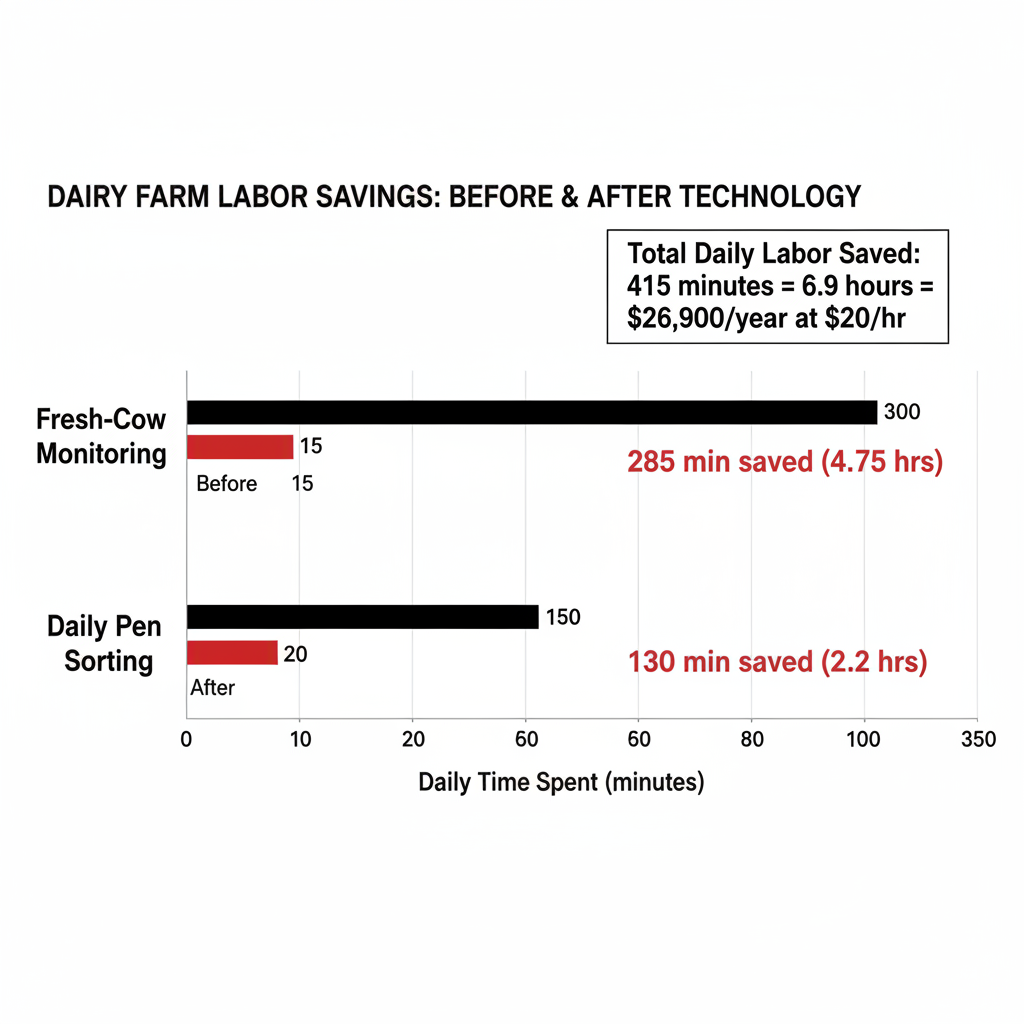
So, where do you find $20,000 to $45,000 you’re not currently capturing? Not from buying new equipment. From actually using what’s already in the barn. Dan Reuter used to spend up to five hours a day locked up with fresh cows at his 850-cow operation in Peosta, Iowa. He had activity collars on every animal — but they were basically expensive heat-detection tags. When he finally turned on the rumination-based fresh-cow reports, his morning check dropped to five or ten minutes, twice a day, at the computer. “I can check fresh cows in the morning in five or 10 minutes and then go work on only the ones that need help versus being in the barns for five hours,” Reuter told a Progressive Dairy roundtable in 2019. That’s seven-year-old data — the technology has only gotten more capable since, which makes his results a conservative baseline, not a ceiling.
The Adoption Numbers Look Great. The ROI of Dairy Technology Doesn’t Add Up.
USDA’s Economic Research Service published ERR-356 on January 22, 2026, covering five waves of ARMS data from 2000 through 2021 (McFadden and Raff). The adoption picture is strong:
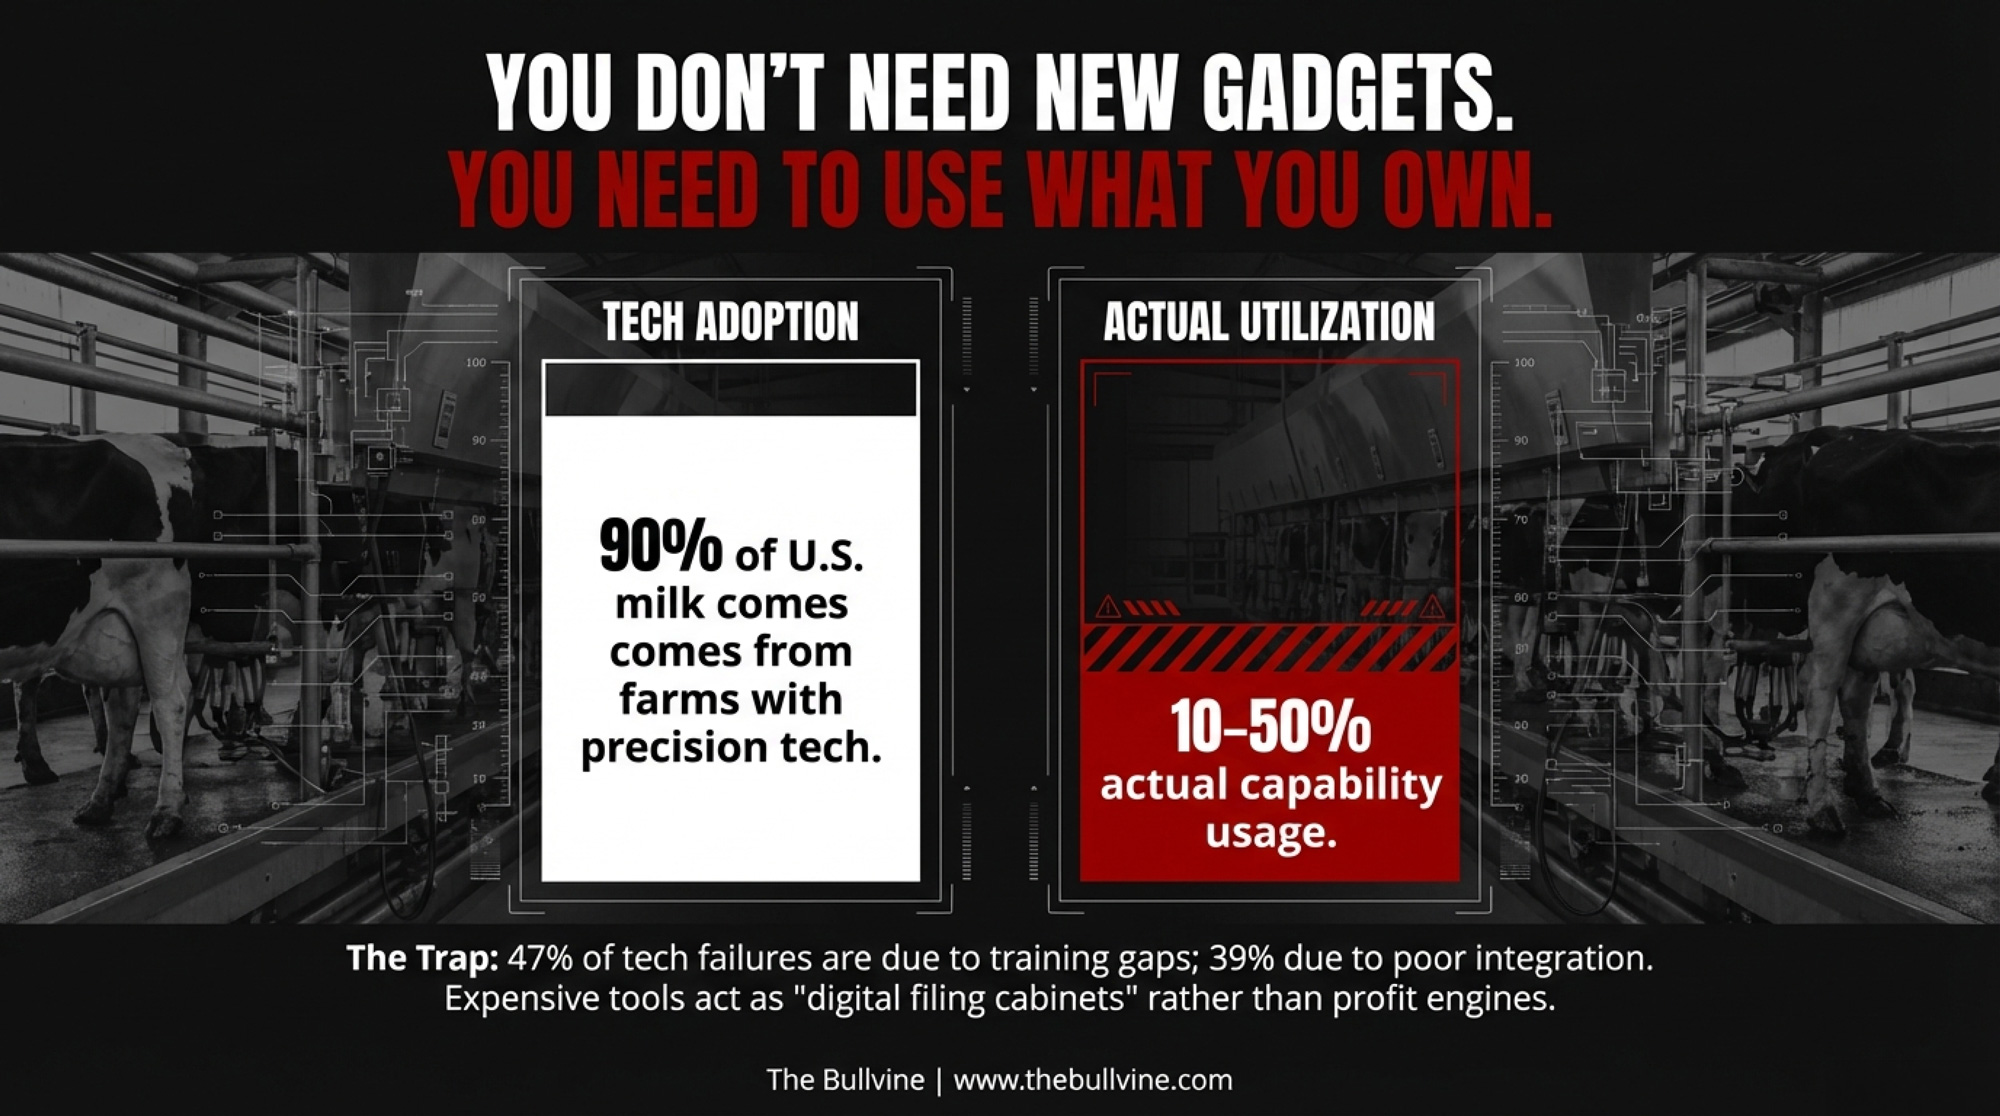
- 90%+ of U.S. milk production now comes from farms using individual cow records, nutritionist-designed feed, or reproduction-related technologies
- Roughly half of all U.S. milk is produced on farms using computerized feed delivery
- Precision dairy technology adoption overall jumped from 24% in 2000 to 46% by 2021
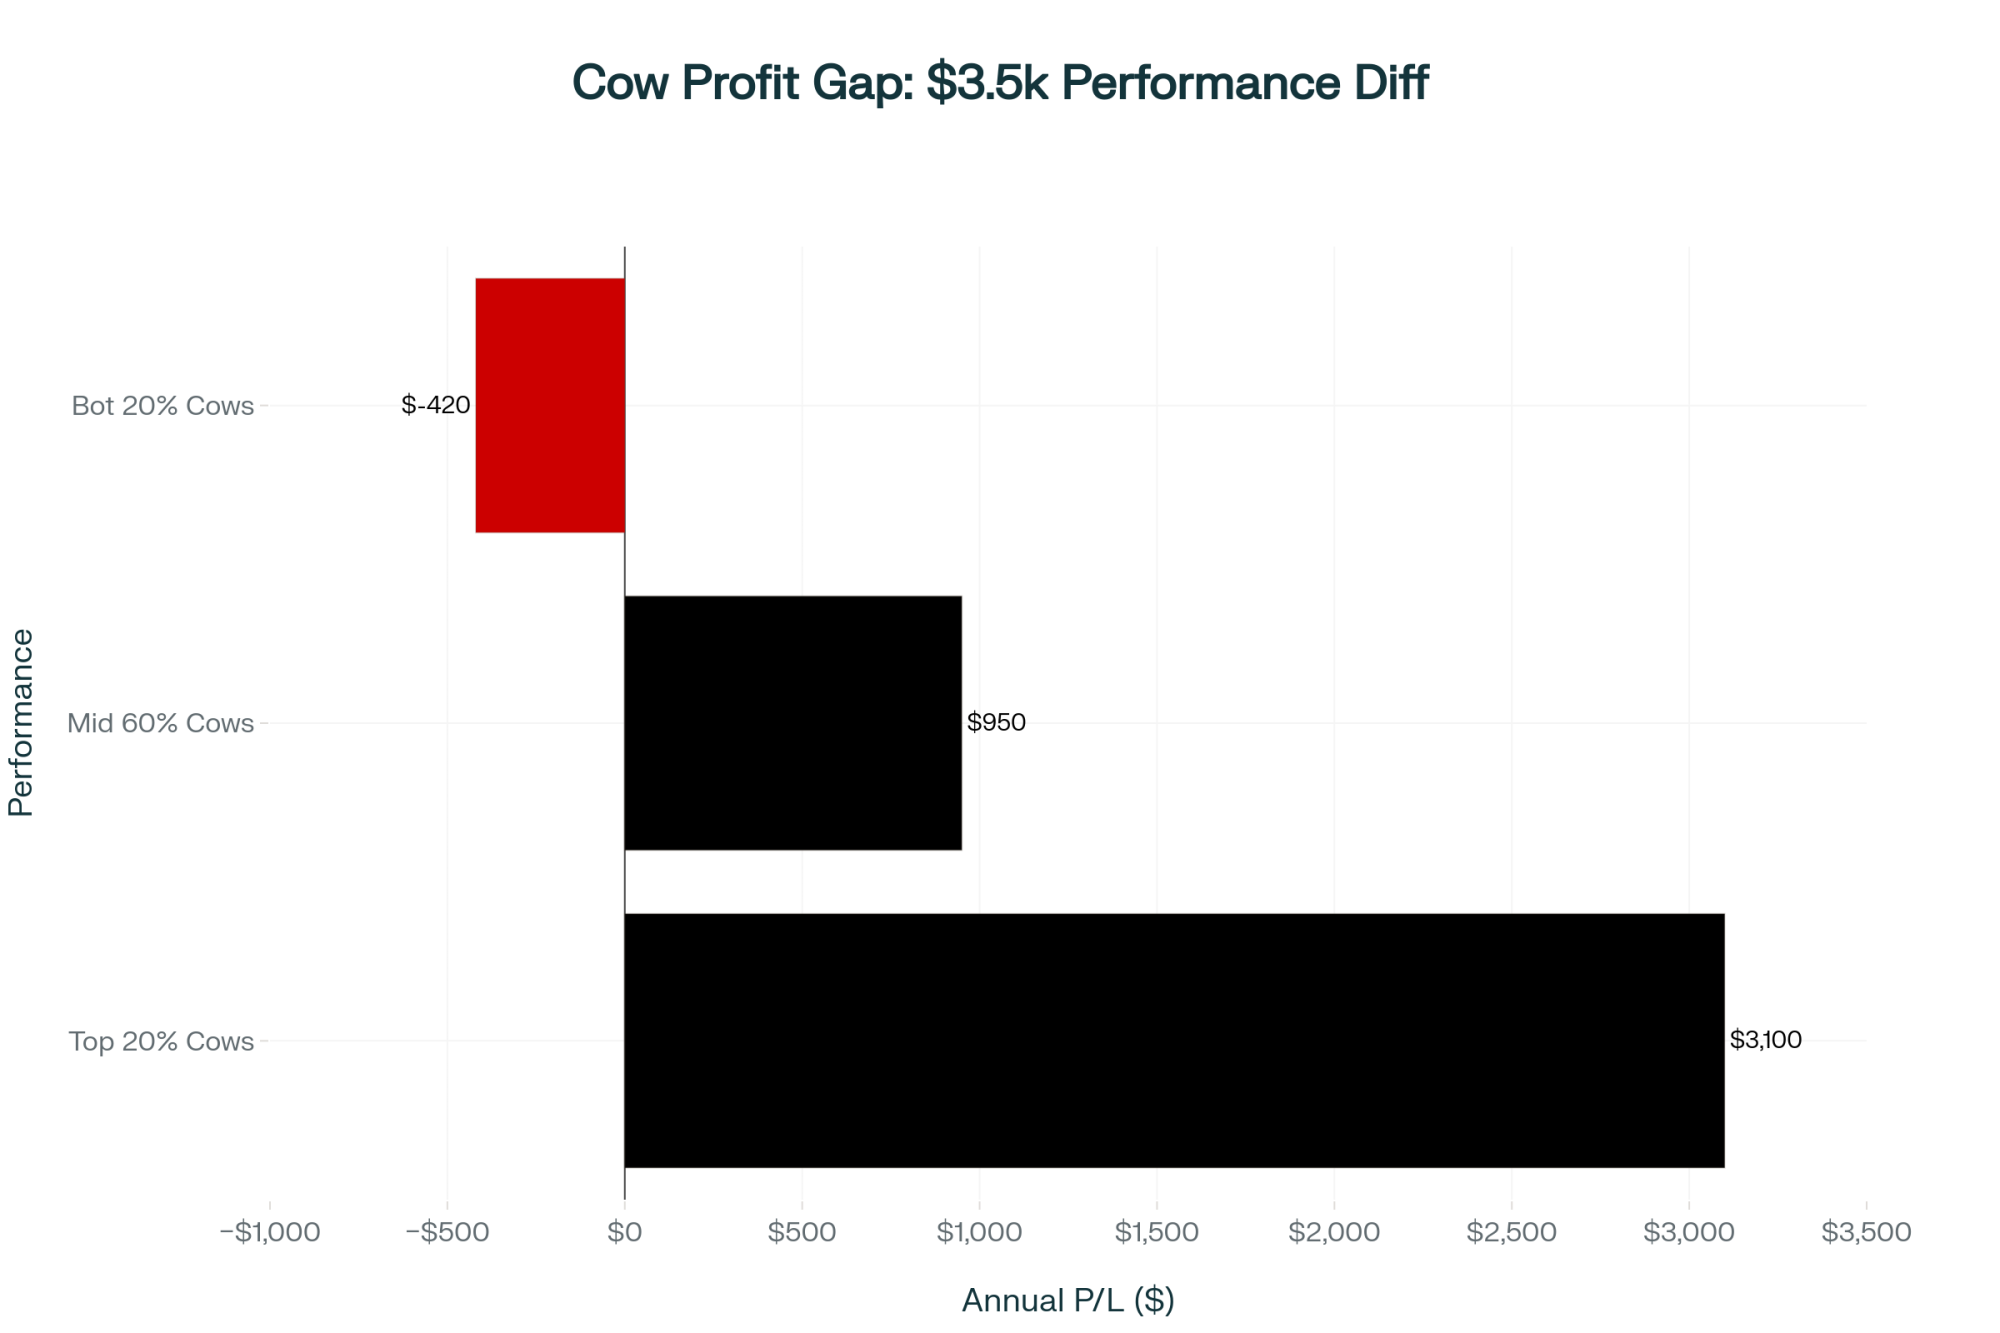
- Operations using two or more classes of precision technologies show 13% higher dairy net returns than non-adopters, on average — an adjusted treatment effect controlling for selection
But ERR-356 doesn’t measure depth of use. Two academic studies fill that gap:
- A 2024 Colorado State University study of 266 dairy farm employees found 93.7% said technology made them more efficient — but 31% cited not knowing the language of the technology as their primary barrier to full use (Erickson et al., Translational Animal Science)
- A University of Wisconsin–Madison study (Fadul-Pacheco et al., Animals, 2022) found that 14% of temperature and activity sensors and 13% of sort gates are abandoned—not due to hardware failure, but to integration failure.
And The Bullvine’s own April 2025 analysis of dairy tech failures told the same story from the dollar side: 47% of failed implementations were linked to inadequate training (averaging $18,200 in losses per failure) and 39% to poor system integration (averaging $23,500). Over 40% of farmers avoided cloud-based solutions entirely because of compatibility issues. One northern Minnesota producer learned the hard way when air-powered sort gate components failed during a cold snap because they hadn’t been properly winterized — shutting down his entire sorting operation for three days during breeding season. A small detail, but the kind that makes or breaks a six-figure investment.
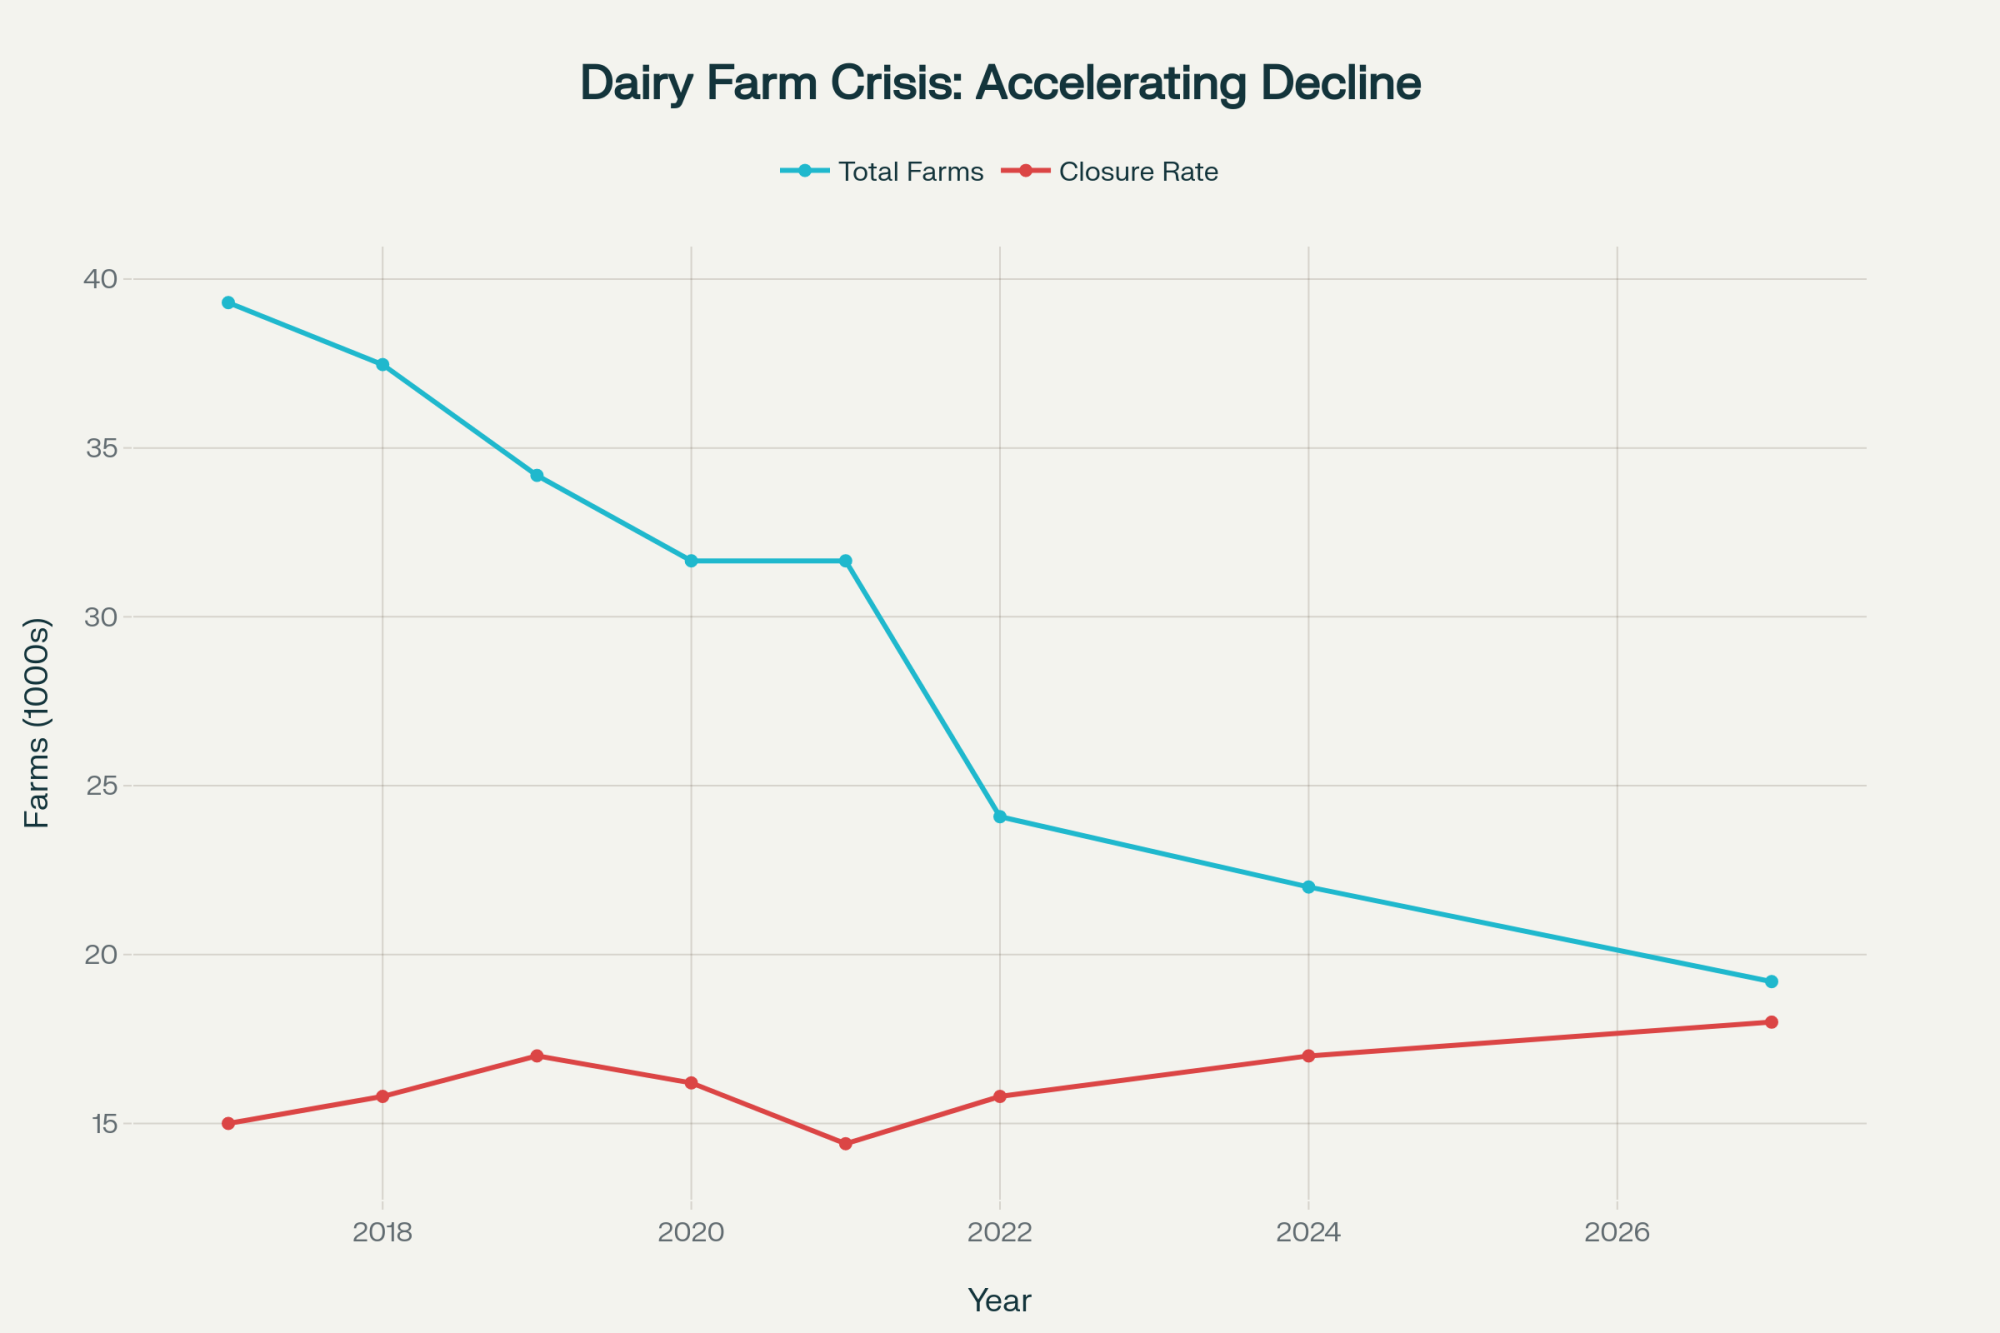
The operations most exposed? Mid-size progressive dairies in the 200- to 2,000-cow range. Large enough to have invested in collars, software, and automation. Rarely staffed with a dedicated integration person. And with Rabobank projecting roughly 2,800 U.S. dairy closures per year through 2027, the margin for wasted capacity no longer exists.
| Technology Type | Adoption Rate | Underutilization Rate | Primary Barrier | Avg. Loss per Failure |
| Activity/Rumination Collars | 90%+ of U.S. milk | 14% abandoned | Language barrier (31% cite) | $18,200 |
| Herd Management Software | 94% (large ops) | Used as “filing cabinet” | Poor system integration (39%) | $23,500 |
| Automated Sort Gates | ~50% (progressive herds) | 13% abandoned | “Sticky-note override” common | $18,200 |
| Precision Feeding Systems | 50% of U.S. milk | 10–50% capability use | Inadequate training | $18,200hnology has only gotten more |
Three Profit Leaks Hiding in Plain Sight
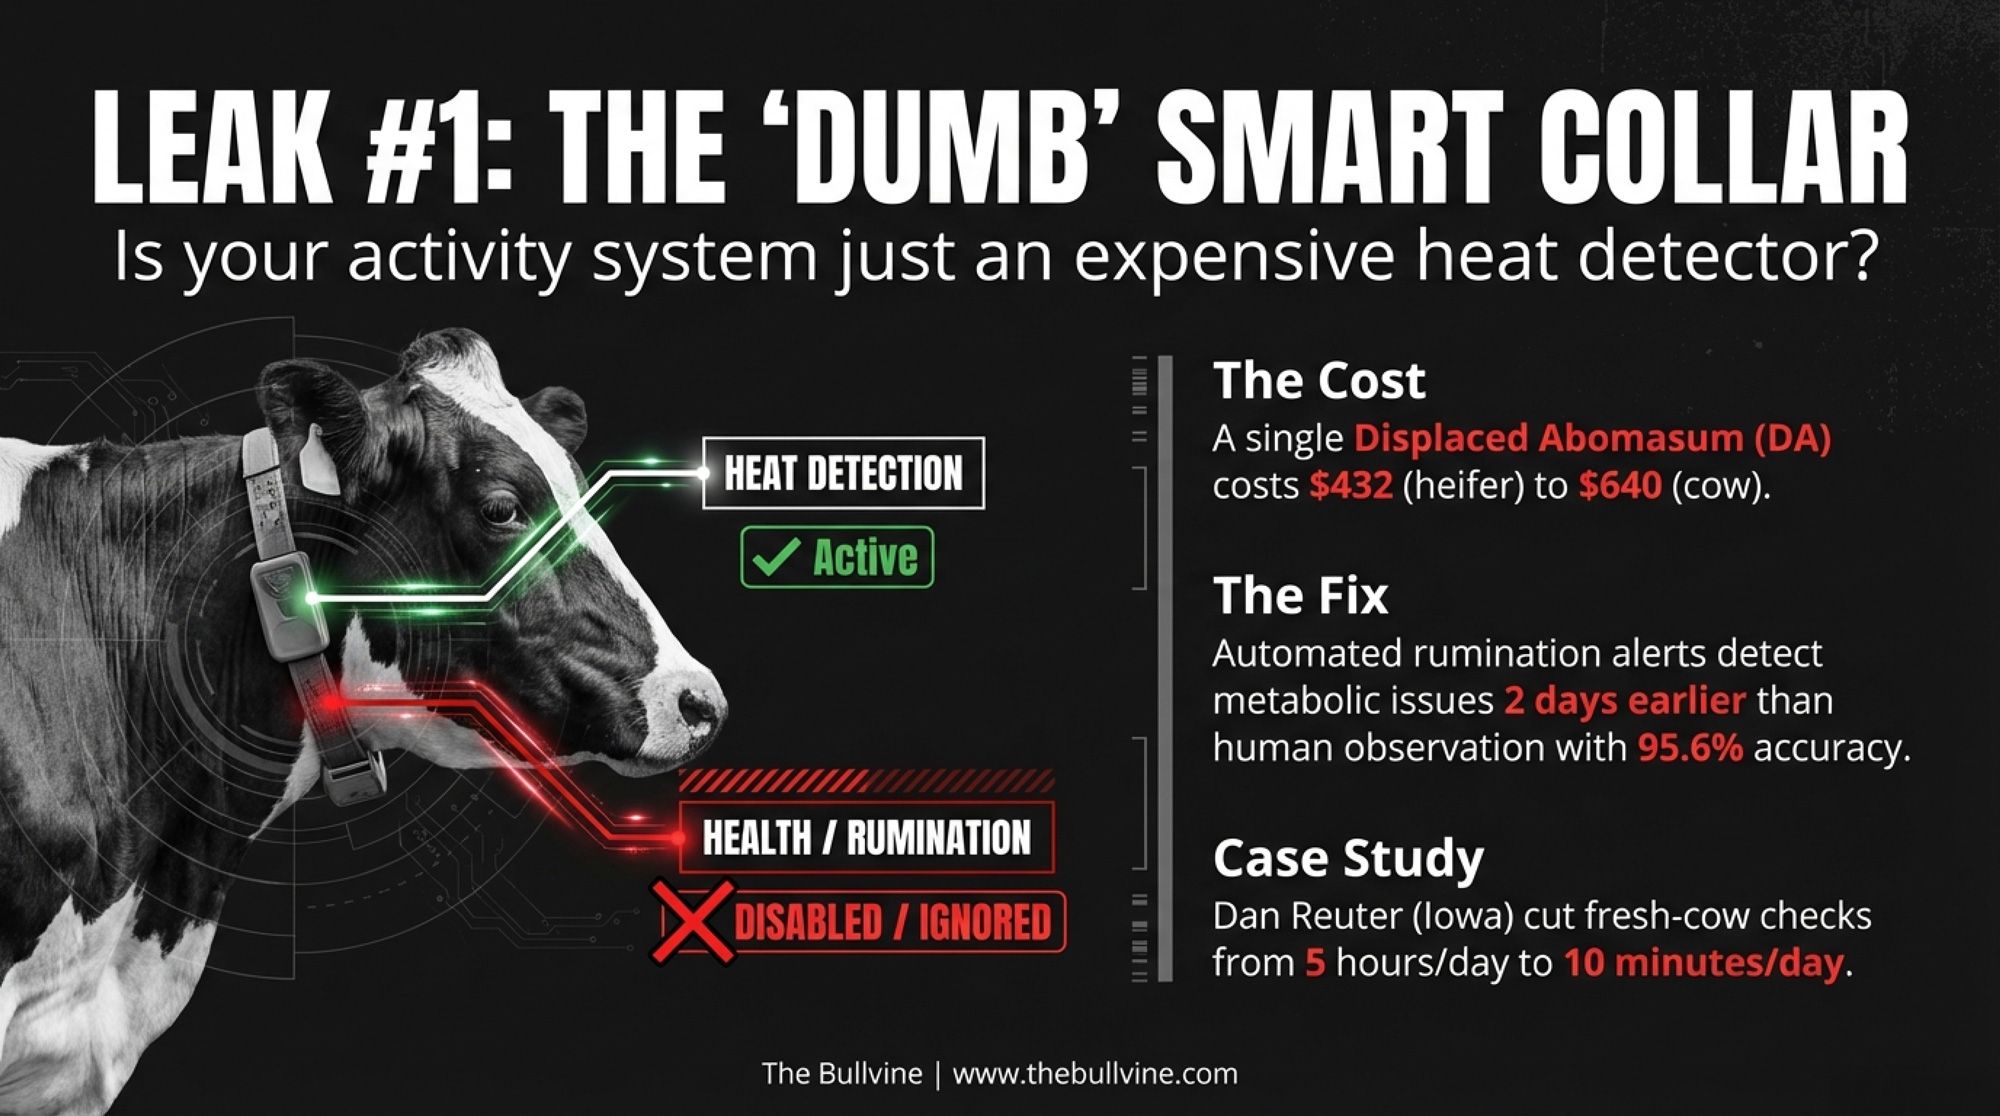
Leak #1: Collars that only detect heats. Modern activity collars track rumination, eating behaviour, and health indices around the clock. On most farms, they function as estrus-detection devices — one of a dozen capabilities. Brian Waymire, dairy manager at a roughly 4,500-cow operation across two dairies in Hanford, California, built daily rumination threshold reports into his fresh-cow protocol. In a 2019 industry roundtable, he reported that fresh-cow treatments dropped by two-thirds. His team eliminated routine temperature-taking entirely in the early post-partum period. Like Reuter’s numbers, that’s 2019 data — treat it as a floor for what’s possible today.
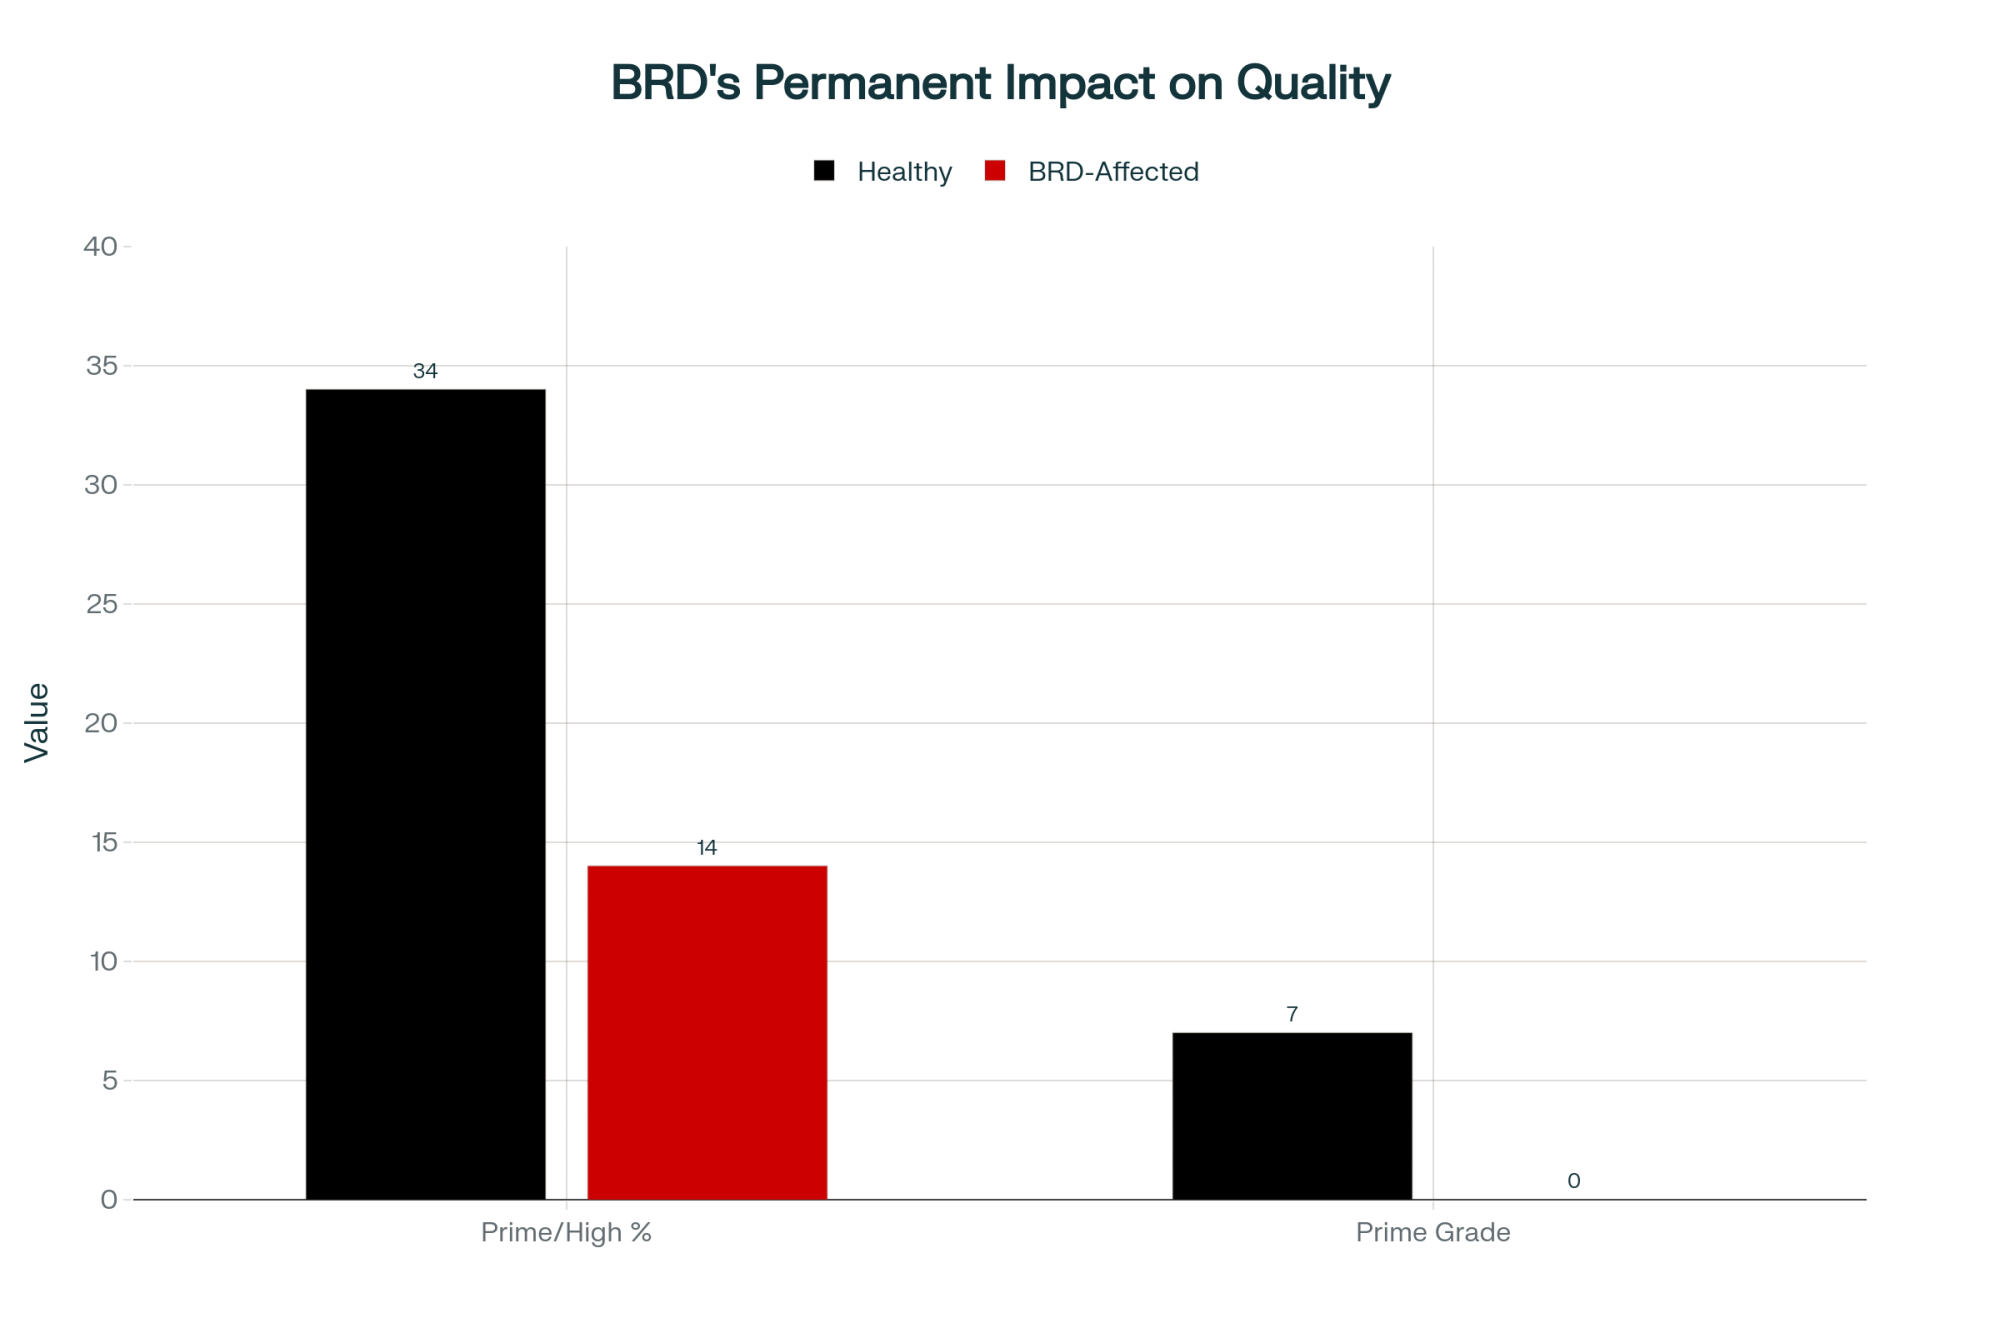
Cornell University work led by Julio Giordano (published 2022; data from 2013–2014) showed collar-based rumination and activity monitoring detected metabolic and digestive disorders with 95.6% accuracy in the first 80 days in milk, catching problems an average of 2.1 days earlier than skilled farm personnel, with just a 2.4% false-positive rate.
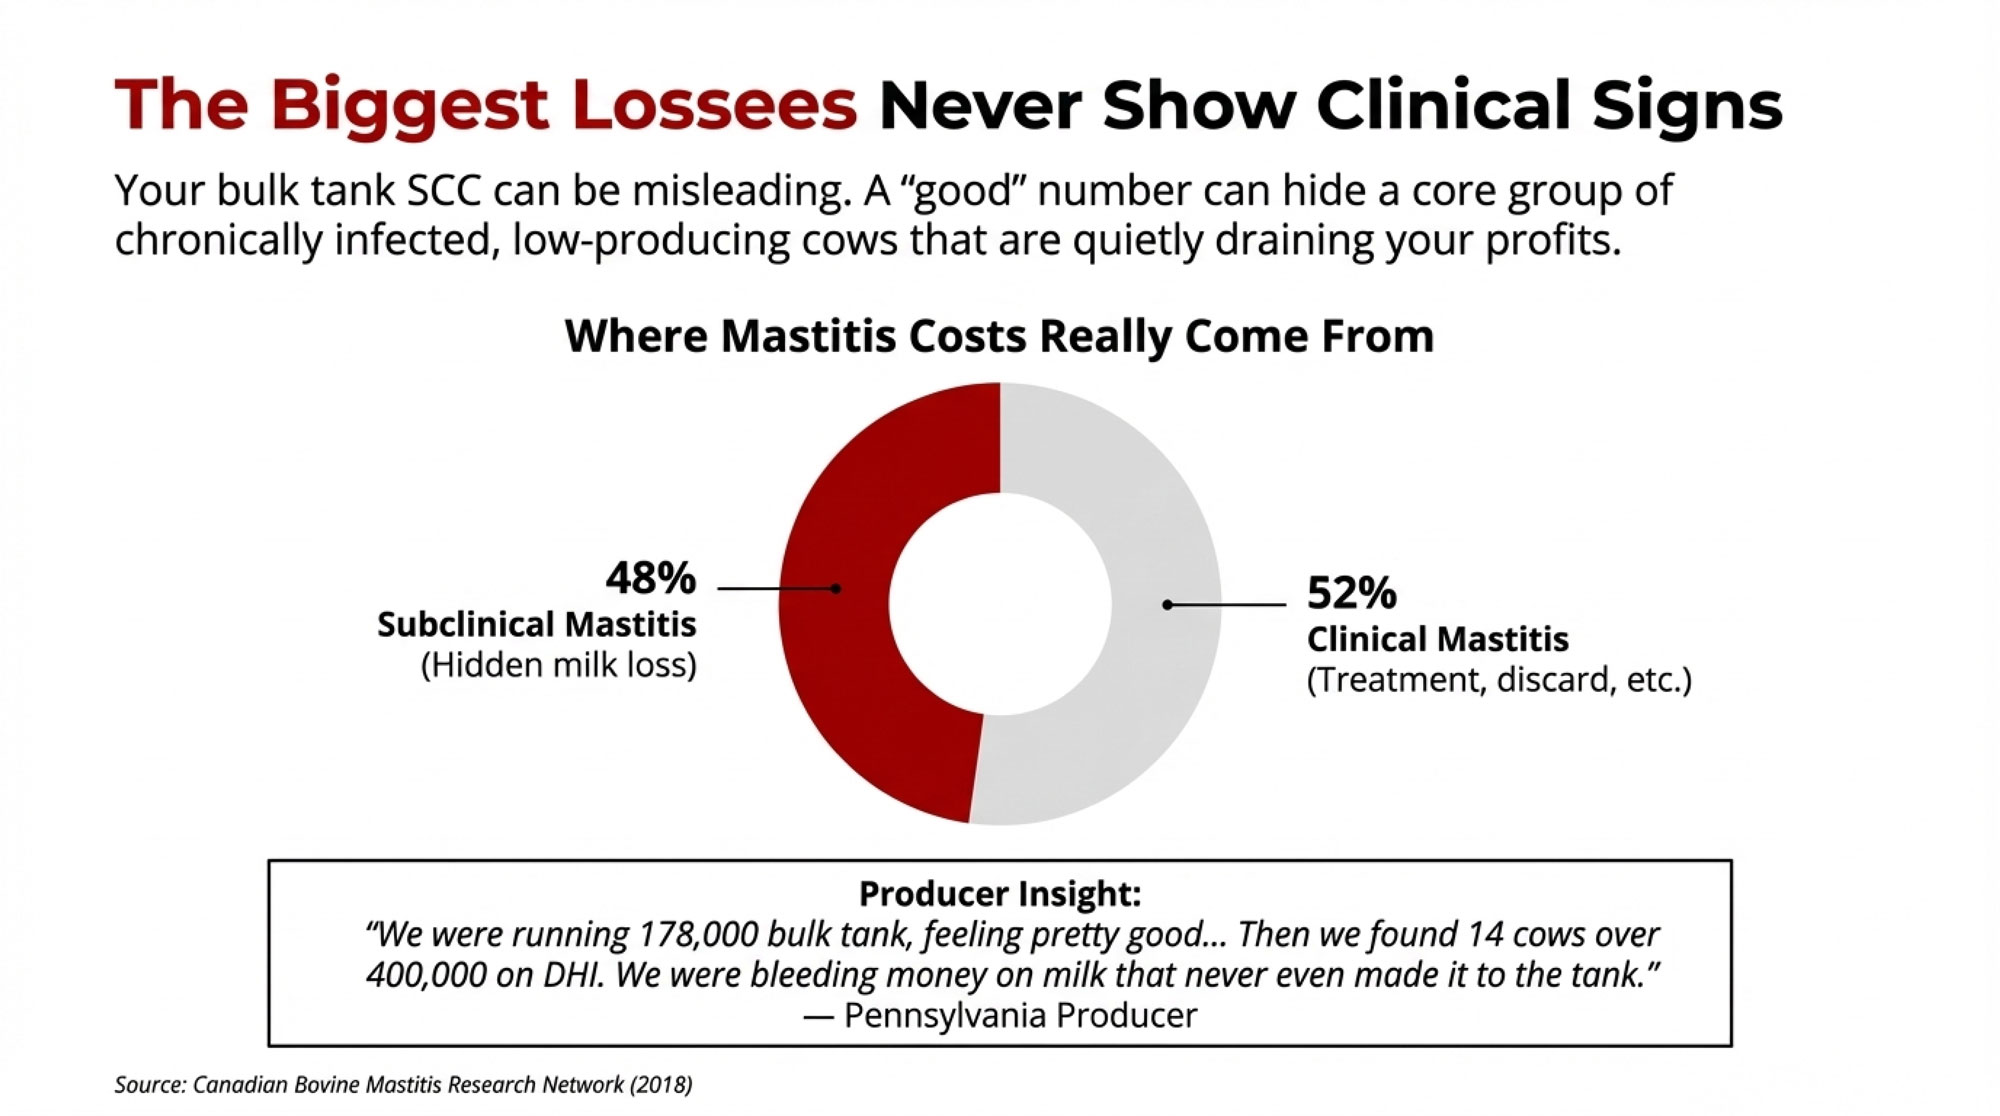
The Cost of a Single DA: $432 per heifer, $640 per cow — including treatment, milk loss, reproductive impact, and culling risk (Liang et al., Journal of Dairy Science, 2017). Catching five to ten cases early on a 400-cow herd saves $2,000–$6,000 in direct DA costs alone — and the early-detection benefit extends to ketosis, metritis, and other fresh-cow conditions where intervention costs compound fast.
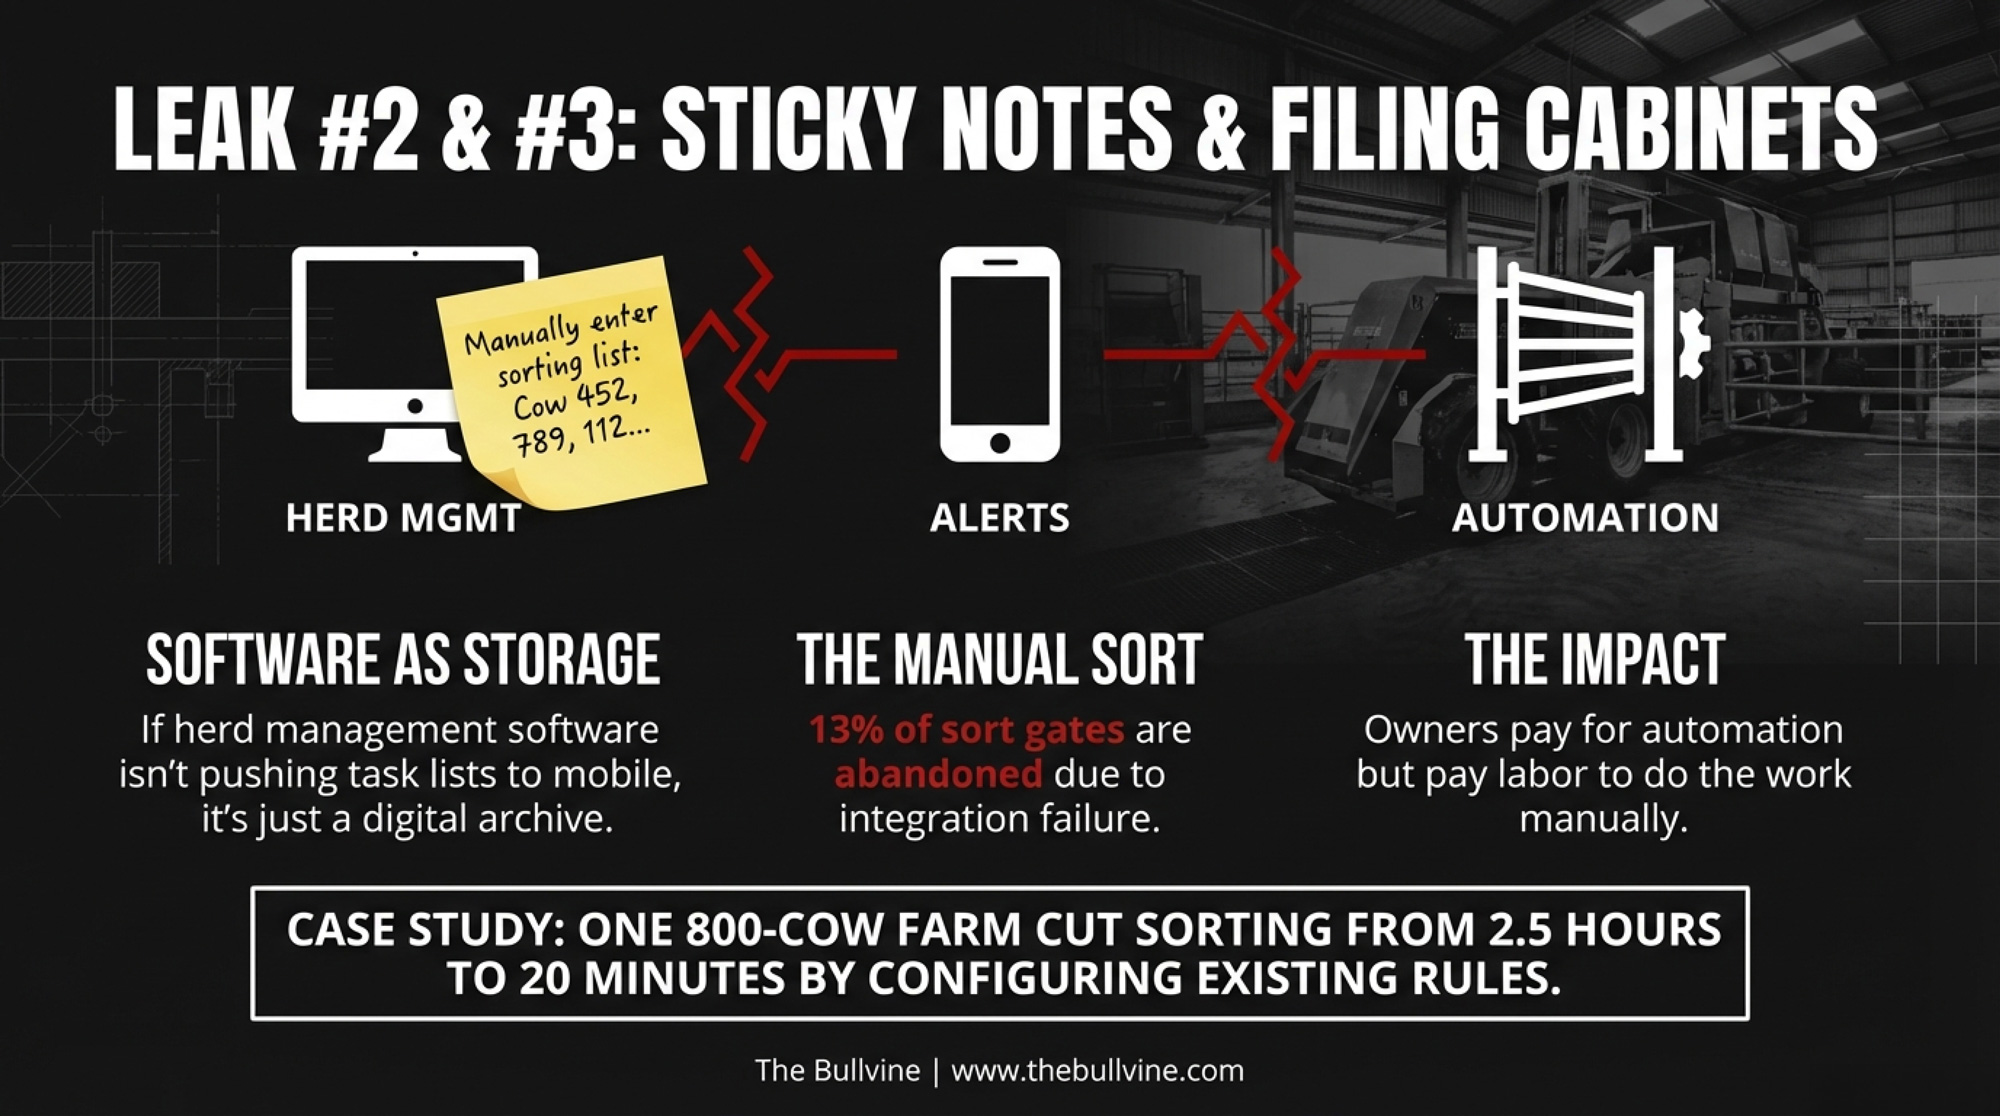
Leak #2: Herd software used as a filing cabinet. USDA’s NAHMS Dairy 2014 study found 94% of large operations(500+ cows) used an on-farm computer record-keeping system. But too many farms treat their software as a digital record book — entering freshenings, breedings, and treatments, then printing an occasional repro summary. Modern platforms generate protocol-based daily task lists, push them to mobile devices, and set threshold alerts for milk drops or SCC spikes. When those features sit dormant, someone’s handwriting reproduces lists on a whiteboard — and cows with early metabolic signals slip through until they’re clinically obvious.
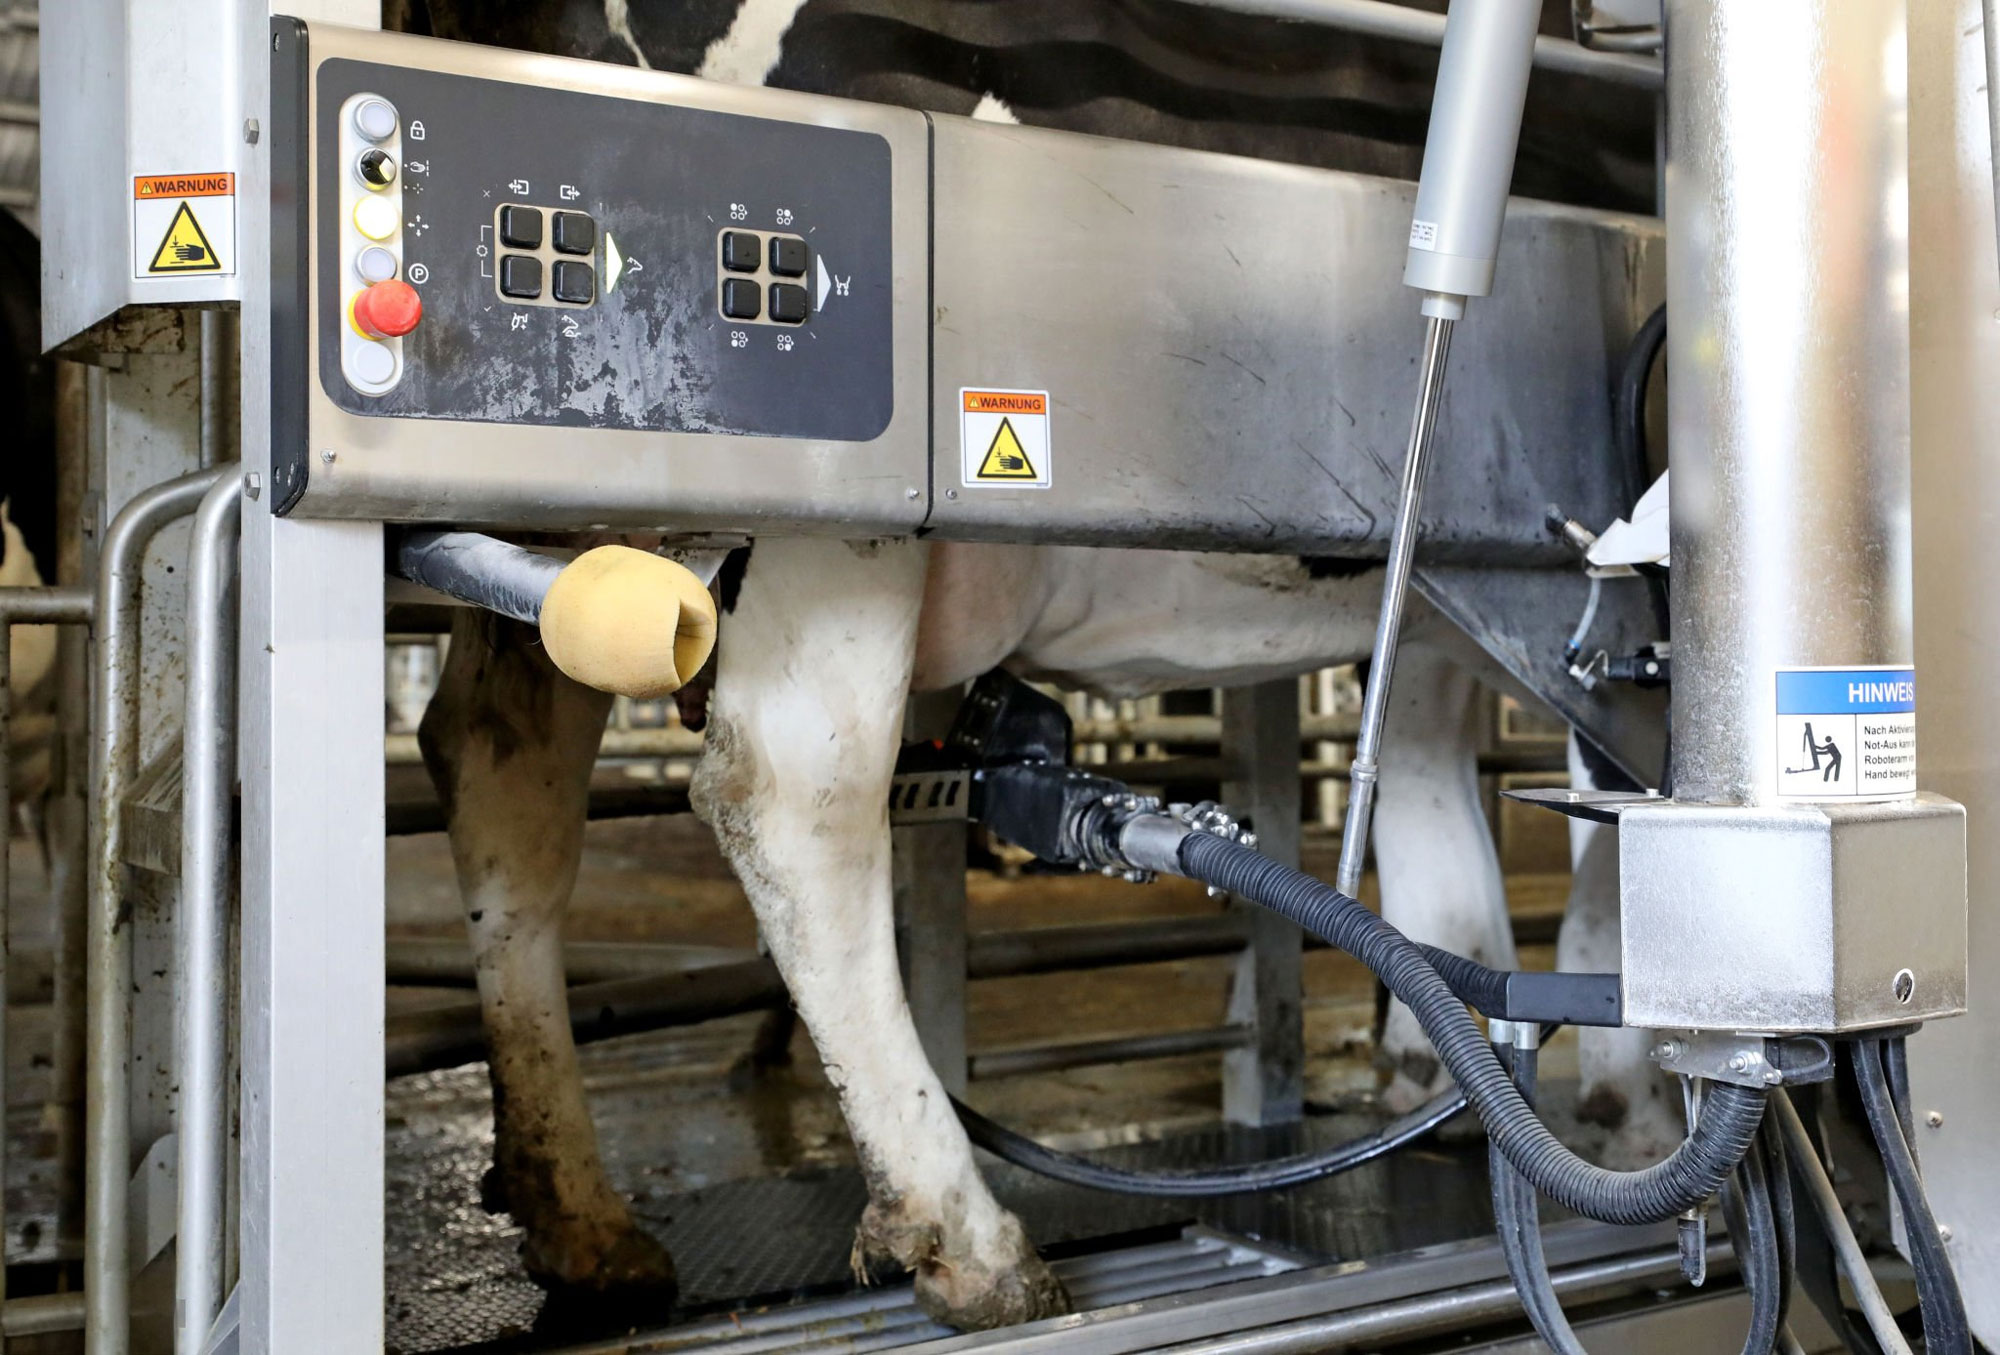
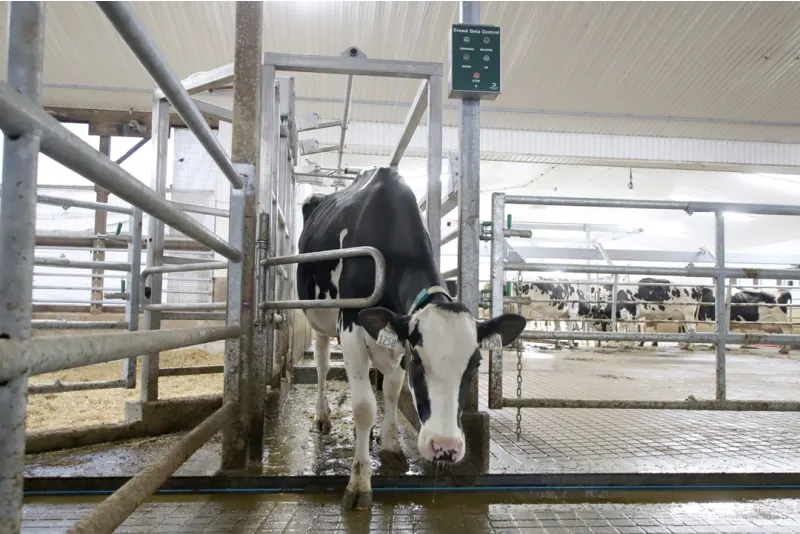
Leak #3: Sort gates running on sticky notes. An 800-cow operation profiled in The Bullvine’s July 2025 sort gate analysis cut daily sorting from 2.5 hours to roughly 20 minutes by configuring and trusting the automated rules. At a 1,100-cow all-Jersey operation in Melba, Idaho — running automated meters, sort gates, and leg tags since 1999 — the owner described the shift: the gates “freed up time for that employee that was normally in the back of the barn, watching cows and catching cows”. Sort accuracy: 99%. The hardware was already there. The missing piece was integration and confidence.
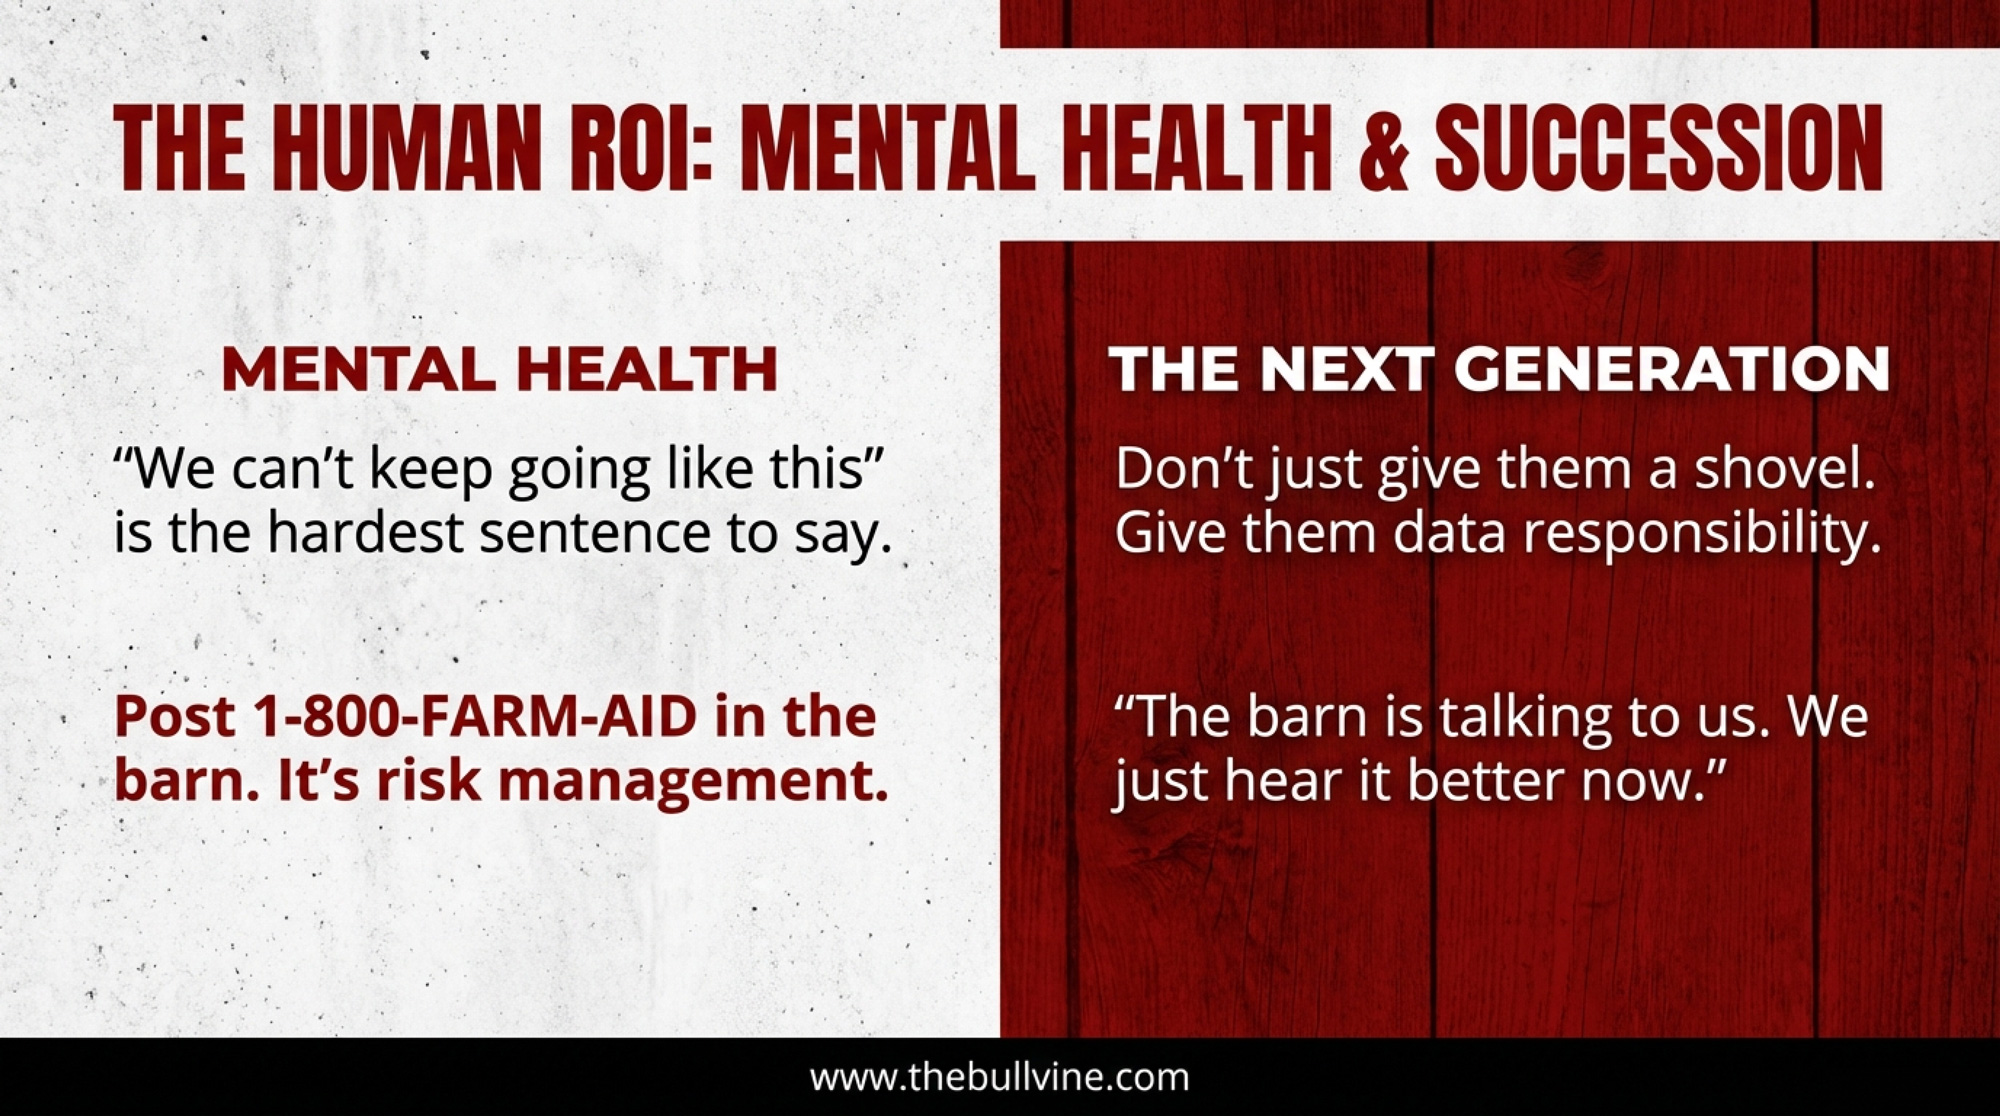
📌 The Language Barrier: The Utilization Problem Nobody Talks About

31% of dairy farm employees say not knowing the language of the technology is their biggest barrier. Not the tech itself—the language.
When dashboards and manuals are English-only and your frontline crew speaks Spanish, the system defaults to whichever employee happens to read the interface. If they’re off that day, nobody checks the alerts. And yet 95.6% of those same employees said they felt comfortable using technology. They want to use it.
Your move: Ask whether your current system’s alerts, task lists, and dashboards exist in your crew’s primary language. Not all vendors offer Spanish-language interfaces yet — so that call may reveal a gap rather than a quick fix. But knowing the gap exists is the first step. A set of laminated bilingual visual checklists for the barn office costs almost nothing.
The Wiring Problem
Vendor ecosystems still don’t talk to each other. That Wisconsin data — 14% abandonment on activity sensors, 13% on sort gates — is largely an integration failure. The Bullvine’s own tech failure analysis found 39% of failed implementations traced back to poor system integration, costing an average of $23,500 per failure. The human becomes the integration layer. Printing lists, matching tag numbers, and standing at the sort lane with a stick. Which is exactly the job the technology was purchased to eliminate.
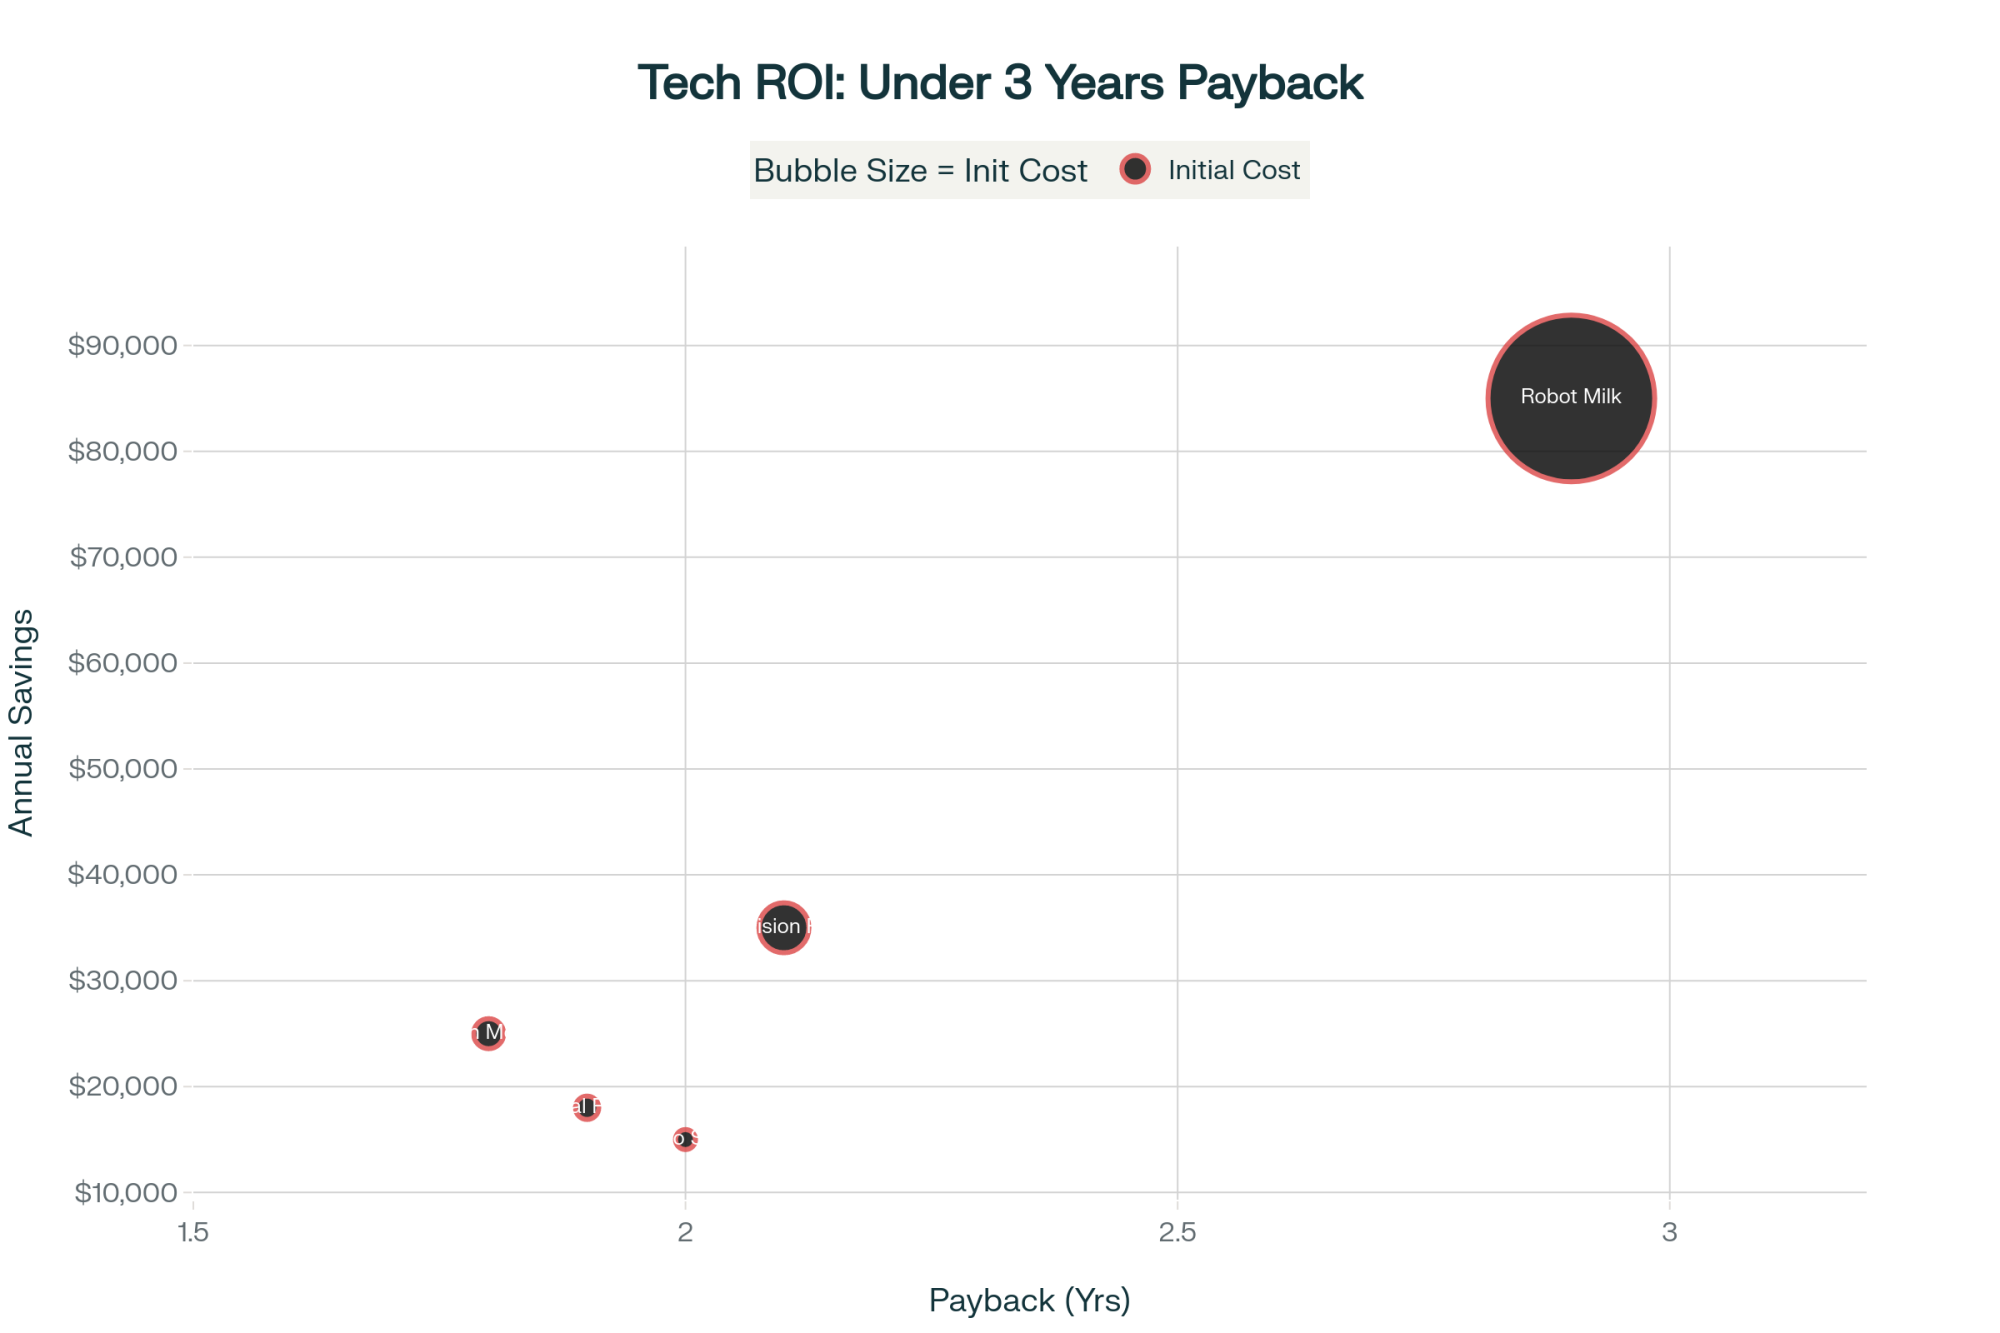
| Profit Leak | Current State | Activated State | Opportunity Cost/Cow | Annual Cost (400-cow herd) | Fix Timeline |
| Leak #1: Collars | Heat detection only | Rumination alerts, early DA/ketosis detection | $5–$15 | $2,000–$6,000 | Days 1–10 |
| Leak #2: Herd Software | Filing cabinet | Automated task lists, threshold alerts, mobile push | $25–$60 | $10,000–$24,000 | Days 11–21 |
| Leak #3: Sort Gates | Sticky-note override | Integrated sort rules, sync-drug savings via heat detection | $6 | $2,400 | Days 22–30 |
| TOTAL | — | — | $36–$81/cow | $14,400–$32,400 | 30 days |
ERR-356 found that adopters of precision tech spend less on paid labour, unpaid labour, and veterinary care than non-adopters. But that’s the adopter average. For the farms that installed the tech and then stopped learning it, those savings stay theoretical.
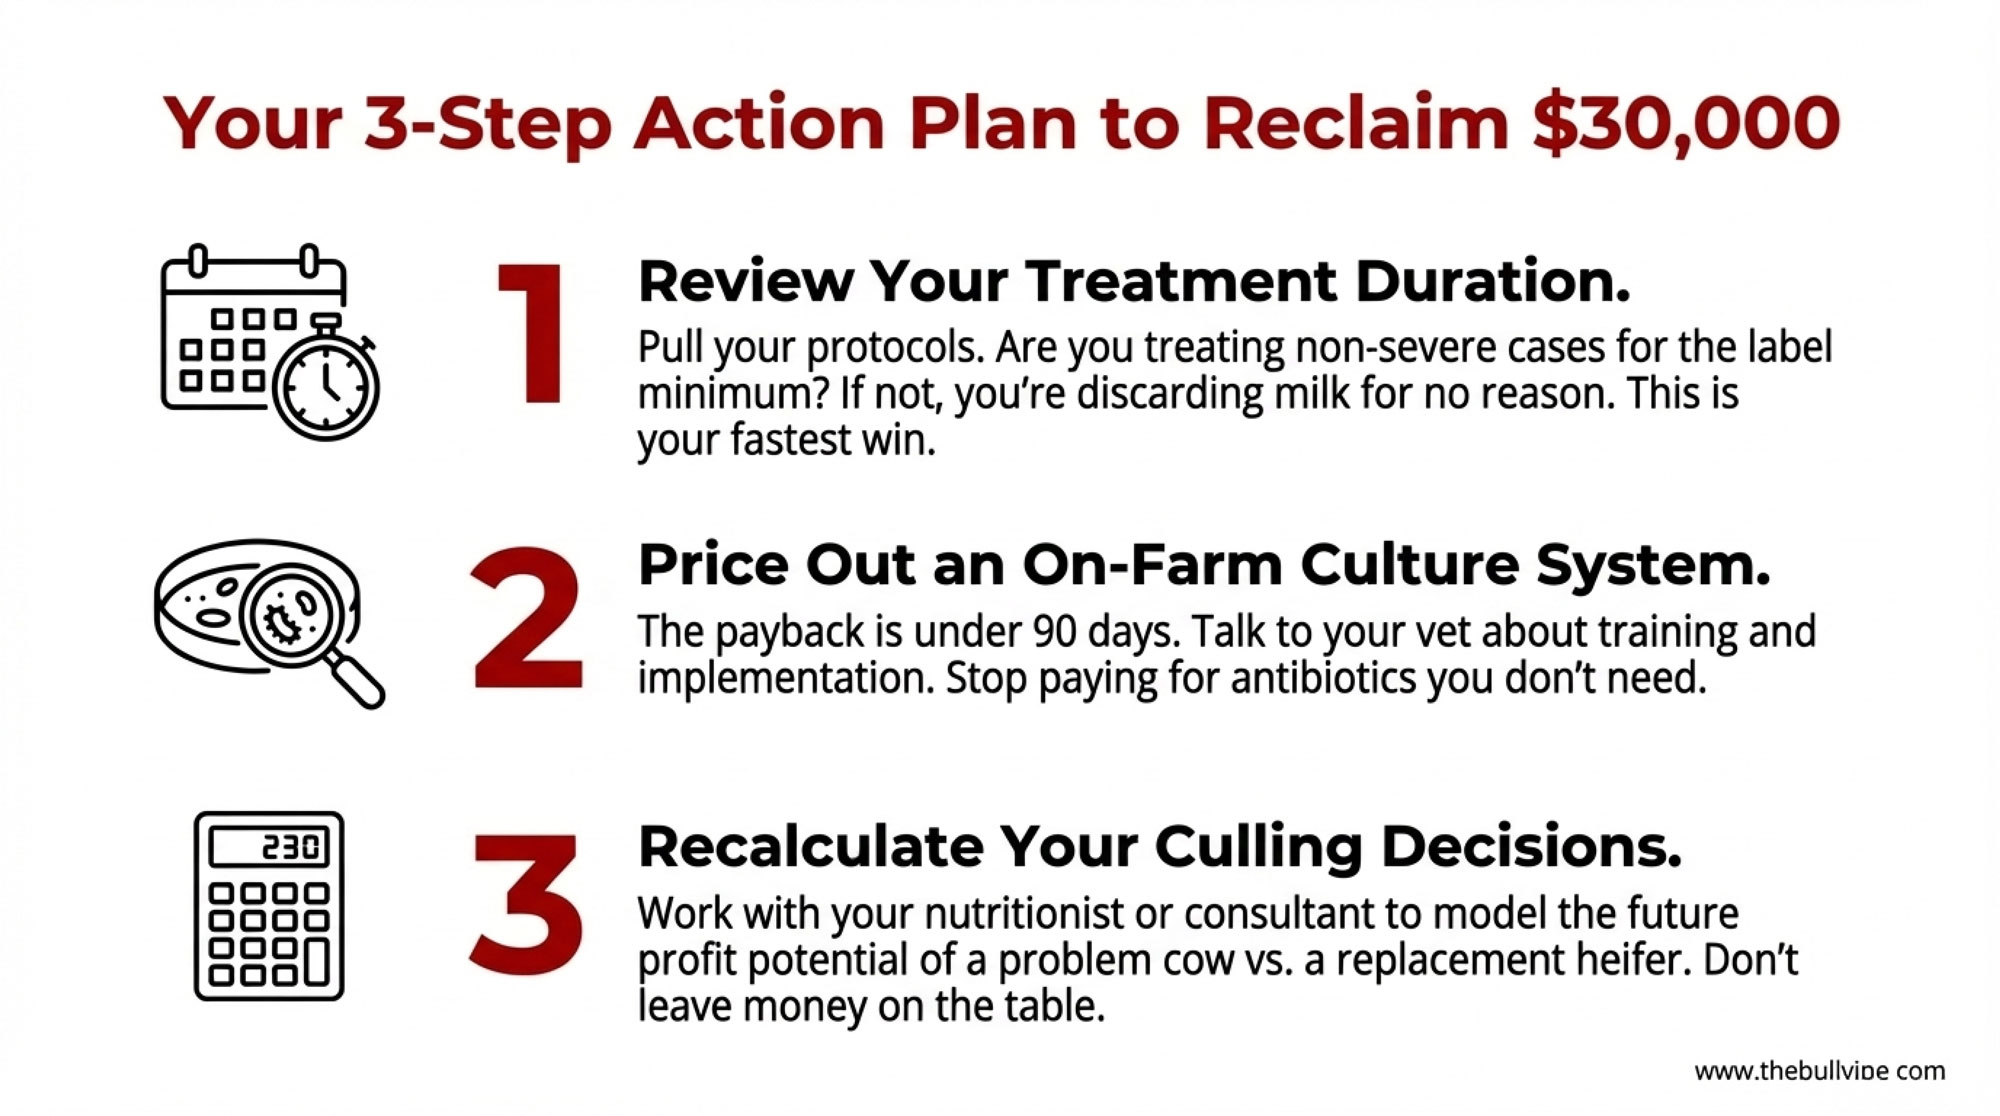
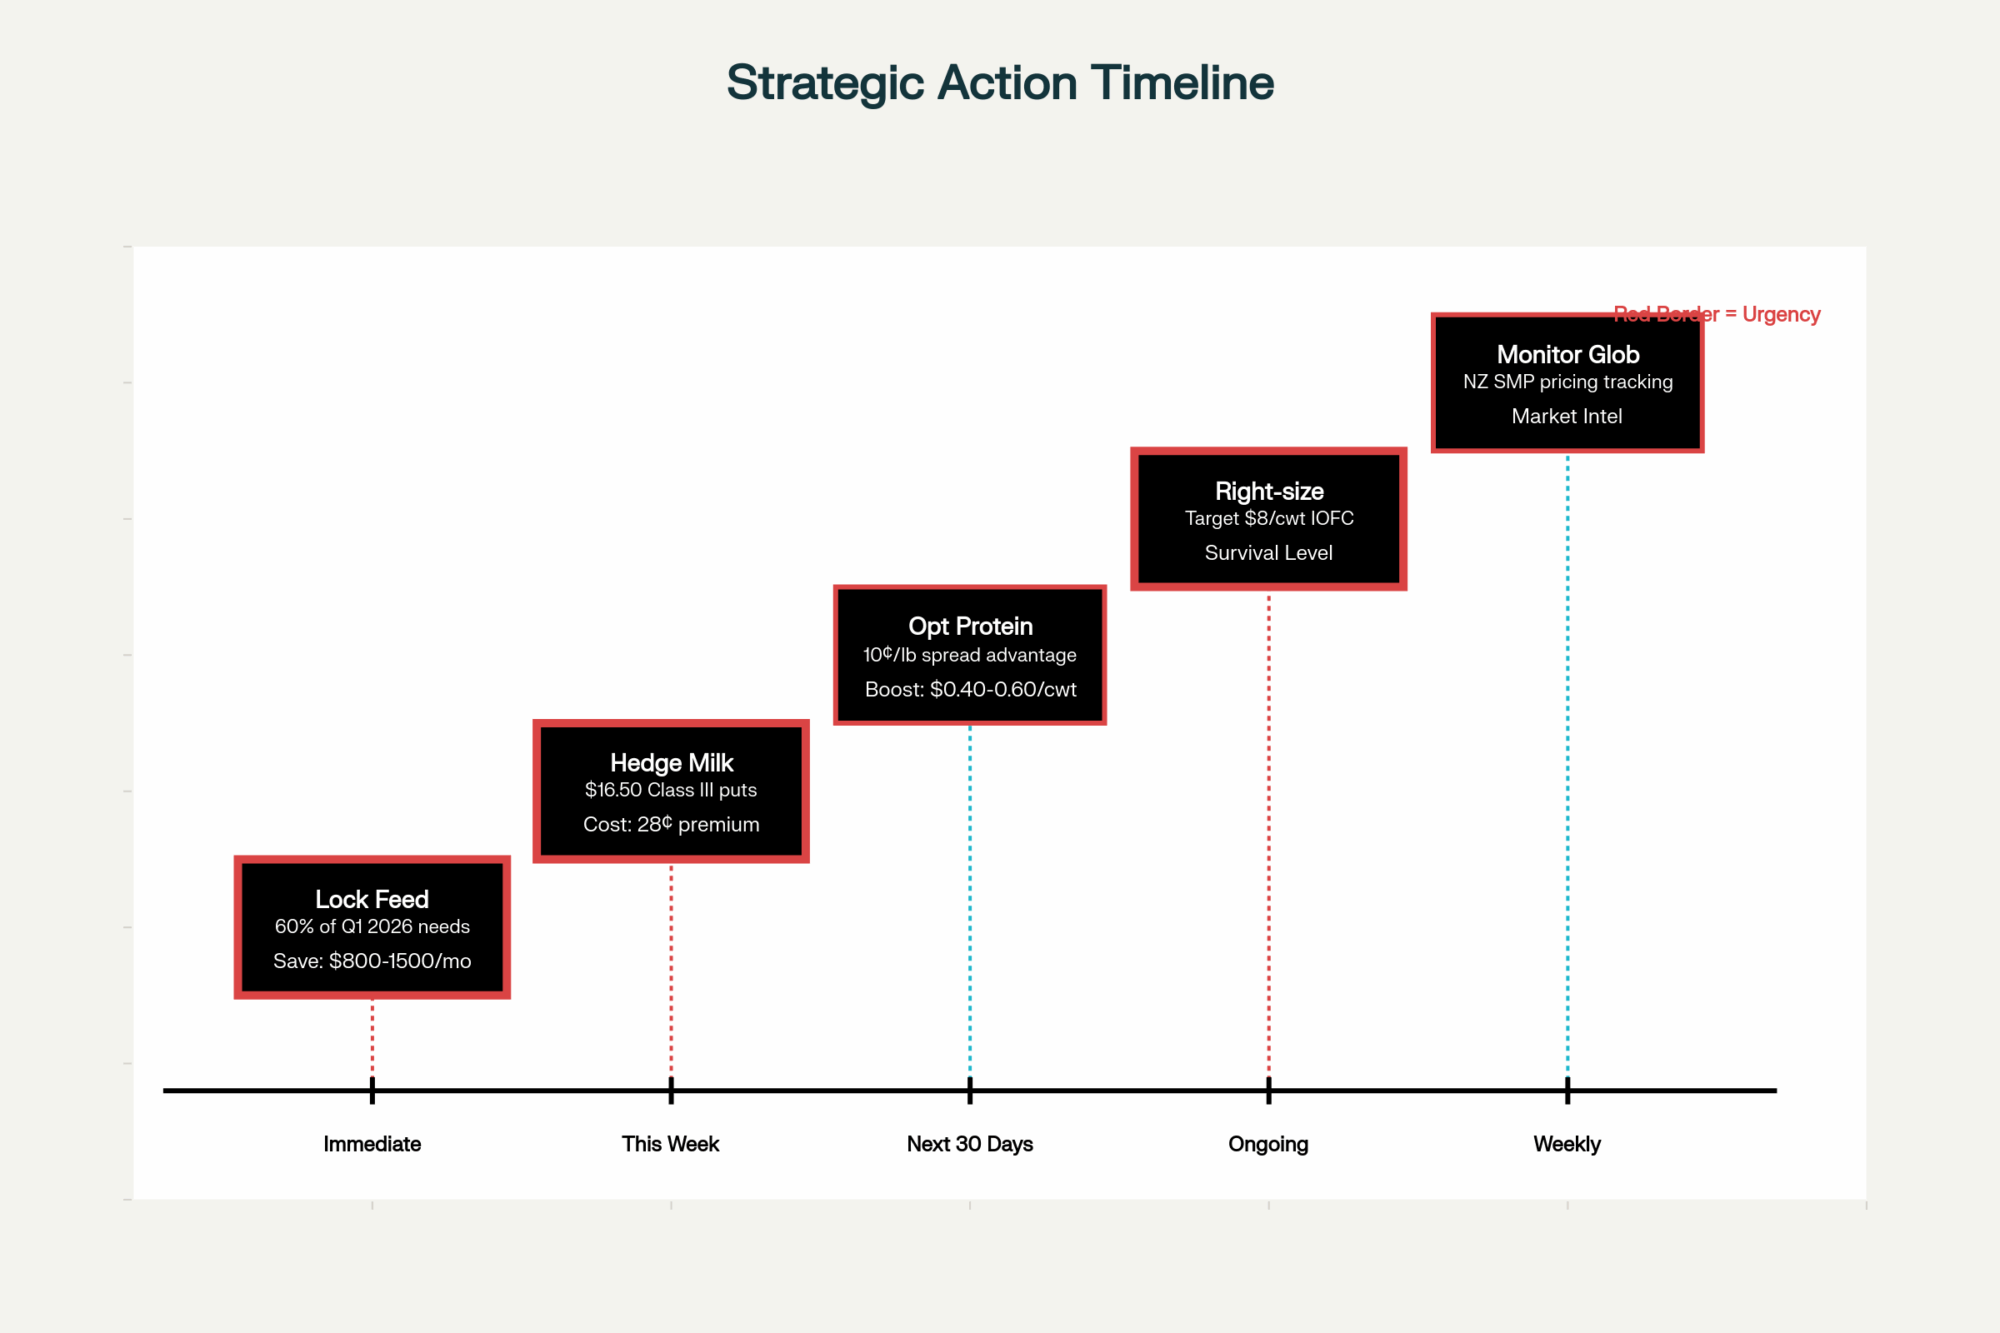
The 30-Day Tech Tune-Up
You don’t need new capital. You need 30 days and some honesty.
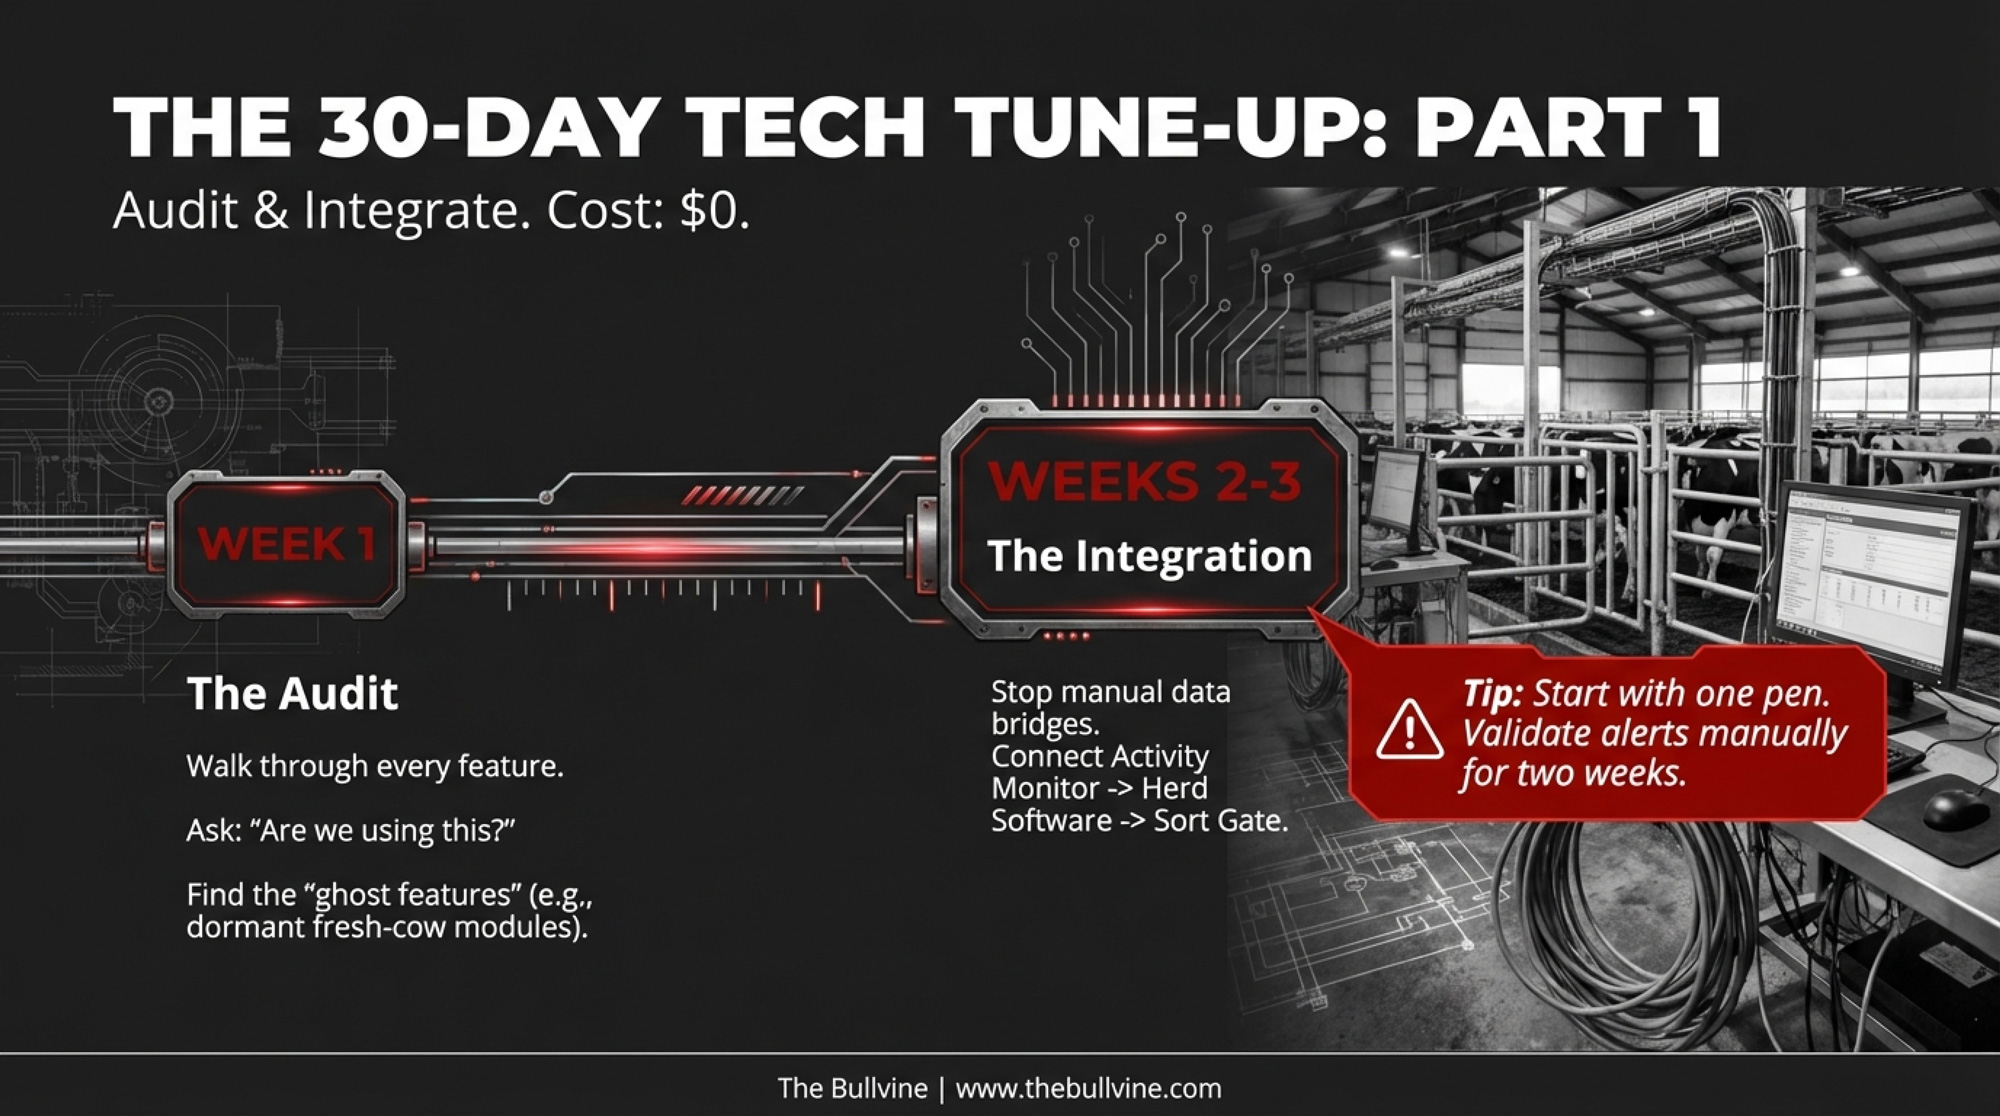
| Phase | Goal | Key Action | Trade-Off |
| Week 1: Audit | Find the “ghost” features | Walk each system through the daily user and vendor feature lists. For every feature: are we using this? If not, why? Reuter’s dairy discovered its entire fresh-cow health module was dormant. | Costs nothing but time and candour. |
| Weeks 2–3: Integrate | Stop the manual data bridges | Pick the highest-value link first (e.g., activity monitoring → herd software → sort-gate rules). Get both vendors on the same call. Test with one pen and one sort rule before going farm-wide. | If sensor connectivity is spotty, keep a pen-walk backup for two weeks while you validate alert accuracy on your own cows. |
| Week 4: Train | Empower the frontline | Create bilingual visual “Quick-Start” laminates. Identify 2–3 super-users, train them to proficiency, then have them train peers. Run 10-minute weekly feedback huddles. | Demands sustained management attention. If you can’t commit to weekly check-ins for at least eight weeks, utilization drifts right back. |
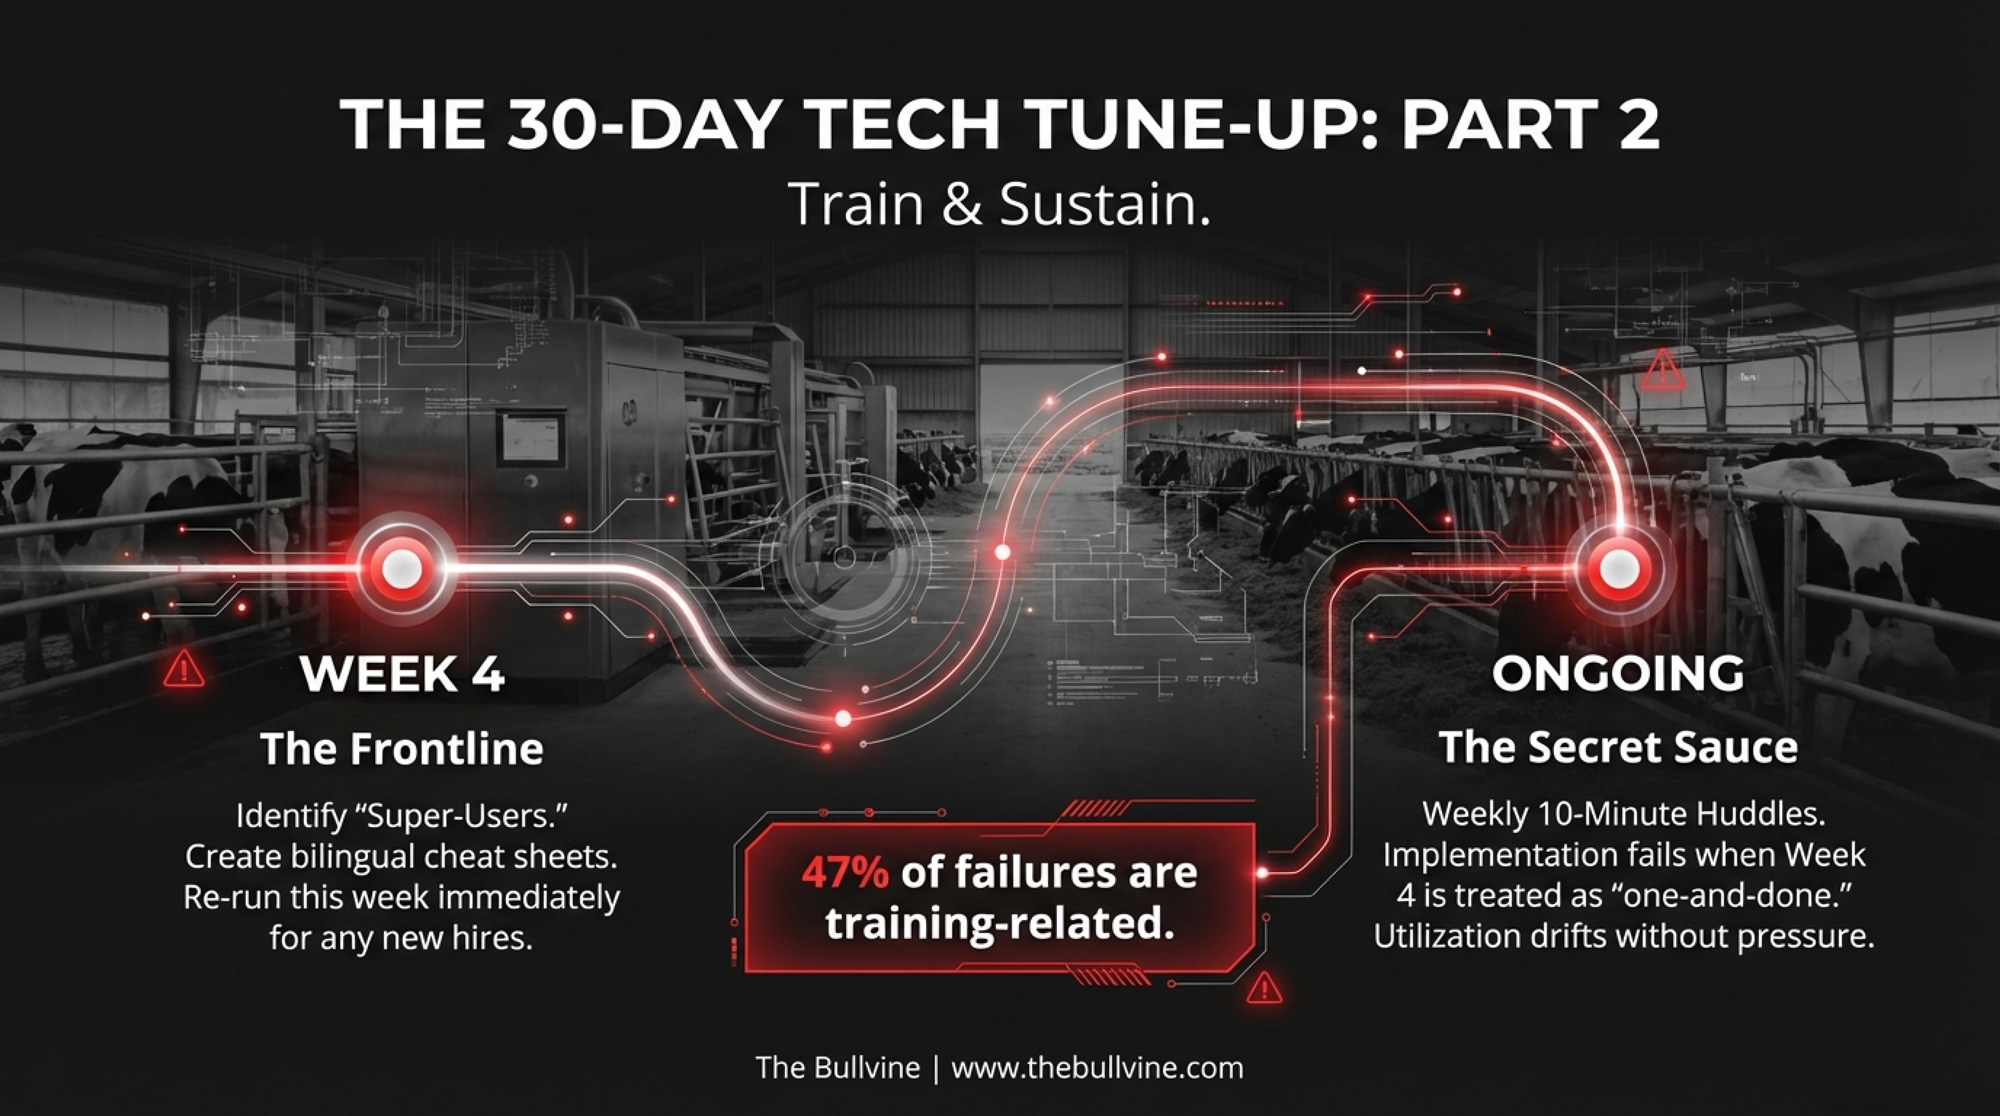
Already tried this and stalled? You’re not alone. That 47% training-failure rate — averaging $18,200 in losses per failed implementation — suggests the most common breakdown isn’t the technology. It’s attempting integration without sustained weekly follow-up. The tune-up fails when Week 4 gets treated as a one-and-done rather than an ongoing management commitment. If your first attempt died after two weeks, the fix is simpler than you think: restart at Week 4 with the huddle model. Ten minutes a week. That’s what separates the farms that make it stick from the ones that quietly go back to sticky notes.
The other objection we’ll hear: “I don’t have time to sit on the phone with vendors.” Fair. But if you’re spending 2.5 hours a day on manual sorting that a configured gate could handle in 20 minutes, you’re already spending the time — just on the wrong task.
Where the $20,000–$45,000 Comes From
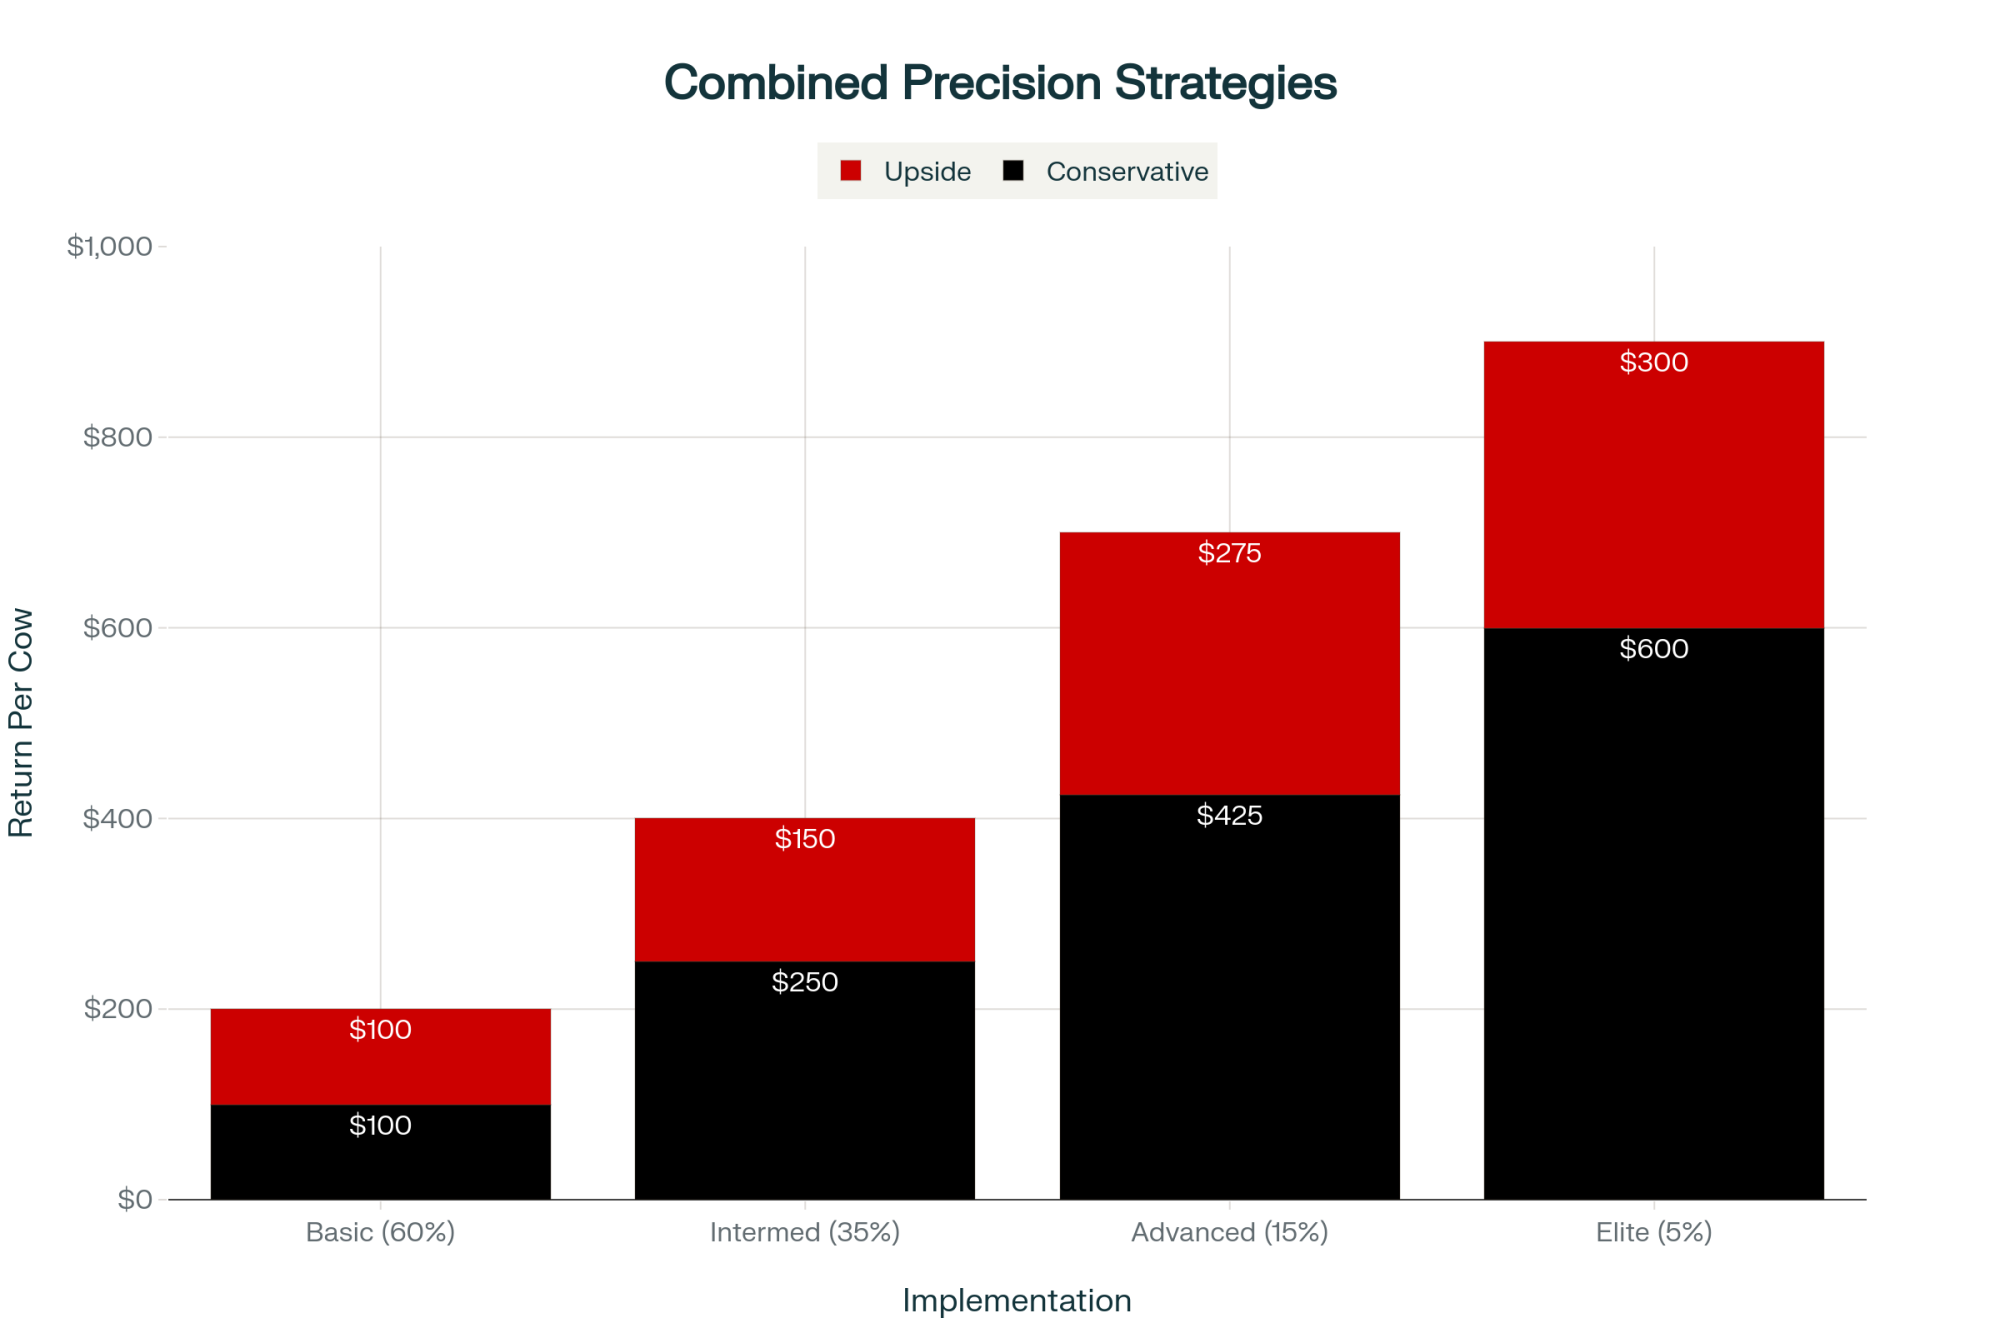
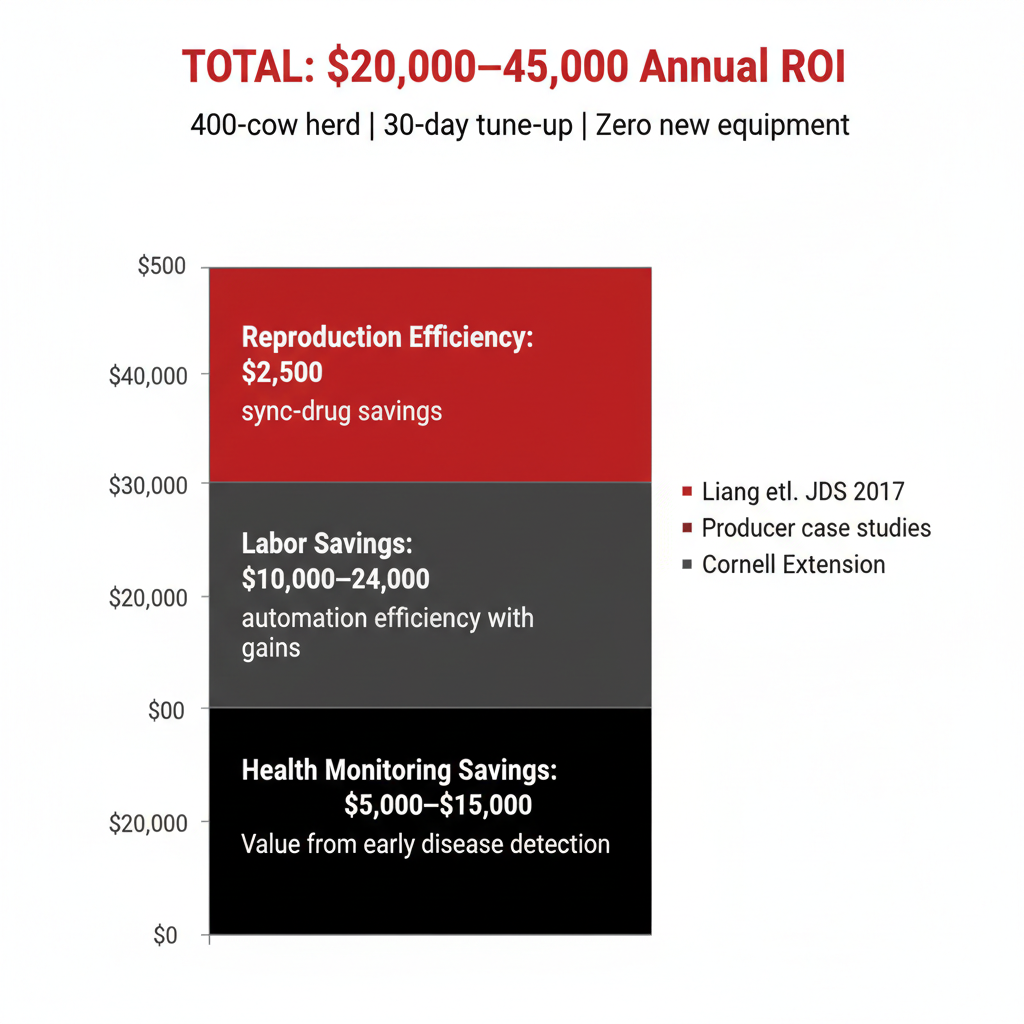
That composite ROI for a 400-cow herd stacks three separately documented levers. These come from different studies on different operations — your herd won’t necessarily realize all three simultaneously. But here’s the math:
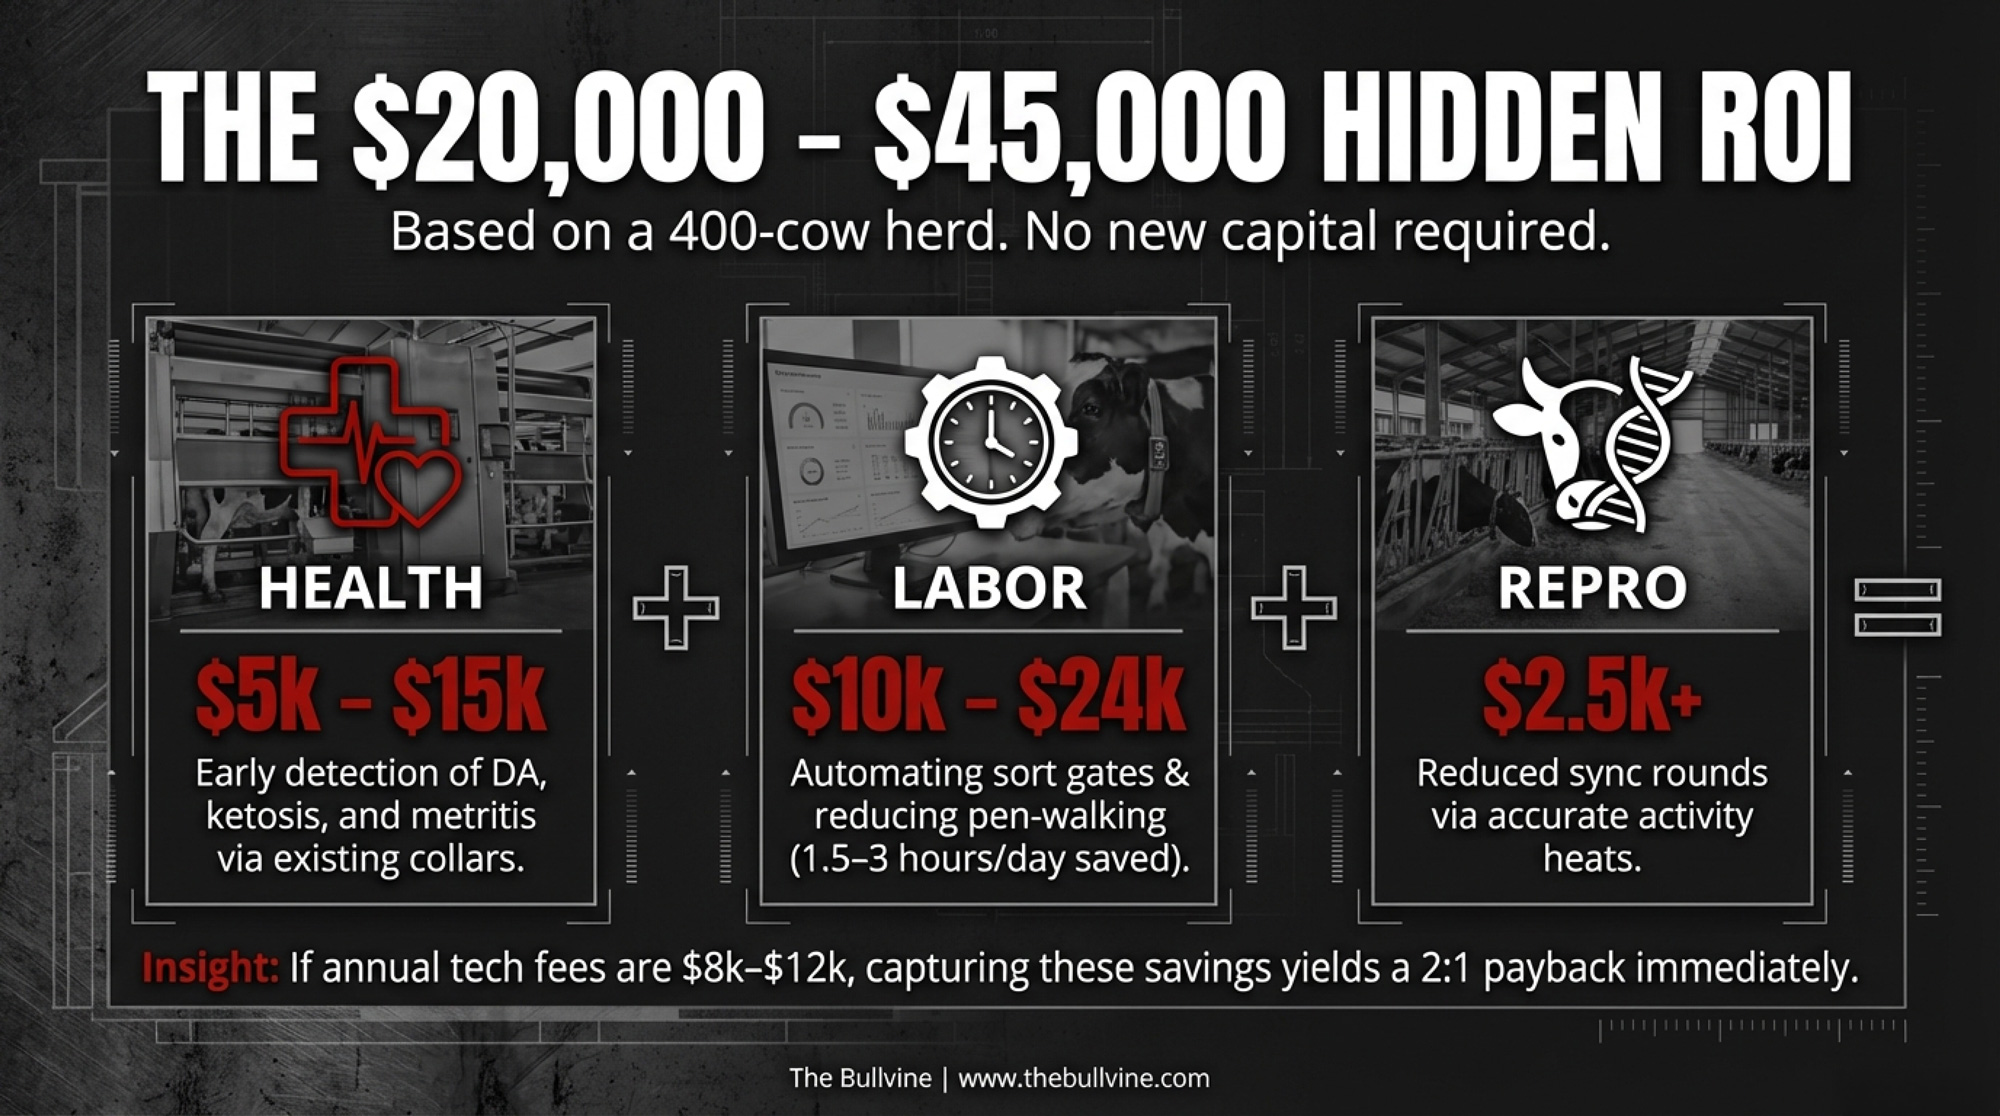
- Health monitoring (early detection of DA, ketosis, metritis): Preventing 5–10 DA cases at $432–$640 each (Liang et al., JDS, 2017) saves $2,000–$6,000 in direct DA costs. Add earlier ketosis and metritis intervention — where Pfrombeck et al. (JDS, 2025) found sensor-assisted monitoring returned €23–€119/cow/year in high-incidence herds (a European research-herd study using a different sensor type — directionally relevant, not a direct comparison) — and the health component reaches an estimated $5,000–$15,000 on a 400-cow herd with above-average disease incidence. Caveat: Pfrombeck showed returns as low as -€33/cow/year in already-healthy herds.
- Labour savings (sort-gate automation + fresh-cow monitoring efficiency): Cutting 1.5–3 hours of daily sorting and pen-walking. At $18–$22/hour, 365 days a year, that’s $10,000–$24,000.
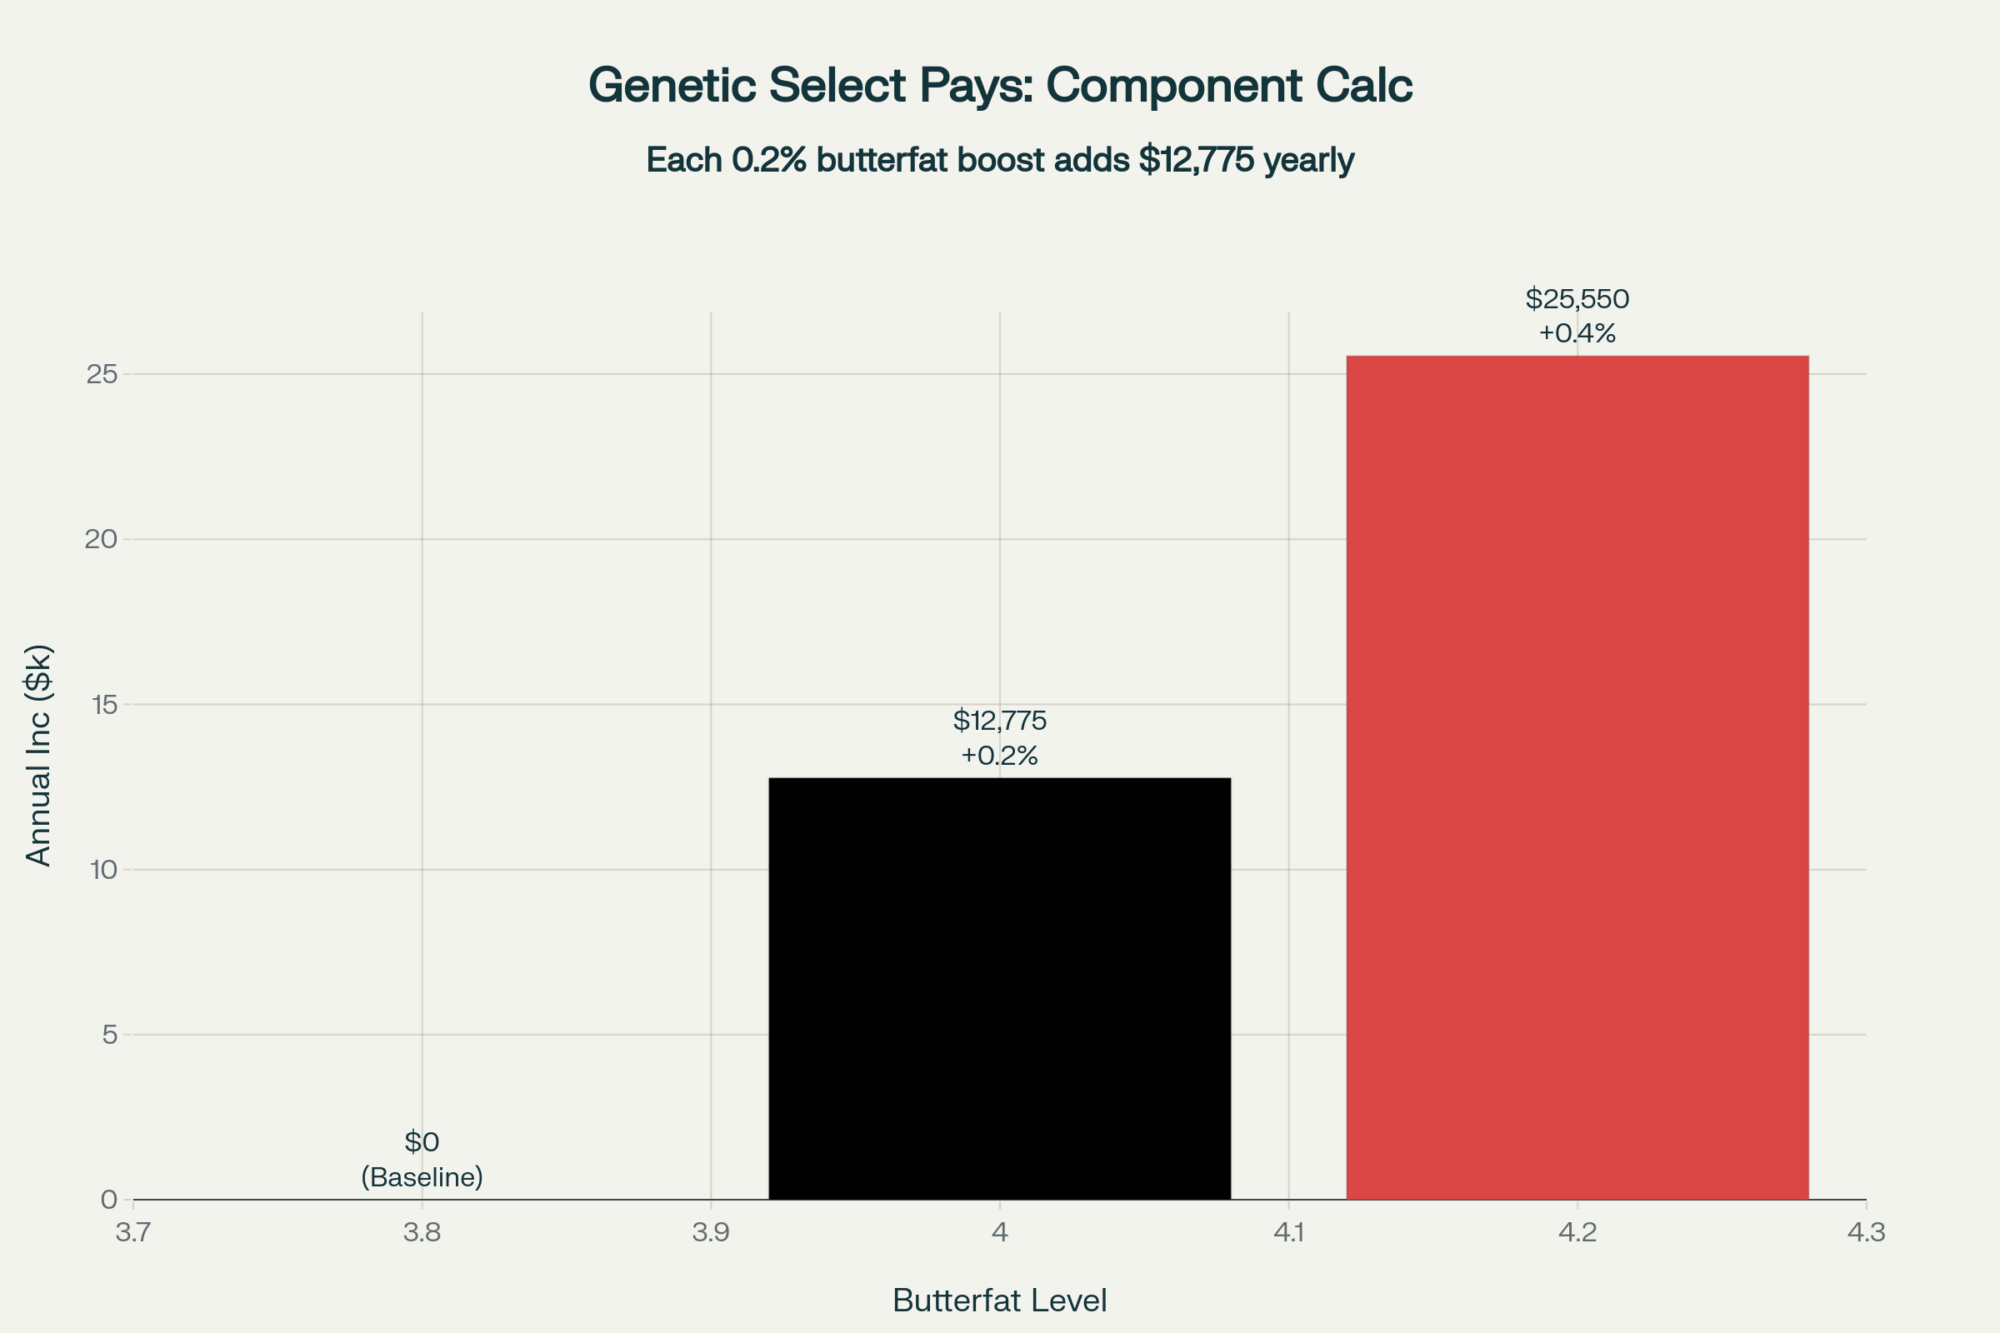
- Reproduction (fewer sync rounds via better heat detection): Cornell Extension estimates a single Ovsynch round at $12.90 per cow. The Bullvine’s own July 2025 sort gate analysis confirmed $12 per head in sync-drug savings when pairing automated sorting with activity monitors to breed 85% of cows off natural heat. On a 400-cow herd where activity-detected heats divert half the herd from one sync round, that’s roughly $2,500.
Total range: roughly $20,000–$45,000/year. If your total annual tech subscription and service costs run $8,000–$12,000 across all three systems, even hitting the low end of this range puts you at roughly 2:1 payback or better. Run your own numbers against these three levers.
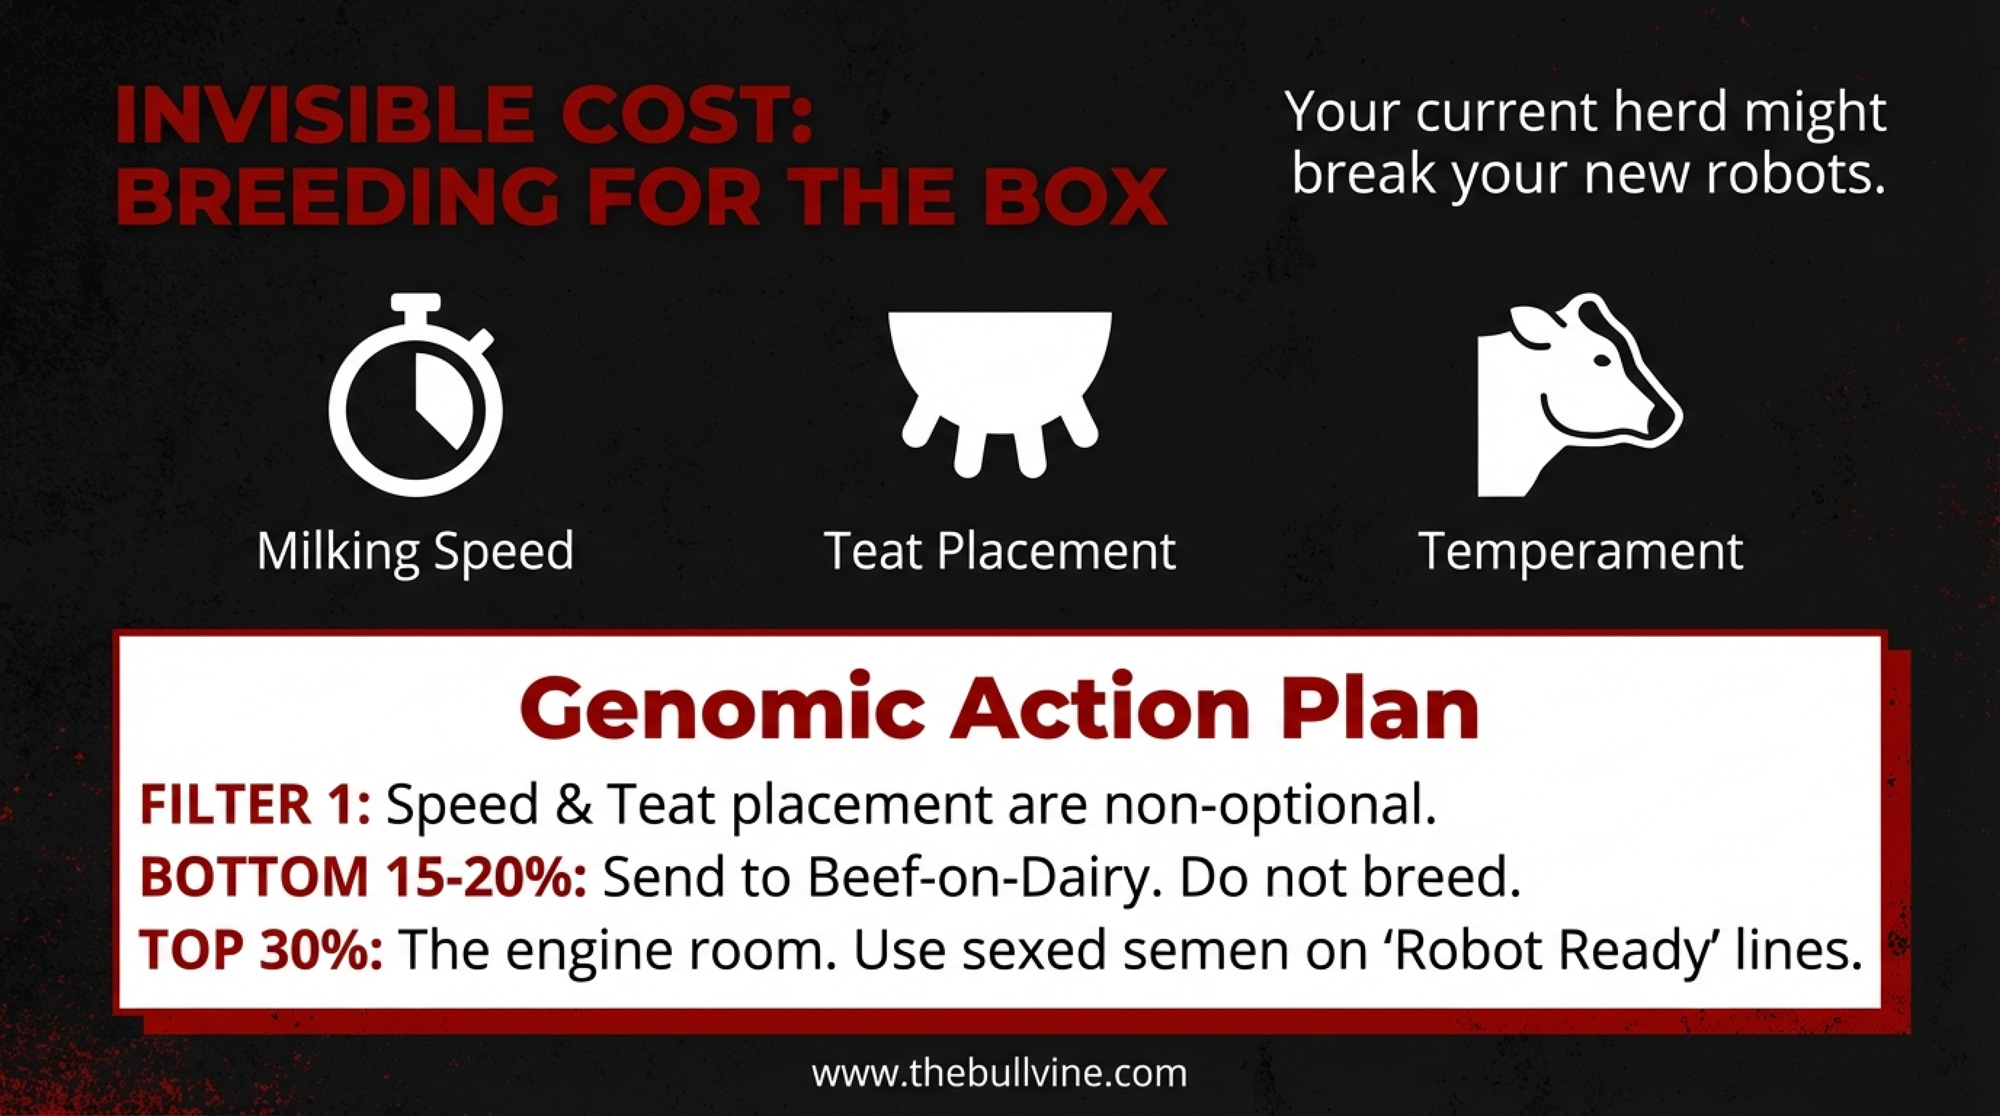
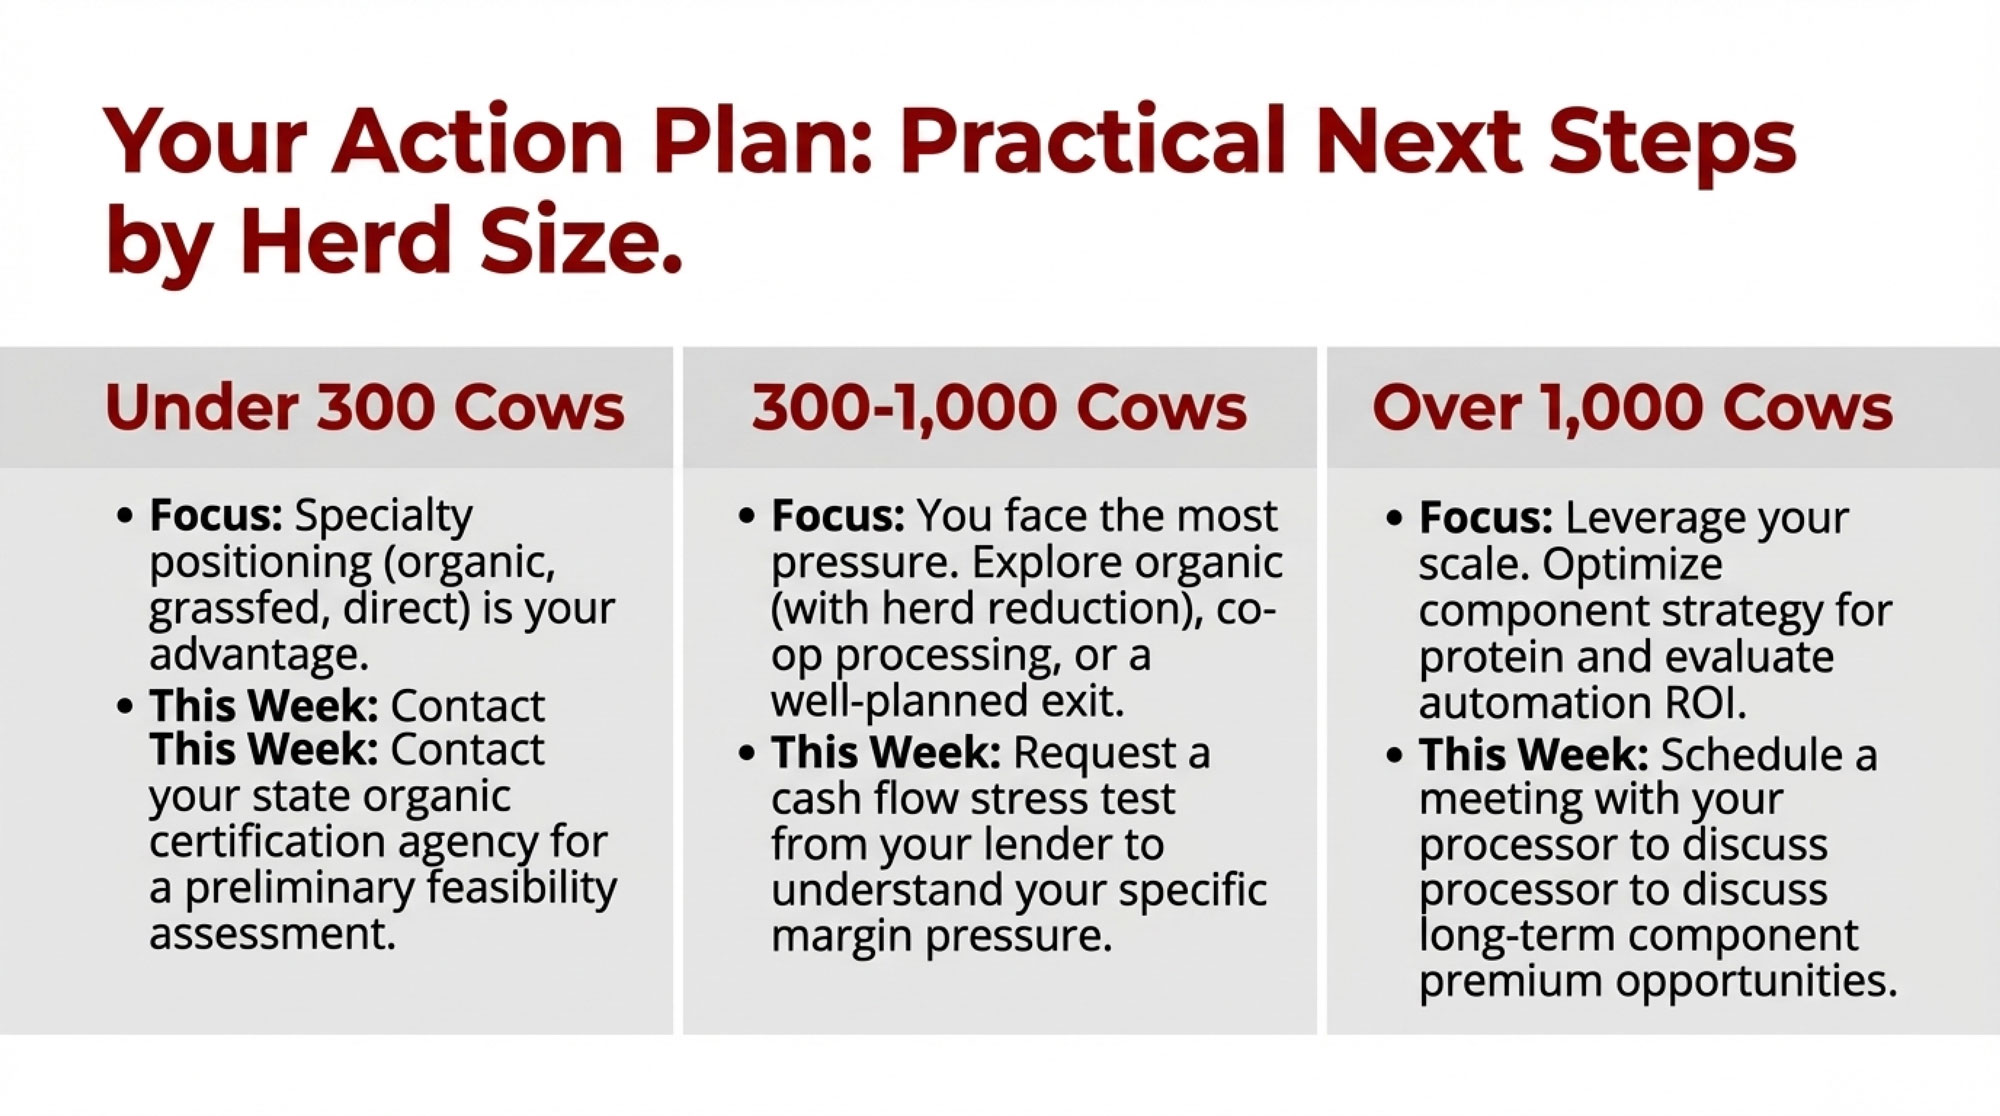
What This Means for Your Operation
- 200–500 cows, collars and herd software, no sort gate: Your biggest lever is the collar health-alert module. Turn on rumination-based fresh-cow reports and act on them daily. Impact is largest if your fresh-cow disease rate runs above breed average.
- 500–1,500 cows, all three systems installed: Integration is your multiplier. Alerts become tasks, tasks become sort commands, and sorted cows are waiting when the vet arrives. The labour savings at this scale are where the top end of the $20K–$45K range lives.
- Already at 80%+ utilization with a clear bottleneck: That’s when buying new technology makes sense. Run the audit first. If the honest answer is “we’ve activated everything, and we’re still stuck,” a new tool is justified.
- Labour and language are your primary constraints: Start with the bilingual checklist approach and the super-user training model before touching integration settings.
- Baseline health is already strong: Be realistic about the ceiling. Pfrombeck’s data showed negative returns in some good-health scenarios. Focus on labour and repro savings instead.
Key Takeaways
- Adoption isn’t the bottleneck anymore. Utilization is. USDA shows 46% precision dairy adoption by 2021, with 90%+ of U.S. milk from farms using cow-level production technology. The equipment is in the barn.
- The combined ROI of closing the utilization gap could reach $20,000 to $45,000 per year for a 400-cow herd — a composite of three documented levers, not a single study on a single farm.
- The 30-day tune-up requires no capital. It requires management time, vendor coordination, and — critically — sustained weekly follow-up. Skipping that last part is how 47% of implementations fail.
- Before you sign your next technology purchase order, ask your team one question: what features are we not using on the systems we already own?
Signals to Watch
- Your vendor releases a major software update. New features mean new dormant capabilities. Re-run Week 1 within 30 days.
- You hire or turn over herd staff. New employees inherit old habits, not full capability. Re-run Week 4 training with every staffing change.
- Your fresh-cow metrics shift. If DA, metritis, or ketosis rates climb — or pregnancy rate slides — your first question shouldn’t be “what do we buy?” It should be “what stopped getting used?”
The Bottom Line
With Class III closing 2025 at $15.86, all-milk forecast at $18.95, and full costs at $19.14 for the average large herd, there’s no room to leave $20,000 sitting inside systems you’ve already paid for. Rabobank estimates 2,800 farms will close annually through 2027. The ones that make it won’t be the ones with the most gadgets. They’ll be the ones that manage people and processes well enough to squeeze full value from what’s already in the barn. Run your own Week 1 audit this month. What’s the one feature you’re paying for but not using?
Complete references and supporting documentation are available upon request by contacting the editorial team at editor@thebullvine.com.
Learn More
- Why Your Best Workers Keep Messing Up Simple Tasks—And How to Fix It – Gain an immediate management edge by fixing the “human-tech gap.” This breakdown exposes why standard SOPs fail and arms you with a protocol-driven framework to ensure your crew executes tasks accurately without constant oversight.
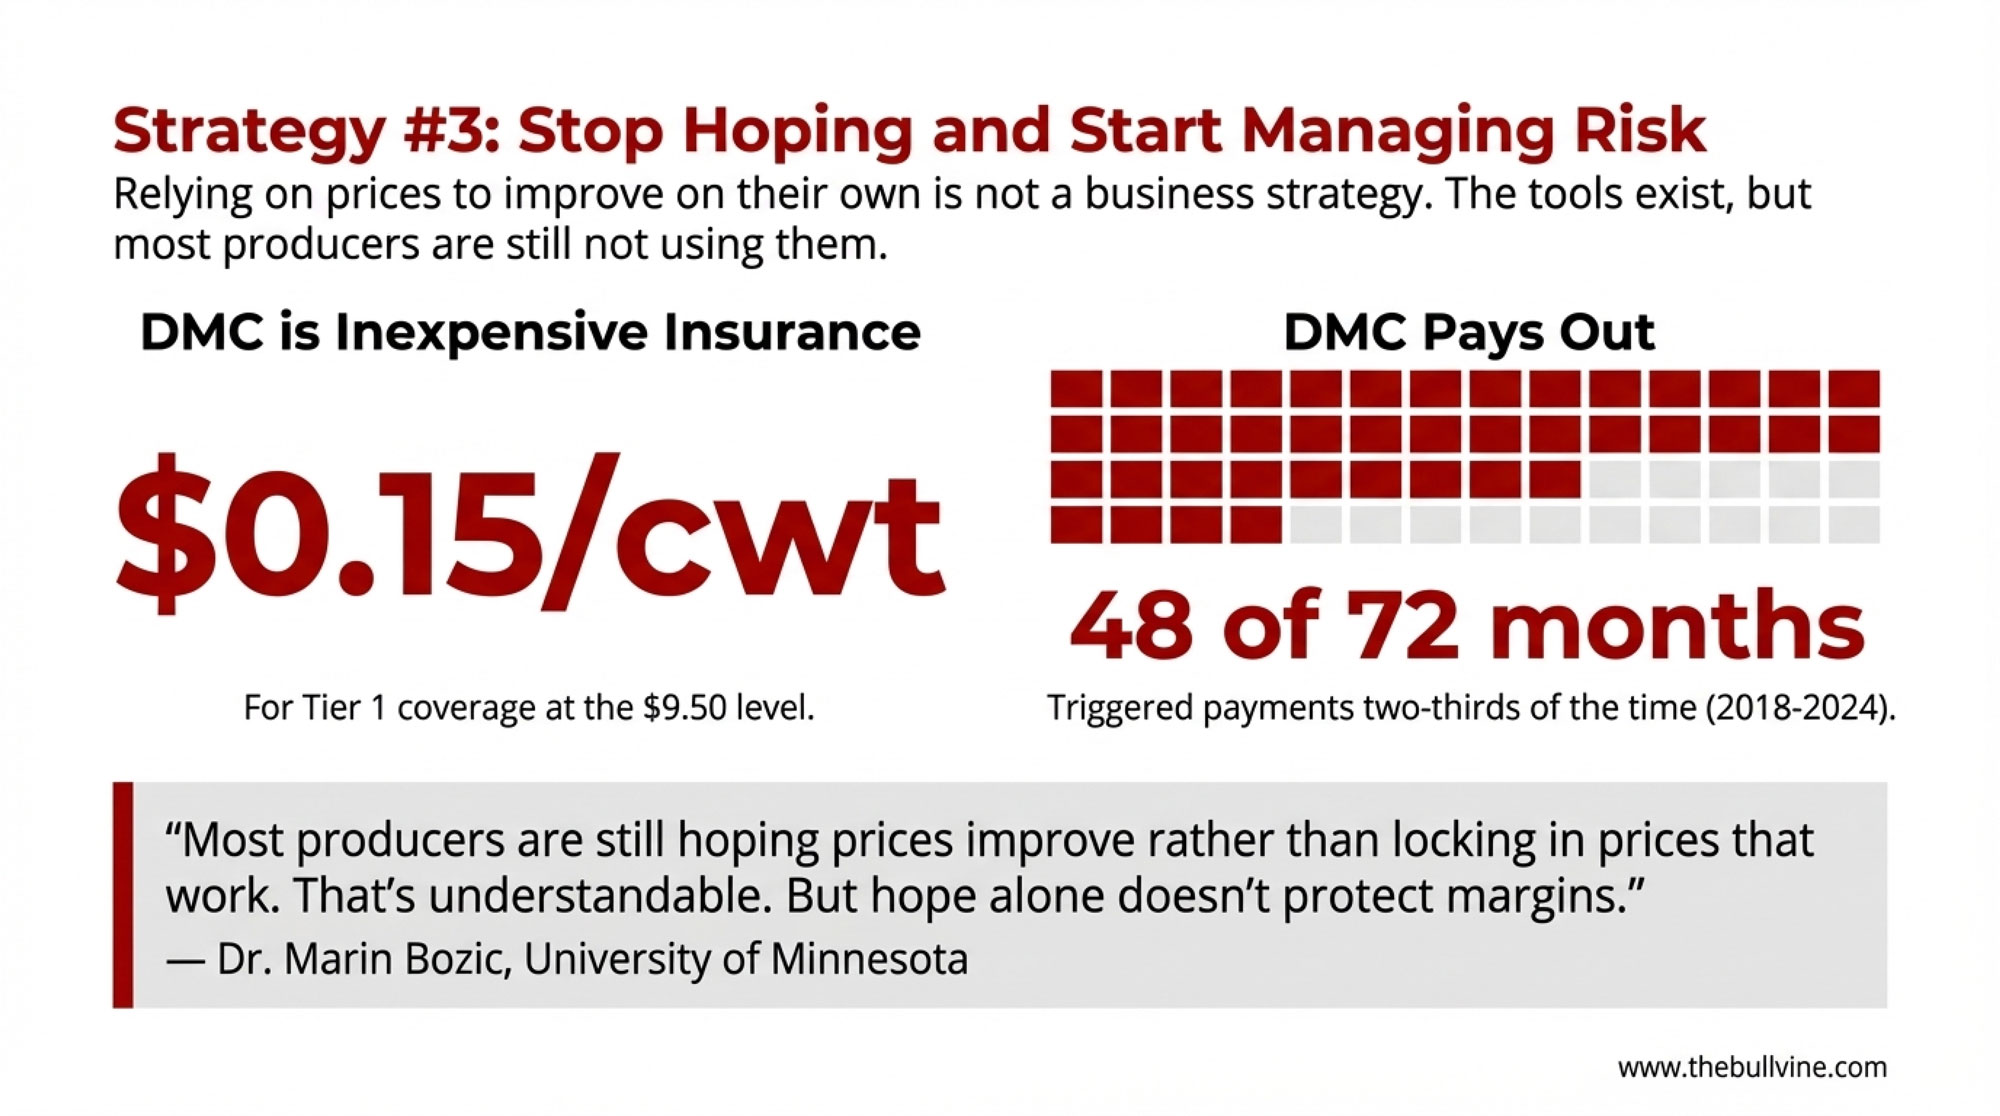
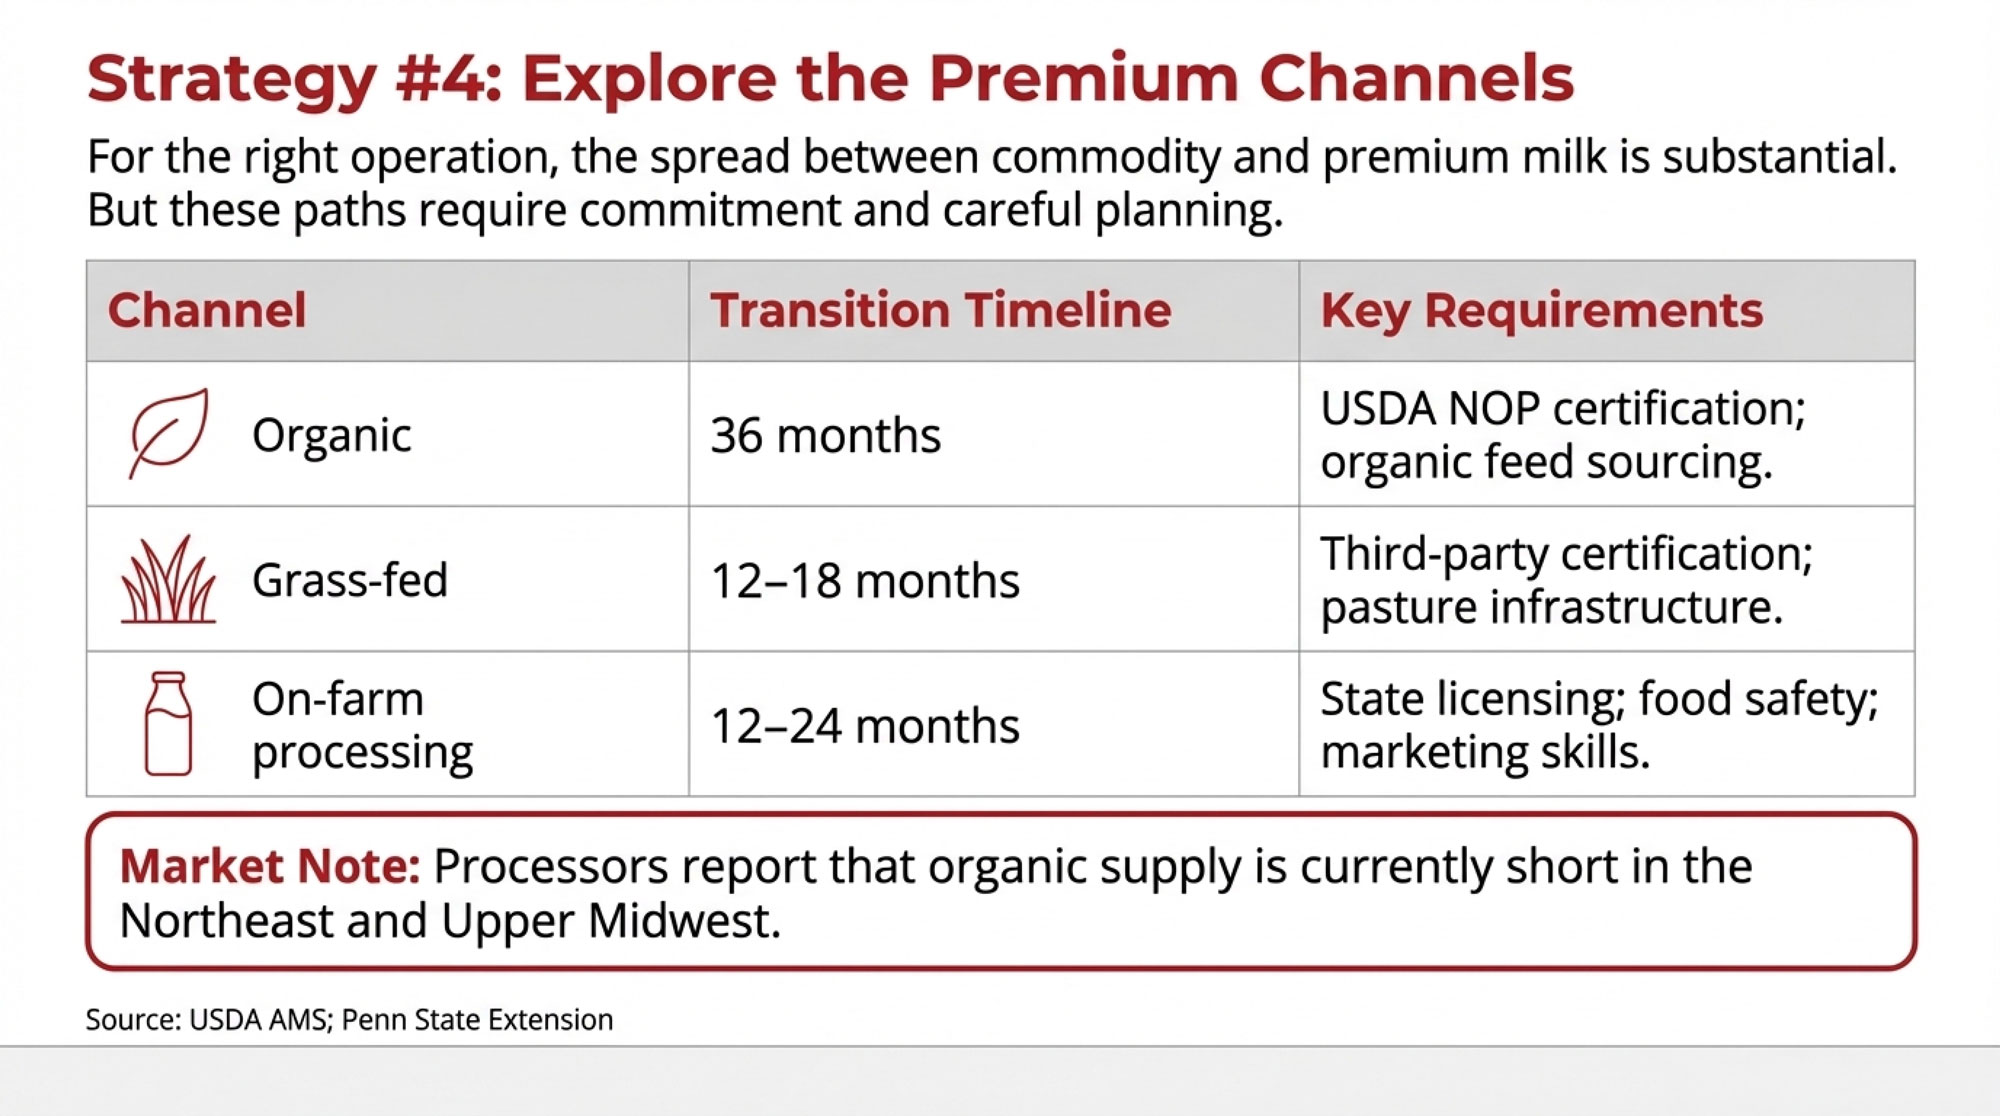
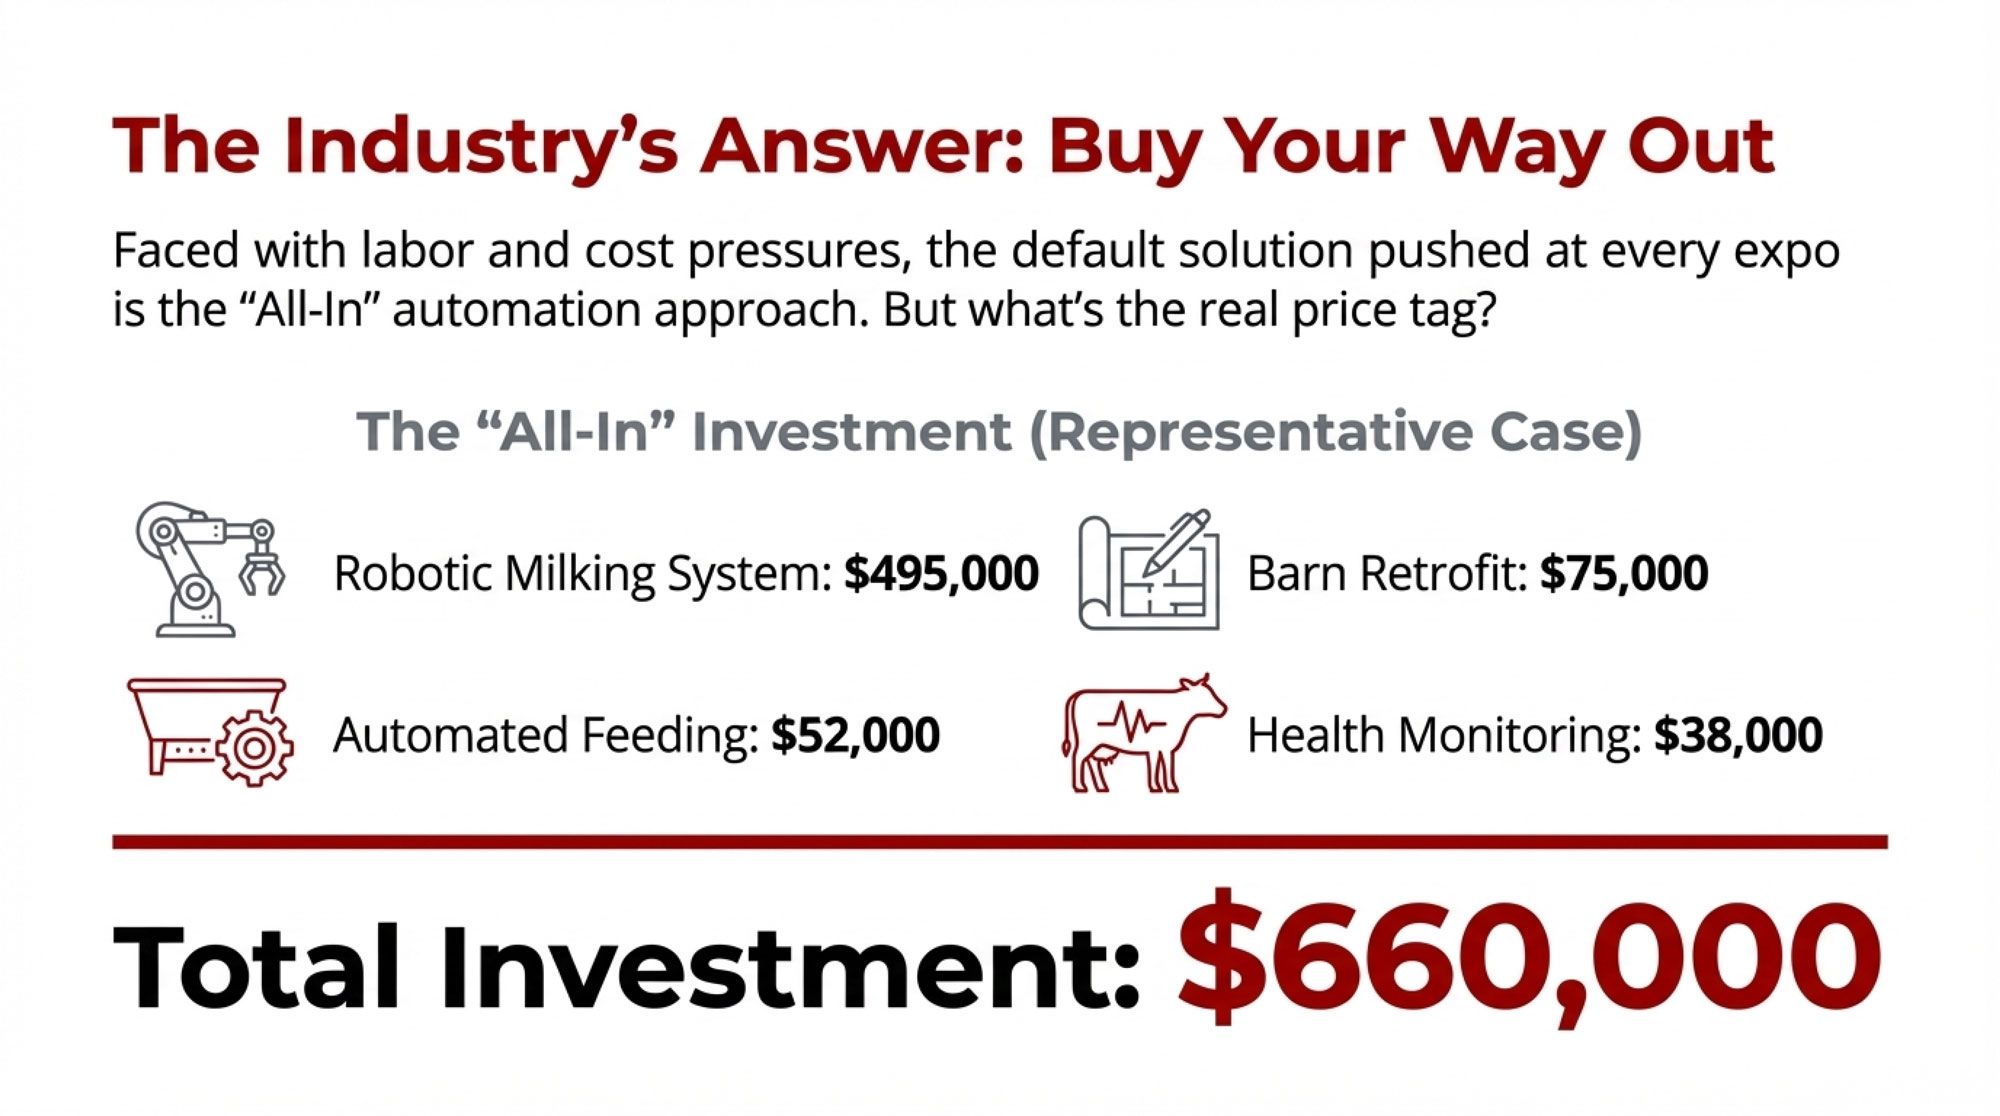
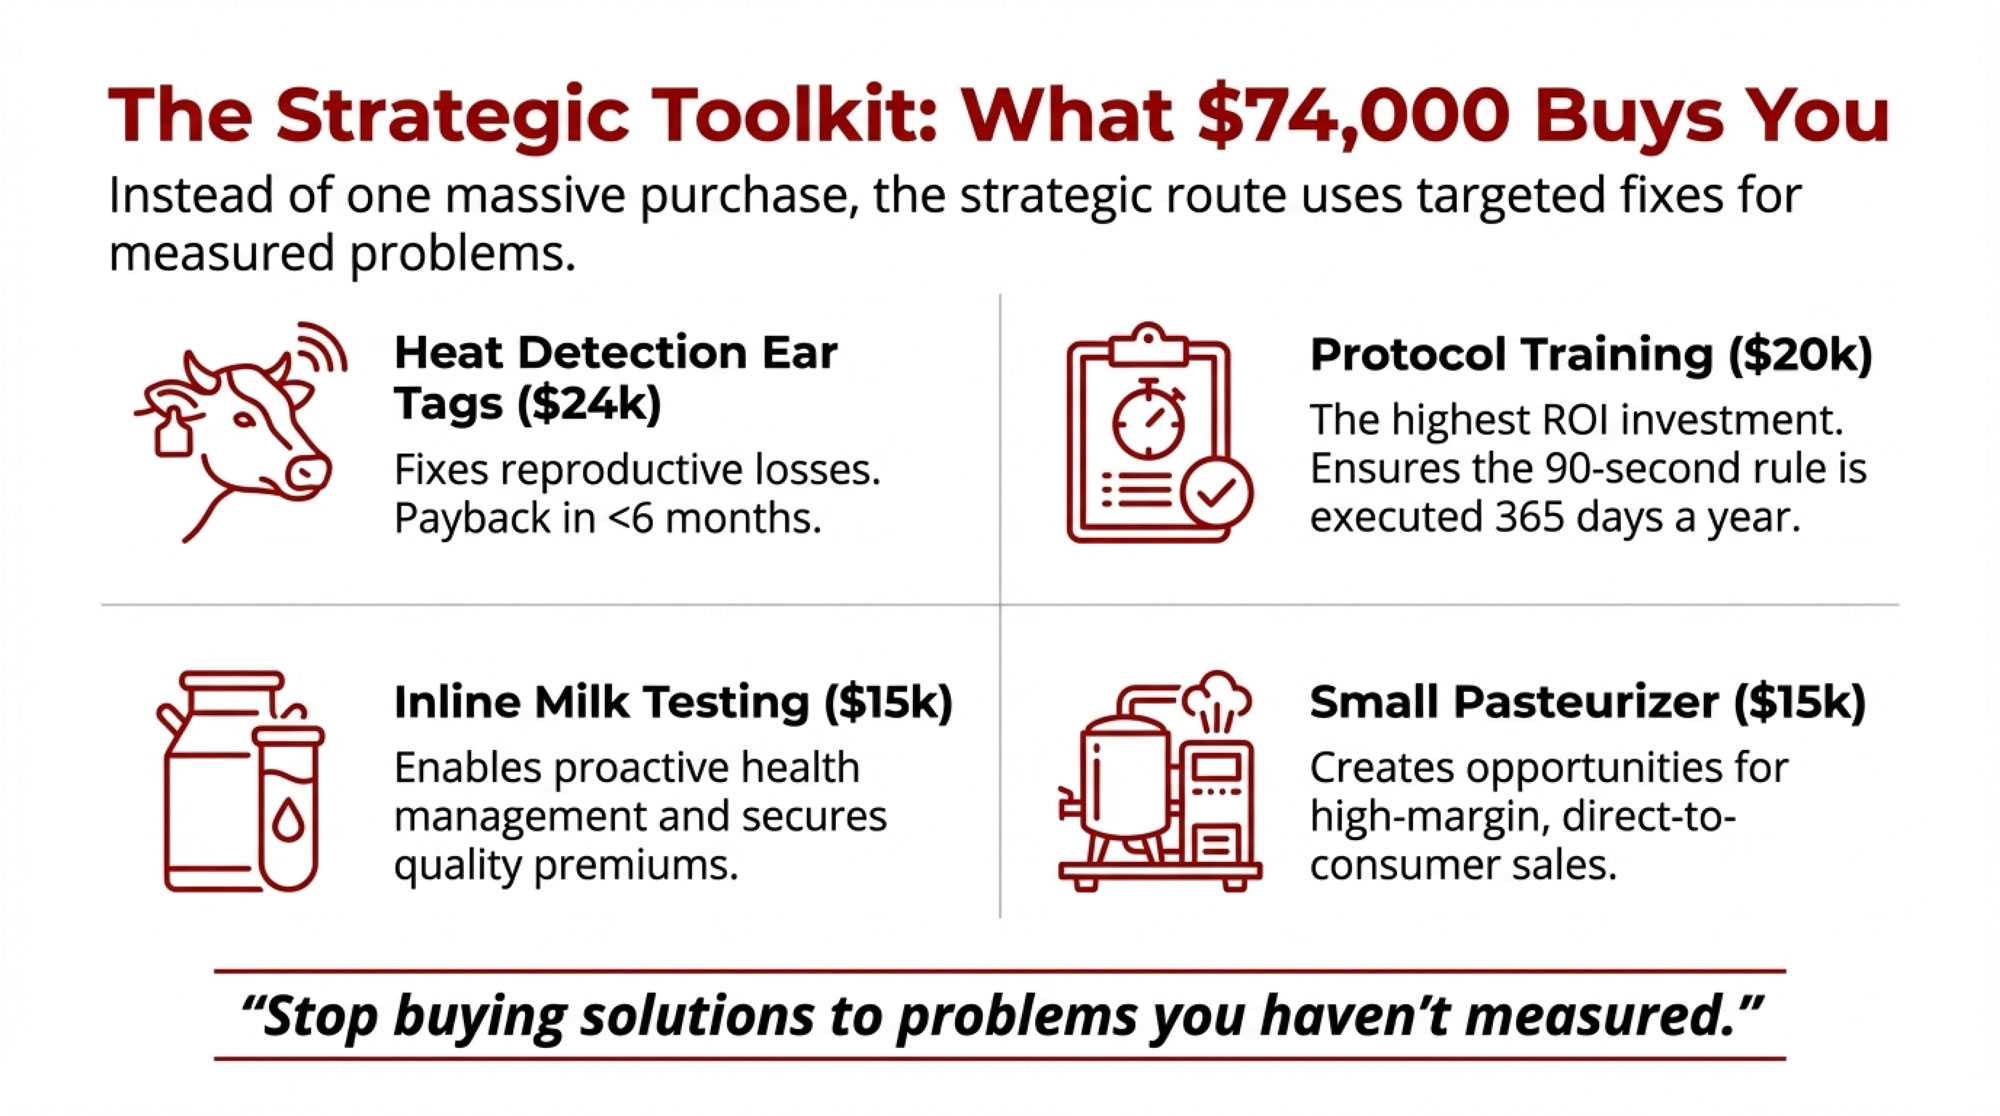
- 2,800 Dairy Farms Will Close This Year: Here’s the 3-Path Survival Guide for the Rest – Secure your farm’s future against the projected 2026 consolidation wave. This survival guide delivers three distinct strategic routes for operations facing margin pressure, helping you position your business to survive the shakeout and thrive long-term.
- Why Smart Dairy Producers Are Quietly Banking on Sort Gates While Everyone Else Sleeps on the Biggest Efficiency Play of 2025 – Master the biggest efficiency play of the decade by automating your cow movement. This analysis reveals how maverick producers use sort gates to eliminate manual labor, achieving 99% accuracy in breeding pens while cutting handling costs significantly.
 Join the Revolution!
 Join the Revolution!
Join over 30,000 successful dairy professionals who rely on Bullvine Weekly for their competitive edge. Delivered directly to your inbox each week, our exclusive industry insights help you make smarter decisions while saving precious hours every week. Never miss critical updates on milk production trends, breakthrough technologies, and profit-boosting strategies that top producers are already implementing. Subscribe now to transform your dairy operation’s efficiency and profitability—your future success is just one click away.