Butterfat’s on top, powder’s under pressure—and the milk check now tells a story few saw coming
EXECUTIVE SUMMARY: Butterfat’s booming, powders are sliding, and together they’ve redrawn the dairy marketplace. This isn’t just another price cycle—it’s a lasting shift in how milk value is measured and paid. China’s preference for premium fats, new processor investments, and stronger herd genetics are driving a global realignment. Farmers who embrace component-based pricing, focused feeding, and risk protection remain profitable even as traditional markets weaken. The message heading into 2026 is clear: the future belongs to those who manage what’s inside the tank, not just how much fills it.

Walk into any farm shop or co-op office this fall, and chances are you’ll hear the same discussion. Butterfat is holding strong, while powders just can’t find their footing. The market doesn’t feel balanced anymore. What’s interesting here is that this gap doesn’t seem like a short-term pricing quirk—it looks and feels like a lasting shift in how milk value is determined.
Fat Holds Steady, Powder Loses Traction
Looking at the latest Global Dairy Trade (GDT) auctions, it’s easy to see the disconnect. The GDT index has fallen for five consecutive events, down roughly 1.4% in mid-October. Butter and anhydrous milk fat (AMF), however, remain firm, trading between $6,600 and $7,000 per tonne. Meanwhile, skim milk powder (SMP) is soft, sitting near $2,550 per tonne.
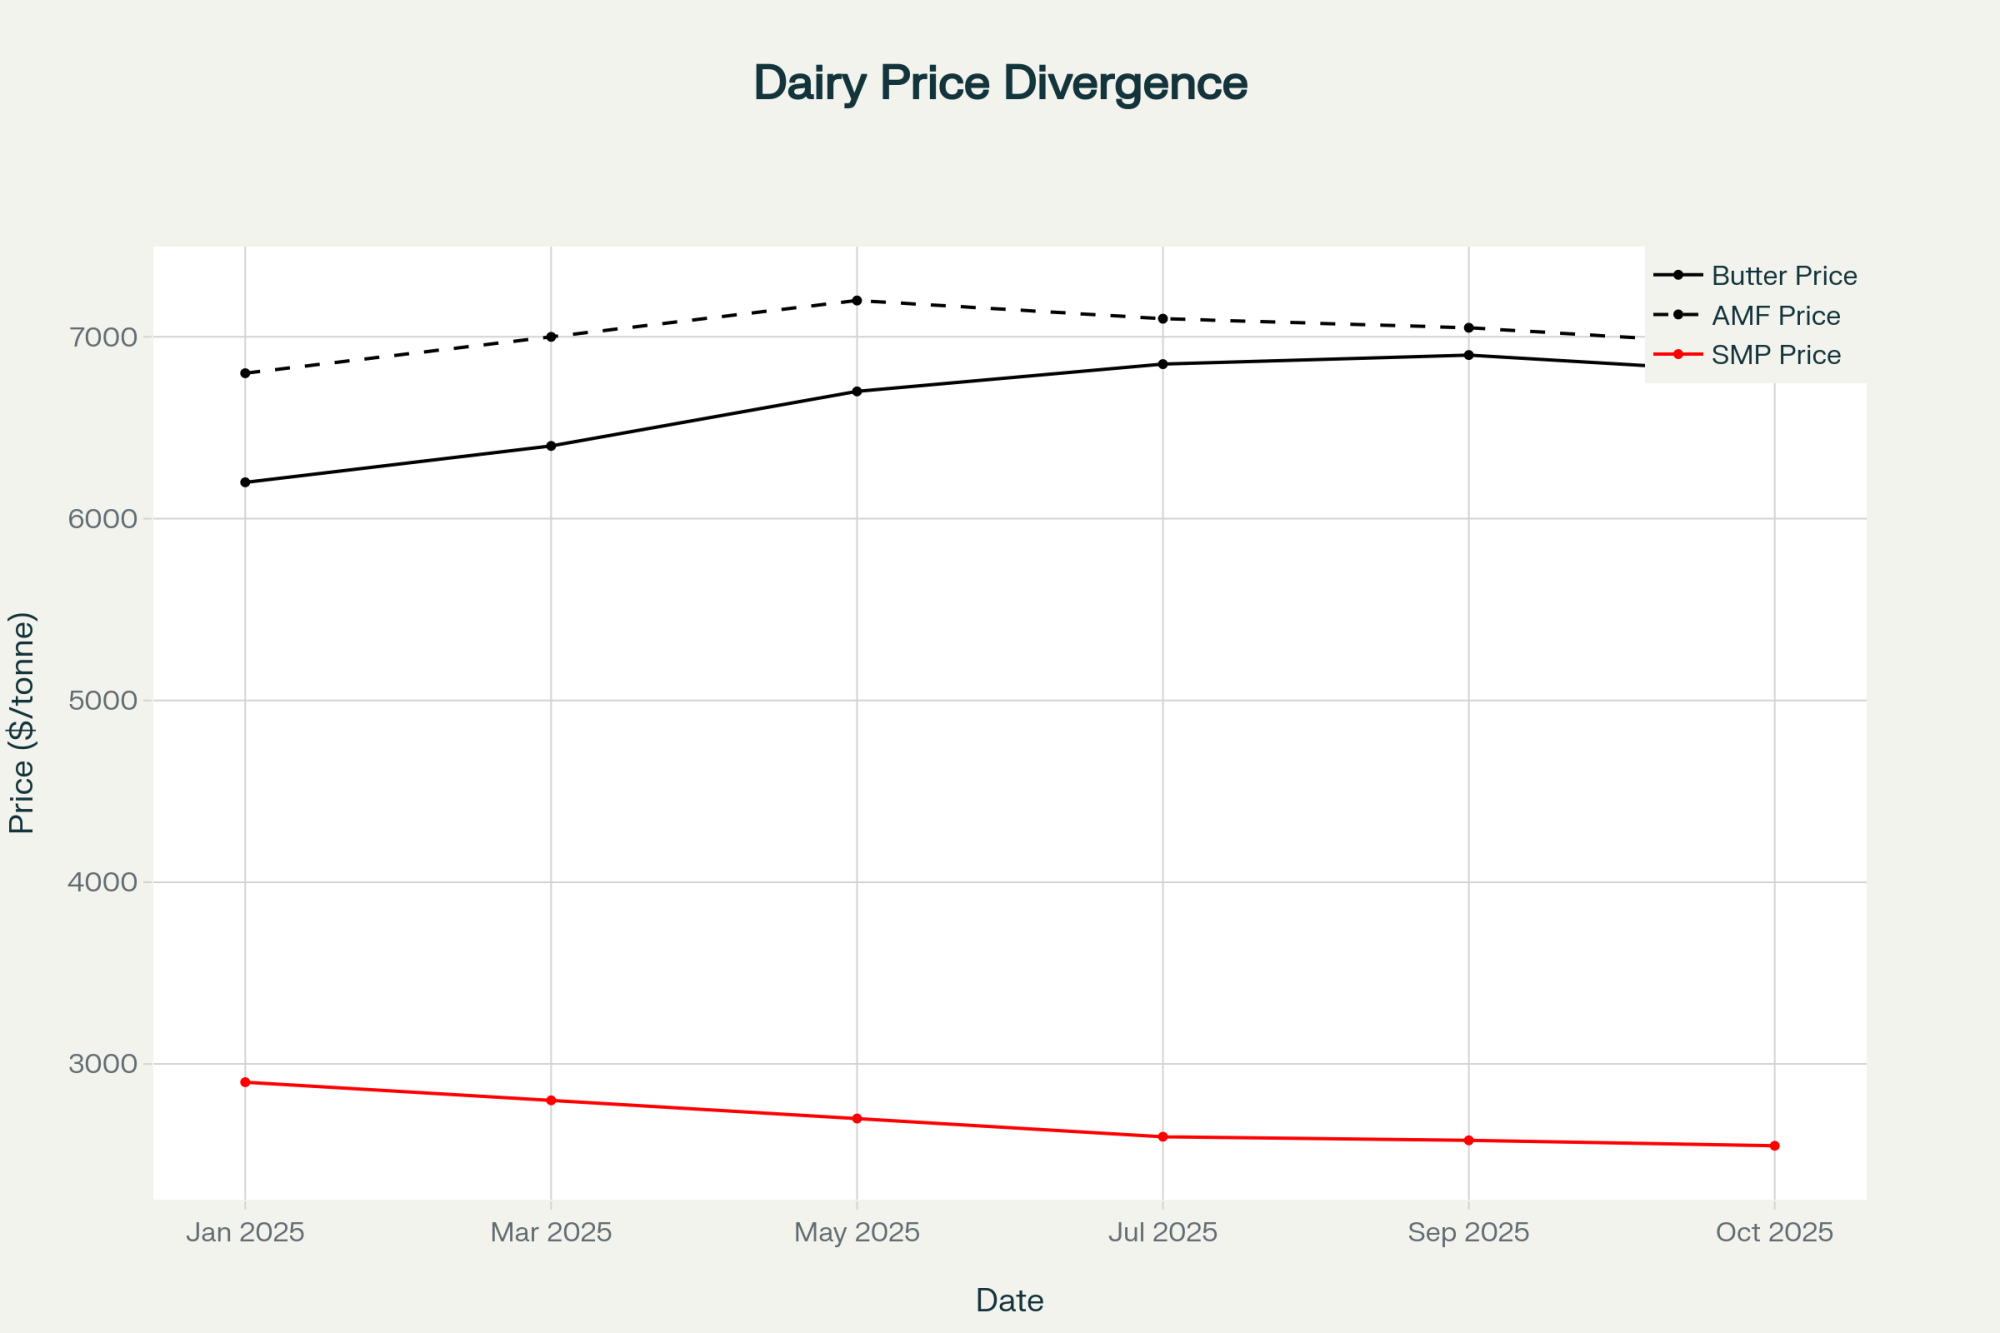
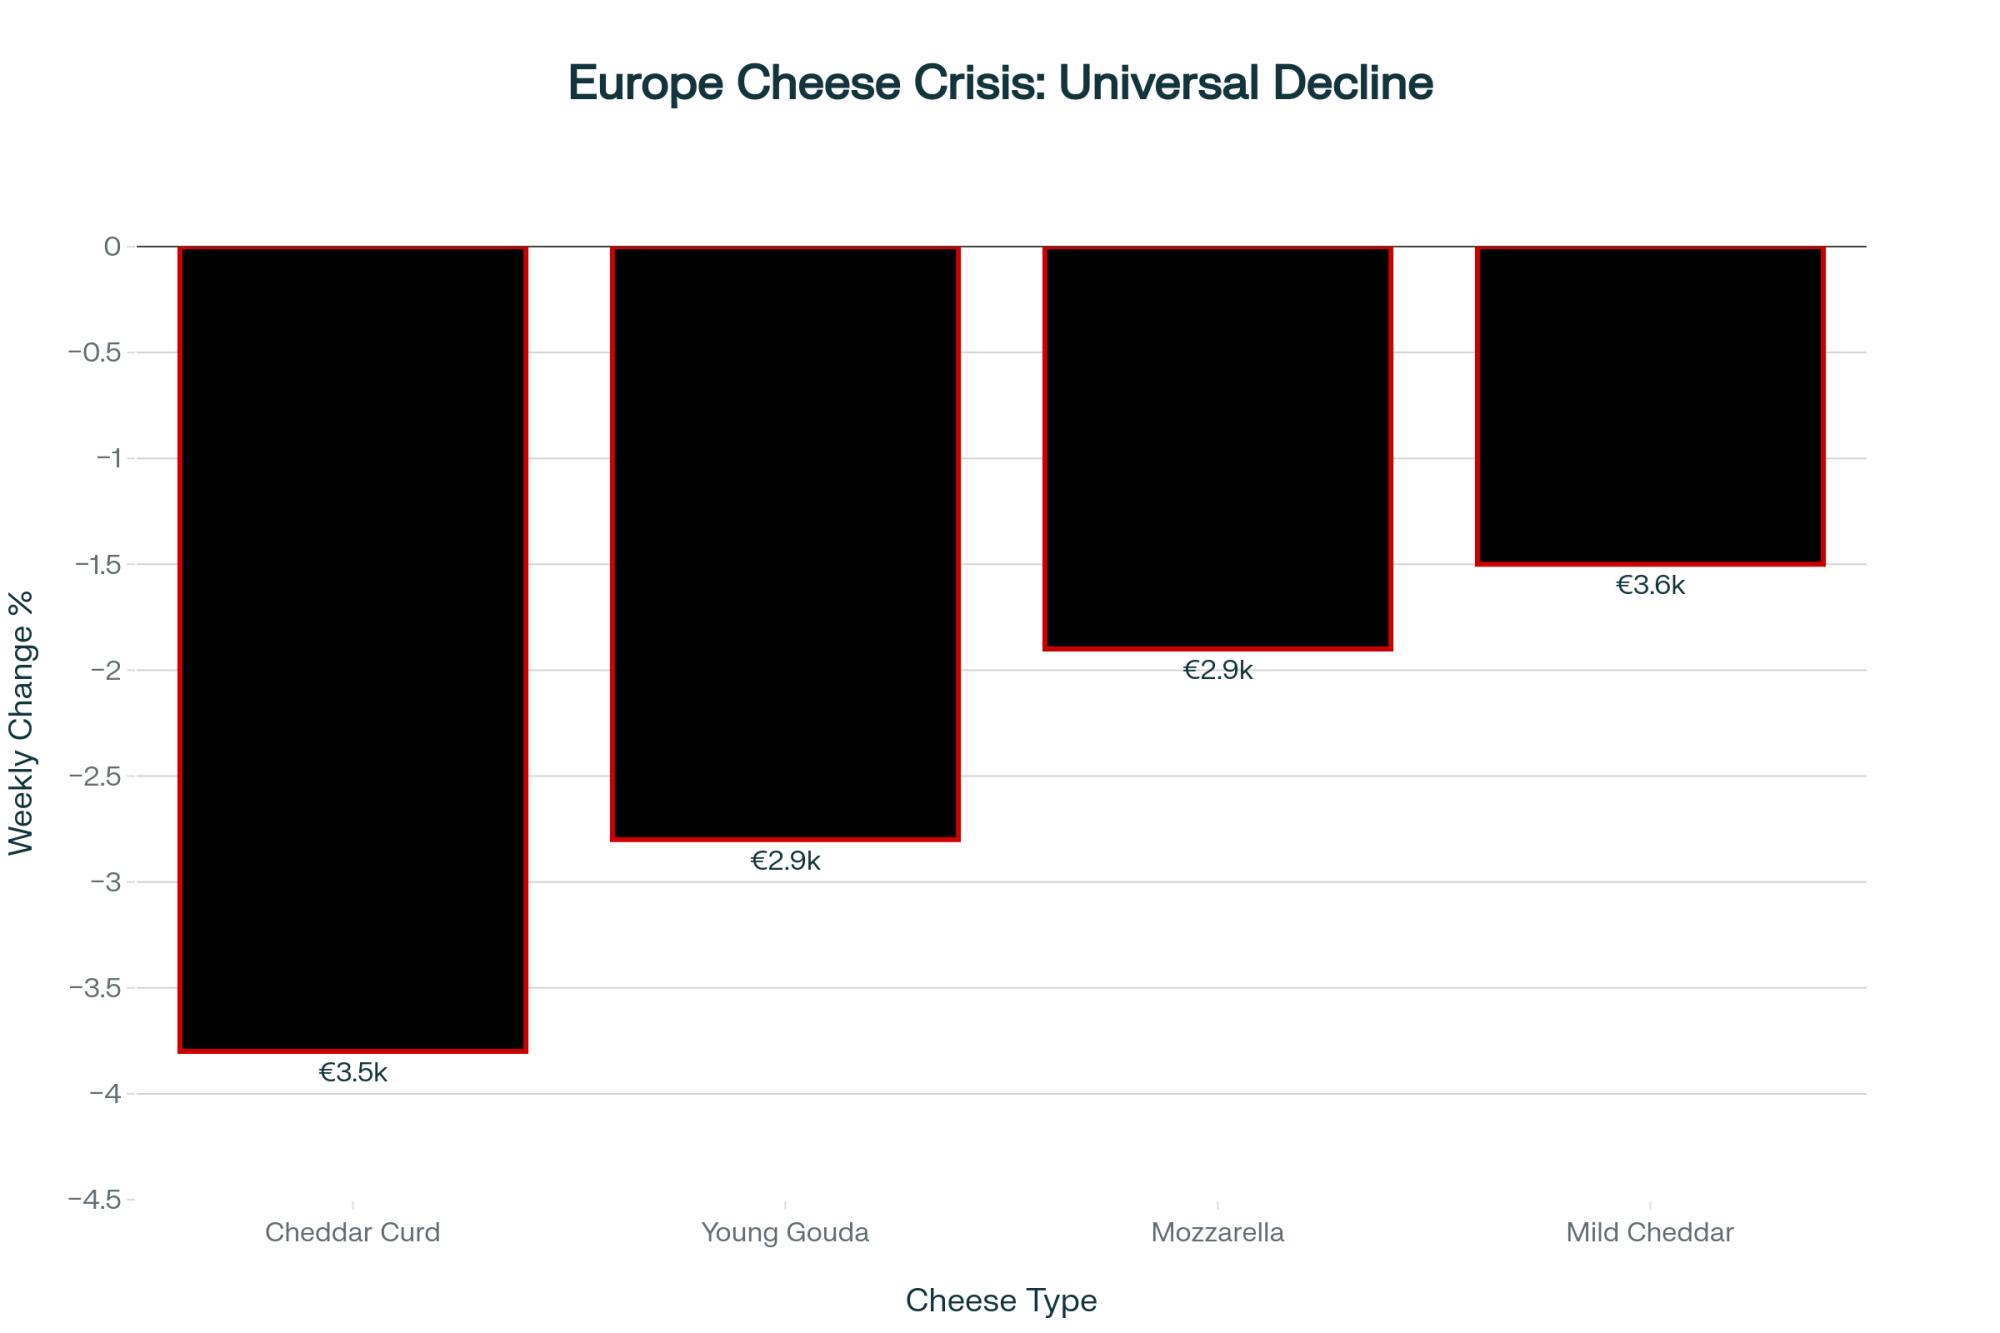
That pattern isn’t isolated to one region. According to the EU Commission Market Observatory, SMP fell about 1% this month, while butter barely moved. In the United States, USDA Dairy Market News reported CME butter prices hovering around $3.15 per pound, roughly aligned with global benchmarks after accounting for shipping and grading differences.
The CoBank Dairy Outlook (October 2025) calls this “a composition-driven divergence.” In simple terms, the milk market isn’t paying for volume anymore—it’s paying for what’s inside. AMF, at 99.8% pure milkfat, is ideal for global manufacturers who need precision and performance. Butter, at 82% fat, still has a place, but powders are losing ground as demand in infant formula and rehydrated products slows.
China’s Import Strategy Speaks Volumes
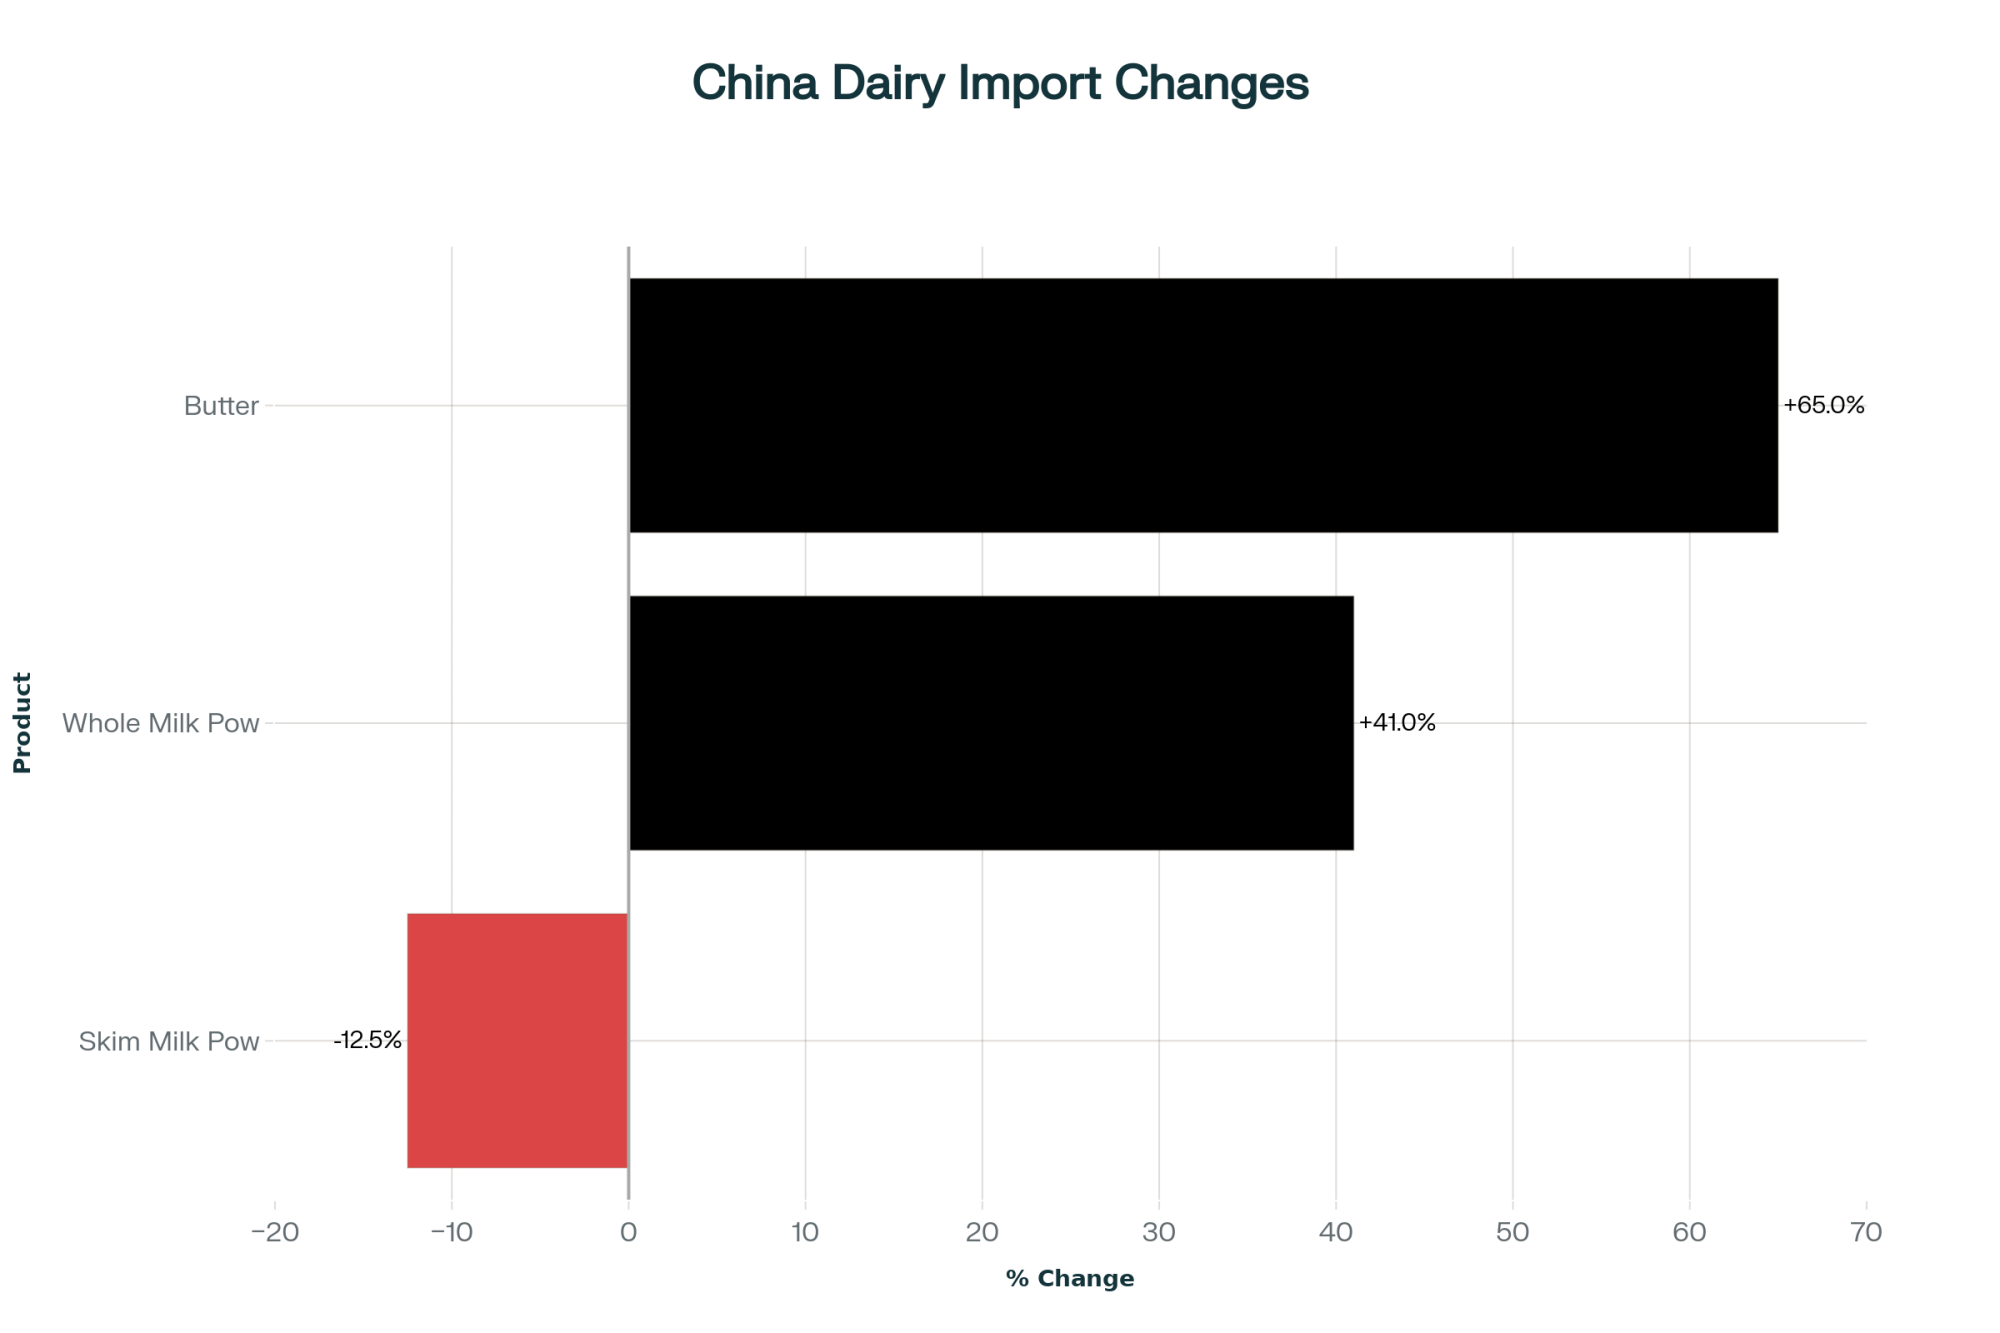
The best way to understand this trend is to look at China, where import behavior has changed dramatically. The Chinese Customs Administration reported that butter imports rose 65% year over year, whole milk powder climbed 41%, and SMP dropped 12.5%.
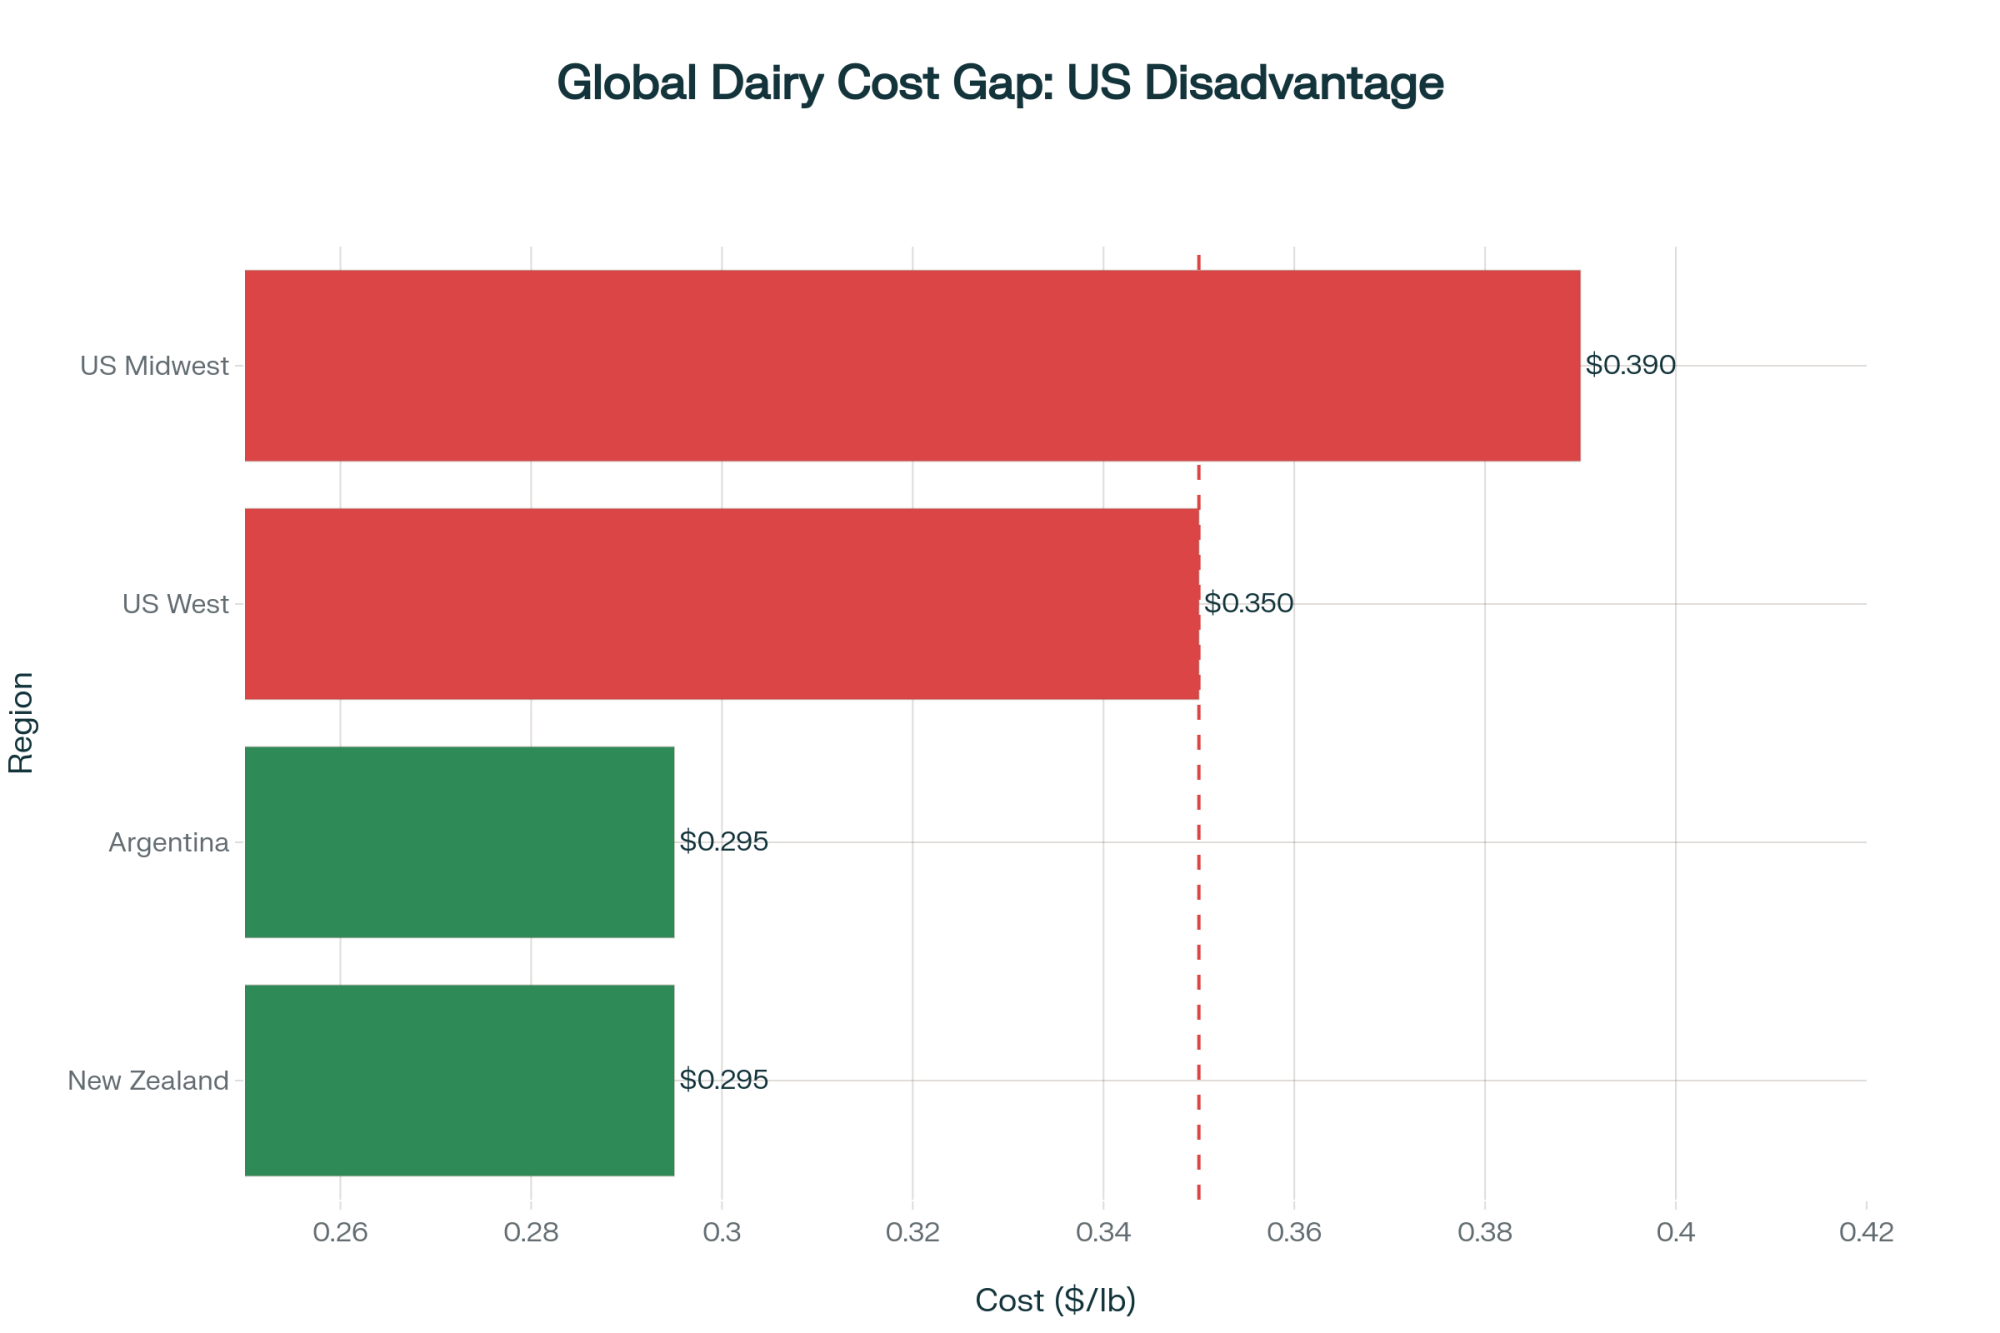
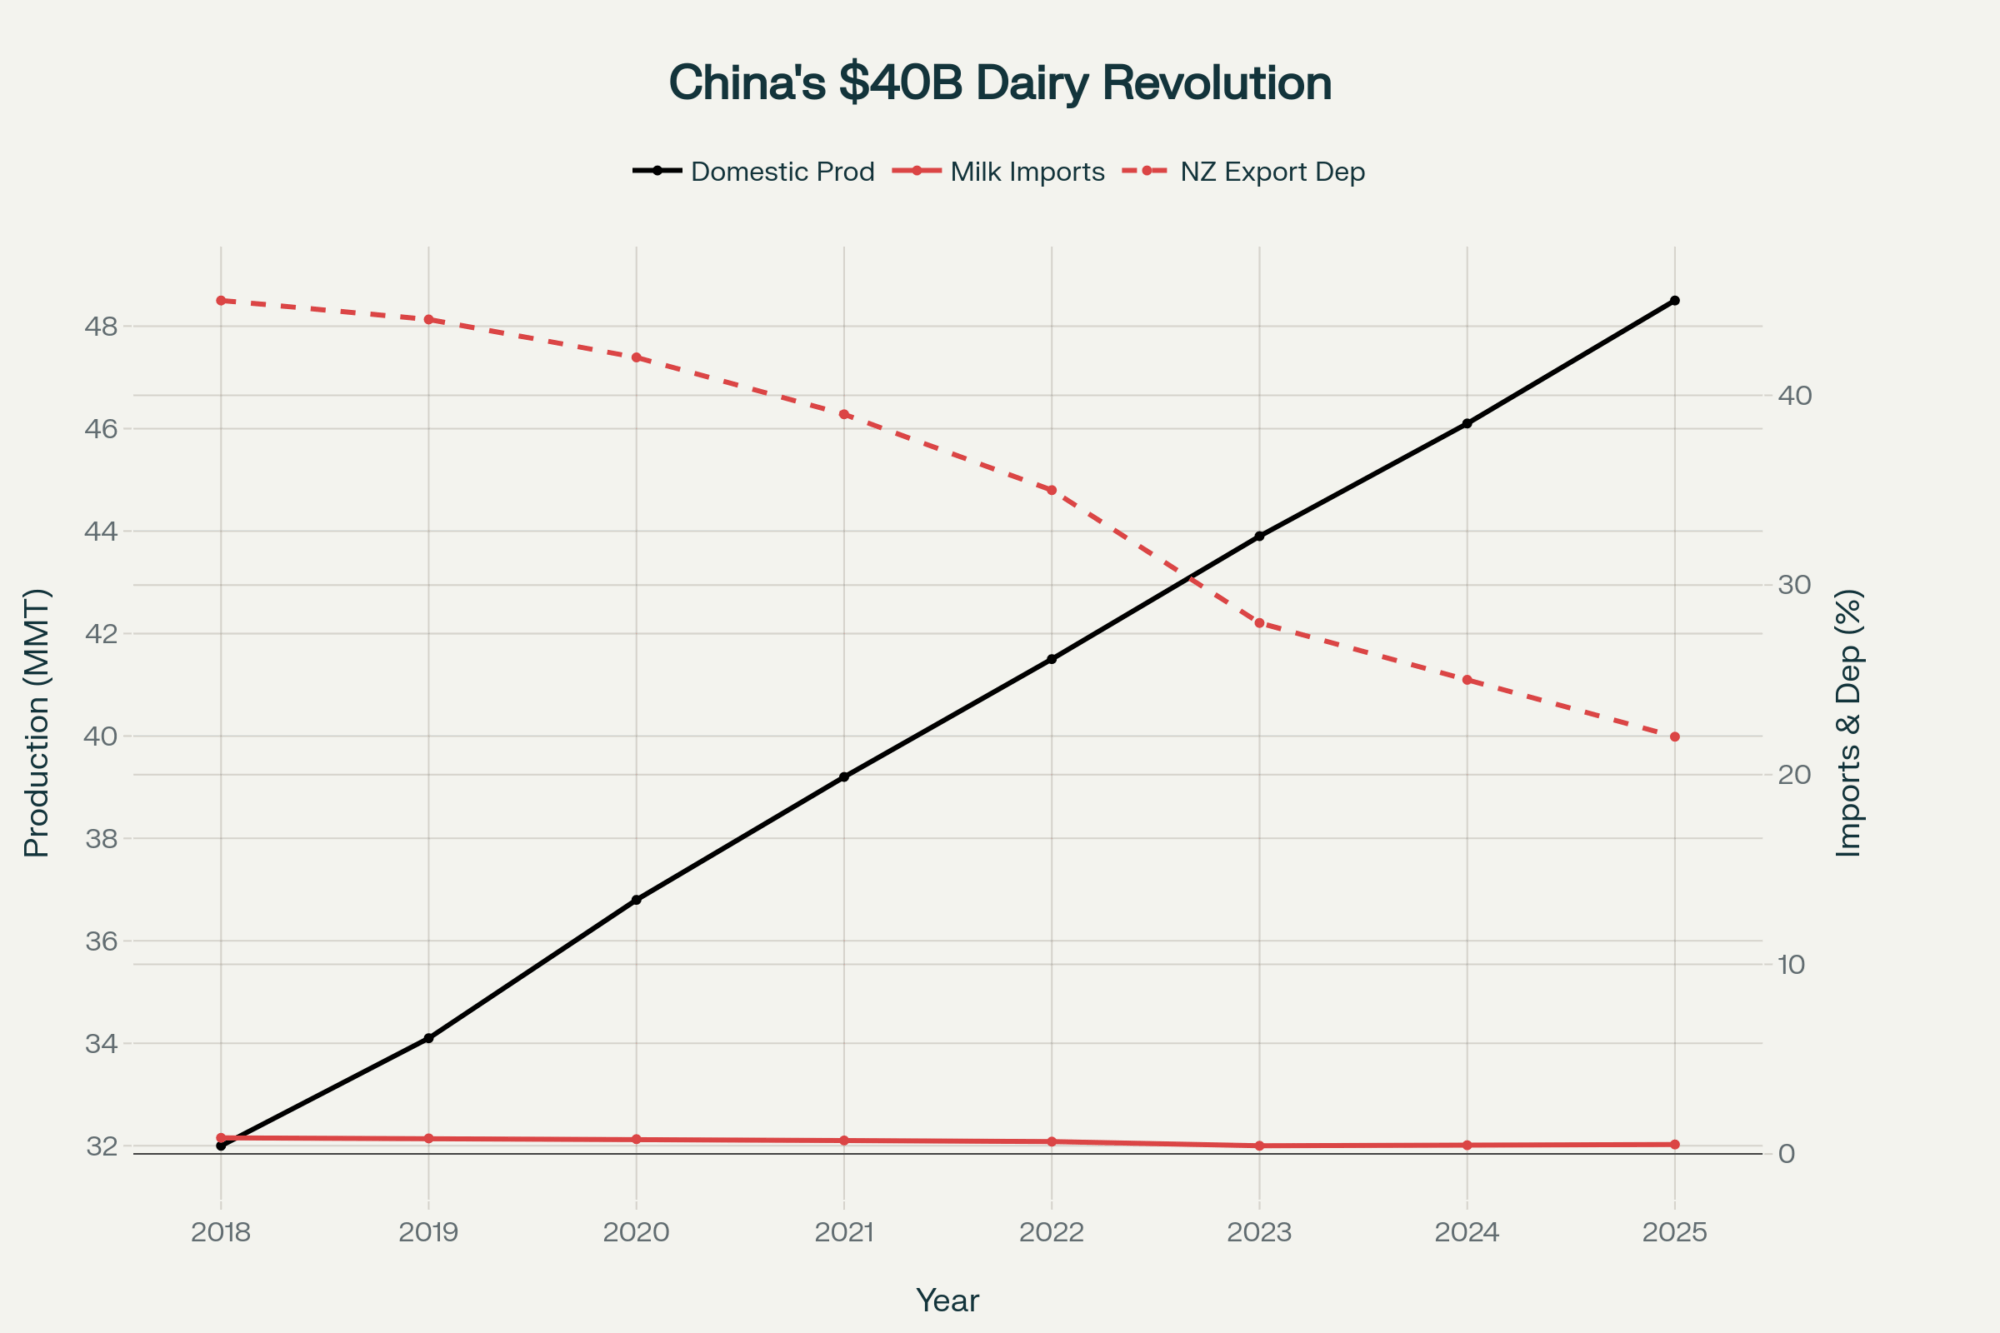
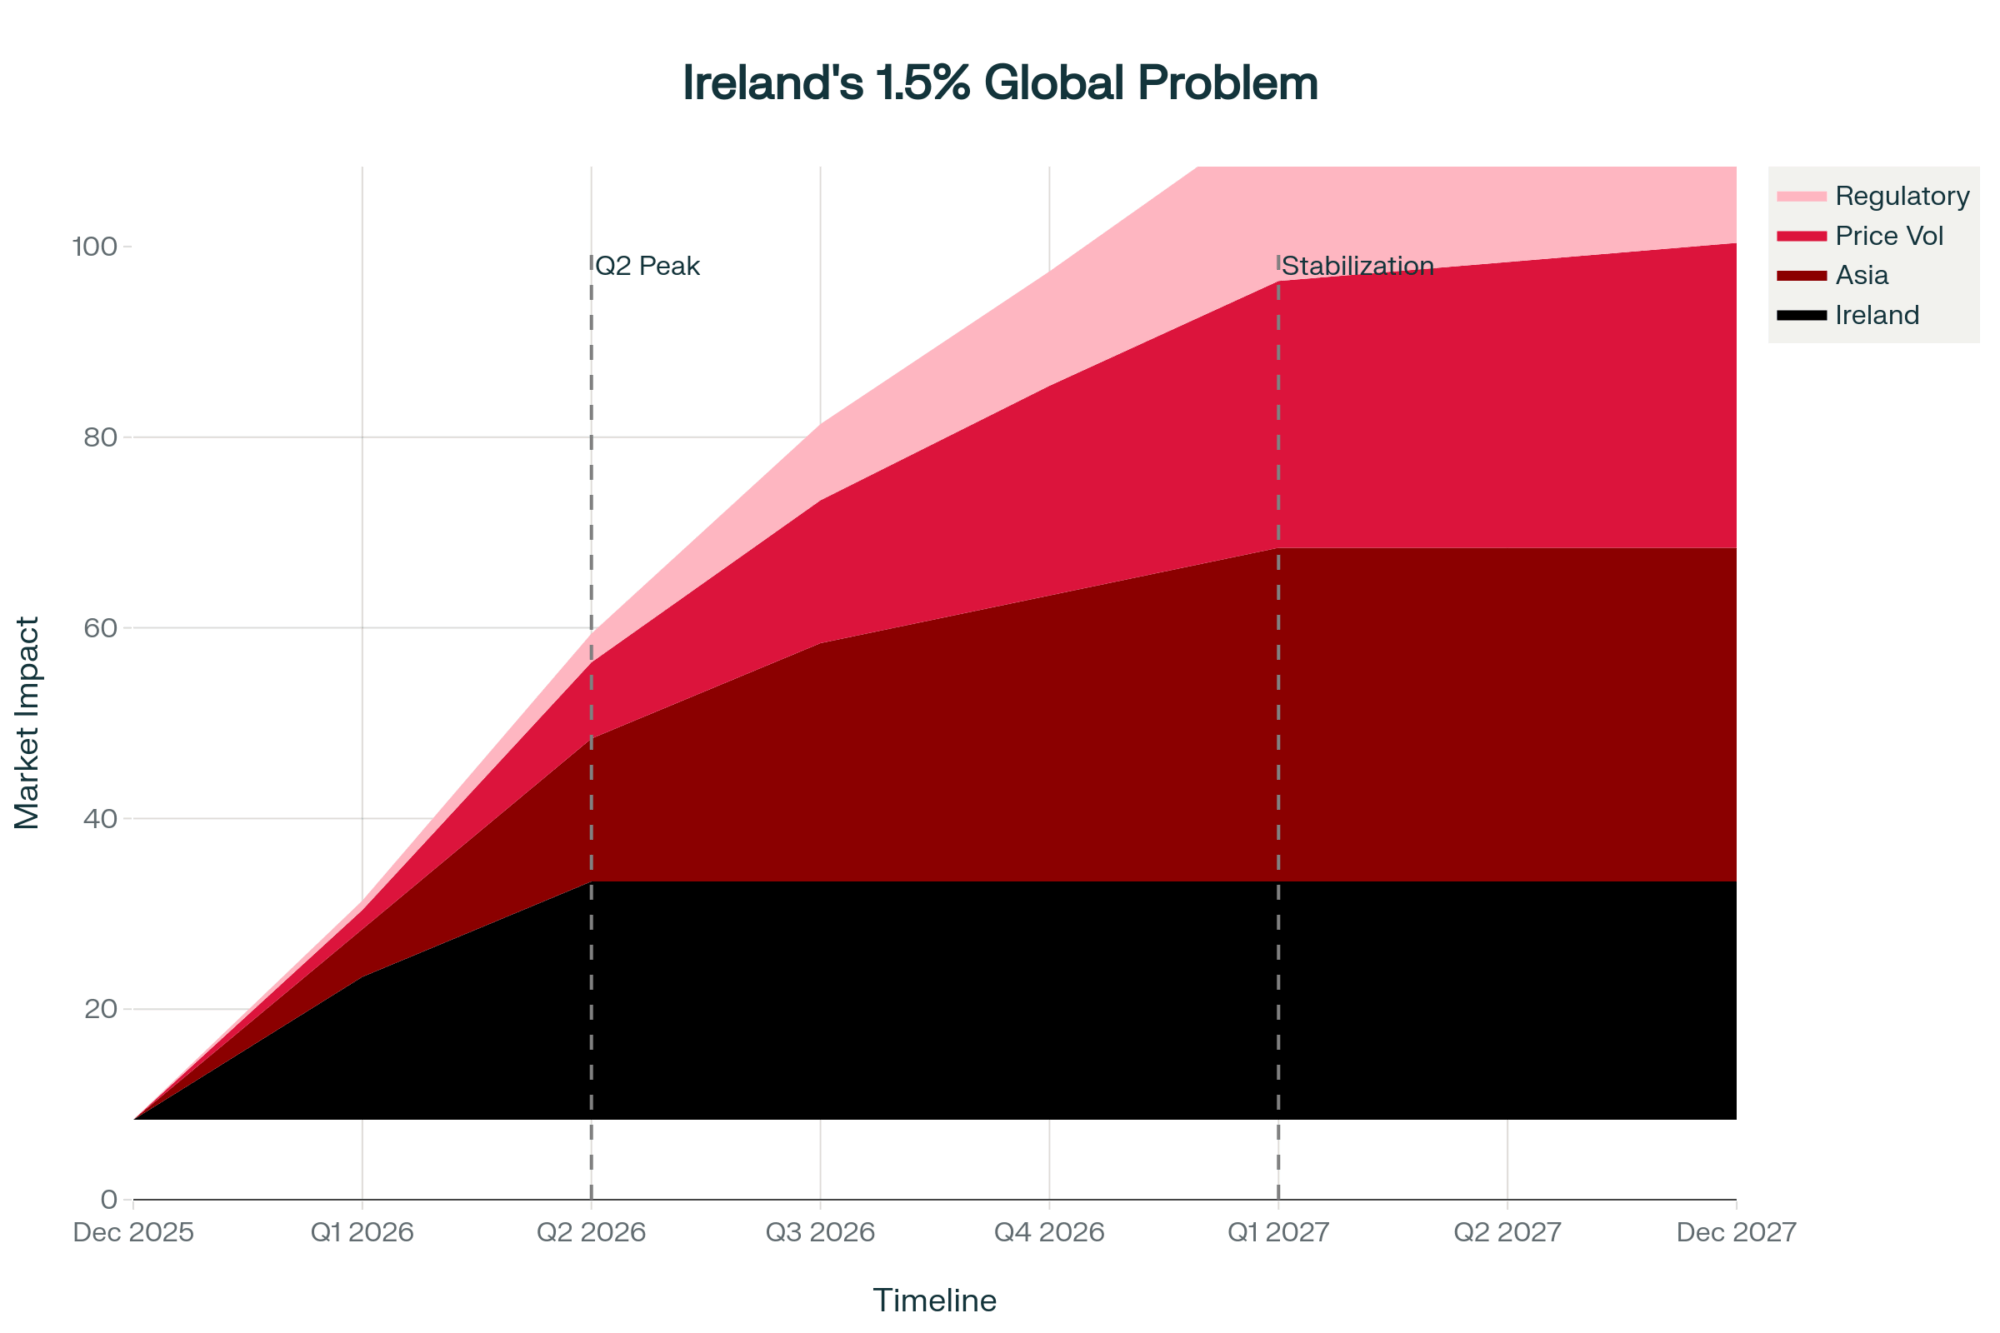
At the same time, the USDA Foreign Agricultural Service (FAS) confirmed that China’s milk production grew to 41.9 million tonnes in 2024, a rise of 6.7%. Those numbers sounded encouraging, but they also created oversupply at home. Processing plants are drying roughly 20,000 tonnes of milk a day, often at a loss. The OCLA Argentina Dairy Market Outlook (September 2025) estimates those losses at 10,000 yuan per tonne, or about $1,350 USD, thanks to high input and energy costs.
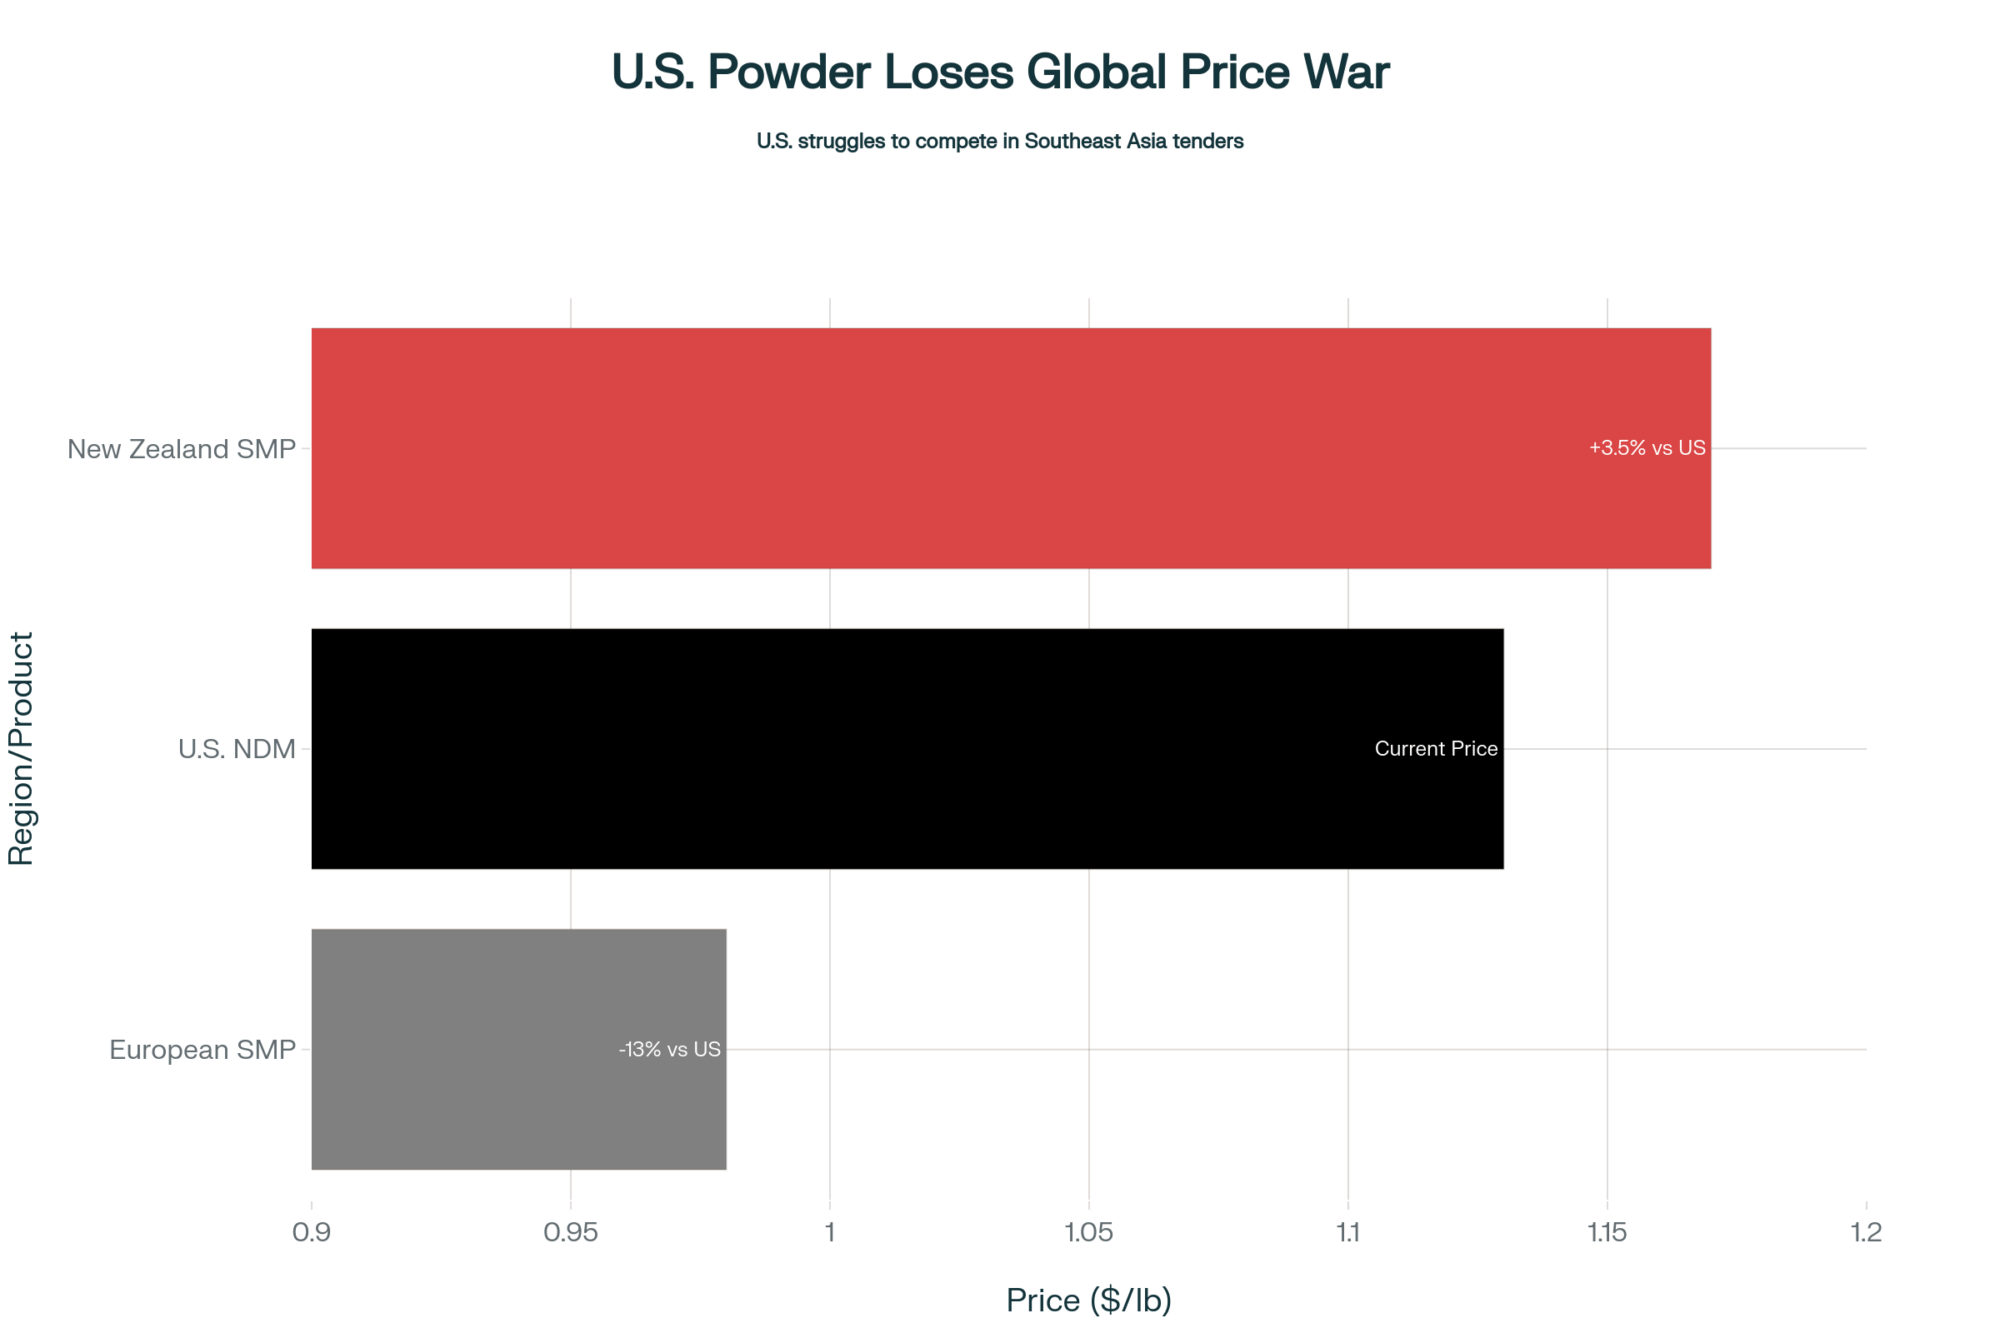
Here’s where things get interesting. China can produce plenty of powder. Where it struggles is in high-purity fats like AMF and industrial butter. Domestic processors lack the cream-separation and fractionation capacity found in markets like New Zealand, Europe, and the U.S. So their strategy has shifted. They’re importing what they can’t make efficiently. That choice has reinforced fat premiums in the global marketplace.
This development suggests a new normal for international trade. Countries will compete not on total milk output, but on how effectively they produce—and market—the right components.
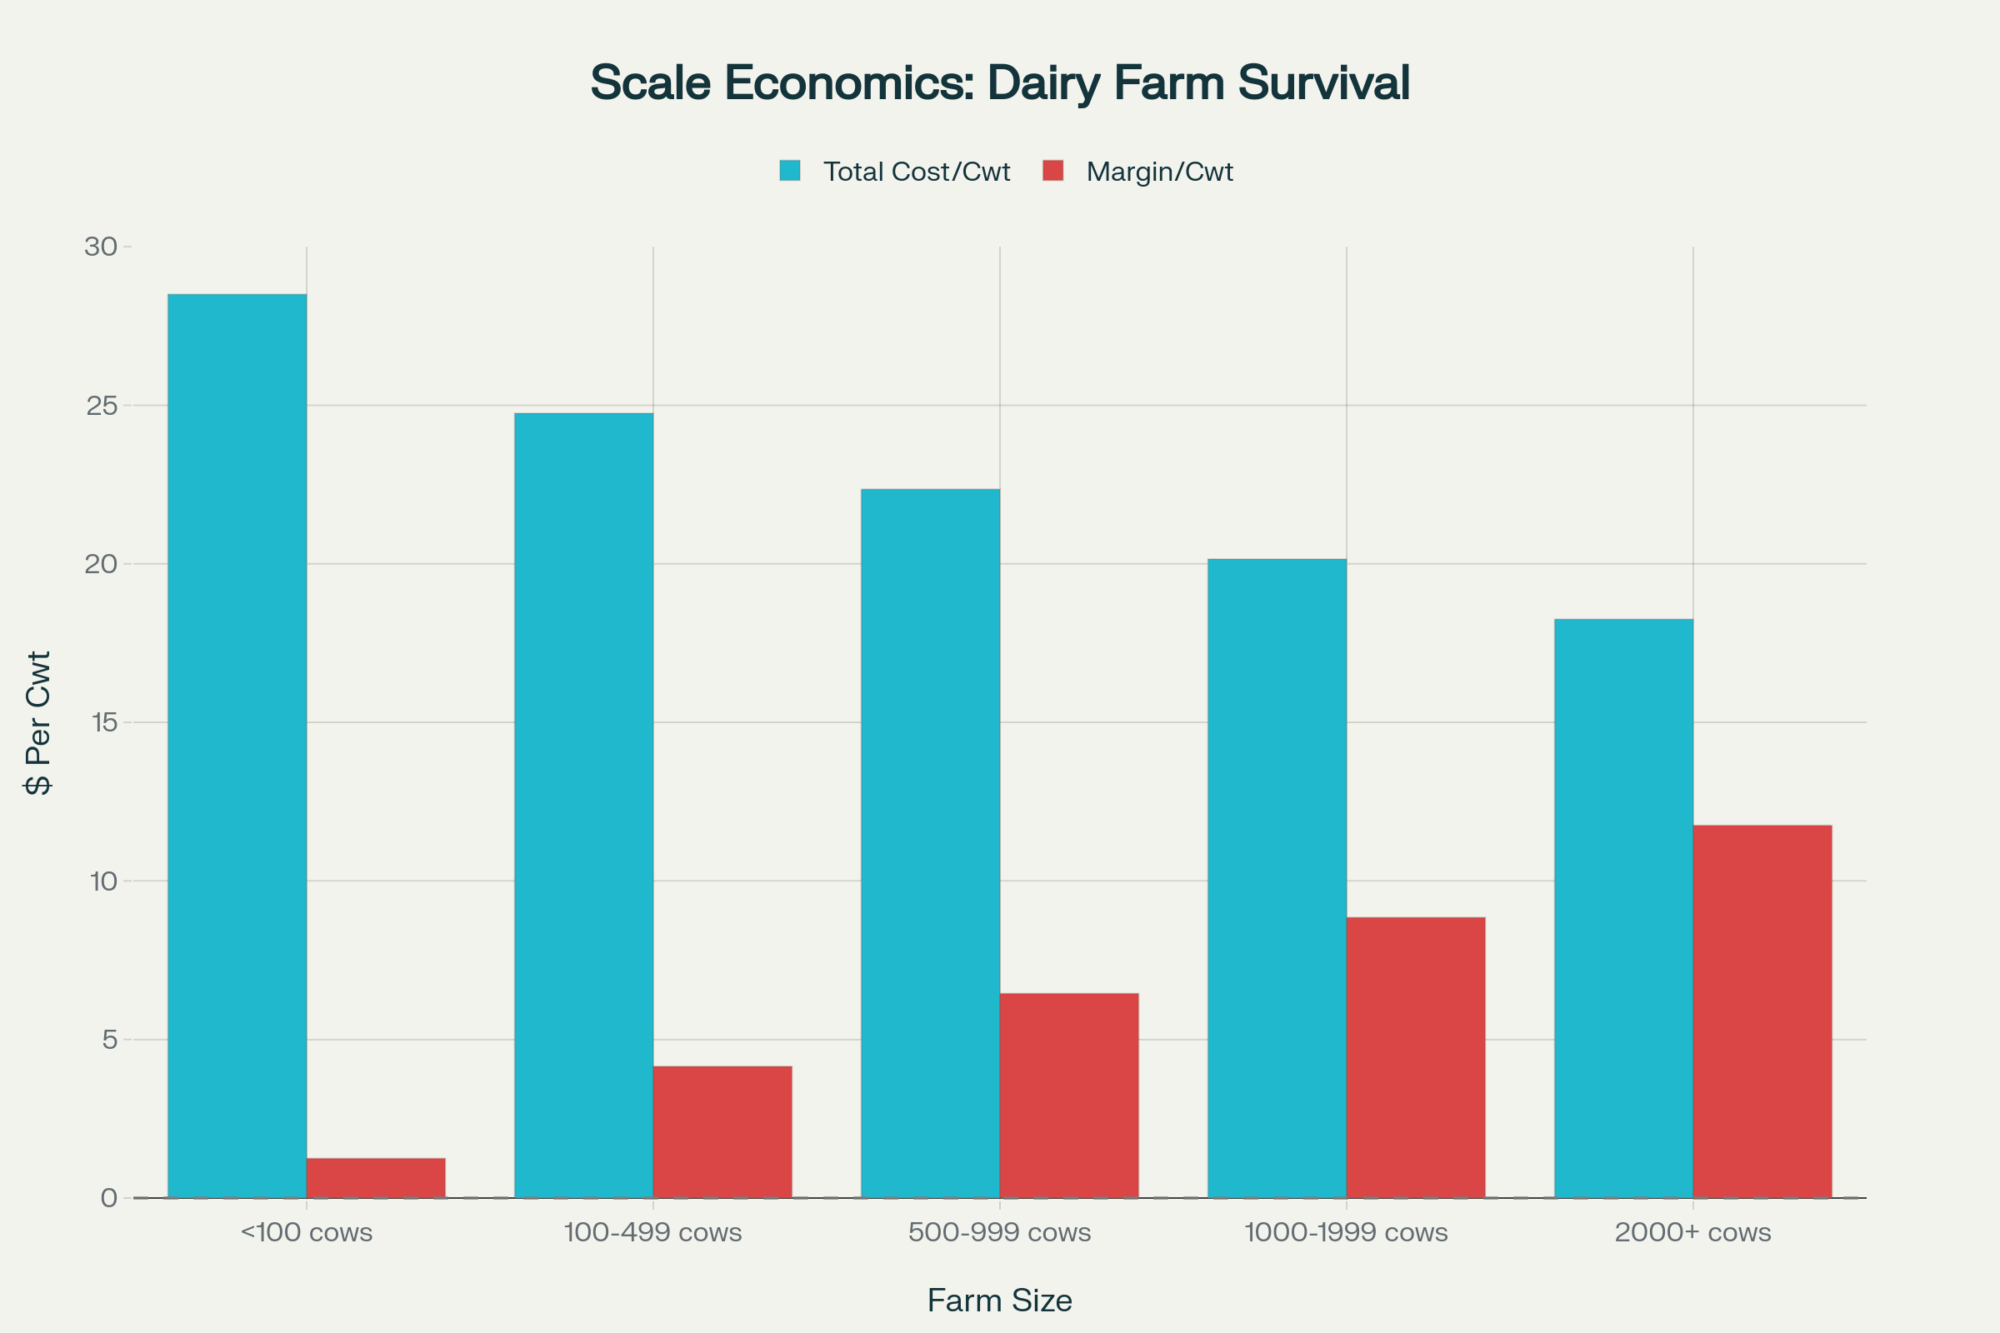
Why U.S. Farmers Are Still Standing tall
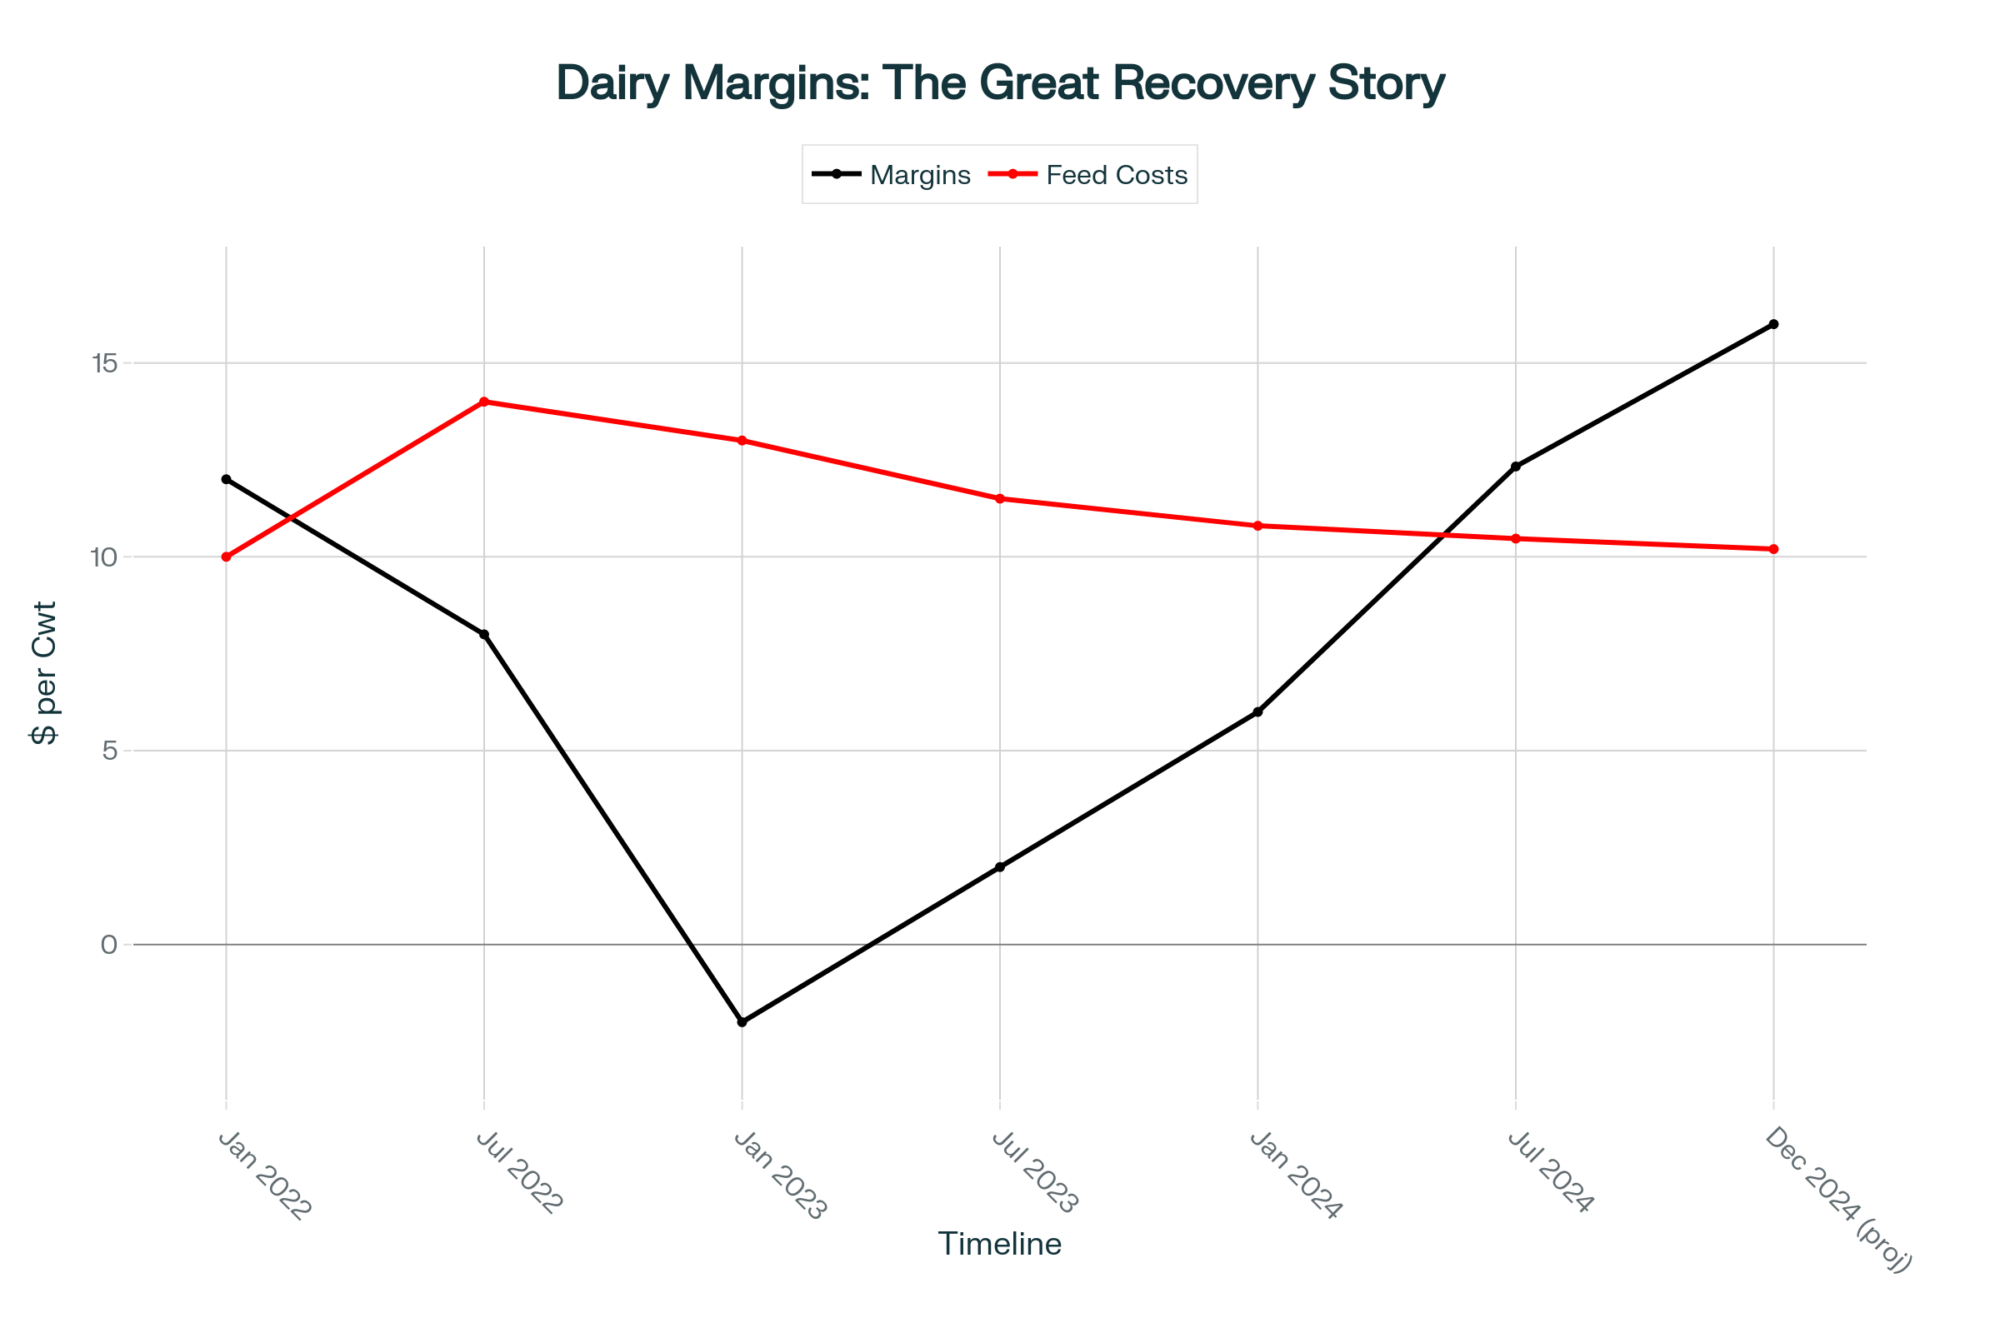
Looking back through cycles like 2015 or 2020, it’s clear farmers have become better prepared to weather volatility. Part of that comes down to management maturity and new financial safety nets that didn’t exist a decade ago.
Risk Management Tools Are Paying Off
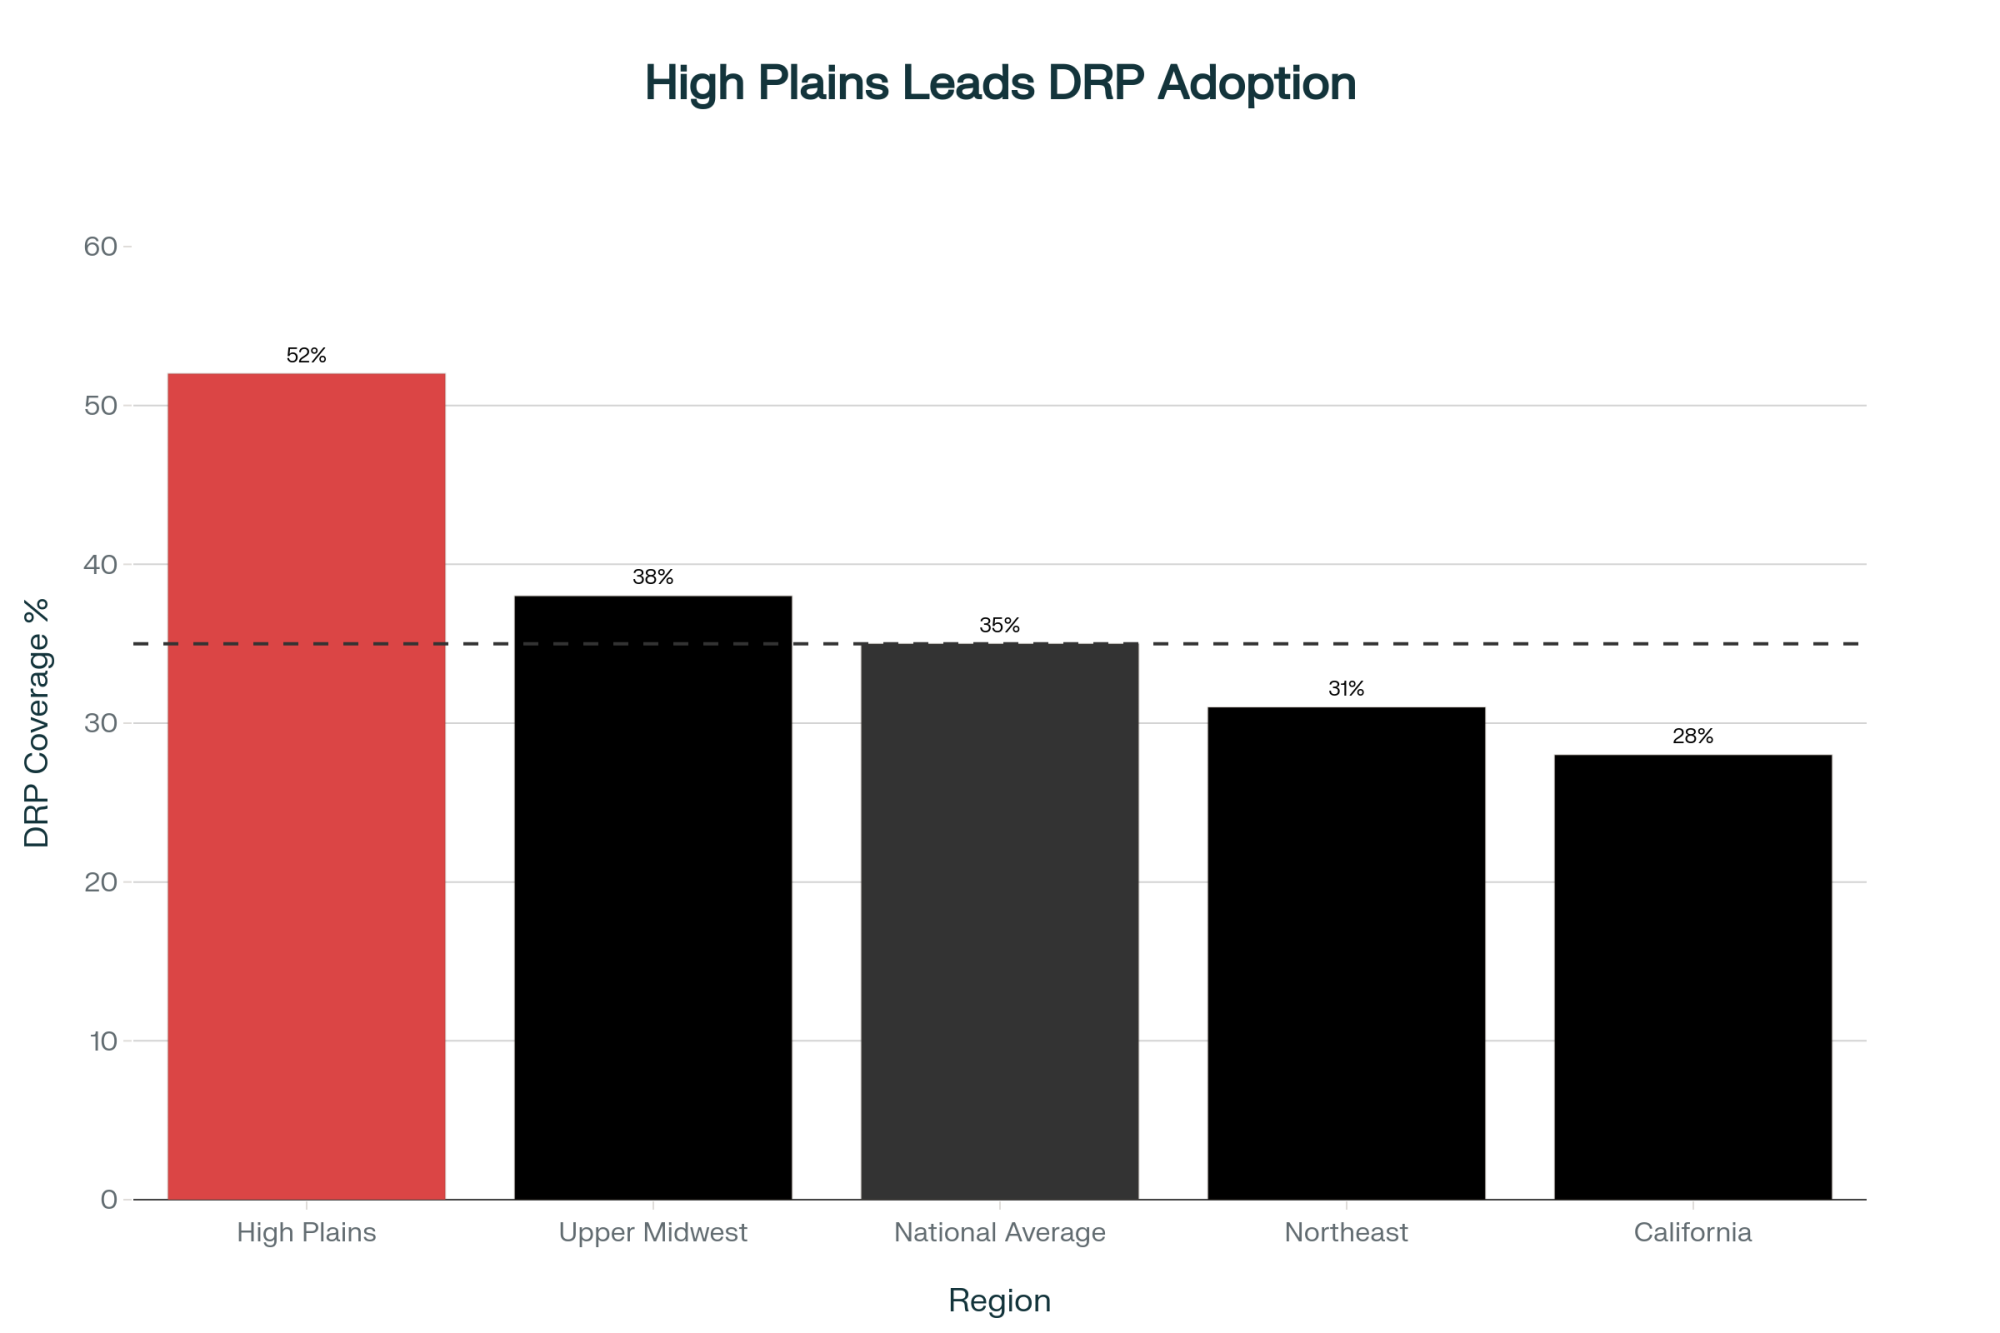
According to the USDA Risk Management Agency (RMA), about 35% of U.S. milk production is now protected under Dairy Revenue Protection (DRP), with participation surpassing 50% in the High Plains. Those policies are helping farms hold margins through increasingly unpredictable shifts in global pricing.
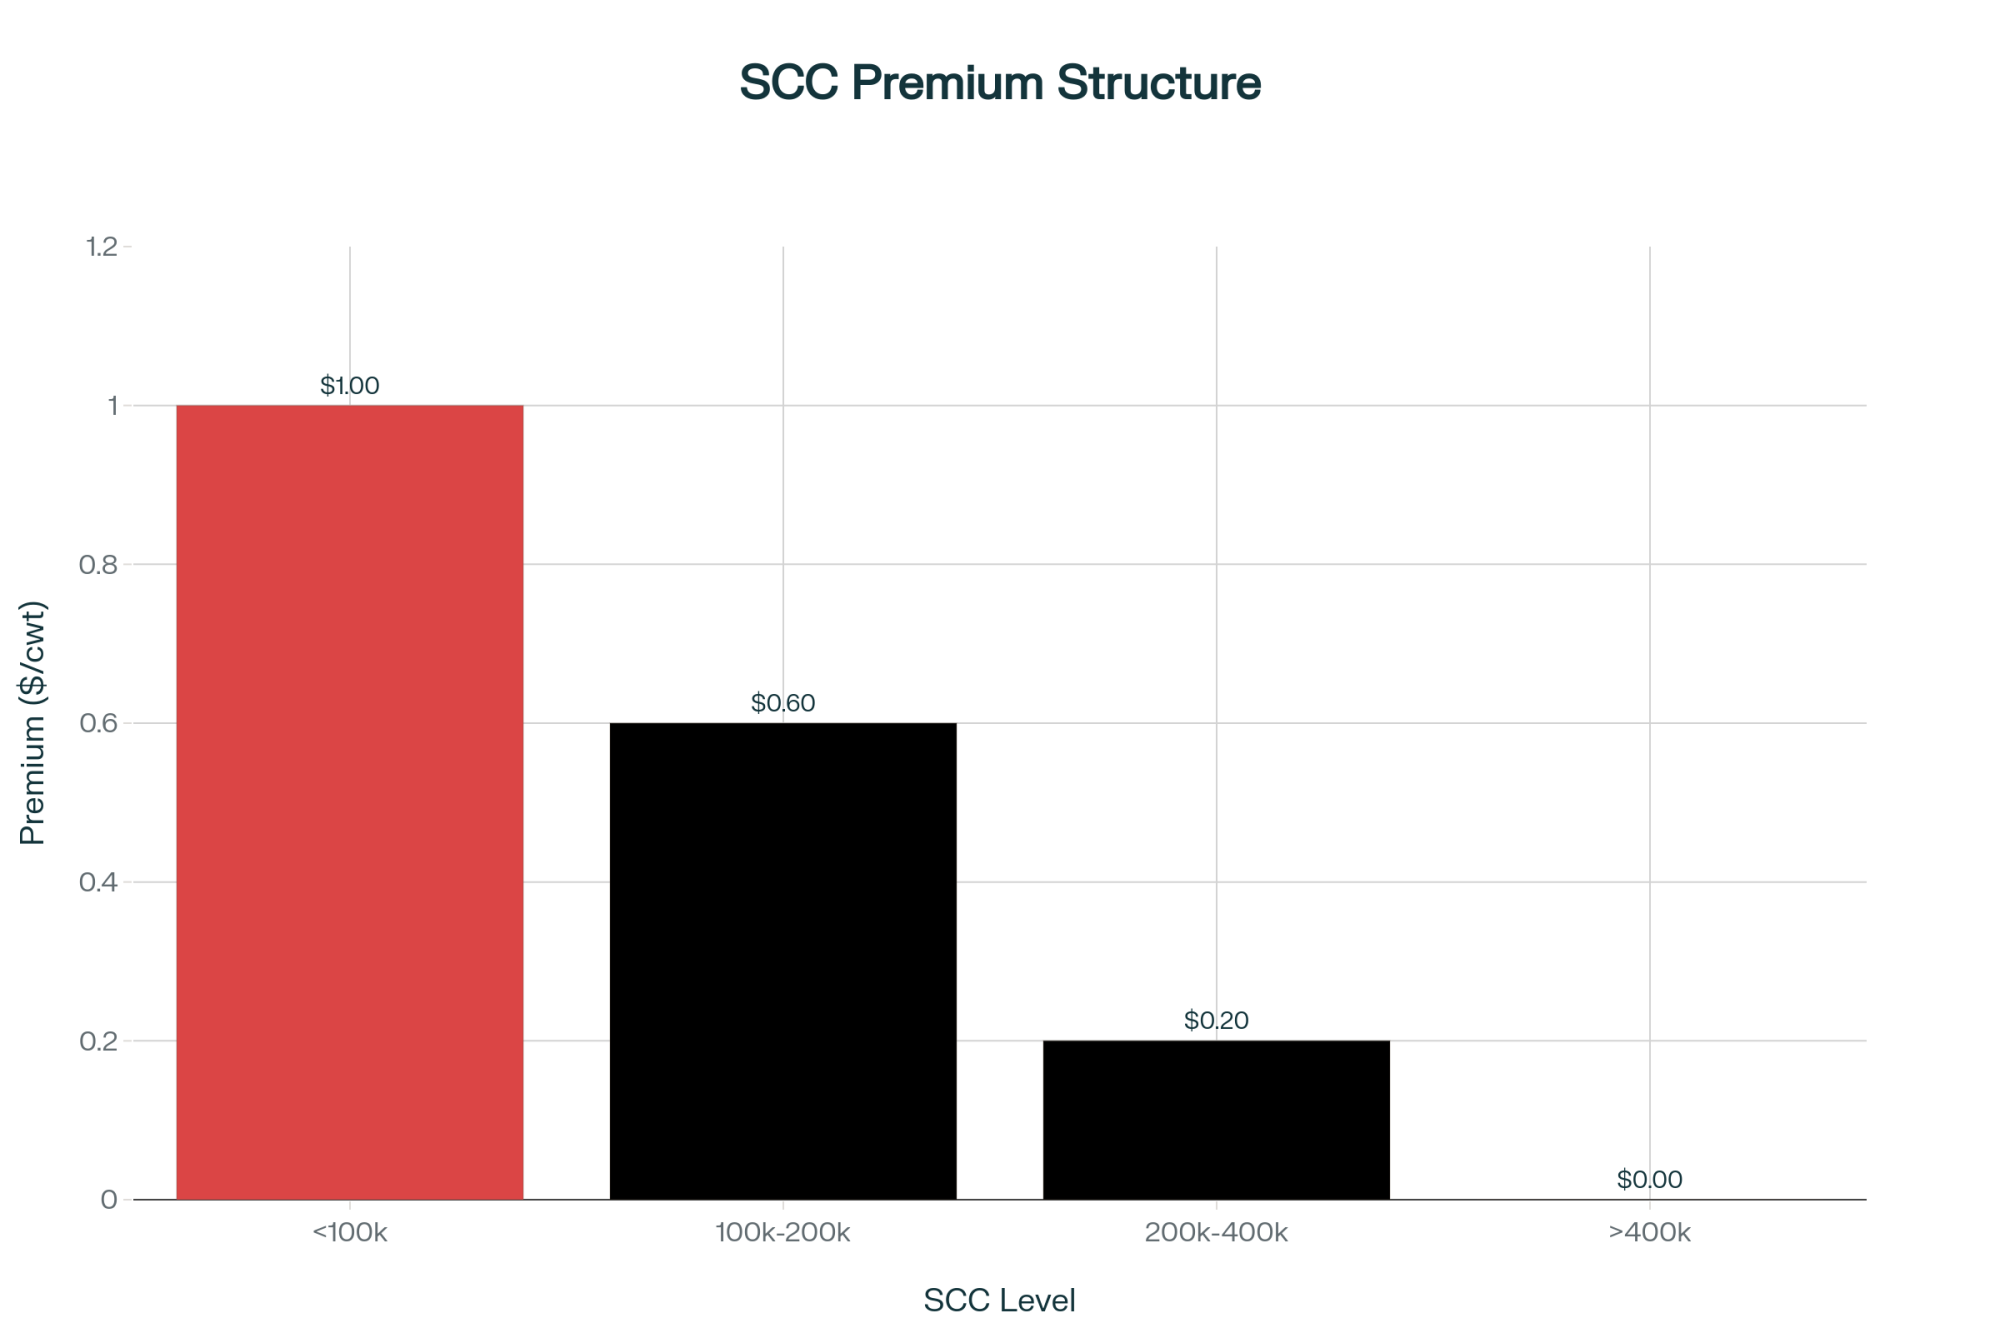
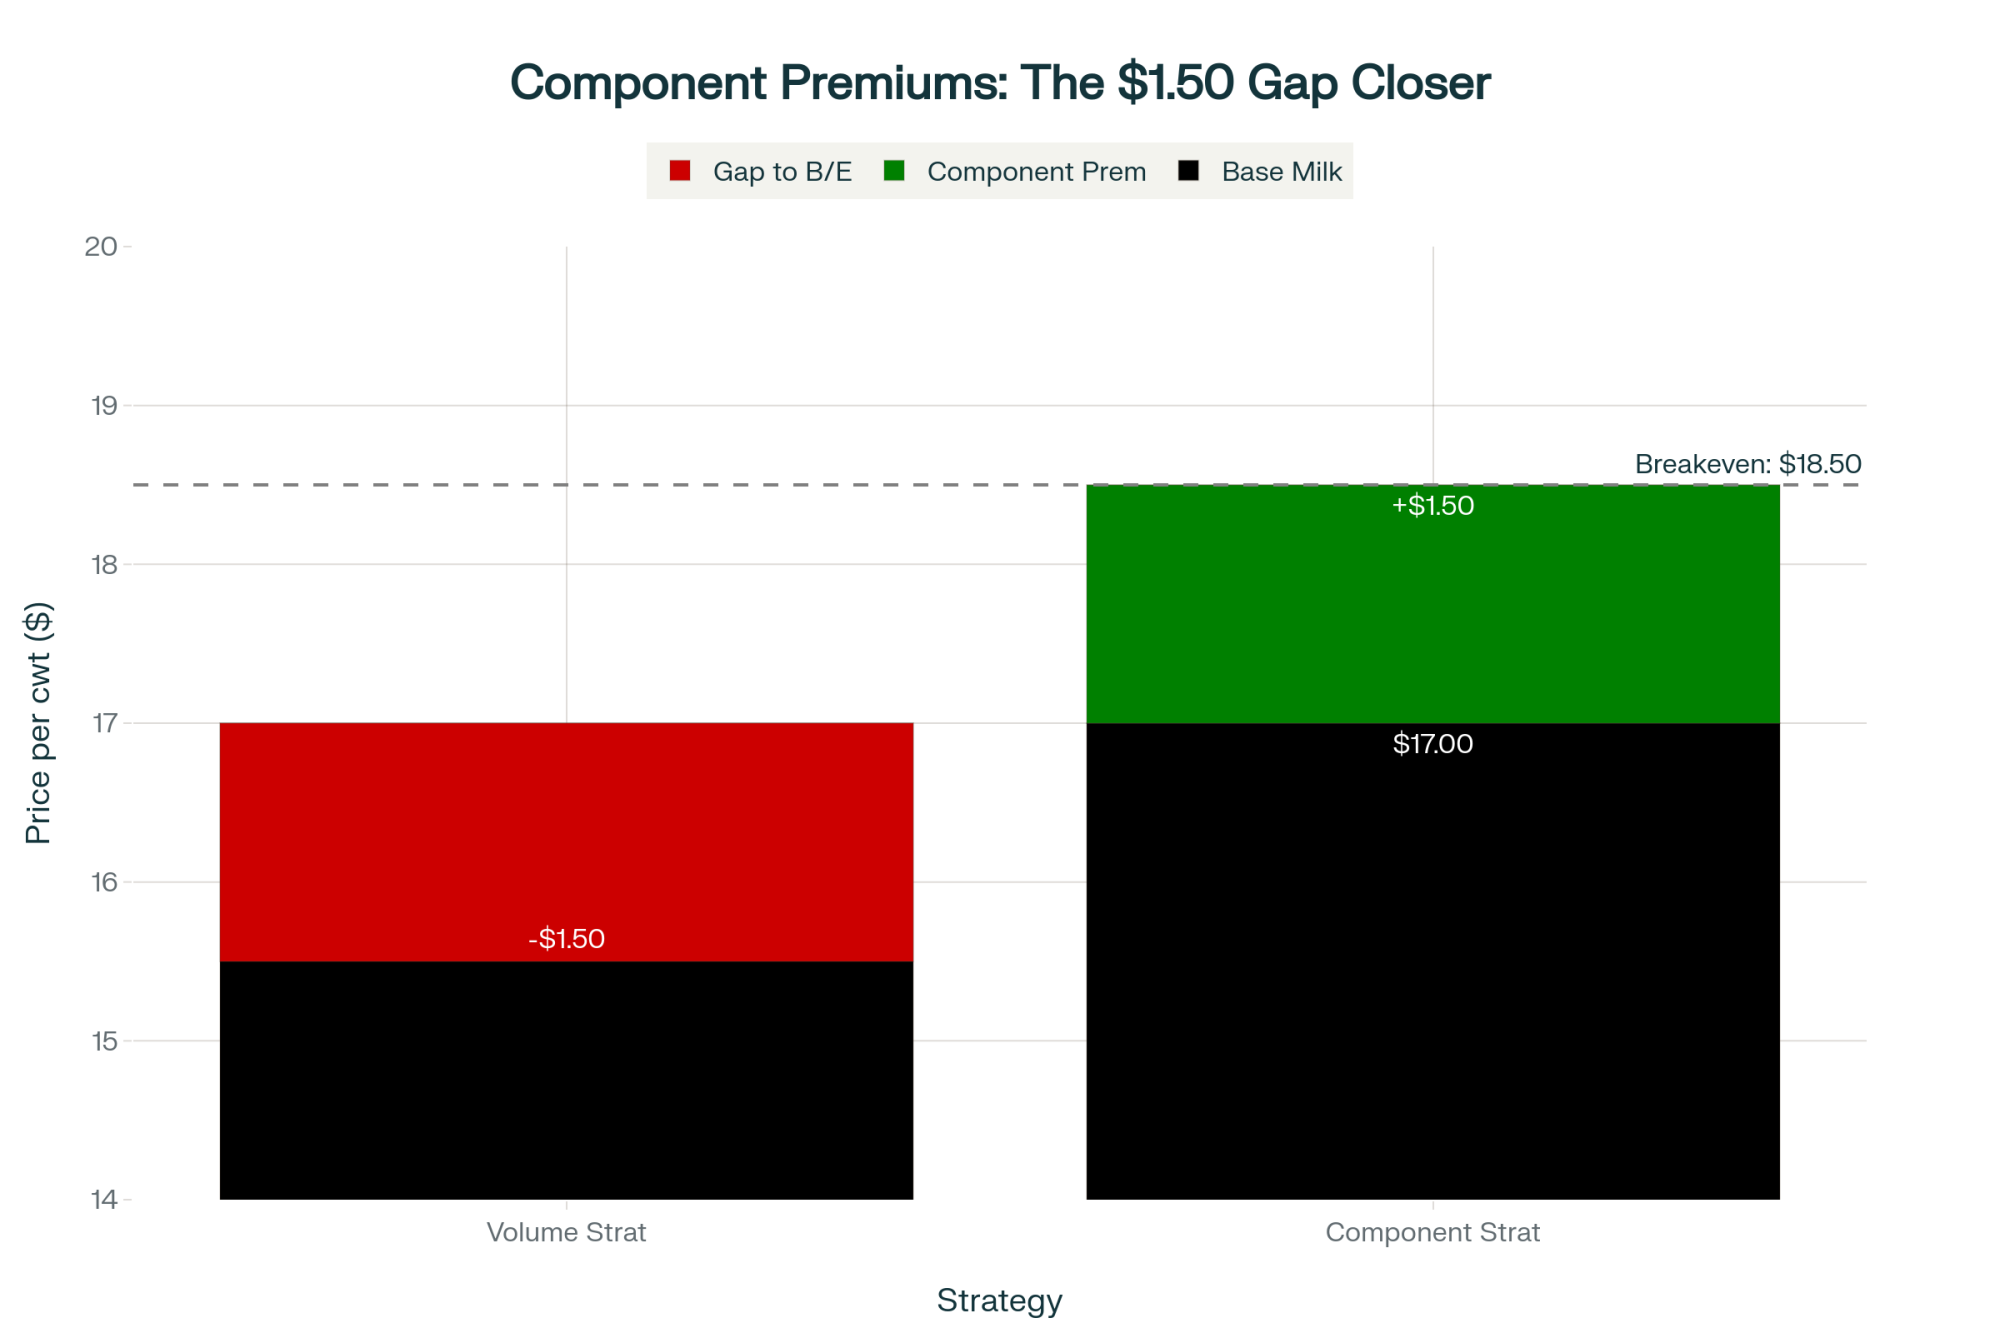
Component Programs Reward Quality, Not Quantity
More than 90% of milk in the country is now sold under Multiple Component Pricing (MCP). Herds averaging 4.3% butterfat and 3.4% protein consistently earn $1.50 to $2.00 per hundredweight more than standard 3.7/3.1 herds, according to USDA AMS data. That’s a structural incentive, not a fad.
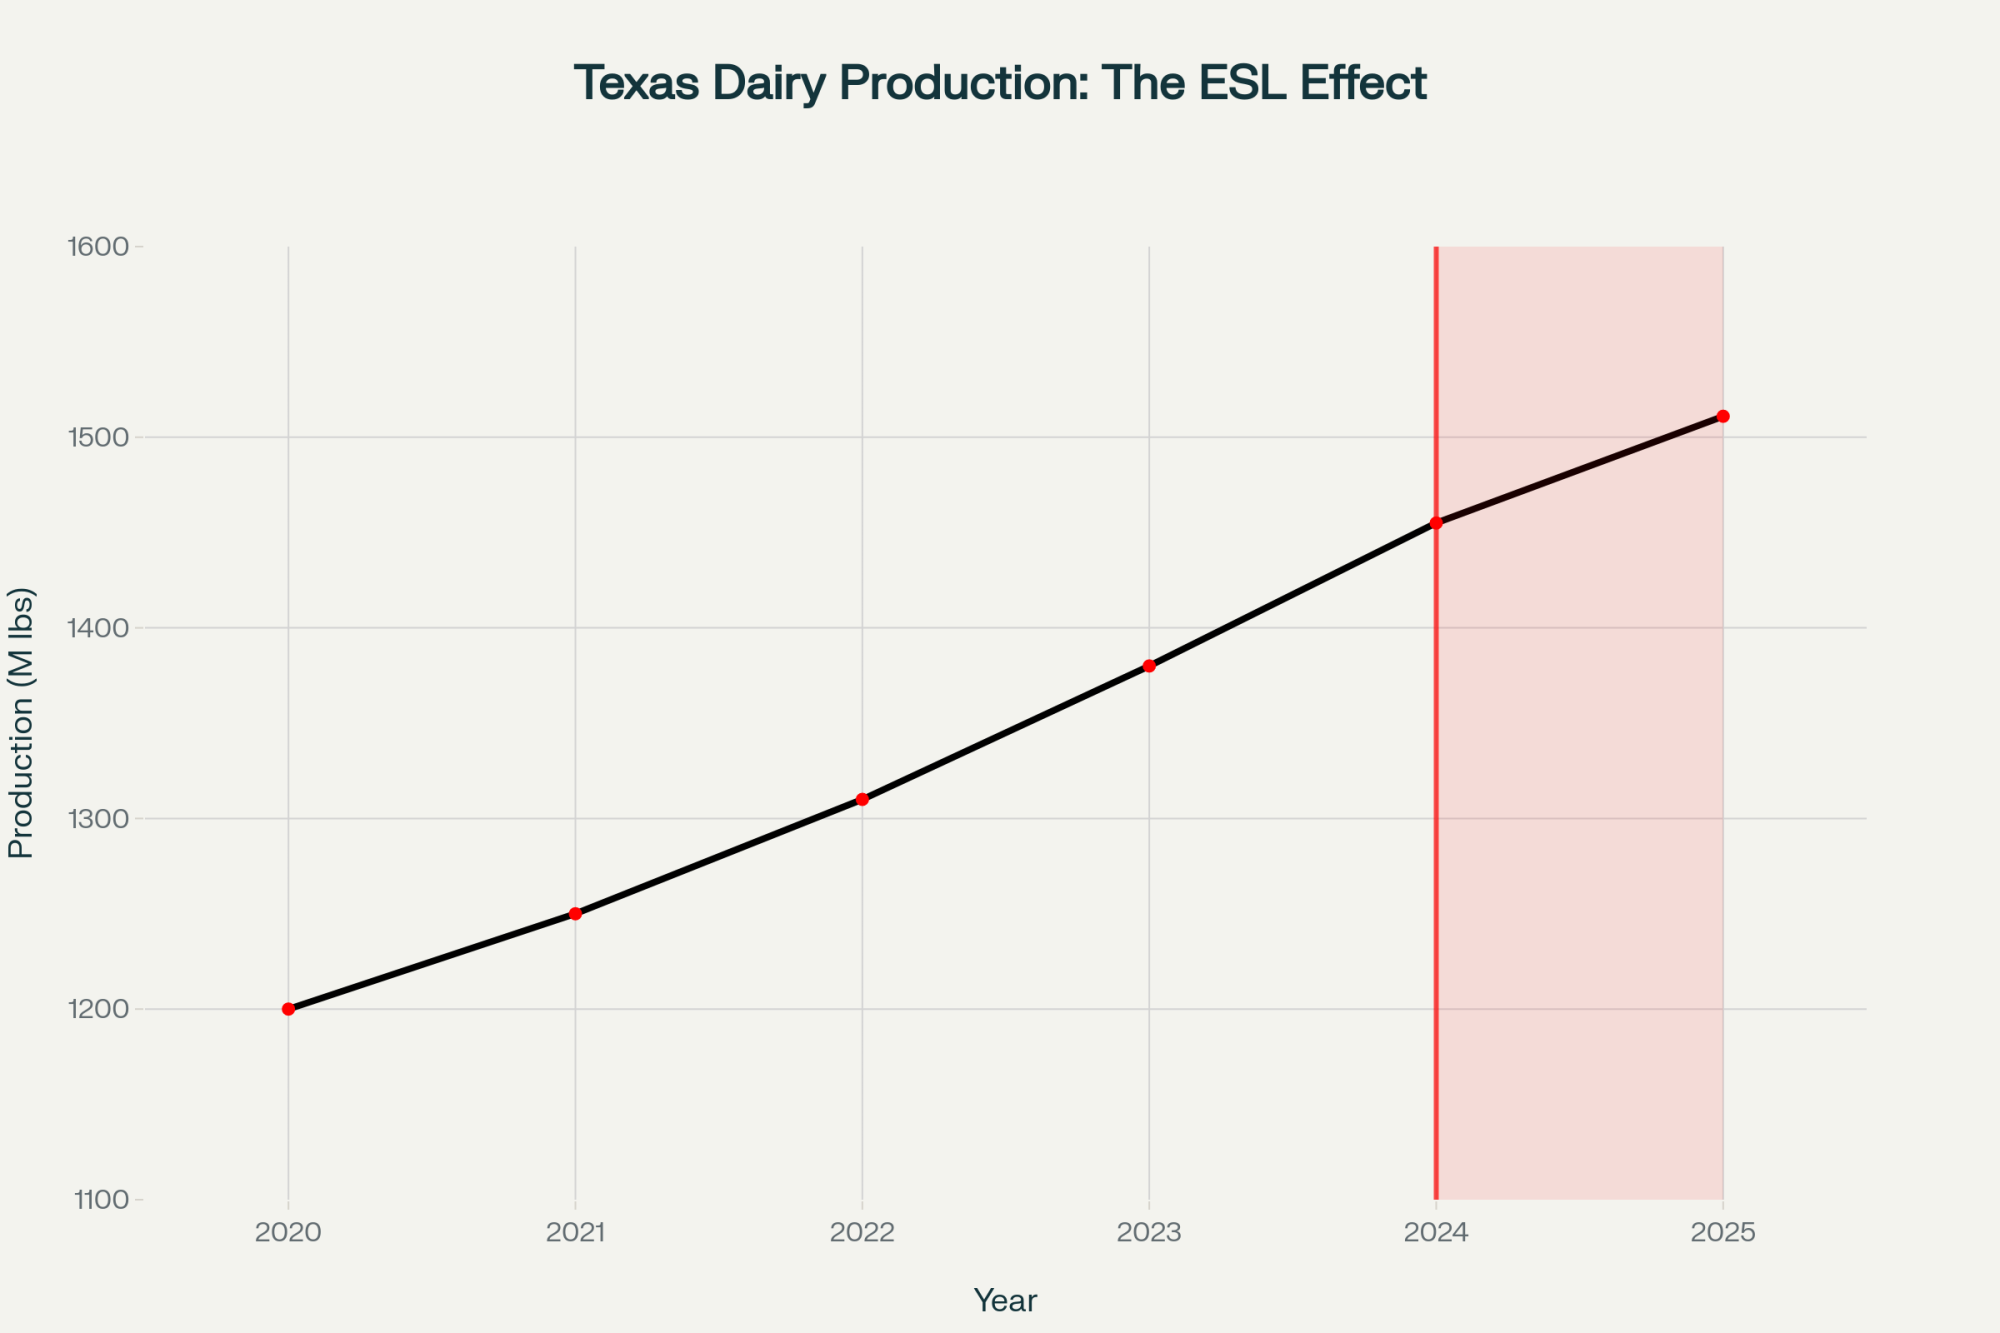
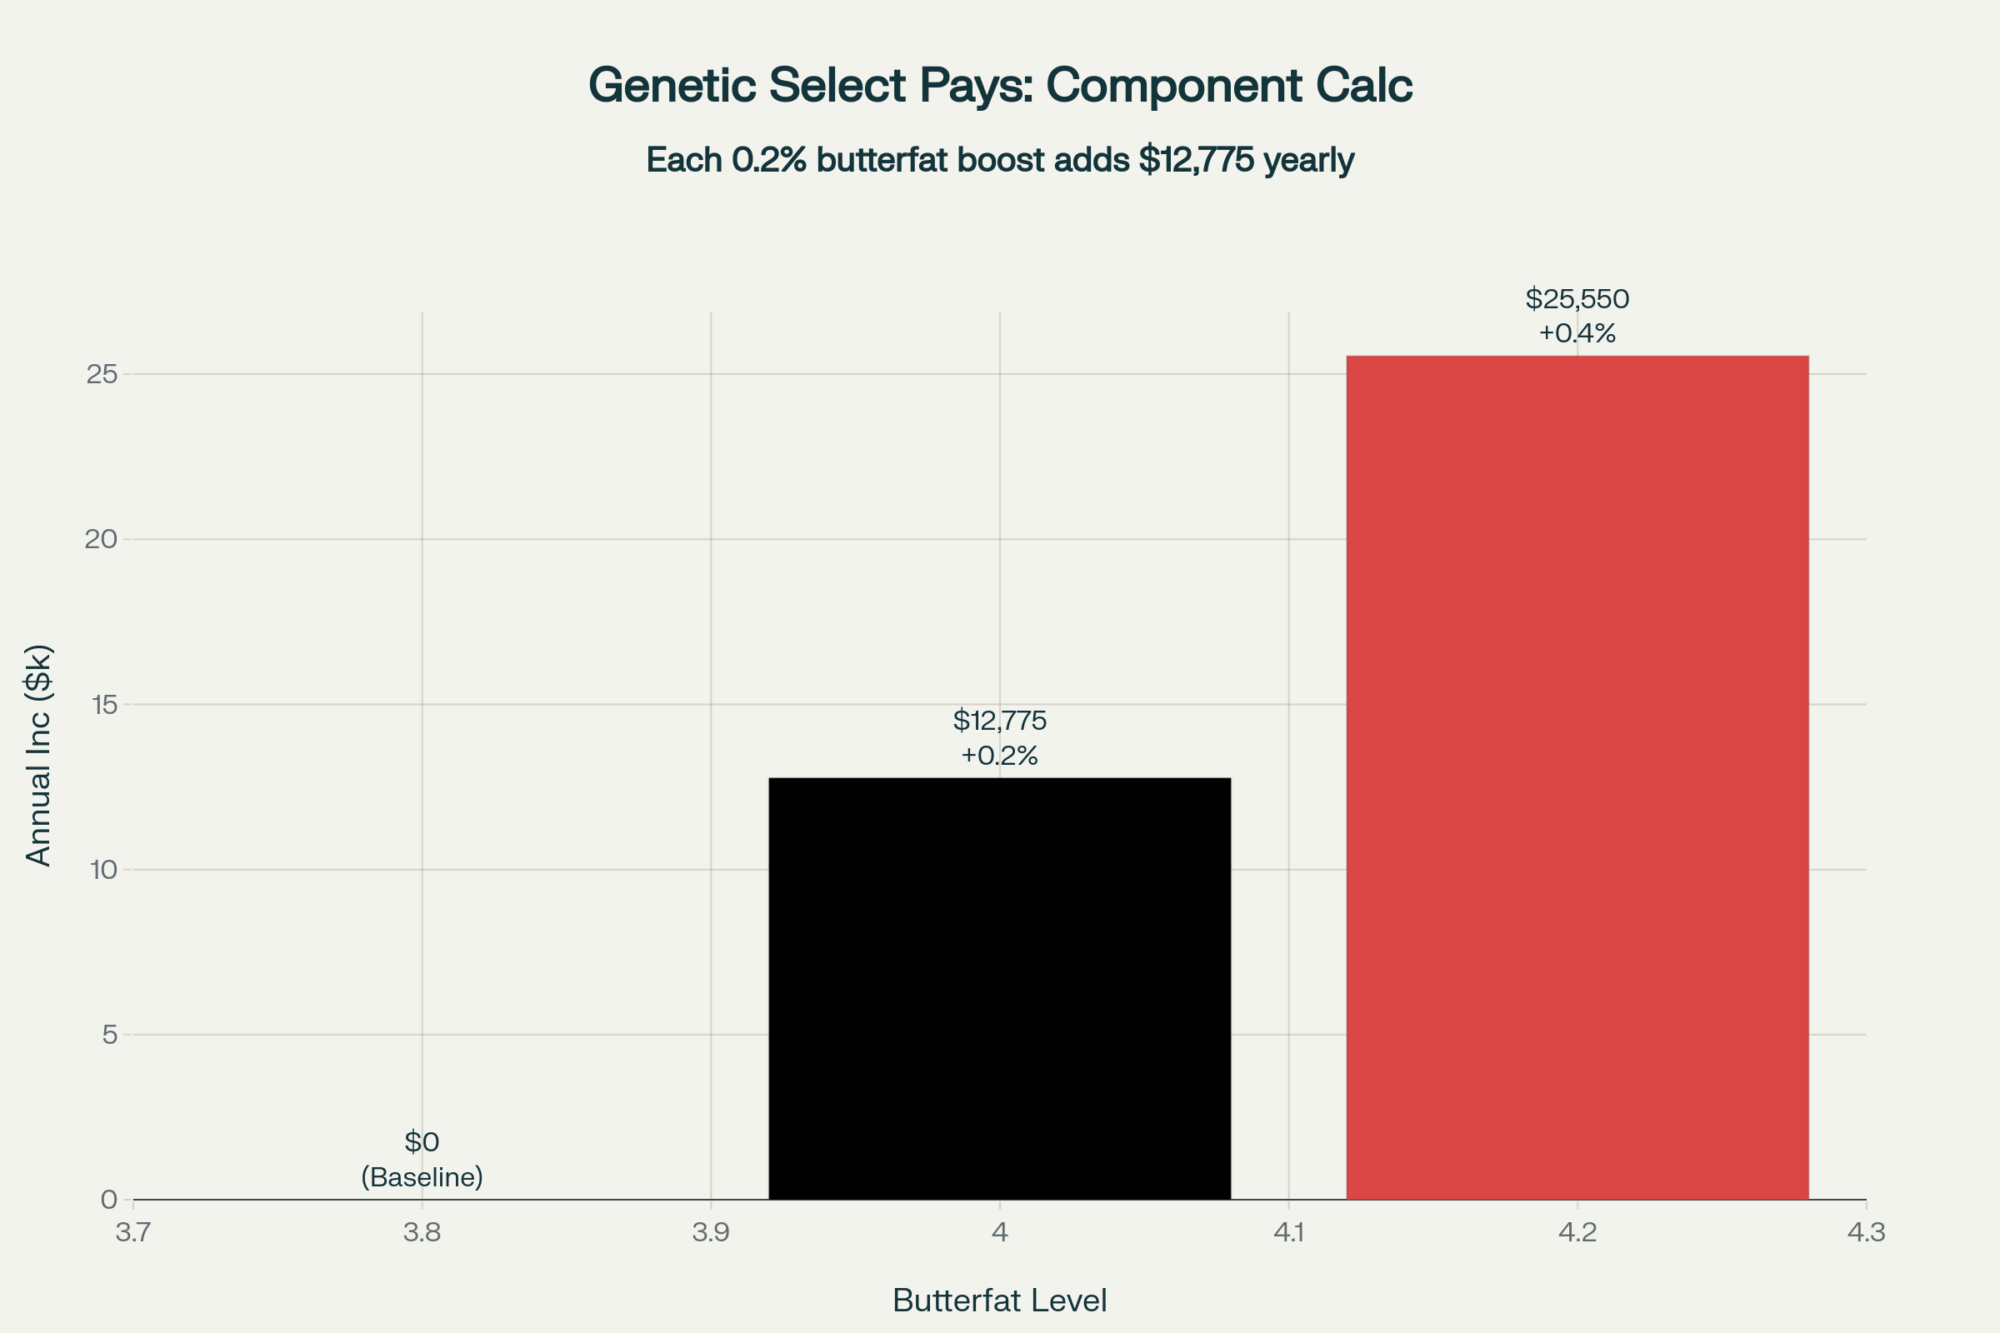
Genetics and Feeding Continue to Change the Curve
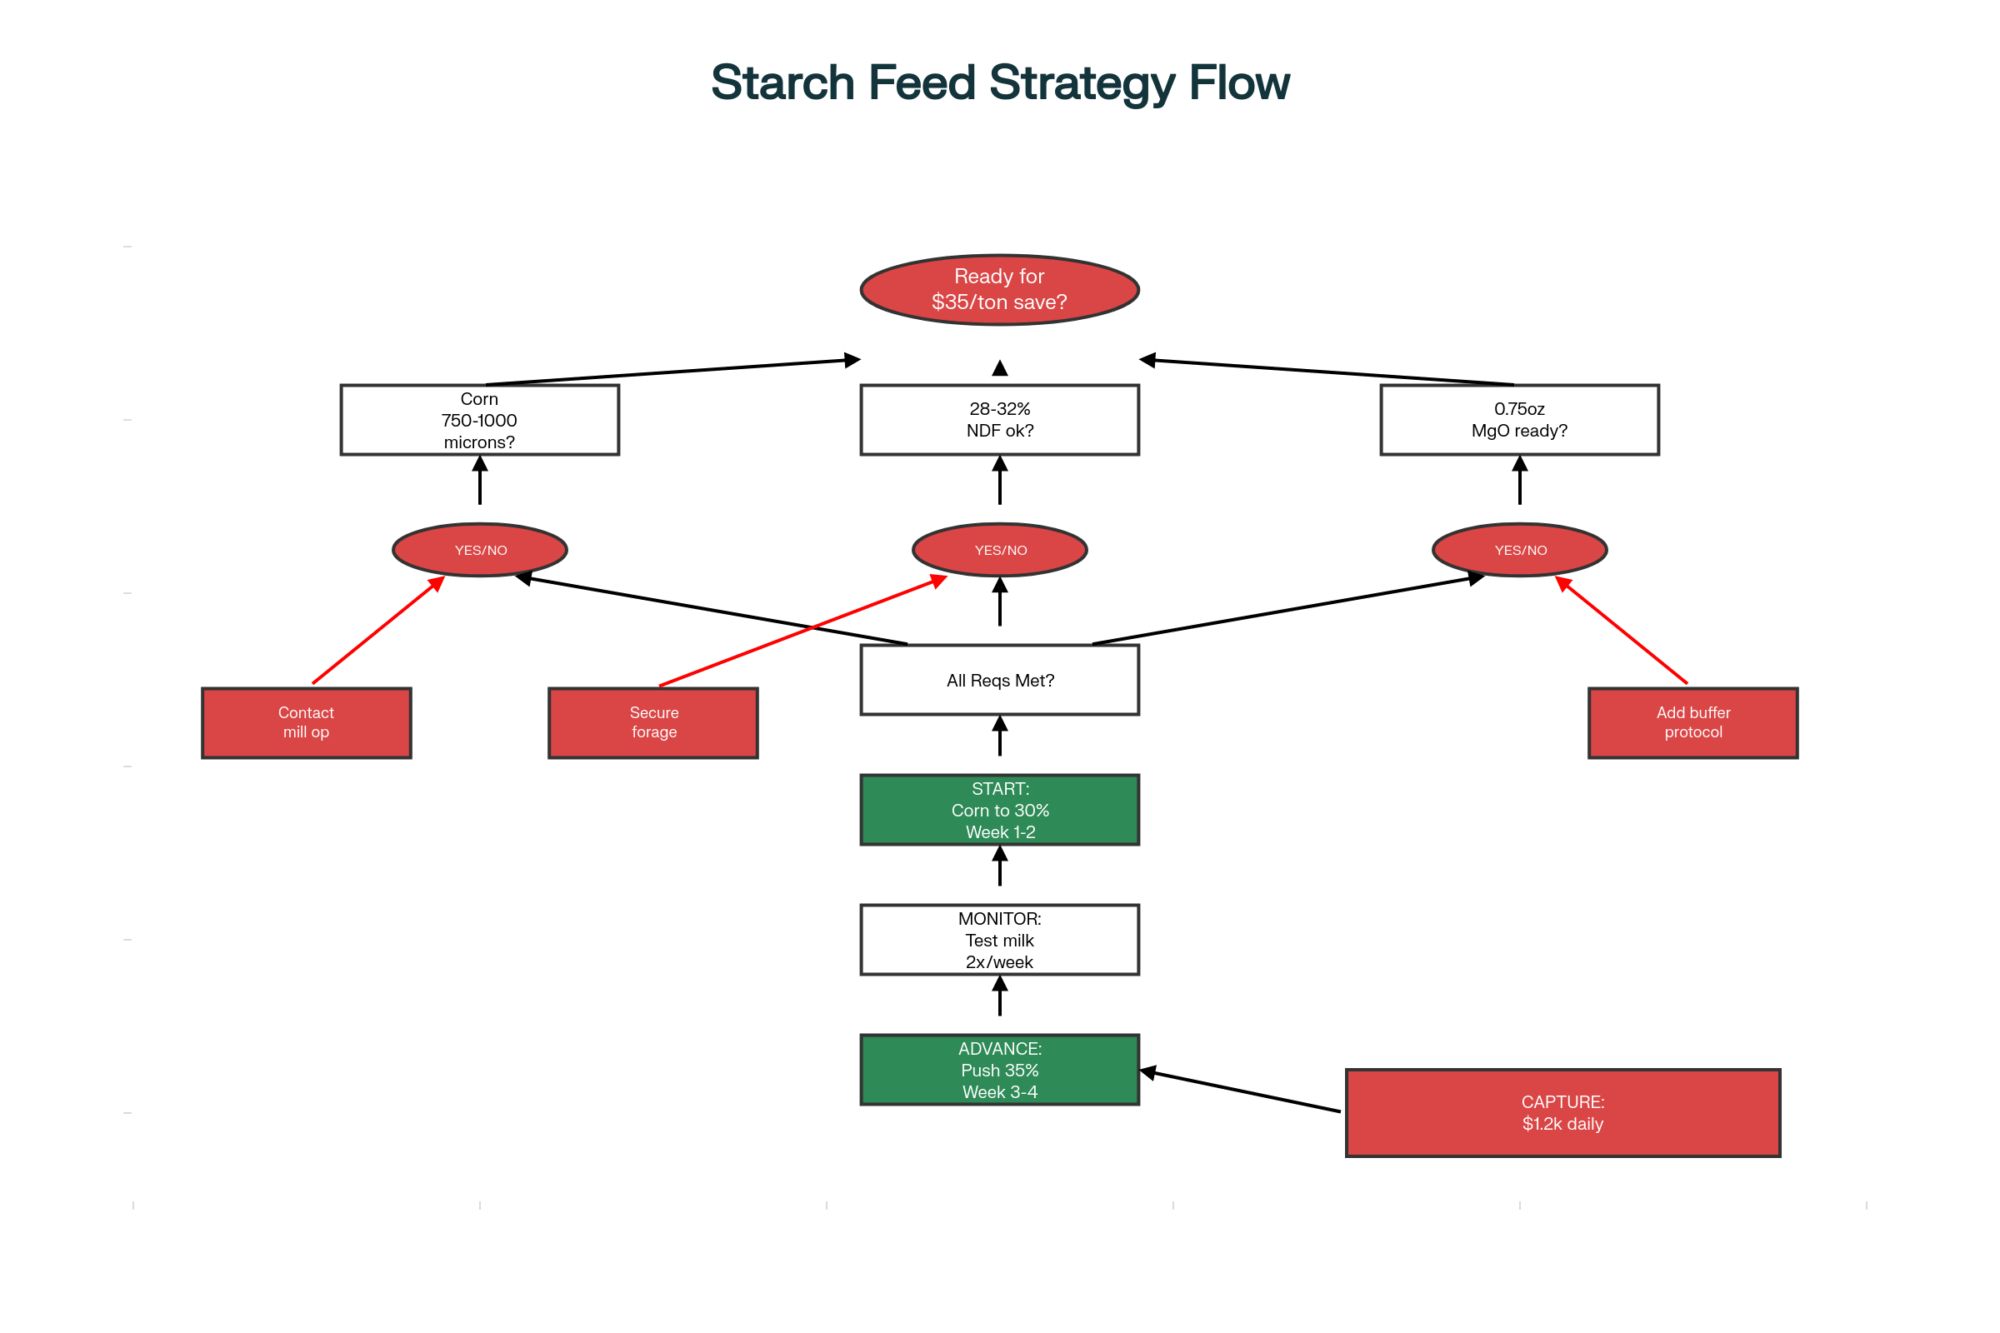
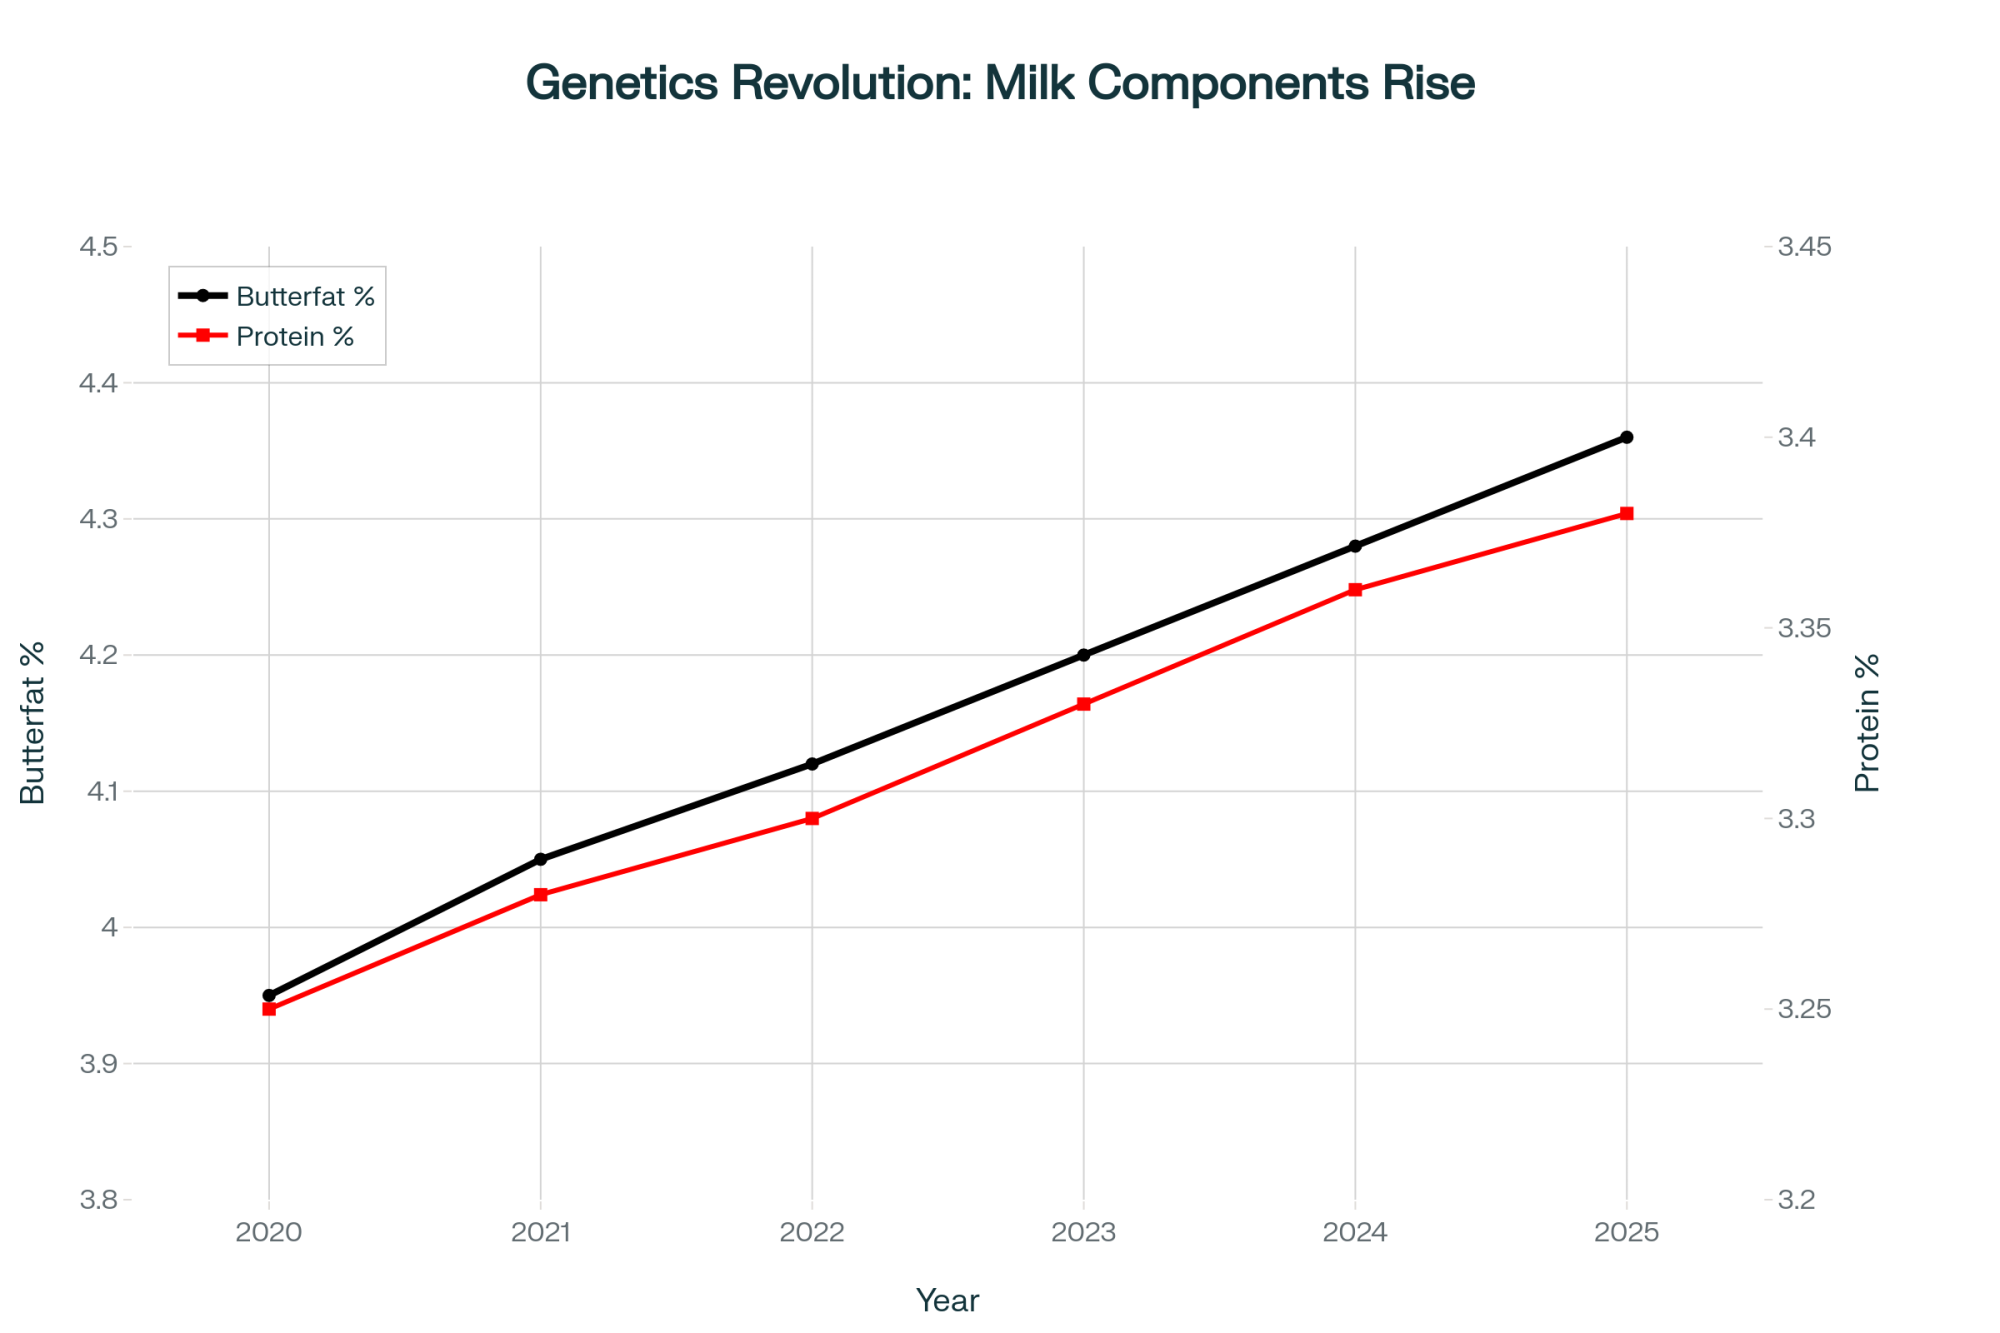
CoBank and USDA data show national butterfat averages rising from 3.95% in 2020 to 4.36% this year, while protein moved to 3.38%. The Michigan State University Extension (2025) recently found that feeding 5–6 pounds of high-oleic roasted soybeans per cow daily improved butterfat by 0.25–0.4 percentage points within 30 days, while enhancing rumen consistency and herd condition.
What’s encouraging here is that improvements are cumulative. As one extension specialist explained during a recent producer roundtable, “The cows are doing the same work, but the milk’s worth more.” It’s proof that managing for higher components is one of the most direct paths to better returns.
The Processor Pivot: From Volume to Value
Processors are feeling this market divide just as strongly as producers are. And frankly, some are better positioned than others.
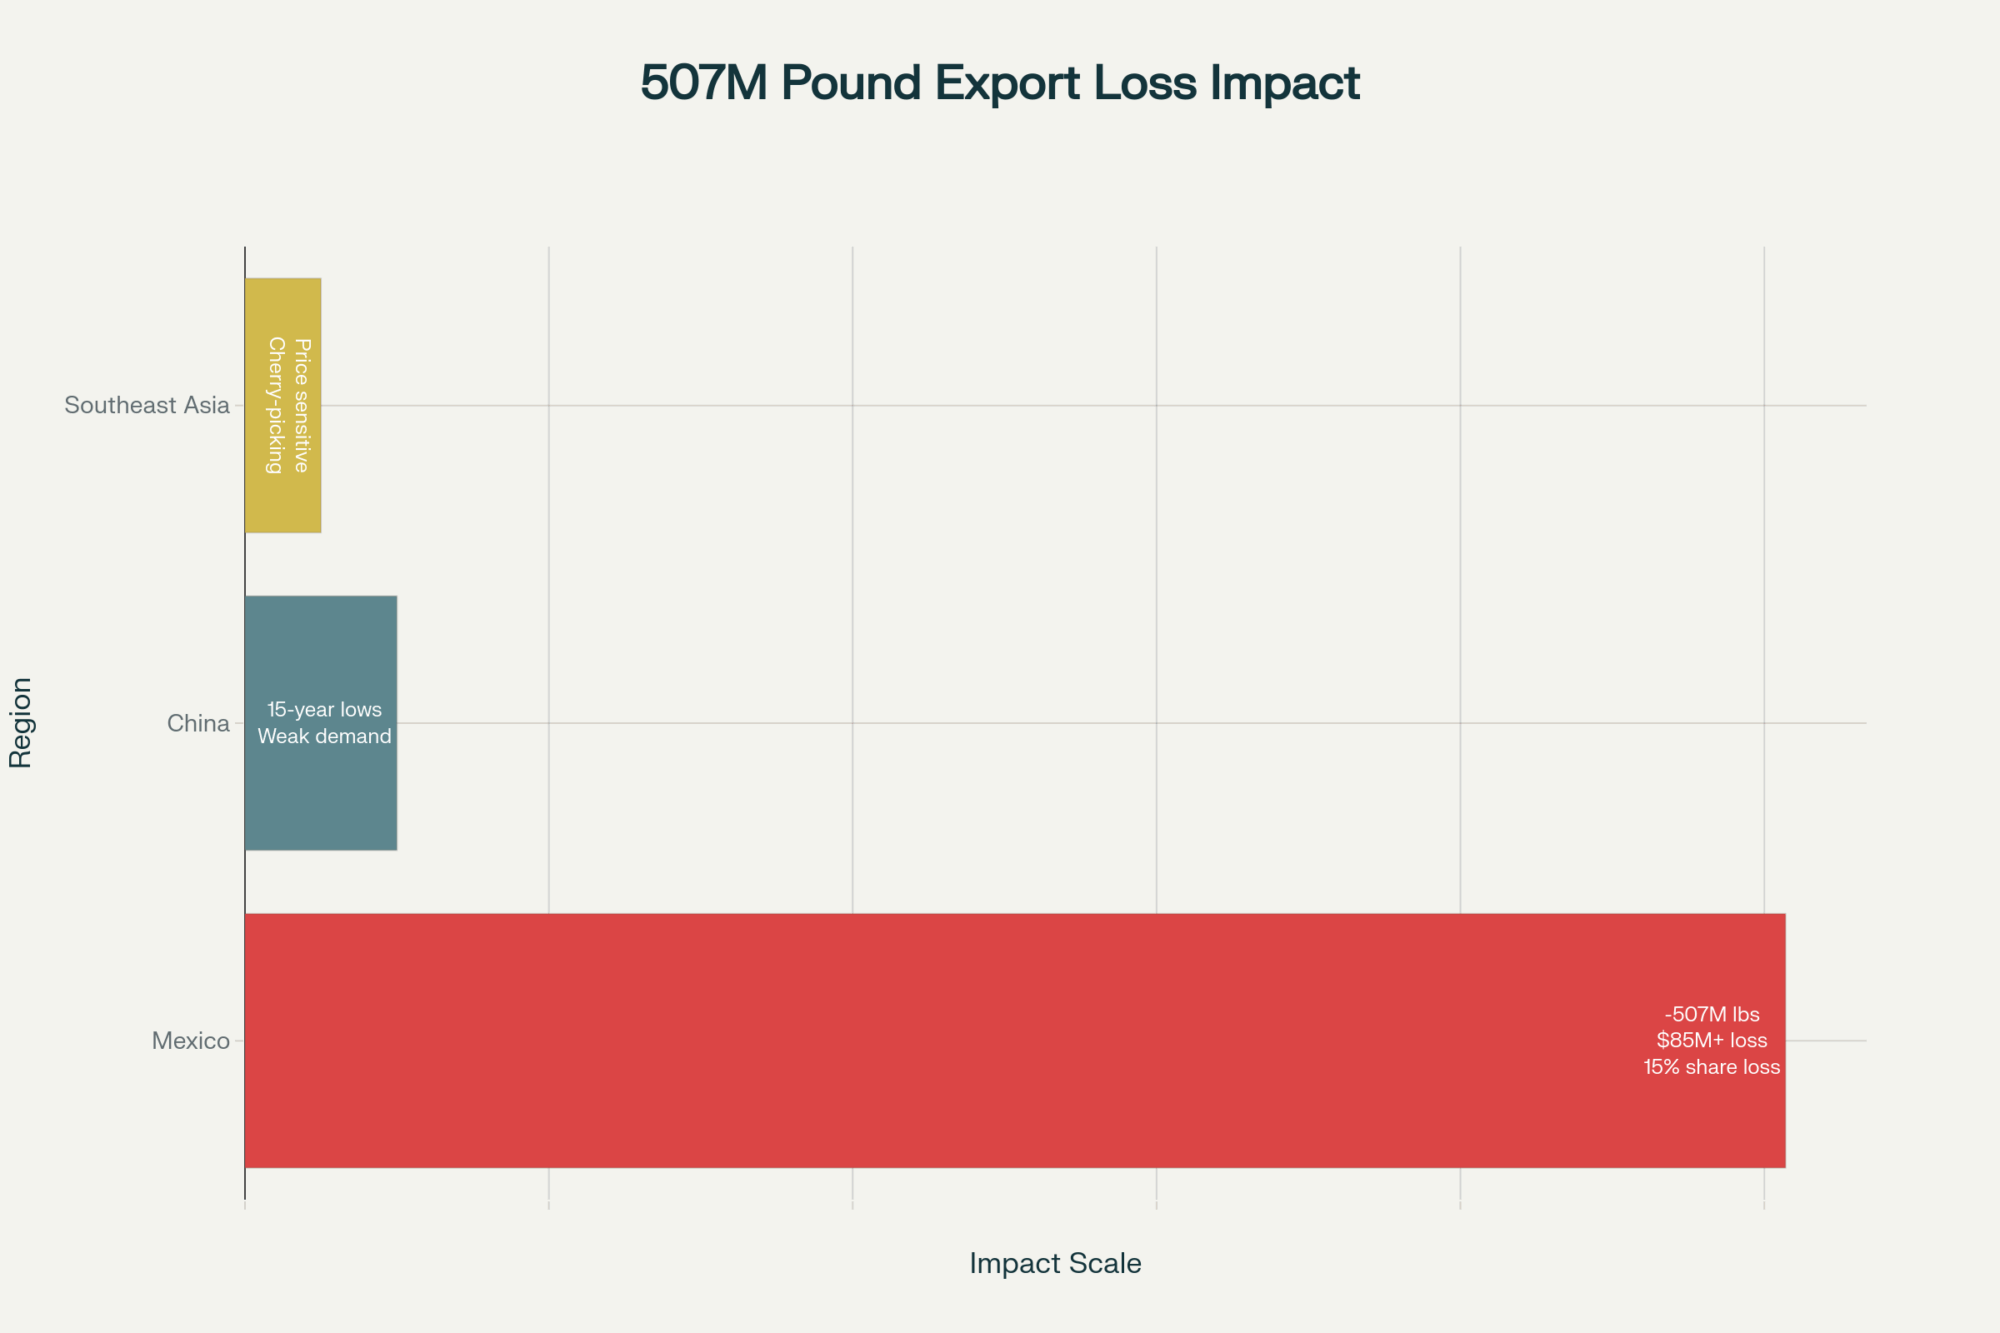
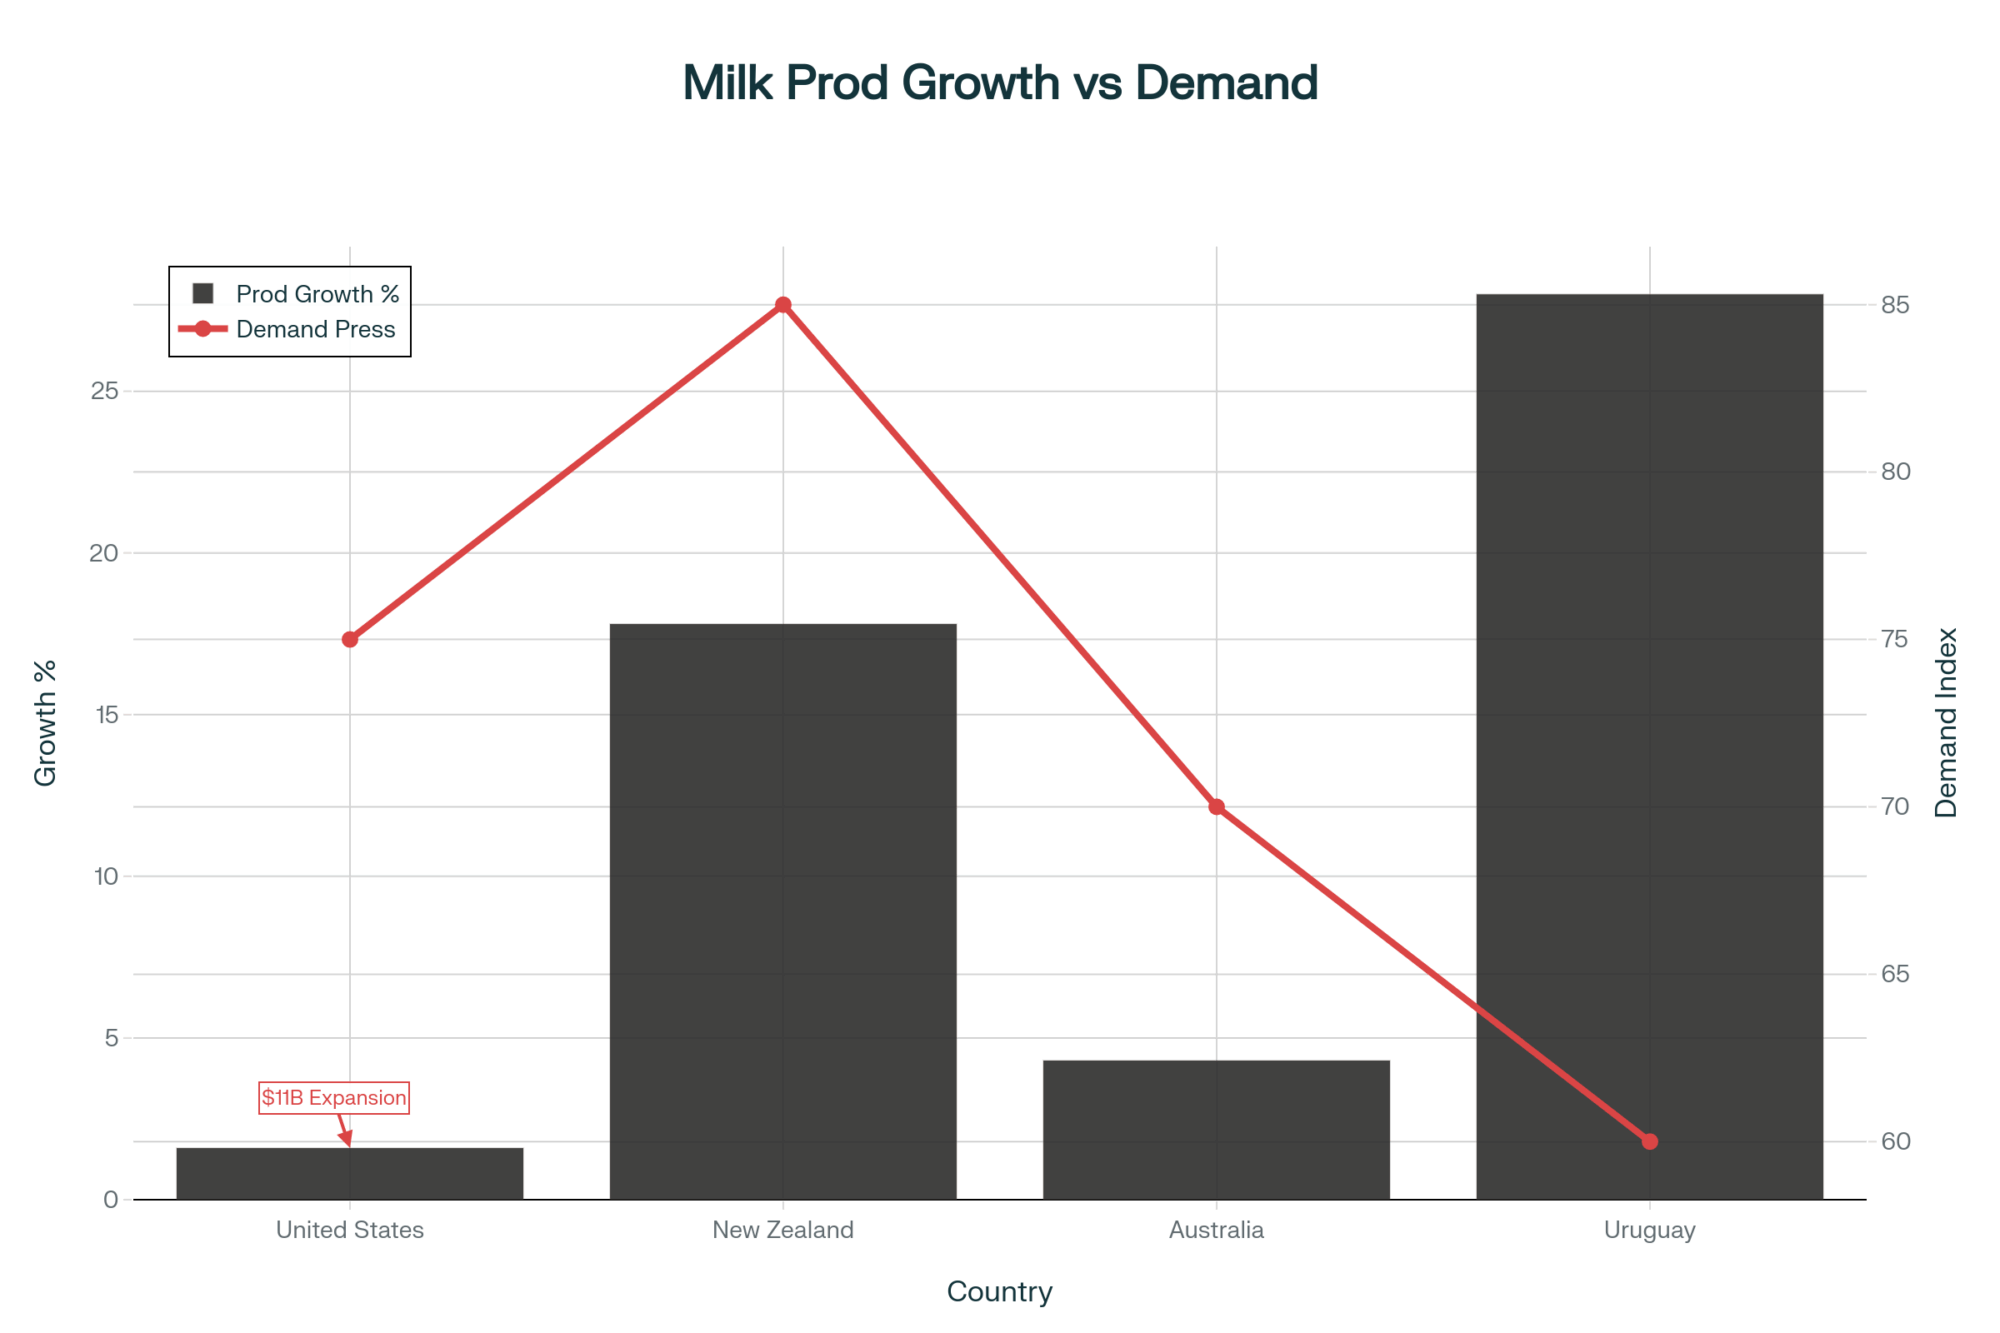
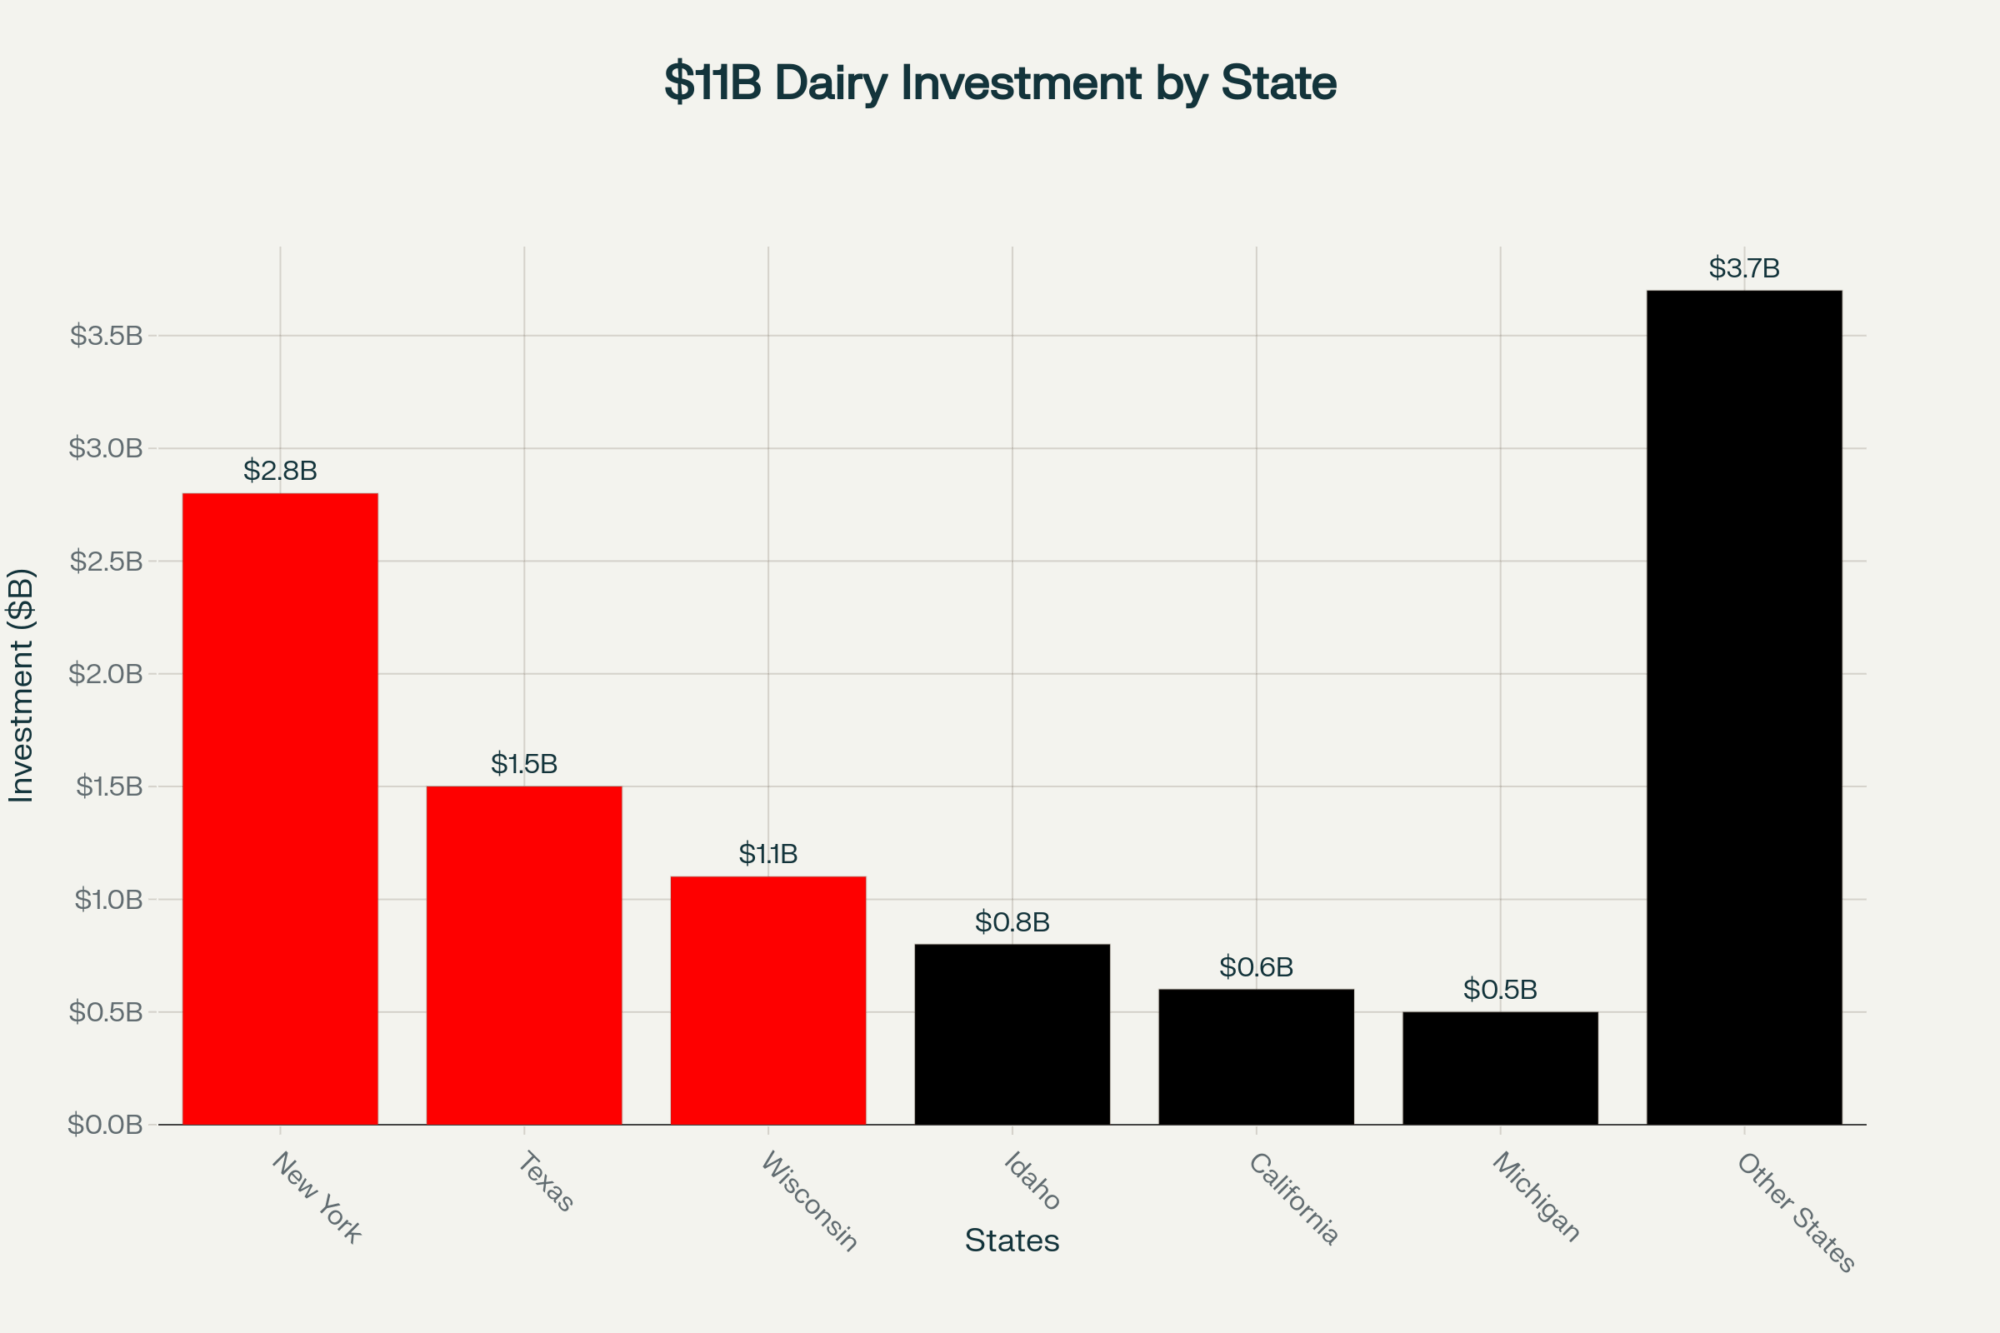
Let’s look at Darigold’s Pasco, Washington facility, which represents one of the industry’s most ambitious bets on global powder capacity. The plant—a $1.1 billion facility capable of processing 8 million pounds of milk per day—was planned to supply milk powders and butter to Southeast Asian buyers when those markets were booming back in 2019. But global dynamics changed faster than expected. Reports confirm the company had to deduct around $4 per hundredweight from producers’ milk checks this summer to offset startup losses. Powder-heavy exports aren’t what they used to be.
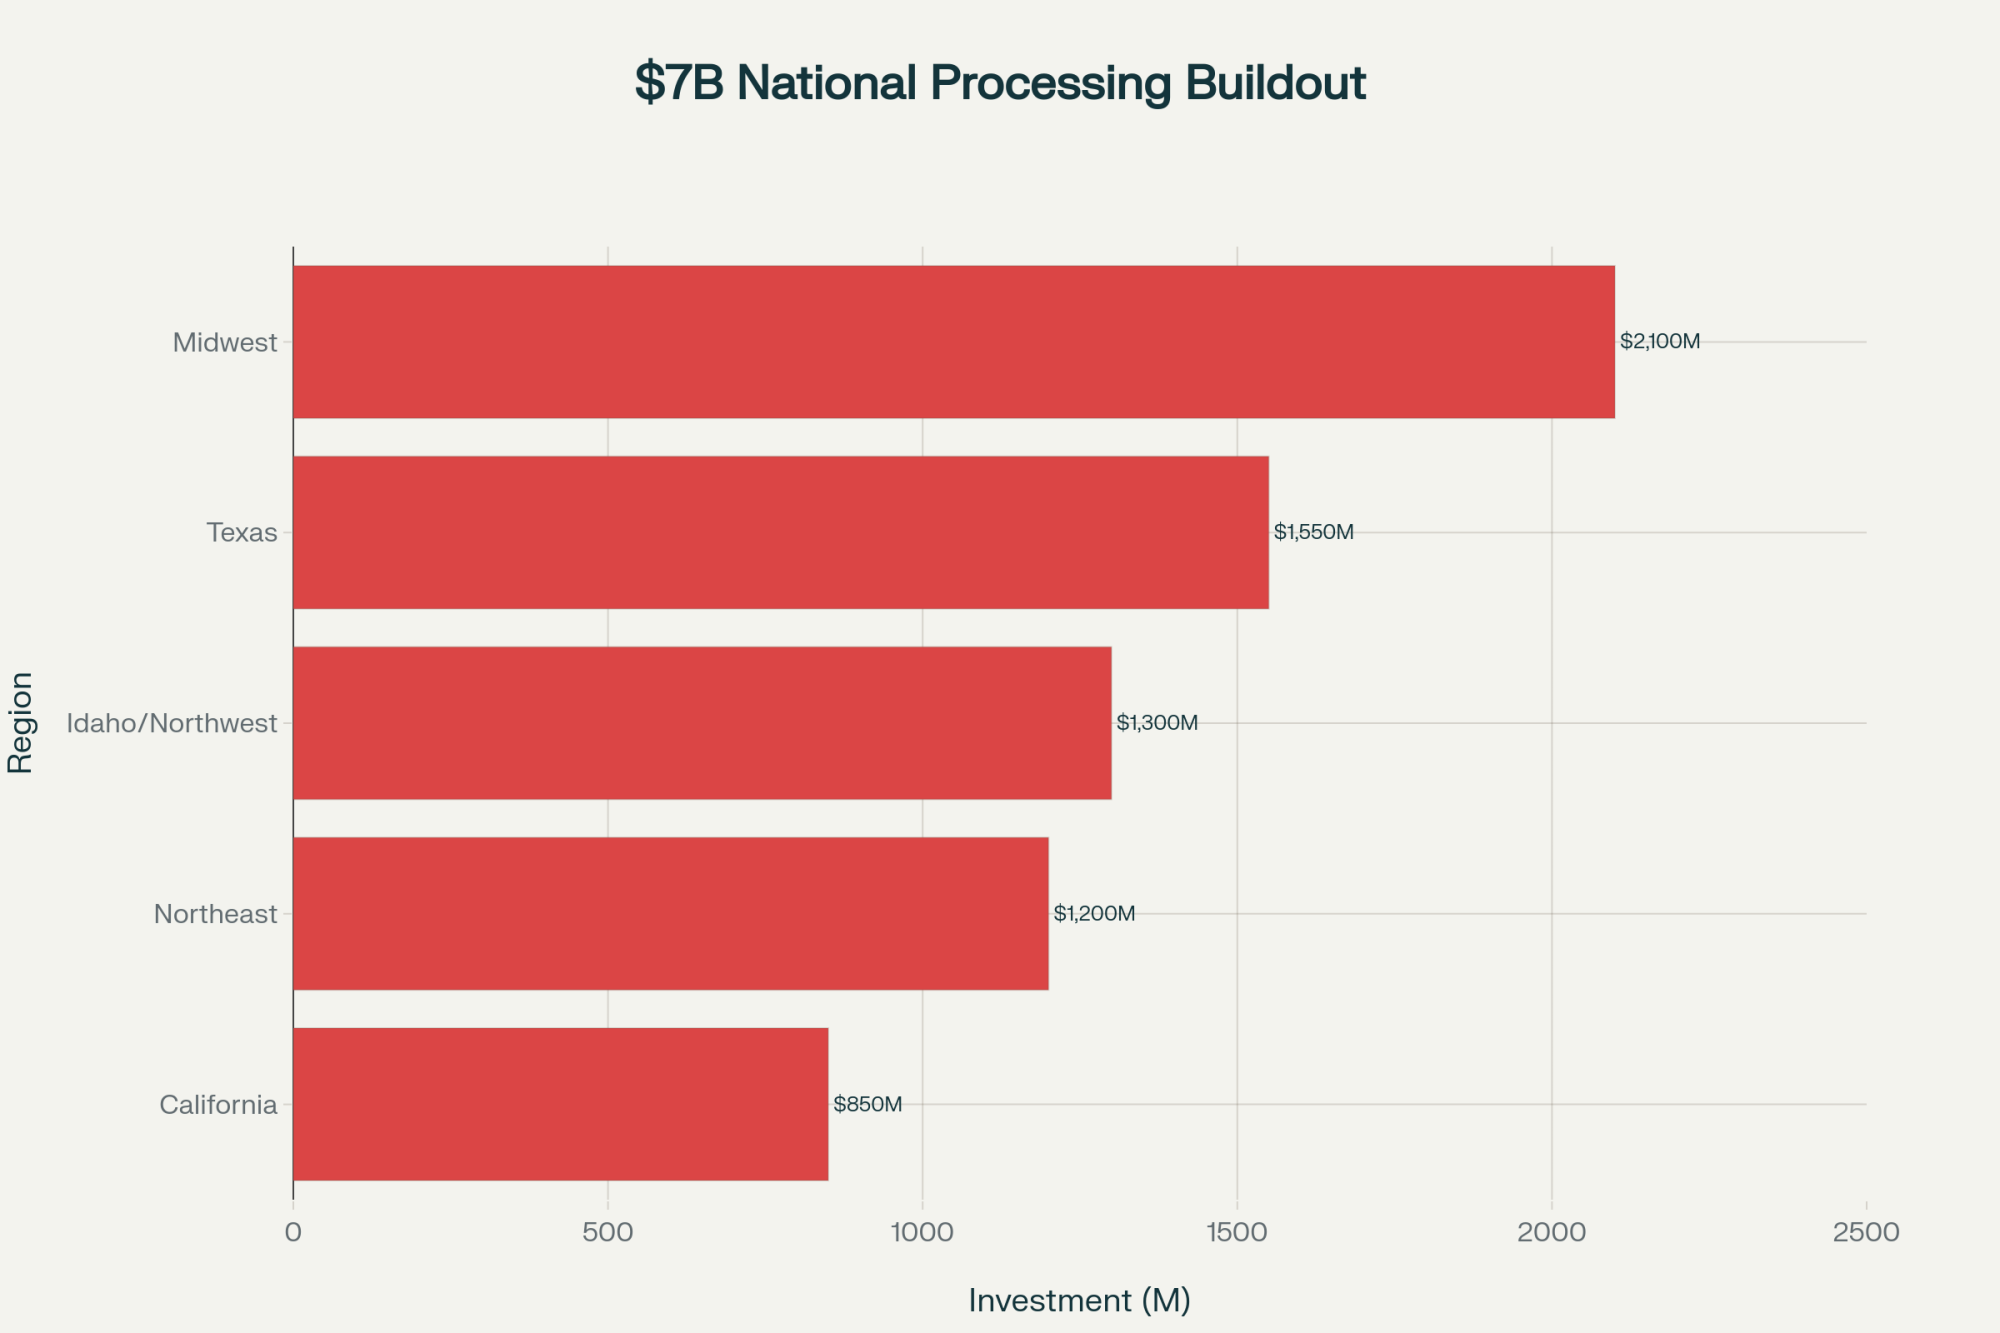
Contrast that with processors like Hilmar Cheese (Texas), Leprino Foods (Kansas), and Lactalis USA, which have expanded into cheese, whey protein, and AMF production. They’re diversifying toward higher-solids, higher-margin production that keeps milk geographically and economically competitive. Reports from First District Association (Minnesota) and Idaho Milk Products echo the same trend—premium payments now hinge on component tests because that’s where processors make their profit.
Here’s the hard truth: the U.S. industry is splitting not just by product, but by intent. Powder is still a volume game. Component ingredients are an efficiency game.
Could Butterfat Overshoot?
It’s a fair question to ask whether everyone aiming for higher fat could create the next surplus. CoBank’s August 2025 Outlook flagged that butterfat production might be “growing faster than demand absorption.”
But here’s where genetics help us. The USDA Agricultural Research Service (ARS) and Holstein Association USAperiodically adjust their Net Merit (NM$) and Total Performance Index (TPI) formulas to reflect changes in milk pricing. That means breed selection is constantly reweighted to economic reality. If fat premiums fall or protein values recover, herd objectives shift almost automatically.
The point is, dairy efficiency—not just butterfat—is what creates long-term stability. It’s why balance will always outlast fads.
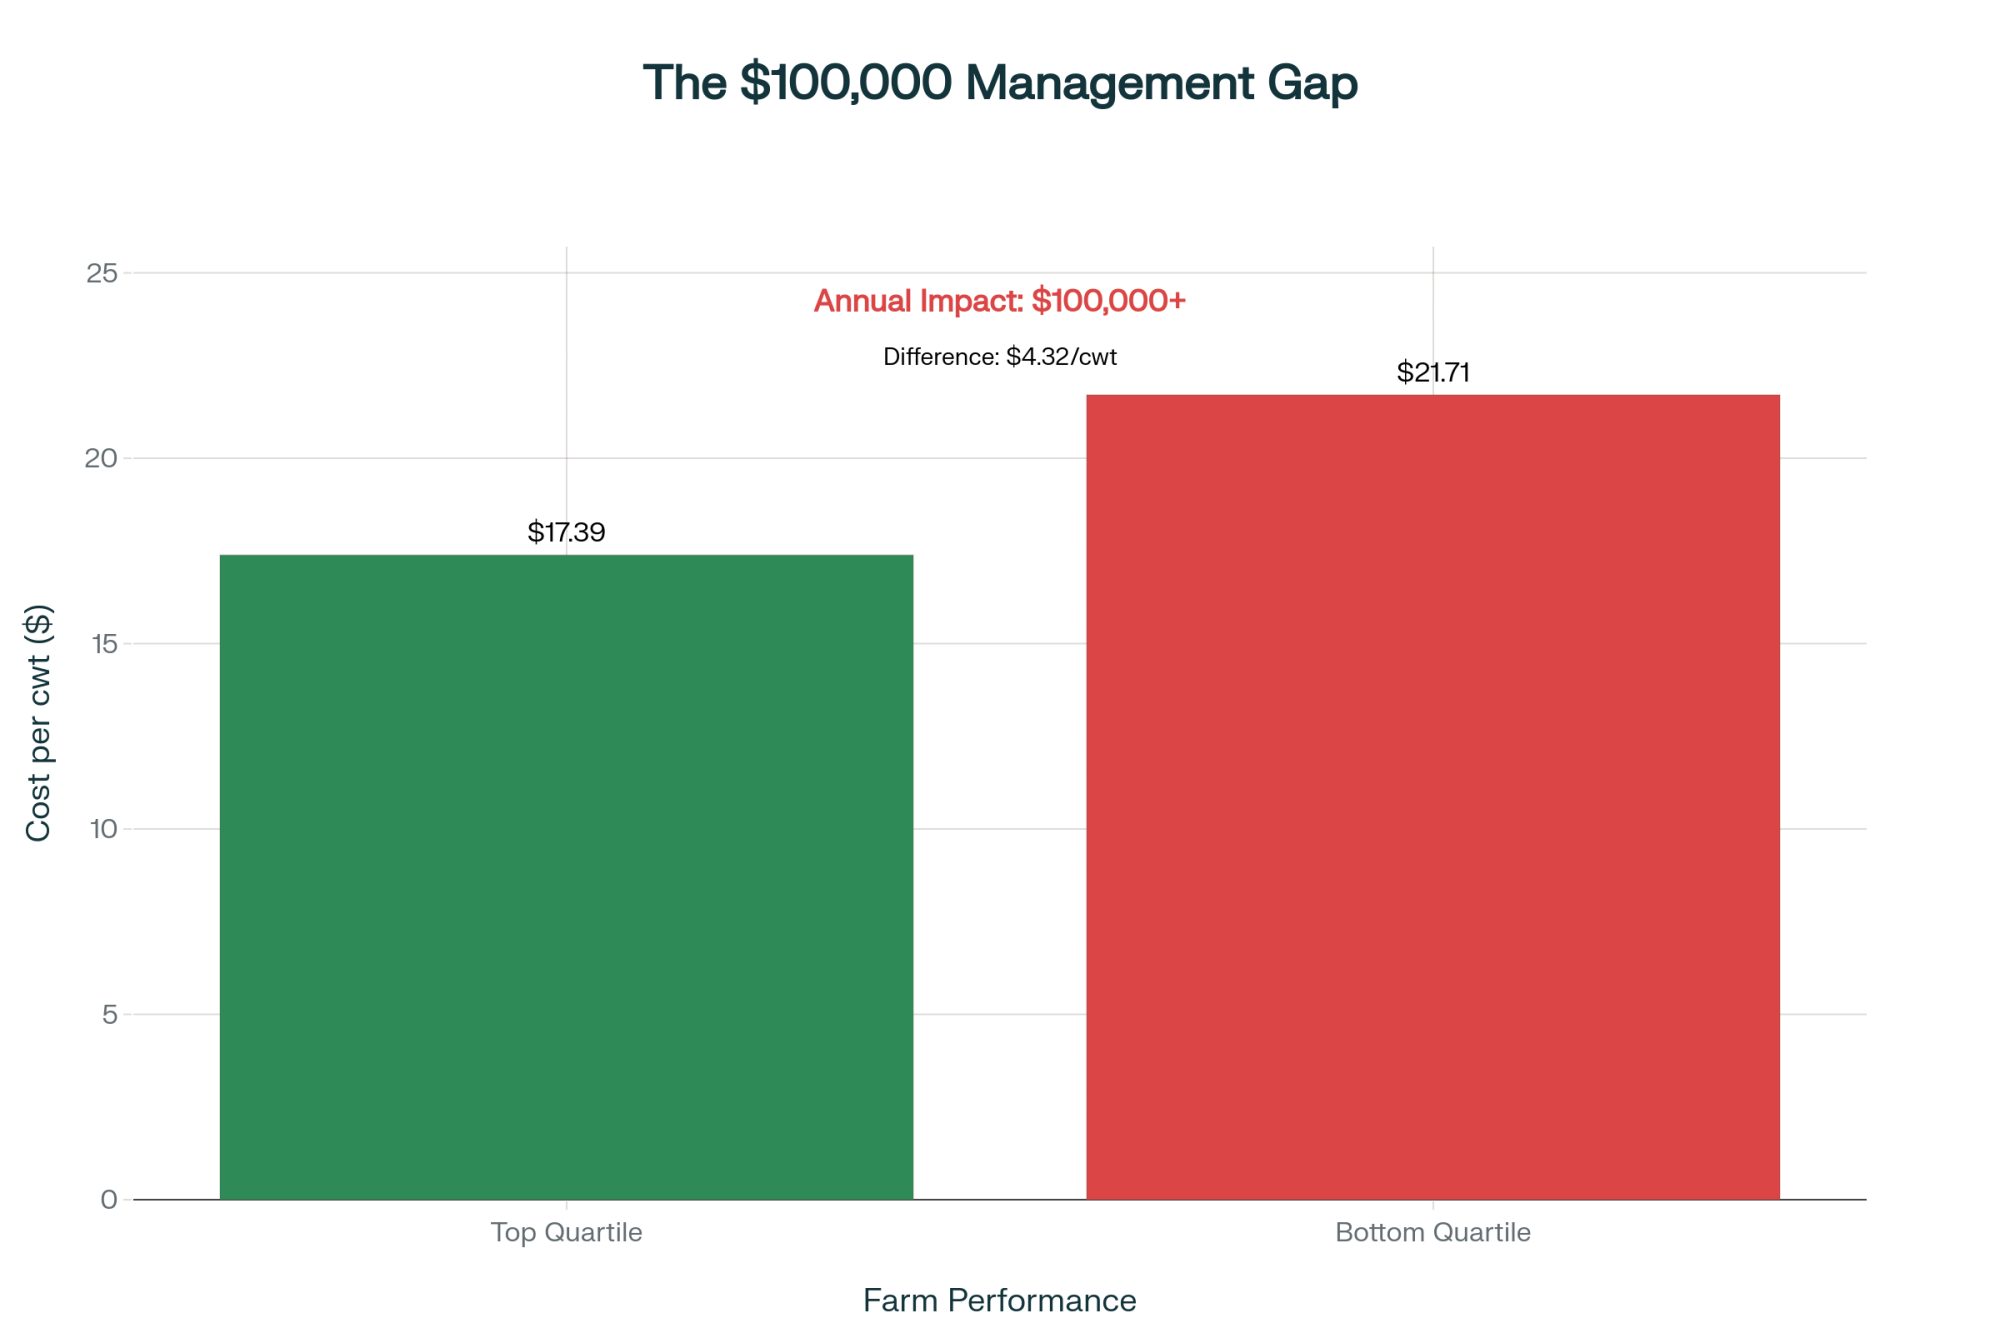
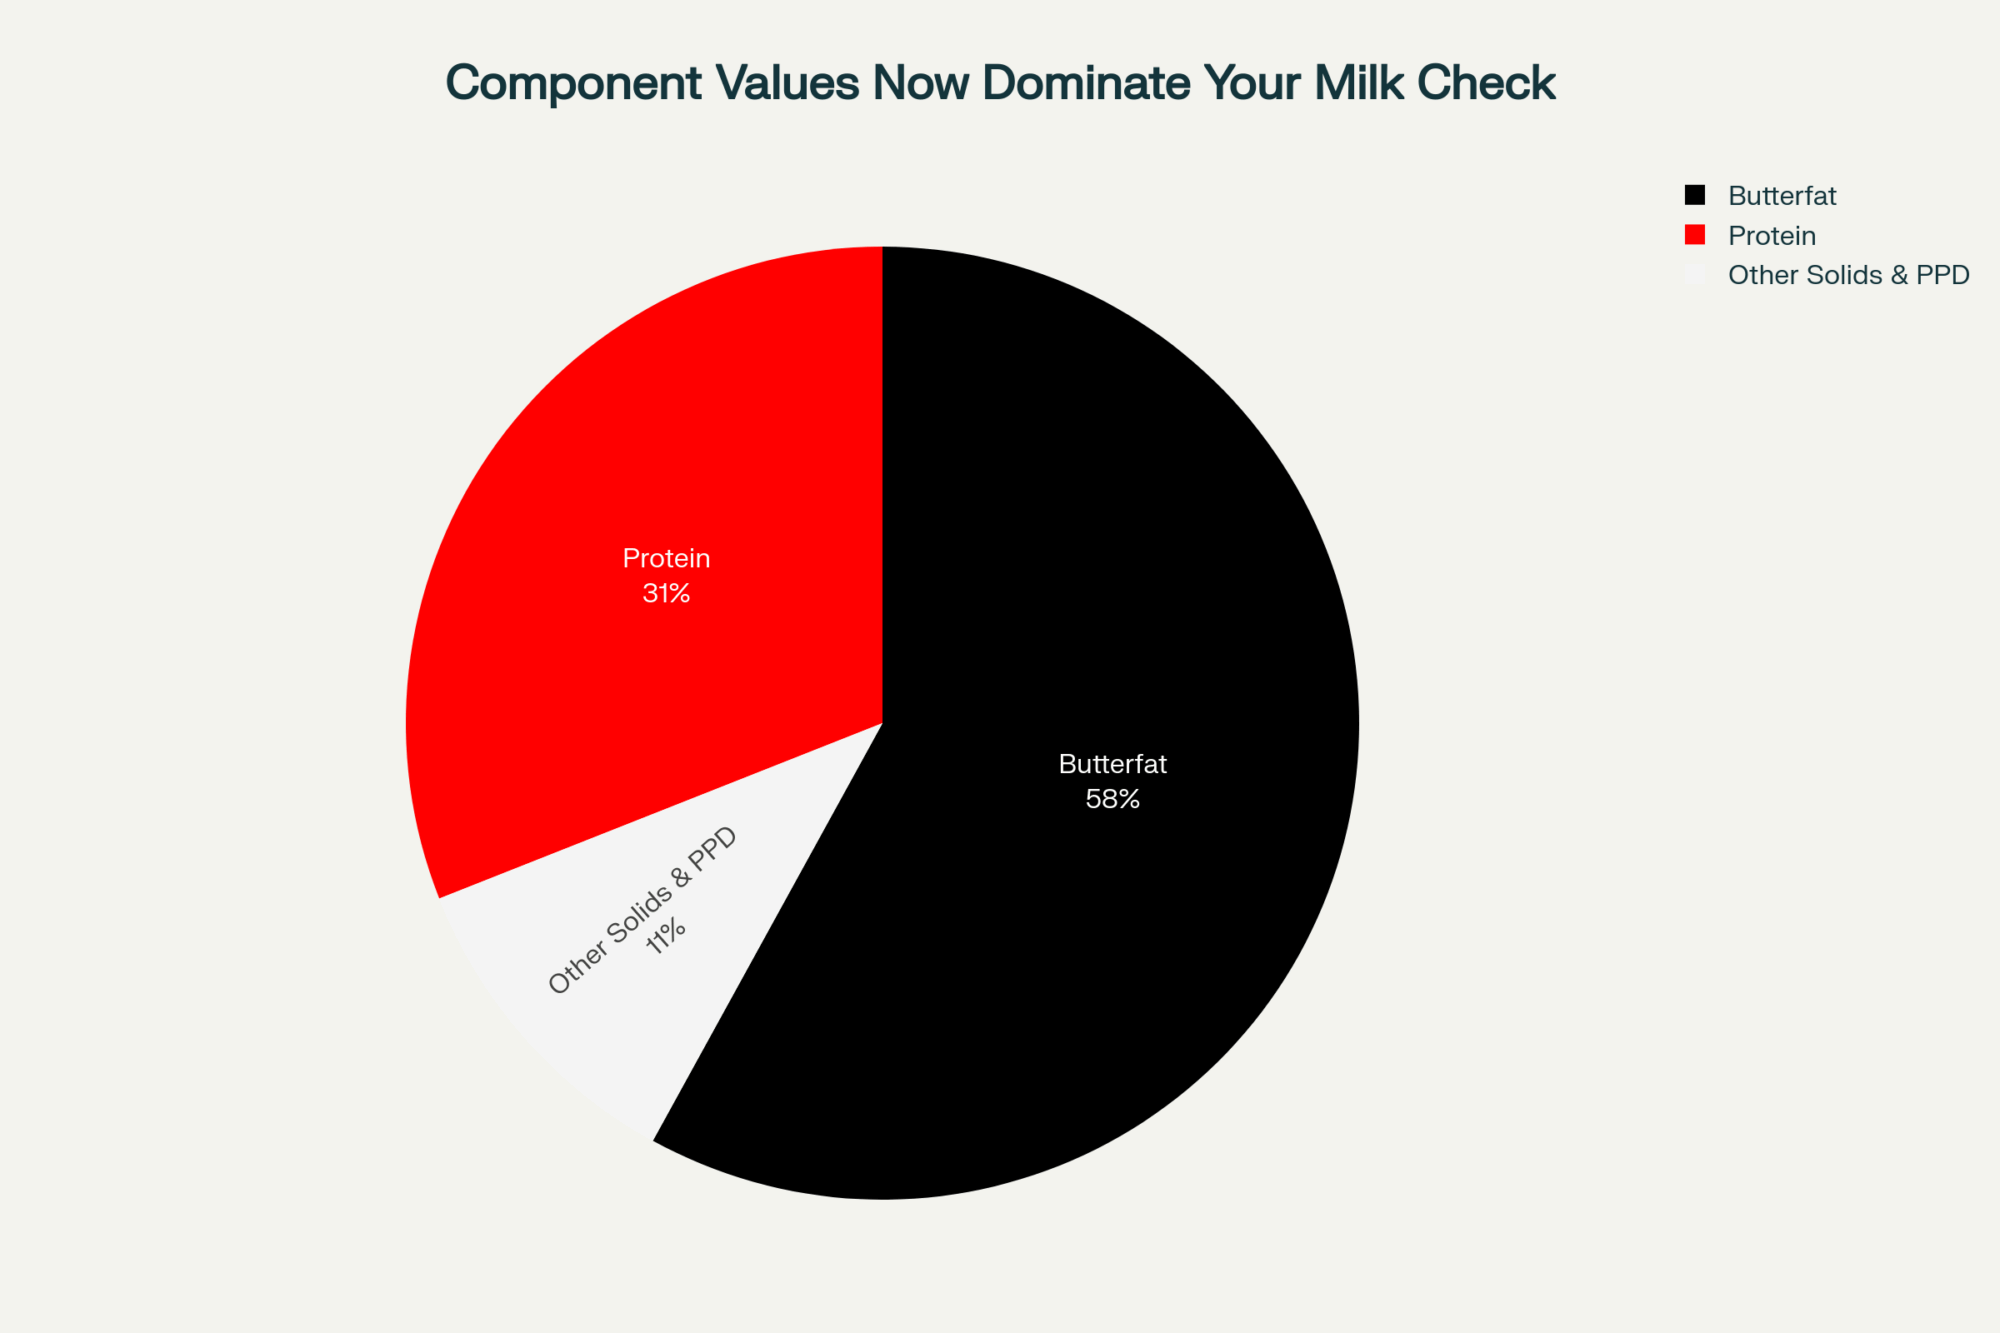
The Metric That Matters: Component Spread
When you strip away all the noise, one figure tells the story: the component spread—the pay gap between baseline milk (3.5% fat / 3.0% protein) and high-component milk (4.4% fat / 3.4% protein).

As USDA AMS Federal Order data shows, that premium has averaged more than $2 per hundredweight throughout 2025. If it holds, producers essentially have proof that processors are permanently paying for composition, not volume.
A USDA market economist summed it up best in a September forum: “When the value is tied to solids instead of water, you’re not in a price cycle anymore—you’re in a new structure.”
Practical Lessons Going Into 2026

- Track Your Components Monthly.
Treat butterfat and protein performance as management metrics alongside fertility, transitions, or somatic cell counts. Precision wins. - Start Small, Build Momentum.
Genomic testing (around $40 per heifer) and ration adjustments are quick-return investments in this pricing climate. - Match Your Processor Relationship.
AMF and cheese plants prize solids. Powder plants still chase volume. Know which market pays for the milk you make. - Breed and Feed for Balance.
Fat and protein efficiency outweigh extremes. Avoid chasing a single number. - Protect Margins with Modern Tools.
DRP coverage, component contracts, and multi-year agreements keep income steady when markets fluctuate.
The Bottom Line: This Isn’t a Crisis—It’s an Adjustment
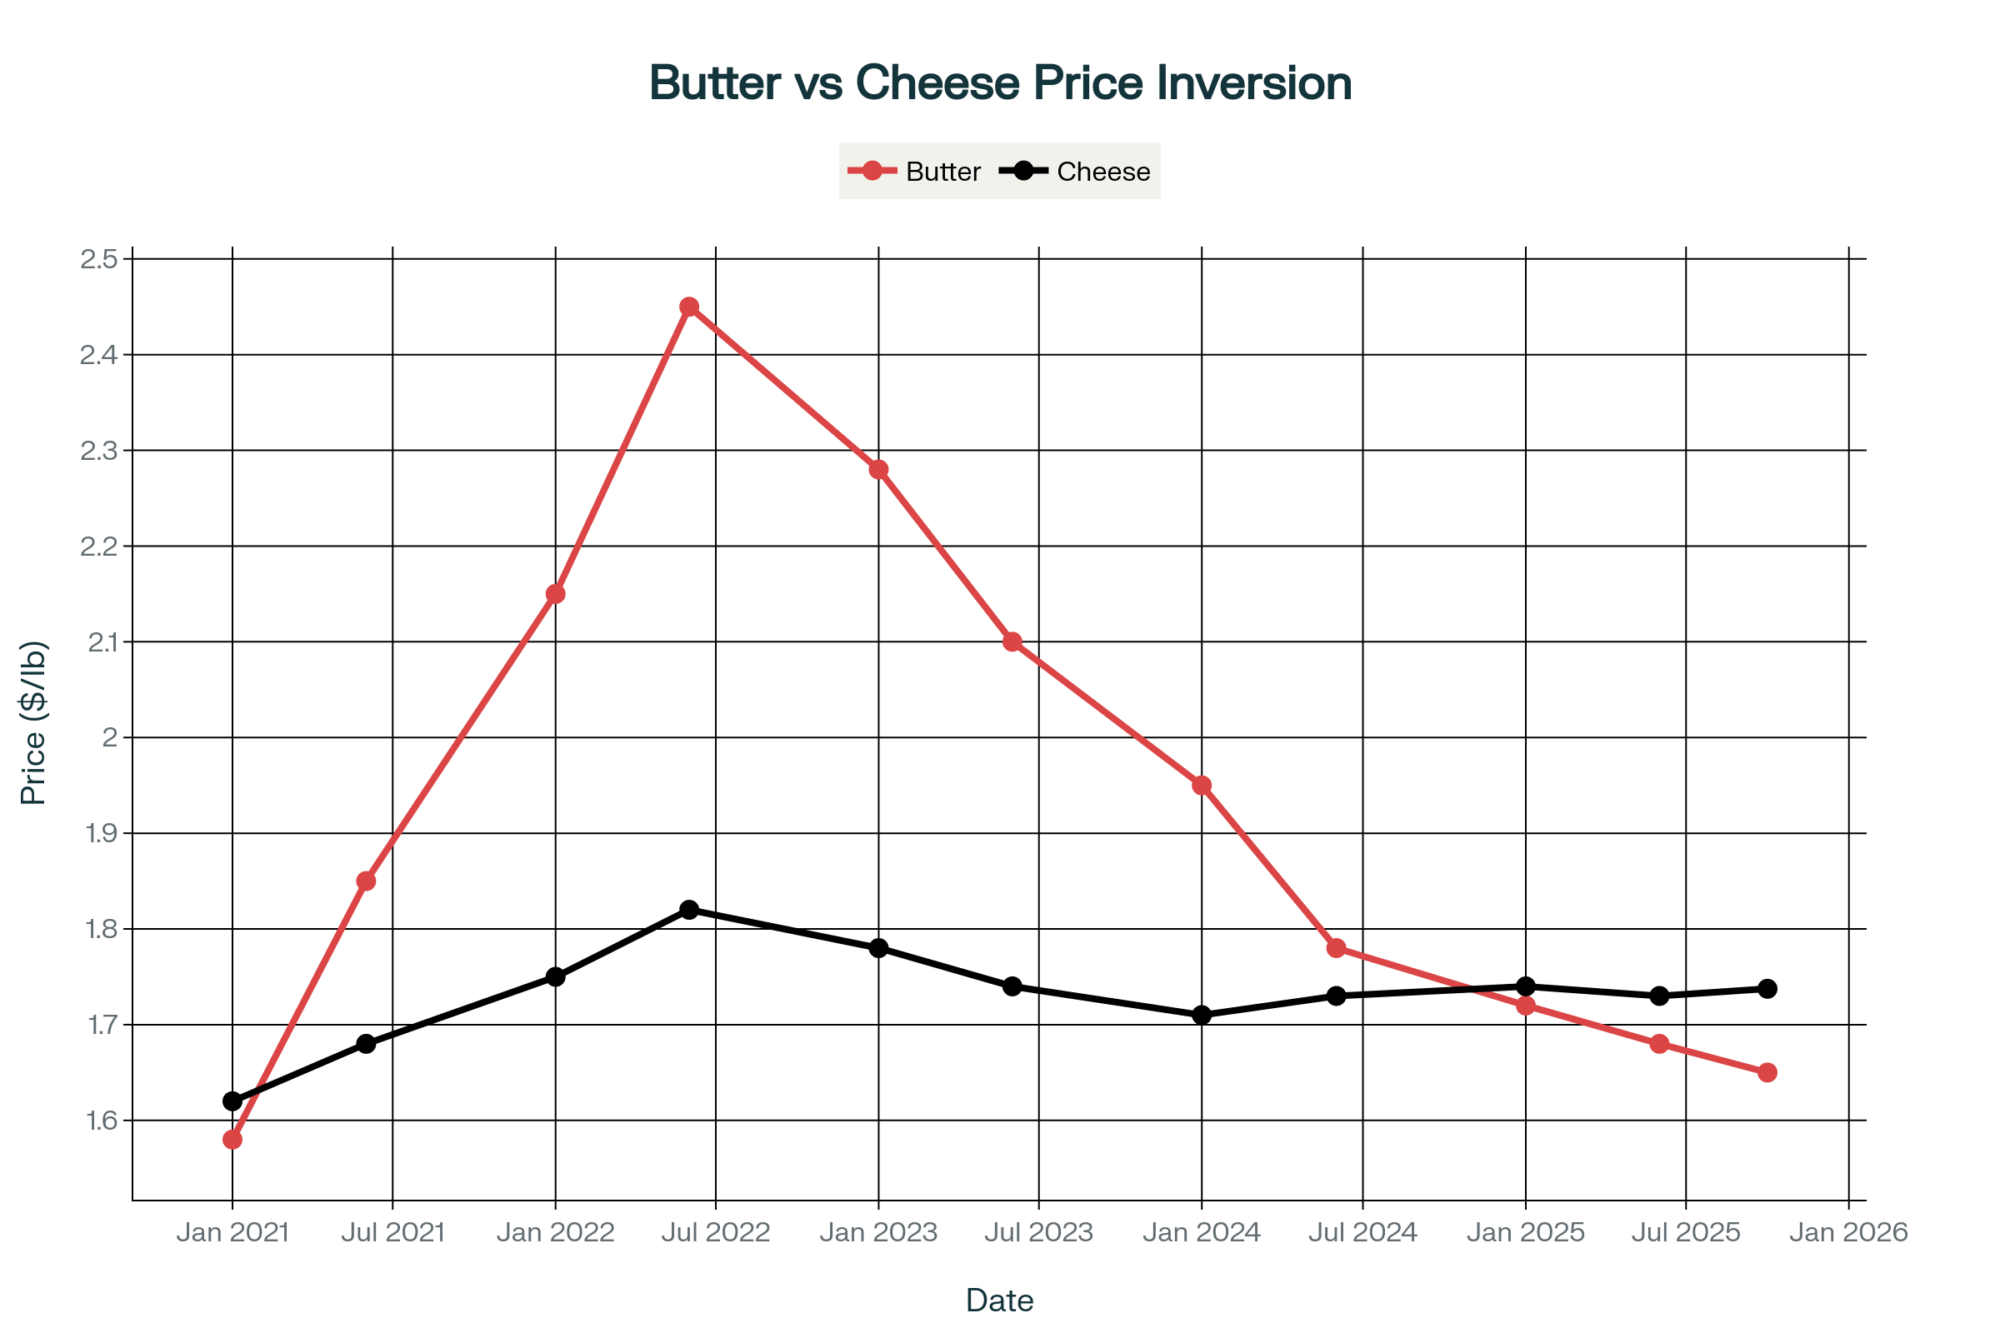
Every producer knows the milk market runs in cycles. But what’s happening right now feels different. Butterfat remains firm because the world wants quality ingredients that add value to food manufacturing. SMP is struggling because bulk reconstitution isn’t growing anymore.
For farmers, the lesson is clear: you don’t have to rebuild your entire operation to adapt—just fine-tune what you’re already measuring. Improving components, reviewing contracts, and aligning milk output with processor demand will go further than chasing volume.
The bottom line? The milk check no longer rewards gallons—it rewards balance, precision, and composition. The farms paying attention today are the ones positioning themselves to thrive long-term.
Key Takeaways:
- Butterfat is booming while powders slide, signaling a lasting shift in dairy value and pay structures.
- China’s strategic focus on high-fat imports and domestic powder production is reshaping global trade dynamics.
- U.S. farmers maximizing components—and protecting with DRP—are turning market volatility into opportunity.
- Processors investing in solids-based products like cheese and AMF are outpacing those tied to bulk powder markets.
- Heading into 2026, milk checks will favor precision over production—the farms that measure will be the ones that win.
Complete references and supporting documentation are available upon request by contacting the editorial team at editor@thebullvine.com.
Learn More:
- Seizing the Moment: Maximizing Milk Solids Output Through Strategic Nutrition and Genetics – This guide provides the tactical “how-to” behind the main article’s strategy, detailing specific nutritional adjustments and genetic selection criteria. It offers actionable methods for boosting butterfat and protein to capitalize on the component pricing opportunities discussed.
- 2025 Dairy Market Reality Check: Why Everything You Think You Know About This Year’s Outlook is Wrong– Delving deeper into market dynamics, this article analyzes the economic forces and policy shifts influencing component values. It provides the strategic context for the fat-powder divide, revealing how export markets and processor investments are rewarding component-focused producers.
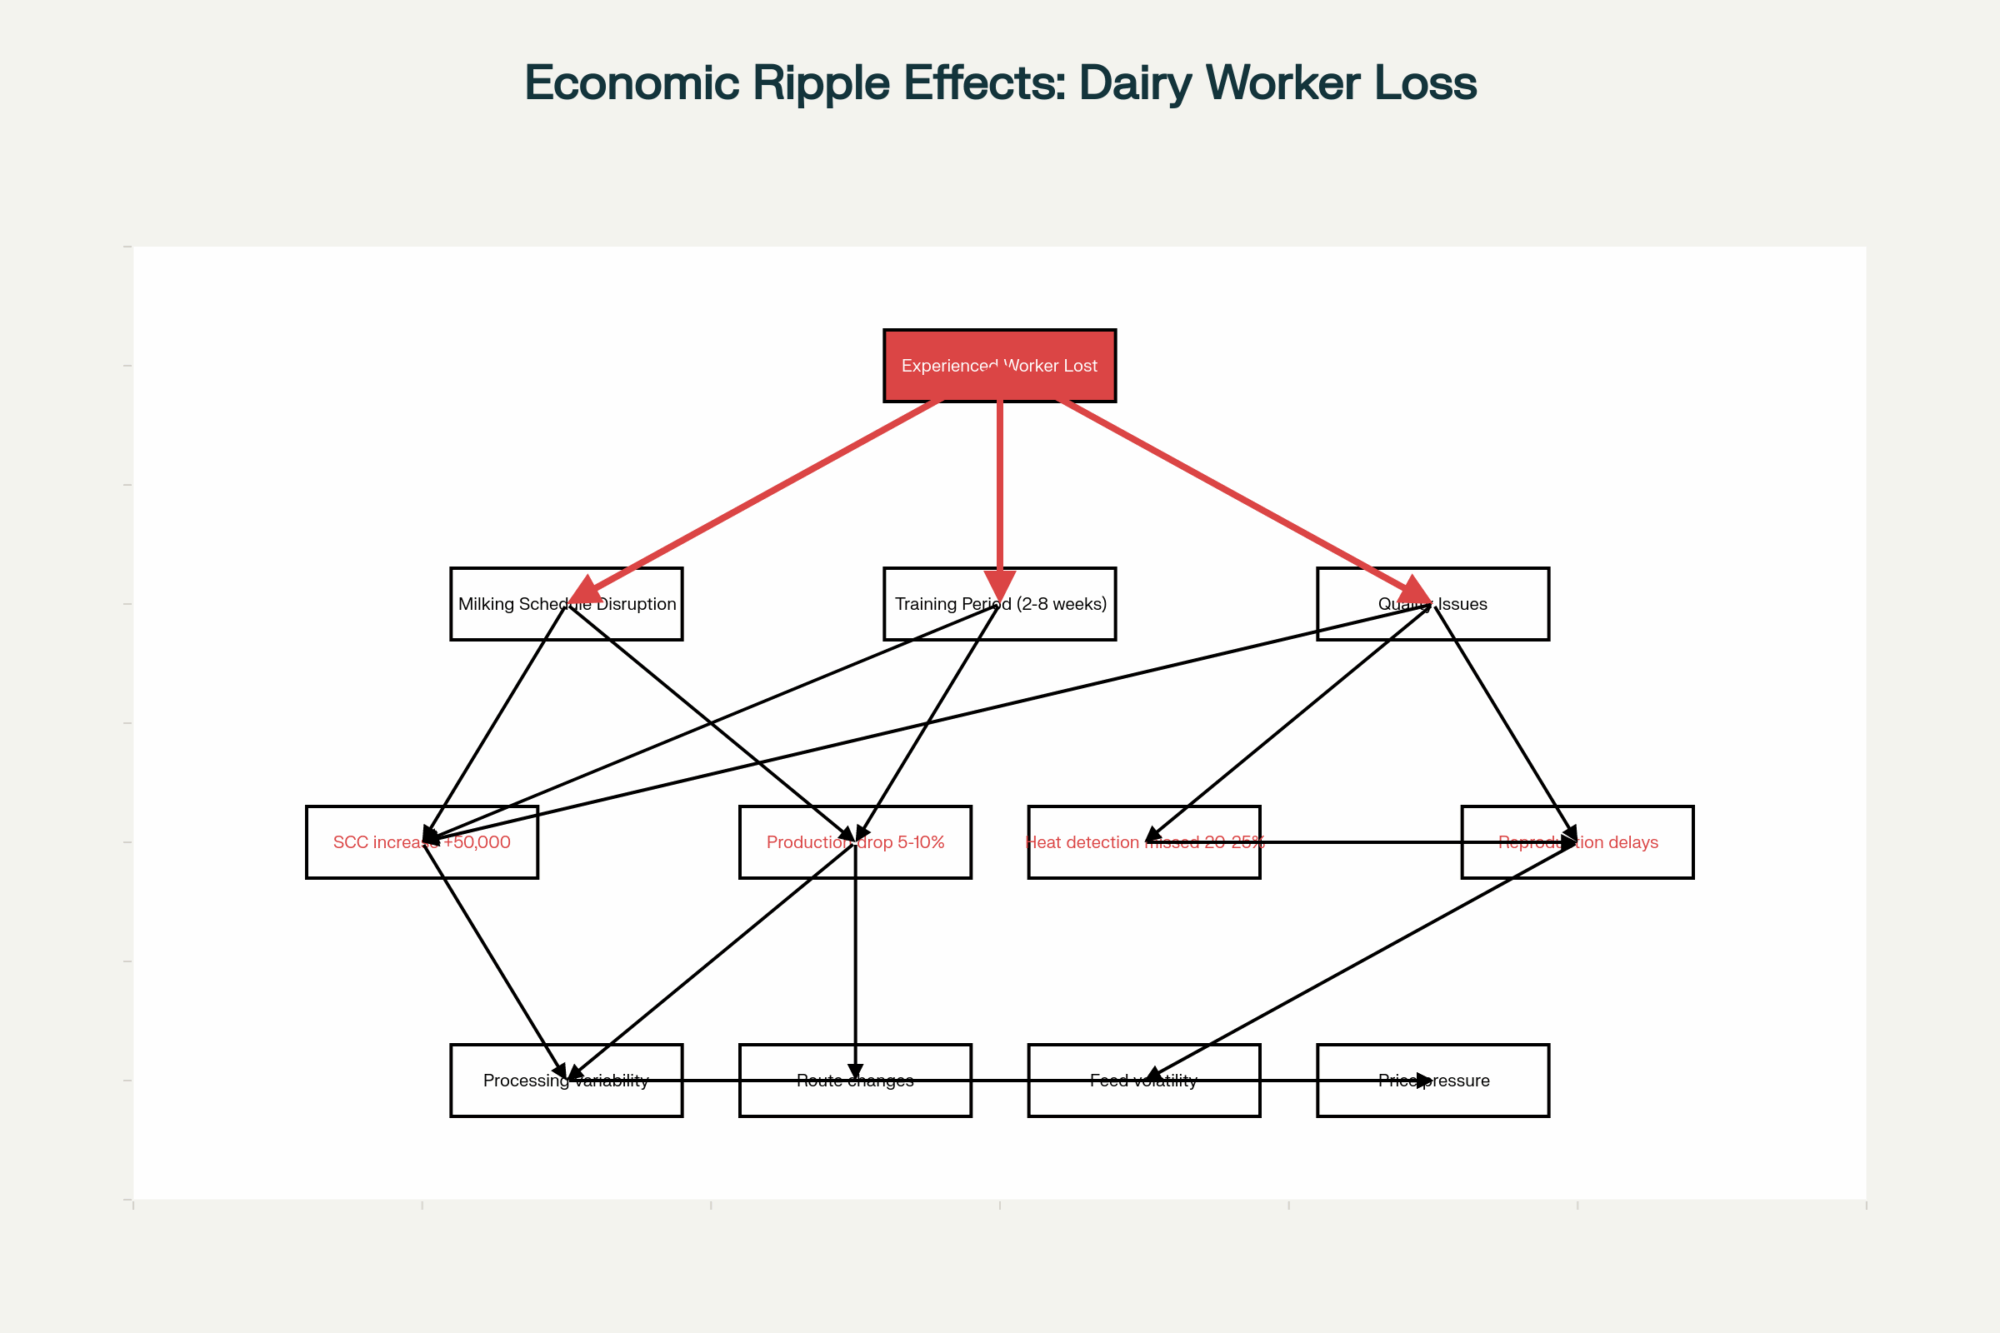
- ICE Raids Resume: Why Dairy’s $48 Billion Labor Crisis Exposes Our Innovation Failure – This piece explores how technology adoption creates a competitive edge. It demonstrates the ROI of automation and AI in managing herds for higher efficiency and better components, linking innovation directly to profitability in a volatile market.
 The Sunday Read Dairy Professionals Don’t Skip.
 The Sunday Read Dairy Professionals Don’t Skip.
Every week, thousands of producers, breeders, and industry insiders open Bullvine Weekly for genetics insights, market shifts, and profit strategies they won’t find anywhere else. One email. Five minutes. Smarter decisions all week.