


When corn drops to $4.13 while soybean meal holds at $275, the feeding strategies that worked last year might be costing you thousands.
EXECUTIVE SUMMARY: What farmers are discovering right now is that the traditional relationship between corn and protein feed costs has completely inverted, creating what might be the most significant feed arbitrage opportunity we’ve seen in years. With CME December corn futures at $4.13 per bushel, while soybean meal remains anchored at $275 per ton, progressive dairy operations are capturing $2-3 per hundredweight advantages by strategically increasing corn inclusion to 35-40% of grain mixes – well above conventional recommendations. Research from the University of Wisconsin-Madison and Cornell, published this year, confirms that properly managed herds can handle these elevated starch levels when three conditions align: corn processed to a particle size of 750-1,000 microns, physically effective fiber maintained at 28-32% NDF, and strategic buffering with magnesium oxide. The convergence of China purchasing just 20-30% of typical soybean volumes, drought affecting 70% of U.S. production areas according to the Drought Monitor, and cull cow prices at $145/cwt creates what industry analysts describe as a 90-120 day window before La Niña weather patterns and ethanol economics likely reverse these dynamics. Operations implementing phased approaches – starting with simple TMR consistency improvements that cost nothing – are seeing income over feed cost improvements within 30 days, with one Wisconsin producer reporting $1,200 daily savings after careful implementation.

I was speaking with a Wisconsin dairy producer last week – he runs about 450 cows near Fond du Lac – and his nutritionist had just walked him through something that completely changed his perspective. Been feeding the same ration for eighteen months, you know how it goes. But when the nutritionist showed him that corn delivered energy at one-quarter the cost of protein, that got his attention real quick.
“We were basically writing checks we didn’t need to write,” he told me. “Every single day.”
What’s interesting is I’m hearing similar stories from producers everywhere – it doesn’t matter if you’re milking 200 cows in Vermont or running 2,000 head out in California. What is the traditional relationship between energy and protein feed costs? It’s turned completely upside down. And those who’ve caught on are seeing feed cost advantages that, honestly, I wouldn’t have believed myself six months ago.
The Current Market Reality Check
Let’s dig into the numbers here. CME December corn futures settled at $4.13 per bushel this week. That’s down from those stomach-churning peaks above $4.50 we dealt with earlier this year. Meanwhile, the Chicago Board of Trade has soybean meal at $275 per ton – it’s been there for weeks now, like it’s stuck in park.
Here’s what really matters, though. When you run the standard National Research Council energy calculations, corn’s delivering digestible energy at about six cents per pound. I had to check that twice myself. That’s what we usually pay for wheat middlings or corn gluten – the bargain stuff, right? But protein through soybean meal? Nearly 25 cents per pound.
This 4:1 ratio changes everything about how we think about rationing.

The USDA’s October World Agricultural Supply and Demand Estimates put U.S. corn production at 410-415 million metric tons. That’s substantial. Yet, soybean processing capacity cannot keep up with domestic meal demand, even at these prices that should theoretically slow things down.
And China? Based on USDA Foreign Agricultural Service export data, they’re buying maybe 20-30% of what they typically purchase from our harvest. We’re talking billions in trade, that’s just… not happening. Creates some interesting domestic opportunities, to say the least.
Weather’s been throwing curveballs, too. The U.S. Drought Monitor indicates that approximately 70% of the country is experiencing drought at various levels. I’ve been hearing from Extension folks across the northern states – many producers are seeing significant reductions in homegrown feed. The Wisconsin farms I work with are scrambling to find hay wherever they can.
However, and this is important, irrigated areas in Iowa, Illinois, and Indiana maintained relatively strong corn production. So, you’ve a peculiar situation where corn’s relatively available overall, but forage is scarce in many regions.
Rethinking Starch Limits Based on Current Research
You know, when I first heard about producers pushing starch to 35-37%, I was skeptical. We’ve all been told – keep starch below 28% or deal with acidosis, right?
But work published in the Journal of Dairy Science over the past year from researchers at Wisconsin-Madison and Cornell has really opened my eyes. The studies show that with proper management, cattle can handle these higher starch levels. And that “proper” part is crucial.
Three things have to line up. First, corn needs to be processed down to a particle size of 750-1,000 microns. Most operations I visit? They’re still at 3,000 microns or coarser. Big difference there. Second, you must maintain a physically effective fiber level of 28-32% NDF, primarily from high-quality forages. No cutting corners. Third, buffering becomes critical – we’re talking about 0.75 ounces of magnesium oxide per cow, religiously.
Here’s something that doesn’t get discussed enough: when managing starch levels, you must be extra cautious about total dietary sulfur. University of Minnesota veterinary diagnostic work shows that high-starch diets combined with elevated sulfur levels can increase the risk of polioencephalomalacia – essentially a thiamine deficiency that causes brain lesions. If you’re already challenging the rumen with higher starch, adding high-sulfur feeds becomes particularly dicey. Keep total dietary sulfur below 0.4%.
Processing matters more than most people realize. According to the National Research Council’s 2021 Nutrient Requirements of Dairy Cattle (8th edition), steam-flaked corn hits about 87% total tract starch digestibility. Cracked dry corn? Lucky to get 45%. When you improve that particle size reduction, you’re essentially feeding a different feed entirely.
The physiology is also quite interesting. Research published in Animal Feed Science and Technology in 2024 shows that when corn processing is optimized, those volatile fatty acid ratios – the acetate to propionate balance – stay above 2.5 to 1. That means you’re preserving butterfat even at these higher starch levels. Would’ve been heresy to suggest five years ago.
I know a producer in Nebraska who attempted to increase the starch content to 38% without adjusting the processing or buffering. Bad move. Within two weeks, three fresh cows stopped eating, and butterfat levels dropped by 0.4%. He pulled back to 32% and everything normalized. The lesson? These higher levels work, but only with meticulous management.
The DDGS Quality Minefield
A purchasing manager for a large Minnesota dairy recently informed me that they’re running about 2,000 cows. With DDGS priced at $180-200 per ton regionally, it appears to be a favorable comparison to soybean meal on paper.
“But we’ve rejected four loads this past month,” she said. “Two with fat over 12%, one had that burnt smell, and one tested at 1.3% sulfur. Any of those could’ve cost us thousands.”
| Parameter | Optimal | Acceptable | Danger | Reject |
| Fat Content | 5-7% | 7-9% | 9-12% | >12% |
| Protein Content | 28-32% | 26-28% or 32-34% | 24-26% or 34-36% | <24% or >36% |
| Sulfur Content | 0.35-0.5% | 0.5-0.7% | 0.7-1.0% | >1.0% |
| Color/Heat Damage | Golden | Light Brown | Dark Brown | Black/Burnt |
The U.S. Grains Council’s quality surveys reveal significant variation – fat ranging from 5% to 14%, protein from 24% to 32%, and sulfur from 0.35% to over 1.4%. These aren’t minor differences, folks.
Research published in the Professional Animal Scientist journal consistently shows that keeping fat below 9% is essential, as milk fat depression will consume any savings. That golden color tells you it’s properly dried. Dark brown or black? Heat damage has caused the protein to become locked up.
Several commercial labs can help with quality monitoring. Dairyland Laboratories in Wisconsin, Rock River Laboratory with locations across the Midwest, Cumberland Valley Analytical Services in Pennsylvania – they all run comprehensive DDGS panels. Industry standards generally recommend keeping acid detergent insoluble protein below 12% of total protein. That’s your heat damage indicator.
Sulfur needs special attention, especially if you’re also pushing starch levels. When DDGS sulfur goes above 0.7%, combined with high-sulfur water and metabolic stress from high-starch diets… you’re asking for trouble. I’ve seen it happen.
Three Strategies That Actually Work
Strategy 1: TMR Consistency – The Foundation
I recently visited a dairy near Shawano, where the owner showed me something straightforward yet incredibly effective. After a University of Wisconsin Extension workshop on mixing consistency, he started timing every TMR load.
“Four minutes exactly,” he said, pointing to this beat-up kitchen timer on the mixer. “Not approximately. Not until it looks good. Four minutes.”
Research published in the Journal of Dairy Science by Penn State in 2024 shows that reducing TMR variation from 15% to below 5% generates 4-5 pounds more milk per cow daily. That’s an immediate return from better mixing alone.
Within a week, this producer observed tighter manure consistency, improved cud chewing, and a noticeable increase in the bulk tank. No new feeds, no expensive additives. Just consistency.
The key here – and what many people overlook – is that consistency matters more than perfection. A slightly suboptimal ration fed consistently beats a perfect ration with 15% variation every single time.
Strategy 2: Strategic Corn Inclusion
Several nutritionists I work with are carefully incorporating corn into grain mixes at 35-40% of the total. Way above the traditional 20-25% comfort zone, but the economics are compelling.
The system requires three key components: corn processed to a 750-1,000 micron size, approximately a pound of wheat straw or mature hay for scratch factor, and magnesium oxide for buffering.
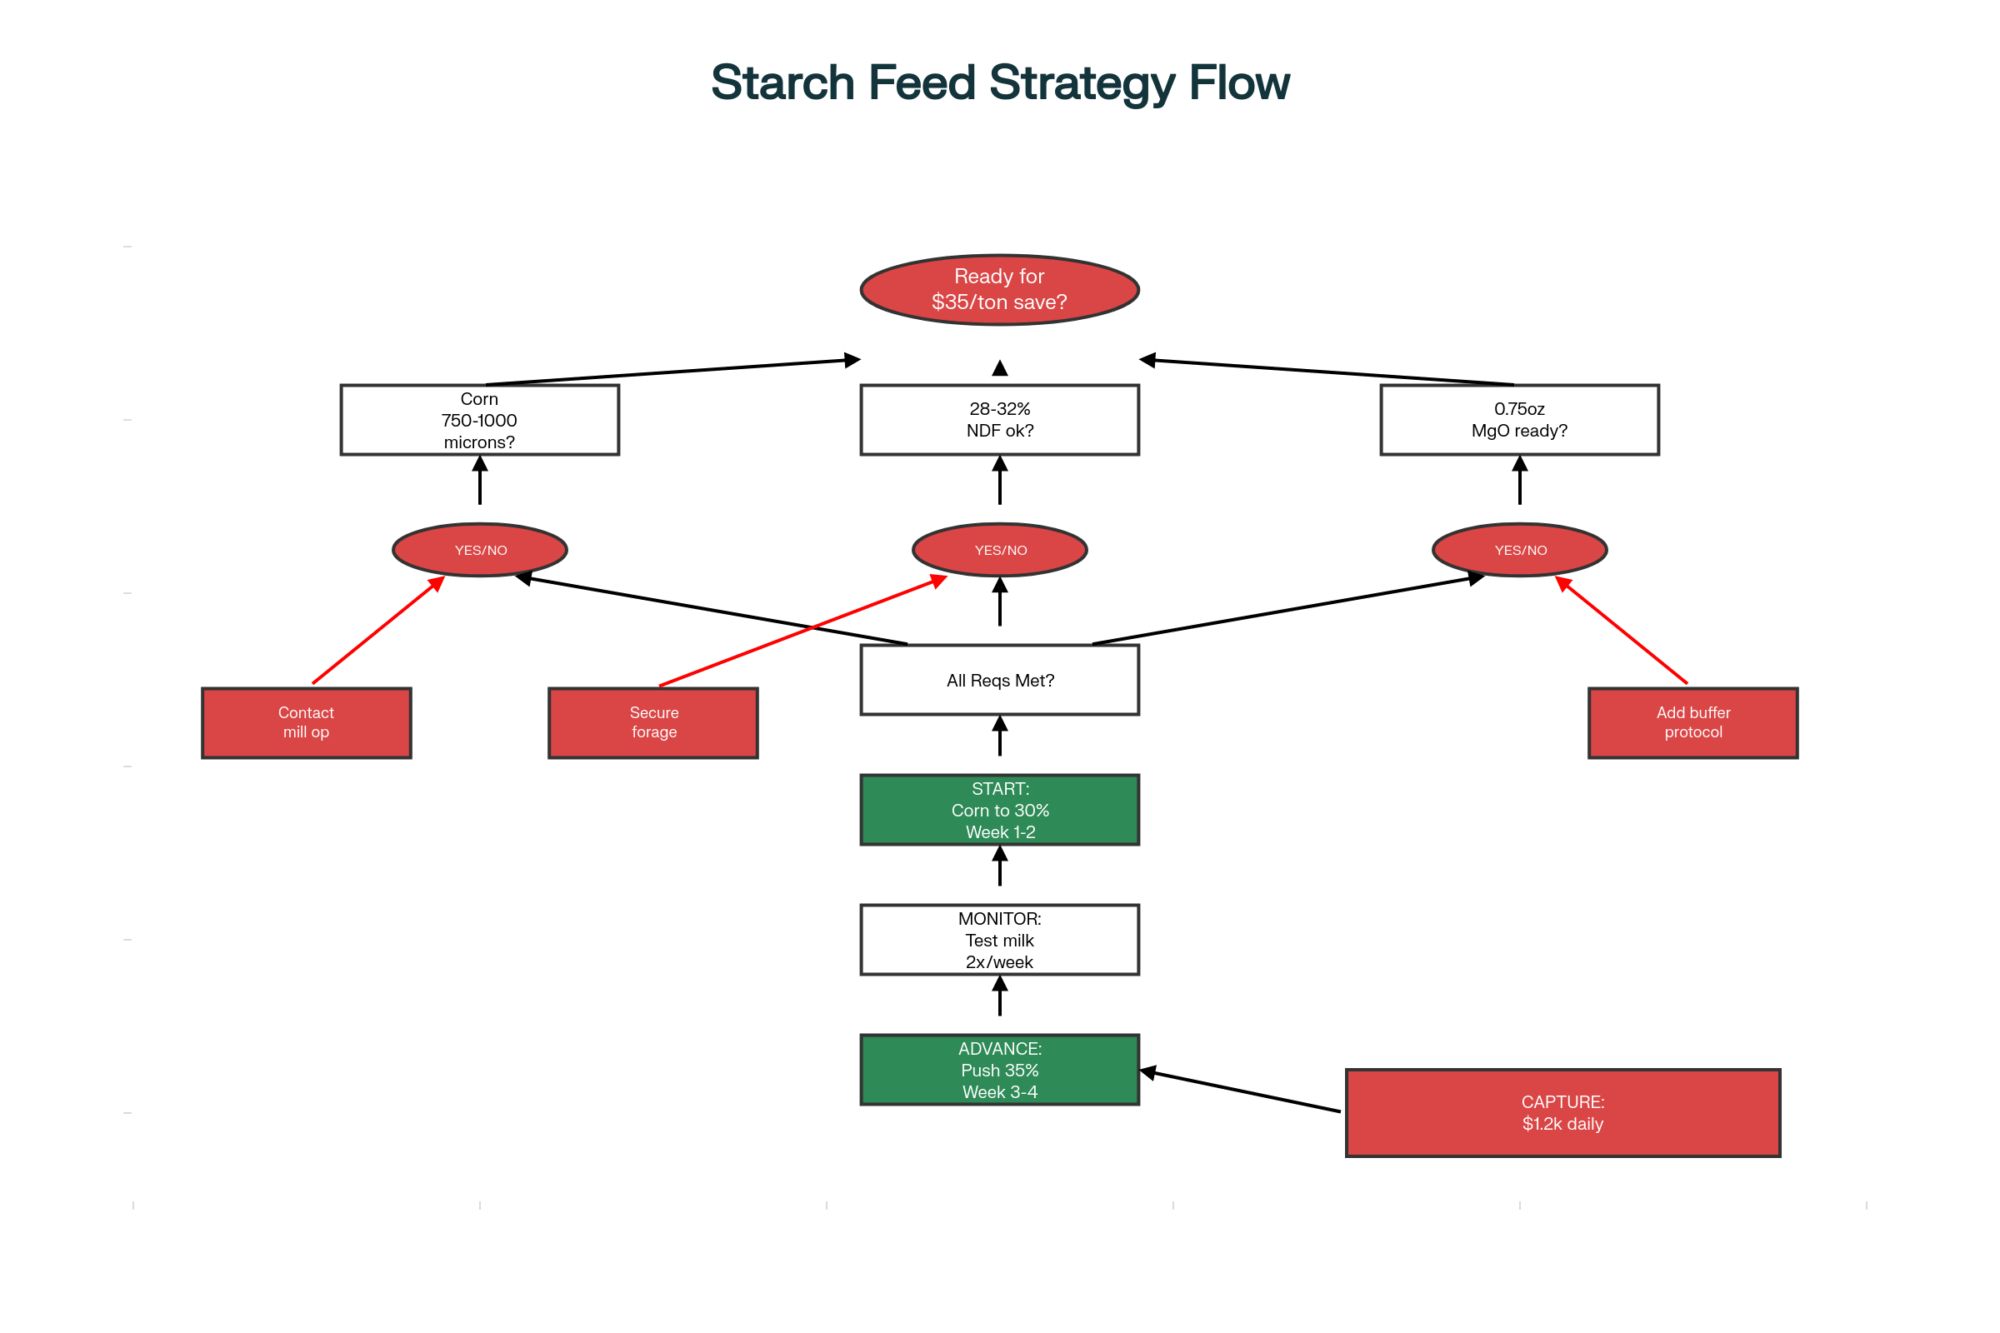
Here’s the math: Based on current Chicago Board of Trade pricing, a one percentage point increase in corn, while reducing soybean meal, saves approximately $3.50 per ton of grain mix. Here’s how that calculation works: corn at $4.13/bushel equals $147.50/ton. Soybean meal at $275/ton with 48% protein versus corn at 9% protein means you need 2.5 pounds of corn to replace 1 pound of SBM energy-wise. The price differential creates a $3.50/ton savings for every percentage point shift.
Moving from 25% to 35% corn? That’s $35 per ton saved. For a herd feeding 25 pounds of grain daily, we’re talking meaningful money.
Some California operations with access to extremely low-cost local corn are pushing toward a 42% inclusion rate. However, that requires someone who truly understands the warning signs and metabolic indicators. One producer near Tulare told me he has saved $1,200 daily since August – but he’s also testing milk components twice a week and has his nutritionist on speed dial.
Strategy 3: Revenue Diversification Beyond Milk
An Ohio dairy farmer recently showed me his approach, and it’s brilliant in its simplicity. Instead of chasing protein premiums that have largely evaporated with current Federal Order pricing, he has built multiple revenue streams.
“Bottom 40% of the herd gets bred to Angus,” he explained. “Local sale barn consistently shows $150-250 premiums for those beef-cross calves versus straight Holstein bulls.”
Then there’s strategic culling. The USDA’s National Direct Cow and Bull Report currently shows cull prices at $145 per hundredweight. Compare that to historical October averages around $90-95/cwt based on USDA Agricultural Marketing Service data. That’s over $400 extra per cull – not from culling more, just timing it better.
Making It Work with Tight Cash Flow
The practical challenge – and I hear this constantly – is funding these changes when working capital’s already stretched. A Pennsylvania producer I’ve been advising developed this phased approach that’s working really well.
First two weeks, focus on the free stuff. Time those TMR loads. Four minutes, every time. Review your cull list against current strong prices. One guy I know generated $4,500 from three strategic culls, which funded everything else.
Weeks three and four, test gradual changes. Increase corn by just a pound per cow to start. Sample DDGS from multiple suppliers before making a commitment. Lock in only 30 days of corn to prove it works in your operation.
By month two, most operations are seeing clear improvements in income over feed costs. “First month was tough,” the Pennsylvania producer told me. “Questions from everyone. But when we showed real profitability improvements, they came around.”
The Window Is Closing
Considering future trends and seasonal patterns, this opportunity won’t last forever. CME March 2026 corn already trades at $4.34 – that 21-cent premium tells you the market expects things to tighten.
Several factors could shift this quickly. China typically returns to U.S. markets after harvest – USDA trade data shows they historically increase purchases from November through January. When they do, soybean meal often jumps $30-50 per ton within weeks.
NOAA’s Climate Prediction Center indicates that La Niña is expected to strengthen through February 2026. Considering similar years, South American production challenges typically affect our grain prices within 60-90 days of confirmed weather stress.
And ethanol economics matter too. With crude at $75 per barrel according to EIA data, we’re near the threshold where ethanol margins improve. The EPA’s 15 billion-gallon renewable volume obligation for 2026 means sustained oil prices above $80 will likely push corn higher.
Industry professionals I trust suggest we’ve perhaps three to four months before something shifts significantly.
Regional Adaptations and Global Context
| Region | Primary Strategy | Key Advantage | Corn Inclusion | Savings Potential | Critical Factor | Risk Level |
|---|---|---|---|---|---|---|
| Wisconsin/Midwest | Push corn to 35-40% | Local corn access | 35-40% | $1,000-1,200/day | Forage scarcity | MODERATE |
| California/West | Max corn at 42% | Irrigation stability | 40-42% | $1,200-1,500/day | Component testing | HIGH |
| Texas/Southwest | Cottonseed + corn | Regional proteins | 30-35% | $800-1,000/day | Water costs | LOW-MOD |
| Idaho/Northwest | Stable forage focus | Consistent alfalfa | 38-40% | $1,100-1,300/day | Processing quality | LOW |
| Vermont/Northeast | Organic premiums | Premium markets | N/A | Premium capture | Certification | DIFFERENT |
What works in Wisconsin might not work in Texas, and that’s fine. Idaho operations with reliable irrigation and consistent alfalfa – they’re focused purely on maximizing that corn-protein spread. Their forage is stable, so they can push harder on grain.
Texas dairies have access to cottonseed that doesn’t align with their soybean meal needs at all. Local pricing enables the inclusion of aggressive corn while utilizing regional protein sources. Smart adaptation.
Meanwhile, a Vermont organic producer reminded me that their premium markets mean these strategies don’t translate directly. “Our feed economics are completely different,” she said. And she’s right – context always matters.
Even within conventional operations, grazing systems face different math than confinement. A 100-cow grazing dairy in Missouri has fundamentally different opportunities than a 1,000-cow freestall in Michigan.
Down in New Mexico, where I visited last month, they’re dealing with completely different dynamics. Water costs drive everything there. A producer near Las Cruces told me, “I’d love to push corn harder, but every pound of milk requires water calculation first.”
Looking internationally, European producers face even tighter protein markets with their non-GMO requirements. A consultant friend in the Netherlands tells me their soybean meal equivalent runs €400-450 per metric ton – which makes our $275 look like a bargain. Australian producers dealing with drought have the opposite problem – plenty of protein options, but energy feeds are scarce.
Quick Reference: Key Monitoring Metrics
When pushing these strategies, watch these indicators like a hawk:
- Rumination time: Should stay above 400 minutes daily
- Manure scores: Keep below three on the 5-point scale
- Milk components: Butterfat shouldn’t drop more than 0.2%
- Total dietary sulfur: Keep below 0.4% when pushing starch
- TMR particle size: Test weekly when changing corn processing
Implementation Keys for Success
After dozens of conversations with producers navigating this market, clear patterns emerge.
Start with accurate math. Calculate your actual delivered corn-to-soybean meal price ratio. Not Chicago prices – your delivered costs, including basis and freight.
Test your TMR consistency. I guarantee it’s more variable than you think. Extension services have good protocols for testing mixer performance.
Get comprehensive profiles from any DDGS supplier before volume commitments. Don’t trust last month’s analysis – quality varies by plant, even by day. Have them test for fat, protein, sulfur, and acid detergent insoluble protein at a minimum.
Review culling with current prices in mind. That cow you planned to cull in spring? Today’s prices might change that timing.
Have honest conversations with your nutritionist. Some resist higher corn inclusion based on older guidelines. Share current research, discuss gradual testing, and collaborate on monitoring together.
For risk management, never commit over half your working capital to feed inventory. Keep flexibility. And always have multiple protein suppliers. Single-source dependence is asking for trouble.
Looking Forward: Preparing for the Next Cycle
That Wisconsin producer from the beginning? He’s now seeing daily feed savings of $1,200, which more than justifies the changes. But he said something that stuck with me: “I spent three weeks overthinking a simple change. Should’ve just tried it carefully, monitored, adjusted. The real risk was paralysis while the opportunity slipped away.”
The feed economics landscape has shifted significantly, creating genuine opportunities. Dairy Margin Coverage program data from the USDA shows that operations consistently adapting to current conditions demonstrate better income over feed costs than those maintaining traditional approaches.
This window exists now, but it won’t last forever. Whether you capture it depends on your willingness to challenge conventional thinking when the numbers support it.
As someone said at our last co-op meeting: “The math is clear. Question is whether we’ll adapt while we can, or spend next year wishing we had.”
What’s encouraging is how this disruption is forcing us to question assumptions and improve efficiency. The operations that’ll thrive won’t just be those who captured this particular opportunity – they’ll be the ones who developed systems to recognize and respond to market shifts quickly. That’s a capability worth building regardless of where prices go next.
Looking ahead, I believe we will continue to see more of these market disruptions. Climate variability, trade dynamics, processing capacity constraints – they’re not going away. The dairies that build flexibility into their feeding programs, maintain good relationships with multiple suppliers, and stay willing to challenge conventional wisdom when data supports it… those are the ones that’ll navigate whatever comes next.
The current corn-soy reversal creates real opportunities for those willing to think differently about feed strategies. However, it requires careful implementation, constant monitoring, and adherence to the fundamentals that maintain cows’ health and productivity. Get those right, and the economics take care of themselves.
Complete references and supporting documentation are available upon request by contacting the editorial team at editor@thebullvine.com.
KEY TAKEAWAYS:
- Immediate savings of $35/ton on grain mix achievable by shifting from 25% to 35% corn inclusion, translating to $1,000+ daily for 500-cow operations – but requires corn processing at 750-1,000 microns, not the typical 3,000
- DDGS at $180-200/ton looks attractive, but quality varies wildly – fat content ranges from 5-14%, sulfur from 0.35-1.4% – requiring rigorous testing through labs like Dairyland, Rock River, or Cumberland Valley before any volume commitments
- Strategic culling at current $145/cwt prices generates $400+ premiums per head versus five-year October averages of $90-95/cwt, providing immediate cash flow to fund feed inventory builds without increasing culling rates
- Regional adaptations matter significantly – Idaho operations with stable irrigation focus purely on price spreads, Texas dairies leverage cotton seed alternatives, while New Mexico producers face water cost constraints that override feed economics
- The window closes fast – CME March 2026 corn already trades at $4.34 (21 cents higher), China typically returns to markets November-January, and La Niña patterns historically trigger South American production issues that impact prices within 60-90 days
 The Sunday Read Dairy Professionals Don’t Skip.
 The Sunday Read Dairy Professionals Don’t Skip.
Every week, thousands of producers, breeders, and industry insiders open Bullvine Weekly for genetics insights, market shifts, and profit strategies they won’t find anywhere else. One email. Five minutes. Smarter decisions all week.


