Archive for Dairy Farm Profitability – Page 2

£10,000 a Month in the Red: Why UK Dairy Margins Collapsed – And What’s Actually Working

When processor profits climb while your milk check drops, it’s not a coincidence. It’s a message. And once you understand what that message is telling you about how the modern dairy supply chain works, you can stop second-guessing yourself and start making strategic decisions.

Executive Summary: A 200-cow UK dairy loses roughly £10,000 every month when milk price sits 8-10ppl below cost of production. Right now, that describes most operations. AHDB’s April 2025 data shows just 7,040 producers remaining in Great Britain—down 2.6% in a single year—while First Milk’s operating profit climbed 22% to £20.5 million. Retail discounters now command nearly 20% of UK grocery spend, and post-Brexit policy lacks the milk-specific safety nets that cushioned the 2015-2016 crisis. This isn’t farm failure. It’s market structure. Three approaches are delivering real results for producers fighting to stay viable: strategic culling of the bottom 15% of the herd, precision feed management with qualified nutritionist support, and capturing beef-cross calf premiums through targeted breeding. Combined, these strategies can reduce monthly losses by £7,000-8,000—buying time to explore processor alternatives and the collective engagement approaches already producing results in Ireland.

UK dairy margin pressure

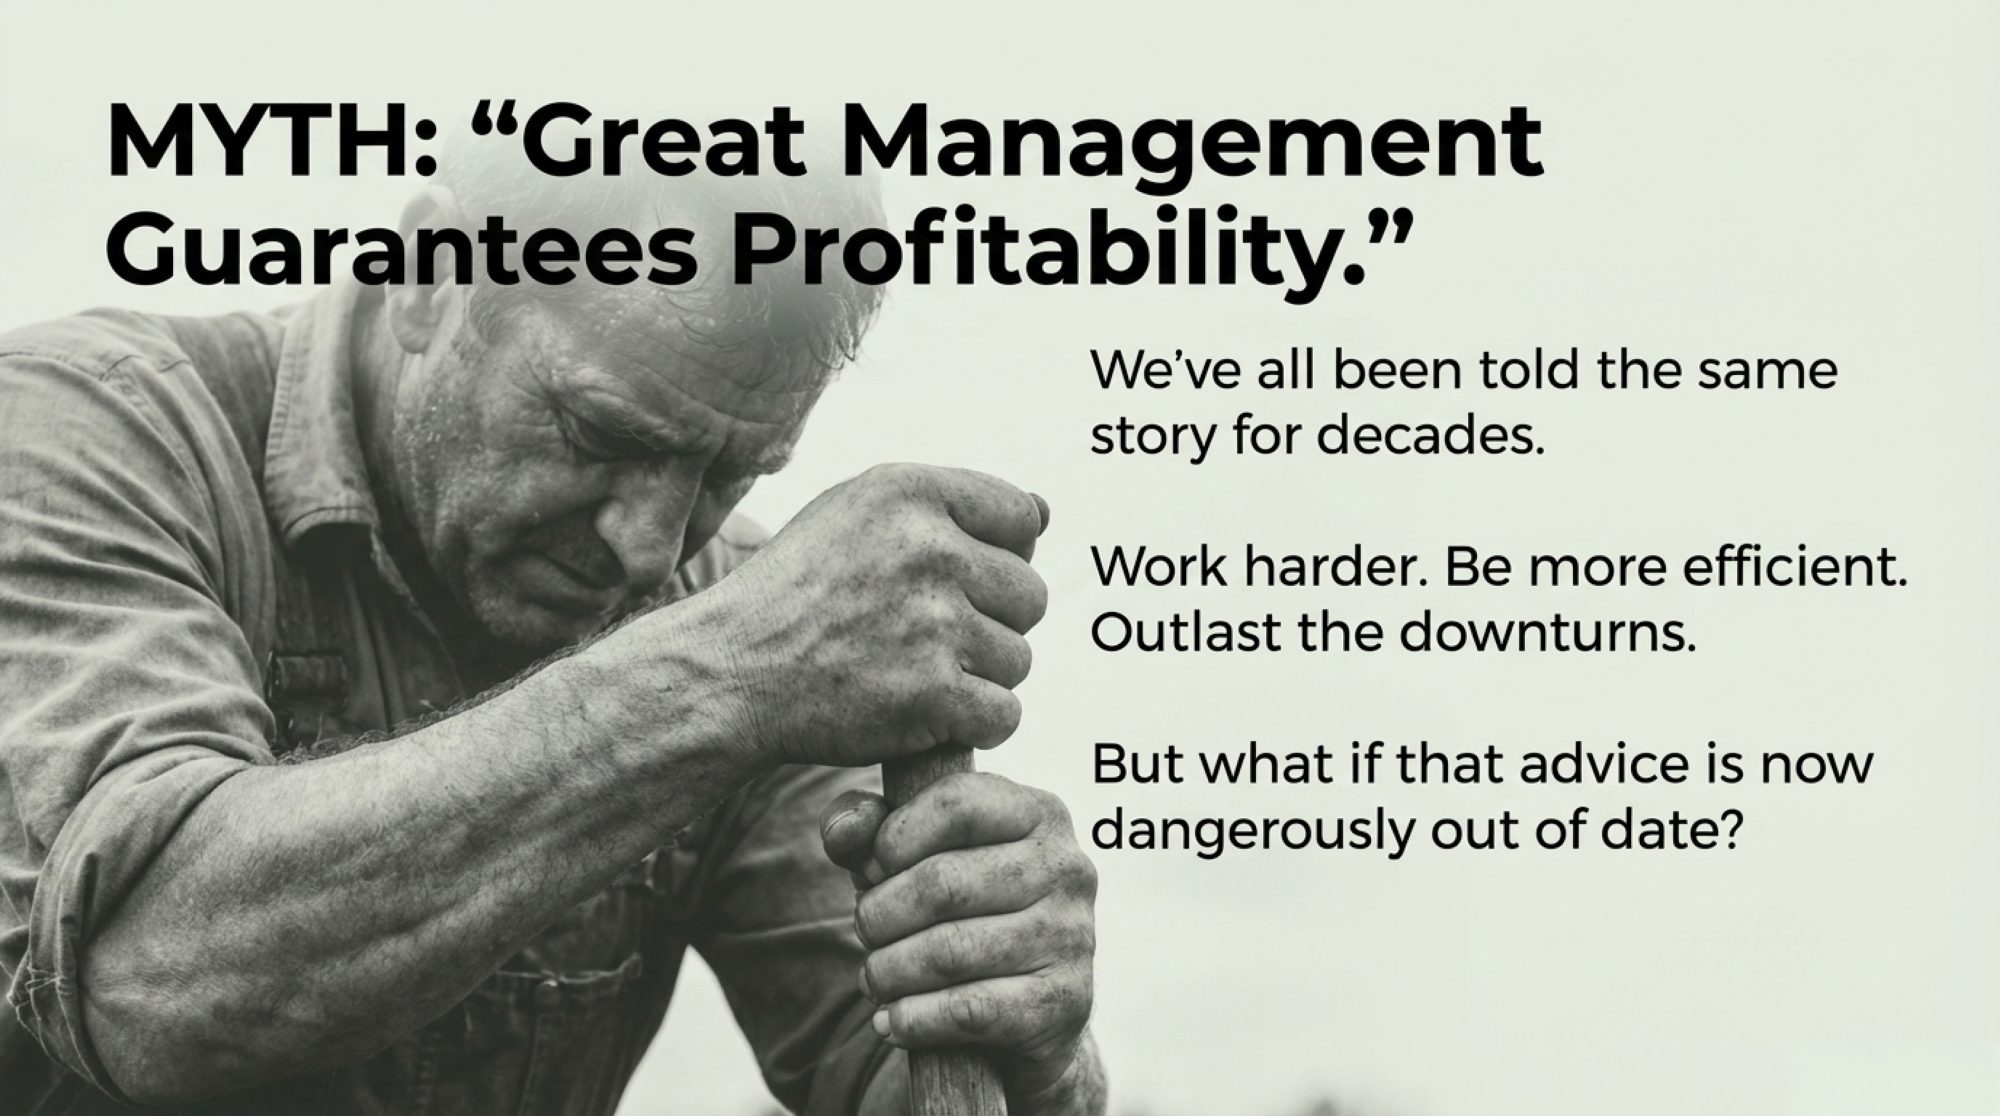
I’ve been talking with UK dairy farmers a lot lately, and you know what keeps coming up? This quiet worry that maybe they’re just not good enough at this anymore. That somehow the losses they’re seeing reflect something they’re doing wrong.

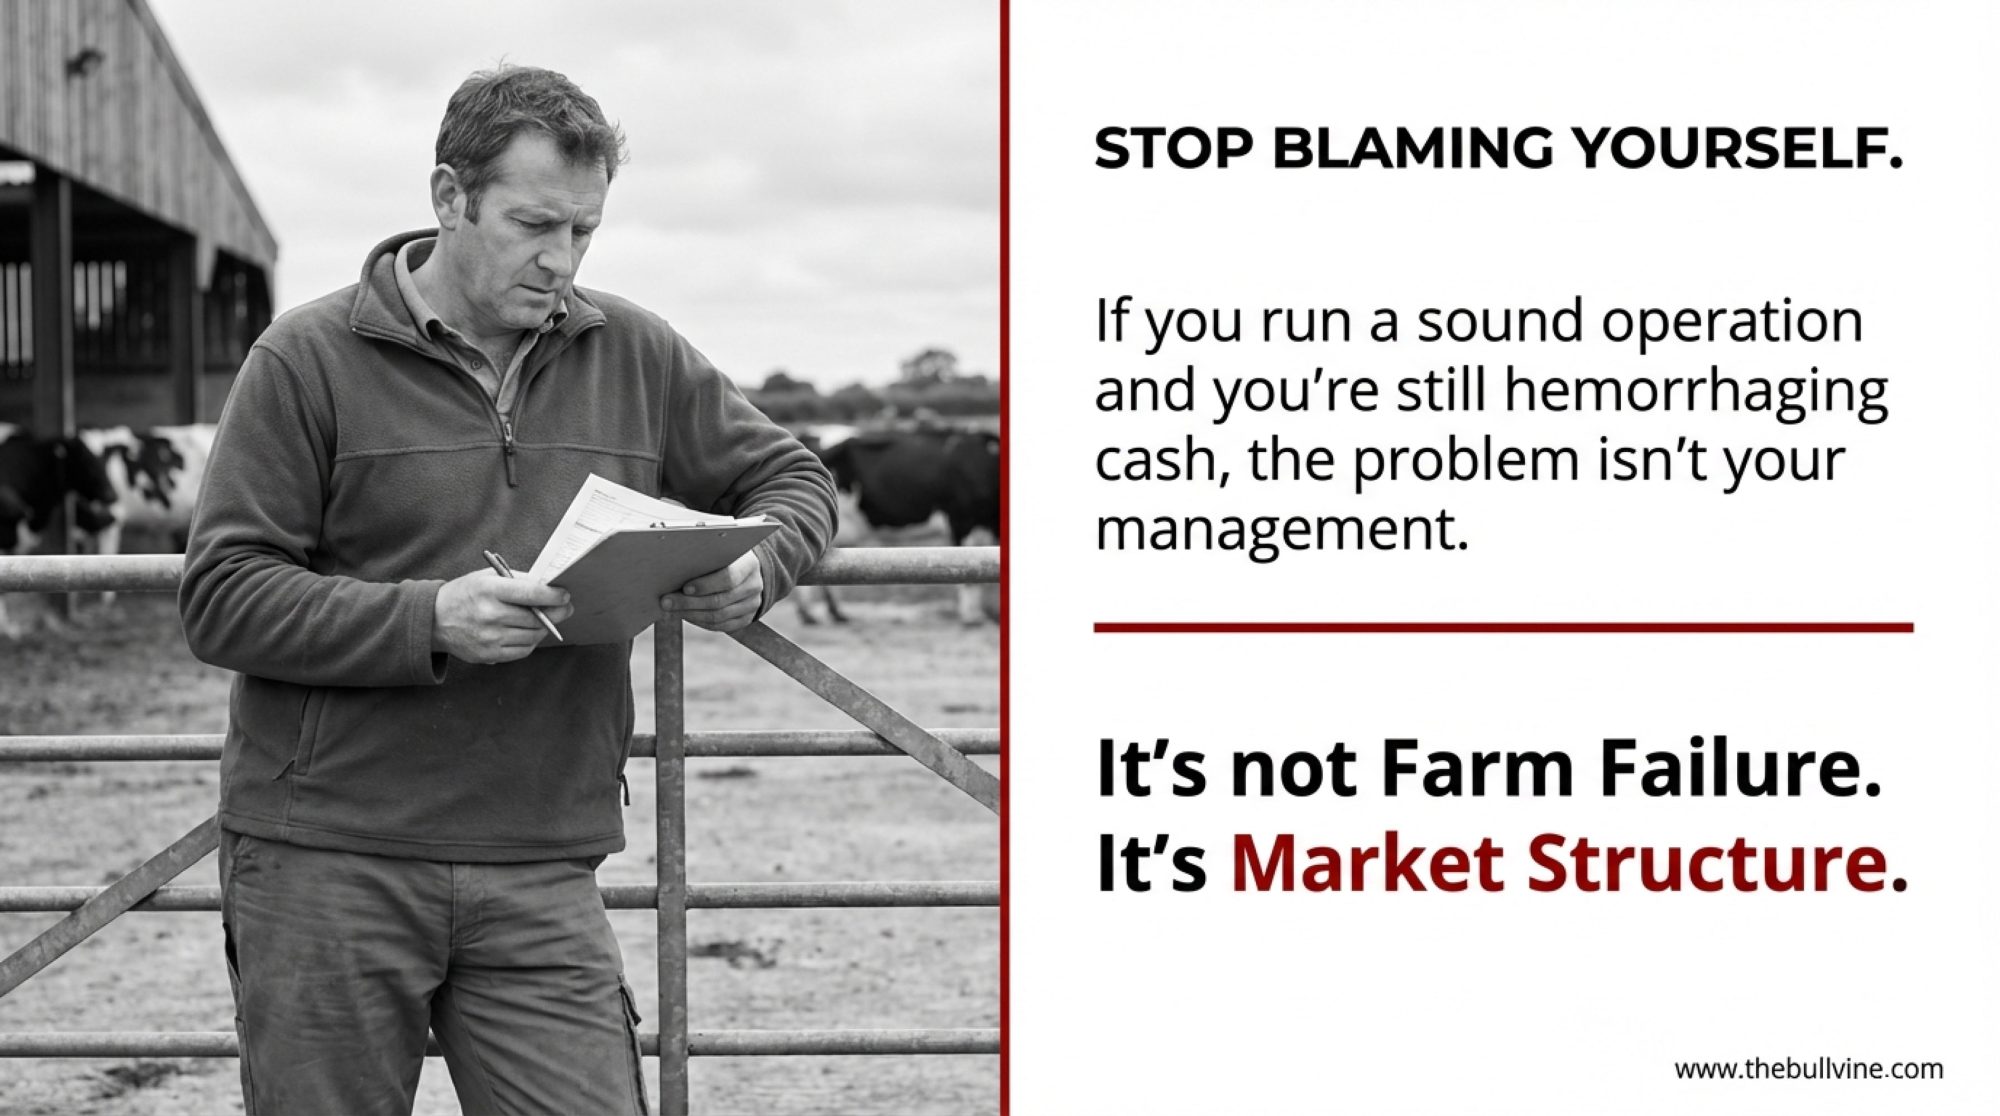
Here’s what I want to say to that: if you’re running a technically sound operation—decent yields, reasonable cell counts, professional management—and you’re still hemorrhaging money, that’s not farm failure. That’s market structure. And there’s a real difference between those two things.

Let me walk you through what I’m seeing.

The Numbers Behind the Frustration

So let’s start with the processor side, because that’s where this story begins.

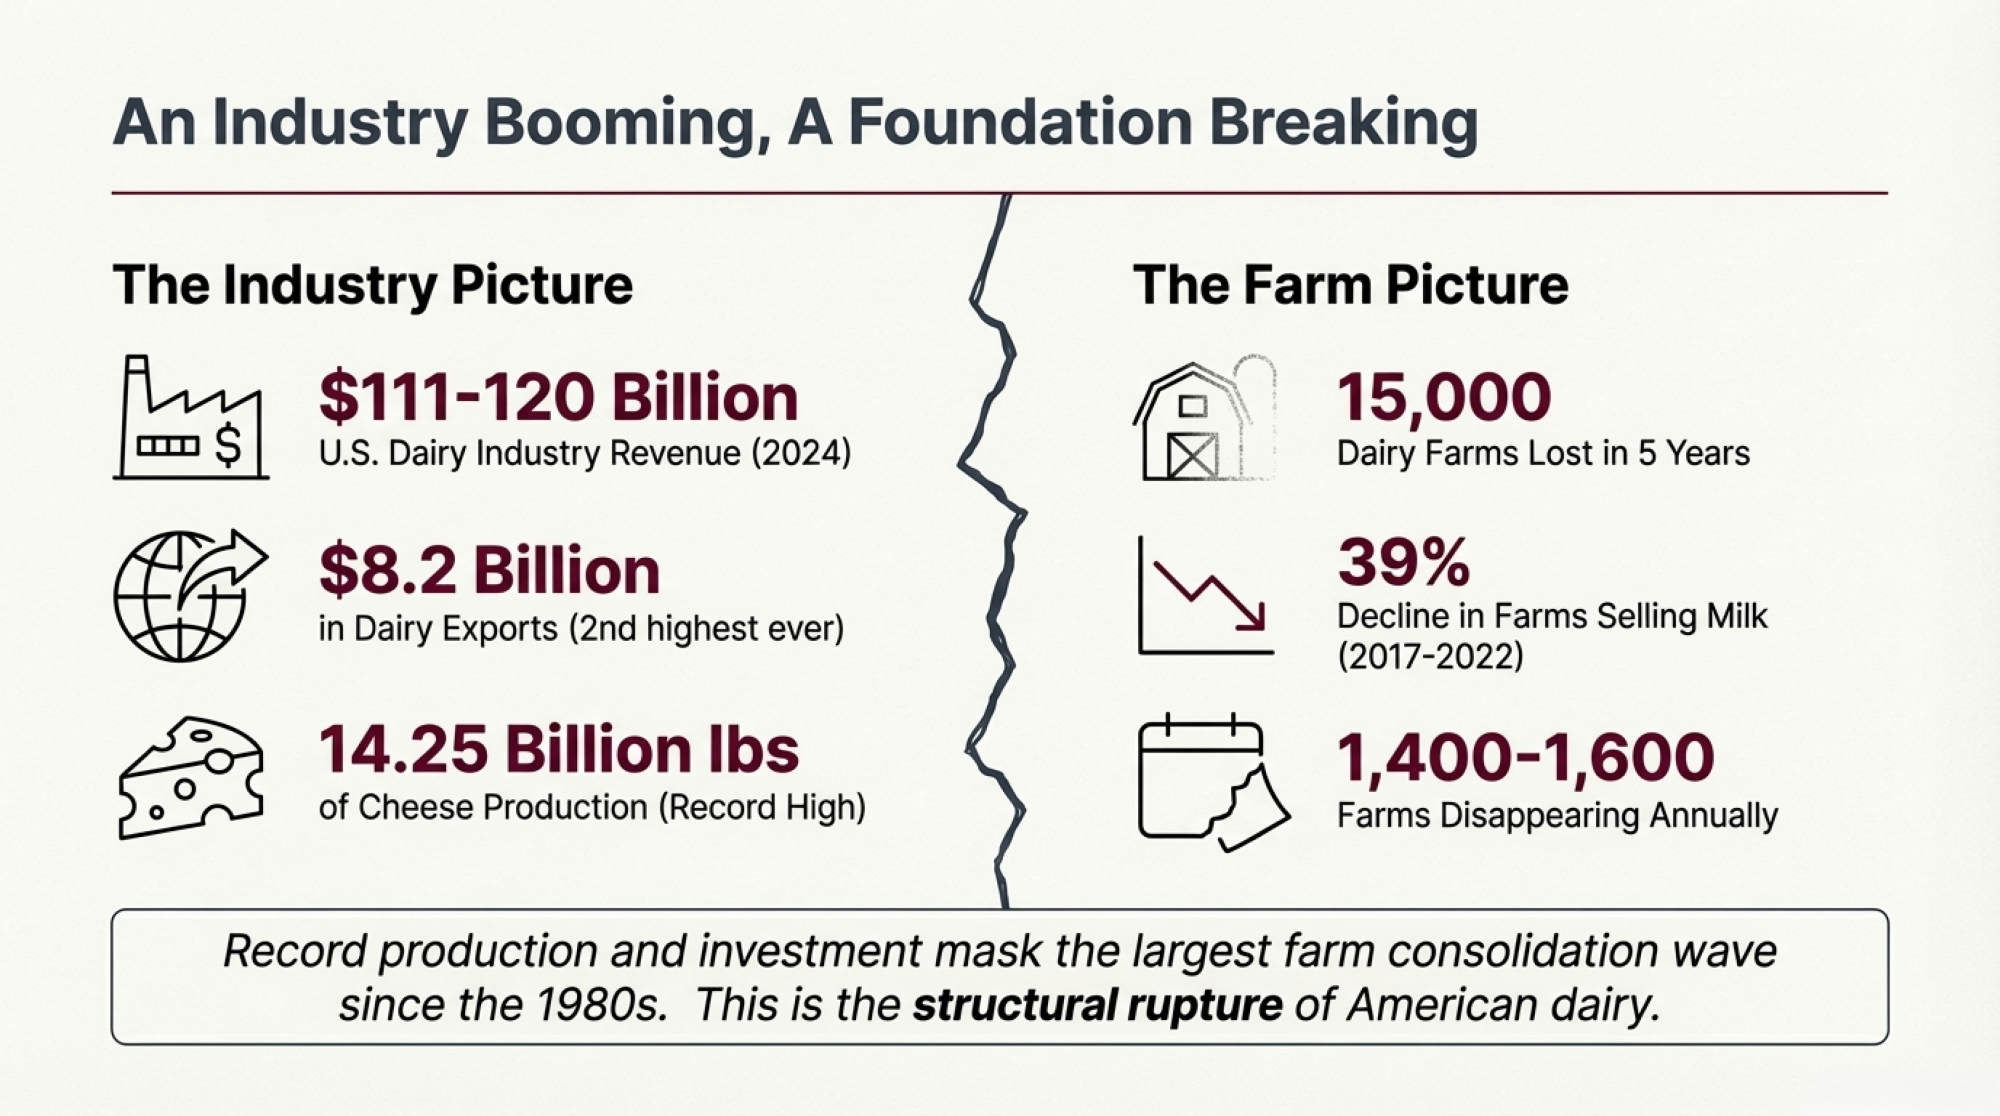
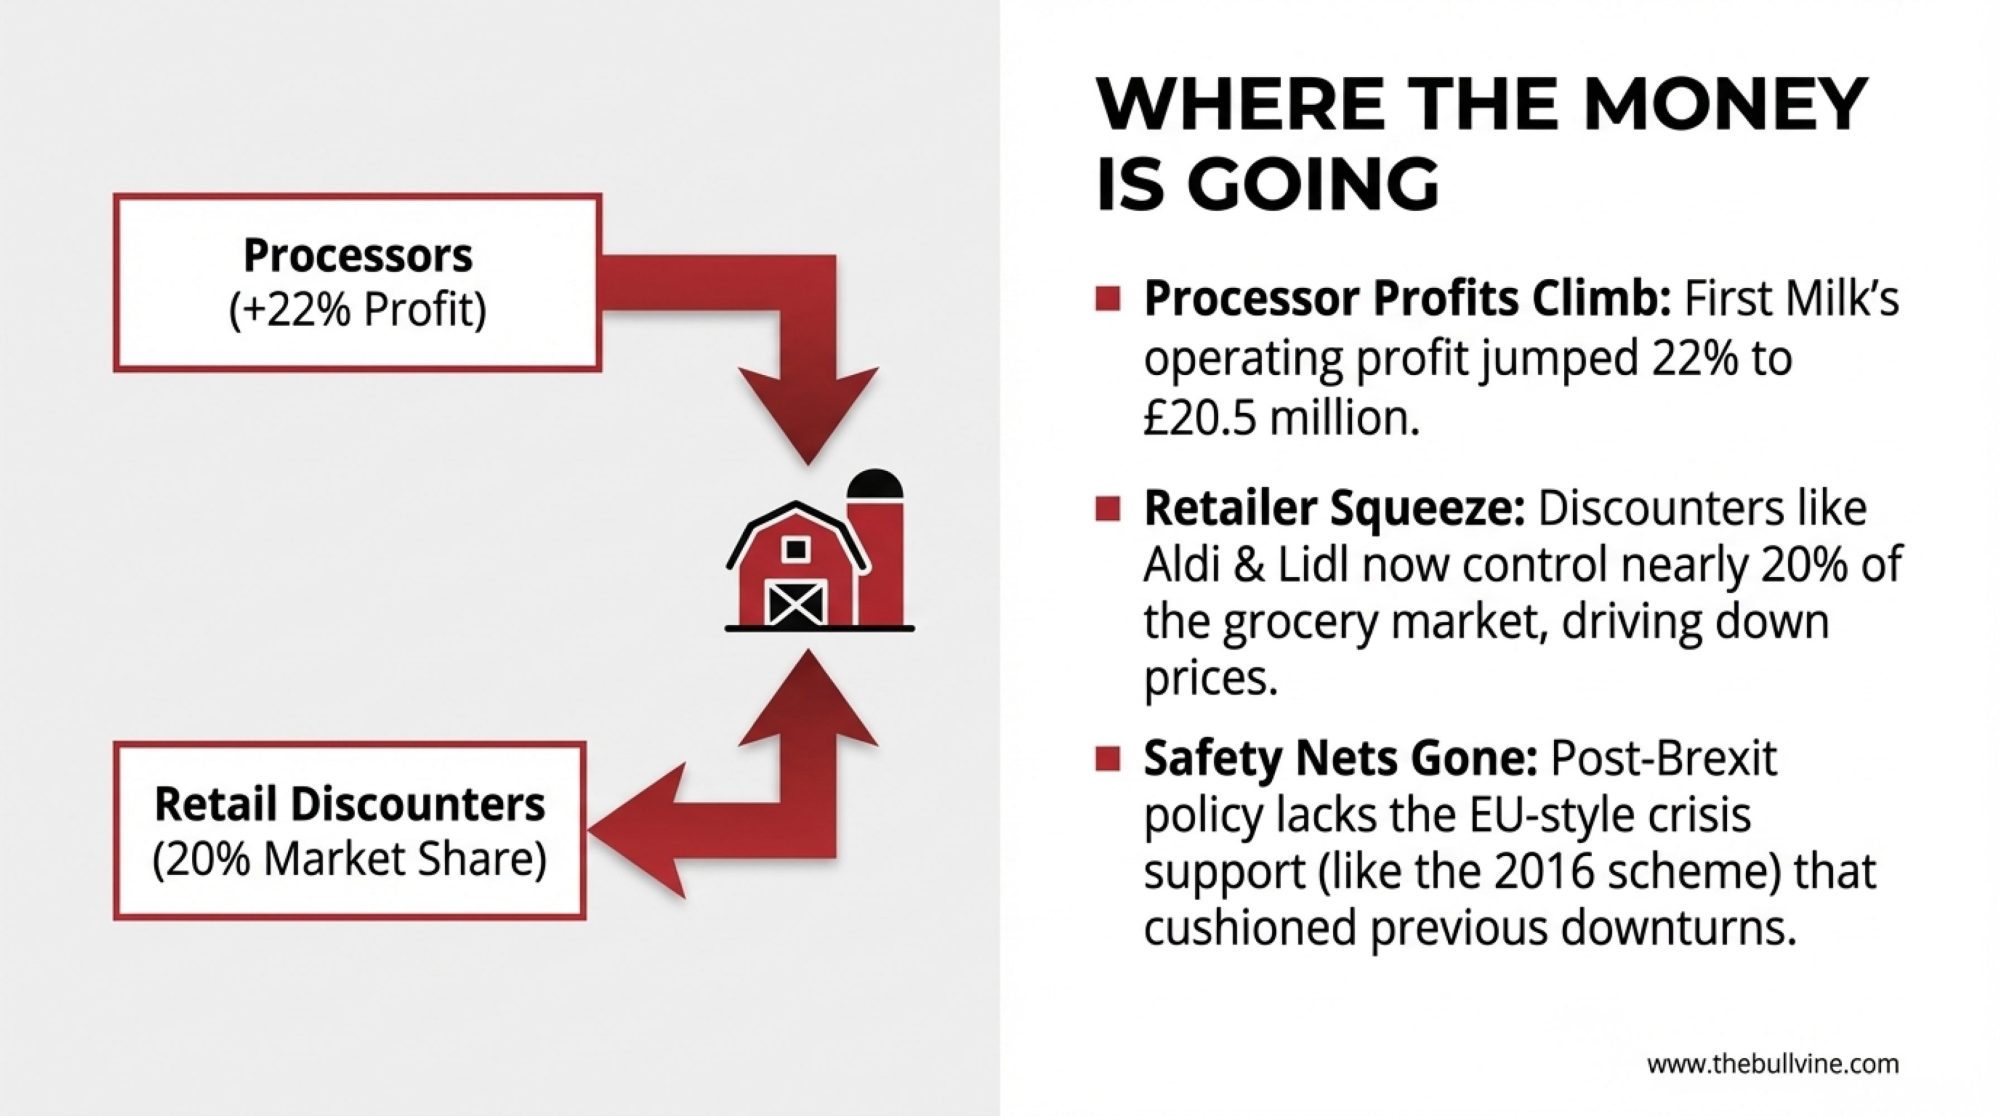
First Milk’s Annual Financial and Impact Report for the year ending March 2025 shows turnover of roughly £570 million and operating profit around £20.5 million—up from £16.8 million the previous year. That works out to an operating margin just over 3.5%. The cooperative points to higher product volumes and the full integration of BV Dairy as key drivers.


Metric
2023/242024/25Change
First Milk Operating Profit£16.8 million£20.5 million+22% ↑
First Milk Operating Margin~3.2%~3.6%+0.4pp ↑
GB Dairy Producers~7,2407,040-2.6% ↓
Farms Exitedn/a~200-200 farms ↓

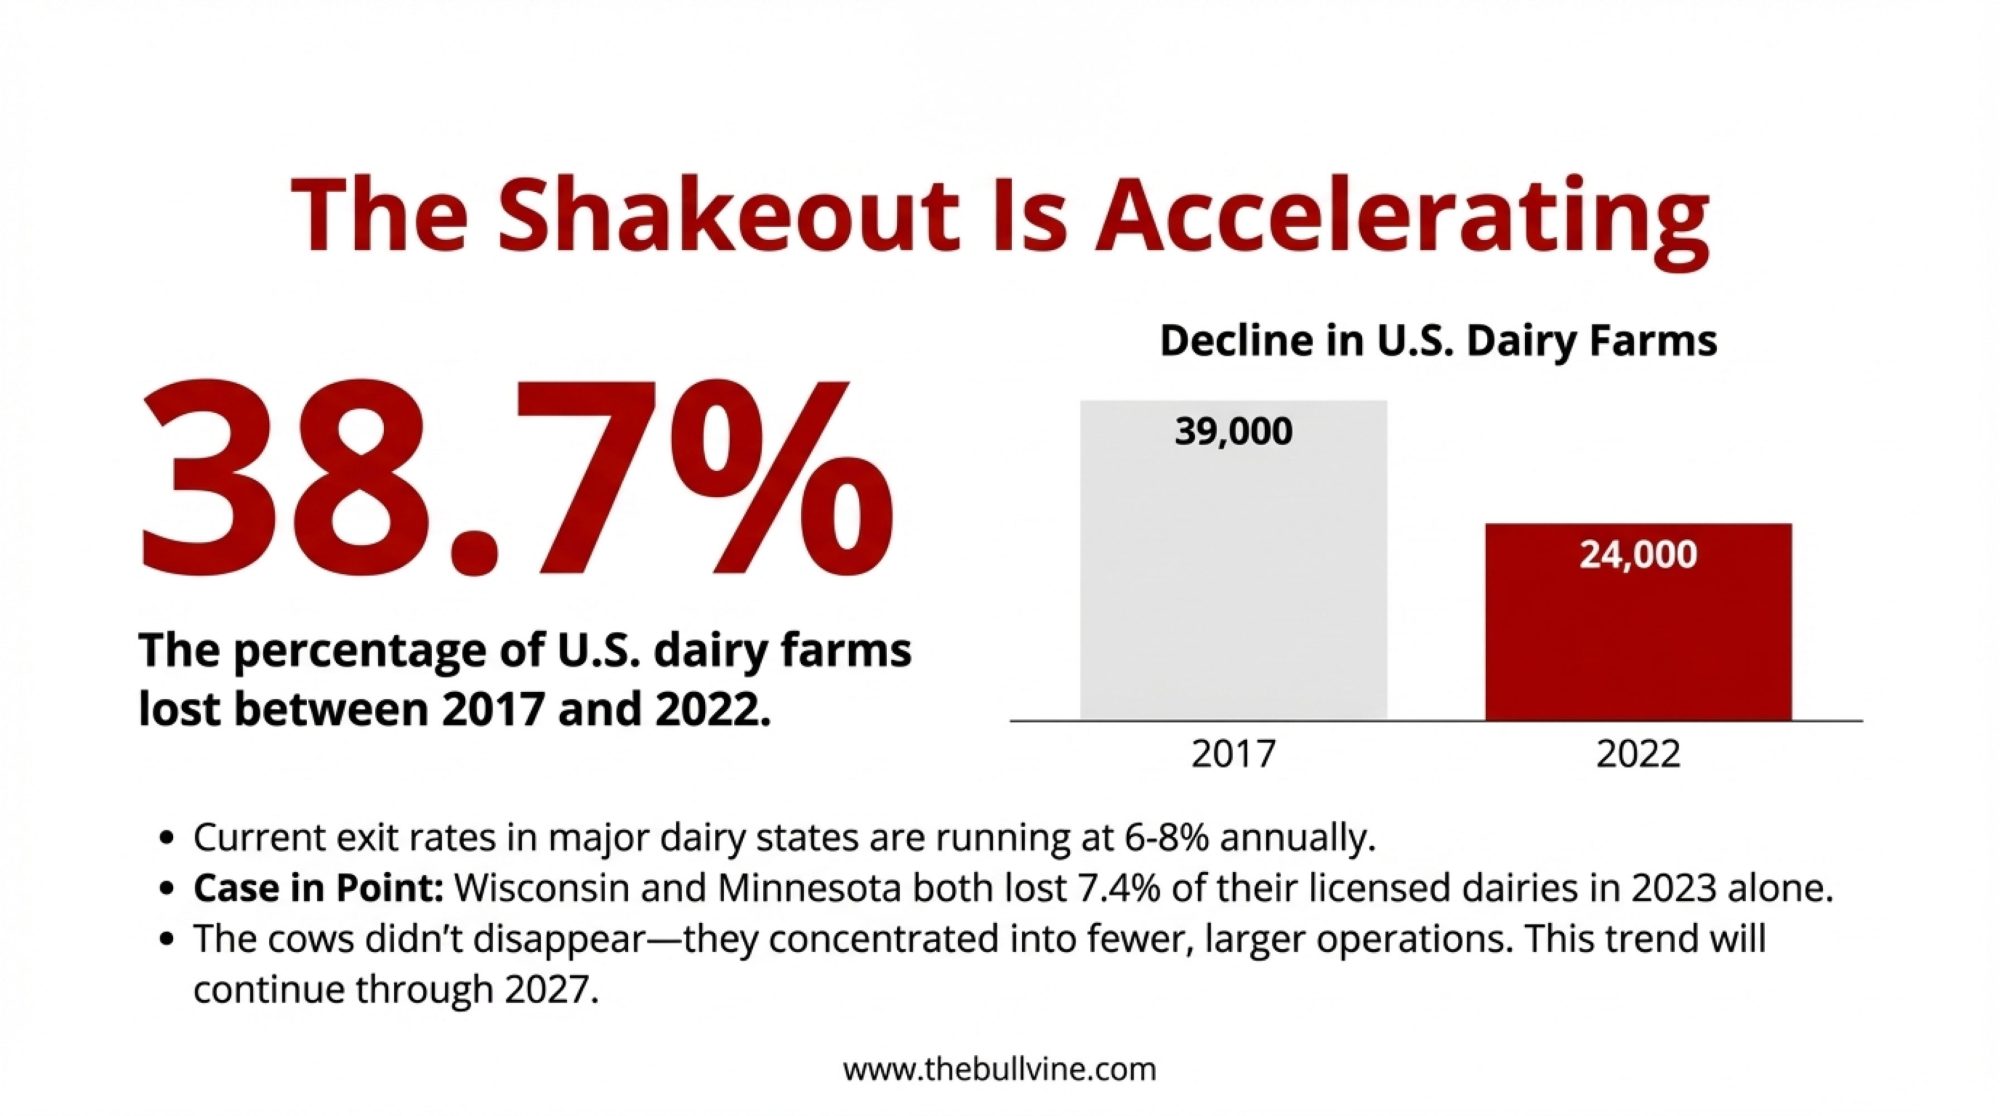
Meanwhile, AHDB’s producer numbers survey from April 2025 shows we’re down to about 7,040 dairy producers in Great Britain. That’s around 160 fewer than the previous survey in October, and nearly 200 fewer than a year ago—a 2.6% annual decline. The exits tend to cluster ahead of winter housing, which makes sense when you think about the capital and workload involved in bringing cows inside.

Here’s what’s interesting, though. Even as farm numbers drop, total milk production keeps climbing. AHDB data shows the GB milking herd continuing its gradual decline, but litres per farm keep rising. Fewer farms, bigger herds, more milk per unit. That pattern’s been consistent for decades now.

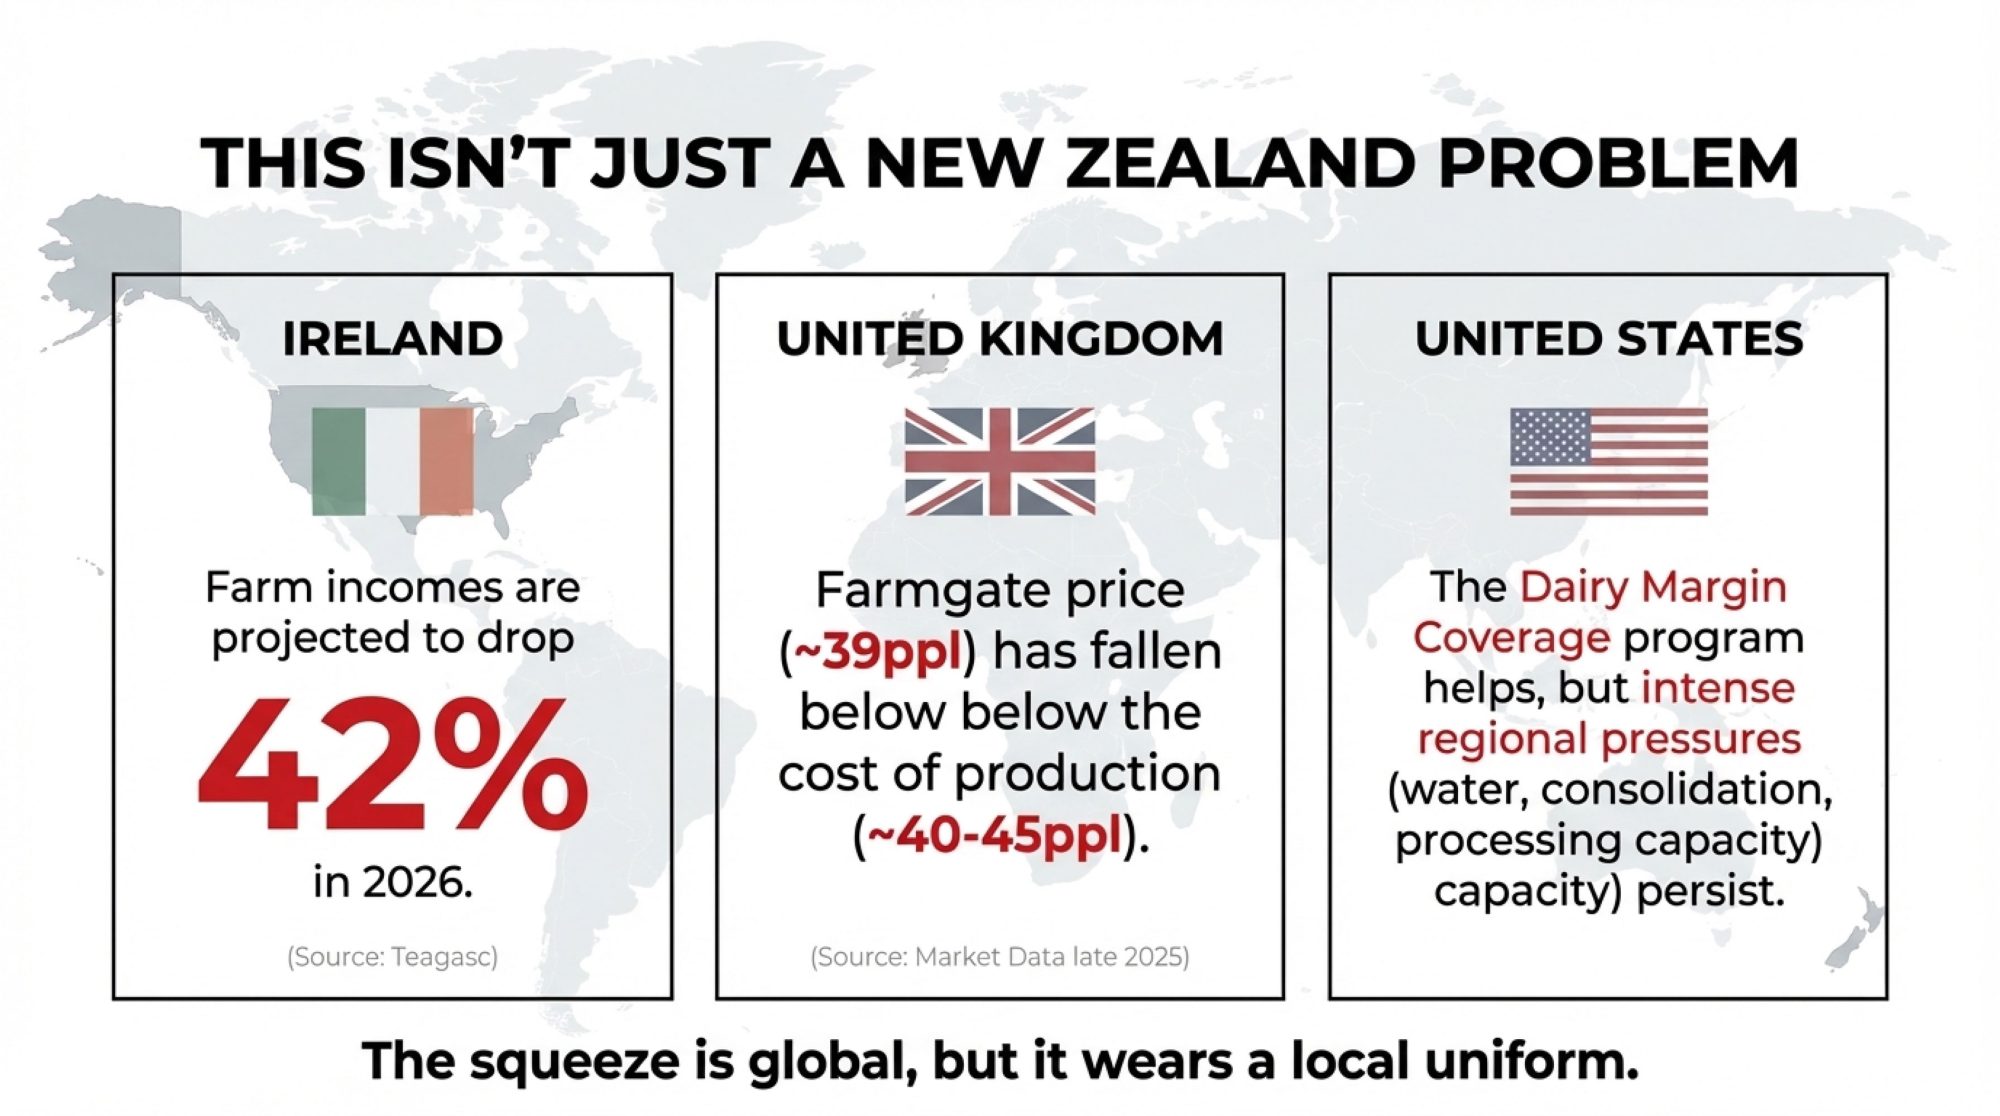
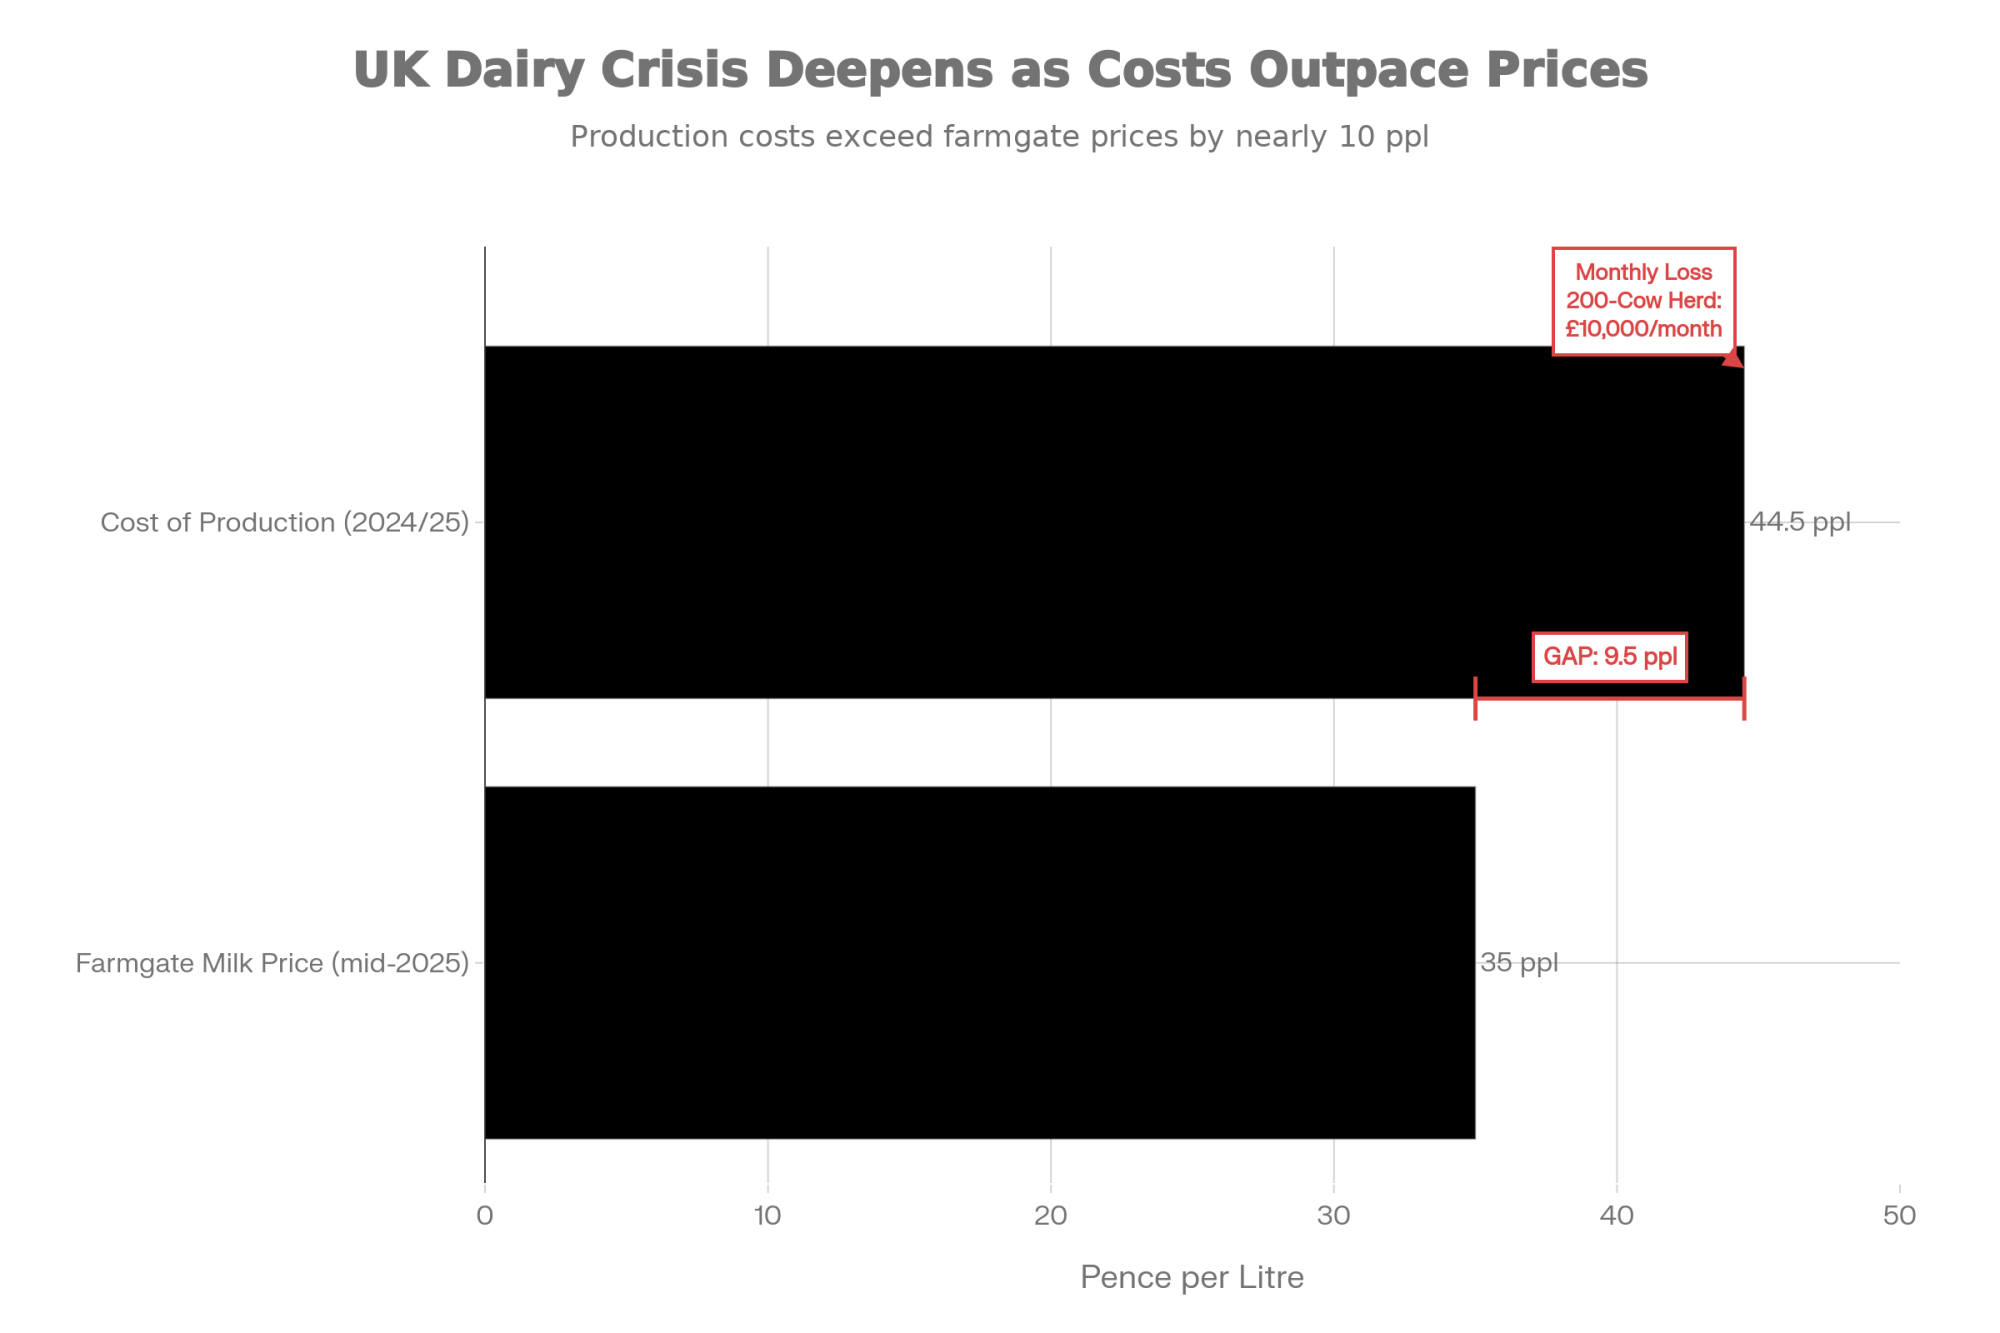
And the cost picture? The Dairy Group’s September 2024 newsletter pegs the UK cost of production for 2023/24 at around 45 ppl, with their forecast for 2024/25 at approximately 44.2 ppl. Their analysis suggests it’s “extremely unlikely” we’ll see costs drop back below 40 ppl anytime soon.

So when farmgate prices sit in the mid-30s and the cost of production hovers in the mid-40s, you’ve got a gap of roughly 8-10 ppl. For a 200-cow herd producing about 1.5 million litres annually, that works out to something like £120,000 a year—close to £10,000 a month just to stand still.

The £10,000 gap that’s killing UK dairy farms isn’t about bad management—it’s about market structure.

Now, every farm pencils out differently. But consultants I’ve spoken with say these kinds of numbers line up pretty closely with what they’re seeing in real accounts.

Why This Cycle Feels Different

If you’ve been farming through previous downturns, you’re probably thinking about 2015-2016 right now. Similar oversupply pressures, similar price corrections. But something feels different this time, and I think that instinct is worth exploring.

During the 2015-2016 crisis, Brussels stepped in with a €150 million EU-wide scheme—created through Delegated Regulation 2016/1612—that paid farmers voluntarily to reduce milk deliveries for a few months. According to the European Court of Auditors’ special report on the EU’s response to the milk market disturbances, aid was set at €14 per 100 kg of milk to reduce deliveries by around 1.1 million tonnes. It wasn’t a perfect solution, but it was something.

Since leaving the EU, the UK hasn’t had a like-for-like replacement for that specific tool. Support has tended to come through broader environmental schemes and general farm payments rather than milk-specific production incentives. When processors announce cuts today, there’s less cushion. And it’s worth noting that devolved agricultural policies mean Scottish and Welsh producers face different support landscapes than those in England—something that adds another layer of complexity when comparing notes with neighbours across borders.

The retail landscape has shifted, too. Kantar’s December 2025 grocery data shows Aldi holding about 10.5% of the UK market and Lidl at 8.1%. Together, discounters now account for close to a fifth of all grocery sales—up from around 13.6% just five years ago. That buying power inevitably influences how hard they push wholesale prices, including dairy prices. It’s not that traditional supermarkets don’t care about farmgate sustainability—many genuinely do—but it’s harder to hold that line when your competitors are focused purely on cost.

And then there’s the processor balance sheet question. First Milk and others have taken on debt for capacity investments and acquisitions. When leverage ratios are around 3x and debt service coverage needs to be protected, there’s real pressure to maintain margins. I don’t think farmers should dismiss these constraints as excuses—they’re genuine business realities that boards have to navigate.

What producers are discovering is that the support architecture from the last major crisis has changed. Understanding that helps you think more clearly about your options.

Three Approaches That Are Actually Working

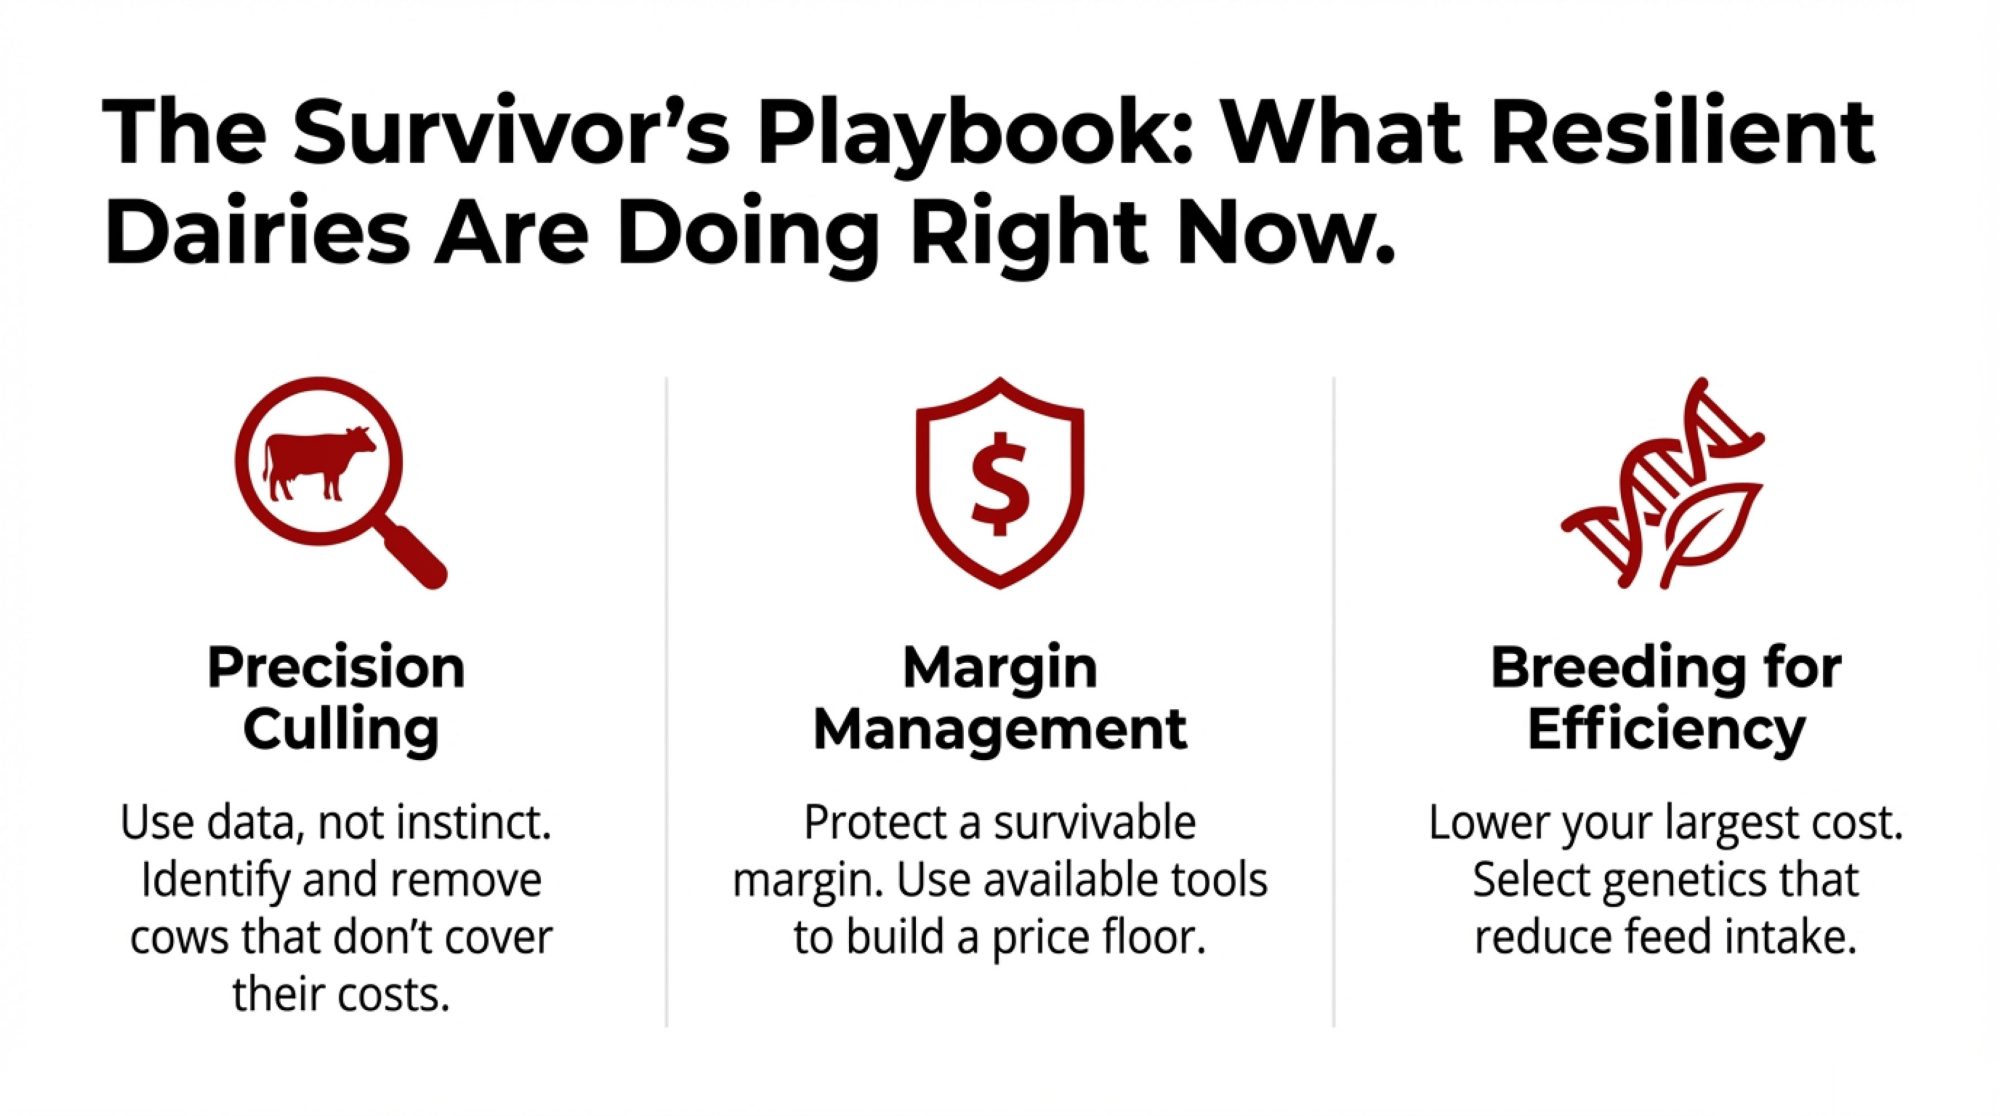
Understanding the market is useful, but you need actionable steps. I’ve been tracking what’s delivering results for farms navigating this environment, and three approaches keep coming up in the operations that are extending their runway.

Taking a Hard Look at the Herd

Here’s something that sounds counterintuitive but makes good financial sense: thoughtful culling can improve your monthly position even while reducing production.

You probably know this already, but the bottom 15% of most herds—cows with persistent cell counts above 400,000, yields consistently below 20 litres daily, or chronic fertility challenges—consume similar feed, labour, and veterinary resources as top performers while generating less revenue meaningfully. We’ve understood this principle for years, but current market conditions make acting on it more urgent.

I recently spoke with a consultant who walked through the numbers with a 200-cow client in northern England. They identified about 30 chronically under-performing cows—high cell counts, repeated fertility issues, cows that had been given plenty of chances—and sold them into a solid cull market at roughly £650 a head. That brought in close to £20,000 in cash.

Financial ComponentCalculation (200-cow herd)Impact
Bottom 15% Identified30 chronically under-performing cowsHigh SCC, low yield, poor fertility
Immediate Cull Revenue30 cows × £650/head£19,500 cash
Monthly Feed SavingsReduced ration costs + supplements£2,000-3,000/month
Annual Feed Savings£2,500/month × 12 months£24,000-36,000/year
Total Year 1 Financial ImpactCash + savings£43,500-55,500

Source: Consultant case study, northern England; cull market pricing autumn 2025

More importantly, the farm cut its monthly feed bill by several thousand pounds and saw modest savings in vet and labour costs. The net effect moved them from a deeply negative monthly position to a more manageable one.

While every herd pencils out differently depending on your system, your cull market, and your costs, these are the kinds of numbers many accountants are now working through with clients. The key is being honest about which animals are genuinely contributing and which are just consuming resources. Work with your vet to ensure culling decisions account for your calving pattern and transition cow management—you don’t want to create gaps in your fresh cow pipeline that cause problems six months down the road.

With December and January typically being strong months for cull cow demand—processors need to fill orders before spring, and the beef trade tends to hold up well through winter—the timing for these decisions is actually reasonable right now.

Getting Smarter on Feed

Feed typically represents 40-60% of production costs, so even modest improvements here compound meaningfully. Two levers deserve attention, and they work well together.

The first involves precision nutrition. Advisers from groups like The Dairy Group and Kingshay regularly highlight the gap between typical and efficient operations on concentrate use—sometimes 0.50 kg per litre versus 0.41 kg per litre. That gap represents real money over the course of a lactation.

But here’s the thing—and I can’t stress this enough—closing that gap requires proper involvement from a nutritionist. Cut too aggressively without professional guidance, and you risk losing more in butterfat and protein performance than you save on inputs. I’ve seen farms try to do this on their own and end up worse off because yields or components drop. Get someone qualified involved before you change rations.

The second lever is collective purchasing. Advisers from Kingshay and The Dairy Group report that members of their buying groups can often secure noticeably better prices on straights and blends than lone buyers—sometimes shaving several pounds per tonne off the ticket price. The exact savings vary by region and by what you’re buying, but across a winter, those differences add up.

What’s encouraging is that I’m hearing about more farms in the Southwest and Midlands joining these groups this autumn. The administrative overhead is minimal, and the buying power is real.

Finding Revenue on the Margins

This is where farms can add income without major capital requirements.

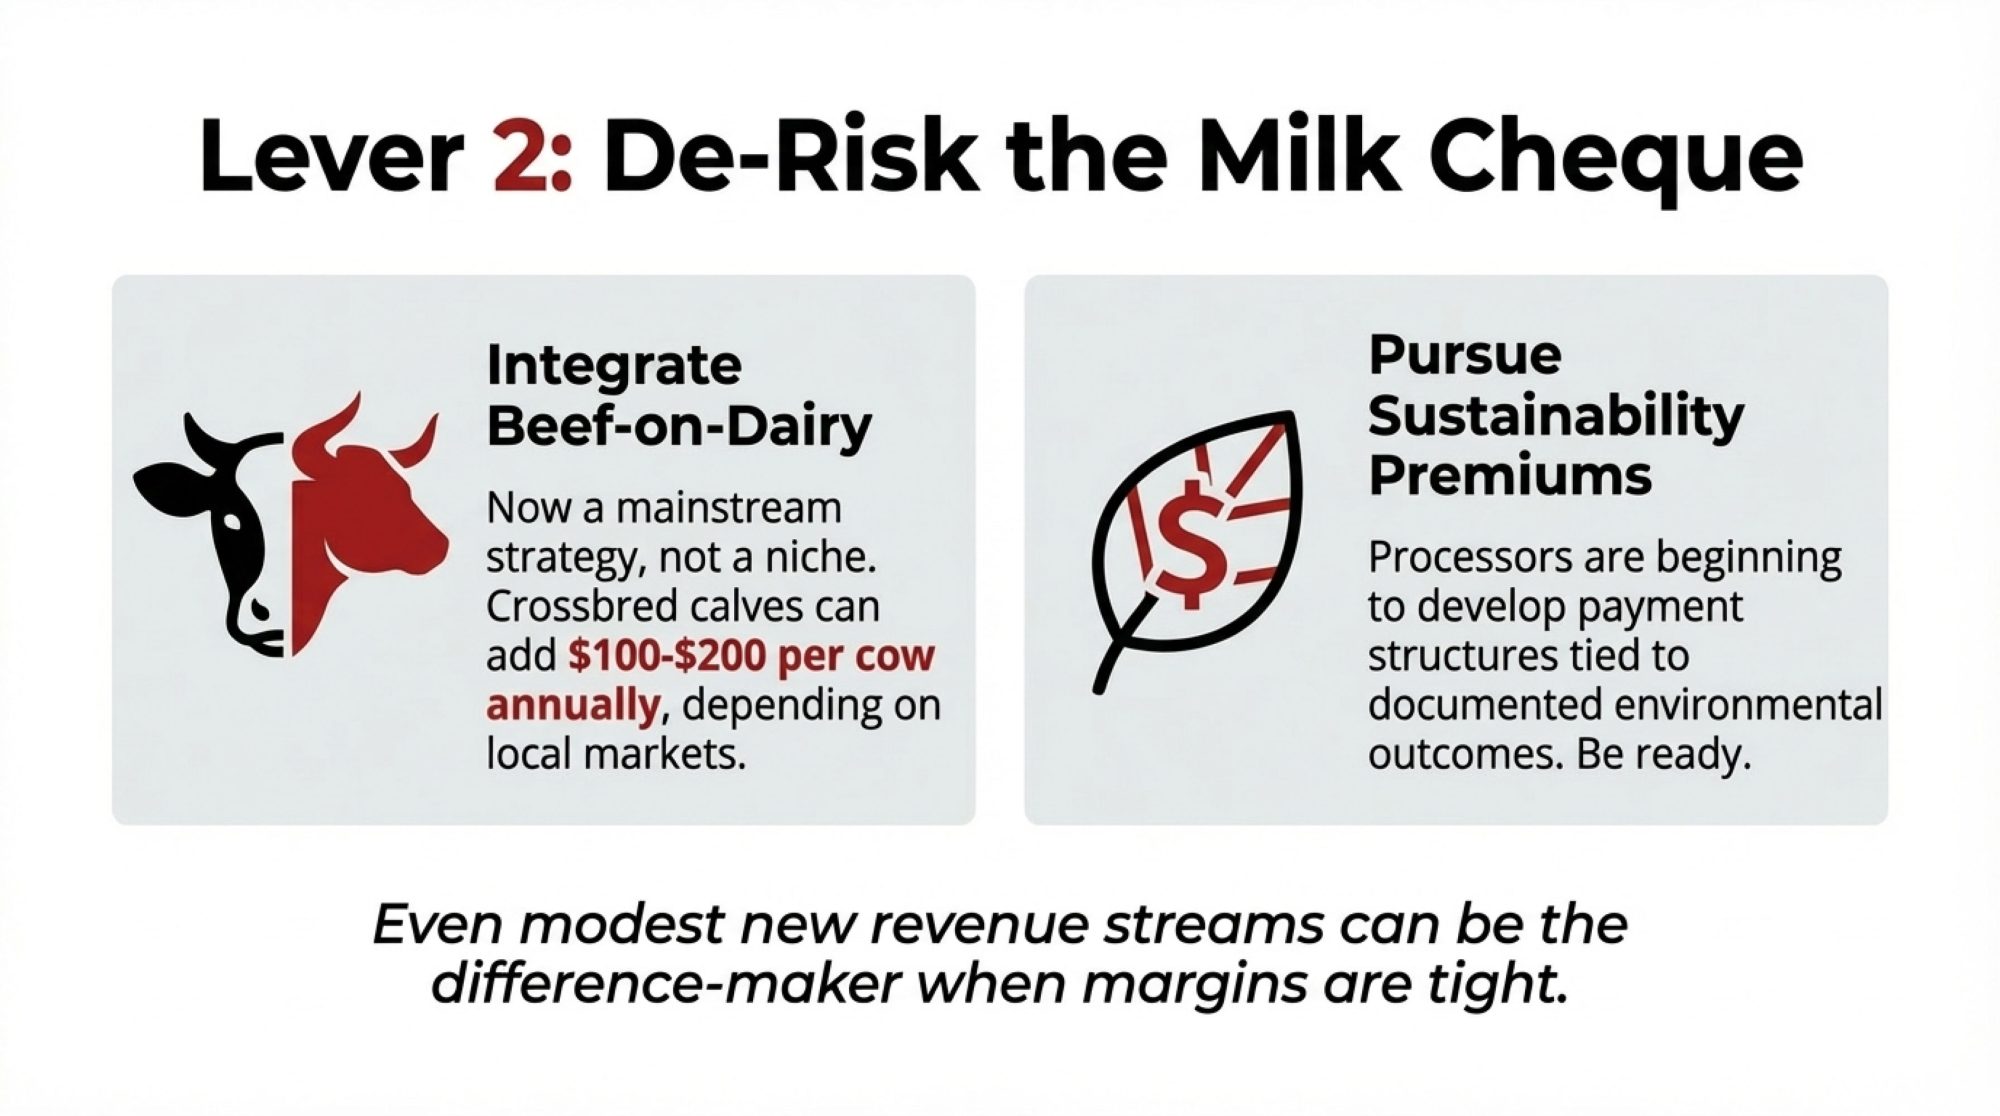
In current UK auctions, it’s not unusual to see well-bred beef-cross dairy calves selling for several times the value of plain dairy bull calves. One recent market report from the South of England showed continental-cross calves comfortably into the low hundreds of pounds, while plain dairy bulls lingered at much lower values. Using sexed beef semen on cows not needed for herd replacement is a straightforward way to capture some of that premium.

Calf TypeTypical Market ValueAnnual Calves (200-cow herd)Annual RevenuePremium vs Dairy Bull
Plain Dairy Bull£20-4050£1,000-2,000Baseline
Beef-Cross (Continental)£100-15050£5,000-7,500+£4,000-5,500
Your OpportunitySwitch 40-50 calves40-50+£3,200-6,000£80-120 per calf

For a 200-cow operation with flexibility on breeding decisions for 100-plus females, targeting 40-50 beef crosses annually can add meaningful revenue without changing much else about your system.

The contracting opportunity also deserves a look. The NAAC Contracting Prices Survey for 2024-25 puts typical charges for slurry spreading with a tanker and trailing shoe at around £75 per hour, with forage harvesting operations ranging from £83 to over £200 per acre depending on the service level. For a farm with decent machinery and some spare labour capacity, doing a modest amount of contract work for neighbours can turn idle time into a few hundred pounds a month during peak seasons.

Neither of these is transformative on its own. But combined with the herd and feed work, they add up to something that can make the difference between a sustainable position and a forced exit.

44-45 ppl
Your real cost of production
According to The Dairy Group's September 2024 analysis, this is where UK operations sit today. If your milk check is in the mid-30s, you're underwater before you start.
7,040
Dairy producers remaining in Great Britain
AHDB's April 2025 survey count. That's 2.6% fewer than a year ago. The exits are accelerating, and they're concentrated in winter—right now.
£10,000/month
What a 200-cow herd loses when prices sit 8-10 ppl below cost
That's £120,000 a year just to stand still. This is the gap farms are trying to close with the strategies in this article.

The Combined Picture

When I model all three approaches together—strategic culling, feed optimisation, and revenue diversification—the financial shift becomes meaningful.

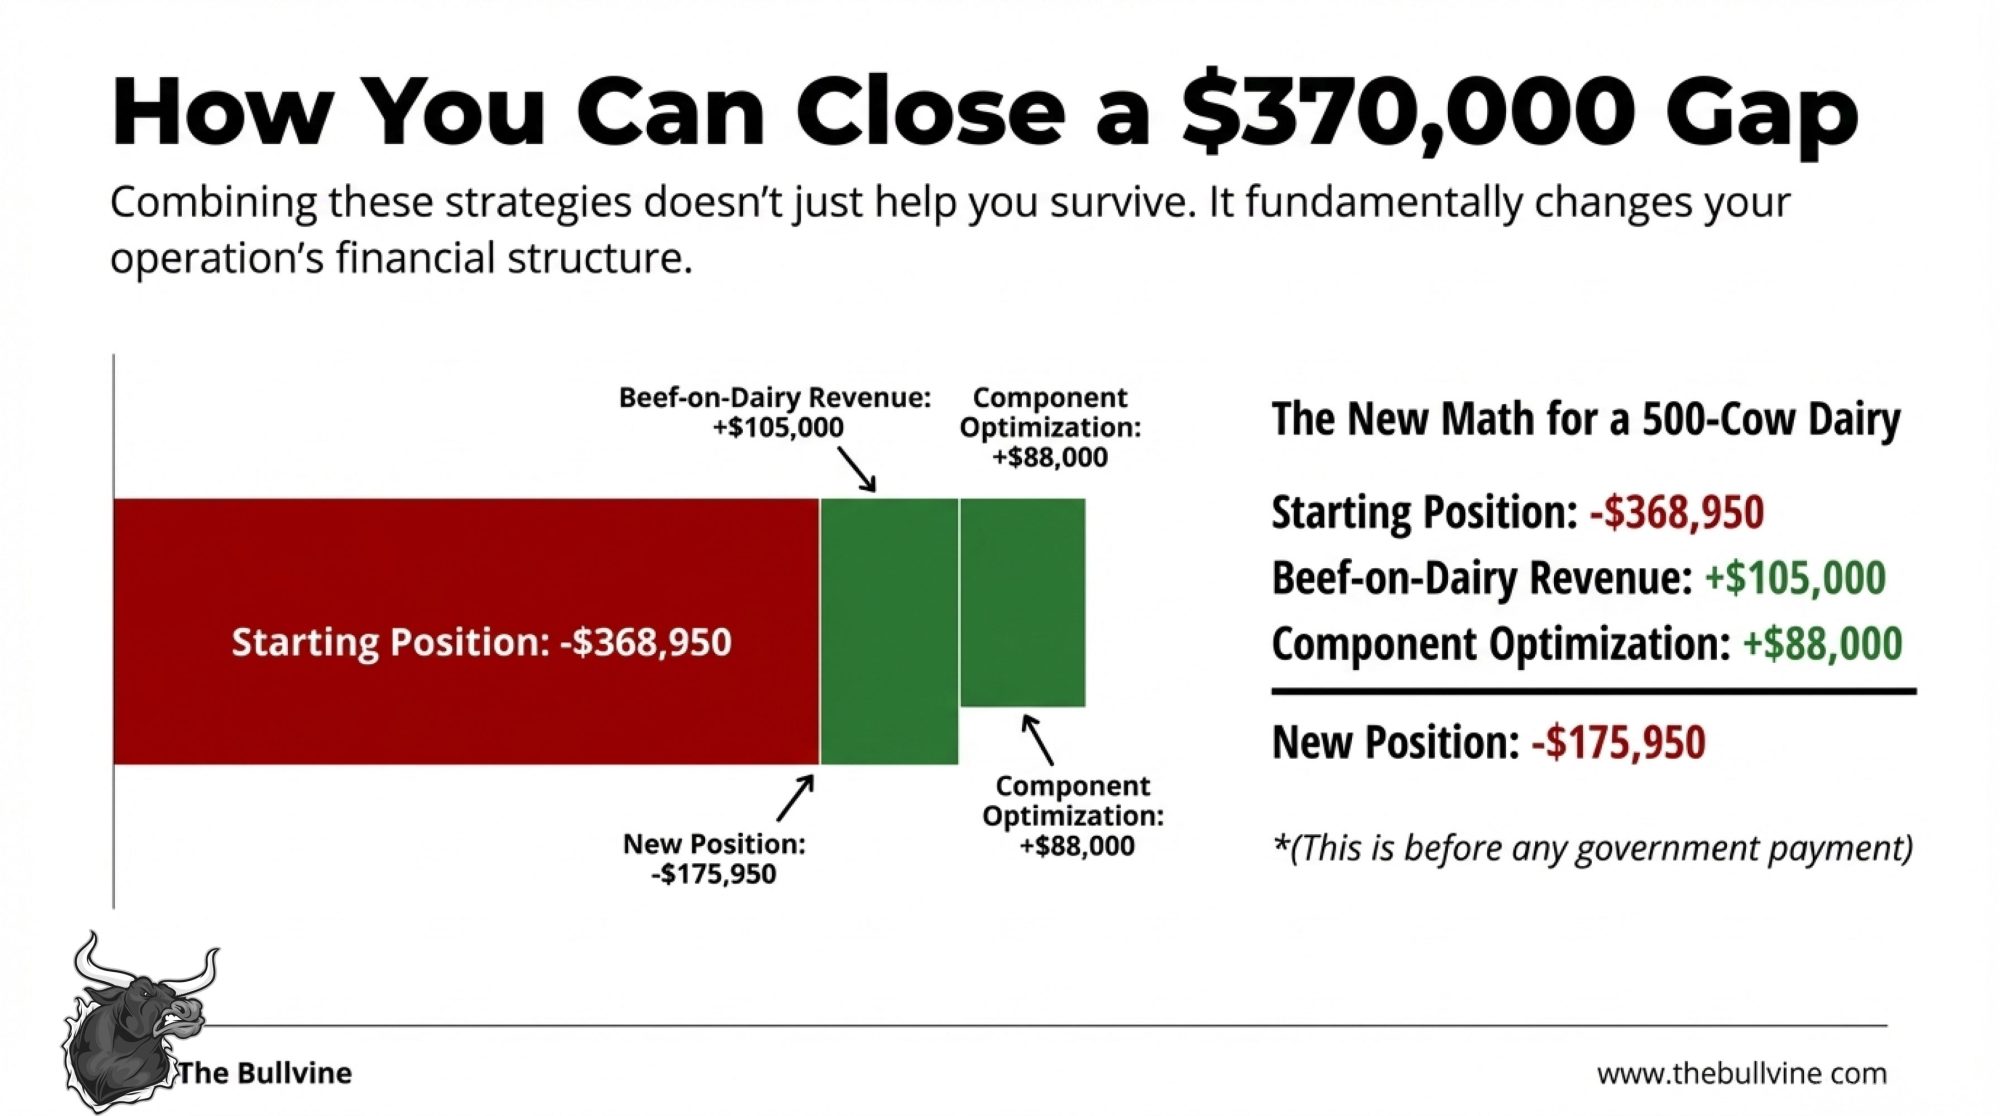
For a 200-cow operation starting at roughly £10,000 monthly losses, you might get that down to £2,000-3,000 monthly through these changes, plus a one-time cash injection from the cull animals. For larger 500-cow operations, the numbers scale accordingly.

From crisis to breathing room in three strategic moves. This waterfall chart shows the actual financial trajectory when UK dairy farms implement

That’s not a permanent solution—farmgate prices are still below the full cost of production. But it creates time. Time to explore processor alternatives if better prices are available elsewhere. Time to think about collective approaches. Time to restructure financing if needed. Time to plan transitions thoughtfully rather than under immediate pressure.

And that time matters more than people often realise.

What the Irish Experience Suggests

I’ve been following developments at Dairygold in Ireland because they offer an interesting case study in producer coordination.

When Dairygold announced pricing adjustments this autumn, Irish farming media reported that several hundred farmers quickly organised around concerns about pricing and attended regional meetings with detailed written questions. While the exact figures vary depending on who you talk to, producers on the ground say this collective approach helped prompt partial improvements in the farmgate price rather than further cuts.

Their approach was notably constructive—no protests or supply withholding, just organised attendance at meetings with specific questions about pricing formulas, operational costs, and capital allocation. When a meaningful share of your supplier base shows up with identical written questions, it changes the tone of the conversation.

What’s worth noting is that UK farmers actually have stronger legal frameworks available to them. Recent Defra regulations mandate pricing transparency and good-faith engagement in dairy contracts, and producer organisation structures enable collective dialogue without competition law concerns.

The barrier isn’t legal authority—it’s coordination. And the Irish experience suggests coordination doesn’t require formal structures or membership dues. It requires communication channels, commitment mechanisms, and producers willing to engage constructively with specific questions.

Looking Ahead: What the Projections Suggest

If current pricing dynamics persist, what trajectory should producers anticipate?

Based on AHDB data and Andersons’ outlook analysis, the consolidation pattern we’ve seen for decades looks set to continue—possibly accelerate. According to the Andersons Outlook report covered by Dairy Global, authors Mike Houghton, Oliver Hall, and Tom Cratchley project that GB dairy producers could fall to between 5,000 and 6,000within the next two years. Average herd size would continue climbing, possibly toward 250 head or beyond. Total production would likely remain stable as surviving farms expand.

In 24 months, UK dairy could lose another 1,500 farms—and average herd size will climb past 250 head. 

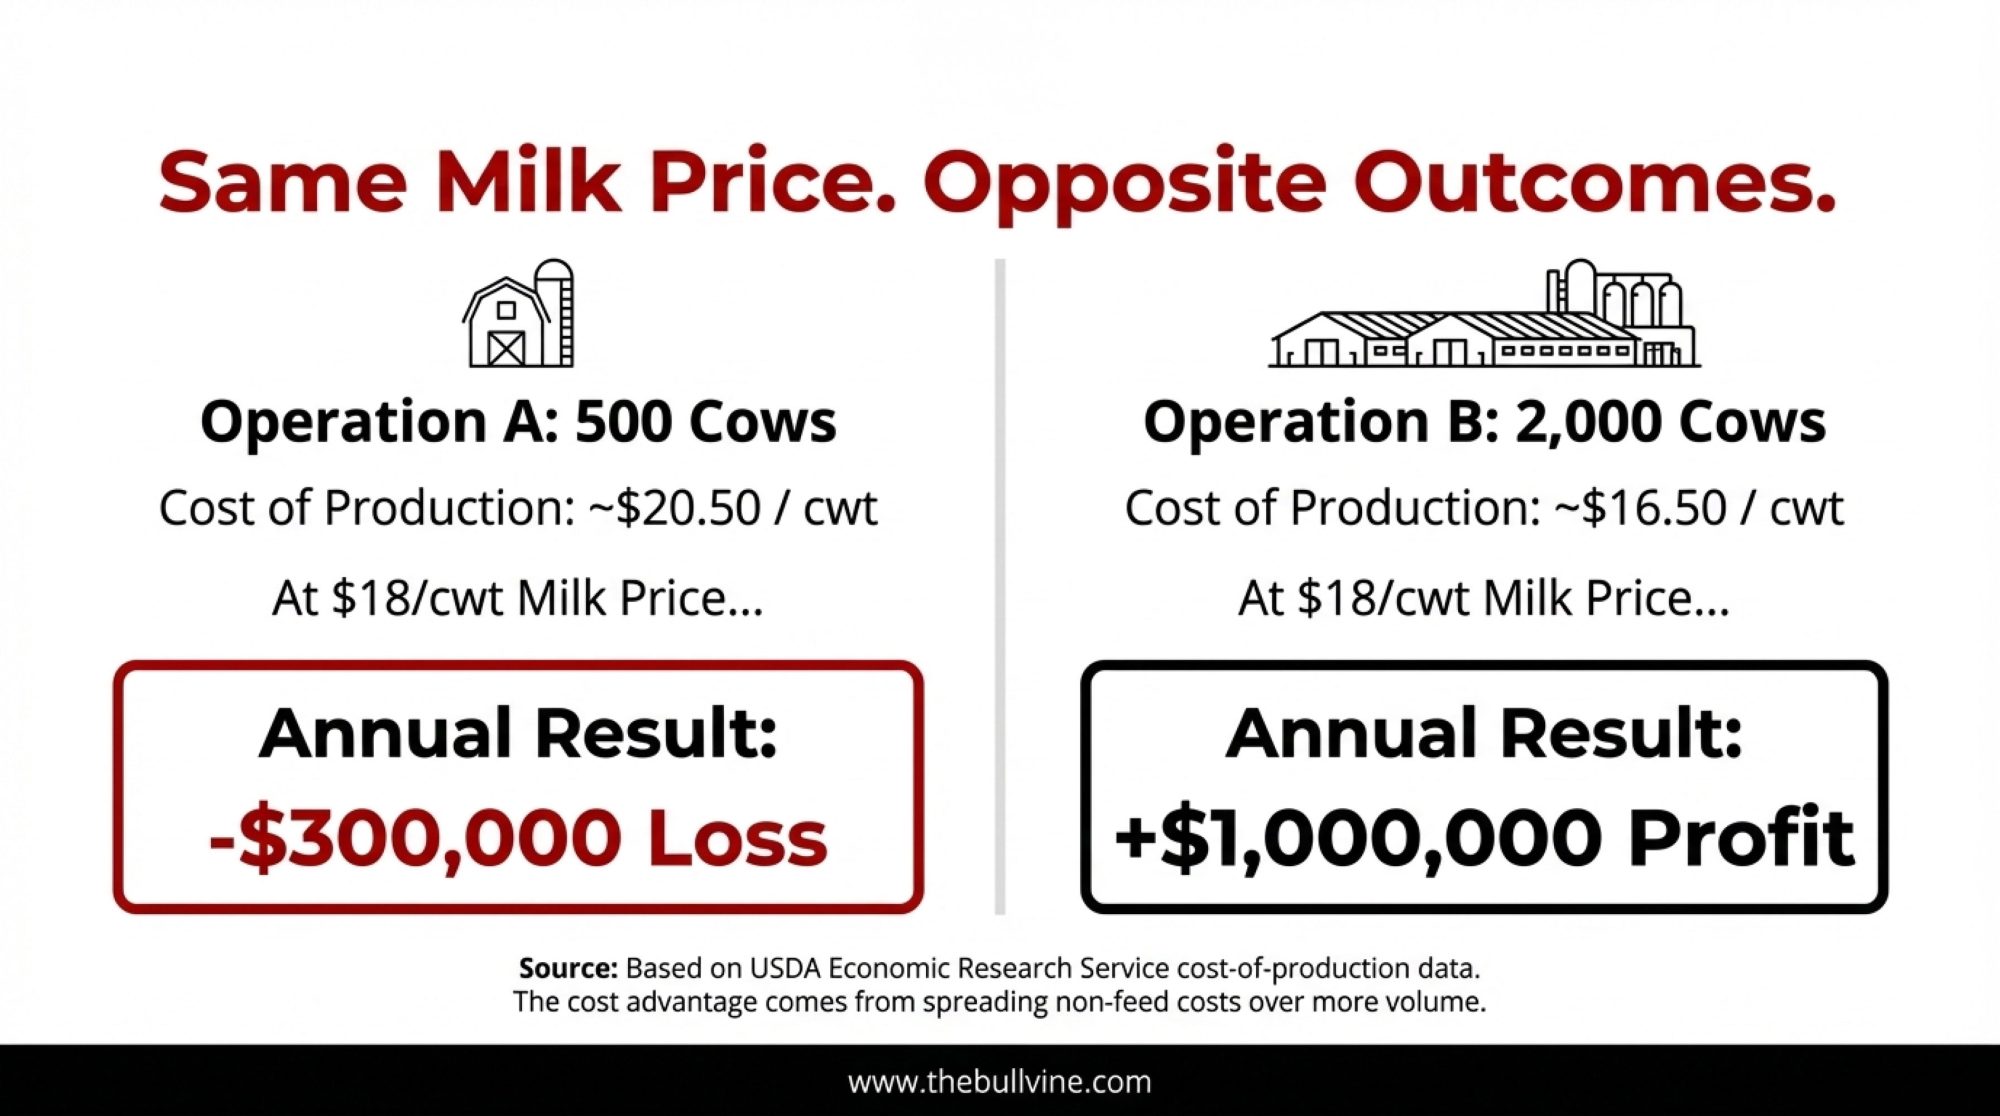
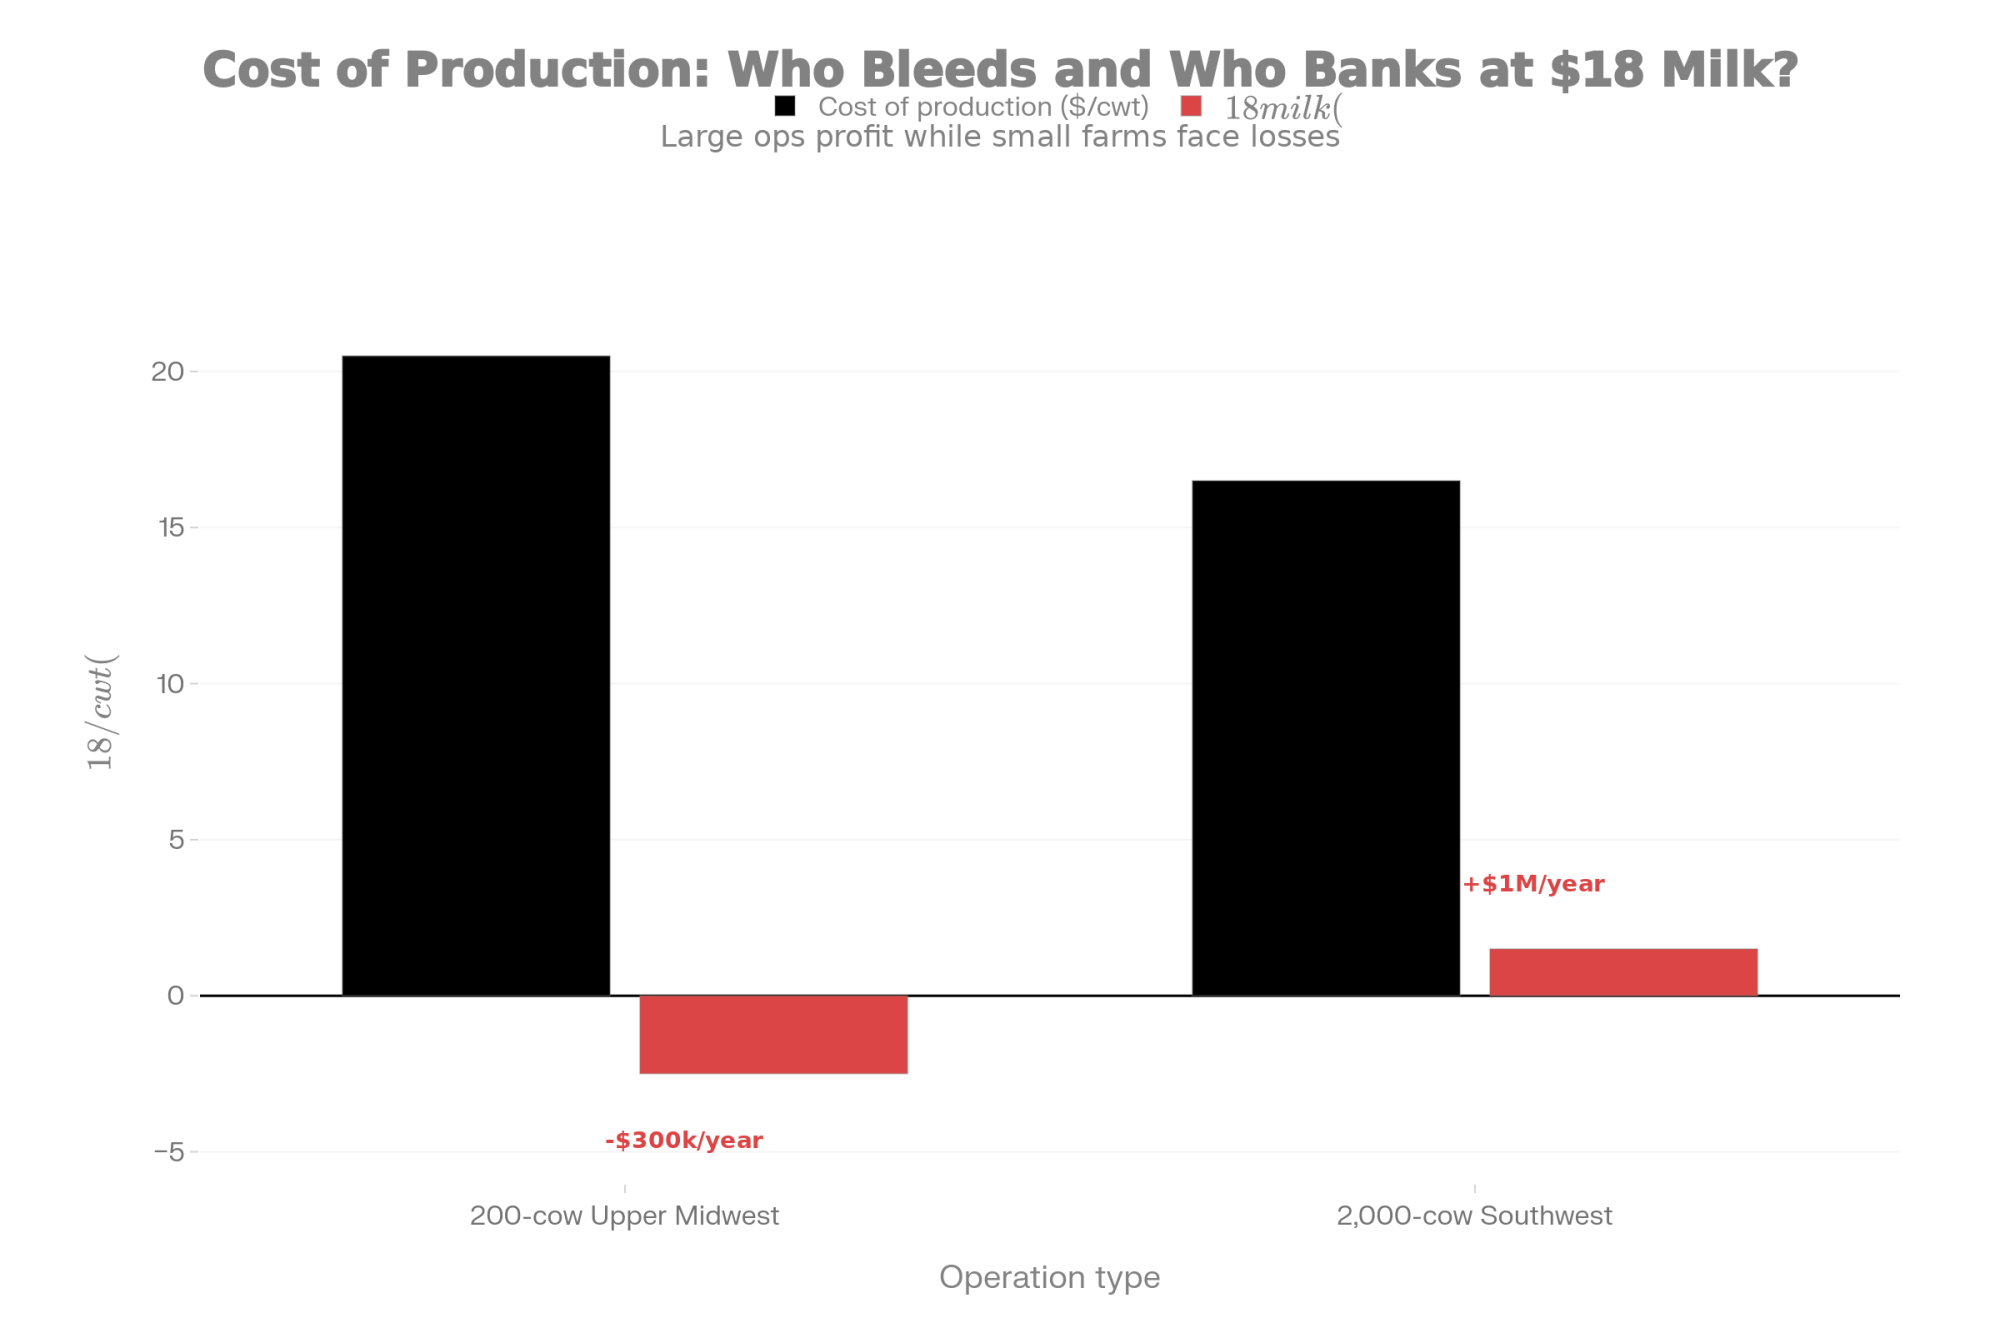
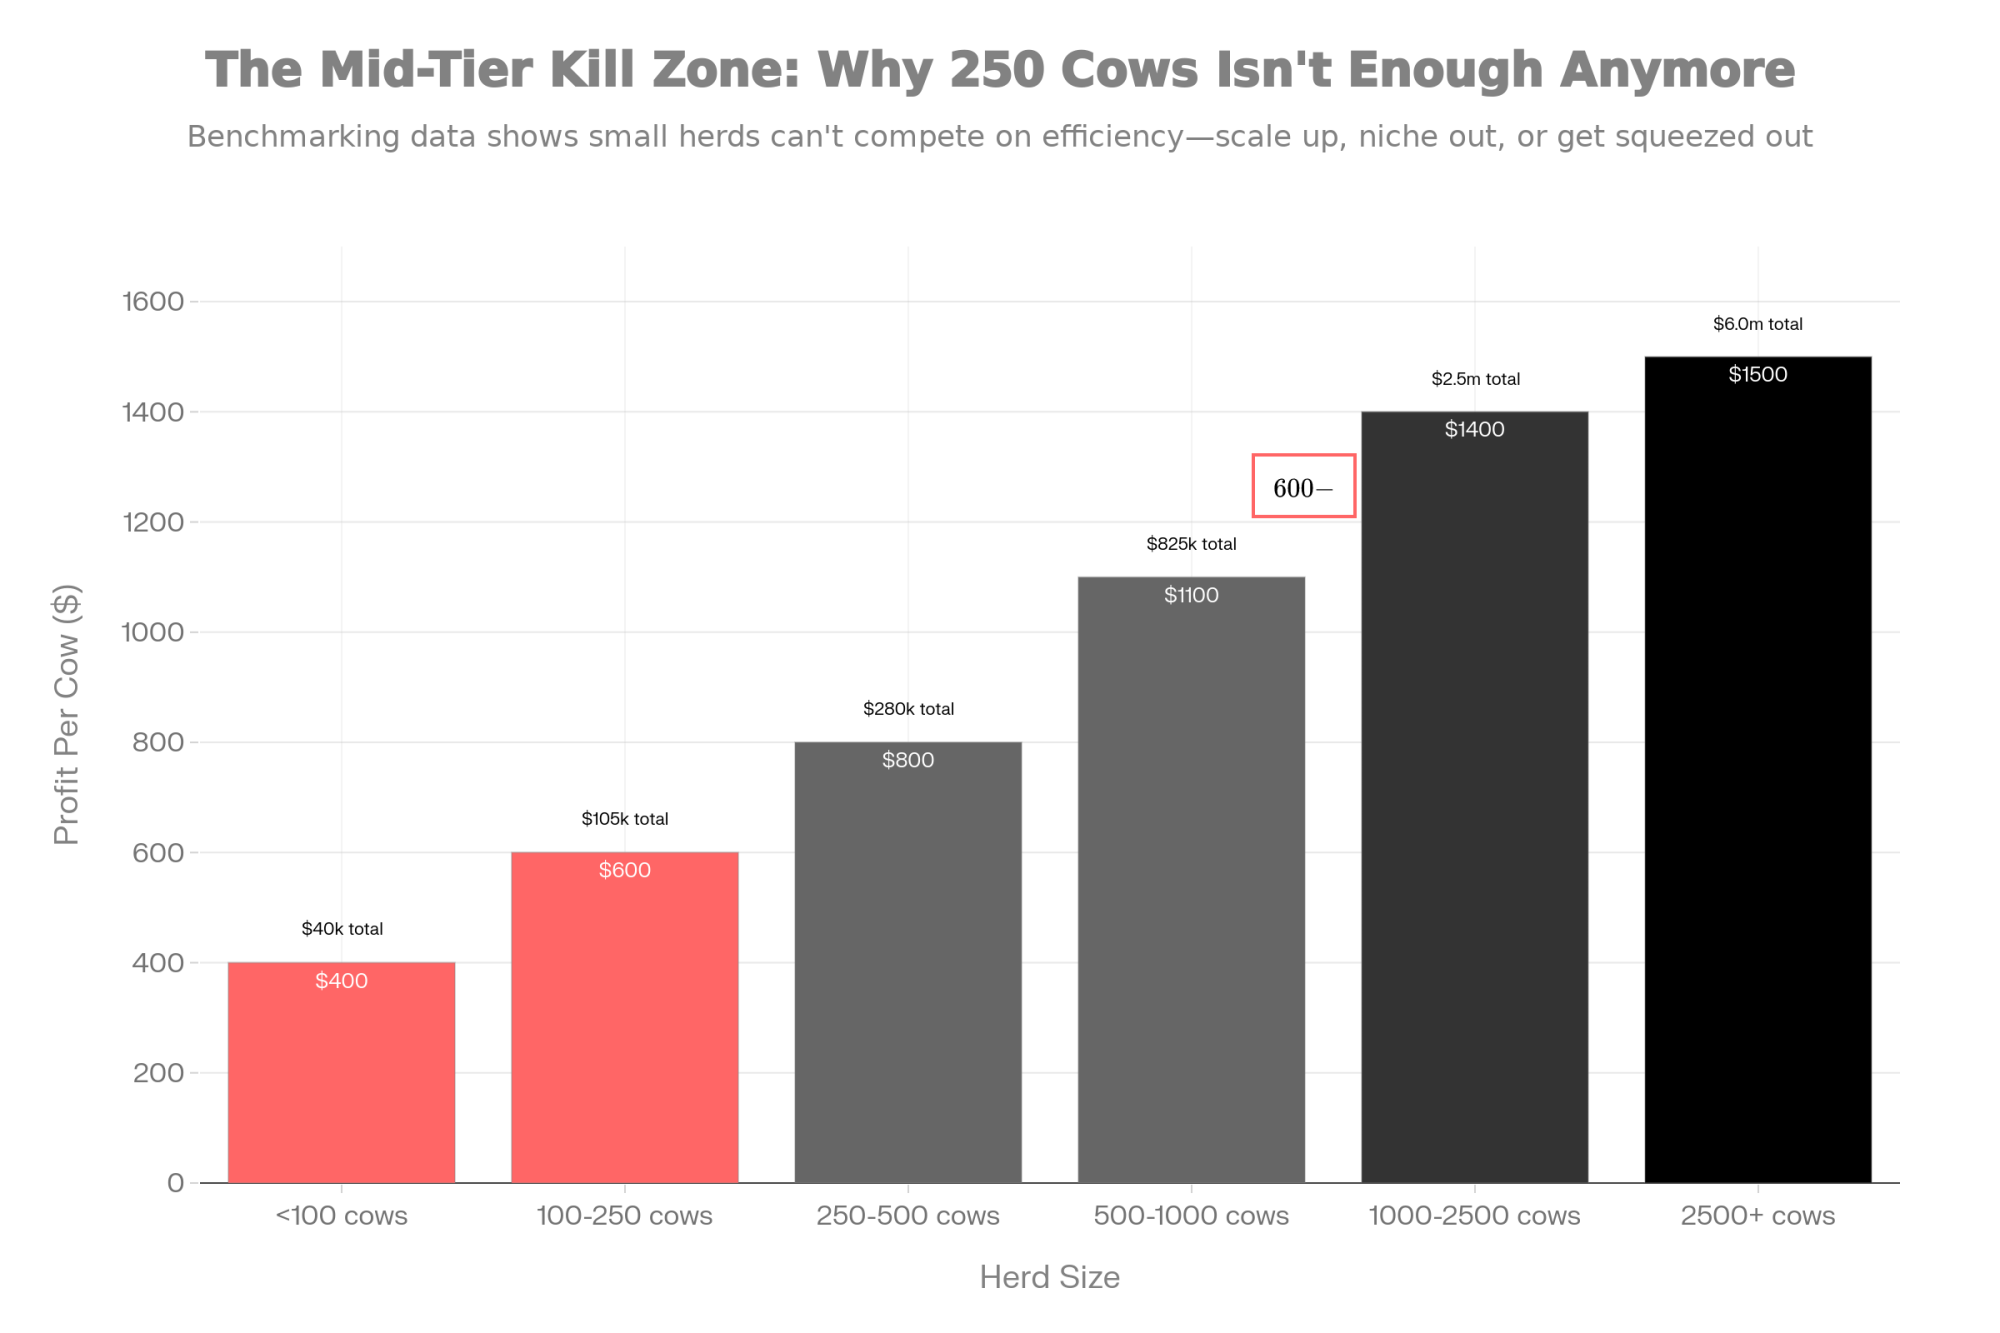
Exit rates will probably vary significantly by scale and region. Smaller operations—those under 100-150 cows—generally face steeper challenges because their cost structures tend to run higher. Larger operations often achieve better economies of scale on fixed costs. That’s not a judgment about who’s a better farmer; it’s just the economics of spreading overhead across more litres.

Understanding this trajectory helps you make informed decisions about your own operation and timeline.

A Word on Cooperatives

Under UK cooperative law, boards are expected to act in the long-term interests of the society and its members, which often means paying close attention to balance-sheet strength, covenants, and investment needs alongside the current milk price. In practice, management decisions sometimes lean toward protecting the co-op’s viability, even when members face short-term income pressure.

I want to be fair here—boards aren’t being malicious when they make difficult pricing decisions. They’re navigating genuine constraints and competing obligations. But fairness has limits.

Loyalty is a two-way street. If the governance structure consistently prioritizes the institution over the member’s survival, the member has to ask a hard question: Am I actually an owner here, or am I just a supplier with a liability attached?

Because there’s a difference between a cooperative that asks members to share sacrifice during difficult periods and one that protects its margins while members bleed equity. The first is partnership. The second is something else entirely.

Different cooperative models do exist internationally. Some Canadian and European structures have achieved farmgate prices meaningfully above UK equivalents through different charter provisions and member engagement approaches. Whether UK cooperatives could evolve similarly is an open question—but it won’t happen without sustained producer engagement in governance processes. Boards respond to pressure. If members don’t apply it, nothing changes.

The Bottom Line

If you’ve read this far, you’re probably thinking about what all this means for your own situation. Let me offer a few thoughts.

First, understand where your losses are actually coming from. If you’re losing money but your operational metrics—yield, cell count, fertility, labour efficiency—compare reasonably well to industry benchmarks, your challenge is primarily market structure rather than farm management. That distinction matters for how you respond.

Second, don’t wait to act on the things within your control. The herd optimisation, feed work, and revenue diversification I described aren’t heroic measures—they’re sound management practices worth pursuing regardless of market conditions. Many farms should already have been doing this work. Current conditions just make it more urgent.

Third, explore your options on processor relationships. If there are meaningful price differences between your current buyer and alternatives, those differences add up fast. A few pence per litre on a million-plus litres is real money. Understand your contract terms, your notice requirements, and what’s actually available in your area.

Fourth, consider whether collective engagement makes sense for you. The Irish example shows that coordinated, fact-based dialogue can influence how processors make decisions. You don’t need to start a movement—even talking with neighbours about what you’re seeing in your milk cheques and what questions you’d want answered can be valuable.

And finally—and this one matters—make your decisions from clear analysis rather than frustration or self-doubt. If your operation is technically sound and you’re still losing money, that’s important context. It means the problem isn’t fundamentally about you. It means there are structural market factors at work. And understanding that changes how you evaluate your options.

These are difficult times in the UK dairy industry. But difficult times also clarify what matters and what actions are worth taking. The farms that navigate this well won’t be the ones who hoped for markets to improve. They’ll be the ones who understood their situation clearly, acted on what they could control, and made thoughtful decisions about their future.

That’s within everyone’s reach.

Practical Resources

  • AHDB Dairy: Benchmarking tools, market data, and cost of production analysis at ahdb.org.uk/dairy
  • Kingshay: Dairy costings service and buying group information at kingshay.com
  • The Dairy Group: Technical consultancy and feed analysis at thedairygroup.co.uk
  • NAAC Contractor Rates: Current pricing guides at naac.co.uk

Key Takeaways 

  • The gap is £10,000/month. That’s what a 200-cow herd loses when milk sits 8-10ppl below cost. Most UK dairies are there now.
  • It’s not your farming. Processor profits up 22%. Producer numbers down 2.6%. This is market structure—not management failure.
  • Three moves that work. Cull the bottom 15%. Tighten feed with a nutritionist. Capture beef-cross premiums. Combined savings: £7,000-8,000/month.
  • You’re buying time, not salvation. These strategies create breathing room—to switch processors, explore collective action, or plan transitions on your terms.
  • Coordination changes everything. Irish producers shifted pricing through organised, fact-based engagement. UK farmers have stronger legal tools. They just need each other.

Complete references and supporting documentation are available upon request by contacting the editorial team at editor@thebullvine.com.

Learn More:

The Sunday Read Dairy Professionals Don’t Skip.

Every week, thousands of producers, breeders, and industry insiders open Bullvine Weekly for genetics insights, market shifts, and profit strategies they won’t find anywhere else. One email. Five minutes. Smarter decisions all week.

NewsSubscribe
First
Last
Consent

$11 Billion Bet on Protein: Is Your Milk Check Positioned to Win?

A structural shift in dairy economics is creating new opportunities for farms producing protein-rich milk—and understanding these dynamics can help inform decisions in the months ahead.

Executive Summary: Dairy processors just made an $11 billion bet on protein—and that changes the equation for every milk check in America. With whey protein isolate trading above $8.50 per pound and the April 2025 Net Merit revision boosting Feed Saved from 12% to nearly 18%, the industry is signaling where value is heading for the next decade. Producers combining targeted genetics with amino acid nutrition are seeing protein improvements worth $60,000-70,000 annually on 500-cow operations. The catch? Your pricing structure determines whether you actually capture that value. Farms in large pooled cooperatives often keep only a fraction of their component gains, while those on direct Class III pricing retain most of what they produce. Before investing in protein optimization, one comparison matters most: what you received per pound of protein versus the Class III protein price over your last three months. That gap reveals whether this opportunity is real for your operation—or whether you’d simply be subsidizing someone else’s premium.

You know, if you’ve been watching your milk checks closely over the past year or so, you’ve probably noticed something shifting. Back in May 2024, USDA Cold Storage data showed butter inventories climbing to nearly 380 million pounds—the highest we’d seen since 2020. That’s a lot of butter sitting in warehouses.

Metric20202024Change
Butter Cold Storage (million lbs)282380+35%
Whey Protein Isolate Price ($/lb)$5.10$8.50+67%
New Protein Facility Investment$2.1B$11.0B+424%

And here’s what got my attention: around the same time, cheese processors across the Upper Midwest started signaling they were receiving more cream than they needed for optimal cheese production. For those of us who remember when butterfat premiums seemed like they’d climb forever, it was a notable moment.

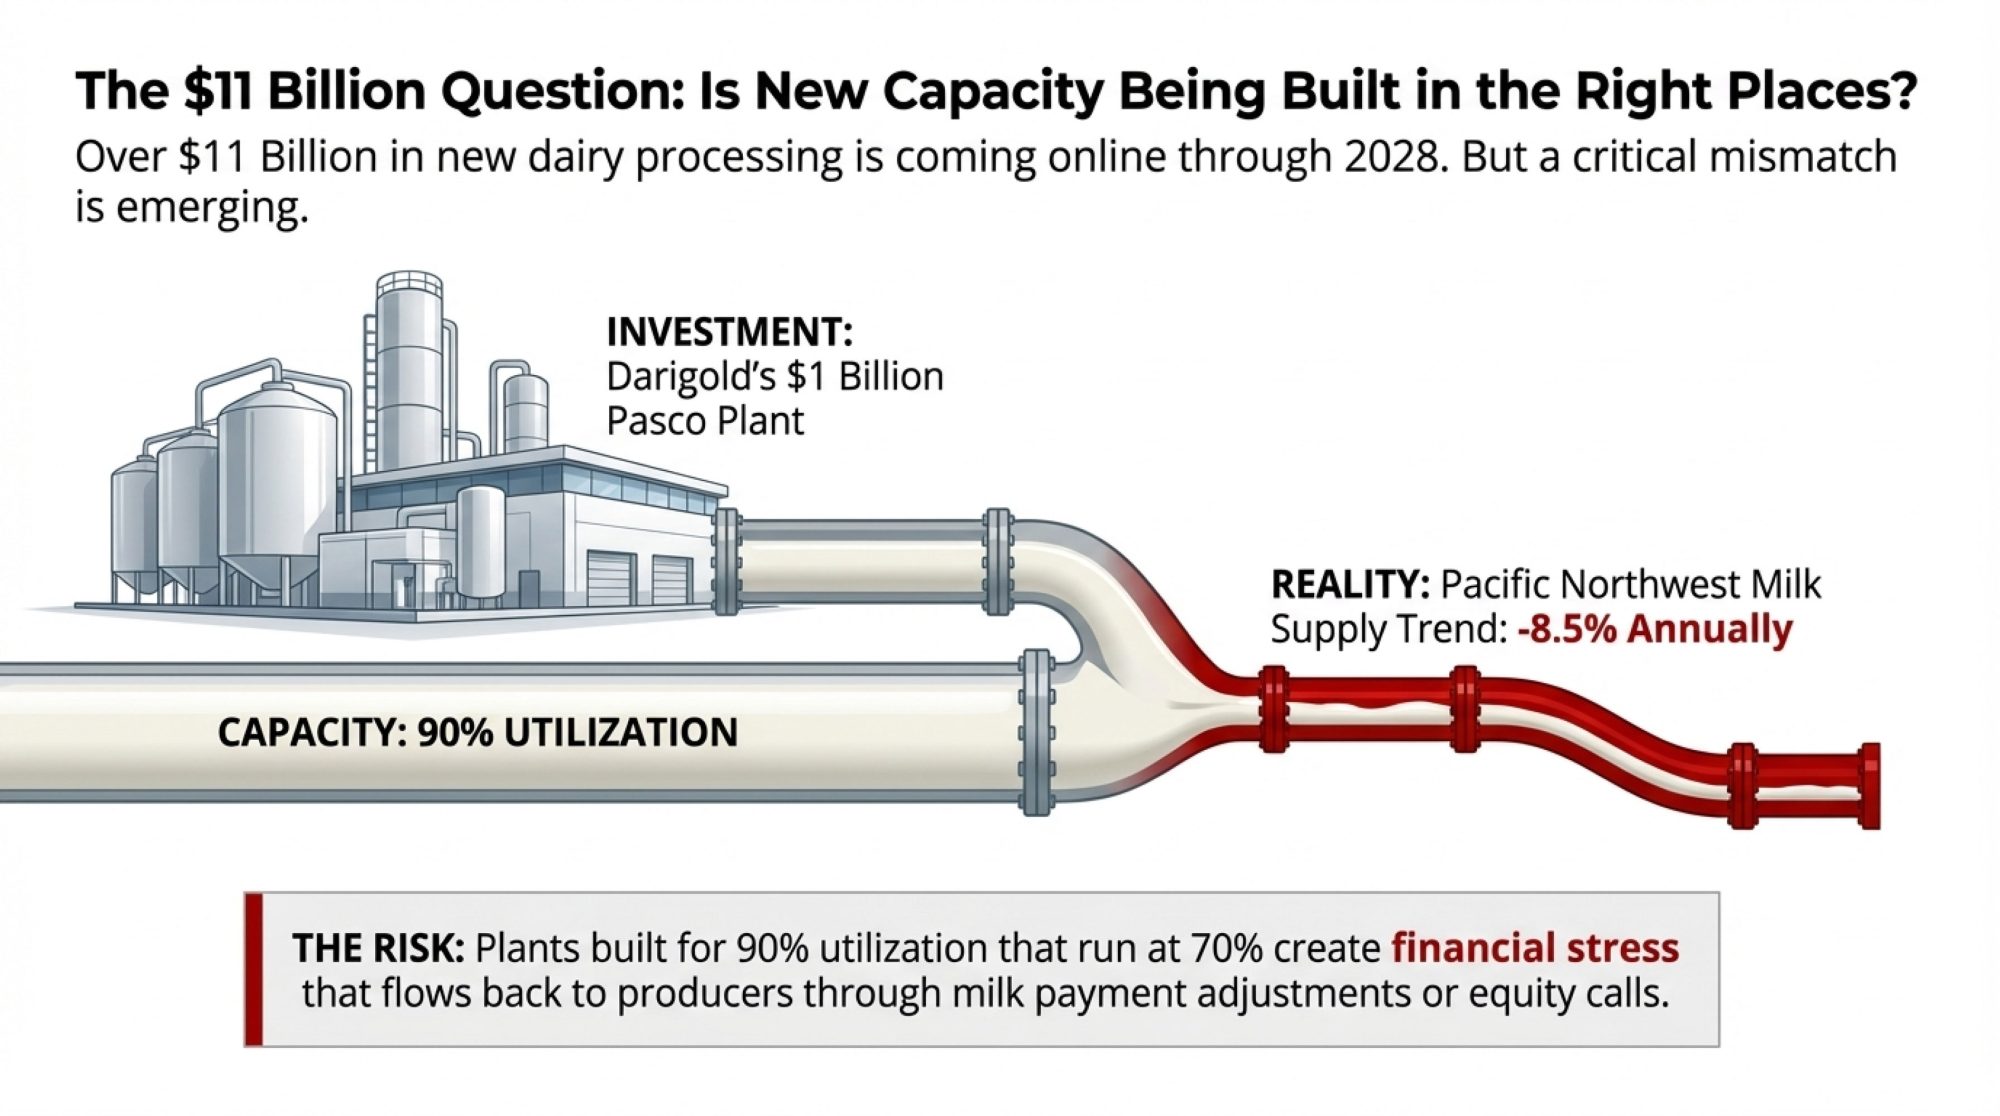
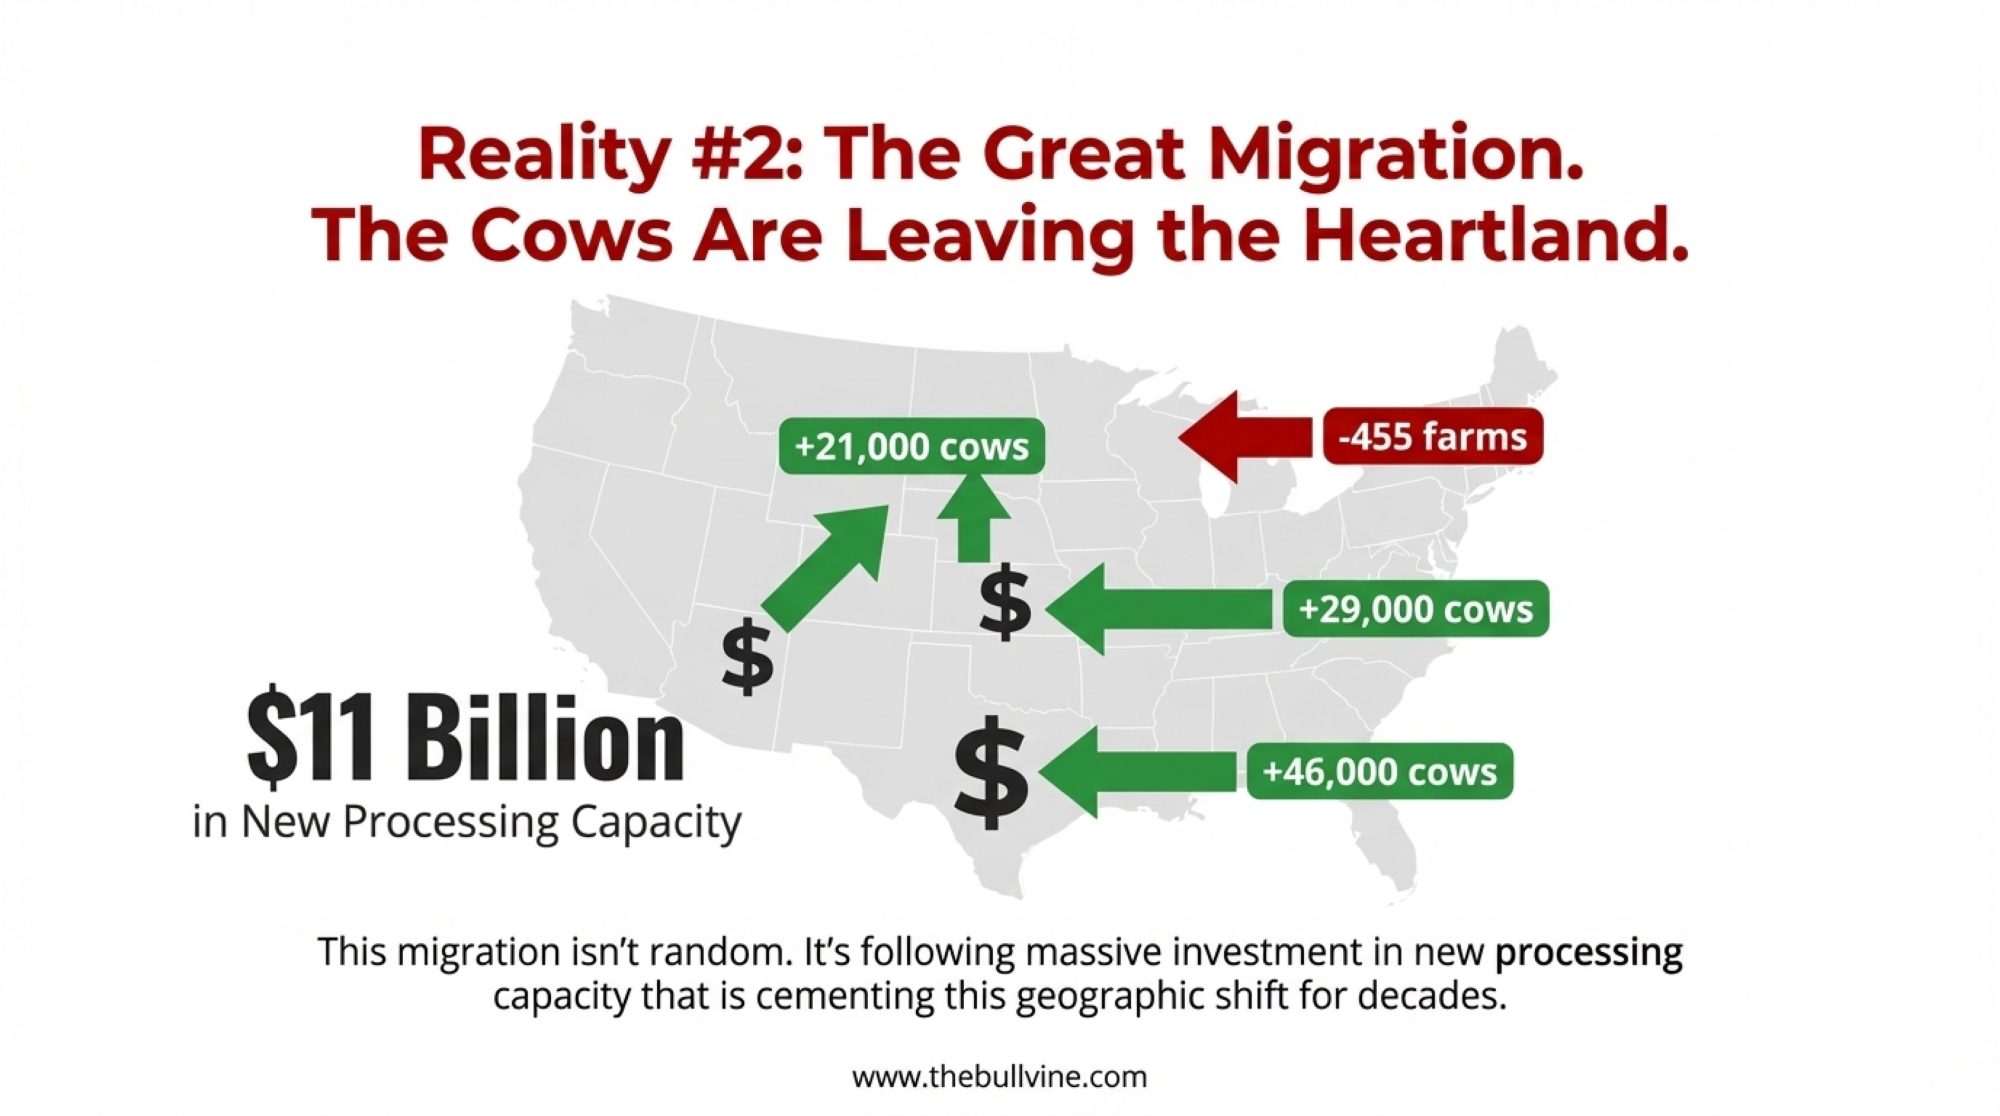
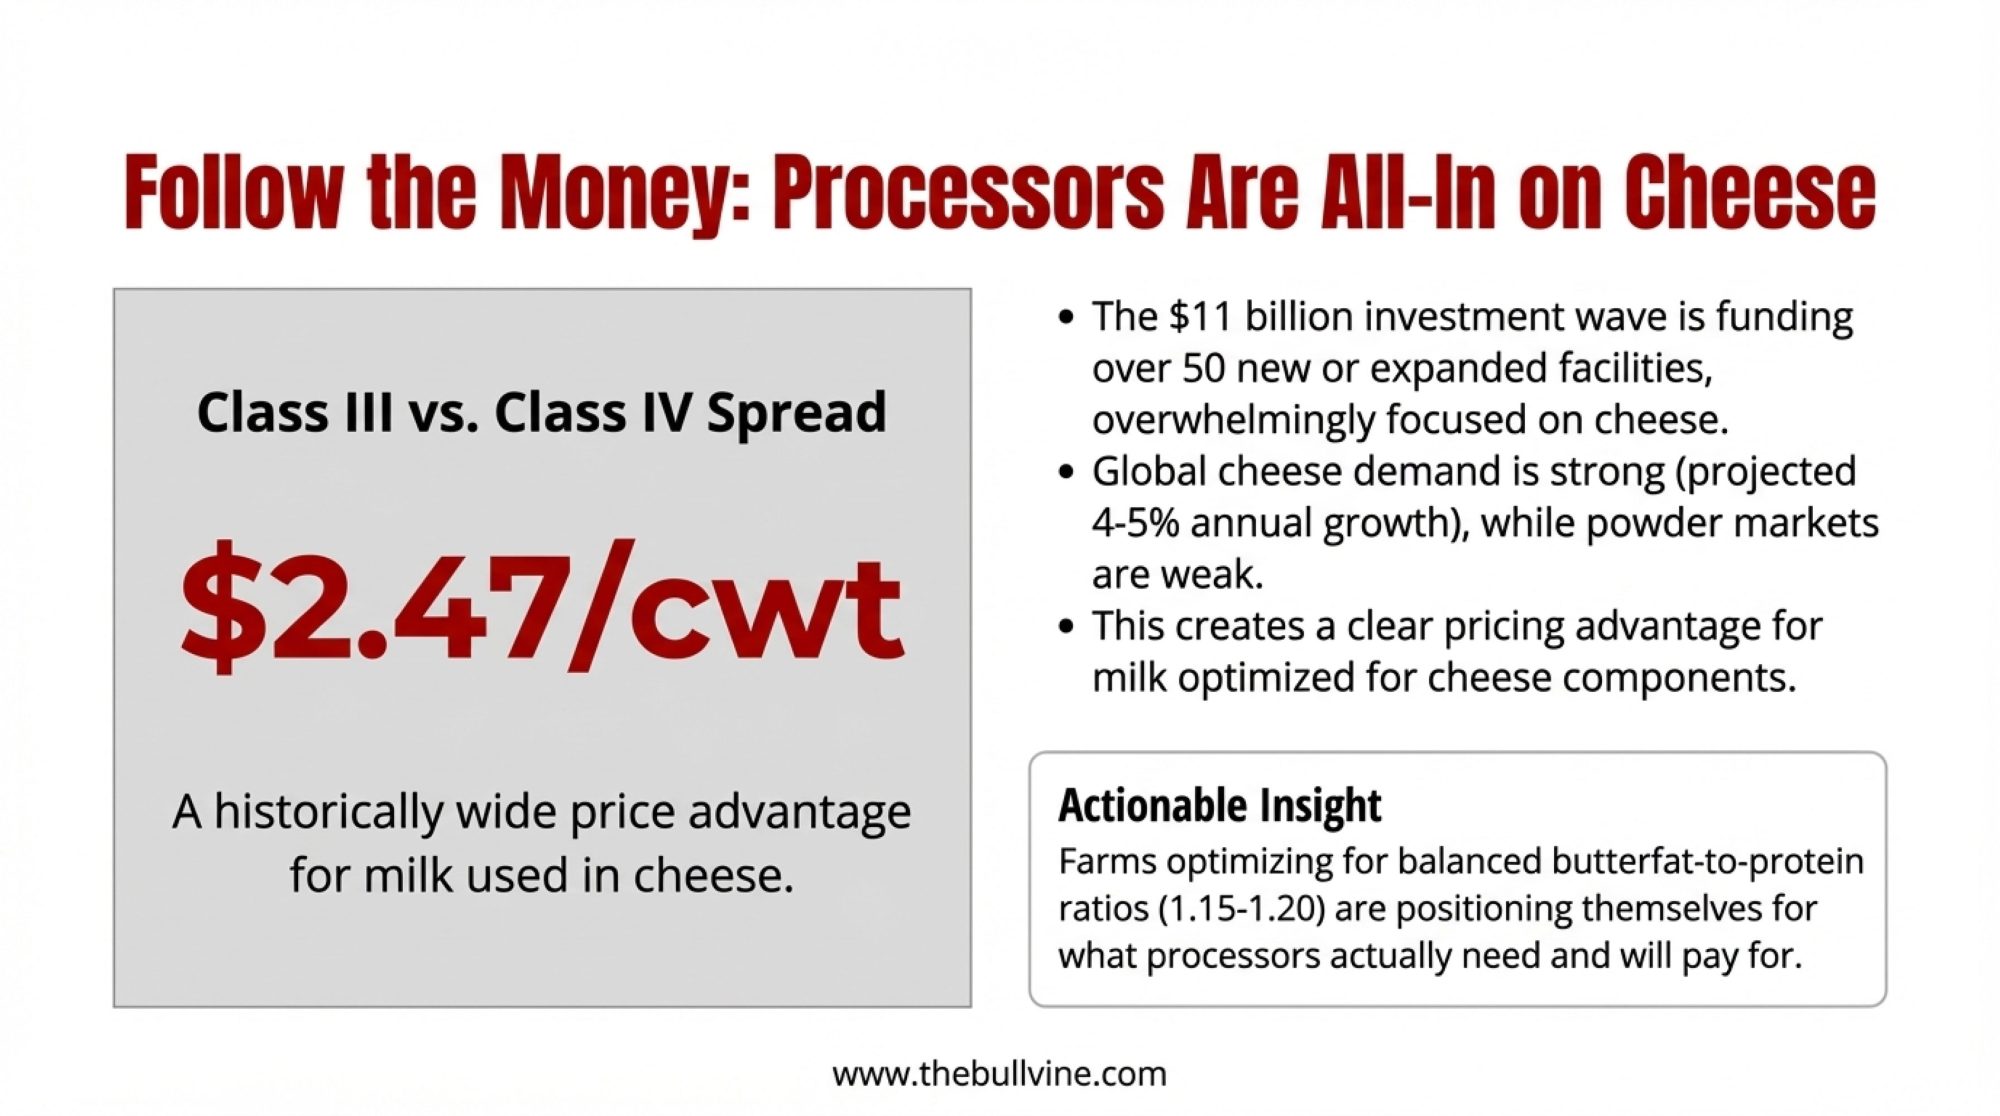
What’s happening isn’t that butterfat suddenly lost value—it hasn’t. It’s that processors have committed serious capital to cheese and whey protein facilities, and that’s changing what they need from the milk supply. The International Dairy Foods Association announced in October 2025 that America’s dairy processors have invested more than $11 billion in new and expanded manufacturing capacity across 19 states—with over 50 projects coming online between now and 2028.

That’s not a small bet. And it tells you something about where the industry sees value heading over the next decade.

Following the Investment Money

When I’m trying to understand where dairy markets are heading, I’ve always found it useful to watch where processors actually put their capital. Talk is cheap, but $870 million facilities tell you something.

That’s what Leprino Foods committed to their Lubbock, Texas plant—a decision the Texas Governor’s office and Texas Tech Research Park both documented back in April 2022. We’re talking about an 850,000-square-foot facility designed from the ground up for integrated mozzarella and whey protein production. When you build that kind of infrastructure, you’re making a decade-long bet on where value will come from.

And Leprino isn’t alone in this. Hilmar cut the ribbon on a $600 million facility in Dodge City, Kansas, back in March 2025—Dairy Processing magazine covered the opening extensively. Fonterra invested $240 million in New Zealand mozzarella capacity a few years back. Across Wisconsin and Minnesota, regional processors have been adding whey protein recovery equipment alongside cheese expansion projects.

What’s interesting is that this isn’t just a U.S. phenomenon. You’re seeing similar capital flowing toward protein and whey infrastructure in the EU and Oceania—which suggests this shift reflects global demand patterns rather than a temporary domestic trend. When processors on three continents are making the same bet, it’s worth paying attention.

What’s different about these investments compared to previous buildouts? The explicit focus on capturing whey value. I remember hearing Dr. Mark Stephenson—who recently retired as Director of Dairy Policy Analysis at UW-Madison—make this point at an industry meeting. Modern cheese plant economics increasingly depend on monetizing both the cheese and whey streams. Processors who can efficiently convert whey into high-value protein products have developed a meaningful competitive advantage.

The pricing reflects this shift. USDA data from late 2024 showed whey protein isolate climbing above $8.50 per pound—record territory—and prices have continued strengthening into 2025. If you look at USDA Dairy Market News reports, whey protein concentrate has more than doubled in many markets from where it sat back in 2018.

Why such sustained strength? Several factors have converged globally, which is part of what makes this feel structural rather than cyclical. China remains one of the world’s largest importers of dairy ingredients, with significant demand for infant formula components. Sports nutrition markets in Asia and Europe continue expanding. Meanwhile—and this one caught most of us off guard—the rapid adoption of GLP-1 weight-loss medications has created substantial new protein demand. Industry analysts have noted that patients on drugs like Ozempic are advised to maintain high protein intake, and that’s flowing through to whey consumption in ways nobody predicted five years ago.

When processors can generate meaningful revenue from whey alone, their willingness to pay for protein-rich milk makes straightforward economic sense.

What the Net Merit Changes Tell Us

The April 2025 revision to Net Merit offers another window into where the industry sees value heading. If you haven’t looked at the updated trait weights from the Council on Dairy Cattle Breeding, they’re worth examining.

Here’s how the emphasis shifted:

TraitPrevious Weight (2021)New Weight (2025)Change
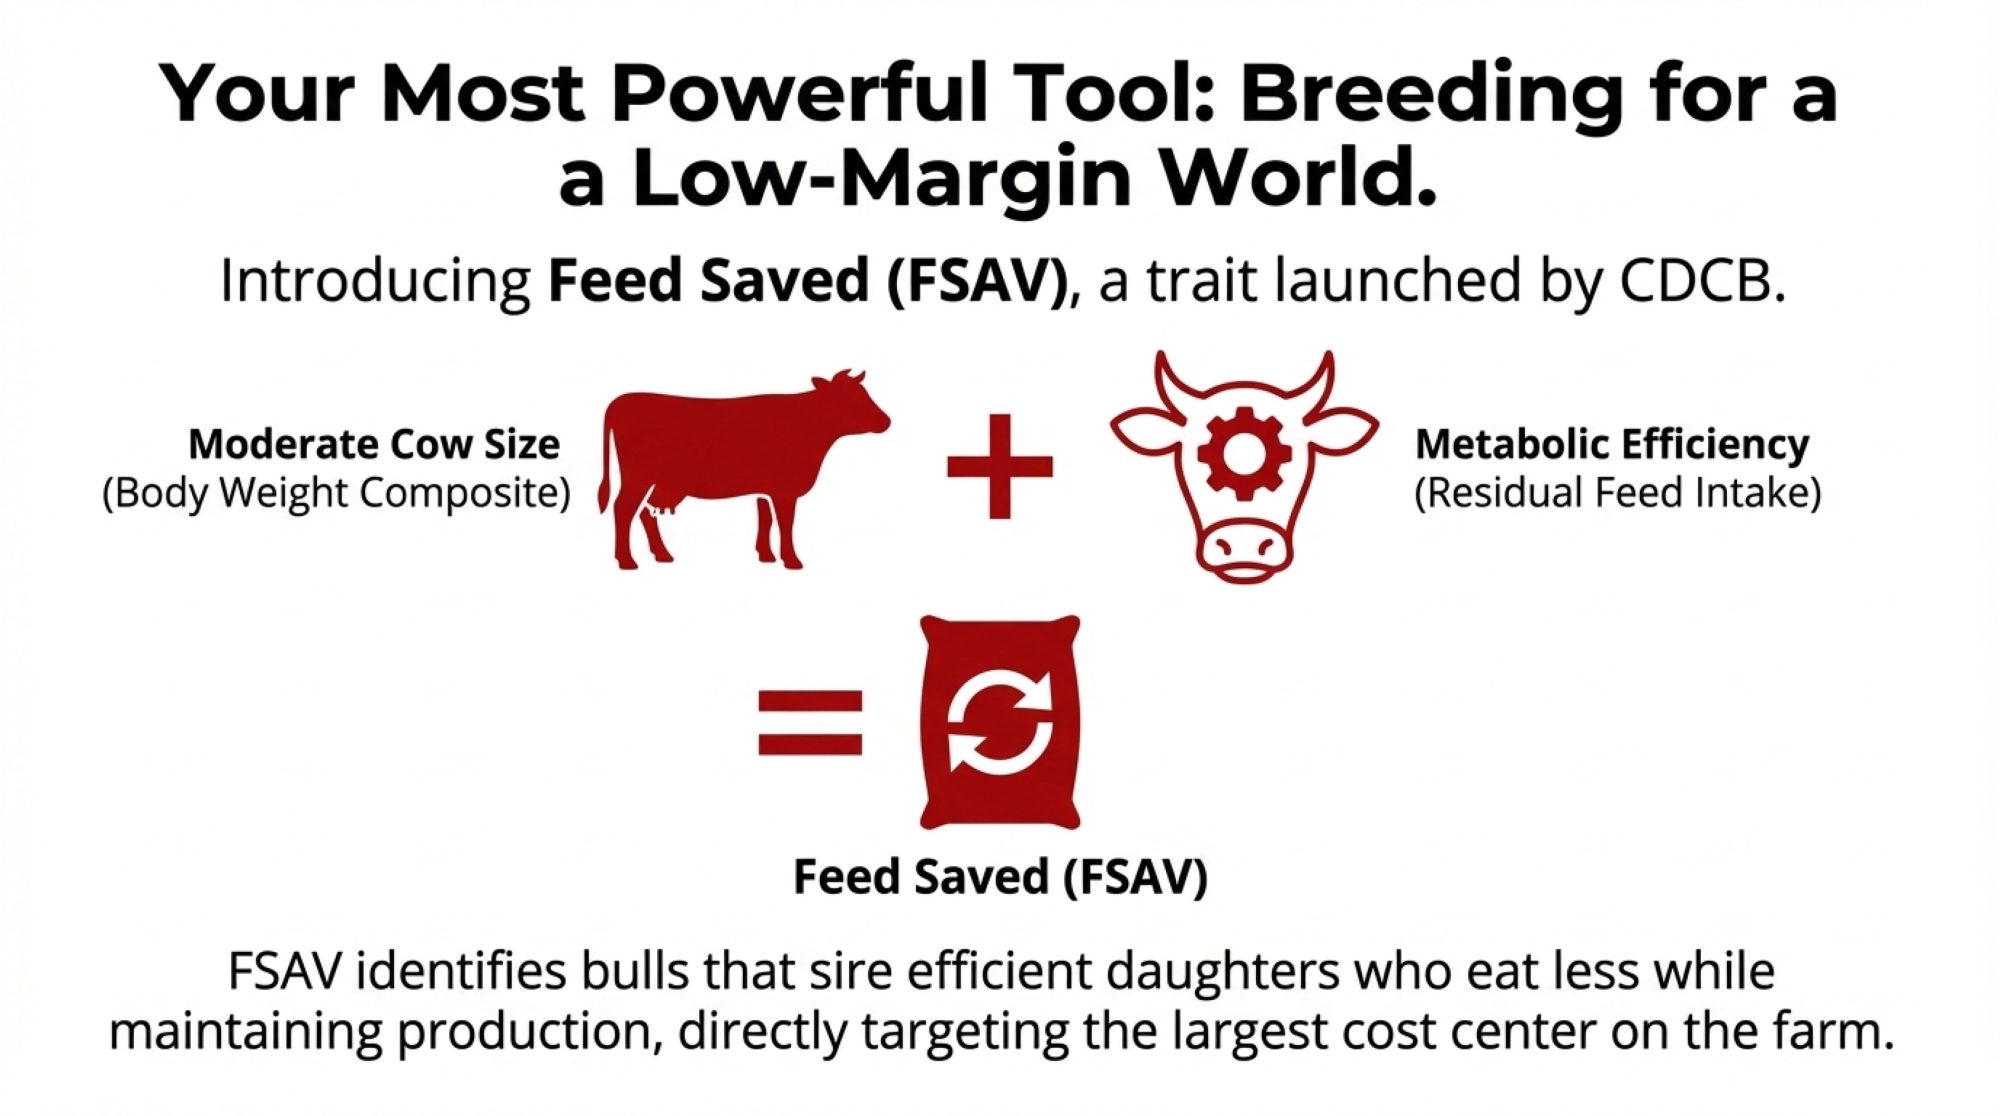
Feed Saved12.0%17.8%+5.8%
Butterfat28.6%31.8%+3.2%
Protein19.6%13.0%-6.6%
Productive Life11.0%8.0%-3.0%
Cow Livability7.0%8.0%+1.0%
Heifer Livability1.3%2.0%+0.7%

That decrease in protein weight catches people off guard at first—it seems to contradict everything we’ve been discussing about protein demand. But dig into the methodology, and it makes more sense. Protein value is now being captured through multiple pathways in the formula—feed efficiency, component relationships, and longevity factors. A bull producing efficient daughters with strong components and a good productive life captures protein value across several trait categories rather than just one line item.

What does this means practically? Bulls that looked middling under older indexes—solid on efficiency and percentages but perhaps not flashy on production—are ranking considerably higher now. I’ve talked with several producers who’ve gone back through old sire catalogs and found bulls they’d passed over now sitting in the top tier.

One Wisconsin dairyman put it well: “Same genetics, completely different economic picture. The index finally caught up with what processors want to buy.”

The Nutrition Piece

Farms seeing the strongest protein gains are generally combining genetic direction with targeted nutrition work. The approach that’s gotten the most traction centers on rumen-protected amino acid supplementation—specifically methionine and lysine.

The science here is fairly well established at this point. Research published in the Journal of Dairy Science and extension work from programs like Penn State has documented that methionine and lysine are frequently the first-limiting amino acids for protein synthesis in typical corn silage-based Midwest rations. When you can get adequate methionine past the rumen and into the small intestine, cows can convert more of their dietary protein into milk protein.

What does implementation actually look like? Based on extension recommendations from Wisconsin, Minnesota, and Cornell, most successful protocols run around 15 grams of rumen-protected methionine per cow daily, balanced with lysine at roughly a 3:1 ratio. But the amino acids aren’t magic—they work best when the underlying ration is already well-balanced.

And here’s something I’ve noticed: farms often see protein responses from improving the basics before they even add supplements. Better feeding frequency, improved bunk management, attention to fresh cow nutrition during those critical first 60 days… sometimes the fundamentals matter most.

The transition period deserves particular attention. Research from land-grant universities has shown that close-up dry cow nutrition influences early lactation performance in meaningful ways. Getting that pre-fresh nutrition right sets the table for everything that follows.

When farms execute this well, they’re typically seeing protein improvements of 0.15 to 0.25 percentage points within a month or two—though results vary depending on the baseline diet and management. Run that math on a 500-cow herd, and you’re looking at meaningful dollars—potentially $60,000-70,000 annually at current component premiums.

Of course, there’s investment required on the front end. Amino acid programs run $25,000-35,000 per year for a herd that size, plus genetic program costs. Most farms doing this well are seeing positive returns within about a year.

But—and this is important—that math depends heavily on how your milk is actually priced.

The Pricing Question That Matters Most

Here’s where individual circumstances become crucial, and where I’ve seen producers make costly assumptions.

Not all milk payment systems reward improvements to components equally. Depending on your situation, the same investment might generate very different returns.

If you’re on component-indexed pricing—straight Class III or IV federal order payments—protein improvements generally flow through to your check within a few weeks. These operations typically capture a significant portion of the commodity value from their component gains.

Pooled cooperative pricing is more complicated. When your milk blends with dozens or hundreds of other farms before payment calculations happen, individual component improvements get diluted across the pool. I spoke with a producer in central Wisconsin who learned this the hard way—invested significantly in nutrition and genetics, moved his tank from 3.05% to 3.28% protein, but his cooperative pools 94 farms, and the pool average barely budged. He got paid on the pool number, not his individual achievement.

Fixed contracts present another scenario. Multi-year arrangements may not reflect component changes until renegotiation, regardless of what’s happening in commodity markets.

⚠️ A Word of Caution for Large-Pool Operations

If you’re shipping to a cooperative that pools 100+ farms, it’s worth getting written confirmation of how your individual component improvements will be valued before ramping up amino acid spending. Ask specifically: “Will my protein be paid out above the pool average, or blended into the pool before my check is calculated?”

I’ve seen situations where producers invested $30,000+ annually but captured only a fraction of the value their cows actually produced—in some cases, by my rough math, maybe 20-30% of what they’d have received under direct component pricing. Your numbers will be different, so pull your last few settlement sheets, compare your protein line item to the Class III protein price during those months, and see what the gap actually looks like for your operation.

Get the details in writing before you write that first feed additive check.

Pricing StructureComponent CapturePayment LagAnnual Impact (500-cow)Risk
Direct Class III90-98%2-3 weeks+$68,000Low
Small Pool Co-op (20)70-85%4-8 weeks+$52,000Moderate
Large Pool Co-op (100+)25-35%8-12 weeks+$22,000High
Fixed Multi-Year0% until renewal12-36 months$0-$15,000High

Before committing resources to protein optimization, have a direct conversation with your cooperative or processor. Some questions worth asking:

Questions for Your Processor

  • How exactly is protein valued in my payment?
  • What premium applies per point above baseline?
  • Is my pricing tied to commodity markets or fixed?
  • How does my individual production factor into payment versus pool averages?
  • Are changes to component pricing under consideration in the next few years?

Getting clear answers—ideally in writing—helps ensure your investments match your actual payment reality.

Thinking About Timing

Farms that started this work back in late 2024 have developed certain advantages—genetic progress, processor relationships, and, in some cases, contract terms that reflected the recruitment phase of new facility buildouts.

Looking at how things are unfolding: 2024-2025 represented the buildout phase, with new capacity coming online and processors actively seeking milk to fill facilities. Premium arrangements were more available during that window.

Through 2026-2027, we’ll likely see that capacity reaching target utilization. Processor relationships are solidifying, and the terms available to new suppliers may differ from what early movers secured.

By 2028-2029, assuming demand projections hold, markets should approach something like equilibrium. Premiums probably moderate from current peaks—not disappear, but normalize.

For operations starting now, this means entering somewhat behind early movers. Genetics compound over time, so there’s a gap that doesn’t fully close. But farms that begin today can still achieve meaningful improvement compared to operations that make no changes. The opportunity looks different from than it did in 2024, but it’s certainly not gone.

A Few Things Worth Thinking Through

Every strategic direction involves tradeoffs, and the protein focus is no exception. Here are a few considerations that deserve honest attention.

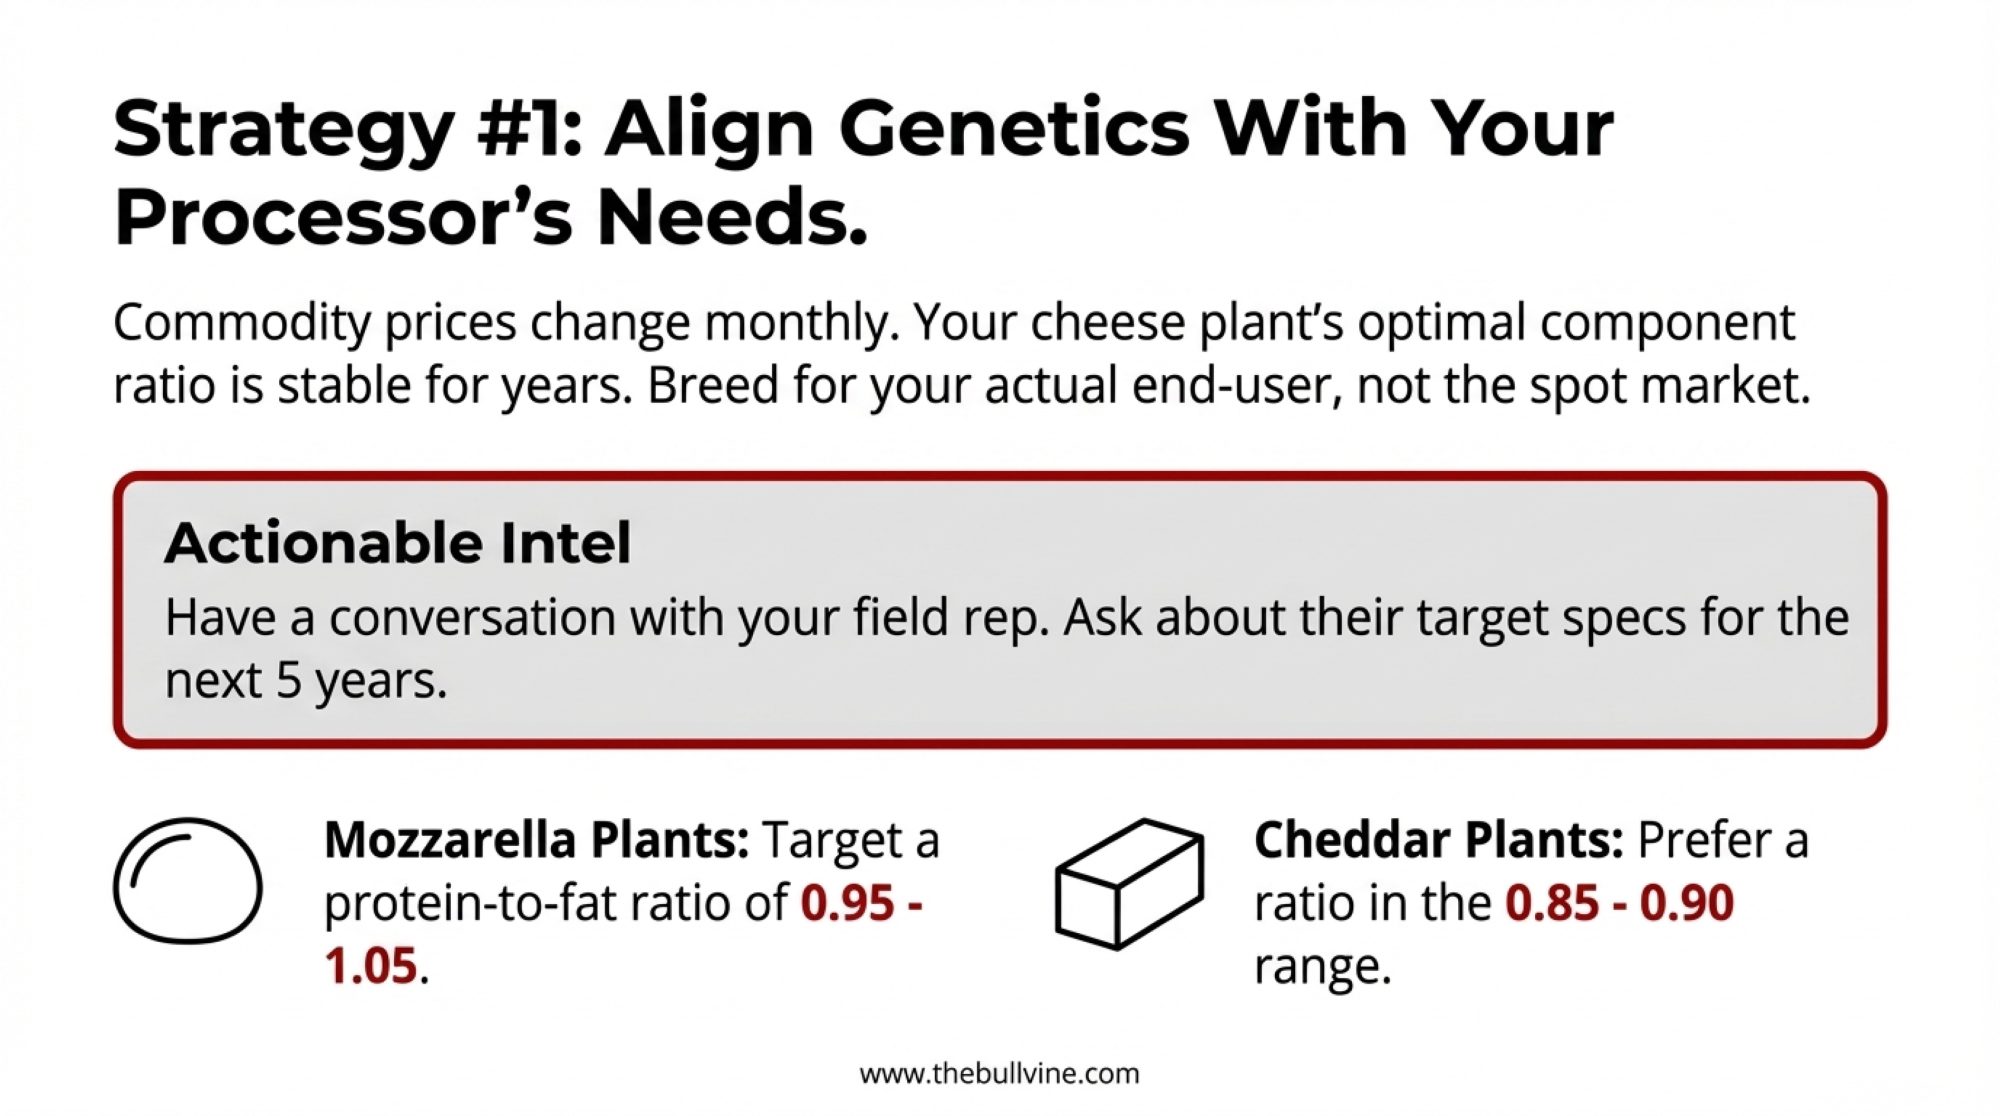
Component ratio balance matters for cheese manufacturing. Research from the American Dairy Products Institute indicates that most cheese production works best with protein-to-butterfat ratios in the 0.80-0.90 range. CoBank economist Corey Geiger has noted that cheesemakers strive for ratios near 0.80—anything significantly lower can affect cheese quality. Farms that substantially increase protein while butterfat falls may find their milk components less desirable for certain applications.

Input cost variability has surprised some operations. Rumen-protected amino acid prices spiked significantly back in 2021-2022 when supply disruptions hit. Building some flexibility into nutrition programs helps manage that exposure.

Genetic diversity deserves ongoing attention, too. With genomic selection concentrating breeding on popular sire families, inbreeding levels have climbed substantially over the past couple of decades—recent CDCB data shows levels exceeding 15% in some young Holstein bull populations. The costs show up in fertility and health over time, though they’re easy to overlook in the short term. Maintaining reasonable sire diversity isn’t just academic—it’s practical risk management.

Regional market variation matters quite a bit as well. Upper Midwest farms near major cheese processors are well-positioned for this approach. Operations in fluid milk markets or regions where butter production dominates may see more limited benefit regardless of their component achievements. Knowing your market matters before optimizing for it.

The Sustainability Angle

When sustainability premiums first entered industry conversations, I’ll admit to some skepticism about whether they’d actually show up at the farm level. That picture seems to be evolving.

With the EU’s Carbon Border Adjustment Mechanism set to take full effect next month, in January 2026, processors exporting cheese to Europe will face new carbon-intensity-based costs. This creates real incentive to source lower-emission milk. Paying farmers for documented carbon reductions becomes economically rational when it saves on export compliance costs.

Here’s what connects this to protein work: farms improving feed efficiency while maintaining strong milk components inherently reduce emissions per unit of output. Research from universities including Penn State and UC Davis suggests that improved efficiency translates to lower carbon intensity per pound of milk solids produced.

Done thoughtfully, component optimization and emissions reduction can complement each other rather than compete.

Several European cooperatives have already implemented farmer incentive programs along these lines. U.S. processors are developing pilot programs. This probably isn’t the primary reason to pursue protein optimization today, but it’s an increasingly relevant factor that may strengthen the case over time.

Getting Started Thoughtfully

For operations considering this direction, the first 90 days often matter more than elaborate long-term plans. Based on conversations with producers who’ve navigated this successfully, here’s a reasonable framework:

The first month should focus on understanding your actual situation. Document current milk composition—protein, butterfat, and their ratio. Have honest conversations with your processor about how components are valued in your payment. Look at your current genetics through the updated Net Merit lens.

The second month is for testing at conservative levels. Maybe start amino acid supplementation around 10-12 grams rather than full protocols. Focus on feeding fundamentals and bunk management. Track composition weekly rather than waiting for monthly tests.

By month three, you should have enough information to determine whether this fits your operation. If the response looks positive, genomic testing can identify your strongest replacement genetics. Continue building processor relationships with real data. Evaluate whether deeper investment makes sense given what you’ve learned.

This approach generates actual information before requiring major commitments.

The Bottom Line

The dairy industry is working through its most significant component value evolution in quite some time. How individual farms respond will depend substantially on their specific circumstances—pricing structure, regional market, capital situation, and risk tolerance.

A few things seem reasonably clear from the data and from conversations with producers navigating these decisions:

The underlying shift appears structural. Processor investments of $11 billion don’t respond to temporary signals. The infrastructure going in will influence economics for years.

Individual circumstances determine actual returns. Understanding precisely how your milk is priced matters enormously before committing resources.

Nutrition typically shows results faster than genetics. Amino acid work can demonstrate effects within weeks; genetic progress compounds over years. Using nutrition gains to fund genetic investment creates sustainable momentum.

Thoughtful risk management enhances outcomes. Maintaining component balance, reasonable fertility standards in genetic selection, sire diversity, and program flexibility all contribute to durable success.

Some farms will determine, after careful analysis, that their situation makes this direction less attractive. That’s genuinely useful information.

For others, there’s still an opportunity to develop a thoughtful approach aligned with where the industry appears headed. The terms differ from early mover advantages, but the fundamental economics remain sound for many operations.

Here’s your challenge: Pull your milk checks from the last 3 months this week. Calculate exactly what you received per pound of protein versus what the Class III protein price was during those months. If the gap is more than 15%, you’re losing money to your payment structure—and no amount of genetic progress or nutrition investment will close that gap until you address the pricing problem first.

The processors have placed their bets. The question is whether your operation is positioned to benefit—or whether you’re subsidizing someone else’s protein premium.

Key Takeaways 

  • $11 billion in new facilities signals processors are betting long-term on protein—this is structural, not cyclical
  • Net Merit 2025 reshuffled genetics—Feed Saved jumped from 12% to 18%; some bulls you overlooked now rank at the top
  • Nutrition delivers faster than genetics: 15g daily methionine + 3:1 lysine ratio can boost protein 0.15-0.25 points within 60 days
  • Your pricing structure is everything—farms in large pooled co-ops may capture only 20-30% of component improvements
  • Do the math before you invest: Compare 3 months of protein payments to Class III prices—a gap over 15% means fix pricing first

Complete references and supporting documentation are available upon request by contacting the editorial team at editor@thebullvine.com.

Learn More:

The Sunday Read Dairy Professionals Don’t Skip.

Every week, thousands of producers, breeders, and industry insiders open Bullvine Weekly for genetics insights, market shifts, and profit strategies they won’t find anywhere else. One email. Five minutes. Smarter decisions all week.
NewsSubscribe
First
Last
Consent

$950 Per Cow Is Only the Start: Bird Flu’s True Cost to Your Dairy

$4.4M in federal aid—still not enough. The $950/cow figure? It doesn’t count the high-genomic 2-year-old you had to cull because her quarter dried off.

Executive Summary: Cornell’s research puts H5N1 losses at $950 per clinically affected cow. Farmers who’ve lived through outbreaks say that’s just the starting point. The study tracked direct losses over 67 days but explicitly excluded breeding setbacks, lost premiums, and the genetic value of high-genomic animals you’re forced to cull—costs that compound long after the acute phase ends. One California dairyman received $4.4 million in federal aid and says his actual losses exceeded it. With 1,790 herds confirmed across 18 states and vaccine approval stalled by trade politics, the outbreak keeps growing, while biosecurity alone can’t stop a virus that spreads through workers traveling between farms. The playbook for producers: document every cost obsessively, fortify your financial reserves, and push your representatives hard—because we have the tools to fight this, and every month of delay is money out of your pocket.

You’ve probably heard the official estimate—about $950 per clinically affected cow. But farmers who’ve actually lived through H5N1 outbreaks are finding the true cost runs considerably higher. Here’s what the research shows, why it matters for your operation, and where things are headed.

Jonathan Cockroft didn’t need anyone to explain the math to him. When H5N1 swept through his Channel Islands Dairy Farms operation in California earlier this year, the federal indemnity payment came to about $4.4 million. His actual losses? They exceeded that figure—and kept climbing as the ripple effects moved through his breeding program and production cycle.

“The check helps,” Cockroft told the Los Angeles Times this past July. “But it doesn’t cover what we actually lost.”

And you know, his experience isn’t unusual. As of early December, USDA APHIS data shows H5N1 has spread to roughly 1,790 confirmed herds across 18 states. That’s a significant jump from where we were even six months ago. Dairy producers from California’s Central Valley to Wisconsin’s dairy heartland are getting a hard education in the gap between official loss estimates and what actually shows up on the balance sheet.

Understanding that gap isn’t about pointing fingers at anyone. It’s about helping you make informed decisions—about biosecurity investments, about financial planning, about the policy conversations happening right now in Washington.

The Economic Gap: What Research Measures vs. What Farms Experience

MetricOfficial Research (Cornell)On-Farm Reality
Loss Per Cow~$950 in direct, quantifiable lossesDirect losses + premiums, genetics, labor surge
Recovery Timeline67-day acute observation periodMonths before production normalizes
What’s CapturedMilk loss, mortality, and early cullingBreeding setbacks, SCC penalties, overtime costs
Key GapMeasures the acute phaseHidden costs compound across seasons

Source: Cornell University, Nature Communications, July 2025. On-farm observations from producer reports and USDA epidemiological summaries.

What the Official $950 Figure Actually Measures

Let’s start with what that number represents, because here’s the thing—it’s not wrong. It’s just measuring something specific.

That $950 figure comes from Cornell University research published in Nature Communications this past July. The researchers followed an Ohio dairy operation through a full H5N1 outbreak and documented direct economic losses per clinically affected cow, including decreased milk production, mortality, and early removal from the herd.

The study was thorough. They tracked a herd with 776 clinically affected lactating cows over a 67-day observation period and found total production losses averaging around 945 kilograms—that’s over 2,000 pounds, or nearly a ton of milk—per clinically affected cow. For that group, total documented losses came to approximately $737,500.

Fair enough. But what farmers on the ground are discovering is that the acute phase is really just the beginning of the story.

The Hidden Costs That Keep Adding Up

Recovery takes longer than the paperwork suggests. The Cornell team documented production impacts lasting at least two months in clinically affected cows, and many veterinarians and producers report that getting a herd back to its pre-outbreak groove can take considerably longer—especially when older cows or stressed transition cows are hit hard. Production doesn’t just snap back to baseline when clinical signs resolve. Some animals never fully recover their previous peak.

Reproductive impacts hit breeding programs hard. This is where operations with strong genetic programs really feel it. Abortion rates spike during outbreaks. Conception rates drop. Breeding cycles get disrupted in ways that take a full lactation cycle to sort out. I’ve spoken with producers who say they’re setting their breeding programs back a year or more.

For a Bullvine reader, this is the heartbreak. When you cull a high-genomic 2-year-old because her quarter dried off from H5N1, you aren’t just losing a cow—you’re losing the dam of your next sire analyst contract.

When you’ve invested years in genomic selection and careful mating decisions, watching that progress unravel is devastating—and none of that shows up in the per-cow calculation.

Quality premiums disappear. For operations built around butterfat performance or somatic cell count bonuses—and that’s a lot of farms in Wisconsin and the Northeast, especially—H5N1 is particularly brutal. SCC spikes during and after infection can disqualify milk from premium markets. A farm earning an extra dollar-fifty to two dollars per hundredweight on quality bonuses can watch that revenue stream vanish overnight. And rebuilding those numbers takes months of careful fresh cow management and culturing.

The labor-management surge is real. Farmers who’ve been through it describe round-the-clock monitoring during acute phases, increased veterinary visits, enhanced biosecurity protocols, and staff overtime. These costs don’t appear anywhere in the official calculations—they just get absorbed into that season’s operating expenses.

Genetic losses compound over the years. This one’s harder to put a number on, but it matters enormously if you’ve invested in your breeding program. When high-value animals are culled due to permanent udder damage or reproductive failure, decades of selection work can be undone. Anyone who’s built a herd over generations understands exactly what I’m talking about.

What This Means for Your Planning

So what does the true picture look like? Well, that depends on your operation. The Cornell research gives us a solid baseline of about $950 per clinically affected cow for direct, quantifiable losses. But—and here’s the key part—the researchers specifically note that their estimate doesn’t capture longer-term reproductive impacts or changes in herd structure.

Because of that gap, economists and producers expect the true long-run cost per affected cow to be higher than $950 once those additional factors are accounted for. How much higher depends on your genetics program, your premium market position, and how hard the outbreak hits your best animals.

For a 500-cow dairy experiencing a typical outbreak affecting 15-20% of the herd, even using just the verified $950 figure, you’re looking at direct losses of roughly $70,000-$95,000. Add in those hidden costs—the extended recovery period, the breeding setbacks, the lost premiums—and the true impact grows from there.


Cost Category
Cornell Study Captured?Cost Per Cow (USD)Timeline/Notes
Milk production loss (acute phase)Yes$62067-day observation period; ~945 kg lost per cow
Mortality & immediate cullingYes$230Direct animal replacement costs during outbreak
Acute veterinary & treatmentYes$100Medications, diagnostics, emergency care
Extended production depressionNo$1402-4 months post-clinical recovery; partial production
Breeding setbacks & abortionsNo$2806-12 months; delayed conception, lost calves
Quality premium losses (SCC/BF)No$1803-6 months to rebuild; varies by market
High-genomic animal genetic valueNo$100Permanent; irreplaceable selection progress
Labor surge & biosecurity operationsNo$85Outbreak duration + 30 days; overtime, PPE, monitoring
TOTAL VERIFIED (Cornell)$950What indemnity calculations use
TOTAL TRUE COST (full cycle)$1,735What your balance sheet actually shows

That’s a different planning conversation than the official numbers alone might suggest. And it helps explain why farmers like Cockroft find indemnity payments—helpful as they are—falling short of actual economic damage.

The Biosecurity Investment Question

Given those numbers, one of the most practical questions on everyone’s mind is straightforward: How much should I invest in enhanced biosecurity, and will it actually protect my operation?

What we’re seeing in the data is more nuanced than any of us would prefer.

The cost picture is clearer than the effectiveness picture. USDA’s current support program offers up to $28,000 per premises for biosecurity improvements, covering a significant portion of equipment and infrastructure costs. That’s genuinely helpful. But when you work through what comprehensive implementation actually requires—enhanced disinfection systems, dedicated PPE facilities, separate equipment for different areas of operation—the investment adds up quickly. And then there are ongoing operational costs for uniform laundering, PPE supplies, and additional labor that continue month after month.

Now for the harder question: does it work?

USDA’s epidemiological audits of affected dairy operations revealed something that complicates this conversation. Even farms with enhanced biosecurity protocols in place experienced continued transmission in a meaningful percentage of cases.

The reason isn’t that farmers are doing something wrong—and I want to be really clear about that. It’s that the primary transmission pathway operates at a level that individual farm protocols can’t fully address.

The Network Problem Worth Understanding

Here’s what I’ve found most eye-opening in reviewing the outbreak investigations: the role of worker mobility.

According to USDA APHIS epidemiological summaries reported by CIDRAP, about 20% of dairy workers on affected farms also work on other dairy operations. About 7% of workers on affected dairy farms also worked on poultry farms. And roughly 62% of farms shared vehicles for transporting cattle, with only about 12% cleaning them before use.

Think about what that means from a practical standpoint. The virus can travel on boots, clothing, and equipment between operations. It’s not that anyone is being careless—it’s the structural reality of how dairy labor markets function, especially in regions where farms are smaller and can’t always offer forty hours a week year-round. Workers need income from multiple sources. The resulting movement creates transmission pathways that no individual operation can fully control, no matter how good their on-farm protocols are.

The takeaway for most of us is this: biosecurity investments remain valuable. They reduce risk, demonstrate due diligence, and protect against multiple disease threats beyond just H5N1. But under current conditions, even excellent protocols provide only risk reduction, not elimination. Any farmer evaluating biosecurity spending should factor that reality into their calculations—and into their financial planning for potential outbreak scenarios.


Biosecurity Measure
Typical InvestmentRisk Reduction PotentialLimitation/Gap
Enhanced disinfection stations$8,500-$12,000Moderate (30-40% reduction in surface contamination)Doesn’t address worker clothing/vehicle transfer between farms
Dedicated PPE & laundering systems$6,000-$9,500 + $400/month ongoingModerate-High (50-60% reduction in barn-to-barn spread)Limited if workers commute from other dairy operations
Visitor/vendor protocols & separate entry$3,500-$7,000Low-Moderate (20-35% reduction in external introduction)Feed trucks, milk haulers, and AI technicians still cross farms daily
Cattle movement quarantine protocols$2,000 + $150/head quarantine costHigh (60-70% reduction from purchased cattle)62% of farms share cattle transport vehicles; 12% clean between use
Worker health monitoring & education$1,500-$3,000 + staff timeModerate (35-45% reduction in symptomatic transmission)20% of dairy workers work multiple operations; 7% also work poultry farms
TOTAL comprehensive implementation$21,500-$35,000 upfront + ~$600/monthCumulative: 40-55% risk reductionEven farms with “enhanced protocols” experienced continued transmission in USDA audits
USDA biosecurity cost-share availableUp to $28,000 per premisesCovers 65-80% of upfront investmentDoesn’t eliminate the transmission network problem

Where Things Stand on Vaccines

No topic generates more questions in dairy right now than vaccination. Let me walk you through what we actually know versus what’s still developing, because there’s a lot of incomplete information floating around out there.

On the product side, Medgene Labs has developed an H5N1 vaccine for cattle, and they’re working with Elanco for commercial distribution. According to Hoard’s Dairyman reporting from March, the vaccine has met all requirements of USDA’s platform technology guidelines and is in the final stages of review for conditional license approval.

Alan Young, Medgene’s Chief Technical Officer, told Agri-Pulse earlier this year that they’re confident the data meets expectations for conditional licensure. So the product exists and appears to work. The holdup is elsewhere.

What’s slowing things down? Several factors are at play, and I want to present them fairly because reasonable people disagree about the tradeoffs involved.

Trade concerns from the poultry sector have been significant. The National Chicken Council and related organizations have expressed worry that vaccination—even limited to dairy—could trigger trading partner restrictions affecting poultry exports. Their concern is that any U.S. vaccination program signals endemic infection to foreign markets, potentially closing doors for chicken and turkey products. Given that U.S. chicken exports alone totaled about $5 billion in 2024, according to industry data, that’s a substantial consideration. We shouldn’t dismiss it out of hand, even if we might weigh the tradeoffs differently.

USDA leadership has also cited a desire for additional field data. Secretary Brooke Rollins told Agri-Pulse in March that there’s “a tremendous amount of work to do before we would even consider that as a potential solution” and that vaccination remains “at least a year or more away.” Whether you agree with that timeline or not, it’s worth noting that regulatory agencies tend to be cautious, especially when trade implications are involved.

What dairy industry leaders are saying is a bit different. The National Milk Producers Federation, International Dairy Foods Association, and multiple state dairy organizations have called for accelerated vaccine deployment. IDFA President Michael Dykes stated in February that the industry continues to “urge USDA and its federal partners to act quickly to develop and approve the use of safe, effective bovine vaccines.” There’s genuine frustration in the dairy community about the pace of progress.

Here’s what I find particularly noteworthy about the trade concern: restrictions are arriving regardless of vaccination status. The Canadian Food Inspection Agency has implemented testing requirements for dairy cattle imports. EU food safety and animal health agencies have raised concerns about H5N1 in U.S. dairy in their risk assessments. Australia and several other markets have enhanced their protocols.

That reality suggests the original calculus around vaccination and trade may need updating. If restrictions are emerging based on infection presence rather than vaccination policy, the argument for delaying vaccines to protect trade relationships becomes less compelling. But these are genuinely complex tradeoffs, and I don’t think anyone has a monopoly on the right answer here.

The Viral Evolution Picture

For farmers trying to assess longer-term risk, let me explain what researchers are watching on the scientific side—because it matters for understanding the urgency of this issue.

The concern among virologists is that continued circulation in mammalian populations increases the likelihood that the virus will acquire mutations that enhance transmission. Each additional month of cattle-to-cattle spread means more viral replication cycles, and with more replication comes more chances for random mutations—most of which are neutral, but some of which could matter.

A newer variant designated D1.1 has been detected in dairy cattle. According to WeCAHN tracking data, it was first confirmed in Nevada on January 31, 2025, and then identified in Arizona on February 11. Some field reports suggest that D1.1-positive herds are seeing more noticeable respiratory signs alongside mastitis, though researchers are still working to define that pattern.

The third major concern—full adaptation for efficient human-to-human transmission—hasn’t been observed. Current human cases remain sporadic with no sustained person-to-person spread documented. But the scientific consensus is that the longer this virus circulates in mammalian populations, the more opportunity it has to evolve in concerning directions. That’s not cause for panic. But it does underscore why public health officials, veterinary researchers, and dairy industry leaders are pushing for faster action.

What Proactive Herds Are Doing Right Now

Across the country, dairy producers aren’t waiting for Washington to reach consensus. Here’s what the smartest operators are doing:

Building Documentation Systems: Smart operators are logging every dime—not just for taxes, but for the inevitable indemnity fights. Production impacts, recovery timelines, breeding disruptions, veterinary costs, overtime hours. If you ever need to show a Congressional office what this actually costs, specific numbers from your own operation are far more compelling than industry averages.

Restructuring Labor: Where possible, larger herds are stopping the “shared worker” loop to cut transmission lines. That’s not feasible for everyone—labor economics are what they are, especially for smaller operations—but farms that can offer consistent full-time hours to keep workers on single operations are reducing one key pathway.

Investing in Early Detection: Daily milk tracking by string is catching drops before clinical signs explode. Farms with strong veterinary relationships are developing monitoring protocols that identify problems early. Close observation of fresh cows—who seem particularly susceptible—and rapid veterinary consultation at the first sign of trouble can reduce outbreak severity even if they can’t prevent infection entirely.

Strengthening Financial Reserves: Producers who’ve watched neighboring operations go through outbreaks are reviewing credit lines, cash positions, and insurance coverage. The farms that weather this best will be those that planned for the possibility before it arrived. That’s not pessimism—it’s the kind of practical risk management that successful dairy operations have always practiced.

Engaging the Policy Conversation: Producer organizations at the state and national levels are amplifying messages to USDA. Individual farmers are contacting Congressional offices. That kind of sustained engagement matters—it reflects dairy constituents making clear that the current pace isn’t acceptable.

Looking Ahead: What to Watch For

Looking ahead, here’s how this might unfold depending on decisions made in the coming months:

If vaccine deployment accelerates and USDA moves forward with conditional approval, transmission could be substantially reduced within six to nine months of deployment. Trade negotiations would need to happen in parallel, but early engagement with trading partners could establish protocols maintaining market access for vaccinated herds. This is the path dairy industry organizations are advocating for.

If the current approach continues with the primary focus on biosecurity and surveillance rather than vaccination, the outbreak will likely continue to expand. Economic losses would keep accumulating. Trade relationships would probably deteriorate further regardless. And the virus would keep circulating—and potentially evolving—in the dairy cattle population.

Regional variation might emerge as a third possibility. Some states might pursue their own approaches more aggressively, creating a patchwork of policies. California’s substantial investments in outbreak response suggest a willingness to act independently. That could accelerate action in some areas while complicating interstate commerce for operations that regularly move cattle across state lines.

Which scenario we end up with depends substantially on decisions made in the next several months. USDA’s next quarterly assessment and any movement on the Medgene conditional license application will be key indicators to watch heading into early 2026.


Scenario
Timeline to DeploymentAdditional Herds Affected (Projected)Cumulative Industry LossKey Tradeoff/Note
Accelerated approval & deployment3-6 months (by June 2026)+450-650 herds$1.8-2.4 billionRequires immediate conditional license; trade protocols negotiated in parallel
Current pace (“at least a year”)12-18 months (by June 2027)+1,800-2,400 herds$4.2-5.8 billionContinues Sec. Rollins timeline; mounting trade restrictions regardless
Extended delay (trade-focused)18-24+ months (late 2027+)+2,800-3,600 herds$6.5-8.9 billionTrade restrictions emerging anyway; poultry export rationale weakens as spread continues
Regional/state-led patchwork6-12 months (varies by state)+900-1,400 herds$2.8-3.9 billionCalifornia and other high-density states act independently; creates interstate commerce complications
Current baseline (no vaccination)1,790 herds as of Dec 2025$2.1-3.1 billion to dateUsing $950-$1,735 per affected cow range × avg herd size ~150 lactating cows × clinical rate ~18%

Note: Loss estimates use Cornell’s verified $950/cow minimum and true cost range up to $1,735/cow, applied to average affected herd clinical rates of 15-20% with 150-200 lactating cows per operation. Projections assume continued monthly growth rates of 200-350 new herds based on Q3-Q4 2025 trends.

What This Means for Your Operation

Let me pull this together into practical considerations.

On understanding the economics: The verified research shows direct losses of about $950 per clinically affected cow—that’s from the Cornell study published this summer. But because that estimate doesn’t include longer-term reproductive impacts or herd-structure changes, the true cost is likely higher once those factors play out. Budget accordingly.

On biosecurity investments: Enhanced biosecurity reduces risk but can’t eliminate it given current transmission dynamics—and that’s not a criticism of biosecurity, just a realistic assessment of what it can accomplish given the network transmission problem. USDA support helps with upfront costs. Just go in with realistic expectations about what any individual farm can control.

On the vaccine conversation: Products are in advanced regulatory review. Industry organizations are pushing hard for acceleration while trade concerns create cross-pressures. Importantly, trade restrictions are emerging regardless of vaccination policy, which changes the calculus somewhat. Stay engaged with producer organizations tracking this situation, because developments could come quickly once decisions are made.

On protecting your operation now: Document everything with specifics. Maintain strong veterinary relationships focused on early detection. Review your financial reserves and credit availability against realistic outbreak scenarios. And engage your representatives with your own farm’s story—specific examples matter enormously in policy discussions.

The Bottom Line

The H5N1 situation represents one of the most significant challenges American dairy has faced in decades. What’s frustrating for many of us is the sense that solutions exist—vaccines are in development, regulatory pathways are established, the science is reasonably clear—but the gap between what’s possible and what’s actually happening remains wide.

Understanding the full economic picture, the transmission dynamics, and the policy landscape helps you make informed decisions and advocate effectively for practical solutions. That’s what this comes down to: having the information you need to protect your operation and push for the responses this situation demands.

We’ve actually got most of the tools we need. The real question is whether we’ll use them in time. And that’s a question dairy farmers shouldn’t have to answer on their own.

Key Takeaways

  • $950/cow is just the beginning. Cornell tracked direct losses over 67 days—breeding setbacks, lost premiums, and genetic value weren’t counted.
  • The hidden costs are brutal. Months of depressed production. Quality bonuses gone. High-genomic animals were culled because their quarters dried off. It compounds.
  • Biosecurity helps, but can’t solve this. 20% of dairy workers work across multiple farms, creating transmission pathways that no single operation can control.
  • Vaccines exist. Approval doesn’t. Medgene’s product is stuck in regulatory review while 1,790 herds across 18 states keep absorbing losses.
  • Your playbook: Document every dollar. Build reserves now. Push your reps hard. The tools to fight this exist—demand they get used.

Complete references and supporting documentation are available upon request by contacting the editorial team at editor@thebullvine.com.

Learn More:

The Sunday Read Dairy Professionals Don’t Skip.

Every week, thousands of producers, breeders, and industry insiders open Bullvine Weekly for genetics insights, market shifts, and profit strategies they won’t find anywhere else. One email. Five minutes. Smarter decisions all week.
NewsSubscribe
First
Last
Consent

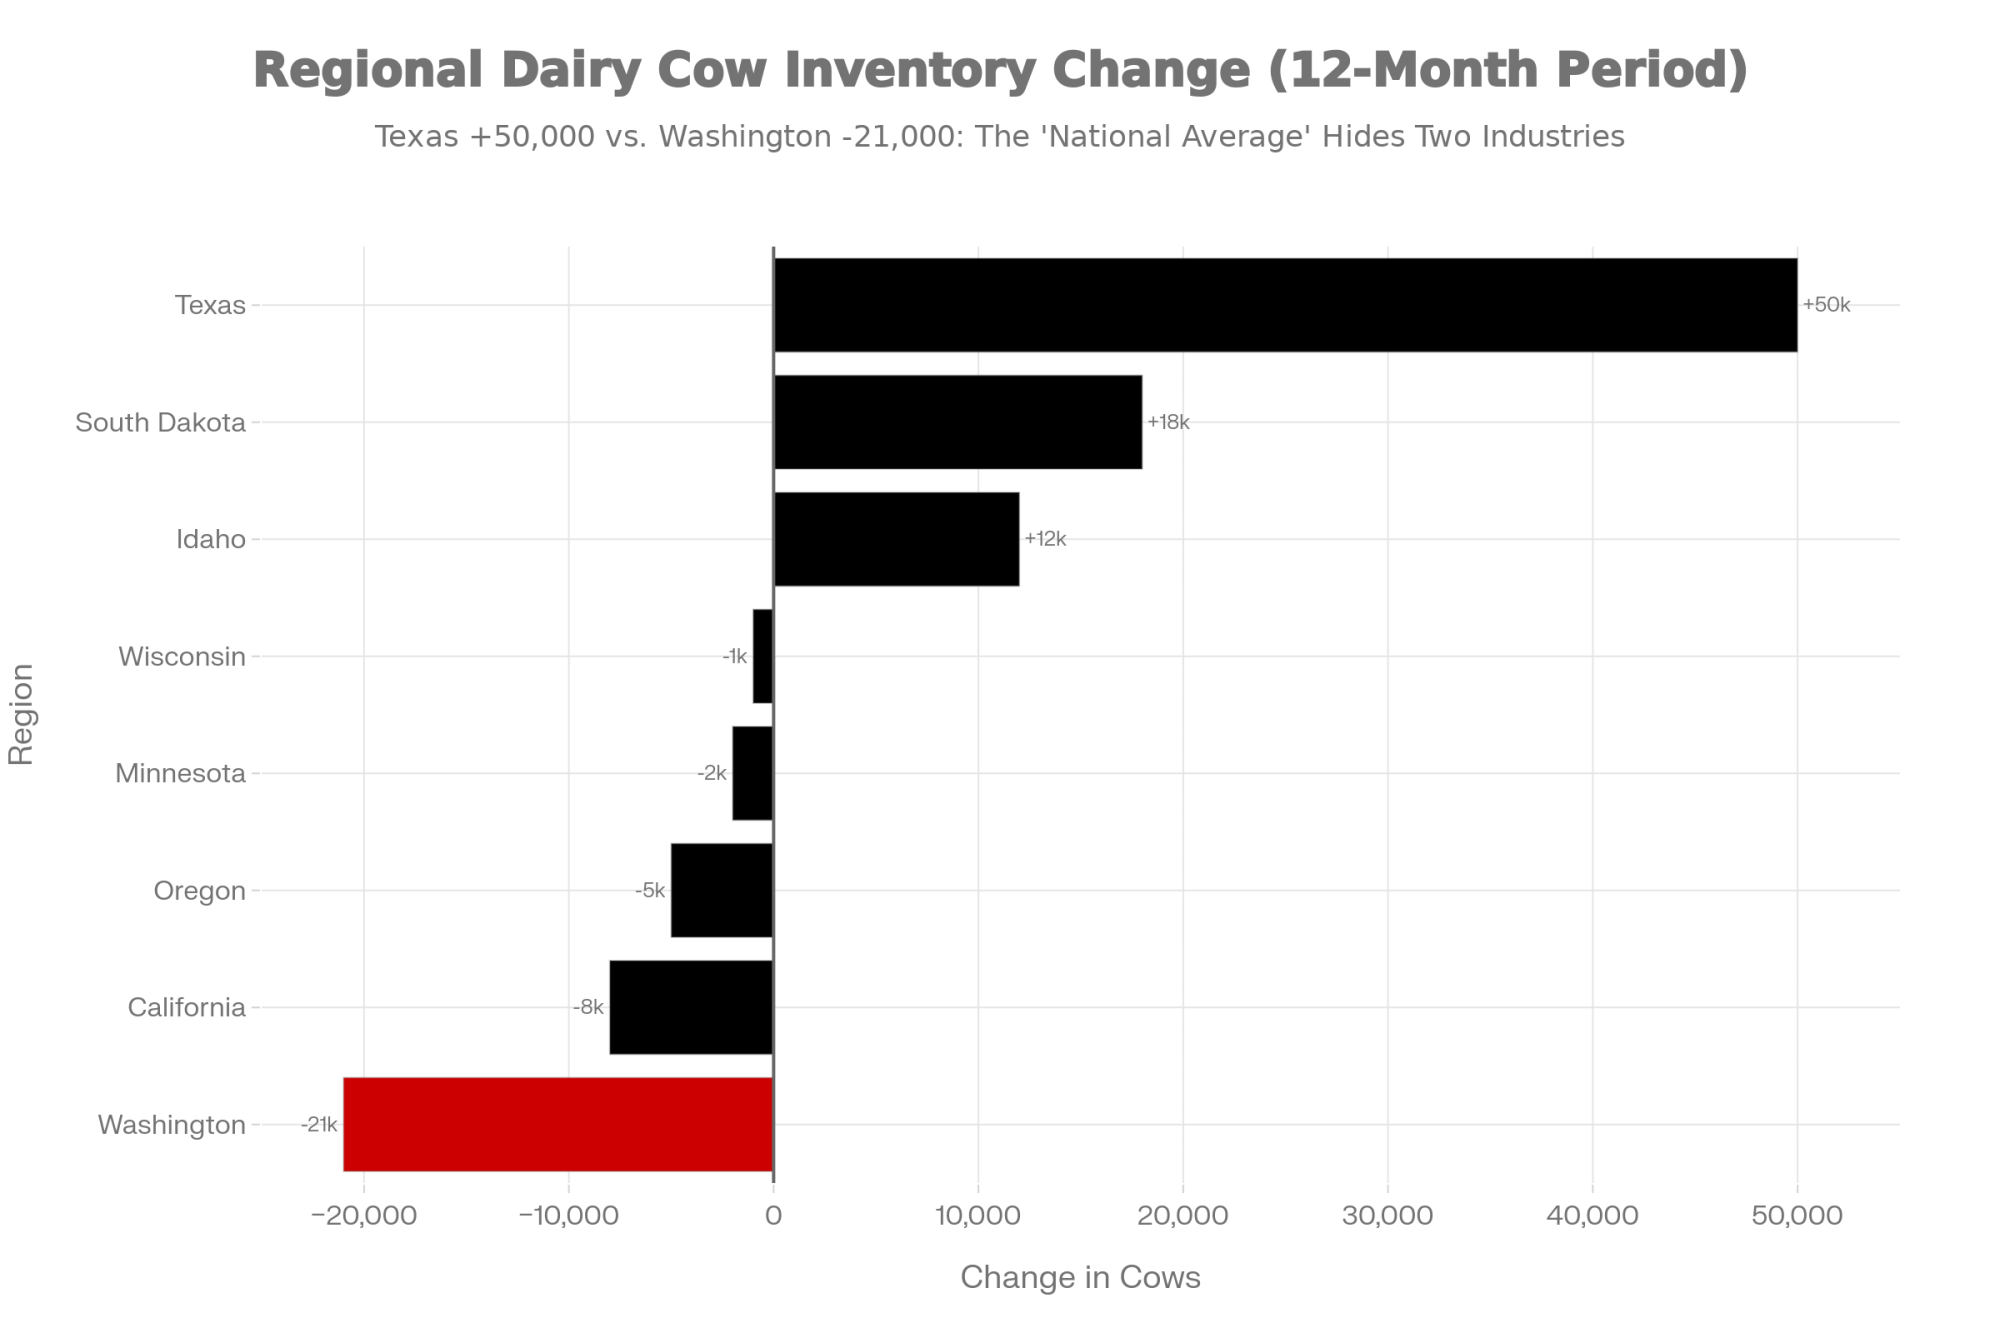
Dairy’s National Average Is a Lie: Texas +50,000 Cows, Washington -21,000 – Your 90-Day Plan

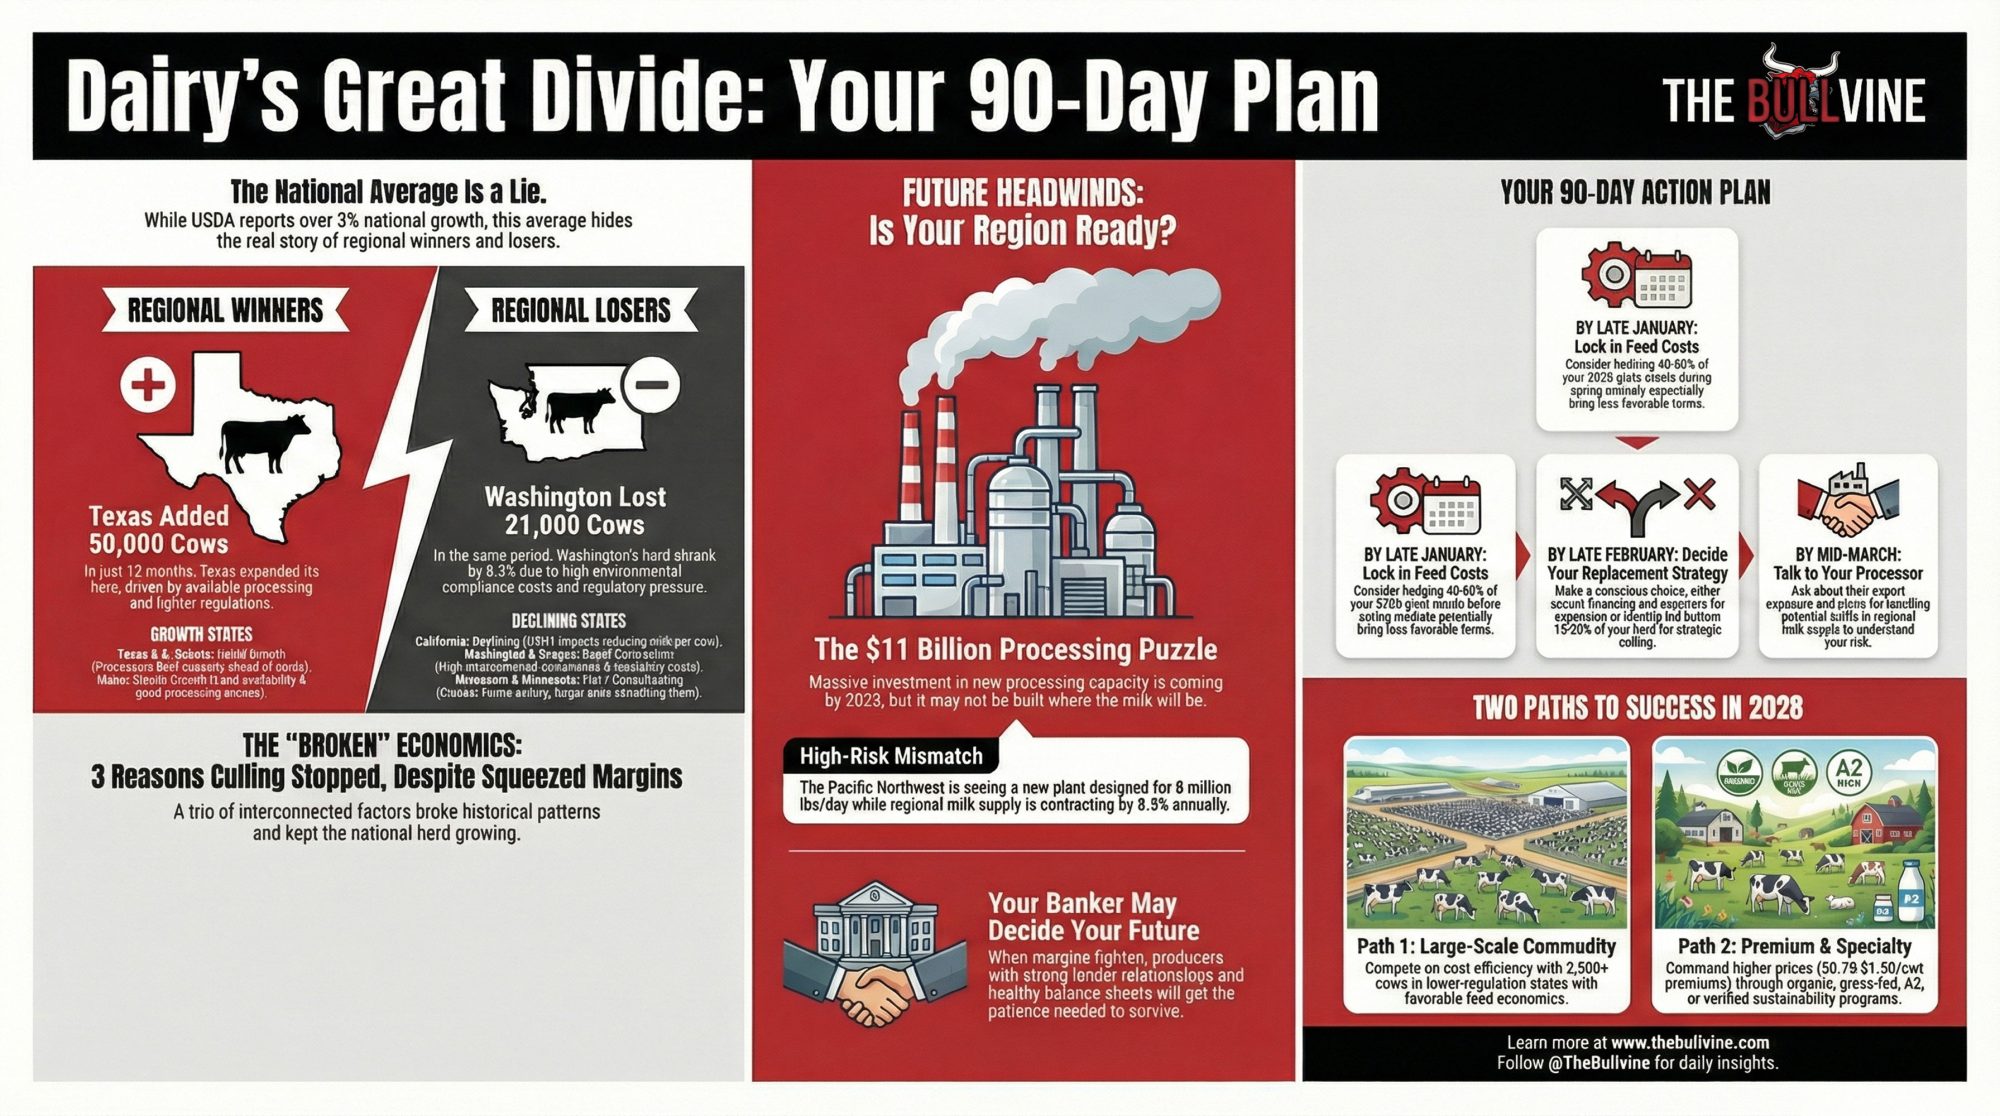
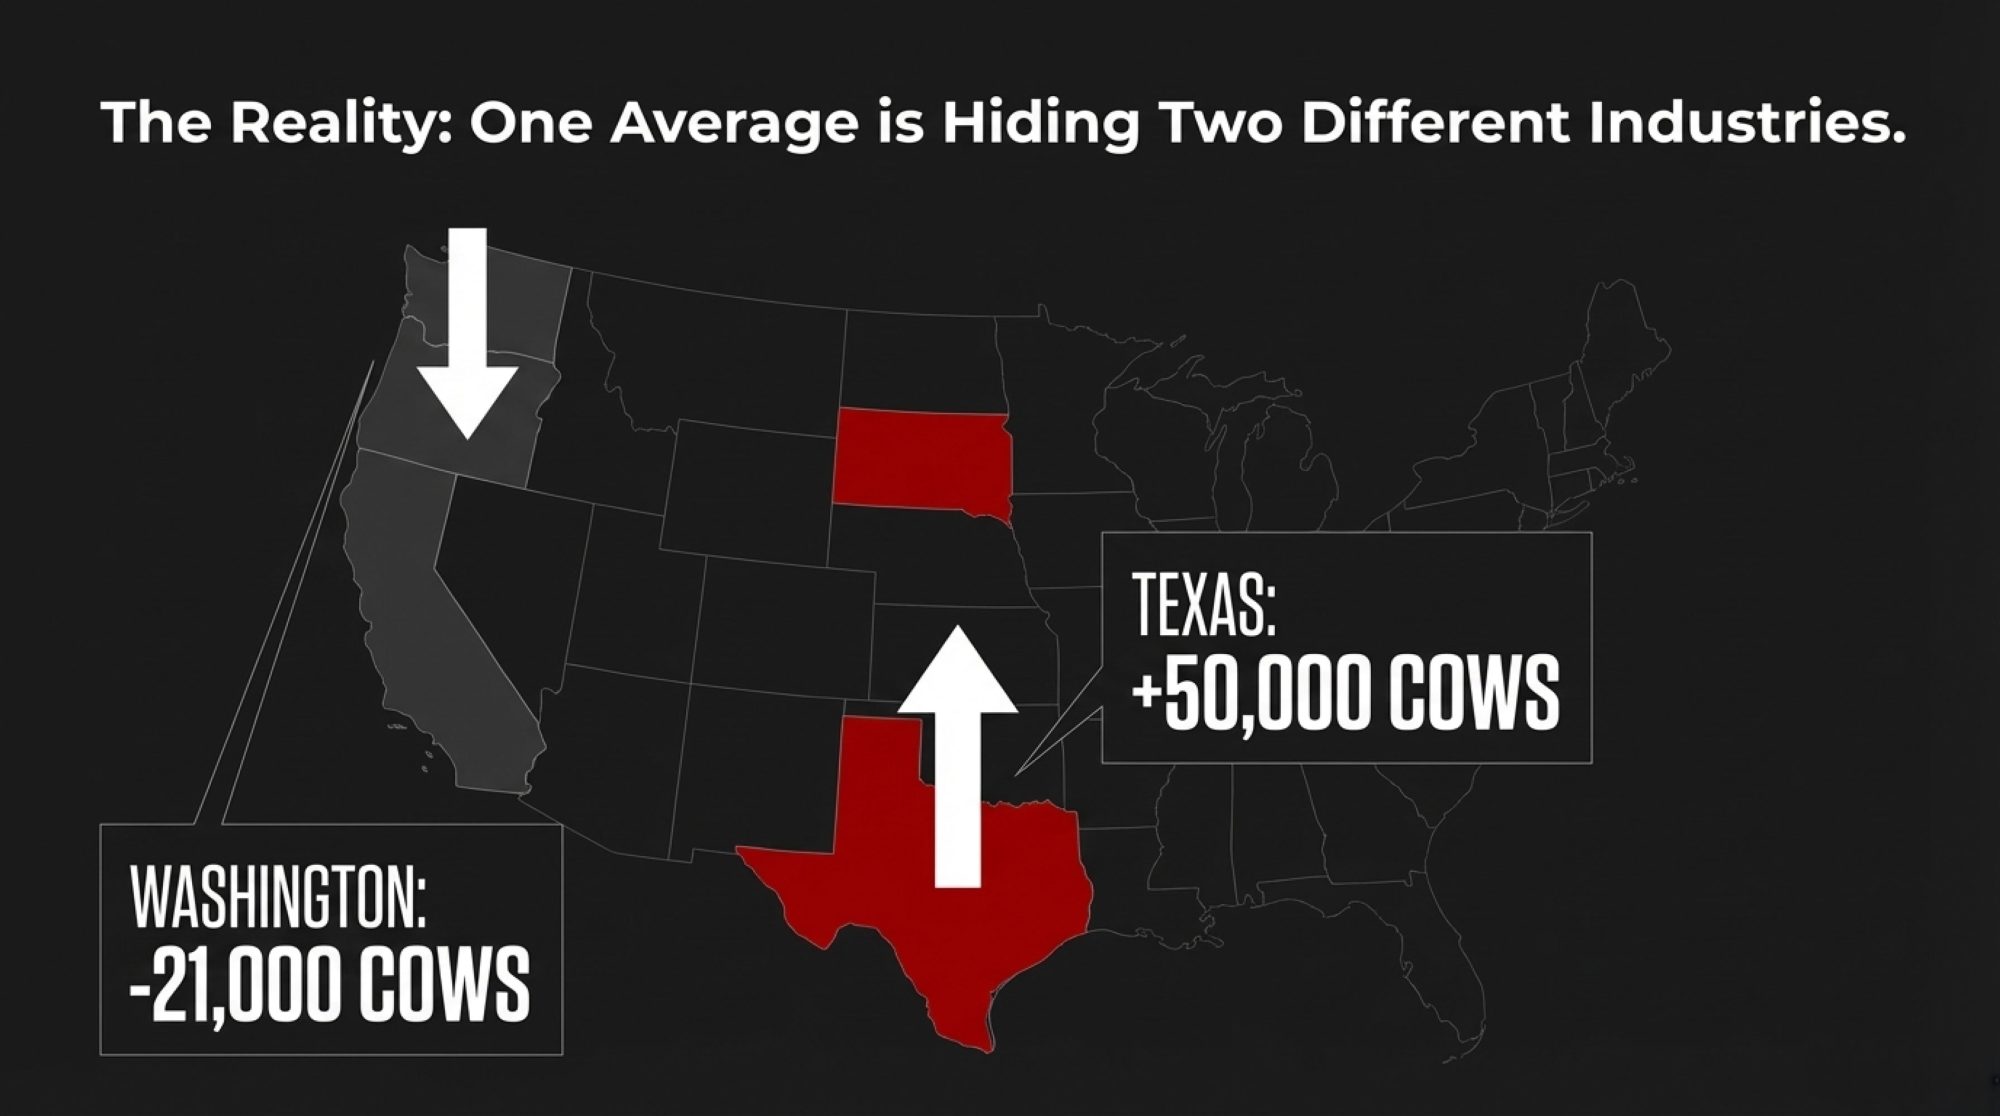
Here’s the thing about national averages—they can hide more than they reveal. While USDA reports 3%+ growth, one state added 50,000 cows and another lost 21,000. Let me walk you through what’s really happening and the decisions that matter most before spring.

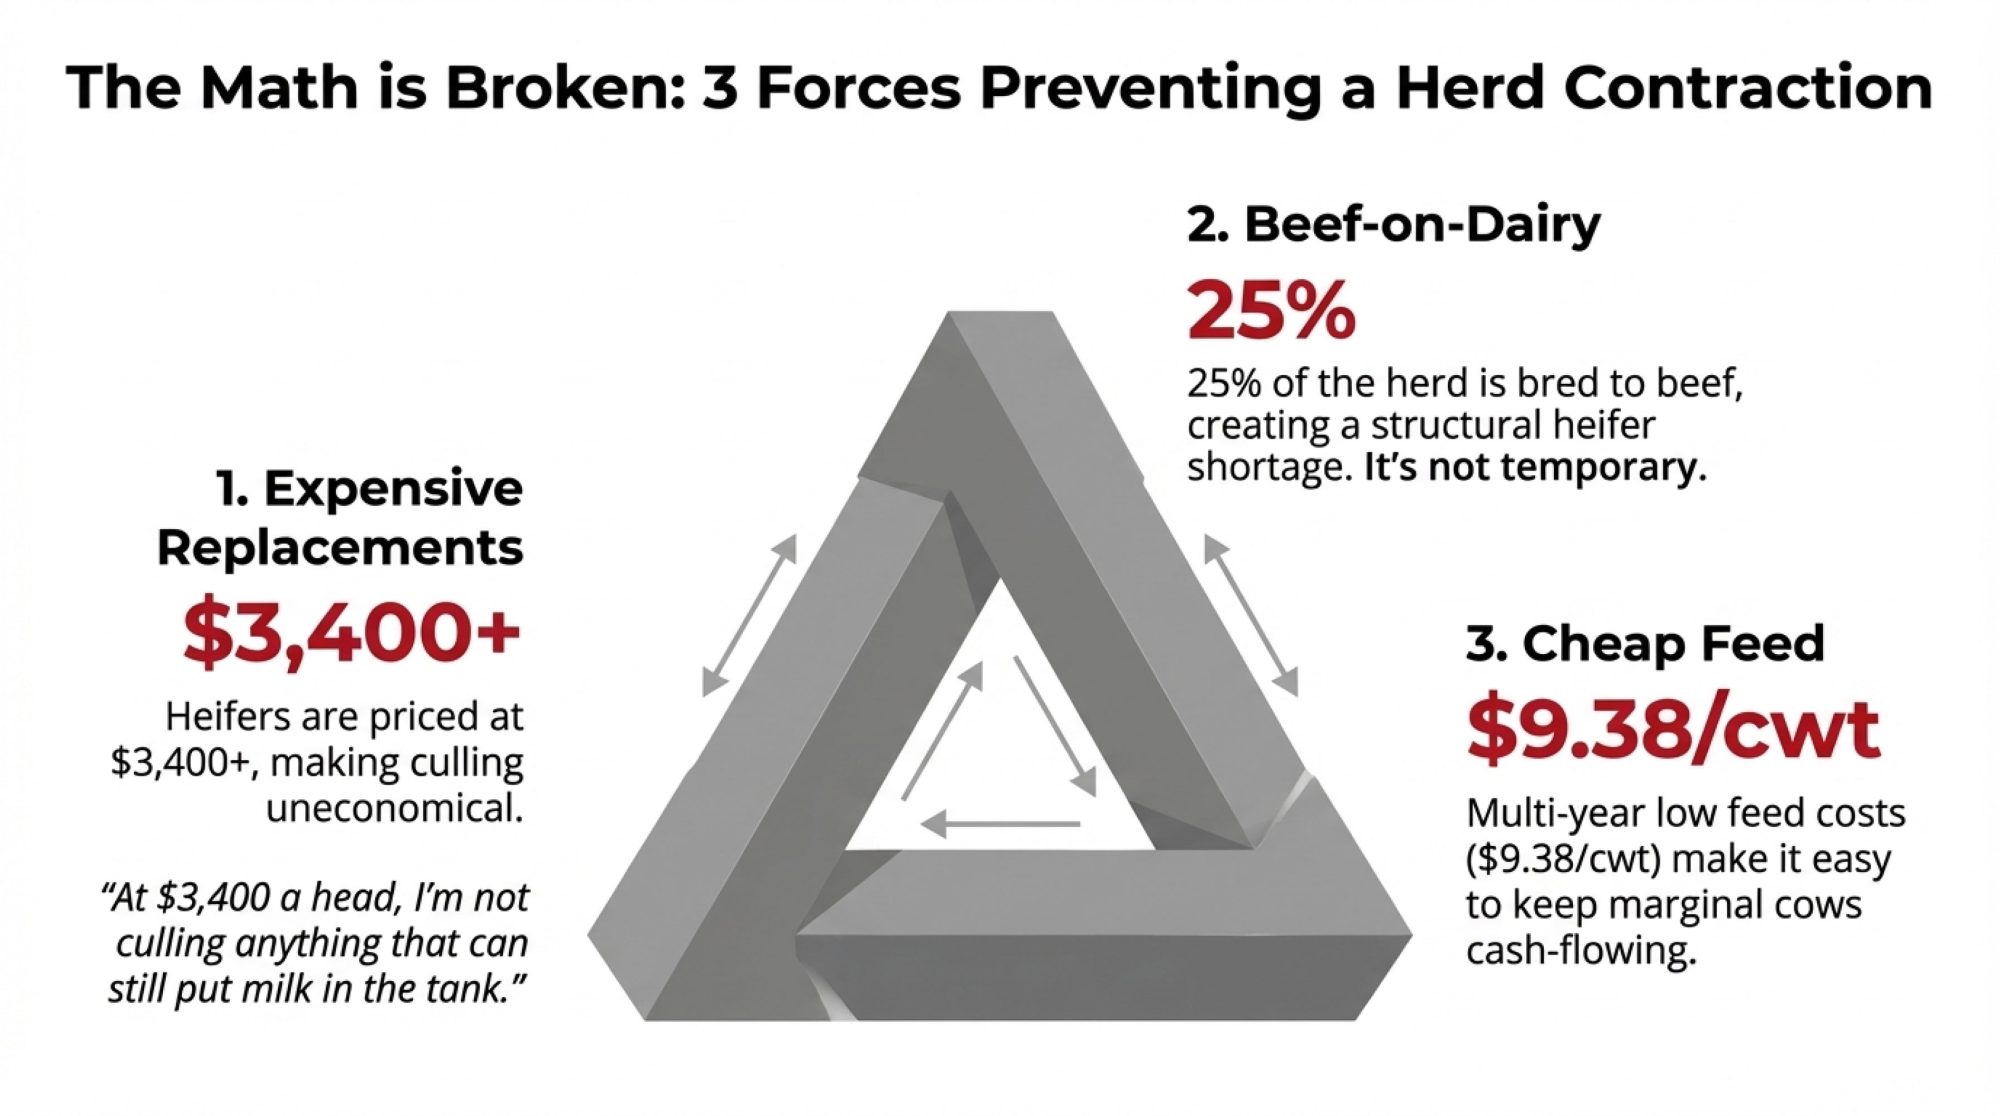
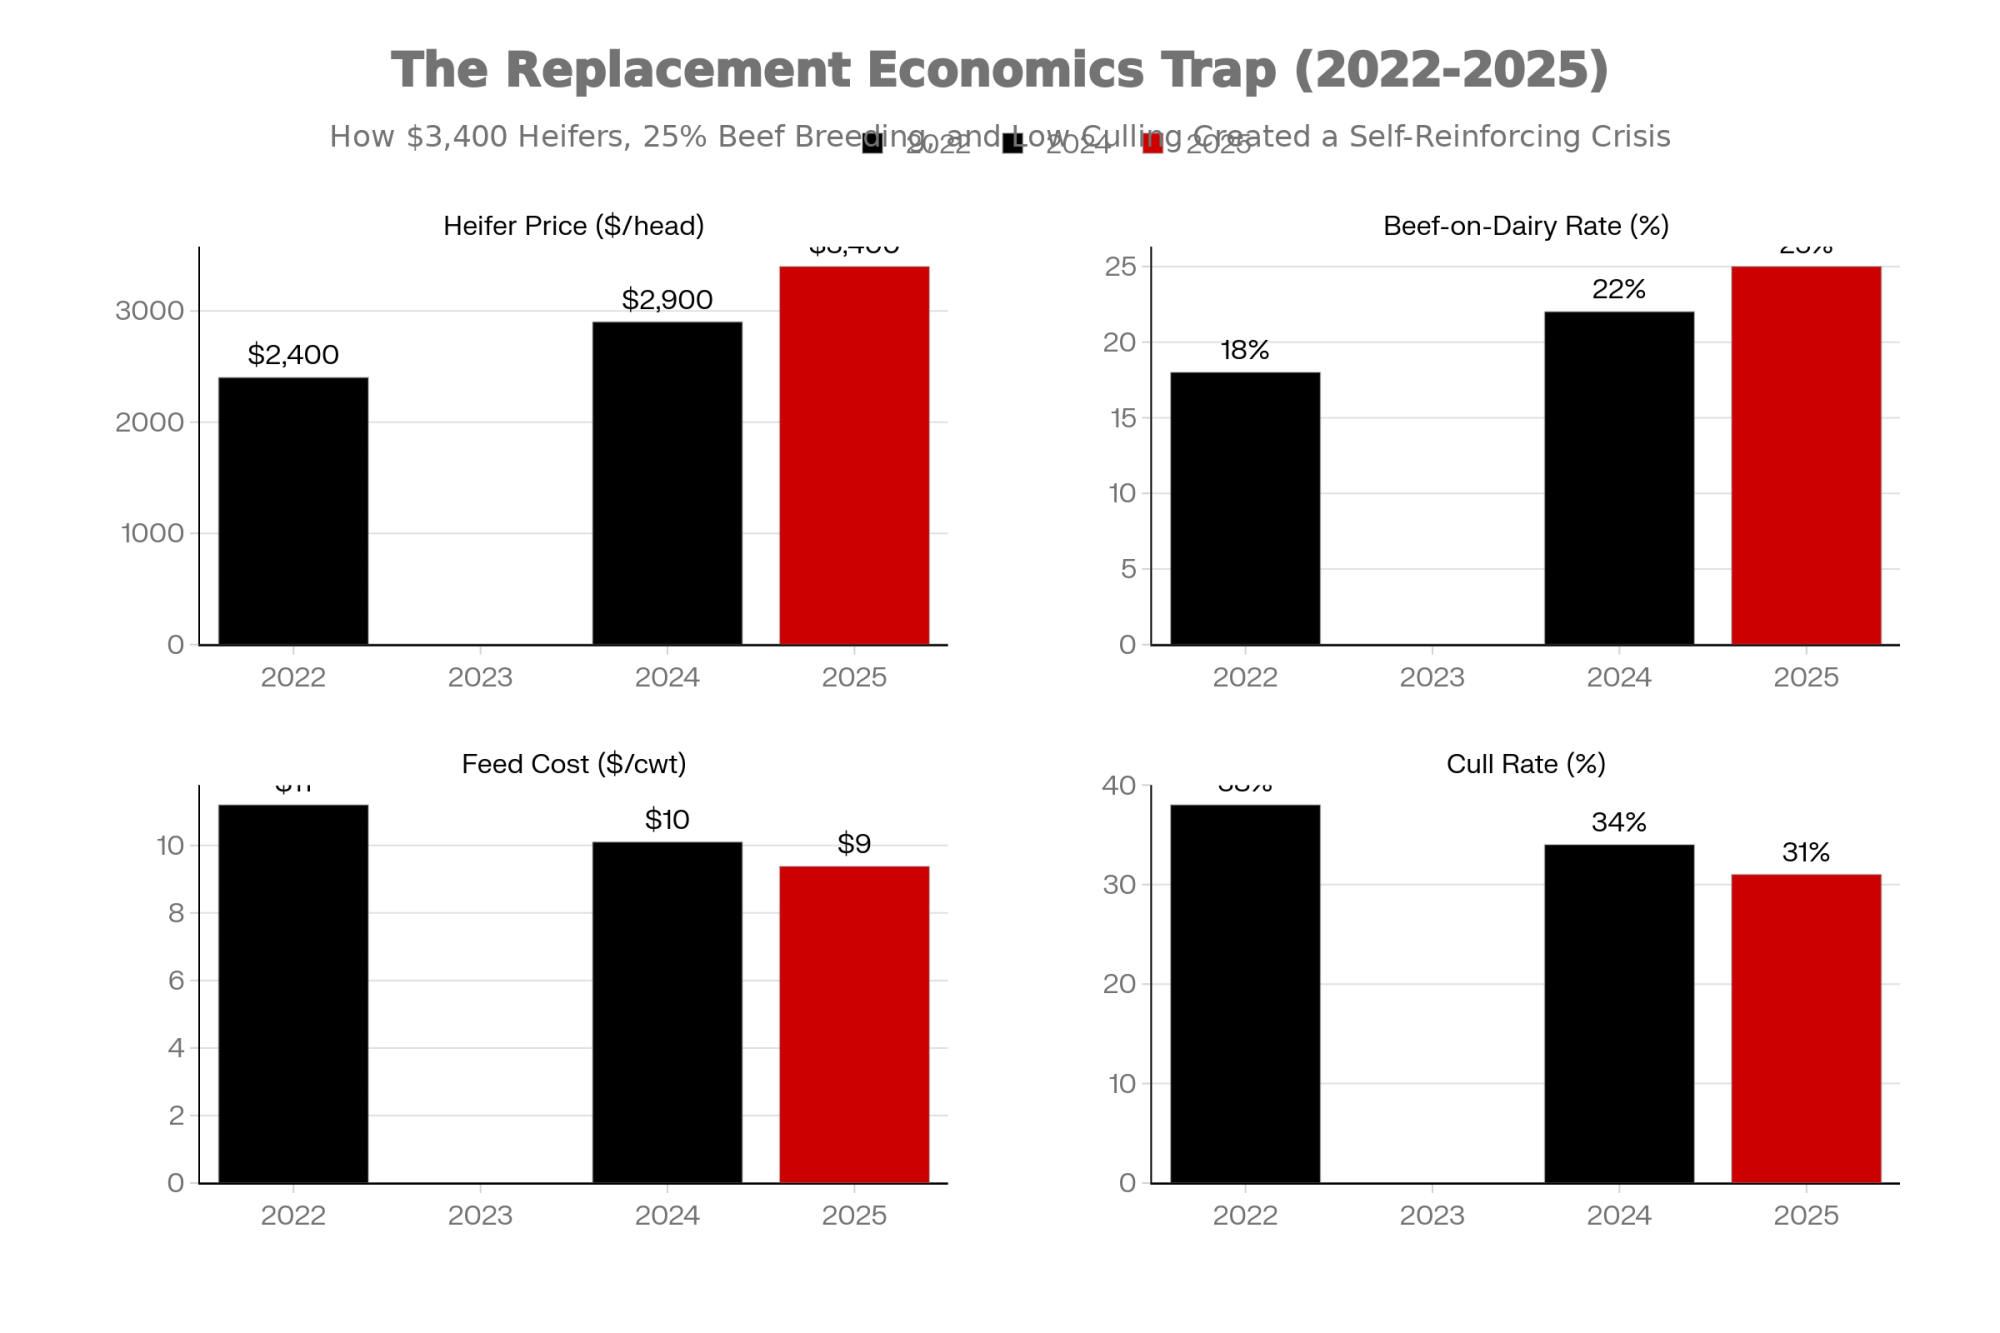
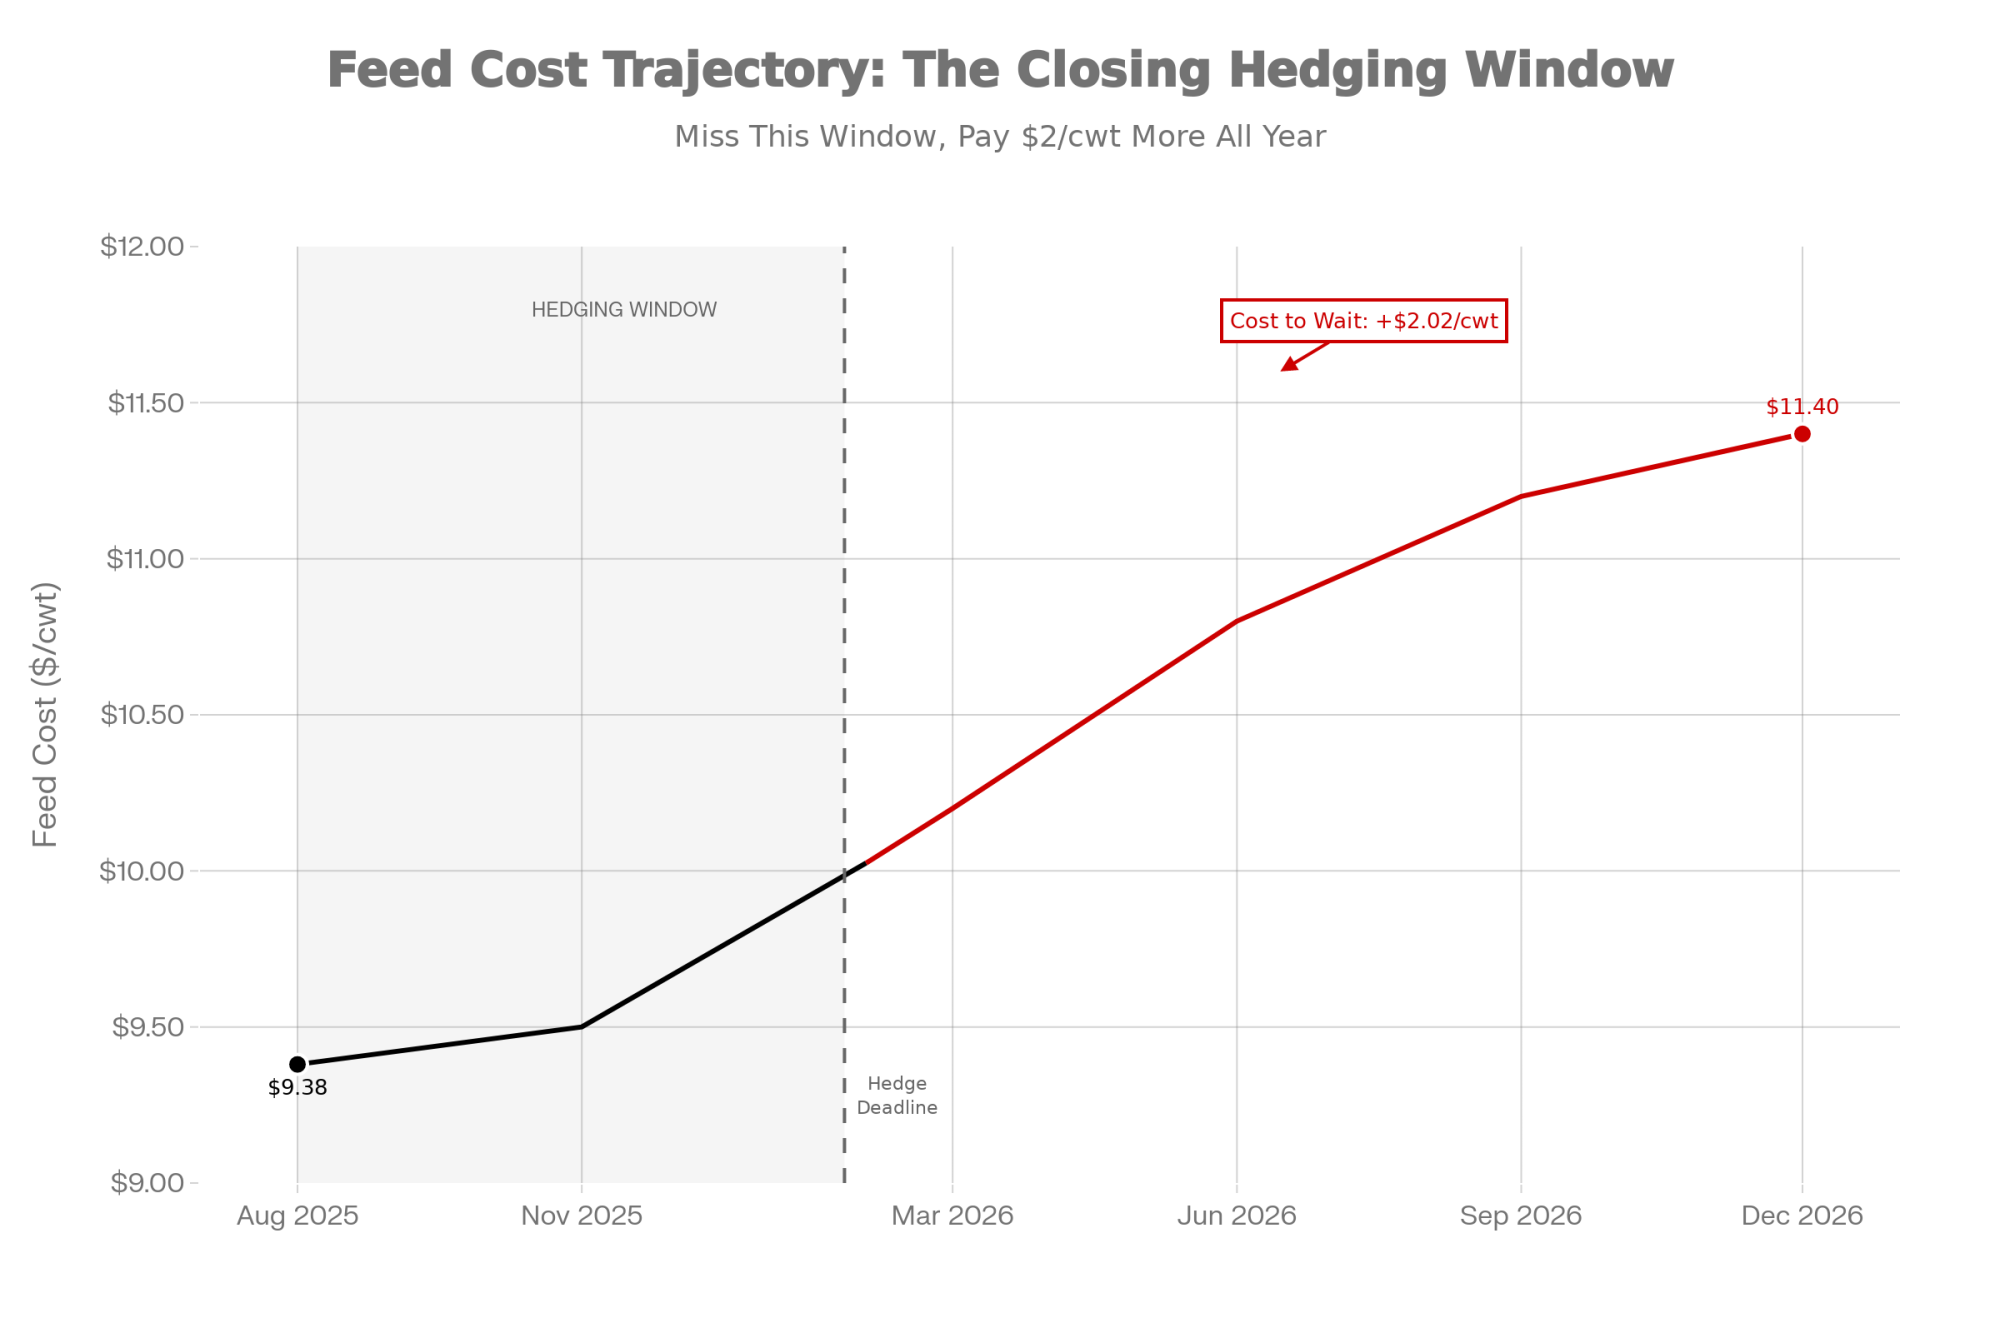
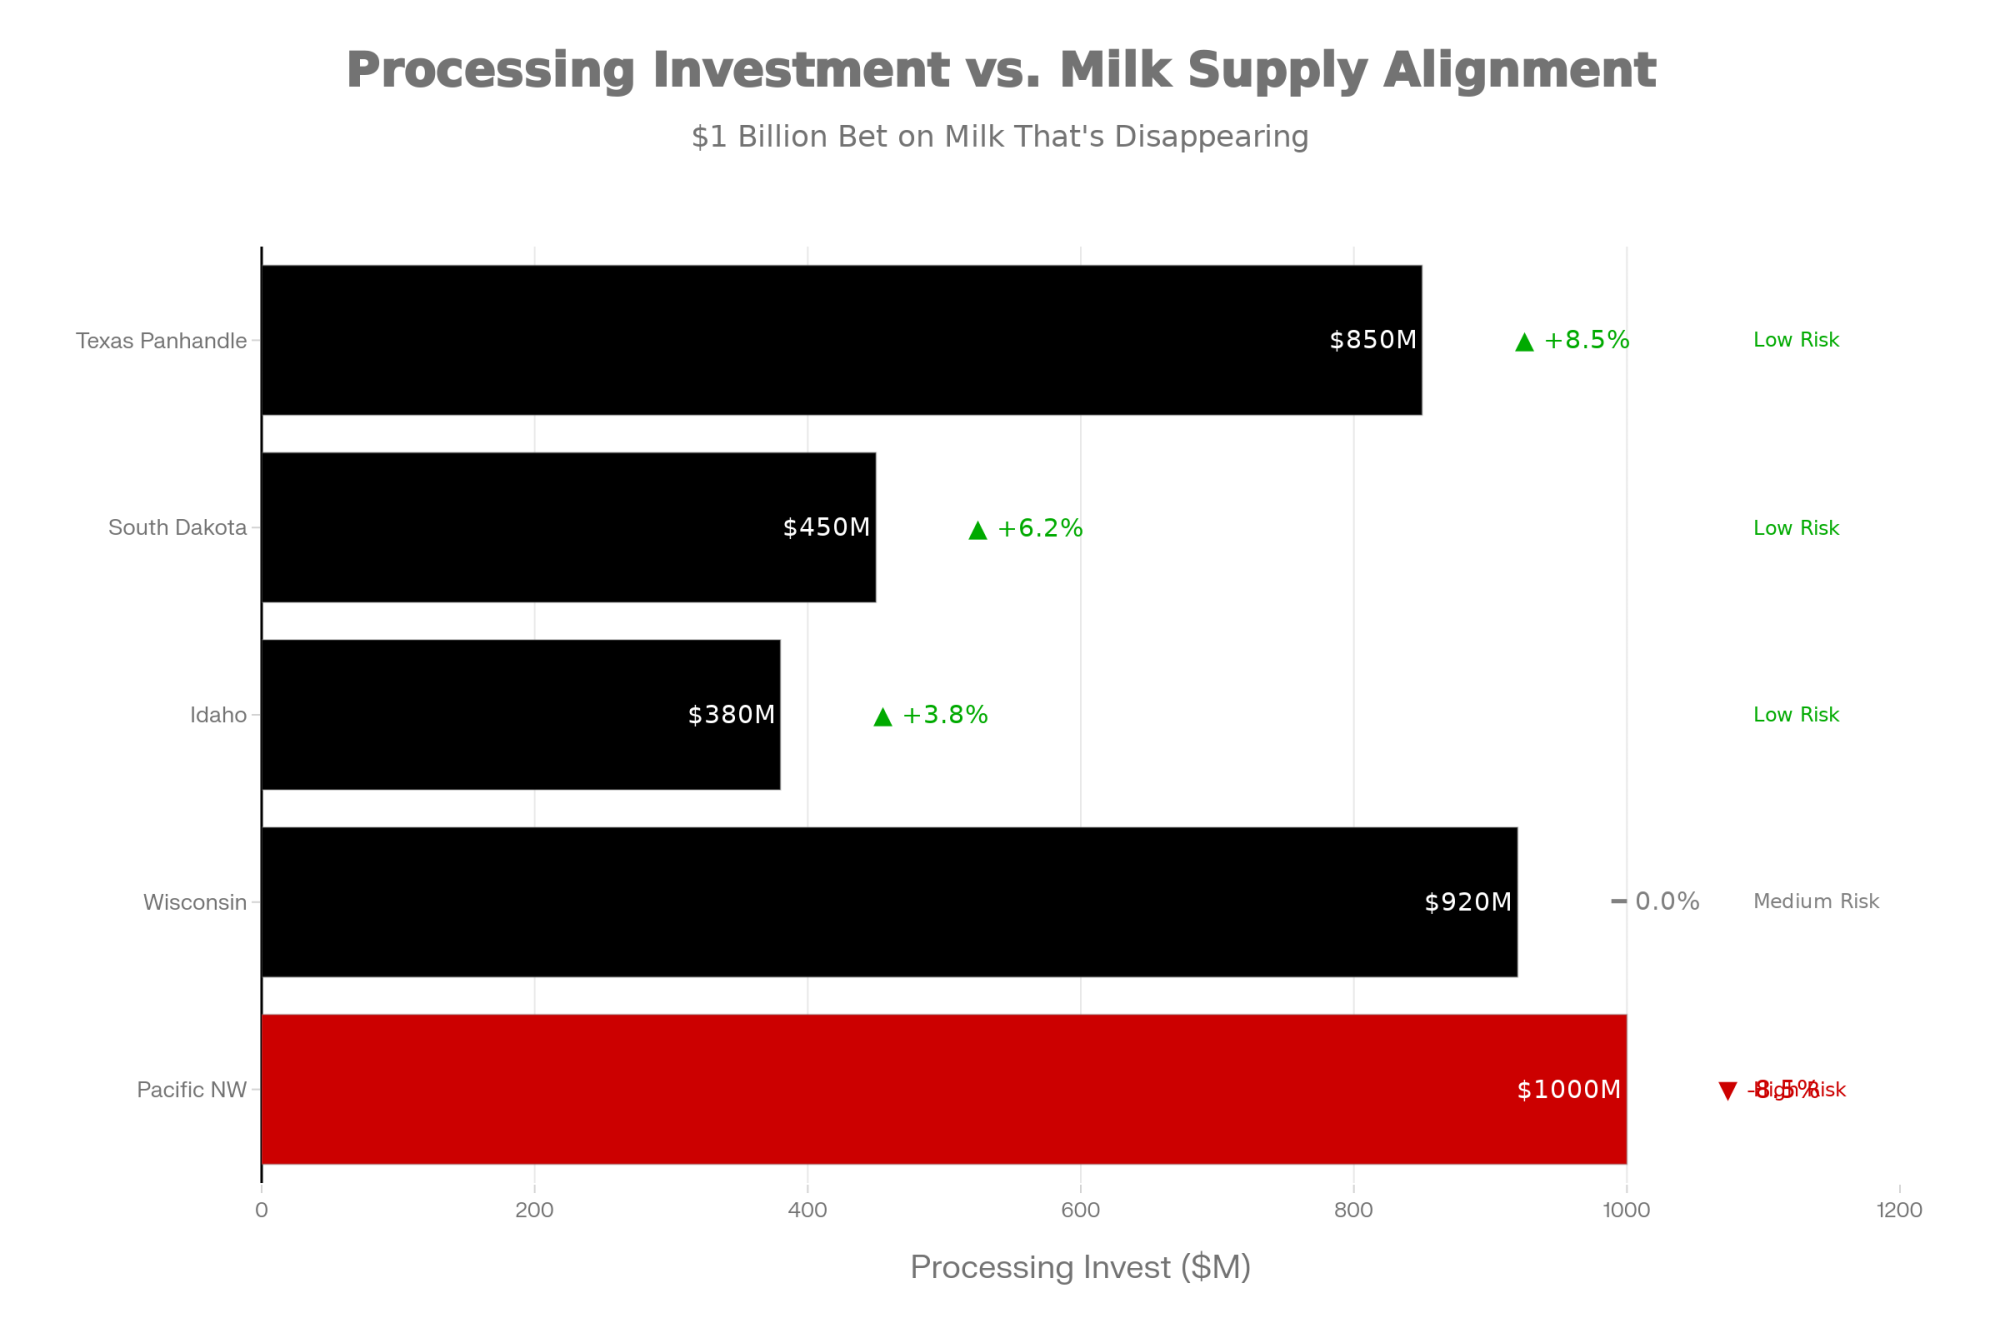
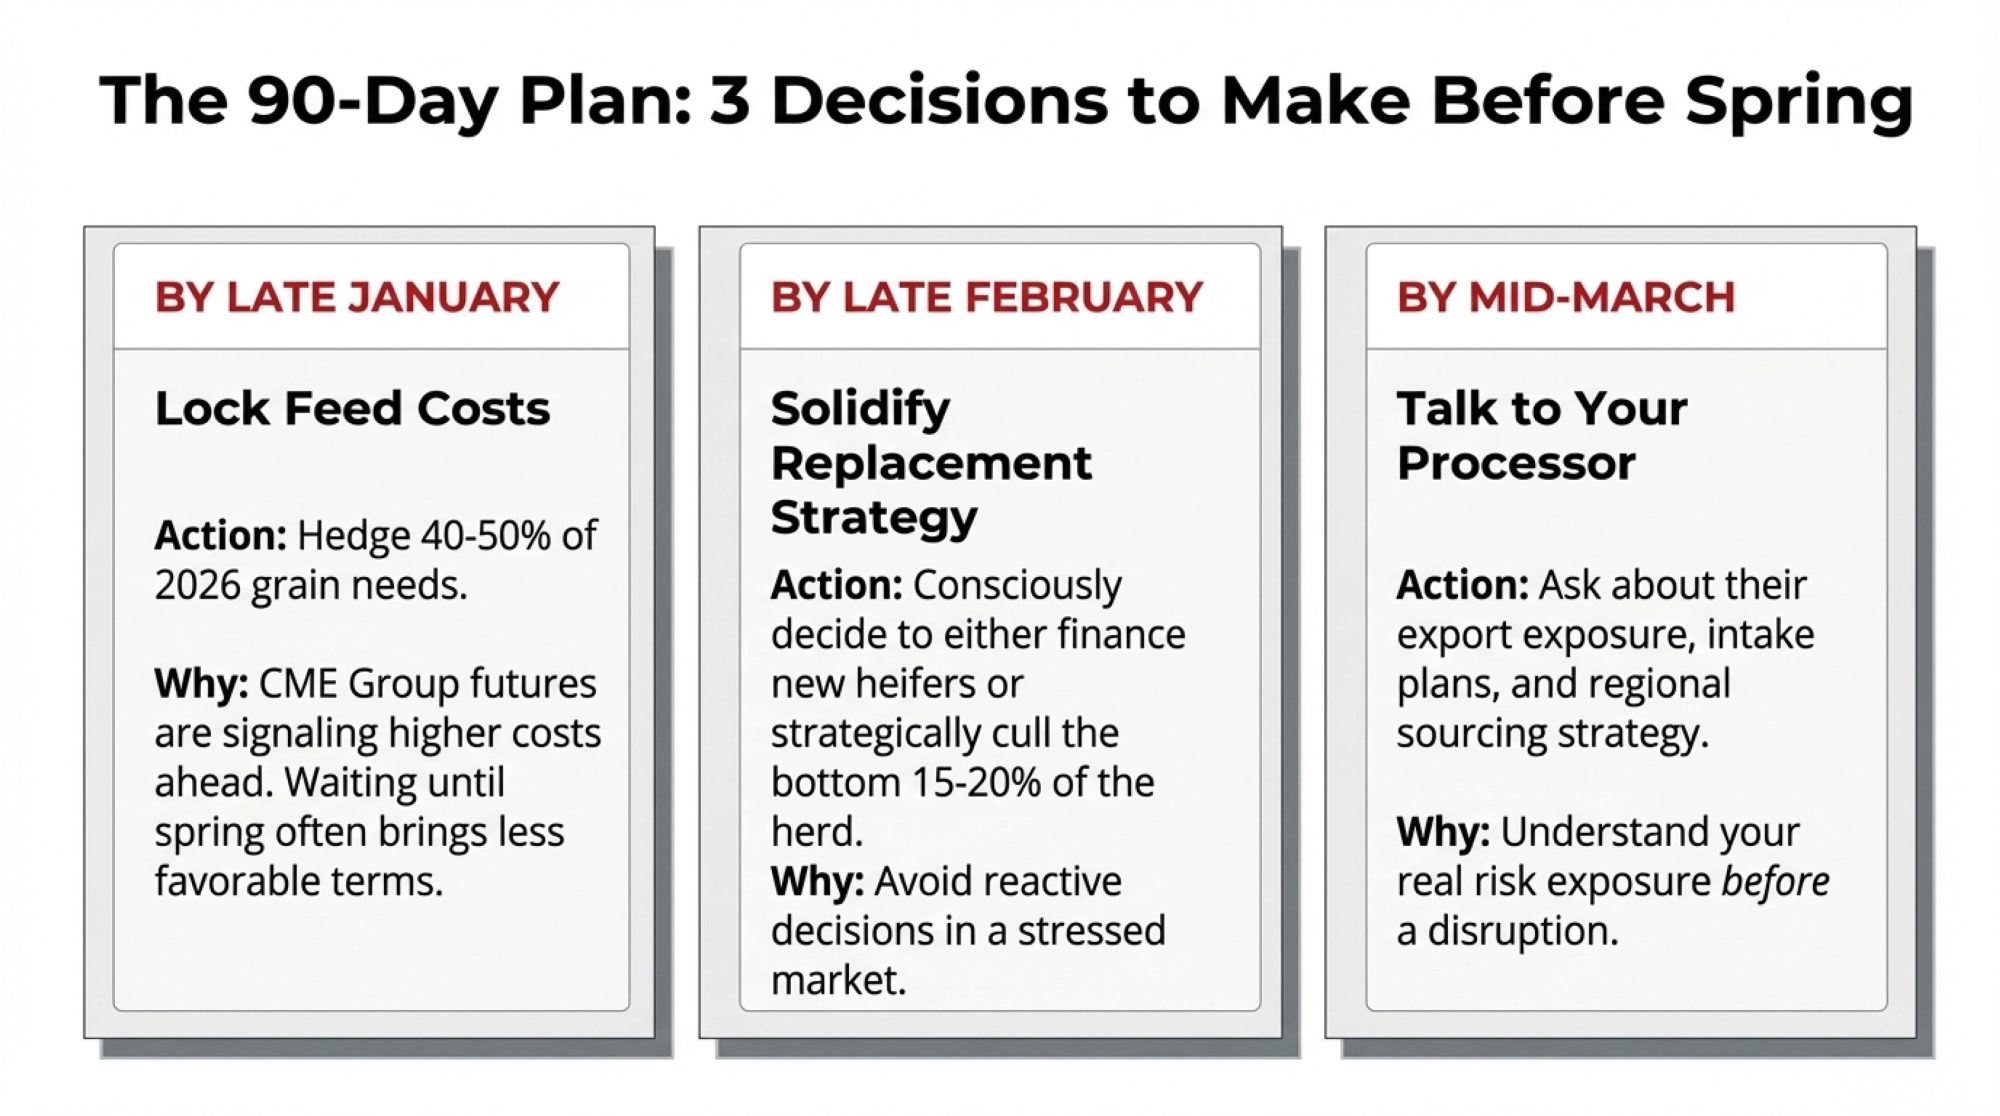
Executive Summary: Here’s what the national dairy numbers aren’t telling you: Texas added 50,000 cows last year while Washington lost 21,000—and both get averaged into that 3% growth everyone’s celebrating. Three self-reinforcing factors explain why herds haven’t contracted despite margin pressure: heifer prices above $3,400, making culling uneconomical; beef-on-dairy breeding consuming 25% of the herd’s replacement capacity; and feed costs near multi-year lows. Add $11 billion in new processing capacity coming online through 2028—much of it potentially misaligned with where milk will actually be produced—and you’ve got an industry approaching a meaningful reset. Smart producers have a 90-day window to hedge feed costs, lock in replacement strategies, and have honest conversations with their processors and bankers. The operations that come out ahead won’t just be the best operators—they’ll be the ones who understood their regional trajectory and kept enough flexibility to move when the time came.

2026 Dairy Industry Outlook

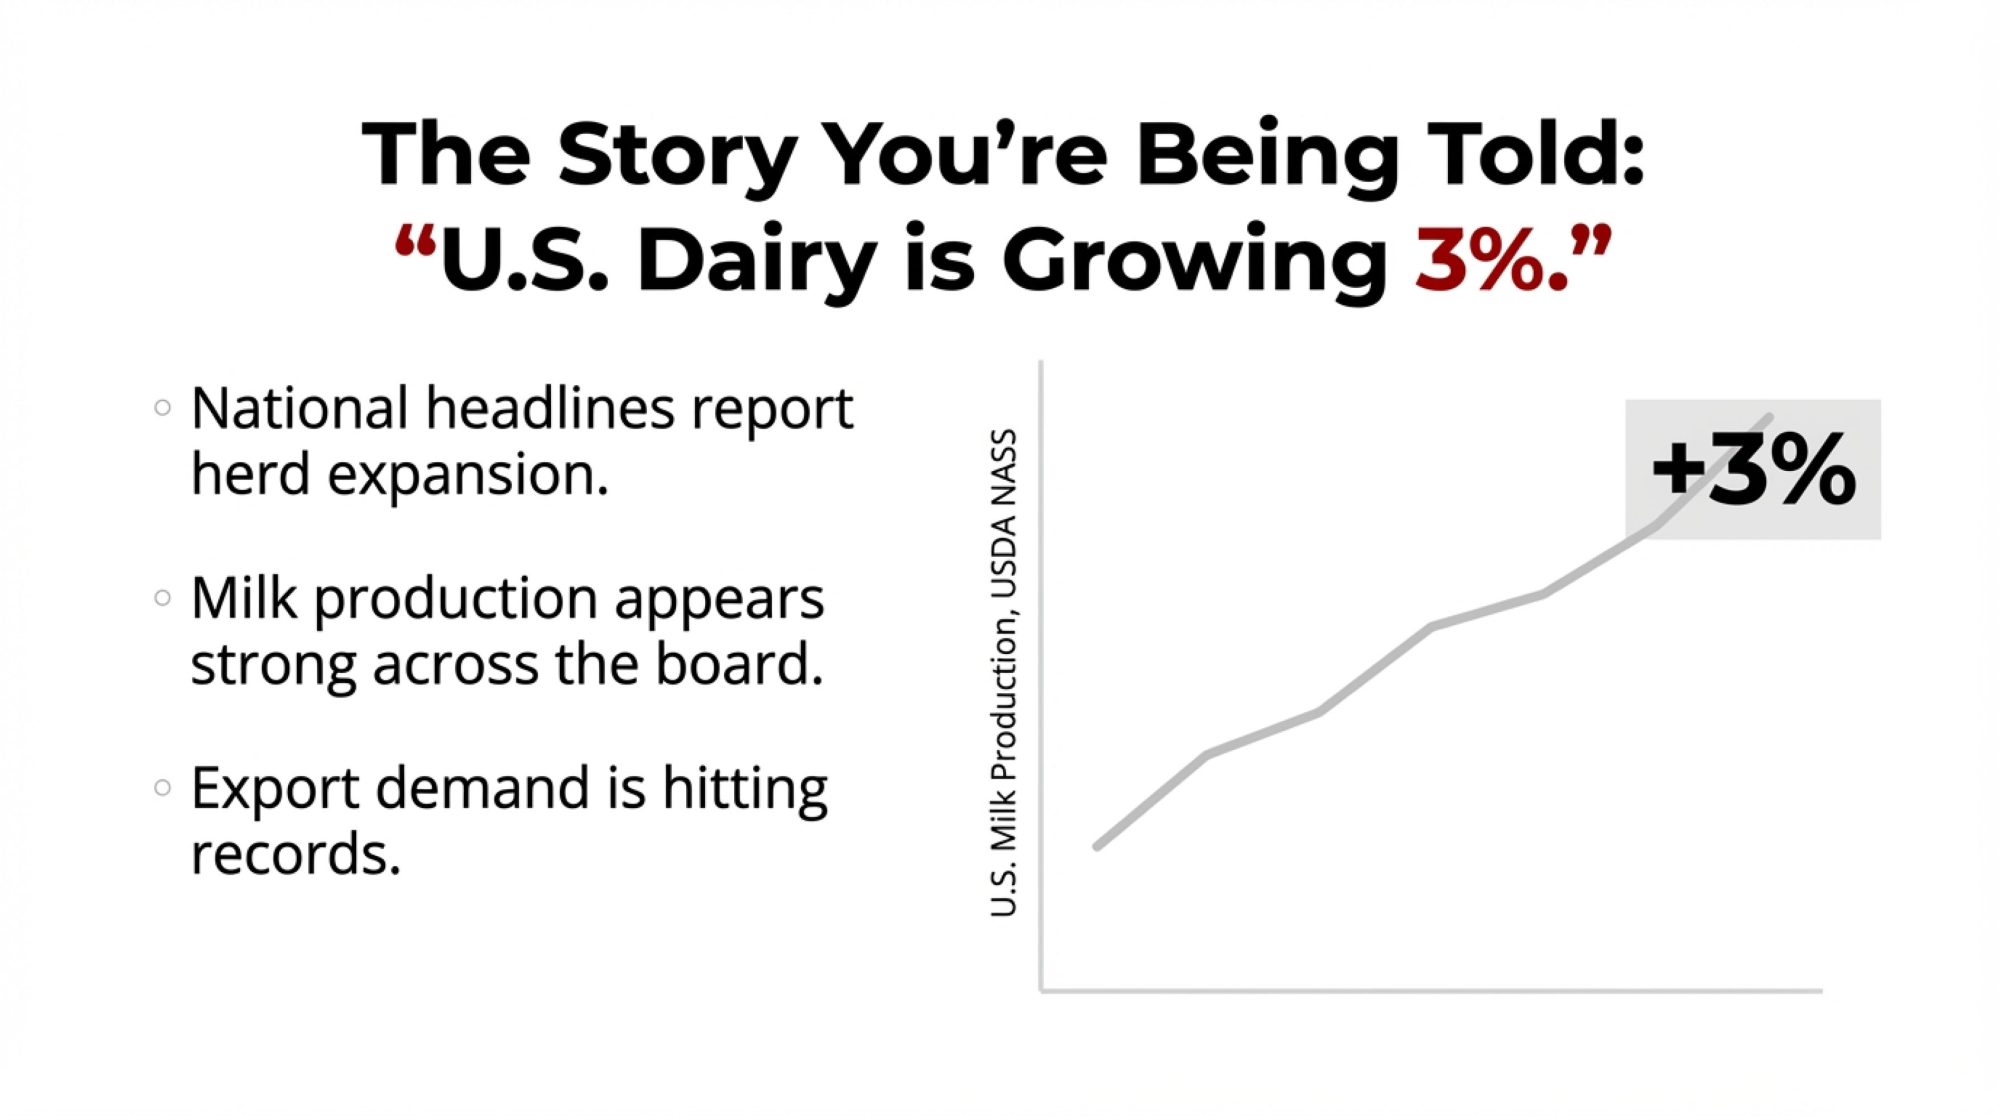
You’ve seen the headlines by now. Milk production up. Herd expanding. Cheese exports are hitting records.

Now here’s what those numbers don’t tell you.

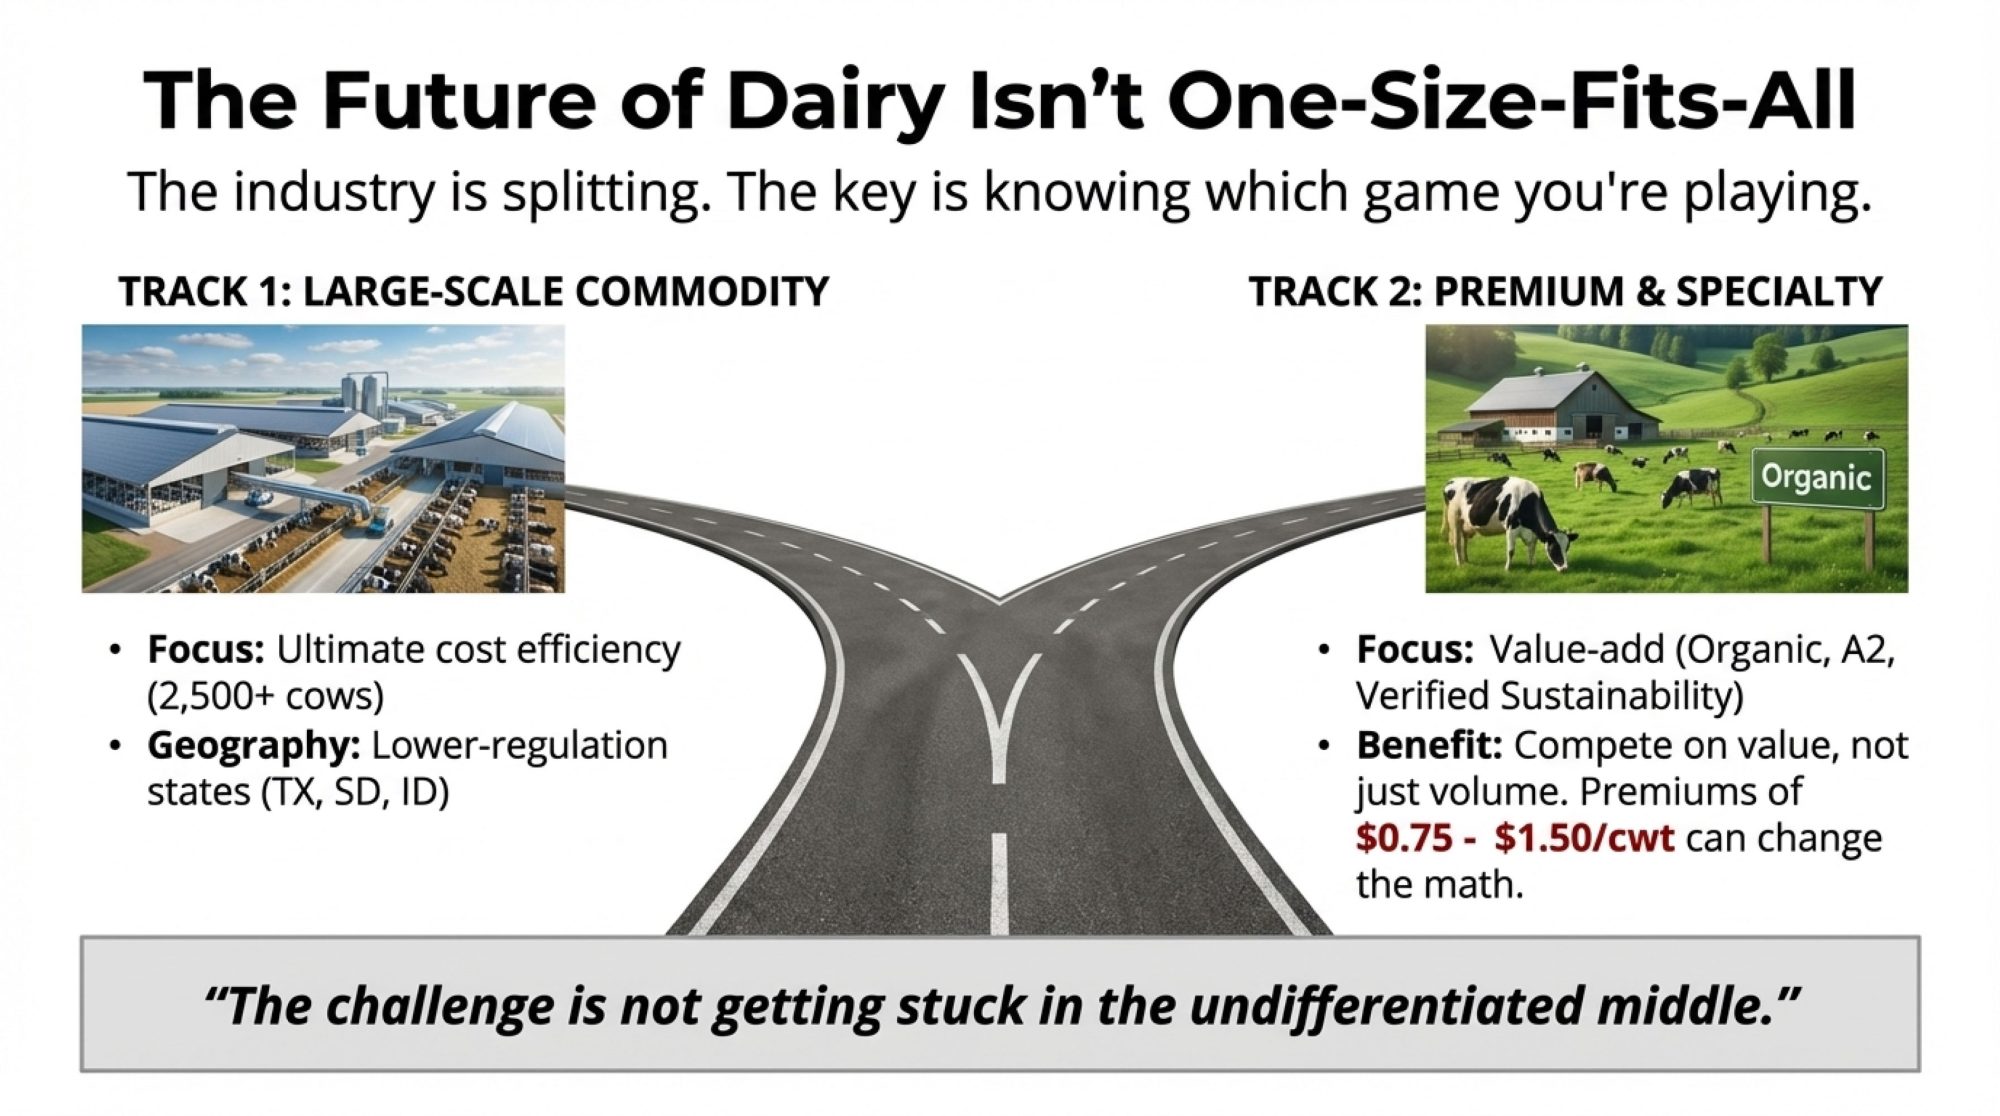
There isn’t one U.S. dairy industry anymore. There are at least two, maybe three—and they’re operating under completely different conditions, facing completely different futures. A producer in the Texas Panhandle and a producer in Washington’s Yakima Valley might see similar milk prices on any given month. But you know what? They’re playing entirely different games right now.

I should mention upfront: not everyone sees it this way. I was talking with a consultant last month who made a pretty compelling case that strong export demand signals continued growth across the board. And honestly, the optimists might be right. But the regional divergence I’ve been tracking suggests the headline numbers are masking something we all need to understand.

So let me show you what I mean.

The Great Divide: Where Dairy Is Growing vs. Where It’s Shrinking

That national milk production number everyone’s quoting—up more than 3% in August according to USDA NASS—is really just the average of dramatically different regional stories.

Here’s how it actually breaks down:

RegionWhat’s HappeningThe NumbersWhat’s Driving It
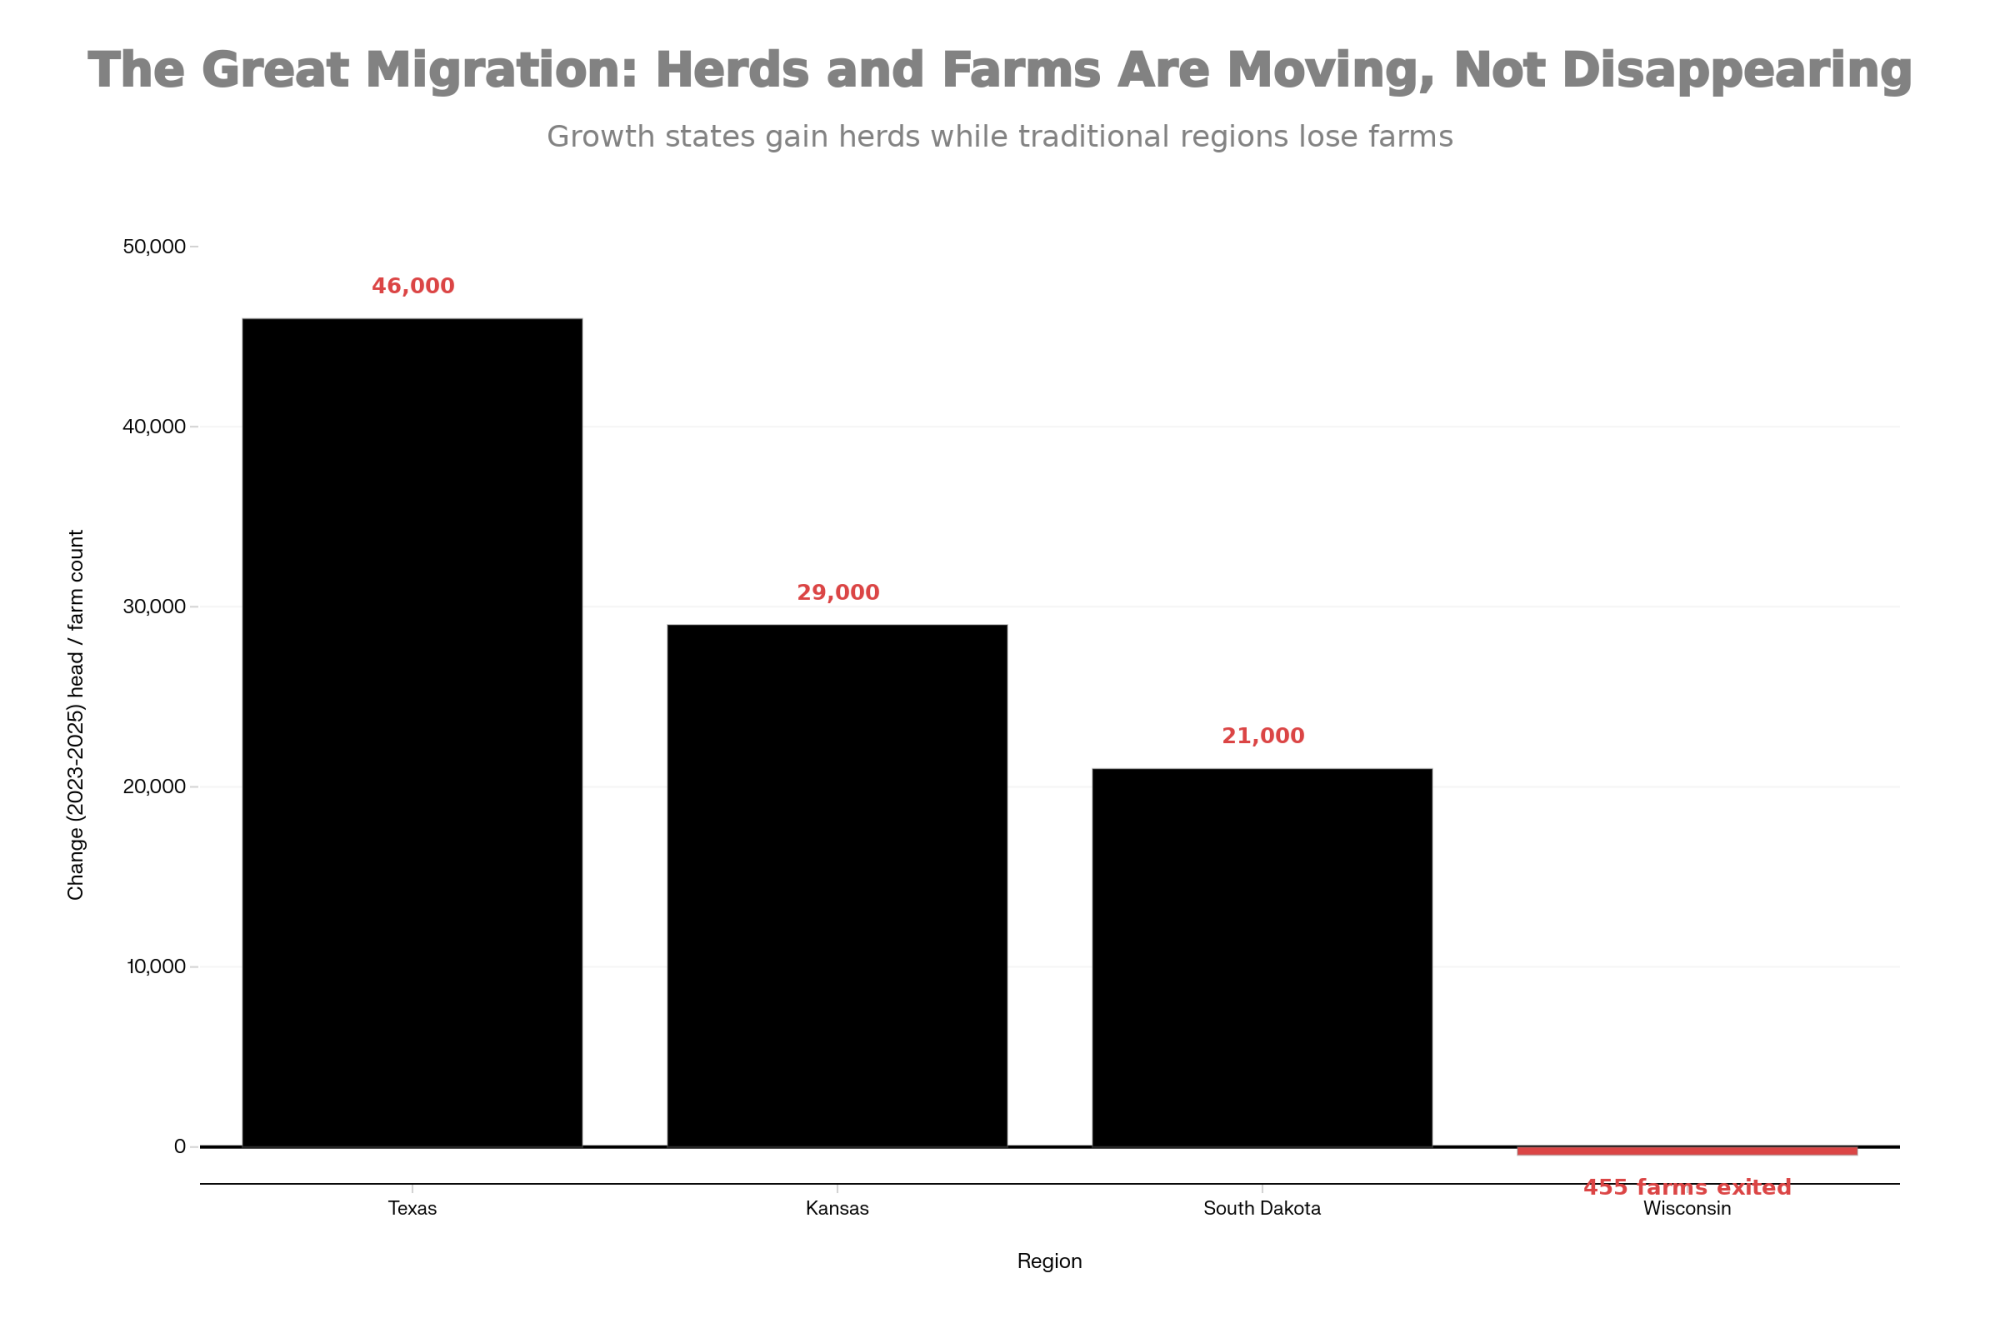
TexasRapid expansion+50,000 cows in 12 monthsProcessing built ahead of herds; lighter regulations
South DakotaStrong growthValley Queen is adding capacity for 25,000 cowsProcessor investment is pulling producers in
IdahoSteady growthContinued herd expansionLand availability; good processing access
WisconsinFlat, consolidatingProduction is barely above flat in 2025Smaller farms exiting; larger ones absorbing neighbors
MinnesotaConsolidatingSteady structural changeSimilar pattern to Wisconsin
CaliforniaDecliningProduction down despite stable herdH5N1 impacts; milk per cow dropping
WashingtonRapid contraction-21,000 cows year-over-year; -8.5% outputEnvironmental compliance costs; EPA involvement
OregonSteady declineContinued farm attritionAir quality regulations; rising costs

Data from USDA NASS September 2025, Dairy Herd Management, Farmers Advance, and IDFA analysis

You see what’s happening here? Texas added enough cows to fill a major cooperative. Washington lost enough to empty one. And we’re calling that a “national trend.”

What’s Fueling the Growth States

I had a chance to tour a newer Texas Panhandle operation last spring, and a few things really stood out to me.

First—and this is important—the processing came before the cows. Cheese plants in Dumas, Amarillo, and Lubbock were already running when producers started expanding. That sequencing matters more than people sometimes realize. You don’t have to wonder where your milk’s going when there’s a plant down the road hungry for supply.

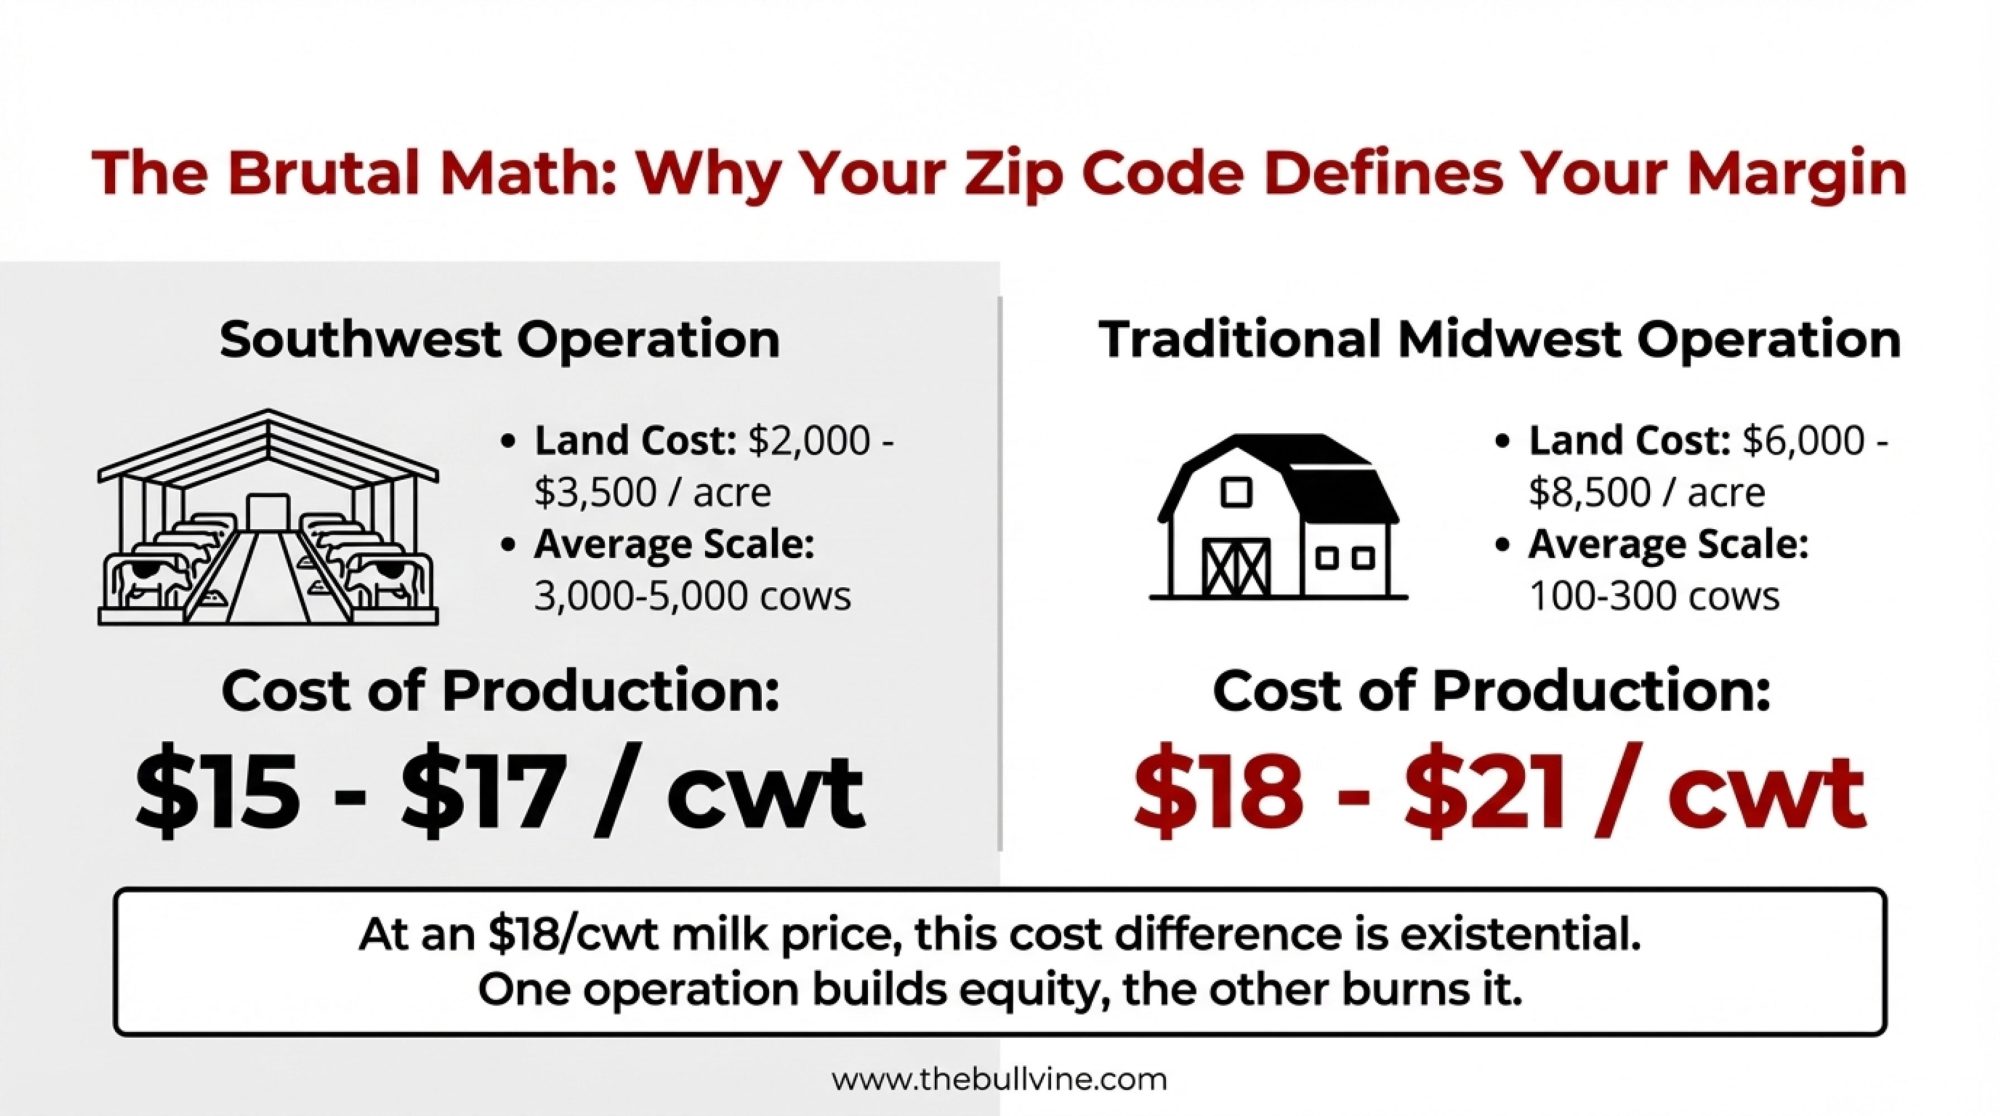
The feed economics work differently out there, too. Land costs and crop prices create structural advantages that are hard to replicate in traditional dairy regions. And while Texas certainly has regulations, the overall compliance burden is measurably lighter than that faced by coastal operations.

South Dakota’s telling a similar story. Dairy Herd Management reports that Valley Queen’s expansion could accommodate roughly 25,000 additional cows over 2025-2026. The processor built the capacity first. The cows are following.

What’s Driving the Contraction

Now, Washington’s situation… that’s tougher to watch.

A producer I know in the Yakima Valley—third-generation, solid operator—told me he’s spending more time with regulators than with his cows some weeks. That’s an exaggeration, but it captures something real about what’s happening out there.

The challenges are stacking up: groundwater nitrate issues have brought EPA involvement to some operations. The Washington State Department of Ecology is proposing regulations that would substantially increase costs. Labor costs run higher than competing regions. And the result, according to Dairy Herd Management, is 21,000 fewer cows in October compared to the prior year.

California’s dealing with its own complexity—H5N1 outbreaks have hit productivity in numerous Central Valley herds, contributing to declining milk per cow even while the overall herd held relatively steady. It’s a different challenge, but the direction is similar.

Producers Who’ve Made the Move

Not everyone’s standing still, though. I’ve talked with a few producers who saw the writing on the wall and made strategic relocations. One Wisconsin family I know sold their 800-cow operation two years ago and partnered with an established South Dakota dairy. They’re now managing a larger string with better margins and—here’s what surprised them—less overall stress despite the bigger numbers. “The regulatory load alone,” the son told me, “freed up 15 hours a week we used to spend on paperwork.”

That’s not the right move for everyone. Plenty of operations have deep roots, family land, and established processor relationships that make staying put the smarter play. But it’s worth noting that some producers actively choose their region rather than just accept the one they inherited.

The Math Is Broken: Why High Costs Didn’t Shrink the Herd

Here’s something that’s been puzzling economists for months now: margins got squeezed, but culling rates stayed low. The national herd actually grew when every historical pattern said it should contract.

What’s going on? Three factors, and they’re all connected.


Metric
202220242025
Replacement Heifer Price ($/head)$2,400$2,900$3,400
Beef-on-Dairy Breeding Rate (%)18%22%25%
Feed Cost ($/cwt)$11.20$10.10$9.38
Cull Rate (%)38%34%31%
Heifer Shortage SeverityModerateElevatedCritical

Replacement Heifers Got Really Expensive

You probably know this already if you’ve been to an auction lately. Current prices from USDA Agricultural Marketing Service reports:

  • Upper Midwest: $3,200-$3,500 per head for quality replacements
  • Premium springers: $4,000+ at some California and Wisconsin auction barns

Mark Stephenson—he’s the director of dairy policy analysis at the University of Wisconsin-Madison—has pointed out that at these prices, payback periods on marginal replacements stretch to nearly 15 years.

I was talking with a 400-cow producer in central Wisconsin who put it pretty simply: “At $3,400 a head, I’m not culling anything that can still put milk in the tank.” And that sentiment seems widespread.

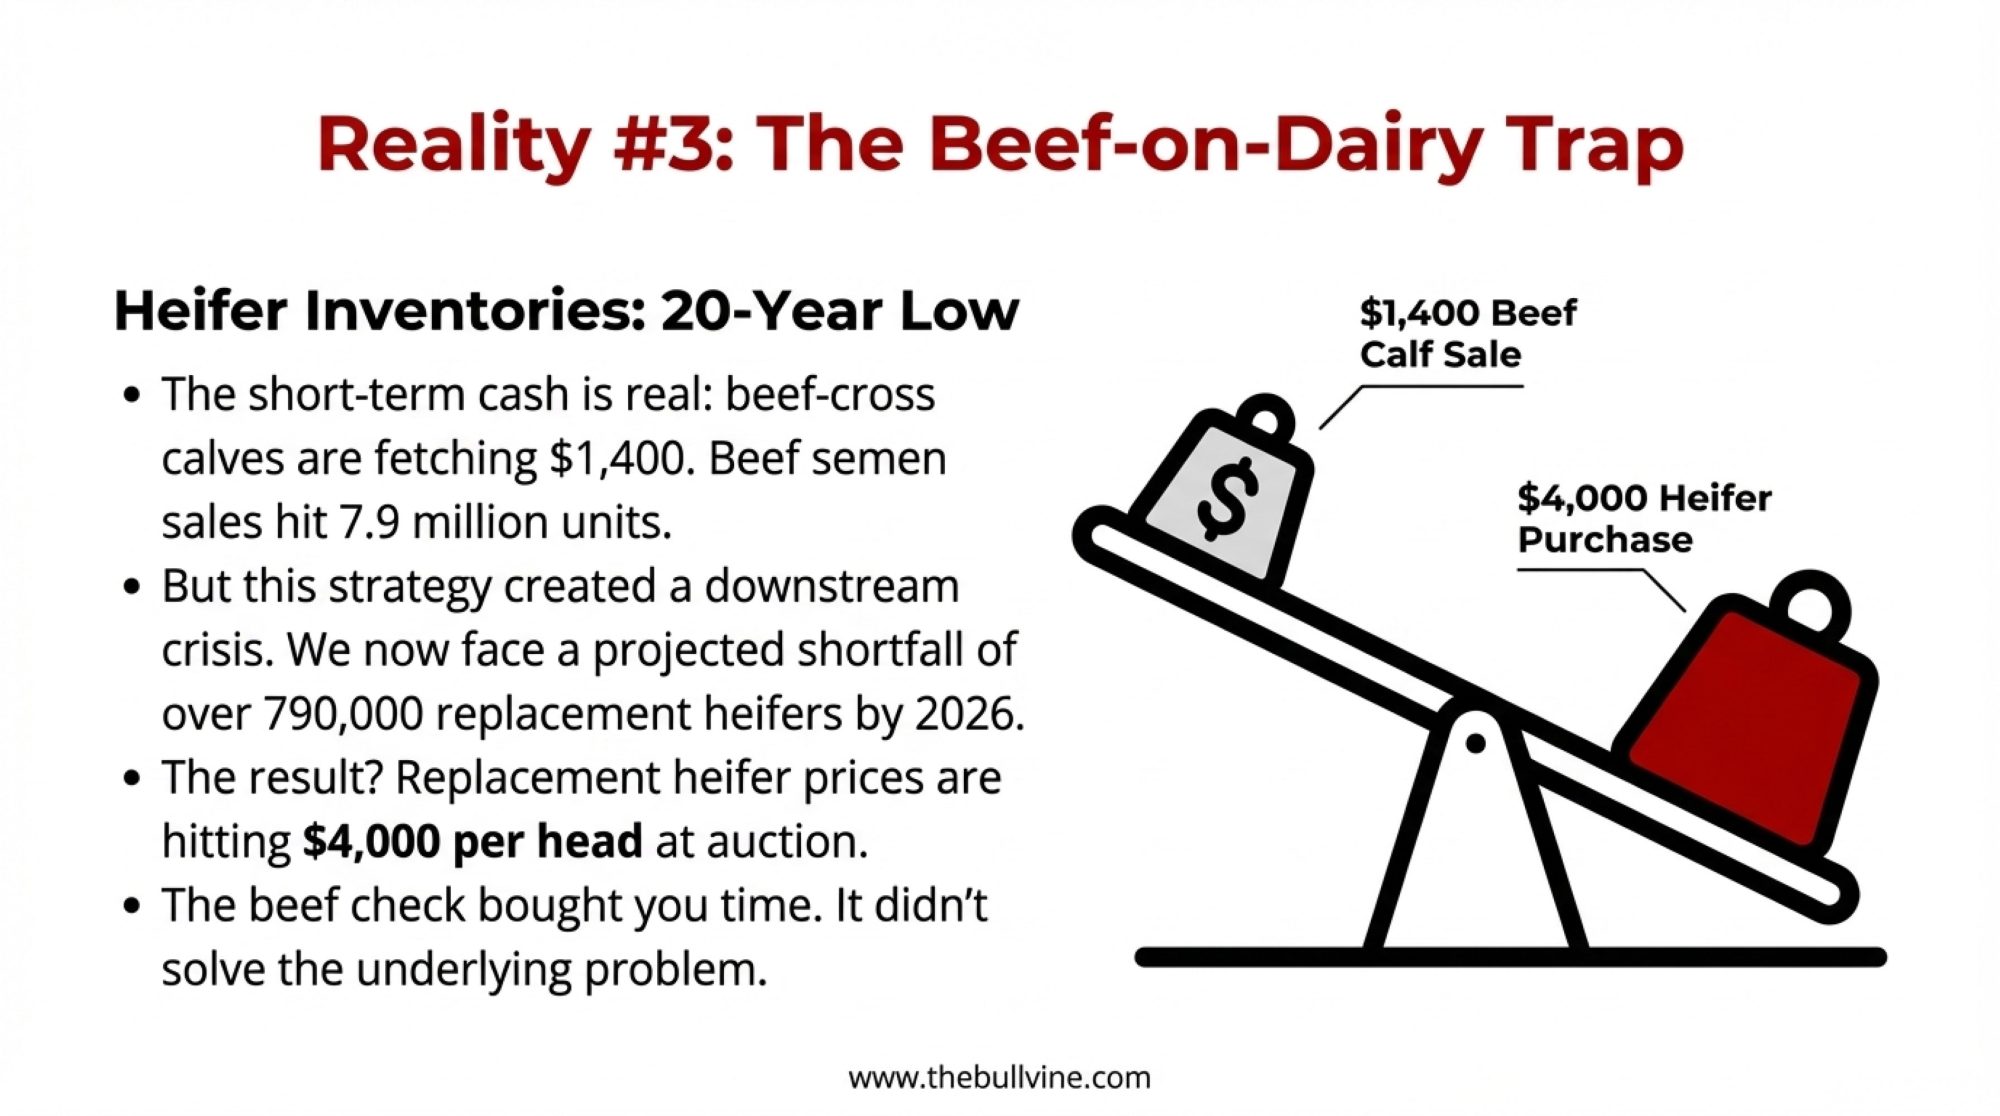
Beef-on-Dairy Changed Everything

This is the part that doesn’t get enough attention, in my view. Council on Dairy Cattle Breeding data shows roughly 25% of the dairy herd is now bred to beef genetics. Those crosses are generating $400-$600 premiums—sometimes more—for quality blacks with good conformation.

But here’s the catch, and it’s a big one: every beef-cross calf is a dairy heifer that doesn’t exist.

The heifer shortage isn’t temporary. It’s structural. And it’s self-reinforcing.

Feed Costs Hit Multi-Year Lows

The USDA Dairy Margin Coverage program calculated feed costs at $9.38 per cwt for August 2025. The Center for Dairy Excellence confirmed that figure—down nearly 50 cents from July. That’s among the lowest readings we’ve seen in years.

When feed is cheap, even that older cow in the back pen—the one you’d normally have shipped by now—can still contribute to cash flow. The economic pressure to cull just isn’t there.

And here’s the trap: These factors reinforce each other. Expensive heifers mean you keep old cows. Keeping old cows means you don’t need expensive heifers. Beef-on-dairy means fewer heifers get born anyway. And cheap feed makes all of it pencil out.

For now, anyway.

Feed Cost Outlook: Why Many Advisors Are Saying Hedge Now

Here’s what’s interesting about the forward markets. CME Group data shows that December 2026 corn futures are trading above current spot prices. The market’s signaling higher costs ahead.

TimeframeWhat Corn’s Telling UsWhat It Means for Feed Costs
Right nowFavorable pricing$9.38/cwt (August DMC calculation)
Dec 2026 futuresHigher than spotCould push toward $11.00+/cwt
Normal price swing+$0.50-$0.75/bushelAdds $1.50-$2.00/cwt to your feed line

Now, futures markets have been wrong before—I want to be honest about that. But the signal’s worth noting.

The window to lock in favorable feed pricing may be closing. I’ll get into specific timing in the action steps below.

PeriodFeed Cost ($/cwt)Futures Signal
Aug 2025$9.38Spot (Favorable)
Nov 2025$9.50Favorable
Mar 2026$10.20Rising
Jun 2026$10.80Elevated
Sep 2026$11.20High
Dec 2026$11.40High

The Processing Puzzle: $11 Billion in New Capacity—But Is It in the Right Places?

IDFA confirmed during Manufacturing Month that more than $11 billion in new dairy processing capacity is coming online through 2028 across 19 states. That’s cheese plants, butter facilities, powder operations, and fluid processing. It’s a massive investment that reflects real confidence in American dairy’s future.

But here’s the question worth asking: Is it being built where the milk will be?

The Mismatch Worth Watching:

RegionProcessing InvestmentMilk Supply TrendWhat to Watch
WisconsinMajor expansions underwayEssentially flat productionWhere does the milk come from?
Pacific NorthwestDarigold’s $1 billion Pasco plant (8M lbs/day)Contracting 8.5% annuallyReal supply/capacity tension
Texas/South DakotaMatched to growthExpanding steadilyBetter alignment

I don’t have a definitive answer on how Darigold plans to fill a billion-dollar facility when regional supply is declining nearly 9% annually. Their leadership clearly sees a path forward that I may not fully appreciate—and they know their market far better than I do.

But facilities built expecting 90%+ utilization that end up running at 70-75%… that financial stress eventually flows somewhere. Often, back to producers through milk payment adjustments or cooperative equity calls. It’s something to be aware of.

The Silent Partner: Why Your Banker Decides Who Survives 2026

Here’s something that rarely makes industry headlines but may matter as much as milk price or feed cost.

When margins compress—and they will at some point; they always do—the question isn’t just “Can my farm cash flow at $14 milk?” It’s “Will my lender give me time to get back to $17?”

That’s not purely an economic question. That’s a relationship question. And it might quietly decide who’s still farming in 2028.

Two producers with nearly identical cost structures can face completely different outcomes:

Producer AProducer B
Modest leverageAggressive expansion of debt from low-interest years
Six months of working capitalThin operating lines
Lender who’s been through dairy cyclesLender with stressed ag portfolio
Gets patience when neededGets pressure instead

A farm financial consultant I was talking with in Minnesota made this point effectively: the best-positioned producers right now aren’t just focused on cost per cwt. They’re using this window—while milk checks are decent and lines aren’t maxed—to:

  • Clean up any covenant issues
  • Term out short-term debt into longer amortizations
  • Build transparent, data-driven relationships with their lenders

The operations that emerge as consolidators on the other side of any transition won’t necessarily be the best operators. They’ll often be the ones whose banks stayed in the game.

The Biosecurity Wildcard: H5N1

I’d be remiss not to mention what’s been on everyone’s mind this year.

USDA APHIS has confirmed Highly Pathogenic Avian Influenza outbreaks in dairy cattle across multiple states, including Kansas, Idaho, Texas, Iowa, and others. The virus can move between herds, particularly through cattle movements and the use of shared equipment.

The current picture: Economic damage has been contained and localized so far. Some affected dairies experience temporary production drops during transition periods and during the fresh-cow phase. Export partners are watching but haven’t acted dramatically.

The risk: If regulators move from “monitor and manage” to “contain and control,” the orderly consolidation we’ve been discussing could become something more disruptive.

What to do now: The basics matter more than ever. Review boot and clothing protocols. Tighten visitor policies. Isolate new animals before introducing them to the string. Be thoughtful about shared equipment between operations.

None of this is new advice for anyone who’s been around dairy cattle. But the stakes for following it have increased.

The Sustainability Angle: $0.75-$1.50/cwt in Potential Premiums

Let’s skip the greenwashing debate and talk about what actually matters here: money.

Global food companies—Nestlé, Danone, and PepsiCo—have legally binding 2030 emission targets they must meet. Multiple pilot programs are already paying producers premiums for:

  • Verified methane reductions
  • Documented feed efficiency improvements
  • Low-carbon-intensity milk tagged to specific supply chains

The math that actually matters:

A “preferred” supplier with documented feed conversion efficiency, verified practices, and tight nutrient management could capture $0.75-$1.50/cwt in stacked value—base premiums, carbon credits, sustainability bonuses, and preferential contract access.

What’s encouraging is that a well-managed 1,500-cow Wisconsin or New York operation with strong sustainability credentials could compete with a 3,000-cow commodity operation. The premium contracts change the math.

Scale isn’t the only path forward. For producers looking for differentiation that doesn’t require doubling herd size, this is worth exploring.

The 90-Day Plan: What to Do Before Spring

Given everything we’ve walked through, what should you actually be doing between now and late March? Let me get specific.

By Late January: Consider Locking Feed Costs

  • Target: Hedge around 40-50% of your projected 2026 grain needs
  • Why now: December 2026 corn futures are already pricing above spot; winter weather and planting signals will move markets further
  • Risk of waiting: March and April often bring less favorable terms

Worth talking through with your nutritionist and financial advisor.

By Late February: Make Your Replacement Decision

If you’ve got capital flexibility:

  • Establish financing now
  • Identify heifer suppliers
  • Be positioned to move fast if prices soften mid-2026

If you’re focused on efficiency:

  • Identify the bottom 15-20% of your string
  • Target chronic health cases and poor reproduction performers
  • Consider strategic culling Q1-Q2 while beef prices remain favorable

The key: Make a conscious choice. Operations that drift into mid-2026 without a strategy end up reacting rather than acting. And reactive decisions during stressed markets rarely work out as well.

By Mid-March: Have the Processor Conversation

Four Questions Worth Asking:

  1. What percentage of our facility’s intake goes to export markets? Which destinations?
  2. What’s our Mexico concentration—and how might USMCA review affect intake decisions?
  3. If you needed to reduce intake by 15-20%, what would the notification timeline be?
  4. If regional supply keeps changing, how does that affect sourcing and our cost structure?

These conversations are easier to have now than during a disruption. The answers tell you a lot about your actual risk exposure.


Deadline
Critical ActionWhy NowRisk of Delay
Late JanuaryHedge 40-50% of 2026 grain needsDec 2026 futures above spotHigher feed costs locked in
Late FebruaryLock replacement strategy (buy or cull)Heifer prices still elevatedForced culling decisions
Mid-MarchProcessor/banker conversationsBuild relationships pre-crisisReactive instead of proactive
April (Post-Action)Monitor and adjustFlexibility to pivotLost opportunities

What 2028-2029 Might Look Like

If current trends hold—and that’s always a meaningful “if”—here’s what seems to be taking shape:

Fewer, larger operations. U.S. dairy farms dropped from over 40,000 to under 25,000 over the past couple of decades. Generational transitions without clear successors continue to accelerate this. It’s not inherently good or bad—it’s just the reality we’re working with.

Geographic shifts. Texas, South Dakota, and Idaho are capturing share. The Pacific Northwest faces headwinds. California likely remains the largest state, but its market share is declining.

Two distinct tracks are emerging. This is the part I find most interesting. The industry’s splitting into large-scale commodity operations—think 2,500+ cows competing primarily on cost efficiency, often in lower-regulation states with favorable feed economics—and premium/specialty production commanding meaningful price premiums through organic certification, grass-fed programs, A2/A2 genetics, or verified sustainability credentials.


Production Model
Typical Herd SizeMilk Price Range ($/cwt)Primary StrategyRisk Level
Large Commodity2,500+$16-18Cost efficiencyCommodity exposed
Mid-Size Conventional800-1,500$17-19Scale up or exitHigh vulnerability
Organic Certified400-900$26-28Premium captureProtected
Grass-Fed/Verified300-800$23-26Direct relationshipsModerate
A2/Specialty200-600$22-25Niche differentiationModerate

I know a 900-cow organic operation in Vermont that’s pulling $26-28/cwt consistently while their conventional neighbors struggle at $18. Different game entirely. And a grass-fed producer in Missouri who’s built direct relationships with regional grocery chains that insulate him almost completely from commodity price swings.

Both tracks can work. The challenge is being clear about which game you’re playing—and not getting stuck in the undifferentiated middle where you’re too small for cost leadership but not specialized enough for premium markets.

This isn’t a story of decline. Dairy demand remains solid. Exports keep expanding. Well-run operations build real wealth.

But it is a story of restructuring. And the producers who navigate it successfully will be those who understand the forces at play, make deliberate choices, and maintain enough flexibility to adapt.

Resources Worth Bookmarking

If you want to track the indicators we’ve discussed, a few sources are worth checking monthly—it takes maybe 20 minutes:

  • USDA NASS Milk Production Reports — released around the 20th
  • CME Group Dairy Futures — corn, soybean meal, Class III/IV signals
  • CoBank Quarterly Rural Economy Reports — solid dairy analysis, heifer market outlook
  • USDA APHIS H5N1 Updates — current outbreak status

The planning window’s open. What you do with it is up to you.

We’ll be watching these developments and keeping you informed as things unfold.

KEY TAKEAWAYS

  • The national average is hiding two industries: Texas +50,000 cows, Washington -21,000—both called “3% growth”
  • Three factors broke the old economics: $3,400+ heifers, beef-on-dairy taking 25% of replacements, and feed costs at multi-year lows
  • $11B in new processing capacity may be misaligned: Plants expanding where milk supply is flat or declining
  • Your 90-day action window: Hedge 40-50% of feed (January) → Lock replacement strategy (February) → Processor/banker conversations (March)
  • Your lender decides who survives: The winners won’t just be the best operators—they’ll be the ones whose banks stayed in the game

Complete references and supporting documentation are available upon request by contacting the editorial team at editor@thebullvine.com.

Learn More:

  • Feed Smart: Cutting Costs Without Compromising Cows in 2025 – Provides a tactical playbook for the “feed cost hedging” strategy mentioned in your 90-day plan. Learn specific methods for forward contracting corn below $4.60 and optimizing forage digestibility to protect margins against the potential spring rally.
  • The Wall of Milk: Making Sense of 2025’s Global Dairy Crunch – Expands on the “24-month trap” and global supply factors currently capping milk prices. This strategic analysis explains why the U.S., EU, and New Zealand expanding simultaneously creates the specific market ceiling your banker is watching closely.
  • Generate $15,000+ Annual Carbon Revenue: The Dairy Producer’s Guide – Delivers the implementation roadmap for the “sustainability premiums” opportunity. Discover how to stack Section 45Z tax credits with feed additives and carbon markets to generate new revenue streams without increasing herd size.

The Sunday Read Dairy Professionals Don’t Skip.

Every week, thousands of producers, breeders, and industry insiders open Bullvine Weekly for genetics insights, market shifts, and profit strategies they won’t find anywhere else. One email. Five minutes. Smarter decisions all week.

NewsSubscribe
First
Last
Consent

The One-Dollar Margin: A Global Wake-Up Call from New Zealand’s Dairy Squeeze

A $9.50 milk price sounds great—until you see the $8.50 break-even. NZ’s one-dollar margin is a wake-up call for dairy farmers everywhere.

Executive Summary: When the world’s lowest-cost milk producers are farming on a dollar of margin, that’s a wake-up call for dairy everywhere. New Zealand’s December 2025 numbers: $9.50/kgMS milk price, $8.50 break-even, one dollar left for debt, drawings, and reinvestment. They’re not alone. Teagasc projects Irish dairy incomes dropping 42% in 2026. UK farmgate prices have fallen below production costs. Rabobank calls global output growth ‘stunning’—the very oversupply compressing margins worldwide. And China’s shift from aggressive importer to tactical buyer has removed the demand safety valve the industry once counted on. The old formula—high prices equal comfortable margins—no longer holds. The farms that make it through will be those building resilience now: feed efficiency, component focus, diversified revenue, right-sized debt. Not growth for growth’s sake. Strategic survival.

When the world’s lowest-cost milk producers are working on about one dollar of operating margin per kilogram of milk solids, that’s worth every dairy farmer’s attention.

That’s exactly where New Zealand finds itself heading into 2026.

Here’s what makes this relevant beyond the Pacific: it’s essentially a real-time stress-test of the global dairy model. From Wisconsin freestalls to Irish grass paddocks to Canterbury’s irrigated pastures, the underlying question is the same.

If New Zealand’s efficient pasture systems can’t maintain comfortable margins at these milk prices, what does that mean for the rest of us?

The narrative has shifted. It’s less about waiting for the next price spike and more about adapting to a new reality—one defined by persistent cost pressure, cautious global buyers, and markets that recover more slowly than they used to.

Understanding the One-Dollar Margin

DairyNZ’s December 2025 Economic Update paints a clear picture.

Farm working expenses have climbed 16 cents to $5.83 per kgMS. Meanwhile, Fonterra revised its 2025-26 farmgate milk price forecast down to a midpoint of $9.50 per kgMS—a notable drop from the earlier $10.00 projection.

DairyNZ puts the break-even milk price for an average reference farm at around $8.50 per kgMS.

That leaves roughly a dollar per kgMS as operating surplus. And that’s before capital repayments, family drawings, or any reinvestment.

Metric2024-25 Season2025-26 SeasonChange
Milk Price ($/kgMS)$10.00$9.50-$0.50
Break-even Cost ($/kgMS)$8.34$8.50+$0.16
Operating Margin ($/kgMS)$1.66$1.00-$0.66
Farm Working Expenses ($/kgMS)$5.67$5.83+$0.16
Interest Costs ($/kgMS)$1.46$1.11-$0.35

Tracy Brown, DairyNZ’s chair and herself a Waikato dairy farmer, offered some measured perspective in their December update: “Profit is still on the table, but the margin gap has clearly tightened, and that means every spending decision on farm needs a harder look.”

That’s a statement worth sitting with.

What This Looks Like on a Real Farm

Think about a fairly typical New Zealand herd—400 cows producing 400 kgMS each. That gives you 160,000 kgMS for the season.

At $9.50 per kgMS, gross milk revenue comes to about $1.52 million NZD. With a break-even point of around $8.50, core operating costs consume roughly $1.36 million.

That leaves approximately $160,000 NZD of operating surplus.

On paper, that’s profit. But reality includes broken gates, aging tractors, and family obligations. The buffer is much thinner than the headline suggests.

I recently spoke with a consultant who works across both New Zealand and Australian operations. His observation: for a 200-cow farm, that surplus might only be $80,000 NZD before tax and drawings. For a 2,000-cow operation, you’re looking at roughly $800,000—but spread across substantially higher fixed costs and larger teams.

Farm SizeProduction (kgMS)Gross RevenueOperating CostsOperating SurplusMargin Per Cow
200 cows80,000$760,000$680,000$80,000$400
400 cows160,000$1,520,000$1,360,000$160,000$400
2,000 cows800,000$7,600,000$6,800,000$800,000$400

The ratio matters more than the headline number. Whether you’re milking 200 or 2,000, everyone’s working with a narrower buffer.

The Takeaway: A $9.50 milk price sounds strong. But with $8.50 break-evens, you’re farming on a dollar of margin—and that dollar has to cover everything else.

Tracing the Cost Increases

Where exactly did those 16 cents go? Understanding the drivers makes them easier to address.

DairyNZ’s Econ Tracker identifies three primary contributors.

Cost CategoryIncrease (¢/kgMS)400-Cow Farm ImpactControllability
Feed Costs+7¢+$11,200Medium – Nutrition strategy
Fertiliser+4¢+$6,400Low – Global commodity
Electricity/Irrigation+2¢+$3,200Low – Fixed infrastructure
Wages+2¢+$3,200Low – Labour market
Repairs/Maintenance+1¢+$1,600Medium – Defer vs invest
Compliance+1¢+$1,600None – Regulatory
Other Operating-1¢-$1,600Variable
TOTAL+16¢+$25,600

Feed costs have risen meaningfully year-on-year across most categories. Palm kernel has been somewhat more stable, but grain and purchased roughage have risen noticeably.

Fertiliser continues to pressure budgets. Phosphate and urea prices remain elevated, driven by energy market dynamics and export restrictions from major suppliers. Teagasc’s Outlook 2026 suggests costs will climb further as the EU Carbon Border Adjustment Mechanism takes effect.

Other operating costs—repairs, freight, wages, fuel, compliance—have all experienced inflation.

The encouraging news? DairyNZ reports that interest costs are easing. Payments are forecast to drop about 35 cents to $1.11 per kgMS for 2025-26.

The catch? Those interest savings are largely offset by increases elsewhere. The budget might show relief on one line, but feed, fertiliser, and operating costs are absorbing it.

For a 200-cow farm, this might mean choosing between replacing an ageing parlour component or making do with repairs. On a 2,000-cow dry-lot operation, it could be the difference between upgrading a feed mixer or deferring that decision another year.

The Takeaway: Feed and fertiliser are eating your interest rate savings before you ever see them.

The Production Paradox

This is where the situation becomes counterintuitive.

New Zealand is currently in its spring flush. DairyNZ reports national milk collections running about 3.4% ahead of last season, with August and October 2025 volumes among the highest on record.

South Island production in October was up 5.7% year-on-year. Customs data shows palm kernel imports are up significantly—a clear indicator that farmers leaned into purchased feed to boost production.

Why does this matter? Because the same pattern is playing out across multiple dairy regions simultaneously.

I’ve been following similar trends in US and European coverage. Where corn or by-products are relatively affordable, there’s considerable temptation to push cows harder to maintain cashflow. Especially when fixed obligations don’t adjust downward just because your milk price does.

At the individual farm level, this appears entirely rational. If you’ve already invested in the parlour, the effluent system, and the bank financing, pushing a few more kilograms through spreads those fixed costs.

But collectively? When New Zealand, the US, Ireland, and parts of Europe all make that same calculation simultaneously, you end up with what Rabobank’s December 2025 commentary described as “stunning” global output growth.

Region2026 Growth ForecastImpact on Global Supply
Argentina+4.0%Aggressive expansion continues
United States+1.3%Steady growth despite tight margins
New Zealand+1.0%Spring flush pushing volumes
European Union0.0%Only major exporter hitting brakes

That additional milk is precisely why price forecasts have moderated.

A Midwest producer I spoke with recently put it simply: “We’re not trying to grow anymore—we’re trying to survive long enough to see the other side.”

The Takeaway: What makes sense on your farm might be making things worse for everyone—including you.

Regional Perspectives

New Zealand’s experience offers the clearest current signal. But similar pressures are emerging across other major dairy regions.

RegionCurrent Margin (2025)2026 ForecastKey Pressure PointCompetitiveness
New Zealand+$1.00/kgMSTight ($0.80-1.00)Feed & fert eating savingsHigh — Pasture based
Ireland€0.115/LSevere (-45%)Butter price collapseMedium — Scale challenges
United KingdomBelow cost (38.5p/L)Further pressureCommodity liquid pricingLow — High costs
United States (DMC)Above $9.50/cwtStable (low feed)Production growthVariable — Regional
European UnionSqueezed — variedContraction likelyChina probe uncertaintyMedium — Policy support

Ireland: Preparing for a Correction

Teagasc’s Outlook 2026 projects that average Irish dairy farm incomes could decline by approximately 42% in 2026. That would take the average income from an estimated €137,000 this year to around €80,000.

Their baseline anticipates milk prices moderating from the high-40s cent per litre range back toward approximately 42 cents.

At 11.5 cents per litre, the average dairy net margin in 2026 is forecast to be down 45% from 2025 levels.

For a 70-hectare, 100-cow family farm, cash surplus after drawings and loan repayments could drop from around €80,000 to closer to €45,000.

That’s manageable if the debt is moderate. For operations that expanded aggressively, the adjustment will be sharper.

The UK: Below-Cost Production

Recent market data shows that farmgate milk prices have fallen below full production costs for many operations.

As of late 2025, Arla’s conventional price sits around 39.21 pence per litre. Müller’s Advantage price drops to 38.5ppl from January 2026.

Industry estimates place all-in production costs closer to the 40-45ppl range.

The picture varies by contract type. Producers on cheese or retailer-aligned arrangements often fare better. But in the commodity liquid segment, some operations are producing milk at a level below full economic cost.

Processors have responded by shifting toward component-based and fixed-volume contracts. Retailers continue to prioritise competitive shelf prices, putting pressure on producers’ margins.

The US: Regional Variations

The American experience differs due to policy structure—and substantial regional variation.

The Dairy Margin Coverage programme has provided meaningful support. The University of Wisconsin Extension reports that through the first ten months of 2023, DMC distributed over $1.27 billion in indemnity payments. That averaged approximately $74,453 per enrolled operation, with around 17,059 dairy operations participating.

But the experience varies dramatically by region.

In California, water costs and environmental compliance add layers of expense that Midwest operations don’t face. Wisconsin operations are navigating processor consolidation and volatility in the cheese market. Northeast producers face declining fluid milk demand and processing capacity constraints.

Larger US herds—1,000 cows and above—are increasingly relying on scale economies and diversified revenue streams. Beef-on-dairy programmes, heifer development, and energy projects are becoming standard.

The Takeaway: The squeeze is global, but every region has its own version. Know your local dynamics.

The China Factor

For two decades, much of dairy’s long-term optimism rested on a straightforward assumption: China would continue buying more.

That assumption deserves recalibration.

New Zealand Treasury’s 2024 dairy exports analysis, Rabobank’s global outlooks, and trade reports identify three meaningful shifts.

Product Category2021 Imports (MT)2024 Imports (MT)ChangeTrend
Whole Milk Powder1,680,000740,000-56%Domestic production surge
Milk Powder (Total)2,580,0001,360,000-47%Structural decline
Skim Milk Powder900,000620,000-31%Domestic substitution
Whey480,000380,000-21%US tariff impact
Cheese140,000170,000+21%Foodservice growth
Butter110,000135,000+23%Bakery sector expansion

Domestic production has expanded substantially. China has invested heavily in large-scale dairy operations. This is structural import substitution, not a temporary measure.

Per-capita consumption growth has moderated. Dairy consumption continues trending upward, but at slower rates than during the expansion years. The steepest part of the adoption curve appears behind us.

Purchasing behaviour has become tactical. Chinese buyers now step back when prices strengthen and increase purchases when value emerges—rather than consistently supporting auctions.

China remains a vital market. But it’s no longer the automatic release valve that absorbs surplus production.

The Takeaway: Don’t count on China to bail out oversupply anymore. That era is over.

What Farmers Are Actually Doing

When margin discussions move from conferences to kitchen tables, what are producers actually changing?

Managing Through Feed

In New Zealand, palm kernel imports are up significantly. Many farmers chose to push production while payout expectations remained near $10/kg MS.

Similar decisions are playing out in US operations where corn and by-products remain relatively affordable.

The logic is straightforward: when principal payments and family expenses don’t flex with milk price, spreading fixed costs across more production can appear to be the only short-term lever.

Strengthening Balance Sheets

New Zealand’s Ministry for Primary Industries notes that some farmers used the strong 2021-2023 payouts to reduce debt rather than adding infrastructure.

That decision is looking increasingly prudent.

On a 200-cow farm, this might translate to directing an extra $20,000 annually toward debt reduction rather than equipment upgrades. On a 2,000-cow operation, it could mean restructuring short-term facilities into longer-term arrangements.

Diversifying Revenue

Beef-on-dairy has become mainstream. Industry analyses suggest crossbred calves can add $100-200 per cow annually, depending on local markets.

Sustainability-linked premiums are emerging as processors develop payment structures tied to documented environmental outcomes.

Even modest additional revenue streams—$50,000-$100,000 annually on a mid-sized operation—can make a meaningful difference when the milk cheque alone isn’t covering the spread.

The Takeaway: Smart operators aren’t just cutting costs. They’re restructuring debt and finding new revenue.

StrategyShort-Term CashflowMargin ImpactRisk LevelBest For
Push Production (Palm Kernel)Improved$0.85/kgMSHigh — Adds to oversupplyHigh debt, large scale
Cut Costs AggressivelyPreserved$1.15/kgMSMedium — Quality risksMedium farms, low debt
Maintain Status QuoSqueezed$1.00/kgMSHigh — Thin bufferNo flexibility
Reduce Debt FirstReduced$1.00/kgMSLow — Future flexibilityStrong balance sheet

Strategic Levers by Scale

Even in challenging margin environments, individual operations retain meaningful levers. They won’t shift global prices, but they determine which side of the margin line you occupy.

Feed Efficiency and IOFC

Research consistently documents substantial variation in feed efficiency—both between herds and within individual herds.

Progress typically comes from:

  • Forage quality management—harvest timing, processing, storage, feedout
  • Fresh cow protocols that establish strong intake patterns during those critical first 30-60 days
  • Active use of income over feed cost metrics as management tools, not retrospective reports

Getting started: On smaller operations, work with a nutritionist to develop simple IOFC reporting by production group. On larger TMR operations, establish monthly review rhythms to identify underperforming groups.

Component Value Capture

As payment systems emphasise solids over volume, butterfat and protein percentages deserve strategic attention.

The value ranges from 75 cents to $1.25 per hundredweight in many component-based systems, even at equivalent volume.

Getting started: Talk with your AI representative about reorienting sire selection toward fat and protein kilograms. Pair that with a nutritionist input on optimising rumen health, not just energy delivery.

Beef-on-Dairy Integration

This has evolved from a niche strategy to standard practice.

Getting started: Begin with market research. Talk with calf buyers about which terminal breeds and calving ease profiles actually command premiums in your area.

Financial Structure

What research keeps showing—across EU and Latin American farms alike—is that how you structure debt often matters as much as how efficiently you produce.

Getting started: Have proactive lender conversations before cash flow challenges emerge. Walk through three-year projections under multiple price scenarios.

The Takeaway: You can’t control global milk prices. But you can control feed efficiency, component focus, revenue diversity, and debt structure.

StrategyImmediate Impact1-Year Margin GainResilienceCapital Required
Feed Efficiency FocusModerate — Slow gains+$0.10-0.20/kgMSHigh — PermanentLow — Nutrition/management
Component OptimizationModerate — Genetic lag+$0.15-0.25/kgMSHigh — PermanentLow — Semen/consulting
Beef-on-Dairy IntegrationHigh — Instant revenue+$0.08-0.15/kgMSMedium — Market dependentLow — Contract only
Aggressive Debt ReductionLow — Reduces cashflow$0/kgMSVery High — Future flexibilityHigh — Requires surplus
Volume Push (Status Quo)High — Spreads fixed costs-$0.05 to +$0.05/kgMSLow — Worsens oversupplyModerate — Feed purchases

What Could Actually Change Things?

If current margin pressure is structural, what developments might shift the trajectory?

Genuine supply contraction would require sustained exits that actually reduce production capacity. We’re seeing accelerating consolidation in parts of Europe, the UK, and Australia. It’s unclear whether the pace is sufficient.

Emerging market demand growth offers longer-term potential in Southeast Asia, Africa, and Latin America. But developing those markets takes time.

Policy and structural changes—such as transition support, improved risk-sharing between processors and producers, and trade agreements—could shift the environment. But political processes move slowly.

None of these are quick fixes. But understanding the possibilities helps inform longer-term positioning decisions.

Key Takeaways

Price levels don’t ensure margin. A $9.50 per kgMS payout with $8.50 break-evens means strong prices can coexist with tight margins.

Volume gains require margin verification. More production can support cashflow while contributing to oversupply. Check IOFC, not just output.

Input decisions carry strategic weight. Feed and fertiliser now warrant careful analysis, not routine repetition.

Revenue diversification has moved mainstream. Beef-on-dairy and sustainability premiums are standard elements, not experiments.

Financial structure shapes survival. Operations that reduced debt during good years enter this period with more flexibility.

Opportunity persists, but looks different. More competition, more selective buying, more scrutiny. Adapt or get squeezed.

The Bottom Line

No individual farm can resolve global oversupply. No policy will quickly restore previous comfort levels.

But careful attention to what New Zealand’s numbers reveal—and thoughtful application regardless of region or scale—can improve the odds of staying on the right side of that one-dollar margin line.

The farms that thrive in 2030 are making decisions right now. Not necessarily to get bigger. But to get more resilient, more diversified, more intentional about where margin actually comes from.

Complete references and supporting documentation are available upon request by contacting the editorial team at editor@thebullvine.com.

Learn More:

The Sunday Read Dairy Professionals Don’t Skip.

Every week, thousands of producers, breeders, and industry insiders open Bullvine Weekly for genetics insights, market shifts, and profit strategies they won’t find anywhere else. One email. Five minutes. Smarter decisions all week.
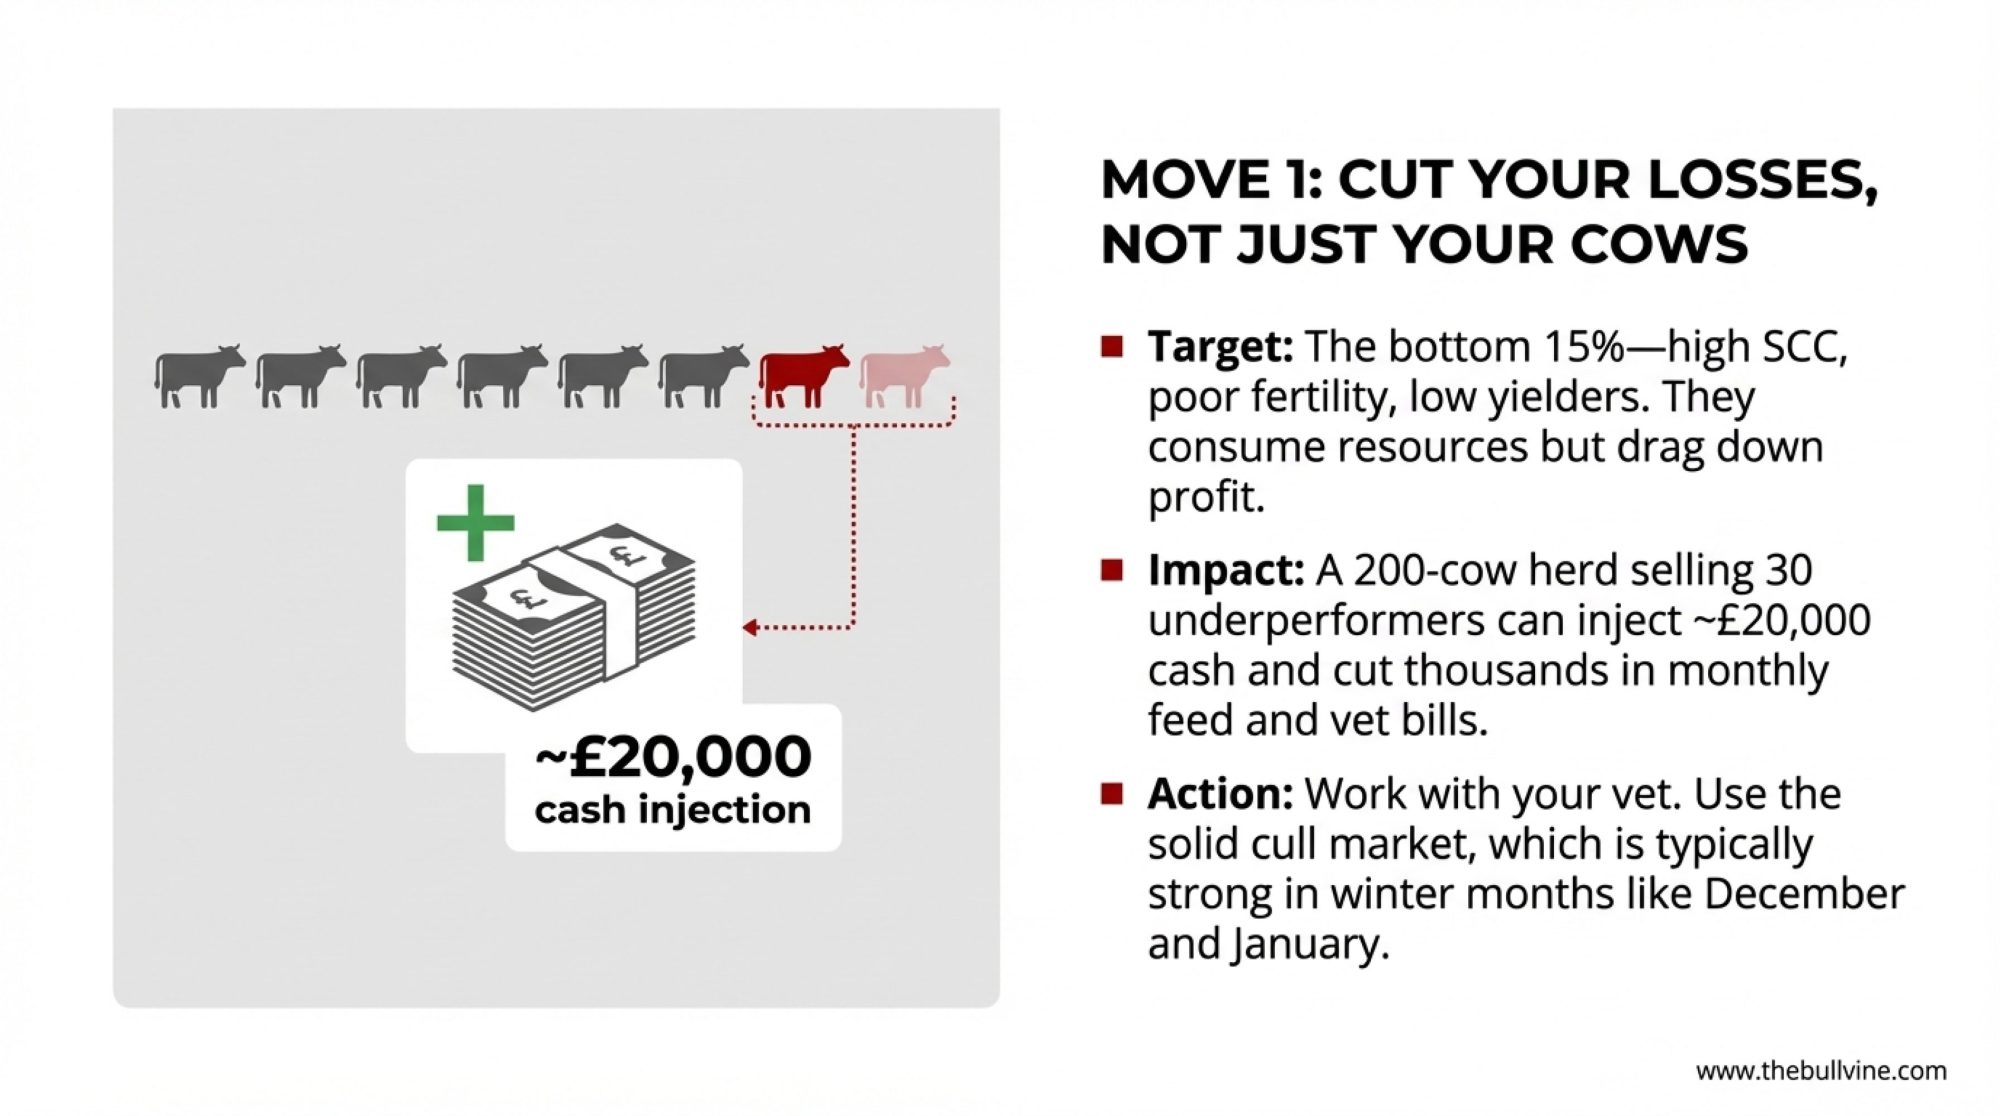
NewsSubscribe
First
Last
Consent

The Cycle Isn’t Coming Back: A Structural Shakeout Is Picking Dairy’s Winners Now

Why this downturn is different—and the brutal math deciding which operations survive

EXECUTIVE SUMMARY: The dairy cycle you’re waiting for isn’t coming back. China added 22 billion pounds of domestic production since 2018, permanently closing a market that absorbed half of global import growth. Meanwhile, American dairying is migrating: Texas gained 46,000 cows last year while Wisconsin lost 455 farms, and $11 billion in new Southwest processing capacity is cementing this shift for the foreseeable future. The economics have turned existential. Operations above $20 per hundredweight are hemorrhaging cash, while larger dairies at $16-17 are building war chests for acquisition. Beef-on-dairy bought time, but created a replacement crisis—heifer inventories at 20-year lows, prices hitting $4,000. This structural shakeout accelerates through 2027. The market doesn’t care about your heritage. It cares about your production costs. Do the math now, or the bank will do it for you.

Stop waiting for the cycle to turn.

Economists tracking dairy markets are increasingly using a word we don’t often hear: structural. This isn’t 2009 or 2018. The game board has changed.

The FAO’s November numbers tell the story: the Dairy Price Index recorded its fifth consecutive monthly decline, dropping to 137.5 points—the lowest since September 2024. Global food prices have fallen for three straight months. But what’s making veteran producers uneasy isn’t just the price decline. It’s what’s driving it.

The forces reshaping this market aren’t cyclical headwinds that will reverse when prices fall far enough. They’re structural shifts that have permanently altered the demand equation. Understanding that distinction changes everything about how we should approach the next few years.

The China Syndrome: Why the Export Dragon Stopped Roaring

If there’s one development that separates this market environment from previous downturns, it’s China’s move toward dairy self-sufficiency. We’ve heard “China is changing everything” before, and sometimes those predictions haven’t aged well. But this time? The numbers don’t lie.

Between 2018 and 2023, China increased domestic milk production by 10 million metric tonnes. Let that sink in for a moment—that’s roughly 22 billion pounds of new milk supply that used to come from exporters like us. According to the USDA Foreign Agricultural Service, they reached the 40.5 million tonne target ahead of schedule. This wasn’t gradual market evolution. It was deliberate policy execution backed by massive state investment.

The Rabobank analysts tracking this have documented the shift in brutal detail. China’s dairy self-sufficiency climbed from roughly 70% in 2018 to approximately 85% by 2023. Their whole milk powder imports got cut in half in a single year—dropping from 845,000 metric tonnes in 2022 to just 430,000 in 2023.

And the domestic farms driving this aren’t small operations. Chinese dairy farms with more than 1,000 head grew from 24% of the national herd in 2015 to 44% by 2020, with government targets pushing toward 56% by 2025. These are modern, efficient mega-dairies designed to eliminate import dependency.

Why does this matter for a dairy farmer in Minnesota or Idaho, or Vermont? Because China was absorbing roughly half of global dairy import demand growth during the 2010-2020 period. That demand engine hasn’t just stalled—it’s running in reverse.

In five years, China added over 10 million tonnes of domestic milk and pushed self‑sufficiency toward 85%. That milk used to be your outlet. Betting on a Chinese demand rebound today is like betting that a brand‑new barn will sit empty.

Industry economists point out that even optimistic forecasts project only about 2% growth in Chinese imports for 2025. That’s nowhere near sufficient to absorb the additional production coming from major exporting regions.

Could Chinese demand recover faster than expected? A severe domestic disease outbreak or major policy shift could alter the trajectory. But those mega-dairy operations represent 20-30 year infrastructure investments. They’re not going away. Building your business plan around hoping they will is a recipe for disappointment.

The Great Migration: Why the Cows Are Leaving the Heartland

While global demand dynamics shift, something equally dramatic is happening right here at home. The geographic center of American dairying is moving—and moving fast.

The USDA’s production reports tell the story. Texas added about 46,000 dairy cows between late 2023 and early 2025, increasing from about 635,000 to roughly 690,000. Texas accounted for about 56% of all U.S. herd growth during that period. Production in the state increased by more than 10% year over year. Kansas added another 29,000 head. South Dakota grew by 21,000.

What’s driving it? Processing capacity. New cheese plants are pulling production to the region like gravity.

Texas A&M AgriLife Extension has been tracking the build-out: Cacique Foods opened their cheese plant in Amarillo in May 2024. Great Lakes Cheese completed their Abilene facility late last year. H-E-B’s processing operation in San Antonio opens this summer. And Leprino Foods’ Lubbock facility reaches Phase 1 completion in early 2026.

Meanwhile, traditional dairy states are hemorrhaging farms. Data from the Wisconsin Department of Agriculture shows the state lost 455 licensed dairy farms in 2023, with monthly exits running at 87-94 operations through late 2024—94 dairies exited in October, 94 in November, and 87 in December.

Here’s the twist: total herd size stayed relatively flat at around 1.27 million cows, and production actually ticked up slightly. The remaining farms are becoming remarkably more efficient—Wisconsin producers achieved 10-pound-per-cow yield gains last year, double the national average.

California faces its own pressures—water constraints and regulatory costs have contributed to herd reductions in recent years, though the state remains the nation’s top milk producer. In the Northeast, many operations have found viability through fluid milk premiums and direct market relationships that provide some insulation from commodity swings.

The cows aren’t leaving these states entirely. They’re concentrating into fewer, larger operations. That’s consolidation, not collapse—though the distinction offers cold comfort to the families exiting the business.

Texas, Kansas, and South Dakota are quietly adding tens of thousands of cows, while Wisconsin loses hundreds of licenses. This isn’t a slow fade; it’s a rerouting of national milk supply toward steel, stainless, and dryer capacity in the Southwest.

The Brutal Math: Why Location Determines Survival

Let’s cut through the sentiment.

When you build a new dairy operation in Texas or the Southwest, you’re typically building at a 3,000-5,000 cow scale with modern facilities optimized from the ground up. Land costs range from $2,000 to $ 3,500 per acre. Feed availability is strong—corn belt proximity, regional sorghum production, steady distillers grain supplies. University extension budgets from the region suggest efficient large operations can often achieve costs of production in the $15-17 per hundredweight range.

Wisconsin operations face different math. Land costs run $6,000-8,500 per acre—two to three times Texas levels. Existing farms often average 100-300 cows. Extension analysis from the region puts the average dairy’s cost of production in the $18-21 per hundredweight range.

At current milk prices of $17-19, that cost differential isn’t just significant; it’s substantial. It’s existential.

A Texas 4,000-cow dairy optimized from scratch can show positive margins at these prices. A 200-cow dairy in the Upper Midwest at the same prices is bleeding cash every single month.

Heritage and sentiment don’t pay the bills. If you’re milking 200 cows in Wisconsin without a niche market or paid-off land, the math is working against you every single month. That’s not pessimism—it’s arithmetic.

This doesn’t mean Upper Midwest dairy is dead. Wisconsin has real advantages: exceptional forage quality, deep industry infrastructure, generations of expertise, and world-class cheese-making facilities. But the farms that thrive there will look different than the traditional model. Larger. More efficient. More specialized. The producers who recognize this and adapt will survive. The ones waiting for the old economics to return will not.

Following the Cheese: Where the Processing Money Is Going

Dairy processors are making strategic allocation decisions that favor cheese production over commodity powders. These decisions have direct implications for which farms command premium pricing.

The investment numbers are staggering. According to the International Dairy Foods Association’s October announcement, U.S. dairy processors are putting approximately $11 billion into more than 50 new or expanded facilities across 19 states, with projects coming online between 2025 and early 2028. Industry publications are calling it the largest investment wave in U.S. agricultural processing history.

The market signal is clear: cheese demand remains genuinely strong. Global cheese market projections show growth of 4-5% annually through 2035. U.S. cheese exports surged significantly in 2025. Domestic consumption continues climbing.

Powder markets tell a different story. The FAO noted that weak import demand for powders—particularly from Asia—contributed to recent price declines, with heavy butter and skim milk powder inventories in the EU adding pressure.

This creates a pricing divergence showing up directly in milk checks. Industry reports from October showed the spread between Class III and Class IV prices reaching around $2.47 per hundredweight—historically wide. For a 500-cow farm, that’s a meaningful income difference depending on how your milk gets allocated.

The guidance from dairy economists is straightforward: think carefully about component profiles and processor relationships. Farms optimizing production for cheese components—typically balanced butterfat-to-protein ratios in the 1.15-1.20 range—are positioning themselves for the products processors actually need.

The Beef-on-Dairy Trap: When Short-Term Cash Creates Long-Term Problems

Beef-on-dairy helps cash flow. No question about it. According to NAAB data, beef semen sales to dairy farms reached 7.9 million units in 2023, with 2024 showing continued growth. Farms producing 300 beef-cross calves annually at current market prices of around $1,400 per head are generating substantial supplemental income.

But beef-on-dairy creates downstream consequences that are about to bite.

CoBank’s dairy analysis team has documented what’s coming: they project roughly 357,000 fewer dairy replacement heifers available in 2025, with an additional 439,000 fewer in 2026. These shortfalls reflect breeding decisions made in 2022-2023 that can’t be reversed. It takes more than two years for a heifer calf born today to enter the milking string.

Here’s where the math gets ugly. CoBank’s analysis shows heifer inventories have fallen to a 20-year low, with prices at some auctions reaching $4,000 per head. Think about that for a moment. If you’re selling beef-cross calves for $1,400 and you need to buy replacement heifers at $3,500-$4,000, the economics of that trade look very different from than they did two years ago.

New processing capacity coming online in 2025-2026 needs milk supply now. But the heifer rebound won’t materially impact milk supply until 2027-2028 at the earliest.

“The beef check helps. But it buys time rather than solving the underlying milk price problem. What producers do with that time is the real question.”

The Scale Advantage: Why Size Matters More Than Ever

USDA’s Economic Research Service publishes cost-of-production data that shows why scale has become the critical survival factor.

For a 500-cow operation at current prices around $18 per hundredweight, total production costs often run in the $20-21 per hundredweight range. Run those numbers across annual production, and you’re looking at losses approaching $300,000 or more per year. That’s roughly $600 per cow in the red.

A 2,000-cow operation at the same milk price sees different economics. Total production costs can run closer to $16-17 per hundredweight when you spread overhead across more volume. That translates to potential profit approaching $1 million annually—$450-500 per cow in the black.

Same milk price. Opposite outcomes.

A 200‑cow Upper Midwest dairy can lose roughly $300,000 a year at $18 milk while a 2,000‑cow Southwest unit clears close to $1 million. Same mailbox price, completely different story. If you don’t know which cost bar represents your farm, you’re flying blind into this shakeout.

The cost advantage comes primarily from non-feed costs: overhead, labor, equipment, and management spread across more production. Agricultural economists note that the cost curve has gotten steeper over the past decade. The spread between high- and low-cost producers has widened, meaning price downturns hit the bottom quartile much harder than in previous cycles.

Operations losing $300,000 annually are burning through reserves. With typical liquid reserves of $50,000-150,000, these farms face 6-18 months before financial stress forces difficult conversations with lenders. The larger operation strengthens its balance sheet—positioning to weather extended weakness or acquire neighboring operations.

The Consolidation Trajectory: Where We’re Headed

According to USDA Census data, the U.S. had about 24,000 dairy farms as of 2022, down from over 39,000 in 2017. That’s a 38.7% decline in five years. During this period, total milk production grew, and the national herd stayed near 9.4 million cows. The cows didn’t disappear—they concentrated into fewer, larger operations.

Current exit rates in major dairy states are running 6-8% annually. Wisconsin and Minnesota both saw 7.4% declines in 2023 alone.

Based on current cost structures and price forecasts, industry analysts project continued consolidation through 2026-2027, with exit rates potentially moderating toward 2028-2030 as the bottom of the cost curve exits and remaining operations stabilize.

These projections could shift based on several variables, including policy changes to the Dairy Margin Coverage program, unexpected demand recovery, disease events, or significant movements in feed costs. But they represent the trajectory suggested by current economics.

What’s Working: Patterns from Farms That Are Thriving

Certain patterns emerge among operations that are well positioned for this environment. None of this is magic—it’s execution.

Component optimization. Forward-thinking operations are shifting focus from pounds of milk to butterfat and protein pounds. Producers selecting for component production and feed efficiency rather than just milk yield are seeing butterfat gains of 0.2-0.3 points and protein improvements of 0.1-0.15 points. At current component prices, that’s often worth more than chasing another 1,000 pounds of milk per cow.

Balance sheet strength. Farms that will weather extended price weakness are preserving every dollar of margin for cash reserves or debt reduction. Agricultural lenders consistently advise producers to manage as if prices were $2 lower than they actually are. The farms that build 12-plus months of operating reserves will have options. The ones operating margin-to-margin won’t.

Feed cost management. With corn prices relatively favorable—USDA projects season-average prices around $3.90 per bushel for 2025—strategic operations are securing pricing on multi-month contracts. The operation with 60% of corn needs forward-priced knows its costs precisely. That certainty creates planning ability when milk prices are volatile.

Proactive lender relationships. Farms approaching lenders early—before struggling—are presenting scenarios showing performance at $18, $17, and $16 per hundredweight. Lenders who understand an operation’s position in advance tend to be more flexible than those who discovering stress after the fact.

The Questions That Matter

As you evaluate your operation, here are the questions that will determine your future:

On your cost position: What’s your true cost of production? Not the industry average—your number. How many months can you sustain current conditions with the reserves you actually have?

On your market position: Is your milk optimized for what processors need? Do you know whether your processor has growing, stable, or declining capacity needs?

On your regional position: Is new processing capacity coming to your area? What’s happening with your neighbors—expanding, maintaining, or showing signs of exiting?

On your timeline: If you’re contemplating an exit, does acting sooner preserve more equity than waiting? If you’re committed to continuing, what specific improvements can you implement in the next 90 days?

The Bottom Line

The dairy industry that emerges from this period will feature fewer, larger, more efficient operations concentrated in regions with processing capacity and favorable cost structures. That’s the direction the data points, consistent with trends underway for decades—just compressed and accelerated.

Some farms will use this period to strengthen their position and emerge as regional leaders. Others will make the difficult but wise choice to exit while equity remains intact.

The market doesn’t care about your family history. It cares about your production costs. Do the math, or the bank will do it for you.

KEY TAKEAWAYS:

  • This isn’t cyclical—it’s structural. China added 22 billion pounds of domestic milk production since 2018, permanently closing a market that absorbed half of global import growth.
  • The cows are moving Southwest. Texas gained 46,000 head last year; Wisconsin lost 455 farms. $11 billion in new processing capacity is cementing this shift for decades to come.
  • Scale now determines survival. Operations above $20/cwt are hemorrhaging cash at current prices. Larger dairies at $16-17/cwt are building war chests for acquisition.
  • Beef-on-dairy bought time—at a price. Heifer inventories hit 20-year lows. Replacements are reaching $4,000 per head.
  • Act while options exist. This shakeout accelerates through 2027. Know your true cost of production—before the bank calculates it for you.

Complete references and supporting documentation are available upon request by contacting the editorial team at editor@thebullvine.com.

Learn More:

The Sunday Read Dairy Professionals Don’t Skip.

Every week, thousands of producers, breeders, and industry insiders open Bullvine Weekly for genetics insights, market shifts, and profit strategies they won’t find anywhere else. One email. Five minutes. Smarter decisions all week.
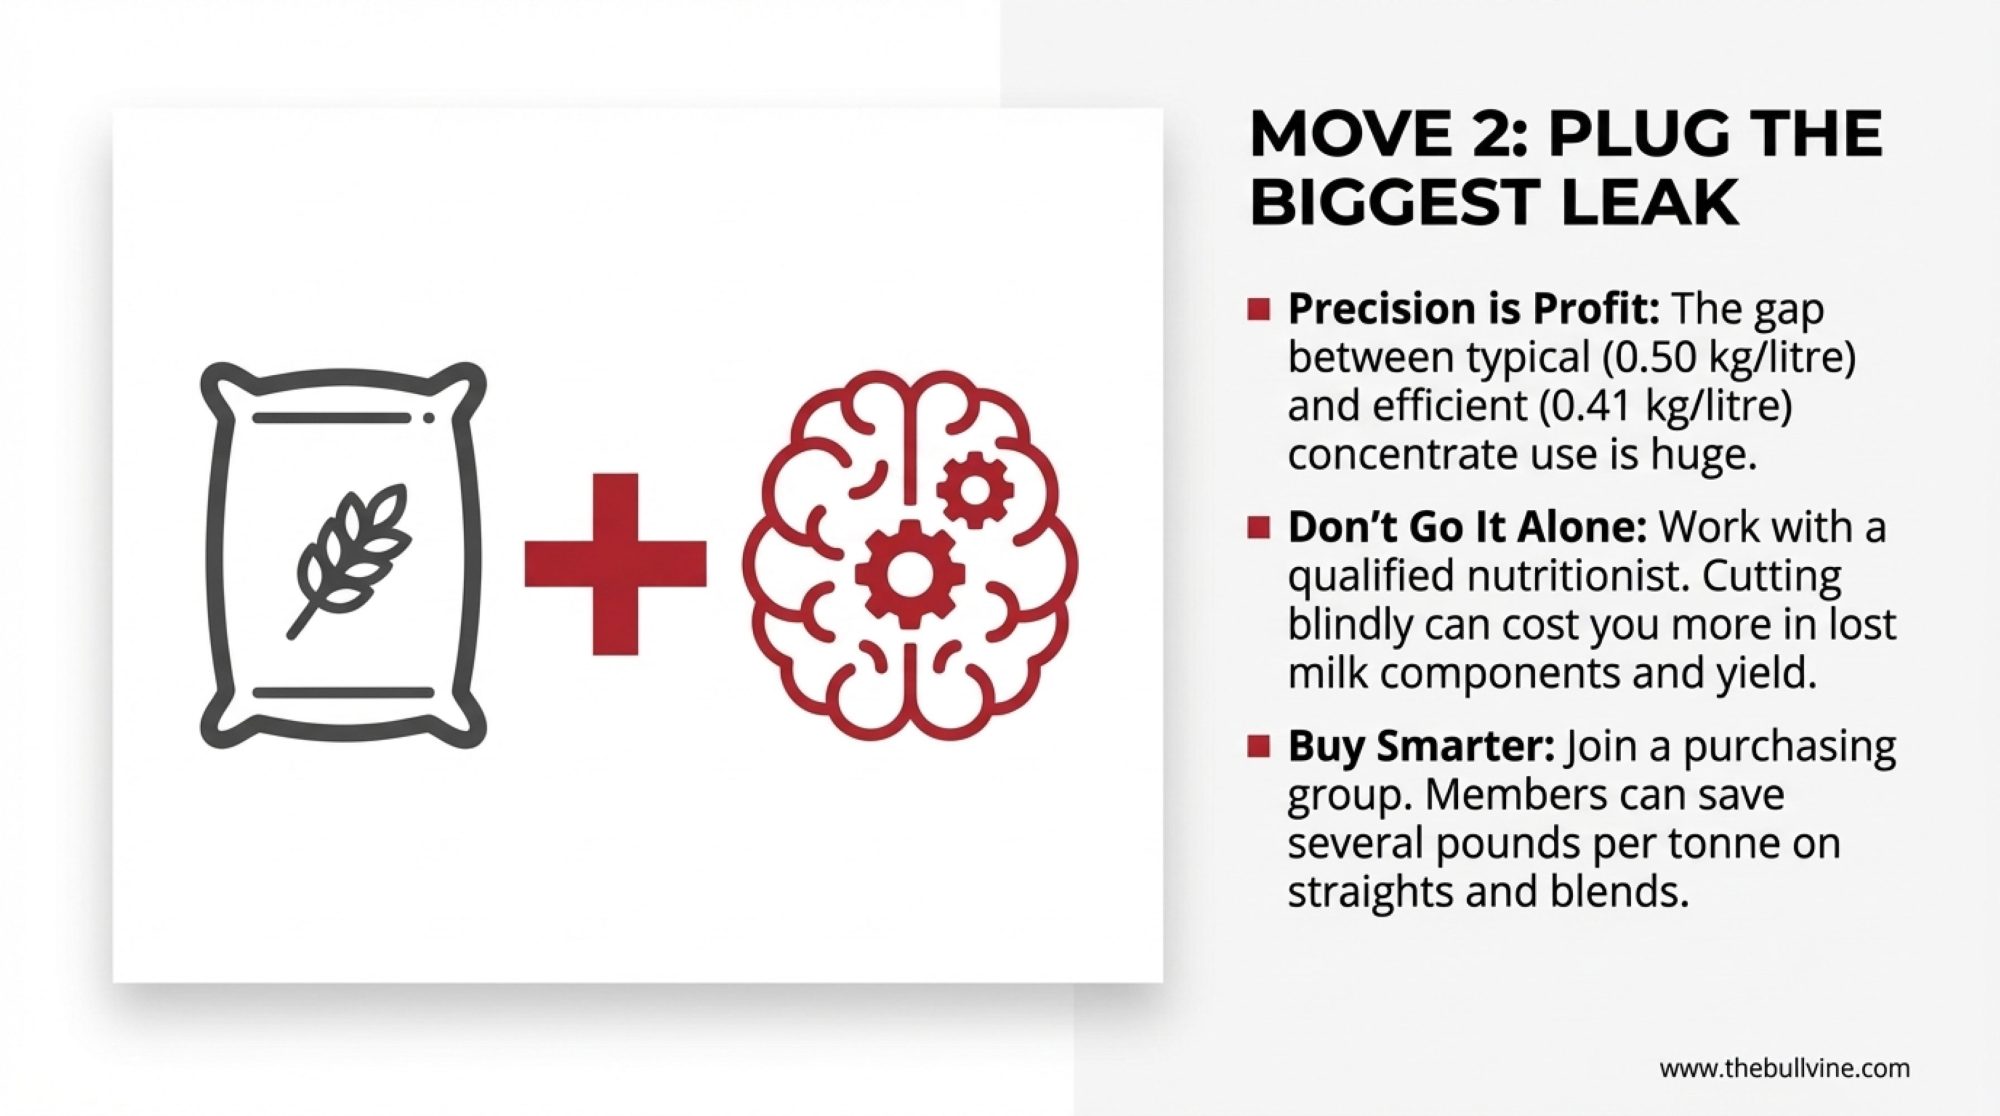
NewsSubscribe
First
Last
Consent

Colostrum. Lameness. Beef Sires. The December 2025 Journal of Dairy Science Just Changed All Three.

At 4 liters, calves kick in pain. Collars miss lameness 23 days early. The wrong beef sire erases your premium. The December 2025 Journal of Dairy Science has the proof—and the fix.

You know how it goes. You settle into a protocol that works, run it for years, and then someone publishes research that makes you question everything. That’s where we are right now.

The December 2025 Journal of Dairy Science published a collection of studies that should make many of us rethink practices we’ve taken for granted. Colostrum volumes. Lameness detection timing. Beef-on-dairy sire selection. Methane genetics. And here’s what’s interesting—these aren’t separate issues anymore. They’re interconnected pieces of an economic puzzle that either fits together or costs you.

Let me walk you through seven findings that carry genuine financial weight.

1. We’ve Been Overfeeding Colostrum—And the Science Finally Proves It

Here’s something that goes against what many of us learned: that “more is better” approach to first-feeding colostrum? The data suggests we’ve pushed past the point of diminishing returns.

Frederick and colleagues at the University of Guelph published their findings in the Journal of Dairy Science, tracking 88 Holstein heifer calves fed colostrum at 6%, 8%, 10%, or 12% of birth body weight. The apparent absorption efficiency of immunoglobulin G peaked in the 6-8% range—calves fed 8% of body weight reached 24-hour serum IgG concentrations of 37.4 g/L. Push to 12%, and you only reach 43.4 g/L despite feeding 50% more volume.

You’d expect a straight line up. That’s not what happened.

What the researchers documented next matters more than the absorption numbers, honestly. Calves in the 10% and 12% groups showed behavioral distress—specifically, kicking behavior indicating gastrointestinal discomfort. The 10% group recorded 21 total kicks; the 12% group had 40. None in the 6-8% groups. That’s not a subtle signal.

For a 40 kg Holstein calf, 8% body weight works out to 3.2 liters maximum in that first feeding. Push beyond that, and you’re overwhelming the gut’s pinocytosis capacity. The excess antibodies pass through unabsorbed, while the calf shows signs of colic.

40 Kicks vs. Zero: The Data That Should Change Your Colostrum Protocol Today. Frederick et al. (JDS, Sept 2025) measured what happens when you push past the gut’s absorption capacity. At 12% body weight (4.8L), you get 40 colic-like kicks and only 16% more IgG than the 8% protocol—while absorption efficiency crashes 19%. The sweet spot? 3.2 liters. Your calves’ guts have been telling you this for years.

I’ve heard from producers who discovered they’d been feeding 4 liters at the first meal for years. The common thread when they switched to 3.2 liters was first feeding with a second feeding at 8 hours? Calf behavior improved noticeably.

The protocol adjustment is straightforward: Weigh the calf. Calculate 8% of body weight. If your colostrum program calls for larger total volumes, split them into smaller volumes. This respects the biology of absorption without sacrificing total IgG delivery.

Now, here’s some important context. Sandra Godden, DVM, at the University of Minnesota, has done foundational work establishing that adequate colostrum volume matters—her research helped move the industry away from underfeeding. Her guidance of feeding up to 10% body weight was a significant advance. What Frederick’s newer research adds is refinement at the upper boundary: the 8% target may be the sweet spot for both absorption efficiency and calf comfort.

Worth noting for those in colder regions: operations with extended birth-to-feeding intervals may need to adjust their timing accordingly. Wisconsin Extension notes that colostrum production tends to slump in fall months, so banking high-quality colostrum from multiparous cows during the peak season makes sense.

And here’s what still matters most—colostrum quality trumps volume every time. A Brix refractometer runs $150-300 and pays for itself the first time it catches a low-quality batch.

Read more: Effects of feeding colostrum volume at 6%, 8%, 10%, or 12% of birth body weight on efficiency of immunoglobulin G absorption, gastric emptying, and postfeeding behavior in Holstein calves

2. The Cellular Reality Behind Chronic Lameness—And Why It Keeps Coming Back

This one gets into the cellular level, and frankly, it explains something that’s frustrated a lot of us—why lameness keeps coming back in certain animals, no matter what we do with footbaths and hoof trimming.

Wilson and colleagues at the University of Nottingham published work in the December Journal of Dairy Science examining collagen composition in the digital cushions of 54 cull dairy cows. The finding that jumped out: Animals with lifetime histories of hoof horn lesions had significantly lower Type I collagen proportions.

So why does that matter for your bottom line? Type III collagen is essentially scar tissue. It lacks the tensile strength of Type I, which is necessary for proper shock absorption. When a cow’s digital cushion shifts toward Type III dominance, she’s walking on a compromised foundation—creating a vicious cycle in which each lameness event further degrades the cushion structure.

Here’s where the numbers get uncomfortable. Robcis and colleagues calculated lameness costs at approximately €307.50 per case (roughly $330-340 USD) through comprehensive bioeconomic modeling of 880 farm scenarios, published in the Journal of Dairy Science in 2023. One of their key conclusions: prevention dramatically outperforms treatment in delivering financial returns. That’s probably not surprising to anyone who’s dealt with chronic lameness cases, but having the economic modeling to back it up helps.

The detection gap is what really gets me. Research consistently shows that automated systems significantly outperform human observation for catching lameness early. Farmers typically detect only about one-third of lame cows identified by researchers using standardized scoring—and that’s not a criticism, that’s just the reality of trying to catch subtle gait changes during a busy day. CattleEye’s AI-powered system, now owned by GEA, can detect mobility changes up to 23 days before human detection. That’s more than three weeks of intervention opportunity we’re currently missing.

And here’s something worth thinking about: activity-based monitoring systems measure quantity of movement, not quality. A cow can maintain her step count while fundamentally changing how she distributes weight. By the time activity actually drops enough to trigger an alert, you’ve usually missed the optimal intervention window.

23 Days. $350. The Detection Gap Bleeding Your Bottom Line Daily. CattleEye’s AI gait analysis catches mobility changes 23 days before human observers or activity monitors—the difference between a $50 footbath intervention and a $400+ hoof trimming case. Activity collars measure how much cows move. Gait AI measures how they move. That distinction is worth $350 per case.

The question to ask any monitoring technology vendor: “What specific behavioral change does your system detect, and at what stage of disease progression does that change become measurable?”

Read more: A history of lameness is associated with reduced proportions of collagen type I relative to type III in the digital cushions of dairy cattle

3. Beef-on-Dairy Economics: Where the Real Money Gets Made or Lost

I’ve noticed that beef-on-dairy conversations tend to focus almost exclusively on the calf premium while glossing over what happens at the calving pen. The honest answer is more conditional than either the “always profitable” or “too risky” camps suggest.

A December 2025 Journal of Dairy Science study analyzed 231,000 calving ease records from first-lactation Holstein and Jersey cows inseminated with Angus, Charolais, or Simmental semen, plus 1.2 million records across the first three lactations. What the genetic analysis revealed is that dystocia outcomes depend heavily on sire selection—not just breed, but the calving ease genetics within that breed.

And here’s what’s encouraging: Research from Penn State and the University of Kentucky found that when producers select beef sires with favorable calving ease indices for mature dairy cows—not heifers, cows—dystocia rates showed no significant increase compared to dairy semen. As Tara Felix, Associate Professor of Animal Science at Penn State, noted in her research summary, “Our results suggest that current beef-dairy sire selection parameters in the United States are not negatively affecting the dairy cow.”

But you can’t just grab any beef semen and expect good results. I’ve heard versions of this story from producers across the Midwest—early adopters who chased maximum premiums without paying close attention to calving ease scores, then watched their heifer dystocia rates climb toward 25-30%. The common thread in the operations that turned it around: switching to strict CE requirements and limiting beef breedings to mature cows made the program profitable. “We got greedy on the calf side and forgot about the cow side” is how one producer put it.

Beef-on-Dairy Conditional Framework

The program generally works if you:

  • Select beef sires with documented calving ease EPDs—don’t just use whatever semen is cheapest
  • Limit beef-cross breeding to mature cows or heifers you’re confident can handle the calf
  • Actually monitor your dystocia rates and adjust breed selection if they start climbing

Angus and Hereford with strong CE scores? The economics generally work. Charolais or Belgian Blue without careful selection? That premium can evaporate fast.

The $45 Question: Is Your Beef-on-Dairy Program Actually Profitable? Penn State/Kentucky research found zero dystocia increase when CE EPDs are enforced. But operations ignoring CE thresholds saw dystocia climb past 25%. The math: $180 calf premium minus $75 dystocia costs = $105 net. Same bull with proper CE selection: $150 net. That $45 difference compounds fast in a 1,000-cow herd.

Read more: A comparative analysis of dairy production systems: Milk production tiers and their impact on dairy calf and heifer cost of production in Brazil

4. Methane Genetics: More Tractable Than Most of Us Assumed

There’s been considerable hand-wringing about methane emissions in cattle—you’ve probably seen the headlines. But the genetics work emerging from Canada, Ireland, and New Zealand suggests we have more selection leverage than many assumed. And here’s the part that matters most: it doesn’t require sacrificing production.

Semex UK, working with Lactanet and the University of Guelph, analyzed over 700,000 milk mid-infrared spectroscopy records. The finding that matters most for practical selection decisions: Methane efficiency traits show heritability of approximately 23%—comparable to production traits and dramatically higher than fertility or health traits, which typically run 3-8%.

Permanent vs. Rented: Why Genetic Selection Beats Feed Additives in the 20-Year Game. Lactanet’s genomic evaluation proves methane traits are 23% heritable—1.5% annual reduction compounding to 20-30% by 2050. Meanwhile, feed additives costing $100-150/cow/year deliver 15-20% reduction while you’re paying. The math favors genetics: permanent, cumulative, zero recurring cost after semen investment.

That heritability number caught my attention. Semex projects that a 20-30% reduction in methane by 2050 is achievable through genetic selection, depending on selection intensity.

The timeline to meaningful herd-level impact looks something like:

  • Generation 1 (2 years): 3-4% reduction in daughters’ methane output
  • Generation 3 (6-8 years): 10-12% cumulative herd reduction
  • Long-term potential: 20-30% reduction through genetics alone

Here’s what should reassure production-focused farmers: The genetic correlation between methane efficiency and milk yield is essentially zero. You can select for high production and low emissions simultaneously without compromise. No trade-off required.

In practice, it’s simpler than overhauling your breeding program. Keep selecting for your primary profit drivers—fat, protein, NM$, health traits. Use Methane Efficiency as a tie-breaker. If two bulls look equivalent on everything that matters to your bottom line today, pick the one with the better Methane Efficiency score. You get the same profitable cow while quietly stripping carbon footprint from your herd with every generation.

International programs are moving fast on this. New Zealand—where pasture-based systems make feed additives impractical at scale—is pursuing genetics as a primary pathway, with their major AI companies developing methane indices for widespread use.

Read more: Comparing the genetic architecture of energy balance predicted by mid-infrared spectrometry, a novel energy deficiency score, and several biomarkers

5. Evaluating Methane Feed Additives: The Questions That Actually Matter

The methane-reduction market is flooded with products right now. Some deliver genuine results; many don’t. What I’ve found is that the difference often comes down to asking the right questions before signing purchase orders.

Four Questions Before You Buy Any Methane Additive

Print this. Bring it to your next sales meeting.

  1. “Show me the DMI data alongside the methane data.” If intake dropped proportionally, you might be looking at an expensive appetite suppressant rather than a real mitigation tool.
  2. “Is this reduction measured in g/day or g/kg DMI?” The answer tells you whether it’s real mitigation or just feed intake depression. Total daily methane can drop simply because the cow eats less—methane yield per kilogram of dry matter intake is what proves the additive actually alters fermentation.
  3. “How long did the trials run?” Anything under eight weeks should raise some skepticism about persistence. The rumen microbiome adapts constantly—many oils and plant extracts show impressive 15-20% reductions initially, then methanogens figure out a workaround.
  4. “Where did the hydrogen go?” This one separates people who understand the biology from people reading a script. Blocking methane means blocking hydrogen disposal. That hydrogen has to end up somewhere—ideally in propionate, which the cow uses for energy and milk. If the vendor can’t explain the hydrogen sink, the rumen might just be becoming stressed rather than more efficient.

Here’s a useful way to think about it: the rumen is essentially a fermentation vat that’s been optimizing itself for millions of years. If someone’s going to claim they’ve fundamentally changed how it works, they need to prove the bugs didn’t just figure out a workaround within a few weeks.

Read more: Graduate Student Literature Review: Limitations in feeding red seaweed Asparagopsisspecies for enteric methane mitigation in ruminants

6. You’re Already Paying for Methane Data—You Just Might Not Know It

Most operations already collect Mid-Infrared spectral data through DHI testing. That’s how the lab measures fat and protein percentages. What’s becoming clear is that the same spectral signature can predict methane output—and you’re already generating and paying for those samples.

The biological mechanism is elegant: Acetate and butyrate production in the rumen releases hydrogen, which is converted to methane, while propionate production uses hydrogen as a sink. These metabolic pathways leave signatures in milk fatty acid profiles that MIR spectrometry can detect.

High-methane cow? Her rumen’s churning out acetate. Her milk is rich in de novo fatty acids.

Low-methane cow? More hydrogen is going to propionate. Different fatty acid profile in the tank.

What this means on your farm: The Methane Efficiency scores appearing on genetic evaluations are derived largely from this data you’re already generating. The infrastructure exists. The question is whether you’re using it.

Those de novo fatty acid readings, by the way, have value beyond methane prediction. They’re also indicators of rumen health. Too-low de novo percentages can signal rumen acidosis—something worth monitoring in your transition cows regardless of where you stand on carbon footprints.

Read more: Genetic parameters of mid-infrared-predicted methane production and its relationship with production traits in Walloon Holstein dairy cows

7. The BLV Connection: What We Know and What We’re Still Learning

Here’s one where I want to be careful about what we claim versus what we’re still figuring out. Some emerging research suggests associations between BLV status in dams and calf health outcomes, including respiratory disease. But the mechanisms remain unclear, and that uncertainty matters for how you respond.

Three potential pathways deserve consideration:

Altered colostrum immunity: BLV-infected dams may produce colostrum with compromised immune components.

Direct immune effects: Calves may experience some disruption of immune function.

Confounded management: High-BLV herds may systematically differ in biosecurity practices, calf housing density, and ventilation—factors that independently affect respiratory disease.

What we know with greater confidence comes from USDA NAHMS survey data and subsequent research: approximately 94% of U.S. dairy herds have at least one BLV-positive cow, with an average within-herd prevalence of approximately 46% (LaDronka et al., 2018). Economic analyses have found that each 10% increase in herd prevalence is associated with rolling herd average losses in the 430-540 pound range, depending on the study methodology.

My honest assessment: Monitor your herd’s BLV status alongside calf health records. If you’re already pursuing BLV reduction for production and longevity reasons—which the accumulating research supports—any potential calf health benefits would be a bonus. But I wouldn’t recommend major program changes based solely on the calf respiratory associations until we better understand what’s driving them.

Read more: The effect of bovine leukemia virus infection on health and growth of nonreplacement dairy calves

Three Things You Can Do This Month

  1. Pull your de novo fatty acid data from your last few DHI reports. If you’re not already looking at it, start. It’s a free window into rumen health—and eventually methane efficiency—that you’re already paying for.
  2. Review your beef-on-dairy sire stack. If you haven’t audited calving ease EPDs recently, do it now. Set a minimum threshold and stick to it. The premium isn’t worth much if you’re burning it on dystocia.
  3. Adjust your colostrum protocol. Cap first feeding at 8% body weight. Split larger volumes into a second feeding at 6-12 hours. And if you don’t have a Brix refractometer yet… well, you know what to add to the supply order.

Research Evaluation Checklist by Decision Type

For Monitoring Technology:

  • What biological change does it actually detect?
  • At what disease stage does that change become measurable?
  • Does early detection enable a cost-effective intervention, or are you just getting bad news faster?

For Feed Additives:

  • Is the effect on yield (per kg DMI) or just production (total daily output)?
  • How long did the trials run?
  • Can the vendor explain the biology, including what happens to displaced hydrogen?

For Genetic Indexes:

  • What’s the heritability and reference population size?
  • What are the correlations with traits you already prioritize?
  • Is this a new selection focus or a tie-breaker within existing goals?

Your experience matters: Does this match what you’re seeing on your operation? If your data differs—particularly on colostrum volumes, lameness detection, or beef-on-dairy outcomes—we want to hear from you. Regional variation is real, and producer feedback improves future coverage. Drop us a line at editorial@thebullvine.com.

Based on the image provided, here is the digitized data converted into a formatted table.

December 2025 JDS Evidence vs. Industry Standard Protocols

Practice AreaTraditional Protocol (Industry Standard)Research-Backed Protocol (December 2025 JDS)Key Impact (Risk/Benefit)
Colostrum First Feeding• 4+ liters
• (~10-12% body weight)
• Single feeding
• 3.2 liters max
• (8% body weight)
• Split into 2 feedings
• 40 kicks vs. 0 kicks(signifying pain)
•  Colic distress
•  IgG absorption 37-43 g/L
Lameness Detection Method• Visual locomotion scoring
• 2-3x per week
• Activity monitors
• AI gait analysis
• Daily automated scoring
• 2D camera systems
• 23-day earlier detection
• $350 cost savings
•  Chronic lameness cycle
Beef-on-Dairy Sire Selection• Any beef breed
• Focus on calf premium
• No CE threshold
• Strict CE EPD threshold
• Breed-agnostic
• Mature cows only
• 10% vs 25% dystocia
• +$108 net per calf
•  Heifer culling
Methane Mitigation Strategy• Feed additives
• $100-150/cow/year
• Ongoing cost
• Genetic selection
• 23% heritability
• One time investment
• 20-30% reduction by 2050
•  Milk production
•  Market access
Methane Cost Impact• Annual recurring cost
• Variable efficacy
• Potential DMI reduction
• Permanent improvement
• Compounding gains
• Zero production trade-off
• Feed additives: **-$0.35/day**
• Genetics: Permanent
•  Sustainability credentials

Key Takeaways:

  • Cap first-feeding colostrum at 3.2L (8% BW): Frederick et al. (2025) found calves fed 12% showed 40 colic-like kicks vs. zero at 8%—beyond that, you’re causing discomfort without improving immunity
  • Detect lameness 23 days earlier with gait analysis: Activity collars measure steps, not weight distribution; AI catches mobility changes in the $50 prevention window, not the $400 treatment stage
  • Enforce calving ease thresholds on beef sires: Genetic analysis of 231,000 records confirms CE EPDs—not breed—determine beef-on-dairy profitability; without strict thresholds, dystocia exceeds 25%
  • Add methane efficiency to your sire criteria: At 23% heritability with zero milk yield trade-off, it’s a cost-free addition—use it as a tie-breaker between otherwise equivalent bulls
  • Review your de novo fatty acid data: MIR spectral analysis in your DHI reports reflects rumen health and methane patterns—actionable insights you’re already generating

Executive Summary: 

The December 2025 Journal of Dairy Science delivers peer-reviewed findings that challenge three protocols most operations haven’t questioned in years—and the financial math demands attention. On colostrum: University of Guelph researchers found that calves fed 12% of body weight had 40 colic-like kicking episodes, versus zero at 8%, making 3.2 liters the new evidence-based first-feeding maximum for typical Holstein calves. On lameness detection: AI gait analysis identifies mobility changes 23 days before activity collars or human observation—that 23-day gap is the difference between $50 early intervention and $400+ treatment costs after lesions develop. On beef-on-dairy: analysis of 231,000 calving records shows profitability hinges on calving ease EPDs, not breed; operations with strict CE thresholds report no increase in dystocia, while those ignoring sire selection see rates climb past 25%. Additionally, methane efficiency is now validated at 23% heritability, with no correlation with milk production—a trait that costs nothing to add to your sire selection criteria. Each finding points to the same conclusion: standard practices are underperforming, and the December 2025 JDS provides the data to fix them.

Editor’s Note: The research discussed here comes from peer-reviewed studies in the December 2025 Journal of Dairy Science and related publications. Economic calculations represent illustrative estimates based on published methodologies and national averages—your costs and returns will vary by region, herd size, and management practices. We welcome producer feedback at editorial@thebullvine.com.

Learn More:

The Sunday Read Dairy Professionals Don’t Skip.

Every week, thousands of producers, breeders, and industry insiders open Bullvine Weekly for genetics insights, market shifts, and profit strategies they won’t find anywhere else. One email. Five minutes. Smarter decisions all week.
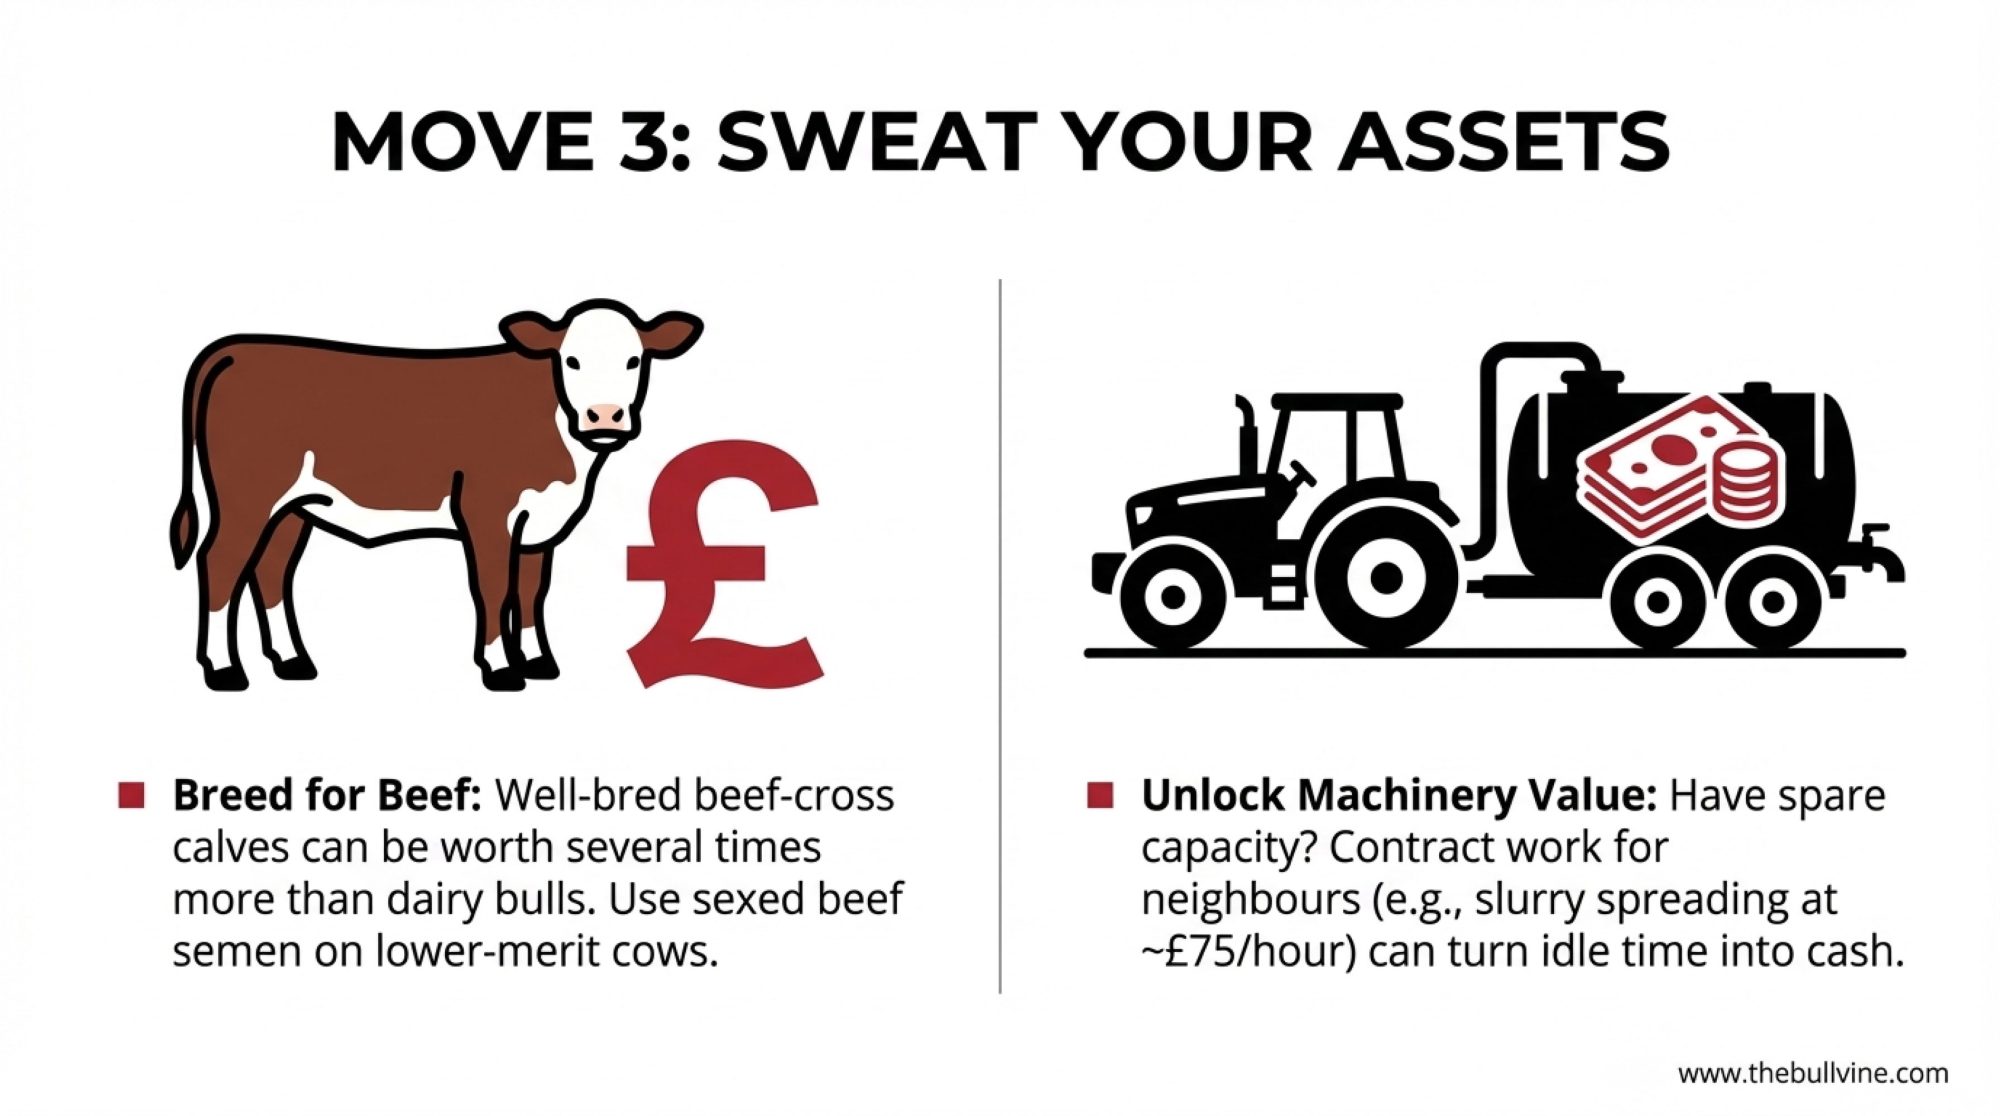
NewsSubscribe
First
Last
Consent

The Next 18 Months Will Decide Who’s Still Milking in 2030 – Here’s Your Checklist

60% debt-to-asset. That’s the red line. Above it, you’re gambling. Below it, you might survive 2026.

Executive Summary: The dairy industry you’ve built your life around is heading into 18 months that will decide who’s still milking in 2030. U.S. production jumped 4.2% year-over-year in September 2025, and with China now 85% self-sufficient, the world’s biggest surplus sponge has dried up. Trade has splintered into regional blocs—Mexico now absorbs over a quarter of our exports, and if that relationship falters, most farms have no backup plan. The math is unforgiving for mid-size operations: Benchmarking data shows herds under 250 cows earning $500-700 less per cow annually than large-scale competitors. If your debt-to-asset ratio is creeping toward 60%, you’re approaching the red line. This analysis delivers a practical checklist for the decisions that matter most—while you still have the runway to make them.

You know, I’ve been talking with producers across the country lately, and there’s a common thread in those conversations that’s worth paying attention to. One third-generation Wisconsin dairy farmer I spoke with recently—he’s running around 200 cows in the south-central part of the state—put it pretty well.

“It’s not just about milk prices anymore,” he told me. “It’s about whether the whole system we’ve built our lives around is going to exist in five years.”

Now, I’ve heard concerns like this before during tough market cycles. But after spending considerable time digging into the data and talking with economists, producers, and industry analysts… I think he’s onto something. The global dairy industry is approaching a point that feels genuinely different from the cyclical ups and downs we’ve all weathered before. And the decisions farmers make over the next 18 months—about expansion, processing investments, market relationships, and yes, whether to keep milking—will shape who’s still in business when things settle out.

So let me walk through what’s actually happening beneath the headline noise. Some of this you probably know already. Some of it might surprise you.

The Supply Picture Building for 2026

Here’s what caught my attention when I started looking at the production numbers: we’re not seeing one region expand while others pull back. Multiple major dairy regions are growing at the same time—and that matters more than people realize.

The U.S. expansion is real and shows no signs of slowing. USDA’s fall 2025 Milk Production reports show cow numbers and output running well above year-ago levels. The September numbers were particularly striking—production in the 24 major states came in 4.2% higher than September 2024, with gains in both cow numbers and milk per cow. And here’s what’s worth paying attention to: industry analysts looking at heifer retention data suggest this expansion momentum is likely to carry into 2026 and possibly beyond. That means production volumes keep climbing even if nobody adds another cow starting tomorrow.

The Production Tsunami: U.S. milk production climbs relentlessly toward 231.3 billion pounds in 2026, with September 2025’s 4.2% year-over-year spike revealing unstoppable momentum—even as traditional export markets evaporate

Dr. Mark Stephenson, who served as Director of Dairy Policy Analysis at the University of Wisconsin-Madison before his recent retirement, has been tracking these trends for decades. As he’s noted in recent industry discussions, we’re looking at production growth momentum that’ll take a year to 18 months to work through the system, regardless of what current price signals might suggest.

Meanwhile, Rabobank’s global dairy analysts point to modest growth continuing in New Zealand and Australia over the next couple of seasons. Not huge numbers, but meaningful when you’re adding milk to markets that are already well-supplied.

And Argentina? That’s the one I think deserves more attention than it’s getting. Industry analysts identify Argentina as one of the fastest-growing dairy exporters today, with milk production projected to grow faster than in the U.S., the EU, or Oceania. They’re expanding capacity and targeting export markets that traditionally absorbed surplus from other regions.

Europe’s situation is a bit different. The European Commission’s recent short-term outlook projects EU production will edge slightly lower in 2025—dropping cow numbers, tight margins, environmental regulations, and disease outbreaks are all playing roles there. But the mega-cooperative mergers happening on that side of the Atlantic—Arla combining with DMK to create roughly a 25-billion-liter entity with combined revenues around €19 billion, FrieslandCampina merging with Milcobel to form another giant with about 16,000 member farms—those are consolidating processing capacity in ways that’ll reshape how things work over there.

Why does simultaneous expansion in the Americas and Oceania matter so much? Because the traditional safety valves for oversupply aren’t available this time.

Three Things Making This Different

Market cycles come and go. I’ve seen enough of them to know that what feels unprecedented often isn’t. But three structural changes make what’s building for 2026 genuinely different from previous downturns.

First, inventory dynamics have shifted. USDA Cold Storage reports show U.S. butter inventories in 2025 near multi-year highs—well above levels seen in 2022 and 2023. European cheese stocks are similarly elevated. In past cycles, processors moved inventory quickly to avoid storage costs. Today’s more regionalized trade structure lets them hold product longer, waiting for better conditions rather than clearing markets on our timeline. What that means practically: don’t expect inventory liquidation to relieve price pressure as fast as we’ve seen historically.

Second—and this is the big one—China’s role has fundamentally changed. From roughly 2010 to 2020, China was the growth market. The safety valve. When global supply got heavy, Chinese demand absorbed it. That chapter’s closed.

Rabobank’s Mary Ledman has been tracking this closely, and what she’s documented is significant: China’s dairy self-sufficiency has climbed from around 70% to roughly 85% over just a few years. Their imports fell around 12% year over year in recent data. The market that once absorbed surplus production is now competing as a supplier.

China Closes the Tap: From 2018’s 70% self-sufficiency to 2025’s 85%, China transformed from the dairy industry’s biggest customer into a competitor, erasing the safety valve that absorbed global oversupply for a decade

And here’s what’s interesting—even though China’s domestic milk production has actually declined slightly, their import demand isn’t growing. Consumption remains weak despite that massive population. Government policy explicitly prioritized domestic production, aiming to expand output over the coming years.

Third, tariff structures have pushed trade toward regional patterns. When trade tensions escalated in early 2025, it didn’t just affect prices temporarily—it reorganized supply chains. Chinese buyers shifted to New Zealand suppliers with preferential trade access. European exporters lost U.S. market share.

I’ve talked with agricultural economists about this dynamic, including folks at Cornell who study the impacts of trade policy. The consensus is sobering: once supply chains reorganize and buyers establish new purchasing patterns, those structures tend to persist even when tariff rates change. Trade policy forces realignment that often sticks.

That’s worth sitting with for a moment. The relationships being built now aren’t necessarily temporary adjustments.

Geography as Destiny

One dynamic I’ve been watching closely is the emergence of distinct regional trading patterns. Where your farm sits within these patterns increasingly shapes your market access and pricing power.

North America’s More Protected Market

The U.S. dairy market has become more insulated through tariff protection. Mexico remains our biggest customer—industry data from CoBank and the U.S. Dairy Export Council shows they bought roughly $2.47 billion of U.S. dairy in 2024, representing well over a quarter of our total export value, which was approximately $8.2 billion.

Trade War Casualties: Between 2020 and 2025, U.S. dairy exports to China collapsed from 15% to 8% of total volume—a 47% plunge—as tariffs and China’s self-sufficiency push restructured global trade flows, forcing regional consolidation around Mexico and Canada

Here’s what’s interesting about this structure: when tariffs affect trade with Mexico and Canada, our whole North American market adjusts without outside supply filling the gaps. The University of Wisconsin’s Center for Dairy Profitability has examined this dynamic in their trade analyses.

What emerges is something like forced regional integration. U.S., Mexican, and Canadian markets operate somewhat independently from global commodity pricing. For farmers here, that means milk prices tend to stabilize around domestic supply and demand rather than global competition.

Former USDA Secretary Tom Vilsack has been vocal about these tradeoffs. In remarks to Brownfield Ag News last October, he warned that continued tariffs could cause lasting damage to U.S. agricultural trade relationships, noting concerns about losing customers to competitors such as Brazil and Argentina, which are “eager to take that business.” Trade protection provides some stability, but it also limits opportunities and creates long-term relationship risks.

That’s a fair summary of the situation. You’re cushioned from global oversupply to some degree, but you also can’t easily capture premium pricing when Asian markets are paying up.

The Asia-Pacific Shift

New Zealand now supplies nearly half of China’s dairy imports through preferential trade access. Australia is positioning aggressively as an alternative supplier, with its dairy council projecting market-share gains in Southeast Asia.

What’s notable is why they’re winning. This isn’t primarily about price competition. It’s geopolitical stability and access to trade agreements that create advantages others can’t easily match.

Recent industry reporting quotes Chinese buyers explicitly prioritizing “supply stability and predictability” over price. Once those supply chains get rebuilt around preferred partners, the relationships tend to persist even when trade conditions change.

For American farmers hoping Asian demand eventually absorbs our domestic oversupply… this is worth serious thought.

Europe’s Consolidation Strategy

Europe’s massive processor consolidation tells you something important: they’re consolidating because they can’t achieve global market dominance, not because they’re winning.

U.S. tariffs hit EU dairy with 15-20% duties, while New Zealand faces around 10% and Australia even less. Recent trade frameworks have provided only limited tariff-free access—far below historical trade volumes.

European dairy is increasingly focused on serving the EU domestic market (where per capita consumption is actually declining), exporting to Africa and adjacent regions with existing trade agreements, and competing for remaining global market share at compressed margins.

The mega-mergers make sense in that context. When you can’t grow externally, you consolidate to survive internally.

The Demand Puzzle

Something that puzzled me initially: global dairy demand actually is growing. The OECD-FAO Agricultural Outlook and various market research firms project steady consumption growth over the next decade, with Asia-Pacific expected to post some of the fastest gains.

So why doesn’t this help producers in North America and Europe?

The growth is geographically misaligned with where we’re producing milk.

The UK’s Agriculture and Horticulture Development Board put out a good analysis on this last summer. Per capita dairy consumption in Southeast Asia remains well below 20 kilograms annually, compared with around 300 kilograms in developed markets. That sounds like massive upside potential.

But building the cold chains, retail networks, and consumer habits takes a decade or more. Our cows produce milk today. Every day. That milk needs a market this month, not in 2035.

Meanwhile, consumption in developed markets continues to slide.

You probably know this already, but USDA data shows per capita fluid milk intake has been falling for decades—we’re now drinking roughly 90-100 pounds less per person annually than folks did in the mid-1980s.

Dr. Glynn Tonsor, Professor of Agricultural Economics at Kansas State University, has studied this extensively. As he’s noted in industry presentations, this isn’t a temporary consumer preference—it’s a generational dietary shift. People born in the 1980s and 1990s drink significantly less milk than previous generations, and that pattern isn’t reversing.

The numbers are pretty simple: producers in Wisconsin, California, Europe, and New Zealand can’t wait a decade for Asian demand to scale. Today’s production floods into commodity channels, putting pressure on prices while structural demand slowly builds in distant markets.

Understanding Processor Dynamics

Let me be careful here because there’s a tendency to frame processor relationships in adversarial terms. That’s not especially helpful. Processors are responding to the same structural forces farmers face. But understanding the dynamics helps explain why farmgate prices don’t always improve even when retail dairy prices rise.

In more regionalized markets, external competition doesn’t constrain processor pricing the way it once did. Think about what that means practically. If your cooperative’s pricing feels inadequate, what’s your alternative? In a truly global market, you could theoretically explore other buyers or export channels. In a regionalized setup? Options narrow considerably.

The Australian Competition and Consumer Commission examined this dynamic in their dairy industry inquiry reports from 2018-2020. What they found isn’t surprising: when fewer processors operate in a region, farmers have fewer switching options, and that correlates with lower farmgate prices.

The U.S. processor landscape has consolidated quite a bit over the decades. While exact historical counts vary by how you define processors, the trend is unmistakable—far fewer processors compete for farmers’ milk today than did a generation ago.

A mid-size Wisconsin producer I spoke with—he asked to remain anonymous to discuss business relationships candidly—described his experience this way: “Five years ago, I had three realistic options for my milk. Today I have one. And they know it. The conversation around pricing is just different when everyone understands you can’t leave.”

The cooperative model is evolving in complex ways.

Dairy Farmers of America now channels a substantial share of its member milk through DFA-owned processing plants. That vertical integration creates tensions. When your cooperative is also your processor, the interests don’t always align cleanly.

This isn’t universal among cooperatives. Organic Valley has maintained farmer-centric governance and stable pricing for its member farms. But they operate in a premium niche. The commodity milk cooperative model faces different pressures.

Alternative Strategies: An Honest Look

When commodity prices compress, many producers consider alternatives such as on-farm processing, direct-to-consumer sales, and specialty products. I’ve talked with farmers pursuing each path. Here’s what the experience and research actually show.

The capital requirement is substantial.

Case studies from Wisconsin, Vermont, and New York—documented through their respective extension programs—show that small cheese rooms or bottling facilities frequently carry six-figure price tags when you combine equipment, building work, and regulatory compliance. On a 200-300 cow operation, that investment can easily equal a sizable chunk of annual gross revenue.

One organic producer in Wisconsin who added on-farm cheese processing about five years ago described the decision as “terrifying” at the time. But she had the scale to absorb it and proximity to Madison’s premium market. A 100-cow farm two hours from any metro area? The math works very differently, she pointed out.

Geography matters more than many folks realize.

Extension and marketing research—including work from the University of Vermont’s Center for Sustainable Agriculture—repeatedly shows that successful direct sales tend to cluster near higher-income, higher-population areas, often within easy driving distance of a metro market.

A producer in rural South Dakota faces fundamentally different market access than one 30 minutes from Minneapolis or Denver. Farms succeeding at direct sales often get $12-20 per gallon versus commodity pricing—but only with the right customer base within practical driving distance.

That geographic constraint excludes many farms from serious consideration for direct-to-consumer strategies, regardless of capability or willingness.

Farms that make alternative strategies work tend to share certain characteristics.

Based on extension research and documented case studies, they typically have enough scale to absorb the capital investment—often 100-plus cows. They’re located within a reasonable distance of processing infrastructure or premium consumer markets. The operators are willing and able to work in sales and marketing, not just production. They have existing capital reserves or credit access. And they’re patient—these transitions generally take three to five years to reach profitability.

For farms meeting those criteria, alternative strategies genuinely can work. For farms missing two or more factors, pursuing alternatives may delay rather than prevent exit.

Decision PathCapital RequiredTimeline to ProfitabilityRisk LevelTarget Profit/CowCritical Success FactorGeographic AdvantageTypical Farm Profile
Scale Up (1000+ cows)$5M – $15M+3-5 yearsHigh (debt load)$1,400 – $1,500Access to capital + cheap feedID, TX, NM, SDCurrent 500-800 cows, <40% debt
Niche Out (Specialty)$150K – $500K3-5 yearsMedium (market)$1,800 – $2,500Premium markets within 60 milesNear metro areasCurrent <200 cows, near city
Right-Size + Tech$250K – $750K1-2 yearsMedium (execution)$1,000 – $1,200Management excellenceWI, MI, PA, NYCurrent 200-600 cows, family labor
Exit with Equity$0 (liquidation)ImmediateLow (opportunity cost)N/ATiming + existing equityAnyCurrent <250 cows, >50% debt

What Determines Mid-Tier Survival

A question I hear constantly: what about the 100-500 cow operations? Not mega-dairies, but not small enough to pivot easily to direct sales. What separates the ones likely to make it from those who won’t?

I’ve spent considerable time looking at this segment, and some patterns emerge.

Financial structure is often the clearest predictor.

Penn State Extension notes that banks generally prefer a debt-to-asset ratio below 60% for farms considering expansion—and that threshold serves as a reasonable risk benchmark more broadly. Farm Credit analyses similarly suggest that operations carrying ratios above that level face elevated vulnerability during prolonged price downturns. Farms that weather extended margin compression typically carry ratios well below that threshold.

Labor has become a critical factor as well.

This is something that doesn’t always get enough attention in these discussions. Mid-tier operations often sit in an awkward spot—too large for family labor alone, but not large enough to offer the wages, housing, and advancement opportunities that larger operations can. Immigration policy uncertainty has made workforce planning even more challenging. The farms that navigate this successfully tend to invest in employee retention: better housing, competitive pay, and clear advancement paths. It’s not just about finding workers anymore—it’s about keeping them.

Processor relationships matter enormously at this scale.

What I’ve noticed talking with mid-tier survivors: most have some form of arrangement with their processor, whether a formal contract or long-standing relationship. The most vulnerable farms sell essentially into spot markets—milk goes wherever the co-op sends it at whatever price the co-op offers.

Jim Goodman, a former Wisconsin dairy farmer who’s been active on farm policy issues and has been featured in agricultural publications, has made this observation: the mid-size farms that survive have often figured out they’re in the relationship business, not just the milk business. They know their processor’s field rep by name. They attend every meeting. They’re not invisible.

Regional concentration tells you something important.

Surviving mid-tier operations cluster in specific geographies: south-central Wisconsin, Michigan’s western lower peninsula, parts of California’s central valley, and pockets of the Northeast near processing infrastructure.

Mid-tier farms in regions dominated by large operations—such as the Texas Panhandle, southern Idaho, and New Mexico—face structural disadvantages that operational excellence alone can’t overcome. If you’re running a 250-cow operation where the average dairy has 2,000-plus cows, you’re not competing on the same terms. Feed costs per ton run higher, labor efficiency runs lower, and processor leverage is minimal.

The successful mid-tier operators I’ve met share a mindset.

They’re not trying to become mega-dairies. They’re not romanticizing small-scale farming either. They’ve made realistic assessments about what their operation can achieve and optimized it within those constraints.

They’ve typically identified one or two specific advantages—exceptional forage production, low-cost facilities, family labor flexibility, proximity to a specialty buyer—and built a strategy around protecting those advantages rather than chasing scale they can’t realistically achieve.

A Mid-Tier Success Story Worth Noting

Not everything in this analysis points toward consolidation and exit. I talked with a 320-cow operation in Michigan’s Thumb region that’s actually positioned well for what’s coming—and their approach offers some useful lessons.

They made three strategic decisions over the past decade that now look prescient. First, they aggressively paid down debt during the strong milk price years of 2022-2024, bringing their debt-to-asset ratio below 40%. Second, they locked in a five-year component-based contract with a regional cheese processor that values their high-protein milk. Third, they invested in employee housing and retention rather than herd expansion.

“Everyone around us was adding cows when prices were good,” the operator told me. “We added a duplex for our two key employees instead. Those guys have been with us for seven years now. That stability is worth more than another hundred cows.”

They’re not immune to what’s coming—nobody is. But they’ve built resilience through relationships, financial discipline, and knowing what they’re good at. That’s a model worth considering.

What the Next Five Years Likely Looks Like

Let me share what the structural forces and consolidation trends point toward. I want to be clear that these are projections based on current patterns—not certainties. Markets can surprise us, and policy changes could shift the trajectory. But the direction seems reasonably clear if present trends continue.

Farm numbers will likely decline substantially.

If current exit rates persist, several industry and academic analysts estimate U.S. dairy farm numbers could fall significantly by 2030—potentially into the low tens of thousands, down from somewhere around 25,000-28,000 today. Similar consolidation pressures are projected in Canada—some observers suggest a substantial portion of their remaining farms could exit over the coming years if trends continue.

Scale concentration will likely increase further.

Current USDA and industry analyses show that large herds—often 1,000 or more cows—already produce the majority of U.S. milk. Most observers expect that share to keep climbing. Mid-tier operations that survive will generally do so through geographic advantage, quality differentiation, or secure relationships with processors.

Smaller operations face steep structural headwinds.

I don’t say this to be discouraging, but to be realistic: farms with under 100 cows face structural challenges that operational improvements alone often can’t overcome. Historical exit rates among smaller herds have frequently ranged from 4% to 7% annually. If anything like that pace continues, a large majority of sub-100-cow operations could exit commercial production over the next decade.

Some will transition to specialty or direct-to-consumer models. Most will exit through gradual herd reduction and eventual sale.

Geography will shape regional outcomes.

The traditional Dairy Belt—Wisconsin, Michigan, California, Idaho, Texas, South Dakota—has concentrated processing infrastructure. Consolidation will continue, but the industry will survive with large-scale producers intact.

Peripheral regions—New England, Mid-Atlantic, Plains states, Southeast—have more limited processing infrastructure and smaller average farm sizes. Exit rates may run higher there. Surviving operations in those areas will likely be scattered and specialty-focused.

Is Change Possible?

Can anything alter this trajectory? Mechanisms exist to slow or shift consolidation, but implementing them requires confronting uncomfortable realities about power, politics, and collective action.

Organized farmer action has shown real influence in some settings.

In Ireland, farmer pushback against Dairygold’s recent price reductions—including coordinated attendance at a key supplier meeting organized through social media—demonstrated that organized producers can influence cooperative decisions on milk pricing. That worked partly because Dairygold operates as a true cooperative with farmer-shareholders who have voting rights and equity stakes. Collective organization gave them genuine leverage.

That model differs meaningfully from structures where farmers supply milk but don’t own equity. The leverage differs accordingly.

Antitrust enforcement shows some activity.

Recent European court decisions have found that coordinated pricing behavior by major dairy buyers did depress farmgate prices, with courts quantifying significant producer losses. Here in the U.S., the USDA and the Justice Department announced a joint initiative last September to investigate agricultural market concentration. That represents progress, though antitrust cases typically take years to work through the system.

Political constraints remain substantial.

Those with the power to implement structural solutions often benefit from current arrangements. Large cooperatives and mega-farms gain from consolidation. Farmer political voice tends toward large-operation representation. Unified action is difficult when most milk flows through a handful of competing cooperatives.

Dr. Marin Bozic, a dairy economist at the University of Minnesota, has summarized this challenge in industry presentations: the mechanisms for change exist, but the political will and farmer coordination required to implement them are the limiting factors.

That’s probably a fair assessment of where things stand.

Your 18-Month Checklist

Based on everything I’ve looked at, here’s your checklist for the next 18 months:

Ruthless Geographic Assessment. If you’re 200 miles from a processor and they drop you, do you have a Plan B? If not, you’re gambling, not farming. Farms within a reasonable distance of major processing infrastructure have structural advantages that operational improvements alone can’t replicate. If location is fundamentally disadvantaged for commodity milk or direct sales, that reality needs to inform every other decision you make.

Scale or Niche—There Is No Middle. USDA and industry profitability analyses consistently show significant differences in production costs between small and large operations. Zisk data from 2025 benchmarking shows that herds under 250 cows earn $500-700 less profit per cow annually than large operations across all regions. If you’re running 80 cows and you aren’t bottling it yourself, breeding high-genomic bulls for A.I. studs, or pursuing some other differentiated strategy, the math is working against you. Efficiency improvements help at the margin but generally don’t close the structural gap.

The Mid-Tier Kill Zone: Benchmarking reveals herds under 250 cows earn $500-700 less per cow annually than large-scale competitors—a structural disadvantage that operational excellence alone cannot overcome

Financial Red Lines. Penn State Extension notes that banks prefer debt-to-asset ratios below 60% for farms considering expansion—and that threshold serves as your risk benchmark more broadly. If you’re approaching that line, stop expanding. Debt reduction is your highest-ROI activity right now. The University of Wisconsin’s Center for Dairy Profitability data shows that income over feed costs swung $12.05 per cwt from peak to trough in just over a year. Operations with heavy debt loads don’t survive that kind of volatility.

The 60% Red Line: Penn State Extension and Farm Credit analyses identify debt-to-asset ratios above 60% as the critical threshold where farms shift from strategic risk to existential gambling during prolonged margin compression

Genetics as a Financial Tool. Reassess your breeding priorities. In a quota-restricted or processor-limited world, pounds of solids per stall is the metric that matters most. The industry is shifting its focus from milk volume to milk solids output. Pounds of butterfat and protein per stall—not just total milk volume—increasingly determines which operations stay profitable. Given that feed historically accounts for around half of production expenses, genetic selection for efficiency is critical. Research on genomic evaluations shows that selecting for residual feed intake (RFI) can deliver annual feed savings of over $250 per cow.

The Exit Strategy. Exiting with equity is a business decision. Exiting in bankruptcy is a tragedy. If the writing is on the wall, sell while herd and land values are still holding. Farms that exit during relative market stability typically retain significantly more equity than those forced out due to financial distress. This isn’t about giving up—it’s about making decisions while you still have options.

Don’t Neglect Workforce Stability. Labor turnover is expensive and disruptive. Farms that invest in employee retention—housing, wages, advancement opportunities—often find that stability pays dividends well beyond the direct costs. That Michigan operation I mentioned didn’t add cows when prices were good; they added housing for key employees. Seven years later, that decision looks brilliant.

Validate Before You Invest. If you’re considering on-farm processing or direct sales, validate demand before buying equipment. Successful on-farm processors I’ve talked with didn’t start with a cheese vat. They surveyed potential customers, secured committed buyers at premium prices, and validated the market. Then they invested. The failures typically reversed that sequence.

The Bottom Line

The dairy industry is working through structural changes that will leave us with different farm structure, processor concentration, and geographic organization than we have today. Understanding these dynamics doesn’t guarantee survival, but it provides a foundation for informed decisions about whether to adapt, invest, or exit on your own terms.

That Wisconsin farmer I mentioned at the start is still evaluating his options. “I’m not ready to quit,” he told me. “But I’m also not going to pretend the numbers don’t say what they say. My grandfather could afford to be stubborn. I can’t.”

That clear-eyed pragmatism—neither false optimism nor premature surrender—seems like the right posture for where we are.

The next 18 months represent a meaningful decision window. By late 2026, when production increases, and work through commodity markets, and regional trading patterns solidify further, options narrow. Farmers who thoughtfully evaluate their position now—with honest assessment of capital, location, scale, and market relationships—can make strategic decisions while they still have agency.

The industry will look different in 2030. The question is whether you’re positioned where you want to be when it does.

Key Takeaways:

  • The global safety valve is gone. China hit 85% self-sufficiency and stopped absorbing surplus. U.S. production keeps climbing 4%+ annually, with nowhere for extra milk to go.
  • Your location is your leverage. Farms far from processors or premium markets face structural disadvantages that no efficiency gains can fix. If your processor dropped you tomorrow, do you have a Plan B?
  • 60% debt-to-asset is the red line. Above it, you’re gambling on margins that aren’t coming. If you’re approaching that threshold, debt paydown beats expansion—every time.
  • Mid-tier is the kill zone. Hoard’s Dairyman benchmarking shows herds under 250 cows earning $500-700 less per cow annually. Scale up, carve a niche, or get squeezed out. There’s no profitable middle.
  • You have 18 months to decide. By late 2026, production surges will have flooded commodity markets and your strategic options will narrow. The farms still milking in 2030 are making these calls now.

Complete references and supporting documentation are available upon request by contacting the editorial team at editor@thebullvine.com.

Learn More:

The Sunday Read Dairy Professionals Don’t Skip.

Every week, thousands of producers, breeders, and industry insiders open Bullvine Weekly for genetics insights, market shifts, and profit strategies they won’t find anywhere else. One email. Five minutes. Smarter decisions all week.
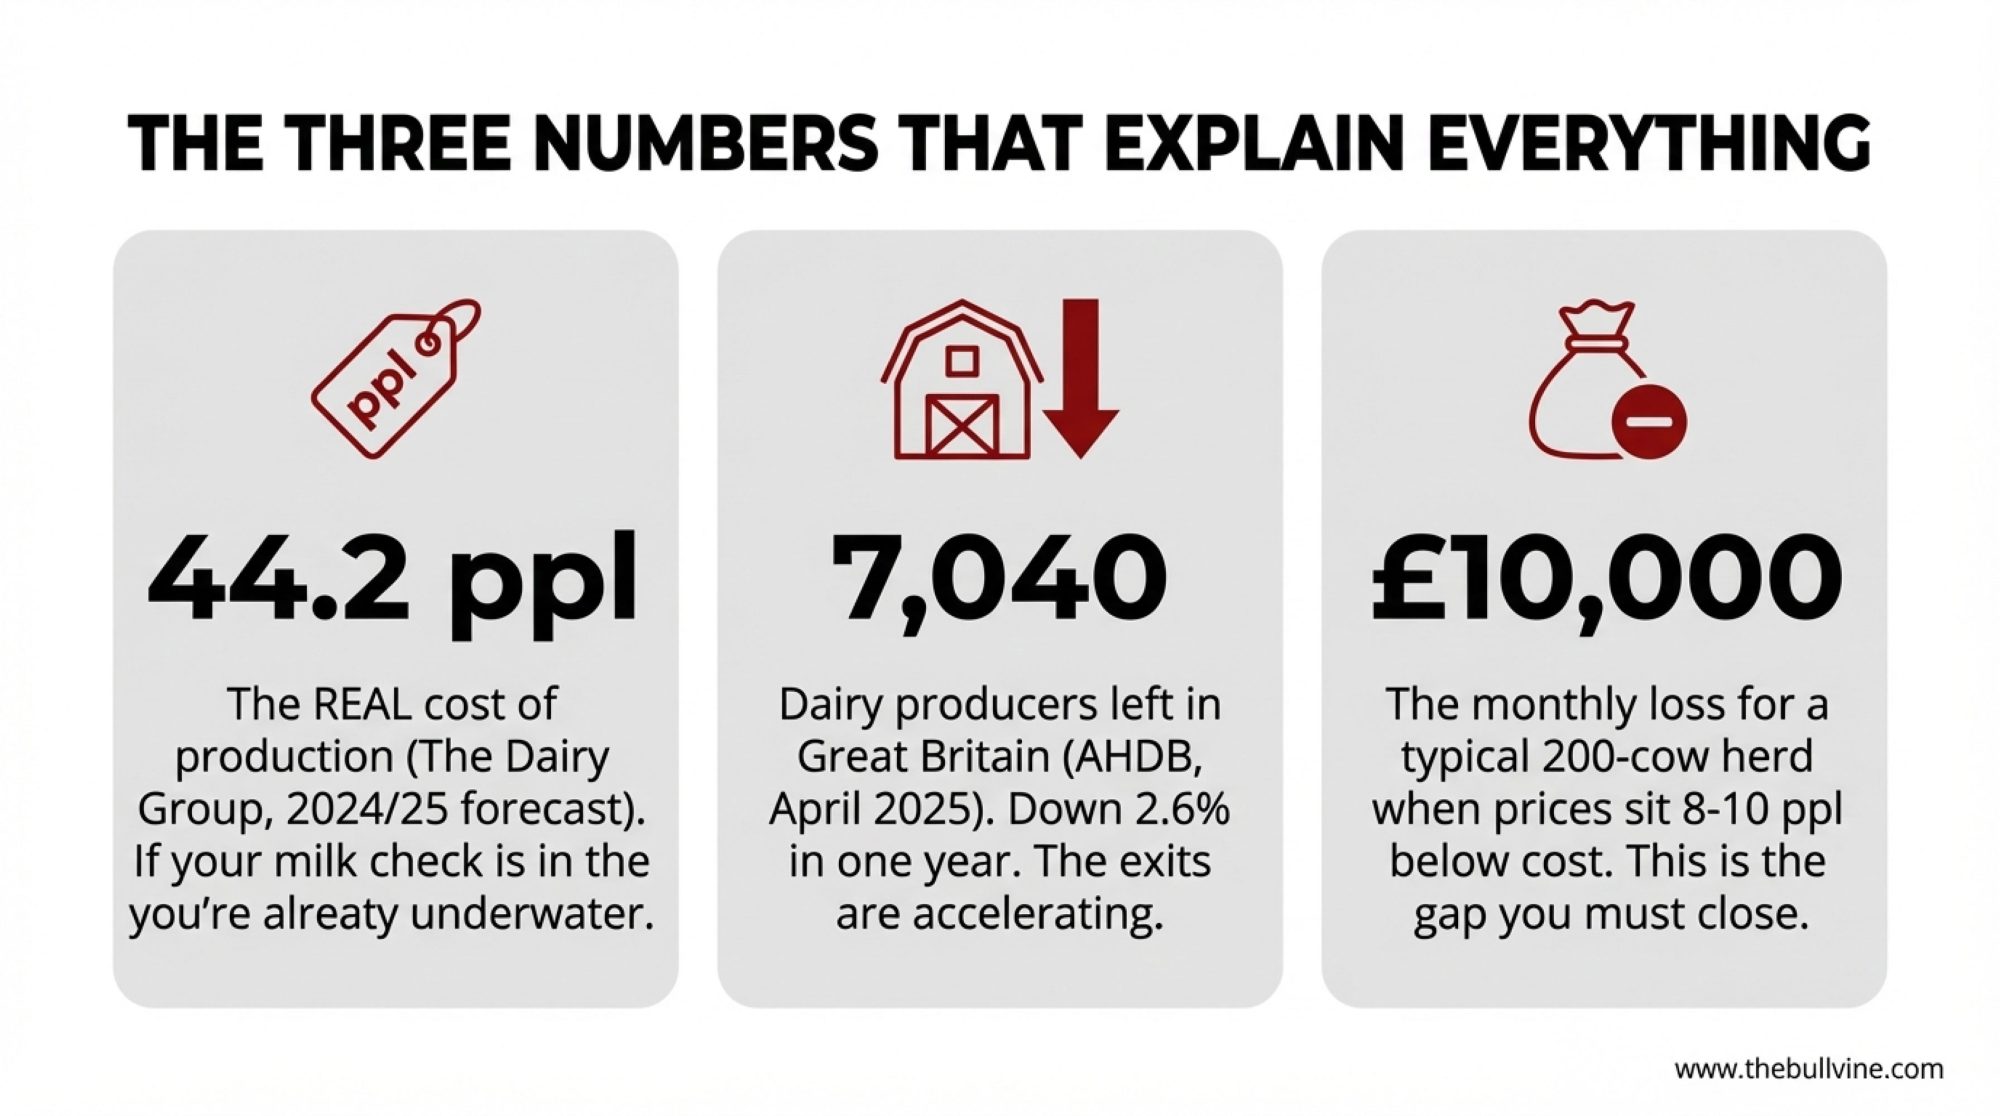
NewsSubscribe
First
Last
Consent

Ferrari Genetics, Go-Kart Support: Why 30,000-Pound Cows Are Gone by Lactation Three

Today’s dairy cows have more genetic potential than any generation before them. And yet we’re dropping race-car engines into go-karts and acting surprised when the wheels start coming off.

Executive Summary: Today’s elite Holsteins can push 30,000 pounds per lactation with butterfat above 4%—genetic firepower unthinkable a generation ago. Yet average productive life remains stuck at 2.7 lactations, costing the industry billions annually. NAHMS data shows 73% of cows leave herds due to health failures, not strategic decisions—with more than half of on-farm deaths occurring before 50 days in milk. The genetics aren’t failing. The support systems are. Barns, cooling infrastructure, and hoof care protocols were designed for smaller, lower-producing animals. Research from Wisconsin, Cornell, and Florida points to the same leverage points: lying time, heat stress, and lameness. Some herds already average 4+ lactations—proof that closing the gap is possible when infrastructure and execution match the genetics.

Dairy Herd Longevity

There’s a way to think about modern dairy genetics that goes beyond the usual comparisons floating around industry publications.

Consider NASCAR.

A NASCAR vehicle is precision-engineered from the blueprint up, designed to operate at the outer edge of mechanical capability. But here’s the thing—that vehicle only delivers its potential when supported by an elite pit crew, optimal track conditions, and infrastructure designed specifically for high-performance racing.

Modern Holsteins fit this description remarkably well. Elite herds now routinely push 30,000 pounds of milk per cow per year, and national breed averages have recently climbed above 4% butterfat for the first time in U.S. Holstein history, according to breed and DHI statistics. Compare that to the early 1980s, when high-teens production was exceptional for a show cow, and you start to appreciate the transformation genomic selection has brought to the industry.

These animals are championship-caliber machines. The question is whether we’re giving them championship-caliber support.

What keeps coming up in conversations with producers—whether I’m talking with folks in Wisconsin, California, or the Northeast—is a consistent theme: barns, cooling infrastructure, hoof care protocols, and stall dimensions on many operations were designed for a different era. For smaller cows, produced less milk, and generated less metabolic heat.

The genetics have changed dramatically. The infrastructure often hasn’t.

I spoke with a Wisconsin producer last fall who’s consistently hitting 4.2 lactation averages, and his take was illuminating: “We’re not doing anything revolutionary. We’re just doing the basics really consistently.”

Those success stories prove what’s possible when genetics and management align. The reasons more operations haven’t reached that level are complex—and as we’ll explore, often have more to do with economics than knowledge.

What the Numbers Actually Show

Before diving into specific management areas, it helps to step back and look at the broader picture.

According to Penn State Extension analysis of NAHMS data, the average dairy cow in the United States now leaves the herd at approximately 2.7 lactations. That number has been fairly stable for some time, which raises an uncomfortable question: with all the advances in genetics, nutrition, and veterinary care, why hasn’t productive life improved?

Part of the answer lies in how cows are leaving herds. Research from the Journal of Dairy Science indicates that roughly 73% of culling decisions are involuntary—meaning cows are leaving due to health problems, reproductive failure, or injury rather than strategic herd improvement decisions.

The breakdown tells the story. According to USDA data: infertility leads at about 23%, mastitis accounts for roughly 19%, and lameness drives approximately 9% of forced exits.

What’s particularly sobering—and this caught my attention when I first saw the data—is that more than half of on-farm cow deaths occur within the first 50 days in milk. These are fresh cows. Animals that haven’t yet had the opportunity to pay back their raising costs, let alone contribute to profitability.

Now, some industry observers make a fair point: shorter productive lives aren’t necessarily problematic if genetic improvement means each replacement animal is substantially better than her predecessor. Dr. Albert De Vries at the University of Florida has done extensive work on optimal replacement economics, and his models show that voluntary culling decisions should factor in the genetic merit of available replacements.

But here’s the key distinction: that logic applies to voluntary culls. When 73% of culls are forced by health and reproductive problems, we’re looking at something else entirely—and it’s worth understanding what’s driving those numbers.

The Rest and Recovery Factor

One of the clearest indicators researchers have identified for predicting cow health and productivity is surprisingly straightforward: how much time cows spend lying down.

Dr. Nigel Cook at the University of Wisconsin School of Veterinary Medicine has been studying this relationship for years. His work, along with research from colleagues at Cornell and the Miner Institute, has established a remarkably consistent finding: every additional hour of lying time (up to an optimal range of 12-14 hours daily) correlates with approximately 2-3.5 additional pounds of milk production per cow per day.

Each hour of lying time a cow loses can cost 2 to 3.5 pounds of milk per day, according to university research summaries. Every single day, that shortfall adds up.

Why does rest matter so much? The biology makes intuitive sense. When cows lie down, blood flow to the udder increases—by 25-30%, according to some estimates. Rumination is more efficient in a lying position. And hoof tissue gets time to dry and recover from constant moisture exposure in alleys and holding areas.

The challenge is that many herds aren’t hitting that 12-14 hour target. Studies using accelerometer data from commercial operations—including research from the University of British Columbia—consistently show average lying times of 8-10 hours in freestall operations. Sometimes, there is less during hot weather or when pens are overcrowded.

For a 1,000-cow herd falling 3 hours short of optimal rest… the math suggests something like 6,000-10,000 pounds of unrealized milk production daily. Over a lactation, that’s significant money left on the table.

What’s Stealing Your Cows’ Rest?

What’s causing the shortfall varies by operation. Sometimes it’s stocking density. Dr. Cook’s research shows that cows lose about 15% of their lying time when stocking density increases from 1 animal per stall to 1.5 animals per stall—a level that’s more common than many producers realize. Other times it’s stall design. Modern Holsteins are simply larger than their predecessors from 20-30 years ago, and stalls built to older specifications may be too cramped for comfortable resting.

The encouraging news? Addressing time barriers to lying often doesn’t require a massive capital investment. Adjusting stocking density, relocating neck rails, and adding bedding depth—these are relatively low-cost interventions that can yield measurable results.

A California producer I spoke with recently reduced stocking from 115% to 100% and saw a 4-pound increase in rolling herd average within 60 days. “I was skeptical,” she told me. “The math said it wouldn’t pay. But the cows told a different story.”

Bedding Systems and the Economics of Comfort

When researchers compare bedding materials, deep-bedded sand consistently ranks at the top for cow health and comfort. This finding has been replicated across studies from the University of Wisconsin, Ontario’s Ministry of Agriculture, and veterinary practices across North America.

The advantages are multi-dimensional. Sand is inorganic, so it doesn’t support bacterial growth as organic materials do. It conforms to the cow’s body, distributing weight and reducing pressure points. And it provides good traction when dry without retaining moisture against the skin.

Dr. Cook’s research has documented that herds on properly managed deep sand show lower rates of hock lesions, reduced mastitis incidence, and longer lying times compared to mattress-based systems.

So why isn’t everyone using sand?

The answer comes down to economics and operational complexity—a theme you’ll notice throughout this discussion. Retrofitting from mattresses to deep sand for a 200-cow barn involves substantial capital investment. Then there are ongoing costs: sand procurement, maintenance of the separation system, increased equipment wear from abrasive material, and additional labor for bedding management.

The payback period—typically 18-24 months when you account for production gains, reduced health costs, and extended productive life—is reasonable for a capital investment. But that upfront requirement presents real challenges, particularly for operations with limited borrowing capacity or uncertain milk price outlooks.

Here’s something worth noting, though. Mattress technology has improved considerably over the past decade. Producers using high-quality foam-topped mattresses with aggressive bedding management—keeping 2-3 inches of clean, dry material on top at all times—can achieve results closer to sand than older research might suggest.

The key, regardless of system, is management intensity. I’ve seen excellent results on sand, mattresses, and even waterbeds when attention to detail is present. And I’ve seen poor outcomes on all of them when management slips.

The Heat Stress Challenge

This is one of those areas where I think the industry conversation is finally catching up with the research—though we’re not all the way there yet.

In warm climates, heat stress is one of the largest drains on productivity and cow welfare. Anyone farming in Texas, Arizona, or California’s Central Valley knows this instinctively. But what strikes me about the economic data is how much larger the impact is than most producers estimate, even experienced ones who’ve dealt with heat stress for decades.

Heat stress costs the U.S. dairy industry $900 million to $1.5 billion annually, according to an economic analysis by the University of Florida and the USDA.

Research from the University of Florida, building on earlier USDA analyses, puts those numbers in stark terms. For individual operations in hot regions, the per-cow impact can reach $500- $700 per year when you account for all cascading effects.

The Hidden Costs Most Producers Miss

Those effects extend well beyond milk production decline during hot weather. Research published in the Journal of Dairy Science has documented reduced dry matter intake (as cows attempt to lower metabolic heat production), compromised immune function leading to higher disease incidence, and impaired reproductive performance. According to Dr. Peter Hansen at the University of Florida, conception rates can drop from 40-50% to as low as 10-20% during heat stress periods.

And there’s a dimension many producers don’t fully appreciate: the effects on developing fetuses can impact the lifetime productivity of offspring. Research increasingly suggests that in-utero heat stress creates lasting changes in immune function and milk production capacity. That’s a long tail on today’s management decisions.

What’s particularly insidious is that damage begins before it’s visually obvious. Research using Temperature-Humidity Index measurements indicates that production impacts begin around THI 68—a threshold crossed more often than many producers realize, even in traditionally “cooler” regions. Modeling and on-farm monitoring show that even in states like Wisconsin and Minnesota, herds frequently experience many days each summer above that threshold, enough to reduce milk yield and fertility measurably.

I’ve spoken with upper Midwest producers who were genuinely surprised to learn that their herds were experiencing measurable heat stress on so many summer days. We tend to think of heat as a southern issue, but the data tells a more nuanced story.

Once THI climbs past about 68, most high-producing herds start to lose milk, whether we see obvious signs or not.

The good news? Cooling infrastructure has become more sophisticated and, in many cases, more affordable relative to its impact. Holding pen cooling tends to offer the fastest payback (since cows are concentrated and often heat-stressed from walking to the milking area and waiting for milking). Feedbunk soakers combined with fans can maintain intake during hot weather. Tunnel or cross-ventilation systems provide consistent air movement but require more substantial investment.

Lameness: The Quiet Productivity Drain

If there’s one area where the gap between research knowledge and on-farm execution is most pronounced, it might be lameness prevention.

The economics are clear—almost surprisingly so. Research from multiple universities estimates the cost of a single lameness case at $90-$340, depending on severity and duration. A 2023 study by Robscis and colleagues found the average to be $336.91 per case, accounting for treatment, milk loss, and reproductive impact. That number surprised me when I first saw it—it’s considerably higher than most producers estimate when you ask them to ballpark the cost of a lame cow.

Farmers consistently underestimate lameness by 50%—missing a $337-per-case profit drain that delays breeding by a month and costs the average 200-cow herd over $13,000 annually

Research in Preventive Veterinary Medicine found that lame cows show calving-to-pregnancy intervals 30-40 days longer than sound herdmates. Perhaps most striking: a substantial portion of culls attributed to reproductive failure actually trace back to lameness as an underlying cause. When cows hurt, they don’t show heat as strongly, they’re harder to breed, and they’re more likely to leave the herd before their genetics can express.

The prevention protocol isn’t complicated. Extension recommendations consistently emphasize regular hoof trimming (2-3 times per lactation, with particular attention at dry-off and early lactation), consistent footbath protocols (4+ treatments per week with proper bath design), attention to walking surfaces, and management of stocking density to reduce the time cows spend standing in alleys.

Ohio State Extension estimates footbath costs at roughly $42 per cow annually for a properly executed copper sulfate program. Add in professional trimming, infrastructure maintenance, and labor, and a comprehensive program for a 200-cow herd runs $15,000-$25,000 per year. The return on that investment—when accounting for prevented cases and their cascading effects—typically exceeds the cost by a factor of three to five.

So why the disconnect between knowledge and action?

Research on farmer behavior points to several factors. Farmer-estimated lameness prevalence typically runs about half of the actual prevalence when researchers conduct independent scoring. Many cases simply aren’t being recognized, particularly in early stages when intervention is most effective. I’ve walked pens with producers who consider their lameness “under control,” only to find prevalence rates above 20% when we systematically score.

There’s also the challenge of sustained execution. Unlike a capital investment that pays back automatically once installed, lameness prevention requires daily attention and consistent protocols. When labor is stretched, and competing priorities emerge, footbath management and trimming schedules often slip.

This isn’t about producers being careless—it reflects the reality of managing complex biological systems with finite time and attention. But it suggests that farms with the labor capacity to implement the protocol consistently may have an underappreciated competitive advantage.

The Replacement Economics Puzzle

Behind many of the management decisions we’ve discussed lies a deeper economic reality reshaping dairy operations in fundamental ways.

The cost of raising a replacement heifer from birth to first calving now ranges from $2,500 to $3,500, depending on region and management intensity. Market prices for springing heifers have reached $2,800-$4,000 in many regions—a significant increase from 2019 levels.

The brutal math: raising a heifer costs $2,500-$3,500 and needs 3+ lactations to pay back, but average productive life is only 2.7 lactations—a structural profit drain

Here’s where the math gets challenging. Penn State Extension analysis indicates it takes over 3 lactations for a producer to recoup heifer-raising costs. Other research—including Dr. De Vries’s work at Florida—suggests that fully paying back the investment may require 5-7 lactations under some economic scenarios.

With an average productive life at 2.7 lactations, most operations are at real risk of not fully recovering their heifer-raising costs before cows leave the herd. That’s a structural problem that no amount of good management can fully overcome.

At an average of 2.7 lactations, most operations are coming uncomfortably close to losing money on the heifers they raise, once all costs are honestly accounted for.

The beef-on-dairy trend has intensified this dynamic. In many U.S. markets over the past year, day-old beef-on-dairy calves have routinely brought $700 to over $1,000, with some reports of top lots averaging close to $1,400 per head during the strongest runs. The immediate cash flow is attractive, and on a per-calf basis, the economics make sense.

But the collective effect has been dramatic. USDA cattle inventory data show U.S. dairy replacement heifer numbers at their lowest level in decades, comparable to the late 1970s. That supply constraint has driven prices to record levels, making it difficult, from an economic standpoint, to raise and buy replacements.

What this means practically is that many operations have reduced culling rates—keeping older cows in production longer because replacements are either unavailable or unaffordable. Industry reports indicate dairy cow slaughter in 2024 has run noticeably below the levels seen in many recent years, reflecting tighter replacement supplies and strong milk prices in some regions.

This isn’t necessarily negative from a longevity perspective. Keeping cows longer is, after all, what the industry has long encouraged. But it changes the management calculus. An older herd with more health challenges requires different attention than a younger herd, and operations that haven’t adjusted protocols may find themselves stretched thin.

What Operations Breaking Through Look Like

Despite these challenges, some operations achieve substantially better longevity outcomes. Looking at what they have in common offers a useful perspective.

Deliberate intensity management: Some high-longevity operations have consciously moderated peak production in favor of more sustainable output over time. Research from Germany and the Netherlands has documented herds averaging 4+ lactations with peak yields intentionally held 10-15% below maximum genetic potential. Less milk per lactation, but more lactations per cow—and the lifetime productivity often pencils out favorably.

Lower debt burden: Operations with debt-to-asset ratios below 40% are more flexible in making infrastructure investments and weathering price volatility. Highly leveraged operations often can’t afford capital improvements that would reduce their costs over time—a challenging cycle.

Strategic heifer programs: Operations raising their own replacements—particularly those using genomic testing to identify high-potential animals early—report significant cost advantages over purchasing from the market. Genomic selection can identify animals with better health and fertility genetics before substantial raising costs are incurred.

These aren’t secret formulas. They’re applications of well-understood principles—but ones that require capital access, operational flexibility, and long-term planning horizons that not every operation enjoys.

Regional Realities

Priorities look different depending on where you’re farming.

For operations in Texas, Arizona, or California’s Central Valley, heat stress mitigation typically offers the fastest return on investment. Production and reproduction losses from inadequate cooling can dwarf other management factors.

In the upper Midwest—Wisconsin, Minnesota, Michigan—heat stress matters during summer months, but lameness prevention and stall comfort often yield more consistent year-round returns. Longer housing seasons mean cows spend more time on concrete and in freestalls, making lying time and hoof health particularly important.

Northeast operations face their own considerations: older barn infrastructure, smaller average herd sizes, and proximity to premium milk markets that can support different economic calculations.

Labor markets vary significantly, too. Operations in regions with reliable labor availability may find it easier to maintain consistent lameness prevention protocols. Those facing chronic shortages might prioritize automation or simpler systems requiring less daily attention.

Generic recommendations only go so far. The right priorities depend on climate, existing infrastructure, labor situation, financial position, and herd demographics.

Where to Focus Limited Resources

Start with zero-cost stocking density fixes before spending six figures—the fastest ROI doesn’t always require the biggest checkbook

Investment Priorities at a Glance

Stocking Density Adjustment

  • Capital: $0
  • Operating: $0 (may reduce revenue short-term)
  • Payback: Immediate
  • Benefit: Lying time, herd health

Footbath Protocol Improvement

  • Capital: $3,000-$5,000
  • Operating: $8,000-$12,000/year
  • Payback: 3-6 months
  • Benefit: Lameness reduction

Holding Pen Cooling

  • Capital: $15,000-$25,000
  • Operating: $2,000-$5,000/year
  • Payback: 6-12 months
  • Benefit: Heat stress reduction

Comprehensive Barn Cooling

  • Capital: $60,000-$90,000
  • Operating: $8,000-$15,000/year
  • Payback: 12-18 months
  • Benefit: Production, reproduction

Deep Sand Retrofit

  • Capital: $80,000-$110,000
  • Operating: $15,000-$25,000/year
  • Payback: 18-24 months
  • Benefit: Udder health, comfort, longevity

All figures are based on a 200-cow herd. Costs vary by region and existing infrastructure.

Finding Your Starting Point

Check stocking density first. Running above 100% of stall capacity? That’s probably your starting point. The best facilities in the world can’t help cows that can’t access them.

Get an honest lameness assessment. Have someone other than regular staff do the scoring—research consistently shows we underestimate prevalence by half. If the true rate exceeds 15%, protocol improvements are likely to yield faster returns than facility investments.

Consider climate exposure. Does your region exceed THI 68 for 60+ days annually? Cooling infrastructure should be near the top of your list.

Evaluate lying times. Cows averaging below 11 hours daily? Look at stall comfort—dimensions, bedding depth, neck rail position.

Review fresh cow mortality. Losing animals in the first 50 days at rates above 2-3%? The issue is likely transition management, not facilities.

Consider financial position. Debt-to-asset ratio above 50%? Focus on cash-flow-positive improvements first—protocol consistency and management intensity often deliver returns without requiring additional capital.

The Bottom Line

Stepping back from all of this, what becomes clear is that the gap between genetic potential and realized performance isn’t primarily a knowledge problem. The research is available. The protocols are documented. Most producers know what best practices look like.

A lot of this comes back to structure, not just day-to-day decisions. Capital constraints limit infrastructure investment. Labor constraints limit protocol consistency. Price volatility makes long-term planning difficult. Replacement economics create challenging trade-offs between immediate cash flow and long-term herd value.

Individual operations can make meaningful improvements within these constraints—and many are doing so. Herds achieving 4+ lactation averages demonstrate that matching management to genetics is possible.

But there’s growing recognition in industry discussions that some challenges may require broader solutions: pricing systems that reward longevity, risk management tools that support infrastructure investment, cooperative models that improve capital access for mid-sized operations. These are conversations worth having, and we’ll be exploring some of these systemic questions in upcoming coverage.

In the meantime, genetics continue to improve. Each generation carries more potential than the last. The cows are ready for championship performance.

The opportunity—and it’s a real one—is building support systems to match. It won’t happen overnight. It won’t look the same on every operation. But for producers willing to honestly assess their limiting factors and strategically focus resources, meaningful progress is achievable.

One management decision at a time, the gap between genetic potential and realized performance can narrow.

The pit crew can rise to meet the machine.

Key Takeaways

What the research shows:

  • Modern genetics deliver unprecedented production potential, but the average productive life remains around 2.7 lactations
  • Lying time, heat stress management, and lameness prevention show strong connections to longevity and lifetime productivity
  • Infrastructure investments typically show 12-24 month payback periods—solid returns, but requiring upfront capital

Practical priorities:

  • Start with an honest assessment of lying time and stocking density—often the highest-impact, lowest-cost interventions
  • Regional climate should guide investment priorities
  • Consistent protocol execution may matter more than facility perfection
  • Evaluate heifer economics given current market conditions—the math has shifted significantly

The bigger picture:

  • The gap between genetic potential and realized performance is more about economics and execution than knowledge
  • Operations achieving exceptional longevity share common characteristics: manageable debt, consistent protocols, long-term planning horizons
  • Industry-level discussions about pricing and capital access will shape what’s possible going forward

Complete references and supporting documentation are available upon request by contacting the editorial team at editor@thebullvine.com.

Learn More:

The Sunday Read Dairy Professionals Don’t Skip.

Every week, thousands of producers, breeders, and industry insiders open Bullvine Weekly for genetics insights, market shifts, and profit strategies they won’t find anywhere else. One email. Five minutes. Smarter decisions all week.
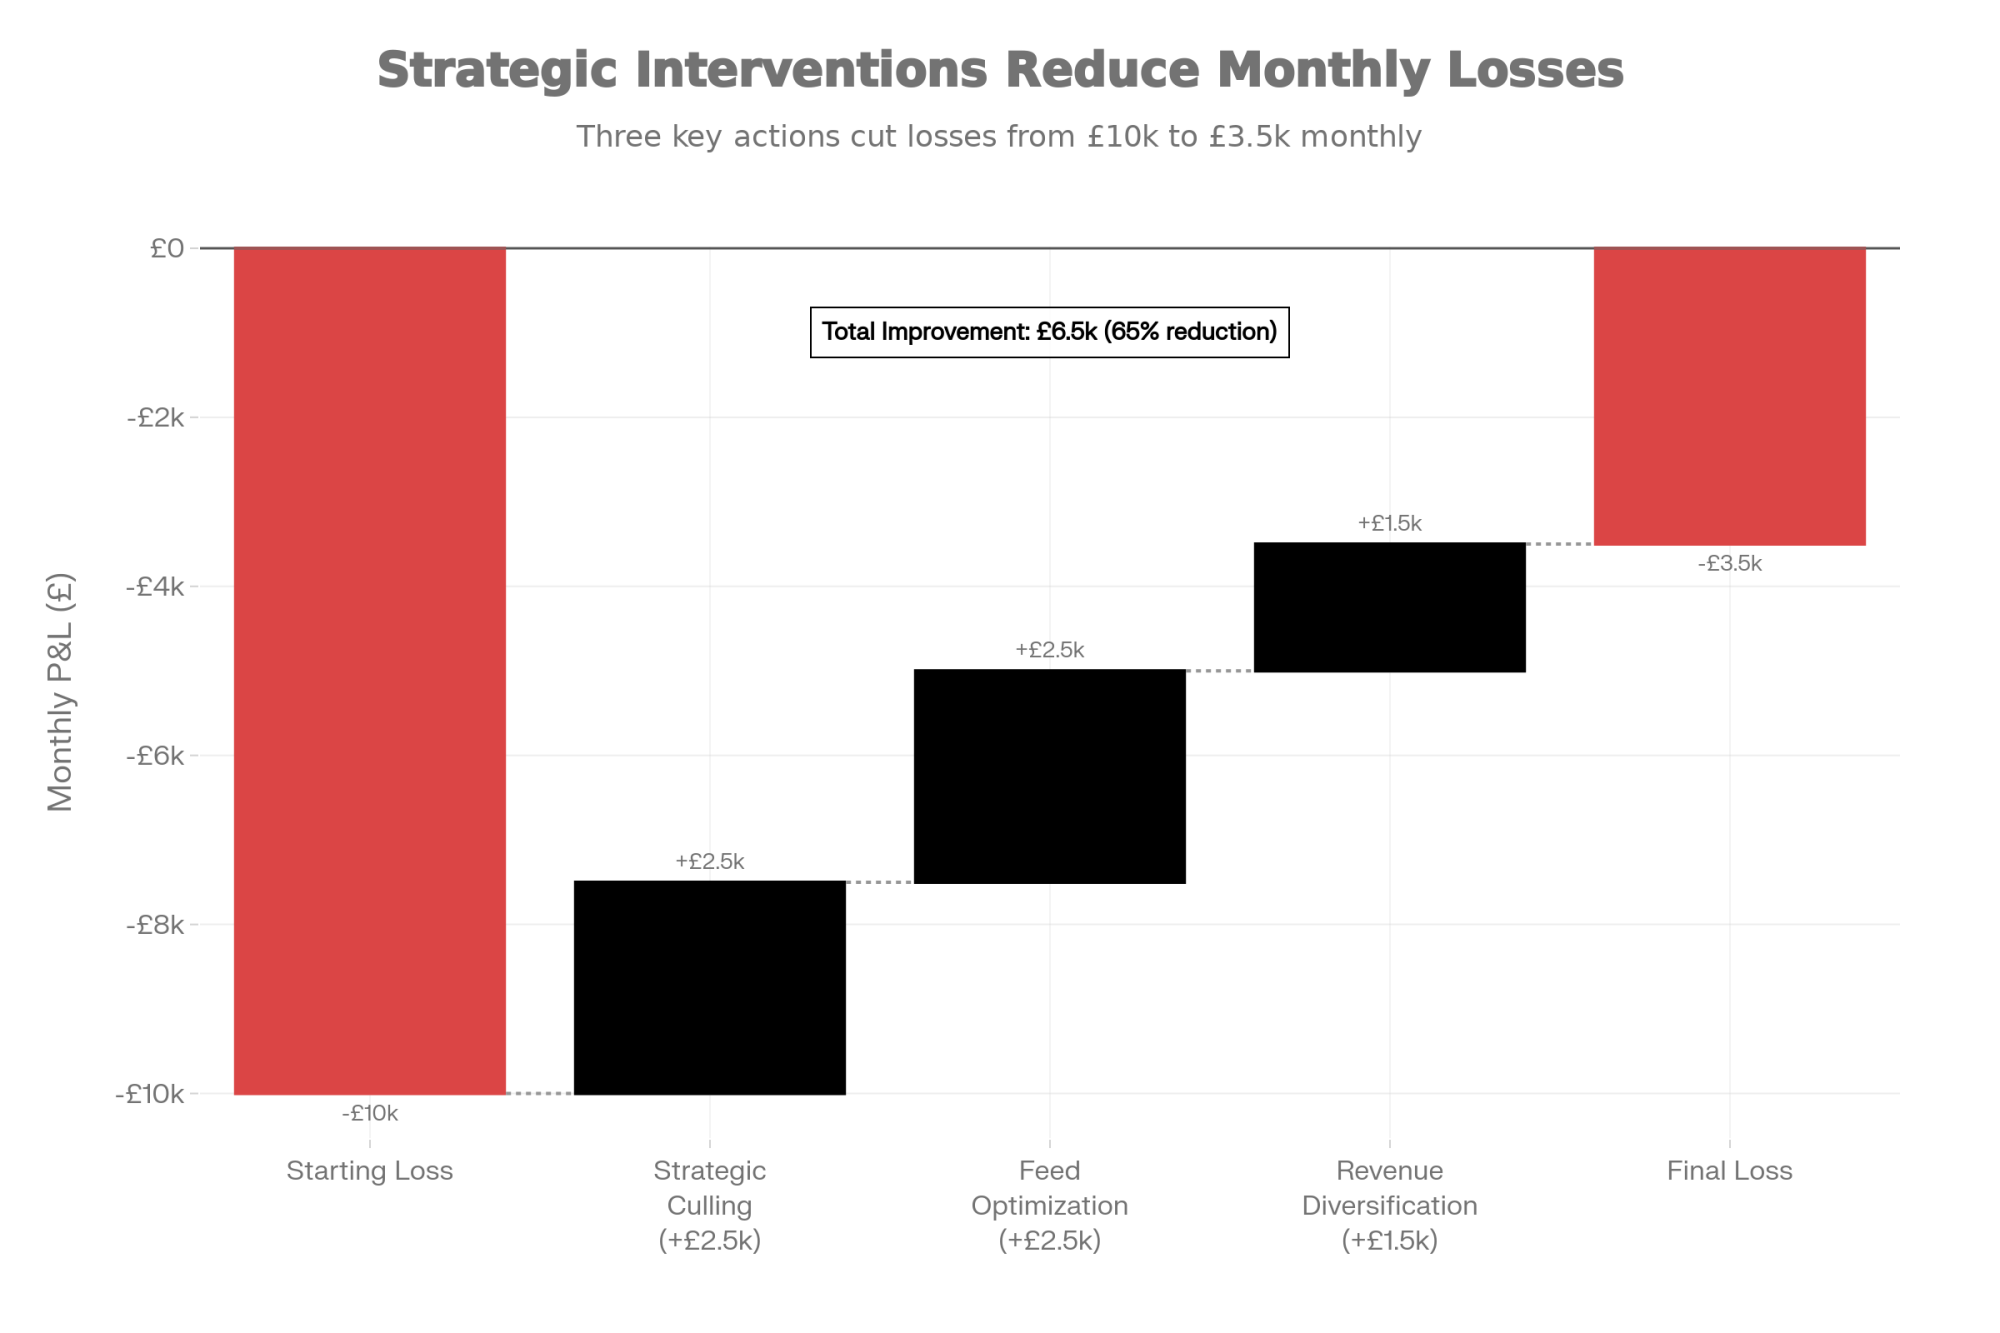
NewsSubscribe
First
Last
Consent

The $775-Per-Cow Secret: Why This California Dairy’s Hospital Pen Stays Empty

His hospital pen is empty. His antibiotic bill is zero. His cows make $775 more each. Here’s how

If you ever visit Trevor Nutcher’s dairy operation out in California’s Central Valley, something will immediately catch your eye—the hospital pen was empty. Not just quiet for the day, but consistently empty. For those of us who recall his operation a few years ago, which involved 20-plus cows cycling through treatment protocols, this is worth discussing.

What’s interesting here is that Nutcher didn’t achieve this through gradual reduction or selective dry cow therapy. He went cold turkey on antibiotics—completely eliminated them. And before you think he’s taking unnecessary risks, let me share what’s actually happened to his operation.

The Real Economics We’re Not Calculating

So here’s what I’ve been thinking about lately—we all know treating mastitis costs money, right? But it’s the hidden expenses that really add up. The milk we’re dumping during those extended withdrawal periods, the productive days lost to chronic cases, those early culling decisions we’re forced to make.

In my conversations with producers from Wisconsin to California, as well as some individuals in the Northeast and Southeast, I’m hearing that resistant cases often cost significantly more than straightforward treatments. What’s particularly interesting is that many producers are reporting higher retreatment rates than a few years ago.

A producer in Pennsylvania mentioned something that stuck with me: “We’re so focused on the treatment cost, we forget about the cow that never quite comes back.” That’s the hidden math we’re not doing.

Examining operations in Georgia and North Carolina, where heat stress exacerbates these issues, the economics become even more challenging. One producer near Athens told me his resistant cases during summer can cost three times as much as winter treatments when you factor in extended recovery.

Understanding What’s Really Happening

Dr. Geoff Ackaert, the technical director and global head of ruminants at AHV International, shared something with me that really shifted my perspective. He described our traditional approach as trying to defeat an organized army by capturing individual soldiers.

Emerging research suggests that bacterial communities form protective structures known as biofilms. You know that stubborn slime that builds up in water tanks? Same basic idea, except it’s happening in udder tissue. These biofilms function like protective shields, making bacteria 10- to 1,000-fold more resistant to traditional treatments, according to AHV’s research documentation.

Here’s what really got my attention—bacteria actually talk to each other using chemical signals. They coordinate their attacks for when the cow’s stressed. That’s why we often see mastitis blow up during transition, heat stress, or when we change the ration. The bacteria aren’t getting stronger; they’re getting better organized.

Joe Soares’ Unintentional Experiment

The Joe Soares operation gave us valuable data during last year’s H5N1 outbreak. His Chowchilla facility followed traditional protocols, including electrolyte support, aspirin powder, and B12 supplementation. Cost them $26.71 per treated cow according to their records. Meanwhile, his Turlock operation implemented AHV’s communication-disruption protocol at $54.02 per cow.

That initial cost difference would make anyone nervous. But here’s what happened: Turlock cows returned to normal production in three days. The Chowchilla group? Some took weeks, with several never returning to previous production levels. The milk production data showed that Turlock maintained 11 pounds more milk per cow per day during recovery. When you do the math, that higher upfront cost turned into a $775 advantage per cow.

What really convinced me was the collar monitoring data—Turlock cows showed measurable improvement in eating and chewing cud within 24 hours.

The Numbers That Matter:

  • Traditional protocol: $26.71/cow with weeks of recovery
  • Alternative protocol: $54.02/cow with 3-day recovery
  • Net advantage: $775 per cow when factoring in production
  • Irish trial results: 74.8% antibiotic reduction
  • Fertility improvement: 9.3% better conception, 28 fewer days open

COMPARISON AT A GLANCE:

FactorTraditional ApproachCommunication Disruption
Initial Cost$26.71/cow$54.02/cow
Recovery TimeWeeks3 days
Production LossVariable, often permanentMinimal
Retreatment RateHigh (30%+ in some operations)Low
Long-term ROIDeclining due to resistance$775/cow advantage
Works With RobotsYesYes, with monitoring benefits

How This Works (And Where It Doesn’t)

So instead of trying to kill bacteria—which just breeds tougher ones—this method scrambles their communication. Think of it like jamming their cell phone signals so they can’t coordinate.

This approach (called quorum sensing inhibition if you want the technical term) prevents bacteria from organizing their group attacks. A cow’s immune system handles individual bacteria just fine—it’s when they all attack at once that problems arise.

The field data from Ireland that AHV tracked is pretty compelling. Six farms with 1,344 cows achieved 74.8% reduction in antibiotic use. But here’s what’s really interesting—conception rates went up 9.3% and days open dropped by 28. We’re talking about overall health improvement, not just udder health.

Now, I should mention that not everyone sees these results. A Vermont grazing operation I heard about had mixed outcomes, partly because their system already had low infection rates. A 200-cow tie-stall barn in Wisconsin found it tough to implement with their setup. Some Southeast operations, which deal with year-round high humidity, report needing adjusted protocols.

For operations with robotic milking systems, there’s actually an advantage—the constant monitoring helps catch that 24-72 hour response window better than visual observation alone.

What Implementation Really Looks Like

Nutcher was candid about his transition. “Those first 72 hours test everything you’ve learned,” he told me. “You see swelling developing, and every instinct says reach for that mastitis tube.”

The difference lies in how quickly it works. Traditional antibiotics provide a familiar, quick knock-down effect within hours. Communication disruption takes 24 to 72 hours as the cow’s own immune system clears out the now-confused bacteria. It’s a different healing, not slower.

From what I’m seeing, successful transitions share these traits:

  • Start with prevention during dry-off and fresh cow periods
  • Look beyond per-treatment costs to total economics
  • Get your vet on board early

Several producers have mentioned that once they calculated milk dump plus early culling, the economics became clearer. But if you’re just comparing tube prices? Yeah, it’s harder to justify.

Dr. Sarah Mitchell, a practicing veterinarian in Wisconsin who has worked with three operations making this transition, told me, “The biggest challenge isn’t the science—it’s changing 30 years of muscle memory when you see that first swollen quarter.”

Is Your Operation Ready?

This approach may not be suitable for every situation. If you’re exiting dairy within two years, you may not recoup your investments. Small operations with fewer than 100 cows may find the per-cow investment challenging. But for operations that keep getting the same cows sick over and over? That’s when it becomes compelling.

Examining different regions reveals varying economic conditions. Texas operations dealing with heat stress see different results than Idaho’s large-scale dairies or New Mexico’s dry lot systems. Grazing operations in the Southeast—places like Tennessee and Kentucky—report different outcomes than large freestall barns out West. Florida producers dealing with year-round humidity face unique challenges that require a different approach.

Consider market access, too. Premium contracts for antibiotic-free milk vary widely by region and processor. Even modest premiums can add up to real money when you’re shipping year-round.

Based on documented trials, operations can see significant reductions in treatment needs—those Irish farms achieved nearly a 75% reduction. Though results vary by system.

What You Can Do Today

For operations considering change, here’s a practical timeline:

  • Month 1-2: Start tracking current treatment costs using the calculator below
  • Month 3: Begin with dry-off protocols
  • Month 4-6: Expand to fresh cow management
  • Month 7-12: Full implementation with ongoing monitoring

HIDDEN COST CALCULATOR:

Calculate Your True Treatment Cost Per Case:

1. Direct Treatment Expense

  • Cost of tubes/medications: $_____
  • Labor (hours × hourly rate): $_____

2. Lost Milk Revenue

  • Days of dumped milk: _____ days
  • Daily production × milk price: $_____/day
  • Total milk loss: $_____

3. Future Production Impact

  • Expected production drop: _____ lbs/day
  • Days of reduced production: _____ days
  • Production loss value: $_____

4. Culling Risk Cost

  • Increased culling probability: _____ %
  • Replacement cost – cull value: $_____
  • Risk-adjusted culling cost: $_____

5. TOTAL TRUE COST PER CASE: $_____

Even if you’re maintaining current protocols, track failure rates carefully. Document retreatment rates, identify chronic cases, and calculate true per-incident costs using the calculator above. This baseline data proves invaluable whether you transition now or later.

Sponsored Post

The Bottom Line

What we’re witnessing here is something fundamental—the conversation shifting from “How do we kill bacteria?” to “How do we prevent them from organizing?” That’s more than a technical change. It’s a whole new way of thinking about animal health.

The producers successfully navigating this aren’t abandoning proven practices completely. They’re combining new understanding with established principles. Sure, it requires education, patience, and sometimes stepping away from familiar protocols. But for operations embracing evidence-based innovation, the rewards look compelling.

The dairy industry has consistently evolved through cycles of innovation. Bacterial communication disruption may represent the next significant advance. Producers exploring these approaches today? They’re writing the management playbooks others will follow tomorrow.

As we all know, change in dairy comes slowly, then suddenly. That empty hospital pen at Nutcher’s operation might be showing us what sudden change looks like when it finally arrives. And for those of us still figuring out our path, it’s worth remembering—we don’t all have to take the same route, but understanding the options? That’s just good business.

KEY TAKEAWAYS

  •  Zero sick cows is achievable: Trevor Nutcher’s hospital pen went from 20+ cows to consistently empty—no antibiotics—by disrupting bacterial communication instead of fighting bacteria directly
  • $775 per cow ROI is documented: Joe Soares proved this during H5N1 with 3-day recoveries versus weeks and 11 lbs more daily milk production
  • Benefits go beyond mastitis: Irish trials (1,344 cows) achieved 74.8% antibiotic reduction while improving conception by 9.3% and cutting 28 days open
  • This rewards high-challenge herds most: Operations with already-low infection rates reported mixed results—know your baseline before investing
  • Your first step: calculate true costs: Most producers underestimate what chronic mastitis really costs when you add milk dump, retreatment, and early culling

EXECUTIVE SUMMARY: 

Trevor Nutcher’s hospital pen used to hold 20+ sick cows—now it stays empty, and he hasn’t used an antibiotic tube since switching protocols. The breakthrough: instead of killing bacteria (which breeds resistance), this approach disrupts their communication, preventing them from coordinating attacks. Real-world proof came during Joe Soares’ H5N1 outbreak—cows on the new protocol recovered in 3 days versus weeks, produced 11 pounds more milk daily, and delivered a $775-per-cow advantage. Irish trials across 1,344 cows documented a 74.8% reduction in antibiotics, while improving conception by 9.3% and cutting days open by 28. This approach isn’t universal—operations with already-low infection rates and small tie-stall setups report mixed results. But for dairies trapped in chronic retreatment cycles, the economics of bacterial communication disruption are becoming impossible to ignore.

Complete references and supporting documentation are available upon request by contacting the editorial team at editor@thebullvine.com.

Learn More:

The Sunday Read Dairy Professionals Don’t Skip.

Every week, thousands of producers, breeders, and industry insiders open Bullvine Weekly for genetics insights, market shifts, and profit strategies they won’t find anywhere else. One email. Five minutes. Smarter decisions all week.
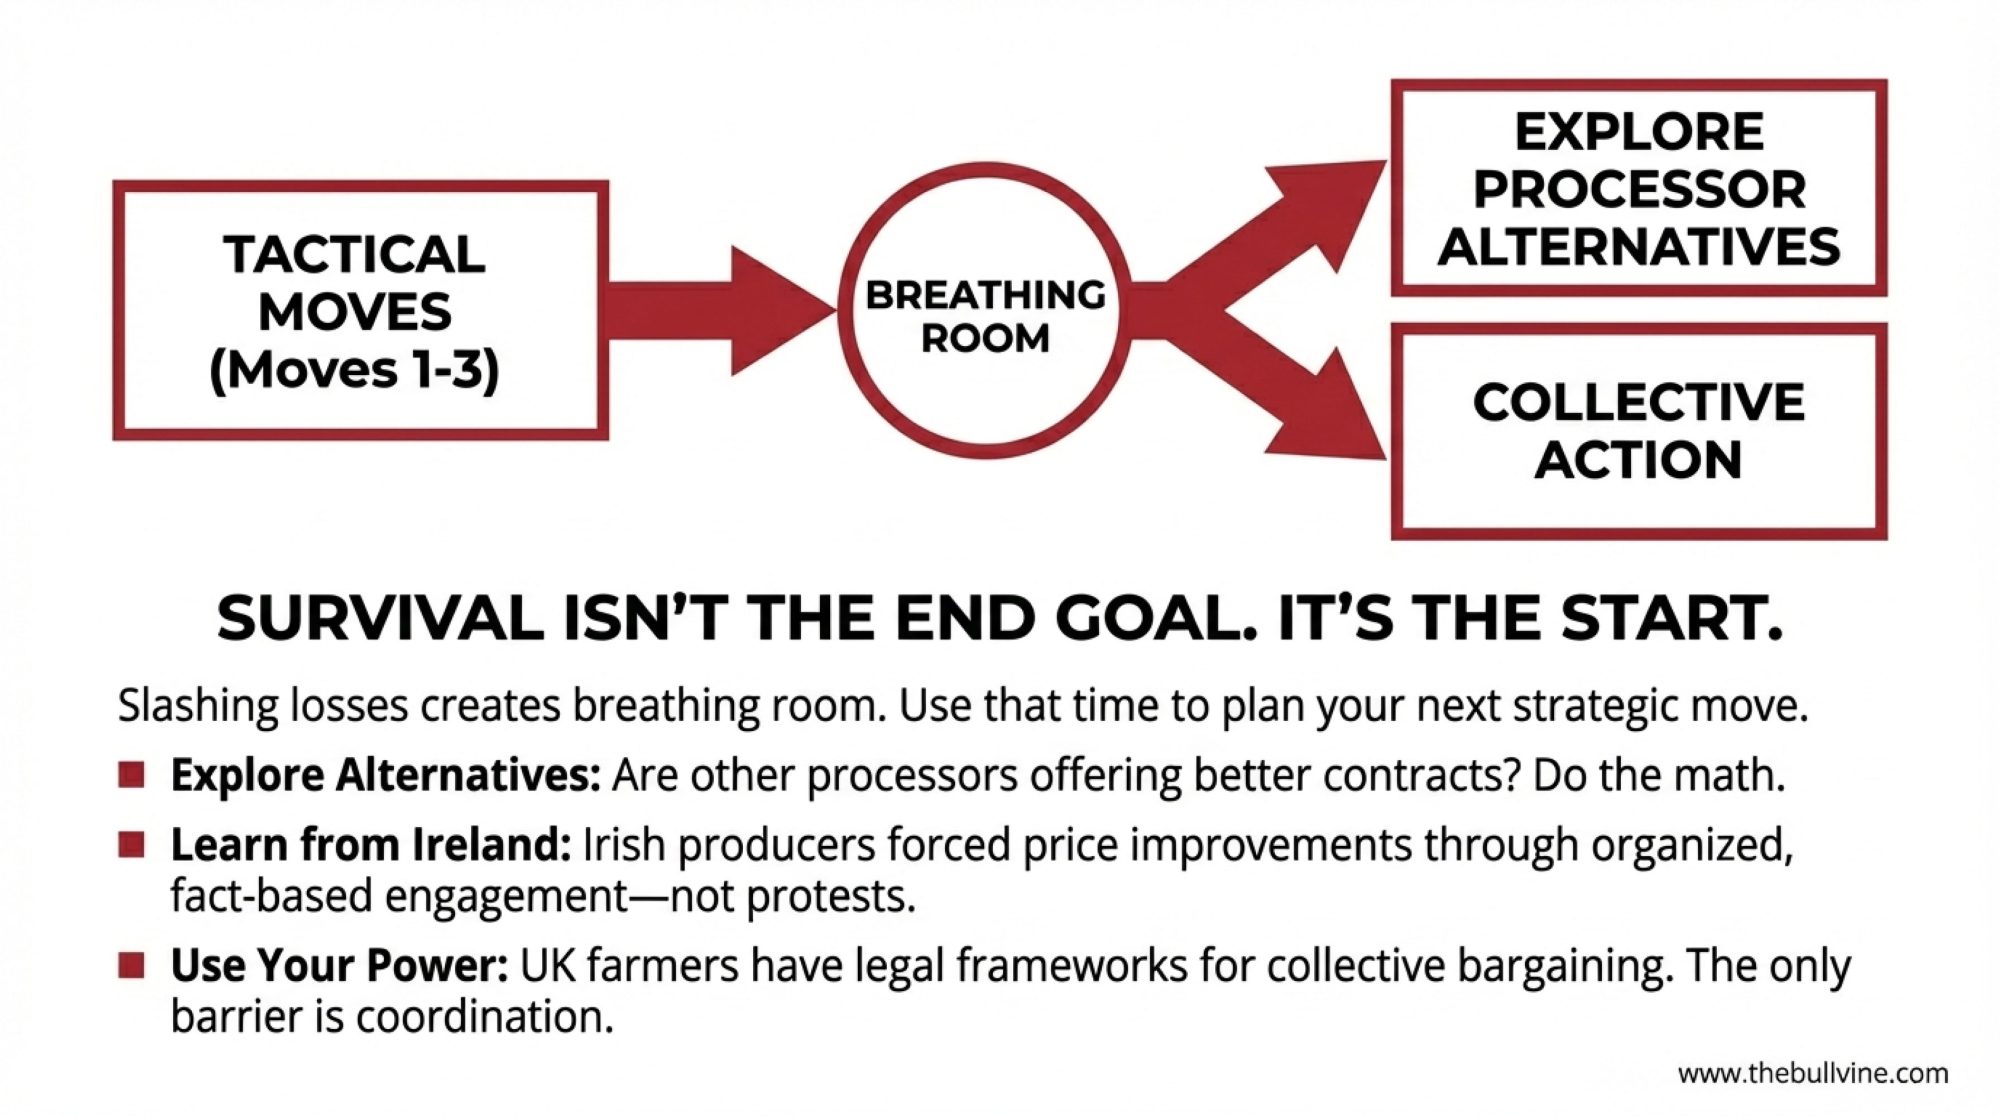
NewsSubscribe
First
Last
Consent

Beyond Cows Per Hour: The Cow-Time Truth That’s Changing Large Herd Robot Math

2,000-cow dairies are learning something from robots that has nothing to do with labor: cows can’t make milk while standing in line.

Executive Summary: Large dairies have measured success in cows per hour for decades. Operations that thrive with robots have flipped that metric—they manage by cow time instead. The biology is clear: high producers need 12–14 hours of lying time daily, and every hour lost to walking or waiting costs 1.5–3.5 pounds of milk. On many 3x parlors, that’s 3–5 hours of hidden loss every day. Robot herds that nail the fundamentals—55–60 cows per unit, proper heifer training, solid hoof health—report 3–8% higher milk per cow after stabilization. But the economics demand honesty: real payback runs 5–7 years, not the 3.8–5 years in vendor models. Recent research adds a key insight: milking speed is 42% heritable, but willingness to visit the robot is almost entirely management-driven. For 2,000-cow operators, the question isn’t robots vs. parlors—it’s whether you’re ready to build around cow biology, not just throughput.

Large herd robotic milking

You know the drill. On a lot of big dairies, the proud number is still the same: “We run 450–500 cows an hour through this parlor.” And to be fair, that’s impressive steel and scheduling. But here’s what’s interesting—as more large herds adopt automatic milking systems, a different story is emerging. Cows per hour and true cow productivity? They’re not always pointing in the same direction.

What farmers are finding is that robots aren’t just a different way to get cows milked. They’re shining a light on hidden time losses, showing how much genetic potential may still be sitting on the table, and prompting a more honest look at labor risk and management discipline.

And here’s the thing—the biggest differences between successful and struggling AMS herds rarely come down to the brand of robot. They come down to cow time, barn design, and how well you run the people side of the business.

Looking at This Trend Through Cow Time, Not Steel

If you strip everything back, a dairy cow still lives on a 1,440‑minute clock every day. Extension specialists keep coming back to the same basic targets you’ve probably heard at meetings.

High‑producing Holsteins and Jerseys should be getting at least 10–12 hours of lying time, with 12–14 hours often cited as the ideal target for top performance and hoof health. The research on this is fairly consistent—according to time-budget studies summarized by multiple land-grant universities, each hour of lying time you lose can cost you roughly 1.5–3.5 pounds of milk per cow per day, depending on stage of lactation and environmental conditions.

Time away from stalls—walking, standing in headlocks, sitting in a holding pen—comes straight out of that lying and ruminating budget.

On many large 3x parlors, especially those with long alleys or dry lot systems feeding into a central milk center, total time away from stalls can run 3–5 hours per day when you add up walk time, holding, and actual milking. When you layer on 4–6 hours of feeding and watering, plus social and transition time, you can see how quickly you approach that 12‑hour rest target.

Every extra hour cows spend out of stalls quietly strips 1.5–3.5 pounds of milk per cow per day. By the time many 3x parlors hit 3–5 hours of walking and waiting, they’re effectively giving up a full milking’s worth of production without ever touching the parlor controls.

I was talking with a nutritionist recently who works across several large California operations. The way she put it was simple: “Most producers don’t realize how much milk they’re leaving on the table until they actually track where their cows spend their hours.”

And the data backs that up. Studies that track both lying time and milk yield tell a consistent story—cows losing just 2 hours of rest per day commonly give 3–7 pounds less milk, and first‑lactation animals tend to be even more sensitive to this.

Tightening time budgets in a parlor can claw back a few points of milk per cow, but the real jump shows up when robots are managed to feed extra milkings to your best genetics. The winners aren’t “robot herds” or “parlor herds”—they’re the people who obsess over minutes, not metal.

What’s particularly noteworthy is that when herds later install robots, whether on part of the herd or across the board, many report 3–8% higher milk per cow once the system stabilizes, even when they end up milking fewer total cows. The common thread? Cows reclaim time for lying and ruminating instead of standing in concrete alleys.

Tightening time budgets in a parlor can claw back a few points of milk per cow, but the real jump shows up when robots are managed to feed extra milkings to your best genetics. The winners aren’t “robot herds” or “parlor herds”—they’re the people who obsess over minutes, not metal.

Now, that doesn’t mean every robot install boosts milk. But it does highlight just how significant those quiet time‑budget losses can be.

The Bimodal Milk Curve Challenge

There’s another factor in high‑throughput parlors that only shows up when you examine milk‑flow curves. And it does not get talked about enough.

Biologically, most cows need about 90–120 seconds between effective teat stimulation and full oxytocin release for a complete milk letdown. But in fast parlors—and many of us have walked through them—it’s common to strip, dip, wipe, and attach in 30–60 seconds, especially when crews are working to hit those cows‑per‑hour targets.

On‑farm flow meters and research trials have documented what happens in these situations.

You get a quick spike as cisternal milk is removed. Then there’s a flat or low‑flow phase while the cow is still waiting hormonally for full letdown. Finally, a second rise once oxytocin finally peaks.

That “start–stop–start” pattern is what we call a bimodal curve. And here’s what the field studies suggest—when you don’t allow enough time for effective letdown, cows can noticeably reduce daily milk harvest, especially high‑yielding, early‑lactation animals who have the most to give.

What I’ve observed in some very fast parlors is that the graphs look great for turns per hour, but not nearly as strong when judged by milk per milking minute.

Robots don’t automatically solve this, but the software makes it easier to respect biology. AMS units can apply consistent stimulation—often with brushes or controlled vacuum—and then wait the full lag period before expecting peak flow. When you look at their flow curves, you generally see a single, smooth peak rather than the “double hump,” suggesting a more complete harvest.

What Farmers Are Finding About Genetics and Milking Frequency

Genetic progress has outpaced a lot of our old assumptions. And this is something worth sitting with for a moment.

Between 1970 and 2020, combined fat and protein production in U.S. Holstein populations increased by more than 900 pounds per cow, with national evaluations crediting about 60–65% of that gain to genetics when you separate out management and environment. Jerseys have shown similar patterns for component yield and feed‑efficiency traits.

The challenge is that realizing that genetic potential depends heavily on milking frequency and cow comfort.

Controlled studies and on‑farm trials provide some useful guideposts. Moving from 2x to 3x milking often increases yield by 8–15% in controlled settings, particularly during early and peak lactation.

Short periods of 4x milking in early lactation can create persistent yield benefits across the whole lactation—because of how additional milkings affect mammary cell activity. And cows differ genetically in their response to higher frequency. Some families show much larger gains than others.

In a conventional 3x parlor, your top and bottom cows are on the same schedule. A high‑genetic‑merit cow that could profitably be milked 4 or 5 times a day stands in line with a late‑lactation cow you’re trying to dry off clean. Both take the same parlor time, even though the return on that time is very different.

What robots change, when managed well, is the flexibility to match milking frequency to each cow’s potential.

In free‑flow AMS barns, peak cows often visit robots 3.5–4.5 times per day, while late‑lactation or lower‑producing cows may be permitted 2–2.5 milkings. Permissions can be adjusted cow by cow based on days in milk, udder health, and butterfat performance.

One illustration worth noting is Countyline LLC in California’s Central Valley—one of the largest robotic Jersey projects in North America, with 32 robots designed for roughly 2,000+ Jerseys, transitioning from a conventional double‑32 parlor. Public profiles indicate strong per‑cow production for first‑ and second‑lactation animals, with the high components you’d expect from intensively managed Jersey herds.

What this development suggests is that, in a robotic setup, “robot minutes” become a resource you allocate to the cows with the best genetic and economic returns, rather than treating all cows equally in terms of time.

Here’s something else worth noting on the genetics front—and it’s one of those details that doesn’t get enough attention. According to research published in the Journal of Dairy Science in 2023, milking speed traits show remarkably high heritability. Average milk flow rate runs 0.43–0.52, and maximum flow rate hits 0.47–0.58 in the AMS data. The new CDCB Milking Speed evaluation released in August 2025 estimates heritability at 42% based on conventional parlor data, making it the highest heritability of any of the 50 traits they publish. The reason both parlor and AMS data point in the same direction is straightforward: how fast a cow lets down milk is fundamentally biological, not system-dependent.

By contrast, behavioral traits like robot visit frequency and milking interval show much lower heritability—around 0.08–0.10, according to a July 2025 Journal of Dairy Science study—indicating they are more management-driven than genetics-driven.

Milking speed and flow sit near the top of the heritability charts, which means you can move the needle fast with the right sires. But robot visit frequency and milking interval barely clear 0.1 h²—proof that you can’t breed your way out of weak barn design, poor training, or chronic lameness.

The practical takeaway? You can select fairly quickly for cows that milk efficiently, but willingness to visit the robot voluntarily depends more on training, facility design, and hoof health than on pedigree.

What Robots Really Change Economically

When a 2,000‑cow operator looks at a capital plan and sees a multi‑million‑dollar robot build versus a more modest investment in a rotary or expanded parallel, payback is naturally front and center. It’s also where vendor projections and independent analyses sometimes diverge.

University extension economists in the U.S. and Canada have built a range of AMS vs parlor budgets. According to economic analyses from Minnesota, Wisconsin, and Canadian extension programs, under good design and strong management, payback for robots often falls in the 3.8–5-year range, driven mostly by labor savings and modest production gains.

But on real farms? Those same teams report that it’s more common to see 5–7 years, especially when you include a realistic transition period.

Vendor spreadsheets often promise payback in under five years, but real, 2,000‑cow AMS herds rarely settle out that fast. Once you count transition headaches, learning‑year dips, and full maintenance costs, a 5–7‑year payback is far more honest—and still defensible when labor risk is brutal.

Looking at those models and field reports side by side, three economic factors consistently emerge:

Labor savings. Studies and case farms typically show milking‑related labor dropping 25–30%, with pounds of milk shipped per full‑time equivalent often rising from around 1.5 million to about 2.2 million pounds per worker per year in AMS herds.

Milk per cow. Once cows and people get through the adjustment period, many robot herds in reviews and surveys report 3–8% higher milk per cow, driven by smoother time budgets, more consistent routines, and higher milking frequency for the top animals.

Overhead considerations. Depreciation, maintenance contracts, electricity, and consumables are higher per cow in a robotic setup than in a parlor, which offsets part of the labor savings.

A multi‑country review comparing AMS and conventional herds over five years found that average profitability was often similar when you adjusted for milk price, scale, and stocking rate. In other words, robots didn’t automatically outperform parlors—the farms that did well in each system tended to be the ones with tight management and good facilities.

So why is this significant? Because it suggests the decision isn’t purely economic for many operators.

In a 2023 peer-reviewed survey of large U.S. farms using seven or more robots, producers identified their top reasons for adopting AMS as chronic difficulty finding and keeping qualified parlor employees, concerns about future wage and regulatory changes, desire for more consistent milking procedures and teat prep, and interest in shifting employees into roles focused on fresh cow management, herd health, and reproduction.

This aligns with what economists are now saying—that robots function as a labor‑risk management tool as much as a production tool. It also explains why some herds are comfortable with a 7–10 year real payback if the alternative is an increasingly uncertain labor situation.

At the same time, extension guidance is clear that in regions where labor remains relatively available and affordable, and where regulatory conditions are different, a well‑designed rotary or parallel parlor may still be the most economical choice—especially for herds that are already efficient on cows‑per‑hour and milk quality.

I’ve seen herds in the Upper Midwest and Southwest with strong local workforces choose a new rotary and perform very well, precisely because their challenge wasn’t labor risk but something like cow flow, parlor age, or heat‑stress management.

A Snapshot from the Pacific Northwest

To make this more concrete, let’s look at one example from the Pacific Northwest that’s been profiled in industry publications.

A Washington State dairy milking around 1,100 cows installed roughly 20 robots in a retrofit scenario, driven largely by labor shortages and a desire for more manageable schedules for both owners and employees.

According to reports from Dairy Herd Management and follow‑up coverage on robotic cow flow, they initially struggled with cow traffic and fetch rates—especially among first‑lactation heifers—and saw milk per cow dip during the first months.

Over time, they made three significant adjustments. They reworked the pen design to create clearer, free‑flow traffic patterns. They invested more heavily in heifer training and hoof health before calving. And they reduced cows per robot into the mid‑50s, even though that meant fewer total cows in milk.

Two to three years in, they reported that milk per cow had recovered and surpassed pre‑robot levels, milking labor had dropped significantly, and owner lifestyle was more sustainable—though maintenance costs were higher than initially expected.

This “dip‑and‑recover” pattern appears fairly typical on well‑managed AMS transitions. A challenging learning year, followed by a more stable, data‑driven routine. It’s something worth keeping in mind if you’re considering the switch.

Understanding Fetch Cows and Building “Robot‑Ready” Herds

Once the new system is running, many managers quickly realize that a significant part of their day is determined by one number: how many cows walk themselves to the robot.

A fetch cow is a cow that doesn’t visit the AMS within the target interval and has to be brought by staff. Extension guidelines and AMS consultants commonly set a goal of no more than 5% of the herd on the fetch list on a given day—roughly three cows per robot—to preserve labor savings and minimize cow stress.

In herds that are struggling with the transition? It’s not unusual to see fetch rates of 15–25%, which can turn “automatic milking” into a time‑consuming cow‑management challenge.

And here’s what’s interesting—fetch cows aren’t random. Several consistent factors show up in both the research and on real farms.

The 4 Primary Causes of Fetching

1. Personality and Temperament Research in Europe and South America has used standardized behavioral tests to classify cow personalities. Cows that are bolder and moderately active tend to adapt faster to robots and end up on fetch lists less often. Very fearful or highly reactive cows typically need more support during the transition.

2. Heifer Training (or Lack Thereof) Studies on “phantom robot” training—where heifers are exposed to the robot area and its sounds before calving—show lower fetching during the first weeks of lactation and better early milk letdown compared with untrained heifers. Many AMS advisors now treat heifer training as a required piece of fresh cow management, not an optional extra.

3. Lameness Lame cows are far less inclined to walk to a robot voluntarily. Reviews from industry publications and North American extension programs connect higher lameness prevalence to higher fetch rates and lower milk per cow. Lame cows in AMS herds are often roughly twice as likely to show up on fetch lists as sound cows.

4. Stocking Density and Barn Design Pushing 70–80 cows per robot to “maximize utilization” tends to mean longer robot queues, more competition, and more timid or subordinate cows giving up on voluntary visits. According to facility guidelines from Wisconsin extension and Lactanet, 55–60 cows per robot is a realistic upper limit for high‑producing herds. Some of the most successful operations intentionally stay a bit lower in fresh or high‑yield pens.

Genetics is part of the picture, too. Analyses of AMS data in North American Holsteins have estimated moderate heritability—0.10–0.15—for traits such as number of successful robot visits and milking interval, with higher heritability for milking speed and teat/udder traits that affect attachment.

This means over time we can genuinely select for “robot‑ready” cows—those that move well, milk quickly, and have udders suited to the technology.

In herds that make robots work well, a common pattern emerges. They run 50–60 cows per robot, especially in fresh and high groups. They emphasize sand‑bedded freestalls, regular hoof trimming, and alley cleanliness before and during the transition. They build structured heifer training into their fresh cow management program. And they make timely culling decisions on chronic fetch cows, regardless of pedigree.

Why Some Large Herds Struggle—or Step Back

It’s worth acknowledging that not every large herd that installs robots ends up satisfied with the decision. In Europe and New Zealand, there are documented cases of farms decommissioning robots and returning to parlors after several difficult years, usually due to a combination of design challenges, unrealistic expectations, and management strain.

Looking at the available data and field experience, a few patterns keep recurring.

Retrofitting Robots into Parlor‑Designed Barns

You probably know this one. The 2023 peer-reviewed survey of large U.S. AMS herds—those with seven robots or more—found that about one‑third of producers said they would change barn design decisions if they could do it again, especially around robot placement and traffic lanes.

Retrofitting robots into barns built around straight‑through parlor flow often creates narrow alleys and “pinch points” near robot rooms, robots positioned in corners rather than integrated into main cow paths, and pen layouts that require cows to move against group flow to reach the milking area.

These issues then manifest as higher fetch rates, reduced lying time, and more variable production—problems that are very difficult to address once the concrete is poured.

Overstocking Robots

On paper, putting 75 cows on a robot instead of 55 looks like an efficient way to spread capital cost. But from the cow’s perspective, it often means longer queues in front of the robot, dominant cows monopolizing access, and timid, lame, or fresh heifers being pushed out and becoming chronic fetch cows.

AMS facility guidelines from Lactanet and university extension programs consistently recommend designing for 55–60 cows per robot for high‑producing Holstein or Jersey herds, with flexibility to run lighter stocking in certain pens when conditions warrant.

Underestimating the Learning Curve

Several studies following farms through AMS transitions report that it typically takes 6–12 months for milk yield, robot utilization, and daily routines to stabilize.

During that period, herds may see a temporary dip in production, elevated somatic cell counts while prep and attachment protocols are refined, and more labor devoted to training cows and staff than initial budgets anticipated.

Case studies and reviews suggest that operations expecting immediate labor relief and a smooth transition tend to experience the most frustration, while those who plan for a “learning year” are more likely to report satisfaction by year two or three.

Data Engagement and Management Approach

The same hardware can produce very different results depending on how it’s managed.

Performance reviews highlight that successful herds check robot and cow data daily—milkings per cow, refusals, failed attachments, activity, conductivity, lying time—and use those numbers to adjust grouping, feeding, and hoof care.

Less successful herds often log in less frequently, focus primarily on bulk tank output, and treat robot alerts as nuisances rather than diagnostic information.

What I’ve observed is that the large herds thriving with robots were typically already comfortable managing by data—tracking fresh‑cow performance, pen‑level butterfat, reproductive metrics, and time budgets—before they ever contacted a robot dealer. Robots don’t compensate for management gaps. They tend to amplify whatever approach is already in place.

Different Regions, Different Right Answers

It’s worth remembering that not every region is facing the same set of pressures.

In parts of the U.S. and Canada where labor is tight, wages are rising, and regulatory requirements are expanding, robots can be a way to convert unpredictable labor costs into more predictable capital and maintenance expenses, even if the margin over feed is similar. In those situations, producers often tell me they value stability as much as financial returns.

In other regions—where there’s still a reliable, reasonably priced local workforce and where dry lot systems and centralized parlors align well with climate and land base—a new rotary or expanded parallel, paired with strong management, can absolutely remain the right choice.

I’ve seen herds in the Upper Midwest, Southwest, and Latin America achieve excellent milk, health, and labor metrics with conventional parlors because they were designed around cow flow and time budgets just as thoughtfully as any robot barn. One Wisconsin operation I visited last year had just installed a new 60‑stall rotary, and they’re hitting numbers that would make any robot farm proud—because they obsessed over time budgets, stall comfort, and consistent protocols.

Seasonal considerations matter too. In hot summers, for example, extra time in holding pens or long walks from dry lots can push cows past their heat‑stress threshold more quickly, whether they’re going to a parlor or a robot. That’s one more reason why time budgets and cow comfort form the foundation, regardless of which milking system you choose.

The broader trend is that the margin for loose time management and inconsistent protocols is narrowing on both sides of the technology discussion. Whether you choose a rotary or robots, cows still need adequate lying time, clean stalls, smooth, fresh cow management, and consistent routines.

Key Considerations for 2,000‑Cow Operators

So, if you’re operating in that 2,000‑cow range and genuinely evaluating your options, what should you take from all this?

Start by measuring time, not by shopping for equipment. Before committing to any major investment, spend several months tracking time away from stalls, lying time, and lock‑up duration in your current system. That exercise alone will reveal how much opportunity—or hidden cost—exists in your current operation.

Recognize that genetics need the right schedule to deliver. Today’s Holstein and Jersey genetics can produce impressive milk and components, but only when milking frequency, comfort, and fresh-cow management align with their capabilities.

Frame robots as a risk‑management decision, not purely an efficiency calculation. Economic models suggest a 3.8–5 year payback is achievable under favorable conditions, but many real farms land closer to 5–7 years, and some take longer. Whether that timeline makes sense depends significantly on your labor outlook and long‑term operational plans.

Take fetch cows, lameness, and heifer training seriously. These three factors will largely determine how “automatic” your automatic milking actually feels. If you’re not prepared to invest in hoof health, stall comfort, and structured training before the robots arrive, your payback will likely be slower regardless of which system you choose.

Be honest about your management approach. If your team already operates from data—milk weights, butterfat performance, reproductive metrics, time budgets—you’re better positioned to succeed with AMS. If decisions are made primarily by intuition, the first investment might need to be in people and processes rather than technology.

Accept that there isn’t a single “right” answer. In some regions and operational contexts, a new rotary with excellent cow flow may be the most sensible long‑term investment. In others, robots will be the best path forward, given labor-market realities unlikely to reverse.

The Bottom Line

What’s interesting about this moment in the industry is that robots are prompting all of us—whether we ever purchase one or not—to think more carefully about how cows spend their time, how we develop and retain our people, and how we build systems capable of performing well over the next 10–15 years.

If this discussion helps you ask better questions, whether you ultimately install a new rotary, a row of robots, or neither, then it’s served its purpose.

KEY TAKEAWAYS

  • Track cow time, not cows per hour: High producers need 12–14 hours of lying time daily. Every hour lost costs 1.5–3.5 lbs of milk—and on many 3x parlors, cows lose 3–5 hours to walking and waiting.
  • Robots recover time, and time recovers milk: Well-managed AMS herds report 3–8% higher production per cow by giving back the hours that parlor routines take away.
  • Use honest economics: Real payback runs 5–7 years, not the 3.8–5 in vendor models. Budget for a 6–12 month learning curve before expecting stable results.
  • Nail the fundamentals before install: 55–60 cows per robot maximum, structured heifer training, and excellent hoof health aren’t optional—they separate success from struggle.
  • Select for speed, train for visits: Milking speed is 42% heritable—breed for it. Willingness to visit the robot is almost entirely management-driven—design and train for it.

Complete references and supporting documentation are available upon request by contacting the editorial team at editor@thebullvine.com.

Learn More:

The Sunday Read Dairy Professionals Don’t Skip.

Every week, thousands of producers, breeders, and industry insiders open Bullvine Weekly for genetics insights, market shifts, and profit strategies they won’t find anywhere else. One email. Five minutes. Smarter decisions all week.
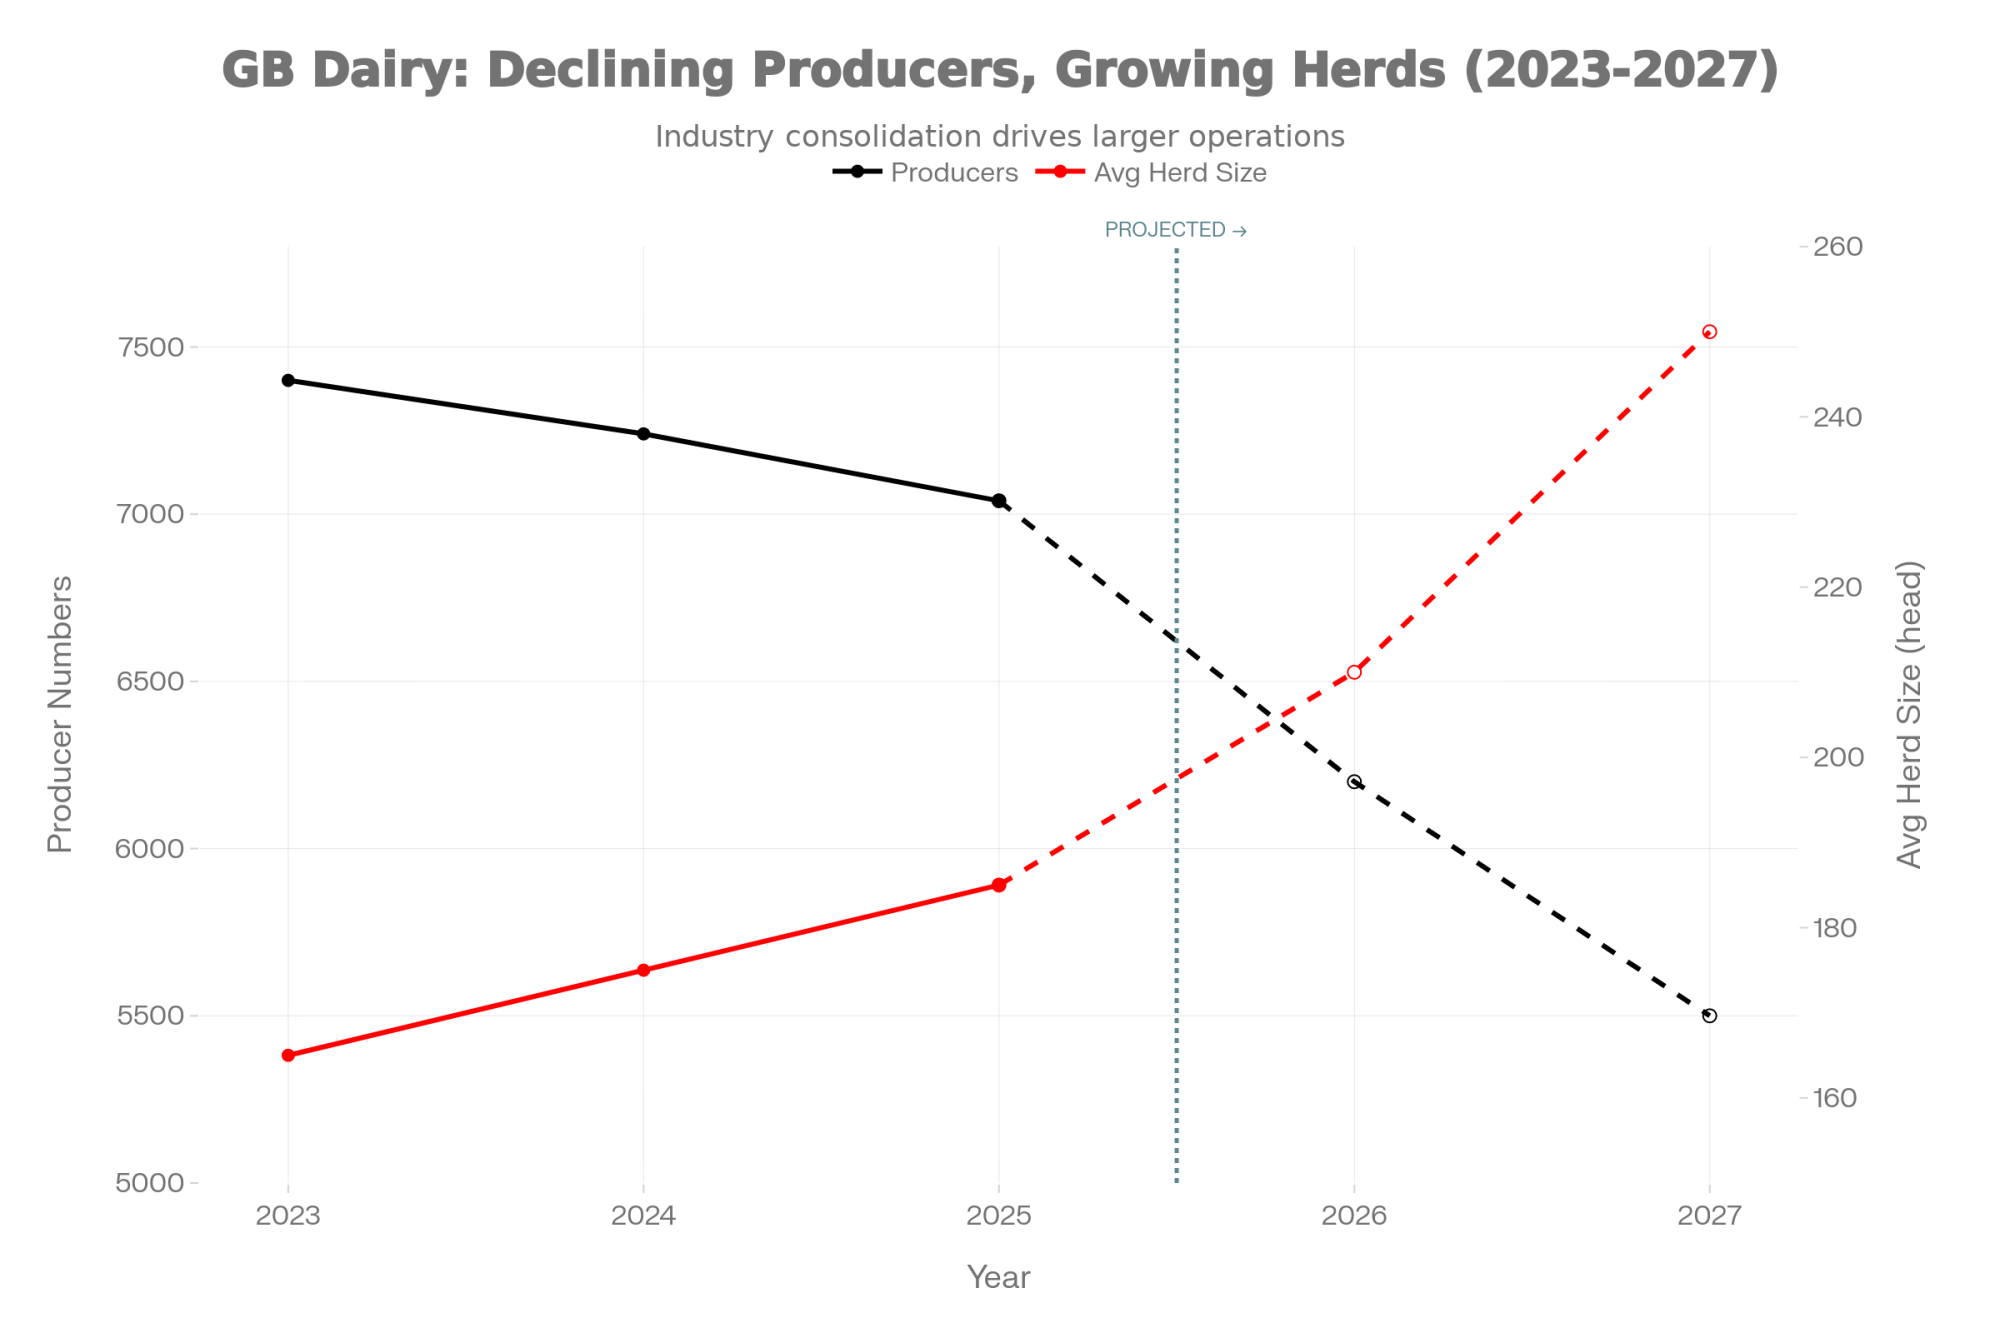
NewsSubscribe
First
Last
Consent

Bailouts, Beef, and Butterfat: When $15K Won’t Fix a $370K Hole

$15,000 from Washington. $370,000 in the red. The bailout’s a band-aid on a bullet wound—here’s what producers who’ll survive 2026 are doing right now.

EXECUTIVE SUMMARY: The $12 billion bailout sounds big—until you run the numbers. Dairy competes for scraps from a $1 billion ‘other commodities’ pool. A 500-cow operation might see $15,000. That covers 4% of projected annual losses exceeding $368,000. The June FMMO reforms made it worse: producers lost $337 million in pool revenue in just 90 days, according to AFBF analysis. But the dairies positioned to survive aren’t waiting on Washington. Beef-on-dairy crossbreeding is generating $90,000-$135,000 in new annual revenue. Component optimization is adding $50,000-$90,000 through butterfat gains. The bailout’s a band-aid—these moves are what separate survivors from casualties heading into 2026.

When the bailout announcement hit Monday morning, Jeff Voelker did what he’s done every month for the past year—he pulled up his spreadsheet and reran the numbers.

Voelker milks 480 cows outside of Marshfield in central Wisconsin. Good herd. Solid genetics. Third-generation operation. The kind of dairy that should be thriving. Instead, he’s been watching his working capital erode month after month, wondering how long the runway really is.

“I appreciate any help Washington sends our way,” Voelker told me when we spoke Tuesday. “But I’m not making business decisions based on that check. I’m making them based on what my cows and my land can actually do.”

That sentiment—grateful but exhausted—captures where a lot of mid-size producers find themselves this December. Because let’s be honest: after years of margin compression, trade wars, pandemic disruptions, and now FMMO reforms that took another bite out of the milk check, there’s a weariness setting in. Another bailout announcement. Another round of wondering if Washington actually understands what’s happening on the ground.

The Trump administration’s $12 billion agricultural aid package brings welcome relief. But for most dairy operations, it’s a band-aid on a bullet wound. Understanding what it actually covers—and more importantly, what it doesn’t—requires looking past the headline figures and getting realistic about what comes next.

Where Dairy Fits in This Package

Let’s be brutally honest: if you’re banking on this $12 billion to fix a structural deficit in your operation, you’re already in trouble. The check will clear, the lights will stay on for another month, but the fundamental math of 2026 hasn’t changed.

Here’s what the check actually looks like.

The bulk of the package—roughly $11 billion according to USDA program details and confirmed by the Washington Times and Forbes—flows through the new Farmer Bridge Assistance program targeting row crop producers affected by trade disruptions. Soybeans, corn, wheat. The commodities that dominate political conversations in farm states.

Dairy’s allocation comes from the remaining $1 billion designated for “other commodities”—a pool we’re sharing with specialty crops and other livestock sectors. USDA officials noted at Monday’s briefing that specific payment rates are “still being finalized.” If you’ve been around long enough, you recognize that language.

What we can do is look at precedent. During the 2018-2019 Market Facilitation Program, dairy received commodity-specific payments of $0.20 per hundredweight according to USDA Farm Service Agency program records. If something similar applies here—and that remains genuinely uncertain—we can start modeling what individual farms might expect.

Estimated payment ranges by operation size:

Herd SizeAnnual ProductionLikely Payment Range
100 cows~23,500 cwt$3,000 – $5,000
500 cows~117,500 cwt$12,000 – $20,000
1,000 cows~235,000 cwt$20,000 – $35,000
2,000+ cows~470,000+ cwt$35,000 – $50,000*

*The MFP had a $250,000 per person cap, with a total household cap of $500,000, which limited larger operations

These estimates assume dairy captures roughly half of that $1 billion “other commodities” allocation. That might prove optimistic depending on how specialty crop interests advocate for their share. We’ll have better clarity when USDA publishes the final rule, likely sometime in January.

The Margin Picture Heading Into 2026

To put these payments in proper context, it helps to understand where dairy margins actually stand right now. And the picture isn’t pretty.

USDA Economic Research Service projects an all-milk price around $19.25-$19.50 per cwt for 2026, which aligns with what dairy economists have been tracking. Mark Stephenson, who spent years as director of dairy policy analysis at the University of Wisconsin-Madison before his recent retirement, has been following these projections closely, and the outlook has remained stubbornly consistent.

Meanwhile, production costs for mid-size operations—those 300 to 700 cow dairies that form the backbone of states like Wisconsin, Minnesota, and Michigan—are running $21.50 to $23.00 per cwt according to University of Illinois FarmDoc analysis and USDA cost of production data. The exact number depends on your region, feed situation, and labor management.

Based on those projections, here’s what the math looks like for a representative 500-cow dairy:

📊 THE 500-COW REALITY CHECK

CategoryAnnual Figure
Milk Production117,500 cwt
Gross Revenue (at $19.50/cwt)$2,291,250
Operating Costs (at $22.64/cwt)$2,660,200
Net Position-$368,950
Bailout Payment~$15,000
Bailout as % of Loss4.1%

That potential $15,000 bailout payment represents about 0.6% of annual operating costs. It covers roughly two weeks of feed. Maybe a month of debt service. It’s meaningful as supplemental support—nobody should dismiss it. But it’s not moving the needle on a $370,000 annual loss.

What’s been consistent in conversations with producers over recent weeks is this recognition. They’re grateful for assistance, but they’ve learned not to build business plans around government payments that may arrive on uncertain timelines and in uncertain amounts. The operations weathering this period best are focused on what they can actually control.

Understanding the June FMMO Changes

This brings us to something that is still causing real frustration across the industry: the Federal Milk Marketing Order reforms that took effect on June 1, 2025.

I’ve talked with several producers who know their milk checks have changed but aren’t entirely sure why. So let me walk through this carefully.

The reforms included several adjustments, but the one generating the most anger is the increase in “make allowances.” These are the manufacturing cost credits that processors deduct from raw milk prices before pool distribution—essentially, what processors retain to cover their costs of turning your milk into cheese, butter, or powder.

Under the new rules, these allowances increased from approximately 5 cents to 7 cents per pound across cheese, butter, and powder classes according to the USDA Agricultural Marketing Service final rule. That adjustment comes directly out of producer prices before you ever see it.

Processors and cooperative leaders will tell you these updates were necessary corrections to the 2008 economics. And sure, inflation is real for everyone—manufacturing costs for labor, energy, and equipment have increased substantially over the past seventeen years. There’s some validity to that argument.

But for the producer on the receiving end of a 7-cent deduction, it feels less like an “update” and more like a wealth transfer from the milking parlor to the processing plant. It’s a bitter pill to swallow watching your milk check shrink to subsidize the processing sector, especially while some of those same processors post record earnings and cooperative patronage dividends remain flat.

The numbers tell the story. The American Farm Bureau Federation analyzed the first three months following implementation. AFBF economist Danny Munch reported in September 2025 that dairy producers collectively received approximately $337 million less in pool revenues than they would have under the previous formula. That’s $337 million out of producer pockets in just 90 days.

For individual farms, the impact varies by region and milk utilization. Operations in cheese-producing regions—Wisconsin, Idaho, parts of California’s Central Valley—appear most affected, with some producers reporting effective price reductions of $0.75 to $0.87 per cwt compared to pre-reform levels.

What this means practically: A 500-cow dairy that might have expected $2.39 million in milk revenue under the old formula could now be looking at $2.29 million—a $100,000 annual difference that makes any bailout payment look like pocket change.

The reform also returned the Class I pricing formula to a “higher-of” structure intended to benefit fluid milk producers and updated composition factors for protein and other solids. For operations in fluid-heavy markets, those changes may partially offset the make allowance impact. But for cheese-market producers—which describes most of the Upper Midwest—the make allowance adjustment dominates everything else.

The Global Context

One factor that often gets overlooked in domestic policy discussions: we’re operating in an interconnected global market, and right now, milk is flowing everywhere.

Rabobank’s quarterly Global Dairy reports show milk supply growth of around 2% across major exporting regions for the second half of 2025. New Zealand posted solid production gains despite earlier concerns about drought. The EU has been running above year-ago levels through much of the year.

This matters because global supply dynamics put a ceiling on how high U.S. prices can realistically climb. That same Rabobank analysis projects supply growth moderating to under half a percent by 2026, but continued pressure on world dairy commodity prices appears likely through at least mid-year.

The takeaway isn’t pessimism—it’s realism. Even if domestic conditions improve, global supply patterns suggest we shouldn’t expect dramatic price recovery to solve margin challenges. Which brings us to what actually might.

How Forward-Thinking Producers Are Responding

Here’s where the conversation becomes more encouraging—and more actionable.

Across the industry, I’m seeing producers treat this moment as an opportunity to accelerate changes they’d been considering. The operations that seem most confident heading into 2026 aren’t waiting for market recovery or larger government programs. They’re focused on revenue diversification and operational refinement—variables within their direct control.

Three approaches keep emerging in conversations.

Building Revenue Through Beef-on-Dairy

This might be the most significant shift in dairy economics over recent years, and if you haven’t run the numbers for your operation, you’re probably leaving serious money on the table.

With beef markets strong, verified crossbred calf values are running $350-$500 per head compared to $25-$75 for traditional Holstein bull calves. According to an American Farm Bureau Federation analysis, dairy-origin cattle account for roughly 20-28% of the annual U.S. calf crop, with beef-on-dairy crossbreds now representing an estimated 12-15% of fed cattle slaughter—and growing rapidly. A 2024 Purina survey found that 80% of dairy farmers and 58% of calf raisers now receive a premium for beef-on-dairy calves.

📊 THE BEEF-ON-DAIRY MATH (500-cow herd, 60% bred to beef)

Revenue SourceHolstein BullsBeef-Cross Calves
Calves sold annually~300~300
Value per head$25-$75$350-$500
Annual calf revenue~$15,000$105,000-$150,000
Net gain from the switch+$90,000 to +$135,000

That’s not a typo. We’re talking about a potential six-figure revenue swing from a breeding decision you can make this week.

I recently spoke with Mark Hendricks, who milks 520 cows near Charlotte, Michigan. He made the transition in 2023. “It’s not complicated,” he explained. “I identified my bottom 60% on genomics, stopped using dairy semen on them, and contracted with a beef aggregator. My calf revenue went from around $15,000 to over $100,000 in one year.”

But here’s what really excites the breeder in me about this strategy: it’s not just about the calf check. When you commit to breeding beef on your bottom 60%, you’re forcing yourself only to generate replacements from your absolute best females. Every heifer that enters your milking string comes from a top-40% dam. You’re accelerating genetic progress while getting paid to do it.

Think about that for a moment. Instead of keeping mediocre replacements because you need the numbers, you’re culling harder, breeding smarter, and generating a six-figure revenue stream in the process. The economics align with the genetics in a way that rarely happens in this industry.

Key considerations if you’re exploring this approach:

  • Forward contracts with beef finishers typically offer $100-$200 per head premium over spot market sales
  • Sire selection matters significantly—calving ease scores and carcass merit both influence value
  • Some cooperatives now offer specific programs for verified crossbred calves
  • Plan breeding strategy around your herd’s actual genetic ranking, not arbitrary percentages
  • Work with your genetics advisor to identify the true cutoff line for dairy replacements

What’s particularly noteworthy is how quickly this has shifted from experimental to standard practice among progressive herds. Five years ago, breeding dairy cows to beef was something you did with your problem animals. Now it’s a deliberate profit center and genetic accelerator.

Optimizing for Components

The FMMO reforms reinforced something that’s been building for years: the market rewards components over fluid volume. If you’re still managing primarily for pounds of milk, you’re chasing the wrong number.

Looking at Council on Dairy Cattle Breeding data and current component pricing, each 0.1% increase in butterfat is worth approximately $0.25 per cwt. That accumulates quickly.

For a 500-cow dairy, moving from 3.8% to 4.1% butterfat—a 0.3-point improvement achievable through genetics and nutrition over 18-24 months—translates to roughly $88,000 in additional annual revenue.

Maria Gonzalez runs a 650-cow operation with her husband near Hanford in California’s Central Valley. “We stopped chasing pounds five years ago,” she told me. “Our rolling herd average dropped about 2,000 pounds, but our milk check went up $40,000. Components changed everything for us.”

What this looks like practically:

  • Shifting genetic selection toward Net Merit (NM$ or CM$) indexes that weight components more heavily
  • Working with your nutritionist on rations supporting de novo fatty acid synthesis
  • Making reproduction decisions based on component performance, not just production volume
  • Tracking Combined Fat + Protein in pounds per cow per day

Producers who do this well tend to set Combined F+P above 7 lbs/cow/day as their benchmark. That seems to be where the economics really accelerate under current pricing structures.

Evaluating Scale and Structure

This is genuinely the most difficult topic, and there’s no universal answer.

Industry economists have noted that operations with 300 to 700 cows often face particular challenges—too large to operate primarily with family labor, but not large enough to capture the fixed-cost efficiencies available to larger operations fully.

USDA Economic Research Service cost of production estimates from 2023-2024 illustrate the scale dynamics:

  • Under 200 cows: $24-$28/cwt
  • 200-500 cows: $21-$25/cwt
  • 500-1,000 cows: $19-$22/cwt
  • Over 2,000 cows: $17-$20/cwt

That $2-$4 per cwt cost advantage at larger scale isn’t primarily about management quality—many smaller dairies are exceptionally well-managed. It’s largely about spreading fixed costs across more production units.

This doesn’t mean mid-size dairies can’t succeed. Many do, consistently. But success at that scale typically requires exceptional operational efficiency, premium market positioning, diversified revenue, or creative approaches to capturing scale benefits.

Options worth considering:

Collaborative arrangements with neighboring operations—sharing equipment, labor, or specialized services without full merger. Several partnerships I’m aware of in Wisconsin and Minnesota involve family operations sharing nutritionists, coordinating heifer programs, or jointly owning harvest equipment. These capture meaningful efficiencies while preserving independent ownership.

Strategic expansion for operations with strong balance sheets and available resources. The numbers suggest reaching 800-1,200 cows meaningfully improves cost structure—if the transition can be managed well.

Thoughtful transition planning for producers approaching retirement without identified successors. Recognizing that exiting while asset values remain relatively strong may better serve family interests than extended losses followed by a distressed sale. That’s not failure—it’s sound business judgment.

The Cooperative Conversation

One topic that emerged repeatedly in my reporting: how cooperatives participated in the FMMO reform process.

The January 2025 referendum approving the FMMO changes passed in ten of the eleven Federal marketing orders. The voting structure itself raised questions for some producers.

Under regulations established in the Agricultural Marketing Agreement Act, cooperatives can exercise “bloc voting”—casting ballots on behalf of member producers rather than requiring individual votes. This means many producers didn’t receive personal ballots; their cooperative boards voted based on their assessment of member interests.

Reasonable perspectives exist on both sides of this structure. Cooperative leaders note that bloc voting enables efficient administration of complex decisions and that elected boards are specifically chosen to make these judgments. That’s a legitimate point, and cooperative governance has deep roots in American agriculture.

Some producer advocates, including the American Farm Bureau Federation, have proposed “modified bloc voting,” allowing individual producers to request separate ballots when they disagree with their cooperative’s position. AFBF’s October 2025 policy brief outlined several such reforms.

USDA hasn’t adopted changes, though discussions continue.

What I’d encourage: understand how your cooperative makes policy decisions and engage actively. Most cooperatives solicit member input before major votes. Participating in those forums—attending meetings, asking questions, communicating with board representatives—is the most direct way to influence decisions affecting your operation.

Succession Considerations

One aspect deserving more attention: what current conditions mean for generational transfer.

When support programs maintain elevated land and asset values despite operating losses, the mathematics for incoming generations become brutal. Young farmers looking to purchase or assume 500-cow operations face asset valuations often based on historical performance or land appreciation, but an operating reality that includes current losses requiring significant working capital.

Farm Credit Canada’s November 2025 succession report found that capital requirements now constitute the primary barrier to next-generation entry, ahead of land availability, family dynamics, or technical knowledge. That finding likely applies similarly in the U.S.

“The worst outcome is transferring an operation to the next generation based on optimistic projections that don’t materialize,” observes Jennifer Horton, a farm succession specialist with University of Minnesota Extension who works extensively with dairy families throughout the Upper Midwest. “Honest conversations about margin expectations, capital needs, and risk tolerance need to happen before transfer. The families that navigate this successfully are those willing to examine real numbers together.”

If you’re considering succession—whether within the family or through an outside sale—this period offers an opportunity for realistic planning while asset values remain relatively strong.

The Bottom Line

Where does this leave the typical mid-size producer?

The bailout represents real assistance. For 500-cow operations, payments in the $12,000-$20,000 range provide meaningful cash flow support—perhaps a month of debt service or a quarter’s veterinary and breeding costs. That matters. But it’s not a strategy.

Here’s what actually moves the needle:

On revenue diversification: If you haven’t evaluated beef-on-dairy seriously, the $90,000-$120,000 annual revenue potential warrants attention this winter. Talk to your genetics advisor and explore forward contracting options.

On components: The $50,000-$90,000 annual impact from butterfat and protein optimization is achievable for most operations. Review genetic direction and nutritional programs through a component lens.

On positioning: Be honest about your cost structure relative to the market. Whether the answer involves collaboration, expansion, efficiency, or a thoughtful transition, making clear-eyed decisions now preserves more options than waiting.

On cooperative engagement: Understand how your cooperative makes policy decisions. Your voice carries more weight than you might assume—but only if you use it.

The dairy industry has navigated challenging periods before and emerged stronger. The operations that thrive through this one will be those that make proactive adjustments based on solid information—not those that wait for Washington to write a check that fixes everything.

That’s not pessimism. It’s practical wisdom.

KEY TAKEAWAYS:

  • The bailout covers 4% of your loss: ~$15,000 for a 500-cow dairy against $368,000+ in annual red ink
  • FMMO reforms already cost producers $337 million: Cheese-region operations are down $0.75-$0.87/cwt on every check
  • Beef-on-dairy is a six-figure decision: Breed your bottom 60% to beef for $90,000-$135,000 in new annual revenue—and faster genetic progress
  • Chase butterfat, not bulk tank pounds: A 0.3% fat improvement = $88,000/year. Target: 7+ lbs Combined F+P daily.
  • The check won’t save you. These moves might. Lock beef contracts and revisit genetics before spring breeding.

Complete references and supporting documentation are available upon request by contacting the editorial team at editor@thebullvine.com.

Learn More:

The Sunday Read Dairy Professionals Don’t Skip.

Every week, thousands of producers, breeders, and industry insiders open Bullvine Weekly for genetics insights, market shifts, and profit strategies they won’t find anywhere else. One email. Five minutes. Smarter decisions all week.
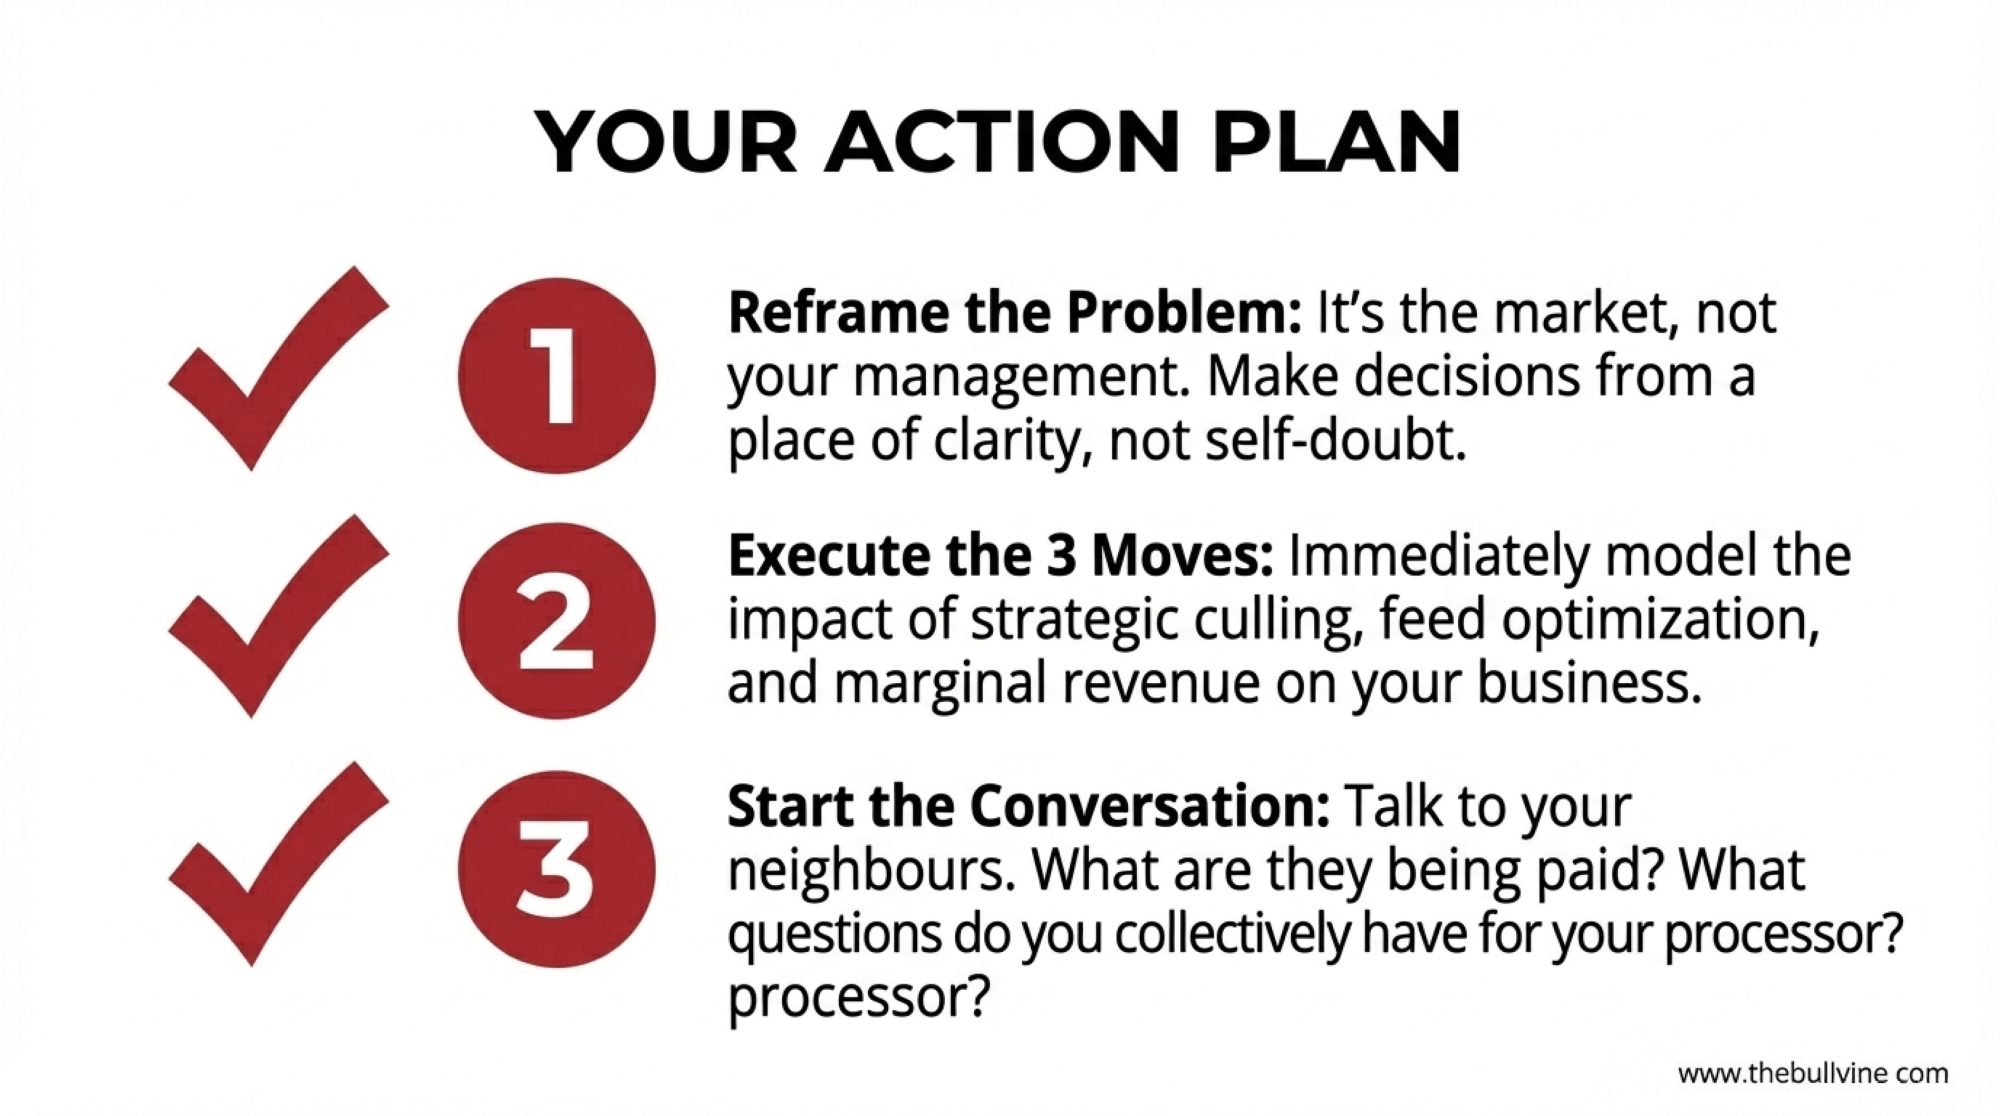
NewsSubscribe
First
Last
Consent

4.3% Butterfat and a Shrinking Check: The 90-Day Window to Reposition Your Operation

Record butterfat. Shrinking checks. The industry’s 25-year breeding strategy just ate itself.

Dairy Farm Profitability 2026

Executive Summary: Here’s the paradox: U.S. dairy herds are testing 4.23% butterfat—an all-time record—yet milk checks are running $3-5/cwt below last year. The genetic industry’s 25-year push for components worked perfectly, and now everyone’s drowning in the success. Butter stocks are up 14%, Class IV prices hit $13.89/cwt in November (lowest since 2020), and the traditional cull-and-restock response is off the table with springers at $3,000+ and heifer inventory at a 47-year low. For operations in the 500-1,500 cow range carrying moderate debt, the next 90 days are decisive—DMC enrollment closes in February, DRP in March, and the choices made before spring will separate farms that reposition from those that get squeezed. Three viable paths exist: optimize for efficiency, transition to premium markets, or exit strategically while equity remains. Standing still isn’t on the list.

I’ve been talking with farmers across the Midwest and Northeast over the past few weeks, and there’s a common thread running through those conversations. A producer will mention their herd’s butterfat at 4.3%—exactly what they spent a decade breeding for—and then pause. Because that same milk is now flowing into a market where the cream premiums just don’t look like they used to.

It’s a strange place to be. You made sound breeding decisions. The genetics are performing. The components are there. And yet the check doesn’t quite reflect it.

So what’s actually going on here? And more importantly, what can we realistically do about it in the next 90 days?

[Image: Side-by-side comparison of a milk check from 2023 vs. 2025 showing component premiums shrinking despite higher butterfat test]

After reviewing the latest market data and speaking with lender advisors, farm management consultants, and producers who’ve been through similar cycles, a clearer picture emerges. This isn’t simply a temporary dip that’ll correct by spring flush. It’s a structural shift that’s been building for years—and the farms that come through it successfully will be those that understand both what’s driving it and which decisions actually move the needle.

The Component Trap: How 25 Years of Smart Breeding Created Today’s Problem

Here’s something that needs to be said plainly, even if it’s uncomfortable: the genetic industry—breeders, AI companies, genomic providers—collectively steered the entire U.S. dairy herd in one direction, and now we’re all standing here wondering what comes next.

That’s not an accusation. Everyone was following the economic signals. But the result is undeniable.

You probably know the broad outlines already, but it’s worth walking through the numbers because they’re pretty striking when you see them together. None of this happened by accident. It’s the result of pricing signals that consistently rewarded butterfat production across two and a half decades.

Consider the trajectory. The average Holstein was testing around 3.7-3.8% butterfat back in 2000, according to Council on Dairy Cattle Breeding historical data. By 2024, that figure had climbed to a record 4.23%—a substantial jump in component concentration. CoBank’s lead dairy economist, Corey Geiger, noted in his analysis last year that milkfat, on both a percentage and per-pound basis, reached an all-time high. In high-genetics herds, 4.3-4.5% is now pretty common.

U.S. Holstein herds have steadily climbed from roughly 3.7% to over 4.2% butterfat in just two and a half decades

This wasn’t a failure of individual breeding decisions. It was a success—of everyone doing the exact same thing at the exact same time.

[Image: Line graph showing U.S. average butterfat percentage climbing from 3.7% in 2000 to 4.23% in 2024]

Federal Milk Marketing Order formulas rewarded butterfat with premium pricing, and the industry responded accordingly. Then, genomic selection tools, which really gained traction around 2009, accelerated genetic progress dramatically. What once took 15-20 years of conventional breeding can now be achieved in roughly half that time. The April 2025 CDCB genetic base reset tells the story—it rolled back butterfat by 45 pounds for Holsteins, nearly double any previous adjustment. That’s how much progress has accumulated in the genetic pipeline.

The economics seemed compelling at the time. A farm producing 4.2% butterfat milk versus 3.8% butterfat earned roughly $0.80-1.20/cwt more on the same volume, based on component pricing formulas. For a 1,000-cow herd producing 25,000 lbs/cow annually, that translated to $200,000-300,000 in additional annual revenue. The incentives pointed clearly in one direction.

And here’s where it gets tricky.

When an entire industry simultaneously optimizes for the same trait, supply eventually outpaces demand. U.S. butter production has grown substantially over the past decade, according to USDA Agricultural Marketing Service data. Cold storage butter inventories showed elevated stocks throughout late 2024, with USDA Cold Storage data reporting September levels at approximately 303 million pounds—up about 14% from year-earlier figures.

Class IV milk futures, which price butter and powder, have reflected this pressure. USDA announced the November 2025 Class IV price at $13.89/cwt—levels we haven’t seen since 2020.

The question nobody in the genetic industry is asking publicly: Should we have seen this coming? And what does it mean for how we select sires going forward?

The Heifer Crisis: Why Your Normal Playbook Won’t Work This Time

What makes this particular cycle tricky is that some of the standard farm-level responses to low prices just aren’t available anymore. I’ve watched this play out in conversations with producers who are working through every option—and finding that familiar levers don’t pull the way they expect.

[Image: Infographic showing dairy heifer inventory decline from 4.5 million in 2018 to 3.914 million in 2025]

The Numbers That Should Keep You Up at Night

The logical response to component oversupply would be culling toward different genetics and restocking. But there’s a significant constraint worth understanding.

Replacement heifers simply aren’t available in the numbers many operations need—and the available ones have gotten expensive. The widespread adoption of beef-on-dairy breeding, which made excellent economic sense when beef prices surged, has reduced dairy heifer inventories to approximately 3.914 million head according to the January 2025 USDA cattle inventory report. That’s the lowest level since 1978.

Replacement heifer numbers have dropped by roughly 600,000 head since 2018, driving springer prices above $3,000

Here’s where the math gets painful. CoBank reported these figures in their August 2025 analysis:

  • National average springer price (July 2025): $3,010 per head
  • Wisconsin average: $3,290 per head
  • California/Minnesota top auction prices: $4,000+ per head
  • April 2019 low point: $1,140 per head
  • Price increase since then: 164%

Let that sink in. If you want to cull your bottom 50 cows and replace them, you’re looking at $150,000-$225,000 just in replacement costs—before you account for the production lag while those heifers freshen and ramp up.

This creates real tension. Operations that would like to cull more aggressively face either limited availability or elevated replacement costs. It’s a completely different calculation than we’ve seen in past downturns.

There’s also a timing consideration that’s easy to overlook. The replacement heifers entering milking strings in 2025-2026 were born and selected 2-3 years ago, when butterfat premiums were still paying handsomely. That genetic pipeline takes time to shift—meaningful changes in herd composition typically require 5-7 years, even with aggressive selection, according to dairy geneticists at the University of Wisconsin-Madison Extension.

The practical takeaway: Even if you start selecting differently today, you won’t see the results in your tank until 2030.

The Ration Workaround That Doesn’t Actually Work

Some producers have explored nutritional adjustments to modify butterfat percentage. I’ve heard this come up in several conversations, and it’s worth addressing directly.

Here’s the challenge—the rumen chemistry driving fat synthesis is interconnected with overall milk production in ways that make targeted adjustments difficult. Dairy nutritionists at Penn State and other land-grant universities have studied this extensively: adjustments that reduce butterfat typically also reduce total milk yield by 3-8%. The feed cost savings, maybe $0.30-0.50/cow/day depending on your ration costs, are often outweighed by lost milk revenue of $1.00-2.00/cow/day at current prices.

In most scenarios, ration manipulation doesn’t improve the overall financial picture. Counterintuitive, but the numbers generally bear it out.

The China Factor: The Export Valve That Closed

One element that’s amplified the current situation—and this deserves more attention in domestic discussions—is the shift in Chinese dairy import patterns.

[Image: Bar chart comparing China whole milk powder imports: approximately 800,000-850,000 MT peak around 2021 vs. approximately 430,000 MT in 2024]

For roughly two decades, China served as a significant outlet for global dairy surplus. When exporting regions overproduced, Chinese buyers absorbed much of the excess. That dynamic has evolved considerably.

China’s domestic milk production has grown substantially over the past several years, reaching over 41 million tonnesaccording to USDA Foreign Agricultural Service data. Self-sufficiency has risen from roughly 70% to around 85%, thereby reducing import demand.

The import trends tell the story clearly. Whole milk powder imports peaked at approximately 800,000-850,000 metric tonnes around 2021, according to Chinese customs data compiled by Rabobank. By 2024, that figure had declined to around 430,000 metric tonnes—a reduction of roughly 50%.

China’s demand for imported whole milk powder has fallen by roughly 50% since its 2021 peak, closing a major export outlet

Here’s what that means at the farm level: when 400,000 metric tonnes of powder that used to go to Shanghai starts competing for space in domestic and alternative export markets, that’s pressure that eventually shows up in your component check. Global dairy markets are interconnected in ways that weren’t true 20 years ago.

Rabobank senior dairy analyst Michael Harvey noted in their Q4 2024 Global Dairy Quarterly that Chinese imports could surprise to the upside if domestic production disappoints and consumer confidence improves. That’s a reasonable alternative scenario to consider.

Honestly? Nobody knows exactly where China goes from here. But planning as if that export outlet will suddenly reopen at 2021 levels seems optimistic at this point.

The Consolidation Accelerator

Dairy farming has been consolidating for decades—that’s well understood by anyone who’s watched their neighbor’s barn go quiet. What’s different about this period is the potential for that trend to accelerate under sustained margin pressure.

According to U.S. Courts data reported by Farm Policy News, 361 Chapter 12 farm bankruptcy filings occurred in the first half of 2025—a 13% increase over the same period last year.

Here’s an important nuance, though: milk production isn’t expected to decline in proportion to the number of farms. The operations most likely to exit tend to be smaller ones that represent a modest share of total volume. USDA projects national milk output at 231.3 billion pounds in 2026—essentially flat—even as the number of operations continues to decrease.

What this means for price recovery: Supply adjustments through consolidation happen more gradually than we might hope.

Three Directions for the Coming Months

For farmers operating in that 500-1,500 cow range—moderate scale, moderate debt, positioned to continue but facing real pressure—the next 90 days present some important decisions.

What’s been striking in conversations with experienced advisors is how consistently they point to the same priorities. The focus isn’t on finding some novel solution. It’s about executing fundamentals with careful attention during a demanding period.

[Image: Calendar graphic highlighting key deadlines: February 2026 (DMC), March 15 (DRP), March 31 (SARE grants)]

Key Dates Worth Tracking

  • December 31, 2025: Target for completing financial position analysis
  • February 2026: DMC enrollment deadline (confirm with your FSA office)
  • March 15, 2026: DRP enrollment deadline for Q2 coverage
  • March 31, 2026: SARE grant application deadline for organic transition support
  • Q2 2026: Period when margin pressure may be most pronounced

Priority 1: Knowing Exactly Where You Stand (Weeks 1-2)

Here’s what farm management consultants consistently emphasize: many operations lack precise clarity about their actual cost of production by component. They know their budgeted figures, but actual costs in the current environment often run $2-4/cwt higher than estimates suggest.

Consider a professional cost analysis through your lender or an independent agricultural accountant. Costs typically run $1,500-3,000, depending on scope and region—but the analysis frequently reveals $50,000-100,000 in costs that weren’t clearly showing up in standard bookkeeping. Your actual investment depends on your operation’s complexity.

Model three price scenarios for 2026:

ScenarioClass IIIClass IV
Base Case$17/cwt$14/cwt
Stressed$15/cwt$12/cwt
Severe$13/cwt

The key benchmark: if your debt service coverage ratio falls below 1.25x in the base case, you’re facing primarily a financing challenge rather than a production management challenge. That distinction shapes everything that follows.

Priority 2: Securing Protection Before Deadlines (Weeks 2-3)

DMC triggered payouts in August-September 2025 when milk margins compressed below coverage thresholds, according to USDA Farm Service Agency payment data. For operations that had enrolled, those payments provided meaningful cash flow support. For those that hadn’t… well, that opportunity has passed.

For a 700-cow operation, margin protection typically costs $35,000-40,000 in premiums based on standard coverage levels—though actual costs vary by operation size and coverage choices. What matters is the asymmetric protection: coverage that could preserve $200,000-300,000 in margin under severe scenarios.

[Related: Understanding DMC Enrollment for 2026 — A step-by-step walkthrough of coverage options and deadlines]

Priority 3: Choosing a Direction (Weeks 3-4)

 Efficiency FocusPremium MarketsStrategic Transition
Best suited forSub-$15/cwt cost structure, solid cash positionWithin 50 miles of metro market, $300K+ reserveAge 55+, elevated debt, uncertain direction
90-day focusIOFC-based culling, Feed Saved geneticsFile organic transition, apply for SARE grantsProfessional appraisal, explore sale/lease
Timeline12-18 months36-48 months6-12 months
Capital requiredLow to moderate$200K-400KLow (advisory fees)

[Image: Decision tree flowchart helping farmers identify which of the three paths fits their situation]

Path A: Efficiency Focus

The core approach remains culling the bottom 15-20% of cows ranked by income-over-feed-cost, not by volume alone. Your 50 lowest-margin cows likely cost $300-400/month more than your top 50 to produce milk. Addressing that can improve annual cash flow by $180,000-240,000.

What I keep hearing from producers who went through aggressive IOFC-based culling during 2015-2016 is pretty consistent: it felt counterintuitive at first. Some of those cows were producing 90 pounds a day. But when they ran the actual economics, those high-volume cows were undermining their cost structure. Taking them out changed everything. Many came out of that period in better shape than they went in.

Producers running large dry lot operations in the West report similar experiences. The temptation is always to keep milking cows. But when you run the numbers, the bottom 10-15% of the herd is often break-even in a good month and loses money in a bad one. Letting them go without immediately restocking—just accepting a smaller herd—can actually improve your average component check per cow. Sometimes, smaller really is more profitable.

On the genetics side, it’s worth looking at “Feed Saved” as a selection trait. CDCB introduced this in December 2020, specifically to identify animals that are more efficient at converting feed to milk. The trait’s weight in Net Merit increased to 17.8% in the 2025 update, which tells you how seriously the industry is taking feed efficiency now. The potential savings vary by herd, but for operations where feed accounts for 50-60% of costs, even modest efficiency gains can translate into meaningful dollars. Talk to your AI rep about what realistic expectations might look like for your specific situation.

Path B: Premium Market Transition

For operations within a reasonable distance of major metro markets and with capital reserves to absorb transition costs, organic conversion or specialty milk contracts offer an alternative direction.

This path involves more complexity than it might initially appear. Organic transition typically means 3-year yield reductions of 10-15% according to data from the Organic Dairy Research Institute, followed by meaningful price premiums once certified. The economics can work—eventually—but the transition period requires substantial financial runway.

What I hear consistently from producers who’ve made this transition: the middle years are harder than expected. You’re essentially getting conventional prices while operating organically. But once you reach certification, the price difference is real. NODPA and USDA Organic Dairy Market News report certified operations receiving farmgate prices ranging from the mid-$20s to $30s per cwt for conventional organic, with grass-fed premiums often running significantly higher—sometimes into the $40s or above depending on your processor and region.

If this direction fits your situation, the 90-day priorities include:

Connect with certified organic dairies in your region through your state organic association—NOFA chapters in the Northeast, MOSA in the Upper Midwest, or similar organizations in your area. Request 2-3 farm visits to understand actual transition costs and challenges. The real-world experience matters more than marketing materials.

Explore SARE grants before the March 31, 2026, deadline. These grants may provide significant cost-sharing support for organic transition—contact your regional SARE coordinator for current funding levels and application requirements, since program specifics change annually.

If you’re committed, file your transition plan with your certifier by March 1, 2026, to start the 3-year clock. Earlier starts mean earlier access to premium pricing.

[Related: Organic Transition Economics: What the Numbers Actually Look Like — Real producer case studies and financial breakdowns]

Important consideration: This path makes most sense if you have substantial equity reserves and you’re genuinely within reach of organic market demand. Not every region has processors paying meaningful organic premiums. Market research should come before commitment—talk to Organic Valley, HP Hood, or whoever handles organic milk in your region about their current intake and premium structure.

Path C: Strategic Transition

This is the path that’s hardest to discuss, but for operators over 55, carrying elevated debt, or genuinely uncertain about long-term direction, a strategic exit while equity remains may represent sound financial planning.

Here’s what farm transition specialists consistently emphasize: a farm with a 45% debt-to-asset ratio that transitions strategically today typically retains significantly more family wealth than the same farm forced to exit in 2027-2028 after extended margin erosion. The difference can easily be $300,000-500,000, depending on circumstances.

That’s not failure. That’s recognizing circumstances and making a thoughtful decision.

University of Wisconsin Extension farm transition advisors make this point regularly in producer workshops: the families who come through in the best financial shape are almost always the ones who made the call themselves, not the ones who waited until circumstances forced their hand. There’s real value in choosing your path.

The 90-day approach for this path:

Obtain a professional appraisal ($2,500-4,000 depending on operation complexity) covering real estate, equipment, herd genetics, and any production contracts.

Explore multiple options—they’re not mutually exclusive:

  • Direct sale to a larger operation (typically a 12-18 month process)
  • Lease arrangement retaining land equity
  • Solar lease opportunities—rates vary significantly by region, but can provide meaningful annual income on 20-30+ acres depending on your location and utility contracts
  • Custom heifer rearing using your existing facilities—particularly relevant given the shortage we discussed earlier

Consult with a farm transition tax advisor. How you structure an exit matters enormously for what you ultimately retain—installment sales versus lump sum, 1031 exchanges, charitable remainder trusts, and other tools can make six-figure differences in after-tax proceeds.

Regional Realities: One Market, Many Situations

One pattern that emerges from these conversations is how differently the same market dynamics play out depending on where you’re farming. The fundamentals we’ve discussed apply broadly, but the specific numbers vary considerably by region.

In Idaho and the Southwest, large-scale operations with export-oriented processing face one set of calculations. These are often dry lot systems with 3,000+ cows, lower land costs, and direct relationships with major cheese manufacturers. When Glanbia or Leprino adjusts their intake, the regional implications differ from what you’d see in Wisconsin. The scale efficiencies are real, but so is the commodity price exposure. Producers in the Magic Valley are watching Class III futures more closely than component premiums—their economics are tied to cheese demand in ways that Upper Midwest producers selling to smaller plants simply aren’t.

In Wisconsin and the Upper Midwest, you’re more likely to encounter diversified operations—500-1,200 cows, often family-owned across generations, with a mix of cheese plant contracts and cooperative relationships. The smaller average herd size means fixed costs per hundredweight run higher, but there’s also more flexibility to adapt. I’ve talked with Wisconsin producers seriously exploring farmstead cheese or agritourism as margin supplements—approaches that wouldn’t make sense at 5,000 cows but can work at 400.

In the Northeast, higher land costs and proximity to population centers create yet another calculation. Fluid milk markets still matter more here than in most regions, even as fluid consumption continues its long decline. The premium path—organic, grass-fed, local branding—tends to be more viable in Vermont or upstate New York than in the Texas Panhandle simply because the customer base is closer and the logistics work better.

Here’s the bottom line on regional differences: Conversations with farmers and advisors who know your specific market really matter. Your cooperative field staff, extension dairy specialist, or lender can help translate these broader trends into your local context. The three-path framework applies everywhere, but the details of execution—which processors are actively buying, what premiums are realistically available, how constrained the local heifer market is—vary enough to influence decisions.

The Bottom Line

The farms that navigate this period most successfully won’t be those that discovered some novel solution—there isn’t one waiting to be found. They’ll be operations that understood the dynamics early, made honest assessments of their own position, and moved decisively while flexibility remained.

The window for making these decisions is now.

For additional resources on margin protection enrollment and strategic planning, contact your local FSA office, cooperative field representative, agricultural lender, or university extension dairy specialist.

Editor’s Note: Production cost data comes from the USDA Economic Research Service 2024 reports. Heifer pricing reflects USDA NASS data through July 2025. Bankruptcy statistics are from U.S. Courts data reported by Farm Policy News. Genetic progress figures reference the CDCB April 2025 genetic base reset. Cold storage and production data are from the USDA Agricultural Marketing Service. International trade figures come from the USDA Foreign Agricultural Service and Rabobank Global Dairy Quarterly. National and regional averages may not reflect your specific operation, market access, or management system. We welcome producer feedback for future reporting.

Key Takeaways:

  • Record butterfat, weaker checks: U.S. herds are averaging 4.23% butterfat, but Class IV has slipped to $13.89/cwt, and butter stocks are up 14%, so the component bonuses many bred for are no longer rescuing the milk check.
  • Heifer math has flipped: Dairy heifer inventory is at a 47-year low (3.914 million head), and quality springers are $3,000+ per head, which means the traditional “cull hard and restock” playbook often destroys equity instead of saving it.
  • This is a structural shift, not a blip: Twenty-five years of selecting for butterfat, China’s reduced powder imports, and slow-moving U.S. consolidation are combining into a multi-year margin squeeze, not just another bad winter of prices.
  • Your next 90 days are critical: Before DMC and DRP deadlines hit in February and March, farms in the 500–1,500 cow range need a clear cost-of-production picture, stress-tested cash-flow scenarios, and margin protection in place.
  • You have three realistic paths: Use this window to either tighten efficiency and genetics around IOFC and Feed Saved, transition into premium/organic markets where they truly exist, or plan a strategic exit while there’s still equity to protect—doing nothing is the highest‑risk option.

Complete references and supporting documentation are available upon request by contacting the editorial team at editor@thebullvine.com.

Learn More:

  • Is Beef-on-Dairy Causing America’s Heifer Shortage? – Reveals the structural mechanics behind today’s replacement crisis, detailing how the aggressive industry-wide shift to beef genetics created the specific inventory gap that is now driving heifer prices to record highs.
  • Cracking the Code: Behavioral Traits and Feed Efficiency – Provides the tactical “how-to” for the Efficiency Focus path, explaining how wearable sensors and behavioral data (rumination/lying time) can identify the most feed-efficient cows to retain when you can’t afford to restock.
  • How Rising Interest Rates Are Shaking Up Dairy Farm Finances – Delivers critical financial context for the Strategic Transition path, analyzing how the increased cost of capital is compressing margins and why debt servicing capacity—not just milk price—must drive your 2026 decision-making.

The Sunday Read Dairy Professionals Don’t Skip.

Every week, thousands of producers, breeders, and industry insiders open Bullvine Weekly for genetics insights, market shifts, and profit strategies they won’t find anywhere else. One email. Five minutes. Smarter decisions all week.

NewsSubscribe
First
Last
Consent

China Promised 100%. Delivered 2.7%. Here’s Your 48-Hour Defense Plan.

They announced 12 million tons of soybeans. Shipped 332,000. That’s 2.7%—and the gap between those numbers is where farms go broke.

Back in October, the headlines announced that China had committed to purchasing 12 million tons of U.S. soybeans. By mid-November, USDA export data told a different story: just 332,000 tons had actually been shipped. For operations making real financial commitments based on trade optimism, that gap is everything.

It’s the elephant in the room at every co-op meeting, yet nobody wants to say it out loud: the headlines are lying to us. Not maliciously, maybe. But consistently.

This isn’t a one-off. When the Phase One trade agreement was signed back in January 2020, China committed to purchasing $80.1 billion in U.S. agricultural goods over two years. The Peterson Institute for International Economics tracked what actually happened: $61.4 billion in purchases. That’s about 77% of the agricultural target and just 58% overall.

Whether that’s a freestall expansion in Wisconsin or new milking equipment out in the Central Valley—these numbers matter enormously when you’re penciling out that loan.

The Promise-Delivery Gap: 2.7% to 77%. That’s the range of what trade has actually delivered in recent years. It’s a wide spread—and it’s the reality farm financial planning needs to account for.

The 2.7% Reality: China’s trade commitments consistently fall short, with the 2025 soybean deal delivering a catastrophic 2.7% while Phase One averaged 77%—a pattern that should change every dairy farmer’s expansion calculus.
Risk FactorPhase One (2020-2021)China Soybean (2025)What Farmers Assumed
Historical Delivery Rate64-87% delivery2.7% delivery100% delivery
Market DependencyMedium – diversified buyersHigh – China-specificLow – “”guaranteed deal””
Price Impact per Deal$0.15-0.25/cwt estimated$0.35/cwt confirmedPrice increases expected
Timeline to Farm Impact90-180 days30-90 daysImmediate benefit
Cooperative ProtectionAbsorbed losses initially€149M losses, mergersCo-op will handle it
Individual Farm DefenseLimited – most expandedDMC available if enrolledNo action needed

The Pattern Nobody Talks About

Trade announcements follow a consistent pattern. Farmers who’ve watched a few cycles are starting to read them differently than the headlines suggest.

The Phase One trajectory:

  • 2020: Deal signed with $200 billion in purchase commitments over two years
  • 2021-2022: China’s agricultural imports from all sources surged to record levels; U.S. exports to China hit approximately $41 billion
  • 2023-2024: Import volumes declined as Phase One commitments expired and China diversified its suppliers
  • 2025: New tariff escalations with announced deals delivering at single-digit percentages

Here’s what makes this tricky: those 2021-2022 numbers were real. China genuinely did purchase record agricultural volumes. Processors genuinely did see elevated component prices. You probably saw the improvement in your own milk check.

The data supporting expansion decisions wasn’t fabricated—it was completely accurate for that specific window.

The question most operations didn’t ask was whether those volumes represented a sustainable baseline or a cyclical peak. That’s a hard question to ask when the current numbers look great, and your lender’s nodding along with the business plan.

Why 2022 Was a Peak, Not a Floor

The gap between black promises and red reality: Phase One targets soared to $43.6B while actual imports peaked at $41B in 2022, then collapsed—proving strong recent years were cyclical highs, not sustainable baselines for your 20-year expansion loan.

Several indicators were available in real-time. Here’s what the data was showing:

African Swine Fever recovery was completing. China’s hog population lost roughly 40% of its sow inventory in 2018-2019, according to OECD analysis. The rebuilding phase drove massive feed imports through 2021. By early 2022, Iowa State University’s Ag Policy Review documented that herd recovery was largely complete. That import surge had an endpoint built in.

Phase One commitments expired December 31, 2021. The agreement was a two-year commitment with a hard stop date. After expiration, continued purchases became voluntary.

China’s dairy self-sufficiency targets were public. The Chinese government explicitly targeted 70% dairy self-sufficiency. By 2022, according to Hoogwegt analysis, they’d reached 66% and climbing. When you’re managing your fresh cow nutrition and component production here, remember—they’re building their own capacity over there.

Economic growth projections were declining. The Asian Development Bank projected that China’s GDP growth would slow from around 8% in 2021 to 5% by 2024-2025.

These indicators were available to anyone looking. The challenge is that recent strong performance tends to overwhelm forward-looking warning signals. That’s an understandable response to good data, not poor decision-making.

How This Hits Your Milk Check

Trade policy disruptions create cascading effects that move from Washington to your milk check faster than most realize.

The 2025 tariff escalation:

When retaliatory tariffs on U.S. dairy into China escalated from 10% to 125% between February and April, the impacts were immediate:

Whey markets contracted sharply. China had been taking about 42% of U.S. whey exports according to USDEC data. When that market closed, domestic supply backed up and prices compressed. If you’ve been watching whey premiums in your component pricing, you’ve felt this.

Lactose faced similar pressure. With China holding roughly 72% of the U.S. lactose export market share, the tariff wall forced processor restructuring.

USDA revised price forecasts downward. Class III projections dropped by about $0.35 per hundredweight.

In practical terms: For a typical 1,000-cow operation producing around 26,000 pounds per cow annually, that $0.35 reduction works out to roughly $91,000 in annual revenue. That affects replacement heifer decisions, equipment upgrades, everything.

University of Wisconsin-Madison dairy economists project that net farm income across the U.S. dairy industry could decline by $1.6 to $7.3 billion over the next four years due to tariff disruptions, with individual farms facing potential income reductions of 25% or more.

Real example: Half Full Dairy in upstate New York—a 3,600-cow operation run by AJ Wormuth—got hit from both sides. Steel and aluminum tariffs added $21,000 to a barn renovation order while milk revenues fell. As Wormuth told reporters in April, they’re facing “a double challenge” in which they can’t raise prices while expenses keep rising.

Whether you’re running a 200-cow grazing operation in Vermont or a 5,000-cow dry lot in New Mexico, that squeeze feels familiar.

What’s Really Happening with Cooperatives

Common assumption: cooperative membership provides meaningful insulation from trade volatility.

Reality: cooperatives face the same structural pressures as individual farms, just with less flexibility to respond.

Case study: FrieslandCampina-Milcobel merger

FrieslandCampina reported a €149 million loss in 2023. Milcobel posted an €11.6 million loss. These weren’t management failures—they reflected a structural challenge.

The cooperative bind: They must accept all member milk regardless of market conditions. That’s the deal. But when processing capacity gets built for peak-year volumes and deliveries decline, cooperatives face rising per-unit costs with limited ability to adjust.

Unlike private processors who can exit markets quickly, cooperatives are bound by charter obligations. The result: they absorb losses to maintain member pricing, eroding equity over time. When losses become unsustainable, mergers or sales become the path forward.

We saw this with Fonterra’s 88% member vote to sell consumer operations to Lactalis this past October.

Rabobank dairy analyst Emma Higgins put it directly: “For dairy cooperatives, the challenges are even more complex, as lower milk intake generally coincides with members withdrawing capital.”

The counterpoint: Some cooperatives have navigated better. Agropur achieved a significant turnaround by aggressively restructuring its debt and refocusing on high-margin segments such as cheese and specialty ingredients. The model isn’t doomed—but it requires proactive management.

Your cooperative’s financial health directly affects your returns. Ask questions at the next annual meeting.

What Smart Operations Are Doing

Several practical approaches keep coming up:

Applying historical execution rates. Rather than planning for 100% delivery, they’re discounting based on historical performance. If Phase One delivered 77%, that becomes the planning assumption.

Stress-testing against zero deal impact. Before expansion decisions, they’re modeling, assuming the deal contributes nothing. If viability depends entirely on the deal working, that’s a different conversation with your lender and family.

Maximizing DMC enrollment. Dairy Margin Coverage provides protection when margins compress—and it doesn’t depend on trade promises. It depends on actual market prices.

Maintaining working capital flexibility. Operations that kept debt-to-asset ratios conservative have more options when markets shift. It’s not pessimism—it’s room to maneuver.

Exploring market diversification. Direct sales, specialty products like organic or A2, and regional processor relationships. Not for everyone, but it’s optionality that didn’t exist a decade ago.

Your 48-Hour Playbook for Trade Announcements

When the next deal gets announced, work through these steps:

Step 1: Check the History (30 minutes)

The Peterson Institute maintains a tracker showing the promised versus actual purchases under Phase One. Before reacting to any announcement, look at historical delivery rates.

The calculation: New promise × historical execution rate = realistic delivery estimate.

Phase One ran at 58-77%. The 2025 China soybean promise delivered 2.7%. That range gives you boundaries for scenario planning.

Step 2: Model for Zero (1-2 hours)

Have your accountant run a 12-month cash flow assuming no additional revenue from the announced deal.

Questions to answer:

  • What’s my debt-service-coverage ratio? (Target: 1.25+ per Farm Credit guidelines)
  • Can I cover debt service if export demand doesn’t materialize?
  • How many months can working capital sustain at reduced prices?

Document what you find. This strengthens lender conversations later.

Step 3: Verify DMC Status (45 minutes)

Contact your local FSA office and confirm Dairy Margin Coverage enrollment. If open and you’re not enrolled, evaluate immediately.

The timing trap: Trade announcements create optimism. Farmers skip enrollment. Then deals underperform, prices fall, and the window is closed. The 2025 enrollment closed on March 31.

The protection is most valuable when purchased before you think you need it.

Principles That Hold Up

Announcements are risk factors, not guarantees. The gap between announcement and execution is where farm financial planning actually lives.

Peaks aren’t baselines. Strong recent performance may represent cyclical highs, not sustainable floors. Expansion decisions financed over 10-20 years should be stress-tested across multiple scenarios.

Understand your cooperative’s position. Their balance sheet health affects your returns. Request financial information.

Maintain optionality over optimization. Operations preserving flexibility have more choices when conditions shift. There’s value in leaving room, even if it means not maximizing every metric.

Document your process. Whether you expand or hold back, a record of analysis strengthens lender conversations and demonstrates sound management.

The Bottom Line

Trade promises that deliver between 2.7% and 77% of announced targets raise legitimate questions about how agricultural trade policy functions. Whether the gap reflects deliberate choices or institutional limitations is hard to say.

What’s clear: farmers absorb the consequences while having limited ability to influence outcomes.

This doesn’t mean trade agreements lack value. U.S. dairy exports remain significant—Mexico, Canada, and other markets provide important revenue. The question is how to make sound decisions when the market outlook depends on commitments with highly variable execution.

Until the product ships and checks clear, a trade announcement is a press release, not a market.

The framework we covered—checking history, stress-testing for zero, securing DMC—provides concrete steps within 48 hours of any announcement. None guarantees good outcomes, but it positions you for realistic scenarios rather than headline optimism.

The fact that dairy farmers need a defensive playbook for government trade promises tells us something about the system. Whether by design or neglect, the pattern is clear: promises at 100%, delivery between 2.7% and 77%, farmers navigating the gap.

Until that changes, treat every announcement as a risk to manage—not an opportunity to bet the farm on.

That may sound conservative. Given the track record, it’s the smart play.

Key Takeaways:

  • The promise-delivery gap: 2.7% to 77%. Never 100%. Budget accordingly.
  • The cost: $0.35/cwt price drop = $91,000 annual loss on a 1,000-cow dairy.
  • Cooperatives won’t save you: FrieslandCampina lost €149M. Fonterra members voted 88% to sell.
  • Your 48-hour playbook: Check historical rates. Model for zero revenue. Verify DMC enrollment.
  • The bottom line: Until product ships and checks clear, a trade deal is a press release—not a market.

Executive Summary: 

China promised 12 million tons of soybeans. They shipped 332,000. That’s 2.7%—and your lender doesn’t care about the other 97%. Phase One delivered just 58-77% of agricultural targets, and dairy farmers absorbed the gap: $91,000 in annual losses for a typical 1,000-cow operation when Class III dropped $0.35/cwt. Even cooperatives can’t escape—FrieslandCampina lost €149 million; Fonterra’s members voted 88% to sell to Lactalis. The pattern is consistent: promises at 100%, delivery between 2.7% and 77%, farmers managing the difference. Here’s your 48-hour defense plan for the next trade announcement.

Complete references and supporting documentation are available upon request by contacting the editorial team at editor@thebullvine.com.

Learn More:

The Sunday Read Dairy Professionals Don’t Skip.

Every week, thousands of producers, breeders, and industry insiders open Bullvine Weekly for genetics insights, market shifts, and profit strategies they won’t find anywhere else. One email. Five minutes. Smarter decisions all week.

NewsSubscribe
First
Last
Consent

Your Milk Check Is at the Mercy of a Cheese Shredder: What the Great Lakes Recall Reveals About Dairy’s Broken Supply Chain

Perfect SCC. Elite components. Tight ship. Then a shredder in Ohio failed—and none of it saved your milk check.

EXECUTIVE SUMMARY: Great Lakes Cheese sneezed in Ohio—and dairy farms across 31 states caught pneumonia. The October 2025 recall of 250,000 cases revealed a brutal truth: in a converter supply chain, when middlemen fail, farms absorb the pain through 5-15% intake cuts regardless of milk quality or management excellence. Your perfect SCC won’t save you from quality failures at companies you’ve never heard of. The strategic response isn’t panic—it’s diversification. Beef-on-dairy with verified genetics now commands $1,000-$1,400 per calf, organic premiums reach $33-$45/cwt in undersupplied markets, and cooperative infrastructure can slash traceability costs by 60-75%. With FSMA 204 extended to July 2028, producers have a runway to reposition—and the farms that thrive will be the ones who stopped waiting for a broken system to protect them.

When a metal fragment in a cheese shredder in Ohio can hit a milk check in Wisconsin, we have a problem. The Great Lakes Cheese recall isn’t just a food safety blip—it’s a warning shot about the fragility of the modern “converter” supply chain. And your farm is the one exposed.

I’ve been having conversations with producers across the Upper Midwest lately, and a pattern keeps emerging. Farmers who had no direct relationship with Great Lakes Cheese are feeling ripple effects. Milk intake adjustments here. Some price volatility there. That unsettling realization that something happening several steps down the supply chain can show up on your bottom line.

Let’s walk through what’s actually going on.

Understanding What Happened

Great Lakes Cheese, headquartered in Hiram, Ohio, ranks among North America’s largest cheese companies. They supply roughly a quarter of all packaged cheese in U.S. retail—brands like Walmart’s Great Value, Target’s Good & Gather, Aldi’s Happy Farms. The company has been expanding steadily, including a major facility in Franklinville, New York, that Governor Hochul announced at $500 million back in 2022. Due to inflation and supply chain challenges, that project ended up costing over $700 million by the time it came online in late 2024, according to reporting from the Olean Star.

The recall itself occurred in early October 2025—the FDA publicly classified it in December—and affected over 250,000 cases of shredded and sliced cheese across 31 states. The issue was traced to metal fragments in the supplier’s raw materials.

Here’s what you need to understand about how they operate. Great Lakes functions primarily as what the industry calls a “converter.” They’re not manufacturing cheese from milk in most facilities. Instead, they purchase 40-pound commodity cheese blocks from various suppliers, then shred, slice, and package those blocks for retail.

Put bluntly: Great Lakes is essentially a middleman with a massive retail footprint. And when a middleman of that scale has a problem, they don’t absorb the pain—they pass it upstream immediately. Their suppliers get hit. Their suppliers’ suppliers get hit. And eventually, that pressure falls on the farms that produce milk.

Mark Stephenson—Director of Dairy Policy Analysis at the University of Wisconsin-Madison—notes that the converter model allows processors to source globally, optimize costs, and concentrate capital on packaging and retail relationships. From a business perspective, it makes sense. But from a risk perspective? When the Great Lakes sneezes, they don’t catch a cold. Their suppliers catch pneumonia.

When a cheese shredder fails in Ohio, your milk check drops 15%—even if you’re running a spotless operation 500 miles away. This is what “converter supply chain risk” actually looks like when it hits your bank account

How Disruptions Travel Upstream

Three weeks. That’s how long it took for a metal fragment problem in Ohio to wipe out 12% of revenue for farms that never shipped a drop of milk to Great Lakes. Notice the recovery is twice as slow as the crash—welcome to commodity dairy’s asymmetric risk model

This is where things get practical for those of us producing milk. Understanding these mechanics matters because they reveal how interconnected—and sometimes how exposed—farm-level economics really are.

When Great Lakes pulled those 250,000-plus cases from shelves, their immediate demand for incoming cheese blocks dropped. That reduced demand traveled to their commodity cheese suppliers. Those suppliers adjusted milk intake from processing facilities. And those facilities modified contracts with cooperatives and farms.

USDA Agricultural Marketing Service data shows Class III prices at $19.95 per hundredweight for November 2024—historically a decent number. But regional volatility increased in the weeks following the recall announcement, with cooperatives in affected areas reporting intake adjustments ranging from 5% to 15%, depending on their processor relationships.

What does that mean for a working operation? Consider an 1,800-cow dairy producing around 41 million pounds annually. A 12% intake reduction sustained over several months—reports I’m hearing fall in that range—represents roughly $430,000 in displaced revenue at that Class III price.

I recently spoke with a Wisconsin producer navigating exactly this situation. What struck me was his observation that excellent milk quality scores didn’t provide.

“We run a tight ship. But in a commodity system, my SCC numbers don’t protect me from problems three levels down the chain.”

That’s the reality of the converter supply chain. Your operational excellence doesn’t matter when someone else’s quality control failure determines your fate.

The Broader Context: Industry Trends Worth Watching

I’ve been following dairy consolidation for about two decades now, and the current moment feels distinct. Food safety concerns are accelerating trends already underway—traceability requirements, processor consolidation, and shifting leverage in supply relationships.

The FDA’s Food Traceability Final Rule (FSMA 204) was originally scheduled for January 2026. FDA has since extended the compliance deadline by 30 months to July 20, 2028—that extension was confirmed earlier this year. Still, processors are already adjusting supplier expectations in anticipation.

What the rule requires, regardless of final timing, is detailed record-keeping at each “Critical Tracking Event” that enables regulators to obtain data within 24 hours. For certain cheeses on the Food Traceability List, this creates real implications for supplier selection.

The consumer dimension reinforces these trends. Label Insight research from 2016 found that 73% of consumers are willing to pay more for products that offer complete transparency in sourcing and ingredients. Subsequent industry tracking has consistently confirmed that demand—if anything, it’s grown stronger, particularly among younger consumers.

What this means practically: processors and retailers are beginning to differentiate suppliers based on traceability capability. Some are offering premiums. Others are simply making it a qualification requirement. Either way, the capital needed to meet these expectations isn’t trivial.

What Traceability Systems Actually Cost

One question I kept encountering was straightforward: what does this actually cost a working dairy? I spent time examining land-grant university extension analyses and talking with operations that have made these investments.

According to the University of Minnesota Extension’s 2024 dairy technology investment analysis—with similar findings from Wisconsin and Cornell dairy programs—the picture breaks down into roughly three tiers:

Traceability Investment by Scale

This is the chart that keeps 800-cow dairy owners awake at night. Too big to ignore traceability requirements, too small to spread fixed costs efficiently. The 500-2000 cow range is where cooperative infrastructure starts making financial sense—or you’re paying $120+ per cow for systems the mega-dairies get at $85
Investment LevelCapital CostWhat It IncludesPremium PotentialScale Threshold
Basic Compliance$20,000–$35,000Tank sensors, basic IoT monitoring, cloud record-keepingMeets minimums; limited premiumAny size
Advanced Traceability$350,000–$500,000Individual animal sensors, RFID, blockchain integration, and real-time monitoringPreferred supplier status; $0.50–$0.75/cwt potential3,500+ cows
Comprehensive Digital$1,000,000+AI health monitoring, automated feeding, full supply chain integrationMaximum differentiation; $1.00+/cwt potential5,000+ cows

Financing makes these numbers more challenging. Agricultural lending rates have been running 7.5-8.5% according to late 2024 Federal Reserve surveys—multi-decade highs. A $500,000 loan at those rates requires annual debt service of $65,000 to $75,000 over 10 years. For a 2,000-cow dairy with typical margins, that’s substantial.

Now, it’s worth noting that some operations view this investment differently—not just as a compliance cost but as an operational improvement that generates returns through better fresh cow management, reduced health costs, and improved efficiency across the transition period and beyond. The calculation isn’t purely about premium capture.

Strategies That Are Working

Here’s where I want to shift from analysis to practical observation, because producers are navigating these pressures in genuinely creative ways. Not every approach fits every operation, but these patterns keep emerging in conversations.

Beef-on-Dairy: Quality Genetics or Don’t Bother

The most accessible opportunity—requiring minimal capital—involves strategic use of beef genetics on dairy herds. This trend has been building for years, but current economics make it particularly compelling.

USDA data from January 2024 shows U.S. beef cow inventory at approximately 28.2 million head—the lowest since 1961. Texas A&M AgriLife has confirmed this represents historically tight supplies, and CoBank analysis suggests meaningful herd rebuilding won’t happen until 2027 at the earliest.

But here’s what I need to emphasize, and it’s something The Bullvine has been beating the drum on for years: random beef bulls don’t cut it. The premium prices everyone talks about? They’re not available to just anyone throwing beef semen at their bottom-tier cows.

Every dairy farmer hears about beef-on-dairy premiums, but most are leaving $700 per head on the table. The difference between “some random beef semen” and verified genetics with documented EPDs is the gap between a side hustle and a profit center

Straight dairy bull calves now bring $400-$600 per head at many auctions—a dramatic improvement from the $100-$150 common just a few years back. Beef-cross calves from verified, high-quality genetics (proven Angus, Simmental, or Charolais sires with documented carcass data on Holstein dams) command $1,000-$1,400 at auction today—up from $650 averages just three years ago, according to Laurence Williams, dairy-beef cross development lead at Purina. Premium calves from elite sires can reach $1,500 or more at well-managed sales.

The key word there is verified. Feedlots and calf buyers have gotten sophisticated. They know the difference between a calf sired by a proven Angus bull with marbling EPDs in the top 10% versus some random beef semen picked up cheap. The price gap between generic beef-cross calves and those from verified genetics programs can exceed several hundred dollars per head—a difference driven almost entirely by genetic documentation and buyer confidence.

National Association of Animal Breeders data shows beef semen sales to dairy operations stabilized at record levels—approximately 7.9 million units in both 2023 and 2024—following rapid growth between 2017 and 2022. This isn’t temporary. It’s become structural.

I spoke recently with a California producer who’s breeding 45% of his herd to beef genetics—but he’s meticulous about which sires he uses. His observation: “We tried the bargain-bin approach the first year. Got bargain-bin prices. Now we use verified high-accuracy sires with actual carcass data, and the difference in our calf checks is substantial. The genetics investment pays for itself multiple times over.”

Beyond genetics, calf management determines whether you capture premium prices. Operations achieving top dollar have excellent colostrum protocols (within that critical four-hour window), careful processing procedures, and established feedlot relationships. Quality genetics combined with quality management is the formula. One without the other leaves money on the table.

Organic Markets: A Regional Calculation

For operations in certain regions—particularly the Northeast—organic and grass-fed markets remain undersupplied. The Northeast Organic Dairy Producers Alliance continues tracking demand that outpaces regional supply.

Organic cooperative contracts typically pay $33-$45 per hundredweight, according to NODPA’s 2025 reporting, compared to $18-$22 for conventional contracts. The premium is substantial, though it varies considerably by region, volume, and contract terms.

The challenge, of course, is transition. USDA organic certification requires 36 months of organic management before milk qualifies for premium pricing. That’s three years of elevated costs—organic feed runs 40-60% above conventional—without premium capture.

A Vermont producer I spoke with made the transition between 2019 and 2022. Her assessment was candid: “Those middle months were hard. You’re paying organic costs, selling at conventional prices, and hoping the math works on the other side.” It did work for her operation—she’s now receiving over $40/cwt through her cooperative contract. But she emphasized that financial staying power was essential.

Geography matters enormously here. Northeast markets remain undersupplied for organic milk. Midwest and Western markets show more saturation. If you’re considering this path, regional supply-demand dynamics should drive the decision as much as on-farm capabilities.

Other Diversification Pathways

Beyond beef-on-dairy and organic, I’m seeing producers explore several other approaches worth mentioning.

A2 milk programs are gaining traction in some regions, with processors offering premiums typically ranging from $0.50 to $1.50/cwt for herds genetically tested for the A2 beta-casein variant. The investment is primarily in genetic testing ($25-$40 per animal) and, potentially, in culling or breeding decisions over time. It’s not a dramatic premium, but for operations already making genetics decisions, it’s relatively low-friction additional income.

Direct-to-consumer operations—farmstead cheese, on-farm stores, local delivery—offer meaningful margin opportunities for operations within roughly 50 miles of population centers with populations exceeding 100,000. The catch is bandwidth: you’re adding retail management, food safety compliance, and customer relationships to an already demanding operation. Producers who succeed here generally have family members or partners explicitly dedicated to the retail side.

Agritourism components can leverage dairy heritage for smaller operations near tourist corridors or suburban areas. Farm tours, educational programs, and seasonal events won’t replace milk revenue, but they can provide supplemental income while building community connections that support other direct-sales efforts.

None of these represents a universal solution, but they illustrate the range of options available beyond commodity milk production.

Cooperative Infrastructure: An Emerging Model

One development I find encouraging—though it’s still early—is the rise of cooperative approaches to infrastructure investment. The logic is straightforward: if individual 2,000-cow farms can’t justify $500,000 in traceability technology, can ten farms sharing that investment make it viable?

Several farmer groups in Wisconsin and Minnesota are exploring this model. Typical structures involve 8-12 farms forming an LLC or cooperative, pooling capital to fund shared traceability platforms, and, in some cases, shared processing capacity for value-added products.

Early indications suggest per-farm costs can decrease substantially—potentially 60-75%—while still meeting processor requirements. The trade-off is governance complexity. These arrangements require genuine trust, aligned incentives, and careful legal structuring.

A Minnesota producer involved in exploratory discussions put it this way: “You’re giving up some independence. That’s real. But competing individually against 10,000-cow operations for processor contracts has its own costs.”

It’s worth watching how these structures develop. They may represent an important pathway for mid-size operations facing scale disadvantages in technology investment.

on-dairy with verified genetics sits in the sweet spot—minimal capital, 9-month payback, $320/cow annual return. The bottom-right corner (Direct-to-Consumer) looks tempting until you realize you’re now running two businesses

Maintaining Perspective

I want to be thoughtful about framing here. This isn’t a crisis moment requiring panic. Dairy has always been cyclical. Consolidation has proceeded for decades. Many mid-size operations have successfully navigated previous transitions and will do so again.

What does seem genuinely different about the current environment is the convergence of several trends: regulatory requirements for traceability (even with the FSMA extension to mid-2028), consumer expectations for transparency, the capital intensity of compliance, and processor consolidation, which is affecting market leverage.

Dr. Marin Bozic, the dairy economist at the University of Minnesota who advises Edge Dairy Farmer Cooperative and has testified before Congress on milk pricing, captures this well: “The farms that will thrive over the next decade are those making strategic decisions now—not reactive decisions later. That doesn’t mean panic. It means thoughtful positioning.”

The Great Lakes Cheese recall didn’t create these dynamics. But it made them visible in ways worth understanding. When a quality control issue at a supplier you’ve never heard of can affect your milk revenue, it reveals something meaningful about the supply chain’s structure and risk distribution.

Thinking Through Your Situation

Rather than prescribe universal solutions—every operation differs—here’s how these considerations tend to vary by scale:

Smaller operations (under 500 cows): Comprehensive traceability systems rarely pencil out at this scale. Specialty markets—organic, grass-fed, A2, direct-to-consumer—offer more realistic pathways to premium capture. Beef-on-dairy genetics (verified genetics, not bargain semen) can supplement income meaningfully regardless of herd size. The question becomes: where can you differentiate?

Mid-size operations (500-2,000 cows): This is arguably the most challenging position currently. Large enough that specialty market pivots are difficult, but lacking scale for major technology investments to generate positive returns individually. Cooperative approaches to shared infrastructure, combined with beef-on-dairy diversification using verified genetics, represent viable near-term strategies. The extended FSMA timeline—mid-2028—provides runway to explore options.

Larger operations (2,000+ cows): Comprehensive traceability investments become more justifiable as fixed costs spread across greater production. The strategic question shifts: invest in positioning as a preferred supplier to consolidated processors, diversify revenue streams to reduce channel dependence, or both? Many larger operations are pursuing parallel strategies.

Questions Worth Considering

Before committing to any particular direction, some honest self-assessment helps clarify options:

What’s your realistic timeline? Beef-on-dairy generates returns within months. Organic transition requires years. Which matches your financial position and planning horizon?

What’s your regional market reality? Is organic milk undersupplied or saturated in your area? Are established beef-cross calf buyers accessible? What specialty processors operate within a reasonable hauling distance?

Do you have neighbors who are suitable for a cooperative investment? Shared infrastructure approaches require aligned values and compatible operations. Not every neighboring farm makes a good partner.

What does your succession plan suggest? If the next generation isn’t committed to dairy, heavy investment in long-term technology infrastructure deserves careful evaluation.

Where are your operational strengths? Some farms excel at cow comfort and health management—organic or A2 programs might leverage that. Others have strong calf-raising infrastructure that positions them well for beef-on-dairy premiums.

There aren’t universal answers. But asking these questions honestly tends to clarify which paths make sense for specific situations.

The Bottom Line

What I’ve tried to do here is present what I’m observing as clearly as possible—drawing on USDA and FDA data, land-grant university extension analysis, conversations with credentialed economists, and reports from producers navigating these conditions directly.

The Great Lakes Cheese recall was, in one sense, routine—a food safety incident identified and addressed through established procedures. The system functioned as designed.

But the recall also exposed the ugly truth about converter supply chains: the risk flows upstream while the profits flow down. Your milk quality doesn’t protect you. Your operational efficiency doesn’t protect you. Your SCC scores don’t protect you. In a commodity system feeding into consolidated converters, you’re exposed to failures you can’t see coming and can’t prevent.

The encouraging news: farmers have options. Beef-on-dairy genetics—verified, quality genetics—offer immediate revenue diversification with minimal capital requirements. Specialty markets reward quality and management in ways commodity channels don’t. Cooperative structures can distribute infrastructure costs across multiple operations.

None represent a complete solutions. All require evaluation against individual circumstances, regional markets, and operational capabilities. But they represent genuine pathways—ways to build some insulation against a system that otherwise treats your operation as a disposable input.

That positioning—concentrating on factors within your control while clearly understanding those that aren’t—strikes me as exactly the right approach. The producers I talk with who seem most confident about the future share that orientation. They’re not ignoring industry headwinds. They’re just not waiting for those winds to determine their direction.

Key Takeaways:

  • When Great Lakes pulled 250K cases, farms 31 states away lost 5-15% income—even though they never sold to Great Lakes. Your SCC won’t protect you from converter failures.
  • Beef-on-dairy with verified genetics: $1,000-$1,400/calf. Straight dairy: $400-$600. The genetics gap is worth hundreds per head.
  • FSMA 204 extends to July 2028, but processors are moving now. Alternative revenue streams aren’t optional—they’re insurance.

Complete references and supporting documentation are available upon request by contacting the editorial team at editor@thebullvine.com.

Learn More:

The Sunday Read Dairy Professionals Don’t Skip.

Every week, thousands of producers, breeders, and industry insiders open Bullvine Weekly for genetics insights, market shifts, and profit strategies they won’t find anywhere else. One email. Five minutes. Smarter decisions all week.

NewsSubscribe
First
Last
Consent

The $4.6 Million Mistake: Why the Smartest Dairy Move Comes from Beef

47% to 83%. No new tech. No new genetics. Just stopped fighting biology.

EXECUTIVE SUMMARY: Fighting biology is the most expensive thing you do—it just doesn’t show up as a line item. Australia’s largest cattle operation proved this by boosting weaning from 47% to 83% with zero new genetics and zero new technology. They stopped fighting natural cycles and started profiting from alignment. Sound irrelevant to dairy? Your summer breeding crashes, transition cow disasters, and never-ending replacement costs are the same problem wearing different clothes. Beef-on-dairy just hit $1,400/calf—up from $250 three years ago. Seasonal calving economics are flipping faster than lenders realize. The farms still standing in 2035 won’t be the ones with the most milk. They’ll be the ones that stopped fighting biology and started working with it.

You know, I was at a conference recently when someone brought up Consolidated Pastoral Company—that Australian outfit running 300,000 cattle across 3.2 million hectares. And here’s what’s interesting: they’re dealing with the exact same biological constraints that are probably killing your margins right now.

What I’ve found is they’ve taken their northern Australian beef operations from 47% weaning rates to over 80%, and the Meat & Livestock Australia folks have documented every step. No miracle genetics, mind you. No Silicon Valley nonsense. Just a complete rethink of how they work with biology.

Sound familiar? Because I’ll bet you’re fighting the same battles with lactation cycles, heat stress, and those impossible summer breeding windows. The difference is… well, they stopped fighting and started profiting.

“From 47% to 83% weaning rates through biological alignment—not technology, not genetics, but working with natural cycles instead of against them.”

Infrastructure: Spending Millions to Make Millions

So I was talking to a producer recently who couldn’t wrap his head around CPC dropping $3.5 million on basic infrastructure. We’re talking fences and water points here. Not robots. Not anything fancy.

But here’s what every dairy farmer needs to understand—and this is important—while a TMR mixer is obviously different from a water point in the Outback, the principle is exactly the same. Capital expenditure is worthless unless it unlocks biological potential. Think about it… you’ve probably spent more on that new parlor than CPC spent on their entire fencing project.

Now, northern Australian cattle country is absolutely brutal. The Queensland Department of Agriculture research shows the soil is so phosphorus-deficient that the pasture has maybe a third of what cattle actually need just for maintenance. And during the dry season—we’re talking April through November—lactating cows are literally starving while surrounded by grass. Can you imagine?

The conventional response has always been to just… accept it. Run continuous breeding. Live with those 47% weaning rates. That’s what everyone does, right?

But CPC said no. They put in 200 kilometers of new fencing at about nine grand per kilometer. Thirty water points at sixty thousand each. And here’s the kicker—they’re spending between four hundred thousand and nine hundred thousand annually just on pregnancy testing and moving cattle around.

The payoff, though? For a 20,000-cow operation, that’s 7,200 additional calves every single year. At $650 per weaner—and that’s November 2024 prices, so pretty current—we’re looking at $4.68 million in additional annual revenue. The Northern Territory government’s analysis shows a payback period of less than a year. Less than a year!

So think about your own place for a minute. What biological constraint are you just accepting as “the way it is”? Summer heat stress that everyone complains about, but nobody really fixes? Those transition cow disasters we all pretend are normal? That 60-day voluntary waiting period that, let’s be honest, everyone follows because… well, because everyone follows it?

Turning Red Tape into Premium Pricing

Here’s where it gets really interesting. When Indonesia mandated that 20% of imported cattle be breeding stock in 2017, the whole industry basically panicked. And for good reason—Australia’s export standards couldn’t even certify that an animal could breed. This gap is all documented in the Northern Australia Beef Industry reports, if you want to look it up.

Most exporters, as you’d expect, just shipped whatever they could get away with. Matt Brann from ABC Rural reported in 2018 how Indonesian importers were getting these so-called “breeding cattle” with reproductive problems that went straight to feedlots anyway.

But CPC… they did something clever. They created their own breeding soundness protocols that went beyond what either country required. And now? Indonesian buyers actually pay premiums for that documentation.

This is exactly what’s happening with A2A2 milk, grass-fed certification, all those regenerative agriculture claims we’re seeing. The regulations don’t exist yet, but the producers creating their own verification systems? They’re capturing premiums while everyone else sits around waiting for the government to tell them what to do.

The $500 Calf That Makes Perfect Sense

Okay, this one’s going to sound crazy at first. CPC’s Santori Jabung facility in Indonesia produces calves at a cost of $500 each. Compare that to maybe $60-70 on Australian rangelands. I know, I know—sounds insane.

But Dr. Simon Quigley from the University of Queensland documented what was happening. They had mortality rates exceeding 25-30% when they tried to apply temperate management to tropical conditions. It’s just like your summer pneumonia outbreaks or those heat stress breeding failures we all deal with—wrong system for the environment.

So they made three changes that transformed everything:

First, they set up dedicated colostrum management with round-the-clock monitoring. Any calf that doesn’t nurse within three hours gets bottle-fed in temperature-controlled housing. And get this—mortality dropped from that 25-30% range down to 6-8%.

Second—and the efficiency experts hate this—they concentrated 80% of their calving into just three months. But you know what? Results speak louder than theories.

Third, they got strategic with supplementation. Only during late pregnancy and early lactation. That tiny bump in body condition—from 3.0 to 3.3—cut their days open from 217 to 118. Think about that for a minute.

Indonesia’s $500-per-calf intensive system crushed mortality from 27.5% to 7%, cut days open by 99, and achieved 72% pregnancy rates in brutal tropical conditions—proving biology-first spending beats efficiency-first spending

The result? They’re getting 72% pregnancy rates in absolutely brutal tropical conditions. Your transition barn—that critical period when fresh cows are moving from dry to lactating status—could probably learn something here. Just as those fresh cows need intensive management for a successful transition, these tropical operations need intensive intervention at critical biological moments.

Carbon Credits: The Drought Insurance You’re Missing

Let’s talk carbon for a minute. Australian Carbon Credit Units are trading at $36-42 per tonne according to the Clean Energy Regulator’s latest quarterly report. That works out to about $36-42 per head annually for operations doing regenerative grazing.

Now, it’s not transformative money. But here’s what’s interesting—Garrawin Station’s carbon revenue literally kept them alive during the 2019 drought when their cattle income completely vanished. And for dairy operations, we’re seeing similar opportunities with methane digesters generating credits, cover crop programs building soil carbon, and even manure management improvements qualifying for offset programs in some states.

So let me ask you this: your milk check isn’t guaranteed forever. What’s your backup plan?

“Every dollar spent fighting biology is profit bleeding out. Start asking yourself: what constraints am I accepting that I shouldn’t be?”

Virtual Fencing: Why Silicon Valley Fails on the Farm

You’ve probably heard about virtual fencing. Dr. Richard Rawnsley at the University of Tasmania showed it works great in small paddocks—94-99% containment. Sounds perfect, right?

But then Dr. Dana Campbell at CSIRO found something concerning—9% reduced daily gains under virtual fencing rotations. That’s fifteen bucks per head you’re losing.

That said, I’ve seen it work well for specific dairy applications. There’s a 400-cow grass-based operation in Vermont using virtual fencing just for keeping cows out of wetland areas—it works perfectly for that limited scope. Another Wisconsin farm uses it for temporary paddock divisions during their managed grazing rotation. Small, targeted uses where the technology makes sense.

But at $500-800 per collar for whole-herd implementation? The math just doesn’t work for big operations. It’s like robotic milkers—great technology, but not for everyone.

The Dairy Revolution Hiding in Plain Sight

Alright, here’s where it gets real for us dairy folks.

Your 14-month lactation cycle—you know, calving through milking to dry period and back again—it creates all these problems we just accept as normal. Breeding during negative energy balance. Those heat-stress-related disasters occur every summer. Year-round replacement heifer costs that never end.

Most dairies fight these constraints with more inputs, more technology, more complexity. And let’s be honest… it’s not really working, is it?

I’ve been visiting operations experimenting with seasonal calving—there’s some interesting work happening in Vermont, Ohio, and out in Idaho. Different farms, different approaches, but they’re all aligning their calving with either pasture availability or specific market demands. One Idaho operation I know of is timing fall calving to hit those holiday cheese plant premiums.

And they’re all riding this beef-on-dairy wave too. You’ve seen the prices—$250 three years ago, $1,400 today, according to USDA market reports. Some markets are seeing even higher premiums this year.

“The operations that survived the 2009 and 2020 milk price crashes weren’t necessarily the most efficient—they were the most adaptable.”

Here’s what concentrated calving can deliver:

  • Your peak lactation hits during the highest component periods
  • Breeding happens when cows aren’t dying from heat stress
  • Replacement heifer management that actually makes economic sense
  • Predictable milk composition so you can negotiate premium contracts
  • Lower feed costs because you’re not lactating through garbage forage months

Now, the biggest barrier isn’t biology—it’s the banker. Shifting to seasonal calving absolutely terrifies lenders who are used to those monthly milk checks. But here’s the thing… as feed costs keep climbing, that “steady check” might actually be a steady loss.

The folks in New Zealand figured this out decades ago. Sure, their market structure’s different, but the biology? The biology’s the same.

Making It Work at Your Scale

So what does this mean for your operation?

1. If you’re under 500 cows: Start small. Maybe try a 20% seasonal calving pilot—just see what happens. And definitely look at beef-on-dairy for your bottom-tier genetics. Those premiums are real and, according to USDA outlook reports, they’re not going away. Focus on the no-cost changes first, like optimizing breeding timing for your specific climate and conditions.

2. For 500-2,000 cow operations: Any reproduction improvement that pays back in under two years deserves serious consideration. Start building alternative revenue streams now, before you desperately need them. Could be custom heifer raising, beef-on-dairy, or direct marketing. Just… have something. And remember, operations this size in the Upper Midwest are seeing real success with partial seasonal systems—you don’t have to go all-in immediately.

3. Over 2,000 cows: You’ve got the scale to model a full seasonal transition with beef-on-dairy bridging those dry periods. If you own enough land, carbon programs might actually pencil out despite the volatility. But most importantly, document everything. The next generation needs to know what worked and what didn’t. Large operations in California and Idaho are already testing these models—you won’t be the first.

The Hard Truth Nobody Wants to Hear

CPC’s been around since 1879. That’s 146 years of surviving everything the market could throw at them. And here’s their secret: resilience beats efficiency every time.

Their Indonesian feedlots? Currently losing money. Their breeding systems? Modest margins at best. Carbon projects? Who knows what they’ll return.

But together? Together, they survive everything.

Every dollar you’re spending fighting biology—maintaining production through terrible seasons, managing those heat stress breeding disasters, carrying replacement heifers forever—that’s profit just bleeding out.

The question isn’t whether you can afford to change. Given where input costs are going, environmental regulations, market volatility… can you really afford not to?

Start small if you need to. Test things. Learn what works for your specific situation. But start now, before external pressure forces you into bad decisions.

The Bullvine Bottom Line

We’ve spent fifty years breeding cows to ignore the seasons. Maybe it’s time we stopped ignoring the math. You don’t need 3.2 million hectares to realize that fighting biology is the most expensive line item on your P&L. Whether it’s beef-on-dairy, seasonal calving, or aggressive heat abatement, the farms that survive the next decade won’t be the ones with the most milk—they’ll be the ones with the highest margins.

KEY TAKEAWAYS:

  • Fighting biology is your priciest line item. Those summer breeding failures and transition cow wrecks aren’t bad luck—they’re the cost of working against natural cycles. Australian operations showed that improvements of 47% to 83% come from alignment, not more inputs.
  • Beef-on-dairy hit $1,400/calf. Up from $250 three years ago, per USDA data. For your bottom-third genetics, this isn’t a side gig—it’s a margin strategy.
  • Your “steady” milk check may be a steady loss. Seasonal calving terrifies lenders. But as feed costs rise, that monthly revenue is increasingly monthly red ink. Run your own numbers.
  • Capital without a biological purpose is waste. New parlor won’t fix heat stress conception crashes. Robots can’t solve the negative-energy-balance breeding problem. Spend where biology says yes.
  • Adaptability beats efficiency. The farms standing after 2009 and 2020 weren’t the biggest. They had options when the market didn’t.

Complete references and supporting documentation are available upon request by contacting the editorial team at editor@thebullvine.com.

Learn More:

The Sunday Read Dairy Professionals Don’t Skip.

Every week, thousands of producers, breeders, and industry insiders open Bullvine Weekly for genetics insights, market shifts, and profit strategies they won’t find anywhere else. One email. Five minutes. Smarter decisions all week.
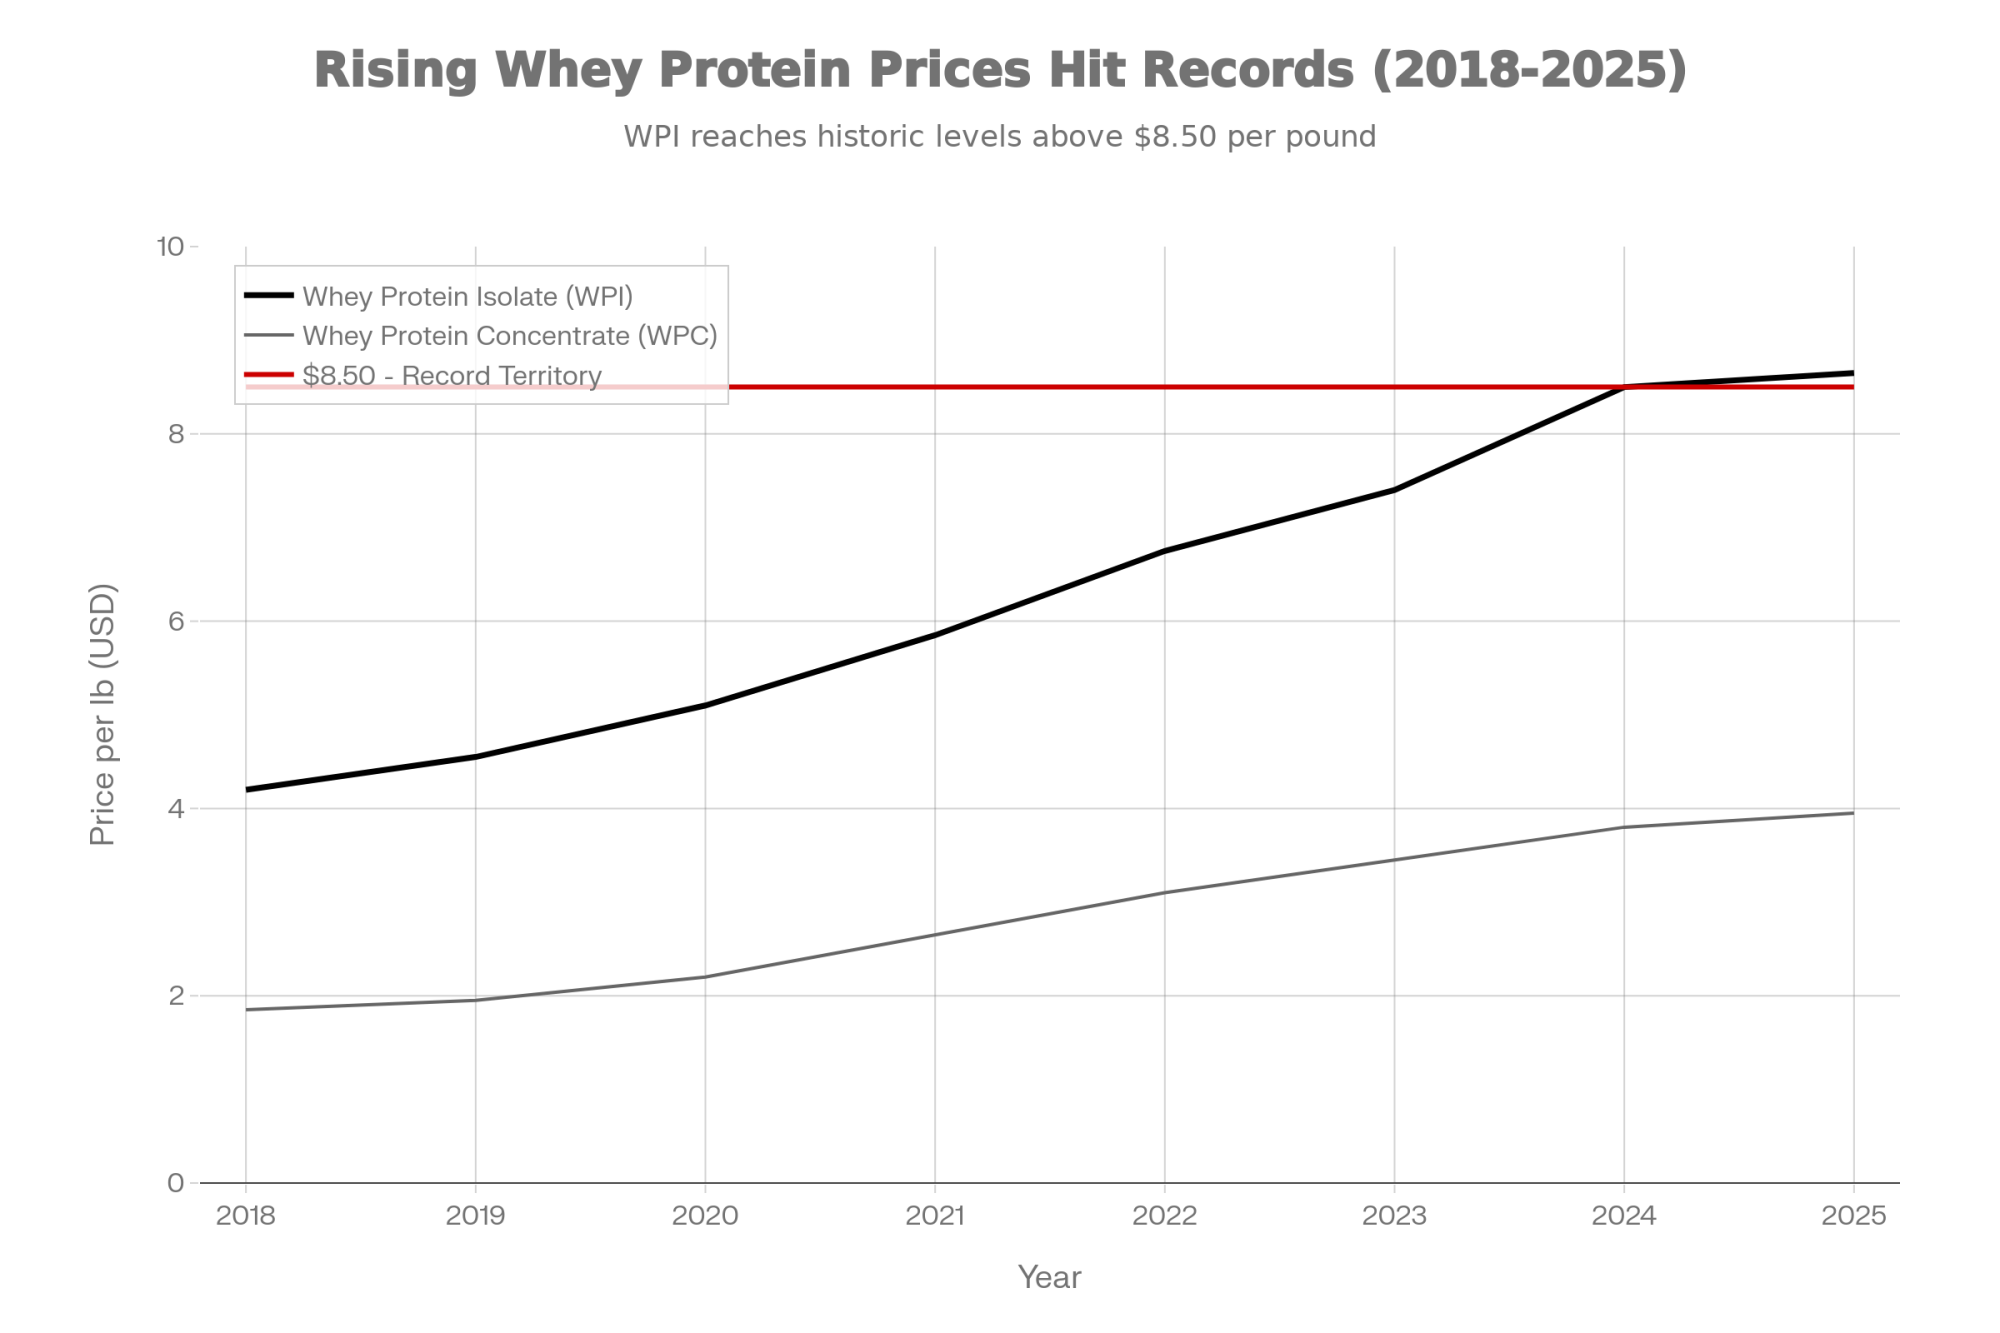
NewsSubscribe
First
Last
Consent

700+ Herds Infected, Export Markets Watching: The Biosecurity Math Every Dairy Should Run

$950 per sick cow. $737,500 per herd. The audit that protects you from those numbers? Most farms aren’t ready.

Executive Summary: H5N1 has swept through more than 700 dairy herds across 16 states since March 2024—and it’s quietly determining which operations keep access to export markets worth $2.32 billion annually. Cornell University researchers documented the toll: $950 per clinically affected cow, with one Ohio herd losing $737,500 in a single outbreak. Biosecurity audits are emerging as the new gatekeepers. Pass with proper documentation, and you’re positioned for export-oriented milk flows and federal assistance. Fall short, and your operation risks being confined to domestic commodity channels. What’s encouraging: most early audit failures stemmed from paperwork gaps, not actual biosecurity problems—a 90-day preparation approach can put most farms ahead of the requirements. The operations moving now aren’t overreacting; they’re running the numbers.

If you’ve spent any time at industry meetings this fall, you’ve probably heard the conversations shifting. Producers are talking about biosecurity audits differently than they were six months ago. Some still view them as bureaucratic overhead—and given everything else competing for attention, that’s an understandable reaction. But something interesting is happening among operations that have lived through H5N1 outbreaks or watched neighbors go through them. They’re starting to see these audits less as paperwork and more as a stress test for whether their business model can handle what’s coming.

That shift matters. These audits are quietly becoming gatekeepers for federal support, signals to processors about supply-chain reliability, and—whether we anticipated it or not—a dividing line between herds positioned for export markets and those that aren’t.

Understanding The Disease Picture

Let’s ground this in what we actually know, because the science has moved pretty quickly.

When USDA confirmed on March 24, 2024, that H5N1 had jumped from birds into lactating dairy cows—first appearing in Texas and Kansas—most of us expected a contained situation. That’s not what happened. By November 2024, federal trackers showed more than 440 confirmed cases across 16 states, rising to more than 700 by year’s end, according to USDA APHIS case summaries. California, Colorado, Michigan, and Idaho—major dairy regions—got hit. In California alone, somewhere between 70-75% of the state’s dairies were affected after August 2024, according to DairyReporter. (For a deeper dive into how this outbreak evolved, see our coverage in “H5N1 Crisis One Year Later: What Dairy Farmers Need to Know.”)

Remember when this was “just a Texas and Kansas problem”? Nine months later, we’re at 700+ herds across 16 states—and that second genotype means the spillover risk isn’t going away. If you’re still waiting to see how this plays out, you’re not being strategic. You’re being late

But here’s what really changes the planning conversation: we’re now dealing with multiple H5N1 genotypes in cattle. In early 2025, USDA’s National Veterinary Services Laboratories documented a second genotype—D1.1—genetically distinct from the B3.13 strain that drove the initial wave, as reported by WeCAHN. D1.1 had already become predominant in many wild-bird flyways and has been linked to severe human cases, including at least one fatal infection, according to CDC situation summaries.

What does this mean practically? Repeated spillovers from wild birds are likely to continue. Cow-to-cow transmission works efficiently in certain housing systems—particularly large freestalls and dry lots with frequent animal movement. This has shifted from a temporary outbreak to an endemic-risk backdrop for the industry. And while researchers are investigating vaccine candidates, no approved H5N1 vaccine for dairy cattle currently exists, leaving biosecurity as the primary management tool.

Dr. Keith Poulsen, DVM, PhD, DACVIM, who directs the Wisconsin Veterinary Diagnostic Laboratory, captured the stakes in comments to Brownfield Ag News: “A national effort to eliminate the B313 variation of the H5N1 virus is important for cow and human health, and to prevent disrupting dairy export markets, which account for 40% of U.S. production.”

That 40% figure is worth sitting with for a moment.

What The Research Tells Us About Herd-Level Impact

We’re fortunate to have solid economic data now. A study published in Nature Communications in July 2025 by Cornell University researchers followed a 3,876-cow Holstein herd in Ohio through an H5N1 outbreak. The findings got my attention—and we covered them extensively in “Bird Flu Bombshell: Dairy Cows Losing a Full Ton of Milk.”

Here’s what they documented:

About one in five cows showed clear clinical signs—sharp milk drop, fever, reduced feed intake. Those clinically affected cows produced roughly 900 kilograms less milk than expected over approximately 60-67 days. When the Cornell team tallied milk losses, elevated culling, and increased mortality, they arrived at an economic loss of about $950 per clinically affected cow. Total losses for that single herd came to around $737,500.

Field observations from affected Central Valley herds suggest these findings track with what producers and veterinarians are seeing: the effects linger longer than expected. Fresh cow performance, butterfat levels, rebreeding rates—these stay suppressed for weeks after cows appear to recover. It’s not a quick bounce-back.

This is what keeps me up at night—and should keep you up too. That Ohio herd? 89% exposed, but only one in five cows looked sick. The other 69%? Milking, mingling, and spreading virus like nothing’s wrong. Your eyes can’t catch this threat

What’s also noteworthy is that serology showed high exposure across the entire Ohio herd, despite only 20% of the herd displaying clinical signs. The Cornell team found that 89% of sampled cows had been exposed, but about three-quarters of those never showed symptoms—they just kept milking at normal levels despite carrying the virus. That’s how quietly this thing can move through a freestall or dry-lot operation while still impacting your shipped solids.

How These Audits Actually Work

Let’s be honest: nobody wants another clipboard in the barn. Most of us got into dairy because we like working with cows, not wrestling with paperwork. But here’s the reality—these audits aren’t going away, and understanding them now beats scrambling later.

The USDA APHIS HPAI Biosecurity Audit Tool is publicly available at aphis.usda.gov. Originally designed for poultry, it’s been adapted for dairy through state programs and “Secure Our Herds” guidance. Penn State Extension and University of Minnesota Extension have both published dairy-specific biosecurity planning guides worth reviewing. (Our “Battle Plan: How to Protect Your Dairy Herd from HPAI” breaks down the practical steps in detail.)

Auditors evaluate three main areas:

First, your written biosecurity plan. They want something farm-specific, not a generic template. That means a premises map showing your Lines of Separation, entry points, housing areas, manure routes, and Personal Biosecurity Areas. Plus written procedures for cleaning, disinfection, visitor control, and response protocols.

Second, personnel understanding. Auditors talk to your people—milkers, calf feeders, hospital-pen crew—and ask them to explain basic concepts. Where’s the LOS? When do you change boots? What would you do if you noticed unusual symptoms? Training logs help, but the conversations matter.

Third, visual verification. They walk through the operation and compare what they see to what’s documented. Are footbaths where the map says? Are they properly maintained? Do traffic patterns match what’s written?

California’s experience with their Biosecurity Compliance Audit Program has been instructive. CDFA reported that most initial shortfalls involve documentation and staff understanding, not an absence of biosecurity practices. Many farms had decent practices but failed early audits because their written plans were too generic, their premises maps missed key features, or their training records were inconsistent.

We don’t have national pass/fail statistics yet. But the pattern from early-adopting states is clear: demonstrating what you do matters as much as doing it.

Stop me if you’ve heard this one: “We can’t afford biosecurity audits.” But here’s what California’s program revealed—70% of failures are paperwork, not practices. You’re probably already doing the hard part. You’re just not writing it down in a way auditors recognize

Running The Numbers

This is where the conversation gets practical. Here’s how the economics stack up at different scales:

Factor200-Cow Tie-Stall (Northeast)500-Cow Freestall (Upper Midwest)3,000-Cow Dry-Lot (Southwest)
Monthly Milk Revenue~$88,000~$265,000~$1.6 million
60-Day Revenue at Risk~$176,000~$530,000~$3.2 million
Estimated Outbreak Cost (20% clinical rate @ $950/cow)~$38,000~$95,000~$570,000
Typical Compliance Investment$10,000–$25,000$25,000–$45,000$75,000–$150,000
Annual Consumables/Staff Time$5,000–$10,000$10,000–$20,000$25,000–$40,000
Quarantine Period30–60 days30–60 days30–60 days

Calculations based on $22/cwt milk price, 80 lbs/cow/day production, Cornell University research benchmarks, and extension cost estimates. Actual figures vary by region and existing infrastructure.

The math is brutal: at every scale, one H5N1 outbreak costs 2-5x more than getting audit-ready. That 200-cow Vermont operation risking $38K to avoid spending $17K? That’s not risk management—that’s wishful thinking wearing overalls

A few things jump out from this table. First, the compliance investment looks much more reasonable when compared to potential outbreak exposure—we’re talking tens of thousands versus hundreds of thousands (or millions at larger scales). Second, that quarantine period hits everyone the same way, regardless of size. Minnesota’s guidance describes 30-day quarantines from the last positive test, often extending to 60 days for multiple negative bulk-tank samples.

The decision point becomes clearer when you lay it out this way.

Understanding Federal Assistance

So here’s the question that always comes up: doesn’t USDA assistance offset this risk? It helps meaningfully, but doesn’t eliminate the exposure.

The ELAP program was expanded in June 2024 for H5N1 milk losses. Per the FSA fact sheet, payments assume a 21-day period of no production when a cow is removed, followed by seven days at 50% production.

The benefit covers about 90% of calculated milk loss—Secretary Vilsack announced this in June 2024, as reported by Brownfield Ag News.

Four practical considerations:

First, ELAP addresses milk loss only—not culling costs, lost pregnancies, or suppressed components over subsequent months.

Second, payments arrive after the fact, sometimes months later. DairyReporter noted that 43% of payments went to dairies that were reimbursed multiple times over a six-month window.

Third, access depends on good records. Incomplete documentation makes navigating these programs considerably harder.

Fourth, most standard livestock mortality and business interruption policies weren’t written with HPAI in mind. Coverage varies—worth discussing with your agent before you need to find out.

What Market Signals Are Telling Us

The regulatory dimension is only part of the picture.

Mexico provides the clearest illustration. In 2023, Mexico imported roughly $2.32 billion in U.S. dairy products—about one-quarter of total exports —and that share grew to 29% by September 2024, according to USDA-FAS data cited by Dairy Global. Mexico relies on U.S. suppliers for over 80% of its imported dairy. (We explored the strategic importance of this relationship in “How USMCA Boosted U.S. Dairy Exports to Mexico by 59%” and more recently in “Your Biggest Dairy Customer is About to Ditch You.”)

CoBank’s December 2024 analysis called Mexico “America’s most reliable dairy customer.” Japan, South Korea, and Southeast Asian markets are also watching how we manage this.

When detections occur, some countries temporarily restrict imports or require additional attestations. While pasteurization inactivates the virus, international buyers want to see systematic on-farm risk management.

Processors are responding by asking more questions about farm-level HPAI testing during contract discussions and encouraging alignment with enhanced biosecurity programs.

What this points toward is an informal tiered system—operations with documented biosecurity positioned for export-oriented flows, while those with weaker documentation may find themselves confined to domestic commodity channels.

The Hidden Benefits

Beyond market positioning and outbreak prevention, there’s something else worth considering. When farms implement these biosecurity protocols—even reluctantly—they often discover unexpected improvements in day-to-day herd health.

Extension materials and producer experiences suggest considerable overlap between HPAI compliance measures—maintained footbaths, defined traffic patterns, separate calf-barn equipment, consistent hospital-area sanitation—and practices addressing environmental mastitis, digital dermatitis, and calf scours.

Operations maintaining strict separation protocols often report fewer diarrhea and pneumonia treatments in youngstock over time. When farms systematically map who and what crosses between zones, they frequently uncover unexpected pathogen risks—shared tools between hospital pens and fresh-cow groups, rendering routes near commodity storage.

We don’t have controlled studies quantifying the relationship between “audit completion equals X% SCC reduction.” But the overlap between audit-ready practices and proven herd-health management is substantial enough that many producers see two benefits from one investment.

A Practical 90-Day Approach

For operations deciding to move forward, here’s what’s working for progressive herds. (For additional technical guidance, our “HPAI H5N1: The 2025 Science-Based Dairy Farm Survival Guide” provides comprehensive protocols.)

Days 1-30: Establish Your Baseline

Model your outbreak scenario. Use actual shipments and current prices to estimate 30- or 60-day disruption impact. Apply Cornell benchmarks at whatever attack rate seems realistic for your system.

Develop a compliance budget. For a 200-cow tie-stall, expect $10,000-$20,000; for 500-1,000 cows, $25,000-$50,000.

Consult advisors. Vets can reality-check risk assumptions. Lenders can evaluate phasing investments.

Days 31-60: Build Your Framework

Create detailed premises maps. Mark entries, housing, pens, storage, and routes. Add LOS boundaries.

Install control points. Automatic footbaths, boot stations, permanent markers, and clear signage.

Establish simple documentation. Clipboards at stations, low-friction compliance.

Seasonal timing matters. Wisconsin or Minnesota farms often prioritize infrastructure before freeze-up, then focus on documentation through winter. In warmer regions, summer heat might push work to milder months.

Days 61-90: Validate Your Systems

Conduct a mock audit. Download the USDA tool, walk your place as an inspector would.

Address gaps. Make correct behavior the path of least resistance.

Organize records. One binder or folder, readily accessible.

Conversations Worth Having

With your processor: Are formal requirements coming? Will audit-ready status influence relationships?

With your vet: Can you walk our premises before an outside auditor? What’s working for similar operations?

With your lender: Concentrated investment or phasing? How would quarantine affect debt service?

With your insurance agent: Does current coverage address HPAI losses? What documentation would be required?

Different Valid Approaches

Not every operation is approaching this identically—and that’s appropriate. A 220-cow Vermont family operation faces different exposure than a 5,000-cow Texas Panhandle dry-lot. Pacific Northwest operations contend with seasonal bird migration; Southeast herds deal with year-round humidity challenges.

Some view HPAI as a temporary disruption—manage it if it arrives. Others see it as structural evolution—dairy moving toward formalized supply-chain partnerships.

Neither approach is right or wrong. They reflect different assessments and risk tolerances. Operations moving earliest tend to already think in multi-year cycles—plant relationships, replacements, genetics, environmental compliance, and now biosecurity as connected pieces.

The Bottom Line: 

H5N1 has infected more than 700 dairy herds across 16 states, with documented losses of $950 per clinically affected cow according to Cornell research. USDA biosecurity audits are becoming gatekeepers for federal assistance and export market access. A 90-day preparation approach can position operations ahead of coming requirements.

KEY TAKEAWAYS:

  • H5N1 isn’t going away: 700+ herds infected across 16 states, two genotypes now circulating, no vaccine in sight—this is the new baseline for dairy risk planning
  • The economic toll is documented: Cornell research: $950 per clinically affected cow, $737,500 lost in one Ohio herd. Peer-reviewed numbers you can use for your own math
  • Audits now decide market access: Documented biosecurity positions you for export channels worth $2.32B annually. Missing paperwork risks confining your milk to domestic commodity pricing
  • Most farms fail on paperwork, not practices: Early audit shortfalls were documentation gaps and training records—you’re likely closer to compliant than you realize
  • A 90-day approach works at any scale: Three phases—baseline, build, validate—with realistic costs from $10K for a 200-cow tie-stall to $150K for a 3,000-cow dry lot

Complete references and supporting documentation are available upon request by contacting the editorial team at editor@thebullvine.com.

Learn More:

The Sunday Read Dairy Professionals Don’t Skip.

Every week, thousands of producers, breeders, and industry insiders open Bullvine Weekly for genetics insights, market shifts, and profit strategies they won’t find anywhere else. One email. Five minutes. Smarter decisions all week.

NewsSubscribe
First
Last
Consent

The €185,000 Trade: What Dairy Farmers Gain – and Give Up – in the FrieslandCampina-Milcobel Merger

That’s real money. But my plant is on the closure list.’ The €185,000 decision 16,000 dairy farmers face on December 16.

EXECUTIVE SUMMARY: On December 16, roughly 16,000 dairy farming families face a vote they can’t take back: merge Milcobel into FrieslandCampina and collect €185,000+ in loyalty bonuses—or walk away and keep the flexibility to leave. For some farmers, the merger offers genuine upside: scale, technical resources, and substantial payments for operations near retained facilities with sustainability practices already in place. For others, plant closures could add thousands in annual hauling costs, and Foqus planet compliance ranges from minor documentation to six-figure capital investments. History provides both warnings and encouragement—DFA’s consolidation brought in $290 million in antitrust settlements, while Irish co-op mergers helped farmers reach export markets they couldn’t access on their own. Geography and current infrastructure determine which outcome you’re likely to see. This analysis provides the framework to run your own numbers, because the right answer depends on your specific situation—and once you vote yes, you can’t vote no later.

Dairy cooperative merger

For one Milcobel member near Antwerp, the December 16 vote isn’t about spreadsheets. It’s about whether her family’s 80-year-old dairy operation will still make sense five years from now.

She milks 95 cows on a farm her grandfather started in 1946. Been a Milcobel member for eighteen years. And like thousands of other Belgian and Dutch dairy farmers, she’s got just over a week to decide whether to merge her cooperative into FrieslandCampina—creating what Dairy Reporter is calling a “€14 billion co-op” that would rank among Europe’s largest.

“They’re offering us €8 per hundred kilos to stay three years,” she told me last week, asking that her name not be used because she’s concerned about pushback from cooperative leadership. “That’s real money. But my nearest plant is on the closure list. So what am I actually voting for?”

Financial reality check: The same merger creates four different outcomes. Geography and infrastructure determine whether €185,000 in loyalty bonuses becomes genuine profit or disappears into hauling costs and compliance investments

You know, it’s the kind of question that doesn’t have an easy answer. What’s unfolding in Belgium and the Netherlands isn’t just one cooperative merger—it’s part of a broader consolidation wave reshaping how milk moves from farm to consumer. And the dynamics here offer a useful perspective for dairy producers everywhere, whether you’re milking cows in Flanders, Wisconsin, or New Zealand.

What’s Actually on the Table

Let me walk you through what FrieslandCampina and Milcobel are proposing, because there’s quite a bit of information floating around, and some of it gets confusing.

The merger would combine both cooperatives’ member farms into one organization. According to FrieslandCampina’s official announcement from December 2024, we’re talking about approximately 16,000 member dairy farmers processing around 10 billion kilograms of member milk annually. That’s across facilities in the Netherlands, Belgium, Germany, and northern France.

The headline incentive—and this is what most farmers are focused on—is an €8 loyalty bonus per 100 kilograms for farmers who commit to the merged cooperative for three years. Dairy Reporter confirmed these terms in their December 2025 coverage.

But here’s where it gets more complicated. The merger also involves what the proposal calls “network optimization”—consolidating processing facilities to improve efficiency. Several plants have been identified for potential closure or transition, according to reporting from Dairy Reporter and the Dutch publication Veeteelt. And that changes the math considerably depending on where you’re located.

EXAMPLE FARM SCENARIO: Mid-Sized Belgian Operation

FactorWhat It Looks Like
Annual production760,000 liters
Three-year loyalty bonus€186,000 total (about €62,000/year)
If the nearest plant closes (+47km hauling)Significant additional transport costs
Potential basis compressionHard to predict, but historical patterns suggest concern
Net positionDepends heavily on your specific situation

The outcome ultimately comes down to plant-closure decisions and post-merger pricing dynamics.

How Geography Shapes the Math

If your current receiving facility remains operational, the merger economics work in your favor. If your nearest plant is closing, you’re looking at a different calculation entirely. And right now, there’s still uncertainty about which facilities fall into which category.

Here’s what we know from previous consolidations—and as many of us have seen, there’s substantial experience with this from the United States and Oceania. Plant closures create real costs for affected farmers. The exact numbers vary quite a bit by region and contract structure, but the pattern is consistent: more distance means more money out of your pocket.

Dr. Marin Bozic, an assistant professor in dairy foods marketing and economics at the University of Minnesota, has extensively studied cooperative pricing dynamics. His work suggests that when farmers have multiple processors competing for their milk, basis stays tight. When options narrow, processors face less price-based competitive pressure. In regions where significant processing capacity has closed, the research indicates the basis can widen over time—sometimes meaningfully.

A farmer from West Flanders, whose nearest plant is on the consolidation list, walked me through his numbers: “The next closest facility is 47 kilometers further. That’s going to add real money to my hauling costs every year. Add potential basis compression, and I’m not sure the bonus covers it.”

Geography is destiny: The Antwerp farmer facing a 47km haul to the next plant? She’ll lose 25% of her loyalty bonus just to transport milk. At 100km, 58% vanishes – turning €185,000 into pocket change

It’s the kind of calculation that keeps you up at night.

Understanding Sustainability Compliance Costs

The merger brings Milcobel farmers into FrieslandCampina’s Foqus planet sustainability program. And you know, this is worth understanding because similar programs are becoming increasingly common across European cooperatives—and many U.S. processors are moving in this direction too.

Here’s what’s encouraging. According to FrieslandCampina’s reporting—and FoodBev covered this in June 2024—member farms received over €245 million in sustainability premiums in 2023. That’s real money flowing to farmers who meet the criteria.

The program offers up to €3.50 per 100kg for full compliance, with a €0.60 per 100kg cooperative deduction regardless of achievement level. Those numbers come directly from FrieslandCampina’s milk price documentation.

What does compliance actually cost? Here’s where things get variable, and I think this deserves more attention than it typically gets in these discussions. Industry estimates and contractor quotes from the Benelux region suggest these rough ranges:

SUSTAINABILITY COMPLIANCE: What Farmers Are Seeing

RequirementEstimated RangeContext
Methane-reducing feed additives€10,000-€15,000/yearFor a 100-cow herd; pricing is still evolving
Grassland biodiversity programs€5,000-€15,000Establishment plus ongoing management
Monitoring & documentation€2,000-€8,000May overlap with existing herd management software
Anaerobic digestion (if required)€500,000-€700,000+Capital cost; not required for all farms

These are general industry estimates. Your actual costs will depend on your current infrastructure and practices.

Two Farmers, Two Very Different Situations

A 130-cow operator from the Netherlands told me he’s feeling optimistic: “I’ve already got most of the grassland practices in place, and my vet has us on a solid animal health monitoring program. We track everything from fresh cow management through the transition period. Hitting the premium tiers is realistic for me.”

His neighbor faces a completely different situation—needs a new slurry system just to get started. “We’re looking at the same merger,” the first farmer said, “but the economics couldn’t be more different.”

And that’s really the story of this whole thing, isn’t it? Same vote, vastly different implications depending on where you stand.

The sustainability trap: Maximum Foqus Planet compliance pays €3.50/100kg – but requires €60,000 annual investment. For medium-sized farms, the math doesn’t work. You’re paid to be green, but you can’t afford to get there

What Global Patterns Tell Us

One thing I’ve noticed covering dairy consolidation over the years: the patterns tend to repeat across regions. Understanding what’s happened elsewhere offers useful context—though not necessarily predictions—for farmers weighing this decision.

Dairy Farmers of America grew substantially in 2020 when they acquired 44 processing plants from bankrupt Dean Foods for $433 million, as Dairy Herd reported at the time. They now handle roughly 30% of U.S. milk production.

History’s harsh lesson: DFA has paid $290 million in antitrust settlements since 2013. The pattern reveals what can happen when cooperative consolidation eliminates competitive pressure – farmers end up suing their own co-op for suppressing milk prices

The legal record is worth knowing about. DFA has paid approximately $290 million in antitrust settlements since 2013:

SettlementAmountWhat Happened
Southeast (2013)$158.6 millionFarm and Dairy and Hoard’s Dairyman covered the court approval
Northeast (2014)$50 millionConfirmed by Dairy Reporter and the National Agricultural Law Center
CME price manipulation (2013)$46 millionDairy Reporter reported on this one
Southwest (2025)$34.4 millionReceived preliminary court approval in August—DFA contributing $24.5 million, Select Milk Producers paying $9.9 million

DFA settled each case without admitting wrongdoing—that’s standard legal practice. But the payments themselves tell you that regulators and courts found the concerns substantial enough to warrant significant compensation.

Fonterra in New Zealand offers another data point. Their farmgate payments dropped from a record NZ$8.40 in the 2013-14 season to NZ$3.90 by 2015-16—a 54% decline in just two years. CowSmo and the New Zealand Commerce Commission both documented this painful period.

And just this October, 88% of Fonterra farmers voted to sell the cooperative’s consumer brands to Lactalis for NZ$4.22 billion. Dairy Reporter covered that vote extensively. The decision reflected, at least in part, the need for capital relief after years of volatile returns.

Now, let me be direct here: I’m not suggesting FrieslandCampina will follow these exact patterns. European dairy operates in a different policy environment—the legacy of milk quotas, CAP support structures, and generally more regional processor competition than you see in parts of the U.S. or New Zealand’s highly concentrated market. But the structural dynamics—processor consolidation, farmer lock-in periods, margin pressure during downturns—are similar enough that the history is worth considering.

Consolidation begets consolidation: FrieslandCampina-Milcobel’s €14 billion merger looked massive in December 2024. Four months later, Arla-DMK announced an even bigger combination. The industry is racing toward fewer, larger players – and farmers are becoming smaller voices in bigger rooms

When Consolidation Has Actually Worked

It’s equally important to acknowledge that not every consolidation story involves the challenges I’ve described. Some have delivered genuine benefits, and that perspective deserves fair representation.

In Ireland, consolidation into entities like Glanbia and Kerry Group helped farmers access export markets and technology that would’ve been impossible at smaller scale. Farmgate prices have generally remained competitive within Europe.

A Dutch producer who went through the original FrieslandCampina formation back in 2008—when Friesland Foods and Campina merged, as Dairy Reporter covered at the time—shared his experience: “The first few years were uncertain. But over time, the scale gave us market access we wouldn’t have had otherwise. My milk price has been competitive.” His operation has grown from 85 to 140 cows since then, and he credits cooperative technical support for improving his herd’s butterfat performance and component quality.

What seems to distinguish successful consolidations? Market structure appears to be key. When the merged entity still faces meaningful competition—either from other processors or export alternatives—farmers tend to fare better. In parts of Belgium and the Netherlands, Arla, Lactalis, and smaller regional processors still compete for milk. That’s a meaningful difference from some U.S. regions where DFA dominates.

Governance at 16,000 Members

Here’s something that doesn’t get discussed enough: what “member control” actually means when cooperative membership reaches the thousands.

With 16,000+ members, each farmer’s direct influence is naturally spread thin. You’re one voice among hundreds in your district, electing representatives who are one voice among many. Some of those representatives become farmer voices on a board that also includes professional directors and relies on executive management for operational decisions.

Farmer advocacy organizations across Europe have raised questions about this dynamic. FrieslandCampina representatives counter that their district structure provides a meaningful local voice, and point to farmer-directors who actively shape major strategic decisions.

Both perspectives have merit. The question for individual farmers: what kind of influence matters most to you, and how does that factor into your decision?

Why This Is Happening Now

Understanding the timing helps contextualize what’s being proposed.

U.S. milk production surged 4.2% year-on-year in September 2025, according to the USDA NASS report—that’s 18.3 billion pounds in the 24 major dairy states. But globally, the picture is more varied. Chinese dairy imports remain well below their 2021-2022 peaks. Processors face margin pressure from multiple directions.

This merger is being proposed because market conditions are difficult and consolidation offers a path to cost reduction—not because times are good and there’s bounty to share.

That’s not necessarily bad for farmers. Cost reduction can translate to competitive milk pricing over time. But it’s worth understanding the motivation clearly.

When the Merger Might Work Well

This merger will likely work well for some farmers:

  • Large operations near retained facilities: The €8 bonus is largely an additive income
  • Farmers already meeting sustainability targets: Compliance means documentation changes, not capital investment
  • Operations planning to expand: Larger cooperatives often offer better access to credit and technical support
  • Succession situations: Three years of predictable bonus payments during transition has real value

Five Questions Worth Asking Yourself

QuestionWhat to Think About
What’s my actual baseline?Real farmgate price after all deductions—not the announced price
What’s my plant closure risk?Distance to the next facility if yours closes
What will sustainability cost me?Investment needed vs. the premium I can realistically achieve
What’s my net position?Bonus minus added costs
What’s flexibility worth?Once you’re locked in, your options narrow

The Part That Doesn’t Fit in Spreadsheets

The Antwerp farmer I spoke with shared something that’s stayed with me: “My grandfather started this farm because he wanted to be his own boss. My father kept it going because he believed in the cooperative model—farmers working together as equals. Now I’m being asked to vote for something so large that my individual voice becomes very small.”

That feeling deserves respect. It doesn’t override economics. But it’s not irrational either.

What It Comes Down To

  • Run your own numbers. Generic promises don’t translate uniformly across all operations.
  • Know your geography. Plant closure risk matters more than almost anything else.
  • Be realistic about sustainability costs. Premium programs create genuine opportunities—but so do the investments required to qualify.
  • Learn from history, but don’t assume it repeats. Every situation has unique elements, and European dairy markets differ meaningfully from U.S. and New Zealand structures.
  • Understand the trade. You’re exchanging flexibility for scale benefits and transition payments.

The Antwerp farmer will cast her vote on December 16. She’s still undecided—running numbers, talking with neighbors, trying to separate what matters from background noise.

“Once I vote yes, I can’t vote no later,” she said. “That’s worth sitting with.”

She’s right. The financial analysis matters. But so does understanding clearly what you’re being asked to exchange—and whether what you’re getting back genuinely works for your operation and your family.

Have you experience with cooperative mergers? We’d like to hear from you. Contact our editorial team at www.thebullvine.com—farmer perspectives help the entire industry better understand these decisions.

KEY TAKEAWAYS:

  • €185,000+ in real money: Loyalty bonuses for farmers committing three years to the merged cooperative—enough to ease debt loads, fund equipment, or smooth a succession transition
  • A lock-in you can’t escape: Three years committed with no exit clause, even if your plant closes, hauling costs spike, or circumstances change dramatically
  • Geography determines your math: Farmers near retained facilities see the bonus as additive income; those facing plant closures may watch it disappear into hauling costs and basis compression
  • History offers both warnings and models: DFA’s $290 million in antitrust settlements shows consolidation risk; Irish co-op mergers demonstrate that scale can genuinely benefit farmers when competition remains
  • Run your numbers before December 16: Plant closure risk, Foqus planet compliance costs, and current infrastructure determine your actual outcome—and once you vote yes, you can’t vote no later

Learn More:

The Sunday Read Dairy Professionals Don’t Skip.

Every week, thousands of producers, breeders, and industry insiders open Bullvine Weekly for genetics insights, market shifts, and profit strategies they won’t find anywhere else. One email. Five minutes. Smarter decisions all week.

NewsSubscribe
First
Last
Consent

The Cheap Feed Trap: Why the Wall of Milk Won’t Break and How to Protect Your Margins

Your cows cover their feed. Your banker’s calm. So why are the sharpest producers culling now? Because they see what’s coming.

EXECUTIVE SUMMARY: Dairy farmers worldwide are caught in a trap: record milk production, collapsing wholesale prices, yet on-farm economics that make every cow look like she’s paying her way. AHDB’s December 2025 forecast puts UK output at “uncharted levels”—13.05 billion litres, up 4.9%—while USDA projects US production hitting 229.1 billion pounds in 2026. Three factors are blocking the market’s usual self-correction: milk-to-feed ratios near 20-year highs, strong cull values that encourage waiting, and contract structures that delay price pain for weeks. The 2015-16 EU crisis offers a hard lesson—farms that survived prioritized margin over volume, kept fixed costs lean, and acted early. Those that waited often lost their operations. This feature delivers a three-step culling framework, worked financial examples, and the critical questions to ask your banker and nutritionist before the exit window closes.

Looking at global dairy markets right now, the most striking thing isn’t just that milk is plentiful—it’s how long production is holding up despite softer prices.

Great Britain’s latest milk forecast tells the story pretty clearly. AHDB’s December update has 2025/26 output reaching a record 13.05 billion litres, up about 4.9% on the previous milk year, with April–November deliveries already running 5.5% ahead of last season. Those are significant numbers for a mature market.

At the same time, AHDB’s November wholesale data paint a sobering picture: UK butter averaging £4,290 per tonne—down nearly £1,870 since June. Bulk cream is now worth almost half what it was in September 2024. And mild Cheddar has broken below £3,000 per tonne for the first time since July 2021.

What farmers are finding—in Britain, across the EU, in the US and down in Oceania—is that this doesn’t feel like a short, sharp price dip that will quietly self-correct. The usual brakes we’re used to seeing (high feed costs, weak cull prices, big government buying programmes) aren’t in the same place they were ten years ago.

Now, weather swings, animal disease, or policy shifts could certainly change the picture faster than any forecast suggests. But the smart bet right now is to plan as if this is a phase, not a quick bounce.

This feature takes a farmer-first look at the data, the history, and the on-farm decisions that matter most over the next 12–18 months.

Global Milk Production: Multiple Exporters Expanding at Once

Here’s what makes this particular cycle different: several major exporters are expanding at once, rather than one region growing while another pulls back.

In Great Britain, AHDB’s December forecast describes the situation as “uncharted levels”—their words, not mine. Strong grass growth and better yields per cow are driving those record volumes. Meanwhile, US data mirrors this saturation: USDA’s July WASDE report raised the 2025 forecast to 228.3 billion pounds and the 2026 forecast to 229.1 billion pounds—that’s 900 million pounds higher than they projected just a month earlier. Modest herd growth and continued gains in milk per cow are doing the work on both sides of the Atlantic.

Record UK and US milk volumes underscore why the ‘wall of milk’ is so slow to crack

Producers across the UK report experiences similar to those of their American counterparts—favorable conditions pushing rolling averages up significantly, with milk flowing whether the market wants it or not.

Across the wider EU, the picture is a bit more nuanced. While overall production for 2025 was initially forecast marginally below 2024 levels according to the USDA’s December 2024 outlook, conditions in the second half of the year have supported stronger-than-expected output in several key exporting regions. AHDB’s October review noted European milk production “roaring back to life in Germany and France,” helped by milder weather and those lower feed costs we’re all noticing.

Down in Oceania, New Zealand’s pasture-based sector has recovered from recent weather challenges. USDA and CLAL data show that from January to June 2025, New Zealand milk yields totaled 8.71 million tonnes—a 1.4% increase compared to 2024 —and June’s figures exceeded previous records thanks to favorable weather and early calving.

And then there’s the demand side—this is where it gets particularly interesting. China, which for years acted as the pressure valve for global skim and whole milk powder, is in a very different phase. Domestic raw milk output has increased while per-capita dairy consumption growth has slowed. Multiple industry analyses indicate that China’s stronger domestic production is constraining import demand for Oceania powders compared with earlier years.

Why does this matter? Because we don’t have the classic offset we’ve seen in other cycles. There isn’t a major drought knocking one exporter back, or a sudden demand boom somewhere else to soak up the surplus. From a farm-gate perspective, that’s worth careful consideration.

Three Reasons the Market Isn’t Self-Correcting

In the old pattern many of us remember—and I’ve watched a few of these cycles now—milk prices slid, feed stayed expensive, margins got squeezed, and the response was fairly quick: more culling, fewer fresh heifers, supply eased, prices stabilised in 9–12 months.

This time, three features are slowing that self-correction.

The Three Reasons at a Glance:

  1. Cheap feed is softening the blow—milk-to-feed ratios near 20-year highs
  2. Strong cull values create a false sense of “I can always sell later.”
  3. Contract structures delay price signals by weeks or months

Cheap feed is softening the blow

First up is feed. In many regions, it’s simply cheaper than milk has been for some time.

AHDB market commentary and UK advisory notes for 2025 show the milk-to-feed price ratio near multi-year highs. As AHDB analyst Susie Stannard noted in a June Dairy Reporter piece, feed costs are reasonable enough that the milk-to-feed ratio is at an almost 20-year high. AHDB’s Q2 review confirmed that although the ratio has declined very slightly, it remains near that 20-year peak.

In the US, the Dairy Margin Coverage programme’s income-over-feed margin has often sat just above the main payout triggers—not because milk prices have been spectacular, but because corn, alfalfa, and soybean meal backed off their 2022 peaks. Wisconsin and California producers report the same thing: feed’s cheap, so the cow still pencils out on paper.

Here’s the thing, though. Extension economists at Wisconsin and other land-grant universities have pointed out something worth considering: this can make individual cows look better on paper than the whole business feels. A fresh cow might more than cover her ration and transition costs, but the farm still has to pay labour, power, interest, and machinery from a tighter cheque.

This is the paradox driving today’s oversupply: ration economics scream “keep milking,” while cull cheques whisper “you could exit anytime.” That’s fine in a short dip; it’s lethal in a long, flat market.

On many spreadsheets, the conclusion becomes, “The cow is paying her way, so we’ll keep her.” The risk? That spreadsheet is looking at feed, not the full cost of keeping that stall filled.

Strong cull prices create a false sense of security

The second feature is cull value—and this one cuts both ways.

UK beef and cull reports for 2025 show deadweight cow prices averaging around 420–450p/kg for much of the year. That’s well above long-term norms. North American reports tell a similar story: tight beef supplies and solid cattle prices have supported cull values through 2024 and into 2025.

Penn State Extension educator Michael Lunak made an interesting observation in a Dairy Herd article last autumn: the more a dairy can shift its culling from involuntary (injury, disease, breakdowns) to voluntary (strategic removal of low producers or problem cows), the more likely it is to be successful. As he put it, “Culling cows from the bottom of the herd makes room for more profitable cows.” He noted that typical overall cull rates around 35–37% aren’t inherently bad if more of those are strategic choices rather than forced exits.

From one angle, this environment makes culling a valuable financial tool. Every “passenger” cow you move today can generate more cash for feed bills, repairs, or debt reduction than she would have three or four years ago.

But there’s another side to consider: strong cull values can quietly encourage a mindset of, “If things really get bad, I can always sell a bunch of cows later.” If many producers end up thinking the same thing and time that “later” together, the exit door can get crowded quickly—and cull values can soften faster than anyone expects.

Contract structures delay price signals

The third factor lives in the milk contract—and this is something that’s evolved significantly over the past decade.

We’ve seen more UK and EU buyers move to deals that blend retail-aligned or cost-of-production-style pricing for a base volume, with A/B or similar structures for extra litres (where A is paid at the headline price and B is tied more closely to commodity returns).

Defra’s fair dealing rules and AHDB explainers go into how these contracts are meant to balance risk between buyer and producer while giving processors tools to manage surplus. In principle, that’s reasonable. In practice, it creates some timing challenges.

When markets are tight, B-litres can be a useful outlet. When butter, cream, and powder are under pressure, they can drop well below the cost of production. Farmers in GB and Ireland have reported that, in late 2025, B-milk, particularly powder, has at times been priced far below their overall costings—even while their A-price looked stable on paper.

The twist is timing. You make feeding, breeding, and fresh cow stocking decisions today; the milk cheque that fully reveals the effect of low-priced B-milk arrives weeks later.

A 2023 study on UK dairy price transmission, published in the journal Commodities, found that shocks at the farm level don’t always pass cleanly downstream, and that movements in one part of the chain often lag those in another. This builds on what researchers have observed for years: dairy supply is genuinely difficult to stabilise because of all these small delays and signals that don’t line up neatly.

Putting this all together, cheap feed, strong culls, and delayed contract signals go a long way toward explaining why barns are still full, even as global price indicators are flashing amber.

Lessons from the 2015–16 Dairy Crisis

To get a better handle on what might come next, it helps to look back at the 2015–16 EU milk crisis, when the end of quotas, steady supply growth, and weaker demand combined into a tough 18-month stretch for European producers.

Several independent studies and farm-business reviews have since examined which operations were more likely to come through that period intact. The patterns are fairly consistent—and they offer some useful guidance for today.

More milk from forage, less from the feed wagon

Research in agricultural economics journals found that European herds that got a larger share of their production from home-grown grass and silage tended to have lower and more resilient production costs.

Those farms could trim concentrate levels or push grazing and forage utilisation harder when prices dropped, without their output collapsing. By contrast, high-yield units where an extra 3,000–4,000 litres per cow were driven primarily by bought-in concentrates were more exposed. When milk prices dipped below the marginal value of that extra feed, the economics quickly stopped working.

Here’s what’s encouraging, though—this is something farmers can actually work on. Teagasc’s National Dairy Conference messaging in December 2025 reinforced that the strongest relationship with profitability in Irish grass-based systems isn’t milk per cow. It’s the grass utilised per hectare. About 40% of the variability in margin is explained by how much grass the farm grows and uses well.

That’s a powerful finding, and it applies beyond Ireland. Whether you’re running a grazing operation in the Southwest of England or managing a TMR system in the Midwest, the principle holds: the more of your milk that comes from home-grown feed, the more flexibility you have when prices tighten.

Lower fixed cash commitments

A second pattern was around capital structure—and this one deserves careful thought.

EU and national analysis showed that many farms which struggled the most had loaded up on new parlours, machinery, and buildings during the good years, and went into the downturn with high monthly finance payments. Those payments didn’t shrink when milk did.

Farms running older but paid-off kit (maybe with more workshop time and fewer shiny tractors) often had greater ability to cut back on non-essential spends without breaching covenants temporarily. Advisors who went through that period still talk about “machinery per litre” and “barn cost per stall” as critical resilience metrics.

I’m not suggesting anyone should avoid investment—modern facilities and equipment matter for efficiency and quality of life. But the timing and financing of those investments make a real difference when cycles turn.

Liquidity, timing, and fresh cow management

The third difference was liquidity and timing. Farms that entered the 2015–16 period with some cash on hand (or at least undrawn credit) and acted early tended to have more options.

Many of them did a “strategic shrink” in the first six months: they culled the bottom 10–15% of the herd while cull prices were still decent, used the cash to shore up their balance sheet, and ran the remaining cows harder and smarter.

Those who tried to “wait it out” with a full herd and no buffer were more likely to be forced to sell cows or land later, often at lower prices.

Producers who came through 2015–16 in good shape often note the same pattern: the cows they kept were the ones that freshened well and bred back. That wasn’t a coincidence—it was a strategy. Strong fresh cow management made every remaining stall more valuable, especially when the decision had been made to run fewer cows.

It’s worth saying: quotas and policy tools are different today, and climate rules add another layer. But the core operational lessons—milk from forage, sensible fixed costs, sound transition management, some liquidity, and willingness to adjust sooner rather than later—still apply.

Supply Chain Dynamics: Where Processors and Retailers Fit In

What farmers also notice, quite understandably, is that pain isn’t always evenly distributed along the chain.

Work on UK milk price transmission found that retail prices can be sticky on the way down. Wholesale and farm-gate prices may react more quickly to global markets than the price of a block of cheese or a pint of milk in the supermarket chiller. Similar studies on EU dairy supply chains have flagged that processor and retailer margins may widen for a time when farm-gate prices fall, until contracts and competition pull them back towards normal levels.

That can feel frustrating—and it’s a fair observation.

From a farm-level planning view, though, the practical takeaway is this: the fastest and most controllable levers are on your own side of the bulk tank.

Processors, retailers, and traders will make their adjustments, and there are legitimate pressures on them too (energy costs, labour, and environmental compliance). But those changes take time to filter back into milk prices. That’s why the rest of this piece focuses on what’s inside your control.

Strategic Herd Reduction: A Three-Step Framework

Farmers who came through previous downturns in reasonably good shape rarely talk about “chasing litres at all costs.” More often, they talk about tightening up the margin per cow and protecting cash.

In practice, that often started with a structured look at which cows were genuinely contributing and which were simply filling stalls.

The Three-Step Framework at a Glance:

  1. Pull the right data: DIM, pregnancy status, SCC trends, component yields, contract structure, feed costs
  2. Flag the passengers: Open/late cows, chronic SCC problems, repeatedly lame or problem animals
  3. Rank by value, not volume: Sort by fat+protein kilos, stress-test bottom 10–15% at B-milk prices

Here’s how to work through each step using your own recording data and a bit of quiet time at the kitchen table.

Step 1: Pull the right herd data

From your herd management software and milk recording, pull days in milk and pregnancy status for each cow, recent somatic cell count trends (at least the last three tests), and milk, fat, and protein kilos per cow over a consistent recent period—say the last 30 or 60 days. Also note your current contract structure, including any A/B litres and how B-milk is priced.

From your costings (AHDB’s Promar Milkminder in GB, Teagasc reports in Ireland, or university benchmarks in North America), have your latest feed cost per cow per day and an up-to-date estimate of the total cost of production.

This sounds basic, but you’d be surprised how many operations don’t have all of this in one place.

Step 2: Flag the obvious “passengers”

Next, make a first pass with clear rules that don’t require a calculator.

Look for cows that are open and late—any cow open beyond an agreed DIM threshold (say, greater than 150–200 days) with no clear breeding plan, particularly if she’s in her third or later lactation. Flag chronic SCC or mastitis cases—cows that have repeatedly tested over your bonus threshold and regularly drag the bulk tank toward penalty territory. Losing a quality bonus can be the difference between black and red ink. And note problem cows: repeatedly lame animals, three-quartered cows, dangerous or extremely slow milkers that add stress to every milking.

This ties back to Lunak’s point from Penn State: the more you can shift culling from involuntary to voluntary—strategic removal of low producers or problem cows—the more likely you are to improve herd profitability over time.

Mark these as “review candidates.” Once you see them all on one page, there are usually more than you expect.

Step 3: Rank by milk value, not just milk volume

This is where the conversation gets interesting. Instead of just looking at litres, shift to milk solids.

Many buyers in Europe, Oceania, and North America increasingly pay on fat and protein, and even where volume is still primary, higher-solids milk often has more value once it’s into cheese, butter, or powder.

Sort the remaining cows by fat plus protein kilos per day, not just litres. Identify the bottom 10–15% on that solids basis. Often, these are cows that look “good” because of fluid yield, but when you factor in components and feed, they’re not pulling their weight.

Now ask a simple “what if?” question for that bottom slice: if this milk were effectively priced at a lower B-price or spot value, would this cow still cover her feed and variable costs?

To stress-test, some advisers suggest modelling those cows at a conservative milk price consistent with recent B-milk or spot values (especially where powder and cream have come under pressure) and subtracting your current feed cost per cow. If the margin is tiny or negative, that animal is essentially being subsidised by her herdmates.

Industry commentary in Dairy Herd Management and Hoard’s has echoed this approach, noting that when herds go through their books honestly, a bottom 10–15% group almost always emerges that can be culled with surprisingly little impact on total milk revenue—and a meaningful impact on cash and labour load.

Worked Example: What a 10% Cull Actually Looks Like

Let’s put some rough numbers around this, because the concept is easier to grasp with specifics.

Take a 200-cow, year-round calving herd in GB or the northern US. Average yield: 32 litres per cow per day, 4.0% fat, 3.3% protein. Latest costings show feed cost at about £4.00 (or roughly $5.00) per cow per day, with total cost of production around 35–36p/litre or $18–19/cwt.

Suppose that, using the framework above, the farm identifies 20 cows that are late-open, chronically high in SCC, and at the bottom of the solids ranking. If those animals average 300 kg deadweight at around 430p/kg (consistent with recent UK cull averages from AHDB cattle data), the cull cheque comes to roughly £26,000 before costs.

Daily feed costs drop by about £80, or around £2,400 per month, plus a bit of saved parlour time, bedding, and transition management overhead.

Milk sold might fall by 500–600 litres per day, but if those were mainly low-solids, higher-risk litres that were pushing the farm into B-milk, the hit to revenue can be smaller than expected. In some A/B setups, that reduction in total volume can actually improve the average milk price by keeping more litres in the better-valued A-band.

Obviously, every farm is different. Some will decide to cull more, some less, and some not at all. The point isn’t the exact number. It’s that a small, strategic shrink can unlock both immediate cash and lower monthly outgoings without undermining the core of the herd.

Conversations with Your Banker and Nutritionist

What farmers are finding is that conversations with lenders, nutritionists, and accountants go better when they’re started early and anchored in numbers rather than gut feel.

A few questions that have come up again and again in advisory meetings this season:

“If milk averaged X pence per litre (or $Y/cwt) for the next 12 months, what would that do to our cash-flow and overdraft?”

“How many months of operating costs do we currently have in working capital or undrawn credit?”

“What happens to our covenants if we reduce cow numbers by 10–15% but improve margin per cow?”

“Are there any high-cost debts we can refinance to ease monthly pressure if prices stay only average through 2026?”

These aren’t comfortable conversations. But they’re far better to have now, when you have options, than later when you don’t.

On the nutrition side, advisers are encouraging herds to look at whether they’re still feeding “for the cheque they had last year” or for the one they have now.

That might mean trimming some additives, shifting emphasis slightly from maximum litres to steadier components, or matching rations more tightly to groups (fresh cows versus late-lactation) to squeeze a bit more efficiency out of each tonne of silage and concentrate.

Strong fresh cow management—keeping transition problems, culls, and early deaths down—also shows up in the research as a major driver of both animal welfare and long-run profitability. Healthy, well-transitioned cows are far more likely to make it into that top tier of solids producers that you really want in the barn.

In Canada, supply management and quota systems buffer much of the day-to-day price volatility, but even there, Dairy Farmers of Canada and Farm Credit Canada have noted that tighter returns and changing product mixes are placing greater emphasis on cost control, milk quality, and component yield per kilogram of quota. The efficiency conversation is happening everywhere, even where prices are more stable.

Risk Management: Insurance, Not Speculation

Risk-management tools—such as fixed-price contracts, futures, and options—often spark mixed reactions. Some producers have used them for years; others have had experiences that make them cautious.

Recent guidance from university and industry economists is fairly consistent: treat these tools as insurance against very bad prices, not a way to outguess the market.

In practice, that might look like locking in or insuring a portion of expected milk at a level that, when combined with your costings, at least covers feed, routine bills, and a realistic debt payment. It means accepting that you won’t hit the exact top—the win is not being forced to sell all your milk at the bottom. And it means matching hedge volumes to your realistic production after any planned culling or stocking changes, so you aren’t over-hedged and tied to volumes you might not ship.

In Europe, some processors now offer fixed-price pools or index-linked contracts that can serve a similar purpose for farmers who are uncomfortable with direct futures trading. In New Zealand, Fonterra and others have rolled out fixed milk price schemes and options that are increasingly used as planning tools rather than speculation.

The common thread is using these tools deliberately, as part of a broader risk plan, not on a hunch.

What’s interesting is that when you talk with operations that have come through choppy periods in decent shape, they rarely say “hedging saved us.” They more often say “hedging helped us sleep at night while we did the real work on costs, cows, and grass.”

Wildcards: Weather, Disease, and Policy

It’s also fair to say that models and forecasts only get us so far. Weather, animal disease, and policy can all quickly tilt the board.

Recent years have reminded us how regional droughts, wet harvests, or mild winters can turn forage plans upside down and push more or less milk into the system than expected. Animal health issues—from mastitis pressure in wet housing to broader concerns like avian influenza affecting dairy operations in some regions—can affect both productivity and trade flows. Policy changes related to climate, trade, or support programmes can also alter incentives. The EU’s ongoing environmental targets are one example; Canadian quota policy and US farm bill debates are another.

All of that is a long way of saying: your plan for 2026 doesn’t need to be set in stone. It does, though, help to have a plan—and to revisit it a couple of times a year as new information comes in.

The Bottom Line

Pulling this together, a few practical lessons seem to be emerging from both the current data and the 2015–16 experience.

We’re probably in a longer phase, not a quick dip. Multiple exporters are growing at once while major buyers like China are more cautious, and outlooks from AHDB, USDA, Teagasc, and others still point to comfortable supplies into 2026. Building plans that assume a full, rapid rebound may be optimistic.

Cheap feed and good cull values are helpful but can mask underlying stress. They make it possible to carry marginal cows longer and delay decisive action—which works out fine if prices turn up quickly, but creates risk if they don’t.

Margin per cow is a better guide than litres per cow. Whether you’re on pasture-based grass systems or TMR in a freestall or dry lot, the herds that consistently earn room to reinvest tend to know their milk-from-forage numbers, watch solids, manage fresh cows carefully, and think in terms of margin rather than volume.

Liquidity and flexibility buy options. Cash in the bank, undrawn credit, and manageable fixed payments give breathing space when prices wobble or fresh cow problems crop up. It’s often the lack of liquidity—not a single bad month—that forces hard decisions.

There’s no single “right” answer. For some, the best move is to tighten the belt, trim the bottom of the herd, and ride this out. For others—especially where succession is unclear, or debt is heavy—an orderly, thought-through exit while cow and land values are still decent might be the wiser route. Either way, it’s better to make that choice on your own terms than have it made for you.

What this oversupply episode is really doing is pushing every dairy business—big or small, housed or grazing-based—to ask a simple but important question:

What do we actually want this farm to look like in five years, and what steps today move us towards that rather than away from it?

There’s no template, and there’s no shame in different answers. The common thread is taking a hard, honest look at numbers, cows, and goals—and then making changes while you still have room to manoeuvre.

KEY TAKEAWAYS 

  • The cheap feed trap is real: Milk-to-feed ratios near 20-year highs make every cow look profitable—masking a global oversupply that won’t self-correct
  • Margin per cow beats litres per cow. Every time. Farms that survived 2015-16 knew this and acted early, before options disappeared
  • Find your passengers: Late-open cows, chronic SCC cases, and low-component producers are quietly being subsidized by your best animals
  • Have the hard conversations now: Model cash flow at lower prices. Stress-test your covenants. Your banker would rather hear your plan than your panic
  • The exit window is open—but not for long: Today’s strong cull prices are an opportunity to act, not a reason to wait. If everyone sells later, that door closes fast

Complete references and supporting documentation are available upon request by contacting the editorial team at editor@thebullvine.com.

Learn More:

  • The True Cost of Raising Heifers: Are You Raising Too Many? – Breaks down the hidden impact of heifer inventory on farm liquidity and demonstrates how reducing heifer numbers can free up working capital without sacrificing future production potential—a key tactic for the “Strategic Shrink.”
  • Beef on Dairy: The Golden Ticket? – Provides a strategic analysis of the beef-on-dairy market, offering producers methods to maximize the value of their lower-ranking animals and leverage the “strong cull values” mentioned in the main article to create a second, reliable revenue stream.
  • Why Genomics is the Best Investment You Can Make – Delivers the technical “how-to” for the article’s Step 3: Rank by Value, showing how to use genomic data to accurately identify the bottom 15% of the herd that drains profit, ensuring you are culling the right cows for the right reasons.

The Sunday Read Dairy Professionals Don’t Skip.

Every week, thousands of producers, breeders, and industry insiders open Bullvine Weekly for genetics insights, market shifts, and profit strategies they won’t find anywhere else. One email. Five minutes. Smarter decisions all week.

NewsSubscribe
First
Last
Consent

$2,000 Cull Cows Are Exposing Dairy’s Biggest Lie: Management Can’t Save You Anymore

Cull cow: $2,000. Daily milk profit: $2. You’re not failing – you’ve been lied to about what survival actually requires.

EXECUTIVE SUMMARY: The management myth just died. USDA’s October 2025 data confirms what the numbers have been screaming: your location now determines your profitability more than your skills ever will. Cull cows are fetching $2,000 as beef while daily milk margins scrape by at $2-3 per cow—and the smart money has noticed. Federal Milk Marketing Order data shows cheese-oriented regions pulling $1.00-1.50/cwt more than powder areas, handing some operations a $50,000+ annual advantage their neighbors can’t touch, no matter how hard they work. The heifer shortage—at 1970s lows—has flipped from crisis to cash flow, with producers breeding surplus heifers now banking $100,000+ annually. Billions in new processor investments are creating what analysts call “permanent regional stratification,” and lenders are already tightening credit windows. Strategic repositioning isn’t a five-year plan anymore—it’s a five-month decision. October’s culling data proves the reshuffling has already begun, and the producers who act now will be the ones still standing when the dust settles.

The USDA’s October 2025 Milk Production report confirms what we’ve all been feeling in our gut: The national herd is shrinking, but you know what? The reasons have fundamentally changed. This isn’t just about milk prices anymore—we’re watching a restructuring that’s making everything we thought we knew about good management seem… well, less relevant than it used to be.

Here’s the math we’re all looking at. October’s Class III milk was hovering in the mid-$16s per hundredweight, according to CME Group’s daily settlement data. Take your typical cow producing around 65 pounds daily—she’s bringing in maybe $11 in gross revenue. Feed costs? Using the USDA Farm Service Agency’s Dairy Margin Coverage calculations from October, we’re looking at roughly $8 to $9 daily per cow. That doesn’t leave much after labor, utilities, and keeping the lights on…

Meanwhile—and here’s what has everyone talking over morning coffee—that same cow is worth close to $2,000 as beef. USDA’s Agricultural Marketing Service weekly reports show cull cows bringing $1.60 to $1.70 per pound in some regions. A decent 1,200-pound cow? Do the math.

As one Extension economist down in Mississippi who tracks livestock markets put it to me, “When you’re looking at these beef prices, producers are asking themselves some pretty rational questions.”

But this goes deeper than just comparing milk checks to beef prices, doesn’t it? What October’s really showing us is the start of something bigger—where geography, genetics, and who you’re shipping to will matter more than ever. Management excellence? I hate to say it, but it’s becoming less relevant in the face of structural disadvantages.

The New Revenue Stream: Breeding for the Market, Not Just the Milking String

Here’s something clever that’s changing the entire breeding game—and I think more of us need to be talking about this. If you breed 20-25% more heifers than you need for replacements and sell the extras at these premium prices… well, as many of us have figured out, a 600-cow herd selling 30 surplus heifers at around $3,500 each? That’s roughly $100,000 in additional annual revenue. We’re talking about turning what most see as a constraint into a profit center.

USDA’s January 2025 Cattle inventory report shows dairy heifer numbers at historically low levels—we haven’t seen this level since the late ’70s. All those years of breeding for beef-on-dairy when milk prices were tough? Well, now we’re seeing the consequences—or maybe the opportunities.

Recent auction reports from key dairy states show good springers regularly trading above $3,000 per head, with top groups occasionally pushing past $4,000 per head. I spoke with an extension specialist at the University of Florida who’s been tracking this closely. “The consistency of these high prices,” he said, “that’s what’s remarkable. We’re not seeing the usual seasonal dips.”

A lending specialist at CoBank pointed out something fascinating—and think about this—the shortage that prevents you from expanding also prevents your competition from growing. Operations that might have expanded to grab market share? They simply can’t get the heifers at prices that make sense. It’s creating this forced discipline in the market that we haven’t seen before.

Smart producers are figuring out different ways to optimize. Can’t solve problems through expansion anymore—that playbook’s out the window. Instead, you’ve got to improve within your existing footprint. Genetic selection becomes crucial when you can’t add cows. I’m seeing more genomic testing than ever before.

I recently heard from a 480-cow operation in central Wisconsin that made the switch to component-based optimization last spring. They’re seeing an extra $3,800 monthly just from butterfat premiums alone, even with slightly lower volume. “We’re producing less milk but making more money,” the owner told me. “That’s not something I thought I’d ever say.”

How Geography Trumps Management

You know, the old wisdom was that efficient operations outlast downturns. We’ve all believed that, right? But what I’m seeing now challenges that thinking in ways most of us haven’t fully grasped yet.

Federal Milk Marketing Order data from October 2025 shows some cheese-oriented regions getting roughly $1.00 to $1.50 more per hundredweight than powder-oriented areas. Think about that for a minute—if you’re running a thousand cows, that gap could mean $50,000 or more annually. That’s not something you can just manage your way around, no matter how good you are at what you do.

And the driver behind these gaps? It’s these massive processor investments we’re seeing. The International Dairy Foods Association’s October 2025 capital investment tracking report shows billions in new and expanded dairy processing projects—dozens of facilities either under construction or recently announced across multiple states through the rest of this decade.

The concentration is what gets me. Texas is seeing major cheese facilities go in, including that big Leprino project near Lubbock everyone’s talking about. New York’s seeing major expansions in yogurt and premium milk. Idaho’s getting more cheese capacity around Twin Falls with Glanbia’s expansion. Wisconsin continues to add to its cheese infrastructure, with multiple expansion projects underway. Even the California Central Valley, despite its challenges, is seeing selective investment in specialized products.

What dairy economists at universities like Cornell and Wisconsin are telling me is this creates something like “permanent regional advantage.” Makes sense when you think about it. If you’re near these new cheese plants, you’re capturing premiums. If you’re shipping to butter and powder? Those challenges compound every month.

The producers in growth states—places like Idaho and Texas, where this new capacity promises good premiums—they culled selectively in October to upgrade genetics. Smart move.

But in other regions? Southwest dairy operations dealing with water restrictions, or Southeast producers managing not just heat stress but increasingly volatile feed costs and limited local grain production—that culling represented something different. Those folks are reducing exposure to what’s becoming a tougher competitive environment.

Building Your Bridge Through What’s Coming

For operations trying to navigate current challenges while positioning for better times, I’ve been collecting strategies from extension folks and producers who are making it work. From Southeast dairy operations dealing with heat stress and feed availability challenges to Upper Midwest producers managing seasonal variations, to California Central Valley farms wrestling with water costs.

First thing—and this is crucial—you need to understand your true economics beyond just that all-milk price everyone talks about. Several dairy economists at land-grant universities keep emphasizing this, and they’re right. With current component premiums, if you’re optimizing for volume rather than components, you could be leaving tens of thousands annually on the table, even for a modest-sized herd.

Component optimization matters more than ever. With butterfat premiums running anywhere from 50 cents to over a dollar per hundredweight above base in some areas—especially Upper Midwest operations shipping to cheese plants—if you’re still focusing on volume over components, you’re leaving serious money on the table.

Here’s what’s gaining traction based on my conversations:

You need to secure working capital lines now, while your operation still looks stable to lenders. Several ag lenders, including Farm Credit Services and regional banks, are telling me they expect to become more cautious about new working capital over the next year or so. Some are even talking about focusing more on financing acquisitions and restructurings if margins stay tight. That window? It’s narrowing faster than most folks realize.

The Dairy Margin Coverage program makes sense, too. According to the USDA’s Risk Management Agency, October 2025 updates, depending on your coverage level and production history, premiums often run from a few dimes to maybe 70 cents per hundredweight. But that cash flow protection when margins get really tight? Could make all the difference between weathering the storm and… well, not.

And here’s something livestock economists at universities like Kentucky and Kansas State are watching—CME feeder cattle futures have pulled back sharply since mid-October. Producers who locked in their beef-on-dairy calf values earlier are feeling pretty good right now. Consider hedging at least half your production to protect what’s become crucial revenue.

What’s interesting is that the operations doing these things aren’t expecting prosperity if milk prices drop to the $14-16 range that the USDA’s World Agricultural Supply and Demand Estimates suggest for next year. They’re building resilience to stay independent through what could be a tough stretch before things improve.

The Technology Factor and Labor Reality

The technology piece matters here too—and it’s changing the labor equation dramatically. Robotic milking systems, which can cost $150,000-250,000 per stall, are becoming more feasible for larger operations that can spread those fixed costs.

But here’s what’s interesting: these systems aren’t just about milking efficiency. They’re addressing the chronic labor shortage that’s hitting dairy farms nationwide.

One Pennsylvania producer running four robots told me, “We went from needing six milkers to basically one herd manager. In a market where finding reliable labor costs $18-22 per hour plus benefits, that math changes everything.”

For mid-sized farms, though, the capital requirements are creating another pressure point that’s accelerating consolidation decisions. And for those sub-300 cow operations? The technology investment rarely pencils out unless you’re adding significant value through on-farm processing or direct marketing.

Why Processors Keep Building While We’re Struggling

This apparent contradiction—processors pouring billions into new capacity while we’re dealing with tight margins—it makes more sense when you look at the longer game they’re playing.

Several outlooks from groups like Rabobank’s Q3 2025 Global Dairy Quarterly point to some interesting dynamics. The International Dairy Federation’s World Dairy Situation report is talking about potential gaps between global supply and demand later in the decade if trends continue.

Recent trade data from USDA’s Foreign Agricultural Service shows Chinese imports of cheese and whole milk powder running well ahead of year-ago levels. Countries like Indonesia are expanding school milk programs that could add meaningful demand over the coming years. And with EU production constrained by environmental regulations, the U.S. is positioned well as a growth supplier.

Gregg Doud, who served as U.S. chief agricultural trade negotiator and now works with Aimpoint Research, explained it well at the recent World Dairy Expo: “Processors aren’t building for today’s prices. They’re looking at where they think we’ll be in 2028, 2030. The current downturn? It actually helps their positioning by limiting competitive expansion.”

What’s less visible—and this is based on industry analysis from groups like CoBank and what I’m hearing through the grapevine—is that a large share of new processing capacity appears to be already tied up in multi-year arrangements with larger farms. Contracts negotiated when prices were recovering in ’23 and ’24, locking in supply regardless of current spot conditions. It’s creating this two-tier market that not everyone fully grasps yet.

The Information Gap That’s Hurting Smaller Operations

One challenge I keep hearing about from mid-sized operations is what university economists call “information asymmetry.” Basically, larger farms dealing directly with processors often see market shifts months before that information reaches smaller producers through traditional channels.

This gap shows up in several ways. Larger operations often have earlier visibility into processor needs and plans. They might subscribe to proprietary research from firms like Terrain or StoneX, which costs tens of thousands of dollars annually. Meanwhile, smaller operations rely on cooperative communications that, honestly, can lag market realities by quite a bit.

A Pennsylvania producer managing 600 cows—a fifth-generation dairy farmer—put it to me straight: “We thought October’s price drop was temporary. We didn’t realize how much had already been decided about where the industry’s headed. By the time we understood, our lender was already getting cautious about new credit.”

The practical impact? By the time many producers recognize these fundamental shifts, the window for smart positioning has already narrowed considerably.

Regional Winners and What’s Creating Lasting Advantages

The geographic distribution of new processing investment is creating what analysts at CoBank call “permanent regional stratification.” Strong words, but they’re not wrong.

Looking at Federal Milk Marketing Order data from October 2025 and processor announcements, here’s who’s seeing sustained advantages:

Idaho’s Magic Valley continues to benefit from expansions in cheese infrastructure. USDA National Agricultural Statistics Service data shows Idaho among the fastest-growing milk states, with many operations reporting solid annual gains. The Texas Panhandle’s seeing competitive pricing from multiple cheese plants.

Kansas—and this surprised me—has emerged as a real growth story, with some of the strongest percentage gains in the country according to USDA data. Central New York’s premium milk and yogurt facilities are creating genuine competition for local supplies.

But then you’ve got regions facing structural challenges. The Pacific Northwest remains primarily powder-oriented with limited cheese processing. California’s Central Valley operations are dealing with both water costs and a commodity-focused product mix that limit pricing upside.

Southwest dairy producers face increasing water restrictions and rising costs for heat-stress management. Southeast operations are wrestling with not just heat stress but also limited local feed production and basis challenges that add $30-40 per ton to feed costs. The Upper Northeast faces geographic isolation that creates significant transportation penalties that can substantially erode margins.

The hard truth? And this is tough for many of us to accept—operational excellence can’t overcome a structural pricing gap of $1 or more per hundredweight by geography. That recognition is driving some of October’s herd adjustments.

Practical Steps Depending on Your Situation

Based on what’s emerging from October’s data and conversations with folks making it work, here’s what I’m seeing:

If You’re in a Growth Region:

Focus on genetic improvement within your existing herd rather than expansion. A Texas producer near one of the new cheese plants told me, “We’re genomic testing everything and being selective like never before.”

Work on developing direct processor relationships where possible. Several Idaho producers tell me they’re having success negotiating directly rather than relying only on their co-op. And consider partnerships with neighboring operations—achieve some scale advantages without individual expansion.

If You’re in a Challenged Region:

You need an honest evaluation of your long-term position given structural disadvantages. Run scenarios at different milk prices—$14, $16, $18—to really understand your breakevens. It’s sobering but necessary.

Look at diversification that reduces dependence on commodity pricing. I know Northeast producers are finding success with on-farm processing, agritourism—not for everyone, but worth considering. California Central Valley operations are exploring specialty milk products that command premiums despite the region’s challenges.

For those sub-300 cow operations, the math gets even tougher. But I’m seeing some find success through direct marketing, value-added products, or transitioning to organic, where premiums can offset scale disadvantages. Others are forming producer groups to share resources and negotiate collectively.

And assess whether relocating might work, though as one Wisconsin friend said, “The math on moving with current land and heifer prices? Brutal.”

Universal Strategies That Work:

Secure financial flexibility now while credit’s available. Every lender I’ve talked to expects standards to tighten over the next year.

Implement component-focused production aligned with how your processor actually pays. This means regular ration work, good DHI records.

And develop non-milk revenue streams. Despite some recent softening, beef-on-dairy remains profitable according to cattle market folks at the Chicago Mercantile Exchange. Every bit helps.

The Consolidation Already Underway

Let’s be honest about what’s happening here. Consolidation isn’t some future possibility—it’s here, right now. USDA’s 2022 Census of Agriculture shows dairy farm numbers in the mid-30,000s, and USDA Economic Research Service economists expect that to continue declining as the industry consolidates.

What’s driving this? ERS research consistently shows larger herds tend to have lower costs per hundredweight than smaller ones—often by several percentage points. Processors prefer fewer, larger suppliers to reduce complexity.

Technology adoption, especially robotic milking systems that can run $150,000-250,000 per stall, requires capital that favors bigger operations. The labor savings alone—reducing milking staff by 60-80% while addressing the chronic shortage of qualified dairy workers—makes automation almost mandatory for operations planning to survive long-term.

And the heifer shortage prevents smaller operations from achieving competitive scale, even if they wanted to.

Rather than viewing consolidation as failure—and this is important—many are recognizing it as evolution. As one university dairy economist at Wisconsin explained, “Operations that position strategically, whether through improvements, repositioning, or thoughtful exit timing, preserve more value than those forced into decisions.”

The Bottom Line

Several outlooks, including the Food and Agricultural Policy Research Institute’s baseline projections, suggest better price prospects later in the decade if global demand continues growing and herd size stays in check—though these are projections, not guarantees, as we all know.

Factors that could support recovery: The heifer shortage physically constrains expansion for a while. Global demand appears to be growing faster than supply, according to FAO data. Environmental regulations limit expansion in some major producing regions. And all this new processing capacity will need higher milk prices to generate returns.

But—and this matters—recovery probably won’t benefit everyone equally. Operations with secured processor relationships, geographic advantages, and superior genetics will likely capture premiums. Others might find that even recovered prices don’t fully offset their structural disadvantages.

What October’s Really Telling Us

After looking at the data and talking with folks across the industry, several lessons emerge pretty clearly.

Geography increasingly determines destiny. Those regional pricing gaps reflect structural realities that great management can’t overcome. If you’re in a disadvantaged region, that needs to factor into your planning—like it or not.

The heifer shortage creates both constraint and opportunity. Operations that optimize within their existing footprint while potentially monetizing excess production can turn the shortage to their advantage. Creative producers are making this work.

Information and relationships matter more than ever. Direct processor relationships and access to good market intelligence increasingly separate operations that thrive from those that struggle. Better information pays—literally.

Financial positioning can’t wait. Every lender emphasizes this—the window for securing working capital and risk management tools is months, not years. Wait until you need flexibility, and it might not be there.

Strategic positioning beats stubborn persistence. Whether improving for independence, positioning for acquisition on good terms, or planning an orderly exit, proactive decisions preserve more value than reactive ones. There’s no shame in strategic repositioning—it’s smart business.

We’ve weathered dramatic transitions before—from diversified farms to specialized operations, through technological changes and trade upheavals. This is another transition. What’s different is both the speed and the degree to which these advantages are becoming structural. Operations that recognize and adapt, rather than hope for a return to old patterns, are best positioned.

October’s strategic culling by forward-thinking producers shows something important: successful operations aren’t waiting for change to happen to them. They’re actively positioning for whatever comes next.

For those still evaluating, October’s message seems clear—the time for strategic decisions is now, while you’ve got options and can preserve value through thoughtful positioning.

The path forward won’t be identical for everyone—and that’s fine. But understanding the forces reshaping our industry helps inform decisions. In a world where change keeps accelerating, maybe the biggest risk is standing still.

For more specific information on programs mentioned, producers can check with their local USDA Service Center, university extension offices, or agricultural lenders.

KEY TAKEAWAYS 

  • Your zip code now outweighs your work ethic: Cheese regions earn $1.00-1.50/cwt more than powder areas—that’s $50,000+ annually, no amount of great management will ever close
  • The heifer shortage is now your profit center: Breeding 20-25% surplus heifers generates $100,000+ annually while locking competitors out of expansion at today’s prices
  • Your lender’s flexibility has an expiration date: Working capital windows slam shut by mid-2026—secure financing now, not when you desperately need it
  • This is a five-month decision, not a five-year plan: October’s culling data proves the reshuffling has begun—producers positioning now will be the ones still milking in 2027

Complete references and supporting documentation are available upon request by contacting the editorial team at editor@thebullvine.com.

Learn More:

The Sunday Read Dairy Professionals Don’t Skip.

Every week, thousands of producers, breeders, and industry insiders open Bullvine Weekly for genetics insights, market shifts, and profit strategies they won’t find anywhere else. One email. Five minutes. Smarter decisions all week.

NewsSubscribe
First
Last
Consent

The $500 Transition Gap: Why Your Neighbor’s Fresh Cows May Outperform Yours by Next Winter

Next winter, one dairy will have fewer sick fresh cows and better margins. Yours or your neighbor’s? The gap starts now.

You know that feeling when you’re doing morning checks and spot a cow that’s just… off? Maybe she’s standing away from the bunk, head low, looking like she’d rather be anywhere else.

We’ve all been there. And we all know what comes next—that cow’s probably about to cost you anywhere from three hundred to a thousand dollars, depending on whether she develops ketosis, metritis, or decides to really complicate your week with multiple problems.

So here’s what’s interesting about the research coming out of Penn State lately. Adrian Barragan and his team over in their veterinary school think they’ve found a better way to prevent these crashes before they happen—and the thing is, they’re not asking you to buy fancy new equipment or send blood samples to a lab every week.

They’re using information most of us already collect.

THE ECONOMICS: Clinical ketosis costs $300-$350 per case in treatment plus 600-800 pounds of lost milk, while metritis runs $300-$500 per case—based on foundational research adjusted for current costs

You probably know the basic economics already, but it’s worth laying out just how expensive transition problems really are. Foundational research by McArt and colleagues, adjusted for current feed and treatment costs, estimates clinical ketosis at $300-$350 per case. And that’s before you count the 600 to 800 pounds of milk you’re typically losing over that lactation.

Metritis? Cornell and other research groups have been tracking this for years. More recent estimates put the true cost at $300 to $500 per case when you factor in treatment, lost production, and downstream fertility impacts.

And here’s the kicker—when a cow gets multiple diseases (and research shows that happens about 35% of the time in that first month), you’re looking at losses that easily top a thousand dollars per cow. Makes you think, doesn’t it?

But—and this is where it gets complicated—the farms that could benefit most from this approach are often the ones that can’t actually implement it. Let me explain what I mean.

Understanding Which Cows Need Help (And When)

What farmers are finding with targeted cow management is that it’s surprisingly straightforward, at least in theory. Barragan’s framework focuses on three windows we’re all managing anyway: dry-off (about 60 days before calving), close-up (those critical two to three weeks before), and calving itself.

At each of these points, there are specific red flags that predict trouble ahead.

Take dry-off, for instance. We all know overconditioned cows are trouble—anyone with a body condition score of 3.75 or higher is asking for metabolic problems. Penn State tracked thousands of cow lactations over several years, and these cows produced about 560 pounds less milk during the first 16 weeks of their next lactation. Plus, they have 10% more health events.

That’s not exactly news to most of us. But having the hard numbers helps justify why we need to manage the condition more carefully.

Here’s another risk factor worth watching: high producers at dry-off. Cows still making 45 pounds or more when you’re trying to dry them off face increased risk of milk leakage and intramammary infections. The combination of high production and high body condition at dry-off? That’s your highest-risk group right there.

And then there’s the somatic cell piece. Pam Ruegg at Michigan State and Noelia Silva del Rio out at UC Davis have both shown that cows over 200,000 cells at dry-off have compromised colostrum quality. Their calves end up with lower antibody levels. These cows will produce about 1,000 fewer pounds of milk over the first 16 weeks, too.

Quick Reference: Targeted Cow Risk Windows

  • Dry-off (60 days before calving): Flag cows with BCS ≥3.75, high production (>45 lbs/day), or SCC >200,000
  • Close-up (21-14 days before): Watch for feed intake drops >30%, pen moves, DCAD balance issues
  • Calving: First-calf heifers, twins, and dystocia cases need immediate targeted protocols

Why Timing Changes Everything in Transition Management

Looking at this from a different angle, we’ve always known intuitively that some cows need more attention than others. Good managers—you know the type—they have that sixth sense about which cows are going to crash.

What’s fascinating here is how precision transition research actually quantifies what we’ve suspected all along. The same cow might need completely different interventions depending on when you catch her.

The anti-inflammatory work is particularly revealing. In peer-reviewed trials, Barragan’s team tested meloxicam at multiple time points. First-calf heifers treated a day or two before expected calving showed remarkable responses—up to 10 to 11 pounds more milk per day over the early lactation period in some trials, though results do vary by herd and individual cow.

A quick regulatory note here: meloxicam use in dairy cattle is considered extra-label in the United States, meaning it requires a valid veterinarian-client-patient relationship and prescription. This isn’t something you can pick up at the farm store—work with your vet if you’re considering this protocol.

Even at the conservative end, we’re talking 450 to over 1,500 pounds of extra milk over 150 days. At current market values averaging around $20 per hundredweight, that’s real money. And what really got my attention—stillbirth rates in these treated heifers dropped by about 20 percentage points in Penn State’s research.

But here’s where it gets interesting. Older cows? They showed a different pattern. They didn’t show the same positive response to prepartum treatment and, in some trials, showed no economic benefit from blanket prepartum protocols. Mike Overton from Elanco has been tracking these protocols on commercial dairies, and he’s finding that the timing question really matters by parity.

So that one-size-fits-all protocol we’ve been using for years? Turns out we need to be smarter about it.

The Reality Check: Making This Work on Real Farms

Let’s have an honest conversation about implementation. Knowing what to do and actually getting it done consistently are two completely different animals, right?

I’ve been tracking operations from Vermont to New Mexico, trying to implement these precision protocols, and here’s where things typically fall apart. First, somebody has to reliably score body condition—every cow, every time. Research from Wisconsin and other land-grant schools shows that when two people score the same cow, they disagree by half a point or more, roughly a third of the time. That’s enough to misclassify a cow completely.

Then you need to track which cows got flagged. Your feed crew needs different TMR specs for different risk groups. The fresh cow team needs to know which protocol applies to whom.

And here’s what nobody talks about at conferences—when José takes a few days off, and Miguel covers his shift, does Miguel know that cow 1847 is on the high-risk protocol? In many cases, probably not.

Marcia Endres at the University of Minnesota has been a leader in precision dairy research for years. What her work consistently shows is that farms with integrated herd management software—where BCS scores, milk weights, and health events flow into a single system—have significantly higher adoption rates for precision protocols than farms that try to manage everything in spreadsheets.

The gap is substantial. That tells you something right there.

The Economics: Traditional vs. Targeted Approaches

KEY FINDING: Field trials show farms implementing targeted transition protocols can achieve $200-$500 net benefit per cow per lactation through reduced disease and improved milk production

Looking at actual implementation data from extension-supported trials, the numbers tell a compelling story.

With traditional blanket treatment, you’re treating every cow the same at dry-off. Costs you about $45 to $60 per cow across your whole herd. Fresh cow disease rates typically run 27 to 35% in the first 60 days (that’s from NAHMS data), and you’re losing 600 to over 1,500 pounds of milk per affected cow.

Now with the targeted approach, you’re identifying high-risk cows at each transition point and customizing what they get. Low-risk cows might only need $15 to $25 worth of attention. High-risk animals receive $65 to $95 in targeted support.

What happens? Disease rates can drop to 18-24% in the critical first 60 days—we’re talking a 25-30% reduction, based on what extension programs are seeing in the field. And you’re recovering 500 to 1,000 pounds of milk per prevented case.

When it all shakes out, farms are seeing net benefits of about $200 to $500 per cow per lactation. But—and Chuck Guard from Cornell’s ambulatory clinic emphasizes this—that’s only if you can execute consistently. Big “if” there.

Why 80% of Farms Can’t Jump on This Yet

Here’s something we need to address head-on. Most of us are running on razor-thin margins right now. USDA’s latest economic outlook shows roughly half of dairy farms are projected to be profitable this year.

The all-milk price averaging around $20 per hundredweight sounds okay until you factor in elevated feed costs and labor shortages, pushing wages up into the double digits from recent years. Suddenly, that margin disappears real quick.

When you’re worried about making December’s feed payment, investing in new management protocols—even ones that pencil out great on paper—feels like a luxury you can’t afford.

There’s also the behavioral economists’ “prevention paradox.” Jennifer Van Os over at Wisconsin has been studying how farmers make decisions, and it’s fascinating. When you prevent ketosis, nothing visible happens. The cow doesn’t get sick. There’s no vet bill. No treatment record. It’s… psychologically unsatisfying, if that makes sense.

But when you miss one, and she crashes? That’s immediate, visible, and it sticks with you.

I heard an illustrative story at a recent producer meeting that captures this perfectly. A Wisconsin dairyman shared anonymously: “We tried targeted dry-off protocols for six months. Caught most of the high-risk cows. But we lost one valuable genomic heifer that we misclassified. That $3,000 loss is what I remember—not the dozen we saved.” Whether that’s one producer’s experience or a composite of many I’ve heard, it reflects a genuine psychological barrier that the research confirms is widespread.

Lessons from Europe’s Regulatory Push

You want to know what actually drives industry-wide change? Europe’s experience with selective dry cow therapy offers a masterclass.

The EU implemented Regulation 2019/6, which banned prophylactic antibiotic use—including blanket dry cow therapy—effective January 28, 2022. That date matters because it forced a complete industry shift.

According to European research, about two-thirds of Italian dairy farms had transitioned to selective protocols by the end of 2022. The Netherlands has become the gold standard, going from relatively low adoption to over 80% in just a few years.

The difference? Farmers changed because they had to.

But here’s what’s encouraging—Volker Krömker from Copenhagen University has been tracking outcomes, and after some initial resistance, Dutch farmers using selective protocols actually saw mastitis rates drop below what they had with blanket treatment. The whole infrastructure adapted: vet schools started requiring SDCT training, milk buyers provided protocol support, and software companies built decision trees right into their platforms.

Meanwhile, U.S. voluntary adoption is sitting at roughly one in four farms. The contrast is pretty striking.

Where Targeted Management Actually Works Today

Despite all the challenges, certain operations are making these protocols work brilliantly. What separates them?

Looking at successful implementations from Maine to California, you see patterns. Scale helps, but it’s not everything. Sure, a 3,000-cow operation in Idaho finds it easier to justify the cost of dedicated transition management software. But I’m also seeing 300-400 cow herds in places like Wayne County, Ohio, succeeding because their co-op provides shared advisory support.

Regional variations matter too. Down in New Mexico and Arizona, where heat stress just compounds everything, producers like Tom Barcellos out in Tulare County tell me precision management becomes even more critical. As he puts it, “When it’s 110°F in July, you can’t afford to guess which cows need extra support.”

In Florida, where the humidity is brutal, a group near Okeechobee adapted the protocols to conduct twice-daily body condition scoring during summer. Over in Texas, some of the larger operations near Stephenville are finding that targeted protocols help offset the stress of their long summers. Up in Vermont, where winter housing gets tight, farms are focusing more on the close-up pen management side of things.

And out in the Pacific Northwest—you know how wet it gets there—the larger dairies near Yakima Valley are finding targeted protocols help manage the stress that mud and moisture put on transition cows. One producer in Sunnyside told me they flag any cow that spent more than 2 weeks in the hospital pen during the last lactation. Those girls automatically get extra attention at dry-off, regardless of other metrics.

What do successful operations have in common? Three things keep coming up: integrated data systems (increasingly using cameras for BCS scoring), strong veterinary partnerships for ongoing tweaks, and what Nigel Cook from Wisconsin calls “implementation discipline”—basically, someone owns the process and reviews outcomes every month without fail.

Implementation Timeline: What to Really Expect

  • Weeks 1-4: Set up protocols, train your team, get baseline numbers
  • Weeks 5-12: Work out the bugs, build staff confidence
  • Months 3-4: Don’t panic—temporary plateau is normal
  • Months 5-6: Positive trends start showing up, fine-tune protocols
  • Month 7+: Full ROI kicks in, system runs itself

Making Targeted Protocols Work on Your Farm

After watching dozens of operations try this, here’s my practical advice if you’re thinking about it.

Start ridiculously simple. Pick ONE intervention for 90 days. I’d suggest dry-off BCS flagging. Now, this next part is my own practical recommendation, not part of any formal research protocol: get yourself an orange livestock marker. Every cow over 3.75 gets an orange stripe on her tailhead. That’s it. Everyone knows orange means “controlled energy dry cow ration.” Simple, cheap, and visible to every person who walks through that pen.

Set realistic expectations. Research on implementation curves suggests the average time to positive ROI is around five to six months. Some farms see a temporary production dip in month two as systems adjust. You need to budget for that.

And here’s crucial—involve your entire team from day one. Not a memo. Not a meeting where half the guys are checking their phones. A hands-on session where your feeders, fresh cow crew, and whoever does dry-off physically walk through the process together. Gustavo Schuenemann from Ohio State found that farms with hands-on training show significantly better compliance with protocols than those using written SOPs alone.

Track only what matters. Pick three things: fresh disease rate (shoot for under 20%), 60-day milk average (watch the trend, not the absolute number), and days to first service (target under 70). Review them monthly. Ignore everything else at first—you’ll drive yourself crazy otherwise.

The Hard Truth About Implementation Readiness

I need to be direct here. If you’re struggling to cover operating expenses, targeted transition management shouldn’t be your priority right now. This approach works best for farms with positive cash flow and at least six months of operating capital in reserve.

It’s one of those cruel ironies—the farms that most need efficiency gains are often least equipped to implement them. Chris Wolf, the ag economist at Cornell, calls this the “productivity trap.” The bottom 40% of farms by profitability are producing at significantly higher cost than the top 40%, but they lack the capital to make improvements that would close that gap.

Critical Limitations to Consider

Let’s be clear—targeted transition management isn’t universally applicable. Genetic differences matter. Jersey herds show different risk thresholds than Holsteins. Kent Weigel’s genomic research at Wisconsin shows cows with high genetic merit for health traits may show less dramatic response to targeted interventions—they’re already more resilient.

Facility design impacts success, too. Farms with two-row freestalls and adequate bunk space see better results than overcrowded three-rows. Peter Krawczel from Tennessee documented that overcrowded facilities—stocking densities in the 110-120% range and above—negate a significant portion of targeted protocol benefits as the stress from overcrowding overwhelms the precision interventions.

And geographic factors can’t be ignored. What works in Wisconsin’s climate needs adjustment for Louisiana’s humidity or Colorado’s altitude. You’ve got to calibrate locally.

What Would Accelerate Industry Adoption

Three things could shift targeted management from “interesting option” to “this is how we do things now.”

First, processor requirements. If the big co-ops like DFA or Land O’Lakes started requiring transition management documentation for quality premiums, adoption would happen overnight. Tillamook’s already doing this with SCC-based dry-off protocols for their suppliers.

Second, cooperative infrastructure. When your co-op provides training, software access, and shared advisory as part of membership, smaller farms can suddenly access the same tools as the big guys. Organic Valley’s vet support program is a good model for this.

Third, federal support. USDA’s got significant funds allocated for precision agriculture through 2027. If they added transition management to their cost-share eligibility, it would substantially lower barriers.

The Bottom Line for Your Dairy

The transition period drives the majority of our health problems. We’ve known this for decades. What targeted cow management offers is a systematic way to identify and prevent these problems before they turn into expensive disasters.

But as we’ve talked about, knowing what to do and being able to do it are vastly different challenges. The science is solid. The economics work. Whether this becomes standard practice really depends on how the industry chooses to support implementation.

My advice? If you’re interested, start small. One protocol. One risk factor. Track your results religiously. And definitely get your vet and nutritionist involved from day one—this isn’t something you figure out alone.

The cows that need help are already in your barn. You walk past them every day. The question is whether you can build a system to identify and support them before each one costs you $500 to $1,000.

Some operations can absolutely do this today. Others need infrastructure development first. Understanding which category you’re in—honestly, without wishful thinking—that might be the most valuable assessment you make this year.

And here’s the thing that keeps me up at night: if you won’t pick one simple flag and execute it for 90 days, your neighbor probably will. In a year from now, one of you will have lower fresh-cow disease, better butterfat levels, and a stronger balance sheet.

Which one do you want to be? 

Key Takeaways:

  • The savings are proven: Farms executing targeted transition protocols cut fresh cow disease rates by 25-30%, saving $200-$500 per cow per lactation—and the gap between early adopters and everyone else is widening
  • Inaction costs more than you think: Ketosis runs $300-$350 per case, metritis $300-$500, and over a third of fresh cows develop multiple problems in their first month
  • Most dairies aren’t ready yet: Roughly 80% of U.S. operations lack integrated herd software or the cash reserves to implement precision protocols consistently—but that’s changing
  • The science scales: European farms mandated to adopt selective dry cow therapy in 2022 now report lower mastitis rates than they had with blanket treatment
  • Start with one thing: Flag cows with BCS ≥3.75 at dry-off, track outcomes for 90 days, and involve your vet—simple execution beats sophisticated plans that never happen

Executive Summary: 

Transition cow crashes are quietly draining dairy profits—ketosis and metritis each cost $300-$500 per case, and over a third of fresh cows develop multiple problems in their first month. Research from Penn State, Cornell, and Wisconsin shows that targeted protocols identifying high-risk cows at dry-off can cut disease rates by 25-30%, saving $200-$500 per cow per lactation. The challenge? Roughly 80% of U.S. dairies lack the integrated data systems or financial reserves to execute these approaches consistently. European farms mandated to adopt selective protocols in 2022 now report lower mastitis rates than they had with blanket treatment—proof that the science works at scale. Successful U.S. operations share three factors: integrated herd software, strong veterinary partnerships, and someone who owns protocol review every month. The realistic starting point is straightforward: flag body condition scores at dry-off and track outcomes for 90 days. By next winter, the gap between farms preventing fresh cow crashes and those still reacting to them will show up clearly on the balance sheet.

Complete references and supporting documentation are available upon request by contacting the editorial team at editor@thebullvine.com.

Learn More:

The Sunday Read Dairy Professionals Don’t Skip.

Every week, thousands of producers, breeders, and industry insiders open Bullvine Weekly for genetics insights, market shifts, and profit strategies they won’t find anywhere else. One email. Five minutes. Smarter decisions all week.

NewsSubscribe
First
Last
Consent

The Wall of Milk: Making Sense of 2025’s Global Dairy Crunch

This downturn feels different because it is. Four major exporters expanded at once, and $15 milk is testing every assumption. Here’s what the resilient dairies know.

EXECUTIVE SUMMARY: When producers say this downturn feels different, they’re right. For the first time, the U.S., EU, New Zealand, and Argentina all expanded production within the same window—creating a “wall of milk” that pushed July 2025 output to 19.0 billion pounds while Class III dropped from the $20s to around $15. Here’s what makes it unusual: exports are at record levels, confirming this is a supply squeeze, not a demand collapse. Dairy’s 24-month biological timeline means decisions that made complete sense at $22 milk are now delivering into a $15 market, with no quick reversal possible. Beef-on-dairy has added real value but also reduced the number of replacement heifers to 3.9 million head—the lowest since 1978—limiting culling flexibility when some operations need it most. The dairies navigating this effectively share common strategies: precision culling using income-over-feed-cost data, margin protection through DMC and Dairy Revenue Protection, and breeding for feed efficiency using traits like Feed Saved. This cycle will accelerate consolidation, but producers who know their numbers and deploy available tools will emerge stronger when markets rebalance.

As milk checks tightened through 2025, I kept hearing the same thing from producers across the country: “We’ve seen low prices before, but this one feels different.” And as many of you have probably sensed on your own operations, they’re right. This isn’t just one region working through a rough patch. The U.S., the European Union, New Zealand, and key South American exporters all pushed production higher within a fairly tight window. A lot of that milk is now competing for the same buyers at the same time.

The 24‑month lag exposed: production peaks just as prices crash, proving this downturn is about too much milk, not weak demand

What makes this cycle particularly challenging is that feed, labor, interest, and environmental compliance costs haven’t returned to the levels we saw a decade ago. That’s especially true in higher-cost regions like California and parts of Western Europe. So you’ve got more milk hitting the market, softer world prices, and cost structures that remain stubbornly elevated. That combination is creating what many are calling the “wall of milk.”

In this piece, we’ll walk through what farmers and analysts are learning about this cycle: how the 24-month expansion lag plays out in practice, how beef-on-dairy has delivered real benefits while also creating some unexpected ripple effects, why lenders and processors kept supporting growth even as signals shifted, how different regions are experiencing this downturn in very different ways, and what the operations navigating this well seem to have in common. The goal is to offer a clearer view of the bigger picture so the decisions you’re making—about cows, facilities, or risk management—are grounded in how this system actually works.

Why This Cycle Really Does Feel Different

Let’s start with the production numbers and work back toward the parlor.

USDA’s Milk Production reports paint a stark picture:

  • July 2025 Output (24 major states): 18.8 billion pounds initially, revised to 19.0 billion
  • Year-Over-Year Growth: +4.2%—the strongest since 2021
  • Total National Production: 19.6 billion pounds
  • Cow Numbers: Approaching the highest levels seen in decades

On the infrastructure side, the industry has been busy. More than 50 new or expanded dairy plants—particularly cheese and powder facilities in the Upper Midwest, Texas, and the High Plains—have come online, representing roughly $8 billion in capital investment over the past several years.

Leonard Polzin, the Dairy Economist and Farm Management Outreach Specialist at UW-Madison Division of Extension, framed it well at the 2025 Wisconsin Agricultural Outlook Forum. He noted that the industry is seeing “a substantial increase in processing capacity,” with an estimated $8 billion in gross investment creating new demand for milk. The challenge, as he pointed out, is that policy uncertainties—including potential tariffs and questions about labor availability—could affect prices before that demand fully materializes.

The picture looks similar in other major producing regions:

  • European Union: EU Milk Market Observatory data show deliveries climbing modestly in 2024, with product stocks building in early 2025 as cheese, butter, and powder production outpaced demand growth
  • New Zealand: Fonterra’s 2025/26 season forecast shows milk solids volumes running several percent ahead of the prior year, with farmgate payouts around NZ$10 per kg of milksolids
  • Argentina: Ministry data and Tridge reports show national milk output in early 2025 running 10.9% above the same period in 2024, with March posting gains of 15.9% year-over-year

Here’s where it gets interesting on the demand side. Exports have actually performed well:

  • July 2025 U.S. Exports: 1.6 billion pounds (milk-fat basis)
  • Year-Over-Year Export Growth: +53%—a record for any single month
  • Yet Class III/IV Futures: Trading in the mid-teens through much of 2025, below full-cost breakeven for many conventional operations
July 2025 was the strongest export month in U.S. history, with shipments up 53% year‑over‑year—yet total production still outran demand by another 4.2%. That’s not a demand collapse; it’s too much milk from too many exporters at once.

The takeaway? World demand hasn’t collapsed. Exports are actually quite strong. But supply from multiple major exporting regions has grown faster than demand can absorb in the near term. That’s what makes this feel different from the regional downturns many of us have worked through before.

The 24-Month Expansion Timeline: When Biology Meets Economics

One of the lessons this cycle keeps reinforcing is how much dairy expansion is a commitment you can’t easily unwind. The biology and capital requirements simply don’t move on futures-market time.

Think back to 2023 and early 2024. Milk prices were strong, butterfat levels were excellent across many herds, and balance sheets looked healthier than they had in years. In that environment, deciding to add a pen, upgrade the parlor, or build out the dry cow facilities made a lot of sense. The numbers supported it.

Land-grant extension economists who model these decisions describe a fairly predictable timeline. In those first few months, you’re signing contracts, ordering equipment, and closing on financing. As one University of Wisconsin farm management publication notes, by the time the ink is dry, most of the financial risk is already committed—even though no extra milk has shipped yet.

Through months four to twelve, the facility goes up while you’re either buying bred heifers or ramping up your own replacement program with sexed semen. Cash is flowing out, but the additional milk revenue hasn’t started. Then in months thirteen through twenty-four, those heifers freshen, pens fill, and milk per stall climbs. The challenge is that the broader market—running on that same 18-24 month biological timeline—may have shifted considerably since you started.

Peter Vitaliano, who served as Vice President of Economic Policy and Market Research at the National Milk Producers Federation before retiring at the end of 2024, was already flagging concerns back in February 2024. He noted that “due to a number of factors, we’ll probably see a larger drop than usual” in dairy farm numbers, partly because USDA counts were likely collected before additional farms closed at the end of 2023 due to margin pressure. He added that any margin improvement wouldn’t “constitute anywhere near a full recovery from the financial stress that dairy farms, pretty much of all sizes, are experiencing.”

The 24-Month Trap in Action

I’ve been hearing about situations like this from lenders and consultants: a 900-cow Wisconsin operation signed expansion contracts in early 2024 for 300 additional stalls, with heifers due to freshen by mid-2025. By the time that barn was full, Class III had dropped from the low $20s to around $15.

The extra milk revenue is real, but so is the debt service. Over six months, the gap between projected and actual margins consumed roughly $180,000 in working capital that had been earmarked for feed prepays and equipment upgrades.

The family isn’t in crisis, but there’s no cushion left. They’re working with their lender on revised cash-flow projections and tightening culling criteria to protect equity.

Decisions that made complete sense at $22 milk are now playing out in a $15 world.

Beef-on-Dairy: Real Benefits with Some Unexpected Effects

Beef-on-dairy has been one of the more significant developments in recent years, and it’s delivered genuine value to many operations. At the same time, as it’s scaled across the industry, it’s also changed some dynamics that historically helped balance supply. What I’ve noticed talking with producers is that most understand the benefits clearly—but the systemic effects are only now becoming apparent.

Where the Value Has Been Clear

The research and market data are consistent on this: well-managed beef-on-dairy programs substantially increase calf value compared to straight dairy bull calves. Day-old beef-cross calves often fetch several hundred dollars more, and in program relationships where carcass performance is documented, they can approach native beef calf values.

With milk prices softening in the first half of 2025, beef has become a driver of dairy farm profitability through both cull cows and dairy-beef calves. For many operations, this revenue stream has made a meaningful difference in a tight-margin year.

Some Effects Worth Understanding

What’s become clearer over the past year is how beef-on-dairy interacts with culling decisions and replacement availability when prices fall.

Consider the culling dynamic. A few years ago, that seven- or eight-year-old cow with middling production and some foot issues—bred to a dairy bull and carrying a $50-100 calf—was an easier decision when milk prices dropped. Today, if she’s carrying a beef pregnancy that could bring four figures at calving, the economics pull toward keeping her “one more lactation.” Across a larger herd, those decisions on the bottom 15-20 percent of cows can add meaningful volume that wouldn’t have been in the tank in previous downturns.

Culling DecisionDaily Milk RevenueDaily Direct CostsDaily Net MarginStrategic Action
Keep Low Performer$9.00$8.00$1.00Deferred culling
Replace with High Performer$13.00$9.00$4.00Aggressive culling
Daily Margin Difference+$4.00+$1.00+$3.00Per stall advantage
Impact Over 6 Months$540Single cow (180 days)
Scale: 30 Cows in 600-Cow Herd$16,20030 decisions

On the replacement side, the numbers tell a striking story:

  • January 2025 USDA Cattle Report: Dairy replacement heifers over 500 pounds dropped to just 3.914 million head—the lowest since 1978
  • Heifer-to-Cow Ratio: 41.9%, the smallest since 1991 (per CoBank lead dairy economist Corey Geiger)
  • Primary Driver: More matings going to beef semen, fewer dairy heifer calves being raised

That pruning made sense when heifer-raising costs were high, and beef calves commanded strong premiums. But it also means some operations that would like to cull more aggressively now don’t have the springers available to maintain stall utilization.

From windfall to choke point:” day‑old beef‑cross calves jumped from roughly $650 to $1,400, replacement heifers surged past $3,000, and heifer inventories fell nearly 20%. The same strategy that rescued margins is now what’s limiting culling options in a $15 milk world.

And there’s a productivity element worth noting. Because the heifers that are raised tend to come from the top of the genetic pool—identified through genomic testing—they often bring stronger milk and component performance than the animals they replace. Leonard Polzin noted at the 2025 Wisconsin Ag Forum that “despite a 0.35 percent year-to-date decline in total milk production, calculated milk solids production increased by 1.35 percent.” The industry is meeting demand “more quickly than in the past,” even with somewhat fewer total gallons.

None of this suggests beef-on-dairy is problematic. It’s been valuable for many operations. The consideration is managing it as part of an overall herd and business strategy rather than simply as a breeding decision.

Understanding Why Growth Continued

A reasonable question producers ask is why banks, co-ops, and processors kept supporting expansion even as supply signals shifted. You know, it’s easy to look back and wonder what everyone was thinking. But looking at the incentive structures helps explain the pattern—and honestly, it makes more sense than it might first appear.

The Lender Perspective

Ag lenders work within risk models and regulatory frameworks that emphasize historical cash flow, current balance sheet strength, and collateral values. In 2022-2023, many dairy clients showed multiple years of positive returns and improved equity. Land values in dairy regions were firm. Cull cow and breeding stock values had recovered.

Farm finance research consistently shows that lenders lean heavily on these historical and collateral metrics rather than attempting to time commodity cycles. Add competitive pressure—banks and farm credit systems competing for the same well-run operations—and you can see how turning down an expansion with strong historical numbers often meant losing that relationship to a lender willing to proceed.

From the credit committee’s perspective at the time, financing expansion with their strongest clients appeared reasonable and well-supported by the available data. The depth of the 2025 correction wasn’t yet visible in those metrics.

The Processor View

For processors, the math centers on fixed costs and throughput. Depreciation, labor, and energy don’t decline proportionally when a plant runs below capacity. With billions invested in new cheese, powder, and specialty facilities over the past decade, plant managers face pressure to run at high utilization, spread fixed costs effectively, and maintain market share.

That creates incentives to encourage volume growth from existing shippers, sign new suppliers, and move cautiously on base-excess programs that might push producers toward competitors. Some buyers have implemented tiered pricing systems that discount over-base milk, but these tools are often adopted late in the cycle and rarely coordinate across an entire region.

The result is a system in which internal metrics rewarded growth and utilization, even as external data pointed to a building supply. That’s not a criticism—it’s recognizing how institutional incentives shape behavior.

Regional Variations: Same Prices, Different Realities

One aspect that gets lost in national averages is how differently the same price environment affects operations across locations. As many of us have seen firsthand, cost structure, regulatory environment, and market access all matter enormously.

California: Navigating Significant Headwinds

California operations face several overlapping pressures this cycle.

Water constraints continue tightening. Implementation of the Sustainable Groundwater Management Act and new dairy waste discharge requirements from the State Water Resources Control Board are limiting groundwater pumping and establishing stricter nitrate standards in parts of the Central Valley. Environmental compliance costs—for covered lagoons, digesters, and monitoring systems—continue adding capital and operating expenses. And labor costs, housing prices, and land values remain substantially higher than in most other dairy regions.

When Class IV prices are in the low teens and world butter and powder prices are soft, those structural costs make breakeven difficult, particularly for operations that recently invested in facility upgrades. Understandably, some families are evaluating whether another 20-year investment cycle makes sense in that regulatory and cost environment.

Upper Midwest: Cost Structure Advantages

Wisconsin and neighboring states present a different picture.

A November 2024 University of Wisconsin-Madison study found that dairy contributes about $52.8 billion annually to Wisconsin’s economy, with substantial value coming through processing rather than just farm-level milk sales. The region’s processing network has grown considerably, with cheese plant expansions and new facilities drawing milk from an expanding geography. Feed costs benefit from local production, and land and labor costs, while rising, remain below coastal levels.

Low Class III prices continue to pressure margins, and smaller operations face ongoing consolidation. But many Upper Midwest producers describe having a cost structure that provides a path through this downturn with good management, even if it’s not comfortable.

New Zealand: Low Costs, High Exposure

New Zealand’s pasture-based system delivers meaningful cost advantages—solids produced with less purchased feed and lower energy use in favorable seasons. The 2025/26 forecast payout around NZ$10 per kgMS suggests many operations are maintaining positive margins, though narrower than recent years.

The trade-off is exposure. New Zealand sells the vast majority of its production into export markets. Shifts in Chinese demand, Southeast Asian buying patterns, or currency movements translate quickly into payout adjustments. Low production costs provide resilience, but global market volatility is a constant factor.

Europe and South America: Policy and Economic Dynamics

EU production has edged modestly higher overall, but policy pressure to limit cow numbers in high-density areas for environmental reasons is influencing regional patterns. The bloc appears to be shifting toward cheese and higher-value products while moderating output of commodity powders and butter.

Argentina’s production surge—that 10.9 percent first-quarter increase—reflects improved weather and on-farm economics. But Argentine producers also navigate inflation, policy uncertainty, and volatile input costs that can shift margins dramatically in short periods.

The point is that $15 milk creates very different situations in Tulare, Green County, Canterbury, and Santa Fe. Regional context matters enormously.

The Breeding Solution: Selecting for Feed Efficiency in a Low-Margin World

Here’s something that deserves more attention in these conversations: your genetic decisions today are one of the most powerful tools you have for navigating tight margins over the next decade. And there are now specific, measurable traits designed exactly for this environment.

Feed Saved: A Trait Built for This Moment

The Council on Dairy Cattle Breeding (CDCB) launched Feed Saved (FSAV) back in December 2020, and it’s become increasingly relevant as margins compress. The trait combines two components:

  • Body Weight Composite (BWC): Selecting for moderate-sized cows that require less feed for maintenance
  • Residual Feed Intake (RFI): Identifying cows that are metabolically more efficient—eating less than expected based on their production and body weight

According to Holstein USA’s April 2025 TPI formula update, every pound of feed saved returns approximately $0.13 per cow per lactation. That might sound modest, but across a 500-cow herd over multiple generations, the cumulative impact is substantial.

What’s particularly interesting is the research backing this. A November 2024 study published in Frontiers in Geneticsexamining genomic evaluation of RFI in U.S. Holsteins found that the difference between the most and least efficient first-lactation cows averaged 4.6 kg of dry matter intake per day—while producing similar amounts of milk. Over a 305-day lactation, that’s a significant difference in feed costs. The same study found even larger spreads in second-lactation animals.

How the Industry Is Weighting Efficiency

The April 2025 Net Merit update from CDCB reflects this shift. As Holstein Association USA’s TPI formula now shows:

  • Production (including Feed Efficiency): 46% of total index weight
  • Feed Efficiency $ Index: Combines production efficiency, lower maintenance costs from moderate body weight, and better feed conversion (RFI)

What’s encouraging is that research shows meaningful genetic variation in feed efficiency—the November 2024 Frontiers in Genetics study found RFI heritability in lactating U.S. Holsteins at approximately 0.43 (43%), indicating substantial potential for genetic progress through selection. That’s higher than many health and fertility traits, which means you can actually move the needle on this.

Efficiency MetricDaily Feed (lbs DM)Annual Feed Cost @ $0.12/lbMilk Production (lbs/day)Breeding Strategy Impact
Standard Efficiency Cow55$2,40985Baseline
High Efficiency Cow (Feed Saved)50$2,19085RFI + Feed Saved traits
Annual Advantage per Cow-5 lbs/day$219 savedSame outputImmediate selection
500-Cow Herd Annual Impact$109,500Same outputHerd-wide savings
10-Year Genetic Improvement$1,095,000Same outputCompound benefits

Practical Application

For producers looking to incorporate feed efficiency into their breeding programs:

  • Look for bulls with positive Feed Saved (FSAV) values in their genomic evaluations
  • Consider Body Weight Composite alongside production traits—extreme frame size increases maintenance costs
  • Balance feed efficiency with health and fertility traits; the most efficient cow isn’t profitable if she doesn’t breed back or stay healthy
  • Work with your AI representative or genetics consultant to model how different selection emphases might affect your herd’s economics over 5-10 years

This isn’t about abandoning production goals. It’s about recognizing that in a low-margin environment, the cow that produces 85 pounds while eating 10% less feed may be more profitable than the cow producing 90 pounds at average efficiency.

What the More Resilient Operations Have in Common

Every downturn separates operations that preserve equity and position well for the recovery from those that don’t. Several patterns are emerging among farms navigating this cycle effectively—and what’s encouraging is that most of these are things within a producer’s control.

Making Culling Decisions with Better Data

Operations that are doing well are generally bringing greater precision to culling. That means tracking income over feed cost by pen or individual cow, using parlor data and feed records to identify animals that are not covering their direct costs, plus a reasonable share of overhead. It means using genomic information and reproductive performance to spot heifers and cows unlikely to generate positive returns. And it means connecting culling plans to realistic replacement availability rather than culling until pens feel empty and then scrambling for springers.

The math consultants’ walk-through is straightforward: a cow generating $9 in milk revenue and consuming $7 in feed, plus $1 in bedding, breeding, and health costs, clears $1 in labor, debt, and margin costs. Replace her with a fresher or higher-producing animal netting $4 daily above direct costs, and over six months, that stall contributes $720 more. Scale that to 30 similar decisions in a 600-cow herd, and the difference exceeds $20,000 in half a year. That kind of analysis is making some producers more willing to make uncomfortable culling decisions earlier.

Managing Margins Rather Than Guessing Prices

Another pattern is shifting from attempting to call price tops to protecting survivable margin ranges.

Dairy Margin Coverage continues providing value for eligible operations, particularly smaller herds. A 2025 Government Accountability Office review noted that USDA paid out nearly $2.7 billion more to DMC participants than it collected in premiums from 2019 through 2024—significant catastrophic protection.

More operations are using Dairy Revenue Protection to establish floors on portions of future production, sometimes combined with feed contracts that define at least a rough margin band. The approach isn’t about optimizing returns; it’s about narrowing the range of outcomes to avoid truly damaging quarters.

Suppose you haven’t explored these tools recently. In that case, your local FSA office or an extension dairy specialist can walk you through current enrollment options and help you model how different coverage levels might fit your operation’s risk profile.

Treating Beef-on-Dairy as a Managed Program

Operations that consistently achieve value from beef-on-dairy tend to approach it systematically rather than opportunistically. That means selecting sires with documented growth, feed efficiency, and carcass data—often aligned with specific feedlot or packer programs. It means coordinating with buyers on calving timing, health protocols, and genetics to capture available premiums. And it means maintaining enough high-merit dairy genetics to ensure replacement availability as conditions change.

This program approach doesn’t eliminate beef market volatility, but it improves the odds of consistent returns and preserves flexibility on the dairy side. If you’re looking to establish these relationships, many breed associations and AI companies now maintain lists of feedlots and packers actively seeking dairy-beef partnerships.

Continuous Focus on Feed Efficiency

Feed remains the largest expense for most operations, and in low-margin periods, every pound of dry matter needs to perform. The farms that manage well keep returning to fundamentals: grouping by lactation stage so rations match requirements, reducing shrink through bunker management and feed-handling practices, and monitoring feed efficiency as a core metric.

Relatively modest improvements—a tenth or two-tenths improvement in feed efficiency, a few percentage points less silage waste—can represent $0.50-1.00 per hundredweight in income over feed cost. Across millions of pounds of annual production, that compounds into meaningful dollars.

Looking Toward 2027-2028: Reasonable Expectations

Forecasting specific prices years out isn’t realistic, but we can identify directions based on current trends and policy trajectories. These are scenarios, not predictions—individual outcomes will vary considerably.

The consolidation pattern is well-documented. Lucas Fuess, Senior Dairy Analyst at Rabobank, noted in his analysis of the 2022 Census of Agriculture that the U.S. lost nearly 40 percent of its dairy farms between 2017 and 2022—from about 39,300 to around 24,000—while total production rose because “larger farms show lower production costs.” This downturn will likely accelerate that trend.

By the late 2020s, several developments seem probable:

The total number of licensed U.S. dairies may fall below 20,000, with an increasing share of national volume coming from herds milking several hundred to several thousand cows. Regional patterns may sharpen, with lower-cost areas—much of the Upper Midwest and Central Plains—holding or gaining share, while higher-cost, more regulated regions see gradual declines in cow numbers as families choose not to reinvest. Beef-on-dairy will likely remain prevalent but may stratify further between well-structured programs that capture consistent premiums and undifferentiated approaches that face greater volatility.

Globally, New Zealand will remain important in the powder and butterfat markets, while the EU continues to shift toward cheese and value-added products within environmental constraints.

The Bottom Line

These are the conversations I’m hearing producers have with their teams, advisers, and families. Every operation faces unique circumstances, and general advice only goes so far—but these questions seem to be helping people think through their situation:

  • Where are you in your own expansion timeline? How many heifers are scheduled to freshen over the next 18-24 months? Do those numbers align with what your facilities, labor, feed base, and market access can profitably support at current price levels?
  • Do you have clear visibility on cow-level economics? Which animals are covering feed plus a reasonable share of labor, debt, and overhead—and which aren’t? What would tightening culling criteria by 5-10 percent look like, and is your replacement pipeline ready for that?
  • How much of your margin is protected versus hoped for? What portion of the next 12-24 months could you realistically put under DMC, DRP, or forward contracts? Have you had direct conversations with your lender about your risk management approach?
  • Is your beef-on-dairy program intentional? Do you know what your calf buyers specifically want, and are you breeding to those specifications? Are you confident that your current approach will leave enough high-quality dairy replacements for the herd you want to be running in three years?
  • Are your genetic criteria aligned with a low-margin reality? Are you selecting strictly for high production, or are you also prioritizing Feed Saved, moderate frame size through Body Weight Composite, and Residual Feed Intake to lower lifetime maintenance costs? In an environment where feed represents 50-60% of production costs, breeding decisions made today will shape your cost structure for the next decade.
  • Are you making decisions for this week or for the next several years? Culling, breeding, feeding, capital allocation, and even family succession—are these being decided tactically or within a longer-term framework?

This cycle is demonstrating that individually sensible decisions—expanding when returns were strong, adding beef value to calves, filling new processing capacity—can produce collective oversupply when everyone responds to the same signals simultaneously. None of us individually controls global supply and demand. What each operation can control is understanding its position within the bigger picture, knowing its own numbers thoroughly, and using available tools—biological, genetic, and financial—to improve the odds of still being here, on your own terms, when conditions improve.

KEY TAKEAWAYS 

  • This is a global supply collision, not a demand problem. The U.S., EU, New Zealand, and Argentina all expanded at once—yet exports hit record highs. Pure oversupply.
  • The 24-month trap is unforgiving. Decisions that made sense at $22 milk are now delivering into a $15 market. Biology doesn’t wait for prices to recover.
  • Beef-on-dairy reshaped the culling equation. Replacement heifers dropped to 3.9 million—the lowest since 1978—limiting flexibility exactly when operations need it most.
  • Resilient dairies share three priorities: precision culling based on income over feed cost, margin protection through DMC and DRP, and breeding for feed efficiency traits.
  • Consolidation will accelerate—preparation separates outcomes. Producers who know their numbers and deploy available tools now will emerge stronger when markets turn.

Complete references and supporting documentation are available upon request by contacting the editorial team at editor@thebullvine.com.

Learn More:

The Sunday Read Dairy Professionals Don’t Skip.

Every week, thousands of producers, breeders, and industry insiders open Bullvine Weekly for genetics insights, market shifts, and profit strategies they won’t find anywhere else. One email. Five minutes. Smarter decisions all week.

NewsSubscribe
First
Last
Consent

The €27,000 Question 80% of Dairy Farmers Can’t Answer (This Winter, You Will)

80% of dairy farmers can’t answer a €27,000 question. After this winter, you won’t be one of them.

EXECUTIVE SUMMARY: There’s a €27,000 (~$29,000 USD) question that 80% of dairy farmers can’t answer: What’s your feed efficiency ratio? That single number determines whether your operation’s biggest expense—50-70% of costs according to USDA data—generates profit or disappears into the manure pit. The math is compelling: improving from 1.4 to 1.6 efficiency captures €281 per cow annually without new genetics, additional cows, or capital investment. Research from Iowa State’s Dr. Lance Baumgard, Cornell’s transition cow program, and Penn State Extension reveals three proven strategies: systematic measurement, silage preservation, and metabolic optimization. Winter 2025-2026 is your measurement window—housed cattle, stable rations, no heat stress confounding your baseline. All you need: seven days, a bathroom scale, and a moisture tester. The bottom line is simple: you can’t deposit milk production; you deposit margin.

Growing numbers of progressive dairy operations are discovering that a single metric—feed efficiency—holds the key to capturing thousands in additional profit without producing more milk. Here’s what the industry’s efficiency pioneers are finding, and how your operation can benefit from their insights.

The question caught the experienced dairy farmer off guard during a routine consultation last winter: “What’s your current feed efficiency ratio?” After successfully managing 100 cows for 15 years, producing a respectable 35 kilograms of milk per cow daily, he couldn’t answer. Like many in the industry, he knew total feed costs and milk production, but not the critical ratio connecting them.

What happened next transformed his operation. Within twelve months of implementing systematic efficiency measurement, his farm captured over €15,000 (~$16,200 USD) in additional profit—without buying a single additional cow or increasing milk production. His story reflects a broader awakening across the dairy industry: improvements in feed efficiency from 1.4 to 1.6 generate approximately €270 (~$290 USD) per cow annually, based on current commodity prices of €0.25 per kilogram dry matter and €0.40 per kilogram milk. For a typical 100-cow operation, we’re talking about €27,000 (~$29,000 USD) in potential improvement.

This builds on what we’ve seen in operations worldwide. Farms implementing comprehensive efficiency strategies report remarkably consistent results. With feed costs accounting for 50-70% of operational expenses, according to USDA Economic Research Service data, understanding this metric has become fundamental to sustainable dairy farming.

Understanding the Industry’s Relationship with Efficiency Data

What’s particularly noteworthy is how sophisticated we’ve become in certain areas—genomic testing, milk component analysis, reproductive protocols—while feed efficiency remains a blind spot for many successful operations. I find this fascinating, actually.

Industry consultants Jacques Bernard and Christine Massfeller regularly encounter this pattern. When they ask fundamental questions about dry matter consumption or cost per kilogram of energy-corrected milk, even experienced producers often pause. This isn’t about capability—it reflects how our industry has traditionally measured success.

Recent industry observations suggest that while most farms diligently track milk production and components, regular efficiency calculation remains less common. The gap between what we measure and what drives profitability deserves our attention.

THE GOLDEN RATIOS: Know Your Efficiency Targets

GroupTarget
Whole Herd> 1.5
High-Producing Group> 1.7
First-Lactation Heifers> 1.6
Late Lactation> 1.2

⚠️ WARNING: Fresh Cows (First 21 Days) Above 1.5 = Metabolic Danger Zone

Fresh cows with efficiency above 1.5 are actually experiencing a dangerous negative energy balance, mobilizing body reserves at an unsustainable rate despite appearing to be top producers. Cornell University’s transition cow management resources indicate that these animals face a substantially higher risk of metabolic disease.

The Economics Behind Efficiency Improvement

Let me walk through some practical mathematics that illustrates why this matters so much to your bottom line. Consider a standard scenario with 35 kg of daily milk production at a milk price of €0.40 per kilogram and a dry matter feed cost of €0.25 per kilogram.

Metric1.4 Efficiency1.6 EfficiencyDaily Difference
Dry Matter Intake25.0 kg21.9 kg-3.1 kg
Feed Cost (€0.25/kg)€6.25€5.48€0.77 Saved
Income Over Feed Cost€7.75€8.52+€0.77 Profit
Annual Impact (100 Cows)+€28,100 (~$30,350 USD)

The difference—€0.77 per cow daily—accumulates to €281 annually per animal. Scale that across 100 cows, and you understand why progressive producers are prioritizing this metric.

I recently spoke with a Wisconsin producer who shared an interesting perspective. His cows are producing 2 kg less milk than three years ago, yet his operation is significantly more profitable because feed costs dropped by double digits through efficiency improvement. Sometimes the path to profitability isn’t about maximum production—it’s about optimal conversion.

Learning from Poultry and Swine: A Different Approach

The contrast between dairy and monogastric operations offers valuable lessons. Poultry and swine producers monitor feed conversion with remarkable precision, whereas dairy producers have traditionally focused elsewhere. Why this difference?

Part of it comes down to the simplicity of measurement. Tracking tissue growth in a broiler is straightforward compared to partitioning nutrients across milk components, body condition, and reproduction in dairy cattle. Their shorter production cycles provide rapid feedback, and integrated technology has become standard infrastructure.

Modern broiler facilities employ AI-powered systems, achieving impressive precision in automated monitoring. Swine operations use real-time tracking for weight, growth, and intake patterns. This isn’t futuristic—it’s current standard practice enabling continuous optimization.

What’s encouraging is dairy’s technological evolution. The Cattle Feed Intake System developed at the University of Wisconsin-Madison uses 3D cameras and deep learning for individual cow monitoring. Early adopters report payback within 18 months through efficiency gains alone. We’re catching up, and the results are promising.

Recognizing Efficiency Problems: Key Indicators

If you’re observing these signs, it’s time for closer examination:

  • Consistent whole corn kernels in manure—beyond occasional presence
  • Warm silage face—noticeably above ambient temperature, sometimes steaming
  • Severe TMR sorting—refusals predominantly long stems while grain disappears
  • Variable manure consistency within pens—suggesting diet variation
  • Body condition variance exceeding 0.75 points within groups
  • Reduced cud chewing—below the target 7-10 hours daily
  • Long particle predominance in refusals—above 19mm

Penn State Extension’s feed management resources indicate that multiple symptoms typically correlate with efficiency below 1.3.

Three Complementary Strategies for Efficiency Improvement

The evolution of nutrition strategies over the past decade has been remarkable. What started as competing philosophies has matured into complementary systems addressing different efficiency aspects.

Strategy 1: The Measurement Foundation (Data > Assumptions)

Improvement starts with accurate data. German-based AHRHOFF GmbH, operating across multiple countries since 1996, exemplifies this approach. Feed advisor Rainer Kossmann describes their priority as helping clients develop an intuitive understanding of herd consumption through systematic measurement.

The systematic approach incorporates digital tracking for precise dry matter intake, Penn State Particle Separator analysis for sorting behavior, manure evaluation for passage rate assessment, and regular moisture testing for ration accuracy. This foundation reveals the actual difference between assumed and actual intake—often a 10-15% gap worth thousands of dollars annually.

Strategy 2: Preserving Feed Value (The Hidden Rumen Driver)

Forage quality determines rumen function potential—and this is where many operations unknowingly leak profit. Luis Queiros from Lallemand Animal Nutrition explains how energy preservation during storage and feedout represents an often-overlooked opportunity.

Quality inoculant technology, incorporating specific bacterial strains like Lactobacillus buchneri and L. hilgardii, delivers measurable benefits. Research consistently demonstrates typical responses of 1.5 kg additional dry matter intake and nearly 2 kg increased fat-corrected milk. Properly treated silage maintains stability for over two weeks after opening, compared to just days for untreated material. The investment math is compelling: €4,500 (~$4,860 USD) in inoculant typically returns €12,600 (~$13,600 USD) in preserved feed value, before accounting for production benefits.

Strategy 3: Metabolic Optimization (The Stress-Efficiency Connection)

Research from Iowa State University’s animal science department, led by Dr. Lance Baumgard and published in the Journal of Dairy Science, demonstrates how metabolic stress fundamentally compromises efficiency. When cows experience heat stress, transition challenges, or subclinical acidosis, gut barrier function deteriorates. This “leaky gut” response triggers immune activation, consuming glucose equivalent to 25-30 liters of milk—energy that could otherwise support milk synthesis.

University of Florida’s dairy science team has quantified the opportunity through heat abatement studies. Operations implementing comprehensive cooling protocols during summer months recovered 8-12% of heat-stress-related efficiency losses. The key insight: stress management isn’t separate from nutrition—it’s foundational to feed conversion.

Cornell University’s transition cow program reinforces this connection. Their research shows that cows experiencing inflammation during the transition period allocate more nutrients to immune function and less to milk production. Targeted interventions—proper close-up nutrition, minimizing social stress, optimizing stocking density—can shift this balance back toward production. Some operations implementing comprehensive transition protocols report efficiency improvements of 0.1-0.2 points within the first 60 days in milk.

Strategic Timing: Why Winter Matters for Measurement

Over years of consulting, I’ve observed that operations that begin efficiency programs in winter consistently achieve superior results compared to those that start in summer. The science supports this pattern.

Winter provides measurement advantages that summer simply can’t match. Housed cattle consuming consistent TMR eliminate the variables inherent in grazing systems. Research from the University of Minnesota demonstrates that TMR-to-pasture transitions can initially reduce intake by nearly 30%, making accurate efficiency calculations challenging during grazing seasons.

Temperature effects matter enormously. When the Temperature Humidity Index exceeds 72, production impacts begin. USDA data from southwestern operations shows average decreases of around 12%, with severe heat causing dramatic drops. Winter measurement reveals true biological capacity rather than heat adaptation.

By mid-winter, silage has stabilized post-fermentation but hasn’t deteriorated. Moisture content remains consistent week to week—essential for calculation accuracy. Plus, without fieldwork pressure, you have bandwidth for careful measurement and analysis. As Dr. Jane Sayers from Northern Ireland’s CAFRE observes, winter provides an opportunity to focus on intake monitoring, which is often overlooked during busier seasons.

Regional Considerations and Operational Realities

Different systems require different approaches—what works for California’s Central Valley operations won’t necessarily translate to Irish grazing systems or Wisconsin tie-stalls.

Pasture-based operations in Ireland, New Zealand, and parts of the Netherlands face unique measurement challenges. Daily efficiency can swing 0.2-0.3 points based on grass quality and weather. These farms benefit from establishing winter baselines during housing, then using those benchmarks to evaluate grazing performance.

Large confined operations in California, Arizona, and emerging markets have measurement consistency advantages but face greater heat stress challenges. These systems often achieve dramatic efficiency gains from metabolic support strategies, particularly during the summer months.

Smaller operations sometimes question whether efficiency improvement justifies investment. The percentage gains remain consistent regardless of scale—a 30-cow herd capturing €8,100 (~$8,750 USD) annually still achieves excellent returns. The key is appropriate implementation: perhaps weekly rather than daily measurement, creative use of existing equipment, and acceptance that progress beats perfection.

Organic producers face intervention restrictions but consistently achieve respectable efficiency through careful forage management and natural fermentation optimization. Several Northeast organic operations report 1.55+ efficiency using approved methods exclusively.

Your 7-Day Efficiency Startup Checklist

Starting efficiency measurement doesn’t require sophisticated infrastructure. Here’s a practical approach using equipment most farms already have:

Day 1: The Weigh-In. Establish your weighing system—a bathroom scale with a bucket works initially. Conduct your first dry matter test using microwave methods validated by extension services. Record pen populations and milk production with components. This is your baseline moment.

Days 2-6: The Data Gather. Continue recording delivered feed from your mixer display, weigh refusals, and test moisture. Calculate daily intake and efficiency while watching for patterns. Don’t chase perfection here—consistency matters more than precision initially. You’re building a habit, not writing a research paper.

Day 7: The Reckoning. Calculate weekly averages by group. Fresh cow efficiency above 1.5 or a herd average below 1.3 warrants immediate consultation with a nutritionist—these indicate intervention needs. This is the number that tells you whether you’re leaving money on the table.

The calculations are straightforward: Dry matter intake equals delivered feed times dry matter percentage, minus refusals times their dry matter percentage, divided by cow count. Energy-corrected milk calculators from Cornell or Penn State handle standardization. Efficiency equals ECM divided by DMI.

Investment Reality and Return Expectations

Transparency about costs builds trust. Based on current market conditions, here’s the realistic investment requirements:

Measurement systems require approximately €3,500 (~$3,780 USD) initially, €2,200 (~$2,375 USD) annually for feed management software, moisture testing equipment, particle separation tools, and scales.

Silage preservation runs €4,500 (~$4,860 USD) annually for inoculant at typical application rates. This investment consistently returns triple value in feed preservation alone, before production benefits.

Transition and metabolic support through quality mineral programs and stress mitigation protocols costs around €3,500 (~$3,780 USD) annually for 100 cows. University research suggests that even modest improvements in transition cow health can recover this investment within the first lactation.

Investment CategoryYear 1Ongoing
Measurement Systems€3,500 (~$3,780)€2,200 (~$2,375)
Silage Preservation€4,500 (~$4,860)€4,500 (~$4,860)
Transition & Metabolic Support€3,500 (~$3,780)€3,500 (~$3,780)
Total€11,500 (~$12,420)€10,200 (~$11,015)
Conservative Benefit€20,000-27,000 (~$21,600-29,160)
Typical Payback5-7 months

Industry Evolution and Future Considerations

The dairy industry faces an interesting crossroads in measuring and reporting efficiency.

Major processors across Europe—Danone, Arla, FrieslandCampina—are incorporating efficiency metrics into sustainability programs and payment structures. While specific program details continue evolving, the direction is clear: efficiency measurement is transitioning from optional to essential.

Carbon market developments offer additional opportunity. Regulatory frameworks in California and Europe are beginning to assign value to efficiency improvements as methane reduction strategies. Operations achieving 1.6+ efficiency may access substantial additional revenue through emerging carbon credit markets.

Within several years, industry observers expect efficiency reporting will become standard for premium market access, sustainability program participation, and competitive financing. Progressive lenders already incorporate these metrics into risk assessment.

Practical Takeaways for Your Operation

The €27,000 annual opportunity exists within your current genetics through management improvement. Unlike genetic selection, requiring years, management delivers returns within months. Each month’s delay represents approximately €2,250 (~$2,430 USD) in foregone benefit.

Starting simple with consistent measurement beats waiting for perfect systems. Basic tools—scale, moisture tester, spreadsheet—combined with two hours weekly effort can generate substantial efficiency gains.

Winter timing provides optimal measurement conditions. January through March offers stable feeding without heat stress or grazing variables, establishing accurate baselines for year-round improvement.

Sequential implementation maximizes success. Begin with a measurement to understand current performance. Address forage quality to secure your input foundation. Then optimize metabolic health through evidence-based transition protocols. Each phase builds on previous improvements.

The 1.5 efficiency threshold separates sustainable from struggling operations. Below 1.3 indicates a crisis requiring immediate attention. Above 1.5 provides a foundation for optimization toward 1.6+ targets where premium opportunities emerge.

As one experienced consultant observed: “Weekly efficiency calculation drives profitable decisions. Annual calculation generates excuses. Never calculating ensures slow decline without understanding why.”

KEY TAKEAWAYS

  • €281 per cow. €27,000 per herd. Every year. Moving from 1.4 to 1.6 efficiency captures this without new genetics, additional cows, or capital investment. It’s management money—yours to take or leave.
  • Fresh cows above 1.5 efficiency aren’t stars—they’re sirens. High early efficiency signals dangerous mobilization of body reserves, not superior genetics. These cows are heading for ketosis. Monitor them; don’t celebrate them.
  • Three strategies. One system. No shortcuts. Measurement reveals your baseline. Silage preservation protects your inputs. Metabolic optimization unlocks conversion. Skip one, and the others underdeliver.
  • Winter 2025-2026 is your measurement window—use it. Housed cattle, stable rations, no heat stress skewing numbers. January through March gives you the cleanest baseline you’ll get all year.
  • The barrier to €27,000? Seven days and a bathroom scale. Add a microwave for moisture testing and a spreadsheet. That’s it. Start this week. Stop guessing. Start weighing.

The Bullvine Bottom Line

You can’t deposit milk production; you deposit margin. Genetic potential means nothing if your conversion is poor. For the cost of a bathroom scale and a moisture tester, you can unlock €27,000 (~$29,000 USD) in hidden value this winter. Stop guessing and start weighing.

Complete references and supporting documentation are available upon request by contacting the editorial team at editor@thebullvine.com.

Complete references and supporting documentation are available upon request by contacting the editorial team at editor@thebullvine.com.

Learn More:

The Sunday Read Dairy Professionals Don’t Skip.

Every week, thousands of producers, breeders, and industry insiders open Bullvine Weekly for genetics insights, market shifts, and profit strategies they won’t find anywhere else. One email. Five minutes. Smarter decisions all week.

NewsSubscribe
First
Last
Consent

The Cooperative Trap: UK’s 32p Milk Crash Proves Your Co-op Won’t Save You

When a Welsh dairy farmer sat in that boardroom and voted to slash his own income by £78,000 a year, he wasn’t being foolish. He was being a fiduciary. And that distinction matters for every cooperative member reading this.

Executive Summary: Mike Smith milks 450 cows in Wales and serves as vice chairman of First Milk. This month, he voted to cut his own milk price to 32.25p—a decision that costs his operation approximately £6,500 every month. He wasn’t being foolish. He was fulfilling his legal duty: UK company law requires cooperative directors to protect the enterprise first, even when farmgate prices fall below the 43-47p most producers need to break even. That tension between member interests and cooperative survival explains why UK dairy has consolidated from 35,000 farms in 1995 to roughly 7,000 today—and why analysts project just 4,000-5,000 by 2030. Cooperatives deliver real value: market access, collective bargaining, shared risk. But insulation from global oversupply? That’s not part of the deal. North American producers shipping through DFA, Agropur, or provincial marketing boards face the same structural dynamics—and understanding them now, while you still have options, is the point.

Dairy Farm Profitability Strategies

Mike Smith runs a 450-cow dairy in Pembrokeshire, Wales. He’s also vice chairman of First Milk, one of the UK’s largest British-headquartered farmer-owned cooperatives. This month, he sat in a boardroom and voted to cut his own milk price—a decision that will cost his operation roughly £6,500 every single month.

That image stuck with me as I worked through what’s happening across UK dairy right now. A farmer-owner, voting against his own short-term interest, because the alternative was watching the cooperative face serious financial difficulty. It tells you something important about how cooperative economics actually work when markets turn challenging—and it’s something Wisconsin, Ontario, and every other cooperative-heavy dairy region should understand.

This chart shows how UK dairy farms collapsed from roughly 35,000 to 7,000 in a single generation, with another third likely gone by 2030. Cooperatives kept processing capacity afloat, but the price mechanism quietly selected who stayed and who exited. The system is working exactly as designed—and that should scare any producer betting their future on membership alone.

The Numbers Behind the Decision

First Milk announced its January 2026 price at 32.25 pence per litre, down a staggering 3.6ppl from the prior month. That’s no small adjustment. According to Mike Smith in First Milk’s official announcement: “This change reflects the continuing challenges in the market. UK and global milk production remain at record levels, and there is still no sign of improvement in the supply/demand imbalance.”

Production costs vary significantly across UK dairy operations. What’s interesting here is that grazing systems generally run lower than housed herds, and regional differences in feed and labor costs create quite a range. Industry benchmarking from AHDB and farm business consultancies like Kite Consulting consistently shows that fully-housed systems average somewhere in the mid-to-upper 40s pence per litre when all costs, including unpaid family labor, are accounted for. According to Promar International’s UK Dairy Producer Cost Analysis 2025, leading producers sustain production costs of 41-43 pence per litre.

Let’s run some realistic numbers on a 150-cow herd shipping about 103,000 litres monthly. If we assume production costs around 43ppl—reasonable for a well-managed system:

  • Monthly revenue at 32.25ppl: £33,217
  • Monthly production cost at 43ppl: £44,290
  • Monthly shortfall: Around £11,073

That’s burning through £133,000 or more each year before the family draws any income for living expenses. The 3.6ppl cut alone strips roughly £3,700 monthly from an already tight position.

Here’s what’s worth noting, though. First Milk has maintained a strong corporate performance—the BV Dairy acquisition significantly expanded its processing capacity. But those processor-level numbers don’t change the reality that farmgate prices have to track global commodity markets, regardless of how well the creameries perform. The processing business can be healthy while the farm business struggles. That disconnect frustrates producers, understandably so.

This comparison shows the brutal reality of December 2025 pricing: all conventional UK processors are paying members less than even the best‑in‑class 43ppl breakeven cost. Only organic producers clear the breakeven wall. When co‑op boards talk about ‘alignment with market conditions,’ this is what they mean.

Understanding Why Cooperative Boards Make Difficult Choices

I’ve followed cooperatives across three continents over the years, and the pattern at First Milk is one I’ve seen before. Understanding these mechanics matters because they apply across all cooperatives that handle commodity dairy.

First, let’s acknowledge what cooperatives genuinely provide—and these benefits are real and significant. Collective bargaining power. Guaranteed market access even when spot buyers disappear. Shared infrastructure investment that individual farms couldn’t finance alone. There’s a good reason the cooperative model has endured for over a century in dairy.

But when global supply substantially exceeds demand—as it does currently—those benefits don’t override fundamental market dynamics.

First Milk’s board includes farmer directors like Mike Smith, who manage substantial operations themselves. These aren’t distant executives making decisions about someone else’s livelihood. They’re producers facing the same pressures as every other member.

Why did they vote for reductions? Three factors typically converge in these situations.

There’s a fiduciary duty. UK company law—specifically Section 172 of the Companies Act 2006—requires directors to act in the best interest of the enterprise as a going concern. When the cooperative faces potential covenant pressure on significant debt, preserving the business takes legal precedence over maximizing short-term member returns.

Then there’s the volume obligation built into the cooperative structure. Unlike corporate processors who can decline volume, cooperatives generally must accept what members ship. When global supply surges, that milk needs processing—even when margins suffer. Müller’s agriculture director Richard Collins acknowledged this pressure directly in their November announcement: “We’re seeing market price reductions, and daily collection volumes are still significantly higher than they were last year.”

And competitive positioning matters more than many producers realize. Arla UK set December prices at 39.21ppl (down 3.50ppl). Müller moved to 38.5 ppl (down 1.5 ppl). Freshways went to 30.4ppl. If First Milk holds significantly above market while competitors price lower, retailers shift contracts. Volume drops. Fixed processing costs are spread across fewer litres. The trajectory from there becomes concerning.

How One Welsh Family Is Working Through the Numbers

What follows is a composite based on industry figures and conversations with UK dairy advisors—not a specific identifiable operation, but representative of decisions many families are working through right now.

The Morgans milk 165 cows on 200 acres outside Carmarthen. Third generation on the land. Two children—one considering returning to farm after agricultural college, one leaning toward other opportunities.

Their numbers heading into 2026:

  • Monthly production: 114,000 litres
  • First Milk price (January): 32.25ppl = £36,765 revenue
  • All-in production cost: 44ppl = £50,160
  • Monthly gap: Around £13,395

They’re carrying about £340,000 in debt—equipment loans, a 2019 cubicle shed, and an operating line. Their debt-to-asset ratio sits around 45%. DEFRA’s Balance Sheet Analysis suggests that’s actually in reasonable shape compared to many UK dairy operations.

The family has been running scenarios this autumn:

Scale up option: Adding 80-100 cows would require roughly £400,000 in new investment—buildings, livestock, and slurry capacity. At current prices, that creates a larger shortfall with more debt service. They’d need milk to recover to 38-40ppl within three years for expansion to work financially. That’s possible, but far from certain.

Exit option: Cull cow prices are historically strong right now. AHDB’s weekly livestock reports from late 2025 showed deadweight cows averaging well above the five-year average. Land in their area has traded around £8,500/acre recently, according to Farmers Weekly market reports. They could likely clear debt and retain meaningful equity. But three generations of work and the children’s potential inheritance make this more than a financial calculation.

Reduce and reassess: They’re seriously considering culling 25-30 head this winter, generating £40,000-50,000 in cull revenue while beef prices hold. That cuts feed costs immediately and gives 18 months to see how markets develop. It’s not a permanent solution—more of a managed pause that preserves options.

Herd SizeMonthly LitresRevenue @ 32.25pCost @ 43pMonthly LossAnnual Bleed
100 cows68,000£21,930£29,240-£7,310-£87,720
150 cows103,000£33,218£44,290-£11,072-£132,864
200 cows137,000£44,183£58,910-£14,727-£176,724
300 cows205,000£66,113£88,150-£22,037-£264,444
450 cows (Mike Smith)308,000£99,330£132,440-£33,110-£397,320

The son, home for Christmas, asked his father what he thought would happen to UK dairy over the next decade. The response was sobering: “A lot of the farms that are here now won’t be in ten years. The question is whether we’re among those who continue or those who don’t.”

The Global Supply Dynamics Driving These Pressures

This situation feels different from previous dairy downturns—and that distinction matters for how farmers might respond.

The 2015-16 downturn was largely demand-driven. Russia embargoed EU dairy. Chinese buying slowed significantly. When those external factors resolved, prices recovered. This time, pressure is coming from the supply side. That’s more challenging because there’s no single external event to wait out.

Irish milk production increased substantially through 2025. AHDB’s tracking shows January-May 2025 Irish output running 7.6% above the same period in 2024—with March up 8%, April up 13%, and May up 7%. That’s farmers pushing volume ahead of tightening nitrate regulations—an understandable response to policy changes, but one that’s flooding markets with additional supply.

Meanwhile, European production dynamics are complex. USDA’s Foreign Agricultural Service EU Dairy Forecast from February 2025 showed EU milk deliveries forecast to decline marginally by 0.2% in 2025, with low farmer margins and environmental restrictions pushing some smaller producers out. But GB production tells a different story entirely—AHDB’s December 2025 forecast update projects UK milk production for 2025/26 at a record-breaking 13.05 billion litres, up 4.9% from the previous milk year.

The Global Dairy Trade auction results reflect these dynamics. The December 2025 auction saw the index decline 4.3%—the eighth consecutive decline—with butter crashing 12.4% to US$5,169 per tonne. AHDB noted that “increasing global dairy milk supplies and product stocks are weighing heavily on prices currently.”

Global dairy prices have fallen at every single GDT auction since spring, with the steepest hit in November and butter down 12.4% in December. That’s not a storm you ‘ride out’ with a bit of overdraft. It’s a structural oversupply that forces co‑ops to use your milk cheque as the shock absorber.

Independent dairy analyst Chris Walkland offered a stark assessment in late November: some producers could face milk payments between 30 and 35 pence per litre for eight to nine months.

The Brexit Trade Dimension

Everything described so far applies to dairy producers globally. But UK farmers are navigating the same supply environment while operating outside the EU’s single market. That creates additional complexity.

Trade data analyzed by Logistics UK shows UK dairy and egg exports to the EU declined approximately 6% since Brexit. The documentation requirements have proven substantial.

The mechanics are straightforward but add costs. Every dairy shipment to the EU requires export health certificates, veterinary sign-off, and potential border inspections under the sanitary and phytosanitary (SPS) control framework introduced in 2024. An analysis by Stone X noted that “the UK and EU now treat each other as ‘third countries,’ meaning any dairy products moving across the Channel are subject to rigorous SPS checks.”

John Lancaster, head of EMEA and Food Consultancy at Stone X, observed: “Volatility is nothing new for the dairy sector, but the nature of that volatility is evolving. The UK, traditionally a net importer of dairy, has seen strong milk collections in recent months, likely leading to reduced imports in 2025. This elevated supply, combined with administrative barriers to export, has meant that local spot prices can swing more sharply.”

UK dairy exports to the EU have slipped around 6% since Brexit—not because Europe banned our products, but because red tape throttles every truckload. While Irish and Dutch milk moves freely inside the single market, British producers fight the same oversupply with added paperwork drag.

Ireland and the Netherlands face similar global supply pressures. But they operate within the single market—frictionless trade, shared regulations, and access to EU support mechanisms. UK producers are competing with additional administrative and cost burdens that other major producing regions don’t face.

What Successful Adaptation Looks Like

Alongside these challenges, some operations are finding paths forward. The strategies vary but share a common element: reducing pure commodity exposure.

Millbrook Dairy in the West Midlands has developed direct export relationships, particularly targeting Middle Eastern markets where UK cheese commands a premium positioning. According to Dairy Reporter’s coverage from May 2025, the company has faced Brexit, COVID-19, the Red Sea crisis, and US tariffs—but rising global demand for premium cheese and butter has created opportunities for those willing to navigate the complexity.

Several Welsh operations have moved toward organic certification and secured premium contracts. While conventional prices have crashed below 35ppl for some, organic producers continue receiving prices in the upper 50s ppl—First Milk’s organic price remains at 57.95ppl, unchanged from the conventional cuts.

We’re actually seeing similar patterns in North America. Some Upper Midwest producers have moved into farmstead cheese or on-farm processing to capture more margin. A few Ontario operations have built agritourism components that complement their dairy income. These aren’t easy pivots—they require capital, skills, and market access—but they show the “expand or exit” framework isn’t the only path available.

None of these approaches fit every situation. They require specific circumstances and opportunities that vary significantly by region and operation. But they illustrate that other paths exist for those positioned to pursue them.

Questions Worth Asking Your Cooperative

For North American farmers watching the UK situation, there’s practical value in understanding what to monitor closer to home. DFA handles a substantial share of the US milk supply through cooperative structures. Canadian cooperatives like Agropur and provincial marketing boards face similar dynamics when global markets shift.

Having specific questions ready when cooperative leadership presents forecasts or pricing updates can be valuable:

On volume management:

  • Is the cooperative implementing or considering base-excess programs or volume adjustments?
  • What percentage of members are shipping above base allocation?
  • How does the cooperative plan to balance supply if market conditions weaken?

On financial position:

  • What are the cooperative’s current debt covenants, and how much flexibility exists?
  • What milk price level would create covenant concerns?
  • How much of the operating profit comes from processing versus member milk margin?

On forward planning:

  • What price scenarios is management modeling for the next 12-24 months?
  • At what price level would capacity rationalization become necessary?
  • How are competing processors positioned, and what’s the risk of contract shifts?

These aren’t confrontational questions—they’re the kind of information that business owners should reasonably have about enterprises they collectively own.

Indicators Worth Watching

The UK situation offers a framework for what to monitor. Several metrics are worth tracking.

Supply growth provides early signals. USDA’s monthly Milk Production report is the primary source. If year-over-year growth exceeds 3% for six consecutive months, supply is outpacing demand. That pressure eventually reaches farmgate pricing. Wisconsin producers might watch regional production trends particularly closely, given the concentration of cooperative membership in the Upper Midwest.

Futures markets offer forward visibility. CME Class III cheese futures below $17/cwt for extended periods suggest markets are pricing in oversupply conditions. Monthly checks of forward curves provide useful context for planning.

Cooperative communications often signal direction if you listen carefully. When leadership emphasizes “supply balance,” “market alignment,” or “production discipline,” they may be preparing ground for pricing adjustments. Richard Collins at Müller noted they’re “keeping a close eye on supply and demand”—that language often precedes action by 60-90 days.

Cull market conditions indicate exit dynamics. Strong cull prices create exit incentive—but also suggest culling hasn’t reached levels that would meaningfully reduce supply.

When multiple indicators converge, the UK pattern becomes more relevant to local planning.

The Broader Industry Pattern

After three decades in this industry—starting with a Master Breeder operation and later founding The Bullvine—I keep returning to a pattern that deserves direct discussion.

Cooperative commodity dairy, by its structural design, tends to address supply-demand imbalances partly through changes in membership. That’s not necessarily a failing of the model—it’s inherent to how cooperatives function in commodity markets. When global supply exceeds demand, and prices fall below production costs, cooperatives adjust farmgate pricing to maintain processing viability. Those price adjustments create pressure on higher-cost operations. Some exit. Supply eventually contracts. Prices stabilize for continuing producers.

The cooperative continues. Membership consolidates. The cycle continues.

AHDB’s latest survey of milk buyers revealed an estimated 7,040 dairy producers in GB as of April 2025—a loss of 190 producers (2.6%) since the previous year. Against a backdrop of rising volumes, this suggests a continued shift toward fewer, larger farms. Industry exits typically occur during the winter months, before housing and other input requirements rise seasonally.

This isn’t an argument against cooperatives. Their benefits remain genuine—market access, collective bargaining strength, shared risk, and infrastructure investment beyond individual farm capacity. But it does argue for a realistic understanding of what cooperative membership provides. Insulation from global market forces isn’t among those benefits.

Practical Considerations by Situation

For operations with strong balance sheets—debt-to-asset below 40%: This environment may present opportunities. Industry transitions often create acquisition possibilities. Operations that can achieve competitive production costs at scale, with family commitment to a long-term horizon, may be well-positioned for the consolidation ahead.

For operations with moderate leverage—40-60% debt-to-asset: Focus on cash preservation and maintaining flexibility. Cull strategically to generate near-term cash while beef prices remain favorable. Explore loan restructuring while lenders remain accommodating. Develop realistic exit valuations to understand your position. The objective is to navigate 24 months without eroding equity, then reassess.

For operations with higher leverage—above 60% debt-to-asset —the situation requires an honest assessment. At current UK price levels, highly leveraged operations face compounding challenges that can steadily erode equity. Voluntary, well-planned transition while cull and land markets remain favorable often preserves more family wealth than delayed, pressured decisions. That’s a difficult conversation, but an important one.

For all operations: Know your actual cost of production—including properly valued family labor. Understand your cooperative’s financial position and be prepared to ask informed questions. Watch the indicators that might signal your region following similar patterns. And recognize that choosing your timing generally produces better outcomes than having timing determined by circumstances.

Editor’s Note: All pricing data cited in this article comes from official processor announcements and AHDB reports from November-December 2025. Production cost figures reference AHDB, Promar International, and Kite Consulting industry benchmarks. National and regional averages may not reflect your specific operation’s circumstances. We welcome producer feedback and regional case studies for future reporting. Contact: andrew@thebullvine.com

Resources for Ongoing Monitoring:

Key Takeaways

  • 32p milk, 43p costs. First Milk’s January 2026 price leaves most UK producers hemorrhaging cash—£11,000+ monthly on a mid-size herd. The gap isn’t a glitch. It’s global oversupply working exactly as markets do.
  • A farmer voted to cut his own pay. Vice Chairman Mike Smith slashed his milk price by £6,500/month because UK law requires cooperative directors to protect the enterprise first. Fiduciary duty trumps member income when the cooperative’s survival is at stake.
  • Cooperatives manage consolidation—they don’t prevent it. UK dairy shrank from 35,000 farms to 7,000 over thirty years. Cooperative membership provided orderly exits and market access for survivors, not insulation from structural economics.
  • The supply glut is structural, not seasonal. Irish milk up 7.6% through May. GB production at record highs. Eight straight declines in the Global Dairy Trade auction. There’s no external shock to wait out—this is the new baseline until supply contracts.
  • Your turn is coming. DFA, Agropur, and provincial marketing boards face identical cooperative economics. The producers who understand these dynamics now—and position accordingly—will have options when pricing pressure arrives. The rest will have the options the market gives them.

Complete references and supporting documentation are available upon request by contacting the editorial team at editor@thebullvine.com.

Learn More:

  • Decide or Decline: 2025 and the Future of Mid-Size Dairies – This strategic guide targets the “squeezed middle” (700-1,200 cows), outlining three specific survival paths: intended expansion, rigorous optimization, or strategic exit. Essential reading for producers needing to calculate if their debt-to-asset ratio supports the scale required to survive current consolidation trends.
  • Global Dairy Market Dynamics: Navigating Volatility and Strategic Opportunities in 2025 – Expand your understanding of the supply-side pressures mentioned above with this deep dive into 2025 Global Dairy Trade (GDT) indices and regional production forecasts. It provides the broader economic context needed to anticipate price floor movements before they hit your milk check.
  • Digital Dairy: The Tech Stack That’s Actually Worth Your Investment in 2025 – Move beyond buzzwords with this ROI-focused analysis of farm automation and data integration. It demonstrates how integrating specific technologies—like AI-driven feed management—can slash costs by 5-10%, offering a tangible way to protect margins when milk prices fall below production costs.

The Sunday Read Dairy Professionals Don’t Skip.

Every week, thousands of producers, breeders, and industry insiders open Bullvine Weekly for genetics insights, market shifts, and profit strategies they won’t find anywhere else. One email. Five minutes. Smarter decisions all week.

NewsSubscribe
First
Last
Consent

22 of 30: Genosource’s Historic Sweep of the December 2025 US Holstein Genetic Evaluations

73% of the top 30 NM$ bulls. One breeding program. The December 2025 Holstein evaluations just rewrote the genetic playbook.

Executive Summary: The December 2025 US Holstein genetic evaluations expose a seismic shift: Genosource now owns 22 of the top 30 Net Merit bulls—73% of the industry’s elite profit genetics under one roof. GENOSOURCE RETROSPECT-ET defends the #1 NM$ position at $1296, while BEYOND HI-LEVEL-ET commands GTPI at 3612, a 73-point jump that widens the gap at the top. Newcomer SAN-DAN ON CALL-ET exploded onto the scene at #3 GTPI (3574) with production numbers that demand attention: 1845 Milk, 151 Fat, 70 Protein. Type leadership remains locked between SHG LEGO and REDCARPET STORY ARC-ET at 3.85 PTAT, while Red & White genetics surge forward with SIEMERS RLE PAPAYA-RED-ET topping at 3221 GTPI. The consolidation of profitable genetics into a single program isn’t a trend—it’s the new reality, and breeders who adapt their sire selection now will compound this advantage for generations.

December 2025 Holstein evaluations

Dairy breeders and industry professionals, welcome to our analysis of the December 2025 US Holstein Genetic Evaluations. This round of evaluations saw numerous high-ranking newcomers and shifts among the established leaders across the major indices, underscoring the continued rapid turnover in elite genomic performance.

GTPI (Genomic Total Performance Index) Highlights

The December 2025 evaluations present a highly competitive Top 100 GTPI list for bulls over 12 months with NAAB codes, with significant consolidation among the leading bull providers.

Top Movers and Shakers

BEYOND HI-LEVEL-ET maintains its position as the #1 GTPI bull overall, posting a GTPI of 3612. The bull demonstrates strong production credentials with 1121 PTA Milk, 145 PTA Fat, and 59 PTA Protein, combined with a solid Health Index of 6.5.

The top of the list saw considerable shifting:

  • BEYOND SHPSTR GOLLEY-ET made a major move to the #2 position in December, reaching 3605 GTPI. This sire excels with high PTA Fat (147) and strong PTA Type (1.51).
  • SAN-DAN ON CALL-ET (3574 GTPI) enters the top rankings directly at #3. This sire is exceptional for production, yielding 1845 PTA Milk, 151 PTA Fat, and 70 PTA Protein, while also ranking #9 for Net Merit at $1222.
  • OCD TROOPER SHEEPSTER-ET (3572 GTPI) now stands at #4 in the general Top 100 GTPI ranking.
  • PROGENESIS WATCHMAN rounds out the top five at 3568 GTPI.
  • BEYOND HI-PACE-ET secures #6 with 3566 GTPI, adding depth to the Beyond program’s GTPI dominance.

New Sires in the GTPI Top 100

The December 2025 GTPI ranking features numerous exciting new entrants that cracked the Top 100. Key new sires debuting near the top include:

  • S-S-I OLD RICHARD-ET ranks high at #7 with 3553 GTPI
  • S-S-I SIEMERS N MCLAURIN-ET follows closely at #8 with 3549 GTPI, showing impressive PTA Type (1.81) and Udder Composite (1.16)
  • STGEN MAZOR-ET (3539 GTPI) and GENOSOURCE LANDMAN-ET (3537 GTPI) secured the #11 and #12 spots, respectively
  • BEYOND HOORAY-ET also debuts strongly at #13 (3537 GTPI)
  • GENOSOURCE YAGERMEISTER-ET at #16 (3533 GTPI) and OCD SHEEPSTER ROCK-ET at #17 (3528 GTPI)

Net Merit ($NM) Evaluation Overview

The December 2025 Net Merit rankings reveal a seismic shift in genetic leadership that dairy breeders cannot ignore: Genosource bulls now hold an astounding 22 of the top 30 NM$ positions—representing 73% of the elite profitability tier. Even more remarkably, Genosource claims 5 of the top 7 spots, including the #1 position.

This level of concentration is unprecedented in modern Holstein genetics and signals a fundamental change in how profitable genetics are being developed and marketed. The Genosource breeding program has clearly cracked the code on balancing high production with health, fertility, and longevity traits that drive lifetime profitability.

NM$ Leaders

GENOSOURCE RETROSPECT-ET successfully defends its title as the #1 NM$ bull, achieving $1296 NM. This bull also appears at #87 on the GTPI list with a GTPI of 3477, demonstrating balanced genetic merit across multiple selection indices.

The Genosource dominance continues throughout the rankings:

  • 551HO06566 is the #2 NM$ sire at $1274 NM, featuring 2089 PTA Milk and 77 PTA Protein
  • STGEN STUART-ET ranks #3 NM$ at $1250 NM, providing 1666 PTA Milk, 145 PTA Fat, and 71 PTA Protein
  • GENOSOURCE MIKAIL-ET holds the #4 NM$ position with $1246 NM
  • GENOSOURCE ELVIS-ET at #5 with $1245 NM
  • GENOSOURCE VAMOOSE-ET at #6 with $1231 NM
  • GENOSOURCE ENDURANCE-ET at #7 with $1227 NM

Production Powerhouses in the NM$ Rankings

Many of the top NM$ bulls exhibit high combined Fat and Protein (CFP) figures, which are vital for milk component revenue. Notable examples include:

  • GENOSOURCE BENCHMARK-ET (NM $1207, #11) boasts the highest CFP among the top NM sires at 228
  • SAN-DAN ON CALL-ET, ranking #9 NM$ with $1222, delivers 221 CFP from 1845 PTA Milk
  • GENOSOURCE YUPPIE-ET (#27 NM$) showcases extreme production at 2662 PTA Milk, ranking high despite challenging functional traits, including Productive Life of -0.3 and Daughter Pregnancy Rate of -3.0

PTAT (Prediction of Transmitting Ability for Type) Focus

The December 2025 PTAT list features sires that transmit superior conformation and functional type.

PTAT Top Performers

The top two sires continue their dominance:

  • SHG LEGO remains #1 with 3.85 PTAT
  • REDCARPET STORY ARC-ET holds #2 with 3.85 PTAT

For breeders prioritizing show ring success or building maternal lines with exceptional udder quality, the stability at the top provides confidence—these proven type transmitters aren’t going anywhere. No emerging challenger has broken 3.75 PTAT, meaning the path to elite conformation genetics remains clearly defined.

Key Shifts and New Additions in the PTAT Top 50

  • STONE-FRONT EYECANDY APOLLO holds steady at #3 with 3.73 PTAT
  • GENOSOURCE SEENOFEAR-ET is a new, high-ranking entrant at #4 with 3.70 PTAT
  • ESKDALE HULU SHOUTOUT-ET (3.59 PTAT) secured the #8 spot
  • LAND-PRIDE UNBEATABULL-ET debuts at #19 with 3.38 PTAT
  • DG SANTINUS RC is a high-ranking newcomer at #20 (3.37 PTAT)
  • LE-O-LA CHISEL-ET secured #27 (3.30 PTAT)
  • COLDSPRINGS LAURENT 9901-ET debuted at #47 (3.14 PTAT)

Red Carrier and Red & White Genetic Leaders

Red Carrier (RC) GTPI

The Red Carrier list shows strong genetic progress at the elite level:

  • S-S-I SIEMERS FALCIFORM-ET maintains the #1 RC GTPI position at 3353, demonstrating a strong Health Index (5.8) and high Daughter Pregnancy Rate (DPR 2.1)
  • OCD DOMINANCE SUNDAY-ET holds steady at #2 with 3315 GTPI
  • The newcomer 551HO06476 enters at #3 (3302 GTPI)
  • New sires penetrating the Top 50 include 582891323034-ET (#5, 3276 GTPI) and STGEN GUDO P-ET (#7, 3264 GTPI)

Red & White (R&W) GTPI

The R&W GTPI rankings remain dynamic with multiple new entrants:

  • SIEMERS RLE PAPAYA-RED-ET is the #1 R&W GTPI bull at 3221 GTPI
  • DENOVO 21873 OKAFOR-RED-ET debuts strongly at #2 (3220 GTPI)
  • STGEN OCEAN-RED-ET is the #3 R&W GTPI bull at 3198 GTPI
  • GENOSOURCE MORRIS-RED-ET holds the #9 position at 3164 GTPI
  • New sires APRILDAY ORPH LYON-RED-ET (#5, 3182 GTPI) and STGEN RED LION-ET (#7, 3166 GTPI) mark strong debuts

The 391-point gap between SIEMERS RLE PAPAYA-RED-ET (3221) and BEYOND HI-LEVEL-ET (3612) represents the closest Red & White genetics have come to elite black & white performance in recent memory—a milestone that validates years of focused colored cattle breeding.

Red Carrier and R&W PTAT

In the Type rankings for colored cattle, REDCARPET STORY ARC-ET remains the dominant sire, leading the combined R&W and Red Carrier PTAT list at 3.85 PTAT. Other notable performers include:

  • ESKDALE HULU SHOUTOUT-ET makes a powerful entrance at #2 with 3.59 PTAT
  • DG SANTINUS RC debuts at #3 with 3.37 PTAT
  • LE-O-LA CHISEL-ET debuts at #5 with 3.30 PTAT
  • SKI-BRITE JOEL-RED-ET debuts in the Top 50 at #43 (2.66 PTAT)

The Bottom Line

This consolidation of profitable genetics demands a strategic response. Review your current sire lineup against these rankings and ask: Does your genetic strategy align with where profitability is actually being generated? Whether you prioritize NM$, GTPI, type, or colored genetics, the December 2025 evaluations provide clear direction—and clear leaders—in every category.

Key Takeaways

  • Profit genetics monopolized: Genosource captures 22 of 30 top Net Merit positions—73% of the industry’s most profitable sires now come from one program, led by RETROSPECT-ET at $1296
  • GTPI leadership extends: BEYOND HI-LEVEL-ET dominates at 3612; newcomer SAN-DAN ON CALL-ET explodes to #3 (3574) with 1845 Milk, 151 Fat, and dual ranking at #9 NM$
  • Type titans hold firm: SHG LEGO and REDCARPET STORY ARC-ET lock the PTAT summit at 3.85—no emerging challenger breaks 3.75
  • Red & White within striking distance: SIEMERS RLE PAPAYA-RED-ET reaches 3221 GTPI, closing the gap to just 391 points behind the #1 overall bull

Complete Lists:

Data source: Council on Dairy Cattle Breeding (CDCB), December 2025 genetic evaluations. All rankings reflect bulls with NAAB codes over 12 months.

The Sunday Read Dairy Professionals Don’t Skip.

Every week, thousands of producers, breeders, and industry insiders open Bullvine Weekly for genetics insights, market shifts, and profit strategies they won’t find anywhere else. One email. Five minutes. Smarter decisions all week.

NewsSubscribe
First
Last
Consent

Wisconsin Proves It: Processed Alfalfa Adds $30K/Year – But Execution Is Everything

$30K/year from processed alfalfa. Wisconsin proved it. This tech rewards discipline—and punishes wishful thinking.

EXECUTIVE SUMMARY: Wisconsin researchers just proved what skeptics doubted: mechanically processed alfalfa silage can add $30,000/year to a 100-cow operation. But here’s what separates farms that profit from farms that waste money. The September 2024 Journal of Dairy Science study documented 1.5 kg/day more energy-corrected milk and 5.8% better feed efficiency—that’s $29,000-30,000 in milk revenue plus $8,600 in feed savings annually. The catch is straightforward but unforgiving: this only works on quality forage under 45% NDF. Process weather-damaged hay over 50% and you’re burning cash, not saving it. This technology rewards disciplined managers and punishes wishful thinking—farms already hitting quality targets see full returns, while those struggling with harvest timing need to solve that problem first. No technology rescues poor execution. Start with custom processing at $3/ton, book your operator by March, and let your own numbers make the final call.

Here’s what’s interesting: New research from Wisconsin shows mechanically processed alfalfa silage can boost energy-corrected milk by 1.5 kg per day and improve feed efficiency by nearly 6%. But the real story? It only works if your operation can handle the logistics.

At a Glance:

  • Milk production gain: 1.5 kg ECM/day per cow
  • Annual revenue increase: $29,000-30,000 (100 cows)
  • Processing cost: $3/ton custom hire or $50-75K equipment
  • Feed efficiency improvement: 5.8% less DMI for the same production
  • Break-even: Immediate with custom hire; 3.5 years with ownership
  • Quality threshold: Process only if NDF < 45%
Wisconsin nailed it: Mechanically processed alfalfa blows past traditional in every metric—if you nail the forage quality. That 12-point NDF digestibility jump and 1.5 kg ECM day? That’s real, documented by UW research.

You know, we’ve been making alfalfa silage the same way for generations—cut it, wilt it, chop it, pack it. Works fine, right? But what I’ve been following closely is this fascinating work coming out of the University of Wisconsin-Madison that might actually change how we think about forage processing.

The researchers up at the Dairy Forage Research Center in Prairie du Sac tracked 36 mid-lactation Holsteins over six weeks, and what they found in this September’s Journal of Dairy Science really caught my attention. They’re showing that mechanically processed alfalfa silage improved neutral detergent fiber digestibility from about 40% to nearly 52%. That’s almost a 12-point jump—and you don’t see that kind of improvement very often in forage research.

Here’s what’s really encouraging: The milk fat content went from 3.81% to 3.93%, and feed efficiency—that’s your energy-corrected milk per kilogram of dry matter intake—climbed by nearly 6%.

Matt Pintens, who led the research team, put it perfectly when he said they were “seeing cows do more with less.” The processing level index—that’s basically how much the cell walls get ruptured—jumped from about 38% with our conventional chopping up to 74% with mechanical processing. That’s a huge difference in how accessible that fiber becomes to the rumen bugs.

For a typical 100-cow operation here in the Upper Midwest, we’re talking about an additional $29,000 to $30,000 in annual milk revenue, based on what USDA’s reporting for current Class III prices around $19-20 per hundredweight. But here’s the thing—and this is where it gets interesting for those of us actually farming—it only works if you can execute the logistics properly.

How This Processing Actually Changes Things

Let me walk you through what’s happening at the cellular level, because it helps explain why this matters so much. When we chop alfalfa the traditional way, those cell walls stay mostly intact. You’ve got your cellulose, hemicellulose, and lignin all locked up tight, and even the best rumen microbes struggle to break through. The folks at Michigan State Extension have been documenting this for years—up to half the structural fiber in conventional silage can pass right through the cow undigested.

What mechanical processing does—and specifically, we’re talking about using a screenless hammermill after the alfalfa’s wilted in the field—is physically rupture those cell walls. The hammers essentially shred and fiberize the stems, creating way more surface area.

Dave Combs, the emeritus professor down at Madison, has this great way of explaining it: “Think of it like trying to dissolve a sugar cube versus granulated sugar—same material, but one dissolves immediately because of surface area.” That’s exactly what we’re doing for those rumen microbes.

The Wisconsin research documented faster fermentation, higher volatile fatty acid production—especially acetate, which you know is crucial for butterfat—and just more efficient energy extraction from the same amount of feed.

What really surprised me in their behavioral data was this: Cows fed the processed silage spent 49 more minutes lying down every day. They went from 751 minutes to 800 minutes of lying time. And their eating time? Dropped from 282 to 253 minutes daily. They’re eating more frequent but shorter meals—about 9.6 meals a day, averaging 27 minutes, compared to about nine meals averaging 32 minutes on conventional silage.

The Economics: When It Pencils Out (And When It Doesn’t)

Boost herd revenue by $30k with mechanical alfalfa processing. Wisconsin research reveals the NDF thresholds and logistics required for 5.8% better efficiency.

Tom Harrison, a nutritionist who’s been working with farms up in Vermont on this technology. Shares that “The economics are compelling, but only if you can execute the logistics.”

Quick Math for a 100-Cow Herd

Here’s what the Wisconsin study is showing:

  • Energy-corrected milk increase: 1.5 kg/day per cow
  • Annual production gain: 54,750 kg ECM for the whole herd
  • Butterfat yield increase: 2,920 kg annually

Based on what we’re seeing for component pricing this November, you’re looking at:

  • Conservative scenario ($19/cwt Class III): $29,233/year
  • Moderate scenario ($19.50/cwt with butterfat strength): $29,842/year
  • Optimistic scenario ($20/cwt with Class IV premium): $30,450/year

Custom Hire vs. Ownership: Breaking It Down

Processing OptionInitial InvestmentAnnual CostNet Benefit (100 cows)Break-Even Point
Custom Hire$0$600 (200 tons @ $3/ton)$28,600-29,850/yearImmediate profit
Equipment Ownership$50,000-75,000$7,750 (depreciation + maintenance)$21,450-22,700/year3.5-3.7 years
Co-op (3 farms)$17,000-25,000 per farm$2,600 per farm$26,600-27,850/year1.5-2 years

The Wisconsin Custom Rate Guide released this year shows custom processing at about $3 per ton. Now, in Wisconsin and Minnesota, you’ll find maybe 5-7 custom operators total. Eastern states typically have 1-2, while California’s Central Valley has 3-4, mostly concentrated near the major dairy regions. Beyond these regional operators, your state’s custom harvester association often maintains updated lists—definitely worth checking before harvest season.

I talked with John Martinez, who’s milking 120 cows near Tulare. He went the ownership route last year. “We figured with our harvest schedule and doing 300 tons of alfalfa annually, ownership made sense,” he told me. “But honestly, if I was doing less than 200 tons, I’d stick with custom hire.”

What often gets overlooked—and this is important—is the feed efficiency bonus. The Wisconsin study documented that 5.8% improvement in efficiency. For a herd eating 2,730 kg of dry matter daily, that’s 57,794 kg less dry matter consumed annually for the same production. With what the USDA’s Hay Market Report is showing for alfalfa values around $150 per ton dry matter, that’s another $8,669 in annual savings. That’s real money.

Quality Matters: Where Processing Shines and Where It Doesn’t

This is crucial, and the Wisconsin researchers were very clear about it: processing benefits vary dramatically depending on your starting forage quality.

You know, I’ve noticed farmers sometimes think processing can save a poor cutting. It can’t. Here’s what the data from Wisconsin and Extension research is showing:

How Different Quality Levels Respond

Premium first-cut (38% NDF, 72% NDF digestibility): This is your sweet spot. Processing takes digestibility from 72% up to around 81%—that’s the full benefit shown in the research, worth $30,000+ annually for a 100-cow herd.

Good first-cut (40% NDF, 68% NDF digestibility): Still excellent. You’re looking at digestibility jumping to 76%, with returns of $28,000 to $29,000 annually.

Marginal quality (42-45% NDF, 58-64% NDF digestibility): This is where many of us end up when rain delays harvest by a week. Processing still helps—digestibility improves to around 64-72%, generating $20,000 to $24,000 in value. It’s viable, but you’ve got to watch your costs.

Poor quality (50%+ NDF, less than 45% NDF digestibility): Here’s where processing hits a wall. You might see digestibility improve from 45% to maybe 49%, but that’s only worth $8,000 to $12,000 annually. Often not worth the processing cost.

As Dan Undersander, the forage specialist emeritus at Wisconsin, explains it: “The lignin content is the limiting factor. Once lignin hits 7-8% of dry matter—which happens in overmature or weather-damaged alfalfa—mechanical processing can’t overcome that biochemical barrier.”

Sarah Chen, who runs 200 cows over in Idaho, learned this the hard way. “We tried processing some rain-damaged first cut that tested at 52% NDF,” she told me. “Complete waste of money. Now we only process cuts under 45% NDF, and we segregate anything over that for the dry cows.”

Implementation: What’s Actually Working on Farms

After talking with extension specialists and farmers who’ve tried this technology, I’ve identified three make-or-break decisions:

Decision 1: How Will You Access Processing?

The biggest mistake I see? Farmers are waiting until June to start looking for a custom operator for the July harvest. By then, everyone’s booked solid.

Mark Olson at Minnesota Extension puts it bluntly: “If you want custom processing, you need to lock in an operator by March, period. Most regions only have one or two operators within 50 miles.”

Progressive Forage’s survey this year confirmed that custom operators in the Upper Midwest are typically booked 4-6 weeks in advance during peak season. And here’s something to consider—weather delays affect everyone at the same time. When your harvest is pushed back by rain, so is everyone else’s.

Decision 2: What Will You Actually Process?

Not everything needs processing. This surprised me when I first looked at the economics, but it makes perfect sense.

For a typical 100-cow operation producing maybe 200 tons of alfalfa silage annually:

  • First-cut at optimal quality (40-42% NDF): Process 80-100 tons
  • Second-cut (typically 35% NDF already): Skip it—it’s already high quality
  • Weather-delayed or poor cuts: Segregate for dry cows, don’t process

Jim Walsh, who milks 85 cows in Pennsylvania, has this figured out: “We only process our best first-cut, maybe 60 tons out of 180 total. Second and third cuts are already leafy enough. And anything that gets rained on? That goes to the heifers.”

Decision 3: How Will You Feed It?

This is where many farms stumble. You can’t just dump processed silage in with everything else and expect magic to happen.

The farms seeing the best results are those that can segregate. Lisa Thompson in New York dedicates her processed silage to her 25-head fresh cow group. “They’re the ones that need the highest quality feed, and they’re easiest to track for milk response,” she explains. “Within two weeks of starting on processed silage, our fresh group’s milk fat test jumped from 3.75% to 3.91%.”

Your Practical Timeline

Based on what’s worked for successful adopters I’ve interviewed, here’s a realistic timeline:

December-January (Right Now):

Start making those calls. Contact your current forage chopper about processing capabilities. Call your Extension office—they often know who’s running hammermills in your area. Here are the numbers if you need them:

  • Wisconsin: UW-Madison Forage Team at (608) 263-2890
  • Minnesota: University of Minnesota Forage Program at (612) 625-8700
  • Pennsylvania: Penn State Forage Specialist at (814) 863-0941
  • New York: Cornell PRO-DAIRY at (607) 255-4478
  • Other states: Check www.foragenetwork.org/state-contacts

Pull your harvest records from the last couple of years. When did you actually cut? What quality did you achieve? Be realistic about your typical harvest windows.

February-March:

Lock in your custom operator. Get the rate in writing—the Wisconsin Custom Rate Guide shows $2.50 to $3.50 per ton is typical. Specify your target processing level—you want a PLI of 70+ for this to work right.

Tom Harrison advises: “Don’t just say ‘process my alfalfa.’ Specify moisture targets, processing intensity, and get a commitment on timing.”

April-May (Pre-Harvest):

Get baseline measurements. Pull forage tests on your current conventional silage. Document current milk fat percentages and component levels. You need this data to prove whether processing works on your farm.

Plan your storage. Where will processed silage go? Can you keep it separate? Even just using a different bag or dedicating one section of your bunker makes tracking easier.

Being Honest About What We Don’t Know Yet

I think it’s important to be transparent here. The Wisconsin study, while rigorous, was a single trial, conducted at a single location, with 36 cows over six weeks. That’s solid science, but it’s not the whole story.

Dave Combs acknowledges this: “We need multi-year, multi-location data. We need to see how this performs in different climates, with different alfalfa varieties, especially the new reduced-lignin genetics.”

What we don’t know yet:

  • How processing performs with low-lignin varieties like HarvXtra or Nexgrow
  • Long-term effects beyond the six-week study period
  • Performance in large freestall operations with 500+ cows
  • How results vary between spring versus fall cuttings

As Harrison puts it, “I’d love to see data from California’s Central Valley versus Wisconsin versus the Maritime provinces. Different climates, different harvest patterns—will the results hold?”

Making the Decision: Who Should Jump In?

After reviewing all the research and talking with farmers who’ve tried this, here’s my take:

You should seriously consider processing this season if:

  • You consistently harvest first-cut alfalfa at 40-45% NDF or better
  • You have a reliable custom operator available (or 200+ tons annually to justify ownership)
  • You can segregate processed silage in storage
  • You track milk components and feed quality regularly
  • Current butterfat premiums in your market exceed $0.30/cwt

You should probably wait if:

  • Your typical first-cut runs 48%+ NDF due to weather delays
  • You can’t segregate storage or feeding groups
  • You’re switching forage contractors frequently
  • You don’t have systems to measure milk component response

Rick, who farms 150 cows in Minnesota, put it well: “This technology is like buying a better corn planter. It only helps if you can plant on time and manage the crop properly. Same with processing—it amplifies good management but can’t fix poor execution.”

What’s interesting is that farms already doing a good job with forage quality see the biggest absolute benefit. If you’re hitting 40% NDF consistently, processing can take you to the next level. If you’re struggling to get below 48% NDF, you’ve got bigger problems to solve first.

The research from Wisconsin is compelling, and the early farm adoptions I’m seeing suggest the benefits are real. But like any technology, success depends more on implementation than innovation. Start small, measure everything, and let your own data guide your decisions.

As one Extension specialist told me—and I think this really nails it—”The best farms aren’t the ones with the most technology. They’re the ones that can execute the technology they have.”

For those ready to take the next step, mechanical processing of alfalfa silage represents a genuine opportunity to improve feed efficiency and milk components. Just make sure you’re ready to execute the logistics before you commit to the technology.

For more information on mechanical processing research and custom operator listings, contact your state Extension forage specialist or visit the U.S. Dairy Forage Research Center website at www.ars.usda.gov/midwest-area/madison-wi/us-dairy-forage-research-center/

KEY TAKEAWAYS

  • $30K/year is verified science: Wisconsin’s September 2024 Journal of Dairy Science study documented a 1.5 kg/day increase in ECM and 5.8% better feed efficiency. For 100 cows, that’s $29,000-30,000 annually—plus $8,600 in feed savings.
  • Only quality forage pays off: Processing boosts digestibility 12 points on premium first-cut (40% NDF). Above 50% NDF? Save your money—lignin wins, and you lose.
  • Custom hire beats ownership for most: $600/year custom vs. $7,750/year ownership. Same result, zero equipment risk. Only consider buying at 200+ tons annually.
  • This rewards good managers, not bad ones: Farms already hitting 40% NDF get the full benefit. Still struggling past 48%? Fix your harvest timing before buying technology.
  • March deadline—call this week: Most regions have 1-2 custom operators who book solid 4-6 weeks ahead. Contact your Extension office now, or you’re sitting out 2026.

Complete references and supporting documentation are available upon request by contacting the editorial team at editor@thebullvine.com.

Learn More:

The Sunday Read Dairy Professionals Don’t Skip.

Every week, thousands of producers, breeders, and industry insiders open Bullvine Weekly for genetics insights, market shifts, and profit strategies they won’t find anywhere else. One email. Five minutes. Smarter decisions all week.
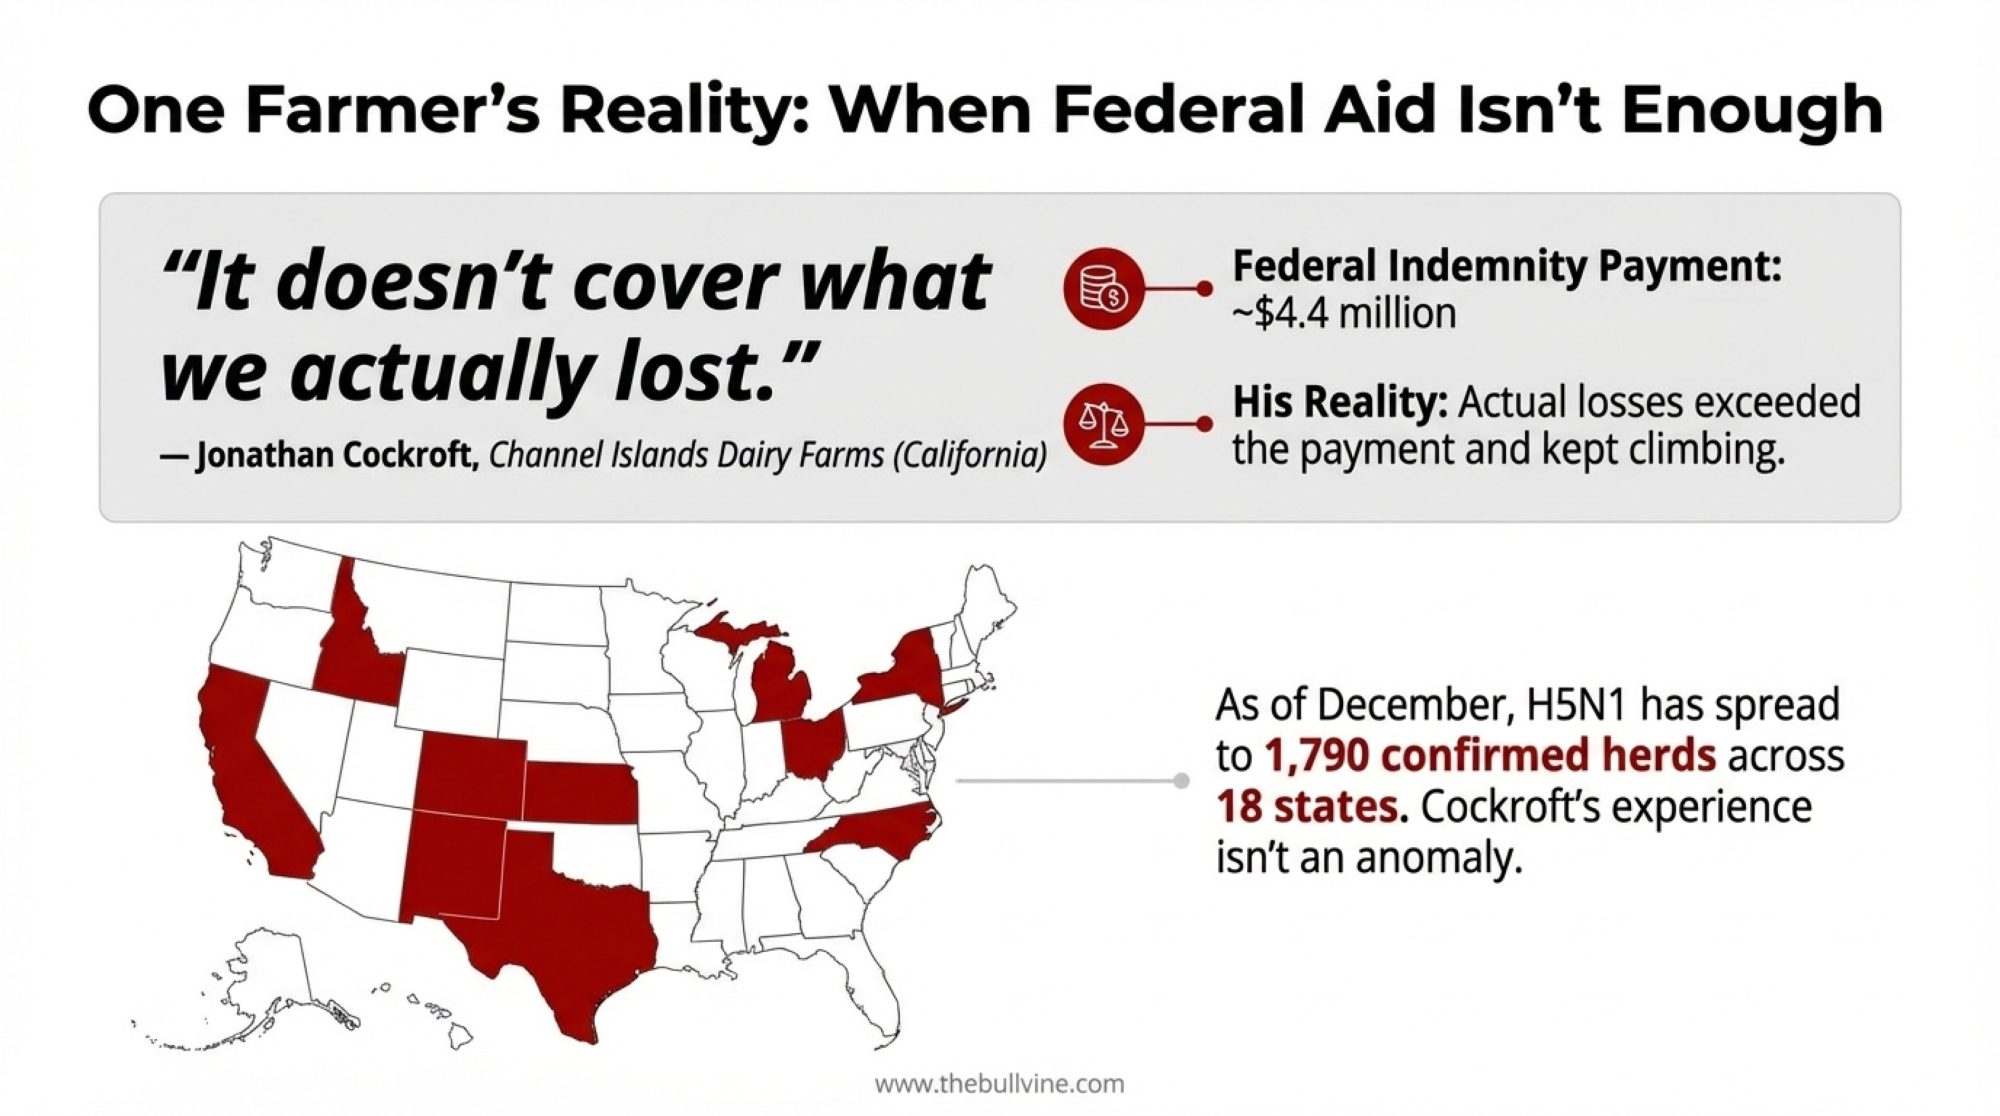
NewsSubscribe
First
Last
Consent

Water Excellence Is Table Stakes – Market Position Is the Game

California: No water to buy. Wisconsin: Can’t spread when you need to. Texas: Just add cows. Geography is destiny in dairy.

Dairy Water Management

Executive Summary: Water management has shifted from competitive advantage to survival requirement—but paradoxically, excellence alone won’t save your farm. As California’s SGMA eliminates up to one million irrigated acres by 2040 and drives $2.2 billion in feed cost impacts, the industry is discovering that breeding for feed efficiency reduces water footprint more dramatically than infrastructure improvements. Meanwhile, consolidation has concentrated 65% of milk production in 1,000+ cow operations, where scale economics overcome any efficiency gains smaller farms achieve. Yes, that $180 valve fix, saving a million gallons, matters, and UC Davis’s smart soaking systems, cutting water use by 86%, are revolutionary—but only if you have market access and verification infrastructure to monetize sustainability, which drives 1.7% higher sales growth. The uncomfortable truth: water optimization is your entry fee to stay in business, while genetics, scale, and secured buyer relationships determine whether you’re still milking cows in 2035.

You know, sitting here thinking about where we’ve ended up with water management, it’s pretty remarkable how fast things have shifted. Just a couple of years ago, we were mostly talking about upgrading plate coolers and fixing leaky valves. Now? Water’s become this baseline competency that basically determines who’s still milking cows five years from now. But here’s what keeps me up at night—and maybe you’ve been thinking this too—water excellence alone won’t save your operation. The farms that survive the next decade? They’re the ones who’ve figured out market access, understood their regional water reality, and locked in the right scale or specialty positioning. That’s the uncomfortable conversation most of us are having over coffee these days.

Why This Matters Now (Even Though It Won’t Save Us by Itself)

So here’s what’s driving all this. Out West, you’ve probably heard about SGMA—California’s Sustainable Groundwater Management Act—, and it’s systematically pulling irrigated acres out of production. The Public Policy Institute of California (PPIC) projects that one-fifth of irrigated acreage in the San Joaquin Valley will go offline by 2040. We’re talking somewhere between 500,000 and nearly a million acres getting fallowed, with counties like Kern, Tulare, and Fresno taking the worst of it. And you know what? That’s not a drought we can wait out. That’s permanent structural change in how we access water for growing feed.

What’s encouraging, though—and this caught my attention in the latest McKinsey research with the dairy executives—is that products marketed as sustainable are growing sales at a rate 1.7 percentage points higher than conventional products—accumulating 28% total growth versus 20% over the last five-year cycle. So when farms can credibly verify and tell their water story, the market responds. That’s real money sitting there.

What I’ve found talking to producers across different regions is that these two realities—the physical water limits out West and these measurable market rewards for doing sustainability right—they’re completely redefining what “good water management” even looks like. And it’s not the same everywhere, which is something we all need to understand better.

The Four-Stage System We’ve All Settled On (And Why It Actually Works)

Here’s what’s interesting about where most progressive operations have landed—and maybe you’re already doing this. We’ve pretty much standardized on this four-stage cascade that gets every drop working multiple times. You start with clean cold water to plate-cool the milk, then capture that warmed water for sanitizing equipment, move it to barn cleaning, and finally, that nutrient-rich effluent goes out to irrigate feed crops.

UC Davis laid out the science on why that first stage—the plate cooler—is such a workhorse. The countercurrent heat exchanger pulls heat out way more efficiently than relying only on bulk tank refrigeration. And when you capture that warmed water for the next job, you’re essentially getting free preheating for your sanitation cycle. Pretty slick when you think about it.

What’s also catching attention—especially for those of us dealing with summer heat—is the innovation happening in cow cooling. UC Davis has been running trials showing ‘smart soaking’ systems—which rely on sensors to spray only when cows are present—that cut cooling water use by up to 86% while also dropping energy use. In those Central Valley operations where it’s triple digits all summer, that’s huge. The field results suggest you can maintain cow comfort with targeted, intermittent cooling, using a fraction of the energy traditional systems require.

Now, the technical playbook for all this is proven and honestly not that expensive—we’re talking $3,000 to $5,000 for basic improvements on a 200-cow dairy. But here’s the thing we need to be honest about: doing this well in 2025 is table stakes. It’s not your winning strategy by itself anymore.

The Genetics Piece Nobody’s Talking About (But Should Be)

While we’re all focused on plumbing and plate coolers—and those matter—we can’t ignore the cow herself. You probably know this already, but feed production accounts for the lion’s share of our water footprint, especially when we irrigate alfalfa and corn silage. So, the fastest way to cut water use? Breed a more efficient cow that needs less feed to make the same pounds of fat and protein.

That’s why we’re seeing such rapid uptake of feed efficiency indices. Feed Saved, which the Council on Dairy Cattle Breeding publishes, is fascinating—it combines residual feed intake with body weight composite to tell you expected pounds of feed saved per lactation. Higher is better, obviously. It’s our first national evaluation that directly targets feed efficiency in dairy cattle, and the logic is pretty straightforward: cows delivering the same components on less dry matter need fewer irrigated acres behind them.

We’re also seeing proprietary indices like EcoFeed gaining traction, with independent trials showing real improvements in feed conversion on participating herds. The direction is clear—if you’re selecting sires today, you want high feed efficiency and moderate mature size. That cuts your feed needs for both maintenance and production, freeing up water without sacrificing butterfat performance.

I’ll be direct here: if water efficiency isn’t part of your sire selection today, you’re basically locking in higher resource costs for the next three generations of cows. That’s a long time to be on the wrong side of this trend. And with the current heifer shortage limiting expansion options, genetic progress becomes even more critical for improving efficiency within your existing herd size.

Regional Realities (Because California’s Crisis Isn’t Wisconsin’s Challenge)

Looking at this across regions, what’s become clear is that we’re not all dealing with the same problem.

Out in the Southwest, it’s all about quantity. SGMA enforcement is fundamentally a water-access story more than a parlor-efficiency story. The PPIC figures that about one-fifth of Valley irrigated acres could be gone by 2040, which flows straight into feed costs. California’s dairy and beef sectors are looking at impacts of about $2.2 billion by 2040, mostly through higher feed costs as those acres go offline.

Ryan Junio, who runs 4,200 Jerseys over in Pixley, put it pretty bluntly: “As a dairy producer, this is an ever-growing challenge and is my top concern.” And he’s not worried about some future problem—he’s looking at potential 50% groundwater cuts in the next couple of years. For operations like his, “good” water management means securing allocations, maybe tapping recycled municipal water, definitely diversifying feed sourcing, including outside the basin.

Now, flip over to the Northeast and Upper Midwest—completely different game. Water’s abundant, sometimes too abundant. The focus is solely on protecting groundwater and surface water from nutrient pollution. Wisconsin’s SnapMaps system, for instance, doesn’t care about your gallons per cow. It maps where you can spread manure based on soil vulnerability and groundwater flow.

Jim Risser, who farms 700 acres in Pennsylvania’s Susquehanna watershed, explained it well: keep fields planted and vegetated, and you’re creating a natural filter before water hits the streams. His operation maintains vegetation cover for about 50 weeks a year, specifically to improve water quality.

In those Midwest operations with sandy soils and shallow water tables, storage capacity and timing become everything. Producers there are investing heavily in concrete storage and injection equipment—not to save water, but to protect it. The April spreading windows that used to work don’t anymore with our changing weather patterns.

Market Signals That Are Reshaping Everything

Three things are steering every water investment decision I’m seeing in 2025:

First, these structural constraints aren’t temporary. SGMA’s glide path and surface flow rules will idle acreage regardless of how efficient any single farm gets. That repricing rations everywhere—not just in California—because the West supplies a huge chunk of U.S. dairy production.

Second, sustainability has become a baseline. McKinsey’s latest survey found it dropped from executives’ “priority” lists, but not because it matters less—it’s because 84% of companies already have programs running. Still, that cumulative growth advantage for sustainable products? That keeps everyone’s attention.

Third, the innovation pipeline is now all about water performance. Those UC Davis smart-soaking trials showing up to an 86% reduction? They’re attracting serious interest from operations where summer cooling can run $20,000 to $30,000 monthly when the heat really sets in.

What Actually Works (The Practical Toolkit)

Here’s something you can literally do tomorrow for zero cash outlay (just 20 minutes of your time). Grab a 20-liter bucket and a stopwatch. Time how long does it takes to fill that bucket at your plate cooler discharge. Do the same at your wash hoses, alley flush lines. Now you’ve got flow rates. During a full milking, track how long each run lasts. Multiply it out. You’ve just mapped your water use by process, and I guarantee you’ll find surprises.

In Wisconsin operations, audits often reveal that yard wash varies by 15 gallons per cow or more between morning and afternoon milkings. Usually, it’s a sticky valve, or someone changed protocols seasonally and forgot to change back. Cost to fix that sticky valve? Often less than $200 for a plumber, or $20 for parts if you do it yourself. If that saves 15 gallons per cow per day year-round on a 200-cow dairy, you’re looking at roughly 1,095,000 gallons saved annually. Even if it’s just during the 165 hot days when you’re doing heavier yard washing, that’s still about 495,000 gallons. Either way, the math gets impressive fast.

From there, your biggest return is completing that reuse loop. Capture plate-cooler water—it’s already done its cooling job—route it to equipment cleaning, then to barn washing, and finally to irrigation. Every progressive operation I know runs some version of this.

💧 WATER SAVINGS QUICK WINS

Things you can do this month that actually matter:

  • Fix those leaky valves – Usually $50-200 for repair; saves 10,000-50,000 gallons yearly, depending on how bad the leak is
  • Install trigger nozzles – About $400-600 total; typically cuts parlor water 15-25% just by eliminating continuous flow
  • Adjust cooling timers or sensors – $400-600; can reduce cooling water up to 70% when tied to cow presence and actual heat load
  • Capture plate-cooler water – $500-1,500 in basic plumbing; recovers 50-70% of your cooling water for the next job

The Follow-Through Problem We Don’t Talk About

Let’s be honest about something. Most of us don’t struggle to start these projects—we struggle to keep going when fresh cows start coming hard, feed prices jump, or we lose a key employee. That’s why those cooperative and processor programs actually matter. They provide benchmarking, third-party verification, and—this is key—those quarterly check-ins that keep us honest.

The industry tracking shows farms in structured programs maintain their measurement discipline at 3 to 4 times the rate of farms trying to go it alone. That’s the difference between having a good idea at a conference and actually improving your operation.

Making Water Performance Mean Something to Consumers

The data suggests consumers really do reward credible stewardship—that 28% versus 20% growth differential over five years is real money. But only when they can understand and trust what you’re claiming.

Try framing it like this: “Our 200-cow dairy saves about half a million gallons annually—that’s enough water for roughly 35 families for a year.” People get that. Then explain the cascade simply: “The water that cools our milk then cleans our equipment, flushes our barns, and finally irrigates our crops with captured nutrients.”

And always, always anchor it to third-party verification—whether that’s your co-op’s sustainability report or your processor’s benchmarking program. Verified beats vague every single time.

The Uncomfortable Truth About Who Survives

I’m going to say the quiet part out loud here, because I think we owe each other honesty. Water excellence won’t overcome structural gaps in market access and scale. Consolidation has shifted most milk to bigger operations—about 65% now comes from herds over 1,000 cows—and that percentage keeps climbing.

In the West, SGMA will reduce irrigated acres regardless of your parlor efficiency. In the Northeast, nutrient rules are a manageable cost if you plan ahead. But everywhere, the farms positioned actually to thrive tend to fit three profiles: larger herds with committed buyers and capital; regional operations embedded in verified sustainability programs; or specialty producers—organic, regenerative, grass-fed—with contracts that support the extra cost of certification and long-term measurement.

Water management is a baseline competency now. Important? Absolutely. But it’s not the differentiator by itself.

What California’s Teaching the Rest of Us

California’s showing us all a preview of water-constrained dairying. UC Davis and the state energy folks are deploying cooling tech that cuts both water and energy use. It’s promising stuff. But even with those wins, SGMA-driven acreage losses keep feed pressure high.

A Central Valley nutritionist I know recently told me, “We’re completely reworking our rotations, partnering with growers outside the basin, even bringing in more feed from the Midwest. The efficiency helps, but feed sourcing is the real challenge now.”

And this is where that breeding piece pays off—higher feed efficiency and moderate cow size reduce the feed needed per unit of fat and protein you’re shipping. It all connects.

Your Action Plan (Because We All Need One)

I know you’re juggling all this alongside transition cows, labor issues, trying to hold butterfat levels, maintaining drylots—everything that makes dairy farming what it is. The key is starting somewhere. Even that bucket-and-stopwatch audit gives you a baseline.

Today (20 minutes of time): Map those flow rates and run times. Build your baseline.

This month ($500-3,000): Fix the obvious stuff—leaks, oversized nozzles, cleaning protocols that run too long.

This quarter ($5,000-15,000): Complete your reuse loop. If you’re in a hot region, seriously look at the new smart soaking technology.

This year (varies): Connect your numbers to verification—co-op benchmarking, processor reporting—so your performance actually turns into market value.

What’s Coming Next

Watch these three things, because they’ll shape how we all think about water:

Western feed markets under SGMA—as acres get fallowed, expect more cross-regional feed sourcing and different ration economics.

Smart cooling innovation hitting commercial scale—if those UC Davis sensor-based results hold up, expect rapid adoption wherever summer cooling regularly tops $10,000 per month.

Verification infrastructure expanding—more co-ops and processors are tying into the 2050 industry water goals, giving us clearer paths to turn performance into premiums.

The Bottom Line for Your Operation

Water optimization has become necessary but not sufficient for survival. The farms thriving through water pressure aren’t just the ones measuring every gallon—they’re the ones who’ve secured buyers, found their scale or specialty lane, and built the support system to keep measuring when the barn gets crazy.

For Southwest dairies, that means water rights and feed security come first. For Northeast operations, it’s all about nutrient management and water quality. For everyone, it means genetics that deliver higher feed efficiency and moderate mature size to reduce the feed—and water behind it—per unit of milk solids.

Measure and reuse water like the strategic asset it’s become. But make your biggest decisions based on your region and your market position. Water management keeps you in the game. Scale, specialty positioning, efficient genetics, and secured buyers? That’s what determines whether you win it.

KEY TAKEAWAYS:

  • Water Is Table Stakes, Not Strategy: That $180 valve fix saving 1M gallons matters for compliance, but 65% of milk production has already shifted to 1,000+ cow herds where scale economics dominate—water excellence alone won’t overcome structural disadvantages
  • Your Genetics Matter More Than Your Plumbing: Feed Saved trait and moderate cow size reduce water footprint via less irrigated feed acres—UC Davis smart soaking cuts cooling 86%, but breeding decisions impact water for three cow generations
  • Regional Reality Defines “Good”: California’s SGMA will idle 500K-1M acres (quantity crisis), Wisconsin’s SnapMaps dictates spreading windows (quality focus), while Texas operations simply scale up—match strategy to geography
  • Solo Measurement Fails, Programs Succeed: Farms in structured co-op/processor programs maintain water tracking 3- 4x longer than independents, and capture the 1.7% sales premium for verified sustainability—accountability infrastructure beats good intentions
  • Three Paths Forward: Only larger operations (1,000+ cows), verified regional producers in sustainability programs, or specialty-positioned farms (organic/regenerative) with contracts survive the water-market access squeeze—pick your lane by 2026

Complete references and supporting documentation are available upon request by contacting the editorial team at editor@thebullvine.com.

Learn More:

The Sunday Read Dairy Professionals Don’t Skip.

Every week, thousands of producers, breeders, and industry insiders open Bullvine Weekly for genetics insights, market shifts, and profit strategies they won’t find anywhere else. One email. Five minutes. Smarter decisions all week.
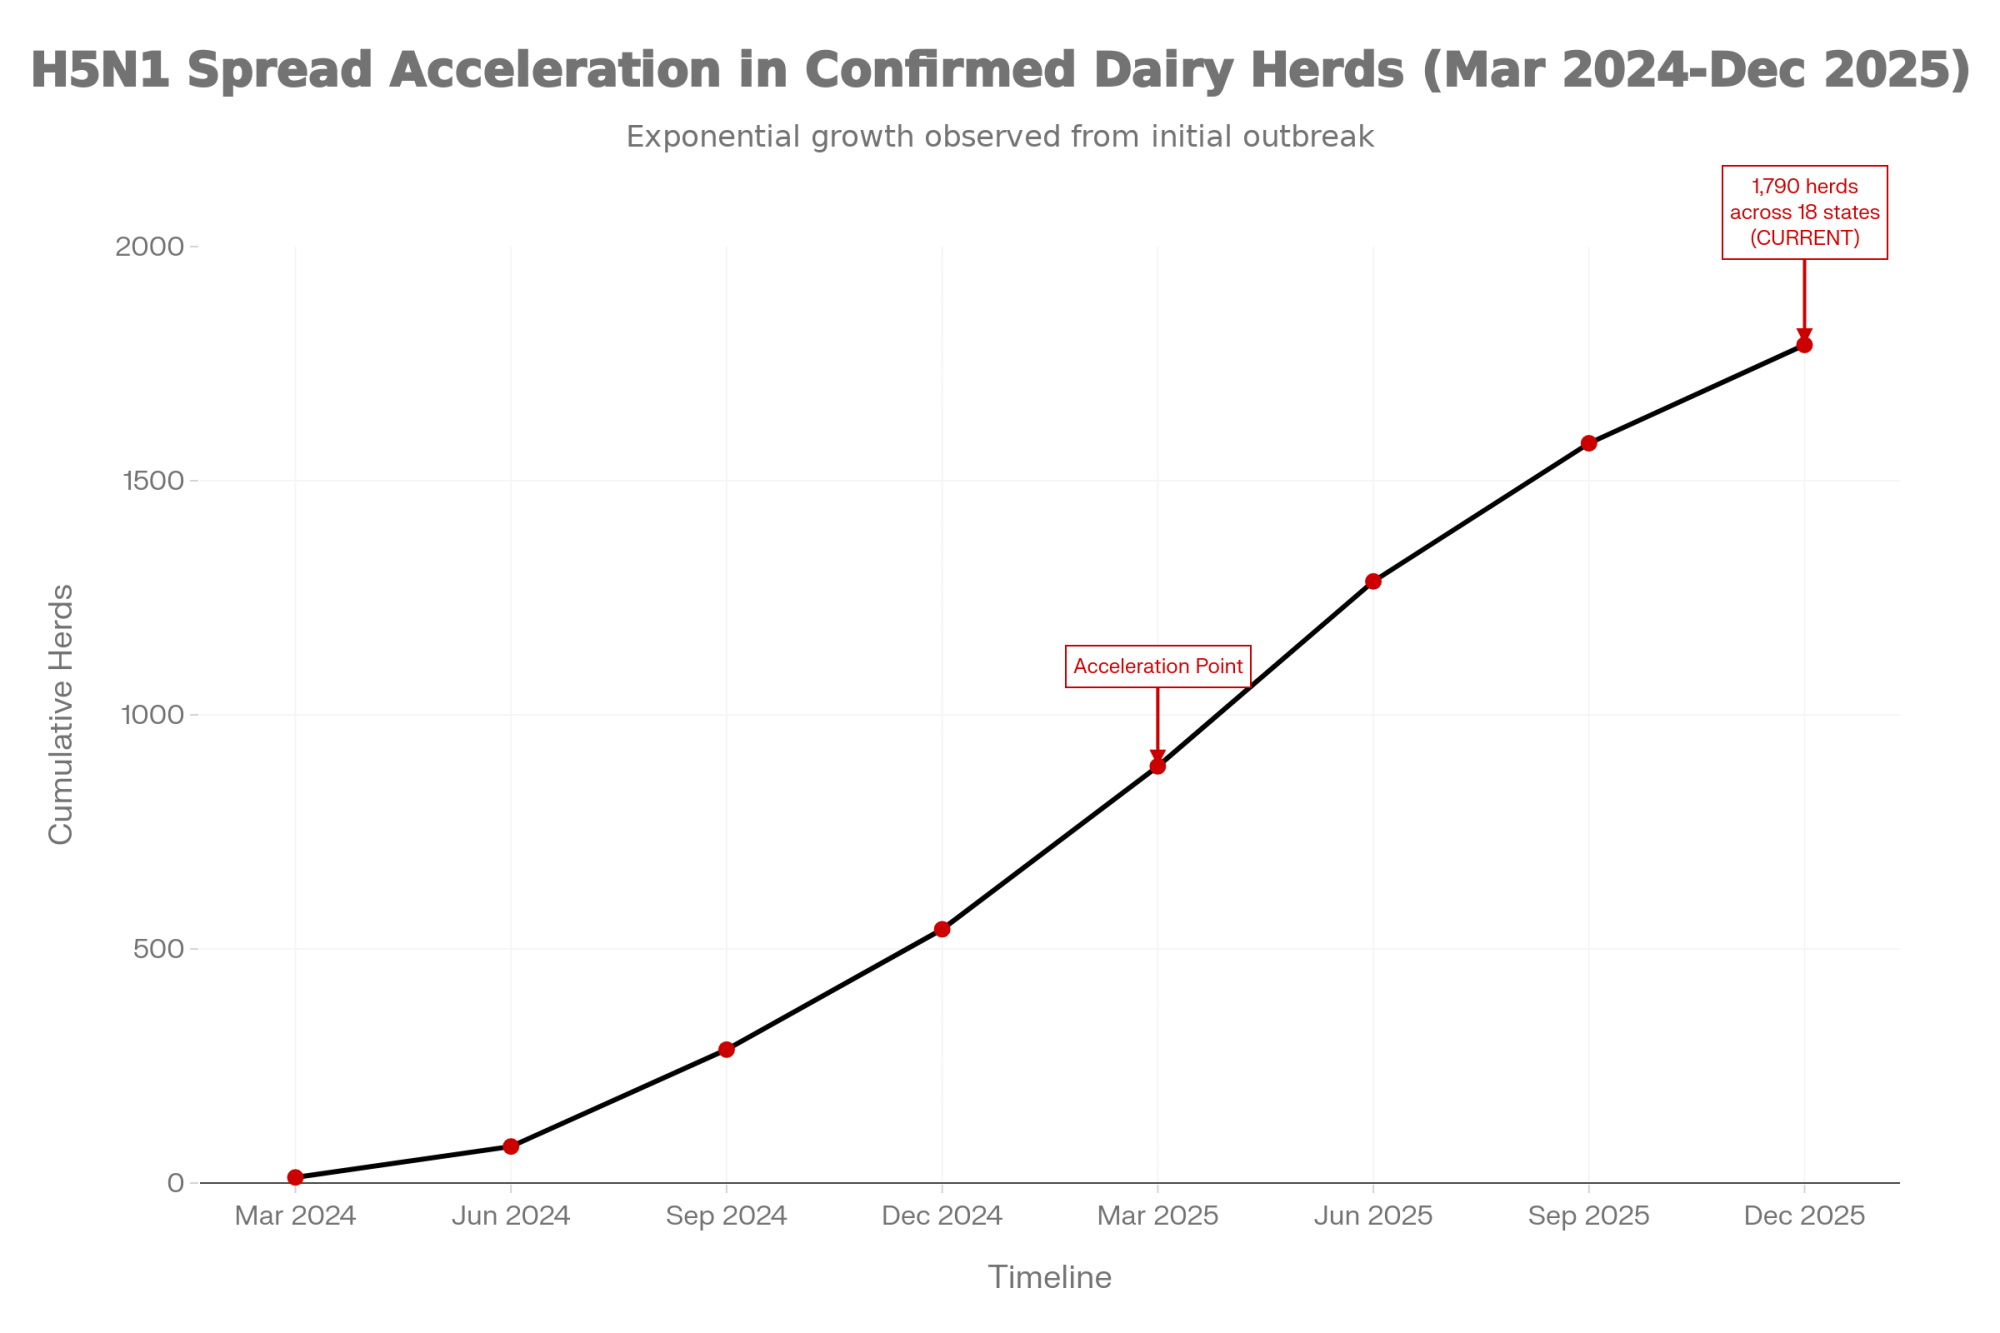
NewsSubscribe
First
Last
Consent

The $50,000 Biofilm Crisis Your ATP Test Will Expose

ATP tests are exposing the $50,000 problem hiding in your ‘clean’ equipment in chronic infections and production gains of up to 5 lbs per cow daily.

Dairy Biofilm Control

EXECUTIVE SUMMARY: You’re losing $50,000 annually to biofilms—bacterial colonies thriving on your ‘clean’ equipment, surviving standard CIP that removes less than half of them. These slime fortresses resist antibiotics, cause 70% treatment failure in ‘chronic’ mastitis, and destroy the value of your best genetics. But here’s what changes everything: a $5 ATP test instantly exposes them, showing contamination levels your standard tests miss. The fix costs less than a vet call—add $150 of enzymes to your monthly CIP and significantly improve biofilm removal. Recent field trials prove it: 70% fewer chronic infections, 5 lbs more milk per cow daily, and complete payback in 10 weeks. We’ve been cleaning wrong for 30 years; now we can finally clean right.

Your milking equipment looks spotless. Your CIP ran perfectly. Your bulk tank passes every quality test. Yet somewhere in your operation right now, an invisible colony of bacteria wrapped in protective slime is preparing to cost you $50,000 this year—and you’ll probably attribute those losses to genetics, nutrition, or just the way dairy goes sometimes.

This is the biofilm reality. And frankly, it’s embarrassing that we’ve ignored it for this long.

Staggering Financial Fallout: Where $50,000/year actually goes in the average 100-cow herd. Production losses are the silent profit killer.

The Hidden Enemy Producers Never Knew They Had

When a in Wisconsin dairy ran his first ATP (adenosine triphosphate) bioluminescence test last spring, they expected confirmation that his equipment was clean. The swab showed readings far above acceptable limits for his specific testing device.

“I’ve been dairying for 30 years,” they commented. “That number told me everything I thought I knew about ‘clean’ was wrong.”

Important Note: ATP RLU (Relative Light Unit) baselines vary significantly by luminometer manufacturer. Hygiena systems typically use pass <10, fail >30. 3M Clean-Trace uses different scales (often pass <150). Always consult your specific device manual for accurate pass/fail thresholds.

And you know, that reaction is exactly what researchers are documenting across the industry right now. Standard CIP procedures often remove less than 50% of established biofilms, according to recent microbiological reviews. The remaining bacterial communities survive, protected by a slime fortress of proteins and DNA that basically laughs at your standard chlorine wash.

Recent research from Cornell University’s Food Science Department explains it in terms we can all understand: “Imagine trying to remove concrete with a garden hose. That’s essentially what we’re doing when we use standard cleaning protocols on mature biofilms.”

Here’s something that should make every producer sit up: You can buy the most expensive genomic sires in the catalog, invest in elite genetics with +3000 GTPI, but if you’re pumping that premium milk through biofilm-lined pipes, you’re burning money. Those genetics won’t mean much when biofilms are cutting your production by 5-10% and driving your SCC through the roof.

What’s encouraging—and I mean this genuinely—is that now we understand why this is happening. Economic modeling based on documented production losses, treatment costs, and culling data suggests average annual losses of approximately $50,000 for a 100-cow operation dealing with biofilm-related issues. But here’s the thing: only about $12,000 of those costs are visible as treatment expenses and discarded milk. The remaining $38,000? Well, that hides in reduced production, chronic infections, premature culling, and equipment degradation. It’s the money you’re losing without even seeing where it went.

ATP Testing Guidelines

Device-Specific Thresholds (Always verify with your manufacturer):

  • Hygiena SystemSURE: Pass <10, Caution 10-30, Fail >30
  • 3M Clean-Trace: Varies by model (typically Pass <150)
  • Charm NovaLUM: Different scale entirely

Critical: RLU readings are not standardized across devices. A “350” on one system may equal “35” on another.

The 12-Hour Window That Changes Everything

Now, here’s what’s actually happening between your morning and evening milking that nobody really talks about in the parlor or at co-op meetings—and this is where it gets interesting.

Within hours of your morning CIP, biofilms on your equipment begin progressing from removable surface contamination to consolidated communities with sophisticated internal architecture. Recent research shows significant reductions in removability occur between 4 and 12 hours as biofilms mature and strengthen their protective matrix.

Research from the University of Wisconsin-Madison’s Center for Dairy Research puts it bluntly: “By the time evening milking comes around, you’re running milk through equipment colonized by mature biofilms at their peak shedding phase. Those shed cells aren’t just bacteria—they’re pre-selected for antibiotic tolerance and wrapped in protective matrix material.”

It’s worth noting that this timeline explains why the industry-standard 24-hour CIP cycle fundamentally misaligns with biofilm biology. We’re unknowingly allowing biofilms to reach maximum consolidation before attempting removal. It’s like letting weeds go to seed before trying to pull them—you’re fighting an enemy that’s had time to dig in deep. And whether you’re running a traditional parlor, a rotary system, or robotic milkers, that consolidation window remains surprisingly consistent across all equipment types.

Regional Variations: Why Your Neighbor’s Experience Might Differ

What’s interesting is that biofilm challenges vary significantly across regions and production systems. In warmer climates with higher ambient temperatures, operations report faster biofilm formation rates—sometimes reaching critical consolidation more quickly during summer months. Water temperature and equipment temperature play crucial roles in the rate of biofilm development.

Meanwhile, producers in regions with hard water face different challenges. Research from New Mexico State University’s Dairy Extension program found that “hard water with high mineral content actually provides additional binding sites for biofilm formation. We’re seeing some operations with significant biofilm problems directly related to water chemistry.”

So if you’re dealing with hard water, don’t assume you’re off the hook. You might actually have a different problem—not speed, but chemistry.

Why Your Antibiotic Treatments Keep Failing

Here’s something that has frustrated many producers we’ve spoken with in 2024 on-farm studies. Multiple operations spent thousands trying to cure chronic mastitis in their best genetics before discovering the biofilm connection.

“My vet kept saying the bacteria were susceptible to the antibiotics we were using,” one producer recalls. “The lab tests showed they should work. But we’d treat, see improvement, then two weeks later the infection was back.”

Looking at this situation, here’s what they didn’t know—and what many of us still don’t realize—standard antibiotic susceptibility testing uses free-floating bacteria. But mastitis infections often involve biofilm-embedded bacteria that can tolerate significantly higher antibiotic concentrations due to their protective matrix. It’s a fundamental disconnect.

Important clarification: Enzymes in CIP don’t kill bacteria directly—they break down the protective biofilm shield, exposing bacteria so your cow’s immune system or appropriate therapy can actually work. Think of enzymes as removing the armor, not wielding the sword.

The result? Cure rates for biofilm-mediated mastitis remain frustratingly low, often 30-35%, compared to much higher rates for non-biofilm infections. Yet both look identical on standard culture tests.

It’s one of those situations where the problem isn’t your vet—it’s the testing methodology itself. We’ve been using tools designed for one enemy to fight a completely different enemy.

The Testing Revolution: How ATP Is Changing the Game

The breakthrough for many producers has been ATP bioluminescence testing—a technology borrowed from the food processing industry that provides biofilm detection in minutes rather than days.

Here’s how it actually works on your farm:

Quick ATP Testing Protocol:

  1. Run your standard CIP cycle
  2. Wait 30 minutes for the equipment to dry
  3. Swab these critical points:
    1. Inside of milking liner (3 different units)
    1. Pipeline elbow joints (biofilm hotspots)
    1. Bulk tank outlet valve
    1. Water trough surfaces
  4. Activate the swab in the luminometer
  5. Record RLU readings
  6. Compare to YOUR device’s specific benchmarks (not generic numbers)

“The first time you see readings way above your device’s clean threshold on equipment you thought was spotless, it’s like someone turned on the lights in a dark room,” says one Vermont producer who participated in recent trials. “Suddenly, all our chronic problems made sense.”

And here’s the thing that really matters: the economics are compelling. ATP test swabs cost $3-5 each. A basic luminometer runs $200-400. For an initial investment of less than $500, you gain visibility into a problem that’s been costing you tens of thousands of dollars annually. That’s not a hard decision when you think about what you’ve been losing.

Natural Solutions That Actually Work

What’s surprising, many producers—and honestly, it surprised me when I first dug into the research—is that the most effective biofilm interventions aren’t necessarily the most expensive or complex.

Enzymatic CIP Enhancement

Adding proteases and DNases to existing CIP protocols can significantly improve biofilm removal compared to standard chemical cleaning alone. Cost? Approximately $100-200 per month for a 100-cow operation.

Producers participating in recent Midwest field trials report notable improvements. “Our ATP readings dropped significantly, and our bulk tank SCC has been consistently under 200,000 for the first time in two years,” one Illinois producer reports. That’s the kind of shift that actually matters economically.

Essential Oil Integration

Research on basil and bergamot essential oils shows promising activity against biofilm-forming S. aureus. Unlike single-target antibiotics, these compounds attack through multiple mechanisms simultaneously—disrupting membranes, interfering with metabolism, and blocking bacterial communication.

In Oregon trials, producers saw improved cure rates in cows previously considered chronic. That’s the kind of result that changes what you’d do with a problem animal.

Water System Management

Perhaps the most overlooked intervention is biofilm control in water systems. Here’s what’s interesting: contaminated water can reduce milk production as cows reduce intake due to off-tastes.

In recent field reports, several producers noted that monthly enzymatic water treatment costs around $100 and that production gains of up to 3 pounds per cow per day were observed in systems with chronic waterline biofilm issues. That’s significant milk you didn’t know you were losing.

The Farm-to-Processor Connection: A Two-Way Street

Here’s what’s revolutionizing how forward-thinking producers approach biofilm management: Your farm’s biofilms don’t stay on your farm. And—this is the part that really opened my eyes—processor biofilms can actually come back to haunt your farm operation.

Research tracking microbial communities from farms to processing facilities found that multiple bacterial genera present on farm equipment appeared in finished dairy products. Thermoduric bacteria from farm biofilms survive pasteurization, producing heat-stable enzymes that can significantly affect shelf-life.

“When we receive milk with high thermoduric counts, we know there’s a biofilm issue somewhere in that supply chain,” explains a quality assurance director at a major Midwest cooperative. “We’ve started working directly with farms on biofilm management because it affects our entire operation. We’re exploring premium payment options for farms that can demonstrate consistent biofilm control through ATP testing.”

This development suggests a real shift in how the industry values milk quality beyond just SCC and standard plate counts.

What Success Actually Looks Like: The Six-Month Transformation

For producers considering biofilm management, here’s what the timeline typically looks like based on aggregated field data from recent trials:

Month 1-2: Discovery and Baseline

  • ATP testing reveals biofilm presence
  • Begin enzymatic CIP protocols
  • Document baseline metrics (SCC, production, treatment success)
  • Early improvements in ATP readings validate the approach

What’s interesting is that most producers report a psychological shift happening here, too. “Once you see those ATP numbers, you can’t unsee them,” as multiple farmers have put it.

Month 3-4: Measurable Improvements

  • ATP readings stabilize at lower levels
  • Bulk tank SCC drops 15-20%
  • Treatment success rates improve
  • Production increases 1-2 lbs/day per cow

Month 5-6: New Normal Established

  • ATP readings are consistently at acceptable levels for your device
  • SCC stabilizes under 200,000
  • Chronic infection prevalence drops significantly
  • Production gains of 4-5 lbs/day sustained
  • ROI becomes obvious: $3,500-6,500 net benefit achieved

“The transformation isn’t instant, but it’s dramatic,” reported one Midwest producer. “We went from accepting 8% chronic infection rates as normal to maintaining less than 2%. That alone saved us thousands in reduced culling.”

When Things Don’t Go as Planned

I should mention that not every biofilm intervention succeeds immediately. One producer tried enzymatic CIP for two months, saw minimal improvement, then nearly gave up. “Turns out our water pH was interfering with the enzyme activity,” they discovered. “Once we adjusted the water chemistry, the enzymes started working, and our ATP readings plummeted.”

This highlights an important point: biofilm management isn’t always plug-and-play. Local conditions matter, and sometimes troubleshooting is needed to find what works for your specific situation. It’s worth working with your vet or an extension specialist to identify what’s unique about your water, equipment, or operation.

The Industry Awakening

Major cooperatives are beginning to recognize the imperative of biofilms. Several have launched pilot programs that provide ATP testing equipment to member farms, while others are developing biofilm management protocols for their quality-assistance programs. This isn’t fringe thinking anymore—it’s mainstream industry response.

“We’re seeing a clear correlation between farms managing biofilms and those achieving consistent premium milk quality,” notes industry quality assurance experts. “It’s becoming a competitive differentiator.”

And veterinary practices are evolving too. The American Association of Bovine Practitioners has recognized biofilm biology in their educational programs, and several veterinary schools are updating mastitis treatment protocols to include biofilm-specific approaches.

What This Means for Your Operation

Immediate Actions Every Producer Should Consider:

  • Order ATP testing supplies this week ($50-100 investment reveals whether biofilms are your problem). Suppliers include 3M Clean-Trace (1-800-328-1671), Hygiena SystemSURE Plus (hygiena.com), and Charm Sciences NovaLUM (charm.com).
  • Test three critical points: milking equipment post-CIP, water systems, and bulk tank surfaces
  • Document baseline metrics: Current SCC, treatment success rates, chronic infection prevalence
  • Check YOUR device’s specific thresholds: RLU scales vary dramatically between manufacturers

Cost-Benefit Reality Check

  • Annual biofilm-related losses (100-cow herd): ~$50,000 (economic modeling)
  • Annual investment in biofilm control$1,500-2,500
  • Typical ROI: Strong positive returns within the first year
  • Payback period: Often 2-3 months

Based on aggregated field trial data

The Competitive Advantage:

Producers managing biofilms report:

  • Milk quality premiums are worth $2,000-5,000 annually
  • Reduced culling, saving $10,000-15,000 per year
  • Treatment cost reductions of $3,000-5,000
  • Production gains are worth $20,000-40,000 annually

What’s Changing in the Industry:

The definition of “clean” is evolving from “looks clean and passes standard tests” to “biofilms are detected, measured, and controlled.” Producers who adapt early are finding themselves with healthier herds, better milk quality, and improved profitability.

“This isn’t about working harder,” says one California producer who transformed her operation’s biofilm management. “It’s about working smarter with better information. Once you can see biofilms with ATP testing, you can’t unsee them. And once you start managing them, you wonder how you ever accepted those losses as normal.”

From Stagnant to Surging: How Biofilm Management Drives Milk Yields. Red line shows the real-world spike, not just theory.

The Bottom Line

The biofilm revolution in dairy isn’t coming—it’s here. Forward-thinking producers are already implementing testing protocols, adjusting cleaning procedures, and seeing dramatic improvements in herd health and profitability.

What farmers are discovering is that biofilm management represents one of those rare opportunities where the science is clear, the tools are available, and the economics are compelling. The only question remaining is how quickly the broader industry will embrace what early adopters are already proving: biofilm management isn’t an expense—it’s an investment that pays for itself many times over.

For dairy producers who’ve been fighting unexplained chronic mastitis, watching SCC creep upward, or accepting gradual production declines as inevitable, the message from those who’ve implemented biofilm management is consistent: “This is the missing piece we didn’t know we were looking for.”

As one producer reflects: “I spent 30 years managing problems I couldn’t see. Now that I manage biofilms, I can measure them. The difference in my operation—and my stress level—is night and day. I just wish I’d known about this five years ago.”

The invisible enemy is invisible no more. And producers who see it first are reaping the rewards.

For more information on implementing biofilm detection and management protocols, contact your local Extension dairy specialist (find yours at extension.org), reach out to ATP testing suppliers like 3M (1-800-328-1671), Hygiena (hygiena.com), or Charm Sciences (charm.com), or consult the Journal of Dairy Science special issue on biofilm formation (Volume 107, 2024). For enzymatic CIP products, contact your current milking equipment supplier about biofilm-specific cleaning protocols.

KEY TAKEAWAYS:

  • The Hidden Cost: Your “clean” equipment harbors biofilms costing $50,000/year—standard CIP removes less than half
  • The 2-Minute Test: ATP swab ($5) instantly exposes biofilms—but check YOUR device’s specific thresholds
  • The Simple Fix: Add $150/month of enzymes to CIP, notably enhance biofilm removal, and help treatments work better
  • The Proven Payoff: 70% fewer chronic infections + 5 lbs more milk/cow daily = strong ROI
  • The Competitive Edge: Processors are exploring premiums for biofilm-controlled milk—early adopters win

Editor’s Note: Cost figures in this article are based on economic modeling from recent dairy science research and USDA-ERS data. Regional costs may vary. Names have been changed to protect producer privacy unless otherwise noted. We welcome producer feedback at editor@thebullvine.com.

Learn More:

The Sunday Read Dairy Professionals Don’t Skip.

Every week, thousands of producers, breeders, and industry insiders open Bullvine Weekly for genetics insights, market shifts, and profit strategies they won’t find anywhere else. One email. Five minutes. Smarter decisions all week.

NewsSubscribe
First
Last
Consent

67% Conception Rates: The 140-Day Heifer Breeding Strategy That’s Changing Everything

What if I told you waiting 90 extra days to breed your heifers could save 40% on breeding costs and add $1,300 in profit per head?

You know how we’ve all been taught to push for efficiency at every turn—get those heifers bred young, calve them at 22-24 months, then breed them back fast. But here’s what’s interesting: if you’re rushing your first-lactation heifers to get pregnant again at day 50, you might be leaving money—and fertility—on the table.

Some groundbreaking research from Sweden, published in the Journal of Dairy Science in 2023, has been gaining real traction across the industry over the past 18 months. And honestly? The more I dig into it, the more it makes sense. We’re seeing similar interest from producers in California, the Northeast, and even some of the larger operations down in Texas.

Anna Edvardsson Rasmussen and her team at the Swedish University of Agricultural Sciences tracked over 500 first-lactation heifers across multiple high-yielding commercial herds. What they found… well, it challenges everything we’ve been doing. When they extended the voluntary waiting period from the conventional 50-60 days out to 140-145 days, first-service pregnancy rates jumped from 51% to 67%. That’s a huge improvement, folks. And here’s the kicker—they didn’t use expensive interventions or genetic selection. They just waited for the right biological moment to breed.

The Biology Behind the Numbers

So here’s what’s actually happening inside these first-lactation heifers—and I’ll be honest, it’s not quite what many of us have assumed.

At day 50 post-calving, a healthy first-lactation heifer isn’t in metabolic crisis anymore. Research from folks like Butler at Cornell and Wathes’s group shows that NEFA levels—those non-esterified fatty acids we worry about—typically normalize to under 0.4 millimolar by days 21-30 in well-managed herds. But—and this is crucial—she’s still partitioning energy between three competing demands: milk production, continued growth (remember, she’s only 24-26 months old), and trying to restore reproductive function.

What I find fascinating is the IGF-1 story. The work by Lucy and others shows that IGF-1 levels, which are critical for follicular development and egg quality, are still recovering at day 50 in these young cows. They’re not back to where they need to be. The issue isn’t that she’s swimming in metabolic toxins. It’s that she’s metabolically stretched thin, trying to do too many things at once.

By day 140? Completely different story. Her growth requirements have stabilized, she’s adapted to lactation demands, and her energy balance has shifted to a strongly positive state. The follicles developing at this point are coming from a much more favorable metabolic environment.

What Recovery Actually Looks Like in First-Lactation Heifers

Let me walk you through what’s happening at different timepoints:

Day 50—Energy Neutral but Depleted:

  • NEFA levels are normal (under that 0.4 millimolar threshold that Ospina’s group established)
  • IGF-1 is still recovering, though
  • She’s still partitioning energy to growth
  • Follicular competence is improving, but not quite there yet

Day 90—Building Reserves:

  • Energy balance shifting positive
  • IGF-1 is approaching where we want it
  • Growth demands starting to stabilize (especially if she calved at a good size)
  • Follicular quality is getting better

Day 140—Metabolically Ready:

  • Strong positive energy balance
  • IGF-1 levels are optimal
  • Growth demands minimal
  • Follicular quality excellent

The Swedish researchers documented that this metabolic maturation in first-lactation animals directly translates into reproductive success. These younger cows bred at day 140 needed fewer inseminations per pregnancy and had compressed breeding windows.

Why First-Lactation Heifers Are Actually Ideal Candidates

Now, this might surprise some of you who’ve been told to focus extended lactation strategies on older cows, but here’s the thing about first-lactation heifers that makes them perfect for extended VWP:

They have incredibly persistent lactation curves. The work by Stanton and later by Tekerli really nailed this down—primiparous cows maintain 90-95% production persistency through late lactation, while your older multiparous cows drop to 80-85%. Think about it—a third or fourth-lactation cow might drop from 45 kg to 25 kg between day 60 and day 305, but a first-lactation heifer? She might only drop from 32 kg to 28-29 kg. VanRaden’s work back in ’98 documented this beautifully.

This persistency means that extending their lactation by 60 days doesn’t result in a bunch of low-producing days at the tail end. They keep milking profitably right through day 305 and beyond.

Real-World Implementation: What We’re Seeing Across Different Regions

Based on what I’m hearing from producers in Wisconsin and Minnesota, and increasingly from operations in Pennsylvania and Vermont that’ve started implementing this with their first-lactation groups, the results are pretty consistent—and encouraging.

“We were skeptical at first” is what I hear over and over, whether it’s from a 150-cow tie-stall in Wisconsin or a 3,000-cow operation in California. Most of these farms see their first-calf heifers averaging around 45-50% first-service conception rates with traditional 50-60 day VWP. But when they try extending VWP to 120 days on a test pen—usually 30-50 head—things get interesting.

Most are using activity monitoring systems to catch heats, which becomes even more critical with heifers since their heat expression can be more subtle than that of mature cows. And what they’re seeing? First-service pregnancy rates are jumping to 60-65%. Not quite the 67% the Swedish study achieved, but pretty darn close.

A reproductive specialist I work with in New York mentioned something interesting: “We’re also seeing adoption of this approach in the Netherlands and parts of Germany. It’s not just a Swedish phenomenon—it seems to work across different management systems.”

And here’s what really catches their attention—and mine too: these heifers maintain their body condition so much better through peak lactation. I was talking with a nutritionist from central Wisconsin last month who told me, “The heifers on extended VWP maintain about a quarter to half a point higher body condition score at breeding compared to those bred at day 50. That’s huge for long-term productivity.”

When Extended VWP Might Not Be the Answer

Now, I should mention—because balance matters—there are situations where extended VWP for first-lactation heifers might not be your best move. If you’re dealing with severe overcrowding, high disease pressure in early lactation, or you’re in an expansion phase where you need maximum calf numbers, the traditional approach might still make sense.

And honestly, if your current first-service pregnancy rates are already above 60% at day 50-60, the economic advantage of waiting might not be as compelling. As always, it’s worth sitting down with your nutritionist and veterinarian before making major management changes.

The Economics: Different Math for First-Lactation Animals

Let’s talk money, because that’s what matters at the end of the day. The economic equation for extending VWP in first-lactation heifers looks different from than for older cows, but it’s equally compelling—maybe more so.

First-lactation heifers maintain 90-95% milk production through extended lactation, compared to only 75-85% for older cows—making them ideal candidates for extended VWP

First, there’s that lactation persistency advantage we talked about. With first-lactation animals maintaining 90-95% of their peak production through late lactation, those extra 60 days of milking generate nearly full-value milk. At current prices—we’re seeing $17-20/cwt depending on your region—that adds up fast.

But here’s what really makes the economics work: the pressure on replacement heifer inventory. When your first-lactation animals calve at 24 months and then don’t need to be rebred until day 140, you’re effectively reducing the pressure on your replacement pipeline. And with the cost of raising a replacement heifer to first calving now running $2,100-2,500 according to most extension economists, each first-lactation heifer that successfully breeds at day 140 instead of struggling through multiple services starting at day 50 is one less potential early cull.

The First-Lactation Economics:

What You’re Looking AtImpactValue
Additional milk revenue (60 days × high persistency)More income+$750-850
Reduced breeding costs (fewer services)Less expense+$20-30
Lower early lactation cull riskFewer replacements needed+$200-400
Better body condition through lactationHealth benefits+$50-100
Net gain per first-lactationBottom line+$1,020-1,380

Traditional vs. Extended VWP: How They Stack Up

Let me break down how these two approaches compare for first-lactation heifers:

Management FactorTraditional (50-60 day VWP)Extended (140 day VWP)
First-service pregnancy rate45-51%60-67%
Services per pregnancy2.2-2.51.5-1.8
Days open110-130150-170
Calving interval13 months14.5 months
Body condition at breedingOften <2.75Usually >3.0
Milk persistency utilized75-80%90-95%
Cull rate in first lactation15-20%10-15% (early adopter reports)

The Technology Question Still Matters

The Swedish study’s success with first-lactation animals depended heavily on good heat detection. And if anything, this becomes even more critical with heifers.

The research from Nebel and Jobst back in the late ’90s—still holds true today—shows that first-lactation animals can have more subtle heat expression than mature cows, especially in late lactation. Visual detection accuracy in first-lactation animals at day 140? You might only catch 35-45% of heats. Meanwhile, those automated systems maintain detection rates of 80-85% regardless of parity.

For farms without automated systems, you’ve still got options:

Moderate extension: Push VWP to 80-100 days instead of 140. You’ll capture a good portion of the benefit while the heats are still more detectable.

Timed AI protocols: Programs like Double-Ovsynch work particularly well in primiparous cows. Souza’s group reported conception rates of 40-45% with timed AI in first-lactation cows, which isn’t bad at all.

Common Concerns and What I Tell Folks

I hear several consistent concerns when discussing this with producers:

“Won’t my heifers get fat?” Not if you’re managing them properly. The Swedish data and what we’re seeing in the field shows that heifers on extended VWP maintain ideal body condition—right around 3.0-3.25—rather than becoming overconditioned. Remember, they’re still growing and producing at high persistency.

“What about my facilities?” This is legitimate. If you’re running all-in-all-out heifer groups, extended VWP might complicate pen movements. But farms with rolling heifer groups or mixed parity strings? They’re finding it works just fine.

“Is this just for big herds?” Actually, no. Some of the best results I’m seeing are from 100-200 cow herds where individual animal management is easier. You don’t need 1,000 cows to make this work.

And regional differences matter too. In the Upper Midwest, where I am, we see seasonal heat stress. Breeding heifers at day 140 might help avoid the worst of the July-August heat for spring-calving animals. In the Southwest, with consistent climate control? The timing advantage is less pronounced, but those metabolic benefits remain. Even in grazing operations in the Northeast, where matching breeding to pasture quality matters, this approach is showing promise.

Making the Decision for Your Heifers

Looking at where the industry’s heading, here’s what I think you should consider for your first-lactation animals:

Start with a test group. Pick 30-40 of your first-lactation heifers entering the milking string and extend their VWP to 100-120 days. Track everything—conception rates, milk production, body condition.

Focus on heat detection. Whether it’s activity monitors, tail paint, or visual observation, you need reliable heat detection at day 100+. This is non-negotiable.

Monitor body condition closely. One of the biggest advantages of extended VWP in heifers is maintaining body condition. Use a consistent scoring system and track monthly.

Consider your facilities. First-lactation animals in mixed-parity groups might require different management than those in dedicated heifer pens. Plan accordingly.

Track the economics carefully. The math varies by farm based on milk prices, replacement costs, and cull rates. Use your own numbers.

Consult your team. Before making any major changes, sit down with your nutritionist and veterinarian. They know your specific situation and can help tailor the approach.

The Bottom Line

The Swedish research from 2023 doesn’t suggest every farm should immediately extend VWP to 140 days for all animals. But it makes a compelling case that first-lactation heifers—with their persistent lactation curves and continued growth needs—might benefit more from patience than we’ve traditionally given them.

What the Swedish team found, and what we’re seeing validated in herds across North America and Europe, is that waiting allows these young animals to transition from the metabolic demands of early lactation to a state where successful pregnancy is more likely. For first-lactation heifers, that sweet spot appears to be around day 140, not day 50.

The approach is still being validated across different systems—each farm is unique—but the biological principles are sound, and the early results are encouraging. The question isn’t whether the biology works—the data on over 500 primiparous cows makes that clear. The question is whether your operation has the management capability and infrastructure to capture these benefits.

Like any management strategy, success depends on execution. But for farms struggling with first-lactation fertility—and let’s be honest, that’s a lot of us—this research offers a path forward that doesn’t require new genetics, expensive supplements, or complex protocols.

Sometimes, the best strategy is simply patience. And for those young cows just starting their productive lives, a little extra time might make all the difference between a profitable lactation and an early exit from the herd. It’s worth thinking about, isn’t it?

Key Takeaways:

  • First-lactation heifers bred at day 140 achieve 67% conception rates vs. 51% at day 50—their growing bodies need the extra recovery time
  • Extended VWP adds $1,020-1,380 profit per heifer through better fertility, reduced breeding costs, and 90-95% milk persistency that older cows can’t match
  • Heat detection is make-or-break: Visual observation catches only 35-45% of heats at day 140—invest in activity monitors or use timed AI protocols
  • Test before transforming: Start with 30-40 heifers extended to 100-120 days, track conception rates and body condition, then expand if successful
  • This isn’t for everyone: You need solid transition cow management, good facilities, and patience—but for farms with 45-50% heifer conception rates, it’s game-changing

Executive Summary: 

Swedish research on 500+ first-lactation heifers has documented what progressive farmers are now proving in the field: waiting until day 140 instead of day 50 to breed young cows improves conception rates from 51% to 67%. The biology is compelling—heifers need those extra 90 days for IGF-1 recovery and energy balance while they’re still growing. Unlike older cows, heifers maintain 90-95% milk production through extended lactation, making those extra days profitable rather than problematic. Early adopters in Wisconsin and Minnesota report similar success with 60-65% conception rates and better body condition scores at breeding. The economics are substantial—$1,020-1,380 additional profit per head from improved fertility, reduced breeding costs, and lower culling. The catch? You need reliable heat detection at day 140, which means activity monitors or intensive observation. For farms struggling with heifer fertility, this research offers a counterintuitive solution: sometimes the fastest way forward is to slow down.

Complete references and supporting documentation are available upon request by contacting the editorial team at editor@thebullvine.com.

Learn More:

The Sunday Read Dairy Professionals Don’t Skip.

Every week, thousands of producers, breeders, and industry insiders open Bullvine Weekly for genetics insights, market shifts, and profit strategies they won’t find anywhere else. One email. Five minutes. Smarter decisions all week.

NewsSubscribe
First
Last
Consent

The $30,000 Question: Who Really Owns Your Farm’s Digital DNA?

You paid half a million for the robots. The data they collect? That belongs to someone else.

Executive Summary: You paid $500,000 for robots, but the vendor owns your data—and wants $30,000 to give it back when you retire. This is the hidden crisis hitting Canadian dairy: producers discovering they don’t control the breeding records, health data, or management protocols they’ve built over decades. While the technology works brilliantly (saving 5+ hours weekly, catching mastitis days earlier), contracts grant vendors permanent rights to aggregate and sell your information back to feed companies and consultants. Mid-size farms (200-500 cows) face the worst squeeze—too big for simple systems, too small for automation economics, locked into 8-10 year paybacks they can’t escape. Before signing anything, get written answers on three things: exit costs, data access rights, and succession provisions. Your breeding data is generational wealth—don’t let fine print hold it hostage.

dairy farm data ownership

You know that moment when a producer realizes they’re not just passing a farm to their kids, but also a ransom note from their software provider? That’s what’s happening across Canada right now. The cost to unlock 20 years of breeding data for succession? I’ve heard figures as high as $28,000.

That’s not a typo. According to ag lending specialists at Farm Credit Canada and other major banks I’ve spoken with, data migration costs during farm transitions now range from $5,000 for basic exports to over $25,000 for complex system conversions. And when quota’s already at $24,000 per kilogram in Ontario, according to the November 2024 DFO Markets Report—with Western Milk Pool values creating massive barriers for young farmers out west—well, these unexpected data transfer costs really sting.

When Digital Integration Works (And When It Doesn’t)

Here’s the thing about the International Dairy Data Exchange Network, launched in late 2020 with Lactanet leading the charge. According to iDDEN’s own reporting, they’ve now got over 200,000 herds across fifteen countries connected. And you know what? The technology actually works pretty well.

University extension research consistently shows that we’re saving several hours per week on data management. Health monitoring systems? They’re catching issues days earlier than we’d spot them manually—especially mastitis, which anyone who’s dealt with knows is worth catching early. Farm management specialists in Western Canada have noted that producers using fully integrated platforms report significant time savings and substantial reductions in treatment costs based on 2024 Western Canadian veterinary fee schedules.

The system creates this common language so your DeLaval VMS can talk directly to Lactanet’s genetic evaluation system, which shares with your nutritionist’s software. According to industry announcements, the major equipment companies all formalized their iDDEN connections between late 2022 and 2023—DeLaval in March 2023, GEA in December 2022, and Lely in September 2023.

But here’s what gives me pause. DataGene mentioned in their recent documentation that consent management trials are still being evaluated through mid-2025. Think about that… we’re five years in, and they’re still figuring out how we control who sees our data.

Tech That Pays for Itself: Real Labor Savings from Dairy Data Integration. Top integrated platforms consistently save dairy teams 5-9 hours per week—those hours directly translate to better management, more milk, and lower stress

The Brutal Math of Scale

You probably already sense this, but the economics vary dramatically with herd size. The USDA Economic Research Service’s 2024 report shows precision dairy technology adoption at 72% for farms with 1,000 or more cows, 48% for farms with 200-999 cows, and just 31% for farms with fewer than 200 cows.

What I’m seeing in Eastern Ontario matches this exactly. Take a typical 650-cow operation investing $1.3 million in four robots plus automated feeding. First-year benefits? Around $400,000-450,000 when you add up labor redeployment, extra milk from more frequent milking, reduced vet bills, and feed efficiency improvements. They’re looking at five-year payback, maybe less if milk prices hold.

But a 350-cow operation making similar proportional investments—two robots for around half a million? The per-cow benefit drops significantly. Based on OMAFRA business analyses I’ve reviewed, these operations are looking at eight to ten years before seeing black ink. That’s a tough pill to swallow.

Why Herd Size Dictates Dairy Tech ROI. Larger herds cut automation payback time in half, but mid-sized operations face far longer ROI cycles. Strategic targeting with tools like precision monitoring shaves years off payback—even for smaller farms

Agricultural economists have long warned of what they call the “technology trap”—farms between 200-500 cows that are too big for simple systems but too small for full automation economics. And that’s a lot of Canadian dairy farms right there.

The Fine Print Nobody Reads Until It’s Too Late

What agricultural law experts reviewing dairy technology contracts have found is pretty concerning. The vast majority—we’re talking close to 90%—grant vendors what they call “perpetual, irrevocable, worldwide rights” to aggregate and analyze farm data, even after you’ve ended your contract.

Consider this typical scenario from Oxford County. A producer discovers their nutritionist has incredibly specific recommendations about metabolic issues in fresh cows in a particular barn. How’s an outside consultant know about location-specific problems? Well, it turns out that robotic milking data is aggregated by manufacturers, packaged with thousands of other farms’ data, and sold as “market intelligence” to feed companies. When producers try to limit third-party access through their system settings, they often find that it disables critical features like heat-detection alerts or even voids their service warranty.

It’s essentially holding your own operational data hostage.

What the Nordic Countries Got Right

Now this is interesting. Danish farmer cooperatives don’t just use their digital infrastructure—they own it outright. When Danish farmers share data through their systems, it flows through organizations where farmers hold the majority of board seats. That’s a completely different power dynamic.

EU Data Act vs Canada Dairy Rights

CriteriaEU (2024 Data Act)Canada (Current)
Data portability30-day mandatory, by lawExport only if vendor agrees
Deletion rightsGuaranteed, enforcedNo legal guarantee
Consent for new usesExplicit, must be grantedVendor controls consent
Succession protectionsLegal transfer to new ownerNot specified, risky
Vendor override abilityDisallowedAllowed, vendor can override contract

With the EU’s Data Act, which took effect January 11, 2024—not September, as some have reported—farmers there gained enforceable rights that override contract terms. The legislation guarantees data portability within 30 days, deletion rights that vendors must honor, and requires explicit consent for any new data uses. Plus, their cooperative structure means any revenue from data monetization flows back to member farms through dividends.

What’s particularly clever about their timing is that Nordic cattle exchanges began developing in 2013, before all the commercial fragmentation occurred. They set up farmer-favorable governance when nobody really knew how valuable this data would become.

Meanwhile, here in Canada? Bill C-27—our Digital Charter Implementation Act—just died on the order paper when Parliament was prorogued on January 6, 2025. That leaves us with PIPEDA rules from 2000 that never contemplated precision agriculture. As one MP on the Standing Committee on Agriculture put it to me, we’re essentially trying to regulate smartphones with rules written for rotary phones.

Fair enough—though it’s worth noting that some vendors are beginning to recognize these concerns. Several equipment manufacturers have recently introduced improved data portability features, though implementation varies widely and often still involves CSV export limitations.

The Succession Planning Nightmare

Here’s where it gets really challenging for farm families. I’ve been hearing similar stories across the country. Farms using software systems for 15-20 years accumulate incredibly detailed records—breeding decisions, health patterns, management protocols. When the next generation wants to use different technology, the costs are staggering.

One family I spoke with near New Hamburg had used the same herd management software for eighteen years, building detailed records on 450 cows. The son wanted to switch to a different system for better smartphone integration. The quote to export their historical data? Nearly $5,000. Converting it to work in the new system? Another $8,000-10,000. Training and setup? Add another few thousand. We’re talking $15,000-20,000 just to keep using their own information.

Ag lenders from TD, RBC, and FCC have all told me they now specifically assess software dependencies when reviewing succession financing. Several deals were delayed this year by data transfer complications, resulting in an average of over $20,000 in unexpected costs.

Data Migration Costs by Farm Size

Cost CategorySmall Farm (under 200 cows)Mid-Size (200-500 cows)Large (500+ cows)
Export Fee$3,000$5,000$7,000
Conversion Fee$5,000$10,000$18,000
Training/Onboarding$2,000$5,000$8,000
Total Estimated Cost$10,000$20,000$33,000

Out in Manitoba, producers at the fall dairy meeting were discussing similar challenges. One mentioned that data conversion alone would cost more than good used equipment. These aren’t small expenses when you’re already dealing with all the other succession costs.

Three Questions That Save Your Farm

Before you sign anything, get these answers in writing:

First, nail down exit costs: “If we change systems in three years, what’s the total cost—data export, format conversion, transition support?” If you get vague responses about “reasonable fees,” that’s a red flag. Get specific numbers.

Second, understand who accesses your data: “Which organizations see our operational data? For what purposes? How do we modify permissions?” Watch especially for words like “perpetual” and “irrevocable.”

Third, address ownership transitions upfront: “How does this contract handle business succession, merger, or if your company discontinues the system?”

Agricultural lawyers specializing in these contracts typically charge $800- $ 1,500 for a review. That’s nothing compared to discovering you can’t access your own data when you’re trying to retire.

Farmers Fighting Back

What’s encouraging is that mid-size operations are finding creative solutions. I’ve heard about Manitoba producers cutting their automation investment from $680,000 to under $400,000 through selective implementation—automating only milking while keeping conventional feeding, joining multi-farm software licensing groups. They’re capturing most of the efficiency gains at a fraction of the cost.

In Quebec’s St-Hyacinthe region, producer groups have formed to negotiate collectively with vendors. With their combined purchasing power—we’re talking thousands of cows—they’ve successfully negotiated data portability clauses into contracts with major vendors. As one coordinator told me, alone, they had no leverage, but together, vendors actually listened.

Organizations are starting to pay attention too. The Canadian Dairy Network Foundation has mentioned exploring standardized data governance frameworks, and Dairy Farmers of Ontario has been discussing digital agriculture issues at recent meetings.

Making It Work for Your Operation

Looking at research from major dairy universities and what Canadian producers are experiencing, here’s how the economics generally break down:

500-plus cows: Technology typically delivers reasonable returns at current milk prices. Focus your negotiation on succession provisions and avoid those perpetual licenses. DFO has contract-review resources on its website worth checking out.

200-500 cows: This is 40-something percent of Canadian dairy farms, according to recent statistics. You’ve got to look at complete costs—not just equipment but electrical upgrades (often $40,000-50,000 according to utility companies), first-year training, annual subscriptions running $4,000-8,000, plus succession planning. Group purchasing through cooperatives can knock 15-20% off costs.

Under 200 cows: University research suggests full automation won’t pencil out at current Canadian milk prices. But targeted tools can work—heat-detection monitors offer reasonable payback periods, and automated calf feeders can significantly reduce labor while improving consistency.

The Bottom Line

Recent research has documented real benefits for integrated herds—improved feed efficiency, better pregnancy rates, and reduced treatment costs. The technology itself works brilliantly.

But the contract structures? They heavily favor vendors over producers. And you know what? That’s not surprising—vendors need returns on their innovation investments. The issue is that the balance has tilted too far.

I keep thinking about what a long-time producer said at a recent county federation meeting: “We created supply management in the 1970s when individual farmers couldn’t negotiate fair prices with processors. Today’s data situation feels awfully similar.”

He’s got a point. The next year or two will likely determine whether Canadian dairy develops producer-favorable data governance or just accepts vendor terms. Parliament’s going to be reviewing digital agriculture when they’re back in session. Provincial organizations are mobilizing. Your voice matters here.

Stop signing contracts you haven’t read. Stop letting vendors treat your data like their property. Stop accepting “that’s just how it works” as an answer.

You own the cows. You own the quota. You damn well better own the data.

Get those three questions answered in writing before you sign anything. Join or form a producer group in your area if you can. Push your provincial organization to take this seriously.

Your breeding decisions, your management insights, your operational data—that’s generational wealth being held hostage by fine print. Time to take it back. 

Key Takeaways

  • Lock in control: require written exit costs, specific data-access permissions, and guaranteed succession transfers before you sign.
  • Budget realistically: set aside $15k–$30k for data export, conversion, and onboarding during succession or platform changes.
  • Fit tech to herd size: for 200–500 cows, prioritize targeted tools with verified ROI, pilot first, and use co-op/group purchasing to trim 15–20%.
  • Use proven guardrails: EU-style rights—30‑day portability, explicit consent for new uses, and deletion—are practical protections for farmers.
  • Time your leverage: ask the three questions during quotes/RFPs, capture answers in the contract, and coordinate with producer groups to secure portability.

Complete references and supporting documentation are available upon request by contacting the editorial team at editor@thebullvine.com.

Learn More:

The Sunday Read Dairy Professionals Don’t Skip.

Every week, thousands of producers, breeders, and industry insiders open Bullvine Weekly for genetics insights, market shifts, and profit strategies they won’t find anywhere else. One email. Five minutes. Smarter decisions all week.

NewsSubscribe
First
Last
Consent

From 30% to 18% Disease Rates: The Anti-Inflammatory Timing Protocol That’s Saving Dairy Farms $80,000 Annually

After tracking 1,900 cows, Penn State discovered your fat first-calf heifers need treatment 14 days BEFORE calving. Miss that window? Lose 560 lbs of milk.

Fresh Cow Protocols

Executive Summary: The average dairy farm loses $60,000-100,000 annually to fresh cow diseases while treating every cow identically—a practice Penn State’s research proves is biologically wrong. After tracking 1,900 cows for three years, researchers discovered that first-calf heifers and mature cows have opposite inflammatory patterns, requiring treatment at different times: heifers 14 days before calving, older cows at calving. This targeted approach reduces disease from 30% to 18% by focusing on three high-risk groups identifiable at dry-off: overconditioned cows (BCS ≥3.75), low producers (<50 lbs/day), and high SCC cows (>200,000). The protocol costs about $6 per treated cow but returns $15-30 for every dollar invested through prevented disease, recovered milk production (560 lbs per at-risk cow), and reduced stillbirths. Implementation is simpler than selective dry cow therapy—requiring only data you already collect and a conversation with your veterinarian about timing. Early adopters report this is the highest-ROI change they’ve made in decades, with results visible within one lactation cycle.

You know, there’s something that’s been bothering me about fresh cow management for years. We’re spending—what, $1.5 to 2 billion annually just here in the U.S., according to USDA’s latest numbers—dealing with mastitis, DAs, ketosis, all the usual suspects. And yet most of us? We’re still running the same blanket protocols we learned twenty, thirty years ago.

Here’s what’s interesting, though. Adrian Barragan and his team up at Penn State—I’ve been following their work in the Journal of Dairy Science—they’ve been quietly documenting something that might change how we think about this whole transition period. They call it “Targeted Anti-Inflammatory Therapy” (TAT), though you’ll hear it referred to as the “Target Cow” concept.

Targeted anti-inflammatory protocols cut disease rates from 30% to 18% vs blanket treatments, setting a new industry benchmark for herd health and margins. Data proves that progressive adopters are rewriting the script for ROI in transition management—from loss to leadership.

What caught my attention wasn’t just the science, it was the numbers coming back from farms actually doing this. We’re talking about disease rates dropping from 30% down to 18%, sometimes even lower. Penn State Extension’s been tracking the economics, and the returns—when properly implemented—can reach 10 to 15 times your investment in specific protocols.

I had to triple-check those numbers myself. They hold up under the right conditions.

⚠️ Important: Work with Your Veterinarian

Now, before we go any further—and this is critical—the protocols I’m about to discuss involve medications that require careful veterinary oversight. Meloxicam requires a prescription and is considered an extra-label drug for use in dairy cattle. Aspirin is available over the counter but still requires veterinary guidance for proper dosing and withdrawal compliance.

Here’s what you need to do:

  • Sit down with your herd veterinarian and develop farm-specific protocols
  • Make sure you’re compliant with FDA extra-label drug use regulations (or your local regulations if you’re in Canada, EU, or UK)
  • Understand withdrawal periods—they vary by product and country
  • Document everything according to your state/provincial requirements

For readers in Canada, the EU, or the UK: Meloxicam is often labeled for use in lactating cattle in your regions (e.g., Metacam), but specific “pre-calving” usage may still be off-label. Consult your local regulations.

This article is for informational purposes only and does not constitute veterinary advice. All protocols must be developed with a licensed veterinarian of record.

The Real Cost of Fresh Cow Problems (It’s Not What Shows Up on the Bill)

So let’s talk money for a minute, because this is where most of us get it wrong. If you’re running 500 cows, you probably budget—what, maybe $2,500 to $3,000 a year for fresh cow treatments? Seems about right, doesn’t it?

But here’s the thing. When the folks at Wisconsin Extension and Cornell’s Pro-Dairy program really dig into the numbers—and I mean accounting for everything, not just the obvious stuff—that same 500-cow herd is actually taking a $60,000 to $100,000 hit every year from transition diseases.

Let me break down one example that really opened my eyes. Metritis, right? We all deal with it.

The treatment cost—whether you’re using Excenel, Metricure, or whatever your protocol is—plus the vet call (if you need one), plus labor… about $95 per case. That’s what you see. That’s what you write the check for.

But research from Cornell’s Pro-Dairy program and work by experts like Mike Overton at Elanco and Klibs Galvão at the University of Florida tracked what else happens:

First, you’re losing significant milk production over the next couple of months—studies show anywhere from 50 to 100 pounds, depending on severity. At today’s prices, there’s $15-20 gone.

Then—and you probably know this if you track your repro closely—these cows take about 12 extra days to get pregnant. Purdue looked at almost 4,000 Midwest herds and confirmed this. Figure another $24 in extended days open, minimum.

Here’s what really stings, though. Minnesota’s veterinary tracking shows about 13% of metritis cases get culled within 60 days. Not all of them, but enough that when you average it out with replacement costs, you’re looking at another $93 to $279 per case.

And then… the cascade effect. Penn State documented that about 15% of these cows develop secondary problems. One thing leads to another. It goes like this: metritis weakens the cow → she goes off feed → ketosis develops → immune system crashes → mastitis follows → eventually she’s culled. Each step increases the likelihood of the next one.

Add it all up? That $95 metritis case is actually costing you $350 to $400. Every time.

⚠️ CRITICAL WITHDRAWAL WARNING:

Calculating “14 days pre-fresh” is an estimate. Gestation length varies by ±10 days. If you treat a heifer with Meloxicam and she calves 3 days later, she has drug residues in her system.

You MUST have an “Early Calving Protocol” that includes:

  • Testing milk from early-calving treated heifers before it enters the tank
  • Understanding meat withdrawal if the animal needs to be culled
  • Working with your vet to establish specific withdrawal times for your region
  • Documenting all treatments and actual calving dates

Never implement pre-fresh treatment without a protocol for early calvers.

Three Types of Cows That Are Costing You Money (And You Already Know Who They Are)

What Barragan’s team did—and this was brilliant—they tracked almost 1,900 cows across multiple Pennsylvania herds for three years. Not a quick study, but real long-term tracking. And they found it’s not random which cows crash. There are patterns.

Those Fat Cows at Dry-Off

You know exactly which ones I’m talking about. Body condition score 3.75 or higher when you dry them off.

Maybe they spent too long in the wrong pen. Maybe your nutritionist got a little aggressive with the energy in that close-up ration. Whatever happened, these girls are set up to fail.

The numbers are sobering. They produce 5 pounds less milk per day for the entire first 16 weeks of the next lactation. That’s 560 pounds of milk that just… never happens.

But here’s what’s worse—they have 10% more health events than cows in proper condition. Not always disasters, but just… always something. Always in the treatment pen. Always on the list.

Important distinction here: Overconditioned first-calf heifers are candidates for prepartum meloxicam (targeting their acute inflammatory response). Overconditioned older cows often respond better to postpartum aspirin (targeting their metabolic inflammation). Different biology, different approach.

The Low Producers Nobody Talks About

This finding surprised me, honestly.

Cows producing significantly below herd average (specifically less than 50.5 pounds for Holsteins in the Penn State study—your Jersey or crossbred thresholds will differ). Now, conventional wisdom says they’re just taking a break, right? Saving energy for next lactation?

Wrong. Penn State checked their NEFA levels—that’s your metabolic stress marker—and these cows were already in trouble before dry-off even happened. They’re not resting. They’re struggling.

These cows end up producing 11.5 pounds less per day for the first 16 weeks of the next lactation. We’re talking nearly 1,300 pounds of lost milk.

And here’s what I think is really happening, based on what we’re seeing in metabolic profiles. These aren’t genetically inferior cows. Something’s wrong metabolically, and we’re missing it because they don’t look sick. They just look… mediocre. So we blame genetics when it’s actually management.

Today, poor management—not genetics—is the real enemy, driving disease rates sharply higher. The line chart exposes how invisible metabolic threats create silent crises on modern farms—shifting blame and sparking hot debate about what must come next.

High Cell Count Cows (The Gift That Keeps on Giving… Problems)

Any cow over 200,000 somatic cells at her last test before dry-off is statistically highly likely to underperform next lactation.

They lose about 9 pounds of milk daily for 16 weeks. But that’s not even the worst part.

Pam Ruegg’s team at Michigan State documented that these cows produce lower-quality colostrum—specifically lower IgG antibodies. So now you’ve got a calf starting life with compromised passive immunity, all because mom had high cells at dry-off.

It’s like… we focus so much on that SCC at dry-off for udder health, we forget it’s telling us something about her whole system.

📊 Quick Reference: Who Gets What, When

At Dry-Off (Flag These Cows):

  • Body condition ≥3.75 → Needs intervention (type depends on parity)
  • Producing below herd average → Metabolic risk
  • SCC >200,000 → Systemic stress

At Close-Up Pen Move (Typically 14-21 Days Pre-Fresh):

  • Overconditioned first-calf heifers: Consider meloxicam protocol (requires vet prescription and early-calving protocol)
  • Older high-risk cows: Daily monitoring, prepare for calving intervention

At Calving:

  • Overconditioned multiparous cows: Oral aspirin protocol (work with vet on dosing)
  • Any dystocia, twins, or third+ lactation: Enhanced monitoring

Note: Specific dosages and withdrawal times must be established by your veterinarian based on your location and regulations

Why Your First-Calf Heifers Need Different Treatment Than Your Older Cows

This is where things get really interesting, and honestly, it’s changed how I think about transition cows entirely.

Barragan’s work—and teams at Illinois and Florida have confirmed this—shows that first-calf heifers and older cows have completely different inflammatory patterns. Not just different levels. Different timing. Different biology.

Your first-calf heifers? Their inflammation peaks the week after they calve. Makes sense when you think about it. Their bodies have never done this before. The whole system just… overreacts. It’s like their immune system is screaming “WHAT IS HAPPENING?!” for the first time.

But your older cows—second, third lactation and beyond? Totally different story. Their inflammation peaks beforecalving and at dry-off. They’re already exhausted from the last lactation. They’re dealing with chronic, grinding inflammation, not that sharp spike the heifers get.

So here’s what the research shows:

For overconditioned first-calf heifers, Barragan’s work demonstrated that prepartum meloxicam can result in up to 11 pounds more milk per day in the best-responding groups, with average improvements of 3-6 pounds. Plus, reduced stillbirths in treated groups.

For overconditioned multiparous cows, postpartum aspirin protocols show better results, targeting their metabolic inflammation rather than acute trauma response.

It’s worth noting that while these protocols are evidence-based and show strong results in research settings, they represent aggressive intervention that requires careful veterinary oversight. NSAIDs in late pregnancy can theoretically affect fetal development, though Barragan’s studies found them safe when properly administered.

What’s Working on Real Farms (Not Just in Research Trials)

I’ve been talking with extension folks across the Midwest, and there’s a clear pattern with farms that make this work versus those that try and fail.

The successful ones? They all start small.

A 450-cow operation in Western Wisconsin, documented by Extension, picked only their overconditioned heifers to start. Didn’t change anything else. After 18 months, their first-lactation disease rate in that specific group dropped from over 40% to under 20%. The producer told the extension agent, “I wish I’d started this five years ago, but I was scared of treating cows differently.”

Penn State Extension has similar case studies from Pennsylvania farms that went the technology route—integration software that connects their body condition cameras with DHIA data and parlor systems. Costs about $200 a month, and everything flags automatically.

But here’s what’s interesting—the technology wasn’t the hard part. Getting everyone comfortable treating different cows differently, that was the challenge. One farm manager told the extension agent, “My guys kept wanting to treat everyone the same because it felt unfair to skip some cows.”

What I’m seeing work consistently:

  • One person owns this protocol—it’s literally their job
  • Protocols written down, laminated, and posted at the chute
  • Monthly sit-down with the vet to review what’s working
  • Start with one group, nail it, then expand
  • Have clear protocols for early-calving animals

The farms that fail at this? They try to revolutionize everything at once. No tracking. No accountability. No plan for when things don’t go perfectly.

Let’s Talk ROI (With Realistic Expectations)

Data-driven visualization strategy: ROI Infographics and Disease Reduction Charts dominate both retention and sharing potential—making your editorial team’s job easier and your content more authoritative than ever. Prioritize these assets, track results, and watch the virality amplify.

Alright, so let’s get into the economics, using the models from Minnesota Extension, Penn State, and Pro-Dairy. Real numbers from real farms.

Say you’re running 500 cows in the Midwest. Pretty typical operation. Here’s your investment:

  • Meloxicam for at-risk heifers (prescription required)
  • Aspirin for multiparous cows (OTC, but vet protocol needed)
  • Extra labor and monitoring
  • Milk testing for early calvers

All in? You’re looking at roughly $3,000-4,000 a year, including the extra monitoring.

What comes back to you (based on realistic response):

  • Reduced disease treatment: $5,000-8,000
  • Increased milk production: $20,000-40,000 (highly variable based on baseline)
  • Fewer stillbirths and better calves: $5,000-10,000

In well-managed herds, you’re looking at $30,000 to $60,000 in benefits.

The return can be 10 to 15 times your investment when everything clicks. But let’s be clear—not every farm sees these results. Success depends on execution, baseline disease rates, and how well you dial in the protocols for your specific situation.

Remember Selective Dry Cow Therapy? This Is That Moment Again

You know what this reminds me of? About ten years ago, when selective dry cow therapy started getting pushed.

I remember sitting in a presentation where Pam Ruegg—she was at Wisconsin then, now at Michigan State—was explaining why we didn’t need to treat every quarter of every cow at dry-off. Half the room thought she’d lost her mind. “Too risky!” “Too complicated!”

Today? It’s just what progressive farms do. Standard practice.

Same pattern here:

  • Initial resistance (“It’s too complicated”)
  • Few early adopters prove it works
  • Word spreads at the coffee shop, not in the journal articles
  • Suddenly, everyone’s doing it

The early adopters I’m seeing with targeted anti-inflammatory protocols—they’re already two, three years into fine-tuning this. By the time it becomes “normal,” they’ll have such a head start.

Making It Work for Your Operation

Look, this isn’t one-size-fits-all. Different setups need different approaches.

Running a tie-stall with under 100 cows? You don’t need fancy software. A clipboard and some colored leg bands work fine. Vermont Extension documented several 60 to 80-cow operations doing exactly this. Works great.

Mid-size freestall, say 100 to 500 cows? This is where some automation starts making sense. Maybe spring for those body condition cameras—they’re running $15,000 to $25,000 installed now. Or, at minimum, get your parlor software to talk to your DHIA records.

Big operation, over 500 cows? You need full integration. Period. Manual tracking doesn’t scale. Every large herd case study that’s succeeding has automated flagging and someone whose specific job includes transition cow coordination.

And don’t forget regional differences. Different climates, different calving patterns, different challenges.

Where This Is All Going (And Why You Should Care)

Based on the trends I’m seeing—Progressive Dairyman’s data backs this up—we’re heading for a pretty clear split in the industry.

By 2030, farms using targeted protocols are projected to have disease rates around 12-15%. Farms still doing blanket treatment? Still stuck at 30%.

That’s not a small gap. That’s the difference between thriving and struggling.

And the regulatory pressure… it’s coming whether we like it or not. California’s already there with SB 27. The EU’s way ahead of us. FDA’s guidance on antibiotic use isn’t getting looser.

Mike Overton from Elanco frequently speaks about this at conferences: the future is precision transition management becoming standard practice, not optional innovation.

So What’s This Mean for Your Farm?

Look, the science here is solid. Penn State, Cornell, Wisconsin, Illinois, Florida—they’re all finding the same thing. Different cows need different treatments at different times. When you think about it, it’s obvious. We just haven’t been paying attention.

The economics can be compelling when properly implemented. But success isn’t guaranteed—it requires commitment, proper protocols, and careful execution.

Most of us have the data we need sitting in DairyComp right now. We’re just not using it systematically. Success isn’t about technology—it’s about commitment and workflow.

My advice? Work with your vet to develop a protocol. Pick one group—maybe those overconditioned heifers. Track everything for six months. Let your own numbers guide you. Then build from there.

According to the USDA, we lost another 2,100 dairy farms last year. Margins keep getting tighter. This isn’t just about doing better anymore. It’s about positioning for the future.

Your 90-Day Implementation Plan

✓ Week 1-2: Schedule a comprehensive planning session with your veterinarian

✓ Week 3-4: Audit your data capabilities and establish baseline metrics

✓ Week 5-8: Develop protocols including early-calving contingencies

✓ Week 9-12: Begin implementation with ONE group—document everything

✓ Day 90: Review with your vet—adjust protocols based on results

Critical Reminders:

  • Establish milk testing protocols for early-calving treated animals
  • Maintain strict treatment records for regulatory compliance
  • Work with your vet to establish proper dosing—never guess
  • Expect variation in results—fine-tuning is normal

This article is for informational purposes only and does not constitute veterinary advice. All protocols must be developed with a licensed veterinarian of record.

Key Takeaways:

  • Your fresh cow diseases cost 4X more than you think: $95 treatment becomes $400 in total losses—but strategic timing prevents 40% of cases
  • Different cows need different timing: Overconditioned heifers need anti-inflammatory treatment 14 days BEFORE calving (when inflammation builds), mature cows AT calving (when it peaks)
  • Focus on three high-risk groups at dry-off: Fat cows (BCS ≥3.75 lose 560 lbs milk), low producers (<50 lbs/day), and high SCC cows (>200,000)—treating just these generates 20:1 returns
  • Implementation is simpler than you think: Uses data you already collect, costs $6/cow, requires one veterinary consultation to set protocols—most farms see results within one lactation
  • Start small to prove it works: Pick overconditioned first-calf heifers, treat at close-up pen movement, track results for 6 months—let your own data convince you

Complete references and supporting documentation are available upon request by contacting the editorial team at editor@thebullvine.com.

Learn More:

The Sunday Read Dairy Professionals Don’t Skip.

Every week, thousands of producers, breeders, and industry insiders open Bullvine Weekly for genetics insights, market shifts, and profit strategies they won’t find anywhere else. One email. Five minutes. Smarter decisions all week.

NewsSubscribe
First
Last
Consent

The 90-Second Milking Window That’s Paying $126,000 – and Beating Every Robot

Master the 90-second milking rule that’s earning smart dairies $126,000—no robot needed.

So I was walking the aisles at World Dairy Expo last month, and what really got me was how nearly every booth was pushing some kind of automation as the solution to all our problems.

That same trip, I stopped by a 250-cow operation near Fond du Lac. The milkers were rushing through prep in maybe 45 seconds—when we all know biology needs closer to 90. Meanwhile, the owner’s shopping for robots while potentially leaving $126,000 in annual production sitting right there in the parlor.

What’s interesting is that Cornell just released its 2024 Dairy Farm Business Summary, which backs up something I’ve been noticing for a while now. The gap between farms that are making it and those that aren’t? It’s not really about who has the newest equipment.

The Numbers That Tell the Real Story

Cornell’s latest data is eye-opening. Top farms in New York are running at $15.79 per hundredweight in operating costs. The bottom ones? They’re hitting $22.32.

That’s a $6.35 gap between similar-sized operations with pretty much the same technology.

You’ve got 500 cows producing 25,000 pounds annually? That efficiency gap is worth about $79,000. Not from buying new equipment—just from doing what you’re already doing better.

Brazilian researchers looked at 378 dairy farms adopting precision technology—published their findings in the Animals journal back in 2021. About a large share of adopters reported limited realized benefits, underscoring that adoption alone didn’t guarantee performance gains. But you know what? The farms that just focused on nailing their basic protocols? They saw returns right away without spending anything on new gear.

I’ve been talking with producers out in California lately, and down in Georgia too, and they’re telling me the same story—dropped hundreds of thousands on cooling systems or new facilities before realizing the real problem was inconsistent feeding schedules. Different climate, same underlying issue.

And you know what’s interesting? Even operations in New Zealand—where they’re dealing with completely different grazing systems—are finding the same thing. It’s not about the technology. It’s about the execution.

“Farmers think they’re buying free time. They’re really just buying different obligations.”

Five Questions Before Writing That Technology Check

□ Have we actually put a dollar figure on what our problems are costing us right now?

□ Are we in the top 25% for how well we’re doing what we’re already doing?

□ Is this technology going to help us stand out in the market, or just make us slightly better at commodity production?

□ Do we have people who can actually run this stuff, or are we hoping to find unicorns?

□ Can we hit 15% returns and still have money in the bank for when things go sideways?

Why Those 90 Seconds Matter More Than You Think

You know how crazy it gets during second cutting—everybody’s rushing. But here’s the thing: oxytocin doesn’t wait for us.

UW–Madison tracked 16 farms and found and what he found shouldn’t surprise anyone who’s been around cows. Farms that hit that sweet spot—60 to 90 seconds between first touch and unit attachment—they’re getting 4-6% more milk.

Not from better genetics. Not from fancy supplements. Just from timing it right.

And here’s something else—it matters whether you’re milking Holsteins or Jerseys. Jerseys tend to let down a bit quicker, maybe 10-15 seconds faster on average. But the principle’s the same.

THE GOLDEN WINDOW: Your 90-Second Milking Protocol

What’s all this worth? Well, let me walk you through the math.

On 500 cows averaging 75 pounds daily, even a conservative 5% bump from proper timing gets you about 1,875 extra pounds per day. The current Base Class I price was $18.21/cwt, according to the USDA’s latest market report.

Do the math—that’s about $126,000 a year. From timing. Not technology.

Beyond volume, research shows proper stimulation timing can lift butterfat percentages and lower SCC—quality bonuses most dairies leave on the table.

Penn State Extension has been looking at training on farms, and in most operations they’ve studied, formal training is pretty sparse. Workers are mostly learning from whoever was there before them. It’s like a game of telephone where everybody loses.

What’s worse is that during planting and harvest—protocol drift accelerates when everybody’s pulled in different directions.

Two Roads Diverged in a Dairy Farm

Extension folks across the Midwest have been tracking different approaches to technology adoption, and the patterns they’re seeing are crystal clear. Let me share what they’ve found—these are representative cases, not specific farms, but the numbers are real.

The “All-In” Approach

Farms facing typical challenges—about 30% turnover, $21/cwt costs, 220,000 somatic cells—often buy everything. Based on what dealers are charging these days:

  • Robotic system: $495,000
  • Barn retrofit: $75,000
  • Automated feeding: $52,000
  • Health monitoring: $38,000

Total: $660,000

But here’s what Minnesota’s research tracking these systems shows: you don’t eliminate labor—you change it. Instead of paying $15/hour for milkers, you’re paying $25-30/hour for technicians. And good luck finding them.

Production gains? University studies show 2-3% is realistic, not the 7% dealers promise.

Annual debt service: $30,00 to $100,000
Actual benefits: $65,000 to $100,000
Net result: $35,000

The Strategic Route

Now, I’ve seen farms take a different approach. Same problems, but they ask, “What’s actually costing us money?”

Strategic investments based on Extension case studies typically look like this:

  • Heat detection ear tags: $24,000 (fixes quantified reproduction losses)
  • Inline milk testing: $15,000 (enables premium capture)
  • Protocol training: $20,000 (the one nobody talks about)
  • Small pasteurizer: $15,000 (direct sales opportunity)

Total: $74,000

What happens? Based on composite results from university tracking, conception rates jump from mid-40s to low 60s. Training delivers 4-5% more milk. Cornell and UVM data show that organic premiums add $250-$300 per cow. Direct sales can bring $70,000-85,000 from just 15% of production.

“Stop buying solutions to problems you haven’t measured.”

YOUR 4-PHASE IMPLEMENTATION ROADMAP

Phase 1 (Months 1-3): Get Brutally Honest

  • Independent assessment: $5,000-8,000
  • True cost of production analysis
  • Problem quantification in dollars

Phase 2 (Months 4-7): Fix the Basics

  • Training & protocols: $15,000-25,000
  • Expected returns: 1,500% first-year ROI
  • No conference sponsorships, just results

Phase 3 (Months 8-12): Pick Your Lane

  • Top-25% commodity efficiency?
  • Organic/specialty markets?
  • Agritourism opportunities?

Phase 4 (Year 2+): Strategic Technology

  • Only if problems cost more than solutions
  • Only if it enables differentiation
  • Only if you have the workforce
  • Only if a 15% ROI is achievable

ROI COMPARISON: The 300% Difference

Investment ApproachAll-In AutomationStrategic Technology
Total Investment$660,000$74,000
Annual Returns$65,000$200,000-250,000
Net Annual Result$35,000$150,000
ROI9.8%300%

These are representative outcomes based on Extension case studies—your results will vary

What Really Happens to Your Labor

Finnish researchers looked at this back in 2016, and Marcia Endres at Minnesota has been tracking it ever since. Yeah, milking time drops from 5 hours to 2. But you know what shows up instead?

Watching screens. Midnight alarms. Tech support holds. Being on call 24/7.

As Marcia says, “Farmers think they’re buying free time. They’re really just buying different obligations.”

You’re not replacing a $15/hour milker with nothing. You’re replacing them with a $25-30/hour technician—if you can find one who wants to live in rural Wisconsin and answer their phone at 2 AM.

The Canadian Agricultural HR Council says we’ll be 1,000 workers short by 2029, with a third of our current people ready to retire. But robots need fewer people with way more skills. So we’ve got workers who can’t do tech work and tech workers who don’t want to live where the cows are.

Any of us who’ve gotten that 2 AM robot alarm knows what I’m talking about.

Small Doesn’t Mean Dead—It Means Different

USDA tells us we lost 15,221 dairy farms between 2017 and 2022—that’s 39% gone. And when you see big farms running at $17/cwt while small farms face $33/cwt according to the USDA’s Economic Research Service, it looks pretty hopeless for the little guys.

But here’s something interesting—a small minority—maybe 10% based on ERS estimates—are actually making money despite their small size. How?

Three approaches that work:

Elite execution: I know of operations in places like Skagit County, Washington, running under 200 cows at under $18/cwt with 50+ cows per worker. It’s exhausting, but it’s possible.

Finding your niche: Cornell’s 2024 organic dairy tracking shows certified farms pulling $250-300 extra per cow. Vermont’s been watching this for a decade—100-cow organic dairies making money while their conventional neighbors go under.

Down South, producers in Georgia and Florida tell me that being the only dairy for 200 miles creates automatic premiums. Geography becomes an advantage. And operations at 5,000-8,000 cows—not quite mega-scale but bigger than most—they’re finding automation sweet spots that work at their size.

Smart technology: Not robots. Targeted fixes. $25,000 for heat detection to prevent your reproductive disaster. $15,000 on milk quality monitoring to qualify for premiums. Not $665,000 on a robot hoping to fix everything.

Where Do We Go from Here?

So here we are. Milk costs around $20, feed eating 60% of revenues according to Penn State’s 2025 outlook, and they can’t find good help. The temptation to buy your way out is real.

But the farms thriving keep proving the same thing: doing the basics really well beats fancy equipment almost every time.

Most of us have $100,000-plus sitting right there in the parlor. It doesn’t need financing. It doesn’t need a technician from three counties away. It just needs us to do what we already know how to do, consistently.

Looking ahead, some interesting opportunities are developing. Programs like USDA’s Climate-Smart Commodities are paying $20-50 per cow for verified carbon reductions. Processors like Danone, through its “Dairy Farmers of Tomorrow” program, and Nestle, through its Net Zero Roadmap, offer select benefits as well as some offer contracts with $0.50 to $1.00/cwt sustainability premiums—though these are limited and require specific documentation.

These aren’t about technology. They’re about management and documentation—rewarding what good farmers already do.

Your cows don’t care about robots. They care about those 90 seconds before you put the milker on. They care about eating at the same time every day. They care about someone noticing when they’re in heat.

Maybe we should care about the same things.

Because with 39% of farms gone in five years, what separates survivors from statistics isn’t who bought the most technology. It’s who got the basics right first, then used technology strategically to make good even better.

The path forward isn’t in the dealer’s catalog—it’s in doing what we already know works, day after day after day.

That’s not what gets the spotlight at Expo. But when you look at who’s still milking versus who’s having an auction, it’s the story the numbers keep telling.

Key Takeaways:

  • The 90-second milking rule is adding $126,000 a year to smart dairies—no robots required.
  • Farms chasing automation before fixing fundamentals lose money twice—on milk and on debt.
  • Precision routines and trained teams outperform half-million-dollar robots every time.
  • Targeted fixes—heat detection, training, timing—average 300% ROI without new equipment.
  • Dairy’s next winners aren’t high-tech—they’re high-discipline.

Executive Summary:

Dairy’s future isn’t being built by robots—it’s being rebuilt by precision. According to Cornell’s 2024 Dairy Farm Business Summary, top operations outperform neighbors not through automation, but through disciplined execution. The research is clear: a well-timed 90-second milking routine can deliver 4–6% more milk and more than $126,000 in extra revenue annually—without buying a single new machine. Meanwhile, farms chasing automation often trade labor headaches for technical ones while falling behind on fundamentals. Cornell, UW-Madison, and Penn State all point to the same truth: technology multiplies skill—it can’t replace it. In a volatile milk market, the smartest dairies in 2025 aren’t betting on gadgets. They’re doubling down on training, timing, and teamwork that pay real dividends.

Complete references and supporting documentation are available upon request by contacting the editorial team at editor@thebullvine.com.

Learn More:

The Sunday Read Dairy Professionals Don’t Skip.

Every week, thousands of producers, breeders, and industry insiders open Bullvine Weekly for genetics insights, market shifts, and profit strategies they won’t find anywhere else. One email. Five minutes. Smarter decisions all week.

NewsSubscribe
First
Last
Consent

The $700 Truth: Your Best Milkers Are Your Worst Investment (And 3,000 Dairies Just Proved It)

Just found out our 90-lb cow loses $3/day while our 85-lb cow makes $10/day. The difference? 6kg of feed. This changes everything

Executive Summary: What if your highest-producing cows are actually costing you money? Feed efficiency technology deployed across 3,000 dairy farms proves it’s not just possible—it’s common. The numbers are stark: cows producing identical 100-pound milk yields show daily profit swings from -$7 to +$10, based solely on whether they consume 17kg or 23kg of feed. Ryzebol Dairy transformed this insight into action, breeding inefficient cows for beef ($700 premiums) while focusing genetics on the efficient third that actually drives profit. At $75-150K investment returning $470/cow annually, payback takes just 3-5 years. The industry is splitting fast between operations still chasing volume, and those chasing profit—and the profit-chasers are pulling away.

For nearly a century, dairy farming has operated on a simple equation: more milk per cow equals more profit.

But what farmers are discovering through new feed efficiency technology is turning that fundamental assumption on its head. The highest-producing cows in many herds are actually the least profitable—a revelation that’s prompting forward-thinking operations to reimagine their breeding, feeding, and culling strategies completely.

I recently had a fascinating conversation with Clare Alderink, general manager of Ryzebol Dairy’s 3,000-cow operation in Bailey, Michigan. When his farm implemented Afimilk’s feed efficiency estimation system, the data revealed something that challenged everything he thought he knew about his herd.

“There’s no way the service knew these cows were from the same farm, yet all those cows found themselves on the top of the list as the most feed efficient.”

All of his most feed-efficient animals traced back to one group of purchased Holsteins—cows that weren’t his top milk producers but were generating the highest profit per dollar of feed consumed.

The Hidden Economics That Traditional Metrics Miss

You know, what’s really striking when you dig into the economics is just how much variation exists between seemingly similar operations.

The folks at Vita Plus Corporation ran an analysis in 2024 examining 20 Midwestern herds—all shipping roughly 100 pounds of energy-corrected milk per cow daily. What they found should make every dairy farmer pause.

Income over feed cost ranged from less than $7 to greater than $10 per head per day.

Think about that $3.50 daily difference for a moment. On a 1,000-cow operation, we’re talking about over $1.2 million in margin opportunity annually. Money that’s essentially invisible if you’re only tracking milk production.

QUICK TAKE: THE EFFICIENCY GAP

Cow GroupDry Matter Intake (kg/day)Difference (kg/day)Cost Savings per Cow (lactation period)
Efficient17.306$700
Inefficient23.306$0

What’s interesting here is that we’re finally understanding the mechanism behind this variation through individual cow measurement. A study published in Frontiers in Genetics in 2024 evaluated genomic markers for residual feed intake in 2,538 US Holstein cows.

The differences they found between efficient and inefficient animals were eye-opening:

  • First-lactation cows? The most efficient animals consumed 17.30 kg of dry matter daily, while the least efficient needed 23.30 kg
  • Second-lactation cows showed an even wider gap, with efficient cows eating 20.40 kg versus 27.50 kg for inefficient animals

Now, here’s where it gets interesting for those of us looking at feed bills.

According to University of Wisconsin Extension data, feed costs in the Upper Midwest are averaging around $381 per ton of dry matter. That 6 kg daily difference? It represents roughly $700 per cow per lactation in feed cost variation between animals producing identical milk volumes.

Shane St. Cyr from Adirondack Farms in New York put it perfectly:

“You have the income half of the equation on most dairies. But without that expense equation, you’re really kind of flying blind.”

The Strategic Breeding Revolution: Beef-on-Dairy Meets Feed Efficiency

Perhaps the most dramatic shift I’m seeing—and I’ve been watching this space closely—is how farms are completely rethinking their breeding strategies once they have feed efficiency data in hand.

Instead of the old approach (trying to create replacement heifers from every cow that’ll stand still long enough to breed), operations are now using what’s essentially a three-tier system:

TOP 20-30% (HIGH EFFICIENCY):

  • Bred with sexed dairy semen
  • Create the next generation
  • Keep these genetics forever

MIDDLE 40-50%:

  • Conventional dairy semen
  • Backup replacement strategy
  • Flexible based on herd needs

BOTTOM 20-30% (LOW EFFICIENCY):

  • Bred exclusively with beef semen
  • Generate $350-700 premiums per calf
  • Transform losses into profit centers

The beef-on-dairy market has absolutely exploded in ways that, honestly, nobody saw coming five years ago.

Purina Animal Nutrition surveyed 500 dairy producers in 2024 and found that 80% are now receiving premiums for beef-on-dairy calves. Some crosses are fetching over $1,000 in tight cattle markets, particularly in Texas and the Central Plains.

Think about this for a minute:

  • Purebred dairy bull calf: $50-150 (if you’re lucky)
  • Many producers: Actually paying disposal costs
  • Same cow bred to beef: $500-850 per calf

The math here isn’t subtle, folks.

For Ryzebol Dairy, this strategic allocation based on feed efficiency data has completely transformed how they view their inefficient cows.

“I want that efficient cow to stay in my herd a long, long time,” Alderink explained. “Whereas the other inefficient cows I would want to use to make a beef calf because she’s a lower-value cow.”

What University Research Missed: The Power of Individual Variation

Here’s something that really drives home why on-farm measurement matters more than controlled research trials. Ryzebol’s experience with high oleic soybeans illustrates this perfectly.

The university studies—Penn State ran a trial with 48 Holstein cows in 2024, and Michigan State published similar work—showed that high-oleic soybeans improved energy-corrected milk and components. The improvements were significant, particularly for butterfat. Solid research. Peer-reviewed. Convincing stuff.

So Ryzebol implemented them herd-wide and saw improvements.

But then Alderink did something the research couldn’t do. He used individual cow feed efficiency data to dig deeper.

“Increasing the average doesn’t always tell the whole story. It may have made our best cows really efficient and done little for the low cows.”

What he discovered should make every nutritionist rethink how we apply research findings:

TOP 30% OF COWS:

  • Excellent milk and component response
  • Strong returns on premium ingredient cost
  • Worth every penny

MIDDLE 40%:

  • Marginal improvement
  • Barely justified the extra cost
  • Questionable economics

BOTTOM 30%:

  • Little to no benefit
  • Essentially throwing money away
  • Better off with standard ration

This insight—that research-validated improvements don’t apply equally to all animals—represents a fundamental shift in how we can optimize nutrition economics.

The Technology Landscape: Understanding What’s Real vs. What’s Promised

Let’s talk about what this technology actually does, because there’s plenty of confusion out there.

Afimilk’s feed efficiency service represents a breakthrough in estimating individual cow feed efficiency through collar sensor data. The system tracks eating time and rumination patterns, then combines this with milk production information to generate efficiency values for each animal.

You’re entering weekly dry matter intake data from your feeding software to calibrate the estimates. According to validation studies at UW-Madison, the correlation between the algorithm’s estimates and actual measured intake has proven strong enough for commercial application.

THE NUMBERS THAT MATTER:

InvestmentAnnual servicePayback periodROIBeef premiumFeed savings
$75,000-$150,000 (500 cows)$10,000-$25,0003-5 years$470/cow/year$350-700/calf$700/cow/lactation

Early adopters are reporting that the technology can deliver $470 per cow in annual profitability gains through better breeding and culling decisions.

On a 1,000-cow operation? That’s nearly half a million dollars in annual value.

Though I should note—and this is important—that’s assuming farms actually act on the data.

The Adoption Reality: Barriers Beyond Technology

Despite these clear economic benefits, several factors are creating real headwinds for adoption.

CAPITAL CONSTRAINTS We’re talking $75,000-$150,000 for basic sensor systems on 500 cows. Field data from early adopters suggests payback periods of 3-5 years. But that upfront investment? It’s tough when milk prices are volatile.

SYSTEM INTEGRATION Feed efficiency estimation needs to pull data from multiple sources:

  • Milk meters
  • Cow ID systems
  • Feeding software
  • Health records

According to Progressive Dairy’s 2024 tech adoption survey, approximately 70% of North American dairies have older equipment or mixed vendors. Additional integration costs that nobody mentions in the sales pitch.

PSYCHOLOGICAL RESISTANCE Here’s the barrier nobody wants to talk about. Kent Weisenberger from Vita Plus put it bluntly in a recent podcast:

“The technology works fine. Whether farmers will cull their favorite high-producing cow because she’s inefficient? That’s the real question.”

It’s worth noting that feed efficiency estimation isn’t a silver bullet for every situation. Grazing-based operations or farms with highly variable feed quality from homegrown forages might find the economics less compelling.

Environmental Benefits: The Profit-Sustainability Alignment

What I find particularly interesting about feed efficiency selection is how environmental benefits just naturally emerge from economic optimization.

You’re not trying to save the planet—you’re trying to make money—but the planet benefits anyway.

Research from Wageningen University in 2024 found that methane production varies by approximately 25% within herds due to genetic factors. The correlation between feed efficiency and methane reduction is strongly positive.

Since April 2023, Canada has been implementing national genetic evaluations for methane emissions through Lactanet. They’re projecting 20-30% reductions in breeding alone by 2050.

The Council on Dairy Cattle Breeding calculates that genomic selection for feed efficiency has already delivered $70 per cow per year in additional value—before accounting for any environmental benefits or carbon credits.

The key point? You don’t need expensive additives. Simply breeding from more efficient animals reduces methane automatically at zero additional cost.

Looking Ahead: The Industry Transformation

Here’s where things get really interesting for the bigger picture.

If enough operations start breeding away from high-volume, low-efficiency genetics, it fundamentally challenges what the breeding industry has been selling for decades.

VikingGenetics launched their Feed Efficiency 3.0 program earlier this year, explicitly prioritizing efficiency over raw production. Meanwhile, established players like Semex and Alta have scrambled to launch “sustainable genetics” programs.

The uncomfortable truth? While high producers generally dilute maintenance costs effectively (gross feed efficiency), metabolic efficiency—measured as Residual Feed Intake—is a distinct genetic trait. You can have a high producer that’s metabolically inefficient, or a moderate producer that’s exceptionally efficient at the cellular level.

For 40 years, the breeding industry chose production over efficiency. With feed accounting for 50-75% of operating costs, according to USDA data, the math increasingly favors a more nuanced approach.

THE BULLVINE BOTTOM LINE: Your Monday Morning Action List

IMMEDIATE ACTIONS (THIS WEEK):
□ Calculate your current income over feed cost variance between top and bottom cows
□ Call your nutritionist—ask if they’ll support data-driven feeding changes
□ Visit a farm already using the technology (find one in your area)

EVALUATION PHASE (NEXT 30 DAYS):
□ Get quotes from 3 vendors for feed efficiency estimation systems
□ Run your herd’s numbers: What’s your potential at $470/cow/year?
□ Talk to your banker about financing options (3-5 year payback)

DECISION CHECKPOINT:
□ Can you afford to wait while neighbors gain $700/cow/lactation advantage?
□ Will you act on uncomfortable data about favorite cows?
□ Are you ready to challenge 40 years of production-first thinking?

The technology exists. The economics are proven. The only question: Will you act before your neighbors do?

As Alderink reflects: “I think we are just scratching the surface on all this, but it is taking us down a path where we can really start to look at these things because we have something to measure it.”

That ability to see which cows convert feed efficiently—versus which simply produce milk—represents the difference between optimizing for volume and optimizing for profit.

In today’s margin environment, that distinction increasingly determines which operations thrive and which struggle to survive.

Your move.

Key Takeaways:

  • The $700 Discovery: Efficient cows (17kg DMI) and inefficient cows (23kg DMI) produce identical milk but differ by $700/lactation in profit—measure to know which you have
  • Transform Your Breeding: Feed data creates three profit tiers → Top 30% get premium genetics | Bottom 30% produce beef calves ($350-700 each) | Middle 40% flex by needs
  • Precision Feeding Pays: Individual response data shows premium feed additives only benefit ~30% of cows—saving $200+/cow by removing non-responders from expensive rations
  • Competitive Clock Ticking: 3,000 early adopters gaining $470/cow annually are building herds 10-15% more efficient by 2030—each month you wait widens the gap

Complete references and supporting documentation are available upon request by contacting the editorial team at editor@thebullvine.com.

Learn More:

The Sunday Read Dairy Professionals Don’t Skip.

Every week, thousands of producers, breeders, and industry insiders open Bullvine Weekly for genetics insights, market shifts, and profit strategies they won’t find anywhere else. One email. Five minutes. Smarter decisions all week.

NewsSubscribe
First
Last
Consent

The Hidden Week That Costs You $350 Per Heifer (And How to Fix It)

That 3-day-old embryo determines if she’ll produce 2,600 more pounds of milk. Most producers have no idea.

EXECUTIVE SUMMARY: The first seven days after conception determine more about lifetime productivity than the next seven years of management—yet most producers ignore this critical window. University of Florida research proves simple interventions yield massive returns: choline-supplemented embryos produce calves 25 pounds heavier at weaning, dry cow cooling prevents $350 per heifer in losses, and avoiding bull overfeeding improves embryo quality in ways semen analysis can’t detect. Progressive dairies implementing these strategies report first-year savings of $60,000-70,000 with an 18-month payback on cooling investments. The science is clear: you’re either programming for success or accepting mediocrity before pregnancy is even confirmed. Ask your ET provider one question—’ Are you using choline?’—and start capturing gains your competitors are leaving on the table.

dairy developmental programming

We spend millions on genomic testing, elite semen, and perfect rations. Yet new research suggests we’re leaving the biggest efficiency gains on the table by ignoring the first week of an embryo’s life. While you’re focusing on the proof, biology is focusing on the programming. If you aren’t managing the first seven days, you’re building a Ferrari engine and putting it in a Honda chassis.

I’ve been following this research coming out of Peter Hansen’s lab at the University of Florida for the past three years, and honestly, it’s completely changed how I think about reproduction. What we’re seeing from operations in California, Wisconsin, and across the Midwest suggests that producers who understand developmental programming are building advantages that compound through generations. And those who don’t? Well, they’re leaving serious money on the table.

Here’s what’s interesting—I was talking with a producer near Turlock last month, and he said something that stuck with me: “We used to think reproduction ended at conception. Now we realize that’s when the real work begins.” That pretty much sums up this whole shift in thinking.

When Genetics Meet Environment: The Choline Discovery That Changes Everything

So Peter Hansen—he’s published over 400 papers on reproductive biology, by the way—has this great way of explaining it. He says we’ve gotten really good at optimizing everything after calves are born. The best nutrition, perfect housing, optimal photo periods. But we don’t really think much about what’s happening when they’re embryos or fetuses. And that’s where we might be missing the boat.

What’s fascinating is that Hansen’s team, working with researcher Eliam Estrada-Cortes, discovered something almost embarrassingly simple. They added choline to the culture medium for IVP embryos. Now, choline’s naturally present in the uterus—we’re talking millimolar concentrations here—but it’s typically absent from commercial culture media. Their work, which appeared in The FASEB Journal in 2021 and was replicated in Biology of Reproduction just this year, shows remarkable consistency.

The results? Calves from those choline-treated embryos consistently weigh more at weaning. We’re talking 15 to 25 pounds heavier on average, and here’s the kicker—those advantages persist straight through to slaughter. Even at physiologically relevant concentrations—just four micromoles per liter, basically what you’d find in blood—you still get these effects.

Now, if you’re doing embryo transfer, this next part is really interesting. When Estrada-Cortes looked at muscle tissue from four-month-old calves, they found 670 differentially methylated DNA sites out of about 8,100 they examined. The affected genes control growth, metabolism, cellular proliferation—basically all the fundamental processes that influence an animal’s entire productive life.

As Hansen explained it to me, “We’re not changing the DNA sequence. We’re changing how genes are expressed—which ones are turned on or off, and when.” Think of it like having the same recipe but changing the cooking instructions. Makes sense, right?

The Epigenetic Revolution: Why Your Dry Lot Decisions Matter More Than You Think

Let me break this down in a way that actually makes sense. You know how DNA is like the blueprint for building a barn? Well, epigenetic modifications are like the building permits that determine which parts of that blueprint actually get built, in what order, and how big they are.

During those first seven to fourteen days after fertilization—when that embryo’s just a ball of cells—these “building permits” are being written. Environmental factors like nutrient availability, temperature, and stress hormones all influence which genes are marked for activation or silencing. And once that window closes, these marks become semi-permanent. That’s the part that should make us all pay attention.

A reproduction manager from one of those big 3,000-cow operations near Hanford had this great insight when we talked: “Once we understood that what happens in the first week determines so much, we completely changed how we think about our IVP program. We’re not just counting blastocysts anymore—we’re thinking about quality at the cellular level.” That’s exactly the shift we all need to be making.

And here’s something else to consider—this could have implications for sexed semen use too. If we’re already manipulating sperm for sex-sorting, understanding these epigenetic factors becomes even more critical. We’re stacking technologies, so we need to optimize each one.

Heat Stress: The Multi-Billion Dollar Problem Hiding in Your Dry Pen

Now, if you’re up in Wisconsin, you might think heat stress is mainly a problem for those folks down in Texas or Arizona. But the research tells a different story—and it’s one that should concern every producer north of the Mason-Dixon line.

Geoffrey Dahl’s group in Florida has been doing incredible work on this, publishing some eye-opening data in the Journal of Dairy Science. Here’s what calves born to heat-stressed dry cows face:

  • They absorb about 33% less immunoglobulin from colostrum
  • They’re roughly 23% smaller at birth—we’re talking 8 to 10 pounds lighter
  • They produce about 19% less milk in the first lactation—that’s around 2,600 pounds over 305 days
  • And they’re 20% less likely to complete that first lactation

The mechanism behind all this, which was detailed in Biology of Reproduction earlier this year, is fascinating. During those last 60 days of pregnancy—when that fetus is packing on 60% of its birth weight—heat-stressed cows redirect blood flow from the uterus to the skin for cooling. So the developing calf experiences what amounts to chronic mild oxygen deprivation.

I know a Jersey producer in central Minnesota who learned this the hard way. They had a brutal July a couple of years back—temperatures and humidity combined to push the temperature-humidity index over 72 for three weeks straight. The calves born that October? They’re still dealing with the effects. More treatments, slower growth, and now that they’re coming into milk, production is definitely off.

By the time these heat-stressed calves hit the ground, they’re already behind. Their intestinal tissue shows higher rates of cell death, reducing the surface area available for absorbing those critical immunoglobulins. Their thymus and spleen—basically the headquarters of immune development—are measurably smaller. It’s a cascade that starts before they’re even born.

Bulls: The Hidden Variable Nobody’s Measuring Right

Here’s something that genuinely surprised me when I dug into the research—your bull’s body condition might matter more than his proof. I know, I know, that sounds crazy, but hear me out.

Arslan Tariq’s work at the University of Florida examined what happens when young bulls are pushed onto high-gain diets—you know, the standard protocol to get them to market weight faster. Bulls gaining 1.81 kilos per day versus a moderate 1.22 showed completely normal sperm motility and morphology. Any AI stud would stamp them “high fertility” and ship that semen worldwide.

But when Tariq used that semen for IVF? Completely different story. Embryo cleavage rates dropped significantly, blastocysts had fewer cells, cell death rates increased, and development timing lagged behind. The kicker? Standard semen analysis can’t detect any of this. The sperm look perfect, swim fine, and fertilize eggs normally. But they’re carrying what you might call epigenetic baggage—altered small RNAs and methylation patterns that compromise embryo development.

One semen procurement manager from a Wisconsin cooperative told me recently, “We’ve been evaluating bulls all wrong. We’re looking at motility and morphology when we should be asking about how that bull was raised and fed.” That’s a pretty profound shift in thinking, isn’t it?

The Seminal Plasma Question: What Are We Throwing Away?

For decades, the AI industry has removed seminal plasma before freezing semen. Makes perfect sense from a storage perspective—seminal plasma contains proteins and minerals that interfere with freeze-thaw survival. But research from Gabriela Macay’s doctoral work at Florida suggests we might be discarding liquid gold.

Offspring from inseminations where seminal plasma remained showed some pretty impressive advantages: heavier birth weights by 5 to 7 pounds4 to 8% greater milk yield in first lactation, and better persistence in the herd—basically, they stick around longer through multiple lactations.

What’s in this stuff? According to work that came out in Frontiers in Cell and Developmental Biology this year, seminal plasma contains these tiny extracellular vesicles—think of them as molecular FedEx packages—carrying proteins, lipids, and RNA molecules. High-fertility bulls, particularly in some Sahiwal research, exhibit distinct vesicle signatures, with proteins involved in energy production and sperm function.

But here’s the really interesting part—these vesicles don’t just help sperm. They interact with the cow’s reproductive tract, modulating immune responses and potentially influencing early embryonic development. It’s a whole communication system we’ve been, well, washing down the drain.

What Top Operations Are Actually Doing (And Getting Right)

Looking at the numbers—2.2 million embryos produced globally last year, up almost 16% according to the International Embryo Technology Society—you’d think everyone’s on the same page. But spend time with the operations getting exceptional results, and you’ll see some distinct patterns.

Take De-Su Holsteins out in New Mexico. They’re producing about 200 embryos a month, but what sets them apart isn’t volume—it’s their obsession with details that most operations ignore. They track offspring performance through multiple lactations and feed that data back into breeding decisions. They’ve adjusted bull management to avoid overconditioning. Their culture media protocols focus on mimicking natural oviductal conditions rather than just maximizing blast rates.

Down in California, I’ve heard from several operations that reducing nutrient concentrations in culture media by as much as 75% produces the same pregnancy rates with better calf quality. As one embryologist put it, “We were providing excessive supplementation that may actually impair embryo development. More isn’t always better.” That’s a lesson we could probably apply to a lot of things in dairy, right?

The real game-changer, though? Preimplantation genetic testing. Operations using PGT-A are reporting pregnancy rate improvements of around 7.5% and live birth rates up nearly 6%. As a Texas producer told me, “At about $300 per test, it pays for itself if it prevents just one failed pregnancy.” Hard to argue with that math.

The Economics: More Compelling Than You’d Think

Let’s talk dollars and cents here, because that’s what determines whether any of this actually matters on your farm.

The Compounding Advantage: Progressive operations implementing developmental programming strategies build an $800,000+ advantage over 5 years compared to operations using conventional approaches alone

Dry cow cooling for a 500-cow operation runs between $20,000 and $30,000 for a basic soaker-and-fan setup. Sounds steep, I know. But economic modeling from the University of Florida shows the payback period is typically under 1.5 years, with a benefit-cost ratio of about 3-to-1. Each heat-stressed replacement heifer costs you around $350 per cow in lost first-lactation milk alone—and that’s not even counting the health costs.

Colostrum management improvements? They cost virtually nothing. A BRIX refractometer runs maybe $300 to $500. Training your calf crew to feed 4 liters within 2 hours instead of “whenever we get to it”? That’s free. The return? Calves gain an extra 15 to 25 pounds by weaning, with 20 to 30% fewer treatments. Do the math on your antibiotic bills—it adds up fast.

Bull condition monitoring is basically free, too. Actually, you’ll save money feeding bulls for moderate gains instead of pushing them hard. Research from Tennessee shows feed costs drop 12 to 15% when you target moderate versus aggressive weight gains.

“Several western dairies report savings north of $50,000 annually from reduced treatments and improved growth when integrating colostrum and cooling protocols.”

One central California operation estimated first-year savings between $60,000 and $70,000 after implementing these strategies, based on herd health and production records reviewed by their consulting veterinarian. This year, those heifers are coming fresh, and preliminary data shows they’re outproducing their older herdmates by over 4 pounds per day. That’s real money.

Regional Realities: One Size Doesn’t Fit All

Know Your Risk: Annual heat stress days (THI >72) vary dramatically by region, from 100+ critical days in the Southwest to just 10-15 days in the Pacific Northwest—but even one week matters during peak breeding season

What works in California might not translate directly to Vermont, and that’s worth acknowledging.

In the Southwest and Southern Plains, where you’re dealing with 100-plus days of heat stress annually according to NOAA data, dry cow cooling isn’t optional—it’s survival. These operations are already seeing the difference between cooled and uncooled cohorts in their DHI reports.

In the Upper Midwest, heat stress might be critical for only 30 to 50 days, but those days often coincide with the peak breeding season. As one Minnesota producer noted, “We only need cooling for six weeks, but those six weeks determine our entire next calf crop.” That’s a pretty important six weeks.

In the Southeast, where humidity is a challenge, the temperature-humidity index remains elevated even at night. Georgia Extension guidance confirms that producers there run fans 24/7 from May through October. Different challenge, same principle.

Up in the Northeast and Pacific Northwest, where we get those occasional heat spikes but generally milder summers, the approach is different again. Vermont and Oregon producers I’ve talked with focus on portable cooling solutions they can deploy during those critical heat events. They’re not investing in permanent infrastructure like their Southwest counterparts, but they’re not ignoring it either. Strategic shade, increased water access, and temporary fans during those 10-15 critical days can make all the difference.

For grazing operations, it’s trickier. You can’t exactly install sprinklers in your pasture. But strategic shade structures, rotational grazing to maximize tree shade during peak heat, careful dry cow management—these still apply according to pasture management literature from multiple land-grant universities.

Your Monday Morning Action Plan

So you’re convinced this matters. What do you actually do about it?

This Week:

  • Order a temperature-humidity monitor for your dry pen—they’re 50 to 100 bucks
  • Check the body condition on any bulls you’re using
  • Pull records on colostrum feeding times for your last 20 calves

Next 30 Days:

  • Get quotes for a basic cooling system—fans and sprinklers
  • Buy a BRIX refractometer and start testing every batch of colostrum
  • Set up a simple spreadsheet to track calf health events by birth date

Next 3 Months:

  • Implement your cooling system before the heat hits
  • Standardize colostrum protocols: 4 liters within 2 hours, period
  • Start tracking weaning weights by birth cohort

Next 12 Months:

  • Evaluate your embryo production partners—ask specifically about their culture media
  • Ask your IVF/ET service provider specifically: “Are you using choline-supplemented media?” If they aren’t, ask why
  • Consider PGT-A testing for your high-value embryos
  • Build the data systems to connect calf performance back to prenatal conditions

The Competitive Reality Check

Here’s what I think happens over the next five years, based on everything I’m seeing.

The operations that integrate developmental programming now—really integrate it, not just dabble—will build advantages that compound. We’re talking 3 to 4% production advantages, 15 to 20% reduction in health costs, better feed efficiency, and superior reproduction. Add it up over five years, and you’re looking at an $800,000-plus advantage for a 1,000-cow dairy. That’s not pocket change.

The operations that don’t? They’ll still make progress through genetic selection—everyone will. But they’ll be leaving 40 to 50% of potential gains on the table because their animals can’t fully express those genetics.

Several nutritionists working with Midwest herds note that genetics may be the engine, but developmental programming acts like a tune-up—both matter to herd performance. You can have a Ferrari engine, but if it’s not tuned right, a well-tuned Honda will beat you every time. That pretty much nails it.

What Does This All Means for Progressive Producers

What’s fascinating about this whole field is how it connects things we thought were separate. Your dry cow cooling affects colostrum quality. Colostrum quality affects immune development. Immune development affects feed efficiency. Feed efficiency affects lifetime productivity. It’s all connected in ways we’re just beginning to understand.

The competitive landscape is shifting faster than most producers realize. Yes, genetic gains remain important—nobody’s arguing against genomic selection. But the operations that will thrive aren’t the ones with marginally better genetics. They’re the ones who that understand genetics are only half the story. The other half—how those genetics get expressed—depends on decisions you’re making right now.

The science is clear. The economics are compelling. The early adopters are already seeing results. The question isn’t whether developmental programming matters—it absolutely does. The question is whether you’ll be among those leveraging these insights for competitive advantage, or among those wondering why the neighbors’ calves always seem to do better.

Looking at this trend, one thing becomes crystal clear: we spent two decades learning how to get cows pregnant reliably. The next frontier isn’t about conception rates—it’s about ensuring those pregnancies produce calves programmed for exceptional lifetime performance.

As that reproduction manager from California put it, “We used to think breeding success meant a positive preg check. Now we know success is determined by what happens in those first seven days after conception.” That’s a fundamental shift in how we think about reproduction.

And that shift? It’s happening right now, whether your operation is ready or not.

KEY TAKEAWAYS: 

  • The Science: Those genetics you paid thousands for? Their expression is programmed in the first 7 days after conception—before you even know she’s pregnant
  • The Money: Simple interventions = massive returns: $350/heifer saved, $60-70K year one, $800K+ over 5 years (1,000-cow dairy)
  • The Action: Ask ET providers “Are you using choline?”, cool dry cows (3:1 ROI), monitor bull condition—not just motility
  • The Urgency: Top 10% of herds are already doing this. Every month you wait, the competitive gap widens

Complete references and supporting documentation are available upon request by contacting the editorial team at editor@thebullvine.com.

Learn More:

The Sunday Read Dairy Professionals Don’t Skip.

Every week, thousands of producers, breeders, and industry insiders open Bullvine Weekly for genetics insights, market shifts, and profit strategies they won’t find anywhere else. One email. Five minutes. Smarter decisions all week.

NewsSubscribe
First
Last
Consent

Ditching Robot Pellets: How Smart Farms Save $36,000 and Improve Milk Components

Plot twist: Your cows visit robots for the TMR behind them, not the pellets. This mistake costs $100K/year.

Executive Summary: What if the dairy industry has been wrong about robot pellets for 25 years? Growing evidence from 75+ farms across Wisconsin and Ontario shows that eliminating pellets entirely saves $36,000-46,000 annually while improving butterfat by 0.3-0.4%—with no long-term production loss. University research from Saskatchewan, Wisconsin, and Guelph confirms these pioneers’ discovery: cows visit robots to access fresh TMR beyond them, not for the pellets, making that $100,000 annual expense unnecessary. But here’s the reality check: success requires guided-flow infrastructure (not free-flow), premium forage quality, dedicated management, and the financial capacity to weather 10-15% production drops during a difficult 16-24 month transition. This revolution isn’t for everyone—operations with fewer than 200 cows or limited finances should proceed cautiously. What makes this story remarkable isn’t just the economics; it’s proof that some of agriculture’s most expensive assumptions have never been properly questioned.

You know, for more than two decades, those of us investing in robotic milking systems have accepted one fundamental truth: feeding pellets to the robot is essential to motivate voluntary cow visits. Equipment manufacturers designed for it. Nutritionists built entire programs around it. We all budgeted for it without question. But here’s what’s interesting—what if this core assumption, built into thousands of robotic dairy operations worldwide, turned out to be optional?

That’s exactly what a growing number of progressive dairy farmers are discovering. By eliminating feed pellets entirely from their robotic milking systems, operations from California to Wisconsin are reporting annual savings of $36,000–$46,000 per 200 cows, improved milk components, and simplified management—all while maintaining or even increasing production. Their success is backed by recent research from leading universities and represents a fundamental rethinking of how robotic dairy systems can operate.

What fascinates me most is that this isn’t just about cutting feed costs. It’s about what happens when farmers question inherited practices and discover that some of our industry’s most accepted truths might actually be holding us back.

The Discovery That Started It All

Matt Strickland, who operates Double Creek Dairy near Merced, California, didn’t set out to revolutionize robotic milking. With 500 cows and eight DeLaval VMS V300 robots, he was simply observing his herd with fresh eyes—something we could all probably benefit from doing more often.

Working alongside herd adviser Kelli Hutchings—whose Wyoming ranching background brought a completely different perspective to dairy operations—Strickland noticed something that challenged everything the industry had told him. The cows weren’t particularly excited about the robot feed. What they really wanted was to reach the feedbunk on the other side. The robot wasn’t the destination; it was more like a toll booth on the highway to fresh TMR.

“I didn’t invest in robots to feed my cows,” Strickland explains. “I got the robots to milk my cows.”

Now, that might sound obvious, but think about how much infrastructure and cost we’ve built around the opposite assumption. Over approximately two years, Strickland’s operation gradually reduced and eventually eliminated pellets from all eight robots. The results? Well, they defied everything we thought we knew:

  • No significant change in robot visits
  • No increase in incomplete milkings
  • Milk production actually increased
  • Butterfat improved by 0.3–0.4%

Today, only seven cows in Strickland’s 500-head operation still receive pellets—individual animals with specific needs that justify the cost. That’s a pretty remarkable shift from where they started.

What the Research Actually Shows

Here’s where it gets really interesting from a scientific perspective. Strickland’s experience isn’t some outlier or lucky break. Recent research from multiple institutions validates what these pioneering farmers are discovering in practice.

The University of Saskatchewan team, led by PhD student Sophia Cattleya Dondé working under Dr. Greg Penner at their Rayner Dairy Research and Teaching Facility, revealed something that should make us all pause. Changing pellet starch concentration—whether 24% or 34%—had essentially zero effect on milk production or voluntary visits. Even more eye-opening: when cows consumed additional pellets, they weren’t adding to their total intake. For every 1 kg increase in pellet intake, cows reduced their partial mixed ration intake by 0.63 kg on average. They were just swapping one feed source for another.

University of Wisconsin Extension research found something equally surprising—farms offering higher grain amounts in the robot actually produced less milk. Separate research from the University of Guelph examining Canadian farms found that feed push-up frequency correlated with higher production, with each additional five push-ups per day increasing milk yield by 0.77 lbs per cow.

It’s worth noting that the Wisconsin study also found free-traffic barns produced more milk than guided-flow barns overall, though higher pellet feeding wasn’t necessarily associated with more milk—potentially because farms feeding high pellet amounts in free-traffic systems were often compensating for poorer forage quality.

And then there’s the Vita Plus survey of 32 Upper Midwest herds from 2018 that really caught my attention. The biggest surprise? Pellet cost and composition had no effect on income over feed cost. In fact—and this is where it gets counterintuitive—farms feeding simple, low-cost pellets like corn gluten feed or basic shelled corn were more profitable than those using premium formulations.

An Important Note on Adoption

It’s worth emphasizing that pellet-free robotic milking is still an emerging practice, not yet an industry standard. While 75+ farms across Wisconsin and Ontario have successfully made this transition, and the research supports the concept, this represents early adoption rather than widespread acceptance. The equipment manufacturers continue to include pellet systems as standard, most nutritionists still recommend pellets, and the vast majority of robotic operations worldwide continue using them. What we’re seeing is growing evidence that pellets may be optional for well-managed guided-flow operations, but each farm needs to carefully evaluate whether this approach fits their specific situation. This isn’t a universal recommendation—it’s an opportunity for certain operations to consider.

Understanding the Economics: Where the Money Really Goes

Let’s talk dollars and cents, because that’s what keeps us all in business. The financial case for pellet-free operations extends far beyond just the obvious feed savings.

When you really dig into what a typical 200-cow robotic operation spends on pellet infrastructure, the numbers are eye-opening:

Annual Pellet System Costs:

  • Raw pellet costs (10 lbs/cow/day at $250/ton): $91,250
  • Inventory management labor: $2,500–$4,000
  • Feed table programming and updates: $1,500–$2,500
  • Feed waste and shrink (3–5%): $3,600–$5,400
  • Rodent control (attracted by stray pellets): $1,200–$2,000
  • System maintenance and calibration: $1,500–$2,500
  • TOTAL ACTUAL COST: $101,000–$109,000

Now, when farms eliminate pellets, they’re not simply pocketing all these savings—that would be too easy, right? Successful transitions require reinvestment:

Required Reinvestments:

  • Higher-quality forage: $800–$1,200 annually
  • Increased feed push-up labor (1–2 additional hours daily): $8,760
  • Enhanced monitoring systems: $2,000–$5,000
  • Potential infrastructure adjustments (gate modifications if needed): $0–$15,000

NET ECONOMIC BENEFIT: $18,000–$39,000 annually, plus an additional $10,400 from butterfat improvements of 0.2–0.4%. That’s real money we’re talking about.

Regional Success Patterns: Where It’s Taking Hold

The real numbers manufacturers won’t show: Pellet-free farms outproduce traditional robot barns—both in yield and milk components.

What I’ve found particularly interesting is how adoption patterns vary by region. We’re seeing the strongest uptake in Wisconsin’s central dairy corridor—about 45 farms as of late 2024—Southern Ontario around the Woodstock area with roughly 30 operations, and isolated pockets in Quebec.

Jay Heeg’s operation near Colby, Wisconsin, provides a compelling example of regional success. Heeg Brothers Dairy currently milks 1,050 cows in their conventional parlor and 450 in a new robot barn that opened in December 2023. From day one—and this is the key part—that robot barn has operated completely pellet-free using a guided-flow design.

Wisconsin/Ontario host 75 of 103 pellet-free farms—regional clustering drives change, not marketing.

The performance comparison really tells the story. Their robot barn with no pellets produces 98 lbs per cow per day, versus about 94 lbs in the parlor. Butterfat runs 4.5% in the robot barn. Somatic cell count? Lower in the robot barn, too.

“The cows have been performing well,” Heeg reports. “Once they’re trained, they do better without you out there in the pen.”

You know what’s notable? In these regions where multiple farms have adopted pellet-free systems, it’s becoming normalized. Once three or four neighbors prove it works, the regional skepticism evaporates pretty quickly. California remains more isolated—Strickland is still somewhat of a lone pioneer there—but Wisconsin and Ontario are seeing cluster effects.

The Reality Check: Not Every Farm Should Try This

Let me be really clear about something that doesn’t always get discussed openly. I recently spoke with a 120-cow operation in Vermont that wisely decided against attempting pellet-free after honestly assessing their situation. They had a free-flow barn, variable forage quality, and limited capital reserves. Smart decision to wait.

Not every operation is positioned to succeed with pellet-free systems. Through analyzing successful transitions and, honestly, some notable failures, four non-negotiable factors emerge.

First, you absolutely need guided traffic flow. Free-flow barns, where cows have unrestricted access to all areas, typically require pellets to maintain voluntary visits. Research from Michigan State and Cornell consistently backs this up. Guided-flow systems with pre-selection gates naturally direct cow traffic through the robot, making pellets less critical for motivation.

Second, when pellets disappear, your TMR becomes everything. And I mean everything. Successful operations maintain forage with greater than 65% NDF digestibility (test this, don’t guess), consistent moisture content with no more than 2% variation, excellent fermentation quality with pH below 3.8 and minimal heating, and fresh feed delivery timed to stimulate activity—usually 2–3 AM and 2–3 PM works best.

Third, fresh cows and heifers require dedicated training. We’re talking about bringing them through the robot manually 3 times daily for a minimum of 3–6 days. That’s approximately 18 hours of labor per fresh cow during the initial training period. It’s a front-loaded investment that pays dividends later.

And fourth, the transition requires 16–24 months of focused attention. You’ll see temporary production dips, increased fetch labor, and need systematic problem-solving skills. Farms attempting quick transitions or lacking dedicated oversight consistently fail. I’ve seen it happen multiple times—the farm that thinks they can “ease into it” over a month usually gives up by week six.

Navigating the Transition: What Really Happens

The transition to pellet-free isn’t a simple switch—it’s a carefully managed process that requires patience and, frankly, some courage during the tough weeks.

In weeks 1–2, you’ll see an immediate 10–15% production drop as cows adjust. This is normal, not a sign of failure. Keep reminding yourself of that at 4 AM when you’re questioning everything.

Weeks 3–8 are what I call the valley of despair. Fetch labor intensifies. Production remains 8–12% below baseline. You’ll have mornings when 30 cows refuse the robot, and you’re wondering what you’ve done.

But then weeks 9–16 arrive. Gradual recovery begins. Rumen function stabilizes—you can actually see this in the manure consistency. Behavioral adaptation completes, and milk components start improving.

By months 4–6, production returns to baseline or slightly higher, with improved components. The economic benefits become visible. You can actually breathe again.

Here’s the critical insight from those who’ve been through it: Most farms that fail give up during weeks 6–8 when the challenges feel overwhelming, but the benefits haven’t materialized. Understanding this as a normal phase—not a crisis—is essential for success.

Risk Mitigation: Your Exit Strategies

Something the research doesn’t always cover, but farmers need to know—what if you need to reverse course?

If production drops by more than 20% by week 8, you can reintroduce pellets at 50% of the original amount, stabilize for 2 weeks, then reassess. Several farms have successfully used this “pause and reset” approach.

Another option is to keep your fresh cows and first-lactation heifers on pellets while transitioning only mature cows. This reduces risk while you learn what works for your specific situation.

Some northern operations have found success going pellet-free during the grazing season, when TMR quality is highest, then reintroducing minimal pellets during the winter months, when forage quality varies more.

Industry Response: Reading Between the Lines

The equipment and feed industries are navigating this trend carefully, and their responses tell us a lot about where it might go.

DeLaval has published technical documents on no-feed practices and featured pellet-free farms at World Dairy Expo 2025. But here’s what’s telling—they continue to include pellet delivery systems as standard on new installations, positioning no-feed as a “specialist application” for sophisticated operators. That’s strategic positioning, not wholehearted endorsement.

Feed companies are quietly diversifying. I’ve noticed more pushing of liquid feed supplements and “alternative robot feeds” in the past year. Smart nutritionists are repositioning as “whole-system optimization” experts rather than pellet specialists. They see the writing on the wall.

Current adoption patterns and market response suggest pellet-free systems may remain in the 5–15% range for specialized operations in the near term, though exact industry projections remain speculative. The measured response from manufacturers and feed companies indicates they’re hedging their bets rather than embracing wholesale change.

Self-Assessment: Is Your Operation Ready?

Success FactorMust Have (Red Flag if Missing)Warning Signs (Proceed with Caution)Deal Breaker (Wait Until Fixed)Your Score (✓)
Traffic Flow SystemGuided-flow with pre-selection gatesFree-flow barn designFree-flow without modification options
Forage Quality (NDF Digestibility)>65% NDF digestibility60-65% NDF digestibility<60% NDF digestibility
TMR Moisture Consistency<2% variation2-3% variation>3% variation
Fresh Cow Training Capacity3 manual passes daily for 3-6 daysLimited labor (2 passes daily)Cannot commit to training
Financial Reserves$50K-$70K buffer (200 cows)$30K-$50K buffer<$30K reserves
Herd Size>200 cows OR strong finances120-200 cows with tight margins<120 cows with debt
Management Time Available3-4 hours daily during transition2-3 hours daily available<2 hours daily available
Nutritionist SupportAligned and supportiveNeutral or uncertainActively opposed

Before you even think about attempting a pellet-free transition, honestly evaluate your readiness. And I mean honestly—not optimistically.

For your facility, do you have guided-flow traffic with properly sized commitment pens at 6–7 cows per robot? Can cows move from the robot to the feedbunk without bottlenecks? Are your gates reliable and well-maintained?

Looking at your forage program, can you maintain consistent TMR quality with no more than 2% dry matter variation? Do you have covered storage and quality testing protocols? Is your forage digestibility consistently above 65% NDF?

And for management capacity—this is crucial—can you dedicate 3–4 hours a day to training during the transition? Do you have financial reserves to absorb $50,000–$70,000 in transition losses for a 200-cow herd? Are your nutritionist and veterinarian aligned and supportive?

Score yourself honestly on each dimension. Operations with strong capabilities across all areas are excellent candidates. Those with multiple weaknesses should address fundamental issues before attempting this transition.

Looking Beyond Pellets: What This Really Means

This pellet-free movement reveals something bigger than operational optimization. It demonstrates how entire industries can build complex systems around assumptions that never get questioned.

Think about it—this pattern of inherited practices becoming unquestioned truth likely exists in other areas of dairy management we haven’t even examined yet. Three-times-daily feeding schedules—is it really necessary? Complex genetic selection protocols—how much complexity actually adds value? Traditional parlor labor models—could workflow redesign cut labor 30%? Precision feeding systems—does the complexity justify the cost?

The farms that will thrive in the coming decades won’t be those perfecting existing systems. They’ll be those willing to ask uncomfortable questions about fundamental assumptions.

Key Takeaways for Your Operation

For operations considering pellet-free transitions, here’s what matters most.

First, assess your readiness honestly. This works brilliantly for farms with guided-flow barns, strong forage programs, and management capacity to weather transition challenges. It fails predictably for operations lacking these foundations.

Second, budget for the transition period. Expect 8–12 weeks of production losses totaling $50,000–$70,000 for a 200-cow operation. If you can’t absorb this without financial stress, wait until you can.

Third, connect with others who’ve done it. Reach out to producers in Wisconsin’s central corridor or Southern Ontario who’ve successfully transitioned. Their practical insights are invaluable. The Dairy Farmers of Wisconsin maintains a peer network list, and several Ontario producer groups facilitate farm visits.

Fourth, consider your regional context. If other farms in your area have successfully transitioned, you’ll face less skepticism from advisers and find more peer support. Being the regional pioneer is significantly harder.

And fifth, think generationally. Young farmers building new operations should seriously consider guided-flow, pellet-free designs from the start. It’s much easier than retrofitting later.

For specific guidance and support, the University of Wisconsin-Madison Extension offers robotic milking workshops quarterly. Contact Dr. Francisco Peñagaricano and his team. The University of Saskatchewan provides research updates through its Rayner Dairy facility, led by Dr. Greg Penner’s team. Cornell PRO-DAIRY maintains an AMS discussion group for Northeast producers. And the Ontario Ministry of Agriculture hosts pellet-free transition webinars through their Dairy Team.

What’s encouraging is that the pellet-free revolution isn’t really about pellets. It’s about recognizing that dairy innovation comes from farmers willing to test assumptions, not from equipment manufacturers or feed companies protecting existing business models.

As one Wisconsin dairy extension specialist told me recently: “The most valuable skill for the next generation of dairy farmers isn’t optimizing current systems—it’s questioning whether those systems are actually optimal.”

That questioning mindset, more than any specific practice or technology, will determine which operations thrive in an evolving dairy landscape where labor is scarce, margins are tight, and consumer preferences keep shifting.

The farms making these transitions today aren’t just saving money on pellets. They’re developing the adaptive capacity that will serve them regardless of what challenge comes next. And in an industry facing constant change, that capability might be worth more than any amount of feed savings.

Sometimes seeing it work on a neighbor’s farm is worth more than all the research papers combined. And that’s exactly what’s starting to happen across Wisconsin and Ontario—one successful transition at a time.

Have you tried reducing the number of pellets in your robot herd? What’s been your experience—success, challenges, or somewhere in between? Tell us in the comments below.

Complete references and supporting documentation are available upon request by contacting the editorial team at editor@thebullvine.com.

Learn More:

The Sunday Read Dairy Professionals Don’t Skip.

Every week, thousands of producers, breeders, and industry insiders open Bullvine Weekly for genetics insights, market shifts, and profit strategies they won’t find anywhere else. One email. Five minutes. Smarter decisions all week.

NewsSubscribe
First
Last
Consent

Whole Milk is Back in Schools. Here’s Why Only 834 Dairy Farms Will Really Win.

After 13 years of scientific vindication and structural transformation, the Senate’s unanimous approval reveals important lessons about policy, persistence, and what it really takes to survive in American dairy

EXECUTIVE SUMMARY: Whole milk returns to schools after 13 years, validating what dairy farmers knew all along—but for 17,000 operations that closed during the wait, vindication came too late. The University of Toronto’s 2020 research showed that whole milk reduces childhood obesity by 40%, yet policymakers needed five more years and a new administration to act. Today’s transformed industry means only farms with 1,500+ cows can capture meaningful returns ($40,000-$80,000 annually) from school contracts, while farms with fewer than 500 cows are effectively locked out. The December 31, 2025, deadline for cooperative engagement is the last chance to participate until 2029—but many mid-size farms are finding better opportunities in value-added production, earning 30% revenue increases versus marginal school milk returns. The harsh lesson: in agricultural policy, being scientifically right matters less than being financially resilient enough to outlast institutional inertia.

Whole Milk in Schools

You know, when I watched the celebrations after the Senate unanimously passed S.222 on November 20th—that’s the Whole Milk for Healthy Kids Act—I had mixed feelings. Don’t get me wrong, after thirteen years of being told our product was harmful to children, finally getting vindication feels good.

But I recently had coffee with a producer from central Wisconsin who put it perfectly:

“We won the battle, but the war changed while we were fighting it.”

— Wisconsin dairy farmer, November 2025

And that’s what I keep hearing as I talk with folks across the industry. This victory arrives in a fundamentally different world than the one we knew in 2012. The real question isn’t whether we were right about the science—turns out we were—but rather, what does this actually mean for operations trying to make it work today?

The Science Story: What Actually Changed Things

So let me walk you through what happened with the research, because it’s pretty revealing about how this whole system works.

The University of Toronto published this meta-analysis back in early 2020—Dr. Jonathon Maguire’s team analyzed 28 studies covering nearly 21,000 kids from seven countries. And here’s what knocked me sideways when I first read it: children drinking whole milk showed 40% lower odds of being overweight or obese compared to those drinking reduced-fat milk.

Think about that for a second. The 2010 policy that yanked whole milk from schools—we’re talking about 30 million students in the National School Lunch Program—that whole thing was built on the idea that cutting saturated fat would fight childhood obesity. The Toronto research basically said we might’ve had it backwards all along.

What’s really interesting is its consistency. Eighteen of those 28 studies pointed in the same direction. Not a single study showed that reduced-fat milk actually lowered obesity risk.

As the University of Toronto folks noted, these findings meant we needed to completely rethink our assumptions about whole milk and kids’ health.

But here’s where it gets frustrating, and I bet many of you felt this too. The 2020 Dietary Guidelines Advisory Committee had this research right in front of them—it’s in Part D, Chapter 9 of their Scientific Report if you want to look it up. They acknowledged it, called the evidence “limited” because it wasn’t from randomized controlled trials, and recommended no change to policy.

It would take five more years and a complete change in political administration before anything actually moved. That gap between having the evidence and getting the policy to shift? That’s something every agricultural sector needs to understand.

What Really Happened While We Were Waiting

The numbers tell part of the story, but they don’t tell all of it. USDA’s Census of Agriculture shows we went from about 43,000 dairy farms down to around 26,000. But let me break down what that meant in places we all know.

Wisconsin’s Department of Agriculture reported 2,740 operations closed. Pennsylvania’s Center for Dairy Excellence documented 1,570 farms gone. New York’s Department of Agriculture and Markets recorded 1,260 fewer operations.

These aren’t just statistics—these are neighbors, fellow co-op members, families we’ve known for generations.

What’s really revealing, though, is the structural shift. USDA’s Economic Research Service report from July shows that operations with over 2,500 cows actually grew from 714 to 834. Meanwhile, those mid-sized herds—the 500- to 999-cow operations that used to be the backbone of so many regions—declined by 35%. And farms running 1,000-2,499 head? Down 10%.

You know what this tells me? This isn’t just consolidation in the traditional sense. It’s a fundamental restructuring of who can even access certain markets anymore.

Component pricing arrangements, pooling structures, institutional procurement requirements—they’ve all evolved in ways that increasingly favor operations with scale and capital reserves.

Gregg Doud, President of the National Milk Producers Federation, acknowledged this reality in their press release after the Senate vote: “While we celebrate this victory, we must recognize that market access will vary significantly by operation size and regional positioning.”

He’s right. That’s the hard truth we need to face.

Three Producers, Three Different Paths

I was visiting with producers in three different states last month about exactly this. Dave from southeastern Pennsylvania, running 750 cows, told me, “We survived by diversifying early—not because we saw this coming, but because we couldn’t afford to wait around.”

A producer named Carlos down in West Texas with 3,500 cows had a different take: “We built for institutional markets from day one. Scale was always our strategy.”

And Sarah, milking 120 cows up in Vermont, said simply, “We stopped trying to compete in commodity markets five years ago. Best decision we ever made.”

Three different paths, all working. That’s what’s interesting about where we are now.

What the Whole Milk Opportunity Actually Looks Like

So here’s what industry analysts and cooperatives are projecting. If whole milk adoption in schools reaches 50%, we could see butterfat demand increase by tens of millions of pounds annually.

Schools account for roughly 8% of total fluid milk consumption through about 4.9 billion meals served each year—that’s based on USDA data—so we’re talking about meaningful volume.

But the distribution of that benefit? That’s where it gets complicated.

Based on what Federal Milk Marketing Order data and cooperative communications are suggesting, here’s how it breaks down:

Who Wins from Whole Milk’s Return?

Operation SizeProjected Annual ImpactStrategic Move
1,500+ Cows+$40,000–$80,000Aggressively bid 2026 RFPs; leverage volume for contracts
500–1,000 Cows+$1,500–$3,000 (marginal)Evaluate admin costs vs. return; focus on efficiency gains
Under 300 CowsLow/InaccessibleFocus on direct market/specialty; skip commodity school bids

Each operation needs their own pencil work here, but the pattern is clear: scale determines access.

The Timeline You Absolutely Need to Know

If you’re thinking about pursuing this, the window for action is pretty specific:

December 2025 is really your last shot to engage your cooperative about interest.

School districts typically release their RFPs between January and March 2026. You’ll need to get your documentation and compliance certifications together in February—and trust me, there’s a lot of paperwork.

Bids are due April through May. Awards get announced in June. New contracts start July 1, 2026.

Miss that window? You’re looking at waiting one to three years for the next cycle. That’s just how institutional procurement works.

What’s Actually Working Out There

While everybody’s been focused on the whole milk policy news, I’ve been tracking what successful operations are actually doing day to day. And the patterns are pretty instructive.

Value-Added Production: More Than Just Buzzwords

Market research shows that value-added dairy products are growing at about 12% annually, while fluid milk is pretty flat.

Michael Dykes, Senior Vice President for Regulatory Affairs at the International Dairy Foods Association, keeps saying what a lot of producers are discovering on their own: differentiation and innovation capture premiums that commodity markets just don’t offer.

Here’s what I’m seeing work:

  • Lactose-free products commanding decent premiums
  • A2 milk is getting significant price advantages in metro markets
  • Artisanal products at farmers’ markets are capturing really impressive margins—USDA’s direct marketing research backs this up consistently

I visited a family operation near River Falls, Wisconsin, last month that put in bottling equipment through a USDA Value-Added Producer Grant. They’re processing about 60% of their production on-farm now, and they’re seeing revenue increases pushing 30%. Plus, they created three local jobs.

But they’ll also tell you it took two years of planning and serious capital commitment. It’s not a quick fix.

Technology: What the Early Adopters Are Finding

The data on precision management is getting clearer, and it’s worth paying attention to.

IoT health monitoring systems are showing productivity improvements in the 15-20% range, with payback periods of 18-24 months—that’s based on extension research and what early adopters are reporting.

Precision feeding is demonstrating meaningful cost reductions, we’re talking tens of thousands annually for mid-sized operations. Robotic milking shows solid yield increases, though you’re looking at ROI horizons beyond seven years.

What’s interesting is how successful farms are approaching it. Mark from central Michigan told me, “We started with monitoring—low investment, quick returns. That funded our next technology step.”

That staged approach keeps showing up in the success stories.

Cooperative Innovation: Old Ideas, New Applications

Here’s something that gives me hope. Edge Dairy Farmer Cooperative’s President, Brody Stapel, recently discussed how producer groups are rediscovering collective bargaining power through the Capper-Volstead Act. This isn’t nostalgia—it’s a smart strategy.

Penn State Extension documented 12 Pennsylvania operations, each averaging 350 cows, that formed their own cheese-making cooperative. They’re getting $1.50 to $2.50 per hundredweight premiums through regional direct sales.

By controlling processing and marketing, they basically created their own market channel. Takes significant coordination, but it’s absolutely replicable.

How Different Regions Are Handling This

The whole milk opportunity plays out differently depending on where you are, and understanding your regional context really matters.

Traditional Dairy States: Infrastructure Without Volume

Wisconsin, Pennsylvania, New York—we’ve got the infrastructure and cooperative relationships to access school markets. But with way fewer farms to benefit now, the impact gets concentrated among fewer producers.

Wisconsin’s still losing hundreds of operations annually, according to their state statistics.

Bob Bosold from the Dairy Business Association frames it well: the infrastructure persists, but we’re down to half the number of farms we had when whole milk was banned. The survivors tend toward larger scale and efficiency, but there’s just fewer of them to capture the benefit.

Expansion Regions: Built for This

Texas, Idaho, and New Mexico operations? They were essentially designed for institutional contracts.

With $11 billion in processing capacity additions expected through 2026, according to industry investment tracking, these regions are optimized for high-volume, standardized production.

Average herd sizes in these areas now measure in the thousands, which aligns perfectly with procurement requirements. New facilities incorporate automated systems ensuring consistent butterfat ratios and daily delivery capacity from day one.

It’s industrial-scale dairying, and for that market segment, it works.

Specialty Markets: A Different Game Entirely

Vermont, Northern California, pockets of the Northeast—they’ve largely exited commodity competition. And honestly? Market research suggests organic dairy could exceed $30 billion by 2030.

For these regions, that represents a way better opportunity than school contracts.

Vermont’s Agency of Agriculture finds that about 75% of remaining farms now do value-added or direct marketing, up from 31% in 2012.

That’s not retreat—that’s strategic repositioning, and it’s working for them.

Understanding How Policy Actually Works

The whole-milk experience taught me something important about how agricultural policy really works. Scientific evidence alone—even compelling evidence like the Toronto study—doesn’t automatically drive policy change.

When FDA Commissioner Martin Makary started talking about ending what he called the “fifty-year war on saturated fat,” and Agriculture Secretary Brooke Rollins expressed support for whole milk, they provided something dairy producers couldn’t: institutional permission to challenge established frameworks.

That permission, not just the science, enabled the change.

NMPF had been citing the Toronto research since 2020, submitted formal comments, provided testimony—and followed all the proper channels. But as they noted in their testimony, they kept encountering “institutional commitment to existing guidance despite evolving science.”

The 2020 Dietary Guidelines Committee acknowledged potential benefits of higher-fat dairy for children but stuck with existing recommendations, saying the studies were observational rather than randomized controlled trials.

That’s institutional inertia in action—not conspiracy, just systematic resistance to change.

What This Means for Different Operations

Based on what I’m hearing from producers and seeing in market dynamics, here’s how I’d think about it:

Large operations (1,500-plus cows): You should probably evaluate school contracts pretty aggressively during that 2026 procurement window. The potential return likely justifies the effort.

And use that baseline volume to leverage value-added investments. But get talking to your cooperative now, not in March.

Mid-size operations (500 to 1,000 cows): You’ve got a more complex calculation. Those modest school premiums might not justify the administrative headaches.

University economics research keeps showing that value-added production, marketing alliances, or specialty certification offer better risk-adjusted returns for operations of your size.

Smaller operations (under 500 cows): Institutional markets are probably structurally out of reach, and that’s okay.

Extension research consistently shows that direct-to-consumer, on-farm processing, agritourism, or specialized production delivers way better margins than competing in commodity markets.

The Real Lesson Here

Here’s what the whole milk saga really reveals about agricultural policy:

  • Institutional frameworks resist change even when faced with strong contrary evidence
  • Individual operations can’t survive indefinitely waiting for policy-market misalignment to fix itself
  • Industry organizations face real constraints limiting how hard they can push
  • Political context matters just as much as scientific evidence

“The 17,000 farms that closed weren’t wrong about the science. They just couldn’t survive the wait.”

That’s the sobering part.

Looking Ahead: What Success Looks Like Now

Industry forecasts from major agricultural lenders suggest continued consolidation toward something like 15,000 total U.S. dairy farms by 2030.

The industry’s brutal restructuring: Total farms plunged 60% from 43,000 to 26,000 while mega-dairies with 2,500+ cows surged 67%—a tale of two industries in one policy shift

Within that reality, though, success patterns are emerging from USDA and extension data:

  • Operations with multiple revenue streams show way better five-year survival rates
  • Technology adopters demonstrate clear margin advantages
  • Direct market relationships command premium pricing
  • Innovative cooperative structures are creating market access for mid-sized producers who work together

What’s encouraging is that these strategies were working before the whole milk policy changed. The policy shift provides favorable conditions, not a fundamental transformation.

The Bottom Line

Whole milk’s return validates what many of us have understood intuitively about nutrition and what kids actually want to drink. That vindication deserves recognition, and I’m genuinely glad we got here.

But the thirteen-year wait extracted enormous cost from our industry. The farms that made it through built resilient businesses that didn’t depend on policy alignment finally happening.

So yeah, pursue whole milk opportunities if you’re positioned for it. But build your operation assuming policy corrections might take another decade—or might never come at all.

That’s not pessimism. That’s just strategic realism based on what we’ve all watched unfold.

The industry emerging from this period will be different—more concentrated, more specialized, more technology-enabled. Whether that’s good or bad depends on your perspective and where you sit.

What’s certain is that adaptability, not policy dependence, determines who’s still farming five years from now.

This moment offers real opportunity for those positioned to capture it, validation for those who stuck it out, and lessons for all of us about how science, policy, and agricultural economics actually interact.

How we apply those lessons will shape what American dairy looks like going forward.

Your Next Steps

If You’re Considering School Milk Contracts:

  • Contact your cooperative before December 31, 2025
  • Request procurement specifications and compliance requirements
  • Evaluate administrative capacity against projected returns

For Value-Added Exploration:

  • USDA Value-Added Producer Grant program: rd.usda.gov/vapg
  • Your state dairy association for regional guidance
  • Extension dairy specialists for business planning

For Technology Investment Planning:

  • University extension technology adoption studies
  • Your equipment dealer’s ROI calculators
  • Peer producers who’ve implemented similar systems

For Cooperative Innovation:

  • Capper-Volstead Act resources through the USDA
  • State extension cooperative development programs
  • Regional producer alliance case studies

General Resources:

  • National Milk Producers Federation: nmpf.org
  • International Dairy Foods Association: idfa.org
  • Your state dairy association
  • Local extension dairy specialist

Based on legislative records, USDA data, industry reports, and conversations with producers through November 2025. For operation-specific guidance, talk with your advisors who know your situation.

KEY TAKEAWAYS

  • December 31, 2025, Deadline: Contact your cooperative now for 2026 school contracts, or wait 3 years
  • Scale Determines Success: 1,500+ cow operations gain $40-80K/year; farms under 300 cows are locked out
  • Science Was Always Right: Whole milk reduces childhood obesity 40%—but 17,000 farms closed waiting for policy to catch up
  • Better Options Exist: Mid-size farms seeing 30% revenue gains from value-added production vs. marginal school milk returns
  • Adapt or Wait: Surviving farms built businesses that don’t depend on policy victories

Complete references and supporting documentation are available upon request by contacting the editorial team at editor@thebullvine.com.

Learn More:

The Sunday Read Dairy Professionals Don’t Skip.

Every week, thousands of producers, breeders, and industry insiders open Bullvine Weekly for genetics insights, market shifts, and profit strategies they won’t find anywhere else. One email. Five minutes. Smarter decisions all week.

NewsSubscribe
First
Last
Consent

Why the Same Cutting Height Earned One Farm $167,000 and Cost Another $36,000

6 inches or 18 inches? Wrong answer costs $36,000. Right answer gains $167,000. Context determines which.

corn silage cutting height

EXECUTIVE SUMMARY: Two neighboring farms made the same cutting height adjustment—one gained $167,000, the other lost $36,000, and new Wisconsin research explains exactly why. A meta-analysis of 35 studies shows that raising corn silage cutting height from 6 to 18 inches consistently increases starch by 2.7% and digestibility by three units, while sacrificing 0.8 tons/acre in yield. But whether this trade-off pays off depends entirely on your context: milk price, grain cost, herd genetics, inventory buffer, and management sophistication determine whether you’re the winner or the loser. Modern stay-green hybrids have completely reversed traditional thinking—immature stalks now hurt starch concentration more than fiber quality, making wetter corn benefit more from high cutting. This guide provides the exact decision framework, economic calculator strategies, and implementation timeline needed to position your farm on the profitable side of this $200,000 swing.

Every August, producers make a mechanical adjustment that swings profitability by six figures. The decision on cutting height has evolved from a simple harvest preference to a complex economic gamble that affects everything from milk production to inventory security.

A new 2024 comprehensive meta-analysis from the University of Wisconsin—Dr. Luiz Ferraretto’s team pulled together 35 studies with over 150 observations—challenges everything we thought we knew about corn maturity and cutting height. When combined with today’s volatile markets, the data is fascinating—and a little scary.

Under the right conditions, adjusting your cutting height could generate an extra $167,000 annually for a 500-cow dairy. But that exact same decision, under different circumstances, could cost you $36,000. Here’s why the context matters more than the setting.

The Science That’s Changing Everything

So Ferraretto’s Wisconsin team discovered something remarkably consistent across all those studies. For every centimeter you raise that cutting height—that’s about 0.4 inches for those of us still thinking in imperial—your corn silage gains 0.09 percentage units of starch and 0.08 units of NDF digestibility. But you’re also losing 0.06 tons per acre in yield. Every single time.

Now, those numbers might sound small, but let’s put this in perspective. When you raise your cutting height from 6 inches to 18 inches—a 30-centimeter increase—here’s what happens:

  • Your starch content jumps from around 28% to 30.7% (that’s a 2.7 percentage point gain)
  • NDF digestibility improves from 55% to 58% (3 units better)
  • NDF content drops from 45% to 42.3% (2.7 points lower)
  • But you’re losing approximately 0.8 tons per acre in yield

The quality improvements are remarkably consistent across different hybrids and growing conditions—that’s what made the research so compelling. The yield loss? That’s guaranteed too. But whether that trade-off makes economic sense… well, that depends entirely on your specific situation.

When Modern Genetics Flip the Script

Here’s where it gets really interesting—and honestly, it caught me off guard when I first saw the data. Those stay-green hybrids that dominate the seed market now? They’ve completely decoupled ear maturity from stalk maturity in ways that flip our conventional wisdom on its head.

The Wisconsin research revealed that wetter corn below 32% dry matter shows the strongest starch response to increased cutting height—we’re talking 0.10 percentage units per centimeter. Meanwhile, drier corn above 37% DM shows greater fiber digestibility (0.12 units per centimeter) but lower starch digestibility.

This contradicts what most of us learned years ago, doesn’t it? But when you think about how stay-green genetics actually work, it makes sense. These hybrids keep stalks green and photosynthesizing while the grain matures normally—it’s like the ear and stalk are running on completely different schedules. So at lower whole-plant moisture, you’ve got these mature ears sitting on relatively immature, high-moisture stalks. The bottom portions haven’t fully lignified yet, which makes them more of a starch-diluting factor than a fiber-quality problem.

What we’re seeing is that those immature stalks hurt you more by watering down starch concentration than by adding indigestible fiber. By the time you hit 37% DM, those stalks have finally lignified, and suddenly the cutting-height benefit shifts from starch concentration to improved fiber digestibility. Complete reversal of traditional thinking.

Two Scenarios, Same Decision, Completely Different Outcomes

Let me share two economic scenarios that really drive home why context matters more than the cutting height itself. These are based on detailed modeling using actual market conditions.

Scenario One: When Things Go Wrong—A $36,000 Loss

Picture a typical 500-cow dairy facing 2024 market conditions: milk at $20/cwt, corn at $3.90/bushel, and what seems like adequate inventory levels. They’ve read the Wisconsin research, seen those quality improvements from high cutting, and decide to chop at 18 inches instead of their usual 6 inches.

On paper, the math looks solid. They’re expecting a realistic 0.5 lbs/day milk response (reasonable for average genetics), worth about $18,250 annually. Grain savings from better forage quality add another $8,600. Against a silage yield loss valued at $10,820, they’re projecting a comfortable $16,000 gain.

But here’s where reality bites. That yield loss leaves them with dangerously thin inventory margins—something that doesn’t become apparent until March. A mold outbreak costs them a week’s silage. Weather delays compound the shortage. By April, they’re scrambling to buy replacement forage at $180/ton—typical spring pricing in the upper Midwest. Production drops 8 lbs/day when silage runs short because cows simply can’t eat enough alternative feeds. When you run all the numbers, it’s a $36,000 net loss from a decision that looked profitable in August.

Scenario Two: When Everything Aligns—$167,000 Additional Profit

Now consider the same 500-cow size, but under different conditions: milk at $25/cwt (as we saw in 2022-2023), grain at $20/cwt, with about 30% of the herd being high-producing, early-lactation cows averaging 55 lbs/day. This operation has genuine surplus inventory—not just “probably enough” but a real buffer—and excellent ration management with monthly forage testing.

Here’s what makes the difference: Those high producers physically can’t eat enough low-quality forage to maximize their genetic potential. They’re maxed out on intake. Better fiber digestibility from high cutting means lower rumen fill and higher passage rates, allowing more intake. In this scenario, the modeling shows these responsive cows converting the quality improvement into 1.6 lbs/day additional milk—worth $73,000 annually.

At $20/cwt, reducing supplementation by 3 lbs/cow/day saves $109,500. Against a $15,500 silage yield loss, the net result is $167,000 in additional profit. Same decision, completely different outcome.

The Tale of Two Farms: Economic Comparison

FactorLosing FarmWinning Farm
Milk Price$20/cwt$25/cwt
Grain Cost$14/cwt$20/cwt
Herd ProfileAverage genetics30% high producers (55 lbs/day)
Milk Response0.5 lbs/day1.6 lbs/day
Inventory StatusThin marginsGenuine surplus
Spring Shortage$41,000 replacement feedNone
Annual Result-$36,000 loss+$167,000 profit

The Middle Ground: A Practical Framework for Real Decisions

Most operations I work with fall somewhere between these extremes, facing milk prices around $21-22/cwt and moderate conditions where the economics don’t clearly point one direction. For these farms, the Wisconsin research suggests looking beyond pure economics to what I call the six critical tiebreaker questions:

The 6 Tiebreaker Questions

1. Are you meeting milk quota or supply contracts? If you’re under quota, extra milk has real value. But if you’re already flush and dumping or selling at lower prices? There’s zero upside to additional production. This is especially relevant for farms in Federal Order areas with base programs.

2. What are your herd genetics for feed efficiency? Those genomically selected, high-merit cows with +3000M genetics—they respond better to forage quality improvements than average commercial genetics. If you’ve been investing in genetics, you need to feed for it.

3. When do your cows freshen? Fall and winter fresh cows are in peak early lactation when feeding that high-quality silage—exactly when they’re most responsive. Spring calvers? They’ll be mid-to-late lactation by the time new silage is fed. Makes a huge difference.

4. How sophisticated is your forage testing and ration management? Monthly testing and active ration adjustments capture quality gains. If you’re testing once or twice a year, you’re probably missing the optimization window entirely.

5. What’s your working capital situation? Can you absorb an $80,000 swing if things go sideways? Tight margins mean lower risk tolerance—that’s just reality for many operations right now.

6. How important is feed cost predictability? High-cut silage reduces grain dependency, providing more stable feed costs when grain markets are volatile. For farms with locked-in milk contracts, this predictability has real value.

What I’ve found is that farms answering “yes” to four or more of these should lean toward high cutting. Those with two or fewer “yes” answers should favor conventional height. It’s not perfect, but it’s been remarkably consistent in predicting success.

The Wisconsin Calculator: More Strategic Tool Than You Think

The University of Wisconsin’s Corn Silage Cutting Height Calculator has become an essential tool—you can find it at dairy.extension.wisc.edu under their forage resources. But here’s what I’ve learned: it’s not about plugging in numbers once and calling it done.

The strategic farms run three milk price scenarios—conservative at $20, realistic at $22, and optimistic at $25. They test different yield baselines using their worst-case, average, and best-case historical yields. They vary baseline forage quality inputs to see how much improvement actually matters for their specific situation.

What’s really valuable is how the calculator makes the cost-per-ton reality impossible to ignore. When it shows your silage cost rising from 5/ton DM at conventional cutting to 3/ton at high cutting, you have to ask yourself: Do I genuinely believe my herd can convert that quality into enough milk to justify paying an /ton premium? That’s the real question, isn’t it?

Regional Variations Matter More Than You Think

Something I’ve noticed working with farms from California to New York—the optimal strategy varies significantly by region. In the Northeast, where purchased forage is readily available but expensive, inventory buffer matters less than in the upper Midwest, where replacement forage might be 200 miles away. California dairies with year-round production and minimal seasonality in fresh cow patterns face different economics than Pennsylvania operations with strong seasonal calving.

In the Southwest, where corn is often harvested multiple times per year, the risk of inventory shortages is lower, making high-cut strategies more viable. Meanwhile, in areas like Idaho, where transportation costs for replacement feeds are substantial, that 0.8 tons/acre yield loss becomes much more costly to replace if things go wrong.

Implementation Reality: The 60-75% Achievement Factor

Even with perfect planning, field reality introduces complications that the research can’t fully capture. Modern forage harvesters, even good ones, maintain cutting height within plus or minus 2-3 inches at best. That creates quality variation across every field.

Your 250-acre field isn’t flat. You’ve got valleys where the header runs at 13 inches, ridges where it hits 22 inches, all while you’re targeting 18 inches. You end up with four distinct quality profiles in a single harvest. When your forage test shows 29.5% starch instead of the projected 30.7%, that’s not necessarily a management failure—it’s equipment variation meeting field reality.

Given equipment consistency limitations and field variability, farms with basic equipment are likely to capture 60-75% of research-projected benefits, while precision-equipped operations may achieve 80-90%. But we’re talking an additional $15,000-25,000 for that precision equipment. Is capturing that extra 15% worth twenty grand? That depends on your operation’s scale and economics.

When Safety Trumps Everything: The Drought Factor

Drought-stressed corn throws all economic calculations out the window. Ohio State and Penn State Extension research demonstrates that nitrate accumulation in drought-stressed corn can reach 5,524 ppm in the lower third of stalks, compared to just 17 ppm in ears. With livestock safety thresholds at 1,000 ppm NO3-N, high cutting becomes mandatory regardless of economics.

The 2012 Midwest drought provided stark lessons about nitrate risk management. Extension reports from that period show that farms implementing high-cutting strategies and testing for nitrates generally avoided the livestock health issues—including animal deaths and reproductive failures—that affected operations using conventional cutting practices. No amount of saved tonnage is worth risking your herd’s health.

If you’re dealing with drought stress, the protocol is clear: test for nitrates before harvest, chop at 12+ inches minimum if levels exceed 1,500 ppm, and allow 3-4 weeks fermentation before feeding. It’s not about economics at that point—it’s about keeping your cows alive and healthy.

Why Are Seed Companies Silent on Harvest Strategy?

Here’s something that frustrates me, and probably you too: We’re spending $400 per bag on stay-green hybrids without anyone explaining how those genetics should influence harvest decisions six months later. I’ve sat through dozens of seed sales presentations, and they focus on yield, standability, and disease resistance—all important—but remain completely silent on how stay-green characteristics affect cutting-height optimization.

This communication gap means we’re making genetic investments in March that fundamentally alter our harvest economics in August, yet the connection is rarely made explicit. You’d think a simple matrix showing recommended cutting heights and quality responses by hybrid would be standard by now. But I haven’t seen a single major seed company provide this information.

The companies have their reasons, of course. Testing the cutting-height response for each hybrid is expensive. It complicates marketing. And honestly, they see it as a harvest management issue, not a seed selection issue. Fair enough from their perspective, but it leaves us in the dark when we’re trying to make informed decisions.

Critical Decision Timeline for Success

Looking at operations that consistently get this right, timing is absolutely critical. Here’s the timeline that actually works:

March-April (Seed Selection): Identify which hybrids have stay-green genetics. Note any “delayed senescence” or “premium stay-green” traits. Understand that these will respond differently to cutting height.

Late July (Critical Planning Week): Run the Wisconsin Calculator with multiple scenarios. Test drought-stressed fields for nitrates (5-10 plants, lower third). Score yourself on those six tiebreaker questions. Document your cutting height decision per field—in writing.

Early August (Harvest Preparation): Communicate specific targets to your harvest crew. Calibrate equipment, verify header consistency. Plan for that plus-or-minus 2-3 inch variation around the target.

During Harvest: Test first loads immediately for DM and quality. Adjust if quality differs from projections. Document actual versus planned for next year’s reference.

Post-Harvest: If nitrates were elevated, ferment for at least 3-4 weeks. Retest before feeding. Share results with your nutritionist for ration adjustments.

Key Takeaways for Strategic Implementation

What’s become clear from both the research and what we’re seeing in the field is that successful operations aren’t looking for a universal cutting height strategy. They’re the ones asking hard questions in July, testing their assumptions, and adapting their approach to match their specific economic reality.

The economics are incredibly context-dependent. That same cutting height that could generate $167,000 under optimal conditions might cost $36,000 under different circumstances. Your specific combination of milk price, grain cost, herd genetics, inventory situation, and management capability determines the outcome—not the height itself.

Quality improvements are real but not automatically bankable. Lab results consistently show improved starch and digestibility. But whether your cows convert that into milk depends on everything from ration reformulation to rumen microbiome variation to what percentage of your herd is actually in early lactation when you’re feeding that silage.

Variable strategies often work best. Instead of a single height across all fields, the smartest operators I know cut stay-green hybrids higher, conventional hybrids at standard height, and drought-stressed fields at a higher height, regardless of variety. It’s more complex, sure, but it captures value where it exists while avoiding losses where risk is high.

Looking Ahead

The decision on corn silage cutting height has evolved far beyond a simple mechanical adjustment. It’s become this sophisticated economic optimization that requires integrating agronomy, nutrition, economics, and risk management. The farms that recognize this complexity and plan accordingly are capturing significant value. Those that don’t? Well, they’re leaving money—sometimes substantial amounts—in the field.

The Wisconsin research provides the scientific foundation we needed. Their calculator and other economic modeling tools offer practical decision frameworks. But ultimately, each farm has to evaluate their unique situation against volatile markets, uncertain weather, and the biological variability that’s just part of dairy farming.

The $200,000 question isn’t whether to cut high or low. It’s whether you’re making that decision with complete information, at the right time, for your specific operation. In an industry where margins keep tightening and every decision counts, that level of strategic thinking around something as seemingly simple as cutting height might just be the difference between profitability and loss.

What’s interesting is how this all connects back to the bigger picture of precision management in dairy. We’re no longer in an era where one-size-fits-all recommendations work. The profitable farms of tomorrow—probably including yours—will be those that can integrate complex information, make field-specific decisions, and execute with discipline. Even on something as basic as where to set the chopper head.

You know, at the end of the day, it’s about being intentional with every decision. And that’s what separates the operations that thrive from those just trying to survive.

Additional Resources

Wisconsin Corn Silage Cutting Height Calculator: dairy.extension.wisc.edu/articles/corn-silage-cutting-height-calculator-background-and-guide/

Nitrate Testing Guidelines:

  • Ohio State Extension: Nitrate Toxicity in Livestock
  • Penn State Extension: Managing Drought-Stressed Corn Silage

Key Decision Thresholds:

  • Nitrate Safety: <1,000 ppm NO3-N
  • High-Cut Consideration: 4+ “yes” on tiebreaker questions
  • Economic Breakeven: Typically 0.5-1.0 lb/day milk response needed

KEY TAKEAWAYS

  • Same decision, $203,000 difference: Context (milk price, genetics, inventory) determines if you win or lose
  • Quality gains are guaranteed, profits aren’t: 2.7% more starch costs 0.8 tons/acre—the math only works with the right conditions
  • Stay-green genetics changed everything: Wetter corn now benefits MORE from high cutting than dry (opposite of tradition)
  • Winners plan in July, losers react in August: Use Wisconsin’s calculator to model YOUR specific scenario
  • Drought corn = mandatory high cut: Nitrates >1,500 ppm override all economics—it’s about safety

Complete references and supporting documentation are available upon request by contacting the editorial team at editor@thebullvine.com.

Learn More:

The Sunday Read Dairy Professionals Don’t Skip.

Every week, thousands of producers, breeders, and industry insiders open Bullvine Weekly for genetics insights, market shifts, and profit strategies they won’t find anywhere else. One email. Five minutes. Smarter decisions all week.

NewsSubscribe
First
Last
Consent

Carbon Credits: $150,000 for Large Dairies, $3,000 for Family Farms – Here’s Why

Two dairies. Same carbon practices. One makes $150K, the other makes $3K. The difference isn’t what you think.

EXECUTIVE SUMMARY: Athian paid dairy farmers $18 million for carbon reductions in 2024, but the money isn’t flowing where you’d expect—large farms pocket $150,000 yearly while small operations get just $3,000 for identical practices. The math explains why: although per-cow profits are similar at $40-56, only operations with 2,000+ cows can justify the $28,000-37,000 upfront investment and 6-12 month payment delays. Add requirements for digital records and working capital above 1.25, and 80% of U.S. dairy farms simply can’t participate. Yet for qualified operations, carbon credits offer genuine value—transforming feed additives you’re already considering into profit centers. This article delivers real economics, explains why scale wins again, and provides a practical framework for determining whether carbon credits make sense for your specific operation.

So I was reviewing Athian’s latest announcement the other day, and here’s what caught my eye—they’ve actually distributed million to dairy farmers for emissions reductions since early 2024. Not promises, not projections. Real checks hitting real farm accounts. And what’s interesting is, these are for practices many of us have been considering anyway for operational efficiency. You know how it is—in our industry, sustainability initiatives usually mean spending more money for the privilege of doing the right thing. This development, though, it deserves our careful attention.

I’ve been talking with producers from Vermont to New Mexico who’ve navigated these dairy carbon credit programs, and I’ve noticed a fascinating pattern emerging. Success varies dramatically across operations, and here’s what might surprise you—it’s not about environmental commitment or willingness to adapt. What I’ve found is it’s primarily about operational scale, cash flow position, and whether you’ve already got your data management systems dialed in.

Understanding the Market Forces at Play

Let’s talk about what’s really driving these payments. As many of us have seen, major food companies—Nestlé and Mars among them—have committed to reducing supply chain emissions by 30% before 2030, according to their recent sustainability reports. And here’s the thing: since most of their carbon footprint originates at the farm level rather than in processing facilities, they’re actively seeking verified reductions from us dairy suppliers.

This has led to something called “insetting”—basically, these companies are investing in emissions reductions within their own supply chains rather than buying random offset credits from who knows where. DFA pioneered this approach in January 2024, becoming the first U.S. cooperative to purchase verified livestock emissions reductions through Athian’s platform. Their initial transaction involved a Texas dairy using Elanco’s Experior technology, and they documented 1,150 metric tons of CO2 equivalent reduction. That’s not theoretical—it’s verified, third-party audited through SustainCERT standards, and most importantly, paid for.

What distinguishes this from all those previous carbon initiatives we’ve seen come and go? The verification rigor. These dairy carbon credit programs require comprehensive documentation—you’re matching feed invoices with ration records, integrating milk production data, running everything through standardized calculation models, and having independent auditors verify it all. This level of verification means buyers can confidently report these reductions to their stakeholders.

Current Practices Generating Returns

Looking at current market activity, four practice categories are demonstrating consistent value for dairy farm profitability, and each has distinct operational requirements and economics worth understanding.

Feed additives for enteric methane reduction have really emerged as the primary pathway. Bovaer—that’s the 3-nitrooxypropanol compound from DSM-Firmenich—got regulatory approval in Canada and the UK in January, and the FDA completed their review in May. What’s encouraging is the research consistency: across 56 peer-reviewed studies, we’re seeing approximately a 30% reduction in enteric methane when administered at recommended doses. According to the Journal of Dairy Science’s comprehensive analysis, this translates to a 10-15% reduction in overall GHG intensity per unit of milk production.

Now, pricing varies considerably by region and purchase volume—you probably know this already. Industry data suggests Bovaer costs range from $0.30 to $0.50 per cow daily, while Rumensin (that’s monensin from Elanco) typically runs $0.13 to $0.15 per cow per day. Rumensin provides modest emission reductions, but it also delivers about a 3% improvement in feed efficiency, according to Elanco’s published data. That’s nothing to sneeze at when you’re looking at overall dairy milk check revenue.

Precision nutrition approaches, particularly those low-protein, amino acid-balanced rations, offer another pathway without requiring infrastructure investment. These strategies reduce nitrogen excretion and associated nitrous oxide emissions while potentially improving your feed cost efficiency. Ajinomoto’s AjiPro-L protocol, which Athian approved in April, exemplifies this approach. University of Wisconsin Extension trials indicate potential for both ration cost savings and carbon credit generation, though—as you’d expect—results vary by operation.

Anaerobic digester systems continue to provide opportunities for larger operations. You can stack RNG revenue, RIN credits, nutrient products, and now carbon insets. But let’s be realistic about the economics here—USDA NRCS data and Cornell’s agricultural economics research show you need at least $1,800 per cow in capital investment. Even with RCPP cost-share programs covering 50-75% of installation costs, that’s a serious commitment that really only pencils out at significant scale.

What I’m particularly interested in are these whole-farm carbon intensity protocols. Rather than requiring specific expensive interventions, they measure your overall emissions per unit of milk production. California’s CDFA has been developing this methodology, while the Innovation Center for U.S. Dairy has been creating parallel frameworks. If you’re already efficient—getting more milk from fewer cows with less waste through better genetics and reproduction—you should theoretically qualify even without fancy additives. And looking ahead, emerging technologies such as seaweed-based additives and genetic selection for lower-emission cows could further expand options, though they are still in development.

Economic Realities Across Different Scales

Here’s where things get really interesting for dairy farm profitability, and the implications vary dramatically by operation size. Let me share what I’ve learned from producers at different scales, including those Southeast operations dealing with heat stress and different housing systems.

A Wisconsin producer I know with 450 cows spent three months getting all his documentation together, and when the first payment came through, it was $4,200. As he told me, “It’s certainly welcome income, but when you consider the time investment and upfront costs, it doesn’t fundamentally change our operation.”

For a typical 500-cow dairy in Wisconsin or Pennsylvania—and I’ve run these numbers with several folks—participating in carbon credits for dairy farms looks something like this: Initial investment in feed additives runs $25,000 to $30,000 annually, assuming you’re using a combination of products. Data system upgrades, if you need them, add $2,000 to $5,000. Nutritionist consultation and protocol documentation typically cost another $1,000 to $2,000.

So you’re looking at a total upfront investment of $28,000 to $37,000.

And here’s the kicker—you pay these costs immediately, but receive carbon credit payments after 6 to 12 months of verification, per Athian’s current terms. That means you need that cash sitting available, not borrowed.

Current carbon pricing at $60 per ton represents a historical high—the Ecosystem Marketplace reports voluntary carbon markets averaged just $6.37 per ton in 2024. At these prices, a 500-cow operation might generate $5,000 to $8,000 in annual carbon revenue. Combined with potential feed efficiency gains of $15,000 to $20,000, net benefits could reach $20,000 to $28,000 annually. But that’s assuming stable carbon prices, smooth verification, and favorable baseline calculations…

The economics shift significantly at larger scales. An Idaho dairy manager I spoke with, who’s running 3,200 cows, explained: “We’re generating about $47 per cow from carbon credits, plus the feed efficiency improvements. At our scale, that translates to over $150,000 annually—meaningful revenue that justifies the administrative investment.”

This reveals something important for dairy milk check revenue: while per-cow returns are similar ($40-56 for smaller operations versus $43-57 for larger ones), the absolute dollar amounts make participation worthwhile for larger operations while remaining marginal for smaller ones.

Operations That Should Consider Alternatives

Based on extensive discussions with producers and financial advisors from Michigan to Arizona, certain operations face structural barriers that make successful participation in current dairy carbon credit programs challenging for overall dairy farm profitability.

If your working capital ratio is below 1.25, you don’t have the financial flexibility to manage that 6 to 12-month payment delay. The Farm Financial Standards Council identifies this as a critical threshold for operational stability, and I’ve seen this play out firsthand. One producer near Viroqua, Wisconsin, with 380 cows, carefully analyzed his situation. He told me, “Borrowing to cover upfront costs at 8% interest would essentially eliminate any carbon revenue benefit. The mathematics simply didn’t support participation.”

If you’re still using paper-based or basic spreadsheet record-keeping, the documentation burden will probably eat you alive. These carbon programs for dairy farms require integrating feed invoices, ration records, and milk production data in formats that support third-party verification. It’s not impossible with manual systems, but honestly, the administrative burden often becomes prohibitive.

“The transition from paper to carbon credits simply doesn’t occur—it’s from digital systems to carbon credits.”

Pasture-based operations encounter technical limitations with current protocols. Both Bovaer and Rumensin require consistent daily dosing through total mixed rations. DSM’s product development pipeline includes slow-release bolus systems for grazing operations, but they aren’t yet commercially available. These producers may find better opportunities in whole-farm intensity protocols that recognize the inherent efficiency of well-managed grazing systems. This is particularly relevant for Southeast producers, where year-round grazing is more common.

And if you’re approaching retirement within 5 to 7 years, you should carefully evaluate participation. These programs typically achieve optimal returns over 10 to 15-year horizons, allowing carbon revenues to compound and infrastructure investments to fully amortize.

Industry Structure Implications

Something we need to consider thoughtfully is how these programs might affect industry structure and long-term patterns of dairy farm profitability. Large-scale operations in Texas, Idaho, and California that implement comprehensive carbon programs might generate $200,000 or more annually. That creates meaningful cash flow advantages and balance sheet improvements that can influence expansion decisions and market dynamics.

Meanwhile, a 400-cow operation might generate $3,000 in carbon credits—barely covering administrative costs. When milk prices cycle from $20 to $16 per hundredweight, as they periodically do, operations with substantial carbon revenue cushions have clear advantages in weathering these downturns.

Current USDA Census of Agriculture data show we’re losing 2,100 to 2,800 dairy farms annually, with exits concentrated in the 150- to 1,500-cow range. While dairy carbon credit programs don’t cause this consolidation, they may influence its pace by providing additional advantages to operations already benefiting from economies of scale.

This raises important questions about program design and accessibility that we as an industry continue to grapple with.

Common Success Factors

Producers successfully participating in these programs—whether they’re in the Northeast, Midwest, or Western regions—share several characteristics worth noting for those seeking to enhance dairy milk check revenue.

Cooperative participation proves crucial. Working through established programs at DFA, Land O’Lakes, or similar organizations significantly reduces administrative complexity. The co-ops handle documentation aggregation, facilitate buyer connections, and provide technical support that individual producers would struggle to replicate on their own.

Financial strength matters—a lot. Successful participants typically maintain working capital ratios above 1.5, giving them the flexibility to manage payment timing without incurring debt. As one Wisconsin producer with 1,100 cows near Fond du Lac observed, “If carbon payments are necessary for cash flow, the operation probably isn’t ready for program participation.”

These successful producers view carbon credits as complementary to operational improvements rather than primary drivers of dairy farm profitability. A Pennsylvania dairyman with 750 cows explained their perspective: “We were evaluating Rumensin for efficiency gains regardless. The carbon credits transformed a good decision into an obvious one.”

And digital infrastructure proves essential. Not necessarily sophisticated systems, but at least DHIA participation, computerized ration management, and organized record-keeping. The transition from paper to carbon credits simply doesn’t occur—it’s from digital systems to carbon credits.

Verification Processes and Practical Considerations

Understanding verification helps set realistic expectations for dairy carbon credit programs. Programs begin by establishing baseline emissions using models with acknowledged uncertainty ranges of 15-25%, in accordance with IPCC methodology and UC Davis CLEAR Center analysis. Your baseline could vary substantially in either direction—something to keep in mind.

Implementation requires comprehensive documentation—feed invoices, ration formulations, production records, and health events. Verification bodies, including SustainCERT and other ISO 14064-accredited auditors working with Athian, review this documentation through varying combinations of remote review and farm visits.

One Wisconsin producer with 650 cows near Bloomer experienced the complexity of verification firsthand. Initial approval was questioned 6 months later when butterfat levels changed, potentially indicating variation in the feed additive. Three additional months of documentation were required to verify consistent feeding practices. The final payment arrived 11 months late, rather than the anticipated 6.

Credit registration on Athian’s blockchain ledger prevents double-selling within their system. But as the Institute for Agriculture and Trade Policy noted in their recent analysis of insetting risks, enforcement mechanisms across different platforms remain underdeveloped. Something to be aware of.

Looking Ahead: Realistic Expectations for 2030

If current trajectories continue, what might we reasonably expect for dairy farm profitability by decade’s end?

Industry-wide emissions intensity could decrease 20 to 30% through combined adoption of feed additives, ration optimization, and efficiency improvements. California Air Resources Board data already show a 20% reduction in methane intensity from early adopter programs, suggesting this target is achievable.

Mid-size farm participation could expand through cooperative-led programs that aggregate verification costs and streamline administration. Replicating DFA’s model across major cooperatives could make participation as routine as DHIA testing for appropriately positioned operations.

Carbon price stabilization through corporate commitments seems plausible. Companies might guarantee minimum prices of $40 to $50 per ton for verified reductions from their supply chains, providing investment confidence for participating producers.

Policy mechanisms could amplify market-based approaches. Implementation of the 45Z tax credit under the Inflation Reduction Act could establish price floors. State programs, like California’s $25 million methane-reduction initiative through its Climate Smart Agriculture program, demonstrate potential for complementary support.

Realistically, I anticipate 2,000 to 3,000 larger farms generating $150 to $300 million in cumulative payments by 2030—meaningful for those operations but unlikely to transform industry-wide economics or substantially alter consolidation patterns affecting dairy milk check revenue across all farm sizes.

A Practical Decision Framework

For producers considering participation to enhance dairy farm profitability, here’s a systematic evaluation approach based on actual participant experiences:

Step 1: Assess your working capital ratio. Below 1.25 indicates you need operational stabilization before adding program complexity.

Step 2: Calculate your true break-even costs, including all expenses. If you’re exceeding $20 per hundredweight in current markets, carbon credits won’t address fundamental profitability challenges.

Step 3: Evaluate available cash reserves. Can you deploy $25,000 to $35,000 for 6 to 12 months without borrowing? Interest costs often eliminate carbon revenue benefits.

Step 4: Engage your cooperative. Established programs with clear protocols and payment histories indicate readiness. “Exploring options” suggests patience might be warranted.

Step 5: Review your documentation capabilities. Digital ration management, DHIA participation, and nutritionist relationships all contribute to readiness.

Step 6: Consider your time horizon. Ten-plus year operational plans align well with program economics. Five-year exit strategies likely don’t.

This framework probably excludes 70 to 80% of U.S. dairy farms, which itself reveals important characteristics about current market design and its impact on dairy farm profitability.

Broader Industry Implications

The emergence of functional dairy carbon markets represents genuine progress. It demonstrates corporate willingness to invest in verified emissions reductions, validates market mechanisms for environmental progress, and rewards efficiency improvements that many of us pursue regardless.

Yet it also illuminates the limitations of the agricultural market. These mechanisms naturally favor scale, sophistication, and capital access—characteristics already driving industry evolution. Programs generating $150,000 annually for large operations while offering $3,000 to smaller farms reflect market dynamics rather than program design flaws.

This isn’t attributable to any particular organization or conspiracy. It’s simply how markets function when transaction costs are substantial and economies of scale are significant. The relevant question isn’t fairness but rather our collective comfort with carbon markets as another factor influencing industry structure and dairy milk check revenue distribution.

My assessment? These represent useful tools rather than transformative solutions for dairy farm profitability. Well-capitalized operations already pursuing efficiency improvements will find carbon revenues provide a welcome acceleration. Marginal operations won’t find salvation here. For the broader industry, it’s another advantage accruing to scale in an already scale-advantaged system.

Evaluate these opportunities based on your specific situation. But maintain realistic expectations about carbon credits as supplemental revenue rather than foundational income, especially given agriculture’s historical pattern of commodity price volatility.

Athian’s $18 million in payments is real. The practices deliver results. The verification systems function. But whether this matters for your particular operation depends entirely on where you sit within dairy’s increasingly differentiated structure. And that’s the conversation we need to continue having—not just whether carbon markets work, but how they work within our evolving industry landscape and their real impact on dairy farm profitability.

Editor’s Note: Producer experiences shared in this article are based on interviews conducted in November 2025.

KEY TAKEAWAYS

  • The $18M reality: Carbon credits paid dairy farmers real money in 2024, but large operations (3,000+ cows) capture $150,000 annually while family farms (500 cows) get just $3,000-8,000 for identical practices
  • Why scale always wins: Per-cow profits are virtually the same at $40-56, but you need 2,000+ cows to cover the $30,000 upfront investment and 6-12 month cash flow gap
  • Your qualification checklist: Must have a working capital ratio >1.25, digital record systems already running, and participate through established co-op programs—miss any one and you should pass
  • Bottom line decision: Carbon credits work for well-capitalized operations planning 10+ year horizons, but won’t save struggling farms—they amplify existing advantages rather than leveling playing fields

Complete references and supporting documentation are available upon request by contacting the editorial team at editor@thebullvine.com.

Learn More:

The Sunday Read Dairy Professionals Don’t Skip.

Every week, thousands of producers, breeders, and industry insiders open Bullvine Weekly for genetics insights, market shifts, and profit strategies they won’t find anywhere else. One email. Five minutes. Smarter decisions all week.

NewsSubscribe
First
Last
Consent

The Great American Dairy Heist – Who Really Owns Your Milk Check in 2025?

66% of US milk money goes to 834 farms. The other 23,000 farms? Fighting for scraps. Which side are you on?

You know, looking at the American dairy landscape right now, you’d think we’re swimming in success. And in some ways, we are. The numbers are massive—we’re talking about a $111-120 billion industry that’s breaking production records while processors pour $11 billion into new facilities through 2028.

But here’s what’s interesting: while the industry gets bigger, the number of farmers running it keeps getting smaller.

The 2024 Dairy Power Rankings: Who Controls Your Milk Check

So let’s talk about who actually controls the milk flowing from America’s farms to consumers’ fridges—and more importantly, what that means for your operation.

The Giants: Who Owns the Checkbook?

Company2024 RevenueThe Real Story
Lactalis$31.9 BillionThe Global King: French giant buying everything in sight.
DFA$23 BillionThe Co-op Giant: Your “partner” with 44 processing plants.
Land O’Lakes$16.8 BillionDiversified Domestic: 23.2% US market share.
Saputo$13.9 BillionThe Aggressive Expander: 8.4% growth, highest in industry.
Nestlé N.A.$6.5-7.5 BillionThe Diversifier: Infant formula to coffee creamers.
Schreiber$7 BillionThe Hidden Giant: Supplies every major retailer.
Danone N.A.$5.5-6.5 BillionThe Yogurt King: Pushing plant-based hard.
Leprino$3.6 BillionThe Pizza Emperor: Controls 85% of US pizza cheese.

Lactalis, that French dairy behemoth, sits firmly at the global summit with .9 billion in worldwide dairy sales as of 2024. They’ve been on quite the acquisition spree lately. Just this year, they grabbed General Mills’ US yogurt business for $1.5 billion, and they’re in the process of acquiring Fonterra’s consumer operations for another $2.3 billion. Their Président cheese brand alone jumped 45% in brand value this year to $3.2 billion. That’s… well, that’s a lot of cheese.

Now, Dairy Farmers of America—that’s where things get complicated for American producers. DFA reported $23 billion in total revenue for 2024, making them the third-largest dairy company globally. They marketing milk for over 11,000 members and handle roughly 30% of US milk production. But here’s the rub that’s got farmers talking: DFA now owns 44 processing plants.

Think about what that means. When you’re selling milk to your own cooperative that also owns the processing plants, who’s really benefiting when margins get tight? Industry data shows that when milk prices crashed 30-40% in 2023, processors with integrated operations captured margin expansion while producers absorbed the losses. It’s something worth considering when you’re evaluating your marketing options.

“You’re not their partner; you’re their raw material supplier.”

The Department of Justice had concerns as well. When DFA bought Dean Foods’ assets for $433 million in 2020, they had to agree to strict conditions to prevent market manipulation. That tells you something about the concentration of power we’re dealing with here.

Land O’Lakes rounds out the domestic powerhouses with $16.8 billion in 2023 revenue, though they’ve been navigating tough waters lately. Despite the challenges, they maintain a 23.2% market share in US dairy product production and continue expanding their Tulare, California, facility. You’ve probably noticed their increased focus on value-added products—that’s not accidental.

Foreign Money, American Milk: The International Takeover

What’s fascinating—and maybe a bit concerning—is how foreign companies are carving up the American dairy market. Nestlé North America pulls in around $6.5-7.5 billion, though that includes infant nutrition and coffee creamers alongside traditional dairy. Their global dairy segment has been flat for three years running at about billion. Danone North America generates $5.5-6.5 billion, pretty much dominating the yogurt space while pushing hard into plant-based alternatives.

And then there’s Saputo, the Canadian giant. They posted $13.9 billion in 2024 with an impressive 8.4% growth rate—the highest among the top players, actually. They’re operating 29 US plants and have been particularly aggressive in cheese production and fluid milk processing. Their success shows what focused expansion with strong financial backing can accomplish.

You know what’s interesting about these international players? They often bring different approaches to their relationships with farmers. Many producers in the upper Midwest have mentioned that some of these companies maintain more consistent field presence than we’ve seen from domestic processors in recent years. Whether that translates to better prices… well, that’s another conversation.

The Silent Empire: Why Leprino Controls Your Pizza

Here’s something that might surprise you: America produced a record 14.25 billion pounds of cheese in 2024, with Wisconsin alone cranking out 3.75 billion pounds—that’s 26.3% of the nation’s total. But the real story is who controls that production.

Now, Leprino Foods—they’re the ones you might not hear much about, but they’re actually the world’s largest mozzarella producer with about $3.6 billion in revenue. They control roughly 85% of the US pizza cheese market. Think about that next time you’re eating pizza… pretty much any pizza. Meanwhile, Schreiber Foods, with $7 billion in revenue, is another major player in the cheese game, though they’re more diversified across different cheese types.

Together with Sargento, these companies hold about 30% of the shredded cheese market. Wisconsin might make the cheese, but increasingly, a handful of companies decide its fate.

What’s particularly telling—and this is something many of us have been watching—is that while overall cheese production hit records, output actually fell in three of the top six cheese-producing states last year. Pennsylvania’s production plummeted 11% to 463.5 million pounds, and Iowa dropped 2% to 387.7 million pounds. Here’s what’s happening: processors are consolidating production in states with the largest, most efficient operations. California, which produces about 20% of the nation’s milk, keeps gaining market share while smaller dairy states lose processing capacity. The cheese plants follow the milk, and the milk increasingly comes from fewer, larger farms. It’s geographic consolidation on top of farm consolidation.

Export Boom or Bust: Where Your Milk Really Flies

Let’s talk about the export boom, because this is genuinely exciting for producers near the right facilities. The US hit $8.2 billion in dairy exports in 2024—that’s the second-highest total ever, only behind 2022’s $9.7 billion. Mexico has become America’s dairy lifeline, purchasing $2.47 billion worth—that’s 29% of all our dairy exports. They’re buying 919 million pounds of nonfat dry milk and skim milk powder, plus 352 million pounds of cheese.

But—and there’s always a but, isn’t there?—the processors investing in export-capable facilities are banking on milk from specific types of farms. That $11 billion in planned dairy manufacturing expansions through 2028 isn’t being built for 24,000 small dairies. These facilities need consistent, large-volume supply chains. The new large-scale powder plants being built across the Midwest and West are increasingly working with limited numbers of high-volume suppliers to ensure consistency.

The Brutal Math: 24,000 Farms and Falling

15,866 Farms Vanished in 5 Years: Every size category collapsed except mega-dairies (2,500+ cows), which grew 17%. This isn’t natural attrition—it’s industrial restructuring designed to eliminate family farms

BY THE NUMBERS:

  • 15,000 farms lost in 5 years
  • 834 farms control 66% of revenue
  • $11 billion in new facilities, excluding small farms
  • 1,400-1,600 farms are disappearing annually

The 2022 Census of Agriculture laid it bare: America had 24,082 dairy farms, down from 39,303 just five years earlier. We’re losing farms at a breathtaking pace.

But what’s really reshaping the industry—and you probably see this in your own community—is where the milk comes from. Today, 65% of America’s dairy herd lives on farms with 1,000 or more cows. The 834 largest dairies, those with 2,500-plus head, control 66% of US milk sales by value. Meanwhile, 80% of dairy operations have fewer than 500 cows but produce less than 25% of the nation’s milk.

Think about what that means for processor relationships. If you’re running 150 cows in Pennsylvania, you’re competing for processor attention against operations running 5,000 head in New Mexico or Idaho. The processors are making what they see as rational business decisions—it’s more efficient to work with fewer, larger suppliers. But that efficiency comes at the cost of market access for smaller producers.

The $11 Billion Bet Against Small Farms

According to the International Dairy Foods Association, we’re seeing the biggest ag investment surge in US history—$11 billion flowing into 53 new or expanded dairy manufacturing facilities across 19 states between 2025 and 2028. That’s not just expansion; that’s transformation.

The $11 Billion Message: New processing capacity designed for 1,000+ cow operations only. Every dollar of this investment assumes smaller farms won’t exist to supply it. This isn’t market evolution—it’s systematic elimination

These aren’t small cheese plants or local bottling operations. We’re talking about massive facilities designed for export markets, specialized ingredients, and value-added products. They need a consistent, year-round milk supply in volumes that would have seemed impossible a generation ago.

The companies making these investments—DFA, Saputo, Land O’Lakes, and the foreign multinationals—they’re not betting on the current farm structure. They’re betting on continued consolidation. They’re pre-securing milk supply through exclusive contracts with mega-dairies because they know smaller operations will struggle to meet their volume and consistency requirements.

“Solo farms are dead farms.”

MetricSmall Farms (<200 cows)Mega-Dairies (2,000+ cows)Advantage
Cost per cwt$42.70$19.14Mega: -$23.56
Annual cost/cow$8,540$3,828Mega: -$4,712
Processor relationshipsCompeting for attentionDirect contracts/premiumsMega: Priority
Export facility accessMinimalDirect supply agreementsMega: Locked in
Component premiums$0-2/cwt$2-4/cwtMega: +$2
Survival rate 2017-2022-42%+17%Mega: Growing

Your Survival Playbook: Size-Specific Strategies That Work

Despite everything, there are reasons for optimism—if you know where to look and how to adapt.

For the Small Herd (<200 Cows): Think Outside the Tank

  • Go Organic: The organic dairy sector grew 7.7% to $8.5 billion in 2024, with organic whole milk sales up 13.2%. Organic fluid milk now holds 7.1% market share, up from just 3.3% in 2010.
  • Form Strategic Alliances: Regional cooperative marketing efforts have shown promising results, with small dairy groups in Pennsylvania and other states reporting premiums of $2-4/cwt when supplying specialty markets.
  • Direct Marketing: On-farm processing, farmstead cheese, agritourism.
  • Specialty Production: A2A2 milk, grass-fed certification, local brand development.

For the Middle Ground (200-1,000 Cows): The Tough Spot

  • Quality Premiums: Producer quality alliances in the Upper Midwest have successfully negotiated component premiums averaging $2-3/cwt by guaranteeing consistent butterfat above 4.0% and low somatic cell counts.
  • Component Specialization: High-component Jersey operations in California consistently achieve butterfat levels above 5.0% and protein above 3.7%, earning substantial component premiums.
  • Technology Adoption: Robotic milking systems can significantly reduce labor requirements while improving the milking consistency that processors demand.
  • Producer Alliances: Pool milk with similar-sized operations to negotiate directly with processors.

For the Big Players (1,000+ Cows): Maintain Your Leverage

  • Contract Flexibility: Never forward contract more than 60-70% of production.
  • Transportation Control: Own your hauling or maintain multiple options.
  • Price Protection: Demand escalators tied to feed costs in long-term contracts.
  • Market Diversification: Don’t depend on a single processor—maintain relationships with 2-3 buyers.
  • Component Focus: Invest in genetics and nutrition to maximize component premiums.

What seems to work best across all sizes? Collaboration without consolidation. Producer groups that maintain independence while negotiating collectively are seeing success in various regions. They’re still independent farms, but they’re learning to work together when it makes sense.

Five Questions That Could Save Your Farm

Looking at all this market concentration, here are the critical questions you should be asking:

  1. What percentage of your milk goes to export markets versus domestic?
  2. How does your pay price compare to farms of similar size in neighboring states?
  3. What quality premiums are available, and what’s required to earn them?
  4. Are there volume commitments that could lock you into unfavorable terms?
  5. What happens to your market if this processor closes or consolidates facilities?

The Bottom Line

The American dairy industry is being reshaped by forces beyond any individual farm’s control. The players are getting bigger—Lactalis will likely crack $35 billion globally within two years. The processors are getting pickier—they want consistent, large-volume suppliers. The exports are getting more critical—without Mexico and Canada, we’d be drowning in surplus.

Your challenge isn’t just producing quality milk anymore. It’s navigating a market where your cooperative might be competing for the same margins you need, where foreign companies control major segments, where 66% of value comes from 2,000 farms while 22,000 others fight for the remainder.

Knowledge really is power in this environment. Know who you’re selling to. Understand their global strategy. Recognize that the $111-120 billion American dairy industry looks impressive from 30,000 feet, but at ground level, it’s increasingly controlled by fewer hands making bigger bets on a future that might not include every farm—unless farms adapt to their reality or create their own path.

The dairy industry’s future is being written right now in boardrooms from Paris to Kansas City. Make sure you understand the script, because whether you’re milking 50 cows or 5,000, these companies aren’t just buying your milk—they’re determining whether your next generation will have a market at all.

Key Takeaways

  • Your Real Competition: It’s not other farmers—it’s your own co-op. DFA owns 44 processing plants, controls 30% of US milk, and profits when farm milk prices crash.
  • The 66% Rule: Just 834 mega-dairies now control 66% of all US milk revenue ($73 billion), while 23,000 smaller farms split the remaining $38 billion. Every processor’s future plans assume you won’t exist.
  • The Foreign Takeover No One’s Discussing: Lactalis (French, $31.9B), Saputo (Canadian, $13.9B), and Nestlé (Swiss, $6.5B) control more American dairy than you think—and they’re buying more every year.
  • Your Three Survival Paths: (1) Scale to 1,000+ cows for processor attention, (2) Capture premiums via organic/specialty markets (+$4-8/cwt), or (3) Form producer alliances to negotiate collectively.
  • The 2028 Deadline: $11 billion in new processing capacity comes online by 2028, designed for mega-farms only. If you haven’t adapted by then, you won’t have a market.

Executive Summary: 

Your milk check is now controlled by eight companies—three of them foreign—who’ve captured a $111 billion industry while 15,000 American dairy farms vanished in five years. The betrayal runs deep: DFA, your ‘farmer-owned’ cooperative, owns 44 processing plants and pocketed profits as milk prices crashed by 40%, while members lost billions. Today’s reality: 834 mega-farms control 66% of all US milk revenue while 23,000 smaller farms compete for the remaining third. With processors pouring $11 billion into facilities designed exclusively for 1,000+ cow operations, the message is unmistakable. This isn’t market evolution—it’s deliberate elimination of family dairy farms.

Editor’s Note: Market data cited reflects 2024 financial reports and USDA statistics through November 2025. Company revenues include total sales, not exclusively dairy operations. Regional variations apply.

Learn More:

Carol Prelude Mtoto: The £40 ‘Failure’ That Saved the Holstein Breed

How an Overpriced Italian Specialist Became Worth Billions (And Why His Story Could Save Your Herd from What’s Coming Next)

Carol Prelude Mtoto didn’t look like a production superstar, but his deep rib and rugged constitution provided the essential strength the breed had lost. While neighbors chased high-index frailty, this bull was quietly engineering the modern survivor.

You know that moment when you realize you’ve been doing everything wrong?

Farmers across Yorkshire had it in 2008, standing in empty barns, watching auctioneers sell off what was left. The high-producing daughters of those “bargain” bulls they’d bought five years earlier? They’d crashed and burned when feed costs doubled and milk prices tanked. Spectacular production for two lactations, then… nothing. Metabolic disasters. Fertility nightmares. Udders that looked like they’d been through hell.

Meanwhile, their neighbors—the ones who’d invested a premium £40 per straw in that expensive Italian specialist back in ‘98—were still milking. Still profitable. Fourth and fifth lactation cows just quietly doing their job while everyone else’s genetics fell apart.

The difference between those farms came down to one decision in October 1998. Whether to spend a painful £40 on Carol Prelude Mtoto—a massive premium when neighbors were buying “bargain” bulls for a tenner—or take the easy route and buy the cheaper, high-production sensations everyone else was using. At £40 per straw when standard proven bulls cost £10-15, Mtoto was a contrarian investment most farmers couldn’t justify.

Here’s the thing… the spreadsheets were dead wrong.

What happened with Mtoto isn’t just breeding history. It’s playing out again right now, except this time we’re using genomics to make the same mistakes at digital speed. And if you’re not seeing it in your barn yet, trust me—you will. We all will.

When Production Became a Disease

Let’s talk about what the industry looked like when Mtoto showed up. Picture walking into any tie-stall operation in the mid-’80s. You know that smell, right? Silage, manure, and something else that hits you wrong. Then you see them—Bell daughters everywhere.

Christ, those cows could milk. Carlin-M Ivanhoe Bell was putting 1,700 pounds above average into bulk tanks across North America. By the late ’80s, his genetics appeared in the pedigrees of nearly 30% of the Holstein population. Every AI stud was pushing his genetics hard. Every producer wanted them.

Producers who managed operations during that era tell the same story. “Those first two years were like Christmas morning every day,” they remember. “You’re watching the tank fill up, doing the math in your head, thinking you’ve figured out this whole dairy thing.”

But here’s what nobody wanted to admit—Bell daughters were frail. Narrow through the chest. Fragile, really. Their udders? By the second lactation, they were hanging so low you worried they’d drag on concrete. And third lactation… if they made it that far.

“It was like a battlefield,” producers from that era still say. “Cows down with milk fever everywhere. Others were standing with their legs all splayed out, trying to hold up udders that had completely broken down. We were getting maybe two, two and a half lactations before they were done.”

The math was brutal once university researchers ran the numbers. Cornell and others documented that Bell daughters lived significantly shorter, productive lives. In some cases, 2-3 years less than balanced genetics. All that spectacular production didn’t mean squat when you’re constantly buying replacements.

Farmers still shake their heads when they talk about it: “The production was so incredible those first couple years, we kept telling ourselves it was worth it. By the time we figured out what we’d done to our herds, Bell genetics were everywhere. There was no going back.”

The industry had created production monsters wrapped in tissue paper. And almost nobody saw the correction coming from, of all places, Italy.

The £40 ‘waste’ becomes the £24,000 advantage. Mtoto-type genetics deliver 450% higher net profit (,700 vs ,400 per cow) despite identical initial costs, proving longevity genetics transform farm economics through 4 additional lactations and 40% lower costs per lactation. This is the spreadsheet that saved Yorkshire farms in 2008

The Italian Accident That Changed Everything

July 13, 1993—a bull calf gets born in Italy, in that region where they make real Parmigiano. Nothing special about him. Average size. Production genetics that were, let’s be honest, pretty mediocre.

But Carol Prelude Mtoto had something hidden that you couldn’t see at birth—and I know this sounds weird—but it was all about how tight the teat ends would close after milking.

Stay with me here because this matters…

You know how after you pull the milkers off, there’s that window—maybe an hour, an hour and a half—where the streak canal’s still open? That’s when bacteria can cruise right up into the udder, especially when the post-milking spray misses the target. It’s like leaving your barn door open in a thunderstorm while the cows are lying in wet bedding.

Now, some bulls transmit daughters with loose, relaxed teat ends. Great for parlor throughput—those cows milk out fast. But they’re mastitis magnets. Others, like Mtoto? His daughters had tight teat closure. Annoyingly tight. Slow milkers that drove parlor managers crazy.

Producers in the Parma region called them ‘hard milkers’ and constantly complained about them. But this was the biological trade-off for survival. While neighbors were burning through antibiotics, treating mastitis every damn day, those Mtoto daughters just kept producing clean milk. Year after year. No treatments. No culled quarters. No cell count problems.”

The economics were invisible until you actually sat down and did the math. That extra couple of minutes of milking time? Maybe €30 a year in labor. But the vet bills you didn’t have, the cows you didn’t cull, the extra lactations you got? That was €2,000-3,000 in additional profit per cow. Per cow!

Breeding for Survival, Not Show Scores

But here’s what really made Italian breeding different…

Over 80% of Italian milk wasn’t going into retail jugs—it was becoming Parmigiano Reggiano, Grana Padano. Those Protected Designation of Origin cheeses with regulations so strict they make your bank’s lending standards look relaxed. And those cheese factories? They’d reject your milk flat-out if the cells were too high. When you’re aging cheese for two, three years, protein content matters way more than volume.

Italian dairy leaders from that era explained it simply: “We weren’t breeding for those production records Americans chase. We were breeding for cows that could deliver consistent, quality milk for cheesemaking while lasting long enough, actually, to turn a profit.”

Think about it. A cow pumping out 30,000 pounds for two years means absolutely nothing if the cheese factory won’t take her milk.

The Italian approach seemed backwards to those of us chasing TPI—that’s Total Performance Index, basically the dairy world’s report card for Holstein genetics. But when you can’t just throw corn silage at everything, when cheese factories set your market standards, when your family farm has to last another generation… mastitis resistance becomes survival, not luxury.

Mtoto was engineered to fix what Bell broke. His sire, Ronnybrook Prelude—himself a Starbuck son—brought good frame and dairy character. His dam, a Blackstar daughter, brought constitution. And there was Chief Mark back there for udder perfection. It was like someone designed the exact correction the industry needed but didn’t know it wanted.

By ’98, when Avoncroft brought him to Britain, Mtoto had proven himself across Italian herds. His daughters weren’t production champions. They were survivors—lasting when others broke down, staying healthy when others needed constant treatment.

According to UK dairy records from August 2025, his mature proof shows somatic cell scores of -13, a HealthyCow index of +17, and a lameness advantage of +0.7.

The £40 price tag wasn’t cheap. At nearly four times the cost of standard proven bulls, it was basically saying: “This bull solves expensive problems—if you’re willing to pay upfront to avoid them.”

Most farmers weren’t. Who could blame them? Why pay £40 for mediocre production when £10 bought you bulls with spectacular numbers on paper?

The Eight-Year-Old Cow That Changed Everything

Now here’s where it gets interesting…

The Pickford family from Staffordshire had purchased a Canadian heifer, Condon Aero Sharon, recognizing something in her genetics worth investing in. By ’99, Sharon was eight years old, still going strong. The AI companies? They literally laughed at the Pickfords wanting to flush her. “Too old,” they said. “Obsolete genetics.”

Helen Pickford still remembers the conversation: “The reps kept showing us data on first-lactation heifers. Dad just kept saying, ‘But Sharon’s still here, still producing well. These heifers you’re pushing—will their daughters still be milking in eight years?'”

The Pickfords, working with ABS’s St. Jacob’s program, made a decision that defied conventional wisdom. They bred their mature cow to Mtoto—that expensive Italian specialist with mediocre production proofs. They were essentially doubling down on contrarian genetics.

July 23, 1999. Morning mist at Spot Acre Grange in Staffordshire. Sharon drops a speckled bull calf. They named him Picston Shottle. Nothing special happened that day. The industry had moved on to newer, more “cutting edge” genetics. (Read more: From Depression-Era Auction to Global Dominance: The Picston Shottle Legacy)

What came next rewrote everything.

The “Obsolete” Matriarch: At eight years old, Condon Aero Sharon (pictured) was dismissed by genetic experts as having outdated bloodlines. The Pickford family ignored the data, seeing a rugged survivor instead. By breeding this “obsolete” cow to the overlooked Mtoto, they produced Picston Shottle—proving that actual longevity on concrete beats theoretical potential on a spreadsheet.

When Customer Satisfaction Beats Computer Models

Shottle goes into progeny testing—five years before you know anything, right? By 2006-2007, when his daughters start milking, the numbers look solid but not earth-shattering. Nothing that screams “generational breakthrough.”

The Ultimate “Customer Satisfaction” Bull: While experts critiqued his “obsolete” pedigree, farmers couldn’t get enough of him. Picston Shottle (pictured) didn’t just top the charts; he produced the kind of “invisible,” trouble-free cows that paid off mortgages, proving that real-world profitability always beats a spreadsheet prediction.

But something weird starts happening across the herds using him…

“Farmers would try ten straws, then call wanting hundreds more,” producers involved in that era recall. “The reorder rate was unlike anything we’d seen.”

Why? Shottle daughters were invisible cows. The ones that never show up on your treatment sheets. They’d milk out at a reasonable speed—faster than pure Mtoto daughters but still measured. Breed back first or second service. Just quietly produce for five, six, or seven lactations.

Wisconsin dairy consultants from that period report visiting herds where farmers had named multiple cows after Shottle—Shottle’s Pride, Shottle’s Dream, you name it. “These cows paid for my kids’ college,” one producer explained. “They’re family.”

Then, in January 2008. USDA CDCB records confirm Shottle achieved the #1 TPI ranking in the United States. A British bull from a mature dam and an expensive, slow-milking Italian sire. He maintained top rankings for multiple consecutive sire summaries. Something that almost never happens.

By retirement? ABS documentation confirms the sale of 1.17 million doses. Industry records indicate over 100,000 daughters across multiple countries. Breed classification data showing 9,674 Excellent daughters through 2014.

The estimated economic impact? Based on daughters’ combined milk production, improved longevity, and reduced health costs across multiple decades, industry analysts calculate the value in the billions globally.

Helen Pickford remembers when Shottle hit #1: “Dad didn’t say much. But that evening, he walked out to Sharon’s stall—she was still with us then, twelve years old—and just stood there with her for a while. She’d lived to see her son become one of the most influential bulls of his generation. You could see it in his eyes… all those experts who said she was too old, that we were wasting money on obsolete genetics? They’d been looking at the wrong numbers all along. Sharon knew. She always knew.”

But here’s what really matters—Shottle proved the industry’s obsession with production indexes was completely backwards. The most profitable bull of his generation came from genetics that everyone said were overpriced and underperforming.

Why His “Failure” Actually Proves His Success

Okay, so here’s the part that’ll mess with your head…

Look up Mtoto’s current proofs in 2025 relative to the modern base. The production numbers have fallen off a cliff due to thirty years of genetic progress. On paper, with negative kilos of milk and fat compared to today’s heifers, he looks like a statistical ghost.

But here’s what you need to understand—the breed average resets every five years. What was “high production” in 1998 is now below average. A bull from 1993 should have negative production numbers in 2025. If he didn’t, it would mean the breed hadn’t improved in thirty years!

Look closer at the health traits. Despite thirty years of genetic progress, his influence on somatic cell count and lifespan remains positive. His SCC score still sits at -13. HealthyCow index at +17. These health advantages haven’t eroded—they’ve become foundational.

It’s actually pretty simple when you think about it. Mtoto’s daughters had such good udders and lasted so long that they became the new normal. What was exceptional in ’98 is now just average—because his genetics lifted the entire breed’s baseline.

University genetics researchers explain it this way: “When we look at current genomic data, genetics from bulls like Mtoto consistently show up in regions associated with udder health and longevity. These aren’t random leftovers. They’re functional genes that survived thirty years of intense selection because they actually work.”

The negative production numbers don’t mean he failed. They mean he succeeded so completely that exceptional became ordinary.

It’s like… you know how milk cost roughly 40-50 cents per gallon in the mid-1960s, while the minimum wage was around $1.25 per hour? Same milk costs $4 now. The baseline shifted. The world moved on. But the foundation—Mtoto’s genetics—stayed put, supporting everything built on top of it.

The Disaster We’re Speed-Running Right Now

And this is what’s keeping me up at night…

We’re doing Bell all over again, except genomics makes it happen at warp speed. No five-year wait to see if daughters work. We’re marketing bulls from birth based on DNA predictions. If those predictions miss something—and they always do—we saturate the breed with problems before anyone notices.

I was at a large operation in the Midwest last month. Beautiful first-calf heifers, genomic tested at birth, bred to the highest TPI bulls available. The herd manager knows that half won’t make it to third lactation. I know it. But those numbers look so good on paper…

The Numbers Game Nobody Wins

Here’s the pattern that’s killing us…

You walk through any modern freestall now—especially these new robotic barns with all the technology—and you see it. Cows with spectacular genomic indexes are struggling through their second lactation. Metabolic disasters, even though we know more about nutrition than ever. Conception rates that require a reproductive specialist just to maintain.

A young producer in central Wisconsin told me last week: “I spent $50,000 on genomic testing and top-ranked semen last year. Half those first-calf heifers are already gone. My neighbor is using bulls ranking #350 with good health proofs? His cows are entering their fourth lactation. I feel like an idiot.”

That’s the reality nobody talks about at the sales meetings.

Producers managing operations across major dairy regions report similar patterns. “Herds using top-10 TPI bulls exclusively are seeing the same thing,” one Wisconsin consultant shared. “Great first lactation, problems by second, gone by third. Meanwhile, daughters from bulls ranking #300-400 with elite health traits? They’re still here after five years.”

Dairy genetics researchers at major universities have been warning about this. They note we’re selecting hard for traits we can measure genomically—production, type—while underweighting survival traits that are harder to predict. It’s Bell 2.0, except faster. More thorough. More dangerous.

Research on Holstein genetic diversity shows concerning patterns. Studies indicate the breed’s effective population size has collapsed to approximately 50-100 animals. We’re one disease outbreak from disaster, still chasing TPI like it’s gospel.

And here’s what really kills me—we know better. We’ve seen this movie before.

The 2025 Mtoto Is Already in Your Catalog

Here’s what keeps me up: the bull we need right now? He’s probably already out there. Ranking #300-something on TPI with elite fertility, great health traits, exceptional longevity, and yeah, moderate production.

Nobody’s using him because we all filter for top-50 and never see him. Plus, he probably costs more per straw than the “bargain” high-TPI bulls that’ll crash in two lactations.

Think what that bull would need today. Daughter pregnancy rates at +3.0 or better. Real metabolic resilience—cows that don’t crash during early lactation. Right teat structure for robots (because let’s face it, that’s where we’re headed). Some heat tolerance for what’s coming climate-wise. Feed efficiency for when corn hits $8 again.

That bull exists. I’d bet the farm on it. But he’s not sexy. He’s not topping lists. He’s probably priced at a premium because the breeding company knows his value. Just like Mtoto was.

As recent industry analysis of the Florida herds after the 2024 hurricane season showed, it wasn’t the highest-producing herds that made it through the storms. It was the ones with resilient genetics that could handle stress. The same will be true for whatever 2026 throws at us.

The Bottom Line

When you drive past what used to be productive dairy land in Yorkshire, It’s all housing development now—”Dairy Farm Estates” or whatever they call it. Makes you want to laugh and cry simultaneously.

Farmers still operating in those areas tell the same story over coffee: “Neighbors laughed at us for paying four times the price for those overpriced Mtoto straws back in ’98. Called it a waste. But when 2008 hit, our Mtoto descendants were still making a profit. Their high-production cows were bleeding money despite putting more in the tank.”

And that’s what this comes down to. The genetics that look expensive today look cheap in retrospect. The “bargains”? They become the mistakes that kill operations.

Standing in barns today where sixth-generation descendants of those Mtoto crosses are still working—no drama, no issues, just consistent production year after year—you realize what actually matters.

It’s not the cow producing 40,000 pounds before crashing. It’s the one nobody notices. Shows up every day for seven years. Breeds back without fuss. Never needs treating. Quietly pays the bills through every crisis.

“Shottle daughters saved farms,” producers who lived through 2008 will tell you flat out. “When feed doubled and milk crashed, operations with higher-producing herds went under. Those moderate-production cows that lasted six lactations? They kept us alive.”

Look, I’m not saying abandon genomics. Production still matters. Innovation matters. We’re not going backwards.

But somewhere in that catalog is a bull that costs more than you want to pay. Doesn’t top any lists. Most of us will skip him for cheaper bulls with better numbers.

The operations that recognize him—that understand survival beats spreadsheets and that premium genetics are worth premium prices—they’ll still be farming in 2050. The ones chasing cheap, high-index perfection? They’ll be case studies in what went wrong.

We’re at the same crossroads as ’98. Climate change is accelerating. Input costs are volatile. Consumer demands are shifting. Regulations tightening. Perfect conditions? They’re ending. Fast.

The question isn’t whether your cattle can hit 40,000 pounds under ideal management.

The question is whether they’ll still be alive and profitable when everything goes sideways. Because—and trust me on this—everything’s about to go sideways.

Your breeding decisions today determine whether your operation survives or becomes suburban development. Whether you’re still milking in 2050 or just a memory.

Carol Prelude Mtoto died peacefully in 2003, never famous outside breeding circles. Shottle passed away in 2014 after a distinguished career. But tonight, across six continents, their descendants are quietly milking. Invisible cows generating visible profits. Proving real genetic worth isn’t measured in show ribbons or rankings.

It’s measured in survival.

The £40 question remains: What are you willing to pay for genetics that last?

The catalog’s open. Your neighbors are ordering those cheap bulls with spectacular numbers. History says that won’t end well for them.

Your move.

KEY TAKEAWAYS:

  • Four times the price, ten times the return: Mtoto’s £40 “waste” became billions in value through daughters that lasted six lactations vs. 2
  • The best cows are invisible: They never need treatment, breed back first service, and quietly profit for 7 years—all from “inferior” genetics
  • Today’s #1 genomic bull = Tomorrow’s Bell disaster: Half your genomic heifers won’t see third lactation (sound familiar?)
  • Your 2026 savior is hiding at #300-400 TPI: Look for DPR +3.0, SCS <2.7, exceptional health traits—yes, he costs triple
  • History’s lesson: Farms that bought cheap in ’98 don’t exist; farms that paid a premium are still profitable

EXECUTIVE SUMMARY:

When Carol Prelude Mtoto arrived in Britain at £40 per straw—four times the normal price—farmers called it highway robbery for a slow-milking Italian bull. Ten years later, only farms that paid for that ‘robbery’ survived the 2008 crisis. The secret: Mtoto daughters lasted six profitable lactations while cheap, high-production genetics crashed after two. His son, Shottle, became the #1 bull globally, generating billions in value from genetics that everyone said were worthless. Today’s genomic selection is making the identical mistake—chasing cheap indexes while premium-priced health genetics get ignored. The bull that saves your farm in 2026 is in your catalog now, overpriced and overlooked, just like Mtoto was.

Learn More:

The Sunday Read Dairy Professionals Don’t Skip.

Every week, thousands of producers, breeders, and industry insiders open Bullvine Weekly for genetics insights, market shifts, and profit strategies they won’t find anywhere else. One email. Five minutes. Smarter decisions all week.

NewsSubscribe
First
Last
Consent
Send this to a friend