









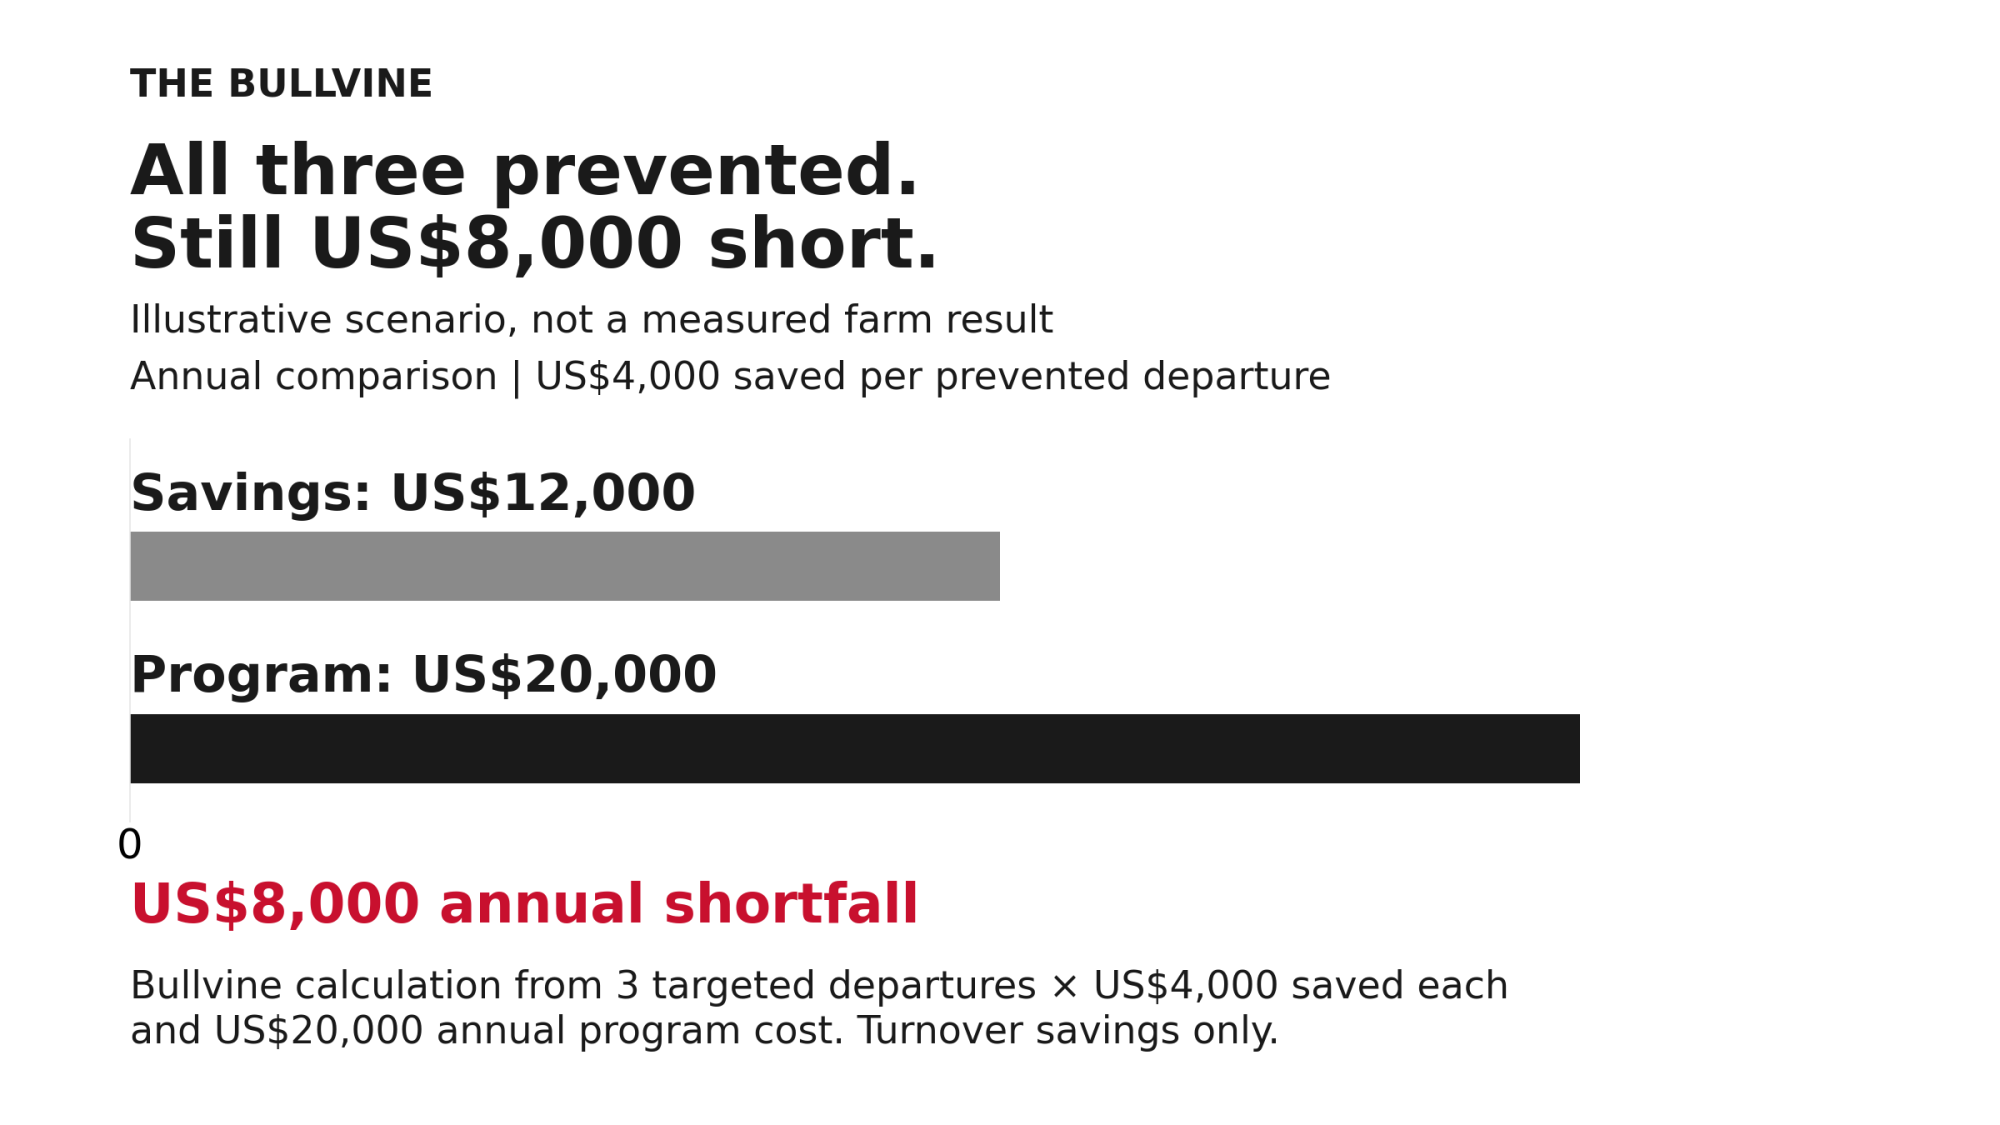
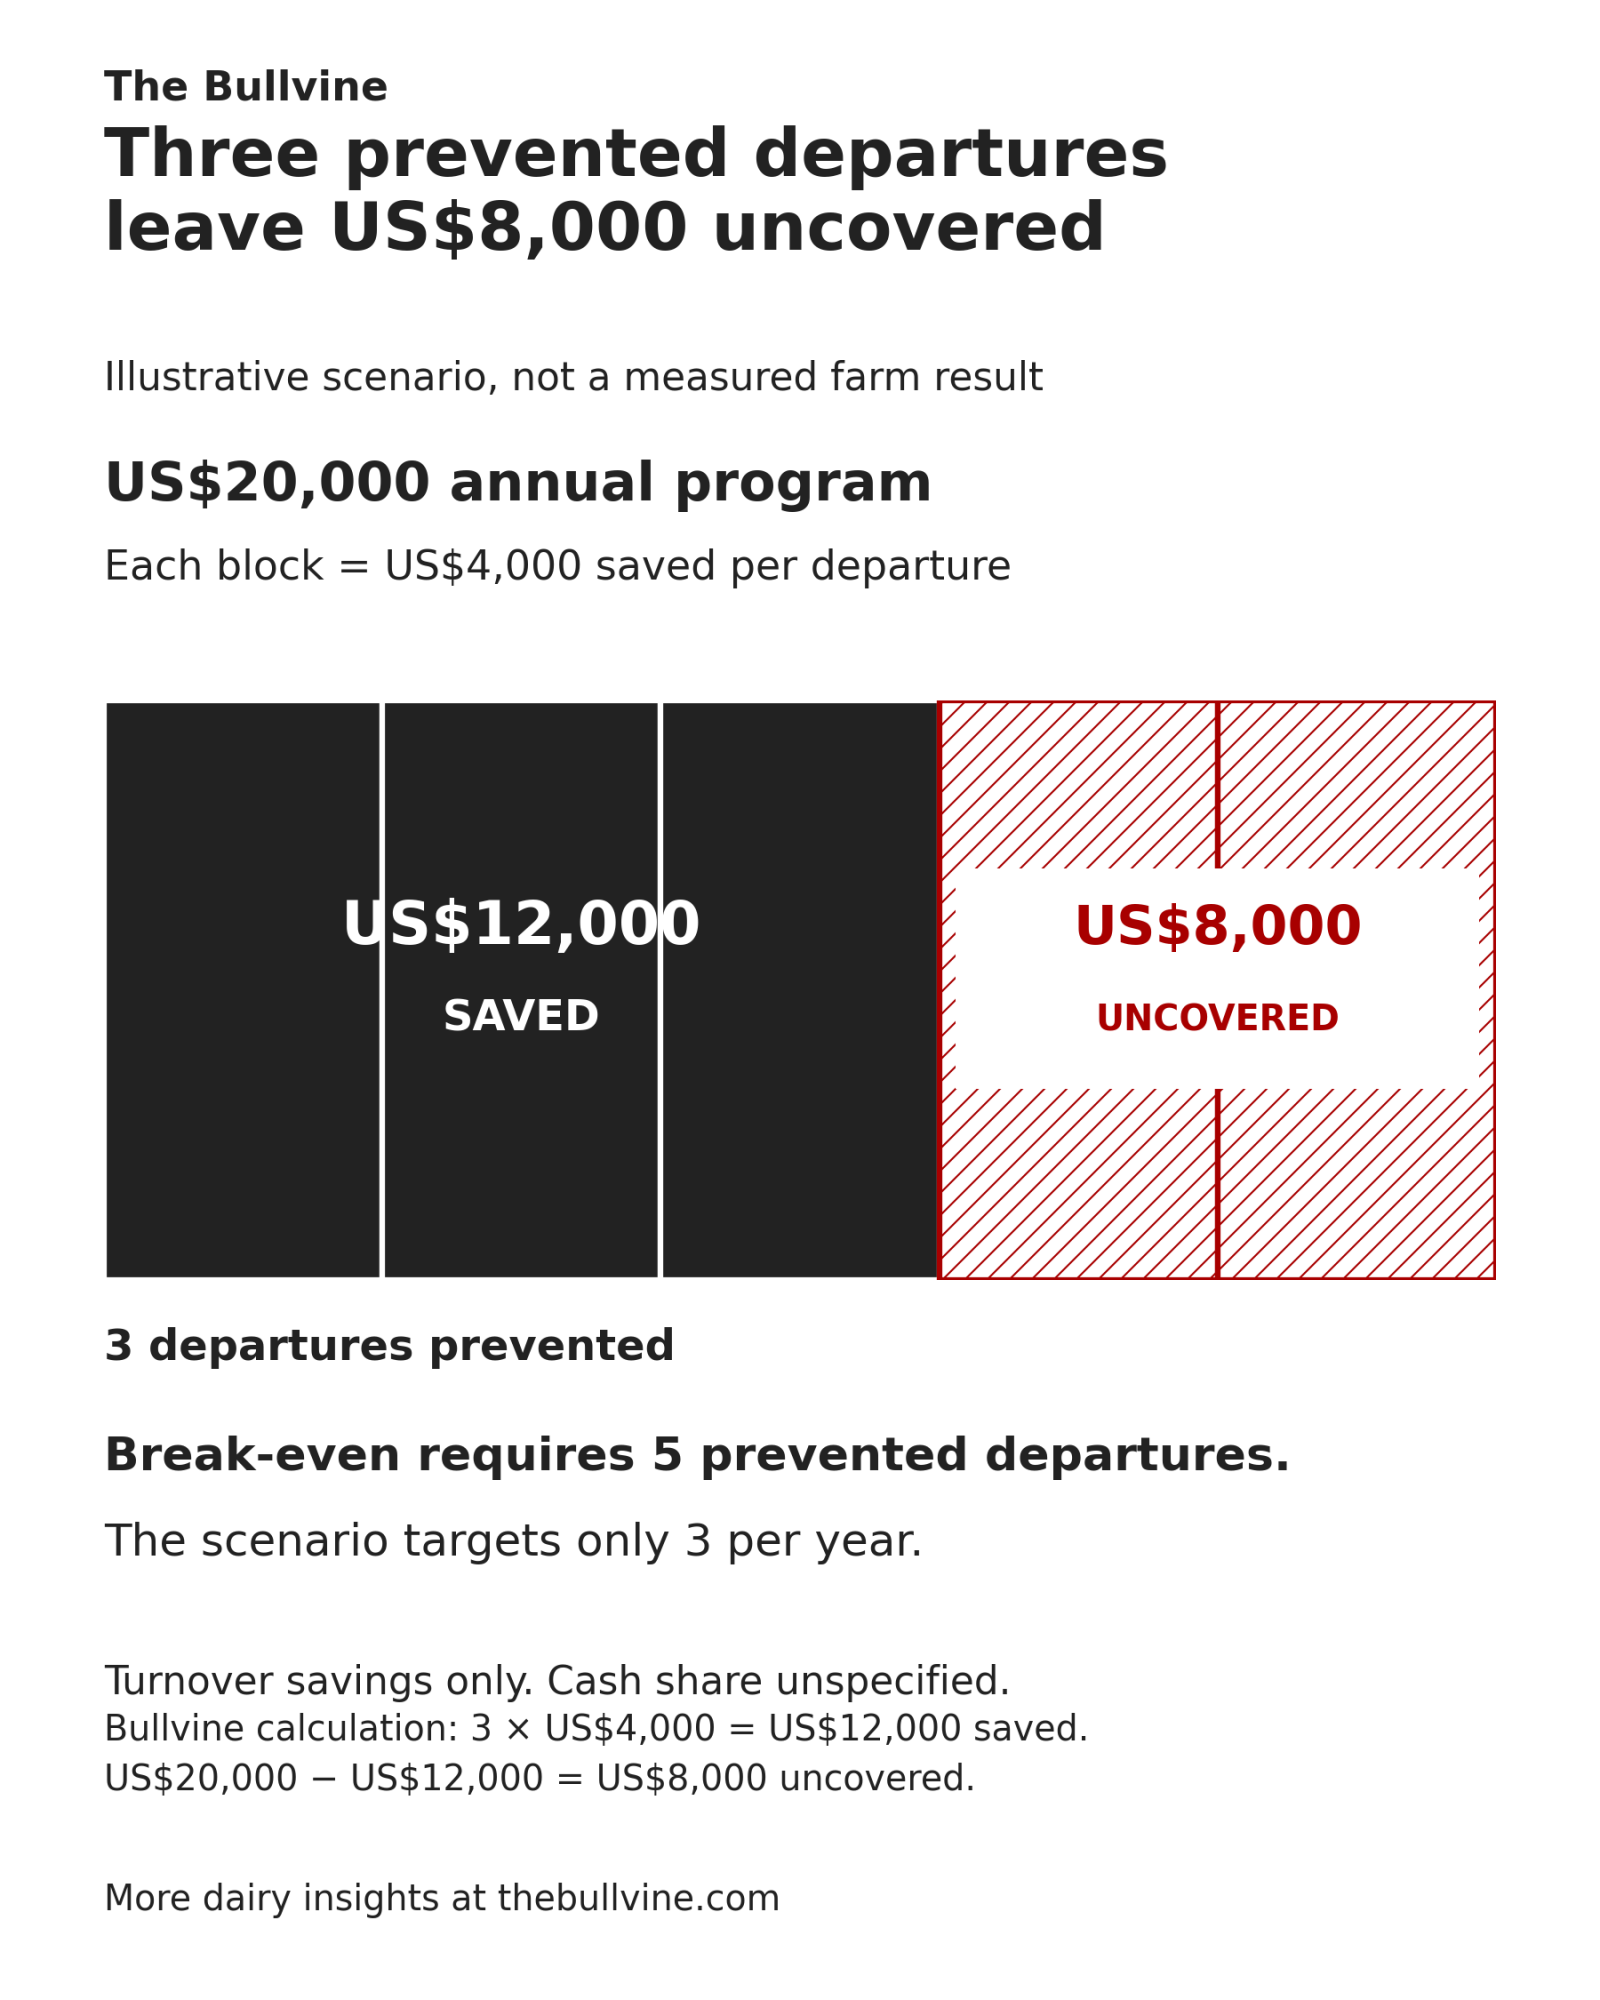
Three targeted departures, US$4,000 saved on each. Stop all three and you’ve saved US$12,000 against a US$20,000 bill—US$8,000 short. Bullvine’s math says you’d need five.
For an illustrative US$20,000-a-year retention program saving US$4,000 per prevented departure, the calculation is straightforward: stop all three targeted departures on a 400-cow herd and you’re still US$8,000 short. Break-even takes five. Raise the saving to US$8,000 and the bar drops to 2.5 a year.
Iowa State University Extension’s partial-budget guide, updated October 2024, provides the method. Bullvine applies it here to a narrower question: how much turnover expense would this particular program actually avoid?
What does a departure actually cost you?
Billikopf and González’s 2012 research article identifies recruitment, hiring, training, and lost productivity as turnover costs, citing general-industry estimates that put turnover at 150% of an employee’s annual wages. Because those are not dairy measurements, our US$4,000–US$12,000 range relies on stated assumptions; swap in your own number if your records show more. Regardless of the baseline, your budget must still subtract costs no longer incurred.
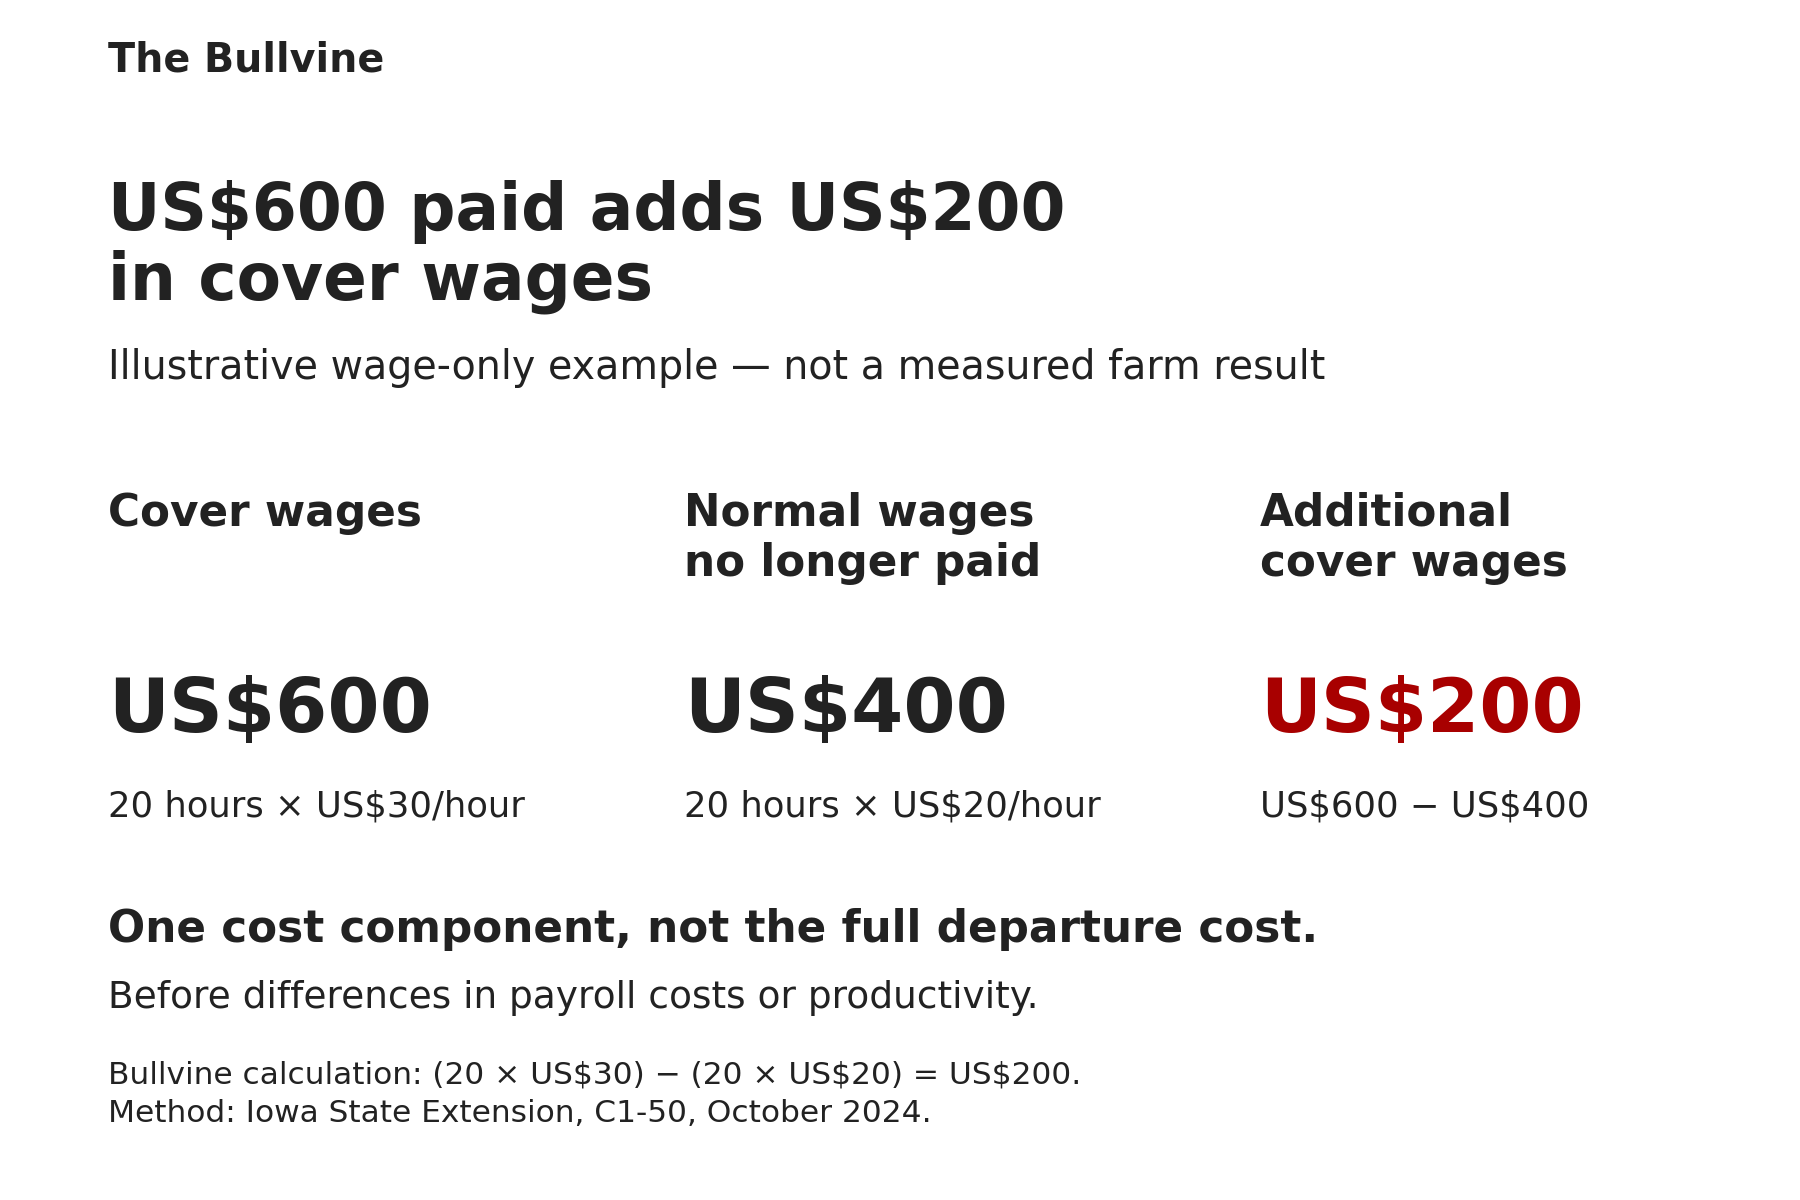
Take vacancy cover. In this hypothetical wage-only example, existing staff cover 20 hours at US$30/hour instead of the US$20/hour normally paid. Bullvine’s math: US$600 paid minus US$400 no longer paid equals US$200 in additional cover wages. That is one part of the departure cost, before any differences in payroll costs or productivity. We ran the same kind of test on the break-even on relief labor.
The same logic applies to the new hire. Credit whatever productive work they do from their first day. And don’t charge both a slower parlor and a milk-loss percentage for the same slowdown unless you can show two separate effects.
Keep net cash changes separate from reassigned staff time. Log trainer hours, but do not count unchanged payroll as extra cash or count the same lost work twice. We covered the same gap between time freed and payroll cut in robot milking ROI. Count milk-related savings as added receipts less added costs, not gross milk sales. Run the cash-only test using cash program costs and cash savings per prevented departure.
Which departures can a retention program actually stop?
A reason for leaving isn’t a probability of staying. In a 2009 survey of 209 dairy employees in three California counties, Gregorio Billikopf and Gustavo González recorded reasons for leaving 222 previous dairy jobs. Compensation and benefits led at 29%; schedules and time off accounted for 11%. Those figures describe past departures, not the share a pay or scheduling change would prevent.
The researchers didn’t seek out people who had left the industry for good, such as retirees, so the survey cannot establish a minimum level of unavoidable turnover. It describes California workers surveyed in 2009, not today’s Midwest workforce.
DairyNZ, the levy-funded New Zealand dairy industry-good organization, says in its employee survey summary, updated April 2026, that pay, workplace relationships and time off are leading reasons for leaving dairy. These are reported reasons for leaving the sector, not measured effects of a retention program on your farm.
So the useful move is to sort your own departures. A schedule complaint is something you can work on. A retirement is a succession problem. A farm closure isn’t a retention problem at all. Billikopf and González note that “some turnover may be beneficial”—a departure can open the door to a better-qualified hire. Account for any defensible benefit from the replacement as well as the transition costs; do not assume every departure is a net loss. Price only the departures the program targets.
What the US$20,000 program has to prevent
Running the Numbers
Herd: 400 cows (illustrative Midwest freestall). All dollar amounts are US dollars. The three targeted departures are an assumed annual baseline without the program; the model counts turnover savings only. Herd size and milk shipments determine the per-cwt figures, not the break-even departure count.
| Layer | Input | Value | Source |
| Published evidence | Method | Count only changed costs; net additions against reductions | Iowa State Extension, C1-50, Oct 2024 |
| Published evidence | Categories | Cost categories: recruitment, hiring, training, lost productivity | Billikopf and González, 2012 |
| Stated assumption | Milk shipped | 25,000 lb/cow/yr × 400 = 10,000,000 lb = 100,000 cwt | Bullvine assumption. Use your own milk check |
| Stated assumption | Departures tied to the problem the program targets | 3 per year | Bullvine assumption |
| Stated assumption | Avoidable cost per targeted departure (net of offsets) | Low $4,000 · Central $8,000 · High $12,000 | Bullvine sensitivity, not benchmarks |
| Stated assumption | Program commitment, including implementation time | $20,000/yr | Bullvine assumption |
Bullvine calculation: Low, central, and high refer to assumed savings per prevented departure—not program success rates.
| All amounts US$ | Low | Central | High |
| Targeted turnover cost/yr (3 × cost) | $12,000 | $24,000 | $36,000 |
| Targeted turnover cost per cwt | $0.12 | $0.24 | $0.36 |
| Program cost per cwt | $0.20 | $0.20 | $0.20 |
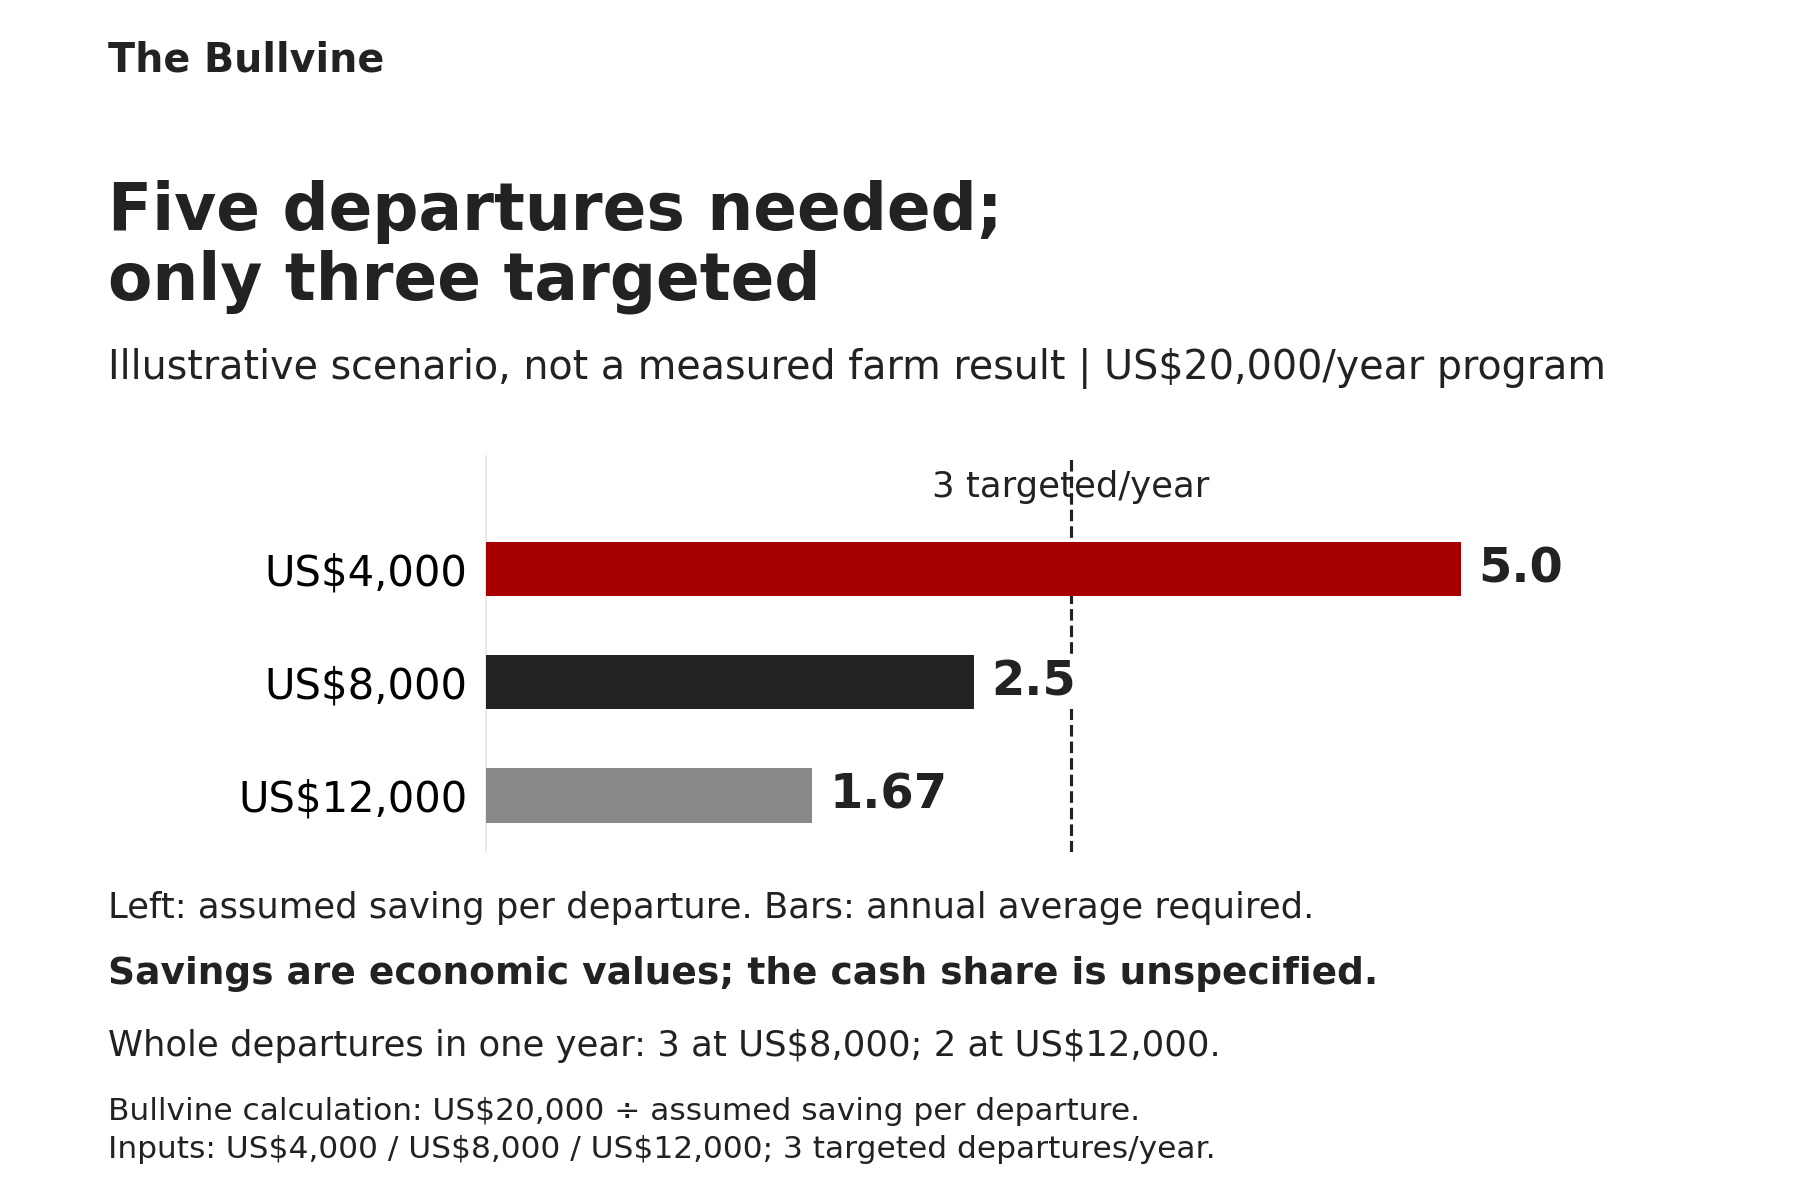
| Departures to prevent to break even ($20,000 ÷ cost) | 5.0 | 2.5 | 1.67 |
| Share of the 3 targeted departures that must be prevented | Not possible | 83% on average (all 3 in a single year) | 56% |
Read it this way: At US$8,000, break-even averages 2.5 departures a year; at US$12,000, 1.67. Both can pay without stopping every targeted departure on average. In a single year, whole people count: three at US$8,000 or two at US$12,000. The assumptions don’t say how much of the saving is cash.
One trap in the per-cwt line: ship 25% more milk with the same turnover bill and the $/cwt falls. The bill didn’t shrink. Always print the dollars and departures next to the ratio, the same way we report labor cost per cwt by herd size.
How do you decide before your records are perfect?
You don’t need a full cost study to set a hurdle. You need five entries on one page:
- The specific change you’re buying: a schedule, supervisor training, or an onboarding plan, not “retention.”
- Its full cost over the same year as the expected savings, including implementation time and any added wages, benefits, or relief cover across the affected staff, with cash costs shown separately.
- The departures it targets, with unknown reasons left as unknown.
- A provisional avoidable cost per targeted departure, marking what’s documented and what’s estimated.
- The break-even count, a spending cap and a review date.
Unsupported milk losses cannot justify the spend. If the proposal needs every targeted departure prevented to pay, it has no room for a missed outcome; test a lower prevention rate before committing. You may still have good reasons to fix a workplace problem. Just don’t dress those reasons up as turnover savings. As Iowa State’s guide puts it, a budget “can only estimate possible financial impacts, not assure them.” The guide also recommends rerunning the budget with different assumptions to see how much risk you’re taking on, which is exactly what the low, central and high cases do.
The 30/90/365-day playbook
| Horizon | Do | Requires | Urgent when | Backfires when |
| Next 30 days: open a cost file at the next departure | Give one person ownership. Log the last day, who covered which shifts, extra paid hours, the normal wages no longer paid, trainer hours, and the date the replacement works on their own. | Schedules, payroll, and a one-line training log you already have. | You’re weighing any retention spend above what one departure plausibly costs. | You select only unusually costly departures. Record every departure from the start date, then group the costs by the problem the proposal targets. |
| Next 90 days: run the break-even on any proposal on the table | Fill in the five entries and compute departures required ÷ targeted departures. | A departure list sorted by reason and a provisional cost range. Use reconciled departure files where available; one file is a starting point, not a reliable average. | The proposal needs nearly every targeted departure prevented to pay. Test whether it still pays with fewer prevented departures before committing. | You count every departure in the pool, including retirements and discharges the program can’t touch. |
| Next 365 days: check the result against the hurdle | Compare targeted departures and costs before and after, alongside spending. Convert to $/cwt only on matching annual milk shipments. | A year of consistent files and the program’s actual cost. | Spending renews automatically. | A quiet year gets credited to the program. Fewer departures can come from the labor market, herd changes, or luck, so report the result as an outcome you observed, not proof the program caused it. |
Next 30 days: open a cost file at the next departure.
- Do: Give one person ownership. Log the last day, who covered which shifts, extra paid hours, the normal wages no longer paid, trainer hours, and the date the replacement works on their own.
- Requires: Schedules, payroll, and a one-line training log you already have.
- Urgent when: You’re weighing any retention spend above what one departure plausibly costs.
- Backfires when: You select only unusually costly departures. Record every departure from the start date, then group the costs by the problem the proposal targets.
Next 90 days: run the break-even on any proposal on the table.
- Do: Fill in the five entries and compute departures required ÷ targeted departures.
- Requires: A departure list sorted by reason and a provisional cost range. Use reconciled departure files where available; one file is a starting point, not a reliable average.
- Urgent when: The proposal needs nearly every targeted departure prevented to pay. Test whether it still pays with fewer prevented departures before committing.
- Backfires when: You count every departure in the pool, including retirements and discharges the program can’t touch.
Next 365 days: check the result against the hurdle.
- Do: Compare targeted departures and costs before and after, alongside spending. Convert to $/cwt only on matching annual milk shipments.
- Requires: A year of consistent files and the program’s actual cost.
- Urgent when: Spending renews automatically.
- Backfires when: A quiet year gets credited to the program. Fewer departures can come from the labor market, herd changes, or luck, so report the result as an outcome you observed, not proof the program caused it.
The number to check before you sign
If the avoidable saving per targeted departure is zero or negative, turnover savings cannot cover a positive program cost. Otherwise, divide the annual program cost by that saving, using the same cash or economic basis for both. If the program cannot plausibly prevent that many departures, the turnover math doesn’t support the spend. A cost model has to be allowed to return zero. A retention proposal has to be allowed to lose money.
Will your retention program pay for itself?
See how many departures you actually need to prevent to break even in under 60 seconds.
How we calculate this
- Break-Even: Annual Program Cost ÷ Avoidable Cost per Departure.
- Net Impact: (Targeted Departures × Avoidable Cost) – Annual Program Cost. A negative number is a shortfall.
- Turnover Cost/cwt: (Targeted Departures × Avoidable Cost) ÷ Annual cwt shipped.
- Share Required: (Break-Even Departures ÷ Targeted Departures) × 100.
Illustrative estimate based on your inputs and Iowa State Extension, C1-50, Oct 2024. Not financial advice. Bullvine calculation.
A Bullvine tool · Last updated Nov 2026
Methodology Note: All amounts are US dollars. Bullvine’s break-even is program cost ÷ avoidable cost per targeted departure. Turnover cost per cwt is annual targeted departures × avoidable cost ÷ annual cwt shipped. “Avoidable cost” means the net cost that preventing a departure would actually remove. Compare the departure with the same period without it: include additional spending and documented lost contribution margin, subtract expenses no longer incurred, and value reassigned staff time separately where it has a defensible opportunity cost. Count the replacement’s output in that productivity comparison once. The low/central/high costs are sensitivities Bullvine chose to show how the answer moves. They aren’t measured dairy replacement costs or a confidence interval. The 400-cow herd, 25,000 lb/cow, three targeted departures, and a $20,000 program are stated assumptions. The accounting method follows Iowa State Extension File C1-50 (Oct 2024). The cost categories follow Billikopf and González (2012), who draw on general-industry turnover studies. All calculations are Bullvine’s.
Complete references and supporting documentation are available upon request by contacting the editorial team at editor@thebullvine.com.
Learn More
- Robot ROI Reality Check – Free Dairy Robot Calculator — Arms you with a screening tool to stress-test robotic milking pitches against your actual payroll. Exposes the hidden 1.4x installation multiplier and calculates true breakeven years before you commit capital to replace staff.
- Cut Labor Costs from $375 to $165 Per Cow: The Dual Strategy That’s Saving American Dairy — Follows the money on the impending $53.5 billion industry wage squeeze. Reveals how combining targeted automation with workforce evolution slashes per-cow expenses, building structural resilience against long-term policy shifts.
- Dairy Labor on a Knife Edge: 70% Undocumented, $52.8B at Risk, and the 500-Cow Choice Between Wages, Robots, or Exit — Dismantles the myth that H-2A visas provide an easy fix for round-the-clock parlors. Breaks down the true $24–$30 hourly compliance burden, forcing mid-size operations to confront their vulnerability to structural turnover.
The Sunday Read Dairy Professionals Don’t Skip.

Every week, thousands of producers, breeders, and industry insiders open Bullvine Weekly for genetics insights, market shifts, and profit strategies they won’t find anywhere else. One email. Five minutes. Smarter decisions all week.