









Borden’s published statement names no replacement plant. Before deliveries change, get the receiving commitment and a $/cwt net comparison, including hauling, in writing.
Borden says its Lafayette plant will close January 9, 2027. If your milk goes there, get two things in writing before deliveries change: who will receive it, and how the new terms, including hauling, change your net payment.
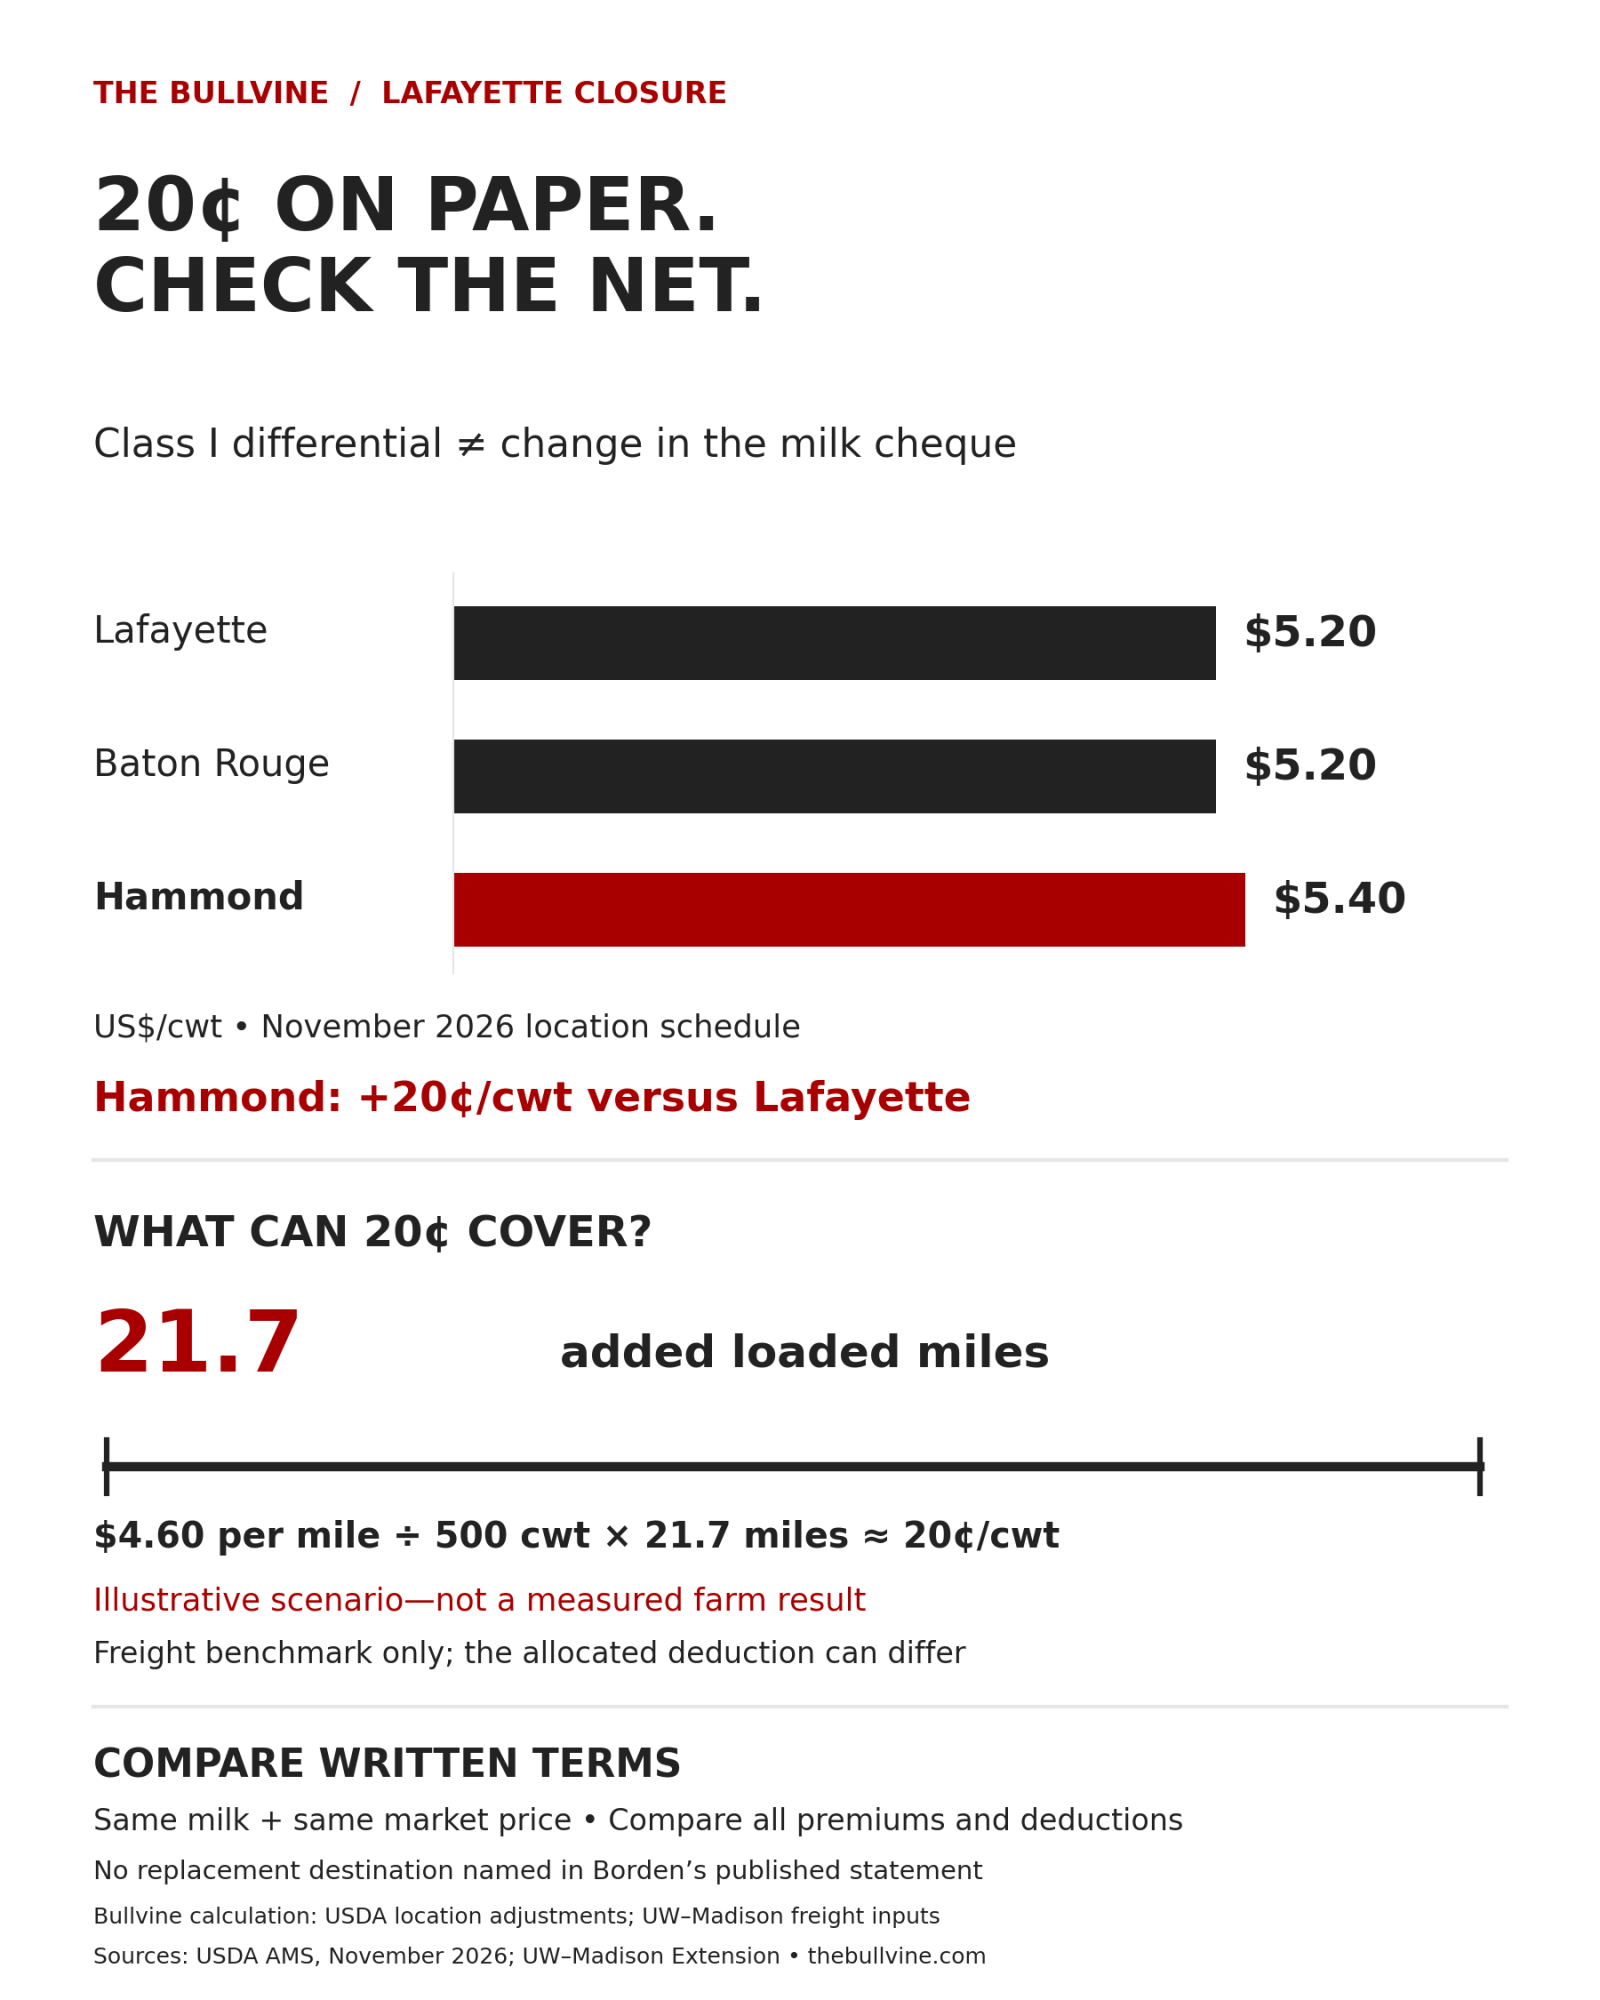
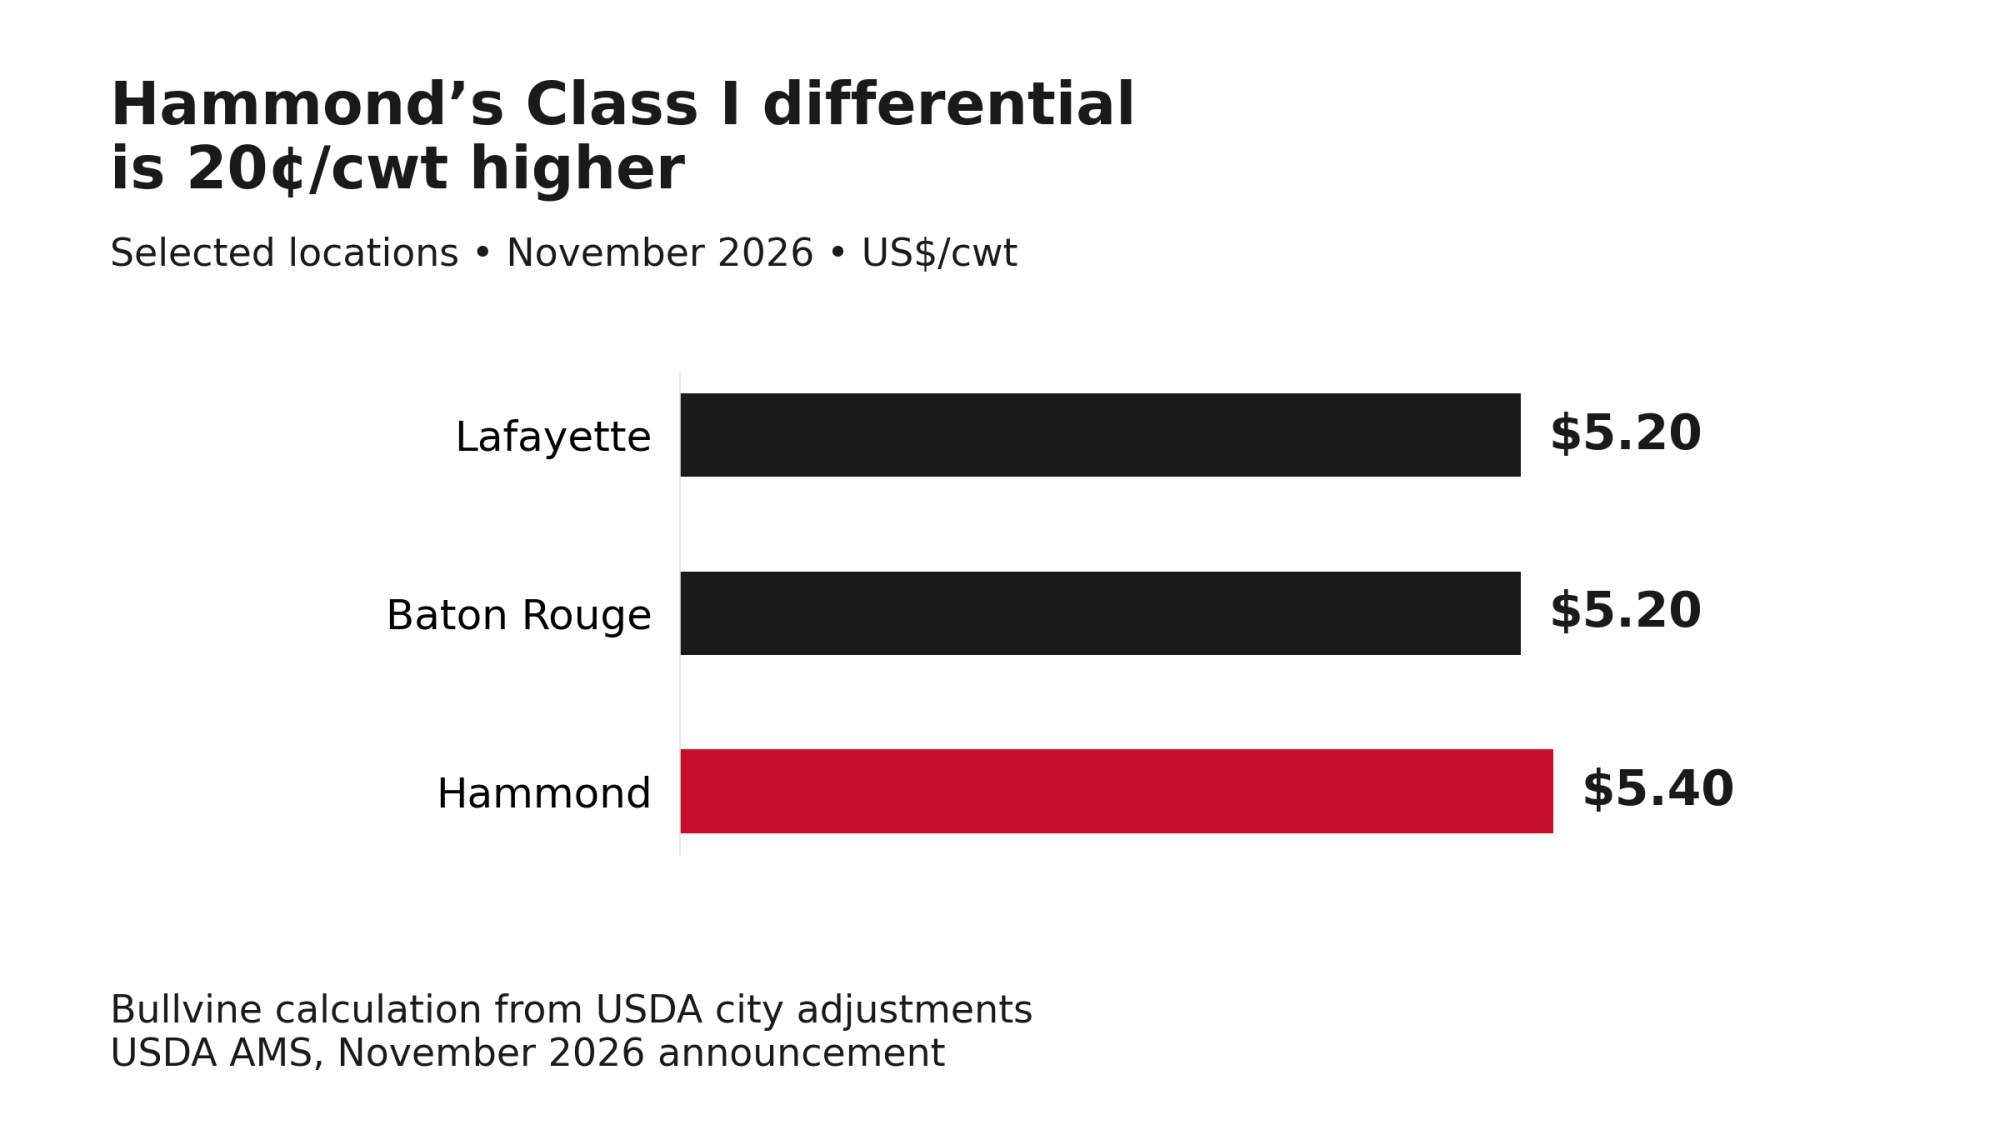
Hammond’s Class I differential is 20¢/cwt above Lafayette’s. Bullvine’s math: on the 56,000 cwt shipped annually in our example, a 20¢/cwt difference equals US$11,200 a year before any offsetting changes. But Borden’s published statement names no replacement receiving plant; Hammond and Baton Rouge are comparison locations here.
Federal Order 7 also applies plant location adjustments to required handler payments for producer milk. Ask how the adjustment enters your buyer’s or cooperative’s settlement, then compare premiums and deductions. For milk marketed through a cooperative, the co-op’s pay plan determines how much of that adjustment reaches members. Compare the recurring terms first. If transition assistance is offered, evaluate it separately.
What Borden announced
In a statement published by Acadiana News First, New Dairy/Borden confirmed its Lafayette operation will close permanently on January 9, 2027. The Advocate reports the closure will eliminate 149 jobs.
The statement says the company is “actively coordinating with our customers and suppliers and will communicate operational adjustments directly as they occur.” It doesn’t name receiving plants, committed volumes, pricing, hauling deductions, or transition support.
How does Federal Order 7 price Hammond against Lafayette?
USDA’s Announcement of Advanced Class Prices—November 2026, released October 21 by the Southeast order’s market administrator, reproduces the location schedule effective June 1, 2025. Each city’s adjustment is measured against Atlanta’s $5.80/cwt Class I differential. All dollar amounts in this article are US dollars.
| Location | USDA adjustment to Atlanta | Class I differential (Bullvine calculation) | vs. Lafayette |
| Lafayette | −60¢/cwt | $5.20/cwt | — |
| Baton Rouge | −60¢/cwt | $5.20/cwt | 0¢ |
| Hammond | −40¢/cwt | $5.40/cwt | +20¢ |
Schematic, not to scale. Regulatory-listed plants, not confirmed receiving destinations. Location adjustments: USDA AMS, November 2026 announcement. Plants: FDA IMS list.
FDA’s IMS list shows Kleinpeter Farms Dairy in Baton Rouge and Prairie Farms in Hammond as listed fluid plants. A listing doesn’t mean either plant has open capacity or has agreed to take Lafayette milk.
The schedule establishes the location difference. Your settlement comparison must show how that adjustment, premiums, and deductions combine to change your net payment. As with USDA’s Class III factor change, a benchmark change isn’t a cheque change.
Freight cost vs. the deduction on your cheque
University of Wisconsin–Madison Extension separates the truck’s extra bill from your extra deduction. Its Milk Hauling Quick Reference says it plainly: “Hauling charges are negotiated among farms, haulers, and handlers, and FMMOs do not regulate them.” It also warns that the hauling line on a cheque isn’t measured freight cost and can interact with premiums and other terms.
The Southeast order also runs marketwide transportation and delivery credit funds to offset the cost of moving supplemental milk. USDA lists November assessments of 60¢/cwt for the transportation credit fund and 50¢/cwt for the delivery credit fund on FO7 Class I producer milk. Ask your buyer whether any credit applies to redirected Lafayette milk, and who receives it.
Extension’s planning range is $4.60–$5.00 per loaded mile on a load of about 500 cwt. That equals 0.92–1.00¢/cwt per added loaded mile. At the lower rate, about 22 added loaded miles equal the 20¢/cwt benchmark. These are planning estimates, not route quotations.
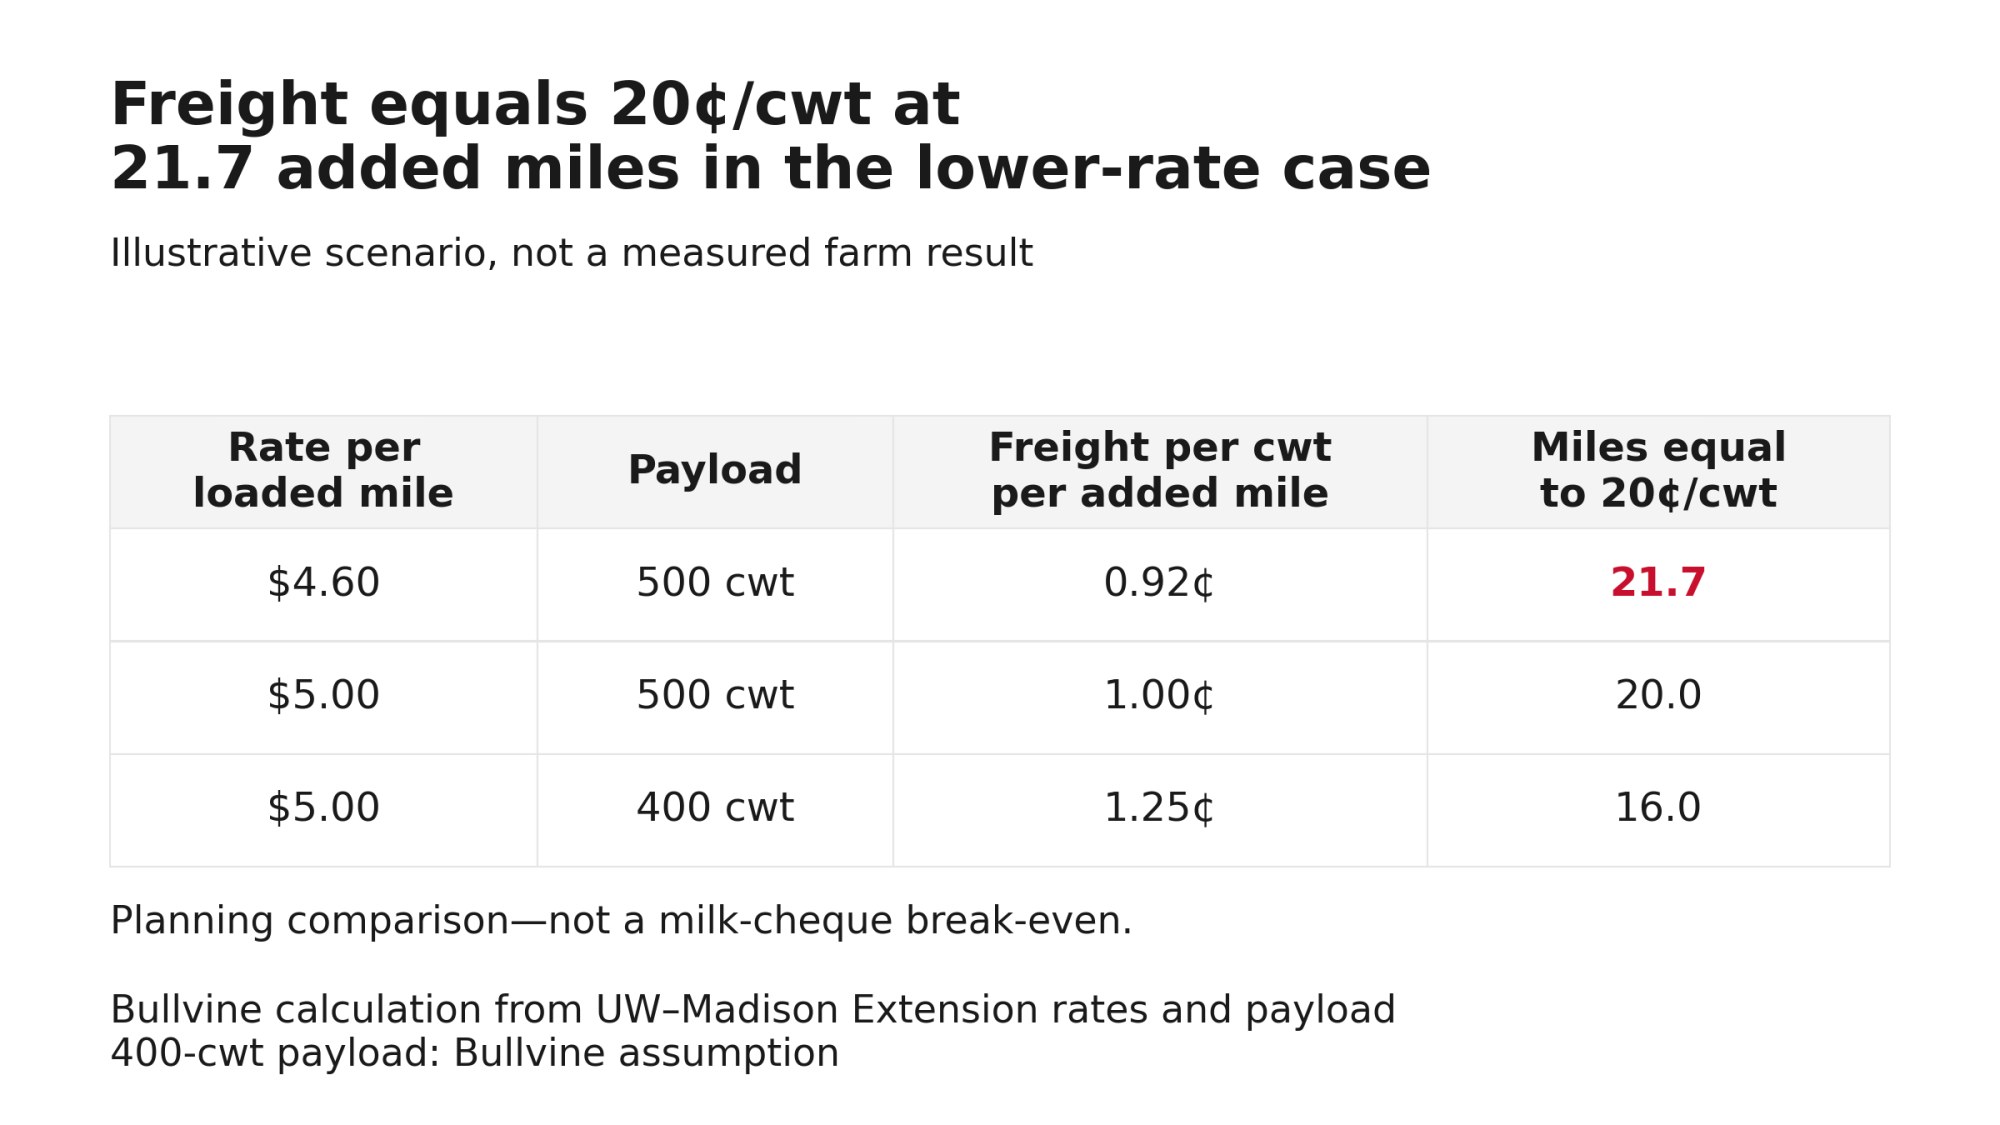
| Cost per loaded mile | Payload | Cost per added loaded mile per cwt | Added miles equal to 20¢/cwt |
| $4.60 | 500 cwt | 0.92¢ | 21.7 |
| $5.00 | 500 cwt | 1.00¢ | 20.0 |
| $5.00 | 400 cwt | 1.25¢ | 16.0 |
The 400-cwt payload is our assumption. These distances compare estimated freight cost with a 20¢/cwt benchmark; they don’t establish your milk-cheque break-even.
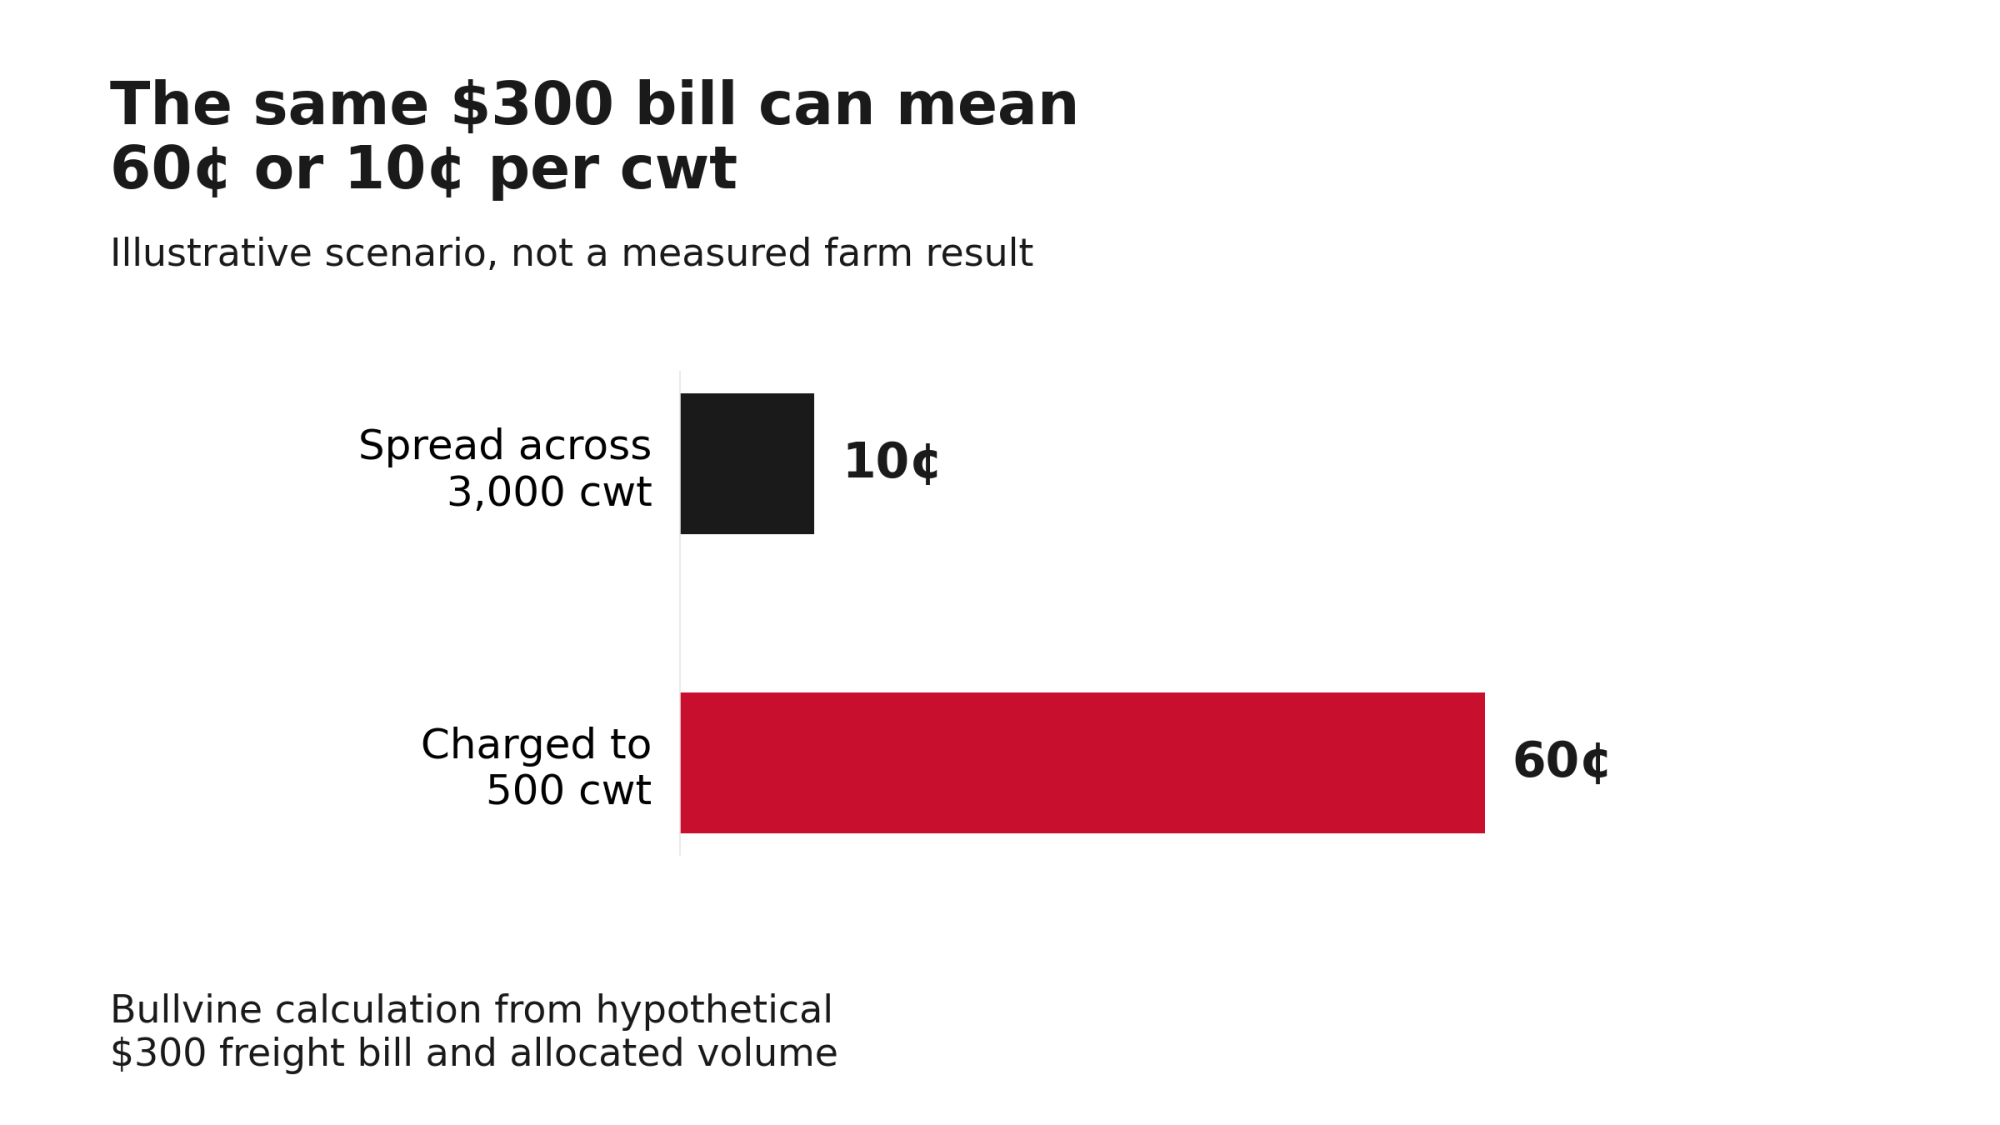
How the cost gets shared matters as much as the cost itself. Take a hypothetical $300 extra freight bill on one 500-cwt load. Charged to that load alone, it’s 60¢/cwt; spread across 3,000 cwt, it’s 10¢. Don’t stop at the rate. Ask which pounds share it, which costs it covers, and when it can change.
What does 20¢ mean on 400 cows?
LSU AgCenter estimates Louisiana had 6,618 milking cows producing nearly 93 million lb in 2025. LSU identifies these as Extension estimates, not the official state statistics published by NASS.
Our example assumes 400 cows shipping 14,000 lb per cow annually. Dividing LSU’s estimated statewide production by its cow count gives about 14,050 lb per cow; we rounded that to 14,000 and assumed it was shipped. Use your own annual shipped pounds to scale the result.
- Annual shipments: 400 × 14,000 lb = 5.6 million lb, or 56,000 cwt. That’s the equivalent of 112 full 500-cwt tanker loads, not an assumed pickup schedule.
- A 20¢/cwt increase in recurring net payment would equal 56,000 × $0.20 = $11,200 a year, or $28 a cow.
- Freight at $5.00/mile and 500 cwt: 20 added loaded miles × $5.00 × 112 load-equivalents = $11,200 a year. That equals the full 20¢ benchmark if this herd bears all of the added freight.
Ongoing net differences, excluding any temporary support, at −10¢, −40¢ and −70¢/cwt (hypothetical, not Lafayette offers):
| Ongoing net change, excluding any temporary support | Annual reduction per cow | Annual reduction, 400 cows | Average monthly reduction |
| −10¢/cwt | $14 | $5,600 | $467 |
| −40¢/cwt | $56 | $22,400 | $1,867 |
| −70¢/cwt | $98 | $39,200 | $3,267 |
If temporary assistance is offered, compare its amount and expiry date with the recurring revenue change. A payment that offsets a loss during the transition doesn’t remove that loss after it expires.
What this means for your operation
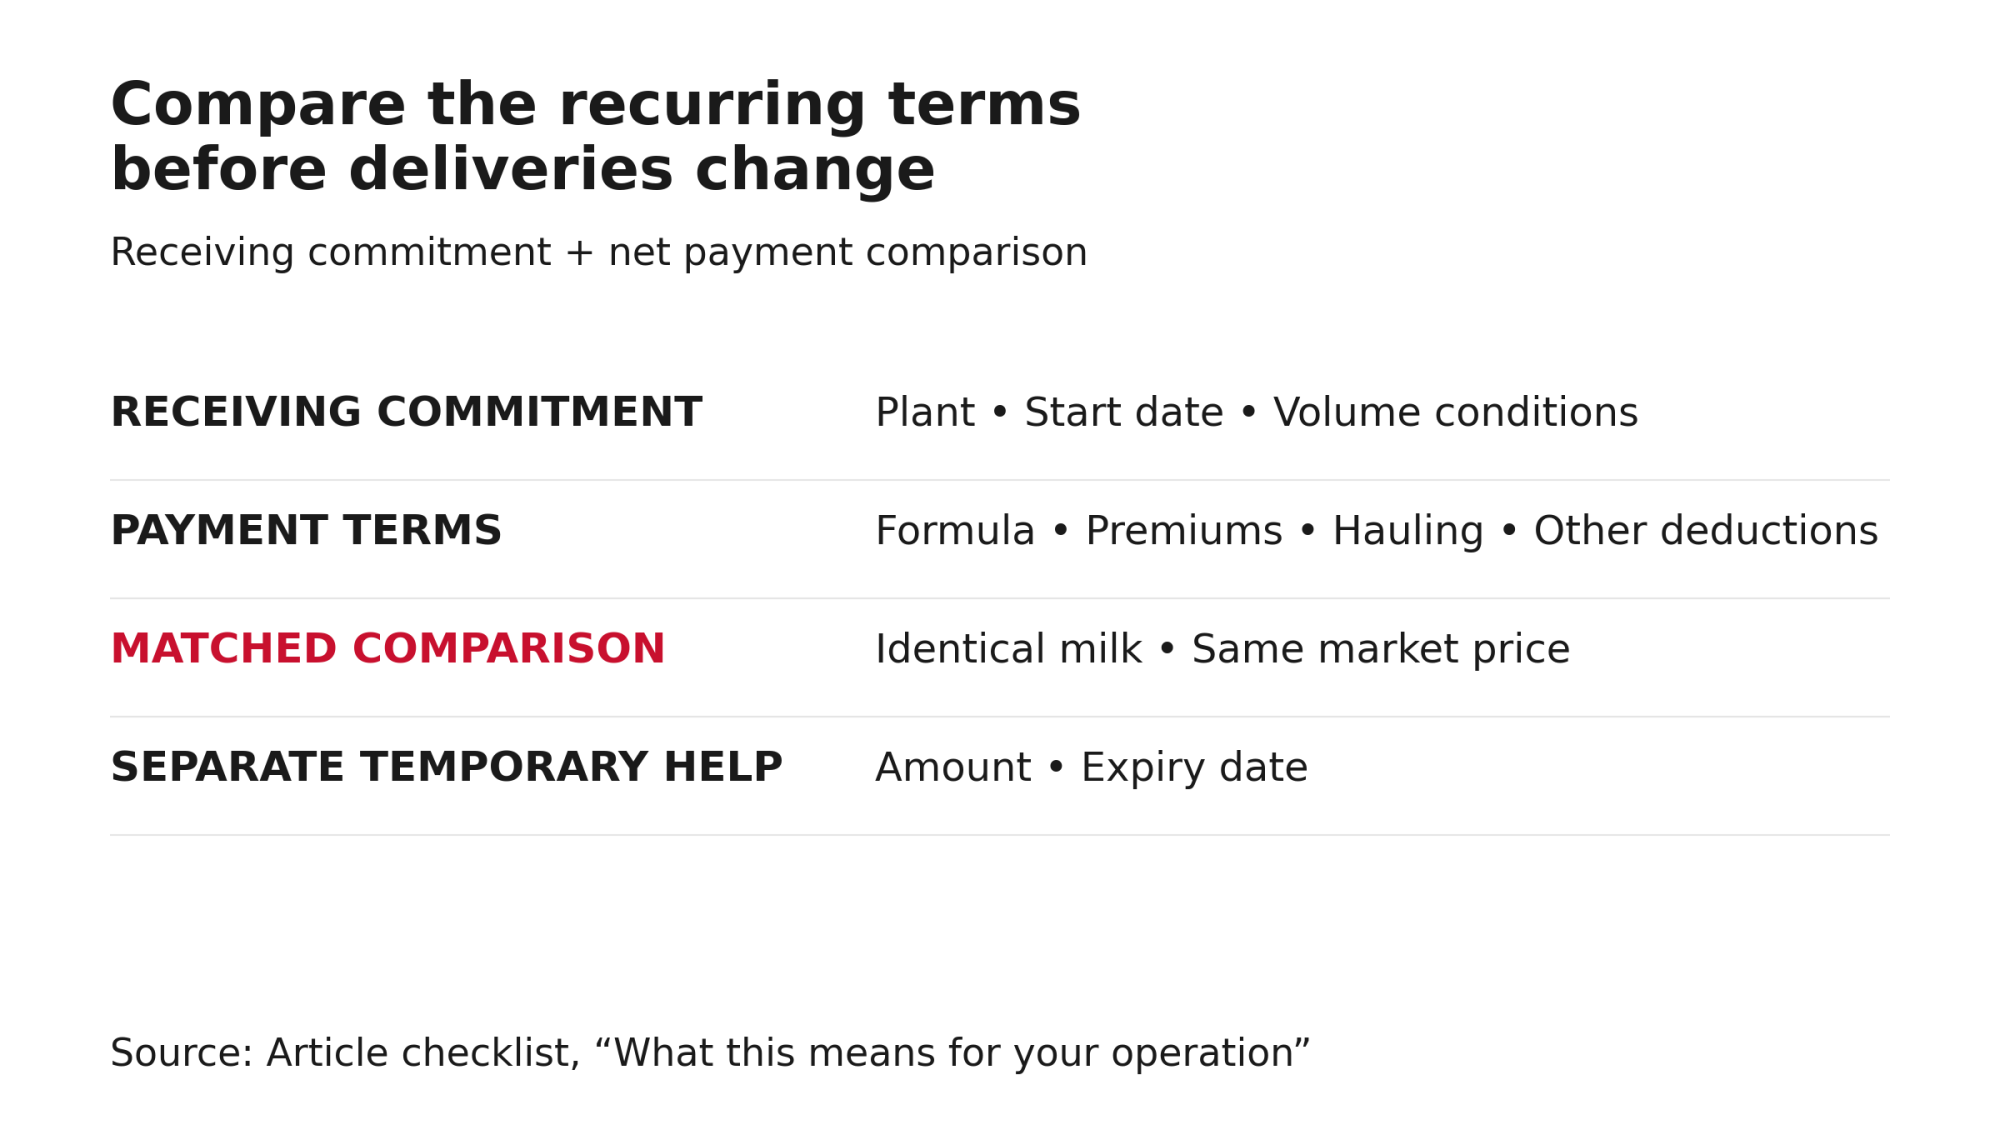
| When | What to get or check |
| Before deliveries change | A named receiving plant, start date, volume conditions and written payment formula. Ask the buyer to calculate old and proposed terms for identical milk at the same market price. |
| Before accepting the terms | The hauling rate and allocation rule: which costs and pounds are included, whether charges are fixed or per cwt, and when they can change. Ask whether any transportation or delivery credit applies and how it’s treated. It’s the same rule as any service renewal: get price and data terms in writing. |
| Before committing, with your lender if needed | Put the recurring revenue difference into the cash-flow budget. Show any temporary assistance separately, including its amount and expiry date. |
| When the first settlement covering redirected deliveries arrives | Check pounds, payment rates, premiums and deductions against the written terms. Separate deliveries made under the old and new arrangements, and account for changes in market prices. |
| Before assistance expires or terms change | Recalculate the recurring result and assess alternatives early. Don’t give up an outlet without a confirmed replacement. |
The one number to get in writing before January 9
Knowing where your milk is going isn’t the same as knowing what you’ll be paid to send it there. Ask for one number in dollars per cwt: the proposed recurring net payment minus the current net payment, calculated for identical milk at the same market price and excluding any temporary support.
A positive result means more recurring milk revenue for the same milk, not necessarily a profitable farm. That’s the gap between the gross price and what lands in your cheque. For either a gain or a loss, multiply the per-cwt change by your annual shipped cwt.
Will your new Class I differential cover the extra freight?
Enter your hauling rates and proposed destination to calculate your net milk-cheque impact in under 60 seconds.
How we calculate this
Net per cwt = $0.20 differential – $0.20 freight = $0.00
Annual Net = $0.00 × 56,000 cwt = $0
Methodology Note
- Location differential (Bullvine calculation): Atlanta $5.80 plus the USDA city adjustment. Lafayette and Baton Rouge = $5.20; Hammond = $5.40. Difference = 20¢/cwt. Source: USDA AMS FO6/7, Oct. 21, 2026.
- Freight per added loaded mile: rate ÷ payload. $4.60/500 = 0.92¢; $5.00/500 = 1.00¢; $5.00/400 = 1.25¢. Rates and the 500-cwt payload come from UW–Madison Extension’s $4.60–$5.00 planning range; the 400-cwt payload is our assumption.
- Benchmark miles: 20¢ ÷ cost per added loaded mile = 21.7 / 20.0 / 16.0. These compare freight cost with a 20¢ benchmark; they aren’t milk-cheque break-evens.
- Shipment assumption: The assumed 14,000 lb shipped per cow is rounded from LSU’s estimated production per cow. Multiplying by 400 cows and dividing by 100 gives 56,000 cwt/year. This is an illustrative shipment volume.
- Settlement identity: Δ ongoing net = Δ recurring payable price − Δ allocated hauling deduction − Δ other deductions. Temporary support is excluded.
- No double counting: Freight cost and allocated deduction are never combined. FO7 credit assessments are context, not payments to any producer.
- This article is based on Borden’s published statement and public USDA, FDA, eCFR, UW–Madison Extension and LSU AgCenter data. The Bullvine did not contact Borden before publication.
Learn More
- The USDA Formula Change No Milk Check Explains — Arms you with the hard math to calculate your structural margin loss from the 2025 make-allowance restructure. Breaks down how a hidden $0.90/cwt deduction scales by herd size, preparing you for your next lender meeting.
- FMMO Pays $1.71/lb for Butterfat Worth $2.95: What USDA’s December Report Tells You About Your Milk Check in 2026 — Reveals the $1.24/lb spread between global butterfat export values and your FMMO payouts. Follows the money on regional processing capacity shifts to show exactly who captures your component premiums and how to respond.
- FMMO Reality Check: Why 2025’s $2.3 Billion Dairy Pricing Revolution Exposes the Fatal Flaw in American Milk Marketing — Delivers a tactical blueprint to out-manage new regulatory drag using precision transition nutrition and component-focused genetics. Dismantles the “higher-of” Class I formula illusion and exposes a $91 million annual wealth transfer to processors.
The Sunday Read Dairy Professionals Don’t Skip.

Every week, thousands of producers, breeders, and industry insiders open Bullvine Weekly for genetics insights, market shifts, and profit strategies they won’t find anywhere else. One email. Five minutes. Smarter decisions all week.