Cargill Milwaukee never bought your calves. Tyson did. See how a 4,200-cow Wisconsin herd with 2,500 beef‑on‑dairy crosses is rewiring its sire and packer risk.
Executive Summary: Ebert Enterprises in Algoma, Wisconsin, runs 4,200 cows and raises 2,000–2,500 beef‑on‑dairy crosses a year, using beef premiums to keep inflation from chewing up their margins. The Cargill Milwaukee plant that just hit the headlines is a ground beef facility that hasn’t slaughtered cattle since 2014, so it never bought their calves — or yours. The real shock to beef‑on‑dairy economics came earlier, when Tyson shut its 5,000‑head‑a‑day Lexington, Nebraska, plant and cut capacity at Amarillo, tightening kill‑floor access as CattleFax and NAAB data show volume surging to 3.22 million beef‑on‑dairy calves and 7.9 million beef semen units in dairy herds. That mismatch is why the Eberts now track where their calves actually land, spread their marketing beyond a single buyer, and favor Angus and Simmental‑Angus sires through AI — breeds with strong documented feedlot and carcass performance. Penn State research backs that play, showing all beef × Holstein sires can hit Choice, but some deliver far better gain and marbling than others. For your herd, the message is blunt: beef‑on‑dairy still works, but only if packer capacity and carcass predictability sit right beside conception rate and calving ease in your breeding plan.
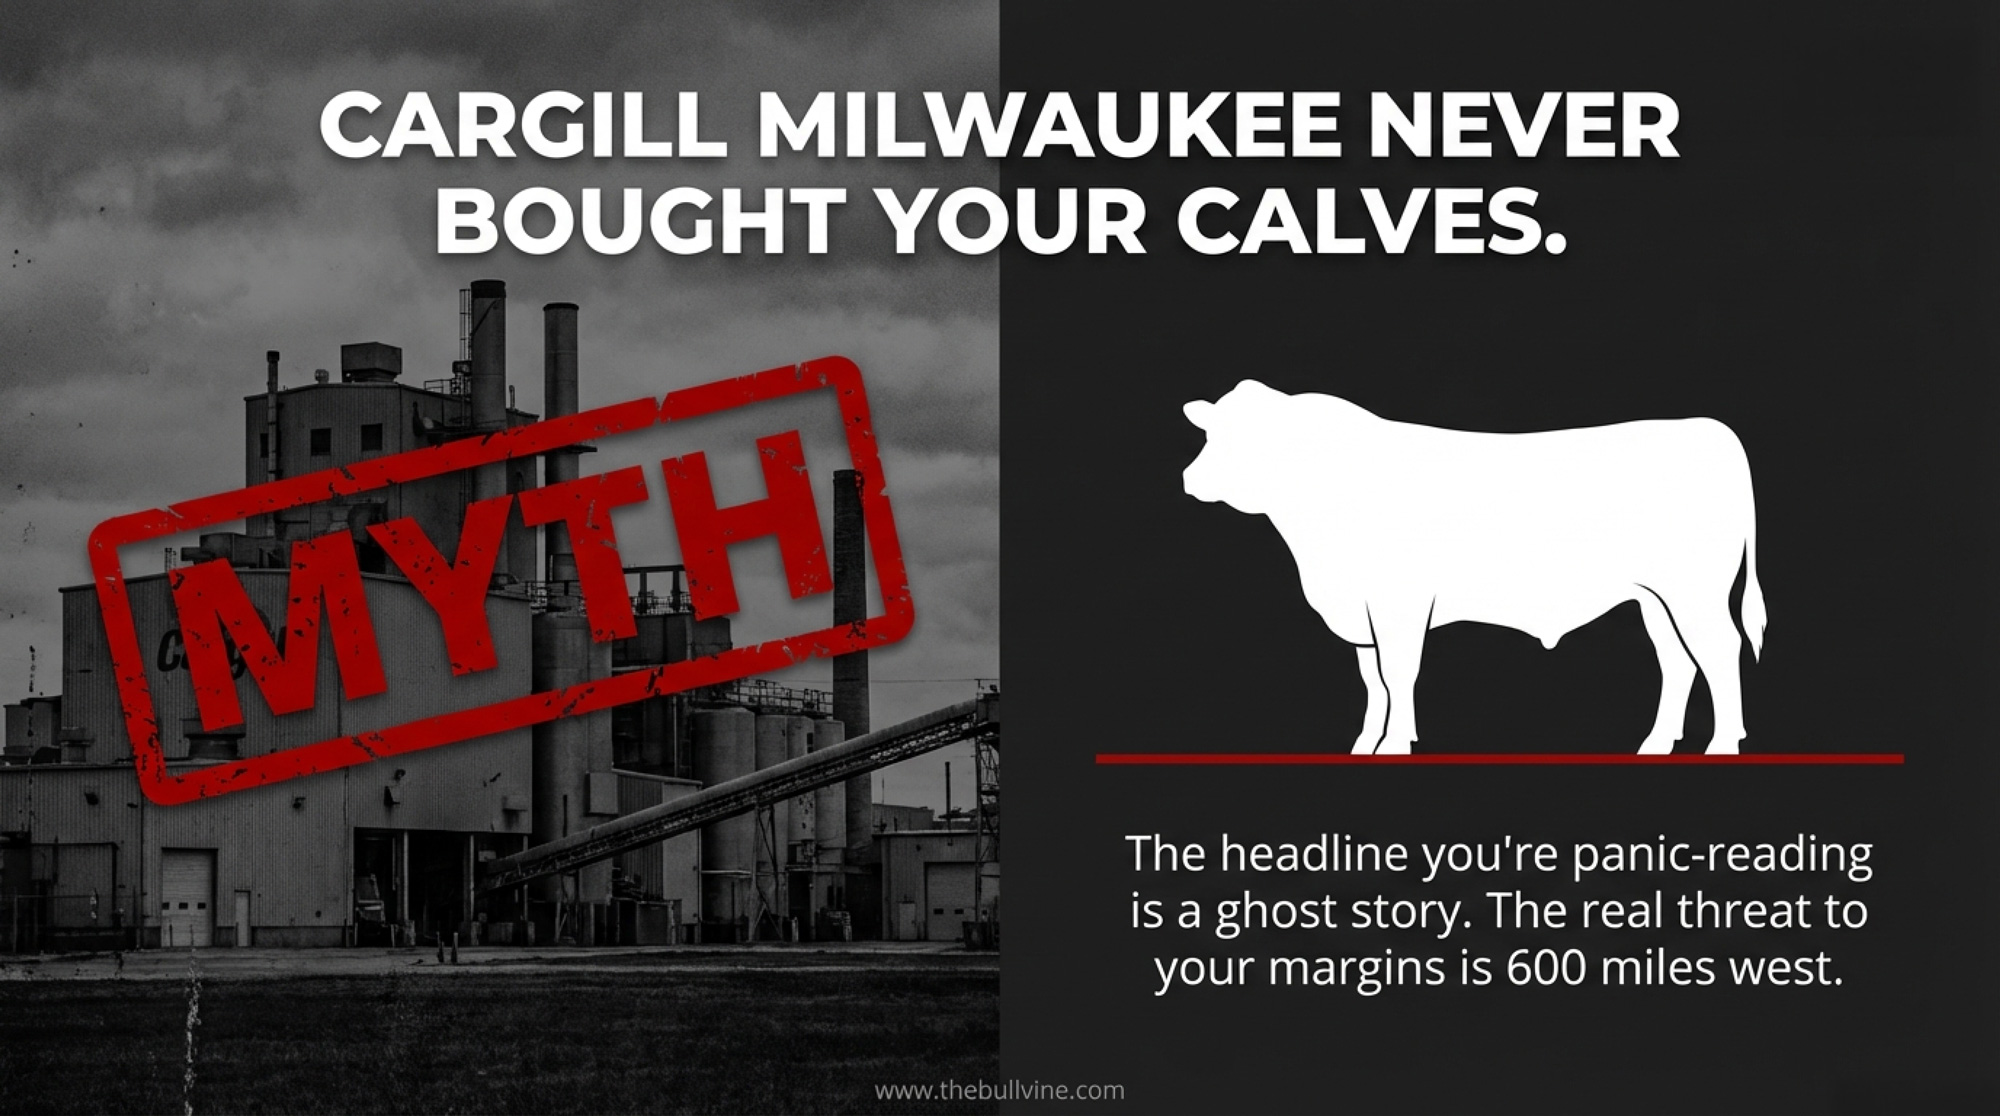
The Milwaukee headline was a ghost story. But if you aren’t looking at Nebraska, you’re missing the real monster under the bed.
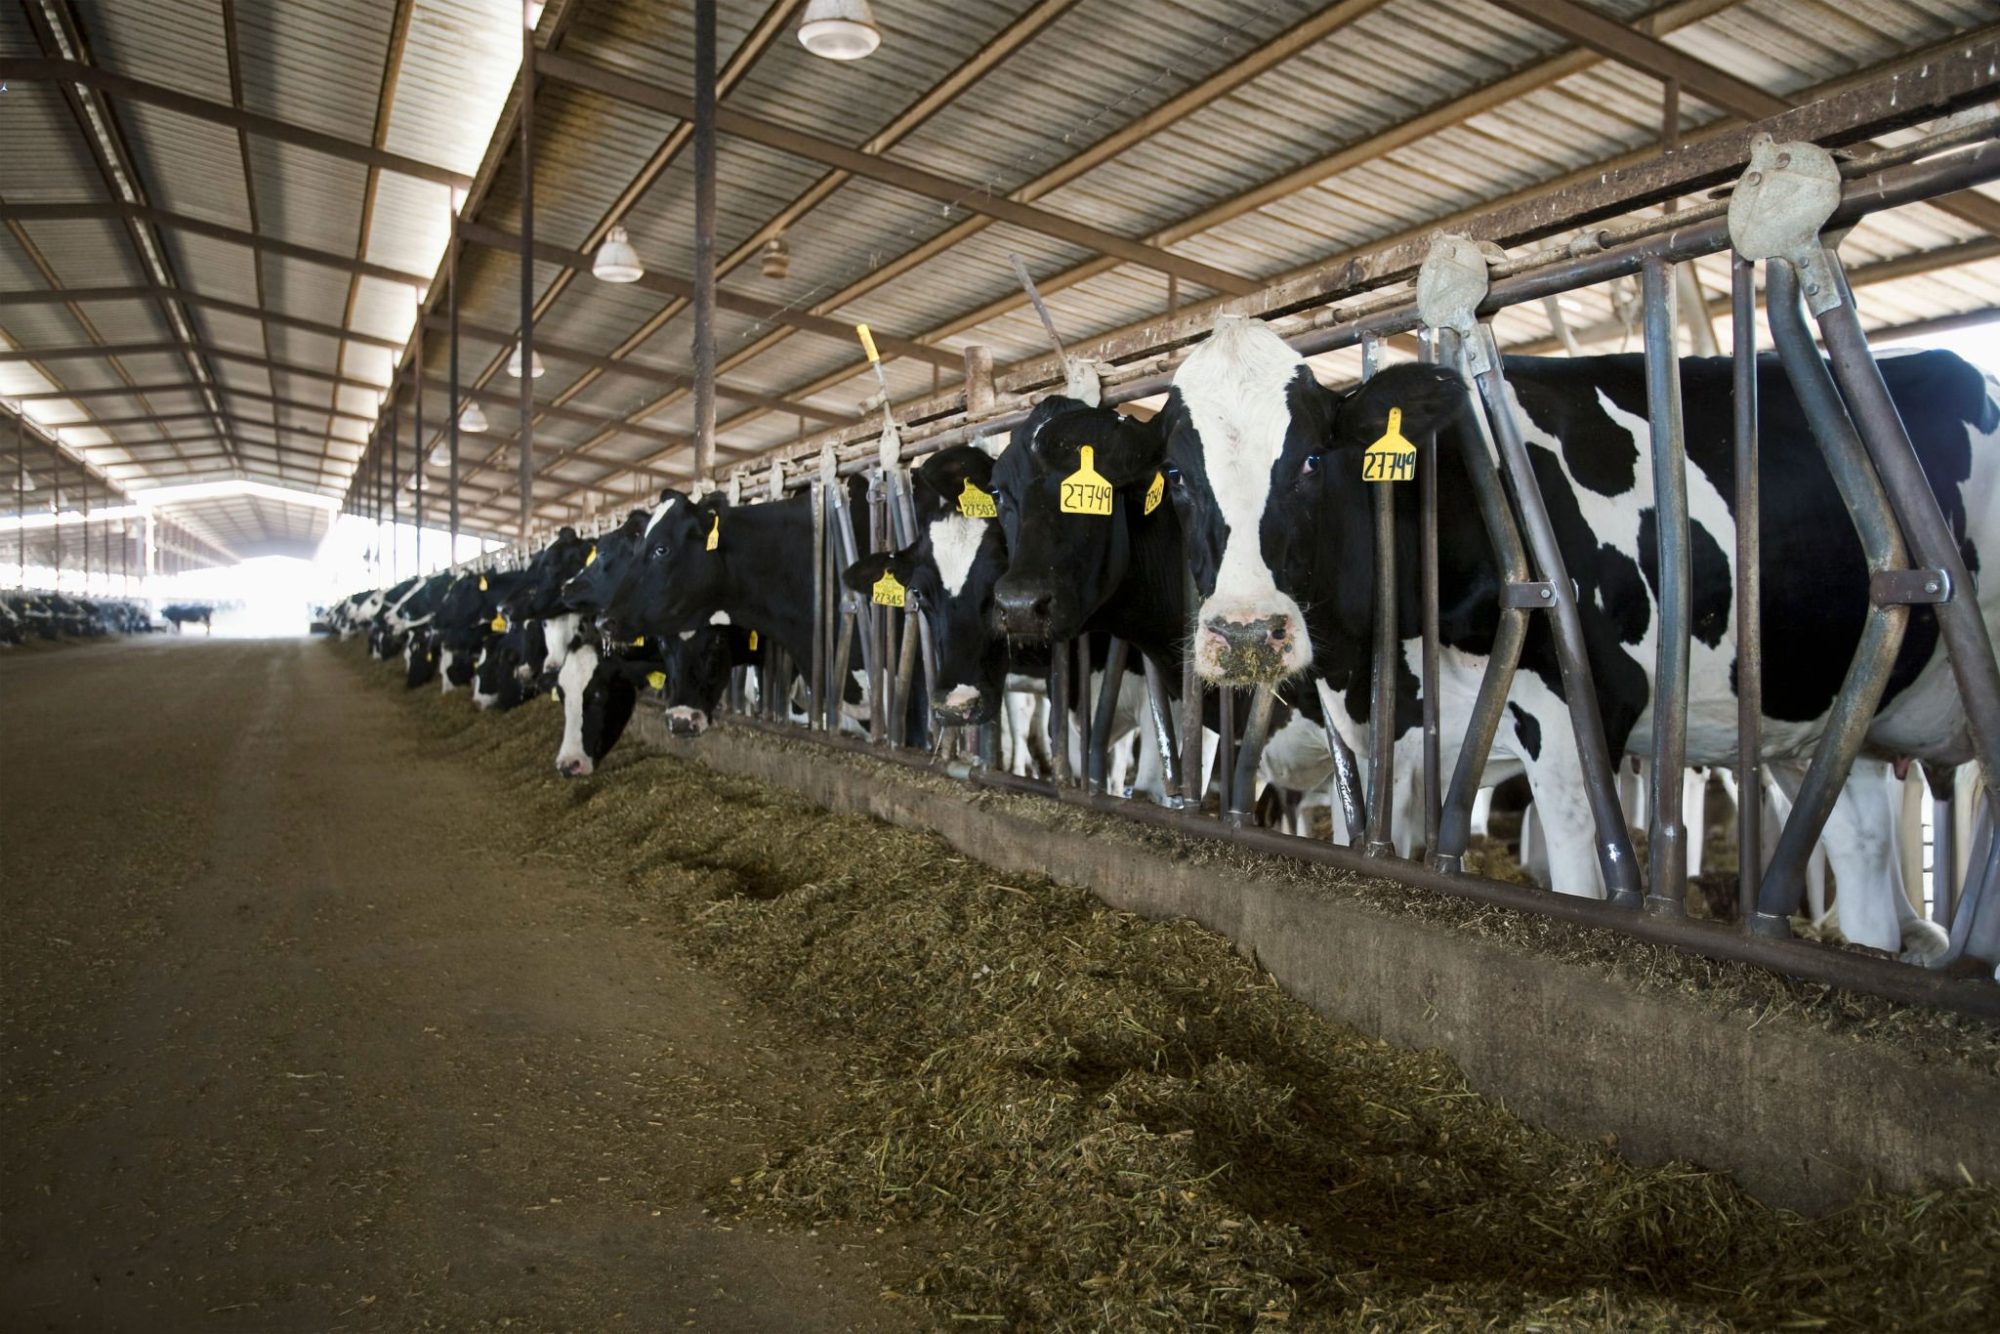
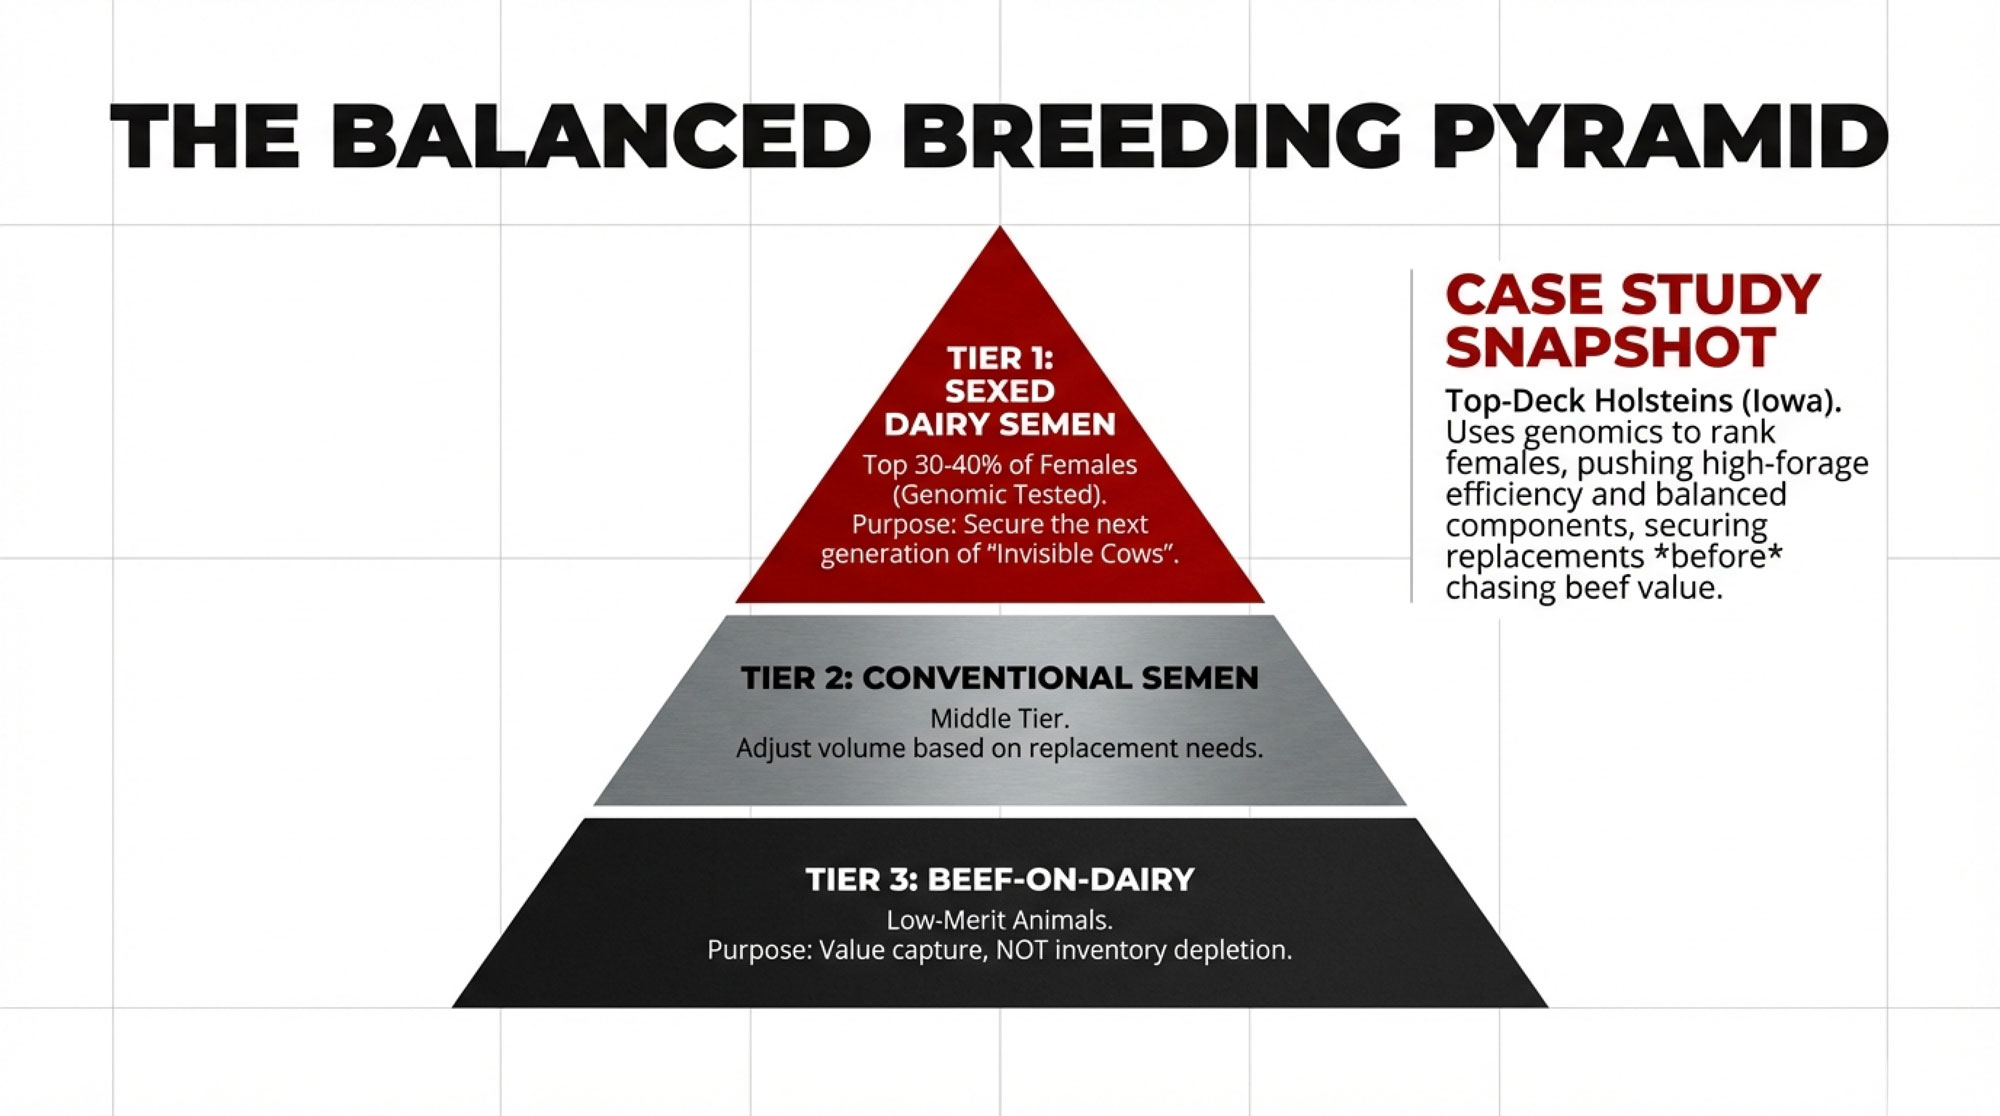
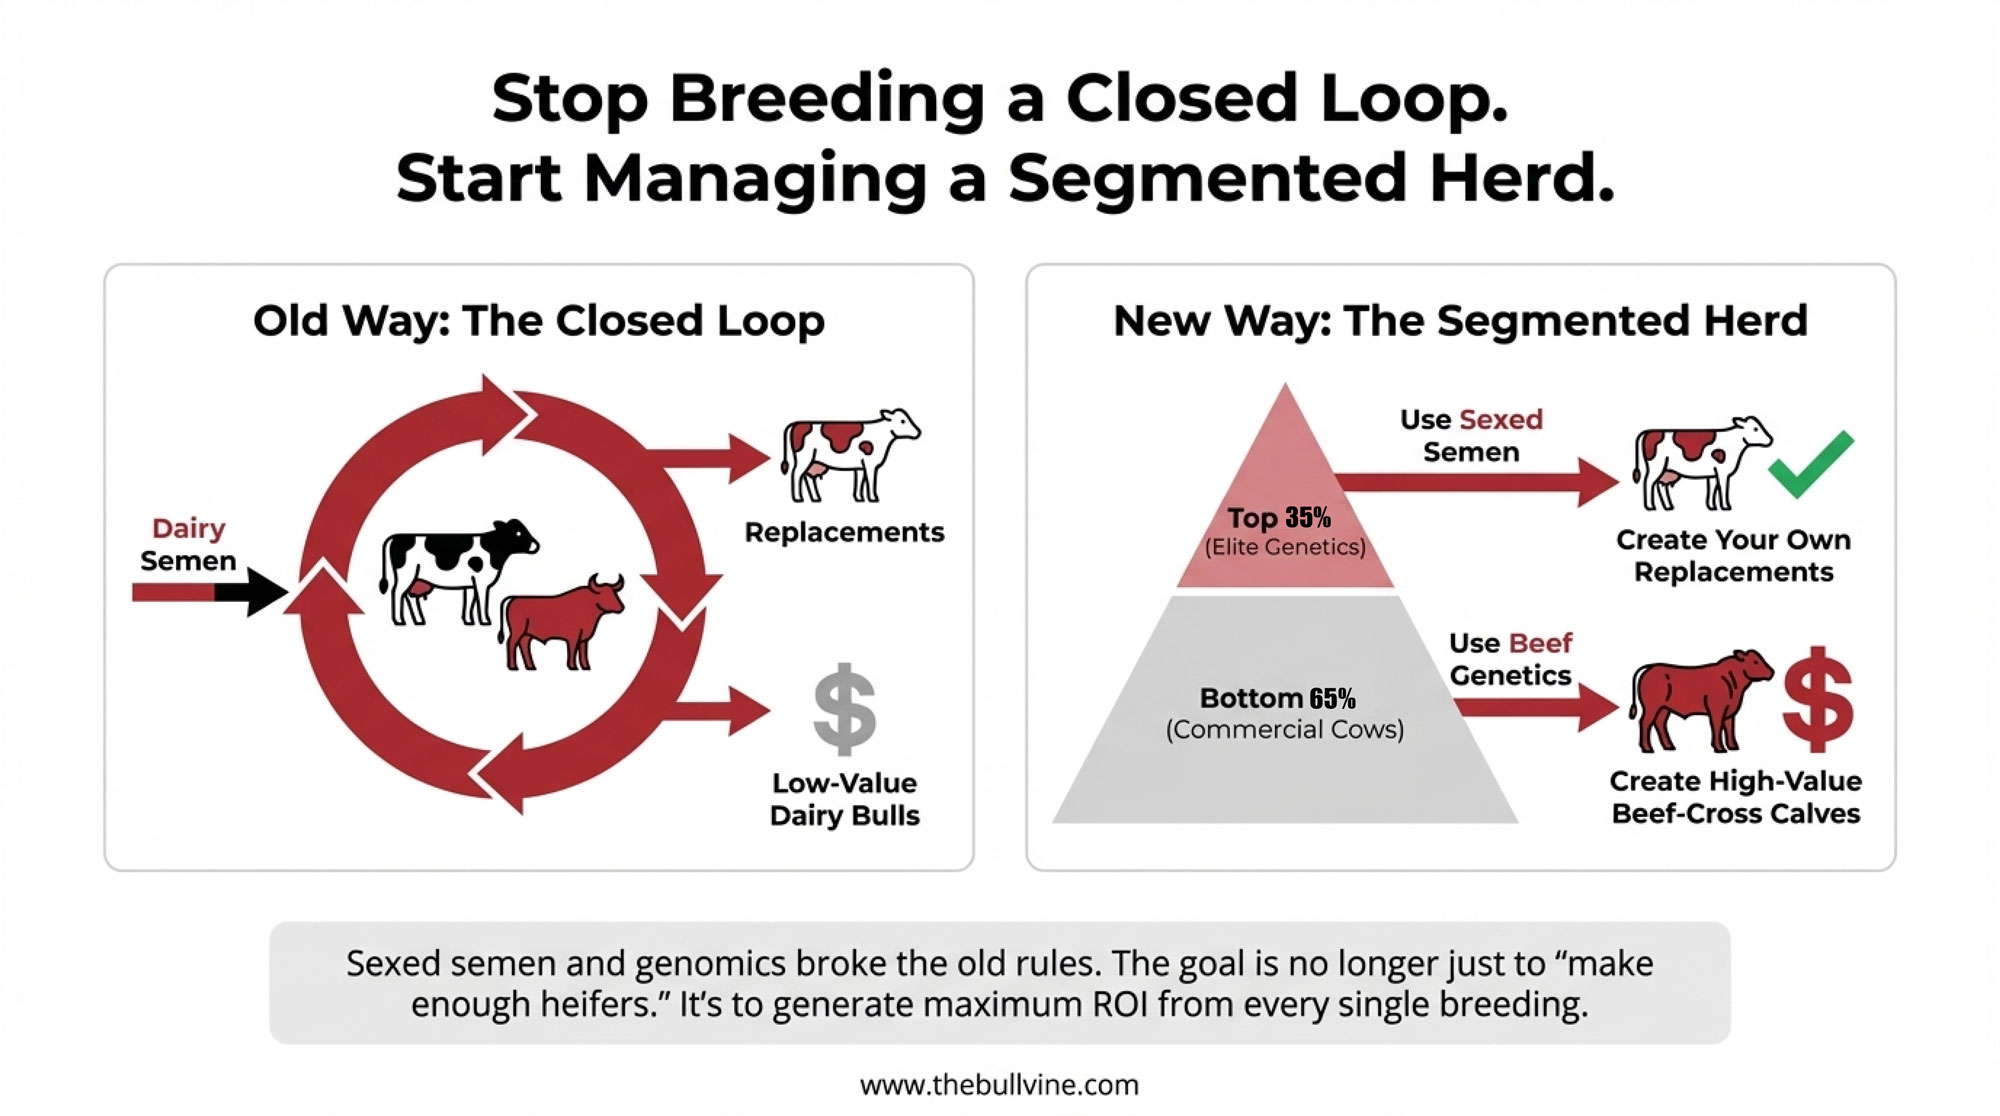
Randy Ebert knows the beef-on-dairy math as well as anyone. He and Renee run Ebert Enterprises near Algoma in Kewaunee County, Wisconsin — a sixth-generation operation with son Jordan and daughter Whitney now the seventh generation at the table. They milk 4,200 cows three times a day through an 80-stall rotary parlor and farm close to 9,000 acres. The family breeds the top 20% of the herd to sexed dairy semen and puts AI Angus and Simmental-Angus bulls on the rest, raising between 2,000 and 2,500 beef cattle from post-wean to finish, depending on the cycle.
“This is one of the few things that is helping us combat inflation costs of what we do, is what beef has done to us,” Ebert told Brownfield last July.
So a packer closure in Milwaukee gets your attention when you’ve got that many beef crosses moving through the system. Here’s the problem: the plant that’s closing wasn’t buying anyone’s calves.
The Facility That Didn’t Process Your Calves
Cargill filed a WARN Act notice with the Wisconsin Department of Workforce Development on February 10, confirming the permanent closure of its facility at 200 S. Emmber Lane in Milwaukee. About 221 positions will be eliminated. Production stops around April 17, full closure by May 31.
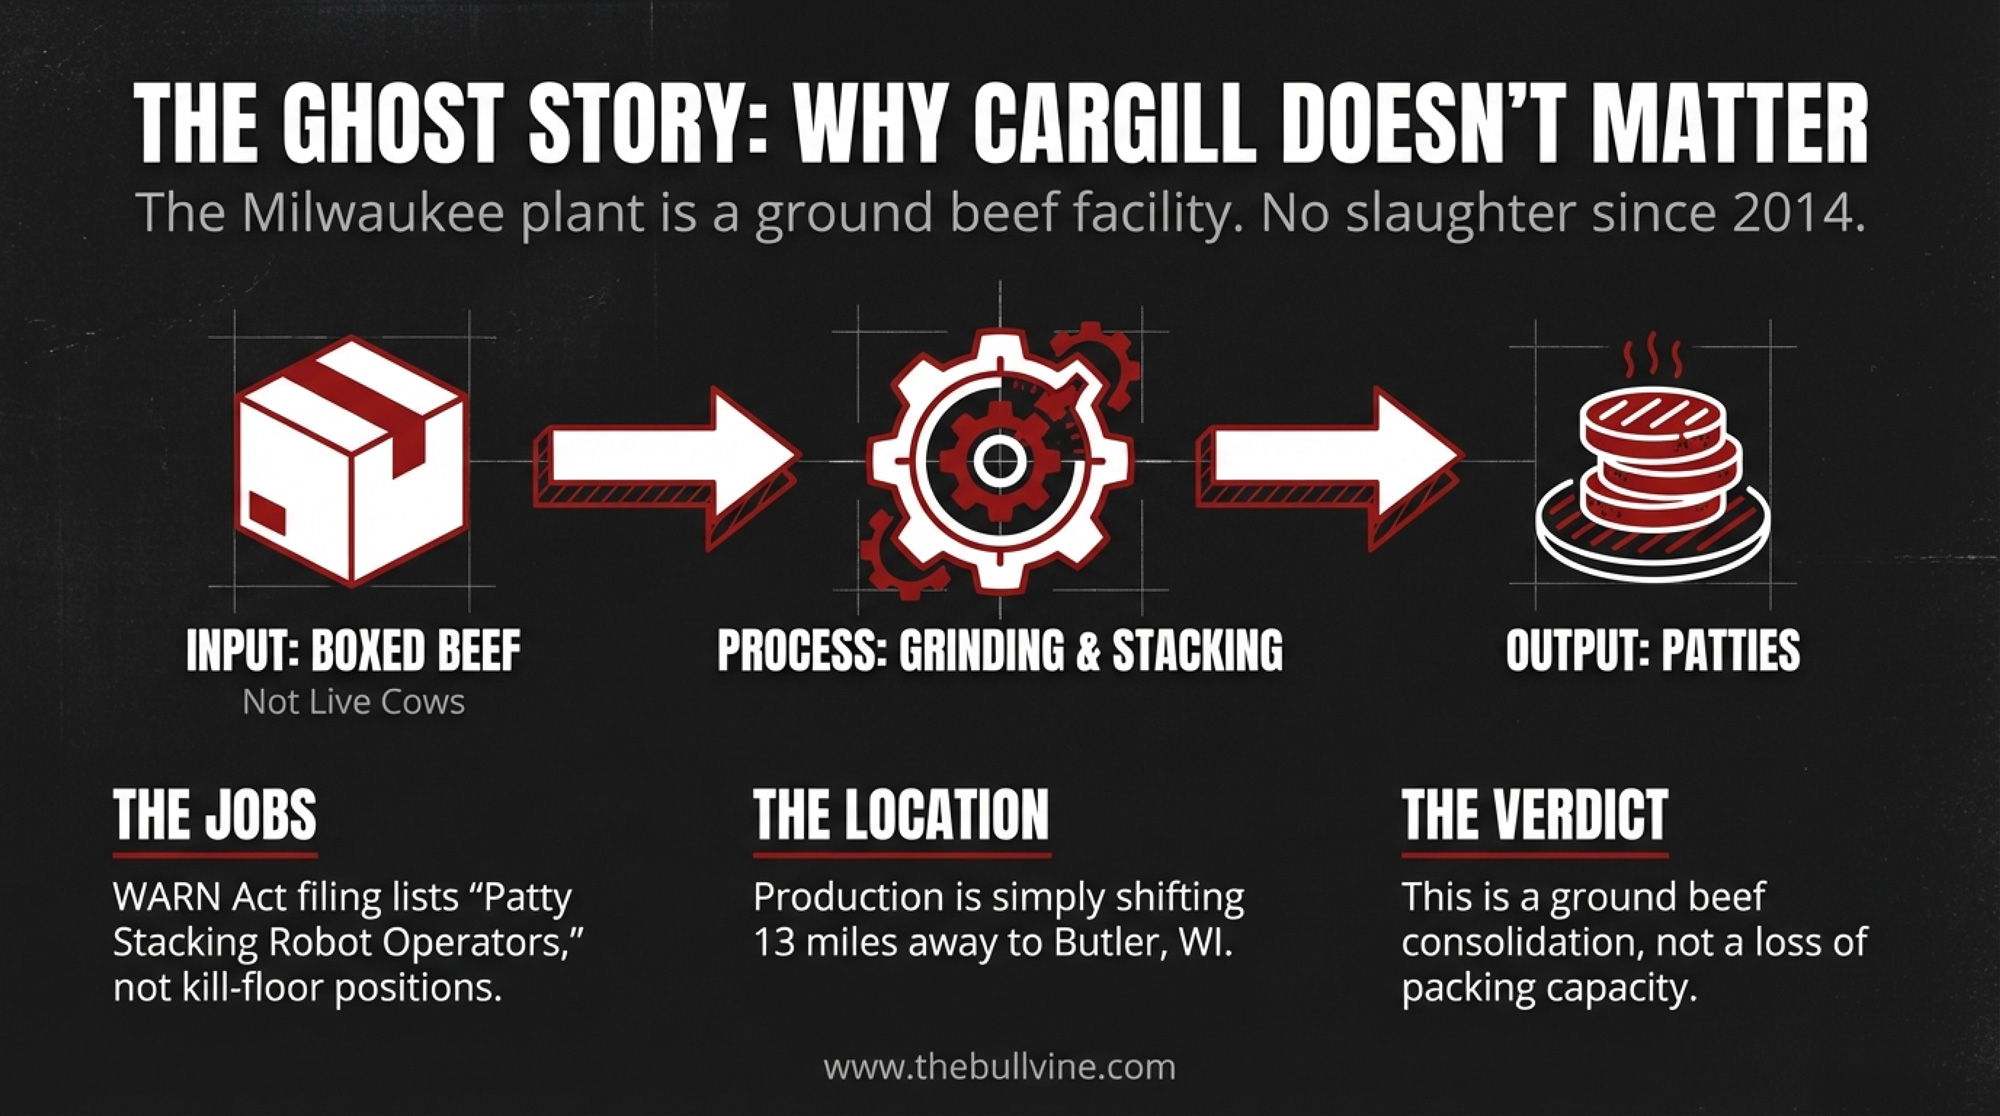
But look at what they actually make there. The WARN filing lists job titles like “CR Production Grind,” “Grinder Operator,” “Formax Operator,” and “Patty Stacking Robot Operator.” Not a single kill-floor position. This plant takes boxed beef as an input and turns it into ground beef and value-added meat products for grocery store private labels. It doesn’t slaughter cattle. It doesn’t accept live animals.
Cargill did run a cattle harvest operation at this site once — a real one, processing 1,300 to 1,400 head per day after purchasing it in 2001. But that slaughter plant closed on August 1, 2014, when Cargill cited a tight cattle supply. The ground beef operation was the only part that stayed open. And even that production isn’t leaving the area — it’s shifting to Cargill’s Butler, Wisconsin facility about 13 miles northwest, where roughly 500 employees already make frozen ground beef patties for restaurant chains.
This isn’t a loss of packing capacity. It’s a ground beef consolidation within the same metro area.
5,000 Head a Day Gone: The Closure That Actually Matters
The event that should have your attention happened two months earlier and 600 miles west.
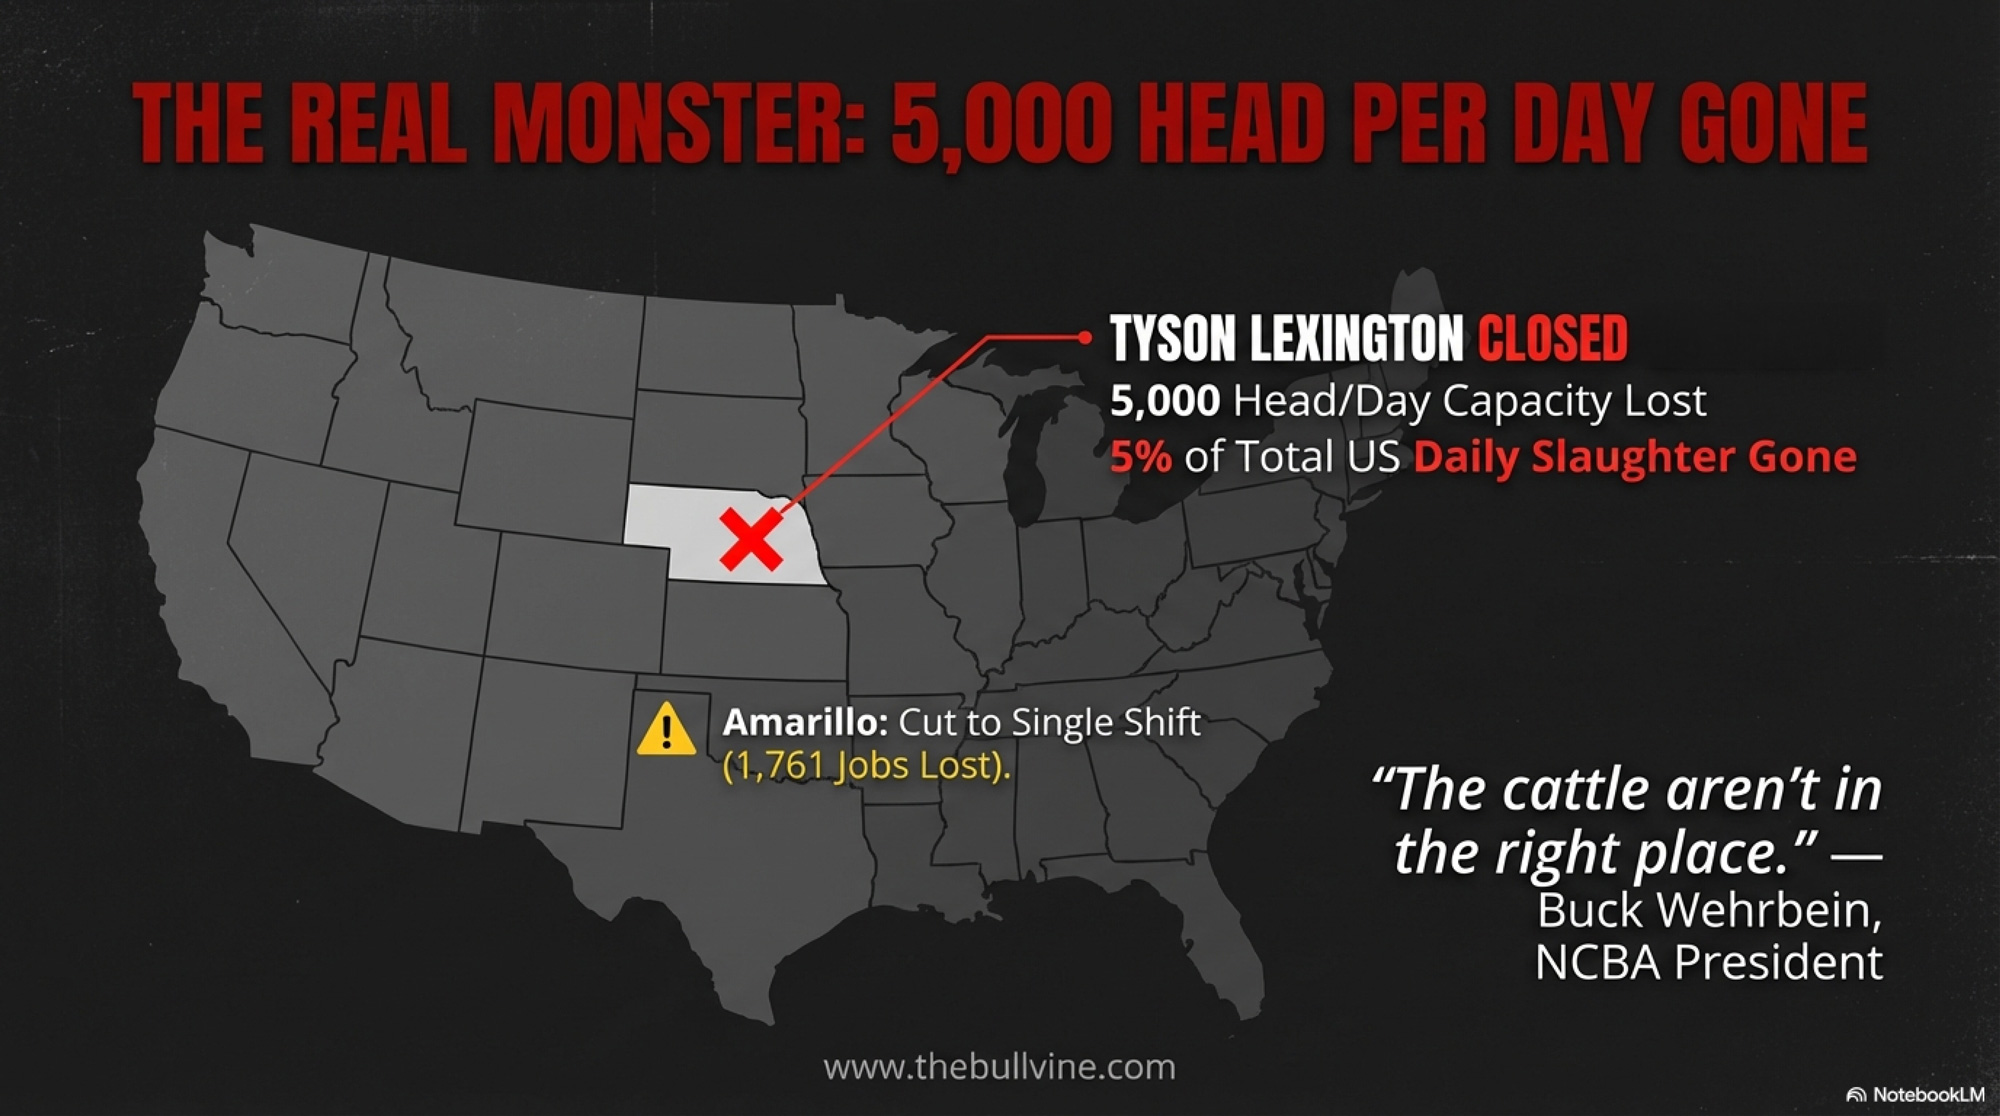
On January 20, Tyson Foods permanently shuttered its beef processing plant in Lexington, Nebraska. This was a full-scale cattle harvest operation — roughly 5,000 head per day, or about 5% of total daily U.S. beef slaughter capacity, according to Brownfield Ag News. More than 3,000 workers lost their jobs. Tyson simultaneously cut its Amarillo, Texas, plant to a single shift, eliminating another 1,761 positions according to a WARN notice filed with the Texas Workforce Commission.
Buck Wehrbein, president of the National Cattlemen’s Beef Association and a Nebraska cattle feeder himself, didn’t dance around it: “It’s not really a surprise that we lost those plants because the herd is down so far. We were all worried about this.”
And then the line that matters most if you’re breeding beef-on-dairy:
“The cattle aren’t in the right place.” — Buck Wehrbein, NCBA President
Fewer slaughter plants mean longer hauls for finished cattle, fewer packers bidding at the feedlot gate, and less competition working its way back to the price of your week-old beef-cross calf. That calf’s value is tethered to what a packer will pay for the finished animal 18 months from now. When fewer packers bid, the tether gets thinner.
3.2 Million Calves Need Somewhere to Go
To understand why infrastructure deserves this much attention, look at what dairy producers have built — and how fast.
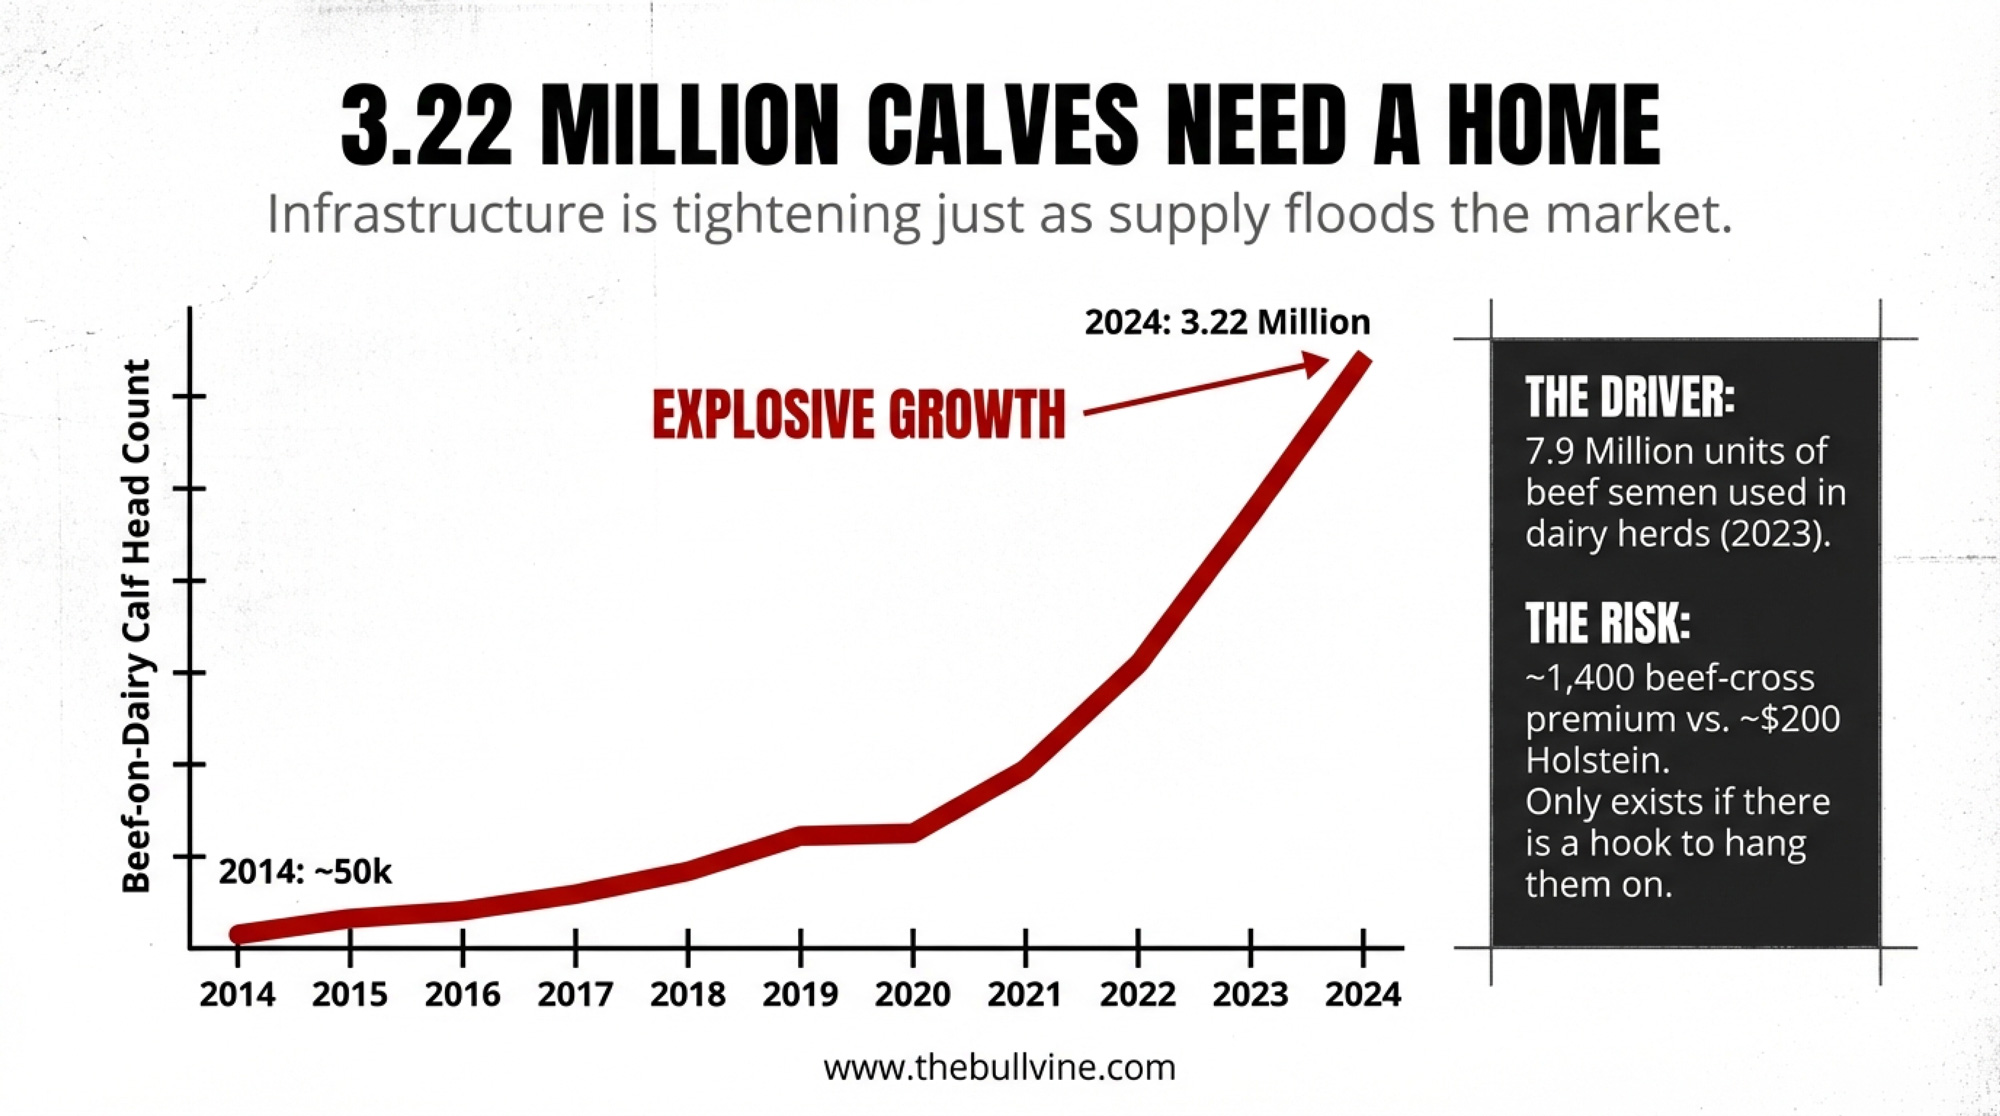
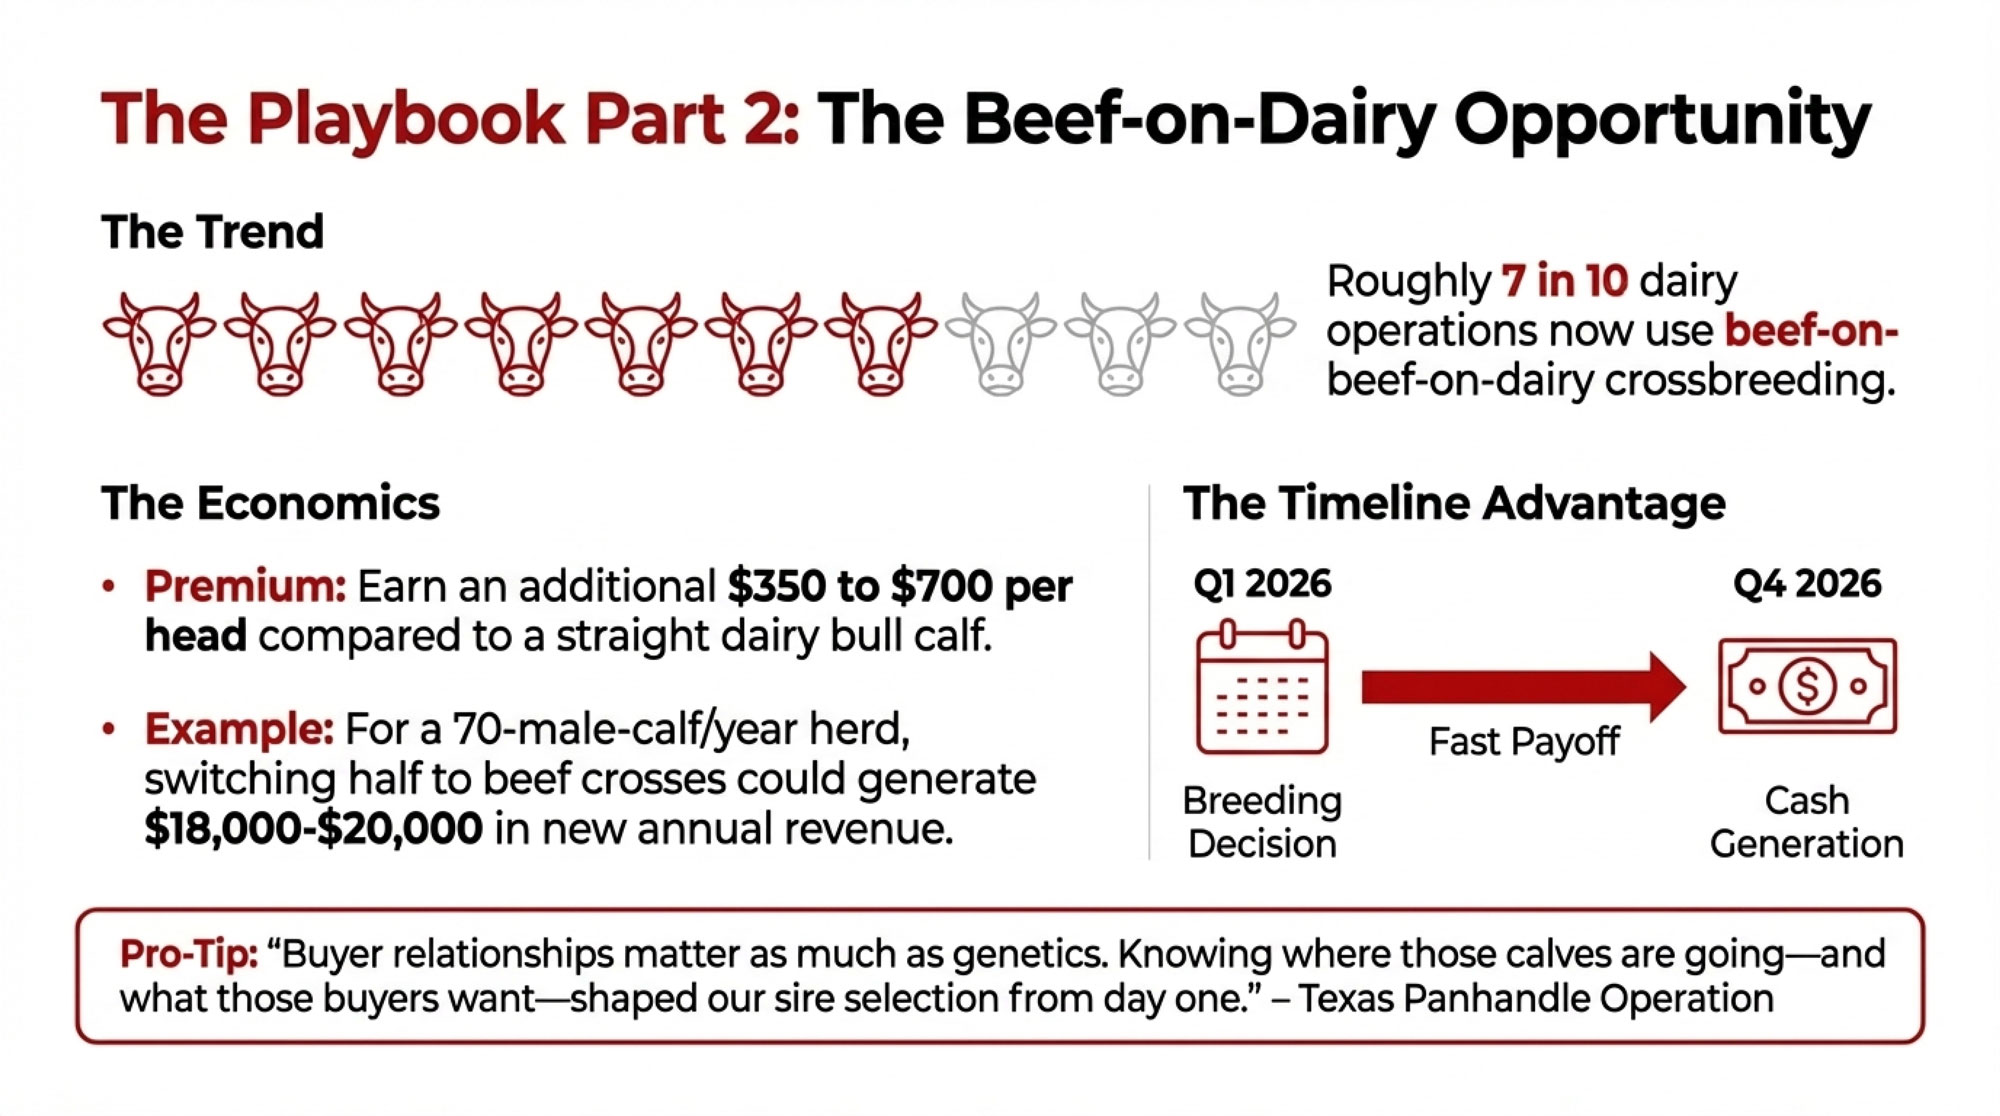
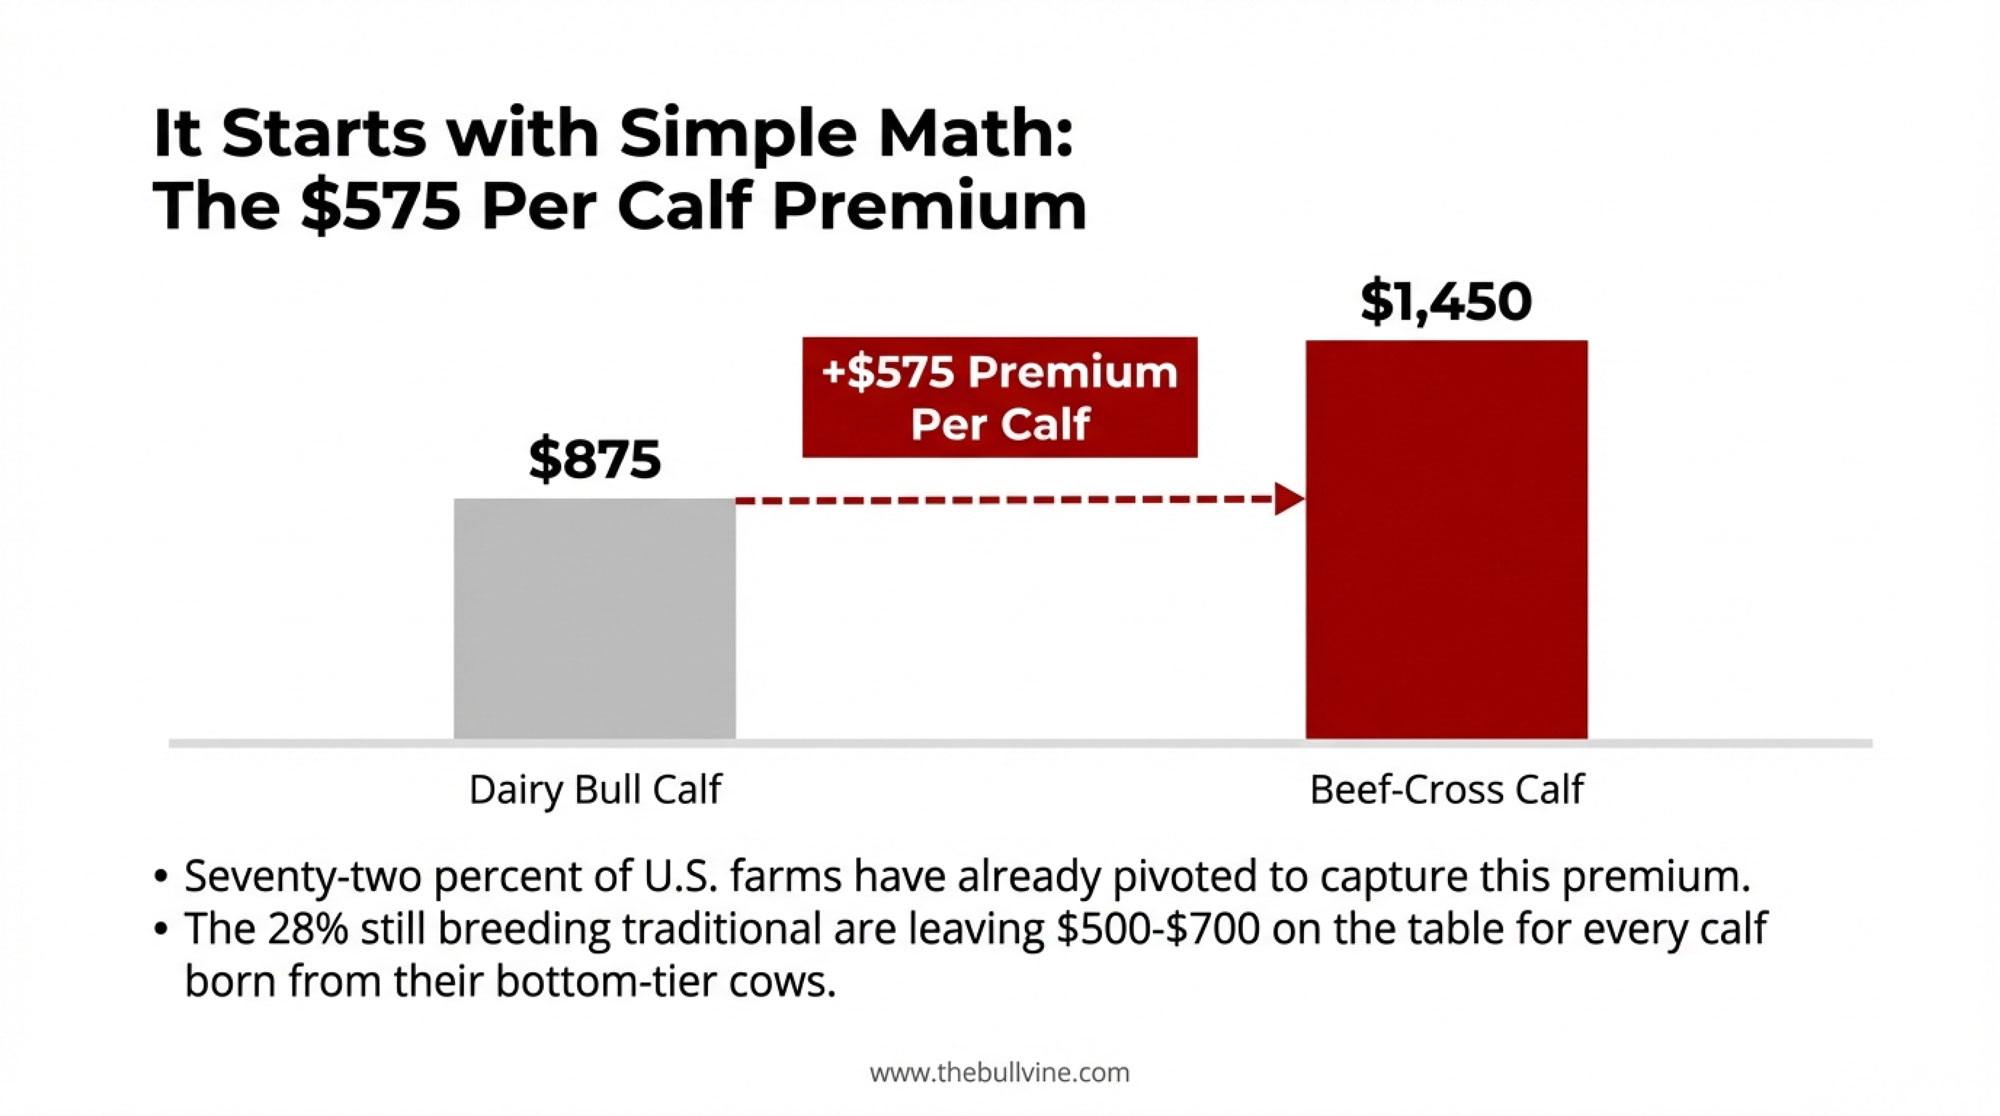
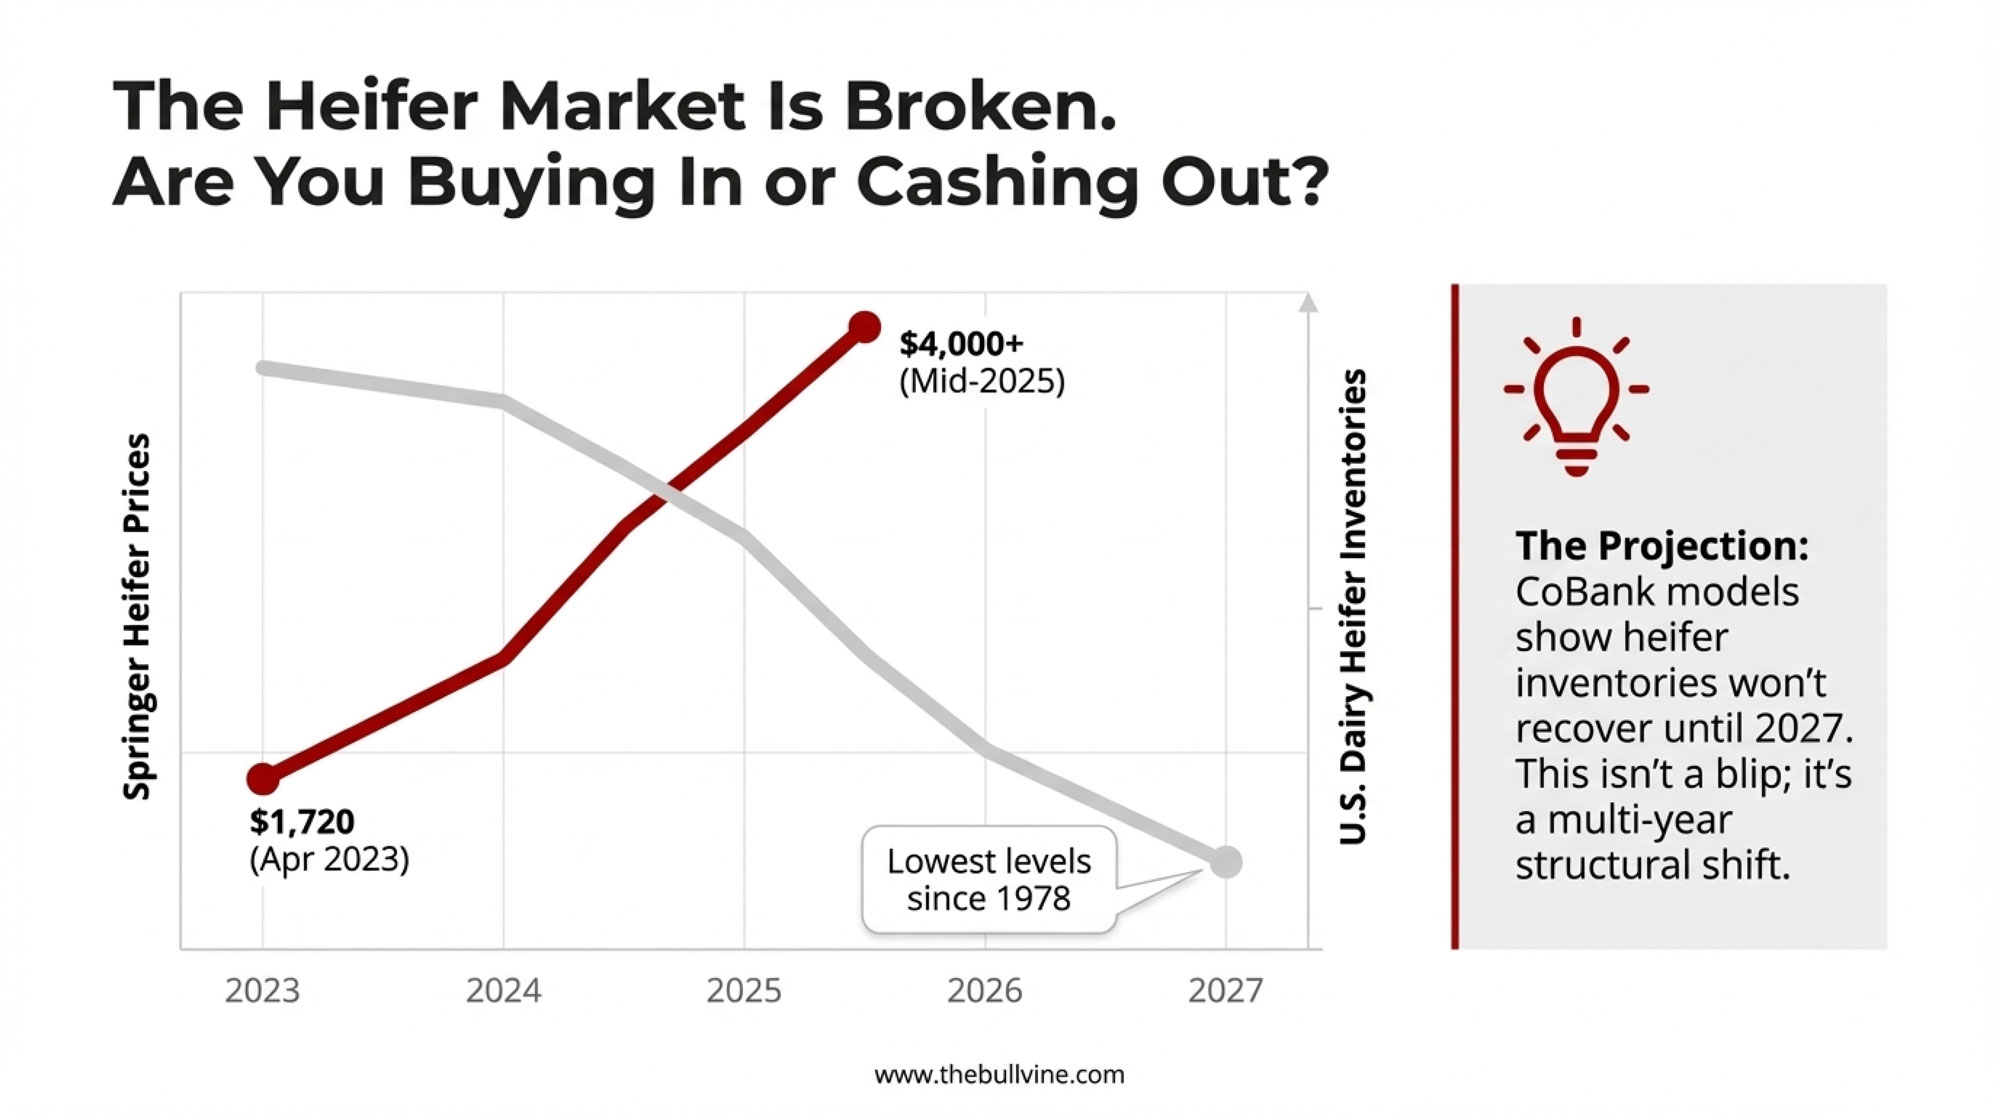
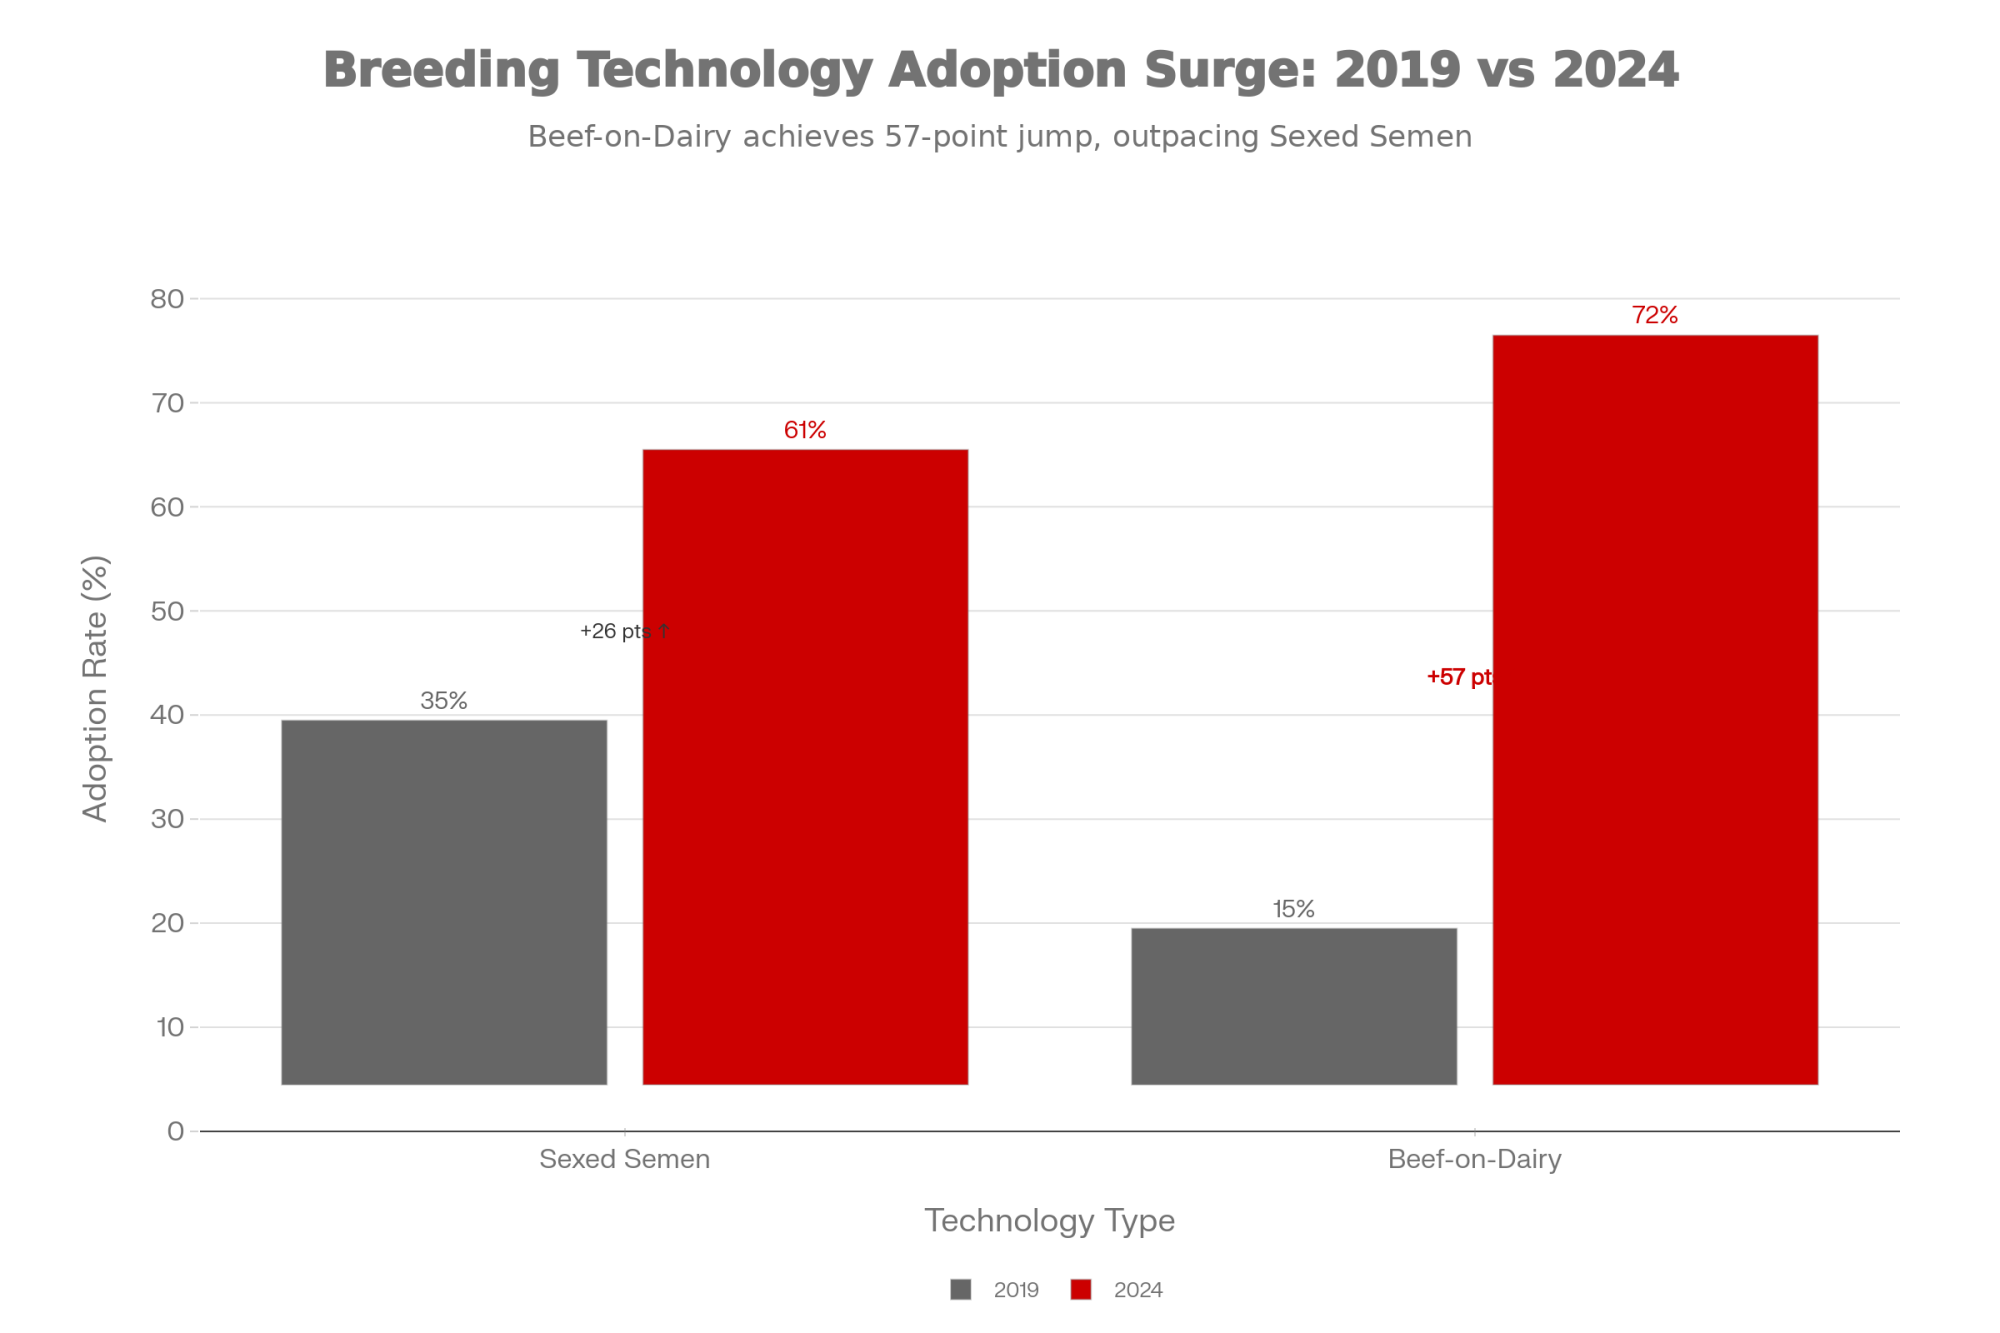
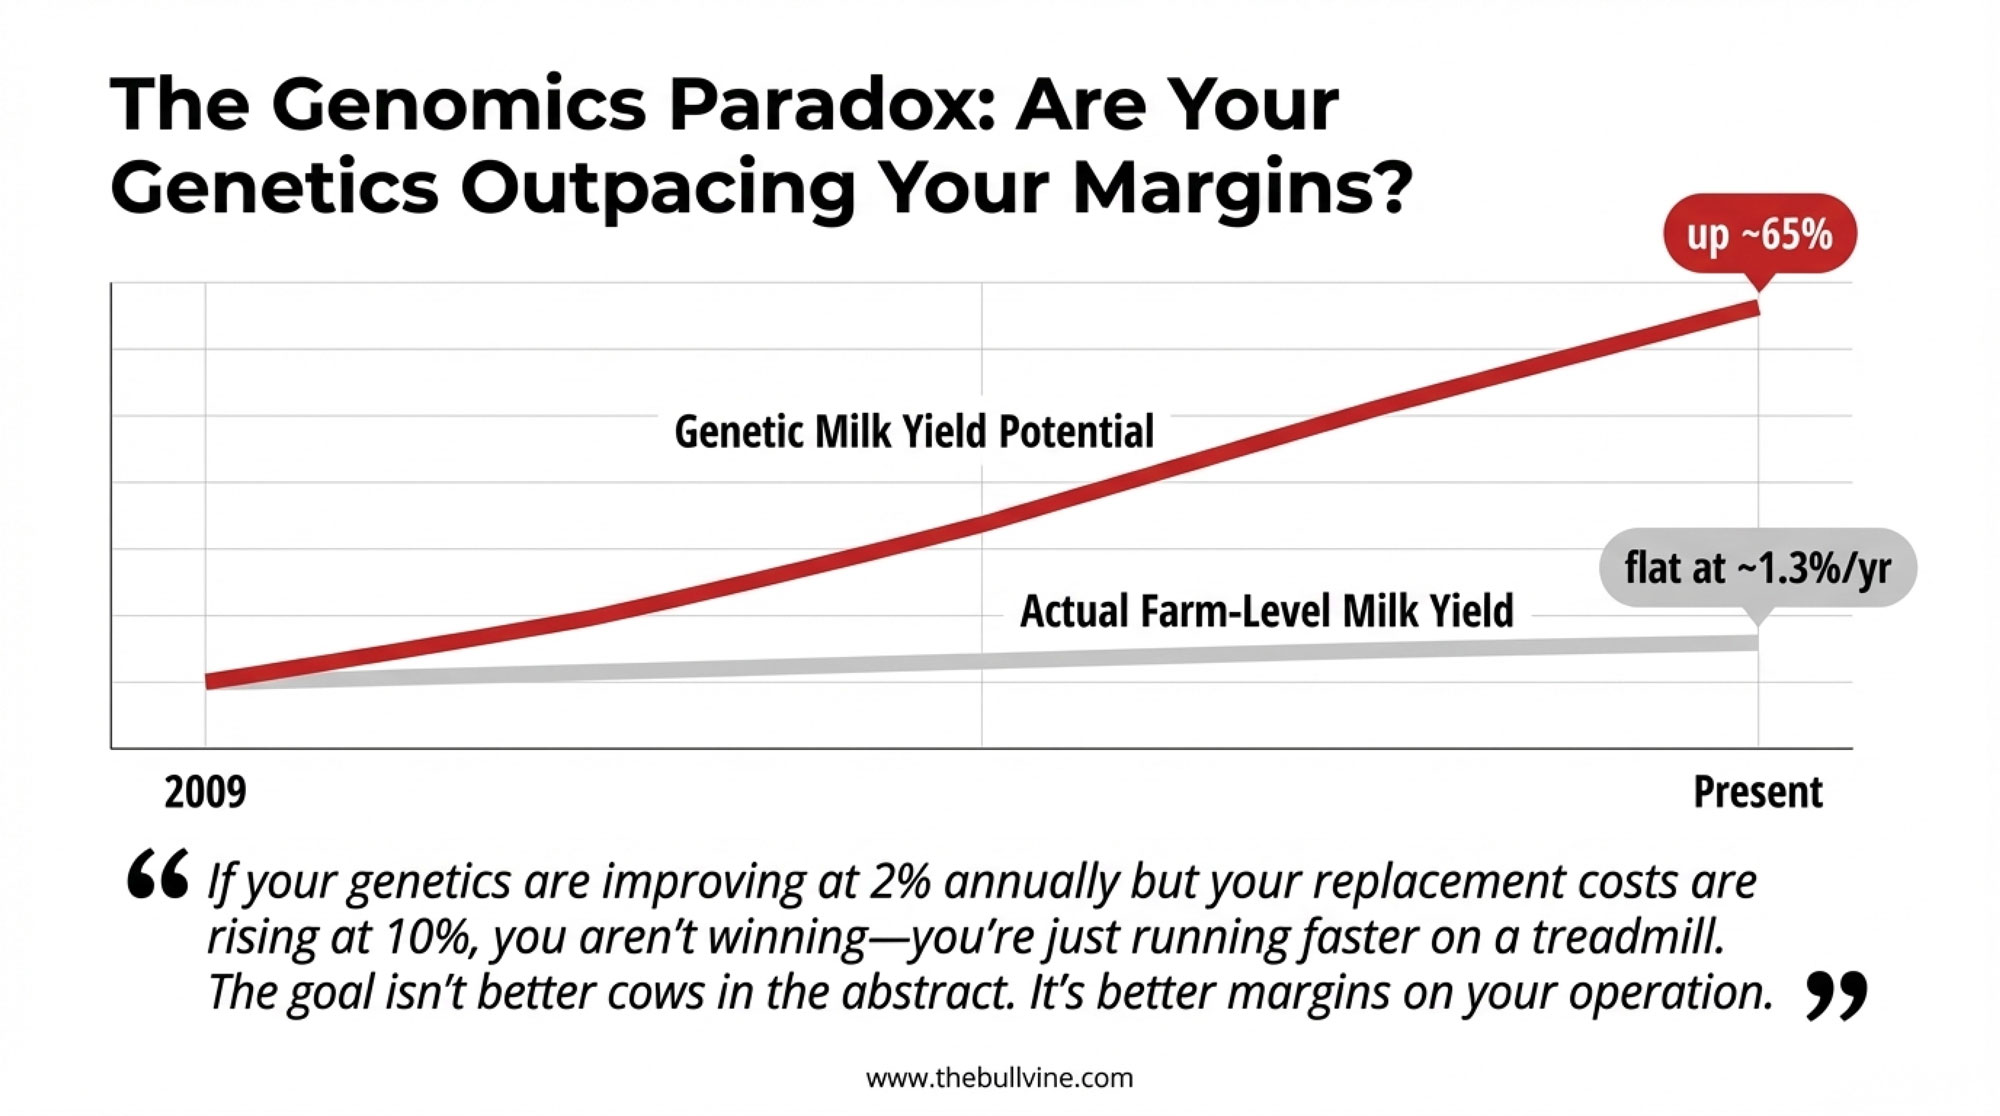
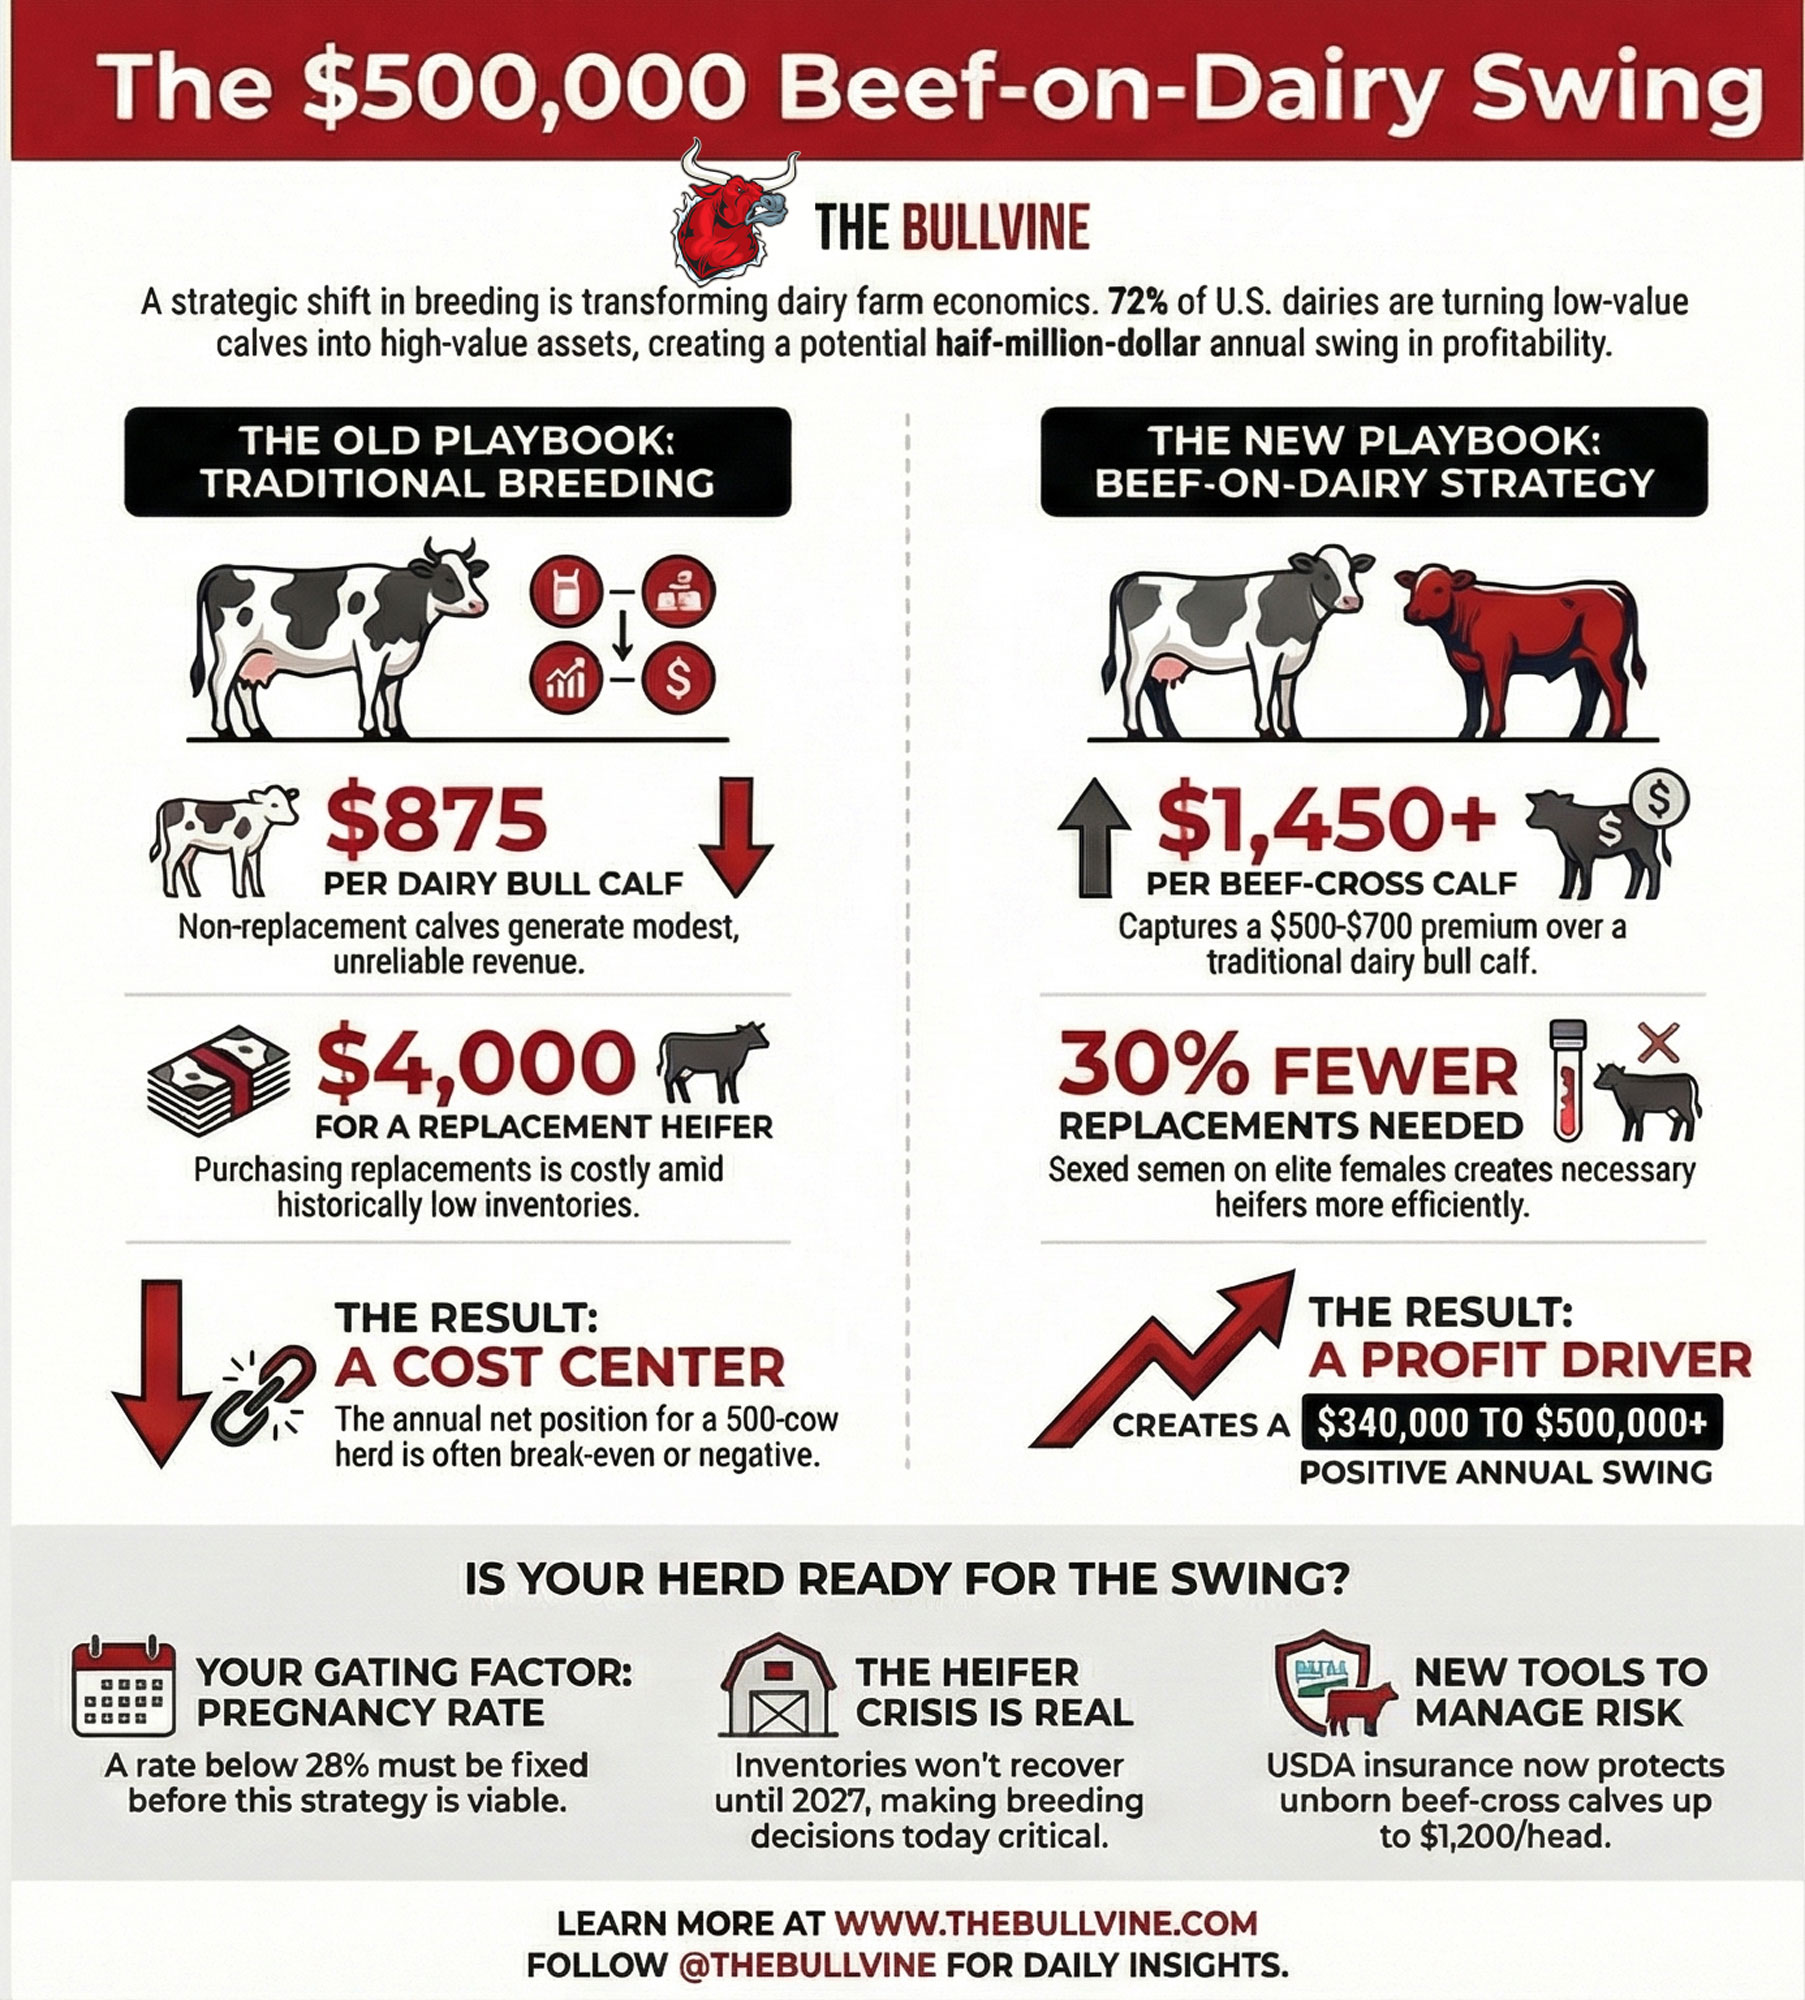
CattleFax estimates beef-on-dairy calf production jumped from roughly 50,000 head in 2014 to 3.22 million in 2024. The American Farm Bureau puts national adoption at 72% of U.S. dairy farms now using beef genetics on at least part of the herd. And NAAB data confirms that of the 9.4 million units of beef semen sold domestically in 2023, 7.9 million went into dairy herds — making beef-on-dairy the second-largest category of semen used in dairy cattle behind gender-selected dairy semen. That 7.9 million figure held steady through 2024, when total domestic beef semen sales rose to 9.7 million units.
The economics driving that growth are obvious. Beef-cross calves have commanded prices as high as $1,400 day-old, compared to roughly $200 for conventional Holstein bull calves. At that kind of spread, the premium still justifies the program for most operations. But only if you’re actively managing marketing channel risk—not assuming it away.
The Eberts illustrate how that commitment plays out at the farm scale. Jordan told Dairy Star the family has been breeding beef “for over 10 years,” and Brownfield reported their beef-on-dairy efforts began roughly fourteen years ago. In 2013, they decided to start raising their own beef cattle rather than selling calves. “We make more beef calves now than dairy calves,” Jordan said. With only the top 20% of the herd designated for dairy semen, the remaining roughly 80% goes to beef bulls. Farm Progress profiled them at 2,200 beef crosses in 2021; Dairy Star reported 2,500 post-wean-to-finish in January 2024, while a Visit Algoma listing from the same year put it at approximately 2,000. They market through Equity Livestock and have even added their own harvest facility and the Ebert Grown retail brand.
That kind of commitment — breeding protocols restructured, a butcher shop and restaurant built to capture more of the value chain — doesn’t reverse easily. Which makes the question of where those calves ultimately end up a lot more than academic.
Three Pressure Points Between Your Beef-on-Dairy Calf and Its Buyer
The infrastructure challenge hits differently depending on your scale. A 200-cow dairy selling 80 beef-cross calves a year through a single local auction is more exposed to any one of these shifts than a 4,000-cow operation with multiple marketing channels. Scale doesn’t eliminate risk, but it changes where the risk concentrates.
Here’s a quick-glance look at the three facility moves shaping the landscape right now:
| Facility | Location | Daily Capacity | Impact on Your Calves |
|---|---|---|---|
| Cargill Milwaukee | Milwaukee, WI | Ground beef only (ZERO live cattle since 2014) | NONE – Never bought your calves |
| Tyson Lexington | Lexington, NE | 5,000 head/day | CRITICAL – 5% of U.S. capacity GONE |
| Tyson Amarillo | Amarillo, TX | Cut to single shift | HIGH – 1,761 jobs eliminated |
| AFG America’s Heartland | Wright City, MO | 2,400 head/day (NEW) | POSITIVE – Built for dairy-beef crosses |
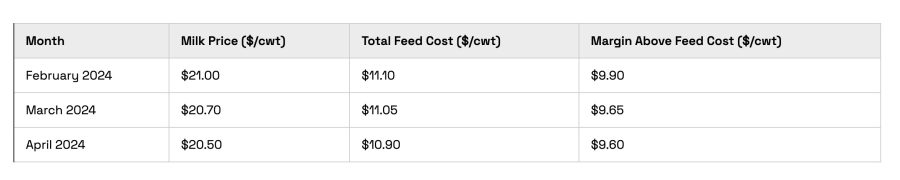
Packing capacity is tightening. USDA’s February 10, 2026 WASDE report projects 2026 beef production at 25.987 billion pounds — about 0.3% below 2025 levels. That continues a multi-year contraction as the beef cow herd sits at historic lows. The agency has revised its 2026 forecast upward in each of the last two monthly reports, largely due to heavier carcass weights. But the direction is still down year-over-year, and when packers bleed money, they close plants. Tyson’s restructuring is Exhibit A.
Geography is getting harder. A University of Wisconsin Extension survey of 40 dairy farms using beef-cross genetics found the average herd produced 454 beef-cross calves per year, with the largest operations topping 6,200 annually. These calves move through auction barns, calf ranches, and regional dealer networks that all depend on nearby infrastructure staying intact. When a plant closes in central Nebraska, feedlot operators in that region ship finished cattle farther, and that cost works its way backward.
Marketing costs are rising on their own. Wisconsin’s DATCP proposed increasing auction barn licensing fees from $420 to $7,430 — a 1,669% jump — and livestock trucker registration fees from $60 to $370. Jason Mugnaini of the Wisconsin Farm Bureau called it “a substantial burden on markets, dealers, and truckers that will unavoidably be passed down to farmers.” Public outcry forced DATCP to scale the proposal back to a more modest inflationary adjustment, but the revised fees still leave an annual funding gap exceeding $680,000.
Not All Contraction: New Capacity With Wisconsin Roots
One major development is working in the other direction.
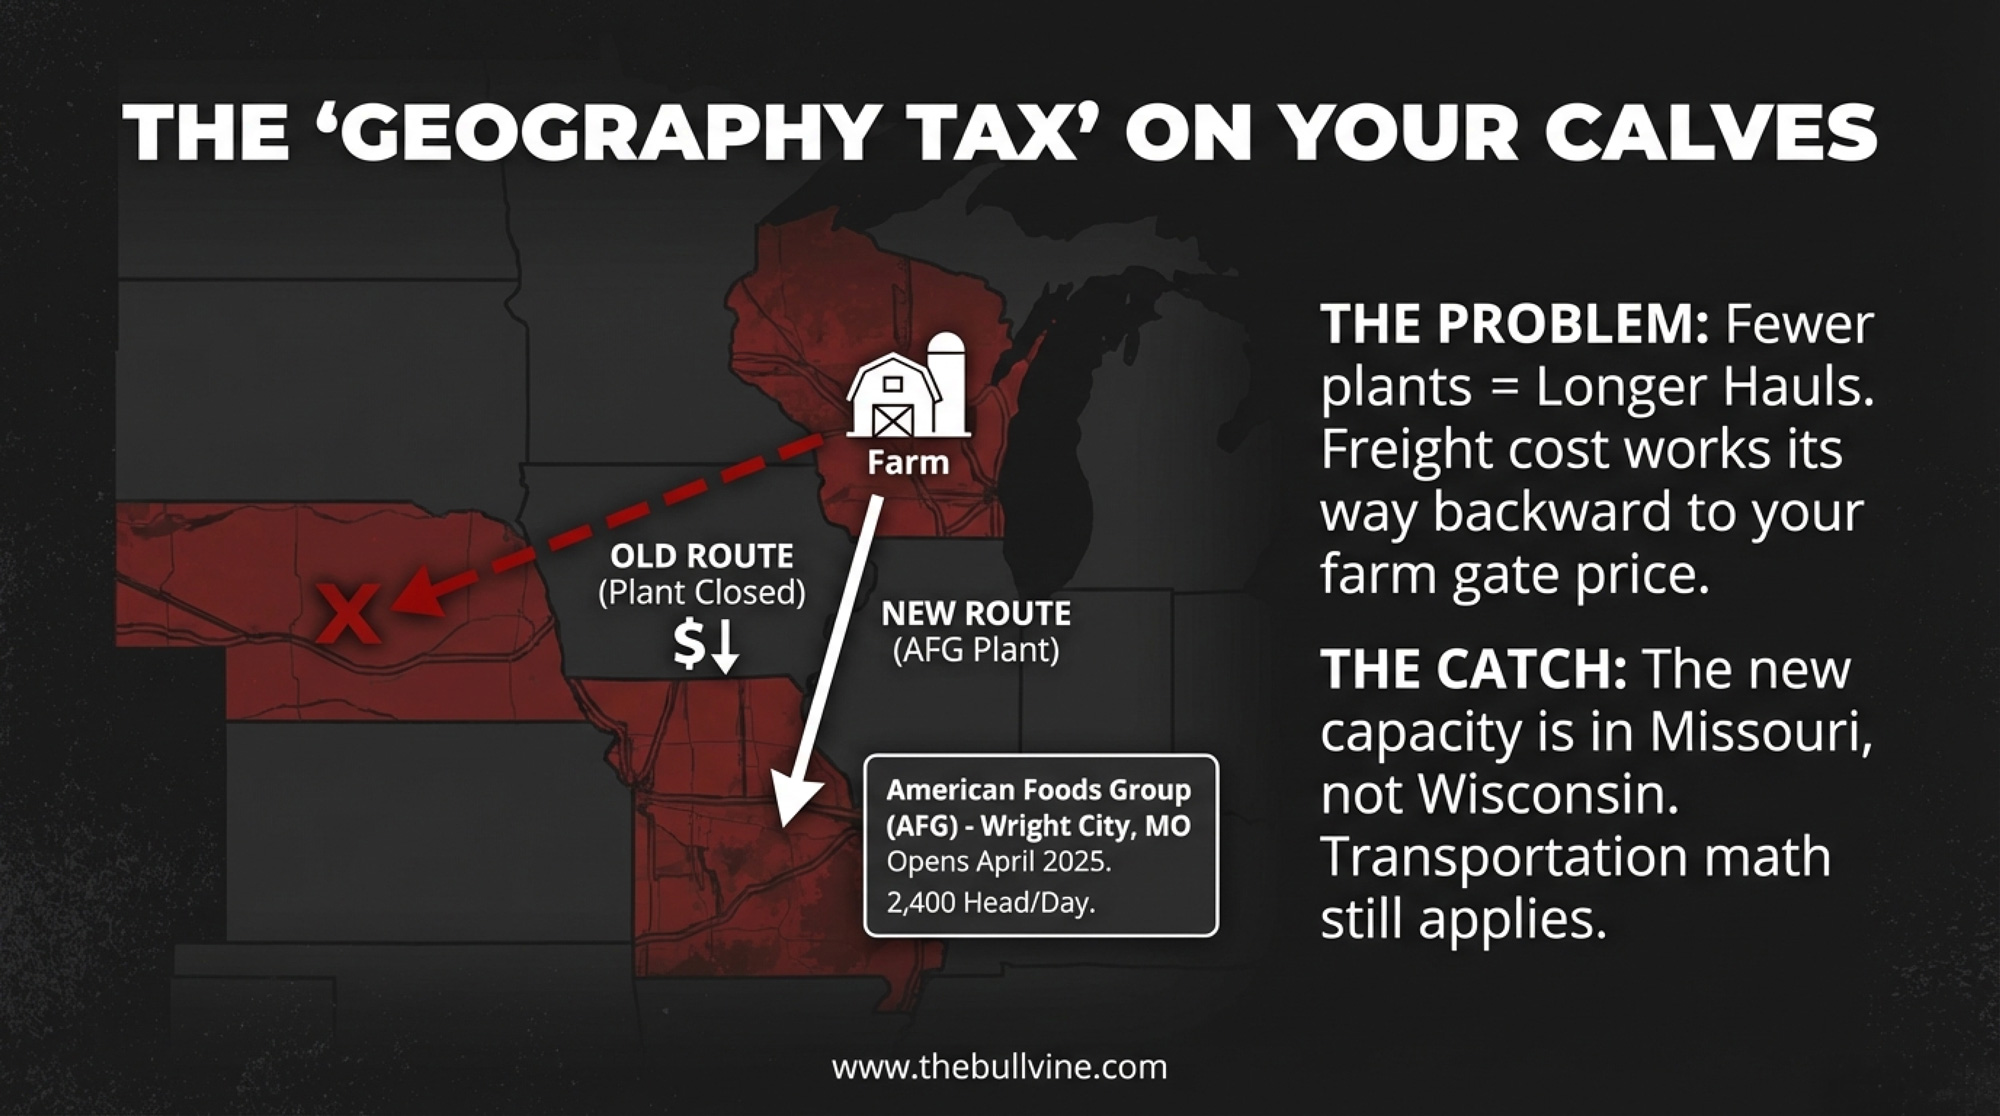
American Foods Group, headquartered in Green Bay, Wisconsin, opened its $800 million America’s Heartland Packing plant in Wright City, Missouri, in April 2025. The facility spans 775,000 square feet, has the capacity to harvest 2,400 head per day, and is projected to employ 1,300 workers at full capacity.
AFG president Steve Van Lannen told Brownfield before the plant opened that dairy-origin cattle were central to the business model: “A big part of our model is the dairy industry. There will be opportunities for cattlemen to feed those beef-dairy crosses.”
That’s meaningful — a Wisconsin-headquartered company building specifically to handle mixed cattle, including dairy-beef crosses. But the plant is in Missouri, not the Upper Midwest. For Wisconsin producers, the transportation math still matters.
The Bottom Line
The Cargill Milwaukee headline is a useful false alarm. It exposes a question most of us haven’t asked directly: Do you actually know the path your beef-cross calves travel from your farm to a packer’s kill floor?
But it should also sharpen a harder question about your sire stack. Because, as the Tyson closure proves, when capacity is tight, packers get picky. They aren’t just buying “beef-on-dairy” — they’re buying predictable rail performance.
- Map your supply chain this month. Ask your calf buyer which feedlot your calves reach, and which packer that feedlot uses. If they can’t or won’t tell you, that gap in visibility is itself a risk.
- Count your marketing channels. If more than two-thirds of your beef-cross calves go through a single auction barn or buyer, you’re overexposed. Smaller herds may find diversifying harder — which is exactly why it matters more, not less.
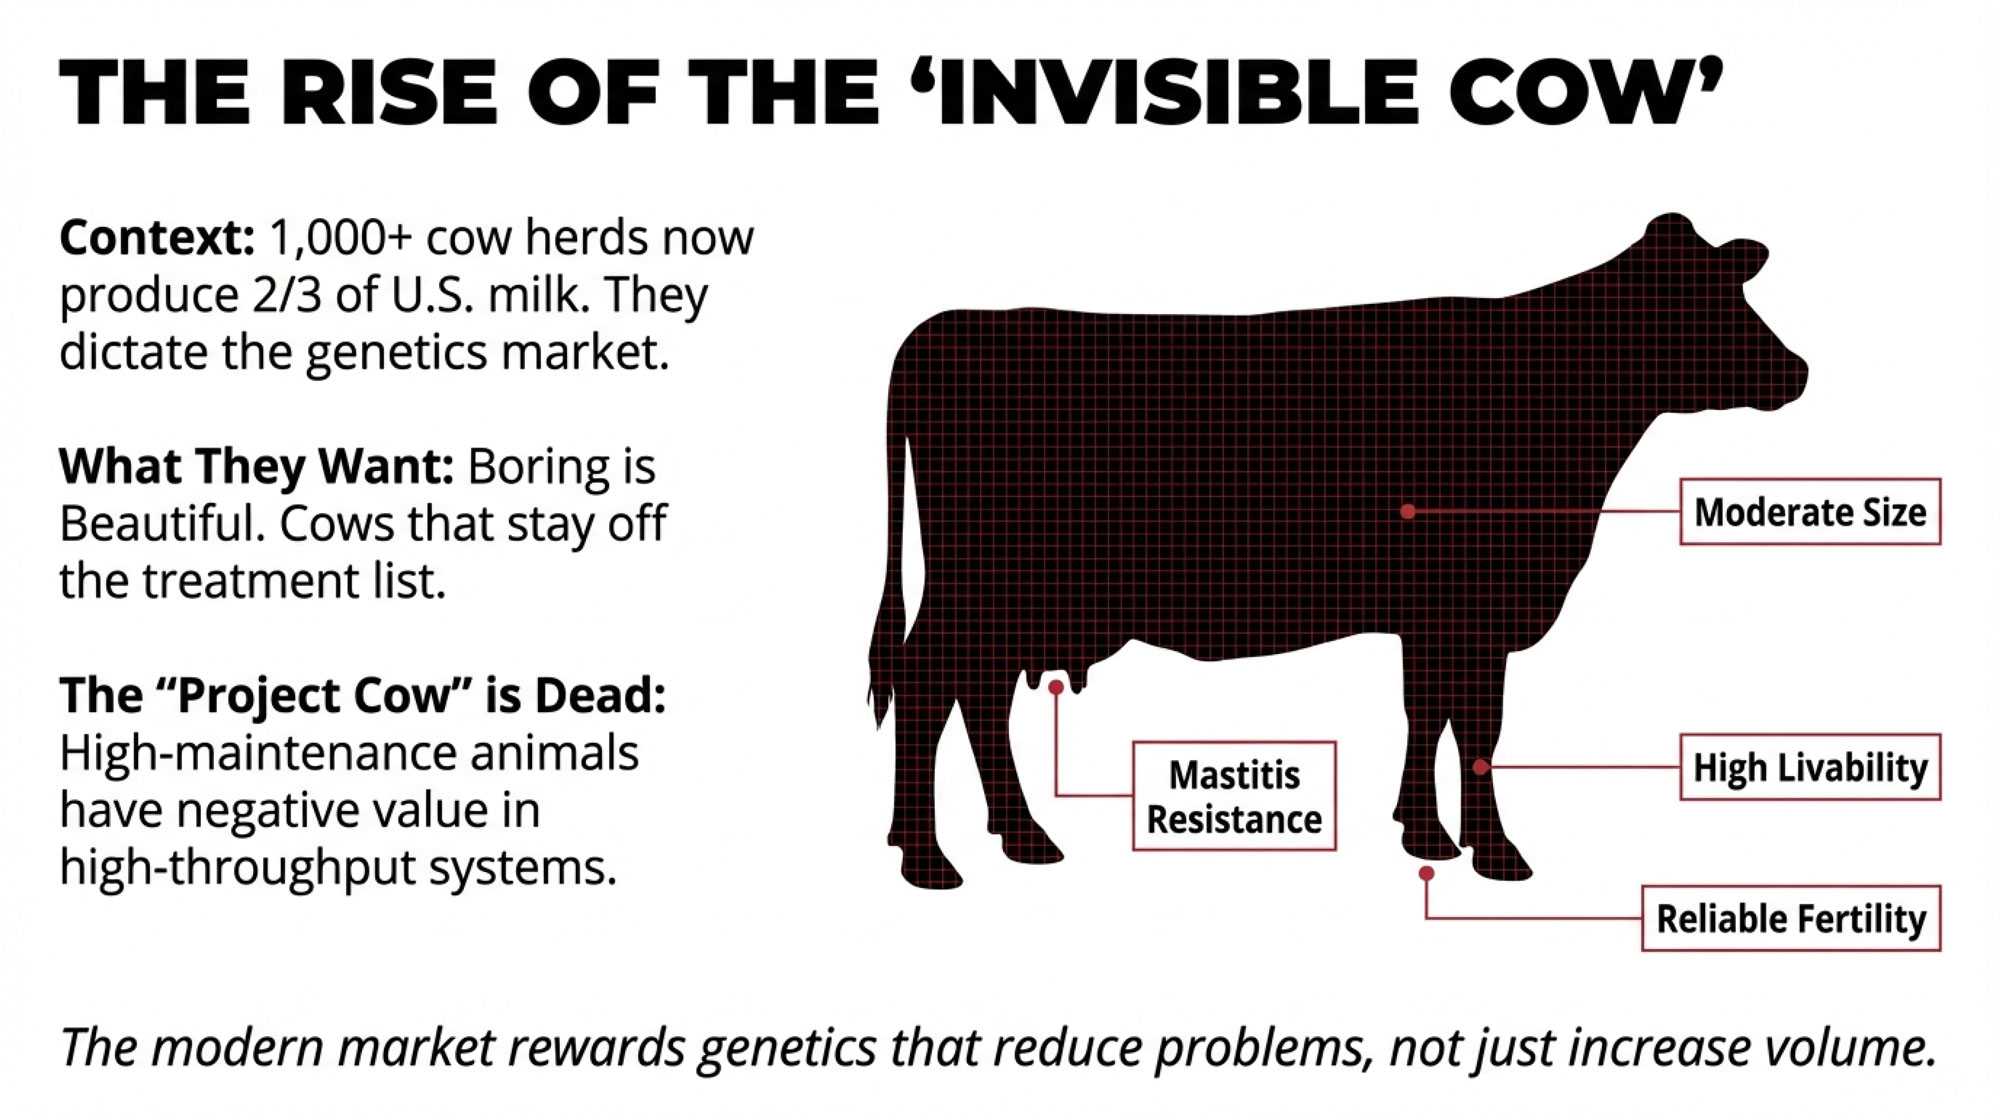
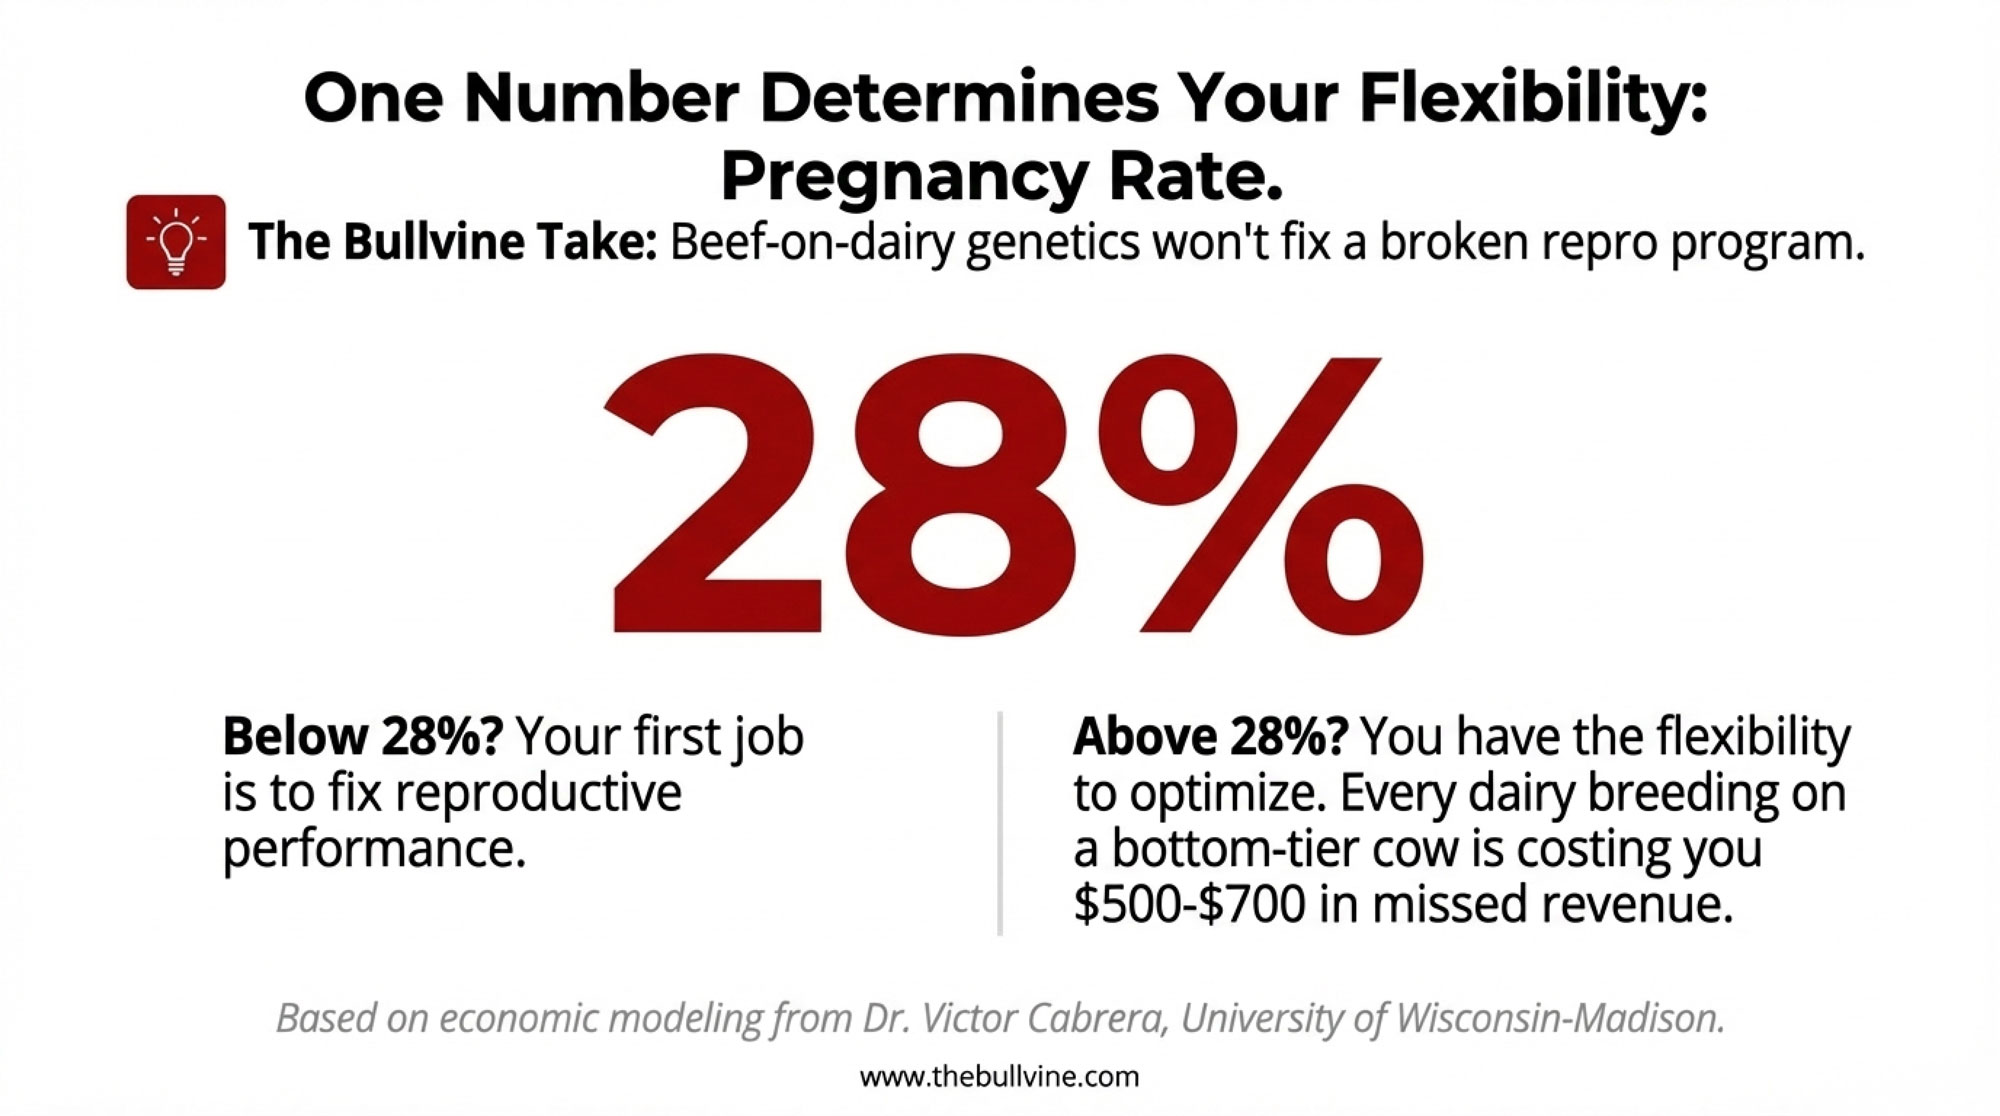
- Move past the three C’s. The UW Extension survey found most Wisconsin producers still pick beef sires primarily for conception rate, calving ease, and semen cost. Those matter. But when fewer plants are competing for your calves’ finished product, carcass uniformity becomes the trait that separates you from the skip list.Feedlots forecast finish dates and schedule packer appointments for entire pens — inconsistent growth rates within a pen mean some animals hit the target and others miss, creating discounts for the whole group. Andrew Sandeen of Penn State Extension, relaying feedback from JBS beef plant buyers, described the challenge head-on: “Everything from the quality to the shape and size — it’s all over the board.” JBS had built strategies around the consistency of straight Holstein beef. As beef-on-dairy volume grows, that variability is becoming a real friction point for packers.
- Select for what the packer actually measures. Ribeye area and shape, marbling, yield grade, and moderate frame — those are the traits that earn premiums at the rail. A 2024 Penn State study led by Basiel et al. evaluated 262 beef × Holstein steers across seven sire breeds over three years and found that, on average, all sire breed groups graded USDA Choice with yield grades of two or three. But within that average, sire selection drove meaningful variation: Angus-sired steers gained 1.76 kg/day versus just 1.39 kg/day for Wagyu-sired steers (P < 0.01), and marbling scores ranged from 4.14 (Limousin-sired) to 5.03 (Red Angus-sired). The Eberts use Angus and Simmental-Angus crosses through AI — breeds that showed strong feedlot ADG in that same research. That’s not a coincidence. It’s a marketing strategy disguised as a breeding decision.
- Don’t confuse processing with packing. Cargill Milwaukee makes ground beef for grocery stores. It doesn’t buy cattle. Before you react to any plant closure headline, check whether the facility handles live animals or boxed beef. The difference determines whether the story applies to your farm.
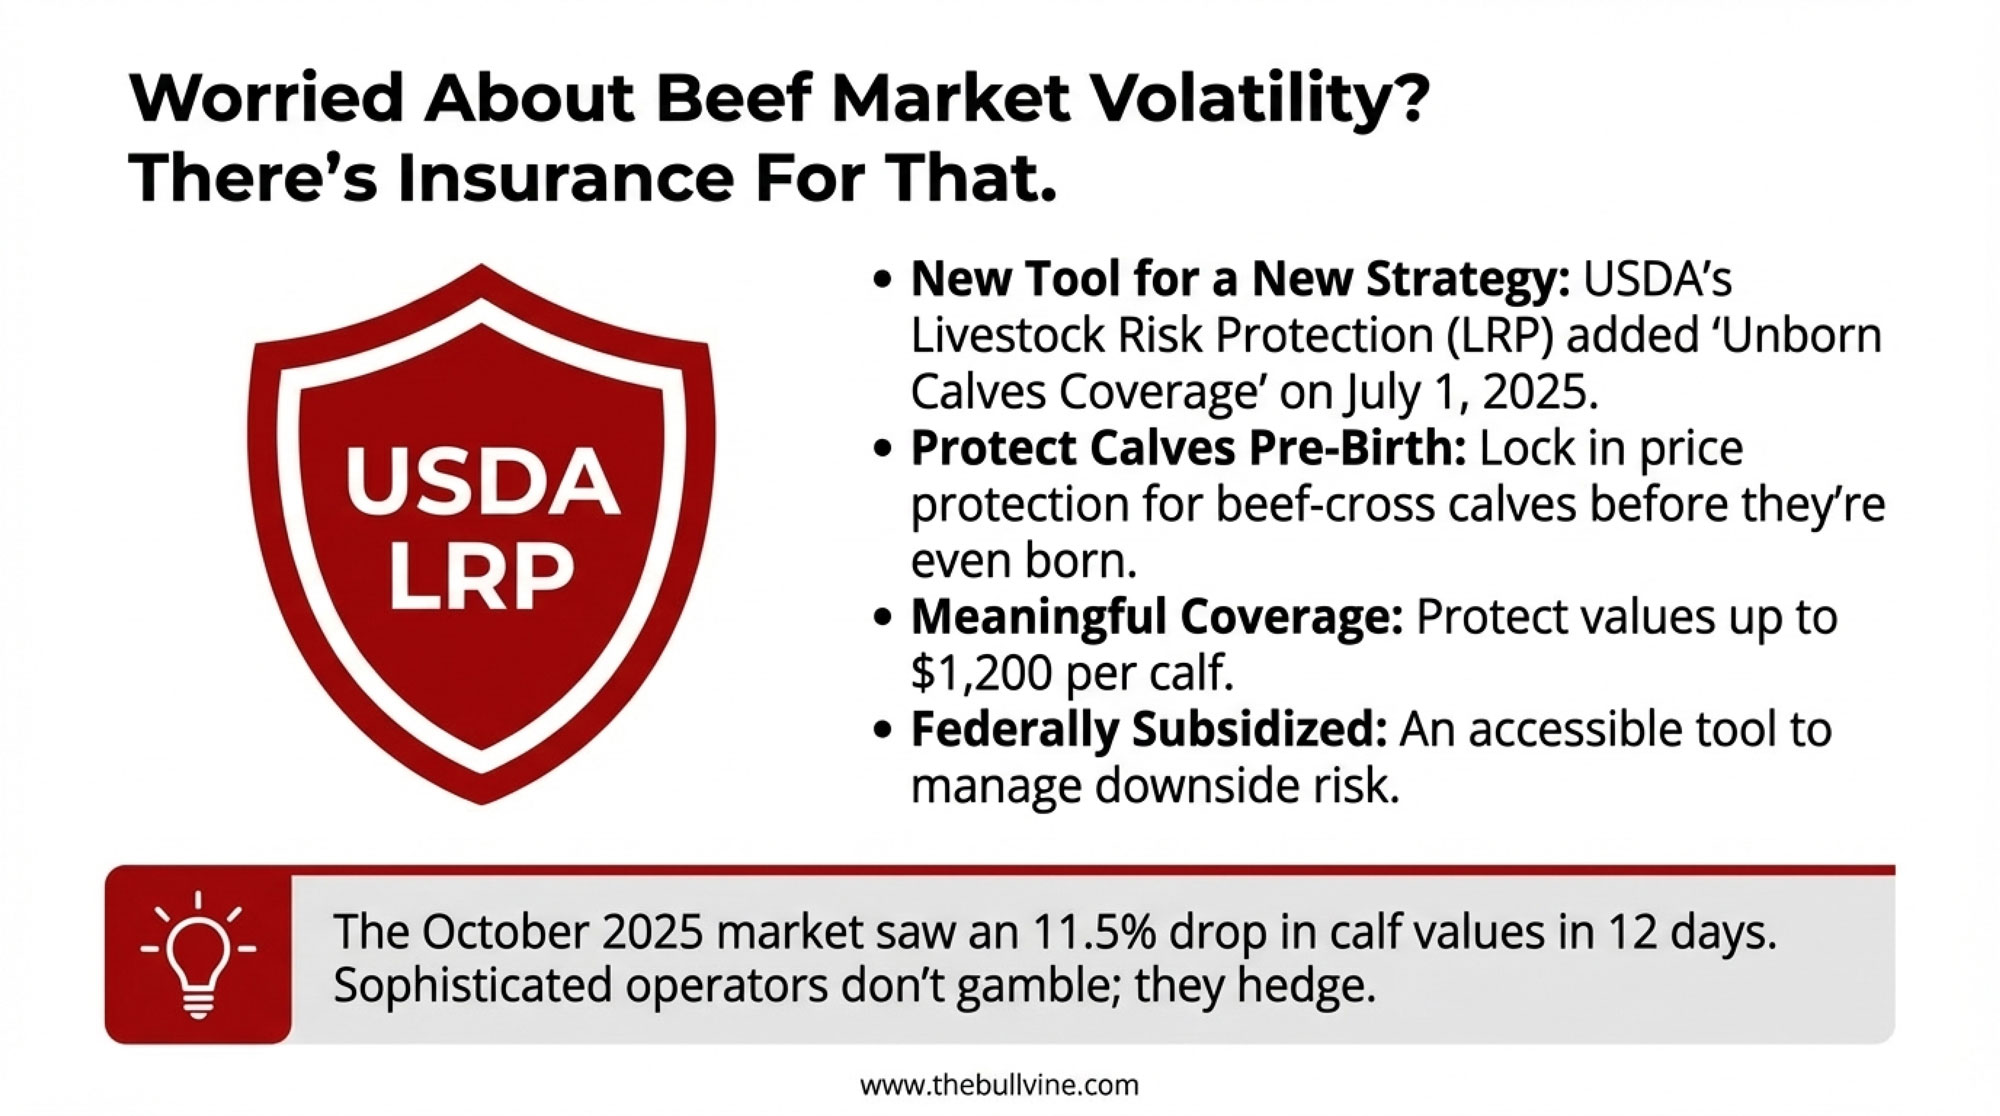
- Know your nearest packing plants — and what happened to them in the last 12 months. Tyson Lexington is gone. AFG Missouri is new. Cargill stated in November 2025 that it doesn’t intend to close any of its eight primary beef processing facilities and is investing in them. That landscape shifts. Stay current. Watch USDA’s next Cattle report and any signals on AFG Missouri’s actual throughput mix — both will indicate where beef-on-dairy infrastructure is heading through the rest of 2026.
The Eberts learned something interesting when they added on-farm meat processing through their Ebert Grown brand. Making their own sausage products, Randy told Brownfield, actually cost more than buying from a supplier. “We can still buy that product cheaper from a supplier than what we can efficiently do it,” he said. “That’s where we thought we could vertically integrate and have an advantage, and it’s actually, it isn’t that way.”
It’s a quietly important detail. The beef-on-dairy math works — the Ebert family has spent over a decade building a program with 2,000-plus head to prove it. But every link in that chain has its own economics, and assumptions about what you control versus what the system controls get tested eventually. Knowing the difference between a ground beef plant and a packing plant isn’t trivia. And neither is knowing the difference between a sire that gets your cow pregnant and one that gets your calf paid. As capacity tightens, the calves with predictable carcass performance are increasingly the ones that find homes first — and that reality should be part of every sire selection conversation you have this spring.
Key Takeaways
- The Cargill Milwaukee plant that’s closing is a ground beef facility that hasn’t slaughtered cattle since 2014, so it never bought your calves and doesn’t change your day‑to‑day beef‑on‑dairy marketing.
- Tyson’s 5,000‑head‑a‑day Lexington shutdown — plus cuts at Amarillo — is the real pressure point, tightening kill‑floor access beef‑on‑dairy volume has jumped to about 3.22 million calves and 7.9 million beef semen units in dairy herds.
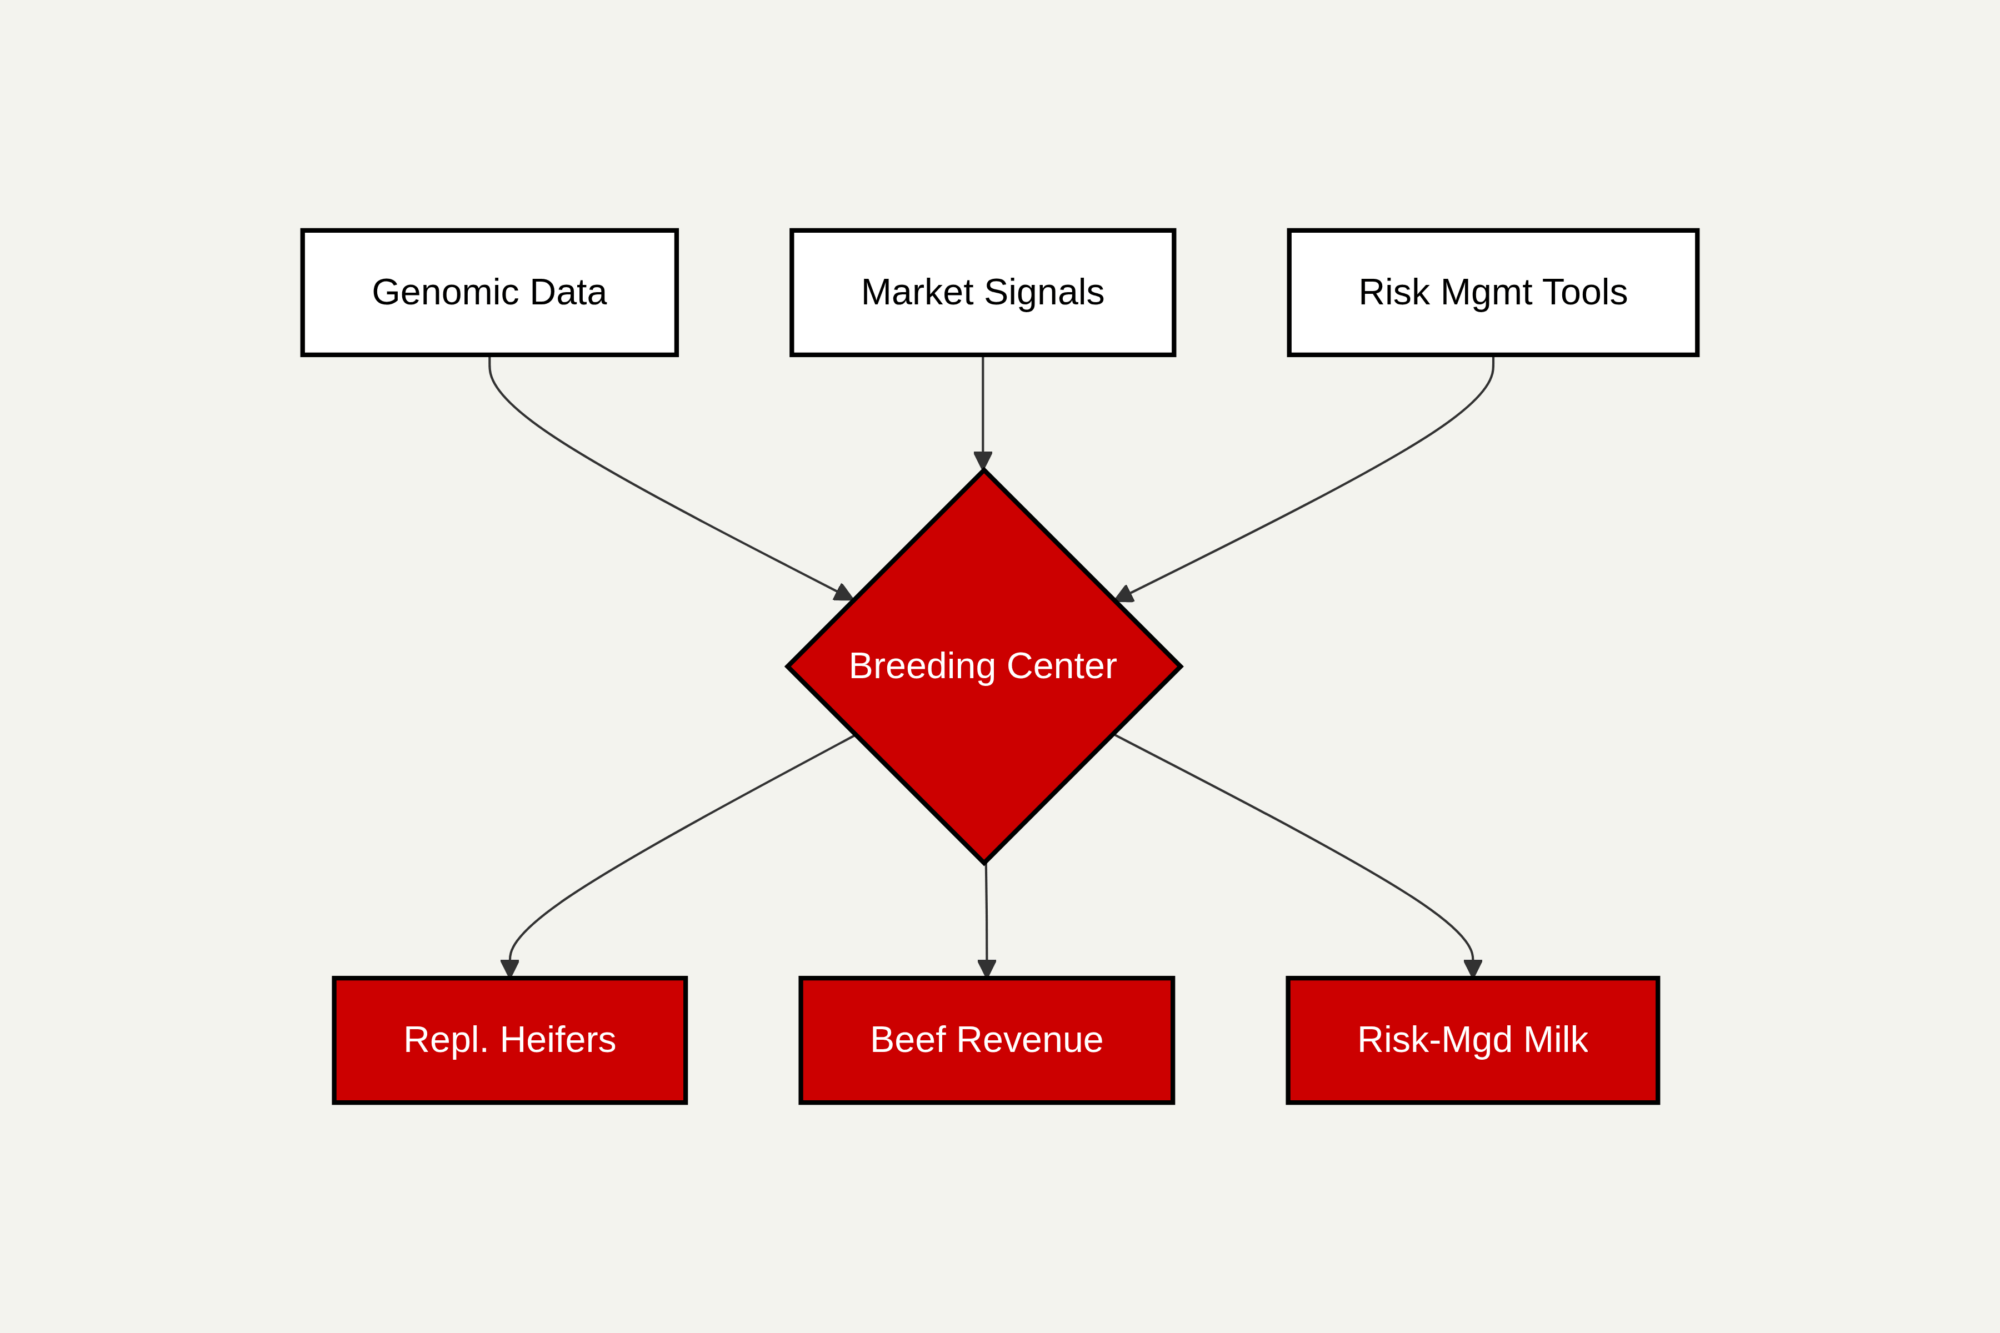
- Ebert Enterprises’ 4,200‑cow Wisconsin herd shows one workable path: know exactly where your calves go, avoid being tied to a single buyer, and use Angus and Simmental‑Angus sires with documented feedlot and carcass performance, not just the cheapest semen.
- Penn State data backs that approach, finding that all beef × Holstein groups average Choice, but some sire breeds deliver significantly better gain and marbling — the kind of consistency packers remember when hooks are tight.
- If you’re serious about beef‑on‑dairy, packer capacity and carcass predictability now belong in the same conversation as conception rate and calving ease every time you build your breeding list.
Complete references and supporting documentation are available upon request by contacting the editorial team at editor@thebullvine.com.
Learn More
- Beef-on-Dairy’s $6,215 Secret: Why 72% of Herds Are Playing It Wrong – Stop leaving money on the table by chasing the wrong premiums. This breakdown arms you with a specific ROI framework to pivot from “just selling calves” to capturing the full margin your genetics deserve.
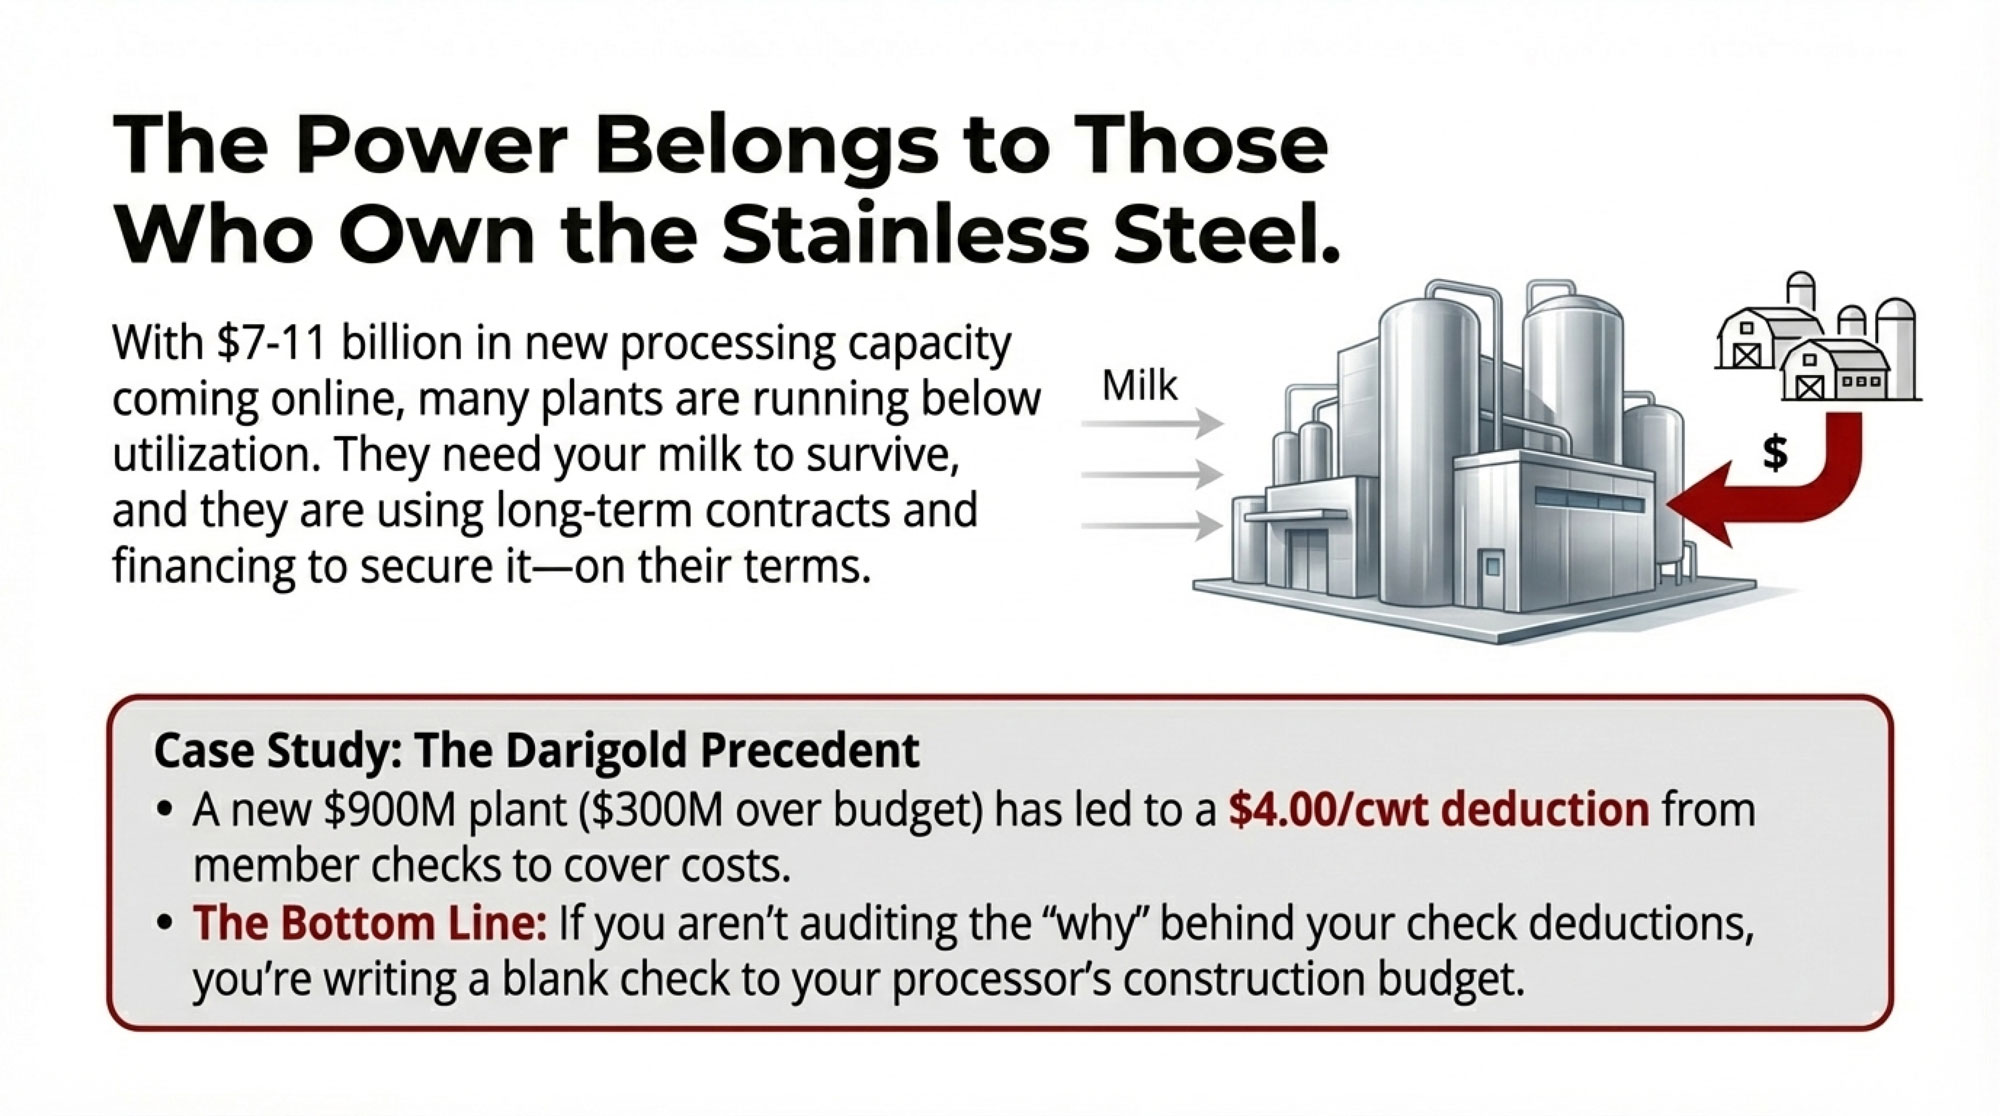
- Processor Power Play: Is Your Milk Check Getting Squeezed? – Packer consolidation isn’t just a beef problem—it’s a dairy blueprint. This analysis exposes the structural shifts in regional processing, giving you the foresight to position your operation before the next major plant closure.
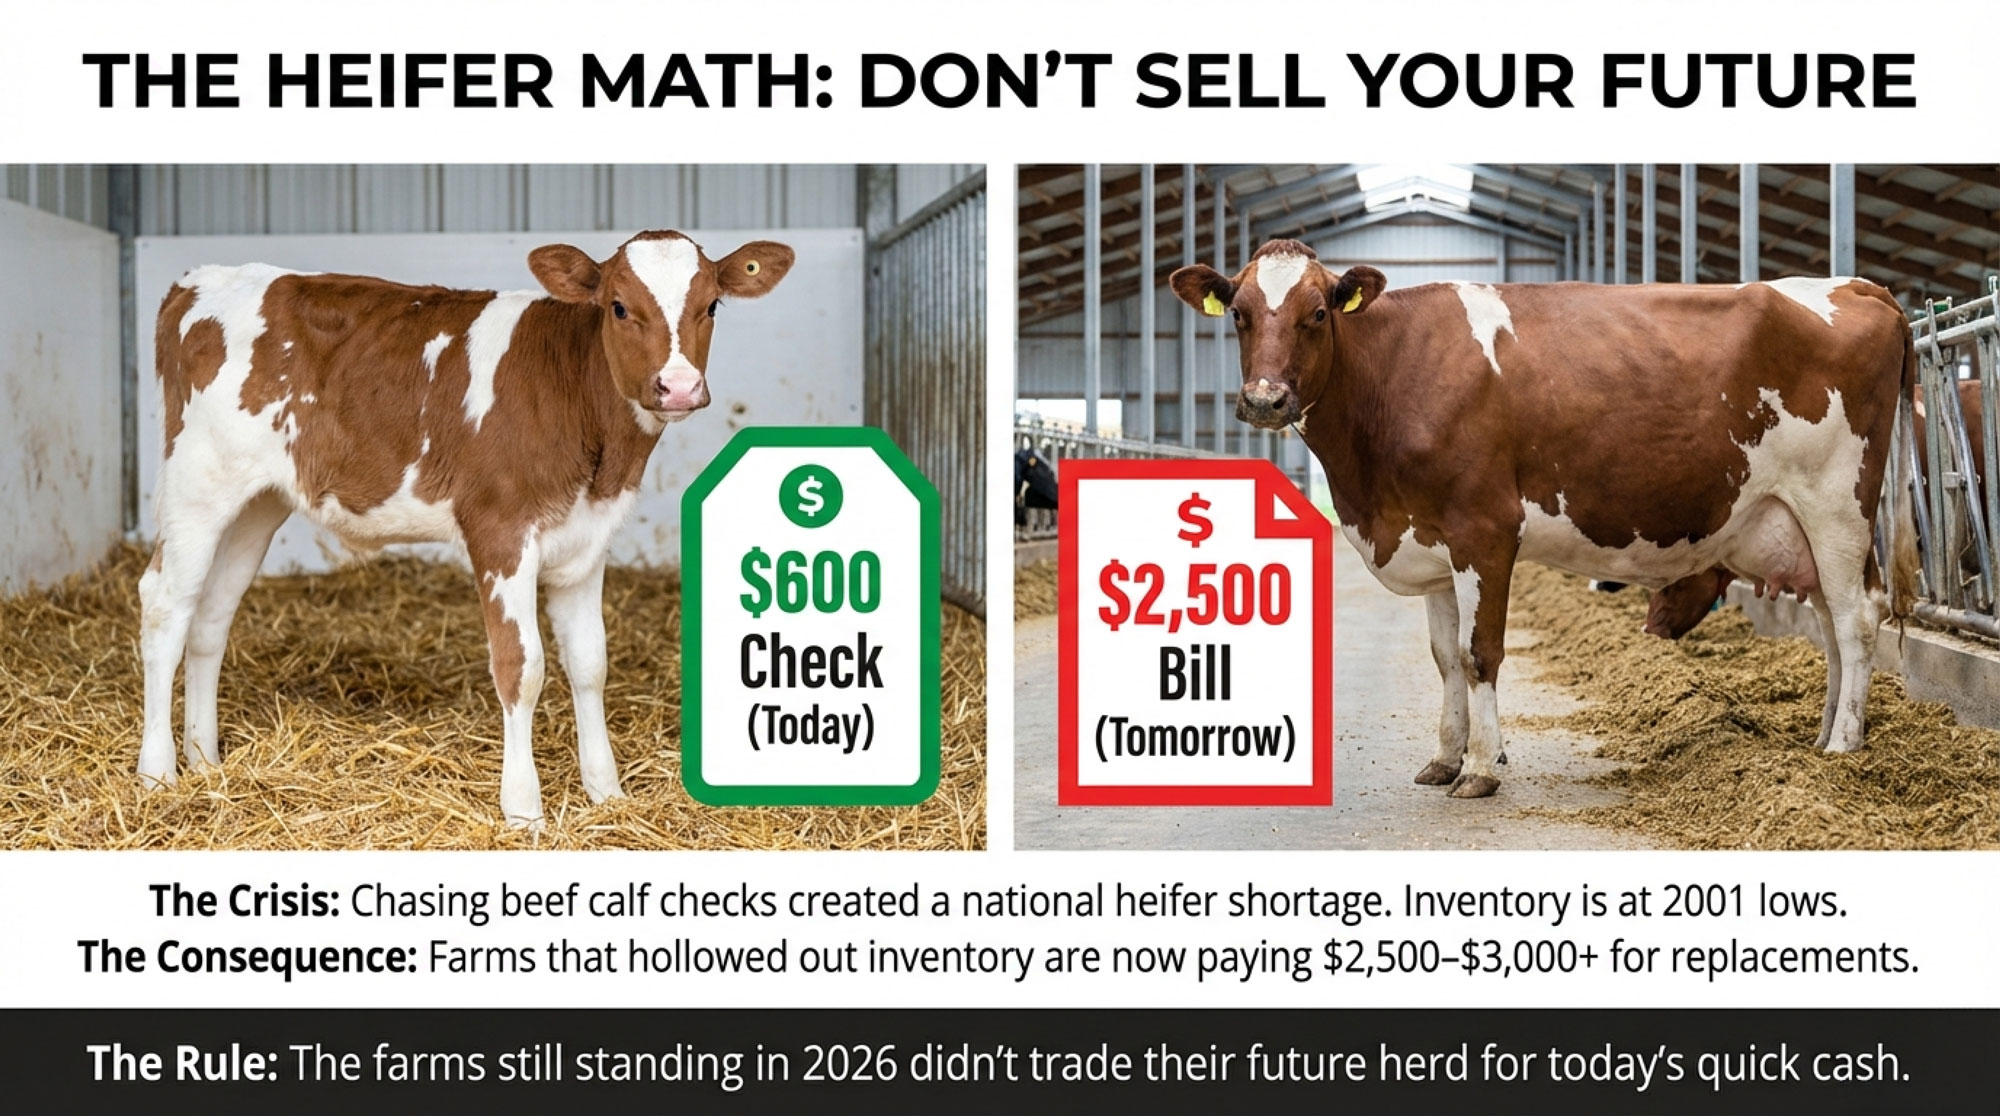
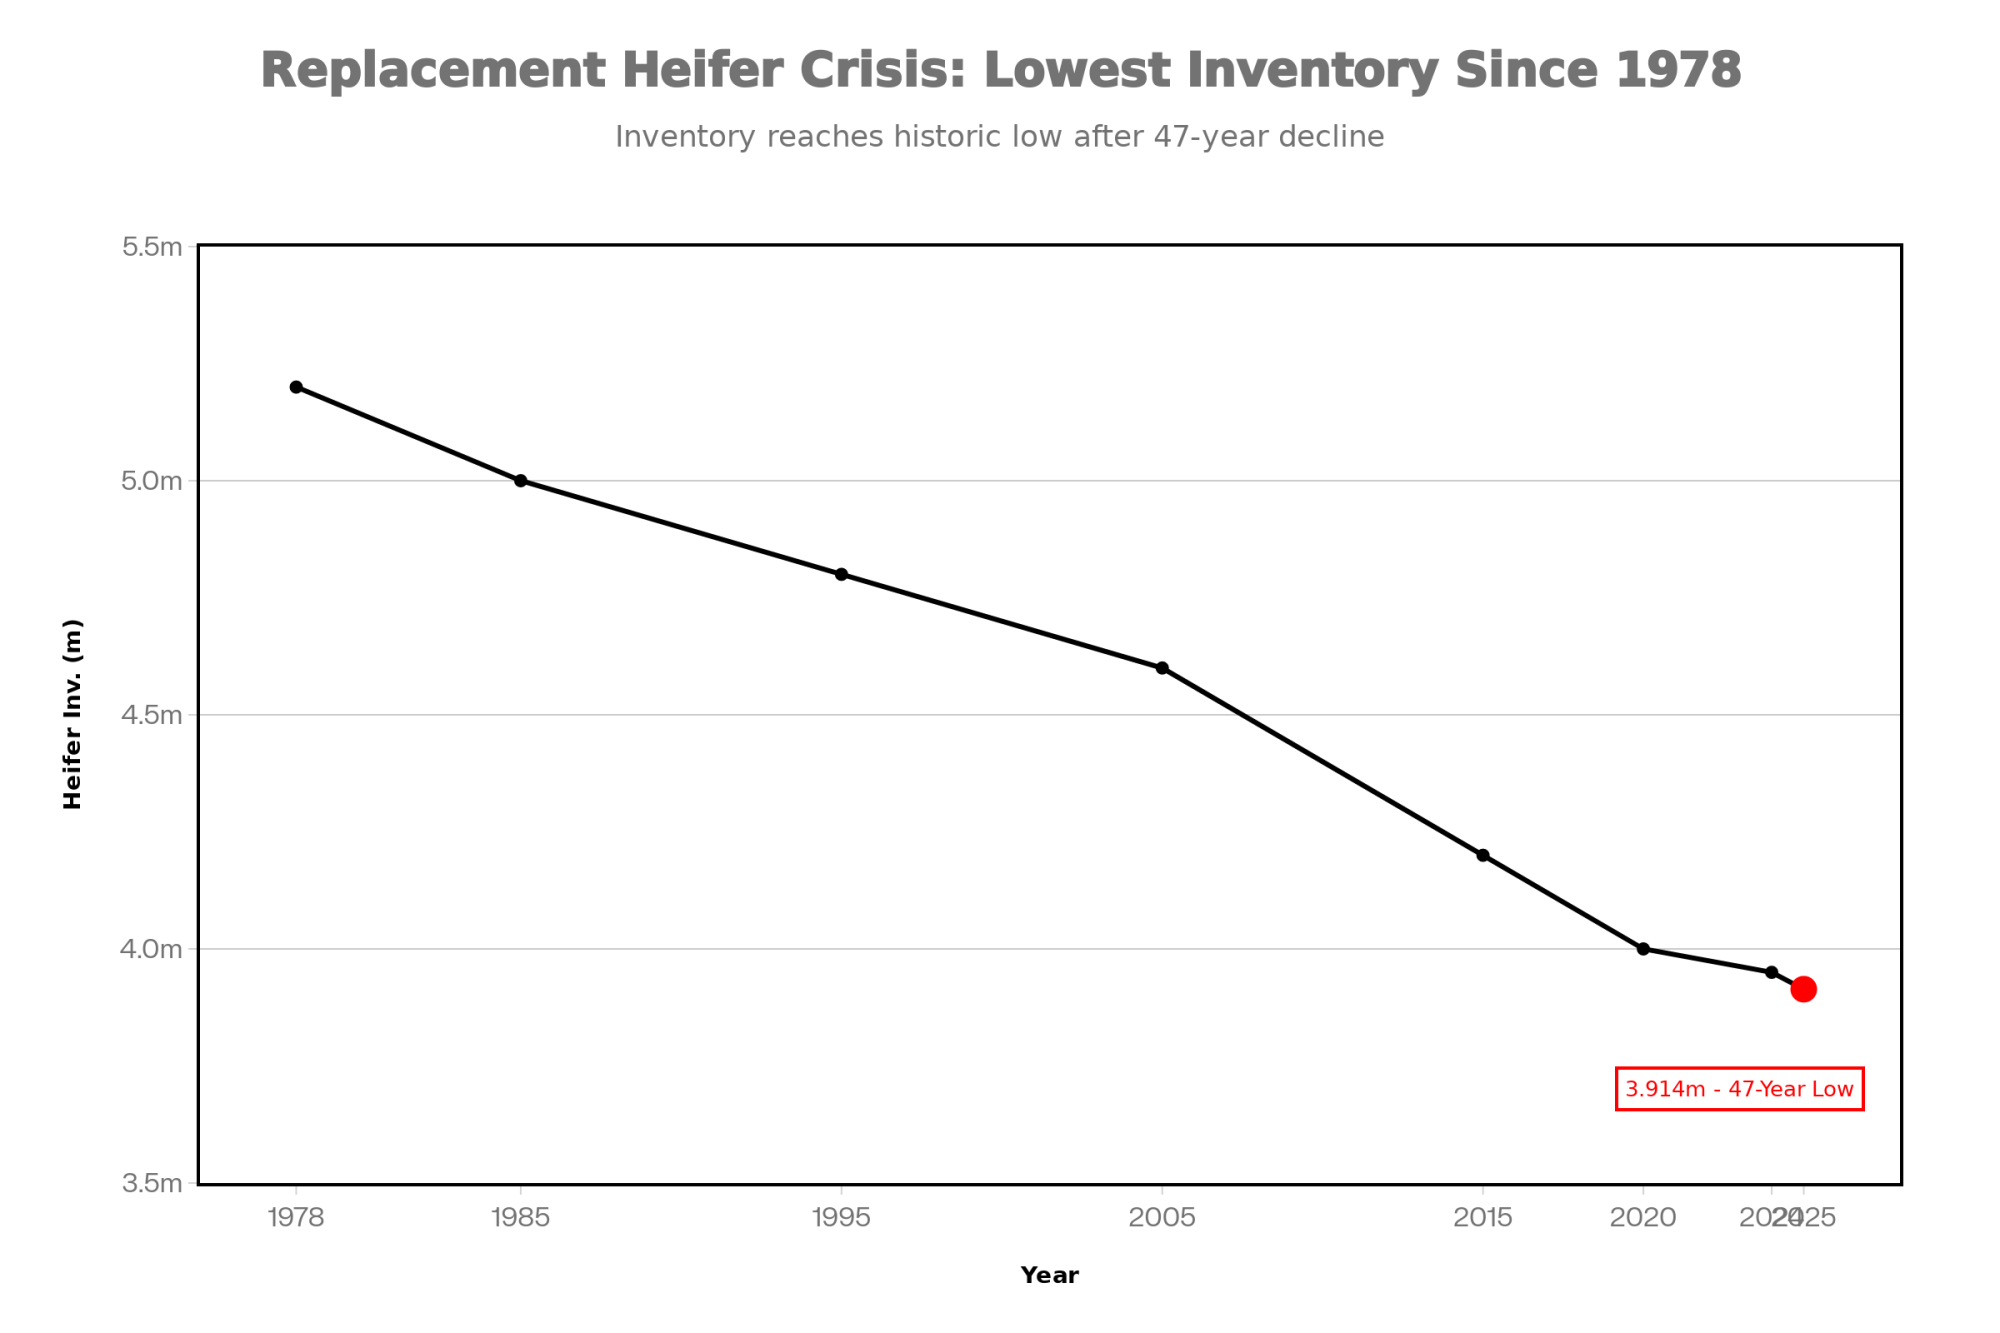
- $3,010 Per Heifer. 800,000 Short. Your Beef-on-Dairy Bill Is Due. – The beef-on-dairy craze has a massive blind spot: your own replacement pipeline. Discover how maverick herds are using precision data to balance beef premiums without nuking their future dairy herd’s genetic progress.
 Join the Revolution!
 Join the Revolution!
Join over 30,000 successful dairy professionals who rely on Bullvine Weekly for their competitive edge. Delivered directly to your inbox each week, our exclusive industry insights help you make smarter decisions while saving precious hours every week. Never miss critical updates on milk production trends, breakthrough technologies, and profit-boosting strategies that top producers are already implementing. Subscribe now to transform your dairy operation’s efficiency and profitability—your future success is just one click away.