










One permit, one formula change, and what they mean for a 400-cow herd heading into fall renewal.
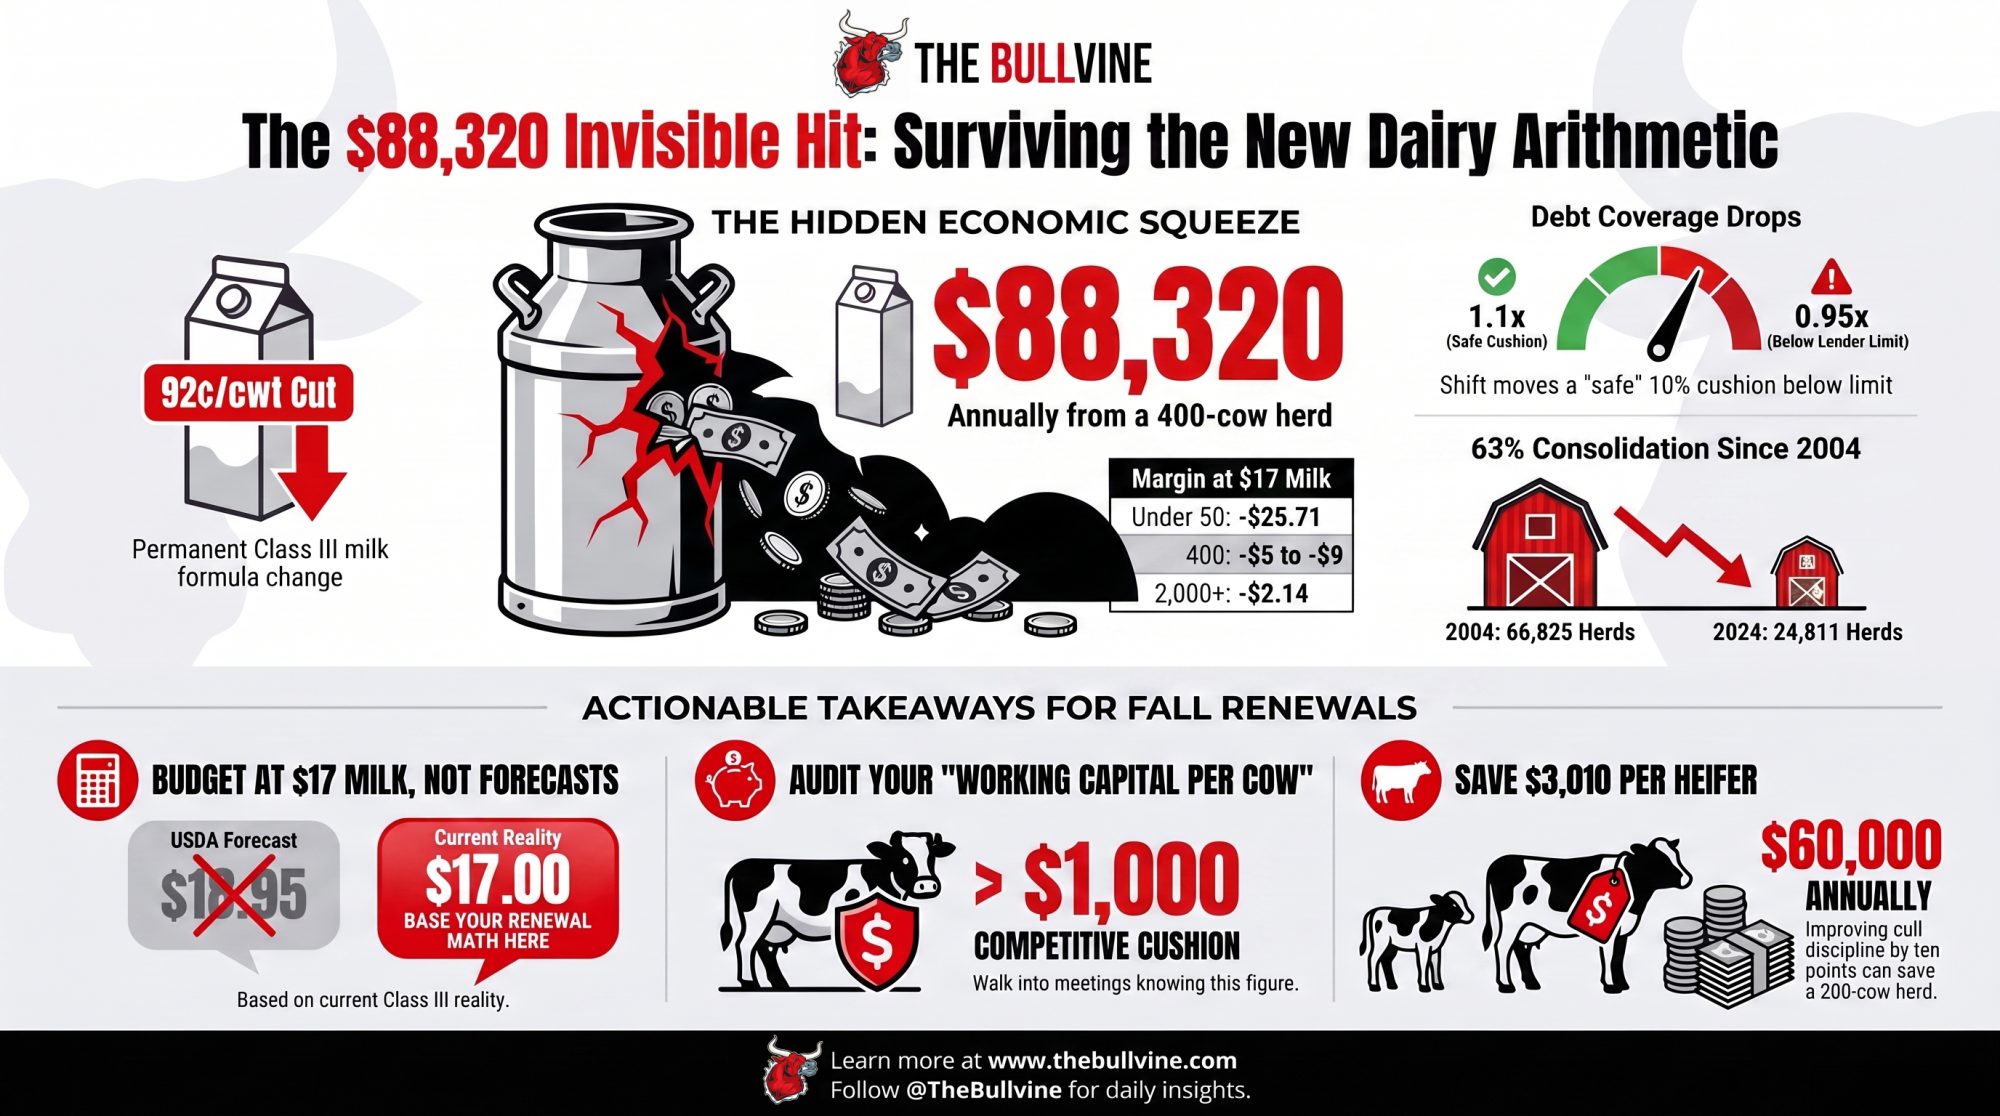
EXECUTIVE SUMMARY: USDA’s June 2025 make-allowance change pulled 92¢/cwt out of Class III, and on 400 cows shipping 240 cwt each that’s $88,320 gone this year with no line item on the statement. The same formula shift took 85¢ from Class IV and $337 million out of pool value in its first three months, according to American Farm Bureau. Run it against a debt-service ratio and it stops being abstract: a herd sitting at a comfortable-looking 1.1x drops to roughly 0.95x, below the line most lenders treat as a covenant problem. Meanwhile Minnesota cleared Riverview LLP to expand one dairy near Morris from 7,855 cows to 18,855 without a full EIS, and North Dakota permitted a 25,000-head site now under judicial review — the visible end of a curve that’s taken U.S. licensed herds from 66,825 in 2004 to 24,811 in 2024. USDA’s 2021 ARMS data puts total economic cost at $19.14/cwt for 2,000-plus cow operations against $42.71 for herds under 50, a scale gap no amount of barn management closes. What management does move: cull discipline at $3,010 a heifer, robot throughput past the 50.5-cow average, and feed shrink above 6–7%. Before your fall renewal meeting, walk in holding two numbers — your coverage ratio at $17 milk, not USDA’s $18.95 forecast, and your working capital per mature cow.
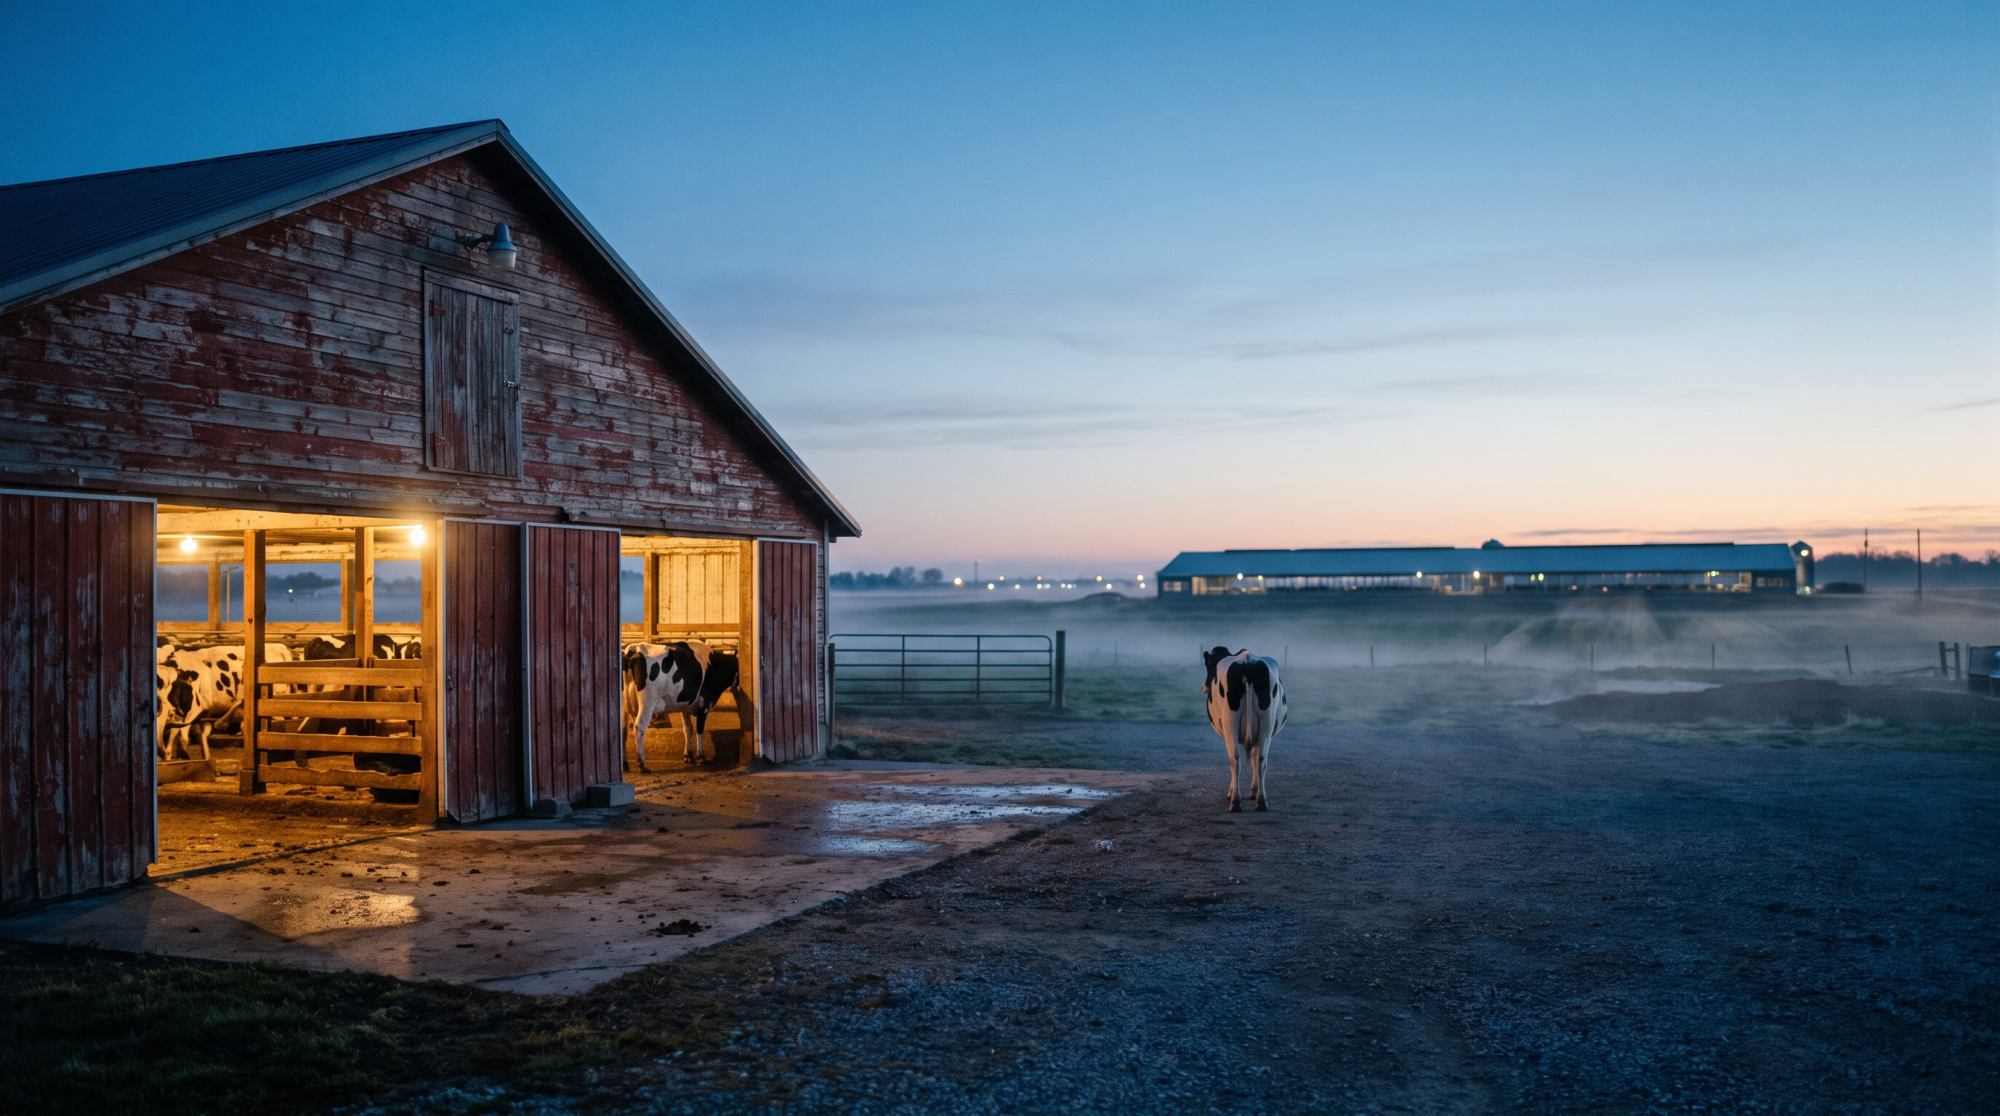
Riverview LLP asked Minnesota for permission to grow one dairy near Morris from 7,855 cows to 18,855. In June 2026, the Minnesota Pollution Control Agency said yes — and declined to require a full Environmental Impact Statement. Riverview already runs 16 permitted feedlots in Minnesota holding more than 135,000 cows, roughly a third of the state’s herd.
Somewhere down the road from that site, somebody’s milking 400. They’re heading into a fall renewal meeting with a lender stress-testing at $17 milk, and they’ve already lost about $88,320 this year to a federal order formula change nobody at the farm gate voted on. Same state, same weather, same feed market, completely different arithmetic.
| 18,855 | Cows approved at a single Minnesota site, June 2026 |
| 92¢/cwt | Permanent Class III cut from the June 2025 make-allowance change |
| $88,320 | What that costs a 400-cow herd annually, with no invoice attached |
| 63% | U.S. licensed dairy herds lost between 2004 and 2024 |
What the Permit Actually Regulates
Minnesota’s feedlot permit reviews manure storage, groundwater draw, and water quality. Not herd size. Not market concentration. Not what a 19,000-cow barn does to hauling economics for everyone shipping the same direction. According to MPCA filings, Riverview’s permit clears up to 226 million gallons of groundwater a year — voluntarily trimmed from an initial 452 million — with 250 million gallons of manure storage spread across roughly 13,200 acres.
Riverview describes the project differently, and the framing matters. On its own project page, the company characterizes West River as adding an 11,000-cow farm adjacent to a dairy that’s operated in Stevens County for years, following more than three years of work with state agencies. MPCA extended the public comment period at the company’s request. Riverview projects 40-plus permanent jobs plus hundreds of construction positions across a 16-to-24-month build.
Minnesota Farmers Union vice president Anne Schwagerl has publicly argued the state’s feedlot rules, written in the late 1990s, never anticipated an operation approaching 19,000 cows — roughly 60 times Minnesota’s average herd. Carrie Redden, a Stevens County livestock farmer, said after the decision that she was frustrated the agency didn’t mandate an EIS. Both are affiliated with groups opposing the permit. Doesn’t make their arithmetic wrong, and it doesn’t make Riverview’s job numbers wrong either.
The $88,320 Nobody Sent You a Bill For
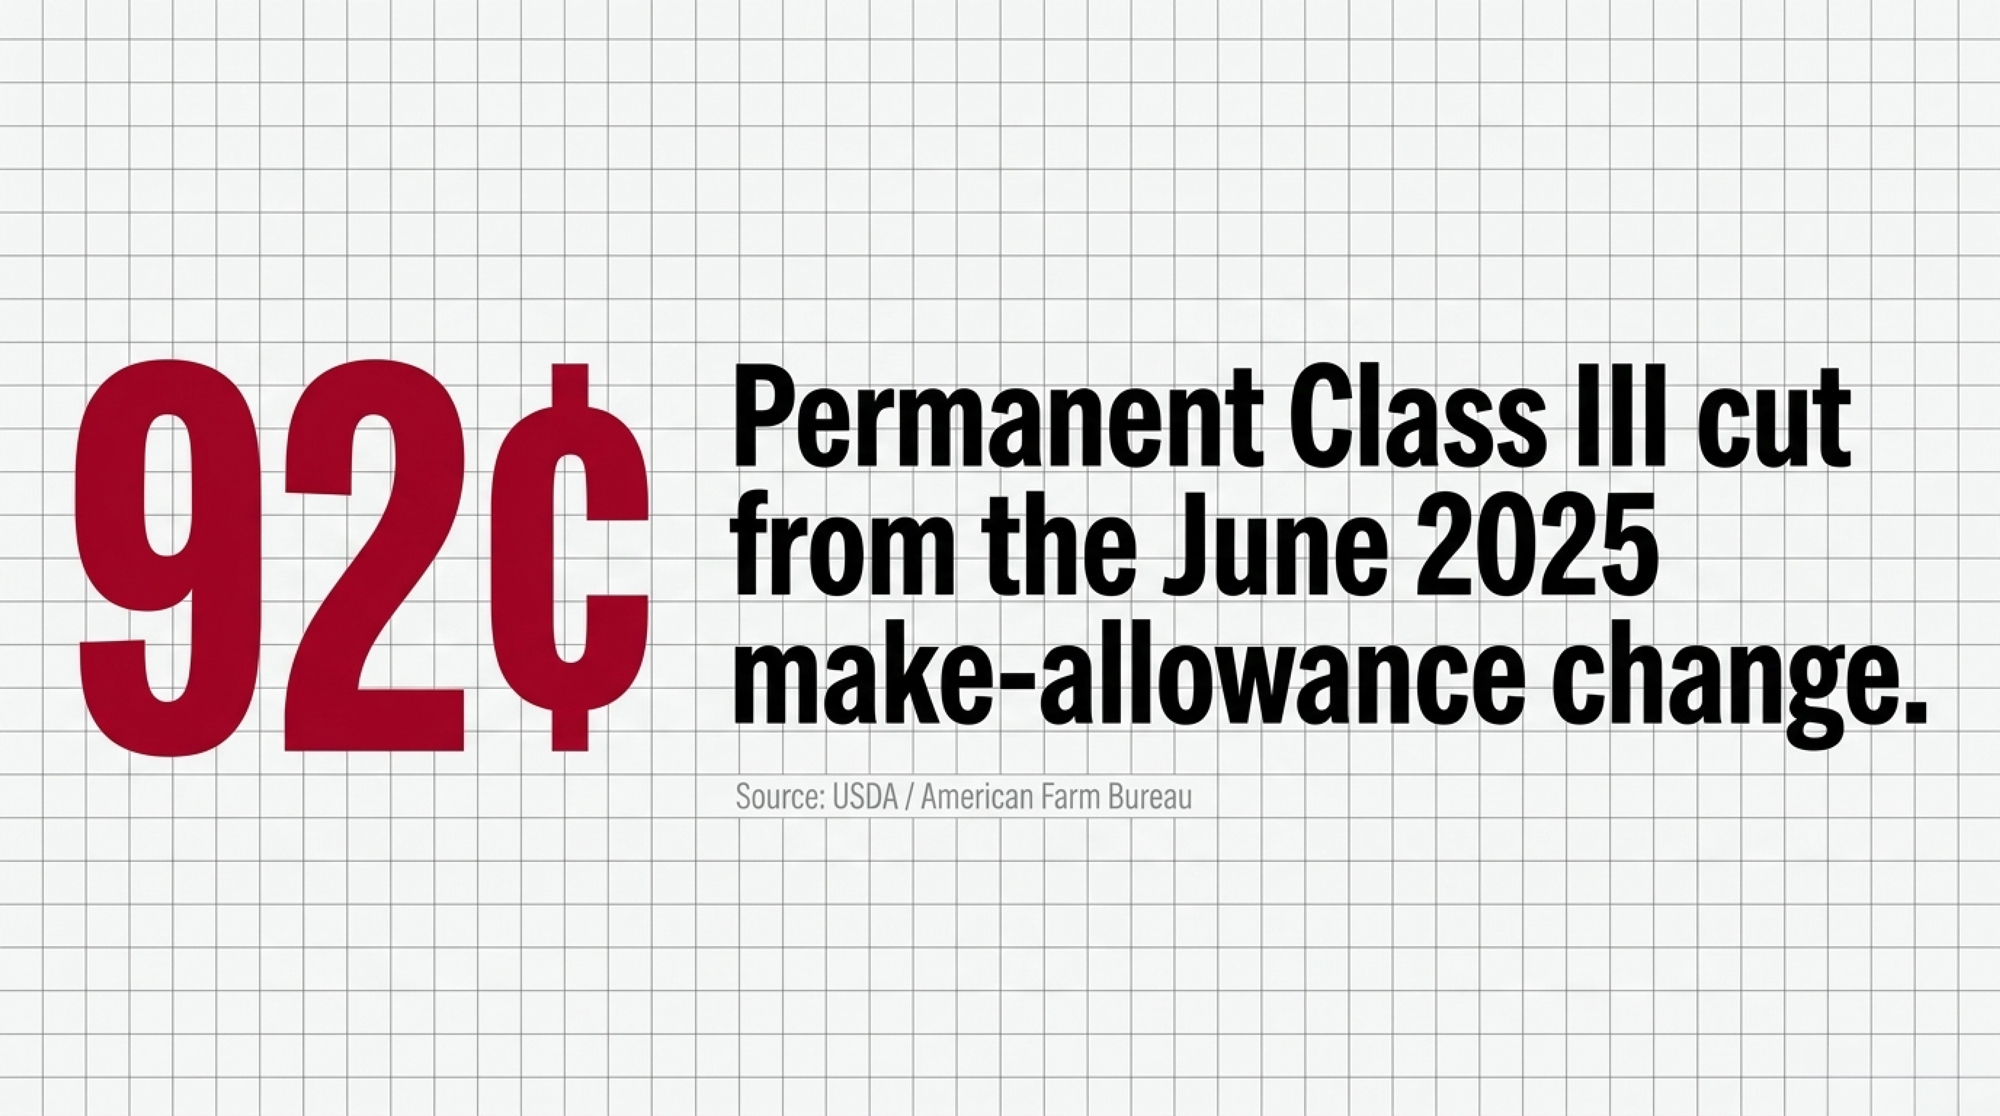
USDA’s amended Federal Milk Marketing Order pricing formulas took effect June 1, 2025, raising make allowances to 25.19¢ per pound for cheese, 22.72¢ for butter, 23.93¢ for nonfat dry milk, and 26.68¢ for dry whey. The final rule was published in the Federal Register on January 17, 2025. American Farm Bureau measured the first three months under the new rules: Class III prices fell 92¢/cwt, Class IV fell 85¢, and $337 million came out of pool value.
No vote at the farm gate. No line item on your statement. It lives inside the formula.
Run it on 400 cows at 240 cwt per cow per year — 96,000 cwt shipped. Multiply by 92¢, and you get $88,320 a year, gone. On 250 cows, that’s $55,200. On 700, $154,560. Nobody manages their way out of it, because it isn’t a management variable.
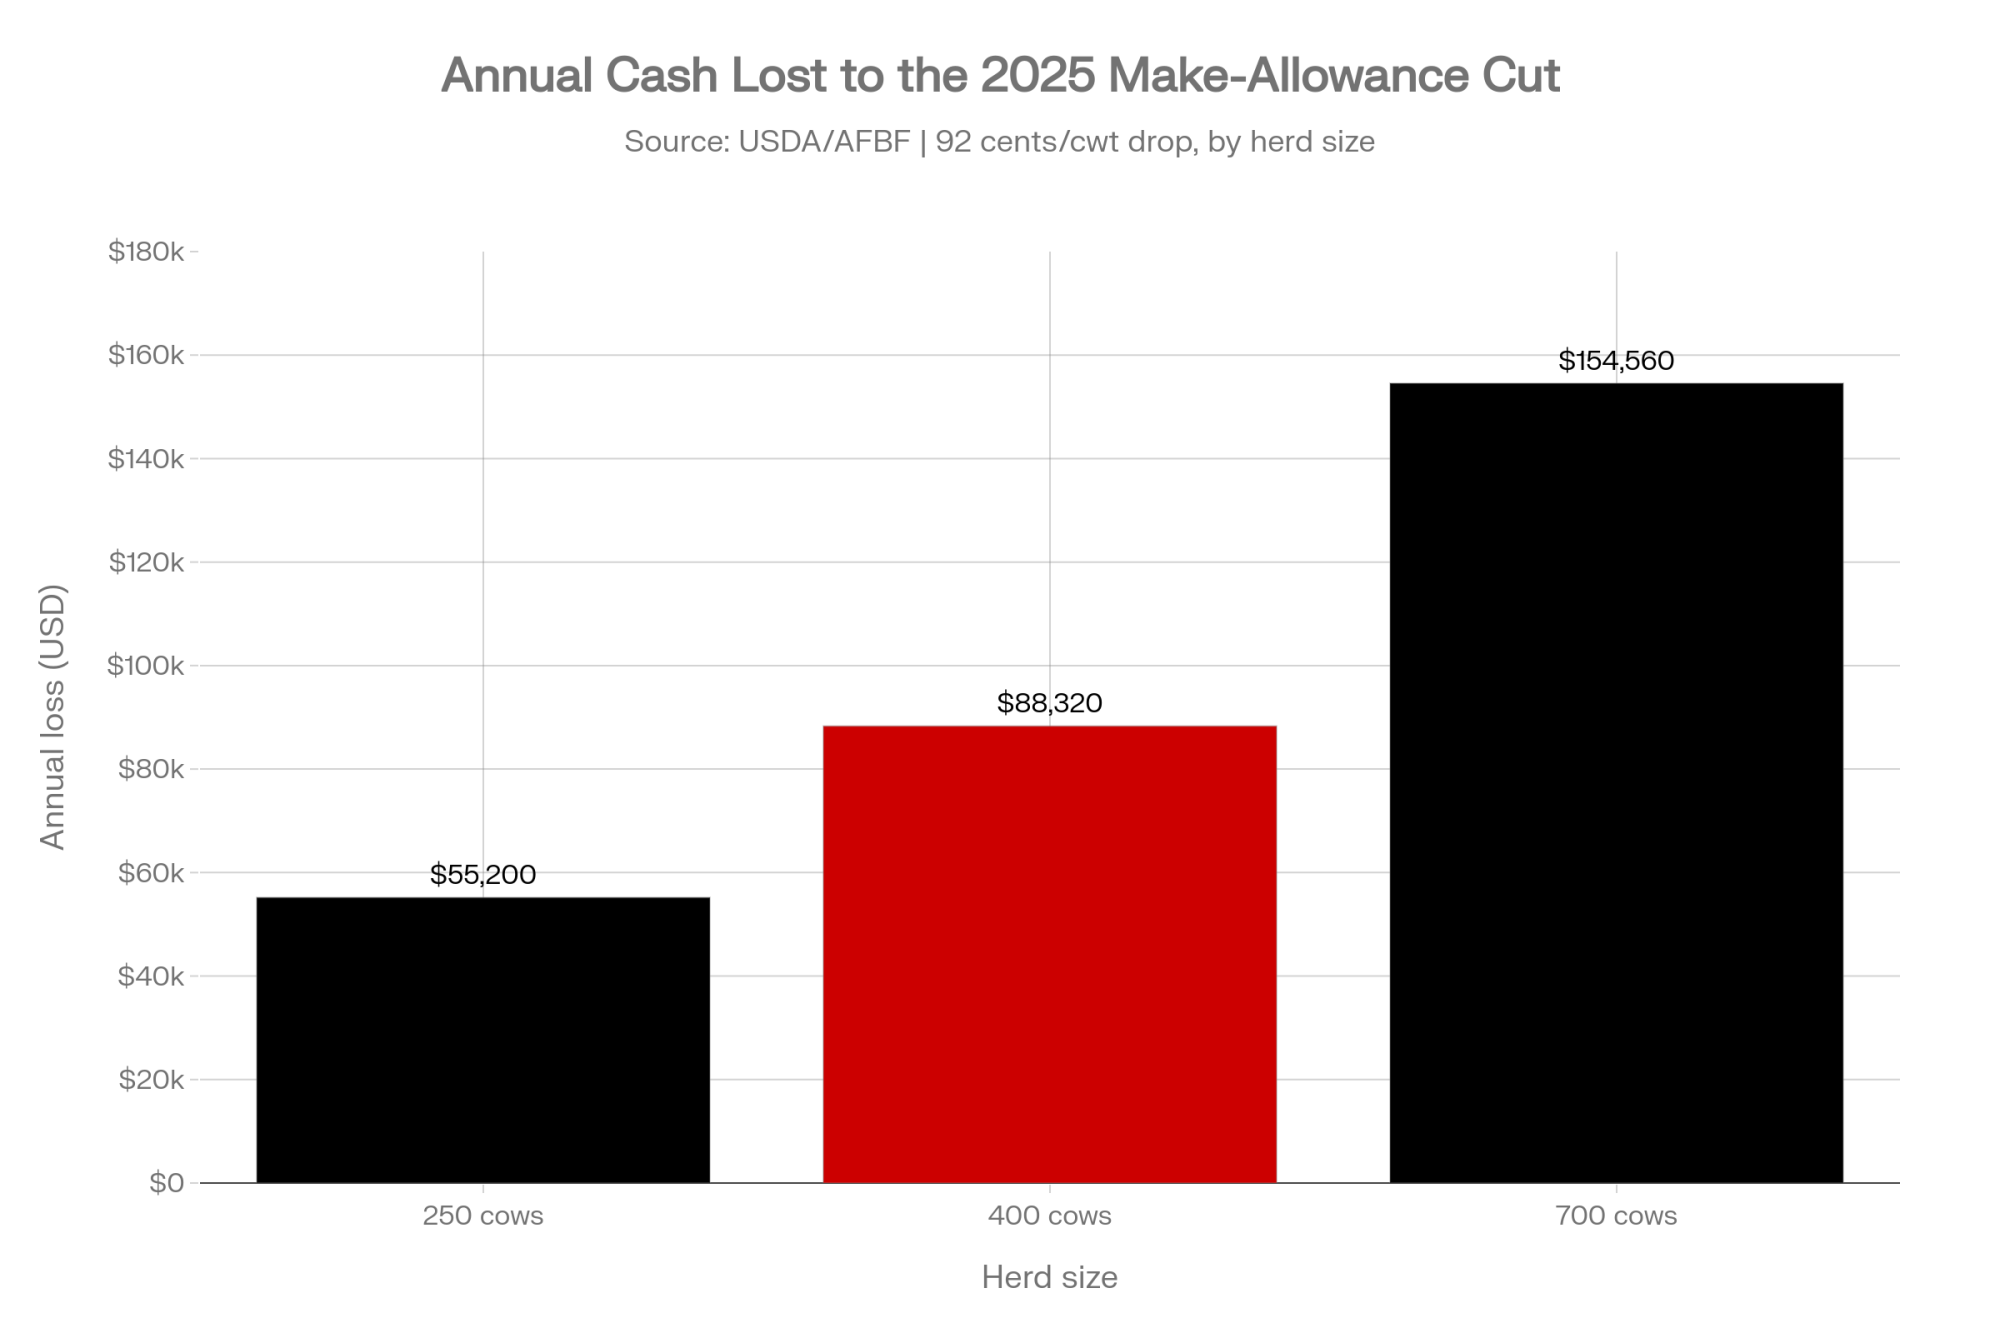
That’s at 24,000 pounds per cow. Ship 26,000 and the hit runs proportionally bigger — about $95,680 on the same 400 cows. Higher production, bigger bite.
How Much Does a 1.1x Coverage Ratio Actually Protect You?
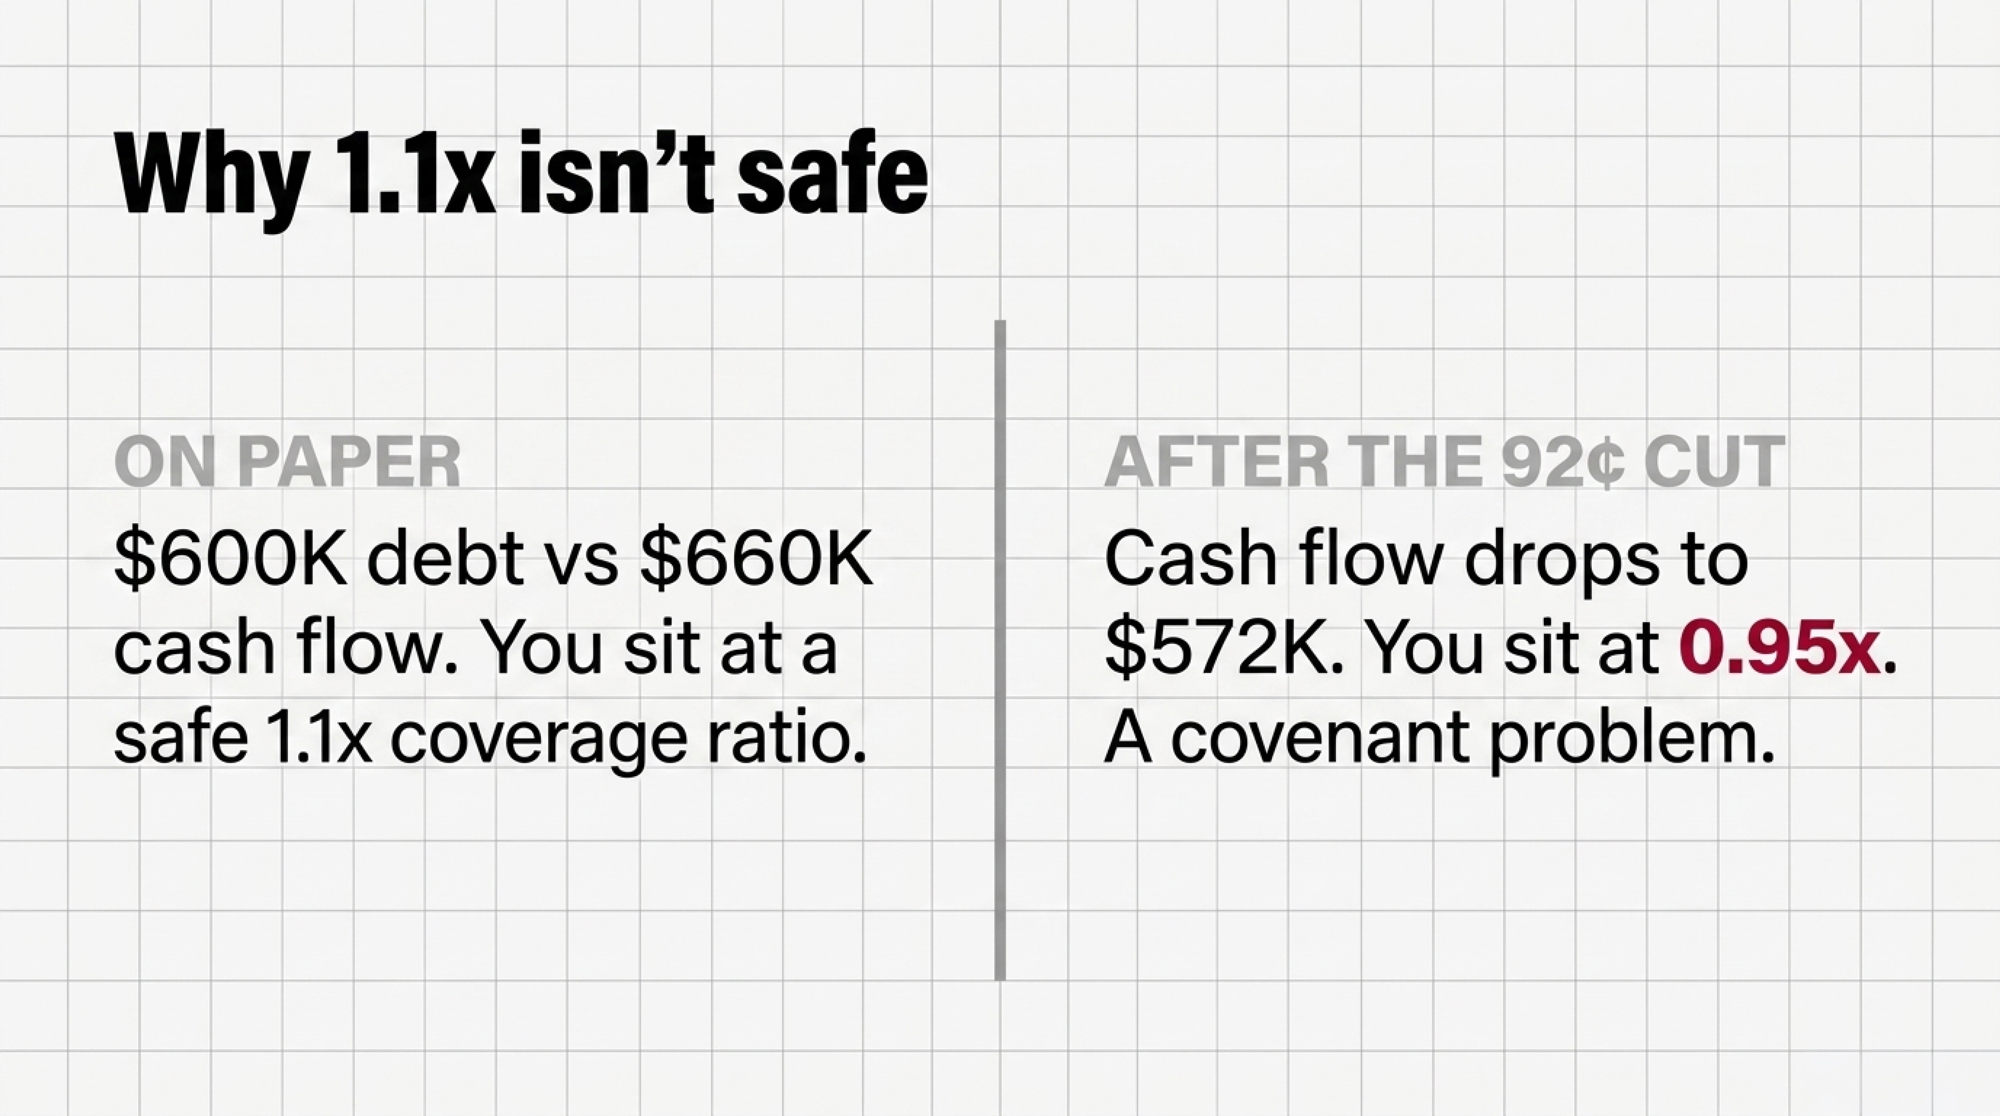
Less than it sounds like. Lenders generally want debt-service coverage above 1.25x and treat anything under 1.0x as a covenant problem. Cornell’s Dairy Farm Business Summary puts the top group at 2.95x and the bottom at 0.36x. A 1.1x reads like you’re above water. It’s a 10% cushion.
Now apply the make-allowance hit. It doesn’t touch your debt payment — it pulls cash out of the numerator. Take a hypothetical 400-cow operation carrying $600,000 in annual debt service, heavy at $1,500 a cow and the profile of a recent expansion, against $660,000 in available cash flow. That’s 1.1x. Strip out $88,320 with no offset, and you’re at $571,680 against the same obligation. Roughly 0.95x. Below the line. Those debt-service figures are illustrative, built from the ratio definition rather than a real farm’s books — run your own.
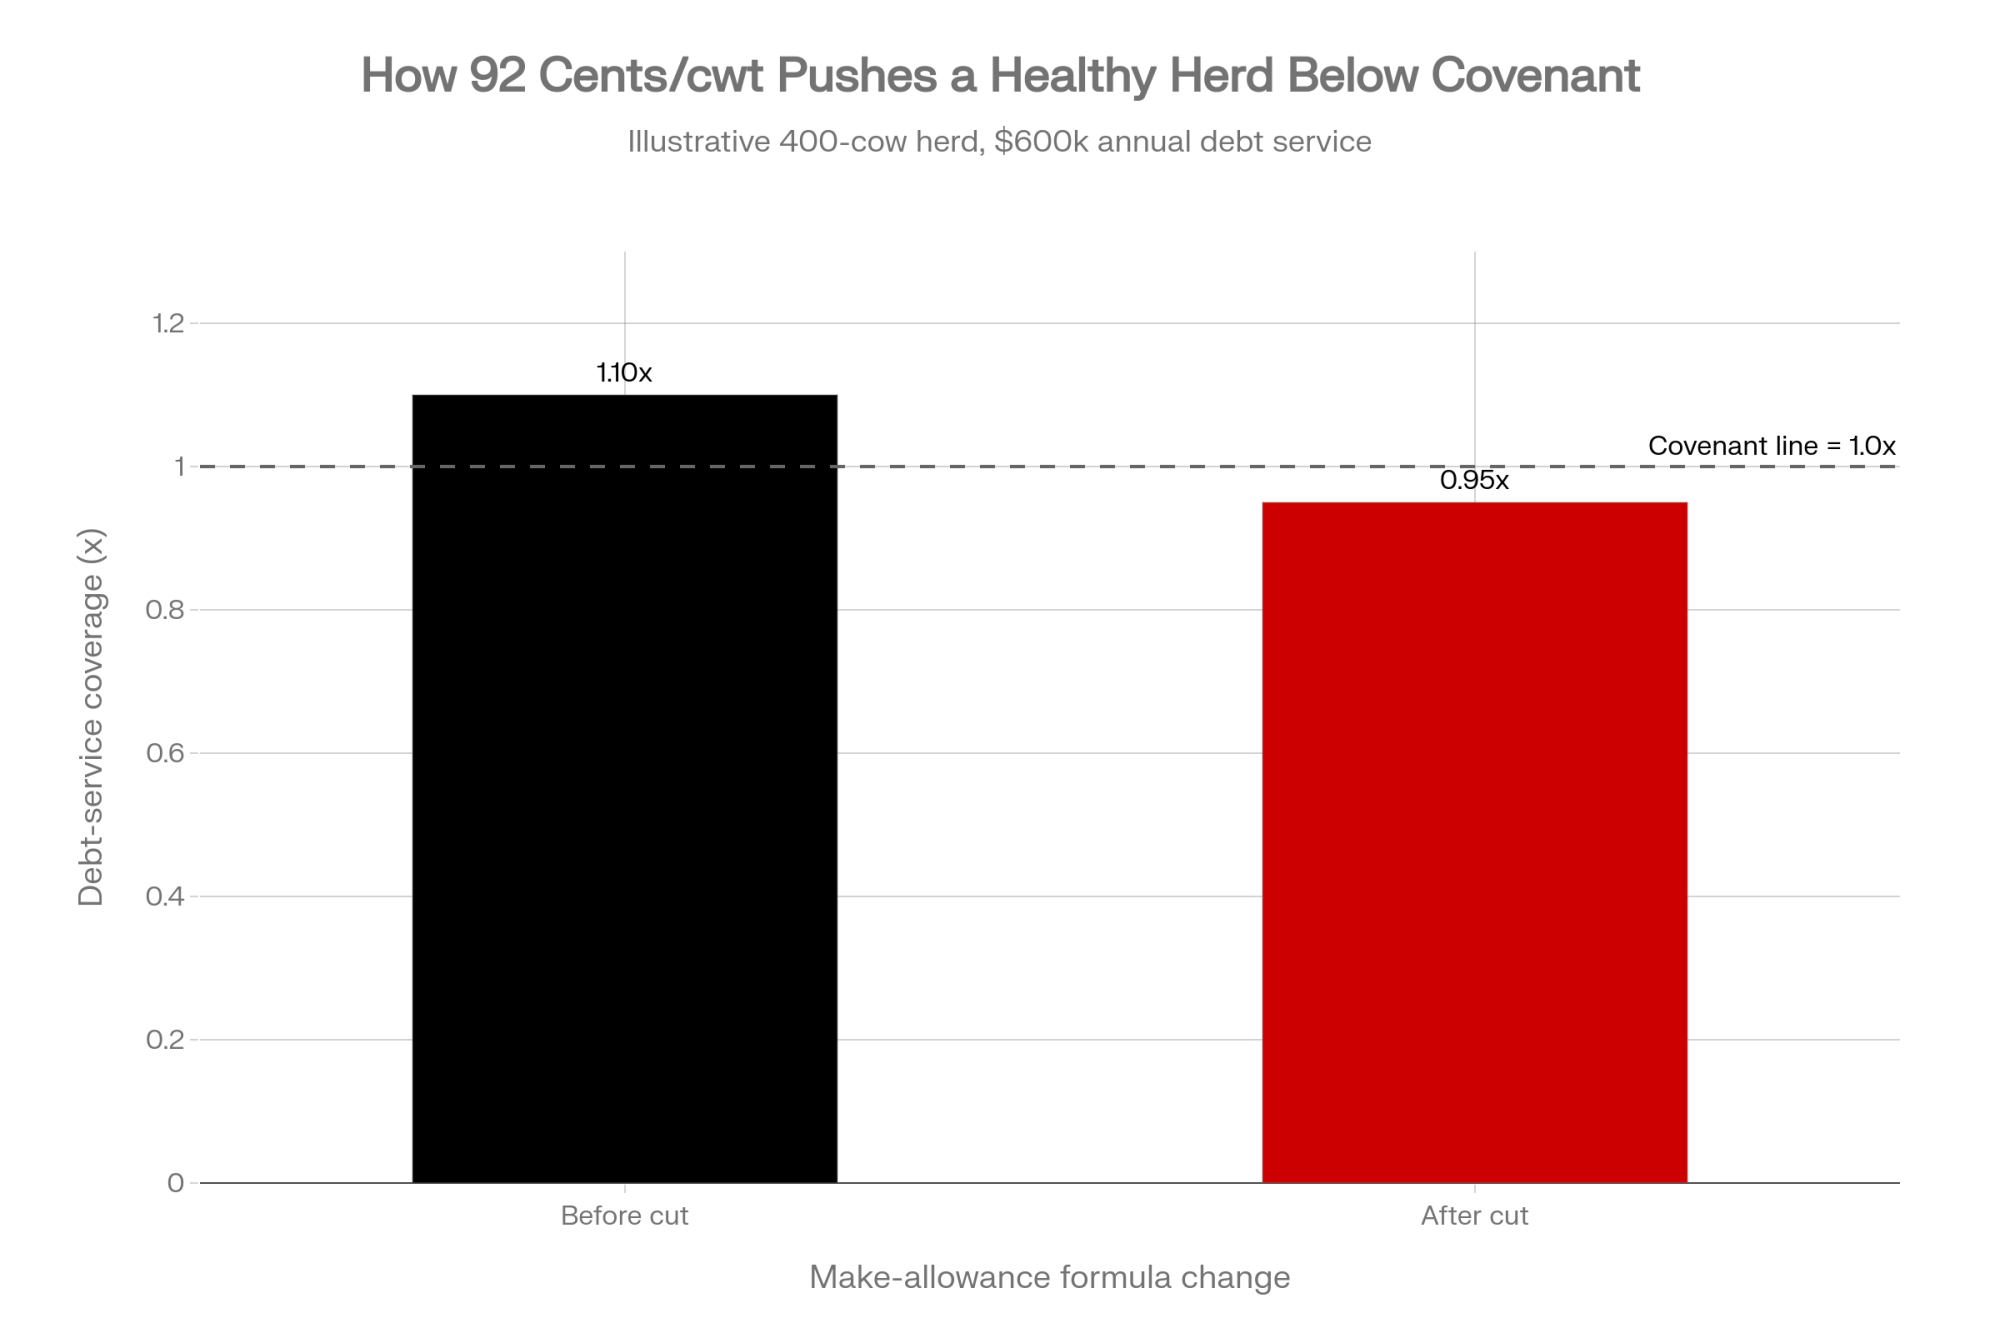
Economists at the Federal Reserve Bank of Kansas City have estimated 10–15% of dairy producers are in significant financial stress at current prices. What no dataset tracks is how many are already past the line and haven’t done the arithmetic. Your renewal meeting is where you find out which side you’re on.
| Metric | Minnesota (West River) | North Dakota (Herberg Dairy) |
| Herd size approved | 18,855 cows | 25,000 head |
| Regulatory outcome | Approved, no full EIS required | Approved via ag stormwater exemption, no federal permit |
| Legal challenge status | Public comment extended, no lawsuit reported | Under judicial review — ruling pending since July 13, 2026 |
| Nearby water sensitivity | Groundwater draw capped at 226M gal/yr | 1.5 miles from Red River, drinking source for 4 cities |
The North Dakota Version
The Minnesota permit isn’t the only one on Riverview’s board. Same company, bigger barn, harder fight. North Dakota’s Department of Environmental Quality issued a permit on September 24, 2025, authorizing Riverview to build and operate Herberg Dairy — 25,000 head — in a 641-page final decision. Add the 12,500-cow Abercrombie Dairy near Wahpeton and those two sites together run 37,500 cows against a statewide herd of about 8,700.
DEQ’s reasoning is the part worth reading closely. The agency concluded the application and supporting documentation showed the facility is not a point source subject to a federal discharge permit, leaning on the agricultural stormwater exemption in the Clean Water Act. No discharge, no federal permit. That’s the whole hinge.
The Dakota Resource Council sued to overturn it, arguing the site’s location a mile and a half from the Red River — drinking water for Fargo, West Fargo, Moorhead and Grand Forks — plus 27 residential wells within two miles, demands federal review. Riverview’s attorney, Andrew Dosdall, told the court DEQ had followed a rational process. Judge Susan Bailey heard arguments July 13, 2026, and took the matter under advisement, noting from the bench that it wasn’t her place to judge the science. No ruling as of publication.
A parallel challenge to the Abercrombie permit was dismissed — but on improper service, not on the merits. Worth knowing before anyone reads that dismissal as a verdict.
63% Gone, and More Milk Than Ever
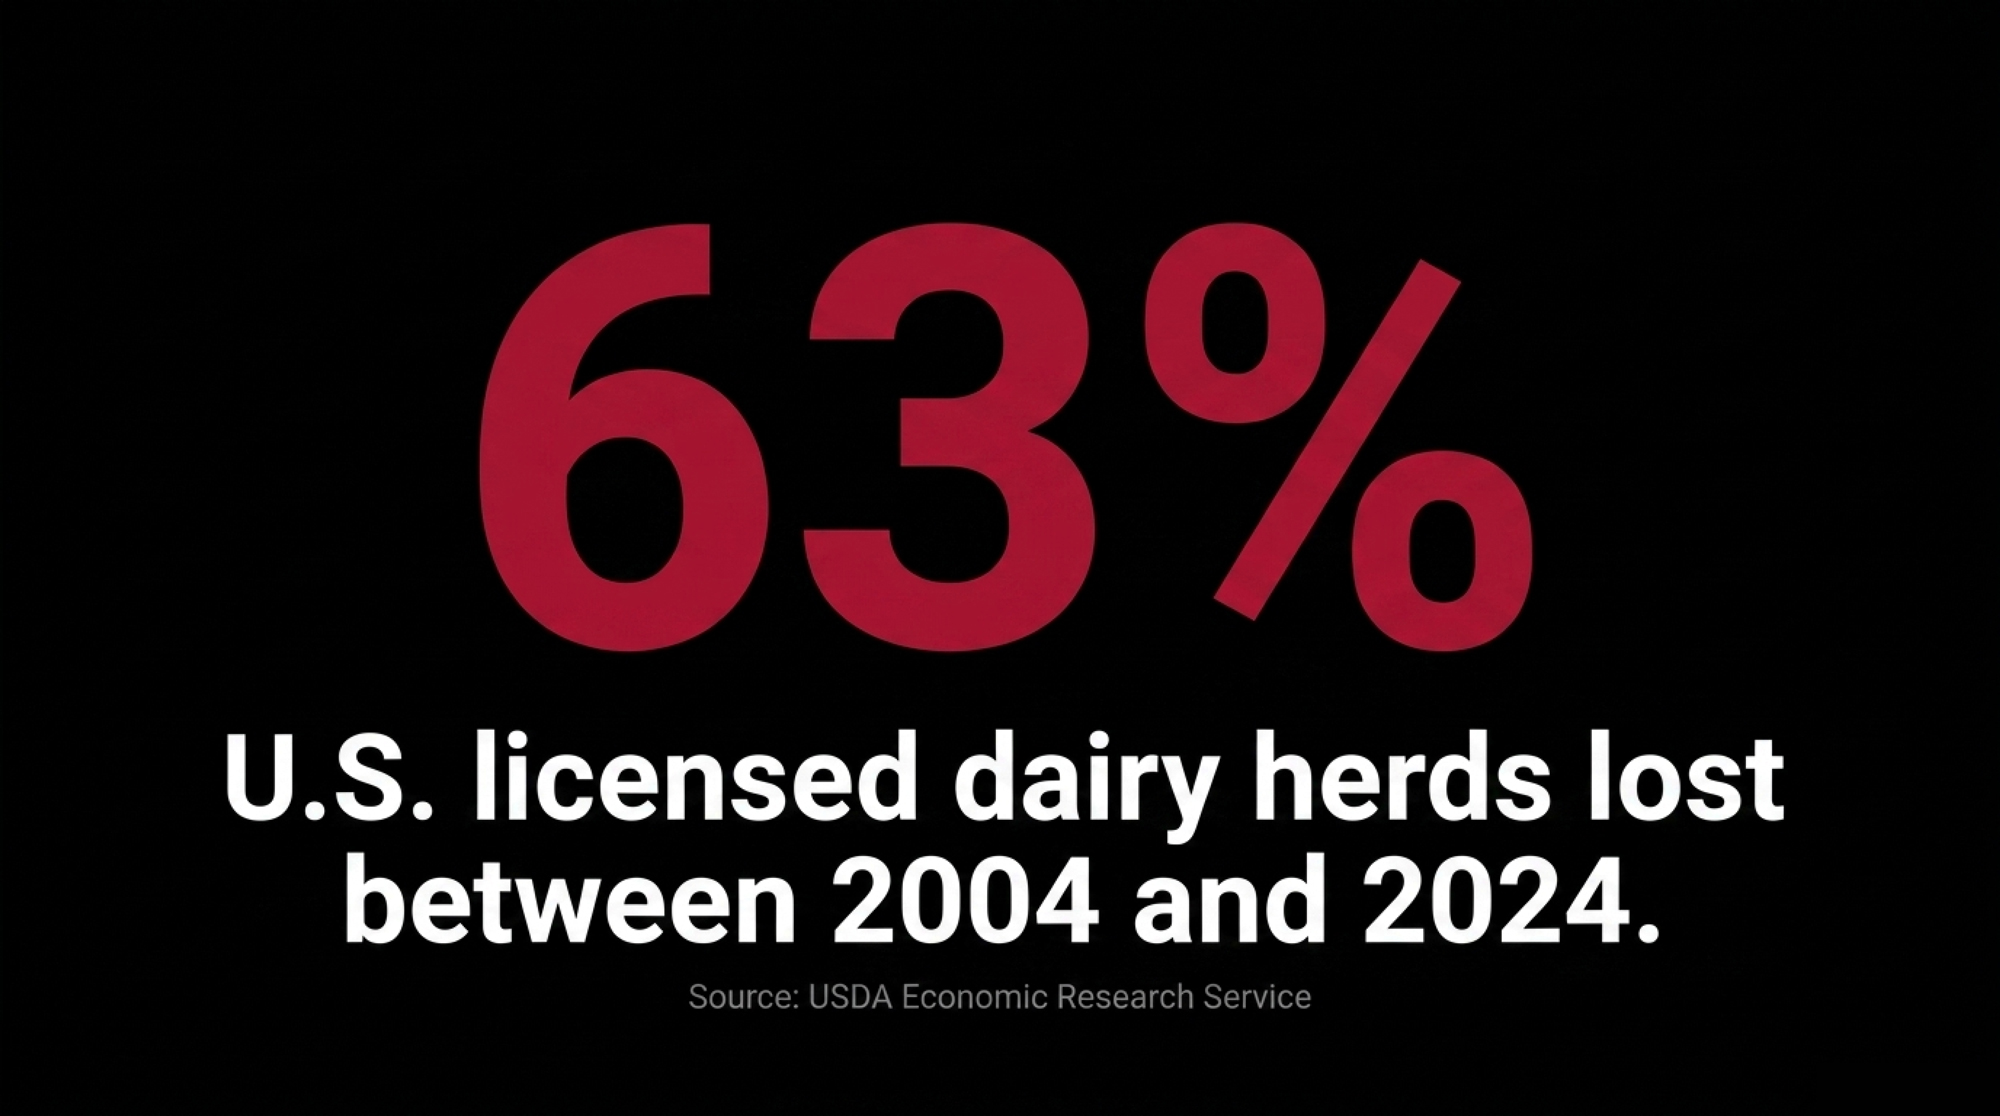
USDA’s Economic Research Service counted 66,825 licensed U.S. dairy herds in 2004. By 2024: 24,811. That’s 42,014 operations gone, and where the curve goes next depends on who you ask. Several analysts now project fewer than 20,000 farms by 2030, though estimates run from roughly 24,000 down to the mid-teens depending on the model.
Milk didn’t follow the farms down. National production climbed from 170.8 billion pounds in 2004 to a projected 234.5 billion in 2026.
None of this caught USDA by surprise. ERS published a dedicated report, Consolidation in U.S. Dairy Farming, in 2020, documenting the shift as structural transformation rather than a price cycle — and noting the pace in dairy far outran other agricultural sectors. The research said structural. The policy toolkit kept getting built for cycles. Between 2020 and 2025, the country shed 8,043 dairy farms, with Wisconsin absorbing 22% of that. Pennsylvania lost 490 herds in 2025 alone by one industry count, an 11.7% drop in a single year.
Who’s Actually Leaving — and What They Walked Away With
Hank Choate milked 485 cows at Choate’s Belly Acres in Cement City, Michigan, on a 29,133-pound rolling herd average. Fifth-generation operation, Centennial Farm, Michigan’s 2016 Dairy Farmer of the Year. He sold the whole string in a five-hour online dispersal on August 18, 2021 — and milk price wasn’t the trigger. Labor was. The family had put $1.3 million into barn upgrades between 2009 and 2018 and still couldn’t find or keep people.
“To be honest, I’m relieved,” Choate told Farm Progress after the sale. That’s not a man who lost — that’s a man who’d been carrying something heavier than debt. His daughter, Stacey Hughes, framed it as protecting the ground: “This land has been in our family since 1837, and we intend to keep it that way. Unfortunately, big and hard decisions need to be made to do so.” Freestalls hold machinery now. The family farms 1,800 acres of corn, beans, and wheat.
Jim Beardsley ran registered Holsteins in Columbiana County, Ohio, and dispersed 237 head on November 22, 2019, after health problems collided with the 2015 price collapse. He was 61. Three stepchildren, none of them taking over. Here’s the part that matters: the 237 head averaged $1,160, his top cow brought $4,150, and the sale cleared his debts with money left to keep the farm.
That’s what a strategic exit looks like on paper. “You never want to sell your farm or cattle or equipment when you’re forced out,” Beardsley told Farm and Dairy in February 2020. He’d watched the alternative: “You can’t ignore the numbers. You see people that do that, they’re going through their equity. And you get on the side where there’s no way you can get out. It’s ugly.”
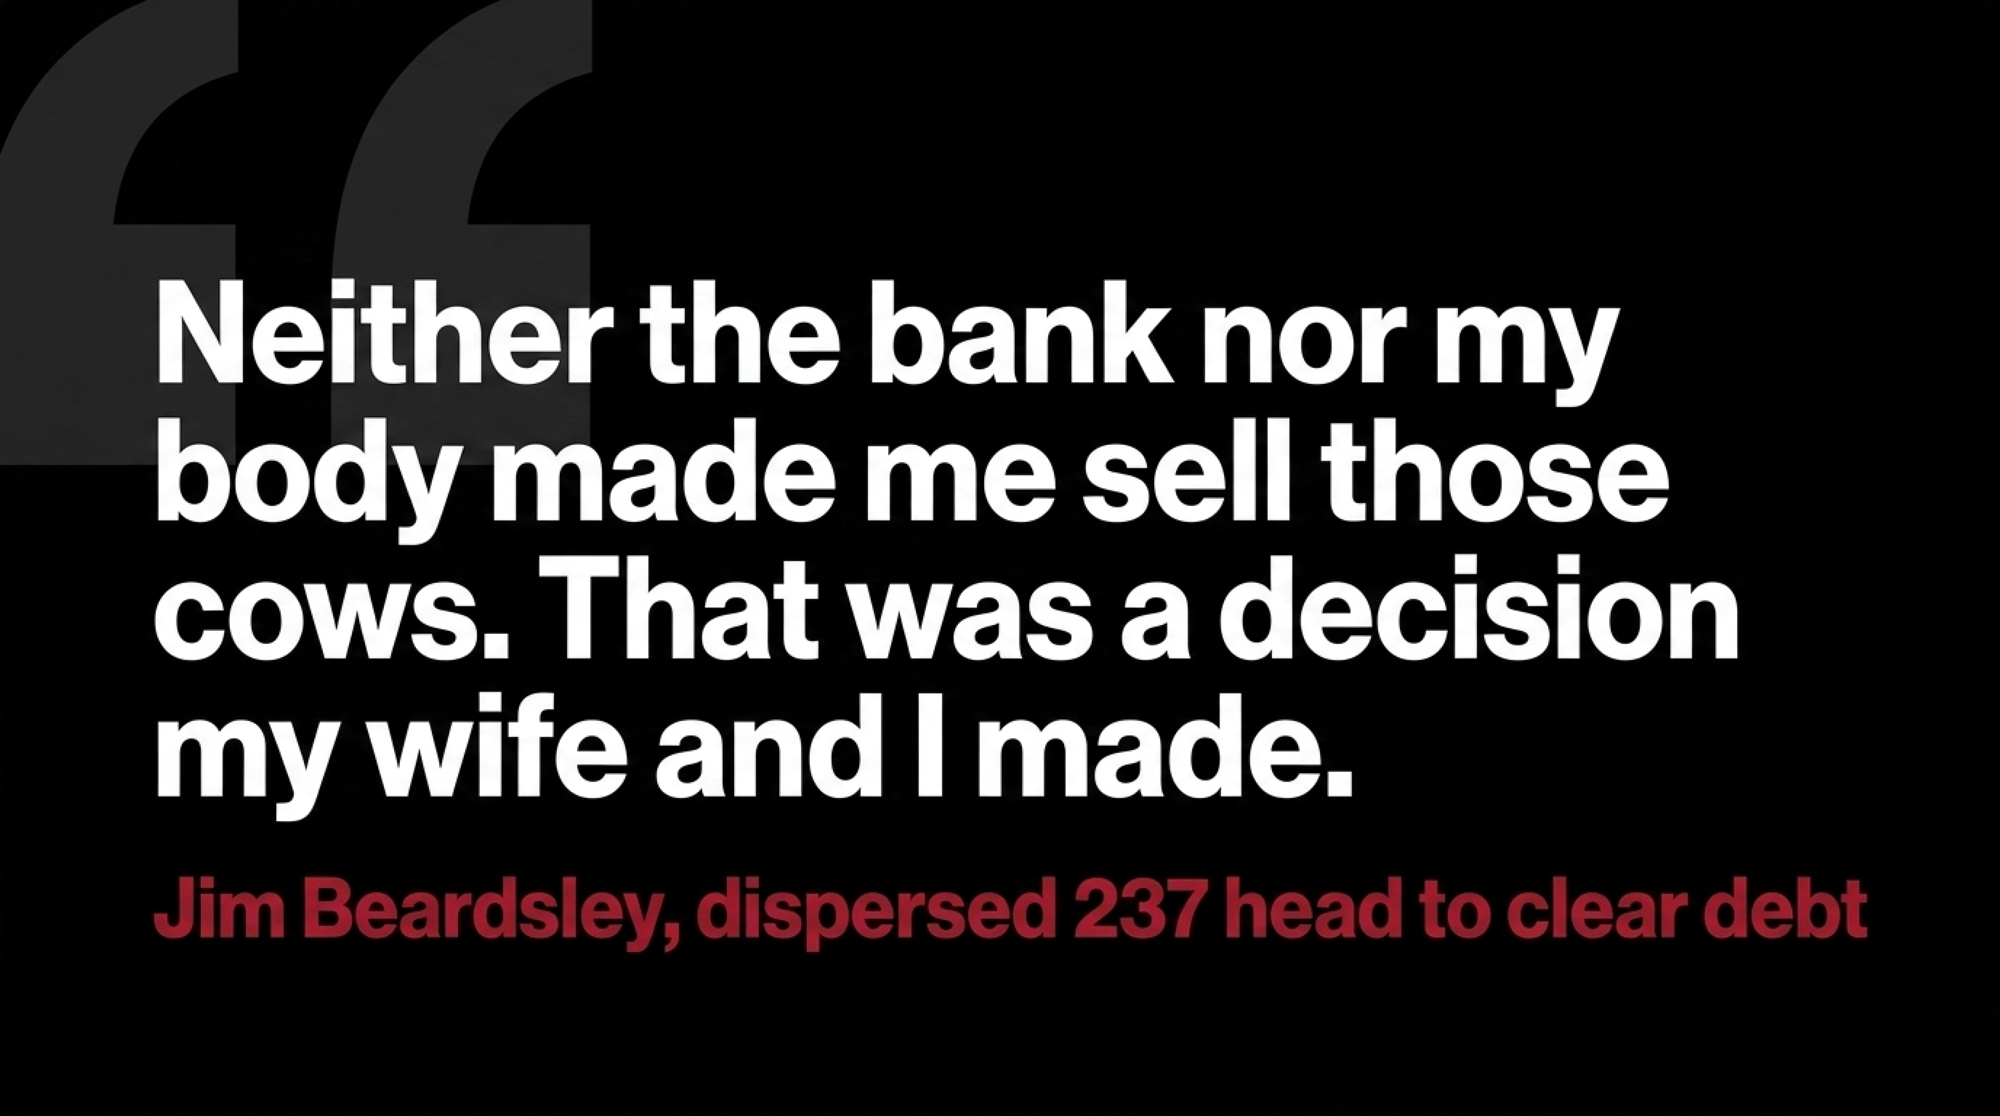
And this: “Neither the bank nor my body made me sell those cows. That was a decision my wife and I made.” Four days after the dispersal, he was converting barns for beef steers. Beardsley ran his version of the coverage-ratio math back in 2019, on a sale bill instead of a spreadsheet — and neither man had a bank setting the clock. That’s the distinction worth more than any price forecast here.
Which Barn Changes Actually Move Your Cost of Production?
Start with the honest number versus the headline one. USDA’s all-milk forecast for 2026 sits between $18.95 and $20.70, depending on which month it was issued. Class III — the base most Upper Midwest and Northeast herds get paid against — ran $16.16 in March, $16.92 in May, with AgCountry projecting $17.25 for the back half. July futures settled at $15.63 on August 4. Budget at $17, not $19.
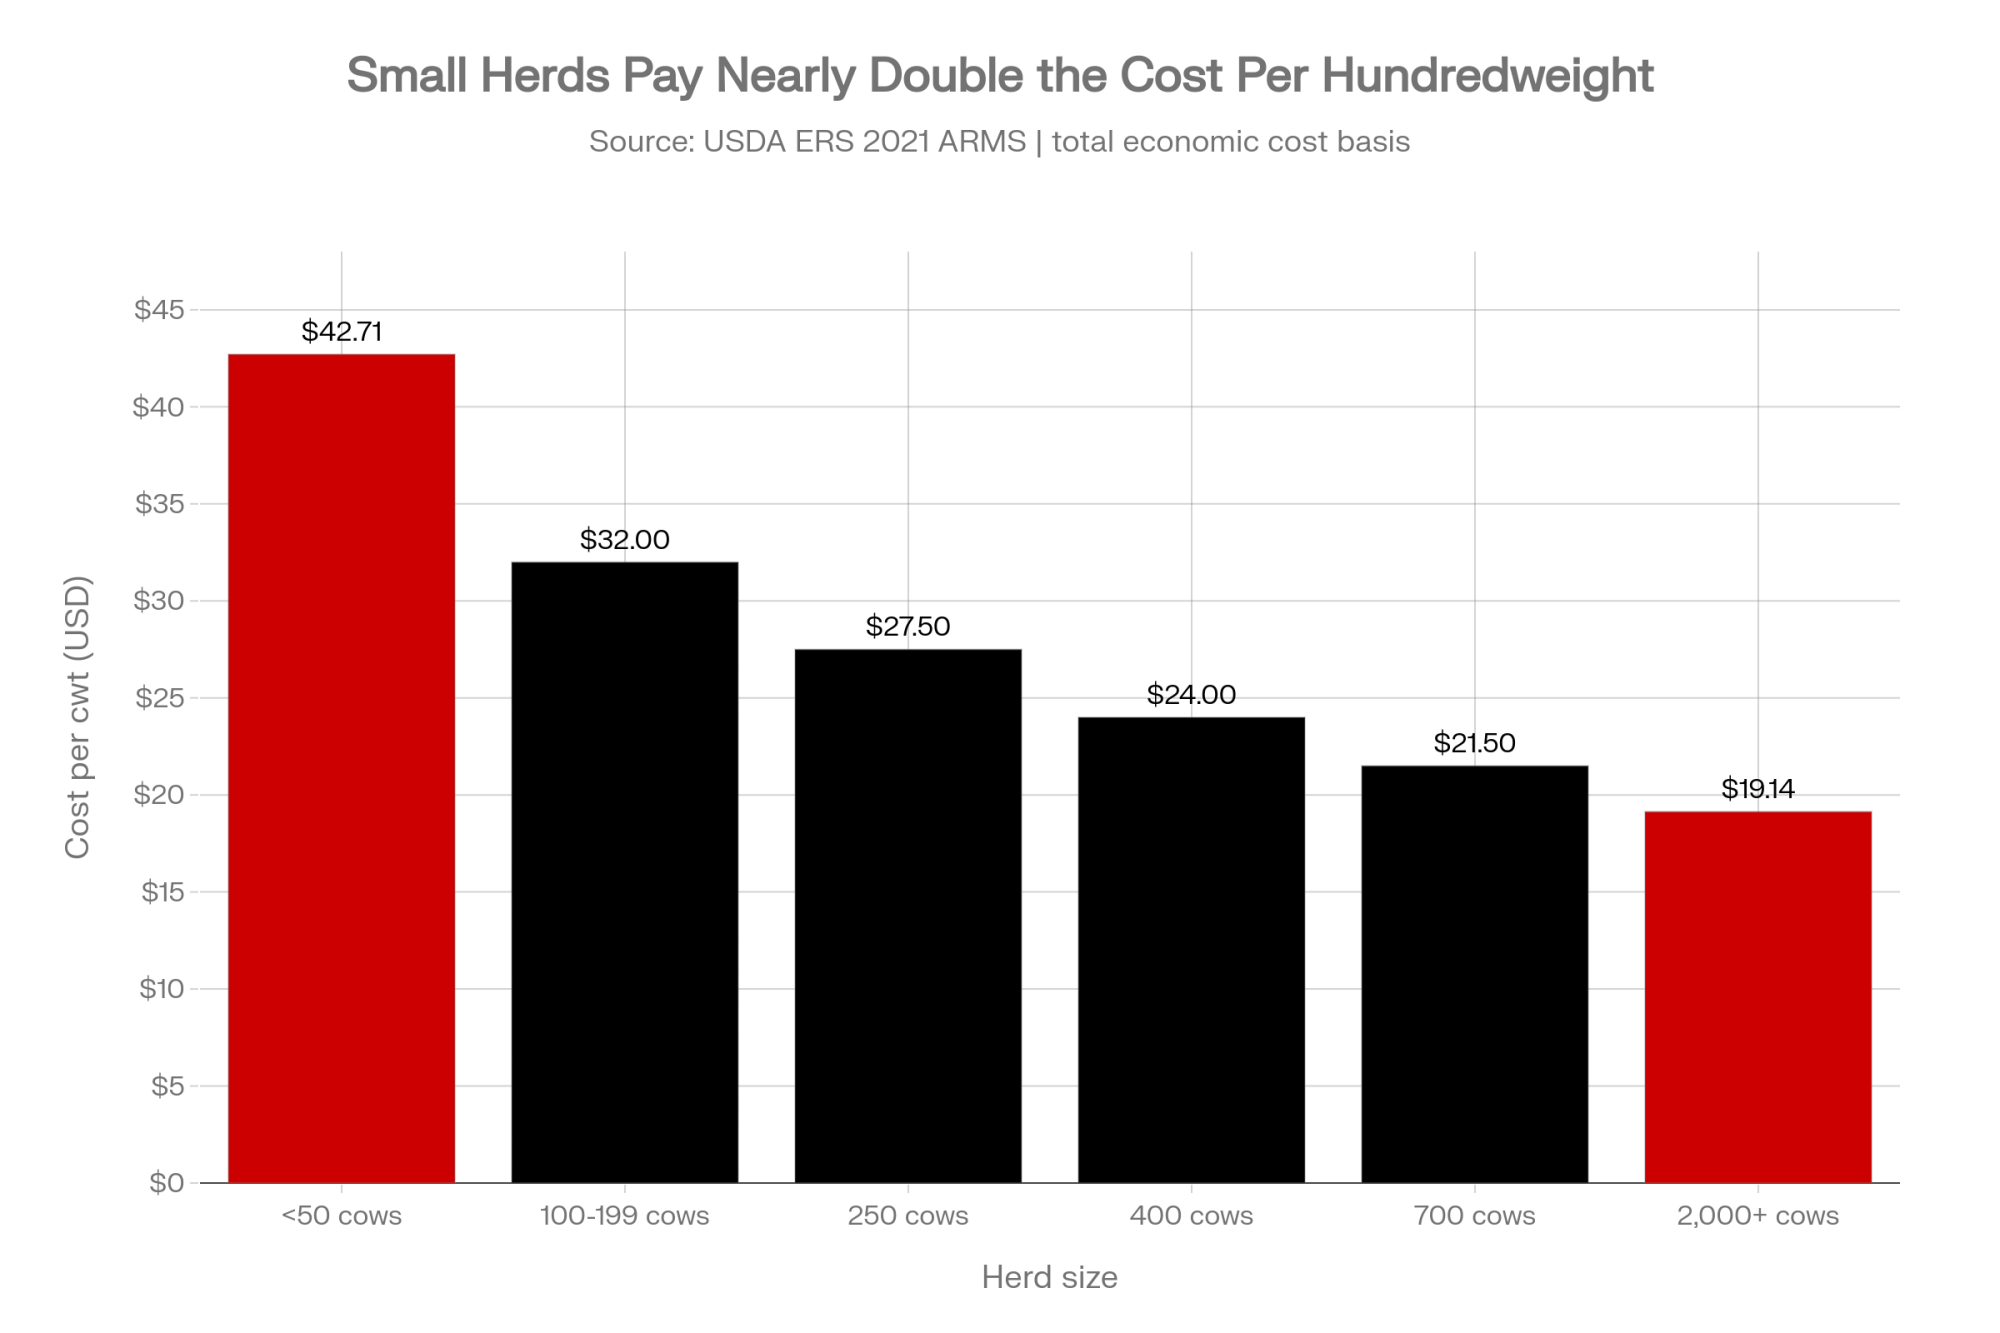
Scale doesn’t close that gap evenly. USDA’s 2021 ARMS data, reported through ERS, put total cost to produce 100 pounds of milk at $42.71/cwt for herds under 50 cows against $19.14 for operations of 2,000 or more. Those are national figures on a total economic cost basis, meaning unpaid family labor and full depreciation are in there — not just what clears your checkbook. Cornell’s Dairy Farm Business Summary puts 100–199 cow herds in the $31–33/cwt range on the same basis, though that’s a different, Northeast-specific dataset and not directly comparable to the USDA series.
Between those endpoints, here’s a planning frame for three herd sizes. The middle bands are interpolated, so treat this as a place to start your own math rather than a quote for your operation — and remember these are total economic costs, not cash costs, so they’ll look worse than your checkbook does.
| Herd size | Annual cwt shipped | Est. total economic cost/cwt | Margin at $17 milk | Margin at $20 milk |
| 250 cows | 60,000 | $24 – $31 | –$7 to –$14 | –$4 to –$11 |
| 400 cows | 96,000 | $22 – $26 | –$5 to –$9 | –$2 to –$6 |
| 700 cows | 168,000 | $20 – $23 | –$3 to –$6 | $0 to –$3 |
Four levers actually move the line. Replacement strategy first: heifers hit $3,010 a head, so cutting involuntary culls by ten points on a 200-cow herd — about twenty animals — keeps roughly $60,000 in replacement cost off the books annually. Robot throughput second: real North American barns average 50.5 cows per box, and well-run 60-cow barns post about 13% better net returns than badly run ones at the same count. The gap is fetch rates and kilograms per minute, not the spec sheet.
Then labor structure. A full-time hire runs $45,000–$50,000; robots cut milking from 6.5 hours a day to 1.5, but they carry a seven-year negative cash-flow valley before that trade pays. Choate’s $1.3 million in barn upgrades didn’t fail on the engineering — he still couldn’t staff the place. And feed shrink above 6–7%, which shows up nowhere on a milk check and everywhere at year-end.
| Lever | Type | Annual dollar impact (400-cow herd) | Farmer control |
| Cull rate reduction (10 pts, ~20 head) | Management | ~$60,000 saved at $3,010/heifer | Full control |
| Robot throughput (50.5 vs 60 cows/box) | Management | ~13% better net returns at same cow count | Full control |
| Feed shrink above 6-7% | Management | Varies, hits margin directly | Full control |
| Make-allowance formula cut | Policy/Structural | –$88,320, permanent | No control |
Options and Trade-Offs
Run your renewal numbers in the next 30 days — before the meeting, not during it. Walk in holding two figures: debt-service coverage at $17 milk, and working capital per mature cow. One benchmark in circulation puts a competitive cushion above $1,000 per mature cow. Costs you an evening. Where it fails: using last year’s milk price instead of the forward strip, which is exactly how a 1.1x turns into a surprise.
Attack the three levers you control. Cull discipline, robot throughput, and shrink are where a mid-size herd finds real dollars without buying land or cows. Works when you’ve got the capacity to hold a protocol for two quarters. Doesn’t work as a rescue — these move cost of production over quarters, not weeks, and none of them offsets an $88,320 formula change by itself.
Then there’s the one nobody schedules. USDA’s 2022 Census of Agriculture found 71% of dairy farms had engaged in estate or succession planning, the highest of any commodity — but only 28–29% of household members involved in daily decisions were part of that planning. Sixty percent of producers report no defined plan at all, with a quarter of current operators set to retire by 2031. A 2009 Journal of Extension study by Kaplan, still cited across the extension network, found the barrier was passive communication and unresolved family issues, not missing paperwork. Beardsley had three stepchildren and no successor, and he priced that into his timing at 61 rather than at 71. A plan you haven’t said out loud isn’t a plan.
A planned exit is a strategy, not a surrender. Beardsley’s 237 head averaged $1,160 and cleared his debt. Choate sold 485 cows from a herd averaging over 29,000 pounds and called it a relief. Both men set their own terms — timing, buyer, what stayed in the family. What it costs you is accepting the decision before the balance sheet forces it, and that’s the part nobody wants to do early.
Key Takeaways
- If your debt-service coverage sits between 1.0x and 1.25x, model the 92¢ make-allowance cut as permanent, not cyclical — on 400 cows that’s roughly $88,320 a year off the numerator, and it doesn’t reverse when prices recover.
- If you’re budgeting off USDA’s all-milk forecast, rebuild it on Class III. The spread between USDA’s $18.95 forecast and the $16–17 range you’re actually paid against is your entire margin of error.
- If you’re above 6–7% feed shrink or below 50 cows per robot with a growing fetch list, those two move cost of production before any capital purchase does.
- If nobody in your family has said out loud who’s milking these cows in ten years, that’s your open item — not the barn upgrade.
- If your involuntary cull rate is climbing, price it at $3,010 a head and decide whether longevity is worth a protocol change this fall.
- If you can’t state your working capital per mature cow right now, get that number before your lender does.
Before Your Next Renewal Meeting
Riverview’s next barn isn’t a threat on its own. It’s a reference point — it tells you how far the cost curve runs between your scale and theirs, and how much of that distance has to be closed by management rather than growth. So where does your breakeven actually sit at $17 milk, and does your lender have the same number you do?
Plenty of producers can name their herd average to the pound and go quiet when asked about working capital per cow. If that’s you this month, the two figures above are the place to start — and if you want a faster read on where your operation sits in the consolidation math, our 5-Question Decision Engine runs herd size, trajectory, cost position, succession and capital access in about a minute. It’s built on USDA Census survival data plus our own modeling, and it won’t know your debt service, so treat it as a starting point rather than an answer. The full cost-per-cwt breakdown by herd size, with the lender ratios attached, runs in next week’s Bullvine Weekly.
Run Your Numbers
Dairy Farm Corridor Score Calculator — Puts the 92¢ make-allowance hit next to your hauling cost and your state’s attrition pressure, then flags total structural drag as a share of gross milk revenue. Two numbers you didn’t choose, one score that tells you how exposed your location already is.
Complete references and supporting documentation are available upon request by contacting the editorial team at editor@thebullvine.com.
Learn More
- Pellet-Free Robotic Milking: The $36740 Decision Your Operation Needs to Make Now — Slashes feed costs by $36,740 per 200 cows while boosting butterfat by 0.2–0.4%. Arms you with a concrete protocol to recover margin without buying equipment or changing herd size.
- Darigold’s $4/cwt Deduction. Idaho’s Five-Processor Bidding War. The Map That Shows Which Side You’re On. — Exposes how processor consolidation creates a $3.00–$4.25/cwt regional value gap. Delivers a structural framework to evaluate your buyer leverage and address risk before committing to long-term debt.
- Dairy Tech ROI: The Questions That Separate $50K Wins from $200K Mistakes — Reveals scale-specific capital benchmarks and the $27/hour labor breakeven threshold for automation. Prevents six-figure capital missteps by matching precision technology directly to your herd size and infrastructure capacity.
 The Sunday Read Dairy Professionals Don’t Skip.
 The Sunday Read Dairy Professionals Don’t Skip.
Every week, thousands of producers, breeders, and industry insiders open Bullvine Weekly for genetics insights, market shifts, and profit strategies they won’t find anywhere else. One email. Five minutes. Smarter decisions all week.




