








The report says 7% ash. The crew figures 1% was dirt. Bullvine’s mass balance puts that 1% at 2.86 points, not one — and shows ash can climb with no soil at all.
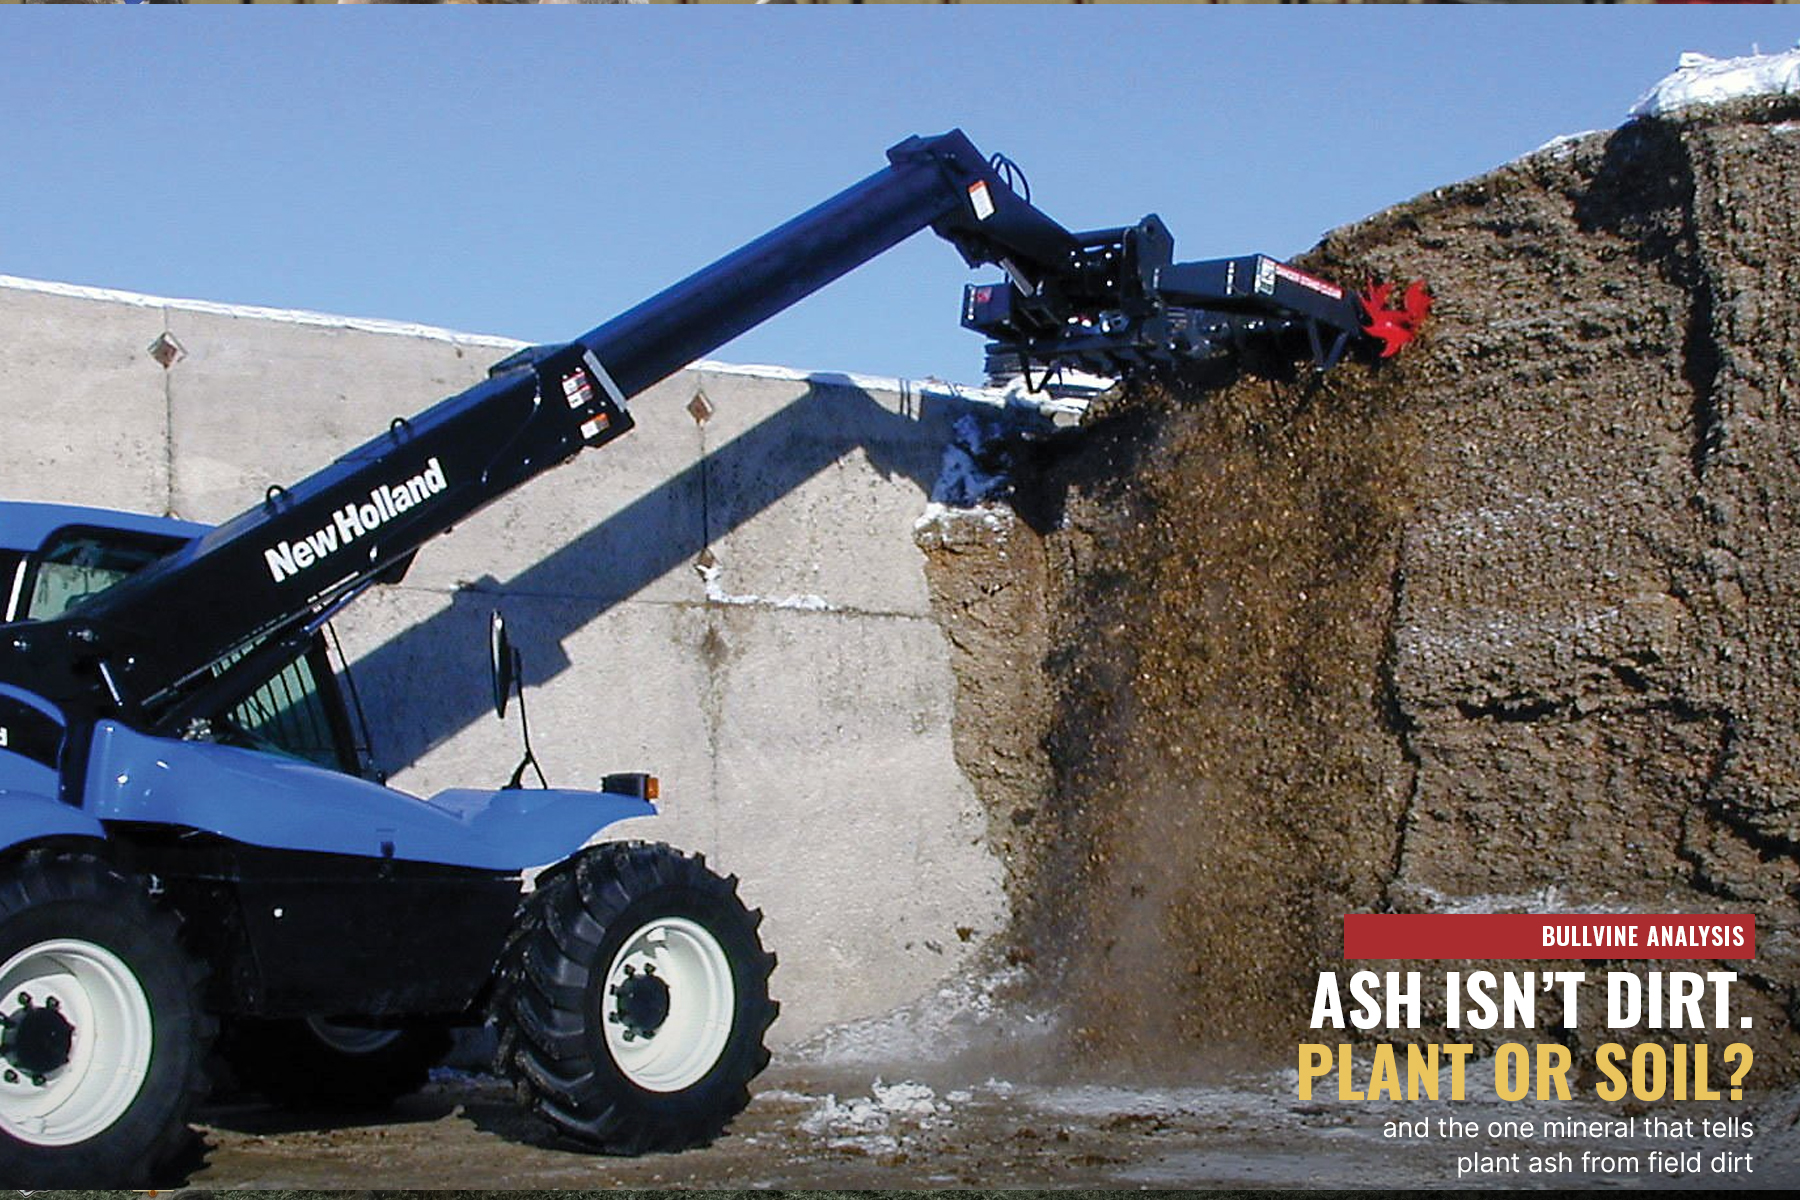
Your forage report says 7% ash on a dry-matter basis. Somebody on the crew figures about 1% of the fresh load was soil. Those two numbers can’t be compared directly, and knowing “1% soil” isn’t enough to work out what it did to the ash figure. Penn State reports ash as a share of dry matter — the mineral residue left after a sample burns — and treats an elevated result as an indirect sign of possible contamination, not a soil measurement.
Two denominators, two different things
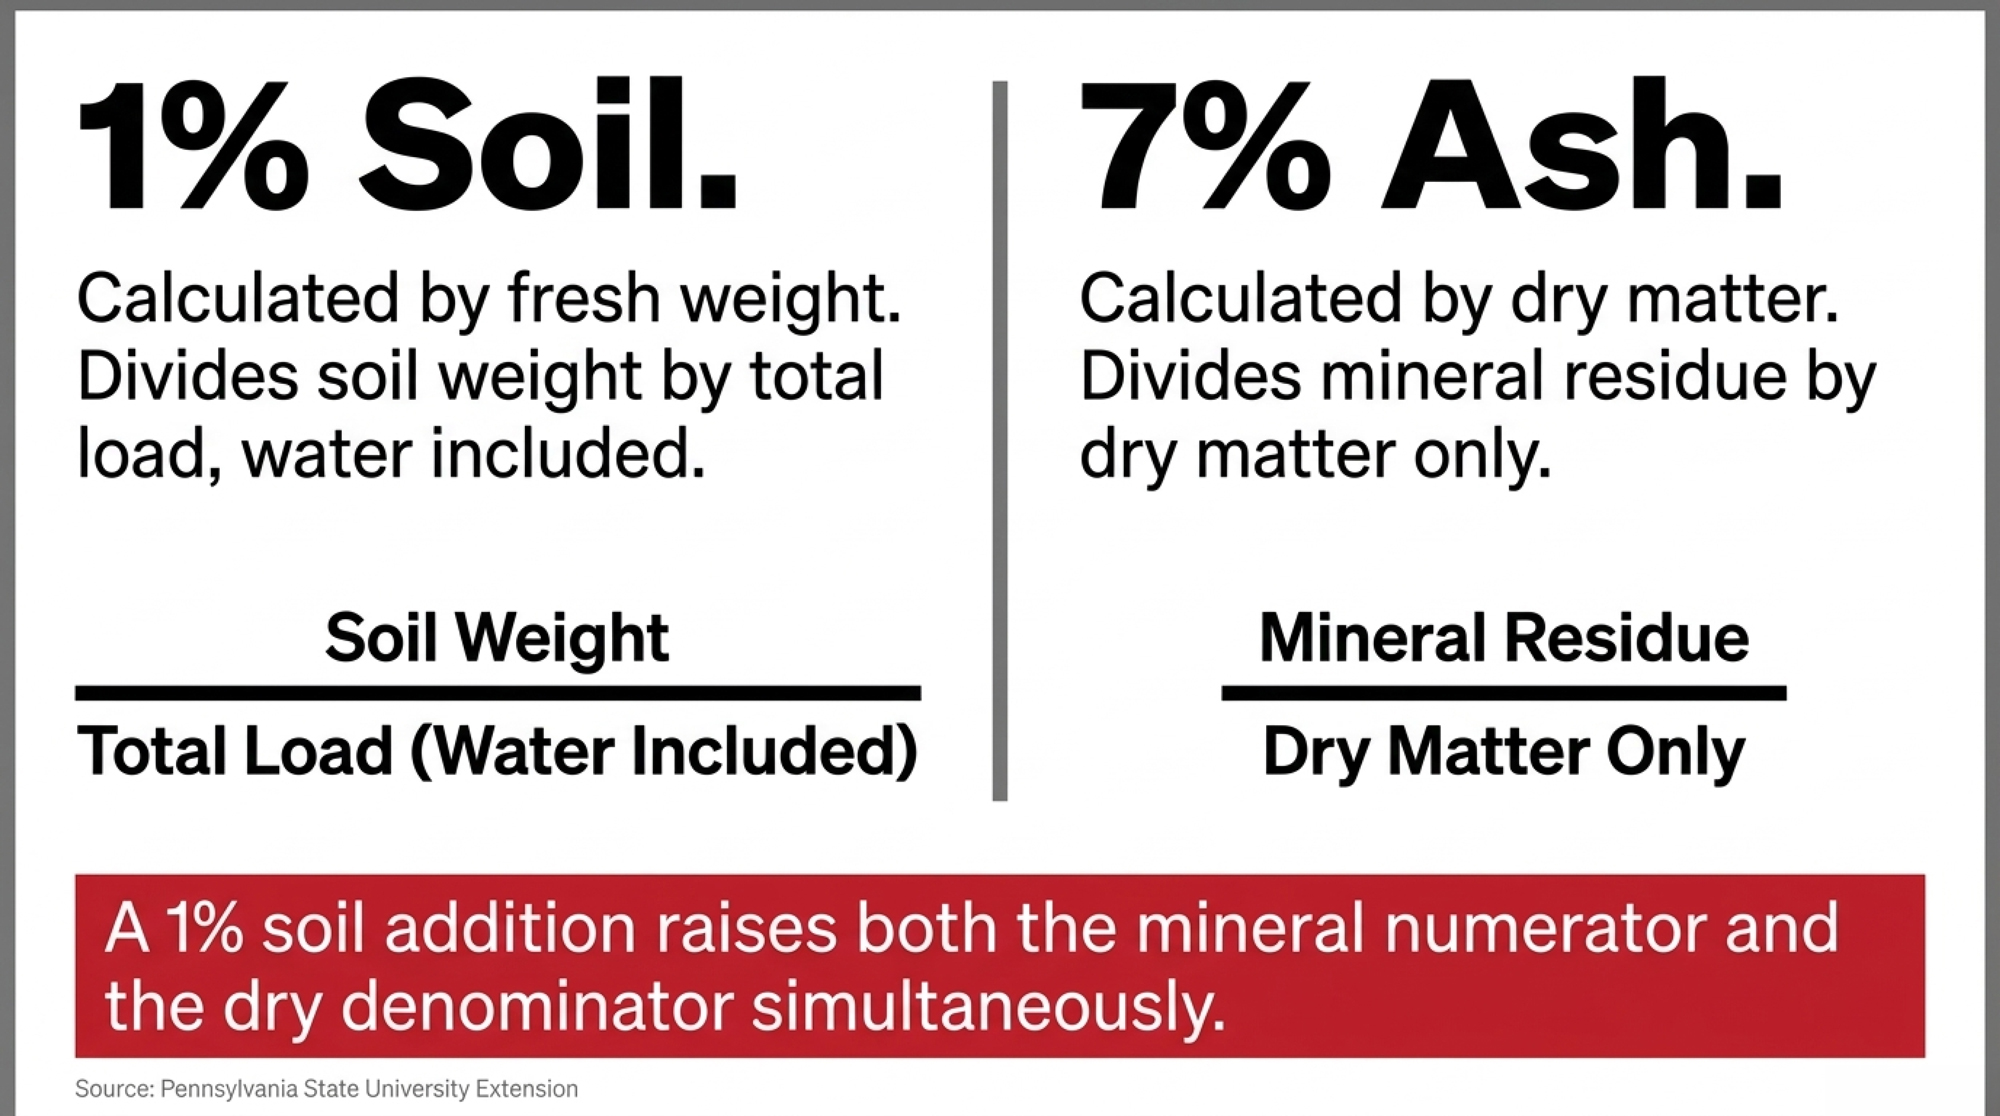
The 7% divides mineral residue by the load’s dry matter. The 1% divides soil weight by the load’s fresh weight, water included. Penn State defines dry matter as what remains after water is removed and ash as the inorganic residue after combustion, so the two figures need converting before they can sit side by side.
Total ash isn’t total dirt, either. University of Minnesota Extension separates internal ash — the calcium, potassium and phosphorus the plant took up — from external ash picked up as soil, and notes that the internal share has nutritional value.
One worked example
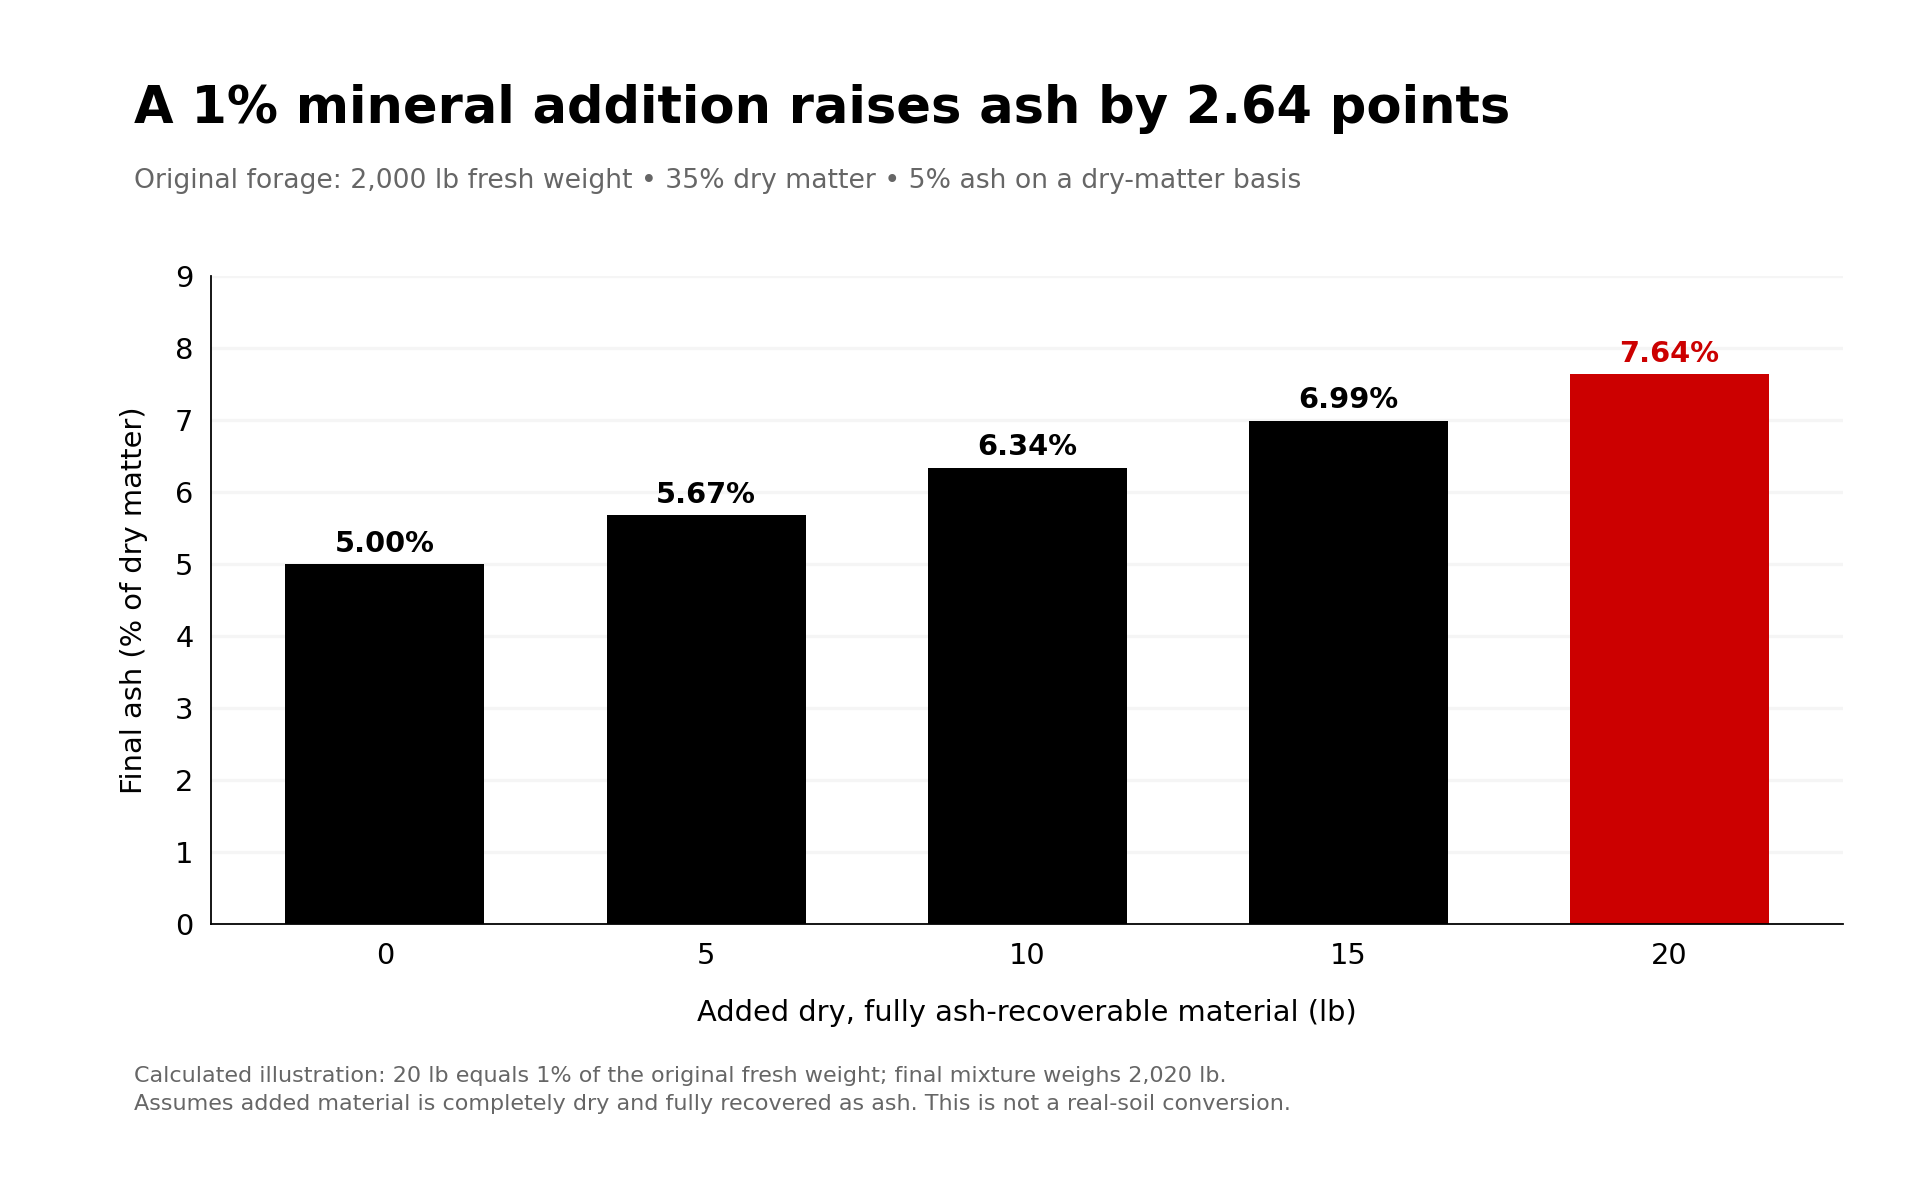
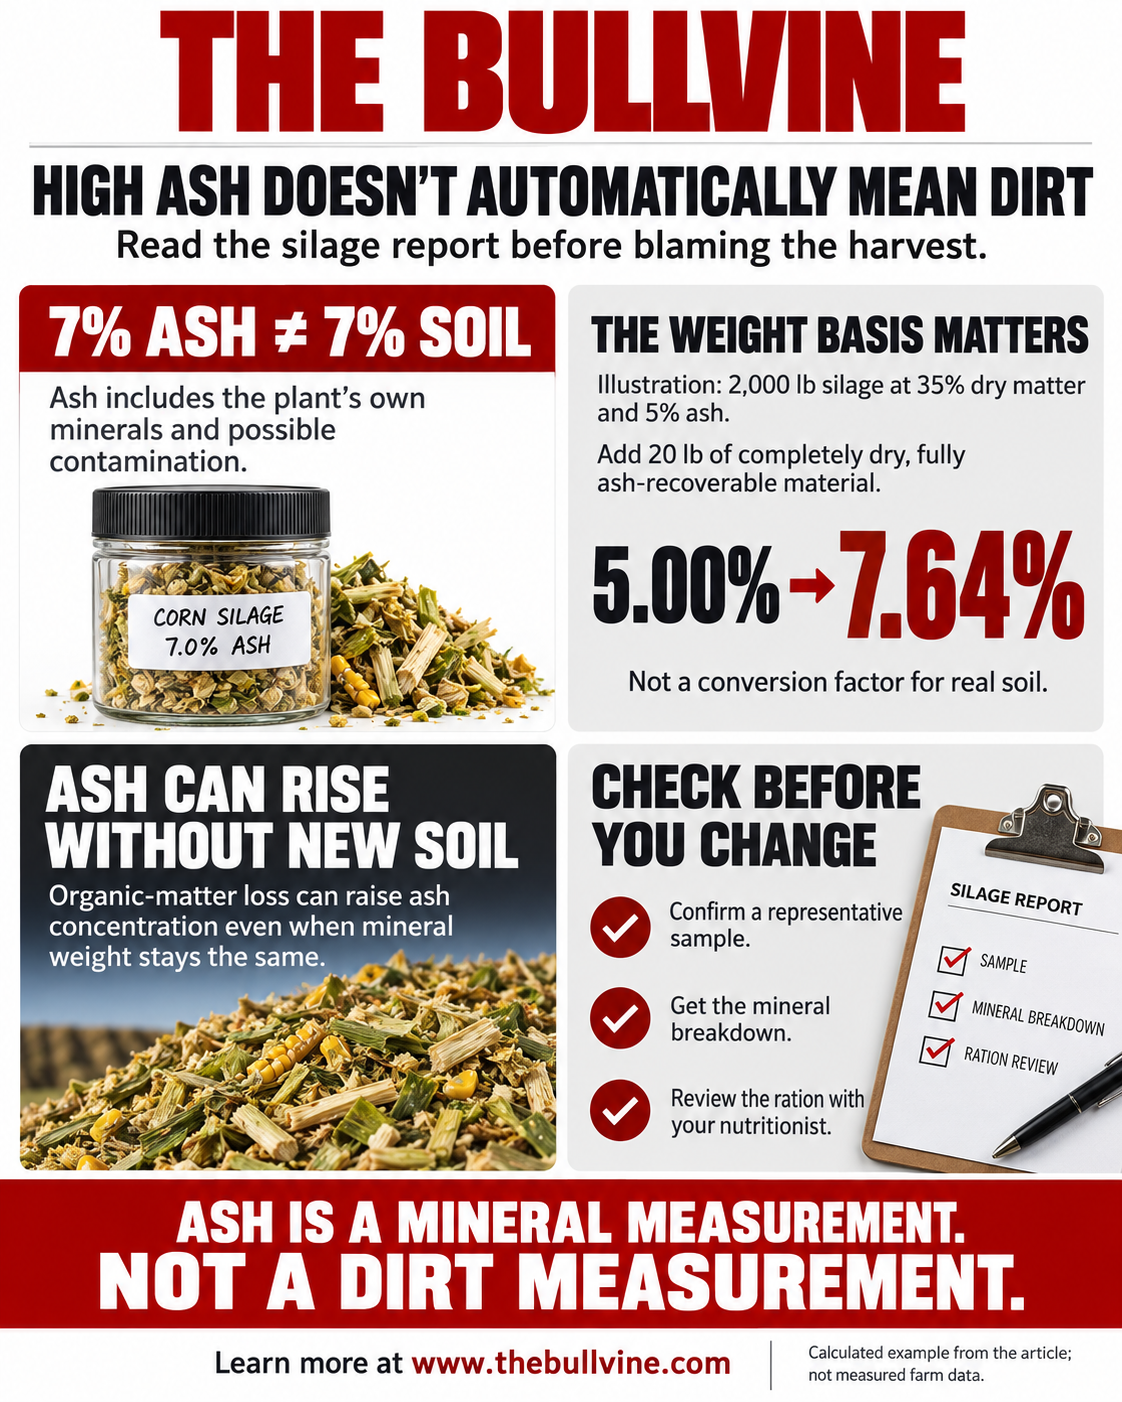
Bullvine math, not measured farm data. Start with 2,000 lb of clean forage at 35% DM and 5.00% ash. Add 20 lb of material that is, strictly for this calculation, entirely dry and entirely recovered as ash — just under 1% of the final fresh load.
| Before | After | |
| Fresh weight | 2,000 lb | 2,020 lb |
| Dry matter | 700 lb | 720 lb |
| Mineral residue | 35 lb | 55 lb |
| Ash, % of DM | 5.00% | 7.64% |
Roughly 1% by fresh weight moved the DM-basis ash by 2.64 percentage points, not one, because the addition raised the mineral numerator and the dry-matter denominator at the same time. Across Penn State’s 32–38% corn-silage DM window the net change runs from about 2.9 points at the wet end to about 2.4 at the dry end.
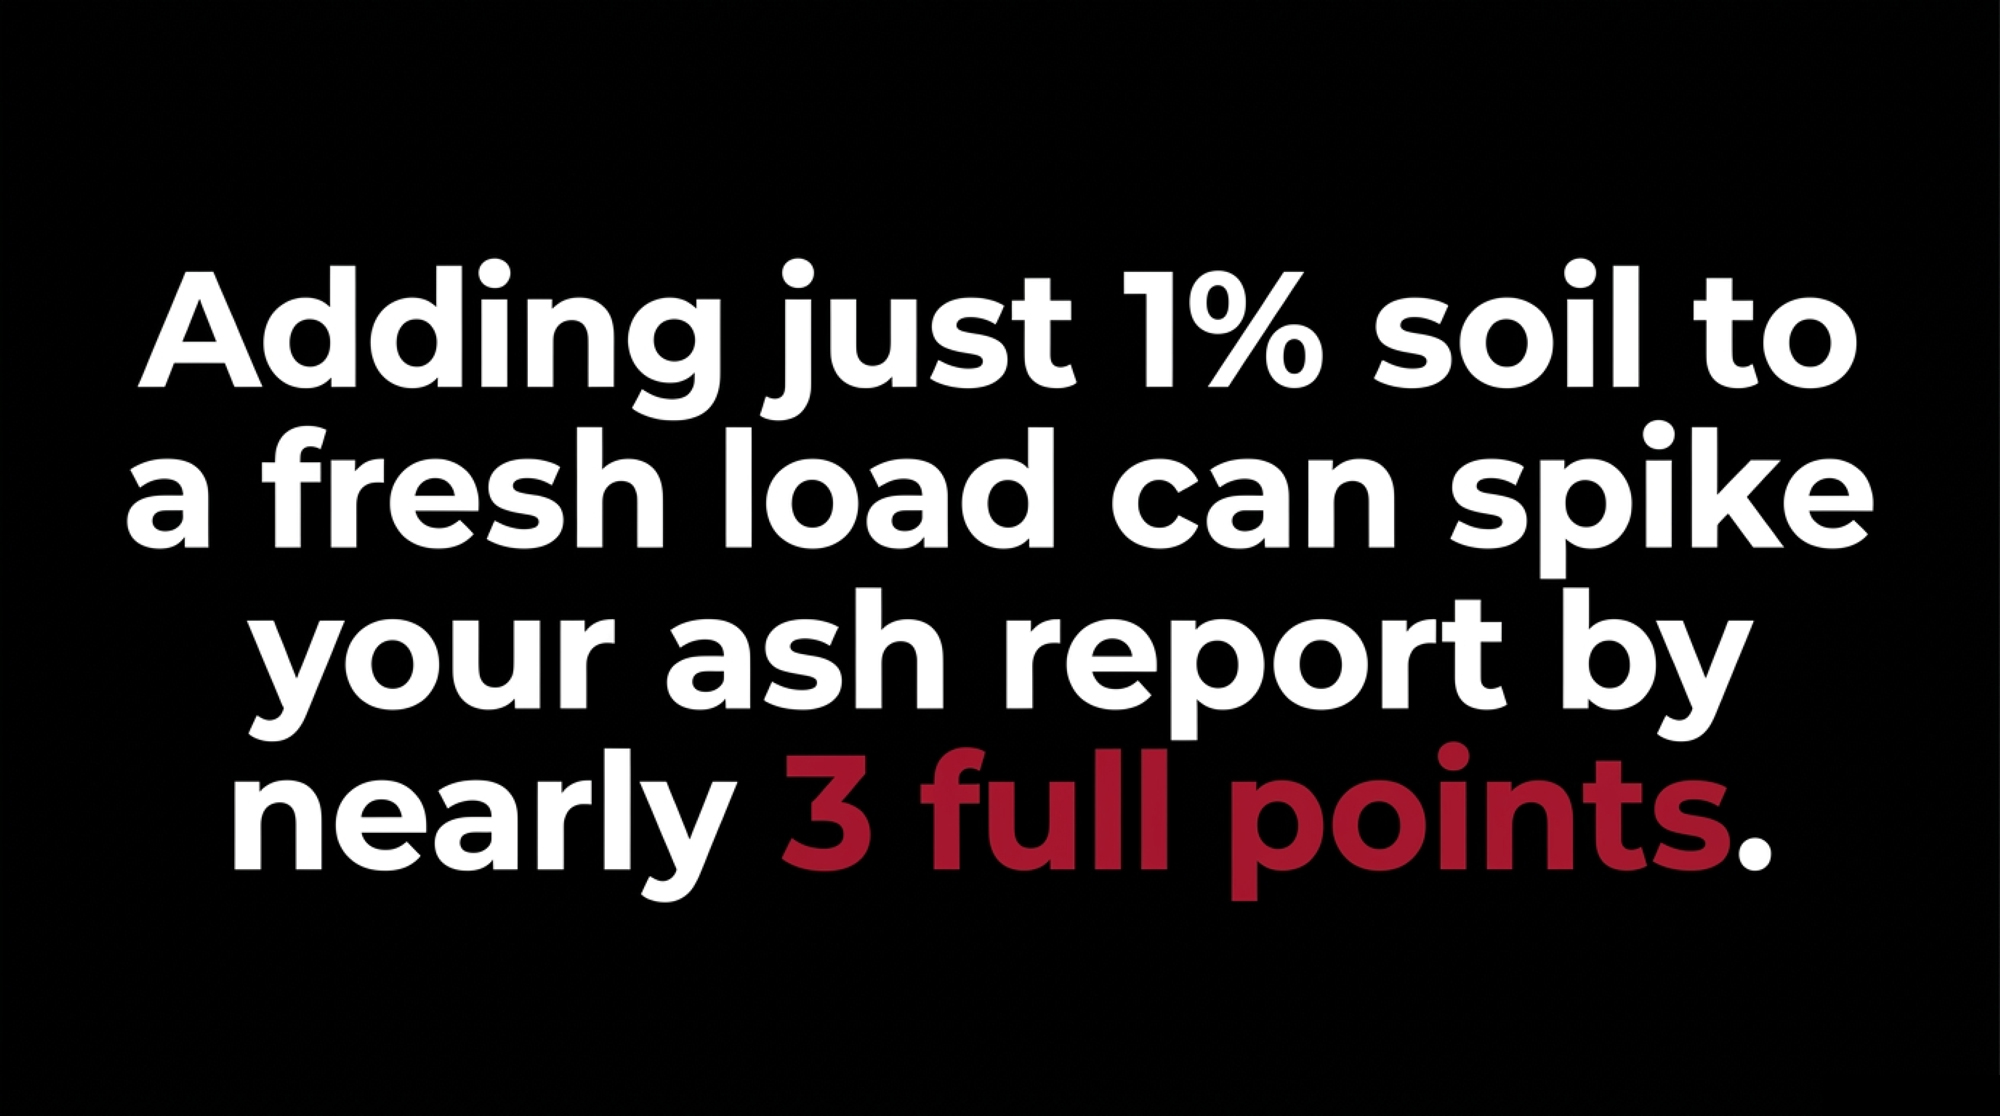
What this proves: the “1% soil equals 1 point of ash” shortcut fails as a general rule. What it doesn’t prove: that real soil behaves like pure dry mineral. Field soil carries water and organic matter, so converting a soil weight into an ash contribution needs three inputs your forage report doesn’t give you — the contaminant’s weight, its dry-matter fraction and the ash fraction of that dry matter. This example explains why the shortcut fails. It is not a farm-specific soil calculator.
How ash rises without added soil
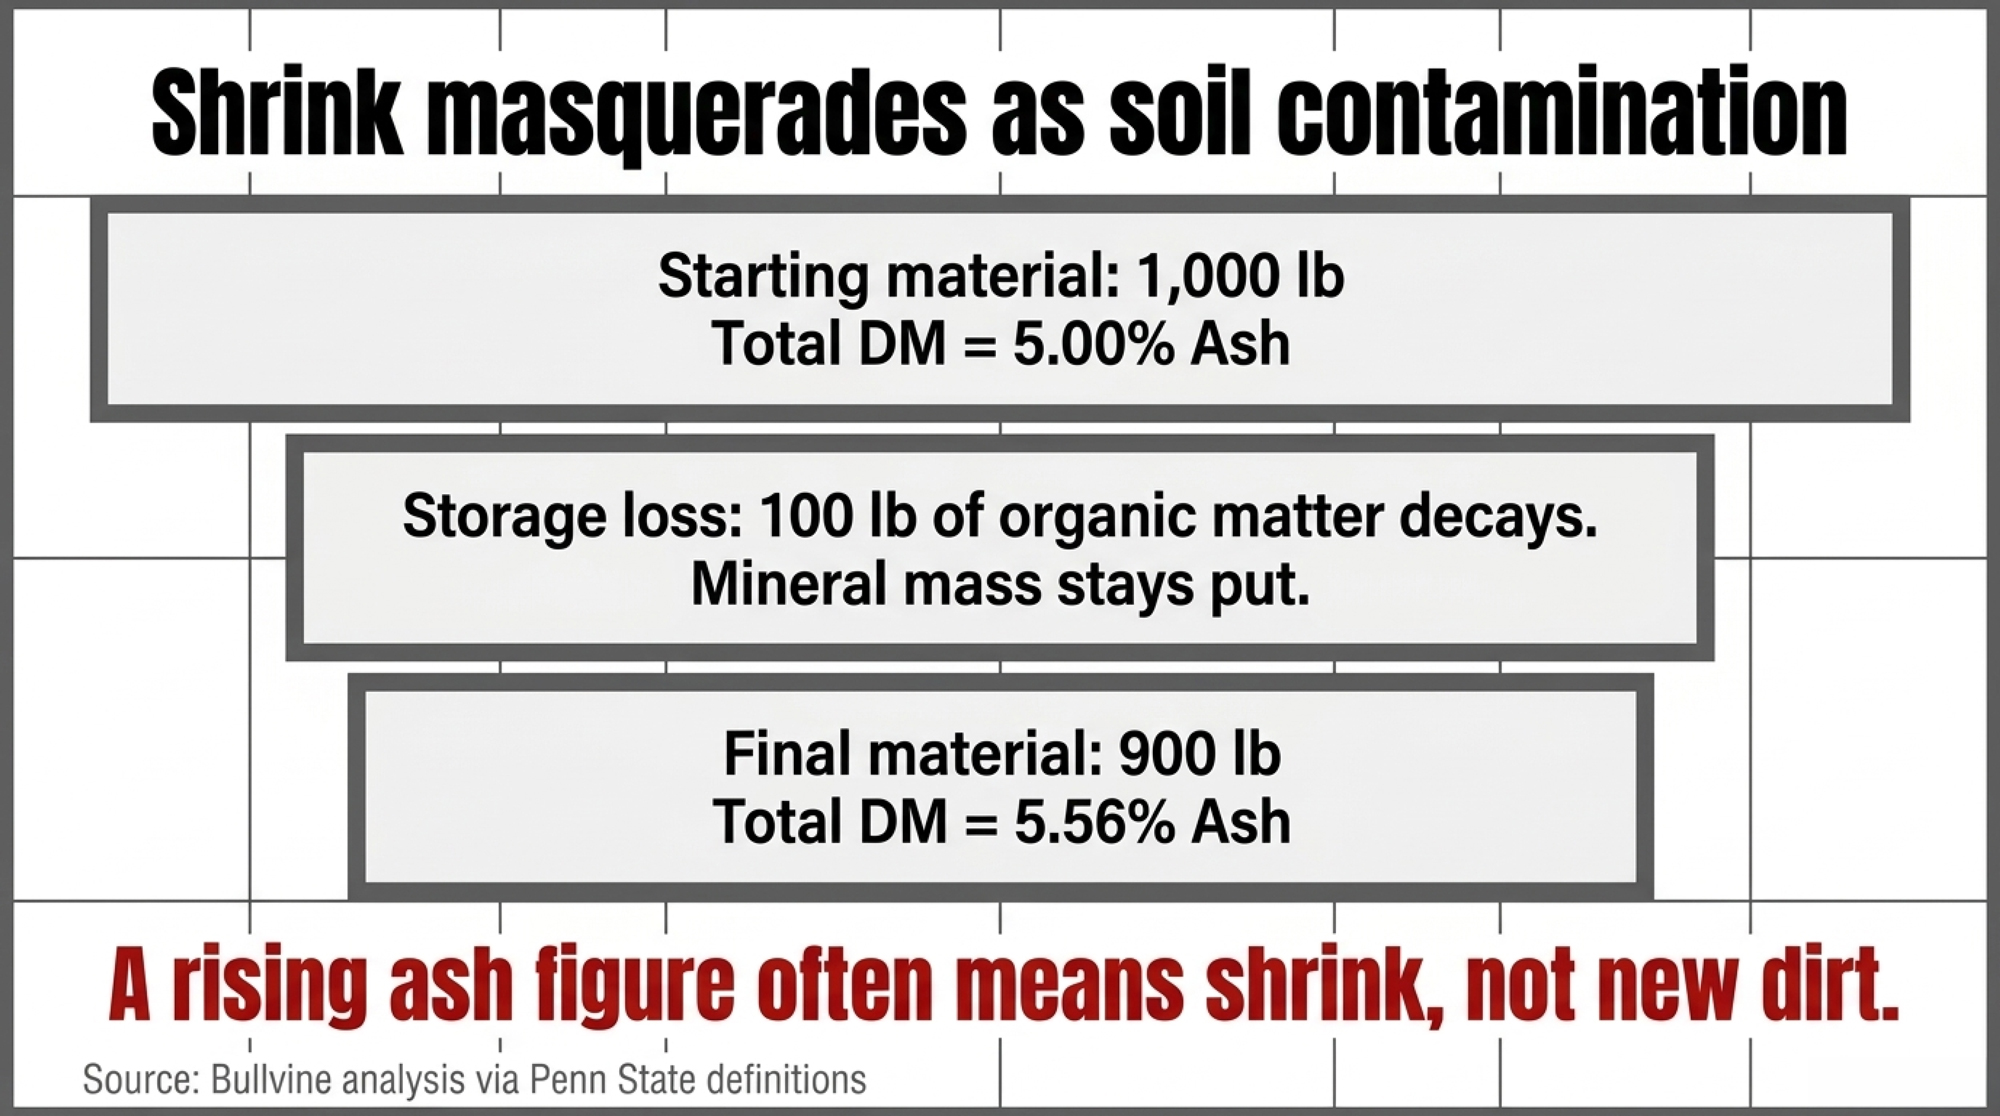
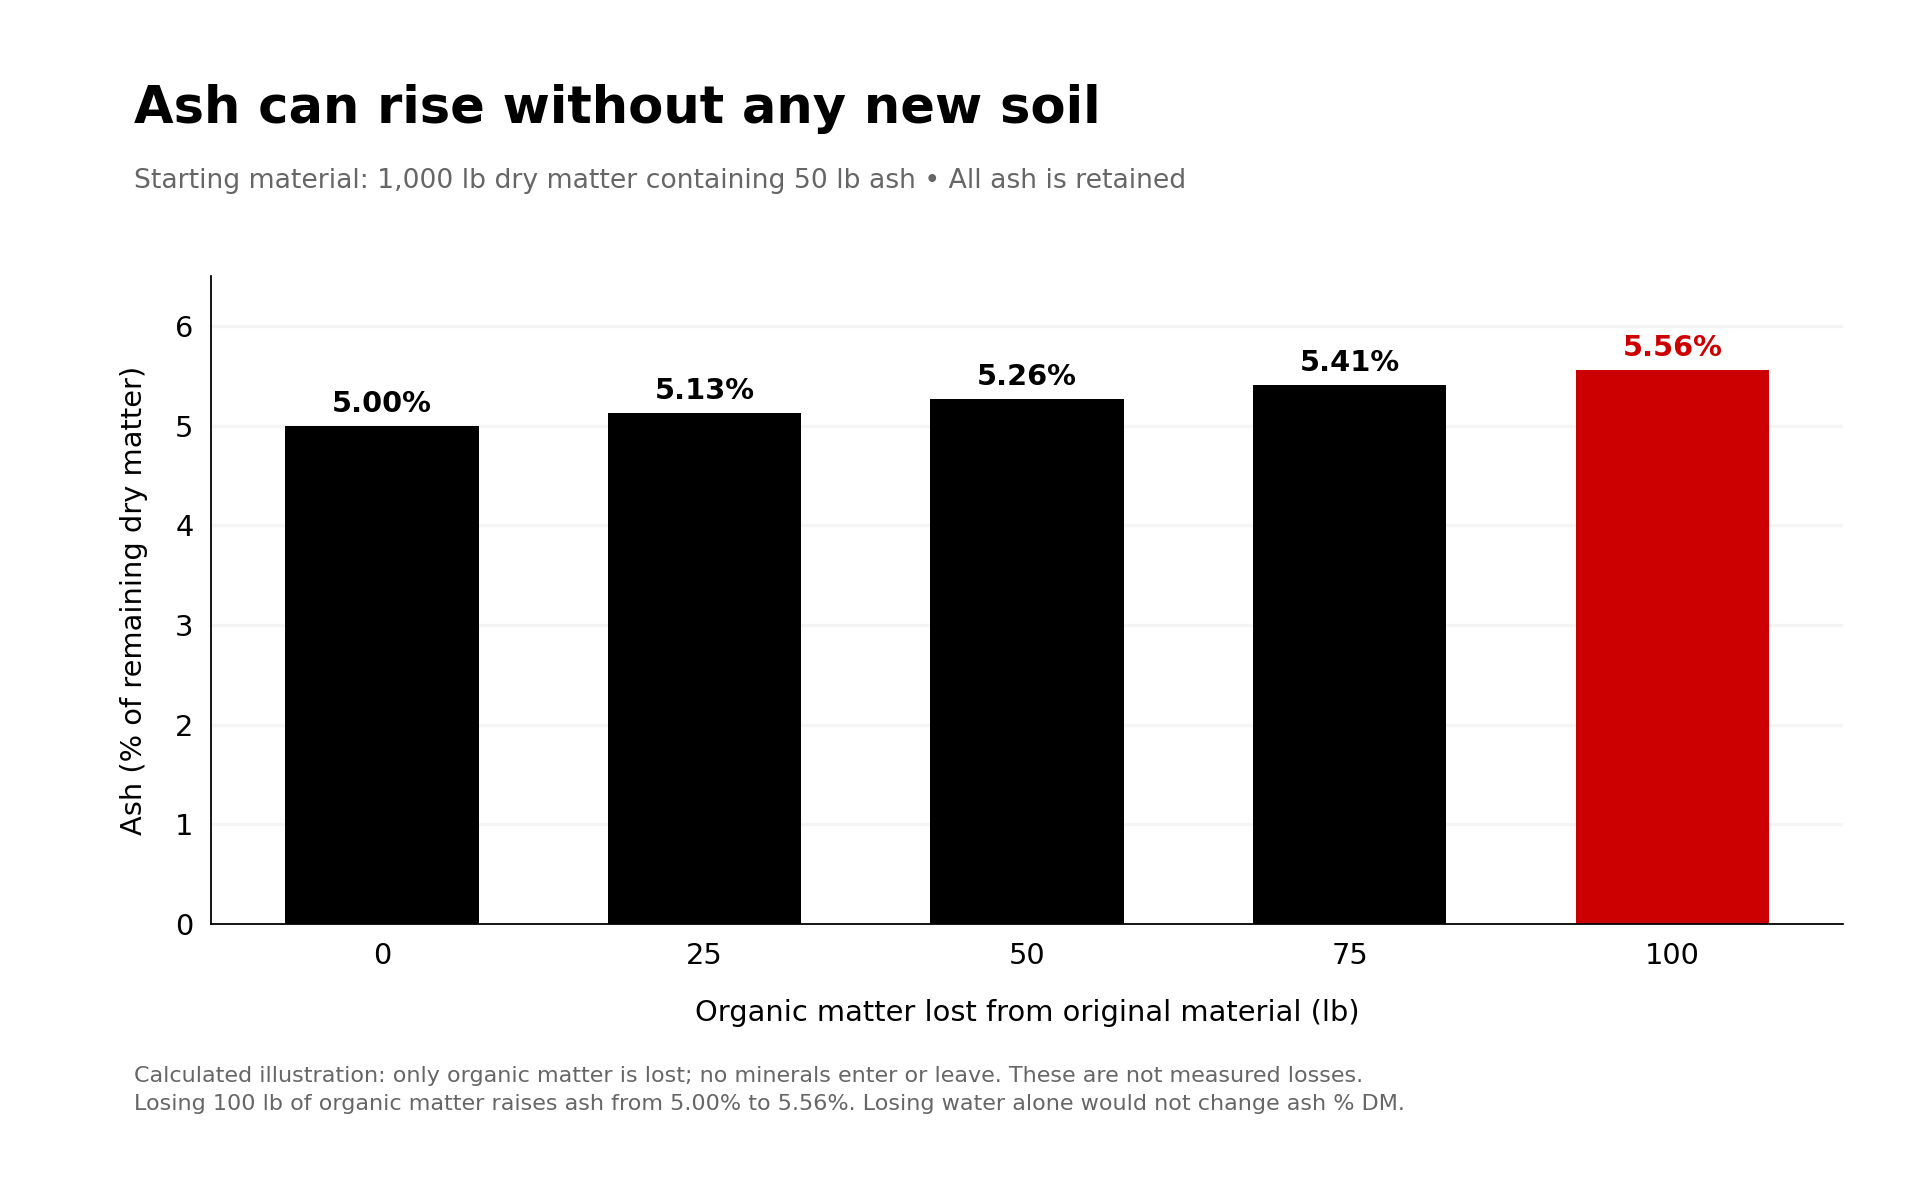
If organic matter disappears while mineral mass stays put, ash becomes a larger share of what’s left.
| Defined condition | Mineral residue | Total DM | Calculated ash |
| Starting material | 50 lb | 1,000 lb | 5.00% |
| Lose 50 lb organic matter only | 50 lb | 950 lb | 5.26% |
| Lose 100 lb organic matter only | 50 lb | 900 lb | 5.56% |
Bullvine illustration, not measured storage loss. It follows from Penn State’s definitions of DM and ash, and it means a rising ash figure can be consistent with storage loss rather than new soil. Losing water alone changes nothing on a DM basis. The final percentage won’t tell you which mechanism moved it.
The one number that separates plant from soil
Ohio State’s Bill Weiss put it plainly in 2019: crop, maturity and luxury potassium uptake shift plant ash “by only a few percentage points,” while harvest practices and soil conditions can add “5 to more than 15 percentage points” with little change in major minerals. That’s why the size of the jump matters more than the absolute figure. His reference points, now several years old but still the ones labs quote: cool-season grasses about 7–9% ash, legumes 10–12%, normal corn silage about 5%.
Explanations worth checking, with the evidence that helps investigate each:
- Wrong crop or stage. Internal mineral content differs by crop and generally falls with maturity, so compare like with like before calling a result high.
- Luxury uptake. Plants take up potassium beyond requirement in high-K soils, lifting tissue minerals with no loose soil involved; check the mineral profile against fertility and manure records.
- Sample bias. Utah State’s sampling guide stresses representative composites and keeping material with different histories separate; ask the lab about its method before assuming error.
- Actual contamination. Soil splashes onto plants in the field or gets picked up during harvest, and it drives trace minerals — iron, manganese, aluminum — far above normal; even confirmed contamination doesn’t name the operation responsible.
What ash can and can’t carry
A reliable result that represents the forage being fed is usable now, even with the cause unresolved. At 7% ash, each 100 lb of DM holds roughly 93 lb of organic matter — Bullvine arithmetic from Penn State’s definition of organic matter as DM minus ash. An unexplained cause doesn’t invalidate a representative result; a biased sample does make it unsuitable for the whole lot.
Ash carries no energy, so all else equal, energy concentration falls as ash rises — Weiss calls the relationship linear. What you can’t do is turn that direction into a magnitude from the ash figure alone, because Penn State’s energy evaluation also weighs nutrient concentrations and digestibility; don’t derive an energy penalty or a grain-replacement rate from ash by itself. And there is no universal safe line: Weiss states that “we do not know how much ash is too much,” and conditions his dilution advice on very high iron confirming the ash is soil.
Your five-step checklist
- Verify the sample and the reporting basis. Confirm the figure is % DM, identify exactly what material the sample represents, and don’t unintentionally combine distinct lots when you’re trying to tell them apart.
- Compare the appropriate crop at a comparable stage, and ask whether the jump is a few points or a lot more.
- Review reliable composition data with your nutritionist — a representative result is usable while the cause stays open.
- Use mineral results and records to investigate contamination. Normal corn silage averages about 250 ppm iron; Weiss’s rule of thumb is that forages below roughly that level usually carry little soil, and the likelihood rises as iron climbs above it. Pair the panel with harvest-day weather and field notes. Before changing mineral supplementation, use mineral-specific data — don’t adjust potassium, magnesium or trace feeding from total ash alone.
- Evaluate storage loss with comparable samples and independent evidence. A higher ash concentration in like-for-like samples may be consistent with organic-matter loss, but read it alongside sampling quality, lot identity, storage records and shrink evidence — two samples don’t prove mineral mass held constant, and they don’t rule out new contamination.
Editor’s note: All calculations in this article are Bullvine’s, built from stated hypothetical inputs. They illustrate how reporting bases interact; they are not measurements from any farm, and no financial loss or milk response is inferred.
Methods note: working the example backwards
Starting instead from a 2,000-lb final load at 35% DM and 7% ash, with 1% of fresh weight (20 lb) assumed to be entirely dry mineral: load DM = 700 lb; total mineral residue = 49 lb. Contaminant contribution to final ash percentage = 20 ÷ 700 × 100 = 2.86 percentage points, measured against final-mixture DM. Inferred original forage ash = 29 ÷ 680 × 100 = 4.26% DM. The difference between the final 7% and that inferred concentration is about 2.74 percentage points; the two figures differ because removing the contaminant also shrinks the forage’s own denominator. The contaminant’s share of total ash mass would be 20 ÷ 49 — a different quantity again.
Complete references and supporting documentation are available upon request by contacting the editorial team at editor@thebullvine.com.
Learn More
- Bunker Silo Management: Stop Shrink from Eating Your Milk Check — Arms you with proven bunker packing protocols that halt 8% dry matter shrink, showing how proper face management protects fermentation stability and keeps $0.35 per hundredweight from vanishing before the feed ever touches the mixer.
- Feed Efficiency Genetics: How Breeding for Lower Intake Protects Long-Term Margins — Dismantles traditional intake assumptions by detailing how genomic selection for dry-matter efficiency saves $120 per cow annually in maintenance feed costs, shifting your long-term herd strategy from forage volume reliance toward metabolic conversion.
- On-Chopper NIR Sensors: Real-Time Forage Quality or Expensive In-Cab Novelty? — Exposes the real field accuracy of instantaneous chopper spectroscopy, revealing whether on-the-fly dry matter and constituent tuning prevents $50,000 bunker fermentation disasters or merely generates expensive dashboard clutter during high-speed custom harvesting.
The Sunday Read Dairy Professionals Don’t Skip.

Every week, thousands of producers, breeders, and industry insiders open Bullvine Weekly for genetics insights, market shifts, and profit strategies they won’t find anywhere else. One email. Five minutes. Smarter decisions all week.