Understanding and correctly using genetic indexes is important to breeders who derive a significant portion of their profit from dairy cattle breeding decisions. Major changes in the expression of indexes do not occur frequently but when they do occur it can be a time of confusion and perhaps lack of trust. The Canadian total index, LPI, has been used for over twenty years by Canadian breeders, as well as by breeders from other countries who source genetic material from Canada. When changes occur in the LPI indexing system, as is the case just now in April 2013, it is important that the reasons for the changes and the results be understood and incorporated into breeders’ decision processes.
Why Change?
For some time now the LPI values, especially for Holsteins, have been increasing quickly for all animals but it has been most noticeable for animals that have genomic evaluations. Breeders questioned how these young animals with indexes that are about 65% reliable can be significantly superior to recently proven top end bulls and active cows with their own performance values. As most breeders refer to the absolute LPI number, significant differences between the leaders on the various listings left doubt in accuracy in breeders’ minds. For breeders who think is bottom line terms and do not follow the LPI numbers closely, comment were often heard about the fact that numbers are numbers but it is annual cow profit that pays the bills, expands the business and sends the kids to college. Point being that the LPI difference between animals over-stated the net dollar difference between animals. These questions, comments and concerns were heard loud and clear by the CDN’s Genetic Evaluation Board so it studied the matter and took action.
LPI Scaling
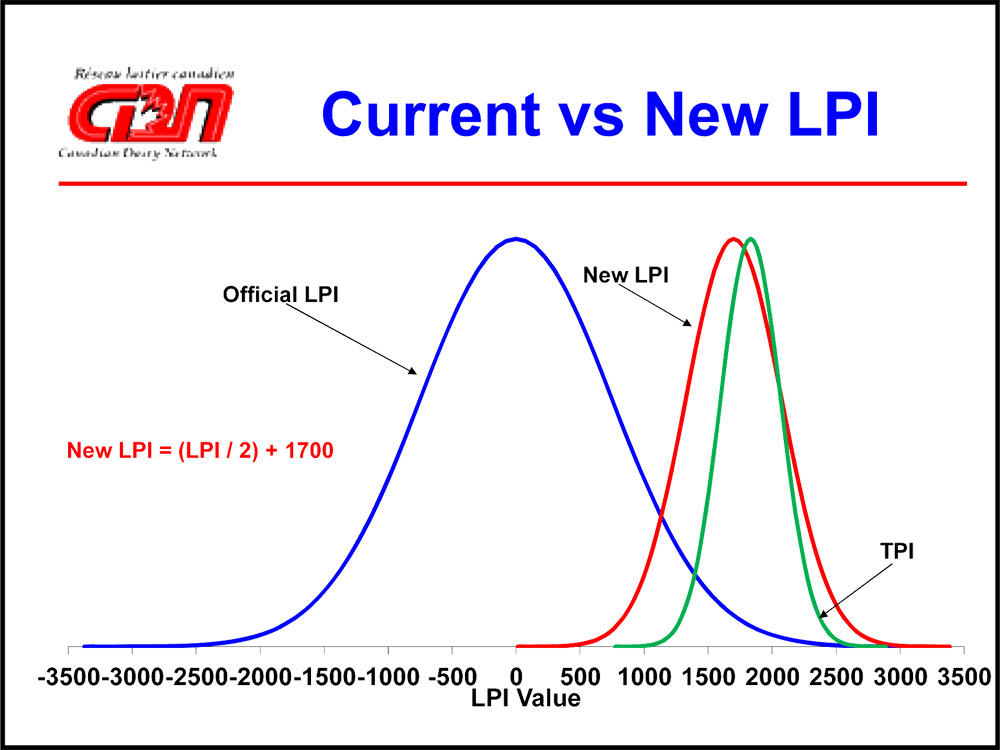
The extreme range (-3500 to +3500) in Canadian Holstein LPI values had many drawbacks. It assigned most older long-lived profitable cows a negative value thereby telling a story that was not true and limiting the saleability of their subsequent generation. It assigned values that indicated significant differences between animals when the actual dollar differences were not that large. And due to the scaling effect for animals at the very top of the breed it gave values far exceeding the actual differences. This latter point was especially true for bulls and heifers with only parent averages and genomic evaluations.
While studying possible solutions, CDN noted that in other major dairy breeding countries the scale for their total merit index is much much smaller than Canada’s 7000 point range. CDN decided to adopt a publication methodology for the LPI similar to what the TPI™ has used for many years. That involves calculating a value and adding a ‘constant’ to it.
New LPIs
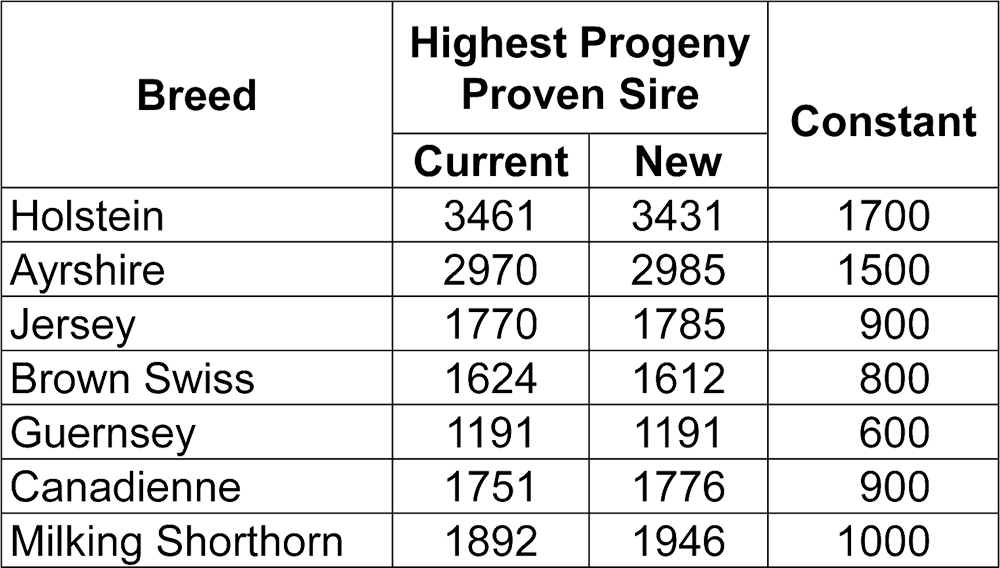
Effective April 09, 2013 the new LPI formula is ½ Previously calculated LPI + Constant.

Note that the highest progeny proven sires do not change in value.

Note that the range in values of Holstein LPIs is now much more similar, although slightly more, than the range for Holstein TPI™
Sire LPIs
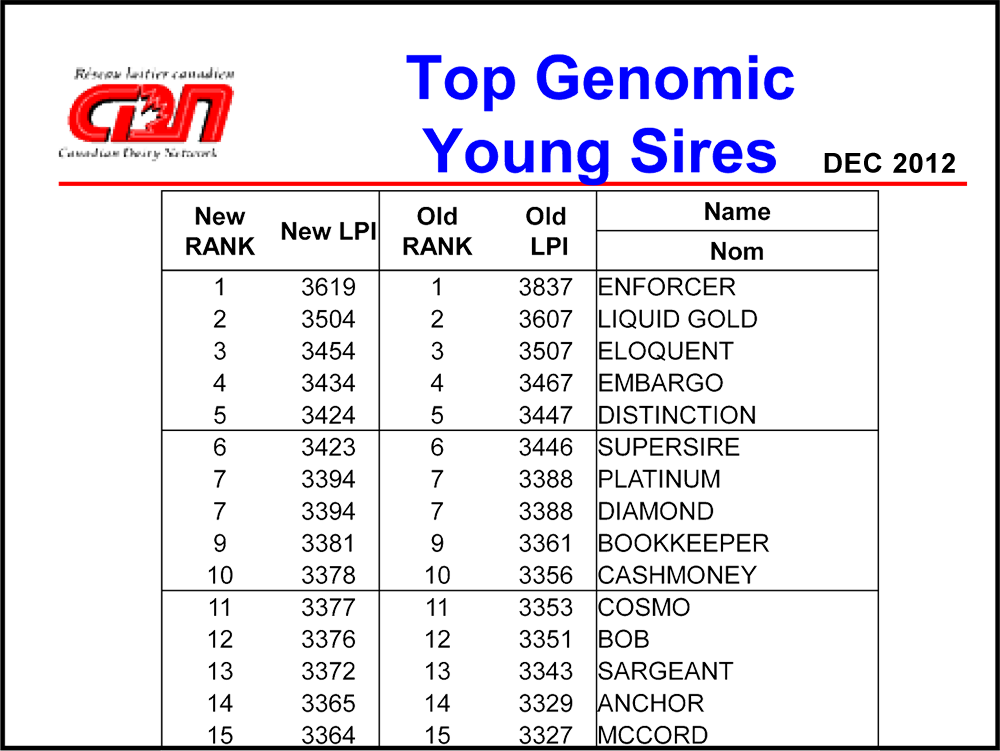
It is important to note that this re-scaling of LPI does not re-rank animals. But it does bring the progeny proven sires and genomically evaluated young bulls much closer in their values.

It is important to remember that LPI is the Canadian system for ranking animals according the weights assigned to the numerous genetic indexes of important for lifetime profit. For Holsteins the weights at 51% Production, 34% Durability and 15% Health and fertility while for Jerseys those weightings are 57%, 33% and 10% respectively. Breeders wanting to place more or less emphasis on the various can calculate their own rankings using the CDN calculator available at www.cdn.ca or going the Bulvine’s bull listings for alternative ranking systems (Read more: Bullvine Performance Index (BPI) – Top Sires December 2012).
Using Genetic Indexes
Indexes are a very constructive tool to genetically breed better animals for the future. As genetics is less than half of the reasons animal differ in profitability, much depends on breeders to not only produce the animals that will be profitable but also to feed and manage them. Some suggested ground rules to follow when making sire or heifer selections are:
- Use LPI, TPI™ or Net Merit are you primary list reduction tool for sires or herd replacements
- Always check out the index values for the traits important to you (i.e. protein, fat, feet & legs, udders, SCS, fertility,..). Eliminate animals from the list that do not meet your requirements.
- A quick way to eliminate animals is to use % RK (percentile rank).
- Animals below 75% RK for any yield or conformation traits will likely leave progeny that reduce your profit.
- Animals below 60% RK for health and fertility traits will not move your herd ahead for these traits of emerging importance.
The Bullvine Bottom Line
Even though the method of expressing genetic indexes may differ from trait to trait or country to country, it is always important to have a plan on what you want to improve genetically in your herd and then to select the sires or replacement females that will produce the results. The re-scaling of the LPI values will come closer to the actual dollars amount animals return in their lifetime profit and will more accurately compare older and younger animals. By all means keep your genetics current and on target to your needs. It is best to throw out the semen from low indexing bulls. Buy high ranking genetics. It always pays big dividends.
Get original “Bullvine” content sent straight to your email inbox for free.


Leave a Reply
You must be logged in to post a comment.