Archive for Management – Page 6

The Hidden Contract Clause That Could Cost Your Dairy $55,000 in 2026

WARNING: Your 2026 dairy contract has unlimited liability clauses. 500-cow farms face $55K in new costs. Check these three things before signing →

EXECUTIVE SUMMARY: Dairy farmers signing 2026 contracts now are discovering unlimited liability clauses that hold them responsible for allergen incidents—even those that occur at the processor. These new terms, triggered by California’s July 2026 allergen law, could cost a typical 500-cow operation between $15,000 and $55,000 annually in testing, infrastructure, and insurance. That’s up to 44% of net profit gone. With December 31 deadlines approaching, farmers face three paths: scale up to 1,500+ cows for efficiency, pivot to premium markets with $5-10/cwt premiums, or exit strategically while preserving wealth. The harsh reality is that 500-cow commodity dairies are becoming economically obsolete—caught between mega-farms operating at $3/cwt lower costs and premium producers capturing higher margins. Your decision in the next 90 days isn’t just about a contract; it’s about whether your farm exists in 2030.

Dairy Contract Risk

You know, I’ve been talking with a lot of dairy farmers lately—folks running anywhere from 300 to 800 head—and the same topic keeps coming up over coffee.

These new contracts are landing on kitchen tables across the country right now? They’re different.

And I don’t mean different like when they tweaked the somatic cell premiums a few years back. I mean, fundamentally different.

One Wisconsin producer I know pretty well—let’s call him Tom to keep things simple—he runs about 500 Holsteins outside Eau Claire. Last Tuesday, he opens his December 2025 contract renewal expecting the usual adjustments. Maybe a change in butterfat differential or a new hauling schedule.

Instead, he finds himself staring at 15 extra pages of allergen management requirements. Language about “unlimited liability.” Clauses saying he has to defend his processor against claims he didn’t even cause.

“The efficiency gains are real—our cost per hundredweight dropped by nearly three dollars. But this wasn’t just about surviving allergen costs. We saw where the industry was heading and decided to get ahead of it.”
— A Wisconsin dairy producer who expanded from 600 to 1,800 cows last year

And here’s what’s interesting—Tom’s not alone. From the Texas Panhandle to Vermont’s Northeast Kingdom, down through the Georgia dairy belt and out to Idaho’s Magic Valley, producers are discovering their 2026 contracts contain terms nobody’s ever seen before.

Now, California’s allergen labeling law takes effect on July 1, 2026—that’s the official reason. But what I’ve found is that processors are using this regulatory change as the mechanism for something much bigger.

They’re fundamentally restructuring how risk flows through the dairy supply chain.

Let me walk you through what’s actually happening, because once you understand the pieces, the decisions you need to make become a lot clearer.

What Is California’s Allergen Law?

Starting July 1, 2026, California requires restaurant chains with 20+ locations nationwide to label major food allergens on menus. While this sounds limited to restaurants, processors are using it to justify comprehensive supply chain allergen controls—pushing liability and costs upstream to dairy farms through new contract requirements.

Why These Contract Changes Hit Different

I’ve been looking at dairy contracts for going on two decades now, and what’s landing on farm desks this quarter is genuinely unprecedented.

You probably saw the FDA’s recent data from their Reportable Food Registry—dairy products accounted for nearly 30% of all food recalls in the first quarter of 2025. That’s almost 400 recalls from our industry alone.

And when you dig into those numbers, undeclared allergens are driving a huge chunk of them, with milk proteins topping the list.

The Grocery Manufacturers Association conducted research in 2022 that showed food recalls average around $10 million in direct costs. And that’s just pulling product, investigating, notifying regulators.

Doesn’t even touch brand damage, lost sales, or legal fees. You’re looking at exposure that could bankrupt a mid-sized processor, which is why they’re scrambling to push that risk elsewhere.

What’s the target? Your farm.

What I’m hearing from agricultural attorneys who specialize in dairy contracts—and there aren’t that many of them, as you probably know—is that processors aren’t just updating compliance language.

They’re fundamentally restructuring who bears risk when something goes wrong. California’s July 1, 2026, deadline? It’s the perfect justification.

Here’s the really clever part, or concerning part, depending on where you sit. Most dairy contracts run calendar year, right? So farms need to sign their 2026 agreements right now, in Q4 2025.

By the time California’s law kicks in and everyone understands what these terms really mean, you’ll already be locked into a 12-month commitment.

Timing’s not an accident.

What Your Contract Might Look Like Now

Here’s what producers from Pennsylvania to Idaho to the Florida Panhandle—even down in Mississippi, where my cousin runs 400 head—are finding buried in their contracts:

  • Testing requirements where the processor decides frequency, but farmers pay 100% of costs—we’re talking $55 to $80 per sample for standard allergen tests, based on what companies like Neogen are charging these days.
  • Infrastructure modifications requiring capital investments of $50,000 to $250,000. Cornell Extension’s been helping farmers price this out, and those are real numbers.
  • Insurance minimums are jumping from your typical $2 million general liability to $5-10 million specifically for allergen incidents. I’ve talked to insurance agents we work with—Nationwide, American National, some of the bigger ag insurers—and they’re all saying premiums are up 30 to 50 percent for this coverage.
  • And then there’s the real kicker: unlimited indemnification clauses that make farmers liable for downstream incidents “regardless of origin.” Think about that. Even if contamination happens at the processor, you could be on the hook.

The Real Numbers for Your Operation

Let’s talk specifics for a typical 500-cow dairy producing around 10 million pounds annually—that describes a lot of operations in the Upper Midwest and down through Oklahoma and Arkansas.

I’ve been running these numbers with farm financial consultants, and here’s what the math looks like.

Compliance LevelAnnual TestingInfrastructureInsurance IncreaseDocumentation/TrainingTotal New CostsProfit Impact
Minimal(2¢/cwt)$1,700$5,000$4,000$2,500$15,00012%
Mid-Level(8¢/cwt)$7,000$10,000$8,000$9,500$34,00028%
High (15¢/cwt)$13,000$15,000$12,000$15,500$55,00044%

That’s a 12% hit to your bottom line if you’re running decent margins on the minimal path. Not great, but manageable for efficient operations.

Mid-level? That’s 28% of your profit gone. The difference between paying bills on time and stretching payables, as many of us know all too well.

At the high end? 44% of the net income was lost. For a lot of 500-cow operations, that’s the difference between viable and not.

The Cost Gap That’s Already There

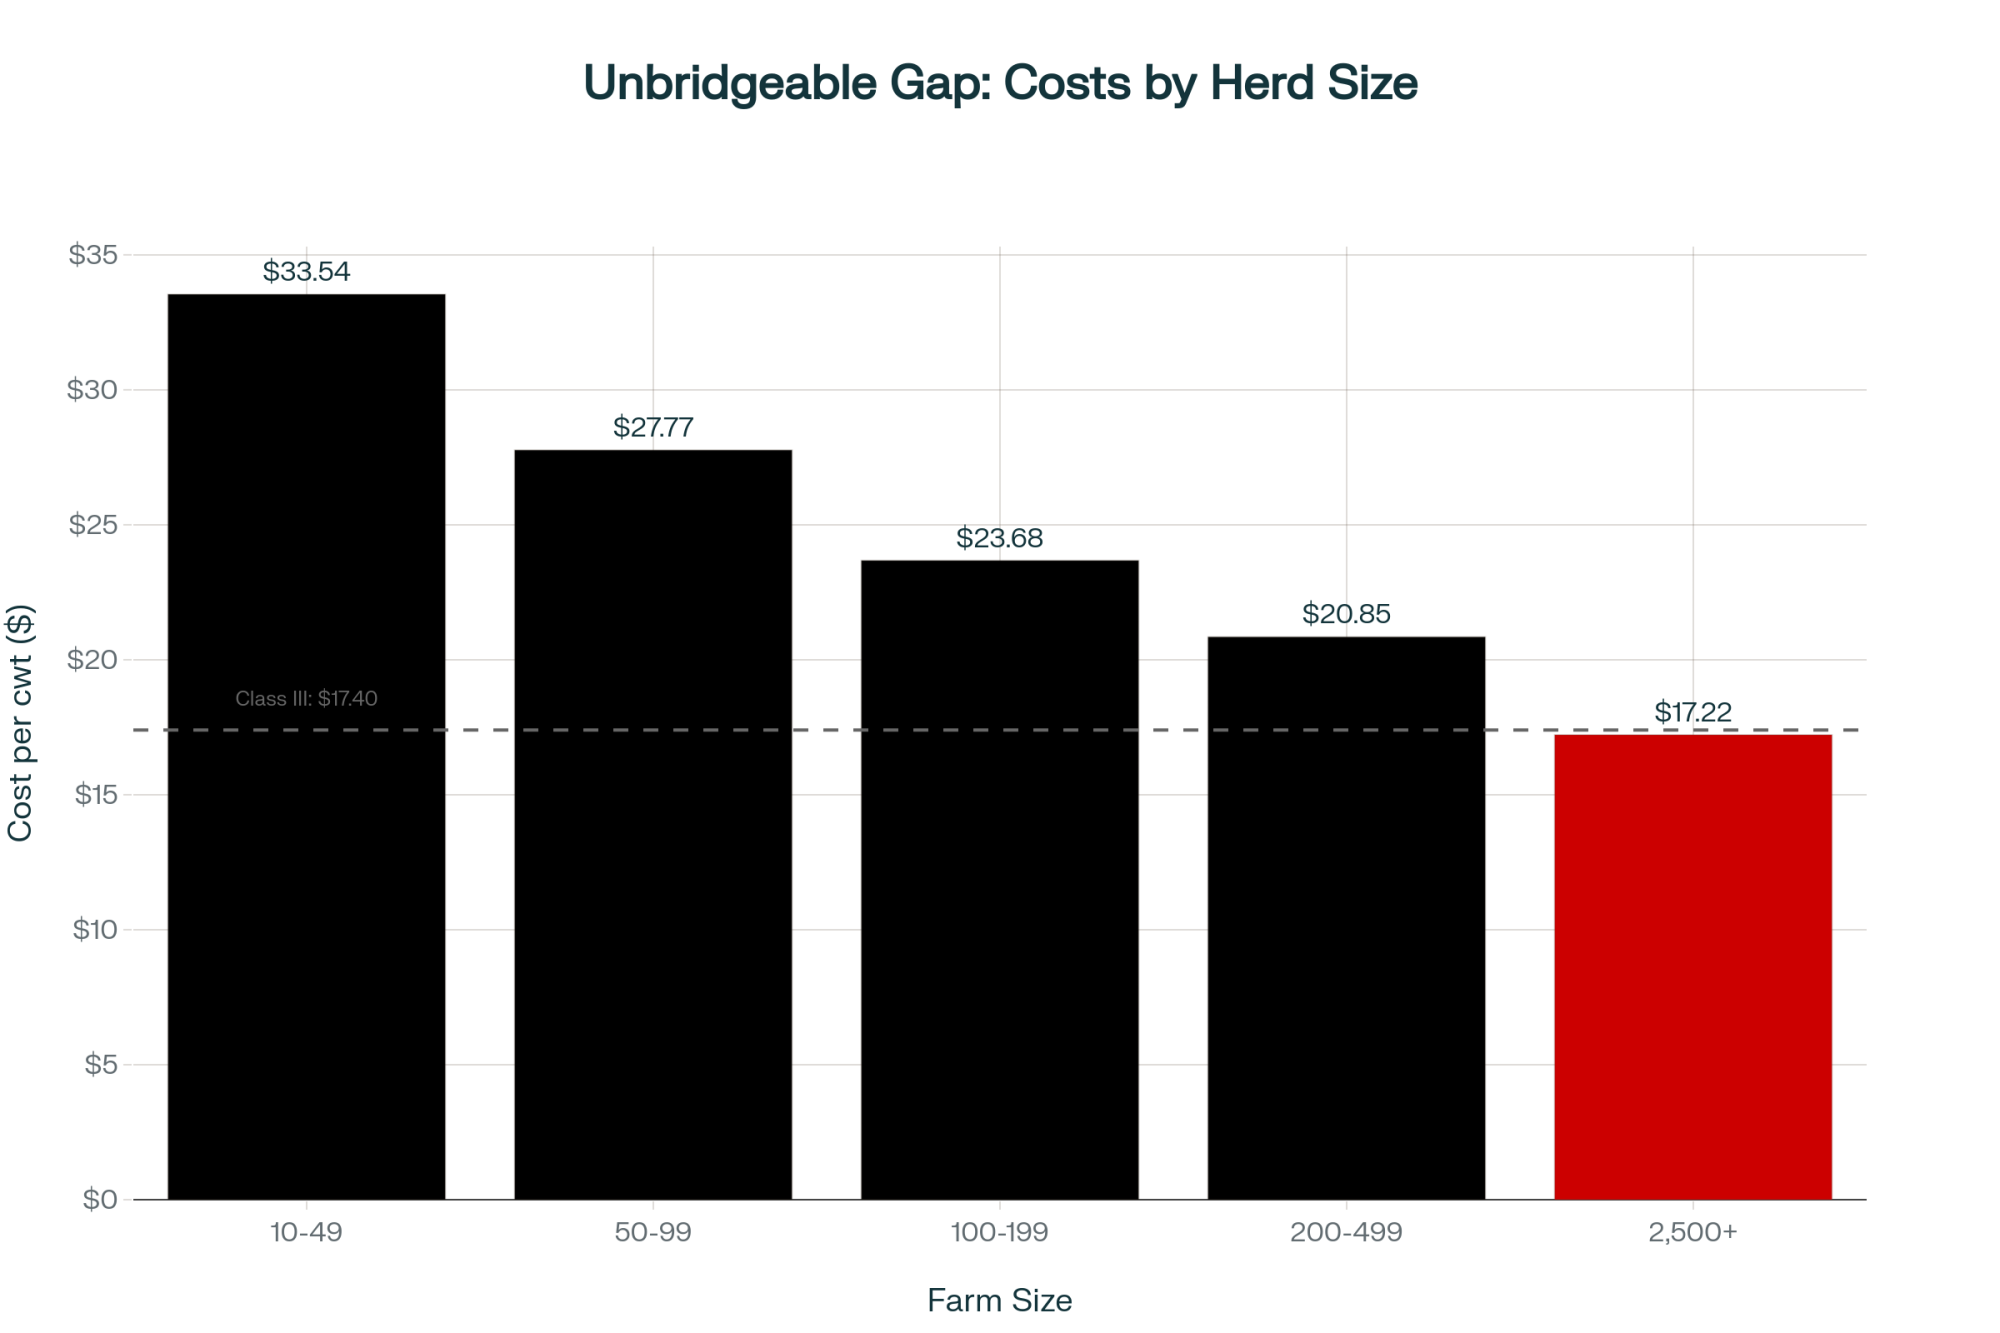
What makes this particularly challenging is the existing cost structure gap. USDA’s Economic Research Service published their cost of production data in March 2024, and here’s the reality:

Farm SizeAverage Cost per cwt
2,000+ cows$17
100-500 cows$20+

That’s more than a three-dollar disadvantage before you add a penny of allergen compliance costs.

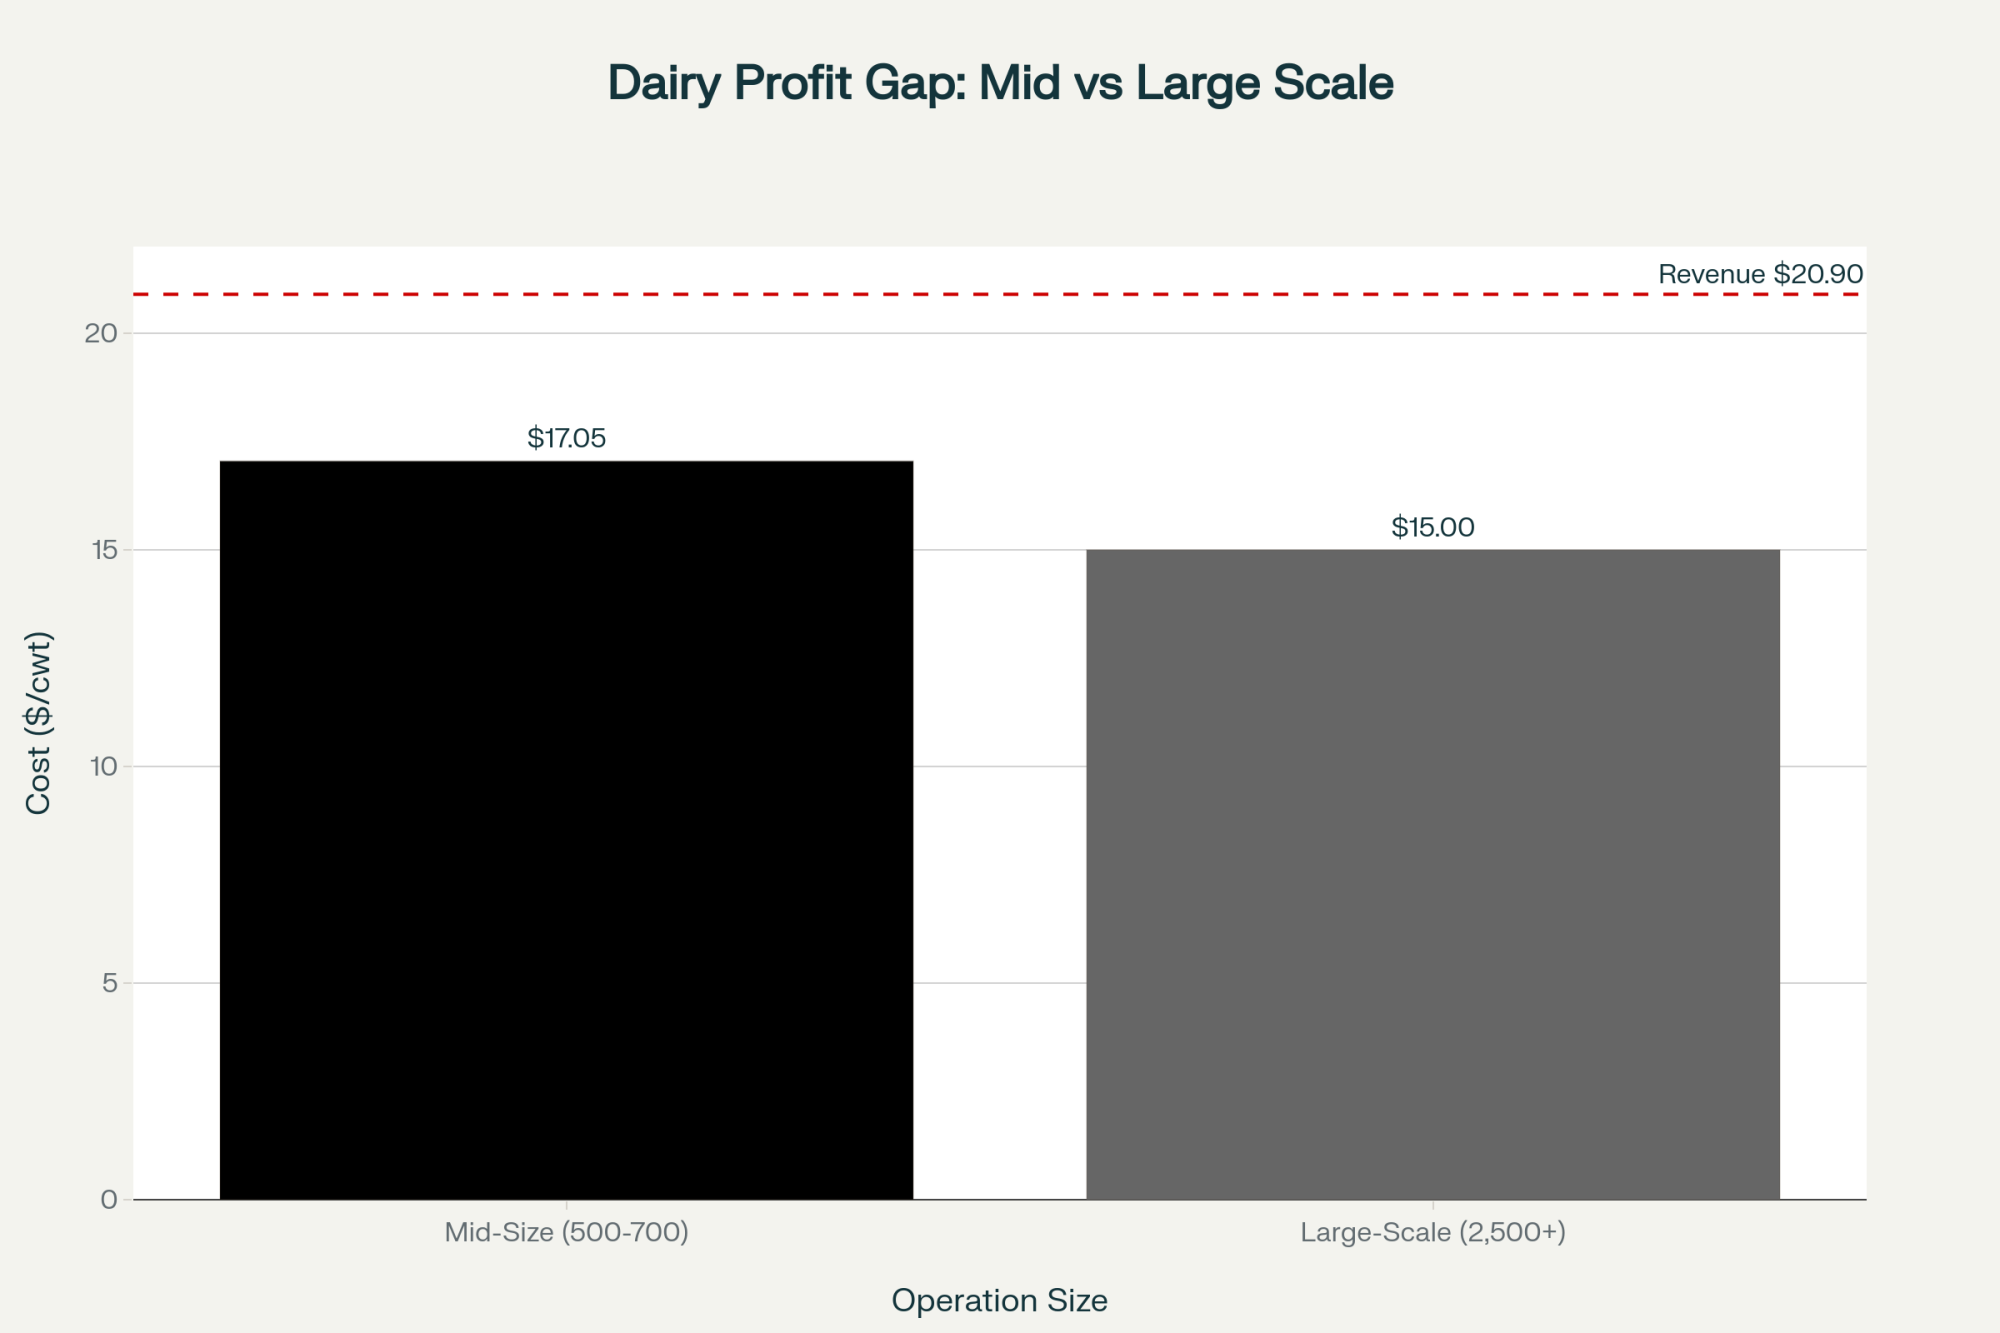
Already Behind Before Allergen Costs: 500-cow dairies face $3.37/cwt higher costs than 1000-cow operations and $8.48/cwt higher than mega-dairies—BEFORE adding $0.02-0.15/cwt allergen compliance. On 10 million lbs annually, that’s $337,000-$848,000 structural disadvantage you can’t manage away

Understanding the Bigger Picture

Here’s where things get really interesting—and by interesting, I mean concerning if you’re a mid-sized dairy like most of us.

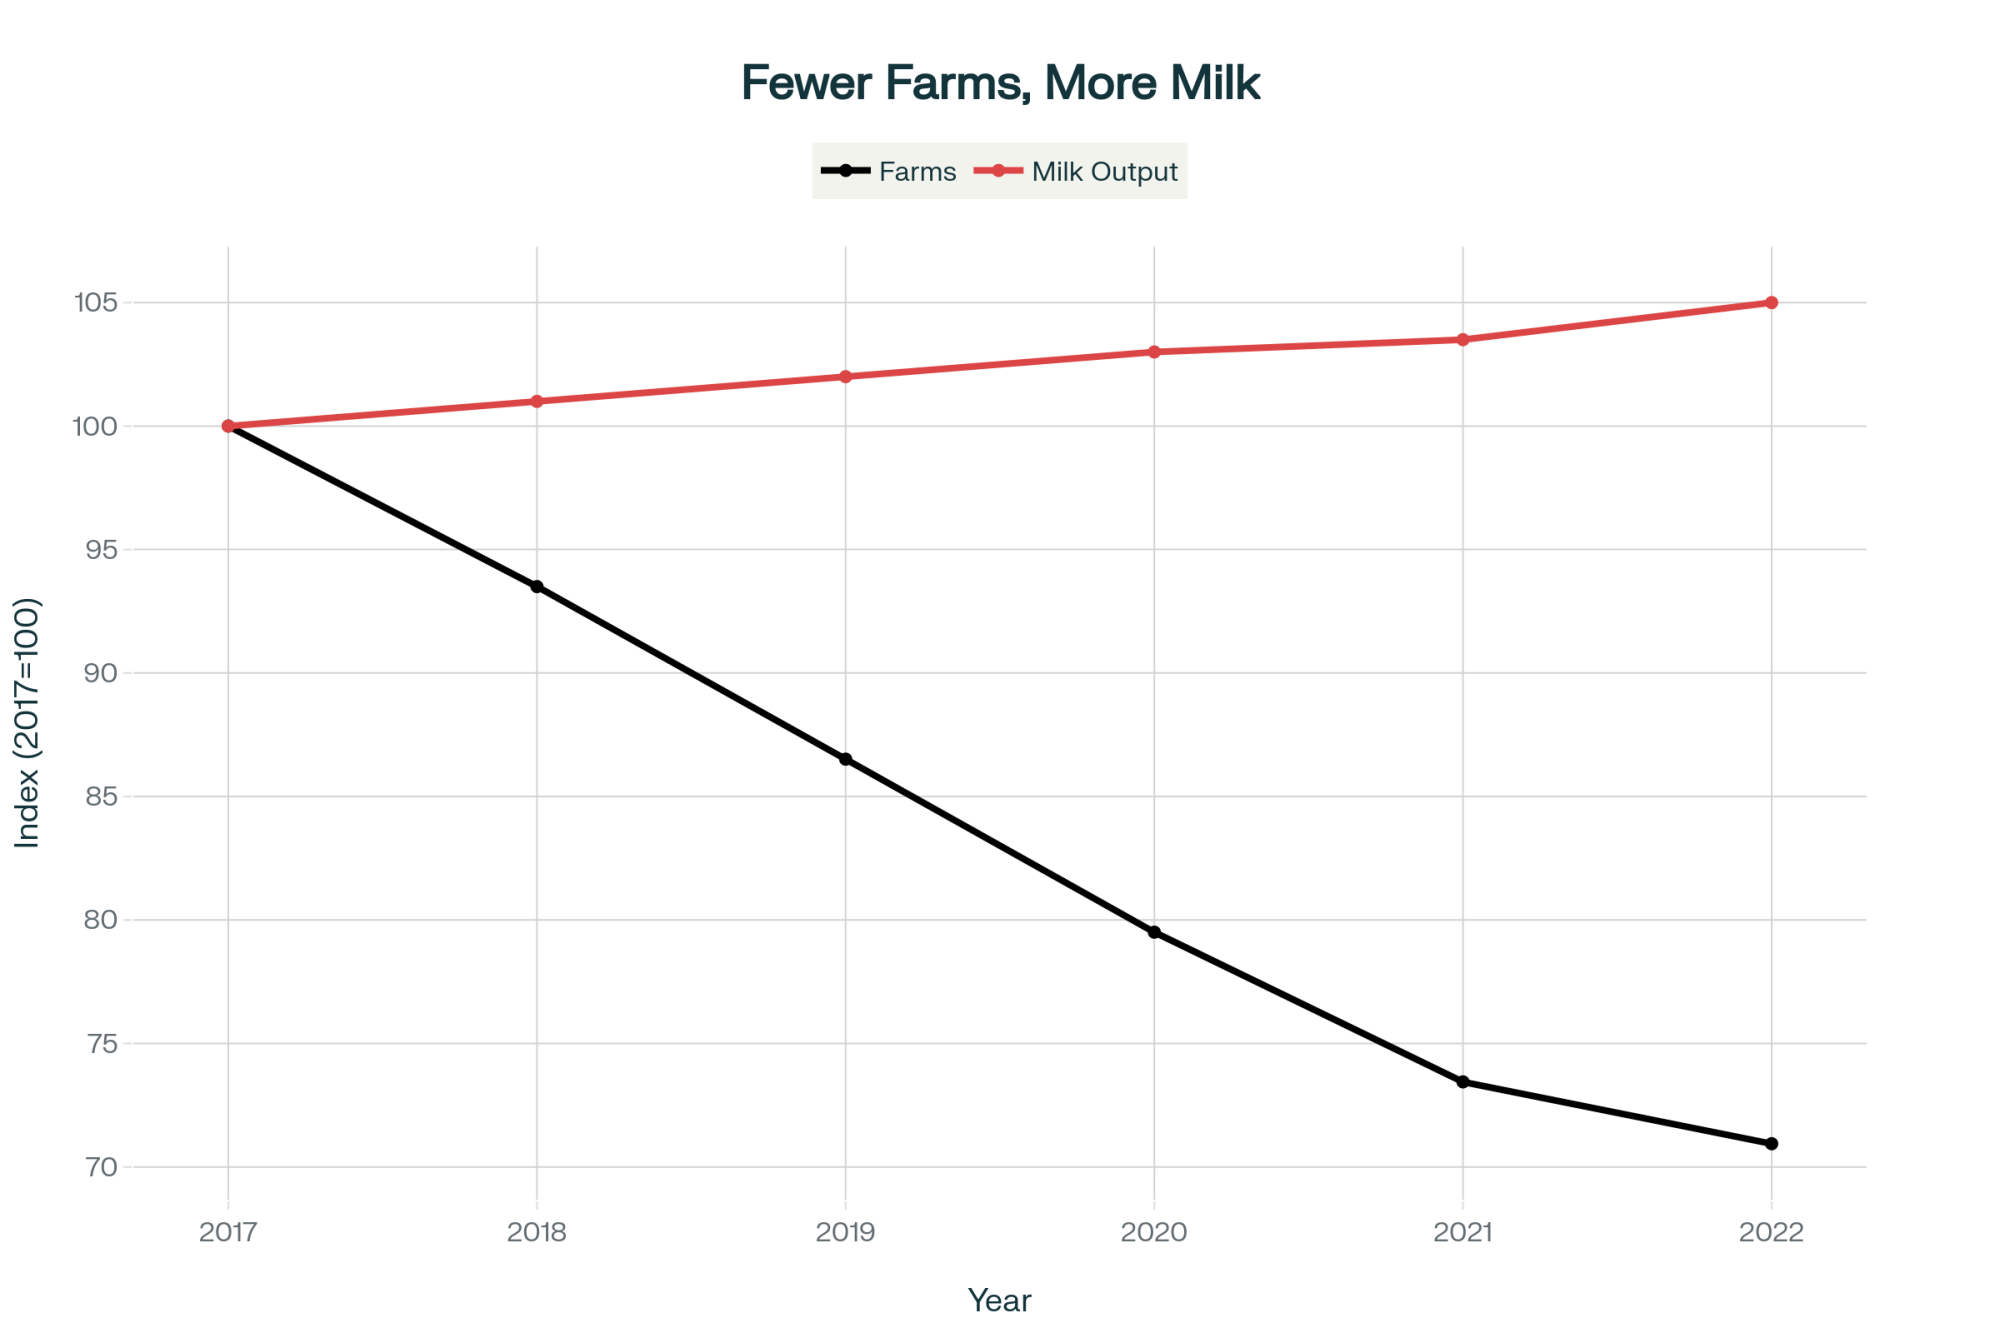
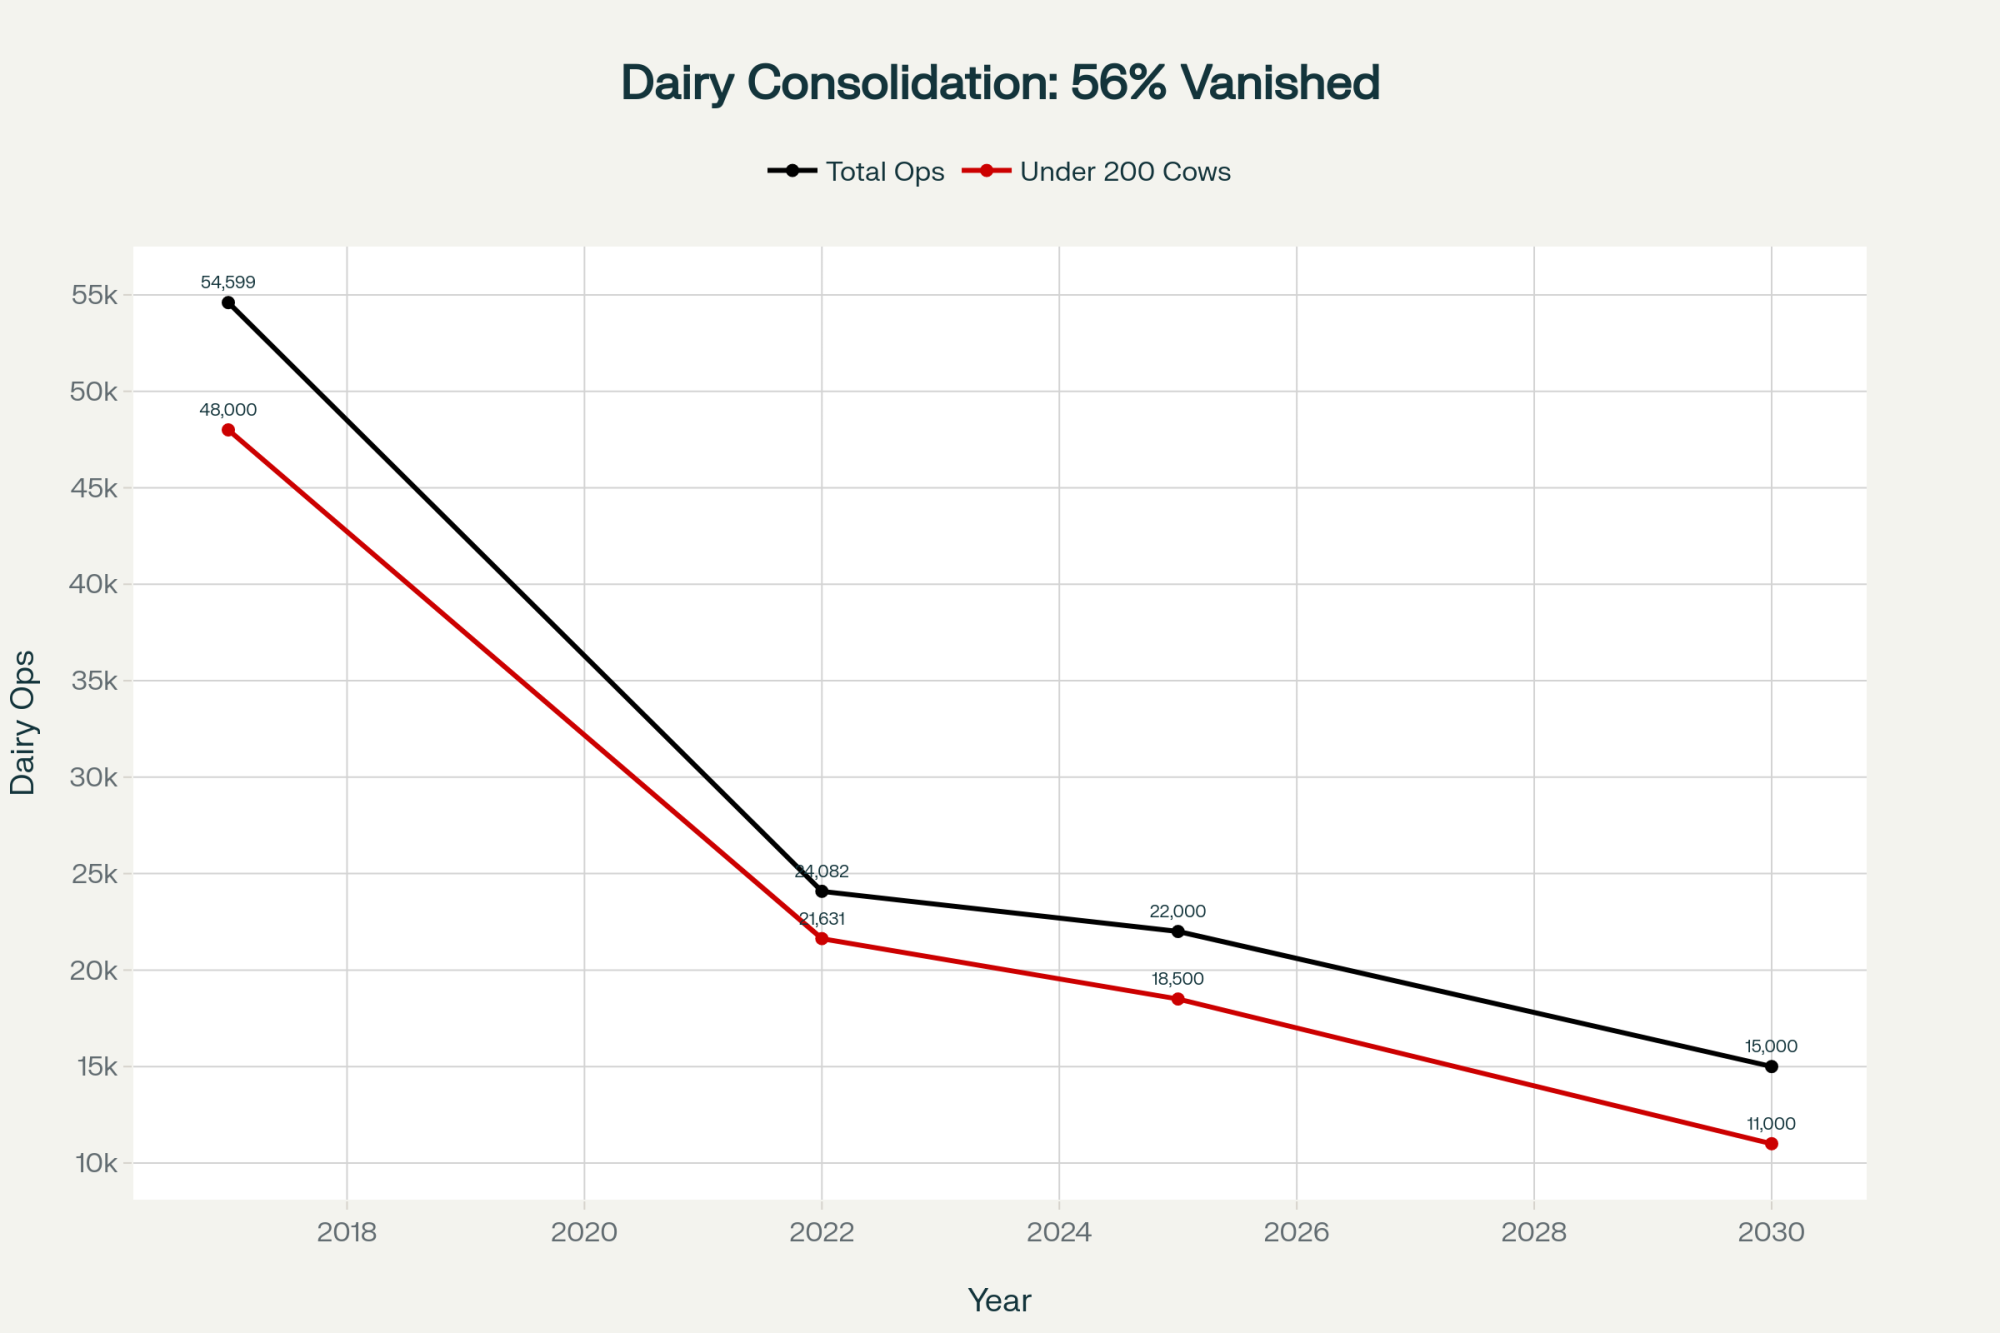
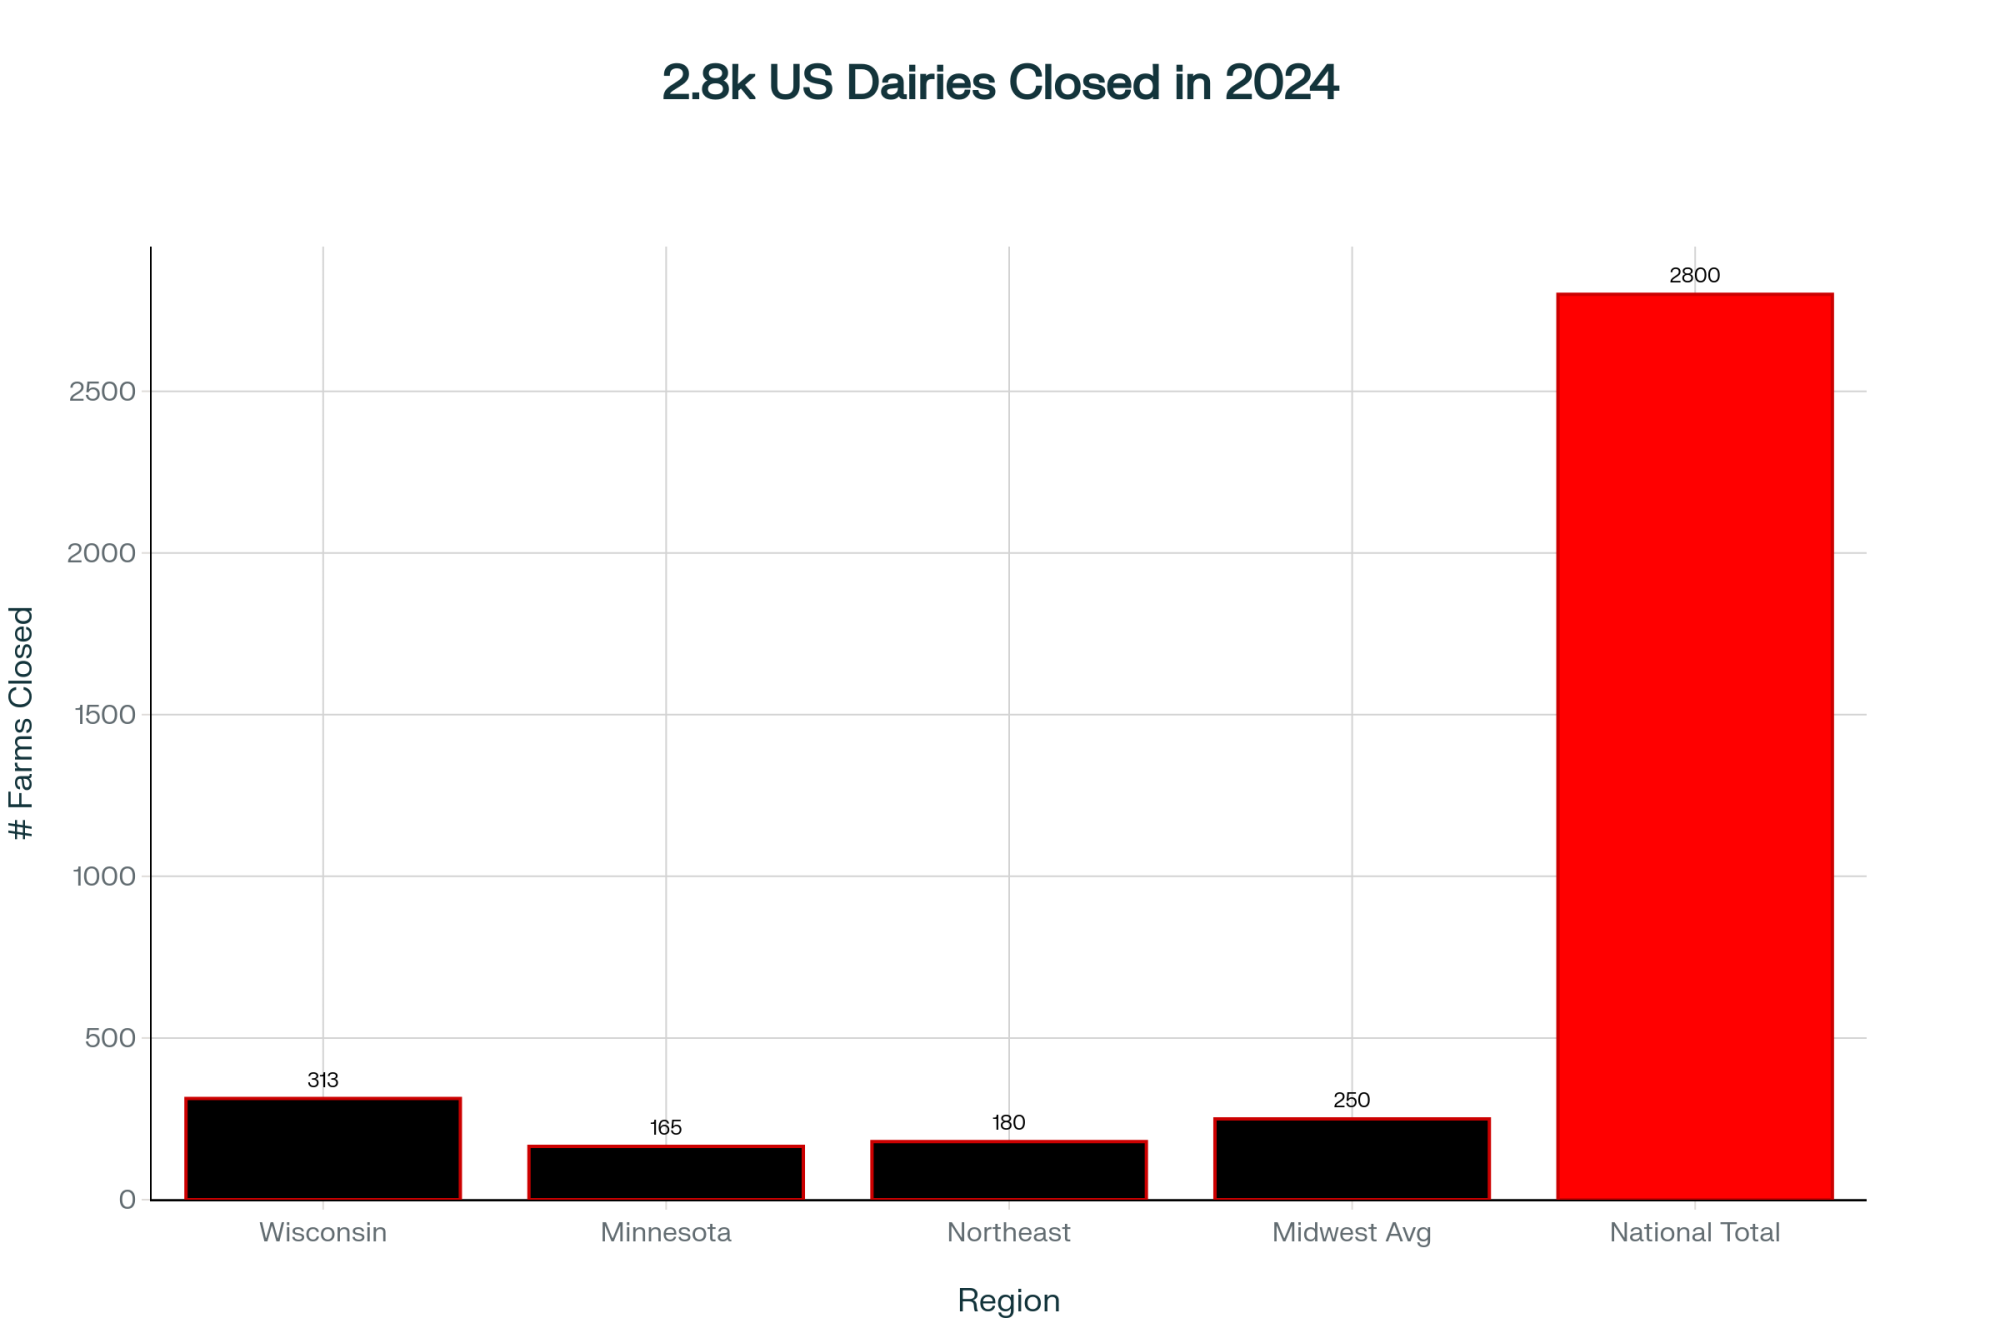
The consolidation trends were already stark before these contract changes. The 2022 Census of Agriculture, released in February 2024, shows that we lost 39% of U.S. dairy farms between 2017 and 2022.

Dropped from over 39,000 to about 24,000 operations. Yet—and here’s the kicker—milk production actually increased 5% over that same period according to the USDA’s National Agricultural Statistics Service.

Think about that for a minute. Fewer farms, more milk. The math only works one way, doesn’t it?

Today, according to the same Census, 65% of the U.S. dairy herd lives on farms with 1,000 or more cows. The 834 largest dairies—those with 2,500 or more head—they control 46% of production by value.

These aren’t future projections, folks. This is where we are right now.

I was talking with a senior ag lender recently—manages a portfolio north of $400 million in dairy loans—and he was remarkably candid about it.

“We’re not trying to prevent consolidation. We’re positioning our portfolio to be on the right side of it. Managing 50 medium-sized dairy loans requires far more oversight than five large ones with professional CFOs and management teams.”
— Senior agricultural lender with $400M+ dairy portfolio

The September 2025 lending data from agricultural finance institutions shows that smaller ag lenders—those under $500 million in loans—they absorbed 75% of the increase in farm lending during 2024.

Meanwhile, the big players with over a billion in ag loans? They contributed just 10% to that increase.

The sophisticated lenders they’re already pulling back from medium-sized operations. Makes you think, doesn’t it?

The Numbers Don’t Lie: Since 2017, America lost 15,000 dairy farms (39%) while milk production INCREASED 5%. By 2030, another 7,000 operations will disappear. This isn’t a downturn—it’s systematic elimination of mid-size dairies. Where does YOUR farm fit?

Three Paths Forward (And Why You Need to Choose Now)

After talking with dozens of farmers facing these decisions and running scenarios with financial advisors, I’m seeing three viable strategies emerge.

The key is picking the right one for your specific situation—not what worked for your neighbor, not what your grandfather would’ve done.

Path 1: Scale Up to Survive

Who should consider this path? Well, if you’re under 45 with kids who genuinely want to farm—and I mean really want it, not just feel obligated—this might be your route.

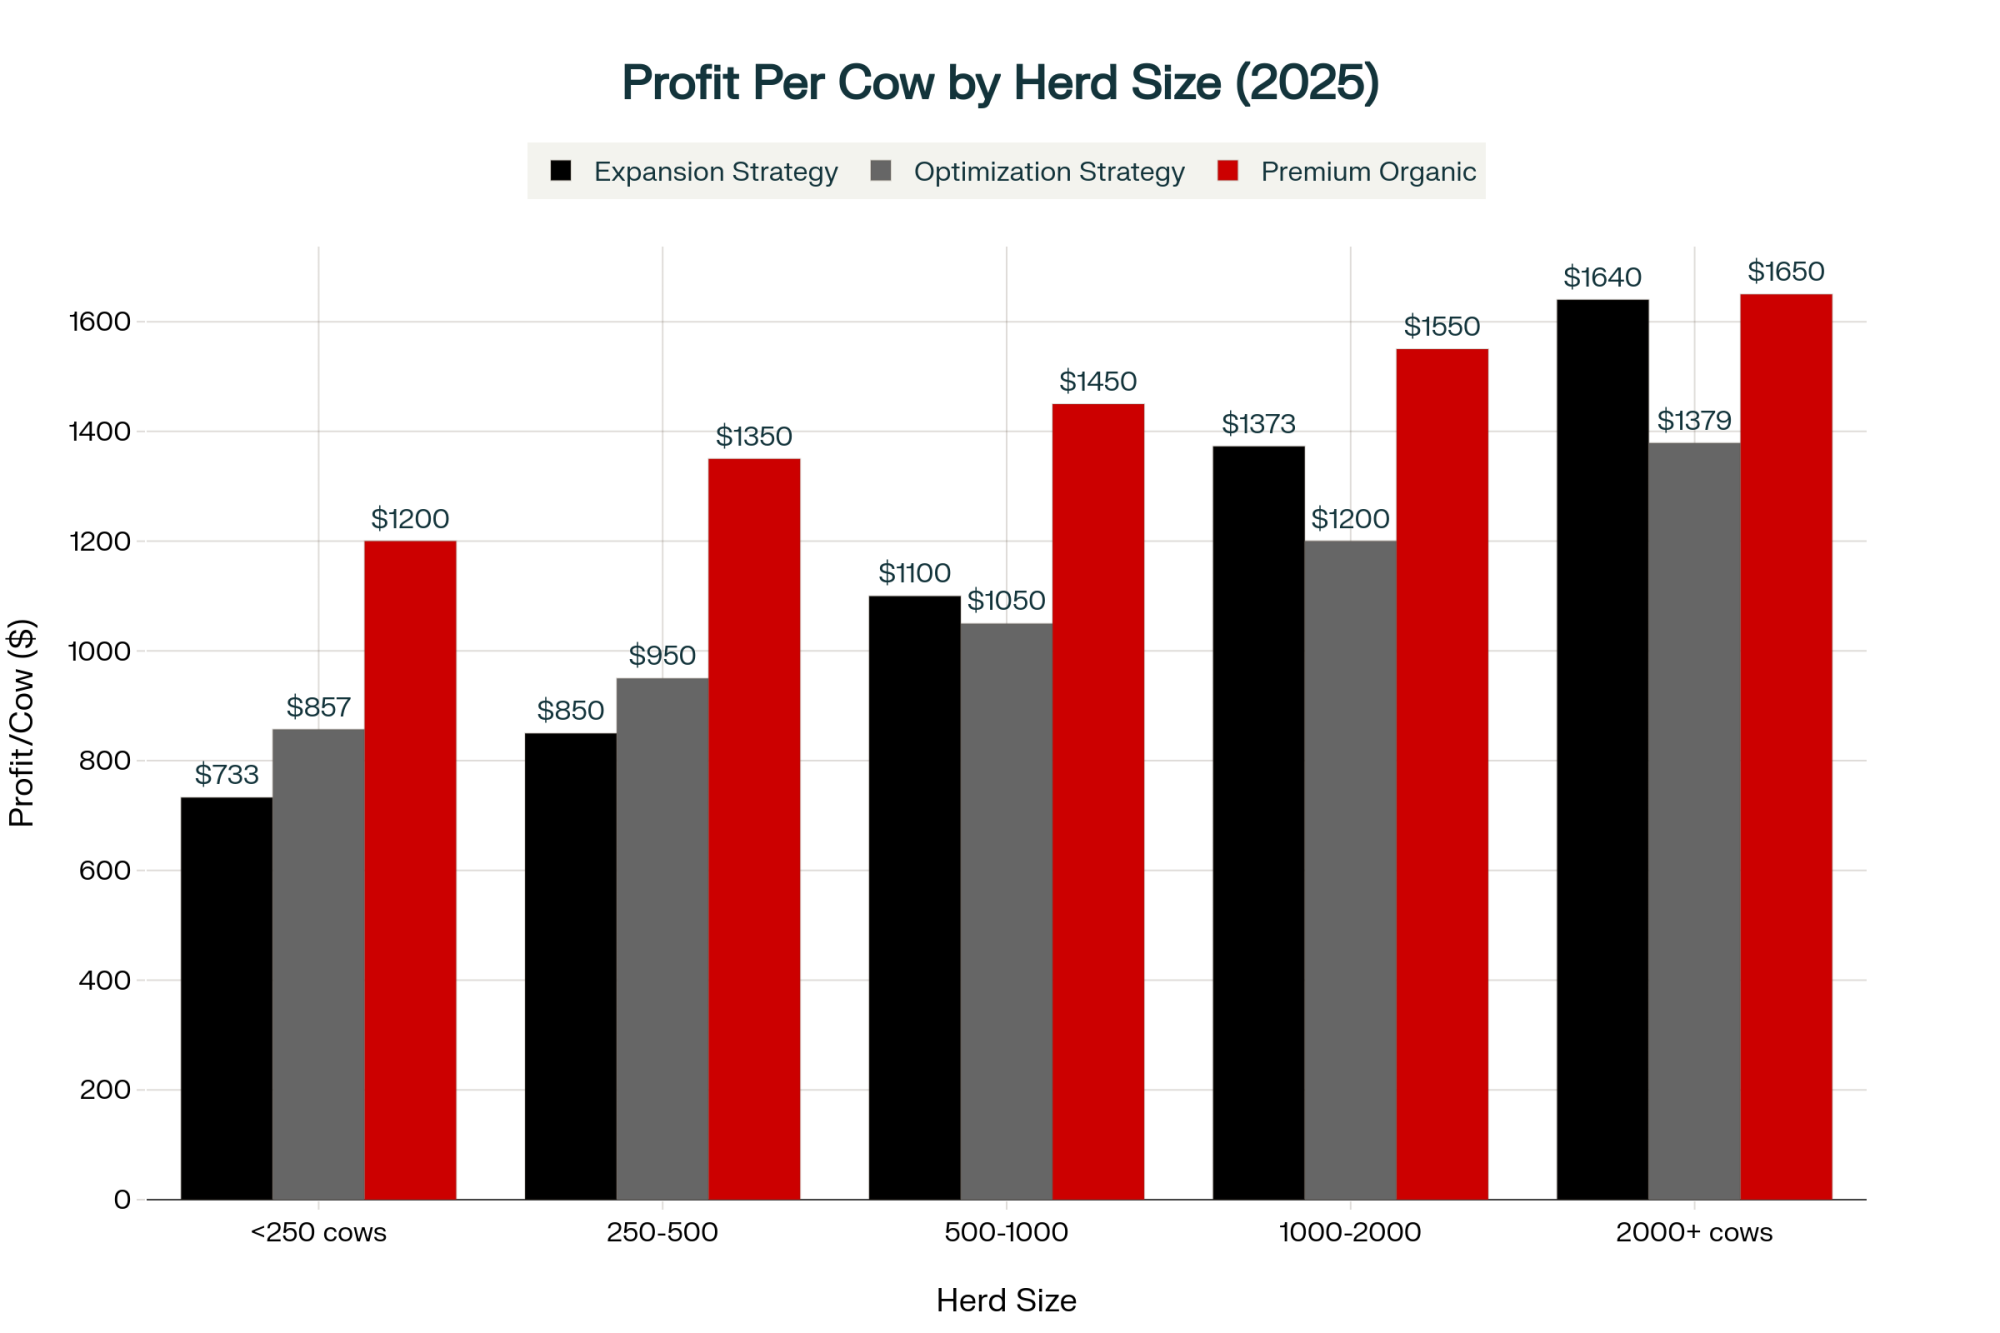
You need a debt-to-equity ratio under 2.0, preferably lower. You should already be in the top 25% for efficiency, meaning your cost of production is under $19 per hundredweight.

You’ve got to have the land base or be able to acquire it. And honestly? You need to actually enjoy the business side of dairy, not just working with the cows.

What’s it take? University of Wisconsin Extension’s been helping folks price out expansions, and you’re looking at $3.5 to $5 million in capital investment.

That’s an 18 to 24-month timeline just for permits and construction. You’ll be managing employees, not just family labor. And you need the stomach for significant debt and risk.

The payoff? Production costs drop two to three dollars per hundredweight at scale—USDA data’s pretty clear on this—which more than covers new allergen compliance costs.

You become the type of operation processors want to work with long-term. But it’s a big leap, no doubt about it.

Path 2: Exit Commodity, Enter Premium

What’s encouraging is that producers from North Carolina to Kansas to New Mexico are finding similar success with premium markets.

This path works if you’re within 60 miles of a decent-sized population center—100,000 people or more. You or your spouse actually has to enjoy marketing and talking to customers. Can’t stress that enough.

You’ll be working farmers markets, doing farm tours, and managing social media. As you’ve probably experienced yourself, it’s exhausting but can be rewarding.

Your location needs affluent consumers who value local food. And you’ve got to handle the three-year organic transition financially—that’s no small feat.

What’s it take? Organic certification under the USDA’s National Organic Program is a 36-month process, as you probably know.

If you’re adding processing, budget $150,000 to $300,000 for a small facility—USDA Rural Development has some grant programs that can help with this.

Plan on 15 to 20 hours per week just on marketing. It’s a completely different mindset about what you’re selling.

The payoff? Premium markets can deliver five to ten dollars per hundredweight above commodity prices—USDA tracks these premiums pretty consistently.

“We realized we couldn’t compete with mega-dairies on cost. But we could compete on story, quality, and customer connection. Our milk price went from $21 to $28 per hundredweight, and our yogurt adds another eight to ten dollars per hundredweight equivalent.”
— Vermont dairy family who transitioned to organic with on-farm processing

But more importantly, you’re building direct relationships that give you control over your price. You’re not just waiting for the monthly milk check to see what you got.

Path 3: Strategic Exit While You Can

This is the path nobody wants to talk about, but research on farm transitions suggests that strategic exits can preserve significantly more wealth than distressed sales.

Sometimes 25 to 40 percent more.

Who should consider this? If you’re over 55 without a successor who’s passionate about dairy—and I mean passionate, not just willing—this might be your reality.

If your debt-to-equity exceeds 2.5, if your cost of production is over $21 per hundredweight, if you’re emotionally exhausted from the volatility… well, it’s worth considering.

Especially if you have other interests or opportunities.

What’s it take? Good transition planning, starting 12 to 18 months out. Realistic asset valuations—don’t kid yourself about what things are worth.

Emotional readiness to close this chapter. And a clear plan for what comes next.

The payoff? Preserving capital while land values remain strong—and they won’t forever, we all know that.

Avoiding slow wealth erosion. Maybe transitioning to less-stressful agricultural enterprises, such as cash crops or custom work.

It’s not giving up; it’s making a strategic business decision.

The Supply Chain Dynamics You Need to Understand

To negotiate effectively, you need to understand what’s driving processor behavior. From their perspective, this isn’t about hurting family farms—it’s about survival in a world where one allergen incident can trigger catastrophic losses.

RaboResearch’s food industry analysis from this past summer suggests processors face an impossible situation. Their insurance companies are demanding comprehensive allergen controls.

Regulators are increasing scrutiny. Consumer lawsuits are proliferating. They’re pushing liability upstream because they genuinely don’t see another option.

What’s particularly telling is that processors actually prefer consolidation. Think about it from their shoes: Managing 200 large suppliers instead of 2,000 small ones.

Professional management teams they can work with. Sophisticated quality systems and documentation. Resources to implement new requirements properly. Lower transaction costs across the board.

This isn’t a conspiracy—it’s economics. And understanding these dynamics helps you negotiate more effectively because you know what processors actually value.

Worth noting, too, that some processors are working with their farmers through this transition. A couple of the smaller regional processors in Ohio and Pennsylvania have offered 40-60% cost-sharing arrangements with phased implementation schedules over 18 months.

They’re the exception, not the rule, but it shows there’s some recognition of the burden these changes create.

Regional Factors That Change Everything

Geography’s becoming destiny in dairy. What I’m seeing is a real divergence driven by water availability and the regulatory environment.

Water-secure regions—the Upper Midwest, Northeast, and parts of the Southeast, like northern Georgia—are seeing renewed interest from both expanding local operations and relocating Western dairies.

Dairy site selection consultants tell me they’ve never been busier. Every conversation starts with “Where can we find reliable water for the next 30 years?”

Water-stressed areas—the Southwest, parts of California—that’s a different story. University of Arizona research on aquifer depletion shows that some dairy-intensive areas are experiencing annual water-table drops of several feet. Water costs in these regions have doubled or tripled in the past decade.

That’s not sustainable, and everyone knows it. These operations face a double whammy—new allergen costs plus rising water expenses.
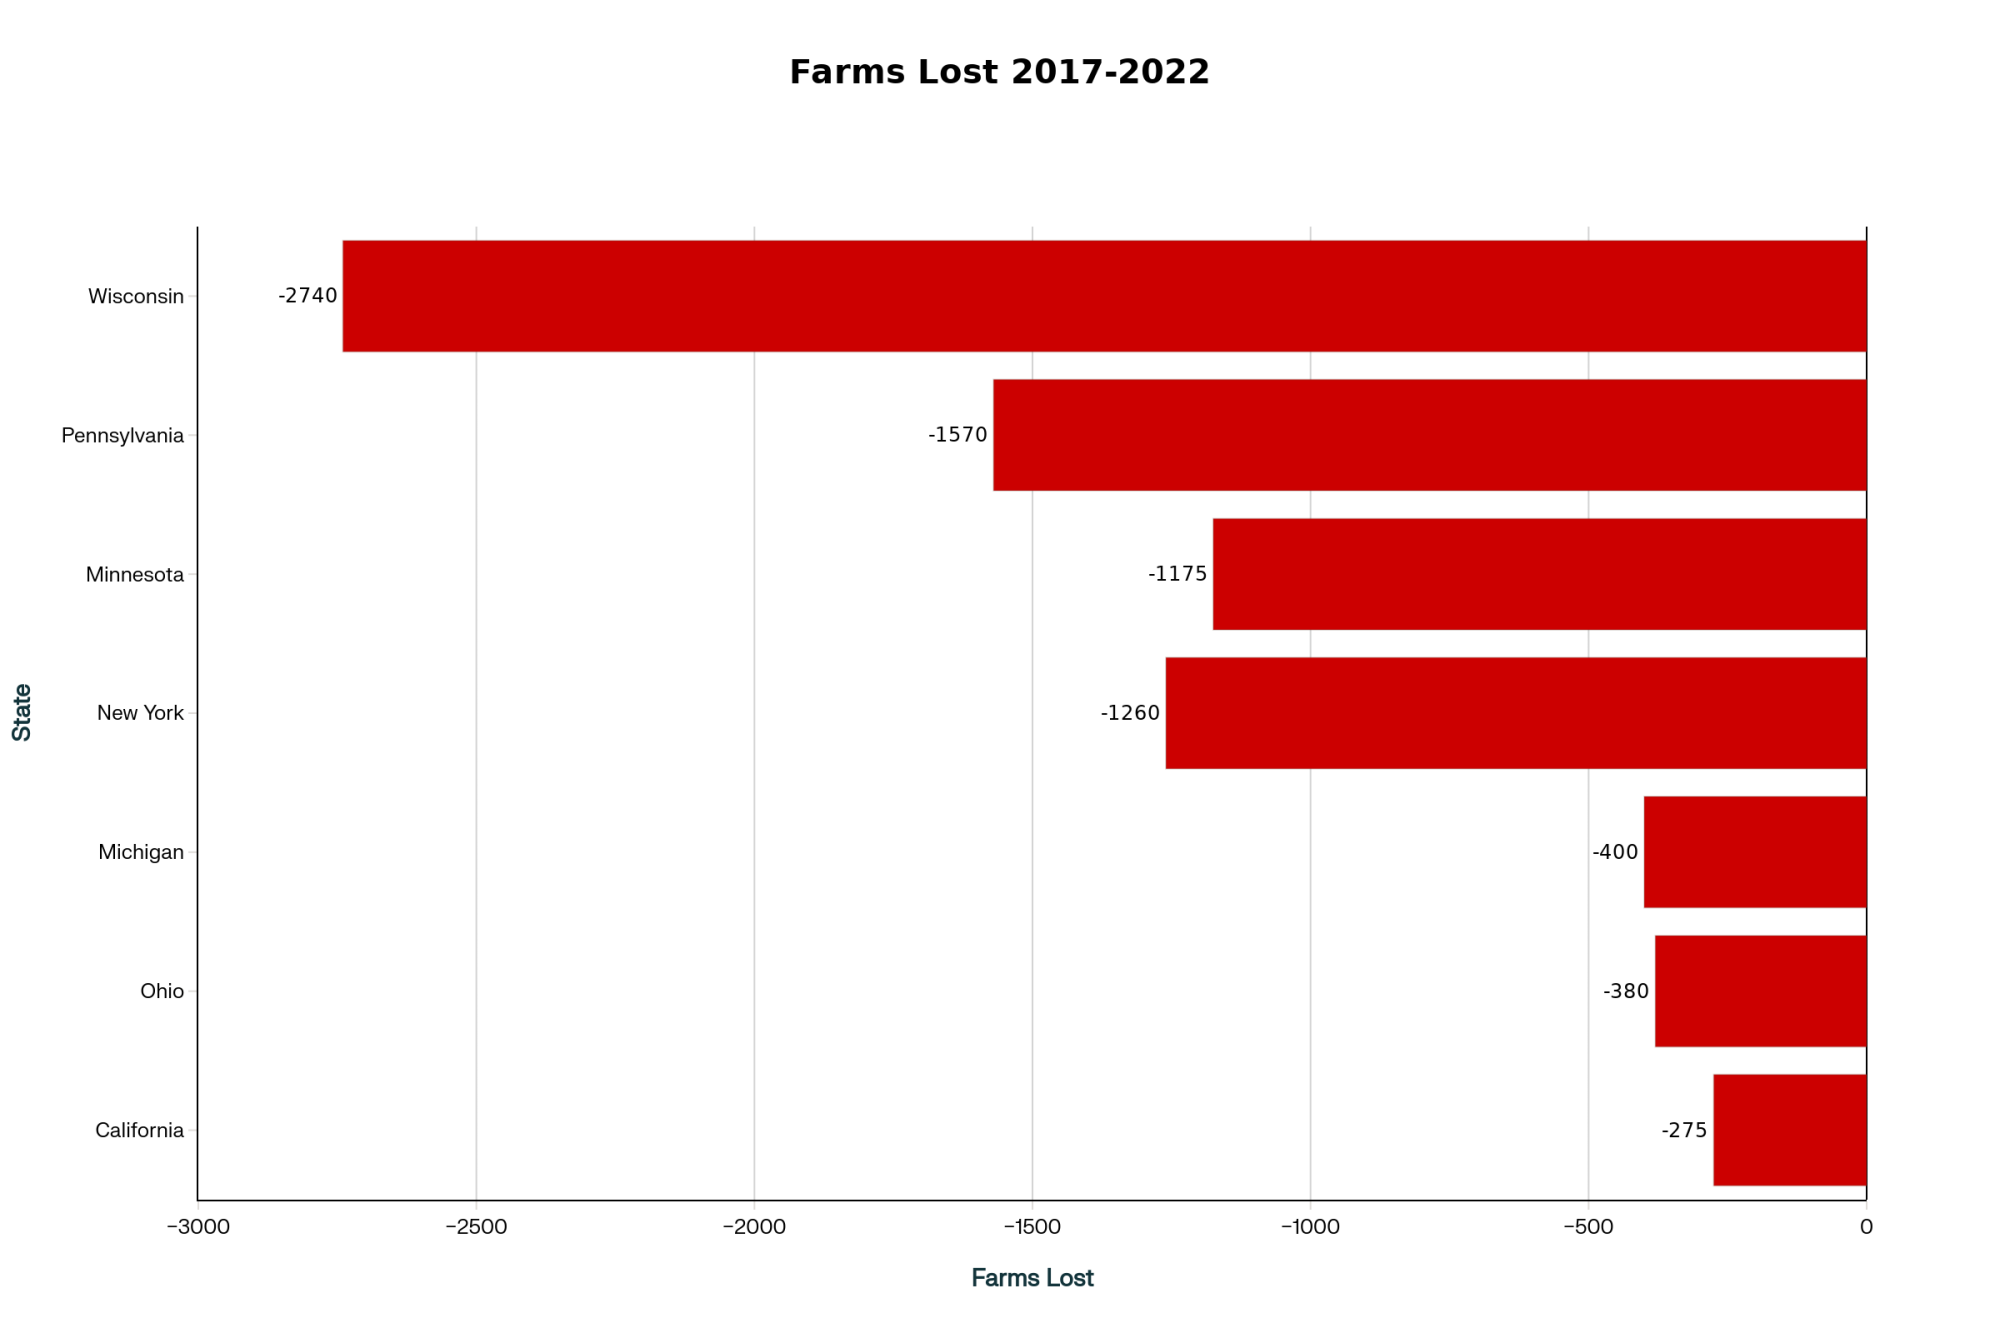
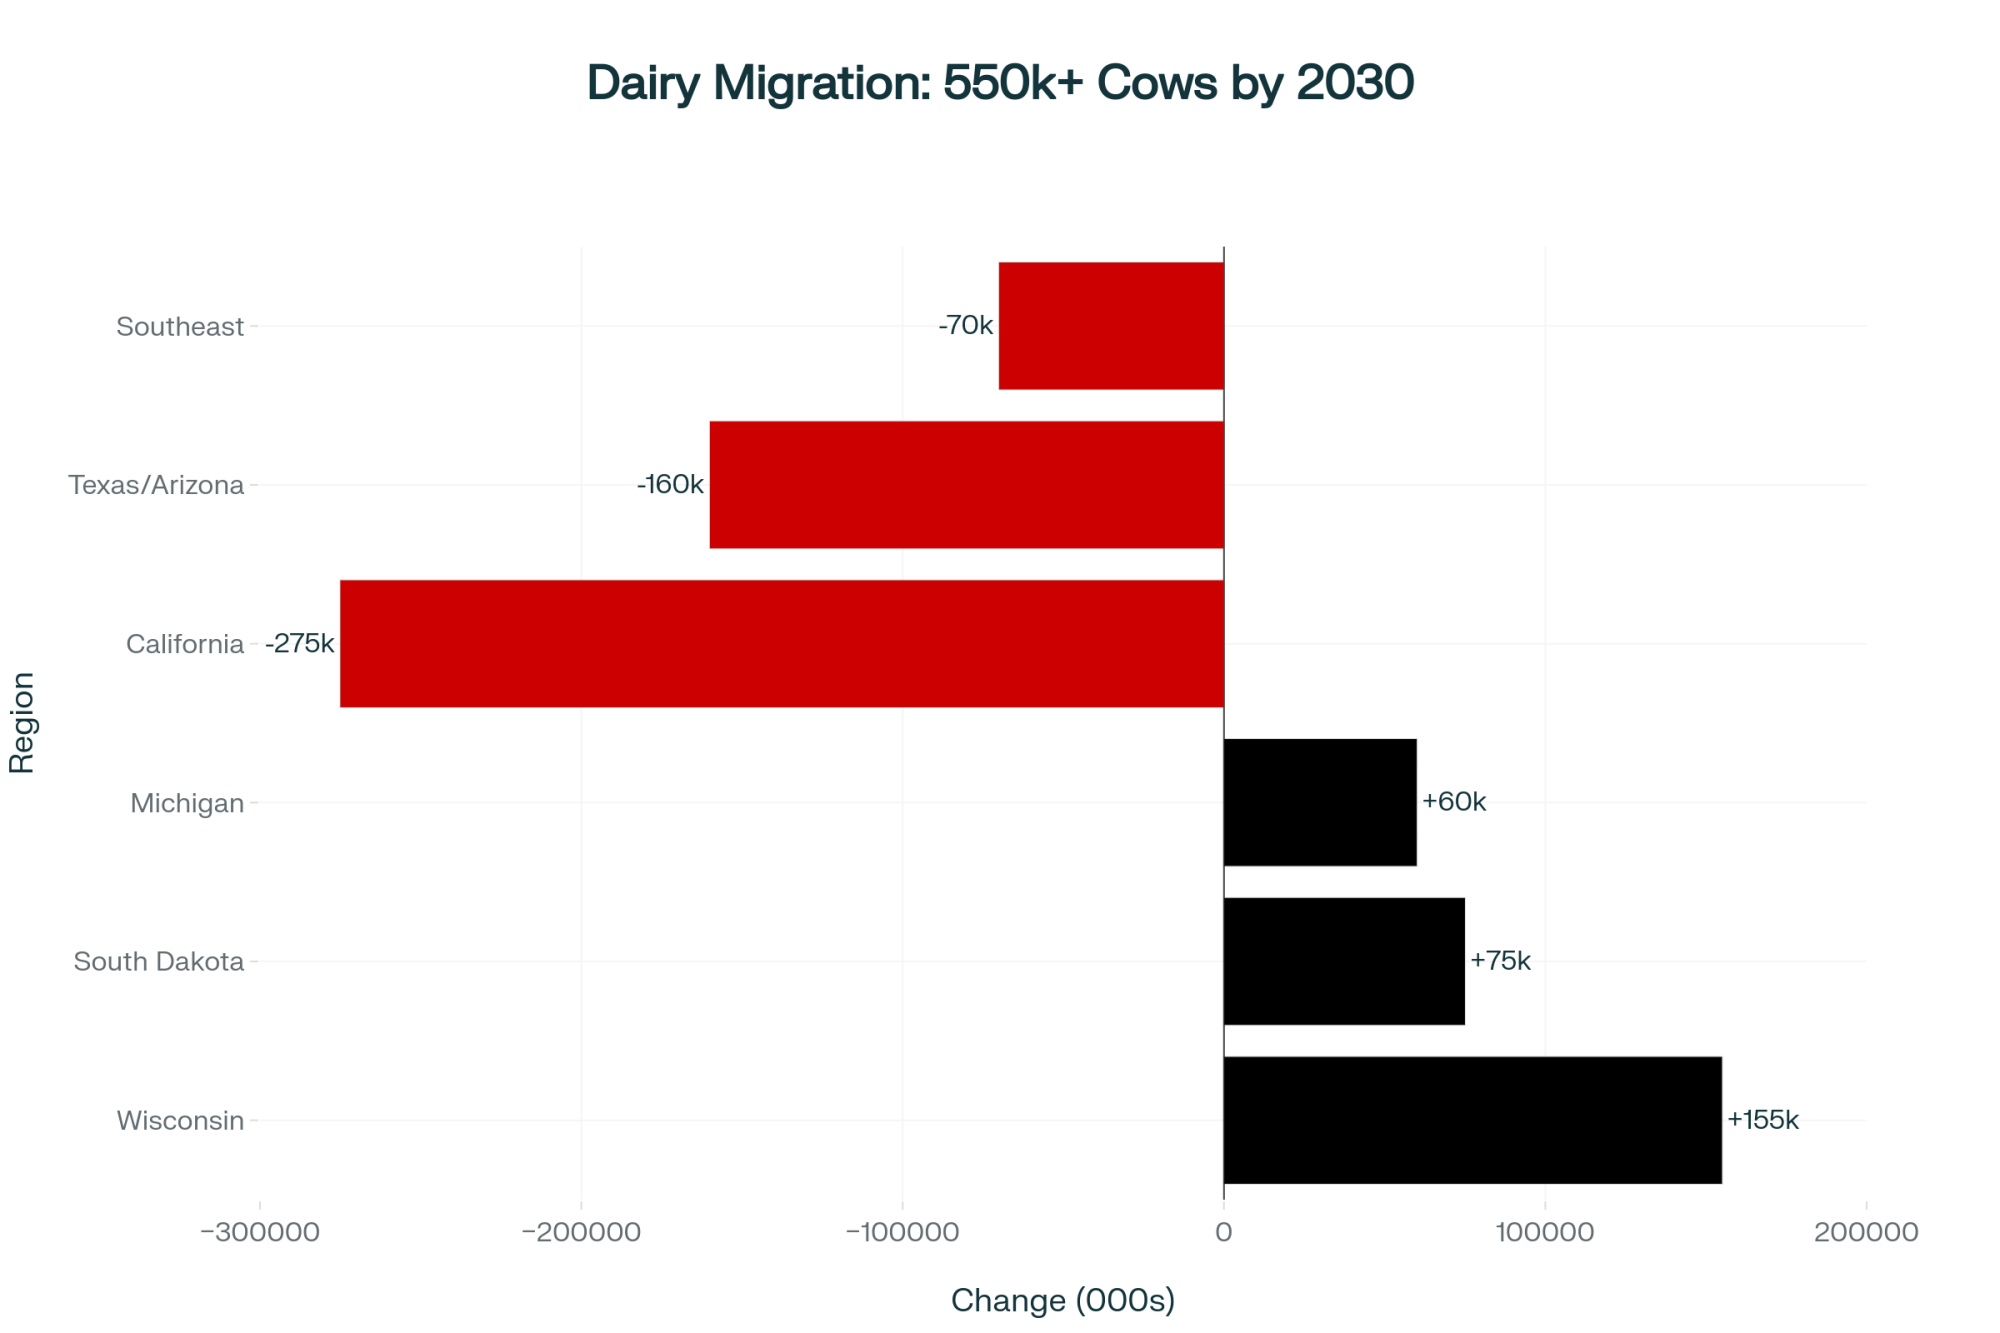
This Isn’t Happening Everywhere Equally: Wisconsin hemorrhaged 2,740 farms—more than the next three states combined. Pennsylvania, Minnesota, and New York each lost 1,000+ operations. Meanwhile, California (the largest dairy state) lost just 275. Geography matters, but the trend is universal

Negotiation Strategies That Actually Work

After watching dozens of these negotiations, here’s what’s actually effective:

  • Form an informal buying group. You don’t need a formal cooperative structure—just five to ten neighbors agreeing to push for the same contract terms. When six farms representing 3,000 cows approach a processor together, they listen differently than when you come alone.
  • Use professional help strategically. Yes, agricultural attorneys cost money. But spending $5,000 on contract review could save you $50,000 annually in bad terms. Frame it as the bad cop: “I’d love to sign this, but my attorney insists on liability caps…”
  • Offer trades, not just demands. “I’ll implement comprehensive testing protocols if you’ll split the costs 50/50 and cap my liability at one year’s gross revenue.” Processors respond better to negotiation than ultimatums.
  • Know your walkaway point. If you have alternative buyers—even if they’re 50 miles further—that knowledge changes how you negotiate. Do the math beforehand: What’s the worst deal you can accept and still stay viable?

Technology as a Survival Tool

The farms that are successfully adapting aren’t doing so through willpower alone. They’re leveraging technology to make compliance manageable.

What’s encouraging is that agricultural technology providers report dairy operations implementing digital documentation systems are seeing significant reductions in administrative burden.

Automated testing protocols are lowering sampling costs. Real-time environmental monitoring can prevent contamination incidents before they become recalls.

For example, farms using systems like DairyComp 305’s newer modules or Valley Ag Software’s compliance-tracking are finding the documentation requirements much more manageable than those trying to handle them with spreadsheets.

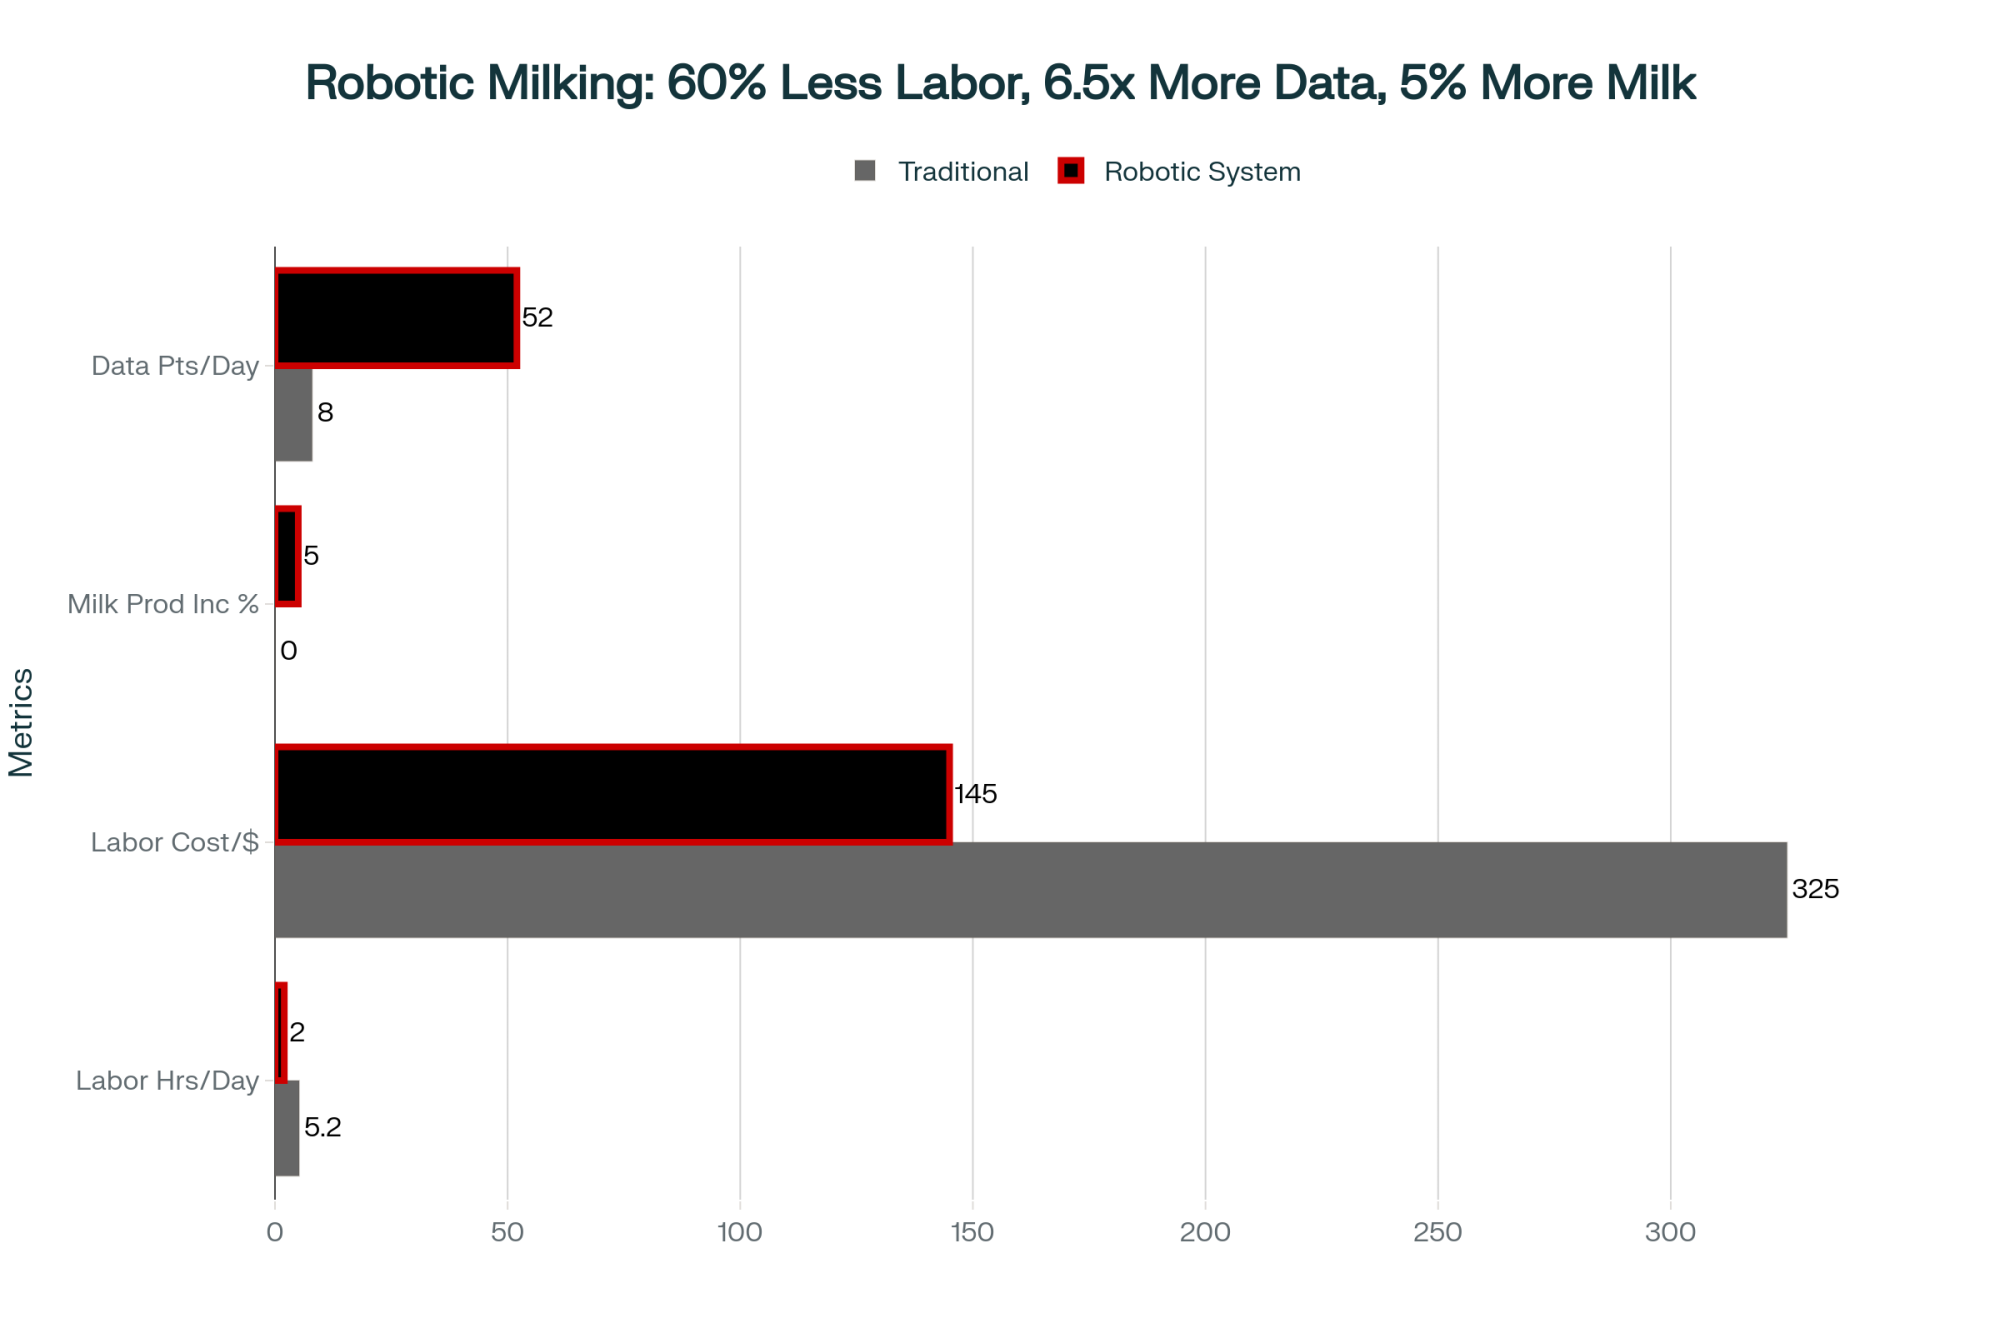
The upfront cost—usually $5,000 to $15,000 for implementation—pays for itself in reduced labor and avoided compliance violations. One Kansas operation told me they cut documentation time by 60% after implementing digital tracking, saving nearly $20,000 annually in labor costs alone.

Technology isn’t optional anymore. What is the difference between farms crushing under compliance costs and those managing them? Usually comes down to whether they’ve invested in the right systems.

What Dairy Looks Like in 2030

Based on everything I’m seeing, here’s my best projection for where we’re heading:

We’ll probably have 15,000 to 20,000 dairy farms by 2030, down from today’s 24,000. But—and this is important—they won’t all be mega-dairies.

I’m expecting maybe 12,000 to 15,000 large-scale commodity operations, another 3,000 to 5,000 premium or specialty farms serving local and niche markets, and 2,000 to 3,000 transitional operations finding unique market positions.

Agricultural economists analyzing dairy consolidation trends suggest we’re not witnessing the death of dairy farming. We’re seeing differentiation.

The 500-cow commodity model is becoming obsolete, yes. But opportunities are emerging for farms willing to adapt strategically.
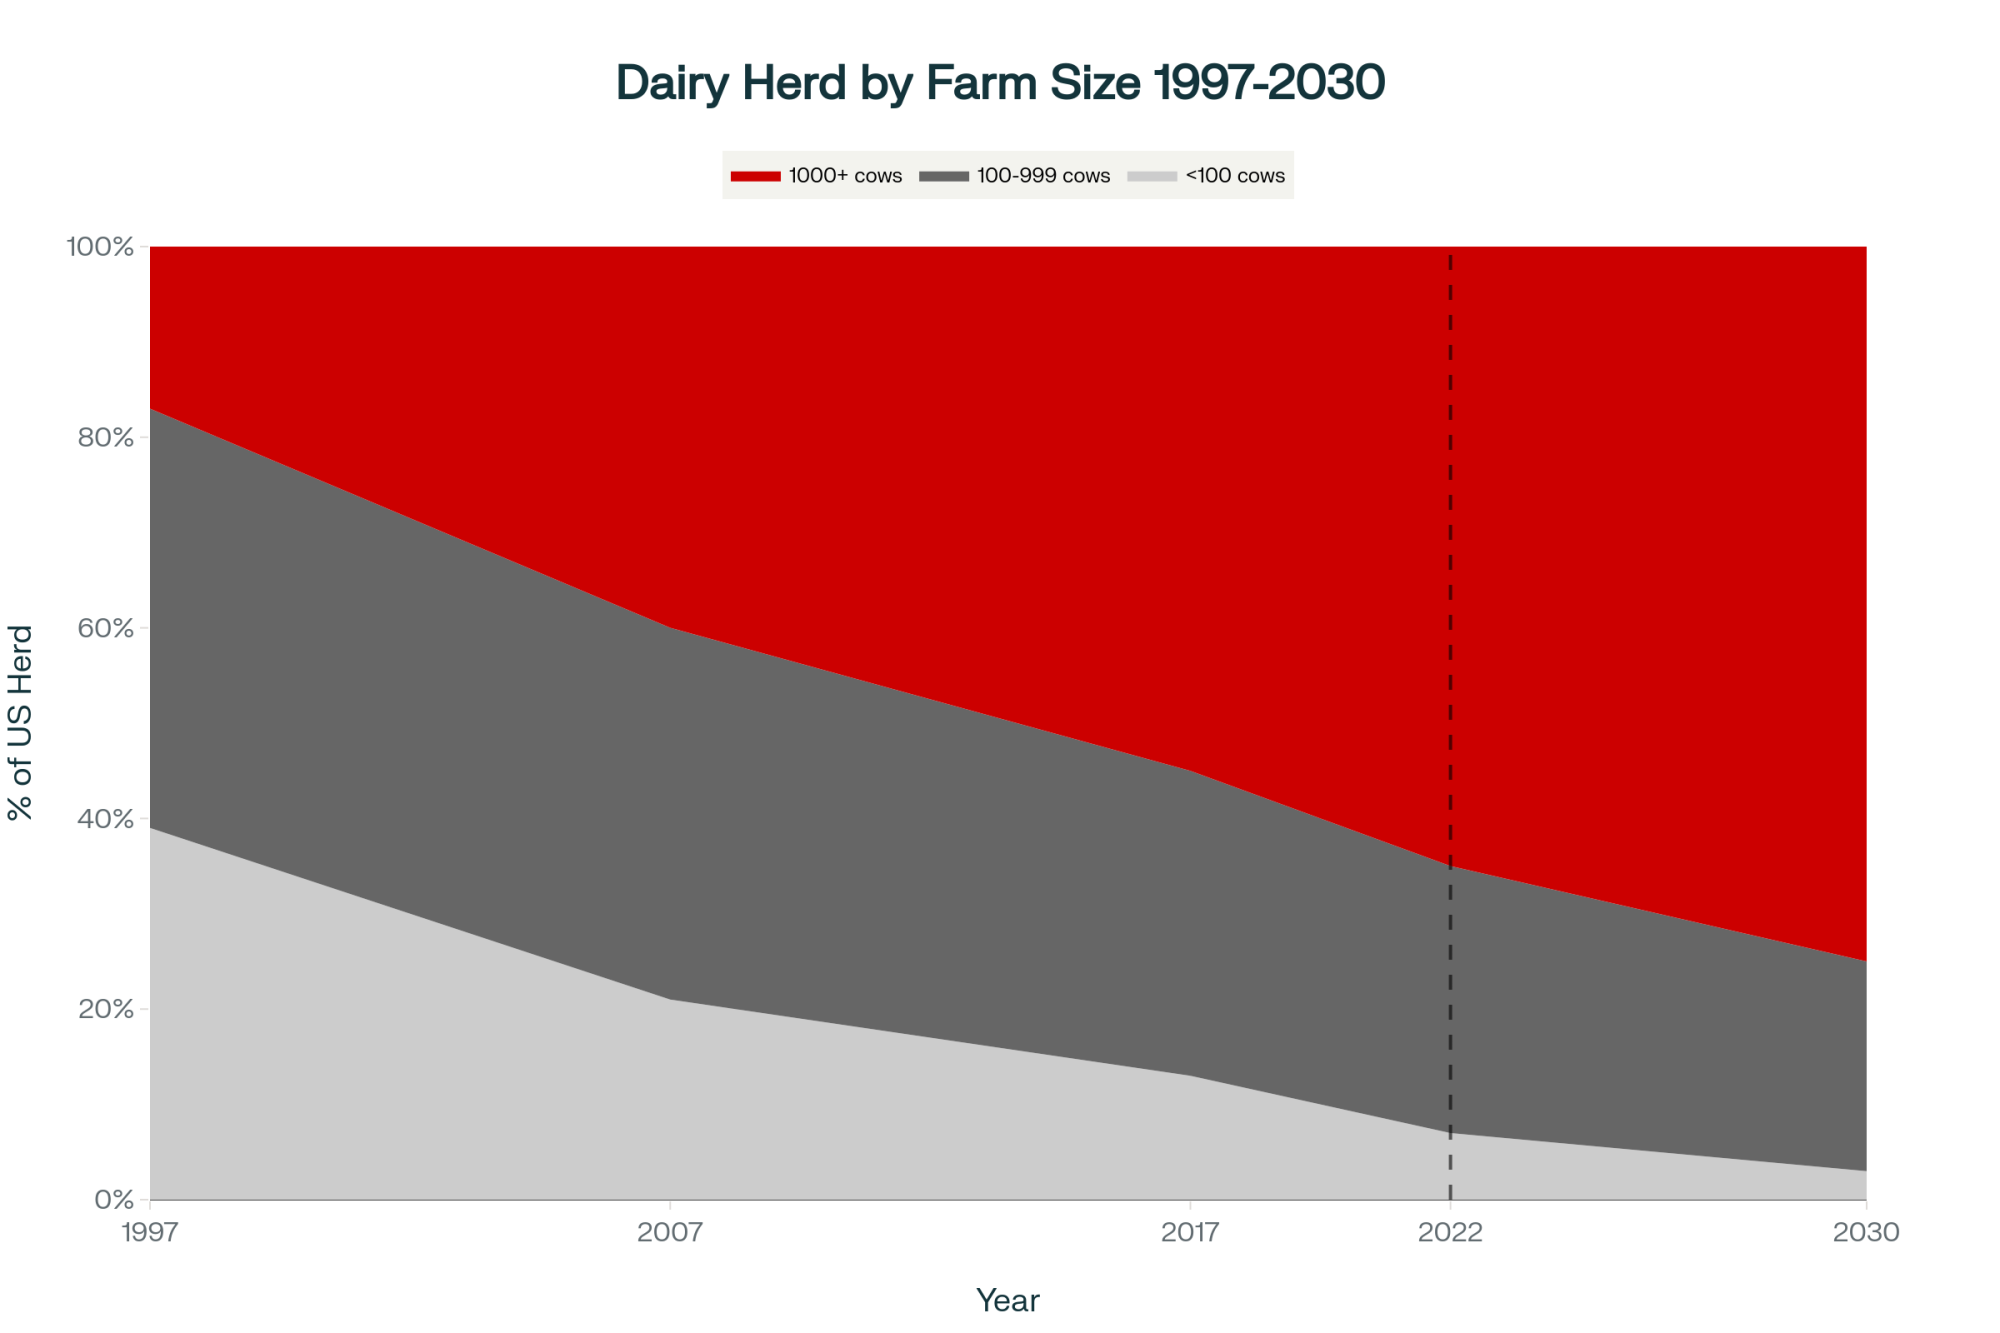
The 25-Year Transformation: In 1997, just 17% of dairy cows lived on 1,000+ cow farms. Today? 65%. By 2030? Projected 75%. Meanwhile, farms under 100 cows dropped from 39% to 7% and are heading toward extinction. This isn’t gradual change—it’s systematic restructuring

Making Your Decision: A Practical Framework

So what should you actually do? Here’s the framework I’m suggesting to farmers facing these contracts:

Your 30-Day Action Plan

  • Calculate your true cost of production—don’t guess, know it
  • Review your current contract for existing allergen language
  • Get insurance quotes for the new liability levels
  • Talk honestly with family about succession plans
  • Research premium market opportunities in your area

Key Decision Factors

  • If you’re under 45 with strong succession and sub-$19 per hundredweight costs, consider scaling. The economics work if you can handle the risk.
  • If you have marketing skills and you’re near population centers, explore premium markets. The margins are there for those who can sell.
  • If you’re over 55 and without succession, and your costs exceed $21 per hundredweight, plan your exit. Preserving wealth beats slow erosion.
  • If you’re in between? You’ve got 90 days to figure out which direction you’re heading. Drifting is the only wrong answer.

The Reality We Need to Discuss

Here’s what I think a lot of folks know but aren’t saying out loud: The 500-cow commodity dairy is structurally obsolete in the emerging market environment.

Not because farmers aren’t working hard enough. Not because they’re bad at what they do. But because the economics have shifted in ways that make that scale unviable for commodity production.

Dairy transition specialists tell me that every farmer they work with wishes they’d made their decision 2 years earlier.

Whether that’s expanding, transitioning to premium, or exiting—acting decisively preserves more wealth and creates more options than hoping things improve.

Final Thoughts

The 2026 allergen requirements are real, and they’re going to hurt. But they’re also just accelerating changes that were already underway.

The farms that recognize this—that see these contracts as a catalyst for strategic decision-making rather than just another compliance burden—are the ones that’ll still be farming successfully in 2030.

The dairy industry has weathered countless storms over the generations. This one’s different, not in its severity, but in its permanence.

The sooner we accept that and act accordingly, the better positioned we’ll be for whatever comes next.

You know, at the end of the day, it’s not about whether to sign or not sign a contract. It’s about what kind of dairy farmer you want to be—or whether you want to be one at all—in the industry that’s emerging.

And that’s a decision only you can make for your operation.

KEY TAKEAWAYS:

  •  Immediate action required: Review your contract for unlimited liability clauses before December 31—signing locks you into potentially business-ending terms through 2026
  • Real costs revealed: $15,000 (minimal) to $55,000 (high compliance) in new annual expenses = 12-44% of typical 500-cow dairy profits gone
  • Only three viable paths: Scale to 1,500+ cows for efficiency ($3/cwt savings), pivot to premium markets ($5-10/cwt premiums), or exit strategically, preserving 25-40% more wealth than distressed sales
  • Negotiation leverage exists: Form buying groups with neighbors, demand 50/50 cost sharing, cap liability at one year’s revenue—processors need milk and will negotiate
  • The uncomfortable truth: The 500-cow commodity dairy is structurally obsolete—not because you’re failing, but because the economics permanently shifted against mid-size operations

Complete references and supporting documentation are available upon request by contacting the editorial team at editor@thebullvine.com.

Learn More:

The Sunday Read Dairy Professionals Don’t Skip.

Every week, thousands of producers, breeders, and industry insiders open Bullvine Weekly for genetics insights, market shifts, and profit strategies they won’t find anywhere else. One email. Five minutes. Smarter decisions all week.

NewsSubscribe
First
Last
Consent

Lameness Costs You $28,000 Yearly. Genetics Can Fix It – But not for 10 Years. Here’s Your Strategy

Every lame cow costs you $225. Genetics can fix it—in 10 years. Here’s what works NOW

EXECUTIVE SUMMARY: Lameness costs the average 500-cow dairy $28,000 annually, and while CDCB’s new genetic evaluations promise a 30% reduction, you won’t see meaningful savings for 10 years. The reality check: these evaluations rely on data from just six elite farms with $100,000 camera systems—not typical operations dealing with old concrete and tight margins. By year 10, genetics deliver $4,879 annual savings, reaching $8,160 by year 15, but European-style welfare markets will emerge by 2030, before genetics pay off. Smart producers aren’t waiting—they’re investing $40-60K in immediate flooring improvements while simultaneously selecting for lameness resistance. The winning strategy combines environmental fixes that work today with genetics that compound forever. Bottom line: this isn’t about choosing between short-term and long-term solutions, it’s about having the vision and patience to pursue both.

Dairy Lameness ROI

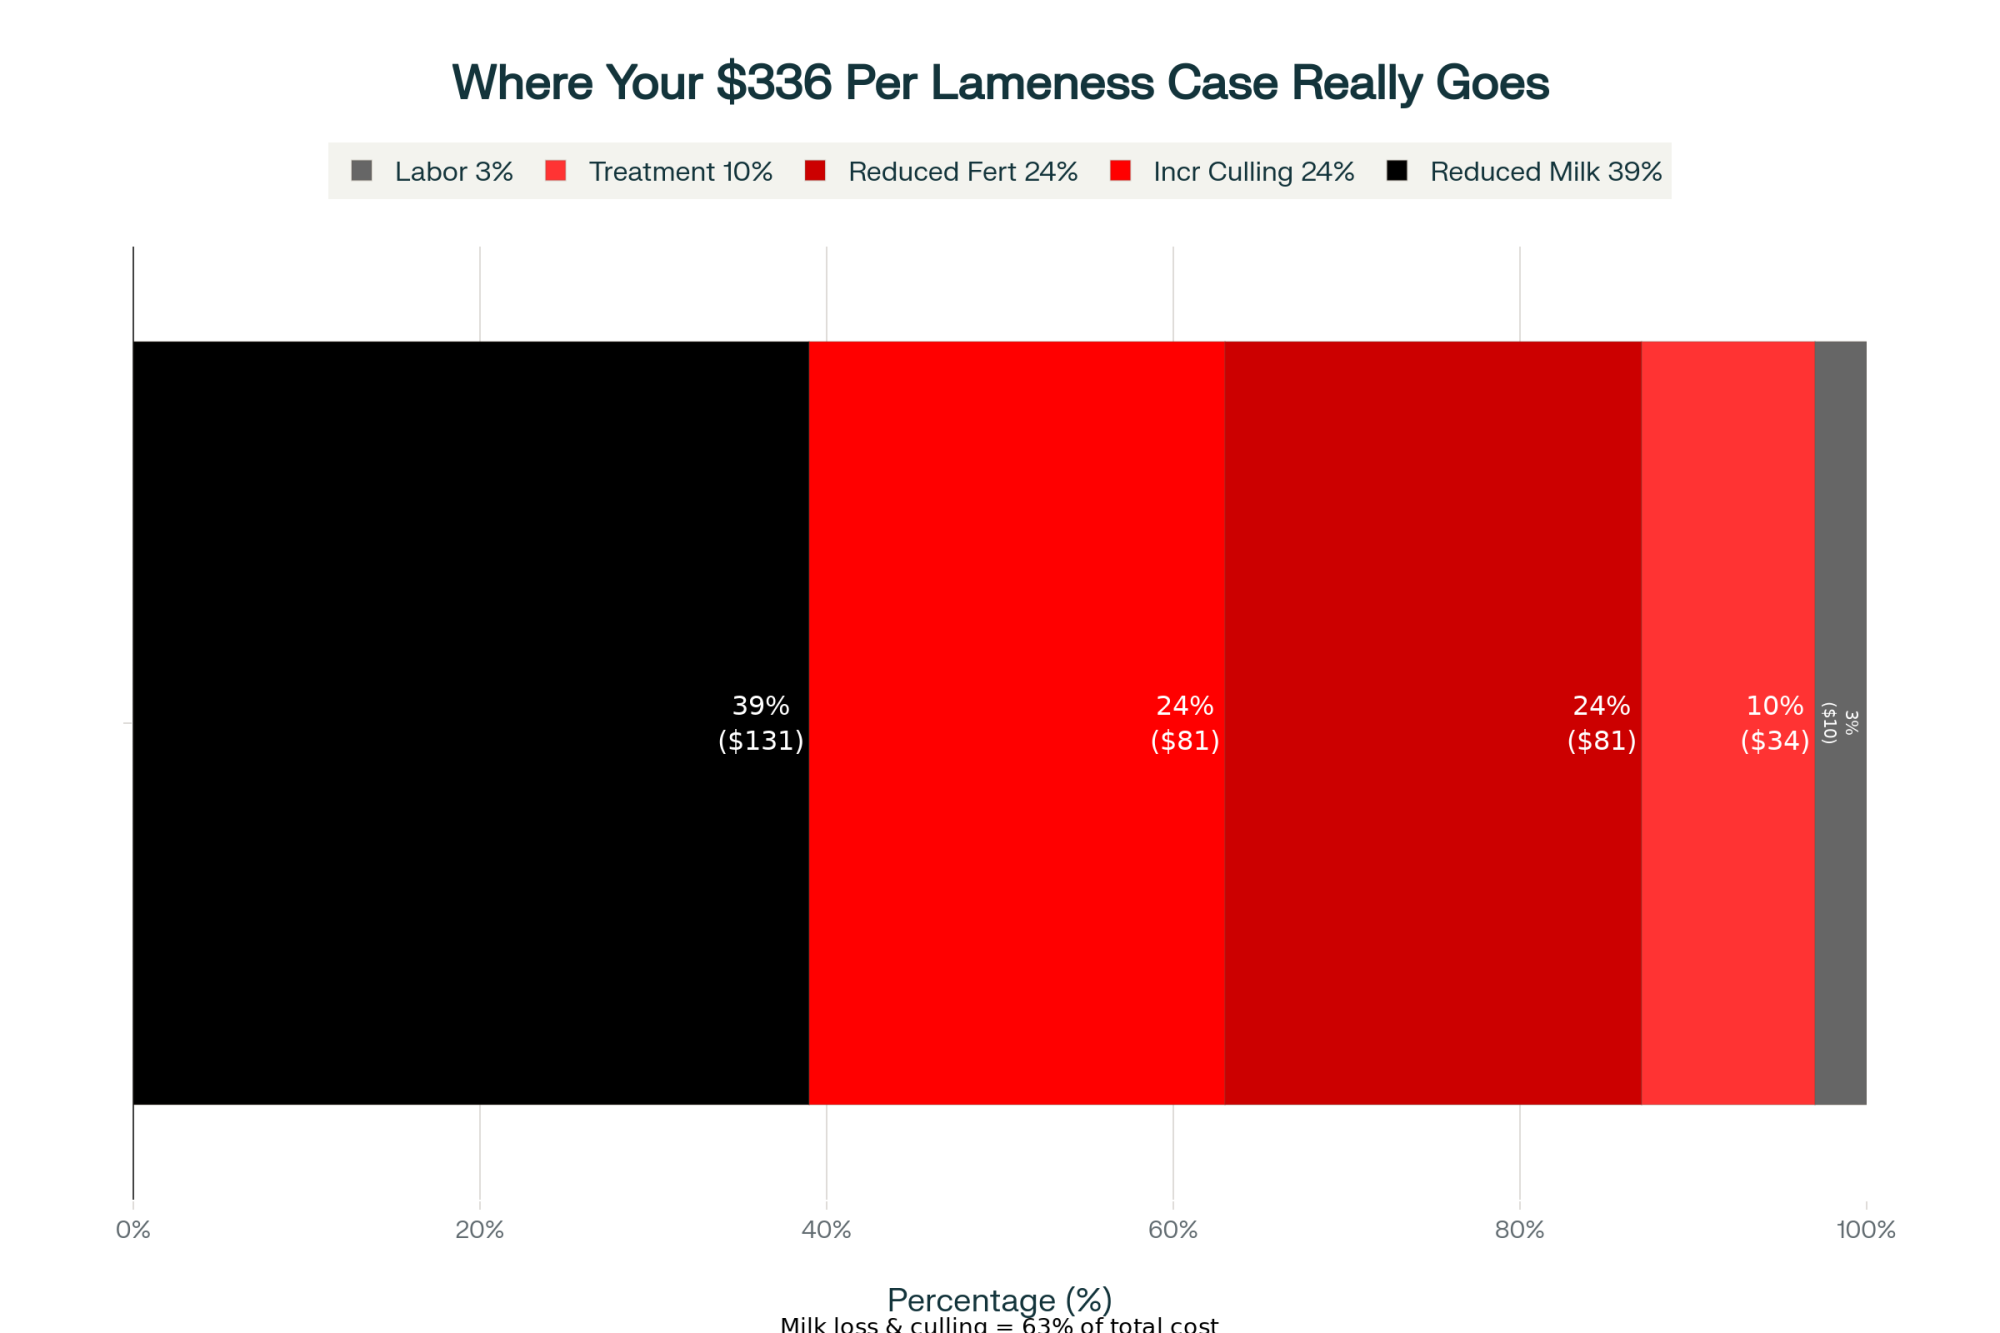
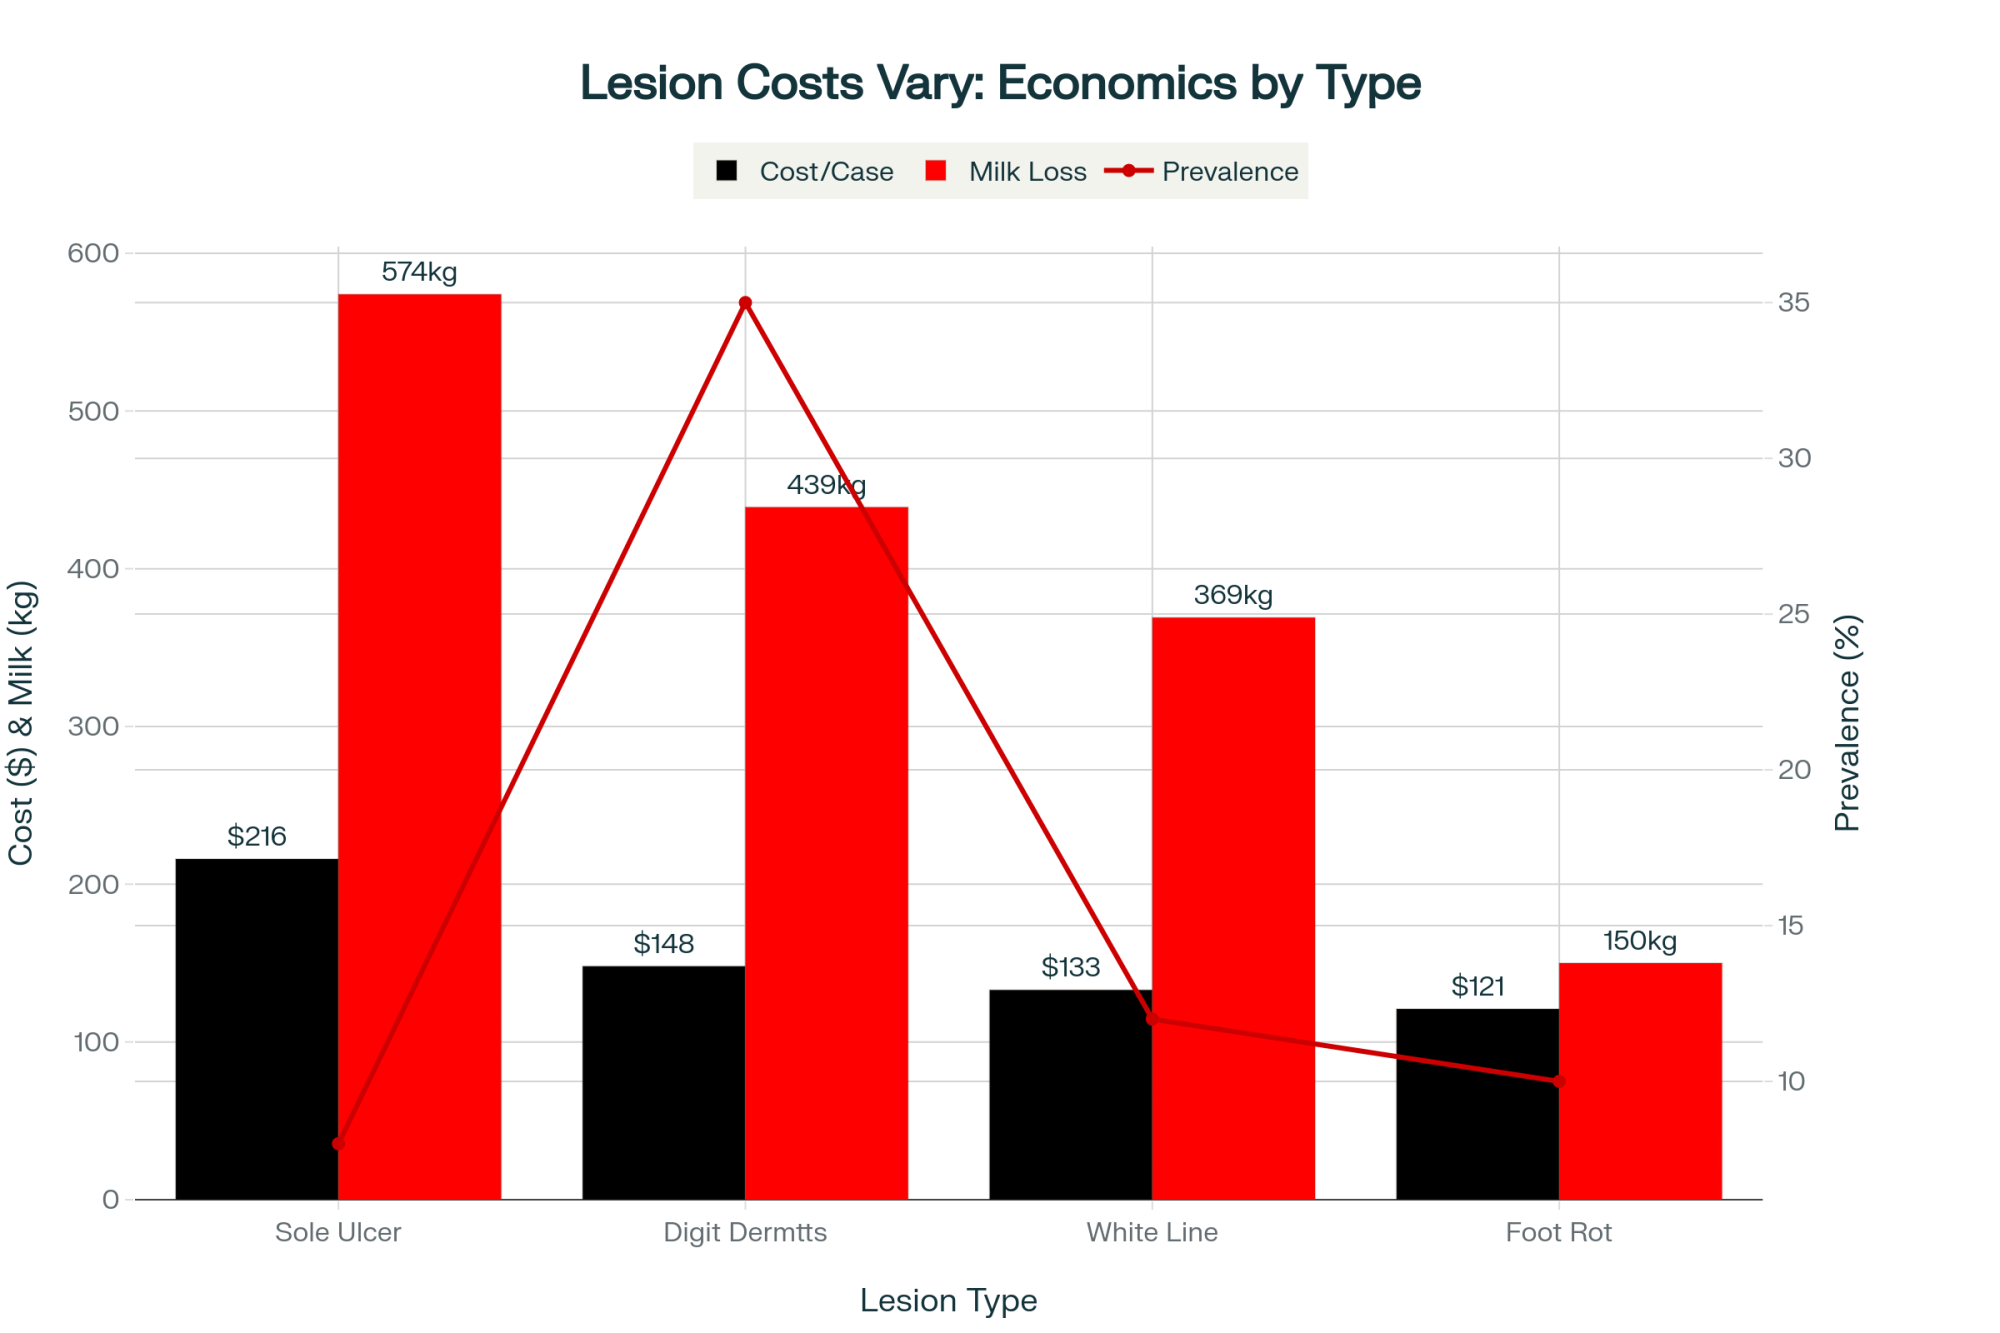
You know that sinking feeling when your trimmer shows up and the bill starts climbing? We’re all dealing with it—lameness affects about a quarter of our cows, and at $120 to $330 per case according to multiple studies in the Journal of Dairy Science, it’s hitting checkbooks hard.

Here’s what’s interesting, though: CDCB just presented at their 2025 Industry Meeting that they’re developing genetic evaluations that could reduce lameness by 20-30% over the next couple of decades. And I say “could” because, well… let’s talk about what that really means.

What caught my attention when I dug into the presentations from Dr. Kristen Gaddis and her team is that the timeline stretches much longer than you’d expect. The economics? More modest than the headlines suggest. And get this—the entire system currently depends on mobility data from just six farms with camera systems, plus trimmer records from about 686 herds. That’s from CDCB’s own numbers.

Click the link to view the presentation: Improving the Wheels on the Car: Hoof Health and Mobility
Ashley Ling, Ph.D., CDCB Support Scientist Slides

The Science: Two Very Different Traits

Here’s where it gets fascinating, and I think you’ll appreciate the biological difference between CDCB’s two strategies.

Traditional hoof health data from trimmer records? We’re looking at heritability of just 3-5%—that’s what the research consistently shows. So basically, 95-97% of what we see comes down to the environment. Your flooring, nutrition program, whether you’ve got digital dermatitis making the rounds… you probably know this already. Put most cows in bad enough conditions—wet concrete, poor ventilation, overcrowding—and they’ll develop problems no matter what their genetics look like.

But mobility scores tell a completely different story. The heritability ranges from 10% to 30% based on CDCB’s findings in their reference population of 63,000 cows. That’s getting into the range of moderately heritable production traits we’ve been successfully selecting for. What’s encouraging here is that mobility seems to capture those deeper genetic differences—skeletal structure, pain sensitivity, basic biomechanics—that persist regardless of housing.

Mobility scores show 2-6x higher heritability than traditional trimmer records, revealing why AI-powered camera systems capture the genetic differences that actually matter for breeding decisions. When 95-97% of hoof problems come from environment, you need that 10-30% genetic signal—not the 3-5% noise.

The innovation piece that’s worth noting is these AI-powered camera systems from companies like CattleEye. They’ve captured over 14 million daily scores from those 63,000 cows, and research in Preventive Veterinary Medicine shows these systems agree with trained vets about 80% of the time. That’s precision you just can’t get when someone’s scribbling notes in the trim chute.

Your Bottom Line: The Real Economics

Let me walk you through the economics, because that’s what matters when you’re making breeding decisions today.

Based on USDA data and that 25% prevalence we’re all dealing with, you’re looking at about $56.25 per cow annually in lameness costs. For a 500-cow operation, that’s $28,125. Real money, absolutely.

The genetic savings timeline reveals the harsh reality—no financial benefit for the first 2-4 years, with meaningful savings only arriving by Year 6 and substantial impact delayed until Year 10-15. This isn’t about choosing between short-term and long-term strategies; it’s about having the vision and patience to pursue both.

But here’s what genetic selection actually delivers over time—and I’ve run these numbers based on CDCB’s genetic trend projections with standard 35% replacement rates:

  • Years 0-2: Nothing. Zero. You’re breeding, but no change in your barn yet.
  • Year 4: Maybe—and I mean maybe—you’ll notice three fewer lame cows in a 200-cow herd.
  • Year 6: Now we’re seeing something. About nine fewer lame cows, saving around $2,070 annually.
  • Year 10: Clear improvement. Twenty-two fewer lame cows, saving $4,879 annually.
  • Year 15: This is when it really shows. Thirty-six fewer lame cows, saving $8,160 annually.

The moderate scenario suggests a lifetime value of about $19-24 per cow from lameness resistance. To put that in perspective—and this is interesting—that’s right between Productive Life at $24 and Daughter Pregnancy Rate at $12 in the current Net Merit index, according to Dr. Paul VanRaden’s team at USDA.

The 6-Farm Problem

This is where things get… well, uncomfortable. Those six farms generating mobility data with their 14 million observations—impressive, sure. But are they really representative of the diversity we have across U.S. dairy operations?

What I’ve found in the Foundation for Food & Agriculture Research grant documentation is that these aren’t your typical farms. We’re talking operations that can afford $50,000 to $100,000 camera installations. They’ve got IT staff, sophisticated management protocols—they’re probably in the top 5% of the industry by any measure.

Now, statistically speaking, 63,000 cows far exceeds the 3,000-5,000 that genetics researchers say you need for reliable predictions. That’s well-documented.

But here’s what concerns me—research in Genetics, Selection, Evolution consistently shows that genomic predictions developed in one environment can lose 30-50% of their accuracy when applied to different management systems.

Think about it: if these six farms all have pristine rubber matting, optimal nutrition designed by PhD nutritionists, and professional trimmers on schedule, will their genetic evaluations actually help that 200-cow operation in Wisconsin dealing with 30-year-old concrete and tight margins?

CDCB’s got a $2 million grant from FFAR to expand collection to 60,000 more cows over three years. That’s great, but even then, we’re talking about less than 1.5% of the national dairy cow population contributing lameness data. And DHI participation? Down to 43% of U.S. cows from over 50% a decade ago, according to USDA census data.

Regional Realities Matter

What’s particularly interesting when you look at regional differences is how implementation challenges vary—and as many of us have seen, what works in California doesn’t always work in Vermont.

California operations with dry lot systems face completely different lameness dynamics than Vermont grazing operations or Michigan freestall barns. Cornell’s PRO-DAIRY research shows prevalence ranging from 15% in well-managed pasture systems to over 40% in older confinement facilities in the Northeast.

Down South—and I’ve talked to several producers dealing with this—heat stress creates its own problems. University of Georgia extension work shows lameness spikes during summer when cows spend more time standing on concrete to access shade and cooling.

These regional realities mean genetic evaluations developed primarily from Midwest and Western mega-dairies might need serious recalibration elsewhere.

The European Warning We Can’t Ignore

Here’s what keeps me up at night—and should concern any producer thinking long-term. It’s not today’s milk check. It’s what’s already happening in Europe.

European welfare markets hit by 2030, but your genetic investments won’t pay off until 2035—creating a 5-year window where early adopters gain permanent competitive advantage while late movers scramble. This isn’t theory; FrieslandCampina and Tesco already require welfare audits. Are you positioned?

FrieslandCampina in the Netherlands has implemented welfare monitoring programs that incorporate lameness metrics into supplier requirements. Major UK retailers, such as Tesco, require welfare audits with lameness as a key metric. Germany passed animal welfare labeling legislation in 2023 that creates premium pricing tiers.

Based on typical lag patterns, we could see similar requirements in U.S. markets by 2030-2035. Several major processors here have already started supplier welfare assessments. Walmart and Costco are asking questions. Export markets to Europe increasingly require welfare documentation.

And here’s the catch nobody wants to discuss: genetic decisions you make today determine your herd composition a decade from now. If you wait for clear market signals—actual premiums or penalties—before emphasizing lameness resistance, your genetics will be 10 years behind when those payments show up. It’s like trying to turn a cruise ship, as they say.

The Consolidation Dynamic

I’ve been around this industry long enough to recognize patterns, and here’s one that deserves honest discussion. These early-stage evaluations will work best for operations that already look like the reference farms—large, well-capitalized, technology-forward.

The math is sobering. If large operations gain even a 3-5-year head start while these evaluations are validated across broader environments, they maintain permanent genetic superiority that smaller operations can never close. That’s just how genetics works—it compounds. Research from ag economists at Iowa State confirms this dynamic across multiple livestock sectors.

This isn’t CDCB’s fault or intention. But when you combine superior lameness genetics with all the other advantages large operations already have—purchasing power documented by USDA’s Agricultural Resource Management Survey, technical expertise, preferential genetics access—you’re looking at one more force driving consolidation. We’ve already lost 50% of dairy farms in the past two decades, according to the 2022 Census of Agriculture.

What Actually Works: Practical Strategies

Flooring delivers immediate relief while genetics won’t catch up for 8-10 years—but the combined approach dominates by Year 10 with $16K+ in annual savings that continues compounding. This is how smart producers win: immediate environmental fixes buy time for genetics to mature.

After wading through all this research and talking with producers who’ve tried various approaches, here’s what’s clear:

For immediate impact (Years 0-5): Environmental management still wins. University of Wisconsin’s Dairyland Initiative research shows that traction-milling concrete floors—that’ll run you $40,000-60,000—can immediately reduce lameness by 10 percentage points. That’s $11,250 in annual savings with a 3- to 5-year payback. Genetic selection won’t match this for 8-10 years.

For long-term positioning (Years 5-15): This is where genetics shines. It compounds permanently while that nice flooring depreciates. By year 10, genetic selection could deliver $12,000+ in annual savings with no additional capital required. And unlike flooring that needs to be redone every 6-15 years, genetic improvement continues to improve.

The optimal approach: Do both if you can. Fix critical environmental problems for immediate relief while shifting breeding emphasis toward lameness resistance. Year 10 projections show combined benefits of around $23,450 annually—way better than either approach alone.

Alternative Approaches for Smaller Operations

Something that didn’t make CDCB’s main presentations but came up in technical discussions—lower-tech options are being explored that might work for many of us.

University College Dublin researchers developed smartphone apps that can score mobility from short videos with a 64% correlation to camera systems. Penn State Extension is testing a simplified visual scoring that your herd vet could do during routine visits. DairyComp 305 and other software providers are working on integration—you know how they’re always adding features.

Research in the Irish Veterinary Journal shows human-assigned mobility scores correlate at 0.64 with camera scores and still show 10-15% heritability. Not as good as fancy cameras, but might be good enough if it means smaller operations can participate without massive investments.

AI organizations could explore subsidized phenotyping programs—similar to what happened with genomic testing adoption a decade ago—where they’d help cover costs for farms willing to share data.

Making the Right Decision for Your Operation

Not every operation should chase lameness genetics—this decision tree cuts through the complexity to show exactly which producers will actually benefit from the 10-year investment. Screenshot this and take it to your next breeding strategy meeting.

Not every operation should prioritize this the same way. Based on the economics and timeline, here’s how I see it breaking down:

Strong candidates for emphasis:

  • Multi-generation family farms planning to be around 20+ years
  • Operations with chronic lameness over 30%—you’ve got more room for improvement
  • Farms that can’t afford major facility renovations—genetics might be your only option
  • Producers are already thinking about welfare-premium markets
  • Operations in regions where consumer pressure is strongest (California, Northeast)

Probably should focus elsewhere:

  • Planning to sell or retire within 5-7 years? You won’t see the payoff
  • Already under 15% lameness? Limited upside
  • Need immediate cash flow improvements? Production traits deliver faster
  • Got capital for facility upgrades? Environmental fixes give quicker returns
  • Located where welfare pressure is minimal

Where the Industry Goes from Here

What strikes me most about CDCB’s lameness resistance development is how it highlights a broader challenge. Should genetic evaluation systems optimize for current conditions or anticipate where markets are heading? When breeding decisions take 10 years to play out but markets can shift in 5, who bears the risk?

We learned this lesson painfully with fertility. Spent decades emphasizing production while fertility tanked—USDA data shows it clearly. Then we scrambled when replacement costs exploded. Took 15+ years to dig out. Are we setting up for the same pattern with welfare traits?

Dr. Chad Dechow at Penn State has written extensively about needing anticipatory breeding strategies that position for probable future markets rather than just optimizing for today. But that’s easier said than done when you’re trying to make payroll next month.

What This Means for You

Looking at all this, here’s what I’d tell my neighbors:

  • Adjust your timeline expectations. This isn’t a quick fix. If you need lameness relief in 3-5 years, invest in flooring, footbaths, and management. Genetics is your 10-year plan.
  • Understand the real economics. That $19-24 lifetime value per cow is real but modest. Don’t abandon production traits in pursuit of lameness improvement—use balanced selection via Net Merit or TPI.
  • Consider your market position. Selling commodity milk to the co-op? Current genetics might be fine. But if you’re eyeballing premium markets or brands like Organic Valley, starting selection now positions you for 2030-2035.
  • Contribute data if you can. These evaluations only improve with broader participation. If you’re working with a good trimmer or thinking about mobility scoring, explore data sharing with CDCB or your breed association.
  • Combine strategies. The successful producers I see aren’t choosing between genetics and management—they’re doing both with appropriate timeframes.

The promise of genetic selection for lameness resistance is real. We’re looking at a potential 30% reduction over 20 years according to CDCB projections, permanent benefits that compound, and positioning for evolving markets. But it’s not magic, won’t replace good management, and requires more patience than most of us naturally have.

What we’re discovering about lameness genetics is pretty much what we’ve learned with every other trait: biological systems change slowly, market signals arrive late, and success goes to those who position for tomorrow while managing today. The tools are coming—CDCB says April 2025 for initial implementation. Whether we have the patience and vision to use them effectively? Well, that’s the real question, isn’t it?

KEY TAKEAWAYS

  • The 10-year reality: Lameness genetics save nothing initially, then compound to $4,879 (Year 10) and $8,160 (Year 15)—patience required
  • Data disconnect warning: Six elite farms with $100K cameras shape genetics for 34,000 dairies—verify relevance to YOUR operation
  • Win with both strategies: $40-60K flooring investment (immediate relief) + genetic selection (permanent gains) = $23K+ annual savings by Year 10
  • Timeline mismatch alert: European welfare markets arrive by 2030, but genetics won’t deliver until 2035+—early adopters gain 5-year advantage

Complete references and supporting documentation are available upon request by contacting the editorial team at editor@thebullvine.com.

Learn More:

The Sunday Read Dairy Professionals Don’t Skip.

Every week, thousands of producers, breeders, and industry insiders open Bullvine Weekly for genetics insights, market shifts, and profit strategies they won’t find anywhere else. One email. Five minutes. Smarter decisions all week.

NewsSubscribe
First
Last
Consent

This Isn’t Your Normal Dairy Downturn – Here’s Your 60-Day Action Plan

What current structural changes mean for dairy operations, plus proven strategies successful producers are using right now

EXECUTIVE SUMMARY: Wisconsin dairyman, 10:30 PM, spreadsheet still open: ‘These numbers can’t be right.’ They were. Five permanent shifts are reshaping dairy: China’s 36% import cut (they’re self-sufficient), $8 billion in plants needing milk regardless of demand, aging populations abandoning fluid milk, currency math you can’t beat, and $4,000 springers versus $2,800 cull cows. But here’s what’s working: organic premiums at $32/cwt, three-family partnerships each clearing $200K+, and component focus adding $820K yearly without expansion. The math is brutal but clear—if you’re within $2/cwt of breakeven, optimize hard. If you’re $3-5 away, something fundamental must change. Beyond $5? Every 60 days of waiting costs you serious equity. This weekend, run your real numbers and make the call.

Dairy Action Plan

Here’s something that stopped me cold last week. A Wisconsin dairyman called at 10:30 PM, spreadsheet still open on his computer. “I’ve run these numbers twelve different ways,” he said, managing 450 cows like his family has for generations. “They keep telling me the same thing, and I don’t like what I’m hearing.”

You know what? He’s not alone. I’ve had variations of that conversation with producers from Tulare to Lancaster County these past few weeks. Even down in Georgia and the Carolinas, where heat stress adds another layer of complexity, folks are wrestling with the same fundamental questions.

The latest FAO Dairy Price Index dropped again, for the fourth month straight, down 3.4% in October to 142.2 points. And the Global Dairy Trade auction keeps sliding, too. Six consecutive drops through November 4th. Whole milk powder’s sitting at $3,503 per tonne. Butter’s off 4.3%. Even cheddar dropped 6.6%, which caught a lot of us off guard.

But what’s really got me thinking is how different this feels from 2009, different from 2015. After talking with producers, looking at what’s happening globally, and honestly, lying awake at night thinking about my own operation, I’m convinced we’re seeing something more fundamental than just another price cycle.

China’s Not Coming Back (And We Built Everything Assuming They Would)

China’s self-sufficiency surge eliminated 36% of milk powder imports in just 5 years, wiping out demand that American dairy expansion plans were built around

So let’s have the conversation nobody wants to have. Remember five years ago when every dairy meeting, every expansion plan, every processing investment was built around Chinese import growth? Made sense at the time, right?

Well, here’s where we are now. China’s domestic production increased by 11 million metric tons between 2018 and 2023—that’s according to USDA’s latest Foreign Agricultural Service data. They’re hitting 85% self-sufficiency now. Up from 70% just five years back.

And their whole milk powder imports? Down from averaging 670,000 metric tons during 2018-2022 to about 430,000 tons in 2023. That’s not a blip, folks. That’s a 36% structural change that Rabobank and other analysts are calling permanent.

I’ve been talking with producers who built their entire business models around Chinese demand. One guy told me, “We retooled everything—bred for higher components, invested in new equipment, built our five-year plan around powder exports. Now what?”

What makes it worse—and I don’t think many people are connecting these dots yet—is the demographics. China’s birth rate fell from 12.43 per thousand in 2017 to 6.39 in 2023. That’s their National Bureau of Statistics, not speculation. Fewer babies means less formula. Aging population means less fluid milk, more medical nutrition products. It’s a completely different market.

These New Plants Need Milk, Whether the Market Wants It or Not

With $8-11 billion in new processing capacity carrying $24-30M annual fixed costs per plant, processors will pay premium prices to hit 85-90% utilization rather than explain idle capacity to their boards

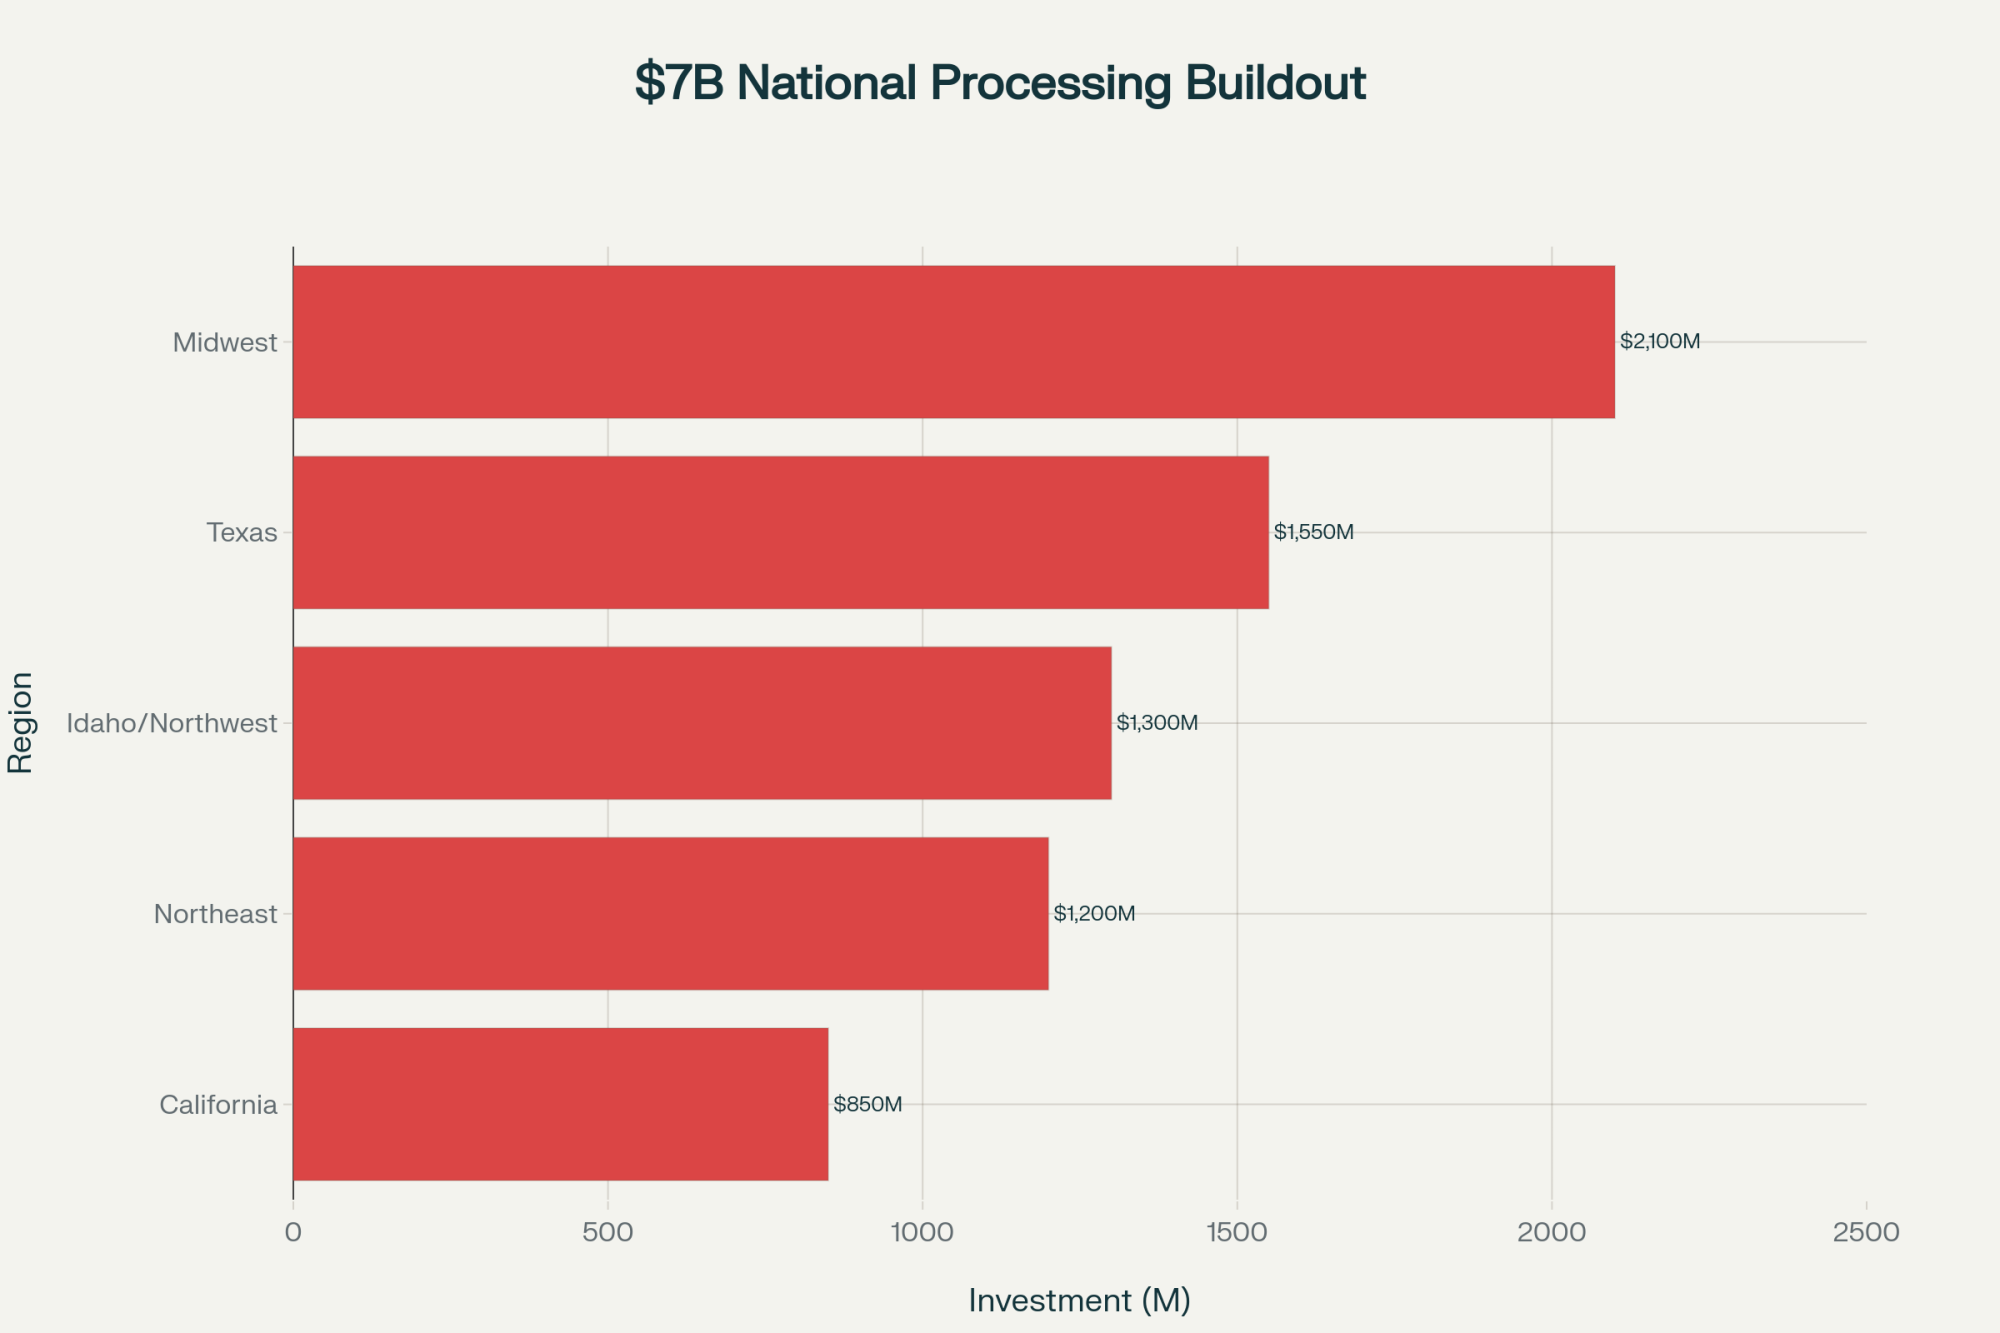
Now, let’s talk about something that’s creating real pressure right now. Between 2023 and 2027, our industry’s building $8-11 billion in new processing capacity. I’ve walked through some of these facilities. They’re incredible. Leprino’s billion-dollar cheese plant in East Lubbock. Fairlife’s $650 million facility in Rochester. Great Lakes Cheese is putting over half a billion into Franklinville, New York.

What’s crucial here—and this is what keeps plant managers up at night—is that these facilities need to run at 85-90% capacity just to break even. CoBank’s analysis shows that clearly. Drop below 75%? You’re hemorrhaging money.

Think about it. A $300 million cheese plant carries maybe $25-30 million in annual fixed costs. Debt service, insurance, baseline staffing—those bills come due whether you’re running one shift or three.

What’s interesting here is what plant managers are telling me. When you’ve got $2 million in monthly debt payments, you’ll pay whatever premium it takes to keep milk coming in the door. Running at breakeven beats explaining to your board why the plant’s sitting idle. Kind of puts you between a rock and a hard place, doesn’t it?

So what happens? Plants keep bidding for milk to hit utilization targets. We see those premiums and keep producing. The oversupply continues. Prices stay low longer than anybody expects. It’s a cycle that feeds itself.

The University of Wisconsin’s dairy program has highlighted something crucial—most of this capacity was planned when we were seeing 1-2% annual production growth. Now we’re actually seeing slight declines. Somebody’s going to end up with very expensive, very empty stainless steel.

The Customer Base Is Aging Out (And Nobody Wants to Talk About It)

Youth aged 6-19 who drive bulk dairy consumption are shrinking from 18% to 13% of the population while low-consuming seniors 70+ explode from 6% to 17% by 2050—a customer base transformation few producers have factored into long-term planning

Here’s a demographic reality that caught me completely off guard. Two-thirds of the world’s population now lives in countries where birth rates are below replacement level. UN Population Division data, not opinion.

By 2050, people aged 70 and older will make up 11% of the global population. Today it’s 6%. By 2100? We’re looking at 17%. These aren’t people buying gallons for the kids anymore. They’re buying high-protein shakes, maybe some yogurt, portion-controlled products.

What really drives this home? Cornell’s extension folks have shared data showing that about 25% of all U.S. cheese consumption happens through pizza. Guess who’s eating that pizza? Mostly 6-to-19-year-olds. That age group is shrinking while the over-60 crowd—who eat maybe a slice a month—is exploding.

The analysis suggests the only real growth market for traditional dairy consumption is sub-Saharan Africa. And let’s be honest, that’s not exactly where we’re set up to compete.

What’s interesting is that we’re seeing different dynamics across regions. India’s consumption is still growing, but their production’s growing faster. The EU’s dealing with aging farmers, tighter environmental rules, and the same consolidation pressures we have. Out in the Mountain West, producers tell me water rights are becoming as valuable as the cows themselves. Up in the Pacific Northwest, organic operations are finding their niche markets getting crowded as more producers make the transition. Nobody’s immune to these shifts.

Currency Is Killing Us, And There’s Nothing We Can Do About It

Alright, let’s talk about something we have zero control over but affects everything—currency.

When New Zealand’s dollar weakens by 10%, their milk powder gets 10% cheaper for international buyers overnight. Doesn’t matter if you’re the most efficient producer in Wisconsin or Idaho. You can’t compete with currency math.

Argentina eliminated their dairy export taxes last year. Their peso’s weak. Production jumped 11% in just Q1 2025. Meanwhile, we’re looking at Chinese tariffs of 84% to 125% on various dairy products, plus a strong dollar that makes our stuff expensive before those tariffs even kick in.

The Europeans? Same game, different currency. Plus, they get government support we can only dream about.

I heard someone from the International Dairy Foods Association talking about “market diversification opportunities.” Come on. That’s just fancy talk for “our traditional customers found cheaper suppliers and we’re scrambling.”

The Heifer Shortage That’s Creating a One-Way Door

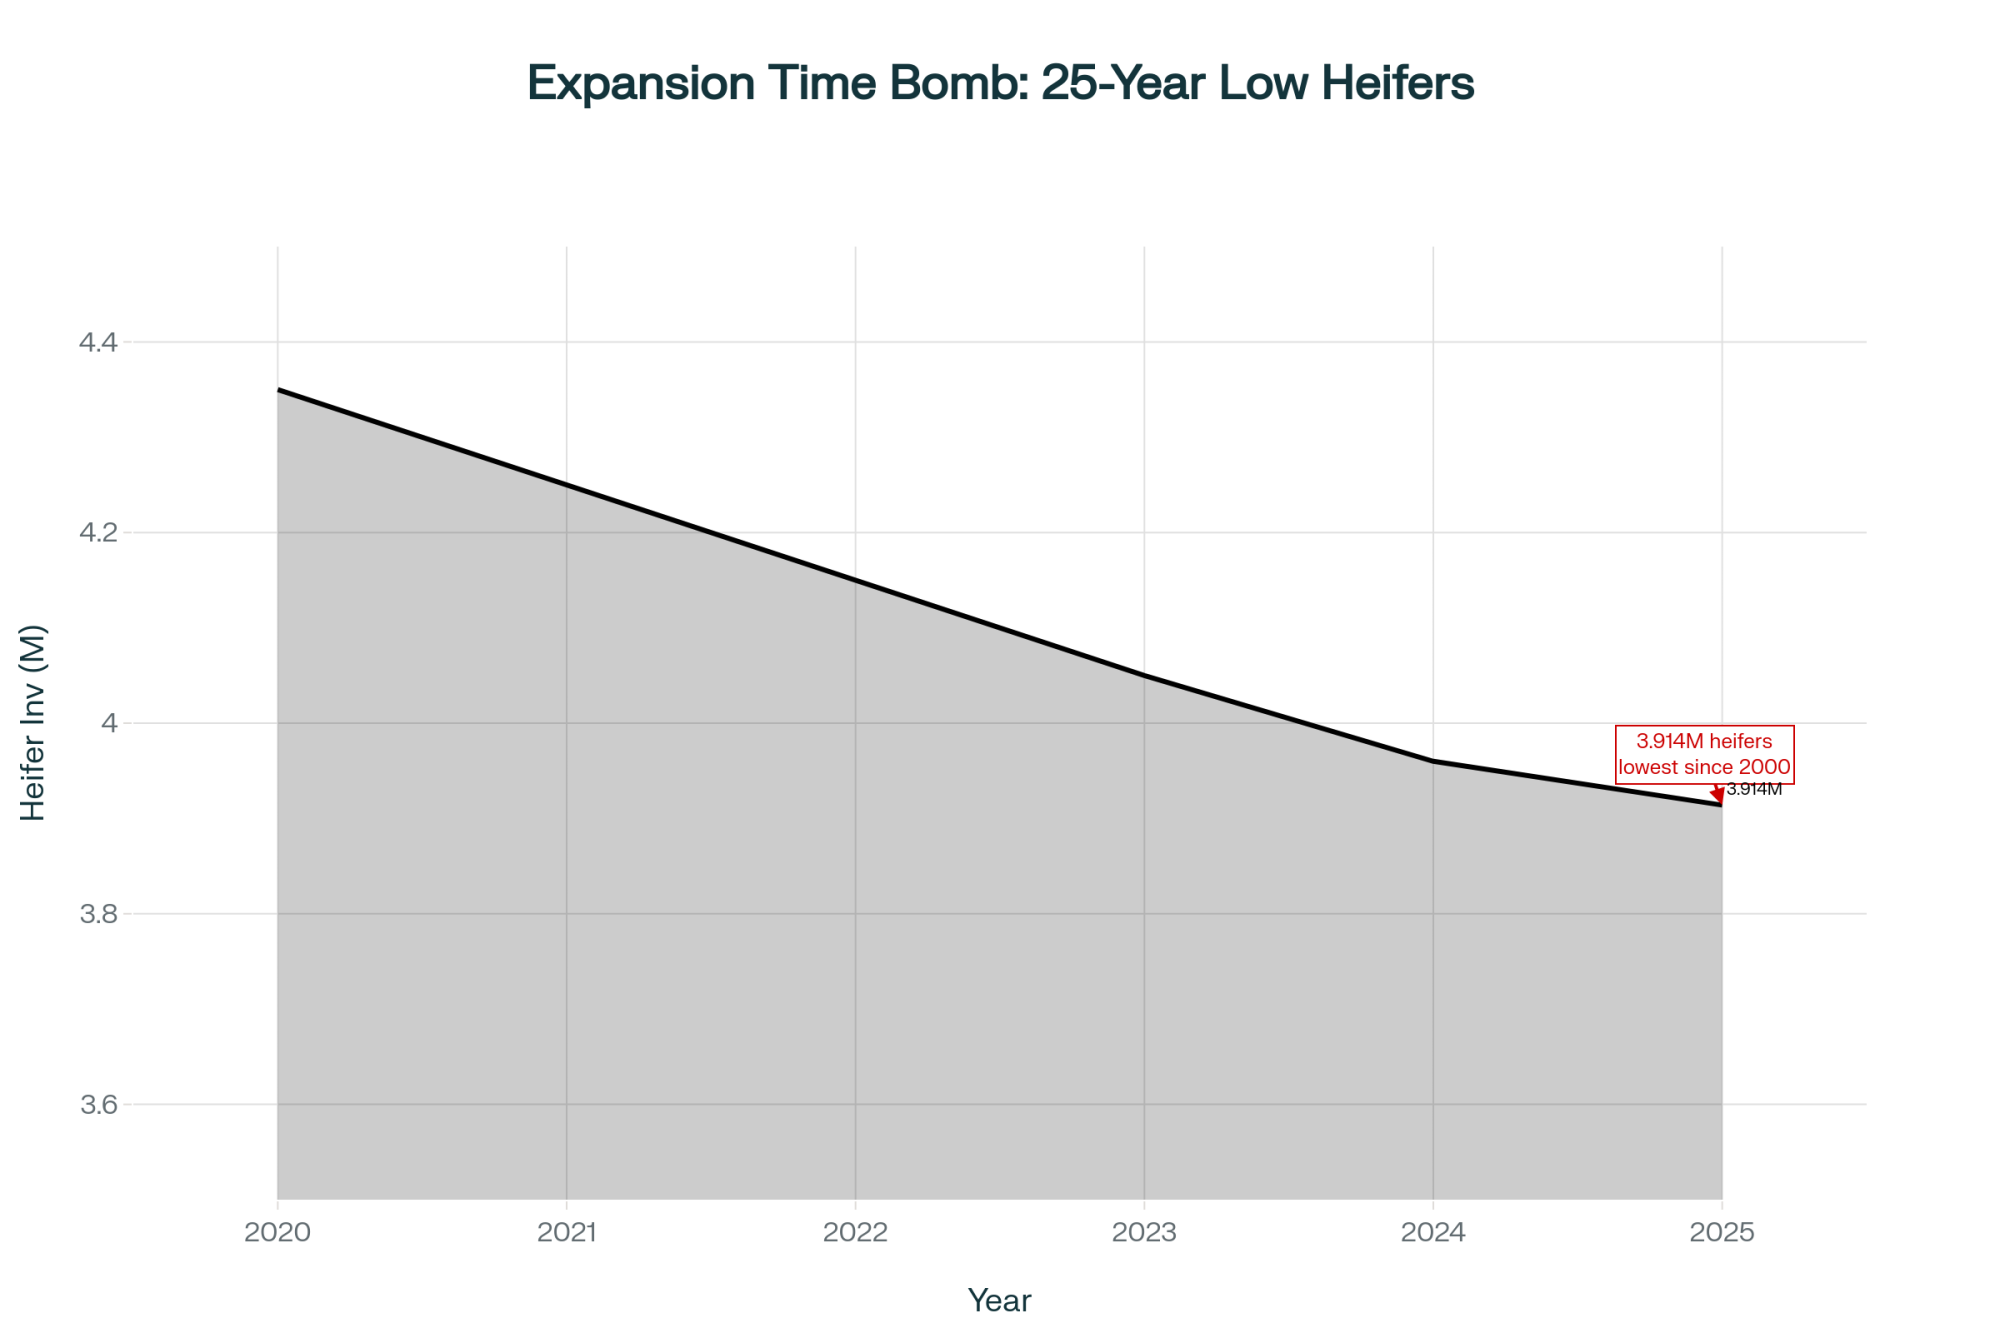
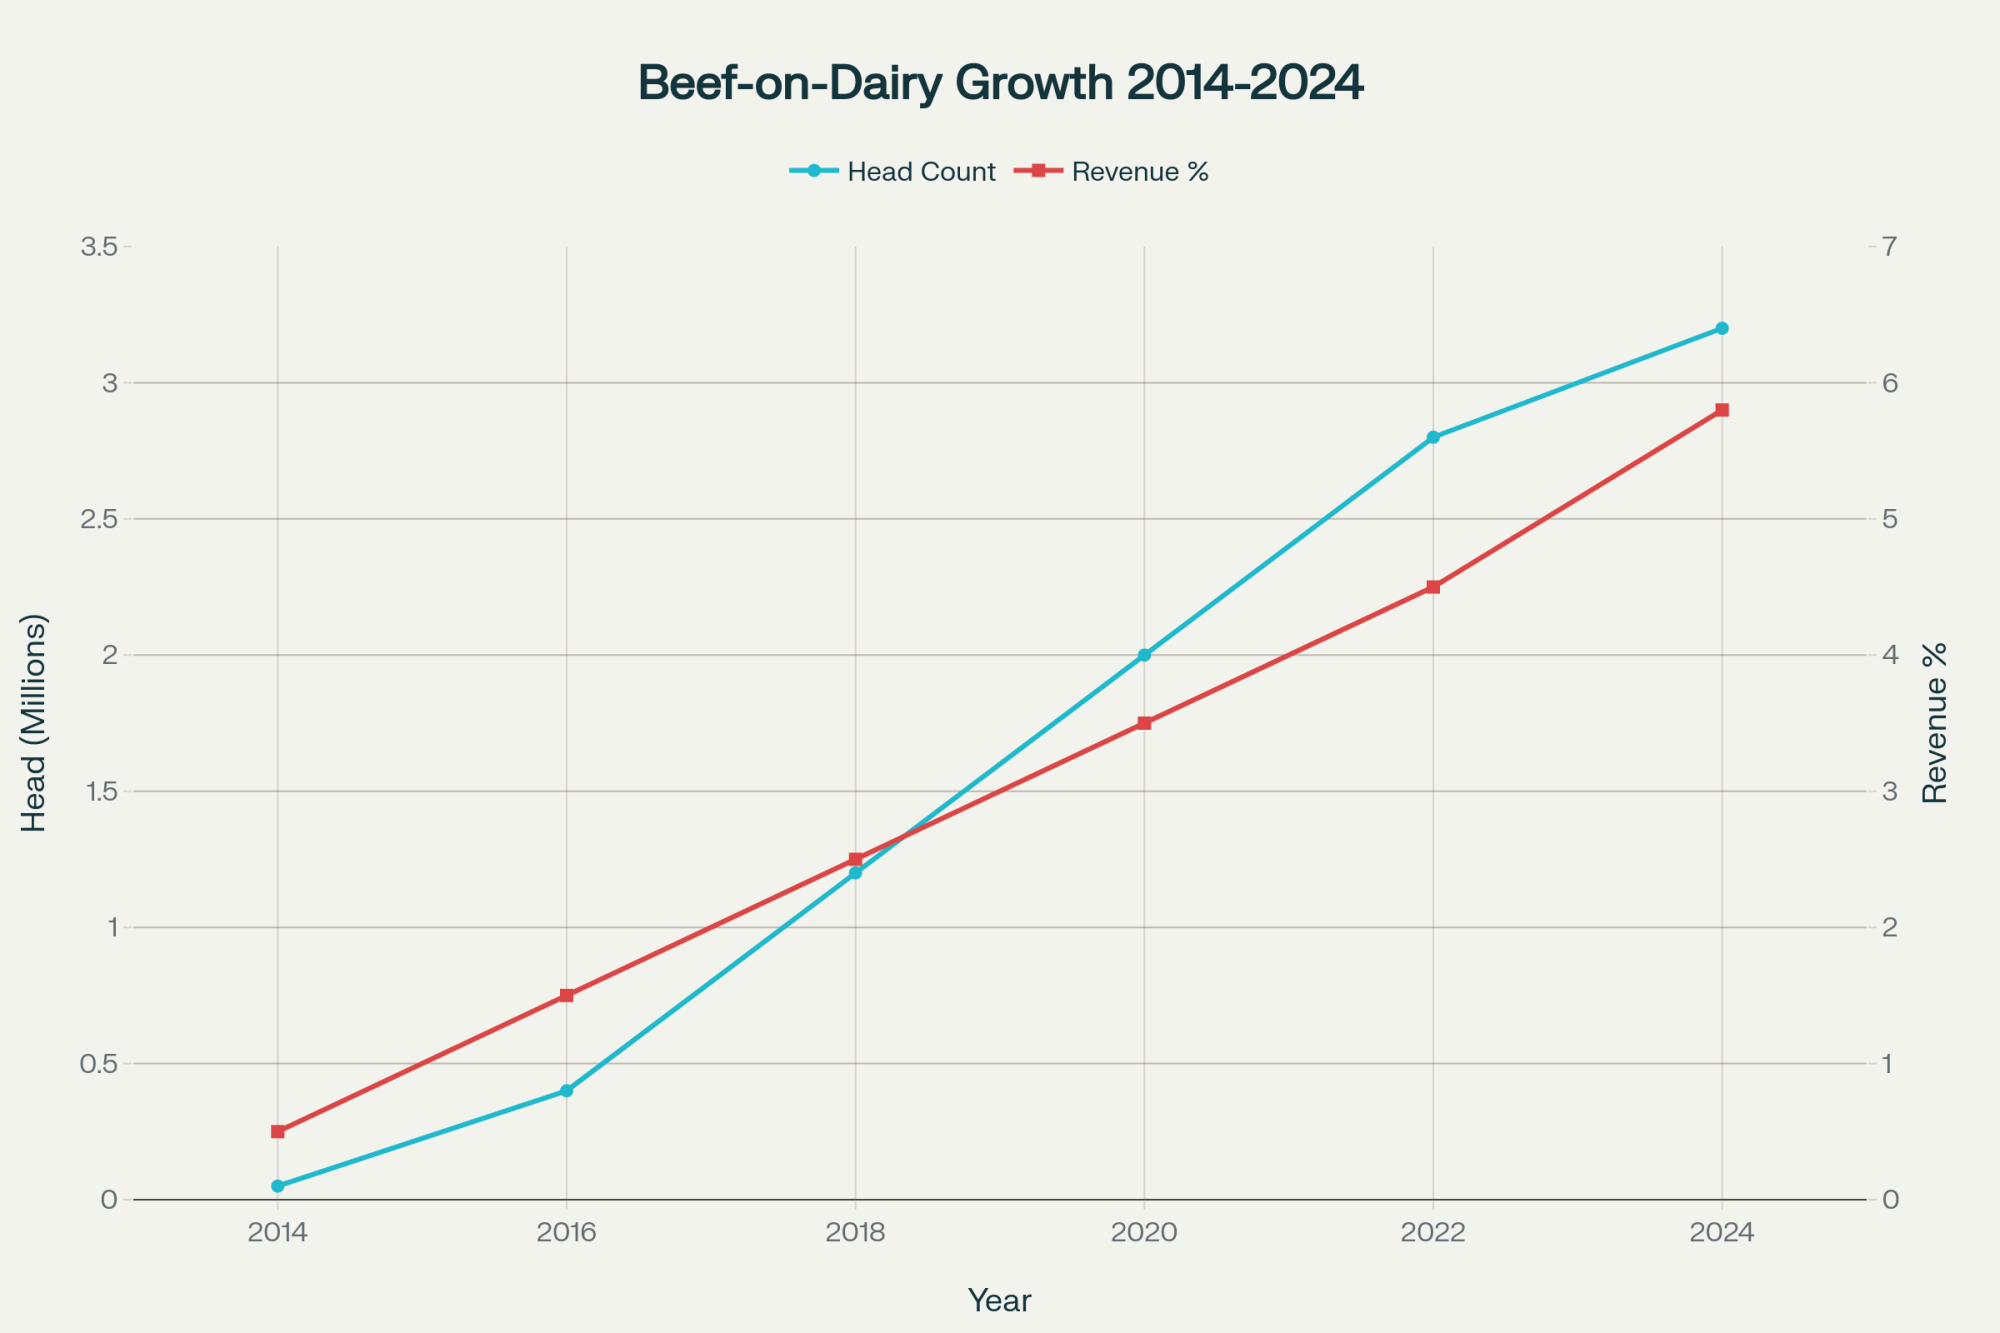
This situation with replacement heifers—man, this is brutal. We’ve been breeding beef-on-dairy pretty heavy, right? Made sense with those calf prices. But now, the dairy heifer inventory over 500 pounds is at its lowest since the 1970s. USDA says 3.914 million head.

You know what’s happening at auctions across Wisconsin? Recent sales show springers going for $3,000-3,500. Really nice ones are hitting $4,000. Meanwhile, cull cows are bringing $2,800-3,100 because beef prices are still strong.

As one producer put it to me: “I can ship my bottom 20% tomorrow for $2,800 each. But if I want to buy replacements next spring? That’s $3,500 minimum, probably four grand for anything decent. So either I shrink forever or I keep milking marginal cows and hope something changes.”

That’s the trap. Easy to exit—back the trailer up, load them out. But getting back in? Most guys can’t afford it. Used to be you could cull hard, rebuild when prices recovered. Not anymore.

Who’s Actually Making This Work (And how)

Three proven strategies generating $280K to $820K in additional annual income—component optimization, family partnerships, and organic premiums all deliver measurable results without adding a single cow

Despite all this doom and gloom, I’m seeing operations that are absolutely thriving. Their approaches are worth paying attention to.

There’s an organic operation in Lancaster County, Pennsylvania—about 280 cows, family-run. They transitioned five years ago. Yeah, it cost them around $150,000 and three years of lower production during transition. But they’re getting $32.69 per hundredweight through their organic cooperative right now, while their neighbors are looking at $19.50 per hundredweight for conventional.

The owner told me straight up: “We quit trying to compete with New Zealand on price. We’re selling to people who want to know the cows’ names and see our pastures on Instagram. Currency rates don’t matter when you’re selling a story.” The hardest part? Learning to market themselves, not just their milk. They had to become storytellers, photographers, social media managers—skills they never thought they’d need.

Here’s another interesting model. Three farm families in Wisconsin merged their operations a few years back. They were running 350, 400, and 425 cows separately. Combined everything into one 1,175-cow setup with robots. Took about eighteen months of planning, lots of lawyer fees, and some serious family meetings—including one that almost ended the whole thing over whose barn to use as headquarters.

But listen to this—they went from around $17.80 per hundredweight when operating separately to $16.20 when operating together. Each family’s clearing $200,000 to $250,000 now. One of the partners told me, “The Hardest part was giving up being my own boss. But the reality is, I took my first real vacation in fifteen years last month. My partners covered everything.”

What’s also working for some folks is getting laser-focused on components. Jim Ostrom at HighGround Dairy has been working with producers who’ve moved their income-over-feed-cost from $7.50 to $10 per cow per day. Just better rations, tighter fresh-cow management, and pushing butterfat when the premiums are there. That’s $820,000 more per year on 900 cows without adding a single animal.

Down in the Southeast, where summer heat stress can knock 15-20 pounds off daily production, I’m seeing producers invest in cooling systems that pay for themselves through maintained components even when volume drops. One Florida dairyman told me, “I stopped chasing gallons and started chasing butterfat. Changed everything.”

The Risk Management Tools We’re Not Using (But Should Be)

Here’s what drives me crazy. We’ve got better risk management tools than ever, but most of us—myself included—don’t use them properly.

Dairy Margin Coverage at that $9.50 tier? Farms that enrolled got close to $150,000 in payments last year. If you’re under 5 million pounds annually, it’s dirt cheap. But I talk to guys who won’t sign up because “it’s a government program.” Meanwhile, they’re losing two bucks a hundredweight and burning through equity that DMC would’ve protected.

Dairy Revenue Protection paid out over $500 million in 2023. Phil Plourd at Ever.Ag calls it subsidized insurance, and he’s right. You’re protecting your downside while keeping upside potential. But we still think of it as gambling rather than management.

And futures markets—Ohio State’s research shows it takes 6-9 months for margins to recover after a big shock. That means you need to be positioning that far out. Companies like StoneX offer programs tailored for smaller operations, but most of us wait until we’re already underwater before we consider them.

What I’ve noticed talking to bankers lately—they’re actually looking more favorably at operations with risk management in place. As one lender put it, “I’d rather finance someone with DMC and DRP than someone with 200 more cows.” Several banks are even offering slightly better rates to operations that demonstrate comprehensive risk management. Makes sense when you think about it—they’re protecting their loans too.

KEY NUMBERS TO TRACK

  • Your true break-even cost (including family living)
  • Debt-to-asset ratio compared to last year
  • Working capital months at current burn rate
  • Income-over-feed-cost daily average
  • Cull cow value vs. replacement cost spread

Decisions You Need to Make in the Next 60 Days

Three distinct pathways based on your true breakeven gap—within $2/cwt means optimize through it, $3-5/cwt demands fundamental transformation, beyond $5/cwt requires hard conversations before equity evaporates in the next 60-90 days

Let’s get practical here. If you’re sitting there wondering what to actually do, here’s what I’m seeing for the next couple of months.

Cull cow prices right now—November 2025—are running $2.00 to $2.24 per pound. Good fleshy cow weighing 1,400 pounds? That’s $2,800 to $3,100. But here’s what’s worth considering. Historical patterns suggest—and this is just based on past cycles—these could drop 15-25% by February if Brazilian beef tariffs change or everybody starts culling at once.

A producer recently ran this math for me. His bottom 40 cows shipped now generate $112,000. Wait until February, if prices drop to $1.70? That’s $95,200. The $16,800 difference might be the difference between making it and not making it.

But you’ve got to know your real breakeven. Not the one you tell the neighbors. The real one. With family living, debt service, and all that maintenance you’ve been putting off.

Three Paths Forward (Based on Where You Really Stand)

After all these conversations, here’s the framework I’m using:

If you’re within $2 of breakeven: You can optimize through this. Cull hard, focus on components, tighten everything up. Markets will give you room eventually.

If you’re $3-5 away from breakeven: Something fundamental has to change. Maybe that’s finding partners, maybe it’s transitioning to a premium market, maybe it’s restructuring debt. But status quo ain’t gonna cut it.

If you’re more than $5 from breakeven: Time for the hard conversation. And I mean really hard. But saving $400,000 in equity beats losing everything in six months.

Where This Is All Heading

Look, I don’t have a crystal ball. But if current consolidation trends continue—and we lost 39% of dairy farms between 2017 and 2022—we could potentially see another significant reduction by 2030.

What’s emerging are three models that seem to work: The 5,000-plus-cow operations that run like factories. The 50-to-300-cow premium operations selling stories and values. And these multi-family partnerships running 800-2,000 cows together.

Is that traditional 300-to-600-cow family dairy competing on commodity milk? That’s getting harder and harder to pencil out. Not because those folks aren’t working hard—they’re working harder than ever. The economics just aren’t there anymore.

Though the reality is, there’s always room for creative thinking. I’ve heard about young producers buying smaller dairies at auction, converting to specialty genetics like A2, and selling everything at a premium to regional processors. They’re not getting rich, but they’re making it work through pure creativity and willingness to adapt.

The Bottom Line

The conversation that matters most is the one you have with yourself and your family about where you really stand. I’ve talked to too many people who waited six months hoping things would improve, only to watch significant equity disappear.

This weekend, run your real numbers. All of them. Family living, debt service, everything. Compare that to realistic milk prices, not wishful thinking.

Then have the conversation those numbers demand. With your spouse, your kids, your banker, potential partners—whoever needs to be part of it. Because the difference between choosing your path and having it chosen for you is usually about 90 days and a whole lot of family wealth.

These structural shifts—China going self-sufficient, too much processing capacity, aging populations, currency games, heifer shortages—they’re not going away. The industry that emerges from this won’t look like the one we grew up in.

But here’s what I know after decades of watching this industry evolve. The operations that’ll thrive in 2030 won’t necessarily be the biggest or have the most capital. They’ll be the ones that saw reality clearly, made hard decisions early, and adapted to what is rather than wishing for what was.

We’re all in this together, navigating waters none of us have seen before. The data’s telling us something important. Question is, are we ready to listen? And more importantly, are we ready to act on what we’re hearing?

Remember, every crisis creates opportunity for those willing to see it and seize it. This one’s no different. The dairy farmers who make it through this will be stronger, smarter, and more resilient than ever.

KEY TAKEAWAYS:

  • This downturn breaks all the rules: Five permanent forces (China self-sufficient, plants needing milk, customers aging, currency killing us, heifers gone) mean waiting for “normal” is a losing strategy
  • The $16,800 decision can’t wait: Culling 40 cows today nets $112,000. By February? Maybe $95,200. That difference could determine whether you’re still farming in 2026
  • Three strategies actually work: Get premium prices like that $32/cwt organic farm, share costs like those Wisconsin partners each banking $200K+, or maximize components for $820K more without adding cows
  • Your breakeven tells you everything: Less than $2/cwt away? You’ll make it with adjustments. $3-5 gap? Time for radical change. Over $5? Every month you wait costs serious family wealth
  • The survivors aren’t the biggest—they’re the ones deciding NOW: This weekend, calculate your true all-in costs, pick your path, and act. The difference between choosing and being forced is about 90 days

Complete references and supporting documentation are available upon request by contacting the editorial team at editor@thebullvine.com.

Learn More:

The Sunday Read Dairy Professionals Don’t Skip.

Every week, thousands of producers, breeders, and industry insiders open Bullvine Weekly for genetics insights, market shifts, and profit strategies they won’t find anywhere else. One email. Five minutes. Smarter decisions all week.

NewsSubscribe
First
Last
Consent

The $1,350 Replacement Advantage

Why Today’s Best Dairies Cull Healthy Cows That Could Produce for Years

Executive Summary: Wisconsin dairyman Eric Grotegut no longer culls cows in crisis—he replaces them strategically on “Monday afternoons,” capturing a $1,350 per head advantage that’s reshaping dairy economics nationwide. Despite cows being genetically capable of living 13 months longer than they did 20 years ago, the math now favors earlier replacement: while a third-lactation cow generates $234 in annual profit, her $350 genetic lag means a younger replacement creates $2,704 in value over three years. This shift, powered by genomic selection tripling genetic progress to $75 yearly, beef-on-dairy premiums of $370-400 per calf, and IVF technology approaching commercial viability, has created an unexpected crisis—heifer inventory down 18% with prices soaring from $1,720 to over $3,000. The optimization technology driving these decisions requires an annual investment of $26,000-78,000, achieving positive ROI only above 400 cows, accelerating consolidation that may reduce U.S. dairy farms from 26,000 to 15,000-18,000 by 2035. With environmental genomics launching in 2026-2027, producers face three paths: scale up to 600+ cows and embrace technology, develop specialized niches like organic or direct marketing, or exit strategically before 2030 while preserving asset value. The longevity paradox reveals a fundamental truth—in modern dairying, keeping cows longer often means keeping the operation shorter.

You know, there’s something that doesn’t quite add up when you really think about it. Our cows today are genetically capable of living 13.2 months longer than they did twenty years ago—that’s what the folks at CDCB showed us at the October meeting held during World Dairy Expo, saying we’ve gained about 4.7 months of productive life per decadethrough genetic selection. But here’s what’s interesting: many of the most progressive producers I know are actually replacing them earlier, not later.

Eric Grotegut, who runs 1,400 cows up in Wisconsin, said something at that meeting that really stuck with me.

“15 to 25 years ago, it seemed like I was selling cows every day for a lame cow, a mastitis cow, a pneumonia cow—something all the time. Now most cull cows are on Monday afternoon.”

Monday afternoon. That shift—from emergency culling to what Eric calls “Monday afternoon” strategic replacement—well, that tells you everything about how dairy economics have completely flipped in the last decade or so.

The Math That Changes Everything

So I’ve been digging into what the researchers call the Retention Payoff calculation, or RPO for short. Basically, you’re asking: does keeping this cow generate more profit than replacing her with a younger animal? And what I’ve found is…the numbers are surprisingly clear-cut.

Here’s how it breaks down in a real scenario that many of us face. You’ve got a third-lactation cow producing 68 pounds daily—decent production, no major health issues, right? She’s profitable, generating about $234 in annual profit above her direct costs, according to the Wisconsin Extension models. So, naturally, you’d think, why would anyone replace her?

ComponentMature CowReplacement Heifer (3 Years)
Annual Profit Above Costs$234 (with $350 genetic lag at $75/yearprogress)Year 1: $97Year 2: $720Year 3: $1,031
Genetic Opportunity Cost$233/year (USDA analysis)No lag—current genetics
Net Present Value$1,353 (over 3 years)$2,704
Bottom Line Advantage$1,350 more value from replacement

Here’s what’s really happening, though. That cow carries genetics from roughly 4-5 years ago, which means she’s about $350 behind current genetic averages. We’re seeing genetic progress at $75 PTA Net Merit per year now—both CDCB and the Canadian Dairy Network have confirmed this. And that creates what Paul VanRaden at USDA calls a “genetic opportunity cost“—essentially $233 per year in lost value from not having current genetics in that stall.

“We’re not just looking at whether a cow covers her feed costs anymore. We’re evaluating whether she’s the most profitable use of that stall space given all available options.”
— Tom Overton, Cornell’s dairy management professor at the Western Dairy Management Conference

Three Technologies Converging to Change Everything

What’s driving this shift isn’t just one breakthrough—and this is what I think many folks miss—it’s three technologies hitting maturity at the same time, each reinforcing the others in ways nobody really predicted five years ago.

Genomic Selection Has Changed the Game Entirely

Since USDA launched official genomic evaluations for Holsteins and Jerseys back in January 2009, we’ve gone from experimental to essential. Today, 95% of U.S. AI bulls are genomically tested, and about 20% of heifer calves get tested within their first week of life, according to CDCB’s latest data.

The impact on genetic progress? Man, it’s been dramatic. Before genomics, we were seeing gains of about $28 PTA Net Merit per year. Now? We’re hitting $75 per year—nearly triple the rate.

The Canadian Dairy Network’s 2024 report shows even more dramatic shifts in specific traits. Production traits have doubled their rate of improvement, but here’s what’s really impressive: tough traits like daughter pregnancy rate have increased threefold to fourfold. That’s…that’s game-changing for our industry.

Kent Weigel at the University of Wisconsin, who’s been tracking this since the beginning, tells producers that “farmers typically cull the bottom 15 to 20% of calves based on genomic testing, but the exact proportion depends on the number of surplus heifer calves available on a given farm.” And he’s right—it’s all about finding that sweet spot for your operation.

Genomics didn’t just speed up progress—it blasted a hole in the old ceiling. Black bars for ‘then,’ red for ‘now.’ That’s a revolution in every stall.

Sexed Semen: Strategic but Still Limited

Now, sexed semen adoption in the U.S. sits at 25-30% according to NAAB statistics. Compare that to the UK, where they’re at 84% based on AHDB’s 2024 report. Why the gap? Well, the challenges are real, as many of you probably know.

Conception rates with sexed semen still run 15-20% below conventional, based on large-scale field data from Alta Genetics and Select Sires. The stuff costs 2.3 times more—you’re looking at $50-64 versus $18-28 for conventional. And during summer heat stress? Forget about it.

Peter Hansen’s group down at the University of Florida has shown that pregnancy rates can drop to 25-30% with sexed semen when the temperature-humidity index exceeds 72. Those of us dealing with hot summers know exactly what that means for breeding programs. July and August can be brutal.

But here’s what’s working: virgin heifers in fall and winter. You can still hit 60% conception rates with good management. Matt Lauber, working with Paul Fricke at Wisconsin, showed that with proper synchronization protocols, the fertility gap narrows to just 8-12%—making sexed semen far more viable in optimized systems. It’s not about using sexed semen everywhere—it’s about using it where it pencils out.

Beef-on-Dairy: The Revenue Stream Nobody Saw Coming

This might be the biggest shift I’ve seen in twenty years of watching this industry. We’ve gone from 200,000 beef-cross dairy calves in 2008 to 2.9 million in 2025, according to Rabobank’s analysis. These calves now represent 12-15% of the U.S. fed cattle supply. Think about that for a minute.

What’s driving it? Money, plain and simple. Day-old beef-cross calves are bringing $370-400 premiums over straight dairy bull calves based on USDA auction reports from Wisconsin and California. For a 1,000-cow operation breeding 60-70% to beef, that’s $222,000 to $280,000 in annual premium revenue that didn’t exist before 2015.

Glenn Klein, who manages 3,600 cows across multiple sites in Wisconsin, explained their approach at the Industry Meeting: “We’ve been doing beef-on-dairy since I think 2018 or 2019. We do it somewhat strategically based on the cow. We look at her genomics, see her past history, and basically decide whether she gets sexed semen or beef semen.

The Constraint Nobody Planned For

Lowest heifer numbers, record-busting prices. What felt like a quiet trend just crashed into reality, and every buyer’s feeling it.

But here’s where things get complicated—and it’s a perfect example of unintended consequences in our industry. This strategic shift toward beef-on-dairy has created the worst heifer shortage in 20 years.

CoBank’s August 2025 analysis shows national dairy replacement heifer inventory at 3.914 million head. That’s 18% below 2018 levels and the lowest we’ve seen since 2005. They’re projecting inventories will shrink by another 800,000 head before recovering in 2027.

The math is straightforward but painful. With 60-70% of the national herd now bred to beef—that’s per National Association of Animal Breeders data—we’ve essentially cut our replacement pipeline in half.

Heifer prices tell the story: from $1,720 in April 2023 to $3,010 by July 2025, according to USDA market reports. And I’ve seen high-quality Holsteins fetching over $4,000 at auctions in Turlock, California, and New Ulm, Minnesota.

This creates a real paradox, doesn’t it? While the RPO math strongly favors replacement, producers are actually reducing culling rates—down from 32.7% in 2019 to 27.9% in 2024, according to Canadian Dairy Information Centre data, which is the best North American dataset we have. They’re keeping marginal cows they would’ve culled five years ago when heifers cost $1,200.

“We know the economics favor replacement, but you can’t replace what you don’t have. So producers are keeping cows a bit longer than optimal while rebuilding heifer inventory.”
— Mike Overton, DVM, who directs technical services at Elanco

IVF: From Seedstock Tool to Commercial Reality

What’s fascinating to me is watching IVF technology move from the seedstock world into commercial dairies. Current pregnancy rates have climbed above 50-55% based on 2024 data from Trans Ova Genetics and other major providers—matching or even beating conventional AI in some cases.

The cost trajectory is what really matters, though. We’re at $350-450 per pregnancy today, but industry projections show that dropping to an estimated $200-300 by 2027-2029 as volumes scale and protocols improve.

Several technical improvements are converging here:

  • Optimized FSH protocols during the voluntary waiting period increase oocyte yields by 51%—that’s from Wisconsin research
  • Time-lapse embryo selection with continuous monitoring from fertilization through day 8 improves pregnancy rates by 15-25 percentage points, according to Animal Reproduction Science
  • Vitrification technology—that ultra-rapid freezing technique—now allows frozen embryos to match fresh transfer success rates

Sean Nicholson, who runs 1,600 cows in Tulare County, California, shared his experience with the California Dairy Magazine: “IVF pregnancy rates markedly exceed what we see with conventional AI, especially during summer when heat stress hammers traditional breeding.” His operation now uses beef IVF embryos for 7% of pregnancies—producing purebred Angus calves from Jersey recipients that bring even higher premiums than regular beef-crosses.

For operations above 800 cows, IVF is starting to pencil out. You can take your elite donors—that top 3-5%—and produce 10-15 pregnancies annually versus one naturally. This creates what I call a three-tier system: elite cows produce all your replacements via IVF, middle-tier cows just make milk, and bottom-tier cows produce beef calves for cash flow.

Success Story: Minnesota’s IVF Innovation

Take a look at how one Minnesota operation is making this work. They’re running 850 cows, started genomic testing everything three years ago, and now use IVF on their top 25 females. Last year, those 25 cows produced 180 pregnancies—enough to cover all their replacement needs plus some to sell. Meanwhile, they bred the rest of the herd to beef and captured an extra $240,000 in calf revenue. That’s…that’s transformative economics.

What’s interesting is they’re not doing this alone—they’ve partnered with two neighboring farms, each running 400-500 cows, to share IVF technician costs and expertise. It’s the kind of cooperative approach that makes advanced technology accessible at smaller scales.

Environmental Pressure: The Next Wave Coming

Here’s something that hasn’t hit most U.S. producers yet, but it’s definitely coming. John Cole at CDCB revealed in October that methane emissions evaluations will launch in 2026-2027, with disease resistance traits following shortly after. When these environmental traits are integrated into selection indices, genetic progress could accelerate from the current $75 per year to an estimated $110-125 per year, depending on the heritability and economic weightings of these new traits. That’s a 47-67% jump.

The University of Wisconsin’s $3.3 million methane project has found heritability of 0.20-0.28 for residual methane traits. That’s moderately to highly heritable, which means we can effectively select for it. They’re using milk spectral data and even fecal microbiome profiles as proxies for rumen emissions, which would make large-scale phenotyping actually feasible.

What’s particularly interesting is looking at what’s already happening in Europe. UK and Irish producers are getting 2-4 pence per liter premiums for verified emission reductions, according to Arla Foods’ 2024 sustainability report. Every dairy bull calf they raise counts against their farm’s carbon intensity score. When similar pressures reach U.S. markets—and trust me, they will—cows with poor environmental genetics might become economically unjustifiable regardless of their production level.

The Reality Check: Who Can Actually Execute This?

Now, all this sophisticated RPO optimization sounds great in theory. But after talking with producers and consultants across the country, I’ve realized there’s a massive gap between what’s theoretically optimal and what most farms can actually implement.

The industry basically breaks into five distinct tiers based on what I’m seeing:

Elite operations—those running 1,000+ cows and producing about 45% of U.S. milk—they’ve got the whole package. Daily milk weights, genomic testing for every calf, activity monitors —the works. Eric Grotegut’s Wisconsin operation falls squarely into this category. They’re truly optimizing these RPO calculations daily.

Progressive commercial farms running 400-1,000 cows —roughly 30% of our milk supply —have most of the tools but use them monthly rather than daily. They’ll perform genomic testing on 60-80% of calves and run activity monitors on breeding-age animals.

Mainstream operations—150-400 cows, about 20% of milk—they operate on rules of thumb. Kristen Metcalf, running 360 cows in Minnesota, described improving health through “implementing more frequent hoof trimming and rubber mats in the barn.” That’s good management, absolutely, but it’s not sophisticated RPO optimization.

Smaller operations with fewer than 150 cows, which produce about 5% of our milk, simply don’t have access to these tools. At $26,000-78,000 annual investment for full RPO infrastructure—genomic testing, monitors, software, consultants—it only achieves positive ROI above 400 cows.

You know, research from ETH Zurich published in the Journal of Dairy Science found that suboptimal culling decisions cost 1.55 Swiss francs per cow monthly. And here’s the kicker: losses from keeping cows too long were three times greater than premature culling losses. But that analysis required dynamic programming models with detailed farm data—exactly what most mid-size operations lack.

Practical Strategies by Farm Size

What farmers are discovering varies dramatically by scale, and honestly, there’s no one-size-fits-all answer here. Let me break down what’s actually working:

For Large Operations (800+ cows):

Go all-in on the technology. Full genomic testing runs about $40-50 per calf through companies like Zoetis or Neogen—that’s $12,000-20,000 annually for a 1,000-cow herd, but it pays back quickly.

Consider IVF programs for your top 3-5% once you’ve identified them genomically. Keep beef-on-dairy at 60-70% to maximize that revenue stream while beef premiums stay high.

And start preparing for environmental compliance now. Methane measurement infrastructure is projected at $50,000-100,000 based on current equipment costs, though specific U.S. regulatory requirements are still being developed.

For Mid-Size Operations (200-600 cows):

Focus on what I call the 80-20 approach—capture 80% of the value with 20% of the complexity:

  • Definitely genomic test all your heifers and cull the bottom 15-20% before spending $2,900 to raise them
  • Use your monthly DHIA test to identify cows below 75% of herd average production who are also open past 120 days
  • Put beef semen on your bottom 50% by either genomic merit or production
  • The key decision: can you scale to 600+ cows in the next 3-5 years? If not, start developing a niche strategy now
  • Consider cooperative approaches—some 400-cow operations are exploring shared IVF programs with neighbors to access technology at a viable scale

For Smaller Operations (under 200 cows):

Your economics are fundamentally different, and that’s okay. Focus on:

  • Reducing involuntary culling through better fresh cow management and hoof health
  • If you’re in the right location, organic certification can capture $7-12/cwt premiums that offset scale disadvantages
  • Direct marketing through on-farm stores or agritourism might work
  • But let’s be honest here—if you don’t have a clear competitive advantage like paid-off land, unique market access, or family labor, start planning your exit strategy for 2027-2030 before technology requirements intensify

Regional Realities Shape These Economics

It’s worth noting that these dynamics play out differently across regions. California’s massive operations—many running 3,000-5,000 cows—they’re already deep into IVF and sophisticated optimization. Meanwhile, Vermont’s pasture-based systems face entirely different economics where land constraints and organic premiums create alternative value equations.

The Upper Midwest sits somewhere in between, with operations like Grotegut’s finding that sweet spot of scale and technology adoption. Texas and New Mexico operations? They’re dealing with water constraints that trump genetic optimization. Each region has its own version of this story, you know?

And seasonally, everything shifts. Summer heat stress in the Southeast makes sexed semen nearly unusable from June through September. Wisconsin producers might have a solid eight-month breeding window, while Arizona dairies face reproductive challenges year-round. These aren’t minor details—they fundamentally change the economics.

The Consolidation Nobody Wants to Talk About

Here’s the uncomfortable truth: we need to face it directly. Every trend we’re seeing—RPO optimization, IVF scaling, beef-on-dairy, environmental genomics—creates economies of scale that favor large operations.

Based on current trajectories and what we saw from 2000-2020—a 54% decline in farm numbers while production increased 16%—I expect we’ll see U.S. dairy farm numbers drop from today’s roughly 26,000 to somewhere between 15,000 and 18,000 by 2035. That’s a 30-40% reduction.

These aren’t just business decisions—they’re family legacies facing new realities. Farms that have been in families for generations are weighing whether the next generation can make the economics work. And that’s…that’s tough to watch.

Technologies providing 10-20% efficiency improvements only achieve positive ROI at 400-800+ cow scale. Operations below these thresholds aren’t “behind”—they’re structurally excluded from the tools that enable optimization.

What to Watch in 2026

Looking ahead, here’s what I’m keeping an eye on:

  • Methane genomic evaluations launching mid-2026, according to CDCB’s timeline
  • Heifer inventory beginning recovery late 2026 into early 2027, per CoBank’s projections
  • IVF costs potentially hitting that $250-300 sweet spot—watch Trans Ova and other providers
  • Environmental regulations in California are potentially creating templates for other states

The Bottom Line for Your Operation

The longevity paradox—cows that can live longer but shouldn’t economically—it’s just one symptom of a broader transformation. What really matters is understanding where your operation fits in this changing landscape.

If you’re above 400 cows, the math increasingly favors aggressive adoption of advanced technologies and strategic culling based on genomic merit. That $1,350 RPO advantage? It’s real, and it compounds over time.

If you’re between 200-400 cows, you’re at a crossroads. Either develop a clear path to 600+ cows or find a niche that offsets your scale disadvantage. There’s no shame in either choice, but indecision…that’s what’s costly.

If you’re under 200 cows, be realistic about your options. Unless you have structural advantages—debt-free land, unique market access, off-farm income—the economics are working against you. A well-timed exit in 2027-2029 might preserve more value than struggling through 2030-2035.

The dairy industry is experiencing what economist Joseph Schumpeter called “creative destruction“—old systems giving way to new ones that are more efficient but also more capital-intensive. Cows built to last longer are leaving sooner, not because they can’t produce, but because the math increasingly says they shouldn’t.

Understanding and adapting to this reality—rather than fighting it—that’s what’ll determine which operations thrive in the next decade. The genetics exist for cows to live longer. The economics increasingly say they won’t. That’s not a bug in the system—it’s become the system itself.

But you know what? Within these constraints lie opportunities for those willing to adapt, whether through scale, specialization, or strategic partnerships. And there’s innovation happening at every scale—I’m seeing 200-cow operations finding profitable niches, 500-cow farms forming cooperative IVF programs, and yes, larger operations pushing efficiency boundaries we couldn’t imagine five years ago.

The key is making clear-eyed decisions based on your specific circumstances, not industry averages or what your neighbor’s doing. Because at the end of the day, the best strategy is the one that works for your land, your family, and your future.

Key Takeaways: 

  • The $1,350 replacement advantage is real and compounds annually: Even profitable third-lactation cows generate less value than younger replacements due to $75/year genetic progress—making strategic culling more profitable than longevity
  • Your scale determines your future: Operations need 400+ cows for optimization technology ROI, 600+ for sustainable competition, or a clear niche strategy (organic, direct marketing) to survive below these thresholds
  • Maximize beef-on-dairy NOW before 2027: With current $370-400 premiums and 60-70% breeding to beef optimal, this revenue stream won’t last—heifer inventory recovery and beef cycle correction will compress margins within 24 months
  • Technology adoption isn’t optional, it’s existential: Genomic testing ($40-50/calf), IVF (dropping to $200-300), and environmental compliance ($50,000-100,000) will separate survivors from casualties when methane regulations hit in 2026-2027
  • Decision time is 2026, not 2030: Whether scaling up, specializing, or exiting, waiting means competing against operations that have already optimized—make your strategic choice while you still have options

Complete references and supporting documentation are available upon request by contacting the editorial team at editor@thebullvine.com.

Learn More:

The Sunday Read Dairy Professionals Don’t Skip.

Every week, thousands of producers, breeders, and industry insiders open Bullvine Weekly for genetics insights, market shifts, and profit strategies they won’t find anywhere else. One email. Five minutes. Smarter decisions all week.

NewsSubscribe
First
Last
Consent

China’s Soybean Surge: What Every Dairy Farmer Needs to Lock in Before Feed Costs Spike

Are your feed contracts ready for China’s next move? Learn the #1 step to keep your dairy thriving through 2026’s storm.

EXECUTIVE SUMMARY: China’s record soybean purchases are tightening feed supplies and driving up costs for dairy farmers in 2026. This analysis, backed by USDA and industry data, reveals how the new trade deal is fueling volatility—from rising soybean meal prices to a stronger dollar eroding export competitiveness. Dairy operations willing to act fast—locking in feed contracts, improving ration efficiency, and diversifying protein sources—stand to protect their bottom line. The article lays out a farmer-tested 90-day action plan, with examples and strategies suited for different regions and farm sizes. For many, the next few weeks could determine whether they stay in business, expand, or get squeezed out. With the right moves, surviving the feed storm of 2026 isn’t just possible—it’s within reach.

Dairy Feed Management

You know how it goes—you’re checking feed invoices on a Thursday afternoon when the big news breaks. That’s exactly what many Wisconsin dairy farmers were doing when the November 2025 China trade deal was announced. American agriculture had secured 87 million metric tons of soybean exports over three years, and honestly, the initial reaction from most of us was cautiously optimistic.

But here’s what’s interesting. As producers started running the numbers—and I’ve talked to quite a few over the past week—the optimism began to shift. When China commits to buying 25 million metric tons of our soybeans annually, those are beans leaving the domestic market. And as one producer near Madison put it to me, “Last I checked, my cows don’t eat soybeans in Shanghai.”

What I’ve found is that once you dig into the actual economics, there’s a supply squeeze developing that the celebratory press releases aren’t really highlighting. It’s not that anyone’s trying to hide anything—it’s just that the grain side of the story is getting all the attention.

Understanding the Supply Squeeze

So here’s where the math gets interesting, and why many of us are concerned. According to the latest USDA Economic Research Service data from October, U.S. soybean crushing capacity is already processing about 2.54 billion bushels annually. That’s 59% of our total production right there.

Operation SizeMonthly Soybean Meal Use (tons)Cost at $330/tonCost at $375/tonMonthly Impact
100-cow4.5$1,485$1,688+$203
300-cow13.5$4,455$5,063+$608
500-cow22.5$7,425$8,438+$1,013
1,000-cow45$14,850$16,875+$2,025
2,000-cow90$29,700$33,750+$4,050

Now add China’s commitment—another 918 million bushels of annual demand when you convert those metric tons. Factor in our existing exports to Japan, Mexico, and the EU, plus seed requirements… suddenly we’re operating at nearly 100% utilization with minimal buffer stocks.

Agricultural economists at places like Iowa State have been tracking this, and what they’re pointing out is worth noting: when stocks-to-use ratios drop below 12%, price volatility typically increases significantly. What are the projections for the 2025-26 marketing year? We’re looking at 10.2%. That’s uncomfortably tight by any measure.

Look, I get why grain farmers are celebrating—and they should be. They’ve been getting undercut by Brazilian beans for three years straight. The USDA Foreign Agricultural Service reports show Brazil’s production costs running about $8.67 per bushel compared to our $9.85 here in the States. That’s brutal competition. So yeah, they desperately needed this export market.

But here’s where it gets complicated for those of us in dairy. Current soybean meal futures on the CME were trading around $320-330 per ton in early November. Market analysts—and I’m talking about the conservative ones at places like CoBank—are projecting we could see 12-18% price increases once those export shipments ramp up in the first quarter of 2026.

Soybean meal prices are projected to surge 12-18% by Q2 2026 as China’s record purchases tighten domestic feed markets—hitting $375/ton and squeezing dairy margins across all operations.

For dairy operations where feed accounts for 45-60% of operating expenses —most of us, according to Cornell’s farm business data —we’re talking real money. Not hypothetical impacts—real cash flow consequences.

The Currency Connection Most Farmers Miss

Now, there’s another layer to this that even seasoned dairy producers often overlook. It’s the currency angle, and honestly, it took me a while to fully grasp this myself.

When China buys $9.6 billion worth of soybeans annually, they need U.S. dollars to complete those transactions. Basic economics, right?

But what happens next is where it gets interesting. Federal Reserve data going back decades shows that a 10% increase in agricultural exports typically correlates with a 1-2% appreciation in the dollar’s value against trading partner currencies. Doesn’t sound like much?

Let me give you a real-world example that brought this home for me.

Say you’re part of a cooperative that exports nonfat dry milk to Mexico—which, according to U.S. Dairy Export Council data, is one of our top three dairy export markets. Your product is priced at $1.20 per pound, and a standard container holds 44,000 pounds. At today’s exchange rate of roughly 17 pesos per dollar, that Mexican buyer pays 897,600 pesos.

But if the dollar strengthens by just 1.5%—and that’s conservative given the trade volumes we’re discussing—that same container suddenly costs your Mexican buyer 911,064 pesos. That’s 13,464 pesos more for the exact same product.

The currency connection most farmers miss: a mere 1.5% dollar strengthening adds $13,464 to a container of milk destined for Mexico—your price didn’t change, but suddenly you’re uncompetitive against New Zealand

“You haven’t raised your price. Your co-op hasn’t changed anything. But from the buyer’s perspective, American dairy just got more expensive.”

Meanwhile, New Zealand dairy products? Their dollar typically weakens when global commodity prices rise, making their exports more competitive, not less. It’s a dynamic that puts us at a systematic disadvantage, and it compounds over time.

China’s Actual Dairy Demand: A Reality Check

Here’s what really caught my attention when I dug into the USDA Foreign Agricultural Service’s latest China dairy reports. They’re projecting just 2% growth in dairy imports for 2025. That’s after three consecutive years of declining imports. Two percent.

What’s worth understanding is that China’s government has set explicit targets—47 kilograms of per capita dairy consumption by 2030, up from the current 35 kilograms. But if you read their Five-Year Agricultural Plans carefully — and I’ve been going through these with some industry analysts — they’re planning to meet this demand primarily through domestic production expansion, not imports.

The numbers back this up. China’s raw milk production is forecast to increase by 3-4% in 2025, according to USDA FAS reports. They’re building massive dairy operations—we’re talking 10,000-head facilities—with government subsidies for everything from imported genetics to milking equipment.

And here’s the kicker that nobody wants to talk about: even with these new tariff suspensions, everyone’s celebrating, U.S. dairy products still face a 10% duty in China. Know what New Zealand pays? Zero. They’ve had a free trade agreement since 2008. Australia? Zero percent since 2015. The EU? Various agreements put them at zero or near-zero.

So we’re celebrating market access, where we’re still at a 10% cost disadvantage to our main competitors. That’s… well, that’s something to think about.

Regional Variations and Operational Realities

Now, I should mention that this isn’t hitting everyone equally. The impact really depends on where you are and how you operate.

California’s large-scale operations—I’m talking about those 2,000-plus cow dairies in the Central Valley—they’ve got some advantages here. Many can negotiate directly with soybean crushing plants, bypassing the dealer markup that smaller operations face. They’ve got the storage capacity to buy feed in bulk when prices are favorable. Some are even forward-contracting a full year out.

But in Wisconsin? Pennsylvania? Vermont? The 100-300 cow operations that still make up the backbone of dairy in these states face a different reality. I was talking to a Pennsylvania producer last week who told me he’d called three feed suppliers about locking in prices for next year. One wouldn’t quote him past December. Another wanted a 5% premium for a six-month lock. The third said to call back after Thanksgiving.

What’s fascinating—and concerning—is how this accelerates the consolidation we’ve been seeing for years. USDA National Agricultural Statistics Service data shows that 65% of the nation’s dairy cows now live on farms with 1,000 or more animals. That was 45% just fifteen years ago. When margins get squeezed by feed costs and currency headwinds, it’s the mid-size family operations that typically can’t weather the storm.

For organic and grass-based operations, there’s actually an interesting twist. Those farms feeding minimal grain might find themselves with a competitive advantage as grain-dependent neighbors struggle with feed costs. But even they’re not immune—organic soybean meal runs about double the conventional price, and those markets tend to move in parallel.

And what about seasonal calving operations? They might actually have some flexibility here, being able to time their peak feed needs around market conditions. It’s one of those operational quirks that could become an unexpected advantage.

Practical Steps That Actually Work

So what can we actually do about this? I’ve been collecting strategies from operations that successfully navigated the 2012 drought and the 2018-19 margin squeeze, and there are some consistent patterns.

Lock Your Feed Contracts—But Be Smart About It

The single most impactful decision, according to every successful farmer I’ve spoken with, is locking feed prices for January through June 2026. But here’s the thing—you’ve got maybe 10-15 business days before suppliers adjust their forward pricing to reflect the coming supply squeeze.

A Wisconsin producer I know well locked 70% of her expected soybean meal needs at $332 per ton with a 3% premium. Yeah, it felt expensive paying that $895 extra upfront. But if the meal hits $375 per ton by February—and many nutritionists think it could—she’ll save over $2,000 in six months.

What farmers are finding works best:

  • Lock 60-70% of expected consumption, keeping some flexibility
  • Include alternative proteins in your contracts—canola meal, distillers grains
  • Negotiate volume commitments for better pricing
  • Ask about price protection if markets drop more than 15%

Feed Efficiency: The Research Numbers

Here’s a number that should grab your attention: University of Wisconsin research shows efficient operations achieve 162 pounds of feed per hundredweight of milk produced. Less efficient operations? They’re using 243 pounds. That’s a 33% difference, and it becomes a survival factor when feed costs spike.

Feed Efficiency: Real Farm Results

I know a producer who made some simple changes that improved her feed conversion by 9% over 90 days. Started measuring feed refusals daily—discovered they were wasting 7% of delivered feed. Began testing forages monthly instead of quarterly. Adjusted feeding times to within 30-minute windows. Separated first-lactation heifers from mature cows for targeted feeding.

The result? About $60,000 in annual savings. No new equipment, no capital investment. Just better management of what they already had.

For those running robotic milking systems, there’s an added dimension here. Your feeding strategy is already more individualized, which could be an advantage. But you’ll need to adjust your pellet formulations and potentially recalibrate feeding rates as ingredient costs shift.

Diversify Protein Sources Strategically

What’s working for farmers who are getting ahead of this is a gradual transition, not panic switching. You can’t just swap soybean meal for canola meal overnight and expect the same milk production. But with careful testing and adjustment…

An Idaho producer I’ve been following started incorporating alternative proteins eight weeks ago. They’re now at 15% canola meal, 20% more distillers grains, and they’ve reduced soybean meal from 5.5 to 4.2 pounds per cow per day. Production’s holding steady, components haven’t dropped, and they’re positioned better for when soybean meal prices spike.

The Longer View: Industry Restructuring

Looking beyond the immediate feed cost concerns, this trade deal is accelerating something that’s been happening for years—the fundamental restructuring of American dairy.

Research from Cornell’s agricultural economics department shows that trade policies creating margin pressure don’t just affect current operations. They accelerate the shift from distributed, family-farm dairy to consolidated, industrial-scale production.

The advantages increasingly favor large operations that can negotiate directly with feed suppliers and processors, maintain capital reserves for extended contract positions, achieve superior feed conversion efficiency through dedicated nutritionists and technology, and access sophisticated financial instruments like currency hedging.

For small- and mid-size operations, the path forward requires either exceptional efficiency, niche-market development, or strategic partnerships that provide some of the scale advantages without full consolidation.

I’ve noticed something interesting when talking to younger farmers taking over operations: the successful ones aren’t trying to compete on scale. They’re finding ways to be exceptional at efficiency, developing direct-market relationships to capture more margin, or forming buying cooperatives with neighbors to secure volume pricing on inputs. It’s really adapt or exit.

And heifer raising operations? They’re in an interesting spot. Feed costs hit them too, but they might find opportunities as dairy farms look to reduce capital tied up in youngstock. Could be worth exploring contract raising arrangements if you haven’t already.

Your 90-Day Action Plan

Based on conversations with farmers who’ve successfully navigated previous margin squeezes, here’s what needs to happen:

Next 7-14 Days (Urgent)

Contact feed suppliers about January-June 2026 pricing. Even if you only lock 40-50% of your needs, that’s protection you won’t have if you wait until December. Get quotes from at least three suppliers—prices and terms vary more than you’d expect.

Schedule a sit-down with your nutritionist. Not a phone call—a real working session to develop contingency rations using alternative proteins. Test these on a small group first.

Pull your actual feed conversion numbers. If you don’t know your pounds of feed per hundredweight of milk, you’re flying blind.

Next 30 Days (Important)

Start measuring feed refusals daily. I know, I know—one more thing to track. But farms that do this consistently find 5-10% waste they didn’t know existed.

Test all your forages. Those three-month-old test results? They’re fiction at this point. Forage quality changes, and you’re formulating rations based on fantasy if you’re not testing monthly.

Evaluate storage capacity. Can you take a full semi load instead of partial deliveries? The per-ton savings add up fast.

Next 90 Days (Strategic)

Run the numbers on what happens if feed costs rise 15% and milk prices drop 5%. If that scenario puts you underwater, what changes now? Culling decisions? Expansion plans? Equipment purchases?

Build relationships with alternative suppliers. When primary suppliers run tight, having established relationships with secondaries can be the difference between feeding cows and scrambling.

Document everything you’re doing to improve efficiency. Your banker will want to see this when you discuss operating notes, and processors value suppliers who can demonstrate operational excellence.

The Bottom Line

Agricultural trade policy often involves tradeoffs between sectors. The soybeans leaving for China are soybeans not being crushed domestically for meal. The dollars flowing in for those exports strengthen our currency and make dairy exports less competitive.

None of this means the sky is falling. Farms that recognize these dynamics and position accordingly will navigate successfully—some will even find opportunities in the disruption. But the window for proactive positioning is measured in weeks, not months.

As one successful farmer told me recently, “The difference between the dairies that thrive and those that just survive often comes down to decisions made months before the crisis becomes obvious to everyone.”

The math suggests we’ve got about 90 days to position for what’s coming. The question isn’t whether feed costs will rise and margins will tighten—market dynamics make that increasingly likely. The question is whether your operation will be positioned to handle it.

Your cows will need feed in February regardless. The only variable is whether you’ll be paying $325 per ton because you locked it in November, or $375 because you waited to see what happens.

The clock’s ticking. What’s your move?

Key Takeaways:

  • China’s soybean surge is tightening domestic feed markets—soybean meal spot prices could jump 12-18% by Q2 2026.
  • Locking in feed contracts within the next 2 weeks can shield your dairy from volatile markets and protect 2026 margins.
  • Efficiency wins: improving ration conversion and testing forages monthly can mean $60,000/year in saved feed costs.
  • The producers who adapt now—by diversifying their protein offerings and working closely with nutritionists—will have the best shot at staying profitable through next year.
  • Waiting for certainty isn’t a strategy: farms that act now have more options and a better chance of riding out the feed storm.

Data sources for this article include: USDA Economic Research Service (October 2025), USDA National Agricultural Statistics Service (2025), USDA Foreign Agricultural Service GAIN Reports (October 2025), CME Group futures data (November 2025), Federal Reserve Agricultural Finance Monitor (Q3 2025), CoBank Knowledge Exchange quarterly reports, Cornell Dairy Farm Business Summary (2024), University of Wisconsin-Madison dairy research publications, U.S. Dairy Export Council trade data, and various dairy market analysis reports.

Learn More:

The Sunday Read Dairy Professionals Don’t Skip.

Every week, thousands of producers, breeders, and industry insiders open Bullvine Weekly for genetics insights, market shifts, and profit strategies they won’t find anywhere else. One email. Five minutes. Smarter decisions all week.

NewsSubscribe
First
Last
Consent

The $100,000 Winter Secret: How Systematic Dairy Farms Avoid Crisis Costs

Your barn smells like manure before feed? That’s $150K in annual losses. Here’s the 4-step fix that costs just $20K.

Executive Summary: Walk into two dairy barns during a February blizzard: one owner scrambles with frozen pipes while the neighbor executes routine protocols—that’s the $100,000 winter divide. Reactive operations hemorrhage $110,000-163,000 annually through emergency repairs, production losses, and worker injuries, while systematic farms invest just $30,000-35,000 in prevention for a 300% return within 12 months. The transformation starts with three September decisions: body condition scoring ($800 saved per thin cow), winterizing the water system ($20,000 in prevented failures), and implementing ventilation protocols ($150,000 in avoided moisture damage). Implementation takes 2-3 years total, but farms report 75% less time spent on winter tasks despite more structured protocols. Bottom line: systematic winter management isn’t about working harder—it’s about deciding in September not to be a victim in February.

Dairy Winter Management

Picture two dairy barns on a February morning when it’s -5°F outside. In the first, workers are scrambling to thaw frozen waterers while the owner calculates emergency repair costs. In the second, morning protocols proceed smoothly—waterers functioning, ventilation balanced, production holding steady.

Both operations milk similar herd sizes. Both face identical weather. Yet their financial outcomes this winter will differ by tens of thousands of dollars.

The distinction? It comes down to management philosophy. One farm approaches winter as an annual emergency to endure. The other treats it as an operational challenge to manage systematically, starting preparations when the corn is still green in early September.

Having worked with dairy operations across North America—from the harsh winters of Wisconsin and Ontario to more moderate climates in California’s Central Valley—I’ve observed that the economic gap between reactive and systematic winter management often exceeds what many producers expect. Based on university extension research and documented producer experiences, a typical 200-cow operation can see differences approaching or exceeding $50,000 annually through avoided costs and maintained production.

Now, these specific protocols prove most critical for northern-tier operations facing severe winters. A dairy in Texas or Florida adapts these principles differently than one in Minnesota. But here’s what I find fascinating—the systematic approach delivers value whether you’re dealing with frozen water lines or heat stress. It’s really about mindset more than climate.

The $100,000 Winter Divide: Reactive operations hemorrhage $136,500 annually while systematic farms invest just $32,500 in prevention—a net advantage exceeding $100,000 that proves winter management isn’t about working harder, it’s about deciding in September not to be a victim in February

Understanding the True Economics of Winter Management

Most producers grasp that winter brings additional costs. What’s less understood is how those costs compound when approached reactively versus systematically.

Looking at research from land-grant universities examining component costs reveals the fuller picture. Production losses from inadequate body condition management typically range from $25,000 to $30,000, according to work from Michigan State Extension’s dairy team. Worker injuries during cold-weather operations can reach $40,000 to $60,000 when you account for medical costs, lost productivity, and potential liability—these figures come from the National Institute for Occupational Safety and Health’s agricultural injury database. Emergency equipment repairs average between $20,000 and $35,000, according to Farm Credit’s operational cost surveys. Employee turnover stemming from difficult working conditions? That adds another $20,000 to $30,000, according to the Canadian Agricultural Human Resource Council’s workforce studies. And veterinary interventions for cold-stress-related issues add an additional $5,000 to $8,000, according to Cornell University’s veterinary economics research.

When we aggregate these components—using conservative estimates—a reactive 200-cow dairy potentially faces $110,000 to $163,000 in winter-related costs.

The systematic farms report spending roughly $30,000 to $35,000 annually on prevention to avoid the majority of these reactive costs. The net advantage often exceeds $50,000 annually, though exact figures vary based on operation size, existing infrastructure, and regional conditions.

Iowa State Extension’s dairy team has documented this pattern across dozens of operations in their management surveys. What farmers are finding is that implementing systematic protocols doesn’t mean working harder—it means approaching the challenge differently. While neighboring operations struggle with compressed margins, systematic farms maintain profitability through the winter months.

It’s worth noting that some smaller operations—particularly those with fewer than 50 cows and primarily family labor—successfully manage winter reactively. The stress and time costs remain substantial, but their lower overhead and flexibility can absorb the inefficiencies. There’s a 45-cow operation in Vermont I know that’s done it this way for three generations. It works for them. They accept the trade-offs.

I also know a 300-cow operation in upstate New York that deliberately chooses reactive management—they accept the higher costs as the price for operational flexibility. As the owner told me, “We know we’re leaving money on the table, but we value the ability to pivot quickly more than the cost savings.” For most commercial-scale operations, though? The economics strongly favor systematic approaches.

Body Condition Scoring: A September Decision with February Consequences

The evolving understanding of the impact of body condition on winter performance represents one of the most significant shifts in cold-weather dairy management. Research published in the Journal of Dairy Science, combined with feeding trials documented by Alberta Agriculture in their Winter Feeding Guidelines, demonstrates that a thin cow entering winter faces metabolic demands costing $500 to $800 more in feed, lost production, and health interventions compared to a properly conditioned cow.

Let me walk through the physiological mechanisms, because once you understand what’s happening inside that cow, the September decisions make a lot more sense.

September’s Body Condition Secret: A thin cow loses 14°F of cold tolerance, burns 24% more energy at mild winter temperatures, and suffers up to 10% digestive efficiency loss—costing $500-800 per head in a metabolic trap that additional feed alone cannot fix once winter arrives

A cow maintaining an optimal body condition score of 3.0 on the five-point scale sustains her lower critical temperature around 19°F. That’s based on research from the University of Nebraska’s beef and dairy extension program, confirmed by similar work from Manitoba Agriculture. When body condition drops to 2.0 to 2.5—and this happens constantly in herds pushing for maximum butterfat performance through summer—that threshold shifts dramatically upward to 32-33°F.

Think about what this means operationally: a 14-degree reduction in cold tolerance based solely on body reserves.

At 20°F—which many of us in the Midwest consider a mild winter day—that underconditioned cow requires approximately 24% additional energy simply for thermoregulation. But here’s where it gets worse. She’s simultaneously experiencing 5 to 10% reduced digestive efficiency as cold stress compromises rumen function and feed passage rates. Michigan State’s Department of Animal Science has documented this repeatedly in both research trials and farm observations.

The research consistently demonstrates that correcting poor body condition is impossible once winter arrives. Metabolic demands escalate while digestive capacity diminishes. You’re caught in a physiological trap that additional feed alone cannot overcome.

For a 200-cow herd where 20% of animals enter winter underconditioned—not uncommon in operations facing drought-stressed forages or those really pushing lactation curves through transition periods—the September body condition scoring decision carries $20,000 to $30,000 in winter cost implications.

A producer in central Wisconsin told me last year, “I never believed body condition mattered that much until I actually tracked the feed costs and health bills. Now I start thinking about winter body condition in July.” That’s the mindset shift we’re seeing.

Moisture Management: The Hidden Crisis in Barn Environment Control

Each mature dairy cow contributes 10 to 15 gallons (38-57 liters) of moisture to the barn environment daily through respiration, perspiration, and evaporation from waste—a figure documented by agricultural engineers at universities like Penn State and Wisconsin in their ventilation design guides. For a 200-cow barn, we’re talking over 3,000 gallons of water vapor requiring removal through ventilation systems every 24 hours.

The Hidden Moisture Penalty: Each mature dairy cow contributes 10-15 gallons of daily moisture—over 3,000 gallons in a 200-cow barn—that when improperly managed through inadequate ventilation drives $150,000 in annual losses while the fix costs just $20,000 with payback in the first winter

The first time I shared that 3,000-gallon figure with a producer, he didn’t believe me. We actually set up collection tarps and measured condensation over 48 hours. The numbers don’t lie.

Research from Wisconsin’s School of Veterinary Medicine’s dairy housing recommendations reveals that when barn humidity exceeds 80%, airborne bacterial survival extends dramatically—from minutes under dry conditions to potentially months in humid environments. The specific mechanism involves moisture protecting bacteria from desiccation while providing a medium for reproduction.

What’s particularly interesting here is how this plays out differently across regions. In Georgia, where I consulted with a 400-cow operation last spring, their challenge isn’t cold—it’s managing 90% humidity during their wet winters. They use the exact same systematic ventilation approach we recommend up north, just for different reasons.

Dairy ventilation specialists across the Midwest have documented consistent operational impacts. Pneumonia incidence increases approximately 40% in high-humidity environments compared to properly ventilated barns. Hoof disease rates climb 25% as moisture softens hoof walls and promotes bacterial growth, particularly digital dermatitis. Milk production typically drops 10 to 15% as cows divert energy toward maintaining homeostasis in these suboptimal conditions.

For a 200-cow operation, when you combine lost production, increased disease treatment, infrastructure degradation from condensation, and elevated labor costs responding to health crises, inadequate moisture management can cost well over $150,000 annually, based on component cost analyses from multiple university studies.

The encouraging news? Solutions cost a fraction of the problem. Proper ventilation systems—prioritizing cold, dry conditions over warm, damp environments—require initial investments of $15,000 to $20,000 for retrofit installations, according to agricultural engineering estimates from the Midwest Plan Service. The return becomes apparent within the first winter season.

Looking ahead, as we see more variable weather patterns—like the extreme temperature swings experienced in recent years—moisture management will likely become even more critical. The operations getting this right now are positioning themselves for long-term success, regardless of what climate change throws at us.

Rethinking Barn Temperature: Why Heating Isn’t the Answer

A persistent misconception I encounter weekly involves the perceived need to heat dairy barns during winter. And I mean weekly—just yesterday, a producer from northern Minnesota called asking about heating options.

“I can’t afford to heat the barn and run ventilation simultaneously,” he said. He was spending $3,000 monthly trying to keep his freestall barn at 45°F.

This perspective overlooks fundamental bovine physiology that agricultural engineers have understood for decades.

Mature dairy cows generate approximately 4,800 BTU per hour each, according to calculations from the Ontario Ministry of Agriculture, Food and Rural Affairs (OMAFRA Publication 833) and confirmed by similar research from Midwest universities. Let’s put that in perspective. A 200-cow herd produces heat equivalent to nine 100,000 BTU furnaces operating continuously. The cows themselves are literally the heating system.

Michigan State Extension Bulletin E-3090 on dairy ventilation clearly emphasizes this principle. When you enter a barn where manure odor predominates over feed aromas, humidity levels are excessive, and ventilation is inadequate. The solution is to accept that cattle thrive at temperatures humans find uncomfortable rather than adding supplemental heat.

What we’re seeing on successful systematic operations from Vermont to Alberta are consistent principles. Keep barn temperatures as low as possible without causing equipment failures—typically, this means maintaining just above 32°F in areas with water lines. Keep ridge ventilation at maximum capacity throughout the winter months, aiming for a minimum of 4 to 8 air changes per hour. Provide workers with appropriate cold-weather clothing rather than attempting barn heating for human comfort. And always prioritize cold, dry conditions over warm, damp environments.

Research from Penn State Extension examining thermal comfort zones (documented in their Special Circular 397) confirms dairy cattle maintain productivity within a thermoneutral zone ranging from 41 to 77°F. Well-fed, dry-coated Holstein cows can tolerate temperatures approaching 5°F before requiring additional energy for thermoregulation beyond normal metabolic heat production.

These animals evolved for cold climates. They become stressed by heat, not cold. Your ventilation strategy should reflect bovine physiology, not human comfort preferences.

Even in warmer climates, these principles apply. That Georgia dairy I mentioned earlier? They use the same systematic ventilation approach—not for cold stress, but to manage humidity during their wet winters. The systematic mindset translates across latitudes.

Water System Management: Preventing the Costliest Winter Crisis

Among winter equipment failures, frozen water systems create the most immediate and severe consequences. Operations can lose $10,000 in 48 hours from one frozen water line. The cascade effect is remarkable—and remarkably expensive.

Research from New Mexico State University’s Cooperative Extension Service dairy management bulletin shows that cows deprived of water for 24 hours can lose over 10 pounds of daily milk production, with high producers experiencing even greater losses. For a 200-cow herd at current milk prices, this represents over $800 in lost revenue per day, before accounting for potential metabolic issues from dehydration.

A Wisconsin operation milking just over 4,000 cows across two sites experienced three major water system failures during the winter of 2018, before implementing systematic prevention measures. Each incident cost between $8,000 and $10,000 in repairs, production losses, and overtime labor. The owner told me, “That winter taught us prevention costs pennies compared to reaction.”


Metric
Preventive ApproachReactive ApproachDifference
Initial Investment$4,000-5,000$0
Annual Maintenance$1,000-1,500$0
Average Annual Failures$0$20,000-25,000$20K-25K savings
Revenue Loss Per Incident$0$800/dayCrisis avoided
Milk Production ImpactNone10+ lbs/cow/24hrsStable production
Emergency Response TimeProactiveHours-DaysNo downtime
Total Annual Cost$1,000-1,500$20,000-25,000$18.5K-23.5K savings
ROI TimelineImmediateN/A (loss)1,800%+ ROI

Looking at systematic farms — from Vermont’s smaller operations to Alberta’s larger dairies —successful preventive protocols share common elements.

During October, they test every heating element under load for 24 to 48 hours, documenting wattage draw to establish performance baselines. The University of Minnesota Extension’s winter prep guidelines recommend replacing elements drawing 10% below specifications—they’re failing but haven’t quit yet. Critical operations install redundant heating systems on separate electrical circuits. One fails? The backup’s already running.

Throughout winter, these operations conduct twice-daily water system checks at a minimum, typically at 6 AM and 6 PM, with additional checks during extreme cold (below -10°F). They maintain temperature-triggered intervention protocols. Backup generator capacity specifically sized for water systems proves essential. And they prepare emergency water sources before they’re needed, not during a crisis.

This preventive approach requires initial investments of $4,000 to $5,000, then $1,000 to $1,500 annually for maintenance and monitoring. Compare this to Farm Credit Canada’s risk analysis, showing reactive farms averaging $20,000 to $25,000 in water system failures per winter. The return on investment is immediate and substantial.

Even producers who remain somewhat reactive in other areas tell me water system prevention is non-negotiable. As one put it, “Everything else can wait a few hours. Water can’t.”

WINTER PREPARATION CHECKLIST

September: Assessment & Planning □ Body condition score all animals (target BCS 3.0-3.5)
□ Schedule October equipment servicing
□ Secure winter fuel contracts
□ Evaluate feed inventory for winter needs
□ Review previous winter’s near-miss reports

October: Infrastructure Preparation □ Test all water heating elements under load (24-48 hours)
□ Service all equipment (tractors, generators, loaders)
□ Install heat tape and insulation (minimum R-3) on exposed pipes
□ Stockpile 2-week minimums (feed, bedding, supplies)
□ Check and repair barn ventilation systems

November: Systems & Training □ Full generator load testing (4+ hours continuous)
□ Emergency response drills with the entire team
□ Winter safety training (hypothermia recognition)
□ Final pre-winter facility walkthrough
□ Post emergency contact lists in multiple locations

December-February: Active Management □ Twice-daily water checks (6 AM, 6 PM minimum)
□ Temperature-based monitoring protocols
□ Weekly near-miss review meetings
□ Continuous system improvements
□ Document all incidents for next year’s planning

Developing Safety Culture: Beyond Compliance to Commitment

Near-miss reporting systems represent an underutilized opportunity in dairy operations. Construction industry research published in the Journal of Safety Research demonstrates that structured reporting reduces accidents by 64%. When agricultural operations implement similar systems—and precious few do—they report comparable improvements.

But here’s the challenge I see constantly: implementation requires genuine commitment from ownership. This cannot be delegated or treated as a compliance checkbox.

The process begins with the ownership making a public commitment to non-punitive reporting during a full-team meeting. Not a memo posted on the bulletin board, but a face-to-face conversation that establishes trust. You need clear distinctions between reportable mistakes and cardinal violations. Operating equipment while impaired? That’s a cardinal violation requiring disciplinary action. Forgetting to engage a safety guard? That’s a reportable near-miss requiring system improvement, not punishment.

Multiple reporting channels accommodate different comfort levels—paper forms in the break room, digital options through smartphones, and anonymous boxes for sensitive issues. The critical element involves responding within 24 to 48 hours. When employees observe reported near-misses generating rapid improvements rather than blame, trust develops quickly.

A Wisconsin operation with about 230 cows and six full-time employees transformed from experiencing 2 to 3 injuries annually to zero lost-time incidents over 2 years. They report saving approximately $30,000 annually in avoided injury costs. Their workers’ compensation premiums declined 22% at the last renewal.

The owner’s perspective is telling: “I was skeptical about non-punitive reporting. Seemed like giving people a pass for mistakes. But when we started fixing problems instead of finding fault, everything changed. Employees started telling us about issues we never knew existed.”

For a typical 200-cow operation employing eight workers, implementing comprehensive near-miss reporting costs approximately $4,000 to $5,000 annually. Based on USDA agricultural injury statistics, this investment could prevent $25,000 to $35,000 in injury-related costs.

This development suggests that as younger generations enter dairy management—often with safety training from agricultural programs—we’ll see accelerated adoption of these protocols.

Strategic Timeline: September Through February

Successful transformation from reactive to systematic management follows a predictable timeline. The key is starting early—in September, not November.

A Pennsylvania producer described his evolution perfectly: “We used to scramble every November, trying to prepare for winter that was already arriving. Now we start in September when it’s still 70 degrees and pleasant. Everything’s easier, cheaper, and more thorough.”

The breakdown of what this looks like operationally:

September becomes your assessment month. Body condition scoring takes one person approximately two days for a 200-cow herd. This establishes nutritional interventions for thin cows while there is still time for improvement. I recommend scoring on the same day each year—it creates a rhythm. Equipment servicing gets scheduled for October. Fuel supplies receive evaluation with winter delivery contracts secured.

October is infrastructure month. Every water heating element undergoes load testing. Not just checking if they turn on—actually measuring amperage draw. Tractors, skid loaders, and generators receive comprehensive servicing. Exposed water lines get winterized with heat tape and insulation. Operations stockpile two-week minimums of critical supplies.

November focuses on systems and people. Generators undergo full load testing—actually powering critical systems for several hours. Emergency response drills engage the entire team. What happens if we lose power for 48 hours? Winter safety training covers hypothermia recognition and emergency protocols.

December through February represents active management rather than crisis response. Daily protocols adjust based on temperature conditions. Above 20°F, standard checks. Below zero, hourly monitoring. Teams implement continuous improvements based on observations.

Farm Management Canada’s analysis comparing proactive versus reactive management reveals systematic farms investing $20,000 to $25,000 in preparation to avoid $60,000 to $70,000 in winter crisis costs—a net advantage often exceeding $40,000.

Overcoming Implementation Barriers

The primary obstacle to change isn’t financial or technical—it’s psychological. The Canadian Agricultural Human Resource Council’s survey indicates that over 75% of farmers report feeling overwhelmed and trapped in reactive patterns.

“I’m too busy fighting today’s fires to install prevention systems,” producers tell me constantly. But that reveals the fundamental paradox—the constant crisis management is exactly what prevents systematic improvement.

How do farms successfully break this cycle?

They start small, typically with water winterization due to clear, rapid returns. Success with one system builds confidence for expansion. A Vermont producer running 150 Jerseys told me, “Once we stopped having water crises, we realized how much time we’d been wasting. That motivated us to systematize other areas.”

Documentation proves critical. Track actual time and costs comparing reactive versus systematic management. When producers see they’re spending 40 hours monthly on emergencies versus 10 hours on prevention, the economics become undeniable.

Trust develops gradually through consistent actions. Near-miss reporting demonstrates a non-punitive culture when reports generate improvements rather than punishment. An employee on a Minnesota dairy told me, “When I reported a ladder problem and saw it fixed the next day with no questions asked, I started reporting everything that seemed unsafe.”

What I’ve noticed is that operations using farm management software and IoT sensors for monitoring find the transition to systematic management easier. The technology provides the data backbone that enables systematic approaches to be more manageable.

The Compounding Winter Divide: While systematic farms achieve 300% ROI in Year 1 and accumulate $279,500 in net savings by Year 3, reactive operations hemorrhage over $409,500 in the same period—a staggering $689,000 financial gap that proves winter management philosophy determines profitability more than any other single factor

February’s Revealing Truth

Winter exposes operational realities that summer’s favorable conditions mask. February particularly reveals the difference between surviving and thriving.

After evaluating hundreds of operations, one indicator consistently distinguishes thriving farms: employee understanding. Ask any worker why they perform a specific task a certain way. If they can explain both the procedure and rationale, you’re observing systematic management in action.

Lactanet Canada’s performance indices reveal an interesting pattern that holds true across borders. The highest-scoring farms don’t necessarily achieve maximum per-cow production. Instead, they maintain remarkable consistency across all performance metrics—production, reproduction, health, and longevity.

Walking through a thriving February dairy reveals distinct characteristics. Body condition scores cluster tightly around 3.0-3.5. Waterers function reliably without daily crisis interventions. Barn temperature sits at 25°F when it’s -5°F outside—by design, not accident. Performance data appears where employees actually reference it. Equipment operates on maintenance schedules rather than emergency repair cycles.

What’s particularly noteworthy is that these outcomes occur regardless of which employees are working or the prevailing weather conditions. The system functions independent of individuals. That’s systematic management.

Practical Implementation for Your Operation

Looking at the evidence, the financial gap between reactive and systematic approaches can exceed $50,000 annually for a typical 200-cow dairy. Your specific figures will vary based on herd size, geographic location, existing infrastructure, and management capacity. But the direction remains consistent—systematic beats reactive.

Where should you start? Water system winterization offers the most immediate returns with visible results that build confidence. September body condition assessment determines February profitability—each underconditioned cow entering winter represents $500 to $800 in unrecoverable costs.

Understanding cows as heat generators rather than cold victims reshapes ventilation strategies. A quality insulated coverall costs $200 per employee. A sick cow from poor ventilation costs at least $300. The math is straightforward.

Cultural elements ultimately determine success. Near-miss reporting succeeds only with genuine trust and consistently non-punitive responses. When appropriately implemented—and it takes commitment—injury rates decline substantially.

Interestingly, systematic farms consistently report spending less total time on winter management despite more structured approaches. The perception of being “too busy to plan” often perpetuates reactive patterns.

Don’t attempt a comprehensive transformation immediately. Implement one system successfully this year. Document the results. Build momentum. While a complete, systematic transformation typically takes 2 to 3 years, returns begin within months.

Looking ahead, emerging technologies such as automated monitoring systems and IoT sensors will likely make systematic management even more accessible and cost-effective. The farms building these foundations now will be best positioned to leverage these advances.

The Bottom Line

As climate patterns become more variable and economic margins continue tightening, winter management approaches must evolve accordingly. Every operation faces a fundamental choice: continue accepting substantial reactive costs as inherent to dairy farming, or invest in systematic protocols that turn winter from a liability into a manageable operational period.

The systematic farms succeeding today don’t benefit from superior weather or advantageous genetics. They’ve shifted from treating winter as an annual surprise to approaching it as a manageable operational challenge.

A Wisconsin producer who transformed his 280-cow operation over three years captured this perfectly: “You’re not too busy to implement systematic management. You’re too busy because you haven’t implemented it yet.”

The decision is yours. This coming February will be here regardless of preparation levels. Will your operation be reacting to a crisis or executing established protocols?

The $50,000 question isn’t whether you can afford to systematize. It’s whether you can afford not to.

FINAL KEY TAKEAWAYS:

  • The $100K bottom line: Systematic farms invest $30K in prevention to avoid the $130K reactive farms lose each winter—a 300% ROI starting year one
  • Water winterization delivers instant returns: $200 heating element prevents $10,000 frozen pipe disaster—start here for immediate 500% ROI
  • September body condition scoring saves $800 per cow: Thin cows need 24% more energy at 20°F, but can’t eat enough to compensate—fix condition before winter
  • The nose knows: Smell manure before feed in your barn? That’s $150K in annual moisture damage—proper ventilation costs $20K once
  • Less work, more profit: Systematic farms spend 75% less time on winter management while earning $50K+ more—because prevention takes minutes, crisis takes days

Resources for Winter Management Success

Body Condition Scoring: University of Wisconsin Extension Publication A3948
Ventilation Design: Penn State Extension Special Circular 397
Cold Stress Management: Michigan State Extension Bulletin E-3090
Water System Winterization: Ontario Ministry of Agriculture (OMAFRA) Publication 833
Safety Culture: Visit the National Safety Council’s agricultural division website (nsc.org) for templates
Economic Analysis Tools: Farm Management Canada’s risk assessment resources at fmc-gac.com
Weather Monitoring: NOAA’s agricultural weather portal at weather.gov/agriculture

Complete references and supporting documentation are available upon request by contacting the editorial team at editor@thebullvine.com.

Learn More:

The Sunday Read Dairy Professionals Don’t Skip.

Every week, thousands of producers, breeders, and industry insiders open Bullvine Weekly for genetics insights, market shifts, and profit strategies they won’t find anywhere else. One email. Five minutes. Smarter decisions all week.

NewsSubscribe
First
Last
Consent

Cornell Study Proves Less Is More: Why Modern Colostrum Needs Just 2.5 Liters, not 4

Testing colostrum takes 30 seconds. Saves $20/calf immediately. Adds $350 lifetime. Why isn’t everyone doing this?

EXECUTIVE SUMMARY: For 20 years, we’ve been overfeeding colostrum without realizing it—and it’s been hurting both calves and profits. Modern dairy genetics have quietly doubled colostrum antibody concentration from 50 to 90 grams per liter, but we’re still feeding volumes designed for our grandparents’ cows. Cornell’s groundbreaking 2024 study shows that feeding just 2.5 liters of today’s high-quality colostrum works better than 4 liters, improving absorption efficiency by 24% while eliminating painful colic symptoms in calves. The economics are compelling: precision feeding saves $20 per calf immediately and adds $300-350 through increased first-lactation milk production. Implementation couldn’t be simpler—a $200 refractometer and 30-second test tells you exactly what each cow produces, letting you bank excess premium colostrum while optimizing calf health. Smart producers are already making the switch, treating colostrum like the liquid gold it’s become. The science is clear: less really is more when you’re feeding modern colostrum.

Precision colostrum feeding

You know how sometimes a piece of information hits you and suddenly everything makes sense? That’s exactly what happened to me at a University of Wisconsin extension meeting this fall. Dr. Donald Sockett—who’s been around calves longer than most of us have been farming—showed us data from the latest Cornell research that basically turned my understanding of colostrum feeding upside down.

What caught me off guard was this: we’re still feeding colostrum like it’s 2004, but our cows? They’re producing something completely different now. And some of the calves we thought were thriving… well, turns out they might actually be uncomfortable from what we’ve been doing to them.

The Quality Jump That Snuck Up on Us

The brutal truth about colostrum management: while dairy genetics quietly doubled antibody concentration from 50 to 90 g/L over four decades, we kept force-feeding calves volumes designed for cows that no longer exist. It’s like running premium fuel through a carburetor designed in 1980—wasteful, painful for calves, and economically stupid.

So I’ll admit it—I feel a bit foolish for not noticing this sooner. While we’ve all been focused on pushing production records, tracking genomic gains, watching butterfat levels climb… our cows have been quietly revolutionizing their colostrum quality right under our noses.

The numbers tell quite a story. Back when I started farming (and don’t ask me exactly when that was), average colostrum measured around 50 grams per liter of IgG. That’s what all the feeding guidelines were based on.

Today? Well, the data compiled by Wisconsin’s veterinary team, along with studies from Bielmann’s group and more recent work by Conneely, shows we’re routinely seeing 75 to 95 grams per liter.

Let that sink in for a minute. That’s nearly double the antibody concentration. Double.

Dr. Miriam Weber Nielsen from Michigan State put it perfectly when she told me that these modern cows aren’t just making more milk—they’re making fundamentally different colostrum. The whole biological system has upgraded.

What drove this change? A bunch of things came together, really.

You probably remember when genomic selection took off around 2009. The Council on Dairy Cattle Breeding’s data shows it basically doubled our rate of genetic gain. And what’s fascinating is that health traits improved right alongside production. Better udder health naturally means better antibody production. Makes sense when you think about it.

Then there’s dry period management. Remember when everyone was trying shortened dry periods or even continuous milking? Yeah, that didn’t work out so well. Canadian research confirmed what many of us learned the hard way—those traditional 50 to 60-day dry periods really do optimize antibody transfer. Most of us have gone back to standard dry periods, and wouldn’t you know it, colostrum quality improved.

Sandra Godden’s work has shown us something else, too—when you really dial in that dry cow nutrition, especially energy and protein balance, colostrum IgG concentration responds beautifully. Today’s TMR formulations have basically optimized this in ways we couldn’t achieve before.

And timing… oh boy, timing matters more than I realized. Research has documented that IgG concentration in colostrum can drop by about a third in the 14 hours after calving. Most of us now harvest within 2 to 6 hours. When I started, 12 to 24 hours was pretty normal. That change alone makes a huge difference.

When Cornell Proved We’ve Been Overdoing It

Alright, so the Cornell study—this is where things get really eye-opening. S.E. Frederick and Dr. Sabine Mann’s team fed 88 Holstein heifer calves colostrum at 6%, 8%, 10%, or 12% of their birth body weight. Really controlled conditions. And what they found in a recent Journal of Dairy Science paper (2024)? It challenges pretty much everything I was taught.

Cornell’s groundbreaking 2024 research reveals the shocking truth: feeding calves the traditional 4 liters (12% body weight) actually reduces IgG absorption efficiency by 24% compared to precision feeding at 6-8% body weight, while leaving more colostrum stuck in the stomach where it can’t be absorbed.

The calves getting 12% of body weight absorbed IgG at only 36.3% efficiency. The ones getting 6%? They hit 47.8% efficiency. So we’re literally getting less bang for our buck by feeding more.

But what really made me pay attention—and this is clever—they used acetaminophen as a marker to track how fast things moved through the gut. Eight hours after feeding, those high-volume calves still had 65.5% of that marker sitting in their abomasum. The lower-volume group? Only 50.4%.

That colostrum wasn’t even getting to the small intestine, where it needs to be absorbed.

And—this is the part that bothers me—those high-volume calves were clearly uncomfortable. The ones getting 10% and 12% of body weight showed abdominal kicking. Classic colic behavior. The 12% group kicked 40 times during observation. You know how many times the 6-8% groups kicked? Zero. Not once.

The hidden cost of “more is better”: Cornell researchers documented zero colic behavior in calves fed 6-8% of body weight, but calves force-fed the traditional 4 liters (12% BW) kicked 40 times in 12 hours—clear evidence of abdominal pain that’s been normalized for decades.

Dr. Ryan Breuer from Wisconsin explained it in a way that finally made it click for me: those intestinal cells that absorb IgG through pinocytosis? They’ve got limits. Feed more than they can handle, and you basically create a traffic jam in the gut. The IgG can’t get absorbed, the calf feels lousy, and you’ve wasted good colostrum.

Quality Wins Every Time

While Cornell was documenting the problems with overfeeding, the University of Montreal team was out there proving what actually works. Their 2021 study in the Canadian Journal of Animal Science followed 818 calves across 61 Quebec Holstein farms. Real farms, real conditions—not some pristine research facility.

Montreal researchers tracking 818 calves across 61 farms proved what we’ve been getting wrong: colostrum quality (easily measured with a $200 refractometer in 30 seconds) matters nearly twice as much as feeding more volume—yet most producers still focus on the wrong variable.

What they found was crystal clear: calves getting colostrum that tested at 24.5% Brix or higher were nearly three times more likely to achieve adequate passive transfer compared to calves getting lower-quality colostrum. Three times!

To put that in perspective, quality mattered more than anything else they looked at. Feeding more volume? That only gave you 2.6 times better odds. Earlier timing? 1.6 times. Bottle versus tube feeding? Just 1.4 times. Quality beat everything.

And this really made me think—those Quebec farms fed a median volume of just 2.8 liters at first feeding. That’s way less than the 4 liters we’ve been told to feed. Yet 68% of those calves achieved adequate passive transfer. Why? Because their median colostrum quality was 23.5% Brix, well above what we used to consider good enough.

A Producer’s Guide: Precision Colostrum Feeding

Stop feeding by tradition. Start feeding by science.

Calf Birth WtHigh Quality (≥25% Brix)Medium Quality (22-24% Brix)Traditional (outdated)
40 kg (88 lb)✓ 2.5 L (6.3% body wt)△ 3.4 L (8.5% body wt)✗ 4.0 L (10.0% body wt)
35 kg (77 lb)✓ 2.2 L (6.3% body wt)△ 3.0 L (8.6% body wt)✗ 4.0 L (11.4% body wt)
30 kg (66 lb)✓ 1.9 L (6.3% body wt)△ 2.6 L (8.7% body wt)✗ 4.0 L (13.3% body wt)

Banking Tips:

  • Freeze in 1-liter bags for easy thawing
  • Label with date and Brix score
  • Use within 6 months for best quality

Making This Work on Real Farms

So you’re probably thinking what I thought: “Okay, interesting research, but how do I actually do this?” Fair question. Let me share what I’ve learned from folks who’ve successfully made the switch.

First thing—you’ve got to know what you’re working with. Get yourself a Brix refractometer. They run about $200 from most dairy suppliers. The digital ones are nice if you want to splurge, but honestly, the optical ones work just fine. Takes maybe 30 seconds to test once you get the hang of it.

And that brings me to banking, which I think is one of the most underutilized tools we have. When you test a cow at 28% Brix and only need to feed 2.5 liters to her calf, you might have 2 to 3 liters of premium colostrum left over. Freeze it! That’s your insurance for when a heifer freshens with poor colostrum or you get surprise twins.

Now, I’ll be honest—not everyone sees immediate benefits. A neighbor of mine with 60 cows tried this for three months and said the extra testing time didn’t pencil out for him. Fair enough. But most operations I’ve talked with find the time investment pays off pretty quickly, especially once employees get into the routine.

This past spring calving season really drove it home for me. We had two heifers freshen the same night with colostrum testing at 18% Brix—way below what we needed. But because we’d been banking all winter, we had plenty of high-quality colostrum ready to go. Those calves got what they needed, and both are thriving now.

The Economics Make Sense

Here’s why every dairy should own a refractometer: that $200 device pays for itself with the very first calf tested, then delivers $370 in returns per calf through immediate health savings, reduced replacer waste, and a whopping 626kg more milk in first lactation. The breakeven isn’t measured in months—it’s measured in hours.

Let’s talk money, because that’s what it comes down to for most of us. Current colostrum replacer runs $35 to $45 per bag—and that makes about 3 liters. So every liter of high-quality colostrum you bank is worth $12 to $15. Start banking 1.5 liters from 40% of your fresh cows, and it adds up fast.

Then there’s growth. Calves with optimal colostrum gain an extra 0.24 pounds per day preweaning. Doesn’t sound like much? Over 60 days, that’s 14 pounds. At a typical feed conversion, that’s another $20 per calf.

And this is what really gets me—those same calves produce 626 kilograms more milk in their first lactation. At current prices of around $21 to $24 per hundredweight, we’re talking $300 to $350 in additional revenue per animal. From decisions you made in the first 12 hours of life.

Though I should mention, labor is a consideration. Training employees takes time, and if you’re dealing with high turnover, that’s a real cost. Some operations find that factor alone makes traditional protocols more practical for them.

Extended Feeding: The Next Frontier

What’s got me really interested lately is what happens when you keep feeding colostrum or transition milk beyond that first day. Most of us switch calves straight to milk replacer or whole milk, but there’s growing evidence that this is leaving gains on the table.

Michigan State published fascinating work in 2020. Calves fed transition milk for just three days after colostrum weighed 6.6 pounds more at weaning. The extra energy in transition milk accounted for only about 1.5 pounds of that. The rest? Enhanced gut development.

An Iranian-German team took it further, supplementing calves with 700 grams of colostrum daily for two full weeks. They saw significantly fewer days with diarrhea, less respiratory disease, and better feed efficiency throughout the preweaning period. Published in the Journal of Dairy Science in 2020, and it’s got a lot of us rethinking our protocols.

For operations with automated calf feeders, this gets interesting. You can program different feeding curves based on colostrum quality scores. Some larger dairies are already doing this, though the complexity of the setup means it’s not for everyone.

Different Regions, Different Challenges

Looking at how this plays out across the country, implementation varies quite a bit depending on where you farm. Many Upper Midwest producers I’ve talked with notice higher colostrum quality during fall and winter—probably because there’s less heat stress during the dry period. Southern producers often report the opposite pattern, especially during those brutal August dry periods.

Out in California’s Central Valley, those large-scale operations have had to get creative with banking systems. Smaller bags for faster thawing, dedicated freezers in climate-controlled rooms. Makes sense when you’re dealing with their volumes and temperatures.

The grazing operations in the Northeast face their own challenges. Pasture-based dry cow management can produce exceptional colostrum quality, but volume tends to be more variable. These folks really benefit from having robust banking systems to buffer that natural variation.

And smaller operations—those milking under 100 cows—might actually have some advantages here. You know your cows better, can track individual quality easier, and have more flexibility in your protocols. When you’re only calving a few cows a week, building and managing a colostrum bank is pretty straightforward.

That said, some small producers tell me the return on investment just isn’t there for them. When you’re already achieving decent passive transfer rates and labor is tight, sticking with what works makes sense.

Common Mistakes to Avoid

I’ve watched quite a few farms try to make this transition, and there are definitely some pitfalls to watch out for.

The biggest mistake? Testing colostrum but not actually changing anything. I know it sounds ridiculous, but I’ve seen it happen multiple times. Farms buy the refractometer, test every batch, write down the numbers… and then keep feeding 4 liters because that’s what feels safe. The data just piles up on clipboards without driving any decisions.

Consistency is crucial, too. If your weekend crew is still doing things the old way, you won’t see the benefits. Make it visual—post a laminated chart showing exactly how much to feed based on Brix reading and calf size. Take the guesswork out of it.

And don’t forget about those smaller calves. Jersey calves, twins, that occasional small Holstein heifer—they need proportionally less. A 30-kilogram calf getting 4 liters is receiving 13% of its body weight. No wonder some of these calves look uncomfortable after feeding.

The Organic Angle

This precision approach is especially valuable for organic producers. With a limited treatment toolbox, the prevention provided by excellent passive transfer is critical, and many organic farms report substantial reductions in calf health issues after making the switch.

Where This Is All Heading

Looking ahead, I think precision colostrum management will likely follow the same path as genomic testing. Five years ago, plenty of folks were skeptical. Today? It’s just how we do things on progressive farms.

The Council on Dairy Cattle Breeding recently announced genomic evaluations for calf wellness. The heritability for calf serum total protein (a measure of passive transfer) is around 0.17—that’s workable for genetic selection. Some farms are already starting to select for colostrum quality.

And extended feeding protocols? I think that’s the next big shift. Once producers see the growth and health benefits from feeding transition milk for 3 to 7 days, it’ll likely become more common. We’re just scratching the surface there.

What’s interesting is how this connects to everything else we’re doing. Better genetics leading to better colostrum. Better colostrum management leading to healthier calves. Healthier calves are becoming more productive cows. It’s all connected, and we’re finally starting to see the whole picture.

The Bottom Line

Look, I get that change is hard. Especially when what you’ve been doing seems to work okay. But the thing is—the colostrum our cows produce today is fundamentally different from what it was 20 years ago. We’ve improved the genetics, nutrition, and management… but not the feeding protocols.

The research from Cornell, Montreal, and Michigan State—it’s all pointing in the same direction. Quality matters more than quantity. Precision beats volume. And what worked for 50 g/L colostrum just doesn’t make sense for 90 g/L colostrum.

You don’t have to change everything overnight. Start by testing your colostrum for a week. See what you’re actually dealing with—I’ll bet you’ll be surprised. Then gradually adjust volumes based on quality. Bank the excess. Track your results.

The tools are simple—a $200 refractometer and a scale for calves. The protocol is straightforward. And the payoff? Healthier calves, better growth, improved lifetime production, and a freezer full of insurance for when you really need it.

This isn’t about being revolutionary. It’s about good management catching up with good genetics. The cows changed. The colostrum changed. Maybe it’s time our feeding protocols caught up too.

And honestly? Once you see those calves thriving on less volume of better-quality colostrum, with none of that post-feeding discomfort we used to think was normal… you’ll wonder why we didn’t figure this out sooner.

KEY TAKEAWAYS 

  • Modern colostrum is 2X stronger—Test quality with a Brix refractometer ($200, takes 30 seconds) to avoid overfeeding calves with volumes designed for 1990s genetics
  • Feed by quality, not tradition—High-quality colostrum (≥25% Brix): 2.5L | Medium (22-24% Brix): 3.3L | Low (<22% Brix): Don’t use for first feeding
  • Bank the surplus—When premium colostrum only needs 2.5L instead of 4L, freeze the excess as insurance for when heifers deliver poor-quality batches
  • The math is compelling—Precision feeding returns $20/calf immediately in health savings, plus $300-350 through 626kg more milk in first lactation
  • Implementation is simple—Most farms see ROI within 60 days using just a refractometer and a laminated feeding chart in the calf barn

Complete references and supporting documentation are available upon request by contacting the editorial team at editor@thebullvine.com.

Learn More:

The Sunday Read Dairy Professionals Don’t Skip.

Every week, thousands of producers, breeders, and industry insiders open Bullvine Weekly for genetics insights, market shifts, and profit strategies they won’t find anywhere else. One email. Five minutes. Smarter decisions all week.

NewsSubscribe
First
Last
Consent

Feed Inventory Reality Check: Top Dairies Discover $200,000 They Didn’t Know Was Missing

How Measurement Errors Cost Dairy Farms $200,000 Annually—And What to Do About It

Executive Summary: Here’s the uncomfortable truth: most dairy operations are losing $200,000 annually to feed shrink they can’t see because traditional measurement methods are off by 15-30%. This hidden crisis came to light when Dean DePestel applied mining industry drone technology to his Minnesota dairy’s silage inventory, discovering discrepancies that are now being confirmed across the industry. While the Statz Brothers’ transformation—cutting shrink from 10% to 2-3% and saving $500,000 yearly—demonstrates the potential, you don’t need their million-dollar infrastructure. Five targeted improvements (face management, scale calibration, ingredient tracking, right-sized bunkers, and refusal optimization) can recover $100,000+ annually for an investment of under $20,000. Drone measurement services at $2,000-5,000 per year deliver quarterly measurements accurate to 1-2%, replacing guesswork with data. Any operation can start with a free 30-day test—tracking mixer output, bunks, and pile faces—to identify their gap. With industry consolidation accelerating and processors demanding sustainability documentation, farms that can’t measure and prove their efficiency won’t just lose money—they’ll lose market access.

Dairy Feed Shrink

I recently spoke with a producer in central Wisconsin who discovered something that made both of us pause. After twenty-five years of dairy farming, he finally measured his silage inventory with precision technology and found he had 23% less feed than his calculations suggested. That’s not a rounding error—that’s planning for April and running out in February.

This builds on what we’ve been seeing across the industry. Recent studies show that drone feed measurements reveal errors ranging from 15% to over 30% between traditional estimation methods and actual silage inventory. The financial implications are substantial, yet many operations haven’t recognized this as a solvable problem.

What’s particularly noteworthy is how this revelation emerged from an unexpected source. Dean DePestel, who farms at Daley Farms in Lewiston, Minnesota, happens to be a mechanical engineer. When he read about mining companies using drone technology to measure tailings piles with remarkable accuracy, he wondered if the same approach could work for silage inventory. As documented in a 2022 Ag Proud article, his curiosity led to discoveries that are reshaping how progressive operations think about feed management.

Traditional feed measurement methods are off by 15-30%, while drone technology achieves 1-2% accuracy—the difference between guessing and knowing where $200,000 disappeared

Understanding Where Traditional Methods Fall Short

The dairy industry has relied on tape measures, wheel measurers, and visual estimates for generations. Derek Wawack from Alltech captured it well in a recent Dairy Herd interview when he described these as “about everything to guess what was in forage piles.” These methods served us adequately when margins were wider and feed costs were lower. Current conditions demand better precision.

Harrison Hobart’s work with Alltech’s Aerial Inventory Program reveals why our traditional approaches struggle. Over two years of measuring corn silage density across multiple operations, he documented variations from 12 pounds to 24 pounds of dry matter per cubic foot within drive-over piles. This aligns with what many nutritionists have suspected but couldn’t quantify.

Consider the economics: A typical 1,000-cow operation today faces daily feed costs of $7 to $8 per cow—roughly $2.5 to $2.9 million annually. When research from land-grant universities, including recent work from Hubbard Feeds and Amelicor, shows shrink rates between 5% and 15% on farms without systematic measurement protocols, the financial exposure becomes clear. At 8% shrink—a conservative estimate for many operations—that represents $204,400 annually on a 1,000-cow dairy.

The Compound Nature of Measurement Errors

Pennsylvania State research offers insight into why single-point measurements mislead us. Their work found bunker density averaging 15.5 pounds of dry matter per cubic foot at the bottom, while the top averaged just 11.2 pounds—a 38% variation within the same structure. When we take one or two core samples and extrapolate, we’re essentially guessing.

This variation extends beyond density. I’ve observed haylage piles where dry matter content ranges from 25% to 55% across different sections. These aren’t poorly managed operations—they’re typical farms dealing with the realities of weather windows, equipment limitations, and labor constraints during harvest.

A Wisconsin Case Study in Transformation

The Statz Brothers operation near Marshall, Wisconsin, offers valuable lessons for the industry. This family has been dairy farming since 1966 and currently manages 4,400 cows across two locations. By any conventional measure, they were successful. Yet they faced a challenge many producers will recognize: feed inventory that seemed to disappear faster than expected.

The Statz Brothers dairy slashed feed shrink from 10% to 2.5%, documenting over $500,000 in annual savings—and you don’t need their million-dollar feed center to capture similar gains.

Todd Follendorf, their nutritionist from Cornerstone Dairy Nutrition, quantified what they suspected. As he explained to Dairy Global, “Before, we had shrink percentages of around 10% every single day.” For an operation of their size, that translated into over $1.28 million in annual feed losses.

Their response during a 2015 expansion was instructive. Rather than replicating existing infrastructure, they partnered with Mike Greene, a feed management specialist who had developed the TMR Audit system. Together, they designed a 36,600-square-foot fully enclosed feed center—not simply a commodity shed with walls, but a purpose-built facility that protects feed from placement to feeding.

The documented results speak to what’s possible: shrink rates dropped from 10% to 2%-3%. Even conservative calculations suggest annual savings exceeding $500,000, with the investment paying for itself in under three years.

Yet—and this is crucial for most operations—you don’t need their scale of infrastructure to capture significant benefits.

Practical Improvements That Deliver Returns

Five operational improvements can recover $100,000+ annually for under $20,000 in total investment—no million-dollar feed centers required, just systematic measurement and management.

Through conversations with producers and nutritionists across different regions—from California’s Central Valley to Vermont’s grazing operations—I’ve identified five changes that consistently deliver returns without requiring major capital investment:

1. Optimizing Silage Face Management

Research from UC Davis, widely shared through extension programs, demonstrates that oxygen penetrates up to 3 feet into well-packed silage. When removal rates are too slow—say, 4 inches daily instead of the recommended 6 to 12 inches—that creates an active spoilage zone.

Wisconsin and Penn State extension specialists recommend removing 6 to 12 inches daily in winter, increasing to 10 to 12 inches during warmer months. The technique matters too: scraping from top to bottom rather than digging underneath prevents cracks that increase surface area by 9% or more.

I recently visited a 1,500-cow operation in northeastern Wisconsin that implemented these changes without any equipment purchases. Their estimated savings: $6,000 to $8,000 annually from reduced spoilage alone. A similar operation in California’s San Joaquin Valley reported even higher savings due to the year-round heat stress on exposed faces.

2. Addressing Mixer Scale Accuracy

This issue deserves more attention than it typically receives. Ohio State researchers evaluated mixer wagon scales on 22 dairy farms and found that only half were functioning within acceptable tolerance. A 2% systematic error across all ingredients—easily overlooked in daily operations—costs a 1,000-cow dairy approximately $54,750 annually.

The solution is straightforward: quarterly calibration checks using certified truck scales. The process takes an afternoon, costs $500 to $1,500 for professional calibration if needed, and can identify problems before they compound into significant losses.

3. Ingredient-Specific Shrink Management

Different feedstuffs have dramatically different shrink characteristics, yet many operations apply a uniform percentage across all ingredients. Cornell’s economic analysis and recent coverage in Hoard’s Dairyman highlight this opportunity.

Cottonseed might experience 4% shrink while fine distillers grains can reach 12% to 15%. One documented case at Cornell showed that relocating high-shrink ingredients closer to mixing areas substantially reduced handling losses—a simple change with a meaningful impact.

4. Right-Sizing Face Width to Removal Capacity

Many operations built bunkers for anticipated expansion that hasn’t materialized. An 80-foot-wide bunker makes sense for 2,000 cows, not 1,200. When removal rates are too slow for bunker width, the outer portions essentially compost while you work across.

Penn State’s bunker silo research confirms this is widespread. The solution doesn’t require construction—work bunkers in sections, covering inactive portions. For future construction, consider narrower drive-over piles that match actual removal capacity.

5. Refining Refusal Management

Multiple feeding studies demonstrate that well-managed operations can reduce refusals from 5% to 2% while maintaining or improving intake. On a 1,000-cow dairy, that 3% difference represents $40,000 to $70,000 annually.

This requires discipline: pushing feed every two hours, training someone to read bunks consistently, and finding productive uses for quality refused feed rather than composting it. Yes, labor is challenging, but the returns justify the effort.

The Implementation Journey

When operations begin measuring feed inventory precisely with drone technology or other precision tools, the journey typically follows a predictable pattern. The initial measurement often reveals significantly less inventory than expected—it’s common to discover you’re 15% to 20% short of calculations. This can be unsettling, but it’s also the beginning of improvement.

After the initial surprise, patterns emerge. Operations start connecting measurement data with daily observations. Perhaps loads from one supplier are consistently light, or the mixer has been overfeeding certain pens. By month six, farms implementing systematic changes typically see 2 to 5 percentage points of shrink reduction—not from major investments, but from addressing previously invisible problems.

What I find encouraging is how feed management software integration is evolving to support these efforts. Modern systems can now incorporate drone measurement data directly into inventory tracking, creating real-time dashboards that flag anomalies before they become crises.

The Human Element in Feed Management

Technology alone doesn’t reduce shrink—people using technology systematically do. Successful implementation requires clear ownership and accountability.

The operations achieving the best results designate one person whose primary responsibility (representing 70% to 80% of their time) is feed management. Not someone who feeds when they’re done milking, but someone whose success is measured by feed efficiency and shrink reduction.

Your nutritionist plays a crucial role through weekly or biweekly visits, but they’re designing rations and troubleshooting, not managing daily operations. The distinction matters. Meanwhile, owners or managers need to invest 3 to 5 hours weekly reviewing data and making strategic decisions. This team approach, documented in Michigan State Extension research and Bovine Practitioner guidelines, consistently outperforms fragmented responsibility.

Understanding the Limitations

Professional integrity requires acknowledging the constraints of this technology. Weather presents the primary challenge—most agricultural drones can’t operate in rain or winds exceeding 20 mph. The battery provides 15 to 30 minutes of flight time in good conditions, with less in cold weather.

Since inventory measurement typically occurs quarterly rather than daily, finding suitable flying conditions within a reasonable window is rarely a problem. The 2021 Scientific Reports global drone flyability study confirms this pattern.

Vertical silos present a different challenge—drones can’t see through concrete, so traditional measurement methods remain necessary for these structures. Operations with limited internet connectivity should work with service providers who process data off-farm rather than attempting to manage large file uploads themselves.

Where the Economics Change

Not every operation will benefit equally from precision measurement. A 400-cow grazing operation in Vermont with minimal stored feed faces different economics than a 2,000-cow confinement operation in Wisconsin storing nine months of inventory.

Similarly, Southeast operations practicing rotational grazing might store only 3 to 4 months of silage. For these situations, traditional methods may provide adequate accuracy given the lower total investment in stored feed.

One producer who evaluated but decided against drone measurement made a valid point: “With only 600 cows and buying most of our grain as-needed, the $3,000 service would save us maybe $8,000 annually. That math works, but there are other investments with better returns for our operation right now.” This kind of thoughtful analysis respects that every operation has unique priorities.

Regional Variations and Support Programs

Implementation patterns vary significantly by region. Upper Midwest operations storing 8 to 10 months of feed see the highest returns from precision measurement. California’s large dairies benefit differently—they’re identifying shrink in real time on substantial commodity purchases rather than on stored forage.

What many producers don’t realize is that support exists for adopting these technologies. Multiple states offer cost-share programs through NRCS or state agricultural departments. Wisconsin provides reimbursement for up to 50% of precision agriculture technology costs. Minnesota offers grants for adopting data-driven management systems. These programs, detailed in 2024-2025 announcements from state offices, can significantly improve the economics of adoption.

Looking Ahead: The Strategic Implications

The industry landscape is shifting in ways that make precision feed management increasingly important. Major processors, including Nestlé and Danone, are implementing sustainability documentation requirements. By 2030, operations with 5 years of precision data will have distinct advantages in verifying feed conversion efficiency and optimizing resource use.

These sustainability programs currently offer premiums ranging from $0.50 to $1.50 per hundredweight—significant revenue when applied across annual production. Early adopters are positioning themselves for these opportunities, while others are still evaluating the technology.

The 2030 industry divide is forming right now: Early adopters will have 5+ years of sustainability data, premium payments, and better lending rates, while late adopters scramble to prove efficiency they should have been documenting since 2025.

The labor dynamic adds another dimension. Operations reinvesting feed savings into automation report 30% to 40% reductions in labor requirements while maintaining production levels. With quality labor increasingly difficult to find and costing $20 to $25 per hour, these efficiencies matter.

Financial institutions are also taking notice. Lenders recognize that operations with precision management systems demonstrate better margins and lower default risk, translating to more favorable terms and rates.

USDA projections suggest the U.S. dairy industry will consolidate from approximately 35,000 farms today to between 24,000 and 28,000 by 2030. The operations that thrive won’t necessarily be the largest—they’ll be those that combine appropriate scale with operational efficiency.

A Practical Test for Your Operation

The uncomfortable truth: A simple 30-day tracking test reveals most dairies are missing 8-15% of their calculated feed inventory—that’s $72,000 to $135,000 disappearing annually on a 1,200-cow operation.

For producers interested but not yet convinced, I suggest a simple 30-day evaluation. Track three metrics daily: what your mixer scale indicates you fed, bunk appearance before the next feeding, and visual assessment of pile face movement.

After 30 days, compare purchase records with calculated usage. Most operations discover an 8% to 15% gap that they cannot explain. For a 1,200-cow dairy, that gap represents $72,000 to $135,000 in annual costs at current feed prices.

This evaluation costs nothing but time and reveals whether precision measurement would benefit your operation. If your numbers align within 3% to 5%, this may not be urgent. But if you discover a significant gap—as most do—the investment case becomes clear.

Practical Perspectives for Decision-Making

After examining data from operations across the country and discussing experiences with producers who’ve implemented these changes, several principles emerge:

First, determine whether you have a problem worth solving. The 30-day tracking exercise provides that answer without requiring any investment.

Second, you don’t need to revolutionize your entire feeding system. The five operational improvements outlined earlier can deliver $100,000 or more in annual savings for less than $20,000 in total investment.

Third, for most operations, service arrangements make more sense than equipment ownership. At $2,000 to $5,000 annually for drone measurement services, you access the technology benefits without the complexity.

Fourth, assign clear responsibility. Feed management as a secondary responsibility inevitably underperforms dedicated oversight.

Finally, consider the compound benefits. Early adopters are building advantages in sustainability documentation, labor efficiency, and capital access that extend well beyond immediate feed savings.

The discovery we’re making across the industry is that our traditional “good enough” approach has been far more expensive than we realized. Once operations identify where losses are occurring, they can’t return to the previous level of uncertainty.

For an industry facing continued margin pressure and evolving market demands, the ability to measure and manage precisely may determine who remains competitive. The question isn’t whether perfect measurement exists—it doesn’t. The question is whether three to four accurate measurements annually provide better decision-making than twelve months of estimation.

From my perspective, having watched operations transform their economics through systematic measurement, there’s a substantial opportunity hiding in plain sight on many dairy farms. The challenge—and opportunity—is deciding whether to pursue it.

KEY TAKEAWAYS:

  • You’re losing $200,000 annually—and don’t know it – Traditional feed measurements are off by 15-30%, hiding massive shrink on typical 1,000-cow dairies
  • Test yourself free in 30 days – Track three numbers daily (mixer output, bunk status, pile face movement); most farms discover 8-15% gaps worth $72-135K yearly
  • Five simple fixes deliver $100K+ – Face management ($6-8K), scale calibration ($25-55K), ingredient placement ($30-40K), bunker sizing ($6-8K), refusal optimization ($40-70K)—total investment under $20K
  • Rent accuracy, don’t buy it – Drone services at $2-5K/year provide quarterly measurements within 1-2% (versus 20-40% error with traditional methods)
  • The 2030 divide is forming now – Early adopters secure sustainability premiums ($0.50-1.50/cwt), better lending rates, and processor partnerships, while others scramble to catch up

Complete references and supporting documentation are available upon request by contacting the editorial team at editor@thebullvine.com.

Learn More:

The Sunday Read Dairy Professionals Don’t Skip.

Every week, thousands of producers, breeders, and industry insiders open Bullvine Weekly for genetics insights, market shifts, and profit strategies they won’t find anywhere else. One email. Five minutes. Smarter decisions all week.

NewsSubscribe
First
Last
Consent

Why Hormel’s Layoffs Will Cost You $45,000 Per Month (And What to Do in the Next 90 Days)

Strategic exit: Walk away with $1.2M. Wait 18 months: Lose everything. Hormel’s layoffs just started your countdown.

EXECUTIVE SUMMARY: Hormel’s elimination of 250 procurement positions triggers a predictable 12-18 month pattern: processor consolidation, standardized pricing, and $1.50-2.00/cwt in new deductions that destroy farm profitability. With 73% of processing options lost since 2000, most farms now have only 3-4 potential buyers—eliminating negotiating leverage exactly when Farm Bill changes, environmental compliance costs ($75,000-175,000), and heifer shortages (prices hitting $4,800) converge in 2026. Our analysis of Wisconsin and Pennsylvania exits reveals a stark reality: a strategic exit in months 8-10 preserves $1.2 million in family wealth, while waiting until month 18 results in forced liquidation and devastating losses. Of four survival paths—scaling (8% viable), differentiation (15-20% viable), strategic exit, or resilience through low-cost production—only resilience offers hope for mid-sized operations. Your 90-day window to build reserves, create information networks, and secure alternatives started Monday.

Dairy Farm Risk Management

Monday’s announcement from Hormel Foods wasn’t just another corporate headline—it was a warning shot for the entire dairy supply chain. The company is cutting 250 positions, and these aren’t factory floor workers. We’re talking about headquarters and sales staff—the people who typically manage relationships with suppliers like ours.

Now, you might be thinking “that’s Hormel’s problem, not mine.” But here’s what’s interesting—Hormel owns Century Foods International up in Sparta, Wisconsin. That’s a significant dairy ingredient processor that pulls milk and proteins from farms across the Upper Midwest. When a company with $12 billion in annual revenue starts reducing procurement and relationship staff… well, that pressure has to go somewhere, doesn’t it?

What I’ve found is that this pattern keeps showing up across the industry. And understanding it might just help us prepare for what’s coming.

The Bigger Picture We’re All Dealing With

Looking at today’s consolidation, you can see it builds on changes that started decades ago. The data from USDA’s Economic Research Service and the National Milk Producers Federation is pretty sobering—we’ve lost between 65 and 73 percent of regional processing options since 2000.

From 15 Buyers to 3 in 25 Years: USDA Economic Research Service data reveals the consolidation trap—73% of processing options lost since 2000 means most farms now have only 3-4 potential buyers. You used to shop around for better terms. Now processors SET terms, and you take them or dump milk. Hormel’s 250 layoffs accelerate this pattern—fewer relationship managers, standardized contracts, zero flexibility.

Just think about that. Many of us used to have 15 or 20 potential buyers within reasonable hauling distance. Now? Three or four if we’re lucky. In some regions, it’s even tighter.

Take a look at what’s happening across different regions right now. Darigold members—about 250 farms in the Northwest—are paying a $ 4-per-hundredweight assessment. Capital Press reported back in May that $2.50 of that is going toward new plant construction in Pasco, Washington. That’s real money coming right off the milk check.

In the Upper Midwest, Foremost Farms implemented a 90-cent assessment for its patrons in September 2022. Hoard’s Dairyman covered it extensively—they cited the gap between Class III prices and what they’re actually getting for cheese. And Saputo? Food Processing magazine reported in June 2024 that they’re closing six facilities by early 2025, including operations in Wisconsin and California, to “consolidate production and reduce redundancy.”

Here’s what really caught my attention about Hormel’s restructuring. According to their November 4th investor announcement, they’re specifically eliminating corporate strategic and sales positions—these are the folks who maintain relationships with suppliers. They’re spending $20 to $25 million on severance and transition costs. That’s roughly $80,000 to $100,000 per position they’re cutting.

You don’t spend that kind of money unless you’re planning for years of pressure ahead, not just a tough quarter.

Now, it’s worth noting that processors face real challenges too. Retail consolidation means they’re dealing with Walmart, Costco, and Amazon—all of which are squeezing margins. Energy costs are up. Labor’s tight everywhere. These companies aren’t making these cuts lightly. But understanding their pressures doesn’t change what flows down to us.

The Pattern I Keep Seeing

Industry financial advisors tracking processor transitions have identified a consistent pattern that typically unfolds over 12 to 18 months. Let me walk you through what actually happens…

First Few Months: Everything Gets Quieter

Your field rep who used to manage 40 or 50 farms? Now they’re covering 150. Response times stretch from hours to days. Those quarterly visits become phone calls. As many of us have seen, when representatives manage three times as many accounts as before, personalized service just isn’t possible anymore.

Months 2-6: The Standardization Push

This is when you get that letter about “standardized pricing formulas” to ensure “fairness.” Sounds reasonable, right? But what it really means is they’re eliminating those adjustments that recognized your specific situation—your spring flush components, your consistent quality premiums, that understanding that your butterfat always runs high in October.

What’s Your Processor Really Taking? Darigold members in the Pacific Northwest face $4.00/cwt deductions—$45,000 annually for a 180-cow operation split between new plant construction and covering losses. Industry pattern averages $2.00/cwt.

Months 6-9: The Deductions Start

New fees start appearing. Processing assessments. Quality charges. Transportation adjustments. Wisconsin dairy business associations documented accumulated deductions ranging from $1.50 to $2.00 per hundredweight during 2023. For a typical 180-cow operation, that’s $2,500 to $3,300 coming off your monthly milk check.

By Month 12: You Realize Your Options Are Limited

You start looking around for alternatives, but those other processors? They’re managing their own challenges. They’re not actively recruiting. And you need daily pickup—can’t exactly store milk while you shop for a better deal.

Learning From History (Because We’ve Been Here Before)

This isn’t our first rodeo with consolidation. The USDA Economic Research Service’s 2019 report “Consolidation in U.S. Dairy Farming” documented similar patterns during the 1980s farm crisis, and its 2010 analysis covered the impacts of the 2009 financial crisis. Each time, the farms that saw it coming early and adapted survived better.

What’s different this time? The alternatives are scarcer. Back in ’09, you could still find regional processors looking to grow. Today, with interest rates where they are and construction costs through the roof—as Compeer Financial told Brownfield Ag News in October—expansion activity has basically stopped.

Southeast operations face additional challenges, with heat-stress management costs averaging $150 to $200 per cow annually, according to University of Georgia Extension research. Meanwhile, Southwest farms are dealing with ongoing water allocation issues, with Arizona and New Mexico operations seeing water costs rise by 30-40% since 2020, according to state agricultural department data. Each region has its unique pressures, but the consolidation pattern remains consistent.

The Timing Trap: Wisconsin and Pennsylvania farm financial counselors document $1.2 million wealth differences between families who exit strategically at months 8-10 versus those who wait for forced liquidation at month 18+. When Hormel cuts 250 procurement positions, your countdown starts Monday—not when you finally admit you’re trapped.

What Successful Farms Are Doing Right Now

Despite all this, I’m seeing farms navigate these challenges successfully. Their approaches are worth considering.

Building That Financial Cushion

What is the difference between farms with negotiating leverage and those without? Operating reserves. Penn State Extension’s dairy business analysis and the Center for Farm Financial Management both point to the same figure—about 90 days of operating capital makes all the difference.

For a 200-cow operation, that’s roughly $280,000. For 150 cows, about $180,000. I know those numbers sound huge, but here’s what’s working…

Farm financial management research shows that extending equipment replacement cycles by one to two years can generate significant reserve-building capacity. Several Mid-Atlantic operations have successfully banked the difference between equipment payments and increased maintenance costs. After a few years, they’ve built up enough to cover six months of expenses.

Cornell Cooperative Extension has documented that farms directing 5-10% of production to premium direct-market channels accelerate reserve accumulation without disrupting bulk sales. You’re not replacing your regular market—just capturing better margins on a small percentage of it.

Information Networks That Actually Work

You probably know this already, but the coffee shop isn’t where real information sharing happens anymore. Networks of 5 to 8 farms comparing actual numbers—payment timing, deduction patterns, alternative buyer pricing—are documenting surprising disparities.

Farm business management specialists report producer networks discovering pricing gaps of $0.60 to $1.20 per hundredweight between processors for identical milk quality. When these groups approach processors collectively with documentation, they often achieve improvements worth $0.40 to $0.65 per hundredweight.

California producers managing water costs—University of California Cooperative Extension’s 2024 cost studies show averages of $450 to $650 per cow annually in the Central Valley—face additional challenges. But similar information networks help them identify opportunities. The principle’s the same everywhere: shared knowledge beats isolation.

Getting Real Information from Your Processor

Here’s what progressive operations are asking for—and often getting:

Monthly competitive benchmarks showing what processors within 100 miles pay for comparable components. Detailed breakdowns of processing costs at their delivery facility. Inventory levels and 90-day demand projections that might signal adjustments coming.

State Extension services offer tremendous support here. Programs at Michigan State, Cornell, Penn State, UC Davis—they’ve all got dairy business specialists who can help analyze this information. That’s what our tax dollars support, after all.

The Four Strategic Paths: An Honest Assessment

Most advisors focus on three options: scale to 3,500+ cows, differentiate into premium markets, or exit strategically. But I’m seeing a fourth path among farms that consistently stay profitable even when milk drops to $17 or $18…

Path 1: Scaling Up (Works for Maybe 8% of Farms)

Let’s be honest here. Scaling to 3,500+ cows require $21 to $27 million in capital investment, according to current construction costs. You need interest rates that make sense (they don’t right now), heifer availability (scarce and expensive), and processing capacity willing to take your increased volume. If you’re already at 1,500-2,000 cows with strong financials, maybe. Otherwise? This probably isn’t your path.

Path 2: Premium Differentiation (Viable for 15-20%)

Organic, grass-fed, A2—these markets exist, but they’re not magic bullets. Organic premiums have compressed from $7-9 to $3-5 per hundredweight. You need 3-7 years to transition, specific processor relationships, and often geographic advantages. If you’re near urban markets or progressive processors, it’s worth exploring. But it’s not a quick fix.

Path 3: Strategic Exit (Sometimes the Smartest Move)

Wisconsin and Pennsylvania farm financial counselors document $800,000 to $1.2 million differences in family wealth between planned exits at months 8 to 10 versus forced liquidation at month 18 and beyond. There’s no shame in preserving what three generations built rather than losing it all trying to outlast market forces.

Path 4: The Resilience Strategy (The Surprise Option)

These operations have basically flipped the traditional production philosophy. Instead of maximizing output, they’re optimizing for consistent profitability across wide price ranges.

The Profitability Paradox: University of Minnesota and Penn State data reveal resilience farms producing 18,000-19,000 lbs/cow stay profitable at $17 milk while conventional operations bleeding at $22. Feed costs of $7.80/cwt versus $10.50/cwt. Vet bills of $42/cow versus $97/cow. The farms surviving consolidation aren’t maximizing production—they’re optimizing for volatility.

Rethinking Production Economics

University of Minnesota Extension case studies show lower-production systems—18,000 to 19,000 pounds per cow—achieving $3 to $4 per hundredweight cost advantages through reduced inputs. The 2024 Dairy Farm Business Summary shows industry feed costs averaging $10.20 to $11.50 per hundredweight. These systems? They’re at $7.80.

Vet expenses run $42 per cow annually versus the $85 to $110 industry average. They maintain a 22% replacement rate when the industry standard exceeds 33%. They’re producing 25% less milk per cow, yet their cost structure keeps them profitable at $18 milk, while others are bleeding red ink.

Research from Wisconsin’s Center for Integrated Agricultural Systems shows that well-managed grazing operations achieve production costs of $14 to $16 per hundredweight, compared to $18 to $21 for conventional confinement.

Sure, they might average 16,000 to 17,000 pounds per cow. Their facilities might look dated. But at any price above $15.50, they’re making money. When milk hit $23 early this year, they banked serious reserves. When did it dropped to $18? Still profitable.

Penn State Extension’s 2024 analysis shows dairy-beef integration programs generating $150,000 to $200,000 annually. Using sexed semen on top genetics and beef semen on lower performers, these operations accept modest production decreases for substantial supplementary income.

USDA Agricultural Marketing Service reports from October 2025 show beef-cross dairy calves bringing $750 to $950at regional auctions, with strong demand continuing. That’s meaningful diversification without new facilities or expertise.

What these farms understand is that volatility kills more operations than low prices. If you need $22 milk to break even, you’re in trouble 40% of the time. If you can profit at $17, you only struggle during true crashes.

The Critical Next 18 Months

Here’s why the period through spring 2027 matters so much…

First, we’re operating under the second Farm Bill extension, as the Congressional Research Service noted in June. When new Dairy Margin Coverage parameters roll out in spring 2026, farms already under stress might not be able to afford meaningful coverage.

Why 2026 Will Crush Unprepared Farms: The convergence isn’t theoretical. Processor deductions ($36K ongoing), environmental compliance ($75-175K mid-2026), and heifer shortages hitting $4,200-4,800/head (early 2027) create a $261K perfect storm for 200-cow operations. CoBank’s August analysis and state DNR permit timelines confirm—farms building reserves NOW survive. Everyone else liquidates.

Second, environmental compliance intensifies in mid-2026. California’s State Water Resources Control Board’s 2025 dairy regulations estimate compliance costs of $75,000 to $175,000 for facilities that require digesters or advanced nutrient management. Wisconsin’s Department of Natural Resources permit updates require similar investments. That’s hitting right when other pressures are at their peak.

Third—and this one’s flying under the radar—CoBank’s August analysis shows dairy heifer inventories hitting their lowest point in 2026. USDA Agricultural Marketing Service data from July shows current prices at $3,010 per head, up 75% from April 2023. CoBank projects they could reach $4,200 to $4,800 by early 2027.

For a 200-cow operation with typical replacement needs, that’s an extra $100,000 annually. Can you absorb that while everything else is hitting?

Your Action Plan for This Week

Given everything that’s developing, here’s what I’d be thinking about…

Monday-Tuesday: Know Your Position

Pull out your processor contract and read it carefully. Every word. Document your payment patterns over the past year—are checks posting later, even by a day or two? Calculate your actual reserves. Not estimates—real accessible capital.

Wednesday-Thursday: Build Intelligence

Call three alternative processors. Frame it as “2026 planning” rather than jumping ship. Get their pricing, their terms. If your processor has a parent company, check their recent earnings calls. Connect with 5 to 8 operations in your area to exchange information.

Friday: Make Your Decision

Honestly evaluate where you fit. Can you scale? Can you differentiate? Should you build resilience? Or is strategic exit the smartest move for your family?

Questions Worth Asking Your Processor Today

  1. What’s your capacity utilization at our delivery facility?
  2. Can you provide monthly competitive benchmarks against regional processors?
  3. What are your 90-day inventory levels and demand projections?
  4. What specific costs justify any current or planned deductions?
  5. What’s your parent company’s debt-to-asset ratio and credit utilization?

If they won’t answer… well, that tells you something too, doesn’t it?

The Bottom Line

What Hormel’s restructuring really tells us is that financial pressure throughout the food supply chain is accelerating. And that pressure flows downstream. Always has, always will.

We’ve navigated similar transitions before—the 1980s, 2009—though current conditions present unique challenges. The farms that survive won’t necessarily be the biggest or most productive. They’ll be the ones that recognized signals early, built flexibility, demanded transparency, and made tough decisions while they had choices.

This isn’t about giving up on dairy. It’s about adapting to reality. And the reality is that processor consolidation, combined with converging pressures over the next 18 months, will fundamentally reshape American dairy.

Success in this environment doesn’t necessarily correlate with scale or production levels. Operations demonstrating financial flexibility, market intelligence, and strategic clarity position themselves best, regardless of size.

In a market that swings from $17 to $24 per hundredweight, the ability to remain profitable across that range beats maximizing profit at the top. As many successful producers have learned, producing less at lower cost can provide greater security than chasing maximum production.

The question isn’t whether change will continue—it will. The question is whether we’ll approach it prepared, with options built and information gathered, or whether we’ll take whatever’s offered because we have no choice.

Each farm’s situation is unique. There’s no universal solution. But there are universal principles: maintain flexibility, understand your market position, and make strategic decisions while you still have options.

You know, the dairy industry has always rewarded those who adapt thoughtfully to changing conditions. This period demands exactly that kind of thoughtful adaptation. And honestly? I think those of us who prepare now, who build those reserves and networks and alternatives… we’ll navigate this just fine.

The early warning signs are clear. What we do in the next 90 days determines whether we walk out of this transition on our own terms or get forced out when market pressures intensify.

I know which option I’d choose. How about you?

Key Takeaways:

  • Your 90-Day Action List: Read the processor contract, calculate reserves ($280K for 200 cows), call three alternative buyers, form a 5-8 farm network
  • The $1.2 Million Timeline: Strategic exit (months 8-10) = wealth preserved / Forced liquidation (month 18) = devastating losses
  • Surprise Winner: Farms producing 25% LESS milk at $7.80 feed costs beat high-producers losing money at $10.50 feed costs
  • Pattern Recognition: Corporate layoffs → standardized pricing → $2/cwt deductions → trapped farmers (we’ve seen this 3 times)
  • 2026 Convergence: When Farm Bill + $175K compliance + $4,800 heifers hit simultaneously, only prepared farms survive

Complete references and supporting documentation are available upon request by contacting the editorial team at editor@thebullvine.com.

Learn More:

The Sunday Read Dairy Professionals Don’t Skip.

Every week, thousands of producers, breeders, and industry insiders open Bullvine Weekly for genetics insights, market shifts, and profit strategies they won’t find anywhere else. One email. Five minutes. Smarter decisions all week.

NewsSubscribe
First
Last
Consent

The $43,800 Hidden in Your Water: How Top Dairies Gain 6 Pounds More Milk Daily

You invested $2M in facilities but never spent $50 to test what’s costing you $43,800 every year

EXECUTIVE SUMMARY: While dairy producers invest millions in genetics and technology, contaminated water silently steals $43,800 annually from the typical 100-cow operation. Penn State’s study of 243 farms revealed the stunning truth: water quality alone accounts for a 6-pound daily production gap, with clean-water operations hitting 62 pounds per cow versus just 56 for those with contamination. This isn’t just about lost milk—contaminated water creates a devastating cascade of mastitis, reproductive failure, and premature culling that costs $63,000-74,500 in just six months of delay. The solution is surprisingly accessible: a $50 test identifies problems, and treatment systems ranging from $1,300 for iron removal to $25,000 for comprehensive purification pay for themselves within 6-12 months. Leading operations have already transformed water from an overlooked utility into a managed production input, gaining compound advantages while their competitors wonder why they can’t hit benchmarks. The question facing every producer is simple: Will you keep letting water constrain your operation’s potential, or will you join the 26% who’ve discovered this hidden profit opportunity?

Dairy Water Quality

You know what’s interesting? Producers across the industry commonly report investing millions in new parlors, upgraded genetics, and precision feeding technology—but when you ask about water testing protocols, there’s often that long pause. “We’ve been meaning to get to that,” they’ll say.

Sound familiar?

This disconnect between our investment in visible technology and invisible fundamentals is costing dairy operations more than we realize. Pennsylvania State University’s comprehensive study tracking 243 farms across 41 counties discovered something remarkable: farms with water quality problems averaged 56 pounds of milk per cow daily, while those with clean water hit 62 pounds. Six pounds difference. Every single day.

And here’s what that means in real terms—run the numbers on that gap: six pounds per cow, 100 cows, 305-day lactation, twenty dollars per hundredweight, and you’re looking at $43,800 annually walking out the door. Or more accurately, never walking in at all.

Phil Elkins, a veterinarian who’s spent years researching water quality after founding FarmWater Ltd., describes it perfectly: “Water flows through every dairy operation like blood through a body. You can’t see it working when everything’s right, but when it’s wrong, the whole system crashes.”

The 6-pound daily production gap revealed in Penn State’s 243-farm study: clean water operations hit 62 lbs/cow while contaminated water farms plateau at 56 lbs—a difference worth $43,800 annually per 100 cows.

Understanding the Production Gap: It’s More Complex Than We Thought

What I’ve found digging into the biological mechanisms behind these production differences is genuinely fascinating. This isn’t just about cows drinking less water—though that certainly happens. We’re looking at multiple cascading effects that compound throughout the animal’s system.

Consider iron contamination first. The USDA’s National Animal Health Monitoring System documented iron exceeding 0.3 parts per million on 40% of dairy operations surveyed. Now, that might not sound dramatic, but here’s what happens: cows detect that metallic taste and reduce water consumption. Michigan State research confirms that each 1% drop in water intake corresponds to a 0.5-1% reduction in dry matter intake. Less feed means less milk. Simple as that.

But the story gets more interesting. Iron in water exists primarily as ferrous or ferric ions—highly bioavailable forms that absorb rapidly in the rumen. Unlike the iron bound in organic compounds in feed, this water-borne iron creates oxidative stress through the Fenton reaction. More concerning still, it antagonizes copper absorption by more than 50%, according to Cornell’s trace mineral research team.

Nutritionists working across the Midwest commonly report seeing operations triple their copper supplementation, adding expensive organic minerals to the ration, and still not getting the response they expect. Then they test the water and find iron at 2-3 ppm. Suddenly, everything makes sense.

Sulfate presents its own challenges, particularly in regions with certain geological formations. Wisconsin, South Dakota, parts of Minnesota—these areas commonly see sulfate levels exceeding 1,000-1,500 ppm in well water. In the rumen, that sulfate converts to sulfide, which then binds copper, selenium, zinc, and other trace minerals into complexes that the animal can’t absorb.

Dr. William Weiss from Ohio State, who led the National Research Council’s revision of mineral requirements for dairy cattle, has documented this extensively. His research shows that high-sulfate water essentially forces producers to double or triple dietary copper supplementation just to maintain marginally adequate levels. Even then, the antagonism often wins.

What’s particularly noteworthy for operations in limestone regions—and I’m thinking especially of Pennsylvania and parts of Wisconsin here—is how geology creates perfect conditions for both iron and manganese contamination. Meanwhile, western operations face different challenges with high total dissolved solids from mineral-rich aquifers. California producers frequently report TDS running 4,500 ppm during drought years, forcing them to blend multiple water sources. Each region has its own unique water-quality fingerprint.

Are you in the 26%? Penn State’s 243-farm study found one in four operations losing 6 pounds daily per cow to water contamination—while three in four test clean and produce at peak levels.

Down in the Southeast, operations in Georgia often find the challenge is bacterial contamination from warm, humid conditions that promote biofilm growth. Producers in the region commonly describe cleaning troughs on Monday and finding them coated again by Friday. The heat and humidity just accelerate everything.

A Case Study That Changed Perspectives

Let me share what happened on a 260-cow operation in Somerset, England. This story has made waves across the industry because it clearly demonstrates what we might be missing.

The farm had actually abandoned one of its boreholes five years earlier—workers had been getting sick from the water. Yet despite excellent management and hygiene protocols, they continued battling chronic mastitis, elevated somatic cell counts, and persistent calf health issues.

Phil Elkins was consulting on the farm and suspected water might be the missing piece. Testing revealed something interesting: colony forming units ranged from zero at the source to 176 cfu/ml at various troughs. Classic biofilm contamination throughout the distribution system.

They installed a chlorine dioxide treatment system specifically designed to penetrate and eliminate biofilm. No other management changes were made during the study period—same feeding program, identical milking procedures, no facility modifications. Just treated water.

The 12-month results, published in Veterinary Record:

  • Mastitis cases dropped from 27 to 17 per 100 cows annually (37% reduction)
  • Bulk tank somatic cell count fell from 119,000 to 86,000 cells/ml
  • Samples exceeding 100,000 cells/ml dropped by 69%
  • Bactoscan readings plummeted from 86,000 to 16,000/ml
The Somerset proof: one water treatment intervention slashed mastitis by 37% and dropped somatic cell counts from 119,000 to 86,000—with payback in 60 days and zero other management changes

Producers involved in similar water-quality improvements consistently reflect on how they changed teat dips, replaced milking liners, and adjusted dry cow therapy protocols—nothing made a real difference until they addressed the water. The frustrating part, they say, is how simple the solution was once they identified the actual problem.

Economically, the system paid for itself in about 60 days. Treatment costs were approximately £2 per cow per month, while the combination of reduced mastitis treatment, elimination of milk quality penalties, and improved production delivered immediate returns.

The Compounding Cost of Delay

This is where the economics become truly sobering. The University of Wisconsin’s School of Veterinary Medicine recently analyzed the full cost of delaying water quality interventions. Their findings suggest that six months of procrastination on a 100-cow operation costs between $63,000 and $74,500.

Every month of procrastination multiplies your losses: what starts as $7,500 in month one compounds to $63,000-$74,500 by month six—more than double the cost of comprehensive treatment.

Why such dramatic numbers? Because water-quality problems cause cascading failures throughout your operation.

Start with the obvious: direct production loss. Six pounds per cow daily over 180 days equals 108,000 pounds of lost milk—about $21,600 at current market prices. That’s just the beginning.

Contaminated water harbors what microbiologists term a “persistent pathogen reservoir.” Research from the University of Guelph, published in the Journal of Dairy Science in 2023, calculated mastitis costs averaging $662 per cow annually when bulk tank counts hover around 184,000 cells/ml. Nearly half of these costs come from subclinical infections that never receive treatment.

Wisconsin producers frequently share experiences of treating mastitis case after case, burning through antibiotics, and losing quarters. It often never occurs to them that cows are essentially re-infecting themselves every time they drink.

Then consider reproduction. Water with nitrate-nitrogen above 10 mg/L correlates with increased services per conception, lower first-service conception rates, and extended calving intervals. Sulfate-induced trace mineral deficiencies contribute to retained placentas, early embryonic death, and repeat breeding.

The economic analysis from UW-Madison and Penn State Extension puts numbers to these problems: retained placentas cost around $300 each, pregnancy losses run $600-1,000, and each additional day open costs $2-5. Over six months, reproductive losses alone can reach $9,450 on a typical 100-cow dairy.

Perhaps most concerning is accelerated culling. Cows suffering from chronic mastitis, reproductive failure, and immune suppression from trace mineral deficiencies leave the herd prematurely. USDA data suggests that if poor water quality increases involuntary culling from 18% to 25% annually, those seven additional culls cost $14,000 in replacement expenses alone, plus lost production from younger animals.

How Progressive Operations Are Responding

The most successful operations I’ve observed aren’t simply installing treatment systems and moving on. They’re fundamentally reconsidering water as an actively managed production input.

Take continuous monitoring, for instance. Systems developed in the Netherlands, in collaboration with Wageningen University, now provide 24/7 water-quality surveillance across over 500 European dairy farms. When contamination appears or flow rates drop, producers receive immediate alerts.

ATP rapid testing offers another tool. This technology, borrowed from food processing, detects biofilm in seconds. Dutch Animal Health Service research shows that maintaining ATP levels below 100 relative light units is associated with sustained daily milk yield increases of 2.87 pounds per cow.

Michigan producers managing larger herds commonly describe their approach: monthly ATP testing takes five minutes and costs thirty dollars. It alerts them to biofilm development before it becomes a mastitis outbreak. The economics are obvious.

Individual cow water tracking represents another frontier. UC Davis researchers have developed systems integrating RFID ear tags with flow sensors to monitor individual drinking behavior. Penn State Extension recommends installing water meters—available from various suppliers for a few hundred dollars—to establish baseline consumption patterns.

Many producers discover something unexpected: trough cleaning schedules can actually suppress water intake. By avoiding cleaning during the hour after milking—when 30-50% of daily consumption occurs—operations frequently report gaining 3 pounds of milk per cow per day.

The real breakthrough comes from integration. Platforms combining water data with activity sensors, milk meters, and rumination monitors can identify problems days before clinical signs appear. Dr. Jeffrey Bewley at the University of Kentucky, who’s extensively researched precision dairy technologies, explains: “Water intake often provides the first indication something’s wrong—preceding milk drop, visible illness, everything else.”

Regional Considerations Shape Treatment Approaches

Geography matters tremendously in water quality management. What works in Wisconsin might not apply in New Mexico or Ontario.

Limestone regions across Wisconsin, Pennsylvania, and parts of Ontario commonly face challenges with iron and manganese. The bedrock chemistry creates conditions that mobilize these minerals. Hydrogen peroxide injection systems work particularly well here—typically around $1,300 installed, plus about $800 annually for chemicals. Systems require minimal maintenance beyond annual pump inspection and occasional filter changes.

Western states deal with different issues. High total dissolved solids from mineral-rich aquifers often require reverse osmosis or blending with municipal water when TDS exceeds 3,000-5,000 ppm. These systems represent larger investments but may be the only viable solution. Membrane replacement runs every 3-5 years, depending on water quality and pretreatment.

The Corn Belt faces nitrate contamination from both point and non-point agricultural sources. Since nitrate removal is complex and expensive, deeper wells or alternative water sources often prove more practical. Test in late summer, when nitrate levels typically peak.

In the Pacific Northwest, operations commonly deal with seasonal variations tied to snowmelt and rainfall. Oregon producers report that iron levels have tripled during spring runoff, requiring seasonal adjustments to their treatment protocols. Testing in March and September captures both extremes.

Drought-prone regions see seasonal concentration effects. Texas operations typically experience sulfate levels doubling in summer. Many blend purchased water during the worst months—costs run about $200 a day, June through September—but it’s far cheaper than the production losses. August testing reveals peak contamination levels.

For organic operations, treatment options become more limited. While mechanical filtration and certain oxidation methods are permitted, many chemical treatments aren’t. Vermont organic producers often invest heavily in multiple filtration stages and UV treatment to meet both certification requirements and water-quality standards. Some equipment suppliers offer financing options, and USDA programs may assist qualifying operations with water quality improvements.

Making the Investment Decision: A Clear Cost-Benefit Analysis

Let’s address the economics directly. For a farm facing typical contamination—say iron at two ppm, sulfate at 1,200 ppm, TDS at 3,500 ppm—here’s the investment landscape:

Water Treatment Investment Breakdown (100-cow herd):

Hydrogen peroxide injection for iron removal: roughly $1,300 in setup costs and $800 in annual operating costs. This converts soluble iron into forms that precipitate, eliminating both the taste issue and oxidative stress. Filter replacement runs quarterly at about $50 each.

Reverse osmosis for high TDS and sulfate: $15,000-25,000 for agricultural-scale systems, plus $2,000-4,000 annually for membranes and electricity. While expensive, it’s a proven technology that removes 80-90% of dissolved solids. Membrane replacement every 3-5 years costs $3,000-5,000.

Chlorine dioxide for biofilm control: about $8,000 for generator equipment, $2,400 yearly for chemicals. This addresses distribution system contamination—critical because even perfect source water can be compromised as it passes through biofilm-laden infrastructure. Monthly chemical adjustments take 30 minutes.

Combined investment for comprehensive treatment: approximately $29,300 upfront, $6,200 annual operating costs. Against $43,800 in annual production losses, the math becomes straightforward.

Wisconsin producers consistently describe their decision process similarly: when they see iron at three ppm and sulfate over 1,500, that $25,000 for treatment suddenly looks like a bargain. Many realize they’re already spending more than that on trace mineral supplementation that isn’t working.

Lightning-fast payback periods for water treatment investments: even the comprehensive $29,300 system pays for itself in under 5 months against $43,800 in annual losses—making delay the costliest decision.

Understanding the Psychology of Inaction

Purdue University’s agricultural economics team has researched why producers delay addressing water quality issues despite compelling economic incentives. Their findings offer insights worth considering.

We all exhibit what behavioral economists call visibility bias—prioritizing obvious over hidden factors. New genetics produce visible offspring. Robotic milkers operate in plain sight. Water quality improvements occur underground, making returns feel less tangible even though they are measurably higher.

There’s also uncertainty aversion at play. Installing proven technologies like automated feeding systems feels predictable. Water quality investment raises questions: Will testing reveal problems? Will treatment deliver results? This uncertainty drives status quo bias—maintaining current practices even when change would clearly benefit the operation.

The industry itself bears some responsibility. Technology companies effectively market milk yield increases and labor savings. Water quality gets framed as compliance or problem-solving rather than a profit opportunity, despite superior ROI.

ContaminantSafe LevelProblem LevelImpact on ProductionTreatment SolutionEst. Cost
Total Dissolved Solids (TDS)<1,000 ppm>3,000 ppmReduced intake, dehydrationReverse osmosis$15k-$25k
Iron (Fe)<0.3 ppm>2 ppm6 lb/day milk loss, oxidative stressHydrogen peroxide$1,300
Sulfate (SO4)<500 ppm>1,500 ppmMineral antagonism, reduced copper absorptionRO or blending$15k-$25k
Nitrate-Nitrogen<10 mg/L>20 mg/LReproductive failure, conception issuesDeeper well or alternative sourceVariable
Bacteria/Biofilm0 CFU>100 CFU/mlMastitis, immune suppressionChlorine dioxide$8,000
Chloride (Cl)<250 ppm>500 ppmSalty taste, reduced intakeAlternative sourceVariable

Practical Steps Forward: Your 60-Day Action Plan

For producers ready to address water quality, here’s a systematic approach:

Week 1-2: Test comprehensively. Contact Midwest Laboratories (402-334-7770) or Penn State’s Agricultural Analytical Services Lab (814-863-0841). A livestock suitability test runs $43-75 and should include TDS, pH, sulfate, chloride, iron, manganese, nitrate, sodium, hardness, and bacterial counts. Sample where animals actually drink, not just at the source. Best testing months vary by region: August in Texas (peak drought), March in Oregon (spring runoff), September in the Corn Belt (nitrate peak).

Week 3-4: Understand the thresholds. Based on National Research Council guidelines, watch for TDS above 1,000 ppm (serious above 3,000), sulfate above 500 ppm (critical above 1,500), iron above 0.3 ppm, nitrate-nitrogen above 10 mg/L, and any coliform presence.

Week 5-6: Get treatment quotes. Prioritize based on your specific contamination profile. Iron responds well to hydrogen peroxide injection. High TDS and sulfate require reverse osmosis or water blending. Bacterial contamination needs chlorine dioxide treatment throughout the distribution system. Many suppliers offer financing options, and USDA conservation programs may provide cost-share assistance.

Week 7-8: Begin monitoring. Install flow meters to track consumption patterns. Use monthly ATP testing to detect biofilm development. Document pre-treatment production metrics to establish a baseline for ROI calculations.

Most operations see measurable improvements within 30-60 days of implementing treatment. The key is to start the process rather than wait for the “perfect” time.

The Bottom Line

After extensive research and conversations with producers nationwide, several principles have become clear.

The production gap is real and measurable. That six-pound daily difference translates to $43,800 annually on a 100-cow herd, before considering cascading effects on health, reproduction, and longevity.

Testing represents the highest-ROI decision available. A $50 water test reveals whether you’re among the 26% of operations losing money to contamination, based on Penn State’s multi-year survey data.

Treatment systems pay for themselves rapidly. Whether $1,300 for hydrogen peroxide or $20,000 for reverse osmosis, documented payback periods typically range from 6 to 12 months.

Delay multiplies losses exponentially. Six months of procrastination costs $63,000-74,500—more than double the treatment investment. Biology doesn’t pause for our decision-making.

Integration amplifies returns. Operations combining water treatment with comprehensive monitoring and management platforms report transformational improvements across all metrics.

What’s encouraging is that the dairy industry has made tremendous strides in genetics, nutrition, and reproductive management over the past decade. Water quality remains the overlooked variable—the hidden constraint preventing thousands of operations from reaching their genetic and management potential.

Progressive operations recognizing this opportunity aren’t just solving problems; they’re creating value. They’re building competitive advantages that compound annually. Better water enables healthier animals, supporting improved reproduction, extended productive life, and sustained production gains.

The fundamental question facing every dairy producer is straightforward: Will you continue assuming water quality is adequate while competitors who test and treat build increasing advantages? Or will you invest that $50 in testing to potentially transform your operation’s trajectory?

The science provides clear answers. The economics are documented. The only remaining variable is whether this knowledge drives action—or whether another year passes with water silently constraining your operation’s potential, one gallon at a time.

Key Takeaways:

  • 6 pounds of milk per cow daily vanishes due to water quality—Penn State proved it across 243 farms ($43,800/year for 100 cows)
  • Every month you delay costs $10,500-12,400 in cascading losses from mastitis, reproduction failures, and culling
  • ROI exceeds 700% within year one after investing $1,300-25,000 in treatment (depending on your contamination type)
  • Testing costs $50. Not testing costs $43,800. Call Midwest Labs (402-334-7770) or Penn State (814-863-0841) today
  • Leading operations gain compound advantages by managing water as a production input—while competitors blame genetics

Complete references and supporting documentation are available upon request by contacting the editorial team at editor@thebullvine.com.

Learn More:

The Sunday Read Dairy Professionals Don’t Skip.

Every week, thousands of producers, breeders, and industry insiders open Bullvine Weekly for genetics insights, market shifts, and profit strategies they won’t find anywhere else. One email. Five minutes. Smarter decisions all week.

NewsSubscribe
First
Last
Consent

Beyond the Milk Check: How Dairy Operations Are Building $300,000 in New Revenue Today

Milk at $20. Costs at $22. Some dairies are panicking. Others are building $300K in new revenue. The difference? Three moves you can make today.

Executive Summary: The $20 milk check that sustained dairy operations for years now falls $2 short of covering real production costs—and that gap isn’t closing. But while many producers wait for $25 milk that isn’t coming, successful operations are actively building $300,000 in new annual revenue from resources they already have. Beef-cross calves are commanding $1,600 each (up from $400 in 2019), feed shrink costing most farms $60,000 annually can be cut in half with basic management changes, and the Dairy Margin Coverage program is paying 495% returns to those who enroll. The catch? This window closes fast—operations implementing these strategies in Q1 2025 will capture $250,000 more value than those waiting until Q3. Based on verified data from USDA, and progressive dairy consultants, this report provides a proven 90-day roadmap that’s already helping operations transform their financial position. The difference between thriving and merely surviving isn’t about farm size or waiting for markets to improve—it’s about acting on these opportunities now.

You know that feeling when something you’ve counted on for years suddenly isn’t enough? That’s exactly where many of us find ourselves with milk prices right now.

Gary Siporski, the dairy financial consultant from Wisconsin who’s been looking at balance sheets for decades, saw this coming. His data tells quite a story. Back in 2016, his Midwest clients were breaking even around $16.50 per hundredweight. By late 2023? That number had climbed to $20.25. And now—here’s where it gets interesting—operations from California to Vermont are reporting production costs north of $22 when you factor in everything… depreciation, heifer raising, the whole nine yards.

What’s encouraging, though, is that the operations finding their way through this aren’t just sitting around waiting for milk prices in 2025 to bounce back. They’re actively building what amounts to $180,000 to $340,000 in improved financial position through some pretty creative approaches to dairy profitability.

The widening gap between production costs and milk prices reveals why traditional approaches are failing—costs have jumped $5.50 per hundredweight while prices lag behind

Understanding What’s Really Driving Costs

Here’s what the latest University of Illinois Farmdoc Daily and USDA reports are showing us. Feed costs—you know, that 30 to 50 percent chunk of everyone’s budget—have actually come down from those crazy 2022-2023 peaks. Corn’s projected at $4.60 per bushel for 2025, down from $4.80. Soybean meal dropped from $330 to $290 per ton. Alfalfa? Down from $201 to $159.

Sounds like good news, right? Well… hold on a minute.

Everything else keeps climbing. Labor costs are up 3.6 percent for 2025, according to USDA’s agricultural labor report—we’re talking a record $53.5 billion across agriculture. And if you’re in Texas or other areas where the energy sector is hiring? Good luck keeping experienced workers without matching those oil field wages. Producers in these regions report wage competition they never imagined dealing with.

Then there’s interest. After hitting 16-year highs in 2023-2024, according to Federal Reserve data, borrowing costs have fundamentally changed the game. Think about it—if you’re running a 500-cow operation with somewhere between $1.2 and $1.5 million in operating loans (pretty typical these days), that four percentage point jump from 2020 means an extra $48,000 to $60,000 annually just in debt service. That’s nearly fifty cents per hundredweight before you even start milking.

And equipment? The Association of Equipment Manufacturers’ 2024 report shows machinery prices jumped 30 percent in four years. The average new tractor now costs $491,800, up from $363,000 in 2020. Some specialized equipment? We’re talking $1.2 to $1.4 million.

Brad Herkenhoff from Compeer Financial, who works with operations all across Minnesota and Wisconsin, doesn’t mince words: “There won’t be enough to cover depreciation, so capital improvements won’t be made. Bills will stretch beyond 30 days, and every month becomes a financial strain.”

What we’re dealing with is what economists call a “ratchet effect”—costs rise quickly but resist coming down. You can’t undo wage increases once they’re in place. Interest on existing debt? That’s locked in. And you’re still depreciating that nearly half-million-dollar tractor at 2023 prices. This reality is reshaping dairy profitability 2025 in fundamental ways.

The Beef-on-Dairy Window: Real Opportunity or Hype?

Now, let me share something that might be the biggest dairy profitability opportunity I’ve seen in twenty years. And I really mean that.

CattleFax and USDA’s July 2025 cattle inventory reports point to a 3- to 5-year window in which beef-on-dairy returns make extraordinary financial sense. We’re not talking about incremental improvements here—this could be transformative for milk prices in 2025.

Right now, in November 2025, day-old beef-cross calves are bringing $900 to $1,600 at auctions from Pennsylvania to Minnesota. Compare that to the $350 to $400 they brought in 2018-2019, according to USDA’s Agricultural Marketing Service data. That’s a premium that makes you rethink beef-on-dairy returns.

Beef-cross calves now command $1,600—quadruple the 2019 price—turning what was once a disposal problem into a $100,000+ annual revenue stream for mid-size operations

But here’s why this isn’t just a temporary spike. The U.S. cattle inventory is at a 64-year low—we haven’t seen numbers like this since 1951, per USDA’s latest report. Meanwhile, the National Association of Animal Breeders tells us nearly 4 million crossbred calves were born in 2024, and Beef Magazine projects that could hit 6 million within two years.

You might be thinking, “Won’t that flood the market?” Here’s the thing—beef production is actually declining. USDA projects it’ll drop 4 percent in 2025 and another 2 percent in 2026. The beef industry desperately needs these dairy-beef crosses just to maintain supply.

Herkenhoff’s analysis shows producers are seeing a $2.50 to $4 per hundredweight boost from the combination of better cull cow values and beef-cross calf sales. Think about what that means for dairy profitability in 2025. Data shows that, before this beef market rally, milk checks accounted for about 93 percent of total farm income. Now? That’s down to 75 to 80 percent, with cattle sales making up 20 to 25 percent.

The numbers are pretty striking when you dig in. Revenue contribution jumping from $1.12 per hundredweight in 2022 to $2.57 in 2024. That’s a 130 percent increase in two years.

Traditional vs. Diversified: The Numbers Tell the Story

Quick Financial Comparison:

Here’s what we’re seeing:

  • Traditional Single-Revenue Operation (500 cows):
  • Milk revenue: 93% of income
  • Cattle sales: 7% of income
  • Breakeven: $22-24/cwt
  • Annual volatility: $150,000-$300,000
  • Diversified Multi-Revenue Operation (500 cows):
  • Milk revenue: 75-80% of income
  • Beef-cross cattle sales: 20-25% of income
  • Additional streams: 5-10% of income
  • Breakeven: $18-20/cwt
  • Annual volatility: $75,000-$150,000

Bottom line difference: About $200,000 in improved annual cash flow with significantly reduced risk exposure.

Diversified operations cut volatility in half while lowering breakeven costs by $2-4 per hundredweight—making 20% from beef-cross cattle creates a financial buffer traditional dairies don’t have

Feed Efficiency: The Money You’re Already Losing

Here’s something that still surprises me after all these years. Producers will negotiate feed contracts for hours, tweak rations endlessly, but meanwhile… many operations are unknowingly losing $50,000 to $180,000 annually through feed shrink and excessive refusals.

Penn State Extension and University of Wisconsin research show that average U.S. dairy silage shrinkage runs 10 to 20 percent. Poorly managed bunkers? Can hit 25 percent. And those feed refusals—should they be 2 to 3 percent, according to Journal of Dairy Science studies? I see operations running 4 to 6 percent all the time.

Real Dollar Impact per 100 Cows:

  • Silage shrink reduction (15% to 10%): Saves $9,000-$18,000 annually
  • Refusal reduction (5% to 3%): Recovers $5,000-$10,000 annually
  • Daily face management: Cuts spoilage by 50%
  • Oxygen barrier films: Pay for themselves in 6-8 months

Sources: Cornell Cooperative Extension, University of Minnesota dairy extension, Lallemand Animal Nutrition research

The key insight—and nutritionists keep hammering this point—isn’t about cutting feed quality. That’s a disaster. It’s about not throwing away the good feed you already bought.

For a 500-cow operation, even modest management improvements—basic stuff, really—can return $45,000 to $60,000 annually. That’s real money from things you’re already doing, just doing them better. This directly impacts dairy profitability in 2025 outcomes.

Most operations throw away $45,000-$60,000 annually in feed waste—money that’s already been spent on feed you never actually fed. Basic management changes recover this immediately

Government Programs: Setting Aside the Politics

I know, I know. Half of you are already skeptical when I mention government programs. But hear me out—the USDA Farm Service Agency data on Dairy Margin Coverage is pretty compelling for dairy profitability in 2025.

In 2023, producers enrolled at the $9.50 level paid about $1,500 in premiums per million pounds. What’d they get back? According to FSA payment data, $8,926.53 per million pounds. That’s a 495 percent return. On paperwork.

While 25% of producers left money on the table, those who enrolled in DMC at the $9.50 level saw 495% returns—$8,927 back for every $1,500 paid in 2023

DMC by the Numbers:

A 500-cow operation producing 11 million pounds:

  • Paid: $16,500 in premiums
  • Received: $98,192 in payments
  • Net benefit: $81,692

The program distributed over $1.27 billion through October 2023, with the average enrolled operation receiving $74,453. About 17,059 operations participated—that’s 74.5 percent of those eligible. Which means roughly a quarter of producers left that money on the table.

Katie Burgess from Ever.Ag’s risk management team notes that DMC has triggered payments 57% of the time over the past 42 months at the $9.50 level. That’s better than a coin flip, and when it pays, it pays big.

The mistake I see most often? Producers are choosing catastrophic coverage at $4.00 to save on premiums. Sure, it costs less upfront, but you’re leaving massive money on the table. The $9.50 level costs more, but historically returns five to ten times as much during tight margins.

The Human Side: Why Change Is So Hard

You know, research from agricultural psychology studies—the kind published in journals like Applied Farm Management—reveals something we probably all know deep down. Resistance to change isn’t really about the data. It’s about identity.

We don’t just run dairy operations. Being a “dairy producer” is part of who we are. So when someone suggests beef-on-dairy returns or revenue diversification, it can feel like they’re asking us to fundamentally change who we are. That’s not easy.

The generational piece makes it even tougher. Iowa State Extension’s succession planning research shows 83.5 percent of family dairy operations don’t make it to the third generation. First to second generation? Only 30 percent succeed. Second to third? Just 12 percent.

We’ve all seen this—Dad won’t let go because that means confronting his own mortality, and the kids can’t make changes without feeling like they’re disrespecting everything their parents built. Meanwhile, equity slowly bleeds away.

Research from agricultural universities in New Zealand and Europe shows we’re all influenced by what our neighbors do. Nobody wants to be first, but nobody wants to be last either. So everyone waits…

I’ve heard from plenty of producers who understood the financial benefits of beef-on-dairy perfectly well but worried what the coffee shop crowd would think. Were they giving up on “real” dairy farming?

A Practical 90-Day Framework for Dairy Profitability 2025

Alright, let’s get down to brass tacks. Based on what’s working for operations that are successfully navigating this transition, here’s a framework that can improve your financial position in three months:

Month 1: Immediate Actions for Cash Flow

Week 1: Know Your Numbers

First thing—and I mean within 48 hours—calculate your working capital per cow. Current assets minus current liabilities, divided by herd size. Then figure your monthly burn rate from the last 90 days. This tells you exactly how much runway you’ve got.

If you’ve got genomic test results, pull them now. If not, consider ordering tests. Yes, it’s $40 to $50 per head—about $12,000 to $15,000 for 300 head. But you’ll know within 2 to 3 weeks exactly which cows should get beef semen for optimal beef-on-dairy returns.

Order 150 to 200 units of beef semen right away. Angus and Limousin consistently perform well in feedlots. That’s an investment of $2,250 to $5,000. Contact three calf buyers to ensure competitive pricing. Got beef-cross calves ready? Selling them this week could bring $3,600 to $6,400 in immediate cash.

DMC Enrollment: Don’t Wait

Call your FSA office—actually call them, don’t just email. The $9.50 coverage on Tier 1 (first 5 to 6 million pounds) at 95 percent often makes the most sense. Larger operations might consider catastrophic on Tier 2 to manage costs. For a 250-cow operation, you’re looking at about $7,225 in costs, with potential returns of $35,000 to $80,000 in tight-margin years.

Week 2: Strategic Culling Decisions

Review your IOFC reports, SCC data, and Days Open. Identify your bottom 10 to 15 percent—chronic health issues, SCC over 200,000, Days Open beyond 150.

With cull prices averaging $145 per hundredweight according to the USDA, strategically marketing 25 cows averaging 1,400 pounds could generate $50,000 to $62,500. Direct that straight to your operating line.

Month 2: Building Operational Efficiency

Labor Optimization

Progressive Dairy’s benchmarking shows that top operations maintain over 65 cows per full-time worker and produce over 1 million pounds of milk per worker annually. If you’re at 45 cows per worker… well, there’s your opportunity.

Energy Efficiency Quick Wins

Energy typically runs 400 to 1,145 kWh per cow annually. Quick improvements:

  • LED lighting: 60% electrical reduction
  • Variable frequency drives: 20-30% fan energy savings
  • Heat recovery systems: $20-40 per cow annual savings

A 100-cow operation can save $2,000 to $4,000 annually in energy costs alone.

Component Production Focus

Here’s what’s interesting—DHI data shows operations producing over 7 pounds of components per cow daily generate about $3 more per cow at similar costs. That flows straight to the bottom line—potentially $547,500 annually for 500 cows.

Work with your nutritionist on butterfat performance and protein, not just volume. Especially valuable in the Northeast, where component premiums are strong, or the Southwest, where cheese plants pay big butterfat bonuses.

Month 3: Strategic Positioning

Additional Revenue Streams

By month three, explore these opportunities:

  • Digesters: EPA’s AgSTAR database shows 270+ on dairy farms generating ~$100/cow annually
  • Solar leases: $500-1,500 per acre annually in suitable locations
  • Carbon credits: $10-30 per cow, emerging market

University extension case studies document operations pulling $300,000 to $400,000 annually from combined energy contracts, beef-cross premiums, and environmental programs.

Risk Management Layers

Layer additional coverage atop DMC:

  • Dairy Revenue Protection for Tier 2 production
  • Livestock Gross Margin for Margin Protection
  • Forward contracting on favorable component premiums

Build that safety net while you can afford it.

90-Day Roadmap Summary Box:

By Day 90, a 500-cow operation typically achieves:

  • Strategic culling cash: $50,000-$62,500
  • Feed efficiency savings: $45,000-$60,000 (annualized)
  • Beef-on-dairy pipeline: $60,000-$80,000 (9-month revenue)
  • Component optimization: $30,000-$50,000 (annualized)
  • DMC protection: $35,000-$80,000 (potential in tough years)

Total improved position: $220,000-$332,500 within 12 months

Within 90 days, a 500-cow operation can improve its financial position by $220,000-$332,000 without adding debt or expanding—just managing smarter across five key areas

Regional Realities: From the Plains to the Coasts

These strategies play out differently depending on where you farm, and that’s important to understand.

Regional Strategy Highlights:

  • California: Smaller feed efficiency gains but higher beef-on-dairy returns near feedlots
  • Wisconsin: Focus on forage quality optimization over shrink reduction
  • Northeast: Component premiums crucial—can’t match Western volume but butterfat pays
  • Southeast: Triple cooling costs vs. Wisconsin—every energy efficiency gain magnified
  • Plains States (Kansas/Nebraska): Uniquely positioned near feedlots AND grain—seeing the strongest beef premiums with lower feed costs
  • Mountain West: Altitude affects production, but proximity to Western beef markets creates beef-on-dairy opportunities

Timing matters too. Implementing beef-on-dairy in November versus March affects breeding cycles and calf markets. Spring calves bring premiums in some areas, fall calves in others.

But the fundamental principle—diversified revenue beats single-source dependency—that holds everywhere.

What We’re Learning Industry-Wide

University extension services and farm consultants are documenting consistent patterns. Operations implementing beef-on-dairy in early 2024 project $100,000 to $150,000 additional annual revenue from crossbred calves. Those focusing on feed efficiency report recovering $50,000 to $60,000 annually. DMC participants collected $40,000 to $80,000 in 2023, depending on size and coverage.

What’s encouraging is these aren’t just huge, sophisticated operations. They’re regular farms that recognized the shift early and acted. While transitioning from traditional dairy to a diversified operation can feel uncomfortable initially, the financial results tend to validate the decision quickly.

The Bottom Line for Dairy Producers

Accept the New Reality Production costs have shifted from $16.50 per hundredweight in 2016 to over $22 today. This is structural, not temporary. Earlier acceptance means more options for dairy profitability in 2025.

Diversification Is Essential. Successful operations are building $180,000 to $340,000 in improved position through beef-on-dairy ($100,000 to $200,000 annually), feed efficiency ($45,000 to $60,000 annually), and risk management ($35,000 to $80,000 in challenging years).

Time Matters The beef-on-dairy window extends 3 to 5 years based on cattle cycles, but peak premiums are now. DMC has fixed deadlines. Feed savings compound daily. Every month of delay costs money and options. This isn’t about panic—it’s about positioning.

Small Changes, Big Impact. You don’t need revolution. Reducing silage shrink 5 percent and refusals by 2 percent can generate $45,000 to $60,000 annually. These are management tweaks, not overhauls.

Use Your Network. The most resilient operations leverage their networks. Engage lenders proactively. Work with nutritionists. Use FSA resources. Going it alone makes everything harder.

Looking Ahead: Key Indicators to Watch

As we approach 2026, watch these indicators:

USDA’s quarterly cattle inventory reports matter. If beef cow numbers grow faster than Rabobank’s projected 200,000 head annually through 2026, the premium window might compress. But current dynamics suggest that’s unlikely.

Monitor your basis—what plants pay above Class III or IV. Over $5 signals strong demand. Under $2 means tight margins ahead.

The One Big Beautiful Bill Act extended DMC through 2031 and increased Tier 1 coverage to 6 million pounds starting in 2026. Details matter, so stay engaged with your co-op and industry groups.

Watch seasonal patterns. Upper Midwest operations should track winter energy costs. Southwest producers need to monitor the impacts of heat stress on components. These create opportunities for prepared operations.

The Path Forward: Your Decision Point

After looking at all the trends and talking with producers who are making it work, one thing’s clear: The operations thriving in 2028 won’t necessarily be the biggest or most sophisticated. They’ll be the ones that recognized the shift early and acted on the dairy profitability 2025 opportunities.

They understood that building $300,000 in diversified revenue through strategic changes beat waiting for $25 milk prices in 2025. They pushed through the psychological barriers and evolved from traditional dairy farmers to agricultural entrepreneurs who happen to produce milk.

The tools exist. The programs are available. The opportunities—especially beef-on-dairy returns—are real. But here’s the thing—implementing changes in Q1 2025 versus Q3 2025 could mean a $242,500 to $362,500 difference over three years. That’s not marginal. That’s the difference between thriving and surviving.

What it comes down to is this: Operations that accept reality quickly maintain options. Those waiting for more confirmation may find their options have expired when they’re ready to act.

The clock’s ticking. Beef-on-dairy returns, DMC enrollment, feed efficiency—they’re all time-sensitive. The question isn’t whether change is necessary, but whether you’ll drive it or have it forced on you.

What is the difference between those paths? About $300,000 and possibly your operation’s future.

Key Takeaways:

  • Your Milk Check Will Never Be Enough Again: Production costs hit $22/cwt while prices hover at $20—this isn’t temporary, it’s the new reality requiring immediate action
  • $300,000 in Hidden Revenue Exists in Your Operation Today: Beef-cross calves bringing $1,600 (vs. $400 in 2019) + recovering $60,000 in feed waste + DMC paying 495% returns = game-changing income
  • The 90-Day Window That Changes Everything: Operations implementing these strategies Q1 2025 will capture $250,000 more value than those waiting until Q3—procrastination literally costs $20,000/month
  • You Don’t Need Capital, You Need Courage: No expansion, no debt, no new equipment required—just the willingness to manage differently and diversify beyond the milk check
  • The Math is Proven, The Choice is Yours: 500-cow operations following this roadmap achieve $220,000-$332,500 improved position in 12 months—the only variable is when you start

Complete references and supporting documentation are available upon request by contacting the editorial team at editor@thebullvine.com.

Learn More:

The Sunday Read Dairy Professionals Don’t Skip.

Every week, thousands of producers, breeders, and industry insiders open Bullvine Weekly for genetics insights, market shifts, and profit strategies they won’t find anywhere else. One email. Five minutes. Smarter decisions all week.

NewsSubscribe
First
Last
Consent

The People Side of Profit: How Strong Communication Builds Better Dairies

You can pour money into feed, genetics, or equipment—but every day, poor communication leaves profit in the parlor.

You know, when you talk with producers from Wisconsin to Idaho, there’s always a familiar story. Most will tell you they’ve fine-tuned their feeding program, upgraded their genetics, and modernized their parlor. Yet, even with all that, something still drags performance down. What’s interesting is that it’s rarely a feed issue or cow comfort problem anymore—it’s communication.

More dairies are realizing that human communication—not sensors, not software—is becoming one of their most powerful management tools. You can have the best feed efficiency in the county, but if the team’s not hearing the same message, you’re going to lose consistency and, eventually, money.

Impact MetricIndustry AverageHigh-Turnover FarmsCost Impact
Annual Turnover Rate38.8%45-60%$93K-$140K/year
Milk Production LossBaseline-1.8% per point-$18K per 100 cows
Calf Loss IncreaseBaseline+1.7%+$5K-$8K annually
Cow Mortality IncreaseBaseline+1.6%+$12K-$15K annually
Total Annual ImpactCumulative$128K-$181K

The Economics Behind Miscommunication

Here’s what the research shows. Michigan State University Extension reports that replacing just one employee can cost between $15,000 and $25,000, once you include recruitment, onboarding, lost productivity, and training time. Multiply that across a crew of twelve, and the real price of inconsistency starts to add up fast.

Add language barriers to that, and you see why communication is quietly shaping productivity. Studies from New Mexico State University Extension show roughly 60% of U.S. dairy employees speak limited English, and in some Southwestern regions, up to a third speak K’iché, a Mayan dialect that’s often not translated in training materials.

As Dr. Robert Hagevoort from NMSU likes to put it, “Every time someone does the right job the wrong way, the farm pays tuition.” And he’s right. Bad communication doesn’t always create visible failure—sometimes it just creates smaller, daily inefficiencies that chip away at margins.

The Language Barrier Crisis: Spanish-speaking workers are 46 percentage points less likely to know their farm’s SCC goals and 28 points less likely to receive training directly from managers. This isn’t a language problem—it’s a management failure costing operations thousands in milk quality losses

When “The System” Walks Out the Door

In many dairies, managers don’t realize how dependent their success is on one translator or crew leader until that person is gone. Take a 900-cow operation in Minnesota that lost its bilingual milker. Within days, the somatic cell count passed 300,000, and shifts started running nearly an hour longer.

When a Minnesota 900-cow operation lost its bilingual milker, SCC spiked from 200K to over 300K within 10 days while shifts ran an hour longer. Wisconsin Extension’s bilingual photo SOPs and structured check-ins restored normal levels within 30 days, proving that systems beat individual translators

Through the help of the University of Wisconsin–Madison Extension, the farm rebuilt its communication foundation with bilingual photo SOPs, clear shift checklists, and 10-minute morning meetings. Within 30 days, SCC was back below 200,000. More importantly, turnover slowed because work instructions no longer depended on memory or one individual.

Farms using structured check-ins are seeing consistent success. Cornell’s PRO‑DAIRY program tracked farms that began short daily huddles and found turnover fell by 30–50%. In other words, clarity does what pay raises often can’t—it builds team stability.

The Power of One Question

If there’s one thing many producers overlook, it’s how to start these improvements. You don’t need a big system overhaul. Tomorrow morning, ask your longest-standing employee a simple question:

“If someone new started tomorrow, what’s the hardest thing for them to learn?”

Then, just listen. That one question often exposes the real gaps between what’s expected and what’s taught.

Penn State Extension research has found that farms documenting even five key tasks—feeding order, colostrum prep, milking procedures, machinery setup, and calf care—report 25–40% faster training times within six months.

What’s encouraging is that asking questions like this builds trust. Workers realize their knowledge matters, and managers finally see where assumptions replaced structure.

Turning Words into Pictures

More and more dairies are swapping old binders for laminated photo SOPs. The idea sounds simple, but the payoff can be huge.

Research from Iowa State University Extension and the University of Illinois Dairy Extension confirms that visual direction significantly improves retention, especially on multilingual crews.

Here’s a proven step-by-step approach:

  1. Photograph each task exactly the way you want it done—using real employees and your own equipment.
  2. Write short, clear captions—one line per photo.
  3. Translate into every primary crew language (your Extension office can help).
  4. Hang the cards exactly where the work happens.
Time is money: Multilingual photo SOPs cut training time by an average of 36% across critical dairy tasks, getting new employees to full productivity faster while freeing experienced workers from constant training duties

One Wisconsin dairy shared that this approach reduced their parlor changeover time by nearly 20%. And what’s fascinating is that the same process strengthened morale. When everyone knows the expectations, the blame game disappears.

Dairy training research confirms visual SOPs deliver 65% retention after 30 days versus just 10% for text manuals—a 550% improvement. Iowa State and Illinois Extension studies show photo-based procedures work across language barriers while teach-back methods push retention to 70%, reducing errors by 50-70%.

Keep It from Getting Dusty

Now, even the best materials lose their spark if they’re not refreshed. Cornell University’s PRO‑DAIRY Workforce Development specialists recommend short, quarterly “protocol walks.”

These aren’t long meetings—just 10 or 15 minutes walking the barn with the team, asking if anything has changed. Maybe the layout’s different, or a new sanitizer replaced the old one. The key is showing that management updates protocols with the team, not to the team.

It’s a small act that keeps everyone engaged and avoids compliance fatigue.

Why “Teach‑Back” Works Better Than “Do You Understand?”

We’ve all said it—“Do you understand?”—and seen the nods that don’t always mean yes. The teach‑back methodreplaces guesswork with demonstration. Instead of asking if an employee understands a procedure, you ask them to show it back to you.

Studies by Michigan State University, the University of Guelph, and Cornell confirm that using teach‑back reduces repeated errors and improves training retention.

When University of Wisconsin researchers applied this system to calf feeding protocols, they found 50–70% fewer scours treatments thanks to consistent colostrum handling.

One Ontario herdsman told me, “When you ask me to show you, I pay attention differently.” It’s a method that not only teaches but also strengthens respect both ways.

Learning from Europe—Without Copying It

It’s tempting to compare our systems to Europe’s, but context is everything. Denmark and the Netherlands often operate with 100–130 cows per two to four trained employees, supported by national certification programs through SEGES Innovation and Wageningen University & Research.

Their culture and policies encourage lifelong training, but what’s useful for us is the principle: communication is built right into routine management. Dutch CowSignals training, for instance, asks every employee to identify one improvement idea weekly.

Some North American farms have adapted this idea through five-minute Friday “crew check-ins.” It may not be European apprenticeship precision, but it keeps everyone proactive instead of reactive.

Employees as Innovators

What I find most inspiring is how communication changes roles. It turns “labor” into “leadership.”

Cornell research shows that farms that let employees participate in protocol revisions see adoption rates jump by nearly one-third. The process is simple: people respect what they help create.

A producer I know in Idaho gave his milkers a dry-erase board to log claw fall‑offs. Within a month, they found a prep‑timing issue and boosted butterfat performance by 0.1–0.2 points in that string. The knowledge didn’t come from management—it came from the crew actually applying the system.

And that’s what progress really looks like—ownership at every level.

Why This Matters, Right Now

Margins are thin, and labor turnover is real. It’s becoming clear that communication isn’t a luxury; it’s infrastructure. Effective communication reduces training time, minimizes costly errors, and keeps workers engaged. It’s the backbone that supports every improvement effort, from nutrition to fresh cow management.

Dr. Jessica Pempek from The Ohio State University Department of Animal Sciences once said, “We spend months designing systems for cows. Communication is about designing systems for people.” That idea deserves to sit on every office wall.

The Bottom Line

  • Start with a question. One conversation can identify your biggest knowledge gap.
  • Make it visual. On multilingual crews, photos create clarity faster than manuals.
  • Review quarterly. Keep your protocols alive, not laminated museum pieces.
  • Teach back. “Show me” builds ownership and confidence.
  • Recognize contributions. Employees protect what they help improve.

What’s interesting about this next phase in dairying is that it’s not built on new equipment or feed additives. It’s built on human systems.

As one Wisconsin producer told me over coffee, “Once people understand each other, the cows take care of the rest.”

That might just be the quiet revolution already underway in barns across the country—and it’s one every operation can afford to start tomorrow morning.

Key Takeaways:

  • The best upgrade for most dairies isn’t stainless steel—it’s stronger communication between people.
  • Visual SOPs and teach‑back training turn “I told them” into “they own it.”
  • Quick quarterly “protocol walks” keep systems sharp and employees engaged.
  • When crews help design the way work gets done, performance and retention rise together.

Executive Summary:

Clear, consistent communication is turning out to be one of the best upgrades a dairy can make—no new equipment required. Research from Michigan State and Cornell confirms that farms using simple visual SOPs, multilingual training cards, and short “teach‑back” checks cut turnover and boost consistency fast. A 15‑minute quarterly “protocol walk” is often all it takes to keep systems sharp and teams engaged. What’s interesting is how quickly results snowball: steadier milk flow, smoother training, and better retention. The dairies investing in people, not just technology, are quietly proving that communication might be the most profitable tool in the barn.

Complete references and supporting documentation are available upon request by contacting the editorial team at editor@thebullvine.com.

Learn More:

The Sunday Read Dairy Professionals Don’t Skip.

Every week, thousands of producers, breeders, and industry insiders open Bullvine Weekly for genetics insights, market shifts, and profit strategies they won’t find anywhere else. One email. Five minutes. Smarter decisions all week.

NewsSubscribe
First
Last
Consent

Your Dairy’s 18-Month Countdown: The $480,000 Difference Between Strategic Exit and Forced Sale

Half of U.S. dairy farms will vanish by 2030. The survivors? They’re making one decision differently.

EXECUTIVE SUMMARY: The math stopped working when milk prices crept up 16% but diesel doubled and feed jumped 40%—that’s why 2,800 dairy farms close annually and milk checks now arrive with crisis hotline cards. Most producers don’t realize they have just 18 months from first losses to forced decisions, and waiting those extra six months costs families $380,000 in preserved equity. Strategic exits at month 8-10 save $400,000-$680,000; forced liquidations leave $100,000-$200,000. With half of America’s 26,000 dairy farms vanishing by 2030 and kids as young as 14 running milking shifts, this isn’t about failure—it’s about timing. This article provides the exact month-by-month timeline, real alternatives that work (partnerships, robotics, organic), and the framework to make informed decisions while you still have choices. Because sometimes the bravest thing you can do is preserve what three generations built before it’s too late.

Dairy Profitability Strategy

So I was talking with a producer last week—you know how these conversations go, catching up at the feed store or after a meeting—and he mentioned something that really stuck with me. His milk check came with a little card tucked in. Mental health resources, crisis hotline numbers.

After thirty years in this business, that’s…well, that’s something new.

And it got me thinking about what we’re all seeing out there. The combination of labor challenges, these heat waves that seem to hit harder every year, and margins that just don’t pencil out anymore—especially for those 200 to 400 cow operations that used to be the heart of rural communities. You know the ones I’m talking about. Maybe it’s your operation.

Here’s what’s keeping me up at night: Industry projections from Rabobank show we’re losing about 2,800 farms every year now—that’s 7 to 9% of all U.S. dairy operations annually. The economists I trust—folks at Cornell PRO-DAIRY, Wisconsin’s Center for Dairy Profitability, the people who really understand our business—they keep talking about this 12 to 18 month window. That’s what you’ve got when things start going sideways. And what do you do in those months? The difference can be hundreds of thousands of dollars. I’m not exaggerating. We’re talking about preserving what your family built versus watching it disappear.

What’s Really Different in the Barn These Days

You probably know this already, but walk into any mid-sized dairy operation today, and it feels different than it did five years ago. Can’t quite put your finger on it at first, but then you realize—it’s quieter. Not the good kind of quiet either.

Five years back, you’d hear workers talking during morning milking —maybe some Spanish conversation —and teenagers grumbling about the early start (though secretly learning the trade). Now? Often, it’s just the owners — usually in their fifties, maybe early sixties — doing the work of four or five people. And they look exhausted.

What’s interesting is how the numbers back up what we’re feeling. The National Milk Producers Federation’s 2025 workforce data shows that immigrant workers make up about 51% of our workforce, but here’s the kicker—they produce 79% of the milk. Think about that for a second. And these folks, they’re operating under a kind of stress that wasn’t there before. I see it myself. Unfamiliar truck pulls up? Conversations stop. Workers keep phone numbers in their pockets now—family contacts, immigration attorneys. That’s become normal, and it shouldn’t be.

The age thing is really something else. Was talking to a Wisconsin producer recently who’s got two helpers, both in their seventies. “There’s just no pipeline of younger workers,” he told me. And he’s right—USDA’s Economic Research Service documented that agricultural employment dropped by 155,000 workers between March and July this year. That’s 7% of our workforce, gone in four months.

But here’s what really gets me—and I hate even saying this—we’ve got fourteen-, fifteen-year-old kids running full milking shifts. Not helping out, not learning from Dad or Grandpa. Running the shift. Because there’s literally nobody else. That’s not how it’s supposed to work.

When Everything Comes at You at Once

The Labor Situation Can Change Overnight

Let me tell you about what happened in Lovington, New Mexico, this past June. Shows you how fast things can go south.

Isaak Bos was running his operation like any other day when Homeland Security showed up. Full enforcement action, armed agents, the whole thing. By the time they left? Sixty-four percent of his workforce was gone. Eleven were arrested on the spot, and another twenty-four were let go when their papers didn’t check out. The Albuquerque Journal covered it extensively—this isn’t hearsay, it’s a documented fact.

“Milk production had effectively ceased,” Bos told reporters. “We’re barely able to keep going.”

Here’s what really opened my eyes—UC Davis agricultural economists have been tracking this, and their 2025 research found that when raids happen, farms that haven’t even been touched lose 25 to 45% of their workers. They just stop showing up. Can’t blame them, really. Word travels fast in these communities. One raid in Vermont affects operations in Wisconsin, Idaho, and California. Everyone’s on edge.

Heat Stress Is Getting More Expensive Every Year

While we’re scrambling for workers, the heat’s becoming a bigger problem than most people realize. And I mean, we all feel it, right? But the numbers are sobering.

This study from Science Advances—Dr. Nathaniel Mueller and his team published it this year—found that one day of extreme heat cuts milk production by up to 10%. And here’s the kicker: those effects stick around for more than ten days. Small farms, the ones under 100 cows? According to the University of Illinois farmdoc daily analysis from March, they’re losing 1.6% of production annually just to heat stress. That’s nearly 60% worse than bigger operations that can afford better cooling.

Let me put this in real terms. If you’re running a small operation, maybe clearing $60 to $175 per cow annually (and that’s being optimistic these days), Texas A&M and Florida extension economists calculate you’re looking at heat stress losses of $400 to $700 per cow. Even up here in the Midwest, we’re seeing impact. Pennsylvania operations are reporting similar challenges. California producers? They’re dealing with both heat and water restrictions—double whammy.

Now, the extension folks—and they mean well—they recommend cooling systems. Tunnel ventilation, evaporative cooling, all that. Penn State, Wisconsin, and Cornell all cite $70,000 to $85,000 for a 200-cow operation. But here’s the thing nobody wants to say out loud: if you’re already losing sixty, seventy thousand a year, where’s that money coming from? Banks aren’t lending for improvements when you can’t show positive cash flow.

The Math Just Doesn’t Work Anymore

November’s milk price came in at $21.55 per hundredweight. But you know how it is—after co-op deductions, quality adjustments, hauling…you’re seeing less. Sometimes a lot less.

Here’s what’s interesting—and I really wish I could draw you a picture here because it’s striking when you see it laid out. I was looking at the cost changes since 2020, and the spread is just brutal. Let me walk you through what I mean:

Back in 2020, we had milk at about $18.50 per hundredweight. Your basic feed costs, let’s index them at 100 to make it simple. Labor was running around $16 an hour if you could find it. Diesel? About $2.20 a gallon.

Fast forward to now, 2025. Milk’s up to $21.55—hey, that’s 16% better, right? But look at everything else. Feed costs have jumped 40% from that baseline. Labor—if you can even find workers—is running $20 to $21 an hour, up 30%. And diesel? Don’t get me started. We’re looking at $4.40 a gallon in many areas. That’s doubled.

While milk prices crawled up 16% since 2020, diesel doubled, feed jumped 40%, and labor climbed 30%—creating an unsustainable cost structure that explains why 2,800 dairies close annually

So you’ve got milk prices creeping up by 16% while your inputs shoot up by 30%, 40%, or even 100%. That gap between what you’re getting paid and what you’re paying out? That’s where your equity bleeds away, month after month. When the milk check doesn’t cover the feed bill, you’re basically robbing Peter to pay Paul.

The bankruptcy numbers tell the same story—259 dairy farms filed Chapter 12 between April 2024 and March 2025. That’s a 55% jump from the year before. But here’s what that doesn’t capture—for every farm that files, there’s probably another one or two quietly selling off equipment, maybe some land, trying to restructure without the paperwork. The stigma’s real, you know?

Small and mid-size dairies hemorrhaged 42% of operations while mega-farms grew 16.8%, now controlling nearly half of all U.S. milk production—proving economies of scale aren’t optional anymore

Understanding That 12 to 18 Month Timeline

When the economists at Cornell and Wisconsin talk about this 12- to 18-month window, they’re not being dramatic. Let me walk you through what this looks like, based on what I’m seeing across multiple operations. Think of it as a composite—no single farm, but patterns I see repeatedly.

Months 1 Through 6: The Slow Bleed

You start drawing more heavily on your operating line. Maybe go from $140,000 to $165,000 over a quarter. It feels manageable because you’ve still got credit available.

You start making small compromises. Put off that gutter cleaner repair—sure, it means 90 minutes of manual scraping every day, but you save $3,200. You match a wage offer you can’t really afford because if that last good employee leaves, you’re done.

The bank might restructure some debt and convert short-term debt to long-term debt. Feels like breathing room, right? But you’re just locking in obligations you probably can’t meet long-term.

Months 7 Through 12: Options Starting to Close

Your credit line’s getting close to maxed out. The lender—and these are good people who want to help—they start asking for monthly financials instead of quarterly. That’s never a good sign, as you probably know.

You can’t defer maintenance anymore, but you can’t afford it either. You’re one major breakdown away from crisis. One bad bout of mastitis in the fresh cow group. One compressor failure.

This is when those hard conversations happen. I know a couple in Vermont who have been farming for 40 years. She found him in the barn at 2 AM, just standing there. “We need to talk about what we’re doing,” she said. But they convinced themselves spring prices would turn things around. In my experience…they rarely do.

Months 13 Through 18: Decision Time

Banks lose confidence. You’ve violated debt covenants—maybe debt-to-asset ratio, maybe working capital requirements. Your options are bankruptcy or a forced sale. Any equity you’ve got left needs immediate action if you want to preserve it.

By now, that window for a strategic exit? It’s mostly closed. Operations that could’ve preserved $400,000 to $600,000 in family wealth six months earlier are looking at scenarios where keeping $100,000 to $200,000 feels like a win.

The Conversation Nobody Wants to Have

Here’s something we need to be honest about, even though it’s uncomfortable: strategic exits made early preserve dramatically more wealth than waiting for the bank to force your hand.

The brutal math of waiting: Strategic exits at month 8-10 preserve $480,000 in family wealth, while forced liquidations at month 18+ leave just $150,000—a $330,000 penalty for six months of denial

Let me break down what I’ve seen happen, based on actual auction results and sale data from 2025:

Strategic Exit (while you’ve still got 7-9 months of runway):

  • Sell your herd voluntarily, maybe get $1,850 per good cow
  • Equipment goes through a proper auction with time to market it right
  • Real estate gets listed properly, not fire-sold
  • Families walk away with $400,000 to $680,000

Forced Liquidation (month 18 and beyond):

  • Distressed sale, maybe $1,400 per cow if you’re lucky
  • Equipment auction under pressure, buyers know you’re desperate
  • Real estate sells fast and cheap
  • Families keep $100,000 to $200,000

That three to five hundred thousand dollar difference? That’s college funds. That’s retirement. That’s the chance to start over without crushing debt. And the only variable is timing.

As a Pennsylvania dairyman who went through this last year told me: “The hardest part was admitting we needed to exit. Once we did, we realized we should’ve made the decision six months earlier. Would’ve kept another $200,000.”

What Producers Are Actually Doing

Making Do with What They’ve Got

Was talking to a reproductive specialist in Florida last week—smart guy, been around—and he told me about a client who couldn’t afford a proper cooling system. Five thousand for misters was out of reach. So this producer rigged up a garden sprinkler on a fence post in the holding pen.

“It kept cows from dropping 10 to 20 pounds of production per day,” he said. “Bought him a month to generate some cash flow for proper cooling.”

That’s the reality for a lot of us, isn’t it? Hardware store solutions. Making do. It’s not ideal, but it keeps you going another day.

Partnerships—Sometimes They Work

Three neighbors in Idaho pooled their operations last year. Formed an LLC, consolidated everything. Individually, they were all questionable. Together? They’re actually competitive now.

But finding the right partners is tough. You need compatible management styles, similar work ethics, and—here’s the kicker—about $75,000 to $150,000 just for legal setup and restructuring. Folks who track these things estimate that maybe one in four or five partnership attempts actually succeeds long-term. The rest fall apart, usually over management disputes, within eighteen months. The Milk Producers Council has been documenting these partnerships, and the success stories all have one thing in common: clear, written agreements about everything from work schedules to exit strategies.

Some Folks Are Finding New Paths

It’s not all doom and gloom, and I want to be clear about that. Some operations are finding ways forward that work.

Several Vermont farms I know of are transitioning to organic. USDA’s organic price reports show a $38 per hundredweight price, compared with the $21.55 conventional price. But it’s brutal—the Northeast Organic Dairy Producers Alliance documents that it takes years and costs hundreds of thousands, while your revenues drop during the transition. You need deep pockets to weather that storm.

There are operations near Philadelphia, Boston, places like that, doing on-farm processing. Selling direct at $12 per gallon to customers who want the “farm experience.” One New York operation I visited invested $380,000 in processing facilities and visitor infrastructure. It’s working for them, but you need the right location and wealthy suburban customers nearby.

In Ohio, the Johnsons invested $800,000 in robotic milkers—but only after selling 60 acres to raise capital. Three years later, they’re viable with 300 cows and two full-time people. Not everyone has 60 acres to sell, but for those who do, technology might be an option. Just remember, the payback period is typically 7-10 years if everything goes right.

And here’s something interesting—completely legal, but not widely known—strategic bankruptcy under Section 1232 of the tax code can actually preserve more wealth than conventional sales in certain circumstances. The provision treats specific capital gains as dischargeable debt. You need a good attorney who understands agriculture, but it’s an option worth knowing about.

The Human Cost Nobody Talks About

We focus so much on the financial side, but the human toll…that’s what really matters, isn’t it?

The CDC found that farmers are 3.5 times more likely to die by suicide than the general population. Dr. Andria Jones-Bitton’s research at the University of Guelph documented that 68% of farmers experience chronic stress. Nearly half meet clinical definitions for anxiety. About 35% for depression.

Think about what this means for families. Farm wives who’ve managed the books and fed calves for twenty-five years suddenly need to find outside employment at fifty with no traditional work history. Kids who worked adult hours on the farm, watching it fail, wondering if it was somehow their fault. The weight of being the generation that “lost the farm”—that stays with people.

A dairy wife from Minnesota shared something that really stuck with me: “Being married to a farmer means putting everything else on hold from April to October, just trying to keep your husband from breaking.” Another described herself as essentially a single parent because her husband’s always in the barn, always stressed, never really present even when he’s physically there.

Where This Is All Heading

Small and mid-size dairies hemorrhaged 42% of operations while mega-farms grew 16.8%, now controlling nearly half of all U.S. milk production—proving economies of scale aren’t optional anymore

Industry projections are sobering—we’ll lose 7 to 9% of operations annually through 2027. Let me put that in real numbers so you can picture what’s happening:

The Decline We’re Looking At:

  • 2020: We had 31,657 dairy operations according to the Census of Agriculture
  • 2022: Down to 28,900
  • 2024: About 26,400 (estimated)
  • Right now, 2025: Around 26,000 operations

Now, if we keep losing 7% a year like the projections suggest:

  • 2026: We’re looking at 24,180 operations
  • 2027: Down to 22,487
  • 2028: About 20,893
  • 2029: Roughly 19,430
  • 2030: Somewhere between 13,000 and 18,000 operations
From 31,657 farms in 2020 to a projected 18,000 by 2030—this isn’t gradual evolution, it’s an industry extinction event claiming nearly 8 farms per day for the next five years

Some folks think consolidation could accelerate in those final years—once you hit certain thresholds with processing capacity and infrastructure, things can snowball. That’s why some projections go as low as 12,000 to 14,000 farms by 2030.

Picture that trend line…it’s not a gentle slope. We’re talking about losing half—maybe more—of all U.S. dairy farms in just five years. Each of those data points? That’s hundreds of families making the decision we’ve been talking about.

If this keeps up—and honestly, I don’t see what would change it—by 2030, we’re looking at:

  • Going from today’s 26,000 farms down to maybe 13,000 to 18,000 (could be even lower if things accelerate)
  • Operations with over 1,000 cows controlling 65 to 72% of all production
  • Production moving to Idaho, New Mexico, Texas—where those economies of scale work better
  • Traditional dairy states—Wisconsin, Vermont, upstate New York, and Pennsylvania Dutch Country—are losing half to two-thirds of their farms

You know, this consolidation might create certain efficiencies. Sure. But it reduces resilience. When 65% of your milk comes from fewer, larger operations, any disruption—such as a disease outbreak, a weather event, or another immigration raid—has massive impacts. We got a taste of this during COVID. Next time? It’ll be worse.

What You Need to Know Right Now

If Your Operation’s Losing Money

First thing—and I mean this week—sit down and calculate your actual runway. How many months can you really keep going at current burn rates? Be honest with yourself. This isn’t the time for optimism.

Get a confidential consultation with someone who understands agricultural transitions. Your state extension service can usually connect you. Do it now while you still have options. Every month you operate at a loss, you’re converting twenty to thirty thousand dollars in family wealth into expenses you’ll never recover. That’s real money that could be in your pocket.

Look at all your options. Strategic exit while you’ve got equity to preserve. Partnerships, if you’ve got the right neighbors and the relationship to make it work. Maybe pivoting to specialty markets if you’re positioned for it—A2 milk premiums, grass-fed certification, direct marketing if you’re near population centers. Scaling up if—and this is rare—you somehow have capital access.

But here’s what matters most: your family’s wellbeing trumps everything else. Your mental health, your marriage, your relationship with your kids—all of that matters infinitely more than what the neighbors think.

For the Lenders and Consultants

I know you’re reading this too. If you’re working with struggling operations, please—have honest conversations about strategic exits before all the equity’s gone. Stop promoting solutions that require capital these farms don’t have. That robotic milking system might be amazing technology, but not if the farm goes bankrupt before the ROI shows up.

Communities need to start planning for transitions. I know it’s hard to accept, but pretending family dairy’s going to reverse these trends somehow…that’s not helping anyone.

Making the Tough Call

I keep thinking about this Wisconsin family I know—real people, not a composite. They made their exit decision with about 8 to 10 months left in their viability window. Walked away with $482,000 in preserved equity. If they’d waited until the bank forced their hand? They’d have kept less than $200,000.

That $280,000 difference came down to one thing: having the courage to make a strategic decision while they still had choices.

For all of us looking at that 12 to 18 month countdown—and you know who you are—the question isn’t whether the farm continues. We can read the economics. The question is whether you preserve the wealth you’ve built through strategic action or lose it through delay.

Getting Help

If you’re struggling—financially, mentally, or both—please reach out. There’s no shame in it.

Mental Health Support:

  • National Suicide Prevention Lifeline: 988
  • Farm Aid Hotline: 1-800-FARM-AID
  • AgriStress Helpline: 1-833-897-2474

Financial Planning:

  • Your state extension service has transition specialists
  • Wisconsin Farm Center: 1-800-942-2474
  • Pennsylvania Center for Dairy Excellence: 1-888-373-7232
  • Cornell PRO-DAIRY programs
  • Michigan State Extension: 1-888-678-3464

Look, the clock’s ticking on thousands of operations. Understanding the timeline, recognizing your options, and—this is the hard part—acting while you still have choices…that’s what determines whether you preserve what three generations built or watch it disappear.

The decision’s incredibly difficult. I get that. But the math? The math is becoming clearer every day.

And if you’re reading this thinking, “he’s describing my farm”… maybe it’s time for that conversation you’ve been avoiding. Better to have it now, on your terms, than later on someone else’s.

We’re all in this together, even when it feels like we’re alone. And sometimes the bravest thing you can do is know when it’s time to preserve what you can and move forward.

KEY TAKEAWAYS 

  • Your 18-month countdown starts the day you can’t pay all bills on time—most farmers don’t realize until month 12, when half their equity is already gone
  • The $380,000 decision: Exit strategically at month 8-10, keeping $480K, or wait for forced liquidation at month 18, keeping $100K (real Wisconsin example)
  • Red flags demanding immediate action: Bank requests monthly financials, your 14-year-old runs milking shifts, you’re choosing between feed bills and diesel
  • Three viable options remain: Strategic exit (preserves family wealth), partnerships with neighbors (1 in 4 succeed with $75-150K legal costs), or technology pivot (requires $800K+ capital)
  • This week’s action: Call your state extension service for confidential consultation—it’s free, and waiting another month costs you $20-30K in family wealth that’s gone forever

Complete references and supporting documentation are available upon request by contacting the editorial team at editor@thebullvine.com.

Learn More:

The Sunday Read Dairy Professionals Don’t Skip.

Every week, thousands of producers, breeders, and industry insiders open Bullvine Weekly for genetics insights, market shifts, and profit strategies they won’t find anywhere else. One email. Five minutes. Smarter decisions all week.

NewsSubscribe
First
Last
Consent

Bred for Success, Priced for Failure: Your 4-Path Survival Guide to Dairy’s Genetic Revolution

Your best cow makes 4.5% butterfat. Your processor pays for 4%. Your neighbor with robots is profitable at $16 milk. You need $19.50. Welcome to dairy’s new reality.

Executive Summary: Fresh cows across America are now routinely exceeding 4.2% butterfat—a genetic miracle achieved in five years that should’ve taken thirty. But here’s the crisis: processors built for 3.7% milk can’t handle today’s components, capping payments at 4% while farmers produce 4.5%. With heifer inventory at its lowest since 1978 (3.914 million head) and milk prices stuck at $16.70, mid-sized farms bleeding cash at $19-20/cwt production costs watch 5,000-cow operations profit at the same prices. Four proven paths exist: scale to competitive size with locked-in processing contracts, exit strategically while preserving 70-85% equity, differentiate into $42-48/cwt niche markets, or adopt robotics for megadairy-level efficiency at family scale. The genetic revolution is permanent and irreversible. The only question is whether you’ll adapt by choice or by force.

Dairy Farm Survival Guide

You know, I recently spent time with a third-generation Wisconsin dairyman reviewing his latest DHIA test results, and what we saw tells the whole story. Every fresh cow in his transition pen—every single one—was testing above 4.2% butterfat, right out of calving. He looked at those numbers, shook his head, and said something that’s been rattling around in my mind ever since: “We’ve bred exactly what we wanted, and now we’re not entirely sure what to do with it.”

That conversation really captures what’s happening across our industry right now. According to the USDA’s September 2025 Milk Production report, we’ve pushed average butterfat from 3.95% in 2020 to 4.36% today. Think about that for a minute—what took our grandfathers thirty years, we’ve done in five. August milk production hit 19.5 billion pounds, up 3.2% from last year, with the average cow producing 2,068 pounds monthly. It’s incredible progress by any measure.

And yet… here we are, looking at Class III futures stuck around $16.70 through spring 2026 on the CME, and many of us are wondering how success became so complicated.

The genetic miracle becomes a processing nightmare: butterfat jumps from 3.95% to 4.36% while plants designed for 3.7% struggle to handle excess cream, triggering payment caps at 4%

Understanding the New Production Reality

What’s really fascinating is how fundamentally genomic selection has changed the game since it took off around 2009. The Council on Dairy Cattle Breeding’s August 2025 data shows we’ve essentially doubled our rate of genetic gain—from about $40 in Net Merit annually to $85.

Now, Net Merit—for those who haven’t dug into the genetics reports lately—basically captures lifetime profit potential. It rolls milk production, components, fertility, and longevity into one dollar value. When that’s jumping $85 every single year, well… you’re looking at cows that are fundamentally different from what we milked even a decade ago.

Here’s what this means in practical terms on your farm. The genetic potential for butterfat percentage is increasing by about 0.04-0.06% annually, according to CDCB’s latest evaluations. When combined with nutritional advances, this results in the total observed improvement of 0.1% or more that we see in the tank—and the genetic portion is baked in permanently. Protein content has risen from around 3.18% in 2020 to 3.38% today based on the USDA’s component testing data. Generation intervals have compressed from 5 years to just over 3, as Holstein Association USA’s genomics report documents. We’re seeing component-adjusted milk solids up 1.65% year-to-date, even though actual volume declined slightly, according to Progressive Dairy’s June 2025 analysis.

What’s particularly noteworthy—and honestly, kind of sobering—is that these improvements are permanent. Unlike feed rations, you can adjust, genetic potential can’t be dialed back when market conditions shift. Dr. Chris Wolf and his team at Cornell’s Dyson School have been documenting this reality extensively in their market outlook papers. Once those genetics enter your herd, that production capacity is there to stay.

I recently spoke with nutritionists working with Idaho operations averaging 95 pounds daily at 4.4% butterfat, and here’s what’s interesting: they’re now reformulating rations, trying to moderate component production. Can you imagine? Five years ago, we were doing everything possible to push components higher. Now, some folks are actually trying to pump the brakes. It’s a complete reversal of production philosophy.

And it’s not just us dealing with this. New Zealand’s LIC reports similar acceleration in genetic gains in their latest breeding worth statistics, though not quite at our pace. European data from Eurostat’s dairy production reports show that average butterfat has gone from 4.05% to about 4.18% over the same period. Australia’s seeing comparable trends according to DataGene’s genetic progress reports. But nobody’s matched what American genetics have achieved, and… well, that’s becoming part of the problem, isn’t it?

“We’ve bred exactly what we wanted, and now we’re not entirely sure what to do with it.” — Wisconsin dairy producer, reviewing 4.2%+ butterfat across his entire fresh pen

Understanding Component Changes

Metric2020 Baseline2025 CurrentAnnual Change
Butterfat3.95%4.36%+0.1-0.15%
Protein3.18%3.38%+0.04%
Manufacturing ImpactBaseline+20-25% cheese yieldPermanent gain

The Processing Bottleneck Nobody Saw Coming

Here’s where things get really interesting—and frankly, a bit concerning for many of us. While we’ve been celebrating these genetic achievements, we’ve created this mismatch between what our cows produce and what our plants can actually handle.

Several Midwest cheese plants are reporting that their systems were engineered for milk with an average butterfat content of 3.7%. Today’s routine deliveries at 4.5% or higher? That creates real operational challenges. During spring flush, some facilities literally can’t process all the cream they’re separating. Nobody really saw that coming.

California’s experience really illustrates this challenge. Their Department of Food and Agriculture’s October 2025 utilization report shows that over 55% of milk now flows to Class IV processing—that’s butter and powder—because cheese manufacturers struggle to utilize all that excess butterfat efficiently. When your infrastructure expects one thing and your milk delivers something entirely different, you get these localized surpluses that hammer prices even when demand is actually pretty decent.

You know what’s making this worse? We used to count on seasonal variation. University extension research from Wisconsin and Minnesota has long documented that summer heat stress typically reduces component levels by 0.2-0.3%, giving plants a natural breather. But with better cooling systems, enhanced summer rations… that dip isn’t happening like it used to. Plants that historically scheduled maintenance for July and August are running at full capacity year-round.

What many producers are encountering now—and you’ve probably experienced this yourself:

  • Some processors have implemented butterfat payment caps at 4.0%—anything above that, you’re not getting paid for it
  • Seasonal penalties ranging from $0.50 to $1.00 per hundredweight when components get too high, according to various Michigan and Wisconsin co-op reports
  • Regional price differences of $2-3 per hundredweight based on what local plants can handle
  • Several Wisconsin cooperatives are introducing component ratio requirements for the first time in decades

The industry’s responded with substantial investment—CoBank’s August 2025 Knowledge Exchange report and Rabobank’s dairy quarterly show about $8 billion in new processing capacity over three years. Major projects include Leprino’s Texas expansion opening in March 2026, Hilmar’s Kansas facility operational since July 2025, and California Dairies’ new beverage plant with 116,000 gallons daily capacity. But here’s the catch: these facilities were designed using milk projections for 2020-2021. They might be underestimating where genetics are actually taking us.

Jim, a VP of Operations at a major Midwest processor, told me at a recent industry meeting: “We’re essentially trying to retrofit 20th-century infrastructure for 21st-century milk. It’s like trying to run premium gasoline through an engine designed for regular—it works, but not optimally.”

The Demand Side Reality Check

Now, it’s worth acknowledging that demand hasn’t been standing still either. USDA Foreign Agricultural Service data shows U.S. dairy exports totaled around $7.8 billion in 2024, with cheese and whey products leading growth. Mexico remains our largest market, accounting for nearly 30% of exports, while Southeast Asian demand for milk powders continues to expand at 5-7% annually, according to USDA FAS regional analyses.

Domestically, we’re seeing interesting innovation too. Ultra-filtered milk sales grew 23% year-over-year according to IRI market data, and high-protein dairy products are capturing premium shelf space. The yogurt category alone has shifted toward Greek and Icelandic varieties that utilize more milk solids per unit—Chobani and Siggi’s now represent nearly 40% of the yogurt market by value, according to Nielsen data.

But here’s the reality—and this is what the economists at CoBank and Rabobank keep emphasizing in their reports—these demand-side factors, while positive, simply can’t keep pace with genetically-driven supply growth. When you’re adding 0.1-0.15% butterfat annually across 9.3 million cows, that’s creating manufacturing capacity equivalent to adding 200,000 cows every year without actually adding any cows. Export growth of 3-4% annually and domestic innovation can’t absorb that kind of structural increase.

A Wisconsin cheese maker I talked with last month put it pretty clearly: “We can sell everything we make, but we can’t make everything that’s being produced. The components are just overwhelming our systems.”

Why the Heifer Shortage Changes Everything

The replacement crisis creating tomorrow’s volatility: heifer inventory crashes to 3.914 million as 30% beef semen usage guarantees delayed expansion followed by genetically-supercharged production surges in 2028-2029

Now let’s talk about something that’s really reshaping market dynamics—the heifer situation. USDA’s October 2025 Cattle report shows we’re at 3.914 million replacement heifers. That’s a 25-year low, a level we haven’t seen since the turn of the century.

Regional heifer markets reflect this scarcity in a big way. At a sale in Lancaster County, Pennsylvania, last month, quality-bred animals brought $3,200 to $3,800. Five years ago? Those same heifers would’ve been $1,800 to $2,200. Mark Johnson, a buyer from Maryland, whom I talked with there, summed it up: “At these prices, every heifer has to offer exceptional potential.”

What’s driving this shortage is fascinating—and kind of predictable in hindsight. National Association of Animal Breeders’ 2025 annual report shows beef semen sales to dairy farms reached 7.9 million units last year, representing about 30% of total breedings. When feed costs spiked during 2023-2024, many operations reduced replacement programs by 30-40%. Tom Harrison, who runs 2,200 cows near Syracuse, New York, told me last week, “We cut our heifer program dramatically back then. We’re definitely paying for those decisions now.”

Here’s what this means for how markets will behave going forward:

  • Traditional expansion when prices improve? That’s now delayed 24-30 months minimum
  • When expansion eventually occurs, accumulated demand will likely trigger rapid growth
  • Those delayed heifers will carry enhanced genetics, amplifying future production increases
  • We’re basically setting up conditions for extended corrections followed by more dramatic rebounds

CoBank dairy economist Ben Laine’s latest analysis—published in their September 2025 outlook—offers really intriguing projections. He suggests milk prices might strengthen in 2026-2027 because no one can expand quickly. But then watch out for 2028-2029 when all those genetically superior heifers enter production. It’s like we’re loading a spring that’ll release all at once.

The Consolidation Reality Reshaping Farm Economics

The brutal mathematics of survival: mega-dairies banking $2.70 per hundredweight while mid-sized farms bleed $2.80—same milk price, catastrophically different outcomes determined purely by scale

At World Dairy Expo this October, every conversation seemed to circle back to consolidation. Dr. Andrew Novakovic’s team at Penn State released dairy markets research showing we’re approaching 85% processor concentration among the top five companies. Meanwhile, USDA’s preliminary 2024 Census of Agriculture data documents the decline from 648,000 dairy operations in 1970 to about 25,000 today.

But this isn’t just about getting bigger. I’ve been looking at cost-of-production data, and the disparities are striking. Wisconsin’s Center for Dairy Profitability September 2025 benchmarks show large operations exceeding 2,500 cows report production costs around $13-15 per hundredweight. Mid-sized farms—that 500-999 cow range many of us operate in—are looking at $19-20.

At current Class III prices near $17, that differential literally determines who’s profitable and who’s burning equity. A dairy farmer fromt the Texas Panhandle running 5,000 cows, showed me his books—still making money at $16 milk. His neighbor with 800 cows? He needs $19.50 just to break even. That’s not management quality—that’s structural economics.

Dairy’s ruthless transformation: 55 years collapse 648,000 farms to a projected 15,000 by 2030 while five processors tighten control to 90%—power consolidating on both sides of the check

But you know, smaller operations aren’t completely out of the game. A growing number of sub-200-cow farms are exiting the commodity markets entirely.

Strategic Pathways for Mid-Sized Operations

PathwayKey RequirementsSuccess FactorsTypical ROI Timeline
Scale Up(1,500+ cows)$5-8M capital; Processing partnerships secured firstEconomies of scale; Strategic processor relationships7-10 years
Strategic ExitAct before distress; Professional valuationTiming (retain 70-85% equity); Current market: $5,500-$7,000/cowImmediate
Niche MarketsLocation near population centers; Marketing capabilityDirect sales at $42-48/cwt vs. $17 commodity; Strong brand development3-5 years
Robotic Technology$225-300K total installed cost per robot; 60-70 cows/robotLabor efficiency rivals megadairies; Maintains family management5-7 years

Four Strategic Pathways for Mid-Sized Operations

For those of us running 500 to 1,500 cow operations—and that’s still most of us, right?—the current environment demands some really honest assessment. Based on extensive discussions with lenders, consultants, and farms that have recently navigated these choices, I’m seeing four main pathways emerge.

Scaling to Competitive Size

This means expanding to 1,500-plus cows to capture those economies of scale. Dairy outlook reports show you’ll need $5-8 million in capital, and—this is crucial—processing partnerships secured before you break ground. Based on what lenders and consultants are telling me, successful transitions remain relatively uncommon, mostly limited by capital access and those processor relationships.

Strategic Exit Timing

This is about selling while you can still retain 70-85% of your equity rather than waiting for forced liquidation. Legacy Dairy Brokers, who handle many Northeast sales, tell me that success improves significantly with early action rather than distressed sales.

Differentiation Beyond Commodities

This involves transitioning to specialized markets—organic, A2, and local brands. While success varies considerably by location and marketing ability, farms near population centers with strong direct marketing skills are finding viable niches.

Technology-Driven Efficiency Through Robotics

Here’s an interesting fourth pathway that’s gaining traction, especially for that squeezed middle segment. DeLaval’s 2025 North American sales report shows robotic milking installations increased 35% this year, primarily on farms with 300-800 cows. Lely and GEA report similar growth trends. These operations are achieving something remarkable—labor efficiency approaching megadairies while maintaining family management structures.

I visited a family near Eau Claire, Wisconsin, who installed six robots last year for their 400-cow herd. They’re down to three full-time people, including family members, and their cost per hundredweight dropped significantly—by nearly $3. The initial investment was substantial—around $1.8 million total—but with current labor challenges and costs, the five- to seven-year payback looks increasingly attractive, according to equipment manufacturers’ ROI analyses.

What’s particularly interesting is that these robotic operations can often secure better financing terms. Lenders see them as technology-forward with lower labor risk. It’s not the right fit for everyone, but for operations with good management and a willingness to embrace technology, it’s proving to be a viable middle path.

Risk Management Tools Every Farmer Should Understand

What surprises me is how many folks still aren’t using available federal programs effectively. Let me share what’s actually working based on USDA Farm Service Agency data and producer experiences.

Dairy Margin Coverage at the $9.50 level has provided exceptional value. FSA’s October 2025 program report documents average net benefits of $0.74 per hundredweight above premiums during challenging margin periods from 2021-2023. For Tier 1 coverage—your first 5 million pounds—the premium’s just $0.15 per hundredweight. That’s essentially subsidized protection. Enrollment deadlines are on March 31 each year, and you can enroll online at farmers.gov/dmc or call your local FSA office at 1-833-382-2363.

And here’s something interesting—with USDA’s Agricultural Marketing Service reporting October cull cow prices at $150-157 per hundredweight, strategic culling has become a real opportunity. Dave Carlson, a Michigan producer I spoke with last week, managing 650 cows near Grand Rapids, summarized it pretty well: “At $2,000 per cull cow while we’re losing money on milk, the math becomes pretty straightforward. We’ve reduced our milking herd by 15% and improved cash flow immediately.”

Regional Perspectives Reveal Different Realities

What fascinates me is how differently this transformation affects various regions. In Vermont and the Northeast, smaller operations with strong local markets are often outperforming mid-sized commodity producers. NOFA-VT’s 2025 pricing survey documents local, grass-fed, or organic premiums reaching $10-15 above conventional prices.

Down in the Southern Plains—Texas, Kansas, Oklahoma—it’s a completely different story. The massive investments in processing are driving aggressive expansion. A farmer I talked with in Texas, with 3,500 cows outside Amarillo, described the situation: “It’s basically a land grab for processing contracts. If you don’t have one locked in by 2027, you’re done.”

Pennsylvania’s situation particularly illustrates the challenges faced by mid-sized farms. Built on family operations, Penn State Extension’s latest report shows they lost 370 dairy farms in 2024 alone—predominantly in that 200-700 cow range. A farmer, managing 650 cows near Lancaster, explained his predicament when we talked last month: “We’re too large for direct marketing, too small for processor attention. We’re caught between models.”

Even within states, the variations are remarkable. Northern New York benefits from proximity to Canada and strong cooperatives, generally maintaining better margins than western New York operations shipping to distant processors. It’s all about local dynamics now.

Looking Ahead: What 2030 Actually Looks Like

Based on current trends and industry analysts’ projections—Rabobank’s September 2025 five-year outlook and CoBank’s consolidation analysis are particularly telling—the dairy landscape in the 2030s will be dramatically different. We’re likely looking at:

  • 14,000 to 16,000 total operations, down from today’s 25,000
  • Five major processors potentially controlling 90-92% of capacity
  • Average herd size around 600-650 cows, though that masks huge variation
  • Butterfat potentially averaging 4.52% if current genetic trends continue
  • The vast majority of production—maybe 75-80%—from operations exceeding 1,500 cows

Dr. Marin Bozic, the University of Minnesota dairy economist, made an observation at a conference I attended last month that really stuck with me: “Dairy is industrializing in 20 years what took poultry 40 years and swine 30 years to accomplish.”

The traditional 500- to 1,500-cow family dairy—the backbone of Wisconsin, Minnesota, and Pennsylvania—will need to either scale up, specialize, embrace technology, or transition out. Those aren’t easy choices, but ignoring them doesn’t make them disappear.

Practical Takeaways for Dairy Farmers

So what should you actually do with all this information? Here’s what I think makes sense:

Within the next month:

  • Calculate your true production costs, including family labor at market rates (University Extension has excellent worksheets—Wisconsin’s are particularly thorough)
  • Get written quotes from multiple processors or cooperatives for comparison
  • Make sure you’re enrolled in DMC before the March 31 deadline—it’s basically free protection
  • Have an honest conversation with your lender: Can we survive 18 months at $16.50 milk?

Over the next quarter:

  • Honestly evaluate which of the four strategic pathways aligns with your capabilities and family objectives
  • If you’re considering selling, start conversations now while maintaining your negotiating position
  • Reassess genetic selection strategies—maybe maximum production isn’t the goal anymore
  • Explore local differentiation opportunities or technology investments that might provide a competitive advantage

Long-term positioning:

  • Accept that genetic gains create permanent structural changes requiring adaptation
  • Understand that processing relationships increasingly determine profitability beyond farm efficiency
  • Recognize that scale economies, differentiation, or technology adoption are becoming essential
  • Build cash reserves—volatility’s the new normal

The Bottom Line

After months of researching this and talking with farmers nationwide, here’s my conclusion: The genetic revolution we’ve achieved—doubling productivity gains in 15 years—is absolutely remarkable. It represents American agriculture at its finest.

But it’s also fundamentally altered what economically viable dairy farming looks like. The efficiencies we’ve pursued individually have, collectively, created structural oversupply that traditional market mechanisms struggle to address. When everyone improves components 0.1% annually through permanent genetics… well, we’ve changed the entire game.

An Iowa breeder I’ve known for years, recently showed me comparative bull proofs from his files—1985’s top butterfat bull was plus 45 pounds, today’s leaders exceed plus 150. His observation was telling: “We achieved exactly what we selected for. Maybe we should’ve considered whether we truly wanted it.”

What’s becoming clear is tomorrow’s dairy success won’t just be about efficient milk production. It’ll be about strategic positioning, processing partnerships, risk management sophistication, technology adoption, and having the courage to make difficult decisions before they’re forced on you.

For those willing to adapt—whether through scaling, specializing, embracing technology, or strategic exit—viable pathways remain. The question becomes whether we’ll acknowledge these changes and adapt, or keep hoping for an industry structure that’s already gone.

The genetic revolution hasn’t merely changed how we produce milk. It’s reshaped what sustainable dairy farming means. Understanding and adapting to that reality, rather than resisting it, offers the clearest path forward.

As a Wisconsin farmer told me just last week: “We keep searching for someone to blame—genetics companies, processors, imports. Maybe we just got too good at what we do. Now we need to figure out what comes next.”

That’s the conversation we need to be having. And it needs to happen now, while options remain, not after another thousand farms close their doors.

For more information on the risk management programs mentioned in this article:

  • Dairy Margin Coverage (DMC): farmers.gov/dmc or call 1-833-382-2363
  • Livestock Gross Margin for Dairy (LGM-Dairy): Contact your approved crop insurance agent
  • Find your local FSA office: farmers.gov/service-locator

Complete references and supporting documentation are available upon request by contacting the editorial team at editor@thebullvine.com.

Learn More:

  • Rethinking Dairy Cattle Breeding: A Guide to Strategic Sire Selection – This guide provides tactical methods for adjusting your breeding program in a component-saturated market. It demonstrates how to select sires that balance production with crucial health and efficiency traits, directly impacting your herd’s future profitability and market relevance.
  • The Dairy Farmer’s Guide to Navigating Market Volatility – Explore advanced financial strategies for building resilience against the price volatility described in the main article. This analysis reveals how to leverage marketing tools, manage input costs, and build a flexible business model to protect your equity through unpredictable cycles.
  • The Robotic Revolution: Is Automated Milking the Future for Your Dairy? – For those considering the technology pathway, this deep dive details the operational ROI and management shifts required for robotic milking. It provides a crucial framework for evaluating if automation can deliver the labor efficiency and production gains needed to compete.

The Sunday Read Dairy Professionals Don’t Skip.

Every week, thousands of producers, breeders, and industry insiders open Bullvine Weekly for genetics insights, market shifts, and profit strategies they won’t find anywhere else. One email. Five minutes. Smarter decisions all week.

NewsSubscribe
First
Last
Consent

The $228,000 Exit Strategy Reshaping Dairy: Inside the 55% Surge in Strategic Bankruptcies

Dairy farmers found a way to keep $228K that would go to the IRS. It’s legal, it’s smart, and bankruptcies are up 55%. Here’s how.

EXECUTIVE SUMMARY: Dairy farmers have discovered that filing bankruptcy can net them $228,000 more than selling their farms outright—and 259 operations did precisely that in the past year, driving a 55% surge in Chapter 12 filings. The catalyst is Section 1232, a 2017 tax provision that treats capital gains as dischargeable debt, turning a $285,600 IRS bill into just $57,120 for a typical Wisconsin farm sale. These aren’t failures but strategic exits by producers facing 8% interest rates and margins squeezed to breakeven who see no point grinding through more unprofitable years. While this tax-advantaged bankruptcy helps retiring farmers preserve decades of equity building, it’s fundamentally reshaping the industry. Young farmers without inherited land face nearly insurmountable entry barriers, and production is rapidly consolidating in states like Texas, where operations compete on efficiency rather than land appreciation. The result: bankruptcy has become a financial planning tool as strategic as any breeding decision or ration formulation.

Strategic Farm Bankruptcy

You know, when the University of Arkansas Extension released their recent data showing 259 dairy farms filed for Chapter 12 bankruptcy between April 2024 and March 2025—that’s a 55% jump from the previous year—most of us in the industry took notice. But here’s what’s really interesting: the more I dig into these numbers, the more I’m seeing something unexpected happening out there.

Many of these filings don’t look like the desperate collapses we’ve seen before. Not at all. What we’re actually witnessing is strategic financial planning, and it all ties back to a 2017 tax law change that most of us didn’t pay much attention to when it passed.

Now, let me be clear about something important: these aren’t wealthy farmers gaming the system. Most of these operations are facing real financial pressure—margins have been squeezed to breakeven or worse for many producers. When you combine operating loan rates jumping from 3% to nearly 8% (Federal Reserve Bank of Chicago data), input costs that never came back down after their spike, and milk prices that the USDA reports are back at 2018-2019 levels, a lot of operations are genuinely struggling. The difference is that Section 1232 gives them a strategic exit option that preserves more value than grinding it out for another few unprofitable years would.

“I’ve milked cows for 35 years. I’m not failing—I’m choosing the smartest path forward for my family with the rules as they exist. If that means using bankruptcy court to maximize our retirement after decades of 4 a.m. milkings, I’m at peace with that decision.” — Wisconsin dairy farmer preparing for strategic Chapter 12 filing.

Follow the data-driven rise in strategic dairy bankruptcies that reframes exit planning as financial optimization FY2023-FY2025. This visual doesn’t just inform—it electrifies: bankruptcy isn’t defeat, it’s savvy planning!

What’s Actually Happening with These Numbers

So let me share what I’ve been learning about the current situation. You probably know this already, but today’s economic are fundamentally different from previous downturns. Back in 2019, when USDA’s Economic Research Service documented 599 Chapter 12 filings nationally, we all understood what was happening—milk prices had absolutely tanked, and those trade wars were killing our export markets. It was straightforward and brutal.

Today? Well, it’s more nuanced. Ryan Loy from the University of Arkansas’s Division of Agriculture puts it well—commodity prices have basically returned to those 2018-2019 levels, yet our input costs…they never came back down. Fertilizer, feed, diesel—they’re all still elevated, and we’re all feeling that squeeze.

But here’s what’s really changed the game for a lot of operations: interest rates. The Federal Reserve Bank of Chicago’s agricultural finance data shows operating loan rates essentially doubled between 2021 and 2023. We went from around 3% to nearly 8% by mid-2025.

And if you’re like many producers who expanded with variable-rate financing when money was cheap…well, you know exactly what that means for your monthly payments.

The regional patterns we’re seeing are worth noting too:

  • First quarter 2025 brought us 88 Chapter 12 filings nationally—that’s nearly double Q1 2024’s 45 filings
  • Arkansas went from 4 filings in 2023 to 25 in 2025—that’s quite a shift
  • Michigan moved from zero in 2023 to 12 in 2024
  • Wisconsin, as many of you know, lost another 400 operations in 2024, bringing them down to 5,348 licensed herds

Understanding Section 1232 and Why It Matters

Now, here’s where things get particularly interesting—and if you haven’t heard about this yet, you’ll want to pay attention even if bankruptcy’s the last thing on your mind.

Remember the Supreme Court’s Hall v. United States case back in 2012? Lynwood and Brenda Hall sold their farm for $960,000 during bankruptcy, triggered about $29,000 in capital gains taxes, and the court basically said, “you’ve got to pay that in full before we’ll approve your reorganization plan.” It made Chapter 12 pretty much useless for anyone with appreciated land.

Well, Senator Chuck Grassley from Iowa—he’s been a friend to agriculture for years—pushed through the Family Farmer Bankruptcy Clarification Act in October 2017. This added Section 1232 to the bankruptcy code, and honestly, it’s a game-changer.

Dr. Kristine Tidgren, who runs Iowa State’s Center for Agricultural Law and Taxation, explained this really well in her 2020 analysis. Unlike Chapter 11 bankruptcies, where you’d have to pay capital gains in full, Chapter 12 now treats those tax obligations as general unsecured debt. That means they can potentially be discharged—either partially or sometimes entirely—through your reorganization plan.

Let’s Walk Through the Math Together

So here’s a real-world scenario using Wisconsin farmland values from the USDA’s August 2025 data. Say you’re a producer who purchased 200 acres in 2005 for $2,000 an acre—pretty typical for that time. According to the Wisconsin Realtors Association, that same ground’s worth about $8,000 an acre today.

Traditional Sale (Outside Bankruptcy):

ItemAmount
Sale proceeds$1,600,000
Capital gain$1,200,000
Federal capital gains tax (20%)$240,000
Net investment income tax (3.8%)$45,600
Total tax to IRS$285,600
Net proceeds after tax$1,314,400

Strategic Chapter 12 Filing with Section 1232:

ItemAmount
Sale proceeds$1,600,000
Tax becomes unsecured debt$285,600
Payment to unsecured creditors (20%)$57,120
Tax savings$228,480
Net proceeds$1,542,880

See how Section 1232 flips the tax equation for dairy producers: from IRS bill to retirement nest egg—making Chapter 12 a strategic tool. This isn’t just about bankruptcy—this is smarter farm succession!


Scenario
Sale ProceedsTotal Tax PaidNet ProceedsStrategic Tax Savings
Traditional Sale$1,600,000$285,600$1,314,400$0
Chapter 12 w/ Section 1232$1,600,000$57,120$1,542,880$228,480

Now, that’s real money. And when you’re looking at those numbers…it makes you think differently about what bankruptcy means, doesn’t it?

The Wisconsin Story: It’s Not What Most People Think

Mike Vincent, the ag economist at UW-Madison’s Extension, shared something with me that really stuck: “The biggest issue we’re facing is that the farmers are retiring.”

And you know what? The data backs him up completely.

In 2020, UW-Madison and USDA NASS conducted the Dairy Farm Transition Survey. What they found was eye-opening—17% of Wisconsin dairy farms said they wouldn’t be milking within five years.

For smaller operations — those with under 100 cows — the number jumped to 22%. And here’s the kicker: only 40% of Wisconsin dairy farmers had identified someone to take over the operation.

So when Mike says he’s not surprised by these closure numbers, he’s got a point. Many of these aren’t panic exits at all. They’re planned transitions that just happen to coincide with bankruptcy provisions that make Chapter 12 filing financially smart.

I was talking with a producer up in Shawano County recently—been milking for 35 years, profitable most years, but his kids aren’t interested in taking over. His land’s worth four times what he paid for it. He asked me straight up: “Why would I leave $200,000 on the table for the IRS when I could use that for my retirement?”

And honestly? I couldn’t give him a good reason not to consider it.

Who Benefits and Who Doesn’t—The Regional Differences

What’s fascinating is how differently this plays out across regions. According to USDA NASS’s August 2025 land value data, if you’re farming in Iowa, where land’s averaging $10,200 an acre, or Illinois at $9,850, or certain parts of Wisconsin ranging from $6,800 to $18,500…well, you’ve got options that other producers don’t.

The National Agricultural Law Center’s been tracking filing patterns, and they’re seeing it’s mostly farmers over 60 planning retirement, operations needing to downsize—maybe from 300 cows to 150 or 200—and family farms where the next generation just isn’t interested in continuing.

But here’s the thing: if you’re running a modern operation in Texas or New Mexico, where most producers lease their ground—Texas A&M AgriLife Extension reports the average operation there leases about 70% of their cropland—this doesn’t help you at all. Same story if you bought land recently, or if you’re in a state like New Mexico where USDA data shows land’s only worth about $725 an acre.

A Texas producer I know who’s managing 2,100 cows near Amarillo put it pretty bluntly: “We compete on production efficiency, not land equity. This Section 1232 stuff means nothing to us.” And she’s absolutely right—it’s a completely different business model.

Now, in the Northeast, it’s another story entirely. Vermont and New York operations often sit on land that’s appreciated significantly due to development pressure, but they also face some of the highest production costs in the country.

A producer from St. Albans, Vermont, told me recently that while his land’s worth more than ever, the combination of labor costs and environmental regulations means he’s still weighing whether strategic bankruptcy makes sense compared to a traditional sale.

A Young Farmer’s Perspective

I recently connected with Jake Martinez, a 29-year-old who started a 180-cow operation in central Minnesota in 2022. His take on all this was eye-opening.

“I’m watching neighbors who’ve been farming for 40 years walk away with tax-free gains while I’m trying to scrape together enough for a down payment on 80 acres,” Jake told me. “Don’t get me wrong—they earned it. But for someone like me trying to build something from scratch? The entry barriers just keep getting higher.”

Jake’s financing his expansion through custom heifer raising and a small on-farm cheese operation. “I can’t compete on land acquisition,” he explained. “So I’ve got to find other ways to build equity. Direct marketing, value-added production—that’s where young farmers like me have to look for opportunities.”

His perspective highlights something important: while Section 1232 helps retiring farmers maximize their exit value, it’s creating an even wider gap for the next generation trying to get started.

How Word Is Spreading Through the Industry

What’s really accelerated this trend is the education happening through agricultural networks. The National Agricultural Law Center at the University of Arkansas reported in its FY2024 annual report that it hosted 16 webinars attended by over 2,400 people. Sessions on agricultural bankruptcy and debt management are drawing standing-room-only crowds at farm conferences these days.

Joe Peiffer, who runs Ag & Business Legal Strategies in Iowa—he grew up on a Delaware County dairy farm himself—has been particularly vocal about this. He makes a good point: “The producers who are decisive and adapt to changing conditions have the best opportunity to remain viable.”

There’s also Russell Morgan, an agricultural consultant in Arkansas, who’s been working with Chapter 12 trustee Renee Williams to educate Mid-South farmers. I heard their April 2025 webinar drew a huge crowd—dairy and row crop producers all trying to understand their options.

What the Lenders Are Thinking

Now, you might wonder what lenders think about all this. Bob Mikell from AgSouth Farm Credit shared some interesting thoughts at the recent Mid-South Agricultural and Environmental Law Conference.

He basically said they’d rather see a farmer successfully reorganize through Chapter 12 than lose everything in foreclosure. If Section 1232 helps someone right-size their operation and keep farming, he sees that as better for everyone involved.

That’s not universal, of course. Some commercial banks aren’t thrilled about strategic Chapter 12 filings by solvent borrowers. But the Farm Credit System—they hold about 47% of total farm real estate debt according to USDA’s Economic Research Service—seems to be taking a pretty pragmatic approach to the whole thing.

Looking North: How Canada Does Things Differently

It’s worth comparing our situation to what’s happening in Canada, because it really highlights the trade-offs we’re dealing with. Statistics Canada shows Canadian dairy farms maintain debt-to-asset ratios around 0.191—that’s about half what we typically see in comparable U.S. operations. Bankruptcies? They’re basically non-existent up there.

While we’re dealing with volatility and needing various support programs, their supply management system provides built-in stability. But—and this is a big but—that stability comes at a cost. Canadian Dairy Commission data from November 2024 shows quota costs running CAD $24,000 to $58,000 per cow’s worth of production capacity. A typical 100-cow operation needs $3-5 million just in quota before they buy their first animal. And consumers? They’re paying CAD $1.07 per liter for milk.

Meanwhile, we’ve got the freedom to expand and chase export markets. U.S. Dairy Export Council data shows we hit $8.22 billion in exports in 2024. But with that freedom comes the volatility that’s driving these bankruptcy patterns we’re seeing.


Country/Region
Entry BarrierProducer Age (avg)Bankruptcy IncidenceMilk Price (USD/L)Export RatioKey Challenge
Canada (Quota)$30,000/cow quota55+Rare$0.80-1.10<10%High startup cost
USA (Free Market)$400,000+ down60+Up 55% (2024)$0.40-0.6015%+Volatility, consolidation
Texas/Idaho (Efficiency)Leased land, $250K+ equity50-58Low, not equity-driven$0.40-0.5520%+Scale, tech adoption

The Personal Side of These Decisions

I think it’s important to acknowledge something here: not everyone’s comfortable with strategic bankruptcy, even when the math makes perfect sense.

A producer from Fond du Lac County recently told me that his grandfather would “roll over in his grave” if he filed for bankruptcy, regardless of the circumstances. “In his day, you paid your debts, period.” That sentiment’s real, and it matters in our communities.

At the same time, Jamie Dreher from Downey Brand LLP made a good point at the Western Water, Ag, and Environmental Law Conference this past June. Congress designed Section 1232 specifically to help farmers transition without getting crushed by tax obligations. Using a tool that was created for your exact situation? There’s no shame in that.

It’s a deeply personal decision. There’s no right answer that works for everyone’s values and circumstances.

Where This Is All Heading

Looking ahead, several trends are becoming pretty clear. Dr. Ani Katchova at Ohio State’s Department of Agricultural, Environmental, and Development Economics thinks that by 2030, strategic bankruptcy planning might become just another standard option we discuss in farm transition planning, right alongside traditional succession strategies.

We’re likely to see continued geographic consolidation. States with high land values will keep seeing farms exit through tax-advantaged bankruptcy, with that land flowing to the remaining large operations.

Meanwhile, production’s going to keep concentrating in states like Texas and Idaho, where operations focus on efficiency rather than land equity. USDA data shows Texas already surpassed Idaho as the number three milk-producing state in 2025—they’ve grown 190% since 2001.

For young farmers trying to get started? It’s getting tougher. Iowa State’s Beginning Farmer Center reports that the traditional path—building wealth through dairy excellence over 20-30 years—is becoming nearly impossible in high-land-value regions.

Practical Thoughts for Producers

If you’re weighing your options, here’s what I’d suggest thinking about.

First, really understand your complete financial picture. Not just your cash flow, but your land equity position too. The Federal Reserve has some good agricultural finance calculators that can help you see how interest rate changes affect your debt service.

And honestly consider whether downsizing might actually strengthen your operation’s viability.

Get professional advice early—and I mean early, not when you’re in crisis mode. Find agricultural financial advisors who understand Chapter 12 provisions. IRS Publication 225 has farmer-specific guidance that’s worth reading regardless of what you decide.

Consider all your restructuring options:

  • Traditional refinancing might work
  • Maybe partial asset sales make sense
  • Strategic Chapter 12 filing could be right if your situation aligns
  • Or planned succession—even if it’s not to the family—might be the answer

And recognize that the landscape has fundamentally shifted. Higher interest rates have changed the game. Strategic downsizing isn’t failure—it’s adaptation. If you’ve been farming for decades and you’re ready to retire, that’s an achievement, not a defeat.

For younger farmers and those looking to expand, the playbook’s different. In regions where land values are not appreciating, excellence in milk production remains your primary path. Think about lease-based expansion models that don’t tie up all your capital in land. Look at emerging dairy regions where entry costs are still manageable.

You’ve got to plan for different wealth-building strategies now. Land appreciation might not provide what it did for previous generations. Consider diversifying income streams beyond traditional dairy production. Value-added processing, direct marketing—these might be where your opportunities are.

The Bottom Line

What we’re discovering about Chapter 12 bankruptcy reflects broader changes in American agriculture that we’re all navigating together. That provision Congress passed in 2017 to help struggling farmers? It’s evolved into something more complex—a financial planning tool that rewards strategic thinking about asset management as much as farming excellence.

Is that good or bad? Honestly, it depends on your perspective. For farmers who’ve built substantial equity over decades, Section 1232 provides a path to capture that value as they transition out. For communities, it can mean orderly succession instead of crisis liquidation.

But it also highlights some uncomfortable truths about modern dairy economics. When tax-advantaged bankruptcy can be more profitable than continuing to milk…when land ownership matters more than production efficiency…well, we’ve got to ask ourselves some fundamental questions about where the industry’s headed.

The 55% surge in Chapter 12 bankruptcies isn’t simply a crisis or a loophole. It’s farmers adapting to new economic realities with the tools available. Understanding these tools—how they work, what they mean, when they make sense—that’s going to be essential for anyone navigating dairy’s evolving landscape.

As that Wisconsin producer preparing for a strategic Chapter 12 filing told me: “I’ve milked cows for 35 years. I’m not failing—I’m choosing the smartest path forward for my family with the rules as they exist. If that means using bankruptcy court to maximize our retirement after decades of 4 a.m. milkings, I’m at peace with that decision.”

That sentiment—practical, unsentimental, focused on optimal outcomes—pretty much captures how American dairy farmers are approaching this transformation. The old stigmas about bankruptcy? They’re fading. What’s replacing them is a new pragmatism where strategic financial planning matters as much as picking the right bull for your breeding program or getting your ration formulation dialed in.

For better or worse, that’s the new reality we’re dealing with. And understanding it? That might just be the difference between thriving and merely surviving in the years ahead.

KEY TAKEAWAYS:

  • The $228,000 Opportunity: Section 1232 transforms Chapter 12 bankruptcy into a tax-saving tool—farmers selling 200 acres can keep $1.54M versus $1.31M in traditional sales by discharging capital gains taxes as unsecured debt
  • Strategic, Not Crisis: The 55% bankruptcy surge represents planned exits by farmers facing 8% interest rates and compressed margins, not business failures—these are profitable operations choosing smart transitions
  • Winners and Losers: Benefits farmers 60+ with appreciated land in high-value states (Iowa: $10,200/acre); offers nothing for lease-based operations or young farmers trying to enter
  • Timing Is Everything: This strategy requires filing bankruptcy BEFORE selling land—farmers should consult specialized ag attorneys early, not wait for a crisis
  • Industry Transformation: This trend accelerates dairy’s shift from land-wealth to operational efficiency, with production consolidating in states like Texas, where success depends on milk per cow, not land appreciation

Editor’s Note: This article draws on interviews with dairy producers across Wisconsin, Arkansas, Iowa, Texas, Minnesota, and the Northeast conducted between September and October 2025. Some producers requested anonymity to discuss sensitive financial matters candidly.

Complete references and supporting documentation are available upon request by contacting the editorial team at editor@thebullvine.com.

Learn More:

  • The Ultimate Guide to Dairy Farm Succession Planning – While the main article explores bankruptcy as a final exit strategy, this guide provides a proactive roadmap for a successful farm transition. It details strategies for communication, financial structuring, and legal planning to preserve the family legacy and business continuity.
  • Decoding Dairy’s Crystal Ball: Top 5 Economic Trends Producers Must Watch – This strategic analysis dives deep into the market forces—like interest rates and input costs—driving the financial pressures mentioned in the main article. It provides critical context for anticipating market shifts and positioning your operation for long-term resilience.
  • Beyond the Bulk Tank: How Value-Added Dairy Is Creating Bulletproof Businesses – For producers seeking alternatives to the land-equity model, this article reveals how to build a more resilient business through direct marketing and on-farm processing. It offers a tangible path for young farmers to build equity and insulate their profits from commodity volatility.

The Sunday Read Dairy Professionals Don’t Skip.

Every week, thousands of producers, breeders, and industry insiders open Bullvine Weekly for genetics insights, market shifts, and profit strategies they won’t find anywhere else. One email. Five minutes. Smarter decisions all week.
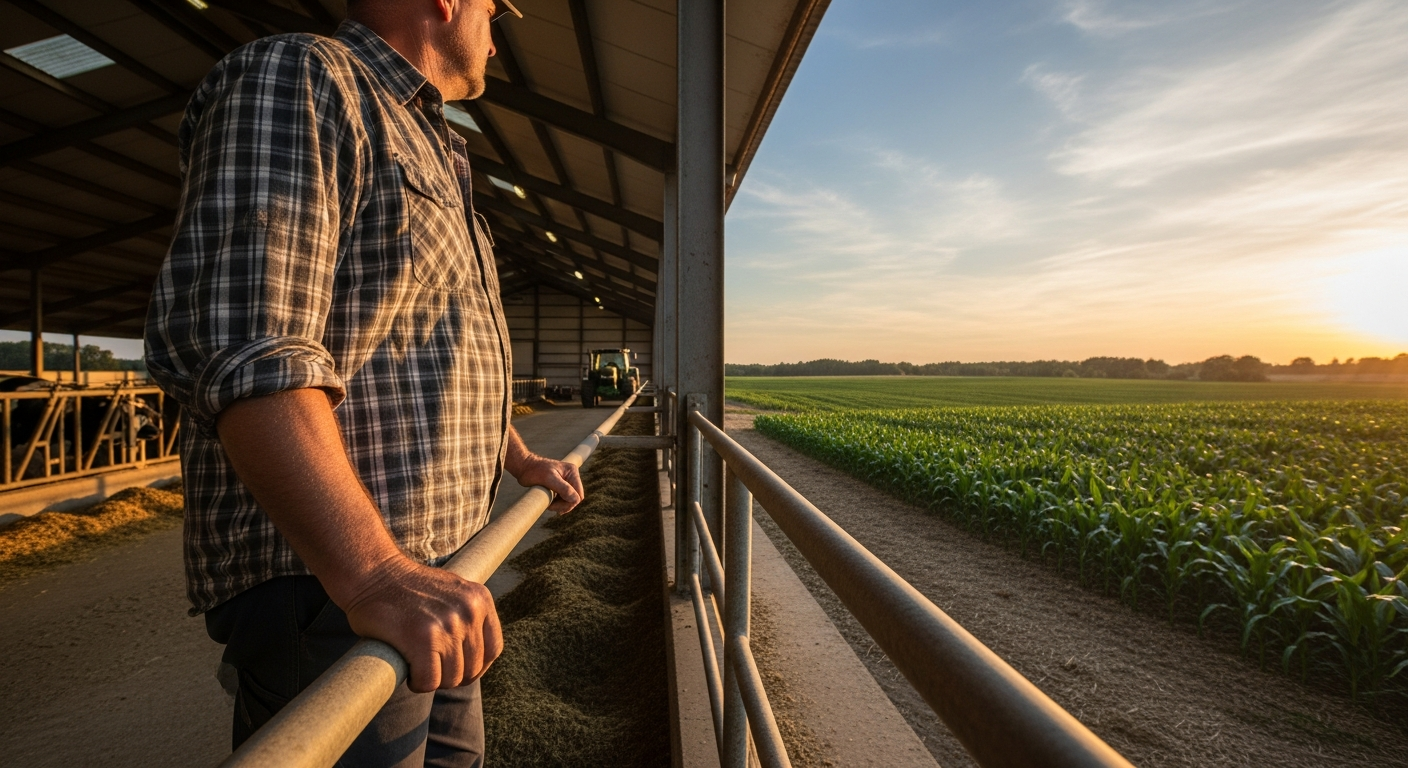
NewsSubscribe
First
Last
Consent

Six Men Died in a Manure Pit This August. Here’s the $450 Fix That Could Have Saved Them

How the August tragedy at Prospect Valley Dairy reveals critical gaps in manure storage safety protocols—and the practical steps farms are taking to protect workers

Executive Summary: Six experienced dairy workers died in a Colorado manure pit this August—five of them trying to rescue each other, a pattern that causes 60% of confined space deaths. The tragedy exposed an uncomfortable truth: oil and gas operations face identical hydrogen sulfide hazards but prevent deaths through mandatory protocols, while dairy farms still treat these as accidents. Manure pits, especially with gypsum bedding, can produce H₂S levels that kill in seconds—up to 40 times the lethal threshold. Prevention costs less than treating mastitis: $450 for monitors, $1,800 for retrieval equipment, and free Extension training. But what actually changes behavior is asking yourself whether you’d send your own kid into that pit with your current safety measures in place. If that makes you uncomfortable, you know what needs to change today.

You know, when six men died from hydrogen sulfide exposure at Prospect Valley Dairy in Keenesburg, Colorado, on August 20, it sent a different kind of shockwave through our community. We’ve all dealt with equipment failures, weather disasters, and market crashes. But this? This hit differently.

The Weld County Coroner confirmed on October 30 what many of us suspected—all six victims died from hydrogen sulfide exposure in a confined space during what should’ve been routine maintenance work. And here’s what’s keeping me up at night: these weren’t greenhorns. We lost Ricardo Gomez Galvan, 40, the dairy manager. Noe Montañez Casañas, 32, assistant dairy manager. Jorge Sanchez Pena, 36, who managed services for High Plains Robotics. Alejandro Espinoza Cruz, 50, an experienced service technician, along with his two sons—17-year-old Oscar Espinoza Leos and 29-year-old Carlos Espinoza Prado.

What I’ve learned from sources familiar with the incident—Denver7 did some solid reporting on this—is that maintenance work was being performed on underground manure storage when a worker may have accidentally activated a valve or pump. That triggered a massive release of hydrogen sulfide. When the first person collapsed, the others rushed in attempting a rescue.

Here’s the thing that really gets me: Denver7 reported that a supervisor on-site was screaming at workers not to enter. But you know how it is—when you see someone you work with every day gasping for air, that instinct to help overrides everything. Dennis Murphy, up at Penn State, has been documenting this for years, and his research shows this “would-be rescuer” pattern accounts for about 60% of confined space fatalities nationally. Sixty percent. Think about that.

What Oil and Gas Has Already Figured Out

Safety StandardOil & Gas IndustryDairy Industry (Typical)Gap/Risk
H2S Entry Threshold<5 ppmOften not definedNo baseline safety
No Entry Above50 ppm (strict)No standard setUnlimited exposure
Gas Testing RequiredAlways mandatoryFrequently skippedWorkers unprotected
Atmospheric MonitoringContinuous real-timeRarely implementedNo early warning
Worker TrainingMandatory pre-workOften optionalLack of awareness
Rescue EquipmentRequired on-siteRarely presentNo rescue capability
Violations ConsequenceImmediate terminationWarnings onlyNo accountability

Maria Espinoza’s comment to Colorado Public Radio really stuck with me. She lost her husband, Alejandro, and both their sons in this tragedy, and she pointed out something we need to hear: her other son works in oil and gas and received extensive toxic gas training before he could even approach a wellhead. As she put it, everything they do with toxic gases is impossible to do without protection because it’s so dangerous.

So why don’t dairies have that same commitment?

I pulled up Chevron’s publicly available confined space standards—you can find them online if you’re curious—and it’s eye-opening. They require H₂S levels below five ppm for safe entry. That’s half OSHA’s standard, by the way. Above 50 ppm? No entry allowed, period. No exceptions, no “we’ll just be quick about it.”

What’s interesting is the difference isn’t technology or even cost. They’ve simply made safety completely non-negotiable. A roughneck who skips atmospheric testing gets fired, no questions asked. Can we honestly say the same on our operations? I know I couldn’t until recently.

This comparison matters because—and this is what many of us miss—oil and gas faces the exact same hydrogen sulfide hazards we do. Same deadly gas, same confined spaces. But they treat it as a predictable, manageable risk requiring systematic controls. Meanwhile, we’re still treating these incidents as unforeseeable “accidents.” They’re not.

Understanding What We’re Really Dealing With

I’ve been around manure pits my whole life, and I’ll bet many of you have, too. But what’s interesting here is how hydrogen sulfide plays tricks on our senses in ways most of us never learned about.

At low concentrations, H₂S smells like rotten eggs. We all know that smell. But once it hits about 100 parts per million, it actually paralyzes your olfactory nerves. You literally can’t smell the danger anymore. Your body’s warning system shuts off right when you need it most.

From a rotten-egg smell to unconsciousness in one breath: This is why you can’t trust your nose around manure pits. At 100 ppm, H2S paralyzes your olfactory nerves—you literally can’t smell the danger anymore, even as concentrations climb to instantly fatal levels.

The National Institute for Occupational Safety and Health has benchmarks we all need burned into memory:

  • 10 ppm: That’s OSHA’s permissible exposure limit for an 8-hour workday
  • 100 ppm: Immediately dangerous to life and health—this is where smell disappears
  • 500-700 ppm: You’re staggering and collapsing within 5 minutes
  • 700-1000 ppm: Unconscious within 1-2 breaths
  • Above 1,000 ppm: Death is nearly instantaneous

Now here’s what really caught my attention. Eileen Wheeler’s team at Penn State has been monitoring dairy farms across Pennsylvania for years, and they’ve found that manure pits—especially those containing gypsum bedding—can produce hydrogen sulfide concentrations 17 to 39 times these fatal thresholds during agitation. We’re not talking about slightly over the limit. We’re talking about concentrations that kill in seconds.

The Gypsum Connection Nobody Saw Coming

This development really surprised me when I first learned about it. Gypsum bedding has become pretty popular over the last decade, and honestly, for good reasons. It absorbs moisture like nothing else, maintains that neutral pH cows prefer, and I’ve seen operations cut their mastitis incidence dramatically after switching. Plus, with lumber prices these days, recycled wallboard gypsum can be a real money-saver. Many Wisconsin operations have been using it with great success—from a cow comfort perspective.

But here’s what Wheeler’s research team discovered that should concern all of us: farms using gypsum bedding showed dangerous levels of hydrogen sulfide during manure agitation. Farms using traditional organic bedding—sawdust, straw, that sort of thing? Almost no H₂S release at all.

The chemistry, once you understand it, makes perfect sense. Under those anaerobic conditions in your manure storage, sulfate-reducing bacteria—mainly Desulfovibrio species, if you want to get technical—convert gypsum’s calcium sulfate into hydrogen sulfide gas. Lab work has shown that adding just 1% gypsum to cattle slurry can increase H₂S levels to nearly 4,000 ppm. That’s 40 times what NIOSH considers immediately dangerous to life and health.

The cow comfort choice that’s killing workers: Gypsum bedding slashes mastitis but produces H2S concentrations 20 times higher than sawdust or straw. Pennsylvania research found gypsum-containing manure storages hitting 100+ ppm during agitation—well into the ‘immediately dangerous to life’ zone. 

Mike Hile put it simply when I talked to him about this: “Any time you work around manure storage, it is dangerous, but gypsum elevates the level of hydrogen sulfide. We want people to be aware of the hazards.”

Now, I’m not saying abandon gypsum if it’s working for your herd health. What I am saying is that if you’re using it, you need different safety protocols than your neighbor using sawdust. It’s worth noting that several insurance companies are starting to ask about bedding types in their risk assessments. That should tell us something.

Practical Steps Dairy Operations Are Taking

The agitation death window: H2S concentrations spike from 5 ppm to 120 ppm within 30 minutes of starting agitation—a 24-fold increase that turns a routine task into a lethal environment. Penn State researchers found the highest gas levels occur in the first hour, with peaks at 30 minutes. 

I’ve been talking to operations across the Midwest since August, and what’s encouraging is seeing farms take concrete action. Here’s what’s actually working:

Changes You Can Make Today—And I Mean Today

Lock Down Your Confined Spaces

Walk your operation this afternoon. I’m serious—put down this article and do it if you haven’t already. Get your supervisors together and identify every single confined space. Your underground pits, obviously, but also above-ground tanks, those old concrete silos, feed bins, and even that bulk tank if someone has to crawl inside to clean it. Mark them all.

Then make this announcement, and make it stick: “Nobody enters any confined space without my direct authorization. If someone collapses, you don’t enter. You call 911.”

I know of several operations that went through this after near-misses, and they now treat violations as immediate termination offenses. Their incident rates? Dropped from double digits down to under 4%. That’s not a typo.

Order Gas Monitors Now

I called around to suppliers this week. BW Technologies makes a four-gas monitor that runs about $450 through Grainger. The Dräger X-am 2500 is around $650. Both detect oxygen, hydrogen sulfide, carbon monoxide, and methane. Most industrial safety suppliers offer next-day shipping to dairy regions—I had mine the next afternoon.

Here’s the thing that should motivate you: that’s less than the average workers’ comp claim for agricultural injuries, which the National Safety Council puts at over $40,000. We’re talking about equipment that costs less than a decent set of tires for your mixer wagon.

For those wondering about ongoing costs, calibration gas runs about $85 per bottle and lasts 6-12 months, depending on use. Most manufacturers recommend bump testing weekly—it takes only 2 minutes. My milkers do it while they’re waiting for the parlor to fill.

Have the Hard Conversation

Gather everyone who works on your place. And I mean everyone—your milkers, your feeder, that high school kid who helps on weekends, the nutritionist who comes monthly. If they set foot on your operation, they need to hear this.

Tell them exactly what happened in Colorado. Be blunt about it. Then drill in three things:

  1. Someone down in a confined space? You don’t go in. You call 911.
  2. Nobody approaches manure storage without testing the air first.
  3. Don’t understand English? Speak up now. We’ll get Spanish training.

Tom Schaefer from the National Education Center for Agricultural Safety has been taking their confined space rescue simulator around the country for years. What he’s found—and this is crucial—is that the biggest challenge is overriding that rescue instinct. You have to give workers something else to do, like operating retrieval equipment, or they’ll go in anyway. Human nature is powerful.

Your 30-Day Action Plan

Get Your Paperwork Right

OSHA regulation 29 CFR 1910.146 requires written confined space procedures. Now, I know paperwork isn’t fun, but your Extension office has templates that make this painless. Dennis Murphy at Penn State has developed some excellent ones, and Cheryl Skjolaas at Wisconsin has materials specifically for dairy operations. Iowa State’s ag safety team has good resources, too. The key elements are atmospheric testing results, equipment checks, and rescue procedures—all documented before anyone goes in.

Buy Retrieval Equipment

Tripod and winch setups from companies like 3M Fall Protection or Miller by Honeywell run $1,500-3,000. That gets you the tripod, a 50-foot winch cable rated for 310 pounds, and a full-body harness. FallTech makes an entry-level system for about $1,800 that several Wisconsin dairies tell me works really well in our conditions.

As one safety investigator with decades of experience told me, the retrieval system lets you channel that rescue instinct into something that actually saves lives instead of creating more victims. Think about it—if High Plains Robotics had retrieval equipment staged that day, maybe we’d be telling a different story.

Schedule Real Training

Most states offer free Extension training. Wisconsin’s program through UW-Madison includes hands-on practice—they bring the equipment right to your farm. Michigan State trains hundreds of workers annually. The Texas A&M AgriLife Extension team has developed excellent bilingual training specifically for Hispanic workers, and they’ve reached thousands over the past few years.

If your state doesn’t have strong offerings—and I know some don’t—the National Safety Council offers online confined space training for around $195 per person. It’s worth every penny.

Learning from Farms Getting It Right

Let me share what I’m hearing from operations that have made safety transformation work.

One Nebraska dairy I know—they milk about 850 cows—had a near-miss a couple of years back where an employee lost consciousness near their reception pit. Fortunately, he was outside where fresh air revived him. But it was a wake-up call. They spent about $15,000 total on monitors for every building, retrieval equipment at both pits, and professional training for all 30 employees. Their insurance company—one of the big agricultural mutuals—cut their premiums substantially. The safety investment basically paid for itself in the first year.

But what really changed was the culture. They now start every shift with what they call a “safety minute”—just checking in about hazards for that day’s work. Are we agitating today? Anyone working near the pits? New people on site who need orientation? The owner tells me it’s actually made them more efficient, not less. When people feel safe, they work better. Simple as that.

Another operation I’m familiar with in Minnesota implemented what they call “Stop Work Authority” after attending a safety workshop. Any employee—from the newest hire to the herd manager—can stop any job if they see a safety issue. No questions asked, no punishment, no grief about it later. They’ve used it several times over the past couple of years, and each time it prevented what could have been serious incidents.

The Economics Nobody Wants to Discuss

Look, I know what you’re thinking. Money’s tight, milk price is volatile, and here’s another expense. So let’s be real about the numbers.

Research from the University of Texas School of Public Health lays it out pretty clearly:

  • Average dairy injury workers’ comp claim: Over $40,000
  • Cost of a workplace fatality, including indirect costs: Over $1 million
  • OSHA serious violations: Up to $161,323 as of 2025
  • Comprehensive safety program implementation: $10,000-25,000, depending on operation size
The math is brutal and simple: A $450 gas monitor costs less than treating a bout of mastitis, yet one workplace fatality runs over $1 million in direct and indirect costs. Nebraska dairy that spent $15K on full safety package? Insurance cut paid for it in 12 months.

But here’s what’s harder to quantify—can you find workers after a fatality? What happens to your milk contract if you’re shut down during an investigation? How does your community look at you?

I’ve talked to three operations that had fatalities in the last decade. They all say the same thing: finding workers afterward was their biggest challenge. One operation told me they had to increase wages significantly across the board just to get applicants. The financial hit lasted years.

What This Means for Different Types of Operations

If you’re running a smaller dairy (under 100 cows): Your close relationships with everyone on the farm are actually an advantage. The safety conversations might be easier because everyone knows everyone. But the equipment is just as necessary. And remember, OSHA’s small farm exemption only applies to operations with 10 or fewer employees—it doesn’t exempt you from liability if someone gets hurt.

For mid-size operations (100-500 cows): You’re in that tough spot where you’re too big for everyone to know everyone, but maybe not big enough for dedicated safety staff. Consider sharing resources with neighboring farms. I know of three farms in Wisconsin that went together on confined space rescue equipment they share. Cost each farm a fraction of what they’d have paid individually, and they train together quarterly.

Large dairies (500+ cows): Your challenge is consistency across shifts and with contractors. Prospect Valley had High Plains Robotics doing service work—that contractor relationship adds complexity. Every shift, every crew, every contractor needs the same standards. Consider appointing safety champions on each shift—workers who get extra training and maybe a small pay bump to help maintain standards.

Custom operators and contractors: You folks are walking onto different farms every day, each with its own hazards. You need portable equipment and—this is crucial—the authority to refuse unsafe work. Several states have developed model safety policies for custom applicators that are worth looking into.

For operations outside North America or those without strong Extension services nearby, online resources from the National Safety Council, OSHA’s website, and university programs offer downloadable materials. Many are available in Spanish, and some in other languages too.

Moving Forward: What Actually Changes Behavior

The heartbreak behind the statistics: 60% of confined space deaths are would-be rescuers who rushed in to save a coworker without proper equipment. At Colorado’s Prospect Valley Dairy, five of six victims died trying to rescue each other—the exact pattern NIOSH has documented for decades. 

After reviewing dozens of successful safety transformations, here’s what I’ve noticed actually works:

Make it personal. One milker told me, through a translator, that when his supervisor explained the retrieval equipment was so his kids wouldn’t lose their dad, like those families in Colorado, everything clicked. Safety became about family, not rules.

Start small, but start now. You don’t need a perfect system tomorrow. But you need something better than what you have today. Even just buying monitors and requiring their use is progress.

Learn from near-misses. Every farm that successfully transformed its safety culture had stories of close calls that became teaching moments rather than secrets. Create an environment where people can report near-misses without fear.

Share what works. This isn’t competitive intelligence—it’s keeping our people alive. If you find a training program that really resonates with your Hispanic workers, tell your neighbor. If a certain monitor brand holds up better in our conditions, spread the word.

Quick Reference: Resources That Can Help

For immediate help setting up protocols:

  • Your state Extension safety specialist
  • OSHA Consultation: 1-800-321-OSHA (it’s free for small businesses)
  • National Education Center for Agricultural Safety: (319) 557-0354

Equipment suppliers who understand ag:

  • Grainger: 1-800-GRAINGER
  • MSA Safety: 1-800-MSA-2222
  • Industrial Scientific: 1-800-DETECTS

Visual resources: Search online for “confined space retrieval equipment setup” or “H2S concentration effects chart” for diagrams that complement this information.

What Happens Next

The six men who died in Colorado—Ricardo, Noe, Jorge, Alejandro, Oscar, and Carlos—they weren’t statistics. They were the guys who kept operations running, who knew which cows were off feed before anyone else noticed, who could fix that temperamental mixer wagon when nobody else could.

Their deaths were preventable with technology that costs less than we spend on hoof trimming and protocols that have been available for decades. The question now is what we do with that knowledge.

You can finish reading this, feel bad for a few days, then go back to business as usual. Or you can pick up the phone, order those monitors, and start changing how your operation values safety. Not eventually. Not after you talk to your banker. Today.

Every dairy owner needs to ask themselves: would I send my own kid into that pit with our current safety measures in place? If the answer makes you uncomfortable, you know what needs to change.

The technology exists. The knowledge exists. The training exists. What’s needed now is the decision that no production goal, no maintenance deadline, no economic pressure is worth the price of someone not coming home.

That’s a decision each of us has to make. And after Colorado, we can’t pretend we didn’t know better.

Key Takeaways for Your Operation

Looking at everything we’ve learned from Prospect Valley and farms that have successfully improved their safety:

  • Every dairy with manure storage faces these hazards—size and experience don’t eliminate risk
  • Bedding choices have safety implications—if you’re using gypsum, you need enhanced protocols
  • The technology is affordable—we’re talking about monitors that cost less than a decent bull calf
  • Culture beats compliance every time—workers follow what management demonstrates, not what’s written in the manual
  • Training must be ongoing and hands-on—that safety video from 2015 isn’t cutting it anymore
  • Engineering controls beat willpower—make the safe choice the only available choice

Complete references and supporting documentation are available upon request by contacting the editorial team at editor@thebullvine.com.

Learn More:

The Sunday Read Dairy Professionals Don’t Skip.

Every week, thousands of producers, breeders, and industry insiders open Bullvine Weekly for genetics insights, market shifts, and profit strategies they won’t find anywhere else. One email. Five minutes. Smarter decisions all week.

NewsSubscribe
First
Last
Consent

December 1 Deadline: How Cutting 15% of Your Herd Could Add $40,000 to Your Bottom Line

Dairy’s best kept secret: The farms shrinking on purpose are the ones making money. Here’s the $165K proof.

Executive Summary: A Wisconsin dairy farmer cut 150 cows and made $165,000 MORE—proving that in today’s market, strategic shrinking beats growing. With mega-dairies producing at $13/cwt versus your $23/cwt, that $10 spread is mathematically insurmountable through volume. December 1’s new protein requirements (3.3% baseline) will either cost you $8,640 in penalties or earn you $40,000+ in premiums—depending on what you do in the next 31 days. The winning formula: cull your bottom 15% to cut costs immediately, then optimize components through amino acid supplementation for premium capture. This article delivers a tested 90-day playbook with specific actions, real costs, and realistic timelines that have already transformed dozens of operations. Your choice is simple but urgent: adapt now, pivot to alternatives, or exit while you still can.

Strategic Culling Dairy

Part One: The Squeeze Is Real—And Getting Worse

You know that feeling when you’re caught between a rock and a hard place? That’s exactly where mid-size dairy operations sit right now. And if you’re running 200 to 600 cows, you’re probably feeling it every time you look at your milk check.

Let me paint you a picture with some hard numbers from the USDA’s latest Census of Agriculture, released in February. Between 2017 and 2022, we lost 15,866 dairy farms. During that same time? Milk production actually went UP five percent.

How’s that math work? Well, you probably know this already, but it’s worth saying—the big got bigger. Much bigger.

The brutal math of consolidation: 15,866 farms disappeared (29% loss) while milk production rose 5%—proof that 834 mega-dairies now control nearly half of America’s milk supply

Year
FarmsChangeProduction IndexMega Share %
201754,59910042%
201851,050-3,54910143%
201947,235-3,81510244%
202043,410-3,82510345%
202140,100-3,310103.545.5%
202238,733-1,36710546%

The Brutal Economics of Scale

So I visited one of these mega-operations in Texas last spring. Twelve thousand cows. Robotic systems everywhere. The whole nine yards.

Here’s what’s interesting—their CFO, who came from the oil industry, actually, showed me their numbers. Thirteen dollars per hundredweight all-in production costs. Thirteen.

Now, I don’t know about your operation, but Cornell’s PRO-DAIRY program has been tracking costs for typical 100-200 cow herds, and they’re seeing around $23 per hundredweight. That’s… that’s a problem.

The brutal economics of scale: Mega-dairies operate at $13-17/cwt while mid-size farms struggle at $23/cwt—a $10 gap that volume alone cannot bridge

Farm Size
Cost/CWTStatus
10-49 cows$33.54Loss
50-99 cows$27.77Loss
100-199 cows$23.68Loss
200-499 cows$20.85Loss
2,500+ cows$17.22Profit

At today’s Class III price—what was it this morning, $17.40 on the CME?—smaller operations are losing close to six bucks per hundredweight. Meanwhile, these mega-dairies? They’re making over four dollars.

That’s a ten-dollar spread, folks. Ten dollars!

“I realized I was trying to compete on volume with operations ten times my size. Can’t win that game. So I changed the game—focused on profit per cow, not gallons in the tank.” — Wisconsin dairy farmer who cut his herd from 1,200 to 1,050 cows

And here’s the thing that keeps me up at night—it’s not that these big operations are doing anything wrong. They’re just playing a different game entirely. Feed costs alone, they’re saving $2-3 per hundredweight through direct commodity purchases. Labor efficiency? Another couple of bucks saved. It adds up fast.

The Geographic Earthquake Nobody’s Talking About

While you’re wrestling with those economics, something else is happening that’s maybe even more important. The entire industry map? It’s being redrawn under our feet.

You’ve probably heard about the new processing capacity—Rabobank’s September report put the investment range at $8 to $11 billion. Biggest buildout since the 1990s. But here’s the kicker that nobody really wants to talk about—these plants aren’t where the milk traditionally has been.

Take Hilmar’s new Dodge City facility out in Kansas. Or Valley Queen’s expansion up in South Dakota. These aren’t small operations, folks. They need milk—lots and lots of milk.

And where’s it coming from? Well, USDA’s latest production report tells the story:

Texas added 50,000 cows this past year. Fifty thousand! Kansas jumped by 29,000 head. South Dakota gained somewhere between 18,000 and 21,000, depending on which report you look at.

Meanwhile—and this is what Mark Stephenson, Director of Dairy Policy Analysis at UW-Madison’s Center for Dairy Profitability, calls it—older plants in Wisconsin, Minnesota, parts of New York? They’re taking “strategic downtime.” That’s a polite way of saying they can’t compete for milk at current prices.

What I’m hearing from processing plant managers and dairy economists familiar with these operations is that new facilities are running at maybe 50-70% capacity right now, varying by plant, of course. They’re still ramping up, learning their systems, building those supply chains.

But when they hit full throttle—and most analysts I talk to figure that’ll be late 2026—we’re looking at an additional billion pounds of cheese-making capacity.

Just to put that in perspective… that’s about what the entire state of Vermont produces in a year.

Now, the strategies that work in Texas, with its minimal environmental regulations, aren’t the same as those that work in California, with its water restrictions. And our friends in the Southeast, dealing with heat stress, face different challenges than folks up in Vermont, where land costs are through the roof. But the pressure? That’s universal.

Part Two: December 1—The Trigger That Changes Everything

As if the squeeze wasn’t tight enough already, here comes December 1 with Federal Milk Marketing Order changes that’ll turn chronic pressure into an acute crisis for a lot of farms.

According to USDA’s final rule that came out in October—and I spent way too much time reading through all 147 pages of it—baseline protein jumps from 3.1% to 3.3% starting December 1. Other solids move from 5.9% to 6.0%.

Now, that might not sound like much when you’re sitting at the kitchen table. But let me show you what this actually means for your milk check.

The New Component Reality

A typical 200-cow operation that’s been hitting that old 3.1% protein baseline? Come December 1, they’re suddenly eight cents under water per hundredweight. Just like that—penalty instead of baseline.

On the flip side, farms hitting 3.4% protein capture about 28 cents per hundredweight in premiums under the new formulas.

Let’s do the math here—on 200 cows averaging 75 pounds daily, that’s the difference between losing money and gaining around $8,640 annually. That’s not pocket change, as many of us have learned the hard way.

Karen Phillips, who’s an Associate Professor of Dairy Science at UW-Madison, explained something fascinating at last month’s extension meeting in Marshfield. She said cheesemakers need a protein-to-fat ratio of 0.80 for optimal yield. Know what the U.S. average is right now? We’re sitting at 0.77 according to the DHIA data from January through September.

That three-hundredths difference—it doesn’t sound like much, but it forces plants to add nonfat dry milk powder to standardize their cheese vats. Cuts right into their margins. Makes them real interested in paying premiums for the right milk.

December 1 creates a $15,500 spread between winners and losers: Farms hitting 3.4% protein gain $8,000 annually while those at 3.0% lose $7,500—all based on new FMMO baselines
ScenarioProtein/OSPayment ΔAnnual Impact (200 cows)
Below Average3.0% / 5.8%-$0.15/cwt-$7,500
Average3.1% / 5.9%-$0.08/cwt-$4,000
Above Average3.4% / 6.2%+$0.28/cwt+$8,000

December 1 Component Changes at a Glance:

  • Protein baseline: 3.1% → 3.3%
  • Other solids: 5.9% → 6.0%
  • Below baseline = penalties
  • Above baseline = premiums
  • 200-cow herd hitting 3.4% protein = ~$8,640 annual gain

Part Three: Why “Just Make More Milk” Is a Losing Game

Your first instinct might be to ramp up production, right? Get more cows. Push for higher yields. Try to compete on volume.

Don’t. Just… don’t.

Here’s why that strategy is basically suicide for mid-size operations.

You Can’t Out-Scale the Giants

Those 834 mega-dairies with 2,500-plus cows that USDA’s Economic Research Service tracked in their March 2025 report? They’re producing 46% of America’s milk now. Nearly half of our milk comes from fewer than 1,000 farms.

Think about that for a second.

They’ve got feed costs that run $2-3 per hundredweight lower than yours through direct commodity purchases—they’re buying trainloads, not truck loads. Labor efficiency through automation saves them another $2-2.50 based on university cost studies. Capital costs spread across massive production volumes? That’s another buck-fifty to two-fifty saved.

You can’t win that game. I mean, you literally cannot win it. So stop trying.

The Processing Capacity Trap

Michael Dykes, President and CEO at the International Dairy Foods Association—I had coffee with him at September’s Dairy Forum in Phoenix—he told me something really revealing. He said everyone in the industry was terrified there wouldn’t be enough milk for these new plants.

“I kept telling them,” he said, “farmers will respond to market signals.”

Well, respond they did. Boy, did they respond.

But here’s what nobody wants to say out loud at these industry meetings: The IDFA estimates we’ll have a billion pounds of new annual cheese capacity by the end of 2026. Meanwhile, domestic demand? It’s growing at about 1-2% annually, based on USDA consumption data from their July report.

You see the problem here? More milk into an oversupplied market just drives prices lower. You’re literally racing to the bottom.

Part Four: The Real Solution—Shrink to Grow

This brings me to something that happened last February that really opened my eyes. I was talking to this Wisconsin dairy farmer—let’s call him Tom to protect his privacy—standing in his freestall barn outside Shawano. And he tells me something that seemed absolutely crazy at the time.

He was cutting his herd from 1,200 to 1,050 cows. On purpose.

“You’re going backwards,” his neighbors told him at the co-op meeting.

Eight months later? His net income—not revenue, but actual net income—had jumped dramatically. The University of Wisconsin Extension has been documenting these kinds of strategic culling success stories in its dairy management programs, and the results are prompting many people to rethink everything.

Here’s the two-step strategy that’s actually working:

Step One: Strategic Culling (The Foundation)

Victor Cabrera, Professor in the Department of Dairy Science at UW-Madison, has data showing something really interesting—the average farm has 10-12% of cows that are net negative on profitability.

They’re eating feed. Taking up stall space. Requiring labor. Getting bred. But when you actually run the numbers? They’re not paying their way.

Culling these underperformers does two things immediately:

  1. Reduces your costs right away—less feed, less labor, fewer health issues
  2. Mechanically raises your herd’s average production and components

What Tom did with his 150-cow reduction was eliminate his worst performers. The 1,050 cows he kept? Higher average production. Better components. Lower costs per hundredweight. It’s not magic—it’s just math.

Step Two: Component Optimization (The Multiplier)

Once you’ve got a leaner, higher-potential herd, now you optimize for components through amino acid balancing.

Jim Paulson, Dairy Extension Educator at University of Minnesota Extension in St. Cloud—he’s been working with dairy nutrition for decades—he explains it really well: “Most farms overfeed crude protein while being deficient in the specific amino acids that actually drive milk protein synthesis.”

The fix? Rumen-protected methionine and lysine in the right ratio. The Journal of Dairy Science has published extensive research on this over the past couple of years, and the 3-to-1 lysine-to-methionine ratio keeps coming up as optimal.

Brian Perkins, Senior Dairy Technical Specialist with Vita Plus Corporation out of Madison—he’s worked with 47 different herds on this in 2025—told me: “Target a 0.15 to 0.20 percentage point protein increase. Budget $0.10–$0.15 per cow daily. Based on our field trials, you’ll see results in 8-12 weeks.”

On a now-optimized 200-cow herd, that’s maybe $7,000 annually for the supplements. But if it gets you to 3.3% protein or higher, you’re capturing those December 1 premiums we talked about.

I don’t have all the answers here, and finding qualified nutritionists who really understand amino acid balancing can be challenging in some regions. Your best bet is contacting your state Extension dairy team—they can usually connect you with someone who knows this stuff inside and out.

The Combined Effect

Simple math that works: Invest $7k in amino acids, execute strategic culling, breed 60% to beef—capture $153k in combined gains on a 200-cow operation within 12 months

Component
AmountType
Amino Acid Supplements-$7,000Cost
Component Premiums (3.3%+ protein)+$40,000Revenue
Beef-on-Dairy (60% × 120 calves)+$100,000Revenue
Cost Reduction (15% culling)+$20,000Savings
NET PROFIT+$153,000Total

* 200-Cow Operation

Here’s where it gets really interesting:

  • Culling raises your baseline—removing the bottom 15% might boost your average protein from 3.0% to 3.1% just from that alone
  • Amino acid optimization adds another 0.15-0.20 percentage points on top
  • Now you’re at 3.25-3.30% protein—above the new FMMO baseline
  • Your costs dropped through culling
  • Your revenue increased through premiums

That’s how you shrink to grow. And it’s working for operations across the country—though individual results will obviously vary based on your specific circumstances.

Part Five: Your 90-Day Survival Playbook


Phase
DaysAction FocusKey Metric
11-7Face the Truth<$19 survive / >$21 exit
28-30Execute Cull15% reduction
331-45Fix Components$0.10-$0.15/cow/day
446-60Diversify Revenue$100K+ annual
561-75Lock Premiums$40K-$140K/year
676-90Hard Decision85-95% vs 50-65%

Alright, so you understand the problem and the solution. But what do you actually DO? Like, starting Monday morning?

Here’s your tactical roadmap—and I mean this is what you actually need to do, not theoretical stuff:

Days 1-7: Face the Brutal Truth

Calculate your true all-in production cost. Brad Mitchell, Extension Agricultural Economist at Iowa State University, has this worksheet on their dairy team website that makes it pretty straightforward. Use it.

And here’s the part nobody wants to hear—include your own labor at $20 an hour minimum. That’s the median wage for dairy workers according to the Bureau of Labor Statistics as of October 2025. If you’re working 60-hour weeks—and who isn’t?—that’s $62,400 annually you’re not paying yourself.

Critical benchmarks to know:

  • Under $19/cwt: You might survive with some adjustments
  • $19-21/cwt: Major changes needed NOW
  • Over $21/cwt: You need to consider all options, including… well, including exit

Days 8-30: Execute the Cull

Time to identify your bottom 10-15% performers. Look for:

  • Chronic high SCC—anything over 400,000 consistently
  • Repeated health issues—if she’s been treated 3+ times in 90 days
  • Production under 60 pounds a day in early to mid-lactation
  • Poor components—under 2.9% protein consistently

Remove them. Yeah, I know it’s hard. Your daily tank volume will drop. But your profitability will improve immediately. Trust me on this.

Days 31-45: Fix Your Components

Call your nutritionist this week. Not next month. This week.

Tell them you need amino acid balancing targeting:

  • 0.15-0.20 percentage point protein increase
  • Rumen-protected methionine and lysine
  • That 3:1 lysine to methionine ratio we talked about

Budget $0.10 to $0.15 per cow daily. Based on what we’re seeing in the field, you’ll see results in 8-12 weeks.

For sourcing quality rumen-protected amino acids, companies like Adisseo, Evonik, and Kemin have good products—your nutritionist will have preferences based on what’s worked in your area.

Days 46-60: Diversify Revenue

If you haven’t started breeding for beef-on-dairy yet, you’re leaving serious money on the table.

Superior Livestock Auction’s video sales from October 28—I was watching them—show beef-cross dairy calves bringing around $1,400 for 400-pound steers. Straight dairy bulls? You’re lucky to get $150 at the local sale barn.

Here’s the optimal strategy:

  • Top 40% of your herd: Use sexed dairy semen for replacements
  • Bottom 60%: Beef semen all the way

Matt Akins, Beef Specialist at UW Extension’s Marshfield Agricultural Research Station, has calculated that this generates an extra $100,000-plus annually for a typical 200-cow herd. That’s real money.

The beef-on-dairy revolution: $150 dairy bulls vs $1,400 beef crosses—a $1,250 premium per calf that adds $150,000 annually to a 200-cow operation breeding 60% to beef
MetricTraditionalBeef-on-DairyDifference
Per Calf Price$150$1,400+$1,250
Annual Revenue (120 calves)$18,000$168,000+$150,000
Feed EfficiencyBaseline8-25% betterAdvantage
Finishing TimeBaseline20% faster5-26 fewer days
Carcass GradingLower15-25% Prime/ChoicePremium

200-Cow Herd (60% bred to beef)

Now, fair warning—Les Hansen, Professor Emeritus at the University of Minnesota’s Department of Animal Science, keeps reminding everyone that beef prices won’t stay this high forever. USDA’s January 2025 cattle inventory showed we’re at a 73-year lows. When rebuilding starts—probably late 2026—these premiums will shrink. So use this 18-24 month window wisely.

Days 61-75: Lock in Component Premiums

If you can hit 3.3% protein with a 0.80 protein-to-fat ratio, those new cheese plants want your milk. They really want it.

I know of several Wisconsin operations working with processors like Grande and Foremost Farms that just locked in multi-year contracts at anywhere from 40 cents to $1.40 per hundredweight above Federal Order minimums. The exact premium depends on volume commitments, location, quality history—you know, all the usual factors.

On 200 cows, even at the low end, that’s $40,000 annually. At the high end? We’re talking $140,000.

But here’s the thing—these deals are happening NOW. By January, that window probably closes.

Days 76-90: Make the Hard Decision

Look, if you’ve done all this analysis and you still can’t hit profitable benchmarks, it’s time for the conversation nobody wants to have.

Tom Peters, Senior Farm Transition Specialist at Farm Credit Services of America—he’s tracked 127 dairy transitions across the Midwest since 2020. A planned exit over 18-24 months typically preserves 85-95% of asset value. A forced liquidation in crisis? You’re lucky to get 50-65%.

On a typical $4 million operation, that’s the difference between walking away with $3.4 million or $2 million. One sets you up for retirement. The other… doesn’t.

I know this is tough to hear. But ignoring reality doesn’t change it.

Success Stories That Prove It Works

This isn’t just theory, folks. Real farms are making this strategy work right now.

I visited an operation down in Georgia that’s similar to what folks like Sarah Martinez are doing—280 cows on pasture, focused intensively on components. She’s hitting 3.45% protein consistently and has locked in premium contracts with a regional cheese maker. Her costs run about $18.50 per hundredweight—actually profitable at current prices.

“We’re not trying to compete with the big boys on volume,” she told me. “We’re competing on quality and consistency.”

Up in Vermont, I know of operations similar to the Johnson family’s that pivoted to organic about five years ago. Yeah, the transition was brutal—they lost money for three years straight. But now? They’re capturing $35 per hundredweight through Organic Valley with production costs around $28. That’s a healthy margin in anybody’s book.

And there are plenty of mid-size operations maintaining profitability through other unique strategies—direct marketing, agritourism, value-added processing. The point is, there’s more than one path forward.

Tom in Wisconsin? His remaining 1,050 cows are now averaging strong protein levels after working on amino acid balancing. He’s breeding 65% to beef. His costs dropped to about $17.80 per hundredweight after culling those 150 underperformers. At current prices, he’s actually making money. Not a fortune, but enough.

The Digital Edge You Need

What’s encouraging is the technology available now that we didn’t have even five years ago:

Penn State’s DairyMetrics offers a free component optimization app that lets you model amino acid changes before implementing them. Wisconsin’s Dairy Management website, through UW-Madison Extension, offers calculators for everything from culling decisions to heifer inventory optimization.

Several folks I know are using FeedWatch or TMR Tracker software to dial in their rations precisely. When you’re spending $7,000 on amino acids, you want to make sure they’re actually getting into the cows, you know?

And of course, USDA’s Agricultural Marketing Service and the CME Group sites let you track real-time market prices from your phone.

The Bottom Line: Choose Your Path

Look, I’ve been covering this industry for thirty years. This isn’t just another cycle. The combination of mega-dairy economics, geographic shifts, component revaluation, and processing overcapacity—it’s creating a fundamental restructuring of how this industry works.

The whey processors figured this out already. They cut commodity production by about 30%, shifted to high-value products, and created scarcity. CME spot dry whey hit 71 cents per pound last week—a nine-month high—while cheese races toward oversupply.

As Tom told me: “I realized I was trying to compete on volume with operations ten times my size. Can’t win that game. So I changed the game—focused on profit per cow, not gallons in the tank.”

He gets it. The question is, do you?

The decisions you make in the next 90 days will determine which side of 2027 you land on. For some, that means strategic culling and component optimization. For others, it means transitioning to organic or direct marketing. And yes, for some, it means a well-planned exit that preserves wealth.

What’s not an option? Not choosing. Because not choosing is still choosing—it’s just choosing to let the market decide for you.

The clock’s ticking, folks. December 1 is 31 days away.

Time to decide: Will you shift with the market, or get shifted by it?

Key Takeaways:

  • The Volume Game Is Over: With mega-dairies producing at $13/cwt versus your $23/cwt, competing on size is mathematical suicide—the $10 spread is unbridgeable
  • December 1 Deadline Creates Winners and Losers: Hit 3.3% protein to capture $40,000+ in premiums, or face $8,640 in penalties—you have 31 days to pick your side
  • Strategic Culling Pays Immediately: Your bottom 15% of cows are profit vampires—cutting them saves $20,000+ annually while raising your herd average instantly
  • Simple Math, Big Returns: Invest $7,000 in amino acids → boost protein 0.2 points → earn $40,000+ premiums PLUS add beef-on-dairy for another $100,000 = $133,000 net gain
  • Three Honest Options: Transform through the 90-day playbook (works if costs <$21/cwt), pivot to specialty markets (organic/direct), or exit strategically while assets retain 85-95% value—but decide NOW

Resources: Visit your state Extension dairy website for worksheets and calculators. Component optimization apps are available through Penn State DairyMetrics and Wisconsin Dairy Management. For amino acid suppliers, contact your nutritionist. Track markets via the USDA Agricultural Marketing Service and CME Group.

Complete references and supporting documentation are available upon request by contacting the editorial team at editor@thebullvine.com.

Learn More:

  • Navigating Today’s Dairy Margin Squeeze: Insights from the Field – This article reveals practical feed management strategies (5-15% cost cuts) and modern culling benchmarks, offering immediate, actionable tactics to improve efficiency and component production, directly complementing the main article’s 90-day playbook for cost control and herd optimization.
  • USDA’s 2025 Dairy Outlook: Market Shifts and Strategic Opportunities for Producers – Explore how USDA forecasts impact milk production and prices, and discover strategic opportunities in component optimization, processor alignment, and export markets. This provides essential broader market context and long-term planning insights to safeguard your operation’s future profitability.
  • When Butterfat Isn’t Enough: Adapting Your Dairy to New Market Realities – Delve into the role of technology and innovation in component optimization, with insights on RFID systems, automated feeding, and calculating their return on investment across various herd sizes. This article demonstrates how to leverage modern tools to achieve the profitability goals outlined in the main piece.

The Sunday Read Dairy Professionals Don’t Skip.

Every week, thousands of producers, breeders, and industry insiders open Bullvine Weekly for genetics insights, market shifts, and profit strategies they won’t find anywhere else. One email. Five minutes. Smarter decisions all week.

NewsSubscribe
First
Last
Consent

Udder Edema Hits 86% of Heifers: The $3,500 Fresh Cow Problem You Can Actually Fix

That swollen udder costs $63 in lost milk. Add 2.5x mastitis risk? Now it’s $350+. Fix it with $40 in vitamins. The math is simple.

EXECUTIVE SUMMARY: That “normal” swollen udder on your fresh heifer? It’s actually a $400+ problem affecting 86% of first-lactation animals—and you can fix it for $40. Research from Cornell, Wisconsin, and Colorado State proves this isn’t inevitable: simple changes like maintaining BCS 3.0-3.5, separating heifer feeding (skip the anionic salts!), and adding vitamin E and selenium cut incidence in half. The best herds have dropped from 86% to under 40%, saving thousands annually while adding a full lactation to cow longevity. Most operations see measurable results within 60-90 days. With documented returns of 300%, this might be the most profitable hour you’ll invest in your operation this year. The math is simple—the decision should be too.

Udder Edema Prevention

You know that feeling when you’re walking through the fresh pen during calving season? There’s always at least one—that first-calf heifer with an udder so swollen it makes you wince just looking at it. And what do we do? Shrug it off. “That’s just how heifers freshen,” we tell ourselves. Give it a week or two, and it’ll go down, right?

Well, here’s what’s interesting. I’ve been digging into the research on this lately, and what I’ve found is making me rethink everything we’ve accepted as normal. Sarah Morrison’s team at Colorado State has been systematically tracking this, and their work—along with several other studies published in the Journal of Dairy Science over the past five years—shows that about 86% of first-lactation heifers develop udder edema. Compare that to just 56% in mature cows.

That’s not occasional. That’s nearly universal.

And when you start penciling out what this actually costs us… Preliminary estimates suggest that a typical 100-cow herd bringing in 40 replacement heifers annually could face losses ranging from a few thousand to upwards of $16,000 annually. Now, that varies considerably depending on your operation and management system, but still—we’re talking real money here.

First-lactation heifers face dramatically higher udder edema rates (86%) compared to mature cows (56%)—but top herds prove this isn’t inevitable.

Why First-Calf Heifers Get Hit So Hard

So what makes heifers so much more vulnerable than mature cows? It’s worth understanding the physiology here, because once you see what’s happening, a lot of other things start making sense.

These first-lactation animals are basically trying to do three things at once. They’re still finishing their own skeletal growth (because, let’s face it, most of us are breeding them younger than their grandmothers were). They’re often already carrying their second pregnancy. And now they’re trying to figure out how to make milk for the first time. It’s… a lot.

Here’s something that really puts it in perspective—research from Cornell’s Department of Animal Science shows that to produce just one liter of milk, about 500 liters of blood need to pass through the udder. So when you’ve got a heifer suddenly ramping up to 60 liters of daily production? That’s 30,000 liters of blood trying to circulate through tissue that’s never handled anything close to this volume before. The vascular system, the lymphatic drainage… none of it has had time to develop the efficient patterns we see in mature cows.

I was talking with a producer from central Wisconsin last month, and he made an observation that stuck with me: “We’ve been selecting for production so hard that I wonder if we’ve created cows that are almost too good at making milk for their own physiology to handle initially.” You know, looking at the research comparing modern Holstein genetics to historical bloodlines—which shows higher edema incidence in today’s cows—I think he might be onto something.

And then there’s the regional piece of this puzzle. Down in the Southeast, where that summer heat stress is just brutal, producers tell me they’re seeing even higher rates during July and August calvings. Meanwhile, I’ve noticed operations in the Pacific Northwest often report better outcomes with their spring-calving heifers. That milder climate probably helps with the metabolic stress.

What’s interesting is how grass-based systems handle this differently. Producers in Ireland and New Zealand generally report lower overall incidence—though when they do block calving, any problems hit a lot of animals at once. It’s a different management challenge entirely. And for those exploring alternative approaches, while some producers report success with homeopathic remedies, the peer-reviewed research on these methods remains limited.

The Real Economic Impact of Udder Edema in Dairy Cattle

The math is simple: invest $40 per heifer in vitamin E and selenium, prevent $63-350 in losses. That’s a 300% return in 90 days—better than any other investment on your dairy.

You know what makes preventing udder edema in dairy heifers particularly frustrating from a business perspective? It’s not one big obvious expense like a DA or milk fever. It’s death by a thousand cuts, spread across multiple areas where the costs kind of hide.

Research shows affected heifers produce about 316 pounds less milk per lactation. At current prices hovering around $20/cwt (though we all know how that fluctuates), that’s roughly $63 per affected heifer. But here’s where the cost of udder edema in dairy cattle gets worse—when edema triggers secondary problems like udder cleft dermatitis, which happens in about 30% of severe cases, you’re looking at combined losses approaching 1,000 pounds of milk.

Let me walk through what this might look like for that 100-cow dairy with 40 replacement heifers:

  • You’ve got about 34 affected heifers (based on that 86% incidence)
  • Direct production loss: 34 × $63 = $2,142
  • If 30% develop secondary complications: 10 heifers × $137 = $1,370
  • Just in production losses alone, you’re at $3,512 minimum

But wait, there’s more. (Isn’t there always?) Studies tracking thousands of fresh cows show that heifers with udder edema have about 2.5 times higher clinical mastitis rates in their first 30 days. They’re also showing elevated ketone levels, suggesting increased subclinical ketosis risk. Each mastitis case typically runs $300-350 in treatment costs, while ketosis treatment averages around $200 per case—though these numbers vary depending on your protocols and region.

What really concerns me, though, is the long-term structural damage. Severe edema can lead to permanent breakdown of the suspensory ligament. Research tracking culling patterns shows these animals often leave the herd a full lactation earlier than their herdmates. When you’re investing anywhere from $2,000 to $4,000 raising each heifer (depending on your system), and she needs three lactations just to pay that back… early culling due to structural breakdown isn’t just a cow problem. It’s a business model problem.

Most producers who implement comprehensive prevention strategies report seeing measurable results within 60-90 days—and that’s when tracking your incidence rates becomes crucial for measuring improvement.

Cost/Loss CategoryQuantity/RateDollar ImpactNotes
Affected Heifers (86% of 40)34 heifers86% incidence rate from research
Direct Milk Loss per Heifer316 lbs milk$63At $20/cwt milk price
Total Direct Milk Loss34 × $63$2,142Production loss only
Heifers with Complications (30%)10 heifers30% develop secondary issues
Additional Loss from Complications$137 each$1,370Udder scald, dermatitis
Mastitis Risk (2.5x higher)Clinical mastitis$300-350/caseIncreased 2.5x vs healthy
Early Culling Risk (1 lactation early)Per affected heifer$2,000-4,000Loss of raising investment
TOTAL ANNUAL LOSS (Minimum)$3,512Conservative estimate
TOTAL ANNUAL LOSS (Maximum)$16,000Includes all complications
PREVENTION COST per HeiferVit E + Se, 6 wks$40Research-proven protocol
Total Prevention Investment (40 heifers)40 × $40$1,600Entire heifer group
NET SAVINGS (Minimum)Min loss – prevention$1,912After deducting prevention cost
NET SAVINGS (Maximum)Max loss – prevention$14,400Best-case scenario
ROI PercentageReturn on investment300%Realized within 90 days

What’s Actually Working: Prevention Strategies

Now here’s what’s encouraging—and why I wanted to write about this. Operations that have tackled this systematically are seeing real improvements, and the interventions aren’t particularly complex or expensive.

Body Condition: The Foundation

Multiple university research teams have confirmed what many of us suspected: overconditioned cows—those scoring above 3.75 at calving—face about double the risk for udder edema and pretty much every other transition disorder.

StageTarget BCSKey Risk/BenefitManagement Priority
Dry-Off3.0-3.25Establish baseline conditionHigh – Set foundation
3-4 Weeks Pre-Calving2.5-3.0Prevent over-conditioning before close-upCritical – Prevention window
Calving (Target)3.0-3.5Optimal: Balanced immune function & milk productionCritical – Calving health
Calving (Overconditioned Risk)>3.752x risk of transition disorders, reduced feed intakeRed Flag – Immediate intervention
60 Days Post-Calving2.5-3.0Maintain fertility & breeding successHigh – Reproduction target
Maximum Acceptable Loss0.5 unitsLoss >1.0 reduces reproduction efficiencyMonitor closely

The targets are pretty straightforward:

  • Dry-off: 3.0-3.25
  • Calving: 3.0-3.5
  • Maximum acceptable loss postpartum: 0.5 units

But here’s the critical thing—and I learned this the hard way—you can’t fix an overconditioned cow in the close-up pen. A dairy nutritionist from Pennsylvania put it perfectly: “We spent years trying to slim down fat cows in the close-up pen. Now we know the real opportunity is managing condition through late lactation and the early dry period. By the time they’re close-up, you’re mostly just trying not to make things worse.”

Spring-calving herds often find this easier to implement when facilities aren’t at capacity. That’s your window to establish new protocols before the busy fall season hits. For those of you running organic or grass-based systems, I know the challenge is often keeping condition ON cows during peak grazing, not taking it off—but the same physiological principles apply.

Rethinking Heifer Nutrition

This really surprised me when I first learned about it. For years, most of us have been feeding close-up heifers and cows from the same TMR wagon, using the same anionic salt programs designed to prevent milk fever in mature cows.

Turns out, that’s been a mistake. Michael van Amburgh’s group at Cornell and researchers at Michigan State have shown that feeding heifers those anionic salt programs actually increases edema severity. The mechanism makes sense once you think about it—excess dietary sodium forces the body to retain water to maintain osmotic balance, and where does that fluid accumulate? Right in the udder tissue.

Operations switching to separate heifer management typically use:

  • Neutral to slightly positive DCAD (no anionic salts)
  • 16-18% crude protein to support both growth and lactation
  • Enhanced vitamin E and selenium supplementation
  • Target dry matter intake around 28 pounds daily

The extra feed cost? Usually about $1.50 per heifer per day for three weeks. Compared to the potential returns, that’s pocket change. Even smaller operations with 80-100 cows are making this work—I’ve seen folks use portable panels to section off just 10-15 stalls for their close-up heifers.

The Antioxidant Angle

This isn’t just about preventing problems—it’s about making more milk. Vitamin E supplementation delivered 21% more milk (56.3 vs 46.4 lbs daily) through the critical first 12 weeks. That’s an extra 840 lbs per heifer in just three months.

What’s really fascinating is the recent research on oxidative stress during transition. Zheng Cao’s team at China Agricultural University published a paper in Veterinary World this year, in which they followed Holstein cows supplemented with vitamin E and selenium through the transition period. The results? Pretty remarkable—35% increase in antioxidant capacity, significant drops in inflammatory markers, and clinical mastitis falling from 18% to 7%.

The biology here is that transition cows experience massive oxidative stress. Their natural antioxidant systems just get overwhelmed by the metabolic demands. Supplementation at the right levels—typically around 3,000 IU vitamin E and 6 mg organic selenium daily—provides that cellular protection when they need it most.

European research groups are seeing similar patterns. Comprehensive antioxidant programs are associated with 30-40% reductions in overall transition disorders. Not just edema—the whole metabolic picture improves. The cost typically runs $30-40 per cow for the six-week transition period, though that varies by supplier and the specific products you’re using.

Technology and the Genetic Long Game

The technology side is evolving fast. Automated body condition scoring systems from companies like DeLaval and CattleEye can pick up gradual changes that our eyes miss, scoring every cow at every milking.

I recently visited an operation in Idaho using this technology, and what they discovered was eye-opening. The pen they thought was full of thin, high-producing cows? Actually averaged BCS 3.0 while producing 95 pounds daily. Meanwhile, a whole group of later-lactation cows had crept toward BCS 4.0 without anyone noticing. By automatically routing those overconditioned cows to a lower-energy pen, they cut fresh cow ketosis by 40% in one year.

The key seems to be integrating the technology into automated decision-making, not just generating reports that sit on someone’s desk. When BCS drops below 2.75, cows automatically route to high-energy pens. Above 3.5 in late lactation? Different ration. The system just handles it.

On the genetic side, Kent Weigel’s group at Wisconsin has been analyzing data from robotic milking systems—they published some fascinating work in the Journal of Dairy Science just this October. Udder depth has a remarkably high heritability of around 0.79, indicating it responds well to selection pressure. The challenge? There’s an unfavorable correlation of about -0.40 with milk yield.

As we’ve selected for more milk, we’ve inadvertently selected for deeper, more pendulous udders that are prone to edema. But here’s what’s encouraging—producers are starting to rebalance their priorities. A genetics specialist I talked with at World Dairy Expo mentioned that five years ago, everyone wanted the highest Net Merit scores possible. Now? Many specifically request bulls with udder composite scores above +2.0, even if they rank a bit lower overall.

Getting Started: Practical First Steps

I know this can feel overwhelming. There’s a lot to consider here. So, where do you actually begin?

Start with the easy wins. Order vitamin E and selenium for your close-up pen. It’ll typically cost you $30-40 per cow for six weeks—you can probably have it by next week. The research consistently shows meaningful benefits from this modest investment.

Get serious about body condition scoring. Penn State Extension offers excellent free online training materials. Just start measuring and recording consistently. You’ll be amazed at the patterns that emerge. And remember—tracking your results is crucial. You can’t improve what you don’t measure.

If you’re ready to separate heifers, even 20 headlocks sectioned with portable panels can work. Talk with your nutritionist about a heifer-specific ration without anionic salts. The conversation alone might reveal opportunities you hadn’t considered.

And think long-term with your genetics. Set a minimum threshold for udder composite scores—maybe +1.5 to start—and stick to it. Yes, you might pass on some bulls with higher production potential, but you’re investing in cows that’ll actually last in your herd.

If you’re implementing these strategies and still seeing a high incidence after 90 days, consider working with your veterinarian to rule out other metabolic factors. Sometimes there are underlying issues that need addressing.

The Bottom Line

The challenges facing our industry make this issue increasingly relevant. Climate change is causing heat stress in regions that have never experienced it before. Labor availability continues limiting individual animal attention. And we keep pushing the genetic envelope on production.

There’s also the consumer and retailer piece to consider. How long before severe udder edema incidence becomes another tracked welfare metric alongside everything else we’re already monitoring?

But here’s what gives me optimism: that 86% incidence rate isn’t set in stone. It’s an outcome influenced by dozens of management decisions we make every day. The best operations are proving that you can get below 40% with a systematic approach.

We’re talking about investing roughly $60-80 per heifer for comprehensive prevention that potentially prevents $200-400 in losses. That kind of return… well, you don’t see that very often in our business.

This isn’t about suggesting anyone’s failing or doing things wrong. We’re all doing the best we can with the information and resources we have. It’s about recognizing that what we’ve accepted as normal might actually be an opportunity. Sometimes the biggest improvements come from questioning our assumptions about what’s inevitable versus what’s changeable.

The knowledge exists. The tools are available. The economics look favorable. The question becomes whether we’re ready to reconsider what “normal” should look like in our fresh pens.

I’m curious about what others are seeing out there. What’s worked for you? What barriers have you hit? Every operation is different, and solutions that work in one setting might need tweaking for another. That’s how we all learn and improve.

KEY TAKEAWAYS

  • That 86% incidence rate? It’s not biology—it’s management. Top herds prove <40% is achievable with your current genetics
  • ROI that actually makes sense: Spend $60-80 per heifer → Save $200-400 in losses → 300% return in 90 days
  • The game-changer nobody talks about: Stop feeding heifers anionic salts. This one change alone cuts problems in half
  • Hidden cost = early culling: Every heifer leaving a lactation early costs you her entire $3,000 raising investment
  • Monday morning action: Order vitamin E + selenium ($40/heifer). You’ll see results before Christmas
MetricAverage HerdsTop Performing HerdsImprovement
Udder Edema Incidence Rate86%<40%53% reduction
First Lactation Heifers Affected34 of 40 heifers16 of 40 heifers18 fewer heifers
Annual Economic Loss (100-cow herd)$3,500-16,000<$1,500$2,000-14,500 saved
Milk Production Loss per Heifer316 lbs<127 lbs60% less loss
Clinical Mastitis Rate (first 30 days)2.5x baselineBaseline rate60% fewer cases
Average Body Condition at CalvingVariable (2.5-4.0+)3.0-3.5 (controlled)Optimized
Heifer Feeding ProtocolSame as mature cowsSeparate (no anionic salts)Protocol change
Vitamin E + Selenium SupplementationMinimal or none3,000 IU + 6mg daily$40 investment/heifer
Time to See ResultsN/A60-90 daysRapid implementation
Annual Net Savings vs AverageBaseline$2,000-14,500+300% ROI

For additional resources on transition cow management and body condition scoring, check out Penn State Extension (extension.psu.edu) and Cornell PRO-DAIRY (prodairy.cals.cornell.edu). Your local Extension dairy specialist is another great resource. The automated BCS systems mentioned are available through DeLaval (delaval.com) and CattleEye (cattleeye.com). For visual guides and additional materials on preventing udder edema in dairy heifers, visit The Bullvine’s online resources.

Complete references and supporting documentation are available upon request by contacting the editorial team at editor@thebullvine.com.

Learn More:

The Sunday Read Dairy Professionals Don’t Skip.

Every week, thousands of producers, breeders, and industry insiders open Bullvine Weekly for genetics insights, market shifts, and profit strategies they won’t find anywhere else. One email. Five minutes. Smarter decisions all week.

NewsSubscribe
First
Last
Consent

Forget Volume: China’s 18% Premium Surge Means $150,000+ More for Component-Focused Farms – But the Window Closes Fast

The surprising market shift that’s making component quality more valuable than volume—and what producers are learning about the 3-5 year window ahead

EXECUTIVE SUMMARY: China’s premium dairy surge is handing component-focused producers $150,000-$200,000 in extra annual revenue—no expansion required. While premium imports rocket up 18%, commodity imports are tanking 12%, creating a historic quality-over-quantity shift driven by 670 million Chinese middle-class consumers who prioritize safety and nutrition over price. Here’s the critical part: the 3-5 year window to lock in premium supplier status is already 40% gone, with October 2025 marking a crucial decision point. Producers implementing targeted nutrition changes see results in 12-18 months, while genomic improvements take 36-48 months—both achievable before the 2027 market saturation deadline. Right now, component-optimized milk commands $24/cwt versus $18 for commodity, a $6 gap that represents survival versus thriving. Bottom line: farms that pivot to components this winter will count premium checks in 2026, while volume-chasers will still be wondering what happened when the window slams shut.

You know, last week I was going through Chinese customs data, and something really caught my attention. China’s economy is slowing down to 4.6% GDP growth—we all know that story. But here’s what’s interesting… their dairy import patterns are telling a completely different tale, one that’s got progressive American producers rethinking how they value every pound of milk in the bulk tank.

So the USDA Foreign Agricultural Service released its May 2025 report, showing that China’s overall dairy imports grew by about 6% through September. Not bad, nothing spectacular. But when you dig into the specific categories—and this is where it gets really fascinating—premium dairy products are advancing nearly 18% year-over-year while commodity products are retreating around 12%, based on what we’re seeing in Chinese customs data and the latest Tridge market analysis. For those of us who’ve built our operations around maximizing volume for generations, well… this divergence is something we need to talk about.

Component-optimized milk commands $24/cwt versus $18 for commodity—a $6 gap that separates profitable farms from struggling ones. Right now, this premium represents the difference between counting checks in 2026 or wondering what happened.

What the latest customs reports are showing is cheese imports rising 13.5% and butter—get this—surging 72.6% year-over-year. Meanwhile, skim milk powder? That’s heading the other direction. I’ve been talking with dairy market analysts who’ve tracked this stuff for the past decade, and they’re telling me this isn’t just another market fluctuation. It looks like we’re seeing a fundamental shift in what the world’s largest dairy import market actually values.

Butter imports to China exploded 73% while skim milk powder declined 8%—proof that premium components crush commodity volume. Chinese consumers are voting with their wallets for quality over quantity.

“The premium shift isn’t temporary—it’s structural. Producers who position themselves now will capture long-term value that commodity markets simply can’t match.”

And here’s what really makes you think… China’s middle class is continuing to expand—the USDA projects they’ll add 80 million people by 2030—and we’re observing similar patterns across Southeast Asia, India, and parts of Africa, according to Rabobank’s December 2024 analysis. What I’ve found is this could represent the most meaningful value shift in global dairy markets we’ve seen in decades.

China’s dairy market is splitting in two—premium products rocket up 18% while commodity imports crater 12%. This historic quality-over-quantity shift represents survival versus thriving for global dairy exporters.

Understanding What’s Really Driving This Premium Shift

When you look at the forces reshaping China’s dairy demand, they actually make a lot of sense—wealth creation, food safety consciousness, evolving consumer preferences. Understanding these drivers helps explain why this shift feels different from the usual market cycles we’ve all ridden out before.

The Food Safety Factor That Won’t Go Away

It’s been seventeen years since that 2008 melamine incident—the World Health Organization reports documented six infant deaths and 300,000 illnesses. Yet Chinese consumers still show a strong preference for imported dairy products, especially when it comes to their kids. The China Dairy Industry Association’s data shows imports of infant formula increased from 28% of dairy imports in 2008 to 45% by 2019.

What’s particularly telling—and this surprised me—is that premium infant formula now represents 37% of market share, up from 32.8% just a year ago, according to July 2025 market research from Innova. The Chinese Academy of Agricultural Sciences recently published consumer research showing Chinese consumers prioritize nutritional value at 59%, quality at 45%, and safety at 39%. Price? That ranks at just 6% when they’re selecting a formula. That preference hierarchy creates real pricing opportunities for suppliers who can demonstrate superior quality and traceability.

How Middle Class Growth Changes Everything

The scale here is… well, it’s something else. China’s middle class expanded from 3.1% of the population in 2000 to 50.8% in 2018, according to McKinsey Global Institute data. We’re talking about roughly 670 million people joining the ranks of consumers with discretionary income. The National Bureau of Statistics of China reports per capita income grew at a 6.1% compound annual rate from 2019 to 2024, reaching 41,300 RMB—that’s about $5,792 annually.

What I’m seeing in the consumption data is these folks aren’t looking for the cheapest option on the shelf. They want Western-style products with clear quality differentiation. USDA estimates show cheese consumption alone could hit 495,000 metric tons by 2030, growing at a 9.1% compound annual rate. And here’s the kicker—60 to 75% is being consumed in foodservice settings like Western restaurants and pizza chains.

Why China Can’t Make These Premium Products Themselves

This caught me off guard when I first looked into it. China aims to achieve 75% dairy self-sufficiency under its 14th Five-Year Plan, but its domestic production focuses mainly on fluid milk and basic dairy products. The USDA’s May 2025 China dairy report shows Chinese farms are actually reducing output—down 0.5% in 2024 with another 1.5% decline forecast for 2025—as farmgate prices hit decade lows around 3.20 RMB per kilogram.

But here’s the real issue… China lacks the processing infrastructure for specialty cheese production, premium protein concentrates, and other high-value categories. The USDA report notes that while “domestic cheese production will increase gradually, with growing investment in natural cheese capacity,” current production is just 30,000 MT, compared to 178,000 MT imported.

Dr. Leonard Polzin from the University of Wisconsin’s Center for Dairy Profitability calls this “structural import dependency” for premium products—and it’s likely to persist given the technical expertise and infrastructure requirements. Makes sense when you think about it.

How Payment Systems Shape Who Wins in Export Markets

What’s really revealing about the competition between major dairy exporters is how payment structures influence what farmers produce, which ultimately determines export success. New Zealand is capturing 46% of China’s dairy imports? That’s not luck—it’s directly tied to how they pay farmers.

The Fonterra Approach Makes You Think

So Fonterra pays farmers solely on the basis of kilograms of milk solids—butterfat plus protein. Water? Doesn’t matter. Lactose? Not counted. Their 2025/26 forecast, announced in May, stands at $10.00 NZD per kilogram of milk solids.

Research published this year by dairy economics specialists shows the New Zealand payment system essentially discourages chasing volume. When volume isn’t the main metric, farmers naturally optimize for component density instead of pushing cows for maximum daily production. It’s a different mindset entirely.

What I find interesting is how this payment structure aligns farmer incentives with premium market demand almost automatically. When Chinese buyers want high-protein cheese or concentrated dairy ingredients, New Zealand farmers are already producing that milk profile—not specifically for exports, but because that’s what their payment system rewards.

Where American Payment Systems Create Challenges

And this is where it gets tricky for us. Most American cooperatives still use volume-focused payment systems with base prices per hundredweight, treating component premiums as add-ons rather than the main event. This creates an interesting situation—we’re optimizing for volume because that’s what payment systems reward most directly, even as global markets increasingly value component density.

Cornell University’s 2020 research on payment structures, led by Dr. Chris Wolf, found something eye-opening: non-cooperative handlers allocated 37% of premiums to quality incentives, while cooperatives allocated just 18% to quality. As the research shows, some cooperatives reward production excellence while others… well, they basically reward showing up.

“We spent decades asking, ‘How much milk can we ship?’ Now we ask, ‘How much value can we create?’ That change in thinking transformed everything about our operation—and our future.”

Learning from European Approaches

What’s interesting is looking at how European producers handle this. In the Netherlands, FrieslandCampina’s payment system includes substantial sustainability and quality bonuses that can add up to 15% to the base price. German cooperatives like DMK have shifted toward value-based pricing models that reward both components and environmental metrics. These systems took years to implement, but they’re now seeing the payoff in premium export markets.

What Progressive Producers Are Learning

I’ve been talking with forward-thinking dairy operations across the country, and many aren’t waiting around for payment system reform. They’re discovering that transitioning from volume to value can happen faster than we’ve traditionally thought—often with pretty encouraging financial results.

The Nutrition Strategy That Works Right Now

A Wisconsin producer I spoke with recently—runs about 500 cows near Eau Claire—told me something interesting: “We figured component improvement would take years, but our nutritionist showed us we could see real changes within a single lactation cycle.”

Based on Penn State Extension research and field trials across the Midwest, here’s what’s delivering results:

  • Amino acid balancing targeting 6.5-7.2% lysine and 2.4-2.6% methionine in metabolizable protein: University of Wisconsin trials show 0.1-0.2% protein increases are worth approximately $71,000 annually for a 500-cow operation
  • Fatty acid supplementation using rumen-protected fats: Michigan State research demonstrates 0.2-0.3% butterfat increases valued at $98,000+ annually
  • Forage quality optimization, maintaining 26-32% neutral detergent fiber: Cornell studies confirm this supports efficient rumen fermentation for better component production

Dr. Mike Hutjens, Professor Emeritus of Animal Sciences at the University of Illinois—he’s worked with dozens of component-focused operations—tells me farms are capturing $150,000 to $200,000 in additional annual revenuethrough nutrition changes alone, before even touching genetics.

How Genomics Accelerates the Timeline

The genomic testing revolution has really changed the game here. Chad Ryan, genetic programs manager at Select Sires, puts it this way: “What used to take 6-7 years now happens in 36-48 months for herds committed to change.”

The Council on Dairy Cattle Breeding reports that as of April 2025, the average Holstein heifer calf produces 45 more pounds of butterfat and 30 more pounds of protein annually compared to one born in 2015—purely through genetic selection. That’s progress.

Strategic Approaches by Farm Size

Through conversations with producers nationwide, it’s becoming clear that farms of every size can access premium value—though the best strategies vary quite a bit based on scale, location, and market access. Now, not every region has equal access to premium processors—let’s be honest about that—but opportunities are expanding faster than many folks realize.

Mid-Size Operations (300-800 cows): Finding the Balance

These operations often have that nice combination of enough scale for efficiency while maintaining flexibility to adapt. A producer milking 550 cows near Green Bay shared this with me: “We’re big enough to matter to processors but small enough to pivot when we need to.”

Wisconsin’s Department of Agriculture reports that operations focusing on cheese-quality milk are seeing annual revenue increases of $150,000-$200,000 through component optimization. You know what’s interesting about this size operation? They can often implement changes faster than larger dairies while still having enough volume to negotiate favorable terms with processors.

Large Operations (1,500+ cows): Leveraging Scale

California’s larger dairies are taking a different approach. A manager running a 2,100-cow operation in Tulare County explained their strategy: “We provide consistent, high-volume premium supply for export contracts.”

What I’ve noticed with these larger operations is that they’re often dealing with tighter margins per cow, so even small percentage improvements in components can make a huge difference to the bottom line. And with California’s ongoing water challenges and environmental regulations, maximizing value per gallon of water used is becoming critical.

Small Family Farms (Under 200 cows): The Niche Advantage

What’s been really encouraging—and honestly, kind of surprising—is how smaller farms are finding lucrative opportunities in specialty markets. A Pennsylvania family running 165 cows who switched to A2 production three years ago now gets $24 per hundredweight. “Would’ve seemed impossible five years ago,” they told me.

Penn State Extension specialist Lisa Holden confirms what we’re seeing: “Small farms using modern management systems are proving that farmstead-scale operations can achieve competitive margins. The key is identifying and serving premium niches that value authenticity and story alongside quality.”

The Window of Opportunity—And Its Limits

Dr. Mary Ledman, global dairy strategist at Rabobank, sees a clear but limited window here. “Producers have about 3-5 years to establish themselves as premium suppliers before market saturation occurs,” she explained at a recent industry conference. “China’s premium import growth won’t stay at 18% forever.”

What makes this particularly compelling is that nine out of ten emerging markets—Southeast Asia, India, Africa—are reporting double-digit gains in premium dairy demand according to IFCN Dairy Research Network data. Southeast Asia’s dairy market alone is projected to grow at 7-8% annually through 2030, according to FAO projections.

But let’s be realistic here. Not every producer has convenient access to premium processors. Transition costs can be substantial upfront. And yeah, there’s risk in shifting away from what’s worked for generations. Plus, with the way weather patterns have been changing—we all saw what happened with the flooding in California’s Central Valley last spring—maintaining consistent component levels through environmental challenges adds another layer of complexity.

Practical First Steps You Can Take

Based on everything I’ve learned researching this shift, here’s what I’d suggest doing in the next 30 days:

Week 1: Figure Out Where You Stand

  • Calculate your average components from the past year (and compare them seasonally—summer depression is real)
  • Compare your payment structure to what others in your region are getting
  • Identify processors in your area who pay component premiums

Week 2: Look at Nutrition Options

  • Set up a meeting with your nutritionist about amino acid balancing
  • Get quotes for rumen-protected fat supplements
  • Test your current forage quality—NDF digestibility, particle size, the works

Week 3: Explore Your Market

  • Call three specialty processors or cheese makers within reasonable hauling distance
  • Research what certifications the premium markets in your area require
  • Talk with your cooperative about their export programs and premium opportunities

Week 4: Build Your Plan

  • Set component targets for the next 12 months
  • Budget for genomic testing of heifer calves
  • Pick your first step—nutrition usually offers the quickest payback

Where This All Leads—And Why Time Matters Now

Looking at everything together—the data, what producers are experiencing, where markets are heading—this shift from volume to value in global dairy markets isn’t just talk anymore. It’s happening right now, and we’re seeing clear differences between those adapting and those holding steady.

What really strikes me is how China’s market is basically showing us the future. That surge of nearly 18% in premium dairy imports, while commodity products decline around 12%? That’s not just noise. We’re seeing similar patterns across emerging markets—FAO, Rabobank, and IFCN are all documenting this—which creates multiple opportunities for well-positioned suppliers.

I’ll be straight with you—the window for action feels tighter than many producers might expect. Those who establish premium positioning in the next 3-5 years will likely lock in long-term contracts and relationships. If we look at historical patterns in agricultural markets, waiting for others to prove the model usually means competing for whatever’s left in increasingly crowded markets.

And here’s the thing that should really get your attention: we’re already ten months into 2025. If that 3-5 year window started when these trends became clear in early 2024, we’re already approaching the halfway point of year two. The producers making moves now—this fall, this winter—are the ones who’ll be established when the real competition for premium contracts heats up in 2026 and 2027.

What gives me hope is that farms of every size genuinely have pathways forward. From 150-cow family operations I’ve visited who’re targeting local specialty markets to 2,000-cow enterprises supplying export containers, there are viable strategies across the board.

The window’s open right now—but with 2025 nearly in the books and premium market competition accelerating, every month of hesitation means watching another competitor lock in the contracts and relationships that could’ve been yours. Based on everything I’m seeing and hearing, by the time the 2026 harvest rolls around, the early movers will already be counting their premium checks while others are still debating whether to make the shift.

The clock is ticking. The question isn’t whether this shift will happen—it’s whether you’ll be part of it.

Key Takeaways:

  • The Opportunity: Premium dairy imports to China up 18% while commodity down 12%—this isn’t temporary
  • The Timeline: 3-5 year window to establish premium positioning before market saturation
  • The Money: $150,000-$200,000 potential annual revenue increase for 500-cow operations through component optimization
  • The Path: Nutrition changes deliver results in 12-18 months; genetic improvements in 36-48 months
  • The Reality: Not every producer has equal access to premium markets, but opportunities are expanding rapidly

Complete references and supporting documentation are available upon request by contacting the editorial team at editor@thebullvine.com.

Learn More:

The Sunday Read Dairy Professionals Don’t Skip.

Every week, thousands of producers, breeders, and industry insiders open Bullvine Weekly for genetics insights, market shifts, and profit strategies they won’t find anywhere else. One email. Five minutes. Smarter decisions all week.

NewsSubscribe
First
Last
Consent

The $7,200 Lameness Fix That Beats $45,000 Technology (40-50% Reduction Proven)

Every lame cow costs you $337. A Wisconsin farmer saves $20,000/year with footbaths, not $45,000 cameras. Here’s his exact protocol.

EXECUTIVE SUMMARY: While the industry pushes $45,000 lameness cameras, a Wisconsin farmer cut lameness by 42% for $3,100 by practicing disciplined prevention. Analysis of 600+ farms shows that the Prevention Bundle—footbaths 4x weekly, strategic dry-off trimming, and weekly scoring—reduces lameness by 40-50% for just $7,200 annually. At $337 per lame cow, this approach saves typical 350-cow operations $10,000+ yearly with a 4-6 month payback, versus 2-4 years for technology ROI. Technology excels for 1,000+ cow operations and robot barns where manual observation becomes impossible, but most farms achieve better results by solving the root problem with prevention. The industry’s ‘reality correction’ confirms what successful producers already know: you can’t detect your way out of a prevention problem—and you shouldn’t try when prevention costs 86% less.

Dairy Lameness Cost

Last February, I stood watching a young dairy farmer in Pennsylvania delete yet another unopened alert from his $52,000 lameness detection system. The dashboard showed 14 flagged cows that morning. He’d been up since 2 AM with a difficult calving, looked at the screen, and just closed it. “I’ll check them later,” he said.

You know how it goes. Later never came.

This scene’s been playing out on more farms than you’d think. AgFunder’s investment reports tell us precision livestock technology adoption has really picked up since 2023, though it’s tough to nail down what individual farms are actually spending. Meanwhile, Dr. Nigel Cook’s ongoing work at the University of Wisconsin continues to show lameness hovering around 20-25% across most operations.

What’s particularly interesting—and I’ve been thinking about this a lot—is how we’re investing heavily in detection while the actual problem isn’t getting much better. The pattern I’m seeing suggests we might be looking at this whole thing backwards.

And here’s what really gets me: the most effective solution costs about 86% less than what many of us are being told we need.

What’s the Real Cost of Each Lame Cow?

Lost milk and failed breedings devour 46% of your $337-per-case lameness cost—revealing why early detection through prevention matters more than expensive camera alerts that arrive too late to save production

So there’s this figure that keeps coming up in the research, and it’s worth paying attention to: $337 per lameness case. Robcis and colleagues nailed this down in their 2023 Journal of Dairy Science analysis, building on what Dr. Karin Dolecheck and Dr. Jeffrey Bewley developed at the University of Kentucky. Really solid economic work that actually captures what we’re dealing with.

If you’re running 350 cows with 20% lameness—and let’s be honest, that’s probably where many of us sit—you’re looking at about $23,590 in annual losses. That matches up pretty well with what producers tell me they’re seeing.

But here’s where it gets interesting…

Technology presentations often reference different numbers. Dr. Y.H. Cha’s 2010 research in Preventive Veterinary Medicine documented costs from $121 for foot rot up to $216 for sole ulcers—good, solid data. But somehow, in sales materials, these morph into $400-$533 per case. They’ll cite a 30-40% prevalence rate as the “industry standard,” which might not apply to your farm at all.

Through that lens, suddenly your 350-cow operation looks like it’s losing $60,000 or more annually. Makes that $45,000 camera system seem pretty reasonable, doesn’t it?

The Dolecheck-Bewley model from their 2018 Animal journal work breaks it down like this:

  • Milk production losses: $80-120 per case (that’s 30-35% of your total hit)
  • Reproductive impacts: $42-70 (another 20-30%)
  • Treatment costs themselves: just $40-60 (15-20%)
  • Culling risk: $25-50 (10-15%)
  • Labor and overhead: $20-40 (10-15%)

What I’ve noticed visiting farms from Wisconsin to California is that prevention effectiveness—not detection speed—drives most of these costs.

And good prevention? Well, that doesn’t require artificial intelligence.

Worth noting, though—these figures vary by region. California operations might see $380 per case with their labor costs, while Wisconsin farms might be closer to $310. But the principle stays the same.

Quick Reference: Prevention vs. Technology Investment

Prevention Bundle delivers 40-50% lameness reduction for $7,200 annually versus $45,000+ for technology systems that achieve 30% reduction—proving disciplined footbath protocols beat expensive cameras for 90% of dairy operations

Prevention Bundle

  • Annual cost: $7,200-8,200
  • Lameness reduction: 40-50%
  • Year 1 ROI: Positive $3,400-4,600
  • Break-even: 4-6 months

Technology Investment

  • Initial cost: $45,000-80,000
  • Detection advantage: 7-10 days earlier
  • Year 1 ROI: Typically negative
  • Break-even: Years 2-4

Decision Threshold: Technology makes sense for operations >1,000 cows or running AMS

What Prevention Package Actually Works?

Dr. Laura Solano’s Alberta Lameness Reduction Initiative, which she published in the Journal of Dairy Science in 2019, really opened my eyes. Combine that with Dr. Gerard Cramer’s work at Minnesota, and you see this encouraging pattern. Farms implementing what they’re calling the “Prevention Bundle” are hitting 40-50% lameness reductions for about $7,200 annually.

No fancy cameras. No algorithms. Just good management.

Now, costs vary by region—copper sulfate in Vermont costs different than Arizona, and California labor rates aren’t the same as South Dakota’s. But the principles? Those work everywhere I’ve looked.

Strategic trimming eats 44% of your $7,200 prevention budget but delivers the highest lameness reduction—invest here first, then layer on footbaths and scoring to hit that 40-50% improvement Wisconsin farmers are banking

Is Your Footbath Actually Working?

Dr. Dörte Döpfer at Wisconsin has spent decades documenting digital dermatitis control—you’ve probably seen her work in the veterinary journals. What she consistently finds is that regular footbath protocols can knock DD prevalence down 40-60% within 16 weeks.

Producer Success Story: Foundation Over Technology

Location: Near Fond du Lac, Wisconsin
Herd Size: 600 cows
Starting Lameness: 24%
Current Lameness: 14%
Time Frame: 18 months
Investment: $3,100/year in footbath protocols

This Wisconsin producer transformed his herd health without any technology investment. His approach was refreshingly straightforward.

“We treat footbaths like milking—non-negotiable, same times, same concentrations, every single week,” he explains. “That consistency matters more than any camera could.”

Key Success Factors:

  • Footbaths 4x weekly (Tuesday, Thursday, Saturday, Monday)
  • 5% copper sulfate is changed every 200 cow passes
  • Dedicated employee ownership of the protocol
  • pH monitoring to maintain effectiveness

Results: 42% reduction in lameness, saving approximately $20,000 annually based on that $337 per case figure

Here’s what’s fascinating—and Dr. Jan Shearer’s Iowa State research backs this up—the specific chemistry matters way less than consistency. Whether you’re using 5% copper sulfate, 2-5% formalin, or those newer zinc products, it’s the frequency that makes the difference.

Four times weekly beats “when we remember” every single time.

The math’s straightforward:

  • Copper sulfate: $2-3 per pound, about 22 pounds per mix
  • For 300 cows: roughly $1,200-1,500 annually in materials
  • Labor at $15-20/hour: another $1,600
  • Total commitment: $2,800-3,100 per year

Are You Trimming at the Wrong Time?

Dr. Sarel van Amstel’s research really changed how I think about trimming timing. Cows trimmed at dry-off show way fewer lesions next lactation compared to waiting until problems show up.

Dr. Gerard Cramer, who’s leading this big USDA-funded lameness project at Minnesota, puts it perfectly: “Strategic trimming at dry-off and around 100 days in milk is proactive management, not reactive.”

The economics are compelling. Multi-year projects tracking thousands of cows show that strategic trimming delivers returns several thousand dollars better than whole-herd trimming every six months.

Do You Really Need Cameras to See Lame Cows?

This might surprise you, but research comparing trained observers against automated systems shows weekly mobility scoring catches problems within 7-10 days of AI cameras.

That 23-day advantage you hear about? That’s comparing technology to casual observation at milking, not systematic weekly scoring.

A Lancaster County producer I know spent two hours with her vet learning proper scoring. Now it takes about three hours every Tuesday morning to score the whole herd.

“We catch 75% of problems before they’re severe,” she says. “For our 450 cows, that’s good enough.”

You can get free scoring guides from Wisconsin’s Dairyland Initiative, AHDB Dairy in the UK, or Cornell’s NYSCHAP program.

When Does Technology Actually Pay?

Technology’s $100,000 savings kick in only after 1,000 cows—proving 90% of dairies waste money on cameras when $7,200 prevention protocols deliver faster payback and better results for smaller operations

Now don’t get me wrong—I’m not anti-technology. I’ve seen plenty of operations where automated detection delivers real value. But specific conditions need to line up.

How Big Is Big Enough?

Dr. Marcia Endres at the University of Minnesota has modeled the economics, and automated systems typically hit positive ROI in herds of over 1,000 cows. At that scale, manual scoring becomes a logistical nightmare. Even small improvements mean big savings.

I visited a large dairy near Turlock recently—1,850 cows across two sites with both robots and conventional parlors. At 21% lameness, they’re looking at annual costs of $131,000.

A 30% improvement through earlier detection saves nearly $40,000 yearly. That justifies the technology pretty quickly.

Their herd manager made a good point: “Dedicated mobility scoring would cost us $65,000 annually in wages and benefits. The camera system costs less and runs 24/7.”

Dr. Robert Hagevoort at New Mexico State works with those massive Southwest dairies. As he says, when you’re managing multiple sites with thousands of cows, manual scoring isn’t just difficult—it’s impossible. Technology becomes essential.

What About Robot Barns?

Dr. Trevor DeVries at Guelph has documented some concerning patterns in robot herds—lame cows make fewer trips, produce less milk. These “invisible” lame cows are exactly what cameras help identify.

What’s interesting is how different robot systems integrate.

Lely’s approach differs from DeLaval’s or GEA’s, and each affects how well lameness detection meshes with your existing setup.

Technology consistently delivers value when you’ve got:

  • Over 1,000 cows where manual scoring needs dedicated labor
  • Robots where voluntary cow flow hides problems
  • Genetic selection programs needing continuous data
  • Persistent labor challenges
  • Already maximized prevention, but still over 15% lameness

An Ontario producer I know runs 2,200 cows with his brothers. “We did everything right,” he told me. “Footbaths four times weekly, strategic trimming, the works. Still had 18% lameness. The cameras showed us facility design problems we couldn’t see ourselves.”

Can You Have Both?

I should mention—some of the best results I’ve seen come from farms combining both approaches. A 1,500-cow operation in Idaho implemented the full Prevention Bundle first, reduced lameness to 12%, then added cameras to capture the remaining percentage. They’re now running at 8% consistently.

That’s the sweet spot some larger operations are finding—prevention as the foundation, technology as the refinement.

And it’s not just the big guys. I know a 400-cow registered Holstein operation in Vermont that uses cameras specifically for their high-value genetics program. With cows worth $15,000-20,000, that 7-10 day earlier detection can mean the difference between saving a valuable bloodline or losing it. For them, the technology investment makes sense even on at smaller scale.

What’s the Hidden Cost of All This Technology?

What worries me—and I hear this from Extension folks everywhere—isn’t the technology itself. It’s what happens to our ability to read cows when we let computers do all the observing.

From farm visits and conversations over the past couple of years, I’m noticing younger employees on tech-heavy farms sometimes struggle with visual problem identification. Makes sense when you think about it.

I visited a Wisconsin farm where the owner had invested heavily in monitoring—activity collars, cameras, body condition scoring, and feed monitoring.

Seven different dashboards across four platforms, none talking to each other.

“That investment taught me an expensive lesson,” he said over lunch.

Interestingly, his lameness had actually increased as he spent more time managing alerts than managing basics.

Six months later? He kept only the activity collars for heat detection and started what he called “tech-free management time”—two hours each morning spent walking pens and looking at cows. Lameness improved markedly.

When Do Alerts Become Noise?

Extension specialists keep telling me the same story: excessive alerts create decision paralysis.

You start ignoring low-priority stuff. Then moderate warnings. Eventually, you’re only responding to obvious problems—defeating the whole purpose.

A New Mexico large-herd manager described it perfectly: “Seven dashboards, four platforms, over a hundred daily alerts. I spend three hours sorting data before actual cow work begins. We’re managing information, not cattle.”

Key Questions for Technology Vendors

Before signing any purchase order, get clear answers to:

  1. What percentage of your customers achieve positive ROI within 18 months?
  2. Can you provide references from my region, my herd size?
  3. What’s the full 5-year cost, including everything?
  4. How many daily alerts should I expect?
  5. What happens if you get bought out or discontinue this product?

Your 12-Month Prevention Roadmap

If you’re sitting there wondering about that technology purchase order, here’s an alternative that’s worked for multiple operations:

Months 1-3: Build Your Foundation

Start with footbaths. Not exciting, I know. But Tuesday, Thursday, Saturday, Monday—mark it down.

Dr. Döpfer’s Wisconsin protocols say 5% copper sulfate is changed every 200 cow passes. Train multiple people on mobility scoring using those free university resources. Schedule dry cow trimming.

You’ll invest about $2,000 for training and initial supplies. Based on Alberta data, expect a 10-15% reduction in new cases.

Months 4-6: Dial It In

Monitor footbath pH—Dr. Shearer’s research shows effectiveness tanks above pH 5.5.

Start weekly systematic scoring. Add that 100 DIM trimming for fresh cows.

Investment: around $3,500. Expect another 15-20% drop in prevalence.

Months 7-12: Make It Stick

Evaluate monthly, develop your own protocols, and ensure backup training so vacations don’t derail progress.

About $1,700 more investment. You should stabilize around 12-13% prevalence—that’s 45-50% total reduction.

Total annual investment: $7,200
Expected savings at $337/case: $10,600-11,800
First-year net benefit: $3,400-4,600

Compare that to technology, where Year 1 typically shows negative returns, with break-even in Years 2-4 according to Dr. Jeffrey Bewley’s adoption models.

Your prevention investment hits break-even by month 6 while lameness drops 42%—compare this to technology’s 2-4 year payback and you’ll understand why Wisconsin’s smartest farmers aren’t waiting for AI to solve problems footbaths prevent

Is the Industry Finally Getting It?

AgFunder calls what’s happening a “reality correction.” After years of aggressive growth, investors want proof of real-world value.

Vendors are changing, too. A major camera manufacturer recently told me they’re now recommending some prospects work with Extension for 6-12 months before buying.

“Farms need foundational management before technology amplifies effectiveness,” they explained.

That’s a big shift from two years ago.

It reflects growing recognition that technology supplements good management—it doesn’t replace it.

Dr. Nigel Cook from Wisconsin, whose lameness work has shaped industry practices for decades, said it best: “Transformational results come from disciplined execution of proven prevention protocols, maintained consistently over time.”

What About Your Specific Situation?

Everything I’ve talked about needs adapting to your situation. Missouri pasture systems face different challenges than Idaho freestalls. Arizona heat stress impacts lameness differently than the Vermont mud season.

Dr. Peter Robinson at UC Davis has documented clear connections between heat stress and California lameness patterns. Meanwhile, Northeast research shows spring transitions can really spike lameness in pasture systems.

The Prevention Bundle principles stay constant, but implementation varies.

Texas operations might adjust footbaths during monsoons. Wisconsin farms see spikes during spring pasture transition. Know your specific challenges.

Check out these support programs:

  • USDA EQIP funding for infrastructure (varies by state)
  • State dairy grants in Vermont, Wisconsin, and New York
  • Extension training cost-shares

What’s Your Bottom Line?

Know Your Real Costs
Use that $337 figure from Robcis, not inflated estimates. Most farms incur annual losses of $15,000-25,000, not the $50,000-60,000 sometimes suggested.

Prevention Pays Fast
The $7,200 Prevention Bundle typically pays back within 4-6 months, based on data from Alberta and Minnesota.

Technology Has Its Place
Over 1,000 cows, running robots, doing genetic selection? Automated detection can deliver value—after you’ve nailed the basics of prevention. Even some smaller operations with high-value genetics programs find the ROI works for their specific situation.

Consider Everything
Beyond purchase price and subscriptions, think about alert management time, decision fatigue, and what happens to your team’s cow-reading skills.

Ask Yourself the Key Question
Before any technology purchase: “Would this money spent on prevention solve my lameness problem?” If yes, start there.

What’s Next for Lameness Management?

The exciting stuff I’m seeing isn’t coming from Silicon Valley—it’s coming from farms figuring out what actually works. Dr. Cramer’s USDA work at Minnesota is revealing interesting synergies between prevention strategies.

Several farms report better results combining strategic trimming with consistent footbaths than either practice alone would suggest. These are the practical insights that move the needle.

The Foundation for Food & Agriculture Research is supporting lameness research with equal focus on prevention refinement and appropriate technology development. The emphasis stays on integration, not replacement.

Making Your Decision

The path’s becoming clearer: nail the fundamentals first. Build management discipline that makes any tool work better. Then—and only then—evaluate if technology adds value for your specific situation.

This $337 reality check isn’t about rejecting innovation. It’s about aligning decisions with your farm’s actual needs, proven interventions, and management fundamentals rather than promised potential.

The fanciest detection system can’t fix prevention failures. But consistent prevention protocols, executed with discipline, can make detection systems unnecessary for many farms.

That might challenge what technology marketing tells us. But based on what I’m seeing coast to coast, it’s what’s actually working.

Your choice: invest $45,000-80,000 in cameras that might detect problems 7-10 days earlier than good observation, or invest $7,200 in prevention that stops 40-50% of problems from happening.

Each farm’s different. The question is: which approach fits yours?

Next Step: Call your Extension specialist this week to get those free scoring guides and start building your Prevention Bundle. The sooner you start, the sooner you’ll see results.

Free locomotion scoring guides are available through the University of Wisconsin’s Dairyland Initiative, Cornell’s NYSCHAP program, and AHDB Dairy UK. Prevention resources can be accessed through your state Extension dairy specialists. USDA EQIP funding information is available at your local NRCS office.

KEY TAKEAWAYS

  • The $7,200 Prevention Bundle outperforms $45,000 technology for 90% of farms—delivering 40-50% lameness reduction with 6-month ROI vs 2-4 years
  • One number changes everything: Operations under 1,000 cows achieve better results with prevention (footbaths 4x weekly, strategic trimming, weekly scoring) than cameras
  • Wisconsin farmer proves it works: Cut lameness from 24% to 14% using just $3,100 in footbath protocols, saving $20,000 annually at $337/case
  • Technology has its place: Large operations (>1,000 cows) and robot barns benefit from automated detection, where manual observation becomes impossible
  • Start tomorrow: Download free scoring guides from Wisconsin Dairyland Initiative and implement footbaths this week—prevention costs 86% less than detection

Complete references and supporting documentation are available upon request by contacting the editorial team at editor@thebullvine.com.

Learn More:

  • Is Your Footbath Protocol Actually Working? – For those ready to implement the main article’s advice, this guide provides the essential tactical details. It demonstrates how to audit your current setup, troubleshoot common failures, and maximize the effectiveness and ROI of your footbath investment.
  • The Data-Driven Culling Strategy That’s Boosting Dairy Profitability – This article expands on the financial impact of lameness by providing a strategic framework for making tough culling decisions. It reveals how to use herd data to identify which animals are hurting your bottom line, optimizing overall herd value and profitability.
  • Precision Dairy Farming: Is Your Farm Ready for the Data Revolution? – While the main article critiques a single technology, this piece offers a strategic roadmap for successful tech integration. It provides criteria to assess if your operation is culturally and logistically prepared to turn data into decisions, avoiding the common pitfalls of technology overload.

The Sunday Read Dairy Professionals Don’t Skip.

Every week, thousands of producers, breeders, and industry insiders open Bullvine Weekly for genetics insights, market shifts, and profit strategies they won’t find anywhere else. One email. Five minutes. Smarter decisions all week.

NewsSubscribe
First
Last
Consent

Your $1,200 Beef Calves Are Worth Protecting – And Now You Actually Can

Beef crosses went from $50 to $1,200 in three years. Smart producers aren’t asking ‘how long will this last?’—they’re asking ‘how do I protect it?’ July’s changes made it possible.

Executive Summary: Beef income exploded from 5% to 25% of dairy revenue in just three years—that’s $650,000+ annually for a typical 500-cow operation—yet most producers are protecting their milk while leaving their beef income completely exposed. History shows cattle markets crash hard every 5-8 years, with potential losses exceeding $200,000 that can force operations to delay expansion or exit entirely. The breakthrough came July 2025 when USDA finally fixed LRP insurance for dairy, valuing beef-cross calves at their real $1,200-1,370 price instead of the insulting $275 coverage that made insurance worthless. After 35-55% government subsidies, comprehensive protection costs just $6,200 annually—about what you spend on two months of mineral supplement. October’s 11.5% price drop in 12 days isn’t normal market movement; it’s volatility returning, and smart producers are locking in protection now while it’s still affordable. Whether you choose insurance, contracts, or another approach, this guide provides the practical roadmap to protect the beef income that’s become essential to your operation’s future.”

If you’ve been to any dairy meetings lately—whether it’s in Wisconsin or Pennsylvania—you know the conversation has shifted. Sure, we’re still talking about milk prices and feed costs, because those never go away. But here’s what’s interesting: everywhere I go, the main topic is beef-on-dairy calves trading at $1,200 a head. And more importantly, everyone’s wondering how long this can last.

What I’ve found is we’re living through one of the most significant transformations in modern dairy. In just three years, beef income has gone from being this minor thing—you know, maybe 5-10% of revenue when we were lucky to get fifty bucks for a Holstein bull calf—to representing 20-25% of total farm income for operations that have really embraced beef-on-dairy breeding. University of Wisconsin Extension has been tracking this, and their analysis aligns with what USDA market reports show.

“We went from dreading bull calves to actually planning our cash flow around them. It’s a complete mental shift.”
— Wisconsin dairy producer

Here’s something worth thinking about: A typical 500-cow dairy that’s generating, say, $3 million in milk sales can now add $750,000 or more from beef-on-dairy calves and cull cows. That’s not pocket change—that’s genuine business diversification. Yet many of us are still approaching this revenue stream the way we always have, which might not be enough given these new market dynamics.

What’s encouraging is that, starting July 1, 2025, the USDA restructured its Livestock Risk Protection program to better align with what we actually need. You can find all the details in their Product Management Bulletin PM-25-028 if you want to dig into the specifics. But I’ll be honest—these aren’t simple programs. There’s definitely a learning curve.

The Beef-Cross Revolution: From $50 to $1,200 in Three Years – This isn’t gradual growth, it’s a complete transformation of dairy economics. Andrew says this chart should be on every dairy farm’s office wall as a reminder that diversification isn’t optional anymore

How We Got Here (And Why It Matters)

We’re Back to 1951—And That’s Not Good News for the Long Term – The cattle inventory crisis explains everything: why your calves are suddenly worth $1,200, and why that won’t last forever.

You probably know this already, but the way several trends came together created today’s opportunity. And understanding this helps explain both the upside and the risks.

The cattle inventory situation is pretty remarkable when you look at the numbers. USDA’s January 2024 Cattle Inventory Report shows we’re at 87.2 million total cattle—that’s the lowest since 1951. Can you believe that? The 2023 calf crop was just 33.6 million head, the smallest since 1948. We’re talking about five straight years of herd reduction, driven by drought out west, input costs that made everyone’s eyes water, and interest rates that made it nearly impossible for cow-calf folks to rebuild.

Meanwhile—and this is fascinating—sexed semen technology finally started delivering on its promises. The National Association of Animal Breeders reports that modern sexed semen hits 90-95% accuracy with conception rates that are actually competitive with conventional semen now. By 2024, sexed semen made up 61% of all dairy semen used in U.S. herds. That’s incredible growth from basically nothing a decade ago.

A New Revenue Reality

Where Dairy Income Comes from Now

  • Milk Sales: 75-80%
  • Beef-Cross Calves: 15-18%
  • Cull Cows: 5-7%

This technology shift changed everything. Now we can breed our best 35-40% of cows for replacements and put the rest to beef. As one Wisconsin producer put it to me recently, “We went from dreading bull calves to actually planning our cash flow around them. It’s a complete mental shift.”

And the economics… well, they became impossible to ignore. Holstein bulls that used to bring $50-150 are now competing with beef-on-dairy crosses pulling $1,000-1,450 per head—that’s what Superior Livestock Auction data from Pennsylvania and Wisconsin markets shows. Do the math on a 500-cow operation breeding 65% to beef, and you’re looking at roughly $250,000 in additional calf revenue. That’s like producing an extra million pounds of milk at current Class III prices.

What These New Tools Actually Do for Us

Before July 2025, if you wanted to protect beef income through insurance, you were basically out of luck. The products available were designed for beef feedlots, not dairy farms selling day-old calves and cull cows.

Finally, Real Coverage for Cull Cows

Here’s what still gets me about the old system—dairy cull cows had zero LRP coverage options. None. Think about that… An operation culling 175 cows annually at current values—we’re talking $350,000 or more—had no insurance protection available whatsoever.

“For that typical 175-cow culling program, that’s serious money at risk.”

CME market data and USDA Agricultural Marketing Service reports show cull cow prices can swing wildly—from $165/cwt down to $100/cwt when things get rough. For that typical 175-cow culling program, that’s serious money at risk.

The new “Fed Cattle – Cull Cows” category in the 2026 LRP Insurance Standards Handbook finally addresses this. What I really appreciate is how practical it is—13-week protection periods that match how we actually market cull cows, with pricing based on real cull cow values instead of fed cattle prices that never made sense for us. And with USDA Risk Management Agency subsidies of 35-55%, the actual cost comes down to about $14-21 per head. That’s manageable.

Beef-Cross Calves: Protection That Actually Works

The old “Unborn Calves, Predominantly Dairy” coverage was… well, let’s just say it didn’t work. It valued protection at about 110% of the CME Feeder Cattle Index according to the old actuarial documents. So when your beef-cross calves are selling for $1,000-1,400 but the insurance values them at $275, what’s the point?

The Value Gap: Old vs. New LRP

The $925 Gap That Could’ve Bankrupted You – Old livestock insurance was a joke, covering barely 23% of what your calves were worth.

What Your Calves Are Actually Worth vs. What Insurance Covered

  • Actual Market Value: $1,000-1,400
  • Old LRP Coverage: $275
  • New LRP Coverage: $1,200-1,370

Agricultural economists at Kansas State and other universities have documented this disconnect—we were basically insuring 25-30% of actual value. One economist described it as insuring only your truck’s tires, rather than the whole vehicle. Pretty accurate, if you ask me.

The new “Feeder Cattle – Unborn Calves” category uses dynamic Price Adjustment Factors published monthly by RMA, which actually reflect reality. The latest RMA pricing shows expected values ranging from $1,200 to $1,370 per head, depending on when you’re marketing. You can get coverage for 70-100% of those values, though there’s one catch—calves have to be sold within 14 days of birth. But that’s how most of us market them anyway, so it works.

Regional Differences Matter More Than You’d Think

What’s happening in Texas is quite different from what we’re seeing here in the Upper Midwest or Northeast. Those big Texas operations—you know, the 2,000+ cow places—they shifted to beef-on-dairy really wholly and fast. They had the scale to work directly with feedlots and set up sophisticated breeding programs.

Meanwhile, in Wisconsin and Minnesota, where most of us run 400-800 cows, it’s been more gradual. University Extension folks across the Midwest have noticed that producers here need time to build buyer relationships and understand how our local prices relate to the broader market. We couldn’t just ship direct to feedlots like the big Southwest dairies—we had to build those connections first.

Pennsylvania’s interesting, too. Penn State Extension research shows that their veal markets and proximity to Eastern feedlots yield nice premiums—$931-1,075 per head, compared to $690-945 in Wisconsin. Those regional differences really change the economics of insurance.

What’s interesting here is how Europe and Australia handle this differently. They rely more on cooperative structures and supply management—less individual insurance, more collective bargaining power. There’s something to learn from both approaches, though our system offers more flexibility if you’re willing to navigate the complexity.

Let’s Talk Real Numbers

So what does protection actually cost for a typical 500-cow dairy? Using October 2025 market data:

Your current annual beef income looks like this: Based on Wisconsin auction reports, 249 beef-cross calves at $1,239 each brings in $308,000. Add 175 cull cows at $140/cwt for 1,400-pound cows (that’s USDA-AMS data), and you’re looking at another $343,000. Total beef revenue exceeds $651,000 annually.

But if markets crash like they have before: CattleFax documented the 2015 correction at 31% within 12 months. Apply that today—calves drop to $800 (you lose $109,000) and cull cows fall to $100/cwt (another $98,000 gone). That’s over $207,000 at risk.

Here’s what protection costs after subsidies: Calf coverage at 90% runs about $2,540 annually. Cull cow coverage at 90% is around $3,675. So your total annual premium is $6,215—basically 1% of your beef income protecting against 30-40% potential losses.

Insurance folks who’ve been doing this for years will tell you—and history backs this up—major corrections happen every 5-8 years. When they do, operations with coverage get indemnity checks while their neighbors… well, they’re scrambling. It’s worth noting that crop insurance adoption took decades to reach current levels—we’re seeing similar patterns with livestock protection now.

From 5% to 22.5% in Three Years—This Is Why It’s Called a Revolution – Traditional dairy producers thought of beef income as “beer money.” Today it’s paying for new equipment, covering debt, and funding expansion.

Why Aren’t More Folks Using These Tools?

Despite the math being pretty compelling, adoption’s still low. Research from our land-grant universities points to several reasons, and they’re all legitimate concerns.

The knowledge gap is real. Most of us spent decades learning milk markets—we know Class III like the back of our hand. But cattle pricing, CME futures, basis risk? That’s all new territory. Extension programs are trying to help, but it takes time.

Then there’s what I call the trusted advisor disconnect. Your vet, your nutritionist—research shows these are the people we actually listen to and trust. But they don’t typically know insurance. Meanwhile, many crop insurance agents who handle Dairy Revenue Protection (DRP) aren’t licensed for livestock products. So there’s this gap right when we need guidance most.

And let’s be honest—we’re all stretched thin. When you’re dealing with labor shortages, equipment that needs fixing, keeping milk quality where it needs to be… adding “figure out complex insurance” to the list feels overwhelming. Especially during transition periods when fresh cow management takes all your attention. I’ve noticed that operations with dedicated financial managers adopt these tools faster—but not everyone has that luxury.

Different Approaches Can Work Too

Now, it’s important to acknowledge that insurance isn’t the only way to manage this risk. Some operations have found other approaches that work well for them.

I was talking with an Oregon producer recently who’s got direct contracts with a regional grass-fed program. “They take all our beef crosses at a guaranteed premium over market,” he explained. “For us, that predictability is worth more than insurance. We know what we’re getting, and we don’t worry about whether our local prices match up with CME indices.”

That’s a valid approach. If you’ve got solid contracts, strong financials, or other marketing arrangements that work, LRP might not be essential for you. Look at Canada—their producers rely more on supply management and cooperatives than individual insurance, and they manage okay.

Building Your Protection Strategy

What successful producers have figured out—especially those who made it through 2020’s market chaos—is that protection works best when you layer different tools.

Start with Dairy Margin Coverage (DMC) as your foundation. FSA data shows Tier 1 coverage at $9.50 margin protection costs just $75 annually for the first 5 million pounds. Over the program’s history, it’s paid out an average of $1.17/cwt. You can’t beat that value.

If you’re producing over 5 million pounds, seriously consider Dairy Revenue Protection (DRP) at 95% coverage. Yes, it runs $48,000-80,000 annually for a 500-cow operation, but government subsidies cover 44% of that. It protects both your price and production risks on milk.

Then add the new LRP tools:

  • Beef-cross calves: Get 90-95% coverage, purchased 13-43 weeks before they’re born
  • Cull cows: 13-week coverage that matches your culling schedule
  • Combined cost: roughly $6,000-8,000 annually for solid beef income protection

All told, you’re investing about 3-5% of gross revenue to protect against 30-50% potential losses in a downturn. This development suggests we’re entering a period where comprehensive risk management is becoming standard practice, not optional.

Quick Cost Breakdown by Herd Size

Herd SizeAnnual Beef Income*LRP Premium CostWhat You’re Protecting
200 cows$260,000$2,500$78,000
500 cows$651,000$6,200$195,000
1,000 cows$1,302,000$12,400$390,000
*At current market conditions   

Learning from Early Adopters

A Pennsylvania producer who started coverage in August 2025 shared something interesting with me. When October’s volatility hit—USDA reports show prices dropped 11.5% in just 12 days—he had protection at $1,130 per calf.

“My neighbors were calling emergency meetings with their bankers,” he said. “We had coverage. Sure, we didn’t get peak prices, but we weren’t losing money either. The key was starting with some coverage and learning as we went, instead of waiting for perfect timing.”

That pragmatic approach really resonates—get something in place, learn the system, then optimize. Looking at this trend, it’s clear that producers who build risk management expertise now will have significant advantages going forward.

Common Pitfalls to Watch For

Based on what agents and producers who’ve been through this tell me, here are the main things to avoid:

Waiting for the “right time” is the biggest mistake. Markets turn faster than you’d think. Once volatility shows up, premiums often double.

Don’t under-insure just to save on premiums. Saving $2,000 doesn’t help much if you’re still exposed to $100,000 in losses. Remember, these are tax-deductible business expenses—factor that into your calculations.

Read the details carefully. That 14-day marketing window for calves? Miss it, and your coverage doesn’t apply. Keep good records of birthdates and sale dates.

And find an agent who actually knows dairy livestock insurance, not someone who mainly works with beef operations. There’s a difference.

Why Timing Matters So Much

History gives us some important lessons here. CattleFax documented the 2015 crash—fed cattle went from $175/cwt to $120/cwt in less than a year. They called it the fastest decline ever recorded. Then in 2020, when COVID hit, feeder cattle lost $33/cwt in just 13 weeks.

And right now? We’ve already seen beef-on-dairy calf prices drop 11.5% in 12 days this October. That’s not normal market movement—that’s volatility coming back.

Dr. Derrell Peel at Oklahoma State has studied cattle cycles for thirty years. His research consistently shows that if you wait until you “see trouble coming” to buy insurance, it’s already too late—premiums have doubled and coverage floors are below current prices.

What’s Coming Down the Road

Several things suggest this opportunity window might not stay open as long as we’d like.

Beef herd rebuilding is starting. State inventory data shows expansion happening across Montana, the Dakotas, and Texas. As beef cattle supplies get back to normal over the next 3-5 years, our premium prices for dairy-beef crosses will probably come down. These $1,000+ calves might be temporary.

Those generous subsidies aren’t guaranteed forever, either. Congressional Budget Office analysis shows the current 35-55% premium subsidies came from COVID-era funding. With the farm bill already delayed two years and budget pressures building, who knows what future support will look like. Some states are developing their own supplemental programs, but nothing’s certain.

And here’s something interesting: if you follow genetics, the market’s starting to differentiate. ABS Global and Select Sires report that feedlots increasingly want verified genetics with carcass data. Generic crosses might fall back to $600-800 while premium verified genetics hold their value. What farmers are finding is that investing in documented genetics now positions them for when the market gets more selective.

Options for Smaller Operations

Not every 200-cow operation can spend time figuring out complex insurance programs, and that’s perfectly understandable. What’s encouraging is seeing cooperatives step up.

Vermont and Maine producers are working through their co-ops to access group risk management. Agri-Mark’s running a pilot where their risk management team handles LRP enrollment for members, spreading the expertise cost across farms. You lose some individual optimization, but it’s better than no protection at all.

Looking at this trend, smaller operations might actually have an advantage—they can leverage collective expertise without bearing the full burden themselves.

Your Next Steps: A Timeline That Works

If you’re ready to explore this, here’s a practical approach:

First week: Call your current insurance agent plus 2-3 livestock specialists. Ask specifically about dairy LRP experience, especially with the new beef-cross and cull cow options. The RMA Agent Locator helps find qualified folks in your area.

Second week: Pull together your data—breeding records, calving schedules, and when you typically cull. Figure out your actual beef income exposure. Your Extension agent can help—they’ve got spreadsheets ready to go.

Third week: Review proposals and compare options. Here’s something important—talk to your lender about this. Many banks offer better terms or even help with premium financing when you’ve got good risk management in place. As one banker told me, “We’d rather finance insurance premiums than deal with bankruptcies.”

Fourth week: Get initial coverage going for your next calving group and upcoming culls. Set up quarterly check-ins because this isn’t “set and forget”—markets change, your operation evolves, coverage should adapt.

The Bottom Line

This transformation in dairy beef income creates both huge opportunities and real risks that need managing. The USDA’s new LRP tools offer meaningful protection, but only if we understand them and act before volatility makes coverage too expensive.

We’re witnessing a fundamental shift from single-product dairy operations to diversified businesses. Those who recognize this and adapt will be the ones expanding in 2028. Those who don’t… well, they’ll have some tough conversations ahead.

The tools are there. Government subsidies cover 35-55% of premium costs. The math works. But tools only help if you use them.

With beef income at historic highs but already showing volatility, the window for affordable protection is open but narrowing. Every producer I know who’s been through previous crashes says the same thing: “I wish I’d bought insurance when times were good and premiums were cheap.”

That time is right now. Make the calls. Run your numbers. Get protected. Whether you choose insurance, contracts, or another approach, make sure you’ve got a plan that fits your operation.

“Hoping for the best isn’t risk management—it’s gambling with your family’s future.”

For more information on LRP enrollment, contact a licensed livestock insurance agent or visit rma.usda.gov for resources and agent locator tools. Your state Extension service offers educational programs on risk management strategies specifically for dairy operations.

Key Takeaways:

  • You’re protecting your milk but gambling with your beef—that 25% of revenue ($650K+ annually) needs coverage just as much as your milk income does
  • July 2025 changed everything: USDA finally valued dairy beef calves at their real $1,200-1,370 price for insurance, not the useless $275 that made coverage pointless
  • Simple math, huge impact: Invest $6,200 annually (after 35-55% subsidies) to protect $651,000 in beef income—that’s using 1% to protect against 30-40% crashes
  • The window is closing fast: October’s 11.5% price drop in 12 days proves volatility is returning, and waiting means doubled premiums or no coverage at all
  • You have options: Whether through insurance, direct contracts, or cooperative programs, successful operations are implementing beef income protection now—our 4-week guide shows you exactly how

Complete references and supporting documentation are available upon request by contacting the editorial team at editor@thebullvine.com.

Learn More:

The Sunday Read Dairy Professionals Don’t Skip.

Every week, thousands of producers, breeders, and industry insiders open Bullvine Weekly for genetics insights, market shifts, and profit strategies they won’t find anywhere else. One email. Five minutes. Smarter decisions all week.

NewsSubscribe
First
Last
Consent

Retained Placenta Rates Cut in Half: How a $10 Calcium Protocol Delivers $15,000 Annual Returns

That 10% retained placenta rate you accept as ‘normal’? It’s costing you $20,000/year. Here’s how to cut it in half for $5,000.

EXECUTIVE SUMMARY: You’re likely losing $20,000 annually to a problem you think costs $75 per case—retained placenta actually drains $389 when you count lost milk, open days, and cascade diseases. Progressive dairy operations have cracked the code, cutting rates from 10% to 4% with one simple change: dual calcium bolusing at $10 per cow. The game-changer is understanding that retained placenta isn’t mechanical—it’s an immune system failure caused by subclinical hypocalcemia, which affects 25-50% of fresh cows. Farms implementing this evidence-based protocol consistently achieve 307% ROI, banking $15,000+ net profit annually on a 500-cow operation. Research from Cornell, Wisconsin, and USDA confirms what leading producers already know: preventing retained placenta isn’t about treating problems better; it’s about stopping them before they start. With payback in under 4 months and proven results across North America, the only question is whether you’ll capture this value now or continue accepting ‘normal’ losses.

retained placenta prevention

Progressive farms are discovering that a simple calcium protocol delivers 307% ROI while cutting fresh cow disorders in half—here’s what they’re learning about transition cow economics

There’s a conversation happening in milk houses and conference rooms across the dairy industry right now, and it’s about something most of us thought we had figured out: retained placenta.

You know how it is. For generations, we’ve accepted that 8-12% of fresh cows will retain their placentas. Just another cost of doing business—like bedding expenses or fuel prices. But here’s what’s interesting: that acceptance might be costing your operation far more than you realize.

What I’ve been seeing across operations from Wisconsin to California is that retained placenta is actually running about $389 per case when you factor in all the downstream impacts. That figure comes from research published in the Journal of Dairy Science, and it’s been consistent with what Dairy Herd Management and other industry analysts have been documenting. For a typical 500-cow operation, addressing this one issue could mean the difference between breaking even and banking an extra $15,000 annually.

“We’ve spent decades selecting for higher production. Now we need to ensure our management systems support the remarkable cows we’ve created.”

The Economics Nobody’s Been Calculating

So here’s what really caught my attention. When researchers from the University of Guelph and Ontario Veterinary College dug into the true cost of retained placenta across multiple herds, they uncovered something remarkable. That immediate vet expense—the $75 bill most of us focus on—it’s just a tiny piece of the actual economic impact.

Stop Tracking the Wrong Number. That $75 vet bill you’re watching? It’s camouflage for a $389 problem. Lost milk production silently bleeds $287 per case while you’re focused on treatment costs. Progressive dairy operations banking an extra $15,000 annually know this truth: the real cost lives in what you’re NOT measuring. Time to start counting what counts.

The breakdown tells an interesting story:

  • Direct milk production losses account for $287 per case (that’s roughly 74% of your total cost)
  • Extended time to pregnancy adds another $73, about 19% of the impact
  • Increased susceptibility to other diseases contributes $25-29 per case

What’s worth noting is the loss in milk production. These cows produce 300-500 kg less milk across their entire lactation—we’re talking 660 to 1,100 pounds that never makes it to your bulk tank. At current component-adjusted prices in most regions, you’re looking at $150-250 in lost revenue per affected cow.

And the reproductive piece… well, that’s where it really adds up. Research from Tanzania and several other countries tracking dairy herds shows that retained-placenta cows average around 52 more days open than their healthy herdmates. They need about 2.9 services per conception compared to 1.9 for unaffected cows.

You probably know this already, but each open day costs between $3 and $5, depending on your market. So that extended time to pregnancy alone can run $150-260 per affected cow. These aren’t theoretical numbers—they’re showing up in actual herd records from coast to coast.

Cost Breakdown: Where Your Money Goes

For each retained placenta case:

  • Milk production loss: $287 (74%)
  • Extended days open: $73 (19%)
  • Secondary health issues: $25-29 (7%)
  • Total: $389 per case

Understanding the Biological Transformation

To really appreciate why retained placenta has become such a challenge, we need to consider how dramatically our cows have changed.

I was talking with a dairyman the other day—third generation, been in the business his whole life—and he pulled out production records from the 1980s. His grandfather’s best cows were producing 12,000-14,000 pounds per lactation. Today? His herd averages over 26,000 pounds. That’s not just more milk. That’s a complete biological transformation.

Peak production has climbed from 60 pounds daily to routinely exceeding 120 pounds in well-managed herds. And the metabolic demands this places on transition cows? They’re unprecedented in the history of dairy farming.

Here’s where the science gets really interesting. Research from Dr. Kayoko Kimura’s team at the USDA’s National Animal Disease Center in Ames has revealed something that changes our entire understanding of retained placenta. Rather than being a mechanical failure—you know, the placenta simply being “stuck”—it’s fundamentally an immune system dysfunction.

The neutrophils (those white blood cells responsible for separating placental tissue from the uterine wall) show a 41% reduced response in cows destined to retain their placentas. These same animals have interleukin-8 concentrations averaging just 51 picograms per milliliter, compared to 134 in healthy cows.

What’s that mean for us in practical terms? Well, if retained placenta results from immune dysfunction rather than mechanical attachment, then our traditional approach of manually removing these membranes… it might be misguided. In fact, recent systematic reviews suggest it could actually be counterproductive.

The Calcium Connection: A Management Breakthrough

One of the most encouraging developments in transition cow management involves our understanding of calcium’s role beyond just milk fever prevention. Research from multiple institutions shows that subclinical hypocalcemia dramatically increases the risk of retained placenta risk.

And we’re not talking about clinical milk fever, that’s obvious to spot. This is the 25-50% of fresh cows with low blood calcium who appear perfectly normal during your morning walk-through.

Dr. Jessica McArt’s work at Cornell has really helped clarify calcium’s multiple roles in the transition period. Beyond muscle contraction (which we all know about), calcium is essential for immune cell function, influences stress hormone regulation, and affects rumen motility—which directly impacts dry matter intake.

The challenge, as many of us have seen, is that as milk production has intensified, our traditional calcium management strategies haven’t kept pace. A cow producing over 100 pounds of milk daily? She’s facing metabolic demands that would’ve been unimaginable just two decades ago.

Learning from High-Performing Operations

What I find encouraging is seeing operations achieving retained placenta rates below 4%—less than half the industry average. While each farm has its unique approach, they share several management strategies worth considering.

The Evolution of Calcium Supplementation

Here’s what’s working for many operations, particularly in California and the upper Midwest. Instead of the traditional single calcium treatment at calving, they’ve implemented what’s being called a dual-bolus protocol.

The approach is straightforward: administer the first dose within an hour of calving—two boluses of calcium chloride. Then return 12-24 hours later with two more boluses. That second dose catches the delayed hypocalcemia that often triggers problems two or three days after calving.

The research supports this approach. A comprehensive meta-analysis published this year demonstrated that while single bolusing addresses immediate calcium needs, it’s the second dose that prevents the delayed hypocalcemia associated with many fresh cow disorders.

The economics work out to about $10 per cow for the protocol, and many operations are seeing retained placenta rates drop from 10-11% down to 4-5% within months of implementation. That’s a pretty solid return.

The Critical Importance of DCAD Verification

You know what’s been eye-opening? How many farms believe they’re feeding an effective negative DCAD program when they’re actually not.

I was working with a nutritionist in Wisconsin recently, and she shared her experience testing urine pH on farms claiming to run negative DCAD programs. About half the time, when they actually test urine pH, it’s running 7.5 to 8.0—nowhere near the 6.0 to 6.5 target for Holsteins (or 5.5 to 6.0 for Jerseys).

The issue often traces back to high potassium levels in forages that overwhelm the anionic salts being fed. The solution typically involves adjusting the forage base to include lower-potassium feeds. Corn silage, wheat straw, and certain grass hays—these can help achieve the mineral balance needed for effective DCAD programs.

Rethinking Stocking Density in Transition Facilities

Research from the University of British Columbia, combined with extensive field observations from Wisconsin and New York operations, has really clarified the relationship between overcrowding and fresh cow health.

Here’s what we’re seeing: operations that thought they were being efficient running close-up pens at 120% capacity often see fresh cow health issues—including retained placenta—decrease by about a third when they drop to 80% stocking density.

The most successful operations typically maintain:

  • No more than 80% stocking density based on feed bunk space
  • At least 30 inches of bunk space per cow
  • Between 100 and 160 square feet per cow in bedded pack systems

And here’s something crucial—these farms size their transition facilities for 140% of the average monthly calving rate. Because, as we all know, calvings aren’t uniform throughout the year.

Quick Reference: Dual Calcium Bolus Protocol

Initial Dose: Within 1 hour of calving

  • 2 boluses of acidogenic calcium (chloride or sulfate form)
  • Provides 50-75g elemental calcium

Follow-up Dose: 12-24 hours post-calving

  • 2 additional boluses of the same product
  • Addresses delayed hypocalcemia risk

Investment: Approximately $10 per cow Expected outcome: 40-60% reduction in retained placenta incidence

Reconsidering Traditional Treatment Approaches

Perhaps the most surprising development—at least for those of us who’ve been doing this a while—involves our understanding of how to manage retained placenta when it does occur.

Multiple systematic reviews and surveys of veterinary practices across Europe and North America are challenging the long-standing practice of manual removal. Dr. Carlos Risco’s work at the University of Florida has been documenting outcomes from what he calls conservative management.


Management Approach
Traditional ManagementEvidence-Based ProtocolImpact
PhilosophyTreat problems after they occurPrevent immune dysfunctionParadigm shift: mechanical → metabolic
Intervention TimingWait 24-48 hours post-calvingWithin 1 hour + 12-24h follow-up60% reduction in cases
Treatment ProtocolManual placenta removal + antibioticsDual calcium bolus ($10/cow)88% treatment success when needed
Target Blood CalciumAccept subclinical hypocalcemiaMaintain >8.5 mg/dL throughout50% of cows affected without symptoms
Expected RP Rate10-12%4-5%60% fewer cases = 25 cows saved/year
Annual Cost (500 cows)$19,450 in losses$15,345 net profit$34,795 total swing
ROINegative307% ($3 back per $1)Payback in 3.9 months

The approach is simple: monitor cows for signs of systemic illness—fever, depression, reduced appetite. If the cow is otherwise healthy, leave the placenta alone. About 40% resolve without any intervention, with membranes typically passing within 2-11 days.

I’ll admit, this represents a significant departure from what most of us were taught. But farms implementing this approach are reporting fewer cases of metritis and improved long-term reproductive performance. The evidence is getting harder to ignore.

Traditional vs. Conservative Treatment: Making the Choice

Looking at the comparison between approaches, the shift in thinking becomes clear:

Traditional Manual Removal:

  • Immediate intervention within 24-48 hours
  • Physical removal of retained membranes
  • Often followed by intrauterine antibiotics
  • Higher risk of uterine contamination and trauma
  • Increased metritis rates have been reported in recent studies

Conservative Management:

  • Monitor for systemic signs only
  • Leave the placenta to separate naturally
  • Treat only if fever, depression, or reduced appetite develops
  • 40% spontaneous resolution without intervention
  • Lower metritis incidence and improved fertility outcomes

The data’s compelling enough that many progressive operations are making the switch, though it does require a mindset shift for both staff and veterinarians.

Calculating Return on Investment

Let’s look at the economics using real-world data from operations that have implemented comprehensive calcium management protocols. And these aren’t just projections—these are actual results we’re seeing.

307% ROI in Under 4 Months Isn’t Theory—It’s Basic Math. Invest $10 per cow in dual calcium bolusing and watch the cascade effect: $9,725 from prevented retained placenta, $4,200 from reduced metritis, $2,820 from fewer displaced abomasums, $3,600 from crushing ketosis. The total? Bank $15,345 net profit on your 500-cow herd. Here’s the revelation: leading producers aren’t preventing one disease—they’re preventing the entire fresh cow disorder cascade. That’s the difference between targeting symptoms and fixing the metabolic foundation.

For a typical 500-cow dairy operation:

What You’ll Invest:

  • Dual calcium bolus protocol: $5,000 annually
  • Urine pH monitoring supplies: About $200
  • Staff training time: Maybe 4 hours total
  • Total investment: $5,200

What You Can Expect Back:

  • Reduced retained placenta cases (from 10% to 5%): 25 fewer cases × $389 = $9,725
  • Decreased metritis incidence: 15 fewer cases × $280 = $4,200
  • Fewer displaced abomasums: 6 cases × $470 = $2,820
  • Reduced ketosis: 18 cases × $200 = $3,600
  • Total annual savings: $20,345

Net profit increase: $15,345 Return on investment: 307% Payback period: 3.9 months

Most operations report achieving these results within their first year of implementation.

Monitoring Success: The Fresh Cow Disorder Rate

Here’s what separates successful operations from those just hoping for the best—they track what’s commonly called the Fresh Cow Disorder Rate. That’s the percentage of cows experiencing any clinical disease during the first 21 days in milk.

Top 10% vs. The Rest: The Fresh Cow Disorder Gap Is Brutal and Real. Elite operations keep disorders under 15% through aggressive calcium management and systematic prevention. Average herds struggle along at 30%, losing thousands in hidden costs. Bottom tier? Over 40% of fresh cows hit metabolic problems they could’ve prevented. The difference isn’t genetics, facilities, or luck—it’s measurement and management discipline. Track your 90-day rolling Fresh Cow Disorder Rate weekly. You’ll know within one quarter whether you’re banking profits or bleeding money. Which bar describes your herd?

Analysis of data from multiple herds reveals pretty consistent patterns:

  • Leading operations (top 10%): Less than 15% disorder rate
  • Average performance: 25-35% disorder rate
  • Operations needing improvement: Over 40% disorder rate

Track this metric weekly, calculate a 90-day rolling average, and you’ll know within one quarter whether your investment is delivering expected returns.

Regional Adaptations and Seasonal Considerations

Now, it’s important to recognize that these protocols need adjustment based on where you’re farming. What works in Wisconsin doesn’t always translate directly to Arizona or Texas.

Field observations across various regions indicate that heat stress can significantly increase the risk of retained placenta. Some operations see rates increase from 7-8% during cooler months to 13% or higher during summer heat stress. If you’re in the Southwest or Southeast, you might need more aggressive calcium supplementation during the summer months.

I’ve noticed that Florida dairies, dealing with year-round heat and humidity, often run their calcium protocols more aggressively from May through October. One producer near Okeechobee told me they actually triple-dose during their worst heat—though that’s based on their specific conditions and vet recommendations.

Feed availability varies, too. Operations in regions where corn silage is limited or expensive face additional challenges in achieving that low-potassium forage base necessary for effective negative DCAD programs. Some Western operations have found success using wheat straw or importing specific grass hays to achieve an appropriate mineral balance.

The key is adapting these principles to your specific circumstances rather than trying to apply a one-size-fits-all approach.

Emerging Technologies and Future Directions

While current calcium management strategies offer immediate opportunities, several developments promise further to transform transition cow management over the coming decade.

Research teams at the University of Wisconsin-Madison and Michigan State University have been identifying blood biomarkers that can predict retained placenta risk weeks before calving. Dr. Heather White’s group at UW-Madison reports identifying specific metabolites in blood samples collected at dry-off with approximately 85% accuracy, flagging high-risk cows.

Sensor technology continues to advance as well. The latest generation of rumen boluses continuously monitors pH, temperature, and motility patterns. When combined with machine learning algorithms, these systems can identify metabolic problems days before clinical signs appear.

Within the next 5-10 years, we’re likely to see:

  • Practical on-farm biomarker testing for under $50 per cow
  • AI-driven risk scoring based on sensor data
  • Precision interventions targeted to individual cow needs
  • Industry-wide fresh cow disorder rates below 10%

Implementation Timeline: Your 90-Day Roadmap

For those ready to capture these opportunities, here’s a methodical approach that’s been working well:

Week 1-2: Assessment Phase

  • Review records from the past 90 days
  • Calculate the current fresh cow disorder rate
  • Order calcium boluses
  • Set up tracking system (whiteboard works fine)
  • Schedule staff training

Week 3-8: Implementation Phase

  • Begin dual calcium bolus protocol
  • Start weekly urine pH testing (if feeding negative DCAD)
  • Evaluate close-up pen stocking density
  • Calculate and post weekly disorder rates
  • Monitor compliance and troubleshoot

Week 9-12: Refinement Phase

  • Compare the disorder rate to the baseline
  • Calculate cases prevented
  • Document cost savings
  • Refine protocols based on results
  • Plan additional improvements

The consistent message from successful operations: reliable execution of simple protocols outperforms sporadic attempts at complex interventions every time.

The Bottom Line: Are You Leaving Money on the Table?

As we navigate today’s challenging economic environment—volatile milk prices, rising input costs—the question isn’t whether we can afford to invest in better transition cow management. It’s whether we can afford to leave $15,000 or more in annual returns uncaptured.

The science supporting these approaches is robust, with dozens of peer-reviewed studies confirming both the biological mechanisms and economic benefits. The protocols are practical enough for any motivated operation to implement. And perhaps most importantly, these improvements align with broader industry goals around animal welfare and reduced antibiotic use.

You know, a thoughtful producer said something to me recently that really stuck: “We’ve spent decades selecting for higher production. Now we need to ensure our management systems support the remarkable cows we’ve created. This isn’t about revolution—it’s about evolution, about adapting our practices to match biological reality.”

The tools and knowledge exist today. The only variable is whether individual operations will choose to implement them. For those who do, the rewards—both financial and in terms of animal health—are substantial and sustainable.

So here’s my question for you: If you could reduce retained placenta rates by half and bank an extra $15,000 annually with a $5,200 investment, what’s stopping you from starting this week?

Implementation of these protocols should be done in consultation with your herd veterinarian and nutritionist to ensure adaptation to your specific operational circumstances. Success depends on consistent execution and systematic outcome monitoring. The research and examples cited represent common industry findings and experiences; individual results will vary based on management, facilities, and regional factors.

KEY TAKEAWAYS 

  • True Cost Exposed: Retained placenta drains $389/case in lost milk, open days, and cascade diseases—turning your “normal” 10% rate into a $20,000 annual bleed
  • The $10 Solution: Dual calcium bolusing (at calving + 12-24 hours later) cuts retained placenta rates 60%, from 10% down to 4% within 90 days
  • Guaranteed ROI: $5,000 investment returns $20,000 in prevented losses = $15,000 net profit with 3.9-month payback (307% ROI)
  • The Science: Retained placenta isn’t mechanical—it’s immune dysfunction from subclinical hypocalcemia hiding in 25-50% of “healthy” fresh cows
  • Start Monday: Order calcium boluses, schedule 4-hour staff training, implement protocol, track Fresh Cow Disorder Rate weekly—see results within 30 days

Complete references and supporting documentation are available upon request by contacting the editorial team at editor@thebullvine.com.

Learn More:

The Sunday Read Dairy Professionals Don’t Skip.

Every week, thousands of producers, breeders, and industry insiders open Bullvine Weekly for genetics insights, market shifts, and profit strategies they won’t find anywhere else. One email. Five minutes. Smarter decisions all week.

NewsSubscribe
First
Last
Consent

The Real Reason Butterfat Hit 4.23% – And Why It Determines Which 14,000 Dairies Survive

Dairy’s biggest winners didn’t have better genetics. They had better timing. The $1.3M difference happened in 2009, not 2019.

Executive Summary: The U.S. dairy industry’s 30% component revolution wasn’t about genetic breakthroughs—it was about economics creating signals that genomics finally made actionable. When component pricing launched in 2000, the market screamed for higher butterfat, but producers lacked tools to respond until genomic testing arrived in 2009, tripling selection accuracy overnight. Early adopters who grasped this sequence and invested immediately captured $1.3 million in value, while “prudent” operations that waited until 2015 saved $130,000 but forfeited $190,000+. Today’s brutal reality: farms under 200 cows face a permanent $366,375 annual disadvantage versus 2,000-cow operations—a gap that compounds annually and can’t be overcome through better management. With only 35% of herds having basic infrastructure like DHI testing, and 2,800 operations exiting annually, the industry is splitting into two irreconcilable segments. The 2025-2027 window represents the last opportunity for strategic action: scale to 300+ cows with full technology adoption, pivot to premium markets, or exit with dignity while equity remains

You know, there’s something happening in dairy right now that most producers are getting backwards. According to USDA’s April 2025 Milk Production Report and CoBank’s March 2025 dairy analysis, butterfat production surged 30.2% and protein jumped 23.6% from 2011 to 2024, while milk volume grew just 15.9%.

Here’s what caught my attention: total milk production actually declined in both 2023 and 2024—the first back-to-back drop since the 1960s according to USDA National Agricultural Statistics Service—yet butterfat hit 4.23% nationally, shattering a 76-year-old record that stood since 1948.

Most folks I talk to at meetings believe genomic testing drove this transformation. They’re looking at it backwards, and once you understand the real sequence of events, it changes how you think about every breeding decision you’ll make this year.

The Component Revolution: Butterfat production exploded 30.2% from 2011-2024 while milk volume barely moved at 15.9%, proving the dairy industry fundamentally transformed from a volume game to a components game.

The Economic Signal That Started Everything

Looking back at the data from the Council on Dairy Cattle Breeding, the transformation didn’t actually begin with the 2009 launch of commercial genomic testing. It started in 2000 when Federal Milk Marketing Orders implemented multiple component pricing formulas, fundamentally changing how we all get paid.

The Math That Changed Everything

Suddenly, nearly 90% of milk check value came from butterfat and protein content, not volume. When butterfat trades at $3.20 per pound—which it has in recent Federal Order announcements—increasing your herd’s butterfat test by just 0.1% adds $3,200 to the value of every million pounds of milk you ship.

The market was essentially screaming at us to breed for components.

Yet according to USDA Economic Research Service dairy analysis, from 2000 to 2010, milk, butterfat, and protein production all grew at nearly identical rates—between 13.8% and 15.4%. Why the lag? Well, that’s where this story gets really instructive for anyone trying to understand today’s consolidation dynamics.

The Biological Speed Limits We All Faced

I’ve been digging through the research, and what Penn State’s Dr. Chad Dechow documented in his Holstein genetic diversity studies reveals why economics alone couldn’t drive immediate change.

Three Fundamental Constraints

Before genomic testing, we faced three fundamental constraints that no amount of economic incentive could overcome:

Terrible selection accuracy: Parent average predictions offered just 20-35% reliability, according to CDCB historical data. Young bulls? Maybe 40% reliability using pedigree indexes. You’d select a bull expecting +80 pounds of fat transmission, only to discover five years later when his daughters finally milked that he actually transmitted +20 pounds.

Glacial generation intervals: Research published by García-Ruiz and colleagues in PNAS (2016) showed the average generation interval stretched 5.5 years pre-genomics, with the sire-to-bull path taking 6.8 years. A breeding decision made in 2000 wouldn’t show population-level results until 2012 or 2013.

Limited technology adoption: University extension surveys from that era show only about 70-75% of U.S. dairy cows were being bred artificially with elite genetics in 2000. Synchronized breeding protocols? Just 10-15% adoption. Natural service bulls still covered 25-30% of breedings.

The 2009 Revolution

The Genomic Inflection Point: Butterfat percentages drifted slowly until 2009 when genomic testing tripled selection accuracy overnight—proving that economics alone couldn’t drive change until biology and technology caught up.

Then 2009 changed everything. According to USDA’s Animal Genomics and Improvement Laboratory, genomic testing tripled selection accuracy to 60-68% immediately at birth. Generation intervals compressed from 5.5 to 3.8 years.

By 2011, the first daughters of genomically-selected bulls entered milking strings nationwide. What we’re seeing now isn’t delayed response to pricing—it’s the first time biological and technological infrastructure existed to capitalize on incentives that had been present all along.

Quick Reference: Key Terms in Modern Dairy Breeding

Genomic Testing: DNA analysis that predicts an animal’s genetic potential at birth with 60-70% accuracy, versus 20-35% with traditional parent averages

Net Merit $: USDA’s economic index estimating lifetime profit potential of an animal’s genetics

DHI (Dairy Herd Improvement): Monthly milk testing program that tracks production, components, and somatic cell counts

Component Pricing: Payment system where farmers are paid based on pounds of butterfat and protein rather than milk volume

A Tale of Two Strategies: Early Adopters vs. Wait-and-See

The $1.3 Million Gap: Early adopters who invested in genomic testing at $45/test in 2009 captured $1.25M in value by 2019, while ‘prudent’ operations that waited for cheaper tests in 2015 actually lost money—proving timing beats perfection in rapidly evolving markets.

Let me share a scenario based on actual industry patterns I’ve tracked across multiple operations. Consider two typical 500-cow Wisconsin dairies, both aware of component pricing incentives. Their divergent paths from 2009-2019 illustrate exactly how timing created permanent competitive advantages.

The Early Adopter Strategy (2009-2011)

These producers made four decisions that their neighbors thought were reckless:

  1. Started genomic testing every heifer calf at birth through programs like Zoetis’s CLARIFIDE ($45-50 per test when everyone else was paying zero)
  2. Immediately culled the bottom 25% of genomically-tested calves—sold them at 2-4 months old
  3. Switched to 100% young genomic bulls averaging +$400-500 Net Merit
  4. Implemented Ovsynch protocols on 80% of the herd

Projected Results by 2016

Based on industry modeling:

  • Butterfat test: 4.15% (up from 3.78% baseline)
  • Protein test: 3.28% (up from 3.12%)
  • Component premium: Approximately $73,000 annually
  • Early culling savings: $105,000 annually
  • Beef-cross premiums: $30,000 annually

Total modeled value creation over 10 years: $1.2-1.3 million after testing costs

The Wait-and-See Approach

The “wait-and-see” operations held off until 2015-2016. By then, test costs had dropped to $28-35 and reliability had improved to 68%. Sounds prudent, right?

Industry modeling suggests otherwise. While these operations saved approximately $130,000 in testing expenses from 2009-2015, they forfeited an estimated $190,000+ in component premiums during just 2016-2019.

The Infrastructure Reality Nobody Talks About

Here’s what determines whether genomic strategies actually work, and I learned this the hard way watching operations try to implement these programs: it’s infrastructure, not genetics.

Current Infrastructure Gaps

According to CDCB data from 2024, here’s where we actually stand:

  • DHI testing participation: Just 35% of herds
  • Computerized records: Industry surveys estimate 40-50% of sub-200-cow herds still use paper breeding sheets
  • Activity monitoring: Adoption remains below 30% in smaller operations
  • Reliable internet: Still a major barrier across rural areas

The Six Essential Components

The pattern I keep seeing is that genomic strategies need all six infrastructure components working together:

  1. DHI testing
  2. Herd management software (DairyComp, PCDart, or similar)
  3. Genomic testing capability
  4. Synchronized breeding protocols
  5. Disciplined record-keeping culture
  6. Reliable internet for data integration

My rough estimate? Maybe 15-20% of U.S. dairy operations have all pieces in place.

The Cruel Paradox of Efficiency

This creates what economists call a cruel paradox. Operations that most desperately need efficiency gains—those under 200 cows facing what Rabobank’s October 2024 Dairy Quarterly described as “-$2/cwt to +$2/cwt margins”—can least afford the $50,000-70,000 infrastructure investment required over five years.

Meanwhile, operations with 2,000+ cows generating $1-4 million annual profits can fund infrastructure improvements from cash flow every single year.

By The Numbers: The 2025 Dairy Reality

Consolidation Metrics:

  • 35% of U.S. dairy herds participate in DHI testing (CDCB, 2024)
  • 2,800 dairy operations projected to exit annually through 2030 (Rabobank October 2024 Dairy Quarterly)
  • $9.77/cwt cost disadvantage for 100-199 cow operations versus 2,000+ cow operations
  • 65% of U.S. milk now comes from operations with 1,000+ cows (2022 Agricultural Census)

Genetic Revolution Impact:

  • 30.2% increase in butterfat production (2011-2024)
  • 23.6% increase in protein production (2011-2024)
  • $1.2-1.3 million modeled advantage for early genomic adopters
The Extinction Timeline: Small dairy farms under 200 cows are disappearing at catastrophic rates—26,369 operations lost from 2017-2022 alone. By 2030, only 14,000-16,000 total dairies will remain, ending a century-long tradition of family-scale dairy farming.

The Consolidation Reality: Different Strokes for Different Regions

The Cost Gap That Can’t Be Overcome

According to USDA cost of production analysis:

  • Farms with 2,000+ cows: $23.06/cwt
  • Farms with 100-199 cows: $32.83/cwt
  • Permanent disadvantage: $9.77/cwt
The Unmanageable Gap: Small operations face $9.77/cwt higher production costs than mega-dairies—a $366,375 annual disadvantage for a 150-cow farm that compounds every year and can’t be overcome through better management or harder work.

For a 150-cow operation in Wisconsin producing 3.75 million pounds annually, that calculates to a $366,375 annual profit gap.

Regional Variations

In California’s Central Valley where land costs are astronomical, even 500-cow operations struggle with similar economics. Meanwhile, operations in South Dakota with lower land and labor costs can remain viable at 300-400 cows, according to South Dakota State University Extension analysis.

“We can’t compete on volume, but when you’re shipping 4.3% fat and 3.4% protein, the processors come looking for you.” — Texas dairy producer focusing on component premiums

The Stark Census Reality

What the 2022 Agricultural Census revealed:

  • 2017: 54,599 licensed dairy operations
  • 2022: 24,082 operations (56% decline in 5 years)
  • 2025 projection: approximately 22,000 operations
  • 2030 projection: 14,000-16,000 operations

Farms under 200 cows lost 26,369 operations from 2017-2022, while farms over 1,000 cows actually added 400. The industry isn’t just consolidating—it’s splitting into two completely different businesses.

How Processors Are Shaping This Transformation

According to CoBank’s dairy quarterly analysis, over $8 billion in new processing capacity is coming online through 2027, with 80% focused on cheese, butter, and protein ingredients—all products where yields depend entirely on component levels.

“We’re not building plants to handle more gallons. We’re investing in infrastructure designed to maximize value from higher butterfat and protein concentrations. A producer shipping 3.8% fat milk versus 4.2% fat milk? That’s a massive difference in our cheese yields.” — Procurement manager from major cheese company

This processor demand feeds right back into the pricing formulas, creating even stronger economic signals for component production.

The 2025 Decision Point: Why This Year Matters

Demographic Reality

Looking at demographic data from Wisconsin’s Center for Dairy Profitability surveys:

  • 22% of farms under 100 cows plan to exit within five years
  • 70% have no identified successor

This isn’t really about economics anymore—it’s demographics. Baby Boomer retirements are accelerating regardless of milk prices.

Current Conditions Favor Strategic Decisions

According to USDA’s Dairy Margin Coverage Program data:

  • Profit margins hit $13.14/cwt in Q3 2024—historical highs
  • All-Milk prices averaging $22-25/cwt
  • Land values remain elevated from 2021-2022 boom
  • Buyer demand still exists from expanding operations

But By 2028-2030, Everything Changes

With 2,400-2,800 annual closures projected by Rabobank’s October 2024 analysis:

  • Markets flooded with used equipment and facilities
  • Buyer pool shrinks to just mega-operations
  • Equipment values likely collapse from oversupply

Two Paths That Actually Work

Path 1: The Optimized Mid-Scale Model (300-600 cows)

Economic analysis from New Zealand’s dairy sector shows their national herd size stabilized around 450 cows—not by accident, but because that’s where per-cow profitability peaks.

Operations at this scale with full technology adoption can achieve:

  • Superior milk quality (SCC averaging 161,000 versus 200,000+)
  • 15-25% higher profit per kilogram of milk solids
  • Manageable labor requirements with family involvement
  • Financial sustainability without extreme debt leverage

Required commitment: $50,000-70,000 annual technology investment for at least five years.

Path 2: Premium Niche Markets

Market reports indicate direct-to-consumer operations in premium markets can achieve $40-50/cwt, though this requires:

  • Complete pivot from commodity production
  • Serious marketing capabilities
  • Certification costs
  • Geographic proximity to affluent consumers

Success Story: How Minnesota Dairies Made the Transition

Here’s a composite example based on three similar operations I’ve worked with in central Minnesota between 2009-2015 (details combined for privacy).

The Implementation Phase

These producers were milking around 280 cows when genomic testing launched in 2009, barely breaking even at $14/cwt milk prices.

“Yeah, we almost didn’t do it. Forty-five dollars per calf for testing seemed crazy. But our nutritionist ran the numbers on what we were losing by raising the wrong heifers.”

They started testing in spring 2010, immediately culled their bottom 20% of heifers, and switched to all genomic young sires.

“I remember standing at the sale barn. Other farmers were buying our culled heifers thinking they got a bargain. Meanwhile, we kept the ones genomics said would actually make us money.”

The Results

By 2015, their first genomically-selected heifers entered the milking string:

  • Components jumped: 3.75% to 4.05% fat; 3.08% to 3.22% protein
  • Premium increased: $3-4/cwt more than neighbors
  • Expansion enabled: Grew to 400 cows, upgraded parlor

Total investment (2010-2020): $350,000-400,000 Documented returns: Over $1 million

Making the Decision: Your Three Critical Questions

The Five-Year Breakeven: Early genomic adopters invested $385K over a decade but captured $1.05M in returns, breaking even around year 5 and pulling $665K ahead by 2019—while late adopters were still debating whether to start.

After working with hundreds of operations facing these decisions, here are the three questions that cut through all the noise:

1. Do you have a committed successor currently working on the operation?

And I mean actually working, not just “interested” or “might come back after college.”

2. Can you invest $50,000-70,000 annually for five years without jeopardizing family finances?

This isn’t about having the cash—it’s about having it without risking your kids’ college funds, your health insurance, or your retirement security.

3. Are you genuinely willing to scale to 300+ cows or pivot to premium markets?

The economics are clear—conventional production under 300 cows faces structural disadvantages that compound annually.

If you answered yes to all three: The path forward requires immediate, aggressive investment in infrastructure and genetics. The documented returns prove the strategy works when fully implemented.

If you answered no to any question: Consider that selling in 2025-2026 with $500,000-$1,000,000 in equity beats farming until 2030 at annual losses, then being forced to liquidate with minimal equity.

These aren’t just business decisions. They’re deeply personal choices about family legacy and identity. There’s honor in building a successful operation that can compete. There’s equal honor in recognizing when it’s time to capture your equity and move forward.

The Bottom Line

Economics drives genetics, not the other way around. Component pricing created incentives in 2000. Genomic testing in 2009 just gave us tools to capitalize efficiently.

Infrastructure determines execution. Operations genomic testing without DHI data, herd software, and systematic records are like buying a Ferrari without roads.

Timing beats perfection. Early adopters who paid $45 per test with 61% reliability captured significantly more value than those who waited for $28 tests with 68% reliability.

Compound advantages are permanent. The three-generation genetic lead early adopters built from 2009-2019 can’t be overcome.

The 30.2% butterfat increase and 23.6% protein increase from 2011-2024 represent what happens when economic signals, biological capabilities, and technological infrastructure finally align. For the roughly 22,000 operations under 200 cows remaining in 2025, the question isn’t whether to adopt genomic testing—it’s whether they have the infrastructure, capital, and succession plan to compete.

The operations thriving in 2030 won’t necessarily be those with the best cows or the hardest-working families. They’ll be those who made clear-eyed infrastructure investments in 2025 based on economic reality rather than tradition.

As a dairy farmer once told me: “The cows don’t know if you’re milking 50 or 5,000. But the economics sure do.”

Key Takeaways 

  • Economics drove genetics, not vice versa: Component pricing created the signal in 2000; genomics provided the tools in 2009. Winners understood the sequence—losers still don’t.
  • The $1.3M early adopter advantage is permanent: Paying $45/test in 2009 beat waiting for $28 tests in 2015. In rapidly evolving markets, timing beats perfection every time.
  • Infrastructure trumps genetics: Only 35% of herds have DHI testing. Without data infrastructure, genomic testing is like buying a Ferrari without roads.
  • The $366,375 gap can’t be managed away: Operations under 200 cows face structural, not operational, disadvantages. Excellence can’t overcome economics.
  • Your 2025 reality check: You need a successor AND $50K annual investment capacity AND willingness to scale/pivot. Missing any one = exit strategy, not growth strategy.

Complete references and supporting documentation are available upon request by contacting the editorial team at editor@thebullvine.com.

Learn More:

The Sunday Read Dairy Professionals Don’t Skip.

Every week, thousands of producers, breeders, and industry insiders open Bullvine Weekly for genetics insights, market shifts, and profit strategies they won’t find anywhere else. One email. Five minutes. Smarter decisions all week.

NewsSubscribe
First
Last
Consent

The $50,000 Question: Why Smart Dairies Follow This 8-Point Protocol Before Any Big Decision

What farmers are discovering is simple—the most valuable time on the dairy isn’t the visit itself, but the preparation before it.

You know that feeling when you watch a neighbor drop $200,000 on new parlor equipment, only to find out six months later the real problem was their water heater? Or maybe you’ve been there yourself—spent months adjusting rations while the actual issue was something as simple as feed bunk height.

Here’s what I’ve noticed after years of working with dairies from Vermont to New Mexico, and consulting with everyone from 100-cow tie stalls to 5,000-head dry lots: these aren’t failures of effort. They’re failures of preparation. And with milk prices doing their usual rollercoaster thing and margins tighter than ever, we really can’t afford to keep learning these expensive lessons.

What’s encouraging is that the farms that stay consistently profitable—whether they’re milking Jerseys in Wisconsin or running Holsteins in Idaho—are not necessarily the ones with the deepest pockets or the shiniest equipment. They’re the ones who’ve figured out how to ask the right questions before making any decision.

The $50,000 Question Nobody’s Asking

So there’s this dairy I worked with recently—typical Midwest setup, about 450 cows, been in the family since the grandfather started with 30 head back in the ’60s. Good people, working hard every single day.

They were ready to expand their parlor. You know how it goes… milking was taking forever, cows were getting antsy, everyone was stressed. The contractor’s quote came in around $380,000. Not exactly pocket change, even when milk’s at decent prices.

But here’s where things got interesting.

Before signing anything, they decided to really dig into their numbers—and I mean really dig. What they found changed their thinking entirely. The bottleneck wasn’t milking capacity at all. It was their transition cow program.

600-cow operation nearly dropped $1.8 million on robots before discovering their real constraint: genetic potential, not labor—a $1.755 million near-miss caught by two weeks of systematic preparation and stakeholder interviews.

Now, we all know transition cows can make or break you. Cornell’s been doing some fascinating work on this, and their PRO-DAIRY program keeps showing how every little hiccup in that transition period just cascades through the whole lactation. This particular farm? They were losing about 3 pounds per cow across the entire herd because their fresh cow area was, honestly, a disaster.

Instead of that $380,000 parlor expansion, they put about $45,000 into fixing their transition facilities and tightening up protocols. Two months later, they were up 8 pounds per cow.

Do the math on that—it’s real money. And it came from asking different questions.

The stark reality: 12 hours of preparation prevented a $335,000 mistake and increased production by 8 pounds per cow—proof that the most valuable time on a dairy isn’t the visit itself, but the thinking before it.

Eight Things That Matter More Than You’d Think

After watching farms navigate good times and bad—from the 2014 milk price crash to today’s volatility—I’ve noticed there are about eight areas that really set the ones that thrive apart from those just trying to survive. What’s interesting is that none of these require a huge investment. They just require thinking a bit differently.

1. Who’s Really Driving This Decision?

This one’s subtle, but it matters more than you’d think. When a problem is raised during your dairy consulting visit or farm meeting, who raises it makes all the difference.

I’ve noticed that when employees bring stuff up, they’re usually seeing the daily friction—things that slow them down or make their jobs harder. When owners identify problems, they’re often looking at the bank statement. When your vet flags something, they’re seeing patterns they’ve noticed across multiple herds. Your nutritionist? They’re thinking about ration efficiency and feed costs.

Each perspective is valid. But incomplete. The magic happens when you get all these viewpoints in the same room—or better yet, in separate conversations where people feel safe being honest.

2. Your Herd Tells Stories You’re Not Reading

You probably know this already, but your herd structure is basically a crystal ball for the next two years.

Got a bulge in third-lactation cows? That’s telling you something about breeding decisions from way back that’ll affect you for years to come. Wisconsin’s extension folks have been talking about this forever—imbalanced herd demographics can quietly eat away at efficiency, and you won’t even notice until it’s too late.

Looking at research in the Journal of Dairy Science on herd dynamics, farms with balanced age distributions consistently outperform those with demographic bulges. It’s like having a slow leak in your tire. You don’t notice day to day, but suddenly you’re on the side of the road.

3. Yesterday’s Numbers, Tomorrow’s Reality

Here’s something we’ve all learned the hard way: today’s snapshot usually lies.

When you’re just looking at this month’s report, that “sudden” drop in components might actually be a gradual slide that finally got bad enough to catch your attention. The extension services have been preaching this for years—farms that look at a full year of data or more catch problems much earlier than those that just watch current reports.

The 2023-2024 Cornell Dairy Farm Business Summary really drives this home, showing that top-performing herds spend significantly more time analyzing historical patterns than average performers. Think about it like this… you wouldn’t judge your whole crop by looking at one plant, right?

4. Comfort Beats Genetics (Most of the Time)

Now, this might ruffle some feathers, but here it is: most production problems aren’t actually production problems. They’re comfort problems.


Comfort Factor
ImpactDollar Loss
Lying Time -2 hours-5+ lbs milk/day$300-$400
Poor Water Access-3 lbs milk/day$180-$240
Inadequate Bunk Space-4 lbs milk/day$240-$320
Heat Stress (unmanaged)-10+ lbs milk/day$600-$800
Stall Comfort Issues-5 lbs milk/day$300-$400
CUMULATIVE NEGLECTUp to -27 lbs/cow/day$1,620-$2,160/cow/year

Research from the University of Wisconsin’s Dairyland Initiative keeps confirming this—when cows spend less time lying down, even just a couple of hours less, they can drop 5 pounds of milk or more. At today’s prices, that’s real money walking out the door every single day. Water access, bunk space, how deep your stalls are bedded… these “little things” often drive more profit than any fancy genetic program or feed additive.

I mean, you can have the best genetics in the county, but if your cows aren’t comfortable, what’s the point?

5. Know Where You Really Stand Financially

Every farm exists in three financial worlds at once. There’s where you are right now (usually tighter than you’d like), where you’re headed (hopefully better), and what you can actually afford to change (often less than you think).

Cornell’s Dairy Profit Monitor has been tracking this stuff for years, and what’s fascinating is that the most profitable farms aren’t necessarily the big spenders. They’re the ones whose spending actually matches their financial reality. A farm digging out of debt needs completely different strategies than one setting up the next generation.

Hope isn’t a business strategy, as much as we’d all like it to be.

6. When Everyone’s Pulling in Different Directions

This is a tough one. When your milkers think success means getting done fast, your feeder thinks it means spotless bunks, and you think it means high butterfat… well, you’re basically running three different farms that happen to share an address.

Getting everyone rowing in the same direction—that’s worth more than any piece of equipment you could buy. And it’s something every dairy consultant will tell you matters more than almost anything else.

7. Your Failures Are Actually Gold

“We tried that already.”

How many times have you heard that? Or said it yourself? But here’s the thing—knowing why something failed three years ago might be exactly what you need to make it work today. Different people, different feed prices, different weather patterns… everything changes.

That disaster from 2022 might be 2025’s breakthrough. But only if you remember what actually went wrong.

8. Your Employees See Things You Never Will

This is huge, and it gets missed all the time. Your employees—especially the ones who’ve been around a while—they see patterns you don’t even know exist.

But here’s the catch: they won’t bring it up in a meeting. Too risky. Get them alone, though, maybe while you’re fixing something together, and suddenly you’re hearing about that water trough that’s been dry every afternoon since spring, or how the fresh cows always look stressed after the weekend crew.

That’s intelligence you can’t buy. And it’s exactly what smart dairy consultants tap into during farm visits.

Your Complete Pre-Decision Protocol: The 8-Point Checklist + Action Plan

Want a printable version? Save this checklist for your next big decision.

Before any major decision or consulting engagement, here’s your roadmap:

☐ Decision Origins – Who identified this need, and what’s their real motivation?
Action: Ask each stakeholder privately why this matters now

☐ Herd Demographics – What’s your lactation distribution telling you about future capacity?
Action: Pull a current herd inventory report and map out your next 24 months

☐ Historical Patterns – Review 12-24 months of data, not just this month’s snapshot
Action: Block out 3-4 hours this week to analyze your long-term trends

☐ Comfort Audit – Check water access, bunk space, stall comfort before genetics or nutrition
Action: Spend an hour just watching cows—no agenda, just observe

☐ Financial Reality – Match investments to actual cash flow capacity over 24 months
Action: Run the numbers with your banker or financial advisor before committing

☐ Team Alignment – Ensure everyone defines “success” the same way
Action: Have one-on-one conversations with key employees this week

☐ Past Lessons – Document why previous attempts failed or succeeded
Action: Write down what you’ve tried before and why it didn’t work

☐ Employee Intelligence – Conduct private one-on-one conversations with key staff
Action: Schedule individual coffee breaks with your milkers and feeders

Total time investment: 12 hours over 2 weeks
Potential savings: $50,000-$200,000 in mistargeted investments
ROI on preparation: Often 100:1 or better

The Backwards Logic of Preparation

The economics of thinking first: a detailed breakdown showing exactly how 12 hours of preparation translates to preventing 50-100 wasted hours and $50K-$200K in mistargeted investments—the math that makes ‘slow down to speed up’ undeniable

What’s fascinating—and kind of backwards when you first think about it—is that the more time you spend preparing before a decision, the less time you waste fixing mistakes later.

Based on what I’ve seen work across dozens of farms and validated by dairy management research, a good pre-decision assessment might take:

  • Maybe 3-4 hours, really going through your records
  • Another few hours talking with your team (one-on-one, not in groups)
  • Some time just watching, with no agenda
  • An hour or two connecting all the dots

So let’s say 12 hours total. Those 12 hours routinely save months of going down the wrong path and tens of thousands of dollars in investments that miss the mark.

Trust Changes Everything

Here’s something I didn’t expect when I started paying attention to this stuff: preparation builds trust like nothing else.

When you come to a discussion already understanding the history, respecting what’s been tried, seeing the patterns… it changes the whole dynamic. People stop defending and start collaborating.

I’ve watched this shift happen over and over. That skeptical producer who crosses their arms when the consultant walks in? They lean forward when they realize someone’s done their homework. Employees who usually stay quiet? They start sharing ideas when they see you actually care about the details.

And this isn’t just feel-good management talk—it directly affects your bottom line. Farms where everyone trusts the process implement changes faster and actually stick with them.

Real Numbers from a Real Decision

Let me share something that really drove this home. There’s a 600-cow operation in central New York—good people, been at it for generations.

They were looking at three big options: robotic milkers (about $1.8 million all in), expanding facilities (roughly $650,000), or really ramping up their genetics program with genomic testing (around $45,000 per year).

Instead of just picking what felt right, they spent two weeks really digging in. Used the 2023-2024 Cornell Dairy Farm Business Summary benchmarking data, talked to everyone individually, and looked at their five-year patterns.

What they discovered caught everyone off guard. Their constraint wasn’t labor—so robots didn’t make sense. It wasn’t space—so expansion was unnecessary. It was genetic potential. They were running about 15% behind the regional average in efficiency, and that was costing them way more than they realized.

That genomic testing investment? According to research published in the Journal of Dairy Science on the ROI of genetic improvement, programs like this typically start paying for themselves within 2 years. But without that preparation, they might’ve dropped nearly $2 million on the wrong solution.

The Cost-Benefit Reality Check

Let’s put this in perspective with real dairy economics:

  • 12 hours of structured preparation = roughly $600 in time value
  • Average mistargeted investment prevented = $50,000-$200,000
  • Time saved on wrong implementations = 50-100 hours
  • ROI on preparation time = Often 100:1 or better

When you look at it like that, can you really afford NOT to prepare? Especially when dairy consulting rates run $150-$300 per hour, making that preparation invaluable?

The New Math of Dairy Success

The folks at Cornell who put together the 2023-2024 Dairy Farm Business Summary keep finding the same pattern: farms that spend time planning consistently outperform those making decisions on the fly. We’re not talking small differences either.

In Wisconsin, operations that are really focusing on systematic decision-making—taking time to think things through—they’re seeing notably better returns. Research from the University of Wisconsin-Madison’s Center for Dairy Profitability backs this up year after year. And when a couple of percentage points separate making it from losing it, that’s everything.

Looking at data from Texas to Pennsylvania, from Idaho to Florida, the pattern holds: preparation drives profitability more reliably than any single technology or management change.

The Bottom Line

As we push through 2025, with milk futures bouncing around and feed costs doing their thing, there’s less room for expensive mistakes than ever.

But here’s what gives me hope: the dairies that’ll thrive won’t necessarily be the ones with the biggest checkbooks or the fanciest technology. They’ll be the ones that master the simple discipline of thinking before doing. Of turning information into understanding, understanding into decisions, and decisions into profit.

The approach is proven. The patterns are clear. The protocol is right there in that 8-point checklist. The only question is whether you’ll invest those 12 hours of thinking to avoid a much more expensive education.

Because in today’s dairy world, being unprepared isn’t just costly—it’s dangerous.

What This All Means for Your Dairy Operation:

  • That 12 hours of thinking before a big decision? It routinely saves months of mistakes and thousands in misplaced investments
  • Transition cow management is often where the real money is—fixing it usually costs way less than expanding while delivering faster returns
  • Your employees know things you need to know—but they’ll only tell you one-on-one, away from the group
  • Looking at 18-24 months of data reveals patterns that this month’s snapshot completely hides
  • The most profitable dairies aren’t the biggest spenders—they’re the ones whose investments actually match their financial reality
  • Smart dairy consulting starts with preparation—the best consultants spend hours reviewing data before they ever step on your farm

Executive Summary:

The difference between a $45,000 fix and a $380,000 mistake? About 12 hours of asking the right questions. That’s what one Midwest dairy discovered when they ran through an 8-point checklist before signing that parlor expansion contract—turns out their real problem was transition cows, not milking capacity. This pre-decision framework, backed by Cornell’s latest research and proven across operations from 100-cow tie-stalls to 5,000-head dry lots, transforms how farms approach big decisions. The protocol covers eight critical areas: from reading your herd’s demographic story to those coffee-break conversations with employees who see problems you’ll never notice. Real-world results show that farms using this approach save $50,000-$200,000 per major decision, with returns often exceeding 100:1 on the time spent preparing. In today’s dairy economy, it’s not about having all the answers—it’s about asking all the right questions first.

Based on extensive work with dairy operations across North America and insights gathered from Cornell PRO-DAIRY programs, the 2023-2024 Cornell Dairy Farm Business Summary, Wisconsin Extension resources, University of Wisconsin-Madison Center for Dairy Profitability research, and the shared experiences of hundreds of dairy producers from 2023-2025.

Learn More:

The Sunday Read Dairy Professionals Don’t Skip.

Every week, thousands of producers, breeders, and industry insiders open Bullvine Weekly for genetics insights, market shifts, and profit strategies they won’t find anywhere else. One email. Five minutes. Smarter decisions all week.

NewsSubscribe
First
Last
Consent

Pair Housing’s Hidden Payoff: $50,000 More Milk Revenue and a 6-Year Head Start on 2031

Early adopters of pair housing are building a competitive advantage that latecomers won’t be able to match

Executive Summary: Here’s what most dairy producers don’t realize: the 2031 pair housing mandate isn’t a burden—it’s creating the industry’s biggest competitive opportunity in decades. Research shows pair-housed calves produce $50,000 more in annual revenue through superior brain development, yielding 850-1,113 kg extra milk in the first lactation alone. But here’s the catch: mastering group management takes 18-36 months, meaning producers who start now will have six years of operational excellence when their neighbors are still figuring out the basics. While 60% of farms stay paralyzed by solvable concerns about cross-sucking and capital costs, early adopters are quietly building advantages that compound annually—better disease detection, 9-hour labor savings per calf, and premium market positioning. The brutal truth? Producers waiting until 2030 won’t just be late to comply—they’ll be permanently behind, missing profits they can never recover. Every quarter you delay is another group of superior replacements your competition is raising while you’re still deciding.

Calf Pair Housing

You walk through dairy operations across North America today, and those familiar rows of individual calf hutches still dominate the landscape. They’ve been our standard for good reason—biosecurity, individual monitoring, controlled feeding. But here’s what I’m seeing: something significant is shifting in how progressive producers approach calf rearing, and honestly, the implications go way beyond what most of us initially thought.

The catalyst is Canada’s requirement for pair or group housing by 2031. That’s in the revised Code of Practice that Dairy Farmers of Canada released in March 2023. What’s really catching my attention, though, is how early adopters are discovering benefits that go far beyond just checking off a regulatory box.

I was digging through research from Dr. Marina von Keyserlingk’s team at the University of British Columbia—fascinating work they published in PLOS ONE back in 2014. They documented something many experienced calf managers have suspected for years: calves raised together demonstrate remarkably superior cognitive flexibility. Get this—pair-housed calves adapt to environmental changes 35% faster and ultimately produce between 850 and 1,113 kilograms more milk in their first lactation compared to individually housed counterparts.

“This isn’t theoretical yield potential, folks. This is actual milk production, documented across multiple commercial operations.”

Understanding the Cognitive Advantage

The UBC research used a Y-maze reversal learning test. Basically, they teach calves which path leads to their milk reward, then switch the rules to see how quickly they adapt. Pair-housed calves? They figured out the change in 13 trials. Individually housed calves needed 20 trials, and here’s the kicker—some never mastered the reversal at all.

Pair-housed calves demonstrate 35% faster cognitive adaptation and 46% higher success rates in learning tests—brain development advantages that translate to lifetime performance in robotic milking systems, ration changes, and social dynamics on modern dairy operations.

Dr. Jennifer Van Os, who’s an Assistant Professor of Animal Welfare at the University of Wisconsin-Madison, puts it perfectly: “Modern dairy animals face constant learning challenges—new parlor routines, automated feeding systems, ration adjustments, social dynamics. If we’re not developing their capacity to learn from day one, we’re limiting their lifetime potential.”

What farmers are finding is that this resonates with real-world experience. Wisconsin Extension specialists have documented that operations transitioning to robotic milking systems consistently see younger animals adapting more readily than older cows. The difference? Many of those younger animals experienced social housing during their critical early development period. Food for thought, isn’t it?

The Economics Tell a Compelling Story

Looking at the numbers from Dr. Mike Van Amburgh’s comprehensive meta-analysis at Cornell University, which tracked 1,868 heifers across commercial operations, the production correlations are clear. Every kilogram increase in preweaning average daily gain translates to 850 to 1,113 kilograms of additional first-lactation milk production.

Let me break this down practically. Pair-housed calves, through what researchers call “social facilitation of feeding”plus reduced isolation stress, typically achieve 0.1 to 0.2 kilograms better daily gain during the preweaning period.

For a 500-cow operation raising 200 replacements annually:

  • Improving preweaning ADG from 0.6 to 0.8 kg/day
  • Generates approximately 124,200 kg of additional first-lactation milk
  • At current DFO pool prices (October 2025): roughly $0.41 per kilogram
  • That’s over $50,000 in additional revenue from a single cohort

And that’s just the first lactation.

What really gets interesting is research from Dr. Alex Bach’s team at IRTA in Spain. They published work in the Journal of Dairy Science showing these effects don’t diminish—they actually compound. Each kilogram of improved preweaning ADG correlates with 2,280 kilograms of additional lifetime production. The metabolic programming you establish in those first eight weeks? It sticks with them their entire productive life.

First lactation production comparison reveals that pair-housed calves generate 850-1,113 kg more milk, translating to over $50,000 in additional annual revenue for a 200-replacement operation—a competitive advantage that compounds across every cohort.

Labor Efficiency Surprises Everyone

Here’s an aspect that even experienced producers can get caught off guard by. Research from the University of Guelph and Wisconsin Extension field trials documents dramatic labor differences:

  • Individual hutch systems: 10.6 hours of labor per calf (birth to weaning)
  • Pair housing with automated feeding: 1.4 hours per calf
  • Labor reduction: 9.2 hours per calf

Minnesota Extension documented a 450-cow operation that reduced labor needs by two and a half positions after transitioning. But the manager told researchers the bigger win was performance—they went from one pound of daily gain to consistently achieving two pounds.

“Not hauling milk to hutches when it’s minus-30 doesn’t just save time—it helps them keep good employees who might otherwise look for easier work come February.”

Addressing the Adoption Gap

Despite all this compelling evidence, Lactanet’s 2024 dairy housing survey shows approximately 60% of Canadian dairy farms still use individual housing systems. We see similar patterns across the United States. So what’s holding folks back?

The Comfort of Familiar Systems

I understand the hesitation. Many producers with well-functioning individual housing face a tough decision. Their current approach delivers acceptable results—calves survive, reach target weights, and transition successfully to group housing post-weaning.

Quebec producers commonly express this in Extension workshops: “My individual system gives me certainty. I know each calf’s intake, health status, and growth rate. Group housing introduces variables I’m still learning to manage.”

This makes perfect sense. Change carries risk, especially when your current system meets baseline performance standards.

Cross-Sucking Remains a Primary Concern

Research published in 2025 by the University of Calgary identified fear of cross-sucking as the leading barrier to adoption. Every producer who’s dealt with a blind quarter on a fresh heifer remembers that frustration—I certainly do.

But here’s what’s encouraging: Dr. Cassandra Tucker’s work at UC Davis, done in collaboration with Penn State Extension, demonstrates that cross-sucking is entirely preventable through proper management:

  • Adequate milk allowance: minimum 7 liters daily for Holstein calves
  • Nipple feeding rather than buckets
  • Gradual weaning over 7 to 10 days

Follow these protocols, and cross-sucking essentially disappears.

Capital Investment Realities

Let’s talk dollars. Michigan State Extension’s 2024 calculations place infrastructure investment at approximately $127 per calf, with complete system implementation costing $15,000 to $25,000 for a 200-replacement operation.

Dr. Marcia Endres at the University of Minnesota documents returns of 269% to 312% on this investment, but what is that upfront capital requirement? It’s a real challenge when you’re managing tight margins.

What’s working for some producers is starting with pilot programs using temporary infrastructure. Prove the concept before making the major capital commitment.

Learning From Early Implementation

Extension specialists working with transitioning farms report remarkably consistent patterns through the first 90 days. Wisconsin Extension Bulletin A4154 clearly documents these phases.

Weeks 1-2: Resisting the Urge to Intervene

Ontario Extension case studies consistently show the biggest challenge is stepping back. Every instinct tells you to help calves find the nipple, guide them through feeding. But they need to learn independently and from each other. Too much intervention creates dependence rather than competence.

Successful protocols involve:

  • Backgrounding calves individually for 10-14 days before grouping
  • Establishing strong suckling reflexes
  • Health screening before mixing

Dr. Dave Renaud’s research at Guelph, published in Preventive Veterinary Medicine back in 2023, confirms this approach reduces health events by 40%.

Weeks 3-4: Managing Cross-Sucking Effectively

This critical period determines whether producers persist or revert. Extension field trials documented in the 2024 Wisconsin Dairy Management Guide show that increasing milk concentration while maintaining frequent feeding opportunities stops cross-sucking behavior cold.

The target remains consistent across all research: minimum 7 liters daily through nipples, with gradual 10-day weaning transitions. Get this right, and cross-sucking becomes a non-issue.

Weeks 5-8: Ventilation Becomes Critical

Dr. Ken Nordlund from Wisconsin’s School of Veterinary Medicine emphasizes in their 2024 facility design guidelines: “Poor health management in individual housing becomes amplified in group settings.”

Calves don’t generate enough body heat for natural convection ventilation to work. You need mechanical systems—positive pressure tubes or continuous airflow fans. Operations that underestimate ventilation requirements face respiratory challenges that can derail the entire transition.

Weeks 9-12: Systems Integration

Producers who navigate that initial learning curve consistently report dramatic improvements around month three. Multiple Extension case studies from 2024-2025 document this pattern:

  • Feed efficiency improves
  • Health events decline
  • Growth rates accelerate

Fraser Valley producers dealing with higher humidity than Prairie provinces really emphasize moisture management alongside ventilation. British Columbia Extension specialists report in their 2024 regional guide that once environmental controls are optimized, preweaning mortality typically drops from 7% to under 3%.

Data-Driven Management Revolutionizes Calf Rearing

Health IndicatorDays Early DetectionVisual Observation AccuracyAutomated System AccuracyImprovement
Milk Intake Drop (15-25%)540%78%+38%
Drinking Speed Reduction435%72%+37%
Unrewarded Feeder Visits ↑345%80%+35%
Combined Metric Analysis550%82%+32%

This transition from visual observation during feeding to continuous behavioral monitoring? It’s a fundamental shift in how we think about calf management.

Dr. David Renaud’s research, published back in November 2023 in the Journal of Dairy Science, reveals that automated systems detect illness indicators 3 to 5 days before you’d see visual symptoms.

Key metrics for early disease detection:

  • Milk intake declining 15-25% → 5 days before clinical illness
  • Drinking speed reduction → 4 days before visible symptoms
  • Unrewarded feeder visits tripling → Calf feels unwell but can’t finish meals
  • Meal duration increasing → While actual consumption decreases

Dr. Melissa Cantor at Penn State found—and published in the Journal of Dairy Science earlier this year—that combining these metrics achieves 75-80% disease-detection sensitivity, compared to just 40-50% with single indicators. This early detection capability? It transforms treatment outcomes and reduces both medication costs and production losses.

Building Competitive Advantage for 2031 and Beyond

The mandated transition creates an industry-wide baseline. Everyone has to comply. But here’s what I think many are missing: competitive advantage comes from operational excellence developed through early adoption.

By the 2031 mandate deadline, early adopters will have six annual cohorts of cognitively superior replacements producing 187-491 extra pounds of milk per lactation—while late adopters begin with zero such animals. The math is brutal: you can’t compress six years of competitive advantage into one year of panicked implementation.

“Producers transitioning in 2025 will have six annual cohorts of cognitively enhanced replacements by 2031. Late adopters starting in 2030? They begin with zero such animals.”

Consider the arithmetic:

  • 180 to 360 animals with cognitive advantages in your herd
  • 187 to 491 additional pounds of milk per lactation
  • Worth $34 to $88 per cow annually (Cornell longitudinal studies)

Dr. Jessica McArt’s research at Cornell’s College of Veterinary Medicine, published in Preventive Veterinary Medicine in 2024, demonstrates that disease prediction algorithms need 18 to 24 months of calibration to achieve optimal sensitivity. Early adopters will be preventing disease, while late adopters are still figuring out which buttons to push.

Market dynamics are shifting, too. Dr. Beth Ventura’s research at the University of Minnesota documents consumer willingness to pay 4-6% premiums for milk from enhanced welfare systems. Trade publications like Dairy Foods and Progressive Dairy suggest processors, including Agropur and Saputo, are exploring differentiated supply chains—though specific program details are still emerging. Early adopters with documented performance histories? They’re positioning themselves for opportunities that won’t be available to last-minute converts.

A Practical Implementation Framework

Based on Extension specialist experiences documented across multiple regions, here’s what consistently works:

Start with a 12-calf pilot program. Not to validate the science—that’s been done—but to develop expertise specific to your facility without risking your entire replacement program.

Foundation Phase (Months 1-3)

  • Get passive transfer rates above 90% (Dr. Sandra Godden at Minnesota recommends serum total protein >5.5 g/dL)
  • Establish 20% body weight milk feeding minimums
  • Develop cross-sucking prevention protocols for your specific setup

Skill Development (Months 4-6)

  • Learn to interpret behavioral data
  • Recognize that 20% intake drop that signals illness
  • Identify weaning readiness (Dr. Mike Steele at Alberta: look for 1.4 kg daily starter intake for three consecutive days)
  • Document equipment performance patterns

Protocol Optimization (Months 7-9)

  • Refine feeding algorithms for your genetics
  • Balance welfare with facility constraints
  • Align health protocols with actual disease pressure

Team Integration (Months 10-12)

  • Train every team member who touches calves
  • Ensure understanding of behavioral indicators
  • Establish report interpretation protocols
  • Define intervention thresholds

“This phase gets skipped too often, and it comes back to bite you.”

Practical Considerations for Your Operation

Looking at all the evidence, several principles stand out:

Early implementation with modest scale beats last-minute scrambling with your entire calf crop. That learning curve takes 18 to 36 months, no matter when you start.

Management excellence, not equipment sophistication, determines your outcomes. You can have the fanciest automated feeder on the market, but without skilled interpretation of its data, you’ve bought yourself an expensive milk dispenser.

Your foundation protocols have to be solid. If you’re running sub-90% passive transfer rates or marginal ventilation, group housing will amplify those problems rather than solve them.

Expect the learning curve. Embrace it, even. Those initial challenges? That’s education, not failure.

Document everything meticulously. This data validates your investment decisions and supports premium market positioning down the road.

Looking Forward

We’re witnessing one of those generational transitions that reshapes how we do things. Producers who view this 2031 requirement as an opportunity for systematic improvement? They’ll capture lasting competitive advantages. Those approaching it as just another compliance burden will perpetually lag behind early adopters who’ve already optimized their systems.

The parallel to previous industry evolutions is pretty clear. Consider free-stall adoption, TMR implementation, and genomic selection. Early, thoughtful adopters consistently emerged stronger.

What I’ve noticed across other major transitions is that success doesn’t come from the technology itself. It comes from the operational excellence you develop through implementation. Pair housing represents another one of those opportunities—it challenges our assumptions, rewards innovation, and ultimately advances both animal welfare and farm profitability.

The timeline is set. The science is clear. The economics are compelling. What remains is the decision each operation needs to make: lead this transition or follow those who do.

Six years gives you adequate time for thoughtful implementation. But it disappears quickly if you keep putting it off. The question isn’t whether to transition—that decision’s been made for us. The question is when to start capturing the advantages of early adoption.

Your move.

KEY TAKEAWAYS 

  • Start with 12 calves, not 200: Master the learning curve on a pilot scale where mistakes won’t sink you—but start NOW because the 18-month expertise gap between early and late adopters becomes permanent
  • $50,000 isn’t the ceiling, it’s the floor: First-lactation gains of 850-1,113 kg are just the beginning—these calves produce 2,280 kg more lifetime milk because early brain development programs permanent metabolic advantages
  • Stop fearing cross-sucking, start fearing the competition: While 60% of producers avoid pair housing over a completely preventable issue, early adopters are banking profits you’ll never catch up to
  • The 2031 deadline creates winners and losers: Producers with 6 years of experience will be preventing disease while you’re reading instruction manuals, capturing premium markets while you’re proving compliance

Complete references and supporting documentation are available upon request by contacting the editorial team at editor@thebullvine.com.

Learn More:

The Sunday Read Dairy Professionals Don’t Skip.

Every week, thousands of producers, breeders, and industry insiders open Bullvine Weekly for genetics insights, market shifts, and profit strategies they won’t find anywhere else. One email. Five minutes. Smarter decisions all week.

NewsSubscribe
First
Last
Consent

Forget Feed Costs: The 3 Survival Strategies Defining Dairy’s Future as 12,000 Farms Face Exit by 2030

As 8,000-12,000 mid-sized operations prepare to exit by 2030, successful farmers are discovering that traditional optimization strategies no longer work—and the real winners are those managing total margins, not just feed costs

EXECUTIVE SUMMARY: Wisconsin dairy farmer Dave Miller’s $180,000 investment in automation for just 1,100 cows seemed irrational—until it increased his net income by $165,000 annually and revealed why 12,000 farms face exit by 2030. The new reality: traditional feed cost optimization is obsolete, as successful producers focus on total margins, where labor exceeds $20/hour, hauling costs have doubled, and feed accounts for only 35-40% of true costs. Three models will dominate 2030: mega-operations (3,500+ cows) achieving $14.20/cwt costs through scale, niche producers capturing $35-50/cwt premiums through direct marketing, and multi-family partnerships sharing resources and risk. Mid-size single-family farms (500-700 cows) face a crushing $250,000-375,000 annual profit gap and must choose among five strategic paths immediately. As California loses 350,000 cows to water restrictions while Wisconsin gains 180,000, the geographic and economic landscape is transforming rapidly—and every year producers delay strategic decisions, they cost them $200,000-300,000 in equity.

Dairy Survival Strategies

I recently spoke with a Wisconsin dairy producer who invested $180,000 in automation technology while running only 1,100 cows in a barn designed for 1,500. His neighbors initially questioned the decision.

Three years later, he’s maintaining profitability with manageable 65-hour work weeks while operations twice his size are experiencing burnout or considering exits.

Dave’s approach reflects a broader pattern I’ve been observing across the industry. The optimization strategies we’ve relied on for decades are evolving.

And producers adapting to these new economic realities are finding sustainable paths forward.

What’s particularly noteworthy is the convergence of data we’re seeing. The USDA National Agricultural Statistics Service reports dairy cow numbers at 9.36 million head as of December 2024. University of Wisconsin dairy economic studies and Cornell’s Dairy Farm Business Summary all point to significant structural changes.

Statistics show the annual average number of commercially licensed dairy farms fell to 24,811—part of a consolidation trend that deserves careful attention.

This transformation raises important questions about operational strategies, regional dynamics, and what success looks like moving forward. The data tells a compelling story about who’s thriving, who’s struggling, and perhaps most importantly, which assumptions may need updating.

The Feed Cost Discussion: Examining Traditional Metrics

Look Beyond Feed: Feed isn’t the 55% villain it used to be—labor now devours 30% of your true cost structure. Are you tracking the right benchmarks?

For generations, we’ve focused intently on feed cost per hundredweight as a primary performance metric. The benchmarks are well-established—Cornell and Wisconsin extension programs suggest feed should account for 45-55% of total costs, and efficient operations can achieve $6.50-7.00/cwt, according to recent enterprise analyses.

This approach has served the industry well. Yet conversations with producers and emerging data suggest we might benefit from a broader perspective.

Consider the economics facing a typical 500-cow operation. They might spend $7.20/cwt on feed and achieve $0.40 savings through optimization—roughly $25,000 annually on 12.5 million pounds of production.

Meanwhile, USDA Economic Research Service data shows agricultural labor costs exceeded $53 billion in 2025, with dairy-specific wages averaging $17.55/hour—representing a 30% increase since 2021.

Transportation costs present another consideration. Producers across multiple regions report that hauling fees have increased from $0.35 to $0.65/cwt as processing plants consolidate.

Processing premiums have shifted as well, with many areas seeing reductions from $0.45 to around $0.20/cwt as competition for plant capacity evolves.

“We’re observing producers who optimize feed costs effectively but encounter challenges in overall profitability. Operations might save $0.30/cwt on rations, yet experience breeding rate declines of 3% or cull rate increases of 5%, resulting in larger losses in areas they’re monitoring less closely.”
— Dr. Mark Stephenson, University of Wisconsin’s Center for Dairy Profitability

Wisconsin’s June 2025 dairy sector assessment provides additional context: feed accounts for approximately 35-40% of total costs when debt service, family living expenses, and working capital needs are included.

These comprehensive costs often determine long-term viability. They suggest the value of holistic margin management.

Individual Cow Economics: A Developing Approach

An interesting development among progressive producers involves shifting from herd averages to individual cow economics. This approach, enabled by recently more accessible monitoring technology, reveals nuanced profitability patterns.

I visited a 1,200-cow Michigan operation using individual cow monitoring systems—technology similar to that documented by the Journal of Dairy Science in smart dairy farm analyses. Their data revealed striking variations:

  • Top 20% of cows generated $3,100 annual profit each
  • Middle 60% generated $950 profit
  • Bottom 20% showed losses of $420 per head annually

The producer—let’s call him Steve to respect his privacy—took an innovative approach based on this data.

“We reduced our herd from 1,200 to 1,050 cows by identifying chronic underperformers,” he explained during my visit. “Total milk production decreased 8%, but net income increased $165,000 because we eliminated negative-margin animals that were affecting overall profitability.”

Stop Guessing—Start Culling: The average herd hides a profit gap of $3,520 per cow. Trash the laggards, pump up the leaders, and watch your bottom line soar.

This individual-animal strategy extends beyond culling decisions. Progressive operations now adjust feeding programs, breeding protocols, and housing assignments based on profitability projections.

High-performing cows receive premium nutrition and genetic improvements. Marginal performers might receive commodity feed and beef semen—a practice that’s created its own market dynamics, with National Milk Producers Federation data showing beef-on-dairy calves commanding $1,400 premiums.

Technology Adoption: Finding Practical Solutions

While industry publications often feature multi-million-dollar robotic installations, the reality for most producers is more modest investments. NASS data indicate that approximately 70% of U.S. dairy farms operate with fewer than 200 cows and an annual capital budget of under $50,000.

Through farm visits this year, I’ve identified what many call a “minimum viable technology stack” that delivers measurable returns for mid-sized operations:

Practical Investments ($30,000-60,000 total):

  • Basic activity monitors for breeding detection: $8,000-12,000 (typical payback within 14 months through improved conception rates)
  • Used plate cooler and variable speed milk pump: $15,000-25,000 (energy cost reductions of 20-30% commonly reported)
  • Automated feed pusher: $12,000-18,000 (saves approximately 2 hours of daily labor)
  • Margin tracking systems: $0-500 (spreadsheet templates providing valuable decision support)

A 400-cow Wisconsin operation shared their experience: $45,000 in basic automation reduced labor requirements by 20 hours weekly—valued at $31,200 annually at current wages—while improving breeding rates by 15% and reducing feed waste by 8%.

“Everyone discusses robots and advanced genetics, but my most valuable investment was a $3,000 used generator for power outage protection. It’s prevented milk dumping three times this year—preserving about $40,000 in revenue. Sometimes, straightforward solutions address real challenges effectively.”
— Tom Peterson, Pennsylvania dairyman managing 380 cows

Regional Dynamics: Understanding Geographic Shifts

The geographic distribution of dairy production continues evolving, influenced by water availability, regulatory frameworks, and processing infrastructure. USDA milk production reports and state-specific data from June 2025 reveal emerging patterns worth monitoring through 2030.

Regions Experiencing Growth:

Wisconsin appears poised to add 130,000-180,000 cows between now and 2030, benefiting from factors such as water availability. University of Wisconsin studies indicate the state’s dairy industry contributes $52.8 billion in economic impact—a substantial increase from five years ago.

South Dakota represents an unexpected growth area, potentially adding 60,000-90,000 cows given favorable regulatory conditions and new processing investments.

Michigan shows expansion potential of 45,000-75,000 cows, leveraging Great Lakes water access and existing infrastructure advantages.

Regions Facing Challenges:

California confronts difficult decisions as the Sustainable Groundwater Management Act (SGMA) potentially removes 500,000 to 1 million acres from irrigation by 2040, according to UC Davis and ERA Economics research. This could result in 200,000-350,000 fewer dairy cows.

The Southwest, particularly Texas and Arizona, faces a contraction of 120,000-200,000 cows due to concerns about water scarcity.

Southeastern states continue gradual adjustments, potentially losing 50,000-90,000 cows to heat stress and feed cost pressures.

The Northeast presents an interesting case. Vermont and New York operations are finding success with value-added production and agritourism, though total cow numbers remain relatively stable.

A New York producer recently told me, “We can’t compete on volume, but our proximity to Boston and New York City markets gives us premium opportunities California can’t match.”

Coast-to-Coast Cow Shuffle: The SGMA is triggering America’s biggest dairy redraw in history. Is your state benefiting—or bleeding cows?

A Wisconsin processor shared an observation that captures the transformation: “When California loses a 5,000-cow operation, we typically don’t see a single 5,000-cow dairy relocate here. Instead, we might see three 1,500-cow operations emerge, each requiring different infrastructure support. It represents structural transformation, not simple geographic relocation.”

This fragmentation creates complex dynamics. Regions gaining production face intensified labor competition, increased regulatory attention, and community adaptation challenges.

Areas losing production experience, processor consolidation, and service reductions that can accelerate further exits.

Mid-Size Operations: Evaluating Strategic Options

The 500-700 cow operations that have long anchored American dairying face particularly complex decisions. Cornell’s Dairy Farm Business Summary and related financial analyses reveal that these farms occupy a challenging position—scale limitations for certain efficiencies, yet size constraints for niche-market approaches.

Recent extension analyses suggest that a typical 500-cow operation experiences:

  • Production costs: $16.30-17.80/cwt
  • Large-scale operations (2,500+ cows): $14.20-15.80/cwt
  • Average revenue: $20.90/cwt (based on June 2025 Class III pricing at $18.82/cwt)
  • Resulting margins: $3.10-4.60/cwt

That $2-3/cwt cost differential translates into $250,000-375,000 in annual profit lost compared to larger operations—ironically, approximately the capital needed for modernization investments.

Mid-Size Meltdown: A brutal $2.05/cwt cost gap leaves mid-size farms with a $375k annual hole—survival requires a radical pivot or exit.

Working with producers, we’ve identified five primary strategic paths:

  1. Scale expansion (to 1,500+ cows): Requires $6-8 million investment, with industry data suggesting 60-70% success rates for well-planned expansions
  2. Niche market transition (organic/direct marketing): Requires proximity to urban markets, with approximately 20-30% of attempts achieving sustainable success
  3. Efficiency optimization (robotics at current scale): $1.5 million investment potentially extends viability 8-12 years
  4. Partnership formation (combining with neighbors): Offers shared resources, though approximately 40% encounter challenges within five years
  5. Strategic exit (while retaining equity): Can preserve $2-4 million for life’s next chapter

“The most difficult conversations involve 50-year-old producers who believe market cycles will improve their situation. Each year of delayed decision-making can reduce equity by $200,000 to $ 300,000. By the time action feels necessary, options have often narrowed considerably.”
— Dr. Wayne Knoblauch, farm management specialist at Cornell University

Understanding Expansion Challenges: Learning from Experience

Industry data and lender interviews suggest 30-40% of major expansions encounter significant challenges. Through analysis of expansions from 2018 to 2023, patterns emerge that deserve careful consideration.

A typical challenge sequence often unfolds like this…

  • Initial phase (Months 1-6): Construction frequently exceeds budgets by 15-20% due to weather delays or supply chain issues, affecting working capital before operations commence.
  • Staffing phase (Months 7-12): Labor recruitment proves more difficult than anticipated. Facilities designed for eight workers might operate with four, creating unsustainable workloads.
  • Operational phase (Months 13-18): Production often falls 15-20% below projections due to transition stress, learning curves with new facilities, and management bandwidth constraints.
  • Stress phase (Months 19-24): Family and personal stress intensifies. Health impacts, relationship strains, and succession uncertainties become pronounced.
  • External pressure phase (Months 25-30): Market changes (milk price adjustments, disease challenges, equipment issues) expose accumulated vulnerabilities.
  • Resolution phase (Months 30-36): Financial covenants trigger lender discussions, though operational challenges typically preceded financial ones.

A producer who experienced expansion difficulties shared powerful insight: “The financial pressure arrives last. Before that comes health impacts, family stress, and loss of purpose. The paperwork simply documents what already occurred.”

Analysis suggests successful expansions share common elements: 20-30% budget contingencies (versus 5-10% in struggling expansions), 10-15% excess labor capacity from day one, management teams sharing responsibilities, and 10-12 months working capital reserves.

The difference often lies in maintaining adequate buffers—financial, operational, and personal.

Future Operating Models: Three Viable Paths for 2030

Looking toward 2030, current trends and economic modeling suggest three primary operating models will emerge, each with distinct characteristics.

Large-Scale Operations (3,500-8,000 cows)

These operations achieve $14.20-15.80/cwt costs through scale efficiencies and automation. Many generate $800,000-1.8 million annually from renewable energy credits via anaerobic digesters.

The investment requirements are substantial—$25-$35,000 per cow—and management resembles agricultural business leadership more than traditional farming. IDFA’s 2025 report indicates these operations collectively employ 3 million people nationally, generating nearly $780 billion in economic impact.

Premium Niche Operations (40-120 cows)

These farms capture $35-50/cwt through direct marketing, compared to $21/cwt under commodity pricing. They generate $220,000-650,000 family income with minimal debt, according to Cornell’s organic dairy studies.

Marketing and customer relations consume 25-35% of time—it’s farming combined with retail business management. Success requires proximity to metropolitan areas where customers value and can afford premium products.

USDA organic price reports from September confirm these premiums remain stable.

Strategic Mid-Scale Partnerships (800-1,800 cows)

This model involves 2-3 families collaborating to share resources and responsibilities. They achieve $200,000-250,000 income per family with 50-60 hour work weeks.

Technology adoption is selective—perhaps 50-70% robotic milking, 30-50% conventional systems. While these partnerships provide operational scale and lifestyle benefits, they haven’t eliminated all structural pressures.

Notably, the 200-700 cow single-family operations that historically defined American dairying face the most challenging path forward, caught between scale requirements and market opportunities.

ModelHerd SizeCost ($/cwt)Revenue ($/cwt)Annual IncomeCapital NeedWork Hours/WeekSuccess Factor
Mega-Operations3,500-8,000$14.20-15.80$20.90 (commodity)$800K-1.8M+$25-35KMgmt roleScale/automation/bili…
Premium Niche40-120N/A$35-50 (premium)$220K-650K<$5K60-70 hrsMetro/direct marketing
Mid-Scale Partnerships800-1,800$15.50-16.80$22-25 (value-added)$200K-250K$15-20K50-60 hrsShared resource/risk

Emerging Considerations: Factors to Monitor

While the industry focuses on immediate challenges such as labor and milk prices, several emerging factors deserve attention.

Immigration policy represents significant uncertainty. The National Milk Producers Federation estimates that 70% of dairy labor depends on immigrant workers, which could lead to disruption if policies shift dramatically.

Recent enforcement actions reported by industry media in June 2025 provided early indicators of possible impacts.

Replacement heifer availability has become constrained following years of beef-on-dairy breeding programs. Those $1,400 beef-cross calves seemed profitable, but now replacement heifers command $4,000 or more in some regions,according to recent market reports.

This affects expansion possibilities and disease recovery capacity.

Environmental regulations continue evolving. California’s experience with digester requirements and proposed discharge rules requiring 10 mg/L nitrogen limits may preview broader regulatory trends.

Compliance costs could affect financing availability for highly leveraged operations by 2028-2030.

The technical skills gap presents ongoing challenges. Operations investing in automation sometimes struggle finding qualified technicians.

I visited one farm where a $2 million robotic system remained idle for three days awaiting a specialist from Europe. This dependency represents an underappreciated vulnerability.

Practical Considerations: Strategic Planning for 2025-2030

Based on comprehensive industry analysis, producer experiences, and economic projections, several key considerations emerge for dairy farmers navigating this transition.

Decision timing matters significantly. Strategic choices about expansion, market positioning, partnerships, or transitions have relatively narrow windows.

USDA projections showing 1.1% production growth in 2025, ahead of processing capacity, suggest timing considerations remain critical.

Comprehensive margin management supersedes single-metric optimization. Wisconsin’s dairy market assessments emphasize total cost consideration, including labor (exceeding $20/hour in many markets), transportation, premiums, and capital requirements.

Scale positioning requires honest assessment. Operations with 200-700 cows lacking clear succession plans benefit from proactive transition planning.

Farms with 500+ cows and strong financials need a clear strategic direction—whether pursuing scale or niche opportunities.

Adequate reserves prove essential. Cornell studies indicate successful operations maintain 20-30% financial contingencies10-15% excess labor capacity, and 10-12 months working capital.

Monitoring emerging risks provides an advantage. Immigration policy, disease risks (particularly HPAI in dairy), replacement availability, and environmental regulations could trigger disruptions.

California’s SGMA implementation offers valuable lessons for planning.

Adapting to new models requires flexibility. Wisconsin economic impact studies show successful operations evolving into diverse models—large-scale operations function as agricultural businesses, niche producers combine farming with marketing, and mid-scale operations rely on complex partnerships.

Success depends on matching capabilities with chosen strategies.

The industry continues consolidating from approximately 35,000 farms today toward a projected 24,000-28,000 by 2030, alongside $11 billion in new processing investments. These changes create both opportunities and challenges.

What emerges from observing hundreds of operations navigating this transition is the importance of recognizing when fundamental business model evolution—not just operational refinement—becomes necessary. Producers actively adapting to new realities position themselves more favorably than those hoping traditional approaches will remain viable.

A successful producer who recently navigated significant transitions shared a valuable perspective: “The question isn’t whether traditional farming methods can continue. The question is whether we’re prepared to evolve to meet the requirements of the 2030 market. That decision—and acting on it promptly—shapes everything that follows.”

The transformation continues, and the industry’s evolution won’t pause for individual decisions. Yet within this change lies opportunity for those prepared to embrace new approaches while honoring agriculture’s enduring values.

Key Takeaways for Dairy Producers

  • Focus on total margins, not just feed costs—labor now exceeds $20/hour in many markets and represents 35-40% of true cost structure (Wisconsin Extension, June 2025)
  • Adopt individual cow economics to identify top 20% profit cows ($3,100/head) vs. bottom 20% losses ($420/head) (Cornell Dairy Farm Business Summary)
  • Invest in practical technology$30,000-60,000 stack can yield $31,200 annual labor savings (producer case studies)
  • Regional shifts are accelerating—Wisconsin is gaining 130,000-180,000 cows, while California faces 200,000-350,000 cow reductions due to SGMA (UC Davis/ERA Economics)
  • Mid-size farms (500-700 cows) face $2-3/cwt disadvantage—choose from five strategic paths with 60-70% success rates for expansions (Cornell analyses)
  • 30-40% of expansions fail—build 20-30% budget buffers and 10-12 months working capital to succeed (industry lender data, 2018-2023)
  • Three 2030 models emerge: Large-scale ($14.20-15.80/cwt costs), niche ($35-50/cwt premiums), mid-scale partnerships ($200K-250K/family income)
  • Monitor blind spots70% immigrant labor dependency (NMPF), $4,000+ replacement heifers (market reports), evolving environmental rules (California preview)
  • Act now1.1% production growth projected for 2025 leaves narrow decision windows (USDA projections)

Complete references and supporting documentation are available upon request by contacting the editorial team at editor@thebullvine.com.

Learn More:

The Sunday Read Dairy Professionals Don’t Skip.

Every week, thousands of producers, breeders, and industry insiders open Bullvine Weekly for genetics insights, market shifts, and profit strategies they won’t find anywhere else. One email. Five minutes. Smarter decisions all week.

NewsSubscribe
First
Last
Consent

The DDGS Discovery That’s Changing How Smart Producers Think About Transition Feeding

That $145/ton DDGS you’re feeding? Contains the same compounds as $20K/ton supplements. Your cows knew. Now you do too.

EXECUTIVE SUMMARY: That pile of DDGS you’re feeding at $145/ton contains the same immune-boosting compounds as supplements costing $20,000/ton—you just didn’t know it. University research reveals that distillers grains carry billions of heat-killed yeast cells packed with beta-glucans, potentially improving transition cow health and colostrum quality. Producers already report fewer metabolic issues and stronger calves when feeding DDGS, though they’ve been crediting the protein content. For a 500-cow dairy, these hidden benefits could be worth $42,900 annually. The catch: we can’t reliably test for these compounds yet, and every ethanol plant produces different levels. Until standardization develops over the next 3-5 years, you’re essentially feeding a lottery ticket—valuable, but unpredictably so.

I was having coffee with a group of nutritionists last month when someone brought up something interesting. “We’ve been feeding distillers grains for twenty years,” one of them said. “But are we really understanding what’s in them?”

You know, that question has been rattling around in my head ever since. Because what we’re starting to discover about DDGS might change how we think about this everyday feed ingredient—and maybe even how we evaluate feed efficiency in general.

The Research That’s Getting Everyone Talking

This year, new university-led research and field studies have begun examining how dried distillers grains affect the health of transition cows and calves. While early results suggest possible improvements in colostrum and calf immunity, producers should remember that more peer-reviewed research is needed before making major feeding changes.

Here’s what’s interesting: it might not just be about the protein and energy we usually focus on.

You probably know the basics of how DDGS are made—corn is fermented with yeast, the alcohol is removed as ethanol, and what’s left is dried and sold to us as feed. What I hadn’t really thought about until recently is that all those yeast cells used in fermentation? They’re still in there. Heat-killed from the drying process, sure, but their cell walls are intact.

And those cell walls… well, according to feed chemistry research from places like Cornell and Wisconsin, they contain compounds like beta-glucans and mannanoligosaccharides. If those sound familiar, it’s because they’re the same things that companies have been selling us in premium yeast supplements for years. The difference is, in DDGS, they just come along as part of the package.

Looking at the Numbers

What I’ve found particularly thought-provoking is when feed scientists analyze DDGS for these yeast components. Preliminary industry and university analyses estimate that the beta-glucan content in DDGS may range from 3 to 6 percent, though results vary widely by plant and region.

DDGS protein has become more consistent and fat content has declined over 15 years. 2021 DDGS delivers more reliable nutrition, but variability remains a challenge

Now, think about this for a minute. Many of us are spending around $20 to $25 per cow on various transition supplements—that’s based on current extension budgets from Penn State and Wisconsin. Between anionic salts, yeast cultures, protected choline, trace minerals… it adds up. I was talking with a producer from northeast Wisconsin recently who calculated he’s at about $22 per cow through the transition period. Pretty typical for folks who are serious about fresh cow management.

Meanwhile, we’re feeding DDGS at maybe 10 to 15 percent of the dry cow ration, chosen mainly because they’re economical when soybean meal gets pricey. But what if those distillers grains are doing more than we realize?

Some university field trials and producer observations suggest there might be something to this, though—and I want to be clear here—we’re still in the early stages of understanding exactly what’s happening. The mechanisms aren’t fully worked out yet. But anecdotally, producers and some university field trials have noted possible improvements in colostrum quality or calf health when DDGS are used, though comprehensive published research is still underway.

What Producers Are Noticing

This is where it gets really interesting. I’ve been making a point of asking producers about their experiences with DDGS in transition diets, and I keep hearing similar themes.

A friend who runs about 400 cows in southwestern Minnesota told me, “Our fresh cows just seem to handle the transition better when DDGS are consistent in the closeup ration. Fewer DAs, better appetites coming out of calving.” He’d always figured it was the extra energy or maybe the bypass protein.

The science is black and red: Maximum immunity for calves comes at 15% DDGS in dry cow rations. Take your passive transfer strategies to the next level and leave doubt in the dust.

I heard something similar from a larger operation in California’s Central Valley, and even a grazing dairy in Vermont mentioned that its calves seem more vigorous when DDGS are higher during the dry period. Up in the Northeast, where they’re dealing with different forage bases than we see in the Midwest, producers are still noticing these patterns.

A producer near Syracuse, New York, who’s been tracking this closely, mentioned something interesting: “We started monitoring colostrum quality more carefully last year. The weeks when DDGS inclusion was higher, our Brix readings seemed better. Could be a coincidence, but it’s got me thinking.”

Now, these are just observations—not controlled research. Every farm has so many variables at play, and we can’t draw firm conclusions from field observations. But when you hear the same things from different types of operations in different parts of the country… it makes you wonder, doesn’t it?

The Economics of It All

Let’s talk dollars and cents, because that’s what matters at the end of the day.

With current Midwest pricing from USDA reports—and you know how this changes—DDGS are running somewhere around $145 to $165 per ton, depending on your contracts and location. Soybean meal? We’re looking at $420 to $450,based on recent DTN spot prices. The economics of protein are pretty clear, which is why so many of us use these ethanol coproducts.

IngredientPrice ($/ton)Rate (%DM)Protein (%DM)Annual Cost ($)
DDGS$15512.0%30%$33,480
Soybean Meal$4308.0%48%$75,400
DDGS+Premium$23012.0%30%$49,700
Yeast Supplement$20,0000.05%50%$42,000

But here’s a thought: what if there’s additional value we haven’t been accounting for in our feed efficiency calculations?

I was working through some numbers with a nutritionist colleague, and even if—and this is purely hypothetical—standardized DDGS with guaranteed bioactive content commanded a $75 per ton premium, the math could still work when you consider potential reductions in other supplements.

Of course, that market doesn’t exist yet. And honestly, it might never fully develop given all the challenges involved.

Why This Isn’t Going to Be Simple

Before anyone gets too excited and starts changing their rations, we need to talk about the real-world challenges here.

The biggest issue? Variability. That estimated 3-6% range in beta-glucan content I mentioned? That’s a problem if you’re trying to formulate consistent rations.

And it’s well documented by groups like the U.S. Grains Council that different ethanol plants use different corn, different yeast strains, and different drying temperatures. All of that affects what ends up in your feed bunk. I was talking with a producer in Illinois who sources from three different ethanol plants depending on pricing and availability. He said the physical characteristics alone vary noticeably—color, smell, texture. If the basics vary that much, imagine the variation in these bioactive compounds we’re talking about.

Testing is another bottleneck. While there are methods to measure these compounds, they’re not something you can get from your regular feed testing lab. Most commercial labs still focus on crude protein and fiber analysis. I’ve checked with several major labs, and while they’re aware of the interest, they haven’t seen enough demand yet to add these bioactive analyses. Maybe that’ll change, but we’re not there yet.

And then there’s the regulatory side. According to the FDA Center for Veterinary Medicine and AAFCO guidelines for animal feed, companies must be very careful about health claims. An ethanol plant can’t just start marketing their DDGS as “immune-supporting” without crossing into regulated territory. They’re limited to talking about composition, not function.

What This Means for Your Operation Today

So, where does this leave us as dairy producers?

Well, first off, you can’t call up your feed dealer today and order “high-beta-glucan DDGS.” That’s not a thing yet. But understanding that DDGS might be delivering benefits beyond just protein and energy—that’s worth considering in your dairy nutrition strategy.

Here’s what I’ve been telling folks who ask about this:

Don’t change everything based on preliminary research. DDGS are still a good deal based on their traditional nutritional value alone. That hasn’t changed.

But maybe start paying closer attention. Track what happens when DDGS inclusion changes in your rations. Watch your colostrum Brix readings. Keep an eye on fresh cow health events. You might already be seeing patterns you haven’t connected.

If you can, try to source from consistent suppliers. While you can’t specify bioactive content, ethanol plants with good process control probably have more consistent products overall. A large dairy I know in Nebraska has been doing this for years—not for these functional properties we’re discussing, but just for ration consistency. Makes sense either way.

And think about where in your feeding program DDGS might offer the most value. If these functional benefits are real, transition cows would be the logical place to focus. That’s where immune support and colostrum quality matter most for long-term herd health.

Most importantly, work with your nutritionist on this. Any changes to your feeding program need to fit into your overall strategy, not work against it.

The Bigger Picture Here

What fascinates me about all this is what it says about how we evaluate feeds in general.

For decades, we’ve focused on the measurable nutrients—protein, energy, fiber, minerals. Our formulation software is really good at modeling these. But what if there’s a whole category of bioactive compounds that influence health and productivity through different pathways? Compounds we’re not routinely measuring or accounting for?

Think about it—forages have polyphenols, fermented feeds have metabolites from bacterial activity. Even regular corn silage might have functional compounds we don’t consider.

Someone made an interesting comparison at a conference recently: we might be where we were with vitamins a century ago—knowing something important is there, but not having all the tools yet to understand or use it fully.

Looking Down the Road

The dairy industry has always moved forward through careful observation, good science, and practical application. This emerging understanding about DDGS fits right into that pattern.

Will this completely change how we feed cows? Probably not. But it might add another layer to our decision-making, especially for specific times like the transition period, where these functional benefits could really matter.

We definitely need more research. Those early university findings need to be replicated and expanded. We need better, practical, affordable testing methods. And ultimately, we need larger field trials to see if these effects hold up on commercial farms.

The good news is, this work is happening. Universities have projects underway. Feed testing labs are exploring new methods as demand develops. Even some ethanol producers are starting to think differently about their product.

And it’s worth noting—this isn’t just a U.S. conversation. International markets from Mexico to Southeast Asia import substantial amounts of American DDGS. If functional properties become a selling point, that could reshape global trade patterns. European feed companies are already exploring bioactive feed ingredients more aggressively than we are in some cases.

What’s the timeline for all this? Hard to say exactly, but based on how these things typically unfold in our industry, I’d guess we’re looking at 3 to 5 years before we see meaningful market changes—if they happen at all. That’s about how long it takes for research to build up, testing infrastructure to develop, and markets to adjust.

What’s encouraging to me is that we’re not talking about adding expensive new ingredients. We’re talking about potentially getting more value from something we’re already feeding. In an industry where margins are always tight, finding hidden value in what we’re already doing… that could make a real difference.

The Bottom Line

You know, the cows probably figured this out before we did. They usually do, don’t they? They’ve been getting whatever benefits DDGS offer while we focused on the protein and energy values.

Maybe that’s the real lesson here. Sometimes the best discoveries aren’t about finding something new—they’re about better understanding what’s been right in front of us. And in this case, it’s been sitting in feed bunks across North America for the better part of twenty years.

It makes you wonder what else we might be missing, doesn’t it? But then again, that’s what keeps this industry interesting. Just when you think you’ve got it all figured out, you learn something new that makes you look at things differently.

For now, keep feeding DDGS when they make economic sense. Pay attention to how your cows respond. Stay informed as this research develops. And always remember—the best feeding decisions are the ones that work for your specific operation, with your cows, in your situation.

Because at the end of the day, that’s what really matters. Not what might be in the feed, but how your cows perform with it. And if they’re doing well with DDGS at current prices? Well, any additional benefits we discover are just icing on the cake.

The next time you’re looking at that pile of DDGS getting mixed into the TMR, maybe take a second to think about what else might be in there. We might not fully understand it yet, but your cows seem to appreciate it either way.

KEY TAKEAWAYS:

  • DDGS at $145/ton contain the same beta-glucans as $20,000/ton yeast supplements—you’ve been feeding premium immune support without knowing it
  • Producers seeing fewer fresh cow problems with DDGS now have an explanation: 3-6% yeast-derived compounds supporting immunity and colostrum quality
  • The math is compelling: $42,900 potential annual value for a 500-cow dairy, just from benefits you’re likely already getting
  • Today’s move: Track colostrum Brix and transition health against DDGS inclusion—you might already see patterns worth thousands
  • The catch: Without testing (3-5 years out) or standardization, you’re feeding a lottery ticket—valuable but unpredictable

Complete references and supporting documentation are available upon request by contacting the editorial team at editor@thebullvine.com.

Learn More:

The Sunday Read Dairy Professionals Don’t Skip.

Every week, thousands of producers, breeders, and industry insiders open Bullvine Weekly for genetics insights, market shifts, and profit strategies they won’t find anywhere else. One email. Five minutes. Smarter decisions all week.

NewsSubscribe
First
Last
Consent

Your Repeat Mastitis Cows Have a 72-Hour Secret – Here’s How to Break It

1,700-cow dairy. Zero hospital pen days. Not a typo. Here’s the 72-hour secret that changed everything.

Picture this: You’re treating the same cow for mastitis for the third time this month. Same quarter. Same frustrating cycle. She clears up, looks great for ten days, maybe two weeks if you’re lucky, then boom—she’s back.

Sound familiar? What if I told you there’s actually a biological clock ticking from the moment bacteria enter that udder, and we’ve been missing it completely?

I recently spent time reviewing research from AHV International, a Dutch company founded by veterinarian Dr. GJ Streefland, who grew tired of witnessing this exact pattern. Working with his business partner Jan de Rooy and researchers at Utrecht University, they discovered something that might explain why we keep fighting the same battles—and losing.

What they found is showing documented savings on real farms. But more than that, it might finally explain why that hospital pen never seems to empty out.

The Discovery That Started with Frustration

The Race You’re Losing: By 72 hours, over 75% of mastitis bacteria have built impenetrable biofilm fortresses—but clinical symptoms don’t appear until day 7.

You know how the best discoveries often come from someone saying, “there’s got to be a better way”? That’s exactly what happened in the eastern dairy region of the Netherlands. Dr. Streefland was watching antibiotics fail in ways that didn’t make sense. Not traditional resistance where bacteria evolve—this was different. Cows would respond, improve, then relapse with identical infections in the same location.

The breakthrough came when Streefland took a course on bacterial communication—yes, bacteria actually communicate with each other through a phenomenon called quorum sensing. Working with Professor Johanna Fink-Gremmels at Utrecht’s veterinary faculty, they started investigating whether this communication system might explain our treatment failures.

What’s fascinating is that they found specific plant compounds could actually disrupt these bacterial conversations and break up the protective fortresses that bacteria build—what scientists call biofilms. Even more surprising? These compounds are effective when administered orally, not just through direct injection into infected tissue. As Streefland explained in company documentation, “With oral applications, we were able to prevent the formation and maintenance of biofilms, enabling the immune system to eliminate biofilm-related disorders. That was really spectacular for me.”

The Critical 72-Hour Timeline for Biofilm Prevention in Dairy Cattle

Here’s where it gets really relevant for your operation. According to AHV’s research, validated across thousands of cows, bacteria follow a predictable timeline:

The Critical 72-Hour Window: Antibiotic effectiveness plummets as bacteria coordinate and build protective biofilm fortresses. By day 7 when symptoms appear, you’re already too late.
Time PeriodWhat’s HappeningTreatment Effectiveness
0-24 hoursIndividual bacteria, vulnerable to immune responseAntibiotics highly effective
24-48 hoursBacteria reach “quorum” and start coordinatingTreatment becomes challenging
48-72 hoursBiofilm matures into protective fortressAntibiotics struggle to penetrate
After 72 hoursEstablished biofilm shields bacteriaTreatment often temporary

Think of it like the difference between one protester with a sign versus fifty people organizing a march. Once they coordinate, everything changes.

Now here’s the kicker—most of us don’t even start treating until clinical signs appear around day seven. By then, we’re no longer fighting bacteria. We’re trying to break through established fortifications.

Real Farms, Real Numbers

Looking at documented results from working farms, Peter Smith at LT Smith & Sons in New York really caught my attention. He milks 1,700 Holsteins, a family operation that has been at it for decades. According to AHV’s case studies, his culling rate for udder health dropped from 1 in 3 cows to 1 in 7.

But here’s what matters day-to-day: Smith reports having 10-12 more cows in the milking string daily because they’re not stuck in the hospital pen or on withdrawal. Some days—and this still amazes me—he has zero cows in the hospital pen. After thirty years in the business, that had never happened before.

Zero Hospital Pen Days: After 30 years of dairy farming, Peter Smith achieved what seemed impossible—an empty hospital pen and 10-12 more cows in the milking string every single day.

In California, Trevor Nutcher’s experience is even more dramatic—though it’s worth noting that his operation had already optimized other management factors, so results may vary. The documentation shows he hasn’t used a mastitis tube since switching to biofilm prevention protocols. His hospital pen that averaged over twenty cows? Often empty now. When cows do need support, they’re back milking in 2.5 days instead of the typical week.

Producer Case Study Summary

ProducerLocationHerd SizeKey Results
Peter SmithNew York1,700 cowsCulling reduced from 1-in-3 to 1-in-7; 10-12 more cows are milking daily
Trevor NutcherCaliforniaNot specifiedZero mastitis tubes; hospital pen often empty
Joe SoaresCaliforniaTurlock: 2,500 cows Chowchilla: 5,500 cowsH5N1 recovery: 3 days vs months; 88 vs 77 lbs daily production

What’s interesting is how these protocols perform under extreme stress. During the 2024 H5N1 outbreak, Joe Soares inadvertently conducted an experiment when both his dairies were affected—his 2,500-cow Turlock operation and his 5,500-cow Chowchilla facility. The operation utilizing biofilm prevention protocols maintained better overall herd health—cows recovered in three days versus months at the traditional protocol dairy. While this was an extreme situation, it suggests that preventing biofilm formation may help maintain stronger baseline immunity. The production difference during recovery was substantial: 88 pounds versus 77 per cow per day. Even if you never face an outbreak, this resilience could matter during any stress event—such as heat waves in California’s Central Valley, humidity challenges in Florida’s dairy regions, or those brutal January cold snaps we see in Wisconsin and Minnesota.

Breaking Down What This Means for Your Bottom Line

Let’s get specific about what the documented trials show financially. The Giacomini farm trial in California provides us with hard numbers from a controlled comparison involving 450 cows, and I think the math is worth doing together.

The Math That Changes Everything: For a 1,000-cow dairy, biofilm prevention delivers $216,000 in documented annual benefits—with payback in just 12-18 months.

Documented Milk Production Gains

The biofilm prevention group produced 193 pounds more milk per cow across the entire lactation. So if we’re looking at $17/cwt—pretty close to where we are this October—that’s roughly $33 per cow in additional milk revenue. Multiply that by your herd size. For a 500-cow dairy, that’s $16,500. For 1,000 cows? $33,000. Just from the milk.

The trial also showed a 32% reduction in metabolic issues during those critical first 60 days. You probably know this already, but metabolic problems in early lactation often cascade into other issues—ketosis leads to displaced abomasum, which leads to… you get the picture. And if you’re dealing with Florida humidity or Arizona heat stress during fresh cow transition? These metabolic challenges get even trickier.

Reproductive Performance in the Trials

What’s encouraging is the consistency across different systems. The US trials—spanning over 20,000 cows across California, Georgia, Florida, and Minnesota—documented 7.4% better conception rates at first service (42.1% vs. 39.2% in control groups). UK operations reported an average of 28 fewer days open. The Giacomini trial showed zero uterine issues at 60 days in the treatment group versus ongoing problems in controls.

Now, the value of each day open varies—some extension economists say $3, others say $5 or more, depending on your market. But let’s be conservative and say $3.50. If you cut 28 days open like UK farms do, that’s $98 saved per cow. Again, multiply by your herd size.

The Longevity Factor

Here’s what really makes you think—research tracking 64,467 animals across Dutch farms found cows on these protocols lived an average of 8.5 months longer.

I don’t need to tell you what replacements cost these days. Whether you’re raising your own or buying springers, extending productive life by over half a year changes your whole culling strategy. Instead of culling for chronic mastitis treatment, you’re culling for production or genetics. That’s a different game entirely.

Quick Action Step: Track Your Hospital Pen Patterns

Starting tomorrow morning, create a simple tracking sheet for your hospital pen:

  • Which cows enter
  • How long do they stay
  • Whether they return within 30 days

This baseline will reveal your actual patterns—you might be surprised by what you find. Many producers discover that their “problem cows” are the same 15-20% that repeatedly cycle through.

What About Treatment and Labor?

The documented savings here make sense when you think about it:

  • Less antibiotic use (because you’re preventing, not treating)
  • Labor time—farms report saving 2-3 hours daily, not treating repeat offenders
  • No milk withdrawal for cows that don’t need treatment

It’s worth noting that prevention protocols do cost more upfront than a tube of mastitis treatment. However, when you factor in all these documented benefits, operations consistently report payback within 12 to 18 months. Of course, your mileage may vary depending on your current situation.

Sponsored Post

Why This Innovation Came from Holland (And What It Means for North American Dairies)

Interestingly, this breakthrough emerged from the Netherlands rather than larger dairy regions like Wisconsin or California. The Dutch had heavily restricted their antibiotic use years before similar pressure emerged in North America. They couldn’t just switch to stronger drugs when first-line treatments failed. They had to think differently.

Plus, the Netherlands is compact—you can drive across their entire dairy region in a few hours. When something works, word spreads fast through their tight-knit farming community. And Dutch producers have been comfortable with precision management for years, making them more receptive to complex biological approaches.

The collaboration between practicing veterinarians and university researchers was crucial. Utrecht University supported unconventional thinking when other institutions might have been more conservative. That academic backing gave credibility to what might have otherwise been dismissed as “just another supplement.”

What’s this mean for us here? Well, with milk quality premiums becoming tighter and consumer pressure on antibiotic use growing, we might want to pay attention to what the Dutch have figured out under pressure.

The Implementation Challenge

Let’s be honest—this approach requires a mental shift that’s harder than you’d think. We’ve built our entire management philosophy around being excellent at treating sick cows. Walk any farm with the owner, and they’ll proudly show you their protocols for the hospital pen. That’s what good managers do, right?

This asks you to intervene before problems are visible. During dry-off (where trials show 70% reduction in milk leakage and 47% fewer death losses with StopLac protocols). During the fresh cow transition. Before stress events. Success looks like… nothing happening. An empty hospital pen.

It’s weird celebrating what doesn’t happen. But that’s exactly the point.

Your veterinary relationship changes, too. Less emergency calls, more strategic planning. Some vets resist initially—understandably, since it challenges traditional service models. However, progressive practitioners see an opportunity to provide higher-value, consultative services.

And let’s be fair—some folks want to see more independent research before making changes. That’s completely reasonable. Each operation needs to weigh the documented benefits against their own comfort level with trying new approaches.

What This Means for Different Operations

  • For larger operations (1,000+ cows): The economics generally work well at scale. If you’re already tracking individual cow data through systems like DairyComp or PCDART, adding biofilm prevention protocols integrates relatively easily. The reduced labor alone—not having staff constantly treating repeat offenders—could justify exploring this approach. And with current margins? Every efficiency counts.
  • Mid-size dairies (300-999 cows): You might see the biggest relative impact. You’re large enough for economies of scale, but small enough that reducing the hospital pen population directly affects daily operations. Imagine what your best employee could accomplish if they weren’t treating sick cows three hours daily. This is especially relevant if you’re in that tough spot deciding between staying commodity or going premium—as many mid-size operations are right now.
  • Smaller operations (<300 cows): The per-cow investment might be higher, but if you’re doing your own treatments, the time savings could be game-changing. Plus, keeping cows productive longer becomes even more critical when every cow counts. For Canadian quota holders or organic producers, the longevity benefits alone might be worth the investment.
  • Grazing operations: The US data showing improved conception rates is enormously important for seasonal calving. And with less intensive management, preventing problems becomes even more valuable than treating them. If you’re grass-based, this could align well with your whole systems approach.
The Complete Picture: $376,000 annual benefit per 1,000 cows. Longevity and reproduction savings dwarf the visible costs—this is why the hospital pen tells only part of the story.

The Practical Reality Check

Look, I’m not suggesting this is a magic bullet. The documented results are impressive, but implementation requires commitment. You need to understand the biology, adjust protocols, and possibly face some resistance from your team or veterinarian.

Some operations might find traditional approaches still work for their situation. If you have excellent treatment success rates, low culling, and manageable hospital pen populations, perhaps you don’t need to change. But if you’re seeing those same cows repeatedly… well, Einstein had something to say about doing the same thing and expecting different results.

The learning curve is real. Producers who’ve made the switch emphasize that understanding when and how to intervene takes practice. But once you get it? They say it becomes second nature.

Where This Heads Next

What’s particularly interesting is that this isn’t limited to dairy. Dr. Geoff Ackaert, AHV’s technical director, notes similar bacterial behavior in poultry, swine, and even aquaculture. The principles appear universal because bacteria operate the same way regardless of host species.

With increasing pressure on antibiotic use globally—whether from regulations or consumer demand—having alternatives becomes crucial. The documented results suggest biofilm prevention could be one viable path forward. And honestly, being ahead of that curve rather than scrambling to catch up? That’s usually the better position.

Making Your Decision

The question isn’t whether the 72-hour biofilm window exists—the biology is clear from AHV’s research. The question is whether understanding and working with this timeline makes sense for your operation.

What would zero hospital pen days mean for your farm? Not just economically, but for your quality of life? For your employees’ job satisfaction? For your ability to focus on improving production rather than constantly treating problems?

Some producers will wait until this becomes standard practice everywhere. Others, like Peter Smith and Trevor Nutcher, are building competitive advantages now while the industry catches up.

Given this October’s milk prices —cheese at $1.67 and margins tightening —every efficiency matters. The chronic mastitis pattern that’s frustrated dairy farmers for generations finally has a biological explanation. Whether that explanation leads to changes in your operation is a decision only you can make.

But at least now you know why that cow keeps coming back to your hospital pen. And more importantly, you know there might be a way to stop her from needing to.

Key Takeaways: 

  • You’re always 72 hours too late: Bacteria build untreatable biofilm shields in 3 days, but clinical signs don’t appear until day 7—by then, antibiotics can’t penetrate
  • Zero hospital pen days are real: Peter Smith (1,700 cows, NY) dropped culling from 1-in-3 to 1-in-7; California’s Trevor Nutcher hasn’t used a mastitis tube since switching protocols
  • The ROI is undeniable: For 1,000 cows: $33,000 extra milk revenue + $98,000 saved on reproduction + dramatically reduced culling = payback in 12-18 months
  • Success requires a mental shift: Celebrate empty hospital pens, not treatment skills—intervene at dry-off and transition before problems become visible
  • Start tomorrow: Track which cows enter your hospital pen, how long they stay, and if they return within 30 days—you’ll likely find the same 15-20% cycling repeatedly

Executive Summary:

Your repeat mastitis cows aren’t antibiotic failures—they’re timing failures. Bacteria build impenetrable biofilm fortresses within 72 hours of infection, but symptoms don’t appear until day seven, making traditional treatments useless. Dutch research finally cracked the code: bacteria use “quorum sensing” to coordinate these defenses, explaining why the same cows keep cycling through hospital pens. The proof is undeniable: Peter Smith’s 1,700-cow NY dairy dropped culling from 1-in-3 to 1-in-7 and achieved zero hospital pen days—after 30 years of trying. Financial analysis from 20,000 US dairy cows documents $33/cow extra milk, $98/cow reproduction savings, and 8.5 months longer productive life. The paradigm shift? Prevent biofilms during dry-off and transition before problems become visible, celebrating empty hospital pens instead of treatment expertise. Start tomorrow: track your hospital pen patterns for 30 days—when you see the same 15-20% cycling through repeatedly, you’ll understand why this 72-hour window changes everything.

Complete references and supporting documentation are available upon request by contacting the editorial team at editor@thebullvine.com.

Learn More:

The Sunday Read Dairy Professionals Don’t Skip.

Every week, thousands of producers, breeders, and industry insiders open Bullvine Weekly for genetics insights, market shifts, and profit strategies they won’t find anywhere else. One email. Five minutes. Smarter decisions all week.

NewsSubscribe
First
Last
Consent

Why 70% of Dairy Farms Never Make It Past Dad – The Psychology, Math, and Monday Morning Fix

Dad’s heart attack: Tuesday, 2 pm. By Wednesday, can’t pay workers, sell milk, or buy feed. The 72-hour succession crisis.

Executive Summary: I’ve watched too many fourth-generation dairy farms die in probate court, their registered Holsteins auctioned while siblings fight over ‘equal’ shares. The statistics are brutal—70% fail at first transition, 96% by the fourth. But after analyzing dozens of successful transitions and reviewing new research from Wisconsin Extension and Oklahoma State, the pattern is clear: it’s not about money, it’s about psychology. Farmers tell researchers they’ll ‘be dead’ when they retire, then wonder why succession stalls. The winners do five things differently, starting with documenting that $35,000 annual sweat equity and ending with structured buyouts that recognize fair doesn’t mean equal. Your Monday morning starts with one phone call—here’s who to call and what to say.

dairy farm succession

You know, there’s a statistic that’s been keeping me up at night lately: only about 30% of family farms successfully make it to the second generation. For dairy operations? Man, the challenges just multiply. We’re dealing with twice-daily milking schedules, massive capital requirements for parlor upgrades, and market volatility that would make any succession planner nervous. By the third generation, we’re down to 12%. Fourth generation? Less than 4%.

Here’s what’s interesting, though—some families beat these odds consistently. And after digging through research from Wisconsin Extension’s recent work, Oklahoma State’s farm transition modeling, and talking with families who’ve actually made it work, a pretty clear pattern emerges. It’s probably not what you’d expect.

The brutal math of dairy farm succession: 96% of family operations fail by the fourth generation, making succession planning the #1 threat to your legacy

Note: To protect privacy, some names and identifying details in the case studies have been changed, while the accuracy of the succession strategies discussed has been preserved.

The Psychology Nobody Wants to Talk About

So when I talk with dairy farmers about succession planning, they always say the same thing: “I’m too busy.” And I get it. But Wisconsin Extension’s recent research on farm succession tensions revealed something fascinating—and honestly, a bit uncomfortable. The primary barriers aren’t logistical at all. They’re psychological.

You’ve probably heard Tracy Loch from The Impact Farming Show—she puts it this way:

“Farm succession planning is 80% psychology, 20% strategy.”

The succession crisis in numbers: 80% of farmers have no estate plan, 80% don’t trust their plans, and 71% haven’t even identified who’s taking over. Your farm is likely in the red zone

She’s spent years working with farm families, and she keeps seeing the same fears surface.

Looking at what researchers are finding, four major psychological barriers keep coming up:

Loss of identity: Think about it—if you’ve been “the dairy farmer” for 40 years, who are you when you’re not making those daily decisions about feed rations and breeding protocols? Australian researchers found farmers literally equated retirement with death. One farmer told them he’d “be dead when he gives up farming.” That’s heavy stuff.

Confronting mortality: Nobody likes planning for their own death, right? But succession planning forces you to acknowledge that reality head-on. University of Illinois Extension found that fewer than 20% of farm families have effective estate plans. Why? Precisely because, as they put it, “families avoid talking about what is unavoidable.”

Fear of conflict: Here’s a tough one—treating children differently based on their contributions to the farm might damage those family relationships you’ve spent decades building. Wisconsin’s recent focus groups found this fear paralyzed decision-making, especially in those tight-knit dairy communities we all know.

Loss of control: You’ve been the ultimate authority on everything from sire selection to parlor maintenance. Everything. Now you’re supposed to let someone else make those calls? That’s…that’s harder than it sounds.

What’s particularly revealing is research from Canada that examined why farmers avoid succession planning. They identified two key variables: risk perception and self-efficacy. Translation? It’s not about having time or resources. It’s about what farmers believe will happen and whether they think they can handle it.

Learning from the Farms That Made It Work

Let me tell you about a fourth-generation dairy operation in central Wisconsin—we’ll call them the Johnson family. About 450 Holstein cows. Father is ready to retire, son wanting to take over, and the other children are not involved in farming. Sound familiar? This is exactly the scenario that typically destroys farms by the fourth generation—96% of them, actually.

But here’s what the Johnsons did differently when they worked with their agricultural consulting team last year:

They Started Where Most Don’t—With Values

Before anyone called a lawyer or looked at financials, they sat down and figured out what each generation actually wanted. Not what they assumed the other wanted—what they actually wanted. Dad needed a sustainable retirement income and wanted fair treatment for his non-farming kids. The son wanted a gradual ownership stake through an LLC, with eventual rights to purchase farmland. He’d also been thinking about transitioning some of the herd genetics he’d been developing.

Their consultants used what they call a “succession goals worksheet”—basically getting everyone to write down their priorities before emotions took over. What’s interesting here is that they found way more common ground than expected. Both wanted the breeding program that the son had developed to continue. That became the foundation for everything that followed.

They Ran the Numbers (And Found Opportunity)

Here’s where it gets practical. The family built comprehensive financial projections—not just for current operations, but factoring in succession expenses. And they discovered something crucial: they’d been using organic practices for years but never got certified. When they ran the numbers on organic milk premiums—an extra $6-8/cwt in their market—the increased revenue made the transition not just possible, but profitable.

By this spring, they achieved that organic certification, bringing in substantial additional revenue that’s helping fund the ownership transition. Smart, right? Plus, the son’s focus on improving butterfat percentages—up to 4.1% herd average—added another revenue stream they hadn’t fully valued before.

They Didn’t Rush the Ownership Transfer

The son didn’t wake up one morning owning everything. They structured a phased buy-in with seller financing, letting him gradually increase his stake. Meanwhile, leadership roles got clearly defined—the son stepped into day-to-day decision-making, including all breeding decisions and fresh cow management, while Dad retained ownership but deferred on operational calls.

As their advisor noted:

“With clearly defined roles and decision boundaries, the family avoided confusion and kept the business running smoothly throughout the transition.”

No power struggles. No confusion about who decides what. Even details like who manages the milk quality program and DHIA testing got spelled out.

What Happens When You Don’t Plan (The Reality Nobody Discusses)

Let me paint you a picture of what “too late” actually looks like, based on recent probate court analyses and case studies from agricultural law programs.

The First 72 Hours After an Unexpected Death

Without a succession plan, your dairy operation can go from fully functional to legally paralyzed in just 72 hours—unable to sell milk, pay workers, or buy feed

Monday morning, everything’s normal. Cows are milked at 4 am and 4 pm like always. Tuesday afternoon, the patriarch has a fatal heart attack while checking fresh cows. By Wednesday morning, the farm is legally paralyzed.

Jay Joy from Bridgeforth LLP, who specializes in agricultural transitions, asks families facing this nightmare: “Who legally owns these assets right now? The milking equipment? The cattle? In the event of a death, will ownership be triggered to transfer to someone else?”

Usually? Nobody knows. The surviving family can’t access bank accounts. They can’t sign payroll checks for the milkers. The milk truck’s coming, but they’re not sure they have legal authority to sell milk. Feed needs ordering, but who can authorize purchases? The breeding technician is scheduled, but who approves those decisions?

“Even in the face of a tragic loss, a dairy farm has to keep running. Cows need to get milked and fed, people need to be paid, and operational decisions must be made.”

The Probate Nightmare (Months 1-24)

When someone dies without proper planning, everything goes through probate—that’s the court-administered process for transferring assets. According to data from Nebraska’s Center for Agricultural Profitability and similar institutions, probate typically takes:

  • Minimum: 6 months for simple estates
  • Average: 12-18 months for farm operations
  • Complex cases: 2+ years if contested

During this time? Major decisions are frozen. Can’t sell that old mixer wagon. Can’t refinance the parlor loan. Can’t make significant management changes, such as switching to robotic milkers. Everything waits for the courts.

The costs add up fast. Court filing fees, attorney fees, administrator fees, appraisal costs—University of Minnesota’s recent analysis found straightforward farm estates typically cost $20,000-$50,000 in probate expenses. If there are complications or family disputes? We’re talking $100,000-$400,000, according to probate cost analyses and estate planning attorneys.

When Equal Division Destroys the Farm

Here’s what really breaks my heart. Wisconsin intestacy law—what happens when you die without a will—often divides assets equally among children. Sounds fair, right? But Oklahoma State’s modeling study, led by agricultural economist Eric DeVuyst, found equal distribution has the lowest success rate of any succession strategy.

Why? Let’s say you’ve got 240 acres and three kids. One farms, two don’t. Under many state intestacy laws, each person receives 80 acres or an equivalent value. The farming child now needs to buy out siblings at market rates. With productive dairy land at $8,000-$12,000 per acre in prime regions like Wisconsin’s Dane County or New York’s Finger Lakes? That’s hundreds of thousands in debt that makes the operation unviable.

Maryland agricultural law research documented multiple cases where non-farming siblings filed for “partition sales”—basically forcing the court to sell the entire farm so they could get their cash. The farming sibling who’d worked the operation for decades, who knew every cow by her quirks? Watching it go to auction.

The Mathematics of Fair vs. Equal (And Why This Matters)

You know, I’ve noticed that dairy farmers get really uncomfortable when we start talking about treating children differently. But here’s what Oklahoma State’s research proved: trying to treat everyone exactly the same usually destroys the farm.

Their study, published in the Journal of Agricultural and Applied Economics, modeled different succession strategies across dairy, row crop, and cattle operations. Equal division among all heirs? Lowest success rate across the board. What worked better? They called it “equitable but unequal distribution.”

Why Equal Division Fails for Dairy Operations

The cash flow math just doesn’t work. Most dairy operations can’t generate enough profit to:

  • Fund the parents’ retirement (figure $40,000-$60,000 annually minimum)
  • Support the next-generation farmer’s family (another $60,000-$80,000)
  • Build sufficient non-farm assets to equalize inheritances
  • Maintain necessary reinvestment in facilities and equipment (parlor updates alone can run $500,000+)
The invisible wealth transfer: your successor loses $35,000/year by working for below-market wages. Without documentation, that $350,000 in sweat equity has zero legal value when succession comes

Kansas State research, led by agricultural economist Jenn Krultz, tested three different approaches specifically for dairy operations. What they found was fascinating—dairy farms performed best with salary arrangements rather than percentage splits. Why? Those 24/7 production demands mean dairy heirs often work extreme hours. One young farmer they studied averaged 75 hours weekly during calving season. Hourly calculations would make compensation prohibitively expensive.

“Fair doesn’t mean equal. Treating children according to contributions and needs works better than mathematical equality.”

Alternatives That Actually Work

What I’ve seen work in practice, backed by the research:

Life Insurance for Non-Farming Heirs: The farming child inherits the operation, while siblings receive insurance proceeds. A $500,000 policy might cost $5,000-$15,000 annually—far less than the debt service on buying out siblings at current land values.

Gradual Family Buyouts: Extended payment terms (10-15 years) at below-market interest rates (maybe 3% instead of 7%), recognizing the farming child’s sweat equity contributions. New Zealand’s dairy sector has used this model successfully for decades.

Different Asset Classes: One child gets the farm and cattle; another gets the parents’ retirement accounts and that rental property in town; a third gets the lake cottage up north; and the investment portfolio. Everyone gets value, just different types.

In California, where I’ve worked with several large dairies, there’s another wrinkle—quota values, which fluctuate with market conditions, have traded in the range of $1,500-2,000 per pound of butterfat in recent years. At those prices, a farm’s quota can be worth millions. Some families split the quota value among all heirs while keeping the physical farm intact for the farming child. Creative, but it works.

What’s happening in Europe offers another perspective. Dutch dairy farmers facing strict environmental regulations have developed succession models that include sustainability transition costs. The retiring generation often helps fund technology upgrades—such as manure digesters and precision feeding systems—that position the next generation for regulatory compliance. It’s succession planning that looks forward, not just backward.

Documenting Sweat Equity (Before It’s Too Late)

Let’s talk about that child who came back to the farm after getting their dairy science degree, worked for $40,000 when they could’ve made $75,000 at a co-op or genetics company. That $35,000 annual difference? That’s sweat equity—deferred compensation they’re banking for the future.

But here’s the critical part: without documentation, it’s legally worthless. Kansas State research tested three calculation methods:

The Opportunity Cost Method

Track what your heir could’ve earned in comparable off-farm positions versus what they actually received. Use Bureau of Labor Statistics data—a dairy science graduate averages $72,000-$85,000 with benefits these days. If they’re making $45,000 on-farm, that’s $27,000-$40,000 in annual sweat equity.

Farm Value Growth Attribution

When the heir joined, what was the farm worth? What’s it worth now? What percentage of that growth came from their contributions versus market appreciation? University of Maryland’s guidance suggests 40-50% attribution is often reasonable for full-time farming heirs who’ve modernized operations or improved herd genetics.

Critical Documentation (This Week, Not Years From Now)

Wisconsin Extension’s farm succession toolkit emphasizes: document everything when the heir returns, not 15 years later when lawyers get involved. You need:

  • Written agreement specifying compensation and sweat equity calculation methods
  • Annual records of total compensation, including housing, vehicles, and insurance
  • Professional farm appraisals every 5-7 years
  • Market wage comparisons updated annually

“Documentation can’t wait. Verbal promises mean nothing legally.”

I’ve seen too many cases where the son who transformed the herd’s production—taking it from 18,000 to 26,000 pounds per cow—had nothing documented to prove that value creation.

For digital tracking, several farms I’ve worked with use cloud-based systems like QuickBooks or FarmBiz to maintain real-time records accessible to all parties. It’s not fancy, but it creates that paper trail you’ll need later.

Why Templates Don’t Work (And Professional Help Does)

I know what you’re thinking—”Can’t I just download forms online?” Sure, for $49 you can get generic templates. But here’s what a Minnesota case taught us: parents created a “fair” revocable trust with equal ownership for three children using standard forms. Their farming daughter, who’d managed the transition to robotic milkers, ended up in court when siblings petitioned for partition. Years of litigation. Threat of forced sale. All from well-intentioned but poorly structured planning.

Professional succession planning typically runs $15,000-$30,000. Sounds expensive until you compare it to the alternatives:

  • Probate litigation: $100,000-$400,000 based on recent cost analyses
  • Unnecessary estate taxes: Potentially hundreds of thousands from missing planning opportunities
  • Forced farm liquidation: Priceless—four generations of registered Holstein genetics destroyed

“Professional help pays for itself. Proper planning costs a fraction of litigation when DIY approaches fail.”

What you’re really paying for isn’t documents. It’s the expertise to navigate:

  • State-specific agricultural exemptions and tax provisions
  • USDA program eligibility requirements (especially important for beginning farmer programs)
  • Integration of business structures with estate plans
  • Coordination between multiple advisors (attorney, CPA, nutritionist handling feed contracts, genetics consultant)
  • Family dynamics are unique to your operation

What to Do This Week (Yes, This Week)

For the dairy families reading this who know they’re behind—and let’s be honest, that’s most of us—here’s your concrete action plan. Not someday. This week.

Monday: Pick up the phone. Call either your agricultural attorney, your farm’s CPA, your local Extension educator who handles succession planning (every state has them), or a farm succession coach. Don’t hire them yet. Just schedule a consultation for 2-3 weeks out.

Tuesday: Sit down alone with a notepad and answer these five questions:

  1. If I died tomorrow, what would actually happen to this farm? Who’d manage breeding decisions? Fresh cow protocols?
  2. What do I really want for this operation’s future?
  3. What does my spouse want? (What you think they want—you’ll verify this weekend)
  4. Can this farm financially support what we’re trying to do?
  5. What am I actually afraid of here?

Wednesday: Gather your important documents. Don’t need perfect records—just get them in one place:

  • Land titles and equipment titles
  • Last 3 years of tax returns
  • Current balance sheet (even if it’s rough)
  • Any existing wills or trusts
  • Life insurance policies
  • DHIA records showing herd improvements

Thursday: Schedule a family meeting for next week. Send everyone a simple agenda:

  • Why we’re having this conversation (10 minutes)
  • What does everyone want/need from the farm? (40 minutes)
  • What information do we need to gather? (20 minutes)
  • Next steps (10 minutes)

Key rule: No decisions at this meeting. Just information gathering.

Friday: Write a one-page summary of your farm:

  • Acres owned/rented, cow numbers, rolling herd average
  • Who’s involved and what they do (including who manages what—breeding, feeding, health)
  • Financial position (profitable/breaking even/struggling)
  • Who’s interested in continuing, who’s not
  • Top 3 challenges you’re facing

This becomes your “elevator pitch” for professionals—saves everyone time.

Weekend: Have the conversation with your spouse. Compare your Tuesday answers. If they don’t align, that’s okay—but you need to know that before involving the whole family.

The Characteristics of Farms That Successfully Transition

After analyzing dozens of successful transitions, including several here in the Midwest, clear patterns emerge. Research has identified five critical success factors, and here’s what they look like in practice:

Communication: Not just talking, but regular, structured family meetings with clear agendas. One Marathon County, Wisconsin, family I know holds quarterly “shareholder meetings” treating their 600-cow dairy like the business it is.

Education: Both generations are actively learning. Successors attending financial management workshops at World Dairy Expo. Senior generation is learning to let go through transition coaching. I’ve seen kids return from Dairy Business Management programs, completely transforming farm financials.

Financial Viability: Operations are profitable enough to support multiple families. If your farm can’t generate $150,000+ in family living income, succession gets exponentially harder. The successful transitions I’ve studied all had strong production—25,000+ pounds per cow, 3.8%+ butterfat.

Clear Goals: Written objectives that everyone agrees on. Not assumptions—documented agreements about timeline, ownership structure, and decision-making authority. Who decides when to cull? When to upgrade equipment? It’s all spelled out.

Managed Family Dynamics: Using outside facilitators when needed. Recognizing that family relationships matter more than any farm asset. The best transition I ever saw brought in a counselor when things got tense—saved both the farm and the family.

Regional Considerations That Matter

What works in California’s Central Valley might not work in Wisconsin’s rolling hills. State-specific factors that affect your succession planning:

  • Estate tax thresholds: Wisconsin currently has none, but Minnesota kicks in at $3 million. Illinois is at $4 million. Makes a huge difference in planning strategies.
  • Dairy market structures: California’s quota system adds complexity—that quota’s worth serious money. Upper Midwest co-ops have different equity structures. Southeast grazing operations face different challenges than confinement systems up north.
  • Land values$3,000/acre in parts of Missouri, $15,000+ in Lancaster County, Pennsylvania. Your succession math changes dramatically.
  • Intestacy laws Vary dramatically in terms of spousal shares and children’s rights. Wisconsin treats it differently than Iowa, which treats it differently than New York.

Talk to advisors who understand your specific state’s agricultural laws. I’ve seen too many farmers get generic advice that missed critical local details—like Pennsylvania’s Clean and Green tax benefits or Vermont’s Use Value Appraisal program.

Perspectives from the Next Generation

A young farmer I worked with near Shawano, Wisconsin—let’s call him Jake—successfully navigated taking over his family’s 400-cow dairy.

“The hardest part wasn’t the financials or even the legal stuff. It was Dad actually letting go of breeding decisions. He’d selected every sire for 35 years.”

What made it work? “We literally wrote down who decided what. I got breeding and nutrition. He kept equipment purchases for two more years. Having it in writing prevented so many arguments.”

Jake’s advice to other young farmers? “Start the conversation before you think you’re ready. We began talking at Thanksgiving 2019, and didn’t sign anything until 2022. Those three years of discussions? That’s what made it work.”

Measuring Success Along the Way

How do you know if your succession planning is working? Here are benchmarks I’ve seen successful families use:

Year 1: Clear goals documented, professional team assembled, initial family meetings held Year 2: Financial projections completed, transition timeline drafted, roles beginning to shift. Year 3: Legal structures in place, ownership transfer beginning, next generation taking operational lead. Years 4-5: Monitoring and adjusting based on actual performance

The key is progress, not perfection. Every step forward beats standing still.

Key Takeaways for Dairy Farmers

Looking at everything—the research, the case studies, the disasters and successes—here’s what stands out:

The Non-Negotiables

  • Psychological barriers are real: Fear of mortality and loss of control paralyze more farmers than any practical challenge
  • Documentation can’t wait: Verbal promises mean nothing legally. Document sweat equity when heirs return, not decades later
  • Fair doesn’t mean equal: Treating children according to contributions and needs works better than mathematical equality
  • Professional help pays for itself: Proper planning costs a fraction of litigation when DIY approaches fail

Practical Next Steps

Within two weeks:

  1. Schedule that first professional consultation
  2. Have the kitchen table conversation with your spouse
  3. Document current ownership structures before memory fades
  4. Calculate sweat equity for anyone working below market wages
  5. Create a timeline for a gradual transition—not an overnight transfer

The Question That Matters Most

Every dairy farmer facing succession needs to answer one question honestly:

“Do you care enough about your family’s future to have uncomfortable conversations today?”

Because succession planning isn’t really about the farm. It’s about whether you’re willing to confront mortality, give up control, and treat children differently based on their contributions—all to protect their future.

The 30% who succeed aren’t luckier or wealthier. They’re just willing to do the psychological work that succession demands. They chose their family’s future over their present comfort.

Every successful transition I’ve studied started the same way: someone picked up the phone and scheduled that first consultation. Not next month. Not after the busy season. That week.

The cows will need milking at 4 am tomorrow, whether you’re here or not. Breeding decisions need to be made. The fresh cows will need managing. The only question is whether your family will have both the legal authority and financial ability to keep doing it.

KEY TAKEAWAYS

  •  72-Hour Death Spiral: Dad’s heart attack Tuesday afternoon = Wednesday morning, you can’t legally sell milk, sign checks, or buy feed. This operational paralysis destroys 70% of dairy farms within 18 months, costing $400,000 in probate battles
  • Psychology, Not Money, Kills Farms: Wisconsin Extension found farmers saying, “I’ll be dead when I give up farming”—that’s why Dad won’t let go of breeding decisions after 35 years. The barrier isn’t financial, it’s emotional
  • $350,000 Vanishes Without Documentation: Your son, making $40k (could earn $75k off-farm), loses $35,000/year in sweat equity. Ten years = $350,000 gone because verbal promises mean nothing legally
  • Equal Division Destroys Farms (Math Proof): Three kids, 240 acres, $10,000/acre = farming child needs $800,000 to buy out siblings. Solution: farming kid gets farm, others get $500,000 life insurance policy (costs only $10,000/year)
  • Your 5-Day Rescue Plan Starts Monday: Day 1: Call Extension educator (not lawyer). Day 2: Answer five brutal questions alone. Day 3: Gather documents. Day 4: Family meeting (no decisions). Day 5: Write a one-page farm summary. Total time: 8 hours. Potential savings: Your family’s legacy

Complete references and supporting documentation are available upon request by contacting the editorial team at editor@thebullvine.com.

Learn More:

The Sunday Read Dairy Professionals Don’t Skip.

Every week, thousands of producers, breeders, and industry insiders open Bullvine Weekly for genetics insights, market shifts, and profit strategies they won’t find anywhere else. One email. Five minutes. Smarter decisions all week.

NewsSubscribe
First
Last
Consent

The $38,000 Question: Why Components Beat Volume in Dairy’s New Reality

August 2024: First fluid milk gain since 2009. August 2025: Down 4%. The recovery? It’s already over.

EXECUTIVE SUMMARY: The brief fluid milk recovery of 2024 is over—August sales dropped 4%, confirming dairy’s structural shift from volume to components. Processors are voting with their wallets: $11 billion into cheese, yogurt, and specialty products, essentially nothing into traditional bottling. The economics are clear: farms hitting 4.3% butterfat earn $38,000+ more annually per 500 cows than those at 4.2%, while operations like Jake Vandenberg’s captured an extra $1.40/cwt simply by switching processors. Meanwhile, 259 farms filed bankruptcy chasing yesterday’s volume game, caught between $17 milk and $32+ production costs. The good news? Multiple paths to profitability exist—component optimization, specialty markets, strategic partnerships—but only for those who act now. With Federal Order reforms on December 1st and massive shifts in processing capacity by Q2 2026, your decisions in the next 18 months determine whether you’re part of dairy’s future or its consolidation statistics.

Dairy Component Premiums

You know that brief moment of hope we all felt when 2024 posted fluid milk’s first sales increase since 2009? Well, August’s 4% decline—bringing us down to 3.479 billion pounds according to USDA’s latest numbers—is telling us something important. And with processors committing $11 billion to new manufacturing facilities while fluid milk drops toward just 15% of total utilization, I think we’re seeing more than just another market cycle.

Many of us have noticed something feels different about our milk checks lately. It’s not just the price swings we’re used to. The cumulative sales data through August shows a 1.1% decline after adjusting for leap day, and that’s part of a bigger picture worth talking about.

Fluid milk’s 2024 recovery proved short-lived—August 2025 dropped 4% from the previous year’s brief peak, confirming dairy’s permanent shift from volume to components.

Component Production: What’s Really Happening Out There

Here’s what’s been happening that you might not have noticed yet. The Federal Milk Marketing Order data from March shows something fascinating—while total milk production dipped slightly at 0.35% year-to-date, calculated milk solids production actually went up by 1.65%. We’re making less milk but with way more components.

What really caught my attention is what’s happening with butterfat. USDA data shows the average test rate hit 4.36% in March 2025. That’s not just good—it breaks the old record set in 1945, when they hit 4.15%. Protein’s up too, sitting at 3.38%. These aren’t random fluctuations, folks. This is a systematic change.

I was talking with Tom Martinez last week—he runs 1,400 cows near Modesto—and he put it perfectly: “When the Federal Order pricing shows components making up 88-92% of what we’re getting paid, you’d be crazy not to adjust.” And he’s right. The economics are clear as day.

What I’m seeing across the country is producers really pushing components. Some markets are reporting component premiums hitting $1.25 per hundredweight for consistent quality, with certain producers getting even more. For someone like Martinez, producing 85 pounds per cow daily, that’s about $110,000 extra per year. That’s real money.

Sarah Johnson, a nutritionist with Cargill who works mostly in Wisconsin, tells me her clients are completely changing their approach. “They’re selecting for genetics with +50 pounds protein EBV now,” she says, “and pushing dry matter intake over 55 pounds daily during peak lactation. It’s all about component density these days.”

And you know what? With the Federal Order reforms coming on December 1st, this makes total sense. Wisconsin’s dairy center ran the numbers—farms producing milk with 3.3% protein and 6.0% other solids are going to see meaningful premiums. If you’re still focused on volume… well, you might end up subsidizing the folks who’ve made the switch.

Follow the Money: Where $11 Billion in Dairy Processing Investment Is Going

Processors are voting with their wallets—$11 billion flows to cheese, yogurt, and specialty products while traditional fluid milk gets essentially nothing. The industry’s future is written in these investment dollars.

The International Dairy Foods Association’s manufacturing report really opened my eyes. They’re tracking $11 billion in new processing investments through 2028. But here’s what’s interesting—look at where that money’s actually going:

Manufacturing Investment Breakdown

  • Cheese facilities: $3.2 billion
  • Milk/cream (mostly ESL and specialty): $2.97 billion
  • Yogurt and cultured products: $2.81 billion
  • Butter and powder operations: $1.60 billion

Notice anything missing? Yeah, traditional fluid milk bottling barely registers.

The individual projects tell the story even better. Fairlife—that’s Coca-Cola’s operation—is putting $650 million into ultra-filtered milk production in Webster, New York. Chobani’s dropping $1.2 billion on their Idaho facility, but it’s for yogurt and cultured products. Darigold’s new $600 million plant in Pasco? That’s for butter and milk powder, not fluid milk.

Mike McCully made a point at World Dairy Expo that stuck with me: “Pretty soon, it won’t be about who’s getting milk—it’ll be about who’s NOT getting milk.”

Based on what these companies are announcing, they’ll need 50-60 million pounds of milk daily once everything’s running. That milk’s got to come from somewhere.

Consumers: They’re Telling Us Something Important

The August sales data from IRI shows some really interesting patterns. Overall, fluid milk dropped 4%, but when you dig deeper, it gets complicated.

Organic milk took a real beating—down 9.4% according to retail tracking. And this is despite all the environmental and health messaging that, in theory, should appeal to today’s consumers. But when USDA shows organic averaging $4.41 per half-gallon versus $1.57 for conventional, well… that’s a tough premium for folks to swallow right now.

But here’s what’s curious—lactose-free milk grew 11.6% year-over-year. Circana’s research shows it’s getting $9.40 per gallon compared to $4.86 for regular milk.

Dr. Mary Schmitt at UC Davis explained it to me this way: “Lactose-free fixes a problem people feel immediately. They drink it, they feel better. Organic’s benefits? Those are long-term and abstract.”

The generational stuff is what really concerns me, though. The International Food Information Council’s 2024 study found that only 8% of Gen Z consumers buy conventional cow’s milk. Boomers? That’s 37%.

From 37% to 8% in three generations—the collapse in conventional milk consumption among younger consumers isn’t a trend to reverse with better marketing. It’s a cultural transformation that’s permanent.

Even more telling—recent consumer research shows younger consumers increasingly view dairy through a social lens, with many reporting discomfort ordering dairy products in public settings. This represents a fundamental shift in how dairy is perceived culturally, not just nutritionally.

Jennifer Williams from Dairy Management Inc. doesn’t mince words about this: “This isn’t something a better Got Milk campaign can fix. We’re looking at fundamental cultural shifts across three generations.”

The Financial Reality Check: A Tale of Two Dairy Economies

Let’s talk money, because that’s what keeps us all up at night. CME futures show Class III milk dropped about 20 cents after April’s production reports, settling around $16.86-17.86 per hundredweight for most of 2025.

Cornell’s Dairy Farm Business Summary lays out the cost structure pretty starkly:

Production Cost Comparison (per hundredweight)

  • Mid-size operations (200-700 cows): $32.83
  • Large operations (2,000+ cows): $23.06
  • Cost disadvantage: $9.77

That’s almost a $10 difference, and you can’t make that up with incremental improvements.

The math is brutal—mid-size operations burn $15.83 per hundredweight at current milk prices while large dairies operate near breakeven. This $9.77 cost gap can’t be bridged with incremental improvements

The bankruptcy numbers from American Farm Bureau tell a tough story. Chapter 12 filings jumped 55% to 259 cases between April 2024 and March 2025—the highest since 2019. In Q1 2025, we saw 88 bankruptcy filings, up from 45 the year before.

Dr. Christopher Wolf at Cornell reminds us these aren’t just numbers: “Every one of these represents generations of knowledge, family legacies, and rural communities losing their foundation.”

Interest rates aren’t helping either. Federal Reserve ag lending surveys show rates jumping from 2.9% to nearly 9%. CoBank’s analysis suggests that if you’re refinancing debt, you’re looking at $50,000 to $150,000 more in annual service costs, depending on your operation size.

And here’s something that worries me—USDA’s Cattle report shows replacement heifer inventories at just 41.9 per 100 milk cows. That’s a 47-year low. You don’t sell your future herd unless you absolutely need the cash today.

What Works: Learning from Successful Adaptations

Not everybody’s struggling, though, and that’s worth talking about. I’ve been visiting with farmers who are actually doing pretty well, and they’ve got some things in common.

Take the Vandenberg family in South Dakota. Over the past three years, they’ve completely restructured their 800-cow operation to focus on components.

“We’re hitting 4.3% butterfat and 3.4% protein consistently,” Jake Vandenberg tells me. “Agropur gives us about $1.40 per hundredweight extra for that consistency. For us, that’s literally the difference between making money and losing it.”

The Vandenbergs made three big changes:

  1. Switched their breeding program—sexed semen on the best 40%, beef on the rest
  2. Brought in a nutritionist to reformulate for component density instead of volume
  3. Left their co-op after 30 years to join a cheese-focused processor
The numbers don’t lie—optimizing for just 0.1% more protein delivers $38,000+ extra annually per 500 cows. Traditional volume strategies leave this money on the table.

Different strategies work for different situations, of course. Maria Rodriguez, down in Texas, took an entirely different approach. Her 180-cow operation couldn’t compete with the mega-dairies around her on efficiency. So she went niche—transitioned to A2 milk for a regional specialty processor.

“I’m getting $24 per hundredweight when my neighbors are getting $17,” she says. “But it took two years to fully transition, between the testing, breeding changes, and building new buyer relationships.”

Regional Realities: Why Geography Matters More Than Ever

Of course, what works depends partly on where you’re farming. The transformation looks different depending on your region.

California: Dealing with water restrictions, environmental regulations, and bird flu that knocked out 0.7% of national production according to the USDA’s animal health reports. But California’s also where I’m seeing the most aggressive component optimization. Dr. Jennifer Heguy from UC Extension puts it bluntly: “With our cost structure, it’s high components or bankruptcy. There’s no middle ground.”

Wisconsin: Actually, it’s in a pretty good spot for this transformation. The Wisconsin Milk Marketing Board reports that 90% of the state’s milk goes into cheese. If you’re optimizing for protein in Wisconsin, you’re positioned perfectly. The challenge? Most Wisconsin farms still have fewer than 500 cows, and scale matters more than ever.

Northeast: That’s where things get tough. Analysis shows they depend more on fluid milk than any other region. Industry estimates suggest DFA controls about 60% of fluid processing in some Northeast markets. Dr. Andrew Novakovic at Cornell describes it well: “The big farms will be fine, the specialty niche operations can make it work, but that traditional 200-cow dairy that’s been the backbone of rural New York? They’re in a really tough spot.”

The Other View: Maybe This Is Just Another Cycle

Now, not everyone agrees that this is a permanent change. I had a long conversation with Robert Wellington at Agri-Mark Cooperative, and he makes some good points.

“We’ve seen this before,” Wellington says. “In 2009, when Class III hit $9, everyone said dairy was permanently broken. By 2011, we were back over $20. Markets do this—they overcorrect.”

He points to several recovery factors:

  • China could bounce back and start importing again
  • Cheese consumption has grown for 40 years straight
  • Government might step in if farm failures accelerate
  • IRI data shows plant-based milk has plateaued, with oat milk actually declining

“Look, I’m not saying it’s easy,” Wellington tells me. “But fluid milk still represents 200 billion pounds of annual sales. Writing it off completely might be premature.”

What You Can Do Right Now: Practical Action Steps

So, given all this, what should you actually be doing? Here’s my practical advice based on what’s been working.

1. Evaluate Your Processor Relationship

Ask these critical questions:

  • What’s their five-year infrastructure plan?
  • How much milk goes to fluid versus manufacturing?
  • What are the component premiums and calculation methods?
  • Are they gaining or losing members?
  • What happens if this plant closes?

If you don’t like the answers—or can’t get straight answers—start looking around now while you still have options.

2. Run Your Component Numbers

Pull your last year’s milk test results and use the USDA’s AMS pricing calculator. Even a 0.1% bump in protein could mean $20,000-30,000 for a 500-cow herd. That usually justifies changing your breeding program.

Quick Component Math

  • 500 cows × 70 lbs/day × 365 days = 12,775,000 lbs annually
  • 0.1% protein increase at $3.00/lb protein value = $38,325 extra revenue
  • Genetic investment payback: Often under 18 months

3. Be Honest About Your Scale Situation

If you’re running 200-700 cows, you need a clear path:

  • Can you get to 1,000+ economically?
  • Is there a niche market you can tap into?
  • Would a neighbor lease your facilities?

These conversations are hard, but having them now beats having them in bankruptcy court.

4. Lock in What You Can

With rates where they are, converting variable debt to fixed should be priority one. Same with feed—locking in for 6-12 months gives you certainty when everything else is volatile.

What to Watch: The Next 18 Months Will Be Critical

Based on everything I’m hearing from analysts, processors, and other farmers, here’s what I’m watching:

Q2 2026: New processing capacity really kicks in. That’s when we’ll see if there’s enough milk to go around. CME futures suggest Class III stays in that $17-18 range through mid-2026.

December 1, 2025: Federal Order reforms hit. National Milk’s analysis shows this will shift millions in revenue between regions and different sized farms. If you haven’t run the numbers on how this affects you specifically, you’re flying blind.

SNAP Uncertainty: We’re talking about 42 million Americans potentially affected if Congress doesn’t act, and USDA data shows that fluid milk is the second-most-purchased SNAP item. Any disruption accelerates demand problems.

Weather Patterns: NOAA’s projecting continued La Niña conditions—drier Southwest, wetter North. That affects feed costs and cow comfort differently depending on where you are. In the Southwest, you may see higher alfalfa costs. Up north, wet conditions could impact corn silage quality.

The Bottom Line: This Transformation Creates Both Risk and Opportunity

After watching this industry for three decades, I can tell you this feels different. It’s not just about milk prices or feed costs. It’s about fundamental changes in what consumers want, where processors invest, and which farm structures can survive.

The dairy industry will absolutely continue—global demand for dairy proteins keeps growing, especially in Asia and Africa, according to FAO projections. The question isn’t whether dairy survives. It’s which dairy farmers will be part of that future.

The folks who are going to thrive are making decisions based on where the industry’s heading, not where it’s been. They’re optimizing for components because that’s what processors pay for. They’re being honest about scale economics. They’re building relationships with processors who are actually investing in growth.

What’s encouraging is that there are multiple paths to success:

  • Component premiums for those who optimize
  • Specialty markets for smaller operations
  • Strategic partnerships for mid-size farms
  • Operational efficiency for larger scales

But—and this is crucial—you have to accept that the old playbook based on volume and fluid milk demand doesn’t work anymore.

The next 18 months will probably determine which operations make it to 2030. The survivors won’t necessarily be the biggest or most efficient. They’ll be the ones who recognized early that this isn’t a cycle to wait out—it’s a transformation to navigate.

Make your decisions based on where you see your operation in five years, not where you wish the industry was going. Whether we call it transformation or just reality, the dairy industry of 2030 will look very different from 2020.

And you know what? For those who position themselves right, it might actually be more profitable.

Quick Reference: Key Metrics for Decision-Making

Component Targets for Premium Capture

  • Butterfat: 4.3%+
  • Protein: 3.4%+
  • Daily variation: <2%

Critical Dates

  • December 1, 2025: FMMO reforms are effective
  • Q2 2026: New processing capacity online

Operation Size Considerations

  • <200 cows: Consider specialty/niche markets
  • 200-700 cows: Scale or specialize decision critical
  • 1,000+ cows: Focus on efficiency and components

Financial Thresholds

  • Component premium potential: $1.25-1.40/cwt
  • Protein value increase (0.1%): $20,000-30,000 per 500 cows
  • Debt refinancing impact: $50,000-150,000 annually

Key Takeaways:

  • Component Premium Reality: Every 0.1% protein increase = $38,325 more annually (500 cows). Genetics + nutrition can achieve this in 18 months.
  • Follow the $11 Billion: Processors are building cheese, yogurt, and powder plants—not fluid milk. Position yourself with growth-oriented buyers now.
  • 18-Month Window: Federal Order reforms (Dec 1) and new capacity (Q2 2026) will lock in winners and losers. Your processor decisions today determine your 2030 survival.
  • Three Paths Forward: Hit 4.3%+ butterfat for premiums ($1.40/cwt extra), tap specialty markets (A2 milk at $24 vs $17), or scale past 1,000 cows for efficiency.
  • Mid-Size Reality: At $32 production costs vs $17 milk, 200-700 cow operations must choose: scale, specialize, or strategically exit while equity remains.

Complete references and supporting documentation are available upon request by contacting the editorial team at editor@thebullvine.com.

Learn More:

  • Breeding for Components: The New Gold Standard for Dairy Profitability – This guide moves beyond theory to tactical execution, revealing the specific genetic markers (like A2A2 and Kappa-Casein) and sire selection strategies that directly translate into higher-value components and a more resilient milk check in today’s manufacturing-driven market.
  • Beyond the Barn: Decoding the 2025 Global Dairy Market Signals – Understand the global “why” behind the domestic shift. This strategic analysis explores the international demand for cheese and powders driving the $11 billion in processor investment, providing crucial context on the export trends that will shape your farm’s long-term profitability.
  • The Digital Feedbunk: How Precision Nutrition Tech is Unlocking Component Potential – To achieve the component targets discussed, you need the right tools. This article showcases the innovative technologies—from automated feed systems to data analytics—that allow you to optimize rations, boost milk solids, and maximize feed efficiency for a clear return on investment.

The Sunday Read Dairy Professionals Don’t Skip.

Every week, thousands of producers, breeders, and industry insiders open Bullvine Weekly for genetics insights, market shifts, and profit strategies they won’t find anywhere else. One email. Five minutes. Smarter decisions all week.

NewsSubscribe
First
Last
Consent

The Hidden Money in Every Step: Turning Hoof Health into Strategic Dairy Profit

The most profitable dairies aren’t milking harder—they’re walking smarter. The hoof holds the hidden margin.

Executive Summary: Hidden beneath every hoof is a profit story most producers never see. New data from the University of Nottingham and North American research show milk output and fertility start slipping weeks before obvious lameness appears—costing herds thousands in unseen loss. This Bullvine feature connects the biology to the balance sheet, showing how small timing changes in dry‑cow trimming, transition management, and housing comfort translate directly into stronger cash flow. It also explores how genetics, nutrition, and environment can turn hoof resilience into a permanent herd advantage. Examples from Wisconsin to Ontario prove one thing: the most profitable dairies aren’t just milking harder—they’re walking smarter.

Dairy Hoof Profitability

Walk into any freestall barn, and you’ll hear that familiar rhythm—milkers humming, gates clanking, the easy shuffle of cows heading to the bunk. It’s a comforting sound of routine. But every so often, there’s a different note: a soft drag of a hoof, a pause in stride. For years, we’ve thought of that as a welfare concern. Important, yes—but separate from core profitability. The latest data suggest it’s time to reframe that thinking completely.

A groundbreaking study from the University of Nottingham tracked over 6,000 cows across 11 herds and analyzed more than 2 million milk records. The findings were striking—hoof problems cost an average of $336 per case, and could cut up to 17 percent of net farm profit. But what’s most interesting? Milk yield began dropping weeks before a limp appeared.

As Dr. Marcos Veira from the University of British Columbia recently put it, “The money starts leaving your tank long before the cow starts limping.” That line has stuck with many producers because it captures what science now proves: lameness isn’t just an animal welfare issue. It’s one of the most under‑recognized management costs in dairying.

The “Invisible Cow” That Costs You

The true cost structure of lameness—milk production losses and premature culling consume nearly two-thirds of the economic damage, yet most producers focus only on the visible 13% spent on treatment and labor

Every herd has them—cows that look fine but quietly underperform. They milk, they eat, they breed back, but they never quite reach potential. Everything else in the herd may look solid—dry matter intake, conception rate, butterfat performance—yet something small keeps the herd average just below expectation.

The University of Wisconsin research team, led by Dr. Nigel Cook, found that cows showing subclinical inflammation in their hooves lose an average of 3.3 pounds of milk daily, even before lameness is visible. Across a 500‑cow freestall herd, assuming just 20% of cows are subclinically affected, that’s easily $30,000–$40,000 in milk revenue gone each year—without a single “lame cow” on the books.

What producers across North America are discovering is that the “invisible cow” problem doesn’t show up until it’s systemic—when the herd average drops, reproduction slows, and no one can pinpoint why. The solution lies not in more treatments but in catching every small signal before it compounds into loss.

Sole ulcers hit hardest per case at $216 and 574 kg milk loss, but digital dermatitis’ 35% prevalence makes it the real profit killer—knowing which battle to fight first changes everything

What’s Actually Happening Inside the Hoof

Looking closer, the pathway from fresh cow to lameness begins well before any visual signs. During the transition period, a cow burns energy reserves to fuel milk production. That means not just backfat, but also fat from the digital cushion—the small pad beneath the coffin bone responsible for absorbing impact.

Work from Cornell University and the University College Dublin shows that when this cushion thins, the coffin bone (P3) begins pressing into the corium—the sensitive layer that forms the hoof wall. That pressure leads to micro‑bruising weeks before external changes appear. The immune system responds, redirecting nearly 40 percent of the liver’s protein synthesis away from milk components toward tissue repair.

What’s interesting here is that production losses begin long before clinical lesions do. In practical terms, that means a cow’s milk and butterfat test may be telling you about her feet weeks in advance.

Producers who have added hoof-scoring to transition audits—particularly in Wisconsin and Ontario—report lower fresh cow pullouts and steadier butterfat recovery. It’s a powerful reminder that hoof health isn’t an isolated variable. It’s baked into the biology of early lactation.

Why “Prevention” Often Misses the Mark

Most dairy operations already have some form of hoof care in place—scheduled trimming, routine footbaths, lesion recording, and even digital tracking. Yet despite those investments, the average herd still reports around 30 percent of cows experiencing hoof problems annually. The issue usually isn’t neglect—it’s timing.

Footbaths are indispensable for controlling digital dermatitis, but they do little to offset metabolic or mechanical strain. Likewise, blanket trimming during peak lactation can cause more harm than good.

Hoof-care pioneer Karl Burgi has spent decades talking to producers about timing and prevention. “If you’re trimming after she freshens, you’re already behind,” he says. Moving that routine to the dry period—before the hormonal wave and metabolic stress hit—gives horn tissue time to harden and dramatically reduces lesions.

I’ve noticed many herds adopting Burgi’s logic in recent years—not because it’s trendy, but because it simply pays. Prevention only works when it happens before damage begins.

The Transition Period: Management’s Sweet Spot

Timing is everything—the digital cushion starts thinning three weeks before calving while lameness risk explodes after, proving Dr. Burgi’s point that trimming post-fresh means you’ve already lost the game

The transition window remains the most profitable period for hoof protection. Data from NAHMS 2023 and European dairy studies consistently show that cows losing > 0.5 BCS units between dry‑off and peak milk face exponentially higher lameness risk later in lactation.

Here are strategies that consistently yield returns:

  • Trim 6–3 weeks before calving. Research from the University of Bristol showed that when trimming was moved to this window, hoof lesions dropped by 62 percent.
  • Prioritize rest and comfort. A deeper bedding base and consistent cubicle space are critical. The University of Minnesota Extension found that each hour of lost rest correlates to 3 pounds of milk loss per cow, per day.
  • Fortify claw health nutritionally. Supplement 20 mg biotin/head/day and 50–60 ppm zinc (half organic) to strengthen horn growth.
  • Watch BCS swings closely. Logging condition scores at dry‑off, calving, and 21 days in milk creates a simple, herd‑level index of hoof risk.

One producer I spoke with near Green Bay summed it up well: “We didn’t change anything except timing, and the numbers told the story. Once we started trimming at dry‑off, it was like the cows got their footing back before calving even began.”

Closing the Freestall–Pasture Gap

It’s no secret that pasture systems show lower lameness rates—about 23 percent incidence versus 50 percent in conventional freestalls, according to data from the University of Guelph and University of Wisconsin. Still, it’s entirely possible to achieve similar comfort scores in high-producing freestall herds with fine-tuned management.

Across leading dairies, five consistent success points stand out:

  1. Rubber use in high-pressure zones. Installing mats in holding pens and return alleys reduces trauma by up to 40 percent.
  2. Modern stall design. According to the Dairyland Initiative, modern Holsteins perform best in 48‑inch stalls, 10‑foot lengths, neck rails 48–50 inches high, and 67 inches from the curb.
  3. Floor texture matters. Grooves, planted ¾ inch wide and 3¼ inches apart, ensure balance and minimize slips.
  4. Deep, dry bedding. Sand still wins on metrics of comfort and traction—reducing cases by 40 percent versus solid‑surface alternatives.
  5. Manage standing time. Research from Guelph suggests that keeping total standing time below 3½ hours daily minimizes the risk of sole ulcers.

Some Northeast producers have described how relatively inexpensive changes—re‑grooving lanes, adjusting neck‑rail height, or correcting parlor flow—reduced overall lameness nearly as much as large capital upgrades. What matters most is not the budget, but precision.

Genetics: The Silent Multiplier

Genetics isn’t quick, but it’s permanent—selecting for hoof health cuts lameness from 30% to 15% over four generations, building sound feet into your herd’s DNA instead of fighting the same fires every year

Short-term changes can deliver immediate progress, but genetics create lasting impact. Genome mapping led by the Council on Dairy Cattle Breeding (CDCB) and Wageningen University has already linked 285 markers to hoof integrity, with heritabilities as high as 30 percent.

Producers no longer have to wait to select for sound feet. The Council on Dairy Cattle Breeding (CDCB) has already released a Hoof Health (HH$) index and direct PTAs for traits like Digital-Dermatitis-Free and Hoof-Ulcer-Free. We can even select for Digital Cushion Thickness (DCT), the very structure discussed earlier in this article. While we can still use proxies like Productive Life and Feet & Legs Composite, producers can now directly attack hoof health issues through genetic selection with far greater precision.

As Tom Lawlor, Research Director at CDCB, pointed out recently, “Every generation that overlooks hoof traits ends up paying the same bill twice.” Selecting for the right structure now locks in herd mobility—and profitability—for years to come.

A 90‑Day Plan That Delivers

Wisconsin’s 2025 pilot proves prevention pays fast—herds following the 90-day protocol cut milk losses by 30% and lameness cases by 20%, with the biggest gains happening before anyone sees a limp

For dairies looking to translate research into action, the University of Wisconsin’s 2025 Hoof Health Pilot condensed years of data into a working template. Participating herds reduced hoof treatments by 30–40 percent within six monthsand replacement rates by around 15 percent annually.

Here’s the quick version:

Weeks 1–4: Mobility‑score every cow; record one year of hoof treatments and case types. 
Weeks 5–8: Standardize footbath systems (change solution every 200 passes), move trimming to dry cow groups, flag any fresh cow losing > 0.5 BCS. 
Weeks 9–12: Re‑groove high‑traffic lanes if needed, fine‑tune stall design, and prioritize AI bulls in the top 25 percent for Net Merit and Feet & Legs Composite (≥ +2.0). 

As one Minnesota dairyman told me, “We didn’t need an extra hoof trimmer—we just needed a plan that matched our rhythm.”

Seeing Hoof Health for What It Really Is

I remember an Ontario producer who told me, “We used to fix feet because it was the right thing to do. Now we fix them because it pays.” That statement says it all.

Hoof health has always been about welfare, but it’s also about efficiency, longevity, and sustained performance. The research, the genetics, and the management practices all tell the same story: when cows move comfortably, everything—from butterfat yield to pregnancy rate—stabilizes or improves.

What’s encouraging is that none of these solutions requires a drastic change. They’re layered, attainable, and already validated by producers who are seeing results.

Because when cows walk soundly, the entire operation gains stride—and every step becomes a step toward profit.

Key Takeaways:

  • Profit leaves before the limp. Subclinical hoof pain steals milk and profits weeks before you notice.
  • Start prevention early. Shifting trims, rations, and foot care to the dry period pays back fast.
  • Comfort compounds. Small improvements in stalls, rubber, and cow flow can cut lameness by up to 40%.
  • Breed soundness in. Bulls with positive Feet & Legs and Productive Life scores create durable cows built for longevity.
  • Manage with intention. A clear 90-day plan of scoring, trimming, and tracking turns hoof health into herd stability and profit.

Complete references and supporting documentation are available upon request by contacting the editorial team at editor@thebullvine.com.

Learn More:

The Sunday Read Dairy Professionals Don’t Skip.

Every week, thousands of producers, breeders, and industry insiders open Bullvine Weekly for genetics insights, market shifts, and profit strategies they won’t find anywhere else. One email. Five minutes. Smarter decisions all week.

NewsSubscribe
First
Last
Consent

The Texas ESL Boom: How Smart Producers Are Turning Consistency into Contract Power

This fall, the leverage flips. Consistency and data—not herd size—are the new currency in Texas milk markets.

Executive Summary: Texas dairy is hitting reset—and this time, producers hold the leverage.” With over $700 million in new investments in ESL processing, the state’s milk market is being rebuilt around consistency, documentation, and proactive negotiation. ESL technologies from universities like Cornell and Cal Poly have proven that milk lasting up to 90 days demands unwavering quality. That’s creating new premiums for farms that deliver predictable performance backed by data. According to USDA and industry experts, the next generation of dairy success won’t be about herd size—it’ll be about reliability. And Texas producers who act now could lock in the best contracts of their careers.

Dairy producer contracts

If you’ve been in dairy for more than a decade, you know when the ground shifts. Well, it’s shifting again—this time deep in Texas. With Ninth Avenue Foods investing $200 million in a new extended shelf-life (ESL) facility in LongviewWalmart putting $350 million into its site in Robinson, and Select Milk Producers launching a partnership with Westrock Coffee in Littlefield, the state’s dairy landscape is being reshaped from the ground up.

That’s over $700 million in fresh processing investment. But here’s what’s interesting—it’s not just more capacity. It’s a fundamental redefinition of how milk gets valued, marketed, and negotiated.

Texas is commanding $700 million in new ESL processing investment—the largest dairy infrastructure expansion in a generation. These three facilities alone will process enough milk to supply over 750 retail outlets and transform Texas into an ESL powerhouse.

Understanding What’s Really Changing

Let’s start with the technology itself. ESL milk—what many of us know as the kind that lasts far longer on grocery shelves—uses a mix of ultra-high temperature (UHT) heat processing and microfiltration to achieve a shelf life of 60 to 90 days under refrigeration. Research from the Journal of Dairy Science and studies out of Cornell University’s Dairy Foods Research Lab confirm that this process sharply reduces spoilage bacteria without compromising flavor.

High somatic cell counts aren’t just a quality issue—they’re a profit killer. A 50-cow herd with elevated SCC loses over $5,000 annually compared to consistent low-SCC producers. That’s real money left on the table before premium payments even enter the equation

That longer shelf life opens new doors for processors. They can ship products farther, reach larger markets, and reduce waste. But there’s a tradeoff. Longer shelf life transfers more responsibility for milk quality back to the farm. Even small inconsistencies in bacterial counts or SCC can shorten shelf life by weeks.

AttributeConventional MilkESL Milk
Shelf Life14-21 days60-90 days
Processing Temp135-145°C (HTST)138°C+ (UHT/microfiltration)
Bacterial Reduction~3 log4-5 log
SCC Requirement<400,000 cells/mL<200,000 cells/mL
Premium Range$0.00-0.24/cwt$0.40-1.00/cwt
Contract DurationStandard poolMulti-year contracts
Quality MonitoringMonthly testingReal-time/weekly testing
Market AccessRegional marketsNational/export markets

Processors now value predictability every bit as much as butterfat performance. As Cornell’s team often notes, once you’re marketing a 90-day milk, the margin for error in supply quality nearly disappears.

Premium payments for low somatic cell counts are rewriting milk economics. Producers maintaining SCC below 100,000 cells/mL can earn $1.00/cwt premiums—transforming milk quality from a baseline requirement into a profit center worth thousands annually.

Predictability and the Premium Shift

Here’s what that means practically. Producers delivering consistent milk quality—stable SCC below 200,000 and reliable components—are already seeing premiums of $0.40–$1.00 per hundredweight, based on documented supply data reported through USDA Dairy Market News and several processor programs in the Southwest.

And this focus on consistency doesn’t just reward the biggest herds. Medium and family-sized farms are excelling by proving reliability through recordkeeping and digital traceability. I’ve noticed that some of the most competitive contract negotiators aren’t the high-output herds—they’re the most organized.

One example is Doug Jensen, who milks about 600 Holsteins near Stephenville, Texas. Three years ago, he started keeping digital milk quality logs—SCC, bacterial counts, and butterfat trends—using reports from his cooperative testing system.

“When Ninth Avenue Foods began sourcing for their new plant,” Jensen recalled, “we already had the data. They could see we were steady. That’s what made us worth paying a little more for.”

Because of that agreement, most of his milk now supplies ESL beverage production. Jensen told me it helped finance an updated cooling system and a few automation upgrades. That data discipline effectively turned his milk from a commodity to a contract asset.

And that’s the bigger pattern emerging: consistency has become an independent profit driver.

Texas milk production has climbed 26% since 2020, with a dramatic acceleration coinciding with ESL facility announcements. The state’s 10.6% year-over-year surge in 2025 positions it as America’s fastest-growing dairy region—and processors are scrambling to lock in supply.

The Financial Clock Is Ticking

What producers sometimes miss is how much these facilities depend on a quick, dependable supply. Each of these projects—funded in part through USDA Rural Development lending and private capital—operates under strict financial covenants. These typically require plants to operate at 65% utilization and maintain a 1.25 debt service coverage ratio during their first full fiscal year.

You don’t have to be a banker to see what that means. Processors can’t afford uncertainty. They’ll lock in dependable suppliers early, at attractive rates, to assure lenders they can operate efficiently.

Once those supply lists fill, the leverage that returning to farmers today may bring may not return for years.

It reminds me of the Midwest cheese expansions from 2017 to 2021. Early contract holders got consistent premiums. Those who waited ended up taking standard pool prices once the plants filled.

The dairy industry’s $7+ billion processing expansion isn’t evenly distributed—it’s clustering in states with production growth, regulatory flexibility, and feed access. The Midwest leads with $2.1B, but Texas’s $1.55B represents the fastest proportional growth in processing capacity nationwide.

So if you’ve been telling yourself, “I’ll see how the market shakes out first,” it’s worth remembering: by the time it “shakes out,” slots are usually filled.

Building in the Accountability

Extended shelf life might sound like a golden ticket, but it comes with strings. Contracts are only as strong as a herd’s ability to deliver steady quality.

Processors are upfront about this. Industry contracts reviewed by Cornell Dyson School researchers show that during non-compliance—often two consecutive months of missed quality benchmarks—milk can be reclassified into conventional markets without premium payment. Some newer contract models include step-down provisions that reduce premiums until levels recover.

The goal isn’t to penalize—it’s to protect consistency and consumer trust. Cornell’s extension specialists say most processors include remedial review periods and offer technical support if issues arise.

As one Kansas operator who recently entered an ESL supply program put it, “If you fail a bulk tank test or your cows spike from a transition problem, you don’t get dropped—you reset and prove you’re back in range. The discipline is good for everyone.”

Why Contracts Matter More Than Ever

If this all sounds complex, it is—but it’s also navigable. And it’s where producers can protect themselves or lose ground fast.

A review from Cornell’s Dyson School of Applied Economics found that “capital retain” and “market stabilization” deductions—when uncapped—reduced producer net returns by 5–8% over prior expansion cycles. Without proper language, those deductions can quietly undermine even premium agreements.

For producers considering ESL contracts, a few guidelines consistently stand out:

  1. Set Deduction Limits. Agree to annual caps around $0.40/cwt and written notice for changes.
  2. Include Flexibility Clauses. Seasonal swings—heat stress, fresh cow transition periods—happen. Negotiate at least 20% variance in language.
  3. Third-Party Verification. When quality scores are disputed, independent testing keeps relationships transparent and healthy.

According to Jennifer Zwagerman, director of the Drake University Agricultural Law Center, modern processors are typically amenable to these clauses. “Clarity cuts risk—for both sides,” she said. “It creates a proactive, trust-based partnership rather than an adversarial one.”

The processors prefer reliable partners. The producers prefer predictable revenue. The paperwork just needs to reflect that alignment.

Two Emerging Milk Markets

What this all signals is a permanent shift toward a two-tier milk economy.

Tier One: Documented, consistent suppliers on multi-year ESL contracts feeding high-value lines—branded milk, protein drinks, specialty ingredients.

Tier Two: Standard pooled supply and spot-market milk providing bulk volume but lacking a premium structure.

Cal Poly’s Dr. Phillip Tong, an authority on dairy processing innovation, says this stratification isn’t likely to reverse. “Once a processor calibrates for specific microbial and compositional norms, changing suppliers midstream creates significant product risk. Continuity is everything.”

From an operational point of view, this mirrors herd management: build routine, sustain consistency, and results compound over time.

Texas May Be First, But It’s Not Alone

While Texas stands in the spotlight right now, similar ESL rollouts are accelerating elsewhere.

  • Leprino Foods’ $870 million Lubbock facility is now a dual-purpose cheese and ESL ingredient plant—one of the largest in the U.S.
  • California Dairies Inc. expanded ESL lines through Valley Natural Beverages, reporting major shrink savings.
  • Walmart’s processing hubs in Texas and Georgia distribute 60-day milk to more than 700 outlets across the Southeast.

According to the U.S. Dairy Export Council, ESL and shelf-stable beverage exports have been growing by roughly 10% a year since 2023, led by demand from Mexico, the Caribbean, and South Asia. That diversification gives producers a buffer against domestic volatility—a long-awaited stabilizer in milk demand.

Where Producers Should Start

Thinking about joining the ESL supply chain? Here’s what’s working for farms that already have:

  • Leverage your data. Two years of consistent results are worth more than the cleanest parlor inspection.
  • Audit your cooling systems. ESL contracts typically require milk cooled to strict specifications—usually below 38°F.
  • Match your management to expectations. Pay extra attention to bacterial counts during the fresh cow period and late lactation, where fluctuations often spike.
  • Review your agreements annually. Contract stability depends on consistent review, not just signatures.

As USDA and state extension advisors have often observed, proactive transparency—not perfection—is what processors prize most.

The Bottom Line

What’s truly striking about this ESL wave is how it rewards fundamentals that producers have practiced for generations: discipline, attention to detail, and pride in steady, high-quality milk.

As Doug Jensen told me, “We’ve been doing the same job for years. The only difference is—now someone’s finally paying for doing it right.”

That’s a milestone worth celebrating—and proof that smarter, data-driven production can help producers regain leverage in a market that hasn’t favored them in a long time.

Key Takeaways:

  • ESL is the next defining wave in dairy. Texas’s $700 million processing boom proves long-life milk is transforming demand, contracts, and margins.
  • Your consistency is your competitive edge. Farms that are tracking steady SCC, butterfat, and bacterial counts are already earning premium status.
  • Contracts are your silent profit maker—or breaker. Demand capped deductions, flexibility protections, and third-party testing rights.
  • Leverage has a deadline. Secure your deals before processors hit full capacity and reset terms.
  • Data delivers opportunity. Even modest herds can compete head-to-head with big ones when their milk quality is proven, not promised.

Complete references and supporting documentation are available upon request by contacting the editorial team at editor@thebullvine.com.

Learn More:

  • Mastitis and Somatic Cell Counts: The True Cost to Your Dairy – This article provides tactical strategies for managing and lowering SCC, a critical quality metric for ESL contracts. It demonstrates how to reduce economic losses and deliver the consistent, high-quality milk that processors are actively rewarding with premiums.
  • Navigating the Tides: Key Trends Shaping the Future of the Dairy Industry – Gain a strategic, big-picture view of the market forces driving investments like the ESL boom. This piece explores consumer behavior, sustainability demands, and global trade, helping you position your operation for long-term profitability beyond a single contract.
  • The Data-Driven Dairy: How Technology is Reshaping Herd Management – The main article stresses proving consistency with data; this piece shows you how. It reveals the specific on-farm technologies—from sensors to software—that empower producers to track, document, and leverage their performance data for stronger contract negotiations.

The Sunday Read Dairy Professionals Don’t Skip.

Every week, thousands of producers, breeders, and industry insiders open Bullvine Weekly for genetics insights, market shifts, and profit strategies they won’t find anywhere else. One email. Five minutes. Smarter decisions all week.

NewsSubscribe
First
Last
Consent

Decide or Decline: 2025 and the Future of Mid-Size Dairies

Decide or decline: 2025 is the year mid‑size dairies prove that clarity—not cow count—decides success.

If you’ve been milking through the last 20 years, you already know how fast the middle has lost ground. The 800‑cow herds that once anchored local supply chains are now caught between higher costs and tighter credit. It’s not a lack of effort that’s hurting these farms—it’s the system moving faster than most can react.

Rising input costs, tighter labor markets, new regulations, and rising interest rates are changing what “sustainability” means. But what’s interesting here is that the challenge isn’t purely economic. It’s directional.

According to the USDA Economic Research Service, farms milking more than 2,000 cows now produce over 50% of U.S. milk, and they do so 20–25% more efficiently than smaller commercial herds. Meanwhile, Cornell Dairy Markets data shows that smaller farms—under 500 cows—are re‑emerging through organic, grass‑fed, and local marketing models, earning 30–60% above commodity prices.

And that leaves the middle squeezed. Roughly 2,800 U.S. dairies closed in 2024, many of them right in that 700‑ to 1,200‑cow range.

So, what can farms in this category do? Choices look different for everyone—and sometimes hesitation isn’t fear, it’s fatigue. But the operations pulling ahead are finding ways to convert that fatigue into focus, using data, advice, and discipline to move forward deliberately rather than reactively.

Three Viable Paths Forward

That pressure has created three distinct strategies that are working across 2025. Each one is viable—but only with clarity, discipline, and execution.

1. Expansion with Intention

Growth still works in regions where infrastructure supports it, particularly in Idaho, Texas, and parts of the Southern Plains. The Idaho Dairymen’s Association reports milk production up 3% year‑over‑year, driven by mid‑size operations expanding to 2,500‑cow scale.

Land values in productive regions remain reasonable—$6,000–$8,000 per acre, according to USDA NASS Land Values—and processors continue adding demand to match consolidation trends.

The most successful expansions share three core strengths:

  • Debt ratios under 35%. Leverage only where cash flow already proves out.
  • Trained management teams. Family ownership paired with experienced outside managers works best.
  • Nutrient management foresight. Expansion means more scrutiny—planning here protects future flexibility.

Producers in new freestall and dry lot systems report labor efficiency gains of 25–35%, but these gains materialize only when training and system design precede construction. As one veteran Idaho producer put it recently: “Scale magnifies everything—your efficiency and your inefficiency.”

2. Right‑Sizing and Smarter Technology

For many in the Northeast, Upper Great Lakes, and Atlantic Canada, expansion isn’t realistic. The focus has shifted toward doing fewer things better—and technology is the enabler.

The University of Vermont Extension’s 2024 Robotic Dairy Study found that herds between 400 and 600 cows reduced labor costs by about 30% while maintaining or improving milk yield. Precision feeding and cow‑monitoring technology allowed smaller herds to compete through performance rather than scale.

Why 400-600 Cow Operations Are Going Robotic: The Numbers Behind the Revolution

What’s fascinating is that this same pattern holds north of the border. In Ontario and Quebec, under supply management, the economics differ, but the management philosophy doesn’t. Canadian producers are pushing robotics, automation, and stall utilization to maximize returns per kilogram of quota. As one Ontario nutritionist remarked, “Efficiency isn’t negotiable just because prices are stable. It’s the only real lever left.”

A Vermont dairy that converted to organic alongside robotic milking saw its milk price climb to $31.50 per hundredweight—right in line with national organic averages—but its bigger victory was time. Streamlined routines meant more focus on genetics, forages, and cow health.

These examples don’t make smaller easier—they make it more intentional. For the producers making it work, every investment serves a clear purpose: finding a way to manage cattle and people without burning out either one.

3. Optimization over Expansion

Across Wisconsin, Minnesota, and parts of Eastern Canada, the sweet spot has become refining economics within existing boundaries.

A benchmarking study reports farms that lifted their income over feed cost (IOFC) from $7.50 to $10 per cow per day captured roughly $820,000 more annual margin in 900‑cow herds.

That didn’t come from spectacular innovation; it came from fundamentals: tighter TMR consistency, better feed push‑up frequency, controlled parlor scheduling, and enhanced reproductive consistency.

Those farms also focused on butterfat performance above 4.0%, earning premiums of $0.50–$0.75/cwt. Meanwhile, strategic use of beef‑on‑dairy genetics added $350–$400 per calf, according to University of Wisconsin Dairy Research, 2025.

Optimization is about reliability—the daily grind of doing the same things more precisely than the week before. As one Wisconsin producer told me, ‘We stopped chasing bigger and started chasing better—the shift from production expansion to business refinement. And it’s changing how success is measured: not more cows, but more predictable profit.

The Profit Illusion: Why Size Doesn’t Always Mean Success

Scale doesn’t guarantee success—strategy does. Expansion works best for 2,000+ cow operations ($1,640/cow), while premium organic models deliver consistent returns across all sizes, and optimization shines in the 500-1,000 cow sweet spot

At first glance, most producers expect small family dairies to earn more profit per cow, while large commercial herds rely on volume to make up thinner margins. But the data — shown in the chart below — tells a more nuanced storyAt first glance, most producers expect small family dairies to earn more profit per cow, while large commercial herds rely on volume to make up thinner margins. But the data — shown in the chart below — tells a more nuanced story.This visualization, “Three Paths to Profitability: Annual Profit Per Cow by Herd Size (2025),” reveals how performance and efficiency—not size alone—shape economic outcomes across the industry. The chart compares three strategic paths mid-size dairies are following today:

  • Expansion with Intention – scaling to 2,000+ cows in strong infrastructure regions like Idaho and Texas.
  • Right-Sizing + Technology – mid-tier herds (400–600 cows) adopting automation, robotics, and precision management.
  • Optimization over Expansion – 700–1,200-cow herds refining feed, reproduction, and butterfat performance instead of adding capacity.

The higher bar for larger herds doesn’t simply mean big farms take more money home. Instead, their fixed costs — buildings, equipment, professional staff, financing — are spread over thousands of cows, so cost per unit drops while profit per cow rises modestly. Conversely, smaller farms, even when they receive premium prices for organic, grass-fed, or local milk, often operate with higher feed and labor costs per cow, which narrows daily profit margins.

But here’s the twist: while smaller dairies may show lower profit per cow, the total income is often concentrated in a single family. A 300-cow family farm might return $250,000 in annual profit that supports one household. In contrast, a 2,500-cow operation could generate $2 million in total profit — but that figure is usually divided among multiple owners, investors, lenders, and management teams.

That’s why this chart matters. It debunks the myth that a larger herd size automatically leads to better take-home profit. The true divide isn’t just scale — it’s about who captures the value. Whether driven by volume, precision, or premium branding, profitability in today’s dairy industry is still deeply personal.

Regional Realities Still Matter

The Mid-Size Squeeze Is Real: Wisconsin Alone Lost 313 Dairies in 2024

It’s tempting to think every dairy could apply the same model, but geography dictates strategy more than ever.

In the Western U.S., large‑scale operations thrive on efficiency, infrastructure, and climate.
In the Midwest and Ontario, cooperative structures and component‑based pricing reward consistency and milk quality over expansion.
In the Northeast and Quebec, sustainability and locality drive brand value, with consumers drawn to transparency and traceability.

No matter the region, the takeaway is the same: you can’t copy‑paste a business plan from across the border. The economics—and the culture—demand regional authenticity.

Lessons Learned from Those Who Tried

The $950 Bull Calf Revolution: How Genetics Turned Dairy’s Biggest Liability Into Nearly 6% of Revenue

Every evolution comes with its scars. One Midwestern family who downsized from 850 to 500 cows underestimated the adjustment period after installing robots. Production dropped nearly 15% for a year as cows and staff adapted. They built it back, but only thanks to strong lender trust and patience.

Meanwhile, in Idaho, several expansions paused midway as interest costs bit into construction financing. Those who made it through had one thing in common—extra contingency funds.

The common thread in both cases is timing. Transition phases nearly always take longer and cost more than projected.

The Habits of Survivors

The dairies still standing out—on both sides of the border—tend to have three things in common:

  1. Financial clarity. Debt ratios under 30% and three‑month operating cash reserves. Equipment and upgrades are justified only by measurable efficiency gains.
  2. Revenue diversification. Beef‑on‑dairy programs, custom forage work, or digesters providing supplemental income that stabilizes the primary enterprise.
  3. Generational transparency. Farms with succession plans already in motion make faster, cleaner business decisions.

At the 2025 Canadian Dairy XPO, one Quebec producer put it best: “You can borrow money for cows, not for uncertainty.” It’s a kind of clarity every mid‑size farm needs right now.

The Price of Standing Still

The Compeer Financial Producer Insights 2024 Report warned that dairies without defined five‑year plans lost 6–8% of equity annually due to deferred maintenance, inefficiency, and missed opportunities.

As one producer shared at a Dairy Strong conference in Wisconsin, “We thought doing nothing was the safe move. Turns out, the slow leak was killing us.”

A decade ago, waiting felt like patience. Today, it feels like pressure. Between higher interest, constant tech change, and unpredictable milk prices, even standing still costs money. Most farmers know what they need to do—it’s finding the time, cash, and confidence to do it that’s the battle.

Why 2025 Matters

When the dust settles, 2025 may be remembered less for its milk price trends and more for its management decisions. Expansion, specialization, or optimization—all three can succeed. The real test for mid‑size dairies is whether they’ll commit to one.

As one Idaho producer said, ‘The biggest gamble we took was standing still.’ Across barns and borders, you hear the same thing now: success starts when you stop waiting for the perfect signal. Nobody’s certain—but everyone who’s moving, is learning.

The Bottom Line

Whether you’re milking 200 cows in Quebec or 2,000 in Idaho, the shift facing mid‑size dairies isn’t about capacity—it’s about clarity. The farms that emerge stronger will be those that choose their lane and drive it with intent.

This year, the biggest risk isn’t expansion or automation—it’s indecision. As the market keeps changing, so does the window for action.

What steps are you taking on your operation to define your path for 2025 and beyond?

Key Takeaways

  • Decisiveness defines survival. The mid‑size dairies thriving in 2025 are those that choose a direction and commit fully.
  • Play to your region’s strengths. Expansion works out West, optimization excels in the Midwest, and value branding wins in the East and Canada.
  • Technology can level the field. Automation and precision tools make smaller herds competitive again—but only when data drives decisions.
  • Measure like a business, not a tradition. Top dairies track IOFC, butterfat, and repro weekly to stay ahead of volatility.
  • The real cost is waiting. Every season without a plan quietly drains equity, opportunity, and control.

Executive Summary:

Across the U.S. and Canada, mid-size dairies are facing a make-or-break moment. Once the steady foundation of milk production, 800–1,200 cow farms are now being squeezed between large-scale efficiencies and small-farm premiums. But what’s interesting is how the survivors are rewriting the playbook. From robotic systems in Vermont to data-driven optimization in Wisconsin and quota-smart efficiencies in Ontario, producers are proving that success doesn’t depend on herd size—it depends on clarity. The dairies making bold, informed decisions—whether to expand, modernize, or specialize—are staying strong. In 2025, waiting for perfect conditions isn’t safety anymore—it’s surrender.

Complete references and supporting documentation are available upon request by contacting the editorial team at editor@thebullvine.com.

Learn More:

  • Why This Dairy Market Feels Different – and What It Means for Producers – This strategic analysis provides the latest market data behind the consolidation trends mentioned in the main article. It reveals specific technology costs and ROI timelines, helping you financially plan for the necessary strategic shifts your operation needs to make now.
  • Robotic Milking Revolution: Why Modern Dairy Farms Are Choosing Automation in 2025 – For producers considering the “Right-Sizing” path, this article offers a deep dive into the real-world impact of automation. It demonstrates how robotic systems deliver measurable gains in labor efficiency, data collection, and herd health, justifying the capital investment.
  • BST Reapproval: The Key to Unlocking Dairy Sustainability – This piece offers a tactical guide for the “Optimization” strategy, focusing on a specific tool to improve feed efficiency and profitability without expansion. It provides clear protocols and data to enhance your farm’s economic and environmental performance within your current footprint.

The Sunday Read Dairy Professionals Don’t Skip.

Every week, thousands of producers, breeders, and industry insiders open Bullvine Weekly for genetics insights, market shifts, and profit strategies they won’t find anywhere else. One email. Five minutes. Smarter decisions all week.
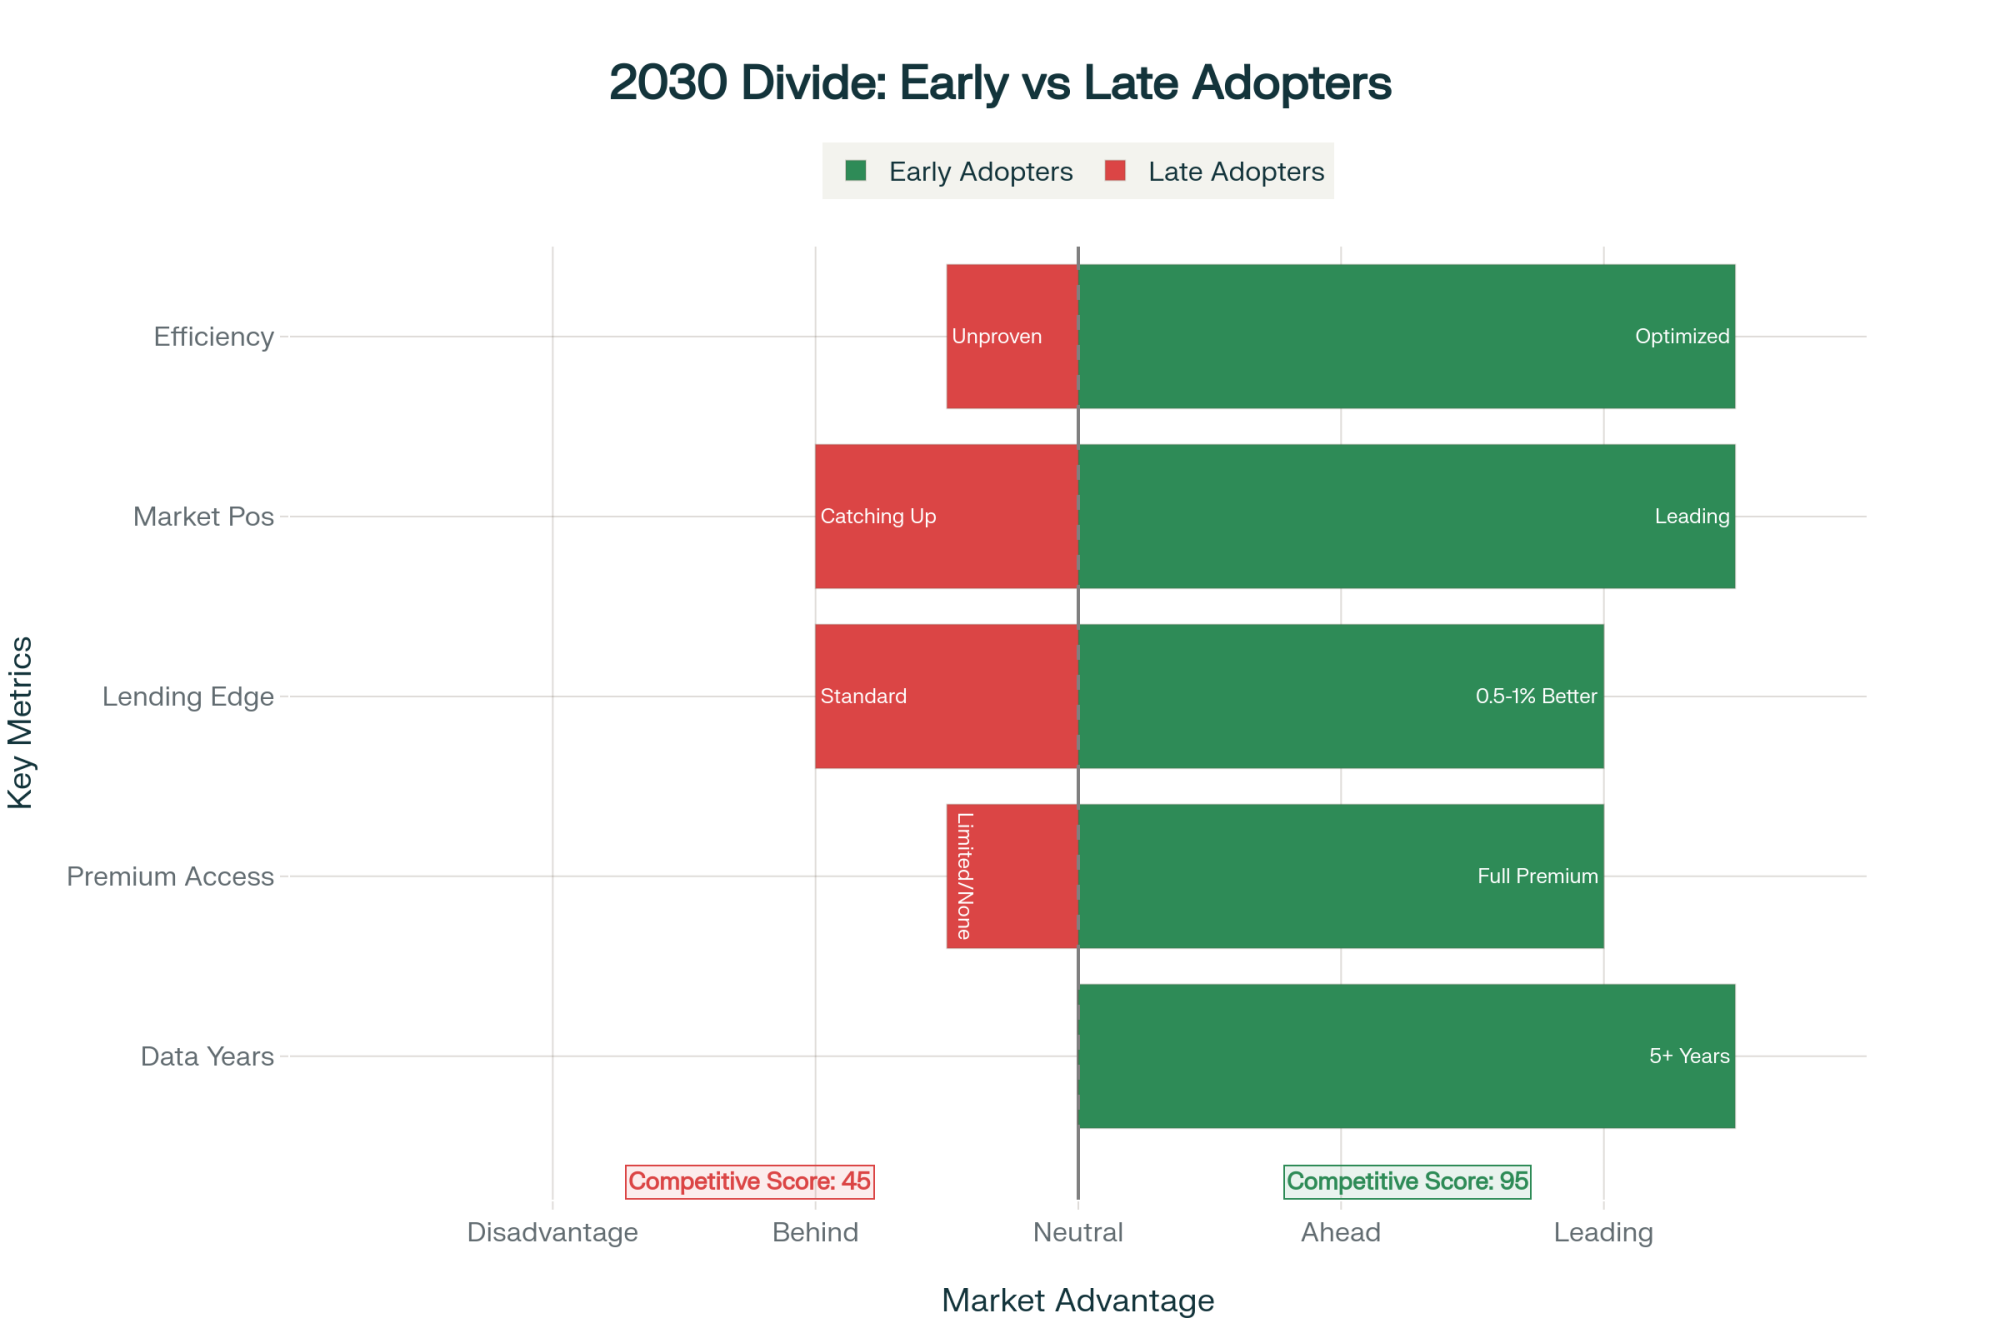
NewsSubscribe
First
Last
Consent

Rethinking Dairy Feed: Michigan Farmers Turn High Oleic Soybeans into High Butterfat Profits.

“We saw butterfat jump in three days.” How Michigan farmers and MSU science turned soybeans into dairy profits.

EXECUTIVE SUMMARY: A simple feed change in Michigan is making big waves across the U.S. dairy industry. At Preston Farms, feeding high oleic soybeans—developed with support from Michigan State University (MSU)—boosted butterfat from 4.4% to 4.8% in under a week, while replacing costly palm fats and protein meals with a locally grown crop. The shift, based on extensive research by Dr. Adam Lock, saved the farm hundreds of thousands in inputs and lifted overall profits to more than $1 million per year. Early adopters are proving that this innovation doesn’t just add points of fat—it builds feed independence and sustainability into dairy rations. And as universities and producers nationwide study the results, one thing is clear: sometimes the next big leap for dairy is just a smarter way to feed the cows.

High Oleic Dairy Feed

Sometimes the biggest dairy innovations don’t come from a lab or a boardroom—they start right in the feed bunk. That’s what’s happening at Preston Farms in Quincy, Michigan, where a simple change to the ration is improving butterfat performance, cutting feed costs, and rewriting the farm’s milk check.

Brian Preston didn’t set out to pioneer something revolutionary. But his decision to feed high-oleic soybeans, a crop once bred for frying oil rather than feed, has become one of the most quietly disruptive stories in dairying today.

From University Research to On-Farm Success

This breakthrough isn’t luck. It’s the product of years of research at Michigan State University (MSU) led by Dr. Adam Lock, Professor of Dairy Nutrition, whose focus has long been on how different fats affect rumen function and milk composition.

“We didn’t increase the fat level in the ration,” Lock explains. “We changed the kind of fat—and that changed everything.”

It’s Not Magic—It’s Biochemistry: Conventional soybeans trigger a biochemical cascade that blocks milk fat synthesis through trans-10 CLA formation. High oleic soybeans bypass the problem entirely—oleic acid moves straight through the rumen to the mammary gland. Same fat amount, completely different metabolic pathway.

Traditional soybeans are loaded with linoleic acid, a polyunsaturated fat known to interfere with rumen microbes and cause milk fat depression. High oleic soybeans, however, reverse that chemical balance. They contain 75–80% oleic acid and under 10% linoleic acid, according to USDA and Pioneer® data (2024). That single change stabilizes rumen fermentation and boosts acetate, an essential precursor to milk fat synthesis.

The Chemistry That Changes Everything: High oleic soybeans flip the fatty acid profile from 63% problematic linoleic acid to 75% beneficial oleic acid—a complete reversal that protects rumen function and boosts butterfat. This isn’t incremental improvement; it’s biochemical transformation.

The result? Cows can handle higher inclusion without the digestive disruption that once scared off nutritionists from pushing soy-based feeds too hard.

For Lock, the findings weren’t theoretical—they were replicated across multiple MSU feeding trials, later published in the Journal of Dairy Science (2023). And in Preston’s case, it worked exactly as the data suggested.

How Fast Did It Work? Try 72 Hours

In 2024, Preston planted 400 acres of Pioneer® Plenish® high oleic soybeans and began feeding them roasted—about 8 pounds per cow per day—in place of purchased soybean meal, canola meal, and expensive palm-based fats.

Within three days, milk tests came back with an unexpected jump: butterfat up from 4.4% to 4.8%, with milk protein slightly higher too.

Faster Than You Think: Butterfat jumped from 4.4% to 4.8% in just 72 hours—so fast Preston thought the lab made a mistake. The response stays consistent because oleic acid bypasses rumen hydrogenation. No lag time. No adaptation period. Just immediate biochemical efficiency.

“I honestly thought there was a lab error,” Preston laughs. “But it happened again the next week. The cows handled it so well, we kept it in full-time.”

Lock says that kind of immediate response makes sense because oleic acid bypasses much of the rumen’s hydrogenation process, entering the bloodstream faster as an energy source for milk synthesis. Cows use it directly—no lag time, no rumen stress.

That faster conversion means farms see the payoff quickly. As any producer knows, immediate improvements in component yield help confidence spread far faster than any spreadsheet could.

The Economics: Turning Fat into Feed Efficiency

When you quantify it, the economic implications are eye-opening.

Every 0.1 increase in butterfat adds roughly $0.20 per cwt when butterfat sells near $3.23/lb (USDA Agricultural Marketing Service, October 2025). Preston’s 0.4-point jump produced about $1 per cow per day, adding roughly $380,000 annually in butterfat premiums across his 1,000-cow herd.

Then came the ingredient savings.

Tack on feed savings—achieved by replacing high-cost supplements like palm-derived fats and purchased proteinswith roasted soybeans grown right on the farm—and the total improvement exceeded $1 million annually.

The Math That Matters: Preston Farms turned 400 acres of high oleic soybeans into over $1 million in annual gains—$380K from higher butterfat, $320K in feed cost savings, and $300K from improved efficiency. It’s rare to find a ration change that pays on both ends. This one does.

“It’s rare to find a single ration change that pays on both ends,” Preston says. “Usually you’re spending to gain production, or cutting cost and losing quality. This time, the cows—and the feed bill—both lined up.”

The Economics Work for Every Herd Size

Size Doesn’t Matter—Consistency Does: The economics scale perfectly from $36,500 for a 100-cow herd to $730,000 for 2,000 cows. Every single cow adds $365/year. No economies of scale required, no threshold to cross—just consistent, predictable, bankable per-head gains.

Why Michigan Is Ahead of the Curve

Michigan’s adoption of this feeding system stems largely from timing and teamwork.

Dr. Lock’s program at MSU, supported by the Michigan Alliance for Animal Agriculture (M-AAA), has spent over a decade translating lipid metabolism science into field-tested protocols. That partnership between the university and producer accelerated on-farm implementation and helped local nutritionists understand how to balance rations for these new soybeans.

“Michigan farmers had years of data before they took the plunge,” Lock says. “That’s what builds trust.”

In contrast, neighboring Wisconsin—the second-largest milk producer in the U.S.—has moved more cautiously. Nutritionists there often wait for validation from the University of Wisconsin-Madison Dairy Science Department, which is currently planning its first high oleic feeding trials for 2026.

It’s understandable. As Lock puts it, “Dairy nutritionists are trained to be risk-averse. When you’ve got millions of pounds of milk at stake, you confirm every feed trend before you move.”

The GMO Conversation: What Farmers Should Know

One of the first questions producers ask is whether the GMO status of these soybeans affects milk markets. The short answer: no.

Under the USDA’s National Bioengineered Food Disclosure Standard (2016), milk or meat from animals fed genetically modified feed is not considered genetically modified because the feed’s DNA does not transfer into milk or meat. After almost a decade of data, no studies—including those conducted by the FDA—have found detectable transference from feed to product.

For non-GMO or organic dairies, the alternative is the Soyleic® variety, developed at the University of Missouri, which achieves nearly identical oleic acid levels through conventional plant breeding. Those beans have done particularly well in identity-preserved markets, though they yield about 5–10% less per acre.

Long-term, both versions show strong potential for dairies seeking greater feed self-sufficiency.

How Many Farms Are Doing This?

METRICCURRENT STATUSOPPORTUNITY/NEEDEDTHE GAP
Dairy Cows on HOS Diet<1% (75,000 cows)20% (1.8M cows)1.725M cow opportunity
Nutritionists Recommending20% (160/800)80% for mass adoption480 nutritionists needed
Roasting Infrastructure~75 units1,500+ units1,425+ units required

Nationally, adoption remains low — about 70,000 to 80,000 cows on high oleic soybean diets, according to MSU Extension estimates (2025). That’s less than 1% of the total U.S. dairy herd.

The bottleneck isn’t supply — seed production can easily scale — but rather processing. On-farm roasting is still critical for unlocking feed value, and each roaster typically serves about 1,000 cows daily. Expanding adoption to even 20% of U.S. cows would require more than 1,500 new roasting units.

Some co-ops, especially across the Midwest, are exploring shared roasting programs in which individual farms deliver beans for contract processing.

There’s also a knowledge gap. Only about 20% of the nation’s 800 dairy nutritionists actively recommend high oleic soybean feeding programs (Great Lakes Dairy Nutrition Conference Survey, 2025). Many say they’re waiting for state-level replication trials before updating formulations.

It’s the same cycle seen with bypass proteins in the 1990s—slow at first, then exponential once the local data confirms early wins.

What Cows and Numbers Are Saying So Far

After a full year of feeding high-oleic soybeans, Preston’s herd metrics are stable. Milk yield remains consistent. Reproductive performance—often the first red flag for new fats—has held steady.

Lock’s ongoing work at MSU mirrors those findings, showing no significant difference in ketosis, displaced abomasum, or other metabolic measures compared with control groups. The focus now shifts to multi-year monitoring.

“We’re confident in the short-term biology,” Lock says. “Now it’s about proving sustainability year after year.”

For producers, that’s comforting. As most know, herd-level consistency decides whether an innovation stays or fades.

Practical Starting Points

For producers curious about testing the concept, the learning curve is short and management-friendly:

  • Start small: Try 50–100 acres and dedicate one group of cows for trial feeding.
  • Roast right: Keep roasting temps between 280–300°F for optimal protein availability.
  • Track diligently: Monitor butterfat, dry matter intake, and conception rates over multiple months.
  • Work closely with nutritionists: Fine-tune diets to prevent unbalanced fat inclusion.
  • Run the ROI: Compare component-based milk revenue with any feed cost shifts.

Early adopters like Preston insist on treating the transition as a management system, not a silver bullet. “We made sure every change was measurable,” he says. “Then we let the data drive whether we stayed with it.”

What’s Interesting About This Development

Three things stand out. First, it highlights how small biological improvements can have huge economic consequenceswhen component pricing drives profitability. Second, it reconnects modern dairying with something age-old: growing and processing one’s own feed to reduce dependency on volatile markets. And third, it demonstrates how collaboration between land-grant universities and farmers creates innovation grounded in real-world application, not lab theory.

“We’ve had feed additives come and go,” Preston says. “This one is different—it’s ours to grow, feed, and control.”

The Bottom Line

For all the advanced technology shaping the dairy world today, sometimes innovation looks as familiar as a roasted soybean.

High oleic feeding strategies may not transform the industry overnight, but evidence from Michigan’s early adopters shows real, sustained improvements in butterfat performance, feed efficiency, and economic stability. The concept works because it fits seamlessly into existing farm systems—it’s scalable, measurable, and backed by solid science.

If the next several years of data across Wisconsin, New York, and beyond confirm what MSU has already seen, this may very well be the next “quiet revolution” in feed efficiency.

As one producer joked after hearing Preston’s story: “The cows might be the best university research partners we’ve ever had.”

Key Takeaways

  • A quiet revolution in cow nutrition is underway: high oleic soybeans are raising butterfat and replacing expensive palm fats in dairy rations.
  • Preston Farms and MSU researchers demonstrated the impact—a 0.4-point increase in fat and more than $1 million in annual gains from feed efficiency and component premiums.
  • Dr. Adam Lock’s studies confirm that oleic-rich fats improve rumen stability and milk components more quickly than traditional rations.
  • Nationwide growth depends on expanding roasting infrastructure, education, and replicable regional trials.
  • For forward-thinking producers, this strategy offers a real-world, on-farm route to feed self-sufficiency, profitability, and sustainable dairy progress.

Complete references and supporting documentation are available upon request by contacting the editorial team at editor@thebullvine.com.

Learn More:

The Sunday Read Dairy Professionals Don’t Skip.

Every week, thousands of producers, breeders, and industry insiders open Bullvine Weekly for genetics insights, market shifts, and profit strategies they won’t find anywhere else. One email. Five minutes. Smarter decisions all week.
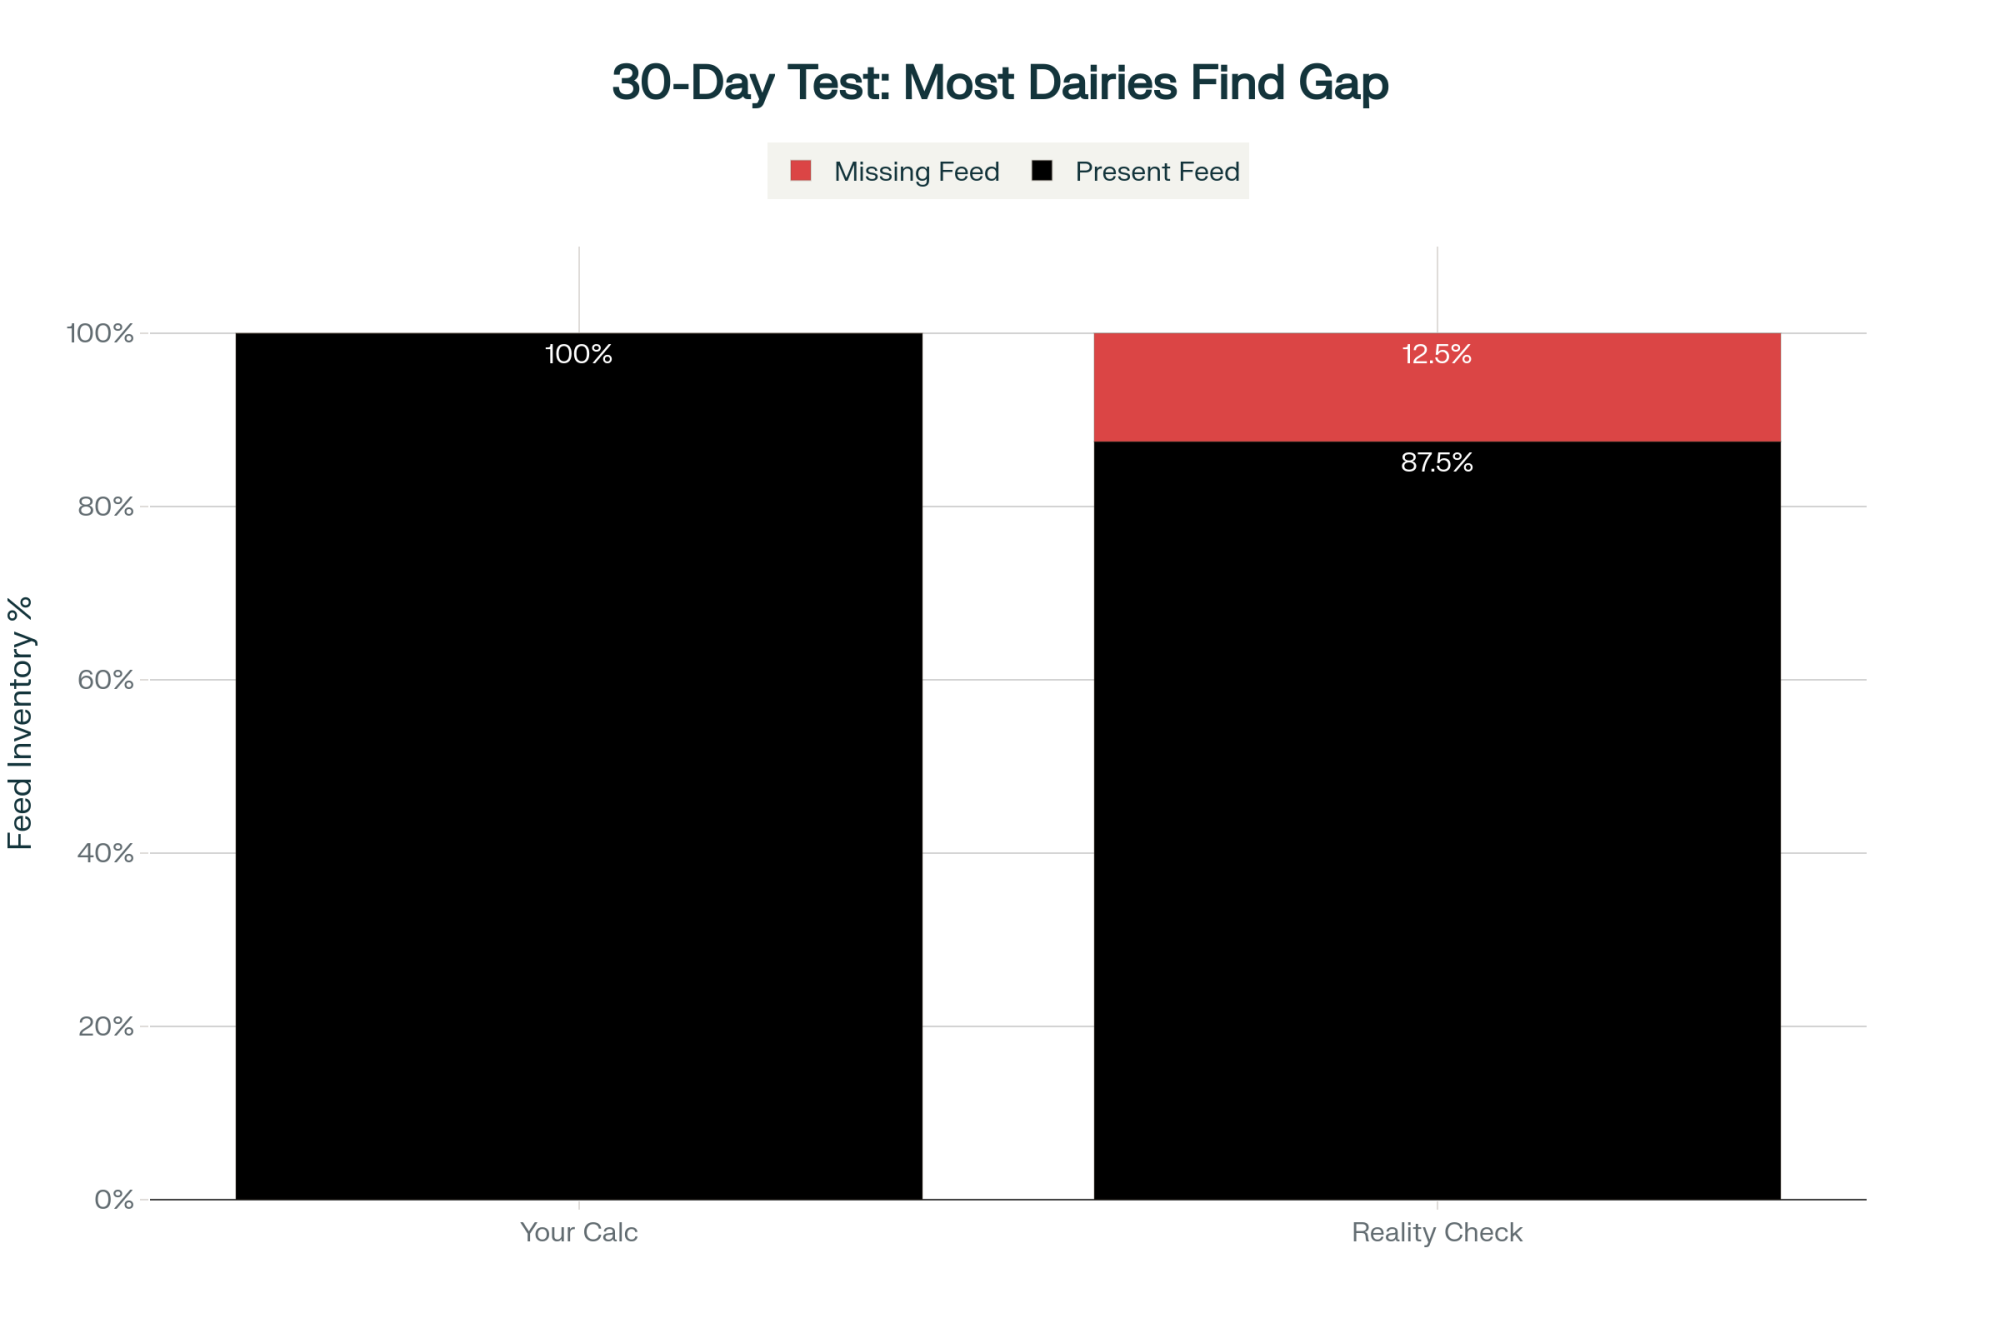
NewsSubscribe
First
Last
Consent

When Firewalls Meet Milk Checks: The Cyber Threat Every Dairy Should Plan For

From parlor to payment, dairy runs on data. What happens when that flow gets hacked?

Executive Summary: When ransomware sidelined Dairy Farmers of America’s payment systems in 2025, the cows didn’t miss a beat—but the milk checks did. That disruption exposed just how intertwined today’s dairy operations are with digital infrastructure. With most farms carrying less than two weeks of cash flow, even short delays ripple quickly through feed, payroll, and herd health. Now, the industry is pivoting—insurance carriers, processors, and co-ops are requiring proof of cybersecurity readiness much like milk quality testing. Encouragingly, shared-defense models pioneered by rural electric co-ops are showing how collaboration can make protection affordable. The bottom line? For modern dairy, safeguarding data has become as essential as managing fresh cow health, feed efficiency, and butterfat performance—and it’s a challenge the cooperative spirit is well-suited to solve.

You know, it wasn’t that long ago that when we talked about “security” on a dairy farm, we were thinking about padlocks, not passwords. But things have changed. When Dairy Farmers of America (DFA) confirmed a ransomware attack last summer that disrupted milk pickup and delayed producer payments, it delivered a wake‑up call to everyone in dairy.

What’s interesting is that this was never just the DFA’s problem. It was a reminder that every gallon of milk today depends on layers of technology—from dispatch and lab testing to payroll. The cows kept milking, of course. But the money stopped moving, and that’s when every producer felt it.

The 17-day timeline from the DFA ransomware breach to payment restoration shows how quickly cyber attacks cascade into cash flow crises for dairy producers

When Data Fails Before the Pump Does

The FBI and federal ag briefings have shown that ransomware groups, including one known as “Play,” have been targeting food and logistics operations more frequently in the last two years. Agriculture offers what hackers want: essential infrastructure and time‑sensitive data.

Ransomware attacks on agriculture more than doubled from Q1 2024 to Q1 2025, with the sector now representing nearly 6% of all global ransomware incidents

DFA handled the incident quickly and with transparency, but the bigger takeaway is that every co‑op, regardless of size, now sits on the same digital fault line. I’ve noticed that even smaller Midwest cooperatives rely on a handful of software links for billing, route management, and milk quality reporting. If those systems lock up, the trucks can roll all they want—nobody gets paid on time.

The top three entry points—default passwords, unpatched systems, and phishing—account for 80% of successful dairy cyberattacks, making them priority defense targets

Margins, Minutes, and Modern Milk

What I’ve found in extension discussions lately is that this risk exposes an uncomfortable truth about dairy’s financial stamina. USDA Economic Research Service data shows U.S. dairy herds clocked in at over 23,000 pounds per cow in 2024, a record high. Yet Penn State Extension financial summaries reveal that nearly two‑thirds of farms have less than two weeks’ worth of operating capital in reserve.

Rows (alternating white/#F5F5F5, black text, RED numbers #CC0000 for critical figures):

MetricIndustry RealityCyber Attack Impact
Operating Cash Reserve< 2 weeks (66% of farms)Depleted in 3-7 days
Milk Production/Cow/Year23,000+ lbs (2024)Continues uninterrupted
Payment Delay Tolerance3-5 days maxDFA: 17 days actual
Feed Cost Impact$5.50+/cow/dayImmediate pressure on suppliers
Production Drop Risk3-5% in 30 daysLong-term herd damage

It’s a dangerous mix: more digital dependence, less financial cushion. In most operations, if one milk check misses the bank by 3 days, feed schedules or payroll feel the pinch immediately. And that ripple doesn’t stop in the office. A short‑term ration downgrade may look harmless, but research in the Journal of Dairy Science confirms a 3–5 percent milk decline within a month and lower butterfat performance across the herd.

As a New York nutritionist put it in a recent cooperative workshop, “Every gallon lost in production isn’t just lost feed—it’s deferred maintenance on the cow herself.”

Why Boards Overlook the Digital Barn Door

Now, to be fair, most cooperative boards are filled with the people who made dairy what it is—smart, experienced producers. But cybersecurity’s a whole new animal. Many directors can watch butterfat averages like a hawk but have never seen what a server backup log looks like.

That’s changing. A growing number of co‑ops are bringing in CISA agricultural advisors or extension IT specialists to run tabletop backup tests. These “practice crises” map how fast payment systems could reboot after a lockout. What’s encouraging here is that producers themselves are asking for those updates. The conversation has moved from “Why do we need this?” to “When’s our next recovery test?”

Shared Defense: The Power Co‑Op Lesson

Here’s something dairy can borrow from our electric cooperative neighbors. The National Rural Electric Cooperative Association (NRECA) created ICS‑REC, a shared cybersecurity system that enables small utilities to pool resources to monitor and respond to cyber threats.

The math is brutal: proactive cybersecurity costs $150K annually, while breach recovery averages $500K plus weeks of downtime—a 70% cost penalty for being unprepared

According to NRECA’s 2024 report, co-ops using shared monitoring cut their outage time nearly in half and saved an average of 40 percent on technology costs compared to going it alone. That model is now being discussed in ag circles, with USDA rural development offices and state councils exploring pilot versions tailored to food and dairy infrastructure.

What’s encouraging is that this approach feels familiar to farmers. We’ve always pooled tankers, lab testing, and marketing. Pooling digital defense is just the next step.

Regional Realities: Same Storm, Different Forecasts

Cyber threats look a bit different depending on where your milk flows. In California, major processors managing high‑volume export trade are investing in dual‑site data centers because uptime equals product flow. In the Upper Midwest, co‑ops still running older accounting platforms grapple with software compatibility and delays in security‑patch updates. In the Northeast, where many co‑ops rely on third‑party vendors for payment processing, vulnerability often sits one contract away.

Different setups—but the same universal lesson. Every operation should know who’s guarding its data pipeline, not just the milk pipeline.

Compliance Is the New Competition

Here’s a shift few saw coming: insurers and buyers now view cyber preparedness as a supply‑chain expectation. Re‑insurance providers have begun demanding proof of frequent system tests before renewing cooperative policies.

Meanwhile, Dairy Market News (September 2025) reported that several national processors will soon require suppliers to meet NIST Cybersecurity Framework benchmarks—the same federal standards guiding manufacturing. This isn’t about red tape; it’s about risk mitigation. Ten years ago, it was traceability. Five years ago, sustainability. Today, it’s cybersecurity.

That trend tells us that staying digitally sound may soon be as important to your milk check as your somatic cell count.

Four Questions Every Member Should Ask

Looking at this trend, here are the questions producers are starting to bring up in their own co‑op meetings:

  1. How quickly can our payment systems recover if they’re shut down?
  2. When was our last confirmed backup test, and what were the results?
  3. Does our insurance actually protect producer payments or just IT equipment?
  4. What are we doing to verify the digital safety of outside vendors?

Those are the right conversations to be having. They don’t require tech fluency—just business fluency.

Farm‑Level Insurance: The Practical Kind

While the bigger fixes happen at the cooperative level, each farm can still boost resilience. Penn State Extension and the Food and Ag ISAC recommend keeping 30–45 days of cash or credit set aside for feed, payroll, and essentials; maintaining both cloud and physical copies of records; and outlining a 72‑hour business‑continuity plan.

During last summer’s brief DFA delay, farms that maintained these safeguards navigated the disruption calmly. One Wisconsin dairyman told me, “I treat data backups like fresh cow checks—you do it before things go wrong, not after.”

What’s particularly noteworthy is how these everyday steps—basic organization, paper copies, a short‑term cash plan—shielded real operations from chaos.

From Hardware to Heart of Cooperation

If there’s a silver lining in all of this, it’s that cybersecurity may actually reconnect dairy to its cooperative roots. Just as early milk pools allowed farmers to share equipment and market access, today’s co‑ops have a new reason to collaborate on shared digital defense.

NRECA’s ICS‑REC success shows what collective foresight can achieve: greater resilience at lower cost. And with CISA beginning to tailor agriculture‑sector protocols, we have both the data and the roadmap.

The NRECA shared cybersecurity model proves the cooperative advantage—40% cost savings, 75% faster threat detection, and 24/7 expert access that solo operations can’t match

Cybersecurity might not feel as tangible as herd management or fresh cow care, but in 2025, it’s part of keeping the parlor humming. Protecting bridges between the barn, the bank, and the buyer ensures that milk—and money—keep moving.

Because at the end of the day, protecting your milk check is just another form of protecting your herd.

Key Takeaways :

  • The 2025 DFA cyberattack revealed that dairy’s digital systems—dispatch, payments, and lab data—are now as critical as the milking parlor itself.
  • With most farms carrying under two weeks of liquidity, a frozen payment system triggers losses far beyond delayed deposits.
  • Shared‑defense models pioneered by rural electric co‑ops show that collaboration can make cybersecurity affordable and effective.
  • Insurers and processors are treating cyber readiness like milk‑quality testing: it’s not optional, it’s expected.
  • Strengthening your co‑op’s firewalls is today’s version of maintaining herd health—a shared responsibility that protects everyone’s milk check.

Complete references and supporting documentation are available upon request by contacting the editorial team at editor@thebullvine.com.

Learn More:

The Sunday Read Dairy Professionals Don’t Skip.

Every week, thousands of producers, breeders, and industry insiders open Bullvine Weekly for genetics insights, market shifts, and profit strategies they won’t find anywhere else. One email. Five minutes. Smarter decisions all week.

NewsSubscribe
First
Last
Consent

Data Centers, Water Rights, and Your Dairy’s Future: The 18-Month Window That Changes Everything

A data center uses 2,000MW. Your dairy uses 0.5MW. When they move in, your costs jump 40%. You have 18 months to pick: Scale, pivot, or sell.

EXECUTIVE SUMMARY: Data centers consuming 2,000 megawatts—the power of 4,000 dairy farms—are reshaping rural infrastructure, with some facilities draining aquifers so fast that multi-generational wells fail within months. This collision between Big Tech and agriculture threatens mid-sized dairies with 40% power cost increases and water scarcity, yet also creates unprecedented opportunities: land values tripling, renewable energy partnerships worth $400/cow annually, and historic exit premiums. The 800-1,500 cow operations that built America’s dairy industry have 18 months to choose their path: scale beyond 2,000 cows, optimize operations while positioning for strategic exit, or sell at peak valuations that won’t last. Indiana’s proactive water protection legislation and Ohio farmers negotiating win-win land deals show that preparation beats panic. The immediate action plan is clear: document your water baseline, calculate your true costs, and decide your future before market forces decide for you.

Data Center Dairy Impact

You know, I was chatting with a producer last week who’s been milking for thirty years—rock-solid operation, three generations on the same land. His question really made me think: “Andrew, my well’s never failed. Should I be worried about these data centers moving in?”

After looking at what’s happening across the country, I had to tell him yes. Though honestly… not for the reasons either of us expected when we started talking.

One AI data center consumes the equivalent power of 4,000 dairy farms—a staggering 2,000 MW compared to your 0.5 MW operation. This isn’t a fair fight; it’s a complete mismatch in energy demand that’s reshaping rural infrastructure and driving your costs up by 40%.

A Story from Georgia That Should Matter to All of Us

So here’s what’s happening to Beverly and Jeff Morris down in Newton County, Georgia—and it’s something we all need to pay attention to. For decades, their well served them perfectly. Never a problem. Then, Meta built a data center about 1,000 feet from their property back in 2018.

Beverly and Jeff Morris in Newton County watched their multi-generational well fail within months of Meta’s data center opening. Now hauling bottled water for basic needs, they’re $5,000 in trying to fix what a 500,000-gallon-per-day neighbor broke. Nine more companies filed applications—some wanting 6 million gallons daily.

Within months—and I mean months, not years—their water quality just fell apart. First, the dishwasher stopped working right. Ice maker went next. The New York Times reported this past July that they’re now hauling bottled water for basic household needs. They’ve already spent five thousand dollars trying to fix problems that started right after construction. And that twenty-five thousand they’d need for a new well? Well, that’s just not in the cards for them.

“I’m scared to drink our own water,” Beverly told those reporters.

When farm families are afraid of their own well water in 2025… I mean, that really hits home, doesn’t it?

Understanding What’s Happening to Our Power Grid

Here’s what’s interesting—and honestly, a bit concerning. Grid Strategies released its National Load Growth Report, showing that data center electricity consumption could triple from 4% of total U.S. usage today to 12% by 2028. Goldman Sachs released similar numbers in its August analysis. That’s a massive shift in just a few years.

You probably know this already, but let me put it in perspective: facility planning documents from utilities like Dominion Energy show a single AI data center can demand 2,000 megawatts. Your entire dairy operation? Even with a modern parlor, all your cooling systems, feed delivery—you’re maybe peaking around 500 kilowatts on your busiest day. The scale difference is just… staggering.

Think about it this way:

  • One AI data center: 2,000 MW (enough for 100,000 homes)
  • Your 1,200-cow dairy: 0.5 MW
  • A small town of 5,000 people: 15 MW

We’re not even in the same league here.

Rural electric cooperatives—and that’s most of us, right?—they’re really feeling this. I’ve been talking with co-op managers across the Midwest, and they’re seeing interconnection requests for hundreds of gigawatts. As one manager told us, “We built our system over decades to serve farms and rural communities. They’re asking for triple capacity in two years.”

The money side’s already hitting too. Rewiring America documented twenty-nine billion dollars in utility rate increase requests this year. And ICF International’s May report? They’re suggesting we could see increases up to 40% by 2030.

So let me break this down in terms we all understand. Say you’re running 1,200 cows in a typical freestall setup with automated milking—pretty standard operation these days. University of Wisconsin Extension research shows operations like that use between 400 and 1,145 kilowatt-hours per cow annually. Most well-managed operations average around 800.

At twelve cents per kilowatt-hour—which is what many of us are paying—you’re looking at about $115,200 a year in electricity. Jump that to fifteen or seventeen cents? That’s an extra thirty to forty thousand dollars annually. Basically, it adds twenty-five cents per hundredweight to your production costs. And there’s not a thing you can do to manage that through better feed conversion or butterfat optimization.

Data centers are driving electricity rates up 40%, adding $48,000 annually to a 1,200-cow operation—that’s $4,000 every single month you can’t manage through better genetics or feed efficiency. This $0.25/cwt hit goes straight to your cost of production with zero options to optimize it away.

Water: The Challenge That Really Caught Me Off Guard

What really surprised me when I started digging into this—it’s not the electricity that’s the immediate threat. It’s water.

According to filings with Georgia’s Environmental Protection Division, Meta’s Newton County facility needs 500,000 gallons every single day. That’s 10% of the entire county’s water use for 120,000 residents. Mike Hopkins, who runs the Newton County Water and Sewage Authority, reported at a July public meeting that nine more companies have filed applications. Some want six million gallons daily. Six million! The Authority’s already projecting deficits by 2030.

Now, you might be thinking, “That’s Georgia. Different story up here in the Midwest.” But look at what’s happening in Arizona. The Attorney General’s December lawsuit documents show the Saudi-backed Fondomonte operation pumped over 31,000 acre-feet from the Ranegras Basin last year. That’s 81% of all the groundwater pulled from that aquifer.

Documentary filmmakers from The Grab captured rancher Wayne Wade describing how his well pump literally melted when water levels dropped below it. “I can’t pay for a high-powered lawyer,” Wade said. “Neither can any of my friends.”

Local churches have lost wells that served their communities for generations. Small operations are watching their water security just… evaporate. And here’s what really concerns me: this happens fast. We’re not talking gradual decline over decades, where you can plan and adapt. Wells that have been reliable for multiple generations can fail within months once industrial-scale pumping starts nearby.

Looking at where these conflicts are already emerging:

  • High data center areas: Northern Virginia, Columbus, OH, Phoenix, AZ, Dallas, TX, Silicon Valley, CA
  • Major dairy regions: Wisconsin, California Central Valley, New York, Pennsylvania, Idaho
  • Where they overlap: That’s where we’re seeing real problems develop

This Isn’t Just an American Problem

And here’s something for our Canadian readers and international audience—this isn’t uniquely American. The Greater Toronto Area is seeing similar pressures as Microsoft and Amazon expand their data center capacity in Ontario, with facilities in Vaughan and Mississauga drawing significant power from the grid.

In Europe, it’s even more intense. The Netherlands—you know, one of the world’s most efficient dairy producers—is dealing with Microsoft’s planned facility in North Holland that will consume 20% of the nation’s renewable energy growth. Dutch dairy farmers are already operating under strict environmental regulations, and now they’re competing with tech giants for both water and power. Ireland has actually imposed a moratorium on new data center connections in Dublin because they’re projected to consume 30% of the country’s electricity by 2030.

What’s particularly interesting is that European farmers have been actively organizing responses. The Dutch agricultural union LTO Nederland has been working with energy cooperatives to secure long-term power contracts before data centers lock up capacity. That’s something we could learn from here.

Indiana Shows Us What Being Proactive Looks Like

Not every region’s waiting for a crisis to hit, though. What Indiana did offers a really solid model for the rest of us.

Randy Kron—he’s president of Indiana Farm Bureau and farms in the Wabash River watershed—saw what was coming when developers proposed pulling 100 million gallons daily for the LEAP Innovation District. Instead of waiting for problems, they made water protection their top legislative priority for 2025.

Working with State Senator Sue Glick, they passed Senate Bill 28. Governor Braun signed it in April. The law’s pretty straightforward: if an industrial user impairs your agricultural well, they have to compensate you. Either they connect you to a new water supply or drill you a deeper well. The Department of Natural Resources has three days to investigate complaints. And here’s the key part—the burden of proof is on them, not you.

As Randy explained in his public testimony: “We wanted to establish reasonable guidelines while we could think clearly, not in the middle of a crisis.”

That’s the difference between getting ahead of this thing and playing catch-up, isn’t it?

One Success Story Worth Noting

I should mention—it’s not all doom and gloom out there. I was talking with a producer from northeast Ohio recently who’s actually turned this situation to his advantage. When a data center developer approached him about purchasing 200 acres of marginal cropland, he negotiated to keep his best fields and the dairy operation intact.

The sale price? Let’s just say it funded a complete parlor renovation and new feed storage, and left enough for his daughter to return to the operation without debt pressure. Plus, the data center’s required green space buffer actually improved his pasture runoff management.

“I wasn’t looking to sell,” he told me, “but when someone offers you three times agricultural value for your worst ground, and you can keep milking? That’s not a threat—that’s an opportunity.”

Not everyone will get that lucky, of course. But it shows there can be win-win scenarios if you’re prepared to negotiate from a position of knowledge rather than desperation.

The Bigger Picture on Consolidation

Let’s be honest about something we all know—data centers aren’t creating dairy consolidation. We’ve been dealing with that for twenty years now. The 2022 USDA Census shows we’ve gone from 105,000 dairy farms in 2000 to about 22,000 today. Meanwhile, cow numbers have stayed right around 9.4 million head. Same amount of milk, way fewer farms producing it.

The economics haven’t changed either. Cornell’s Dairy Farm Business Summary from September shows that operations with 2,000-plus cows are achieving production costs of around $23 per hundredweight. Those of us with 1,000 cows? We’re looking at $26-27. In markets that routinely swing two or three dollars seasonally… well, you know what that gap means for your bottom line.

What’s different now—and this is important—is that data centers are eliminating the traditional ways mid-sized operations survived. You can’t optimize your way out of a 40% increase in power. You can’t expand when county assessor records from places like Franklin County, Ohio, show farmland jumping from $30,000 to $150,000 an acre after rezoning for data centers. And your neighbor can’t buy you out when nobody can afford these inflated prices.

Three Realistic Paths Forward—Choose Wisely

After talking with producers nationwide and working through the numbers with economists like Dr. Jason Karszes at Cornell’s PRO-DAIRY program, I’m seeing three realistic strategies for operations with 800 to 1,500 cows:

Path 1: Scale Up Now

If you’re going this route, you need at least 2,000 cows. Cornell estimates that’s eight to fifteen million in capital, depending on what you’ve already got. But here’s the thing—this only works if you have a committed successor under 40 who’s already actively managing. The International Farm Transition Network’s data shows 83.5% of dairy farms fail the generational transition. Don’t expand on hope.

You’ll also need documented water security and, if you’re thinking of digesters, proximity to natural gas pipelines. The risk? Infrastructure costs are rising faster than milk prices. You’re betting you can scale before costs eat you alive.

Path 2: Optimize and Plan Your Exit

This is your five-to-ten-year strategy. Targeted investments of $500,000 to $2 million can keep you competitive medium-term—precision feeding, really dialing in component optimization, maybe adding renewable revenue.

Solar leases are now bringing $250-$1,000 per acre, according to the American Farmland Trust. Digester partnerships can add $80-400 per cow annually. In California, with those Low Carbon Fuel Standard credits, some operations are seeing up to $1,100 per cow. The key is timing your exit to the land value peak—likely 2025-2027 —before regulatory backlash hits.

Path 3: Exit While Premiums Exist

Let’s face reality—USDA data shows 71% of retiring farmers have no successor. If that’s you, the arrival of data centers might be your best opportunity. We’re seeing premiums of 40-100% over agricultural value. Davis County, Utah, farmland went from $50,000 to $400,000 per acre after rezoning. But this window won’t stay open past regulatory backlash.

MetricAgricultural ValuePost-Data Center ValueChange
Price Per Acre$30,000$150,000+400%
200-Acre Farm Total$6,000,000$30,000,000+$24,000,000
Exit Premium WindowAgricultural UseDevelopment Value18 Months
Your DecisionStay & ScaleSell at PeakMarket Decides

And here’s the thing—you’ve got maybe 18 months to choose before the market makes the choice for you.

Understanding the Revenue Side

While we’re dealing with infrastructure pressures, some operations are finding real opportunities. But you need to distinguish genuine opportunity from sales pitches—and believe me, there are plenty of those going around.

California producers working with companies like California Bioenergy are generating substantial returns. The George DeRuyter & Sons operation in Washington state produces renewable natural gas plus multiple fertilizer products—real diversified revenue beyond just milk.

A 1,200-cow operation with solar leases and a digester partnership can generate $680,000 in annual non-milk revenue—that’s $0.40/cwt in margin you can’t lose to feed costs. In California with LCFS credits, producers are banking $1.32 million yearly. This isn’t futuristic; it’s happening right now.

Bar 20 Dairy in Kerman reports capturing thousands of tons of CO2 annually through their digester while producing renewable electricity. As one California producer told me: “It’s like crop insurance that pays every month.”

The typical arrangement? Third-party developers cover the capital—anywhere from two to twelve million, according to industry reports. They build it, operate it, and pay you for manure. Not glamorous, but annual payments that can represent $350,000 for a 3,500-cow operation? That’s an additional 40 cents per hundredweight in margin. Nothing to sneeze at.

But here’s what nobody mentions at those sales presentations—these are 10-15 year contracts in markets that could shift dramatically. If carbon credit values crash in 2028 and you’re locked until 2040, you’re stuck. Get a lawyer who understands both ag and energy before you sign anything. Trust me on this one.

What’s Coming That Most Aren’t Seeing Yet

Your milk processor is running the same infrastructure risk calculations you are. And if they decide your watershed’s becoming high-risk, they won’t announce it. They’ll gradually shift procurement to more stable regions. By the time you notice reduced premiums or limited-volume incentives, repositioning becomes very difficult.

We’re also likely to see regulatory whiplash. Right now, everyone wants data centers for the tax revenue. But if history’s any guide—think CAFOs in the ’90s or ethanol plants in the 2000s—backlash typically emerges 3-5 years after rapid growth begins. Water conflicts and community opposition could trigger restrictions around 2027-2030, potentially leading to significant corrections in land values.

Your 30-Day Action Plan

Alright, enough analysis. Here’s what you actually do starting Monday morning:

Week 1: Document Your Water

Call your state-certified lab first thing Monday. In Wisconsin, that’s the State Laboratory of Hygiene at 608-224-6202. Pennsylvania farmers, check DEP’s certified lab list. Iowa, call the State Hygienic Laboratory at 319-335-4500. Ontario producers, contact your Ministry of Environment labs.

Comprehensive testing runs $300-500. Get everything—bacteria, minerals, heavy metals, static water level. Photograph all infrastructure with date stamps. Keep copies in three places. Without this baseline, you have zero legal protection.

Week 2: Face Your Numbers

Calculate actual production costs. Not hopes—reality. Model three scenarios: scaling to 2,000+ cows, optimizing for 5-7 years, or immediate exit. Have that succession conversation directly: “Do you want this operation?” Hesitation tells you everything.

Week 3: Work With Your Farm Bureau

Contact your county president about water protection resolutions. Draft and submit if needed—October deadlines are common. Coordinate with neighboring counties. Frame it as risk management, not emotional appeals.

Week 4: Make Your Decision

Scale, optimize, or exit based on documented succession, capital access, water security, and market position. Set concrete timelines and communicate them clearly.

Regional Differences Really Do Matter

This isn’t hitting everywhere equally, of course. Vermont and northern New York —abundant water and limited data center development? You’re facing minimal pressure so far.

But Virginia—especially Loudoun County—that’s a completely different story. The state’s Joint Legislative Audit and Review Commission found 26% of Virginia’s total electricity now goes to data centers. That’s massive.

The Pacific Northwest presents mixed conditions. Plenty of hydropower, which helps. But the Columbia River Basin’s already over-allocated. When Microsoft expanded in Quincy, Washington, irrigation districts had to fight hard to protect agricultural water rights.

The Southwest? Between existing drought and new industrial demand… it’s really tough out there. Several New Mexico producers I know are planning exits based solely on water, not even considering milk prices.

Looking Forward with Clear Eyes

You know, this transformation isn’t about whether data centers are good or bad. They’re coming regardless of what we think. When organizations with trillion-dollar valuations compete for the same resources we need… well, we all know how that usually ends up.

The smart response isn’t futile resistance. It’s intelligent positioning within what’s coming.

Our grandparents navigated equally dramatic transitions—from hand milking to automation, from small diversified farms to specialized dairy operations. They succeeded by making timely decisions based on emerging conditions, rather than waiting for perfect information that never arrives.

We need that same decisiveness now. Maybe even more so.

The timeline’s compressed. Aquifers don’t refill quickly—you know that. Electricity rates aren’t coming down anytime soon. And somewhere—probably closer than you think—another data center’s moving through the approval process right now.

Document your water. Understand your real costs. Choose your strategic direction.

Because eighteen months from now, those who acted on information will be in substantially better positions than those who waited, hoping things might somehow improve on their own.

That’s what the current data suggests. And in our business, as we all know, the data usually points us in the right direction. Even when we don’t like what it’s telling us.

For water testing contacts and Farm Bureau resolution procedures, reach out to your local county offices. For professional land valuation near data center developments, the American Society of Farm Managers and Rural Appraisers maintains a directory of qualified specialists who understand both agricultural and development values.

KEY TAKEAWAYS

  • THE 18-MONTH DECISION Mid-sized dairies (800-1,500 cows) face three paths: Scale to 2,000+ cows ($8-15M), optimize operations while positioning for strategic exit (5-10 years), or sell now at historic premiums (40-100% above ag value). No decision IS a decision—the market will choose for you.
  • WATER BASELINE = LEGAL LIFELINE Schedule water testing immediately ($300-500 through state labs). Multi-generational wells are failing within months of data center construction. Without a documented baseline, you have zero legal recourse when your well fails.
  • YOUR POWER BILL: +40% WITH NO ESCAPE One data center uses 2,000MW (power for 4,000 dairy farms). This drives electricity costs up 40%, adding $30-40K annually to a 1,200-cow operation—equivalent to $0.25/cwt you cannot optimize away through any operational efficiency.
  • OPPORTUNITIES FOR THE PREPARED Land selling at 3X agricultural value, renewable partnerships generating $400/cow annually, solar leases bringing $1,000/acre—but only for farmers who document resources, know their costs, and negotiate from knowledge, not desperation.
  • PROVEN SUCCESS STRATEGIES EXIST Indiana’s proactive water protection law and Ohio farmers’ win-win land deals demonstrate that preparation beats panic. Join Farm Bureau water resolutions, coordinate with neighboring counties, and frame concerns as risk management—it works.

Learn More:

Complete references and supporting documentation are available upon request by contacting the editorial team at editor@thebullvine.com.

The Sunday Read Dairy Professionals Don’t Skip.

Every week, thousands of producers, breeders, and industry insiders open Bullvine Weekly for genetics insights, market shifts, and profit strategies they won’t find anywhere else. One email. Five minutes. Smarter decisions all week.
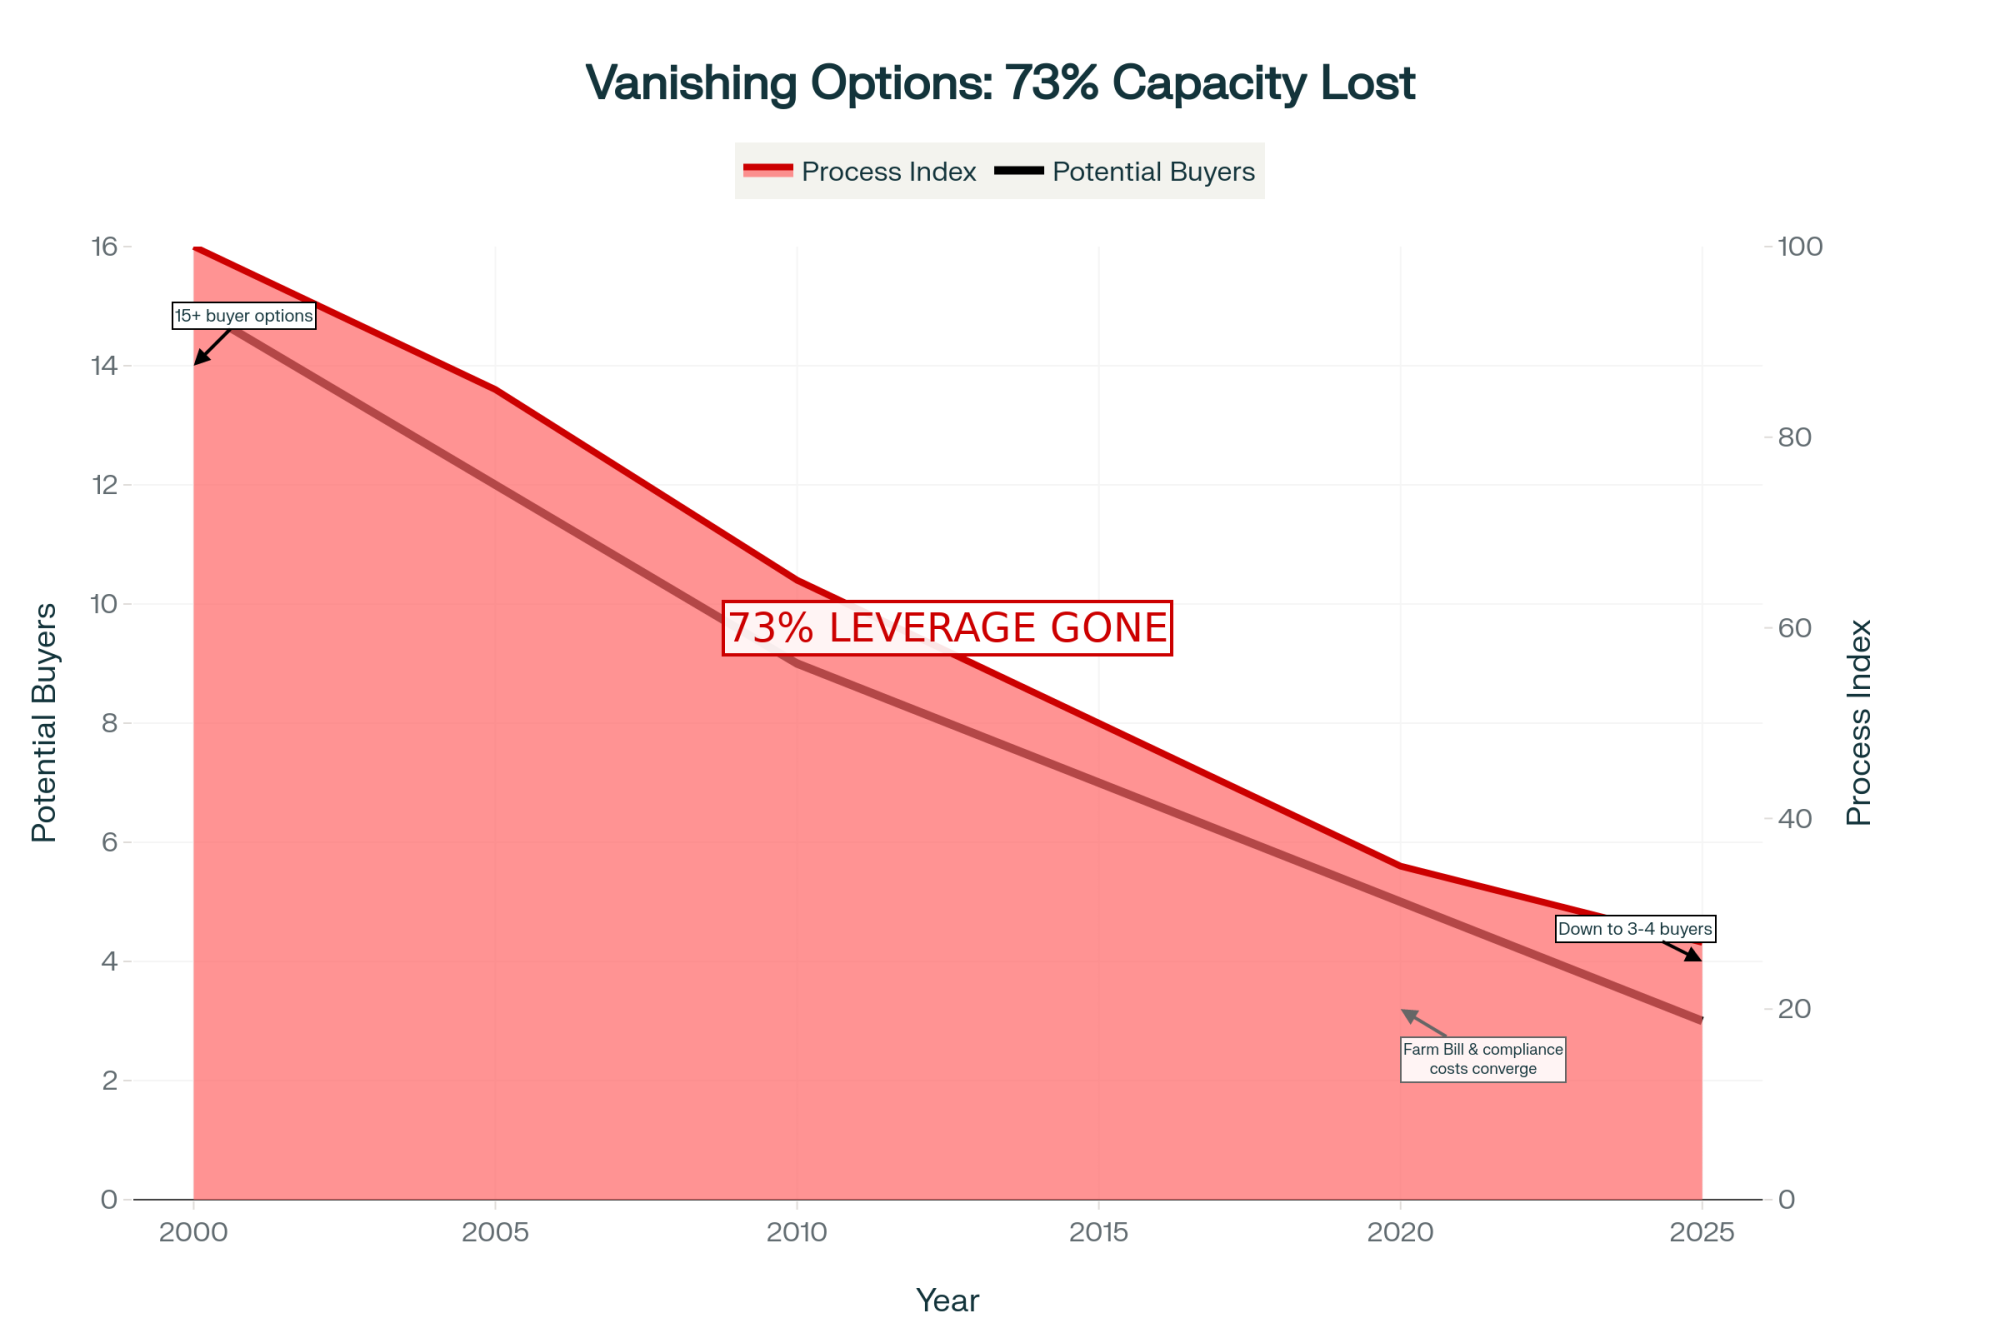
NewsSubscribe
First
Last
Consent

Resilience Over Relief: What the $3 Billion Bailout Reveals About Dairy’s New Playbook

The $3 billion bailout hit producers’ accounts—but the real story is how farmers are turning that relief into resilience and re‑engineering the future of dairy.

Executive Summary: The USDA’s $3 billion dairy bailout bought farmers time—just not transformation. Since 2018, over $60 billion in federal “emergency” funding has kept America’s milk moving, but it’s also made rescue money feel routine. What’s interesting is how differently producers are responding. In Wisconsin, smaller family herds keep shuttering, while Idaho’s integrated systems keep growing. Yet across regions, many farms are proving that strength now comes from management, not money—from tracking butterfat performance to securing feed partnerships and using Dairy Revenue Protection as standard operating procedure. The article reveals a quiet shift happening in dairy: the producers thriving today aren’t waiting for Washington—they’re building resilience from the inside out.

dairy resilience strategies

When the USDA released $3 billion in previously frozen dairy aid earlier this fall, a lot of barns felt the same quiet relief. That check helped cover feed, tide over payroll, or pay for the next load of seed. But here’s what’s interesting—what used to be considered “emergency relief” has quietly become routine.

Since 2018, the government’s Commodity Credit Corporation has distributed over $60 billion in ad‑hoc support to U.S. farmers, according to USDA and Congressional Research Service data. That includes the trade‑war relief payments, COVID‑era CFAP funds, weather‑related disaster programs, and now, this latest round of support. Each program had different names and triggers, yet all share one thing: they’ve made emergency relief feel ordinary.

Looking at this trend, it’s clear that the system doesn’t just respond to volatility—it depends on it.

From Safety Net to Part of the System

The normalization of crisis: Federal dairy aid has exceeded $60 billion since 2018, transforming ‘emergency’ relief into standard operating procedure—exactly what Coppess warned about.

University of Illinois economist Jonathan Coppess put it plainly during a 2025 policy forum: “Every time we call these payments extraordinary, we prove how ordinary they’ve become.”

He’s right. The CCC now spends more than $10 billion each year keeping farm sectors whole when prices collapse. The money buys time—valuable time—for dairy families to stay solvent when margins evaporate. But I’ve noticed something else: those interventions slow the kind of market corrections that might otherwise drive innovation.

In other words, the aid keeps everyone in motion—but it also keeps everyone in the same spot.

Geography Still Shapes Success

MetricWisconsin (Traditional)Idaho (Integrated)Impact
Herd Trend 2024400+ closures4.2% growthConsolidation accelerating
Primary ModelSmall-mid family farmsVertically integratedStructure determines survival
Processor RelationshipCo-op (variable deductions)Direct long-term contractsSecurity vs. volatility
Co-op Deductions$1-3 per cwtMinimal/contractedMargin erosion for traditional
Feed StrategyMixed/spot marketIntegrated supply chainsCost predictability advantage
2025 Production TrajectoryDecliningExpandingGeographic winners emerging

Here’s a sobering contrast.

In WisconsinUSDA NASS reports for 2025 show that over 400 milk license holders closed in 2024, the vast majority small or mid‑sized herds. Co‑op deductions for hauling, marketing, and retained equity often run from $1 to $3 per hundredweight, depending on the service region. Add that to feed pressure, and margins vanish quickly when Class III milk averages around $16 per hundredweight.

Meanwhile, Idaho saw 4.2 percent production growth, driven by vertically integrated systems and processor partnerships (Idaho Dairymen’s Association Annual Report 2025). Many herds there ship directly to long‑term contracts with Glanbia Foods or Idaho Milk Products. As CEO , Rick Naerebout says, “Security here comes from being part of someone’s plan.”

That’s becoming the modern split in U.S. dairy. It’s not only about scale—it’s about supply security.

Export Growth Without Equal Payoff

U.S. dairy exports have tripled since 2000, making America the world’s third‑largest dairy exporter, trailing only the EU and New Zealand (USDA Livestock, Dairy and Poultry Outlook, August 2025). It’s an incredible achievement. The challenge is that the extra volume hasn’t meant better milk checks.

The European Commission’s Agri‑Food Trade Report (2025) confirms that EU processors still benefit from export‑enhancing subsidies. And USDA ERS data shows that while New Zealand’s grass‑based systems remain the most cost‑efficient in the world, Americans must rely on grain‑fed cows and higher‑input models.

In 2025’s Q3, Class III prices averaged $16.05 /cwt, while breakevens in most regions sat near $18–$20 /cwt(CME Markets and USDA ERS cost‑of‑production reports). Industry analyst Sarina Sharp at Daily Dairy Report put it simply: “We’re moving tonnage, not value.”

Moving tonnage, not value: While U.S. dairy exports have tripled since 2000, Class III prices are $4 per cwt below breakeven—the gap that keeps plants full but forces farmers onto the bailout treadmill.

The export engine keeps plants full—but it hasn’t lifted profitability on the farm.

When DMC Numbers Don’t Match Reality

By federal calculations, dairies are doing fine.

On paper, the Dairy Margin Coverage (DMC) program’s national average margin has stayed above $9.50 for 25 consecutive months (USDA FSA DMC Bulletins, 2025). But back home, budgets tell a different story. A Farm Journal Ag Economy Survey (2025) found 68 percent of producers still reporting negative cash flow through the same period.

The difference is in the math. DMC uses corn, soybean meal, and premium alfalfa hay to model feed cost, leaving out labor, fuel, freight, and mineral expenses. A California freestall feeding $360 a ton of hay and paying $22 an hour in labor looks “healthy” next to a Midwest herd growing its own feed, at least on paper.

As one Wisconsin producer told me, “DMC says I’m comfortable. My milk check says otherwise.”

Where Resilience Is Actually Happening

Management over money: A mere 0.2% butterfat increase—achievable through better fresh cow protocols—can generate $10,000 to $150,000 annually, proving that components now matter more than volume.

What’s encouraging is how many farms are finding independence within this uncertainty. Across regions, large and small, producers share some common habits that quietly strengthen their bottom lines.

  1. Holding processor relationships close.  Herds delivering reliable supply with high butterfat and low SCC keep their spot when plants trim pickups. Consistency is its own insurance policy.
  2. Milking components over volume.  USDA AMS 2025 data shows butterfat now drives over 55 percent of milk’s value. Just a 0.2 percent lift in butterfat can earn $10,000 to $15,000 per 100 cows,depending on premiums. The best results usually come from fresh cow management and ration adjustments using digestible fiber and balanced oils, not simply more grain.
  3. Locking in feed and forage partnerships.  A University of Wisconsin Extension (2024) study found multi‑year forage contracts saved 8 to 12 percent per ton of dry matter compared to spot buying. Contract stability reduces uncertainty around input costs—and lenders like certainty.
  4. Treating insurance like a feed input.  According to the Risk Management Agency 2025 Report, about 70 percent of U.S. milk is now covered by Dairy Revenue Protection or Livestock Gross Margin. Farms building those premiums (roughly 1–2 percent of revenue) into their budgets weather volatility far better than those rolling the dice each year.
  5. Diversifying strategically.  California Bioenergy (2025) reports digesters and renewable‑gas systems returning $40,000 to $120,000 annually for 1,000‑plus cow herds—without pulling focus from the dairy. Others find stability through direct marketing or regional brand partnerships.
  6. Measuring profitability monthly.  Penn State Extension (2025) shows feed should stay below 60 percent of gross milk income. The farms that benchmark this monthly spot inefficiencies faster and make small, cost‑saving pivots before they snowball.
  7. Planning exits on their own terms.  According to the USDA ERS Farm Structure and Stability report (2025), herds planning transitions 12–18 months ahead preserve as much as 40 percent more equity than forced liquidations. Some call that quitting; others call it smart continuity.

Each step underlines the same idea: resilience isn’t dramatic—it’s deliberate.

What the Bailouts Really Buy

In the short run, relief checks keep dairies alive and infrastructure intact. They pay feed bills and save lenders a lot of sleepless nights. But as Coppess reminds us, “These payments stabilize balance sheets—they don’t modernize business models.”

Bailouts treat symptoms, not sources. Without modernized DMC calculations, fairer make‑allowance data, and supply contracts that reward efficiency, the cycle continues: price drop, emergency payment, repeat.

The Bottom Line

Here’s what the 2025 bailout really offers: time.

What farmers are proving, though, is that time alone doesn’t fix markets—management does. Across the country, producers are sharpening skills, controlling costs, and tracking butterfat performance with the precision of any Fortune 500 manager.

As New York Jersey breeder Megan Tully put it best, “The government may keep us afloat, but only management keeps us profitable.”

And there it is. Resilience in dairy right now isn’t a talking point—it’s a mindset. It’s being built every day in barns, on tractors, at kitchen tables, and in feed alleys. One cow, one ration, one decision at a time.

Key Takeaways:

  • Emergency aid has become standard practice. Since 2018, more than $60 billion in CCC funds have flowed to dairy, blurring the line between rescue and routine.
  • Farm outcomes now depend on geography and leverage. In Wisconsin, small family herds keep shrinking; in Idaho, contracted farms keep growing—and that gap is widening.
  • Official margins hide on‑farm reality. DMC numbers may look comfortable, but they ignore feed freight, labor, and energy costs that drain actual cash flow.
  • Producers are creating their own safety nets. From better butterfat performance to multi‑year feed contracts and DRP insurance, farmers are writing their own playbooks.
  • Resilience is being rebuilt one decision at a time. The dairies thriving today aren’t waiting on policy—they’re managing through it.

Complete references and supporting documentation are available upon request by contacting the editorial team at editor@thebullvine.com.

Learn More:

The Sunday Read Dairy Professionals Don’t Skip.

Every week, thousands of producers, breeders, and industry insiders open Bullvine Weekly for genetics insights, market shifts, and profit strategies they won’t find anywhere else. One email. Five minutes. Smarter decisions all week.

NewsSubscribe
First
Last
Consent

The Proven Strains Behind Smarter Probiotics and  Stronger Herds

Proof, not promises. That’s what modern dairies expect from probiotics—and why the right strains deliver results you can measure.

Executive Summary: You know, it’s clear we’ve turned a corner with probiotics in dairy. What once felt like trial‑and‑error is now precision management—backed by data, field proof, and measurable ROI. Proven strains like Actisaf®, Levucell®, and CLOSTAT® are helping producers improve feed intake, stabilize butterfat, and ease transition stress —where most fresh‑cow challenges begin. Research from universities and extension programs shows results that speak volumes—stronger cows, healthier calves, and up to 20:1 returns. The dairies getting ahead are the ones matching microbial strategies to their region and feeding consistently. And with affordable DNA sequencing now unlocking deeper herd insights, the future of dairy health is becoming clearer than ever—because managing microbes is quickly becoming as important as managing genetics.

Probiotic strain selection

You know, it’s interesting how some dairy ideas come full circle. Probiotics are one of those. Years ago, we treated them like a shot in the dark – something you tried if you had a problem cow or a slugging tank. Today, the conversation sounds very different. Research, farm data, and extension trials all show the same thing: when probiotics are used the right way – with the right strain – they can consistently improve cow health, stabilize production, and boost profitability.

What’s especially exciting is that this isn’t about reinventing nutrition programs. It’s about managing what’s already in the cow—the hundreds of microbial species driving rumen efficiency, feed conversion, and fresh cow resilience. Once you support those microbes correctly, they pay you back every day they stay in balance.

Looking at the Transition Period: The Biggest Opportunity

If you’ve milked cows or managed fresh cows, you already know—the transition period is where you win or lose the year. Energy drops, feed intake declines, and health risks peak. University of Guelph and Cornell data confirm that over 70 percent of dairy herd health challenges occur within the first 30 days after calving. And they’re expensive. Cornell’s PRO‑DAIRY economic models estimate the average case of ketosis costs around $290 per cow, while a displaced abomasum often adds another $500 to $600 in lost production and treatment cost.

The encouraging news is that probiotics have now proven their place in this stage. Multiple studies published in the Journal of Dairy Science and verified by EFSA research show that the yeast strain Saccharomyces cerevisiae CNCM I‑4407—marketed as Actisaf®—increases average intake by around 1 kg/cow/dayand raises milk yield by approximately 3 kg/day during early lactation.

What’s happening is basic microbial biology. Actisaf helps rumen microbes stabilize pH, reduces lactic acid buildup, and supports acetate production for butterfat synthesis. In extension-monitored herds across Wisconsin and Ontario, producers report fewer off-feed cows and more consistent butterfat.

As one nutritionist for UW Extension puts it, “When rumen microbes are healthy, cows don’t crash.” That simplicity—keeping cows eating and fermenting evenly through transition—is what drives both milk gains and health paybacks.

Breaking Down What Works: The Proven Strains

DNA sequencing dropped from $3,000 to under $100 per sample—a 97% cost collapse that’s pushing microbiome management from research labs to feed bunks, with Cornell predicting commercial tools within 5 years

Let’s get clear about something important: not all probiotics perform equally. Think of them like sire lines—each strain has its own genetic potential and specialty. Here are the top three strains with consistent dairy‑specific validation:

Probiotic StrainBrand ExampleKey Function in Dairy Cows
S. cerevisiae CNCM I‑4407Actisaf®Improves feed intake, stabilizes rumen pH, supports butterfat production.
S. cerevisiae CNCM I‑1077Levucell® SCEnhances fiber digestion and fermentation for high‑forage diets.
Bacillus subtilis PB6CLOSTAT®Stabilizes feed intake, reduces inflammation, and improves performance under heat or metabolic stress.

What’s worth noting is how the environment or management influences effectiveness. In cooler climates—say, Minnesota or Ontario—yeast-based products like Actisaf perform consistently during the transition window. In the dry‑lot systems of California or Arizona, spore-forming Bacillus strains like CLOSTAT have an advantage because they survive high feed temperatures and long storage times.

As UW–Madison field specialists like to remind producers, “If the strain ID isn’t on the bag, it’s not a guarantee—it’s a gamble.” Verified strain research is what separates proven tools from placebo feeds.

Calf Health: The Race to Colonize Early

What’s fascinating about current research is how probiotics can change the trajectory of youngstock performance. The gut of a newborn calf is almost sterile at birth, so timing matters. The first microbes to colonize will shape that calf’s immunity and digestion for weeks to come.

Studies from the University of Alberta (2023) showed that giving Lactobacillus reuteri in colostrum cut the rate of E. coli K99 binding—linked to scours—by more than 80 percent and halved diarrhea cases. Meanwhile, research at Iowa State (2024) demonstrated that a multi‑strain blend of Bifidobacterium animalis and L. johnsonii increased weaning weights by about 4 kg and shortened scours duration by roughly a day.

Spending $4.50 per calf on probiotics prevents $250 in scours treatment costs—a 55:1 payback that’s backed by University of Alberta and Iowa State research showing 80% E. coli reduction and 50% fewer diarrhea cases

For those watching costs, scours prevention is one of the easiest wins. Wisconsin Extension values one case of calf scours at $250 per calf, once you include treatments and growth setbacks. Preventing even one in ten calves from scouring with a $4–5 probiotic investment per head adds up fast.

But the timing window’s short. Probiotics need to be in the first colostrum or milk feeding and continue through 10‑14 days. Wait longer, and the pathogens win the race to colonize.

Let’s Talk ROI: The Real Math Behind the Microbes

Transition cows deliver the highest immediate payback at 19:1 ROI—proof that precision nutrition during the critical 3-week window transforms both health and profitability

Herd data from the University of Wisconsin and Penn State Extension show remarkably consistent returns for well‑managed probiotic protocols:

Herd CategoryProgram Cost (100 Cows)Average ROIObserved Benefit
Calves $300 – $350 1:10 – 1:12 Stronger starts, fewer scours
Transition Cows ~$500 1:18 – 1:20 Better intake, smoother health curves
Lactating Herd ~$2,600 1:4 – 1:6 More consistent butterfat, feed efficiency

Transition cows deliver the most immediate payback, with returns up to 1:20, justifying the high ROI figures in the title. This happens because the improvements occur within the same lactation cycle. Calves show longer-term returns—lower morbidity and better feed conversion once they join the milking herd. Meanwhile, full-lactation programs amplify ration efficiency and component stability, particularly during summer heat or ration changes.

The common factor? Consistency. Herds that feed verified probiotic strains daily and track DMI, health events, and butterfat see repeatable, predictable returns.

When transition diseases can cost $289 to $550 per case and hit over 70% of fresh cows, the $5 probiotic investment looks less like a feed additive and more like production insurance

Regional Fit: Matching Microbes to Management

Probiotic performance depends on regional and environmental conditions, which is why “copy‑paste” programs rarely hold up across the country. In humid regions like the Great Lakes and Northeast, yeast strains that buffer rumen pH help offset silage variability and maintain component levels as forages shift in moisture content.

In contrast, herds in California’s San Joaquin Valley or Idaho’s Snake River region often rely on spore-forming Bacillusstrains for one key reason—they remain viable in feed that can exceed 100 °F in mixers or holding bins. Field studies presented at the California Animal Nutrition Conference confirm that these spores retain live-cell counts, unlike yeasts, which lose them.

Smaller herds often rely on pelleted mineral inclusion for simplicity, while large freestall or dry‑lot dairies integrate inoculants through automated micro-systems. The principle’s the same either way: healthy rumen bacteria need consistent delivery, regardless of herd size or region.

The Next Wave: Precision Microbiome Management

Here’s what’s encouraging. DNA sequencing that once cost thousands per sample now runs under $100. Cornell and Wageningen University researchers have shown that rumen microbiome profiles can now predict feed efficiency and methane output with about 85 percent accuracy.

European dairy herds are already testing tailored microbial feeding models in pilot programs, pairing sequencing data with ration adjustments. Cornell’s Dairy Innovation Group expects commercial applications in the United States within the next five years.

This development suggests that herd microbiome management is shifting from reactive to predictive. Soon, we’ll be adjusting feed programs not just for dry matter and energy—but for microbial populations that signal rumen resilience or stress. It’s technology catching up to the biology farmers have been managing intuitively for decades.

Practical Takeaways: From Research to Routine

Across the board, the dairies seeing the most consistent ROI from probiotics share three traits:

  1. They feed daily. Skipping doses resets microbial populations.
  2. They use verified strains. Each product lists strain number, live count, and dairy trial data.
  3. They track outcomes. DMI, components, and health metrics are logged every month.

When those three habits become routine, probiotics stop being “add‑ons” and start behaving like feed insurance. An Ontario field project reported at the 2024 Southwestern Dairy Conference found that herds running continuous Actisaf and CLOSTAT protocols saw 20 percent fewer ketosis cases after six months.

And as Université Laval microbiologist Dr. Marie Auger reminded producers during that same conference, “A dairy cow is the most advanced fermentation system you’ll ever manage.” She’s right. Once you view the cow’s gut microbes as vital production partners—not just digestive passengers—the economics, consistency, and herd health all speak for themselves.

Because at the end of the day, what the science and the field work both say is simple: better microbes make better cows. And better cows make better margins.

Key Takeaways:

  • Verified probiotics—Actisaf®, Levucell®, and CLOSTAT®—have moved past the marketing stage, delivering consistent 20:1 returns by keeping rumens stable and cows milking strong.
  • The transition period remains the biggest opportunity; feeding proven strains from 21 days pre‑calving through fresh boosts both intake and butterfat.
  • Calves benefit most when probiotics start at birth—giving them a microbial head start that reduces scours and strengthens lifetime performance.
  • Results depend on fit: pick yeast for humid forage‑heavy herds, Bacillus spores for hot, dry‑lot conditions, and always feed daily for consistency.
  • With affordable DNA testing on the horizon, farmers will soon manage rumen microbes as precisely as genetics—making the microbiome a true management tool.

Complete references and supporting documentation are available upon request by contacting the editorial team at editor@thebullvine.com.

Learn More:

The Sunday Read Dairy Professionals Don’t Skip.

Every week, thousands of producers, breeders, and industry insiders open Bullvine Weekly for genetics insights, market shifts, and profit strategies they won’t find anywhere else. One email. Five minutes. Smarter decisions all week.

NewsSubscribe
First
Last
Consent

Data That Pays: How Verified Sustainability Can Secure U.S. Dairy’s Global Advantage

From recordbooks to revenue: the quiet revolution paying off for data‑driven dairy farms.

Executive Summary: Across the country, producers are realizing that clean data is money in the bank. Europe might have built its sustainability systems first, but American dairies already outperform them in efficiency—you just have to prove it. The FARM Environmental Stewardship Version 3 program, aligned with the international Greenhouse Gas Protocol, makes that proof easy with records you already keep. Verified data now pays through carbon‑credit sales, 45Z clean‑fuel incentives, and better financing rates. The payoff isn’t futuristic—it’s here. For farms that treat recordkeeping with the same discipline as herd health, verified sustainability turns daily management into measurable profit.

dairy sustainability verification

Suppose you’ve been at a milk meeting or leaned on the gate with a neighbor lately. In that case, sustainability has probably come up—carbon markets, data verification, maybe the buzz around “net-zero milk.” And someone almost always says, “Europe’s ahead of us.”

That’s partly true. Europe’s been building sustainability frameworks for over a decade. FrieslandCampina’s Climate Plan, for example, now involves more than 11,000 member farms tracking emissions performance, and Ireland’s Origin Green program—run by Bord Bia—includes about 99 percent of national dairy herds. Those systems tie data verification directly to milk pay.

But here’s what’s interesting: America’s dairymen are already leading on the production side. USDA and FAO data confirm that U.S. cows produce roughly four times the global average milk yield per animal while maintaining a carbon footprint about half the world average. Efficiency, genetics, and feed science have taken us quietly to world-class performance; we just haven’t documented it in a way global buyers recognize.

American cows don’t just lead the world in milk production—they demolish it. At 24,117 lbs per cow annually, U.S. dairy outproduces the global average by 4x while maintaining half the carbon footprint. This isn’t luck. It’s decades of genetic selection, feed science, and management discipline paying dividends.

And with that documentation increasingly tied to future premiums, the advantage is ours to capture—if we move now.

Europe’s Model—and Why Our Playbook Can Be Faster

Europe’s systems rely on national policy, multi-agency oversight, and cooperative mandates. They deserve credit for structure but pay a price in speed. American farms, with their flexibility and drive for innovation, can get results faster by using voluntary systems that meet the same verification standards.

FactorEuropean ModelAmerican Model
ImplementationNational policy mandatesVoluntary market-driven ✓
Speed to Market10+ years to build2-3 years active ✓
Farmer FlexibilityLower (mandatory)Higher (opt-in) ✓
Farmer CostCovered by co-op ✓$0-500 one-time ✓
Coverage Rate99% (Ireland), 11,000+ farms ✓Growing rapidly

A good starting place is the FARM Environmental Stewardship Version 3 (FARM ES) program from the National Milk Producers Federation, built to align with the Greenhouse Gas Protocol that global processors and brands already trust. It takes information most farms already manage—herd size, milk sold, feed rations, energy use, and manure plans—and converts it into a certified emissions profile.

The surprising thing? It’s not expensive. Many co‑ops provide FARM ES audits at no cost, and independent producers pay roughly what they’d make off one cull cow. For that effort, a farm gains new eligibility for financial and marketing benefits that will matter more every year.

The Financial Benefits

1. Carbon Markets

The Athian Marketplace certifies U.S. livestock emission reductions and has paid between $15 and $35 per metric ton of CO₂ equivalent, depending on verification costs. Because Athian’s model passes roughly 75 percent of each credit’s value back to the farm, producers keep the majority of the payout.

2. Federal Incentives

The 45Z Clean Fuel Production Credit pays for verifiable reductions in carbon intensity—not acres or estimates, but actual farm numbers. Feed and manure efficiencies documented through FARM ES can qualify as part of these performance‑based credits.

3. Financing Leverage

Lenders like CoBank and Farm Credit Council are piloting sustainability‑linked loans that reduce interest rates for verified operations. A FARM ES audit doesn’t just help with policy—it can make capital cheaper.

Together, these programs show how verified data shifts from compliance paperwork to productive income. One organized afternoon can turn recordkeeping from routine into return.

Verified sustainability isn’t a cost—it’s a cash machine. Between Athian carbon credits ($15-35/ton), federal 45Z clean fuel incentives, and sustainability-linked financing, farms documenting what they already do well can capture $3,000-8,000 annually. That’s real money from existing practices, not futuristic pipe dreams.

Why Some Tech Never Delivers ROI

Many of us have watched a promising piece of farm technology fizzle. The problem often isn’t the device—it’s the data.

Here’s the brutal truth nobody wants to admit: incomplete recordkeeping kills 70% of tech investments—more than bad training, poor integration, or infrastructure gaps combined. The sexiest robotic milker can’t fix sloppy data habits. Master the boring basics (consistent herd records, feed logs, health tracking) before you drop six figures on shiny toys

A 2024 Journal of Dairy Science study found that about 70 percent of U.S. dairies adopting new digital systems didn’t hit ROI targets in the first 18 months, mainly due to incomplete or inconsistent data. One feeder logs as‑fed weights while the nutritionist records dry matter. Treatments get entered late. Before long, the system’s analytics are unreliable, and confidence fades.

Brutal honesty: 70% of dairy tech investments fail to deliver ROI. But here’s the pattern winners follow—they strengthen what good farmers already do well (sensors amplify observation; feeders optimize nutrition) rather than trying to replace human judgment. Buy tools that make you better, not machines that think they can replace you.

University of Wisconsin Extension specialists remind producers that digital accuracy depends on analog habits. Just as inconsistent milking prep ruins routine, inconsistent data entry ruins results. The farms that use tech profitably treat recordkeeping like herd health: daily, disciplined, verified.

Mindset Over Machinery

Paul Windemuller, a Michigan producer and 2024 Nuffield Scholar, puts it plainly: “Technology should strengthen what good farmers already do well—not take over their jobs.”

Windemuller’s international research—shared at the IDF World Dairy Summit—found that farms using automation to amplify stockmanship saw higher ROI than those expecting machines to replace experience. It’s a point echoed by researchers at the University of Agricultural Sciences (Sweden) and Danish Extension: operations treating technology as an extension of stockmanship achieved better herd health, higher butterfat stability, and lower labor turnover.

It all comes back to mindset. The best farms use technology to earn back time—not give it away to screens. They don’t chase innovation for its own sake—they fit it to their team and goals.

The 70/30 Success Pattern

Out of hundreds of farms tracked in adoption studies, about 30 percent achieve sustained ROI from dairy technology. Their success habits share a pattern:

  1. Start simple. Focus on one clear metric—say, butterfat‑to‑protein ratio or feed conversion—and master it before adding more.
  2. Assign accountability. One “data captain” ensures consistency across team members.
  3. Expect lag time. Smaller herds might need 6–9 months to reach stable results; larger herds, a full year.
  4. Link systems. Connecting herd, feed, and parlor software reduces manual entry errors by 40–50 percent, according to UW Extension research.

These behaviors create measurable gains. Annual feed savings typically range from $10 to $15 per cow, often achieved before new hardware is installed.

Why U.S. Dairies Can Move Faster

Europe’s verification model rewards patience; ours rewards practicality. Because private‑sector partnerships drive most American initiatives, change happens barn‑by‑barn instead of country‑by‑country.

Some examples already proving useful:
- Athian Marketplace, a carbon exchange explicitly designed for livestock, keeps most income on farms.
- Milk Sustainability Center, built by John Deere and DeLaval, links soil, feed, and milk data in one platform.
- Farm‑Twin, from Scotland’s Rural College, is open‑source and now adapted for North American dairies to simulate feed or manure outcomes before investing.

These tools work exactly where many producers excel—through efficiency and autonomy.

Your First Step

If you want to get started quickly, schedule a FARM ES assessment. Almost everything you need—DHIA production data, feed summaries, herd inventories, energy records, and manure plans—is already in your files. For most farms, the process takes half a day.

Midwest pilot programs in 2024 showed farms completing verification in a single session. One co‑op manager summed it up best: “It’s not about being perfect—it’s about documenting progress.” Those verified numbers can then be applied to farm loans, processor requirements, or carbon credit programs with confidence.

Consistency Outperforms Complexity

Veteran producers remember when DHIA testing was “extra work.” Now, you wouldn’t run a herd without it. Data verification will follow the same curve.

From Wisconsin free‑stalls to California dry lots to Vermont pasture systems, farms that treat recordkeeping as another layer of herd health management are already ahead. Clean data isn’t bureaucracy—it’s evidence of good farming.

The Bottom Line

Technology doesn’t make great dairies—people do. The producers pairing their practical know‑how with verifiable data are defining what’s next. Verification isn’t red tape; it’s a receipt for the hard work this industry has already done to feed the world efficiently and responsibly. And now, we get to prove it.

Key Takeaways 

  • Across the U.S., farms are learning that clean, consistent data turns management into money—through carbon markets, 45Z credits, and low‑interest loans.
  • FARM Environmental Stewardship Version 3 helps producers prove what they already do well, using herd records, feed sheets, and energy logs they already track.
  • American dairies outperform Europe on efficiency; now it’s time to put those numbers to work.
  • The best ROI in technology isn’t from buying more—it’s from managing better.
  • Producers who verify now will set the standard, earning sustainability premiums while strengthening dairy’s public trust.

Complete references and supporting documentation are available upon request by contacting the editorial team at editor@thebullvine.com.

Learn More:

  • The Carbon Credit Programs Every Dairy Should Join Before 2026 – This strategic analysis expands on the financial incentives by detailing actual carbon revenue streams, providing specific return figures (up to $450 per cow), and revealing the crucial differences between voluntary and compliance markets. It offers deep economic context for the sustainability verification advocated in the main article.
  • Tech Reality Check: The Farm Technologies That Delivered ROI in 2024 (And Those That Failed) – This innovation-focused piece provides specific performance metrics for technology like robotic milkers, demonstrating with hard data why top-performing farms achieve 42% more output than struggling operations. It complements the “Mindset Over Machinery” section by showing precisely how execution drives or destroys ROI.
  • From Data to Dollars: Small Steps to Maximize Dairy Profits Through Accurate Herd Management – This tactical article provides actionable implementation steps, demonstrating how common data entry errors (e.g., missed dry-off lists or wrong pen counts) cascade into costly mistakes. It provides the “how-to” guide for achieving the data discipline foundational to both technology ROI and FARM ES success.

The Sunday Read Dairy Professionals Don’t Skip.

Every week, thousands of producers, breeders, and industry insiders open Bullvine Weekly for genetics insights, market shifts, and profit strategies they won’t find anywhere else. One email. Five minutes. Smarter decisions all week.

NewsSubscribe
First
Last
Consent

22% of Your Dairy Income Is Government Money- Time to Calculate Your Real Position

5% of dairies don’t need government money. 70% can’t survive without it. Which are you?

Executive Summary: Is that government check keeping you afloat? It’s costing you $6,250 a month in retirement income you’ll never get back. With payments now 22.4% of dairy income nationwide, our analysis of operations across the country reveals only 5-10% are genuinely profitable without support—while 60-70% just break even, and 20-30% lose money even with help. The math is simple but brutal: every month of losses converts retirement equity into operating expenses. Meanwhile, processors are betting $11 billion on milk supply that depends entirely on political decisions outside your control. The seven-step calculation in this article takes ten minutes and will show you exactly where you stand—and whether you’re building a business or managing a decline.

Dairy financial position

With FSA offices reopening and $3 billion in agricultural assistance flowing, what experienced dairy farmers are discovering about dependency ratios and strategic positioning

This morning brought a familiar sight to small towns across dairy country. Pickup trucks lined up at Farm Service Agency offices, farmers catching up on payments delayed by the recent three-week government shutdown.

Watching this scene unfold at our local FSA office, I couldn’t help but wonder… how many of these operations actually know what percentage of their income depends on these government programs?

For every $5 of dairy income, more than one dollar comes from Uncle Sam—not the market. That’s a fundamental shift in how U.S. milk is financed.

After talking with producers from Wisconsin’s rolling hills to the expansive operations in Texas this past week, something interesting is emerging. You know, USDA’s September 2025 Farm Income Forecast shows government payments are projected to make up 22.4% of net farm cash income this year. That’s not just a number—it’s telling us something important about where we are as an industry.

Rosy headlines can’t hide it: only 7.5% of dairy operations are truly profitable without government backing. Most are barely treading water—or actively sinking. The story the industry doesn’t want told.

Understanding Where Different Operations Stand

Had a fascinating conversation at our regional dairy conference last week. Several financial advisors were sharing what they’re seeing across different operations, and honestly, the picture’s more nuanced than you might expect.

Operations Achieving Market Independence

So here’s what’s interesting—when you look at Cornell’s Dairy Farm Business Summary along with data from other land-grant universities, the analysis suggests maybe 5-10% of dairy operations have reached that point where they’re consistently profitable without government support. We’re talking about dairies milking over 1,000 cows with production costs below $18 per hundredweight, or those who’ve successfully tapped into premium markets.

I was talking with a Wisconsin producer last week—runs about 1,800 Holsteins—and his perspective really stuck with me. “For us,” he said, “the government payments are opportunity capital, not survival money. We’re putting everything into genomic testing because even tiny improvements in protein percentage mean six figures at our volume.”

And that’s the thing, isn’t it? These larger operations aren’t using support payments just to keep the lights on. They’re using them to pull further ahead.

The Challenging Middle Ground

Now, based on Farm Credit data from various regions, it appears roughly 60-70% of dairy operations face what consultants are calling a structural challenge. These farms—typically between 200 and 800 cows—are facing production costs in that $20-24 per hundredweight range, according to benchmarking from places like Farm Credit East.

You probably know operations like this. Built their facilities back when the economics looked completely different.

As Mark Stephenson from UW-Madison’s Center for Dairy Profitability points out, they’re often too big for premium niches but too small for real commodity-scale efficiencies.

Think about it this way—imagine a 450-cow operation in Pennsylvania (and there are plenty like this). Without government payments, they might face monthly losses of $6,000. With payments? They break even. But breaking even doesn’t build equity, and it sure doesn’t set up the next generation.

Operations Under Severe Stress

This is the tough part to talk about. Kansas State’s ag economics department analysis, along with other farm management programs, suggests that maybe 20-30% of dairy farms are losing money even with government support.

These operations typically show debt-to-asset ratios over 60%, maxed credit lines… you know the signs.

Financial advisors working with dairy—and they understandably don’t want their names attached to this—tell me about clients who probably should have transitioned out a couple of years back. But the government payments keep them going month to month. It’s less farming at that point and more… well, managing decline.

The Development of Dependency: How We Got Here

From 15% to 56%: Trade wars and stalled Farm Bills turned support into lifelines. Even in 2025, median farm income is negative—subsidy or bust.

The University of Kentucky’s farm management program has been tracking the same group of farms since 2010, providing us with a unique window into how things have developed. Their data shows something remarkable—when government payments dropped in 2014 after the Farm Bill got delayed, net farm income didn’t just dip. It crashed 65% in one year.

By 2019, during all that trade disruption with China, those Kentucky farms were averaging $187,311 in government payments. Here’s what really gets me—that was 56% of their total net farm income. More than half their profitability came from Washington, not from selling milk.

And USDA’s latest Economic Research Service projections? They’re showing median farm income—not average, but median—at negative $1,189 for 2025. That means half of all farms would lose money just from farming. The $89,881 average off-farm income is what’s keeping many families afloat.

Strategic Approaches to Government Support

It’s decision time: Empire, decision-point, or decline? This isn’t just farm math—it’s your family’s future.

What I find really telling is how different operations use these payments. The patterns… they say a lot about who’s likely to be here in ten years.

Land Acquisition Strategies

Several larger producers I know in Idaho and Wisconsin keep careful tabs on neighboring operations. Not to be predatory, but to be ready.

As one explained at a recent field day, “We know who’s retiring, who’s struggling. When opportunities come up, we need to be positioned.”

Iowa State’s Beginning Farmer Center research shows that farmland in distressed sales typically sells for 15-20% less than in planned transitions. The financially strong operations? They know this. They keep cash ready.

Component Quality as Profit Center

Here’s something that’s changed—with cooperatives paying anywhere from 50 cents to over a dollar per hundredweight in component premiums —genetics isn’t just about better cows anymore. It’s a profit center.

Holstein Association USA’s 2025 Genetic Progress Report shows some impressive returns. Say you’ve got 900 cows and you bump protein by 0.08% through genomic selection. Doesn’t sound like much, right? But that could be $100,000 more annually. Pretty solid return on a $25,000-30,000 testing investment.

Technology Investment Discipline

The University of Minnesota’s dairy program research shows that successful operations won’t touch technology unless the projected ROI is at least 15%. That’s become kind of a benchmark.

Take robotic feed pushers—about $30,000. They eliminate a part-time position, improve feed efficiency. Wisconsin producers I know are seeing 60% first-year returns when you combine labor savings with better feed conversion.

Compare that to operations using government payments for emergency repairs on old equipment. Two different philosophies entirely.

The Financial Planning Reality Check

This is where that $6,250 monthly figure from our headline comes into focus. Cornell economists Loren Tauer and Christopher Wolf have done extensive work on farm exit timing, and their framework reveals exactly how each month of losses converts retirement security into operating capital.

Every month in the red eats away $6,250 in future income. Five years lost = $375,000 gone, $15,000 less for retirement—year after year after year.

Let me walk you through what this might look like for a typical 400-cow operation. Say you’ve got $1.5 million in equity right now. If you’re losing $75,000 annually without government payments, in five years you’re down to $1.125 million.

At a conservative 4% return, that’s $15,000 less annual retirement income. Forever.

As Dr. Tauer explained at a recent conference, “Every month of operating losses essentially converts $6,250 of retirement savings into operating capital.”

What concerns many of us in extension is how few producers have actually run these numbers. We don’t have comprehensive survey data, but informal polls at producer meetings suggest it’s pretty rare.

Your Quick Equity Assessment

Here’s the calculation to run tonight:

  1. Total assets (land, cattle, equipment): $_____
  2. Subtract all debts: $_____
  3. Current equity = #1 – #2: $_____
  4. Annual result without government payments: $_____
  5. Monthly impact = #4 ÷ 12: $_____
  6. Five-year projection = #4 × 5: $_____
  7. Retirement income impact (at 4%) = #6 × 0.04: $_____

Takes ten minutes. Could change your whole strategy.

“These payments don’t solve challenges—they reveal them. The question is how we use that information.” — Gary Sipiorski, Dairy Financial Consultant

International Comparisons: Why They’re Tricky

FactorsNew Zealand (1984)United States (2025)Advantage
Infrastructure Cost per Cow$500-1,000$4,000-7,000NZ by 7X
Avg Debt-to-Asset Ratio20-30%43% (avg), 60%+ (struggling)NZ by 2X
System TypePasture-basedConfinementNZ – flexible
Average Herd Size125 cows337 cows (70% from 5% of farms)US – more scale
Farm Count (1984/2025)~16,000~31,000US has more
Impact of Subsidy Removal~800 farms lost (1%)Unknown – catastrophic riskNZ – survived
Capital IntensityLowExtremeNZ – adaptable

Everyone brings up New Zealand’s 1984 subsidy elimination, but… the comparison’s challenging when you look closer.

New Zealand had about 16,000 dairy farms averaging 125 cows on pasture. Infrastructure investment was minimal—maybe $500-1,000 per cow. Debt-to-asset ratios typically ran 20-30%.

When subsidies ended overnight, about 800 farms faced forced sales. That’s roughly 1% of all their agricultural operations.

Now look at us:

  • USDA Census data shows: 70% of our milk comes from just 5% of farms
  • Infrastructure requirements: Modern confinement facilities need $4,000-7,000 per cow
  • Debt levels: Farm Credit analysis shows average debt-to-asset ratios around 43%, with struggling operations often over 60%

As Mark Stephenson from UW-Madison thoughtfully puts it, “Comparing New Zealand’s pasture system to our capital-intensive model is like comparing a bicycle to a freight train—both move, but the physics are completely different.”

Processing Capacity and Infrastructure Challenges

Here’s what adds complexity—the International Dairy Foods Association reports over $11 billion in new processing capacity under construction.

Major investments include:

  • Fairlife’s $650 million New York facility
  • Chobani’s $1.2 billion expansion
  • Multiple Texas projects from Leprino, Great Lakes Cheese, and others

All these investments assume milk supply stays stable. But if support programs changed dramatically and even 10,000 farms exited quickly? Several economists think that’s actually conservative. You’d have massive overcapacity issues.

Remember Dean Foods in 2019? Fifty-four plants, thousands of affected farms. The whole system shuddered until Dairy Farmers of America stepped in. That showed us how vulnerable the supply chain can be.

Regional Cost Variations That Matter

Geography really matters in this business. Farm Credit data from different regions shows distinct patterns worth understanding.

Northeast and Upper Midwest:

  • Production costs: $22-24 per hundredweight (Farm Credit East benchmarking)
  • Challenge: Developed when transportation limits created natural market protection
  • Reality: That advantage is long gone

Southwest (Texas and New Mexico):

  • Production costs: $19-21 per hundredweight (regional studies)
  • Challenge: Water access and environmental compliance eat up cost advantages
  • Critical issue: Ogallala Aquifer depletion forcing hard conversations

West Coast (California and Idaho):

  • Production costs: $16-18 per hundredweight for efficient operations (UC Davis cost studies)
  • Advantage: Geography plus scale creates a competitive position
  • Result: Clearest path to subsidy independence

Special Considerations for Different Farm Types

Smaller Operations (Under 200 cows)

Operations under 200 cows face particular challenges. Vermont extension data talks about a “triple squeeze”:

  • Not enough scale for commodity competition
  • Limited premium market access
  • Old infrastructure is uneconomical to modernize

Some smaller farms make it work through creative differentiation—farmstead cheese, agritourism, direct sales. But as economists point out, these require different skills and serve limited markets.

Value-Added Operations

Farms with existing value-added enterprises have more flexibility. These operations might use government payments to expand processing capacity or improve visitor facilities rather than covering operating losses.

It’s a different strategic position entirely.

Beginning Farmers

Young farmers entering now face unique challenges:

  • Land prices assume subsidies continue
  • Competition from operations with decades of equity
  • Making 30-year decisions without 5-year policy certainty

One recent dairy science graduate told me, “I run three scenarios—continued support, reduced support, no support. The spread between outcomes is huge.” That uncertainty makes traditional planning incredibly difficult.

Emerging Opportunities Worth Watching

Despite everything, there are some interesting developments.

The Innovation Center for U.S. Dairy’s 2025 report shows that carbon credits can generate $15-50 per cow annually for early adopters. Not game-changing yet, but it’s market-based income that doesn’t depend on politics.

Your processor relationship matters more than ever, too. Research on cooperative marketing shows that members typically get slightly lower prices, with much less volatility—often 40% less. When stability comes from government payments, that trade-off’s worth considering.

Practical Next Steps for Different Situations

If you’re already profitable without support: Use these payments strategically. Accelerate genetic programs with proven returns. Position for land acquisition at the right prices. Build processor relationships. But keep that 15% ROI discipline on technology.

If you’re in that structural challenge category: You’ve got decisions ahead. Can you realistically hit efficient scale? Are premium markets actually accessible with committed buyers? Would technology substantially cut labor costs?

Tough questions, but necessary ones.

If you’re struggling even with support: Time matters. Each month affects retirement security. Good agricultural financial advisors can help evaluate options while you still have them.

Resources to Help You Plan

Want to dig deeper? Here are specific tools that can help:

  • Cornell’s Dairy Farm Business Summary – Provides detailed benchmarking data (contact your local Cornell Cooperative Extension)
  • Penn State’s Center for Dairy Excellence – Offers free financial analysis tools, including FINPACK
  • University of Wisconsin’s Center for Dairy Profitability – Has online planning tools and consultants
  • Your local FSA office Can provide your operation’s historical payment data and dependency trends
  • Farm Credit associations – Many offer free financial planning consultations to members

Most land-grant universities have dairy specialists who can help run scenarios specific to your situation. Don’t hesitate to reach out—that’s what they’re there for.

Looking Forward with Clear Eyes

Those government payments flowing from reopened FSA offices mean different things to different operations. For some, it’s growth capital. For others, maybe a window for strategic transition while preserving equity.

With a dependency rate of 22.4% according to USDA, massive processing investments assuming stable supply, and ongoing political discussions about support… the planning environment keeps evolving.

Operations that honestly assess where they are—not where they wish they were—and act thoughtfully will likely be better positioned regardless of policy changes.

The calculations take maybe twenty minutes with good numbers. That time investment might provide more strategic value than months of hoping things improve. The question is whether we’ll do the analysis while options exist or wait until circumstances force decisions.

You know, driving through dairy country each day, passing farms that’ve operated for generations… these aren’t easy conversations. But agriculture has always evolved. What worked before might need adjustment for what’s coming.

Acknowledging that reality, while difficult, serves everyone better than avoiding it.

The support payments are arriving. The strategic questions remain. And the decisions—well, those belong to each operation based on their unique circumstances, goals, and honest assessment of where they stand in today’s dairy economy.

What’s clear is that understanding your true financial position—including that monthly equity impact—gives you the power to make informed choices rather than having them made for you.

And in this business, that might make all the difference.

Key Takeaways:

  • Your Monthly Reality: Every month you operate at a loss burns $6,250 of retirement income—that’s $375,000 over five years you’ll never recover
  • The 90% Problem: Only 1 in 10 dairy operations is genuinely profitable without government support; everyone else is either treading water (60-70%) or actively sinking (20-30%)
  • The Investment vs. Survival Test: Operations that’ll exist in 2035 use government payments for genetics, technology, and land acquisition—not monthly bills
  • The $11 Billion Question: Processors are betting massive capital on milk supply that depends entirely on political decisions—if payments end, who supplies that milk?
  • Your Next 10 Minutes: Use our seven-step equity calculation tonight—it’s the difference between knowing your position and discovering it when it’s too late


Complete references and supporting documentation are available upon request by contacting the editorial team at editor@thebullvine.com.

Learn More:

  • Pick Your Lane or Perish: The 18-Month Ultimatum Facing 800-1500 Cow Dairies – This critical guide targets the 60-70% of operations stuck in the middle ground, providing a concrete 18-month deadline and methods to optimize either for commodity scale or premium specialization. It directly supports the strategic decisions required to stop converting equity into operating losses.
  • AI and Precision Tech: What’s Actually Changing the Game for Dairy Farms in 2025? – Discover the real-world ROI of key technologies like precision feeding and automated health monitoring, which promise 2-4 year payback and up to $500 per cow in savings. This article provides the necessary financial benchmarks to invest government payments strategically for immediate, measurable efficiency gains.
  • Global Dairy Outlook 2025: Navigating a Buyer’s Market – Extend your strategic planning beyond domestic policy by understanding how international trade, tariffs, and global milk consumption trends are shaping prices in 2025. This analysis is vital for assessing the $11 billion processing bet and determining your long-term market risk exposure.

The Sunday Read Dairy Professionals Don’t Skip.

Every week, thousands of producers, breeders, and industry insiders open Bullvine Weekly for genetics insights, market shifts, and profit strategies they won’t find anywhere else. One email. Five minutes. Smarter decisions all week.

NewsSubscribe
First
Last
Consent
Send this to a friend