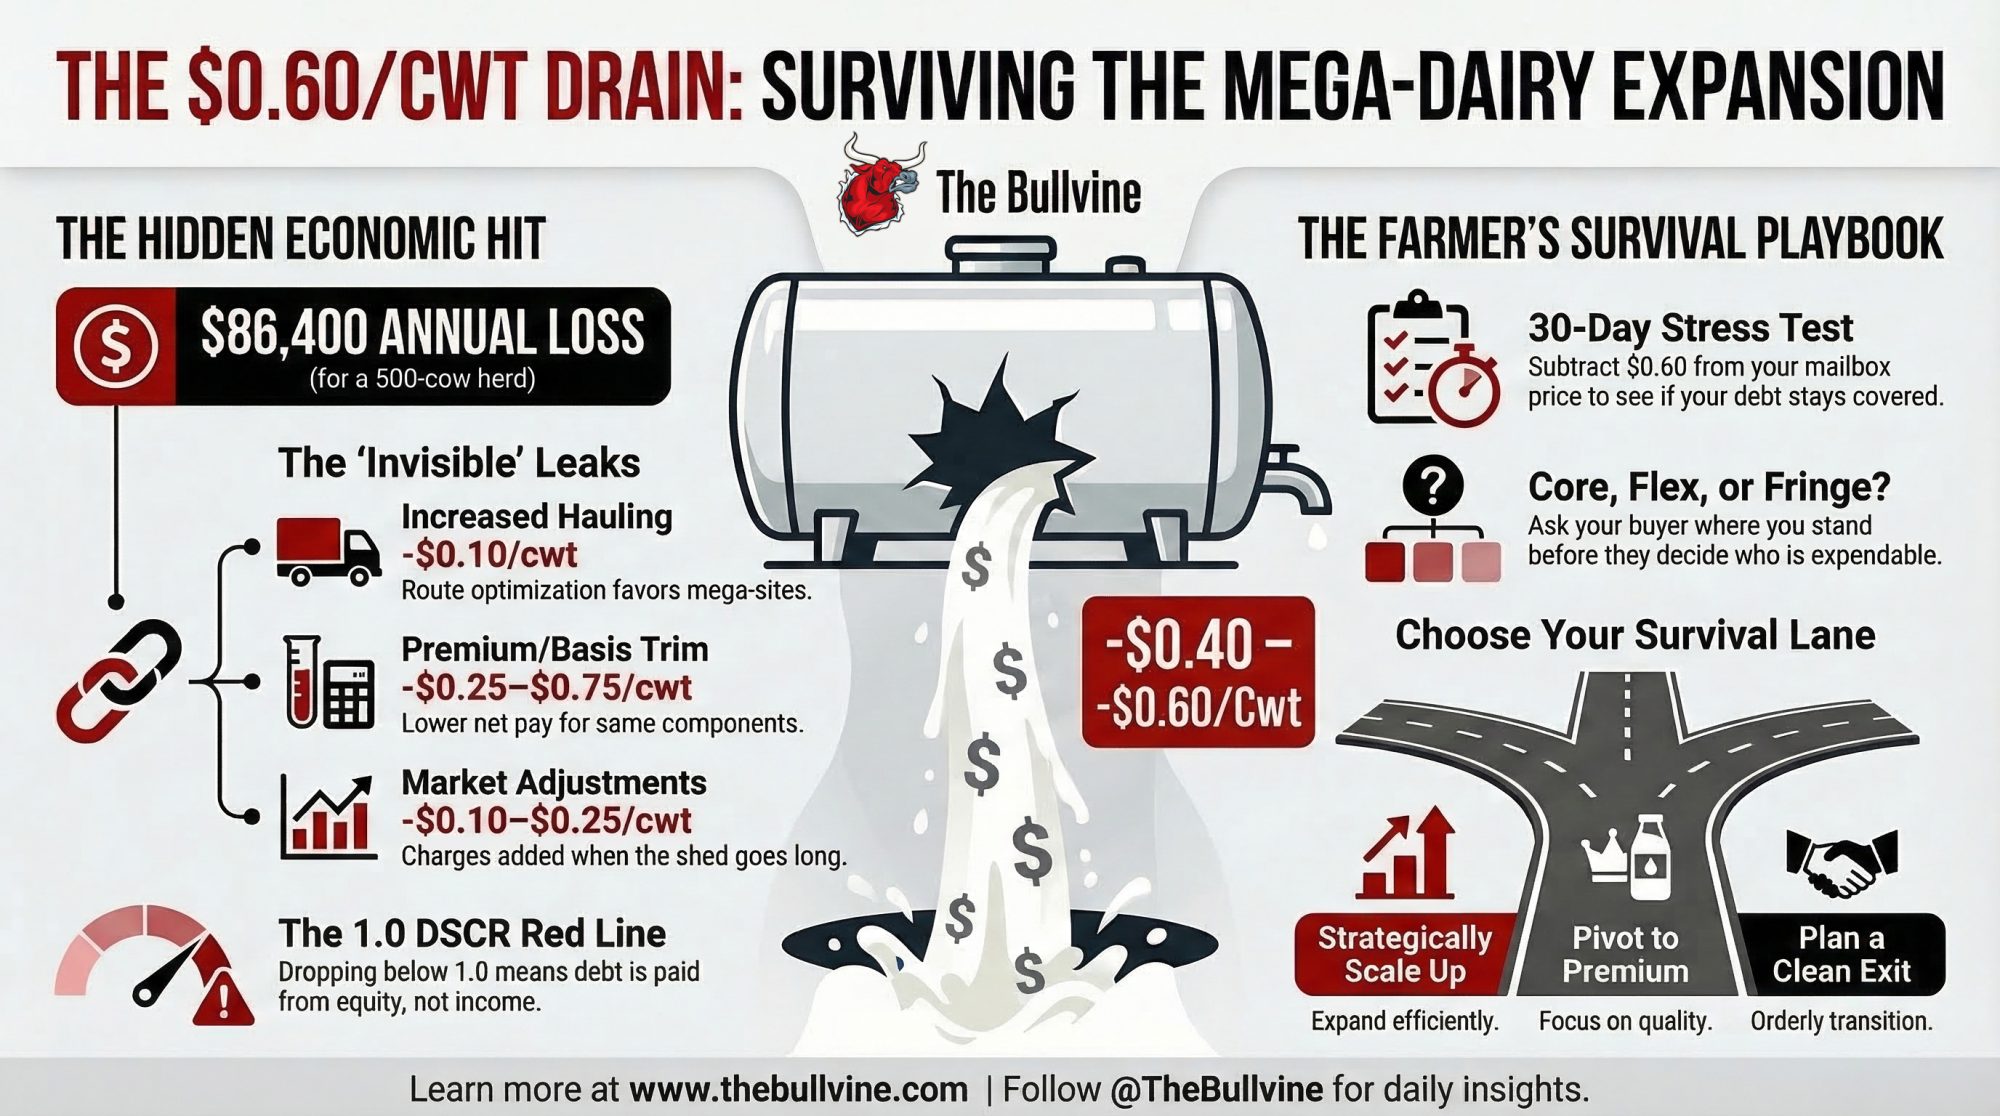
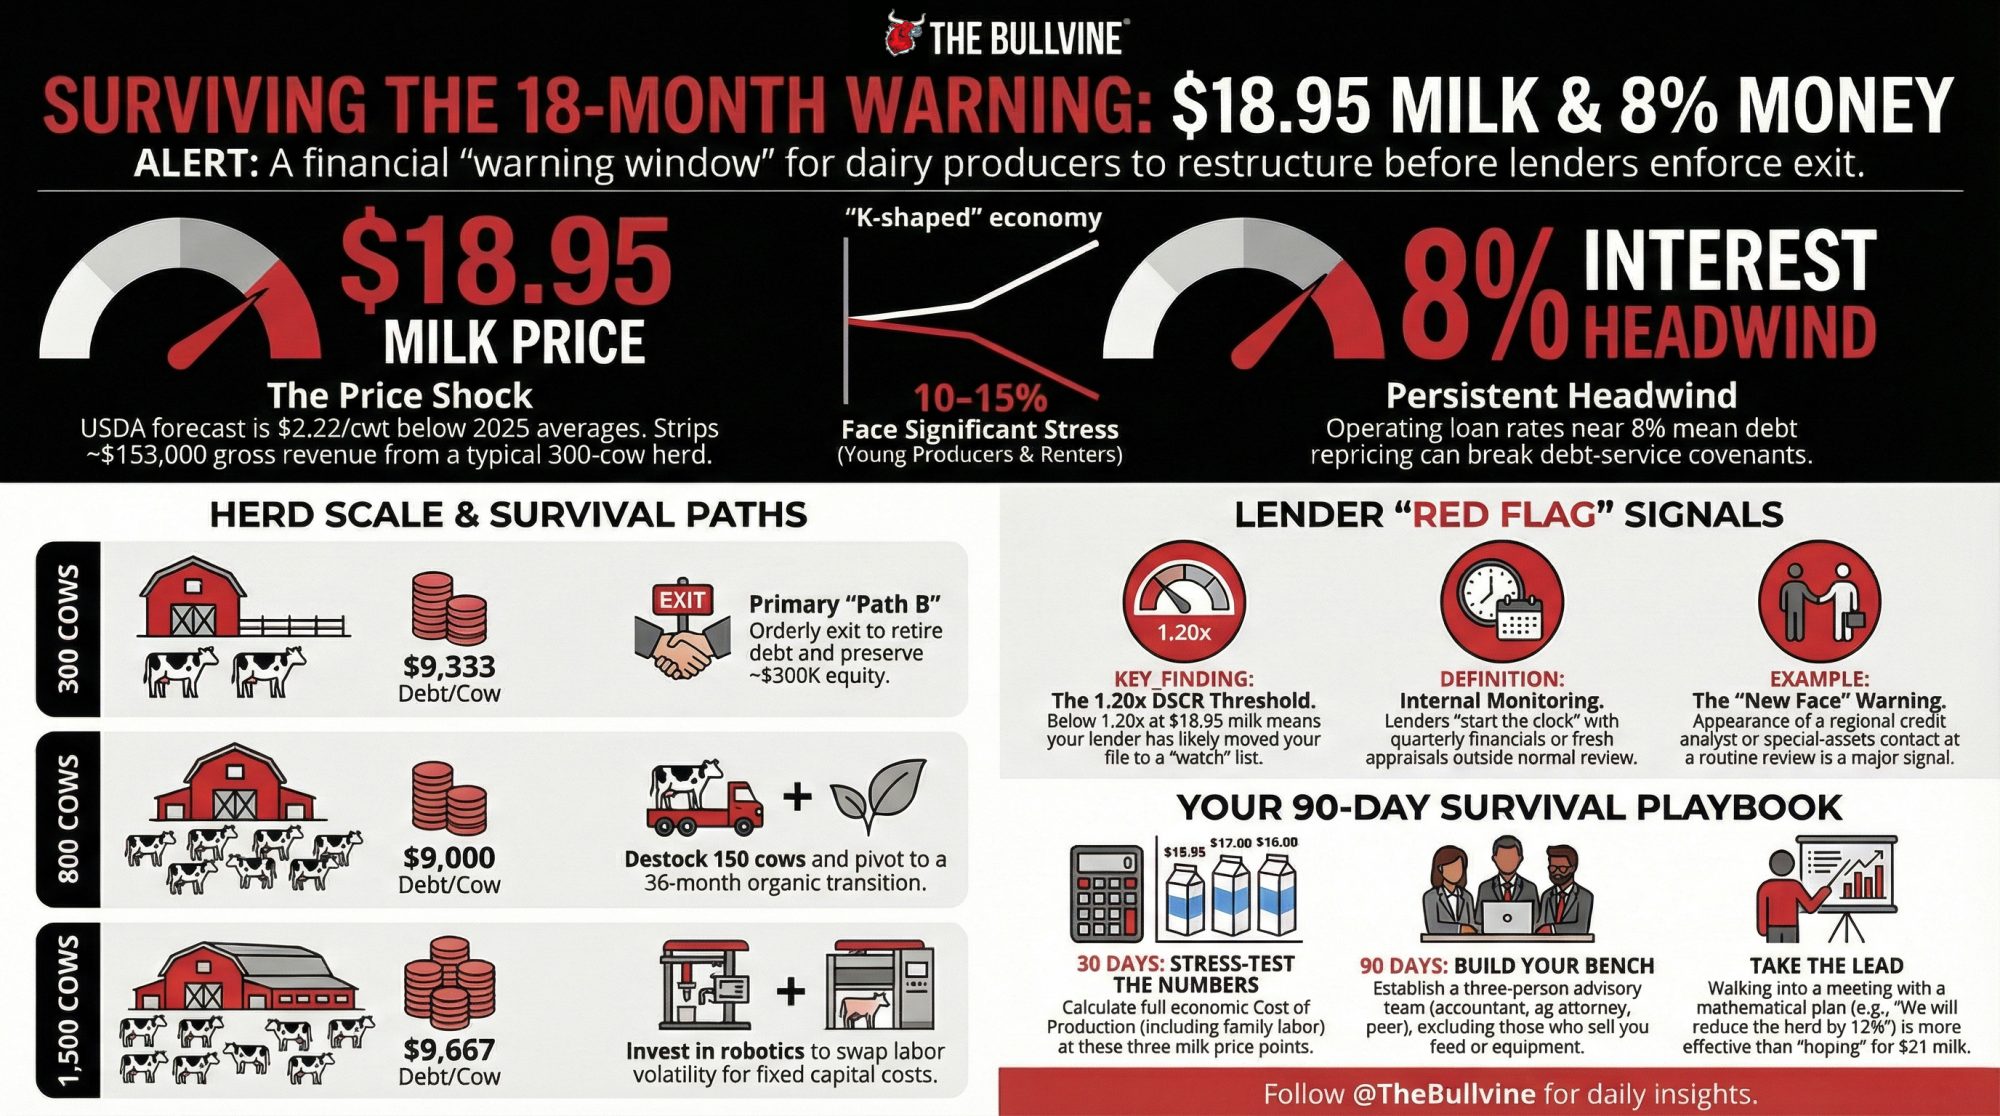
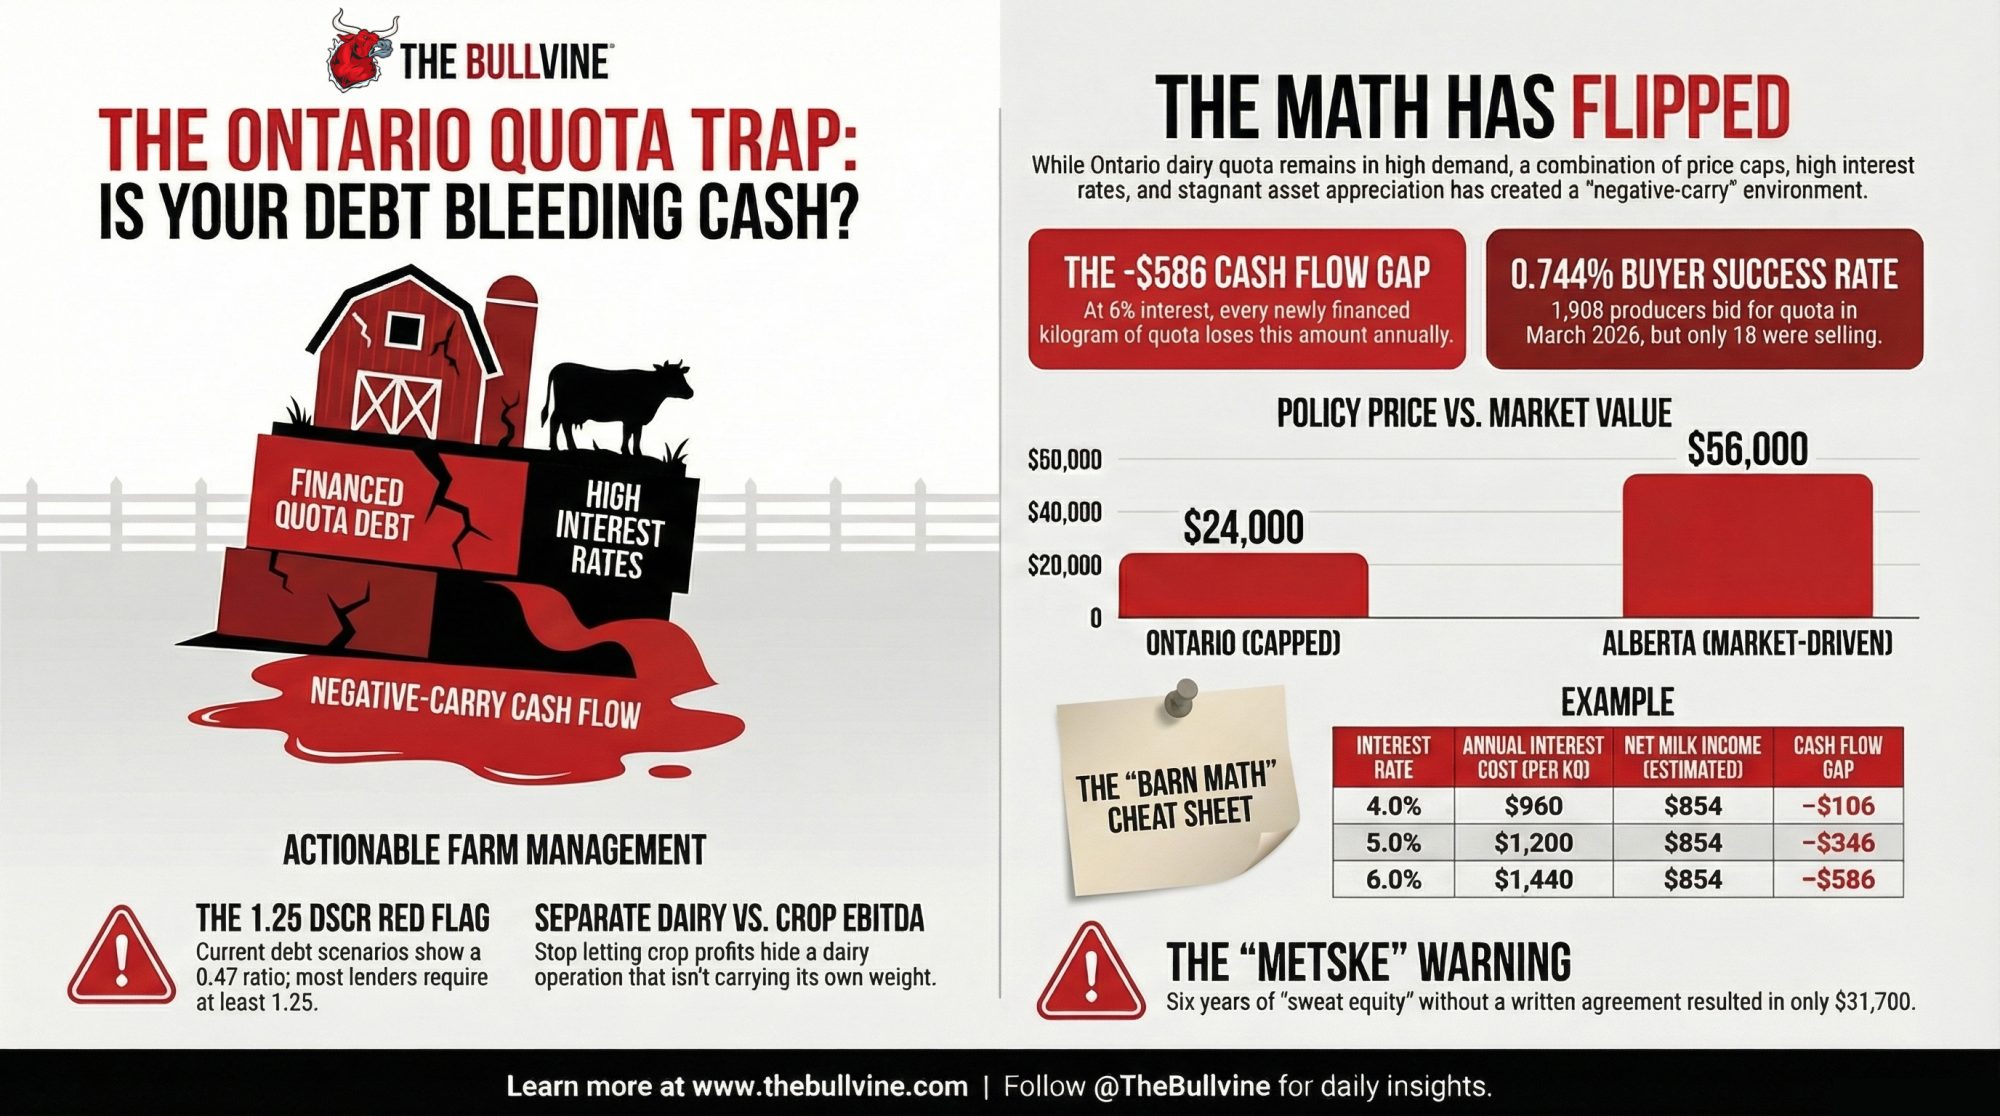
In March, 1,908 Ontario producers bid on quota. Only 190.60 kg traded. Every financed kilogram lost $586 at 6%. The math has flipped — and most farms haven’t noticed yet.
Tim and Amanda Metske ran daily operations on their parents’ 152‑acre Ontario dairy from 2012 to 2018. They invested in quota and cows during those years, working under a family understanding that they’d eventually buy the farm on favourable terms. Martin Metske had discussed a combined price of roughly $2 million — $1 million for the quota, $1 million for the land. But no purchase price, payment terms, or financing structure were ever committed to writing.
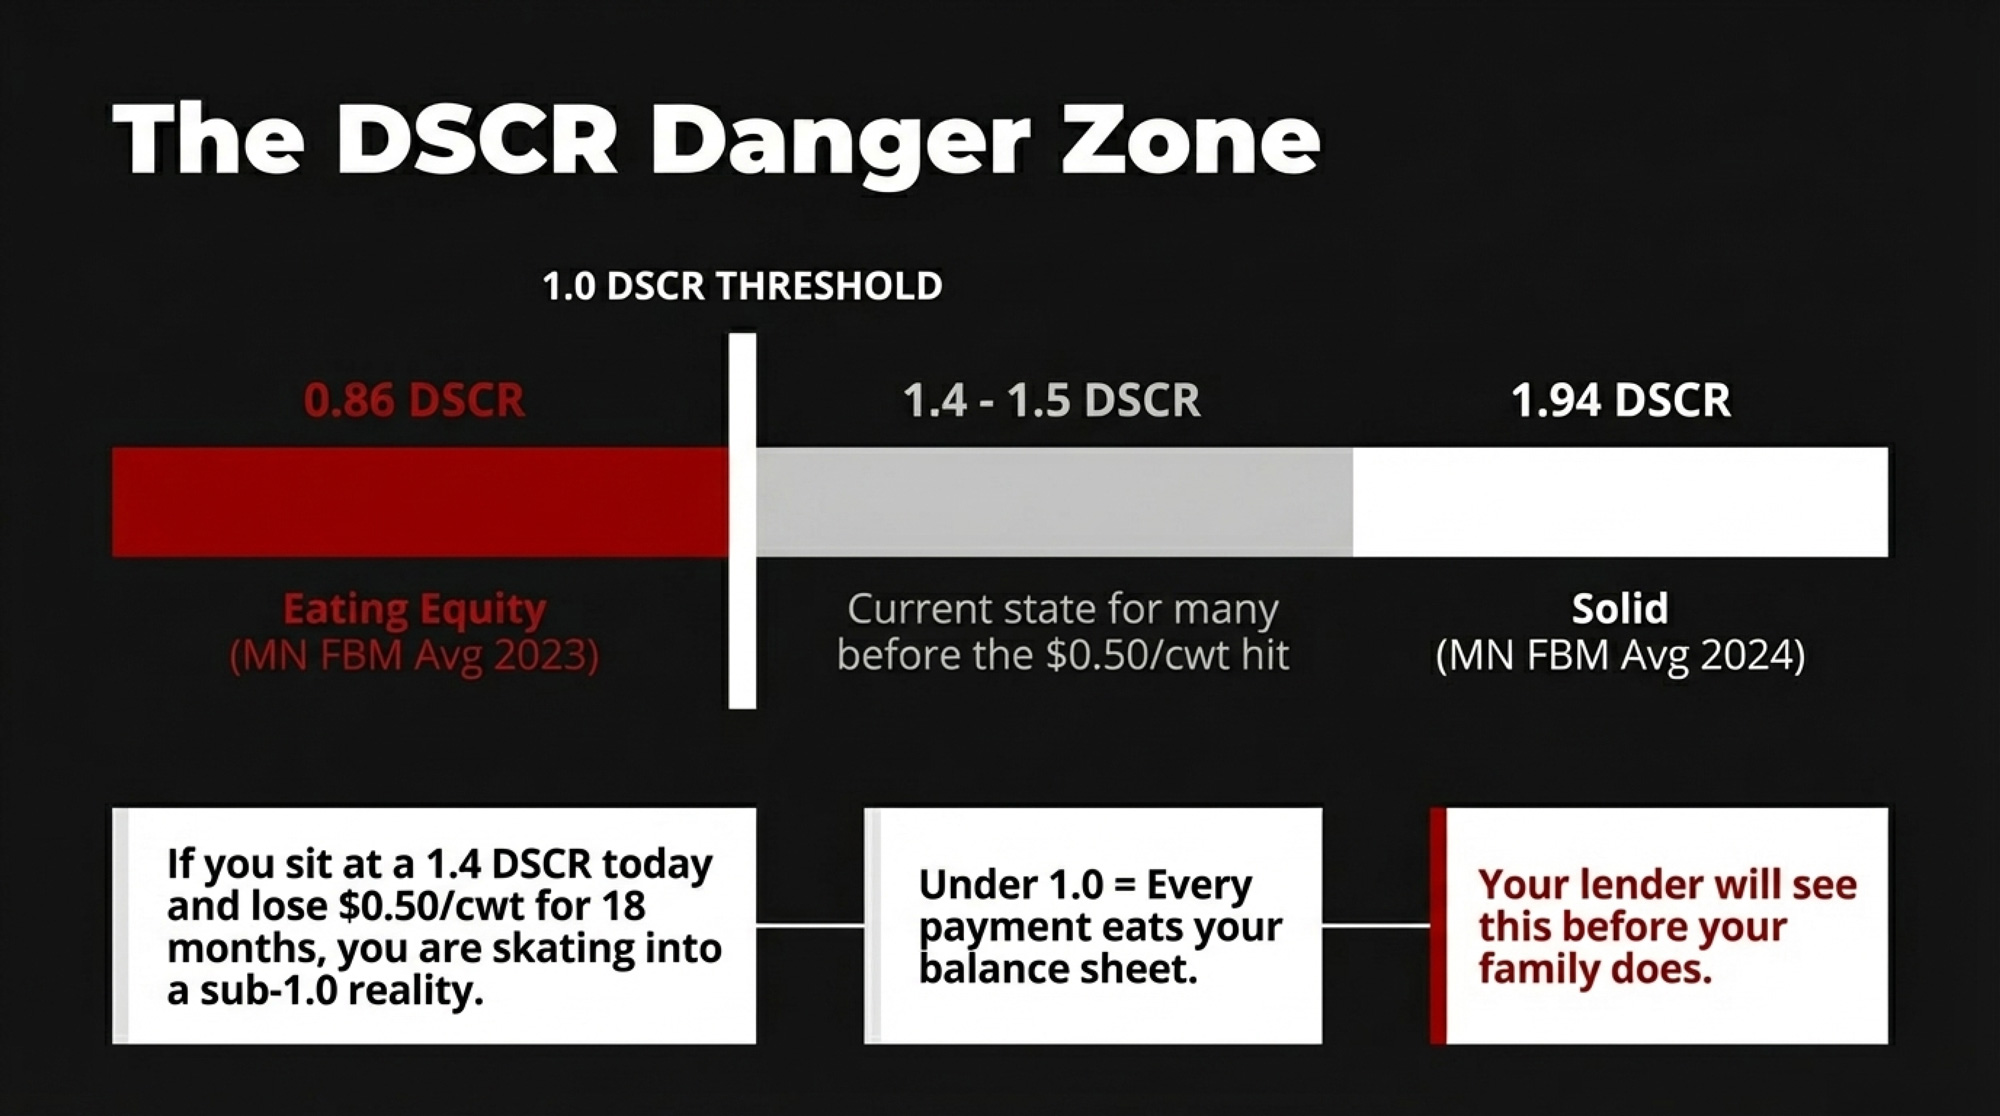
When it fell apart, the Ontario Court of Appeal — in Metske v. Metske, 2025 ONCA 418 — awarded $33,700 for tangible improvements, then subtracted a $2,000 counterclaim. Net recovery: $31,700. Six years on a 152‑acre operation carrying millions in Ontario dairy quota, and the court valued the tangible result at less than one kilogram of Alberta quota is worth today.
That number matters well beyond one family. It shows how fast sweat equity evaporates on a farm where the P5 quota cap fixes the single largest asset at $24,000 per kilogram of butterfat per day — a policy number, not a market number. And right now, the math on buying that asset has quietly turned against anyone carrying debt on it.
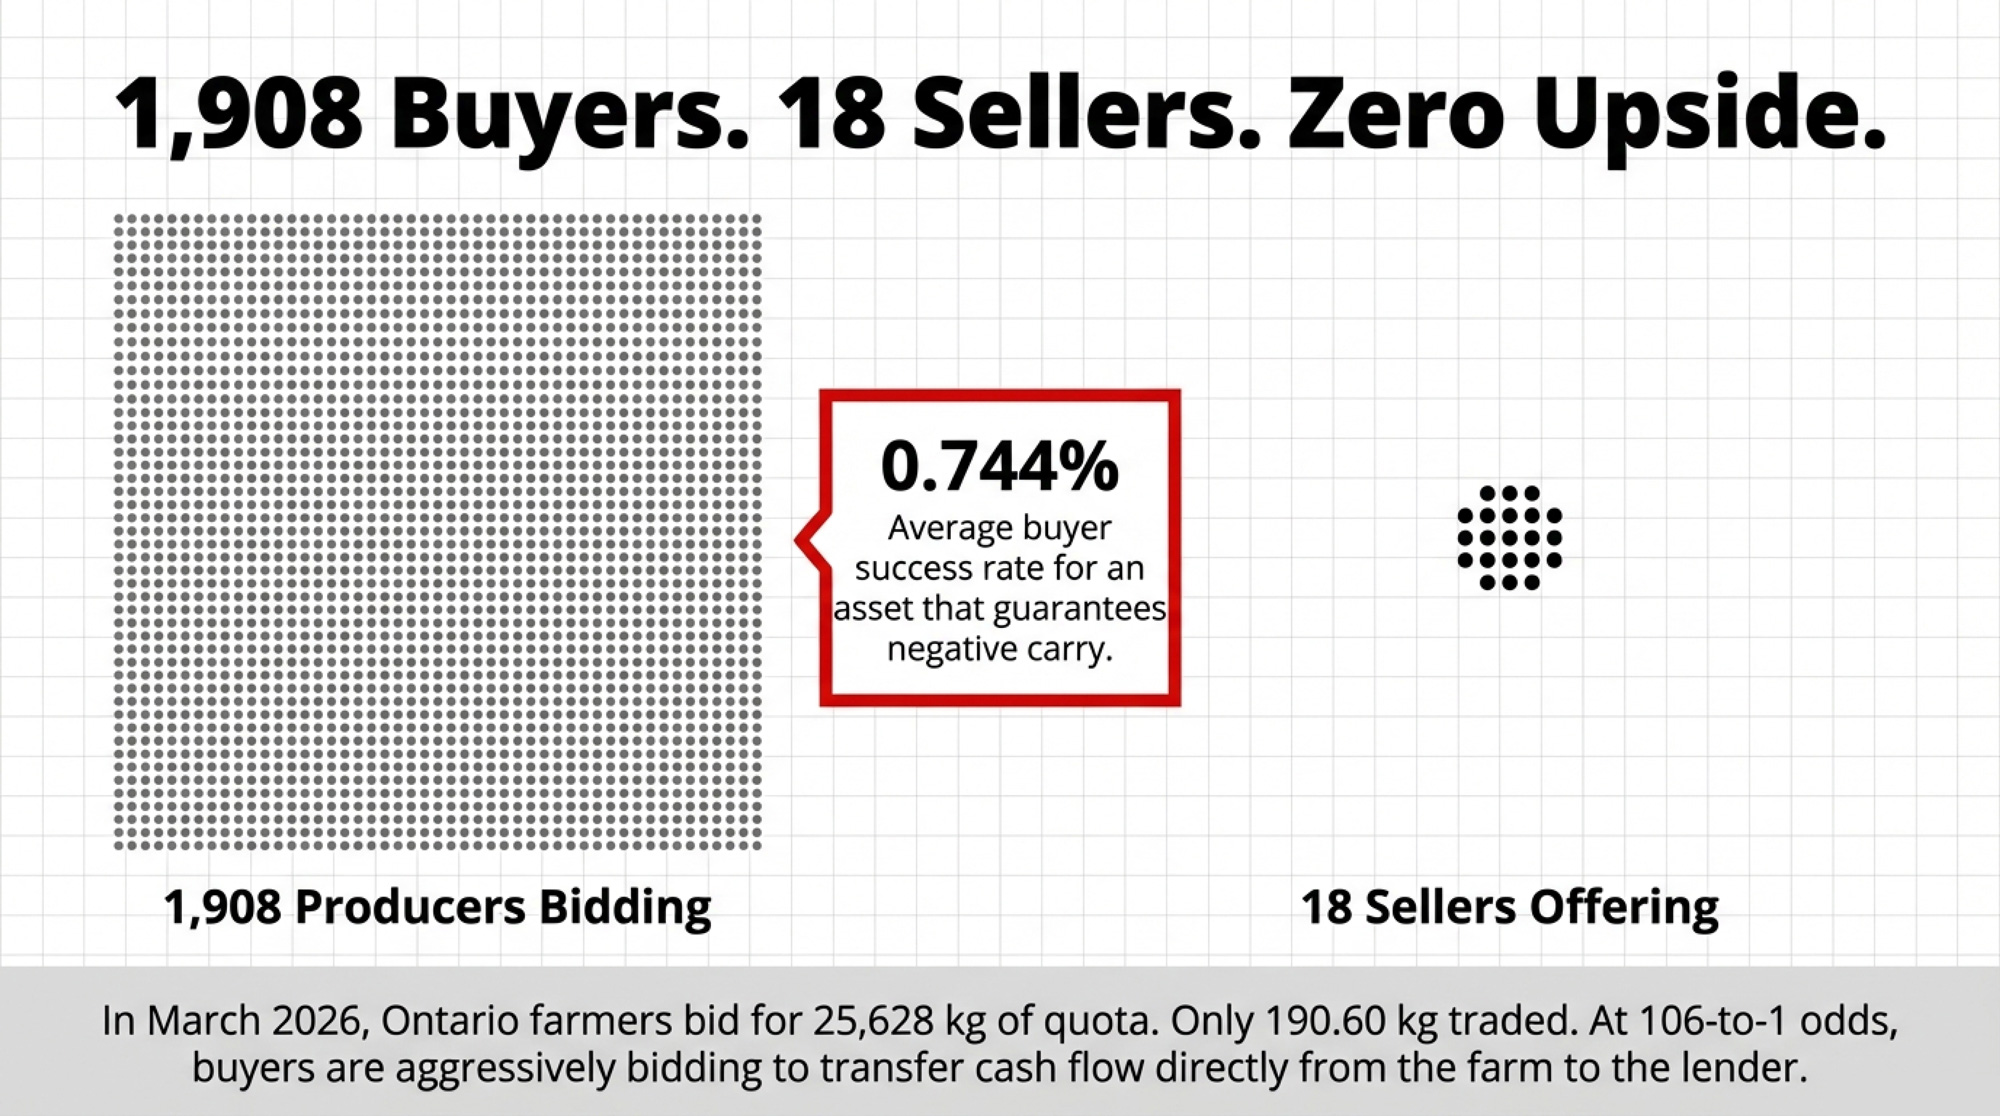
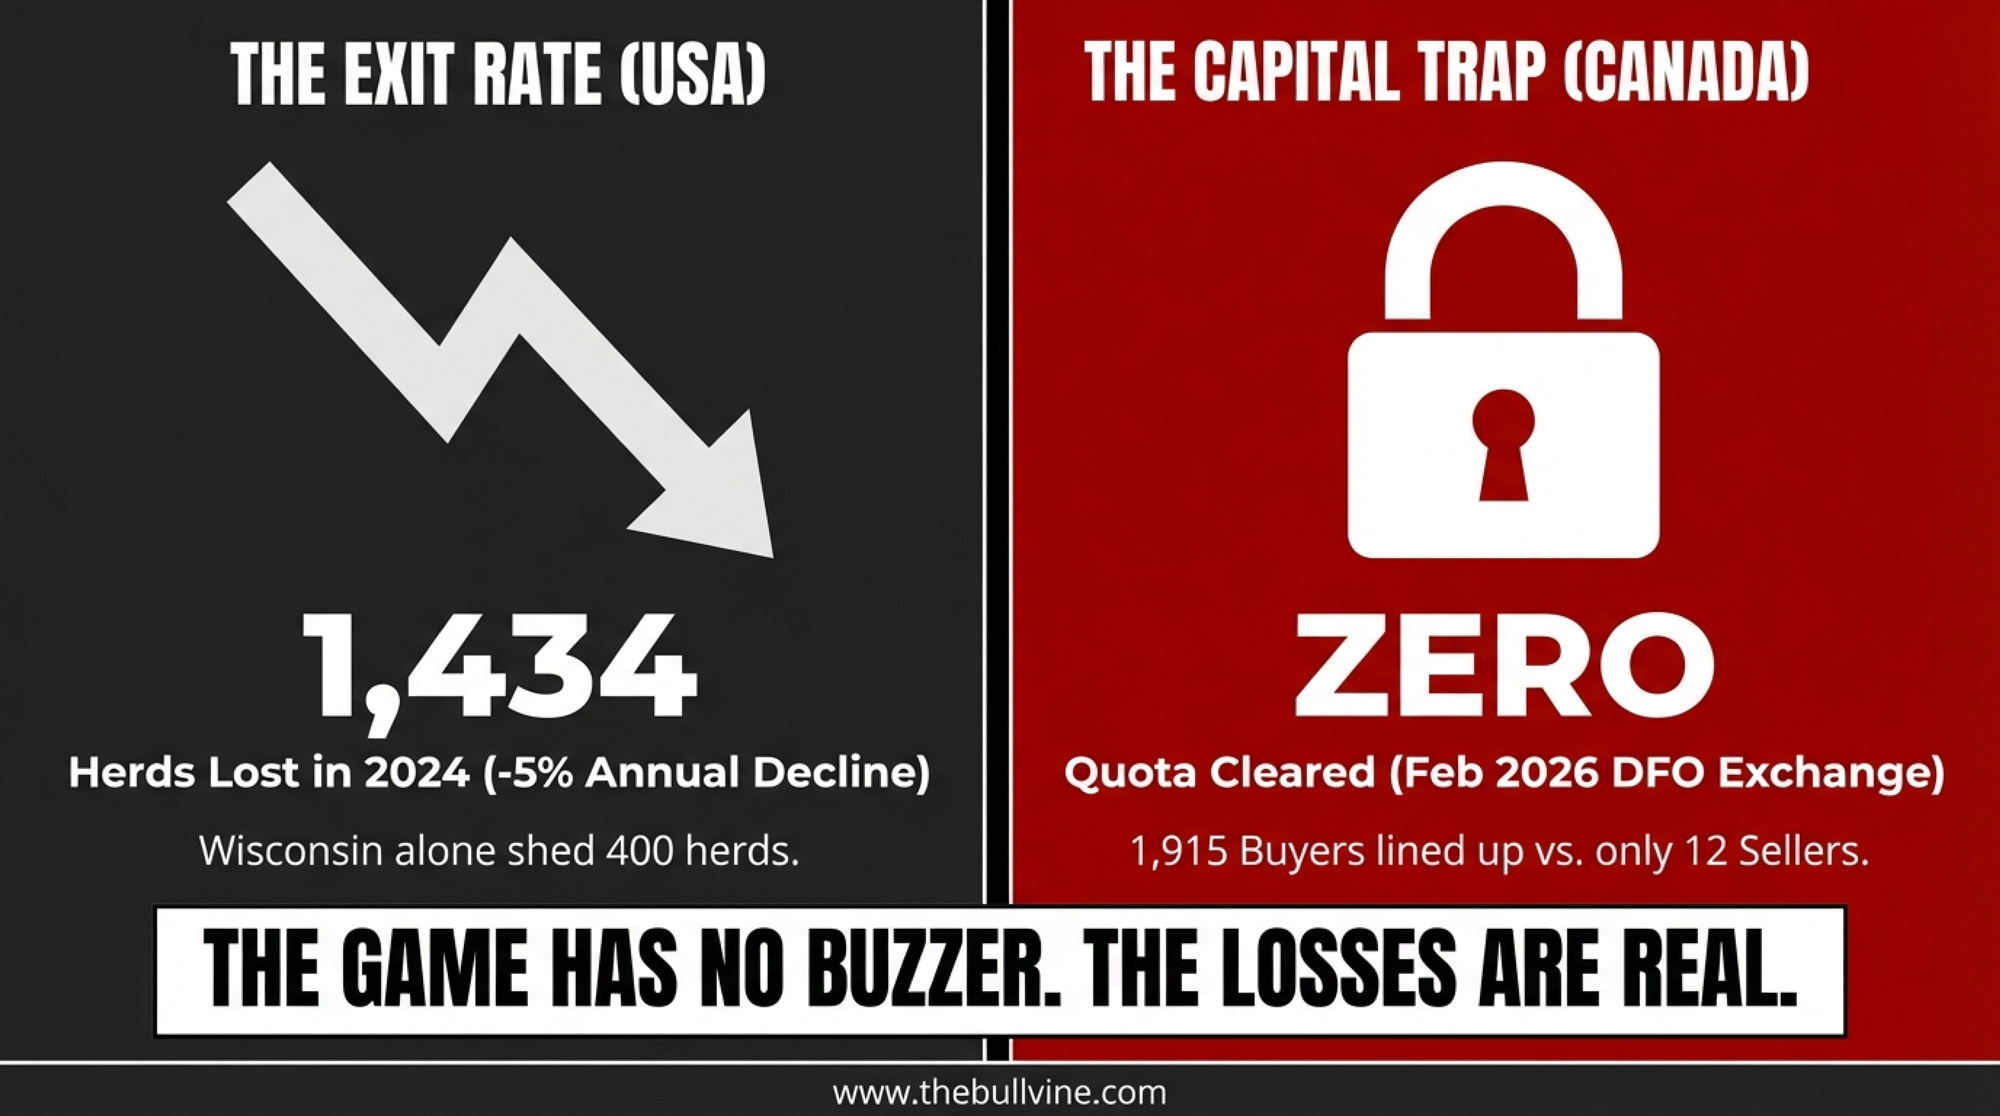
1,908 Buyers. 18 Sellers. Zero Upside.
On March 19, 2026, Dairy Farmers of Ontario released the monthly quota exchange results. The numbers are stark: 1,908 producers placed bids to buy. Just 18 offered quota for sale. All kilograms cleared at the $24,000 cap. Of the 25,628 kg bid by buyers, only 190.60 kg actually traded — what DFO’s own summary calls a “0.744% average buyer success rate.”
A month earlier, it was worse. On the February exchange, 1,915 producers tried to buy. DFO needed 191.40 kg to run even the first allotment round, but only 129.27 kg was offered. The exchange was cancelled outright. Not a single kilogram changed hands.
At roughly 106‑to‑1 by producer count, Ontario farmers are bidding into a market where each newly financed kilogram loses about $586 a year at current rates. That’s not building equity. It’s transferring cash flow from the farm to the lender.
Why Ontario Quota Stopped Growing Your Wealth
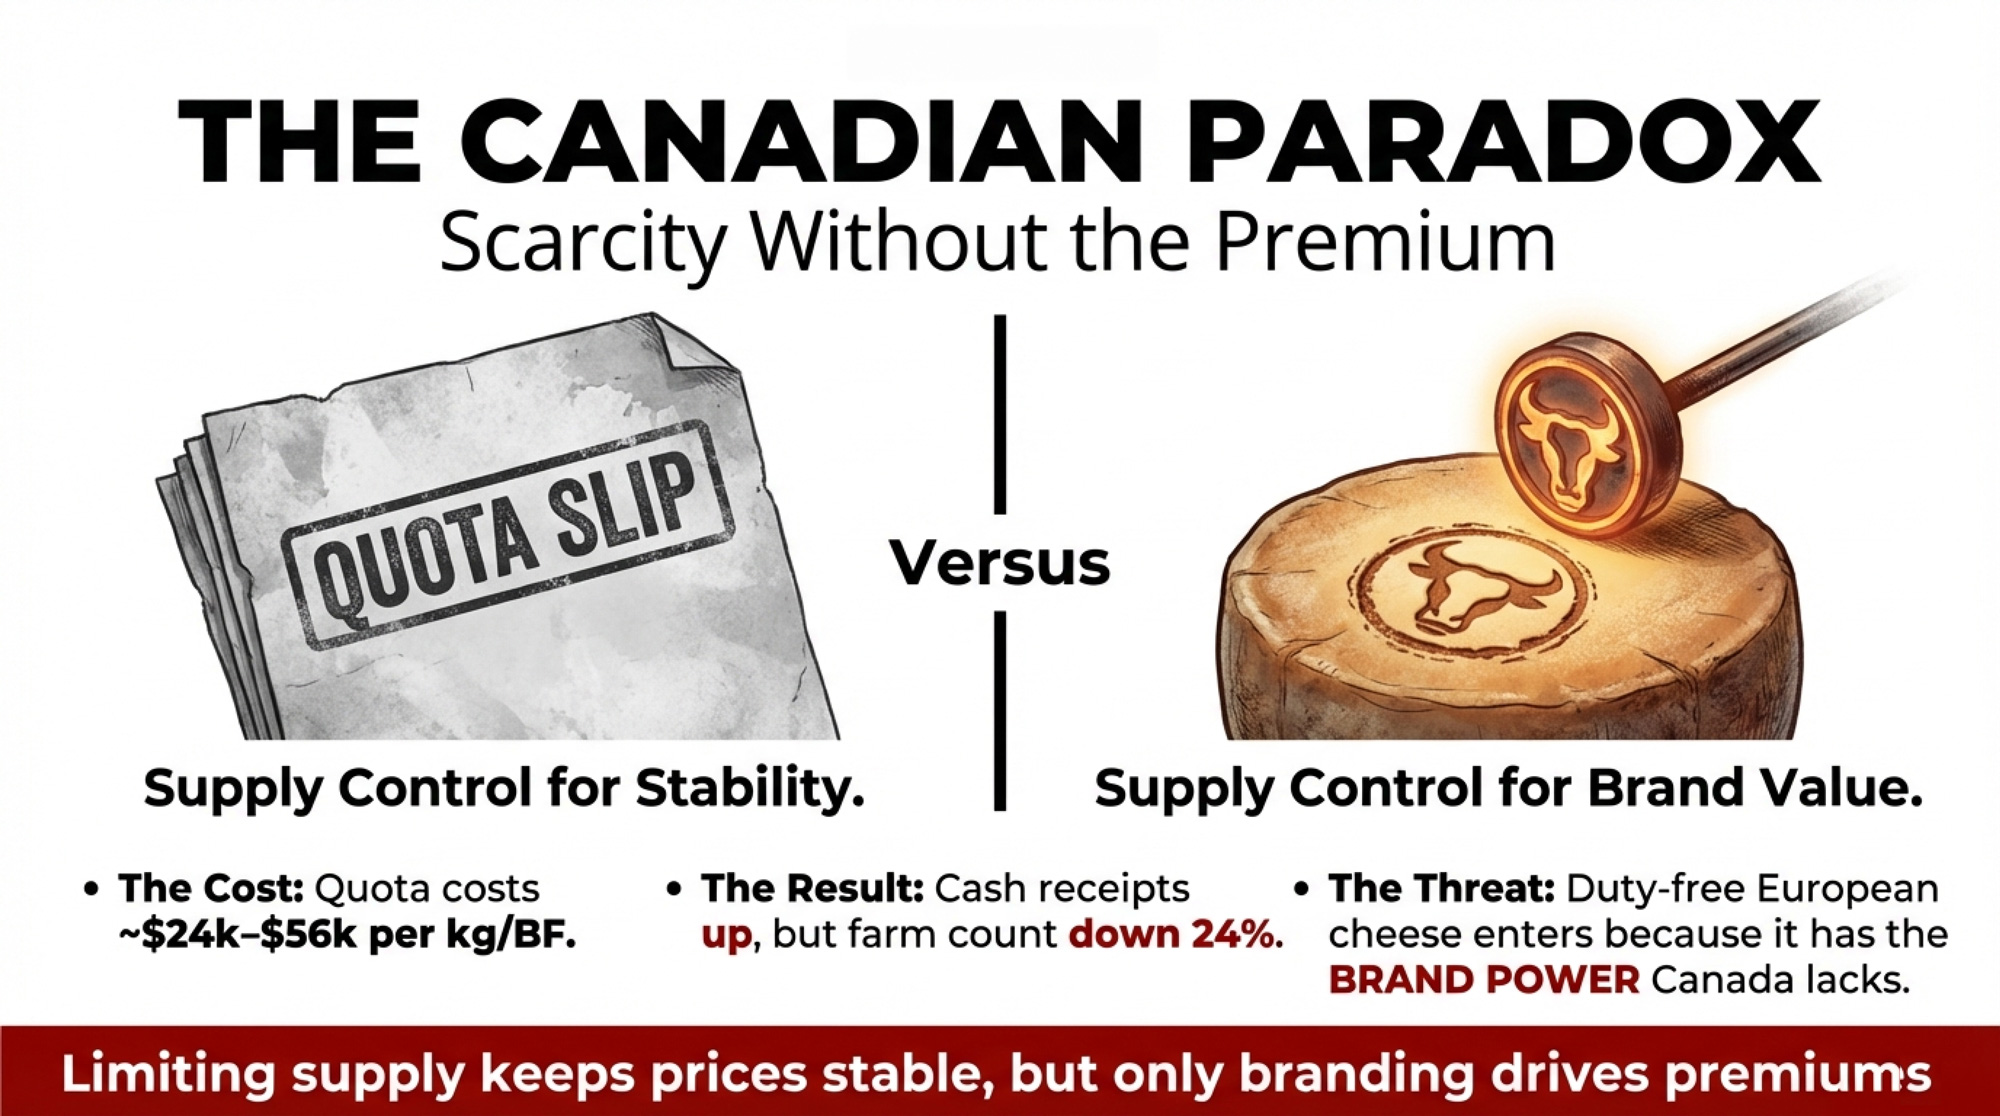
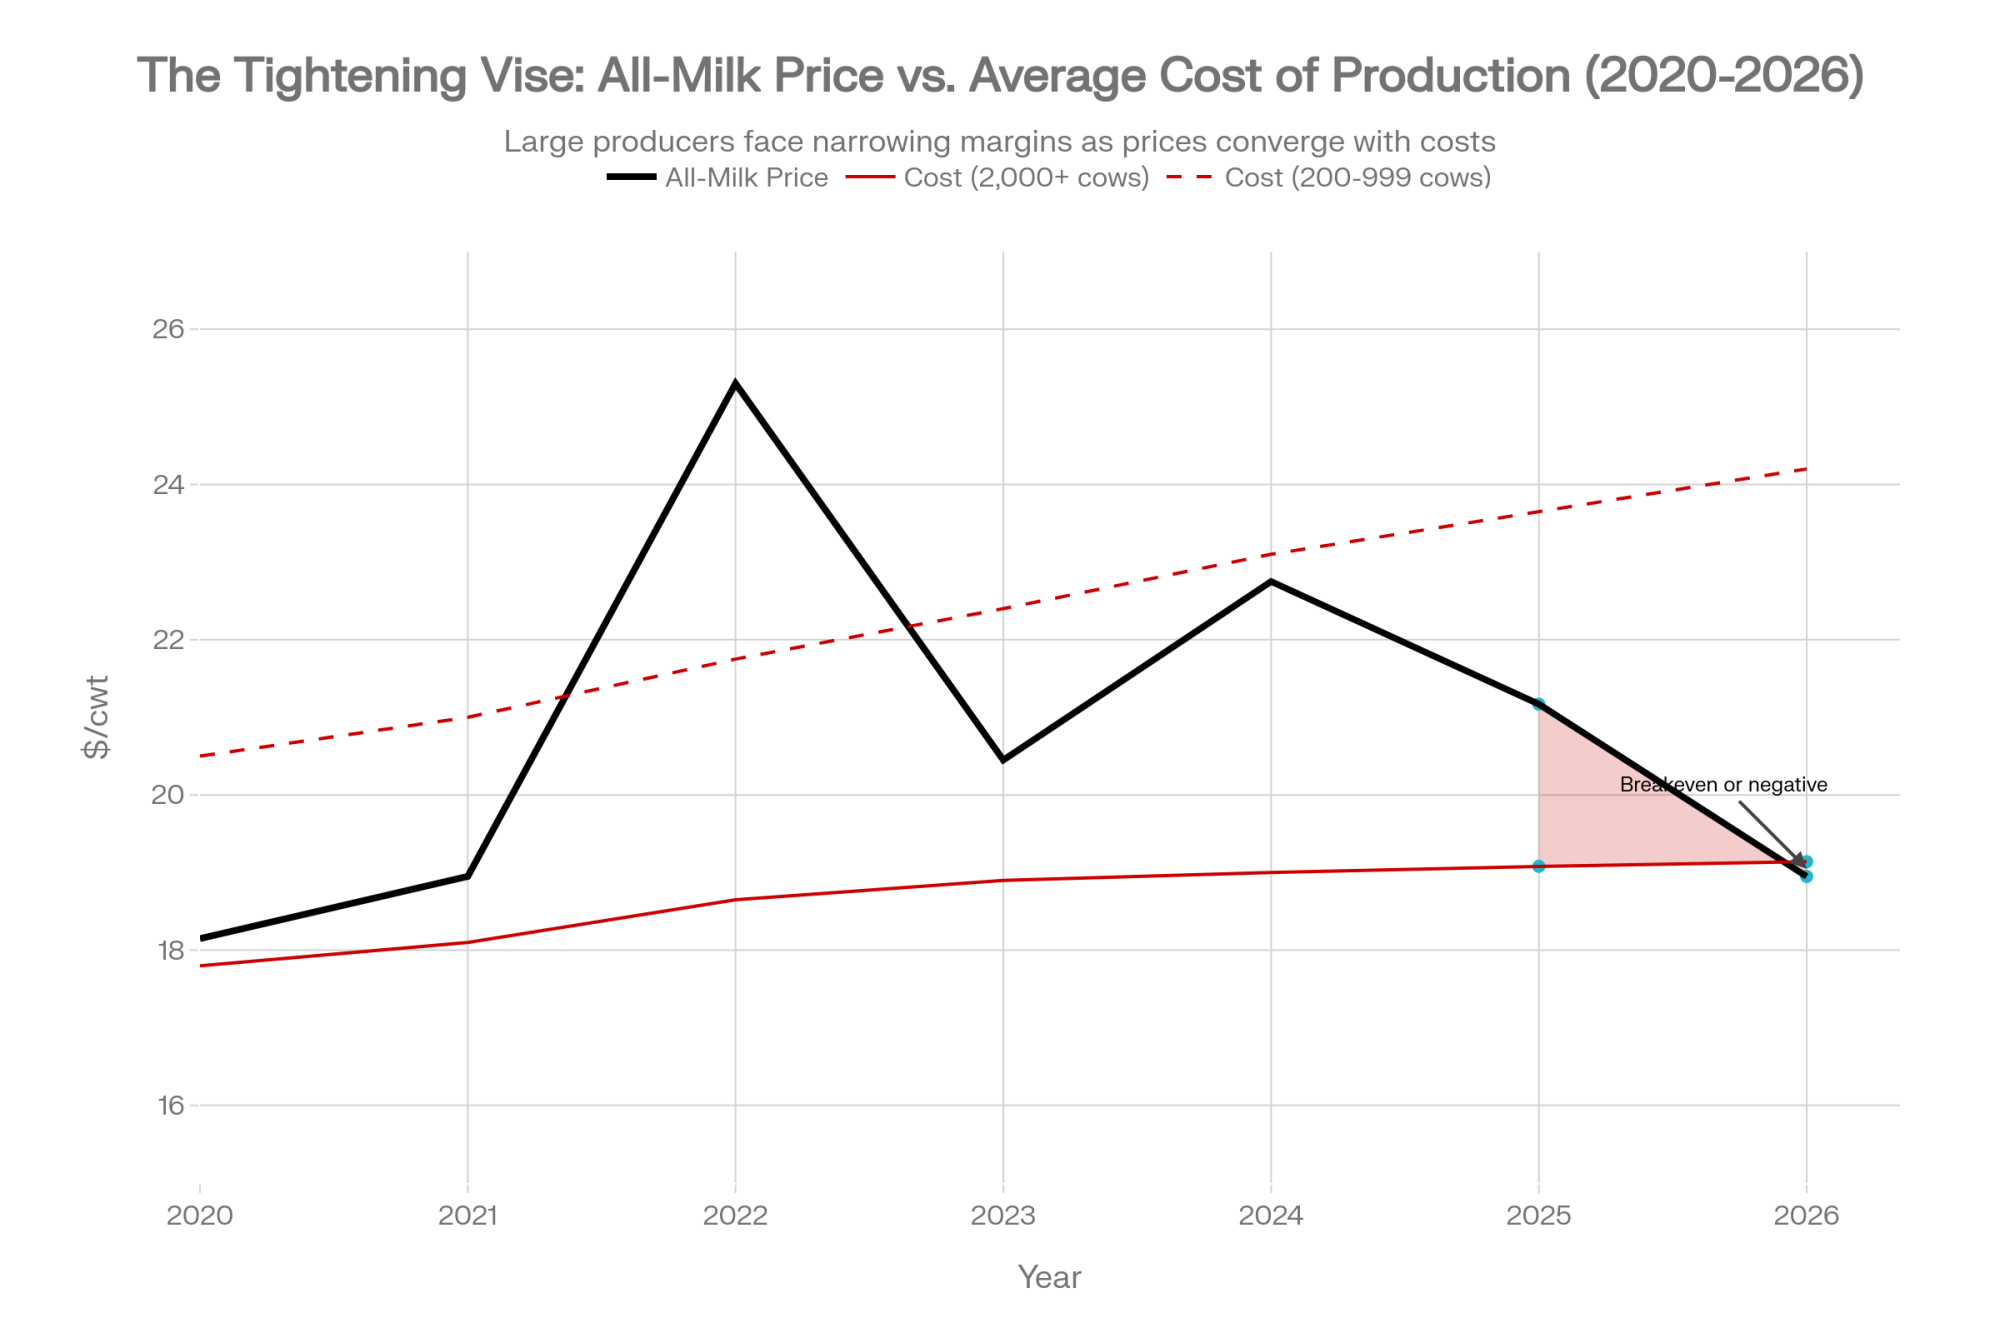
Before the P5 provinces imposed quota price ceilings, values rose steadily. Ontario prices ranged from roughly $17,000 to $22,000/kg around the 1999/2000 dairy year, according to University of Guelph research, and climbed past $40,000/kg in the 2000s before the caps took hold. That capital gain, layered on top of milk income, made quota one of the best‑performing agricultural assets in the country.
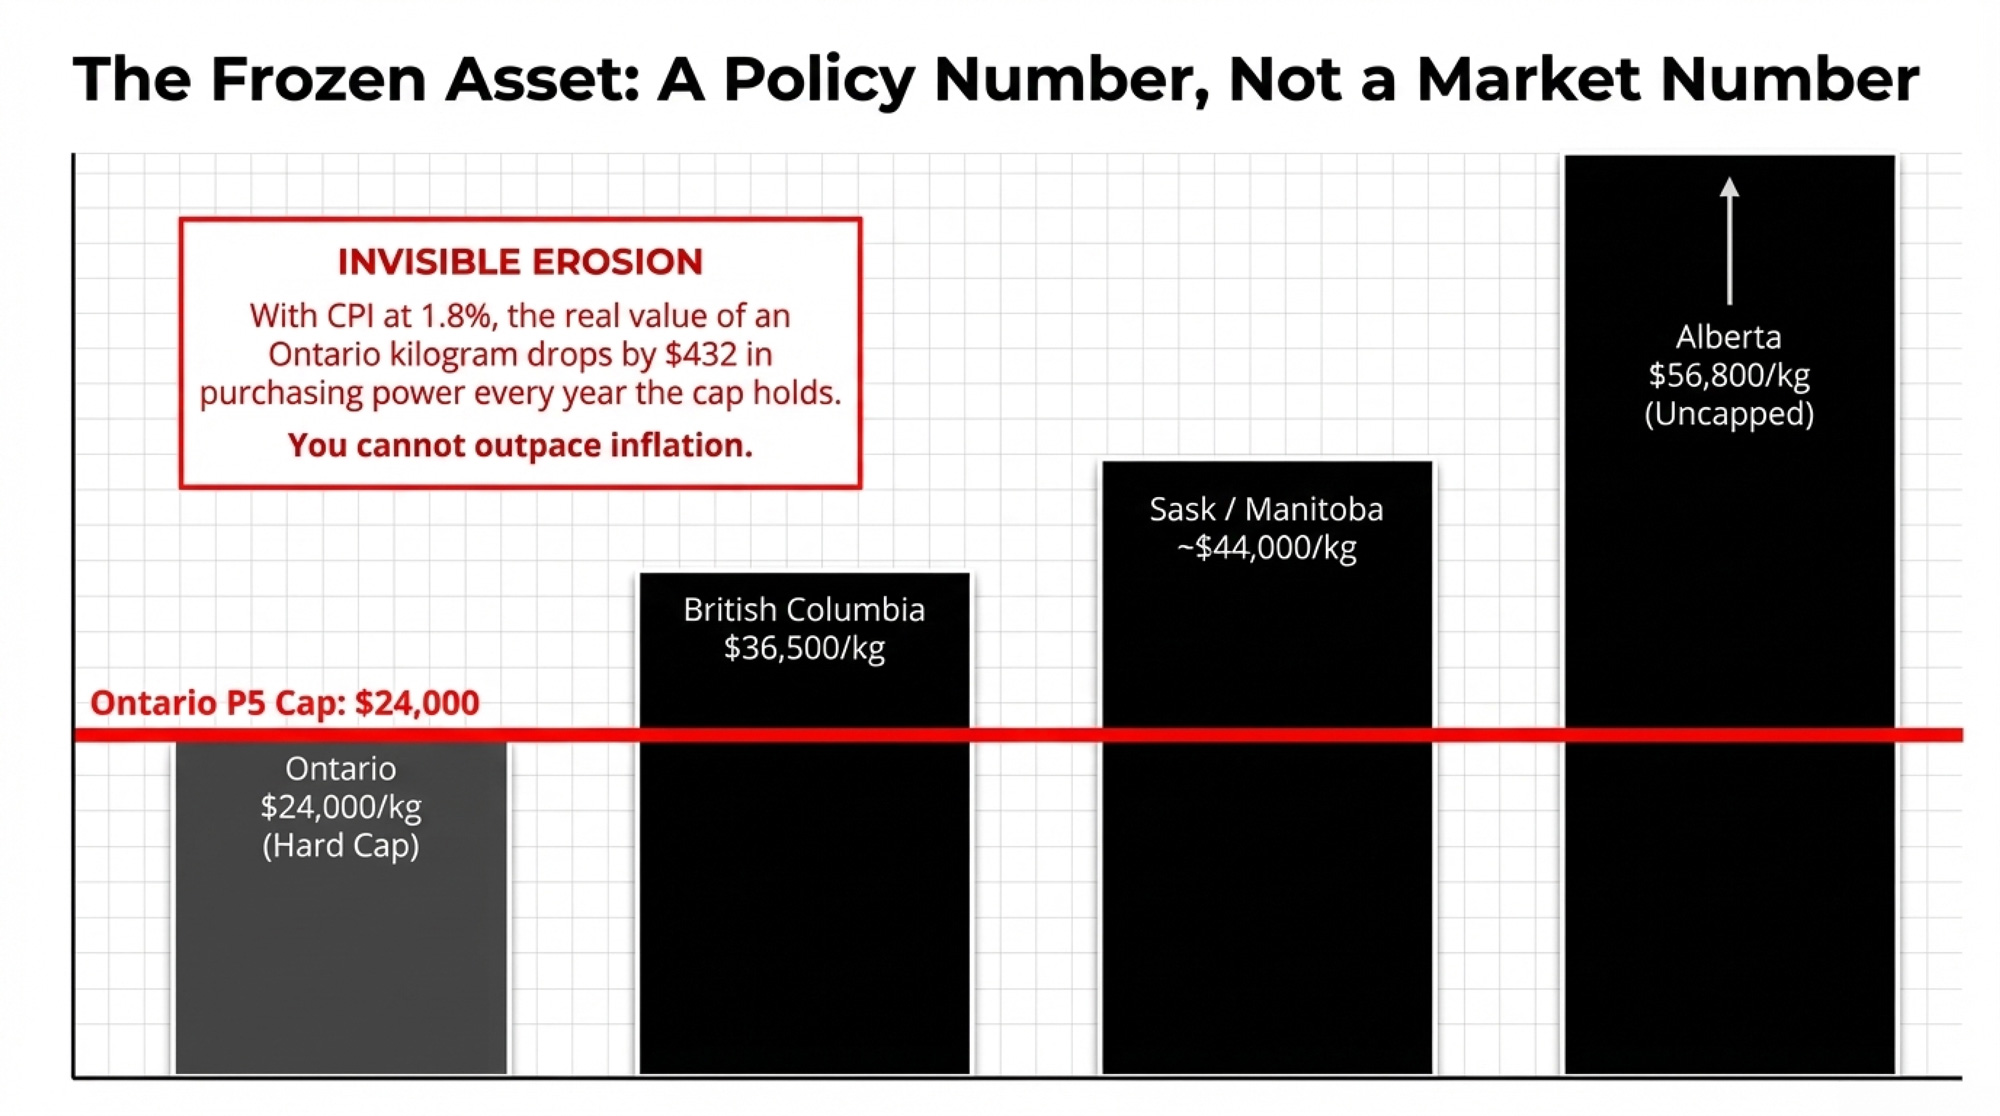
The cap shut off that tailwind. At $24,000/kg, Ontario quota is frozen. It doesn’t climb in a good year, track inflation, or compound. With CPI at 1.8% in February 2026, the real value of each kilogram drops by roughly $432 per year in purchasing power — money you won’t recover as long as the cap holds.
| Metric | Ontario | Alberta |
|---|---|---|
| Current Quota Price (Jan–Feb 2025) | $24,000/kg (policy cap) | $56,648/kg (market price) |
| Gap vs. Ontario | — | +$32,648/kg |
| Appreciation Potential | None (hard cap) | Uncapped; market-driven* |
| Real Value Loss at 1.8% CPI/yr | –$432/kg/yr | Partially offset by price appreciation |
| Supply Management System | P5 / National | P5 / National |
| Annual Cash Flow at 6% Financing | –$586/kg | Negative at same rate; higher income potential |
| Exit Price for Seller Today | $24,000/kg (capped) | ~$56,648/kg (market) |
| Asset Class Behaviour | Fixed liability | Appreciating asset |
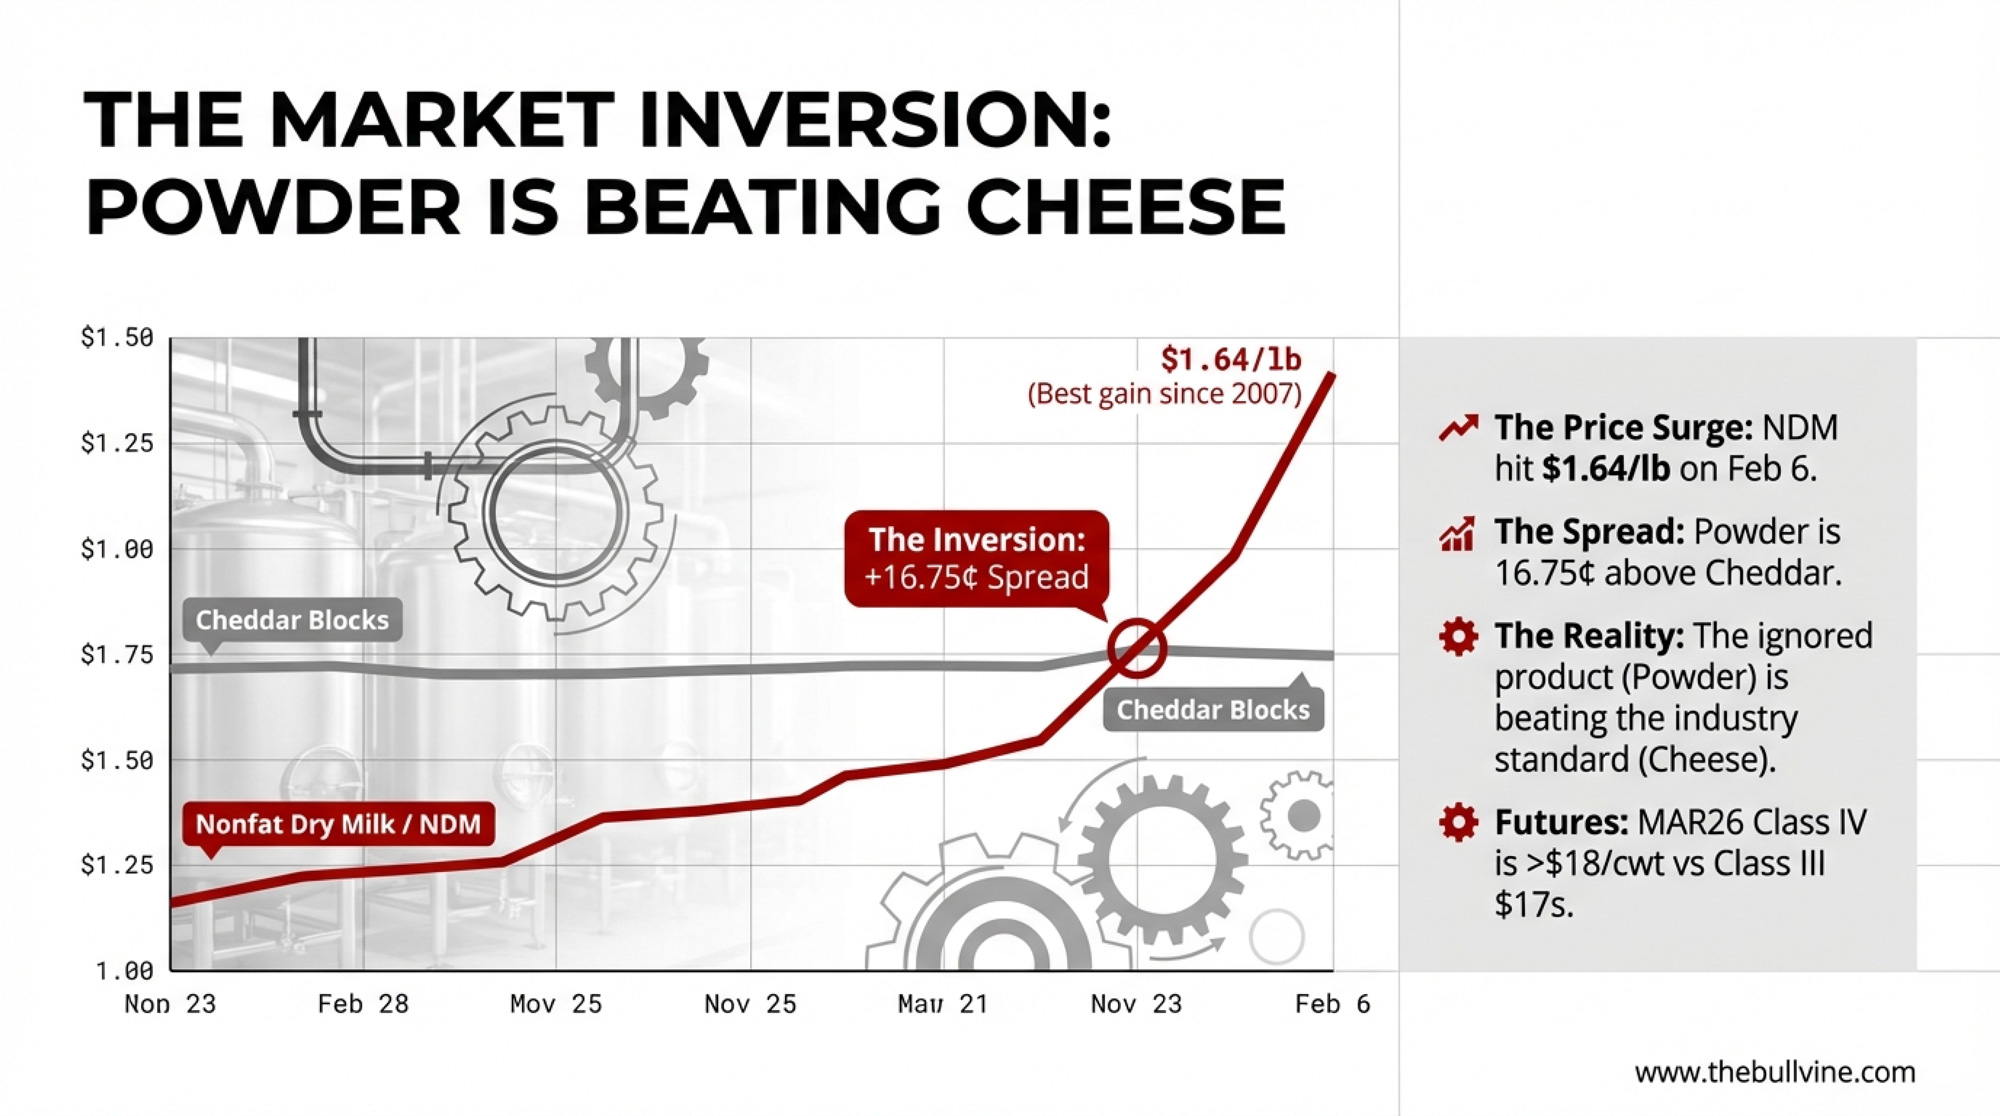
Look west for proof that $24,000 is a policy number, not a market number. According to AAFC’s monthly quota trade data, Alberta’s exchange averaged $56,495/kg in January 2025 and $56,800/kg in February. British Columbia — which caps at $35,500/kg — traded at that ceiling in January and at $36,500/kg in February. Saskatchewan and Manitoba traded in the $40,000–$44,000/kg range over the same two months. Ontario sits more than $32,000/kg below Alberta. Same supply management system. Same national milk pool. Radically different asset values.
Is Every Financed Kilogram of Ontario Quota Now Underwater?
Here’s the barn math. Stick it on a sticky note beside your desk.
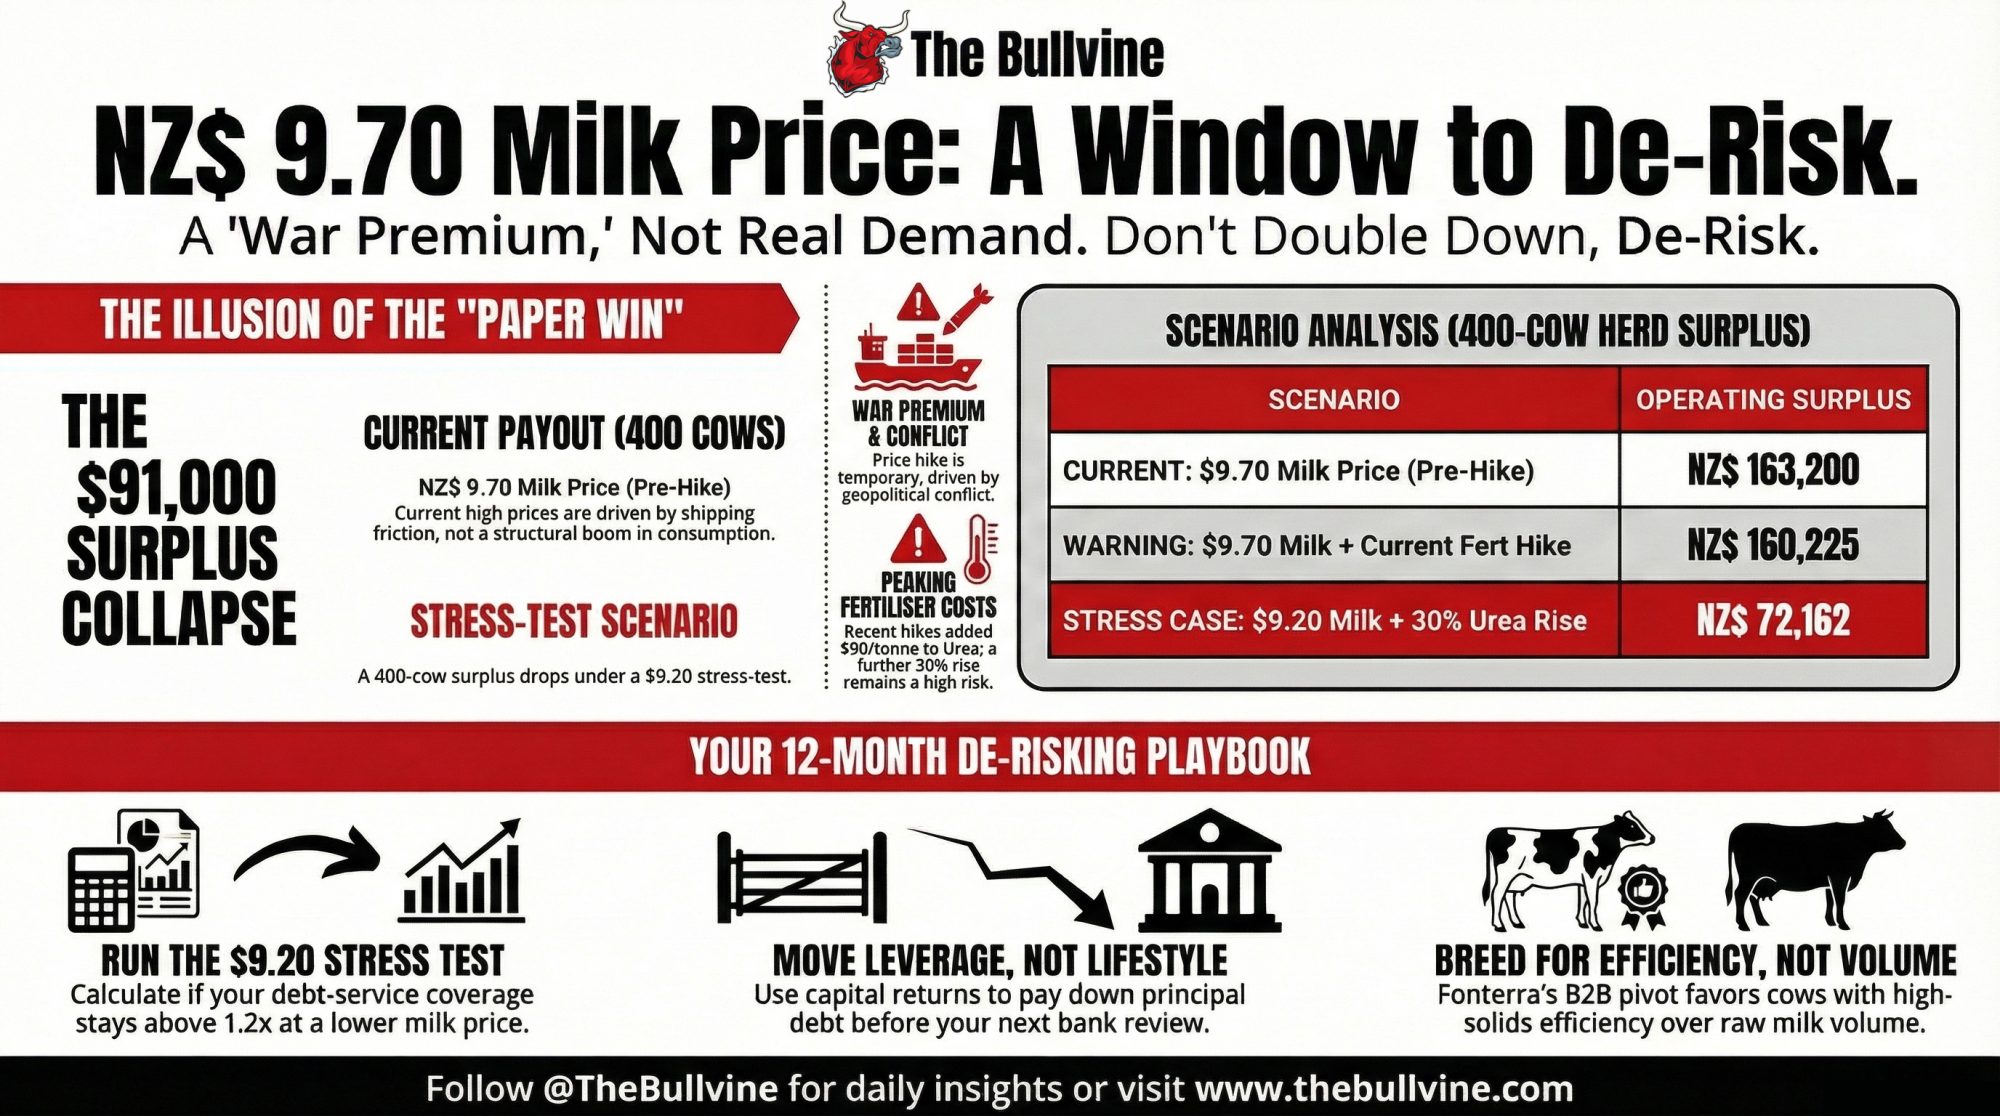
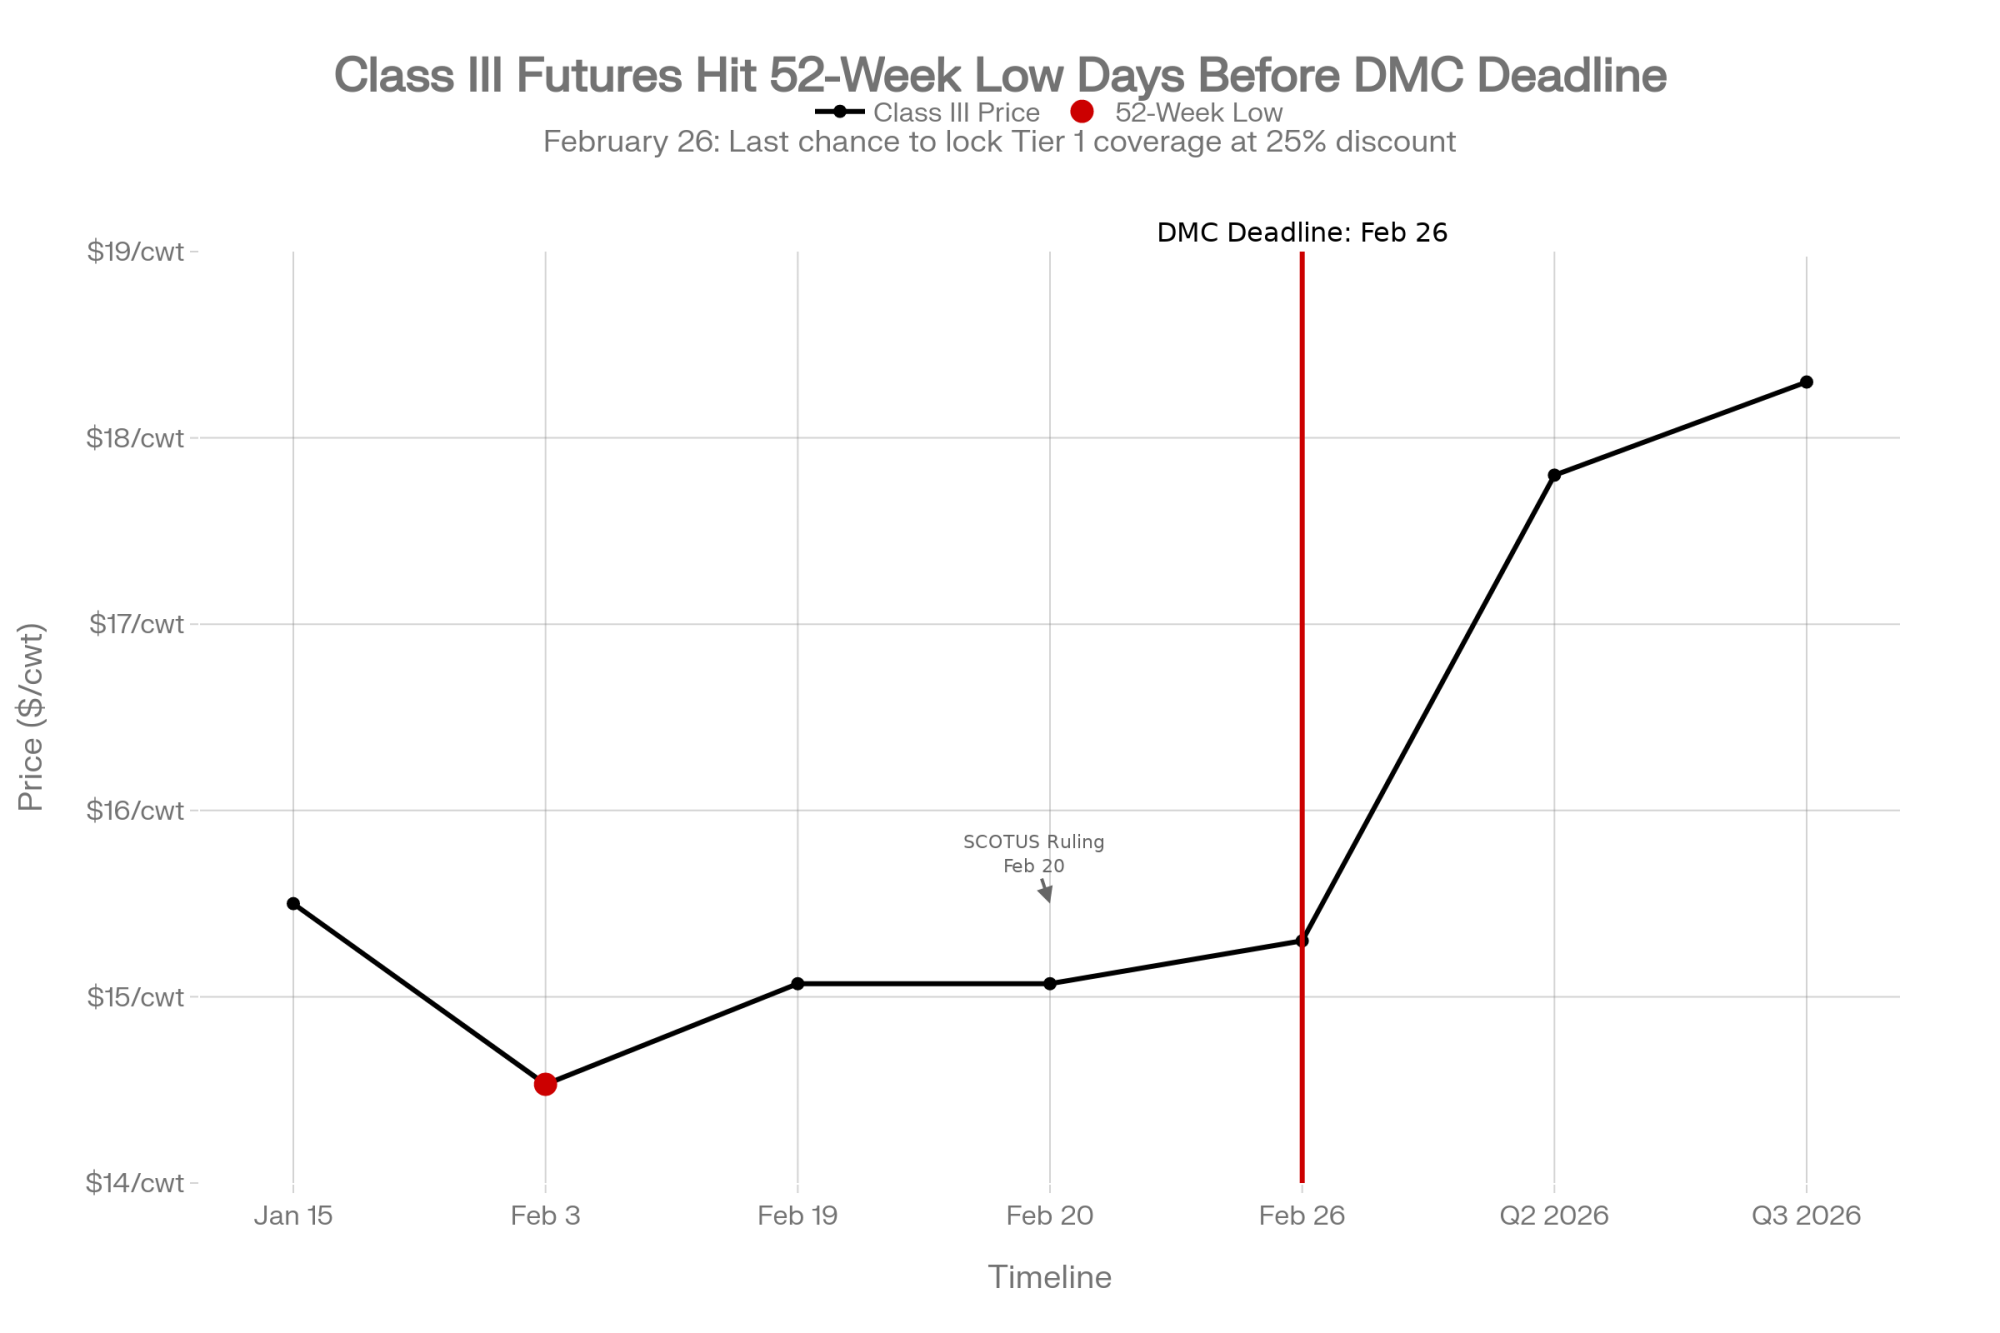
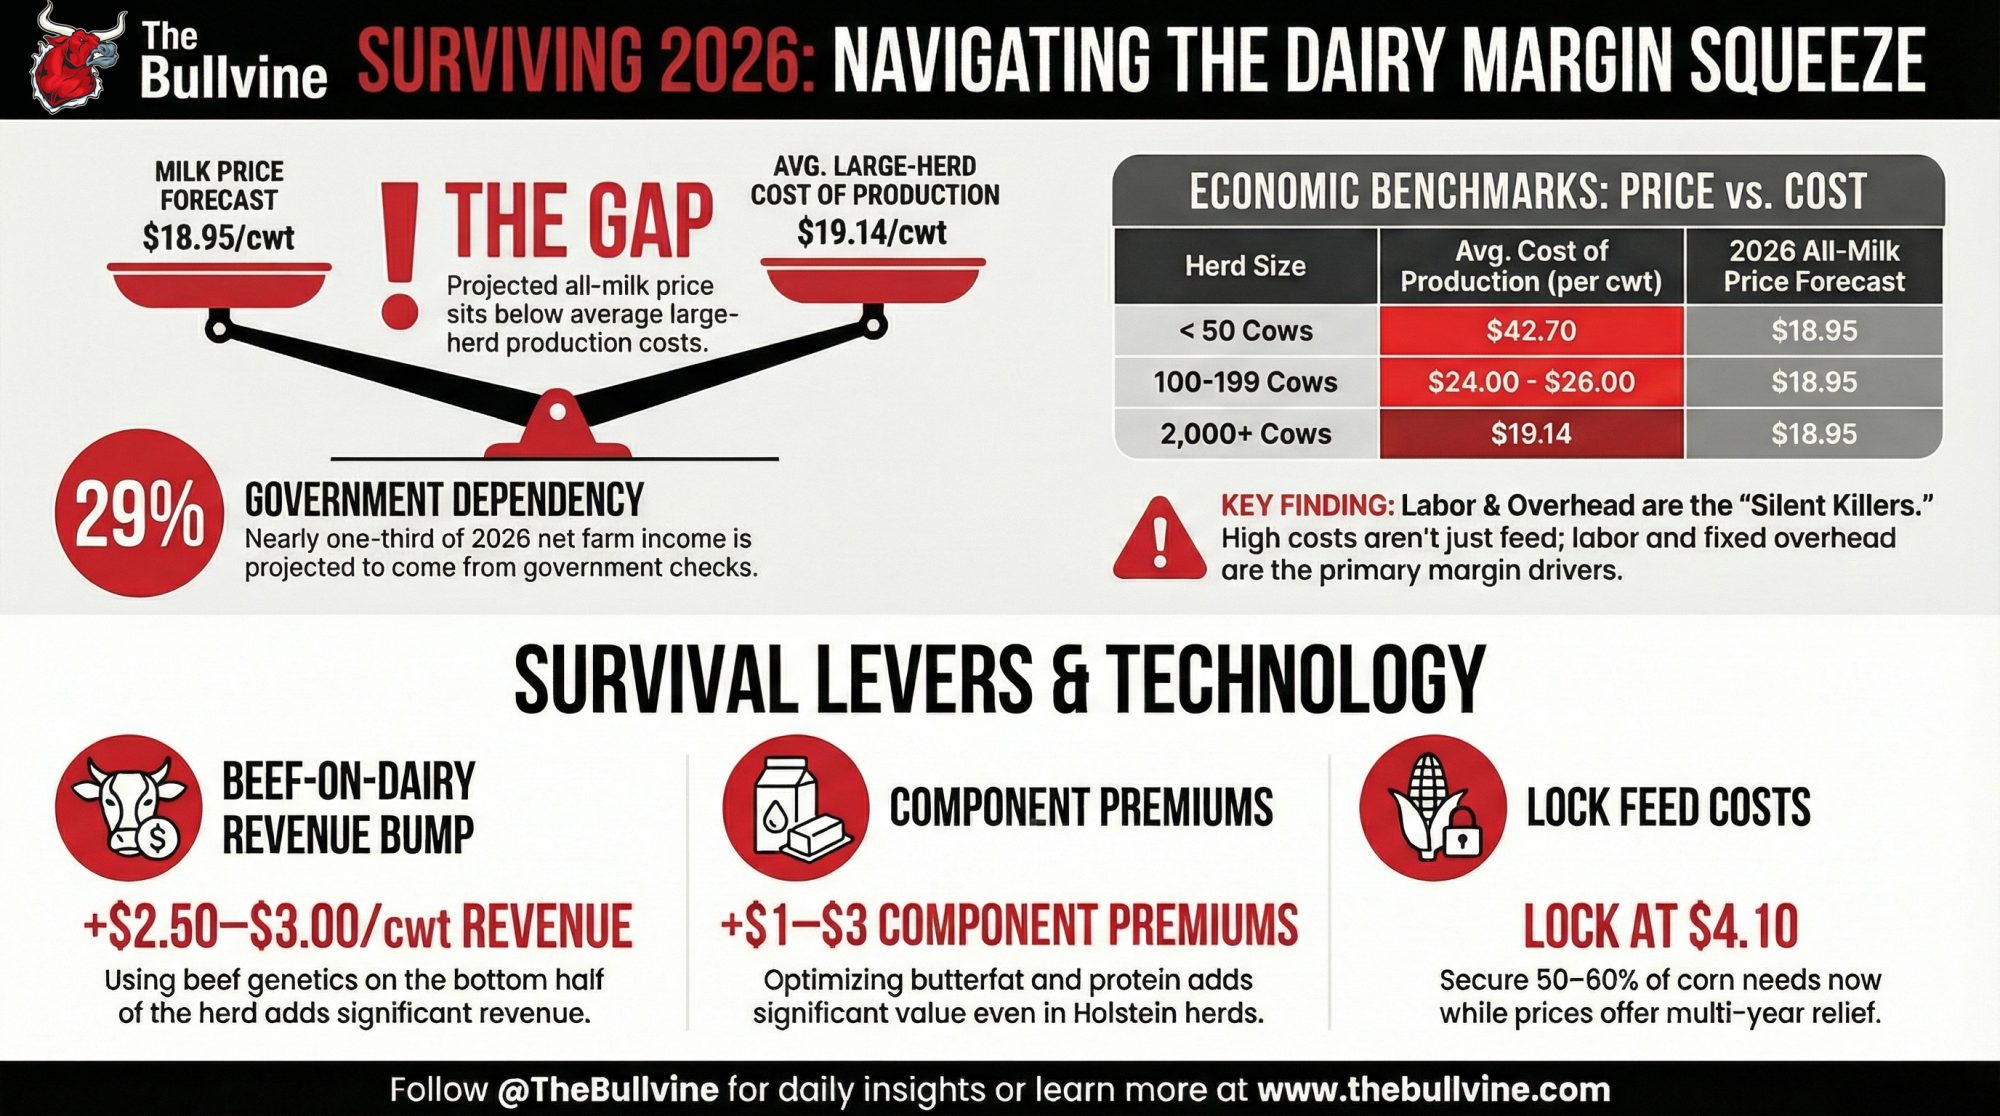
Take one kilogram of Ontario quota at the $24,000 cap. The Canadian Dairy Commission calculated the 2024 cost of production — indexed to the three months ending August 2025 — at $92.82 per standard hectolitre, up 2.72% from $90.36 the previous year. That iCOP result is what feeds the 2.3255% farmgate price increase effective February 1, 2026.
Using current P5 farmgate pricing with that increase baked in, and subtracting cost of production for feed, labour, overhead, and cow depreciation, you land in the ballpark of $854 in net annual milk income per kilogram of quotaon many Ontario herds. That’s The Bullvine’s modeled estimate using current farmgate pricing and recent P5 cost‑of‑production benchmarks — not a DFO or CDC published constant. Your own number will shift with components, feed costs, and overhead. But it’s a defensible mid‑range figure for this math.
The Bank of Canada cut its overnight rate to 2.25% on October 29, 2025, and has held it there through four consecutive decisions — December, January, March — with the next call on April 29. But commercial lenders price quota loans 200–350 basis points above that floor. A rate of 5.5–6% on a quota loan is realistic right now. Nesto’s March 2026 forecast projects no further easing, with bond markets assigning a slight probability of a 0.25% rate hike by October.
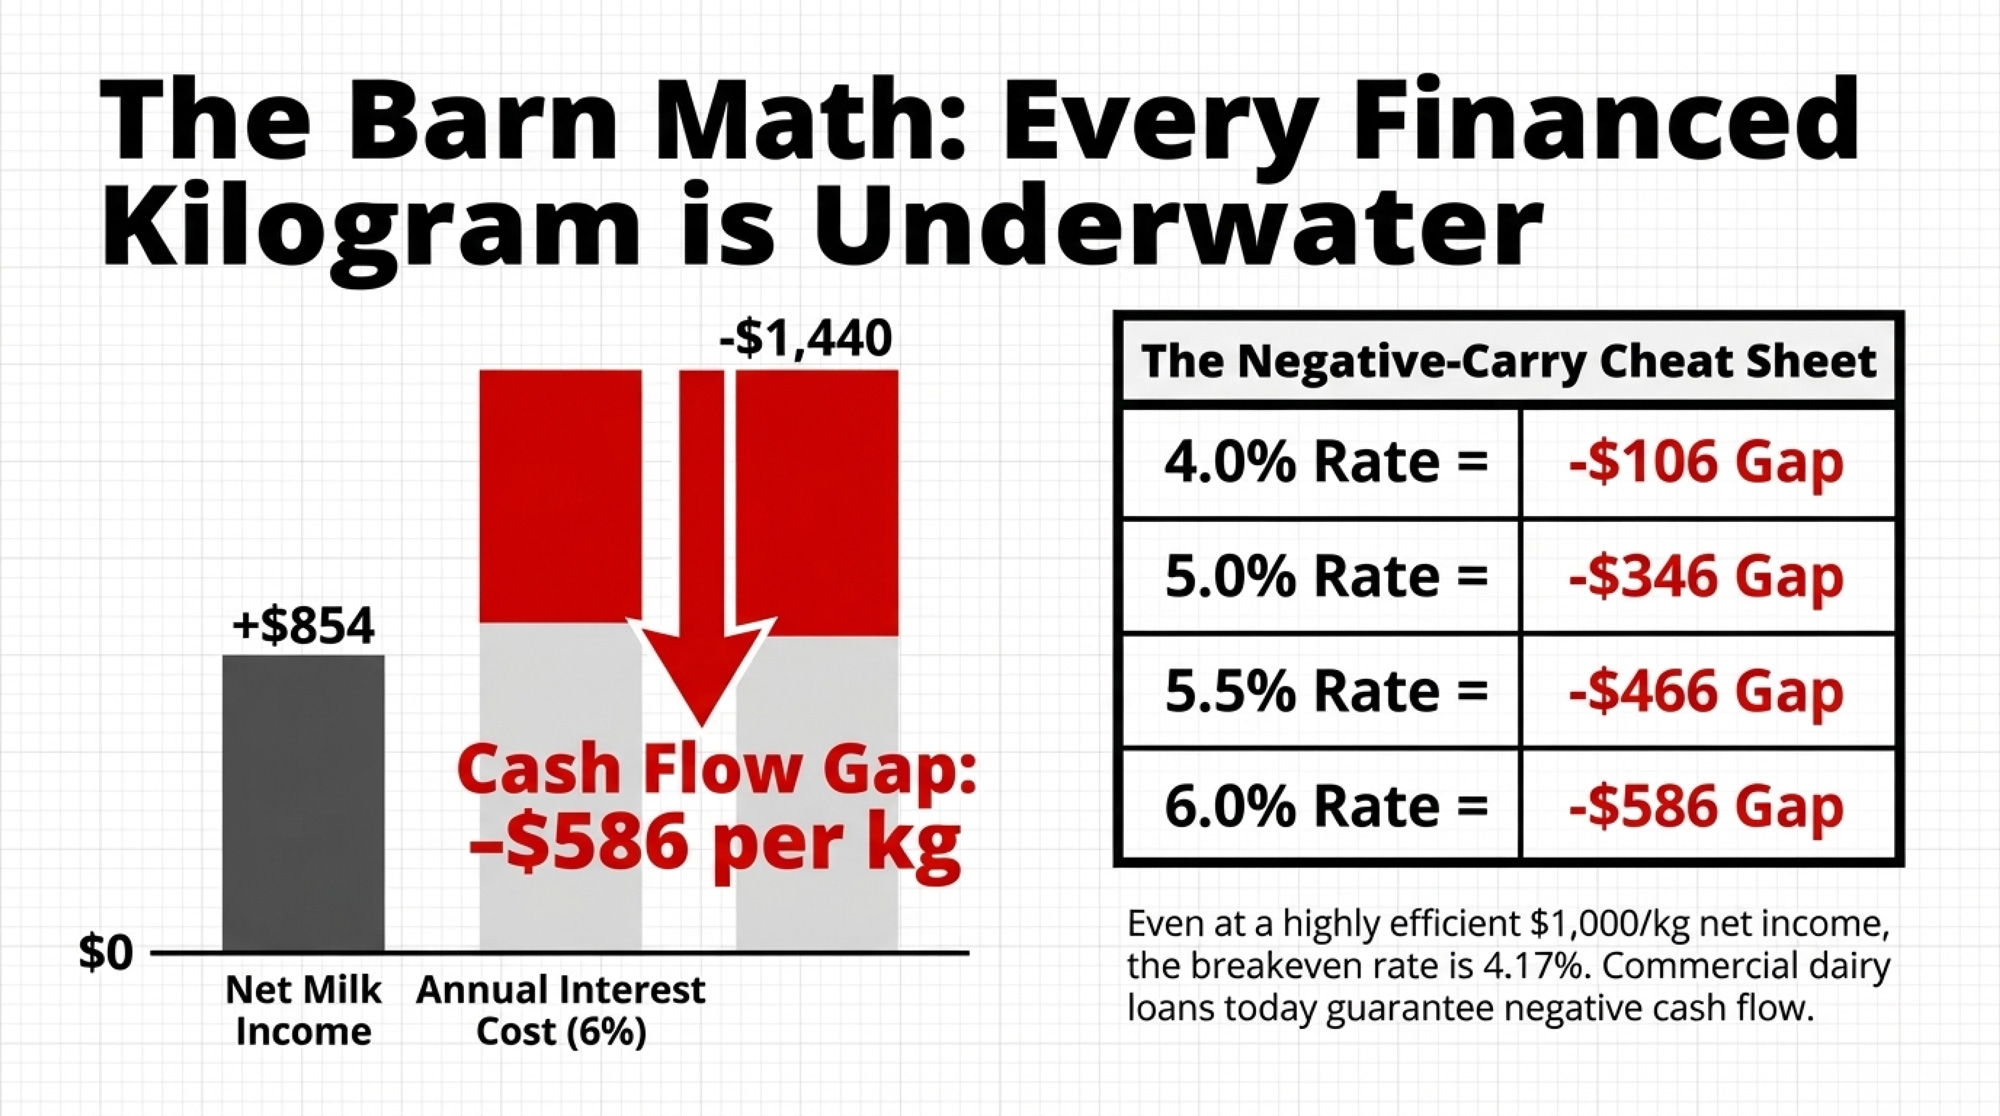
| Loan Rate | Annual Interest Cost/kg | Est. Net Milk Income/kg | Cash Flow Gap/kg/yr | Rate Needed to Break Even |
|---|---|---|---|---|
| 4.0% | $960 | $854 | –$106 | ~3.56% |
| 5.0% | $1,200 | $854 | –$346 | ~3.56% |
| 5.5% | $1,320 | $854 | –$466 | ~3.56% |
| 6.0% | $1,440 | $854 | –$586 🔴 | ~3.56% |
| If $1,000/kg net | $1,200 (5%) | $1,000 | –$200 | ~4.17% |
At $854/kg net income, there isn’t any commercial dairy loan rate on offer today that makes newly financed Ontario quota cash‑flow positive. Even if you’re running tighter than most and clearing $1,000/kg net, your breakeven is only 4.17%. Where’s your rate sitting right now?
Scale it up. Say you’ve picked up 35 kilograms on the exchange in the past few years, all financed at 6%:
- 35 × $586 = $20,510 of cash leaving your operation every year
- That’s interest only. No principal repayment. No new calf barn. Just debt service.
What Did Kyle Horst Find When He Ran His Own Numbers?
Kyle Horst dairy farms with his wife, Jen, and his brother Craig, a school teacher, near Formosa, Ontario. The farm has about 88 kg of butterfat quota, purchased as part of an ongoing operation in 2019.
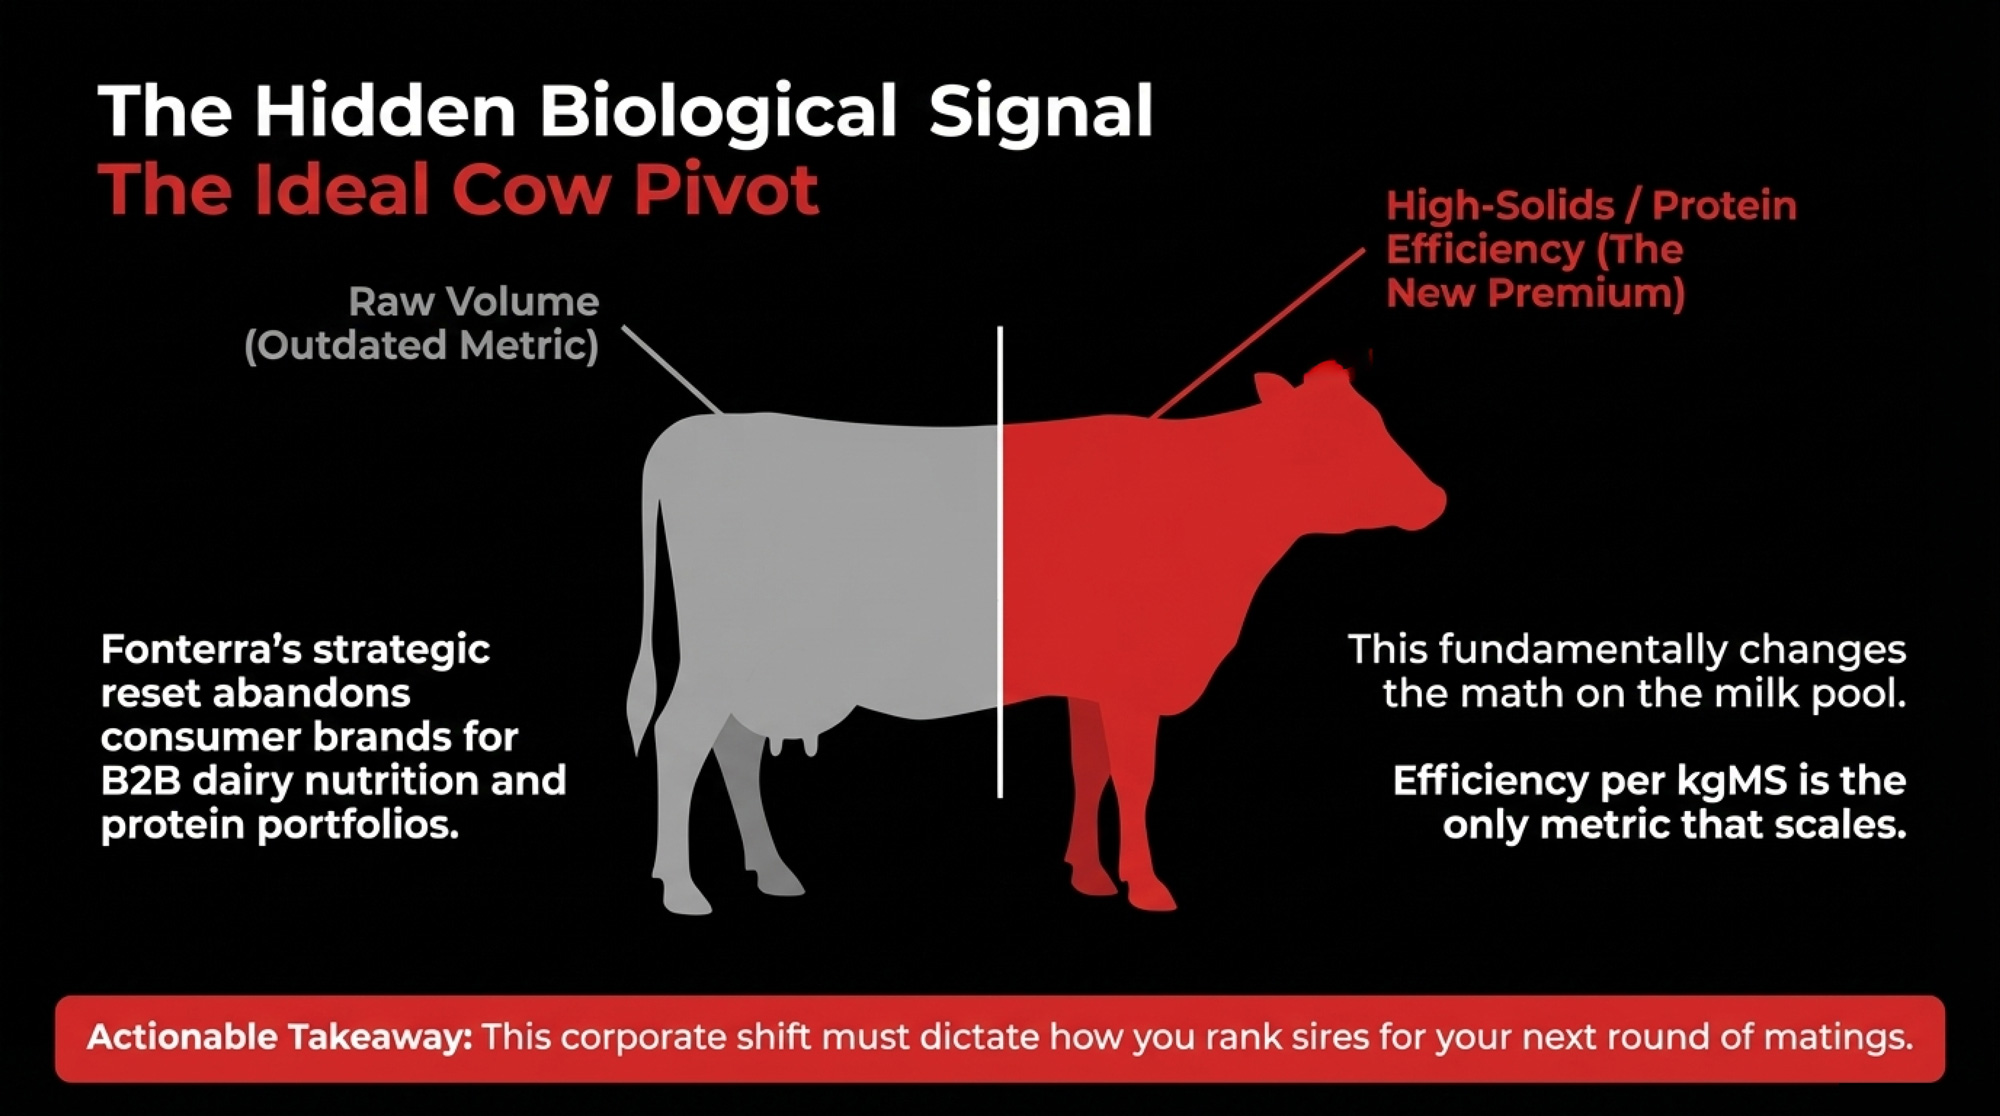
When Horst enrolled in Chris Church’s Central Dairy Solutions course, he came in carrying the assumption most dairy farmers hold: more milk means more money. Church’s data challenged that head‑on.
“When I started the course, I always thought another litre of milk is obviously more profitable, but he brought that into question with good data,” Horst told Farmtario in August 2025. “I still think high performance through better management is a winner at the end of the day. But simply doing it through added cost is not necessarily financially sustainable.”
Church — DVM, MBA, University of Guelph, and founder of Central Dairy Solutions — spent years as a dairy vet before shifting his focus to farm finance. “I always just figured, as long as we could make more milk, we could make the farm more money,” he told Farmtario. “And that’s about as deep as we’d usually go. And unfortunately, that’s as deep as most of the producers go.” His courses walk Ontario dairies through their quota ranges, from 40 kg to 1,200 kg, using metrics such as operating expense ratio, EBITDA per kilogram of quota, and debt‑service coverage.
Are You Running a Dairy, a Crop Farm — or Both Without Knowing It?
The Terpstra family milks about 420 cows near Brussels, Ontario. Joe farms with his wife Barb, daughter Emily, and son Cole. Joe and Emily both took Church’s course as part of their succession planning. According to Farmtario, the family has moved to monthly financial reviews, with Emily now managing the books.
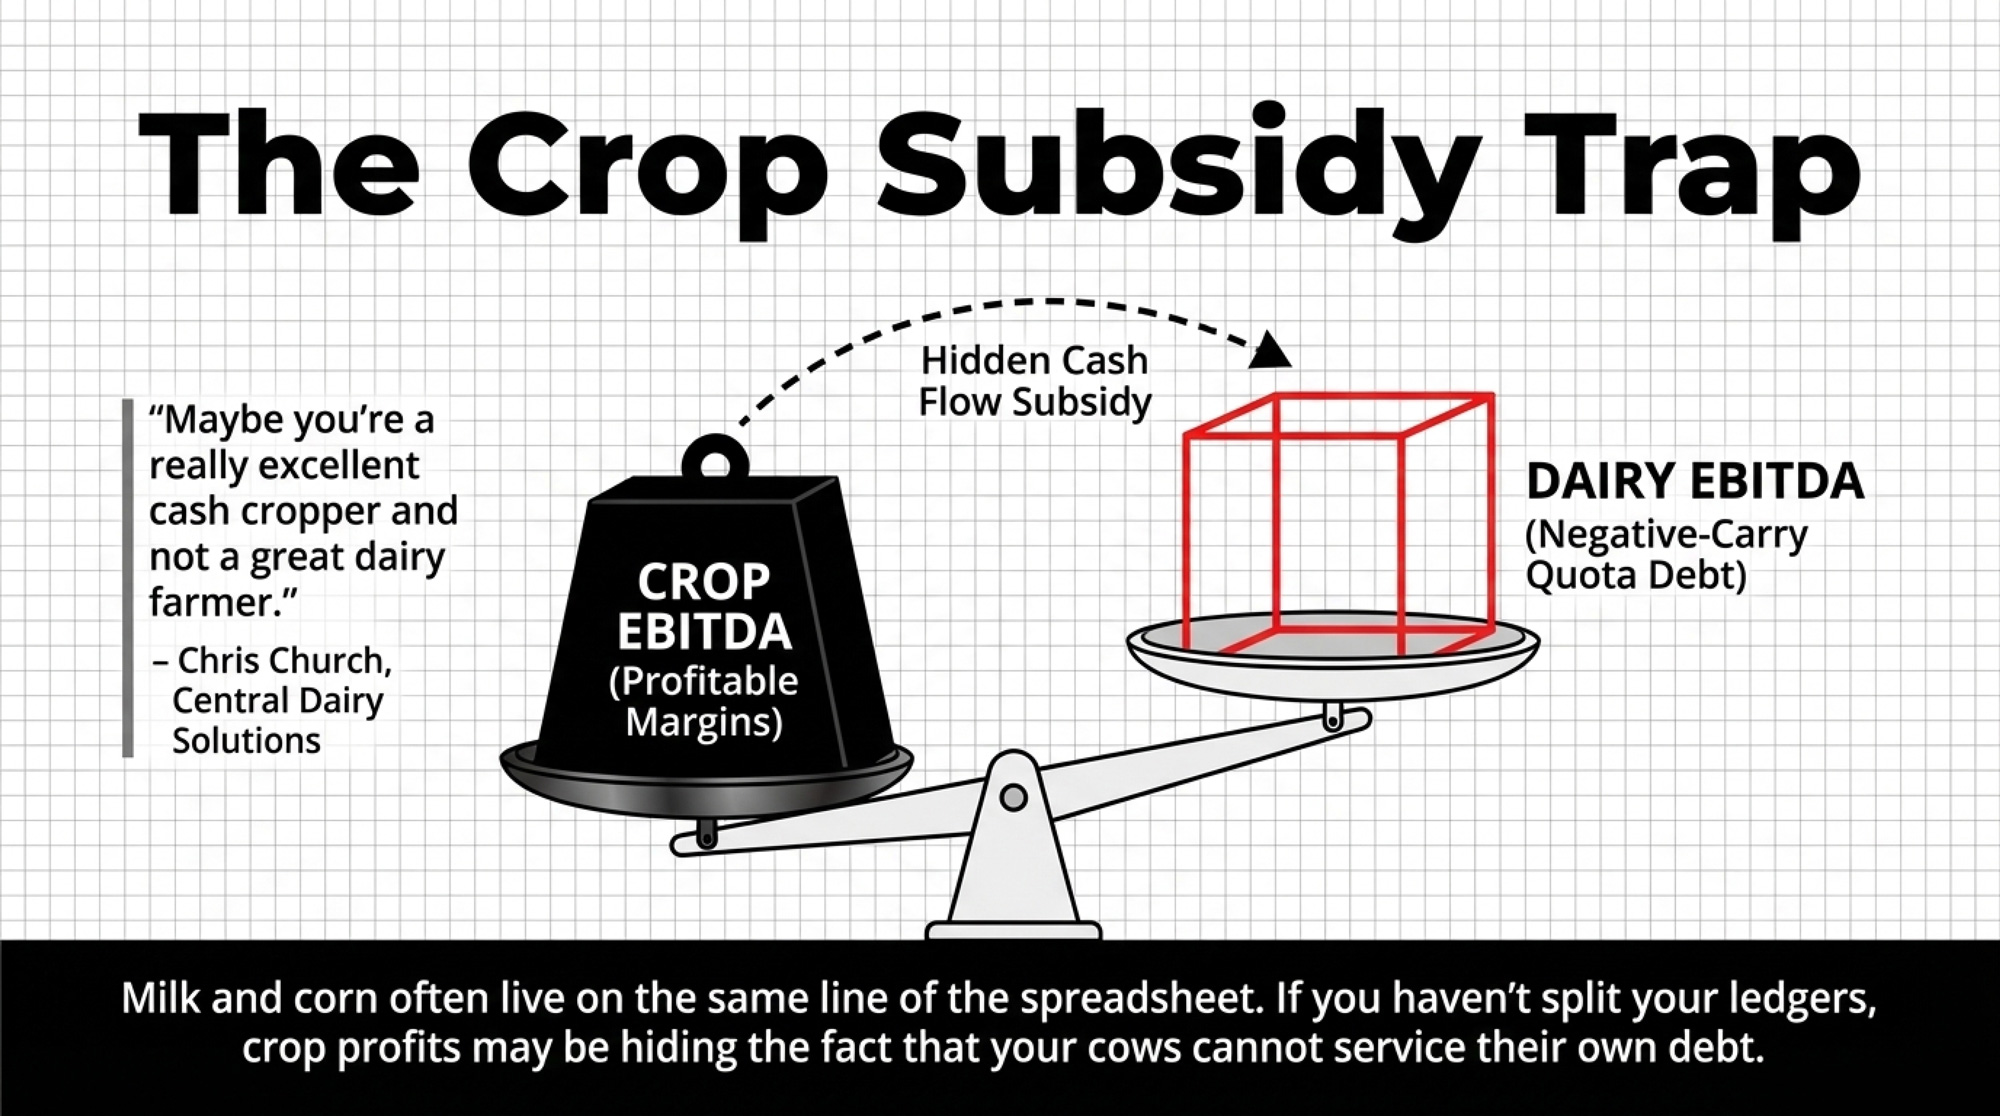
It’s exactly the kind of operation where Church’s framework — splitting dairy EBITDA from crop EBITDA — can reveal whether the cows are actually carrying their own weight or riding on crop margins.
“Maybe you’re a really excellent cash cropper and not a great dairy farmer.”
— Chris Church, Central Dairy Solutions, Farmtario, August 2025
A lot of farms have never actually separated the financial performance of their dairy from that of their cropping operation. Milk and corn live in the same line on the spreadsheet. As long as the overall farm makes the payment, nobody digs deeper.
But when grain prices drop or weather punches your yields, that cross‑subsidy disappears. The dairy suddenly has to stand on its own. If it can’t, that’s when the bank meeting gets tense. And if your dairy numbers and your crop numbers live in the same line — while you’ve also got leveraged quota in the mix — you might be using crop profits to service a dairy business that, on its own, is financing a negative‑carry asset.
The Succession Collision
This is where the Metske ruling, the quota cap, and the interest rate environment crash into each other.
Most Ontario successions assume the next generation will take over quota — structured as a sale, a gradual buy‑in, or a gift with a vendor take‑back. However you paper it, the incoming operator still has to cash‑flow the debt tied to that quota on their own balance sheet.
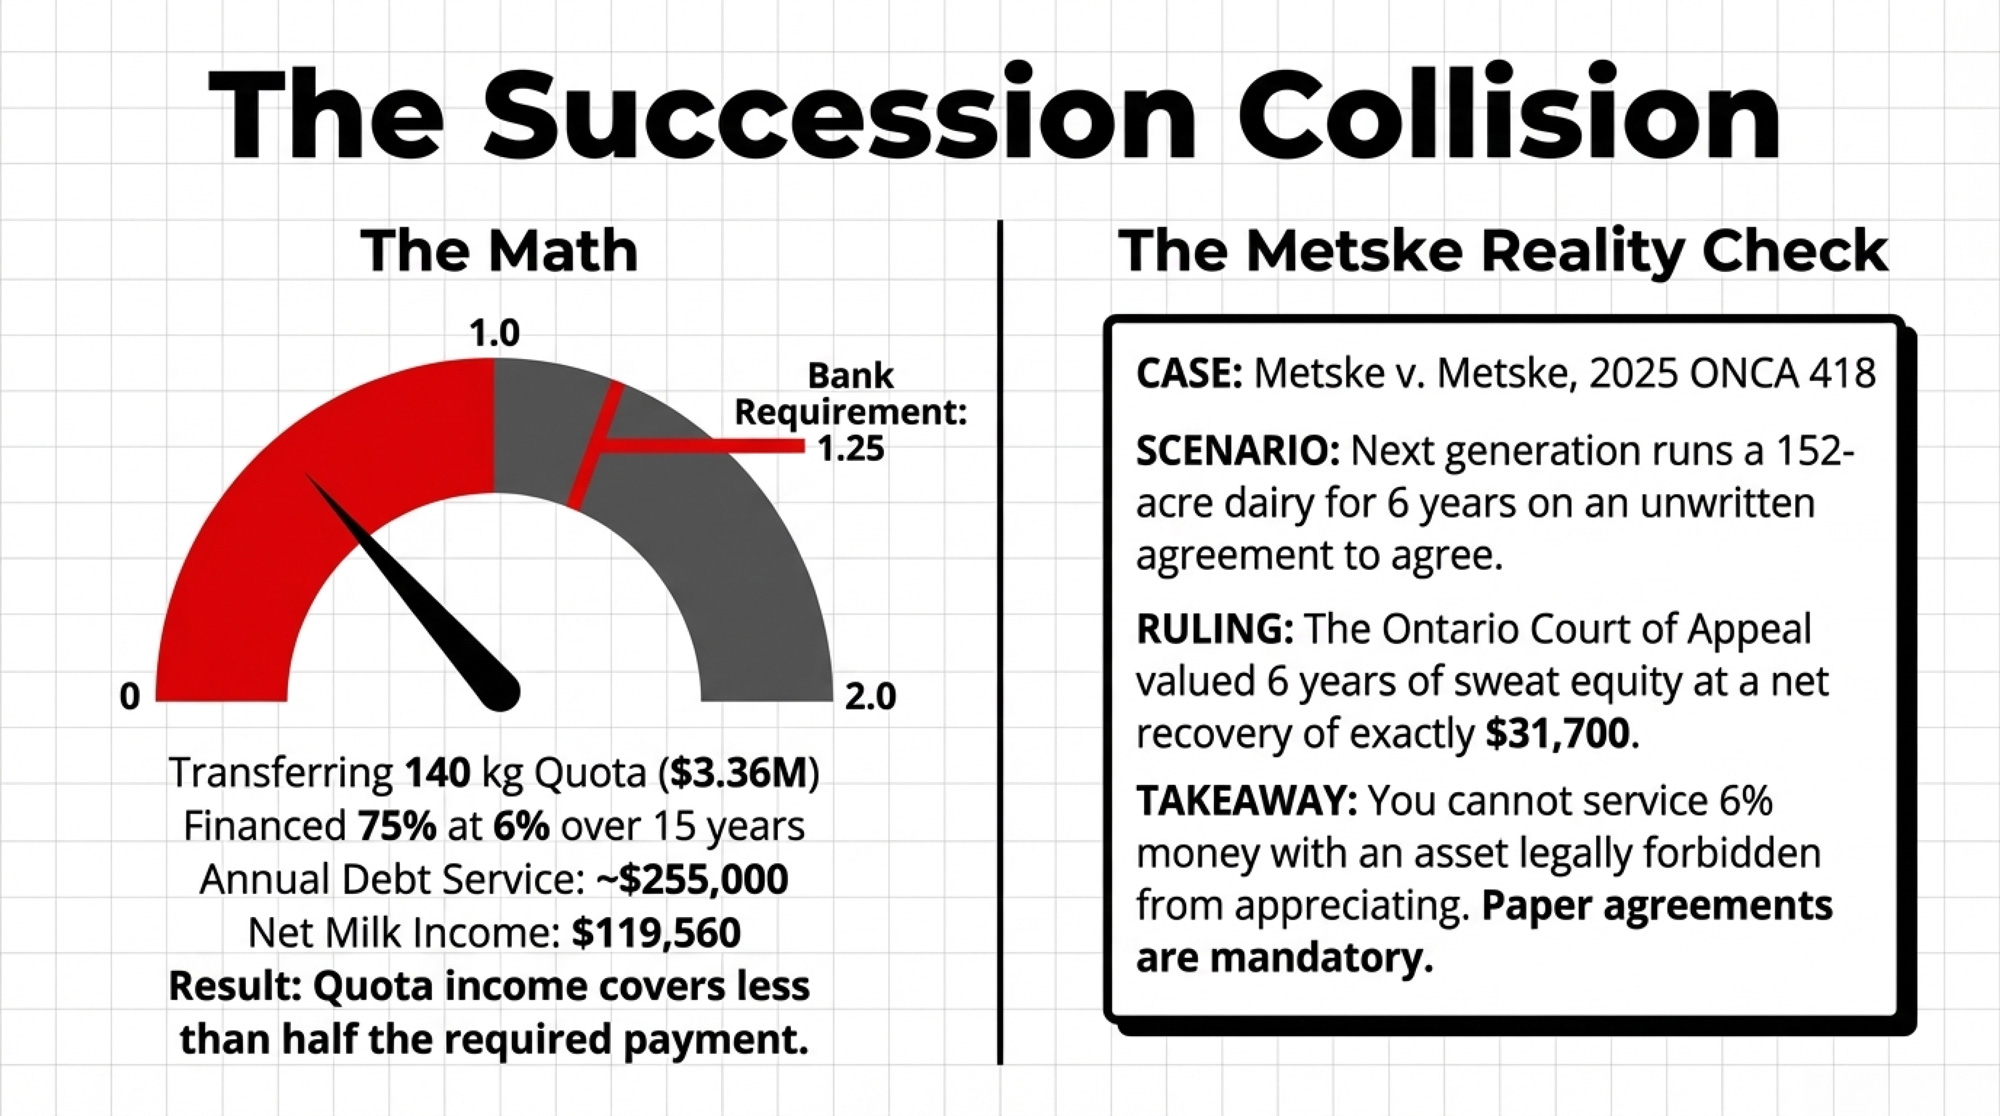
Run a DSCR on a mid‑size scenario:
- Quota position: 140 kg of butterfat per day
- Quota value at $24,000/kg: $3.36 million
- Financing: 75% at 6%, amortized over 15 years
- Loan amount: $2.52 million
- Annual debt service (P+I): ~$255,000
- Net milk income: 140 kg × $854 = $119,560
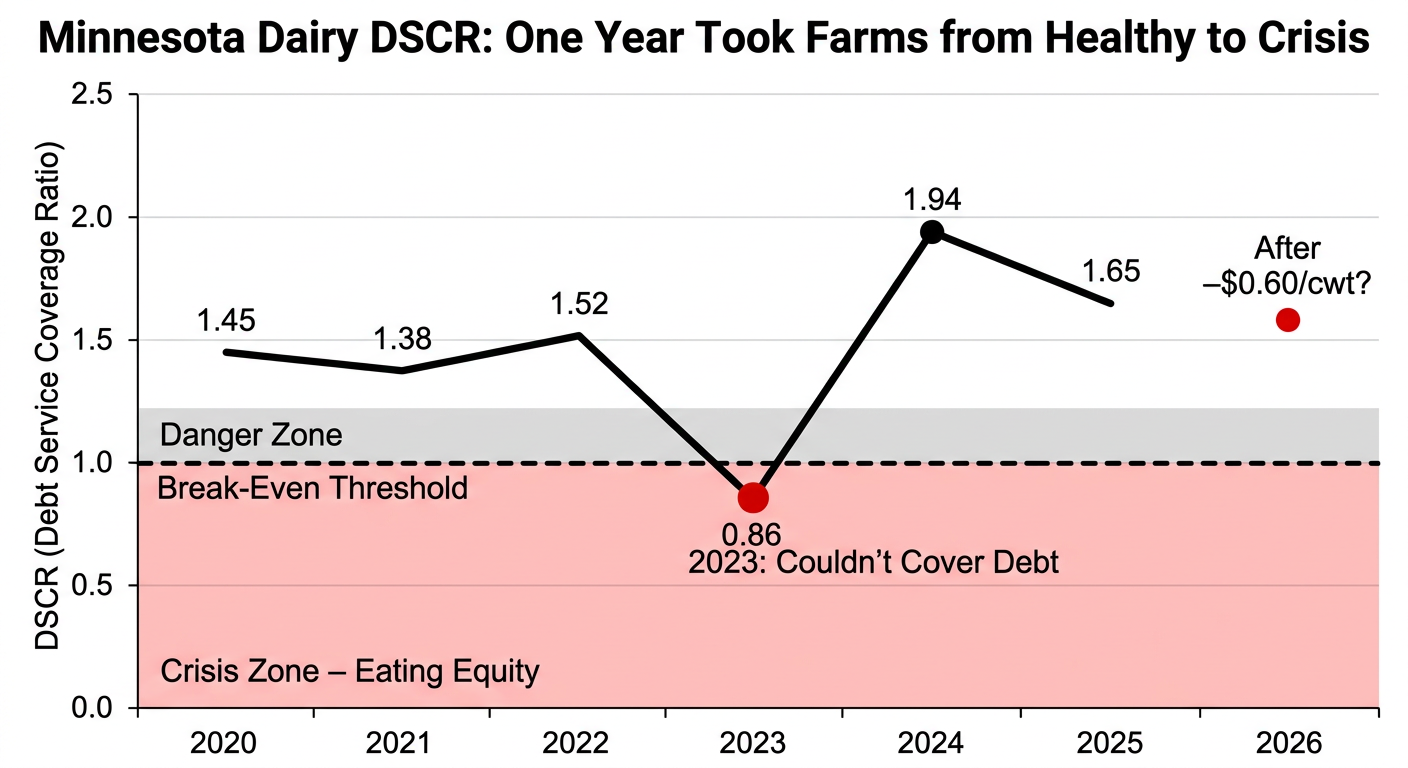
- DSCR: $119,560 ÷ $255,000 = 0.47
Most lenders want at least 1.25. In this scenario, quota income covers less than half the payment. The rest has to come from crops, off‑farm income, parents deferring payments, or more borrowing.
In Metske, the Court of Appeal found the family’s discussions were an “agreement to agree” — too vague to create ownership rights. The parents’ decision to sell their dairy quota separately was held to be a legitimate exercise of autonomy. That’s how six years of contributed labour ended up valued at $31,700.
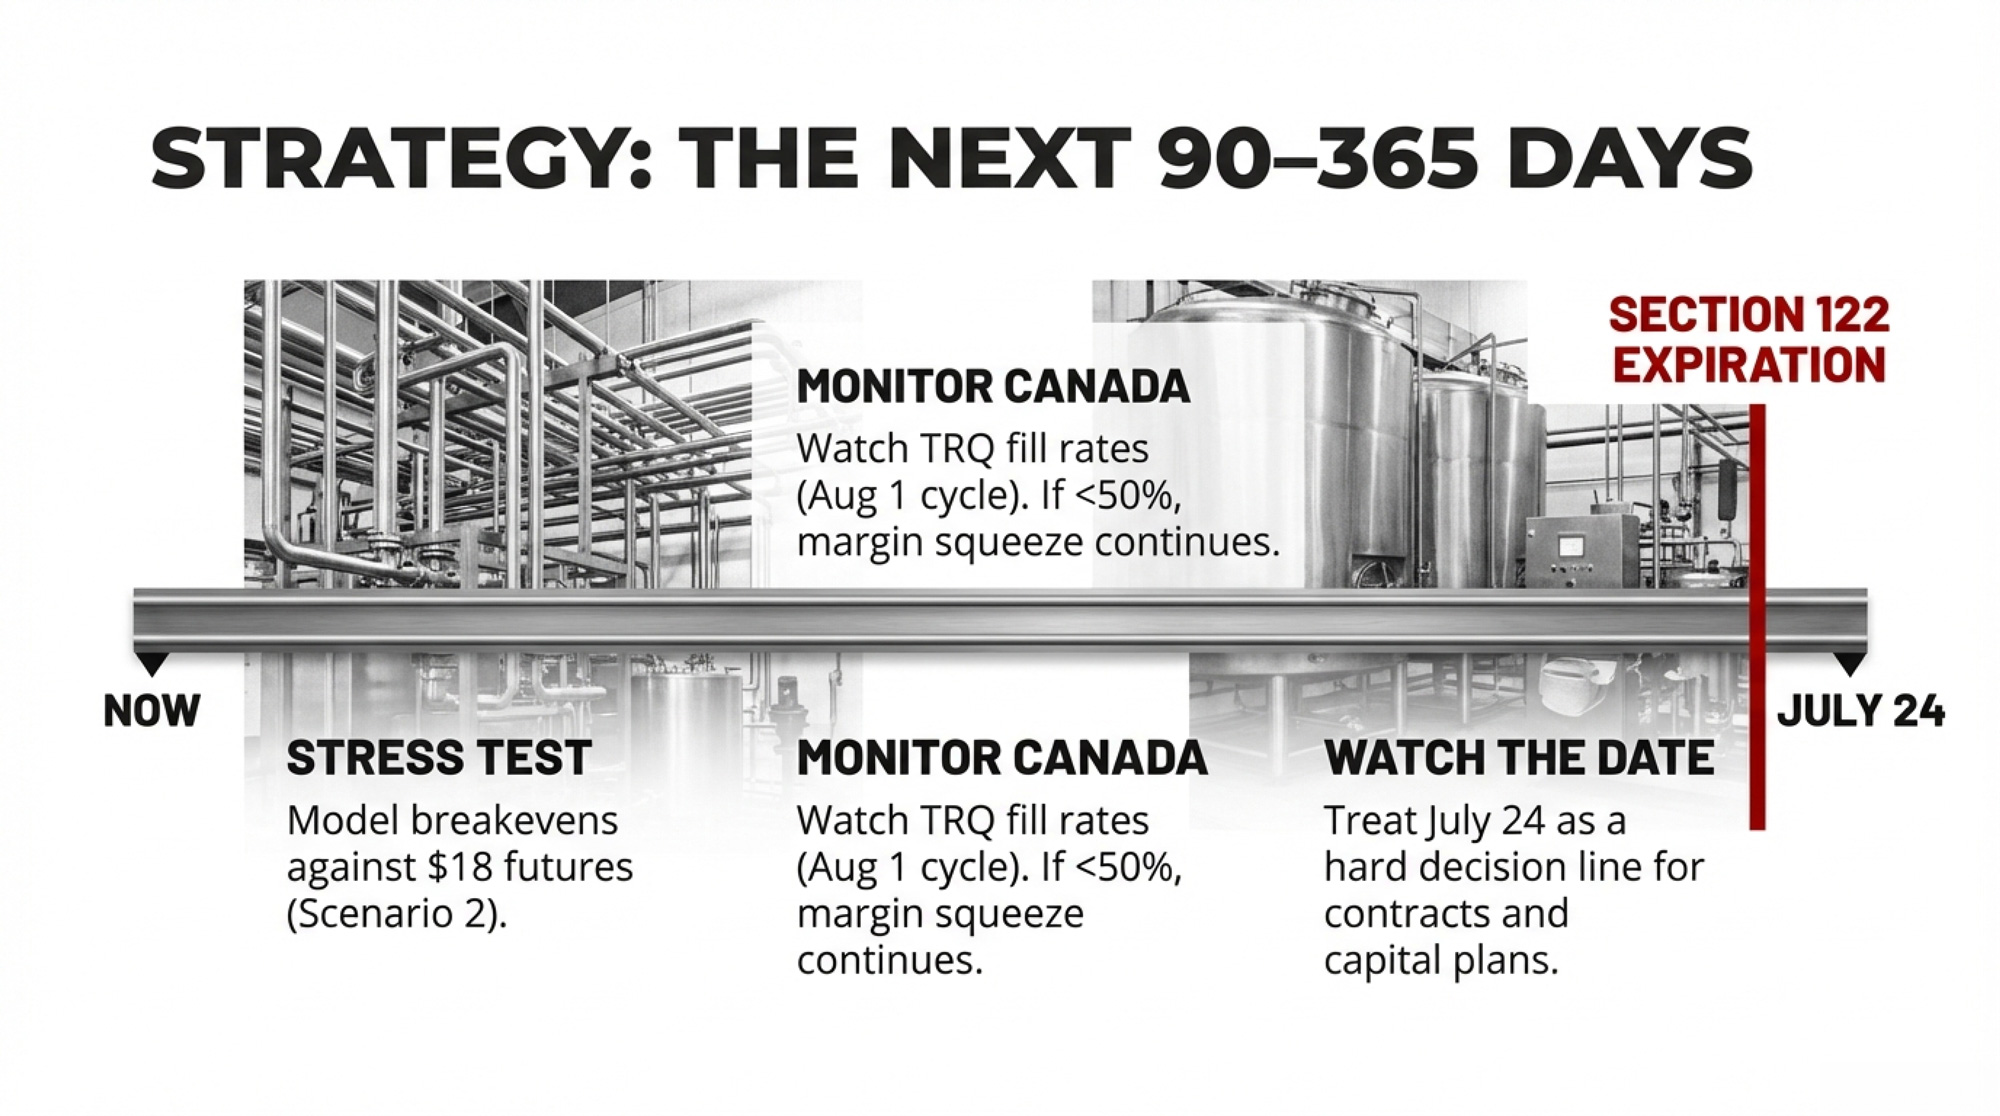
The P5 boards agreed to increase the saleable quota by 1% as of December 1, 2025, which will slightly dilute your share of the national milk pool. The February 2026 farmgate price bump helps offset that erosion, but doesn’t fix the structural problem: you’re trying to service 5.5–6% money with an asset that isn’t allowed to appreciate.
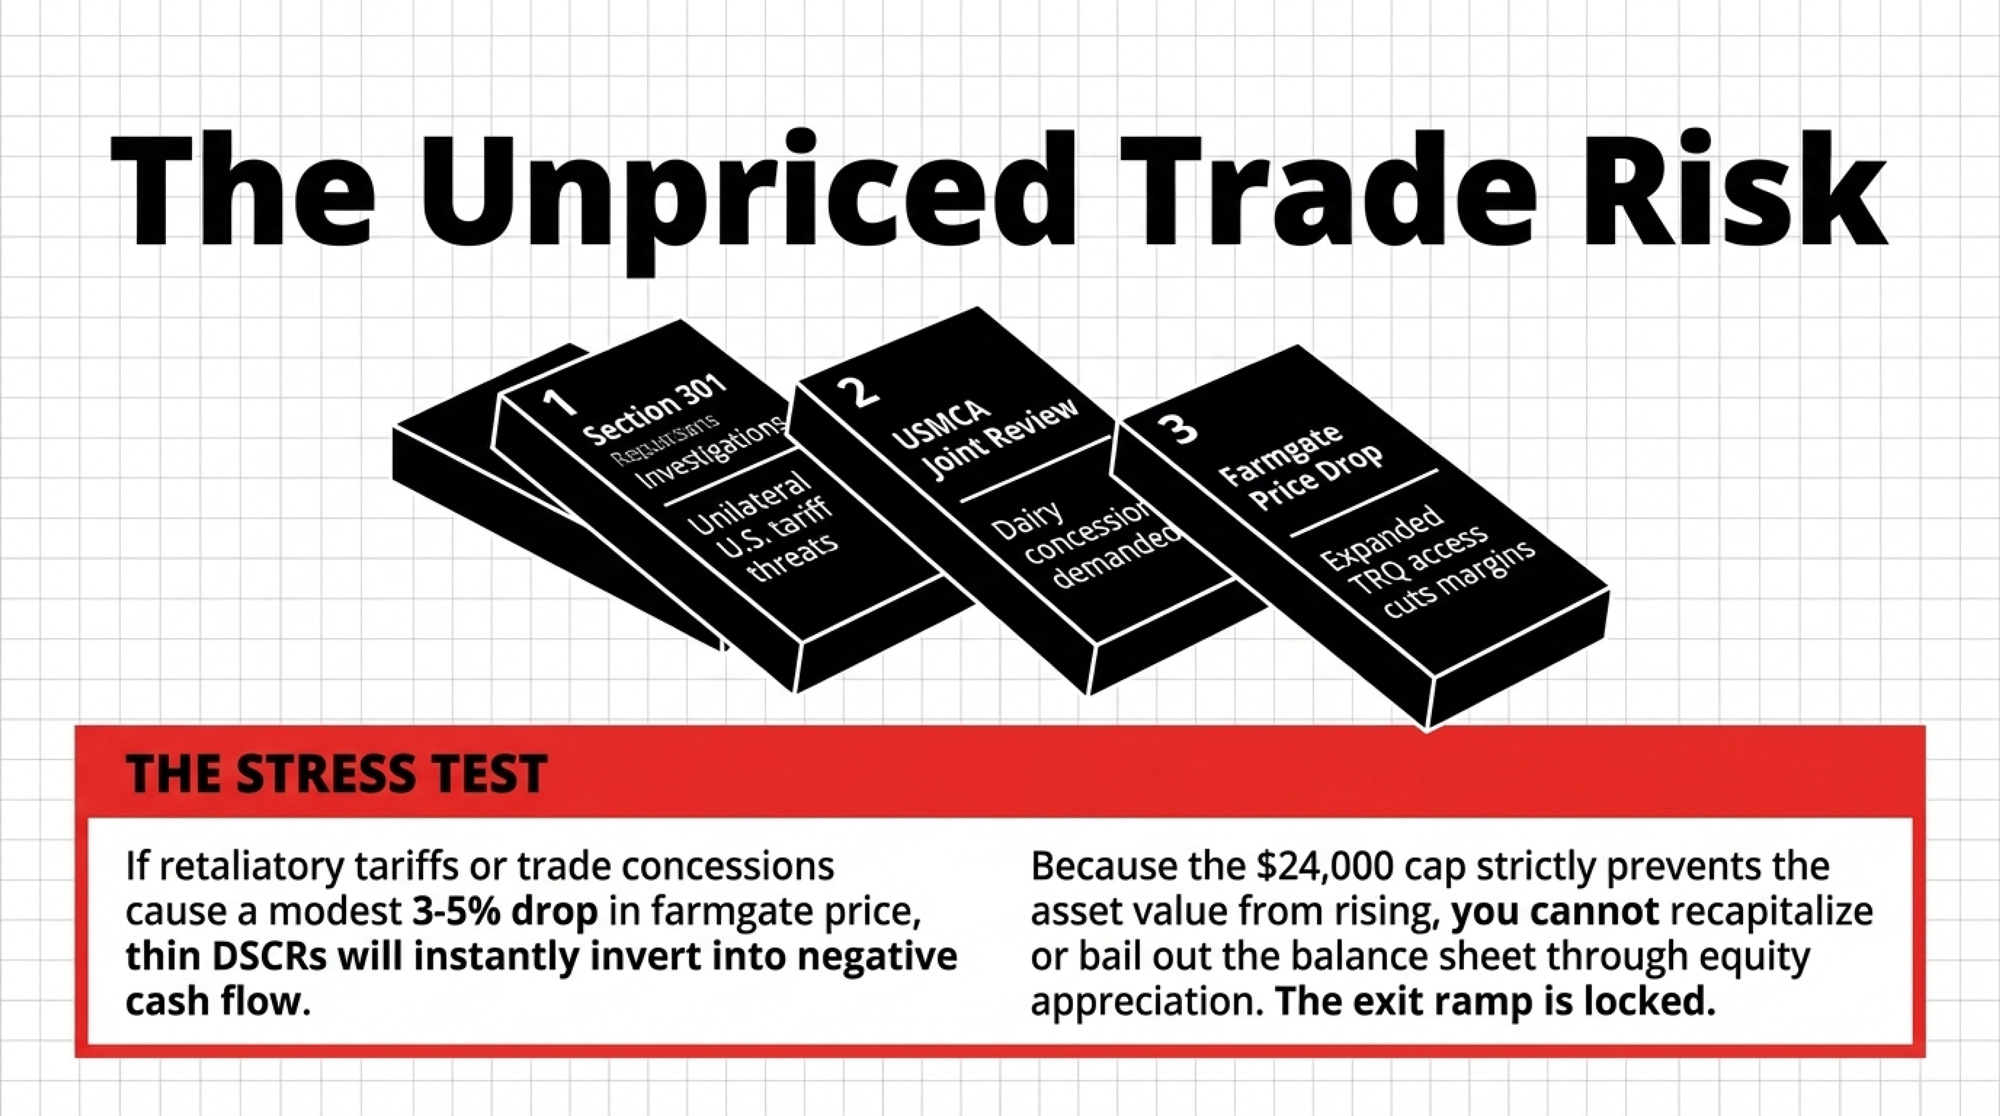
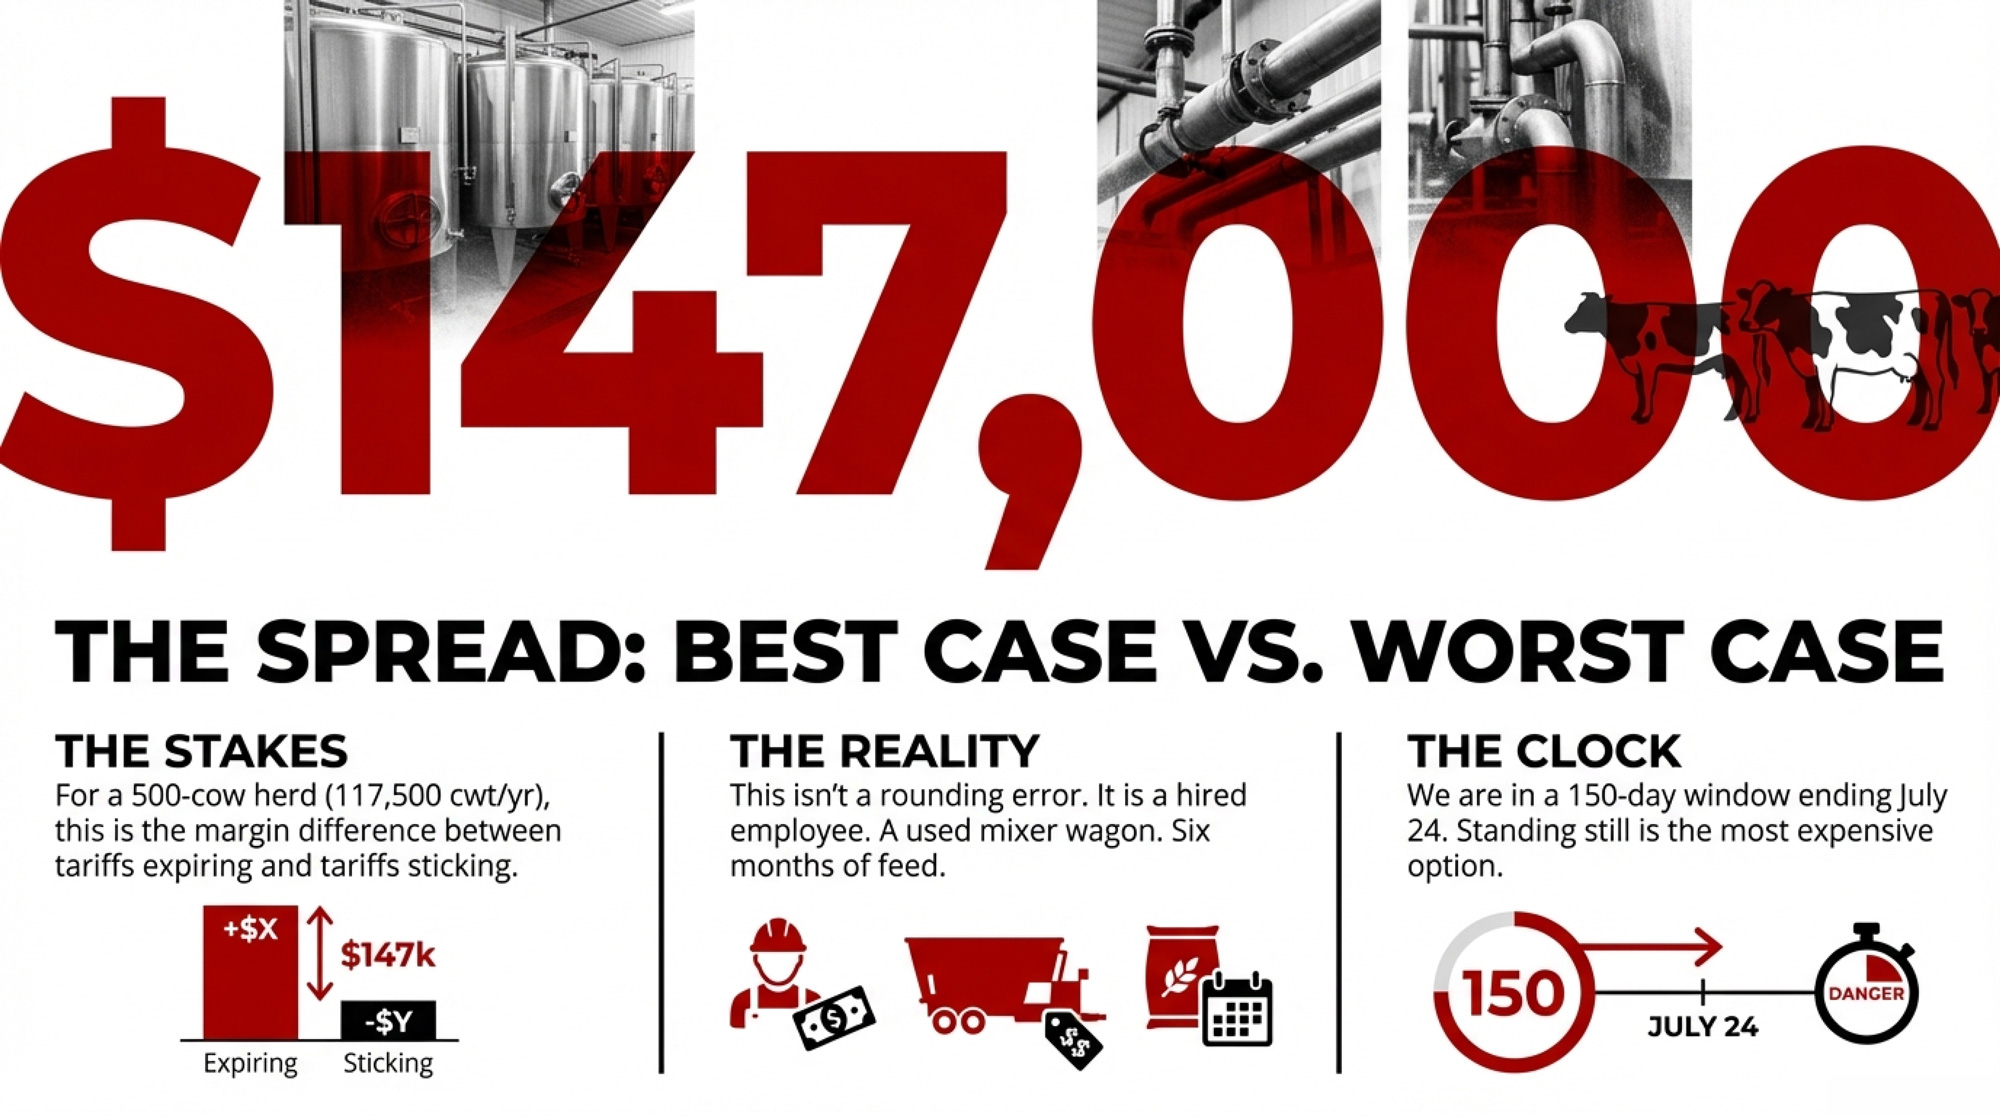
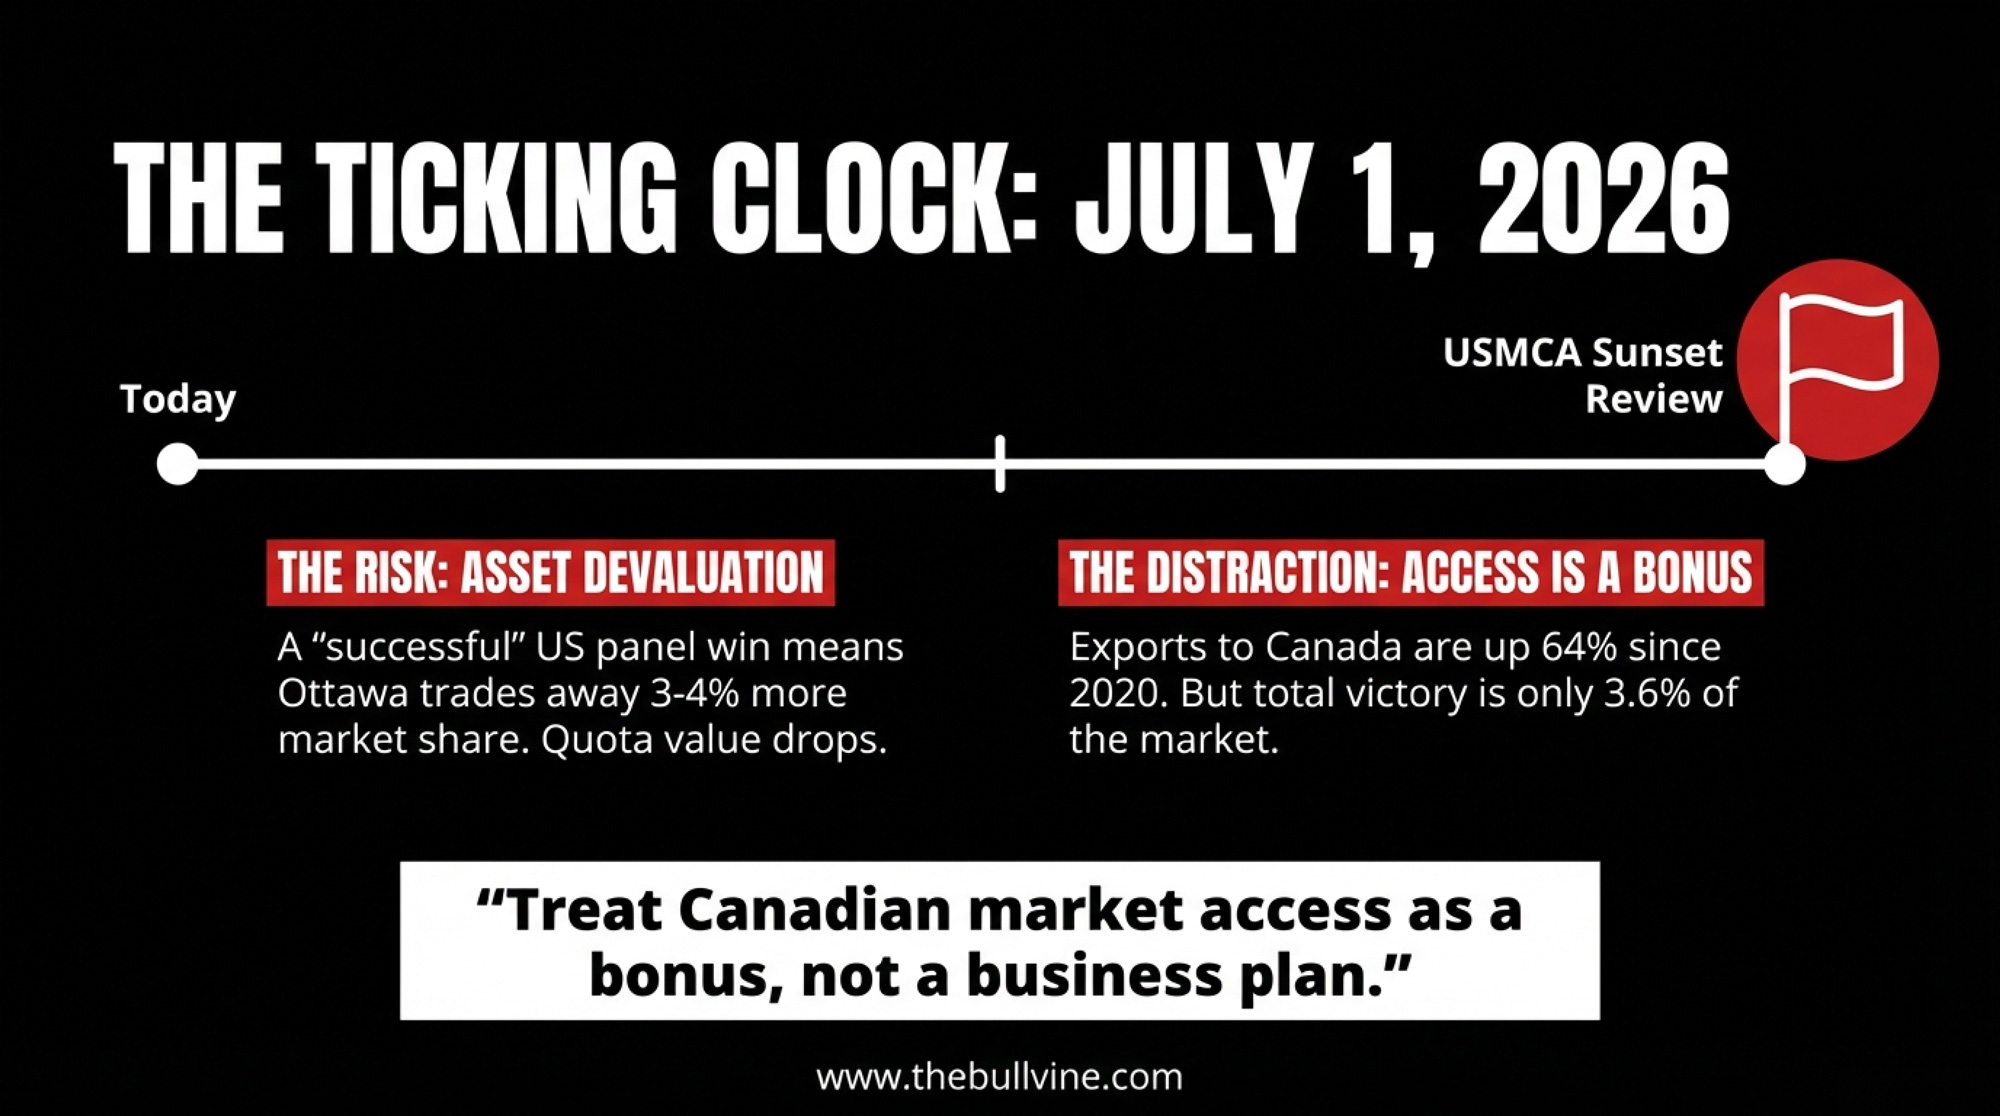
The Trade Risk Nobody’s Priced In
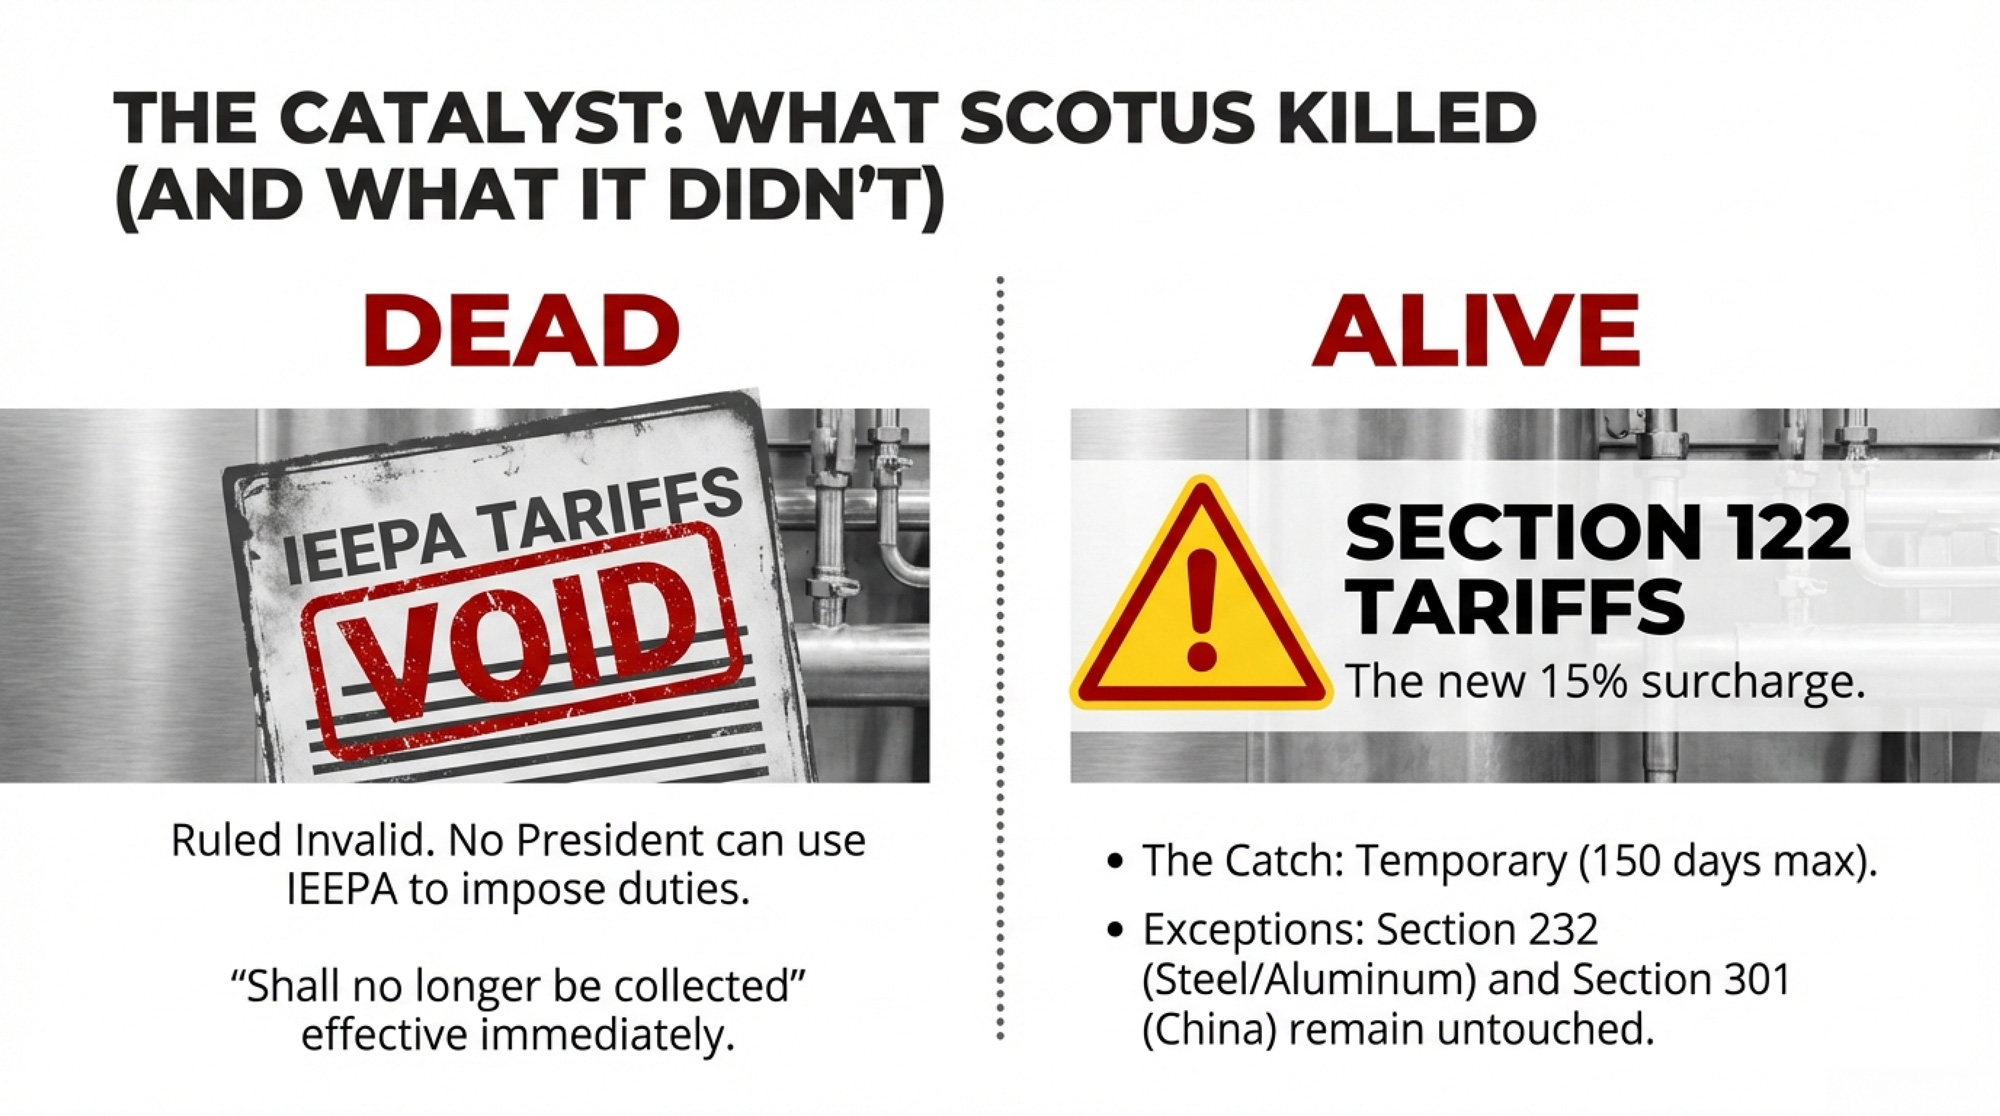
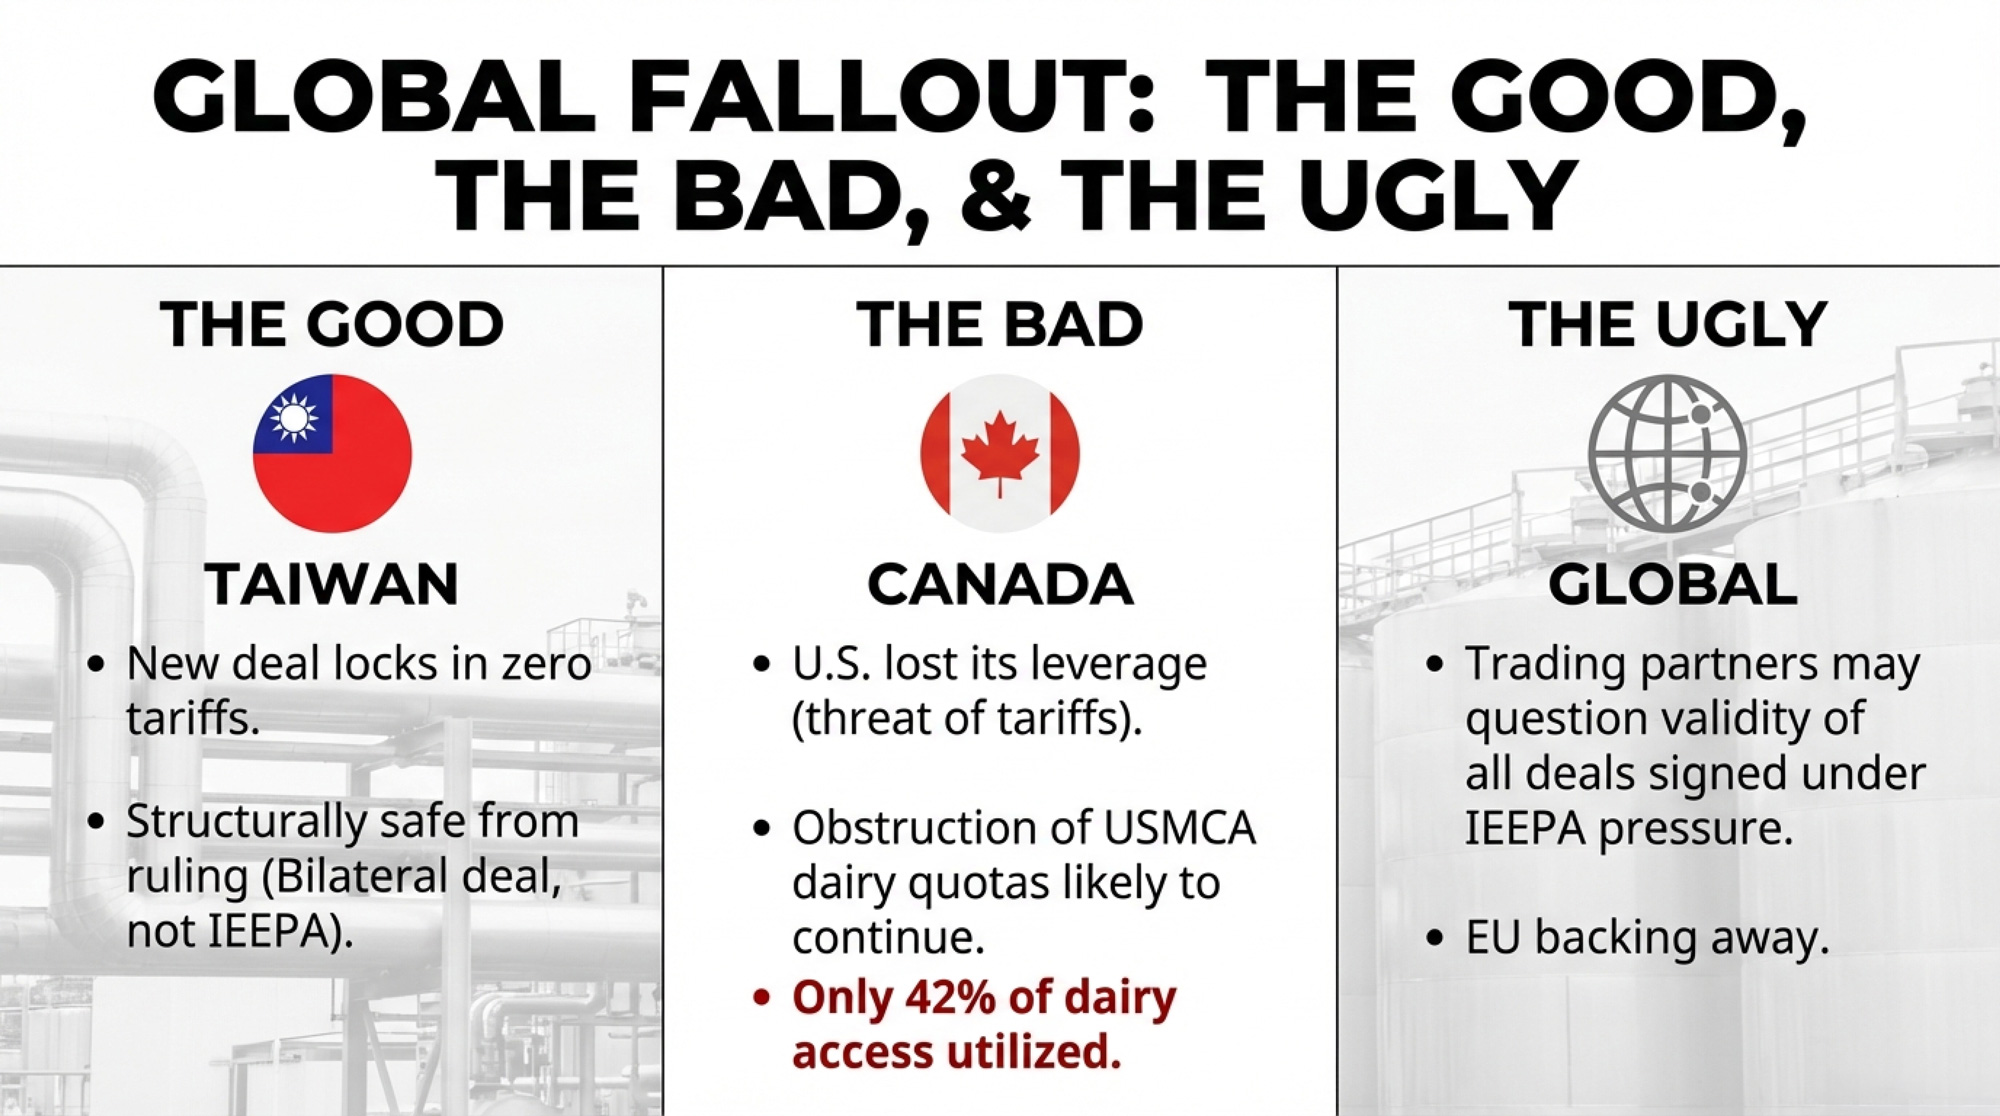
The CUSMA joint review is underway, and it’s not happening in a vacuum. In March 2026, the Trump administration launched Section 301 trade investigations covering Canada and 59 other economies — focused on forced labour and manufacturing overcapacity — after the Supreme Court struck down IEEPA‑based tariffs, according to CBC. USTR fact sheets and the 2026 Trade Policy Agenda make it clear these investigations will feed into the broader USMCA review.
CBC’s coverage notes that U.S. officials have repeatedly flagged Canadian dairy policies as part of a “non‑exhaustive” list of trade irritants. Dairy isn’t the only target, but it’s very much on the table.
Wiens has repeatedly warned that Canada has already conceded roughly 18% of its dairy market access in past trade deals, and that further access would cut directly into domestic production.
Carney has repeatedly said in public that supply management isn’t up for negotiation.
But a Section 301 investigation is different from a negotiation. It’s a unilateral tool the U.S. can use to justify tariffs without Canadian consent. And here’s the link between trade and succession that deserves attention: if a wider TRQ, retaliatory tariffs, or a forced restructuring devalues the exit ramp, the next generation isn’t just fighting to make the numbers work. They’re fighting over a shrinking pie — sale prices might fall at the same time debt loads stay fixed.
Here’s the stress test you can run on your own numbers: assume a modest 3–5% drop in farmgate price if TRQ access expands or tariffs bite. On a farm already running a negative‑carry quota, that price hit drops directly onto your already‑thin DSCR. If a 3–5% decline pushes you below 1.0, you’re into negative cash flow unless something else gives. The quota can’t bail you out by appreciating. The cap keeps that door shut.
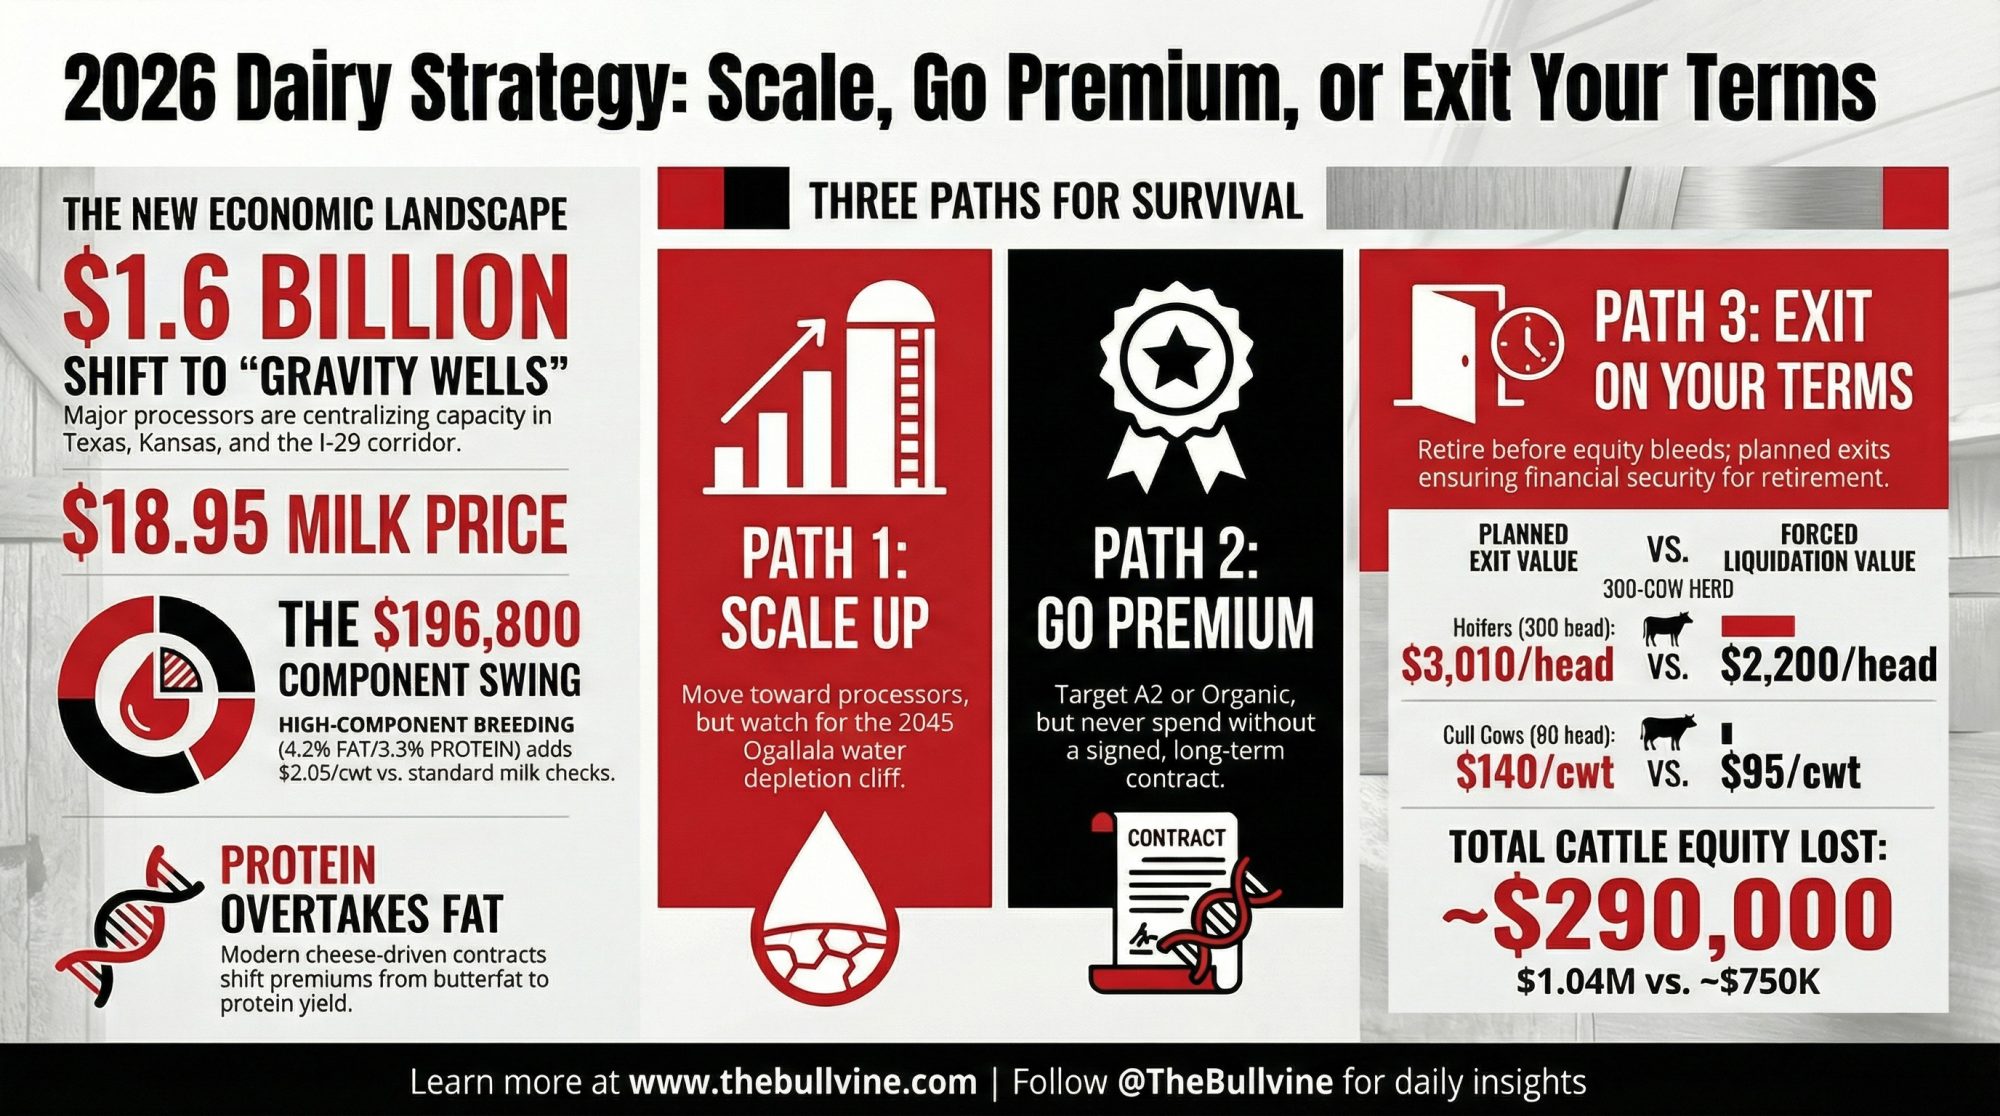
Options and Trade‑Offs for Farmers
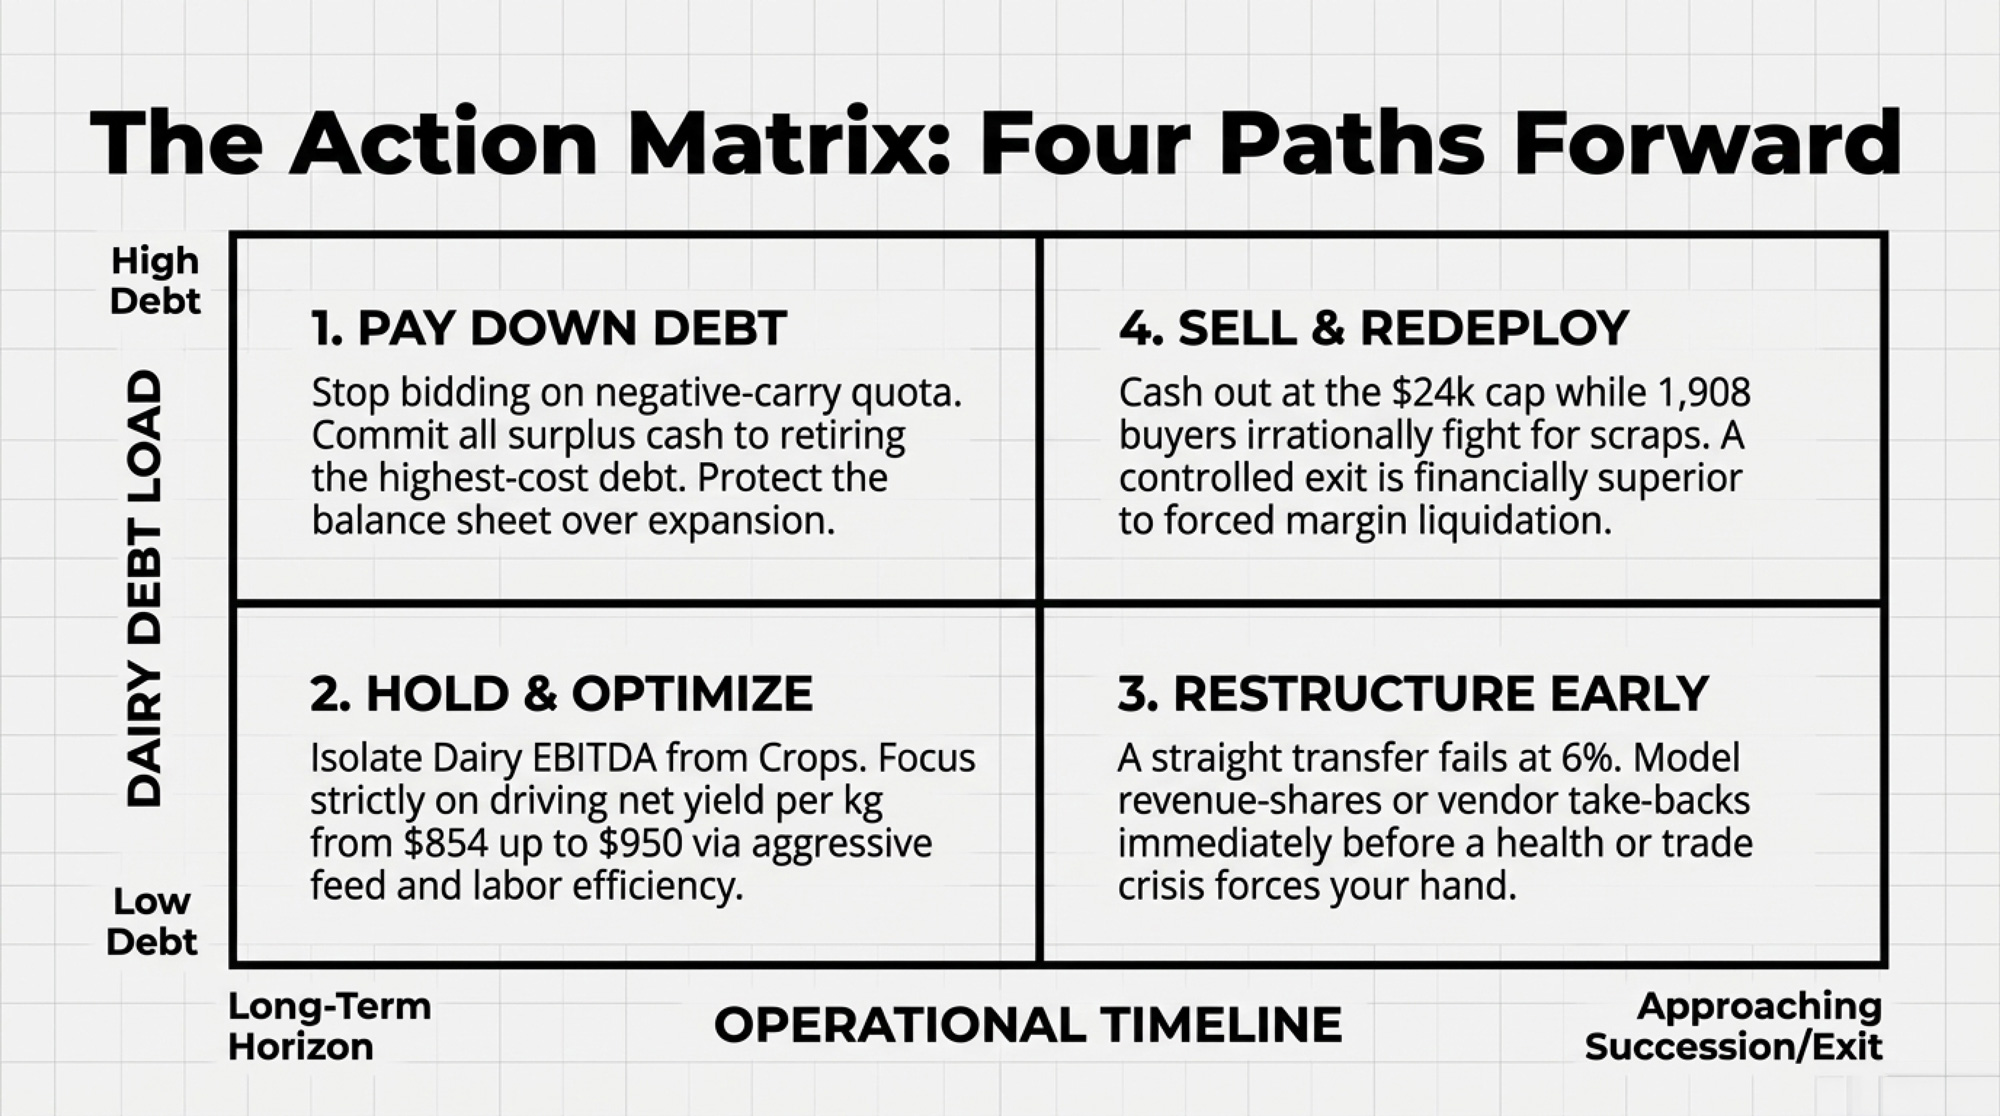
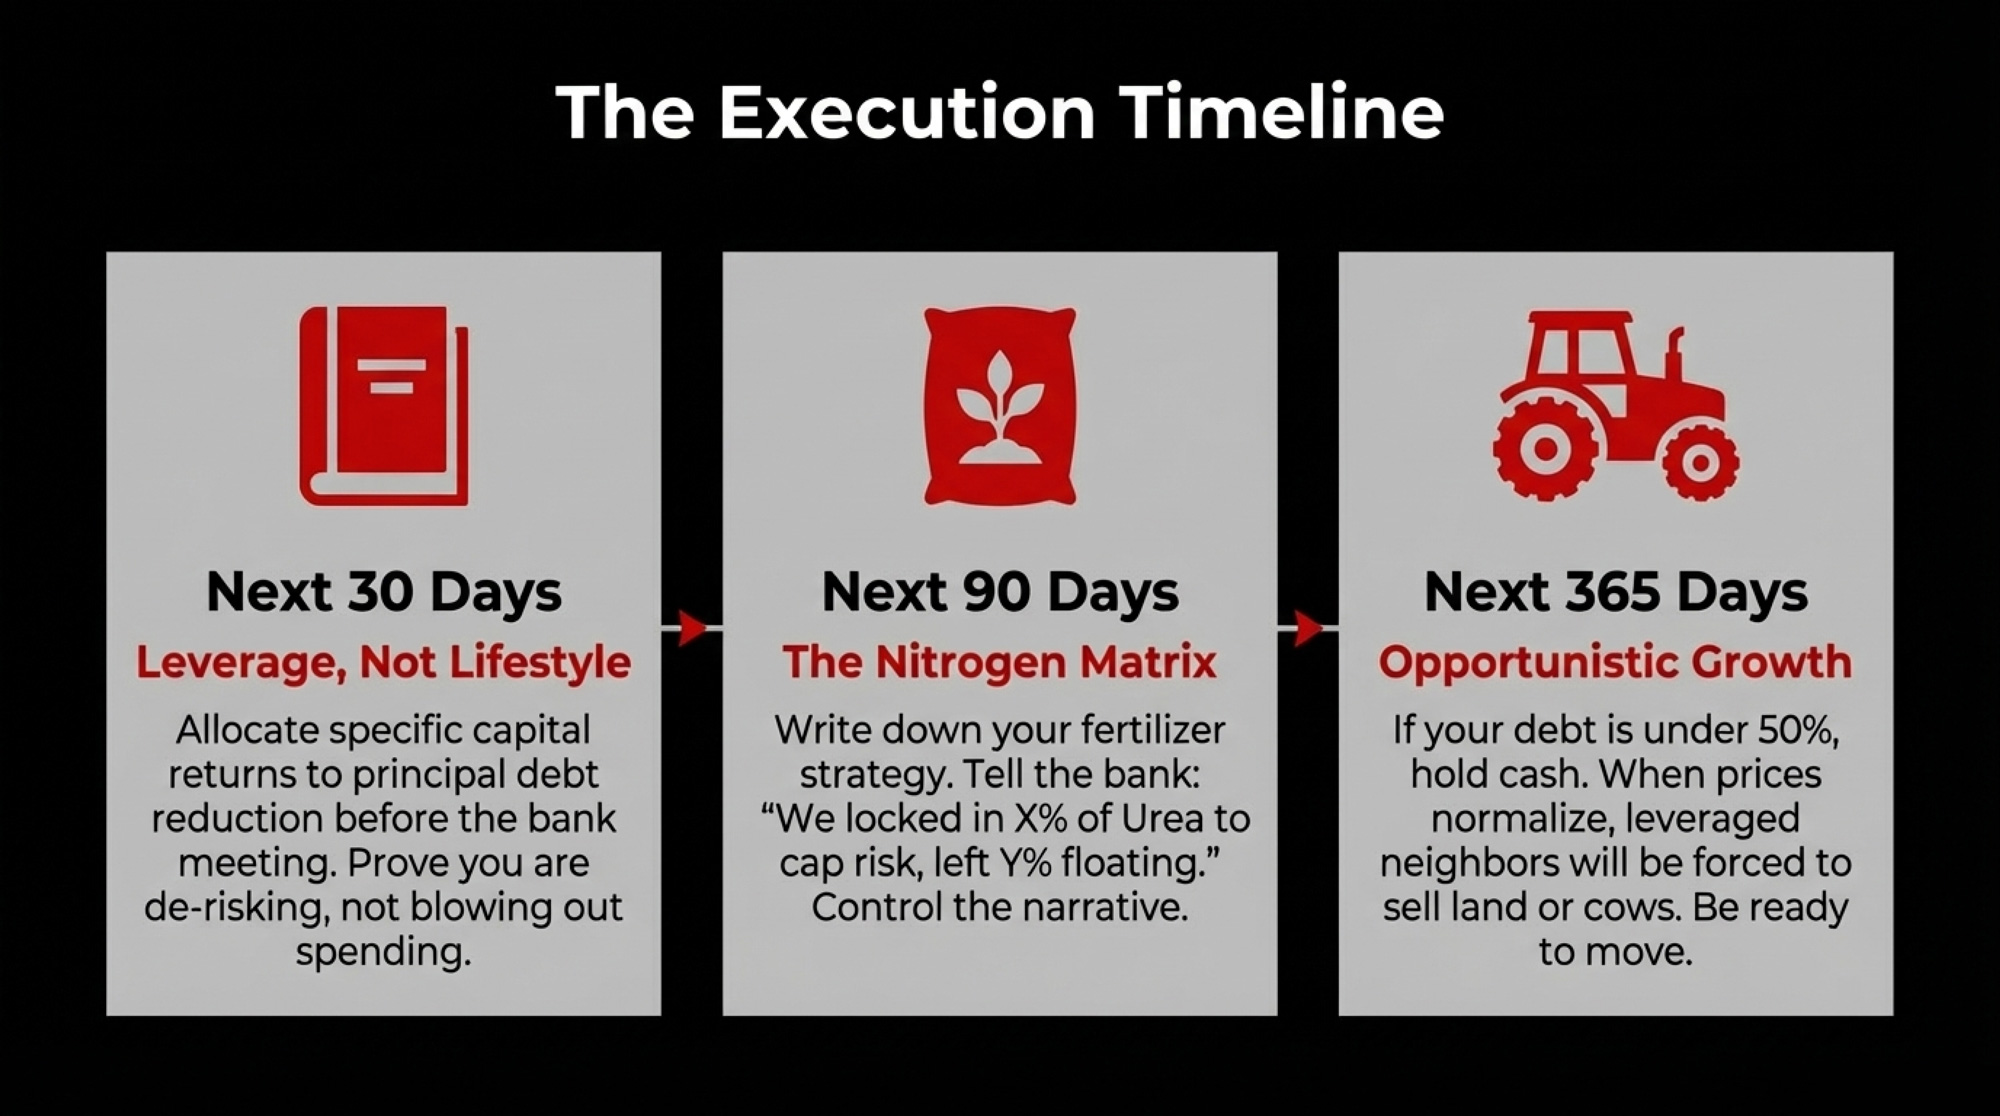
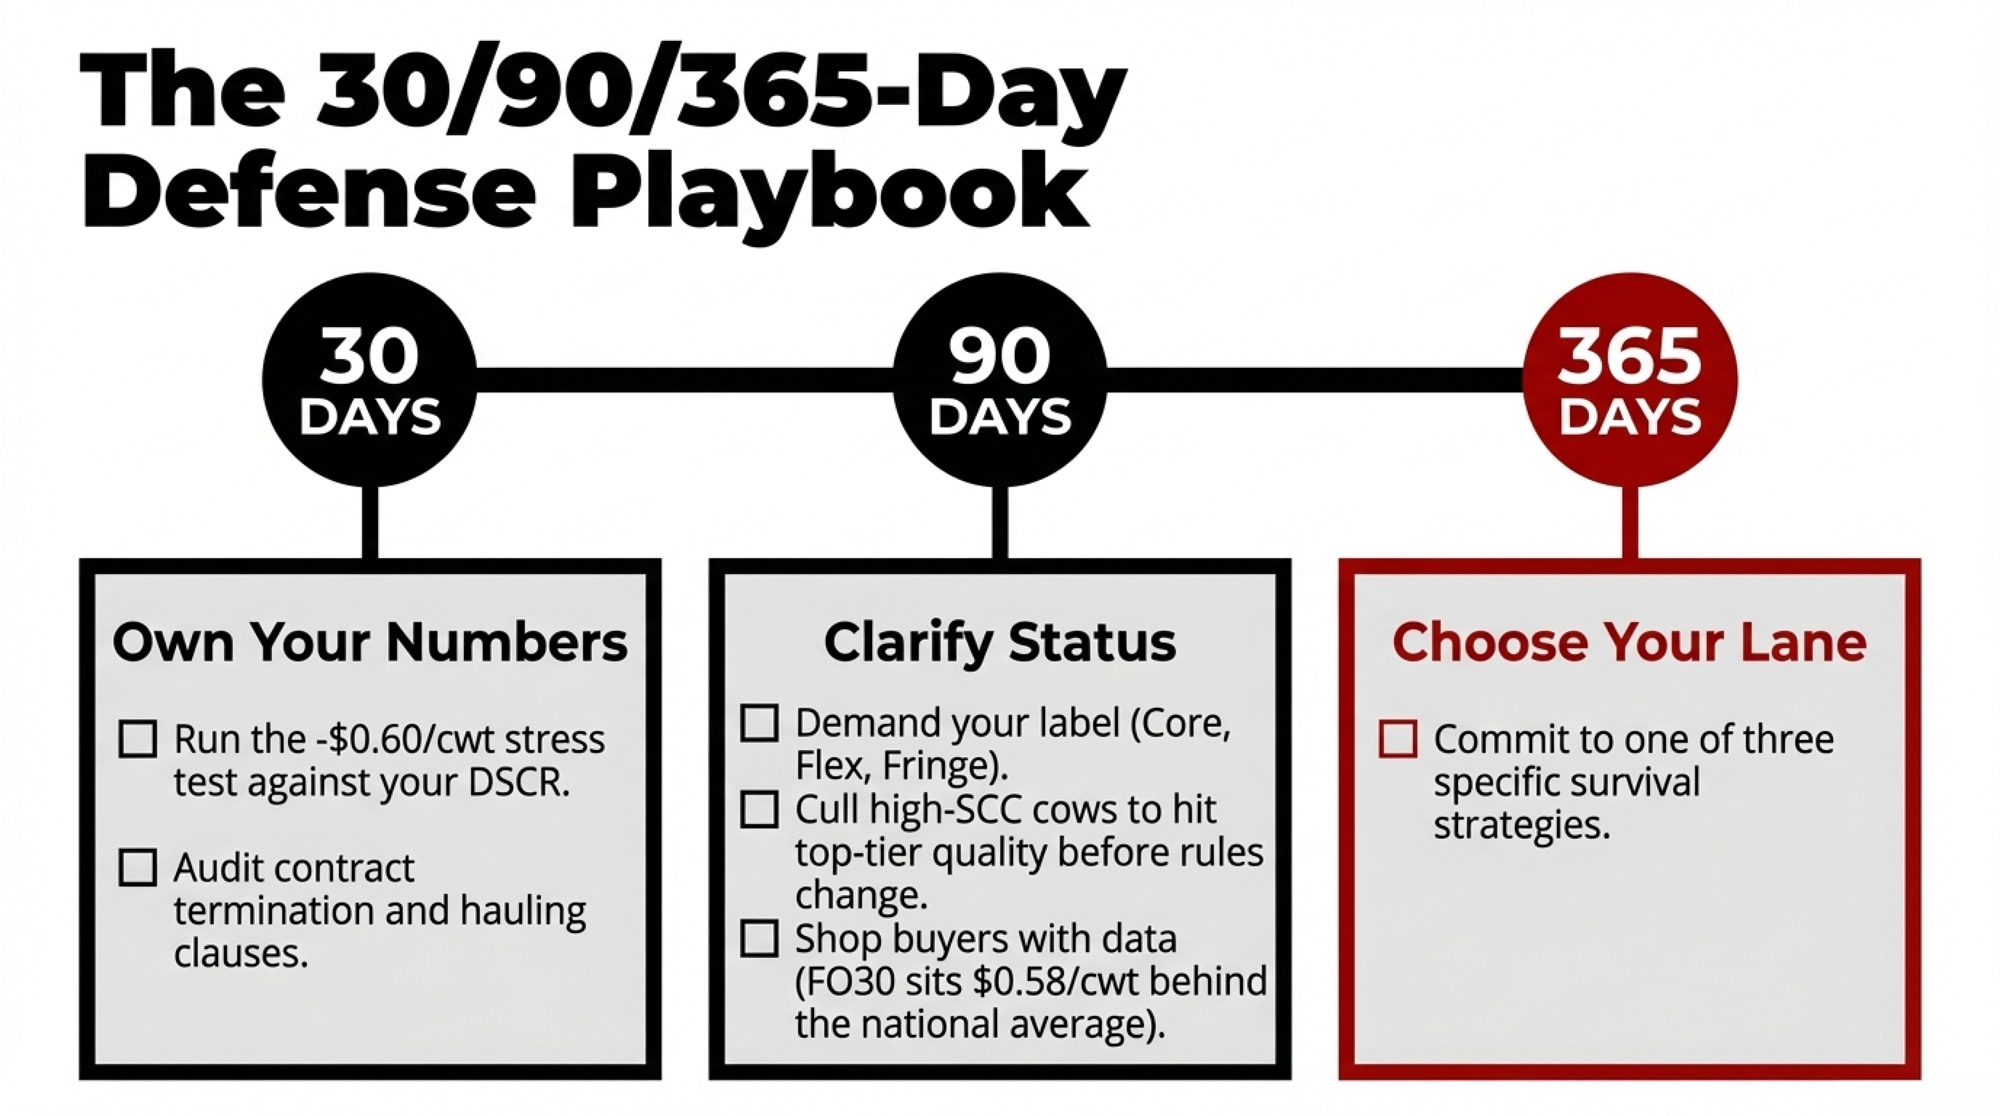
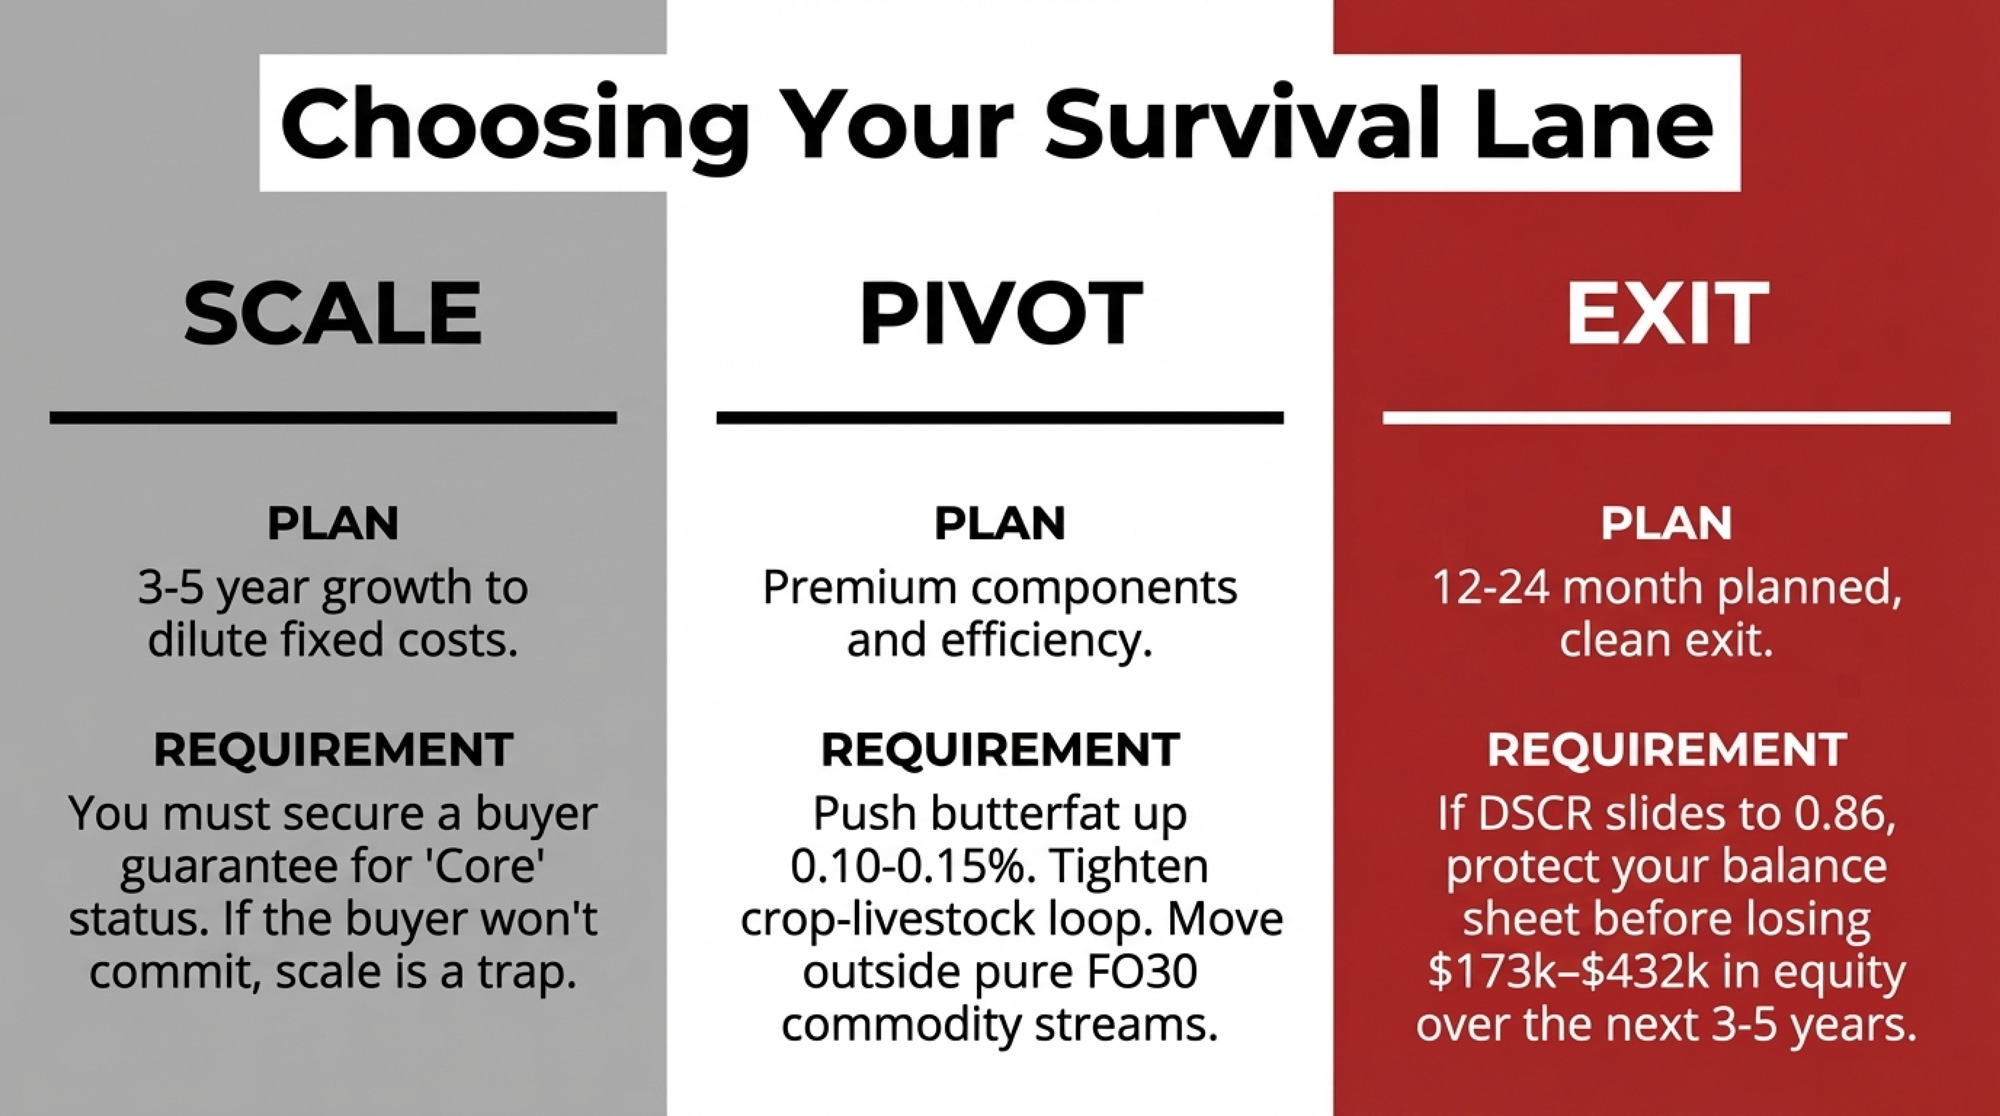
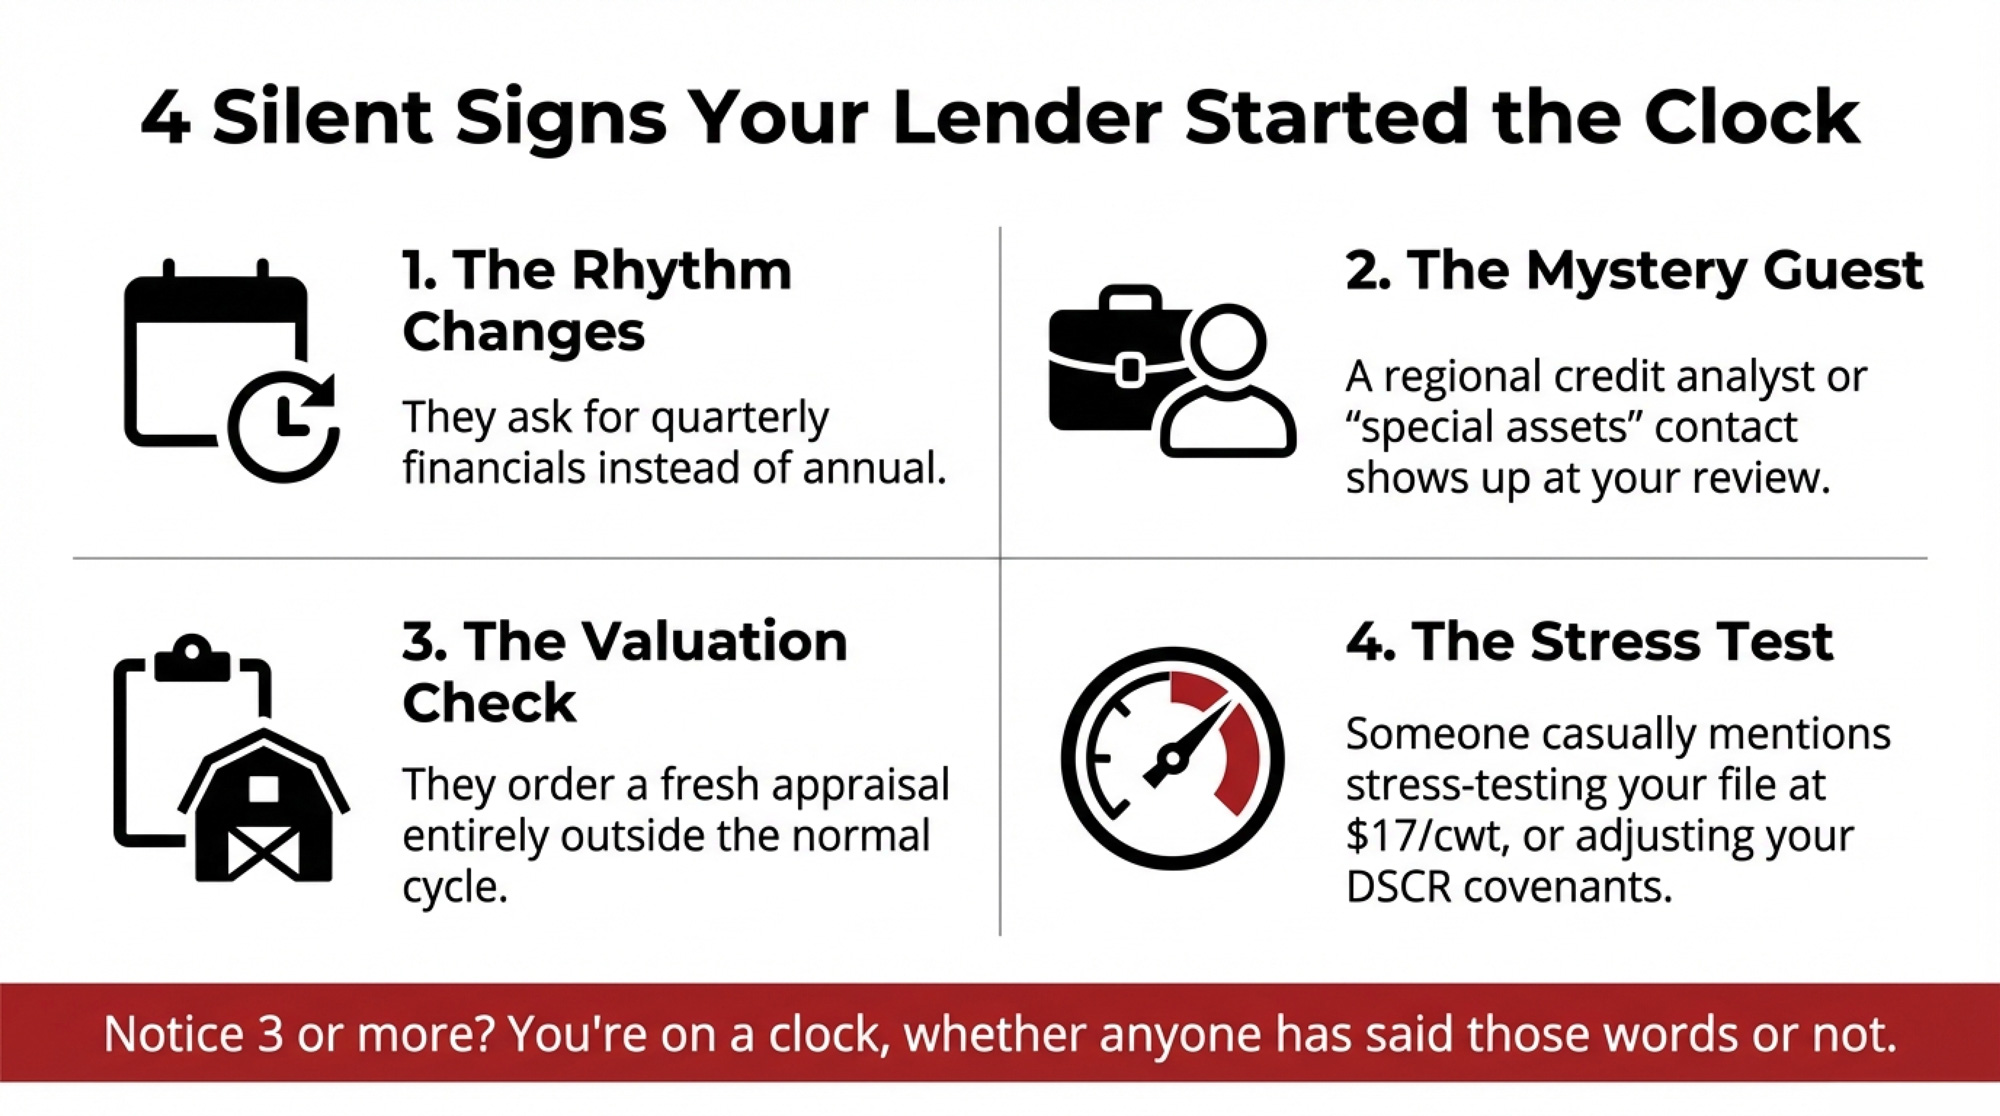
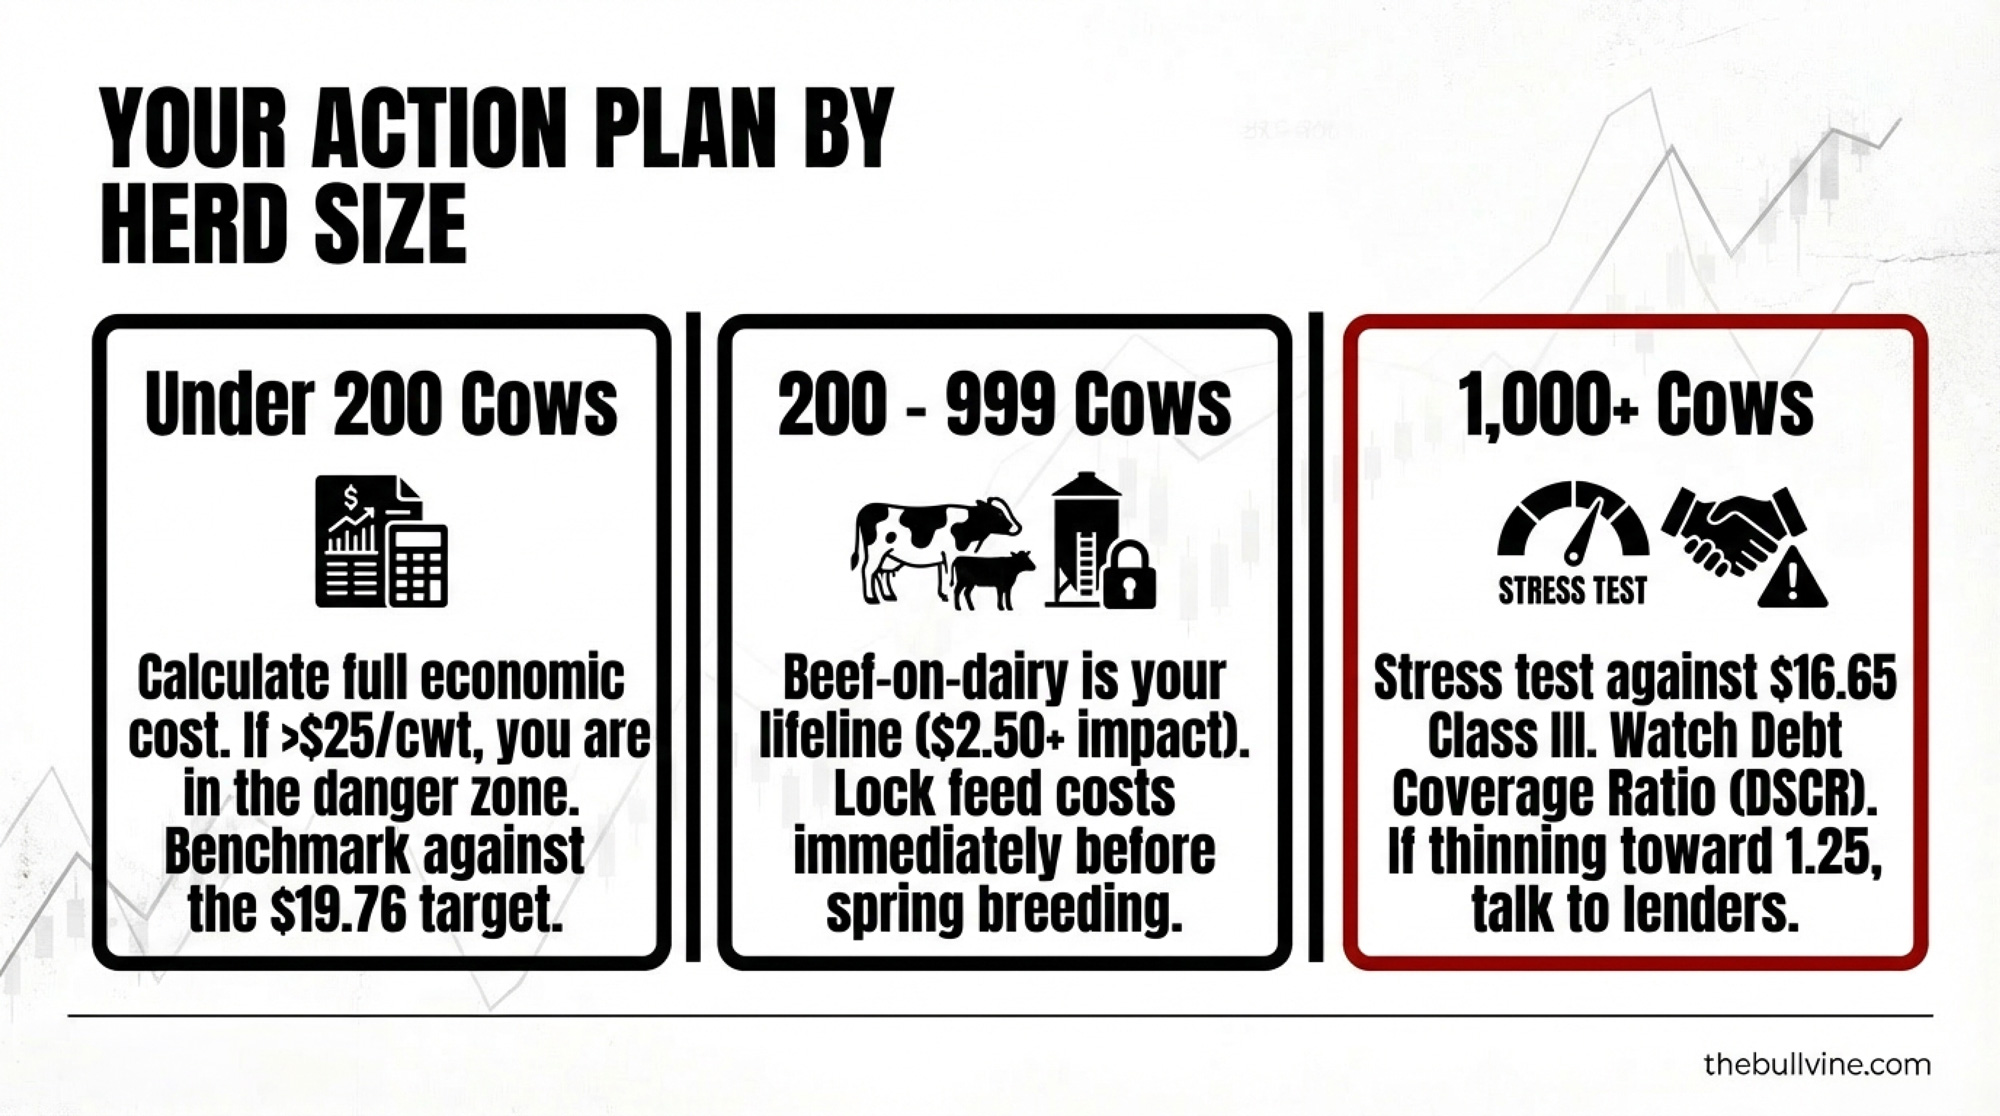
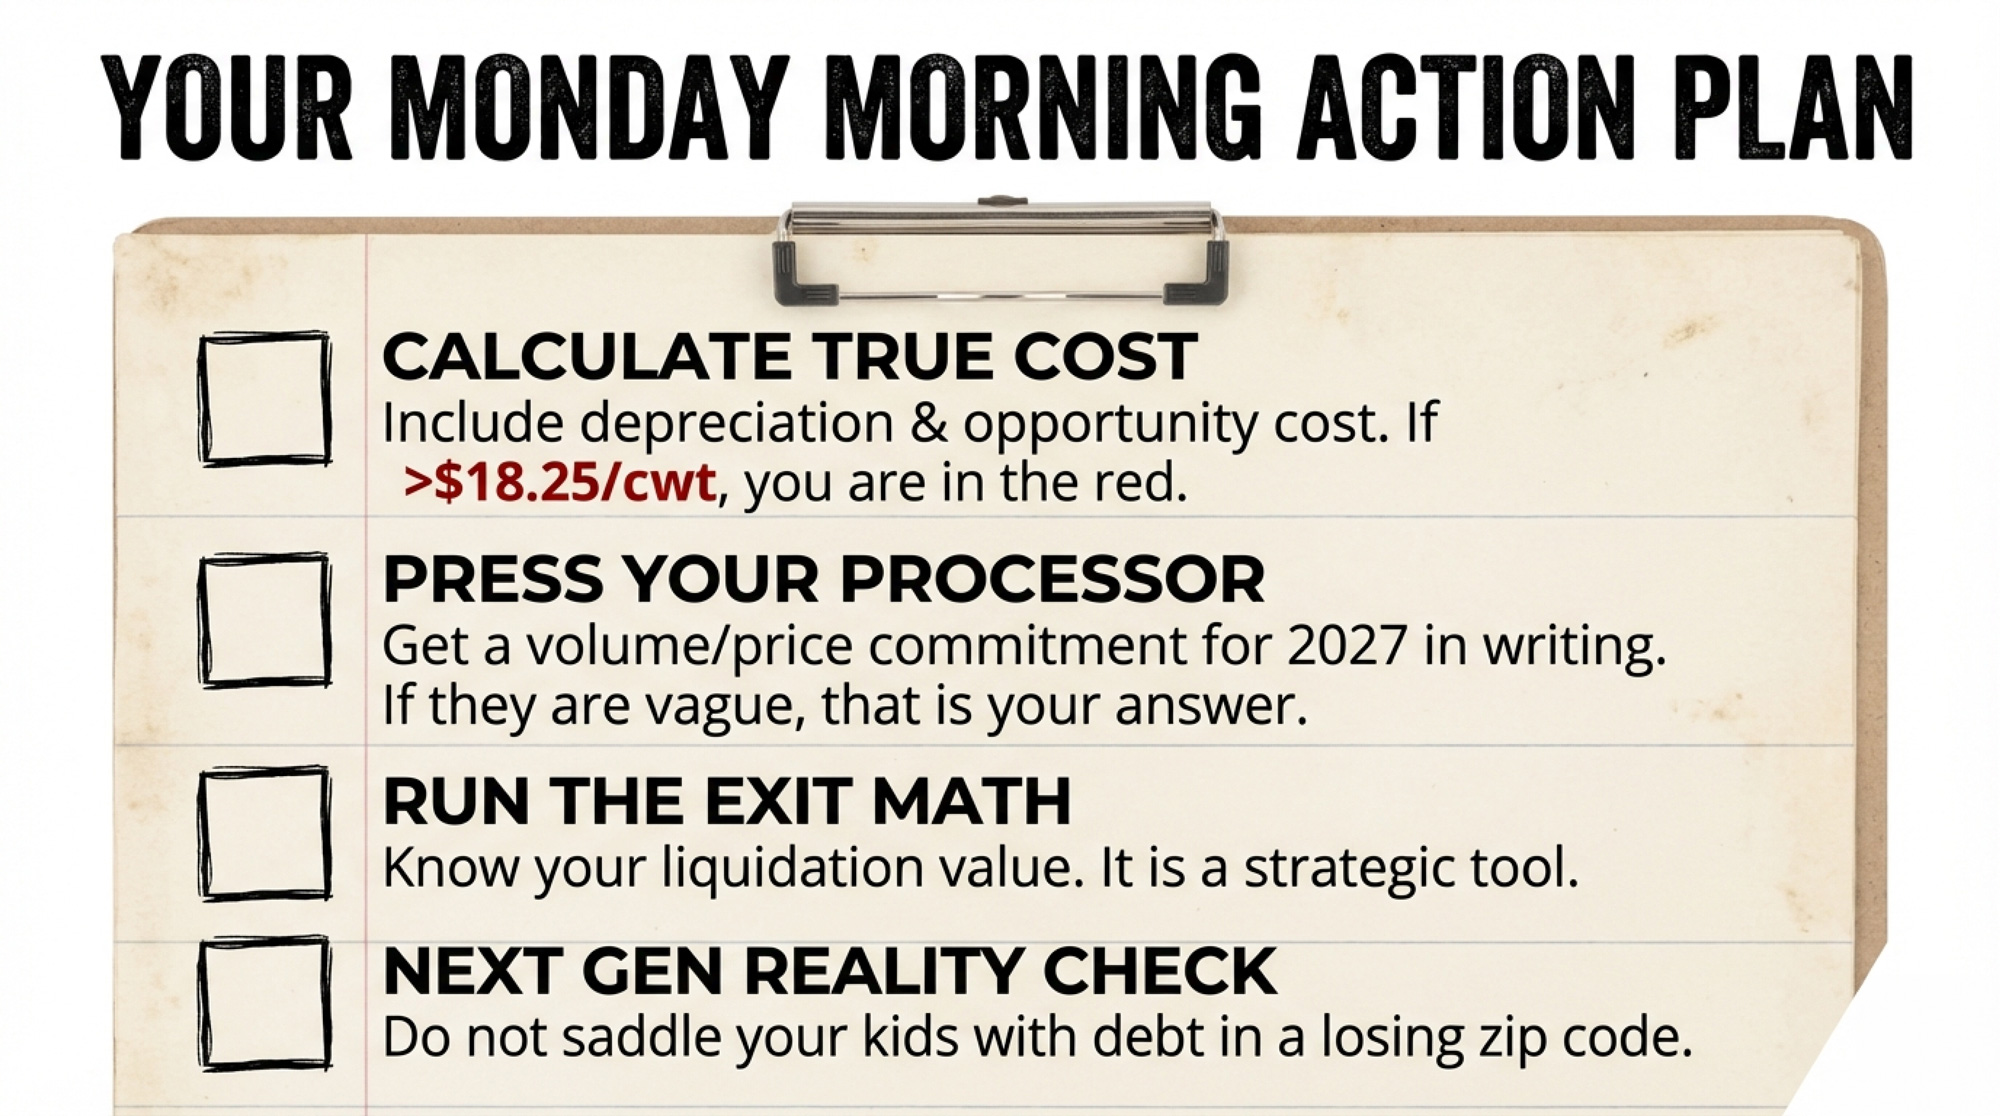
Path 1: Pay Down Debt First — Your 30‑Day Action
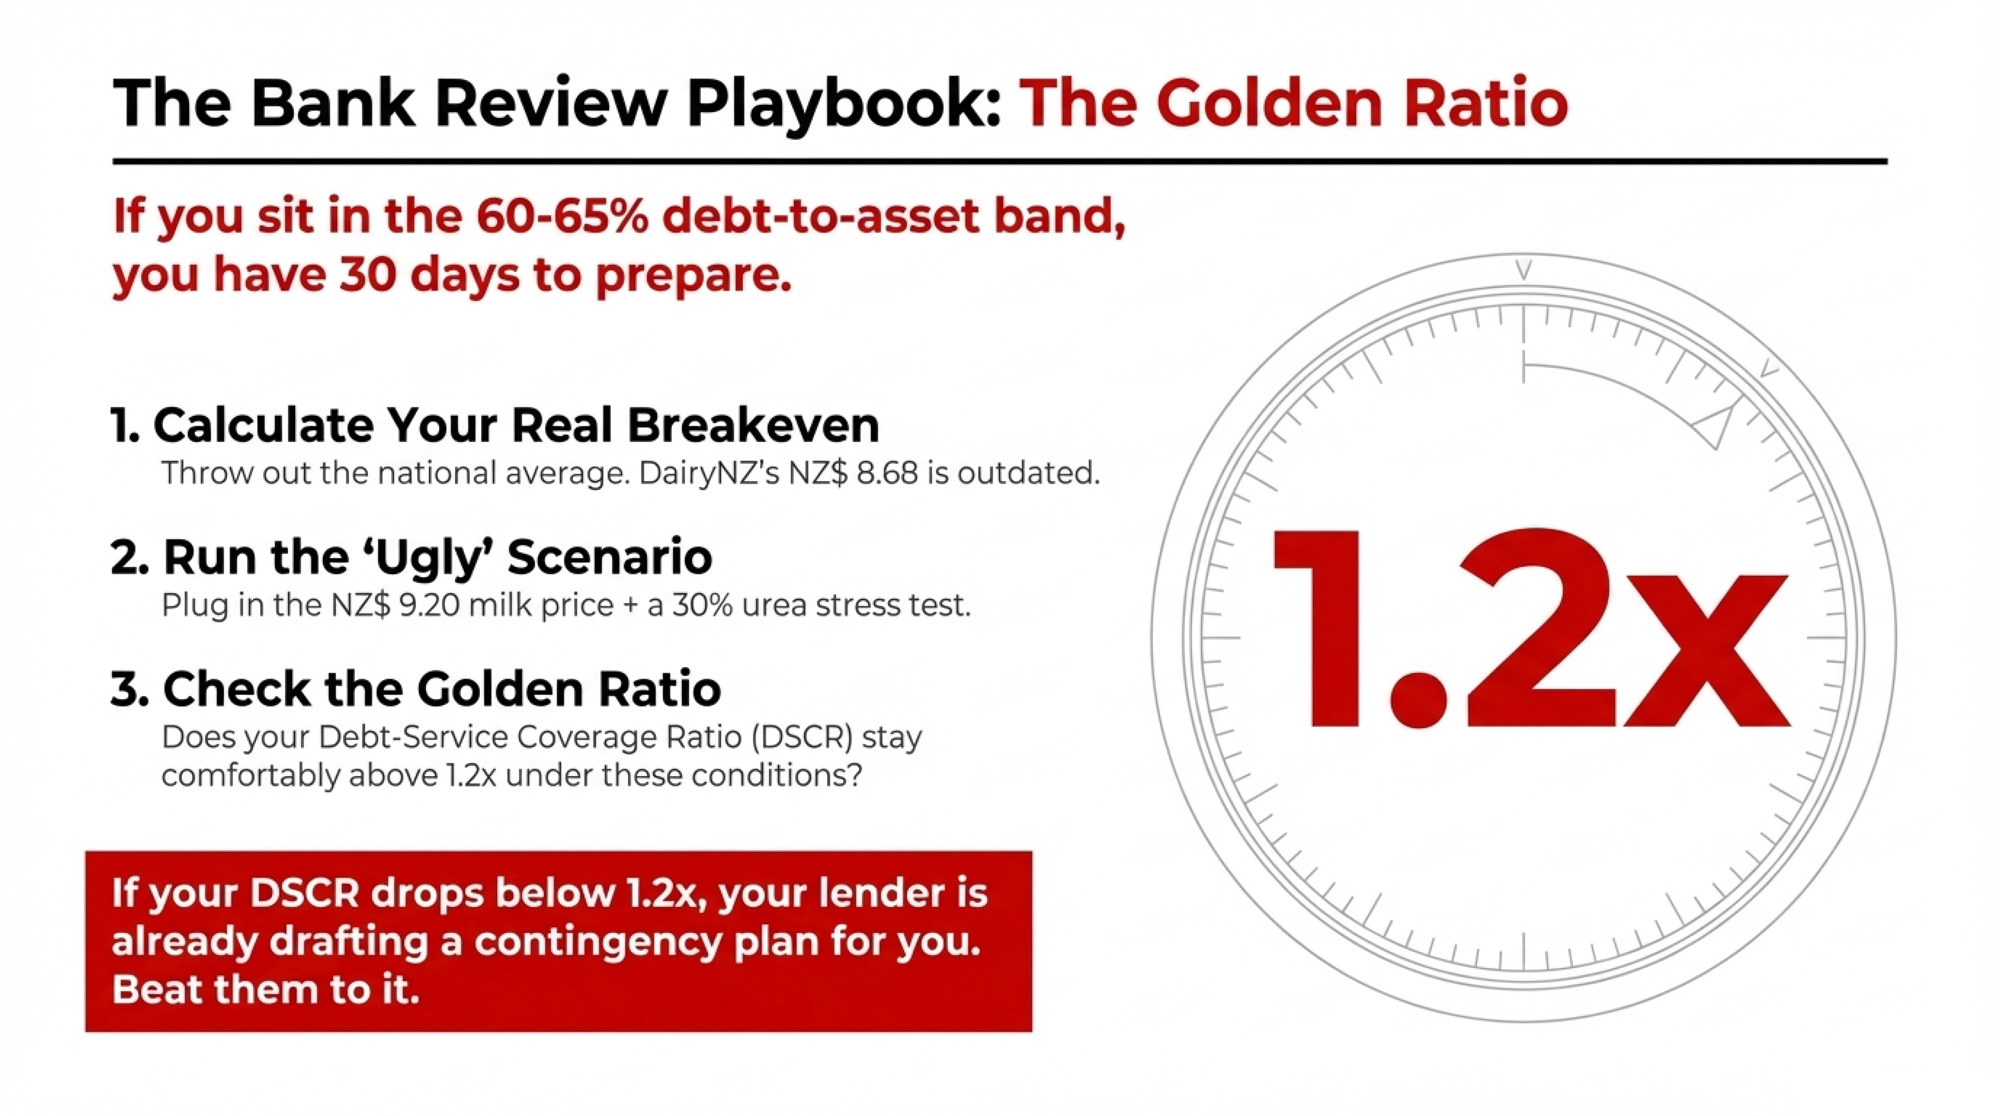
When it makes sense: You’re carrying quota debt at 5% or higher, and your DSCR is hovering near or below 1.25.
What it requires: One meeting with your lender in the next month. Bring your current loan schedule and ask for a simple ranking: highest to lowest effective interest rate. Then commit your next 12 months of surplus cash to retiring the highest‑cost debt instead of bidding on new quota.
Risk/limits: You won’t grow your quota position while your neighbours might. But right now, negative‑carry quota growth is eating equity. You give up bragging rights to keep your balance sheet intact.
Signals to watch: The BoC has held at 2.25% since October 29. Bond markets currently price a small probability of a rate hike by fall. Even if they cut, commercial quota loan rates would need to drop below roughly 3.6% before newly financed quota stops bleeding cash at $854/kg net income, and below 4.17% even at $1,000/kg. Plug your own numbers into the cheat sheet above.
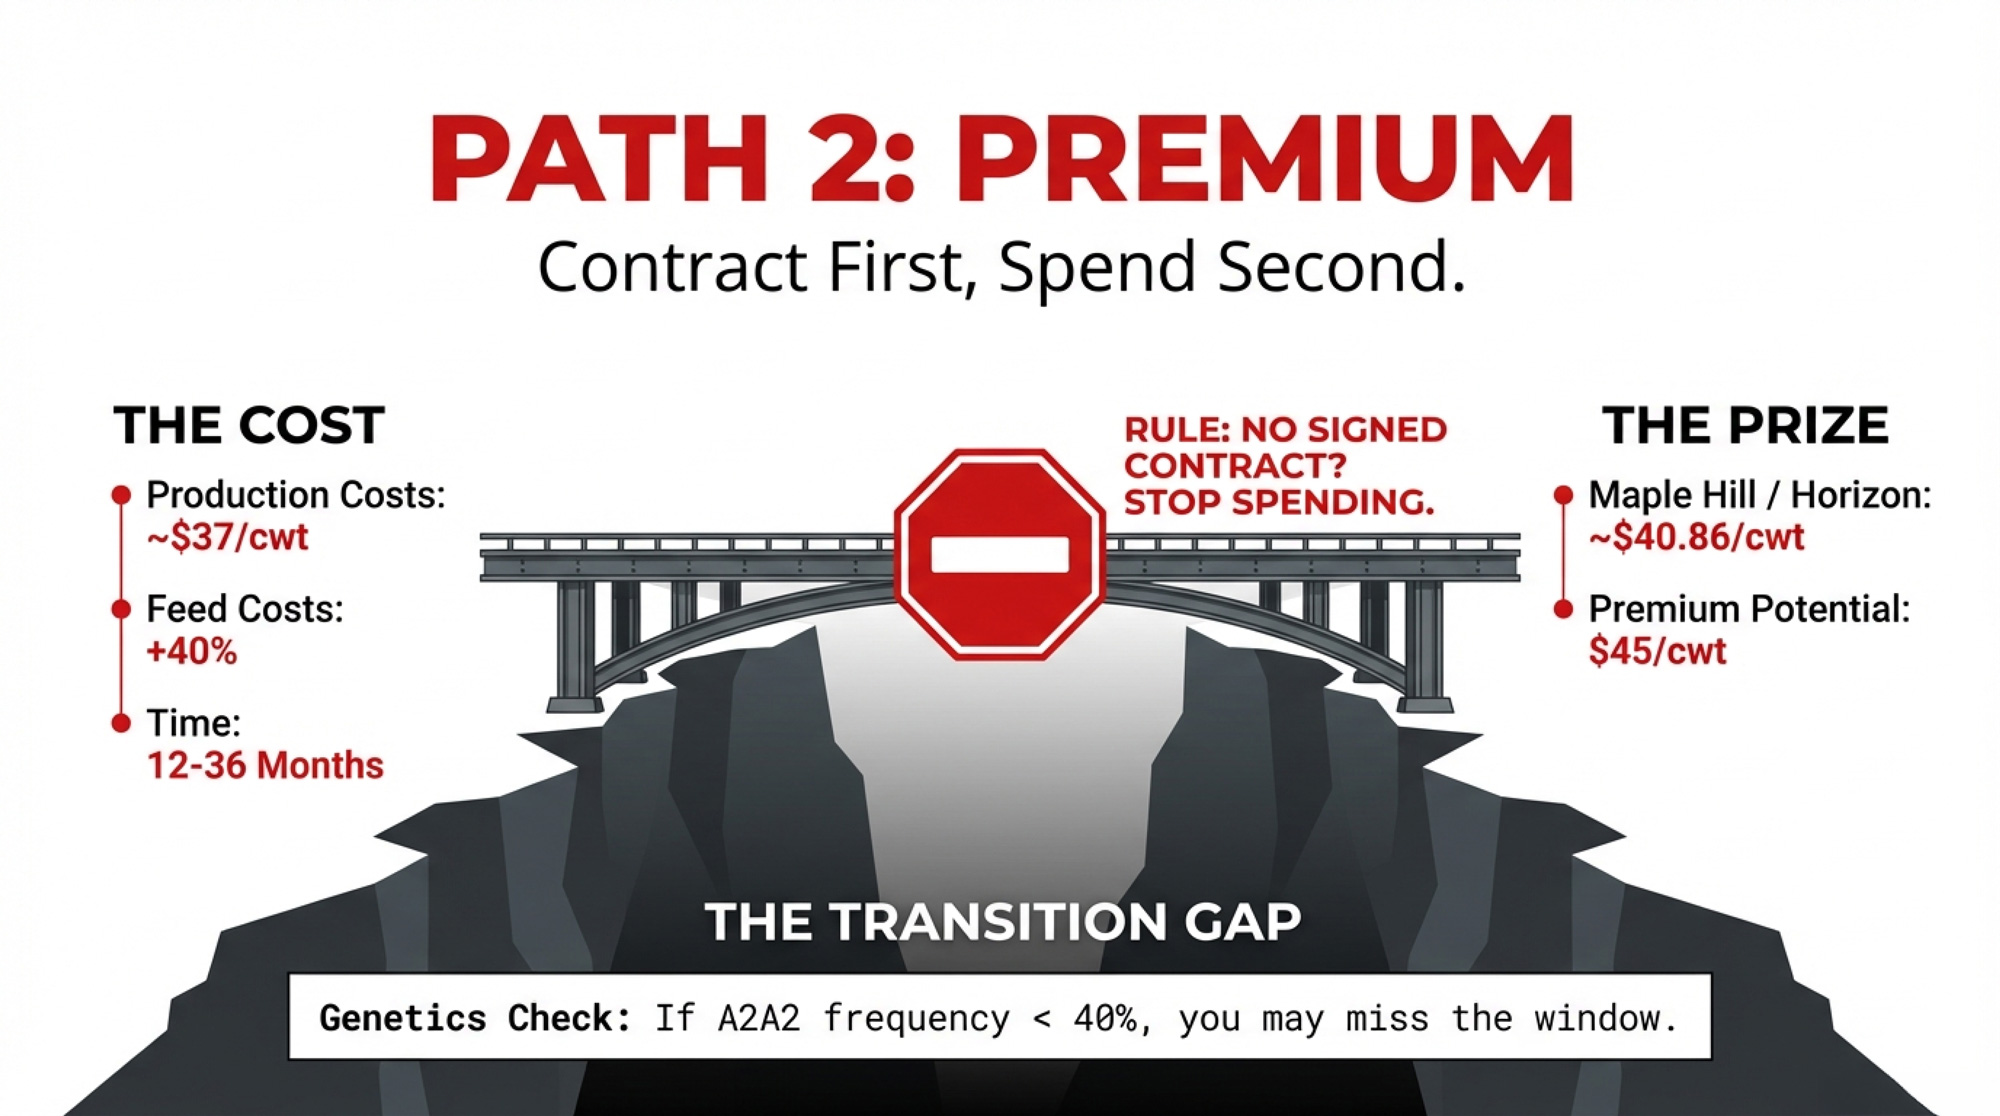
Path 2: Hold and Optimize What You’ve Got
When it makes sense: Your quota is mostly or entirely paid off, and your net yield per kilogram sits comfortably above your personal opportunity cost.
What it requires: Doing the Church‑style split — separate dairy EBITDA from crop EBITDA and calculate net profit per kilogram of quota. Then tighten the screws on the cost of production: feed efficiency, labour per cow, components, and cull strategy. If you’re earning around $854/kg but could push to $950 through better management, that’s the cheapest “quota purchase” you’ll ever make.
Risk/limits: Inflation quietly erodes your real equity every year the cap holds. At 1.8% CPI, that’s $432/year in real purchasing power per kilogram. You’re not building asset value. You’re milking income from a flat line.
Path 3: Restructure the Succession Before the Bank Does
When it makes sense: You’re within 5–10 years of wanting to step back, and a straight transfer at today’s values and rates produces a DSCR under 1.25 for the next generation.
What it requires: Getting uncomfortable now, not desperate later. Sit down with an ag‑focused accountant and your lender to model alternatives: longer amortizations, revenue‑share structures, vendor take‑backs with interest‑only periods, or partial transfers that let the next generation build equity gradually instead of swallowing a $3‑million loan on day one.
Risk/limits: These structures take time and trust. If you wait until a health scare, a marital split, or a CUSMA/301 shock, you’ll be negotiating with fewer options and less leverage. And here’s the trade risk tied back to your succession: if a 301 finding or wider TRQ devalues quota even 10–15%, the exit ramp the parents are counting on to fund retirement gets shorter — while the next generation faces the same debt load on a less valuable asset.
Path 4: Sell and Redeploy
When it makes sense: Your dairy only cash‑flows when crop income props it up, your debt‑to‑asset ratio keeps climbing, and your kids are lukewarm about taking over.
What it requires: Facing the hardest question in farming: is your equity better deployed in quota, cows, and concrete — or somewhere else? Selling quota into a market where 1,908 buyers are chasing 18 sellers at $24,000/kg turns paper into cash fast. That cash can fund debt elimination, retirement, or a pivot into a different enterprise entirely.
Risk/limits: The risk here is almost entirely emotional. You lose the barn, the routine, the identity. Financially, a controlled exit at the cap is far better than a slow slide into forced liquidation if rates stay stubborn and margins tighten. Right now, 1,900+ buyers are competing for scraps. Last month, the exchange was cancelled because not enough quota even made it to the table. That level of demand won’t last forever.
Key Takeaways
- If your blended borrowing rate on quota is above ~3.6%, every new kilogram is cash‑flow negative. At 6%, the gap is –$586/kg/year. Even at a net income of $1,000/kg, breakeven is only 4.17%. Plug your own numbers into the cheat sheet before your next exchange bid.
- If the next generation’s DSCR on quota debt alone falls under 1.25, the succession structure needs to change — not your kid’s work ethic. The Metske ruling shows where “we’ll figure it out later” ends: $31,700 for six years of contributed labour.
- If you haven’t separated dairy EBITDA from crop EBITDA, you don’t actually know which side of your business is profitable. Church’s Central Dairy Solutions courses are working with Ontario farms from 40 to 1,200 kg — and the answers aren’t always what people expect.
- If trade pressure devalues the quota even modestly, the exit and entry ramps both get steeper at the same time. Get the succession on paper now, while the exchange is still massively in the sellers’ favour.
What This Means for Your Farm Right Now
Before the next DFO exchange deadline, ask yourself two questions. When was the last time you ran a real DSCR on your quota loans at today’s rates? And what happens to that ratio if the farmgate price slips 3–5% for a year?
Complete references and supporting documentation are available upon request by contacting the editorial team at editor@thebullvine.com.
Learn More
- The Metskes’ $31,700 Wake‑Up Call: What ‘Not Yet’ Costs a $4 Million Dairy – Exposes the brutal financial consequences of delaying your transition plan. It arms you with a 365-day succession playbook to protect millions in equity from the “agreement to agree” legal trap that sank the Metske family.
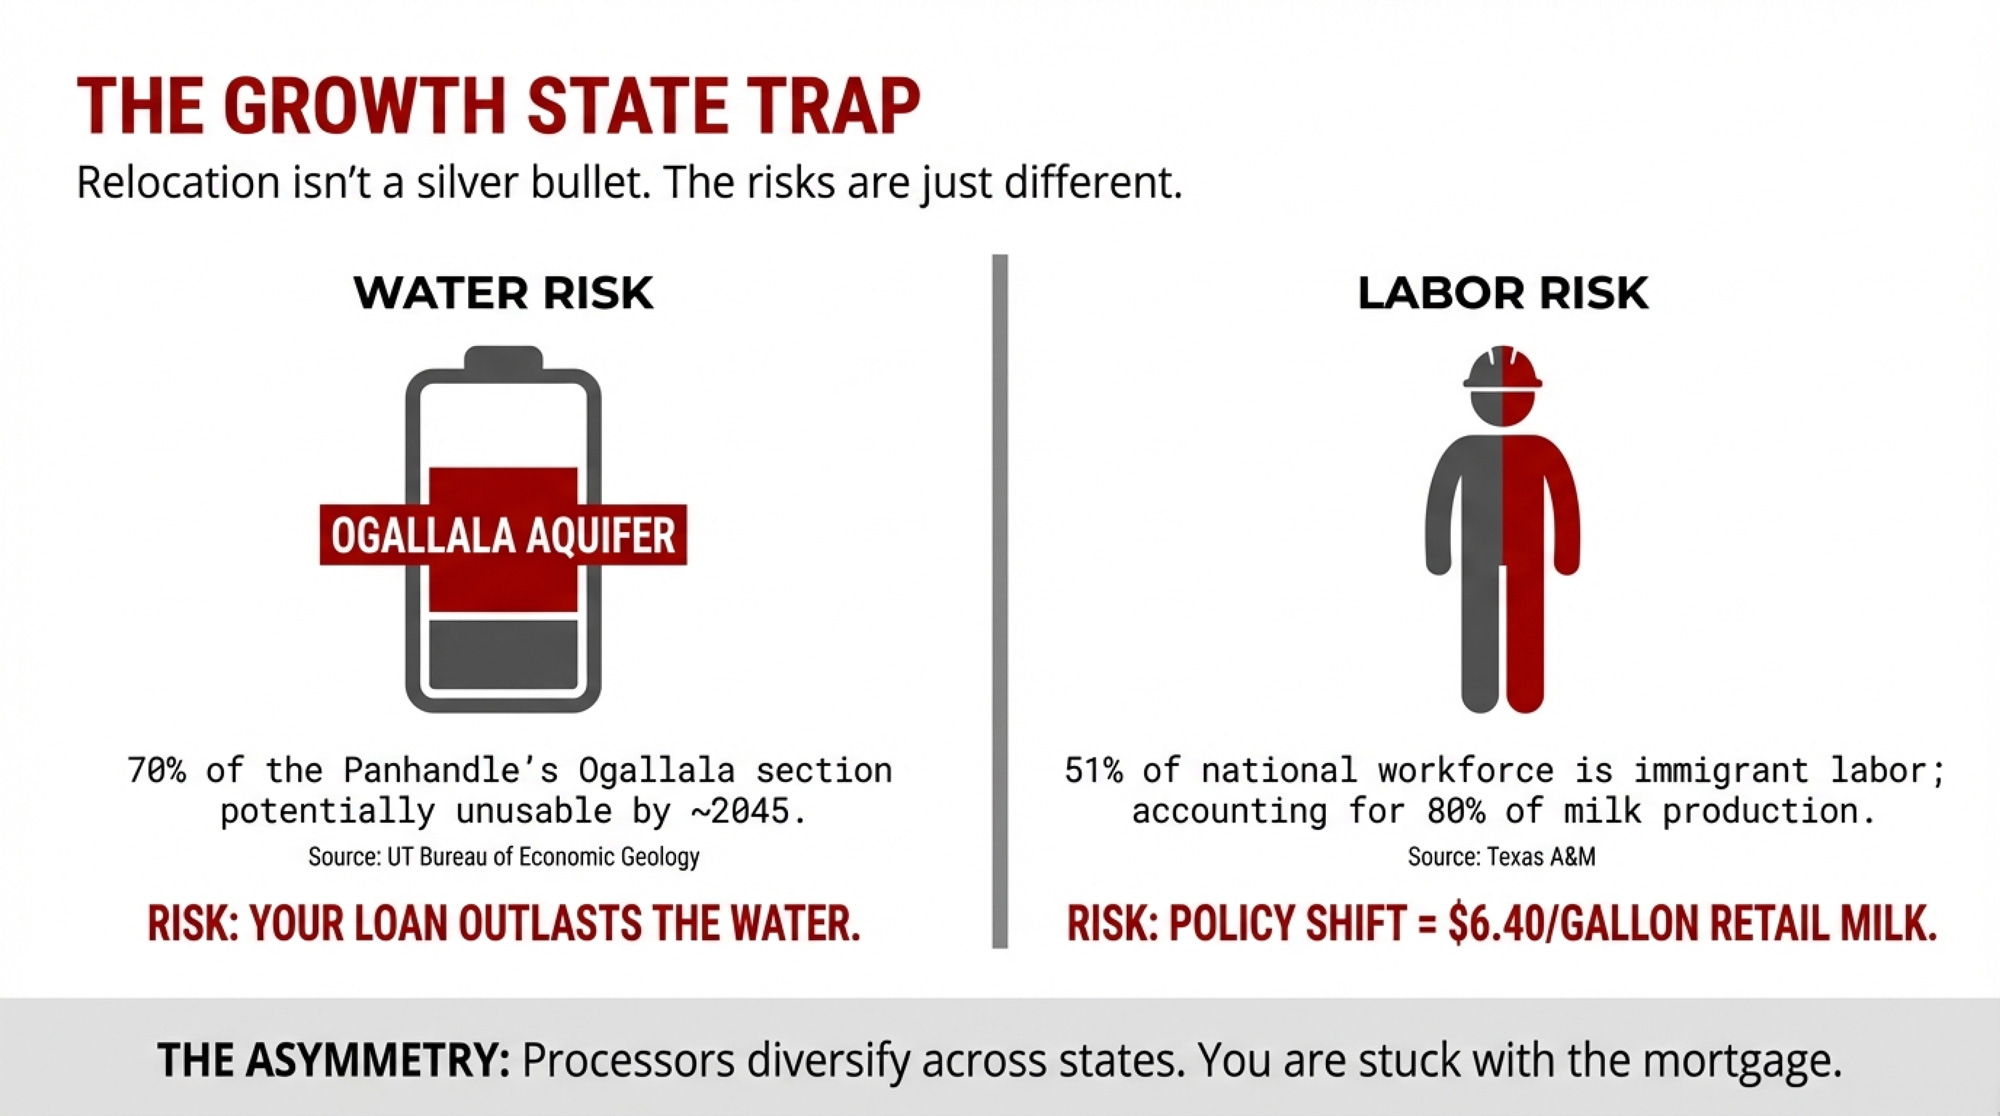
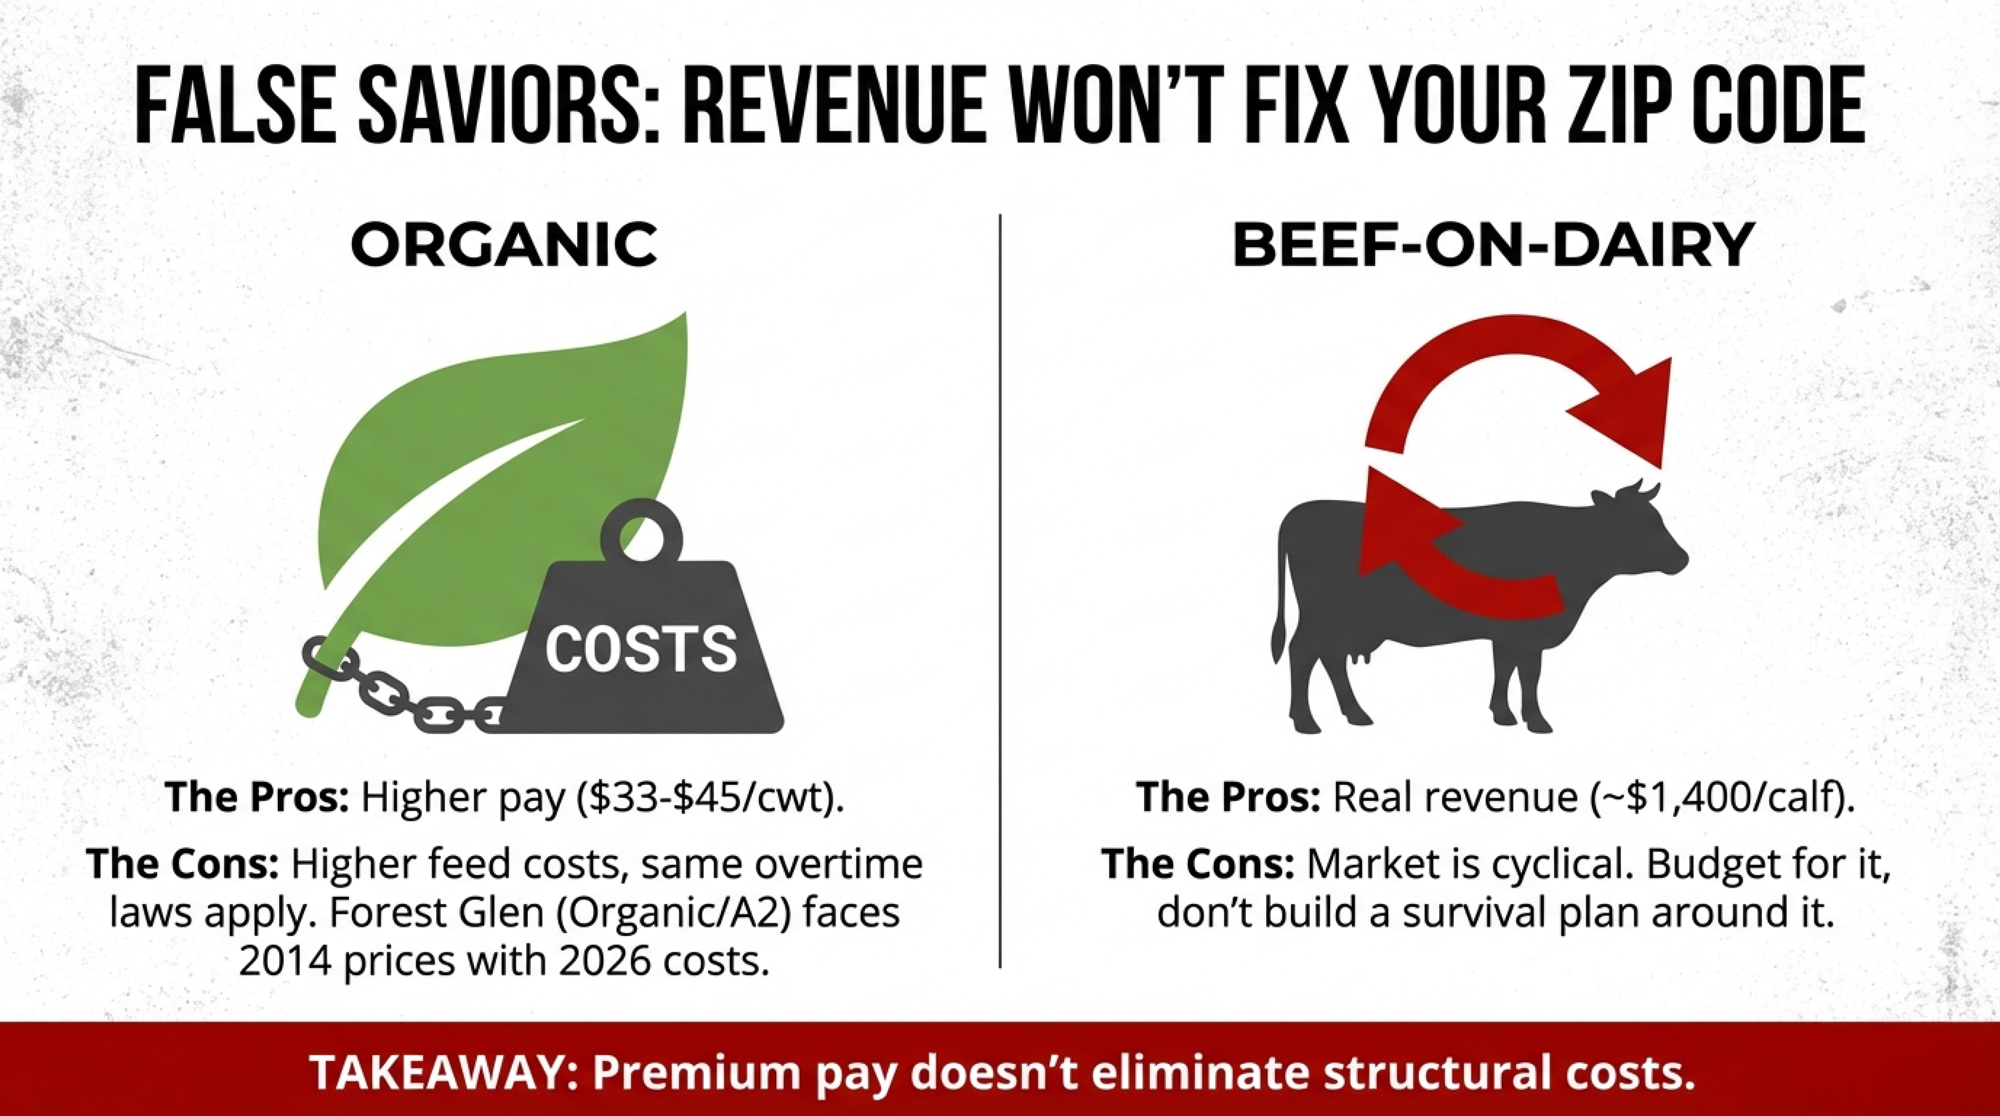
- Beyond Efficiency: Three Dairy Models Built to Survive $14 Milk in 2026 – Reveals strategic positioning for the next five years by moving past simple volume. It delivers a blueprint for mid-tier stability through enterprise diversification, ensuring your operation remains cash-flow positive even during the harshest market downturns.
- The Next Frontier: What’s Really Coming for Dairy Cattle Breeding (2025-2030) – Breaks down how CRISPR gene editing and AI-driven selection are creating $5,000 in extra annual revenue per cow. It delivers a roadmap for capturing 25% price premiums by shifting from commodity milk to designer components.
 The Sunday Read Dairy Professionals Don’t Skip.
 The Sunday Read Dairy Professionals Don’t Skip.
Every week, thousands of producers, breeders, and industry insiders open Bullvine Weekly for genetics insights, market shifts, and profit strategies they won’t find anywhere else. One email. Five minutes. Smarter decisions all week.