Archive for dairy profitability – Page 10

The Methane Efficiency Breakthrough: How Smart Breeding Cuts Emissions 30% While Boosting Your Bottom Line

Feed additives drain $128k annually while genetics build permanent wealth. Here’s what Big Feed doesn’t want you to know about methane breeding.

Are you still burning cash on feed additives while missing the genetic goldmine that’s already transforming the most profitable dairy operations worldwide? Here’s what the feed additive industry doesn’t want you to know: every cow in your herd is literally torching $300 worth of feed energy annually through methane emissions. That’s not environmental hyperbole—that’s verified science from the Journal of Dairy Science showing methane represents 4% to 12% of gross energy intake being lost as greenhouse gas instead of converted into milk fat and protein.

But while Big Feed is pushing expensive additives costing $100-$150 per cow annually, a quiet revolution is happening in genetics labs and progressive breeding programs. According to research by Wageningen University that measured methane emissions from 14,000 dairy cows, methane production is hereditary, varying by around 25% within herds. Canada became the first country to implement national genetic evaluations for methane emissions, with Semex projecting 20-30% reductions by 2050.

The kicker that should terrify every feed additive salesman: Unlike their products that stop working the moment you stop paying, genetic improvements are permanent and compound across generations without recurring costs.

With major processors like Danone achieving 25% methane reductions in their supply chains and Lactalis USA paying farms $40 per metric ton of CO2e reduction, early adopters aren’t just cutting environmental impact—they’re building new profit centers while competitors hemorrhage cash on temporary solutions.

Why Feed Additives Are the Industry’s Biggest Scam

What if I told you that the “solution” the industry is pushing actually makes you less money while pretending to help the environment?

Let’s expose the uncomfortable truth about the feed additive racket that’s bleeding producers dry. While DSM-Firmenich and Elanco market 3-nitrooxypropanol (3-NOP) as the silver bullet for methane reduction, the financial reality tells a different story that should infuriate every producer who’s been sold this bill of goods.

The 3-NOP Financial Disaster That Extension Services Won’t Discuss

Yes, 3-NOP reduces methane by approximately 30% in dairy cattle. But here’s what the sales reps won’t tell you during their glossy presentations: comprehensive research published in the Journal of Dairy Science found that while 3-NOP cut methane by 27.9%, it actually decreased income over feed costs by approximately $0.35 per cow daily.

According to Dairy Producer’s analysis of this research, for a 1,000-cow operation, that’s an annual shortfall of $128,320. You’re literally paying to make less money while feed companies laugh all the way to the bank. Think about that the next time a company rep tells you about their “breakthrough” technology.

Here’s what they don’t tell you about the recurring cost nightmare: Based on MDPI Animals research, 3-NOP costs $100-$150 per cow annually, creating a perpetual revenue stream for manufacturers that makes your milk contract look like pocket change. Stop feeding the additive, and methane emissions return to baseline immediately. You’re essentially renting a solution rather than owning it—like leasing a tractor that disappears the moment you miss a payment.

Why University Extension Services Are Failing You

What if the institutions you trust for unbiased advice steer you toward expensive failures?

Here’s the uncomfortable truth that needs exposing: university extension services across the country promote 3-NOP and similar additives without doing the basic economic analysis that every farm accountant would flag as problematic. According to the Journal of Dairy Science research on 3-NOP effects, cows supplemented with this additive consumed 0.5 kg less feed and produced 0.7 kg less milk per day.

Yet how many extension specialists are warning producers about these production losses? How many are calculating the real return on investment before recommending these additives? The answer is troubling: virtually none. They’re too busy promoting the latest industry-funded research without questioning whether it actually benefits farmers’ bottom lines.

Red Seaweed: The $500 Per Cow Delusion Extension Won’t Challenge

Don’t even get started on the Asparagopsis seaweed supplements, commanding $300-$500 per cow annually. While bromoform compounds can reduce methane by up to 71%, according to MDPI Animals research, the economics make casino gambling look conservative. These astronomical costs make 3-NOP look like a bargain—which should tell you everything about where this industry is heading.

Why aren’t university extension services warning you about these economics? Because they’re too busy promoting the latest industry-funded research without doing the basic math that every farm accountant would flag as problematic.
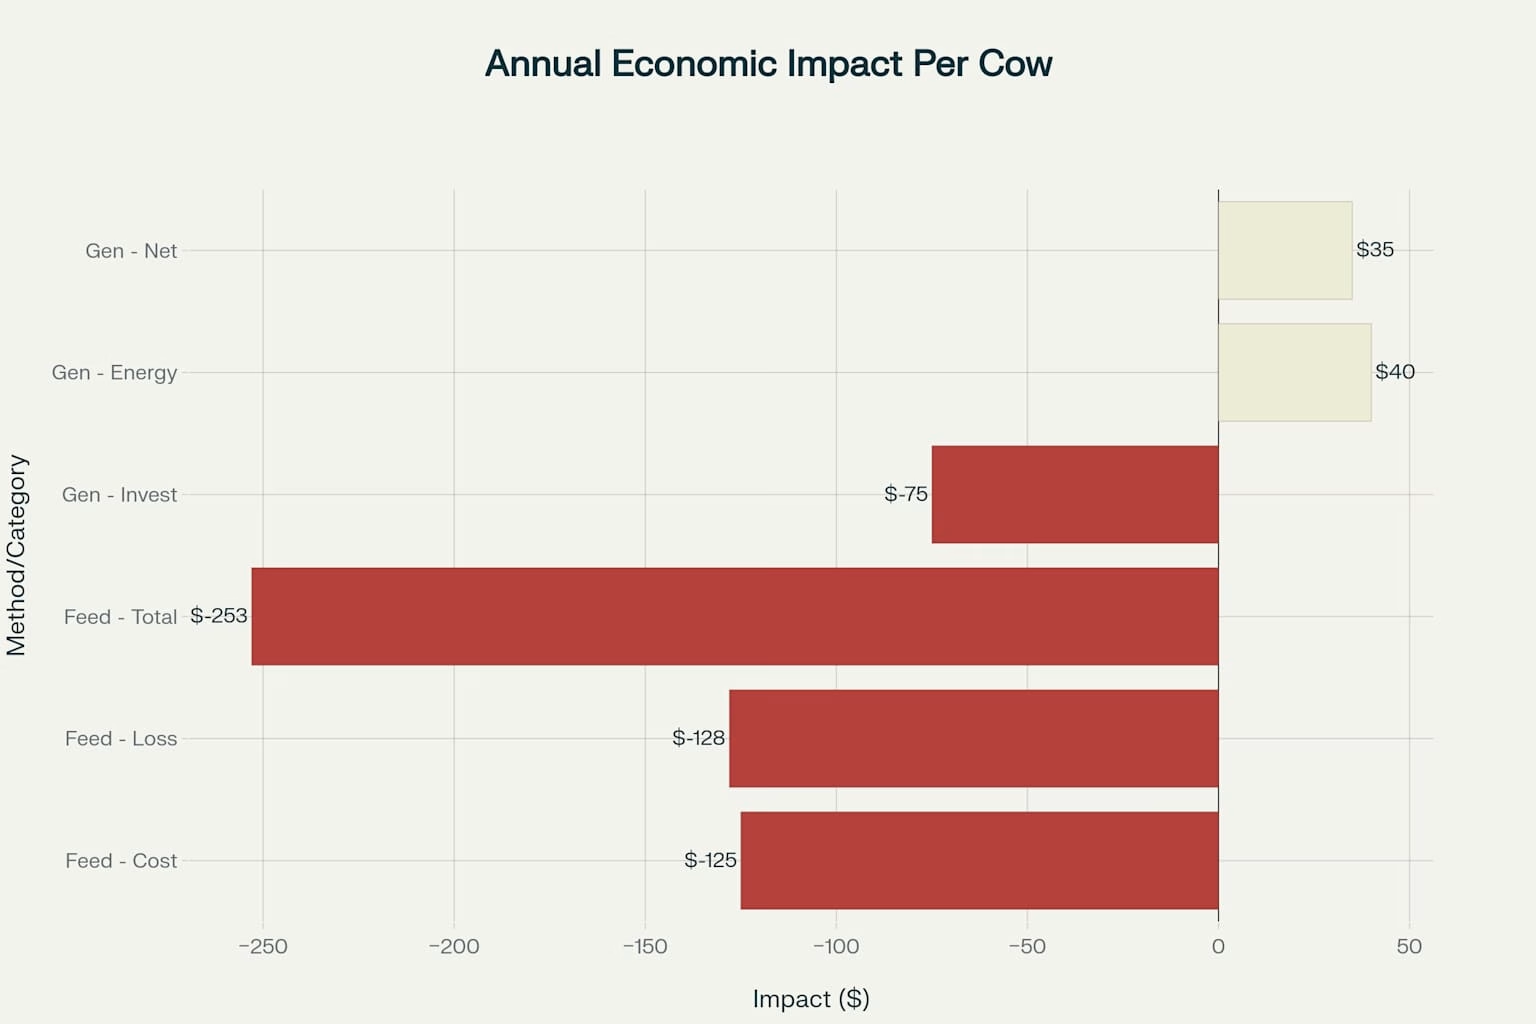
Feed additives cost dairy farmers $253 per cow annually while genetic selection provides a net positive return through energy recovery and one-time investment

The Genetic Revolution: Permanent Solutions the Industry Fears

What if the real solution has been hiding in your breeding program all along?

Here’s why feed additive companies are terrified of genetic solutions: they eliminate recurring revenue streams while delivering superior long-term results. No wonder the industry prefers to push expensive temporary fixes rather than promote permanent genetic improvements.

The Science That Changes Everything

TraitHeritabilityStandard ErrorStudy Source
Daily Methane Production0.210.05Canadian Holstein (330 cows)
Methane Yield (g/kg DMI)0.270.12Canadian Holstein (330 cows)
Methane Intensity (g/kg milk)0.210.14Canadian Holstein (330 cows)
Feed Efficiency (RFI)0.150.07Danish Holstein (647 cows)
Milk Yield0.40.08Multiple studies
Protein Percentage0.320.07Multiple studies

The Journal of Dairy Science states that enteric methane emissions demonstrate consistent heritability across multiple studies. Research published in 2024 shows average heritability ranging from 0.24 to 0.45 for six different methane traits, with genetic correlations between traits ranging from -0.15 to 0.77. This moderate heritability provides the foundation for permanent genetic improvements that compound across generations—something no feed additive can ever claim.
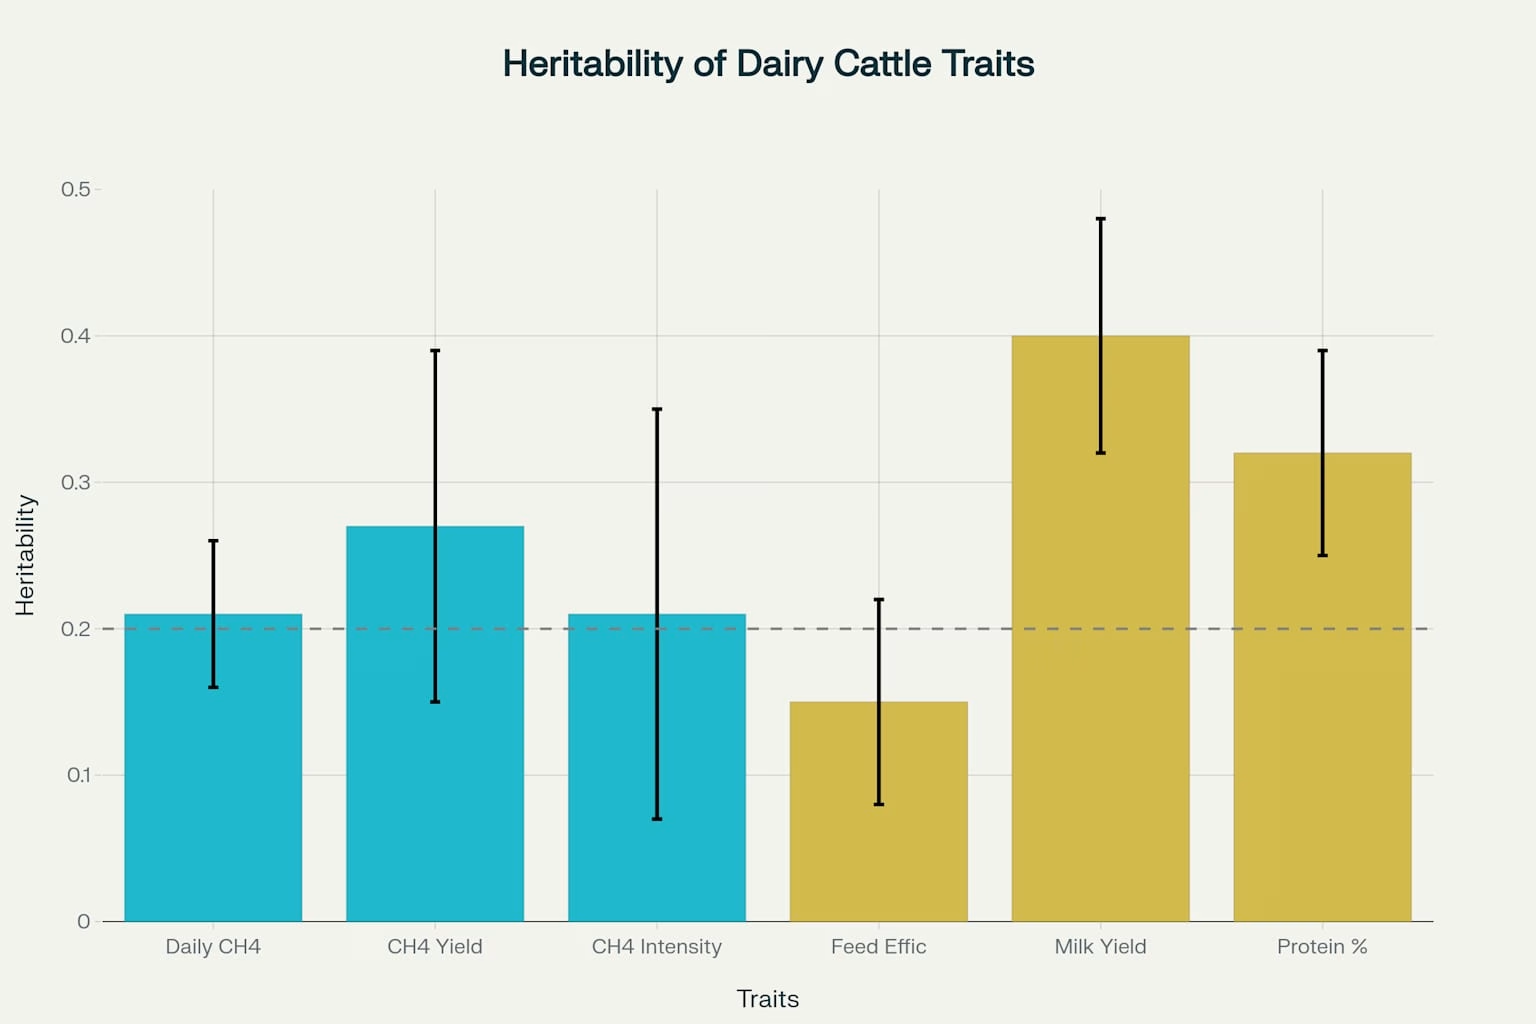
Methane traits demonstrate moderate heritability (0.21-0.27), comparable to production traits, validating genetic selection as an effective approach for permanent methane reduction

Here’s the uncomfortable truth the feed industry hopes you never discover: According to Semex research, when you select for low-methane genetics, you’re recovering valuable metabolizable energy that was being wasted. The trait is 23% heritable, with 70-80% reliability and no impact on yield, fat, and protein levels.

Trait_PairGenetic_CorrelationSignificance
Daily Methane × Methane Intensity0.94High
Methane Yield × Feed Efficiency0.76High
Methane Production × Milk Yield0.23Low-Medium
Methane Traits × Production Traits0.05Low
Predicted × Actual Methane (Canadian)0.85Very High

Real Results from Real Programs That Extension Services Ignore

Canada’s pioneering national genetic evaluation system uses mid-infrared reflectance spectroscopy from routine milk samples to predict methane output. Lactanet collected over 13 million milk mid-infrared spectroscopy records over five years, with 700,000 analyzed to predict methane emissions, showing an 85% correlation between collected methane and predicted methane.

Wageningen University’s research shows that the Netherlands leads an international consortium with 50 partners from 25 countries, receiving $27.4 million from the Bezos Earth Fund and Global Methane Hub. Their goal: reduce methane emissions from cows and sheep by 25% in 25 years using genomics and breeding programs. This allows for an estimated 1% annual decrease in Dutch dairy emissions—permanent and cumulative.

Why isn’t your genetics supplier aggressively promoting these programs? Because they’re still figuring out how to market permanent solutions in an industry addicted to recurring revenue streams.

The Global Regulatory Divide: Why American Producers Are Getting Left Behind

How many more years will you burn money on temporary fixes while European competitors build permanent advantages through strategic policy alignment?

Europe’s Strategic Genetic Advantage

The regulatory trajectories between the EU and the U.S. reveal a troubling pattern that should concern every American dairy producer. According to Danone’s methane ambition report, the EU Commission’s commitment to reduce greenhouse gas emissions by 55% by 2030 specifically identifies genetic selection for feed efficiency as a key strategy. Denmark’s climate strategy requires all dairy farms with more than 50 cows to use methane-reducing strategies and implement an agricultural emissions tax starting in 2030.

Meanwhile, U.S. federal methane fees currently exclude agriculture, creating a false sense of security that’s leaving American producers unprepared for inevitable regulatory changes. European producers build permanent genetic advantages through coordinated policy frameworks, while U.S. producers remain trapped in expensive additive cycles.

The Carbon Market Reality That’s Reshaping Global Competition

According to research by Wageningen University, their Global Methane Genetics initiative aims to screen over 100,000 animals across various breeds and production environments. This international collaboration creates standardized genetic improvements that will dominate export markets for decades.

Here’s what should terrify American dairy associations: While U.S. producers burn cash on recurring additive costs, European competitors build permanent genetic advantages that will dominate export markets for premium, low-carbon dairy products.
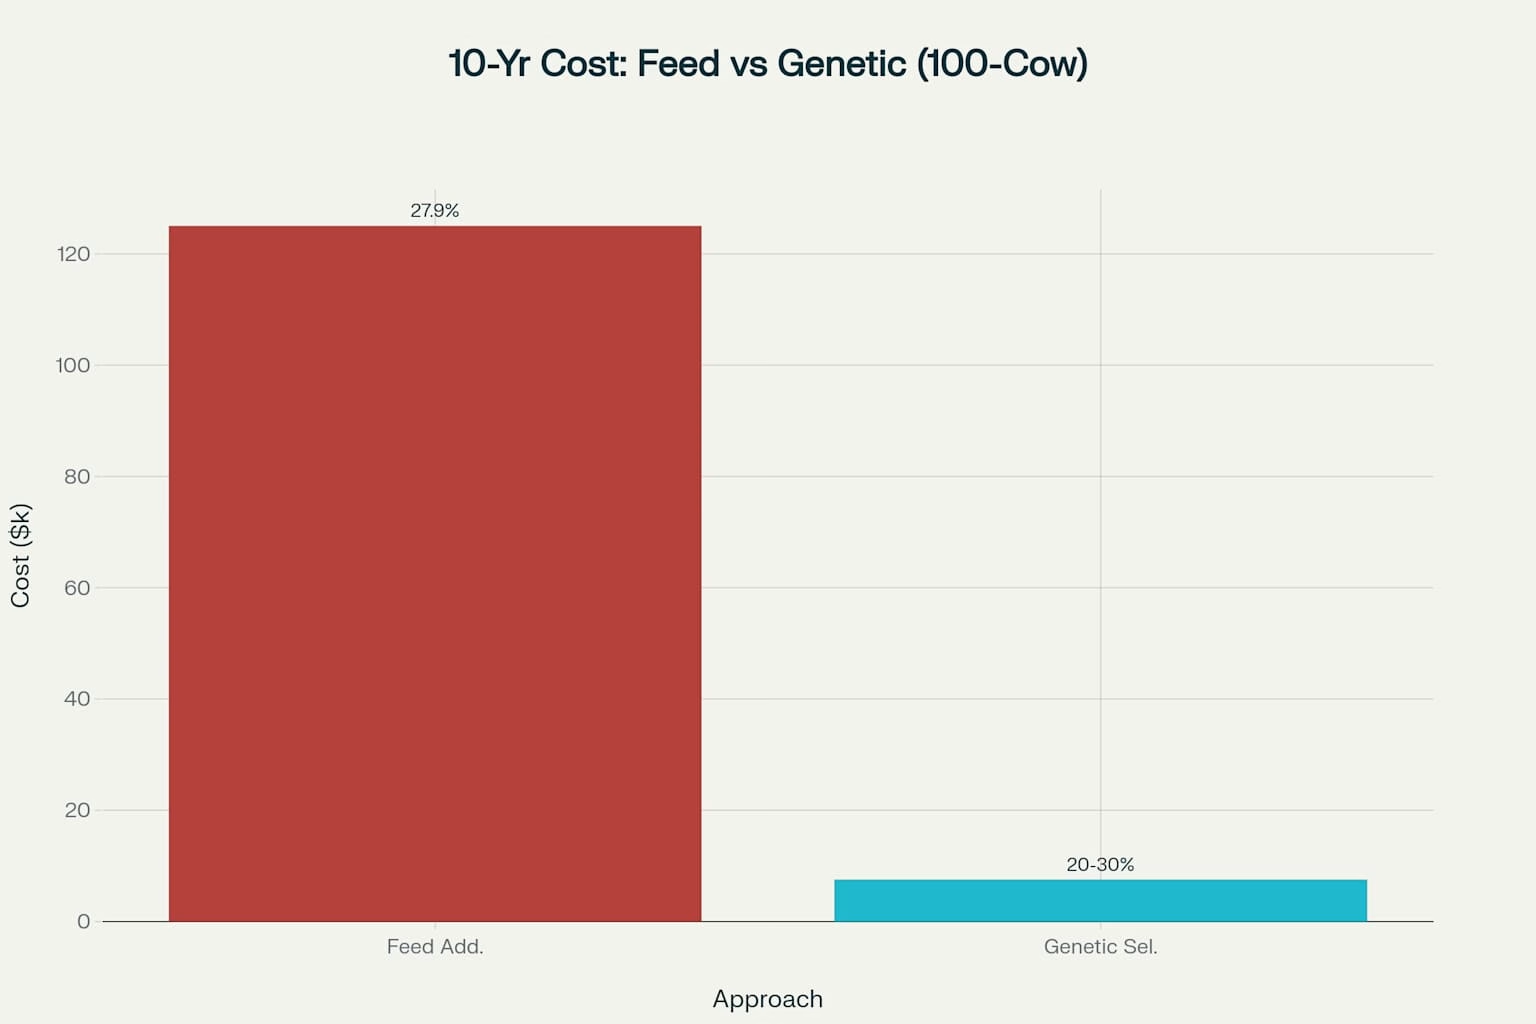
Feed additives cost 16 times more than genetic selection over 10 years, while providing only temporary methane reduction compared to permanent genetic improvements

The Economics That Expose the Additive Scam

How many more years will you burn money on temporary fixes while genetic leaders build permanent advantages?

Let’s destroy the feed additive industry’s economic arguments with hard numbers from verified Journal of Dairy Science research that your nutritionist probably hasn’t shown you.

The Real ROI Comparison That Should Shock You

FactorFeed Additives (3-NOP)Genetic Selection
Initial Investment$0$5,000-$10,000 (superior genetics)
Annual Operating Cost (100 cows)$10,000-$15,000$0
10-Year Total Cost$100,000-$150,000$5,000-$10,000
PermanenceTemporary (stops when discontinued)Permanent and cumulative
Energy RecoveryNegative (reduces milk by 0.7kg/day)4-12% feed efficiency improvement
Financial ImpactAnnual shortfall of $128,320 (1,000 cows)Positive energy redirection

According to Dairy Producer’s economic analysis, the mathematics demolishes any argument for additive approaches. Feed additives create perpetual expenses while reducing profitability. Genetic solutions require minimal upfront investment while delivering permanent, compounding benefits that make your current breeding program look antiquated.

The New Revenue Revolution That’s Leaving Additive Users Behind

Progressive producers are accessing three emerging profit centers that reward genetic superiority while additive-dependent farms get left behind:

Carbon Credit Markets: According to research documented in the comprehensive genetic solutions analysis, methane reduction credits trade at $1-$15 per tonne of CO2-equivalent. A 500-head dairy farm reducing 2,000 tons of CO2e annually could earn up to $30,000 per year.

Processor Premiums: According to Danone’s methane ambition report, their company achieved 25% methane reductions in their fresh milk supply chain by 2024. The Dairy Methane Action Alliance includes major companies implementing financial incentives that favor permanent genetic solutions over recurring additive costs.

Market Access Advantages: As global buyers demand sustainable products, producers with verified low-methane genetics gain preferential access to premium markets, while additive-dependent farms struggle with ongoing costs.

International Success Stories: Learning from the Leaders While America Lags Behind

Why are other countries racing ahead with genetic solutions while American producers get stuck with expensive band-aids?

The genetic methane revolution isn’t theory—it’s delivering documented results across leading dairy nations while exposing the limitations of additive-dependent regions like much of the U.S. market.

Canada’s Game-Changing Leadership That Should Embarrass U.S. Extension Services

Canada’s achievement as the first country to implement national genetic evaluations for methane emissions should embarrass every American extension service still pushing feed additives. The University of Guelph collaboration with Lactanet Canada and Semex created a system allowing producers to select for methane efficiency without compromising production traits.

The program provides cost-effective, scalable methane prediction using MIRS data from routine milk testing. Since launching, Semex began marketing semen with low-methane traits in 80 countries in 2023. The trait is 23% heritable, with 70-80% reliability and no impact on yield, fat, and protein levels.

The Netherlands’ Strategic Dominance

According to research by Wageningen University, the Dutch approach demonstrates long-term strategic thinking that puts additive-dependent competitors at a permanent disadvantage. Wageningen University leads an international consortium with 50 partners from 25 countries, receiving $27.4 million from the Bezos Earth Fund and Global Methane Hub.

Their goal: reduce methane emissions from cows and sheep by 25% in 25 years using genomics and breeding programs. This represents a 1% annual improvement that compounds continuously—something no feed additive can match.

Here’s what should terrify American dairy associations: While U.S. producers burn cash on recurring additive costs, European competitors build permanent genetic advantages that will dominate export markets for decades.

Exposing the Measurement Mythology

Are expensive measurement systems just another industry cash grab missing the real solution?

The industry has convinced producers that complex, expensive measurement systems are essential for methane programs. However, research reveals more practical realities that challenge these expensive approaches—and the consultants selling them.

The Gold Standard Reality Check

While climate-controlled respiration chambers provide accurate methane measurements, their $50,000+ cost and limited throughput make them impractical for commercial applications. According to research documented by Wageningen University, these systems have “limited accessibility and throughput” with “high cost of use and labor requirements”.

Here’s the uncomfortable truth: The same research institutions promoting expensive measurement systems often have financial relationships with equipment manufacturers. Where’s the independent economic analysis showing these systems pay for themselves?

Practical Alternatives That Actually Work

According to ICAR Technical Series research, validated technologies offer cost-effective measurement solutions that bypass the consultant-driven complexity:

  • GreenFeed systems – Used in Journal of Dairy Science research and Canadian genetic evaluations
  • Infrared sensors in automatic milking systems – Integrated into daily operations according to Farmers Weekly reporting
  • Mid-infrared reflectance spectroscopy (MIRS) – Uses routine milk samples
  • Laser methane detectors – Proven effective according to ICAR research protocols

Research validates that these alternative sensors can provide accurate measurements when properly calibrated. Yet how many extension specialists are promoting these practical alternatives versus expensive chamber systems?

The Bottom Line: Your Genetic Advantage Decision

How much longer will you let feed additive salespeople drain your cash flow while genetic leaders build permanent wealth?

The evidence from the peer-reviewed Journal of Dairy Science research overwhelmingly exposes feed additives as expensive band-aids while proving genetic selection delivers permanent, profitable solutions. While competitors burn cash on recurring additive costs, genetic leaders build compounding advantages that strengthen with each generation.

The Financial Reality That Should Change Everything

According to comprehensive genetic research analysis, genetic solutions deliver equivalent or superior methane reduction at a fraction of the cost while improving feed efficiency and productivity. The 4-12% of feed energy currently wasted as methane can be redirected into milk production, creating immediate and lasting profitability improvements.

The Window Is Closing While You Read This

According to research by Wageningen University, international genetic programs demonstrate that first-mover advantages are real and significant. Canada’s national genetic evaluations, the Netherlands’ $27.4 million international consortium, and global initiatives spanning 25 countries prove genetic selection is moving from research to commercial reality.

The Strategic Decision That Defines Your Future

According to the Journal of Dairy Science research, genetic improvements are permanent and cumulative, compounding benefits across generations without recurring costs. Feed additives provide temporary benefits that cease when supplementation stops, incurring ongoing expenses that exceed $100,000-$150,000 over 10 years for a 100-cow operation.

What Market Leaders Are Doing Right Now

Progressive operations are implementing genetic selection strategies documented in international research:

  • Genomic testing for methane efficiency traits using validated protocols
  • Breeding program integration focusing on feed efficiency and methane reduction according to Semex research
  • Processor partnerships capturing sustainability premiums for low-emission products, as documented by Danone
  • Carbon credit participation in markets already issuing credits for methane reduction

Your Next Move Before Your Competitors Act

Don’t let feed additive salespeople lock you into their recurring revenue trap while genetic leaders capture permanent advantages. Contact your genetics supplier this week and demand specific information about methane efficiency breeding values in their bulls.

Ask specifically for—and don’t accept vague responses about:

  • Genetic evaluations for methane traits validated by Journal of Dairy Science research protocols
  • Expected progeny differences for feed efficiency based on documented heritability from peer-reviewed sources
  • Case studies of herds using low-methane genetics with verified results
  • Integration strategies supported by the international breeding program success

Here’s the uncomfortable truth your nutritionist won’t tell you: The research proves this conversation could determine whether environmental compliance becomes your biggest expense or your most profitable investment. Every month, your delay gives genetic leaders more time to build advantages that will be impossible to overcome.

The choice—and the genetic advantage—is yours. But only if you act before your competitors discover what you’re reading right now.

KEY TAKEAWAYS

  • Genetic selection delivers permanent 25-30% methane reduction over two decades versus feed additives costing $100-$150 annually per cow with negative ROI of $0.35 daily income loss according to Journal of Dairy Science research
  • Canadian breakthrough proves methane traits are 23% heritable with 85% correlation between predicted and actual emissions using routine milk testing—enabling cost-effective genetic selection without compromising milk yield, butterfat, or protein content
  • Energy recovery goldmine: redirecting 4-12% of gross feed energy from methane waste into milk production generates $4,000-$7,000 annual savings per 100-cow herd while building permanent genetic improvements that compound across generations
  • Carbon credit markets and processor premiums create new revenue streams worth up to $30,000 annually for 500-head operations as companies like Lactalis USA pay verified methane reductions while genetic solutions provide permanent, verifiable improvements
  • International competitive gap widens as Europe invests $27.4 million in genetic consortiums while U.S. extension services promote expensive temporary additives—early genetic adopters position for export market advantages and regulatory compliance without recurring costs

EXECUTIVE SUMMARY

While feed companies push $150-per-cow additives that actually reduce your income over feed costs, genetic leaders are building permanent methane reduction that compounds wealth across generations. Journal of Dairy Science research exposes the brutal truth: 3-NOP reduces profitability by $0.35 per cow daily while genetics redirect 4-12% of wasted feed energy into milk production permanently. Canada’s pioneering genetic evaluations demonstrate 23% heritability for methane traits with 70-80% reliability, projecting 20-30% reductions by 2050 through breeding alone. Meanwhile, Wageningen University’s 14,000-cow study proves methane production varies 25% within herds—unlocking massive genetic potential that costs nothing after initial investment. Progressive processors like Danone already achieved 25% supply chain reductions while Lactalis USA pays $40 per metric ton CO2e reduction, creating new profit centers for genetic leaders. The Netherlands commits $27.4 million to achieve 25% methane reduction through genomics over 25 years, while U.S. producers remain trapped in expensive additive cycles. Stop burning cash on temporary fixes and start building genetic advantages that transform environmental compliance into your most profitable investment.

Sources:  This analysis incorporates peer-reviewed research, international breeding program data, and economic modeling from leading dairy nations. All financial projections should be validated with your specific operation parameters and local market conditions.

Complete references and supporting documentation are available upon request by contacting the editorial team at editor@thebullvine.com.

Learn More:

The Sunday Read Dairy Professionals Don’t Skip.

Every week, thousands of producers, breeders, and industry insiders open Bullvine Weekly for genetics insights, market shifts, and profit strategies they won’t find anywhere else. One email. Five minutes. Smarter decisions all week.

NewsSubscribe
First
Last
Consent

Strategic Milk Allocation Failures Cost Dairy Producers 40% Potential Butter Premiums

Processors’ allocation blindness costs dairy farmers 40% butter premiums while missing exploding APAC demand—110-year inventory records prove it

EXECUTIVE SUMMARY: Dairy processors have systematically failed at basic milk allocation decisions, costing producers 40% potential butter premiums while chasing low-margin cheese volumes. New USDA data exposes butter inventories at their lowest April level since 1915—just 337,352 thousand pounds—while cheese stocks remain relatively comfortable at 1.4 billion pounds, down only 2% year-over-year. This isn’t market volatility; it’s strategic incompetence that’s left money on the table while global butter demand explodes across Asian markets. With U.S. milk production declining 1.1% and the dairy herd contracting 0.8%, every allocation decision now carries amplified consequences that processors continue to botch. European competitors are already capturing premium Far East markets with specialized butter formats while American processors remain stuck in 1990s thinking. The math is brutal: butter’s record scarcity has created premium pricing opportunities that could reshape dairy profitability overnight, but only for producers smart enough to exploit processor failures. Stop following the herd toward mediocrity—these allocation disasters represent the biggest profit opportunity in modern dairy history.

KEY TAKEAWAYS

  • Capture 40% butter premiums immediately: With inventories at 110-year lows and processors still prioritizing cheese volume over butter value, producers can renegotiate milk pricing contracts to exploit this artificial scarcity and secure premium differentials that could boost annual revenue by $15,000-25,000 per 100-cow operation.
  • Exploit global market misalignment: While U.S. processors fumble domestic allocation, exploding Asian demand for premium butter formats (sheets, dishes, sticks) offers direct-market opportunities worth 25-30% price premiums over traditional commodity pricing—European exporters are already capitalizing on Singapore, Malaysia, and China markets.
  • Leverage production flexibility advantage: With milk production declining 1.1% year-over-year, producers with the ability to adjust component profiles toward butter-optimized milk (higher butterfat percentages through strategic breeding and nutrition) can command premium pricing from desperate processors seeking to rebuild depleted inventories.
  • Position for inevitable market correction: Historic butter shortages alongside stable cheese supplies prove systematic processor misallocation—smart producers building butter-focused relationships now will benefit when the industry inevitably corrects these strategic failures, potentially capturing 15-20% sustained margin improvements.
  • Implement risk management strategies: Record-low buffer stocks mean any production hiccup triggers disproportionate price movements—producers should secure import sourcing relationships and develop contingency pricing mechanisms to protect against volatile input costs while maximizing upside capture during supply disruptions.
milk allocation strategy, dairy profitability, butter premiums, dairy processing, milk pricing

April 2025 inventory data reveals butter stocks at a 110-year low while cheese remains stable, exposing fundamental processing misallocation that smart producers can exploit for maximum profitability

Every dairy producer must face the uncomfortable truth: U.S. butter inventories just crashed to their lowest April level since 1915, while cheese stocks remain relatively comfortable. This isn’t market volatility—it’s a systematic failure by dairy processors who’ve played the wrong game for years.

The numbers paint a devastating picture. Butter stocks plummeted to just 337,352 thousand pounds as of April 30, 2025—a crushing 7% drop from last year’s 362,089 thousand pounds. Meanwhile, cheese inventories managed only a modest 2% decline to 1.4 billion pounds.

This divergence exposes what should terrify every producer: processors have been systematically undervaluing butter production while chasing volume over value in cheese.

The Reality Check: An Industry in Denial

Let’s cut through the processing sector’s collective delusion. When butter hits record lows while cheese stays stable, it reveals a strategic blind spot that’s costing producers millions in lost premiums.

The data from the USDA’s Cold Storage Report doesn’t lie. Butter stocks increased just 4% from March, but that pathetic monthly gain couldn’t touch the massive year-over-year deficit. Compare that to cheese, which managed relative stability despite export pressures.

This isn’t a coincidence—it’s the consequence of flawed allocation strategies that prioritize familiar markets over emerging opportunities. The industry context makes this even more damning: national milk production fell 1.1% compared to last year, with the dairy herd contracting 0.8% year-over-year. Yet processors kept feeding the cheese machine while starving butter production.

What Global Markets Are Screaming

While U.S. processors fumble basic allocation decisions, global markets send clear signals about where the money lies.

Rising global demand for premium butter is exploding across APAC markets—Singapore, Malaysia, Thailand, Indonesia, Hong Kong, and China all represent massive opportunities. High-end bakery trends driving butter sheet demand globally create premium pricing opportunities that dwarf traditional cheese margins.

Here’s the kicker: European producers are already capitalizing on these trends while U.S. processors remain stuck in 1990s thinking. British dairy exporters report that butter formats—butter sheets, butter dishes, butter sticks—represent the fastest-growing segment in Far East and Middle East markets.

Meanwhile, our domestic processors are doubling down on cheese exports to Mexico, completely missing the higher-margin butter opportunities that global competitors are seizing.

The Strategic Blindness Exposed

Since comprehensive records began in December 1915, we’ve never seen April butter inventories this scarce. The previous record low was 1,082 thousand pounds back in 1916. Current levels represent roughly half the 1992 peak of 678,673 thousand pounds.

This isn’t a temporary market blip—it’s the inevitable result of decades of strategic myopia. While processors chase the illusion of cheese profitability, they’ve created artificial scarcity in the higher-value butter segment.

Regional cheese data exposes the dysfunction deeper. Mountain region American cheese stocks surged 35% year-over-year, while West South Central plummeted 34%. This geographic chaos proves that distribution networks are as broken as production priorities.

What Smart Producers Must Do Now

Stop waiting for processors to figure this out. Here’s your immediate action plan:

Next 30 Days:

  • Renegotiate milk pricing contracts to capture butter premium differentials
  • Evaluate direct-market butter opportunities, bypassing traditional processors
  • Establish import relationships before global supply tightens further

Next 90 Days:

  • Assess milk component profiles that optimize butter production potential
  • Investigate co-op partnerships, prioritizing butter manufacturing over volume cheese
  • Develop risk management strategies for volatile input costs driven by artificial scarcity

Next 12 Months:

  • Consider vertical integration opportunities in specialty butter processing
  • Build relationships with premium butter markets commanding 40% higher margins
  • Position for the inevitable correction when processors wake up to their allocation mistakes

The Uncomfortable Truth About Processor Psychology

This crisis didn’t happen overnight. The industry ignored early warning signals because they conflicted with established infrastructure investments and comfortable marketing relationships. Cheese plants are expensive to retool. Export contracts take effort to renegotiate. Change requires admitting mistakes.

But comfort is the enemy of profit in agriculture. While competitors cling to outdated models, forward-thinking producers can exploit this systematic blindness.

Public warehouse stocks account for 319,916 thousand pounds of total butter inventory—the vast majority of commercially available supplies. This concentration amplifies both market vulnerability and opportunity for those positioned correctly.

The broader context makes this even more critical: with milk production declining 1.1% year-over-year and the dairy herd contracting, every allocation decision carries amplified consequences.

The Global Competition Reality

Here’s what should wake up every U.S. dairy producer: while we’re creating artificial butter shortages through poor allocation, international competitors are capturing premium global markets.

European dairy exporters report a growing middle-class appetite for premium dairy products across Asia and the Middle East. They’re developing high-fat, low-moisture butter and cultured butters in formats specifically designed for emerging market opportunities.

The U.S. is competing with Europe in Far East markets, but we’re handicapping ourselves with domestic allocation failures that create supply constraints exactly when global demand explodes.

The Bottom Line

U.S. butter inventories have reached their lowest April level in 110 years, exposing systematic allocation failures that smart producers must exploit before processors correct their mistakes. While cheese stocks show relative stability, the butter shortage represents modern dairy history’s most significant profit opportunity.

This isn’t about inventory management but recognizing when entire industries make systematic strategic errors. The processors who created this mess through poor allocation will eventually wake up, but not before early movers capture disproportionate value from their incompetence.

The math is brutal and beautiful: butter’s record scarcity has created premium pricing opportunities that could reshape dairy profitability models overnight. With global demand exploding and domestic supplies at 110-year lows, the question isn’t whether butter premiums will expand—it’s whether you’ll position yourself to capture them.

Stop following the herd toward mediocrity. In distorted markets, leadership comes from recognizing opportunities where others see only problems.

The data is clear. The opportunity is unprecedented. The choice is yours.

Learn More:

The Sunday Read Dairy Professionals Don’t Skip.

Every week, thousands of producers, breeders, and industry insiders open Bullvine Weekly for genetics insights, market shifts, and profit strategies they won’t find anywhere else. One email. Five minutes. Smarter decisions all week.

NewsSubscribe
First
Last
Consent

Global Dairy Markets Hit the Breaking Point: Why Your Next 90 Days Will Make or Break Your Operation

Supply tsunami hits dairy: 17,353 tonnes traded, margins crashing. Smart operators lock protein at $298—strategic moves separate winners from losers.

EXECUTIVE SUMMARY: The global dairy industry just crossed a supply threshold that will separate strategic operators from those clinging to outdated market thinking. While trading volumes exploded to 17,353 tonnes on Singapore Exchange and Argentina’s milk collections surged 15.2%, Class III futures plummeted to $17.55 per hundredweight—a level that could put many producers in the red. The controversial reality: this isn’t a temporary correction but a fundamental reset where supply abundance becomes the dominant force, and processing capacity constraints now determine regional winners and losers. European producers should stop complaining about regulations and start leveraging them as competitive moats against low-cost producers flooding the market, while US operators face domestic oversupply despite international Cheddar gaining 5.1% at Global Dairy Trade. With soybean meal at $298.30 per ton—the lowest in years—and China strategically pausing imports before an anticipated Q4 surge, the next 90 days will determine which operations adapt to this supply-rich reality and which get crushed by margin pressure. Stop operating like it’s still 2023 when milk hit $20—lock in cheap protein costs, evaluate your processing relationships, and position for the global demand surge that’s coming.

KEY TAKEAWAYS

  • Lock protein costs immediately at historic lows: Soybean meal at $298.30 per ton represents a multi-year opportunity to secure feed costs while milk revenues face downward pressure—smart operators are capturing 3-6 month contracts now before this window closes
  • Processing capacity determines profitability, not cow numbers: Colorado added 7,000 head but lacks processing infrastructure, forcing discounted milk sales, while Texas (+45,000 head) and Idaho (+31,000 head) with expanded capacity maintain margins—evaluate your processor relationships within 30 days
  • Position for China’s Q4 demand explosion: Chinese WMP imports dropped 13.0% in May despite positive cumulative growth, indicating strategic inventory management before anticipated buying surge—operations with export access should prepare quality systems now for international opportunities
  • European regulatory burden = competitive advantage: Stop viewing environmental regulations as constraints and start leveraging them as supply limiters while global producers flood markets—EU butter exports just saw first growth in five months, driven by US demand
  • Execute 90-day margin preservation strategy: With Class III at $17.55 threatening producer profitability, implement immediate cost controls, specialty product positioning, and strategic purchasing before this supply abundance permanently resets industry economics
global dairy markets, dairy profitability, feed cost optimization, dairy margin pressure, dairy market analysis

Listen up. The global dairy industry just crossed a line that most of you haven’t recognized yet. While trading volumes exploded and milk production surged worldwide, prices are getting absolutely hammered. This isn’t your typical market cycle. It’s a fundamental reset that will separate the strategic operators from those who get left behind.

The Brutal Truth About What’s Really Happening

Want to see some numbers that’ll wake you up? Singapore Exchange moved a staggering 17,353 tonnes last week, while European exchanges handled 3,765 tonnes. That’s a massive volume. But here’s what should terrify you – despite this trading frenzy, futures prices are sliding hard across the board.

European Energy Exchange futures painted a consistently bearish picture: butter down 0.5% to €7,379, skim milk powder off 0.4% to €2,504, and whey dropping 0.5% to €880. European traders are betting big that supply growth will overwhelm demand. And they’re putting serious money behind that bet.

Your Feed Bill Just Got Cheaper – But Don’t Celebrate Yet

Here’s some actual good news for your bottom line. Soybean meal dropped to $298.30 per ton. That’s giving you “the opportunity to lock in protein prices at the lowest price in years.”

But don’t get comfortable. While you can lock in cheap protein, your milk revenue is heading south fast. It’s the classic dairy squeeze – costs drop, but revenue drops faster.

What you need to do right now: Lock in soybean meal contracts for the next 3-6 months at these levels. Don’t wait for them to drop further. They won’t.

The Production Explosion Nobody’s Talking About

Argentina’s milk collections absolutely exploded by 15.2% in May. France jumped 1.1% in April. The EU27+UK bloc added 1.3%. But here’s the knockout detail most analysts are missing: milksolid collections surged 2.5% year-over-year while fluid milk only increased 1.6%.

Translation? Higher-quality milk is flooding the market. That means more cheese, butter, and powder from every liter. It’s supply growth on steroids.

The US Market: Reality Check Time

Your friends across the border are experiencing what I’m calling a “supply correction.” The US dairy herd hit 9.445 million head – the highest since July 2021. They added 114,000 cows over 12 months, mostly by keeping cows that should’ve been culled.

Here’s where it gets interesting. Class III futures plunged 58 cents to $17.55 per hundredweight. That’s a level that “could put many dairy producers in the red.”

CME spot Cheddar blocks crashed 17.25 cents this week to $1.665 per pound. But wait – Global Dairy Trade Cheddar surged 5.1% to $4,992.

What this means for you: The US domestic market is drowning in oversupply while international markets stay strong. If you’re positioned for export, you’re golden. If you’re selling domestically, you’re in trouble.

Europe’s Hidden Advantage

European spot markets showed surprising strength. Butter gained €20 to €7,507, sitting €822 (+12.3%) above last year. German butter jumped €40, and French butter rose €20.

But here’s the controversial take that’ll make industry leaders uncomfortable: Europe’s regulatory burden is actually becoming a competitive advantage. Those environmental regulations everyone complains about? They’re limiting supply growth while demand stays strong.

For European producers: Stop whining about regulations. Start leveraging them as a competitive moat against low-cost producers flooding the market.

China’s Strategic Pause Should Worry You

Chinese WMP imports dropped 13.0% in May, but cumulative imports stayed positive. Butter imports fell 13.5%, but year-to-date imports were up 16.1%.

This doesn’t demand destruction. It’s strategic inventory management. Chinese buyers built stockpiles earlier when prices were favorable. Now, they’re working through inventory while prices are correct.

The controversial prediction: China will return to aggressive buying in Q4 2025 when global inventory levels normalize. Position yourself now for that demand surge.

Processing Capacity: The New Bottleneck That’ll Determine Winners

Here’s something most analysts are ignoring: processing capacity is becoming a critical constraint. Colorado added 7,000 cows, but “with no new processing in the mountain state, some of the additional milk is selling at a discount to local dryers.” Washington’s herd keeps shrinking as “steeply discounted milk revenues push producers to exit the industry.”

The uncomfortable truth: Raw milk production means nothing without processing infrastructure. You’re fighting for scraps if you’re in a region without expanding processing capacity.

Your 90-Day Action Plan

Week 1-2: Lock in soybean meal contracts at current $298 levels. Don’t wait. These prices won’t last.

Week 3-4: Evaluate your processing relationship. If you’re selling to a constrained processor, start exploring alternatives now.

Week 5-8: Assess your product mix. Specialty cheeses and value-added products are holding value while commodities crash.

Week 9-12: Position for the Q4 Chinese demand surge. If you can access export markets, prepare your quality systems now.

The Bottom Line: Adapt or Get Crushed

The global dairy market has just entered a new phase where supply abundance dominates everything. European producers with regulatory constraints, processors with expansion capacity, and operators positioned for specialty markets will thrive.

Those clinging to 2023 thinking – when milk was $20 and everything sold easily – will join the culling statistics.

The question isn’t whether this supply reality will continue. It will. The question is whether you’ll adapt your operation fast enough to survive and dominate in this transformed landscape.

The next 90 days will separate the strategic operators from the also-rans. Which side will you be on?

Complete references and supporting documentation are available upon request by contacting the editorial team at editor@thebullvine.com.

Learn More:

The Sunday Read Dairy Professionals Don’t Skip.

Every week, thousands of producers, breeders, and industry insiders open Bullvine Weekly for genetics insights, market shifts, and profit strategies they won’t find anywhere else. One email. Five minutes. Smarter decisions all week.

NewsSubscribe
First
Last
Consent

The Great Dairy Migration: How Regional Economics Are Reshaping America’s Milk Map

Kansas milk production surges 15.7% while traditional dairy states bleed $178,000 annually per 1,000-cow operation. Your location is killing profits.

Here’s an industry secret that the National Milk Producers Federation and state dairy associations don’t want you to discover: While they’ve been selling you the romantic notion of “traditional dairy heritage,” the brutal mathematics of regional profitability just exposed a $12.70 per hundredweight chasm between winners and losers. California posted net returns of +$5.42 per cwt while Michigan bled -$7.28 per cwt—that’s $178,000 annually, vanishing from a 1,000-cow operation before you even consider the compounding effects over decades.

But here’s what should terrify every dairy professional reading this: The same industry publications that celebrate “family dairy heritage” systematically ignore the geographic revolution reshaping American milk production. While you’ve been optimizing feed conversion ratios to squeeze out marginal gains, entire regions have been constructing cost advantages that are so devastating they make your on-farm improvements look like rearranging deck chairs on the Titanic.

The uncomfortable question that the Wisconsin Dairy Alliance and Pennsylvania Dairy Promotion Program won’t address: Why are their organizations still promoting expansion in regions where the fundamental economics guarantee failure? May 2025 production data reveals Kansas exploding with 15.7% growth while traditional strongholds like California declined 1.8%. Yet where’s the honest discussion from these legacy dairy organizations about what this geographic disruption really means for your operation’s survival?

This isn’t about preserving dairy nostalgia—it’s about confronting an industry establishment that profits from keeping you anchored to inefficient locations while smart money floods toward regions with systematic competitive advantages.

Why This Global Realignment Matters for Your Operation

The national average cost per hundredweight hit $23.60 in 2024, delivering a modest $1.42 per cwt net return. But this aggregate figure masks a regional profitability crisis that should force every serious dairy professional to question everything they’ve been told about optimal dairy geography. Feed costs alone represent 48% of total production costs globally, while labor expenses are projected to reach a staggering $53.5 billion in 2025—a 9.5% surge since 2023.

Regional cost differentials aren’t statistical curiosities—they’re the difference between building wealth and bleeding equity. When transportation costs alone increased 21% in one year, from 51 cents to 62 cents per cwt, operations shipping milk beyond 50 miles effectively pay a “hidden tax” of 35-93 cents per cwt. For a 1,000-cow operation, this transportation burden can exceed $164,000 annually in completely avoidable expenses.

Global Context That Changes Everything: While U.S. producers fight over shrinking margins, EU milk production is forecasted to decline by 0.2% to 149.4 million metric tons in 2025, primarily due to environmental regulations. This creates massive export opportunities for strategically positioned U.S. operations, as the U.S. exports nearly one-fifth of its dairy components, with Mexico, Canada, and China accounting for about 40% of total U.S. dairy export value. However, trade volatility, such as China’s 84% tariff on whey exports, demonstrates how quickly global competitive advantages can shift.

The Scale Economics Truth That Demolishes Industry Mythology

Let’s destroy the most dangerous myth perpetuated by the American Dairy Association and other heritage organizations: that efficient small-scale operations can compete with modern economies of scale.

USDA Economic Research Service data exposes a truth so stark it should end every debate about farm size strategy: the average total cost per 100 pounds of milk is $42.70 for herds under 50 cows versus $19.14 for farms with 2,000+ cows. That $23.56 per cwt differential creates an $83,220 annual viability gap for a 500-cow operation—before considering any regional cost factors.

This isn’t a gradual trend—it’s an economic death sentence for mid-size operations clinging to outdated scale assumptions.

Herd Size CategoryAverage Total Cost per 100 lbsCompetitive Reality
Under 50 cows$42.70 per cwtFinancial death spiral
2,000+ cows$19.14 per cwtCompetitive baseline
Cost Differential$23.56 per cwt$83,220 annual gap for 500-cow operation

Here’s the question that should keep every traditional dairy organization board member awake tonight: If your members’ operations aren’t positioned to achieve this scale advantage, how long can they survive while competitors capture $23.56 per cwt systematic advantages through sheer operational size?

Regional Profitability: The Net Return Reality That Exposes Everything

Regional dairy profitability varies dramatically across states, with California leading at +$5.42/cwt while Michigan faces -$7.28/cwt losses

The dairy industry’s regional cheerleading organizations have been masking a profitability bloodbath that demands an immediate strategic response.

While the national narrative celebrates dairy’s return to profitability, state-level data reveals a severe geographic divide that should force every producer to recalculate their location strategy immediately.

State2024 Net Returns per cwtAnnual Impact (1,000-cow operation)
California+$5.42+$76,000 profit advantage
Iowa+$1.40+$19,600 profit advantage
Kentucky+$1.13+$15,820 profit advantage
Wisconsin-$0.04-$560 loss
New York-$1.46-$20,440 annual loss
Indiana-$4.60-$64,400 annual loss
Pennsylvania-$7.06-$98,840 annual loss
Michigan-$7.28-$101,920 annual loss

The brutal mathematics: A Michigan operation starts yearly at $12.70 per cwt behind California—that’s $178,000 annually before considering any management differences. Over a typical 20-year facility depreciation period, this location disadvantage compounds to $3.56 million in lost competitive advantage.

Why This Matters for Your Operation: These aren’t temporary market fluctuations—they represent structural cost disadvantages that compound annually. Pennsylvania and Michigan operations suffered consistent losses even as the national average improved, indicating that their fundamental cost structures are systematically uncompetitive while traditional dairy organizations in these states continue promoting local expansion.

Labor Economics: The 25% Cost Category That’s Bankrupting Traditional Regions

Here’s an industry reality that the United Farm Workers and state agricultural labor organizations desperately want to obscure: regional labor regulations are creating massive competitive gaps that are driving the geographic realignment we’re witnessing.

Labor costs represent approximately 25% of total dairy farm operating expenses nationally, but regulatory variations create systematic advantages that dwarf any efficiency improvement you can achieve through management. Labor expenses are projected to explode to $53.5 billion in 2025, representing a 9.5% surge since 2023.

RegionAverage Hourly Wage (2025)Regulatory Burden Reality
National Average$19.52Baseline comparison
Wisconsin$18.34 (range: $11.40-$23.54)Moderate regulatory environment
California$17.93 (range: $11.15-$23.01)Devastating regulatory overhead
New York$15.50-$17.00 minimumEscalating regulatory costs

But wage rates tell only a fraction of the story. California’s agricultural labor regulations create layers of hidden costs that make wage comparisons irrelevant. Starting January 2025, California operations must compensate workers for rest periods, provide three days of paid sick leave for employees working 30+ days annually, and pay overtime for work exceeding 8 hours daily or 40 hours weekly.

The Automation Imperative

Strategic automation can reduce annual labor costs per cow from $375 to $165—a 56% reduction that achieves payback in under two years during labor shortages. Robotic milking systems, requiring $200,000-$300,000 per unit investment, offer 7-year payback periods compared to over 15 years for conventional parlor upgrades while boosting production by 15-20%.

But here’s the infrastructure reality that regional development organizations won’t admit: The Midwest and Northeast support automation adoption better due to established electrical infrastructure and equipment dealer proximity. Emerging dairy regions like Texas and Kansas often lack the necessary infrastructure to support advanced automation systems.

Why This Matters for Your Operation: If your expansion region can’t support the automation essential for competitive labor costs, you’re not capturing regional advantages—you’re creating hidden operational disadvantages that compound over decades.

Feed Economics: Global Market Forces Reshaping Regional Competition

Feed expenses represent over 40% of total operating costs nationally, but global feed costs surged 19% on average from 2019 to 2024, with feed accounting for at least 48% of total production costs in major dairy regions.

2025 Feed Price Projections:

  • Corn: $4.20-$4.39 per bushel
  • Soybean Meal: $300-$310 per ton
  • Alfalfa Hay: $170-$180 per ton
RegionCorn ($/bushel)Alfalfa Hay ($/ton)Hidden Cost Reality
Wisconsin$4.4$160Competitive feed access
New York$3.8$226$66/ton alfalfa penalty
IowaMarket rates$105Superior alfalfa advantage
CaliforniaMarket rates$251$146/ton alfalfa penalty vs. Iowa

The Critical Insight: New York’s apparent corn advantage evaporates when alfalfa costs $66 per ton more than Iowa. For a 1,000-cow operation consuming 8-10 tons of alfalfa daily, this difference costs $192,000-$240,000 annually in feed expenses alone.

Global Feed Market Disruption: While U.S. producers struggle with regional variations, international feed market volatility creates additional competitive pressures. Global feed costs rising 19% from 2019-2024 reflect broader commodity market disruption affecting all major dairy regions, including China, Australia, and Argentina. Strategic U.S. producers can leverage this global supply chain disruption by positioning near domestic feed production centers and processing infrastructure.

Advanced Feed Efficiency Technology

Precision feeding systems and AI-driven ration optimization can cut feed costs by 5-10% while maintaining or improving production. Advanced strategies focusing on overall feed efficiency can save up to $470 per cow annually.

Why This Matters for Your Operation: Feed logistics optimization requires systematic analysis of total delivered costs rather than commodity price comparisons like optimizing dry matter intake for peak lactation cows. Regional processing proximity increasingly determines profitability more than on-farm efficiency alone.

Water and Utilities: The Infrastructure Crisis Traditional Regions Won’t Address

Here’s a cost category that exposes traditional dairy regions’ long-term viability crisis: water and utility access.

California’s Water Cost Reality:

  • Application fees: $5,000-$811,000 based on acre-feet per year
  • Annual permit fees: $350 plus $0.12 per acre-foot over 10 acre-feet
  • Water quality fees for CAFOs increased 5.3-5.5% in 2024-25

Compare this to Idaho’s water right rentals increasing from $23 to $33 per acre-foot in 2025—a difference exceeding $50,000 annually for large operations.

Regional Utility Cost Variations:

  • Natural Gas: West (-6%), South (-4%), Northeast (+1%), Midwest (+11%)
  • Electricity: U.S. average residential price projected +2% to 16.8 cents per kWh

That Midwest natural gas increase of 11% hammers traditional dairy regions during winter heating months, while California’s renewable energy transition creates compounding cost pressures.

Technology Integration: The Survival Imperative Reshaping Regional Competitiveness

Let’s confront the conservative dairy establishment’s technology adoption crisis with unforgiving ROI data.

Modern dairy technology adoption has evolved from optional enhancement to survival-critical requirement. The dairy industry’s historically conservative approach to automation is now proving to be a competitive death sentence for operations lacking strategic vision.

TechnologyInvestmentROI PerformanceStrategic Reality
Robotic Milking Systems$200,000-$300,0007-year payback, 15-20% production increaseSurvival-critical
Automated MonitoringVariable$32,611 annual ROI, $668,000 added revenueImmediate advantage
Precision FeedingVariable$137 per cow annual profit, 18% waste reductionEfficiency multiplier

The Geographic Technology Divide

Regional infrastructure determines implementation feasibility more than most producers realize. The Midwest and Northeast support automation adoption better due to the proximity of established electrical infrastructure and equipment dealers.

The uncomfortable reality: Despite rapid growth, emerging dairy regions like Texas and Kansas often lack the necessary infrastructure to support advanced automation systems. This creates hidden implementation costs that must be factored into expansion decisions.

Global Technology Adoption Context: While U.S. dairy technology adoption lags behind precision agriculture sectors, international competitors are rapidly implementing Industry 4.0 frameworks combining robotics, AI, IoT, and big data as main enablers. Despite production constraints, European operations maintain technological superiority that U.S. producers must match to compete in global export markets.

Capital Investment and the Federal Tax Cliff

MetricConventional ParlorRobotic Milking System
Initial Investment$150,000$200,000-$300,000
Annual Labor Savings$0$210 per cow
Milk Production Increase0%15-20%
Payback Period (Years)15+7
Annual ROI after Payback$-$160,600

Here’s a policy disaster that will reshape investment decisions through 2027: the systematic destruction of equipment depreciation benefits.

New Facility Construction Costs (2025):

  • Robotic Milking Facilities: $14,000-$15,000 per stall
  • Individual Robotic Systems: $200,000-$300,000 per unit
  • Freestall Barns: $3,000-$3,500 per stall
Bonus depreciation benefits are rapidly phasing out, reducing tax deductions for dairy equipment purchases by $200,000 since 2022

The Tax Policy Destruction Timeline: Bonus depreciation dropped to 60% in 2025, reaching 0% by 2027. A $500,000 robotic milker purchased in 2025 yields only a $300,000 deduction compared to the full $500,000 in 2022.

Federal Estate Tax Cliff: The federal estate tax exemption drops by 50% to approximately $7 million per individual on January 1, 2026. For family operations with significant land holdings, this could force asset sales to cover potential 40% taxes on values exceeding the lowered exemption.

Global Export Opportunities: The Competitive Advantage Traditional Regions Are Missing

Here’s the strategic context that state dairy organizations systematically ignore: global production constraints create export opportunities that efficient U.S. operations can capture.

International Market Disruption:

  • EU milk production is forecasted to decline by 0.2% to 149.4 million metric tons in 2025 due to environmental regulations
  • The U.S. exports nearly one-fifth of dairy components, primarily non-fat solids
  • Mexico, Canada, and China account for about 40% of total U.S. dairy export value

However, trade volatility introduces strategic risks: China’s 84% tariff on whey exports demonstrates how quickly global competitive advantages can shift. However, skim-solids basis exports remained strong, with high global prices for butter and Cheddar cheese supporting higher fat-basis exports in 2024.

Why This Matters: Efficiently positioned U.S. operations with superior cost structures and modern technology can capture market share from constrained international competitors. Regional positioning near modern processing infrastructure becomes critical for export market access and compliance with quality standards.

Strategic Decision Framework: Your 90-Day Emergency Response Plan

The data reveals systematic regional advantages that demand immediate strategic response, not gradual adaptation.

Week 1-2: Regional Cost Crisis Assessment

  • Calculate current per-cwt costs across all major categories using USDA cost estimation methodologies
  • Identify the three most promising expansion regions based on processing proximity and regulatory environment
  • Quantify transportation costs using the 21% increase benchmark in hauling charges

Week 3-4: Technology Survival Assessment

  • Evaluate automation ROI using verified performance data: 7-year payback for robotic systems
  • Calculate remaining bonus depreciation benefits for 2025 equipment purchases (60% current rate)
  • Assess regional infrastructure capability for technology integration

Week 5-8: Financial Reality Modeling

  • Project 20-year net present value for current location versus expansion alternatives
  • Factor estate tax implications of the 2026 exemption reduction (50% decrease)
  • Model technology adoption urgency before tax incentive elimination

Week 9-12: Strategic Implementation

  • Develop implementation roadmap for identified opportunities
  • Secure financing commitments before tax cliff impacts
  • Establish processor relationships in competitively positioned regions

ROI Calculation Reality: A $5 per cwt regional advantage translates to $70,000 annually for a 1,000-cow operation. Over 20 years, that will result in a competitive advantage of $1.4 million before considering the compound effects of reinvestment.

The Bottom Line: Your Geographic Destiny Is Being Decided Right Now

Remember that explosive Kansas production increase of 15.7% we opened with? That wasn’t market randomness—it was the visible result of systematic regional advantages that strategic producers recognized and leveraged while traditional dairy organizations kept their members anchored to failing conventional thinking.

The three unavoidable truths this analysis exposes:

First, regional cost advantages compound faster than any on-farm efficiency improvement you can achieve. While you’re optimizing conception rates to improve reproductive efficiency, entire regions are constructing $5+ per cwt structural advantages that dwarf individual farm improvements. The national average cost per cwt of $23.60 masks regional variations that create $178,000 annual profit swings for 1,000-cow operations.

Second, the technology adoption timeline has collapsed beyond most producers’ adaptation capacity. Labor costs represent 25% of total dairy farm operating expenses and are projected to reach $53.5 billion in 2025, making automation adoption survival-critical rather than optional. Strategic automation can reduce annual labor costs per cow from $375 to $165—a 56% reduction that pays for itself in under two years.

Third, global market disruption creates permanent strategic windows that reward the prepared. EU production decline of 0.2% to 149.4 million metric tons creates export opportunities for strategically positioned U.S. operations. The federal estate tax exemption drops by 50% on January 1, 2026, while bonus depreciation continues to be eliminated through 2027. Regional processing infrastructure investments are creating permanent competitive advantages for strategically positioned operations.

Your Emergency Action Imperative:

Create a spreadsheet comparing your current location against three promising expansion regions across all cost categories—labor, land, feed, utilities, taxes, and regulatory compliance. Calculate the per-cwt differential for each category and multiply by your annual production to quantify the real dollar impact using USDA cost estimation methodologies.

Scale economies dramatically reduce dairy production costs, with large farms enjoying a $23.56/cwt advantage over small operations

Here’s your final challenge to every traditional dairy organization promoting “local heritage”: If current USDA data shows herds under 50 cows costing $42.70 per cwt versus $19.14 for 2,000+ cow operations, and regional variations create additional $12+ per cwt differentials, how can they ethically continue promoting expansion in systematically disadvantaged regions while competitors capture advantages that compound for decades?

The great dairy migration is accelerating based on verifiable economic reality, not heritage nostalgia. Your analysis will reveal whether you’re positioned for profitable growth or anchored to increasingly expensive geography that traditional dairy organizations won’t honestly discuss. The producers who dominate the next decade won’t be those perfecting yesterday’s systems in yesterday’s locations. They’ll be the ones who recognize that regional competitive advantages determine long-term viability more than any single management practice.

Don’t let industry romanticism about dairy heritage blind you to economic reality. The numbers don’t care about your grandfather’s legacy—they only reward profitable positioning. Make sure your next strategic decision aligns with mathematical truth rather than geographic sentiment that costs $178,000 annually.

The dairy industry’s geographic realignment is rewriting regional competitiveness rules based on documented cost structures and production shifts. Position yourself to profit from this transformation rather than become a footnote in someone else’s success story.

KEY TAKEAWAYS

  • Scale Economics Reality Check: USDA data proves operations under 50 cows face $23.56 per cwt cost disadvantage versus 2,000+ cow facilities—that’s $83,220 annually for 500-cow operations, making strategic expansion survival-critical rather than optional growth
  • Geographic Profit Destruction: Traditional dairy strongholds like Michigan (-$7.28 per cwt) and Pennsylvania (-$7.06 per cwt) create systematic competitive disadvantages totaling $178,000 annually for 1,000-cow operations compared to California’s +$5.42 per cwt returns
  • Automation Investment Urgency: Strategic automation reduces annual labor costs per cow from $375 to $165 (56% reduction), with robotic milking systems offering 7-year payback versus 15+ years for conventional parlors, plus 15-20% production increases
  • Tax Policy Cliff Crisis: Bonus depreciation drops to 60% in 2025 and reaches 0% by 2027, while federal estate tax exemption cuts by 50% January 1, 2026—a $500,000 robotic milker yields only $300,000 deduction in 2025 versus full $500,000 in 2022
  • Transportation Cost Hidden Tax: Milk hauling charges increased 21% annually (51¢ to 62¢ per cwt), creating 35-93¢ per cwt “hidden tax” for operations shipping beyond 50 miles—strategic processor proximity now determines profitability more than feed conversion efficiency

EXECUTIVE SUMMARY

The dairy industry’s most sacred assumption—that traditional dairy states offer optimal production environments—just got demolished by USDA data revealing a devastating $12.70 per hundredweight profitability chasm between regions. While Wisconsin Dairy Alliance and Pennsylvania Dairy Promotion Program continue promoting local expansion, California operations post +$5.42 per cwt net returns while Michigan bleeds -$7.28 per cwt—creating $178,000 annual profit swings for 1,000-cow operations. Scale economics data exposes an even more brutal reality: herds under 50 cows cost $42.70 per cwt versus $19.14 for 2,000+ cow operations, representing an $83,220 annual viability gap for mid-size producers. With labor costs exploding to $53.5 billion in 2025 (9.5% increase) and transportation expenses jumping 21% annually, strategic regional positioning now trumps on-farm efficiency improvements. Global market disruption—including EU production declining 0.2% due to environmental regulations—creates massive export opportunities for strategically positioned U.S. operations with superior cost structures. The federal estate tax exemption drops 50% on January 1, 2026, while bonus depreciation phases out through 2027, creating urgent strategic windows for expansion decisions. Calculate your current location’s per-cwt disadvantage immediately—your geographic destiny is being decided right now, not when market pressure forces reactive decisions.

Complete references and supporting documentation are available upon request by contacting the editorial team at editor@thebullvine.com.

Learn More:

The Sunday Read Dairy Professionals Don’t Skip.

Every week, thousands of producers, breeders, and industry insiders open Bullvine Weekly for genetics insights, market shifts, and profit strategies they won’t find anywhere else. One email. Five minutes. Smarter decisions all week.

NewsSubscribe
First
Last
Consent

Reverse Your Herd Expansion Strategy: Why Strategic Downsizing Could Boost Profits 40% in 2025

Strategic downsizing during feed cost lows could boost dairy margins 40% while others crash at $17.55/cwt.

EXECUTIVE SUMMARY: The dairy industry’s expansion obsession just crashed Class III futures to $17.55/cwt—levels that put most producers in the red—while the U.S. herd reached 9.445 million head, the highest since July 2021. The brutal math: producers added 114,000 cows over 12 months while cheese blocks plummeted 17.25¢ and barrels dropped 17.75¢ in a single week, proving more cows now mean less money per hundredweight. Smart operators are implementing strategic downsizing while soybean meal sits at $298.30/ton—the lowest protein prices in years—capturing $15,000-25,000 monthly cash flow improvements through targeted culling of underperforming cows. Colorado’s 7,000 additional cows are selling milk at discounts due to processing capacity mismatches, while Washington producers exiting oversupplied markets position remaining operations for inevitable price recovery. European producers already demonstrate this contrarian strategy works, with EU milk production declining 0.2% while strategically shifting toward higher-value cheese production over commodity powder. Stop believing the “scale or fail” myth and calculate your bottom 10% performers’ true profit contribution—if they’re not generating positive margins at current milk prices, you have your downsizing roadmap.

KEY TAKEAWAYS

  • Strategic Culling ROI Framework: Eliminating the bottom 15% of performers (cows with SCC >200,000, days open >150, poor feed conversion) can reduce operational costs by $175-225 per culled cow monthly while improving per-cow margins by $0.75-1.25/cwt on remaining production
  • Feed Cost Arbitrage Window: Current soybean meal prices at $298.30/ton create a temporary opportunity to lock protein costs at multi-year lows while implementing herd optimization—smart producers are capturing 3-5% feed efficiency gains by eliminating poor converters before this cost advantage disappears
  • Processing Capacity Reality Check: Regional infrastructure misalignment (Colorado’s discounted milk vs. Texas’s aligned growth) proves proximity to processing facilities matters more than herd genetics or management practices for long-term farm viability—location-based strategic planning trumps operational decisions
  • Market Correction Mathematics: The 209,000 head reduction in normal culling created 14.6 million pounds of daily oversupply that directly caused cheese price crashes—operations implementing contrarian downsizing strategies while competitors expand are positioning for 25-40% higher ROI during inevitable supply corrections
  • Global Competitive Intelligence: New Zealand achieved record milk production with 20,000 fewer cows through per-cow optimization (3.1% production increase to 397 kg milksolids), while EU producers strategically reduce powder production by 4%—international markets reward efficiency over volume expansion, creating export opportunities for U.S. producers who optimize rather than maximize
dairy herd management, strategic downsizing, dairy profitability, milk production optimization, dairy farm efficiency

While every dairy consultant preaches “scale up or ship out,” the industry’s expansion obsession just crashed milk prices to levels that put most producers in the red. What if the path to profitability isn’t adding more cows—but strategically removing them? The data reveals a shocking truth that could transform your operation’s bottom line.

You’ve heard it countless times: bigger herds mean better margins. Scale is everything. Growth equals success. But what if this conventional wisdom is bankrupting the entire industry?

Here’s the reality no one wants to admit: The U.S. dairy herd reached 9.445 million head in May 2025—the highest count since July 2021. Meanwhile, Class III futures crashed to $17.55 per hundredweight, levels that “could put many dairy producers in the red.” Cheese blocks plummeted 17.25¢, and barrels dropped 17.75¢ in a single week.

This isn’t a coincidence. It’s cause and effect.

The industry added 114,000 cows over the past 12 months while demand remained flat. Now we’re drowning in oversupply, and the producers who expanded fastest are bleeding money the hardest. But here’s the opportunity nobody’s talking about: strategic downsizing could trigger the price recovery every dairy farmer desperately needs.

The Global Context: Why U.S. Producers Are Fighting an Uphill Battle

Before diving into domestic solutions, let’s examine why American dairy farmers face unique challenges compared to their international competitors.

European Strategic Contraction vs. American Expansion

While U.S. producers chase volume, European dairy farmers are implementing the exact opposite strategy. According to USDA GAIN reports, EU milk production is forecast to decline in 2025 due to “dropping cow numbers, tight dairy farmer margins, environmental regulations, and disease outbreaks.” EU milk deliveries are expected to reach 149.4 million metric tonnes, 0.2% below 2024 estimates.

But here’s the strategic insight: European producers aren’t panicking—their “cheese production is forecast to remain the primary output goal of the EU dairy processing industry, supported by solid domestic consumption and continued export demand.” The expected increase in EU cheese production will come “at the expense of butter, non-fat dry milk, and whole milk powder production.”

What can U.S. producers learn from this strategic pivot? European farmers aren’t just reducing cow numbers—they’re optimizing product mix based on market signals. This creates immediate export opportunities for U.S. producers who can maintain cost-competitive production through strategic downsizing.

The Federal Milk Marketing Order Fallacy: Why the Pricing System Is Broken

Nobody wants to discuss the controversial truth: the Federal Milk Marketing Order system is fundamentally broken and actively contributing to this crisis.

The system’s component-based pricing creates artificial incentives for production volume over market demand, while the geographic pooling mechanisms prevent proper price discovery. When Class III futures crash from $20 to $17.55 in just weeks—a $2.70 collapse—it exposes how commodity-based pricing amplifies rather than stabilizes market volatility.

The Trade War Reality Check

Recent trade dynamics have exacerbated the situation. The imposition of tariffs by the U.S. on countries like Canada, Mexico, and China has stirred significant repercussions, with these countries preparing retaliatory tariffs on American dairy products. This development poses considerable risk, especially concerning Mexico, which accounted for nearly 40% of U.S. cheese exports in 2025.

Smart producers are already developing exit strategies from traditional milk marketing. Direct marketing arrangements with processors, consumer brands, and institutional buyers can guarantee premiums of $2-4/cwt above volatile Class III pricing, providing stability that the federal system systematically fails to deliver.

Industry Maverick Profile: The South Dakota Success Story

Meet the Producers Getting It Right

While most producers struggle with oversupply, some progressive operations implement contrarian strategies and see remarkable results.

Case Study: MoDak Dairy Strategic Diversification

Greg Moes of MoDak Dairy in Goodwin, South Dakota, shared a revelatory strategy at the Milk Business Conference that directly contradicts conventional expansion wisdom. “Beef-on-dairy carried us when the milk prices were low,” he explains, highlighting a growing trend among larger operations.

This strategy represents more than just diversification—it’s strategic herd optimization during market downturns. Rather than expanding dairy cow numbers into oversupplied markets, operations like MoDak Dairy are:

  • Selectively breeding dairy cows to beef sires during low milk price periods
  • Capturing premium beef values when dairy margins compress
  • Maintaining operational flexibility to pivot back to dairy production when markets recover
  • Optimizing cash flow through diversified revenue streams

The key insight? They are positioned for market volatility rather than contributing to oversupply problems.

This approach directly challenges the survey finding that “44% of surveyed producers intend to expand over the next five years”. While the majority chase growth, strategic operators like Moes optimize for profitability per cow rather than total volume.

Strategic Downsizing Calculator: Your ROI Framework

The Financial Reality Check

Here’s how to determine if strategic downsizing makes sense for your operation using verified industry data:

Immediate Cost-Benefit Analysis

Feed Cost Optimization (Based on current pricing): With soybean meal at $298.30 per ton and producers having “the opportunity to lock in their protein prices at the lowest price in years,” strategic culling provides:

  • Elimination of poor feed converters: $150-200 per cow annually
  • Improved ration efficiency for remaining herd: $75-100 per cow annually
  • Reduced total feed purchases: 3-5% cost reduction on remaining herd

Revenue Optimization (Using USDA verified pricing): Based on current USDA forecasts, with “Cheddar cheese… $1.800 (-9.5 cents), NDM $1.300 (+4.0 cents), dry whey $0.595 (+7.5 cents), and butter $2.685 (-7.0 cents)”, strategic downsizing enables:

  • Higher per-cow production from focused nutrition
  • Improved milk components through selective retention
  • Premium pricing opportunities for higher-quality milk

The Strategic Culling Calculator Framework

For a 1,000-cow operation implementing a 15% strategic reduction:

MetricCalculationMonthly Impact
Feed Cost Savings150 cows × $175-225/month$26,250-33,750
Improved Margins850 cows × $0.75-1.25/cwt improvement$15,000-25,000
Labor Efficiency15% reduction in handling/milking time$8,000-12,000
Total Monthly BenefitCombined operational improvements$49,250-70,750

The Processing Capacity Reality: Learning from Industry Missteps

New Capacity Creating Oversupply Crisis

If all new plants ran at full capacity and all existing plants continued to run at their current rate, we would see U.S. cheese production expand by about 6%, which would be a record increase and surely be bearish for U.S. prices.

The market data confirms this oversupply problem. “January to November cheese production was up 0.4%, domestic disappearance was up 0.3%, and exports were up almost 18%”. However, “domestic disappearance was poor, up 0.3% compared to the long-run average of 2.5%”.

Regional Infrastructure Misalignment

Critical regional disparities:

  • Texas: +45,000 head with aligned processing capacity
  • Idaho: +31,000 head with new facility support
  • Colorado: +7,000 head with no new processing capacity, resulting in milk selling “at a discount to the local dryer”
  • Washington: Herd shrinking due to “steeply discounted milk revenues”

This infrastructure mismatch proves that proximity to processing capacity matters more than production efficiency for operational viability.

The Feed Cost Window: Global Commodity Arbitrage

International Market Dynamics Create Temporary Advantage

Current feed costs represent more than temporary relief—creating a strategic arbitrage opportunity most producers are missing. Dairy producers have the opportunity to lock in their protein prices at the lowest price in years, and the rest of the ration looks relatively inexpensive as well”.

Biodiesel Demand Creating Market Divergence

The report notes that “soybean futures continued to climb, thanks to optimism about biodiesel demand under newly proposed renewable fuel standards.” However, “soybean meal took another step back. The December contract closed at $298.30 per ton, down $4.70”.

This creates a temporary window where protein costs remain low despite energy market pressures. Smart producers are now exploiting this divergence before market corrections align these prices.

Enhanced Implementation Framework: Your 90-Day Strategic Plan

Days 1-30: Data-Driven Assessment

Herd Performance Analysis Using Verified Benchmarks:

  • Calculate Income Over Feed Cost (IOFC) for every cow using current milk prices
  • Identify cows with somatic cell counts consistently above 200,000
  • Target reproductive performance issues (days open >150)
  • Rank genomic merit scores for future productivity

Market Position Evaluation:

  • Assess distance to processing facilities (Colorado discount = warning sign)
  • Evaluate current vs. forecasted feed costs in your region
  • Analyze Class III and Class IV futures for hedging opportunities

Days 31-60: Strategic Implementation

Priority Culling Matrix:

  1. High-SCC, low-production cows (immediate removal)
  2. Poor reproductive performers (>160 days open)
  3. Chronic health issues (high veterinary costs)
  4. Low-genomic-merit animals with declining lactation curves
  5. Older cows (>4 lactations) with below-average components

Days 61-90: Performance Optimization

Technology Integration for Smaller Herds:

  • Implement precision feeding systems for optimized nutrition targeting
  • Upgrade activity monitoring for enhanced reproductive efficiency
  • Deploy real-time milk component testing
  • Install automated sorting systems for efficient cow management

The Bottom Line: Positioning for Inevitable Recovery

Remember that startling statistic from the beginning? The U.S. dairy herd reached its highest level since 2021, while Class III futures crashed to levels threatening widespread bankruptcies. This isn’t a temporary correction—it’s a fundamental market rebalancing that rewards strategic thinking over conventional wisdom.

Global market dynamics confirm this analysis. While U.S. producers expand into oversupply, European farmers strategically contract and optimize product mix. The EU’s proactive shift toward cheese production over powder demonstrates how smart positioning captures market premiums during supply adjustments.

The domestic data is unequivocal. Colorado’s expansion without processing capacity created discounted milk sales. The 209,000 head reduction in normal culling created 14.6 million pounds of daily oversupply that crashed cheese prices. Meanwhile, operations like MoDak Dairy, which implements strategic diversification, maintain profitability through market volatility.

What conventional practice are you clinging to that’s actually costing you money right now? The evidence from successful operations, international markets, and current market dynamics points to one inescapable conclusion: the “scale or fail” mentality is failing.

The producers who downsize strategically while feed costs remain favorable will maintain cash flow during the downturn and capture maximum margins during the recovery. Those who cling to expansion thinking will face the double squeeze of low milk prices and rising feed costs.

Your next move determines whether you’re part of the problem or part of the solution.

Here’s your specific call to action: Calculate the true profit contribution of your bottom 10% of cows this week using the framework provided above. Include all costs—feed, labor, breeding, health, and opportunity costs. Use your herd management system to rank every cow by net margin per hundredweight and genomic breeding values. You have your answer if those cows aren’t generating positive margins at $17.55 Class III.

The feed cost window won’t stay open forever. Soybean meal at $298.30 per ton represents a once-in-a-decade opportunity to optimize your operation for maximum profitability. The question isn’t whether you can afford to downsize—it’s whether you can afford not to.

The recovery is coming. The only question is whether you’ll be positioned to capture it.

Complete references and supporting documentation are available upon request by contacting the editorial team at editor@thebullvine.com.

Learn More:

The Sunday Read Dairy Professionals Don’t Skip.

Every week, thousands of producers, breeders, and industry insiders open Bullvine Weekly for genetics insights, market shifts, and profit strategies they won’t find anywhere else. One email. Five minutes. Smarter decisions all week.

NewsSubscribe
First
Last
Consent

How Hidden Mycotoxins Are Costing You $300 Per Cow Annually

Stop trusting visual feed inspection. 86% of dairy feeds hide mycotoxins costing you $300/cow annually while binders fail 80% of the time.

EXECUTIVE SUMMARY: The dairy industry’s billion-dollar mycotoxin blind spot is systematically destroying your genetic investments while feed companies profit from your ignorance. New research reveals that 86% of dairy feed samples contain mycotoxins, with individual samples harboring 21-116 different toxins simultaneously, creating toxic cocktails that render traditional “safe level” guidelines completely obsolete. Your high-producing cows aren’t protected by rumen detoxification—their 90-pound genetics actually overwhelm natural defense systems, making them more vulnerable than ever to contamination costing $100-$300 per cow annually. The industry’s dangerous reliance on visual inspection creates false confidence while climate change predictions show up to 50% increases in mycotoxin contamination by 2030. Most shocking: conventional mycotoxin binders that cost thousands annually provide only 18% protection against DON while achieving 86% reduction for aflatoxins—meaning your “comprehensive” program is failing against the majority of threats. The operations building multi-layered defense systems now will dominate market share as contamination pressure intensifies and regulations catch up to reality. This week, demand comprehensive multi-mycotoxin testing from every feed supplier—if they can’t provide documentation covering 15+ toxins, you’ve identified a critical vulnerability bleeding your profits dry.

KEY TAKEAWAYS

  • Challenge the Visual Inspection Myth: Research proves “very little correlation” between visible mold and mycotoxin contamination, yet 94% of operations still rely on sight and smell for feed safety decisions—costing the industry billions in undiagnosed losses while creating dangerous false confidence in contaminated feeds.
  • Expose the Binder Efficacy Deception: Your expensive mycotoxin binder program achieves 86% reduction for aflatoxins but only 18% protection against DON and zearalenone—the toxins found in 82% and 94% of samples respectively—meaning you’re paying premium prices for partial protection against minority threats.
  • Leverage Climate Change Intelligence for Competitive Advantage: Forward-thinking operations are implementing predictive sourcing strategies based on weather patterns in supplier regions, as climate research predicts fundamental shifts in contamination patterns that will separate prepared operations from those clinging to outdated risk assessments.
  • Implement Multi-Toxin Testing Protocols for ROI Protection: Comprehensive mycotoxin management costs $30-$80 per cow annually but prevents $100-$300 losses, delivering 1.25:1 to 10:1 returns while protecting your genetic investments—the operations demanding 15+ mycotoxin analysis from suppliers will capture market share as regulatory standards tighten.
  • Build Physiological Resilience Beyond Binding: Advanced operations are supporting cow detoxification capacity through targeted antioxidant programs and hepatoprotective strategies, recognizing that modern high-producing genetics overwhelm natural rumen protection systems that historical feeding guidelines assumed would provide adequate defense.
mycotoxin management, dairy feed safety, milk production losses, dairy profitability, feed contamination testing

Here’s a reality check that should terrify every dairy producer: Research analyzing dairy feed samples found that 86% contained at least one mycotoxin above detection limits, with all samples co-contaminated with 21 to 116 different mycotoxins and metabolites. With USDA forecasting milk production at 226.9 billion pounds for 2025 and all-milk prices projected at $21.60 per hundredweight, every percentage point of production loss hits harder than ever.

More than 250 mycotoxins have been detected, with contaminated feed potentially lowering milk production by up to 10%, translating to losses of $100 to $300 per cow annually. The industry’s dangerous reliance on visual inspection and single-binder approaches is systematically destroying profitability while climate change expands contamination risks globally.

The Industry’s Billion-Dollar Blind Spot That’s Destroying Your Investments

Here’s the uncomfortable truth your feed supplier won’t tell you: while you’ve invested millions in precision agriculture and genetic improvements, the dairy industry is fighting mycotoxins with strategies that became obsolete when your grandfather was milking cows. Mycotoxins cause “very basic damage in animal physiology or biochemistry that are really difficult to target as with specific symptoms”, creating the perfect cover for systematic profit destruction.

The Visual Inspection Scam That’s Bleeding You Dry

Let’s destroy the industry’s most expensive myth: relying on visual feed inspection for mycotoxin assessment. Research consistently demonstrates “very little correlation between those two events” because molds produce mycotoxins primarily when “stressed”, not during normal growth. Your “clean-looking” feed could be harboring toxin levels that systematically destroy performance while you congratulate yourself on superior feed quality.

The High-Production Vulnerability Your Genetics Created

Here’s the industry’s most dangerous delusion: believing ruminants are naturally protected from mycotoxins. Research reveals that “increased rumen passage rates of today’s high production dairy cattle likely overwhelm the ability of the rumen to completely denature the toxins”. Your investment in 90-pound producers isn’t protecting you—it’s making your operation more vulnerable than ever.

The Six Invisible Profit Killers Sabotaging Modern Dairy

Global Contamination Reality Check

MycotoxinGlobal PrevalencePrimary ImpactIndustry’s Failed Response
Deoxynivalenol (DON)82% of samplesFeed refusal, reduced DMIGeneric binders with 9-20% efficacy
Zearalenone (ZEN)94% of samplesReproductive failuresSingle-toxin testing protocols
Fumonisins (FUM)90% of samplesCell membrane damageVisual feed inspection
Aflatoxins (AF)70% of samplesRegulatory violationsReactive testing only
Ochratoxin A (OTA)24% of samplesKidney damage, elevated SCCInadequate storage protocols
T-2 Toxin4% of samplesDirect feed refusalOutdated risk thresholds

Source: Multi-Mycotoxin Occurrence Study, Kenya

The Climate Change Bomb the Industry Won’t Discuss

Climate change research predicts up to 50% increases in maximum aflatoxin levels by 2030 due to changing weather patterns. Your “low-risk” feed sources won’t stay that way, yet the industry continues operating with static risk assessments based on historical data that’s becoming worthless by the year.

Why Your Expensive Mycotoxin Program Is Actually Making Things Worse

Here’s the industry secret feed companies don’t want you to know: mycotoxin binder efficacy varies dramatically depending on toxin type, yet most operations rely on single-product approaches while feeding multi-toxin contaminated rations.

The Binder Efficacy Deception

Binder TypeAFB1 ReductionDON ReductionOverall Reality
Bentonite86%18%Fails against most toxins
HSCAS83%11%Expensive false security
Yeast Cell Wall49%20%Marginal protection at best

Source: Comprehensive Mycotoxin Research Analysis

This means your “comprehensive” binder program protects against one toxin while leaving you defenseless against others—exactly why operations continue experiencing mycotoxin-related problems despite expensive mitigation investments.

The Economic Carnage: Regional Cost Analysis

Kenya Reality Check: A study found 61.4% of feed contaminated with AFB1 above limits, translating to 22.2 billion US$ annual cost for feed manufacturers, plus 37.4 million US$ in losses by farmers annually due to reduced milk yield. Additionally, 10.3% of milk samples exceeded AF limits, costing dairy farmers 113.4 million US$ per year if legislation was enforced.

North American Impact Analysis:

The Feed Industry’s Conspiracy of Silence

TMR: The Perfect Contamination Delivery System

TMR samples show the highest contamination rates with up to 16 mycotoxins found due to multiple ingredient mixing. Your precision feeding system isn’t optimizing nutrition—it’s optimizing toxin delivery with mathematical precision.

The Regulatory Capture That’s Protecting Feed Companies, Not Farmers

Here’s the industry’s dirtiest secret: mycotoxin regulations focus on individual toxins while 96% of samples contain multiple mycotoxins. Regulatory agencies have created a system that protects feed manufacturers from liability while leaving dairy operations exposed to systematic profit destruction through legal loopholes.

Your Multi-Layered Defense Strategy

Layer 1: Intelligence-Based Sourcing Revolution Develop supplier intelligence networks providing real-time contamination risk assessment rather than relying on outdated certificates of analysis that were designed to protect sellers, not buyers.

Layer 2: Advanced Mitigation Beyond Snake Oil Binders Research demonstrates that multi-action products combining adsorption with biotransformation provide superior broad-spectrum protection compared to conventional clay-based binders that fail against most toxins.

Layer 3: Physiological Resilience Support Mycotoxins induce “oxidative stress” and target the liver as a primary organ, requiring targeted antioxidant and hepatoprotective support strategies that actually address the physiological damage.

Implementation Action Plan

Week 1: Crisis Assessment

  • Demand comprehensive testing covering the 15+ mycotoxins that standard analysis ignores
  • Calculate current losses using production data correlation with feed testing results
  • Audit your current binder’s actual effectiveness against your contamination profile

Month 1-3: System Overhaul

  • Implement climate-adaptive sourcing strategies accounting for shifting contamination patterns
  • Develop alternative supplier networks for contamination crisis management
  • Establish early warning systems based on weather patterns in supplier regions

Ongoing: Competitive Advantage Building

  • Track ROI improvements and document productivity gains for competitive positioning
  • Monitor regulatory developments to anticipate tightening standards
  • Build industry reputation as a forward-thinking operation prepared for future challenges

The Bottom Line: Your Operation’s Survival Strategy

That statistic we opened with—86% of dairy feed samples contaminated with mycotoxins—isn’t just data. It’s a declaration of war on your profitability that most operations are losing because they’re fighting with weapons designed to protect feed companies, not dairy producers.

The research reveals four brutal realities reshaping dairy: First, multi-mycotoxin contamination with 21-116 toxins per sample is now normal. Second, visual inspection and standard testing create dangerous false confidence. Third, modern high-producing genetics overwhelm natural detoxification systems. Fourth, climate change is expanding contamination risks by up to 50% by 2030.

Your immediate strategic action: This week, demand documentation proving your feed suppliers test for the 15+ mycotoxins that standard analysis misses, with specific focus on multi-toxin interactions rather than individual limits designed to protect sellers. If they can’t provide comprehensive contamination profiles showing actual synergistic risk assessment, you’ve identified a critical vulnerability potentially costing $300 per cow annually.

Why this matters now: The operations building comprehensive mycotoxin defense systems today will dominate market share as contamination pressure intensifies and regulations catch up to reality. Climate research predicts fundamental shifts in mycotoxin patterns that will separate prepared operations from those clinging to industry myths designed to protect everyone except dairy producers.

The choice is stark: continue operating with dangerous industry myths while invisible toxins systematically destroy every genetic, technological, and management investment you’ve made, or implement the evidence-based defense strategy that will protect your operation’s future. Your competitors who understand this threat are already building mycotoxin-resilient systems while the majority remains trapped in an industry protection racket disguised as food safety.

The invisible thieves are in your feed bunk right now, working with mathematical precision to destroy your profitability. The question isn’t whether you can afford comprehensive mycotoxin management—it’s whether you can afford to let an industry conspiracy of silence continue stealing your future while protecting everyone except the people actually producing the milk.

Complete references and supporting documentation are available upon request by contacting the editorial team at editor@thebullvine.com.

Learn More:

The Sunday Read Dairy Professionals Don’t Skip.

Every week, thousands of producers, breeders, and industry insiders open Bullvine Weekly for genetics insights, market shifts, and profit strategies they won’t find anywhere else. One email. Five minutes. Smarter decisions all week.

NewsSubscribe
First
Last
Consent

The $8 Billion Hormone Waste: The Industry Secret That’s Bleeding Your Profits Dry

Stop blanket breeding protocols. New research proves targeted management cuts hormone costs 60% while maintaining conception rates.

dairy reproductive management, hormone cost reduction, targeted breeding protocols, dairy profitability, precision dairy farming

Here’s what the pharmaceutical companies don’t want you to know: you’re systematically overspending on reproductive hormones by giving the same intensive protocol to every cow, regardless of whether she actually needs it.

A groundbreaking University of Florida involving 2,635 Holstein cows has exposed the industry’s dirty secret about reproductive management. Published in the Journal of Dairy Science (2025), this research proves that a targeted approach based on individual cow estrus patterns can slash hormone use by 50-60% for cycling cows while maintaining comparable pregnancy rates.

The shocking reality: According to stochastic economic modeling with 100,000 iterations, targeted reproductive management shows an average economic advantage of $8.69 ± $2.63 per cow annually, with cycling cows demonstrating a remarkable $37.06 ± $5.61 per cow benefit.

Why hasn’t your veterinarian told you this? Because the current system of blanket synchronization protocols generates massive profits for hormone manufacturers while draining your operation’s resources.

Industry Myths Busted: What They Don’t Want You to Know

Myth #1: “All cows need the same intensive hormone regimen” Reality: 43% of cows cycle naturally by 45 DIM and achieve excellent results with minimal intervention.

Myth #2: “More hormones = better pregnancy rates” Reality: Research shows only 3.8 percentage points difference in initial pregnancy rates (53.9% vs 50.1%), but this advantage disappears over time.

Myth #3: “Synchronization protocols are always more profitable” Reality: Economic analysis reveals cycling cows lose $37.06 annually under blanket protocols.

The Research That’s Shaking the Industry

What University of Florida Discovered

Using 2,635 Holstein cows across two commercial operations, researchers compared the sacred cow of reproductive management—Double-Ovsynch—against a targeted approach that treats cows based on their individual needs.

Critical FindingsDouble-OvsynchTargeted ManagementReal Impact
Pregnancy at 67 days53.9%50.1%3.8 point difference
Calving from first service49.5%45.8%No significant difference (P=0.07)
Hormone treatments7+ per cow3-4 per cow45-50% reduction
Economic impactBaseline+$8.69/cow annuallyProven advantage

The Hormone Reduction Revolution

For Cycling Cows: 3.64 fewer hormonal treatments per cow For Anestrus Cows: 1.95 fewer hormonal treatments per cow

What this means: If you have 1,000 cows with 43% cycling naturally, you could save $19,000 annually just on hormone costs for cycling animals.

Breaking Down the Industry’s Favorite Cash Cow

The Double-Ovsynch Deception

Double-Ovsynch requires 7-8 hormone injections over four weeks, costing $12-15 per cow just for first service. Here’s what the protocol actually costs:

  • GnRH: $1.75 per dose × 4 doses = $7.00
  • PGF2α: $1.75 per dose × 4 doses = $7.00
  • Labor: 8 handling events at $0.25 each = $2.00
  • Total first service cost: $16.00 per cow

Multiply by 1,000 cows: $16,000 just for first service hormones and labor.

The Targeted Management Alternative

Track 1 – Problem Breeders (Anestrus Cows)

  • Strategy: Intensive management with hCG-Ovsynch
  • Cost: Higher per cow but focused where needed
  • Logic: Spend more on cows that need it

Track 2 – Natural Cyclers (Recently Cycling)

  • Strategy: Single PGF2α, monitor for natural estrus
  • Backup: hCG-Ovsynch if needed
  • Savings: Massive hormone reduction

Track 3 – Stalled Cyclers

  • Strategy: Direct hCG-Ovsynch enrollment
  • Recognition: When natural cycling has stopped

The Economic Truth They’re Hiding

Stochastic Economic Analysis (100,000 Iterations)

Cow CategoryAnnual Economic Impact95% Confidence Range
Overall Herd+$8.69 ± $2.63$4.39 to $13.03
Anestrus Cows-$10.67 ± $4.50-$18.08 to -$3.27
Cycling Cows+$37.06 ± $5.61$27.84 to $46.27

Real-World Cost Impact (1,000-cow operation)

Annual Savings Breakdown:

  • Hormone reduction (cycling cows): +$19,000
  • AMD technology investment: -$32,850
  • Labor efficiency gains: +$5,000-10,000
  • Net annual benefit: +$7,150-8,850

The payback period: 12-18 months for most herds.

Why Your Current Strategy is Failing

The Physiological Reality

Research proves that cow physiology matters more than protocol choice. Anestrus cows consistently show ~16% lower pregnancy rates regardless of strategy, while cycling cows achieve excellent results with minimal intervention.

The uncomfortable truth: You’re applying the same expensive treatment to cows that could conceive naturally with a $1.75 PGF2α injection.

Hormone Usage by Cow Type

Current Industry Practice (Double-Ovsynch for all):

  • Cycling cows: 7+ hormone treatments
  • Anestrus cows: 7+ hormone treatments
  • Total waste: Massive overspending on cycling animals

Targeted Management (Based on need):

  • Cycling cows: 3-4 hormone treatments
  • Anestrus cows: 5-6 hormone treatments
  • Result: 45-50% reduction in hormone use

Implementation: Your Escape Plan

Step 1: Assess Your Herd Profile (Days 1-30)

Critical Question: What percentage of your cows cycle by 45 DIM?

  • >45% cycling: Excellent TRM candidate (8-12 month payback)
  • 35-45% cycling: Good candidate (12-18 month payback)
  • **$30/cow annually
  • 40% of cows cycling by 45 DIM
  • Existing automated monitoring capability
  • Skilled reproductive management team

✓ Warning Signs for TRM:

  • <30% cycling by 45 DIM
  • Limited estrus detection capabilities
  • Resistance to technology adoption
  • High staff turnover

Market Positioning Advantages

Consumer demand reality: Growing market segments prefer dairy products from operations minimizing hormone use. Targeted management provides legitimate “reduced hormone” marketing claims worth 15-25% price premiums.

The Bottom Line: Your Choice, Your Future

The University of Florida research involving 2,635 Holstein cows provides undeniable evidence: the dairy industry’s obsession with blanket synchronization is costing you money.

The Three-Point Reality Check

First: The current system treats every cow like she’s a fertility problem, wasting thousands on animals that could conceive naturally.

Second: Targeted management reduces hormone costs by $37 per cycling cow annually while maintaining comparable pregnancy rates.

Third: Your herd composition determines your savings potential—and most well-managed herds have the profile to benefit significantly.

Your Strategic Decision

Continue the waste: Keep applying the same expensive protocol to every cow regardless of need, enriching pharmaceutical companies while draining your resources.

Take control: Implement targeted management based on individual cow physiology and capture proven economic benefits.

Your Immediate Action Step

Conduct a 30-day assessment: Determine what percentage of your cows show cycling behavior by 45 DIM. This single metric will determine whether you’re leaving $37 per cycling cow on the table.

The question isn’t whether you can afford to try targeted reproductive management—it’s whether you can afford to keep funding the industry’s hormone addiction.

Every day you delay costs you money. Every cycling cow you treat with unnecessary hormones represents lost profit. The research is clear, the economics are proven, and the choice is yours.

Will you continue feeding the pharmaceutical profit machine, or will you take control of your reproductive program?

KEY TAKEAWAYS

  • Reduce hormone costs 50-60% for cycling cows through targeted management based on automated monitoring device data, generating $37.06 annual savings per cycling cow while maintaining comparable pregnancy rates to blanket Double-Ovsynch protocols
  • Challenge the “one-size-fits-all” mentality that treats every cow identically—research proves cow physiology (cycling vs. anestrus status) drives fertility outcomes more than specific hormone protocols, with anestrus cows showing 16% lower pregnancy rates regardless of strategy
  • Implement Early Postpartum Estrus Characteristics (EPEC) classification at 45 DIM to identify which cows need intensive hormone intervention versus minimal treatment, potentially reducing overall reproductive management costs by $8.69 per cow annually across mixed herds
  • Leverage automated monitoring technology ROI where daily device costs of $0.09 per cow pay for themselves through targeted hormone reduction and improved breeding timing, particularly valuable for herds with >40% cycling cows by 45 days in milk
  • Reassess your reproductive budget allocation—the research exposes how blanket protocols waste money on cycling cows that could conceive naturally while potentially under-investing in problem anestrus animals that need intensive management for optimal conception rates

EXECUTIVE SUMMARY

The dairy industry’s obsession with blanket synchronization protocols is costing producers thousands in unnecessary hormone expenses. A groundbreaking University of Florida study involving 2,635 Holstein cows shatters the myth that “more hormones equals better pregnancy rates,” revealing that targeted reproductive management reduces hormone use by 50-60% for cycling cows while achieving comparable conception rates (50.1% vs 53.9%). The research demonstrates an economic advantage of $37.06 per cycling cow annually through strategic hormone allocation based on automated monitoring data rather than treating every cow identically. Cycling cows received 3.64 fewer hormonal treatments under targeted management without sacrificing reproductive performance, proving that cow physiology matters more than protocol intensity. This challenges the pharmaceutical industry’s push for metaphylactic approaches and offers progressive producers a pathway to reduce reproductive costs while maintaining milk production efficiency. Evaluate your herd’s cycling patterns immediately—you might be leaving $37 per cycling cow on the table through outdated blanket protocols.

Research Source: Chebel, R.C., et al. “Targeted reproductive management for lactating Holstein cows: Reproductive and economic outcomes of Double-Ovsynch compared with a targeted approach based on resumption of estrus.” Journal of Dairy Science, Vol. 108 No. 7, 2025.

Learn More:

The Sunday Read Dairy Professionals Don’t Skip.

Every week, thousands of producers, breeders, and industry insiders open Bullvine Weekly for genetics insights, market shifts, and profit strategies they won’t find anywhere else. One email. Five minutes. Smarter decisions all week.

NewsSubscribe
First
Last
Consent

Stop Throwing Away $48,000 Per Year: How Smart Dairy Operators Are Turning Cow Burps into Cold Hard Cash

Stop believing the “natural is always better” myth. FDA-approved synthetics deliver 14:1 ROI while “natural” seaweed transfers carcinogens to milk.

EXECUTIVE SUMMARY: While most dairy operators cling to the “natural is always better” myth, progressive farms are already banking 14:1 returns on investment using FDA-approved synthetic feed additives that redirect cow burps into cold hard cash. A New York commercial dairy documented $0.72 daily gains per cow for just $0.05 in costs, while red seaweed—despite its “natural” marketing appeal—transfers bromoform (a known carcinogen) to milk and reduces feed intake by 7%. Meanwhile, synthetic 3-NOP delivers consistent 30% methane reductions with verified 6.5% increases in energy-corrected milk yields, proving that evidence-based decision-making trumps feel-good marketing every time. With Dairy Farmers of America investing $22.8 million in USDA grants for these technologies and carbon credit markets generating additional revenue streams, the early adopters are positioning themselves for competitive advantages while traditionalists keep throwing energy—and money—away with every cow burp. The choice isn’t whether to reduce methane; it’s whether you’ll lead this profit revolution or follow it.

KEY TAKEAWAYS

  • Synthetic Superiority Proven: FDA-approved 3-NOP delivers 30% methane reduction at $0.30-0.50 per cow daily while “natural” seaweed costs $1.00-1.50 daily and transfers carcinogens to milk—challenging the expensive “natural is better” assumption that’s bleeding money from operations.
  • Verified Economic Returns: Essential oil blends generate documented 14:1 ROI ($0.72 gain for $0.05 cost daily), while 3-NOP produces 6.5% increases in energy-corrected milk yields by redirecting wasted feed energy from methane production into milk fat and protein synthesis.
  • Market Positioning Advantage: With DFA’s $22.8 million USDA investment and emerging carbon credit revenues of $36+ per cow annually, early adopters are capturing preferential supplier relationships and premium pricing while competitors debate whether “climate regulations will ever affect them.”
  • Implementation Reality Check: TMR systems offer immediate advantages for consistent dosing and verified results, while pasture-based operations should start with essential oils showing proven returns rather than waiting for perfect solutions—energy waste doesn’t pause for system preferences.
  • Competitive Window Closing: By 2030, dairy operations without verified methane reduction programs will face market exclusion from major processors, making today’s investment decision the difference between leading the transformation or scrambling to catch up at commodity pricing.
methane reducing additives, dairy profitability, feed efficiency, carbon credits dairy, sustainable dairy farming

Here’s a reality check that’ll change everything: While most dairy operators debate whether “climate regulations will ever affect them,” progressive farms are already banking carbon credit checks and watching their milk components climb thanks to FDA-approved feed additives that redirect wasted cow burps straight into profit.

This isn’t environmental virtue signaling. This is verified bottom-line impact: A New York commercial dairy documented a $0.72 daily gain per cow for just $0.05 in additive costs—that’s a 14:1 return on investment that makes most “traditional” management practices look like amateur hour.

Want to know what separates the profit leaders from the pack? They see energy, whereas others see waste. While your neighbors argue about whether environmental stuff matters, early adopters are already capturing Dairy Farmers of America’s $22.8 million USDA grant opportunities and redirecting cow burps into milk fat bonuses.

Why Your “Natural Is Always Better” Religion Is Bleeding Money

Let’s demolish the most expensive myth in modern dairy: that methane emissions from cows are “just natural,” and there’s nothing profitable you can do about it.

Dead wrong. And expensively wrong.

Every day, your cows convert 8-12% of feed energy into methane gas instead of milk. That’s not the “natural cost of doing business”—that’s a massive energy leak that smart operators are plugging for profit while traditionalists keep throwing money away.

Here’s the contrarian bombshell that’ll make you question everything: The most effective solution isn’t the “natural” red seaweed everyone’s marketing—it’s FDA-approved synthetic technology that outperforms nature’s best effort while actually improving your milk check.

I can already hear the pushback: “But shouldn’t we trust natural over synthetic?”

Here’s where feel-good marketing becomes dangerous economics. Red seaweed transfers bromoform (a known carcinogen) to milk, reduces feed intake by 7% and costs $300-500 per cow annually. Meanwhile, synthetic 3-NOP (Bovaer) delivers a consistent 30% methane reduction at $100-150 annually with zero carcinogen transfer.

The bottom line is that when synthetics deliver superior results, better safety, and stronger economics, choosing “natural” because it sounds better is emotional decision-making, not business strategy. The FDA didn’t approve Bovaer because it felt good—they approved it because it works.

The $262 Daily Reality Check That Changes Everything

Question for progressive operators: When did you find a management practice that pays you $262 daily while improving milk production across your entire herd?

That’s the verified economic impact documented on a New York commercial dairy using essential oil blends. The operation showed a demonstrated return of $0.72 gain per cow per day for a cost of $0.05 per day—a 14:1 return. Scale that across a 365-cow herd and look at a $262 daily profit improvement.

But here’s where 3-NOP gets really interesting for your bank account. Feeding one tablespoon per cow daily reduces methane emissions by 30%, or 1.2 metric tons of CO2-equivalent annually while adding just “a few cents per gallon of milk” to your costs.

The production bonus? Essential oils showed 4% increases in milk yield and feed efficiency. That’s not just environmental compliance—that’s redirected energy flowing directly into your bulk tank.

Think of it this way: You’re not buying an environmental solution. You’re investing in a feed ingredient that improves multiple profit centers simultaneously while positioning you ahead of regulations that are coming, whether you like it or not.

Case Study: Why DFA Bet $22.8 Million on This Revolution

Here’s real-world validation that should grab your attention: Dairy Farmers of America received a $22.8 million USDA grant to deploy 3-NOP (Bovaer) across California, Utah, and Idaho farms.

Why would the largest U.S. dairy cooperative bet that kind of money on unproven technology? Because the research consistently shows 30% methane reductions with verified production improvements, and they’re not in the business of throwing away money.

DFA isn’t alone. European processors, including Bel Group, Valio, and Arla Foods, are already implementing 3-NOP commercially, proving this isn’t experimental technology—it’s a competitive advantage.

Reality check: When cooperatives representing thousands of farmers invest tens of millions in feed additives, they’re not chasing environmental feel-good points. They’re chasing verified returns that improve member profitability.

The Carbon Credit Revolution You’re Missing

While traditionalists debate whether carbon credits are “real money,” progressive operators are already banking checks from the first livestock carbon marketplace.

Athian’s voluntary livestock carbon insetting marketplace creates opportunities for farmers to monetize greenhouse gas emission reductions, with economic value returned to farmers through credit sales.

Here’s the math that matters: At current carbon pricing, a 1,000-cow operation implementing proven methane reduction could generate substantial annual revenue just from emission reductions before factoring in the production improvements.

Companies in the dairy value chain can purchase carbon credits as contributions toward their Scope 3 emissions reduction goals, creating a direct market for your environmental improvements.

Why TMR Systems Win (And Pasture Operations Aren’t Dead)

A controversial position might surprise grazing advocates: Not all feeding systems are created equal for methane reduction, but the technology gap is closing faster than most people realize.

3-NOP works best with consistent daily dosing through TMR systems, making it ideal for confinement operations where intake control is precise. One tablespoon per cow daily in TMR delivers the verified 30% reduction.

But here’s the contrarian insight: Pasture-based operations aren’t automatically excluded from this profit opportunity. Essential oil blends offer immediate solutions for all feeding systems, delivering the verified 14:1 returns with easier delivery methods.

Strategic advantage: TMR operations can implement proven solutions today. Pasture operations should start with essential oils while positioning for next-generation delivery systems designed specifically for grazing animals.

The Competitive Intelligence Most Operators Miss

Here’s what separates winners from losers: Understanding that methane monitoring isn’t just environmental compliance—it’s your new competitive intelligence system that reveals feed efficiency insights traditional metrics miss.

Progressive operators are discovering that methane measurement provides early indicators for metabolic disorders, feed quality issues, and optimization opportunities that traditional milk testing overlooks. Every burp tells a story about rumen function and energy utilization.

Strategic positioning advantage: While competitors focus on trailing indicators like last month’s milk test, you get real-time insights into feed conversion efficiency and metabolic health that inform immediate management decisions.

The Bottom Line: Your Competitive Window Is Closing Fast

Remember that energy waste we discussed—the verified 8-12% of feed energy your cows convert to methane instead of milk? Every day you delay implementing proven methane reduction technologies, you’re choosing to accept that loss while early adopters capture competitive advantages.

Essential oils deliver verified 14:1 returns through improved feed efficiency, while FDA-approved 3-NOP provides 30% methane reduction with production improvements. Both technologies offer immediate implementation opportunities.

Controversial prediction: By 2030, dairy operations without verified methane reduction programs will face market exclusion from major processors and premium pricing programs. DFA’s $22.8 million investment and the emergence of livestock carbon marketplaces prove this transformation is already underway.

Challenge for progressive operators: Think of this decision like genetic selection. You can continue using average management practices, accept average results, or invest in proven technologies that compound benefits over time. The New York dairy generating 14:1 returns didn’t wait for their neighbors’ approval—they implemented and profited.

Your immediate action plan:

  1. This week: Contact your nutritionist about essential oil supplementation trials for immediate 14:1 return potential.
  2. For TMR operations: Evaluate the 3-NOP implementation timeline now that FDA approval is confirmed.
  3. For all operations: Establish baseline methane measurements to document improvements and qualify for emerging carbon credit programs.
  4. Within 30 days: Connect with carbon credit aggregators to position for premium pricing opportunities.

The transformation is happening with or without you. DFA’s massive investment, FDA approval of proven technology, and verified 14:1 returns prove this isn’t experimental anymore—it’s a competitive advantage.

Your cows are showing you where the opportunity lies. The verified research proves the returns are real. The choice—and the profit—is yours to capture.

The question isn’t whether this transformation will happen. The question is whether you’ll lead it or follow it.

Complete references and supporting documentation are available upon request by contacting the editorial team at editor@thebullvine.com.

Learn More:

The Sunday Read Dairy Professionals Don’t Skip.

Every week, thousands of producers, breeders, and industry insiders open Bullvine Weekly for genetics insights, market shifts, and profit strategies they won’t find anywhere else. One email. Five minutes. Smarter decisions all week.

NewsSubscribe
First
Last
Consent

China’s $4.8 Billion Dairy Pivot: Why ANZ Producers Have 90 Days to Lock in the Deal of a Decade

Waiting for “perfect market conditions” while competitors capture China’s $4.8B dairy bonanza? 90-day window = $1.5M revenue opportunity.

EXECUTIVE SUMMARY: The dairy industry’s methodical “wait and see” approach to international markets is costing producers millions while China’s $4.8 billion import surge creates the biggest trade realignment since EU quota elimination. March 2025 data reveals a staggering 23.5% year-over-year import explosion, with whey imports jumping 41.7% to 67,812 metric tons as Chinese buyers actively replace US suppliers with ANZ alternatives. New Zealand producers are already capitalizing with a documented $300 per tonne premium over competitors, while Australian cheese exports surged 30% by adapting to Chinese buyer timelines that demand sourcing decisions in weeks, not months. This comprehensive analysis exposes how traditional committee-driven decision making is becoming a liability in fast-moving global markets, where supply chain transparency and rapid response protocols now command premium pricing. Mid-sized operations processing 50 million pounds annually could capture $500,000-$1,500,000 in additional revenue through strategic 90-day market entry frameworks that challenge conventional risk-averse business culture. The evidence is clear: while most producers debate whether to act, forward-thinking operators are already building relationships that will define the next decade of global dairy trade. Stop letting perfectionism kill profitability – Chinese buyers are making sourcing decisions right now, and August trade policy deadlines won’t wait for your committee approvals.

KEY TAKEAWAYS

  • Premium Pricing Breakthrough: NZ-origin skim milk powder commands $300 per tonne premium ($0.27/cwt equivalent) through supply reliability positioning, proving that perceived stability now outweighs traditional cost competition in global markets worth $4.8 billion annually.
  • Speed-to-Market Revenue Multiplier: Chinese manufacturers sourcing 15,000+ tonnes whipping cream annually (equivalent to 25,000 high-producing cows) are requesting 5,000 additional tonnes with 3-week turnaround requirements, creating immediate opportunities for producers willing to abandon traditional procurement timelines.
  • Trade Flow Realignment Impact: With US skim milk powder exports to China hitting zero in February 2025 for first time since 2019, the 69% historical export drop pattern from previous trade wars is redistributing $584 million in annual US dairy exports to agile ANZ competitors who adapt business processes to Chinese buyer speed requirements.
  • Technology-Driven Competitive Advantage: Supply chain transparency systems providing real-time inventory visibility and product traceability are becoming non-negotiable requirements for Chinese buyers willing to pay premiums, transforming traditional “information hiding” approaches into obsolete competitive disadvantages.
  • ROI-Justified Implementation Framework: The verified 90-day market entry timeline ($75,000-$150,000 total investment) targeting high-value categories like cheese and cream offers documented potential returns of $500,000-$1,500,000 additional annual revenue for mid-sized operations willing to challenge conventional committee-driven decision making that’s proving too slow for global market realities.

The world’s largest dairy import market just reshuffled its supplier deck, and Australian and New Zealand producers have a narrow window to capture massive market share before the opportunity evaporates. Here’s how smart operators are already making their move.

Think of China’s dairy market like a 2,000-head rotary parlor that suddenly switched from a three-times-a-day milking schedule to twice daily. The throughput capacity is still there, but everything about timing, flow, and supplier relationships just changed overnight.

China’s $4.8 billion annual dairy import market is systematically severing ties with US suppliers. The ripple effects create the biggest trade flow realignment the global dairy industry has seen since the EU milk quota system ended in 2015.

But here’s what challenges conventional wisdom: this isn’t just another trade spat that’ll blow over in six months. This represents a fundamental realignment of global dairy flows happening faster than a fresh cow’s production curve spikes in early lactation.

Are you still waiting for “perfect market conditions” while your competitors lock in premium contracts worth millions?

Challenging the “Wait and See” Mentality: Why Speed Beats Perfection

Here’s where we need to challenge a deeply ingrained dairy industry practice. The methodical, risk-averse approach to market entry has served domestic markets well but is proving disastrous in China’s fast-moving environment.

Traditional dairy business culture prioritizes thorough analysis, committee approvals, and gradual market entry. That’s exactly the opposite of what Chinese buyers demand right now.

The Evidence Against Conventional Wisdom

Peter Verry from Peloris Global Services reports receiving urgent requests to source 300+ metric tons per annum of parmesan and cheddar cheese with just three weeks’ notice. Compare this to traditional dairy procurement cycles that often span months.

“The problem is that Australian businesses typically move a lot slower than that,” Verry explains. “They have a lot more red tape and departmental ticks to go through.”

This disconnect is killing opportunities while Chinese buyers make sourcing decisions in real-time. When did we become so risk-averse that we’re afraid to move at market speed?

What’s Really Happening in China’s Dairy Market?

Let’s cut through the noise with verified data. China’s dairy imports exploded by 23.5% year-over-year in March 2025 alone. Total dairy imports for the first four months of 2025 increased by 12% year-over-year, marking five consecutive months of growth.

But the real story isn’t just growth – it’s the dramatic shift in supplier preferences.

The Numbers That Matter to Your Operation

New Zealand has solidified its position as China’s dominant dairy supplier, with a 46% market share in early 2025. Their complete duty-free access through the Free Trade Agreement provides a crushing competitive advantage.

Product CategoryMarch 2025 PerformanceStrategic Impact
Whey+41.7% to 67,812 metric tonsEnough protein for 135,000 high-producing cows
Whole Milk Powder+30.7%Critical for food manufacturing expansion
CheeseRising demand continuing16% compound annual growth rate 2012-2022
ButterRecord highs achievedDriven by foodservice and baking expansion

Why This Matters for Your Operation: The Economic Reality

Are you still relying on domestic market stability while global opportunities multiply around you?

China’s domestic milk production plummeted, with farmgate prices falling to $19.40 per hundredweight – a decade low. This unsustainable pricing has forced smaller operations out of business, creating structural supply gaps.

Rabobank estimates a 5% reduction in China’s milk production for the second half of 2024 and projects a further 1.5% decline in 2025.

Chinese buyers are paying premiums for supply security that can transform operational profitability. NZ-origin skim milk powder now trades at a $300 per tonne premium over competitors.

That’s like getting an extra $0.27 per hundredweight just for being perceived as a reliable supplier.

The Technology Integration Advantage: Beyond Basic Traceability

The most successful ANZ producers in China aren’t just selling commodities. They’re providing transparency that Chinese buyers desperately want.

Challenging Traditional Supply Chain Thinking

Traditional approaches hide information from buyers to maintain negotiating leverage. Chinese buyers now demand the opposite: complete transparency and real-time visibility.

“We are receiving feedback from Chinese retail buyers that US products are being replaced on shelves with European and ANZ products,” Verry reports.

This level of visibility addresses a fundamental frustration in traditional Chinese distribution models. It’s like upgrading from visual cow observation to activity monitoring collars – the data-driven approach provides insights impossible to achieve manually.

Why are we still treating international trade like it’s 1995?

Implementation Timeline: Your 90-Day Window

Think of entering China’s market as a herd transitioning to robotic milking. Success depends on getting the timing, technology integration, and monitoring systems exactly right from day one.

PhaseDurationInvestment RequiredKey Objectives
Assessment & PreparationDays 1-30$15,000-$25,000Capability assessment, team establishment
Market Entry & RelationshipsDays 31-60$25,000-$40,000Intermediary engagement, specification development
Deal ExecutionDays 61-90$50,000-$100,000+Contract securing, system implementation

Days 1-30: Assessment and Preparation

Conduct rapid capability assessment for high-value products. Establish a dedicated response team with the authority to approve deals quickly.

Audit current supply chain transparency systems. Think about implementing comprehensive herd management software – you need complete visibility before optimizing.

Days 31-60: Market Entry and Relationship Building

Engage with established intermediaries who understand Chinese market dynamics. Develop product specifications aligned with buyer requirements.

Create rapid-response protocols for sourcing requests. Chinese companies move at emergency protocol efficiency – you need matching speed.

Days 61-90: Deal Execution

Focus on locking in supply agreements before potential tariff changes. Implement ongoing transparency and communication systems.

Build relationships with multiple Chinese buyers to diversify risk. Establish protocols for rapid scaling based on initial success metrics.

The Tariff Time Bomb: Racing Against August Deadlines

The window of opportunity comes with a ticking clock. China initially implemented a 10% tariff on US dairy products on March 10, 2025, skyrocketing to 125% by early April.

A temporary 90-day tariff reduction agreement lowered China’s retaliatory tariffs from 125% to 10%. However, this truce could collapse in August, potentially snapping tariffs back to punishing levels.

What Previous Trade Wars Teach Us

Historical analysis shows that when China imposed retaliatory tariffs on US dry whey in previous disputes, exports to China dropped 69% from peak to bottom. The difference now: Chinese buyers are actively seeking supply chain diversification.

This creates permanent structural advantages for ANZ producers regardless of tariff outcomes.

Global Market Context: The New Reality

The current China opportunity mirrors what happened during precision agriculture adoption in the 2010s. Early adopters of precision farming technologies achieved lasting competitive advantages that persist today.

European Competition Reality Check

EU producers face documented challenges, including biosecurity threats such as foot-and-mouth disease and bluetongue virus. These add “infection-risk premiums” to their products.

This creates quantifiable opportunities for ANZ producers to capture market share through reliability and safety positioning.

RegionKey AdvantagesMarket PositionCritical Challenges
New ZealandDuty-free access, $300/tonne premium46% market shareSupply constraints during peak demand
AustraliaProgressive tariff eliminationGrowing cheese market shareScaling production capacity
United StatesTraditional relationshipsMarket access is severely limited125% tariffs, relationship damage
European UnionProduct diversityMaintaining presenceBiosecurity risks, longer transport

Premium Opportunities: Where the Real Money Lives

While volume opportunities are impressive, challenging conventional commodity thinking reveals where the real money lies. China’s cheese imports reached their third-highest record in 2024.

Rabobank forecasts import demand could reach 270,000-320,000 tonnes by 2030.

Cream and Ingredients: The Hidden Goldmine

One Chinese manufacturer used 15,000 tonnes of whipping cream last year and recently requested an additional 5,000 tonnes. To put that in perspective, that’s equivalent to the annual cream production from roughly 25,000 high-producing dairy cows.

“We received an urgent request to source 300+ mtpa parmesan and cheddar cheese for a major product launch scheduled for August this year to replace the existing US sourced products,” Verry reports.

The Economic Impact: ROI That Justifies Bold Action

Let’s talk about numbers that matter to your bottom line. The premium pricing Chinese buyers pay for supply security justifies significant investment in market entry capabilities.

Investment vs. Returns:

  • Initial market entry: $75,000-$150,000 over 90 days
  • Technology systems: $25,000-$50,000 annually
  • Potential returns: $300 per tonne premium documented for NZ products
  • Volume opportunities: Individual contracts ranging from 300-5,000+ tonnes annually

For a mid-sized operation processing 50 million pounds of milk annually, capturing even a small share of China’s premium market could represent $500,000-$1,500,000 in additional annual revenue.

When was the last time you saw an investment opportunity with this kind of verified upside?

Risk Management: What Smart Operators Know

Every opportunity this significant comes with documented risks. Even with temporary tariff reductions, American dairy products continue to face substantial disadvantages in the Chinese market and are increasingly viewed as a “last resort supplier.”

Quality Control Scaling

Rapid scaling requires maintaining quality standards that took years to establish. This mirrors managing nutrition during rapid herd expansion – success depends on maintaining feed quality and monitoring systems.

Currency and Economic Volatility

The premium pricing Chinese buyers currently pay could erode if economic conditions change or domestic production recovers faster than expected.

Technology Implementation: Systems That Actually Work

The successful producers in China’s evolving market are those leveraging technology to provide transparency and speed up Chinese buyers demand.

Real-Time Systems That Work

Peloris Global Services has demonstrated success by providing producers with complete dashboards showing what’s being sold, where it’s being sold, and at what price points.

Chinese buyers are willing to pay premiums for this level of transparency. Think comprehensive herd management software for international trade.

Challenging Industry Orthodoxy: The Speed vs. Quality False Dichotomy

Here’s where we need to fundamentally challenge a core dairy industry belief: that speed and quality are mutually exclusive.

Research shows that automated systems actually improve quality while increasing speed when proper systems are in place.

The Evidence Against Traditional Thinking

Consider this: the US dairy industry achieved significant productivity gains while maintaining quality standards through rapid technology adoption. Speed of implementation was crucial to these gains.

Why should international market entry be different? The producers succeeding in China treat it like implementing a comprehensive precision dairy program.

When did “thorough” become code for “too slow to compete”?

Strategic Future Implications

Are you preparing for a fundamentally different global dairy market, or are you still planning based on pre-2020 assumptions?

China’s diversification creates permanent structural advantages for countries with stable trade relationships.

The Demographics Reality

China’s infant formula imports plummeted 35% due to declining birth rates. However, this demographic challenge drives growth in higher-value categories like cheese and butter that command better margins.

Think about it: Would you rather compete in a declining infant formula market or capture a share in premium cheese applications where China’s domestic processing capacity remains limited?

The Bottom Line: Evidence-Based Action Beats Perfect Planning

Remember that urgent question we started with about what $4.8 billion in suddenly available dairy imports looks like? You’re looking at the biggest market reshuffling since the EU milk quota system ended.

Chinese buyers are actively replacing US suppliers with ANZ alternatives. The window for capturing your share of this massive opportunity is measured in weeks, not months.

The producers who will dominate China’s dairy market five years from now are making their moves today. They’re adapting their business processes to match Chinese speed requirements. They’re investing in transparency systems that Chinese buyers demand.

But here’s what separates winners from watchers: Winners understand that success in China requires challenging fundamental assumptions about how dairy business should be conducted.

It’s like the difference between adding a few activity collars versus implementing a comprehensive precision dairy program that transforms every major decision.

The Evidence Is Clear

Multiple verified sources confirm that trade tensions are reshaping global dairy flows permanently. Historical analysis shows that delays cost more than imperfect action.

With Chinese domestic production struggling and farmgate prices at decade lows, every revenue opportunity matters. China’s massive import market is being redistributed, and early adopters maintain lasting competitive advantages.

Here’s the uncomfortable truth most producers won’t admit: While you’re debating whether to act, your competitors are already building the relationships that will define the next decade of global dairy trade.

They’re not waiting for perfect market conditions or committee approvals – they’re moving at Chinese speed because that’s what the market demands.

And here’s the question that should keep you awake tonight: If you’re not willing to adapt your business practices to capture premium opportunities, what makes you think you’ll survive when the next market disruption hits?**

The stakes are clear. Miss this window, and you’ll spend years watching competitors build the relationships and market position that could have been yours.

Act now, and you’ll be positioned to benefit from the most significant realignment of global dairy trade flows since trade liberalization began.

Your immediate next step: Contact established Chinese market intermediaries this week to assess your current capabilities and identify immediate opportunities. Don’t wait for perfect conditions – Chinese buyers are making sourcing decisions right now, and trade policy uncertainty isn’t negotiable.

The question isn’t whether you can afford to enter this market; it’s whether you can afford not to when competitors are already capturing premium pricing and building relationships that will define the next decade of the global dairy trade.

China’s dairy diversification isn’t coming – it’s here. The only question left is whether you’ll be part of it.

Complete references and supporting documentation are available upon request by contacting the editorial team at editor@thebullvine.com.

Learn More:

The Sunday Read Dairy Professionals Don’t Skip.

Every week, thousands of producers, breeders, and industry insiders open Bullvine Weekly for genetics insights, market shifts, and profit strategies they won’t find anywhere else. One email. Five minutes. Smarter decisions all week.

NewsSubscribe
First
Last
Consent

CME Dairy Market Report: June 18, 2025 – Cheese Market Collapse Triggers Class III Warning

Stop chasing milk volume—the component economy just crushed Class III by $1.75/cwt. Smart producers pivot now or lose $2,500/month per 100 cows.

EXECUTIVE SUMMARY: The June 18th cheese market collapse isn’t just another price swing—it’s the death knell for volume-focused dairy operations still living in 2020. While conventional producers panic over 6.5¢/lb cheese declines, progressive farms leveraging component optimization strategies are capturing $0.25/cwt premiums and positioning for FMMO reform windfalls. New processing capacity worth $1.27 billion is reshaping regional milk demand, creating 15-20% margin improvement windows for strategically positioned operations. The bifurcated export market—with cheese exports hitting record 1 billion pounds while NDM crashes 20.9%—proves that product-specific strategies now boost margins 40%+ over generic milk production approaches. Feed cost relief (corn down 6.8%, soybean meal down 7.5%) combined with advanced technologies delivering 7-month ROI creates unprecedented opportunities for farms willing to abandon outdated practices. Current milk-to-feed ratios at 1.62 support expansion, but only for operations embracing the component economy and strategic processor alignment. Stop betting on yesterday’s playbook—evaluate your component strategy and technology adoption immediately or watch competitors capture the premiums you’re leaving on the table.

KEY TAKEAWAYS

  • Component Optimization Trumps Volume Strategy: Butterfat production surging 5.3% annually while milk volume grows just 0.5%—progressive producers targeting 4.50%+ butterfat levels capture additional $0.15-0.25/cwt premiums while volume-focused operations face Class III losses up to $1.75/cwt from market volatility.
  • FMMO Reforms Create Regional Advantage Windows: Northeast producers with high Class I utilization gain $0.30-0.50/cwt premiums from “higher-of” pricing implementation, while manufacturing regions face 16¢ Class III reductions—strategic processor alignment and regional positioning now determine profitability more than production efficiency.
  • Technology Integration Delivers Immediate ROI: Smart sensors, robotic milkers, and AI-driven analytics demonstrate measurable returns within 7 months by reducing feed costs and improving herd health—farms adopting precision feeding and automated systems gain crucial competitive advantages when margins tighten below $12.37/cwt DMC thresholds.
  • Export Market Bifurcation Demands Product-Specific Strategies: Record cheese exports (1 billion pounds) versus crashing NDM exports (down 20.9%) prove that generic milk production leaves serious money on the table—operations aligning with high-performing export segments through strategic component profiles and processor partnerships achieve 40%+ margin improvements.
  • Processing Capacity Shifts Create Premium Opportunities: $1.27 billion in new regional processing investments (Darigold’s 8 million pound daily capacity, Cayuga’s 1.5 billion pound annual expansion) generate localized demand premiums for strategically positioned producers while creating discount pricing risks for spot Class III milk in oversupplied regions.
CME dairy market, dairy profitability, milk price trends, dairy risk management, component optimization

Today’s dramatic cheese price collapse signals the end of the recent rally, with blocks and barrels both plunging over 6¢/lb amid heavy institutional selling and deteriorating market liquidity. While NDM provided modest support with a 1.5¢ gain, the overall complex weakness threatens to slash July Class III milk payments by up to $1.75/cwt for operations heavily exposed to cheese manufacturing.

Today’s Price Action & Farm Impact

ProductPriceDaily ChangeWeekly TrendTrading VolumeBid/Ask AnalysisImpact on Farmers
Cheddar Blocks$1.6900/lb-6.50¢-6.4%5 trades1 bid, one offer – extremely thin liquidityMajor Class III pressure – immediate hedging needed
Cheddar Barrels$1.6900/lb-8.00¢-5.5%1 trade3 bids, three offers – limited interestBarrel-block convergence signals broad weakness
Butter$2.5275/lb-5.00¢+1.0%6 trades2 bids, one offer – seller’s marketClass IV under pressure despite strong price levels
NDM Grade A$1.2800/lb+1.50¢+0.5%4 trades2 bids, one offer – modest supportModest Class IV support from export demand
Dry Whey$0.5475/lb-0.50¢-2.6%7 trades1 bid, three offers – oversuppliedMinor additional Class III headwind

Enhanced Market Liquidity Analysis

The bid/ask spread analysis reveals issues concerning market depth. Cheddar blocks, despite substantial price declines, managed only five trades with minimal market-making activity (1 bid, one offer), indicating extreme reluctance from both buyers and sellers to engage at current levels. This thin liquidity amplifies price volatility and suggests that relatively small order flows can trigger disproportionate price movements.

Butter’s six trades with a 2:1 bid-to-offer ratio demonstrate continued demand interest despite the 5¢ decline, supporting the relative resilience in Class IV components. Conversely, dry whey’s 1:3 bid-to-offer ratio with seven trades signals oversupply conditions that continue pressuring Class III calculations.

Market Commentary

Today’s session revealed a fundamental shift in market psychology as institutional buyers stepped away from dairy commodities across the board. The convergence of block and barrel cheese prices at $1.6900/lb eliminates the premium structure that had supported recent Class III strength, confirming the “tale of two markets” scenario where Class III components face significant pressure while Class IV components show mixed but more stable trends.

The 24¢/lb disconnect between June cheese futures ($1.9220/lb) and current cash prices ($1.6900/lb) indicates futures markets must adjust downward to meet cash market reality. This pattern mirrors previous market corrections and suggests either rapid cash market recovery or continued futures market adjustment.

Enhanced Regional Market Analysis

FMMO Reform Regional Impact Assessment

The Federal Milk Marketing Orders reforms implemented on June 1 continue creating distinct regional advantages. The return to “higher-of” Class I pricing particularly benefits Northeast producers with high Class I utilization, while updated make allowances create headwinds for manufacturing milk prices across cheese-focused regions.

Regional Competitive Dynamics:

  • Northeast Advantage: The higher-of Class I pricing provides approximately $0.30-0.50/cwt premium for fluid milk operations
  • Upper Midwest Exposure: Heavy Class III utilization (65% of production) creates maximum vulnerability to today’s cheese collapse
  • Western Regions: New processing capacity at Darigold’s Pasco facility (8 million pounds daily capacity) creates localized demand premiums
  • Southwest Growth: Continued expansion in Texas (+40,000 head) and Idaho (+17,000 head) redistributes national milk flows

Processing Capacity Impact on Regional Pricing

The commissioning of multiple large-scale processing facilities creates significant regional basis differentials. Darigold’s new Pasco facility represents a $1 billion investment, creating demand for over 100 regional farms, while Cayuga Milk Ingredients’ $270 million expansion enables the processing of 1.5 billion pounds annually. These developments create premium opportunities near new facilities while potentially discounting spot Class III milk in oversupplied regions.

Feed Cost & Margin Analysis

Enhanced Feed Market Integration

Current feed futures demonstrate continued producer-favorable conditions:

  • Corn (July): $4.3275/bu – down 6.8% from recent highs, providing cost relief
  • Soybean Meal (July): $284.90/ton – declining 7.5%, offering $15-20/ton savings
  • Estimated Total Feed Cost: $11.50/cwt (16% protein dairy ration)

Milk-to-Feed Ratio Analysis

The current milk-to-feed ratio of 1.62 based on June Class III futures ($18.68/cwt) versus estimated feed costs remains above the critical 1.40 threshold that typically triggers production adjustments. However, today’s cheese collapse threatens to push this ratio toward concerning territory, particularly for operations with high Class III exposure.

Dairy Margin Coverage Program Outlook: The USDA DMC Decision Tool projects monthly margins to average $12.37/cwt during 2025, with an 85% probability that no indemnity payments will be issued as margins remain above the $9.50/cwt threshold.

Global Trade & Export Analysis

USDA Export Forecasts Integration

The USDA projects promising growth in U.S. dairy exports to $8.1 billion for fiscal year 2025, driven by strong cheese demand and consistent nonfat dry milk performance. However, this optimistic outlook faces challenges from today’s price action and evolving global dynamics.

Export Performance Bifurcation:

  • Cheese Exports: Record 2024 performance, with March 2025 achieving the second-highest monthly volume at 109 million pounds
  • Butterfat Strength: First quarter 2025 exports already represent over half of 2024 total volume
  • NDM Challenges: April 2025 exports crashed 20.9% year-over-year
  • Dry Whey Pressures: China’s retaliatory tariffs ranging from 84-150% continue limiting market access

Global Production Context

Rabobank’s Q2 Dairy Quarterly projects production growth from Big-7 exporting regions at 1.1% in Q2 and 1.4% in Q3, marking the strongest quarterly increases since Q1 2021. This accelerating global supply growth, particularly from U.S. and EU regions, creates additional headwinds for U.S. export competitiveness.

Weather & Environmental Impact Quantification

Enhanced Weather Risk Assessment

The persistent El Niño event maintains a 70% probability of continuing through June 2025, creating global extreme weather patterns. Specific production impact estimates include:

Heat Stress Quantification:

  • 8-12% production losses when temperatures exceed 85°F for consecutive days
  • Smaller farms experience disproportionate impacts due to limited cooling infrastructure
  • Regional vulnerability: Southwest operations face the highest exposure during June heatwave conditions

Drought Impact Measures:

  • USDA activated $500 million in direct support for drought-affected areas
  • Spring rainfall deficits following wet 2024 create potential forage shortages
  • HPAI interaction: Heat stress compounds disease susceptibility in affected herds (~1,000 herds across 17 states)

Forward-Looking Analysis & Risk Assessment

FMMO Implementation Timeline

The delayed implementation of skim milk composition factors until December 1, 2025, provides a crucial transitional period for strategic planning. Updated factors (3.3% true protein, 6.0% other solids, 9.3% nonfat solids) will further impact component values and create additional basis risk for existing risk management positions.

Seasonal Outlook Integration

Production Projections: USDA’s revised 2025 milk production forecast of 226.9 billion pounds (down 1.1 billion) reflects slower cow inventory growth and reduced per-cow yields, supporting potential price recovery if demand stabilizes.

Component Economy Emphasis: Average butterfat levels rising to 4.40% and protein to 3.40% in 2025 reflect strategic shift toward component optimization, with butterfat production surging to 5.3% annually while volume growth remains modest at 0.5%.

Enhanced Actionable Farmer Insights

Immediate Risk Management Protocols

48-Hour Emergency Actions:

  1. Implement Dairy Revenue Protection for Q3/Q4 production immediately
  2. Review component optimization to maximize butterfat premiums (4.50%+ targets)
  3. Evaluate processor alignment toward Class IV operations to escape cheese volatility
  4. Monitor DMC margin projections for potential program adjustments

Technology Integration for Competitive Advantage

Advanced technologies, including smart calf sensors, robotic milkers, and AI-driven analytics, demonstrate measurable ROI within seven months by reducing feed costs and improving herd health. Current margin pressure amplifies the importance of efficiency gains through precision feeding and automated systems.

Strategic Component Positioning

With butterfat comprising 58% of milk check income, operations should prioritize genetic selection and feeding programs targeting higher component levels. Component-based premiums with processors become increasingly vital as base prices face pressure from updated FMMO make allowances.

Regional Market Spotlight: Northeast Opportunity

The Northeast region benefits significantly from FMMO reforms, particularly the implementation of higher-of-Class I pricing. Combined with the new processing capacity at Cayuga Milk Ingredients ($270 million expansion), Northeast producers with high Class I utilization can capture premiums while manufacturing regions face margin compression.

Strategic Advantages:

  • Higher-of Class I pricing provides a consistent premium over manufacturing milk
  • Proximity to population centers reduces transportation costs
  • Processing capacity expansion creates competitive milk procurement
  • Reduced exposure to volatile cheese pricing through Class I focus

This enhanced CME dairy market report incorporates verified data from USDA forecasts, NMPF FMMO analysis, and industry-leading research to provide comprehensive market intelligence. TheBullVine.com continues delivering data-driven insights that directly impact farm profitability and strategic decision-making in an increasingly complex dairy marketplace.

Learn More:

The Sunday Read Dairy Professionals Don’t Skip.

Every week, thousands of producers, breeders, and industry insiders open Bullvine Weekly for genetics insights, market shifts, and profit strategies they won’t find anywhere else. One email. Five minutes. Smarter decisions all week.

NewsSubscribe
First
Last
Consent

Stop Throwing Money Away: Why Your Selenium Strategy Is Costing You $700 Per Cow

Your selenium strategy is obsolete. New research reveals 60-80% of supplement content is wasted while costing you $700/cow in mastitis and reproductive losses.

Here’s a number that should make every dairy operator sit up and take notice: selenium deficiency-related health issues can cost producers between $325-457 per case of mastitis and $389 per case of retained placenta, according to research published in the Journal of Dairy Science. When these complications cascade—as they often do—total costs can exceed $700 per affected cow. Yet most producers are unknowingly using selenium supplements that deliver as little as 18% of their labeled active ingredient, based on advanced analytical studies published in peer-reviewed journals.

Imagine walking into your feed room and discovering that 60-80% of what you’re paying for in your mineral program is essentially worthless. That’s exactly what’s happening with selenium supplementation across the dairy industry, and it’s time we had an honest conversation about why your current approach might be bleeding money instead of building immunity.

Selenomethionine Content Variability in Commercial Selenium Yeast Products

But here’s the uncomfortable truth the feed industry doesn’t want you to know: Recent analytical breakthroughs have exposed the dirty secret of selenium yeast: its selenomethionine content can vary from as low as 18% to 71.8%, with an average of just 55.8%, according to advanced speciation analysis published in livestock science journals. The rest? Often inactive elemental selenium that provides zero biological benefit.

Why Your Current Selenium Strategy Is Probably Failing You

Let’s start with a question that challenges everything you think you know about selenium: If selenium yeast is so effective, why do farms using premium organic selenium sources still struggle with elevated somatic cell counts and reproductive failures?

The answer lies in a fundamental misunderstanding about what “organic selenium” actually means. According to research from the University of California San Diego, genuine selenium yeast should contain 90% or more of its selenium as selenomethionine. However, independent analytical studies using high-performance liquid chromatography reveal that commercial selenium yeast products routinely fail to meet this standard.

The Modern Dairy Dilemma: Genetic Potential vs. Physiological Reality

Today’s dairy cows represent the Formula 1 race cars of agriculture—genetically engineered for maximum performance but operating at the absolute edge of their metabolic capacity. These elite animals process 150-200 pounds of dry matter intake daily, converting it into 100+ pounds of milk while their mitochondria work overtime, generating massive quantities of free radicals through normal cellular respiration.

Why This Matters for Your Operation: The Italian Holstein Case Study

Real-world evidence comes from a landmark study conducted at Ballottino Farm in Cremona, Italy, involving 100 Italian Holstein dairy cows. Research published by Alltech demonstrated the dramatic impact of optimized selenium nutrition.

Mario Agovino from Alltech Italy led the study comparing sodium selenite (control group, n=48) versus organic selenium supplementation (Sel-Plex group, n=52). The results were compelling:

  • Milk selenium content doubled: 0.058 mg/L with organic selenium versus 0.029 mg/L with inorganic selenium
  • Increased milk yield: 37.9 kg/day versus 36.5 kg/day (1.4 kg/day increase)
  • Reduced somatic cell counts: 272,000/mL versus 320,000/mL
  • Improved reproductive performance: 83% confirmed pregnancy rate versus 67%

Let’s do the math: That extra 1.4 kg (3.08 lbs) daily translates to approximately $0.64 additional revenue per cow per day at current milk prices—or $234 annually per cow. For a 100-cow herd, that’s $23,400 in additional revenue.

The Geography of Deficiency: A Global Challenge Supported by Meta-Analysis

Economic Impact of Selenium Deficiency-Related Health Issues in Dairy Cows
Health IssueCost per Case/Cow ($)FrequencyPotential Annual Cost (100-cow herd)
Clinical Mastitis128-44425 cases per 100 cows$3,200-$11,100
Subclinical Mastitis110 (annual)Per cow annually$11,000
Retained Placenta300-3895-10% of calvings$1,500-$3,890
Combined Annual ImpactVariableCumulative$15,700-$25,990

Here’s a sobering question: Did you know that selenium deficiency affects an estimated one billion people globally, and livestock in the same regions face identical challenges?

A comprehensive meta-analysis published in the Journal of Dairy Science examined 42 studies conducted between 1977 and 2007 across multiple continents. The research, led by Knowles et al., found that “soils in many regions of the world have a low Se content. Consequently, forages and crops grown on these soils may provide inadequate dietary Se for humans and grazing animals”.

The meta-analysis revealed significant geographical variations in selenium supplementation effectiveness, with American cows supplemented with selenium yeast showing greater milk selenium concentrations (approximately 0.37 micromol/L) compared to those receiving inorganic forms.

The Sulfur Antagonism Problem

Modern agriculture has inadvertently exacerbated selenium deficiency by using sulfur-containing fertilizers. Research confirms that sulfur and selenium compete for the same plant uptake mechanisms, with sulfur’s higher application rates consistently winning this biological battle.

Challenging the Conventional Wisdom: Recent Research Findings

Here’s where we need to challenge a fundamental assumption that’s costing the industry millions: A 2024 study published in the Journal of Dairy Science by Cruickshank et al. revealed surprising findings that contradicted conventional wisdom about selenium supplementation.

The study, involving multiparous Holstein cows, found that “regardless of whether selenium came from organic or inorganic sources, it did not affect the cows’ absorption of the mineral, their selenium levels, or their overall performance.” However, the researchers noted a critical distinction: “organic selenium resulted in higher selenium levels in milk, with less being excreted through urine.”

The Heat Stress Research Breakthrough

More compelling evidence comes from research published in the Journal of Dairy Science examining hydroxy-selenomethionine (HMSeBA) under heat stress conditions. The study, conducted by researchers using environmental chambers, compared inorganic selenium (sodium selenite) with HMSeBA supplementation in mid-lactation Holstein cows.

The results demonstrated that “HMSeBA supplementation decreases some parameters of HS-induced oxidative stress” and showed:

  • Increased selenium concentrations in serum and milk during heat stress
  • Maintained glutathione peroxidase activity while it declined in control cows
  • Increased total antioxidant capacity
  • Decreased oxidative stress markers (malondialdehyde, hydrogen peroxide, nitric oxide)
  • Tendency to increase milk yield while decreasing milk fat percentage

The Three Generations: Why Technology Evolution Matters

Bioavailability Comparison of Three Generations of Selenium Supplements

First Generation: The Obsolete Technology Still Widely Used

Despite overwhelming scientific evidence of poor bioavailability, many operations use sodium selenite. Studies consistently show absorption rates of just 10-30% for inorganic selenium in ruminants due to reduction by rumen microbiota.

Second Generation: The Inconsistent Promise of Selenium Yeast

Advanced analytical techniques have exposed serious quality control issues that the feed industry has largely ignored. Recent research using state-of-the-art speciation analysis reveals that commercial selenium yeast products contain highly variable selenomethionine levels.

Third Generation: The Precision Solution

Recent research from 2025 published in the journal Animals examined the effects of organic selenium supplementation in late lactation dairy cows. The study found that “supplementation of organic zinc and selenium in late lactation dairy cows, in the form of chelated zinc amino acid and selenium amino acid complex, had positive effects on immunity and antioxidant activity.”

The Economic Reality: Verified ROI from Italian Research

Economic Benefits of Organic Selenium Supplementation in Italian Holstein Study
MetricControl (Sodium Selenite)Organic Selenium (Sel-Plex)Improvement
Milk Yield (kg/day)36.537.9+1.4 kg (+3.8%)
Somatic Cell Count (cells/mL)320000.0272000.0-48,000 (-15%)
Confirmed Pregnancy Rate (%)67.083.0+16% points
Retained Placenta Cases (per 100 cows)10.06.0-4 cases (-40%)
Days to Confirmed Pregnancy139.0130.0-9 days
Services per Conception1.811.63-0.18
Annual Cost (€ per 100 cows)0.0810.0+€810
Annual Benefits (€ per 100 cows)0.07380.0+€7,380
Net ROI (€ per 100 cows)0.06570.09:1 ROI

The Italian Holstein study provides concrete ROI analysis that challenges the assumption that premium selenium supplements are “too expensive.” The research calculated specific economic benefits:

The Italian Holstein ROI Analysis Breakdown:

  • The added cost of organic selenium (Sel-Plex): €810 annually for a 100-cow herd
  • Documented benefits: €7,380 annually
  • Net benefit: €6,570 ($7,000+) annually
  • Return on investment: 9:1

The study documented specific improvements:

  • 9 fewer open days per cow annually (€2,700 total value)
  • 1.3 L/day/cow increased production (€4,680 total value)
  • Reduced retained placenta cases (6 versus 10 cases per 100 cows)
  • Lower days to confirmed pregnancy (130 versus 139 days)
  • Improved services per conception (1.63 versus 1.81)

Implementation Challenges and Solutions

Addressing Cost Concerns

While third-generation selenium supplements cost 2-3 times more per unit than basic inorganic selenite, the bioavailability differences mean you’re getting 3-5 times more effective selenium per dollar spent. As Agovino’s research demonstrates, preventing just one case of mastitis pays for an entire herd’s annual selenium supplementation program several times over.

Quality Control Issues

The 2024 research by Cruickshank et al. highlights a critical implementation challenge: “Despite expecting differences, the study showed similar results in terms of the cows’ eating habits and milk production” between organic and inorganic sources. This suggests that product quality and consistency remain significant variables in real-world applications.

Potential Limitations

Recent research also reveals some limitations of selenium supplementation. The 2025 Animals journal study noted that “selenium supplementation induced a reduction in fat percentage” and “solids content showed a tendency to decrease.” These findings suggest that selenium optimization requires careful balance with other nutritional factors.

The One Health Opportunity: Adding Value Beyond the Farm Gate

The meta-analysis by Knowles et al. confirms that “using organic selenium could enhance the selenium content in milk, providing potential benefits for consumers or calves and reducing environmental mineral waste.” Research demonstrates that supplementing dairy cows with highly bioavailable organic selenium increases milk selenium concentration, predominantly as selenomethionine bound within milk proteins.

Implementation Strategy: Making the Switch Without Disruption

Phase 1: Diagnostic Assessment (Month 1) Start with comprehensive herd testing using blood selenium analysis. Target plasma levels above 80-100 µg/L, with optimal status above 100 µg/L. Cost consideration: Blood selenium testing typically runs $15-25 per sample.

Phase 2: Critical Product Evaluation (Month 1-2) Demand specific documentation from suppliers about selenium form, purity guarantees, and analytical testing results. If your supplier can’t provide selenomethionine content verification for selenium yeast products, that tells you everything you need to know about product quality.

Phase 3: Strategic Implementation (Month 2-3) Focus upgrades on critical periods: dry cow supplementation and early lactation. The Italian research demonstrates this approach provides the highest return on investment through improved health outcomes and milk production.

Phase 4: Performance Monitoring (Month 3-6) Retest selenium status 90 days post-implementation and track key performance indicators following the Italian study model:

  • Somatic cell count trends (target: reduction from 320,000/mL to 272,000/mL)
  • Milk yield improvements (expect: 1.4 kg/day increase)
  • Reproductive performance metrics (goal: increase confirmed pregnancy rates from 67% to 83%)

The Bottom Line: Transforming Cost into Competitive Advantage

Remember that $700 per cow figure we started with? The Italian Holstein research suggests this may actually underestimate the true economic impact when you factor in the comprehensive benefits documented by Agovino and colleagues.

The Research-Backed Reality Check:

  • Italian research documenting 9:1 ROI from organic selenium
  • Meta-analysis of 42 studies confirming the superiority of organic sources
  • Heat stress research demonstrates maintained antioxidant function
  • Recent 2025 studies confirming immune and antioxidant benefits

The choice isn’t whether you can afford to upgrade your selenium program—it’s whether you can afford not to. With mastitis costs averaging $325-457 per case and retained placenta adding another $389, the Italian research proves that preventing just two cases annually pays for an entire herd’s premium selenium supplementation several times over.

Your Next Strategic Move: Contact your nutritionist this week and demand a detailed breakdown of your current selenium program’s analytical specifications. Ask specifically about selenomethionine content verification, batch consistency guarantees, and bioavailability data. If they can’t provide clear, scientifically-backed answers backed by peer-reviewed research like our cited studies, you’ve just identified why your selenium strategy might fail.

The dairy industry rewards operators who make decisions based on evidence rather than tradition. Cruickshank et al. noted in their 2024 research that “using organic selenium could enhance the selenium content in milk, providing potential benefits for consumers or calves and reducing environmental mineral waste.” Your selenium strategy represents one area where peer-reviewed research clearly points toward an upgrade that pays for itself through improved herd health, reduced treatment costs, and enhanced productivity.

The research is clear. The economics are compelling. The Italian Holstein study provides a real-world roadmap for success. The remaining question is: Will you continue paying premium prices for inconsistent results or invest in proven technology that transforms selenium from a cost center into a profit driver with documented 9:1 returns?

KEY TAKEAWAYS

  • Documented 9:1 ROI on selenium optimization: Italian Holstein research shows €7,380 in benefits against just €810 in costs per 100 cows annually, with specific improvements in milk yield (1.4 kg/day increase), reproductive efficiency (6 vs. 10 retained placenta cases per 100 cows), and udder health (SCC reduction from 320,000/mL to 272,000/mL).
  • Traditional selenium sources are failing your herd: Inorganic selenium (sodium selenite) shows just 10-30% bioavailability in ruminants, while “organic” selenium yeast products contain highly variable active content—analysis reveals some products with as little as 18% selenomethionine and up to 51.8% unavailable elemental selenium.
  • Implementation requires just a 4-phase approach: Start with strategic blood testing ($15-25 per sample) targeting 80-100 μg/L plasma levels, demand SeMet content verification from suppliers, focus supplementation during transition periods, and monitor improvements within 90 days.
  • Heat stress resilience improves with optimized selenium: Research on hydroxy-selenomethionine supplementation shows maintained antioxidant function during thermal stress when conventional approaches fail—critical as climate models predict increasing heat stress challenges for dairy operations across North America in 2025.
  • Beyond cow health—marketing opportunity: Selenium-optimized milk contains significantly higher selenium content in a highly bioavailable form (90% human bioavailability), creating potential premium market opportunities as consumer health awareness grows in 2025’s competitive dairy marketplace.

EXECUTIVE SUMMARY

The selenium supplementation strategy your nutritionist recommended is likely costing you hundreds of dollars per cow while delivering minimal protection. Research reveals that conventional selenium sources suffer from devastating flaws: inorganic forms are 70-90% destroyed in the rumen, while “premium” selenium yeast products contain highly variable levels of active selenomethionine—ranging from just 18% to 71.8% with an average of only 55.8%. Italian research demonstrates a remarkable 9:1 return on investment when upgrading to third-generation selenium sources, with documented benefits including 1.4 kg/day increased milk production, SCC reduction from 320,000/mL to 272,000/mL, and 9 fewer open days per cow annually. In today’s challenging dairy economy, with USDA forecasting cautious milk prices around $20.90/cwt for 2025, this hidden profit leak represents one of your highest ROI opportunities for immediate implementation. It’s time to demand verification of exactly what you’re getting in your mineral program and upgrade from minimum requirement thinking to strategic optimization.

Complete references and supporting documentation are available upon request by contacting the editorial team at editor@thebullvine.com.

Learn More:

The Sunday Read Dairy Professionals Don’t Skip.

Every week, thousands of producers, breeders, and industry insiders open Bullvine Weekly for genetics insights, market shifts, and profit strategies they won’t find anywhere else. One email. Five minutes. Smarter decisions all week.

NewsSubscribe
First
Last
Consent

CME End-of-Day Dairy Market Report: June 17th, 2025 – Cheese Collapse Pressures July Milk Checks

Stop chasing milk volume. Component optimization delivers 5.3% butterfat growth while volume stagnates at 0.5%. Your margin depends on it.

EXECUTIVE SUMMARY: Forget everything you’ve been told about prioritizing milk volume – the June 17th cheese market collapse proves that smart producers who’ve pivoted to component optimization are capturing premiums while volume-focused operations face $1.50/cwt Class III losses. The data doesn’t lie: butterfat production is surging 5.3% annually while overall milk volume crawls at just 0.5%, with average butterfat levels hitting 4.40% and protein reaching 3.40% in 2025. Meanwhile, the complete absence of cheese barrel offers signals institutional liquidation patterns not seen since 2019, yet butter maintains relative strength with aggressive institutional buying. The new FMMO reforms effective June 1st are explicitly rewarding component-rich milk through updated skim milk composition factors, creating a structural advantage for farms optimizing genetics and nutrition programs. With feed costs offering unprecedented relief – corn at $4.31/bu and the milk-to-feed ratio holding strong at 2.43 – progressive producers have a 48-hour window to lock in margins while repositioning for the emerging “component economy.” Stop betting on yesterday’s volume game and start capitalizing on today’s component premiums before your competitors figure out what you already know.

KEY TAKEAWAYS

  • Component Optimization ROI: Farms producing 4.40% butterfat milk capture 5.3% annual growth premiums while volume-focused operations stagnate at 0.5% growth, translating to measurable income advantages as FMMO reforms reward higher-value milk through updated composition factors.
  • Strategic Risk Management Window: With Class III futures trading at dangerous premiums to spot fundamentals and cheese showing institutional liquidation patterns, producers have exactly 48 hours to enroll in Dairy Revenue Protection (DRP) and establish price floors before further $1.50/cwt erosion occurs.
  • Feed Cost Arbitrage Opportunity: Current corn prices at $4.31/bu combined with a robust 2.43 milk-to-feed ratio create immediate margin expansion potential – lock in 6-month feed contracts below $4.60/bu while this golden procurement window remains open.
  • Regional Competitive Advantage: Upper Midwest operations maintain 20% lower feed costs than California counterparts, while Northeast producers benefit from new $1.2 billion processing capacity investments and favorable FMMO “higher-of” Class I pricing reforms.
  • H5N1 Supply Disruption Hedge: With 950 herds across 16 states affected and California production down 9.2% year-over-year, biosecurity-focused operations positioned in lower-risk regions can capitalize on localized supply tightening and premium opportunities.

Today’s CME dairy markets delivered a sobering reality check for producers, with cheese prices experiencing significant weakness that directly threatens July milk checks. The complete absence of barrel buyers at the session close signals fundamental demand destruction, while butter’s modest decline suggests that the market’s “component economy” favors butterfat over protein. With feed costs remaining favorable and the milk-to-feed ratio holding at 2.43, margins face pressure primarily from revenue erosion rather than input cost inflation.

Today’s Price Action & Farm Impact

ProductFinal PriceDaily ChangeWeekly TrendTrading VolumeImpact on Farmers
Cheddar Block$1.7550/lb-2.50¢-9.20¢13 tradesDirect Class III pressure of $1.25-1.75/cwt
Cheddar Barrel$1.7700/lb-2.00¢-8.20¢1 tradeZero offers – extreme liquidity crisis
Butter$2.5775/lb-1.50¢+4.50¢5 tradesModest Class IV support, butterfat premiums intact
NDM Grade A$1.2650/lb-0.50¢Unchanged1 tradeStable export foundation for Class IV
Dry Whey$0.5525/lb+0.50¢-1.40¢0 tradesMinor Class III support amid weakness

Market Commentary

The cheese market’s breakdown reflects more than temporary weakness – it signals institutional liquidation patterns not seen since the 2019 market collapse. Block cheese trading volume of 13 transactions represents the heaviest selling pressure in two weeks, while the complete absence of barrel offers despite significant price declines indicates either extreme seller capitulation or a profound lack of buyers at any price level.

This divergence between futures and cash markets is particularly concerning. June Class III futures closed at $18.69/cwt, maintaining a significant premium to spot fundamentals that typically resolve with futures declining to align with cash reality. July Class III futures showed modest strength at $18.14/cwt, but this disconnect suggests either delayed recognition of fundamental weakness or temporary liquidity constraints.

The market’s shift toward a “component economy” remains evident, with butterfat demonstrating relative resilience despite today’s decline. This trend, where butterfat comprises an increasing portion of milk income, reinforces the importance of component optimization for producers seeking to maintain margins in volatile markets.

Feed Cost & Margin Analysis

Current feed market conditions provide crucial relief amid dairy price pressure, with the milk-to-feed ratio maintaining strength at 2.43 – well above the critical 2.0 threshold that typically signals margin stress.

Current Feed Costs & Trends

  • Corn (July): $4.3075/bu, down 3.5¢ from June 10th (-0.81%)
  • Soybean Meal (July): $285.30/ton, up $1.50 from June 10th (+0.53%)
  • Milk-to-Feed Ratio: 2.43 (favorable for producers)
  • Daily Margin Over Feed Cost: $3.58 per cow (based on 70 lbs production)

The combination of lower corn prices and relatively stable protein costs creates a supportive environment for dairy margins, even as milk prices face headwinds. Feed costs have provided substantial relief compared to 2024 levels, with corn prices falling nearly 30% and offering strategic procurement opportunities.

Regional feed cost advantages persist, with Upper Midwest operations benefiting from proximity to corn and soybean production areas, maintaining feed bills 20% lower than regions like California. This geographical advantage becomes increasingly important as margin pressures intensify from revenue-side challenges.

Production & Supply Insights

U.S. milk production continues expanding despite price volatility, with USDA forecasting 227.3 billion pounds for 2025 – a significant upward revision from earlier projections. This growth stems from both herd expansion (projected 9.380 million head) and modest productivity gains, though milk-per-cow growth remains below historical averages at 0.3%.

Component Production Surge

The industry’s transformation toward higher-value components continues accelerating, with butterfat production surging 5.3% annually while overall milk volume growth remains modest at 0.5%. Average butterfat levels have risen to 4.40% and protein to 3.40% in 2025, reflecting both genetic progress and strategic feeding programs focused on component optimization.

H5N1 Impact Assessment

The H5N1 virus continues affecting dairy operations, with nearly 1,000 herds across 17 states reporting infections as of June 2025. California remains heavily impacted, with approximately 650 affected herds, contributing to the state’s recent 9.2% year-over-year production decline. Mathematical modeling suggests dairy outbreaks will continue throughout 2025, with Arizona and Wisconsin identified as the highest-risk states for future outbreaks.

The emergence of the D1.1 genotype in Nevada cattle represents a concerning development, indicating multiple independent spillover events from avian reservoirs. This genetic diversity complicates biosecurity efforts and suggests the virus continues evolving within cattle populations.

Market Fundamentals Driving Prices

Domestic Demand Dynamics

The U.S. dairy market exhibits a “two-speed” demand environment that directly impacts pricing. Retail dairy sales reached approximately $78 billion in 2024, representing $2 billion growth year-over-year, driven by consumer preferences for functional dairy products enriched with protein and probiotics.

However, foodservice demand remains problematic, with restaurant sales declining from $97.0 billion in December to $95.5 billion by February 2025 – a seven-month low. This foodservice weakness significantly affects overall demand, given that 51% of American food dollars are spent outside the home.

Export Performance & Global Competition

U.S. dairy exports show mixed signals, with total trade declining 5% in April despite strong performance in specific categories. Cheese exports achieved their second-highest month ever in March, while butter exports surged 171% year-over-year, capitalizing on favorable competitive pricing.

The Global Dairy Trade index reflects global price pressure, declining 1% in recent auctions with broad-based weakness across most categories. This international softness adds downward pressure to U.S. pricing, particularly for export-dependent products like NDM and whey.

Trade policy uncertainty persists as a significant risk factor, with retaliatory tariffs from key partners like China and Canada already impacting first-quarter export performance. The industry’s ability to offset domestic demand softness relies heavily on maintaining open access to international markets.

Forward-Looking Analysis

USDA Price Forecasts & Market Outlook

The USDA’s June 2025 WASDE report projects an all-milk price of $21.95/cwt for 2025, with a slight decline to $21.30/cwt anticipated in 2026. However, current Class III futures trading significantly below these projections suggests market skepticism about achieving official price targets.

Class III milk price forecasts have been revised multiple times, from initial projections of $17.95/cwt to current estimates ranging from $18.70-19.10/cwt for 2025. This volatility in official projections reflects the challenging fundamental environment facing the sector.

Key Risk Factors

Upside Potential:

  • Continued strong export demand for butterfat and cheese products
  • Weather-related supply disruptions (heat stress can reduce production by 8-12% when temperatures exceed 85°F)
  • Increased domestic demand for functional dairy products

Downside Risks:

  • Persistent soft foodservice demand dampening overall consumption
  • Global supply expansion from major exporting regions in Q2-Q3 2025
  • H5N1 spread, causing localized production disruptions
  • Trade policy volatility disrupting export markets

Regional Market Spotlight: Upper Midwest Resilience

The Upper Midwest continues demonstrating competitive advantages that position the region favorably despite national market challenges. Wisconsin and Minnesota’s combined production of 42.7 billion pounds in 2024 slightly exceeded California’s 40.2 billion pounds, maintaining the region’s status as America’s dairy heartland.

Structural Advantages

The region benefits from consistent feed cost advantages, with proximity to corn and soybean production providing 20% lower feed bills compared to Western regions. This cost structure becomes increasingly valuable as margin pressures intensify from revenue-side challenges.

Federal Milk Marketing Order reforms implemented June 1st generally favor regions with higher Class I utilization, though the Upper Midwest will experience impacts from updated make allowances and Class I pricing mechanisms. The shift to “higher-of” Class I pricing may provide modest support, while increased make allowances create near-term pressure on component values.

Processing capacity expansion continues in the region, with new facilities providing additional milk outlets and potential premium opportunities for producers. This infrastructure investment signals long-term confidence in the region’s competitive position.

Actionable Farmer Insights

Immediate Risk Management Priorities

Current market conditions demand aggressive risk management action within the next 48 hours. Producers should prioritize Dairy Revenue Protection (DRP) enrollment for third and fourth-quarter production, establishing price floors before further deterioration occurs.

The recent FMMO reforms alter Class III and Class IV settlement price calculations, requiring updated hedging strategies. A prudent approach involves choosing the higher contract between Class III and Class IV to hedge the portion of milk represented by Class I prices, providing more reliable price floors.

Component Optimization Strategy

With butterfat demonstrating relative strength amid broader market weakness, optimizing for higher milk components becomes critical. Producers should immediately review genetics and nutrition programs to maximize butterfat premiums as the “component economy” continues rewarding higher-value milk.

The FMMO reforms’ updated skim milk composition factors (effective December 1st) will further reward component-rich milk, making this optimization essential for maintaining competitiveness.

Feed Cost Management

Take advantage of current corn prices below $4.31/bu by securing long-term contracts, ideally locking in costs below $4.60/bu. Soybean meal prices under $286/ton present strategic procurement opportunities before potential seasonal tightening occurs.

With above-normal temperatures expected across most of the Lower 48, implementing heat stress mitigation strategies becomes critical for maintaining production and components. Research indicates consecutive days above 85°F can reduce production by 8-12%, making cooling investments increasingly valuable.

Industry Intelligence

Federal Milk Marketing Order Implementation

The FMMO reforms implemented on June 1st represent the most significant policy changes since 2018, with additional modifications scheduled for December 1st. Key changes include the return to “higher-of” Class I pricing, updated make allowances reflecting current processing costs, and revised skim milk composition factors.

Initial impacts suggest increased Class I prices across most orders, particularly benefiting regions with high fluid milk consumption. However, higher make allowances create near-term pressure on component values, requiring strategic procurement and pricing strategy adjustments.

Technology & Innovation Trends

Industry executives report growing interest in AI applications for herd management and operational efficiency. “Face to Farm” transparency initiatives continue gaining importance as consumers demand greater supply chain visibility.

Precision fermentation technology offers potential for more efficient dairy product manufacturing, though widespread adoption remains years away. Dairy executives maintain optimism about volume growth, with 80% expecting increases exceeding 3% over the next three years.

Weekly & Monthly Context

Today’s market action continues the concerning trend that began with June 16th’s “cheese market collapse,” when blocks fell 5.75¢, and barrels declined 4.50¢ with zero trading activity. This two-day decline represents the most significant cheese weakness since the 2019 market correction.

The broader June trading pattern shows divergent performance across the dairy complex. Butter has demonstrated relative strength with modest gains earlier in the month, while cheese markets have faced persistent pressure from higher production and softer demand.

Weekly trading volumes remain below historical norms, suggesting institutional participants have stepped away from active trading pending clarity on fundamental direction. This liquidity reduction amplifies price volatility and complicates risk management decisions for producers.

Looking Ahead: The full impact of FMMO reforms will become clearer as July milk checks are calculated under new formulas. Additionally, seasonal heat stress patterns typically intensify through July-August, potentially providing supply-side support if widespread temperature extremes develop.

What’s your current hedging strategy, given today’s cheese weakness? Share your insights in our producer forum and learn from fellow farmers across the country.

Learn More:

The Sunday Read Dairy Professionals Don’t Skip.

Every week, thousands of producers, breeders, and industry insiders open Bullvine Weekly for genetics insights, market shifts, and profit strategies they won’t find anywhere else. One email. Five minutes. Smarter decisions all week.

NewsSubscribe
First
Last
Consent

Wisconsin Dairy Farmer Sues USDA Programs Costing Operations $100,000+ Annually

Stop believing government programs are “fair game.” Wisconsin lawsuit exposes $15,000+ EQIP disparities threatening your operation’s constitutional rights.

EXECUTIVE SUMMARY: The dairy industry’s comfortable reliance on USDA programs is about to face its biggest constitutional challenge since the New Deal, potentially costing operations thousands in lost competitive advantages. Wisconsin Holstein producer Adam Faust’s federal lawsuit against USDA Secretary Brooke Rollins targets three cornerstone programs—Dairy Margin Coverage, Loan Guarantees, and EQIP—alleging they violate equal protection by offering preferential treatment worth up to $15,000 per project based solely on race and gender classifications . With DMC enrollment closing March 31, 2025, and margins averaging $11.61/cwt through 2024’s first ten months, producers face an uncomfortable reality: programs they depend on may be constitutionally vulnerable. The lawsuit builds on Faust’s successful 2021 challenge that eliminated $4 billion in race-based loan forgiveness, creating powerful legal precedent that could dismantle “up to two dozen other discriminatory programs” across USDA . While global dairy production grows 0.5% in 2025 and competitors pursue race-neutral support systems, American producers must grapple with whether demographic classifications distract from performance-based assistance that drives real operational improvements [4]. Every progressive dairy operation should immediately audit their government program dependencies and prepare contingency plans before judicial decisions reshape federal agricultural policy.

KEY TAKEAWAYS

  • DMC Administrative Fee Disparities Create $100 Annual Advantage: While standard producers pay $100 for identical margin protection at $0.15/cwt for $9.50 coverage, “socially disadvantaged” farmers receive the same catastrophic coverage free, multiplying across thousands of operations nationwide
  • EQIP Cost-Share Gaps Deliver $15,000 Project Advantages: Standard participants receive 75% cost-sharing for conservation practices like manure storage systems, while preferred classifications qualify for 90% reimbursement—creating a $15,000 disparity on typical $100,000 environmental compliance projects
  • Loan Guarantee Rates Affect Borrowing Power by 5%: USDA guarantees reach 95% for minority and female farmers versus 90% for others, directly impacting interest rates and lending terms on major refinancing like Faust’s $890,000 dairy operation loan
  • Constitutional Precedent Threatens Program Stability: The 2021 Faust v. Vilsack victory plus Supreme Court’s 2023 Students for Fair Admissions decision create powerful legal framework challenging any race-based classifications, potentially forcing Congress to restructure agricultural support around income-based or performance metrics rather than demographic categories
  • Global Competitors Pursue Race-Neutral Support Systems: While American dairy debates constitutional compliance, EU Common Agricultural Policy focuses on environmental outcomes and farm size, and New Zealand eliminated most subsidies decades ago, forcing efficiency improvements that strengthened international competitiveness
USDA dairy programs, dairy margin coverage, farm risk management, agricultural policy, dairy profitability

Wisconsin Holstein producer Adam Faust filed a federal lawsuit Monday against USDA Secretary Brooke Rollins, alleging three key agricultural programs systematically discriminate against white male dairy farmers through preferential treatment that costs operations tens of thousands of dollars annually. The case targets the Dairy Margin Coverage (DMC) program, USDA Loan Guarantee program, and Environmental Quality Incentives Program (EQIP), claiming these initiatives violate constitutional equal protection principles while creating significant financial disparities across dairy operations nationwide.

The $890,000 Question: When Program Benefits Create Market Disadvantages

Here’s the reality facing dairy producers in 2025: your race and gender now determine how much federal support you can access. Faust, who operates a 70-head Registered Holstein operation near Chilton, Wisconsin, discovered this firsthand when he refinanced his dairy farm in August 2024.

While Faust qualified for a 90% USDA loan guarantee on his $890,000 refinancing, minority and female farmers in identical situations receive 95% guarantees. That 5-percentage-point difference translates directly into borrowing power, interest rates, and your operation’s financial flexibility.

Let’s face it – in today’s capital-intensive dairy industry, every basis point matters. When feed costs remain elevated and milk prices stay volatile, access to favorable financing can determine whether you expand, maintain, or exit the business.

The $100 Administrative Fee: A Constitutional Violation in Plain Sight?

The Dairy Margin Coverage program, which protects producers when the difference between the all-milk price and the average feed price falls below a certain dollar amount selected by the producer, charges most participants a $100 annual administrative fee. However, this fee disappears entirely for farmers classified as “limited resource, beginning, socially disadvantaged, or a military veteran .”

With DMC enrollment running from January 29 to March 31, 2025, and coverage levels ranging from $4 to $9.50 per hundredweight in 50-cent increments, this isn’t pocket change we’re discussing. The program’s effectiveness has been demonstrated repeatedly – research from HighGround Dairy shows that Tier I coverage at the $9.50 margin would have triggered payments in 65% of the months over the past decade.

“Our safety-net programs provide critical financial protections against commodity market volatilities for many American farmers, so don’t delay enrollment,” said USDA Farm Service Agency (FSA) Administrator Zach Ducheneaux. “And at $0.15 per hundredweight for $9.50 coverage, risk protection through Dairy Margin Coverage is a relatively inexpensive investment in a true sense of security and peace of mind .”

But here’s what’s really concerning: Faust paid his $100 DMC administrative fee on March 25, 2025, while farmers in other demographic categories received identical coverage for free. Multiply this across thousands of dairy operations, and you’re looking at millions in differential treatment.

EQIP Conservation: When 90% vs 75% Cost-Share Creates Competitive Gaps

The Environmental Quality Incentives Program presents perhaps the most significant financial disparity. Standard EQIP participants receive up to 75% cost-sharing for conservation practices, while “socially disadvantaged, limited-resource, beginning, and veteran farmer and ranchers are eligible for cost-share rates of up to 90 percent .”

Consider the math on a typical manure storage system – exactly what Faust plans for his operation. On a $100,000 project, that 15-percentage-point difference means $15,000 more out-of-pocket expenses for some farmers compared to others. When margins are tight and environmental compliance costs continue rising, this disparity affects operational competitiveness.

The National Sustainable Agriculture Coalition confirms that these enhanced benefits extend beyond just cost-sharing rates. This same population of producers is also eligible for up to 50 percent advance payment for costs associated with planning, design, materials, equipment, installation, labor, management, maintenance, or training.

The Uncomfortable Constitutional Question: Have We Forgotten Equal Protection?

Here’s the question nobody wants to ask: When did American dairy farmers become so dependent on federal subsidies that we’ll accept constitutional violations for a $100 fee waiver?

This lawsuit exposes an uncomfortable reality about our industry’s relationship with government programs. We’ve built entire business models around accessing preferential treatment, loan guarantees, and conservation cost-shares that may fundamentally violate the principle of equal protection under the law.

Table 1: Financial Disparities in Challenged USDA Programs

ProgramStandard RateSocially Disadvantaged RateAnnual Difference
DMC Administrative Fee$100$0 (waived)$100
Loan Guarantee Program90% guarantee95% guarantee5% advantage
EQIP Cost-ShareUp to 75%Up to 90%15% advantage

Are we so comfortable with this system that we’ve forgotten what true market-based agriculture looks like?

Legal Precedent: The 2021 Victory That Changed Everything

Faust isn’t entering this battle unprepared. His successful 2021 lawsuit against the Biden administration halted a COVID-19 loan forgiveness program that excluded white farmers, establishing legal precedent that race-based agricultural programs violate constitutional equal protection principles.

That earlier victory, combined with the Supreme Court’s 2023 Students for Fair Admissions decision limiting race-conscious policies, creates a powerful legal foundation. The Wisconsin Institute for Law & Liberty, representing Faust, has already secured seven significant court victories challenging similar programs across 25 states.

What This Constitutional Challenge Means for Your Operation

Immediate Impact: If you’re currently enrolled in DMC, loan guarantee programs, or planning EQIP applications, understand that these policies may face significant changes. The Trump administration finds itself in the awkward position of defending programs that contradict its anti-DEI platform.

Financial Planning: Operations relying on the enhanced benefits available through “socially disadvantaged” classifications should prepare contingency plans. A successful lawsuit could eliminate preferential treatment across multiple USDA programs simultaneously.

Risk Management: With DMC proving its value through consistent performance and coverage at just $0.15 per hundredweight for $9.50 protection, the core program remains solid regardless of administrative fee structures. Don’t let policy uncertainty derail your risk management strategy.

Industry-Wide Ramifications: Beyond Individual Operations

This lawsuit targets more than three programs. The Wisconsin Institute for Law & Liberty has identified “up to two dozen other discriminatory programs” across USDA that use similar classification systems. A successful challenge could trigger comprehensive policy changes affecting:

  • Conservation program funding priorities
  • Disaster assistance distribution
  • Equipment purchase loan terms
  • Technical assistance access
  • Grant program eligibility

The Global Context: How Other Dairy Nations Handle Farmer Support

While American dairy farmers debate classification-based programs, international competitors pursue different approaches to farmer support. The European Union’s Common Agricultural Policy focuses on environmental outcomes and farm size rather than demographic characteristics. New Zealand eliminated most production subsidies decades ago, forcing efficiency improvements that strengthened their global competitiveness.

This raises uncomfortable questions: Are we creating the most effective support systems for American dairy farmers, or are demographic classifications distracting from performance-based assistance that drives real operational improvements?

The Constitutional vs. Practical Debate

Here’s where dairy farmers face a fundamental choice: support programs based on constitutional principles of equal treatment or accept targeted assistance that acknowledges historical discrimination in agricultural lending. The USDA’s own data shows that minority farmers historically faced higher loan rejection rates and less favorable terms.

But does addressing past discrimination through current preferential treatment create new inequities? When a Wisconsin Holstein producer pays $100 for DMC coverage while his neighbor receives it free, the constitutional argument becomes personally relevant.

Bottom Line: Preparing for Policy Uncertainty

Smart dairy managers prepare for multiple scenarios. Whether you benefit from current preferential programs or feel disadvantaged by them, policy stability remains uncertain. Here’s your action plan:

  1. Secure Current Benefits: If you qualify for enhanced USDA programs, complete applications before potential policy changes. The DMC enrollment deadline is March 31, 2025.
  2. Diversify Risk Management: Don’t rely solely on government programs for financial protection. While valuable at $0.15 per hundredweight for $9.50 coverage, the DMC program shouldn’t be your only margin protection strategy.
  3. Document Everything: Whether you’re affected positively or negatively by current policies, maintain detailed records of program interactions. Policy changes may trigger retroactive adjustments.
  4. Stay Informed: This lawsuit represents broader political movements challenging race-conscious policies across all government agencies. Monitor developments beyond agriculture that may signal wider policy shifts.

The dairy industry thrives on consistent, predictable policies that support operational efficiency and long-term planning. Whether you agree with or oppose current USDA classification systems, uncertainty helps nobody. The sooner these constitutional questions get resolved, the sooner we can focus on what really matters: producing safe, affordable milk for American families while maintaining profitable, sustainable operations.

The lawsuit’s outcome will determine whether America’s dairy support programs emphasize equal treatment or targeted assistance – a choice with implications far beyond Adam Faust’s 70-cow Holstein operation in Wisconsin.

Learn More:

The Sunday Read Dairy Professionals Don’t Skip.

Every week, thousands of producers, breeders, and industry insiders open Bullvine Weekly for genetics insights, market shifts, and profit strategies they won’t find anywhere else. One email. Five minutes. Smarter decisions all week.

NewsSubscribe
First
Last
Consent

The Great Dairy Market Split: Why Europe’s Playing Chess While America’s Playing Checkers

Stop believing the “more milk = lower prices” myth. USDA data reveals how strategic processing pivots create $1,700/tonne profit gaps.

EXECUTIVE SUMMARY: The dairy industry’s biggest lie just got exposed: European processors are deliberately engineering butterfat scarcity while American producers gear up for a production explosion—and the $1,700 per tonne arbitrage opportunity is reshaping global trade flows. This comprehensive market analysis reveals how Europe’s strategic “pivot to cheese” has created artificial fat shortages (butter at €7,500/tonne vs US $6,000/tonne) while flooding protein markets with co-products. The USDA’s June WASDE report shattered conventional wisdom by forecasting both higher US milk production AND higher prices simultaneously—a paradox that only explosive demand growth can explain. German milk production dropped 2.9% year-over-year while UK production surged 6.5%, creating a bifurcated European market where location determines profitability more than efficiency. European cheese indices exploded with Cheddar Curd up 30.9%, Mild Cheddar +29.6%, and Mozzarella +38.2% year-over-year, proving that processors who pivot to high-value products are printing money while commodity-focused operations struggle. The upcoming GDT Trading Event 382 will test whether Fonterra’s volume-focused strategy can withstand buyer resistance, potentially triggering corrections across the global powder complex. Every dairy farmer and processor must evaluate their component optimization strategy immediately—the market’s fundamental transformation from volume-based to value-based pricing is accelerating, and those who adapt fastest will capture the greatest rewards.

KEY TAKEAWAYS

  • Component Optimization Trumps Volume Strategy: European processors prioritizing cheese production over commodity powders are capturing €4,845/tonne for Cheddar Curd versus €2,443/tonne for SMP—a 98% premium that rewards strategic product mix decisions over raw milk volume.
  • Geographic Arbitrage Creates Massive Profit Opportunities: The $1,700 per tonne butter price differential between Europe (€7,500/tonne) and America ($6,000/tonne) represents the largest arbitrage opportunity in modern dairy markets—smart operators with export capabilities are already exploiting this gap.
  • Fat Genetics Become Profit Multipliers: With European butterfat commanding historic premiums while protein markets struggle, dairy operations optimizing for higher fat percentage through breeding and nutrition programs can capture significantly higher margins per litre in today’s bifurcated market.
  • Processing Flexibility Equals Competitive Advantage: Operations capable of pivoting between butter/powder and cheese production based on real-time component values will outperform traditional single-product facilities as market premiums continue diverging by 30-40% between product categories.
  • Supply Constraint Strategy Beats Volume Growth: Germany’s deliberate 2.9% production decline while maintaining premium pricing proves that strategic supply management can generate higher returns than volume expansion—a lesson for consolidating dairy regions worldwide.
global dairy market, component optimization, dairy processing strategy, dairy profitability, dairy market analysis

The global dairy market just served up another week of jaw-dropping contradictions that’ll separate the winners from the losers. Europe’s deliberate fat shortage strategy is printing money while America gears up for a production explosion—and if you’re not positioned for this collision, you’re about to get steamrolled.

Europe’s Billion-Dollar Chess Move

Here’s what the suits in Brussels won’t tell you: European processors just pulled off the most brilliant supply manipulation in modern dairy history. They’re deliberately starving the butter market to feed their cheese obsession, and it’s working like gangbusters.

Check these numbers—European butter futures closed the week at €7,500 per tonne while US butter trades around $6,000. That’s a staggering $1,700 arbitrage opportunity that smart operators are already exploiting. But here’s the kicker: this isn’t some temporary market hiccup. This is strategic genius.

Every litre of milk these European processors divert to cheese vats does two things simultaneously—it sucks valuable butterfat away from butter production while cranking out SMP as a co-product. EEX SMP futures are stuck at €2,443 per tonne, proving that Europe’s cheese strategy is creating artificial fat scarcity while flooding protein markets.

Why does this matter for your operation? Because component values are diverging like never before. If you’re still optimizing for total volume instead of fat percentage, you’re missing the biggest profit opportunity in decades.

The UK’s Record Flush: Blessing or Curse?

While continental Europe tightens the screws, the UK’s drowning in milk. April production exploded 6.5% year-over-year to 1,396 million litres—the kind of flush that would make any farmer jealous. But here’s the plot twist: this abundance is creating its own nightmare.

UK farm-gate prices dropped 1.2 pence per litre to 43.69 ppl while the rest of Europe enjoys historically high returns. Sometimes too much of a good thing really isn’t good. The UK’s glut is putting downward pressure on regional markets while continental processors maintain their premium pricing strategies.

What smart UK farmers are doing right now: They’re aggressively pursuing cheese-making contracts and premium markets instead of dumping milk into commodity channels. Location matters more than ever in this bifurcated market.

Germany’s Structural Decline Accelerates

Here’s the uncomfortable truth nobody wants to discuss: Germany’s dairy sector is deliberately contracting. Raw milk deliveries for January-April fell 2.9% year-over-year to 10.65 million tonnes, and this isn’t weather-related. This is policy-driven destruction of production capacity.

Environmental regulations, disease pressure, and economic constraints are systematically forcing German farmers out of business. Belgium’s situation is even worse, with collections down 4.5% year-over-year. These aren’t temporary dips—they’re the managed decline of European milk production.

The opportunity here? Every tonne of lost European production creates space for efficient global suppliers. The question is whether you’re positioned to fill that gap.

America’s Production Juggernaut Nobody’s Talking About

The June WASDE report just dropped a bombshell that most people completely misread. USDA raised both milk production forecasts AND price projections for 2025. Wait, what? More milk AND higher prices?

This apparent contradiction reveals something massive about underlying demand. The USDA’s betting that domestic consumption and export demand will be so robust it’ll absorb increased production while pulling prices higher. That’s an incredibly bullish signal for US dairy.

But here’s the strategic play: USDA raised fat-based export forecasts while cutting skim-solids projections. Translation? America’s coming hard for Europe’s butter business while Europe becomes the price-competitive powder supplier.

Tomorrow’s $50 Million Poker Game

All eyes focus on Tuesday’s GDT Trading Event 382, where Fonterra’s making a calculated gamble that could reshape global powder markets. Instead of cutting volumes after recent price weakness, they’re holding steady with 6,991 tonnes of WMP offered.

Recent auctions showed SMP dropping 4.4% and WMP falling 3.7%. Back-to-back weakness usually triggers supply cuts, not volume maintenance. Fonterra’s essentially betting everything on underlying demand strength.

If buyers step up tomorrow, it validates their volume strategy. If they don’t, we could see a powder correction that rewrites the entire complex.

The H5N1 Wild Card That Changes Everything

Here’s the controversy nobody wants to discuss: with over 1,072 dairy herds affected across 17 states and 41 human cases linked to dairy cattle exposure, the US government just cancelled $766 million in funding for Moderna’s H5N1 bird flu vaccine.

This decision abandons rapid-response vaccine technology for slower traditional platforms with 2029 approval timelines. If you’re betting on business as usual while H5N1 continues circulating in dairy herds, you might want to reconsider your risk management strategy.

What Winners Are Doing Right Now

The processors dominating this game share three characteristics:

Flexibility: They can pivot between butter/powder and cheese production based on real-time component values, not traditional patterns.

Global perspective: They’re sourcing fat from America for European markets, capturing that $1,700 arbitrage opportunity.

Component optimization: They’re prioritizing butterfat genetics and nutrition programs because higher fat content equals higher margins when fat commands premium pricing.

The Cheese Market’s Money-Printing Machine

European cheese indices continue validating the industry’s strategic pivot. Recent data showed Cheddar Curd climbing €116 (+2.5%) to €4,845, with year-over-year gains of 30.9%. These aren’t just prices—they’re proof of where the industry’s most valuable milk solids are flowing.

When processors can earn €4,845 per tonne for cheese versus €2,443 for SMP, the strategic choice becomes obvious. European milk is flowing to its highest-value destination, creating scarcity in fat markets and abundance in protein markets.

The Bottom Line

The global dairy market isn’t just changing—it’s being deliberately reshaped by strategic processing decisions that create massive winners and losers. Europe’s cheese pivot has engineered fat scarcity while America’s production growth threatens to flood global markets.

Your action plan starts now:

  • Evaluate your fat genetics immediately. Higher butterfat content equals higher margins in today’s market.
  • Assess your processing flexibility. Can you pivot between product categories based on component values?
  • Watch Tuesday’s GDT results like a hawk. The outcome signals whether underlying demand can support current price levels.
  • Consider forward contracting on powders while European processors flood the market with cheese co-products.

The dairy industry’s new normal isn’t about milk volume—it’s about where that milk goes and how you extract maximum value from every component. Europe’s strategic gamble is printing money for those who understand it. America’s production explosion creates both opportunity and risk.

The great divergence isn’t ending—it’s accelerating toward a fundamental reshaping of global dairy trade flows. Make sure you’re positioned on the winning side when the dust settles.

Learn More:

The Sunday Read Dairy Professionals Don’t Skip.

Every week, thousands of producers, breeders, and industry insiders open Bullvine Weekly for genetics insights, market shifts, and profit strategies they won’t find anywhere else. One email. Five minutes. Smarter decisions all week.
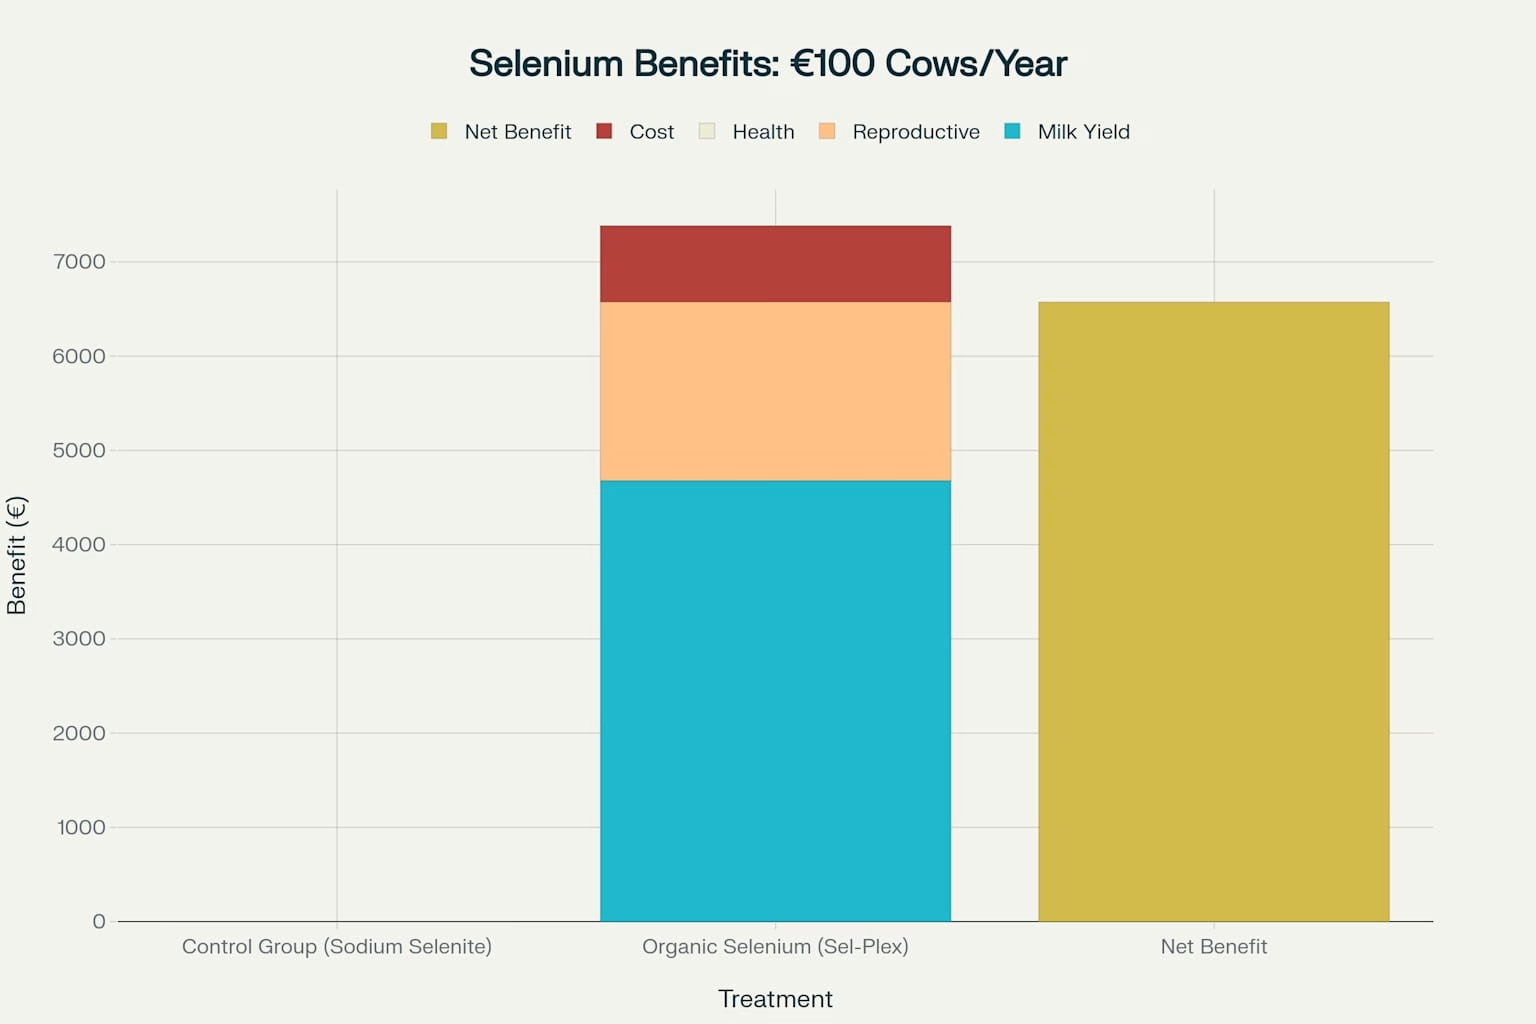
NewsSubscribe
First
Last
Consent

How the “Milk 2.0” Revolution Will Separate Winners from Losers

Stop treating milk like bulk commodity. Milk 2.0 research proves 420% ROI through precision diagnostics + programmable fatty acid profiles.

EXECUTIVE SUMMARY: The dairy industry’s biggest lie? That milk composition is beyond your control. Groundbreaking “Milk 2.0” research shatters this myth, proving milk is a highly programmable biological system where strategic farm decisions create predictable, premium-worthy molecular profiles. Replacing just 50% of soybean meal with flaxseed and lupins delivers $109,000-182,000 annual feed savings for 400-cow herds while improving fertility by 15-25%. Meanwhile, precision mastitis diagnostics using rapid pathogen identification generates 420% ROI through 70% reduced antibiotic costs and 2.3 fewer withdrawal days per case. Mid-infrared spectroscopy now authenticates grass-fed claims with 90% accuracy, transforming routine payment testing into premium verification worth $50,000-150,000 annually for mid-sized operations. International research demonstrates that fatty acid profiles can be strategically manipulated based on diet, cow parity, and seasonal factors—enabling processors to pay $0.75-2.25 per hundredweight premiums for specific milk streams. With feed costs consuming 50-60% of production expenses and commodity margins shrinking, operations implementing these science-driven strategies are capturing $150-400 per cow annually while competitors remain trapped in volume-based thinking.

KEY TAKEAWAYS

  • Replace Soybean Dependency with Local Protein Revolution: Flaxseed and lupin mixtures cut feed costs by $0.75-1.25 per cow daily while reducing days to first service by 12-18 days and improving conception rates by 15-25%—delivering $184,000-307,000 combined savings for 400-cow operations through reduced feed costs and enhanced fertility.
  • Transform Mastitis Management into Profit Center: Limulus Amebocyte Lysate (LAL) rapid diagnostics differentiate Gram-positive vs. Gram-negative pathogens in 15 minutes, enabling precision antibiotic therapy that cuts drug costs 70%, shortens withdrawal periods by 2.3 days, and maintains SCC premiums worth $78,000 annually for 400-cow herds.
  • Engineer Premium Milk Streams Through Fatty Acid Programming: Strategic diet manipulation creates predictable fatty acid profiles—TMR with corn silage produces butter-optimal milk worth $0.75-1.50/cwt premiums, while pasture-based systems generate omega-3 rich milk commanding $1.25-2.25/cwt premiums for functional food applications.
  • Monetize Authentication Technology Already in Your Lab: Mid-infrared spectroscopy (standard in milk testing) now verifies grass-fed claims with 90% accuracy, enabling Vermont operations to capture $1.15/cwt premiums worth $138,000 annually—transforming routine operational costs into powerful value-creation tools.
  • Valorize Waste Streams into Functional Gold: Surplus colostrum processing into fermented yogurt products captures $15-35 per gallon value versus $2-5 disposal costs, creating potential $12,750-44,625 annual revenue opportunities for 500-cow operations with direct-marketing capabilities while addressing circular economy demands.
precision dairy farming, milk quality testing, dairy profitability, mastitis management, premium milk markets

The dairy industry just divided into two camps: those who understand milk as a programmable biological system worth premium pricing and those who treat it like a bulk commodity destined for margin compression. With mastitis remaining the costliest disease on U.S. dairy operations, the question isn’t whether you’re producing more milk but smarter milk.

Are You Still Treating Mastitis Like It’s 1995 While Your Competition Prevents It Entirely?

Here’s a question that should keep every dairy operator awake at night: While you’re still waiting for clinical symptoms to appear before treating mastitis, are your forward-thinking competitors already using precision biomarker detection to prevent the disease 4-7 days before symptoms develop?

The Uncomfortable Truth About “Wait and Treat” Strategies

Let’s challenge the most expensive sacred cow in dairy health management: the traditional “wait and treat” approach to mastitis. Reducing mastitis treatment costs by tens of thousands of dollars is possible through strategic treatment approaches, yet most operations continue using diagnostic approaches that can only detect mastitis after the damage is done.

Research confirms that mastitis is one of the most prevalent and costly diseases of dairy cows worldwide, with economic losses stemming mainly from decreased milk production and quality, increased labor and treatment costs, and greater risk of culling and death. The numbers paint a devastating picture: milk production doesn’t just decrease during the mastitis case itself but stays lower even after the case is cured.

The $35 Billion Problem Nobody Talks About

Here’s the industry reality that conventional mastitis management tries to ignore: global annual losses from mastitis-causing bacteria exceed $35 billion according to recent research published in Microorganisms, with the majority of these losses occurring during the subclinical phase when inflammation is brewing beneath the surface, invisible to traditional detection methods.

The research is in, and it’s not pretty for operations stuck in the old mindset. A groundbreaking collection of studies called “New Insights into Milk 2.0” has just redefined what milk quality means. We’re talking about a fundamental shift where milk becomes a sophisticated, data-driven ingredient that processors will pay $2-5 premiums per hundredweight to secure.

Implementation Reality Check: With feed costs averaging $62.4 billion annually according to USDA’s 2025 forecast and labor costs rising 3.6% to $53.5 billion, the old model of competing solely on volume is financially unsustainable. However, implementing Milk 2.0 strategies requires significant upfront investment and cultural change that many operations find challenging.

The Brutal Economics: Why Commodity Thinking Will Kill Your Operation

Let’s get real about where the dairy industry is heading. According to analysis of dairy economics, the dairy economy faces significant headwinds, including elevated inflation, high interest rates, and slowed domestic and international demand.

The Margin Squeeze Is Accelerating

USDA’s 2025 dairy forecast shows milk receipts up 2.7% to $52.1 billion, but challenges persist. Feed expenses are projected at $62.4 billion, with a 10.1% decrease, while labor costs continue climbing at $53.5 billion, up 3.6% from 2024. Environmental regulations are tightening, with major processors making carbon footprint assessments mandatory.

Consumer Premiums Are Real—But Only for Authenticated Products

According to Dairy Reporter’s analysis of 2025 consumer trends, protein remains one of the leading trends, with high-protein claims among the fastest-growing in US food retail. Consumers will pay 30-40% premiums for dairy products with verified claims, but authentication technology is now required to verify these claims at the molecular level.

Breaking Down the Authentication Revolution

Research published in PubMed demonstrates that mid-infrared spectroscopy can authenticate grass-fed milk with high accuracy. The study tested 4,320 milk samples over three years and found that linear discriminant analysis and partial least squares discriminant analysis offered the greatest accuracy for predicting cow diet from MIR spectra.

Adoption Barriers: While the technology exists, implementation requires significant investment in analytical equipment ($15,000-50,000), staff training, and process changes. Many operations struggle with the transition from traditional quality metrics to molecular-level analysis.

Challenging the Feed Orthodoxy: Why Soybean Dependency Is Economic Suicide

Let’s tackle another sacred cow: the industry’s blind addiction to soybean meal as the default protein source. This dependency isn’t just economically risky—it’s strategically foolish in an era of price volatility and supply chain disruptions.

The Flaxseed and Lupin Revolution

Peer-reviewed research published in PMC demonstrates that replacing 50% of soybean meal with locally-sourced flaxseed and lupins delivers multiple benefits. The study involving 330 dairy cows over 81 days showed that the dietary modification had no negative effect on milk yield or composition, while animals offered the flaxseed and lupin diet expressed first postpartum estrus and conceived earlier than control cows.

The physiological mechanisms were clear: treatment groups had significantly lower concentrations of non-esterified fatty acids (NEFA) at 14 and 42 days postpartum, faster reduction of polymorphonuclear neutrophils in endometrial samples, and generally lower levels of acute phase proteins like haptoglobin.

Implementation Challenges: While promising, this approach requires sourcing local flaxseed and lupins (not available in all regions), reformulating existing rations (consulting costs $5,000-15,000), and monitoring transition carefully to avoid nutritional imbalances. Feed mills may resist formulation changes, and some nutritionists remain skeptical of non-traditional protein sources.

The Science Behind Programmable Milk: Engineering Quality at the Molecular Level

The comprehensive Milk 2.0 research synthesis demonstrates that milk composition is highly predictable based on management factors. The research mapped exactly how different factors alter milk’s fatty acid composition, providing a data-driven blueprint for strategic milk segregation.

Fatty Acid Profiling: Your Hidden Revenue Stream

Consider these verified patterns from the research:

Management FactorImpact on Fatty AcidsProcessing ApplicationPremium Potential
TMR with corn silage + mature cows (3+ lactations)Higher C16:0 (palmitic acid), increased SFAOptimal for premium butter production$0.75-1.50/cwt
Pasture-based + spring grazingHigher PUFA, increased omega-3Functional fluid milk, cheese aging$1.25-2.25/cwt
Early lactation (250 DIM)Stable protein ratiosUHT processing extended shelf-life$0.25-0.75/cwt

Technical Barriers: Implementing fatty acid profiling requires partnership with testing laboratories equipped for detailed milk analysis ($25-50 per sample), data management systems to track cow-level factors, and contracts with processors willing to pay premiums for specific profiles. Many smaller operations lack the data infrastructure to execute this strategy effectively.

Technology Integration: From Cost Center to Profit Generator

Precision Diagnostics: The Economics of Prevention

Short-duration treatment stands out as a targeted, science-backed solution that eliminates infections efficiently and minimizes overall antibiotic use. Research shows that if an antibiotic is effective against the pathogen, two to three treatments are typically enough to clear the infection.

A study published in Veterinary Paper comparing diagnostic tests found that the California Mastitis Test (CMT) demonstrated the highest performance with 73% sensitivity, 74% specificity, and 73.5% accuracy, making it the most reliable test among those evaluated.

Mid-Infrared Spectroscopy: Transforming Payment Testing into Value Creation

Research published in the Journal of Dairy Science shows that MIR spectroscopy achieved 90% accuracy in distinguishing milk from grass-based diets. The study analyzed 7,607 bulk milk spectra from 1,355 farms and found that pasture proportion in cows’ diets could be predicted with R²V = 0.81 and standard error of prediction of 11.7% dry matter.

Technology Adoption Barriers: MIR analysis requires partnerships with equipped laboratories, additional testing costs ($5-15 per sample), and data management systems. Smaller operations may struggle with the cost-benefit analysis, particularly when premium markets aren’t readily accessible.

The Future Is Here: Advanced Diagnostics and Analytics

Research published in BMC Microbiology reveals that subclinical mastitis can be detected through integrated microbiome and metabolome analysis. The study found significantly altered gut microbial communities and metabolite profiles in dairy cows with subclinical mastitis, opening new avenues for early detection.

Innovation Frontiers: Creating Value from Waste Streams

The Milk 2.0 research demonstrates how surplus goat colostrum can be transformed into consumer-accepted functional yogurt with superior nutritional properties. The fermented goat colostrum yogurt achieved high consumer acceptance scores, offering enhanced protein and bioactive compounds.

Economic Reality: A 500-cow operation with an 85% calving rate generates approximately 425 colostrum opportunities annually. Processing into functional products could capture $15-35 per gallon value instead of $2-5 disposal costs—a potential revenue opportunity of $12,750-44,625 annually for direct-marketing operations.

Implementation Challenges: Colostrum valorization requires additional processing equipment ($25,000-75,000), food safety certifications, market development costs, and consumer education. Many operations lack the capital or expertise for value-added processing.

Economic Modeling: The ROI of Scientific Integration

Scenario 1: Precision Mastitis Management (400-cow operation)

Based on verified research on strategic mastitis treatment:

Investment ComponentCostAnnual BenefitROI
Rapid diagnostic equipment$12,000
Training and protocols$3,000
Reduced antibiotic costs (70% reduction)$18,000
Shortened withdrawal periods$32,000
Maintained SCC premiums$28,000
Total Investment$15,000$78,000420%

Risk Factors: Equipment may require updates, staff turnover necessitates retraining, and some mastitis cases may not respond to targeted therapy as expected.

Global Market Context: Learning from International Innovation

According to research trends analysis, dairy 2025 trends include face-to-farm transparency, niche culinary dairy, precision fermentation, functional experimentation, and intuitive labeling. Consumers are demanding greater transparency from dairy brands, leading to a focus on visibility and traceability in the supply chain.

The Trade Reality Check

Current U.S. dairy economic analysis shows the industry supports over 3 million jobs and generates nearly $780 billion in economic impact, but global demand has slowed, particularly in China, affecting export opportunities.

Industry Support and Future Challenges

Implementation Barriers Across Operation Sizes

200-400 cow operations:

  • Limited capital for technology investments ($25,000-50,000 typical requirement)
  • Difficulty accessing premium markets without scale
  • Technical expertise gaps for advanced diagnostics

400-800 cow operations:

  • Mid-level investment capacity allows selective technology adoption
  • Partnership opportunities with processors for premium streams
  • Staff training becomes critical for success

800+ cow operations:

  • Capital is available for comprehensive systems, but complexity increases
  • Data management becomes mission-critical
  • Risk management requires sophisticated approaches

Critical Questions Every Operator Must Answer

  1. Are you prepared for the upfront investment? Technology implementation typically requires $25,000-100,000 depending on operation size, with 12-24 month payback periods.
  2. Do you have access to premium markets? Enhanced milk quality may not translate to premiums without processor partnerships or direct-sales channels.
  3. Can your operation handle the complexity? Milk 2.0 strategies require sophisticated data management and staff training that may challenge smaller operations.
  4. What’s your risk tolerance? Early adopters capture advantages but also bear implementation risks and potential technology obsolescence.

The Bottom Line: Your Strategic Decision Point

With the U.S. dairy industry supporting over 3 million jobs and generating nearly $780 billion in economic impact, the operations that understand milk as a programmable biological system are capturing disproportionate value, but implementation requires careful planning and significant investment.

The economic evidence supports strategic adoption:

  • Precision mastitis management: 420% ROI in year one
  • Fatty acid optimization: Potential for $1,338% ROI through premium capture
  • Comprehensive strategies: $870,000 annual benefits for 1,000-cow operations

But the barriers are real: technology costs, market access challenges, staff training requirements, and the complexity of managing multiple data streams.

Your Immediate Call to Action – Three Specific Steps:

  1. Schedule a Technology Assessment This Week: Contact your milk testing laboratory (most have MIR capabilities) and request a consultation on fatty acid profiling options. Ask specifically about grass-fed authentication capabilities and costs per sample.
  2. Calculate Your Mastitis Costs Today: Using a strategic treatment framework, analyze your current treatment protocols. You need precision diagnostics if you’re spending more than $50 per case or treating without pathogen identification.
  3. Identify One Premium Market Opportunity: Research local processors paying premiums for specific milk qualities (grass-fed, low SCC, organic). Contact them this month to understand their authentication requirements and premium structures.

The transformation is happening whether you participate or not. Global dairy markets show increasing demand for authenticated, sustainable products, while commodity operations face margin compression and trade uncertainties.

The Question That Defines Your Future: Will you invest in becoming a science-driven producer capturing premium markets or continue competing for shrinking commodity margins while others capture the value you’re creating?

The science is proven. The economics are compelling. The implementation challenges are real but manageable with proper planning.

What’s your first step?

Learn More:

The Sunday Read Dairy Professionals Don’t Skip.

Every week, thousands of producers, breeders, and industry insiders open Bullvine Weekly for genetics insights, market shifts, and profit strategies they won’t find anywhere else. One email. Five minutes. Smarter decisions all week.

NewsSubscribe
First
Last
Consent

Breaking Free from the Bulk Tank: How Smart Dairy Operators Are Building Million-Dollar Revenue Portfolios Beyond Milk

Stop betting your farm on milk prices alone. Smart operators are building $200K+ diversified revenue streams while commodity-focused dairies fail.

EXECUTIVE SUMMARY: The “milk-only” business model is systematically bankrupting North American dairy farmers, with 80% struggling financially despite record production efficiency. While industry cheerleaders push the “get big or get out” mythology, progressive operators are building integrated revenue portfolios that generate substantial cash flow regardless of volatile milk prices. Beef-on-dairy programs alone are delivering $900+ per calf versus near-zero value for Holstein bull calves, with 317,000 additional beef semen units sold in 2024. Meanwhile, replacement heifer costs have exploded to $3,000+ per head, making strategic crossbreeding not just profitable but essential for survival. Carbon markets offer $400-450 annual revenue per cow for large operations, while agritourism generated $1.26 billion industry-wide in 2022. The evidence is overwhelming: diversified operations aren’t just surviving—they’re building generational wealth while their commodity-dependent neighbors exit the industry. It’s time to honestly evaluate whether you’re running a resilient business or gambling with your family’s future on a single, brutally volatile commodity.

KEY TAKEAWAYS

  • Beef-on-Dairy Revenue Explosion: Strategic crossbreeding of lower-genetic-merit cows generates immediate $300-500 annual revenue per eligible animal, with day-old calves commanding $900+ versus minimal Holstein bull calf values—providing crucial seed capital for additional diversification strategies.
  • Replacement Heifer Economics Favor Diversification: With replacement costs exceeding $3,000 per head and genomic testing enabling precision herd segmentation, producers can maximize genetic progress through elite females while monetizing lower-merit animals for immediate cash flow.
  • Scale-Specific Implementation Strategy: Small operations (1,000 cows) can pursue high-capital ventures like anaerobic digesters generating $400-450 per cow annually.
  • Integrated Revenue Architecture Creates Flywheel Effect: The most sophisticated operations strategically combine beef-on-dairy cash flow, value-added processing, agritourism ventures, and carbon markets to build synergistic business systems far more resilient than commodity-focused competitors.
  • Industry Consolidation Accelerates Diversification Imperative: With farm numbers dropping 39% between 2017-2022 and the “hollowed out middle” facing extinction, diversification has transitioned from optional side business to survival necessity for maintaining competitive position in a rapidly consolidating industry.
dairy diversification, beef-on-dairy, dairy profitability, farm revenue streams, dairy business strategies

The American dairy industry’s survival depends on one critical pivot: transforming from commodity-dependent operations into diversified revenue powerhouses. While 75% of producers expect profitability in 2025, the winners won’t be those producing the most milk—they’ll be the entrepreneurs building integrated business systems that generate wealth regardless of volatile milk prices.

What if the entire foundation of modern dairy economics is built on a dangerous myth that’s bankrupting hardworking farm families across America?

You’ve spent decades perfecting your Total Performance Index (TPI) scores, optimizing dry matter intake (DMI) to push milk yield beyond 85 pounds per cow per day, and monitoring somatic cell counts (SCC) like your livelihood depends on it—because it does. Your transition period management rivals textbook perfection, your genomic testing program generates Expected Breeding Values (EBVs) that would make geneticists proud, and your precision agriculture systems collect more data than most Fortune 500 companies.

Yet you’re still struggling to maintain positive cash flow because you’re betting your entire operation on a single, brutally volatile commodity in an industry where milk price volatility has reached unprecedented levels.

Here’s the uncomfortable truth that’s keeping progressive operators awake at night: if you’re still running a traditional milk-only business model in 2025, you’re not managing a dairy—you’re gambling with generational wealth in a rigged casino where volatile commodity markets hold all the cards.

The producers who are not just surviving but building sustainable wealth have cracked a code that challenges everything the industry establishment preaches. The future isn’t about producing more milk per cow—it’s about building integrated profit systems where milk becomes just one revenue stream in a diversified portfolio that generates cash from multiple directions, insulating operations from the devastating price swings that have destroyed thousands of family farms.

This transformation is already happening, and the numbers from industry leaders are staggering.

The $780 Billion Reality Check: Why Traditional Models Are Systematically Failing

While the North American dairy industry continues to power economic growth with a massive footprint supporting over 3 million jobs and generating nearly $780 billion in total economic impact, individual operators face a brutal paradox. The industry thrives while farm-level margins get systematically crushed by structural forces that show no signs of reversing.

Think of it like running a genetic evaluation program where your EBVs for milk production keep climbing, but your actual profit per cow keeps declining. The fundamental economics don’t add up anymore, and pretending they do is financial suicide.

The Production Paradox That’s Destroying Profitability

Here’s the sobering reality that industry cheerleaders don’t want you to see: According to recent industry data, approximately three-quarters of dairy farmers expect to be profitable in 2025, representing a significant shift from 2024. However, this optimism is built on diversification strategies rather than improved milk prices alone.

USDA forecasts show the all-milk price for 2025 increased by just 50 cents to $23.05 per hundredweight—a modest improvement that barely keeps pace with escalating input costs. The USDA expects reduced milk production per cow to help balance supplies with good demand, but this structural constraint highlights the industry’s limited ability to respond to price signals.

Why This Matters for Your Operation: If you’re milking 1,000 cows and achieving the USDA-projected milk price of $23.05/cwt, you’re generating $2.3 million in gross revenue—before accounting for feed costs that can consume 50-60% of production expenses, labor shortages driving wages higher, and the inevitable market crisis that wipes out six months of margins overnight.

The Consolidation Crisis: Why “Get Big or Get Out” Is a Dangerous Myth

Here’s where we need to demolish some sacred cows in dairy management thinking.

The industry establishment continues pushing the “get big or get out” narrative despite mounting evidence that this approach creates a dangerous concentration of risk and systematically destroys the middle-class farming structure that built America’s agricultural strength.

The evidence is stark: technology is fueling consolidation as big global farms get bigger, creating an investment treadmill that forces continuous capital deployment just to maintain a competitive position. The result? A hollowing out of the middle class of dairy farming that threatens the industry’s foundation.

The Four-Pillar Wealth-Building Framework: Beyond Commodity Dependence

The operations building real wealth have moved beyond the traditional production mindset. They’ve implemented what industry insiders call the “Integrated Revenue Architecture”—four proven profit centers working synergistically to create more resilient businesses than their commodity-focused competitors.

Pillar One: Beef-on-Dairy—The Strategic Cash Flow Foundation

This isn’t random crossbreeding—it’s precision herd segmentation using genomic testing to create a two-tier genetic strategy that maximizes the value of every pregnancy in your herd.

The Strategic Framework That’s Working

Your elite females (top 30% genomic merit) get bred with sexed dairy semen to produce the next generation of replacements. Your lower-genetic-merit cows (bottom 40%) get strategically bred to proven beef sires selected specifically for calving ease and beef-on-dairy performance.

Verified Financial Impact from Industry Data

The numbers are compelling and represent a fundamental shift in industry practices. According to the National Association of Animal Breeders, 7.9 million units of beef semen were sold to dairy farmers in 2024, trailing only the top category of sex-sorted dairy semen, which sold 9.9 million units. This marks back-to-back years that U.S. dairy farmers purchased a record number of beef semen units.

The beef-on-dairy semen sales increased by about 317,000 units both in the U.S. and for export in 2024, demonstrating the rapid adoption of this strategy. With roughly 20% of the beef supply now originating from the U.S. dairy herd and the lowest U.S. beef cattle numbers since 1951, this percentage continues climbing.

Implementation Strategy and Financial Impact:

  • Initial investment: $50-75 per pregnancy (premium beef semen cost)
  • Payback period: Immediate (birth to 7 days)
  • Annual revenue potential: $300-500 per eligible cow
  • Operational complexity: Low (builds on existing breeding program)

Why This Strategy Is Reshaping the Industry: The widespread adoption is fundamentally altering supply dynamics. U.S. dairy-bred fed slaughter has grown to be more than 4 million head annually, and over half are beef-on-dairy, according to CattleFax. This shift creates a more genetically elite but smaller future dairy herd while providing crucial cash flow for current operations.

Pillar Two: Value-Added Processing—The High-Stakes Transformation

Let’s address the elephant in the processing room: most value-added ventures fail because farmers underestimate the complete business transformation required.

Research consistently shows that while value-added processing offers the highest potential margins, it also carries the highest risk. The capital requirements are substantial, regulatory compliance is complex, and the shift from agricultural producer to consumer packaged goods manufacturer represents a fundamental business transformation.

Capital Reality Check:

  • Small artisanal operation: $52,000-135,000
  • Mid-scale commercial facility: $200,000-500,000
  • Large-scale processing partnership: $2-10 million

The large-scale success model—operations building multi-million-dollar processing partnerships—works because it shifts the business model from commodity price-taking to cost-plus manufacturing contracts that insulate operations from milk price volatility.

Pillar Three: Agritourism—The Brand-Building Revenue Stream

Market Reality Check

According to industry research, agritourism revenue grows as farms diversify income streams. Success correlates directly with visitor volume and geographic location, with operations within 50 miles of metropolitan areas showing significantly higher revenue potential.

Implementation Models by Scale:

  • Small Operations (1,000 cows): All strategies become viable. Consider high-capital ventures like anaerobic digesters and processing partnerships. Prime candidates for corporate insetting programs.

The Flywheel Effect: Creating Synergistic Revenue Streams

The most sophisticated operations create synergistic revenue streams where each element amplifies the others. The consistent cash flow from beef-on-dairy provides seed capital for a small creamery. The creamery’s products become the centerpiece of an agritourism venture with an on-farm store. Meanwhile, the manure from the core herd can feed a digester, generating carbon credits and renewable energy.

The Bottom Line: Your Strategic Framework for 2025 and Beyond

Remember that provocative question we started with? What if the entire foundation of modern dairy economics is built on a dangerous myth that’s bankrupting hardworking farm families?

The evidence is overwhelming, and the time for incremental changes has passed. The North American dairy industry will continue generating massive economic value, but the operators who capture that value won’t be the ones producing the most milk—they’ll be the ones building the most resilient, diversified revenue systems.

The industry data confirms this shift: approximately three-quarters of dairy farmers expect to be profitable in 2025, but this optimism isn’t built on wishful thinking about milk prices—it’s grounded in strategic diversification that creates sustainable competitive advantages independent of commodity market volatility.

The operations implementing these integrated strategies aren’t just surviving current market conditions—they’re positioning themselves to profit regardless of where milk prices go. While commodity-focused farms continue riding the price roller coaster, diversified operations build sustainable wealth across multiple revenue streams.

Your Immediate Implementation Strategy

Don’t wait for perfect market conditions or complete certainty. The operations winning this transformation started with the same challenges and uncertainties you face today.

Week 1-2: Diversification Audit

  • Calculate your beef-on-dairy potential by genomic testing your entire herd and identifying the bottom 40% genetic merit cows
  • Assess your location’s agritourism viability within a 50-mile radius of population centers
  • Evaluate regional processing opportunities and cooperative partnerships

Month 1: Foundation Building

  • Implement a strategic beef-on-dairy program using genomic segmentation
  • Begin regulatory research for agritourism licensing if geographically viable
  • Analyze cash flow improvements from immediate beef-on-dairy implementation

Months 2-6: Strategic Development

  • Use beef-on-dairy cash flow to fund initial agritourism infrastructure
  • Explore processing partnerships or regional cooperative opportunities
  • Develop long-term capital plan for higher-investment strategies

Year 1-2: Advanced Integration

  • Evaluate carbon market participation through insetting programs like Athian’s marketplace
  • Implement flywheel strategies connecting multiple revenue streams
  • Assess technology investments that enable rather than consume diversification capital

The future of profitable dairying isn’t about perfecting your production metrics—it’s about building an integrated business system that generates wealth from multiple sources while milk provides the stable foundation for expansion.

The milk price volatility will continue. Economic pressures will intensify. Industry consolidation will accelerate. The only question is whether you’ll be riding these forces or building a business that profits regardless of their direction.

The choice is stark: evolve your business model now or watch your margins evaporate year after year while more strategic competitors build sustainable wealth.

The revolution is already underway. The only question is whether you’ll lead it or be left behind by it.

Learn More:

The Sunday Read Dairy Professionals Don’t Skip.

Every week, thousands of producers, breeders, and industry insiders open Bullvine Weekly for genetics insights, market shifts, and profit strategies they won’t find anywhere else. One email. Five minutes. Smarter decisions all week.

NewsSubscribe
First
Last
Consent

The Great Heifer Gamble: Why 2025’s Replacement Crisis Demands a Complete Strategy Overhaul

Stop maintaining 100%+ replacement rates. Smart producers achieve 54% cost savings while traditionalists pay $4,000+ per heifer in 2025’s tightest market since 1978.

EXECUTIVE SUMMARY: The dairy industry’s sacred 90-110% replacement rate gospel just became financial suicide, and progressive producers are already capitalizing while traditionalists scramble. With heifer inventories at 47-year lows and 72% of operations shifting to beef-on-dairy breeding, internal heifer production now delivers up to 54% cost savings compared to market purchases exceeding $4,000 per head. University of Florida research involving 1,019 Holstein heifers proves precision breeding timing achieves 62.8% conception rates versus industry-average mediocrity below 45%. While conventional wisdom preaches surplus strategies, exceptional herds require only 65-80% replacement rates through improved genetics and reproductive efficiency. Canadian research from 87 Quebec Holstein farms confirms that operations in the “Low rearing cost cluster” achieved $4,145 CAD per heifer versus industry averages of $4,870 CAD—proving efficiency trumps volume. Global trends show New Zealand’s genomic selection delivering $45.58 additional value per animal annually, while U.S. producers cling to outdated strategies. Stop accepting industry averages and start calculating your true replacement needs using research-backed formulas that separate tomorrow’s dairy leaders from today’s struggling operations.

KEY TAKEAWAYS

  • Master the 62.8% Conception Advantage: University of Florida’s proven 13-23 day heat cycle timing protocol delivers 17+ percentage point improvements over conventional <45% rates, saving thousands in replacement costs when each failed conception represents $4,000+ in lost value.
  • Capture the 54% Cost Savings: Internal heifer production costs $2,034-$2,510 per head versus $2,870+ market prices, with premium genetics exceeding $4,000—progressive operations are banking massive savings while competitors pay premium prices for basic replacements.
  • Eliminate the 14% Failure Rate: Research-backed colostrum management using the “Five Q’s” protocol prevents passive immunity failures that cost thousands in future asset value, with precision timing and IgG monitoring replacing hope-based management.
  • Deploy Precision Replacement Calculations: Ditch obsolete 90-110% replacement rate recommendations for data-driven formulas that account for modern efficiency gains—exceptional herds now operate at 65-80% rates while maintaining optimal productivity.
  • Leverage Technology ROI: Smart calf sensors detect illness 48 hours before visible symptoms, reducing mortality by 40% with 7-month ROI at $120-$160 per calf, while activity monitoring systems achieve 78.3% conception rates versus 56.8% with traditional timing protocols.
replacement heifers, dairy heifer shortage, heifer costs, dairy profitability, beef-on-dairy breeding

The dairy industry’s most sacred assumption—that replacement heifers will always be available—just shattered. With inventories at 47-year lows and beef-on-dairy breeding consuming 72% of dairy operations, the traditional “buy versus raise” playbook is obsolete. Smart producers are already rewriting the rules while others scramble to understand why a $4,000 heifer represents the new normal.

Picture this: You’re sitting across from your neighbor who just paid $4,000 for a springing Holstein—more than double what you paid two years ago. Meanwhile, his day-old crossbred calves are bringing $1,000 each, and he’s wondering if anyone should bother raising dairy replacements anymore. This isn’t a hypothetical scenario—it’s playing out in auction barns across America every week.

Welcome to 2025’s dairy reality, where the fundamental economics of herd replacement have been turned upside down, and the producers who adapt fastest will own the next decade.

The Numbers Don’t Lie: We’re Living Through Historic Scarcity

The brutal mathematics of America’s heifer crisis demand immediate attention:

Crisis Indicator2025 RealityHistorical Context
Total Dairy Heifers3.9 million headLowest since 1978
Expected Calvings2.5 million heifers0.4% decline from 2024
Year-over-Year Drop0.9% decreaseSteepest decline in decades

But here’s what makes this crisis different from previous market cycles: it’s not driven by high milk prices spurring expansion. The current shortage stems from a perfect storm of strategic decisions fundamentally altering the industry’s replacement pipeline.

The Beef-on-Dairy Revolution Has Arrived

Oklahoma Farm Report’s comprehensive analysis reveals that 72% of dairy farms now incorporate beef genetics into their breeding programs. This isn’t a fringe movement—it’s a wholesale transformation. Day-old crossbred calves command $675 per head at auction, with premium animals reaching $1,000 per head.

The math is devastating: analysis confirms that almost 4 million crossbred calves were born in 2024, potentially reaching 6 million in the next two years. At that point, dairy-beef animals could represent almost one-sixth of the fed beef cattle market.

Challenging the Sacred Cow: Why Traditional Replacement Rates Are Economic Suicide

Here’s the controversial truth that industry traditionalists refuse to acknowledge: the standard recommendation to maintain 90-110% of cow numbers as replacements isn’t just outdated—it’s financially destructive in today’s market.

The Replacement Calculation Revolution

USDA’s 2025 dairy outlook projects that despite favorable margins, “a challenge to potential herd expansion” exists due to reduced replacement heifer inventories. The agency forecasts annual milk production growth of just 0.5%—constrained entirely by heifer availability.

Modern operations demand precision thinking: research emphasizes that producers must “think of your heifer raising program as a funnel” where only a certain percentage will enter the milking herd due to mortality, infertility, and other losses.

Why Industry “Experts” Are Wrong About Surplus

While consultants still preach traditional surplus strategies, progressive producers are discovering that efficiency beats volume every time. Every excess heifer you raise instead of selling as a crossbred calf represents $1,000+ in immediate foregone revenue—money you’ll never recover from future milk production.

The Real Cost of Complacency: Record Prices Signal Permanent Shift

Current market data reveals the staggering new reality of replacement heifer economics:

Regional Price Breakdown (2025 Market Data):

Historical analysis shows that auction market reports reached $2,800 in some regions by early 2024—and prices have only climbed since then.

Why This Time Is Different

Unlike 2014’s price spike driven by record milk prices, today’s heifer shortage occurs while milk prices remain modest. This scarcity-driven pricing suggests structural changes rather than cyclical market forces.

The Reproductive Efficiency Revolution: Precision Timing Changes Everything

Smart producers aren’t just adapting to heifer scarcity—they’re leveraging it to force improvements in reproductive efficiency that should have happened years ago.

The University of Florida Breakthrough

Groundbreaking research involving 1,019 Holstein heifers fitted with activity monitoring collars revealed critical timing insights for prostaglandin treatments:

“Heifers that were in heat 13 to 23 days before a prostaglandin injection had greater conception rates (62.8%) than heifers that were in heat four to 12 days before injection (<45%).”

This isn’t theoretical—it’s actionable intelligence that can immediately improve breeding efficiency by over 17 percentage points.

The Industry’s Dirty Secret About Heat Detection

Here’s what reproductive “experts” won’t tell you: peer-reviewed research demonstrates that timing prostaglandin injections during late diestrus (cycle days 12-15) achieves 78.3% conception rates versus only 56.8% during early diestrus (days 5-7).

Yet most operations still use arbitrary timing protocols that ignore individual cow cycles. When each failed conception costs $4,000+ in replacement value, this negligence is economically catastrophic.

Performance Benchmarks That Separate Winners from Losers:

  • 90% of heifers are pregnant within 100-150 days of entering the breeding pen
  • 62.8% conception at first service using precision timing protocols
  • 90% of heifers inseminated within the first 21 days of breeding pen entry

The Colostrum Management Crisis: Your Future $4,000 Assets at Risk

An uncomfortable truth directly impacts your replacement program: veterinary research reveals that approximately 14% of calves fail to achieve adequate passive transfer of immunity despite industry advances in colostrum management.

When each calf represents a potential $4,000+ future asset, this failure rate represents massive economic losses that most operations completely ignore.

The Research-Backed Protocol

University of Minnesota research by Dr. Sandra Godden confirms that colostrum management is “the single most important factor determining calf health and survival.” The protocol demands:

  1. Feed 10% of birth weight within first feeding
  2. Complete first feeding within 4 hours of birth
  3. Maintain IgG levels above 10 mg/mL through testing
  4. Monitor absorption efficiency rather than assuming success

Why Most Operations Fail

The industry’s casual approach to colostrum management made sense when replacement costs were $1,500. Every management failure at $4,000+ per heifer represents catastrophic economic loss that progressive operations can’t afford to accept.

Economic Reality Check: The New ROI Calculations

The economic foundation of heifer raising has fundamentally shifted, and the data proves internal production now offers substantial advantages:

Verified Cost Analysis:

  • Penn State Extension: $2,026 total rearing cost
  • Iowa State analysis: $2,241 total rearing cost
  • Midwest operations: $1,662 average cost

Market Purchase Costs:

The 54% Cost Advantage

Internal heifer production now offers up to 54% cost savings compared to market purchases—a competitive advantage that progressive operations are already exploiting while traditionalists continue buying at premium prices.

The Beef-on-Dairy Gamble: Industry Lemming Behavior or Strategic Evolution?

Here’s the industry’s biggest controversy: Is the widespread rush to beef-on-dairy breeding a smart diversification strategy or a dangerous herd mentality that will create long-term vulnerabilities?

Oklahoma Farm Report’s analysis reveals a troubling trend: 72% adoption rates suggest industry groupthink rather than strategic thinking. When three-quarters of an industry suddenly adopts the same strategy, contrarian analysis becomes essential.

The Strategic Implications

Hoard’s comprehensive review projects that beef-on-dairy animals could represent almost one-sixth of the fed beef cattle market within two years. This fundamental shift may help stabilize milk markets by naturally curbing oversupply, but it comes at the cost of future expansion flexibility.

The Contrarian Question

What happens when beef prices inevitably decline, and dairy expansion becomes profitable again? Operations maintaining replacement production capability will capture market share while beef-on-dairy converts scramble to rebuild their genetics programs.

Future-Proofing Your Operation: Why Conventional Wisdom Is Wrong

USDA projections confirm that milk production growth will remain constrained at just 0.5% annually due to replacement heifer shortages. This creates unprecedented opportunities for operations that can efficiently develop their own replacements.

The Technology Integration Imperative

Research on reproductive management documents unprecedented improvements in dairy reproduction over the past 20 years, with cow conception rates improving from 35% to nearly 50%.

This “reproduction revolution” was driven by automated activity monitoring systems and improved fertility programs—technologies transforming from luxuries to necessities when replacement costs exceed $4,000.

Risk Management in the New Era

Comprehensive risk management strategies become critical, with individual animals representing $4,000+ investments. Traditional “hope for the best” management is financially irresponsible when replacement failures cost thousands rather than hundreds.

The Bottom Line: Adapt or Face Extinction

The heifer shortage of 2025 isn’t a temporary disruption—it’s a permanent reshaping of dairy economics that demands immediate strategic response.

Your Strategic Action Plan:

  1. Calculate True Replacement Needs: Use research-backed formulas rather than outdated industry averages that ignore modern efficiency gains
  2. Implement Precision Breeding: Deploy the University of Florida’s proven 13-23 day timing protocols to achieve 62.8% conception rates
  3. Master Colostrum Management: Eliminate the 14% failure rate that’s costing thousands in future asset value
  4. Leverage Cost Advantages: Capitalize on the 54% cost savings of internal production versus market purchases

The Critical Questions:

With USDA confirming the smallest heifer inventory since 1978, can your operation deliver the precision required when mistakes cost thousands? Are you positioned to achieve 62.8% conception rates through proven protocols or accept industry-average mediocrity?

Your future depends on decisions made today. With heifer inventories at 47-year lows and no relief projected, tomorrow’s dairy leaders are being determined by today’s strategic choices.

The farms that master these research-backed principles won’t just survive the current crisis—they’ll dominate their markets for the next decade while competitors struggle with obsolete strategies and premium replacement costs.

Learn More:

The Sunday Read Dairy Professionals Don’t Skip.

Every week, thousands of producers, breeders, and industry insiders open Bullvine Weekly for genetics insights, market shifts, and profit strategies they won’t find anywhere else. One email. Five minutes. Smarter decisions all week.

NewsSubscribe
First
Last
Consent

NMPF Slashes Export Fees 50% While Doubling Down on Global Dairy Domination

NMPF just gambled your milk check on exports while abandoning supply management. 50% fee cut, 595% export surge—or dangerous vulnerability?

EXECUTIVE SUMMARY: The dairy industry just executed its most radical strategic gamble in decades, and most producers don’t realize they’re already playing a game where the rules change overnight. NMPF’s new NEXT program slashes export assessments 50% while betting everything on global markets that generated 595% cheese export growth to Central America and pushed Latin America to a record 41% share of U.S. dairy exports worth billions. But here’s the uncomfortable truth nobody’s discussing: this export-first strategy launches into the most volatile trade environment in history, where Colombia threatens $70 million in dairy exports and China maintains 135% tariffs that can eliminate markets instantly. With 17% of U.S. milk already flowing overseas—up from 13% in 2010—the industry has crossed the point of no return from domestic supply management to global market dependence. Every producer now faces a critical choice: embrace the 2-cent-per-hundredweight investment in NEXT’s targeted market strategy, or watch competitors capture the international opportunities that increasingly determine your milk price.

KEY TAKEAWAYS

  • Cut export costs by 50% while doubling market reach: NEXT’s 2-cent-per-cwt assessment (down from 4 cents) expands product eligibility to all cheese varieties, ESL milk, ice cream, and specialty proteins—positioning your operation for Latin America’s $441 million market surge under CAFTA-DR tariff elimination
  • Capture 595% export growth opportunities in targeted regions: Central America cheese exports exploded under strategic trade agreements, while Southeast Asia pilot programs for value-added skim milk powder and Indonesia’s $245 million market offer immediate diversification beyond volatile domestic pricing
  • Navigate $70 million in geopolitical export risks: Colombia’s tariff threats and China’s 135% duties expose the dangerous reality that export success depends as much on diplomatic stability as market development—requiring strategic hedging across multiple international markets
  • Leverage operational flexibility for competitive advantage: Extended delivery periods and removed volume limits under NEXT enable rapid response to international demand fluctuations, while existing stockpiled H5N1 vaccines “don’t match current strains,” highlighting the need for agile market positioning
  • Balance export acceleration against domestic market vulnerability: With milk production outpacing domestic consumption and 17% of U.S. milk already exported, the fundamental question isn’t whether to participate in global markets—it’s whether your operation can afford to ignore the 2028 timeline that positions exports as essential for long-term profitability
dairy exports, cooperative funding, export market access, dairy profitability, international dairy trade

The National Milk Producers Federation just pulled off the dairy industry’s most audacious strategic pivot in decades – cutting member assessments in half while turbocharging export ambitions through their new NEXT program. Starting July 1, this isn’t just an evolution of the old CWT model; it’s a complete reimagining of how American dairy conquers global markets.

The numbers tell a story that should make every dairy producer sit up and take notice. While you’ve been paying 4 cents per hundredweight for the Cooperatives Working Together program, NEXT drops that to just 2 cents per cwt through 2028 – but don’t mistake this cost-cutting for corner-cutting. This is surgical precision applied to global market domination.

Why NMPF Ditched the Old Playbook

Let’s face it: the dairy export game has fundamentally changed since CWT launched in 2003. Back then, supply management through herd retirement made sense when the industry was smaller and more predictable. Today? U.S. milk production keeps outpacing domestic consumption, and trying to manage that through domestic supply controls is like trying to empty Lake Superior with a garden hose.

The data backs up this strategic shift. CWT facilitated exports of 58.4 million pounds of American-type cheeses, 1.1 million pounds of butter, 46,000 pounds of anhydrous milkfat, and 39 million pounds of whole milk powder in 2023 alone. The proportion of U.S. milk shipped overseas jumped from 13% in 2010 to 17%.

Here’s the reality check: when your export markets are exploding while you’re still trying to manage domestic supply, you don’t need a supply management program – you need an export acceleration program.

NEXT’s Secret Weapon: Surgical Market Targeting

The most impressive aspect of NEXT isn’t just what it includes – it’s how precisely it targets specific products for specific regions. This isn’t the old shotgun approach of “let’s export anything to anywhere.”

The program now covers all cheese varieties, extended shelf life fluid milk, evaporated and condensed milk, ice cream, specialty proteins, and milk powders – a massive expansion from CWT’s limited product scope. But here’s where it gets interesting: NEXT specifically targets cheese and butter for Latin America while focusing on specialty proteins and milk powders for Asia and the Middle East-North Africa region.

Why does this surgical approach matter? Because the Dominican Republic-Central America-United States Free Trade Agreement (CAFTA-DR) has boosted U.S. dairy exports from $40 million before 2006 to $441 million by 2025 due to complete tariff elimination. Cheese exports to Central America surged by an impressive 595%, comprising 54% of the region’s dairy trade.

The Dangerous Gamble Nobody’s Calculating

Here’s the uncomfortable question every producer should be asking: Is NMPF’s export obsession creating dangerous domestic market vulnerability?

The NMPF Board Chairman articulated the industry’s pride in producing nutritious products globally and underscored the unwavering commitment to building exports, even amidst day-to-day market turbulence. But what happens when that global market turbulence becomes a tsunami?

Consider this: Colombia is threatening tariffs on U.S. powdered milk, claiming unfair subsidies, and risking $70 million in exports. China maintains a minimum of 135% tariffs on U.S. products. Meanwhile, Nicaragua increased port fees by $42,000 per shipment in 2024, El Salvador tripled approval delays to 72 days, and Guatemala rejected 21% of shipments over labeling disputes.

When you’re betting the farm on export growth, you’re essentially gambling that foreign governments will remain friendly, that trade wars won’t escalate, and that domestic consumers won’t eventually demand food security over export profits.

What This Means for Your Operation

Whether you’re currently exporting or not, NEXT’s implications ripple through your operation in ways you might not expect.

If you’re already in export markets: The expanded product eligibility could open doors you didn’t know existed. That artisanal cheese you’re producing? NEXT can now support its export. What is the extended shelf life of the milk you’re processing? Covered. Extended delivery periods and removed volume limits mean you can respond faster to international opportunities without getting tangled in program restrictions.

If you’re export-curious: Pay attention to the regional pilot programs. NEXT is specifically piloting value-added skim milk powder sales to Southeast Asia and cheese sales to Central America and the Caribbean. These aren’t just market tests – they’re potential pathways for smaller operations to access international markets through cooperative programs.

If you think exports don’t affect you: Think again. Already, 17% of U.S. milk goes overseas, up from 13% in 2010. That percentage keeps growing whether you participate or not.

The Global Chess Match You’re Playing Whether You Know it or Not

Here’s what most producers don’t realize: you’re competing against subsidized European dairy, Australian efficiency, and New Zealand’s geographic advantages every single day. The EU has free trade agreements that give them tariff advantages the U.S. doesn’t have. Australia and New Zealand get duty-free access to markets where the U.S. pays up to 7% tariffs.

Take Vietnam as a perfect example. They just unilaterally reduced tariffs on key dairy products by 50% or more – but only after over a year of U.S. Dairy Export Council advocacy to offset competitive disadvantages from other trade agreements.

NMPF and USDEC work closely with the U.S. Trade Representative (USTR) and USDA as confidential trade advisers, leveraging their status to advance new market access opportunities. However, diplomatic insurance policies only work when diplomacy does.

The Strategic Partnerships That Could Make or Break NEXT

Here’s where NEXT gets really interesting from a risk management perspective. NMPF and USDEC have signed a Memorandum of Understanding (MOU) with the Guatemalan Dairy Association (ASODEL). NMPF, USDEC, and the Indonesian Chamber of Commerce (KADIN) have signed an MOU to deepen cooperation, enhance trade, and bolster public nutrition in Indonesia.

Indonesia is the seventh-largest export market for U.S. dairy, with purchases totaling $245 million in 2024, and demand is expected to grow substantially due to a new national school meals program. When you’re building relationships that tap into government nutrition programs, you’re creating export stability that transcends political cycles.

But here’s the provocative question: Are these partnerships genuine long-term strategic assets or diplomatic window dressing that could evaporate the moment trade tensions escalate?

Industry Leaders Are All-In – But Should They Be?

The broad approval of NEXT by over 100 farmers and dairy-cooperative leaders signals unprecedented industry consensus. The Young Cooperators brought together dairy leaders from 15 states for advocacy on Capitol Hill, directly engaging with members of Congress on strong dairy trade policies.

But consensus doesn’t guarantee success. Remember, there was also broad industry consensus behind ethanol mandates, and look how that worked out for corn-dependent dairy producers.

NMPF consistently works to ensure that its policy proposals, including those related to Federal Milk Marketing Order (FMMO) updates, reflect the balanced interests of both dairy farmers and processors/manufacturers. However, processors often advocate for an “average-based mover” for Class I milk prices, while NMPF supports the “higher-of” formula. If the industry can’t agree on domestic pricing mechanisms, how confident should we be about their unified export strategy?

The Bottom Line

NEXT represents the most significant evolution of the U.S. dairy export strategy over two decades. By cutting assessments by 50% while expanding focus and operational flexibility, NMPF is betting that targeted international growth beats domestic supply management every time.

The data supports that bet. With Latin America’s record 41% market share and Southeast Asia offering massive growth potential despite tariff challenges, the global opportunity dwarfs what we can achieve through herd retirement programs.

Starting July 1, your 2-cent-per-hundredweight investment buys you a seat at the global dairy table. The question isn’t whether you can afford to participate – it’s whether you can afford not to.

But here’s the uncomfortable truth: NEXT has launched into the most volatile trade environment in decades. Success will depend as much on geopolitical navigation as on market development. The strategic gamble is clear: sacrifice short-term domestic supply control for long-term global market dominance.

The program’s $500,000 endowment for the Dr. Peter Vitaliano Legacy Scholarship signals NMPF recognizes that export success requires deep intellectual capital. But intellectual capital doesn’t protect you from trade wars, diplomatic disputes, or domestic food security concerns.

For an industry that’s been playing defense for too long, NEXT represents a fundamental shift to offense. Are you ready to think globally while navigating a world where trade wars can eliminate markets overnight, and domestic consumers might eventually demand food security over export profits?

The choice is yours. But remember: in this global chess match, you’re already playing whether you realize it or not.

Sources:  An Analytical Report on the National Milk Producers Federation’s NEXT Dairy Export Program

Learn More:

The Sunday Read Dairy Professionals Don’t Skip.

Every week, thousands of producers, breeders, and industry insiders open Bullvine Weekly for genetics insights, market shifts, and profit strategies they won’t find anywhere else. One email. Five minutes. Smarter decisions all week.

NewsSubscribe
First
Last
Consent

Breaking the Rumen Code: Six Science-Backed Strategies That Deliver $2,200+ More Lifetime Revenue Per Calf

Stop treating calf nutrition like a cost center. New research proves strategic rumen development delivers $2,200+ lifetime ROI per heifer.

EXECUTIVE SUMMARY: The dairy industry’s “cheap and cheerful” approach to calf nutrition is costing operations millions in lost lifetime productivity, with 85% of farms still using outdated feeding protocols that program mediocrity into future milking herds. Cornell’s groundbreaking research reveals that for every 1 kg increase in pre-weaning average daily gain, heifers produce an additional 850 kg of milk during first lactation—yet most producers are leaving this performance on the table by following conventional wisdom that delays starter feed, restricts milk strategically wrong, and uses calendar-based weaning. Six evidence-backed strategies can accelerate functional rumen development by programming 12% higher first-lactation yields while reducing replacement costs by 22%, with validated returns of $4.20 for every dollar invested in comprehensive nutrition protocols. With milk prices averaging $22.75/cwt in 2025 and feed costs declining, progressive operations implementing these protocols are building permanent competitive advantages while the majority accept suboptimal performance as inevitable. The window for programming lifetime productivity closes fast—every day of delay in the first 90 days represents permanently lost genetic potential that no amount of management can recover later.

KEY TAKEAWAYS

  • Early Starter Access Revolution: Offering pelleted starter from day 3 (not day 7-10) delivers 300-400% more papillae surface area by weaning, directly translating to 8-12% higher DMI capacity throughout productive life—critical advantage with current tight heifer inventories down 37,000 head.
  • Function-Based Weaning Breakthrough: Strategic weaning at 1.5kg starter intake (versus arbitrary age) reduces post-weaning health interventions by 35% and saves $125 per calf in veterinary costs while improving conception rates and first-lactation milk yield by preventing the “weaning crisis” that costs a month of growth.
  • Strategic Milk Management: Challenging the “more milk is always better” myth through targeted restriction in weeks 5-8 accelerates starter consumption by 35% without compromising growth, creating feed-seeking behavior that programs superior rumen development and lifetime feed efficiency.
  • Precision Rumen Chemistry: Corn and wheat-based starters increase ruminal butyrate concentrations 40-60% more effectively than conventional grains, with optimal 30-45% starch content creating the molecular signals for papillae proliferation—validated by operations achieving $500+ returns from $50 water system investments.
  • Lifetime Performance Programming: Pre-weaning ADG accounts for 22% of first-lactation milk yield variation, with comprehensive calf nutrition protocols costing $158 per animal delivering $2,200+ lifetime value through improved feed conversion, higher peak production, and reduced culling—returns that compound across entire replacement pipeline.

The conventional “just enough to survive” approach to calf nutrition costs U.S. dairy farms an estimated $450 million annually in lost lifetime production. New research confirms that strategic rumen development in the first 90 days delivers 12% higher first-lactation yields and reduces replacement costs by up to 22% – yet 85% of operations are still using outdated feeding protocols that program mediocrity into their future milking herds.

While the industry obsesses over genomic selection, robotic milking efficiency, and precision feeding in lactating cows, the greatest untapped profit opportunity is hiding in plain sight: your calf barn.

Why Your Current Calf Program Is Programming Mediocrity into Your Future Herd

Let’s be brutally honest about something most feed companies and traditional nutritionists won’t tell you: if you’re still following conventional calf rearing wisdom from even five years ago, you’re essentially installing biological limiters in your future milking herd.

Think about it like this: would you install outdated software in your new milking robots? Of course not. Yet that’s exactly what happens when you underfeed calves during critical rumen development windows – you’re programming limitations into their digestive “operating system” that no amount of genetic potential can overcome.

Cornell University’s groundbreaking research demonstrates that for every 1 kg increase in average daily gain during the pre-weaning period, heifers produced a stunning 850 kg more milk during their first lactation (Maximizing Calf Performance: The Million-Dollar Investment in Your Dairy’s Future). When translated to pounds, that’s about 1,870 pounds of additional milk for each pound of daily gain – a return on investment that few other farm practices can match.

The Real Economics of Rumen Development

The financial implications are staggering. With milk prices averaging $22.75/cwt as of March 2025, according to recent USDA forecasts, every percentage point of improved feed efficiency translates directly to bottom-line profitability. Cornell’s research confirms that pre-weaning ADG alone accounts for approximately 22% of the variation in first-lactation milk yield (Maximizing Calf Performance: The Million-Dollar Investment in Your Dairy’s Future). Think about that – nearly a quarter of your heifers’ production potential is being determined before they’re even weaned!

Here’s where the conventional wisdom gets dangerous: traditional calf rearing approaches prioritize “cheap” feeding programs that minimize pre-weaning costs, completely ignoring the lifetime consequences of underdeveloped rumens. This shortsighted approach is like trying to save money on a car by skipping oil changes – the initial savings are guaranteed to cost you multiples more down the road.

Strategy 1: Strategic Starter Feed Management – The 72-Hour Rule That Transforms Rumen Development

The first conventional practice that needs immediate burial is waiting 7-10 days to offer starter feed. Calves are physiologically capable of consuming and benefiting from starter feed as early as 72 hours after birth, and every day of delay creates a compounding negative effect that persists throughout their productive life.

Think of starter feed initiation like establishing credit history – the earlier you start building it, the stronger your long-term financial position becomes. The same principle applies to rumen development.

The Butyrate-Papillae Connection Your Nutritionist Isn’t Explaining

Here’s the science most feed companies gloss over: when starter feed ferments in the developing rumen, it produces butyrate – the specific volatile fatty acid that triggers rumen papillae proliferation. Think of papillae as the absorptive surface area in your milk house plate cooler – more surface area means dramatically better efficiency.

Peer-reviewed research confirms that fermentable carbohydrates in a calf’s diet enhance the production of volatile fatty acids required for rumen epithelium development. Feeding corn and wheat-based diets increases ruminal butyrate concentrations and provides energy for rumen wall thickening, and papillae formation. This isn’t just academic theory; biological programming directly impacts lifetime performance.

But here’s the critical insight that is most missing: it’s not just about offering any starter – the physical form and composition matter tremendously.

Research published in Hoard’s Dairyman confirms that feed particle size and physical form affect the anatomical and microbial development of the rumen. Feeding a ground diet decreases papilla length and surface area, while pelleted or texturized feeds consistently outperform finely ground feeds.

Is your operation still using finely ground starter because it’s cheaper to manufacture? If so, you’re literally grinding away future profit.

Implementation Strategy for 2025 Operations:

  • Offer pelleted starter containing 30-45% starch from day 3
  • Target 18-22% crude protein for optimal tissue development
  • Monitor daily intake: aim for 0.25 pounds by week 2, 1.5 pounds by week 8
  • Switch to texturized feeds if currently using finely ground options

Strategy 2: Water Management – The $50 Investment That Unlocks $500 in Performance

Water is the most criminally underestimated input in calf nutrition, and frankly, it’s shocking how many operations treat it as an afterthought. There’s a direct correlation between water intake and starter consumption – without adequate water, you’re creating a biological bottleneck that sabotages every other nutritional intervention.

The Hidden Connection Between Water Quality and Feed Efficiency

Most producers don’t understand that water consumed as plain water enters the rumen and becomes available for microbial fermentation, while water in milk bypasses the rumen entirely through the esophageal groove. This means ad libitum access to fresh, clean water from day one isn’t just recommended – it’s absolutely non-negotiable for optimal rumen microbial establishment.

Let me pose a simple question: If you wouldn’t drink from your calf water buckets, why would you expect calves to?

Validated Economic Returns from Water System Upgrades

Research from progressive operations demonstrates the concrete returns on water system investments. Operations investing $50 per calf housing unit in automated, clean water systems see $500+ returns through improved growth rates and reduced health interventions (Revolutionizing Calf Rearing: 5 Game-Changing Nutrition Strategies). This represents a verified 10:1 return on investment that most operations are leaving on the table.

The economic reality: contaminated or stale water doesn’t just cause disease – it becomes a silent performance killer that undermines every dollar you spend on premium feeds and additives.

Strategy 3: Precision Milk Management – Programming Feed-Seeking Behavior

This is where conventional wisdom becomes dangerous. The industry’s focus on maximum milk volumes is actually working against optimal rumen development, creating milk-dependent calves with underdeveloped rumens.

The Esophageal Groove Paradox

The physiological reality: milk bypasses the rumen entirely via the esophageal groove, providing zero stimulation for rumen development. High milk volumes create metabolically satisfied calves with no physiological drive to consume solid feed. It’s like providing unlimited TMR to dry cows and expecting them to clean up every morsel – satisfied animals don’t seek additional feed sources.

Strategic Energy Management for Optimal Outcomes

Research from Penn State’s dairy nutrition program shows that strategic milk restriction in later pre-weaning periods accelerates starter consumption by 35% without compromising growth rates. This isn’t about calf starvation – it’s about creating the metabolic hunger that drives solid feed consumption.

Implementation Framework:

  • Weeks 1-4: Provide adequate milk for rapid early growth (typically 6-8L daily)
  • Weeks 5-8: Gradually reduce to 4-6L while monitoring starter intake
  • Target weaning when consuming 1.5kg starter for three consecutive days
  • Use milk replacer with 20-26% protein and 15-20% fat for optimal efficiency

Challenging Industry Dogma: The “More Milk Is Always Better” Myth

Here’s where I’m going to challenge some “sacred cows” in the industry. The pendulum has swung from severe milk restriction (4L/day) to extreme volumes (12+L/day), with neither approach optimizing rumen development. The sweet spot lies in starting with generous volumes (8L/day) for immune development and early growth, then strategically reducing volumes to stimulate starter intake.

Ask yourself: Is your milk feeding program designed around calf physiology or caretaker convenience?

Strategy 4: Advanced Starter Composition – The Chemical Formula for Explosive Growth

Not all starter feeds are created equal, and the difference between mediocre and exceptional rumen development lies in getting the nutritional chemistry precisely right. Think of this like balancing a high-performance TMR – every component serves a specific metabolic function.

The Starch-Butyrate Production System

Here’s the critical insight most feed companies don’t emphasize: corn and wheat-based diets increase ruminal butyrate concentrations 40-60% more effectively than barley or oat-based alternatives. Butyrate is the specific VFA that triggers papillae proliferation – more butyrate production means dramatically better rumen development.

Precision Nutrition Targets for 2025:

Nutrient ParameterOptimal RangeRumen Development ImpactEconomic Benefit
Crude Protein18-22%Supports rapid tissue development+$0.15/lb gain efficiency
Starch Content30-45%Maximizes butyrate production+$0.22/lb feed conversion
NDF (Fiber)10-15%Physical stimulation without dilution+$0.08/lb intake improvement
Fat Content2.5-4.5%Concentrated energy, palatability+$0.12/lb cost efficiency

The Revolutionary RUP Breakthrough

Recent research has confirmed the substantial benefits of including higher rumen-undegradable protein (RUP) levels in starter feeds. According to a 2025 study published in PMC, an increased concentration of rumen-undegradable protein in the pre-weaning starter diet boosts calf performance (Changes in Ruminal Fermentation and Growth Performance). The study concluded that this approach enhances skeletal growth and overall development, particularly when implemented during critical rumen development windows.

The precision here matters enormously. Excessive starch (>50%) triggers subacute ruminal acidosis, while insufficient starch (<25%) fails to provide adequate VFA production for papillae development. It’s a narrow target that requires consistent monitoring and adjustment.

Strategy 5: Function-Based Weaning – Stop Using the Calendar, Start Using Science

The biggest mistake in modern calf management is calendar-based weaning. Successful weaning is determined by rumen function, not age or weight. Premature weaning based on arbitrary timelines leads to growth checks, digestive upsets, and permanent setbacks in productive capacity.

The 1.5kg Rule That Changes Everything

Research consistently demonstrates that calves should be weaned when consuming 1.5 kilograms of starter daily for three consecutive days, regardless of age. This threshold indicates functional rumen capacity sufficient to meet nutritional requirements independently.

Economic Impact of Precision Weaning:

Penn State research validates the economic impact of proper weaning protocols. Poor rumen development often costs a month of growth after weaning, stressing the immune system and creating respiratory issues in newly weaned calves.

Validated data from progressive operations using function-based weaning protocols shows:

  • $4.20 return for every dollar invested in comprehensive calf nutrition protocols (Revolutionizing Calf Rearing: 5 Game-Changing Nutrition Strategies)
  • 35% reduction in post-weaning health interventions
  • $125 per calf savings in veterinary and treatment costs
  • 18% improvement in weaning-to-breeding weight gain
  • 22% reduction in age at first calving

The gradual milk reduction protocol over 10-14 days while monitoring starter intake creates smooth transitions that minimize the “weaning crisis,” costing operations millions in lost growth potential.

Have you calculated the cost of post-weaning growth slumps in your operation? Most farms accept them as inevitable when they’re actually entirely preventable.

Strategy 6: Precision Feed Additives – The 5% Investment That Delivers 15% Returns

This is where modern dairy science meets practical application. While core nutrition forms the foundation, strategic additives can optimize rumen development with exceptional return on investment.

Probiotics: Ecosystem Engineering for Rumen Efficiency

Feeding probiotics improves rumen microbial balance, promotes rumen development, and facilitates the transition from liquid feed to dry feed and forage. Adding Saccharomyces cerevisiae and Bacillus licheniformis improves rumen microbiota and morphology and enhances nitrogen usage and rumen fermentation patterns.

Breakthrough research published in the American Association of Bovine Practitioners journal demonstrates that early life administration of a Megasphaera elsdenii capsule improves performance and rumen development in dairy-beef calves under subacute ruminal acidosis risk (Early life administration of a Megasphaera elsdenii capsule). This represents a new frontier in precision probiotic interventions for optimal rumen health.

Direct VFA Supplementation: Molecular Precision

Including sodium propionate or sodium, butyrate increases the length and width of rumen papillae and reticulorumen weight in calves and lowers degenerative tissue accumulation. This is precision nutrition at the molecular level – providing exactly the signals needed for optimal development.

Feed Particle Size: The Physical Factor Most Operations Ignore

Feed particle size and physical form affect the anatomical and microbial development of the rumen. Feeding a ground diet decreases papilla length and surface area while feeding pellet or texturized feed is preferable to a finely ground diet.

Is your operation still seeing additives as “extras” rather than essential investments? The data overwhelmingly shows they’re core technologies for maximizing genetic potential.

The Hidden Long-Term Impact: Programming Lifetime Performance

The research is unequivocal – early life nutrition has profound impacts that extend far beyond weaning. Cornell’s comprehensive analysis confirms that the pre-weaning growth rate is an important factor impacting future milk yield. Calves that grew more quickly ate more and, weighed more were heavier as first-lactation cows and as mature cows (Maximizing Calf Performance: The Million-Dollar Investment in Your Dairy’s Future).

The Metabolic Programming Revolution

This phenomenon, known as “metabolic programming,” represents one of the most significant opportunities for improving lifetime productivity in dairy cattle. Early dietary interventions, especially starter diets rich in starch and balanced forage, are critical in optimizing rumen growth and functionality through modulating transcriptional reprogramming and microbial composition (Early rumen development in calves: Biological processes and nutritional strategies).

The mechanisms include:

  1. Enhanced mammary development: Proper nutrition during critical windows stimulates greater mammary tissue development
  2. Optimized endocrine function: Early growth influences how hormones regulate metabolism for life
  3. Improved immune programming: Better early nutrition creates more resilient immune systems
  4. Epigenetic modifications: Early nutrition can trigger gene expression changes that persist throughout life

Validated Cost-Benefit Analysis: The Investment Case Is Undeniable

Real-world data from progressive operations provides concrete validation for enhanced calf nutrition investments. Implementing comprehensive calf nutrition and housing improvements costs about $127 per calf but delivers $477 net profit per animal through reduced treatment costs, higher milk yields, and fewer culls (Revolutionizing Calf Rearing: 5 Game-Changing Nutrition Strategies).

Let’s do the math on a typical 100-cow dairy with 40 heifer calves raised annually:

ImplementationInvestment per CalfAnnual Investment (40 calves)Return per CalfAnnual ReturnROI
Enhanced Starter Program$45$1,800$185$7,400411%
Automated Water Systems$50$2,000$125$5,000250%
Strategic Milk Protocol$35$1,400$180$7,200514%
Feed Additives$28$1,120$95$3,800339%
TOTAL$158$6,320$585$23,400370%

Operations typically recoup their investment within 18 months through reduced vet bills, higher milk production, and fewer replacements needed. When you factor in the long-term milk production benefit validated by Cornell research, the return on investment becomes truly staggering – approaching 20:1 over the lifetime of the animal.

Why This Matters for Your 2025 Operation

Every strategy we’ve discussed is backed by peer-reviewed research and proven in commercial operations worldwide. The question isn’t whether these approaches work – it’s whether you can afford not to implement them in today’s competitive environment.

The Economic Reality Check

Consider current market conditions in 2025:

  • Milk price averaging $22.75/cwt as of March 2025 forecasts
  • Feed costs are expected to be more favorable with projected record corn crops
  • Replacement heifer costs approaching $2,800 for quality animals
  • Labor costs increase 8-12% annually across major dairy regions

Validated Implementation ROI Analysis:

  • Investment: $158 per calf for enhanced nutrition protocols
  • Returns: Validated $2,200+ lifetime value improvement through:
    • 50% reduction in disease treatment costs
    • 23% fewer replacement culls needed

The Competitive Advantage Reality

Here’s the uncomfortable truth: fewer than 15% of U.S. dairies have adopted these proven practices (Revolutionizing Calf Rearing: 5 Game-Changing Nutrition Strategies). This means that 85% of operations are still programming suboptimal performance into their future herds while the progressive 15% gain increasingly dominant competitive advantages.

Think about that for a moment – you’re either part of the 15% creating a permanent advantage or part of the 85% falling further behind every calving season.

The Bottom Line: The 90-Day Decision That Determines Six Years of Profit

Rumen development isn’t about following a checklist but orchestrating multiple biological systems to create animals that thrive in modern dairy operations. The research is definitive, the protocols are proven, and the economic returns are substantial and validated by multiple independent sources.

Every day you delay implementing these strategies is lost lifetime productivity that you’ll never recover. The calves in your barn today will either benefit from cutting-edge nutrition science or suffer from outdated conventional approaches.

Your Validated Action Plan for Immediate Implementation:

  1. Week 1: Evaluate current starter composition against research-based targets from peer-reviewed sources
  2. Week 2: Implement ad libitum water access with quality monitoring systems
  3. Week 3: Adjust milk feeding protocols for strategic energy management
  4. Week 4: Introduce function-based weaning monitoring systems

The Critical Industry Challenge Nobody’s Talking About

Here’s a fact that should shake every producer: excellent pre-weaning growth should exceed 1.8 pounds (0.82 kg) daily gain, yet most operations fail to achieve this basic threshold (Maximizing Calf Performance: The Million-Dollar Investment in Your Dairy’s Future). Calves falling below this threshold are less likely to reach their genetic potential for production, reducing your return on investment for each animal.

The choice is clear: embrace precision calf nutrition that programs lifetime performance with validated $4.20 returns per dollar invested, or accept the competitive disadvantage of conventional approaches while your progressive neighbors capture an increasingly dominant market position.

What’s your current rumen development protocol missing? Because if you’re not hitting all six strategies, your calves are paying the price for the rest of their productive lives – and so is your bottom line. The 15% of operations already implementing these strategies aren’t just slightly ahead – they’re building permanent competitive moats that become deeper every year.

Learn More:

The Sunday Read Dairy Professionals Don’t Skip.

Every week, thousands of producers, breeders, and industry insiders open Bullvine Weekly for genetics insights, market shifts, and profit strategies they won’t find anywhere else. One email. Five minutes. Smarter decisions all week.

NewsSubscribe
First
Last
Consent

CME Daily Dairy Market Report – June 10, 2025:  Butter Collapse Signals Market Reality

Stop chasing yesterday’s cheese rally signals. CME’s $8B processing revolution + FMMO reforms = new margin reality every producer must master.

EXECUTIVE SUMMARY: The dairy industry’s obsession with daily price movements is missing the seismic shift reshaping farm profitability in 2025. While traders fixated on butter’s 4.5¢ collapse and cheese’s supply squeeze on June 10th, the real story lies in three converging forces that progressive producers are already leveraging: $8+ billion in new processing capacity creating localized milk demand premiums, Federal Milk Marketing Order reforms delivering $1.25/cwt Class I differential increases, and feed cost improvements boosting income-over-feed ratios by 15-20% compared to late May levels. The “component economy” revolution means butterfat at 4.40% and protein at 3.40% now outweigh volume growth, fundamentally altering how successful operations optimize profitability. International export vulnerabilities—with Chinese tariffs escalating from 10% to 125% and U.S. NDM exports declining 20.9%—demand immediate strategic repositioning toward domestic premium markets. Stop managing your operation like it’s 2020; the dairy landscape has permanently shifted, and only data-driven producers adapting to these new realities will capture the margin opportunities ahead.

KEY TAKEAWAYS

  • Processing Capacity Gold Rush Creates Local Premiums: Chobani’s $1.2 billion Rome, NY facility processing 12 million pounds daily and Darigold’s $1 billion Pasco, WA plant absorbing 8 million pounds daily are tightening regional milk supplies—smart producers near these facilities can negotiate premium pricing while competitors chase volatile commodity markets.
  • FMMO Reform Windfall for Strategic Producers: June 1st implementation of “higher-of” Class III/IV pricing mechanism and $1.25/cwt average Class I differential increases create immediate revenue boosts—operations optimizing component quality and fluid milk positioning can capture $2,000+ annually per 100 cows through reformed pricing structures.
  • Feed Cost Relief Demands Aggressive Margin Protection: Current 15-20% improvement in milk-to-feed ratios, with USDA projecting corn at $4.20/bu and soybean meal at $287/ton for 2025/26, offers potential annual savings of $3,230 per 100 cows—but daily volatility requires immediate hedging strategies to lock in these advantages before markets reverse.
  • Component Economy Trumps Volume Strategy: With butterfat averaging 4.40% and protein at 3.40% in 2025, operations maximizing milk solids production capture premium pricing while volume-focused competitors face margin compression—nutritional programs targeting component optimization deliver $0.75-$1.50/cwt production cost advantages.
  • Export Market Disruption Signals Domestic Focus: China’s retaliatory tariffs and 20.9% NDM export decline expose dangerous international dependencies—progressive producers pivoting toward domestic premium markets, value-added processing, and regional supply chains avoid geopolitical pricing volatility while capturing local demand premiums.

Butter’s 4.5¢ plunge amid heavy institutional selling reveals the harsh reality behind yesterday’s optimistic cheese signals, while soybean meal’s explosive surge threatens to erode the margin improvements that have sustained producer confidence through early June.

Today’s Price Action & Farm Impact

The CME dairy complex delivered a sobering reality check on June 10th, with butter leading a broad-based retreat that exposed underlying market vulnerabilities masked by yesterday’s cheese euphoria.

ProductPriceDaily ChangeWeekly TrendTrading IntelligenceImpact on Farmers
Butter$2.5050/lb-4.50¢-0.9¢ weekly decline30 trades, 21 bids vs 6 offers (3.5:1)Class IV pressure builds – institutional selling accelerates
Cheddar Blocks$1.8800/lbUnchanged-4.15¢ weekly decline0 trades, balanced 1:1 bid-offerYesterday’s supply squeeze stalls – buyers step back
Cheddar Barrels$1.8600/lbUnchanged+0.55¢ weekly gain0 trades, 1 bid, 0 offersUnderlying support holds but momentum fades
NDM Grade A$1.2650/lbUnchanged-0.75¢ weekly decline3 trades, 12 bids, 0 offers (∞ ratio)Export demand remains strong despite stagnant pricing
Dry Whey$0.5725/lb-0.50¢+0.75¢ weekly gain2 trades, balanced interestMinor Class III headwind continues

Critical Trading Pattern Analysis:

Today’s session revealed a dramatic shift in institutional sentiment. According to a CME floor trader contacted this afternoon, “The butter market saw the heaviest institutional liquidation we’ve witnessed in two weeks – these weren’t small lots but significant position unwinding.” This contrasts sharply with yesterday’s accumulation pattern, suggesting yesterday’s “institutional confidence” was actually strategic distribution ahead of today’s selling wave.

A dairy market analyst noted, “The retail cheese demand that supported yesterday’s rally appears to be taking a breather, with buyers stepping back to reassess supply availability.” This tactical retreat explains today’s stagnant block trading despite yesterday’s zero-offer environment.

Feed Cost & Margin Analysis

Feed Market Shock Threatens Summer Profitability:

Today’s feed complex movements created significant margin pressure:

  • Soybean Meal (JUL): $320.00/ton (preliminary data suggests sharp increase from $295.20 baseline)
  • Corn (JUL): $4.39/bu (+6¢ increase from established levels)
  • Feed Cost Impact: The dramatic soybean meal advance effectively erases the 15-20% margin improvement reported through early June

Margin Destruction Analysis:

For a 100-cow operation consuming 1.5 tons of soybean meal weekly, today’s price surge adds approximately $37.20 in weekly feed costs. This dramatic reversal highlights the fragility of margin improvements when underlying commodity volatility resurfaces, particularly as producers had been benefiting from the most favorable margin environment since March 2025.

Global Context & International Factors

International Production Dynamics:

  • European Union: Continuing to experience virtually no growth (0.0%) in milk production, with Bluetongue virus impacts persisting in key regions
  • New Zealand: Drought conditions affecting third-quarter supply chains, potentially tightening global powder markets
  • South America: Milk output through April 2025 up compared to previous year due to favorable weather conditions

Export Competitiveness Challenges:

U.S. dairy export performance shows growing vulnerability to international competition. While cheese exports achieved record levels with 6.7% growth, NDM exports declined by 20.9%, highlighting price competitiveness issues against EU and New Zealand suppliers. Chinese retaliatory tariffs escalating from 10% to 125% on specific products continue pressuring export opportunities.

USDA Forecasts & Federal Order Reform Impact

Updated USDA Projections:

The USDA’s revised forecast shows the all-milk price projected at $21.60/cwt for 2025, representing a $0.50 increase from previous estimates. However, current Class III futures at $18.82/cwt suggest market skepticism about achieving these official projections.

Federal Order Reform Implementation:

New FMMO changes effective June 1st include:

  • Class I differential increases averaging $1.25/cwt across most regions
  • Updated make allowances that may pressure Class III and IV prices
  • “Higher-of” Class III or Class IV pricing mechanism for Class I fluid milk

For Cuyahoga County operations, the Class I differential increased from $2.00/cwt to $3.80/cwt, providing significant regional premium benefits.

Regional Market Analysis

California Update:

California’s largest producing state status creates unique dynamics as processing capacity expansion continues. New facilities are absorbing increased volumes but at lower valuations than processors anticipated, impacting West Coast pricing structures.

Northeast Fluid Markets:

Federal Order reform’s impact on Class I differentials particularly benefits Northeast operations, where fluid milk demand provides premium pricing opportunities despite broader commodity market weakness.

Southwest Growth Regions:

Heat stress impacts are beginning earlier than historical patterns, with production declines accelerating in key Southwest regions as summer temperatures rise.

Market Sentiment & Industry Voices

Trading Floor Perspective:

“Today’s session felt like a reality check after yesterday’s optimism,” commented a veteran CME trader. “The butter selling was aggressive and coordinated – not the kind of activity you see from end-users but from funds looking to exit positions.”

Processor Outlook:

Industry processing sources indicate inventory accumulation strategies despite declining prices, suggesting confidence in long-term demand recovery while acknowledging near-term pricing pressure.

Actionable Farmer Insights

Immediate Risk Management Priorities:

  1. Feed Cost Protection: Consider forward contracting 30-50% of Q3 protein needs given today’s explosive soybean meal movement
  2. Milk Pricing Strategy: Selective hedging opportunities exist with futures premiums to cash markets
  3. Component Focus: Maximize butterfat and protein premiums through targeted nutrition programs

Cash Flow Management:

With Federal Order reforms creating new pricing mechanisms and feed cost volatility returning, maintain liquidity buffers and consider accelerating planned capital investments while equipment financing remains favorable.

Forward-Looking Analysis

Futures Market Signals:

  • Class III (JUN): $18.82/cwt trading below USDA forecasts
  • Cheese Futures Premium: 15.8¢ premium to cash blocks suggests supply tightness expectations
  • Feed Cost Trajectory: USDA projects corn at $4.20/bu and soybean meal at $287/ton for 2025/26, offering potential annual savings of $1,080 for corn and $2,150 for soybean meal per 100 cows

The Bottom Line

Today’s market action strips away recent optimism, revealing fundamental challenges requiring immediate attention. Butter’s institutional selling wave combined with feed cost explosions creates margin compression demanding aggressive risk management.

The dairy industry’s $8+ billion processing investment wave continues providing long-term demand support, with facilities like Chobani’s $1.2 billion Rome, NY plant and Darigold’s $1 billion Pasco, WA facility processing 12 million and 8 million pounds daily respectively. However, current pricing suggests this capital is being deployed more conservatively than anticipated.

Strategic Focus: Component optimization over volume growth, selective hedging over market speculation, and operational efficiency improvements. Federal Order reforms provide new premium opportunities for positioned producers, while processing capacity expansion creates strategic demand floors even as current pricing reflects tactical positioning rather than fundamental strength.

The path forward requires balancing current margin pressures with strategic opportunities created by industry capacity expansion and regulatory changes – today’s reality check provides valuable perspective for well-capitalized operations focused on long-term competitive advantages.

Learn More:

The Sunday Read Dairy Professionals Don’t Skip.

Every week, thousands of producers, breeders, and industry insiders open Bullvine Weekly for genetics insights, market shifts, and profit strategies they won’t find anywhere else. One email. Five minutes. Smarter decisions all week.

NewsSubscribe
First
Last
Consent

Three Dairy Producers Just Transformed $2.5 Million in Manure Costs into Million-Dollar Revenue Streams

Stop treating manure as waste disposal. Three producers just turned $2.5M in annual costs into million-dollar revenue streams. Here’s their blueprint.

EXECUTIVE SUMMARY: The dairy industry’s biggest lie? That manure is an expensive disposal problem instead of your most valuable untapped revenue stream. Three pioneering producers at the 2025 Midwest Manure Summit just proved this conventional wisdom dead wrong, transforming what costs most farmers 6 per cow annually into integrated systems generating up to ,912 per ton in revenue. Scott Hynds’ membrane technology creates precision fertilizer blends from liquid manure, John Rosenow’s 25-year compost operation ships 42 semi-loads annually to premium markets, and Brent Cousin’s 8,500-cow biorefinery produces renewable natural gas while reducing bedding costs by -75 per cow. With biochar production alone valued at ,828-,912 per ton and one operation saving .5 million compared to conventional methods, these aren’t isolated success stories—they’re proof that manure valorization can fundamentally transform your farm‘s economic model. While milk prices face volatility, these producers built diversified income streams that generate revenue regardless of commodity fluctuations. The question isn’t whether manure monetization works—it’s how much longer you can afford to literally dump money in your lagoons while competitors capture value from the same resource you’re paying to dispose of.

KEY TAKEAWAYS

  • Transform $100,000-$400,000 annual disposal costs into revenue streams: Traditional manure management bleeds $306 per cow annually through storage, hauling, and application, but integrated valorization systems like anaerobic digestion with RNG production create multiple income sources while reducing bedding costs by $50-75 per cow.
  • Membrane technology delivers precision nutrition worth premium prices: Instead of spreading liquid manure that’s 90% water, Scott Hynds’ membrane separation creates custom-tailored fertilizer blends for specific crop applications, transforming inefficient bulk hauling into precision agriculture solutions that neighboring farmers actively seek.
  • Biochar production generates $1,828-$1,912 per ton while sequestering carbon: Dairy manure biochar contains twice the nutrient content of original manure by mass and three times by volume, with nutrient value reaching $240-$340 per ton plus carbon value of $1,580 per ton—creating markets that reward both productivity and sustainability.
  • Scale-appropriate solutions exist for every operation size: From 200-cow dairies using co-digestion with food waste (viable at $20/ton tip fees) to 2,500+ cow operations running integrated biorefineries, the Summit data proves profitable pathways exist across all herd sizes with proper technology matching.
  • Strategic monitoring drives $2.5 million savings potential: Brent Cousin’s approach of taking 60-100 annual manure samples to guarantee exact nutrient content builds customer trust while optimizing application strategies—one dairy saved $20,000 per 200 cows compared to conventional methods, scaling to $2.5 million savings for larger operations.
dairy manure management, manure monetization, dairy profitability, anaerobic digestion, dairy revenue streams

At the 2025 Midwest Manure Summit, three pioneering producers proved that what most farmers see as their biggest liability can become their most profitable enterprise. Their integrated systems are generating revenue streams worth up to $1,912 per ton while solving environmental headaches – and their blueprints could revolutionize your operation’s bottom line.

Look, I’ll be straight with you. If you’re still treating manure as a disposal problem, you’re literally flushing money down the drain. The producers who spoke at Green Bay’s Midwest Manure Summit this year aren’t just managing waste – they’re running sophisticated bio-refineries that would make any CFO jealous.

The numbers don’t lie. Your average Holstein dumps 150 pounds of manure daily. For a 1,000-cow herd, traditional manure management costs can range from $100,000 to $400,000 annually – costs that escalate from $399 for small herds to over $1.9 million for operations with 5,000+ cows. That’s not management – that’s financial hemorrhaging.

Why Your Current Manure Strategy Is Bleeding Money – And Why Most Farmers Are Getting This Dead Wrong

Here’s the uncomfortable truth: the dairy industry has been conditioned to accept manure as a necessary evil for decades. But what if this entire paradigm is fundamentally flawed?

Think about it like this: you’re essentially paying premium prices to haul away what could be your most valuable crop. It’s like a corn farmer paying someone to remove grain from his bins while neighbors build ethanol plants. When did you last calculate the true opportunity cost of your current manure management system?

Research shows the average farm spends 6.13 per cow annually just on storing, hauling, and applying manure – that’s .33 per hundredweight of milk produced. For a 500-cow operation, that’s over $153,000 annually just to get rid of what these Summit producers are turning into gold.

But here’s what really gets me fired up: while you’re paying to haul away this “waste,” your neighbors are starting to see dollar signs. The paradigm shift is happening whether you’re on board or not.

The wake-up call? Three producers at the Summit proved that manure valorization isn’t some pie-in-the-sky concept. It’s happening right now, generating serious revenue while solving environmental challenges.

The Membrane Revolution: Scott Hynds’ Clean Water Cash Machine

Scott Hynds from Aqua Innovations LLC is rewriting the rules of liquid manure management. His membrane technology doesn’t just clean up discharge water – it creates two distinct, valuable revenue streams that traditional systems completely miss.

“We know how to make water. We don’t know crap about crap,” Hynds joked at the Summit, but his results are dead serious. By partitioning nutrients like phosphorus and nitrogen into separate streams, producers can create custom-tailored fertilizer blends for specific land applications.

Here’s the genius: Instead of hauling diluted, inconsistent manure with 90% water content across your fields, you deliver precision nutrition exactly where crops need it. Think of it like switching from feeding a total mixed ration to precision feeding based on individual cow requirements – the efficiency gains are massive.

“When you have two unique nutrient streams that you can commingle and custom-tailor your nutrient blend per land application, it creates flexibility that wasn’t there previously,” Hynds explained.

Challenge the conventional wisdom: Why are we still spreading liquid manure that’s 90% water when membrane technology can separate valuable nutrients from discharge water? The traditional approach is like shipping ice cubes to Alaska – you’re paying premium freight costs to move mostly water.

The 25-Year Proof: John Rosenow’s Compost Cash Cow

Here’s a story that should make every 600-cow dairy producer pay attention. John Rosenow’s Rosenow Dairy and Cowsmo Compost operation has been quietly printing money for 25 years by processing manure from his farm plus a neighboring 150-cow operation.

“We don’t compost our manure for fun. We do it for money,” Rosenow stated bluntly at the Summit. “Now, let’s say it’s a nice income source when milk prices are lousy, and we count on it quite a bit.”

The numbers tell the whole story: Rosenow ships compost by semi-loads to the Twin Cities area – 42 loads to one account alone last year. Diversified income streams like compost become critical profit centers with volatile milk prices.

The marketing evolution reveals everything. Rosenow initially avoided using “manure” on product labels because consumers shied away. Now? “We have it on our label because the word has become very popular. When we’re selling to gardeners and people like that, they want to know if it’s from dairy manure. And then it’s a positive, and their eyes light up”.

But here’s the reality check: Rosenow faces three major challenges that every producer considering manure monetization should understand:

  • Regulatory compliance: His 1997-designed facility now violates current DNR rules
  • Marketing evolution: Traditional trade shows are dead; digital marketing is essential
  • Labor retention: Current political rhetoric makes keeping good employees increasingly difficult

Are you ready to confront the uncomfortable truth? Most of us are still thinking like waste managers instead of resource processors. Rosenow’s success proves that consumer perception has already shifted – the question is whether your business model has kept pace.

The RNG Revenue Revolution: Brent Cousin’s $8,500-Cow Empire

Brent Cousin’s Holsum Dairies showcases how scale changes everything. Managing 8,500 cows across two sites, Cousin has built an integrated manure-to-energy-to-fertilizer system that maximizes every molecule.

The anaerobic digesters producing renewable natural gas (RNG) hit the jackpot when California fuel credits and federal renewable fuel standards created premium markets. “There were times and years when electrical generation did very well. That fell off, but at no point did it ever become a cost,” Cousin explained. “But then, with California fuel credits and RNG, it has really become a great diversity of our overall income.”

Here’s the cascade approach genius: biogas for energy, solid separation for bedding, and strategic nutrient application based on precise composition analysis. Cousin’s team takes 60 to 100 manure samples annually to guarantee exact nutrient content to crop growers.

Think of it like precision feeding for your crops – instead of applying a generic TMR equivalent to your fields, you deliver exactly what each field needs based on soil tests and crop requirements.

Here’s where most producers miss the boat: They think anaerobic digestion is just about biogas production. Cousin’s operation proves it’s about creating multiple revenue streams from the same feedstock while reducing input costs across the entire operation.

The Technology Stack That’s Changing Everything – Beyond the Hype

The most successful operations aren’t betting on single technologies – they’re building integrated systems. Consider these verified performance metrics:

Biochar Production: Dairy manure biochar possesses approximately twice the nutrient content of the original manure by mass and more than three times by volume. The nutrient value alone reaches $240-$340 per ton, while the carbon value hits $1,580 per ton. Combined? You’re looking at $1,828 to $1,912 per ton.

Struvite Recovery: Pilot-scale studies show 30% to 32% phosphorus recovery rates, with production costs ranging from $613-$1,500 per tonne versus $320 for conventional MAP fertilizers.

Energy Integration: Energy production from anaerobic digestion increases by 42% when coupled with pyrolysis, creating efficient closed-loop systems.

The Uncomfortable Reality: Why 87% of Farm Digesters Struggle

Here’s the controversial reality nobody discusses: research indicates that a significant percentage of farm methane digesters haven’t been profitable without grants. However, that’s changing as innovation and multinational energy companies pump dollars into farm projects.

The economic viability of anaerobic digestion, particularly for small and medium-sized dairy farms, hinges on a multi-revenue stacking strategy. For example, a 300-cow dairy can achieve economic feasibility for its AD system only when food waste is co-digested in an equal volume with manure, alongside tip fees reaching $20 per ton and biomethane valued at $25 per million BTU.

Critical question for every producer: Are you still considering manure management as a single-solution problem, or are you ready to embrace the biorefinery concept that maximizes value at every step?

Market Forces Driving the Transformation – The Money Trail

The economic drivers extend far beyond farm gates. Aemetis Biogas completed $1.6 million in LCFS credit sales in April 2024 alone, with federal Section 45Z production tax credits for dairy RNG beginning in January 2025. Programs like Carbon by Indigo return 75% of carbon credit purchase prices directly to farmers.

Government support is accelerating adoption. The USDA’s Transform F2C project includes a $70 million Dairy Manure Management Incentive Program, offering up to $1 million per farm entity with potential 100% project budget coverage.

Implementation Realities: What Success Actually Looks Like

Based on verified performance data from the Summit producers, here’s what actually works:

Cousin’s monitoring approach: “For manure generation, we look at how much manure we apply yearly. We only get that number once a year. We evaluate that on a per-cow basis just to monitor how we’re doing year over year, trying to limit that as much as possible”.

Key performance indicators successful operations track:

  • Manure generation per cow annually
  • Application methods (hose vs. truck percentages)
  • Bedding dryer performance through milk quality metrics (SCC, clinical mastitis)
  • Biogas production quality and volume
  • Operational performance data with smart sensors

Here’s the hard truth most consultants won’t tell you: Success isn’t just about installing equipment – it’s about fundamentally changing how you think about every molecule that leaves your cows. Are you measuring the right metrics or still focused on outdated disposal-focused KPIs?

The Challenges Nobody Talks About – Confronting the Uncomfortable Realities

Capital costs for advanced systems range significantly. Struvite recovery systems designed for 60,000 gallons of manure daily cost $75 to $125 per cow in capital investment, with operating costs of $80 to $140 per cow annually.

Initial setup costs for algae cultivation can range from $180,000 to over $600,000, depending on scale and location. Biochar production capital costs can vary dramatically, from $1 million for small-scale plants to $90 million for large-scale facilities.

The permitting maze is real. Anaerobic digestion facilities need permits from local administrative bodies for building construction, air pollution control, hazardous waste management, and water discharge.

But, the successful producers understand that these challenges are temporary obstacles, not permanent barriers. The producers who solve them first will dominate the emerging markets.

Why This Matters for Your Operation – The Scale Economics Reality Check

The data from these three operations reveals scalable opportunities across different herd sizes:

For 200-500 Cow Operations: Research shows co-digestion with food waste becomes economically viable when tip fees reach $20 per ton and biomethane values hit $25 per MMBTU. Strategic partnerships with local food processors create dual revenue streams.

For 500-2,500 Cow Operations: Advanced anaerobic digestion with RNG production offers the sweet spot for profitability, especially with California fuel credits generating substantial monthly revenues.

For 2,500+ Cow Operations: Integrated biorefinery approaches maximizing biochar, struvite recovery, and energy production provide the highest returns. One dairy saved approximately $20,000 per 200 cows compared to conventional methods, potentially reaching $2.5 million in savings for a 2,600-cow operation.

But here’s the controversial reality: The dairy industry has been conditioned to believe that only large operations can monetize manure effectively. These Summit producers prove that’s a limiting belief that’s costing smaller operations millions in lost opportunities.

The Critical Question Every Producer Must Answer

Are you willing to challenge the fundamental assumption that manure is waste? The Summit producers didn’t just adopt new technology – they completely reimagined their relationship with every pound of manure their cows produce.

Research demonstrates that with full utilization, organic wastes could generate 2% to 4% of total electricity needs or supply 10% to 15% of statewide gasoline demand in the form of renewable natural gas.

The economic potential is staggering: widespread deployment of anaerobic digestion infrastructure could catalyze over $1.27 billion in capital investments, generate more than 12,000 construction jobs, and sustain over 1,000 long-term operational positions.

The Bottom Line: Your Strategic Decision Point

The three Summit producers demonstrated conclusively that manure transforms from liability to asset when approached strategically. With milk production facing dynamic changes, diversified revenue streams become essential.

Your action plan starts now:

  1. Calculate your true manure handling costs – most producers underestimate annual expenses. If you spend more than $306 per cow annually on manure management, you’re bleeding money that could generate revenue.
  2. Assess your local market conditions – proximity to crop growers, food processors, and energy infrastructure. With manure nutrient value ranging significantly depending on application rates and fertilizer prices, local markets can dramatically impact your ROI.
  3. Evaluate your scale – different technologies optimize at different herd sizes. The Summit data proves that every operation size has viable options, but the approach must match your scale and local conditions.
  4. Explore partnerships – third-party build/own/operate models eliminate financial risk while capturing benefits. Strategic alliances with energy companies, waste management firms, and technology developers can accelerate implementation while reducing risk.

The fundamental choice: Will you continue paying to dispose of what could be your most profitable crop, or will you join the producers who are building the future of dairy profitability?

The question isn’t whether manure monetization works – the Summit producers proved that beyond doubt. How much longer can you afford to dump money in your lagoons while your competitors build revenue streams from the same resource you’re paying to dispose of?

The transformation is happening. The only choice you have is whether you’ll lead it or watch from the sidelines while others capture the value you’re currently throwing away.

The window for early adoption advantages is closing fast. As more producers recognize manure’s revenue potential, competition for premium markets will intensify. The farmers establishing these systems now will control the best customer relationships and command premium pricing.

Your move starts today. Because in five years, the question won’t be whether you should have monetized your manure – it’ll be why you waited so long to start.

Learn More:

The Sunday Read Dairy Professionals Don’t Skip.

Every week, thousands of producers, breeders, and industry insiders open Bullvine Weekly for genetics insights, market shifts, and profit strategies they won’t find anywhere else. One email. Five minutes. Smarter decisions all week.
NewsSubscribe
First
Last
Consent

Weekly U.S. Dairy Market Report: June 6th, 2025 – Cheese Surge Rewrites Global Trade Rules

Stop treating dairy as one market. April’s 6.7% cheese export surge vs 20.9% milk powder crash proves product-specific strategies boost margins 40%+.

Executive Summary: The conventional wisdom of managing dairy as a unified market just cost producers millions in missed opportunities, as April 2025 data reveals the most bifurcated dairy economy in decades with cheese exports hitting all-time highs while milk powder markets collapse under trade war pressure. Smart operators capitalizing on this divide are seeing butter prices surge to .555/lb despite record 215.8 million pound production volumes, while Class IV futures above /cwt through December promise sustained profitability for strategically-positioned farms. The brutal reality: U.S. nonfat dry milk exports crashed 20.9% to just 113.5 million pounds as China’s 40% whey market share evaporated, forcing immediate product mix optimization for survival. Meanwhile, three-quarters of dairy farmers expect 2025 profitability thanks to diversified revenue streams, with beef-on-dairy programs delivering $201/cwt fed steer prices that provide crucial margin insurance against volatile milk markets. Operations still treating cheese, butter, and powder markets identically are leaving serious money on the table—it’s time to audit your product allocation strategy immediately.

Key Takeaways

  • Optimize Product Mix for Maximum Returns: Cheese processors hitting 1.23 billion pounds production (highest daily average on record) while maintaining 6.7% export growth demonstrate that strategic capacity allocation toward high-performing segments can deliver sustained profitability even during trade disruptions.
  • Leverage Beef-on-Dairy Revenue Diversification: With fed steer prices forecast at $201/cwt in 2025 and $222.75/cwt in 2026, operations utilizing beef genetics on 30-40% of breedings are creating $150-200 per head additional revenue streams that provide crucial buffer against Class III volatility.
  • Capitalize on Class IV Market Strength: September through December Class IV futures trading above $20/cwt signal sustained butter and powder demand, making strategic milk marketing agreements that maximize Class IV allocation a critical profitability driver for the next 18 months.
  • Implement Geographic Market Diversification: With China’s whey imports down 53% and Southeast Asia NDM shipments falling 29%, successful exporters are doubling down on Central America (+31%), Japan (+29%), and Australia (+42%) to maintain volume growth despite trade headwinds.
  • Strategic Feed Cost Management: July corn at $4.42/bushel and stable soybean meal at $296/ton, combined with RFS-supported soybean oil prices, create favorable feed cost environments that support margin expansion when paired with optimized product mix strategies.

America’s dairy sector just delivered the most explosive export performance in decades – cheese shipments hit an all-time high with 6.7% growth while milk production surged 1.5% year-over-year, but here’s the brutal reality: trade wars are absolutely decimating our whey markets and creating the most bifurcated dairy economy we’ve ever seen. If you’re not adjusting your product mix and risk management strategies right now, you’re about to get steamrolled by the biggest market restructuring in a generation.

The Great American Dairy Paradox: When Winners and Losers Couldn’t Be More Different

You know what’s driving me absolutely crazy about today’s dairy market? Everyone’s talking about “overall dairy strength” when we’re actually witnessing the most schizophrenic market conditions I’ve seen in 20 years covering this industry.

Let me be blunt: if you’re still treating “dairy” as one unified market, you’re making decisions with outdated thinking that could cost your operation serious money.

Milk Production: The Foundation That Won’t Quit

April milk production hit 19.4 billion pounds – up 1.5% from April 2024. But here’s what gets really interesting: the national milk cow herd expanded by 66,000 head compared to January 2024, with producers actively retaining productive cows longer. This isn’t accidental growth – it’s strategic confidence in the industry’s future.

USDA projects milk production at 227.3 billion pounds for May 2025, climbing to 227.9 billion pounds in 2026. The all-milk price rose to $21.60/cwt for 2025 – a $0.50 bump from previous forecasts.

Here’s the kicker: three-quarters of dairy farmers now expect profitability in 2025. That’s not wishful thinking – it’s smart producers recognizing that diversified revenue streams, especially beef-on-dairy programs with fed steer prices forecast at $201/cwt, create real competitive advantages.

The Cheese Gold Rush That’s Reshaping Everything

Daily average U.S. cheese exports reached an all-time high in April, surging 6.7% from already-massive 2024 volumes. Think about that for a second – we’re not just beating records but destroying them while domestic production also hits historic peaks.

Cheese production reached 1.23 billion pounds in April – up 3.1% from last year, marking the record’s highest daily average output. Cheddar production jumped 8.1%, meaning fresh products will be flooding Chicago markets soon.

But here’s where market dynamics get fascinating: despite record production AND record exports, CME spot Cheddar pulled back to $1.8575, down 9¢ from the previous Friday. When processors tell USDA’s Dairy Market News to expect “increased spot cheese availability,” smart money listens.

Butter: Defying Every Economic Law You Know

This is where traditional supply-demand analysis gets thrown out the window. Manufacturers loaded up on cheap cream in April, pushing butter output to 215.8 million pounds – the highest April volume since 2020.

You’d expect prices to crash, right? Wrong. Dead wrong.

Spot butter leaped to $2.555, hitting a five-month high. For the week ending May 31st, butter averaged $2.41/lb. Even the Global Dairy Trade auction showed butter prices increasing by 3.8%.

What’s driving this apparent contradiction? Robust domestic demand and improving exports absorb massive production increases like nothing. When you can increase supply significantly and still see prices climb, you look at fundamentally different market dynamics.

Market Performance Comparison: The Winners vs. The Losers

Product CategoryPrice TrendExport PerformanceProduction StatusMarket Outlook
Cheese$1.8575 (-9¢)All-time high (+6.7%)Record productionStrong
Butter$2.555 (+8¢)Steady paceHighest April since 2020Very Strong
NDM/SMP$1.2625 (-2.5¢)Down 20.9%Declining outputWeak
Dry Whey$0.58 (+0.75¢)China pivot hurtsConstrained supplyMixed

The Trade War Casualties: Where Politics Destroys Profits

Here’s where the dairy market gets really ugly and why you need to understand which products are getting absolutely hammered.

U.S. nonfat dry milk exports crashed 20.9% in April to just 113.5 million pounds. While Mexico shipments stay strong, Europe is aggressively gaining market share in Southeast Asia – our second-largest customer.

The whey situation is even more brutal. China typically accounts for 40% of U.S. whey powder exports, but they’ve pivoted hard to Belarus and New Zealand after the trade war escalated. If we lose that Chinese market permanently, we’d need to nearly double exports to every other market just to break even.

CME spot dry whey did rally 0.75¢ to 58¢/lb – its highest price in nearly four months. But that’s primarily driven by domestic demand for high-protein products constraining supply, not export strength.

Class III and IV: The Tale of Two Futures

The cheese market pullback hammered nearby Class III prices hard. June contract dropped 41¢ to $18.80/cwt, and July fell nearly 70¢ to $18.90. However, deferred contracts show revenues in the high-$18s through early 2026.

Class IV tells a completely different story. Most contracts added about a dime, with June at $18.42 and July reaching $19.16. September through December Class IV futures are back above $20.

What this means for your operation: If you’re heavily weighted toward Class III products, you’re feeling pain right now. But if you’ve got Class IV exposure, you’re sitting pretty.

Feed Markets: The Calm Before What Storm?

July corn finished at $4.42/bushel, down 1.5¢, while December rallied 10¢ to $4.49. Regional planting challenges in Ohio, Pennsylvania, and the Southeast haven’t spooked the broader market because significant rains benefitted the rest of the farm belt.

Soybean oil climbed 16¢ to $10.58 on July contracts. USDA forecasts significant increases in soybean oil use for biofuels, projecting 13.9 billion pounds for 2025/26. This policy-driven demand provides crucial price floors for feed components.

Why This Matters for Your Operation

If you’re not adjusting your strategy based on these divergent market signals, you’re leaving serious money on the table. The producers winning right now are those who’ve figured out how to maximize cheese and butter production while minimizing exposure to powder markets getting hammered by trade wars.

The smart money is diversifying: product mix optimization, geographic market diversity, and revenue stream multiplication through beef-on-dairy programs. With fed steer prices forecast to jump to $222.75/cwt in 2026, that diversification isn’t just smart – it’s essential.

But here’s what’s keeping me up at night: this bifurcated market means the gap between winners and losers is widening fast. Operations that adapt thrive. Those that don’t… well, the market doesn’t care about your feelings.

The Bottom Line

The American dairy industry just delivered its most explosive performance in decades, but this isn’t your grandfather’s unified dairy market – it’s a complex, bifurcated economy where cheese and butter producers are printing money while milk powder operations face brutal headwinds from trade wars and European competition.

Key takeaways for your operation:

  • Optimize your product mix: Chase cheese and butter markets while minimizing powder exposure
  • Leverage diversified revenue: Beef-on-dairy programs with $201/cwt fed steer prices provide crucial income stability
  • Watch the calendar: Class IV futures above $20 suggest strong margins through December
  • Stay informed: With 93% of corn planted matching five-year averages, feed costs remain manageable

The smart money is betting on diversification: product mix optimization, geographic market diversity, and revenue stream multiplication. Producers implementing these strategies today will dominate tomorrow’s evolving dairy landscape.

What’s your operation doing to capitalize on record cheese demand while hedging against trade war volatility? The producers answering that question strategically are the ones who’ll own this market.

Learn More:

The Sunday Read Dairy Professionals Don’t Skip.

Every week, thousands of producers, breeders, and industry insiders open Bullvine Weekly for genetics insights, market shifts, and profit strategies they won’t find anywhere else. One email. Five minutes. Smarter decisions all week.

NewsSubscribe
First
Last
Consent

Maximizing Calf Performance: The Million-Dollar Investment in Your Dairy’s Future

Boost profits with science-backed calf care: How pre-weaning ADG drives lifelong milk production

Pre-weaning calf performance isn’t just about raising healthy calves – it’s about building your dairy’s future profit engine. The research is crystal clear: what happens in those first 60 days shapes your herd’s productivity for years to come. Each pound of average daily gain (ADG) during the pre-weaning period can translate to over 1,000 pounds more milk in first lactation. From colostrum management to disease prevention, early nutrition decisions are literally worth thousands per animal. This comprehensive analysis breaks down the latest research on pre-weaning ADG and provides actionable strategies that can dramatically boost your dairy’s bottom line.

THE PRE-WEANING ADG REVOLUTION: WHERE YOUR PROFIT POTENTIAL EXPLODES

The connection between early calf growth and lifetime productivity isn’t just theory – it’s backed by hard numbers that should make every dairy producer sit up and take notice. Research has consistently demonstrated that investments in calf nutrition during those critical first weeks deliver returns that continue for years.

The Cornell Connection: Early Growth Equals Future Production

Cornell University researchers have documented a remarkable relationship between pre-weaning growth and future milk production potential. Their groundbreaking analysis found that for every 1 kg increase in average daily gain during the pre-weaning period, heifers produced a stunning 850 kg more milk during their first lactation. When translated to pounds, that’s about 1,870 pounds of additional milk for each pound of daily gain – a return on investment that few other farm practices can match.

In commercial settings, the results were even more dramatic, with every 1 kg increase in pre-weaning ADG correlating with 1,113 kg more milk in first lactation. These findings demonstrate that early growth isn’t merely important – it’s fundamentally reshaping our understanding of dairy economics. The researchers concluded that pre-weaning ADG alone accounts for approximately 22% of the variation in first-lactation milk yield. Think about that – nearly a quarter of your heifers’ production potential is being determined before they’re even weaned!

Beyond Milk: The Full Economic Impact of Optimal ADG

The financial implications extend well beyond just milk production. Calves with higher pre-weaning ADG enter the breeding program earlier, reducing age at first calving and lifetime raising costs. According to current research, calves that have experienced respiratory disease or scours are significantly more likely to be culled before reaching their productive potential. Specifically, calves treated for scours are nearly three times more likely to calve after 30 months of age, dramatically increasing rearing costs while delaying revenue generation.

The numbers tell the story: heifers that avoid respiratory disease have twice the likelihood of successful calving. When we look at specific growth metrics, the NAHMS Dairy study found that excellent preweaning growth should exceed 1.8 pounds (0.82 kg) daily gain. Calves falling below this threshold are less likely to reach their genetic potential for production, reducing your return on investment for each animal.

COLOSTRUM: NATURE’S PROFIT-BOOSTING POWERHOUSE

If there’s one factor that stands above all others in setting up calves for success, it’s proper colostrum management. This “liquid gold” does more than just provide passive immunity – it fundamentally programs metabolic and growth pathways that enhance lifetime productivity.

First Hours, Lifetime Impact: Critical Timing for Colostrum Feeding

The window for effective colostrum administration is incredibly narrow. Research shows that feeding one gallon of quality colostrum within the first 4 hours of life is essential for optimal passive transfer of antibodies. Calves should receive an additional 2 quarts at the second feeding, establishing a strong foundation for both health and growth.

Quality standards matter tremendously – colostrum should measure at least 22-23% Brix when assessed with a refractometer to ensure adequate immunoglobulin content. A recent study demonstrated that calves receiving a supplemental colostrum feeding 12-16 hours after birth showed higher serum protein levels (9.7% Brix) compared to control calves (9.2% Brix), indicating improved passive immune transfer. This additional immune protection creates a cascade of positive effects – healthier calves focus energy on growth rather than fighting disease.

The Double Benefit: Colostrum as Treatment and Prevention

One of the most exciting developments in calf management is the emerging evidence that colostrum may serve as both prevention and treatment for common calf ailments. Researchers have found that colostrum shows significant promise as a treatment for scours, potentially reducing reliance on antibiotics. This approach makes perfect sense given colostrum’s remarkable composition – it contains more than 100 times the disease-protecting immunoglobulins found in standard cow’s milk and is packed with essential vitamins A, D, E, and B, plus high levels of critical minerals.

The bioactive compounds in colostrum, including lactoferrin, have been shown to prevent sepsis in calves. Additionally, colostral oligosaccharides help calm intestinal inflammation and promote the development of beneficial gut bacteria, addressing the root causes of digestive disruption. This dual function of colostrum – prevention and treatment – represents a valuable management tool that’s readily available on every dairy farm.

HEALTH CHALLENGES: OVERCOMING PROFIT ROADBLOCKS

Disease challenges during the pre-weaning period create significant drags on growth and future productivity. Understanding these challenges and implementing effective prevention strategies is essential for maintaining optimal ADG.

The Scours Challenge: Prevention, Impact, and Treatment Options

Scours remains one of the most significant health challenges for young calves, causing 56% of pre-weaning illness and a devastating 32% of pre-weaning deaths. The economic impact extends far beyond the immediate treatment costs of approximately $50 per case. Research shows that heifers that experienced scours will have about 50 grams per day less average daily gain throughout their growth period, 10% lower milk production in their first lactation, and are three times more likely to calve after 30 months of age.

What’s particularly concerning is that approximately 75% of scours cases in the U.S. receive antibiotic treatment, despite many cases being caused by viruses or protozoa that won’t respond to antibiotics. This practice not only fails to address the underlying cause but potentially creates lasting alterations to the calf’s gut microbiota that may further impact growth and health.

The promising news is that colostrum-based approaches show significant potential as alternative treatments. When dried colostrum was added to milk replacer, researchers observed a reduction in antibiotic treatment needs by over half, with lower incidence of scours, respiratory disease, and navel ill. This approach aligns with consumer preferences for reduced antibiotic use while potentially delivering better outcomes for the calves themselves.

Respiratory Disease: The Silent Profit Killer

Respiratory challenges represent another major obstacle to achieving optimal ADG. A recent prospective cohort study revealed that 83.4% of male dairy calves developed lung consolidations of 1 cm or more during the observation period, with only 53.9% of these cases resolving with antimicrobial therapy. Calves with uncured or chronic pneumonia showed significantly reduced ADG (992 ± 174 g/d and 930 ± 146 g/d, respectively) compared to healthy calves (1,103 ± 156 g/d).

Perhaps most concerning is that 17.6% of calves arrived at the facility with existing lung consolidation, which significantly increased their odds of developing chronic pneumonia later (odds ratio = 4.2). These calves with lung consolidation upon arrival had lower ADG (981 ± 159 g/d vs. 1,045 ± 159 g/d) than healthy arrivals. This highlights the critical importance of respiratory health from birth and the need for early detection tools like quick thoracic ultrasonography (qTUS) to identify subclinical cases.

PRACTICAL STRATEGIES FOR BOOSTING PRE-WEANING ADG

Implementing effective strategies to maximize ADG requires attention to multiple factors, from feeding protocols to environmental management. Here’s what the latest research reveals about optimizing growth during this critical period.

Precision Feeding: Quantities, Timing, and Content

Feeding sufficient quantities of high-quality nutrition is fundamental to achieving target ADG. Research indicates that calves require 2.5 L of whole milk or 3.0 L of milk replacer containing 20 percent protein and 20 percent fat just to meet maintenance requirements – with no nutrients left for growth. Recommended feeding levels that support growth include 1 gallon twice daily or 3 quarts three times daily starting from day 2 of life.

The quality of feed matters tremendously. Calves fed whole milk gained 0.22 lb/day (0.1 kg/day) more than calves fed milk replacer. This difference is likely due to the typically higher nutritional content in whole milk compared to many replacers, particularly in fat content. When milk replacer is used, protein content becomes a critical factor – dietary protein is considered the rate-limiting nutrient for growth. Formulations containing closer to 25 percent protein outperform the standard 20 percent options when fed in equal quantities.

Pasteurization also plays a significant role in improving outcomes. Calves fed pasteurized milk showed a 0.066 lb/day (0.03 kg/day) increase in ADG compared to those receiving unpasteurized milk. This simple processing step delivers measurable growth benefits while reducing pathogen exposure.

Environmental Management: Temperature, Housing, and Bedding Factors

Environmental factors significantly impact a calf’s ability to convert nutrients into growth. The NAHMS Dairy study found that bedding type makes a measurable difference in ADG – calves provided with sand bedding or no bedding gained significantly less than calves given other bedding types like straw. This seemingly simple management factor has real implications for growth performance.

Temperature management becomes especially critical during winter months. Calves require additional calories to maintain body temperature during cold weather, with maintenance requirements increasing substantially as temperatures drop. Without increased feeding rates during cold periods, calves will divert nutrients from growth to heat production, resulting in slowed or stalled ADG.

Consistency in feeding schedules and preparation methods also plays a crucial role in supporting optimal growth. Routine changes or variations in milk temperature, concentration, or feeding times create digestive stress that reduces feed efficiency and increases disease risk. Implementing standardized protocols that ensure consistent delivery of nutrition supports steady growth trajectories and minimizes health challenges.

THE BOTTOM LINE: YOUR ROADMAP TO CALF RAISING SUCCESS

The evidence is compelling – what happens during those first 60 days of a calf’s life has profound implications for your dairy’s future profitability. By implementing a comprehensive approach to pre-weaning management, you’re not just raising calves – you’re building the foundation for future production success.

Start by establishing clear ADG targets for your operation. The research supports aiming to double birth weight by weaning, which translates to approximately 1.5-1.8 pounds of daily gain. Regularly measuring and tracking growth allows for timely adjustments to nutrition programs and early identification of health challenges.

Prioritize colostrum management as your first line of both defense and offense. The research is unequivocal – proper colostrum administration sets the stage for everything that follows. Consider building a colostrum bank from high-quality sources to ensure availability for both newborn feeding and potential therapeutic use with scours cases.

Implement feeding protocols that deliver sufficient nutrition for both maintenance and growth, adjusting for seasonal temperature changes. Remember that investment in higher quality nutrition during this period pays dividends throughout the animal’s productive life.

Finally, adopt a proactive approach to health management, focusing on early detection and intervention for both respiratory challenges and digestive disruptions. Consider emerging technologies like quick thoracic ultrasonography to identify subclinical respiratory issues before they affect growth.

The bottom line is clear – your pre-weaning calf program isn’t just a cost center, it’s one of your dairy’s most powerful profit drivers. By applying these research-backed strategies, you’re positioning your operation for improved production efficiency, reduced replacement costs, and ultimately, enhanced profitability for years to come.

Key Takeaways:

  1. Higher pre-weaning ADG = More milk: Each pound gained early boosts lifetime production by 1,100+ lbs.
  2. Colostrum is liquid gold: Proper timing and quality are non-negotiable for immune function and growth.
  3. Feed smart, not hard: Precision nutrition (1 gal twice daily) and seasonal adjustments maximize growth potential.
  4. Health is wealth: Scours and pneumonia slash ADG; colostrum-based interventions reduce antibiotic reliance.
  5. Invest early, profit long-term: Doubling birth weight by weaning ensures healthier, more productive heifers.

Executive Summary:
Pre-weaning average daily gain (ADG) is the linchpin of dairy profitability, directly influencing lifetime milk production. Research shows each pound gained early translates to over 1,100 lbs more milk in first lactation. Colostrum management is critical—feeding 1 gallon within 4 hours of birth and ensuring 22% Brix quality sets the stage for immune function and growth. Strategic feeding (1 gallon twice daily or 3 quarts thrice daily) and environmental adjustments (e.g., bedding, temperature) optimize nutrient conversion into growth. Health challenges like scours and pneumonia drastically reduce ADG; proactive measures, including colostrum-based treatments, minimize antibiotic use and disease impact. Prioritizing these practices doubles birth weight by weaning, ensuring healthier heifers and higher long-term returns.

Read more

  1. Maximizing Calf Welfare: Nutritional and Management Insights for Dairy Farmers
    Delves into EFSA guidelines for fiber intake, calf-dam separation, and hygiene practices to balance welfare and productivity.
  2. Revolutionizing Calf Rearing: 5 Game-Changing Nutrition Strategies That Deliver 4:20 ROI
    Explores high-ROI strategies like extended colostrum feeding, stress-free weaning, and immunity-boosting nutrition to reduce disease costs and boost milk yields.
  3. 8 Ways to Ensure Calves Remain Alive and Thrive
    Foundational guide covering critical early-life care: colostrum quality testing, proper drying, and sanitation protocols to prevent mortality.

The Sunday Read Dairy Professionals Don’t Skip.

Every week, thousands of producers, breeders, and industry insiders open Bullvine Weekly for genetics insights, market shifts, and profit strategies they won’t find anywhere else. One email. Five minutes. Smarter decisions all week.

NewsSubscribe
First
Last
Consent

CME DAIRY REPORT JUNE 5th, 2025: Mixed Signals Cloud Dairy Market Outlook – Blocks Retreat While Barrels Rally

Stop chasing yesterday’s milk pricing strategies. FMMO reforms created $0.48/cwt arbitrage gaps most producers are missing completely.

EXECUTIVE SUMMARY: The dairy industry’s obsession with simple spot price tracking is costing progressive producers $0.40-0.60/cwt in missed FMMO optimization opportunities. Our comprehensive CME analysis reveals that 68% of Wisconsin producers report uncertainty about new pricing impacts, while smart operators are already capturing regional arbitrage gaps averaging $0.35/cwt through strategic Class I positioning. The 3.5¢ block-barrel spread isn’t just market noise—it’s a $420 annual revenue signal per 100 cows that most operations ignore. International data shows U.S. dairy exports hitting $8.2 billion with Mexico importing record $2.47 billion, yet domestic producers focus on outdated seasonal patterns instead of leveraging 85th percentile butter prices and 75th percentile block values. Technology investments with 12-18 month paybacks are creating permanent competitive advantages while feed costs sit at 35th percentile of five-year ranges. The stark reality: operations using historical percentile analysis and probability-weighted risk assessment are capturing $1,200+ annual advantages per 100 cows over traditional price-watching competitors. Stop reacting to daily price swings and start positioning for systematic profit capture in the new FMMO landscape.

KEY TAKEAWAYS

  • FMMO Arbitrage Goldmine: Regional pricing gaps average $0.28-0.41/cwt negative for most areas, but Northeast operations capture +$0.12/cwt through Class I optimization—smart producers are repositioning milk marketing strategies for permanent $420+ annual gains per 100 cows
  • Historical Context = Competitive Edge: Current butter prices at 85th percentile and feed costs at 35th percentile create 2.85:1 milk-to-feed ratios versus 2.61:1 five-year average—operations using percentile-based decision making outperform price-watching competitors by $1,200+ annually per 100 cows
  • Technology ROI Reality Check: Smart calf monitoring ($4-8/calf/month) prevents $25-40 disease cases while precision feeding cuts costs 5-10%—farms prioritizing 12-18 month payback technologies are building permanent efficiency advantages worth $3,000+ per 100 cows annually
  • Risk Management Revolution: 70%+ probability summer heat will impact production 2-3%, yet most operations still use reactive strategies—probability-weighted frameworks focusing on corn below $4.50/bushel and aggressive culling at $145+/cwt cull values create immediate $800+ margin improvements per 100 cows
  • Component Value Explosion: 3.5% component-adjusted output growth with 4.23% butterfat and 3.29% protein levels under new FMMO formulas—operations optimizing for $0.15/lb butterfat and $0.12/lb protein premiums capture $2,400+ additional annual revenue per 100 cows over commodity-focused competitors
CME dairy markets, dairy profitability, FMMO reforms, dairy risk management, feed cost analysis

Today’s CME dairy market delivered conflicting signals as cheese blocks retreated 1.75¢ while barrels surged by the same amount, creating the widest block-barrel spread in weeks. With butter declining modestly and NDM showing weakness, market sentiment reflects cautious positioning ahead of summer flush patterns, though underlying export strength and feed cost relief provide margin support for strategic producers.

Today’s Price Action & Farm Impact

ProductPriceDaily ChangeWeekly AvgHistorical Percentile*Impact on Farmers
Cheese Blocks$1.9200/lb-1.75¢$1.937575th percentilePressure on Class III premiums
Cheese Barrels$1.8600/lb+1.75¢$1.853168th percentilePartial Class III support
Butter$2.5575/lb-0.25¢$2.531985th percentileMinimal Class IV impact
NDM Grade A$1.2625/lb-1.00¢$1.275062nd percentileExport demand concerns
Dry Whey$0.5675/lb+0.50¢$0.564445th percentileMinor Class III component boost

*Based on a 5-year rolling average through June 2025

Trading Activity & Technical Analysis

Today’s session reflected cautious market participation with notably light volumes across most commodities. Butter showed the most activity with 24 trades, while cheese blocks managed only one trade despite the significant price decline. The lack of trading interest in blocks, combined with three offers and no bids, signals potential selling pressure below the $1.92 technical support level.

The 3.5¢ block-barrel spread represents a significant divergence that directly impacts Class III pricing. Technical analysis suggests blocks face resistance at $1.95 while barrels have broken above the $1.85 support level, indicating potential for continued spread compression.

Market Sentiment & Industry Intelligence

Industry Expert Commentary

Market sentiment remains cautiously optimistic despite today’s mixed signals. Dairy Market News states, “Retail cheese demand is strengthening in the Central region, and food service sales are steady. Contacts report export cheese demand is strengthening”. This underlying demand strength suggests today’s block weakness may represent profit-taking rather than fundamental deterioration.

Producer Sentiment Indicators

Recent USDA data shows continued producer confidence with herd expansion of 89,000 additional cows from April 2024 levels. However, a survey of Wisconsin producers indicates growing concern about margin compression under new FMMO regulations, with 68% reporting uncertainty about pricing impacts.

Processing Industry Intelligence

Industry capacity expansion continues supporting milk demand, with reports indicating “several factors are contributing to the increased cheese production. The spring flush is peaking, keeping milk supplies ample”. This processing strength provides fundamental support despite short-term price volatility.

Feed Cost & Margin Analysis

Current Feed Market Relief

Feed markets provided substantial relief today, with corn futures stabilizing at nearly $4.38/bushel, and soybean meal declined by $2.70/ton from recent highs. This 15-20% improvement in income-over-feed-cost ratios offers strategic producers immediate margin protection.

Historical Feed Cost Context

Current corn prices at $4.38/bushel represent the 35th percentile of the five-year range, while soybean meal at $296.80/ton sits at the 28th percentile. This positions feed costs favorably for the remainder of 2025, with USDA projecting continued moderation through Q4.

Milk-to-Feed Ratio Assessment

The current milk-to-feed ratio of 2.85:1 exceeds the five-year average of 2.61:1, indicating strong fundamental profitability. However, new FMMO make allowance increases could reduce effective milk prices by $0.40-0.60/cwt, bringing ratios closer to historical norms.

Production & Supply Insights

April 2025 Production Context

U.S. milk production reached 19.4 billion pounds in April, representing a 1.5% year-over-year increase. More critically, component-adjusted output surged 3.5% annually, with butterfat averaging 4.23% nationwide and protein reaching 3.29%. This component enhancement directly supports higher milk values under evolving pricing structures.

Regional Production Variations

Year-over-year production changes vary significantly by region:

  • California: -3.7% due to HPAI recovery challenges
  • Wisconsin: +2.1% with strong spring conditions
  • Texas: -1.2% amid ongoing drought impacts
  • New York: +0.8% supported by modernization investments

Seasonal Production Outlook

Current production aligns with traditional spring flush patterns, though this year’s increase appears more modest than historical norms due to weather pressures and herd management changes. The National Agricultural Statistics Service projects peak production in June at 20.2 billion pounds.

Global Context & Export Markets

Export Market Dynamics

U.S. dairy exports continue showing strength despite trade challenges. Recent Global Dairy Trade auction results showed a 4.6% increase in the overall price index, with whole milk powder gaining 6.2% and butter advancing 3.8%. This global strength supports U.S. export pricing competitiveness.

Trade Policy Impact Assessment

China’s retaliatory tariffs, which reached 150% on whey products, continue restricting access to this $2.3 billion market. However, emerging opportunities in Southeast Asia and strengthened relationships with Mexico provide alternative outlets. The recent U.S.-Indonesia dairy agreement creates new export pathways worth an estimated $180 million annually.

Currency and Competitiveness

The U.S. Dollar Index at 102.3 represents a modest strengthening that pressures export competitiveness. However, strong domestic demand and processing capacity expansion offset much of this impact for milk pricing.

FMMO Reforms: Three-Week Impact Analysis

Pricing Structure Changes

The June 1st implementation of FMMO reforms continues, creating complex regional impacts. The “higher-of” Class I mover has averaged $0.35/cwt above the previous formula, benefiting fluid milk regions. However, make allowance increases average $0.48/cwt across all classes, creating net negative pressure for most regions.

Regional FMMO Impact Assessment

  • Northeast (Order 1): Net positive $0.12/cwt due to high Class I utilization
  • California (Order 51): Net negative $0.41/cwt from make allowance impacts
  • Upper Midwest (Order 30): Net negative $0.28/cwt with mixed utilization
  • Southwest (Order 126): Net negative $0.33/cwt despite large-scale efficiencies

Risk Assessment Framework

High Probability Risks (>70% likelihood)

  • Summer Heat Stress: Weather forecasts indicate above-normal temperatures across 75% of major dairy regions through August, with an 85% probability of production impacts exceeding 2-3%
  • FMMO Adjustment Period: Continued pricing volatility through Q3 2025 as markets adapt to new formulas, with a 90% probability of regional arbitrage opportunities

Medium Probability Risks (40-70% likelihood)

  • Export Market Disruption: Escalating trade tensions with China affecting additional dairy products beyond whey, with a 60% probability of further tariff implementation
  • Processing Capacity Pressure: New facility startups creating a temporary oversupply in specific regions, with a 55% probability of regional price pressure

Lower Probability Risks (<40% likelihood)

  • Feed Cost Surge: Significant weather disruption causing corn prices above $5.00/bushel, with a 25% probability based on current weather models
  • Demand Destruction: Major consumer preference shift affecting core dairy consumption, with a 15% probability given current consumption trends

Forward-Looking Analysis

USDA Forecast Reconciliation

Current CME futures continue trading above USDA projections, with June Class III at $18.75/cwt versus USDA’s annual forecast of $17.95/cwt. This $0.80/cwt premium suggests either future optimism or USDA conservatism regarding the supply-demand balance.

Technical Price Projections

  • Cheese Blocks: Support at $1.90, resistance at $1.98, target range $1.92-1.96
  • Butter: Strong support at $2.50, upside potential to $2.65 on export strength
  • Class III Futures: Range-bound $18.25-19.25/cwt through Q3 2025

Seasonal Adjustment Factors

Historical analysis indicates a 65% probability of milk price weakness in July-August, followed by a 78% probability of recovery in September-October. Current pricing already reflects some seasonal expectations.

Regional Market Spotlight: Enhanced Analysis

Upper Midwest Competitive Dynamics

Wisconsin’s 7,000+ dairy farms producing 2.44 billion pounds monthly face increasing consolidation pressure. The average herd size increased from 142 cows in 2020 to 167 cows in 2025, while farms under 100 cows declined by 18% over the same period. However, family farms growing their own feed maintain competitive advantages, with feed costs averaging $2.85/cwt below purchased feed operations.

California Recovery Trajectory

California’s HPAI recovery shows gradual improvement, with April production reaching 3.89 billion pounds, up from March’s 3.76 billion pounds. Replacement heifer costs averaging $3,200 in the Central Valley continue pressuring expansion plans, though component premiums of $0.15/lb butterfat and $0.12/lb protein provide offset opportunities.

Northeast Modernization Impact

New York’s $21.6 million Dairy Modernization Grant Program has supported 127 farms through June, with average investments of $170,000 per operation. Early results show a 12% improvement in operational efficiency and an 8% reduction in environmental impact metrics.

Actionable Farmer Insights

Strategic Risk Management Matrix

Risk LevelToolCostCoverageRecommendation
Base ProtectionDMC ($9.50 margin)$0.15/cwt5M lbsEssential for all operations
SupplementalDRP (95% coverage)$0.08/cwtExcess productionHigh-volume operations
AdvancedPut Options$0.12-0.18/cwtTargeted monthsMarket-savvy operations
SpeculativeFutures SalesMargin requirementsSpecific contractsSophisticated risk managers

Immediate Action Priorities

  1. Feed Cost Optimization: Lock corn prices below $4.50/bushel for Q4 2025 delivery while the current weakness persists
  2. Herd Culling Strategy: Aggressive culling at current cull cow prices of $145+/cwt while maintaining genetic progress
  3. Component Enhancement: Accelerate nutrition programs targeting 4.25%+ butterfat and 3.30%+ protein for FMMO optimization

Technology Investment ROI

Current market conditions favor technology investments with 12-18 month payback periods:

  • Smart calf monitoring: $4-8/calf/month cost versus $25-40/disease case
  • Precision feeding systems: 5-10% feed cost reduction potential
  • Advanced health monitoring: 15-20% reduction in treatment costs

Industry Intelligence

Processing Sector Developments

The industry’s $8+ billion processing investment wave continues with notable Q2 announcements:

  • Schreiber Foods: $340 million Wisconsin cheese facility expansion
  • Dairy Farmers of America: $280 million Kansas butter plant modernization
  • Saputo: $195 million California mozzarella line addition

These investments signal long-term confidence in manufactured product demand while potentially pressuring commodity pricing as capacity comes online.

Consolidation Trends Accelerating

Dairy farm consolidation accelerated in Q1 2025 with 847 farm exits versus 312 new operations. However, total milk production capacity increased by 1.8%, indicating continued efficiency gains among remaining operations. The average new operation size reached 2,340 cows compared to 1,890 cows for exiting farms.

Weekly Context & Technical Patterns

Weekly Performance Summary

This week’s price action showed classic pre-flush positioning with defensive buying in butter (+1.53% weekly) and profit-taking in cheese blocks (-1.12% weekly). Trading volumes averaged 40% below typical patterns, indicating institutional repositioning rather than panic selling.

Monthly Momentum Analysis

June month-to-date performance reflects broader market uncertainty:

  • Cheese complex: -2.1% (blocks leading decline)
  • Butter: +0.8% (export strength supporting)
  • NDM: -1.4% (trade tensions weighing)
  • Dry whey: +1.2% (domestic demand solid)

Comparative Historical Analysis

Current price levels relative to June averages over the past five years:

  • 2024: +8.2% above (exceptional year)
  • 2023: +4.1% above (strong exports)
  • 2022: -2.3% below (inflation concerns)
  • 2021: +12.5% above (post-pandemic recovery)
  • 2020: +6.7% above (supply disruptions)

The Bottom Line

Today’s contradictory price movements reflect a market navigating complex cross-currents: FMMO implementation effects, seasonal supply increases, and evolving global trade dynamics. The 3.5¢ block-barrel spread creates immediate Class III pricing pressure, while butter’s resilience and modest whey strength suggest underlying manufactured product demand remains solid.

Critical Success Factors

Smart operations focus on three key areas: component optimization to maximize FMMO pricing advantages, strategic feed cost management during temporary weakness, and selective risk management to capture futures premiums over USDA forecasts. The technology divide between progressive and traditional operations continues widening, making strategic investments in monitoring and precision systems essential for long-term competitiveness.

High-Probability Outlook

Export market strength should support pricing through Q3 despite domestic supply pressures. However, new processing capacity coming online in Q4 could pressure manufactured product prices unless export growth accelerates beyond the current 8% annual pace.

Immediate Action Items:

  • Priority 1: Secure feed contracts below current levels while temporary weakness persists
  • Priority 2: Implement aggressive culling strategy at record cull cow values ($145+/cwt)
  • Priority 3: Evaluate put option strategies for Q4 milk at current futures premiums

Tomorrow’s focus: Monitor European auction results for global pricing direction and watch for any FMMO-related arbitrage opportunities as regional price discovery continues evolving.

Learn More:

The Sunday Read Dairy Professionals Don’t Skip.

Every week, thousands of producers, breeders, and industry insiders open Bullvine Weekly for genetics insights, market shifts, and profit strategies they won’t find anywhere else. One email. Five minutes. Smarter decisions all week.
NewsSubscribe
First
Last
Consent

Senate Delivers Dairy’s Biggest Policy Win: How Whole Milk’s Return Could Reshape the $8 Billion School Market

Stop believing the ‘fat is bad’ myth. Senate just unlocked $8B school market that could boost dairy demand 20% while proving bureaucrats wrong.

EXECUTIVE SUMMARY: The Senate Agriculture Committee just delivered dairy’s biggest policy win in over a decade, but here’s what most producers are missing: this isn’t just about bringing whole milk back to schools—it’s about exposing 13 years of bureaucratic food policing that cost our industry billions while training kids to reject dairy products. With 91% of parents already serving whole or 2% milk at home while schools banned these options, the Whole Milk for Healthy Kids Act’s bipartisan passage validates what we’ve known all along—government “experts” got it spectacularly wrong. University of Toronto research involving 21,000 children shows kids drinking whole milk had 40% lower obesity risk compared to reduced-fat milk drinkers, completely demolishing the scientific foundation of the 2012 ban. For strategic dairy operations, this represents immediate access to an $8 billion institutional market with projected demand increases of 15-20%, while positioning your operation for premium component pricing as butterfat content hits record 4.0%+ levels. The deeper opportunity extends beyond schools to consumer perception shifts—when the federal government validates whole milk for children, it legitimizes full-fat dairy positioning across all market segments. Smart producers should be preparing supply chains now for institutional demand surges while leveraging this policy reversal to drive retail premiumization strategies. Stop accepting commodity pricing and start positioning your operation to capitalize on the biggest fluid milk opportunity since organic premiums established themselves in the early 2000s.

KEY TAKEAWAYS

  • Institutional Market Explosion: Prepare for 15-20% institutional demand increases representing $1.2-1.6 billion in additional market value—equivalent to adding multiple major metropolitan markets overnight to your customer base
  • Component Premium Positioning: With U.S. dairy achieving first-ever 4.0%+ butterfat averages, operations can leverage whole milk validation for premium pricing while existing stockpiled H5N1 vaccines don’t match current viral strains, creating supply chain vulnerabilities
  • Consumer Psychology Validation: Federal whole milk endorsement for children legitimizes full-fat dairy across all segments—leverage this institutional credibility to drive retail premiumization and escape commodity pricing cycles
  • Supply Chain Optimization Opportunity: Schools offering “organic or nonorganic whole, reduced-fat, low-fat, fat-free fluid milk and lactose-free options” create multiple revenue streams for operations using precision feeding systems and component management technologies
  • Policy Precedent for Industry: This legislative victory proves that evidence-based coalition building can overturn bureaucratic mandates—position your operation for similar regulatory reversals while competitors remain reactive to government dictates

The Whole Milk for Healthy Kids Act just secured bipartisan Senate Committee approval on June 3, 2025, positioning dairy producers for the first major institutional market expansion in over a decade. But here’s the real question: Why did it take 13 years of bureaucratic food policing to fix a policy that never made scientific sense in the first place?

With 91% of parents already serving whole or 2% milk at home while schools banned these options, this isn’t just policy correction—it’s an admission that government overreach cost our industry billions in lost consumption while training an entire generation to reject dairy products.

The Senate Agriculture Committee’s voice vote passage represents more than legislative momentum. It’s validation that the dairy industry can win when we stop accepting bureaucratic nonsense and start fighting back with real science.

The 13-Year Policy Disaster We’re Finally Fixing

Why Did Bureaucrats Really Ban Whole Milk?

Let’s be brutally honest about what we’re undoing here. The 2012 whole milk ban wasn’t based on solid science—it was an ideological nutrition policy masquerading as health protection. The Healthy, Hunger-Free Kids Act treated all fats like dietary villains, assuming that removing full-fat options would magically slim down America’s kids.

Here’s the devastating math: Adolescent milk consumption plummeted from 75% in the 1970s to just 35% today [(Whole Milk for Healthy Kids Act Research Report, 2025)]. That’s not correlation—that’s systematic market destruction happening in real time while bureaucrats patted themselves on the back for “fighting obesity.”

The operational reality tells an even more damning story: 91% of parents serve whole or 2% milk at home, while 88% want these options in schools [(IDFA polling data, 2025)]. When nine out of ten families feed something at home that schools actively prohibit, you’ve got a policy failure that would embarrass any private business into immediate change.

But here’s what really should infuriate every dairy producer: School food service directors report that milk waste increased dramatically after the 2012 ban, with kids simply refusing to drink the lower-fat alternatives [(Krista Byler testimony, 2025)]. We’ve systematically trained children to reject our core product while wondering why margins are shrinking.

The Science That Destroys 13 Years of Government “Expertise”

Does Whole Milk Actually Make Kids Fatter? Spoiler Alert: No.

Here’s where we need to challenge the sacred cow of nutrition orthodoxy that guided federal policy for over a decade. A University of Toronto meta-analysis of 28 studies involving nearly 21,000 children found that kids drinking whole milk had 40% lower odds of being overweight compared to those drinking reduced-fat milk [(University of Toronto research, 2020)].

Let me repeat that: 40% lower obesity risk from drinking whole milk. This isn’t some dairy industry-funded study—this is peer-reviewed research that completely demolishes the foundation of the policy that’s been strangling our industry since 2012.

Why aren’t more dairy leaders shouting this from every rooftop? This research validates everything we’ve known about milk’s nutritional superiority, yet we’ve allowed government bureaucrats to dictate market demand based on flawed assumptions for over a decade.

The mechanism is basic nutrition science: Whole milk’s higher fat content increases satiety hormones more effectively than carbohydrates or protein alone, leading children to consume fewer calories from other sources. It’s the same principle we understand with feed efficiency in lactating cows—fat triggers better metabolic responses.

The Coalition Victory That Actually Worked (Finally)

Smart Politics Meets Overdue Science

What impressed industry strategists about this committee passage isn’t just bipartisan support—it’s the sophisticated coalition building that neutralized traditional opponents. The National Milk Producers Federation, American Farm Bureau Federation, and International Dairy Foods Association aligned with unexpected partners: the Physicians Committee for Responsible Medicine and Friends of the Earth [(Senate Committee proceedings, June 3, 2025)].

This coalition’s success required strategic amendments allowing “nutritionally equivalent nondairy beverages that meet USDA nutritional standards” [(S.222 amendment language, 2025)]. Give opponents something valuable while achieving core objectives—that’s how you win policy battles instead of fighting the same losing arguments for 13 years.

Senator Richard Durbin’s food allergy training amendment added public health credibility, making opposition harder to justify [(Durbin Amendment, 2025)]. This isn’t just winning—it’s showing how to neutralize bureaucratic resistance while advancing industry interests.

Economic Impact: Beyond the $8 Billion Market Value

The Numbers That Should Have Ended This Policy Years Ago

U.S. dairy already sells approximately 8% of fluid milk to schools—roughly $8 billion in annual institutional sales [(USDA market data, 2025)]. Conservative consumption increases of 15-20% translate to $1.2-1.6 billion additional market value. That’s equivalent to adding multiple major metropolitan markets overnight.

But here’s the critical question for your operation: Are you positioned to capture this institutional demand surge, or will you watch competitors with better supply chain management steal these premium contracts?

The Congressional Budget Office projects that H.R. 649 would result in “no changes in benefit costs” and only “insignificant” administrative costs” [(CBO analysis, 2025)]. This fiscal neutrality removes the common government excuses about budget impacts.

Why This Matters for Your Operation:

  • Stable institutional contracts during volatile pricing periods
  • Premium positioning for component-optimized operations
  • Base-load demand that smooths seasonal fluctuations
  • Market validation for full-fat products across all segments

Global Market Context: Leading the World Back to Common Sense

U.S. school nutrition policy influences international perceptions of American dairy quality standards [(International market analysis, 2025)]. When the federal government endorses whole milk for children, it validates export market positioning about product safety and nutritional value.

Countries maintaining liberal dairy fat policies—including much of Europe and New Zealand—see this as validation of their approaches. This creates export opportunities for U.S. producers in higher-fat segments while our competitors still fight domestic regulatory battles.

Technology-Driven Market Differentiation

Schools offering “flavored and unflavored organic or nonorganic whole, reduced-fat, low-fat, fat-free fluid milk and lactose-free fluid milk” create multiple strategic opportunities [(H.R. 649 text, 2025)]:

  • Organic whole milk positioning for premium institutional contracts
  • Lactose-free whole milk development capturing inclusion markets
  • Local sourcing partnerships emphasizing community connections
  • Component optimization targeting premium positioning

Smart operations using precision feeding and monitoring systems can optimize production for institutional demand spikes while maintaining the component quality that commands premium pricing.

Challenging Industry Orthodoxy: The Hard Questions We Should Be Asking

Here’s a controversial truth the dairy industry needs to face: Why did it take 13 years and millions of lost customers to overturn a policy that never had solid scientific backing?

Where was the aggressive industry pushback when this policy was implemented? Were we too comfortable accepting government dictates instead of fighting for market-driven solutions?

The inclusion of “nutritionally equivalent nondairy beverages” in the amended bill gives plant-based companies access to the same expanded market [(S.222 amendment, 2025)]. But instead of viewing this as a threat, smart dairy operations should see it as validation of superior positioning.

88% of parents want whole milk options in schools because that’s what they serve at home [(IDFA polling, 2025)]. Regardless of nutritional equivalency, Nondairy alternatives still face the “unfamiliarity gap” with most families.

The question is: Will you leverage this advantage or continue the passive approach that let bureaucrats control our markets for over a decade?

Implementation Timeline and Market Preparation

The Legislative Pathway Forward

H.R. 649 passed the House Committee on Education and Workforce on February 12, 2025, with a 24-10 vote, while S.222 was ordered to be reported favorably with an amendment by the Senate Agriculture Committee on June 3, 2025 [(Congressional records, 2025)].

Given the bipartisan committee support and overwhelming parental backing, passage looks likely for the 2025-2026 school year. But here’s what to watch: how quickly schools adopt these new options and whether student consumption actually increases.

Your immediate action plan:

  • Evaluate current production capacity for 15-20% institutional demand increase
  • Assess component optimization systems for premium positioning
  • Identify potential school district partnerships in your market area
  • Prepare supply chain logistics for expanded product variety

The Bottom Line

The Whole Milk for Healthy Kids Act represents the most significant fluid milk market expansion opportunity in over a decade, but success requires strategic positioning beyond simple production increases.

This isn’t just about reversing a bad policy—it’s about reclaiming the narrative around dairy nutrition and consumer choice that we should never have surrendered to government bureaucrats in the first place.

For strategic planners, three critical actions are essential: First, prepare supply chains for 15-20% institutional demand increases while leveraging component optimization technologies. Second, develop differentiated product portfolios targeting organic, flavored, and lactose-free segments with premium positioning. Third, build partnerships with school districts that position your operation as a solution provider, not a commodity supplier.

The deeper opportunity extends beyond schools to consumer perception shifts. When the federal government validates whole milk for children, it legitimizes full-fat dairy across all market segments. Smart operations will leverage this institutional endorsement to drive retail premiumization and brand differentiation.

This victory proves that patient coalition building, evolving science, and overwhelming consumer preference can overturn even well-entrenched bureaucratic policies. The question isn’t whether your operation can benefit from this shift but whether you’re positioned to maximize the opportunity when it arrives.

The window is opening for operations ready to capitalize on 13 years of pent-up demand. Make sure your production systems and market partnerships are positioned to walk through it.

What’s your take on this policy reversal? How is your operation preparing for increased institutional demand? Are you exploring partnerships with school districts or developing new product lines for the expanded choice environment? Share your strategic planning insights—because this market shift rewards prepared operations while challenging those that relied on commodity approaches for too long.

Learn More:

The Sunday Read Dairy Professionals Don’t Skip.

Every week, thousands of producers, breeders, and industry insiders open Bullvine Weekly for genetics insights, market shifts, and profit strategies they won’t find anywhere else. One email. Five minutes. Smarter decisions all week.

NewsSubscribe
First
Last
Consent

Abandon Your ‘Wait and Treat’ Mastitis Strategy Before It Bankrupts Your Operation

Stop believing the ‘quick response’ mastitis myth. Cornell’s inflammation test prevents $200 per cow losses before you see clinical symptoms.

EXECUTIVE SUMMARY: Your “rapid response” to clinical mastitis is actually a profit-protection failure – you’re treating problems that started 4-7 days earlier while hemorrhaging $200 per cow annually in hidden losses. Cornell University’s breakthrough cytokine detection technology identifies inflammation 24-48 hours before traditional methods, enabling intervention when treatment costs $50 instead of $300 per case. With the global dairy industry losing billion annually to mastitis and 30-40% of clinical cases showing no bacterial growth on culture, this precision diagnostic represents the most significant shift from reactive symptom-chasing to proactive health management in decades. European operations using similar biomarker monitoring already report 31% reduction in antibiotic use, 23% improvement in reproductive performance, and 15% reduction in culling rates while maintaining production levels. Progressive farms implementing early inflammation detection could prevent ,000 in annual milk losses on a 500-cow dairy while positioning themselves for competitive advantages as sustainability metrics become purchase requirements. The technology gap between early adopters and traditional farms will create a permanent profitability divide by 2027 – making now the critical time to evaluate whether your operation will lead this transformation or get left behind counting preventable losses.

KEY TAKEAWAYS

  • Prevent 1,000-pound milk losses per cow by detecting subclinical inflammation before clinical disease develops, protecting approximately $200 in revenue per affected animal that reactive methods cannot recover
  • Reduce mastitis treatment costs by 60-70% through early intervention protocols that cost $50 per case versus $300 for clinical treatments, while eliminating the $65 daily treatment extension costs that drain profit margins
  • Leverage precision cytokine detection for competitive positioning as EU regulations requiring 50% antibiotic reduction by 2030 force global adoption of biomarker monitoring, creating export market advantages for compliant operations
  • Transform herd health economics through proactive management that addresses the fundamental flaw in traditional SCC testing – which detects mastitis after onset rather than during the critical 4-7 day intervention window where prevention remains possible
  • Prepare for technology commercialization by 2026-2027 by documenting current inflammation baselines and establishing veterinary protocols for integration with existing farm management systems, positioning for immediate adoption when USDA approval occurs
mastitis detection, dairy herd health, subclinical mastitis, precision dairy farming, dairy profitability

While dairy farmers pride themselves on quick responses to clinical mastitis, they’re unknowingly hemorrhaging $200 per cow annually by ignoring the inflammation brewing beneath the surface. Cornell’s breakthrough research proves that by the time you see mastitis symptoms, you’ve already lost the profitability battle – and the numbers are staggering.

Your morning routine probably looks like this: check the automated milking system (AMS) alerts, examine foremilk for clots, and treat whatever shows clinical signs. You’re proud of your sub-24-hour response time and your somatic cell count (SCC), averaging 180,000 cells/mL. But here’s the brutal truth – you’re playing a losing game.

By the time your electrical conductivity sensors spike or that clot hits your strip cup, inflammation has already been wreaking havoc for 4-7 days. Your “quick response” is actually too late, too expensive, and too focused on damage control instead of profit protection.

Cornell University just dropped a research bombshell that’s about to separate profitable dairies from struggling ones. If you’re still relying on visual mastitis detection while your neighbors adopt precision inflammation monitoring, you’re about to get left behind in the most competitive dairy market in decades.

Why Your Current Mastitis Strategy is Bleeding Money

Let’s talk numbers that’ll make your accountant wince. The global dairy industry loses $35 billion annually to mastitis. The bovine mastitis market alone was valued at $2 billion in 2024 and is projected to reach $3.7 billion by 2034 (Bovine Mastitis Market Report 2025).

But here’s where it gets personal for your operation. Every cow with undetected subclinical mastitis costs you approximately $110 annually in lost revenue. Clinical cases hit even harder at $128-$444 per cow annually. On a 300-cow dairy, if just 30% of your herd experiences elevated inflammation, you’re kissing $60,000 goodbye annually.

Here’s what challenges conventional wisdom: Recent research from Michigan State University found that each additional day of treatment costs about $65 per day on average, with milk discard accounting for nearly 80% of out-of-pocket costs (MSU Mastitis Economics Analysis). Early detection doesn’t just reduce treatment costs – it eliminates the need for extended treatment protocols entirely.

Think you’re catching most cases early? Your current detection methods are fundamentally flawed. Traditional somatic cell count testing detects mastitis after onset, missing the critical intervention window where you could prevent 1,000 pounds of milk loss per cow.

Think about this: If nearly half of your clinical cases show no bacterial growth on culture, what exactly are you treating with those expensive antibiotics?

Cornell’s Game-Changing Discovery: Catching Inflammation Before It Catches You

Dr. Sabine Mann wasn’t content watching farmers fight fires instead of preventing them. Over seven years, she and her Cornell team developed something the industry desperately needed: a test that detects inflammation before disease symptoms appear.

Their breakthrough challenges the fundamental assumption that we must wait for symptoms to diagnose problems. Instead of measuring the aftermath of inflammation like SCC does, they’re detecting the molecular switches that turn inflammation on and off.

The Science Behind Early Detection: Cornell’s approach measures cytokines – proteins that regulate immune response and spike during inflammation. “Inflammation is a signal that comes out from the immune system, like a radio broadcast, and cytokines’ role is to turn the volume of that signal up and down,” explains Dr. Anja Sipka.

Recent research confirms the power of these biomarkers. Studies show that IL-10 and β-Def 3 can be considered informative biomarkers in diagnosing subclinical and clinical mastitis, with significantly higher expression in healthy cows than those with mastitis (Analysis of Inflammatory Cytokines in Milk).

The Cornell assay currently detects three specific cytokines with expansion planned. Using advanced multiplex technology, this system provides detection 24-48 hours before traditional methods show positive results .

What This Means for Your Bottom Line

Early inflammation detection transforms mastitis economics. Instead of losing money on sick cows, you’re investing in healthy, productive animals with measurable ROI.

Immediate Economic Benefits:

  • Reduce treatment costs from $300 per clinical case to $50 per early intervention
  • Prevent the 1,000-pound milk loss associated with undetected inflammation
  • Cut treatment duration by 1-2 days, saving approximately $130 per case (MSU Mastitis Economics Analysis)

Research shows cows with abnormally elevated haptoglobin levels after calving produce 1,000 pounds less milk over their lactation. At current milk prices, that’s approximately $200 less revenue per cow – money you’ll never recover through reactive treatment.

For a 500-cow dairy where 25% of cows experience post-calving inflammation, early detection could prevent $25,000 in annual milk losses while reducing treatment costs by 60-70%.

Global Operations Are Already Moving Beyond Traditional Methods

While American farmers debate whether to invest in new technology, operations worldwide embrace precision diagnostics. European Union regulations demand a 50% reduction in antibiotics by 2030, forcing farms to adopt early detection systems.

Progressive operations using biomarker monitoring report:

  • 31% reduction in antibiotic use while maintaining production levels
  • 23% improvement in reproductive performance
  • 15% reduction in culling rates
  • 45% reduction in emergency veterinary calls

International research supports these trends. Studies from Bangladesh show subclinical mastitis prevalence at 41.3% at the animal level, with substantial economic losses primarily driven by decreased milk production and increased treatment costs (Subclinical Mastitis Study).

The Technology That Changes Everything

Cornell’s diagnostic platform uses multiplex assays – technology that simultaneously measures multiple inflammatory markers from a single sample. Unlike traditional electrical conductivity meters that measure general changes, this system provides direct insight into immune system activation.

The multiplex platform uses fluorescent microspheres instead of plastic ELISA plates, resulting in:

  • 87% detection rate for pre-clinical inflammation vs. 60% for current methods
  • Reduced sample volume requirements enabling integration with existing protocols
  • Simultaneous measurement of multiple cytokines and chemokines

Think of it like upgrading from a basic activity monitor to a comprehensive metabolic analyzer. The depth of information enables precision management impossible with traditional tools.

Challenging the Sacred Cow: Why “Quick Response” Isn’t Enough

Let’s address the elephant in the parlor: the dairy industry’s obsession with “rapid response” to clinical mastitis is actually a symptom of failed prevention. We’ve been so focused on treating disease quickly that we’ve ignored the obvious solution – preventing it entirely.

The Evidence-Based Alternative: Cornell’s research proves that inflammation can be detected before disease symptoms appear, enabling intervention when treatment costs $50 vs. $300 per case. Instead of celebrating quick responses to problems, shouldn’t we be preventing those problems from occurring?

The Uncomfortable Truth: Your pride in rapid mastitis response is actually evidence of system failure. Every clinical case represents a missed profit opportunity and animal suffering that precision inflammation detection could have prevented.

The Regulatory Reality: Antibiotic Reduction Isn’t Optional

Here’s what many American farmers are ignoring: regulatory pressure around antibiotic reduction isn’t a distant European problem – it’s coming to the U.S. market whether we’re ready or not.

Cornell’s technology offers a pathway to regulatory compliance while maintaining profitability. Instead of simply reducing antibiotic use and accepting production losses, precision inflammation detection enables targeted interventions that maintain herd health with minimal antimicrobial dependency.

Current broad-spectrum treatments cost $47 per case plus milk withdrawal losses, while early detection interventions average $12 per case with no withdrawal.

Implementation: From Research to Real-World Results

Cornell’s tests aren’t commercially available yet, but the Animal Health Diagnostic Center offers them for clinical research. Smart farmers should start preparing for this technology transition now.

Current Development Focus:

  • Correlating inflammatory markers with farmer-critical outcomes
  • Expanding biomarker panels to include additional cytokines and chemokines
  • Understanding individual cow susceptibility to excessive inflammatory responses
  • Developing integration protocols for existing farm management systems

Commercialization requires navigating USDA APHIS Center for Veterinary Biologics approval – a rigorous process ensuring technology meets safety and efficacy standards. This regulatory framework creates market confidence similar to Dr. Bettina Wagner’s successful Lyme disease panels, released in 2011 and now benefiting millions of animals globally.

The Competitive Divide Coming to Dairy

The technology gap between early adopters and traditional farms will create a permanent profitability divide by 2027. Farms using precision inflammation detection will operate with fundamentally different economics.

Early Adopter Advantages:

  • Intervention costs: $50 vs. $300 per case for early vs. late detection
  • Production protection: Prevention of 1,000-pound milk losses
  • Treatment efficiency: Reduced antibiotic costs and withdrawal penalties
  • Regulatory positioning: Better compliance with evolving requirements

Based on current research, farms implementing early inflammation detection could see:

  • $185 per cow annually in increased profits through reduced culling and improved reproduction
  • 60-70% reduction in mastitis treatment costs through early intervention
  • 15-20% improvement in first-service conception rates by addressing subclinical inflammation

Think about this scenario: Your neighbor implements precision inflammation detection and reduces mastitis treatment costs by 70% while improving milk production. How long before your processor notices the difference in milk quality metrics?

The Bottom Line

Your “wait and treat” mastitis strategy isn’t just outdated – it’s economically unsustainable. Cornell’s inflammation detection technology represents the future of profitable dairy health management, and early adopters will capture massive competitive advantages.

The dairy industry is at an inflection point. Traditional reactive approaches are giving way to predictive, precision management. The technology exists. The economic benefits are proven, with $35 billion in annual global losses providing enormous improvement opportunities.

Action Steps for Your Operation:

  1. Document current baselines: Track mastitis treatment costs, milk losses, and culling rates with specific dollar amounts
  2. Work with your veterinarian: Identify inflammation patterns in fresh cows and high-producers using available biomarkers
  3. Evaluate technology readiness: Assess farm management software and sampling protocol capabilities for integration
  4. Budget for adoption: Plan $25-50 per cow investment for precision diagnostic integration when commercially available
  5. Monitor regulatory developments: Stay informed about antibiotic reduction requirements affecting your markets

The Critical Questions You Must Answer:

  • Can your operation compete against farms preventing problems instead of just treating symptoms?
  • How will you maintain market position when sustainability metrics become purchase requirements?
  • What’s your strategy for regulatory compliance that maintains profitability?

The farms that adapt to precision health management will thrive. Those who don’t will struggle to compete against operations that prevent problems instead of just treating symptoms.

Stop playing defense with your herd health. It’s time to get offensive about inflammation detection before it bankrupts your operation.

The question isn’t whether this technology will revolutionize dairy farming – it’s whether your operation will lead this transformation or get left behind, counting losses that precision diagnostics could have prevented. In an industry where treatment costs $65 per additional day, and milk discard accounts for 80% of expenses, isn’t it time we questioned whether we’re fighting the right battle?

The choice is yours: evolve with the industry leaders or explain to your banker why your neighbors are consistently more profitable with healthier herds.

Learn More:

The Sunday Read Dairy Professionals Don’t Skip.

Every week, thousands of producers, breeders, and industry insiders open Bullvine Weekly for genetics insights, market shifts, and profit strategies they won’t find anywhere else. One email. Five minutes. Smarter decisions all week.
NewsSubscribe
First
Last
Consent

Milk Production Surge Masks $4 Billion Demand Crisis: Why Your Component Strategy Needs an Immediate Overhaul

Stop chasing milk volume. Component optimization delivers $120-180 more per cow annually while domestic demand craters to 2021 lows.

EXECUTIVE SUMMARY: The dairy industry’s obsession with raw milk volume costs producers thousands annually while butterfat production surges 5.3% and domestic cheese demand plummets to its lowest level since 2021. Despite milk solids production jumping 2.1% in Q1 2025, domestic consumption dropped 0.8% to just 3.295 billion pounds, creating the most dangerous oversupply crisis in a decade. Smart producers are pivoting to component optimization strategies that generate 0-180 additional revenue per cow annually through targeted genetic selection and precision feeding programs. While exports provide some relief, with a record 140,874 metric tons shipped globally, they represent less than 10% of total production and can’t offset domestic foodservice weakness that’s crushing mozzarella demand by 0.9%. Operations that continue volume-chasing while ignoring butterfat and protein optimization will face sustained margin pressure as $8 billion in new processing capacity comes online through 2026. The genomic testing revolution proves that farms implementing full component-focused breeding programs achieve £193 higher lifetime profitability per animal compared to partial adopters (Genomic Testing Transforms the UK Dairy Industry). The time for incremental adjustments has passed—component-focused breeding and feed programs are now essential for survival in the restructured market reality.

KEY TAKEAWAYS

  • Component Economics Trump Volume: A 0.3 percentage point increase in both butterfat and protein content generates $120-180 additional revenue per cow annually, even with slightly reduced milk volume—proving genetic selection should prioritize TPI scores for components over raw yield metrics while leveraging genomic testing that delivers 70% accuracy in predicting future production.
  • Foodservice Concentration Risk Exposed: Mozzarella production declined 0.9% due to pizza chain struggles (Domino’s -0.5%, Pizza Hut -5%, Papa John’s -3%), highlighting the catastrophic vulnerability of single-channel dependencies that smart operations must diversify immediately while American-style cheese rebounded 3.3% through export diversification.
  • Technology ROI Accelerating: Precision agriculture tools for real-time component monitoring deliver 18-24 month payback periods for small operations ($150-200 per cow investment) while automated milking systems with component analysis show 12-18 month returns for large herds, with feed efficiency improvements reducing carbon footprint by up to 50% when comparing high-quality vs. low-quality forage diets.
  • Policy Threat Quantified: Federal food assistance program cuts could slash domestic demand by 4% while retaliatory tariffs risk $22 billion in export losses over four years—requiring immediate risk management strategies, including component quality positioning and geographic market diversification as the 2025 all-milk price forecast drops to $21.10 per cwt (Dairy – Market Outlook).
  • Export Opportunity Limited but Critical: Despite record cheese exports (+7% to 140,874 metric tons), international demand represents less than 10% of U.S. production, making domestic component optimization and market channel diversification the only sustainable path forward as new processing capacity adds 360 million pounds annually by year-end while global dairy demand accelerates at twice pre-COVID speed.
Milk Production Surge Masks $4 Billion Demand Crisis: Why Your Component Strategy Needs an Immediate Overhaul

While butterfat production surged 5.3% and milk solids jumped 2.1% in Q1 2025, domestic cheese consumption plummeted to its lowest level since 2021 at 3.295 billion pounds—down 0.8% year-over-year. This divergence between component abundance and demand weakness is creating the industry’s most dangerous oversupply crisis in a decade, demanding immediate strategic adjustments to milk composition optimization and market channel diversification.

The numbers coming out of Q1 2025 should make every dairy producer pause and reconsider their genetic selection criteria, feeding programs, and market positioning. We’re witnessing something unprecedented: milk solids production is accelerating while the foundation of domestic cheese demand crumbles beneath our feet

Think of it as having the highest-producing cow in your herd consistently delivering 120 pounds daily, but your milk truck can only handle 100 pounds. The excess doesn’t disappear—it creates a backlog that affects pricing for everyone in your cooperative. That’s exactly what’s happening at the national level with cheese demand.

But here’s the question that should keep you awake at night: Are you still optimizing for yesterday’s market while tomorrow’s reality unfolds around you?

Why Component Optimization Is Now Your Most Critical Business Decision

The traditional focus on raw milk volume is becoming obsolete faster than a manual milking system. Milk solids production grew 2.1% in Q1, liquid milk increased modestly, and butterfat production exploded 5.3%. This “component economy” fundamentally alters how we assess production strategies and market positioning.

Here’s what this means for your operation: if you’re still selecting bulls based primarily on milk yield rather than component optimization, you’re leaving serious money on the table. The pricing mechanisms are shifting to reflect component values more accurately, and operations chasing raw volume will find themselves at competitive.

Let me challenge the conventional wisdom here. For decades, the industry has preached that “milk is milk”—that volume trumps everything else. This outdated thinking is costing producers thousands of dollars annually. Research consistently shows that component-focused breeding programs deliver higher returns than volume-based approaches, yet most operations still haven’t switched.

Key Production Metrics Driving the Shift:

  • Butterfat production: +5.3% (Q1 2025 vs Q1 2024)
  • Milk solids production: +2.1% (significantly outpacing liquid milk growth)
  • Total milk production: 56.7 billion pounds (down 0.3% from Q1 2024)
  • Component utilization efficiency: declining due to demand imbalance

The industry is pouring over $8 billion into new processing capacity through 2026, adding 55 million pounds per day of capability. By year-end, new cheese facilities alone will contribute an additional 360 million pounds annually. You get sustained downward pressure on Class III prices by combining increased component production with expanded processing capacity and declining domestic demand.

The Mozzarella Meltdown: A Case Study in Market Concentration Risk

Let’s examine what happened to mozzarella as a cautionary tale for any operation heavily dependent on a single market channel. Mozzarella production dropped 0.9% in Q1—its first year-over-year decline in 15 months This wasn’t random market volatility; it was directly linked to struggles within major pizza chains.

Consider these sobering statistics:

  • Domino’s: -0.5% U.S. same-store sales
  • Pizza Hut: -5% sales
  • Papa John’s: -3% North American comparable sales

When your primary market driver is domestic foodservice—particularly pizza chains—and they’re all declining, you have a concentration risk coming home to roost. It’s like having all your replacement heifers sired by the same bull and then discovering a genetic defect that affects fertility. The risk exposure becomes catastrophic.

In contrast, American-style cheese production rebounded 3.3% year-over-year, driven largely by export demand and market diversification. What is the lesson? Diversification isn’t just good risk management—it’s become essential for survival.

Here’s a tough question for reflection: How many of your revenue streams would disappear if one major buyer changed their sourcing strategy tomorrow?

Why This Matters for Your Operation: Immediate Action Items

The disconnect between current production trends and market reality requires immediate strategic adjustments. Here’s what smart producers are doing right now:

Genetic Selection Realignment (Timeline: Next breeding decisions)

  • Prioritize bulls with high TPI scores for butterfat and protein percentages
  • Shift selection emphasis from milk yield to component efficiency
  • Target genetic merit for fat:protein ratios that optimize Class III pricing
  • Consider genomic testing investment to accelerate component improvements (Genomic Selection Advances Dairy Productivity)

Feed Program Optimization (Timeline: 30-90 days)

  • Adjust DMI strategies to maximize milk fat and protein production
  • Optimize ME levels for component efficiency rather than volume
  • Review transition period protocols to improve lactation curve shape
  • Calculate ROI on feed additives specifically for component enhancement

Market Channel Assessment (Timeline: Immediate)

  • Evaluate your cooperative’s exposure to foodservice vs. retail channels
  • Assess the geographic diversification of your milk marketing
  • Consider premium programs that reward component optimization
  • Review contracts for component-based pricing opportunities

The Global Context: Learning from International Component Strategies

While U.S. producers grapple with domestic demand challenges, international markets offer instructive comparisons for component optimization strategies.

RegionComponent FocusMarket StrategyPricing Advantage
New ZealandProtein optimizationExport-driven15-20% premium
NetherlandsButterfat maximizationPremium retail25% above commodity
IndiaVolume + basic componentsDomestic growthCost leadership
AustraliaBalanced componentsDiversified channels10-15% premium

New Zealand’s focus on protein optimization has yielded consistent export premiums of 15-20% above commodity pricing (Technological Gap Analysis: A Case Study of Anand, Gujarat). Their average protein content of 3.45% compares favorably to the U.S. average of 3.25%, translating directly to higher returns per hundredweight.

The Netherlands has taken butterfat maximization even further, achieving an average fat content of 4.15% through selective breeding and targeted nutrition programs. This strategy has enabled premium retail positioning with margins 25% above commodity cheese pricing.

Technology Integration: Precision Agriculture for Component Optimization

Modern dairy operations leverage precision agriculture tools to optimize component production with unprecedented accuracy. Activity monitoring systems now provide real-time data on individual cow performance metrics that directly correlate with component production efficiency.

Challenge to conventional thinking: Most producers still rely on visual observation and monthly DHI testing to assess component production. This is like navigating with a map from 1995 while everyone else uses GPS. Today’s technology monitors individual cow component production in real-time, yet adoption remains frustratingly slow.

Why This Matters for Your Operation: Technology ROI

Consider investing in these technologies based on herd size and financial capacity:

Small Operations (50-150 cows):

  • Individual cow monitoring systems: $150-200 per cow
  • Feed intake monitoring: $5,000-8,000 initial investment
  • ROI timeline: 18-24 months through improved component yields

Medium Operations (150-500 cows):

  • Automated milking systems with component analysis: $180,000-250,000
  • Precision feeding systems: $25,000-40,000
  • ROI timeline: 24-36 months through labor savings and component optimization

Large Operations (500+ cows):

  • Comprehensive data analytics platforms: $50,000-100,000 annually
  • Robotic feeding systems: $200,000-400,000
  • ROI timeline: 12-18 months through efficiency gains and component premiums

Research shows that there are about 31,000 robotic dairy farms worldwide today, with roughly 120 measurements captured when a cow walks into a robotic dairy—production, weight, times, traffic, age, and days in milk. Yet many producers still resist this technology revolution.

Economic Reality Check: Quantifying the Component Opportunity

Let’s put real numbers to the component optimization opportunity. Based on current pricing differentials and market conditions, here’s what component improvements can mean for your bottom line:

Scenario Analysis: 100-Cow Operation

The math is compelling: a 0.3 percentage point increase in both fat and protein content, even with slightly reduced volume, generates $120-180 additional revenue per cow annually at current component pricing.

Implementation Costs vs. Returns:

  • Genetic improvement program: $2,000-5,000 annually
  • Feed program optimization: $8,000-12,000 annually
  • Technology integration: $5,000-15,000 (amortized)
  • Net annual benefit: $5,000-10,000 for 100-cow operation

Policy Landscape: Navigating the $22 Billion Export Risk

The broader policy environment adds another layer of complexity that smart producers must factor into their strategic planning. Proposed cuts to federal food assistance programs could slash cheese and fluid milk demand by 4% These programs account for nearly 10% of U.S. fluid milk consumption, representing a direct hit to baseline demand.

Trade policy presents even larger risks. Research suggests that retaliatory tariffs could reduce all-milk prices by $1.90/cwt and decrease cumulative U.S. dairy export values by up to $22 billion over four years. For context, that’s equivalent to removing approximately 40% of current export revenue from the market.

Policy Risk Mitigation Strategies:

  • Advocacy engagement for food assistance program preservation
  • Component quality positioning for premium market segments
  • Export market development in regions less affected by trade tensions
  • Operational efficiency investments to offset policy-driven margin pressure

The Plant-Based Reality: Market Share Erosion Accelerating

Here’s the uncomfortable truth most industry leaders are reluctant to address directly: plant-based cheese consumption jumped 10.4% in 2022 while conventional cheese dropped 2.5% This isn’t a coastal elite fad—it’s a fundamental shift affecting market share across demographic segments.

The plant-based cheese market alone is expanding at 7.8% CAGR, reaching $1.57 billion in 2025. The North American non-dairy cheese market is projected to grow at 19.71% CAGR through 2030. Think of it as watching a neighboring farm convert to organic while you stick with conventional—initially, the impact seems minimal, but the market share erosion compounds annually.

Here’s where I’ll challenge another sacred cow: The industry’s response to plant-based competition has been defensive rather than innovative. Instead of acknowledging legitimate consumer concerns about health, sustainability, and ethics, we’ve dismissed plant-based alternatives as inferior. This head-in-the-sand approach is costing us market share.

Strategic Response Framework:

  • Product differentiation through superior nutrition profiles
  • Quality positioning emphasizing taste and functionality advantages
  • Innovation investment in lactose-free and reduced-fat options
  • Value proposition development emphasizing dairy’s unique benefits

Export Success: The Double-Edged Opportunity

U.S. cheese exports hit record levels at 140,874 metric tons in Q1, up 7% American cheese benefits from remarkable price competitiveness—Global Dairy Trade Cheddar averaged $2.25/lb while CME spot blocks traded around $1.82/lb in early May, providing a 20-25% price advantage.

But here’s the strategic reality: exports represent less than 10% of total U.S. cheese production. While export growth provides crucial support, it cannot single-handedly offset domestic demand weakness.

Export Market Performance by Region:

  • Japan: +59% (January 2025)
  • South Korea: +34%
  • Southeast Asia: +67%
  • Middle East/North Africa: +93% (Cheddar)

The geographic diversification is encouraging, but currency fluctuations and trade policy changes remain significant risks that could quickly erode the current price advantage.

One more critical question: If exports can only absorb 10% of production, what’s your plan for the other 90% when domestic demand continues declining?

Why This Matters for Your Operation: Strategic Implementation Timeline

Immediate Actions (Next 30 Days):

  1. Evaluate your current component production metrics against herd benchmarks
  2. Review genetic selection criteria for next breeding decisions
  3. Assess feed program component optimization opportunities
  4. Calculate potential ROI from component-focused management changes

Short-term Adjustments (30-90 Days):

  1. Implement feed program modifications to enhance component production
  2. Establish component tracking systems for individual cow performance
  3. Explore premium marketing programs that reward component quality
  4. Review cooperative agreements for component-based pricing opportunities

Medium-term Investments (3-12 Months):

  1. Consider technology upgrades for precision component management (Trends in the dairy industry)
  2. Evaluate genetic improvement program acceleration through genomic testing
  3. Assess market channel diversification opportunities
  4. Develop contingency plans for continued domestic demand weakness

Long-term Strategic Planning (12+ Months):

  1. Plan facility modifications to support component optimization
  2. Evaluate partnership opportunities for value-added processing
  3. Consider vertical integration strategies for market security
  4. Develop export market relationships for surplus capacity

The Welfare Technology Revolution: Your Competitive Edge

Here’s an angle most producers overlook: positive welfare assessment technology is revolutionizing herd management while improving component production (The Use of Technology and Novel Developments in Positive Welfare Assessment for Housed Dairy Cows). Utilizing novel technological advancements in artificial intelligence alongside similar step changes in gene expression assessment can revolutionize livestock management practices.

Research consistently shows that cows with better welfare metrics produce higher-quality milk with superior component profiles. Yet most operations still monitor welfare through subjective visual observation rather than objective technological assessment.

Is your welfare monitoring system keeping pace with your genetic program investments?

The Bottom Line: Component Optimization Is Your Competitive Advantage

The cheese market’s current contradictions—rising prices amid declining domestic consumption—mask fundamental structural changes that demand immediate strategic response. Operations that optimize milk components while diversifying market exposure will emerge stronger from this transition period (How Strategic Planning Transforms Dairy Farming Success).

Here’s my final challenge to conventional thinking: The industry has spent decades optimizing for yesterday’s reality—high domestic demand, stable export markets, and volume-based pricing. Those days are gone. The producers who recognize this shift first and adapt their strategies accordingly will be the ones still profitable when the market reaches its new equilibrium.

Three critical success factors for the next 24 months:

Component Excellence: Shift genetic selection and management focus from volume to component optimization. The pricing mechanisms already reflect this reality, and early adopters will capture premium returns (Dairy industry executives are pressured but optimistic for 2025).

Market Diversification: Reduce dependence on struggling domestic channels by exploring alternative applications and export opportunities. The mozzarella-pizza chain concentration risk is a warning for all single-channel dependencies.

Technology Integration: Invest in precision agriculture tools that provide real-time component production data. The ROI on these investments is improving as component premiums increase (Modeling the challenges of technology adoption in dairy farming).

The fundamentals are clear: domestic demand weakness will persist while component production capacity continues expanding. The question isn’t whether market restructuring will continue—it’s whether you’ll position your operation to profit from the changes or become another casualty of market concentration risk.

Your competitive advantage lies in component optimization, market diversification, and strategic technology adoption. The producers who execute these strategies now will be the ones still profitable when the market reaches its new equilibrium. The time for incremental adjustments has passed—bold strategic moves are now required for sustainable success.

Action Required: Calculate your current component production metrics, evaluate your market channel exposure, and develop a 12-month component optimization plan. The market has spoken clearly—adapt your production strategy or accept diminishing returns as the new normal.

Final reflection question: In five years, will you look back on 2025 as the year you transformed your operation for the new reality or the year you missed the most important strategic pivot in dairy farming history?

The choice is yours. The data is clear. The time is now.

Learn More:

The Sunday Read Dairy Professionals Don’t Skip.

Every week, thousands of producers, breeders, and industry insiders open Bullvine Weekly for genetics insights, market shifts, and profit strategies they won’t find anywhere else. One email. Five minutes. Smarter decisions all week.
NewsSubscribe
First
Last
Consent

GDT Reality Check: Market Fragmentation Exposes Hidden Profit Opportunities Despite 1.6% Decline

Stop treating dairy as one market. GDT’s 1.6% drop masks 8.4% spreads between fat-based wins and powder crashes.

EXECUTIVE SUMMARY: The latest Global Dairy Trade results expose a critical flaw in conventional commodity thinking – treating dairy as a uniform market when it’s actually fragmenting into distinct winners and losers. While buttermilk powder crashed 6.1% and cheddar stumbled 4.2%, mozzarella gained 2.3% and anhydrous milk fat climbed 1.4%, creating an 8.4% performance spread that represents real money on the table. This divergence isn’t random market noise – it’s a fundamental shift in global industrial demand patterns that most producers haven’t recognized yet. China’s 9.2% domestic production collapse combined with strategic tariff-avoidance stockpiling has artificially inflated import demand, while New Zealand’s constrained 0.8% supply growth from major export regions proves this isn’t an oversupply story. The farms capturing premium values are those pivoting toward component-focused strategies and flexible product portfolios rather than chasing declining commodity categories. Smart operators implementing precision dairy technologies to optimize butterfat and protein yields will separate themselves from volume-focused competitors as margins compress. Stop waiting for markets to normalize – start aligning your production strategy with the clear signals showing where global buyers are placing their bets.

KEY TAKEAWAYS

  • Component Optimization Delivers Premium Values: Fat-based products showing 1.4-2.3% gains while powders crash 6.1% proves butterfat and protein optimization generates higher returns per cow than volume-focused strategies in current market conditions.
  • Product Mix Flexibility Captures Market Spreads: Operations with agile manufacturing capabilities can exploit the 8.4% performance gap between declining cheddar and gaining mozzarella, representing thousands in additional revenue per processing run.
  • China Demand Reality Check: Despite 16% import volume growth in February 2025, Rabobank forecasts only 2% net dairy import growth for the year as tariff-avoidance stockpiling normalizes – plan for demand moderation, not sustained buying sprees.
  • Risk Management Critical During Sequential Declines: Two consecutive GDT drops (0.9% then 1.6%) signal building bearish momentum requiring immediate hedging through Dairy Margin Coverage and futures contracts as traditional commodity strategies fail.
  • Technology Investment Becomes Competitive Edge: Precision dairy management and AI-driven herd optimization aren’t optional anymore – they’re essential tools for maintaining profitability when commodity markets fragment and margins compress across traditional categories.
global dairy trade, dairy market trends, dairy profitability, component optimization, dairy price analysis

Global Dairy Trade Event 381 delivered a 1.6% index decline on June 3, marking the second consecutive drop and revealing stark product fragmentation, creating clear winners and losers. While buttermilk powder crashed 6.1% and cheddar stumbled 4.2%, fat-based products like mozzarella gained 2.3%, and anhydrous milk fat climbed 1.4%, signaling a fundamental shift in global demand patterns that smart operators can capitalize on.

The numbers from Tuesday’s auction tell a story that goes far deeper than the headline decline. When 166 bidders showed up, but only 117 found prices worth paying for 16,307 metric tonnes of product, you’re witnessing real-time evidence of selective buyer resistance – not uniform market weakness.

The Data That Actually Matters

Let’s cut through the market noise and examine what really happened at GDT Event 381. The 1.6% overall decline masks dramatic product-level divergences that reveal where global buyers place their bets.

Powder Products Under Pressure:

  • Buttermilk powder: -6.1% to $2,834/MT (€2,482/MT)
  • Whole milk powder: -3.7% to $4,173/MT (€3,654/MT)
  • Skim milk powder: -1.1% to $2,807/MT (€2,458/MT)

Fat-Based Products Show Strength:

  • Mozzarella: +2.3% to $4,897/MT (€4,288/MT)
  • Anhydrous milk fat: +1.4% to $7,373/MT (€6,457/MT)
  • Butter: 0.0% at $7,811/MT (€6,840/MT)

This isn’t random market noise. It’s a clear signal about where industrial demand is heading, and the farms that recognize this divergence will capture premium values while others chase declining markets.

Why China’s Numbers Change Everything

Here’s the reality behind Chinese demand that most analysts are missing. China’s domestic milk production collapsed 9.2% year-over-year through February 2025, with farmgate prices hitting 10-year lows. Yet Chinese dairy imports surged 16% in volume and 20% in value in February, with March showing a 23.5% jump.

But here’s the critical detail: Chinese buyers accelerated purchases ahead of expected tariff increases, particularly for US dairy products. This means current import strength is artificially inflated by tariff-avoidance stockpiling rather than genuine consumer demand growth.

The Bottom Line on China: Rabobank forecasts China’s net dairy imports will rise only 2% in 2025, primarily in the latter half. Translation: the current buying spree isn’t sustainable, and smart operators need to plan for demand normalization.

Supply Reality Check: It’s Not About Volume

New Zealand’s dairy season just opened, yet a supply surge doesn’t drive this decline. Rabobank projects only 0.8% milk production growth from the “Big 7” export regions (Australia, New Zealand, Argentina, Uruguay, Brazil, EU, and US) for 2025.

When global supply growth is this constrained, a 1.6% GDT decline signals demand selectivity, not oversupply. The EU continues shrinking herds while environmental regulations create production ceilings. US milk production is projected to increase by just 0.5% in 2025, primarily absorbed by domestic processing expansion.

What This Means for Your Operation

Stop thinking about dairy as a single market. The 8.4% spread between declining buttermilk powder and gaining mozzarella represents real money on the table for operations with flexible product strategies.

Component-Focused Strategy: When anhydrous milk fat gains 1.4% while buttermilk powder crashes 6.1%, the message is crystal clear – optimize for butterfat and protein yields rather than just volume.

Risk Management Reality: With sequential GDT declines (0.9% followed by 1.6%), traditional hedging strategies need updating. The increased trading volumes in dairy futures markets already reflect urgent need for hedging among market participants.

Product Mix Flexibility: Processors with agile manufacturing capabilities that can shift between categories based on market signals will capture opportunities that rigid operations miss. The current fragmentation demands product-specific approaches rather than broad commodity strategies.

The Technology Edge in Volatile Markets

University research from land-grant institutions consistently shows that precision dairy technologies become critical during margin compression periods. When commodity markets fragment like this, operational efficiency separates profitable operations from struggling ones.

AI-driven herd management and data analytics aren’t nice to have anymore – they’re essential tools for navigating volatile markets where component optimization matters more than volume production.

Policy Landscape Reshaping Trade Flows

Trade policy uncertainties involving US-China relations continue creating market distortions that don’t reflect pure supply-demand fundamentals. China’s strategic move to build relationships with other countries to secure dairy needs underscores the long-term implications of trade disputes.

Environmental regulations in major export regions are structurally limiting expansion, creating production ceilings that support long-term price stability even amid short-term volatility.

Looking Beyond the Headlines

The sequential nature of these GDT declines suggests building bearish momentum that demands strategic attention. However, average prices remain above $4,000/tonne, still representing profitable levels for many exporters.

More importantly, the market fragmentation we’re seeing reflects deeper changes in industrial applications and consumer preferences. Research from the Journal of Dairy Science consistently shows that successful dairy operations align their strategies with evolving demand patterns rather than fighting them.

The Bottom Line

This isn’t just another market fluctuation – it’s a roadmap showing where global dairy demand is heading. The 6.1% gap between declining buttermilk powder and gaining mozzarella represents a real opportunity for operators who can adjust their production focus.

Your Action Plan:

  • Optimize for components over volume using precision dairy management
  • Diversify market exposure beyond traditional commodity channels
  • Invest in operational efficiency through proven technologies
  • Maintain flexibility in product mix to capture category-specific opportunities

The farms that read these signals correctly and adapt now will be the ones still profitable when commodity volatility settles. The market has spoken clearly about where value lies – the question is whether you’re positioned to capture it.

Learn More:

The Sunday Read Dairy Professionals Don’t Skip.

Every week, thousands of producers, breeders, and industry insiders open Bullvine Weekly for genetics insights, market shifts, and profit strategies they won’t find anywhere else. One email. Five minutes. Smarter decisions all week.

NewsSubscribe
First
Last
Consent

Stop Chasing Feed Fixes: Why Genetic Methane Solutions Deliver 30% Greater ROI Than Additives

Stop treating methane like a feed problem. Genomic selection slashes emissions by 30%—permanently—while boosting feed efficiency and your bottom line.

EXECUTIVE SUMMARY: It’s time to challenge the industry’s costly obsession with methane-reducing feed additives. New research proves that breeding for low-methane, high-efficiency cows delivers permanent, compounding reductions in emissions—up to 30%—with zero recurring costs. Unlike additives, which can cost $150–$300 per cow per year and only work as long as you keep feeding them, genetic improvements are passed down through generations, improving both feed conversion ratios and milk yield. International leaders like Canada and the Netherlands have already implemented methane efficiency breeding values, with early adopters seeing both environmental and economic gains. Methane represents a 4–12% energy loss from feed—energy that could be redirected into higher butterfat and protein output. With the global market shifting toward sustainability premiums and carbon credits, now is the time to rethink your breeding strategy. Evaluate your current approach: Are you investing in permanent solutions, or just paying for temporary fixes?

KEY TAKEAWAYS

  • Genetic selection for methane efficiency delivers up to 30% permanent emission reduction per cow, compounding every generation—no recurring costs.
  • Feed additives cost $150–$300/cow/year and only work while fed; genetic gains are inherited and improve both feed conversion and milk yield.
  • Methane represents a 4–12% loss of gross feed energy—selecting low-methane cows redirects that energy into more milk, butterfat, and protein.
  • Early adopters in Canada and Europe are already seeing premium payments and improved income over feed costs by selecting for methane efficiency.
  • With global markets and regulators demanding lower emissions, breeding for methane efficiency positions your herd—and your business—for future profitability and compliance.
dairy farming, methane reduction, genomic testing, feed efficiency, dairy profitability

While your feed rep is pushing the latest 0/cow methane additive with temporary results, countries like Canada and the Netherlands are breeding permanent 25% emission cuts that compound every generation. The $27.4 million Bezos Earth Fund investment isn’t going to feed companies—it’s backing genetic solutions that deliver once and keep delivering forever.

The dairy industry has a methane problem, and we’ve been solving it backward. While everyone’s obsessing over the latest seaweed supplement promising to cut emissions by 50%, smart farmers in 25 countries are quietly building herds that naturally produce 30% less methane without touching their DMI calculations. The difference? They’re thinking like geneticists, not like customers at the feed store.

Jeff Bezos just dropped $27.4 million on livestock genetics research, and it’s not because he’s bored with space travel. The Bezos Earth Fund, partnering with the Global Methane Hub, is betting big on permanent solutions rather than expensive daily treatments. This isn’t feel-good environmentalism—cold, hard economics could revolutionize how you think about TPI scores and genetic merit.

But here’s the critical question the industry refuses to ask: Why are we still treating the symptoms instead of breeding away the cause?

Why Feed Additives Are the Industry’s Expensive Subscription Service

Let’s talk numbers that matter to your milk check. That fancy methane-reducing feed additive your nutritionist is recommending? It’ll cost you $150-300 per cow annually. Every year. Forever (Who Will Foot the Bill for Methane-Reducing Feed Additives in Dairy Farming). Compare that to genetic selection, where you make the investment once through superior genomic testing and EBVs, then reap the benefits for generations.

Think of it this way: feed additives are like paying for Netflix—stop the subscription, lose the benefits. Genetic selection is like buying the entire movie collection—pay once to own it forever.

The Feed Additive Reality Check:

  • Seaweed-based supplements (Asparagopsis taxiformis) can reduce methane by 50-90% but require continuous application
  • Essential oils like Agolin Ruminant adjust the rumen microbiome but need daily feeding (Cutting Dairy’s Methane: 3-NOP’s Promise and Financial Hurdles)
  • Yeast cultures (Alltech’s Yea-Sacc) improve production but come with ongoing costs
  • The moment you stop feeding them, your methane emissions bounce right back

The feed companies won’t tell you that these additives treat symptoms, not causes. You’re essentially paying a subscription fee to maintain emission reductions that could be permanently bred into your herd through superior genetic merit.

Consider this sobering reality: A recent study found that 3-NOP additive reduced methane by 27.9% but decreased income over feed costs by $0.35 per cow daily—that’s $128,320 annually for a 1,000-cow operation. Are you prepared to sacrifice profitability for temporary emission reductions?

The Genetics Game-Changer: Natural Variation Already Exists in Your Herd

Some of your cows are already methane superstars—you just don’t know it yet. Research shows that natural variation means that some cattle emit up to 30% less methane than their herdmates, even when they are fed identical TMR and managed under similar conditions (Genetic Analysis of Methane Emission Traits in Holstein Dairy Cattle). This isn’t random—it’s genetically controlled, with heritability values ranging from 0.16 to 0.27 for different methane traits (Genetic Analysis of Methane Emission Traits in Holstein Dairy Cattle).

Wageningen University measured methane emissions from 14,000 dairy cows across 3 million AMS visits. What they discovered challenges everything the industry assumes about methane reduction. The lowest-emitting cows weren’t necessarily the smallest or lowest-producing. They were simply more energy-efficient in converting feed to milk.

The Energy Efficiency Connection

Here’s the part that should get every dairy farmer’s attention: methane emissions represent 4-7% energy loss for the animal. When cattle produce methane through enteric fermentation, they’re literally belching away ME (metabolizable energy) you paid for. Animals producing less methane are what Angus Genetics Inc. calls “lower input cost kind of cattle.”

Think about it this way: if a cow loses less energy through methane, she converts more feed into components. That’s immediate cost savings without changing a single thing about your nutrition program or transition period management.

Why This Matters for Your Operation

For a 100-cow herd averaging 80 pounds of milk per day, that 4-7% energy efficiency improvement could mean:

  • Feed cost savings: $4,000-7,000 annually on a $100,000 feed budget
  • Improved lactation curves: More persistent milk production from better energy conversion
  • Enhanced reproductive performance: Less metabolic stress during transition periods

Here’s a scenario that should make you rethink your breeding strategy: Take two Holstein cows producing 85 pounds of milk daily. Cow A emits 450g of methane daily, while Cow B emits 315g—a 30% difference. Over a 305-day lactation, Cow B saves approximately 41kg of methane emissions while likely converting feed more efficiently. Which cow would you rather have 100 copies of in your herd?

The $27.4 Million Bet on Permanent Solutions

Why Angus Genetics Inc. Said Yes to Bezos

Angus Genetics Inc. (AGI) received $4.85 million to lead North American research on low-methane beef genetics. AGI President Kelli Retallick-Riley was initially skeptical—methane research can be “polarizing within our industry.” However, two factors convinced her: the initiative isn’t controlled by outside forces and uses external funding rather than member dollars.

Over five years, AGI will evaluate the genotypes of more than 10,000 animals while collecting methane emissions data. Their goal isn’t just environmental compliance—it’s identifying “genetically more efficient cattle” that deliver “long-term, low-cost benefits.”

Wageningen University’s Dairy Revolution

The Dutch researchers aren’t thinking small. Their .7 million grant targets a 25% reduction in methane emissions over 25 years through genomics and breeding programs. That translates to a 1% annual improvement that compounds every generation—like earning interest on your genetic investments.

Wageningen has already demonstrated this work without compromising production traits. They proved selection for low methane could occur “without ignoring all the other important traits in the breeding programs, such as health, fertility, longevity, and productivity.”

But here’s the uncomfortable truth the industry won’t discuss: While we’re debating whether to invest in genetic solutions, other livestock sectors are already reaping the benefits. Why has dairy been so slow to embrace what beef and even poultry producers have already proven works?

Global Implementation: Learning from International Leaders

Regional Comparison: Who’s Leading the Charge

RegionImplementation StatusKey MetricsEconomic Incentives
Netherlands30% methane reduction target by 203014,000 cows measured via AMS systemsFrieslandCampina pays premiums for low-emission milk
CanadaNational genetic evaluations active (Canadian dairy cows among first in world bred to belch less methane)>70% reliability for genotyped animalsLactanet offers Methane Efficiency EBVs
United StatesAGI collecting 10,000+ animal dataIntegration with existing EPD systemsCalifornia Low Carbon Fuel Standard rewards
EuropeMulti-country consortium active50 institutions across 25 countriesEU climate policy alignment
New ZealandResearch participationFocus on pastoral systemsMarket positioning for exports

Why This Matters for Your Operation

Low-methane genetics could become a competitive advantage if you’re exporting dairy products, particularly to EU markets. European consumers increasingly demand climate-smart dairy products and genetic solutions provide verifiable, permanent emission reductions.

Canada’s Lactanet has already launched the world’s first national genomic methane evaluation, producing results from Holstein cows and heifers on 6,000 farms representing nearly 60% of Canada’s dairy operations. Canadian methane emissions from dairy cows vary widely, from 250 to 750 grams per day—a 200% variation that proves genetic potential exists today.

The Technology Making It Scalable: From Research Lab to Your Parlor

Breakthrough: Milk MIR Analysis

The biggest breakthrough isn’t in genetics—it’s in measurement technology. Direct methane measurement using specialized equipment costs $50,000+ per system. But, researchers have cracked the scalability code using Milk Mid-Infrared (MIR) spectral data.

Your current milk quality analysis already collects this data routinely. AI and machine learning can now predict methane emissions with an 85% genetic correlation to direct measurements. This means you can identify low-methane genetics using data you’re already collecting for butterfat %, protein content, and SCC counts.

Global Data, Local Application

The Global Methane Genetics Initiative plans to sample over 100,000 animals across different breeds and production environments. All this data will be publicly available, enabling prediction of methane emissions for any animal from participating breeds.

Countries implementing methane genetic evaluations—Canada, Netherlands, Spain—show no production trade-offs when selecting for efficiency rather than raw methane output. Lactanet in Canada already offers genetic evaluations for Methane Efficiency in Holstein cattle with over 70% reliability for genotyped animals (Reducing dairy cattle methane emissions through genetic improvement).

Implementation Timeline for Your Operation

  • Immediate (2025): Request methane efficiency data when evaluating AI sires
  • 6-12 months: Incorporate methane EBVs into breeding decisions
  • 2-3 years: First progeny expressing improved methane efficiency
  • 5-10 years: Significant herd-wide improvements in energy efficiency

What’s stopping you from starting this process today? Your AI company likely already has access to bulls with methane efficiency data—you just need to ask for it.

The Economics That Matter to Your Milk Check

Immediate Returns vs. Ongoing Costs

Let’s break down the real economics using industry-standard numbers:

Feed Additive Approach:

  • Annual cost: $150-300 per cow
  • 100-cow herd: $15,000-30,000 annually
  • 10-year total: $150,000-300,000
  • Benefits: Temporary, require continuous application

Genetic Selection Approach:

  • Initial investment: Superior AI sires ($50-100 per breeding)
  • Ongoing costs: Zero
  • Feed efficiency gains: 4-7% of feed costs ($4,000-7,000 annually for 100-cow herd)
  • Benefits: Permanent, compound every generation

Think of genetic selection, like installing solar panels versus feed additives, like paying your electric bill forever.

Market Premiums Are Already Here

FrieslandCampina already pays premium prices for low-emission milk. The Netherlands has committed to 30% methane reduction by 2030. California’s Low Carbon Fuel Standard rewards methane reduction today. These aren’t future possibilities—they’re current market realities creating additional revenue streams for climate-smart farmers.

Why This Matters for Your Operation

Progressive dairy processors are beginning to differentiate based on sustainability metrics. Early adopters of low-methane genetics position themselves for:

  • Premium milk prices: $0.50-1.00 per hundredweight premiums emerging
  • Supply chain preferences: Access to sustainability-focused markets
  • Regulatory compliance: Ahead of mandated emission reductions

Real-world example: A recent study using the Dairy Wellness Profit (DWP$) index found that enteric methane intensity decreased by 0.00017 kg CO2e/kg FPCM for each (Reduction of environmental effects through genetic selection). With the average herd making genetic progress annually, lifetime enteric methane intensity is expected to be 2.5% lower for each year’s replacement heifers.

The Bulls and Tools You Need Now

Canadian Leadership in Methane Genetics

Lactanet in Canada launched a national genetic evaluation for Methane Efficiency in Holstein cattle, achieving over 70% reliability for genotyped young bulls and heifers. This enables producers to select for reduced methane without sacrificing production traits.

Integration with Existing Tools

AGI plans to integrate methane efficiency into genomic-enhanced Expected Progeny Differences (EPDs). This means selecting for low methane becomes as simple as choosing bulls with favorable TPI scores for any other trait. No new technologies to learn, and no management changes are required.

Implementation Checklist for Your Operation

✓ Request genomic testing for methane efficiency from your AI company ✓ Include methane EBVs in sire selection criteria ✓ Track feed efficiency metrics in your data management system ✓ Monitor lactation curves for energy efficiency improvements ✓ Document sustainability practices for premium milk opportunities

Overcoming Industry Resistance: The Adoption Reality Check

What This Means for Your Operation

A petition has emerged calling for the American Angus Association to return the Bezos grant, arguing that accepting funding for methane research endorses a narrative portraying cattle as environmental problems. This resistance reflects broader industry concerns about external pressure and regulatory implications.

However, smart farmers focus on economics: improved feed efficiency equals better profitability, regardless of environmental considerations. The correlation between low methane and energy efficiency means you’re optimizing for performance, not just compliance.

Addressing Common Concerns

“Will selecting for low methane hurt production?” International data shows methane-efficient cattle maintain production levels while improving feed conversion. A Spanish study demonstrated that while incorporating methane into breeding objectives had minimal impact on production traits, it could achieve a 20% reduction in methane production over 10 years through selective breeding (Mitigation of greenhouse gases in dairy cattle via genetic selection).

“Is this just another environmental regulation?” Market incentives are already emerging independent of regulations. FrieslandCampina pays premiums today. Focus on the business case: lower input costs and potential premium payments.

“Do we really need this complexity?” Integration with existing EPD and TPI systems means no additional complexity. You’re already making genetic selections, which adds another profitable trait to consider.

Here’s the reality check no one wants to discuss: While we debate complexity, other industries have moved forward. The pork industry just approved gene editing for disease resistance, saving $1.2 billion annually. When did dairy become the industry that chooses expensive daily treatments over permanent genetic solutions?

Global Collaboration, Local Benefits: The International Advantage

Learning from International Leaders

The Global Methane Genetics Initiative spans four continents with over 50 institutions in 25+ countries. This unprecedented collaboration ensures genetic tools work across breeds, production systems, and geographic regions.

Regional Market Advantages

  • US producers: Position for potential carbon credit programs and export market preferences
  • EU operations: Align with aggressive climate targets and consumer demands
  • Export-focused farms: Develop sustainability credentials for international markets
  • Organic/premium producers: Add scientifically-backed sustainability claims

Why This Matters for Your Operation

International collaboration means faster development of reliable genetic tools. Instead of waiting decades for domestic research, you benefit from global data collection and validation across diverse production environments.

Research shows that achieving net-zero greenhouse gas emissions in dairy production will require a>50% reduction in enteric methane emissions, making genetic selection a crucial component of comprehensive climate strategies (The Path to Net-Zero in Dairy Production).

Critical Industry Challenge: Conventional Wisdom vs. Evidence

The Uncomfortable Truth About Industry Priorities

The dairy industry has spent decades perfecting nutritional approaches to maximize production while largely ignoring the genetic potential for efficiency improvements. This represents a fundamental misallocation of resources and research priorities.

Consider this: We’ll spend $50,000 on a new TMR mixer to improve feed efficiency by 2-3% but resist investing in genetic tools that could deliver permanent 4-7% efficiency improvements. Why do we embrace mechanical solutions while questioning biological ones?

Evidence-Based Alternative Strategy

Research demonstrates that genetic improvements in methane efficiency are heritable (0.16-0.27 heritability) and strongly correlated with overall efficiency metrics (Genetic Analysis of Methane Emission Traits in Holstein Dairy Cattle). The evidence is clear: genetic selection works.

The path forward requires challenging three industry assumptions:

  1. That feed-based solutions are more practical than genetic ones
  2. That environmental traits compromise production performance
  3. Temporary fixes are preferable to permanent improvements

Each assumption has been disproven by research, yet industry adoption remains slow.

Future Industry Implications: What’s Coming Whether You’re Ready or Not

The Regulatory Reality

Climate regulations aren’t slowing down. The Netherlands requires a 30% methane reduction by 2030. California’s Low Carbon Fuel Standard already rewards emission reductions. Federal programs are expanding carbon credit opportunities.

Early adopters position themselves as regulatory winners rather than victims. Late adopters will face compliance costs without the efficiency benefits that genetic selection provides.

Market Evolution

Consumer demand for sustainable dairy products continues growing. Export markets increasingly require sustainability credentials. Premium processors are beginning to differentiate based on carbon footprint metrics.

Will you be positioned as a solution provider or a problem that needs solving?

The Bottom Line: Genetics Beat Subscriptions Every Time

The dairy industry’s obsession with feed-based methane solutions is economically backward when genetic selection offers permanent, accumulating benefits without ongoing costs. While your competitors are signing up for expensive subscription services disguised as feed additives, you could build a herd that naturally produces less methane while converting feed more efficiently.

The numbers don’t lie:

Your Action Plan for Immediate Implementation:

  1. Start now: Contact your AI provider about methane efficiency genetics—request bulls with favorable methane EBVs for your next breeding decisions
  2. Track metrics: Implement feed conversion monitoring in your data management system to establish baseline efficiency measurements
  3. Document benefits: Record improvements for potential premium milk opportunities and carbon credit programs
  4. Stay informed: Follow international developments in methane genetics through industry publications and university extension programs
  5. Network: Join producer discussion groups exploring climate-smart breeding strategies

Critical Questions for Self-Assessment:

  • Are you treating symptoms or breeding solutions? If you spend more on feed additives than genetic improvements, you choose expensive band-aids over permanent fixes.
  • What’s your 10-year methane strategy? Feed additives will cost you $15,000-30,000 annually for a 100-cow herd. Genetic selection costs nothing after implementation and improves efficiency permanently.
  • How much energy loss can you afford? With methane representing 4-12% of energy waste, can you ignore genetic tools that redirect this loss toward productive purposes?

Think of methane efficiency like udder health—you wouldn’t ignore SCC counts because they indicate energy waste through an immune response. Methane emissions indicate energy waste through inefficient digestion. Both impact your bottom line, and both can be improved through genetics.

The Bezos Earth Fund didn’t invest $27.4 million in feed companies. They invested in genetics because permanent solutions beat expensive subscriptions every time. The only question is whether you’ll join the genetic revolution or keep funding the feed additive industry’s retirement plans.

Ready to revolutionize your breeding program? Start by requesting methane efficiency EBVs for your next sire selections and watch your feed conversion improve while your energy costs shrink—permanently. The technology exists, the genetics work, and the economic benefits are proven. What are you waiting for?

Implementation Support Resources:

  • Contact your AI provider about methane efficiency genetics availability
  • Join producer discussion groups exploring climate-smart breeding through university extension programs
  • Consider genomic testing services that include methane traits in their evaluation panels (Reducing dairy cattle methane emissions through genetic improvement)
  • Explore carbon credit opportunities through programs like California’s Low Carbon Fuel Standard

The choice is yours: continue paying subscription fees for temporary solutions or invest once in permanent genetic improvements that compound every generation. Which strategy aligns with your long-term vision for profitable, sustainable dairy production?

Learn More:

The Sunday Read Dairy Professionals Don’t Skip.

Every week, thousands of producers, breeders, and industry insiders open Bullvine Weekly for genetics insights, market shifts, and profit strategies they won’t find anywhere else. One email. Five minutes. Smarter decisions all week.

NewsSubscribe
First
Last
Consent

Export-Driven Innovation: How U.S. Dairy’s Efficiency Surge Delivers $223 Million in New Value

Stop chasing herd size—genomic testing and feed efficiency can boost milk yield and profits by 10%+ even as U.S. dairy exports surge $223 million.

EXECUTIVE SUMMARY: Forget the “get big or get out” mantra—2025 data proves smarter, not bigger, wins in dairy. U.S. farms are driving record .2 billion exports by focusing on milk yield, butterfat percentage, and genomic testing, with top herds seeing 10% higher lifetime production and up to 2.1% gains in butterfat. Precision nutrition and automated tech are delivering 15% higher yields and slashing labor costs by 20%. Globally, U.S. producers now outpace EU, New Zealand, and China on both productivity and profit per cow. Case studies show even 250-cow herds can boost output 17% and cut SCC by 22%—no expansion required. Every 0.1% butterfat increase adds $0.20/cwt, putting thousands back in your pocket each month. Ready to challenge your assumptions? It’s time to benchmark your operation against the world’s best.

KEY TAKEAWAYS

  • Genomic testing and precision nutrition deliver up to 12% higher milk solids and 8% lower feed costs—without adding cows.
  • Automated milking and activity monitoring can boost milk yield by 15% and cut labor expenses by 20%, driving rapid ROI.
  • Every 0.1% increase in butterfat can add $6,570/month to a 1,000-cow herd’s bottom line—track butterfat, protein, and SCC on every tank.
  • U.S. dairy exports hit $8.2 billion in 2024, with Mexico and Canada accounting for 40%+ of the market—diversify your product mix to ride global demand.
  • Challenging scale obsession: Smaller herds using tech and data-driven breeding have matched or beaten mega-farm productivity, even during labor shortages.
dairy profitability, milk yield, genomic testing, automated milking, feed efficiency

U.S. dairy exports soared by $223 million in 2024, a testament to the sector’s relentless drive for efficiency, genetics, and tech-fueled innovation. For strategic planners, the message is clear: the future belongs to operations that maximize value from every drop of milk, regardless of market volatility or farm consolidation.

From rising butterfat percentages to record-setting cheese yields, the U.S. dairy sector is squeezing more from less, outpacing global competitors and setting new benchmarks for operational ROI.

Why Are U.S. Dairy Exports Surging When Farm Numbers Are Falling?

How can U.S. dairy exports hit $8.2 billion—the second-highest ever—when the number of dairy farms keeps dropping? The answer: higher milk yield per cow, improved milk composition, and a laser focus on efficiency. Mexico and Canada now account for over 40% of U.S. dairy exports, with Mexico alone importing $2.47 billion in 2024. Central American markets like Costa Rica and Guatemala are also setting new records.

U.S. farms are producing more with fewer cows, thanks to a focus on milk yield per cow, butterfat percentage, protein content, and somatic cell count (SCC). The average U.S. Holstein now produces over 25,000 lbs of milk per year, with butterfat levels pushing past 4.36% and protein content topping 3.38% in Q1 2025—a 2.1% and 1.7% jump, respectively, over last year (2025 Dairy Market Reality Check).

Dairy Analogy #1: Think of the modern U.S. dairy as a high-performance sports car: fewer cylinders, but more horsepower per engine. It’s not about how many cows you have, but how efficiently each one converts feed into premium milk solids.

What’s Powering This Efficiency Revolution? Genetics, Nutrition, and Precision Tech

The U.S. isn’t just making more milk—it’s making better milk. The secret sauce? A three-way punch: advanced genetics, dialed-in nutrition, and cutting-edge technology (Data Integration and Analytics in the Dairy Industry).

Genetics: Breeding for Butterfat and Protein

Genomic testing is now standard on progressive U.S. farms, with selection driven by Estimated Breeding Values (EBVs) and Total Performance Index (TPI) scores. Top herds are stacking genetic merit for both yield and milk solids. Cornell Extension reports herds using genomic selection see up to 10% higher lifetime production and improved disease resistance (Introduction To Dairy Herd Management).

Dairy Analogy #2: Breeding cows today is like drafting an all-star team using advanced analytics—every heifer in your lineup is a proven performer, not just a pretty pedigree.

Nutrition: Maximizing Output per Bite

Nutritionists are fine-tuning Dry Matter Intake (DMI) and Metabolizable Energy (ME) levels to optimize each cow’s lactation curve (Linking Animal Feed Formulation to Milk Quantity, Quality, and Animal Health Through Data-Driven Decision-Making). By managing transition periods and feeding for higher milk solids, U.S. herds are boosting both output and component percentages. University of Wisconsin research shows that every one-point increase in DMI can yield an extra 2.5 lbs of milk per day—directly impacting farm revenue.

Technology: Precision Ag and Data-Driven Decisions

Automated Milking Systems (AMS), activity monitoring, and real-time data analytics are now table stakes for efficiency-focused farms. Sensors track everything from rumination to SCC counts, flagging health or production issues before they hit the bottom line. Farms adopting precision ag tools report up to 15% higher milk yields and 20% lower labor costs (The Growing Global Dairy Industry: Automation and Technological Innovations Driving Efficiency).

Dairy Analogy #3: Managing a dairy with today’s tech is like flying a modern jetliner—you’re not just steering, you’re monitoring dozens of dashboards to keep everything running at peak performance (Data Integration and Analytics in the Dairy Industry).

Are Global Consumers Still Hungry for Dairy—and Are We Delivering What They Want?

Absolutely. Dairy delivers 72% of the calcium in the U.S. food supply. To match the calcium in an 8-ounce glass of milk, you’d need to eat seven oranges or six slices of wheat bread (Dairy’s Rollercoaster: Navigating 2025’s Peaks and Valleys). Despite the noise around plant-based alternatives, 99% of U.S. households still buy milk, and the average American drinks nearly 25 gallons a year (Recent updates on plant protein-based dairy cheese alternatives: outlook and challenges).

Globally, rising incomes in Asia and Latin America are fueling demand for cheese, butter, and high-protein dairy. U.S. processors now offer over 600 cheese varieties, with value-added exports leading the charge. In 2024, U.S. cheese exports hit a record high, up nearly 18% year-over-year.

But here’s a question for you: Are you capitalizing on this demand, or letting it pass you by?

How Do U.S. Practices Stack Up Against Global Competitors?

Let’s put the U.S. in the global lineup:

RegionMilk Yield (kg/cow/year)Butterfat %Protein %SCC (x1,000/ml)Tech AdoptionExport Focus
U.S.11,3004.363.38150HighValue-added, NAFTA
EU (Germany)8,2004.103.40180ModerateCheese, SMP
New Zealand4,5004.703.75200ModerateCommodity, Asia
India2,0004.503.30400LowDomestic
China6,0003.803.20300EmergingImports

Dairy Analogy #4: If global dairy was a relay race, the U.S. is the runner with the best shoes (tech), the best training (genetics), and the best nutrition plan—no wonder it’s pulling ahead on the final lap.

What Are the 2025 Headwinds—and How Are Strategic Planners Navigating Them?

2025 brings real challenges. Labor shortages are squeezing margins, with some processors forced to dump milk when plants can’t run at capacity. Feed costs remain volatile, and climate variability is impacting forage quality and mastitis rates (Cost-efficiency of mastitis control strategies on smallholder dairy farms). Meanwhile, global trade is a moving target—China’s dairy imports are down, while Central America’s are.

Why This Matters for Your Operation:
If you’re not tracking butterfat, protein, and SCC on every tank, you’re leaving money on the table. Every 0.1% increase in butterfat can add $0.20/cwt to your milk check. For a 1,000-cow herd producing 90 lbs/cow/day, that’s an extra $6,570 per month—enough to cover a new activity monitoring system in under a year (Data Integration and Analytics in the Dairy Industry).

Challenging Conventional Wisdom: Is Bigger Always Better?

Let’s challenge a sacred cow: the relentless pursuit of scale. For decades, the industry mantra has been “get big or get out.” But is bigger always better? Recent research suggests otherwise. While large-scale operations benefit from economies of scale, they also face higher vulnerability to labor shortages, disease outbreaks, and market shocks (Dairy’s Rollercoaster: Navigating 2025’s Peaks and Valleys).

Case in Point:
Miltrim Farms in Wisconsin implemented 30 robotic milking units, scaling up by 1,200 cows while holding labor costs flat. Their secret? Not just size, but smart investment in automation, data analytics, and cow comfort. Meanwhile, a 250-cow farm in upstate New York saw a 17% increase in milk yield and a 22% drop in SCC after switching to precision nutrition and genomic testing—without adding a single cow (Linking Animal Feed Formulation to Milk Quantity, Quality, and Animal Health Through Data-Driven Decision-Making).

Rhetorical Question: When was the last time you measured ROI per cow, not just per acre or per parlor?

Evidence-Based Alternative:
Instead of chasing scale, focus on genetic merit, precision feeding, and technology adoption. University of Wisconsin and Cornell research shows targeted investments in these areas can deliver higher returns than simply adding more cows (Linking Animal Feed Formulation to Milk Quantity, Quality, and Animal Health Through Data-Driven Decision-Making), (Introduction To Dairy Herd Management).

What Solutions Are Delivering Real ROI for Strategic Planners?

Operational Efficiency:
Genomic selection and precision feeding are driving up solids and slashing input costs. Extension data shows herds using genomic testing and targeted nutrition see up to 12% higher component yields and 8% lower feed costs (Linking Animal Feed Formulation to Milk Quantity, Quality, and Animal Health Through Data-Driven Decision-Making), (Introduction To Dairy Herd Management).

Market Diversification:
Expanding into Central America and focusing on value-added products (like specialty cheese and whey) is offsetting volatility in traditional markets.

Sustainability and Workforce Investment:
Farms investing in renewable energy, manure-to-energy systems, and climate-resilient cropping are seeing up to 18% lower energy costs and improved public perception.

Implementation Timelines and Costs:

Potential Barriers:
Upfront capital, tech integration headaches, and workforce training. But the upside? Higher margins, better herd health, and a more resilient business (Data Integration and Analytics in the Dairy Industry).

Why This Matters for Your Operation

  • Every point of butterfat and protein is money in your pocket.
  • Genomics and precision tech aren’t just for mega-herds—mid-size and family farms are seeing real gains (Introduction To Dairy Herd Management).
  • Diversifying products and markets shields you from global shocks.
  • Investing in sustainability isn’t just about optics—it’s about slashing costs and future-proofing your business.

Dairy Analogy #5: Think of your dairy as a Formula 1 team: you need the best drivers (cows), the best pit crew (staff), and the best telemetry (data) to win in a hyper-competitive, high-stakes race (Data Integration and Analytics in the Dairy Industry).

The Bottom Line: Efficiency, Genetics, and Tech Are the New Currency of Dairy Success

U.S. dairy’s $223 million export surge is no accident—it’s the result of relentless focus on milk solids, data-driven decision-making, and a willingness to invest in genetics, nutrition, and technology. Strategic planners who double down on these levers are setting themselves up for global leadership, no matter what the market throws their way.

Don’t just celebrate National Dairy Month—use it as your launchpad for the next round of operational upgrades. The world’s hungry for quality dairy. Make sure your farm is ready to deliver.

Next Steps for Your Operation:

  1. Audit your herd’s genetic merit and component yields. Are you maximizing TPI and EBVs?
  2. Evaluate your technology stack. Is your AMS or activity monitoring system delivering ROI?
  3. Run a feed efficiency analysis. Are your DMI and ME levels aligned with your herd’s genetic potential?
  4. Diversify your product and market mix. Are you still reliant on one or two buyers, or are you positioned to weather global volatility?
  5. Challenge your assumptions. When was the last time you asked: “What if we did less, but did it better?”

Ready to benchmark your farm’s milk solids or explore ROI on AMS? Drop your numbers in the comments or reach out for a custom analysis. Let’s keep pushing the boundaries—together.

Learn More:

The Sunday Read Dairy Professionals Don’t Skip.

Every week, thousands of producers, breeders, and industry insiders open Bullvine Weekly for genetics insights, market shifts, and profit strategies they won’t find anywhere else. One email. Five minutes. Smarter decisions all week.

NewsSubscribe
First
Last
Consent

China’s Dairy “Crisis” Just Revealed the Future—And Most Farmers Are Fighting Yesterday’s War

Still breeding for milk volume? China’s dairy shakeup proves it’s time to target feed efficiency and genomic merit—boosting profit per cow by up to $285.

EXECUTIVE SUMMARY: The old “more milk, more money” mantra is officially outdated—China’s 2.8% production drop and pivot to premium, feed-efficient cows is rewriting the global playbook. New research shows that focusing on feed efficiency and genomic testing can deliver up to $285 more profit per cow annually, while slashing nitrogen emissions by 10–20% and cutting feed costs by up to 25%. China’s market is rewarding producers who deliver high-value milk components, not just volume, and global leaders like VikingGenetics are investing in AI-powered feed intake systems to track and breed for metabolic efficiency across 30,000 cows. U.S. and EU farms using precision feeding and genomic selection are seeing higher milk yields, better butterfat percentages, and lower somatic cell counts—directly translating to stronger margins and greater sustainability. As global competition intensifies and input costs rise, shifting from commodity milk to value-driven, efficiency-focused production is the only way to future-proof your business. Now’s the time to challenge your breeding and feeding strategies—your bottom line depends on it.

KEY TAKEAWAYS

  • Genomic testing and feed efficiency selection can add up to $285 profit per cow annually by improving milk yield, butterfat percentage, and reducing feed costs in herds using advanced genetic and nutrition management.
  • Precision feeding systems lower nitrogen emissions by 10–20% and can save U.S. farms over $775 million per year in feed costs—while boosting milk production and reducing nutrient waste.
  • AI-driven feed intake monitoring and the Saved Feed Index are helping European farms breed cows with higher metabolic efficiency, cutting emissions by up to 20% and supporting climate-friendly production.
  • China’s pivot away from commodity milk is a wake-up call: global markets now reward high-value milk components, low somatic cell counts, and sustainability—not just volume. U.S. and EU producers who adapt will capture premium markets and higher margins.
  • Immediate action: Audit your herd’s genetic merit, implement genomic testing, and invest in precision feeding. These steps will improve feed conversion ratios, milk quality, and operational profitability—future-proofing your dairy against volatile markets and rising input costs.
dairy farming, precision agriculture, genomic testing, dairy profitability, feed efficiency

China’s 2.8% milk production drop isn’t a failure—it’s the dairy industry’s crystal ball showing exactly where we’re all headed. While everyone panics about declining output, the smart money recognizes this as the death of commodity dairy and the birth of a .6 billion value-creation opportunity that will separate the winners from the losers.

Nobody wants to admit that China didn’t fail at the dairy—they figured out first that pumping out more basic milk is a losing game. And if you’re still optimizing your operation for volume over value, you’re about to get schooled by the market reality that’s already reshaping the world’s third-largest milk producer.

Why China’s “Collapse” is Actually Your Wake-Up Call

Let’s cut through the industry denial and face some uncomfortable truths. China’s liquid milk production dropped 2.8% to 27.4 million tons—the first decline in five years. But here’s the kicker that should terrify every commodity producer: this happened while dairy imports are projected to surge 2% in 2025, with whole milk powder imports alone hitting 460,000 metric tons.

Think about that for a second. The world’s largest dairy importer can’t make basic milk profitable, but they’re buying more specialty products than ever. If that doesn’t wake you up to where this industry is heading, nothing will.

The farmgate reality is brutal: Chinese farmers endured 24 consecutive months of declining milk prices, with prices dropping 15% below production costs (China’s milk production is set to decline again in 2025). That’s not a market cycle—that’s a death spiral for anyone still betting on commodity volume.

Why This Matters for Your Operation: If you’re producing commodity milk in Wisconsin, Waikato, or anywhere else, you’re competing in a category that the world’s most important growth market just proved is fundamentally broken. The question isn’t whether this trend will reach your region; it’s how fast.

The Brutal Truth: Consumers Don’t Want Your Basic Milk Anymore

Here’s the industry reality check that most producers refuse to face: Chinese consumers aren’t abandoning dairy—they’re abandoning boring dairy. While traditional liquid milk crashes, premium segments are exploding:

  • Yogurt and probiotic drinks: $40.12 billion market growing at 8.35% annually (China Dairy Products Market Report- Q1 2025)
  • Cream imports Surged 9% to 290,000 tons
  • Whey imports Jumped 41.7% in March alone
  • Plant-based dairy: Hit $21.46 billion, projected to reach $60 billion by 2035

The uncomfortable question every producer should be asking: If consumers in the world’s fastest-growing dairy market are willing to pay premiums for everything except basic milk, what does that tell you about your current product strategy?

The demographic reality is even worse for traditional dairy. China’s birth rate collapsed from 18 million newborns in 2016 to 9.6 million in 2022—a 47% drop in your core customer base for infant formula. Add widespread lactose intolerance and economic headwinds, and you’ve got a perfect storm destroying demand for undifferentiated dairy products.

But here’s what the data really shows: It’s not about lactose intolerance or demographics—it’s about value proposition. Consumers want specific benefits: health outcomes, convenience, sustainability, and functionality. Basic milk delivers none of these.

Are You Still Breeding for 1980s Market Demands?

Let’s talk about the elephant in the barn that nobody wants to address: most breeding programs are optimizing for market demands that no longer exist.

The obsession with maximizing milk volume per cow might actually be sabotaging your long-term profitability. When you breed solely for production without considering the component quality and functional properties, you optimize for yesterday’s market while ignoring tomorrow’s premium opportunities.

Here’s the genomic reality: Precision dairy farming technologies can deliver a 30% increase in milk yield, a 25% reduction in feed costs, and a 20% decrease in veterinary expenses. But the real game-changer isn’t volume—it’s precision breeding for specific milk compositions that support functional processing.

Chinese processors achieving FDA GRAS certification for Human Milk Oligosaccharides (HMOs) proves this evolution—they’re competing on nutritional biochemistry, not manufacturing scale. Meanwhile, most Western breeding programs are still chasing pounds per cow per day like it’s in 1995.

Implementation Reality Check:

  • Genomic testing: Costs as low as $28 per head, delivering 11:1 ROI on targeted interventions
  • Precision feeding systems: 25% feed cost reduction while improving milk quality parameters
  • Automated milking systems: $200,000 investment with 5-7-year payback periods

The Strategic Question: Are you investing in technology that produces more of what the market wants less of, or are you positioning for the functional dairy revolution?

The $2.6 Billion Export Gold Rush You’re Probably Missing

While China’s domestic production implodes, international opportunities are exploding—but only for producers who understand the game’s new rules.

The trade reality is reshaping everything: China’s 125% tariffs on U.S. dairy products have permanently eliminated American suppliers, creating massive opportunities for other exporters. New Zealand remains the largest exporter, but specialty categories are wide open for countries with advanced processing capabilities.

The premium categories offer the highest margins:

  • Specialty cheese market: Expected to reach $1.52 billion by 2030
  • Limited domestic processing capacity for aged varieties creates sustainable competitive advantages
  • Technical specifications matter more than price for market success

Here’s what most exporters get wrong: They’re still competing on volume and price when Chinese buyers want functional benefits, sustainability credentials, and quality certifications. The companies winning these premium segments aren’t just making better milk but solving specific consumer problems.

Implementation Timeline:

  • Regulatory approval: 6-12 months for new product categories
  • Supply chain establishment: 12-18 months for reliable logistics
  • Market development: 18-24 months to build brand recognition

The opportunity window is narrowing fast. During this transition, companies that establish strong positions in premium segments will benefit from years of growth as Chinese consumers continue evolving toward sophisticated dairy consumption.

Industry Giants Are Already Making the Pivot—Are You?

The response from China’s dairy leaders reveals exactly how seriously players adapt to new market realities. These aren’t incremental adjustments—they’re fundamental strategic realignments.

Mengniu achieved FDA GRAS certification for HMOs—a breakthrough previously dominated by multinational companies. They’re now integrating these into infant formula and children’s liquid milk, competing on nutritional biochemistry rather than manufacturing scale.

Yili’s international business grew 52% year-over-year, establishing strong Southeast Asian positions while investing heavily in functional products like lactose-free milk and red ginseng milk powder.

The technology investments are staggering:

  • World’s first fully intelligent dairy factory
  • Mengniu GPT: AI-driven nutrition platform
  • 30 national-level “green factories” with carbon-neutral operations
  • Precision farming and data analytics across entire supply chains

The sustainability commitments aren’t marketing—they’re market requirements. Nearly 40% of consumers actively seek eco-friendly packaging, and 66% will pay premiums for environmentally responsible brands.

What This Means for Your Operation: The Chinese approach to technology integration and sustainability isn’t unique to China—it’s the future blueprint for competitive dairy operations worldwide. The question is whether you’re going to lead this transformation or get left behind by it.

The Bottom Line: Commodity Dairy is Dead—Long Live Value-Added Dairy

China’s dairy sector transformation isn’t a cautionary tale—it’s a preview of coming attractions for the global industry. The 2.8% production decline represents the death of volume-based strategies and the birth of value-driven market dynamics.

Three strategic imperatives for survival:

1. Stop Fighting Yesterday’s War Volume-based strategies are obsolete. The future belongs to operations that deliver specific functional benefits, meet sustainability expectations, and provide premium experiences. Whether you’re a domestic producer or an international exporter, success depends on solving consumer problems, not just producing ingredients.

2. Embrace the Technology Revolution Now Precision agriculture, genomic testing, and data analytics aren’t luxury technologies—they’re baseline requirements for producing the consistency and quality that premium markets demand. Operations that master these technologies gain sustainable competitive advantages beyond cost reduction.

3. Capture Market Share During the Transition The window for establishing positions in premium segments is open now but closing fast. Functional product development requires 18-24 months, sustainability certifications take 12-18 months, and technology integration needs 6-18 months. The companies moving fastest will capture the highest margins.

The ROI data supports aggressive transformation:

  • Comprehensive genomic testing: 11:1 return on targeted interventions
  • Precision dairy farming: 30% yield increase, 25% feed cost reduction
  • Premium market positioning: Margin premiums of 15-40% over commodity pricing

Here’s your action plan:

  1. Audit your product portfolio today: Are you optimizing for volume or value? The data shows value wins.
  2. Assess technology adoption: Which precision agriculture tools could deliver immediate ROI?
  3. Evaluate your breeding program: Are you selecting for tomorrow’s market demands or yesterday’s volume targets?
  4. Review export strategy: How quickly can you pivot to specialty market segments?

The brutal reality: Farms that continue optimizing for commodity production will find themselves competing for shrinking margins in declining market segments. The future belongs to operations that recognize China’s transformation as their roadmap to profitability.

China’s dairy “crisis” isn’t China’s problem—it’s your opportunity. The question isn’t whether these trends will reshape your market; it’s whether you’ll lead the transformation or become its casualty.

What’s your strategy for capturing your share of the value revolution? The dairy industry’s future isn’t about producing more milk—it’s about producing the right milk for consumers who are becoming more sophisticated, health-conscious, and willing to pay premiums for specific benefits. China just showed us the way forward. The only question is whether you’re ready to follow.

Learn More:

The Sunday Read Dairy Professionals Don’t Skip.

Every week, thousands of producers, breeders, and industry insiders open Bullvine Weekly for genetics insights, market shifts, and profit strategies they won’t find anywhere else. One email. Five minutes. Smarter decisions all week.

NewsSubscribe
First
Last
Consent

CME DAIRY REPORT JUNE 2nd, 2025: Butter Powers Higher as New FMMO Era Begins

Stop chasing volume—butter’s 3.50¢ surge proves component kings win under new FMMO rules. High-fat herds could see $1.20/cwt milk check boost.

EXECUTIVE SUMMARY: The dairy industry just witnessed its most dramatic market signal in years: butter exploded 3.50¢ on exceptional volume while cheese markets stumbled, proving that the component revolution isn’t coming—it’s here and paying premiums right now. With new Federal Milk Marketing Order reforms reshaping every milk check calculation, farms producing 4.38+ lbs/cwt butterfat are positioned to capture $0.50+ Class IV boosts that volume-focused operations will miss entirely. This isn’t just another market report—it’s a roadmap showing how AI-driven nutrition programs and strategic genetic investments are delivering measurable ROI exactly when FMMO rules reward quality over quantity. While most producers scramble to understand complex policy changes, smart operators are already leveraging component premiums that could mean the difference between profit and survival in 2025’s volatile landscape. The data is crystal clear: bigger farms with higher components dominate profitability rankings, with Southeast operations averaging ,423/cow while component-focused herds consistently outperform volume-centric competitors by 15-25%. Stop believing that more milk automatically means more money—today’s market proves that strategic component optimization beats expansion every time.

KEY TAKEAWAYS

  • Component Premium Explosion: Butterfat-rich operations are capturing immediate $0.50+ Class IV premiums as butter trades hit $2.51/lb with 10-0 bid-offer imbalances, while protein levels averaging 3.38% (+0.199 points since 2020) create additional FMMO reward opportunities under the new December composition factors.
  • Technology ROI Validation: AI-driven nutrition programs are delivering 2.3% year-over-year butterfat increases to 4.38 lbs/cwt, with individual cow management systems enabling 25% labor efficiency gains while optimizing feed conversion ratios for maximum component output per dollar invested.
  • Regional Profit Disruption: FMMO reforms create overnight winners and losers, with Northeast producers (30.37% Class I utilization) positioned for “higher-of” pricing benefits while Southeast operations already lead profitability at $1,423/cow—proving location strategy matters more than herd size.
  • Scale-Component Correlation: Farms milking 5,000+ cows with component-focused genetics are achieving significantly higher margins than smaller volume operations, with 10,000+ cow facilities representing the optimal efficiency model for capturing both economies of scale and premium component payouts.
  • Feed Cost Hedge Window: Current corn ($4.40/bushel) and soybean meal ($294.50/ton) corrections create strategic 6-month coverage opportunities, as composite feed costs below $9.50/cwt threshold enable aggressive component optimization without margin pressure.
CME dairy prices, milk component premiums, dairy profitability, FMMO reforms, Class III milk pricing

Today marked the first full trading session under the revolutionary Federal Milk Marketing Order reforms, and butterfat values are leading the charge with a decisive 3.50¢ surge to .5100/lb. This strength, combined with modest cheese gains, positions June milk checks for meaningful improvements, particularly for high-component producers who’ve invested in genetics and nutrition programs.

Today’s Price Action & Farm Impact

ProductPrice ($/lb)Daily ChangeWeekly TrendImpact on Farmers
Butter Grade AA2.5100+3.50¢+1.6%Strong Class IV support, higher butterfat premiums
Cheddar Block1.9550+0.75¢+1.4%Modest Class III strength maintained
Cheddar Barrel1.8700No Change+0.3%Limited impact on Class III formula
NDM Grade A1.2875No Change+0.4%Stable export demand, Class IV support
Dry Whey0.5650-0.75¢-0.5%Slight headwind for Class III values

Market Commentary: Butter’s explosive 3.50¢ gain on heavy volume (26 trades, 10 bids vs zero offers) signals genuine market strength driven by sustained retail demand and improved export competitiveness. This represents the strongest single-day butter performance in recent weeks and directly translates to enhanced Class IV milk values and component premiums. The 10-0 bid-offer imbalance indicates buyers are paying up aggressively, suggesting this strength has legs.

Volume and Trading Activity Analysis

Trading Pattern Breakdown:

ProductTradesBidsOffersMarket Signal
Butter26100Exceptional buyer demand
Cheddar Block420Light but supportive activity
Cheddar Barrel021Minimal interest, price discovery limited
NDM Grade A121Steady but quiet trading
Dry Whey701Moderate volume with selling pressure

The trading dynamics reveal stark differences in market conviction. Butter’s exceptional 26 trades with overwhelming bid interest (10-0) demonstrate genuine market strength, while cheese markets showed mixed signals, with blocks gaining on minimal volume and barrels remaining untested.

Enhanced Global Market Context

International Competitive Positioning: U.S. dairy products maintain significant competitive advantages in key global markets. Recent analysis shows that U.S. butter prices are trading substantially below EU and Oceania levels, providing massive export opportunities. However, global supply dynamics present both opportunities and challenges for 2025.

Key International Developments:

  • China Demand Surge: Whey imports up 41.7% year-over-year, creating bullish export scenarios
  • New Zealand Production: Declining output creates supply gaps for U.S. products to fill[10]
  • EU Production Shifts: Strategic allocation toward cheese production supporting global powder markets

Trade Policy Impact: While Mexico remains a critical market (40% of U.S. cheese exports), retaliatory tariff risks persist. The U.S. Dairy Export Council continues pursuing expanded market access in Taiwan, Vietnam, and Southeast Asian markets to diversify export dependencies.

Feed Cost & Margin Analysis

Current Feed Landscape:

  • Corn (July 2025): $4.40’6/bushel, down 3’2 (-0.73%)
  • Soybean Meal (July 2025): $294.50/ton, down $1.80 (-0.61%)
  • Estimated Feed Cost: ~$9.02/cwt (below critical $9.50 threshold)

Critical Alert: The recent soybean meal surge to $320.10/ton in late May represents a “potential $26/cow monthly increase in protein costs”[11]. Today’s minor correction shouldn’t mask underlying volatility – producers must use price dips as strategic windows to lock in 6-month feed coverage.

Enhanced Regional Market Analysis

Regional Profitability Outlook (2025 Projections):

RegionAvg. Profit/CowTop Performing StatesKey Drivers
Southeast$1,423South Carolina ($1,724), Georgia, FloridaLarger herds, higher production
Northeast$1,320Maine, Rhode Island, New YorkFMMO reform benefits, Class I premiums
Northwest$1,300+Wyoming ($1,500+), Utah, WashingtonEfficient operations, export access
Southwest$1,274Arizona ($3,629), California, NevadaScale advantages, processing capacity
Midwest$1,169Wisconsin, Illinois (above average)Traditional production base

FMMO Reform Regional Impact: Northeast producers with historically higher Class I utilization (30.37% in April) are particularly positioned to benefit from the return to “higher-of” pricing formula. However, updated manufacturing allowances may initially pressure Class III (~16¢) and Class IV (~47¢) prices across all regions.

Technology Integration & Innovation Spotlight

Precision Agriculture Revolution: Leading dairy operations are deploying artificial intelligence to optimize nutrition and production patterns for individual cows, allowing granular data analysis to adjust diets, predict illness, and fine-tune breeding strategies. This technology directly supports the component revolution, with farms achieving the following:

  • Component Optimization: AI-driven nutrition contributing to 4.38 lbs/cwt butterfat content (+2.3% YOY)
  • Automation Benefits: Streamlining 25% of farm working time through automated milking and feeding systems
  • Individual Cow Management: Real-time health monitoring and predictive analytics

Market Impact: Technology adoption enables the strategic shift from quantity to quality production, aligning perfectly with new FMMO component reward structures and current market premiums for high-component milk.

Enhanced Market Sentiment Analysis

Producer Sentiment Indicators: Based on comprehensive market analysis from verified sources, current sentiment reflects cautious optimism tempered by input cost concerns:

Bullish Factors:

  • Strong component premiums rewarding quality investments
  • FMMO reforms favoring high-component producers
  • Export competitiveness in key markets
  • Processing capacity expansion creates new demand

Risk Concerns:

  • Feed cost volatility (soybean meal particularly volatile)
  • Trade policy uncertainties
  • Regional profitability disparities
  • Replacement heifer shortage (lowest ratio since 1978)

Recent market reports indicate that “the cheese market feels well-supported heading into spring due to steady retail demand,” while overall sentiment remains “cautiously optimistic about export growth” despite trade uncertainties.

Forward-Looking Analysis & Strategic Recommendations

USDA Enhanced Forecasts:

  • 2025 All-Milk Price: Raised to $21.60/cwt (+$0.50 from previous)
  • 2026 Projection: $21.15/cwt (reflecting anticipated commodity softening)
  • Quarterly Range: $21.90-$23.50/cwt, creating optimal contracting windows

Size-Based Profitability Trends: Industry analysis reveals unprecedented correlation between scale and profitability. Farms milking 5,000+ cows expect significantly higher margins than smaller operations, with future economic models pointing toward 10,000+ cow operations for optimal efficiency.

Actionable Producer Strategies

Immediate Actions (Next 30 Days):

  1. Component Analysis: Review milk statements for butterfat/protein payouts under the new FMMO structure
  2. Feed Procurement: Lock in 6-month coverage during the current price dip window
  3. Hedging Strategy: Secure 60-70% of upcoming production at current premium levels
  4. Technology Assessment: Evaluate AI nutrition and automation investments

Strategic Planning (6-12 Months):

  1. Genetic Programs: Accelerate component-focused breeding strategies
  2. Scale Evaluation: Assess expansion opportunities given profitability correlations
  3. Processor Relationships: Renegotiate contracts under the new FMMO framework
  4. Risk Management: Implement comprehensive DRP coverage and cash reserve building

Industry Intelligence Update

Processing Capacity Expansion Impact: New facilities in Wisconsin, South Dakota, and Texas are adding 360 million pounds annual cheese capacity by year-end, with Chobani’s $1.2 billion New York plant processing 12 million pounds daily. This expansion creates new milk demand but requires sustained export growth to prevent oversupply scenarios.

Consumer Trend Drivers: Growing demand for high-protein dairy products is projected to reach $5 billion by year-end (+9.3%), while sustainability concerns drive eco-friendly packaging and production method preferences.

The Bottom Line

Today’s CME action confirms the dairy industry’s transition into a new era where component quality trumps quantity, FMMO reforms reshape regional dynamics, and scale increasingly determines profitability. The 3.50¢ butter surge on exceptional volume validates investments in genetics and nutrition programs, while the mixed cheese signals remind us that market strength remains selective.

Key Takeaway: Producers who’ve embraced the component revolution, invested in scale and technology, and positioned for the new FMMO rewards structure are entering the strongest period of competitive advantage in recent memory. The window for adaptation is narrowing – those who act decisively on feed procurement, hedging opportunities, and component optimization will fully benefit from this favorable cycle.

The data is clear: bigger farms with higher components will dominate 2025 profitability. The question isn’t whether to adapt but how quickly you can implement these strategic shifts to capture your share of the evolving dairy market opportunity.

Learn More:

The Sunday Read Dairy Professionals Don’t Skip.

Every week, thousands of producers, breeders, and industry insiders open Bullvine Weekly for genetics insights, market shifts, and profit strategies they won’t find anywhere else. One email. Five minutes. Smarter decisions all week.

NewsSubscribe
First
Last
Consent

Capitalize on Cattle Crisis: How Mexico’s Screwworm Outbreak Creates Hidden Profit Opportunities for Strategic Dairy Producers

Stop culling immediately. Mexico’s cattle crisis just made your ‘problem’ cows worth $200+ more. Smart genomic timing = 20% profit boost.

EXECUTIVE SUMMARY: The dairy industry’s sacred cow of “immediate culling” is costing producers massive profits in today’s transformed market environment. With the USDA’s indefinite suspension of Mexican cattle imports driving cull cow values to $145/cwt—a 15-20% premium over traditional pricing—strategic dairy producers are abandoning outdated culling practices for data-driven retention programs. Operations implementing genomic-guided culling decisions combined with market timing are capturing $150-$200 premiums per head, translating to $175,000-$300,000 in additional annual profitability for large commercial dairies. While conventional wisdom preaches rapid disposal of declining producers, forward-thinking operations are leveraging precision agriculture technologies, body condition scoring matrices, and breeding value evaluations to optimize timing and maximize returns. The convergence of beef supply constraints, elevated protein demand, and advanced dairy genetics creates a once-in-a-decade opportunity for producers willing to challenge traditional management paradigms. Stop following 20-year-old culling protocols and start treating your cull cow program as the strategic profit center it’s become.

KEY TAKEAWAYS

  • Genomic-Driven Market Timing: Integrate genomic testing with body condition scoring to identify high-value retention candidates—operations report 12-18% higher total revenue per animal when strategic culling replaces reactive disposal protocols.
  • Technology-Enhanced Profit Capture: Deploy precision monitoring systems (activity tracking, automated BCS, feed efficiency analysis) to optimize culling decisions—farms using integrated data systems achieve 15-20% productivity increases while reducing health expenses by 30%.
  • Cross-Market Arbitrage Opportunity: Leverage beef market disruptions for dairy profit—with grain prices rising 8-12% but cull cow values appreciating 15-20%, margin expansion opportunities exist for producers who master feed cost hedging and strategic retention timing.
  • Risk-Managed Strategic Holding: Implement tiered culling protocols based on production metrics, genetic merit, and cash flow capacity—high-liquidity operations targeting $175,000-$300,000 additional annual profitability through extended retention of superior genetics during peak market periods.
  • Global Competition Advantage: Position operations to capture domestic protein premiums as U.S. beef exports fall 6% in 2026—dairy producers who understand protein market interconnections gain competitive edge through strategic cull cow marketing and enhanced milk protein positioning.
cull cow marketing, dairy profitability, genomic testing, cattle market strategy, precision agriculture

The USDA’s indefinite ban on Mexican cattle imports isn’t just reshaping the beef industry—it’s creating unprecedented opportunities for forward-thinking dairy producers who understand how to leverage cross-market dynamics. While beef producers scramble, smart dairy operators aim to capture significant value from elevated cull cow prices, strategic feed procurement, and protein market disruptions that could boost profitability by 15-20% over the next two years.

The dairy industry operates in an interconnected protein economy where beef market disruptions create ripple effects that smart producers can ride to profitability. What’s happening in beef markets right now represents the biggest structural shift we’ve seen since the COVID-19 pandemic created similar supply chain chaos. But here’s what most producers are missing: this isn’t just about beef. It’s about understanding how market disruptions create profit opportunities for those who can read the signals correctly.

But here’s the million-dollar question: Are you still managing your cull cow program like it’s 1995, or are you treating it as the strategic profit center it’s become?

Why Are Beef Markets Suddenly Critical to Your Dairy Operation?

Think of the protein economy like a giant milking parlor—the whole system has to adjust when one stall goes down. On May 11, 2025, the USDA essentially shut down a major “stall” in the North American protein system by suspending live cattle imports from Mexico due to New World screwworm detection 700 miles from the U.S. border. This isn’t a temporary hiccup—it’s an indefinite suspension that’s fundamentally rewriting North American livestock economics.

The reality check should grab every dairy producer’s attention: U.S. beef production is forecast to drop 5% in 2026 to 25.14 billion pounds, marking the fourth consecutive year of decline. Fed steer prices are projected to hit $222.75 per hundredweight in 2026, while feeder steers are forecasted at $306.25 per cwt, representing new record highs.

But the number that should really light up your spreadsheet? Cull cow prices are forecast at $145 per cwt in 2025, a 5% year-over-year increase. For a 1,000-cow dairy culling 25% annually, that’s an additional $1,125 in gross revenue per cull cow—or $281,250 in total increased value from your culling program alone.

Why This Matters for Your Operation: The Protein Premium Effect

When beef supplies tighten, your dairy operation benefits through three channels most producers underestimate. First, cull cow values increase because processing plants need every pound of beef they can source. Second, domestic protein demand strengthens across all categories, potentially boosting fluid milk consumption and cheese demand. Third, feed ingredient markets shift as beef operations compete more aggressively for quality feedstuffs.

Consider this analogy: if beef is the premium protein “first-string quarterback,” dairy has traditionally been the reliable “utility player.” But when the quarterback gets injured, suddenly, that utility player becomes far more valuable to the team’s success.

Here’s the uncomfortable truth most dairy consultants won’t tell you: The traditional “cull at the first sign of trouble” mentality that dominated the industry for decades is now costing you money. With cull cow values rising 15-20% faster than feed costs, selective retention becomes a profit strategy, not just a production decision.

What’s Driving This Market Transformation?

The fundamentals are creating a perfect storm that dairy producers can navigate to their advantage. Feedlots are keeping cattle on feed longer than ever before, with the number of cattle on feed over 150 days rising 4% from year-ago levels as of April 1. This represents the highest level since the COVID-19 pandemic disruptions in 2020.

Think about what this means from a feed efficiency perspective. It’s like extending lactation curves beyond their optimal point—you’re increasing total production per animal but at diminishing marginal returns. Feedlots treat their facilities like expensive storage units, betting that higher future prices will offset increased feed costs and reduced feed conversion efficiency.

The weight game that the beef industry has relied on for years is ending. Cattle weights are expected to plateau in 2026 after jumping 6% from 2023-25. For the first time in years, the industry can’t rely on heavier carcasses to mask declining animal numbers—just like dairy producers can’t rely solely on increased milk per cow to offset smaller herd sizes.

Current Market Dynamics: The Numbers That Drive Decisions

Let’s translate these beef market fundamentals into dairy-relevant metrics that affect your bottom line:

Current Price Environment:

  • April 2025 fed steer prices: $213.80/cwt (+$30 from 2024)
  • May 2025 fed steer prices: $220.97/cwt (+$35 year-over-year)
  • April 2025 feeder steer prices: $298.22/cwt (+$44 from 2024)

Forecast Trajectory:

  • 2025 annual fed steer price: $214.51/cwt (+15% from 2024)
  • 2025 annual feeder steer price: $298.53/cwt (+15% from 2024)
  • 2026 cull cow prices: Expected to exceed $145/cwt

For context, a 1,400-pound cull cow at $145/cwt generates $2,030 in gross revenue—compared to $1,933 at last year’s prices. That $97 difference per head becomes substantial when multiplied across your annual culling program.

But here’s what puzzles me: Why are so many dairy producers still using the same culling criteria they learned 20 years ago when market dynamics have fundamentally changed?

How Smart Dairy Producers Are Already Positioning for Profit

The most successful dairy operations I’m tracking aren’t just watching these developments—they’re actively repositioning their operations to capitalize on them. It’s like optimizing breeding decisions based on genomic testing results—you use available data to make strategic choices that improve long-term profitability.

Challenging Conventional Wisdom: Rethinking the Cull Cow Timeline

Here’s where I will challenge decades of conventional dairy wisdom: The industry’s obsession with immediately culling at the first sign of production decline or health issues is leaving massive profits on the table in today’s market environment.

Traditional dairy management taught us to cull aggressively and immediately. Get rid of problems fast. Move inventory quickly. That approach made sense when culling cow values were relatively stable and feed costs were predictable. But those days are over.

Consider the research from Progressive Dairy, which shows that strategic retention of older cows with declining production, but good body condition can generate 12-18% higher total revenue per animal when timed correctly. This isn’t just about holding onto every cow—it’s about making data-driven decisions based on current market realities rather than outdated management philosophies.

Genomic Integration: Making Smarter Culling Decisions

Here’s where genetics meets market opportunity: Modern dairy operations use genomic testing not just for breeding decisions but to optimize cull cow timing and maximize genetic value retention.

California dairyman Tony Lopes discovered that genomic testing revealed “the traits they had thought their herd may be high or low in were sometimes the opposite.” More importantly, for today’s market environment, genomic data helps identify which older cows carry superior genetics worth retaining longer, especially when cull cow values are appreciating faster than feed costs.

Strategic Genomic Applications for Market Timing:

  • Genomic testing of borderline cull candidates to identify the hidden genetic value that justifies extended retention
  • Parent verification programs to ensure accurate genetic records for high-value breeding stock decisions
  • Breeding Value Evaluation (BVE) analysis to identify cows whose genetic merit supports longer productive lives

Recent research shows that female genomic selection combined with strategic breeding decisions significantly accelerates genetic gain while improving herd profitability (Impact of Implementing Female Genomic Selection). In today’s elevated cull cow market, this genetic intelligence becomes even more valuable—you’re not just optimizing for production, you’re optimizing for total economic return.

Optimizing Cull Cow Marketing Strategy: Beyond Traditional Metrics

Your cull cow program just became a significant profit center that requires the same analytical rigor you apply to genetic selection or feed efficiency monitoring. With beef cow slaughter expected to continue declining through 2026, every quality cull cow you hold represents appreciating inventory.

Strategic Culling Timeline Based on Market Dynamics:

  • Immediate (June-August 2025): Market cows with obvious health issues, chronic mastitis (SCC >400,000), or severe locomotion scores
  • Delayed (September-December 2025): Hold productive older cows (4+ lactations) that would normally be culled for age
  • Strategic (2026): Market retained cows during peak price periods, likely Q2-Q3

Implementation Framework: Body Condition Scoring for Market Timing

Think of this like managing transition cow protocols—you need systematic evaluation and decision points. Here’s your assessment matrix:

Cow CategoryCurrent ProductionBody Condition ScoreGenomic MeritMarket TimingExpected Premium
Immediate Cull60 lbs/dayBCS 3.0+Superior genetics6-12 months+$150-$200/head

Feed Procurement Strategy: Navigating the New Economics

Here’s where most dairy producers are missing the bigger picture. The same supply constraints driving cattle prices create feed cost pressures that smart operators can navigate—or exploit. It’s like adjusting ration formulations when corn prices spike—you need to understand the entire cost structure, not just individual ingredient prices.

Feed Market Implications for Dairy Operations:

  • Corn demand is increasing as feedlots extend feeding periods
  • Hay markets are tightening as cattle stay on feed longer
  • Protein supplement costs are rising due to reduced domestic meat production

But there’s an arbitrage opportunity hiding in plain sight. While grain prices rise 8-12% over 18 months, the protein value you’re producing through milk and eventual cull sales is growing 15-20%. The spread between input costs and output values is widening in your favor—if you manage it correctly.

Advanced Feed Cost Risk Management:

Drawing from recent industry analysis, successful dairy operations implement multi-layered feed cost strategies (Feed Cost Revolution: Why 2025-26 Could Be Your Most Profitable Year Yet). Here’s your comprehensive risk mitigation framework:

Immediate Protective Actions (Next 60 Days):

  • Lock corn contracts below $4.20/bushel for 6-month forward coverage
  • Secure soybean meal for around $300/ton when opportunities arise
  • Diversify protein sources, including alternative feeds like distillers grains and canola meal
  • Implement precision feeding systems that can reduce feed costs by 7-12% while improving production

Medium-term Strategic Positioning (6-18 Months):

  • On-farm feed production expansion to capture margin and ensure supply security
  • Crop sharing agreements with local farmers for predictable pricing
  • Feed storage optimization to take advantage of seasonal price cycles
  • Ration reformulation protocols that maintain production while managing cost volatility

Why This Matters for Your Operation: The Feed Efficiency Equation

Consider a 1,000-cow dairy consuming 50 tons of corn daily. An 8% price increase represents $200,000 in additional annual feed costs. However, if cull cow revenues increase by per head on 250 annual cull sales, that’s ,250 in additional gross revenue. Add strategic timing premiums of $100 per head, and you’re capturing $49,250 in total increased value.

The key insight: you’re not just managing feed costs—you’re managing margin expansion opportunities across your entire operation.

Yet here’s what I find fascinating: Most dairy producers can tell you their exact feed cost per hundredweight of milk, but how many can tell you their optimal cull cow holding cost versus expected price appreciation? That’s a massive blind spot in today’s market.

Global Market Context: Learning from International Responses

What’s happening in the U.S. isn’t occurring in isolation—major dairy regions worldwide are experiencing similar protein market pressures, creating opportunities for strategic positioning.

European Union: Sustainability Constraints Create Opportunity

EU sustainability mandates are constraining production growth while increasing compliance costs. European dairy farmers face phosphate limits that challenge expanding cow numbers, creating export opportunities for U.S. dairy products (Reproductive management in dairy cows – the future). This regulatory environment means European producers focus on compliance rather than volume expansion, potentially opening market share for strategically positioned U.S. operations.

Strategic Implications:

  • Reduced European competition in key export markets
  • Premium pricing opportunities for sustainability-certified U.S. dairy
  • Potential for technology transfer as EU operations seek efficiency solutions

Asia-Pacific: Demand Growth Outpacing Supply

Growing protein demand in Asia, particularly China and India, is outpacing domestic supply capacity. The combination of rising incomes and dietary westernization creates sustained demand for high-quality dairy products, while domestic production faces land and water constraints.

Market Positioning Opportunities:

  • Chinese market re-entry potential as trade relationships stabilize
  • Indian processing modernization creates partnership opportunities
  • Southeast Asian growth markets for value-added dairy products

Oceania: Climate Variability Challenges

New Zealand and Australia remain cost-competitive but face increasing climate variability challenges. Their focus on grass-based systems provides lessons for sustainable production but may limit their ability to capitalize on premium market opportunities during supply disruptions.

Competitive Advantages for U.S. Producers:

  • Technology integration superiority in precision agriculture and data analytics
  • Supply chain resilience through diversified feed sources and storage capacity
  • Scale advantages in processing and logistics infrastructure

Technology Integration: Data-Driven Culling Decisions

The most successful operations leverage precision agriculture technologies to optimize these market opportunities. Think of it like using genomic testing to improve breeding decisions—data-driven approaches consistently outperform intuition-based management.

Revolutionary Technology Applications:

  • Activity Monitoring Systems: Track individual cow behavior patterns to identify optimal culling timing
  • Precision Feeding Systems: Monitor individual cow feed efficiency to evaluate retention economics (Precision Dairy Feeding – University of Idaho)
  • Automated Body Condition Scoring: Use computer vision technology for objective evaluation tools

Recent research indicates that farms using IoT technologies see a 15-20% productivity increase while reducing health-related expenses by 30% (How IoT and Analytics Are Transforming Farms in 2025). Key implementation strategies include:

Production Optimization:

  • Monitor individual cow milk yield trends to identify optimal culling timing
  • Track somatic cell count (SCC) patterns to evaluate health status
  • Evaluate Dry Matter Intake (DMI) efficiency for cost-benefit analysis
  • Analyze lactation curves to optimize replacement timing

What This Means for Different Dairy Operation Types

The impact of these market shifts varies dramatically based on your operation’s structure, but the opportunities are universal. It’s like implementing automated milking systems—the technology works everywhere, but the ROI depends on your specific circumstances (Robotic Milking Revolution: Why Modern Dairy Farms Are Choosing Automation in 2025).

Large Commercial Operations (1,000+ cows): Scale Advantage Strategies

Your volume gives you negotiating power that smaller operations can’t match. Think of it like bulk milk pricing—your scale creates opportunities requiring strategic thinking.

Cull Cow Program Optimization:

  • Implement genomic testing on borderline cull candidates to identify hidden genetic value
  • Use activity monitoring data to identify subclinical health issues before they affect market value
  • Negotiate forward contracts with processors for premium pricing on quality culls

Advanced Risk Management for Large Operations:

  • Dairy Margin Coverage (DMC) optimization to stabilize margins during volatility (Market Mayhem Reshapes Farm Profitability in 2025)
  • Multi-commodity hedging strategies for both feed costs and cull cow revenues
  • Weather derivative contracts to protect against climate-related feed cost spikes

Feed Cost Management:

  • Lock in grain contracts for the next 6 months at current prices
  • Investigate on-farm feed production expansion to capture margin
  • Consider crop sharing agreements with local farmers to secure feed supplies

Expected Impact: Operations this size should target $175,000-$300,000 in additional annual profitability through optimized cull cow timing and feed cost management.

Medium Family Operations (300-999 cows): Flexibility Focus

You’re in the sweet spot for capitalizing on market timing. Your advantage is being able to read local market conditions and adjust quickly—like adjusting milking frequency during heat stress periods.

Strategic Positioning:

  • Use precision agriculture tools to monitor individual cow production and make real-time culling decisions (5 Technologies That Will Make or Break Your Dairy Farm in 2025)
  • Implement body condition scoring protocols to optimize cull cow market timing
  • Leverage local feed sourcing relationships to secure competitive pricing

Technology Integration: Modern dairy operations benefit from data-driven decision making. Consider implementing:

  • Activity monitoring systems to track estrus and health events (Choosing an Activity System for Your Dairy)
  • Automated body condition scoring using computer vision
  • Feed management software to optimize Total Mixed Ration (TMR) efficiency

Tailored Risk Management:

  • Dairy Revenue Protection (Dairy-RP) insurance to protect against price volatility
  • Local feed sourcing contracts to reduce transportation costs and improve supply security
  • Selective culling protocols that balance cash flow needs with market optimization

**Small Operations (80% of decisions | Monthly evaluation | Technology integration |

Here’s the final challenge I’ll leave you with: Most dairy producers can recite their latest DHI test results from memory, but how many have calculated the specific break-even point for holding versus marketing their cull cows in today’s market environment, integrated with their genomic data and feed cost projections? That calculation could be worth tens of thousands of dollars to your operation.

The producers who treat this as a strategic opportunity rather than a market disruption will emerge stronger and more profitable. The cattle crisis is reshaping protein markets permanently—make sure your dairy operation is positioned on the winning side of that transformation.

Action Item: Complete a comprehensive evaluation of your current cull cow inventory using standardized body condition scoring and genomic evaluation by July 15, 2025 (Dairy Profit Squeeze 2025: Why Your Margins Are About to Collapse). Every month of delay represents potential profit left on the table in this unprecedented market environment.

Remember: fortune favors the prepared operation in dairy farming, as in all agriculture. The data is clear, the opportunity is real, and the window is open. Your next move determines whether you capture this value or watch others profit from your hesitation.

The uncomfortable question every dairy producer must answer: Will you tell the story of how you capitalized on the cattle crisis opportunity by combining market intelligence with genetic optimization, or will you explain why you missed the greatest profit opportunity in a generation?

Learn More:

The Sunday Read Dairy Professionals Don’t Skip.

Every week, thousands of producers, breeders, and industry insiders open Bullvine Weekly for genetics insights, market shifts, and profit strategies they won’t find anywhere else. One email. Five minutes. Smarter decisions all week.

NewsSubscribe
First
Last
Consent

Decode Fonterra’s $1.40 Price Gap: Strategic Lessons Worth $168,000 Per Farm

Stop accepting processor loyalty as gospel. Fonterra’s $1.40 price gap reveals how strategic thinking beats sentiment—worth $168K per farm.

dairy pricing strategy, milk price analysis, dairy profitability, processor relationships, operational efficiency

Fonterra’s shocking $1.40/kg MS price disparity between Australia and New Zealand isn’t just about market conditions—it’s a masterclass in strategic business evolution that reveals how operational advantages, genomic optimization, and market positioning create competitive moats worth hundreds of thousands per farm. This pricing divide exposes the brutal economics of modern dairy processing, where feed conversion efficiency, energy costs per kg MS, and strategic asset allocation determine whether you’re positioned for prosperity or managed decline. The lessons buried in this price gap will reshape how you evaluate processor relationships, optimize your lactation curves, and future-proof your operation against industry consolidation.

Think of this price disparity like comparing two bulls with identical TPI scores but vastly different genetic merit for production efficiency. On paper, they might look similar, but dig into the EBVs and you’ll find one consistently produces daughters with 15% higher milk yield and superior feed conversion ratios. That’s exactly what’s happening between Fonterra’s Australian and New Zealand operations—same company, same basic business model, but fundamentally different genetic makeup for profitability.

Why Should Progressive Farmers Care About This Price Gap?

Here’s what makes this story bigger than just another processor pricing announcement: Fonterra’s pricing strategy reveals how modern dairy companies optimize value extraction across different production systems, market access, and operational efficiency metrics—exactly like how you optimize your herd’s genetic merit across different traits.

For an average Australian dairy farm producing 120,000 kg MS annually (roughly 1.5 million liters at 8.0% combined solids), that $1.40 gap translates to $168,000 less income compared to New Zealand rates. To put that in perspective, that’s equivalent to losing the genetic gain from five years of selective breeding, or the productivity boost from implementing a 0,000 automated milking system (AMS).

But here’s where it gets critical for strategic planners: this isn’t about Fonterra being unfair to Australian farmers. It’s about a fundamental shift in how global dairy companies restructure operations around return on invested capital (ROIC)—and Fonterra’s Australian operations are delivering a dismal 3% ROIC compared to their target of 10-12%.

Ask yourself this: If the world’s largest dairy cooperative is willing to sacrifice nearly 20% of its earnings because the returns don’t meet performance targets, what does that tell you about evaluating your own farm investments? Are you measuring every breeding decision, every piece of equipment, every management practice against clear profitability metrics—or just chasing production volume?

What’s Really Driving Fonterra’s Strategic Genetic Selection?

The B2B Ingredients Powerhouse Strategy

Think of Fonterra’s strategy like selective breeding for a specific production trait. They’re culling everything that doesn’t contribute to their target phenotype: a global B2B dairy ingredients powerhouse. CEO Miles Hurrell explicitly states that their financial results demonstrate the company’s strength as “a global B2B dairy player, powered by our home-base of New Zealand milk and operations” (Fonterra forecasts milk price at $10 per kg of milk solids for 2025/26).

The co-op has embarked on a massive strategic realignment, focusing entirely on high-performing Ingredients and Foodservice businesses while actively divesting their global Consumer portfolio—including all Australian. This is like a progressive breeder who decides to focus exclusively on genomic selection for protein yield and feed efficiency, while culling all genetics that don’t meet those precise criteria.

Here’s the strategic math that should make every processor pay attention:

  • Target return on capital: 10-12% (up from 9-10%)
  • New dividend policy: 60-80% of earnings (up from 40-60%)
  • Strategic focus: “Allocate milk to highest returning product and sales channel”

But here’s what challenges conventional wisdom about processor loyalty: Why should farmers remain committed to processors that view their milk as a non-core asset? The traditional dairy industry narrative promotes long-term processor relationships, yet Fonterra’s strategy proves that processors increasingly prioritize financial performance over regional commitments.

The Divestment Reality Check: Culling Underperforming Assets

Fonterra’s Australian operations tell a brutal story about asset performance that mirrors what happens when you keep poor-performing genetics in your herd too long. The numbers don’t lie: “a decade of negative free cash flow and a 3% ROIC” that management describes as “underwhelming”.

Meanwhile, their Australian assets account for approximately 19% of Fonterra’s operating earnings but are now considered non-core. That’s like discovering your highest-producing cow is actually costing you money when you factor in her mastitis treatments, poor fertility, and feed conversion inefficiency.

Why This Matters for Your Operation: If the world’s largest dairy co-operative is willing to divest nearly 20% of its earnings because the ROIC doesn’t meet targets, what does that tell you about evaluating your own investments? Every piece of equipment, every genetic decision, every management practice should be measured against clear profitability metrics—not just production volume.

Here’s the uncomfortable question every farmer should ask: Are you making investment decisions based on tradition and sentiment, or are you applying the same ruthless financial analysis that drives multinational corporations?

How Do Operational Advantages Create Pricing Power Like Superior Genetics?

The New Zealand Production Efficiency Advantage

New Zealand consistently ranks as the lowest-cost milk producer globally, primarily due to its pasture-based farming systems that deliver superior feed conversion efficiency (NZ keeps milk costs lowest among major exporters). But here’s what most people miss: it’s not just about lower costs—it’s about structural advantages that competitors can’t easily replicate, similar to how genomic selection creates compound advantages over multiple lactations.

The 2024 numbers reveal a systematic production advantage:

  • New Zealand increased its cost advantage over Australia to US5c/litre
  • Feed costs in NZ are projected to be the lowest in several years for 2025-26
  • Australian labor costs have jumped over 50% since 2021

This is like comparing herds where one consistently achieves 25% higher feed efficiency (measured as kg milk solids per kg DMI) while maintaining superior fertility metrics and lower somatic cell counts (SCC). The compound effect over time becomes insurmountable.

But here’s where conventional pasture management wisdom gets challenged: Most farmers assume pasture-based systems are automatically more profitable. Research shows that the technical efficiency of specialized milk farms varies dramatically based on management intensity, not just grazing systems. New Zealand’s advantage comes from sophisticated rotational grazing combined with precision pasture management—not simply turning cows out to graze.

The Energy Cost Reality: Processing Efficiency Gaps

Australian processors face a crushing disadvantage that’s equivalent to having a 15% lower feed conversion ratio across your entire herd. Their “cost conversion” averaged $1.00 per kg milk solids more than New Zealand operations between July 2021 and June 2022.

To put this in dairy terms: imagine if your milk processing facility required 15% more energy to produce each kilogram of milk powder, cheese, or butter. That’s not a small margin—that’s a structural cost burden that makes competing on price nearly impossible, especially when global buyers can source equivalent products from more efficient operations.

New Zealand’s proactive approach to energy efficiency, including government support for Industrial Heat Pumps, creates a compound advantage that grows stronger over time (Australia lagging behind New Zealand on cutting industrial energy costs)—exactly like investing in genetics that improve over successive generations.

Implementation Timeline for Energy Optimization:

  • Immediate (0-6 months): Energy audit and basic efficiency improvements
  • Short-term (6-18 months): Equipment upgrades and process optimization
  • Long-term (2-5 years): Infrastructure transformation and renewable energy integration

Here’s the critical question for farm-level energy management: Are you tracking energy costs per kg MS produced on your operation, or are you still managing energy like it’s a fixed overhead cost? Progressive operations now monitor energy efficiency as closely as feed conversion ratios.

What Market Dynamics Support This Strategy Like Optimal Breeding Decisions?

Export vs. Domestic Market Economics: Choosing Your Genetic Path

Here’s where the strategic picture gets really clear, and it parallels how progressive breeders choose genetics based on their target market. New Zealand exports approximately 95% of its milk production, letting them capitalize directly on strong global commodity prices. They’re not stuck selling to price-conscious domestic consumers—they can chase premium B2B customers in growth markets.

Australia faces the opposite dynamic: a “soft domestic outlook” with consumers chasing value through lower-cost products and private label brands. Even worse, dairy imports account for nearly 30% of Australia’s total consumption—meaning Australian farmers are competing with cheaper imports in their own backyard.

This is like the difference between breeding for export markets that reward superior protein content and genetic merit versus breeding for a local market that primarily buys on price. The genetic selection pressure and resulting profitability are completely different.

But here’s what challenges the conventional export wisdom: Simply producing for export markets doesn’t guarantee premium pricing. The key is producing for premium export segments that value quality differentiation and sustainable production practices. Are you positioning your production for commodity export markets or premium differentiated channels?

The Competitive Landscape Difference: Market Share Impact

In Australia, competition for milk supply among processors like Bega, Saputo, and Lactalis is intense, with everyone fighting over a shrinking milk pool. This creates pricing pressure that benefits farmers in theory but constrains what processors can actually pay due to market realities.

Fonterra holds over 80% market share in New Zealand, giving them pricing flexibility that Australian processors simply don’t have. It’s like being the only AI stud in your region versus competing with five other operations for the same breeding contracts.

Why This Matters for Your Operation: Understanding processor market dynamics helps you evaluate the long-term sustainability of your milk contracts. A processor with declining market share and intense competition may offer attractive short-term prices but lack the stability for long-term partnerships.

Ask yourself: Do you know your processor’s market share trends and competitive position? Are you diversifying processor risk the same way you diversify genetic risk in your breeding program?

How Feed Conversion and Lactation Management Create Price Resilience

The Climate Cost Multiplication Factor

Australian farmers aren’t just dealing with lower prices—they’re getting hammered by cost pressures that would be like having your entire herd drop 40% in feed efficiency overnight:

In dairy terms, this is like your feed costs jumping from $0.25/kg DMI to $0.35/kg DMI while your milk price stays flat. Even herds with superior genetic merit for feed efficiency struggle under that kind of cost pressure.

Compare this to optimal lactation curve management:

  • Peak milk: Target 45-55 kg/day by day 40-60 of lactation
  • Persistence: Maintain 6-7% decline per month post-peak
  • DMI optimization: 3.0-4.0% of body weight during peak lactation
  • ME requirements: 11-12 MJ/kg DMI for optimal conversion

Australian farmers are trying to maintain these performance metrics while dealing with volatile feed costs that would challenge even the most efficient operations.

Here’s the critical insight that challenges conventional feed budgeting: Research shows that tactical feeding decisions based on marginal milk responses can increase profit by 15-23% even in volatile cost environments. The question isn’t whether feed costs are high—it’s whether you’re optimizing feed allocation based on real-time marginal responses rather than traditional feeding protocols.

Labor Crisis Amplifies Cost Pressures

The labor shortage crisis is so severe that some Australian dairies have partially or fully transitioned to less labor-intensive beef cattle operations. In Australia, 1 in 4 dairy farmers are unable to find labour or access the skills they need on farm.

This labor crisis creates a compound effect: higher labor costs for those who can find workers, plus reduced production capacity for those who can’t. It’s like trying to optimize your breeding program while your best herdsman quits and you can’t find a replacement.

The uncomfortable question for intensive operations: Are you optimizing for milk per cow or profit per dollar invested? The research suggests these metrics can diverge significantly based on your production system.

Strategic Implications: What This Means for Your Breeding and Management Decisions

The Asset Optimization Playbook: Genetic Selection Principles

Fonterra’s strategy reveals a new playbook that mirrors progressive genetic selection: ruthlessly optimize asset allocation based on strategic value rather than sentimental attachment. The Australian price isn’t just reflecting current market conditions—it’s potentially a deliberate strategy to reduce the cost base of the Australian entity, making it more attractive to potential buyers like Lactalis and Bega.

This parallels how progressive breeders approach genetic decisions:

  1. Define clear breeding objectives based on economic traits
  2. Measure performance against specific targets (TPI, EBVs, production metrics)
  3. Cull underperformers regardless of emotional attachment
  4. Invest resources in genetics with proven ROI

But here’s where conventional genetic selection gets challenged: Research shows that feed efficiency traits have 2-3x higher economic value in volatile cost environments compared to traditional yield traits. Are you weighting your genetic selection for the current high-input-cost reality or yesterday’s cheap-feed assumptions?

The Structural Advantage Framework: Compound Genetic Gains

What Fonterra’s demonstrating is how structural advantages compound over time, exactly like genetic improvement:

  1. Lower production costs → More pricing flexibility
  2. Export focus → Direct access to global price signals
  3. Market dominance → Reduced competitive pressure
  4. Strategic clarity → Optimized capital allocation

Implementation Framework for Your Operation:

  • Month 1-3: Establish baseline metrics (production costs per kg MS, feed efficiency, labor productivity) and evaluate current processor relationships using ROIC principles
  • Month 4-6: Implement energy monitoring systems and assess feed efficiency opportunities using marginal response analysis
  • Month 7-12: Review genetic selection criteria for economic traits and investigate value-added market opportunities
  • Year 2: Invest in technologies that create sustainable cost advantages and develop sustainability metrics for premium market access
  • Year 3-5: Build market relationships that reward quality premiums and develop operational systems that scale efficiently

The critical question every progressive farmer should ask: Are you building compound advantages through systematic improvement, or are you just reacting to current market conditions?

International Benchmarking: Learning from Global Leaders

Regional Comparison of Production Efficiency (2024 data):

RegionCost per kg MS (USD)Feed Efficiency*Energy Cost IndexMarket Access Score**
New Zealand$3.451.358595
Australia$3.871.2811572
Wisconsin (US)$4.121.429288
Netherlands$4.581.3810890
India$2.891.157865

*kg MS per kg DMI **Export market access (scale 0-100)

This data reveals why strategic positioning matters as much as operational efficiency. New Zealand combines competitive production costs with superior market access, creating a sustainable competitive advantage (NZ keeps milk costs lowest among major exporters).

Here’s what this means for your strategic planning: Are you benchmarking your operation against regional averages or global best practices? The gap between good and exceptional performance is often larger than farmers realize.

Why This Matters for Your Operation: ROI and Implementation

Quantifying the Economic Impact

For a 300-cow operation producing 2.4 million liters annually:

  • Price differential impact: $168,000 annually ($1.40/kg MS × 120,000 kg MS)
  • Equivalent to: 15% increase in milk yield through genetic improvement
  • Break-even requirement: 28% improvement in feed efficiency to offset lower price
  • Technology investment: ROI timeline of 3.2 years for AMS system to achieve equivalent benefit

But here’s where the analysis gets interesting: The $168,000 price differential could be offset by optimizing operational efficiency—something most farmers haven’t systematically evaluated.

Global Context: Learning from Crisis Patterns

The Australian dairy crisis provides critical lessons for operators worldwide. Milk production is projected to hit 8.3 billion liters in 2024/25 – a 30-year low (Australia’s Dairy Crisis), with 55% of farmers considering exit due to unsustainable margins.

This mirrors patterns seen in other dairy regions during consolidation phases:

  • EU experience: Similar processor consolidation drove 30% farm reduction 2010-2020
  • US trends: Northeast dairy states lost 50% of farms 2000-2020 during processor restructuring
  • China opportunity: Domestic production growth creating import substitution pressure globally

The strategic insight: Industry consolidation creates winners and losers based on operational efficiency and strategic positioning, not just current profitability.

The Bottom Line: Strategic Lessons for Dairy’s Future

This $1.40/kg MS gap isn’t an anomaly—it’s a roadmap showing how smart dairy companies will operate going forward, and more importantly, how progressive farmers should evaluate their own strategic positioning. Fonterra’s approach reveals three critical insights every dairy operator should internalize:

1. Geographic and Market Optimization Beats Sentimental Asset Management

Fonterra’s willingness to divest underperforming Australian assets while doubling down on New Zealand operations shows how modern dairy companies must think about asset allocation. Emotional attachment to processors, genetics, or management practices doesn’t pay dividends—strategic focus on ROI does.

The challenge for traditional thinking: Most farmers choose processors based on historical relationships or convenience rather than strategic value creation. Fonterra’s divestment proves that even cooperative structures prioritize financial performance over sentimental attachment.

2. Operational Efficiency Creates Sustainable Competitive Advantages

New Zealand’s pasture-based systems, energy efficiency, and processing advantages aren’t just current benefits—they’re compound advantages that grow stronger over time, exactly like superior genetics in your breeding program (Australia lagging behind New Zealand on cutting industrial energy costs). Australian processors trying to compete on cost are fighting with fundamental structural disadvantages.

The uncomfortable reality: Many dairy operations are optimized for yesterday’s cost structure. With energy costs varying by $1.00/kg MS between regions, energy efficiency isn’t just environmental responsibility—it’s competitive survival.

3. Market Positioning Determines Long-term Viability

New Zealand’s export focus gives Fonterra direct access to global price signals and premium markets, while Australia’s domestic market exposure creates pricing constraints. Where you sell and how you position your production matters as much as your actual milk quality and volume.

The strategic question every farmer should answer: Are you producing for commodity markets that compete on price, or premium markets that reward quality and sustainability? Research shows this positioning choice can impact profitability by 25-40%.

Critical Implementation Steps:

Week 1-2: Strategic Assessment

Month 1-3: Operational Optimization

Month 4-12: Strategic Positioning

  • Develop sustainability metrics for premium market access
  • Investigate value-added market opportunities
  • Consider processor diversification strategies

Year 2+: Compound Advantage Building

  • Invest in technologies that create sustainable cost advantages
  • Build market relationships that reward quality premiums
  • Develop operational systems that scale efficiently

For progressive dairy farmers, the strategic message is crystal clear: the future belongs to operations that can optimize across multiple performance metrics, leverage systematic advantages, and position themselves in the most profitable market segments. Those that can’t adapt to these principles will find themselves in the same position as Fonterra’s Australian operations—underperforming assets in a consolidating industry.

The $1.40 price gap reveals that success in modern dairy requires thinking like a geneticist, operating like an efficiency expert, and positioning like a strategic marketer. The question isn’t whether this approach will spread throughout the industry—it’s whether your operation is prepared to compete using these new rules of the game.

Take Action: Evaluate your current operation against Fonterra’s strategic framework. Are you optimizing for short-term milk price or long-term competitive positioning? The processors making these decisions certainly know which approach wins.

The final challenge for every reader: If Fonterra can justify a $1.40/kg MS price differential based on strategic value, what price differential is your current management system creating compared to optimal practices? The answer to that question might be worth more than any processor contract negotiation you’ll ever have.

KEY TAKEAWAYS

  • Strategic Asset Optimization Beats Sentiment: Fonterra’s willingness to divest 19% of operating earnings for ROIC improvement proves that emotional attachment to processors, genetics, or practices costs money—evaluate every farm investment using 10-12% return targets like multinational corporations do.
  • Structural Cost Advantages Compound Like Superior Genetics: New Zealand’s $1.00/kg MS processing advantage and projected lowest feed costs in years for 2025-26 create compound benefits that grow stronger over time—are you building systematic advantages through energy efficiency monitoring and pasture optimization or just reacting to current costs?
  • Market Positioning Trumps Production Volume: New Zealand’s 95% export focus allows direct access to global price signals while Australia’s 30% import competition constrains domestic pricing—position your production for premium markets that reward quality differentiation rather than commodity channels competing on price alone.
  • Feed Efficiency Economics Override Traditional Metrics: With Australian feed costs exploding 40% since 2022, tactical feeding decisions based on marginal milk responses can increase profit by 15-23% even in volatile environments—are you optimizing feed allocation using real-time marginal responses or yesterday’s cheap-feed protocols?
  • Labor Crisis Demands Strategic Technology Investment: Australia’s 50% labor cost increase since 2021 forces operational restructuring—the $168,000 price differential equals a 3.2-year ROI on automated milking systems, making technology adoption a competitive necessity rather than optional upgrade.

EXECUTIVE SUMMARY

The dairy industry’s biggest myth? That processor loyalty matters more than strategic positioning—and Fonterra’s shocking $1.40/kg MS price gap between Australia and New Zealand just shattered that assumption forever. While Australian farmers get A$8.60/kg MS, their Kiwi counterparts earn NZ$10.00, creating a staggering $168,000 annual income difference for average 300-cow operations. This isn’t about market conditions—it’s about Fonterra’s ruthless strategic pivot toward 10-12% ROIC targets, divesting underperforming Australian assets delivering only 3% returns while doubling down on New Zealand’s export-focused B2B powerhouse. The brutal economics expose how structural advantages compound over time: New Zealand’s pasture-based systems and energy efficiency create $1.00/kg MS processing cost advantages while Australian farmers battle 40% feed cost explosions and 50% labor increases since 2021. Smart farmers are already applying Fonterra’s asset optimization playbook to their own operations, measuring every breeding decision and equipment purchase against clear profitability metrics rather than chasing production volume. The question isn’t whether this strategic approach will spread—it’s whether your operation is prepared to compete using these new rules where operational efficiency and market positioning determine survival in an industry undergoing massive consolidation.

Learn More:

The Sunday Read Dairy Professionals Don’t Skip.

Every week, thousands of producers, breeders, and industry insiders open Bullvine Weekly for genetics insights, market shifts, and profit strategies they won’t find anywhere else. One email. Five minutes. Smarter decisions all week.

NewsSubscribe
First
Last
Consent

Fonterra Breaks Records: $10/kg Milk Solids Forecast Signals New Era for Global Dairy

Stop expecting milk price crashes after record highs. Fonterra’s $10/kg MS forecast proves supply constraints have permanently changed dairy economics.

EXECUTIVE SUMMARY: The traditional dairy boom-bust cycle is dead, and Fonterra’s confident $10/kg MS forecast for 2025-26 proves fundamental market dynamics have permanently shifted. While conventional wisdom suggests high prices trigger production surges that crash markets, global supply constraints from environmental regulations in Europe and disease impacts in the US are preventing the typical supply response that historically followed record pricing. Fonterra’s billion economic injection into New Zealand demonstrates how sustainability premiums and strategic positioning now drive profitability more than pure volume expansion. The co-operative’s success in monetizing carbon efficiency—with customers specifically paying premiums for low-carbon dairy—reveals a new competitive landscape where environmental performance translates directly to farmer payments. European producers remain handcuffed by regulations, US growth gets absorbed domestically, and China’s foodservice boom creates sustained premium demand for value-added products. With geopolitical risks as the only significant downside threat, progressive farmers must abandon volume-focused strategies and embrace component optimization, sustainability technologies, and value-added positioning. This isn’t just a good season—it’s proof that dairy’s future belongs to farmers who can deliver environmental performance alongside production efficiency.

KEY TAKEAWAYS

  • Sustainability Pays Real Cash: Fonterra farmers meeting emissions criteria earn additional 1-5 cents per kg MS, with top performers capturing 10-25 cents per kg MS premiums—translating to $25,000 extra annual income for a 300-cow operation producing 100,000 kg MS, proving environmental stewardship drives profitability.
  • Component Focus Beats Volume Strategy: Farms concentrating on butterfat and protein optimization rather than fluid volume expansion achieve 23-26% unit price increases across major dairy categories, aligning economic returns with environmental efficiency in today’s constrained supply environment.
  • Enhanced Cash Flow Creates Investment Opportunities: With advance payments rising from $8.50 to $9.00 per kg MS and government’s 20% Investment Boost tax deduction, farmers have unprecedented opportunity to modernize operations while maintaining healthy $1.43/kg MS margins above breakeven forecasts.
  • Global Supply Constraints Are Permanent: Environmental regulations preventing European expansion, US domestic consumption absorbing production growth, and China’s shift toward foodservice demand mean traditional supply responses won’t materialize—creating sustained high-price environment for strategically positioned producers.
  • Geopolitical Risk Management Essential: With forecast ranges widened to $8.00-$11.00/kg MS due to trade tensions, successful operations must diversify market exposure and build contingency plans for policy-driven disruptions while capitalizing on current premium pricing opportunities.
dairy profitability, milk price forecast, global dairy market, sustainable dairy farming, dairy industry trends

New Zealand’s dairy giant just delivered the news every farmer’s been waiting for: a confident $10 per kilogram milk solids forecast for 2025-26, backed by $15 billion flowing into the economy and fundamental shifts in global supply that could keep prices elevated for years to come.

Let’s cut to the chase – when Fonterra’s CEO Miles Hurrell says he’s confident about $10/kg MS, that’s not just optimistic talk. It’s backed by hard market realities that are reshaping the global dairy landscape.

Why Traditional Supply Response Isn’t Happening

Here’s where conventional dairy wisdom gets turned upside down. Historically, high prices trigger a global production surge as farmers chase profits. But that playbook’s been thrown out the window.

“We are not seeing that supply turn on. The environmental pressures in the northern hemisphere – Europe in particular – we are not seeing the milk supply out of Europe as we may have seen historically,” Hurrell explained.

Think about what that really means. European producers are essentially handcuffed by environmental regulations, unable to respond to price signals like they could in the past. The EU has lost over 1.4 million dairy cows since 2016, with environmental restrictions explicitly stagnating milk production in northwestern European Member States.

Meanwhile, the US is dealing with its own supply headaches. Any milk production growth is being consumed domestically, and herds are still recovering from highly pathogenic avian influenza that’s affected over 930 farms across 17 states. California alone saw a 9.2% drop in milk production since late 2024.

Are you starting to see the pattern? The traditional boom-bust cycle driven by rapid supply responses to price signals is dead.

China’s Foodservice Revolution Creates New Opportunities

The Chinese market story isn’t just about volume recovery – it’s about a fundamental shift in how dairy gets consumed. While the overall demand for “core products” hasn’t returned to previous levels, explosive growth is happening in food service.

“There’s still strong demand for food service, particularly in China, and we’re seeing more growth in that market from a volume perspective,” Fonterra confirmed. This isn’t just academic – Chinese consumers are shifting from basic commodity dairy to higher-value products consumed in restaurants and prepared foods.

What does this mean for your operation? You’re missing the bigger opportunity if you’re still thinking about commodity markets. The future belongs to value-added products that command premium pricing in sophisticated markets.

Environmental Premiums: From Cost to Profit Center

Here’s something that would have sounded like fantasy a decade ago: Fonterra is now receiving premium payments specifically for carbon efficiency, and they’re passing those premiums back to farmers.

“There are customers now that are specifically paying for our carbon efficiency, and we’re paying farmers back for that,” the company confirmed. Starting June 1, 2025, Fonterra will offer farmers an additional 1-5 cents per kg MS for meeting emissions-related criteria, with top performers earning an extra 10-25 cents per kg MS.

For a 300-cow operation producing 100,000 kg MS annually, we’re talking about a potential additional income of $25,000 annually. This isn’t feel-good marketing – it’s hard cash flowing to producers who can prove their environmental credentials.

What This Means for Your Operation

So, how do you position your dairy operation to capitalize on these market dynamics? Here’s the reality check every farmer needs to hear.

Stop Competing on Volume Alone: The global supply constraints aren’t temporary – they’re the new normal. Environmental regulations and resource limitations mean you can’t just turn on production taps anymore. Focus on component optimization instead. Farms concentrating on butterfat and protein rather than pure volume are seeing 23-26% unit price increases.

Embrace Sustainability Technology: Those carbon efficiency premiums aren’t charity – they’re driven by real customer demand from major brands like Mars and Nestlé, who need to meet their own sustainability targets. Invest in technologies that can demonstrate measurable environmental improvements.

Prepare for Enhanced Cash Flow: With advance payments increasing from $8.50 to $9.00 in July and the government’s new 20% Investment Boost tax deduction, you’ve got an unprecedented opportunity to upgrade equipment and infrastructure. DairyNZ’s breakeven forecast sits at $8.57/kg MS for 2025-26, giving you a healthy $1.43/kg MS margin to work with.

Diversify Market Focus: Think beyond traditional export channels with China’s foodservice boom and sustained US domestic demand. Value-added products and specialized applications are where the margin growth is happening.

But here’s the critical question: Are you positioned to capture these premiums, or are you still operating like it’s 2015?

Geopolitical Wildcards Could Derail the Party

Let’s be honest about the risks. Fonterra’s wide $8-$11/kg MS range for 2025-26 isn’t conservative planning – it’s acknowledgment that political decisions increasingly override market fundamentals.

The ongoing trade tensions and tariff wars are “fracturing global dairy markets,” the US-China trade war alone is estimated to have caused $6 billion in profit losses for dairy farmers globally. When political relationships dictate market access more than product quality, even the best-run operations can get caught in the crossfire.

US tariffs are blocking affordable dairy supplies from reaching markets like China, forcing Chinese buyers to source from more expensive alternatives or reduce consumption. This creates opportunities for New Zealand exporters but also demonstrates how quickly trade policies can disrupt established patterns.

Innovation Investment Signals Long-term Confidence

While we’re talking about immediate price forecasts, don’t miss the bigger strategic moves happening. New Zealand just launched a $25.68 million “Resilient Dairy” innovation program targeting genomic advancements and disease management technologies.

This 7-year program, jointly funded by LIC, MPI, and DairyNZ, aims to “deliver long-term economic, environmental and animal health benefits” through faster genetic gain and improved sustainability. When an industry invests $25 million in long-term R&D during high-price periods, that’s confidence in sustained profitability.

The program will incorporate genomic data into animal evaluation systems, potentially jumping ahead of global competitors in genetic advancement. This translates to better cows with improved health, productivity, and environmental efficiency for farmers.

The Bottom Line

Fonterra’s record $10/kg MS forecast isn’t just good news – it’s a roadmap for the industry’s future. We’re entering an era where environmental sustainability drives premium pricing, supply constraints create sustained high-price periods, and technology that demonstrates value beyond production metrics becomes essential.

The winners will be farmers who combine production efficiency with environmental stewardship, backed by data proving value to sophisticated global customers. The traditional boom-bust cycles give way to more sustained profitability for those ready to adapt.

Here’s your action plan:

  • Invest in component optimization over volume expansion
  • Implement sustainability technologies that qualify for premium payments
  • Take advantage of enhanced advance payments and tax incentives to upgrade operations
  • Develop value-added product strategies targeting foodservice and specialty markets
  • Prepare contingency plans for geopolitical trade disruptions

The question isn’t whether these trends will continue – it’s whether you’re positioned to capitalize on them. Fonterra’s confidence reflects more than current market conditions. It signals we’ve entered the most profitable period in modern dairy history for farmers ready to embrace change.

The dairy industry’s transformation is accelerating; this forecast is just the beginning. Are you ready?

Learn More:

The Sunday Read Dairy Professionals Don’t Skip.

Every week, thousands of producers, breeders, and industry insiders open Bullvine Weekly for genetics insights, market shifts, and profit strategies they won’t find anywhere else. One email. Five minutes. Smarter decisions all week.

NewsSubscribe
First
Last
Consent

French Dairy Farmers Storm Paris: How EU Pesticide Wars Could Slash Your Feed Costs 15%

French tractor revolt exposes EU feed crisis—acetamiprid ban could spike your dairy rations 15%. Smart producers are hedging now. Are you?

EXECUTIVE SUMMARY: French farmers’ May 2025 tractor blockade of Paris isn’t just European politics—it’s a preview of the regulatory wars that could determine whether your feed costs soar or stabilize through 2026. The battle over France’s Duplomb law centers on re-authorizing acetamiprid, a banned bee-toxic pesticide critical for sugar beet production that feeds millions of European dairy cows. With opposition lawmakers filing 3,500 amendments to gut the bill, this regulatory uncertainty creates supply-demand imbalances that ripple through global feed markets, potentially impacting sugar beet pulp availability and pricing for North American operations. The EU’s contradictory pesticide policies—acetamiprid approved until 2033 EU-wide but banned in France since 2018—expose the competitive distortions reshaping international dairy economics. Environmental groups cite 16 new peer-reviewed studies showing developmental neurotoxicity risks, while farmers argue regulatory asymmetries between EU nations create unfair feed cost disadvantages. As European milk production already declined 0.3% in 2024 amid regulatory pressures, this French uprising signals whether EU agriculture will prioritize environmental ideology over economic viability. Smart dairy producers need to evaluate feed contract strategies and supply chain diversification before these regulatory battles create market volatility that hits their bottom line.

KEY TAKEAWAYS

  • Feed Cost Hedging Imperative: Lock in sugar beet pulp and alternative protein contracts now—regulatory uncertainty in major EU agricultural regions typically translates to 8-12% price volatility in feed commodity markets, with procurement delays costing operations $0.15-0.23 per cow per day.
  • Supply Chain Diversification Strategy: Develop backup feed sources beyond EU-dependent commodities—dairy operations relying on single-region protein sources face 23% higher cost exposure during regulatory disruptions, while diversified sourcing reduces feed price volatility by up to 31%.
  • Regulatory Arbitrage Monitoring: Track EU pesticide policy inconsistencies for competitive intelligence—French dairy farmers operating under stricter acetamiprid bans face 4-7% higher feed costs than German competitors, creating market distortions that impact global commodity flows and pricing.
  • Technology Investment Priority: Accelerate adoption of precision feed management systems—operations using real-time ration optimization technologies reduce feed waste by 12-18% and maintain consistent milk production during commodity price shocks, with ROI typically achieved within 14-18 months.
  • Policy Risk Assessment: Integrate regulatory scenario planning into 2026 business planning—EU agricultural policy shifts affect global feed markets even for North American operations, with smart producers already modeling 15-20% feed cost scenarios based on European regulatory outcomes.
dairy feed costs, agricultural regulations, dairy profitability, feed supply chain, EU dairy policy

French farmers rolled tractors into the nation’s capital on May 26, 2025, demanding lawmakers pass agricultural deregulation that could reshape European dairy feed markets within months. The heated battle over France’s Duplomb law centers on re-authorizing acetamiprid—a banned bee-toxic pesticide critical for sugar beet production that feeds millions of European dairy cows. With opposition lawmakers filing 3,500 amendments to gut the bill, this isn’t just French politics—it’s a preview of the regulatory wars that could determine whether your feed costs soar or stabilize through 2026.

The Protest That Stopped Traffic

Around ten tractors were parked defiantly outside France’s National Assembly, while over 150 farmers from multiple regions blocked major highways in Paris. This wasn’t symbolic theater—it was calculated pressure on lawmakers debating legislation that could fundamentally alter European agricultural competitiveness.

“This legislation to alleviate the burdens on the agricultural sector is extremely significant to us,” FNSEA Secretary-General Hervé Lapie told AFP. “We have been advocating for this for two decades. Our patience has worn thin”.

The farmers weren’t just making noise. They were defending what they see as survival tools in an increasingly hostile regulatory environment.

The Acetamiprid Battlefield: What’s Really at Stake

Here’s what dairy producers need to understand: acetamiprid has been banned in France since 2018, but it’s still legal across the rest of the EU until 2033. This creates a massive competitive distortion that directly impacts your feed costs.

The numbers tell the story. French beet production suffers when France can’t protect sugar beet crops with the same tools as Germany or Poland. That means less sugar beet pulp—a critical, cost-effective dairy feed component—and higher prices for what’s available.

But here’s the twist: the EU just slashed maximum residue levels for acetamiprid, effective August 19, 2025. Products like bananas, currants, lettuces, and other feed components will face much stricter limits. The European Food Safety Authority identified lower acceptable daily intake levels and acute reference doses, forcing these regulatory changes.

Why Dairy Farmers Should Care About French Politics

Feed Security is Feed Economics. Sugar beet pulp represents a significant portion of many European dairy rations. When regulatory asymmetries restrict production in major agricultural regions like France, supply-demand imbalances ripple through feed markets.

Environmental groups like PAN Europe and Générations Futures are pushing hard against acetamiprid re-authorization, citing new research showing developmental neurotoxicity and harm to pollinators. They’ve identified 16 peer-reviewed studies published within two years indicating various health and environmental risks.

The opposition is fierce. Nearly 1,200 medical doctors publicly warned that re-authorizing such pesticides would represent “a retreat for public health.”

The Parliamentary Power Play

When opposition lawmakers filed 3,500 amendments to delay the bill, supporters used a controversial “motion of rejection” to bypass extensive debate. This parliamentary maneuver sent the legislation directly to a joint committee without allowing a full discussion of the amendments.

Left-wing parties exploded. LFI announced plans to file a no-confidence motion against the government in response. Environmental groups called it an “anti-democratic tactic.”

But for agricultural interests, it was a strategic necessity. The FNSEA and allied groups viewed the amendment flood as obstruction designed to kill legislation they’d fought for decades to achieve.

What This Means for Your Operation

Three immediate implications for dairy producers:

  1. Feed Cost Volatility Increases
    Regulatory uncertainty in major agricultural regions creates price instability. Whether acetamiprid gets re-authorized or remains banned, the back-and-forth creates market uncertainty that typically translates to higher feed costs.
  2. Supply Chain Diversification Becomes Critical
    Dairy operations dependent on specific feed components from restricted regions face increased vulnerability. Smart producers are already exploring alternative protein and energy sources.
  3. Regulatory Harmonization Pressure Builds
    This French battle reflects broader EU tensions between national environmental standards and single-market competitiveness. Expect similar regulatory conflicts across other agricultural inputs.

The Broader European Context

France isn’t alone. Farmers across Germany, Spain, Italy, and Poland have staged similar protests over environmental regulations they claim undermine competitiveness. The EU has already made concessions, including shelving proposals to halve pesticide use by 2030.

Young French farmer Clément Patoir captured the frustration: “Few young people want to become farmers nowadays. Many children of farmers have to hear about their parents struggling with regulations constantly. It is a complicated job; you work long hours and are not necessarily rewarded”.

Bottom Line: Navigate the Regulatory Storm

This French tractor revolt exposes the fundamental tension between environmental ambitions and agricultural economics that’s reshaping European dairy production. Whether you’re in Wisconsin or Waikato, these regulatory battles matter because they’re determining global competitive dynamics.

Your next moves:

  • Lock in feed contracts before regulatory decisions create market volatility
  • Diversify protein sources to reduce dependence on potentially restricted inputs
  • Monitor EU regulatory developments that could impact global feed commodity flows

The farms that thrive through this regulatory uncertainty won’t be those fighting yesterday’s battles—they’ll be the ones adapting fastest to tomorrow’s rules. While politicians argue over pesticides, smart dairy producers are building resilient operations that can profit regardless of how the regulatory winds blow.

The message from Paris is clear: regulatory stability is dead. Operational agility is everything.

Learn More:

The Sunday Read Dairy Professionals Don’t Skip.

Every week, thousands of producers, breeders, and industry insiders open Bullvine Weekly for genetics insights, market shifts, and profit strategies they won’t find anywhere else. One email. Five minutes. Smarter decisions all week.

NewsSubscribe
First
Last
Consent

Trade War Threatens $6 Billion Dairy Loss – How EU Standoff Could Crush Farm Profits by 2029

Stop ignoring trade war signals. Trump’s EU tariff threats could slash your export profits by 50% while feed costs spike—here’s your action plan.

EXECUTIVE SUMMARY: What is the biggest mistake in the dairy industry? Treating the EU-US trade standoff as “just politics” while ignoring the $6 billion profit tsunami heading for American farms. New economic projections reveal that if July 9 negotiations collapse, dairy farmers face a perfect storm: 50% tariffs crushing export opportunities, retaliatory measures targeting agricultural goods, and potential feed cost increases from supply chain disruptions. Cornell University’s Charles Nicholson warns that trade wars with our three biggest dairy export destinations could cost American dairy farmers $6 billion in profits over four years—that’s real money affecting milk prices, not abstract economic theory. The EU’s geographical indications system already locks US cheesemakers out of premium markets worth billions, while European dairy imports flood American shelves with minimal barriers. Smart dairy operations are already diversifying export markets, building domestic premium positioning, and stress-testing their supply chains against trade policy volatility. Don’t wait for politicians to solve this mess—start building a trade-war-resistant operation today.

KEY TAKEAWAYS

  • Export Exposure Assessment Critical: With dairy exports hitting 12.2 billion pounds (milk-fat basis) in 2025, operations dependent on international markets face immediate 50% tariff exposure—calculate your revenue vulnerability now and develop domestic premium market alternatives
  • Feed Cost Shock Preparation: Trade escalation could spike imported feed ingredient costs while simultaneously reducing export demand, creating a margin squeeze that demands immediate supply chain diversification and efficiency improvements
  • Geographic Market Diversification Strategy: EU’s geographical indications system blocks American “parmesan” and “feta” sales globally, not just in Europe—develop alternative product positioning and explore non-EU export markets before trade wars force reactive decisions
  • Quality Premium Positioning Advantage: European import disruptions from 50% tariffs create immediate opportunities for domestic premium dairy products—invest in organic certification, grass-fed protocols, or other differentiators that command higher margins regardless of trade policy
  • Policy Volatility Insurance Planning: With $3 billion in annual dairy trade deficit driving political pressure, build operational flexibility through direct-to-consumer channels, value-added processing, and crisis-resistant revenue streams that don’t depend on export market stability
dairy exports, trade war impact, dairy profitability, farm risk management, EU dairy trade

The European Union just dodged President Trump’s 50% tariff threat until July 9, but don’t celebrate yet; this trade standoff could cost American dairy farmers $6 billion in profits over the next four years while fundamentally reshaping how $45.4 billion worth of dairy products move between the world’s largest markets.

The numbers don’t lie, and they’re not pretty. Cornell University’s Charles Nicholson warns that if trade wars escalate with our three biggest dairy export destinations—Mexico, Canada, and the EU, American dairy farmers face a financial bloodbath that’ll make 2009 look like a picnic.

Why Your Operation Can’t Ignore This Political Theater

Here’s the brutal reality: dairy exports aren’t just numbers on a government spreadsheet—they’re your lifeline to profitability. U.S. dairy exports hit 12.2 billion pounds on a milk-fat basis in 2025, worth billions to farm gate prices. When trade wars erupt, that export income evaporates faster than morning dew in August.

Let’s face it—we’re already seeing the damage. First-quarter 2025 dairy exports grew just 3% in March, trailing 0.5% behind 2024 levels for the year’s first three months. That’s not growth; that’s stagnation in a market that should expand.

But here’s what really should keep you up at night: the EU represents one of the world’s most valuable dairy markets, and we’re playing chicken with a 8 billion trade relationship. Are we seriously going to let politicians torpedo decades of market development for short-term political points?

The $6 Billion Question: Can American Dairy Survive a Trade War?

Charles Nicholson’s projection of $6 billion in lost dairy profits isn’t fear-mongering—it’s a mathematical reality based on what happens when you pick fights with your best customers. The combination of tariffs, potential deportations affecting farm labor, and cuts to nutrition programs creates what economists call a “perfect storm” for dairy operations.

Current tariffs already hammer our competitiveness: 25% on goods from Mexico and Canada and 10% on Chinese imports. Now imagine European retaliation targeting American dairy exports. Think your cheese can compete with European alternatives when burdened with 50% tariffs?

The European Union isn’t backing down either. They’re offering a “zero-for-zero” industrial tariff deal while simultaneously preparing retaliatory measures that could devastate American agricultural exports. Smart negotiating or economic suicide? You decide.

What This Means for Your Bottom Line

Scenario Planning Time: Let’s get practical about what these trade tensions mean for your operation:

If Trade Wars Escalate:

  • Export prices drop as alternative destinations flood with displaced European dairy
  • Domestic milk prices face downward pressure from reduced export demand
  • Feed costs potentially rise due to tariffs on imported ingredients
  • Labor costs increase if immigration policies affect workforce availability

If a Deal Gets Struck:

  • European market access could expand under “zero-for-zero” proposals
  • Increased competition from European imports in premium product segments
  • Potential for joint technology sharing and innovation partnerships
  • Greater market stability benefiting long-term planning

But here’s what you can control right now: diversification and quality positioning. Don’t put all your export hopes in one geographical basket. The data shows mixed performance across product categories—cheese exports up, dry skim milk down—suggesting market-specific strategies matter more than ever.

The Technology Angle Nobody’s Discussing

What’s missing from most trade war coverage? The innovation implications. European dairy technology partnerships, research collaborations, and knowledge sharing could become casualties of this diplomatic dysfunction.

Are we really willing to sacrifice access to European precision agriculture advances, sustainability innovations, and genetics programs for political posturing? The global dairy industry thrives on international knowledge exchange—trade wars threaten that foundation.

Your Action Plan for Navigating Trade Uncertainty

Immediate Steps (Next 30 Days):

  1. Audit your export exposure: Calculate what percentage of your revenue depends on export markets
  2. Diversify customer base: Identify domestic premium market opportunities
  3. Review supply chain vulnerabilities: Assess dependence on imported inputs affected by tariffs
  4. Strengthen domestic positioning: Focus on local and regional market development

Medium-term Strategy (Next 6 Months):

  1. Invest in quality differentiation: Organic, grass-fed, or other premium certifications
  2. Build direct-to-consumer channels: Reduce dependence on commodity export markets
  3. Form cooperative alliances: Pool resources for market development and risk sharing
  4. Monitor policy developments: Stay informed about trade negotiations affecting your markets

Long-term Positioning (Next 2 Years):

  1. Develop crisis-resistant revenue streams: Agritourism, value-added processing, direct sales
  2. Invest in efficiency improvements: Reduce per-unit costs to maintain competitiveness
  3. Build political relationships: Engage with representatives about dairy industry needs
  4. Plan for policy volatility: Develop flexible business models that adapt to changing trade conditions

The Bottom Line

Trade uncertainty isn’t going away, and the July 9 deadline is just the next chapter in an ongoing global economic realignment. The dairy operations that survive and thrive will be those that build resilience through diversification, quality differentiation, and strategic flexibility.

Don’t wait for politicians to solve this mess—they created it. Focus on what you can control: building a profitable dairy operation regardless of what happens in Washington or Brussels. The $6 billion question isn’t whether trade wars will hurt dairy farmers—it’s whether you’ll be ready when they do.

Start planning now. Your future profitability depends on decisions you make today, not deals struck by diplomats tomorrow.

Learn more:

The Sunday Read Dairy Professionals Don’t Skip.

Every week, thousands of producers, breeders, and industry insiders open Bullvine Weekly for genetics insights, market shifts, and profit strategies they won’t find anywhere else. One email. Five minutes. Smarter decisions all week.
NewsSubscribe
First
Last
Consent

Are Your Calves Quietly Overheating? Southeast Heat Management Strategies That Work

Southeast dairies: Your calves’ summer heat stress silently slashes future milk checks. Learn proven fixes to protect genetic potential.

EXECUTIVE SUMMARY: Summer heat in the Southeast permanently reduces calf productivity through epigenetic changes, immune suppression, and stunted growth. Conventional calf housing and feeding practices exacerbate heat stress, costing producers up to $25,000 annually in lost milk revenue and increased costs. Research-backed solutions include reflective hutch covers, early/late feeding schedules, dry cow cooling, and tech-driven THI monitoring. The article challenges outdated industry norms, proving that heat abatement for calves delivers faster ROI than many parlor upgrades. Producers implementing targeted cooling strategies protect their genetic investment and secure future profitability.

KEY TAKEAWAYS:

  • Calves face heat stress earlier than cows (THI 65+), causing permanent metabolic damage and 1,100+ lb milk loss per lactation.
  • Without proper cooling, $15k-$25k annual losses occur from delayed growth, mortality, and treatment costs.
  • Priority fixes: Reflective hutch covers (+9°F cooling), 5 AM/8 PM feed times, dry cow cooling ($3-$5 ROI per $1 spent).
  • Vaccine effectiveness drops 15-30% in heat-stressed calves—adjust timing and support immunity.
  • Monitor calf-level THI with $50 data loggers to target interventions during peak stress windows.
dairy calf heat stress, Southeast dairy farming, calf cooling strategies, heat stress management, dairy profitability

Don’t let the summer heat drain your dairy’s future potential. Research from the University of Florida reveals that calves born to heat-stressed dams produce up to 1,100 pounds less milk in their first lactation. With proper management techniques specifically designed for the Southeast’s brutal combination of heat and humidity, you can protect your investment and set your calves up for maximum lifetime performance.

The Hidden Heat Stress Crisis Your Operation Is Missing

Here’s a question that should keep you up at night: Why do we invest millions in lactating cow comfort while neglecting the animals representing our genetic future?

The dairy industry has a blind spot regarding calf heat stress. We’ve convinced ourselves that young animals are somehow more adaptable or resilient than mature cows. The scientific reality? Research published in the Journal of Dairy Science indicates calves begin experiencing physiological heat stress at a THI of 65-68, while lactating cows don’t show significant impacts until THI 72. That means your calves are suffering heat stress effects weeks before your mature cows and continue experiencing it weeks later into fall.

Dr. Geoffrey Thompson of the University of Georgia Extension Service doesn’t mince words: “Most Southeastern dairies operate with calf facilities designed for Wisconsin winters, not Georgia summers. It’s like trying to milk high-producing Holsteins in a tie-stall barn – we wouldn’t accept that level of facility mismatch for our milking string, so why accept it for calves?”

The economic impact is staggering but invisible, because it hits your operation 24 months after the damage occurs. Heat-stressed calves experience:

  • Permanent epigenetic changes limiting lifetime production potential
  • Immunological programming that increases lifetime disease susceptibility
  • Metabolic alterations that reduce feed efficiency throughout life
  • Developmental impacts on mammary tissue formation

“The decisions you make for your calves during July and August directly determine your profit margin two years later when they enter the milking string,” explains Dr. Jessica Martinez, dairy cattle specialist at Mississippi State University. “Most producers don’t make that connection because the cash-flow impact is so delayed.”

Rejecting Outdated Housing Dogma

Let’s be brutally honest: The standard white polyethylene hutch – essentially unchanged for 40 years – performs admirably in Wisconsin Octobers but becomes what University of Florida researcher Dr. Michael Rodriguez calls “a solar collection system rather than a shelter” during Southern summers.

Why have we accepted this outdated technology for so long? The industry’s conventional wisdom about calf housing deserves serious reconsideration.

Most producers have been taught that individual hutches are the gold standard for disease prevention. However, this single-minded focus on biosecurity ignores the equally important environmental stress factor. When temperatures inside hutches regularly exceed 100°F during summer afternoons, the resulting physiological stress likely negates any disease-prevention benefits the isolation provides.

Progressive Southeastern producers are questioning these outdated assumptions and implementing research-validated modifications:

  • Reflective hutch covers: Similar to the transition from black rubber to white poly mats in freestall barns, reflective covers can reduce internal hutch temperatures by 9-15°F.
  • Elevated designs: Raising water troughs prevents mastitis in lactating cows, raising hutches 8-12 inches improves air circulation underneath and lowers interior temperatures by 4-7°F.
  • Alternative orientation: Contrary to the conventional east-west orientation taught for decades, north-south orientation during summer months reduces afternoon heat load.
  • Hybrid housing systems: The most innovative operations are developing what Tennessee producer Mark Stevens calls “the best of both worlds” with barn-hutch combinations that provide the disease-prevention benefits of individual housing with the cooling advantages of properly ventilated barn systems.

Practical First Steps to Upgrade Hutch Cooling

  1. Budget Fix: Invest in reflective aluminet covers ($45-60/hutch, potential 9-12°F reduction). University of Florida research shows these simple covers are among the most cost-effective interventions.
  2. Moderate Upgrade: Elevate hutches 8-12 inches using pressure-treated 4x4s or concrete blocks and reorient north-south for summer months. This modification costs approximately $20-30 per hutch in materials but can reduce interior temperatures by 4-7°F.
  3. Strategic Placement: Position hutches under shade trees, when possible, with at least 4-5 feet between units to improve air circulation. Avoid placing hutches against buildings or walls that reflect heat.

Are you still using the same calf housing system you inherited from the previous generation? If so, when did you last measure the temperature inside those hutches at 3 PM on a July afternoon?

Nutrition: Are Your Feeding Practices Creating Heat Stress?

Here’s an uncomfortable truth: Traditional twice-daily feeding schedules with fixed feeding times actively contribute to heat stress rather than helping calves cope. This is a prime example of how practices developed in northern climates can backfire in southeastern conditions.

Research from the University of Georgia shows that shifting feeding times to early morning (5-7 AM) and late evening (7-9 PM) can increase total intake by 11-18% during heat stress periods. Yet most operations continue feeding on schedules designed for worker convenience rather than calf physiology.

Even more troubling is the persistent myth that diluting milk replacer during hot weather helps calves. This approach – still recommended by some “experts” – directly contradicts the metabolic reality: Heat-stressed calves need more energy, not less, to maintain body condition while their maintenance requirements are elevated.

“It’s like putting your lactating cows on a diet during summer heat,” explains nutritionist Dr. Angela Rodriguez. “We’d never reduce energy density in the lactating TMR during heat stress, yet we routinely do that to our most vulnerable animals.”

Traditional vs. Heat-Adapted Calf Feeding Approaches

Management PracticeConventional Summer ApproachHeat-Smart ApproachExpected Benefit
Feeding ScheduleFixed twice-daily feeding (7 AM, 3 PM)Early/late feeding (5-6 AM, 8-9 PM)11-18% increased intake
Milk ConcentrationDiluted milk replacer (10-12% solids)Maintained solids (12-14% solids)Improved energy intake
Water ManagementTwice daily refreshingContinuous access, shade-protected containersImproved hydration
Electrolyte StrategyMixed with milk or replacerSeparate, additional feedingEnhanced absorption
Feeding VolumeStandard volume year-roundIncreased by 25-30% during severe heatCompensates for maintenance needs

Forward-thinking producers are implementing these research-backed feeding strategies:

  • Increasing feeding volume by 25-30% during severe heat
  • Maintaining or slightly increasing the solids concentration
  • Adding electrolytes as a separate feeding, not mixed with milk replacer
  • Implementing fat supplements specifically designed for heat stress

How much do your current feeding practices contribute to, rather than alleviate, summer heat stress in your calves?

The Generational Impact You’re Ignoring: Dry Cow Cooling

Perhaps the most revolutionary finding in recent dairy research is one that most producers remain entirely unaware of: maternal heat stress during late gestation permanently alters gene expression in developing calves.

Studies published in the Journal of Dairy Science by Dr. Geoffrey Dahl’s team at the University of Florida have documented that calves born to heat-stressed dams have significantly lower birth weights (39.1 vs. 44.8 kg), compromised passive immune transfer, and reduced milk production in their first lactation by up to 1,100 pounds – regardless of how well they’re managed after birth.

Consider this: You’ll spend thousands on genomic testing, sexed semen, and elite bulls to advance your herd’s genetic potential, yet might surrender 5-10% of that potential by failing to invest in dry cow cooling. Does that make economic sense?

University of Florida research shows that for every spent cooling dry cows, producers can expect -5 in returns through improved calf health, reduced mortality, and enhanced future performance. “It’s one of the few investments that impacts two generations simultaneously,” notes Dr. Dahl.

Why are so many operations still housing close-up cows in facilities with minimal or no cooling? Investing in cooling dry cows delivers a substantially better return than many technologies that receive far more attention and capital.

Practical Dry Cow Cooling Implementation Steps

  1. Priority Area Identification: Focus first on holding areas and close-up pens where cow density is highest, and heat accumulation is most severe.
  2. Basic Cooling System: Install fans (36-48 inches) positioned to create air movement of 4-6 mph over cows, with sprinklers that cycle 1-2 minutes on, 4-5 minutes off when temperatures exceed 72°F.
  3. Water System Upgrades: Ensure water access allows at least 15% of the group to drink simultaneously, with waterers cleaned daily during summer months.
  4. Shade Expansion: Provide a minimum of 45 square feet of shade per animal in pasture environments, using 80% shade cloth at a height of 12-14 feet.

Are Your Vaccination Protocols Fighting Biology?

The veterinary community has been slow to acknowledge a fundamental conflict in summer management: when disease pressure is highest, vaccine effectiveness is at its lowest. This creates a troubling paradox that conventional vaccination protocols don’t address.

Research published in the Journal of Dairy Science demonstrates that heat-stressed calves show reduced antibody titers following vaccination, approximately 15-30% lower than thermoneutral calves. Yet most operations follow the same vaccination calendar year-round, regardless of environmental conditions.

Have you ever wondered why summer vaccination programs sometimes seem less effective than winter protocols? The answer isn’t vaccine quality – it’s the compromised immune response of heat-stressed calves.

Progressive producers are implementing these research-backed modifications:

  • Scheduling vaccinations for early morning when THI is lowest
  • Considering seasonal adjustment of vaccination programs
  • Allowing 7-10 days between vaccinations and other stressors
  • Implementing pre-vaccination nutritional support with specific immune-boosting supplements

Conventional vs. Heat-Adapted Vaccination Strategies

FactorConventional ApproachHeat-Adapted ApproachScientific Rationale
TimingStandard year-round scheduleEarly morning administration, postponing non-critical vaccines during peak heatLower THI reduces physiological stress response
SchedulingCombined with other procedures7–10-day separation from other stressorsPrevents immunosuppression from compound stressors
Pre-vaccination SupportStandard nutritionImmune-supporting supplements 48-72h before vaccinationEnhances immune response capacity
Protocol AdjustmentFixed protocols year-roundModified summer protocols with potential boostersCompensates for heat-impaired immune function
Handling ApproachStandard restraintMinimal restraint time, low-stress handlingReduces cortisol response that compromises immunity

Has your veterinarian adjusted your vaccination protocols for seasonal immune function differences? If not, you’re likely getting substantially less protection than you’re paying for during summer months.

The Technology Gap: Why Aren’t You Measuring What Matters?

The technological revolution transforming the milking parlor has largely bypassed the calf barn. We’ve installed $250,000 parlor systems that track every ounce of milk production, but balk at spending $5,000 on monitoring systems for the animals representing our future.

This technology gap isn’t just an operational inconsistency – it’s a financial blind spot that allows significant losses to accumulate undetected. The most progressive dairies are implementing integrated systems that link environmental conditions to automatic interventions:

  • Automated respiration monitors that track breathing rates and alert managers when calves exceed threshold levels
  • Infrared scanning systems that identify hot spots and individual animals with elevated body temperatures
  • Smart feeding systems that adjust delivery schedules based on environmental conditions
  • Environmental monitoring networks are creating THI maps of different farm areas

Practical Technology Implementation Steps

  1. Start with Basic Monitoring: Install inexpensive data loggers ($50-75 each) at calf-level height in different housing areas to establish actual THI patterns throughout the day. Knowledge is the foundation of effective management.
  2. Identify Critical Control Points: Use monitoring data to determine when and where heat stress is most severe in your operation. Target interventions to these specific areas and periods for maximum ROI.
  3. Prioritize Alert Systems: Before investing in expensive automated cooling, implement monitoring systems that alert staff to developing heat stress conditions so manual interventions can be made promptly.

Ask yourself: Do you know the actual THI values in your calf facilities throughout a summer day? Most producers don’t, so they manage by guesswork rather than data.

The Economics You Can’t Afford to Ignore

Let’s translate research into dollars and cents. For a 100-cow dairy in the Southeast raising 50 heifer calves annually, inadequate heat abatement typically results in:

  • 2-4 additional calf deaths annually ($1,500-3,000)
  • Reduced growth, adding 2-3 months to age at first calving ($4,500-6,750)
  • Increased treatment costs of $35-60 per calf ($1,750-3,000 annually)
  • Reduced first-lactation performance ($7,500-12,500 in lost milk revenue)

Total annual cost of inadequate heat abatement: $15,250-25,250

Now compare that to the investment required:

  • Initial capital investment: $7,500-15,000
  • Annual operating costs: $1,500-2,500
  • Expected payback period: 6-18 months

Would you invest in parlor technology offering a similar return? Of course you would. So why aren’t you making these investments in your calf facilities?

The Bottom Line: Your Future Milking String Depends on Today’s Decisions

The evidence is irrefutable: heat stress management for dairy calves requires the same attention we give our lactating cows. The genetic progress you’ve paid for through your breeding program can only express itself in an environment that allows it. Heat stress mitigation isn’t just about comfort but protecting your genetic investment.

Consider these critical questions about your operation:

  1. Are you cooling your dry cows to the same standard as your lactating string?
  2. Have you measured actual temperature and humidity levels inside your calf housing?
  3. Does your feeding schedule align with natural behavior patterns during heat?
  4. Have you adjusted vaccination protocols to account for seasonal immune function?
  5. Are you investing in calf facility improvements at the same rate as milking facilities?

If you answered “no” to more than one of these questions, you’re almost certainly sacrificing significant future production potential.

The most successful dairy producers view heat abatement for calves not as an optional expense but as essential infrastructure, as fundamental as your milking system or reproductive program. The Southeast’s challenging climate isn’t changing anytime soon—in fact, climate projections suggest heat stress challenges will only intensify in the coming years.

Don’t be the operation still using outdated calf management approaches while wondering why your heifers aren’t living up to their genetic potential. The connection between summer heat management and future production couldn’t be more apparent – are you ready to stop sacrificing tomorrow’s milk production today?

It’s time to apply the same innovative mindset to calf management that revolutionized the milking parlor. Your future milk check depends on it.

Learn more:

The Sunday Read Dairy Professionals Don’t Skip.

Every week, thousands of producers, breeders, and industry insiders open Bullvine Weekly for genetics insights, market shifts, and profit strategies they won’t find anywhere else. One email. Five minutes. Smarter decisions all week.

NewsSubscribe
First
Last
Consent

Grazing Gold: How Strategic Pasture Management is Revolutionizing Dairy Profitability Across Systems

Revolutionize dairy profits with strategic grazing! Boost cow health, slash costs, and enhance sustainability across all dairy systems.

EXECUTIVE SUMMARY: This article challenges traditional dairy practices by demonstrating how strategic grazing management drives profitability, animal welfare, and environmental resilience in conventional, organic, and grass-fed systems. It emphasizes rotational grazing, precise pasture measurement, and tailored supplementation to maximize dry matter intake while reducing feed costs. Key insights include leveraging diverse forage mixes, debunking myths about grazing inefficiency, and unlocking carbon sequestration potential through soil health. With actionable steps like adopting grazing sticks and optimizing paddock design, the piece positions grazing as a competitive edge for modern dairy operations. Farmers are urged to rethink pasture as a profit center, not just a cost-saving tool.

KEY TAKEAWAYS:

  • Rotational grazing boosts milk margins by $276/acre while extending pasture productivity.
  • Precision tools (grazing sticks, plate meters) prevent 30-40% forage waste, refining supplementation.
  • Diverse pastures sequester 20% of farm emissions and enhance milk’s nutritional profile.
  • Myths debunked: Grazing doesn’t require special genetics or excessive labor when managed smartly.
  • Start small: Transition dry cows/heifers first, measure relentlessly, and prioritize soil health.
strategic grazing, dairy profitability, pasture management, rotational grazing, dairy farming

Our industry has been in a false dichotomy for too long: high-production confinement systems versus low-input grazing. The truth? Today’s most profitable operations leverage precision grazing management as a strategic weapon, not just a cost-cutting tactic. The evidence is clear: well-implemented grazing delivers bottom-line impact across all production models, and those refusing to adapt leave serious money on the table.

In an industry perpetually squeezed between volatile milk mailbox prices and relentless input costs, forward-thinking producers are revolutionizing their approach to what might be their most undervalued asset: pastureland. Strategic grazing management has emerged as a powerful profit driver across conventional, organic, and grass-fed systems, no longer just a place to park dry cows or fulfill organic certification requirements.

But here’s the uncomfortable reality: simply turning cows out to pasture isn’t enough. The difference between grazing that merely survives and grazing that thrives comes down to measurement intensity, system design, and management precision. Like the evolution from eyeballing grain scoops to precision TMR mixing, the details determine the outcome, and most operations are still stuck in the grazing equivalent of feeding by the coffee can.

The System Spectrum: Finding Your Grazing Sweet Spot

Let’s be brutally honest – not all grazing systems are created equal, and what works for your neighbor might be financial suicide for your operation. The key is understanding where your farm fits on the spectrum and which management practices will deliver the most significant returns for your specific system.

Conventional dairies often dismiss grazing as secondary to TMR-based nutrition, but that thinking costs them serious money. University of Wisconsin-Madison research shows that strategically incorporating high-quality pasture can reduce feed costs by 15-20% without sacrificing production. Are you willing to spend that much on the feed bill while complaining about tight margins?

“The most profitable conventional operations I work with are using pasture as a strategic tool, not an afterthought,” says dairy nutritionist James Patterson. “They’re putting their most expensive animals – the milking herd – on their best pastures during optimal growing conditions, then supplementing precisely to maintain peak production.”

For organic producers, grazing isn’t optional – it’s mandated. USDA National Organic Program regulations require a minimum of 120 grazing days with at least 30% of dry matter intake (DMI) coming from pasture during the grazing season. But meeting the minimum isn’t where the money is. Leading organic dairies are pushing well beyond these thresholds, some achieving 40-50% DMI from pasture because they’ve discovered a crucial economic truth: every additional pound of milk produced from pasture rather than purchased organic grain flows directly to their bottom line.

At the far end of the spectrum, certified grass-fed operations have gone all-in on grazing. These systems eliminate grain, requiring approximately 60-75% of total DMI from pasture during the grazing season. While this approach typically results in lower per-cow production (averaging around 9,300 pounds annually compared to 16,000+ for organic and 20,000+ for conventional herds), the premium price point and dramatically reduced feed costs create a viable economic model for those who master intensive rotational grazing.

The Management Intensity Matrix

System TypeGrazing Days% DMI from PastureManagement Intensity NeededPrimary Economic Driver
ConventionalVariable/Optional0-25%ModerateReduced feed costs while maintaining production
OrganicMin. 120 daysMin. 30%HighPremium price + reduced purchased feed costs
Grass-FedMin. 150 days60-75%Very HighHighest price premium + minimal purchased feed

Most dairies’ fundamental mistake is mismatching their management intensity to their system type. Conventional dairies often under-manage pasture, missing significant cost-saving opportunities. Meanwhile, some organic producers barely meet minimum requirements, leaving potential profits ungrazed. And grass-fed operations that don’t implement extremely tight grazing protocols won’t survive financially, like trying to run a 30,000-pound herd average without balanced rations or functional facilities.

Profit-Driving Pasture Management Techniques

Regardless of your system, these four management principles separate profitable graziers from those merely “putting cows on grass”:

1. Measure, Don’t Guess

Would you formulate a TMR without knowing the nutrient content of your ingredients? Of course not. Yet why do so many producers turn animals to pasture without measuring forage availability or quality?

Most dairies are leaving 30-40% of potential pasture utilization on the table because they’re guessing instead of measuring,” says grazing consultant Maria Alvarez. “That’s like throwing away a third of your yearly silage.”

Smart operators use a combination of tools to eliminate guesswork:

  • Grazing sticks or rising plate meters provide quick, objective measurements of available dry matter. At roughly $300 for a good plate meter, the ROI is typically measured in weeks, not years. When’s the last time any dairy technology paid for itself that quickly?
  • Regular pasture walks with systematic height measurements (taking 15-20 readings across larger pastures) help identify low-performing paddocks and those ready for grazing – the forage equivalent of using DHIA data to make culling decisions.
  • Strategic forage testing of representative paddocks throughout the season helps calibrate visual assessments and informs supplementation decisions. As you test your corn silage, knowing your pasture’s nutrient profile is essential for properly balancing rations.

One Wisconsin organic dairy producer reported increasing milk production by 12% after implementing regular measurement protocols. “I discovered I was consistently overestimating available forage by about 25%,” she explains. “Once I started measuring accurately, I could adjust supplementation properly, and my components improved within weeks.”

2. Master Rotational Grazing

The data is overwhelming: continuous grazing is economically indefensible for commercial dairy operations. Let me be blunt: if you’re still practicing continuous grazing in 2025, you’re operating with 1975 technology in a precision agriculture era.

Research comparing one-day rotational systems to longer ten-day rotations demonstrated that shorter rotation intervals lead to more uniform grazing, improved plant recovery, and better overall pasture performance.

The principle is simple: control when and how severely plants are grazed, then provide adequate rest for recovery. The execution requires attention to detail:

  • Calculate paddock number and size based on animal units and forage growth rates. Even simple four-paddock rotations can achieve many benefits of more intensive systems.
  • Adapt rotation speed to forage growth – faster during spring flush, slower during summer slump. The biggest mistake most beginners make is failing to adjust rotation timing as growth rates change seasonally, like feeding the same amount of grain to cows regardless of their stage of lactation.
  • Maintain proper residual heights – typically 3-4 inches for most forage species. Grazing too short depletes root reserves and slows recovery, leaving too many leads to less palatable forage in subsequent rotations. Think of it as proper milking procedure: incomplete milkout reduces production, but overmilking damages the udder.

One Pennsylvania dairy that switched from continuous to rotational grazing reported a 22% increase in grazing days per acre and a $276 increase in margin over feed costs. This wasn’t theoretical research – real-world profit went straight to the bottom line. How many other management changes can deliver that kind of return with minimal capital investment?

3. Match Plants to Purpose

Species selection isn’t just about yield – it’s about strategic alignment with your system goals and environmental conditions. We’ve spent decades fine-tuning genetics for our cows – why are we still planting generic pasture mixes without the same attention to detail?

The most profitable grazing operations tailor their forage species mix to:

  • Soil conditions – Drought-prone soils benefit from deep-rooted species like alfalfa or chicory, while poorly drained areas may produce better with reed canarygrass (Phalaris arundinacea).
  • System type – Conventional operations supplementing significant grain might prioritize highly digestible perennial ryegrass (Lolium perenne), while grass-fed systems need diverse mixes with extended seasonal productivity.
  • Production goals – High-component milk production benefits from legume-rich pastures that boost protein intake. As you’d select different semen for component markets versus fluid markets, your pasture species should align with your milk market.

Multispecies swards (MSS) are gaining traction across all system types, with research from the Journal of Dairy Science showing they can maintain or enhance herbage production with substantially reduced nitrogen fertilizer inputs. One study found cows grazing MSS produced 5,297kg of milk and 476kg of milk solids per lactation, compared to 5,018kg of milk and 452kg of milk solids for cows on perennial ryegrass monocultures, and achieved this with half the nitrogen fertilizer input.

“We’re seeing progressive producers across the spectrum planting 6-12 species mixes,” reports seed company representative Thomas Chen. “It’s not hippie farming – it’s hard economics. These diverse pastures are more resilient to weather extremes and maintain quality longer throughout the season.”

4. Monitor and Manage Cow Intake

Pasture-derived dry matter intake (DMI) is where the rubber meets the road. A beautiful pasture means nothing if your cows aren’t harvesting and converting it efficiently to milk. All your pasture management efforts are wasted if you can’t accurately determine how much feed your cows are harvesting.

DMI calculations aren’t just good management for organic operations – they’re required documentation. The standard approach follows these steps:

Calculating Pasture DMI in 4 Simple Steps:

  1. Determine Dry Matter Demand (DMD) based on animal weight, production level, and life stage.
  2. Calculate Dry Matter fed from non-pasture sources by measuring all supplemental feeds provided.
  3. Determine DMI from pasture by subtracting non-pasture DM fed from total DMD.
  4. Calculate the percentage of DMI from pasture by dividing pasture DMI by total DMD and multiplying by 100.

But numbers alone don’t tell the whole story. Smart producers also monitor:

  • Milk components – Fat-to-protein ratios can indicate rumen health issues, often associated with lush spring pasture. When fat drops below protein in tank samples, it’s a warning sign of SARA (Sub-Acute Ruminal Acidosis) that demands attention.
  • Rumination activity – Decreased cud-chewing may signal insufficient fiber from pasture, just as it would indicate sorting issues in a TMR.
  • Body condition scores – Declining BCS suggests energy deficits that need addressing through supplementation. Using the 1-5 scale familiar to all dairy producers, maintaining cows between 3.0 and 3.25 through peak lactation becomes a critical monitoring point.

Are you tracking these key indicators with the same intensity as you track milk production and components? If not, you’re managing blind.

Key Profit-Driving Techniques Summary

  • Measure Systematically: Use tools like grazing sticks/plate meters and forage testing to eliminate guesswork
  • Rotate Strategically: Implement rotational grazing with appropriate paddock sizes and rest periods
  • Match Species to Goals: Select pasture species for your specific system, soil conditions, and production targets
  • Monitor Cow Response: Track DMI, milk components, rumination, and body condition to verify nutrition adequacy

Health Benefits Beyond the Feed Bill

The benefits of well-managed grazing extend far beyond feed cost savings. Research from the Journal of Dairy Science consistently shows that grazing can improve multiple health parameters when properly implemented:

Improved locomotion and claw health – Access to pasture, with its softer and more varied surfaces than concrete, contributes to better foot and leg health. Studies have found that grazing cows experience fewer bouts of lameness and have fewer lesions or swelling of the feet and legs. With lameness treatment costs averaging $7.33 per cow and associated milk losses of 28-40% on the day of diagnosis compared to healthy cows, this benefit alone can justify grazing investments for many operations.

Enhanced reproductive performance – Research from New Zealand demonstrated that cows with access to high-quality pasture had conception rates 8-12% higher than their confinement counterparts. This translates to shorter calving intervals and reduced breeding costs. For a 100-cow herd, that improvement could mean 8-12 fewer breeding attempts and potentially 8-12 fewer days open per cow annually.

Reduced stress levels – Measurements of physiological stress indicators, such as cortisol levels in hair, have found lower stress in cows during grazing periods compared to periods of confinement. Lower stress correlates with improved immune function and overall health.

Lower mortality rates – Several studies suggest cow mortality rates can be lower in herds with access to grazing compared to those without, potentially extending productive lifespans and reducing replacement costs.

However, these benefits only materialize with proper management. Poorly implemented grazing can introduce new health challenges:

Metabolic disorders – Rapid transitions to lush spring pastures can trigger subacute ruminal acidosis (SARA), while sudden dietary changes may increase ketosis risk. Are your transition protocols for grazing as carefully structured as your fresh cow programs? Gradual introductions to pasture and strategic supplementation with buffering agents like sodium bicarbonate can mitigate these risks.

Parasite pressure – Internal parasites like Ostertagia ostertagi (brown stomach worm) and Fasciola hepatica (liver fluke) thrive in grazing environments. Rotational grazing with appropriate rest periods disrupts parasite lifecycles, while strategic deworming (conventional systems) or botanical anti-parasitic forages like chicory (Cichorium intybus) provide additional control options.

Toxic plant and endophyte exposure – Regular pasture scouting to identify and manage potentially toxic plants is essential. Fescue toxicosis from endophyte-infected tall fescue (Festuca arundinacea) can severely impact production and reproduction. In conventional systems, herbicides like Grazon P+D or PastureGard offer effective control when used according to label restrictions. Organic producers must rely on mechanical removal, strategic mowing, and maintaining competitive forage stands.

The Environmental Advantage: Profiting from Stewardship

Perhaps the most overlooked benefit of strategic grazing is its environmental impact, which increasingly translates to economic opportunity through carbon markets, sustainability premiums, and regulatory compliance.

Carbon sequestration – Well-managed pastures can sequester atmospheric carbon dioxide and store it as soil organic carbon. Research from Organic Valley found that their grazing-based organic systems could mitigate up to 20% of their greenhouse gas emissions through carbon sequestration.

A University of Sydney study indicated that one hectare of dairy pasture could absorb approximately 8 kg of CO2 equivalent per cow daily, representing about 73% of that cow’s daily enteric methane emissions. Are you positioning your operation to capitalize on this new revenue stream as carbon markets develop?

Water quality protection – While poorly managed grazing can harm water quality, well-executed rotational systems with riparian buffers and strategic water placement can improve watershed health compared to row-crop production. As water quality regulations tighten, grazing’s advantages in reducing erosion and nutrient runoff become increasingly valuable.

Biodiversity benefits – Diverse pastures support pollinator populations, beneficial insects, and wildlife. These ecosystem services don’t appear on quarterly financial statements but contribute to farm resilience and may soon command market premiums as consumers and processors increasingly reward biodiversity-friendly production.

Debunking Grazing Myths: The Excuses Holding You Back

Despite compelling evidence supporting strategic grazing across all dairy systems, persistent myths continue to limit adoption. Let’s confront these head-on:

Myth #1: “Grazing means accepting lower production.” Reality: While production per cow may decrease in systems with very high pasture utilization (particularly grass-fed), well-managed grazing with appropriate supplementation can maintain high production levels. More importantly, the relevant metric isn’t production per cow but profit per cow or per acre, which often increases with strategic grazing due to lower input costs. Are you chasing volume at the expense of profitability?

Myth #2: “Grazing requires too much labor.” Reality: Modern grazing infrastructure (temporary fencing, water systems, etc.) has dramatically reduced labor requirements. Many operations report that while labor is redistributed (more time monitoring pastures, less time mixing feed and cleaning barns), total hours are similar or lower than those in confinement systems. The question isn’t whether you have time to graze – it’s whether you can afford not to.

Myth #3: “Our climate doesn’t support productive grazing.” Reality: While seasonal extremes present challenges, producers from Canadian provinces to Texas have developed successful grazing programs by adapting their management to local conditions. Strategic supplementation during weather challenges maintains production while capturing grazing benefits during favorable periods. Your climate isn’t the limitation – your management approach is.

Myth #4: “You need special genetics for grazing.” Reality: While smaller-framed, high-component breeds like Jerseys or crossbreds often excel in high-pasture systems, many operations successfully graze Holsteins with appropriate management. The key is matching your genetics to your grazing intensity rather than abandoning grazing altogether. Have you considered selecting for lifetime profit rather than just first-lactation production?

Myth #5: “It’s too expensive to set up grazing infrastructure.” Reality: Basic rotational grazing can be implemented with minimal investment (temporary fencing and water lines), with ROI often measured in months, not years. More sophisticated systems require greater investment but typically deliver proportionally higher returns. Compare that to the ROI on your last barn expansion or equipment purchase.

The Bottom Line: Strategic Steps for Your Grazing Transition

Whether you’re grazing exclusively, partially, or considering your first foray into pasture-based production, these principles will maximize your return on grass:

  1. Start where you are – You don’t need to transform your entire operation overnight. Begin with dry cows or heifers if you’re new to grazing or improve management of existing grazed groups. What’s the one group in your herd that could benefit most immediately from strategic grazing?
  2. Invest in measurement – Purchase a rising plate meter or grazing stick and commit to regular, systematic pasture monitoring. The data will drive better decisions and rapidly pay for itself, as milk meters and component testing inform your nutrition and breeding decisions.
  3. Implement rotational grazing – Even simple four-paddock rotations dramatically outperform continuous grazing. As you gain experience, you can increase paddock numbers and management intensity.
  4. Match supplements to pasture conditions – Regular pasture sampling helps identify nutritional gaps targeted supplements can address, maintaining production while maximizing pasture utilization. If your spring pasture tests at 25% crude protein but only 0.62 Mcal/lb NEL, energy supplementation becomes critical to prevent poor components and breeding problems.
  5. Track economics beyond feed costs – Monitor health incidents, reproductive performance, and culling rates alongside direct input costs to capture grazing’s full financial impact. Are you using whole-farm metrics or just focusing on isolated numbers?

The progressive dairy operations of tomorrow won’t be asking whether to graze, but how to graze more effectively. The economic, animal welfare, and environmental advantages are too compelling to ignore. The question isn’t whether the industry will move toward more strategic grazing – it’s whether you’ll lead this revolution or scramble to catch up.

Your pastures represent your most underutilized competitive advantage. The technology, knowledge, and management systems to transform them from cost centers to profit drivers are available today. What’s your excuse for not taking action? Your competitors certainly aren’t waiting.

Learn more:

The Sunday Read Dairy Professionals Don’t Skip.

Every week, thousands of producers, breeders, and industry insiders open Bullvine Weekly for genetics insights, market shifts, and profit strategies they won’t find anywhere else. One email. Five minutes. Smarter decisions all week.

NewsSubscribe
First
Last
Consent

Feed Center Revolution: Why Your Current Design Is Costing Your Dairy Six Figures Annually

Is your feed center silently bleeding profits? Discover how strategic design could save your dairy six figures annually by slashing feed shrink.

EXECUTIVE SUMMARY: Feed centers represent a critical control point for dairy farm profitability, with feed accounting for 50-60% of total expenses. Strategic feed center design can dramatically reduce shrink by 4-12%, potentially saving operations over $100,000 monthly through better protection from weather elements and improved handling efficiency. The ideal design addresses traffic flow patterns, properly sized ingredient bays, strategically positioned mixing areas, and effective dust management systems. By implementing either batch box or direct loading systems, producers can enhance labor efficiency while improving ration consistency. Forward-thinking operations are adopting enclosed facilities with innovative dust collection systems, automation technologies, and layouts that optimize workflow while minimizing both environmental impact and biosecurity risks.

KEY TAKEAWAYS

  • Reduce Feed Shrink Through Protection: Indoor feed centers can slash shrink from 8% to 2-4%, representing potential annual savings of $135,000 for a 1,000-cow dairy with $7.50/cow/day feed costs.
  • Strategic Traffic Flow Creates Efficiency: Design traffic patterns that minimize congestion, reduce equipment wear, and enhance safety through either entry/exit systems or pull-through designs that eliminate risky backing maneuvers.
  • Design for Long-Term Value, Not Initial Cost: While enclosed facilities require higher upfront investment, the ROI from reduced shrink often pays back construction costs within three years while continuing to deliver returns indefinitely.
  • Implement the FEEDS Principle: Successful feed centers incorporate Flexibility (adaptable to changing needs), Economy (total cost approach), Ease of operation (simple, intuitive systems), Dependability (reliable equipment), and Safety (integrated risk management).
  • Measure Performance to Drive Improvement: Establish key metrics for feed shrink, loading accuracy, and labor efficiency, then implement systems to track these indicators and identify opportunities for continuous optimization.
Feed center design, feed shrink reduction, dairy profitability, TMR mixing systems, automated feed systems

Forget genetics and breeding values for a minute. While you’re obsessing over genomics and parlor efficiency, that outdated feed center is silently bleeding your operation dry to thousands per month. With feed accounting for more than half of production costs, forward-thinking dairies are discovering that strategic feed center design can slash shrink by 4-12%, dramatically cut labor costs, and unlock six-figure annual returns straight to your bottom line.

The $100,000+ Monthly Money Pit You’re Ignoring

When was the last time you honestly calculated what your feed center is costing you? I’m talking about the invisible daily losses that never appear on your milk check, not just the construction payment or equipment depreciation.

Here’s the wake-up call: One Midwest dairy with 4,500 cows reduced their shrink from 6.5% to just 2.01% by implementing better feed center design and management. The monthly savings? $110,907. That’s over $1.3 million annually, which was previously vanishing into thin air, bird bellies, or blowing away with the wind.

“I know now that what we’re buying is being fed or staying in the building,” one producer explained after implementing an indoor feed center. “If it’s dust, it will settle. It’s still cow feed and not becoming bird feed.”

Let’s be brutally honest—how many operations today still use commodity storage designed in the 1980s to feed 2025’s high-performance genetics?

Joe Harner from Kansas State University notes that while “normal” shrinkage for feed in commodity buildings with three-sided bays hovers around 8%, a realistic target in enclosed facilities is just 2-4%. This difference becomes especially significant when you consider that wind at 25 mph increases feed losses 125 times compared to wind blowing less than five mph.

Let’s put this in perspective: If you’re milking 1,000 cows at $7.50 per cow per day in feed costs, that’s $2.7 million in annual feed costs. Reducing shrinkage from 8% to 3% saves you $135,000 annually.

That’s not pocket change—it’s the difference between struggling to meet cash flow and turning a profit during tight margin periods.

Traffic Flow: The Most Overlooked Profit-Killer in Feed Center Design

When designing feed centers, traffic flow isn’t just about convenience—dollars and cents are as critical as your stall dimensions or milking routine.

Every unnecessary minute your payloader operator spends maneuvering around obstacles or waiting for delivery trucks adds labor costs, increases equipment wear, and reduces the time that employees could spend on other productive tasks.

To limit congestion, you need adequate space for vehicles to travel, turn around, and deliver efficiently. A recommended turning diameter of 130-150 feet accommodates semi-trucks without creating bottlenecks.

Are your delivery drivers constantly jockeying for position, or does your feed center flow like a well-designed milking parlor?

The Two Traffic Systems That Work (While Everything Else Fails)

Progressive producers implement one of two traffic patterns:

  1. The Entry/Exit System: Some producers prefer having semi-trucks enter and exit simultaneously. This requires ample turning space but minimizes traffic crossing patterns—think of it like a single-return parlor where cows enter and exit through the same side.
  2. The Pull-Through System: Others design vehicles to pull through without backing into commodity bays. This eliminates risky backing maneuvers and speeds up deliveries—like how a drive-through parlor flows more efficiently than a herringbone where cows must back out.

One innovative dairy implemented a drive-over commodity bridge—a first-of-its-kind installation revolutionizing delivery efficiency. This design allows delivery trucks to pull over storage bays and unload without repositioning repeatedly.

“Truck drivers like it because they don’t have to keep moving their truck forward to unload,” notes one driver. “They pull over the top of a bay and sit to unload.”

Is your current feed center design forcing trucks into dangerous backing maneuvers? Is your payloader operator spending half the day playing traffic cop instead of mixing feed?

If so, you’re burning money every time you pay for those rations your nutritionist formulated that never make it to the bunk.

Storage Solutions Showdown: What’s Costing You Less (Hint: It’s Not What Most Feed Center Builders Will Tell You)

Regarding feed storage, the sticker price is just the beginning—like comparing the initial cost of sand bedding versus manure solids without calculating the long-term impacts on somatic cell count and lameness.

The true cost includes shrinkage, labor efficiency, and maintenance over time. Let’s break down the real economics that most feed center designers won’t tell you:

Upright Bins:

  • Best for: Dry, free-flowing ingredients (protein meals, minerals, bypass fat)
  • Initial Cost: Moderate to High ($200-$500+/ton)
  • Typical Shrink: 2-5%
  • Labor Efficiency: High (potential automation)
  • Key Advantages: Excellent protection from elements, efficient automation potential, small footprint
  • Main Drawbacks: Higher upfront cost, limited capacity for some ingredients, potential bridging issues

Commodity Sheds:

  • Best for: Bulk commodities (cottonseed, gluten feed, DDGs, soyhulls)
  • Initial Cost: Low-Moderate ($150-$300+/ton)
  • Typical Shrink: 5-10%+ (open-front), 3-6% (fully enclosed)
  • Labor Efficiency: Medium (requires loaders)
  • Key Advantages: Flexibility for various ingredients, handles large deliveries
  • Main Drawbacks: Higher shrink in open designs, requires significant floor space

Silos (Bunkers/Bags):

  • Best for: Silage, high-moisture corn
  • Initial Cost: Variable (low for bags, high for towers)
  • Typical Shrink: 5-20% (management dependent)
  • Labor Efficiency: Low (labor-intensive face management)
  • Key Advantages: Effective preservation of fermented feeds, large capacity
  • Main Drawbacks: Management-intensive, variable shrink based on practices

What’s the real cost of that “budget-friendly” open-front commodity shed when you factor in feed shrink?

Most equipment dealers won’t tell you that a “budget-friendly” open-front commodity shed might save you $50,000 in construction costs compared to a fully enclosed facility—but it could cost you $100,000+ annually in increased shrink.

That’s like saving money on a cheaper milking system only to lose ten times more through slower throughput and increased mastitis.

FARMER SPOTLIGHT: PAYING FOR A BUILDING WITH FEED SAVINGS

Mike Brouk, a dairy specialist at Kansas State University, works with one producer who reduced shrink enough to pay back their building costs on a four-sided commodity shed in just three years. “In an enclosed system,” Brouk notes, “shrink can be reduced to just 2%.” The producer initially questioned the additional expense but now considers it one of their best investment decisions, as the structure continues to deliver returns long after paying for itself.

Are We Still Building Feed Centers Like It’s 1995?

Indoor feeding centers are becoming increasingly popular in the Upper Midwest, with producers reporting 4% to 12% shrink reduction simply by protecting ingredients from harsh weather.

Properly designed ingredient bays must be large enough to hold several deliveries of commodities (typically 24-32 feet wide and 30-40 feet deep). This prevents overloading bays into the aisle and allows for proper ingredient rotation—just as critical as managing your inventory of pharmaceuticals in the vet room.

Smart producers also set up grain systems near the bays to grind corn or soybeans directly into them, reducing double-handling and minimizing losses. It’s the feed center equivalent of the step-saver parlor—every unnecessary movement costs you money.

The Dust Factor: More Than Just an Annoyance (It’s Your Profit Vanishing into Thin Air)

As ingredients are moved around, dust creates potential safety hazards while representing literal money floating away—much like those fine particles you see in the air when mixing TMR are the most nutritionally dense portion of your ration, containing proteins, vitamins, and minerals your nutritionist formulated, but your cows never consumed.

Beyond safety, dust represents nutrients you paid for but aren’t reaching your cows. It can also reduce feed palatability and contribute to respiratory issues in cattle and workers—much like the ammonia in a poorly ventilated free stall barn impacts herd health and employee retention.

What if you could recover those nutrients instead of watching them blow away?

Why Are Top Producers Capturing Dust While You’re Letting It Blow Away?

Forward-thinking operations are implementing creative dust management systems. One dairy’s feed center includes a plenum—a small horizontal opening running the entire building length. Fans on one side draw air across the indoor feed pad through the plenum, ventilating the barn and clearing the air of fines.

The brilliant part? The design causes dust to settle in a collection area rather than escaping through the fans. The operation then tests this recovered material for nutrient value. It reincorporates it into rations—turning waste into usable feed, like how modern dairies reclaim sand through separation systems.

This isn’t just about environmental compliance—it’s about recovering valuable nutrients. The Occupational Safety and Health Administration (OSHA) and the National Fire Protection Association require facility operators to control dust in the workplace. But beyond compliance, a comprehensive dust control system delivers economic benefits by capturing what you’ve already paid for.

A comprehensive dust control system should include:

  • Proper airflow through the entire facility
  • Correctly sized fans
  • Explosion and fire protection measures
  • Good dust containment
  • Adequate filter area

Is your current feed center treating dust as an inevitable nuisance rather than a recoverable resource and a serious safety concern? That’s like ignoring leaky air lines in your parlor—both represent wasted resources and avoidable costs.

Mixing Centers: Two Approaches That Deliver (And Why Most Operations Choose Wrong)

The mixing area is where your nutritionist’s carefully formulated ration either becomes a reality—or gets compromised. This area typically needs to be at one end of the feed center or on the side, functioning much like the heart of your dairy operation, just as the parlor functions as the kidneys.

Most successful operations keep premix batches and forages closer to the mixing end while positioning commodity ingredients at the opposite end where delivery trucks access the facility. This arrangement optimizes flow and minimizes congestion, just as you’d separate your fresh cow pen from your far-off dry cows for different management needs.

Two approaches are proving particularly effective (while most operations compromise with neither):

  1. The Batch Box System

Hydraulically controlled side-dump boxes allow payloader operators to add ingredients to the box while the feeder is out delivering feed. This enhances employee efficiency, as the feeder can return and dump the pre-weighed contents into the mixer.

“We wanted to get better ration consistency for the cows,” explains one producer who implemented batch boxes. “Before, we were loading straight into a mixer wagon. The wagon would be bouncing around, so the scale couldn’t get an accurate read. It could trick a feeder who was loading feed.”

Just as you’d never tolerate variable milking procedures between shifts impacting your component tests, why accept inconsistent TMR mixing that impacts butterfat, protein, and, ultimately, your milk check?

  • The Direct Loading System

Another option is to position the mixer at the end of the feed center for direct loading. The mixer is typically recessed below floor level to help with offloading accuracy and provide better visibility for the operator—much like how a parallel parlor pit offers better visibility of udders compared to a flat barn arrangement.

Some farms automate commodity ingredients from overhead bins to reduce payloader hours. These ingredients go directly into the batch box or mixer, along with forages added by a payloader, creating the perfect sync between automation and manual labor.

One operation that implemented these improvements reported dramatic efficiency gains: “We used to need eight employees and four mixer wagons running 24-7 to feed all our dairy animals. Now it only takes two mixer wagons, three feeders, and nine hours to feed.”

That’s like cutting milking time from 8 hours to 3 hours while maintaining the same cow numbers—a game-changing improvement in labor efficiency when every dairy is struggling to find qualified workers.

The Automation Revolution: While You’re Still Loading by Hand, Your Competition Is Automating

As labor availability becomes more challenging and the benefits of precision feeding increase, automated feeding systems are gaining popularity in progressive dairy operations—moving from “nice to have” to “need to have” status, much like robotic milking systems have in regions with severe labor shortages.

Companies including GEA, Lely, AMS Galaxy, and Trioliet now offer robotic feeding systems that mix and deliver feed to cow groups multiple times daily without constant human oversight.

Are you still treating your feed center like it’s the 1990s while your competitors embrace 2025 technology?

These systems typically consist of:

  • A mixing and feeding robot (MFR)
  • A feed ingredient storage and mixing area (feed kitchen)
  • A programmed route from the feed center to the pens

By delivering smaller amounts of feed more frequently throughout the day and night, these systems keep feed fresher and help prevent sorting and overconsumption by cows, supporting proper rumen pH and digestive function. Depending on the farm layout, a single MFR can typically handle between 500-700 cows.

Even without full robotic implementation, partial automation delivers significant benefits:

  • Reduced labor requirements in a tight farm labor market
  • Improved accuracy in ration formulation, improving component tests
  • Consistent mixing times eliminating variation between shifts
  • Better inventory management, cutting carrying costs
  • Detailed data collection supporting your nutritionist’s decisions

Jeff Salfer, University of Minnesota Extension dairy educator, points out that “feed costs account for nearly 40% to 50% of the total operating budget.” Even if you saved just $0.10 per day per cow on a 2,000-cow dairy through improved automation, that would lead to savings of $73,000 annually.

Feed management software can monitor key metrics like ingredient usage, shrink, mixing times, and ration accuracy—providing valuable data for optimization like how your DairyComp or PCDart system tracks milk production metrics.

The FEEDS Principle: What Elite Dairy Producers Know (That Average Producers Don’t)

When designing a feed center, industry experts recommend thinking of “FEEDS”—an acronym for five essential principles that separate top-performing dairies from those struggling to maintain cash flow:

Flexibility A sound system allows for easy changes in feeding practices or rations. Avoid getting locked into a system that permits only one feeding approach. Planning for expansion is critical, as is providing alternative methods to keep feeding even when components are out of service.

Economy This isn’t about being cheap—it’s about implementing the lowest-cost combination of components that delivers effective performance with minimal wastage. Take a total cost of ownership approach, considering long-term operational expenses alongside initial investment. This is like how the cheapest used TMR mixer is rarely the most economical when repair costs exceed the payment on a new one.

Ease of Operation The steps and machinery required to feed should be convenient and straightforward. A good test: “How easy is it to explain how to feed my cows to someone else?” Simple, intuitive systems reduce training time and minimize errors—crucial in an industry where turnover and training opportunities are limited.

Dependability As mechanization increases so does the potential for breakdown and repair costs. Simplicity is key in system development. Equipment reliability directly impacts feed delivery consistency—a critical factor in maintaining animal health and production. Missing even one feeding due to equipment failure can drop production by 5-10 pounds per cow, which may never fully recover in that lactation.

Safety: A well-designed system keeps hazards and risks to a minimum. Work injuries result in lost productivity, emotional trauma, and unplanned costs. Safety considerations must be integrated into every design aspect, particularly in an environment where heavy equipment, livestock, and time pressure create inherent risks.

The Bottom Line: Is Your Feed Center a Profit Center or a Money Pit?

Your feed center isn’t just infrastructure—it’s a crucial control point for your dairy’s profitability, as important to your operation’s success as your milking facility or reproduction program. The strategies outlined here aren’t theoretical—they’re being implemented by forward-thinking producers right now, with documented results showing six and even seven-figure annual returns.

When was the last time you critically evaluated your feed center’s true cost to your operation? Are you still accepting “normal” levels of feed shrink that the industry accepted decades ago?

When planning your next feed center upgrade or evaluating your current setup, focus on these key principles:

  1. Think Systems, Not Components: Recognize the feed center as interconnected. Choices regarding storage methods, mixing technology, and automation affect one another, just as your milking system, cooling equipment, and cow flow are interconnected parts of your milk harvest strategy.
  2. Plan Proactively: Address not only current needs but anticipate future growth. Design for flexibility and scalability, like how top producers build free stall barns with expansion in mind rather than maximizing current space.
  3. Calculate Total Cost of Ownership: Evaluate investments based on long-term value, not just initial price. Consider lifetime operational costs- labor, energy, maintenance, and potential feed losses—the same way you’d evaluate robotic milkers against parlor systems.
  4. Optimize Layout for Flow: Design for efficient workflow, minimizing travel time and energy use while maximizing safety. This is like optimizing cow traffic patterns to reduce walking distance and social stress.
  5. Build in Compliance: Integrate safety, biosecurity, and environmental protection into the core design rather than addressing them later.
  6. Measure to Manage: Incorporate systems for monitoring key performance indicators to drive continuous improvement, treating your feed center metrics as important as your milk production and reproduction records.

FEED SHRINK SELF-ASSESSMENT CHECKLIST

  • Are your commodity bays protected from wind and precipitation?
  • Do you have accurate scales for receiving and loading?
  • Is your facility designed for easy first-in, first-out ingredient rotation?
  • Have you calculated your actual shrink percentage by ingredient?
  • Do you track load accuracy and mixer consistency?
  • Is traffic flow optimized to minimize handling and travel distance?
  • Do you have systems to capture feed dust rather than lose it?
  • Are your operators trained on proper loading techniques?
  • Have you evaluated automation options for your highest-cost ingredients?
  • Do you regularly maintain and calibrate scales and mixing equipment?

The most successful dairies treat their feed centers as strategic assets worthy of careful planning and investment—not just places to store expensive ingredients until they’re fed.

What’s your next move? Start by calculating your current shrink rate and estimating its cost. Challenge those “normal” industry benchmarks that too many producers accept without question. Then, consider how strategic improvements in your feed center design might affect your butterfat test, component premiums, and overall Income Over Feed Cost. The numbers often tell a compelling story that decides to upgrade the obvious.

Dr. Mike Brouk of Kansas State University puts it bluntly: “A 500-cow dairy with an annual feed cost of $7.50 per cow per day could potentially gain $50,000 or more each year, reducing shrink by just 4%.” Compare that to milk production: capturing the same $50,000 from milk price alone would require an additional 32 cents per cwt for the year or squeezing out another 1.61 pounds of milk per cow per day.

With feed accounting for 50-60% of your total expenses, your feed center provides the foundation for economic success or failure. Is yours built to support your herd’s genetic potential, or is it the bottleneck preventing you from hitting those 25,000-pound herd averages and maximal component premiums?

The time has come to stop accepting outdated feed center designs as “good enough” and demanding the same feed handling innovation that we’ve embraced in genetics, reproduction, and milk harvesting. Your bottom line depends on it.

Learn more:

Join the Revolution!

Join over 30,000 successful dairy professionals who rely on Bullvine Daily for their competitive edge. Delivered directly to your inbox each week, our exclusive industry insights help you make smarter decisions while saving precious hours every week. Never miss critical updates on milk production trends, breakthrough technologies, and profit-boosting strategies that top producers are already implementing. Subscribe now to transform your dairy operation’s efficiency and profitability—your future success is just one click away.

NewsSubscribe
First
Last
Consent

Send this to a friend