Is your dairy in the 10–15% Nathan Kauffman says are in ‘significant’ stress at $18.95 milk and 8% money, and would your bank tell you if it was?
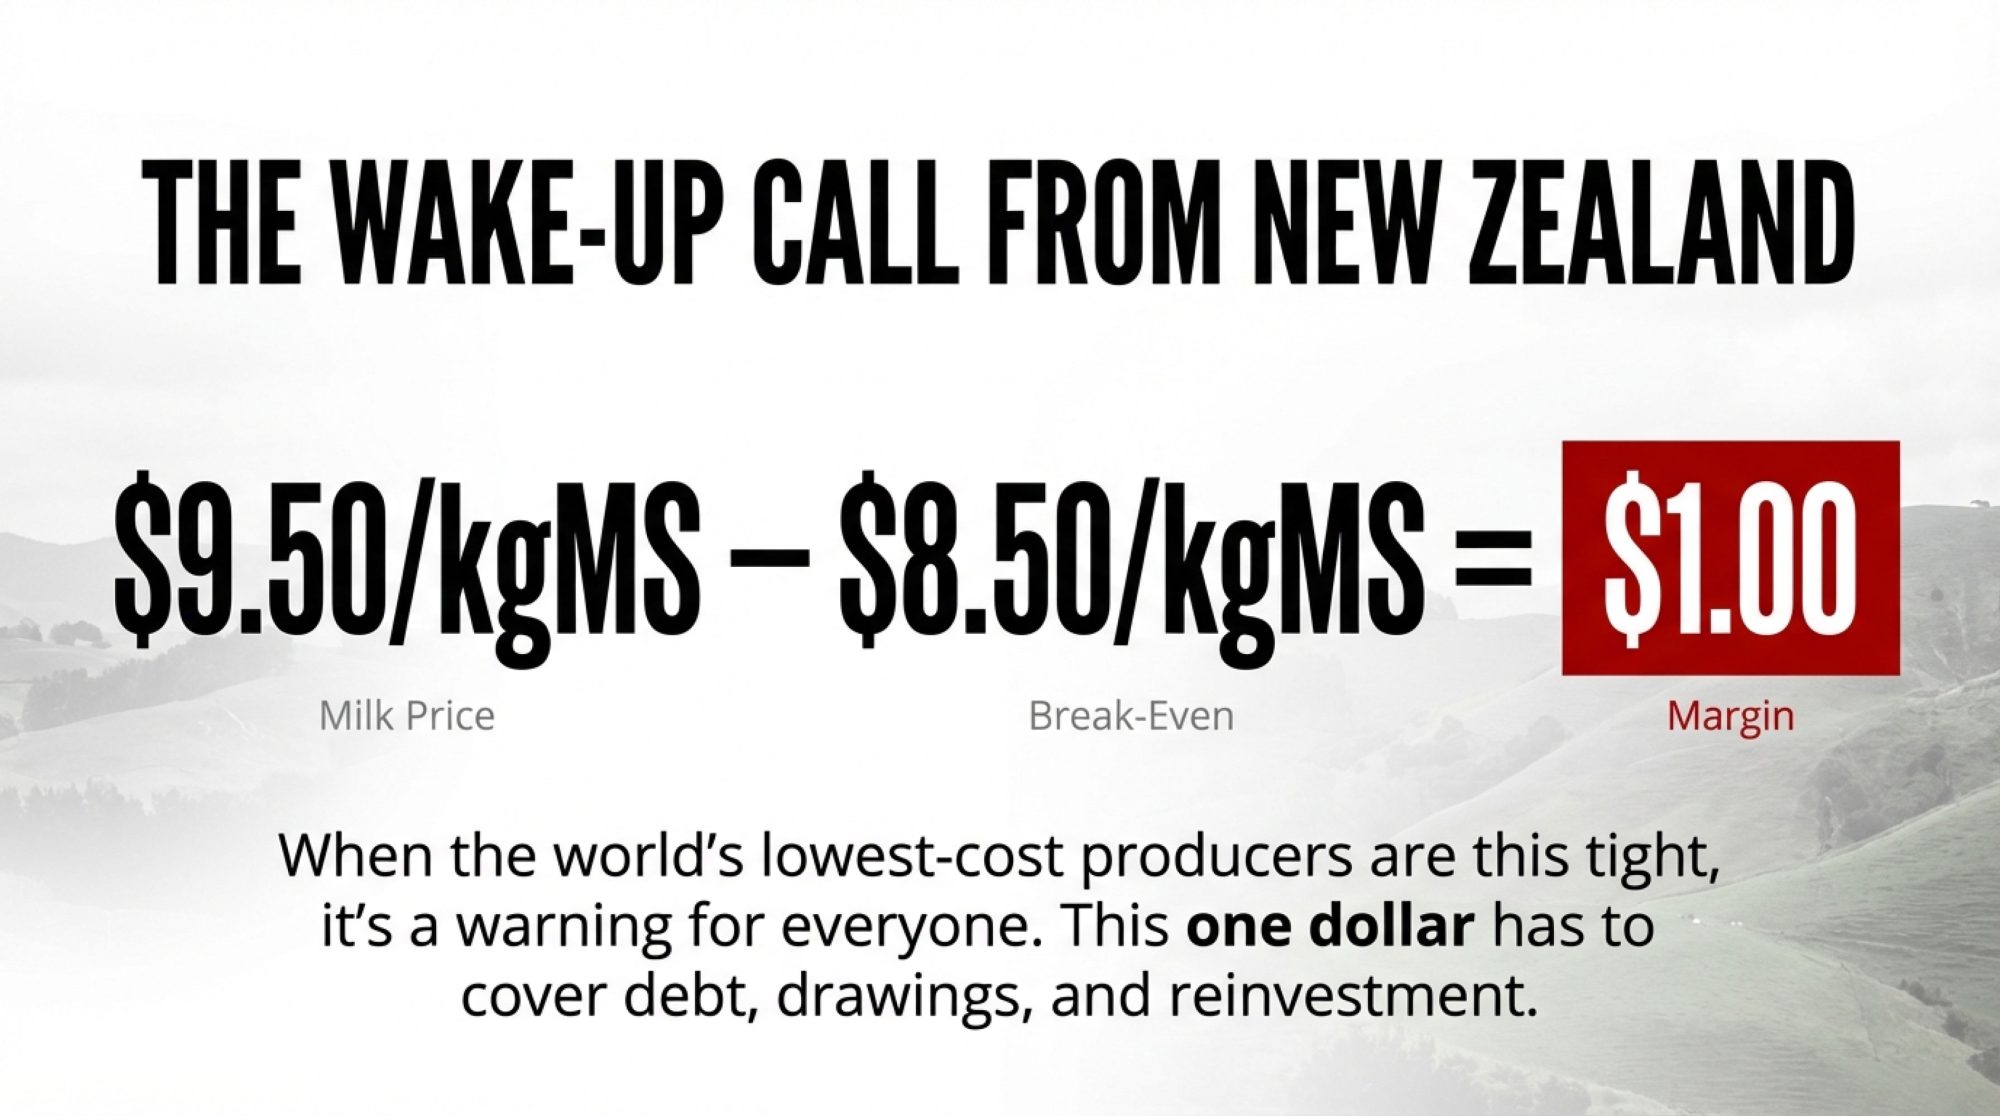
Executive Summary: USDA’s February 2026 WASDE pegs all‑milk at $18.95/cwt, $2.22 below 2025, while USDA‑ERS full‑economic costs for large herds still sit around $19.14/cwt — meaning many dairies are already underwater on paper before interest and principal. Kansas City Fed data shows operating loan rates near 8% and a surge in operating loan volume, with economist Nathan Kauffman warning that 10–15% of producers are in “significant” financial stress even as 80% remain stable. Using three composite herds — 300, 800, and 1,500 cows — the article shows how $18.95 milk, repriced debt, and higher labour costs hit debt‑service coverage ratios and equity, and where fighting, scaling, or exiting pencils actually work. For a 300‑cow herd carrying about $9,300/cow in debt, realistic culling, beef‑on‑dairy premiums, and ration tweaks can close roughly half to three‑quarters of a $195K–$210K cash‑flow gap, while an orderly exit can still retire $2.8M in debt, keep $300K+ in equity, and avoid roughly $200K in herd‑value erosion over 18 months. At 800 and 1,500 cows, the piece walks through concrete “Path A vs Path B” options — components and longer notes vs. destocking and organic premiums, filling empty stalls vs. robots — and shows how each changes DSCR and risk, rather than pretending scale alone is a safety net. It closes with a step‑by‑step DSCR stress‑test at $18.95, $17, and $16 milk, a checklist of lender “red flag” signals, and a 30‑/90‑day playbook so owners can see whether they’re in Kauffman’s 10–15% band and decide how to use the 18‑month clock before their banker uses it for them.
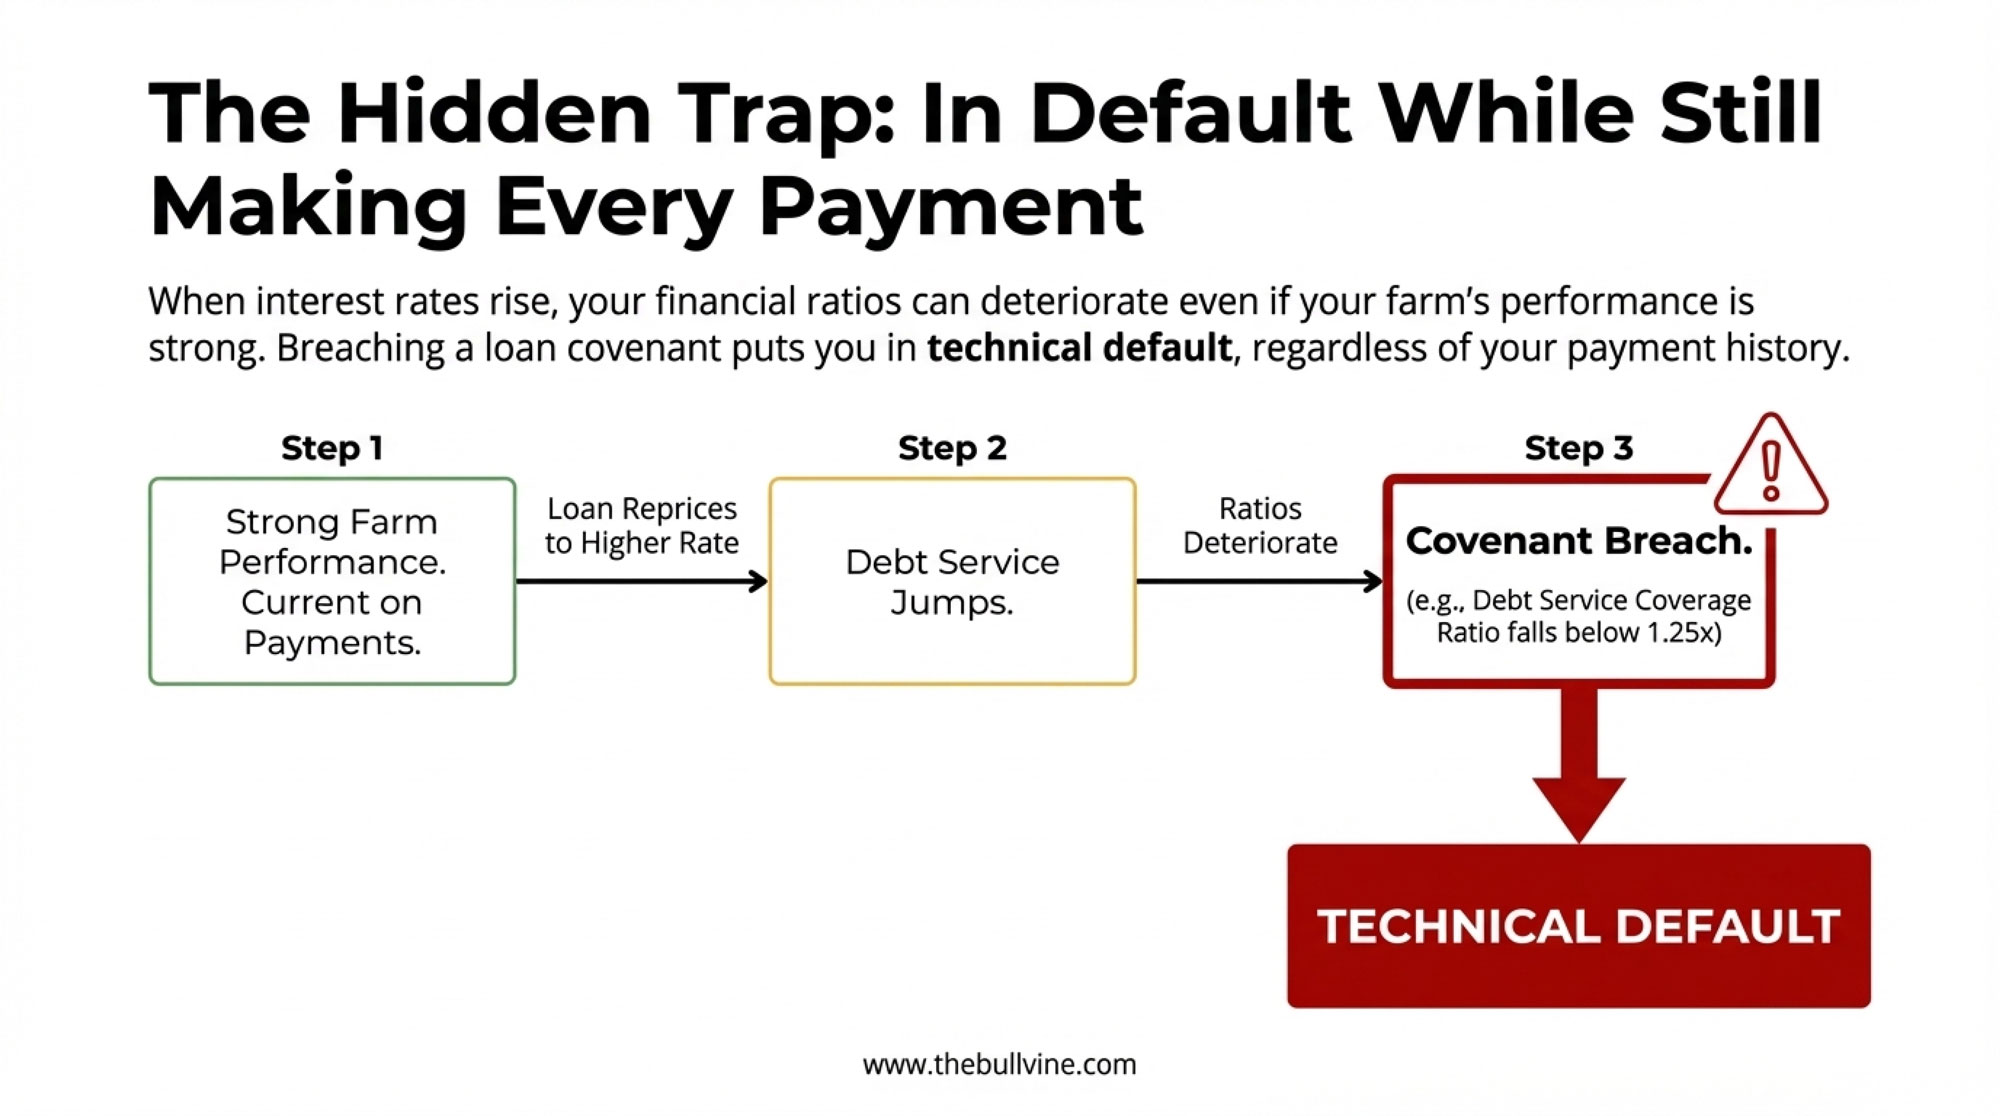
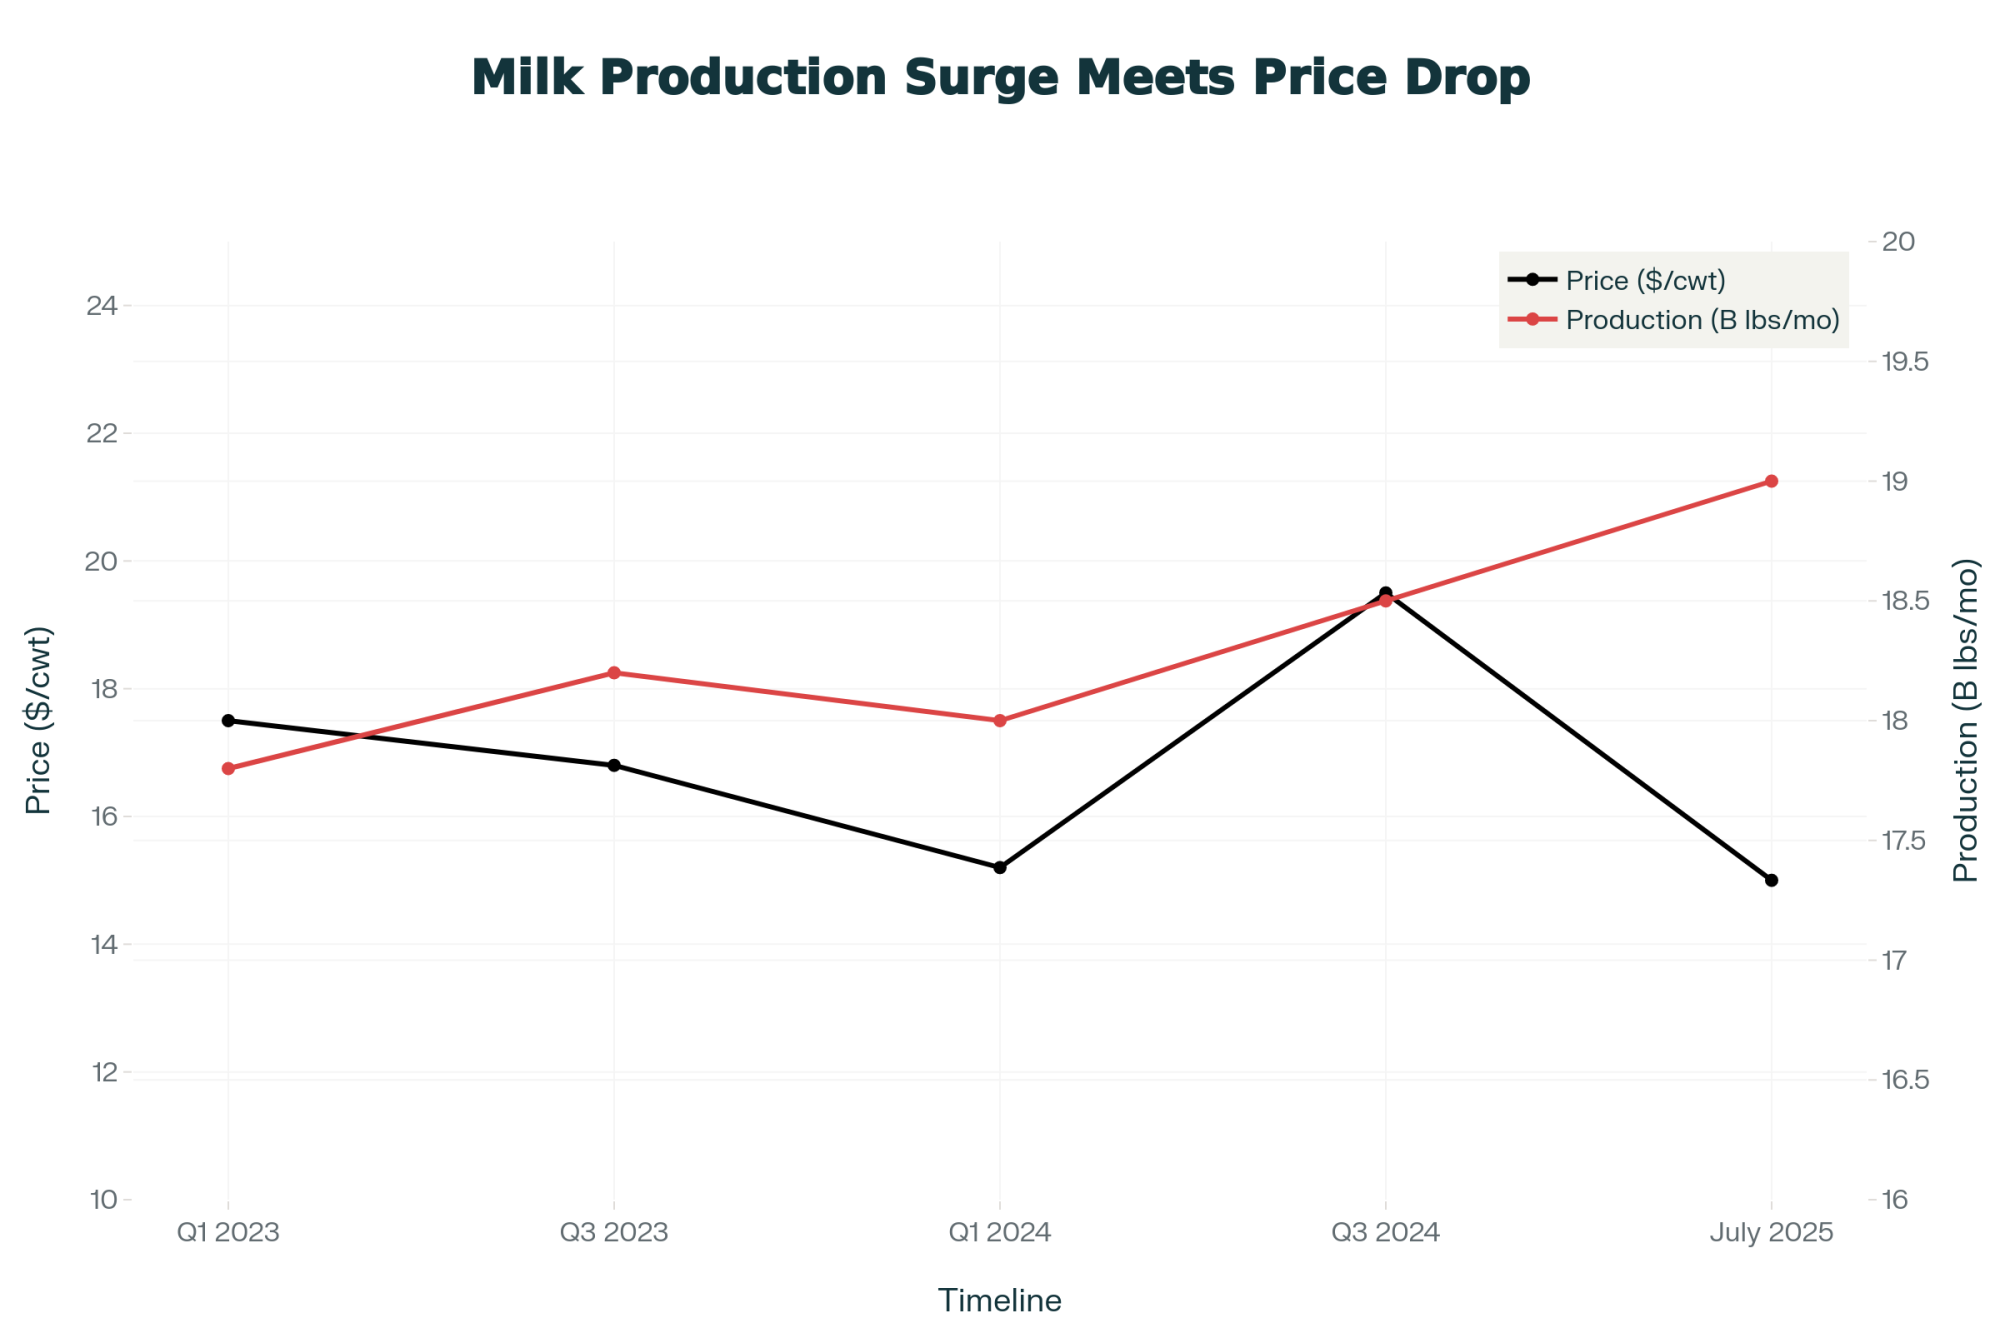
Your lender ran the numbers before you did. While you’re watching Class III futures and tweaking rations, the credit analyst across the hall already stress‑tested your file at $18.95 all‑milk — USDA’s February 2026 WASDE forecast — and flagged the debt service coverage ratio that slipped below covenant. The operating line crept up. Working capital burned faster than revenue replaced it. Nobody said “watch list” out loud. But the file moved.
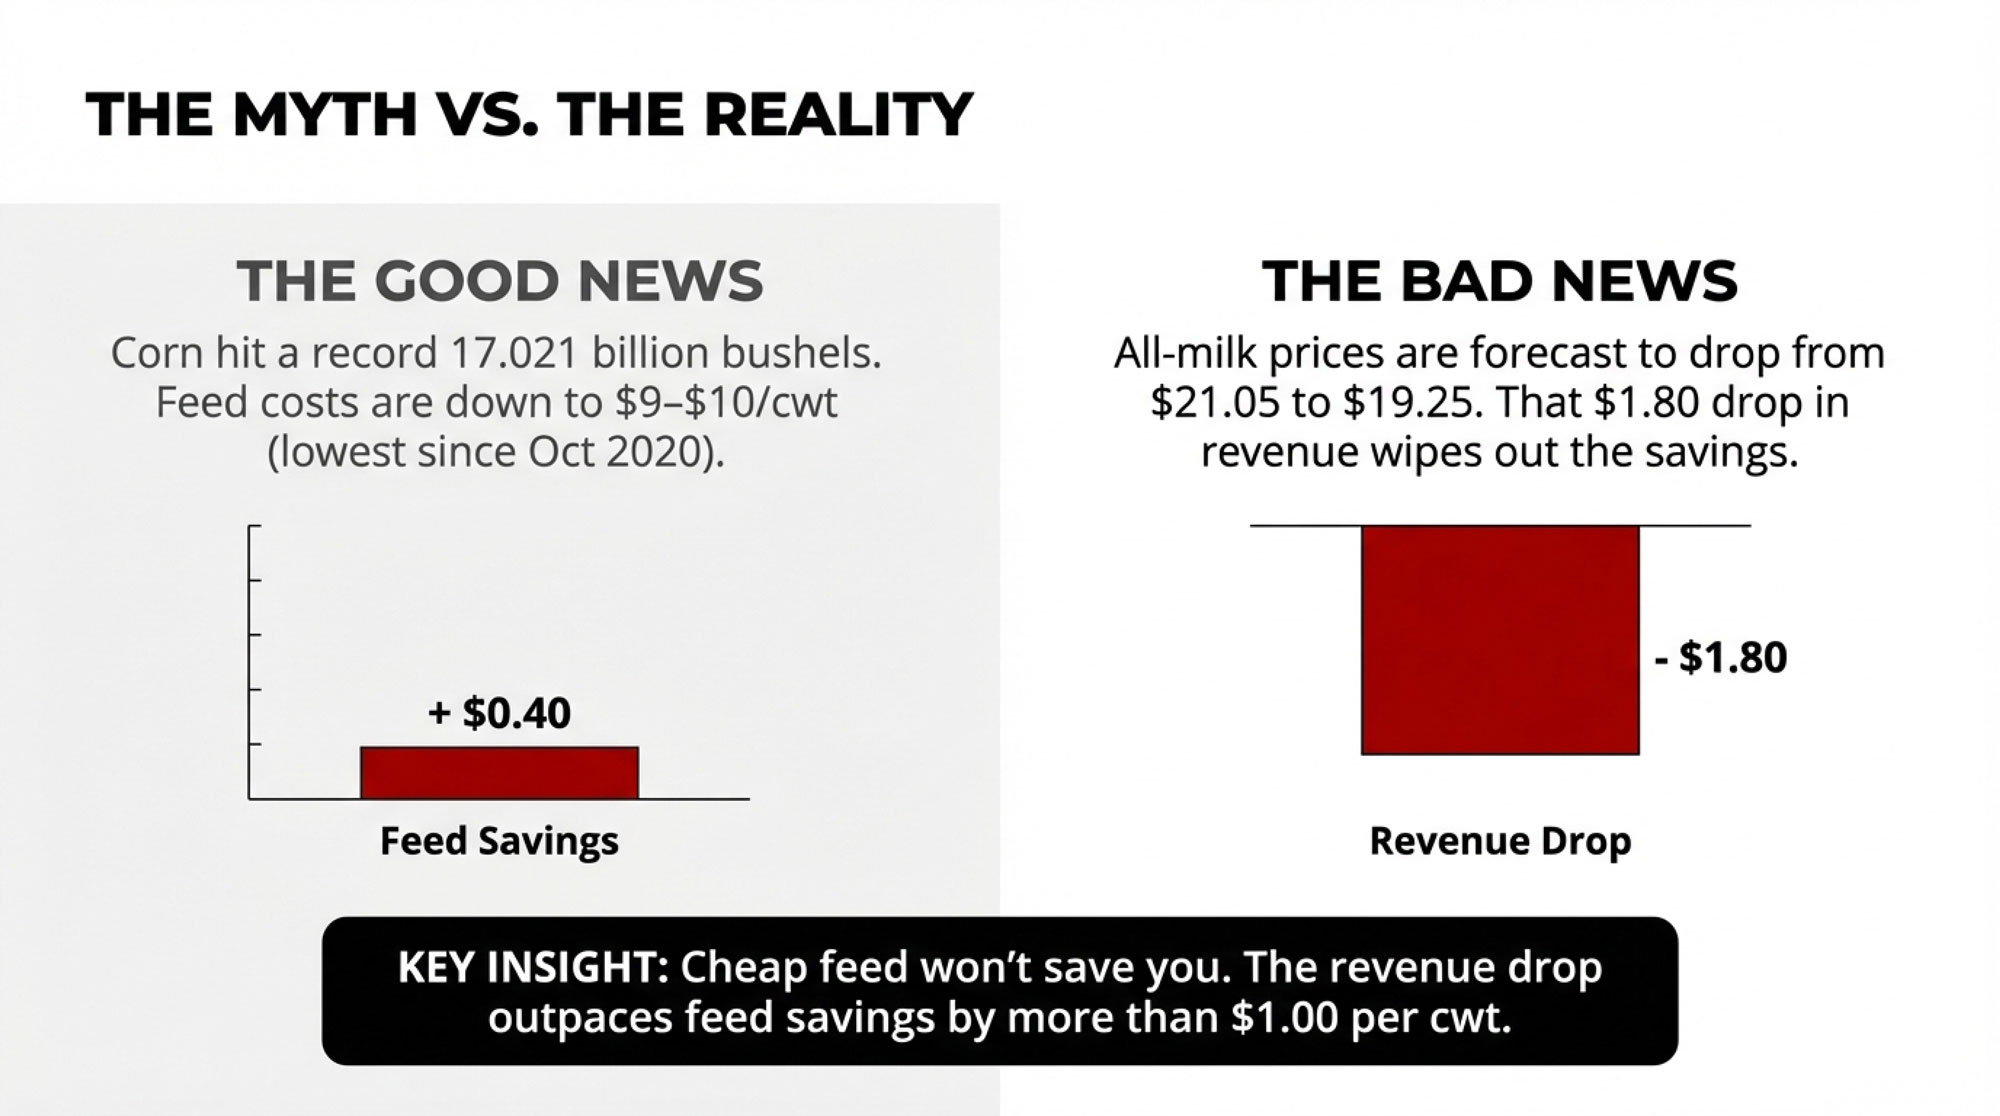
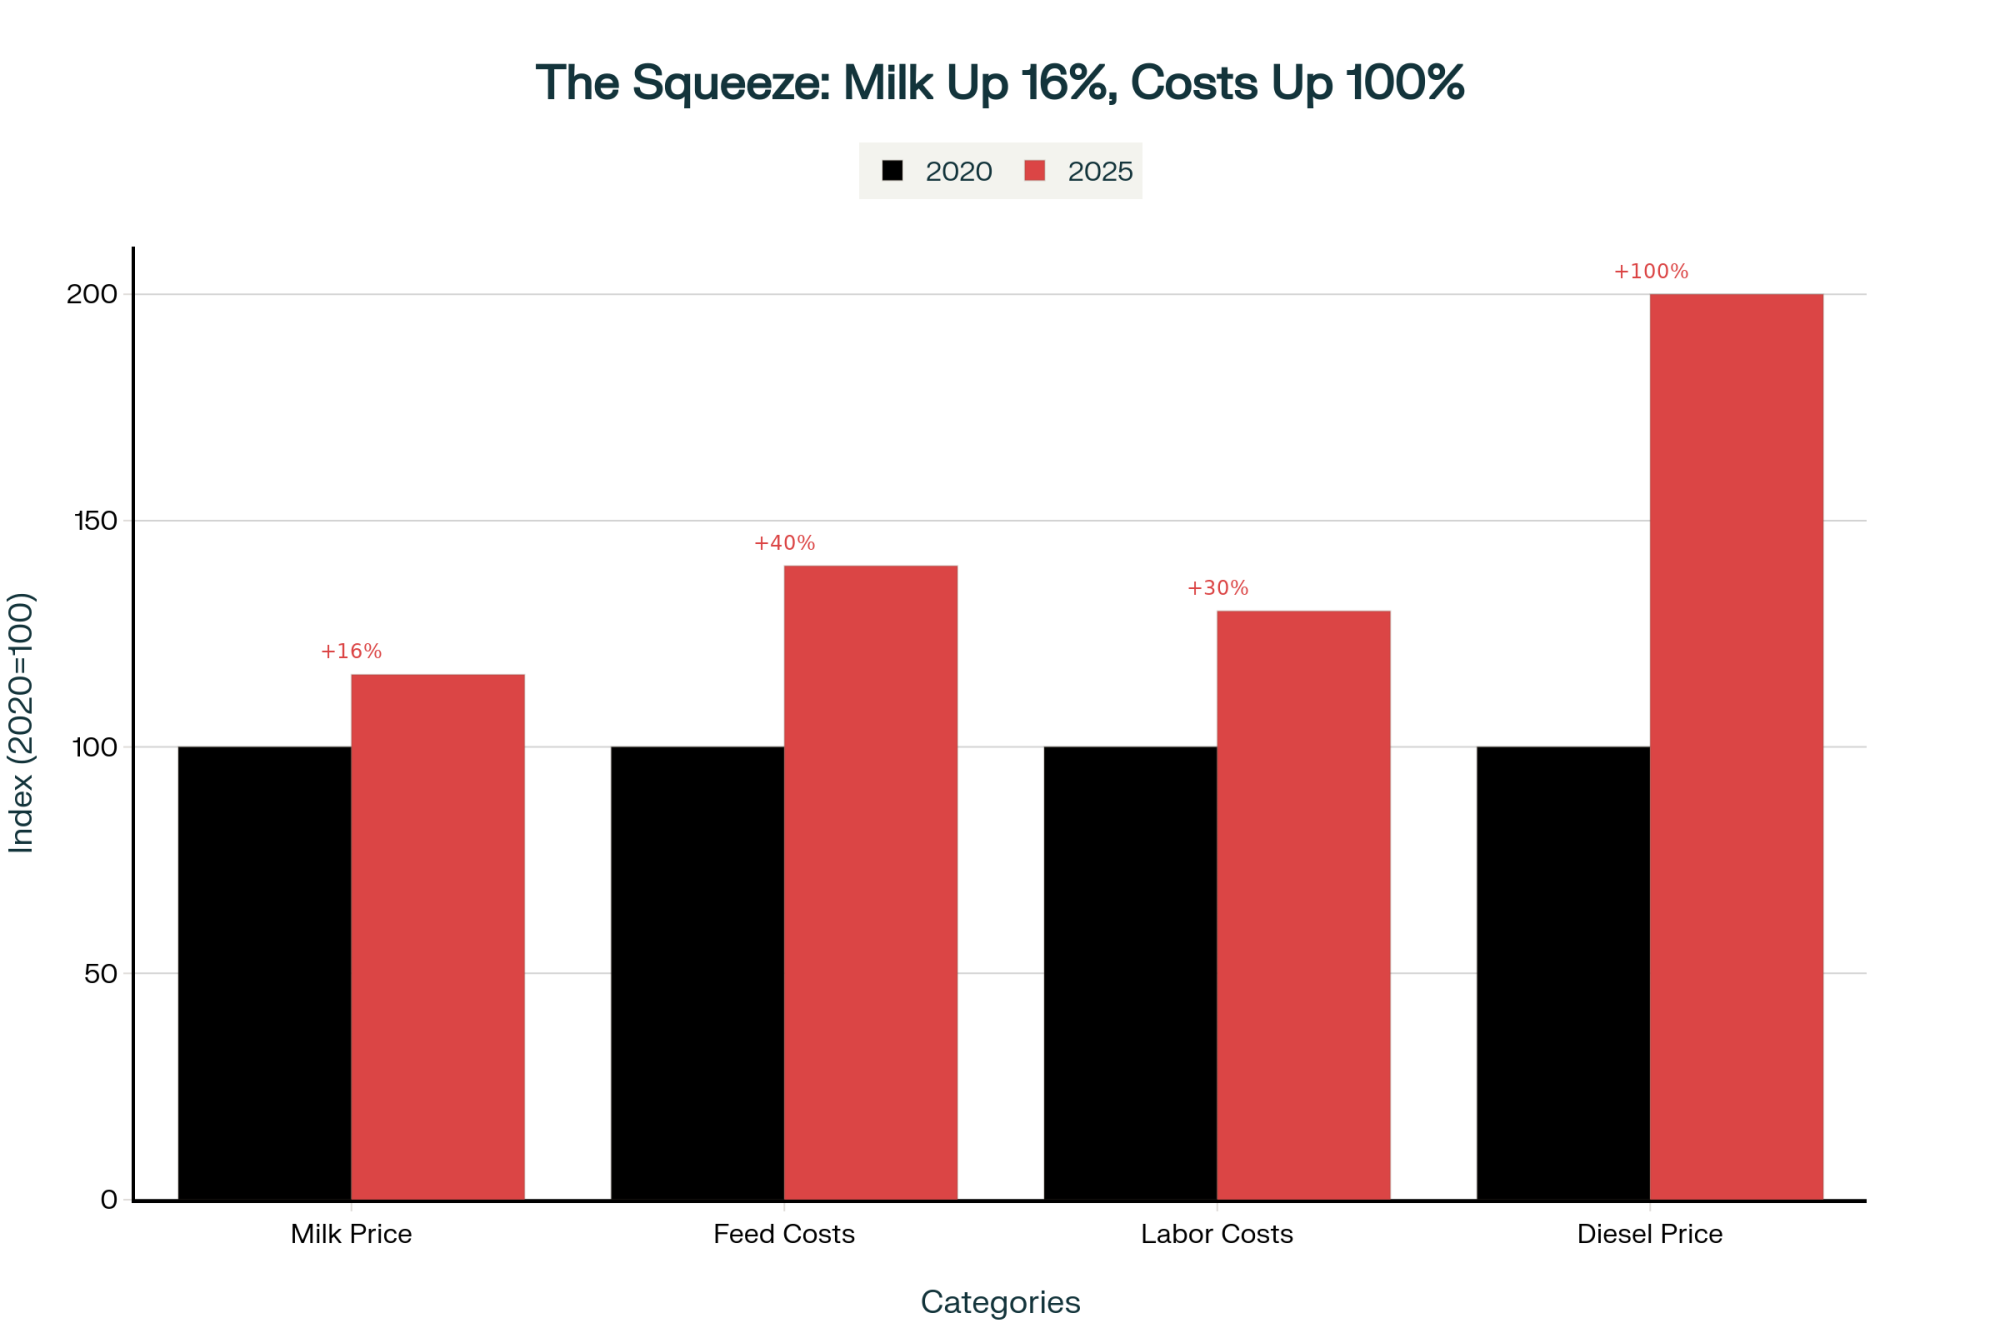
That information gap is one of the most expensive blind spots in farm finance. WASDE has all‑milk down $2.22/cwtfrom a revised 2025 average of $21.17. On a 300‑cow herd shipping 69,000 cwt a year, that’s about $153,000 in gross revenue gone before you touch feed, labour, or interest.
Kauffman’s K‑Shaped Warning
Nathan Kauffman — Senior Vice President and Omaha Branch Executive at the Kansas City Fed, and Executive Director of the Center for Agriculture and the Economy — told a University of Nebraska‑Lincoln webinar on February 12 that the headline credit picture still looks relatively stable. But not for everyone.
“There’s a small increase in delinquencies, but it doesn’t compare with the situation before the pandemic,” he said. Bank debt portfolios show “significant” financial stress for around 10% to 15% of producers — “But that means 80% are still stable.” He described the ag economy as increasingly “K‑shaped”: some operations doing very well, others clearly in distress.
Who’s on the wrong leg of that K? Kauffman pointed at younger producers who haven’t had years to build equity during the 2020–2023 “good years,” and renters without land as collateral. If that’s you, the aggregate averages won’t save your file.
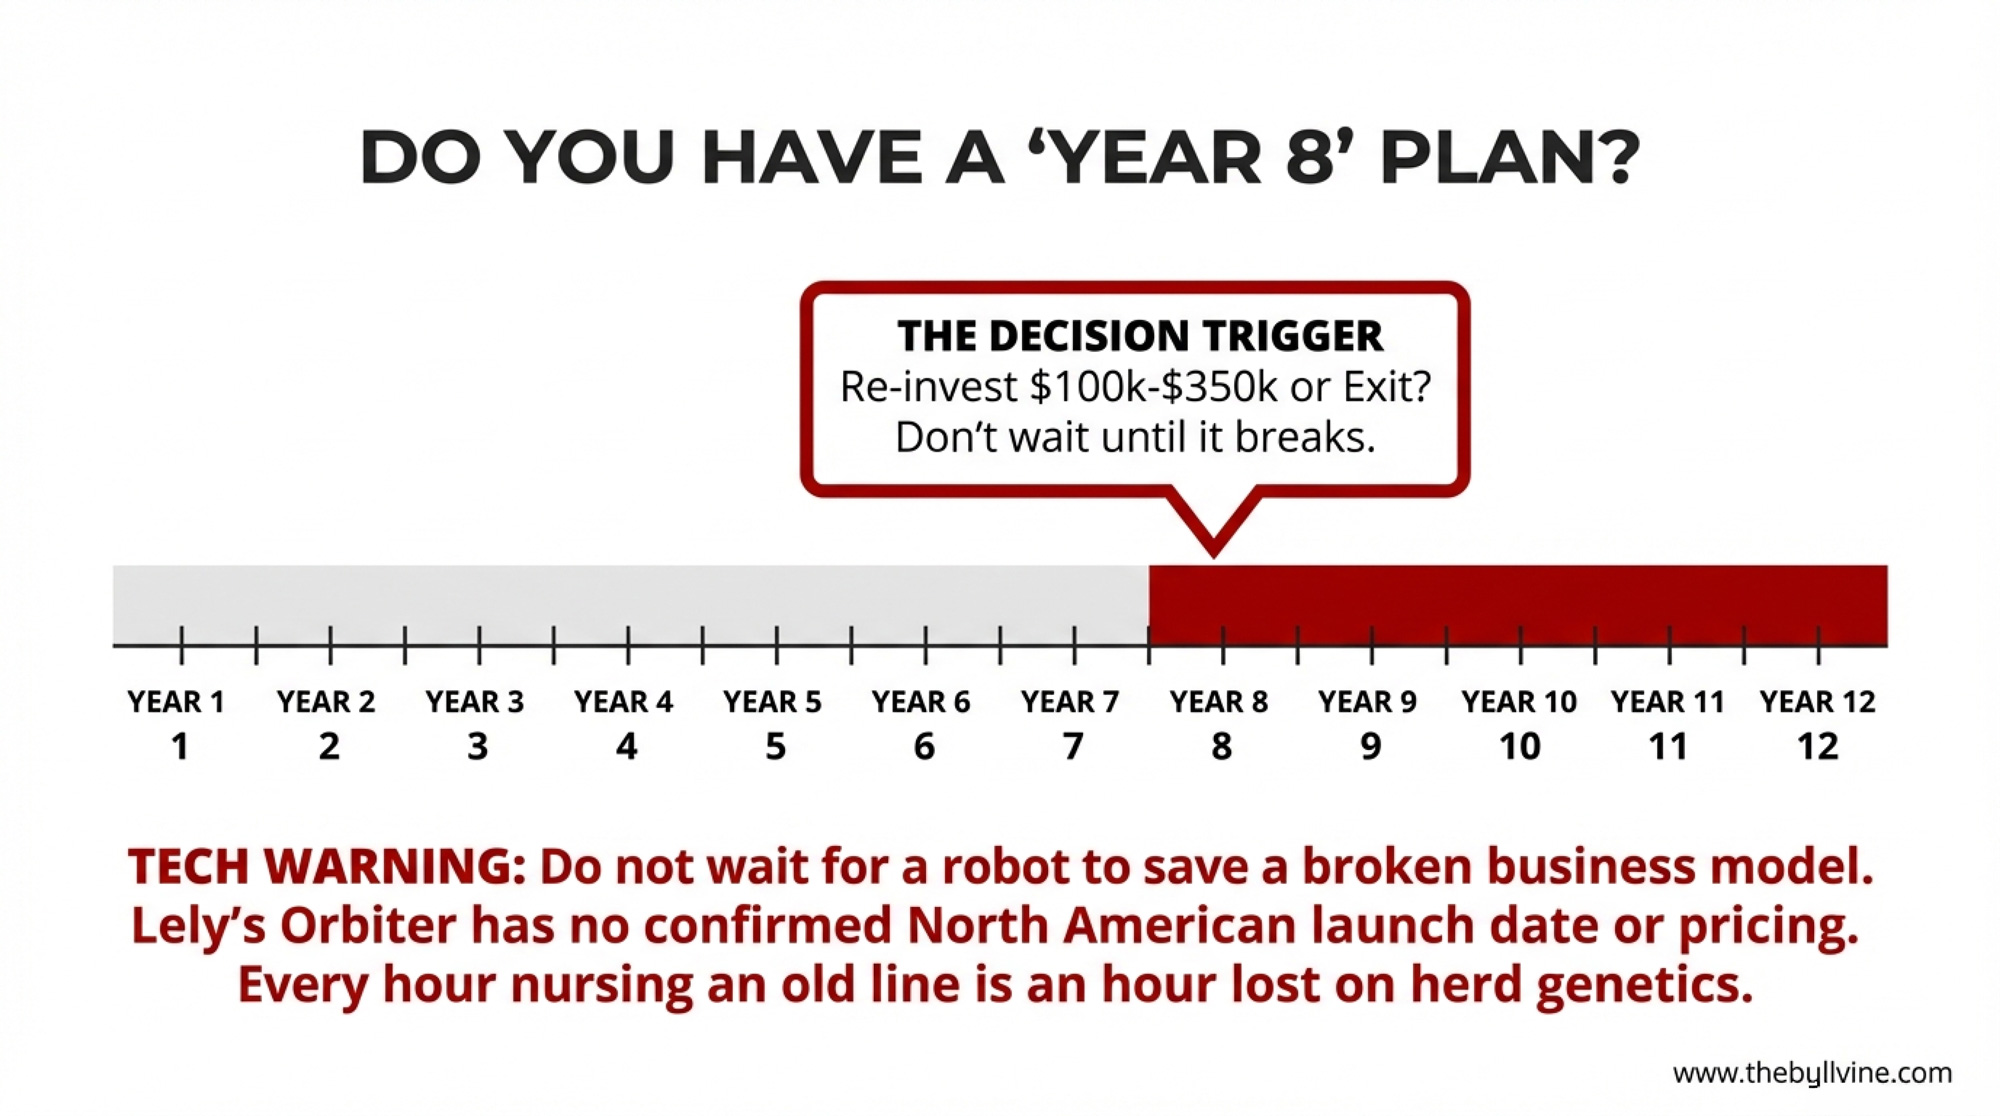
Why the Clock Is 18 Months, Not 12 or 24
Lenders re‑underwrite operating and term debt once a year based on your year‑end numbers. In practice, they’re watching you every month: milk check assignments, feed bills, how your operating line cycles — or doesn’t.
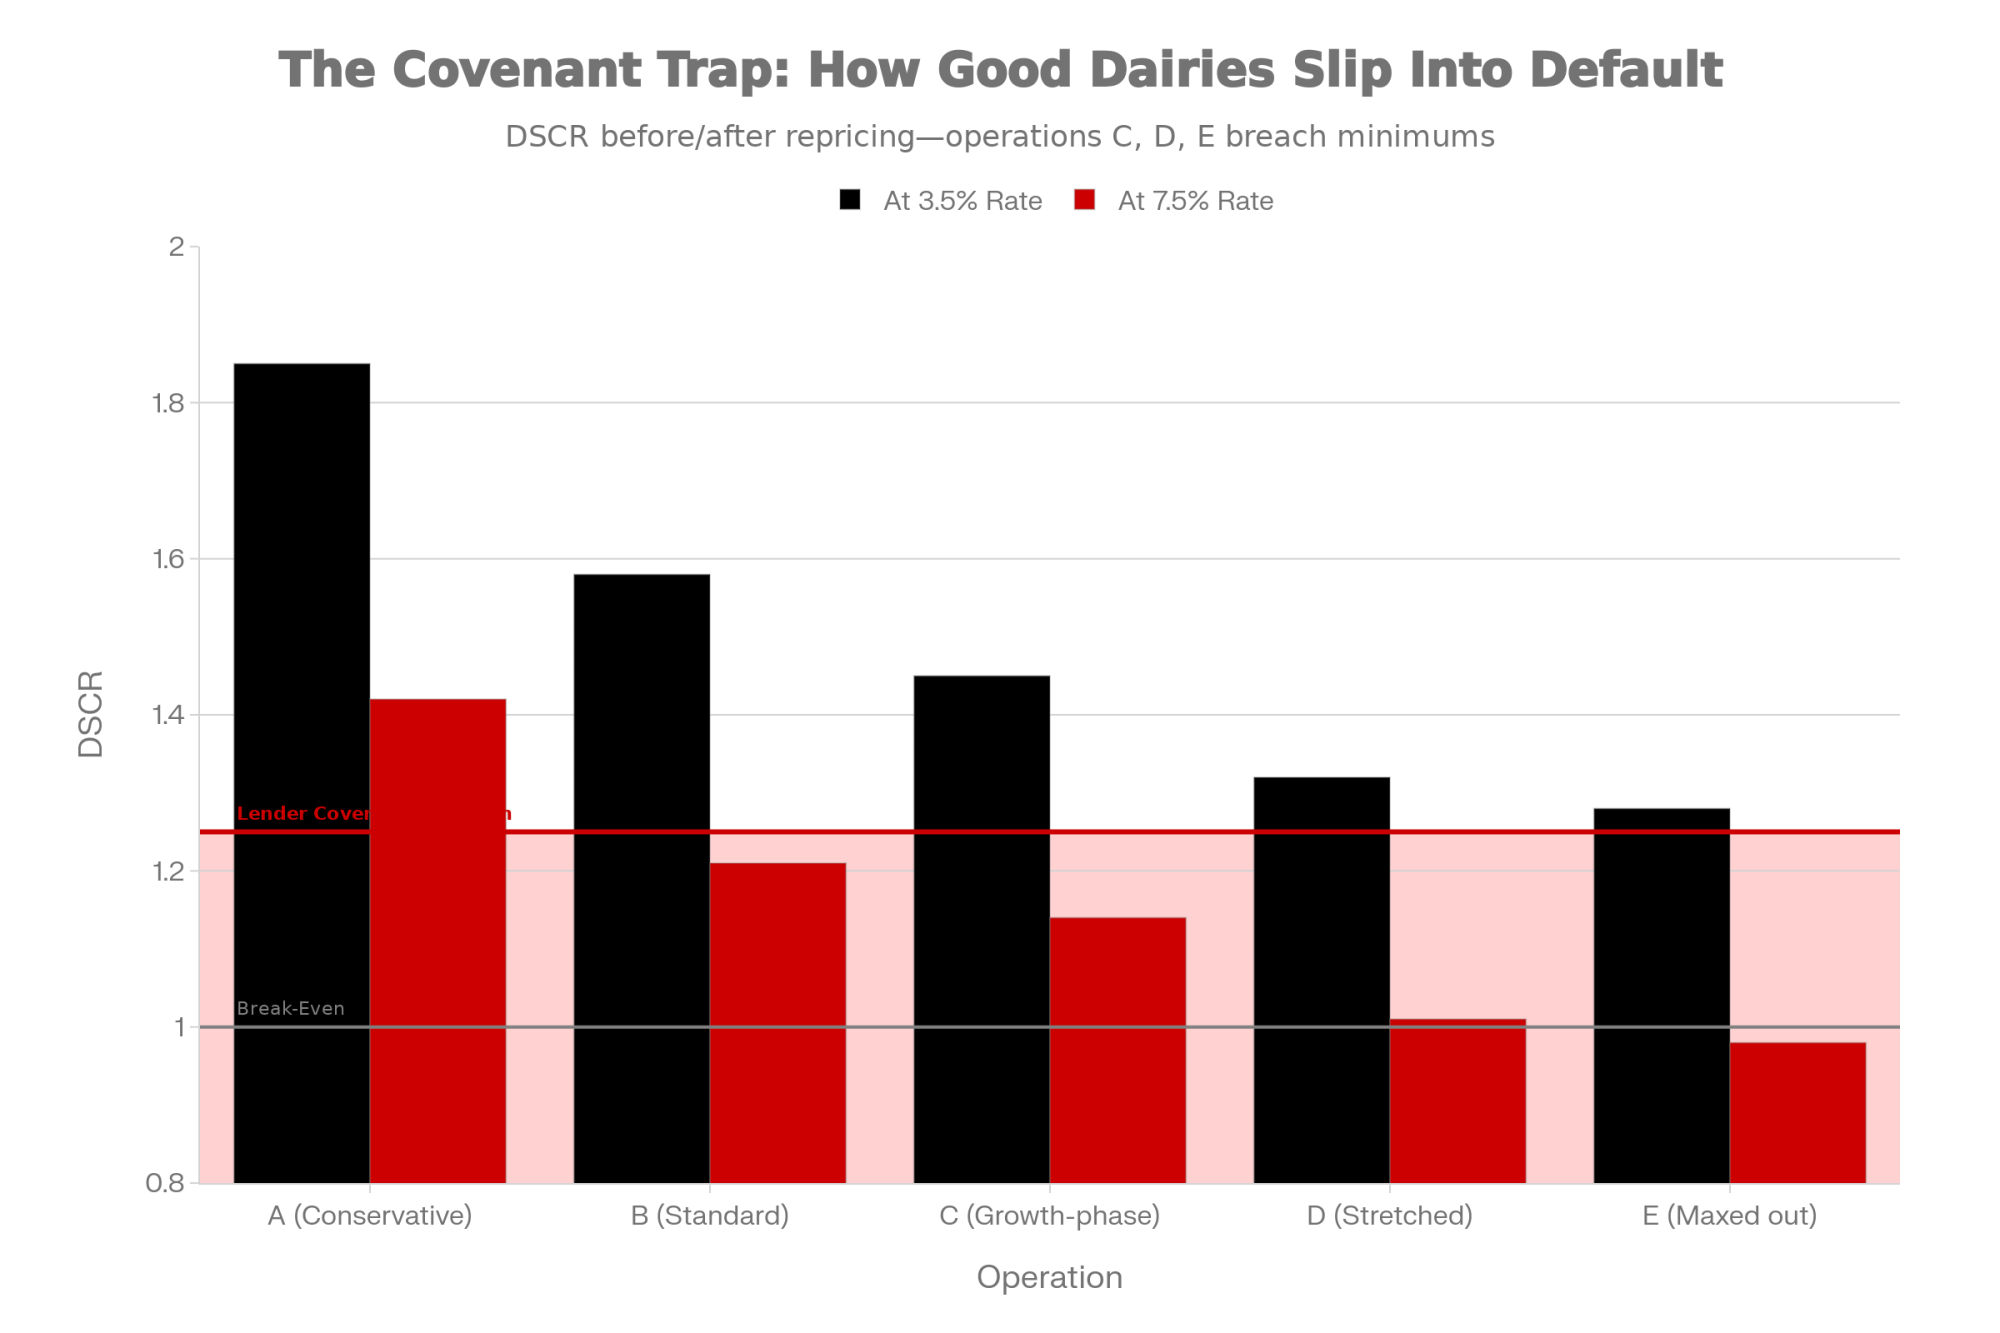
Once internal monitors start blinking — DSCR drifting under 1.25×, working capital down quarter over quarter, an operating line parked at 85%+ with no seasonal dip — your file can move from “performing” to “watch” without anyone saying the words.
Here’s how the 18‑month window plays out:
Year 1 review: Lender flags concerns, tweaks covenants, maybe orders an appraisal.
Year 2 review: Lender looks at whether you actually moved the ratios.
In between: One full production year to bend your numbers back toward safety.
Miss that window, and the conversation hardens. Accelerated repayment. Forced asset sales. Transfer to special assets.
The macro data matches the gut feeling. Kansas City Fed surveys show new farm operating loan volume jumped nearly 40% year‑over‑year in Q4 2025, with strong growth through the year. Farm production loan delinquencies at commercial banks sat around 1.02% in Q4 2025: still low, but trending up.
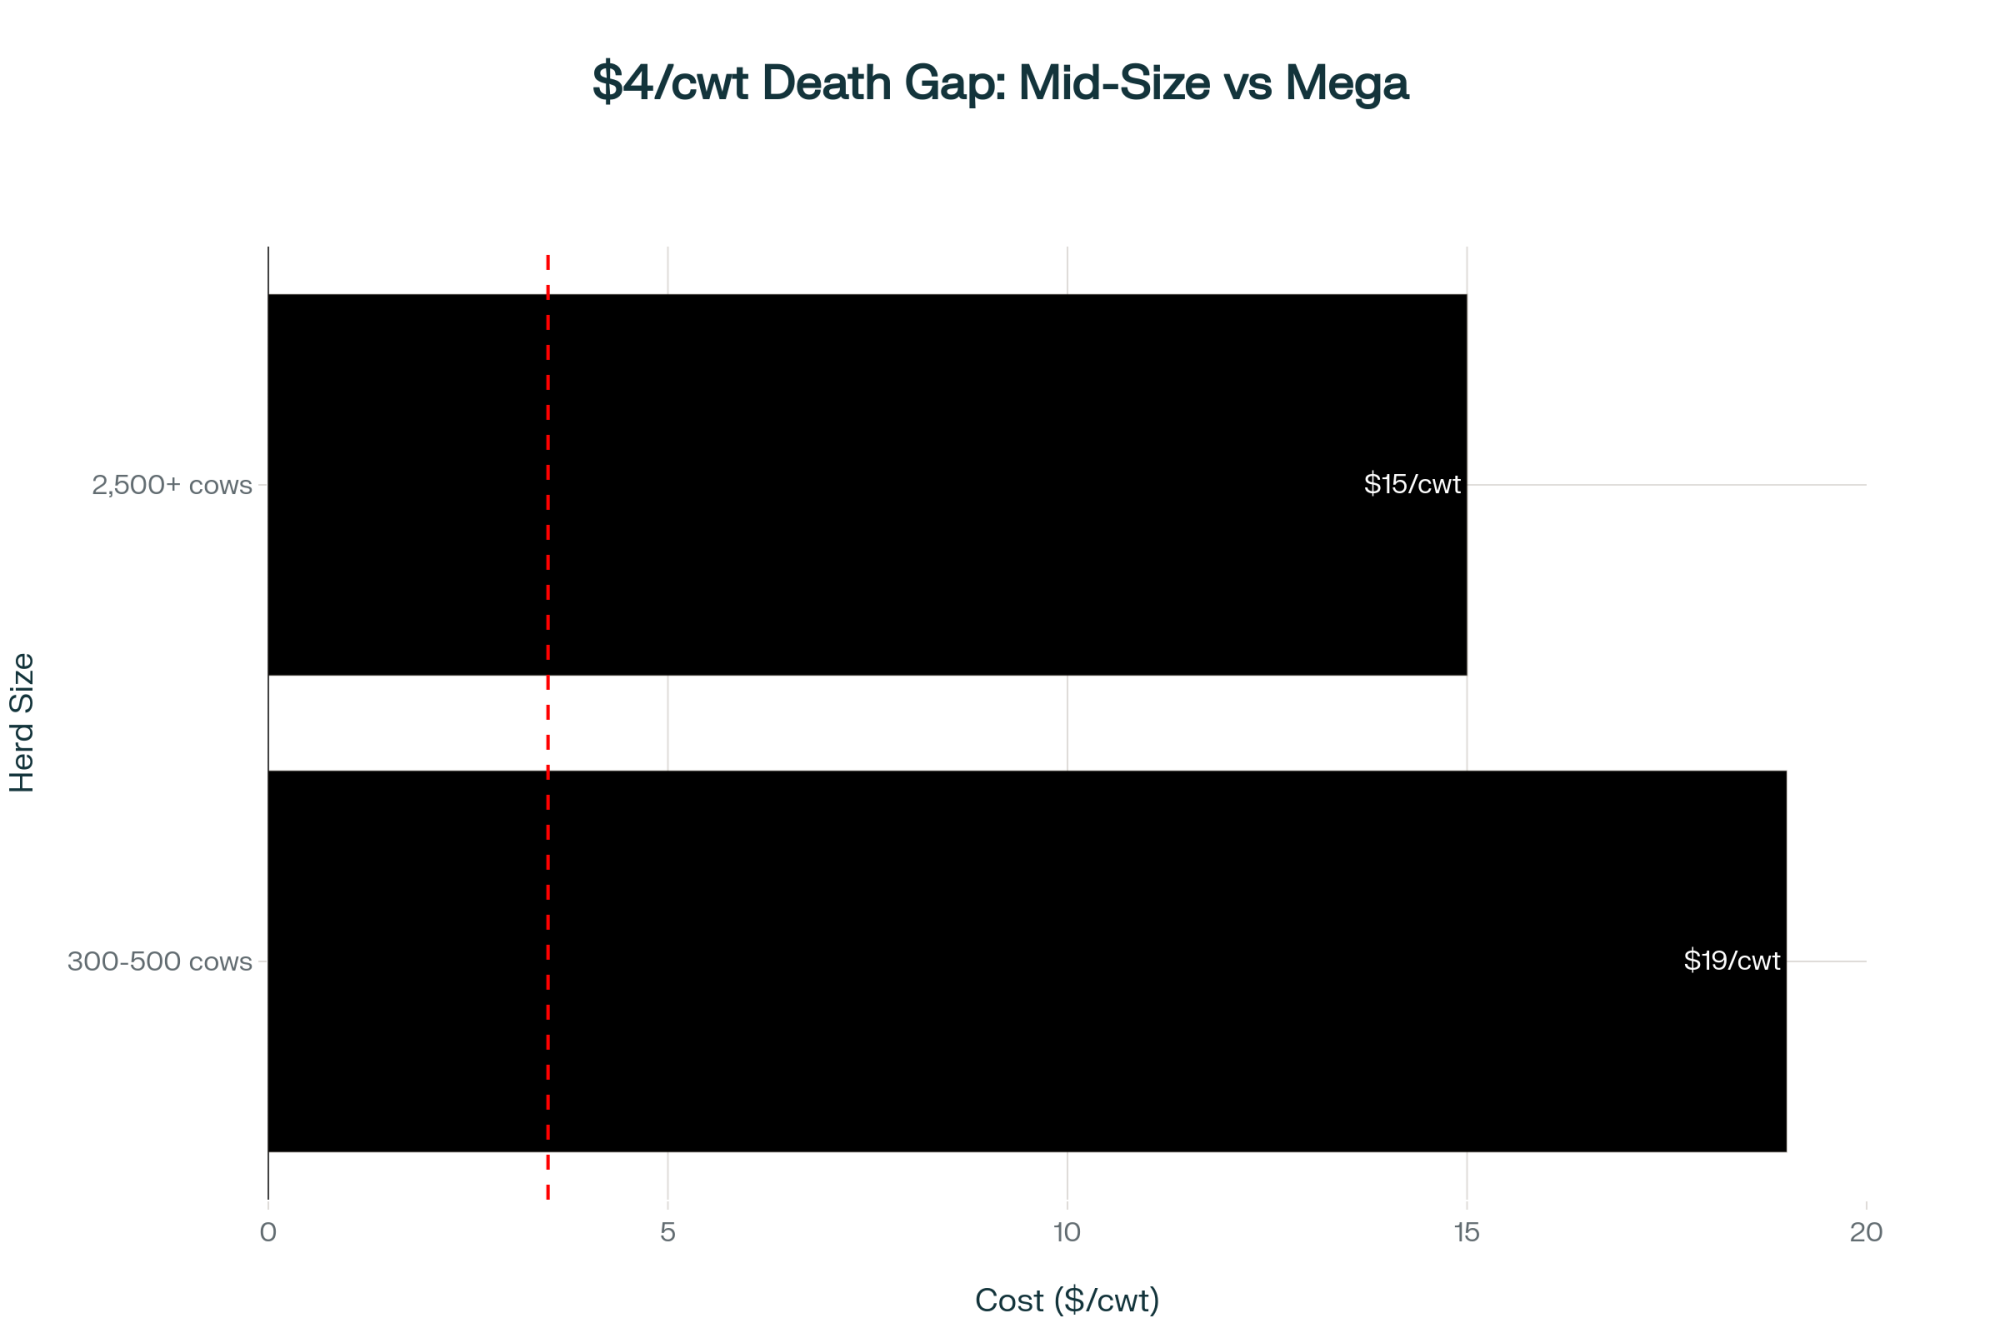
USDA‑ERS puts the full economic cost for herds of 2,000+ cows at $19.14/cwt, based on the 2021 ARMS dairy survey — the most recent available. That includes family labour, owned land, and return on equity; operating costs run lower, but lenders look at the full economic row.
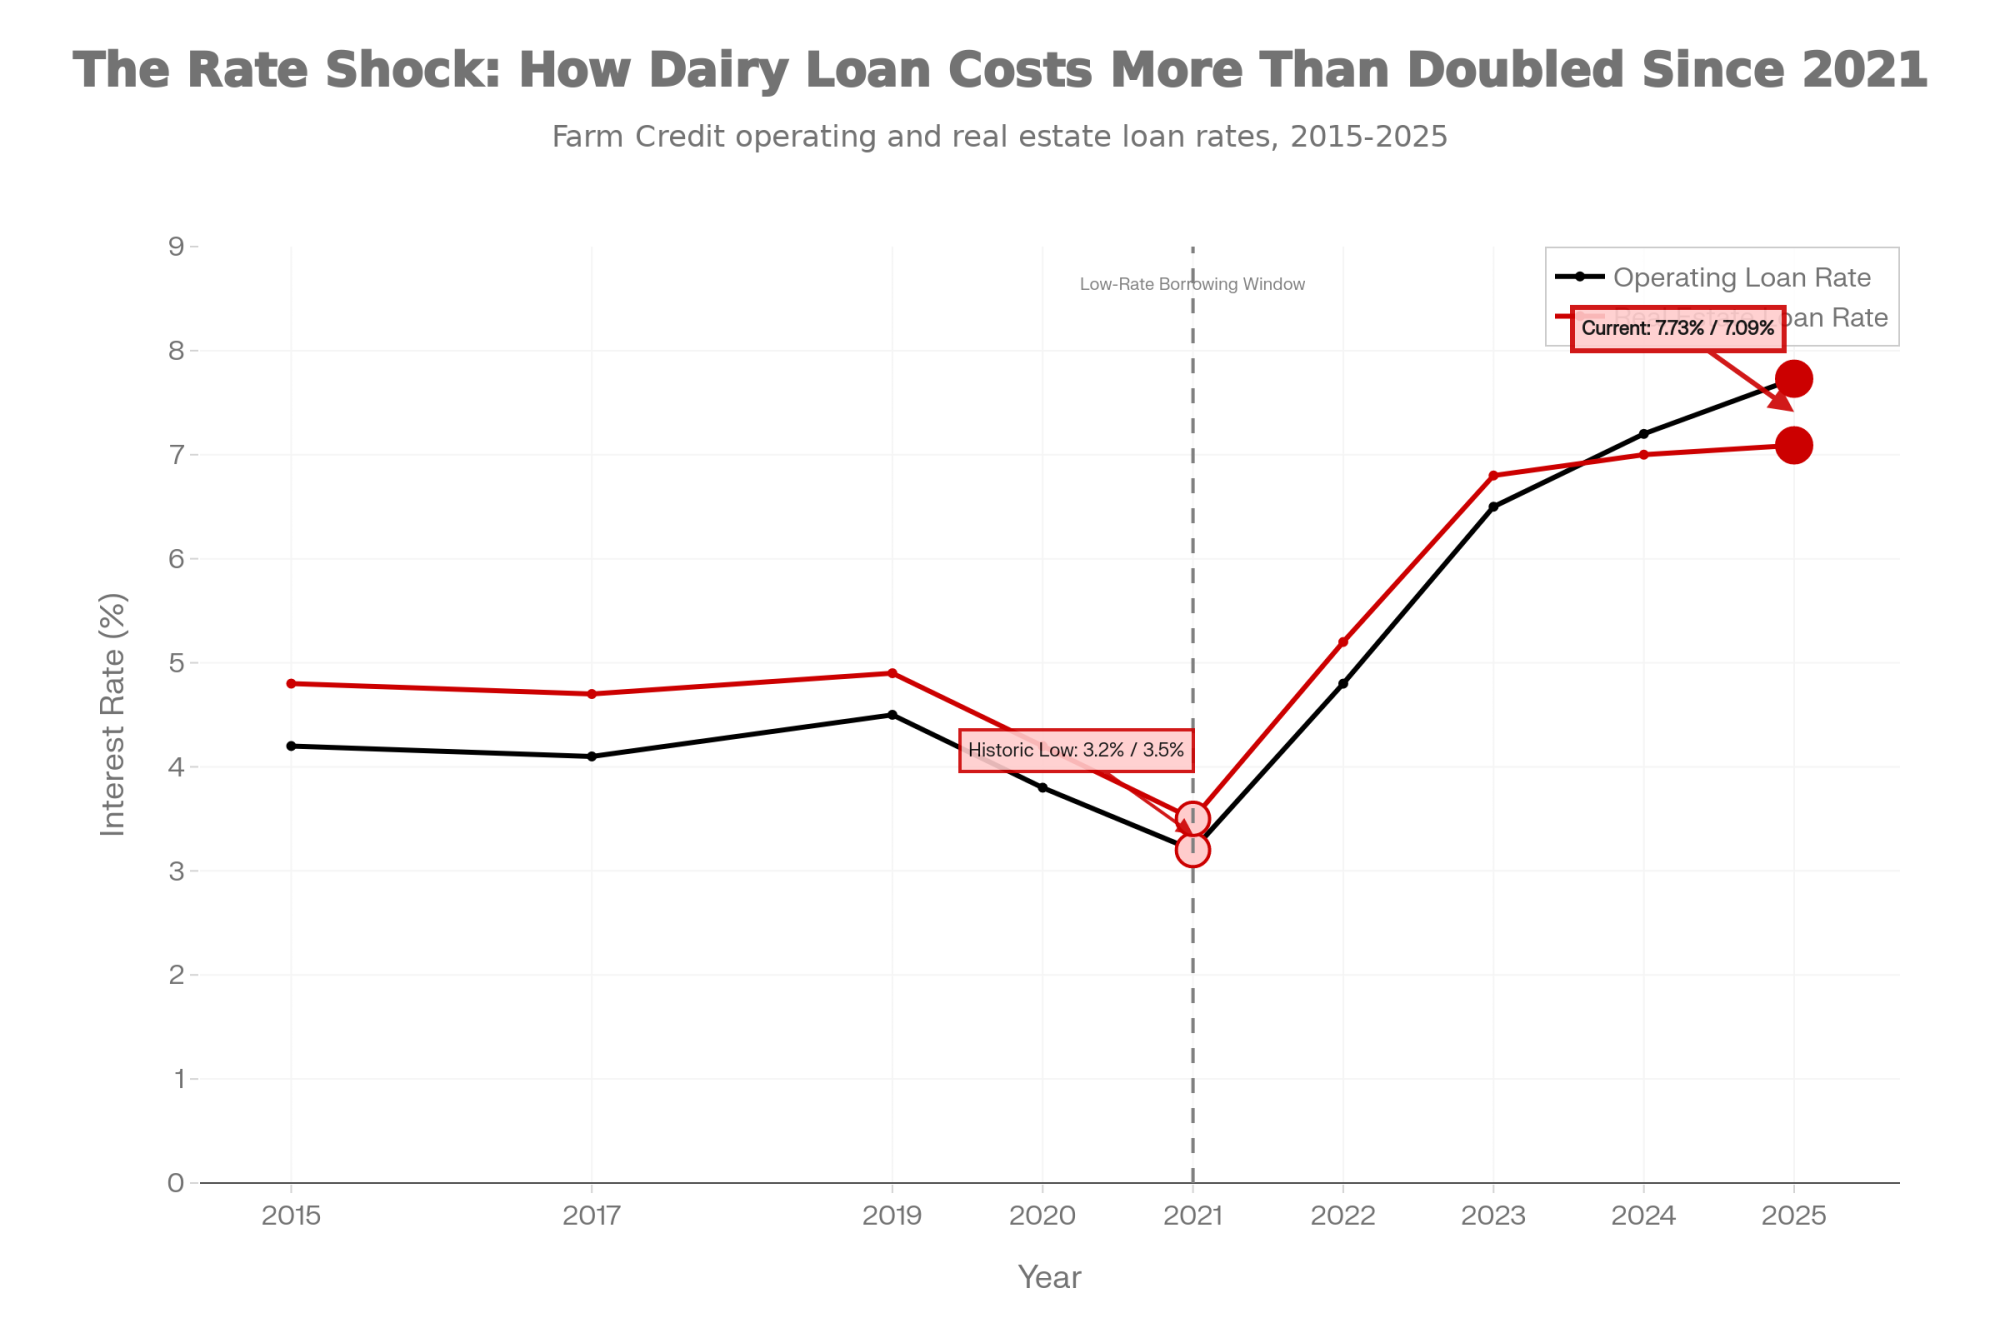
And interest isn’t helping. KC Fed’s Survey of Terms of Lending shows operating loans averaging 8.12% in Q2 2025, down from 8.83% in Q2 2024. Kauffman called the decline “slight” and described interest costs as “a somewhat persistent headwind,” noting some long‑term rates “haven’t moved much, or at all.”
What Cornell’s DFBS Tells You About the Bottom 25%
Before you look at your own books, it helps to know where you sit in the stack.
Cornell PRO‑DAIRY’s 2024 Dairy Farm Business Summary, covering 129 New York farms, shows a wide performance spread. Even in 2023 — a solid milk year feeding into that summary — the lowest‑earning farms struggled to cover debt service. Their debt coverage ratios ran close to or below 1.0× at net milk prices around $22–$23/cwt.
For the long‑term panel group, EB 2024‑5 reports overall DCRs under 1.0× in the repayment analysis, with planned debt payments per cow in the mid‑$500s and farm debt per cow in the mid‑$4,000s. The composite herds below carry heavier debt — $9,000–$9,667/cow — on purpose. They represent the profile Kauffman warned about: expanded when money was cheap, now repricing with less land equity as a cushion.
These composites aren’t real farms. They’re built off real cost structures, current prices, and actual loan‑rate trends. Your job is to plug your own numbers into the same math.
The 300‑Cow Herd: When the Window Is an Exit Question
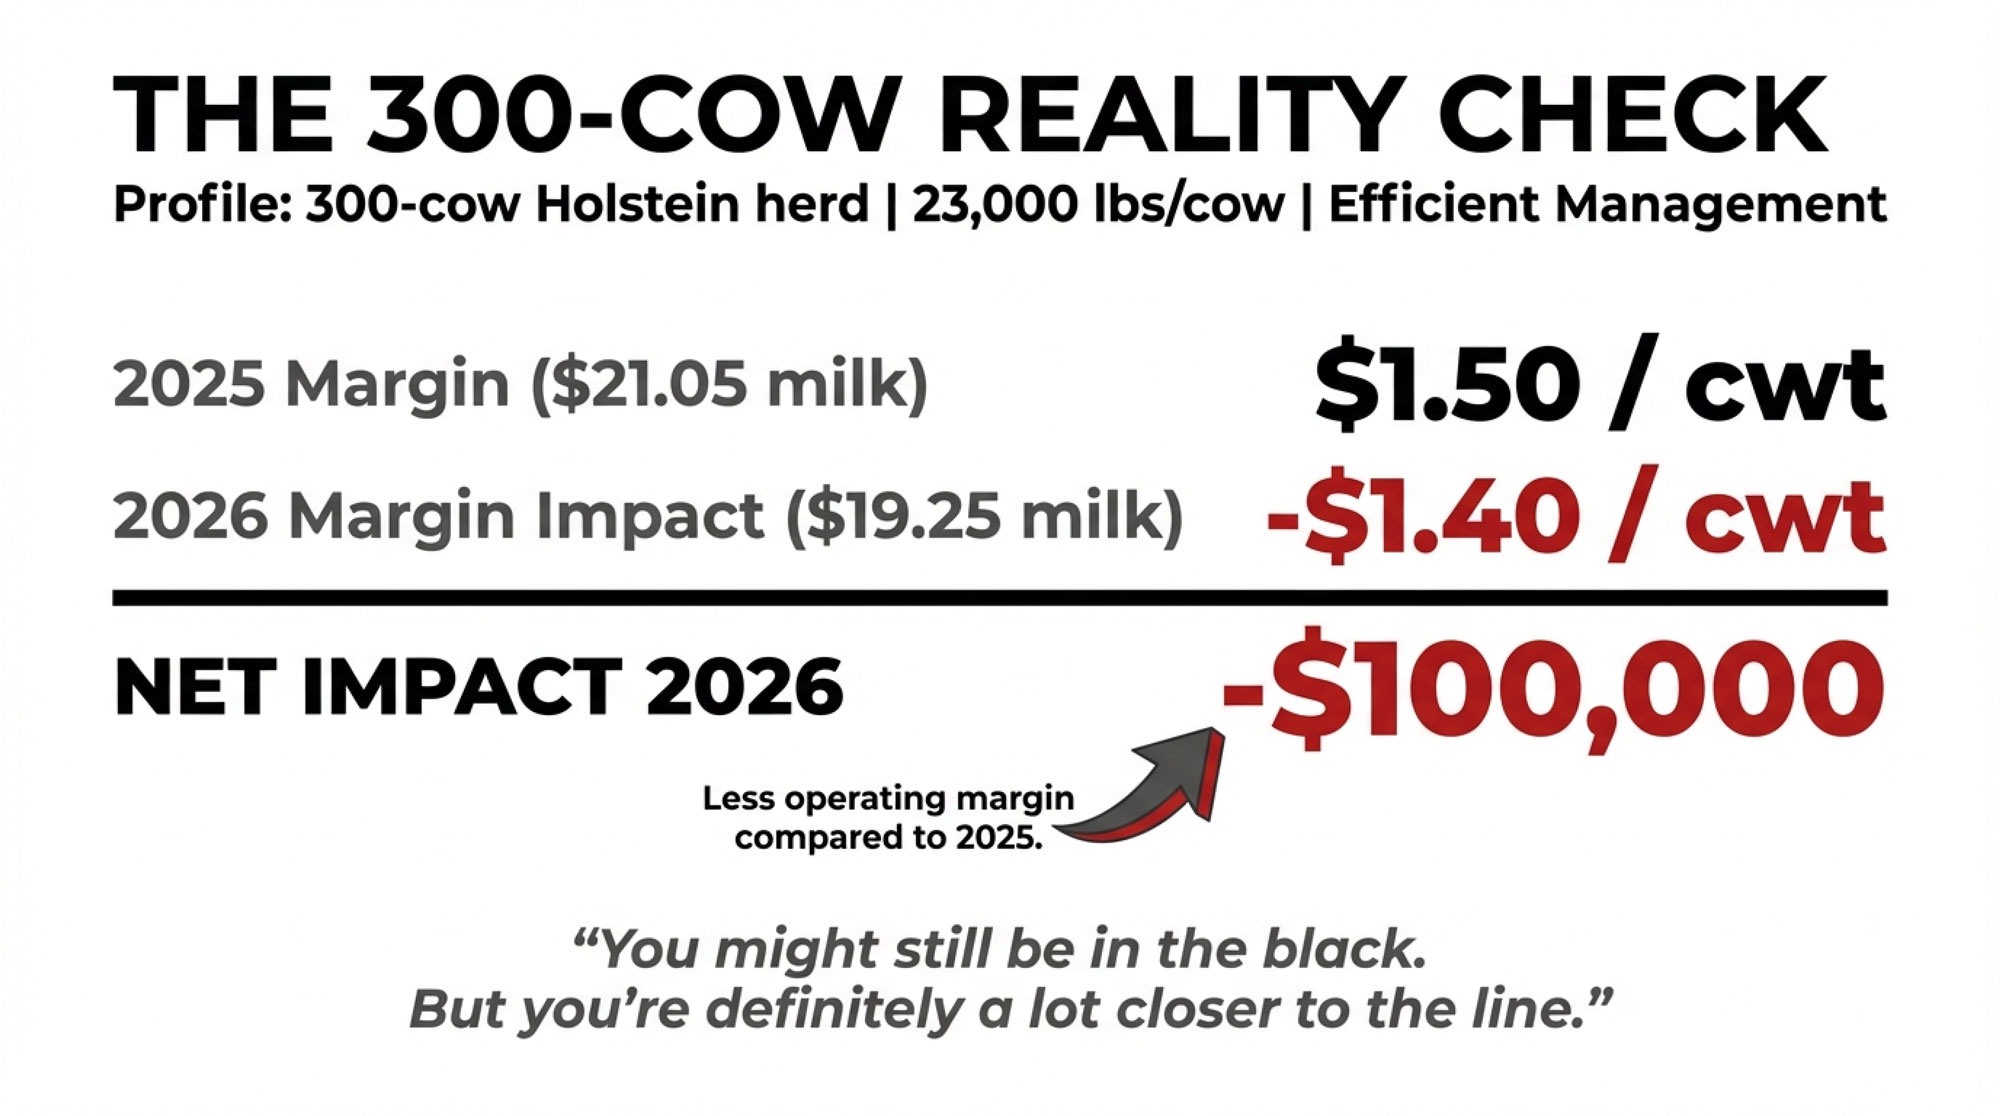
The setup. Three hundred Holsteins at 23,000 lbs — 69,000 cwt shipped a year. Total debt: $2.8M ($1.6M real estate, $800K equipment, $400K operating line). That’s $9,333/cow — well above Cornell’s quartile averages.
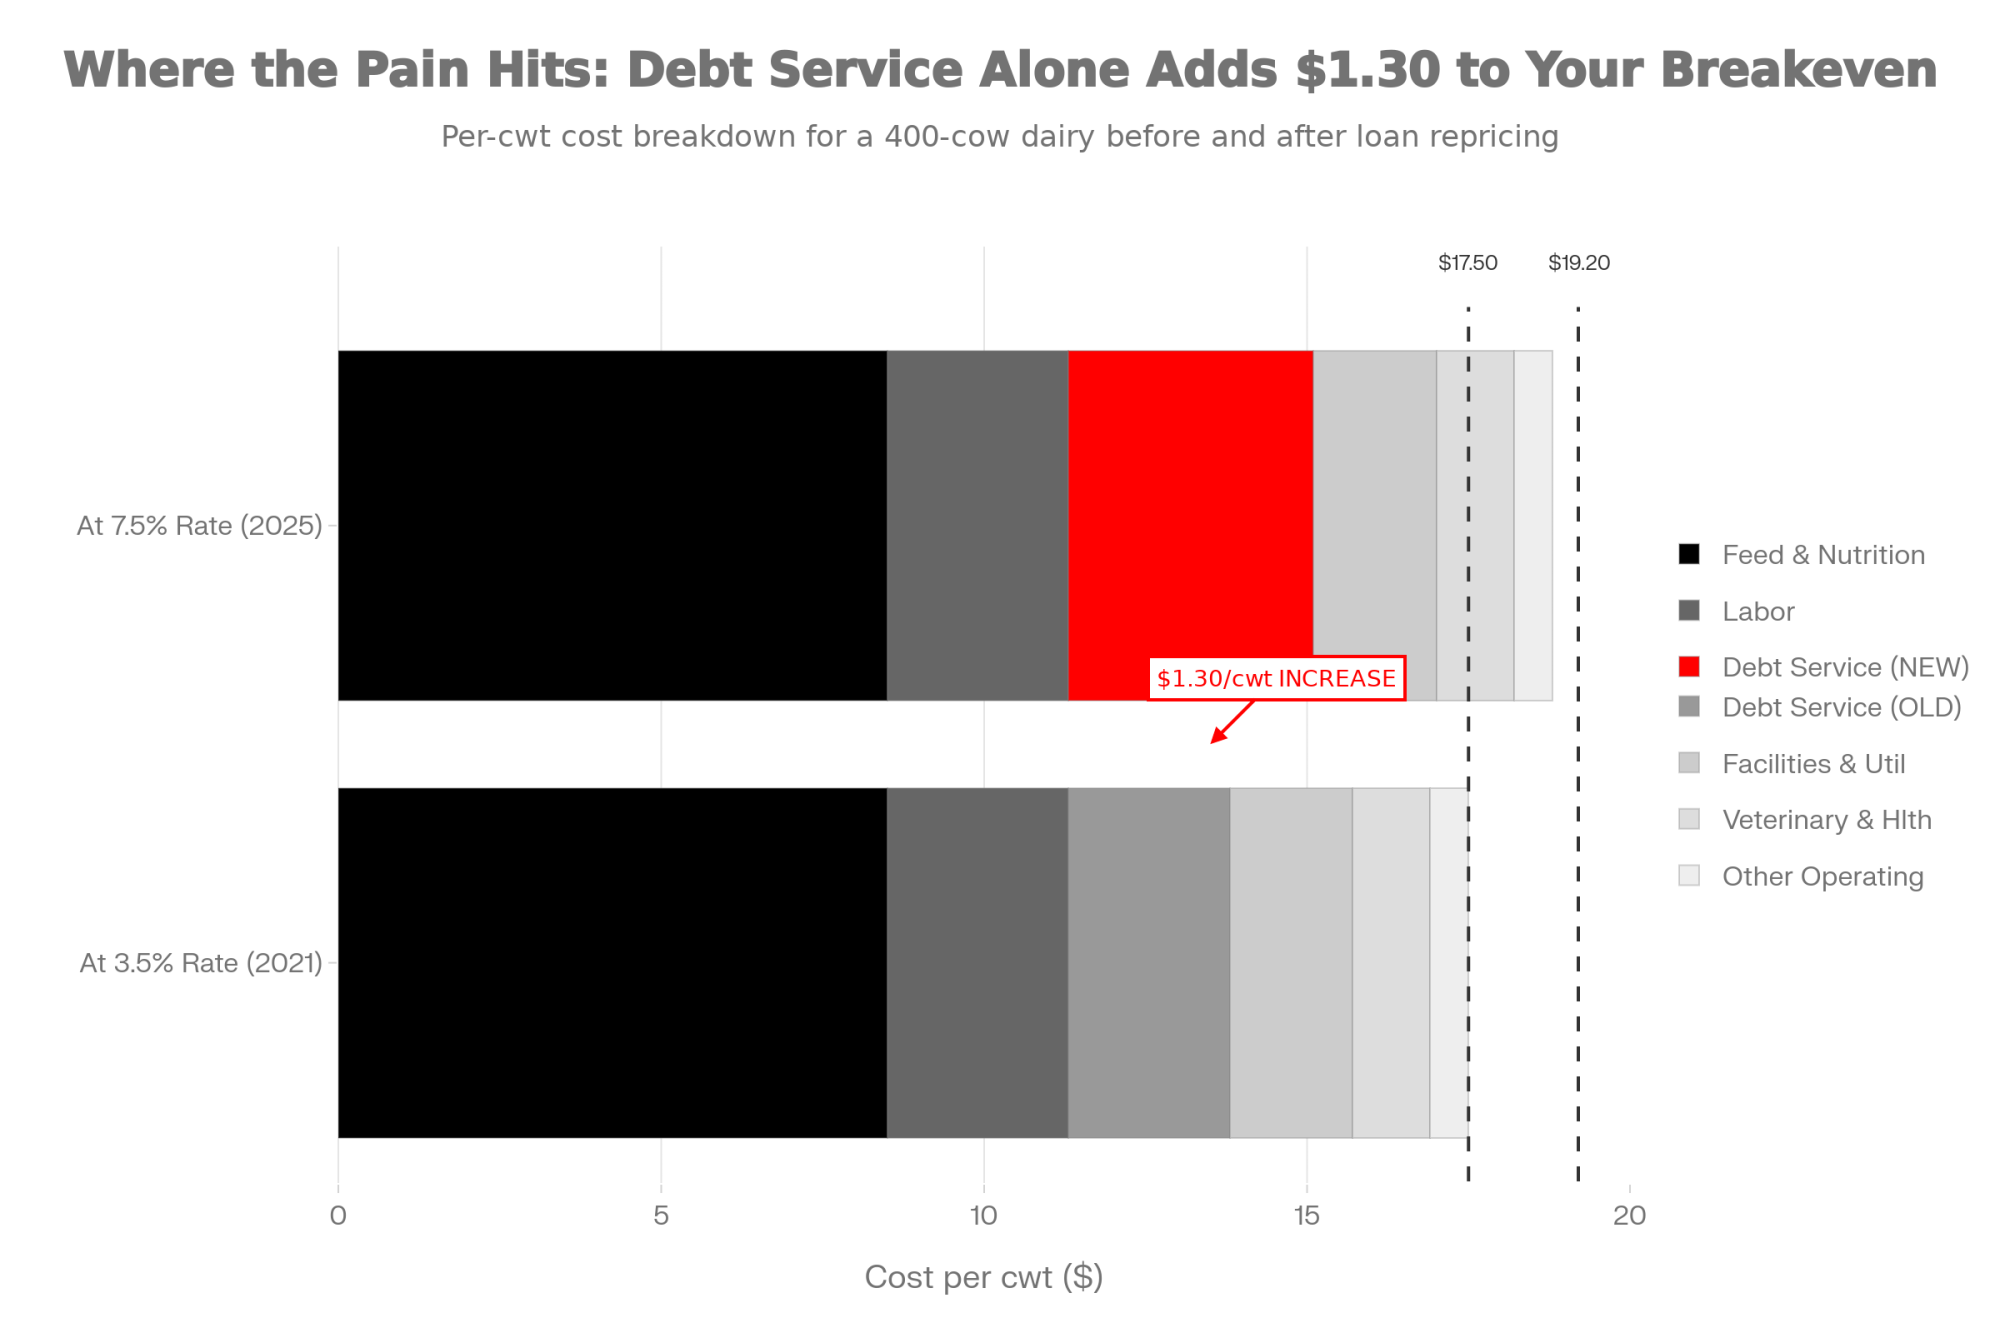
The real estate note repriced last fall from roughly 4.5% to around 7.5%, pushing annual debt service up an estimated $40,000–$55,000 before milk moved a penny.
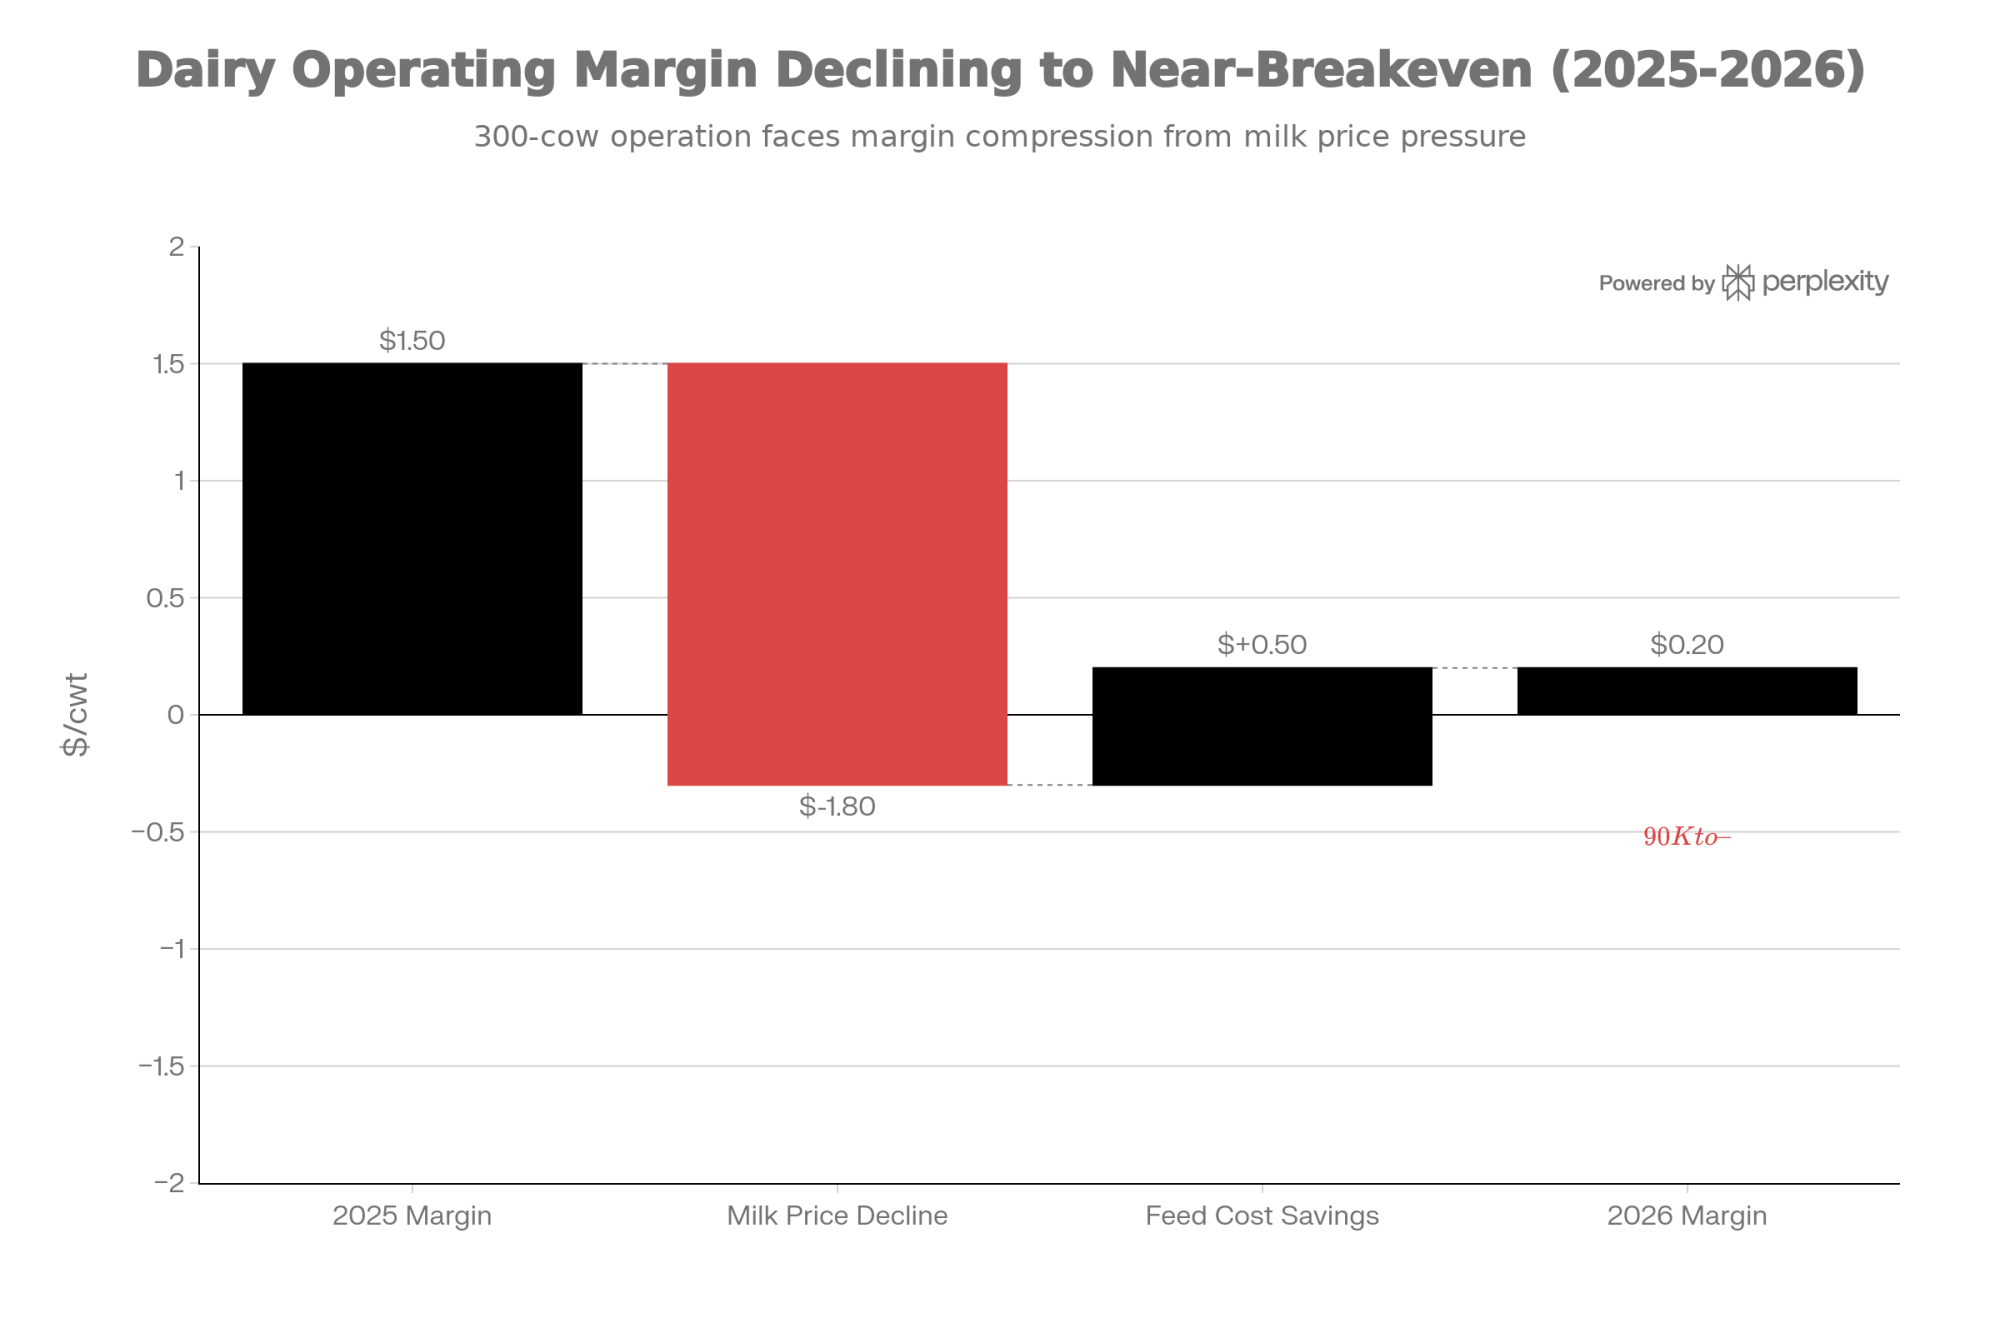
The squeeze. The $2.22/cwt drop across 69,000 cwt strips out about $153,000 in gross revenue. Layer in the extra debt service, and you’re staring at $195,000–$210,000 in added annual pressure. DSCR can easily slide under 1.0×. That’s covenant‑breach territory.
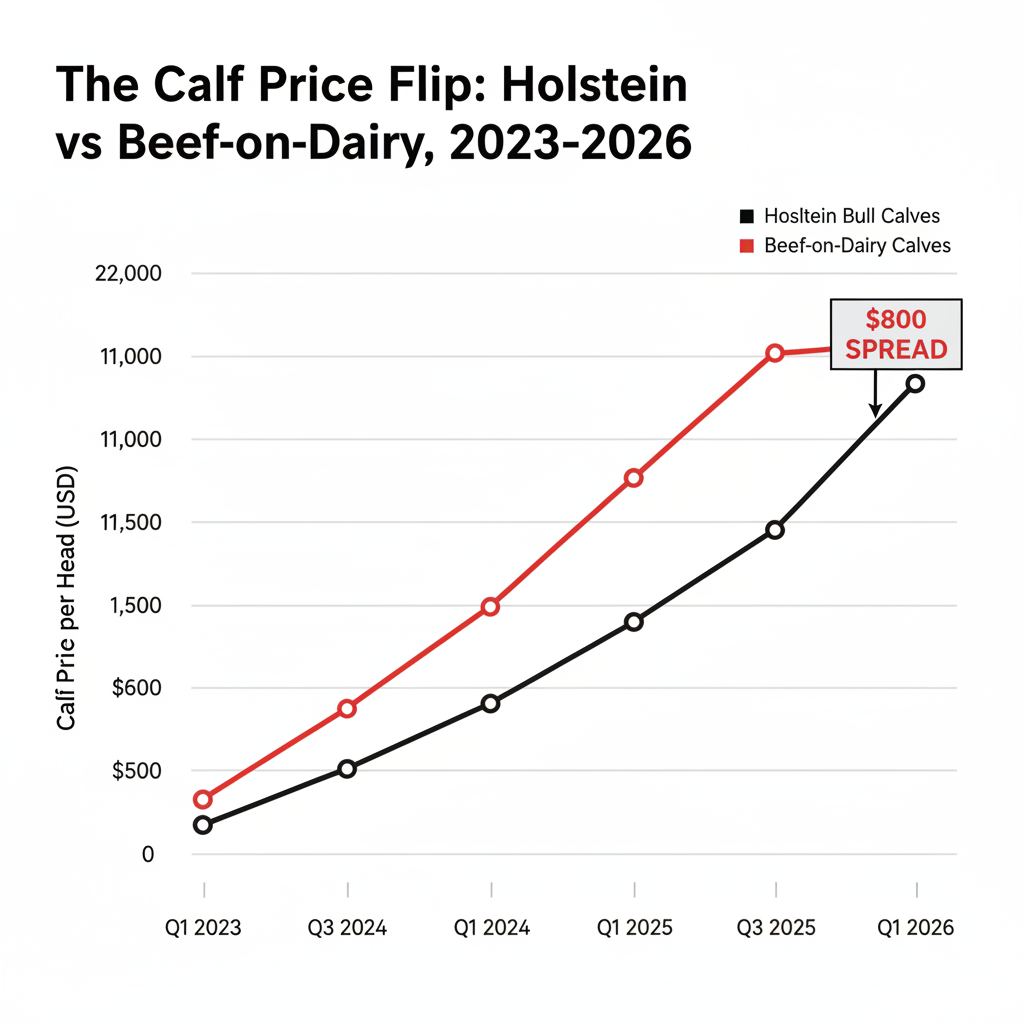
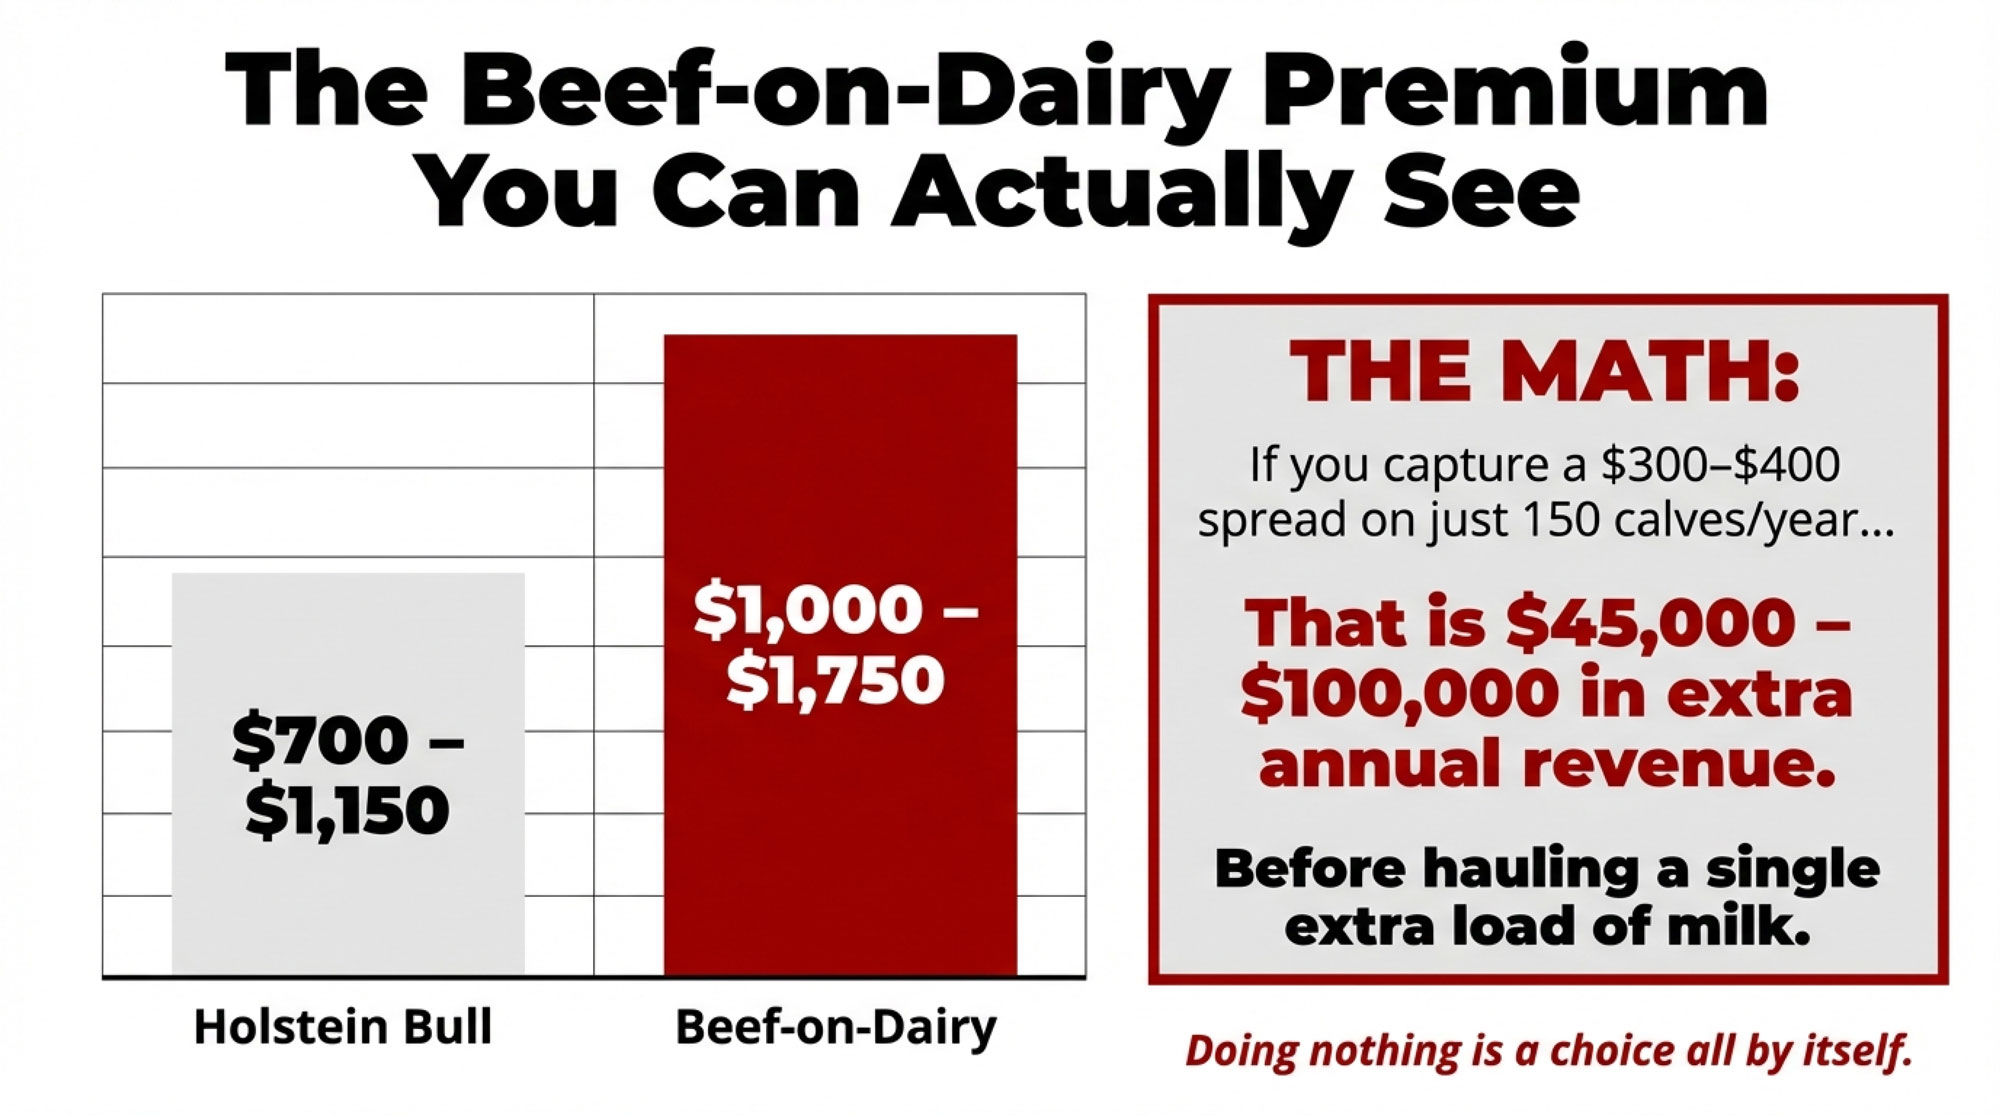
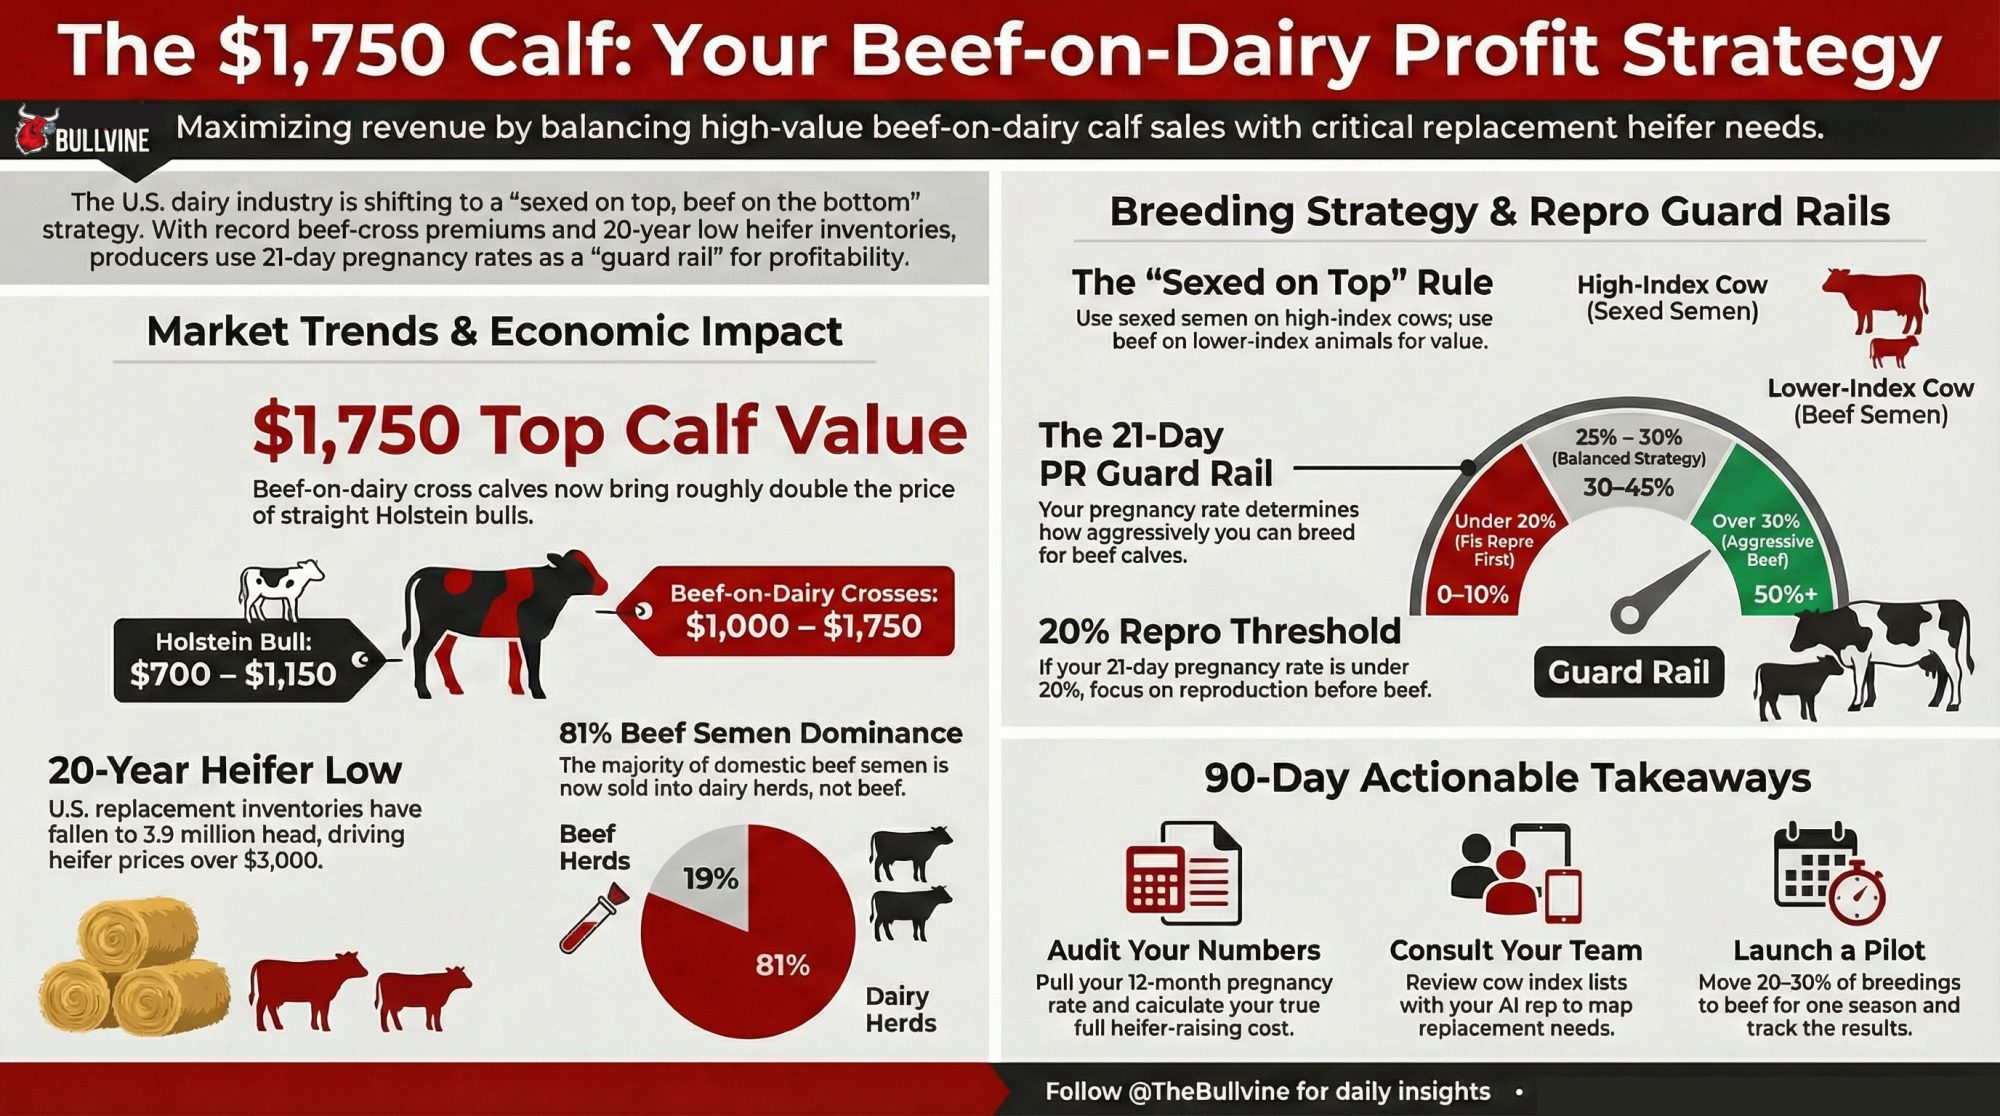
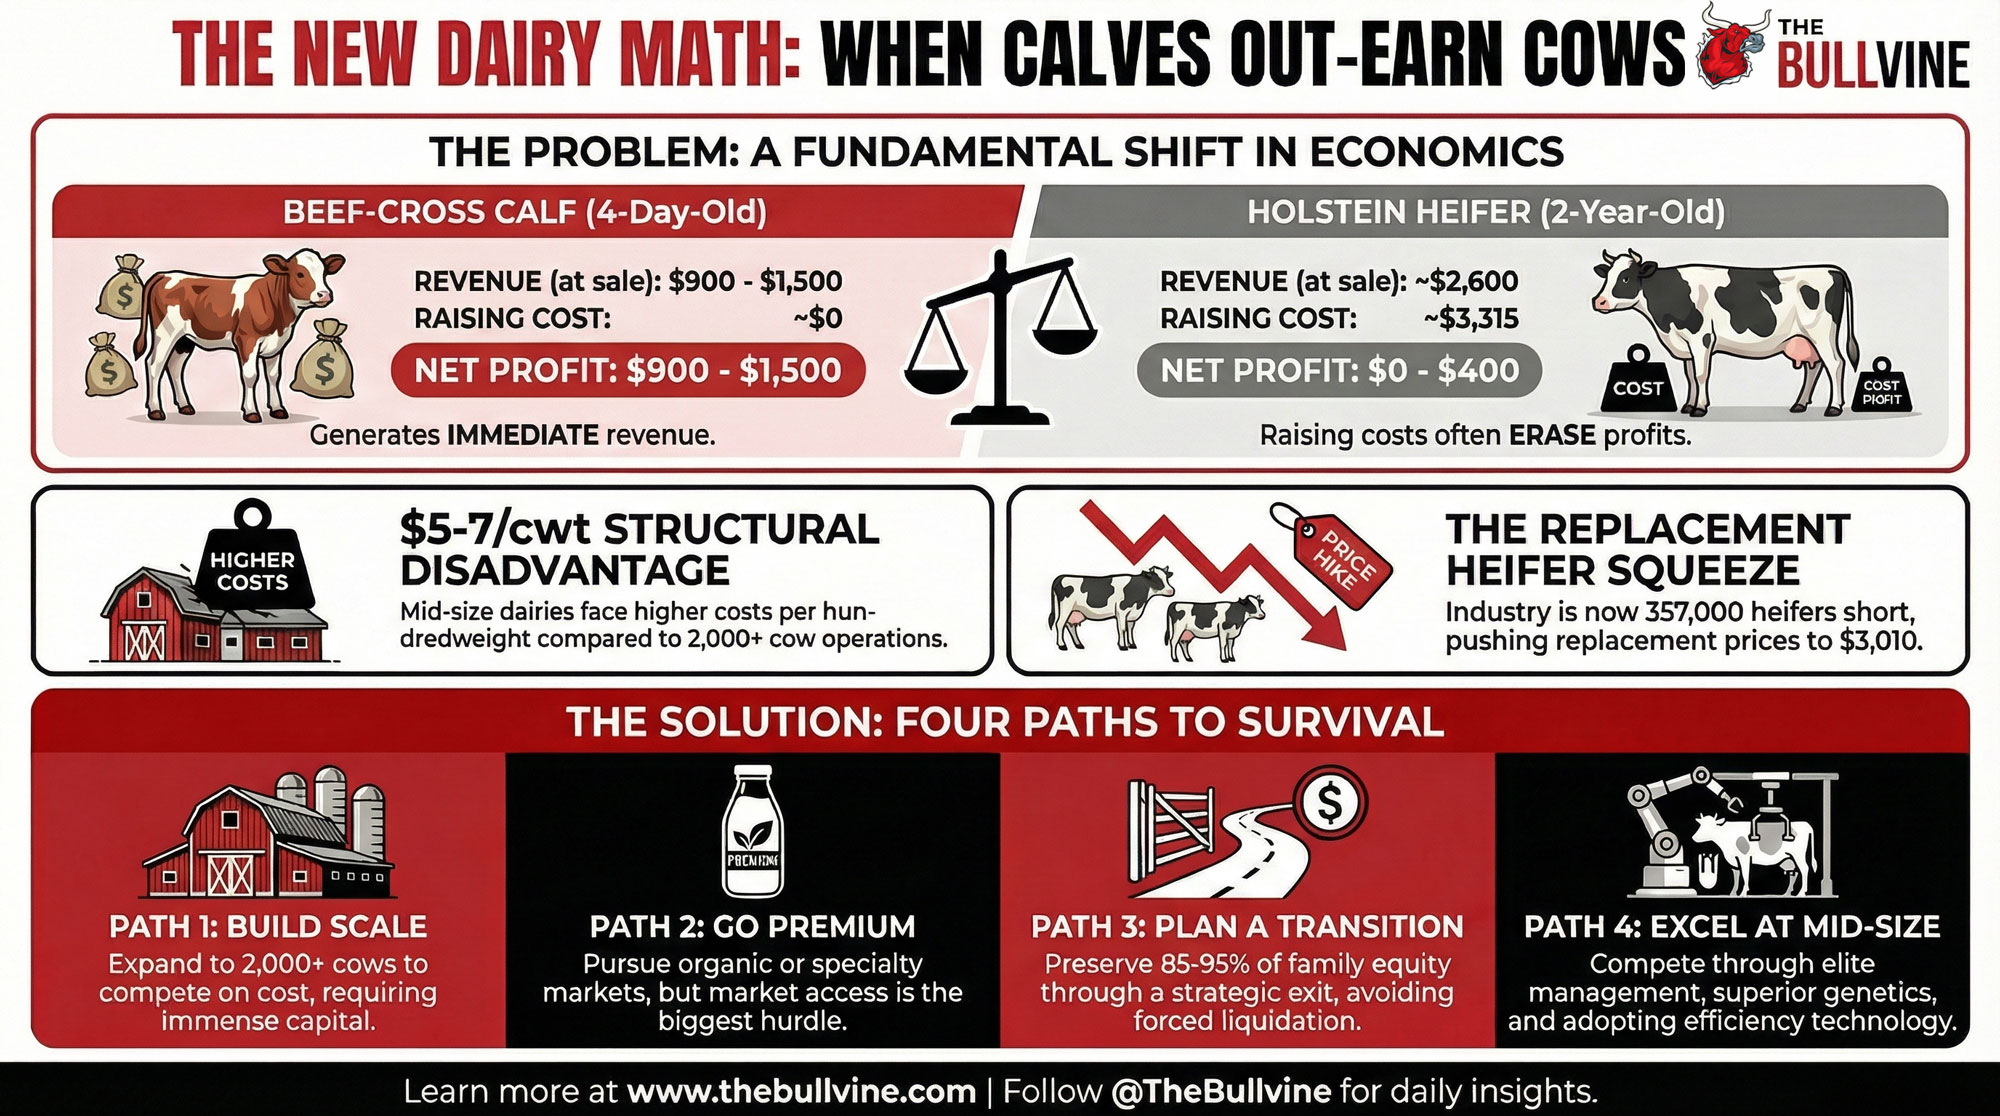
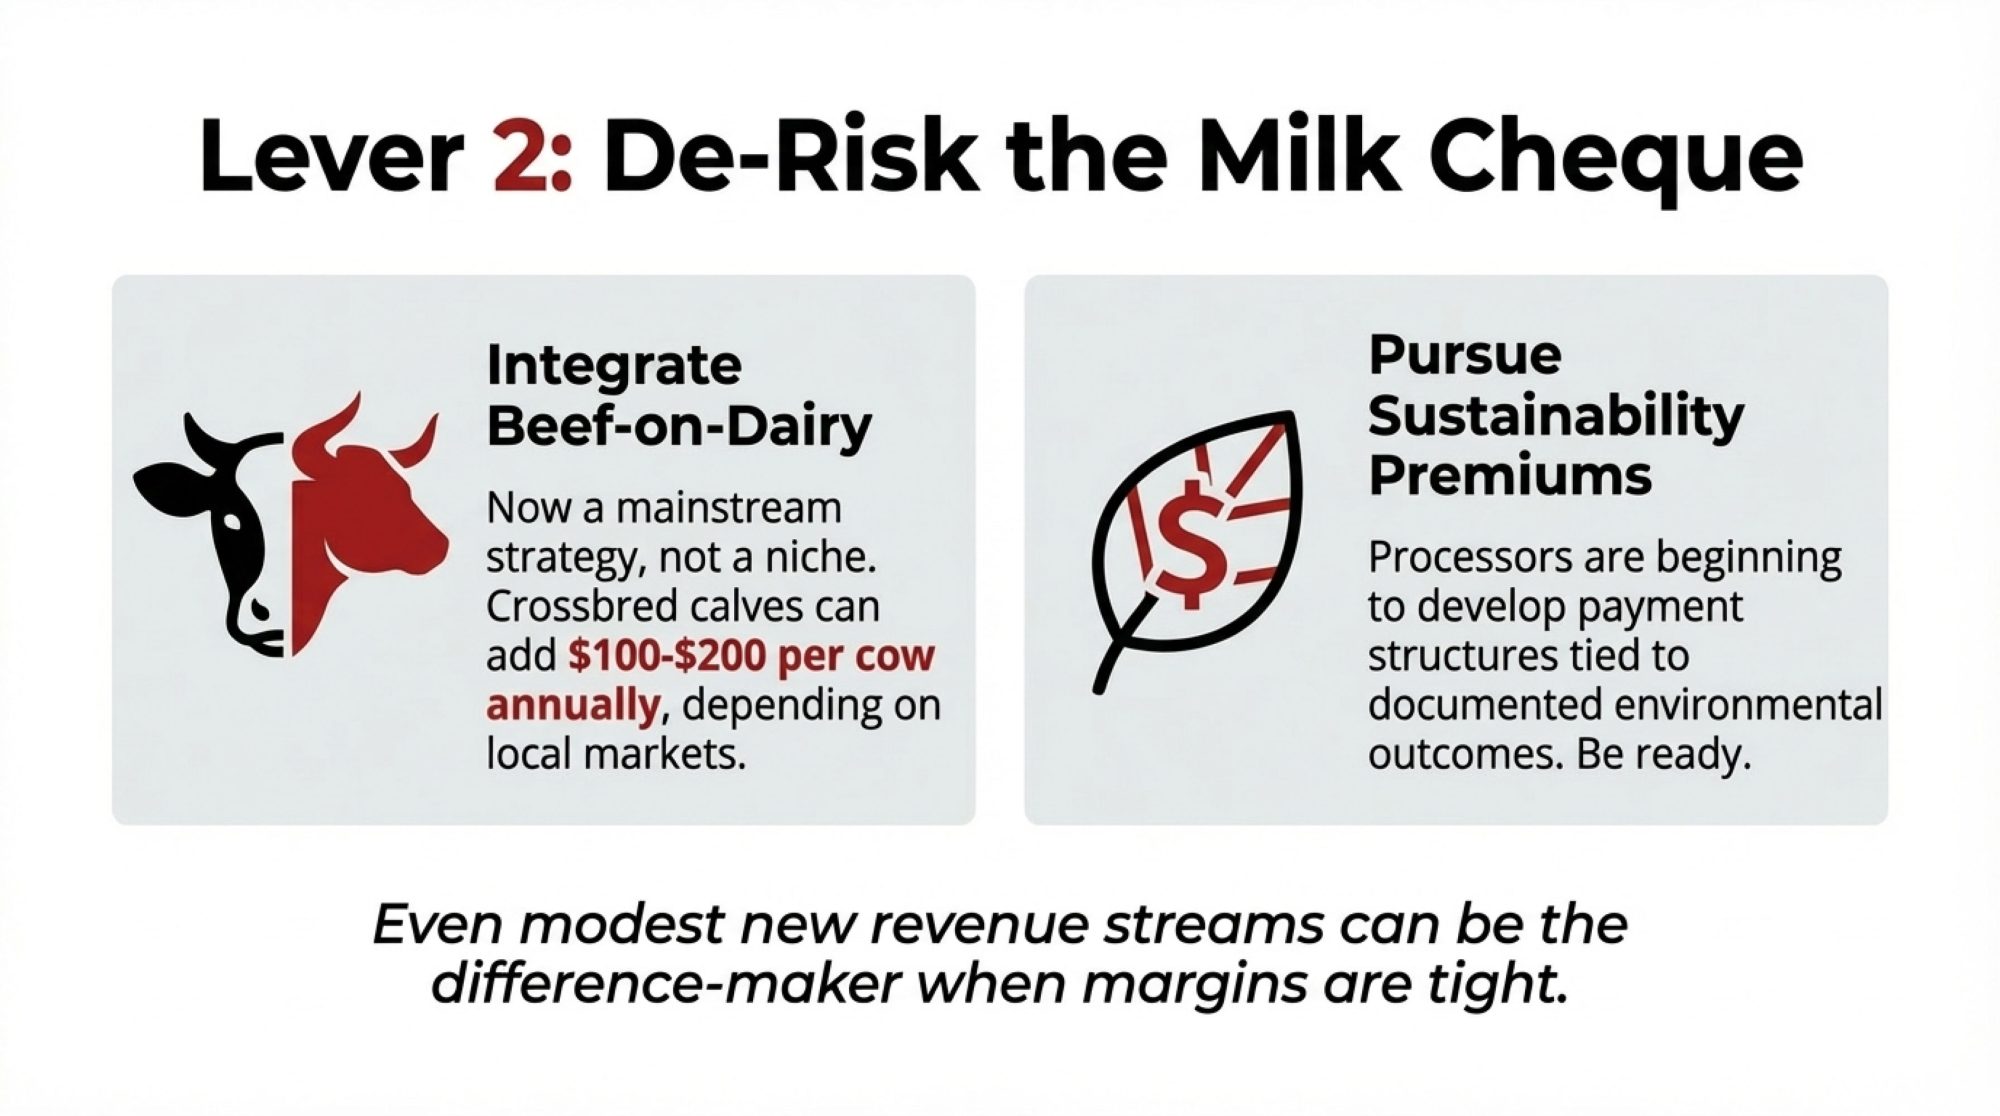
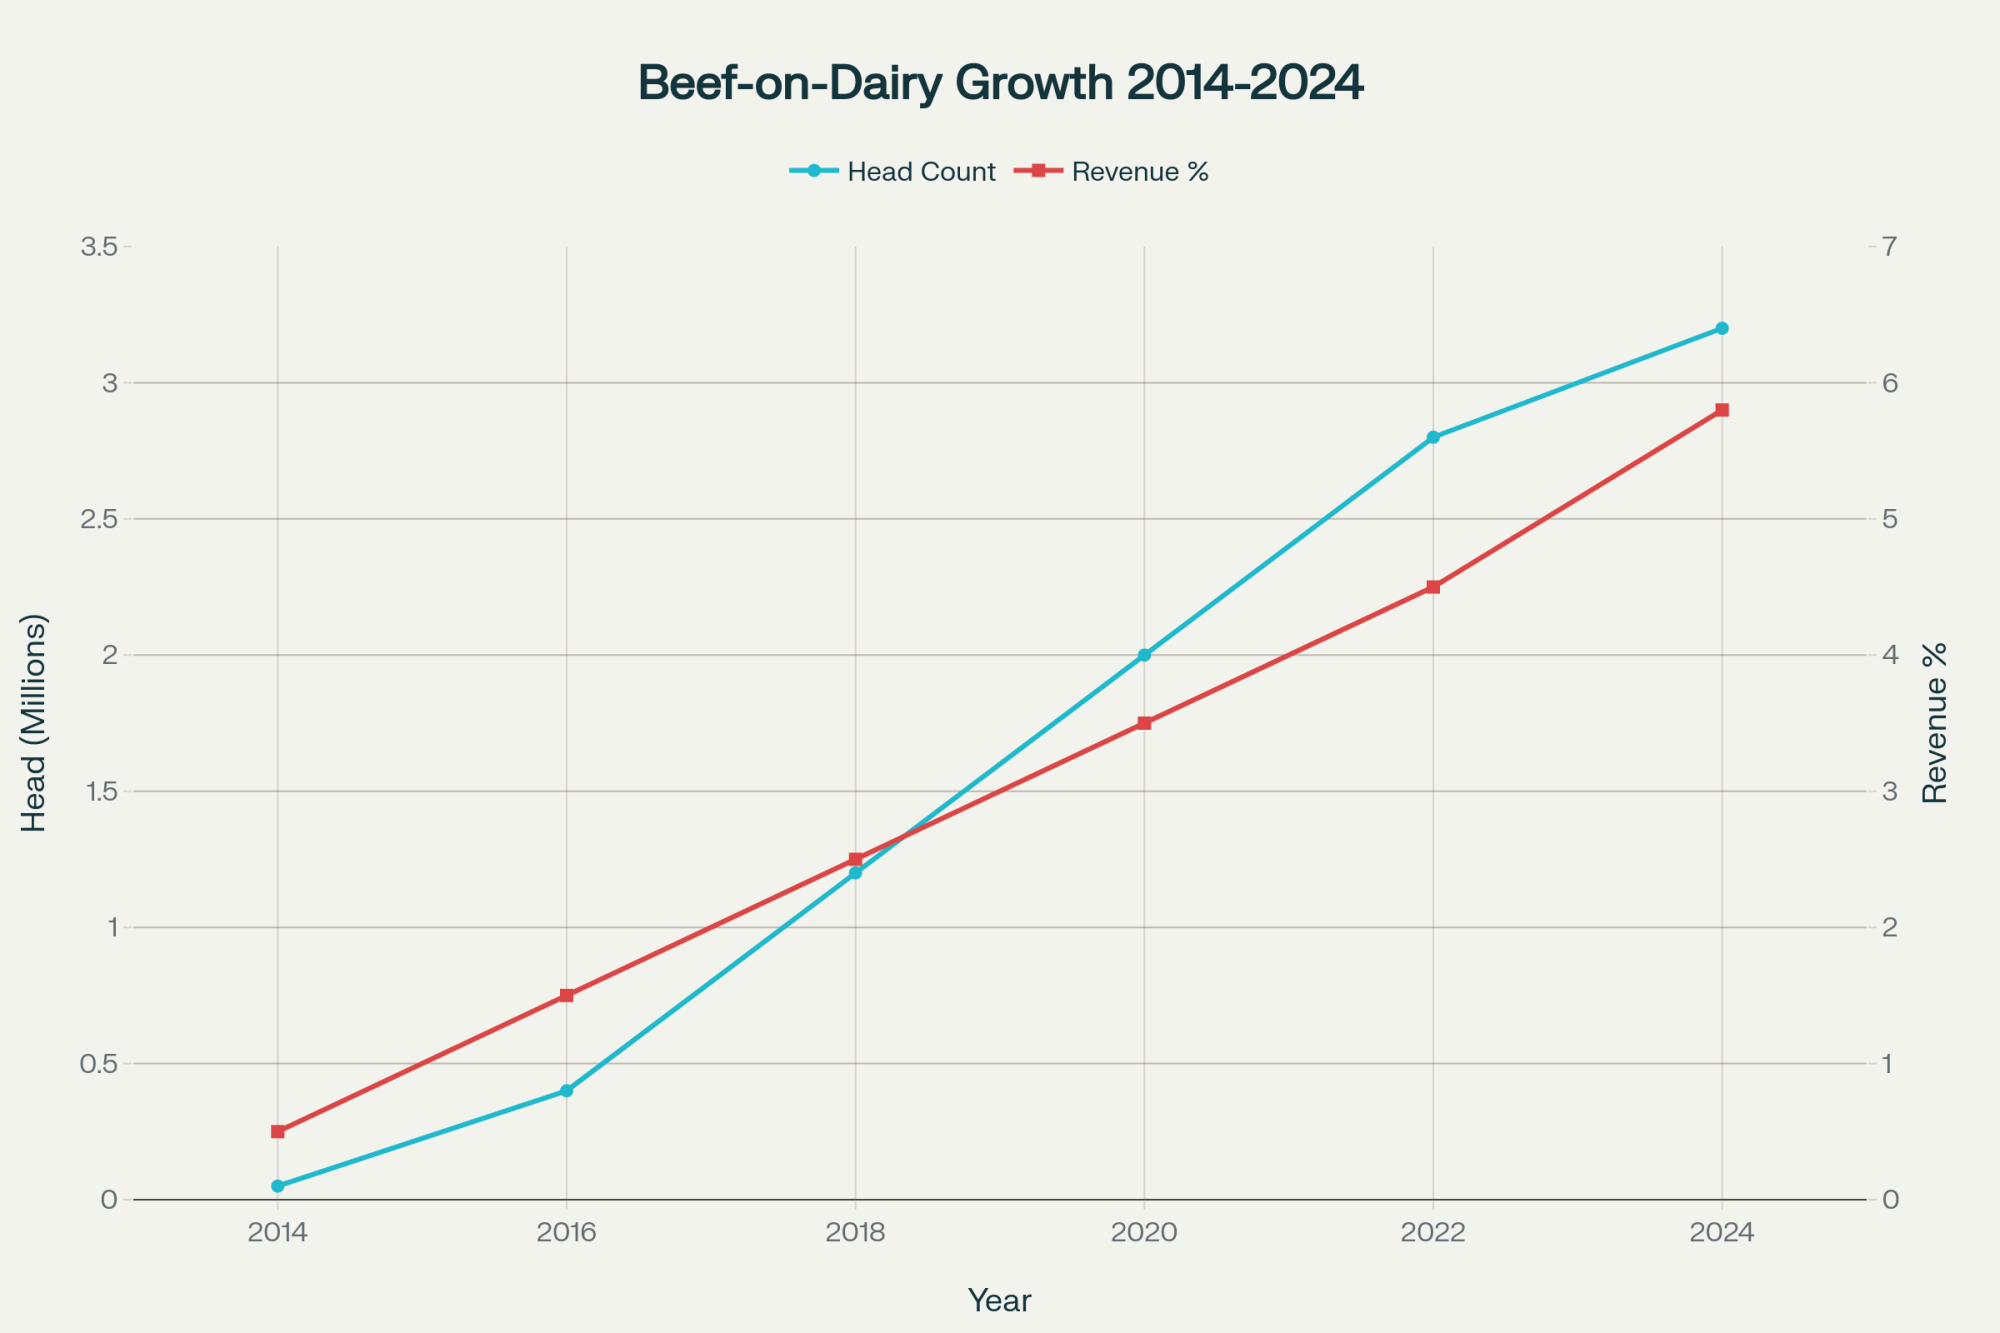
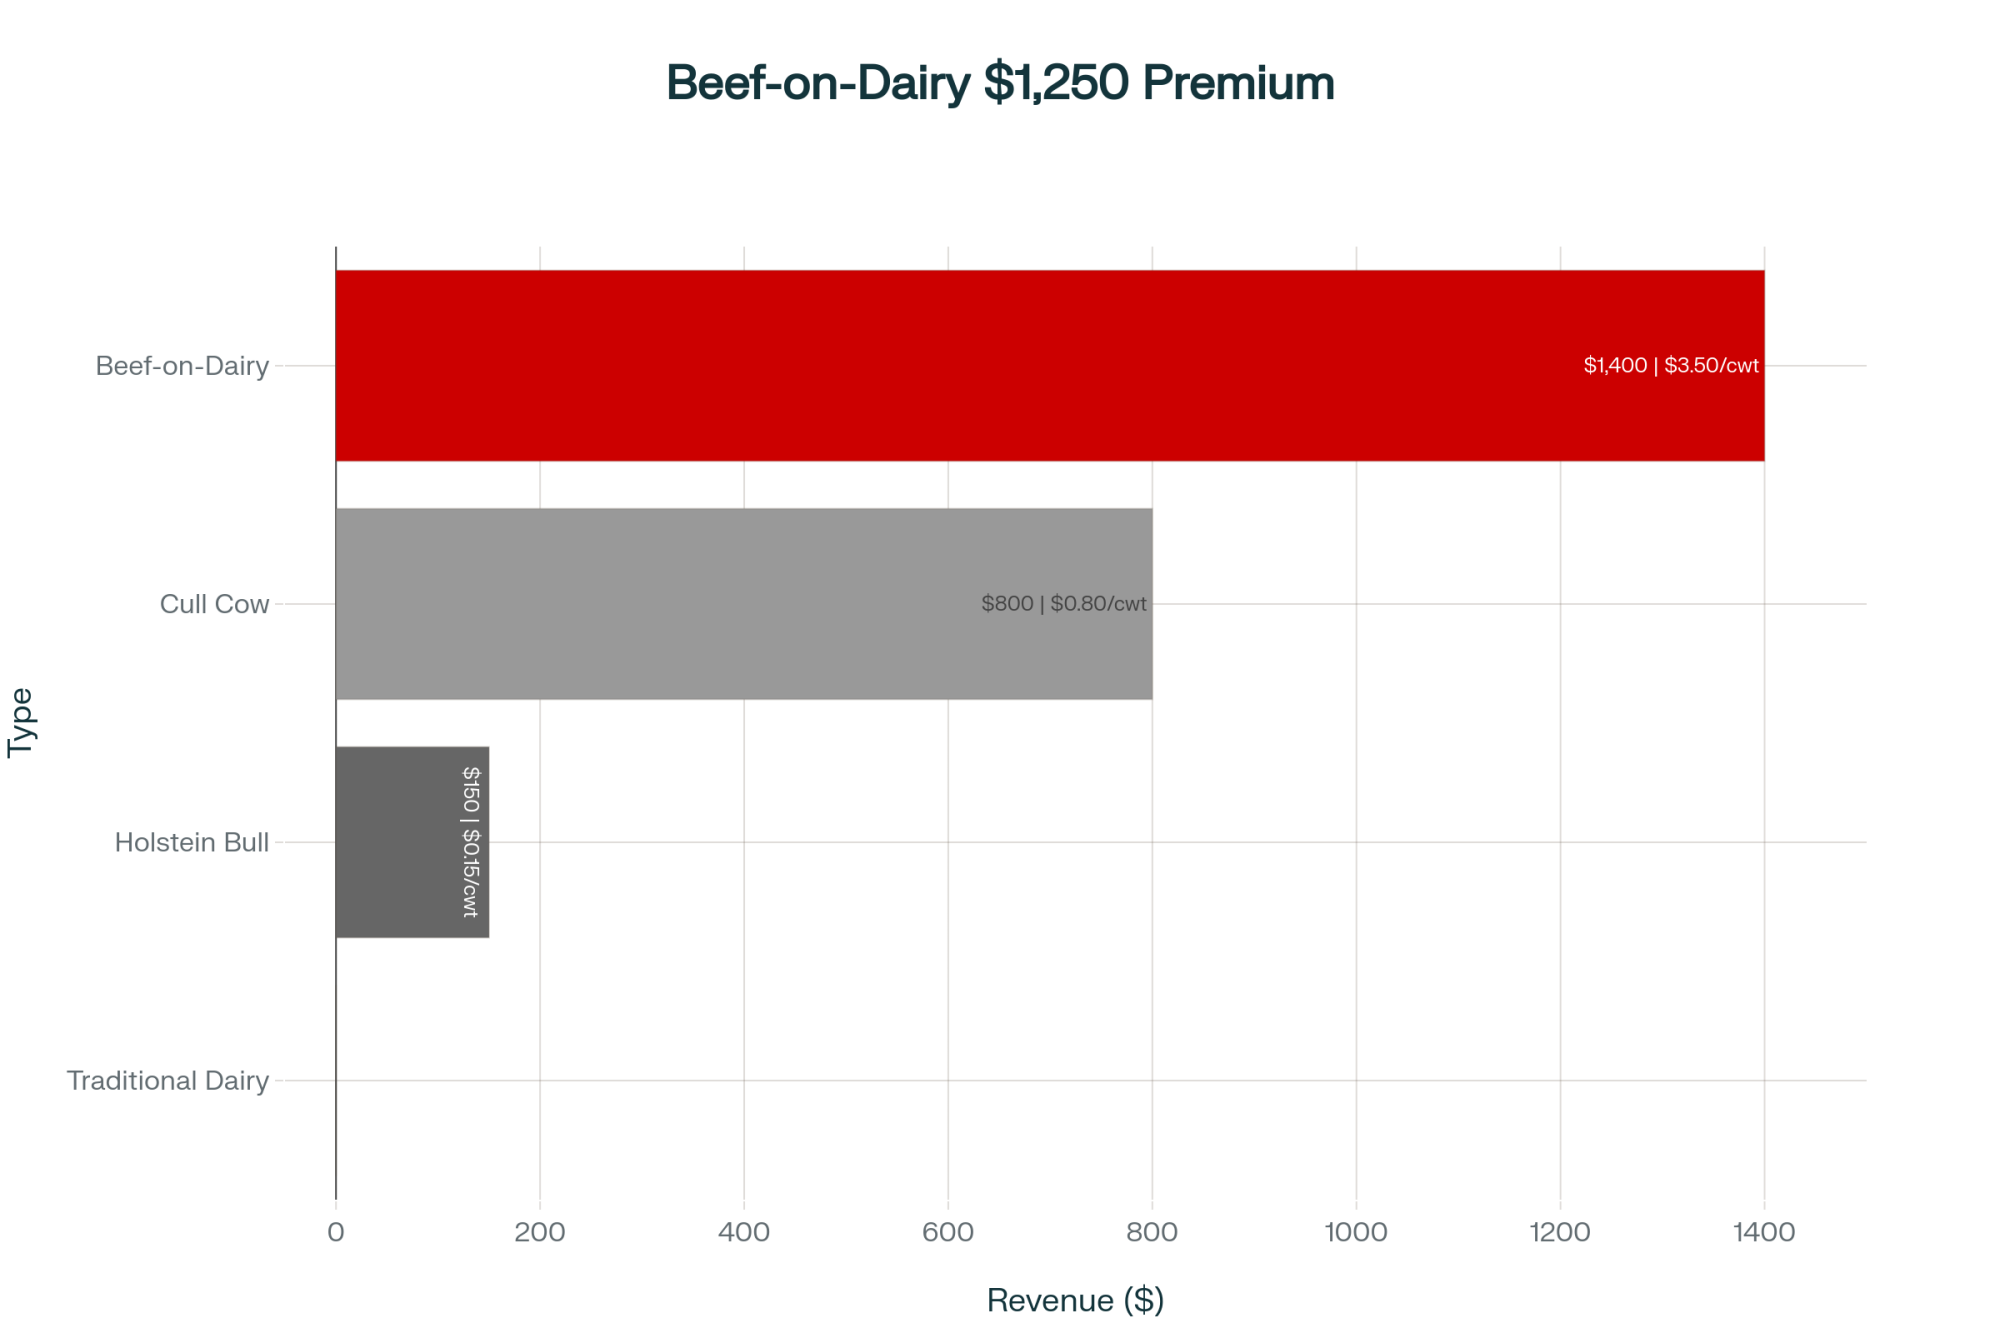
There’s also money that doesn’t show up in milk price charts. Beef‑on‑dairy calf premiums, cull checks, and government payments have been quietly cushioning margins. In strong Wisconsin markets, crossbred beef‑on‑dairy calves have cleared $1,000–$1,750/head versus $700–$1,000 for Holstein bulls — a $300–$750 per‑calf premium. Real cash. But not guaranteed.
The fight math. Cull the bottom 10%: 30 cows at roughly $137/cwt blended (USDA‑AMS), 1,300 lbs live = $1,781/head → about $53,400 applied straight to the operating line. Breed beef‑on‑dairy on your bottom genetics: ~87 saleable calves → $26,000–$65,000 in premium revenue above Holstein bull calf values. Tighten the ration for $0.30–$0.50/cwt on 62,100 cwt → another $19,000–$31,000 in margin.
On a spreadsheet, that exit looks clean. In the kitchen, it doesn’t. For a lot of 300‑cow families, the 18‑month window isn’t just about DSCR — it’s about whether one more generation gets a shot at the home place, or whether you take the equity that’s left and protect your kids from carrying your debt into their forties.
What Does $18.95 Milk Mean for an 800‑Cow Expansion Herd?
If 300 cows is an exit question, the 800‑cow herd is a margin‑compression test — and it’s the profile Kauffman flagged most directly. hpj
The setup. Eight hundred cows at 24,500 lbs = 196,000 cwt a year. Expanded in 2019 with a new freestall and double‑18 parlour. Debt: $7.2M. Blended interest after repricing: ~7.1%. Debt service: roughly $820,000, up an estimated $150,000–$180,000 since rates moved. Full economic COP near $18.40/cwt.
The squeeze. Revenue loss: 196,000 cwt × $2.22 ≈ $435,000. Labour creep — USDA NASS pegged livestock worker wages around $18.15/hour nationally in April 2025, with average farm wages up roughly 3–4% year‑over‑year — adds another $35,000–$65,000 at this scale. Stack it all: $620,000–$680,000 in extra annual cash pressure. DSCR slides from the low 1.30s toward 1.0–1.05×.
Meanwhile, that 2019 freestall, which cost $2.8M to build, might appraise at only $2.0–$2.2M today. Debt‑to‑asset ratio creeps past the 60% covenant. Technically offside without missing a payment.
800‑Cow Playbook
Path
Core move
Annual impact
Trade‑off
A: Components + labour + longer note
Push BF from 3.85% to 4.05% (+$115K); trim 3× milking on bottom cows (+$80K); stretch barn mortgage to 25‑yr amortization (+$92K)
≈ $287K vs. $620K–$680Khit
Keeps 800‑cow scale; demands tight execution on nutrition, labour, and lender cooperation
On Path A, the butterfat math is straightforward: 19.6M lbs × 0.20 percentage points = 39,200 lbs more BF × $2.94/lb ≈ $115,000. That’s real money. But the breeding decisions behind that 0.20‑point shift matter as much as the ration, and as Dr. Kent Weigel has pointed out, nobody can reliably predict component prices five to seven years out.
On Path B, organic pay in the Northeast has held well above conventional. Bullvine’s 2025 coverage of NODPA data showed Upstate Niagara’s 2025 program at $29.50/cwt base plus a $2.75/cwt organic market adjustment and $2/cwtseasonal incentive, and Horizon targeting up to $45/cwt for some larger herds. NODPA’s January 2026 “Pay and Feed Prices” update confirms that Upstate Niagara will move to a $32.50/cwt base, plus a $2.75/cwt regional adjustment and a $2/cwt seasonal incentive in 2026, and notes that other processors raised base pay by roughly $3/cwt going into 2026. Terms vary — contact processors directly for current details.
Certification takes 36 months. You’re not patching this year’s DSCR with organic premiums. What you are doing is giving your lender a different story than “we’re stuck.”
When Scale Stops Being a Safety Net: 1,500 Cows
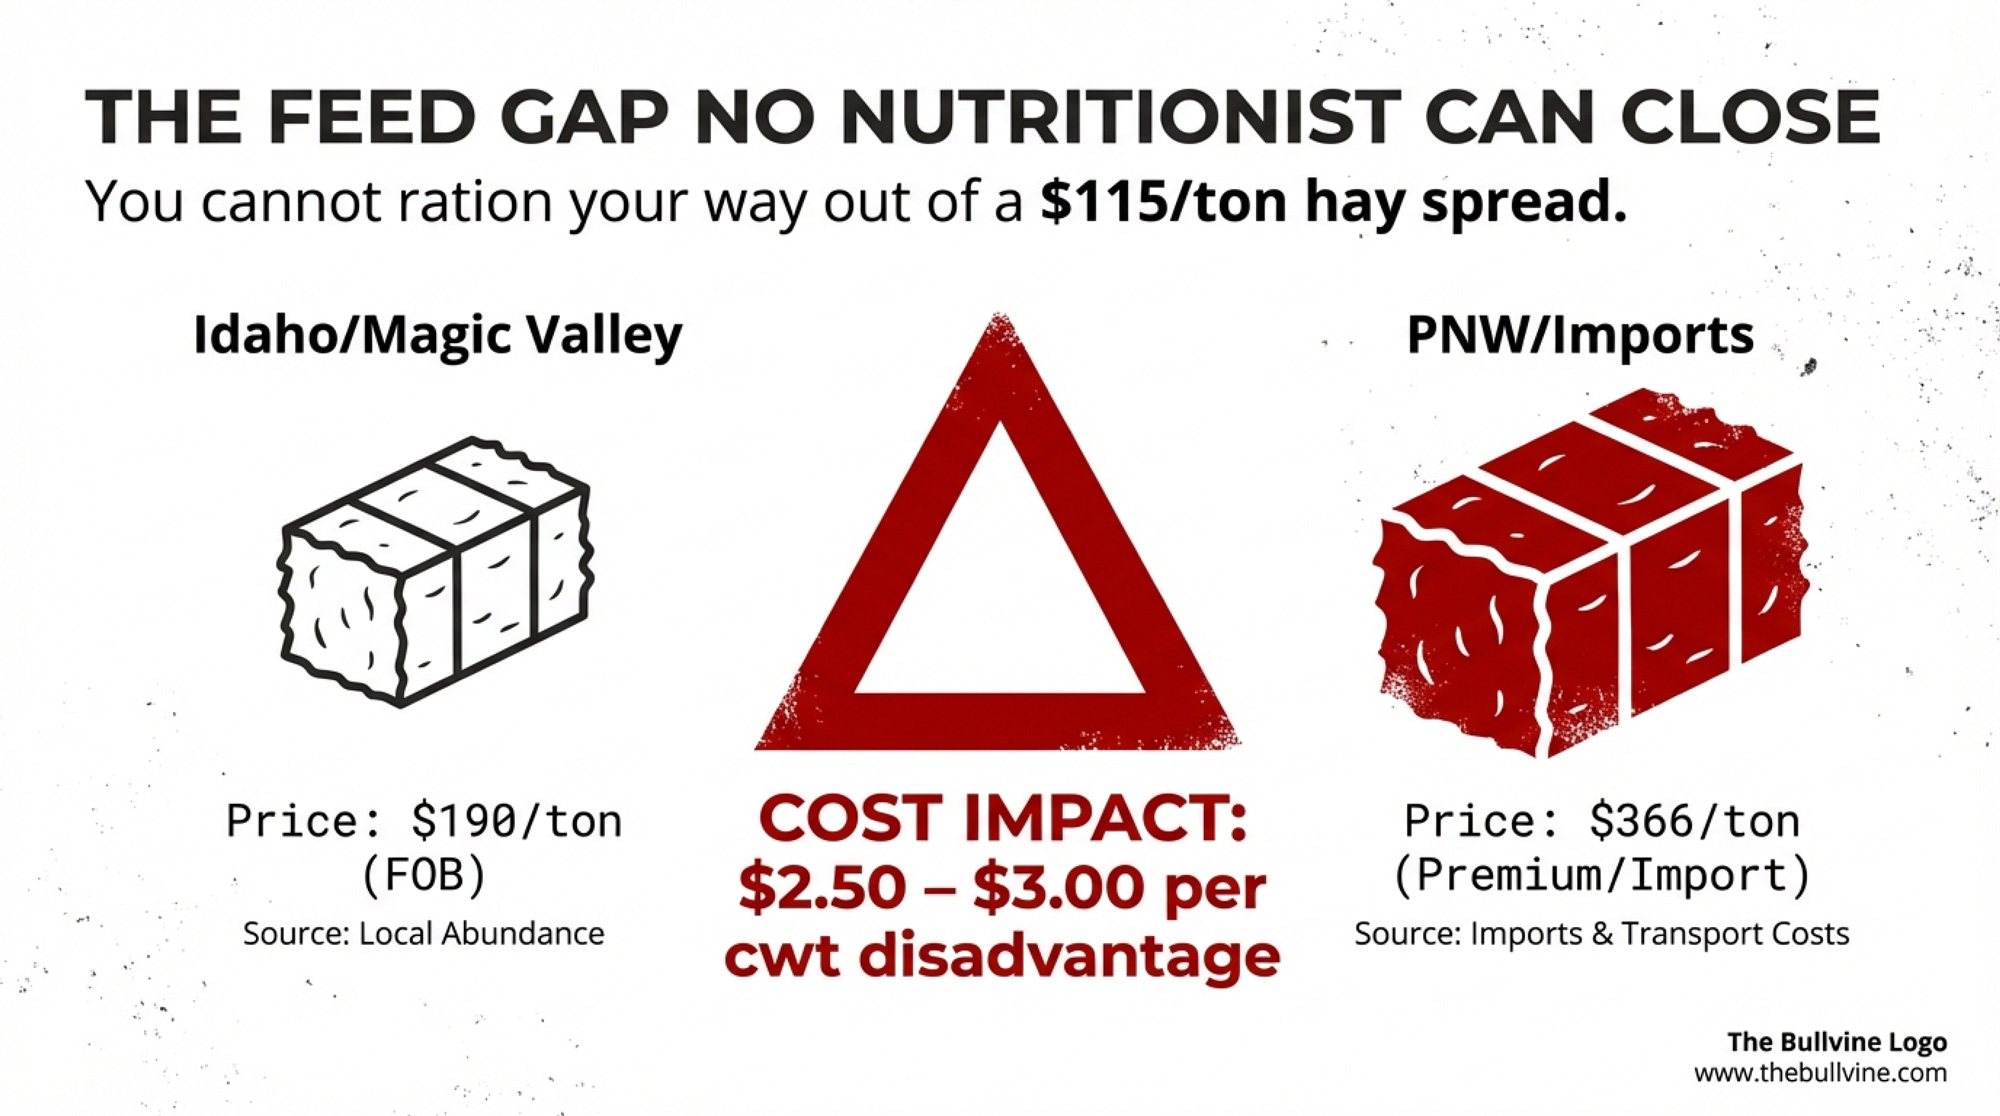
Two sites, 1,500 cows total, 26,000 lbs/cow — 390,000 cwt a year. Debt: $14.5M. COP sits in the top quartile at about $17.80/cwt, better than ERS’s $19.14 average for ≥2,000‑cow herds. Sounds comfortable.
Then a regional processor adjusts its Class III allocation, and your blend drops $0.85/cwt — that’s $331,500. In the same quarter, your H‑2A contractor raises fees 12%, adding $180,000 to labour costs. You’ve eaten $511,500 in cash pressure while still technically “efficient.”
Pre‑shock DSCR: 1.42×. Post‑shock: 1.12×. Scale gave you room. It didn’t make you bulletproof.
Convert one barn to 20 units ($4.4M); labour savings $390K–$520K/yr; extra milk $185K–$296K
Net year‑one: –$41K to +$200K; improves as wages rise
Swaps labour volatility for $4.4M in new capital; may need asset sales or guarantees if DSCR is already thin
ISU extension specialist Larry Tranel pegs the installed robot cost at $185,000–$230,000/unit, with some projects reaching $250,000. At $220,000 midpoint, 20 units = $4.4M — about $616,000/year in debt service over 10 years at current rates. The bet is that wages keep climbing while the robot payment stays fixed.
Herd Size
Path Options
Financial Impact
Key Trade-Off
300 cows
Fight: Cull 10%, beef-on-dairy, ration tweak
Close $98K–$157K of $195K–$210K gap
Buys 6–12 months; may still breach covenants
300 cows
Exit: Orderly liquidation
Retire $2.8M debt, keep $300K+ equity
Out of dairy; avoid $200K herd-value erosion over 18 months
800 cows
Path A: Push components 0.20%, trim labor, stretch note
Path B: Destock 150 cows, begin organic transition
$350K–$430K debt paydown now; premium upside at month 36
Gives up volume immediately; 3-year wait for premiums
1,500 cows
Path A: Fill 300 empty stalls to 1,800-head capacity
Add $347K contribution margin
Deepens processor and H-2A labor dependency
1,500 cows
Path B: Install 20 robotic units
$390K–$520K labor savings + $185K–$296K milk = net +$200K year 1
Swaps labor volatility for $4.4M new capital; DSCR impact if already thin
Ten Signals Your Lender Already Started the Clock
You’re likely on an 18‑month clock if:
Your lender asks for quarterly financials instead of annual.
There’s someone you’ve never met at your review — a regional credit analyst or special‑assets contact.
They order a fresh appraisal outside the normal cycle.
Covenant language gets “adjusted”—temporary waivers and revised DSCR targets.
The conversation shifts from “What are your plans?” to “Walk me through your cost of production.”
They start asking for milk per cow, SCC, and cull rates that weren’t part of prior reviews.
Your operating line renewal comes back with a lower limit or shorter term.
Someone mentions stress‑testing at $17/cwt.
They request personal financials from all guarantors, not just the main operator.
Capital‑expense conversations get met with “Let’s revisit after the next review.”
Three or more? You’re on a clock, whether anyone has said those words or not.
How to Stress‑Test Your Dairy at $18.95 Milk
In the next 30 days:
Pull your full economic COP. Not the rough number in your head. Family labour at $18–$22/hour, depreciation at replacement cost, return on equity included. ERS and Cornell DFBS data show total cost ranging from roughly $20/cwt into the high $20s/cwt depending on herd size and performance. Put that number next to $18.95 and see what you’re really asking your lender to finance.
Run your DSCR at three price points. Use the formula: (Total cwt × milk price – operating expenses) ÷ annual debt service = DSCR. Plug in $18.95, $17.00, and $16.00. Under 1.10× at $17? Red flag. Under 1.20× at $18.95? You’re in the band Kauffman’s data identifies as “significant” stress.
Model your exit equity — today and at month 18. Herd, equipment, land. Subtract every dollar of debt. Then re‑run those values 18 months out with lower prices and more forced timing. On a 300‑cow herd, the cattle‑value spread alone can run around $200,000.
Herd Size
DSCR @ $18.95/cwt
DSCR @ $17.00/cwt
DSCR @ $16.00/cwt
300 cows (23K lbs, $280K debt service)
1.08×
0.82×
0.68×
800 cows (24.5K lbs, $820K debt service)
1.28×
1.05×
0.92×
1,500 cows (26K lbs, $1.45M debt service)
1.42×
1.22×
1.09×
Your herd: ___________
_________
_________
_________
In the next 90 days:
Pick your path and take it to your lender — with a number, not a hope. “We’ll reduce the herd by 12%, apply $X to the operating line, and target a DSCR of 1.22× by Q3. Here’s the math.” That’s a different meeting than “We’re hoping milk comes back.”
Build a three‑person advisory bench that doesn’t sell you anything. Your accountant. An ag attorney. One peer who’s been through financial stress and came out the other side. Not your feed rep. Not your equipment dealer.
By this time next year:
Hit the DSCR target you committed to — or have a planned, orderly exit underway before someone else decides for you.
If you’re in Canada, supply management, quota values, and provincial financing change the per‑cwt math. But lenders still watch DSCR and working capital. The 18‑month pressure window exists under quota, too — it just plays out against land and quota values, not Class III futures.
Key Takeaways
If your DSCR sits below 1.20× at $18.95, you’re in the 10–15% band Kauffman’s data flags as “significant” financial stress. KC Fed work suggests 10–15% of producers are in that zone, even as 80% remain stable, and Cornell’s DFBS shows some farms couldn’t cover debt even in stronger milk years.
At 300 cows with $9,000+/cow in debt, a disciplined exit may preserve more equity than fighting for 18 months. The herd‑value spread alone can run around $200,000 before equipment and real estate discounts.
At 800 cows with 2019 expansion debt repricing from mid‑4s into the 7–8% range, you gave up $150,000+ in cash flow before milk moved a penny. Path A or Path B both beat drifting into the next review with no plan.
At 1,500 cows, scale buys more ways to respond — not immunity. One processor adjustment and one H‑2A contract change can add roughly $500,000 in annual pressure, even in a top‑quartile COP herd.
The Bottom Line
The producers who still have options 18 months from now won’t be the ones who hoped for $21 milk. They’ll be the ones who ran the DSCR math at $18.95, $17, and $16 before their lender did — and walked into that meeting with a decision, not just a problem.
Where does your DSCR actually sit today?
Complete references and supporting documentation are available upon request by contacting the editorial team at editor@thebullvine.com.
Learn More
Feed Smart: Cutting Costs Without Compromising Cows in 2025 – Arms you with a precision-feeding roadmap to slash up to $470 per cow in annual costs. It reveals how to leverage co-products and forage digestibility to protect production while margins tighten, providing immediate relief for your Monday morning ration decisions.
Decide or Decline: 2025 and the Future of Mid-Size Dairies – Exposes the three survival paths for mid-sized dairies facing structural industry shifts. You’ll gain a clear-eyed framework for regional positioning, financial clarity, and succession planning to ensure your operation remains a viable legacy through 2027 and beyond.
Every week, thousands of producers, breeders, and industry insiders open Bullvine Weekly for genetics insights, market shifts, and profit strategies they won’t find anywhere else. One email. Five minutes. Smarter decisions all week.
Six farms, four countries, zero marketing budget — and more reach than $102.7M in anti‑dairy campaigns. Are you letting strangers explain your barn?
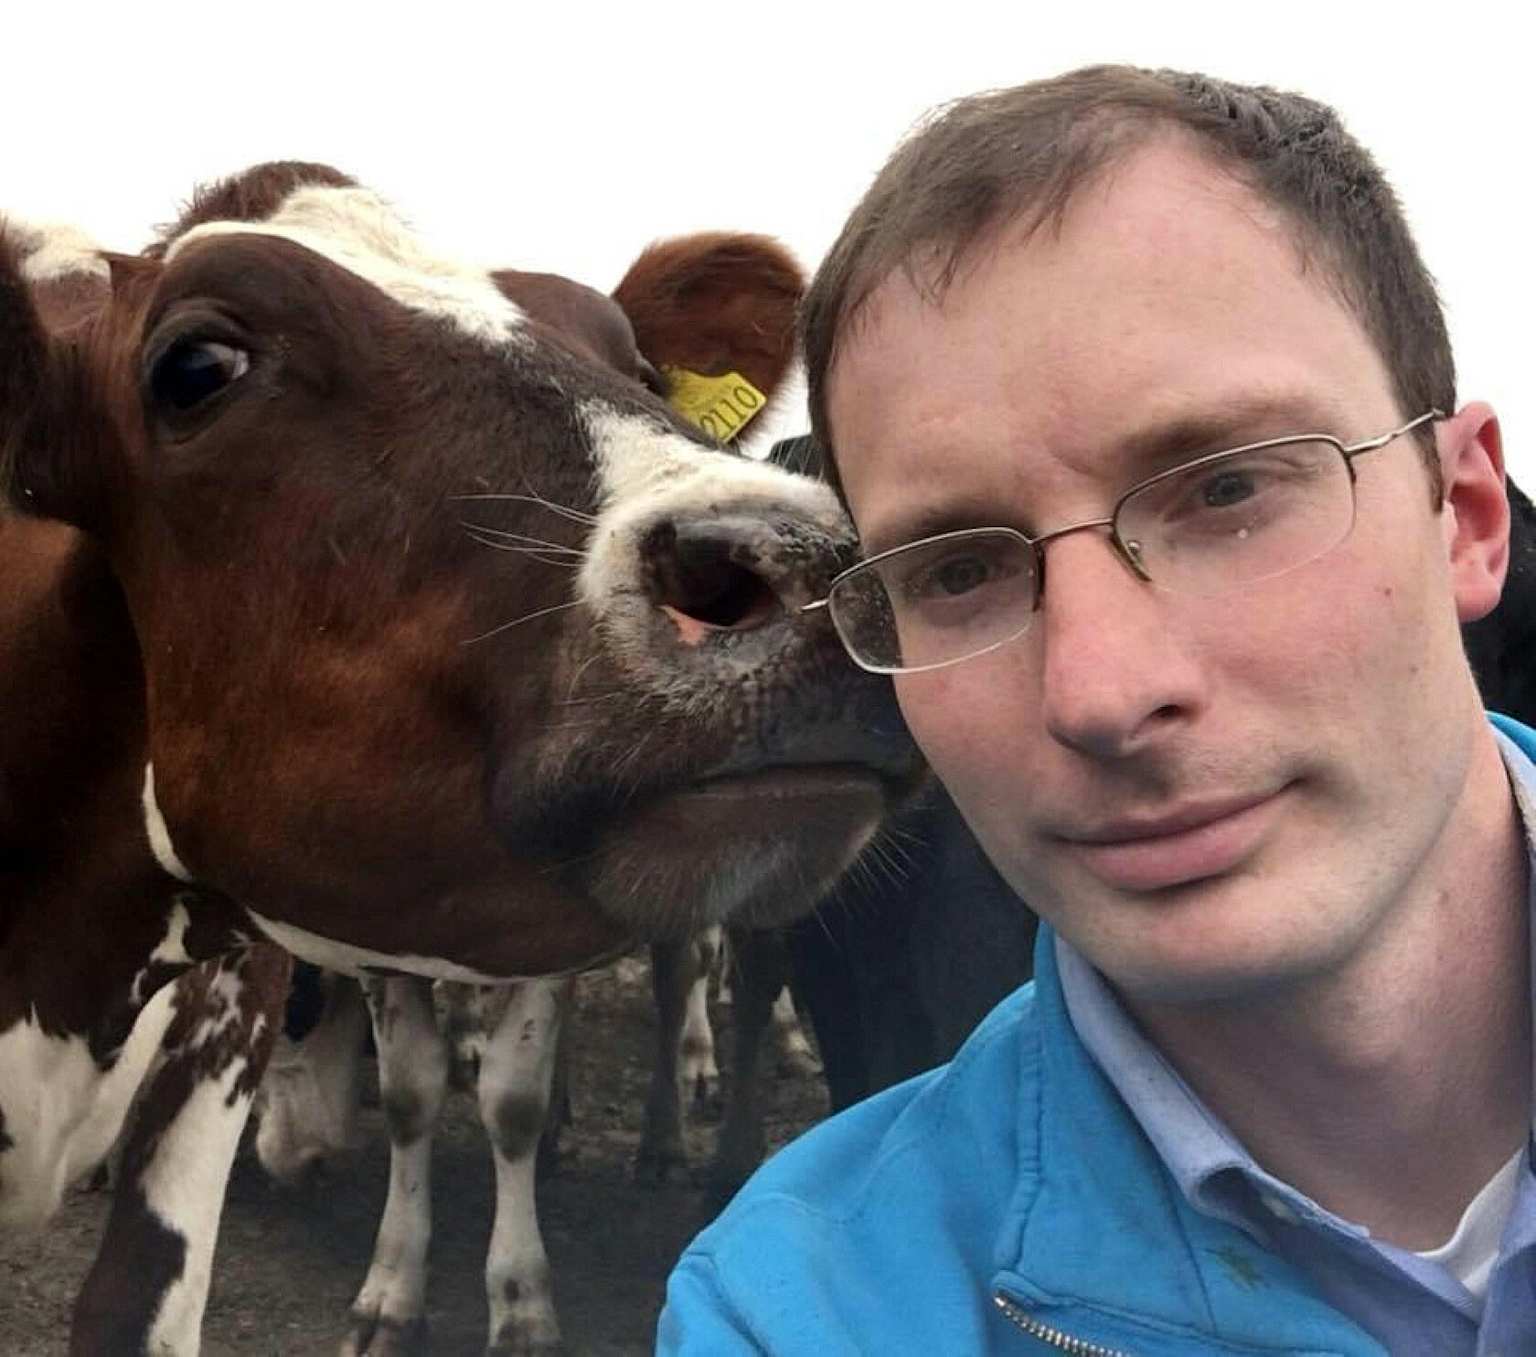
Nathan Ranallo — Nate the Hoof Guy — in west-central Wisconsin. He’d never edited a piece of footage before 2020. The 880 million views came because he didn’t bother starting.
Nathan Ranallo had been trimming hooves in west-central Wisconsin for more than two decades when he started filming his work and posting it online in 2020. “Maybe a year prior to that, I was still using a flip phone,” he told Wisconsin Public Radio. “I had never edited a single piece of footage in my life.” His reasoning, as he later told Wisconsin Public Radio: push back on viral clips that made standard procedures look like torture, and show what proper hoof care actually looked like.
Here’s why this matters to you, even if you never plan to post a single video: these farmers are building something the dairy industry has struggled to buy for decades — real consumer trust. If you’re not shaping the public story of your operation, someone else is telling it for you. They probably won’t get it right.
He told Wisconsin Public Radio he figured other farmers might watch — he never anticipated the broader audience. Two of his most popular TikTok videos have since pulled more than 150 million views combined (Wisconsin Public Radio, July 2024). His YouTube channel — launched in February 2020 — has grown to more than 1.7 million subscribers and passed 880 million total views as of February 2026 (Social Blade; VidIQ).
On TikTok, he’s at roughly 2 million followers. Facebook has 1.6 million users (The Tilt, August 2024). Ranallo — now known to the internet as Nate the Hoof Guy — didn’t see it coming. “Little did I know that it wouldn’t be just farmers watching this, but it would be many more people,” he told Wisconsin Public Radio. “It kind of exploded on me.”
What a Cow Pedicure Teaches About Trust
Social license sounds like something a consultant made up for a PowerPoint. But the concept is dead simple: it’s the informal permission the public gives your industry to keep operating. Lose it, and you get ballot initiatives, regulatory crackdowns, and retail buyers who want to talk to somebody else.
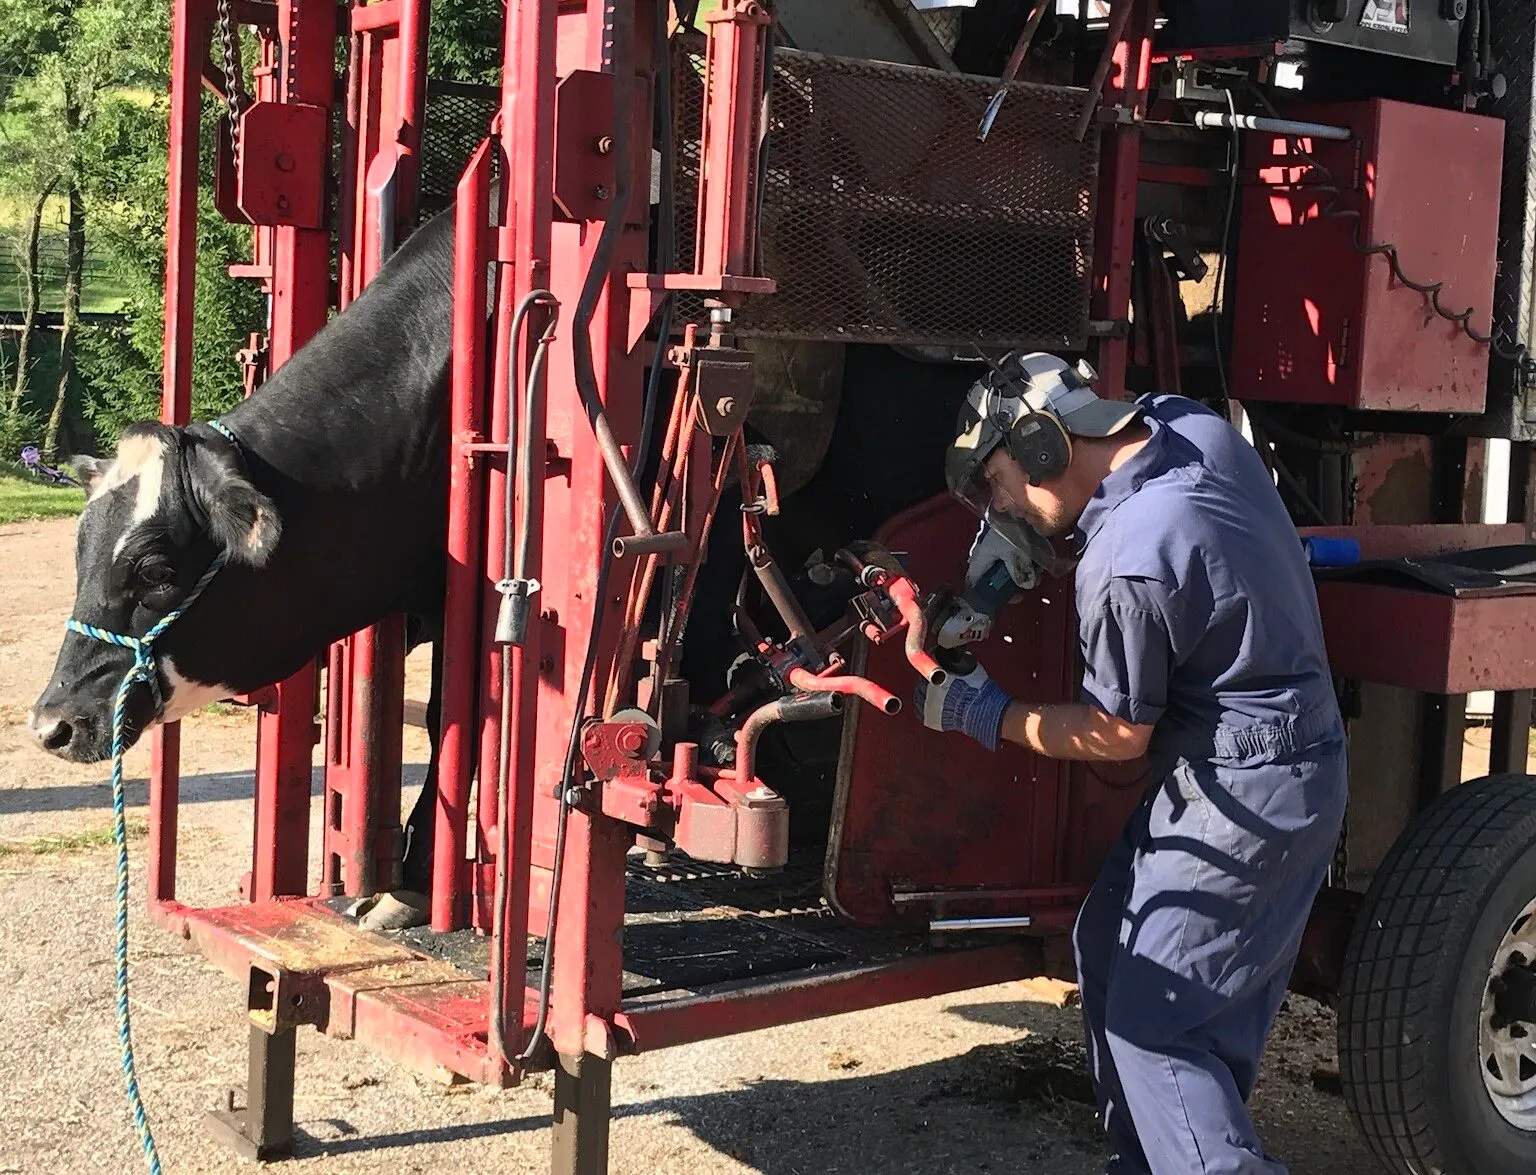
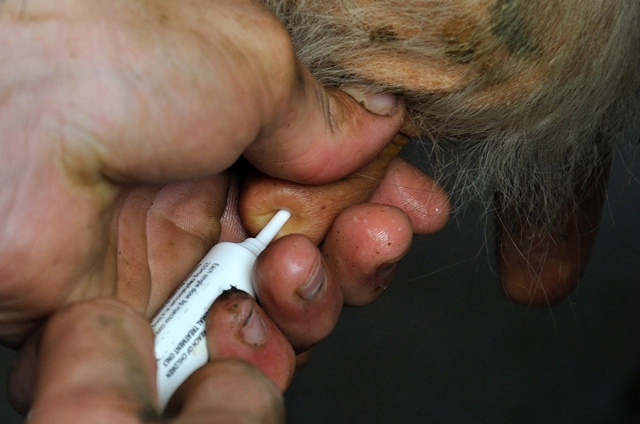
Ranallo builds social license without ever using the phrase. His videos look intense — paring overgrown claw, draining abscesses, clearing stones. But he explains every step.
Hoof horn is dead tissue, he tells viewers, much like a fingernail. “The analogy I like to use is: The hard hoof part that they walk on is like a boot that we would wear. We wouldn’t ever feel it if we were taking a rock out of the sole of our boot,” he told Wisconsin Public Radio. The lesions inside the claw are painful, and he’s clear about that, but careful trimming relieves the pressure — you can see the cow walk easier right after treatment.
For millions of viewers who’ve never set foot on a dairy, that’s the moment the industry stops being scary. The psychology mirrors power-washing videos and pimple-popping compilations: a visible problem, methodical work, satisfying relief. Ranallo adds something those genres don’t have — context and education.
The content side isn’t a hobby anymore, either. VidIQ’s algorithmic estimates — based on public view counts, not confirmed earnings — placed Ranallo’s monthly YouTube revenue at $8,000–$24,000 as of fall 2025. Those aren’t guaranteed numbers, and your mileage will vary wildly — but they’re worth weighing against the 30 to 50 hours a week he puts into content production. He also runs a Facebook paid-subscriber tier at $1.99/month and sells merchandise (The Tilt, August 2024). He told WiscNews that he spends 45 to 50 hours a week on hoof trimming and another 30 to 50 hours on content — essentially two full-time jobs.
At the low end — $8,000 a month from YouTube, 30 hours a week producing content — that works out to about $62 an hour. At the high end — $24,000 a month, 50 hours a week — closer to $111. You won’t touch those numbers; he’s an extreme outlier with more than 1.7 million subscribers. But the real value for most farm creators isn’t ad revenue. It’s the consumer trust that already exists before a crisis hits your county. And if you want to understand the real cost of lameness — and why hoof health is your most underrated profit driver, the connection between what Ranallo shows on camera and what’s happening in your barn is tighter than you’d think.
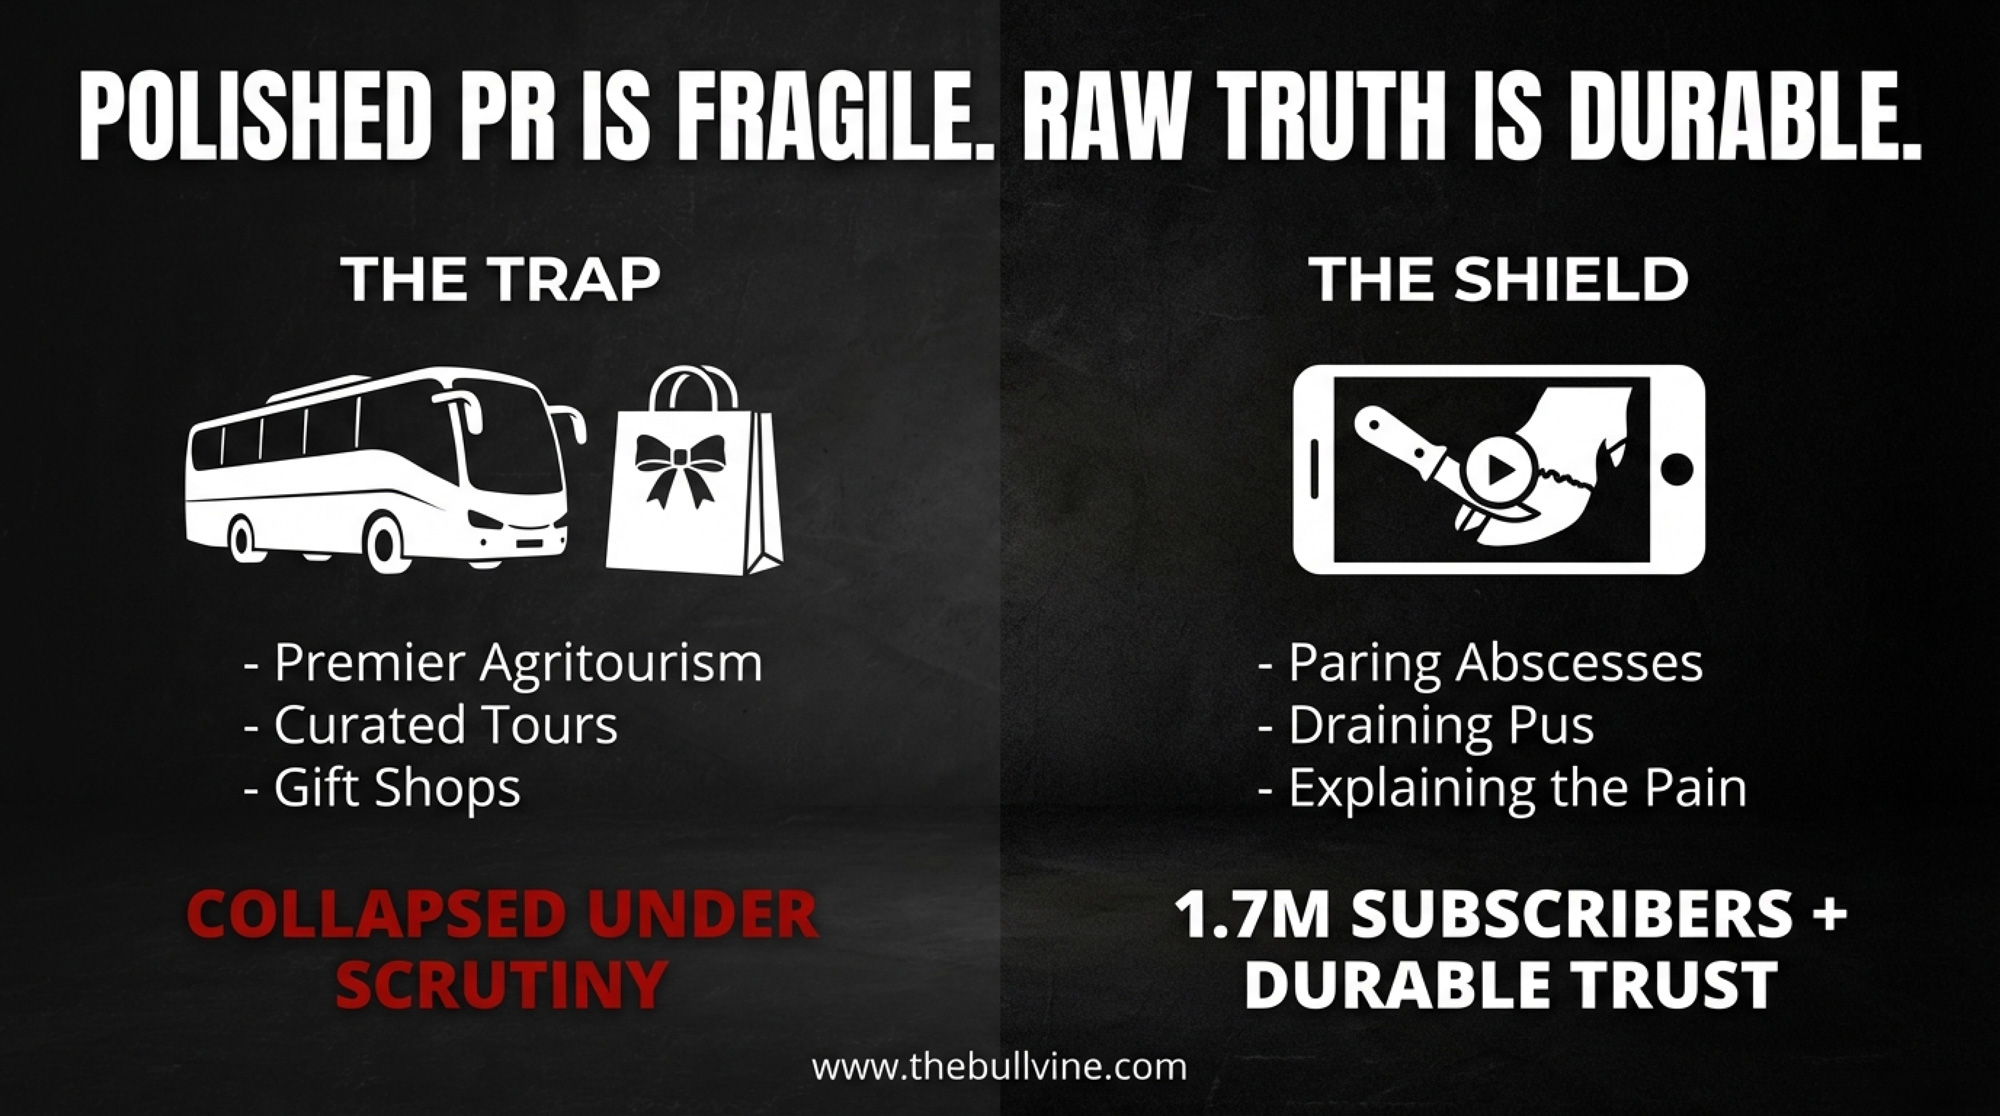
When Polished Transparency Shatters
And crises do hit. In June 2019, undercover footage from Fair Oaks Farms in Indiana went viral overnight (CBS News, June 2019). This wasn’t some anonymous operation with no public face — Fair Oaks was the Midwest’s premier agritourism destination, drawing more than 600,000 visitors a year to guided dairy tours and a birthing barn where visitors watched calves being born (Guardian, June 2019; IndyStar, June 2019).
Fair Oaks Farms in Indiana — 600,000 visitors a year, guided tours, a calf birthing barn. The actual working barns weren’t on the route. That gap is what collapsed in June 2019.
Retailers pulled Fairlife products from shelves. Owner Mike McCloskey posted a widely circulated video apology. Fair Oaks had invested more in public engagement than almost any dairy in the country — but it was the polished, curated kind. Guided bus tours and gift shops sat along the visitor route while the actual working barns didn’t (Center for Land Use Interpretation, 2013; IndyStar, June 2019).
When undercover footage showed what happened where the tours didn’t go, the gap between the brand and the barn destroyed trust more thoroughly than if there’d been no public face at all. That’s the distinction Ranallo, Pemberton, and Payne demonstrate in their own content: showing the raw, sometimes ugly, daily reality weathers scrutiny. A visitor center shatters under it.
A New York dairy that faced a PETA campaign offers the flip side. The owner called an AP reporter who’d requested an interview and invited her to the farm. The reporter declined the visit — but dropped the story entirely.
In her research, she’d found a news release from the New York Animal Agriculture Coalition about the farm’s NYSCHAP certification and contacted Cornell’s PRO-DAIRY program, which confirmed the farm’s reputation (Bovine Veterinarian, May/June 2016). The difference wasn’t size or budget. It was whether authentic trust existed before the camera showed up. That story — and others like it — speak to why social license is the issue dairy can’t afford to ignore.
Can a 4,500-Cow Operation Feel Personal?
One of the most stubborn myths in the public dairy conversation — and one your consumers almost certainly believe — is that scale automatically equals cruelty. MVP Dairy in Celina, Ohio, is proving that assumption wrong one TikTok at a time.
MVP is owned and operated by two fourth-generation farming families: the McCartys of Colby, Kansas, and the VanTilburgs of Celina, Ohio. The operation milks 4,500 cows and supplies Danone North America (PR Newswire, June 2020). “As 4th generation farmers, we know the care we provide to our cows, land, and team members today can help create a more sustainable world tomorrow,” co-owner Ken McCarty told Dairy Reporter when MVP earned its B Corp Certification (Dairy Reporter, June 2020).
That certification carries weight. To become a B Corp, MVP completed B Lab’s Impact Assessment — covering governance, workforce, community, and environmental performance — scoring 106.3 at its initial 2020 certification, well above the 80-point minimum (PR Newswire, June 2020). B Lab’s current listing shows a score of 102.7 following recertification (bcorporation.net, accessed February 2026). The farm is also DairyCARE certified through Where Food Comes From and was named the 2020 Innovative Dairy Farm of the Year.
Those credentials sit behind the TikTok feed. On social media, MVP doesn’t look like a sustainability report — it looks like cow-comfort walkthroughs, parlor routines, and “pampering the girls” trends, shot by real people in the barn. An audit score north of 100, plus a person in coveralls talking to the camera? That combination makes a 4,500-cow dairy feel like a place you could walk through, not a place you’d protest outside.
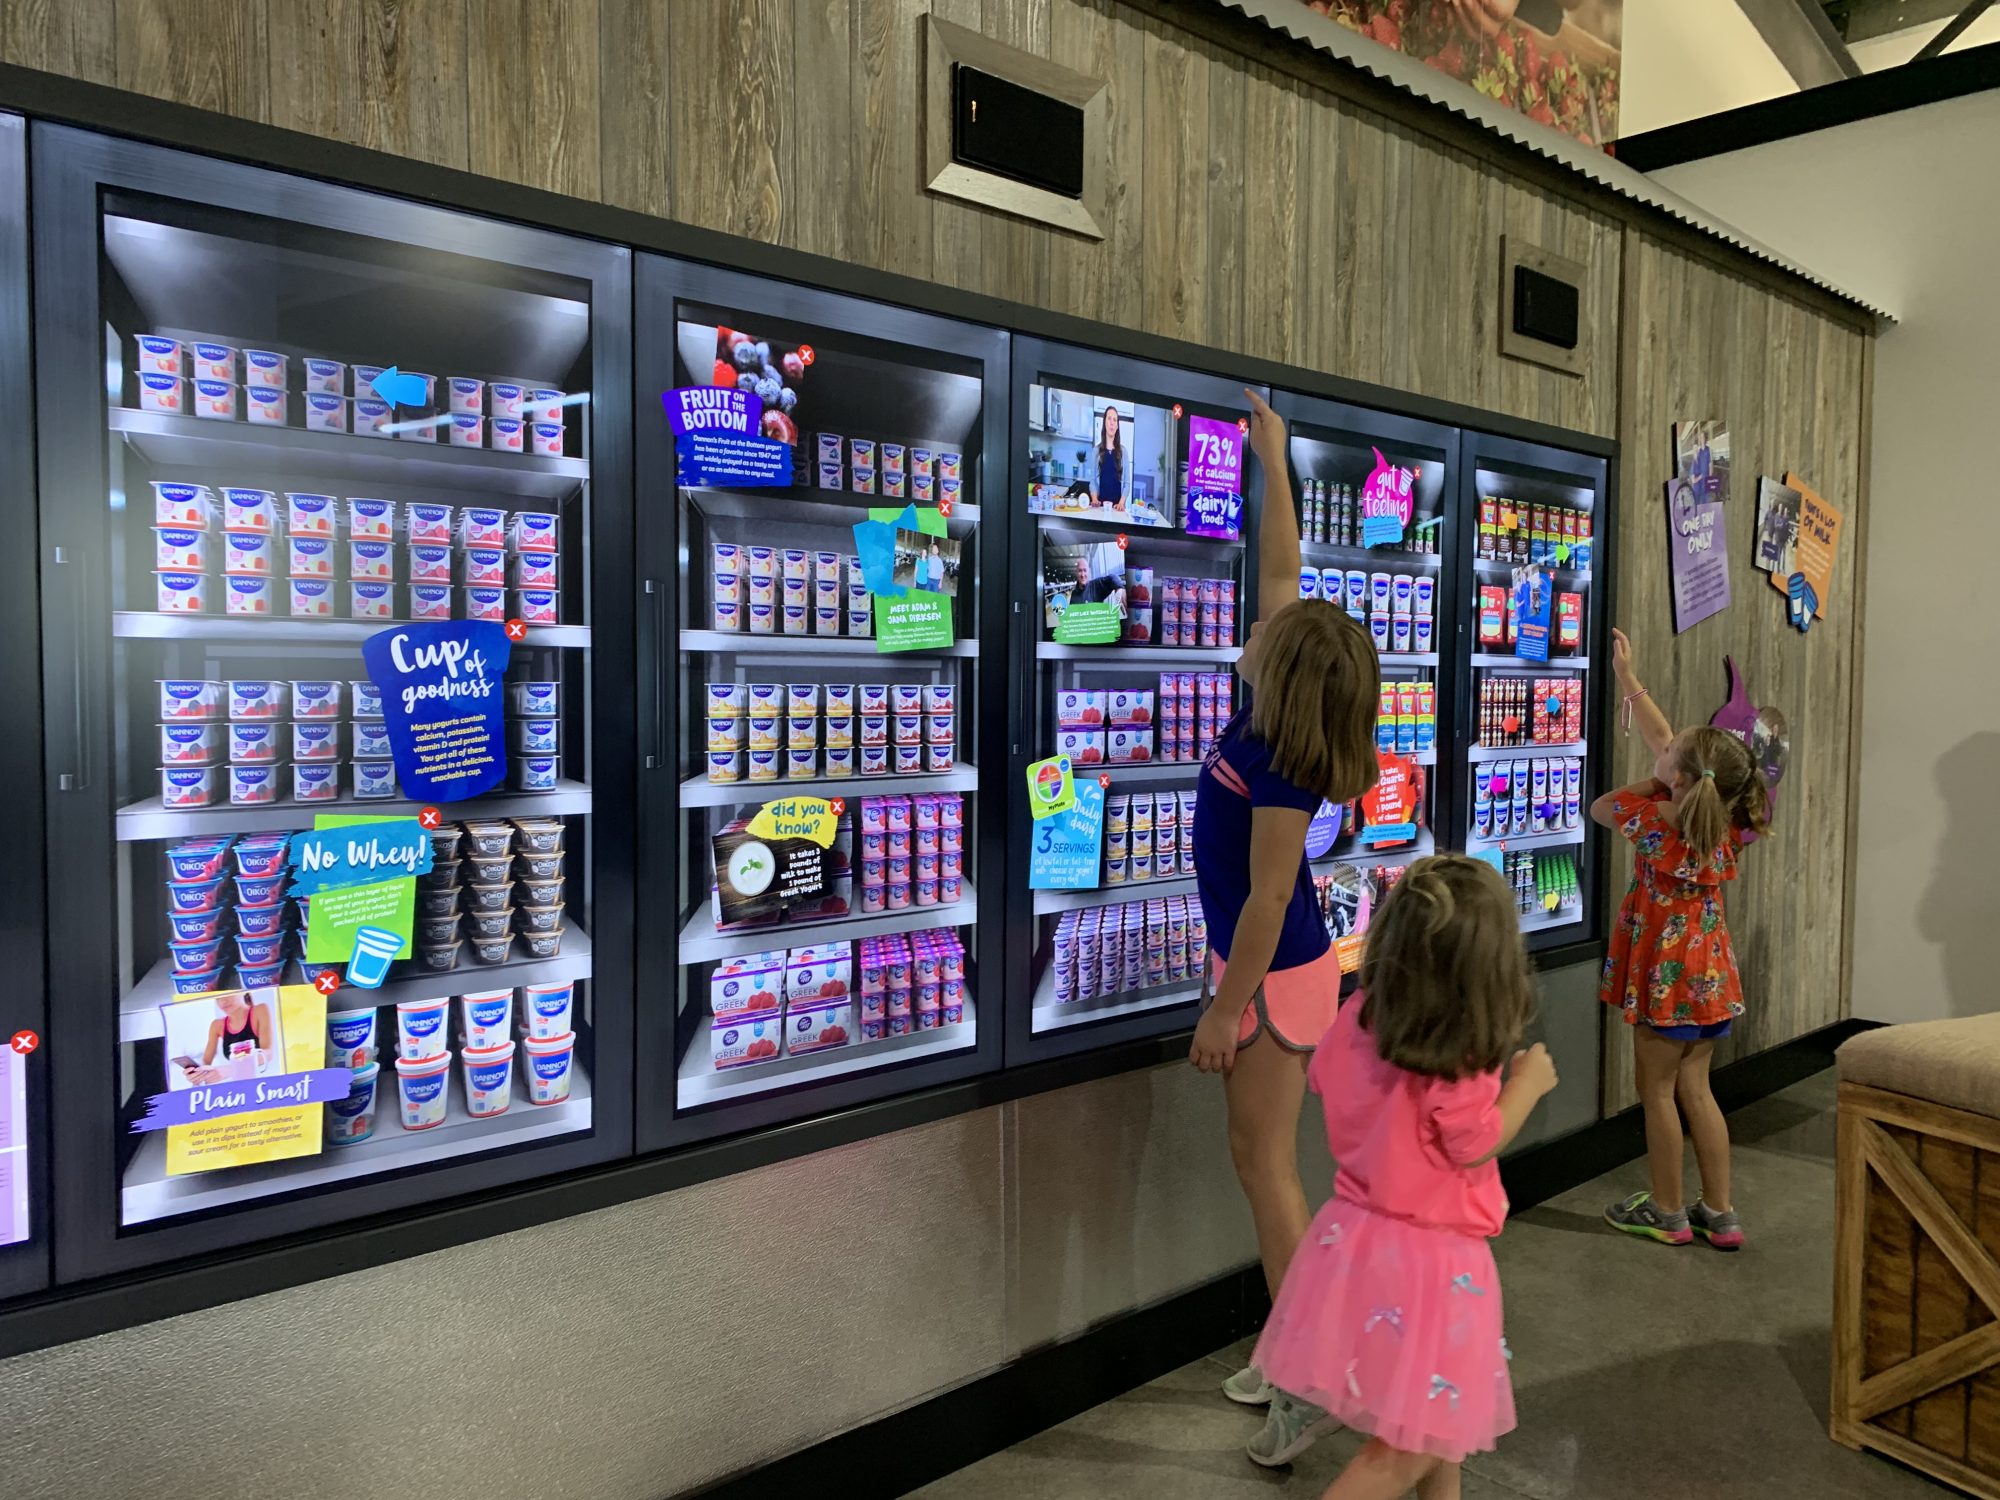
MVP took that principle offline, too. The Dairy Learning Center, a nonprofit onsite, invites the public to explore interactive displays, view cows being milked on a carousel, and shuttle through the free-stall barns (dairylearningcenter.com; TripAdvisor, 2026). Unlike Fair Oaks, MVP pairs the physical experience with daily, unpolished social content and third-party verification. It’s the combination that builds durable trust.
Inside MVP Dairy’s Learning Center in Celina, Ohio — a 4,500-cow operation that invites the public through the barns, not around them. B Corp certified. DairyCARE audited. Hands-on, not hands-off.
Should Your Dairy Farm Be on Social Media?
That’s the real question this whole trend forces. And the honest answer is: it depends on what you’re trying to accomplish, how much time you can spare, and what you’re protecting against. But the farmers building a real farm social media presence share patterns worth studying.
Tom Pemberton runs a mixed dairy-and-beef operation at Birks Farm near Lytham in Lancashire, England (BBC, November 2019). His YouTube channel has grown to 591,000 subscribers and more than 228 million views across over 1,000 uploads as of early 2026 (Social Blade, January 2026). What makes Pemberton worth your attention is what he doesn’t hide — the slurry, the silage, the equipment breakdowns, the days when nothing works. His audience returns not for highlights but because the full picture, grim days included, feels real.
What Makes a Cow Go Viral?
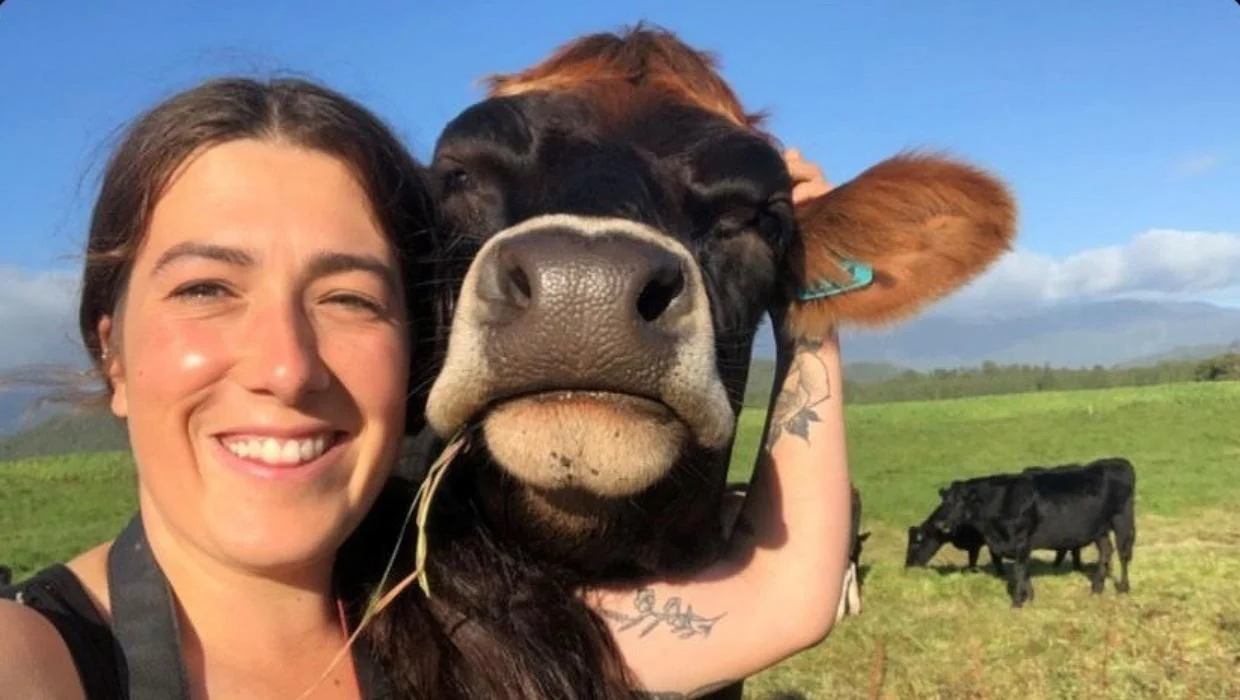
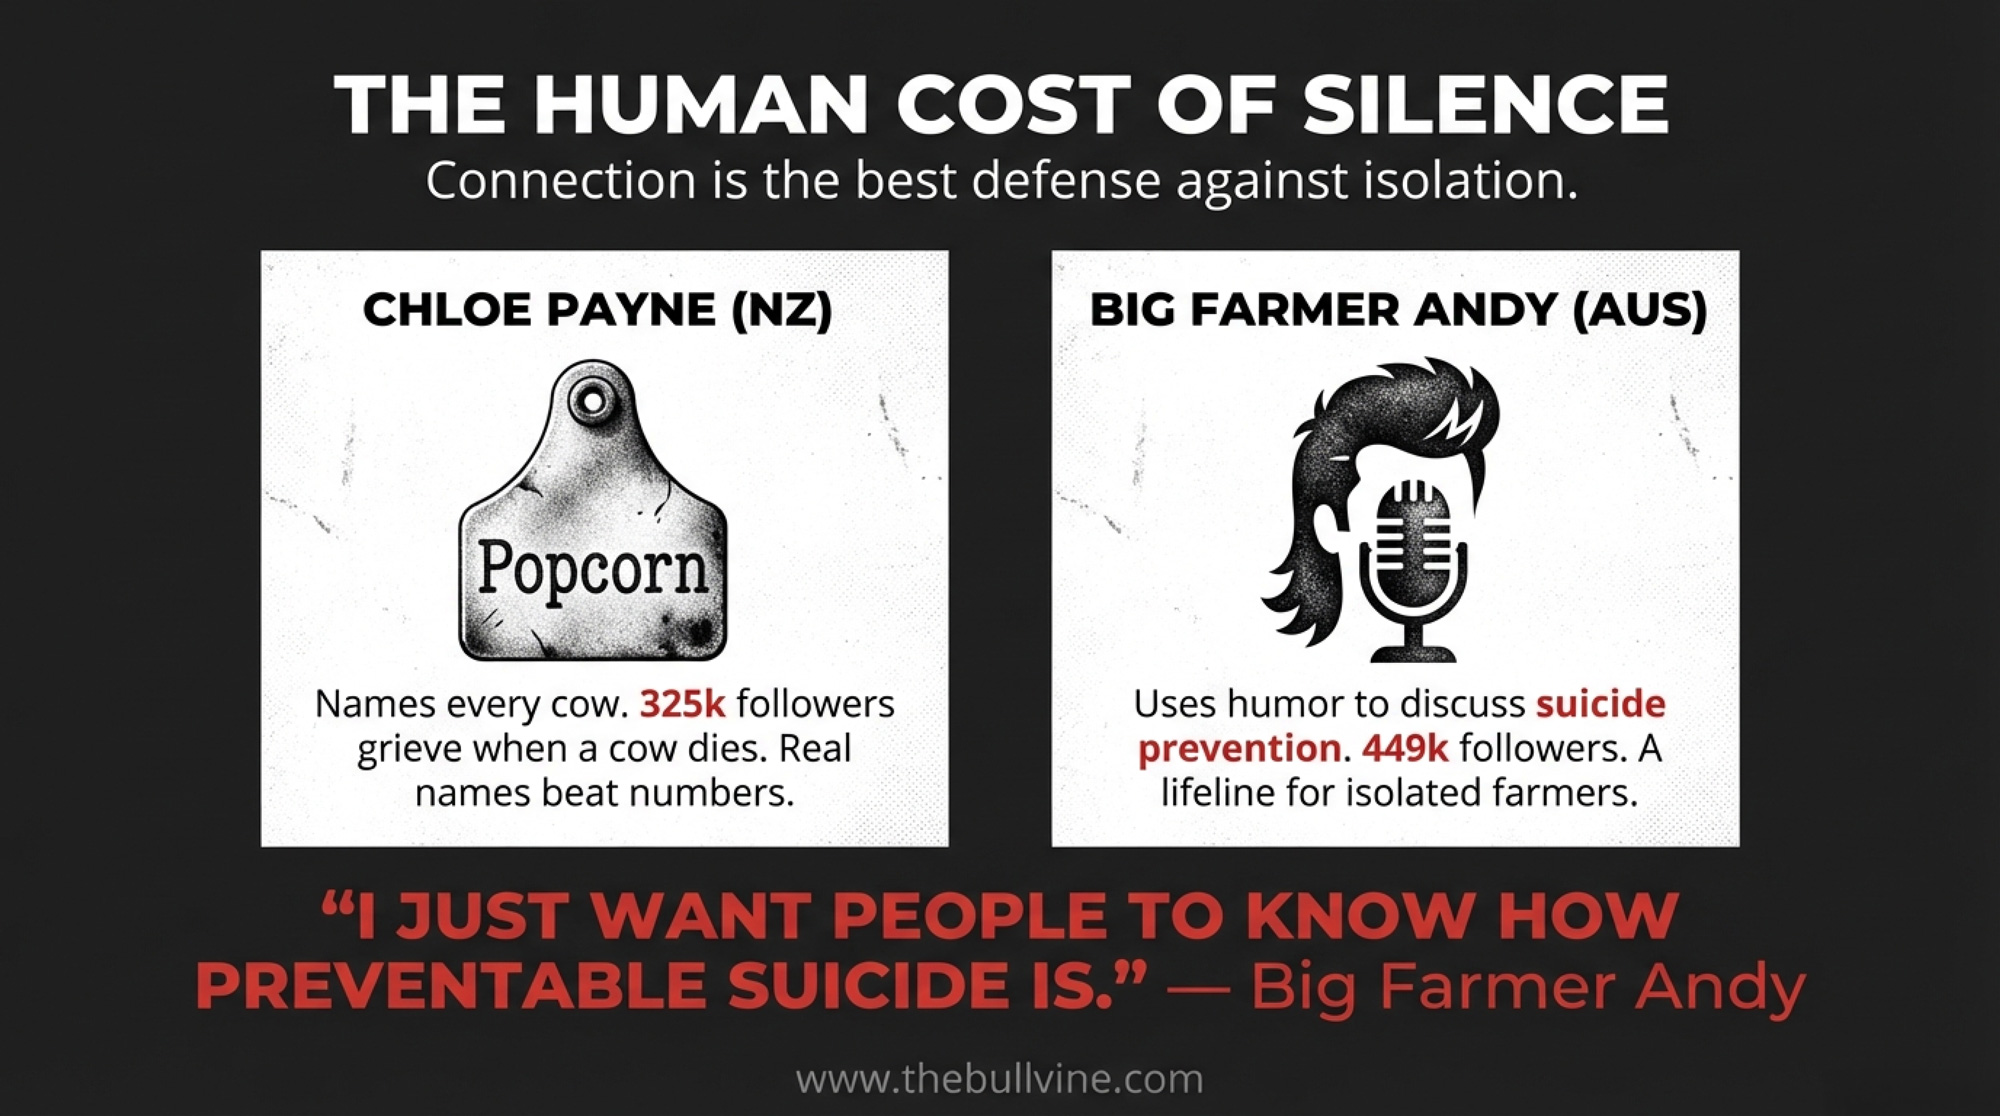
Down in Ikamatua on New Zealand’s West Coast, herd manager Chloe Payne took a completely different route to the same destination. She manages 600 mixed-breed cows — mainly Fleckvieh — on a 240-hectare milking platform, and owns 26 personally, all with names (Guardian Online, May 2024). Her Instagram account, Cows of New Zealand (@cowsofnewzealand), reached 325,000 followers by mid-2024 after gaining 270,000 in a single year.
Chloe Payne and friend, Ikamatua, New Zealand. The tattoo on her arm is Brown Sugar — a Jersey she loved enough to ink permanently. 325,000 Instagram followers showed up for exactly this.
A cow named Popcorn was one of her first viral stars — Payne told the Guardian that people still follow her account years later because of Popcorn. Then came Barbie, a Fleckvieh-Friesian calf whose photo pulled 2.4 million likes on Instagram and wound up on Khloe Kardashian’s account (NZ Dairy Exporter, January 2024). And Brown Sugar, a Jersey so beloved that Payne had a tattoo of her inked on her thigh (NZ Dairy Exporter, January 2024).
When Gingerbread — Brown Sugar’s daughter died in the spring of 2023, Payne compiled a video tribute to her life and shared it with her followers, many of whom had watched the calf grow up on their feeds (NZ Dairy Exporter, January 2024). “They see what happens on the farm and get to see that cows here are not just a number,” she told the NZ Dairy Exporter.
“If We Don’t Show It, Someone Else Will”
Jan Kielstra — SaskDutch Kid on YouTube — rounds out the picture from Saskatchewan. His parents, Bruce and Vicki, started milking 42 cows in 1996; today, Kielstra Holsteins runs roughly 380 head (YouTube channel description, 2026). His YouTube has grown to 223,000 subscribers and 63 million views (VidIQ, January 2026). His take on why he does it is the simplest version of the argument: “If we don’t show how we do things on a farm, someone will” (Sweet Peas Evening Ag News, March 2020).
Real dirt, real names, real problems outperform polish. They always have. For a different kind of story about the family that chose dairy chores over the NHL draft, the theme is the same — showing that the real thing beats selling the shiny version.
What Does Farm Social Media Actually Cost?
Chloe Payne is honest about the money. She told the Guardian in May 2024 that her Instagram is still a hobby and doesn’t generate much income — though she’d love to earn enough to eventually retire her pet cows. Even with 325,000 followers, the direct revenue isn’t there yet.
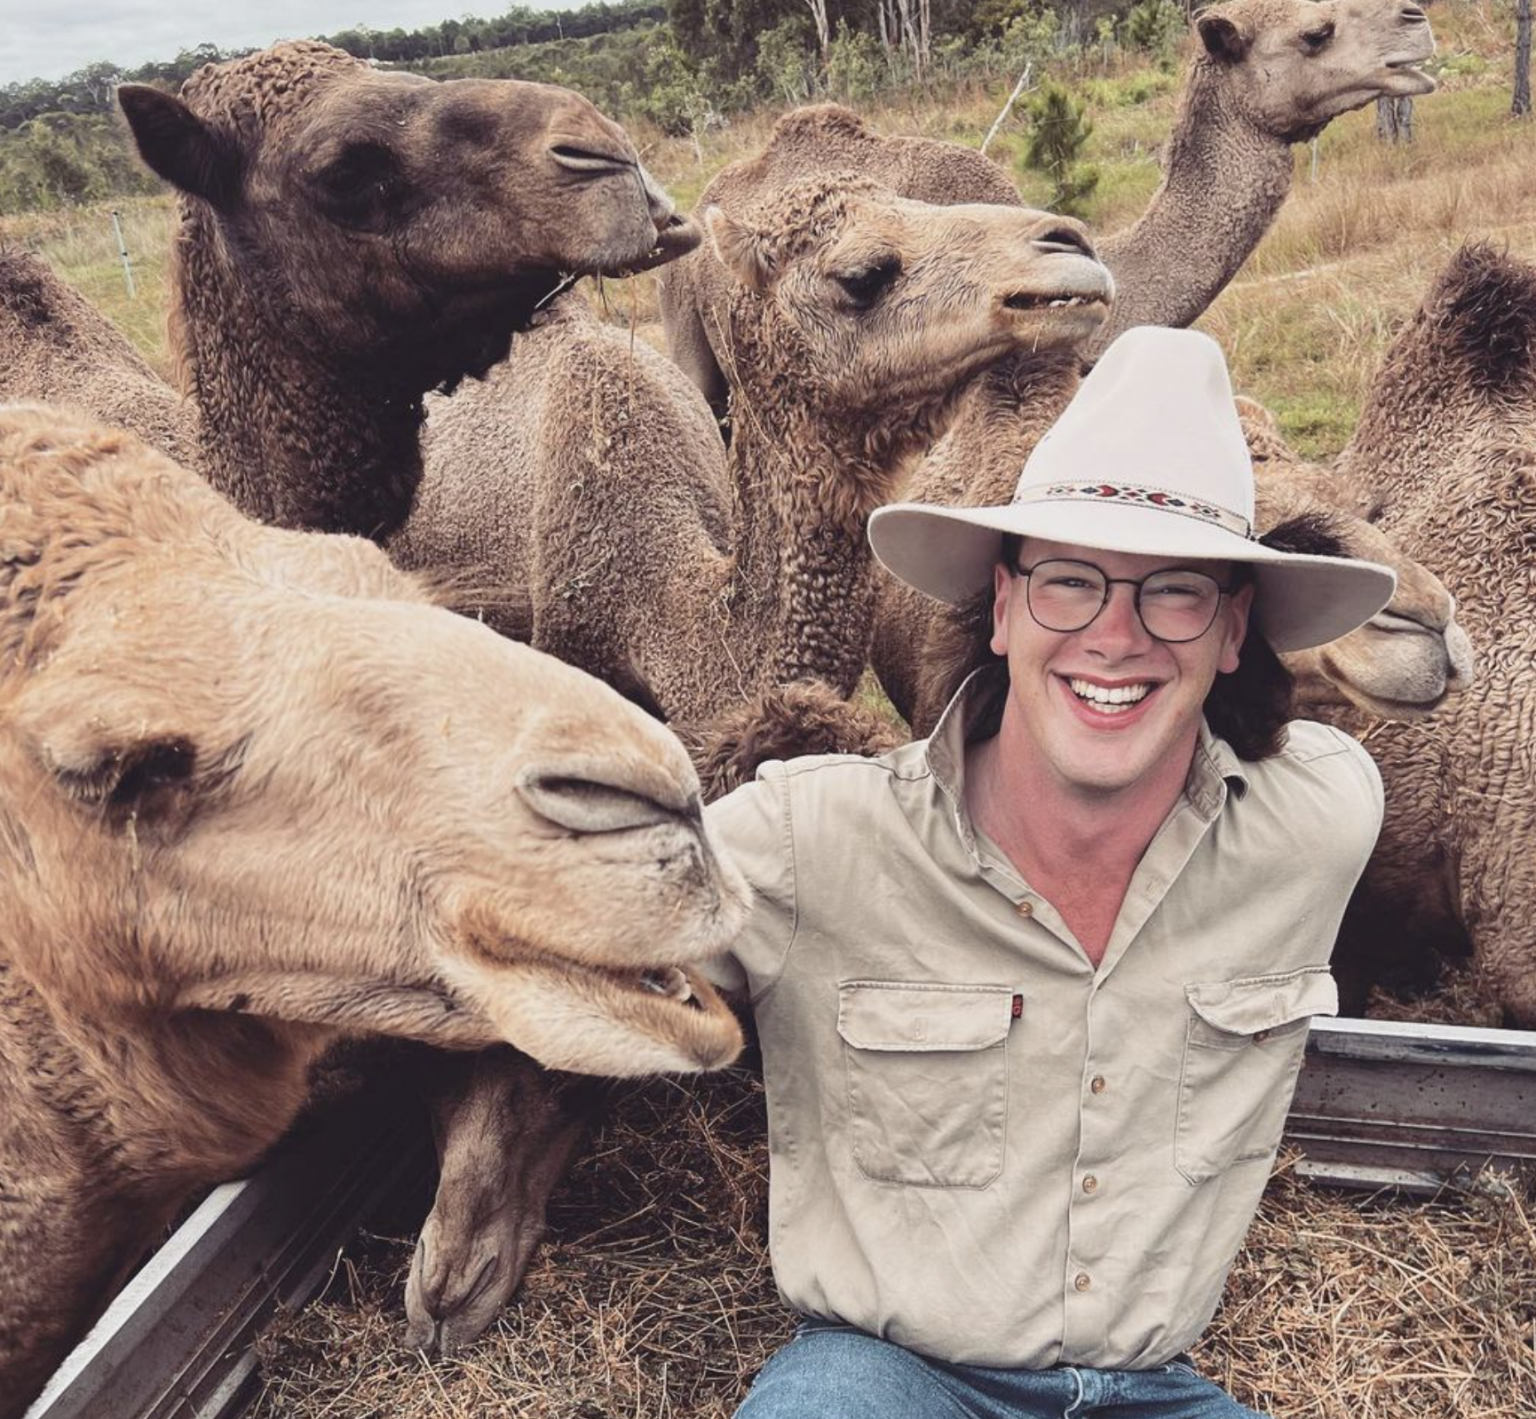
Big Farmer Andy — a third-generation dairy farmer in Australia whose grandfather emigrated from Holland in 1936 — started on TikTok almost by accident (Australian Farmers podcast, September 2022). A nose operation in November 2020 left him stuck inside for two weeks, so he posted some old farm videos to kill time. They blew up. His TikTok following stood at 449,200, with 14.5 million likes, as of early 2026 (TikTok, January 2026).
Big Farmer Andy — “Full time farmer, part time washed up tiktoker” — surrounded by what are very clearly not dairy cows. His humour built a TikTok audience of 449,200. His honesty about three mates lost to suicide is why they stayed.
Andy’s hook is humour — his bio reads “Full time farmer, part-time washed-up TikToker.” But his most important content isn’t funny. He’s one of the few agricultural creators willing to talk openly about the mental health toll of farming. “I also know, in my life, three young men who have died from suicide,” he told the Australian Farmers podcast.
“I know there are a lot of people in the community who struggle and suffer in silence,” Andy said in the same interview. “I just want people to know how preventable suicide is.” He grew a fundraising mullet to raise money for Australia’s Black Dog Institute and directs followers to mental health resources (Australian Farmers podcast, September 2022; 4BC, March 2023).
That’s the trade-off nobody puts in the marketing deck. Social media gives dairy farmers a tool for consumer engagement, yes. But for isolated operators, it can also be a lifeline — a bridge to the outside world during stretches when the only conversations you’re having are with the herd. The flip side is real, too: visibility invites hate comments, trolls, and scrutiny you didn’t ask for. Payne told the Guardian she focuses on the followers who genuinely want to learn about the industry — that’s the right line. And if isolation is a factor on your operation, Andy’s experience points to something worth reading: the suicide risk dairy farmers face — and what your operation can do about it.
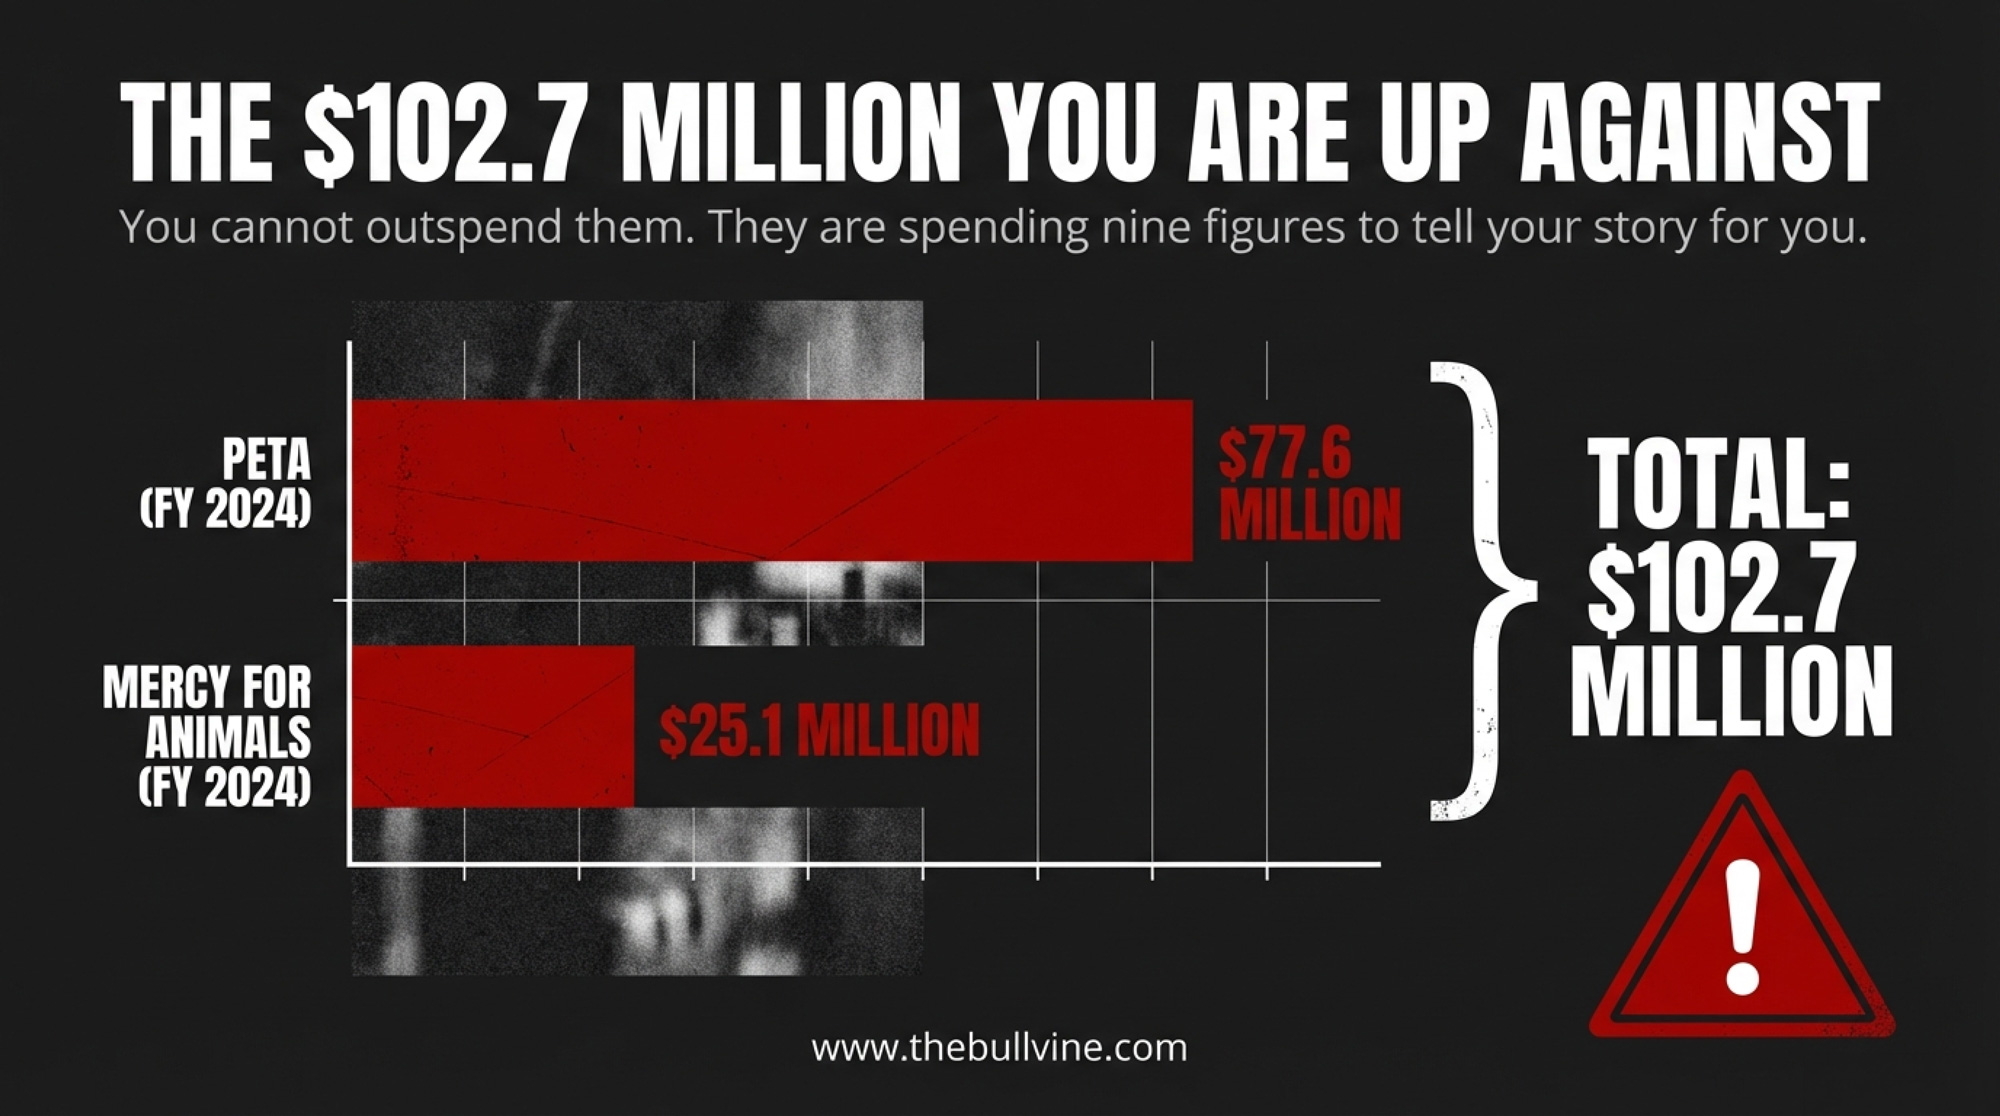
The $102.7 Million You’re Up Against
None of this replaces solid genetics, good nutrition, or profitable management. A TikTok account won’t fix your production costs. But consider what you’re up against.
PETA alone spent $77.6 million in its fiscal year ending July 2024 (PETA financial report). Mercy for Animals reported another $25.1 million in consolidated spending for its FY 2024 (MFA audited financial statements, year ending December 31, 2024). That’s $102.7 million from just two organizations — before counting Humane World for Animals (formerly the Humane Society of the United States, rebranded February 2025), which dwarfs both. When you look at who really owns your milk check, the money flowing against dairy’s public image is part of the same picture.
You’re not going to outspend them. You can out-trust them — but only if the trust is already built before the camera shows up. Fair Oaks showed how fast a curated public image can collapse when the reality behind it doesn’t match. Ranallo, Pemberton, and Payne are showing the raw, unfiltered version holds up to scrutiny.
Herd Size
Daily Production per Cow (lbs)
Milk Price ($/cwt)
Daily Revenue Loss
30-Day Total Loss
300 cows
75
$18
$4,050
$121,500
300 cows
75
$21
$4,725
$141,750
500 cows
75
$18
$6,750
$202,500
500 cows
75
$21
$7,875
$236,250
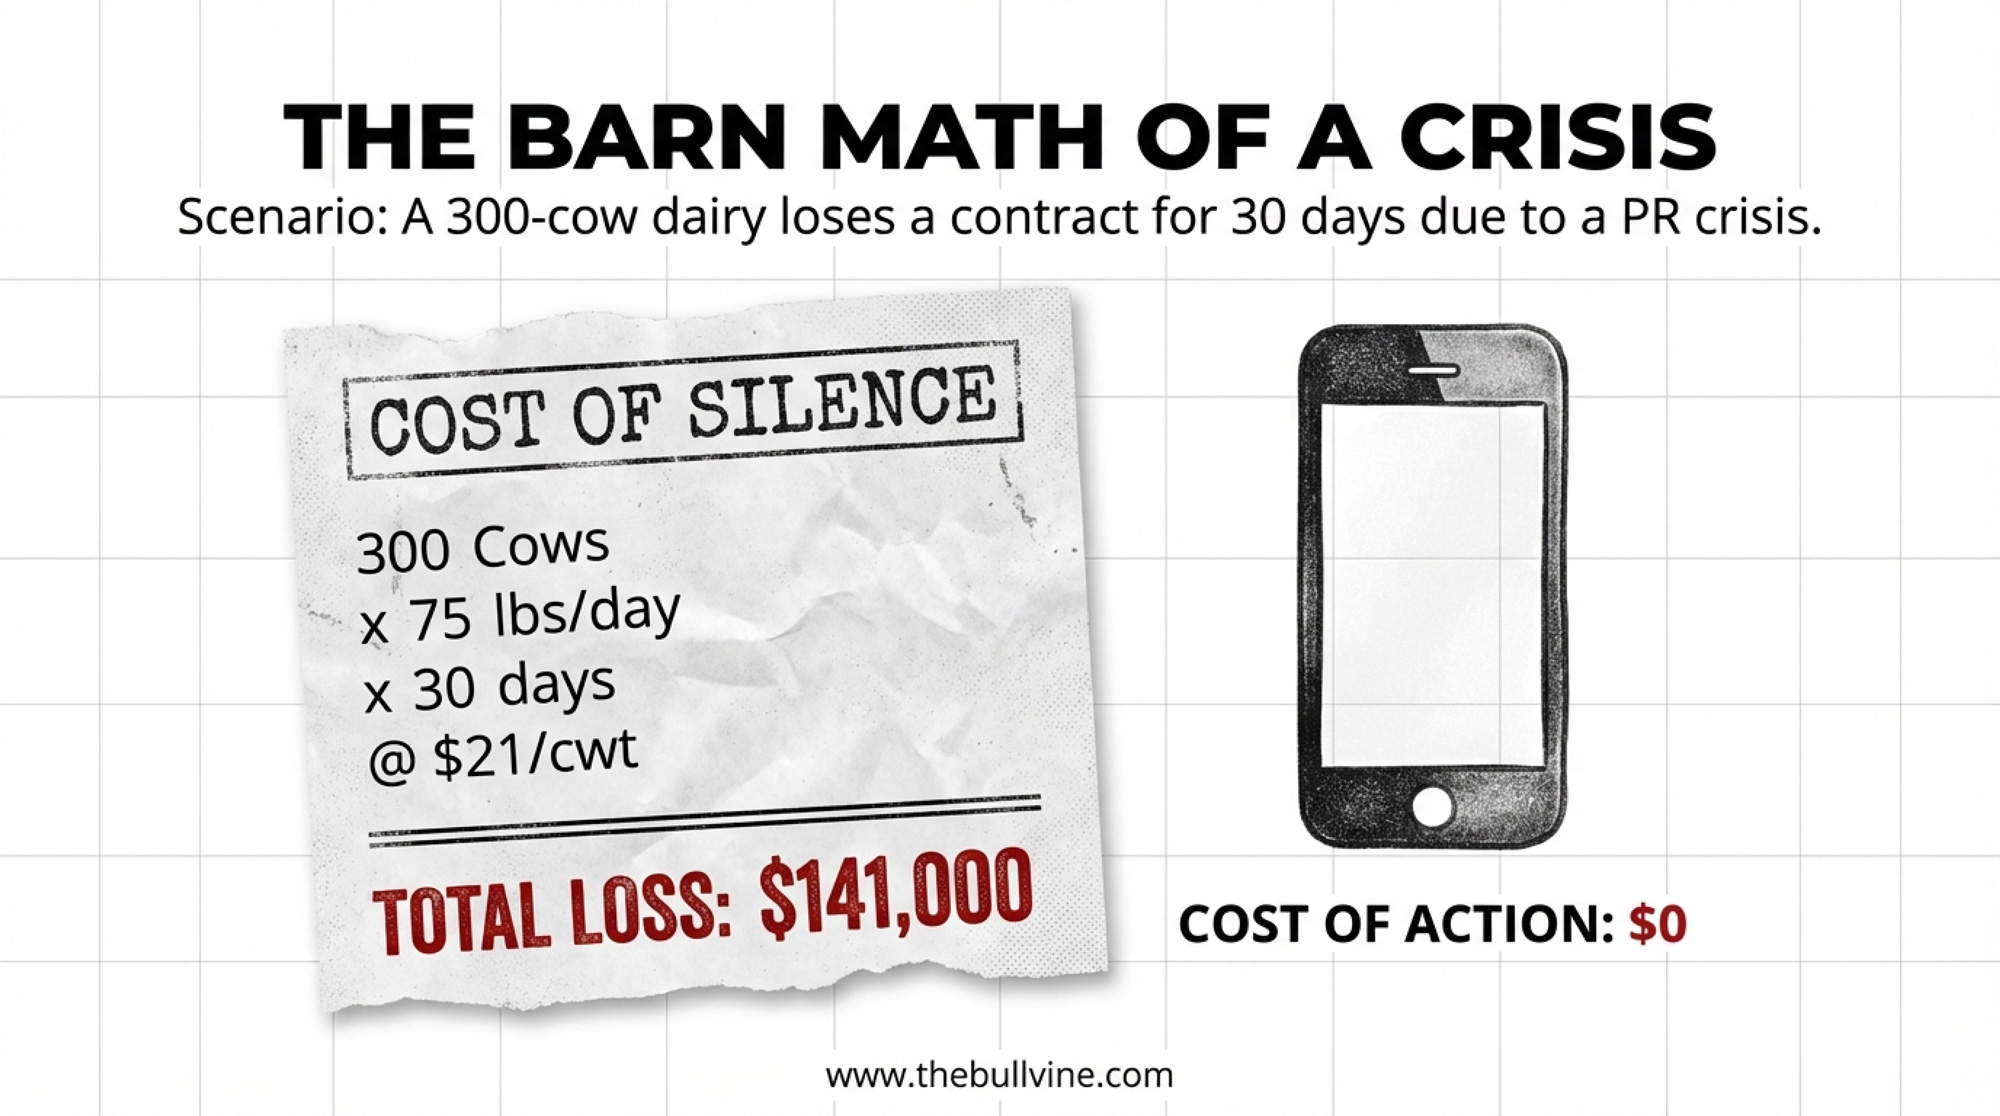
Think of it this way: if your 300-cow operation lost a processor contract for even 30 days over a consumer-trust crisis — at even $18/cwt on 75 lbs/day, and that’s conservative; USDA’s 2025 all-milk price ran around $21 (USDA WASDE, 2025) — that’s roughly $121,500 in milk revenue with nowhere to go. At $21/cwt, the hit climbs past $141,000. The cost of one phone and 20 minutes a week looks different against those numbers.
Creator / Operation
Platform(s)
Total Reach / Followers
Herd Size / Scale
Core Content Approach
Nate the Hoof Guy (Nathan Ranallo)
YouTube, TikTok, Facebook
880M+ YouTube views, 1.7M subscribers
Hoof-trimming service
Unedited hoof-care procedures with methodical explanations
Large operations supplying consumer-facing brands or in high-scrutiny regions
Turn scale into asset via third-party verification + raw content + public access
Don’t quit—this is crisis insurance, not an experiment
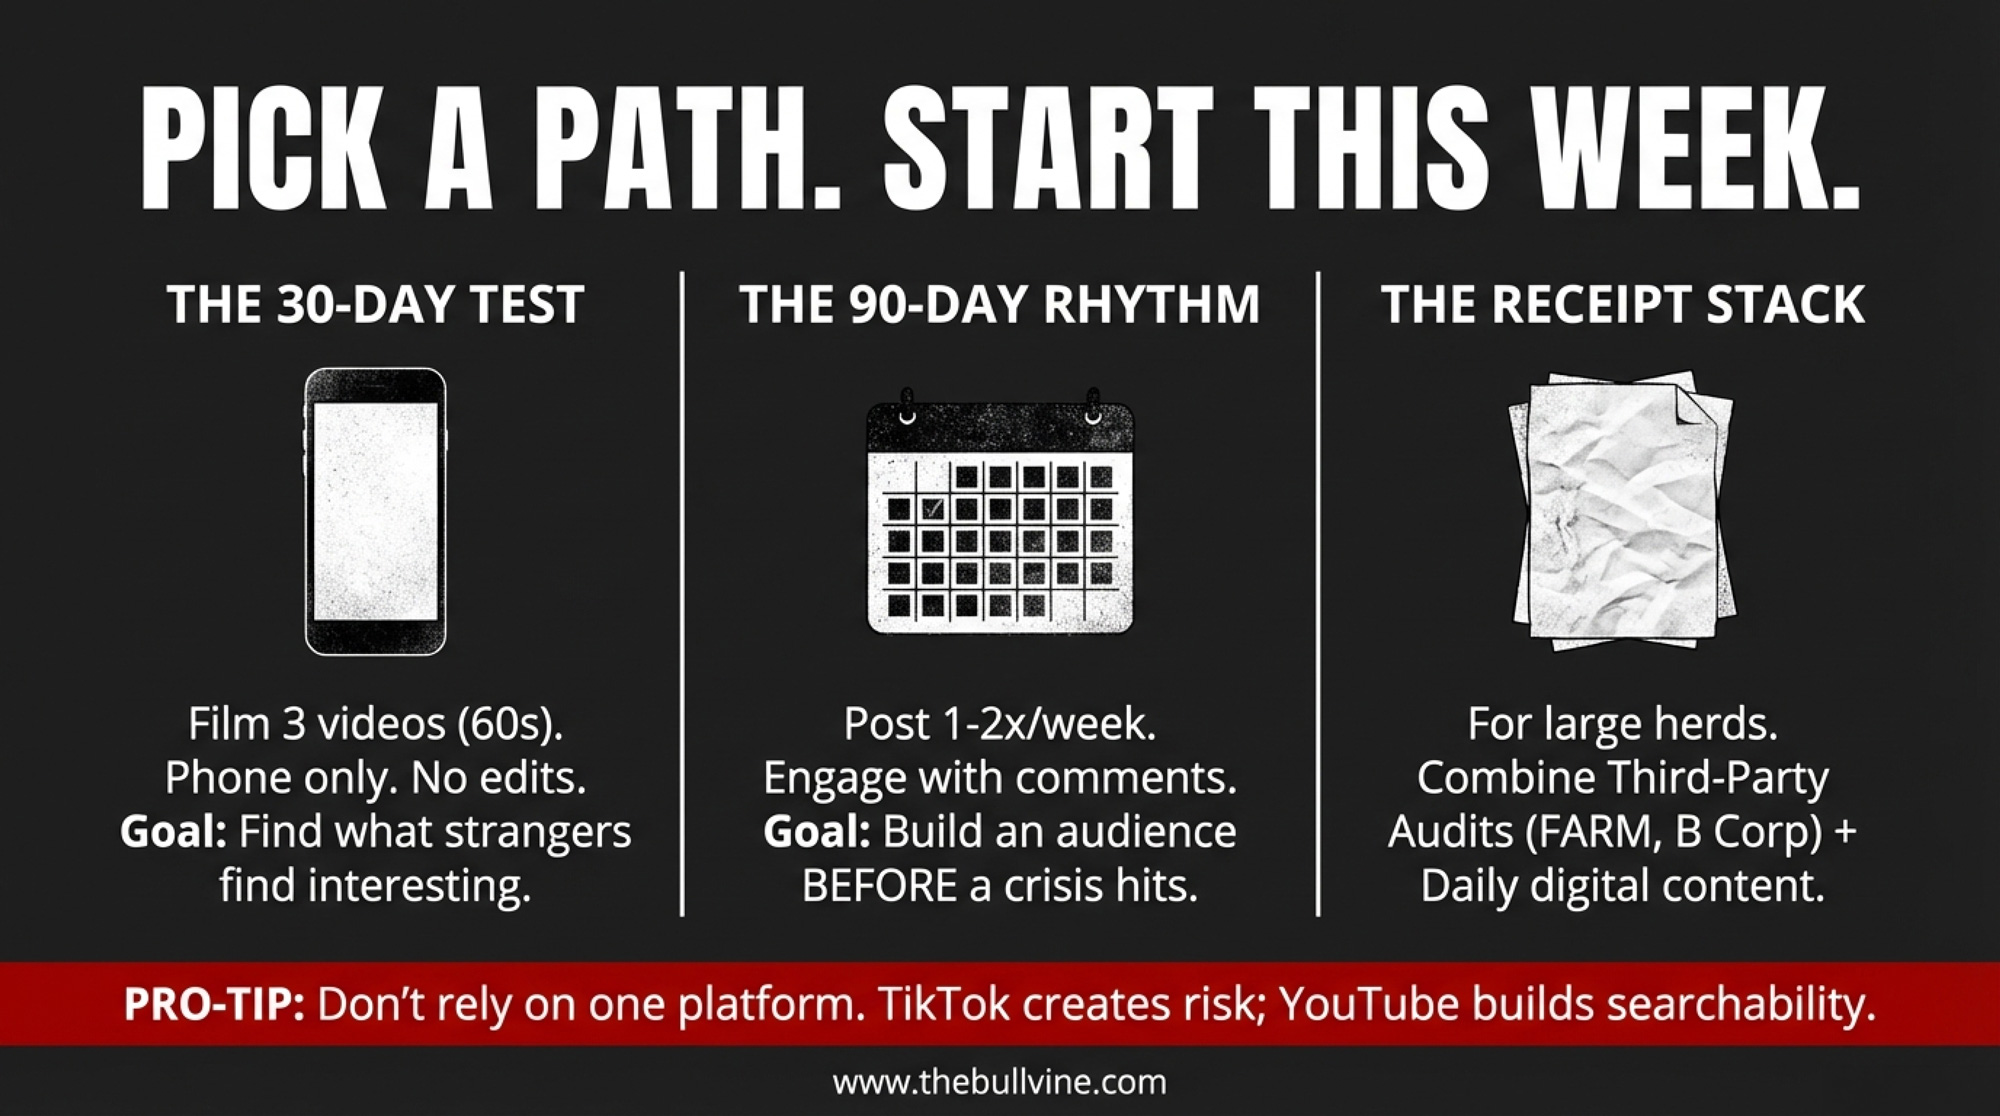
Path 1: The 30-day test — just start. Film three short videos (60–90 seconds) of daily operations. Phone only. No editing, no script. Post on whichever platform your local consumers use most. Ranallo went from a flip phone to 880 million YouTube views — his early videos were rough, and that didn’t matter.
Kielstra’s advice: “Just pick up your phone and start taking pictures and videos of what you do around the farm” (Sweet Peas Evening Ag News, March 2020). Your goal in the first month isn’t to build an audience — it’s to discover what about your operation people find interesting. It’s rarely what you’d guess. Cost: 20 minutes per video. Time to first post: this week.
Path 2: Build a weekly rhythm — the 90-day commitment. Pick one platform and post consistently once or twice a week. Engage with every comment — Kielstra has said the early comments on each upload make the effort feel worthwhile. Find your farm’s “oddly satisfying” moment: the one thing a non-farmer would watch twice.
This path takes 2–4 hours per week. The trade-off is real time diverted from operations. The payoff is a growing audience that trusts you before any controversy hits. If you’re getting zero engagement after 90 days, switch platforms before quitting.
Path 3: Stack the receipts—the 365-day strategy. If you’re a larger operation, pair third-party audits (DairyCARE, B Corp, FARM Program) with a consistent digital presence. MVP Dairy’s model — a B Corp score well above the 80-point threshold, plus daily human-scale content, plus a physical learning center — is the strongest shield available when consumer perception is a direct business risk.
If you sell fluid milk or supply a processor with a public brand, this is you. The investment is significant, but it turns your size into an asset rather than a liability. Pair it with unpolished digital content and independent verification, or you’re building a facade instead of a foundation.
One caution across all three paths: don’t build your entire presence on a single platform. TikTok faced a U.S. divestiture mandate for most of 2025 before a joint venture deal closed on January 22, 2026 (Axios, January 2026) — Pemberton’s strength is YouTube, a long-form, searchable platform that doesn’t depend on any one app’s survival. Whichever path you’re on, the broader forces reshaping dairy operations aren’t slowing down. It’s worth understanding what consolidation means for your operation’s next move.
Key Takeaways
If you supply a processor with a consumer-facing brand, your operation’s public visibility isn’t optional — it’s part of the trust chain. Ask your fieldman or co-op what their transparency expectations look like this month.
If your region has faced activist campaigns or ballot initiatives, an established digital presence is cheaper insurance than crisis PR after the fact. One New York dairy’s years of NYSCHAP participation killed a PETA-driven AP story before it ran (Bovine Veterinarian, May/June 2016). Start with Path 1 this week — three videos, twenty minutes each.
If you’re running a large operation with no authentic public face, study MVP Dairy’s model — then study what happened to Fair Oaks when curated transparency met undercover footage. The combination that holds is third-party audit, plus raw content, plus a willingness to let people see the real barn.
If isolation is a factor on your operation — and on a dairy, it almost always is — content creation can serve double duty. Andy’s experience isn’t unusual. The digital connection matters even when the audience is small.
The Bottom Line
A herd manager in Ikamatua has 325,000 followers who know her cows by name. A hoof trimmer in Wisconsin — a guy who told Wisconsin Public Radio he’d never edited a single piece of footage in his life — built an audience of 880 million views. So who’s telling your story right now?
Complete references and supporting documentation are available upon request by contacting the editorial team at editor@thebullvine.com.
Learn More
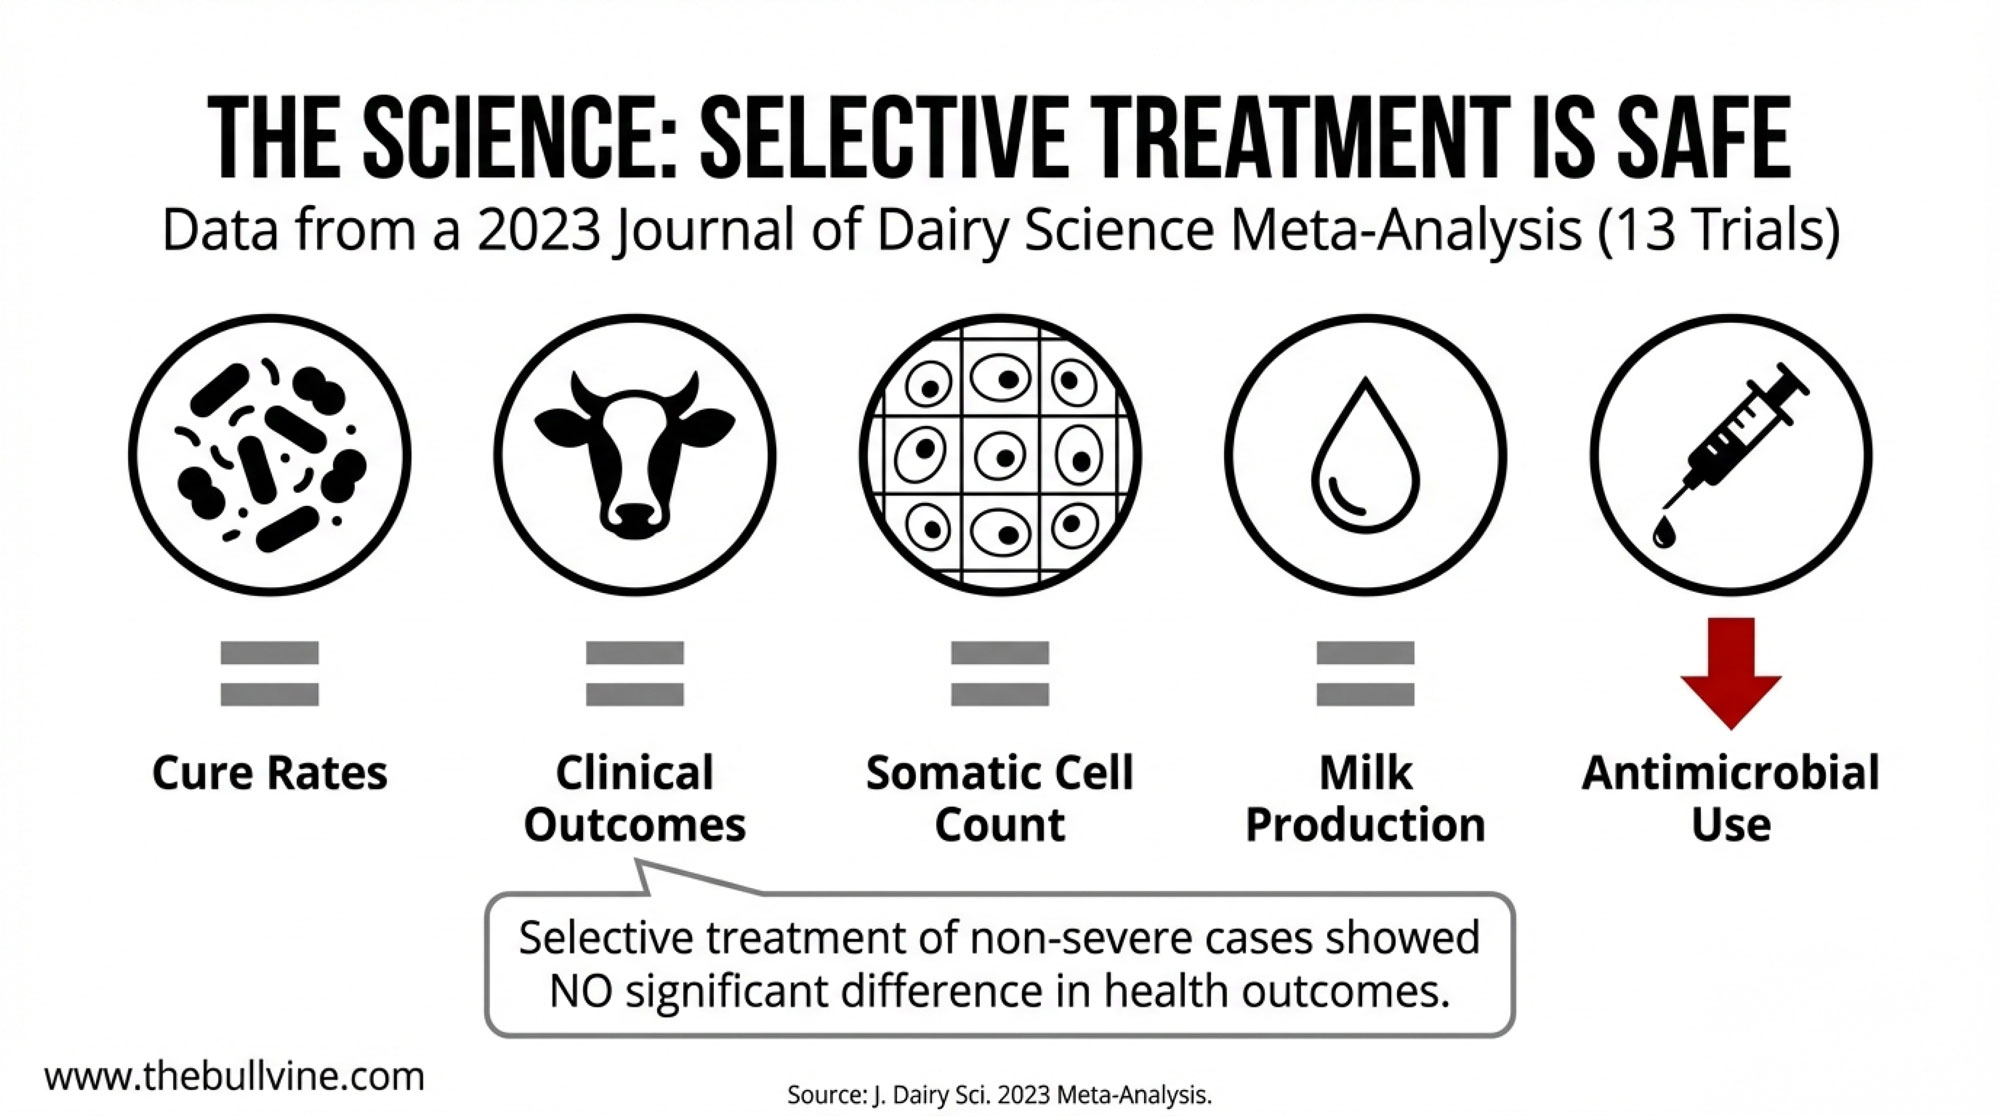
Zero Mastitis Tubes Since March: The Real Cost of Lameness – Delivers a brutal reality check on your bottom line. You’ll gain a high-precision method for calculating the hidden drain of lameness, transforming invisible losses into a targeted, actionable strategy for immediate profit recovery.
The American Dairy Heist: Who Really Owns Your Milk Check? – Exposes the financial machinery syphoning your margins. This analysis arms you with the hard data on processor consolidation and global shifts, revealing exactly how to position your equity for the next five years of volatility.
Social License: Why it is the biggest threat to the dairy industry – Reveals why “doing a good job” isn’t enough anymore. This deep dive breaks down how the industry’s boldest mavericks are weaponizing transparency to secure their social license and dominate the high-value consumer market.
The Sunday Read Dairy Professionals Don’t Skip.
Every week, thousands of producers, breeders, and industry insiders open Bullvine Weekly for genetics insights, market shifts, and profit strategies they won’t find anywhere else. One email. Five minutes. Smarter decisions all week.
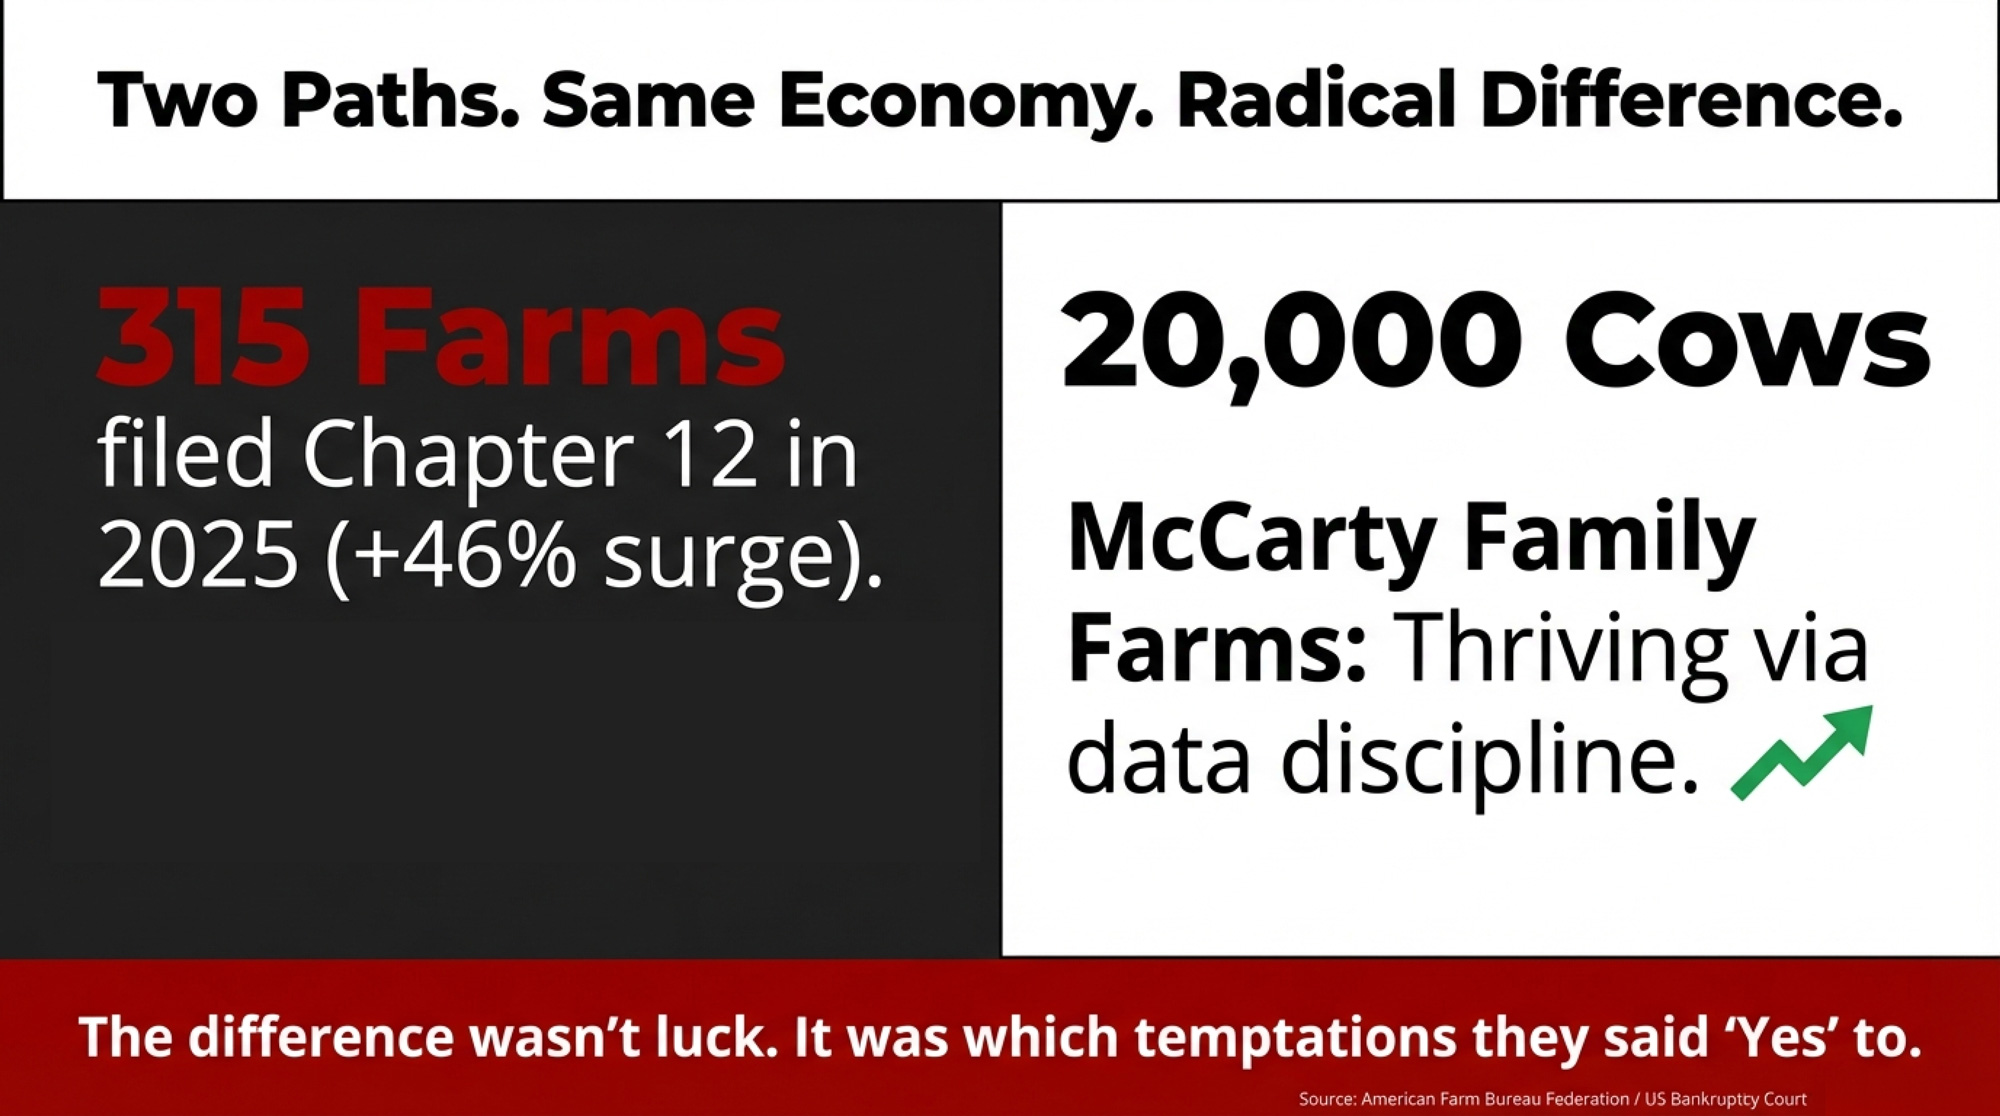
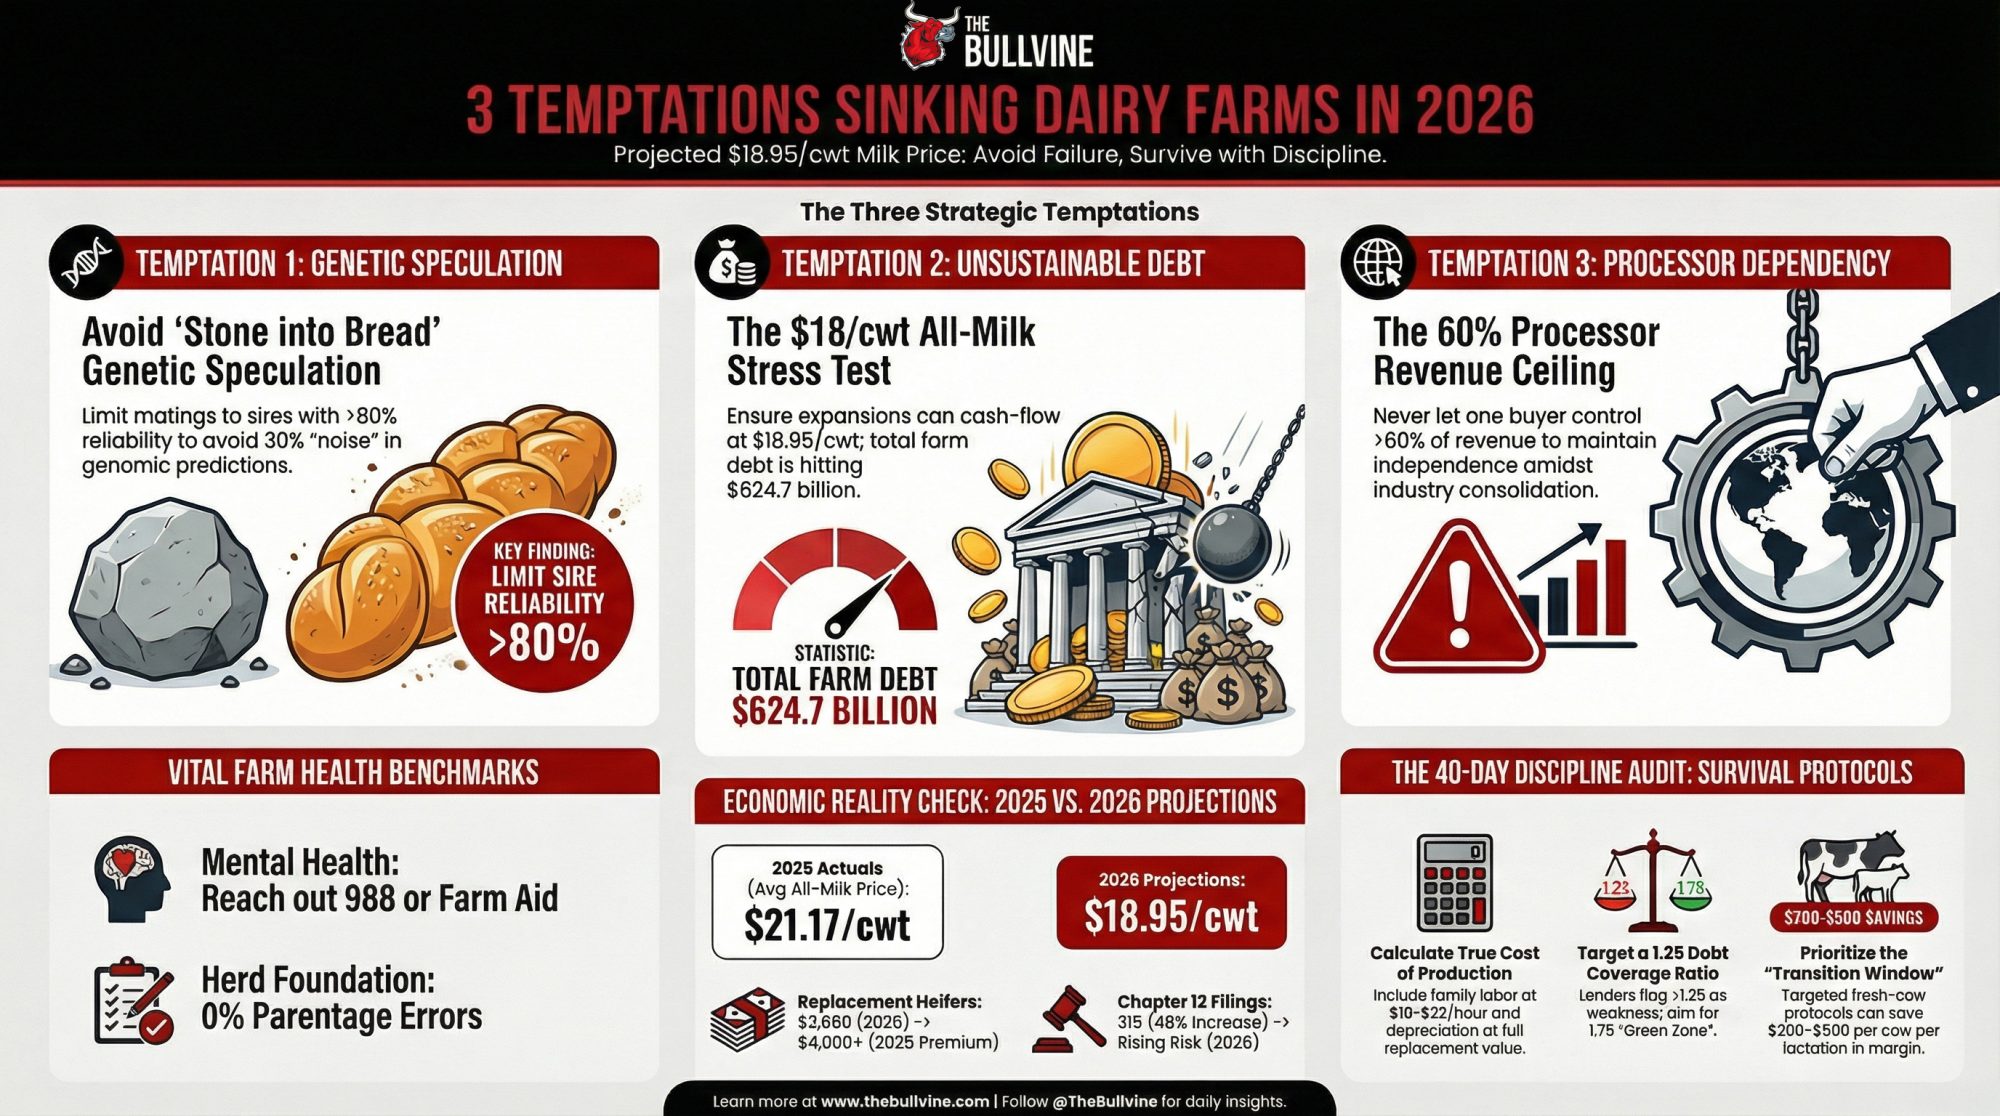
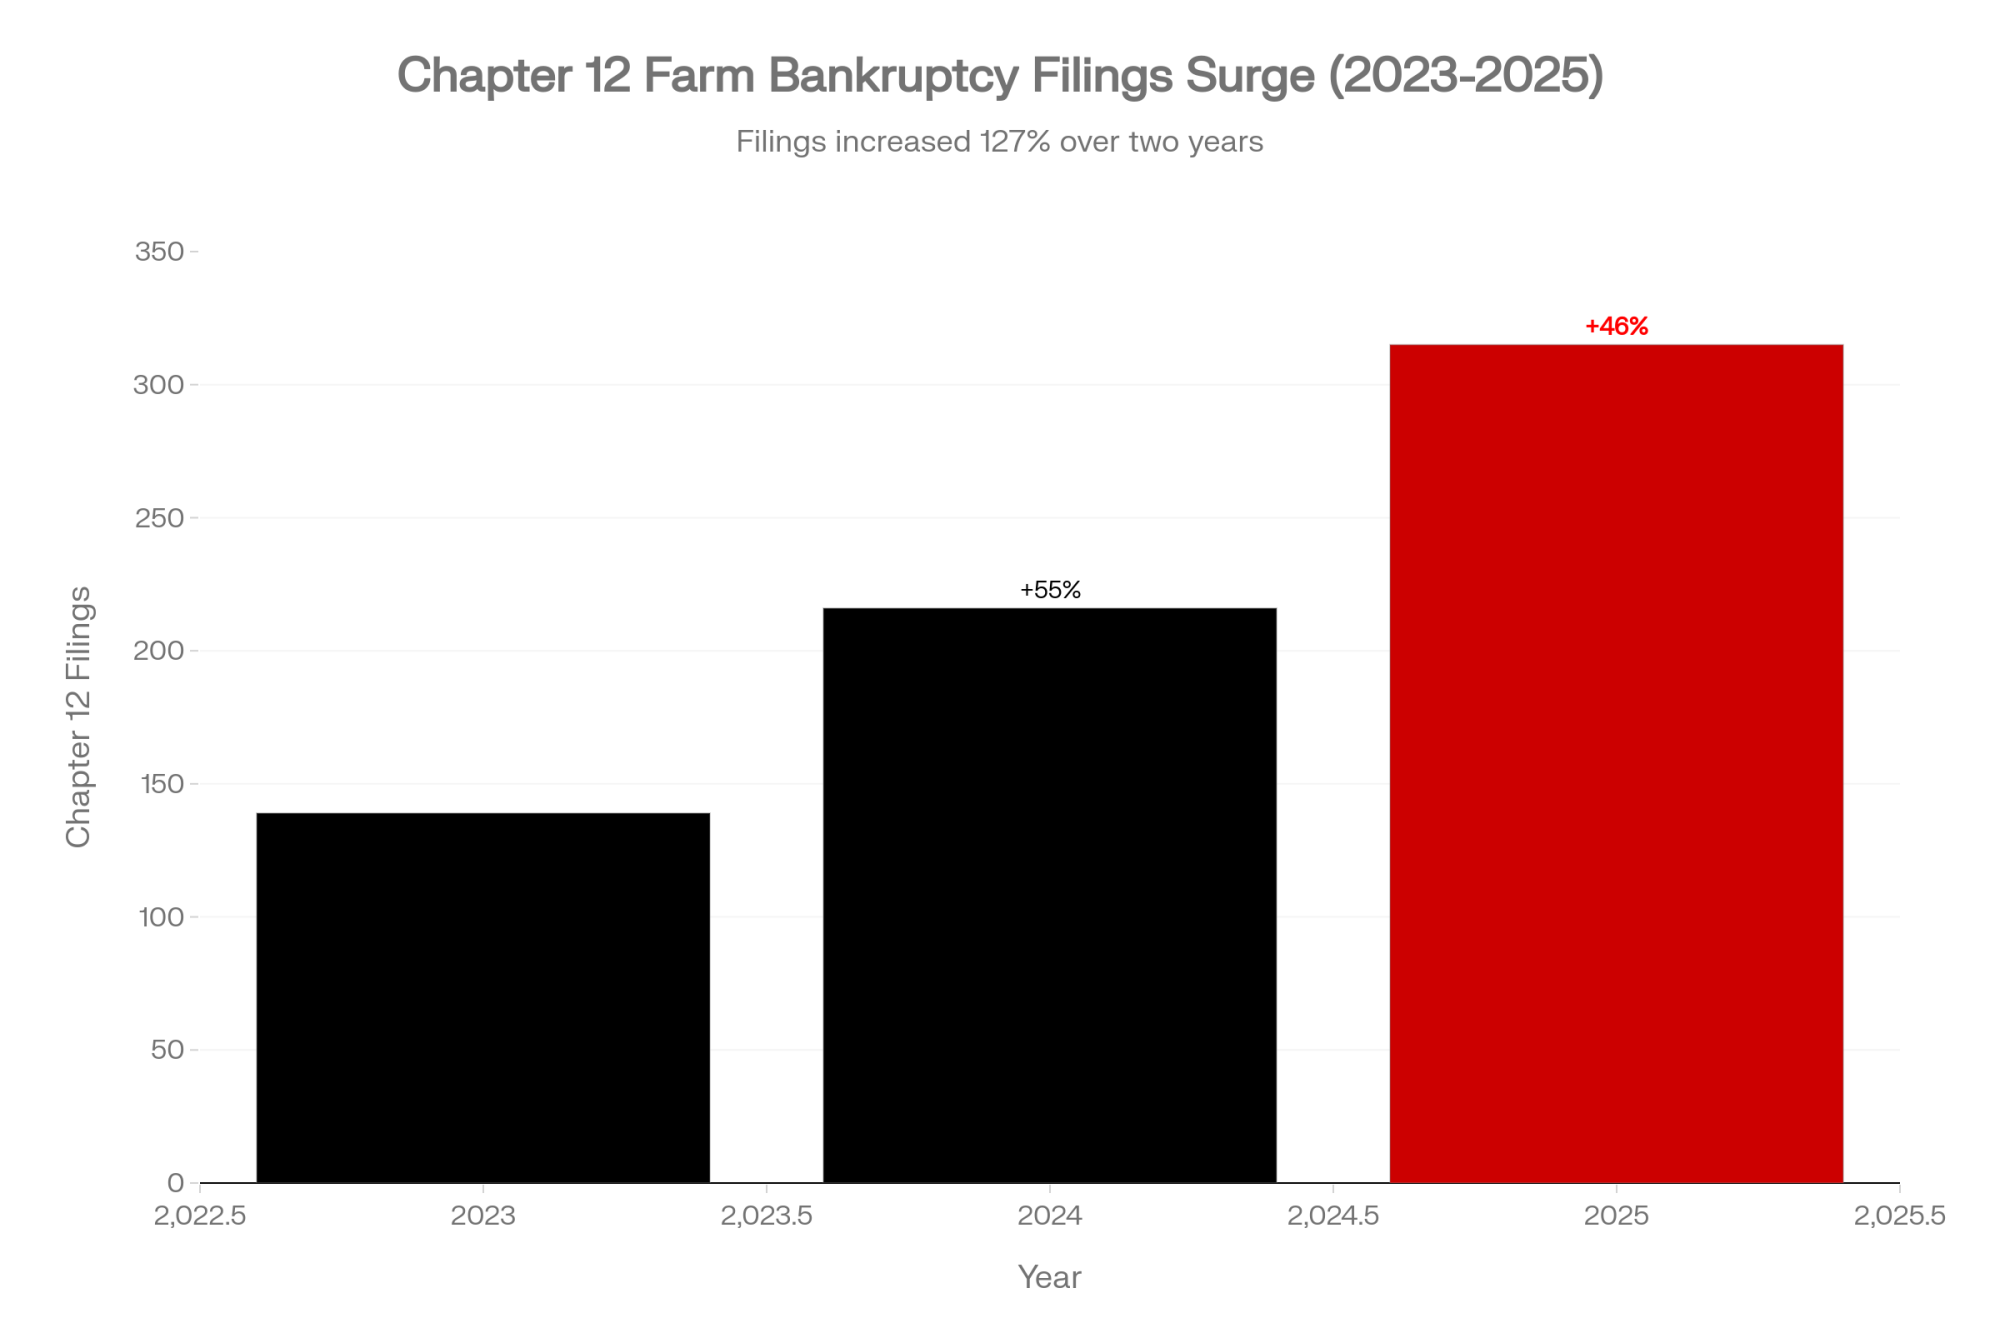
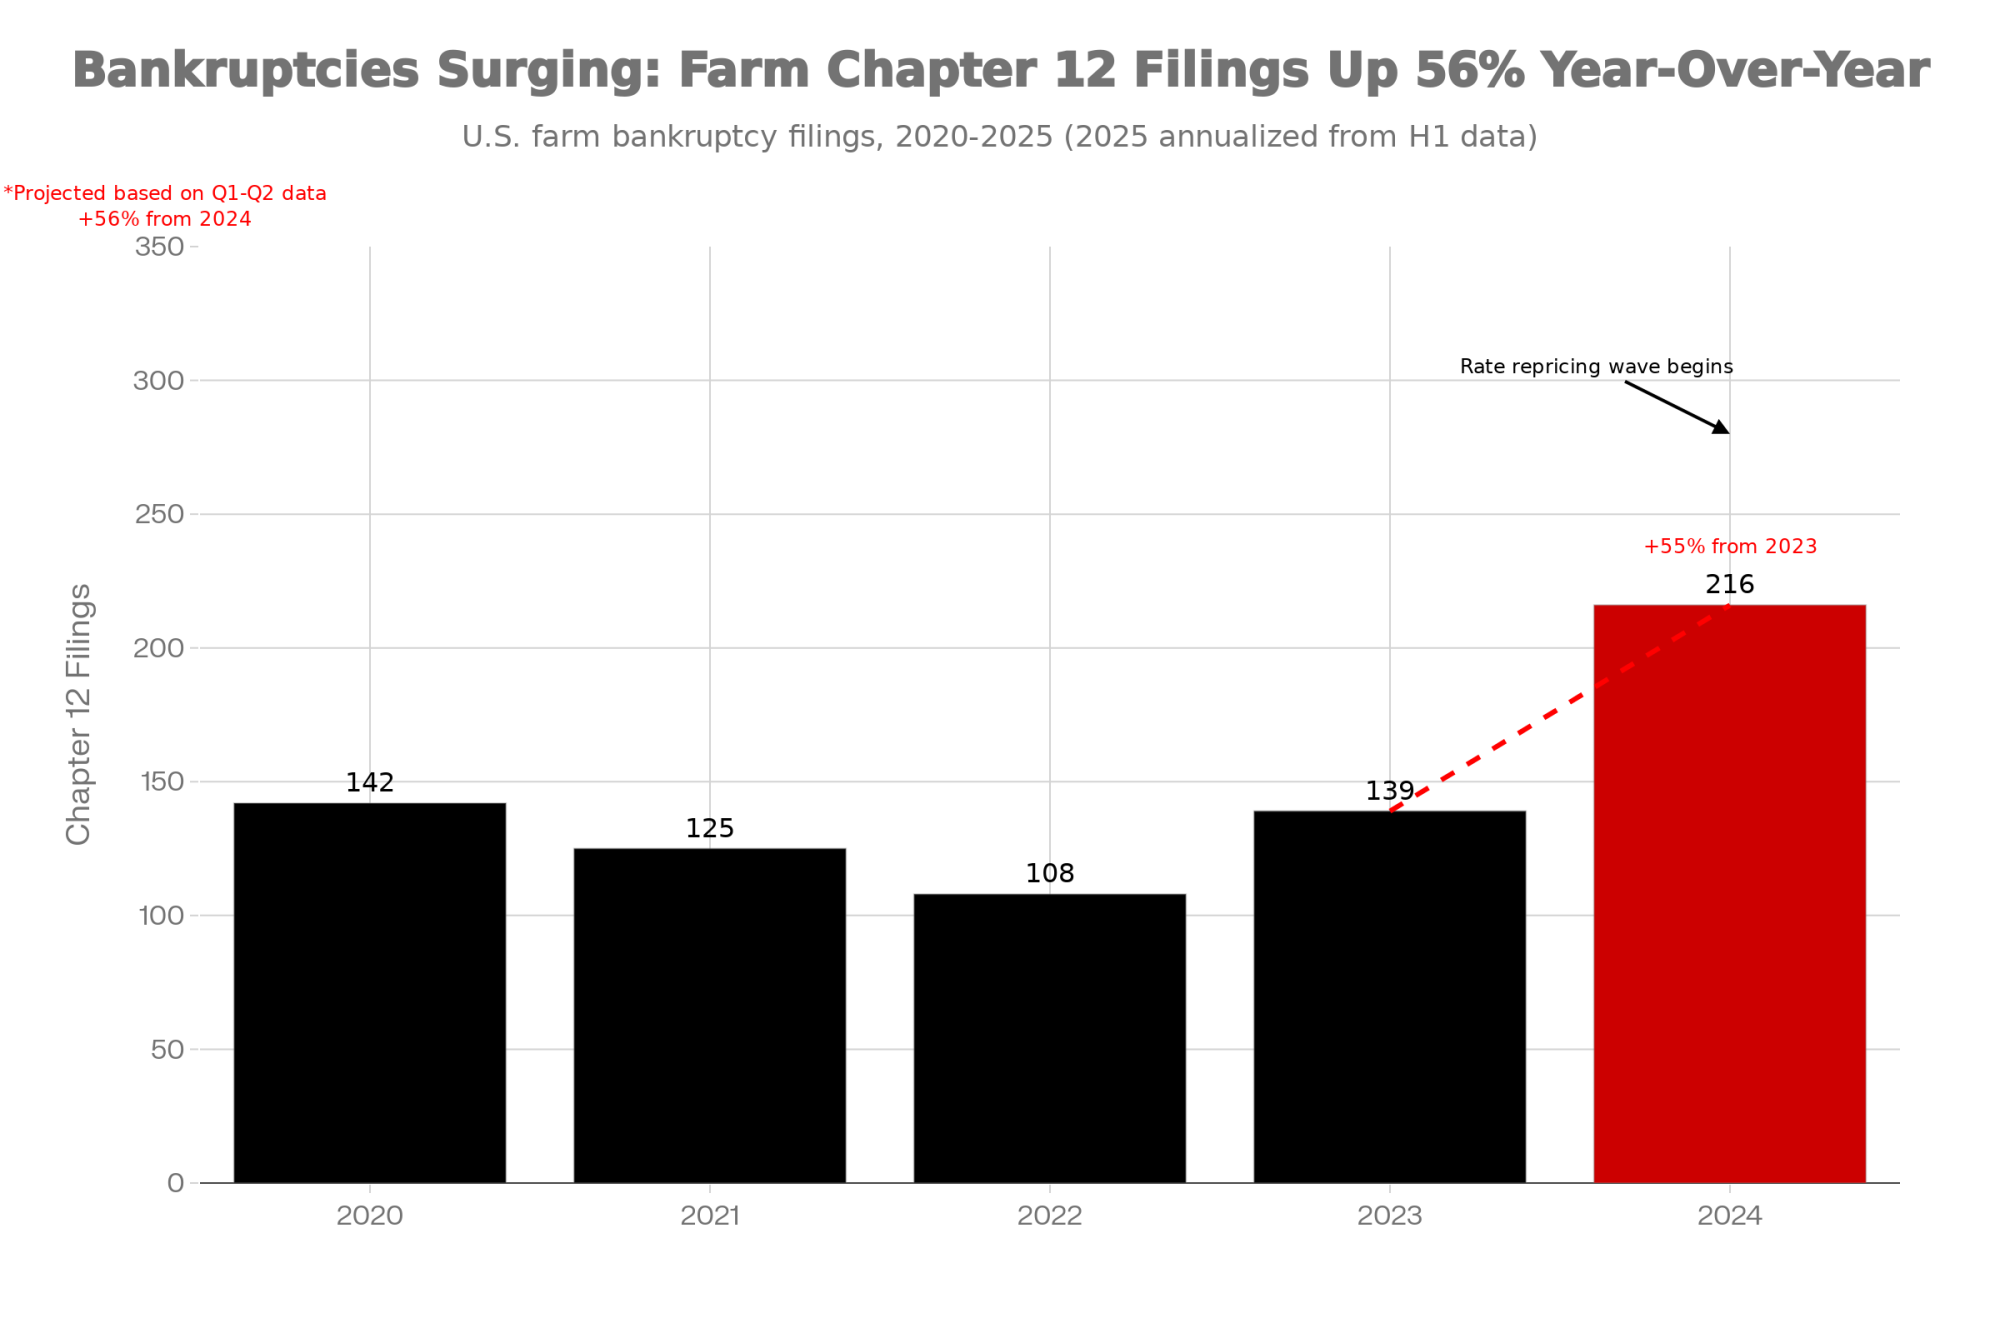
315 farms filed Chapter 12. A 20,000‑cow dairy thrived. The difference? Three temptations almost every farm faces — and a 40‑day pause most never take.
Executive Summary: Three hundred fifteen farms filed Chapter 12 in 2025 — a 46% surge. This feature uses the Lenten Gospel’s three temptations as a mirror for the three decisions destroying dairy operations: chasing unproven genomic sires over disciplined genetics, expanding on record margins into record debt, and surrendering independence to a single processor. McCarty Family Farms’ 20,000-cow, data-first program anchors the survival side; Kooser Farms’ second bankruptcy in six years anchors the warning. A 40-day framework then layers across Lent, the fresh cow transition window ($200–$500/cow at stake), and the darkest weeks of winter — when one in four Canadian farmers surveyed reported thoughts of suicide. The piece closes with a concrete audit protocol: pull your real cost-of-production, stress-test at $18/cwt, and run the ratios before any spring commitment. Every major claim traces to CDCB, USDA, AFBF, Penn State Extension, CDC MMWR, and University of Guelph primary sources.
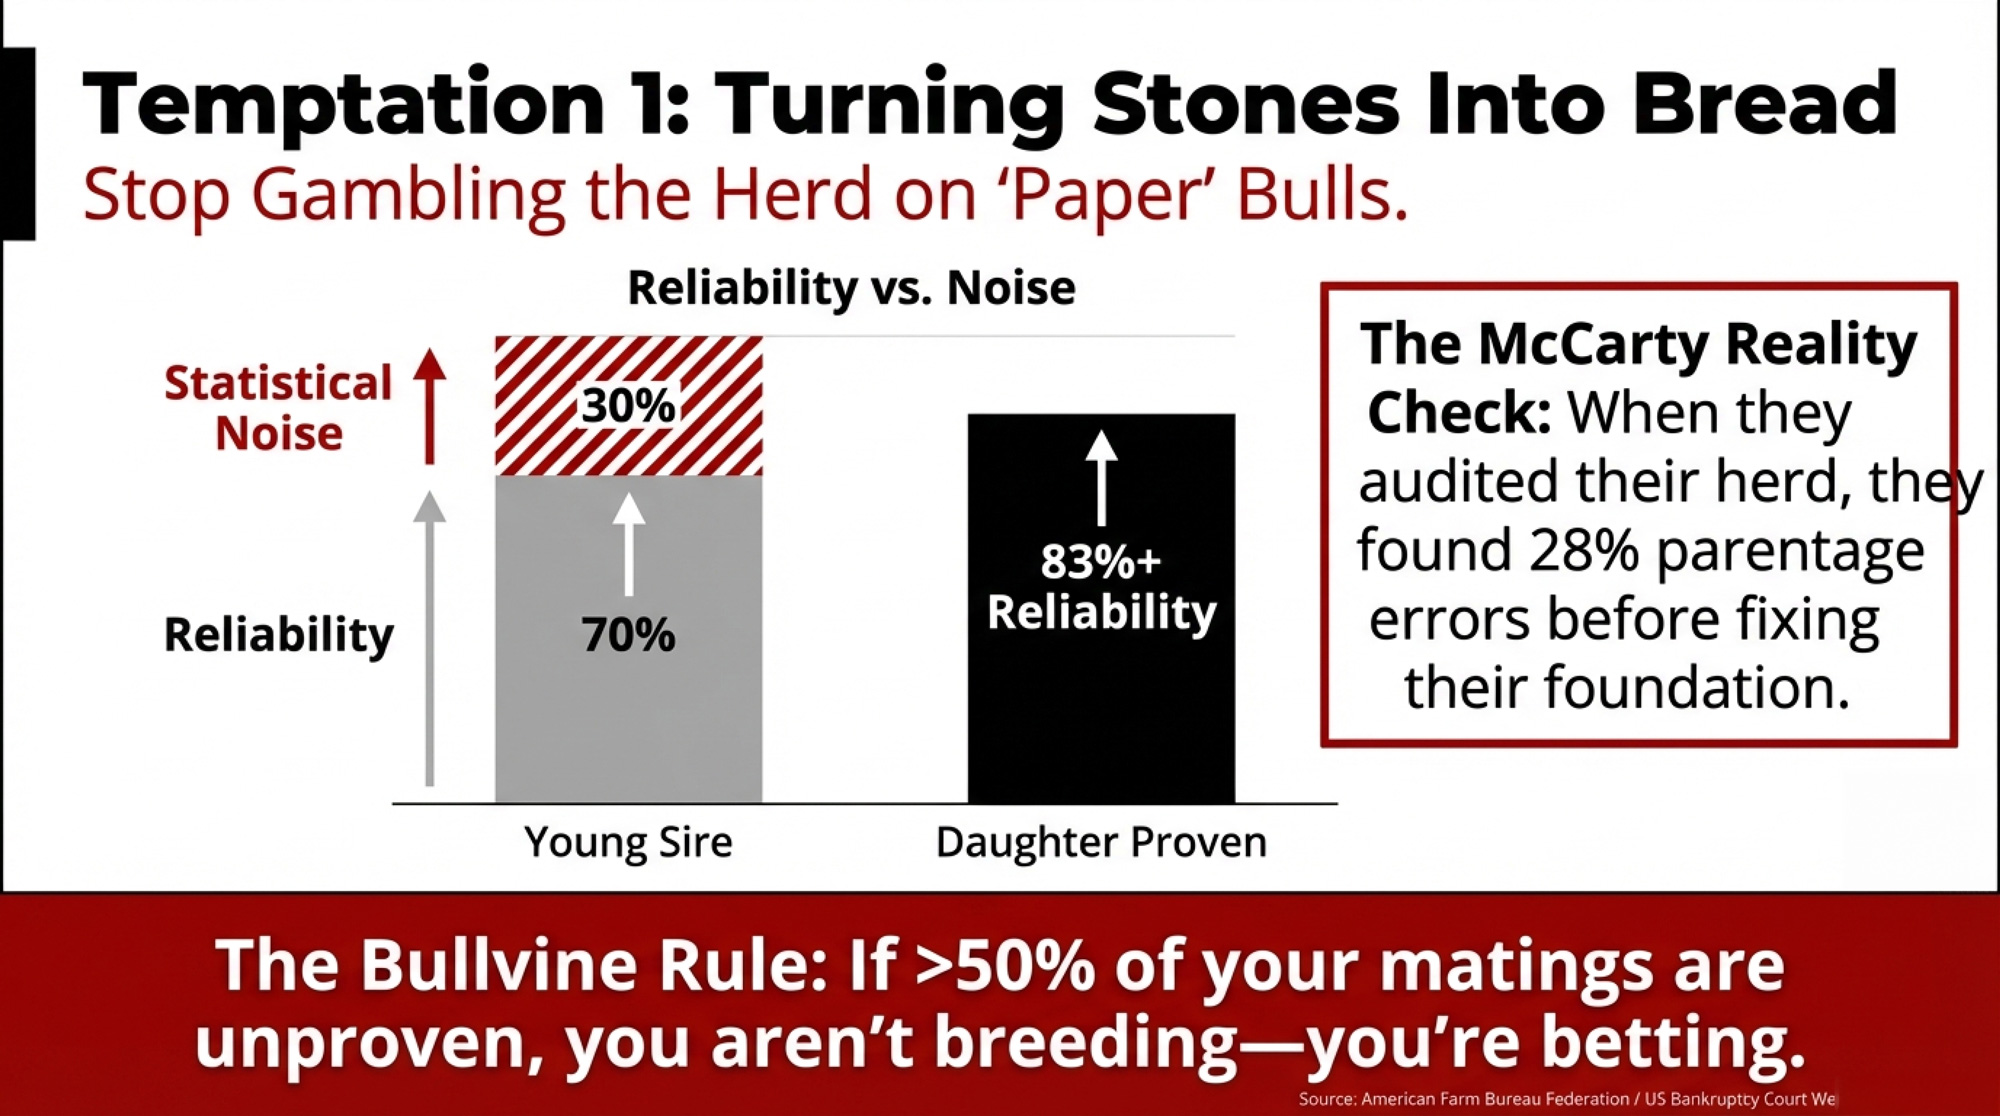
Ken McCarty found 28% of his parentage records were wrong.
That number came out when McCarty Family Farms started genomically testing every heifer across an operation that has grown from 7,000 to nearly 20,000 cows — using the Zoetis Clarifide Plus program. “How can we ever drive the appropriate rate of genetic progress, reduce inbreeding to levels where we want them to be, make the types of breeding decisions that will propel our business forward” without fixing that foundation first, McCarty asked on the Uplevel Dairy Podcast in December 2024. The answer was they couldn’t. So they fixed it, ranked every animal — top half breeds the next generation, bottom half goes to beef — and daily output per cow climbed from 70 pounds to over 100, while somatic cell counts held steady between 120,000 and 180,000.
Meanwhile, on October 2, 2025, Kooser Farms LLC filed for Chapter 12 bankruptcy in the Western District of Pennsylvania — Case #25-22656. It was their second filing in six years. Liabilities between $1 million and $10 million. Assets between $100,001 and $1 million.
Year
Total Filings
Midwest
Southeast
Milk Price
2023
139
42
38
$20.50
2024
216
71
62
$21.80
2025
315
121
105
$22.40
2026
?
?
?
$18.95
Same industry. Same economy. Radically different outcomes. And the difference wasn’t luck — it was which temptations each operation said yes to.
If you went to church this past Sunday — the First Sunday of Lent — you heard the Gospel of Jesus facing three temptations in the wilderness. Stones into bread. Throw yourself from the temple. All the kingdoms of the world. It’s a story about what happens when you’re exhausted and under pressure, and someone offers you a shortcut that seems like salvation.
The pattern playing out on dairy farms right now is the same one. Three temptations. Three lies dressed up as opportunity. And the farmers who recognize them are the ones still shipping milk.
Temptation One: Turning Stones Into Bread
“Command these stones to become bread.” In the Gospel, it’s a temptation to use power for instant gratification when you’re hungry and desperate. On a dairy farm, it’s chasing short-term genetic flash over long-term herd health.
Every proof run brings a new wave of genomic young sires with dazzling indexes. The numbers look incredible — on paper. But a genomic young sire carries roughly 70% reliability. That means 30% of the prediction is noise. A first-crop daughter-proven sire sits around 83%. Second crop? North of 99%. The U.S. genomic selection program has doubled the rate of genetic gain — the average annual increase in Net Merit jumped from $40 to $85 per cow since 2010. Real progress. But those gains come from disciplined use of genomic data across the whole herd, not from betting the farm on a single young sire’s first proof.
Building your sire stack entirely on unproven genomic predictions is turning stones into bread. It looks like food, but it won’t sustain your herd through five lactations.
That’s not an argument against genomics. McCarty Family Farms proves what disciplined use actually looks like. They test everything. They rank ruthlessly. They use indexes like TPI and Dairy Wellness Profit to manage the 60% of their budget that goes to feed. But they don’t anchor their program to any single young sire before he has daughters in milk. Dan Weigel, the Zoetis geneticist who has worked closely with the McCartys, explained on the same podcast that genomic testing unlocked parentage accuracy first—and that gave the farm a dependable foundation to build every other breeding decision on.
What Does the Genetic Gamble Actually Cost?
Here’s the barn math. The Council on Dairy Cattle Breeding estimates genetic gain savings from Net Merit selection at approximately $50 per cow per year — a figure that climbs toward $75 when you factor in the expanded trait indexes added since 2021, including feed saved, heifer livability, and early first calving. On a 200-cow herd, that’s $10,000–$15,000 annually in genetic progress you’re leaving on the table if you refuse to use genomic information at all. University of Alberta research frames it differently: a $50 reduction in genetic lag translates to roughly $33 per cow per year in realized value, using the formula of twice the PTA difference divided by average lactation lifespan.
But chasing unproven sires below 80% reliability and having even 15% of those matings disappoint? You could wipe out that gain through higher cull rates, lower components, and daughters that don’t match their pedigree predictions.
The discipline isn’t choosing genomics or not. It’s choosing which genomic information to trust, and when.
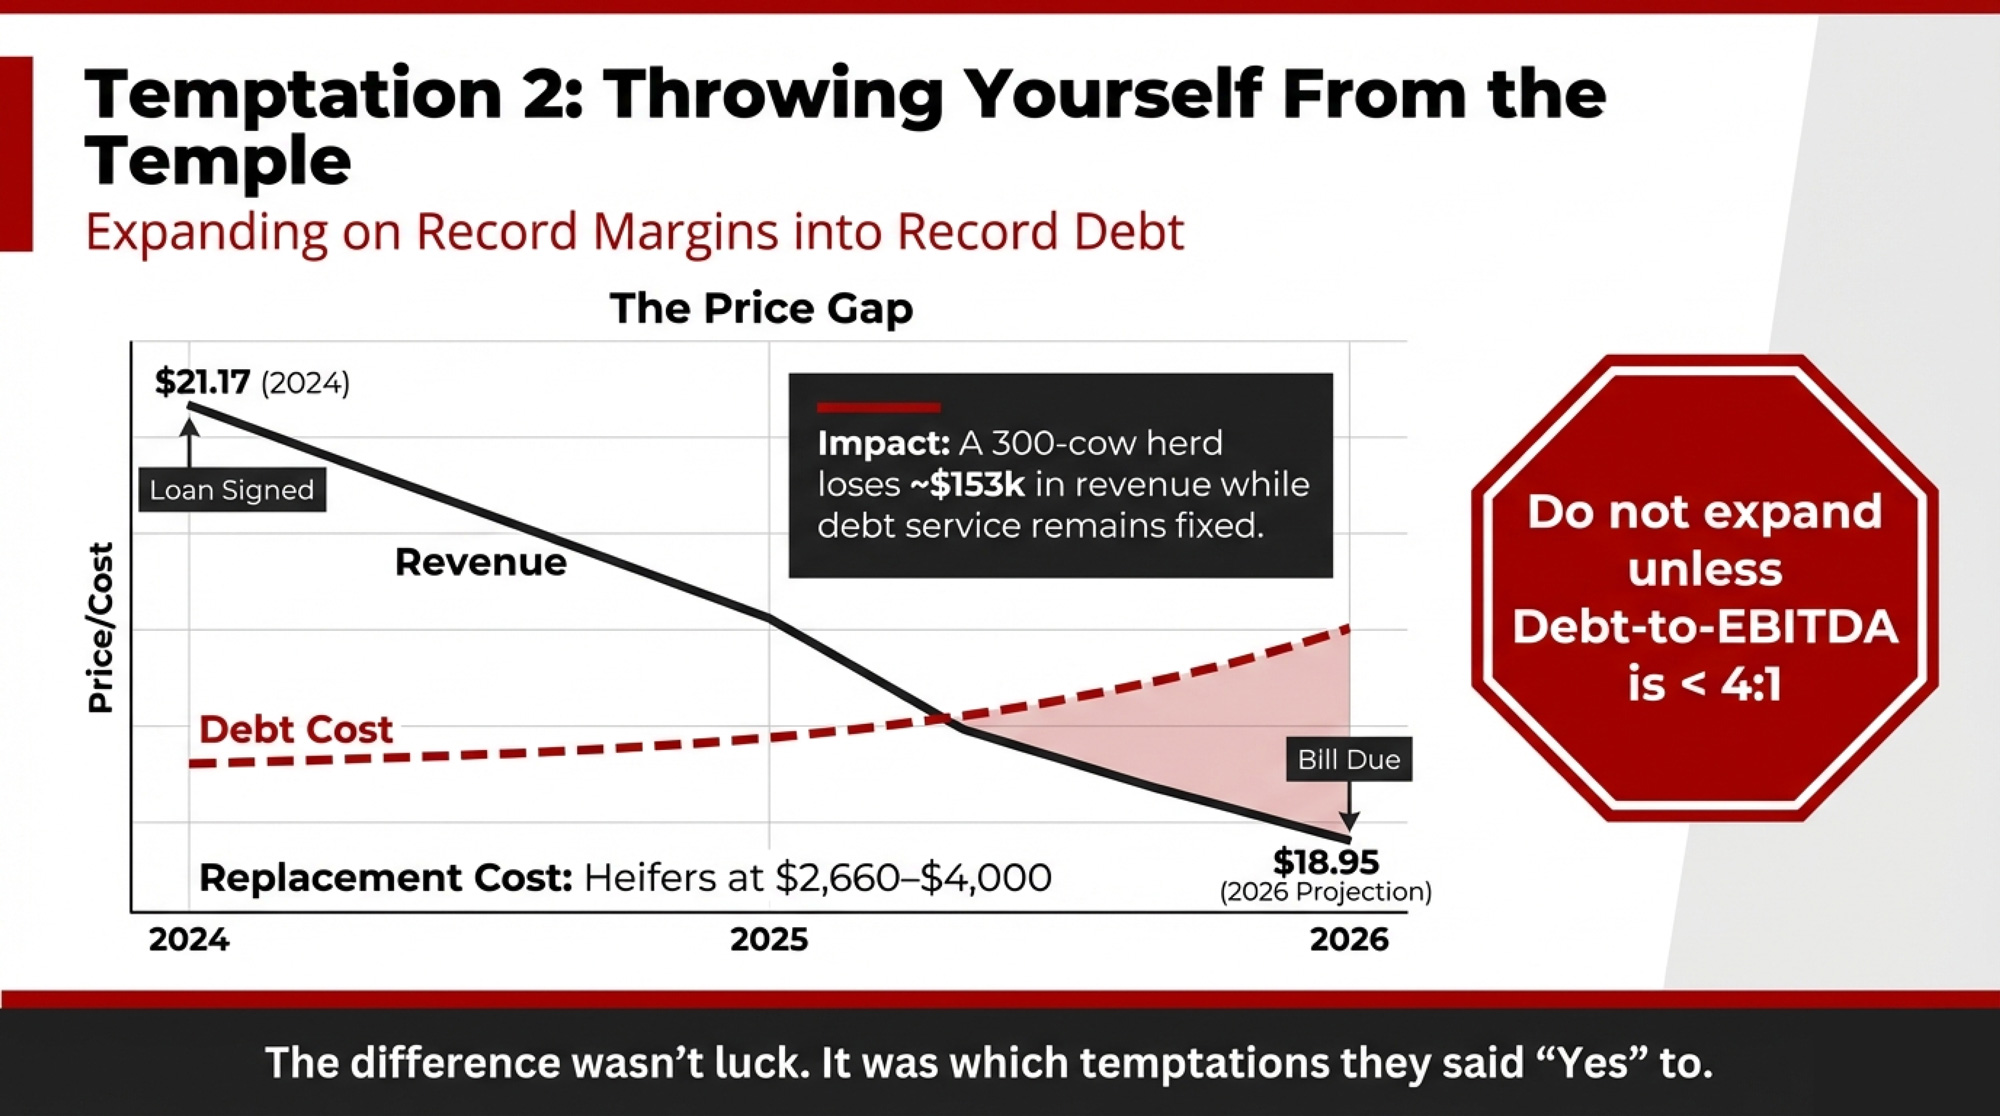
Temptation Two: Throwing Yourself From the Temple
“Throw yourself down, for the angels will catch you.” The second temptation is about presumption — testing limits because you believe you’re protected. On a dairy farm, it’s expanding on record margins because the debt math looks survivable.
The genetic temptation erodes your herd over the years. This one can sink you in months.
Chapter 12 farm bankruptcy filings hit 315 in 2025 — a 46% jump from 2024’s 216 cases, according to the American Farm Bureau Federation. The Midwest took the hardest hit: 121 filings, up 70% year-over-year. Wisconsin went from 2 filings in 2024 to 16 — a 700% increase. Iowa jumped 220%. Missouri, 167%.
Ask Kooser Farms how expansion confidence ends. This Mill Run, Pennsylvania, operation filed its second Chapter 12 in six years. During the first bankruptcy in August 2019, they sold their entire dairy herd and pivoted to crops. Attorney Daniel White of Calaiaro Valencik explained the logic to the Pittsburgh Business Times: the farm had shifted from monthly milk payments to annual crop revenue and needed a payment structure to match. It made sense on paper. Then, adverse weather hammered yields for consecutive seasons, and “Plan B” became a second restructuring.
On February 9, 2026, Judge Taddonio confirmed Kooser Farms’ second restructuring plan. Whether it holds is an open question — the plan still has to survive three to five years of execution in an agricultural economy that already broke it once.
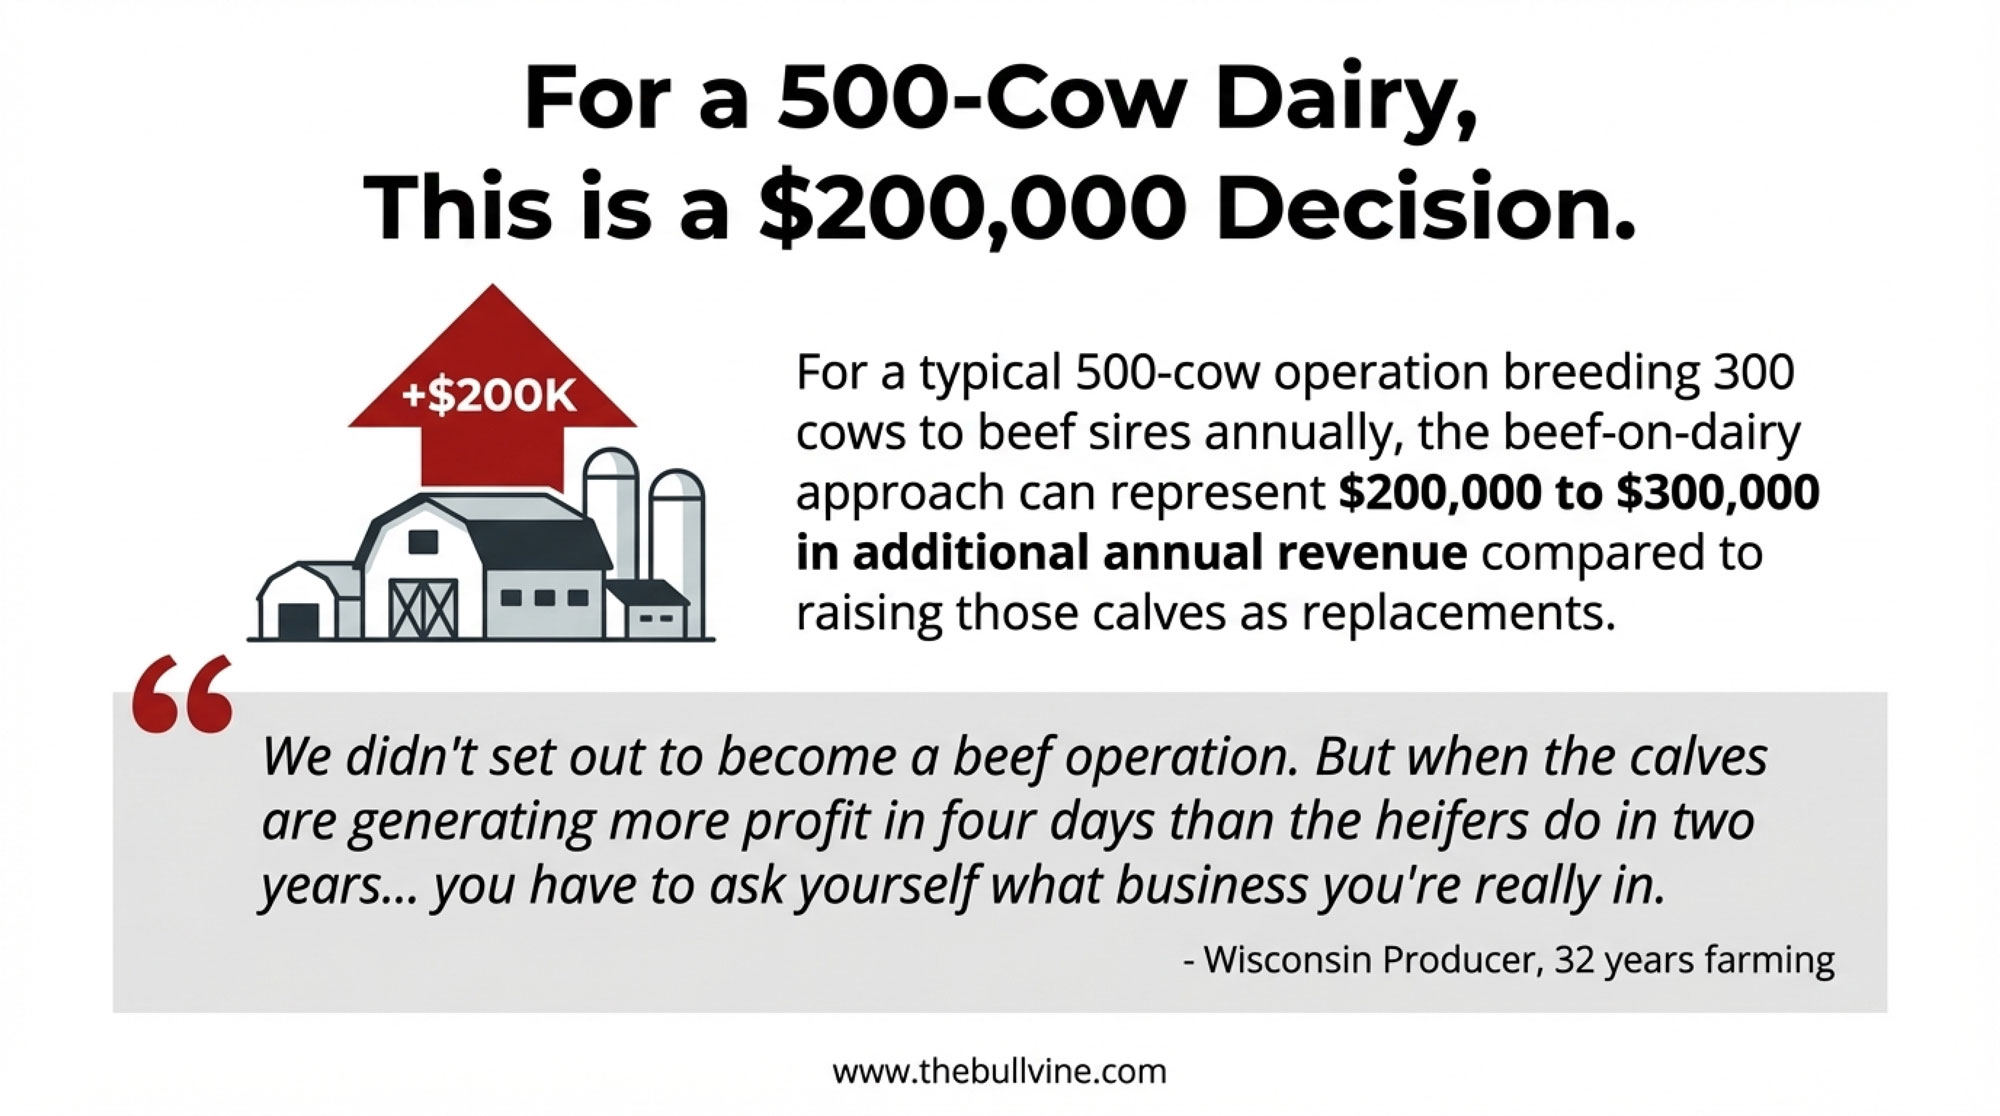
Many of the 315 operations that filed in 2025 expanded when milk prices made the numbers sing. At $24/cwt, you can make almost any barn pencil out. But 2024’s dairy cash receipts hit $50.7 billion, and USDA’s February 2026 WASDE projects $18.95/cwt all-milk for 2026 — down from the revised 2025 average of $21.17/cwt. For a 300-cow herd shipping 69,000 cwt a year, that’s roughly $153,000 in lost gross milk revenue. Total farm debt is expected to hit a record $624.7 billion in 2026, with interest expenses reaching $33 billion.
You see where this goes. Expansion debt taken on at $24 milk has to be serviced at $18 milk. And if your term debt coverage ratio doesn’t clear 1.25 — meaning for every dollar you owe in annual debt service, you’re generating $1.25 in cash available to pay it — you’re one bad quarter from a lender conversation you don’t want to have. Penn State Extension is explicit: many lenders require a minimum term debt coverage of 1.25 just to consider a plan viable, and flag 1.75 or better as the green zone. The University of Wisconsin Extension’s Farm Finance Scorecard uses the same thresholds — below 1.25 is “a concern and a weakness.” Stay below a 4:1 debt-to-EBITDA ratio. No exceptions.
Can Your Expansion Survive $3,500 Heifers and $18 Milk?
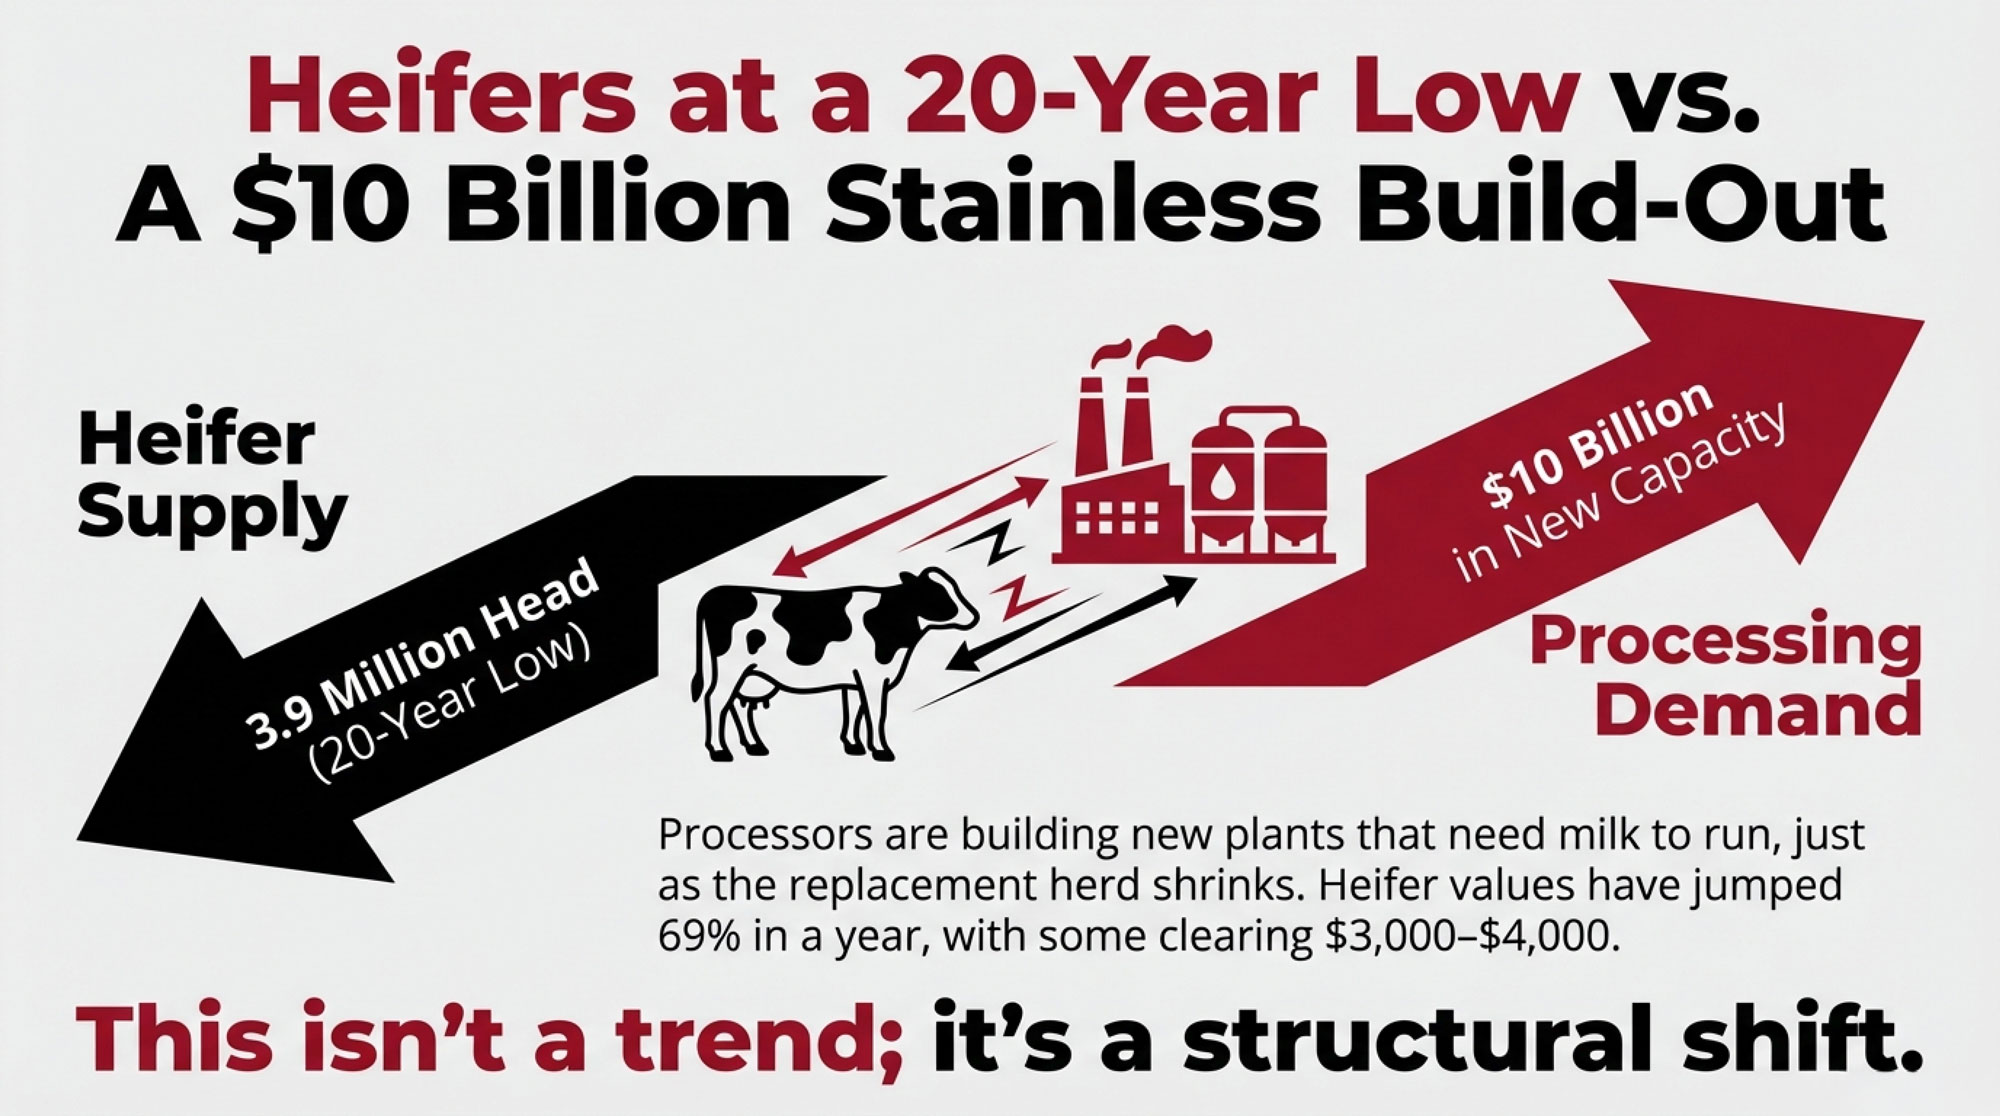
What makes the 2026 expansion especially dangerous? Replacement heifer inventory is at a 20-year low, and prices have hit $2,660–$4,000 per head depending on region, with premium auction heifers routinely clearing $4,000 in California, Minnesota, and Pennsylvania. Beef-on-dairy crossbreeding has been enormously profitable for calf value, but it’s drained the pipeline of dairy replacements.
So you’re building a bigger barn. Your heifer costs alone might run $530,000–$800,000 for a 200-head expansion at those prices. The milk check is falling. Your interest rate isn’t 2022’s anymore. And you’re betting the angels will catch you.
They won’t.
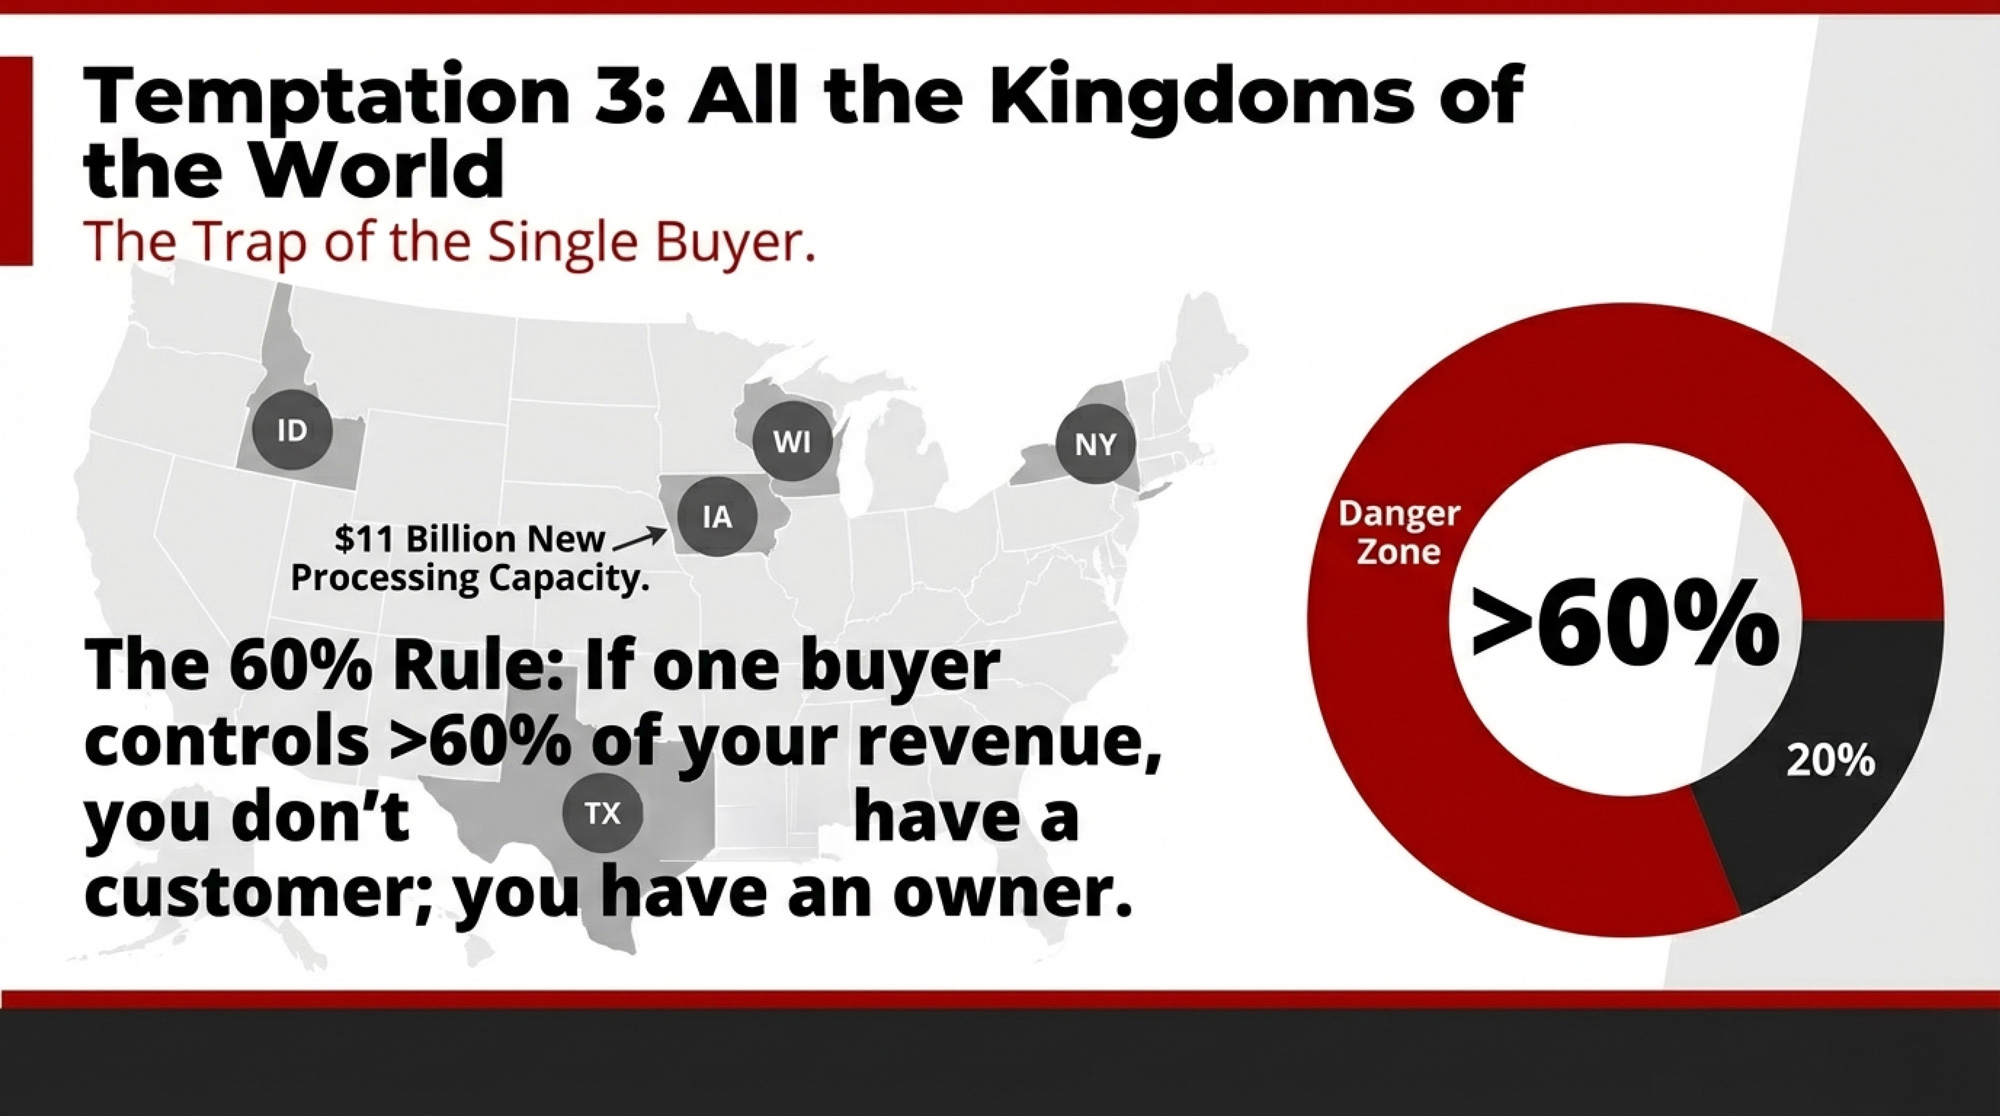
Temptation Three: All the Kingdoms of the World
“All these I will give you, if you fall down and worship me.” The third temptation is about surrendering your independence for the promise of everything. On a dairy farm, it’s tying your operation’s survival to a single processor or consolidation play.
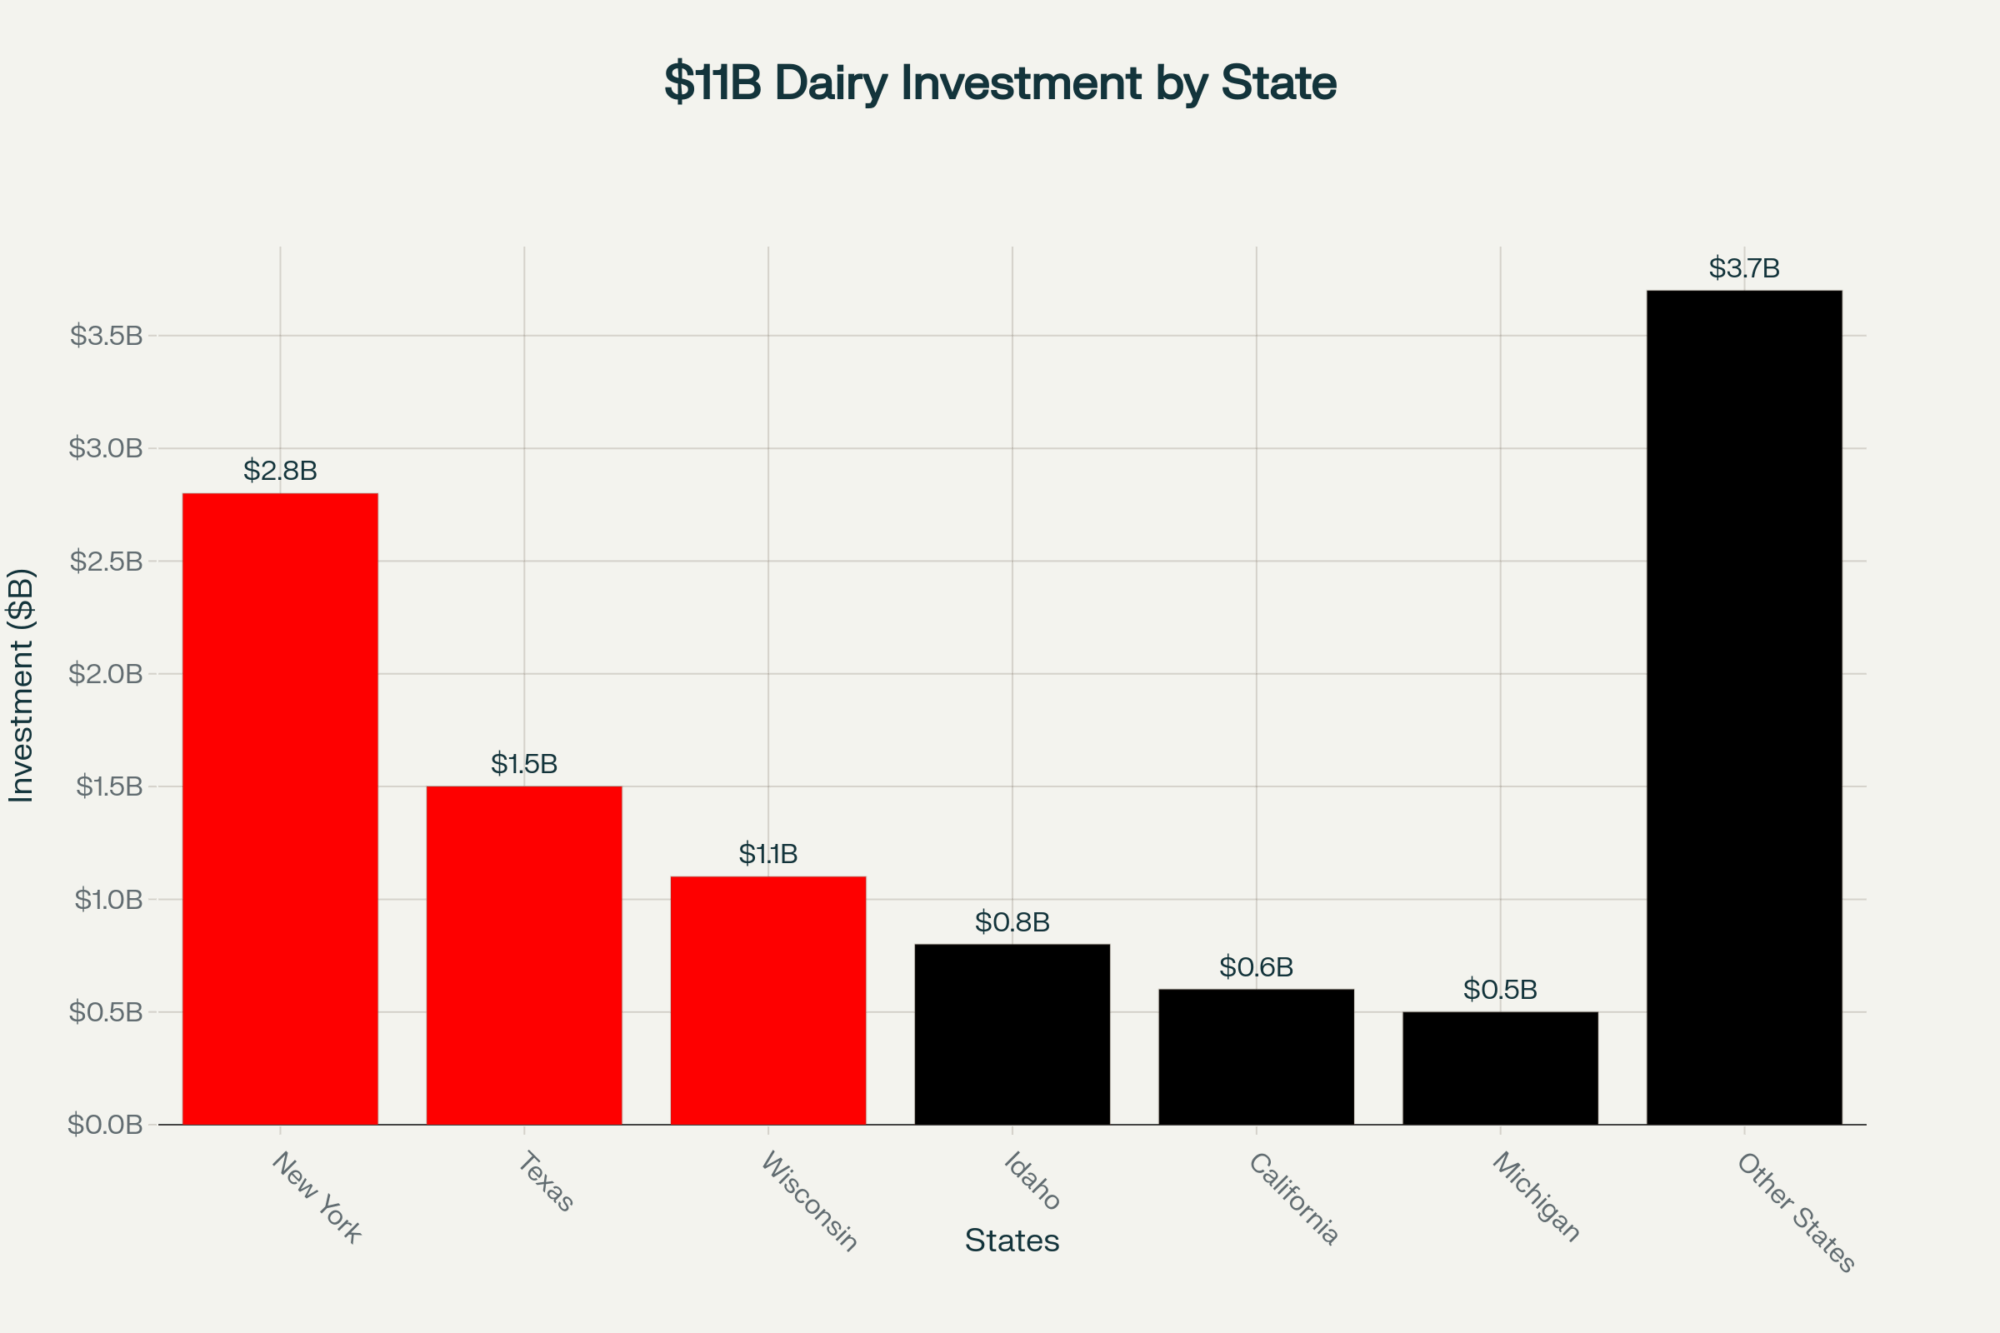
U.S. dairy processors have committed over $11 billion to new and expanded manufacturing capacity across 19 states, with more than 50 individual projects slated for 2025 through early 2028, according to the International Dairy Foods Association. The top five states by investment: New York ($2.8 billion), Texas ($1.5 billion), Wisconsin ($1.1 billion), Idaho ($720 million), and Iowa ($701 million).
Hilmar’s $600 million cheese plant in Dodge City, Kansas, and Leprino Foods’ roughly $1 billion complex in Lubbock, Texas, are the anchors of a processing wave pulling milk production toward the Southern Plains. Ben Laine, senior dairy analyst at Terrain, sees the optimistic read: “If you’re building new cheese plants and you need to fill them with milk, you’re going to pay what it takes to get the milk in there… producers might be able to negotiate and move around, and that’s not something they’ve had in a long time.”
That’s one read. The cautious one is simpler: those plants will fight hard for milk from the most scalable suppliers. They aren’t following milk. They’re creating gravity wells.
For larger operations positioned to fill those plants, this is a real opportunity. But for a mid-size dairy that signs an exclusive supply agreement with a single processor? That’s a kingdom built on sand. When that processor shifts its sourcing, renegotiates terms, or simply doesn’t renew your contract, you’re left with a barn full of cows and nowhere to ship.
How Dependent Is Too Dependent?
In most industries, lenders and risk analysts flag customers with revenue above 20–25% as a concentration concern. Dairy’s regional processor limitations push that practical ceiling higher—but as a working threshold, never let any one buyer control more than 60% of your revenue. Above that, you don’t have a customer. You have an owner who hasn’t filed the paperwork.
Most farms already feel like they’re in this boat. In a lot of regions, you’re effectively tied to one co‑op or processor, with the hauler taking you to the same plant every day. You don’t flip a switch and suddenly have three buyers fighting for your milk — but carving out even 10–20% of your volume for a secondary outlet (on‑farm processing, a specialty contract, or a second plant where geography allows) turns absolute dependence into something closer to leverage.
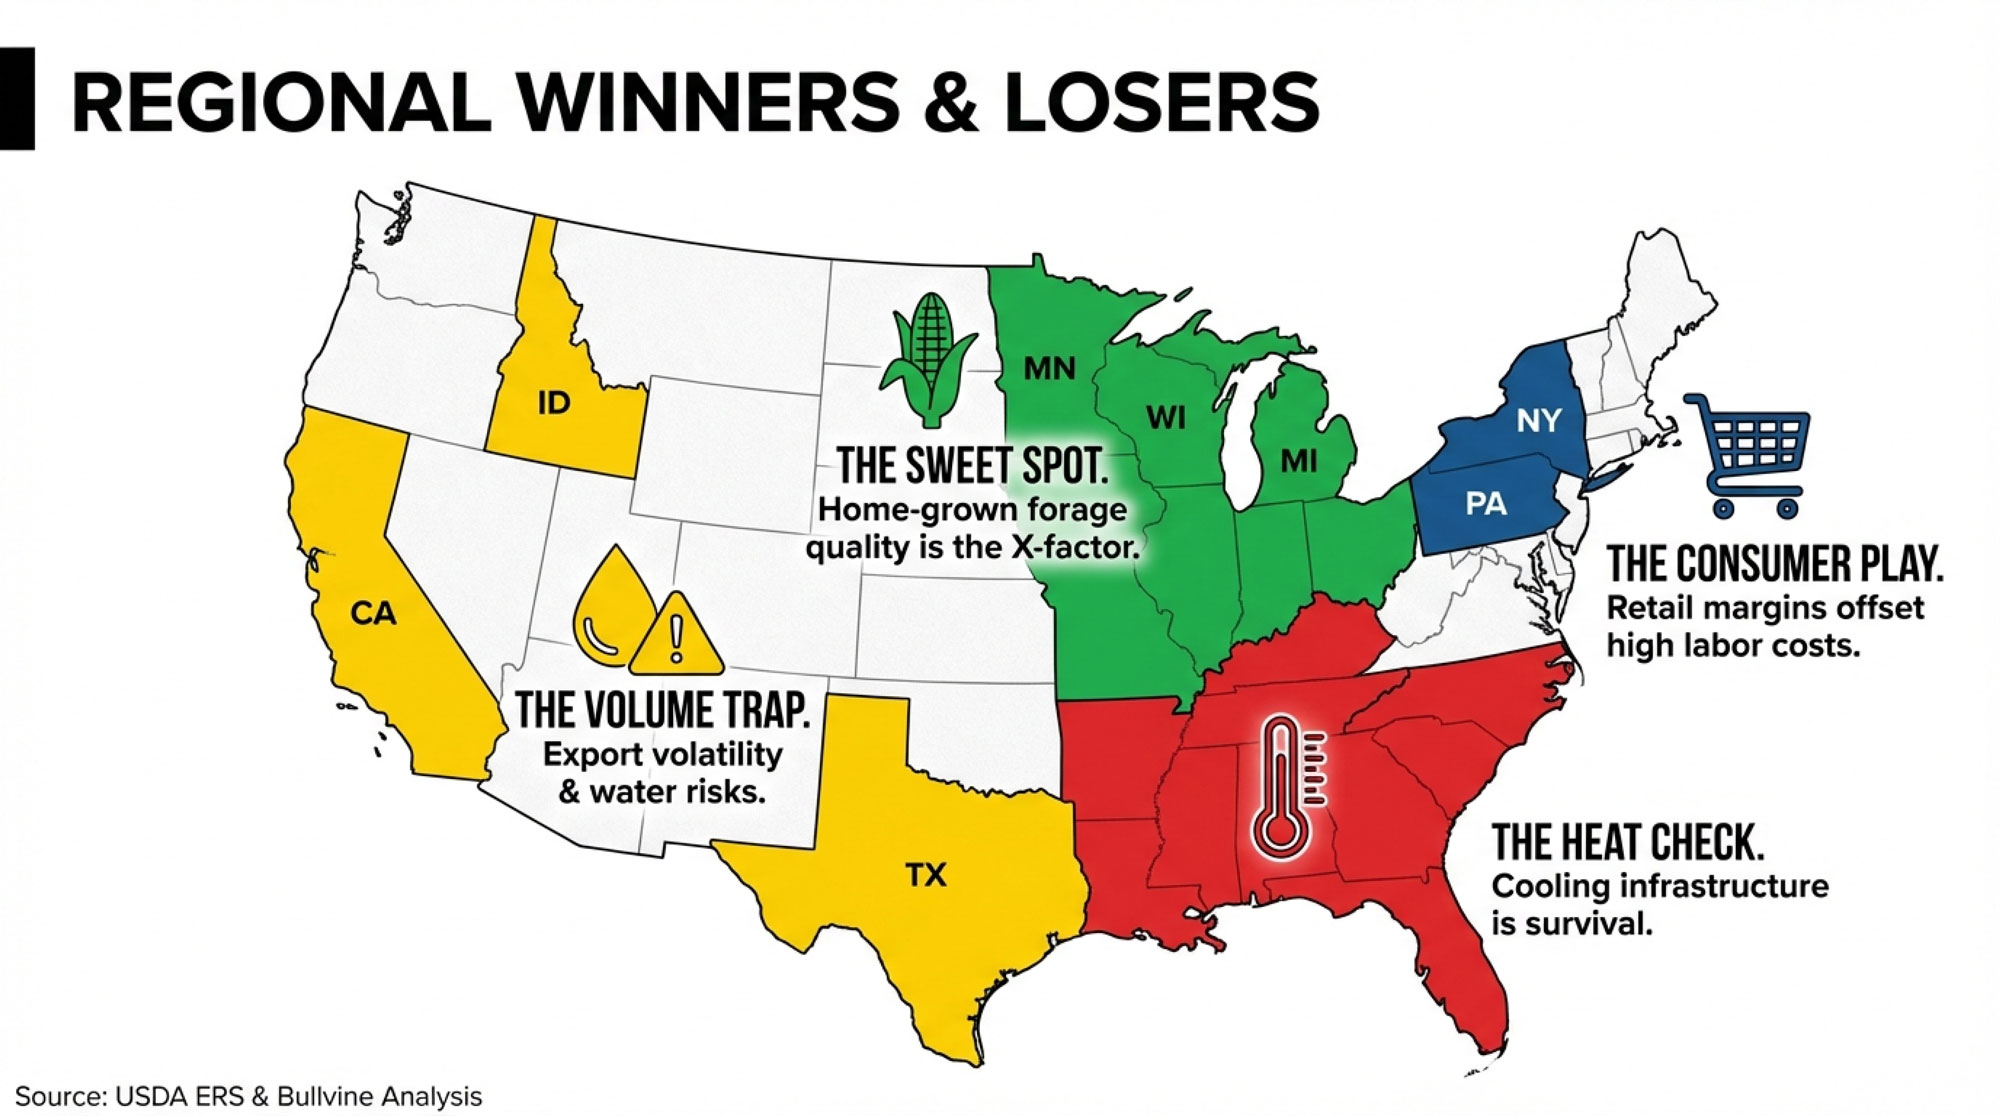
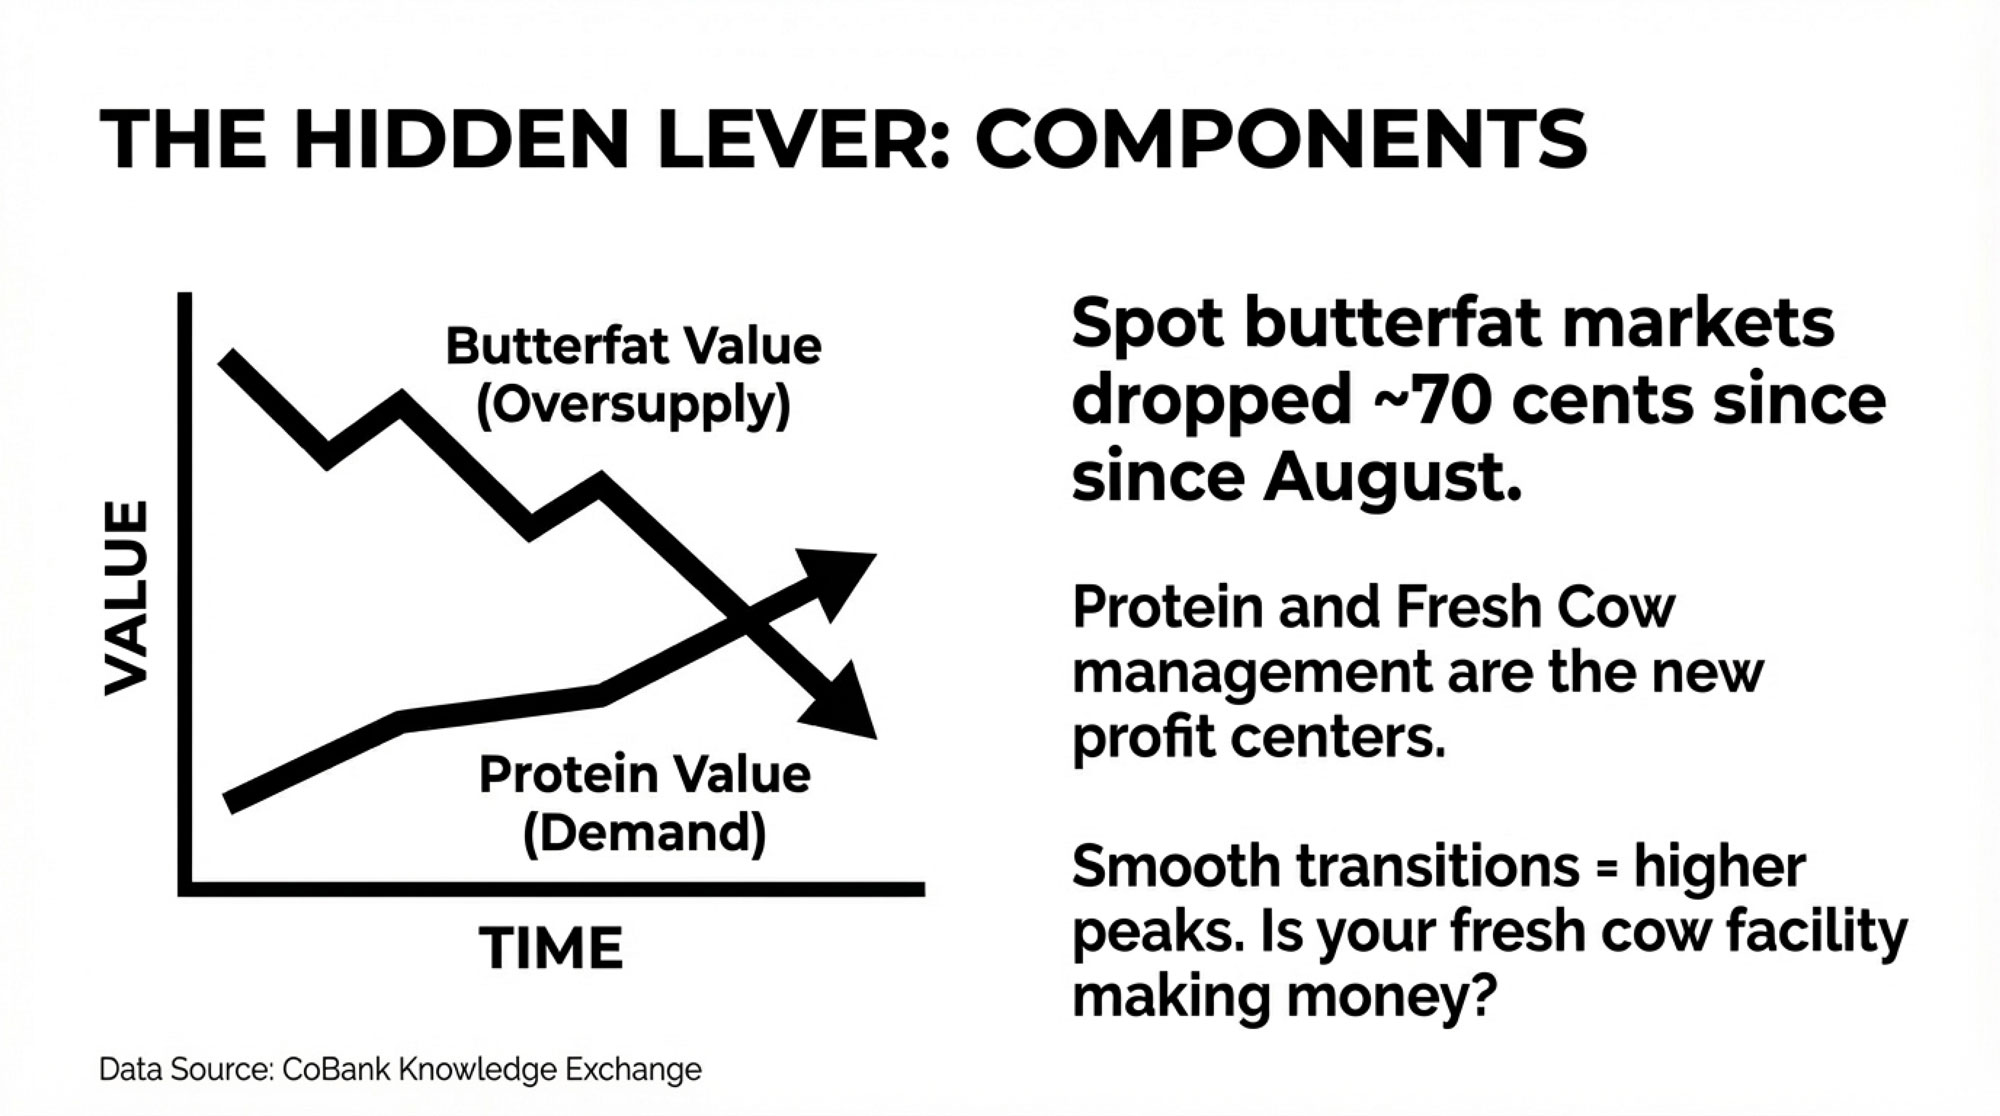
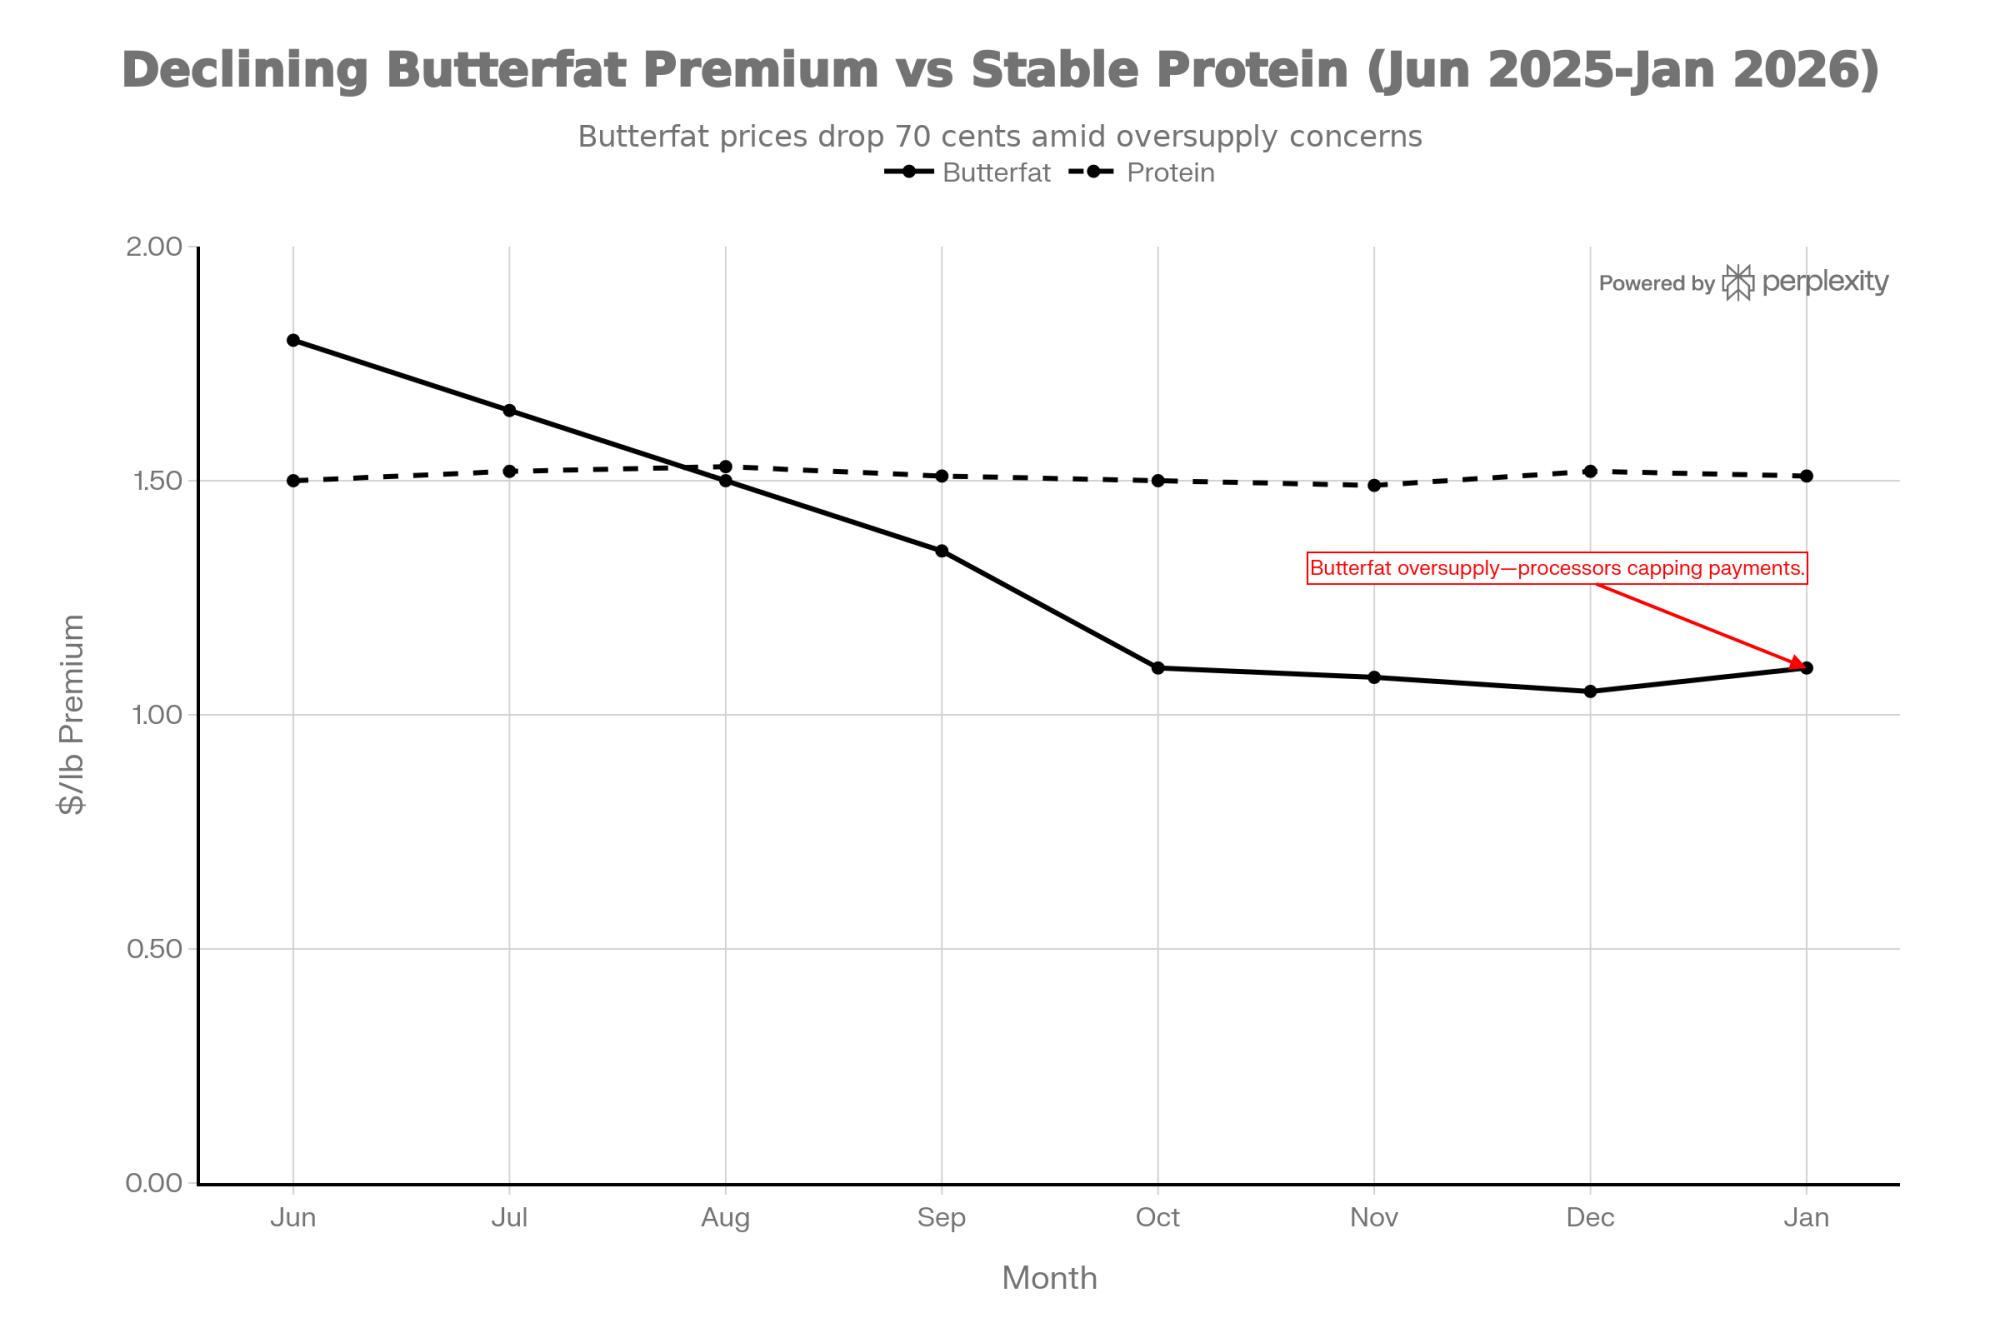
CoBank’s Corey Geiger warned in October 2025 that protein is overtaking fat on the milk check: “Protein will take over the pole position on milk checks because we need more of it.” That shift will reshape which contracts pay what, and operations locked into a single buyer won’t have room to pivot.
Diversifying market access is easier said than done, especially in regions where one processor dominates. But the time to explore alternatives — a specialty contract here, cooperative membership that spreads your risk there — is before you need them. Not after the call comes.
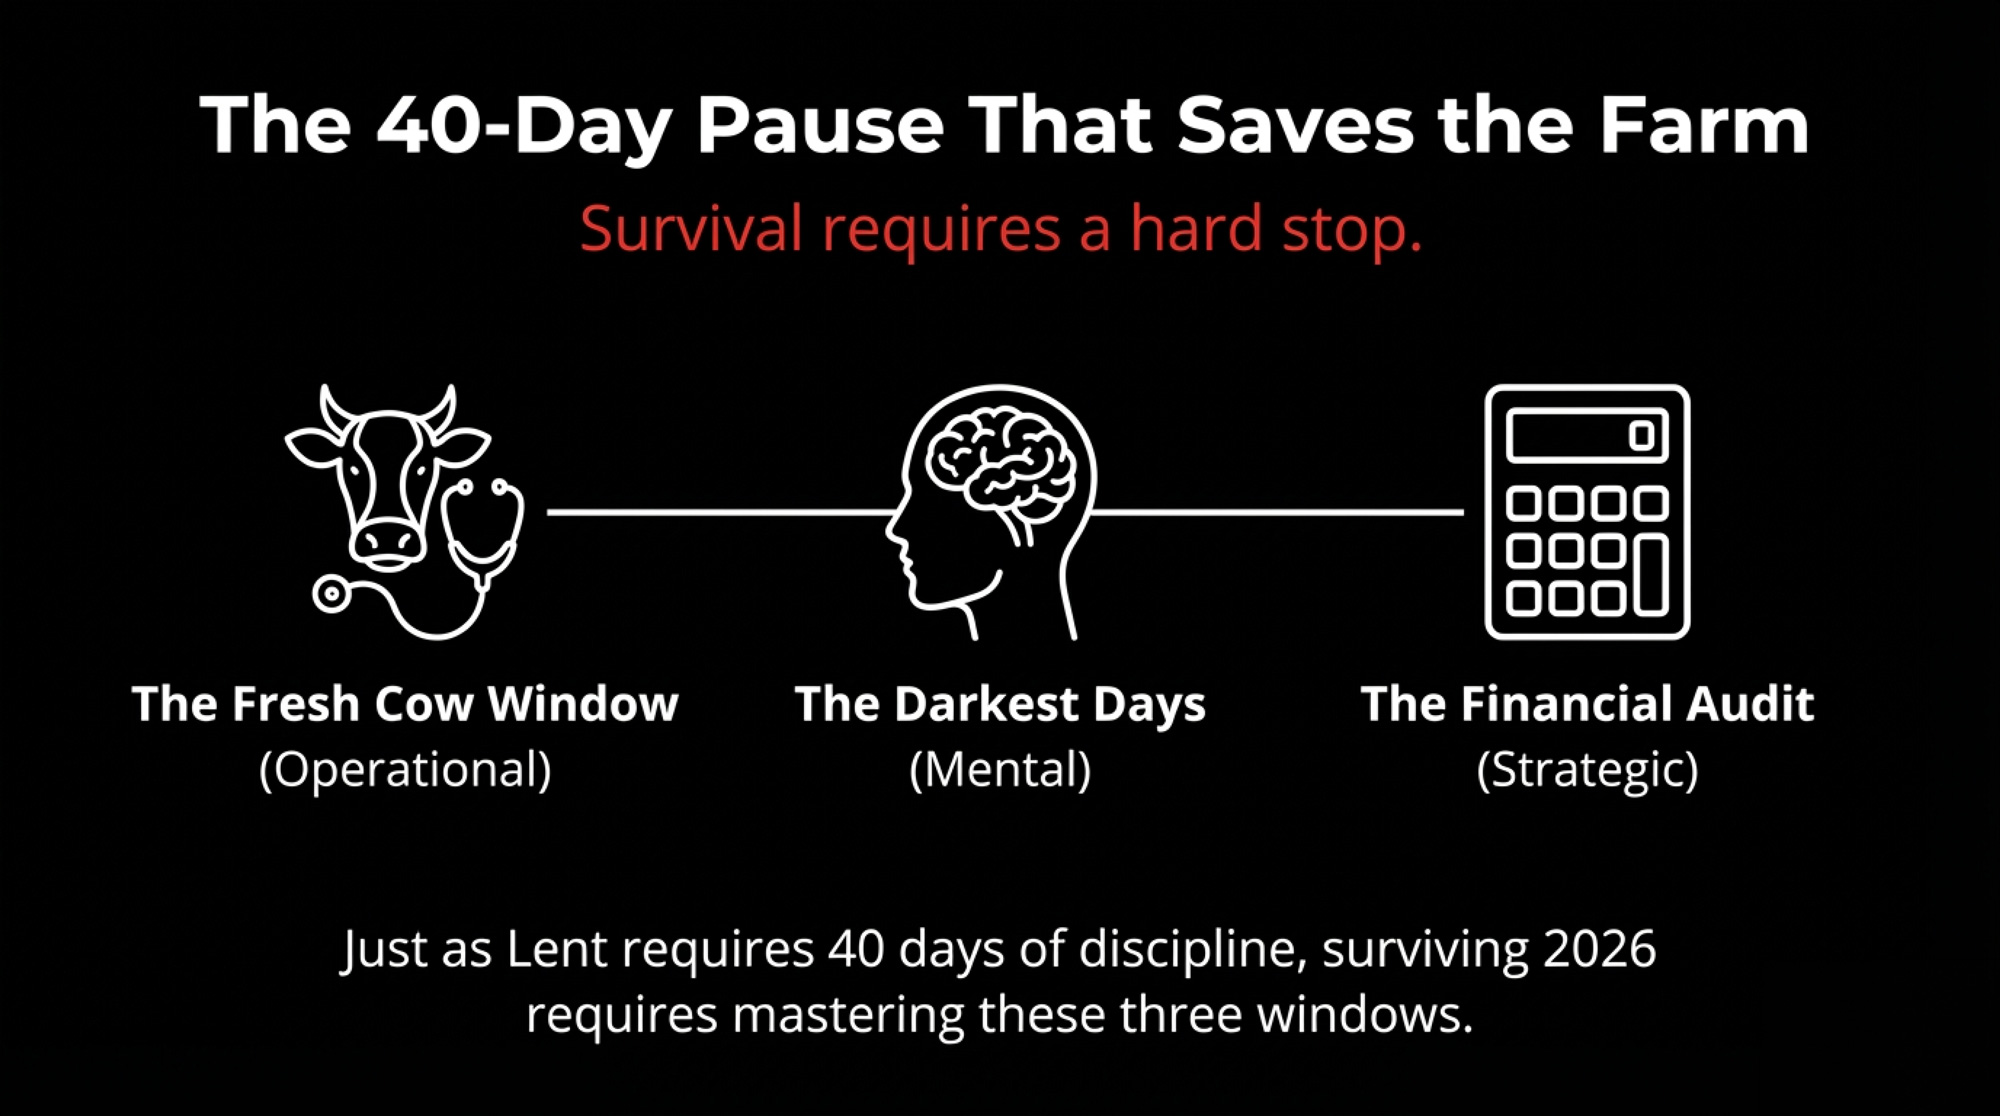
The 40 Days That Test Everything
Lent’s framework isn’t just a metaphor for the three temptations. Forty days shows up in the dairy in ways that are almost eerie, how precisely they parallel the spiritual discipline.
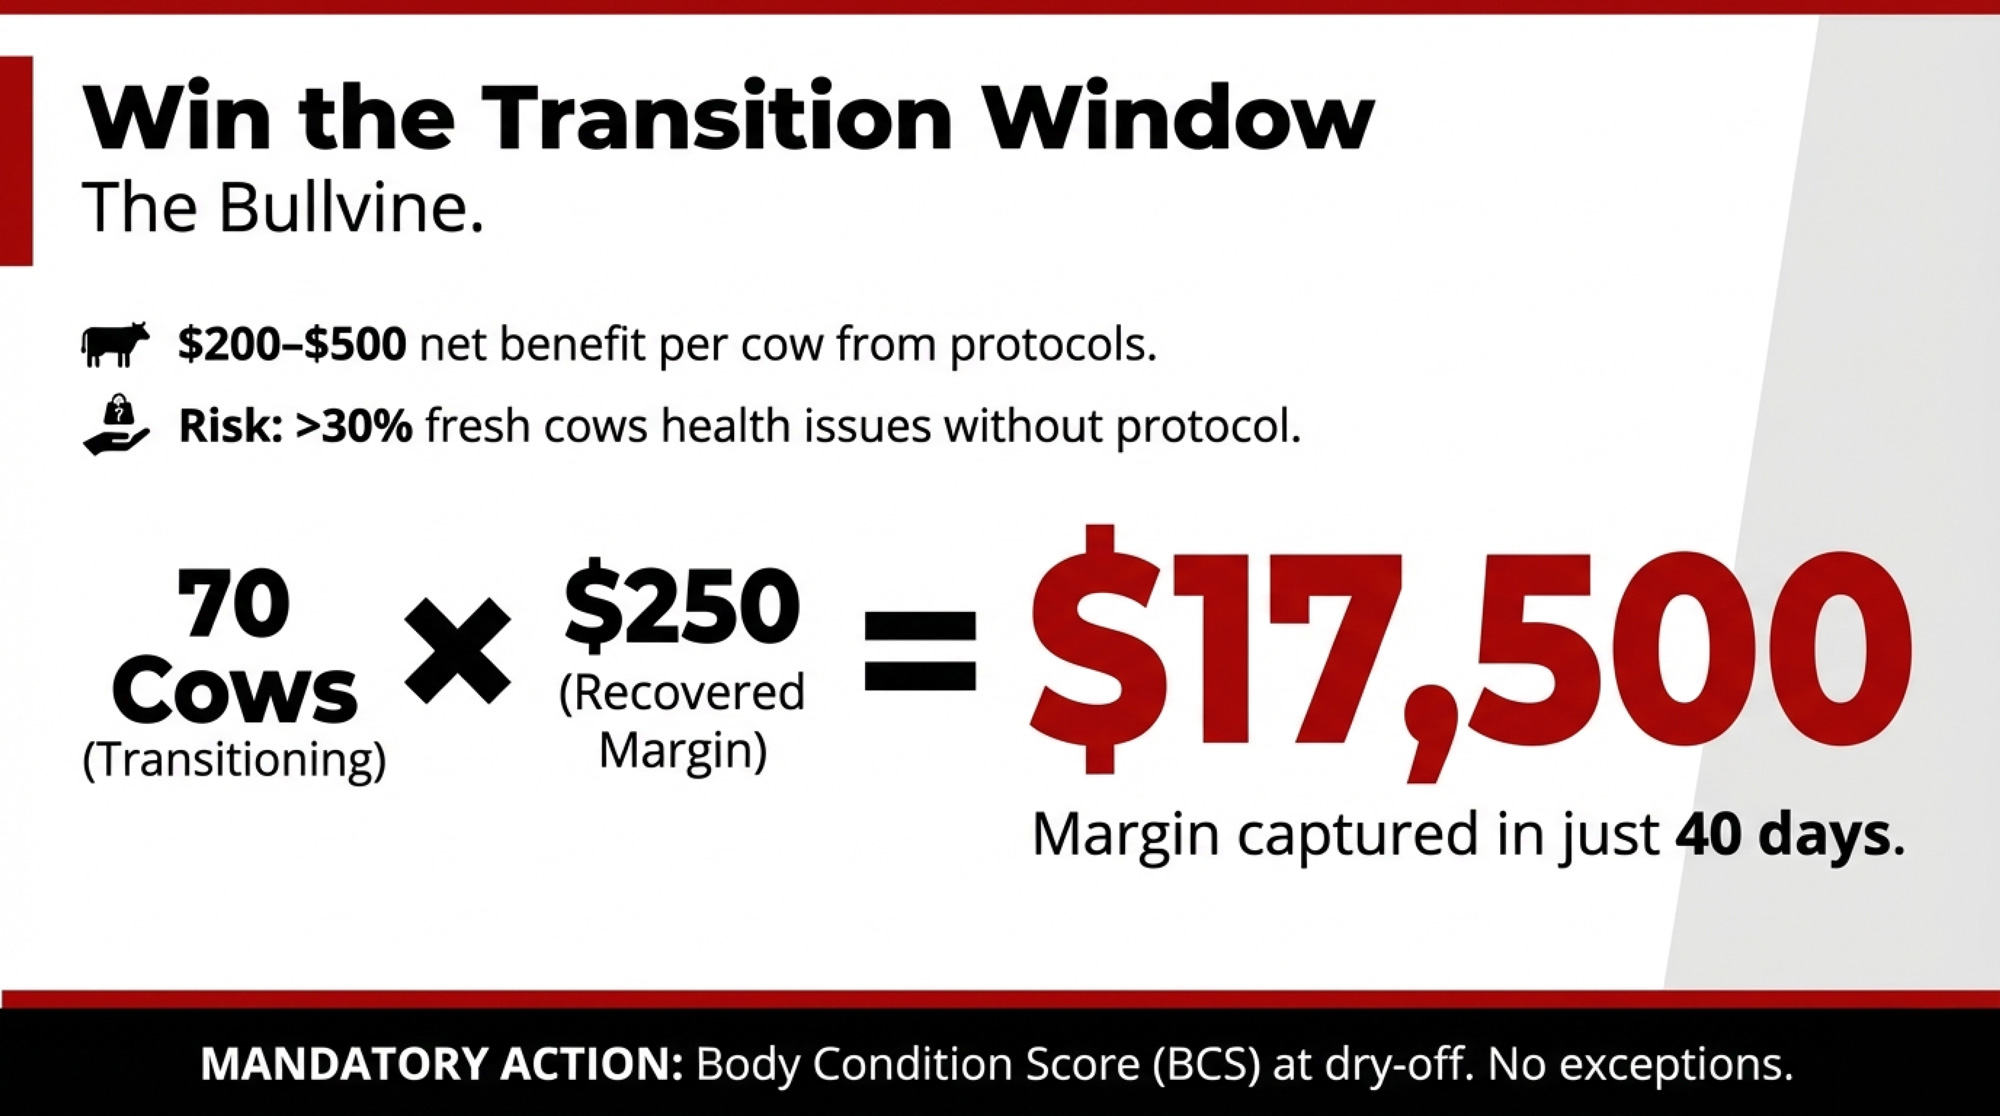
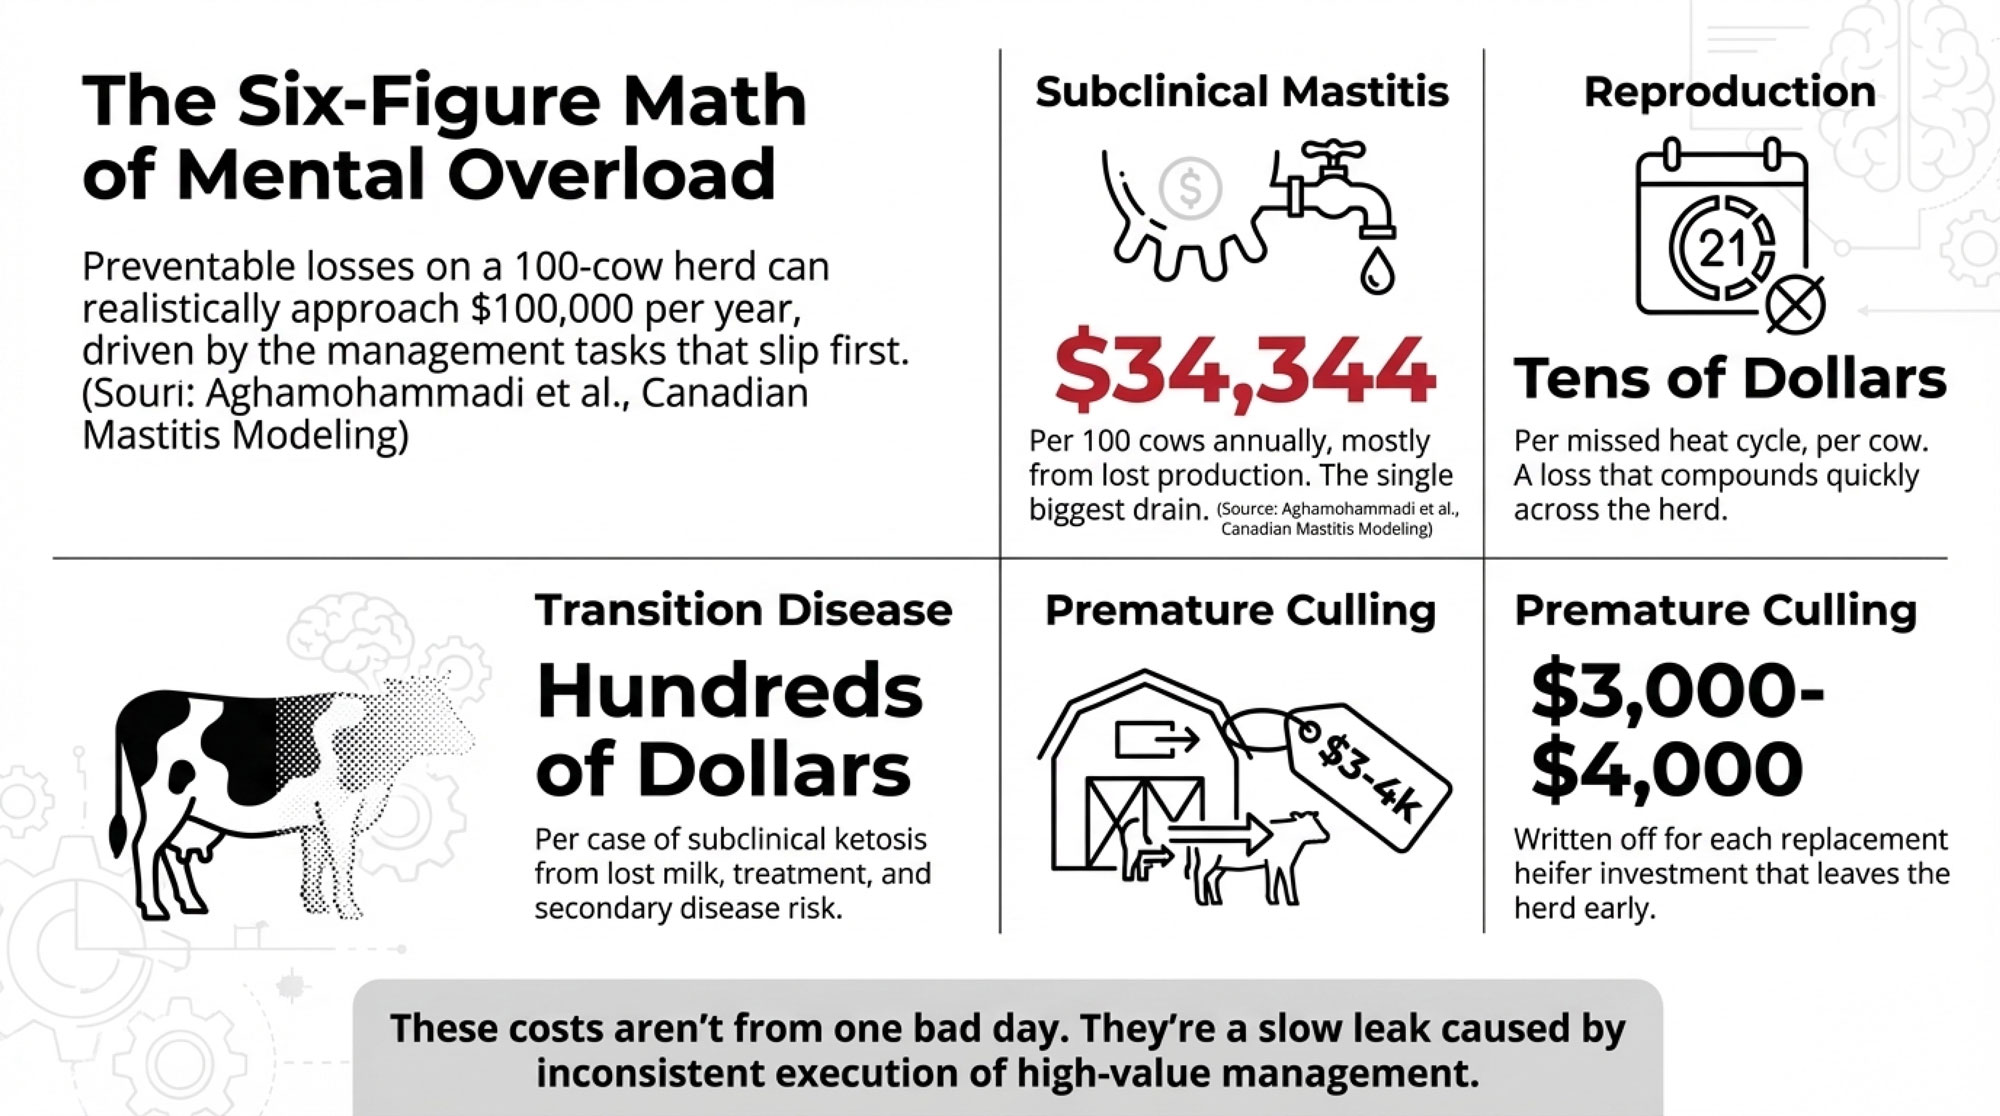
The 40-Day Fresh Cow Window. The transition period — roughly three weeks before calving through three weeks after — is where profitability is won or lost at the individual cow level. Penn State Extension research on transition cow management confirms that over a third of fresh cows develop multiple health problems in their first 30 days, and that targeted protocols addressing subclinical ketosis ($300–$350 per case) and metritis ($300–$500 per case) can deliver a net benefit of $200–$500 per cow per lactation.
The barn math on this is straightforward. A 200-cow herd that freshens year-round puts roughly 65–70 cows through transition in any given 40-day period. If your protocols recover even $250 per cow across those animals, that’s $16,000–$17,500 in margin over 40 days. That’s what farms implementing targeted protocols — body condition scoring at dry-off, DCAD ration management, consistent fresh-cow checks — actually deliver when they execute consistently.
The 40 Darkest Days. And then there’s the window nobody wants to talk about. Late January through early March. Days are shortest, isolation peaks, and the cumulative weight of winter sits heaviest on the people doing the milking.
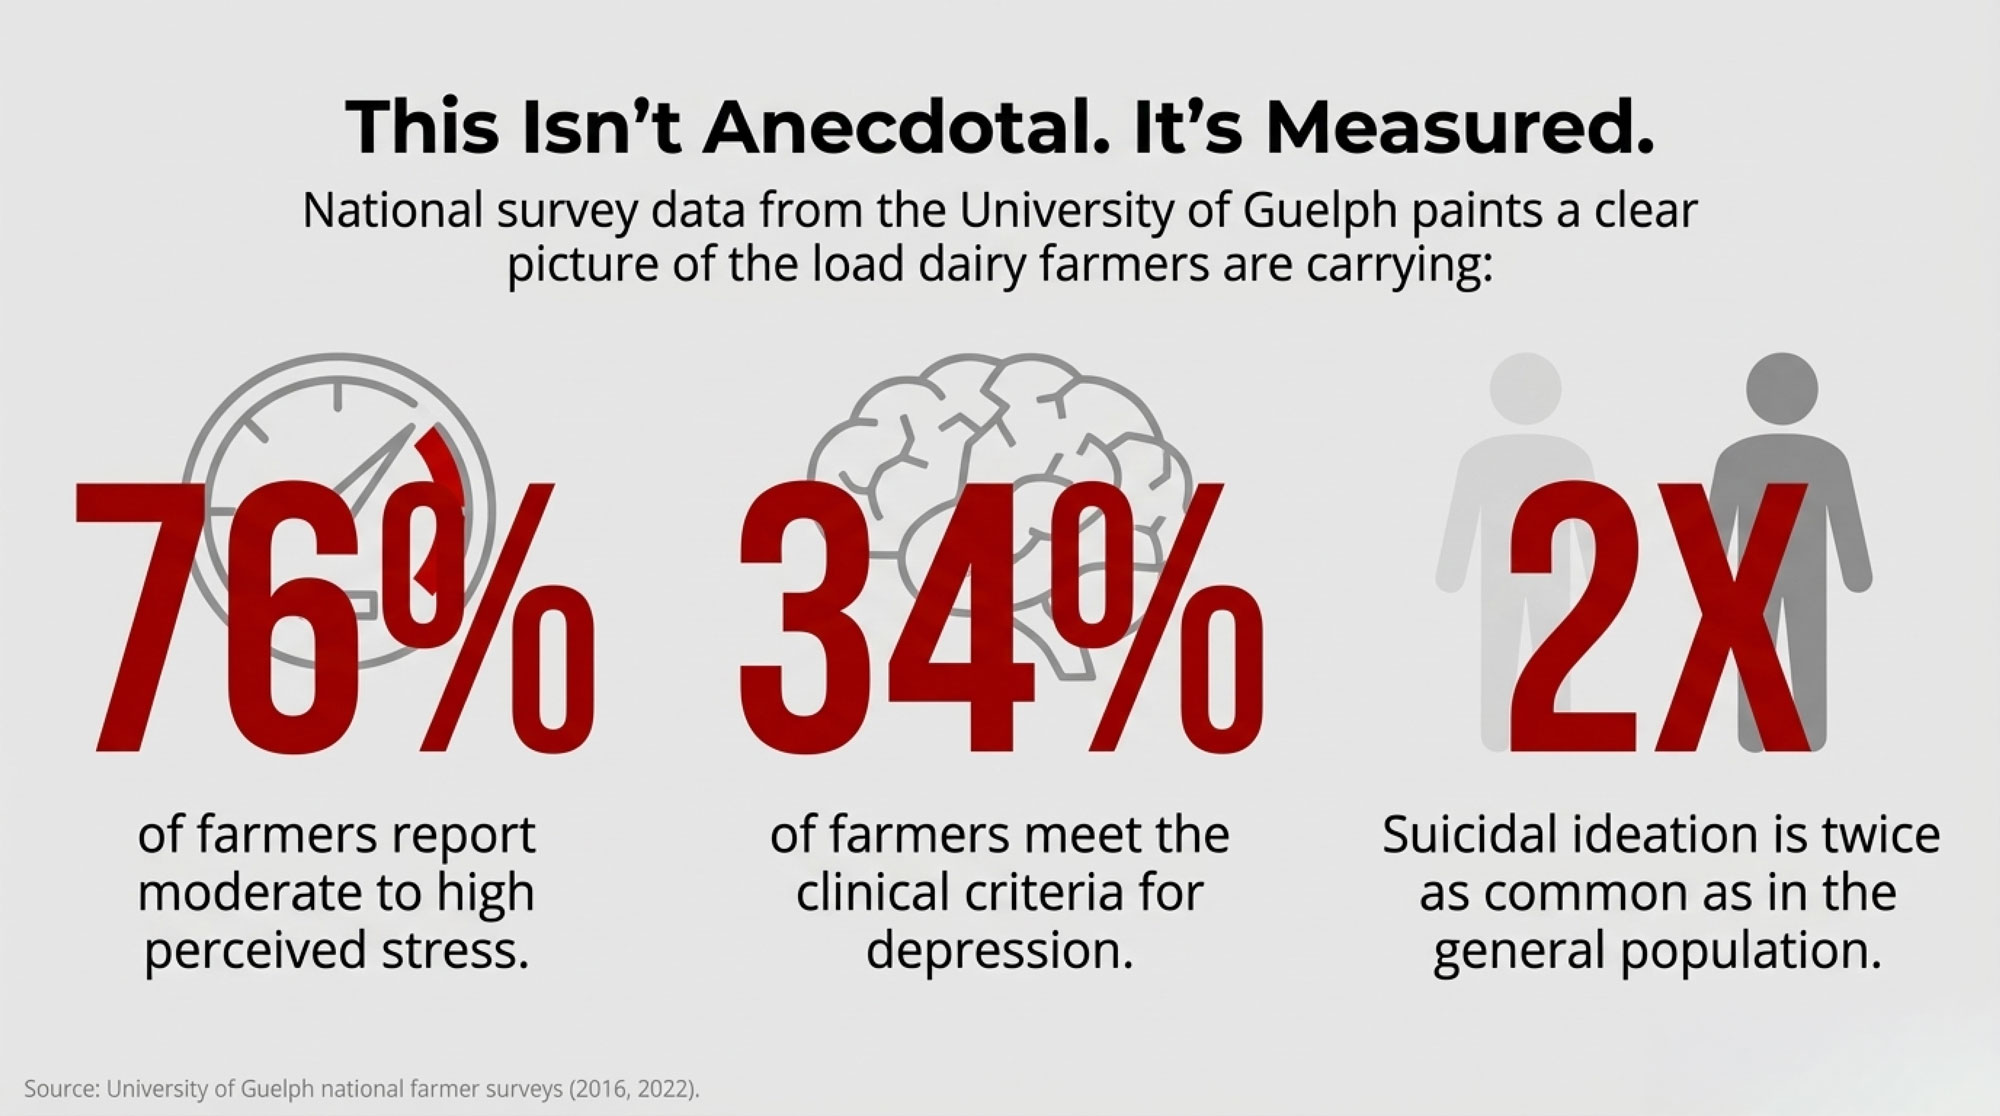
Dr. Andria Jones-Bitton’s research team at the University of Guelph surveyed over 1,100 Canadian farmers and found that 45% reported high stress, 57% met classifications for anxiety, and 35% met classifications for depression. Published in Social Psychiatry and Psychiatric Epidemiology in 2020, it was one of the first large-scale examinations of farmer mental health in Canada. A follow-up study during COVID-19, conducted in 2021, found the numbers held or worsened — 76% reported moderate or high perceived stress. One in four farmers surveyed reported having thought their life wasn’t worth living or had thoughts of taking their own life in the prior 12 months.
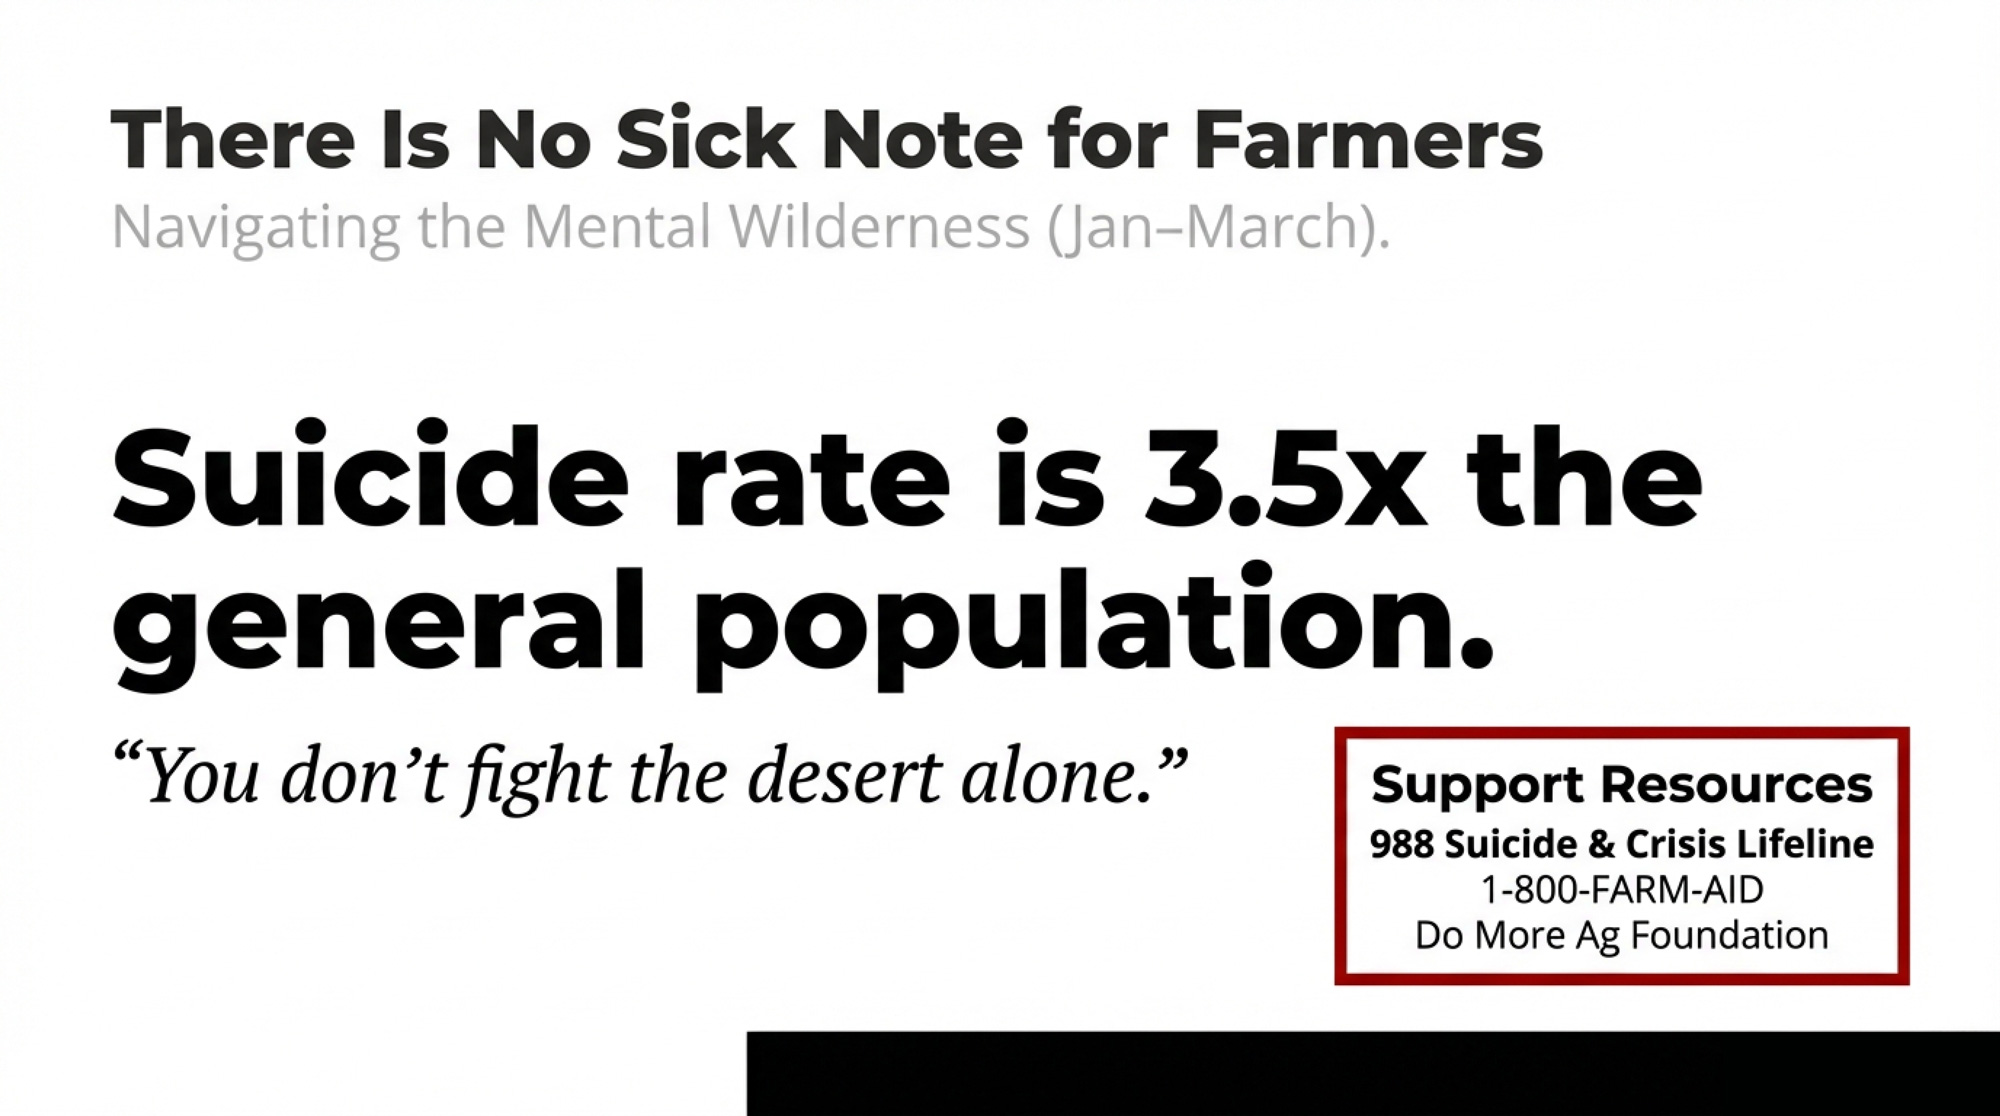
Jones-Bitton told the Saskatoon StarPhoenix that the public’s romanticized image of farming “underestimates the range of stressors that farmers are actually experiencing.” As one participant wrote in the COVID-era survey: “There is no sick note for farmers.”
The National Rural Health Association reports that farmers die by suicide at 3.5 times the rate of the general population — a figure drawn from University of Iowa research covering 1992–2010 that has been cited in federal testimony and NRHA policy briefs. The most recent CDC data, published in MMWR in December 2023 using 2021 death records from 49 states, found that male workers in agriculture, forestry, fishing, and hunting had a suicide rate of 47.9 per 100,000 — compared to 32.0 per 100,000 for all male working-age adults. That’s roughly 50% higher than the national average for men. By either measure, farming remains one of the deadliest occupations for suicide in America.
The wilderness that tests the herd is the same wilderness that tests the farmer. And the Gospel’s answer is the same as the research: you don’t fight the desert alone.
If you or someone you know is struggling:
Farm Aid: 1-800-FARM-AID
988 Suicide & Crisis Lifeline: Call or text 988
Do More Ag Foundation: domore.ag
Crisis Services Canada: 1-833-456-4566
What You Do Before Spring Decisions
Path 1: Impose a 40-day audit before any major decision. Before you sign a breeding overhaul, barn expansion loan, or new processor agreement — stop. Pull your herd’s actual cost of production. Not the number in your head. The real one, with family labor at $18–$22/hour, depreciation at replacement value, and opportunity cost included. Run your debt-to-EBITDA ratio. Stress-test every scenario at $18/cwt all-milk price for six months — USDA’s February WASDE pegs 2026 all-milk at $18.95/cwt, but January’s actual Class III was $14.59. If the decision survives that test, proceed. If it doesn’t, you just saved your operation.
30-day action: This week, pull your last 12 months of actual expenses and calculate your true cost of production — including family labor and depreciation at replacement value. Do it before you commit to any spring decisions.
Path 2: Rebalance your sire stack toward proven reliability. If more than half your matings go to genomic young sires with reliability below 80%, you’re speculating. Use young sires on your bottom-half animals — the ones going beef anyway — and anchor your keeper matings to bulls with at least one daughter-proof cycle behind them. McCarty Family Farms runs nearly 20,000 cows this way. The $85/cow/year in Net Merit gains since 2010 came from whole-herd testing and data-driven culling, not hero-bull betting.
The risk: You may sacrifice some short-term index flash. You gain consistency across lactations. As the 2026 proof runs release, track which young sires maintain their rankings from genomic to daughter-proven. That transition — or lack of it — tells you everything.
Path 3: Audit your processor concentration now. Map your revenue sources. If one buyer accounts for more than 60% of your milk check, start building alternatives before the $11 billion processing investment wave reshuffles your region’s milk market.
Signal to watch: If your processor starts offering longer contract terms with volume floors, they’re locking you in. Negotiate optionality, not commitment.
Path 4: Treat transition like the 40-day audit it already is. If you’re not body-condition scoring at dry-off, you’re flying blind into your most expensive 40 days. Start there.
30-day action: Score every dry cow this month. Set up a tracking sheet — BCS at dry-off, calving date, health events through day 30. 90-day checkpoint: Review outcomes. You’ll have the data to see exactly where your transition dollars are leaking. 365-day benchmark: Run the full audit again next Lent. Compare your February 2027 numbers to this year’s baseline. If you’ve held the line, you’ll know it in the data.
Key Takeaways
If more than 50% of your matings go to sires below 80% reliability, you’re not using genomics — you’re gambling with it. Tier your sire stack: proven bulls on keepers, young sires on beef-cross candidates. McCarty Family Farms found 28% parentage errors before genomic testing cleaned the records. Fix the foundation first.
If your expansion can’t cash-flow at $18/cwt for six months, don’t build. USDA projects an all-milk price of $18.95/cwt for 2026. January’s Class III was $14.59. Stay below 4:1 debt-to-EBITDA. Insist on 1.25 term debt coverage. Kooser Farms filed Chapter 12 twice in six years. Plan B doesn’t always get a Plan C.
If one processor controls more than 60% of your revenue, you have a dependency, not a marketing plan. Start diversifying before the $11 billion processing wave reshuffles your region.
If someone on your operation is struggling, that matters more than any ratio in this article. Call 988 or 1-800-FARM-AID. Isolation is the accelerant. Reaching out is the intervention.
The Bottom Line
The farms that make it through this cycle won’t be the ones who never faced temptation. Every dairy farmer alive has stared at a young sire’s proof and wanted to believe the number. Run the expansion math at peak milk price and felt the pull. Looked at a processor contract and thought, this solves everything.
The ones still milking in 2030 will be the ones who built in the pause. Forty days. Real numbers. And the willingness to admit that some shortcuts aren’t salvation — they’re just stones.
Where does your breakeven actually sit right now? Not last spring’s number. The one that accounts for $3,500 heifers, $624.7 billion in sector-wide debt, and a milk check that just dropped from $21.17 to $18.95 in a single year.
Pull it. Run it. Then decide.
Complete references and supporting documentation are available upon request by contacting the editorial team at editor@thebullvine.com.
Beyond Efficiency: Three Dairy Models Built to Survive $14 Milk in 2026 – GAIN a bulletproof 90-day liquidity plan that safeguards your operation against $14 milk. This analysis delivers three proven business models and reveals how intentional diversification creates a competitive advantage that simple “hard work” never will.
Every week, thousands of producers, breeders, and industry insiders open Bullvine Weekly for genetics insights, market shifts, and profit strategies they won’t find anywhere else. One email. Five minutes. Smarter decisions all week.
If more than half your milk goes to one plant and you don’t have a 72-hour Plan B, this story is about you.
Executive Summary: An Argentine processor, Lácteos Verónica, collapsed in 2025–26, leaving about 150 dairy families with roughly $60 million in unpaid milk and 3,843 bounced checks, while one small tambo that switched buyers early limited its losses. That story, paired with Dean Foods’ 2018 contract terminations, shows how even strong herds get wrecked when most of their milk goes to a single buyer, and the money stops. The article backs this up with current data on Argentina’s consolidation, rising U.S. Chapter 12 filings, roughly 1,420 U.S. dairy farms lost in 2024, and Wisconsin’s drop to about 5,100 herds, arguing that processor risk—not imports—is the real fault line under 2024–2026 margins. For your farm, it boils processor risk into a four-question audit: how concentrated your milk check is, how many days of true cash runway you have, whether you’d act on early warning signs, and who can take your milk within 72 hours if your current buyer fails. It offers practical markers—like targeting 90 days of operating reserves and keeping any one buyer below 50% of your volume, where the market allows—while being honest that some regions have only one realistic plant. The piece finishes by tying the math back to legacy, contrasting families who waited for “patience” with those who moved while they still had choices, and leaves you with a simple challenge: if your processor stumbled tomorrow, would you be Sedrán—or her neighbors?
In April 2025, an Argentine dairy processor started falling behind on payments to its farmers. By mid-year, the checks weren’t just late—they were bouncing. Within months, Lácteos Verónica owed roughly $60 million to about 150 dairy families across Santa Fe province, according to reports from iProfesional and AgroLatam in January 2026. Whether it’s a dairy processor payment default in South America or a contract termination in the Midwest, the math doesn’t change — if you’re shipping most of your milk to one buyer right now, this is a case study in processor risk that could play out anywhere.
Here’s the question worth sitting with: if your processor stopped paying next month, would you have 90 days of oxygen and a Plan B—or would you be feeding cows for free while waiting on lawyers?
April 2025: When Lácteos Verónica Went Silent
Producer Cecilia Sedrán works 60 hectares and runs a small tambo (dairy farm) near San Genaro, Santa Fe. Her family produces about 1,500 liters of milk a day and had been shipping to Lácteos Verónica since 2011, as she described in interviews with both TN Campo (December 2025) and Bichos de Campo (November 2025). No off-farm income. No government backstop.
“Somos dos familias las que vivimos de esto. Lo que generamos todos los días es lo que reinvertimos. No tenemos otro ingreso.”
(“We’re two families that live off this. What we generate every day is what we reinvest. We have no other income.”) — Cecilia Sedrán to TN Campo, December 2025
In mid-2025, Lácteos Verónica’s checks started bouncing — and didn’t stop. Records from Argentina’s central bank, the BCRA, show exactly 3,843 checks to producers rejected by banks. Trucks still rolled. Milk was still left on the farm. Money didn’t show up.
Sedrán’s family switched processors by July 2025 — months before many of their neighbors acted, according to Bichos de Campo. That move limited their exposure to roughly one month of unpaid milk. Other tambos around San Genaro stayed on the route, hoping things would turn. TN Campo reported in December 2025 that some farms now carry unpaid balances above 100 million pesos — around $100,000 USD at early-2026 parallel-market rates (Argentina maintains official and parallel currency markets; the parallel rate, used here, is the rate most commercial transactions actually reference) — and several have already closed or stand on the brink.
“Lo único que nos dicen es que tengamos paciencia.”
(“The only thing they tell us is to have patience.”) — as reported by TN Campo, December 2025
Dean Foods Did This in 2018 — Without the Bounced Checks
Argentina can feel like a world away from Wisconsin or Pennsylvania. But the underlying risk is the same.
Sedrán’s farm isn’t a hobby. Two families depend on it, as she told TN Campo. When Lácteos Verónica stopped paying, there was no Chapter 12 bankruptcy protection, no Dairy Margin Coverage, no FSA disaster loan to bridge the gap. Just a brutally simple choice: keep feeding cows and hope the processor catches up, or find another buyer before cash and credit run dry.
U.S. producers faced a softer-packaged version of the same thing when Dean Foods — then the largest milk processor in the country — terminated contracts with more than 100 farms across Indiana, Kentucky, Pennsylvania, Ohio, New York, Tennessee, North Carolina, and South Carolina in early 2018. As Jayne Sebright, executive director of Pennsylvania’s Center for Dairy Excellence, told Farm and Dairy at the time, the cancelled suppliers were “excellent family farms” — including “young dairy families that have really invested in their farms.”
They weren’t bad operators. They were good dairies tied to the wrong buyer at the wrong time.
The real difference? U.S. farms at least had a structured legal path and some federal program options. Sedrán’s neighbors had bounced checks and a processor literally telling them to “have patience.”
The Comparison: Why This Matters to You
You might think Argentina’s economy is a special case of chaos. But look at the mechanics of the failure. It’s the same plumbing, just a different leak.
Risk Factor
Argentina — Lácteos Verónica (2025–26)
United States — Dean Foods (2018)
The Warning
3,843 bounced checks (BCRA data)
Sudden contract termination notices
The Fallout
≈$60 million USD in unpaid milk across ~150 tambos; 3 plants paralyzed (Suardi, Lehmann, Totoras); ~700 workers at risk (per AgroLatam, Jan 2026)
100+ farms across 8 states forced to find new buyers within ~90 days; multiple plants closed or sold
The Safety Net
Ineffective — legal processes exist but take years while inflation erodes value; producers are told to “have patience.”
Lácteos Verónica defaulted on payments already owed — milk that had already left the farm. Dean Foods cut ties going forward—devastating, but a different kind of pain. Both left producers scrambling for somewhere to ship milk within days.
The Reality Check: On a 300-cow herd shipping 90 lbs/cow at $18/cwt, a 30-day payment failure is a $145,800 hole in your balance sheet. That isn’t a “bad month” — for many, that’s the end of the road.
Herd Size
Daily Production
Milk Price
Monthly Production Value
30-Day Payment Hole
100 cows
75 lbs/cow
$18.00/cwt
$40,500
$40,500
300 cows
90 lbs/cow
$18.00/cwt
$145,800
$145,800
500 cows
85 lbs/cow
$18.00/cwt
$229,500
$229,500
750 cows
88 lbs/cow
$18.00/cwt
$356,400
$356,400
1,000 cows
90 lbs/cow
$18.00/cwt
$486,000
$486,000
Roberto Perracino, president of Santa Fe’s Meprosafe producer group, told LT9 radio in late December 2025: “El año empezó muy bien, con buenos precios y rentabilidad que permitían pensar en invertir. Pero desde mitad de año todo se desmoronó.” (“The year started very well, with good prices and profitability that allowed you to think about investing. But from mid-year, everything collapsed.”)
He added that while annual inflation ran about 30%, milk prices recovered only 8%, while feed, fuel, and silage costs jumped by 25% to 70%.
You’ve seen that movie. Think 2014 highs sliding into the 2015–16 gut punch, or the optimism of late 2022 crashing into 2023’s margin squeeze. The difference in this Argentine case is the snap: solid margins in Q1, followed by a processor meltdown before year’s end. No slow fade. A cliff.
Argentina’s Processor Crisis Is America’s Preview
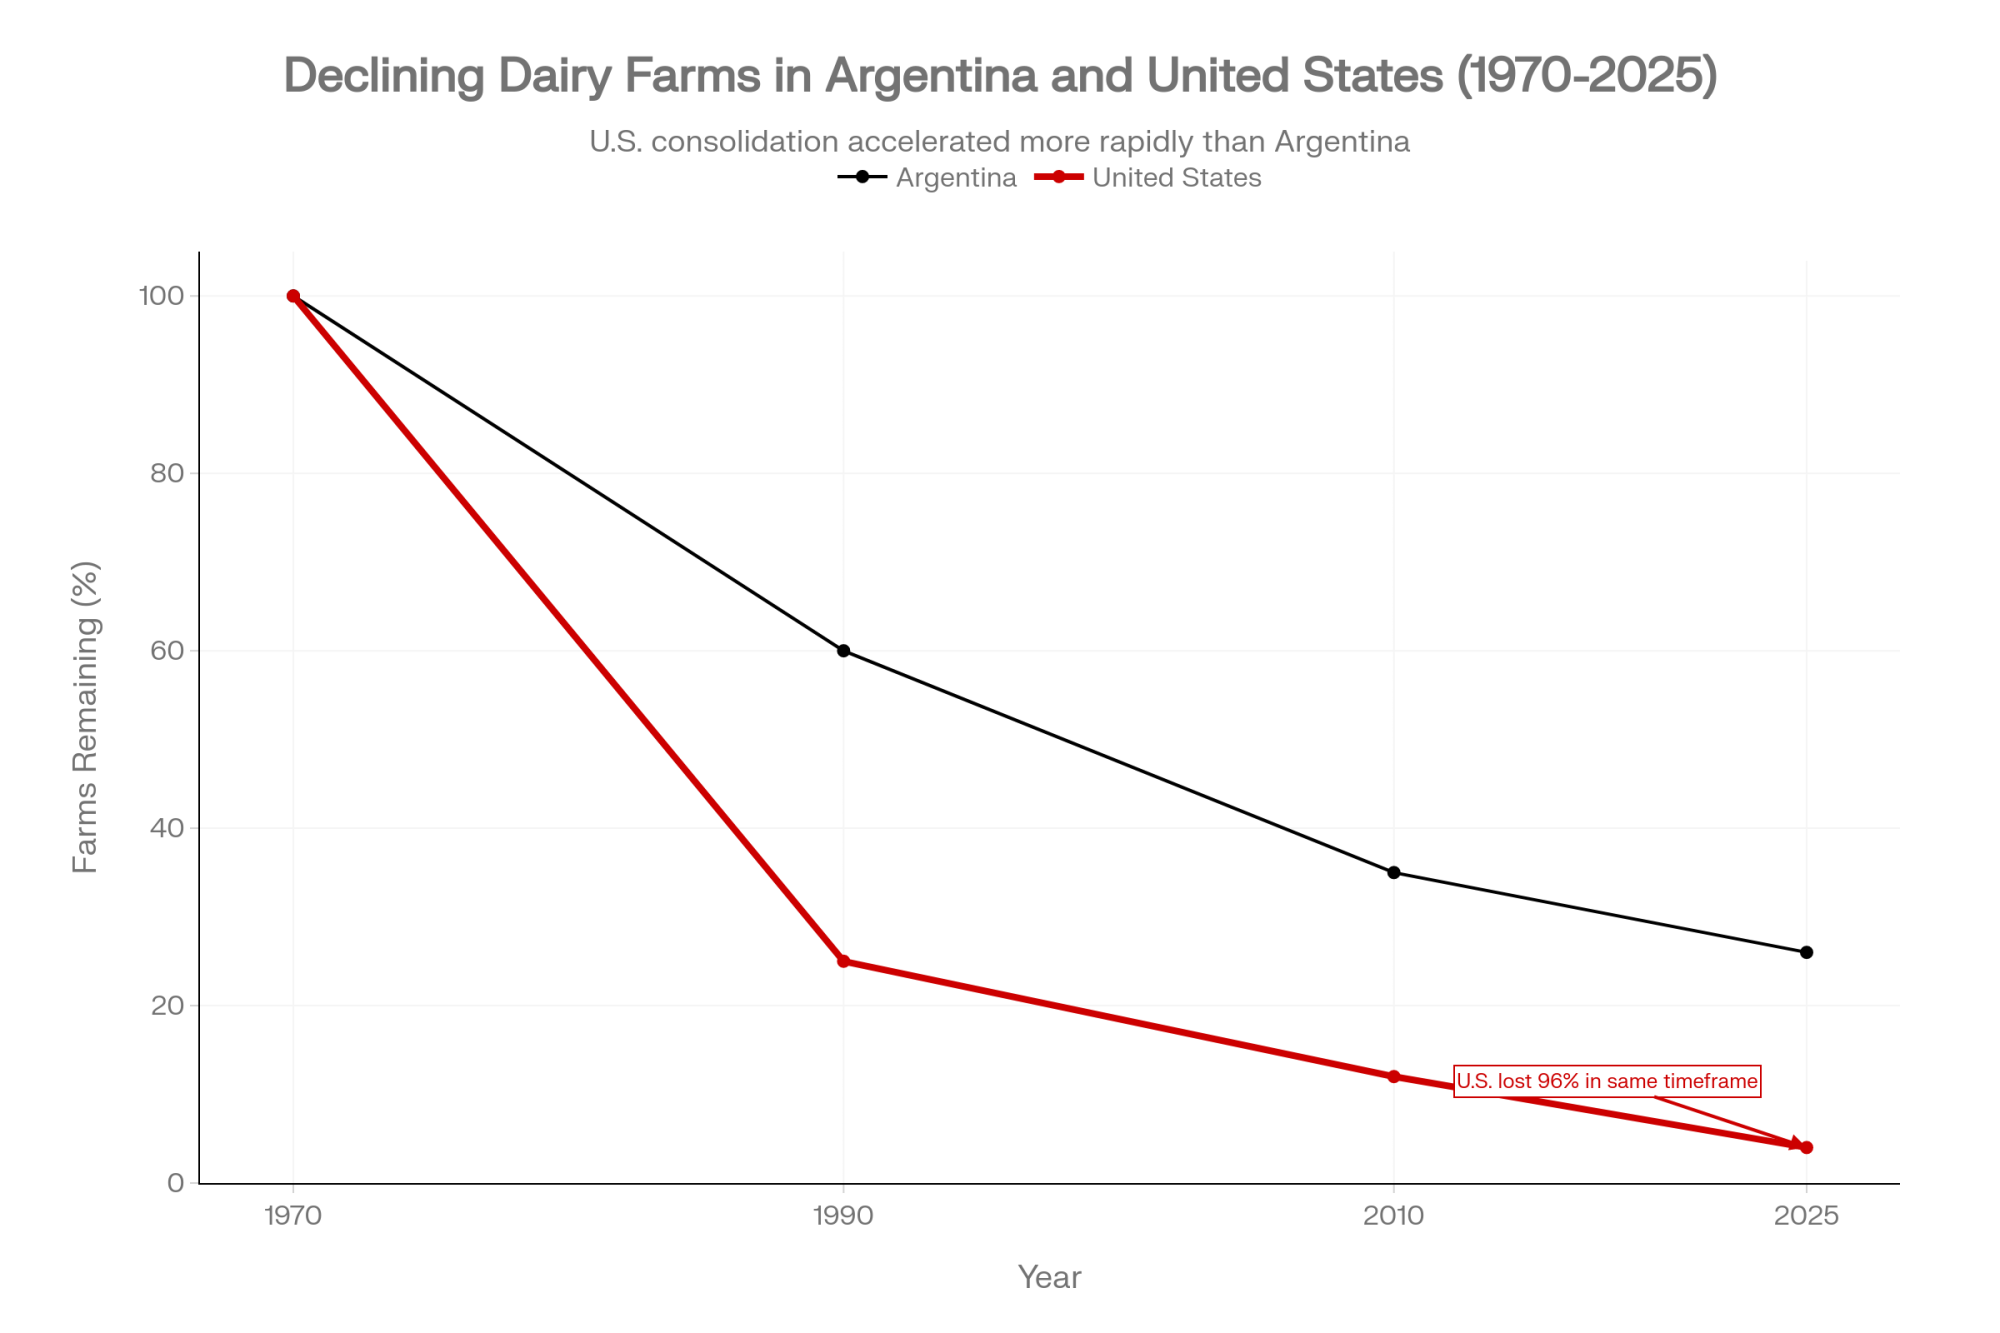
Argentina has already sprinted decades down the consolidation road the U.S. is still running on. Perracino himself put it plainly on LT9: the country went from 35,000 tambos in the 1970s to fewer than 9,000 today.
Metric
Argentina
United States
Peak dairy farms
~35,000 tambos (1970s, per Meprosafe/Perracino)
648,000 farms with dairy cows (1970, USDA ERS)
Current farms
9,013 tambos (end of 2025, OCLA/SENASA)
~24,470 dairy operations (2022 Ag Census)
Decline from peak
~74%
~96%
Avg cows/farm (Argentina)
~166 cows in 2025, up from ~162 in 2024
Similar “bigger survivors” pattern
OCLA data show that just 6.3% of Argentine farms now hold 27.6% of the cows and produce more than a third of the country’s milk. When that much volume is concentrated in a handful of big units, one decision in a boardroom reshapes an entire region’s milk market. And the mid-sized family tambos? They’re negotiating from the weak side of the table every single time.
Wisconsin knows the feeling. The state starts 2026 with about 5,100 licensed dairy herds — 5,115 to be exact, according to USDA NASS data based on Wisconsin DATCP’s Dairy Producer License list as of January 1, 2026. That’s down from more than 15,000 in the early 2000s. The Hartwig family is one example among many. When low prices nearly forced them to sell their Wisconsin herd in 2019, a local banker helped them restructure and survive, as the Milwaukee Journal Sentinel reported. Not every family gets that kind of lifeline.
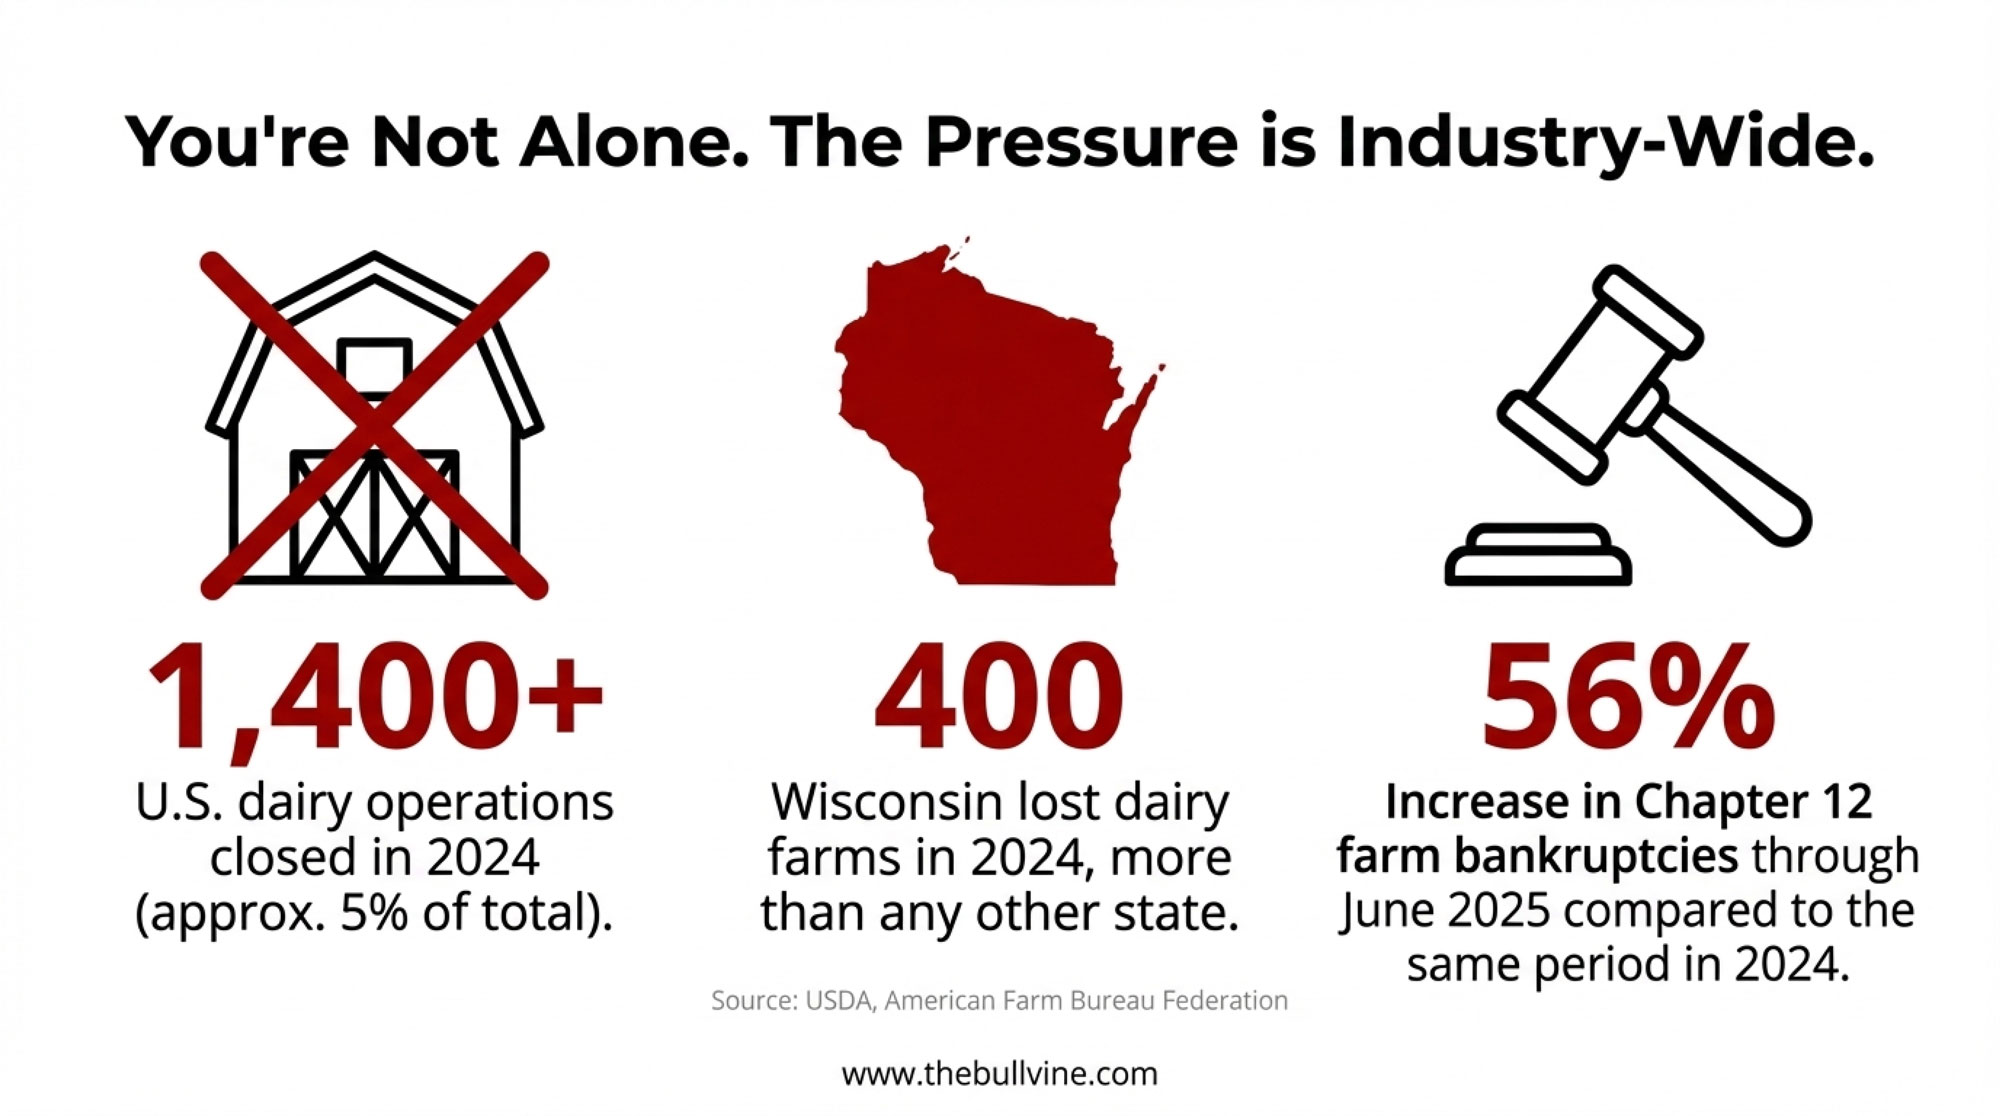
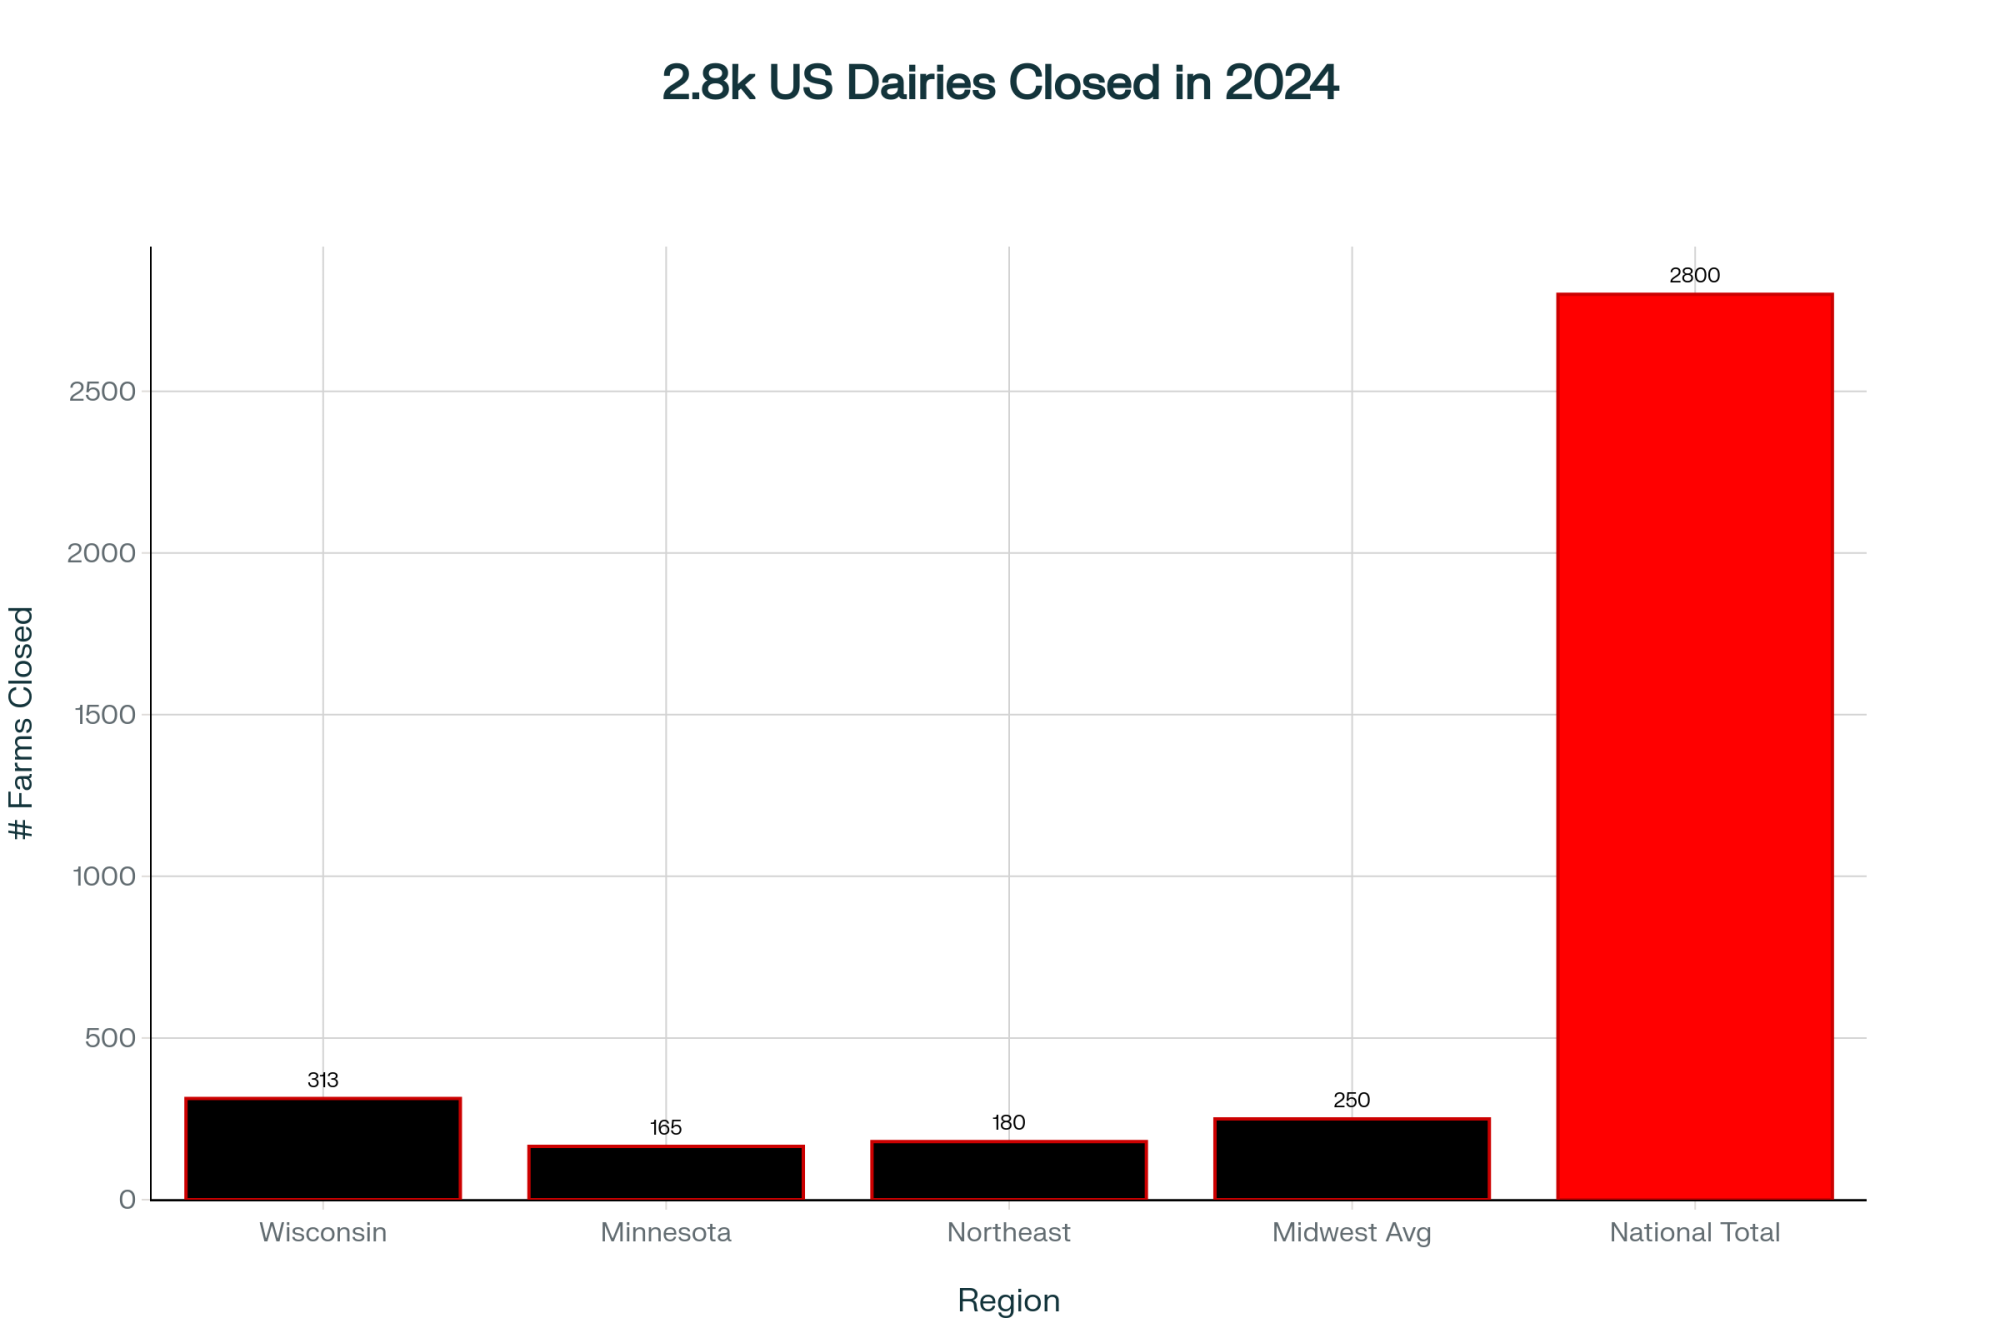
Farm bankruptcy filings have climbed hard across the sector. American Farm Bureau Federation analysis of U.S. district court data shows 216 Chapter 12 farm bankruptcy filings in 2024 — up 55% from 2023. In 2025, that number hit 315, up another 46%. These are all-farm filings, not dairy-specific, but 120 of the 2024 cases were in the 24 major dairy states — and the Midwest dairy belt saw the steepest increases. Meanwhile, USDA data put 2024 dairy farm losses at around 1,420 licensed herds nationally — roughly a 5% drop in a single year.
Same pattern everywhere: mid-sized family dairies getting squeezed between thin farmgate margins and concentrated buyers who have options when you don’t.
Legacy at Risk: When the Tambo Is More Than a Business
Strip this down to dollars, and you miss the deeper loss.
Argentine coverage of the Lácteos Verónica crisis doesn’t just talk about pesos and liters. It talks about legacy. Many Santa Fe tambos have been in the same families since the 1960s and 1970s, often tracing back to Italian and Spanish immigrant settlers. As TN Campo reported in December 2025: “Para muchas familias, el tambo es un legado de generaciones. Hoy, sin ingresos y con deudas en aumento, varios deben abandonar la actividad.” (“For many families, the dairy farm is a generational legacy. Today, without income and with debts mounting, many must abandon the activity.”)
That kind of loss can’t be captured in a spreadsheet. And it plays out the same way in Wisconsin, Pennsylvania, or anywhere else a family’s identity is tied to land and livestock.
This Wasn’t an Import Story
You’ll hear folks pin Argentina’s dairy pain on “cheap imports.” The numbers don’t support that.
Argentina is a net dairy exporter. Argentine Agriculture Ministry data show 2025 dairy export value at $1.69 billion — the strongest performance in 12 years — with roughly 27% of total milk production going to export markets. Imports of milk powder and other dairy products remain small relative to what Argentina ships out.
The damage in this story came from inside the chain:
A major processor overextended and ran out of cash, racking up 3,843 bounced checks and tens of millions in unpaid milk.
Payments to farmers stopped while plants tried to keep running on fumes.
Smaller and mid-sized suppliers with no financial buffer absorbed the losses first.
That’s not a trade-war tale. It’s a processor-risk tale. And it’s worth separating the two, because U.S. dairies sit on the exact same fault line: a small number of large processors, thin margins, and no guarantee the company taking your milk today will still be solvent in three years.
Trade agreements like the EU–Mercosur deal and newer U.S.–Argentina frameworks do change long-term competitive dynamics. But in Sedrán’s case, the crisis didn’t start with someone else’s powder. It started with her own buyer’s balance sheet blowing up.
What This Means for Your Operation
This is where the story stops being about Argentina and becomes a planning session for your own farm. Four questions. Write down your honest answers.
Risk Factor
The Question
High Risk 🚨
Lower Risk ✓
Buyer Concentration
What % of your milk goes to one processor?
> 50% to single buyer
< 50%; multiple outlets
Cash Runway
How many days of operating expenses do you have in reserves?
< 30 days liquid cash
≥ 90 days accessible reserves
Early Warning System
Would you act on warning signs—or wait and hope?
“We’ll give them time”
Written response plan; quarterly processor health check
72-Hour Plan B
Who can take your milk within 3 days if your buyer fails?
No answer / “I’d have to call around”
Written list: alt plants, haulers, pricing
1. How exposed are you to one processor?
Pull your last 90 days of milk checks. If more than 50% of your volume went to a single buyer for that entire stretch, you’re effectively single-sourced.
In some regions, that’s just reality — one major plant within hauling range. But calling it “normal” instead of “high-risk” is exactly how good farms end up in the same spot as Sedrán’s neighbors.
If your number is north of 50%, start thinking about secondary outlets (co-ops, smaller plants, direct-to-consumer channels), contract terms that give you at least some flexibility, and how fast you could actually re-route part of your volume if you needed to. The goal isn’t to blow up a good relationship. It’s to stop pretending concentration doesn’t change the risk math.
2. What’s your cash runway?
Sedrán limited the damage because she had enough cash and credit to stop shipping while she found another buyer. Many of her neighbors didn’t, so they kept feeding cows for free.
Aim for at least 90 days of operating expenses in accessible reserves. On a 500-cow herd, that often means something like $250–$300 per cow in cash or near-cash, depending on your cost structure. Not a magic number — a starting point.
If you’re sitting at 20–30 days right now, don’t beat yourself up. Set a concrete goal to add 5–10 days of cushion each quarter for the next 18–24 months. Slow, boring progress beats “we’re fine” right up until you’re not.
3. Would you see the warning signs — and act?
Sedrán’s neighbors all saw signs: payment dates slipping, checks clearing more slowly, and local media reporting on the company’s financial troubles. Some took action. Others waited, hoping things would turn. You know which group came out ahead.
On your farm, warning signs might include payment schedules being “restructured,” vague responses when you ask about plant capacity, or rumors that your buyer is closing facilities in other states.
Pro-Tip: Watch the “Smoke” If your processor is a private company, ask your lender if they have seen a change in the speed of deposits from that specific entity. Bankers often see the “smoke” (slower clearing times) months before the “fire” (bounced checks).
Once a year, sit down with your lender, accountant, or advisor for a “processor health check.” Pull whatever public data you can — annual reports, credit ratings, news on plant expansions or closures. Ask the blunt question: is this buyer growing, stable, or shrinking? And what would we do if they suddenly “restructured” procurement?
4. What’s your 72-hour Plan B?
If your processor stopped paying tomorrow, who could realistically take your milk in 72 hours? Not six months. Three days.
Write it down: names of alternate plants or co-ops, haulers who could move milk there, rough price expectations in a distressed situation, and how many days you could afford to dump or divert before the bleeding matters.
Put that one-page plan in the same drawer as your emergency vet contacts and power-outage protocol. Make sure at least one other person on the farm knows it exists and where to find it.
Sedrán had enough runway and local options to move quickly. Her neighbors are now pursuing legal claims for their unpaid milk, according to Argentine press reports.
Your Processor Risk Checklist
Print this. Stick it on the office wall. Do the homework before you need to.
[ ] Identify your exposure: Is more than 50% of your milk going to one buyer? Pull 90 days of milk checks and find out.
[ ] Calculate your runway: Do you have 90 days of operating expenses in accessible cash or credit? If not, what’s the gap — and what’s your quarterly plan to close it?
[ ] Monitor the vibe: Are payments slowing down? Is communication getting vague? Schedule an annual “processor health check” with your lender or advisor.
[ ] Draft your 72-hour Plan B: Who gets the milk if the gate stays locked tomorrow? Write down names, haulers, and timelines. One page. Keep it where someone else can find it.
Key Takeaways
Processor failure is not abstract: Lácteos Verónica’s collapse left about 150 Argentine dairy families with roughly $60 million in unpaid milk and 3,843 bounced checks, while one family that switched early limited its loss to about a month.
The same pattern is already on your doorstep, with Dean Foods’ 2018 cuts, rising Chapter 12 filings, roughly 1,420 U.S. dairy farms gone in 2024, and Wisconsin down to about 5,100 herds showing how fast good operations can be stranded when most of their milk goes to one buyer.
For your farm, processor risk boils down to four questions: how concentrated your milk check is, how many days of true cash runway you have, whether you’ll move on warning signs, and who can take your milk within 72 hours if your current buyer stops paying.
The practical targets in this piece are simple but hard to ignore: aim for at least 90 days of operating reserves, keep any single buyer under 50% of your volume where markets allow, and put a written 72‑hour Plan B in the same drawer as your emergency vet numbers.
In the end, the difference between still milking and fighting over unpaid checks wasn’t luck or genetics—it was whether a family treated processor risk as a real threat and acted before hope was their only plan.
The Bottom Line
Cecilia Sedrán didn’t wait to find out how that bet would play out. She moved while she still had choices.
Do you?
Complete references and supporting documentation are available upon request by contacting the editorial team at editor@thebullvine.com.
Learn More
The Triple Cushion Trap: Why 2025’s Strong Margins Won’t Save You in 2026 – Gain an immediate survival checklist for the 2026 transition. This piece delivers a hard-hitting audit of contract terms and labor efficiency, arming you with specific management shifts needed to bridge the margin gap before financial cushions deflate.
The 18-Month Window: Why Your Lender Knows Your Dairy’s in Trouble Before You Do – Reveal the invisible timeline lenders use to grade your operation’s viability. This insight exposes how proactive planning preserves 40% more equity than waiting for a crisis, delivering the strategic advantage of choosing your own exit terms.
Four Farms Exit Daily: The $100K Decision Reshaping Dairy Survival – Arm yourself with unconventional revenue plays like beef-on-dairy and genomic precision that shift annual math by six figures. It breaks down why management effort alone can’t fix structural losses, delivering the innovation roadmap required to stay solvent.
The Sunday Read Dairy Professionals Don’t Skip.
Every week, thousands of producers, breeders, and industry insiders open Bullvine Weekly for genetics insights, market shifts, and profit strategies they won’t find anywhere else. One email. Five minutes. Smarter decisions all week.
Thinking about adding or expanding on‑farm processing? Read this 75-year doorstep story first. It might change your plan.
On January 31, 2026, Juan Hargraves finished the last doorstep milk delivery Cooil’s Dairy would ever make — ending an on-farm dairy processing and direct delivery operation his wife Kirsty’s family had run for more than 75 years in the south of the Isle of Man. For some customers, those rounds had been part of life for more than 60 years. Three generations of the same households opening the same door to find the same family’s milk before dawn.
Nobody was angry. Nobody was bankrupt. The herd of 120 to 130 cows is still milked every morning. But the processing plant needed significant investment that the operation couldn’t justify, and Juan and Kirsty made the call while they still had choices—to refocus on farming and family life. “After much discussion and careful consideration,” they wrote, “we are not in a position to make this investment in the current climate”. If you’re running on-farm processing for a retail channel that only handles a minority share of your total output, the number that killed Cooil’s retail operation — their retail‑to‑wholesale ratio — is one you should know cold.
Juan and Kirsty Hargraves with two of their six children at home on the Isle of Man. For 75 years, the Cooil’s Dairy milk round started just after 1 a.m. — but the hardest work always happened under this roof.
Three Generations, One Route
Leslie Cooil started farming in the Port Erin area around 1942 or 1943, and the doorstep dairy that would define the family business for the next 75 years followed in the early 1950s. “The very start of it would have been Leslie Cooil in about 1942/1943, from what I can get from Ian and Gary Cooil,” Juan told Manx Nostalgia. Ian and Gary — Leslie’s sons — carried on their father’s legacy in the early 1970s, when Ian was about 21 and Gary about 5 years younger. The operation became known locally as Cooil Brothers.
By 2010, Juan had gone from the kid who jumped on the back of the milk truck to a business partner. He first hopped on a Cooil’s truck in 1987, when he was 7, and later went up to the farm to help and worked there until he was 17. In 2004, he took in 120 acres of bare land neighboring the Cooils, running sheep and a few suckler cows while working full‑time on another farm. Buildings went up on that greenfield site in 2007, with more added over time to move the cows to newer facilities and expand the operation. In 2010, entered in to a partnership with the Cooils. In 2014, he bought Ian out upon Ian’s retirement. And in 2020, just six hours after their youngest child was born, Kirsty was signing the papers to buy out Gary’s share of the business — swapping her life as an estate agent for being fully in the dairy with Juan. All of that sits behind the one‑line summary: “Juan and Kirsty took over fully.”
“We’re Cooil’s Dairy Limited. We’ve been Cooil’s Dairy Limited since about 3 years ago now, when my wife, Kirsty, and myself took it over fully,” Juan told Manx Nostalgia in December 2023. “Obviously, our surname is Hargraves, but we’ve kept Cooil as the known trading name”.
By the time they made the decision to close, they were delivering to about 850 houses. Juan is clear: just over 1,000 would have been the peak of COVID, when they took on everyone who wanted deliveries and lived in their area. As customers went back to their usual routines — and as older clients passed away — the number settled back to roughly 850 households.
The team was small and tight. Mark ran two delivery rounds, working pretty much six days a week. Brian handled a third round on Monday, Wednesday, and Friday, and washed every bottle that came back. Lorna bottled the milk. Kirsty managed the office, the accounts, and all Farm Assurance paperwork — which Juan noted had become “a massive thing to undertake.” Juan covered the farm, the milking, and filled in on delivery routes whenever someone was off. Five people. About 850 households. Every week.
And it wasn’t just milk. Cooil’s delivered fresh Manx milk and cream in recyclable glass bottles, plus eggs, potatoes, homemade cakes, and ice cream.
“We’ve made so many friends over the years, saved lives, moved furniture round and even caught criminals in the act,” Juan wrote in the farewell message. During the blizzard of 1994, the family later recalled, the team delivered by tractor and trailer because the milk had to get through. During COVID‑19, Cooil’s took on a wave of new customers as island residents turned to doorstep delivery — a surge that placed heavy additional demands on processing equipment already built for the existing base.
Two Sites, One Dairy
There’s another piece you don’t see if you only watch the milk truck pull up at the door. The processing plant wasn’t even on the same site as the cows by the time the last round went out.
The herd moved to a new greenfield site in 2015, onto the newer facilities Juan and Kirsty had been building since 2007. The processing stayed at the original Cooil’s site. To bridge the gap, they retro‑fitted a DX bulk tank onto an old grain trailer chassis and hauled milk back for processing five days a week. Every load meant diesel, time, and one more moving part that could go wrong between parlour and pasteurizer.
And the work didn’t stop when the van pulled into the yard. “Every evening we had to make sure we had made any customer changes so that the rounds were ready to go just after 1 a.m., the vans were ok to go and there was enough potatoes etc. to go for the morning,” Juan wrote. Even now, a week later, with the rounds done, they’re still catching up invoices. The reality, he says, “hasn’t fully kicked in” — but they already feel a sense of freedom.
“So it fell to me to cover whatever needed doing,” he admitted. In their house, six children meant Kirsty’s hands were full, especially in the mornings. A young lad was working on the farm, but with limited experience, he couldn’t do it all on his own. Relief staff? They couldn’t afford them — and that’s if you could even find someone willing to milk cows one day, bottle milk the next, and drive rounds in the dark the day after that.
“I’ve seen it a few too many times to care to remember,” Juan wrote, “that I’ve had a milkround to cover and I’ve gone out after tea (evening meal), done half of the round, got home for midnight, up at 5 to milk the cows and then finish the round afterwards, all the while we had customers ringing to say they haven’t had their delivery yet.” His own summary of those years is simple: “I was constantly plate spinning.”
The community felt it. “Thank you, Cooil’s Dairy Ltd for your service over the years in rain, hail, and sun — but usually in the dark,” the Ballasalla Village community page posted. “It’s the end of an era”.
The Collapse of the Middle
Cooil’s closure fits a pattern that’s been tightening for decades. In the early 1970s, an estimated 99% of UK milk was delivered to doorsteps, according to Andrew Ward’s No Milk Today. By the late 2010s — before the pandemic temporarily reversed the trend — that share had fallen to roughly 3%. But the closures aren’t spread evenly. They concentrate in a specific zone.
At the top end, scale operators grow. McQueens Dairies in Scotland expanded well before COVID, with turnover climbing 30% in the year before their 2019 facility announcement, per BBC Scotland. By early 2021, they’d opened 11 distribution depots across Scotland and northern England and recruited more than 200 new staff in 12 months.
At the bottom end, micro‑operators survive by stripping overhead to nearly zero. Gareth Baird, a young farmer in Carrickfergus, Northern Ireland, launched his doorstep round in July 2020, targeting 30 bottles on his first night — he delivered 120. No employees. No bottling line. Minimal fixed cost.
The operators disappearing are the ones in between. Family dairies milking 80 to 200 cows, running their own on‑farm processing, employing a small team, and serving a few hundred to a couple thousand retail customers while sending the bulk of their milk to a cooperative. Cooil’s — 120 to 130 cows, five people, 850 houses at the end (just over 1,000 at the COVID peak), 80% of milk to the Creamery — was textbook middle‑zone. And the mechanics that made it unsustainable aren’t unique to the Isle of Man.
Why the Math Stopped Working
If you’re running on‑farm processing, the number that matters most isn’t your customer count. It’s your retail‑to‑wholesale ratio — the share of your total milk output that actually flows through your bottling plant.
At the time of closure, Cooil’s sent approximately 80% of its milk to the Isle of Man Creamery at the cooperative wholesale price, per Manx Radio and 3FM. But that ratio had been worsening. In his Manx Nostalgia interview, Juan described it as “approximately about three quarters” to the Creamery, explaining: “We milk more cows. We’ve got more sort of surplus if you like, and then the rest goes on to the doorstep”. Every cow they added sent more milk to wholesale because the doorstep rounds couldn’t absorb the growth. By the end, only about 20% flowed through the family’s own pasteurizer, bottler, and delivery rounds — and that 20% had to carry the entire fixed cost of processing equipment that costs roughly the same whether it handles a fifth of the herd’s output or all of it (20% utilization means each litre through the bottler carries 5× the fixed cost it would at full capacity).
Here’s what that equipment costs to replace. At the micro end, a basic batch pasteurizer starts around $14,000 USD (Tessa Dairy Machinery), while a complete micro‑processing system runs roughly $18,000 USD (MicroDairy Designs). But Cooil’s wasn’t micro — they were making skimmed, semi‑skimmed, and whole milk plus cream for hundreds of doorsteps. The Northeast Dairy Business Innovation Center’s 2024 Processor Modernization grants show real costs at this level: awards ranged from $62,000 to $350,000 per facility for vat pasteurizers, rotary filler‑sealers, and packaging lines.
Take a bottling line with, say, a 12‑year service life and a $150,000 replacement cost. That’s $12,500 set aside every year just to fund its own successor. Spread that across 850–1,000 customers, and it’s roughly $12–$15 per customer per year in depreciation alone — before energy, bottles, labor, fuel, trailer haul‑back, or vehicle maintenance. And every hour Juan spent nursing a bottling line past its service life was an hour not spent on herd genetics, forage quality, or transition cow management — the core drivers of the 80% of the milk that actually paid the bills. That’s opportunity cost, and it compounds quietly.
Cooil’s faced an additional constraint that most mainland operators don’t. The processing plant and the cows were on different sites. Every litre destined for doorstep delivery was pumped into that DX bulk tank on an old grain trailer, hauled back for processing five days a week, then bottled and delivered. That’s haulage, handling, and risk you don’t see on the milk cheque — but you pay for it.
They also operated under a regulated retail price ceiling. The Isle of Man’s Milk Marketing Committee sets retail milk prices by government order. The price per pint rose to 90p in July 2025, the first increase in roughly two and a half years. When your costs are rising, and your price ceiling is externally fixed, the only lever you have is volume. On an island of around 84,000 people, volume has a hard ceiling, too.
QUICK CHECK: Is Your Retail Channel Paying Its Way?
What would it cost to pay yourself and your partner market rate for every hour you spend on the retail side? That number is your unpaid family labor subsidy. If the retail channel can’t cover it, you’re already eroding — you just can’t see it on the P&L.
Divide your processing equipment’s total replacement cost by its remaining service life in years. Are you banking that amount annually? If not, you’re consuming the asset without replacing it.
Call your cooperative and ask one question: “Could you absorb our full supply volume within 90 days?” If yes, your safety net exists. Knowing that changes how you evaluate everything else.
Juan’s answer to those checks is pretty clear in hindsight. “We were understaffed really, and we could not afford to have relief staff,” he wrote, “and that’s if you could find someone who would do a bit of everything.” In the end, it fell to him to cover whatever needed doing. “All these factors led to my heart not being in the job,” he admitted. The bad days — the midnight‑home, 5 a.m. milking, customers ringing because the milk wasn’t there yet — weren’t constant. But they were frequent enough that, by the end, he was “almost begrudging having to do a milkround” while a new building on the farm and six kids at home all needed him too.
“So the end of an era, saying that seems to be the most commonly used phrase,” he wrote. “Yes, it is in its own way, so many people loved our products and are going to miss them.” But the other line that matters is this one: “At the end of the day, it wasn’t a decision that happened overnight, and we have made it for what we feel is right for us going forward as a family.”
Same Island, Two Models, Opposite Outcomes
Carl Huxham runs Cronk Aalin Farm in Sulby on the Isle of Man
A useful comparison sits on the same island. Carl Huxham runs Cronk Aalin Farm in Sulby, milking 40 cows but routing 100% of his output through nine delivery rounds using electric vans. Nothing goes to the Creamery. He built the operation from scratch, starting in 2006, buying a second‑hand 16‑point Fullwood parlour and bulk tank for £8,000. Every piece of equipment was sized for the volume it actually serves.
“Being on an island, our input costs are all quite high as everything incurs a shipping cost,” Huxham shared. He sells at the same regulated price ceiling that Cooil’s operated under.
The difference isn’t geography or regulation. It’s ratio. At 100% retail, Huxham’s processing equipment is fully utilized by the revenue it generates. At Cooil’s 80/20 split, theirs couldn’t be. If you’re considering building a farm‑direct operation from scratch, Huxham’s model is the template. If you’re inheriting one that’s already split between retail and wholesale, Cooil’s is the cautionary math.
Four Paths Forward
Across the UK and North America, family dairies navigating the same pressure points are finding distinct paths:
The clean exit to cooperative supply. Cooil’s path: cease retail, route all milk through the cooperative. It eliminates processing and delivery costs entirely, preserves the farm, and can execute within 60 to 90 days. The trade‑off is permanent — you surrender the retail premium and the direct community relationship.
The radical downscale. Baird’s model in Northern Ireland strips out every cost layer that burdened Cooil’s: no paid delivery staff, minimal equipment, a radius one person covers before breakfast. It doesn’t scale. And it depends entirely on one body holding up indefinitely.
The channel swap to vending. Milk vending machines have become one of the fastest‑growing farm‑direct channels in UK dairy. A setup costs roughly £30,000, with margins of 60-80 pence per litre, according to The Bullvine’s July 2025 analysis. The model eliminates delivery cost by bringing the customer to you — but also eliminates the community welfare function.
The community‑supported model. Stroud Micro Dairy in Gloucestershire operates as a cooperative, with customers subscribing to seasonal shares. Over 800 community shareholders own Tablehurst and Plaw Hatch Farms in Sussex. When customers pre‑pay for a season’s milk, you know in January what February looks like. The catch: board meetings, annual reports, and governance paperwork most dairy families didn’t sign up for.
Path
Entry Cost
Key Trade‑off
Best Fit
Clean exit to cooperative
Minimal
Lose retail premium permanently
Retail <30% of output; equipment aging
Radical downscale
$5K–$15K
No growth; one person’s stamina
Young farmers; no employees
Vending
~£30K / ~$38K
Lose doorstep relationship
Farms near roads with footfall
Community cooperative
Variable
Governance complexity
Peri‑urban; engaged consumer base
What This Means for Your Operation
This isn’t abstract. Clark Farms Creamery in New York was processing roughly 25% of the farm’s milk — about 3,000 gallons a week — with the remaining 75% still being trucked off. As The Bullvine reported in January, the real premium was roughly $1.15–$2.15 per gallon in extra margin at the cost of 70–90 more hours a week on top of a full dairy workload. Clark shut the creamery down in January 2026 while keeping the cows milking — the same decision Cooil’s made, on the opposite side of the Atlantic.
Strategic Path
Entry Cost (USD/CAD)
Key Trade-Off
Best Fit
Clean Exit to Cooperative
Minimal ($0-$5K transition costs)
Lose retail premium permanently
Retail <30% of output; equipment aging; no succession plan
Radical Downscale
$5K-$15K (minimal equipment, no employees)
No growth; limited by one person’s stamina
Young farmers with no family; high energy; willing to work 7 days/week
Vending Machine Model
~$38K CAD / ~£30K GBP
Lose doorstep relationship and community role
Farms near high-traffic roads; peri-urban locations; strong local brand
Community Cooperative
Variable ($10K-$50K legal/admin setup)
Governance complexity; board meetings; reporting
Peri-urban locations; engaged customer base willing to invest; strong local food movement
On Vancouver Island, Mark at Promise Valley Farm took the opposite approach — a small organic Guernsey herd with 100% A2A2 genetics, processing all milk on‑farm through a self‑serve dispensing machine. “Processing our own milk and making value‑added products has to be part of the conversation for future producers,” he shared. But notice: small herd, all milk through the store. Ratio, again.
The advantage you have that Cooil’s didn’t: pricing freedom. No government committee sets your retail price. You can charge what the local market will bear—but only if you use it deliberately. If you’re pricing farm‑store milk just a dollar above the grocery store “to stay competitive,” you may be leaving the margin on the table that would fund your equipment reserves. And here’s the piece that ties to your breeding program: if your herd’s component profile — butterfat, protein — commands premiums through the cooperative, every litre you divert to flat‑rate retail bottles is leaving that premium on the table. If you’re operating under Canadian supply management, the ratio math shifts because your wholesale floor is higher — but the equipment depreciation math doesn’t.
The wholesale safety net itself is under pressure. AHDB warned in January 2026 that farmgate prices are “set to stay under pressure into mid‑2026” as oversupply squeezes values, with the spring flush likely to make the first half of the year particularly difficult. The UK average farmgate price for December 2025 came in at 40.29 pence per litre, down 6.1% from November and 13% below December 2024. Exiting retail into a weakening wholesale market is still a viable move — but the window where wholesale alone feels comfortable is narrower than it was six months ago.
Confirm your cooperative or processor can absorb your full supply before you need them to. Cooil’s transition to the Creamery happened smoothly on February 1 because that relationship was already in place. Your safety net should exist long before the pasteurizer starts making noises it shouldn’t.
The Technology Temptation (Don’t Wait for It)
If you’ve heard about Lely’s Orbiter — an automated on‑farm processor that pasteurizes, homogenizes, and bottles with minimal labor — you might be thinking automation could change this math. As of December 2025, five units were operational in the Netherlands and Belgium, with sales expanding into Germany. The Orbiter page is live on Lely’s North American website. But there’s no announced NA availability date, no published pricing, and no regulatory pathway confirmed. Lely’s own Astronaut A5 Next milking robot won’t reach the US and Canada until “after local validation in 2026”. The Orbiter is further back in the queue. If your bottling line is at year 9 of a 12‑year service life, you can’t afford to wait for technology that may not arrive at a price point that works for your herd. Cooil’s made the call at their convenience. That’s worth more than any piece of equipment.
Key Takeaways
Track your retail‑to‑wholesale ratio, not just your customer count. When your direct retail channel handles less than 30% of total output, the processing infrastructure is almost certainly overbuilt for the volume. Cooil’s saw that ratio worsen as the herd grew, from about 75% wholesale to 80%. Clark Farms hit the same wall at 75%.
Count your unpaid family labor as a real cost. Cooil’s ran the entire processing and delivery operation with five people, in addition to the farm work. Add six kids and a second site into that mix, and you can see why Juan described his life as “plate spinning.”
You need an equipment replacement plan, not just a repair budget. If your retail margin isn’t building a reserve to replace the bottler, the day it fails, the decision happens to you, not with you.
Surge demand will lie to you. Cooil’s peaked at “just over 1,000” houses during COVID, then settled back to about 850 as people returned to normal. AHDB and Kantar saw similar patterns nationally. Don’t invest based on the peak; invest based on the plateau.
Genetics and components matter to this decision. Every litre you pull from a high‑component herd and sell at flat retail is a litre that doesn’t earn the cooperative’s butterfat and protein premiums. That’s genetics ROI you’re giving away.
Year 8 is your red‑flag year. If your processing equipment is past year 8 of a 12‑year life, you should already be working through your options: full retail, clean exit, downscale, vending, or cooperative model. Not when something breaks. Not when Lely announces an Orbiter for your market. Now.
The Bottom Line
Juan and Kirsty Hargraves closed their retail operation while the farm was still healthy, the staff could be thanked by name, and the community had time to say goodbye. “We would like to think that nobody was ever let down,” they wrote. From Leslie Cooil’s first delivery in the early 1950s, through Ian and Gary’s decades behind the wheel, to Juan and Kirsty’s final round on January 31, 2026 — the milk showed up before dawn, to hundreds of doorsteps, every week. That’s not a failure story.
The question for your operation isn’t whether something like this could happen to you. It’s whether you’d recognize the signals at year 8 — not year 12.
If the weight of a decision like this is sitting on you — or on someone you know — the Farm Aid hotline (1‑800‑FARM‑AID) and the Canadian Ag Mental Health Alliance can help. You don’t have to sort it out alone.
Complete references and supporting documentation are available upon request by contacting the editorial team at editor@thebullvine.com.
English Dairy Farms See Earnings Surge in 2024-25 – But Don’t Get Comfortable – Exposes the danger of relying on temporary farmgate surges. This analysis reveals how to leverage current earnings to fortify your operation against the inevitable price slides that catch unprepared producers off-guard in the three-year outlook.
Milk Vending Machines: Why They Are The Fastest-Growing Farm-Direct Channel – Breaks down the high-margin, low-overhead blueprint for on-farm sales. Discover how vending technology captures a 60-80 pence per litre premium while slashing the delivery and labor costs that eventually sank the traditional doorstep model.
The Sunday Read Dairy Professionals Don’t Skip.
Every week, thousands of producers, breeders, and industry insiders open Bullvine Weekly for genetics insights, market shifts, and profit strategies they won’t find anywhere else. One email. Five minutes. Smarter decisions all week.
The Reynolds family bet half their Idaho farm on dairy. An Oregon neighbor did everything “right” and still bleeds cash. The gap? Up to $600,000 a year in geography, not effort.
Executive Summary: You’re not imagining it — Idaho’s dairy families aren’t just getting lucky, they’re starting every year about $600,000 ahead of similar herds in Oregon and Washington because of feed, labor, and plant math they don’t control. Through the Reynolds family’s R 7 Dairy and the Kircher/Bansen Forest Glen operations, you see how cheap hay, no ag overtime, and billion-dollar-class processing investments in Idaho created a structural edge of $3.10–$4.25/cwt, while Darigold’s $300 million Pasco overrun and $4.00/cwt deductions pushed many Washington members into survival mode. Even a 2,200-cow organic A2 Jersey herd with grazing, a digester, and strong contracts can’t fully outrun a bad zip code once organic feed, overtime rules, and processor margins stack up. This piece doesn’t stop at sympathy; it gives you three concrete paths in a high-cost state — spend millions on robots and automation, pivot hard into ultra-premium contracts, or plan a relocation/exit on your terms instead of the bank’s. It also shows how CDCB’s 2025 Net Merit update — more weight on Feed Saved and fat, less on protein — quietly shifts sire selection from “nice to have” traits to survival filters if you’re fighting high costs. In plain language, it explains why geography now sets your floor, why management and genetics still decide your ceiling, and what decisions you actually have left if your zip code is working against you.
Dave Reynolds didn’t come from dairy. He came from row crops — 2,200 acres of sweet corn seed, silage, wheat, barley, sugar beets, and alfalfa near Kuna, Idaho. He was, by his own admission, “less comfortable with animals.” But his son Tyler took dairy science courses at the University of Idaho and saw what his father couldn’t: the crops they already grew were essentially a dairy ration in the ground. The cows were the missing piece.
When a small dairy nearby went to auction in 2012, every established operator in the valley passed. “For the big dairymen, it was way too old, way too little,” Dave told Capital Press (May 28, 2025). Tyler convinced his father to buy in anyway. They named the dairy R 7 — for the seven members of the Reynolds family.
Today, R 7 Dairy milks more than 700 cows, and dairy accounts for “over half of our business,” Tyler said. “If you include the byproduct beef calves off of it, it’s stronger than that.”
Three hundred miles west in Dayton, Oregon, Robert Kircher and farm owner Dan Bansen run Forest Glen Farms — 2,200 Jersey cows across two operations, certified organic since 1997, shipping specialty milk to Nancy’s Probiotic Foods and Costco’s A2 program. They manage over 1,000 acres of irrigated pasture and 2,000 acres of organic cropland. A 370-kilowatt anaerobic digester generates 3.1 million kilowatt-hours a year for Portland General Electric. By every operational measure, Forest Glen is a textbook.
Here’s what Kircher told Capital Press: “It’s been pretty tough. We’re getting near to what we were seeing pricewise in 2014. But 10 years ago, all your costs were a lot lower.”
The gap between these two operations isn’t inside the parlor. It’s everything outside it.
Idaho’s $3.87 Billion Flywheel
Idaho generated $3.87 billion in dairy farm-gate receipts in 2024 — up 12% from $3.46 billion the year before, according to USDA data cited by the Idaho Farm Bureau (September 2025). Idaho produced 17 billion pounds of milk from 671,000 cows, averaging 25,375 pounds per head — roughly 1,200 pounds above the national per-cow average of 24,178 pounds. Through the first half of 2025, Idaho milk output ran about 7% ahead of the prior year, according to the Idaho Dairymen’s Association.
Texas edged past Idaho for the #3 national production slot in 2024. Rick Naerebout, CEO of the Idaho Dairymen’s Association, told Capital Press he’s confident Idaho will reclaim it — pointing to water constraints already limiting Texas expansion.
The West Coast tells a different story. California’s production dipped in 2024, partly from H5N1 disruptions. Oregon’s output fell 4% to 2.5 billion pounds, cow numbers dropped to 117,000, and the state’s milk value sat at $596 million. U.S. total production was 225.9 billion pounds — down 2% — even as total milk value rose 11% to $50.9 billion.
The Feed Gap No Nutritionist Can Close
You already know feed is your biggest cost. What you might not know is how wide the regional spread has gotten.
National alfalfa hay averaged about $172 per ton in September 2024 (Hoard’s Dairyman, December 2024). The USDA Direct Hay Report showed Good-quality Idaho alfalfa at $190 per ton FOB in late 2025 (USDA AMS, January 4, 2026). For context, NASS reported the 2024 Idaho alfalfa average at $153 per ton — the $190 spot price reflects seasonal and quality variations in the January market. At the Wolgemuth Hay Auction in Leola, Pennsylvania, premium alfalfa/grass mix sold at $320 to $405 per ton — averaging $366 — while premium straight alfalfa brought $305 to $330 (USDA AMS Hay Auction Report #1725, January 14, 2026).
Idaho (Magic Valley)
Pennsylvania (East)
Gap
Alfalfa hay, $/ton
$190 FOB
$305–$405 (avg $366)
$115–$215/ton
Source
USDA AMS Direct Hay, January 4, 2026
USDA AMS Auction #1725, January 14, 2026
Hay cost impact per cwt milk (DMC formula: 0.0137 tons alfalfa/cwt)
Run that spread through the DMC formula — corn at 1.0728 bushels, soybean meal at 0.00735 hundredweight, alfalfa at 0.0137 tons per hundredweight of milk — and the hay component alone creates a feed cost gap of $2.50 to $3.00 per cwt.
For a 1,000-cow dairy producing at Idaho averages (253,750 cwt annually), that translates to north of $600,000 in additional feed costs for the same operation parked in the wrong geography.
University of Illinois dairy scientist Mike Hutjens has benchmarked the value of pushing feed efficiency from 1.4 to 1.5 pounds of milk per pound of dry matter — a genuinely elite gain — at about $0.51 per cow per day, or $186 per cow per year. Real money. Also, less than a third of the per-cow geographic penalty. You can run the tightest ration in Oregon and still lose on feed to an average operation in Jerome.
Labor Law: The Advantage You Can’t Out-Manage
Idaho’s agricultural workers are exempt from overtime under the federal Fair Labor Standards Act, and Idaho imposes no state-level overtime mandate.
That’s not the case next door. California has required ag overtime after 40 hours per week since 2022 for large operations under AB 1066. Washington requires ag overtime after 40 hours — dairy workers have been covered since the state Supreme Court’s Martinez-Cuevas v. DeRuyter Brothers Dairy ruling in November 2020, and all other ag workers since January 2024 under ESSB 5172. Oregon’s House Bill 4002, signed in 2022, currently sets the threshold at 48 hours, dropping to 40 in January 2027 (Oregon Bureau of Labor and Industries).
On a dairy where most employees work 50- to 55-hour weeks, the differential adds roughly $0.60 to $1.25 per cwt. That range is consistent with a Washington-focused study published in Choices (AAEA), which found that dairy farm total wages increased by more than 7% under a 48-hour threshold and by 12% under a 40-hour threshold. Cornell’s Dairy Farm Business Summary documented total labor cost at $3.08/cwt after New York’s 60-hour overtime threshold took effect in 2020, with total wages up 15.9% due to combined minimum wage increases and overtime costs (EB2021-06, October 2021). For Jason and Eric Vander Kooy, milking 1,400 cows near Mount Vernon, Washington, the overtime differential on 50-hour workweeks translates to tens of thousands of dollars annually that an identical Idaho operation simply doesn’t pay. That’s a policy gap, not an efficiency gap.
Worth watching: the federal Fairness for Farm Workers Act has been reintroduced in multiple Congresses (2019, 2021, 2023) to eliminate the FLSA ag overtime exemption. It has failed to advance each time. Moving the other direction, the Protect Local Farms Act (H.R. 240), introduced in January 2025, would pre-empt any state overtime law below 60 hours for ag workers. Neither has passed. For now, the advantage holds.
Stack feed on top of labor. Combined structural disadvantage for the wrong geography:
The Geographic Penalty
Hay component gap: $2.50–$3.00 per cwt
Labor mandate gap: $0.60–$1.25 per cwt
Total structural disadvantage: $3.10–$4.25 per cwt
Before you’ve touched a management lever, hired a consultant, or upgraded a single piece of equipment.
Cost Factor
Idaho
Pacific Northwest
Gap (PNW Penalty)
Alfalfa hay, $/ton
$190 FOB
$305–$405 (avg $366)
+$115–$215/ton
Ag overtime rules
Exempt (federal)
Required after 40–48 hrs
+$0.60–$1.25/cwt
Feed cost impact, $/cwt
~$2.60
~$5.01
+$2.50–$3.00/cwt
Total structural penalty, $/cwt
Baseline
—
+$3.10–$4.25/cwt
Annual cost, 1,000-cow herd
Baseline
—
+$600,000–$800,000/yr
When Processors Pick Your State
Cheap feed and favorable labor law attracted cows to Idaho. Cows attracted processors. Processors attracted more cows. That flywheel now spins at a pace no other Western region can match.
Chobani’s $500 million Twin Falls expansion, announced in March 2025, increases plant capacity by 50% — adding over 500,000 square feet to bring the facility to 1.6 million square feet with 24 production lines. Idaho Milk Products is building a $200 million facility in Jerome. High Desert Milk invested $50 million in 2021. And the University of Idaho’s $45 million CAFE research dairy — billed as the nation’s largest — occupies 640 acres near Rupert in Minidoka County and began milking its first cows in early 2026, with a rotary parlor built to handle up to 4,000 head and plans to ramp to 2,000–2,500 long-term.
Corey Geiger with CoBank put it plainly in July 2025: “The big growth has been coming in Texas, Idaho, Kansas, and South Dakota. That’s most of the growth areas with new dairy processing assets coming online.” The areas with the most growth in milk production aren’t the areas with the highest milk prices — they’re the areas with new processing plant demand.
Now flip the flywheel.
The Darigold Wreck
Darigold’s Pasco, Washington, plant was budgeted at $600 million when the cooperative broke ground in September 2022, promising to “preserve the legacy of nearly 350 multigenerational farms” (Darigold/NDA press release, July 2021). It didn’t go that way. Capital Press reported the plant ran approximately $300 million over budget, citing people familiar with the matter (May 1, 2025). The Chronline characterized the total investment at $900 million (June 4, 2025). Darigold acknowledged cost overruns, blaming inflation, supply-chain issues, changes to building codes, and project complexity.
To cover the shortfall, Darigold imposed a $4.00/cwt deduction on member milk checks — a 20% to 25% cut — for its roughly 250 current members across Washington, Oregon, Idaho, and Montana, down from the nearly 350 cited at the time of the groundbreaking. The breakdown: $2.50 per cwt for construction costs and $1.50 for operating losses, beginning with an initial $1.50 reduction at the end of 2023.
The damage to individual operations has been severe. Dan DeRuyter, milking in Yakima County, Washington, told Capital Press the deductions cost his operation “almost $5 million in the past two years.” John DeJong, whose family shipped to Darigold for 75 years, said it “eliminated investment” and put his dairy in “survival mode.” Jason Vander Kooy laid out his three options: “It’s either we go organic, go on our own, or close the doors” (Capital Press, May 28, 2025).
The 500,000-square-foot plant started taking milk in early June 2025 and began producing powdered milk and butter by August, with a second dryer slated for year’s end. It can process up to 8 million pounds of milk a day. Some of the operations that financed the overrun won’t be around to ship to it.
The Organic Shield — and Its Limits
Forest Glen represents the supposed answer for high-cost regions. Premium products. Contracted buyers. Revenue above the commodity floor.
Organic pay prices vary widely by buyer and program. The Northeast Organic Dairy Producers Alliance reported 2025 farm-gate pay prices ranging from $33 to $45 per cwt for grain-and-pasture-fed dairies, with grass-fed certified operations pulling $36 to $50 per cwt and spot organic loads exceeding $50 per cwt in tight markets. That’s well above the conventional all-milk price — USDA’s ERS Livestock, Dairy, and Poultry Outlook projected the 2026 all-milk average at $18.25 per cwt (January 16, 2026), while the January 2026 WASDE pegged 2026 Class III at $16.35 per cwt, down 70 cents from the prior month’s estimate. Nancy’s Probiotic Foods, based at Springfield Creamery in Springfield, Oregon — a family operation since 1960 — gives Forest Glen a contracted home for organic Jersey milk. The Costco A2 program taps into a market Grand View Research valued at $4 billion in 2024, and projects will reach $11.2 billion by 2030.
So why has the last decade been “pretty tough”?
Because premium pay doesn’t eliminate costs. Organic feed costs more. Three thousand acres of organic cropland take intensive management. Oregon’s overtime rules apply to organic dairies the same as to conventional ones. And the processor captures the bulk of the retail premium — organic farm-gate prices typically land at less than a third of what consumers pay at the shelf. With national organic retail whole milk cresting above $5.00 per half gallon for the first time in April 2025, even a $45/cwt farm-gate check captures a fraction of what the product is worth at the register.
The Kirchers and Bansen make it work because they started nearly 30 years ago, run 2,200 cows to spread overhead, and stack revenue streams beyond milk: registered Jersey genetics, digester electricity, and composted fiber sold to Willamette Valley vineyards as mulch. That’s not a model you replicate from a standing start in 2026.
Revenue/Cost Item
Conventional (PNW)
Organic (PNW)
Net Advantage
Milk price, $/cwt
$18.25 (2026 proj.)
$45.00 (high-end)
+$26.75/cwt
Organic feed premium, $/cwt
Baseline
+$8.00–$12.00
–$8.00–$12.00/cwt
Overtime labor penalty, $/cwt
+$0.60–$1.25
+$0.60–$1.25
No change
Geographic penalty (vs. Idaho), $/cwt
+$3.10–$4.25
+$3.10–$4.25
No change
Beef-on-dairy calf revenue, per head
~$1,400
~$1,400
No change
Net organic advantage after penalties
—
—
+$6.50–$15.15/cwt
Beef-on-Dairy: Real Revenue, Real Ceiling
Tyler Reynolds told Capital Press that including beef byproduct makes dairy’s share of his revenue “stronger than” half. Stewart Kircher was equally direct: “The impact on the beef market is huge from dairies.”
Day-old beef-on-dairy crossbred calves averaged about $1,400 per head in 2025, according to Laurence Williams, dairy-beef cross development lead at Purina — up from roughly $650 three years earlier (Dairy Herd Management, September 2025). Phil Plourd, president of Ever.Ag Insights, expects financial incentives to “continue to lean toward beef-on-dairy activity, even if it’s not quite as lucrative as today.”
That revenue is real. It’s also cyclical. Budget for it. Don’t build a survival plan around it.
Geography Sets the Floor. Management Sets the Ceiling.
A fair objection to this piece: if geography is the whole game, why do some Idaho dairies fail while some Oregon dairies survive?
Because geography doesn’t replace management — it determines where management has room to work. Tyler Reynolds didn’t just happen to sit on cheap hay. He recognized the dairy ration built into his family’s crop rotation, bought into a facility every big operator passed on, and built a beef-on-dairy revenue stream that pushes his dairy share past 50%. The structural advantage gave him the floor. His decisions were built on top of it.
The same is true on the genetics side. CDCB’s April 2025 Net Merit update increased emphasis on Feed Saved from 12.0% to 17.8% and boosted butterfat from 28.6% to 31.8%, while protein dropped from 19.6% to 13.0%. In high-cost regions where every cent per cwt matters, that shift isn’t academic — it’s survival math. Producers who can’t win on geography are increasingly breeding for components and feed efficiency to close the gap from the cow side, selecting bulls for traits that directly address the structural disadvantage their zip code creates.
But here’s the honest truth: even with elite genetics and Net Merit optimization, the cost gap narrows by hundreds of dollars per cow. The geographic penalty runs into the thousands. Management and genetics are the ceiling. Geography is the floor. And when the floor is $3.10 to $4.25 per cwt below your neighbor’s, the ceiling starts a lot higher, too.
What This Means for Your Operation
If you’re milking in Oregon, Washington, or another region where the structural math works against you, the data points to three paths. None is painless.
Automate and stay. Robotic milking and precision feeding can tighten the gap — current systems run $200,000–$300,000 per unit, each handling 50–80 cows. For a 1,000-cow herd, that’s $3–$5 million in capital. Even in the best-case, automation roughly closes a third to half of the $3.00–$4.00/cwt structural gap. Automation buys time. It doesn’t change the zip code.
Pivot to premium. Organic, A2, grass-fed — they all pay more. Forest Glen proves it works at scale with the right starting conditions: established certification, Jersey genetics, contracted buyers, stacked revenue. If you don’t already have most of that infrastructure, the three-year organic transition means three years of organic-level costs on conventional-level checks. Run that math to the penny before you commit.
Evaluate dairy relocation — seriously. Current asset markets favor sellers. USDA’s July 2025 data puts the national average replacement dairy cow at $3,010 per head, with Idaho at $3,050 and Wisconsin at $3,290. Mike North of Ever.ag told Brownfield in January 2025 that Pacific Northwest animals were moving at “north of $4,000 an animal.” But Idaho farmland in the Magic Valley runs $12,000–$18,000 per acre, with cash rent at $300–$390 in top dairy counties (NASS, 2022). You’re not moving into bargain country. If you’re seriously weighing dairy relocation, run the full capital budget — land, facilities, permits, disruption costs — not just the per-cwt savings on feed and labor.
Whatever path fits, do these things now:
Run your actual cost of production per cwt. Include depreciation, family labor at market rates, and the opportunity cost of equity. USDA ERS’s January 2026 outlook projects 2026 all-milk at $18.25/cwt, but Class III futures have slid to $16.35, and CME block cheddar just hit $1.2825 — its lowest since May 2020. If your all-in cost exceeds $18.25, you’re farming upside down. If it exceeds $16.35, the market is telling you something louder.
Ask your processor one question—and get it in writing. Will they commit to your volume in 2027 at a price that covers your production costs? Tyler Reynolds is “hoping to expand, but the creamery hasn’t committed.” If the answer is vague, it’s an answer.
Run the exit math even if you never use it. Every year you farm at a loss, you’re spending a six-figure piece of your family’s net worth on the choice to keep milking in a place the economics have moved past. That might be the right call. It should be a deliberate one.
Factor in the next generation before you commit capital. Rick Naerebout shared that Idaho loses about 10% of its dairy membership a year, often because “the next generation, they see the parents struggling, so they’re not going to continue with farming.” That’s true everywhere. If your kids aren’t in, an expansion note is a bet with no one to carry it.
Scenario
Annual Operating Loss
5-Year Net Worth Impact
Exit Option: Sale Value (Today)
Expansion Option: Debt + Loss
Baseline (break-even)
$0
$0
—
—
Survival mode
–$100,000/year
–$500,000
Preserve equity, redeploy
–$500K equity + $0 debt
Structural disadvantage
–$200,000/year
–$1,000,000
Preserve equity, redeploy
–$1M equity + $3–$5M expansion debt
Darigold scenario
–$300,000/year
–$1,500,000
Preserve equity, redeploy
–$1.5M equity + $3–$5M expansion debt
The Gap That Isn’t Going Away
What separates the Reynolds family’s trajectory from the Kirchers’ decade of tough economics isn’t effort, intelligence, or cow quality. It’s the cost of hay, the labor code, and the processing flywheel — three forces no individual farmer chose but every individual farmer lives with.
That’s the real driver behind dairy consolidation in the West — the gap between regions now exceeds the gap between the best and worst operators within a region. As far back as 2019, Rick Naerebout wrote in Hoard’s Dairyman that Idaho’s 10 largest owners/partnerships milked 32% of the state’s cows, and the top 20 milked 47%. Those shares have almost certainly grown since. The farms that survive and the farms that grow aren’t necessarily the best-managed ones. They’re the ones sitting on the right side of the structural math.
The numbers don’t care about legacy.
Jason Vander Kooy, watching what he estimates as a decline from around 80 dairy farms in Skagit Valley to roughly 10 over the past two decades, put it in terms that cut through any spreadsheet: “We can trace back dairy farming in our family before Christopher Columbus in Europe. I don’t want to be the last generation, so we’re going to make a go of it” (Capital Press, May 28, 2025).
The families who make their next move based on where the structural math is going — not where their grandfather’s fence line sits — are the ones who’ll still be milking in 2035.
Dig in, pivot, or move. But whatever you do, do it on purpose.
Key Takeaways
Where you milk now matters as much as how you milk: Idaho’s cheap hay and no ag overtime create a $3.10–$4.25/cwt advantage — over $600,000/year on a 1,000-cow herd in feed and labor alone.
Processors are picking winners and losers: Idaho adds capacity with Chobani, Idaho Milk Products, High Desert Milk, and CAFE, while Darigold’s $300 million Pasco overrun and $4.00/cwt deductions pushed many Washington members into survival mode.
Premium doesn’t erase geography; Forest Glen’s 2,200-cow organic A2 Jersey herd with grazing, contracts, and a digester still fights 2014-level milk prices under 2026-level costs.
If you’re in a high-cost region, your real choices are to invest heavily in automation, double down on ultra-premium contracts, or design a relocation/exit plan now instead of letting the bank decide later.
Genetics is no longer a side note: CDCB’s 2025 Net Merit shift toward Feed Saved and fat turns sire selection into a survival tool for high-cost herds, not just a way to chase show-ring banners.
Complete references and supporting documentation are available upon request by contacting the editorial team at editor@thebullvine.com.
Learn More
Feed Smart: Cutting Costs Without Compromising Cows in 2025 – Stop throwing money into the manure pit with imprecise rations. This guide arms you with 2025 price forecasts and a true-cost calculation framework to slash feed expenses by 10% without sacrificing your peak milk curve.
Every week, thousands of producers, breeders, and industry insiders open Bullvine Weekly for genetics insights, market shifts, and profit strategies they won’t find anywhere else. One email. Five minutes. Smarter decisions all week.
“Reminder: every extra pound of pre‑weaning gain can mean 1,000+ lbs more milk later. Are your calves leaving money on the table?
You know that frustration when calves look fine one week and then crash the next? Weaning dip stretches into three weeks of depressed intake, respiratory disease clusters right around that vulnerable transition window, and it happens no matter what you try. Most of us have been there—whether you’re running 200 cows in Vermont or 2,000 in the Central Valley. It’s one of those persistent challengesc in calf nutrition and heifer development that never quite seems to get solved.
For decades, we’ve treated this as just the cost of doing business. Calves are fragile. Weaning is stressful. Budget for the treatments and move on.
But here’s what’s interesting—a growing body of research and a smaller group of producers willing to rethink their protocols suggest something different. The weaning dip may be less about inevitable stress and more about accumulated decisions made weeks earlier. And the solutions aren’t necessarily expensive or complicated. They’re just… different from how most of us learned to do things.
I want to walk through what the research actually shows, what some operations are finding when they apply it, and—just as importantly—why this approach doesn’t work for everyone.
The Economics Nobody Wants to Talk About
Let’s start with the numbers, because that’s ultimately what drives decisions.
Dr. Michael Steele’s research group at the University of Guelph has been tracking the long-term consequences of early-life calf health for years. Their work, combined with Swedish research by Svensson and Hultgren, which has been widely cited in the Journal of Dairy Science, documents something that should give us pause: calves experiencing diarrhea in their first month of life produce roughly 340-350 kg (748 – 770 lbs) less milk in their first lactation than healthy calves.
That’s not a typo. We’re talking about nearly 350 kg (770 lbs) of milk—gone—because of a bout of scours in week two.
Dr. Alex Bach, an ICREA research professor working with IRTA in Spain, has been equally direct about respiratory disease. His research shows that heifers treated for bovine respiratory disease before weaning have significantly higher odds of dying or being culled before first calving—with survival rates often running 10-20 percentage points lower than healthy cohorts. The immune insult doesn’t resolve simply because the calf clinically recovers. It reverberates through her productive life.
This connection between early-life health and lifetime performance continues to be reinforced by ongoing research. A 2025 study by Leal and colleagues in the Journal of Dairy Science demonstrated that suboptimal preweaning nutrition creates measurable metabolic differences that persist through first lactation—effects visible in glucose metabolism and overall metabolic profiles well into the heifer’s productive life.
Now, here’s where I think our industry gets stuck. These are long-term consequences. The treatment costs are visible today—you see them on this month’s vet bill. The first-lactation milk penalty won’t appear for 2 years. Most operations—understandably—optimize for what they can see and measure right now.
The challenge, as multiple dairy economists have noted, is convincing producers to invest today for returns they won’t see until that heifer’s second lactation. It’s fundamentally different from evaluating the price of a bag of milk replacer.
And it’s worth sitting with that tension for a moment, because it explains why adoption of these practices has been slower than the research might predict.
What’s Actually Happening in the Calf’s Gut
To understand why certain interventions work, you need to understand what’s developing inside the calf during those first critical weeks. The science here has advanced dramatically in the past decade—and it’s reshaping how progressive operations think about their calf programs.
The Small Intestine Window
Before the rumen becomes functional—roughly weeks one through five—the calf is essentially a monogastric animal. The small intestine handles the heavy lifting for nutrient absorption, and it’s susceptible to early nutrition choices.
Research published in peer-reviewed nutrition journals has mapped digestive enzyme development in young calves, and what these studies have found matters for anyone making decisions about milk replacer formulation: pancreatic proteases operate at only a fraction of adult capacity at birth, gradually maturing over the first three to four weeks.
Why does this matter practically? The calf’s enzyme systems evolved to digest milk proteins, including casein and whey. When you substitute milk proteins by plant proteins like soybean meal or wheat gluten (often done to reduce costs), you’re asking an immature digestive system to handle substrates it’s not fully equipped to handle.
Work published in the Journal of Dairy Science by Ansia and colleagues compared nitrogen digestibility between all-milk protein replacers and those supplemented with enzyme-treated soybean meal. The pattern was clear: all-milk formulas showed notably better digestibility by week three compared to plant-supplemented formulas. That gap represents protein that isn’t nourishing the calf—it’s passing through to the hindgut, where it can feed the wrong bacteria.
Research presented at the 2024 Healthy Calf Conference in Ontario reinforced this point: early-life nutrition—specifically the first 60 days—affects digestive function throughout the animal’s productive life. That framing helps explain why the details matter so much during this critical window.
The Rumen Transition
As starter intake increases around weeks five through eight, something remarkable happens. The rumen transforms from a collapsed, non-functional organ into the calf’s primary fermentation chamber. This transition depends entirely on establishing stable populations of beneficial bacteria—and this is where substrate consistency becomes critical.
Dr. Phil Cardoso’s lab at the University of Illinois has done elegant work tracking how rumen microbial communities develop. Here’s the part that surprised me when I first dug into this literature: rumen bacteria are extraordinarily substrate-specific.
Different bacterial species have evolved enzymatic machinery optimized for specific fermentation substrates. When feed composition shifts—different molasses sources, varying grain suppliers, new protein ingredients—the microbial community has to reorganize around the new substrate profile.
A 2024 study published in Frontiers in Microbiology, which tracked fecal microbiota development in Holstein and Jersey heifer calves, found that the gut microbiome changes rapidly during early life. Instability during colonization leaves the microbial community vulnerable to dysbiosis, where pathogenic species can outcompete beneficial microbes, leading to suppressed immune function and inflammation.
The time required for microbial reorganization varies considerably depending on what you’re measuring and how dramatic the diet change is. Some studies suggest bacterial communities can shift within a week or two. Others indicate that full functional stabilization can take considerably longer, sometimes several weeks or more.
The practical takeaway? During that reorganization period, volatile fatty acid production becomes erratic. And VFAs—particularly butyrate—are what drive rumen papillae development. Inconsistent VFA production means inconsistent rumen development.
Sponsored Post
The Substrate Consistency Question
This is where things get practical, and also where opinions start to diverge among nutritionists.
Several nutritionists I’ve spoken with point to ingredient consistency as the single most overlooked variable in calf programs. The logic is straightforward: if rumen bacteria need stable substrates to establish and function, then constantly changing feed ingredients creates perpetual instability.
Research from the University of Minnesota and other institutions has documented this pattern: calves on fixed formulations show much more consistent day-to-day starter consumption than calves on least-cost programs where ingredients shift with commodity prices. The intake variability isn’t dramatic on any given day, but it compounds over the critical period of rumen development.
Industry estimates suggest the cost premium for specification-guaranteed, consistent-source ingredients is approximately 2-4%—typically $8-12 per calf over a 12-week rearing period. That number varies by region and current commodity markets, but it gives you a ballpark for planning purposes.
The Other Perspective
Now, I want to be fair here, because this isn’t settled science. Not every nutritionist is convinced that ingredient consistency matters as much as some of the research suggests.
“Look, rumen bacteria are adaptable,” argues one dairy nutritionist who asked not to be named because he works with several least-cost formulation systems. “They’ve evolved to handle dietary variation. A healthy calf can adjust to different molasses sources reasonably quickly.”
He has a point about adaptability—cattle wouldn’t have survived as a species without metabolic flexibility. And the research on substrate consistency, specifically in pre-weaned calves (as opposed to mature cattle), is still developing. Most of the microbial stabilization studies were conducted in older animals.
What we can say with confidence is that operations running fixed formulations generally report lower variability in calf performance. Whether that’s causation or correlation with other management factors—like the kind of attention to detail that leads someone to specify ingredients in the first place—is harder to untangle.
Stage-Matched Microbial Support
The growing interest in probiotic supplementation for calves has created what I’d call an implementation gap. Most operations using probiotics deploy the same blend in both milk replacer and starter feed, assuming gut health support works the same way throughout development.
The research suggests otherwise—and this is where things get interesting.
Different Ecosystems, Different Needs
The small intestine during liquid feeding operates in a microaerobic environment—there’s oxygen present. Effective probiotics for this phase include facultative anaerobes like Bacillus subtilis, Lactobacillus, and Bifidobacterium species that can survive stomach acid and establish quickly.
A 2024 study in ASM Spectrum demonstrated that compound probiotics containing multiple Lactobacillus and Bacillusstrains accelerated both immune function development and the establishment of a healthy gut microbiome in newborn Holstein calves—reducing the abundance of harmful bacteria while promoting beneficial populations.
Research published in Scientific Reports and the Journal of Animal Science has shown how certain Bacillus species secrete compounds that promote intestinal epithelial cell differentiation and help inhibit pathogenic biofilm formation. There’s good evidence for measurable improvements in gut barrier function when appropriate strains are delivered during the liquid feeding phase.
The developing rumen is a completely different environment—strictly anaerobic. Oxygen is toxic to the bacteria that should dominate there. Effective rumen probiotics include obligate anaerobes such as Megasphaera elsdenii and Butyrivibrio species, which would die immediately if exposed to the oxygen-rich environment of the small intestine.
“Using the same probiotic blend in milk and starter is like planting the same crops in two completely different climates,” explains Dr. Mike Flythe, a microbiologist with the USDA Agricultural Research Service in Lexington, Kentucky. “You might get something to grow, but you’re not optimizing for either environment.”
Gut Environment
Oxygen Level
Effective Probiotic Species
Primary Mechanism
What Happens If Mismatched
Small Intestine (liquid feeding phase)
Microaerobic (oxygen present)
Bacillus subtilis, Lactobacillus, Bifidobacterium
Epithelial cell differentiation; pathogen inhibition; gut barrier function
Anaerobic rumen species die immediately upon exposure
Developing Rumen (starter feeding phase)
Strictly anaerobic (no oxygen)
Megasphaera elsdenii, Butyrivibrio species
VFA production optimization; pH stabilization; fiber digestion
Oxygen toxic to obligate anaerobes
Industry Standard (single-blend approach)
Both environments, same formulation
Mixed facultative species
Compromise formulation attempting dual-use
Suboptimal colonization in both environments
Stage-Matched Approach
Environment-specific formulations
Oxygen-matched species for each developmental phase
Optimized for gut compartment and maturity stage
Maximizes colonization success and functional support
That analogy stuck with me—it’s a useful way to think about what we’re trying to accomplish.
What the Market Offers
Several feed companies have developed stage-matched probiotic programs. Kalmbach Feeds’ LifeGuard and Opti-Ferm XL technologies represent one approach—different formulations designed for the liquid and solid feeding phases, respectively. Other companies offer similar stage-specific options, and the market continues to evolve as the research develops.
Stage-matched programs do represent a greater investment than basic single-probiotic approaches, though the actual cost differential varies considerably by program design, feeding rates, and supplier. For operations weighing this decision, it’s worth getting specific quotes based on your calf numbers and current protocols—the investment can range from modest to meaningful depending on how programs are structured.
Whether that investment makes sense depends heavily on your baseline performance. Operations already running tight calf programs with low disease incidence will see smaller marginal returns than operations struggling with persistent scours or respiratory challenges. This isn’t a universal solution—it’s a tool that works better in some contexts than others.
The Stress Calendar: Potentially Free Improvement
Here’s something that costs nothing but requires real management discipline—and it might be the most overlooked opportunity in calf management.
Research on weaning stress—particularly work from Dr. Jeff Carroll and colleagues at the USDA-ARS Livestock Issues Research Unit—shows that cortisol elevation from weaning alone is acute but manageable. Elevated for 3-5 days, then returning toward baseline as the calf adapts.
But when weaning coincides with vaccination, dehorning, regrouping, or housing changes, cortisol can remain elevated for 2 weeks or longer, resulting in sustained immune suppression. The calf never gets a chance to recover before the next challenge hits.
The mechanism isn’t additive—it’s multiplicative. Each stressor independently activates the hypothalamic-pituitary-adrenal axis. When stressors overlap, you’re compounding the immune suppression rather than just extending it.
What this means practically: the common approach of “we have the crew here anyway, let’s do everything at once” may be one of the most costly management decisions we make. It’s efficient from a labor standpoint. It’s terrible from a calf physiology standpoint.
Building a Stress Calendar
Operations that separate stressors generally report meaningful improvements. The specific timing depends on your operation, but here’s a general framework:
Disbudding/dehorning: Position 4-5 weeks before weaning, allowing full recovery before weaning stress begins
Weaning: Gradual over 5-7 days (the most recommended weaning is step down process for 10 – 14 days, even if it is not the most used), treated as a standalone event with no concurrent stressors
Vaccination: 7-14 days post-weaning, after acute stress resolves
Regrouping/housing changes: 2+ weeks post-weaning when possible
Research presented at the 2024 Healthy Calf Conference emphasized that gradual weaning has become non-negotiable for operations feeding today’s higher milk volumes. When calves consume eight to twelve liters of milk per day, abrupt weaning creates severe physiological stress. Comparing five-day versus ten-day weaning programs, longer-weaned calves performed better in both gain and grain intake, with fewer health issues during the transition.
I’ve spoken with producers in Wisconsin and across the Upper Midwest who’ve tried separating procedures, and the feedback has been generally positive—many report noticeable reductions in post-weaning respiratory cases. A producer in central Minnesota told me his post-weaning BRD treatments dropped by about a third after implementing a stress calendar. That’s anecdotal, but it’s consistent with the research’s predictions.
That said, I’ve also heard from smaller operations—particularly in the Northeast, where labor is especially tight—where this approach is genuinely impractical. The separated stress calendar requires scheduling flexibility that not every operation has.
And that’s okay. Not every intervention works for every farm.
What Implementation Actually Looks Like
The operations I’ve spoken with that have successfully adopted systems-based approaches share a common thread: they didn’t try to change everything at once. That seems to be the critical success factor.
A Phased Approach
Months 1-2: Establish measurement baseline and address substrate
Lock in ingredient specifications with your feed supplier
Begin rigorous daily measurement—fecal scores, intake tracking, treatment records
Expected outcome: Modest improvement in consistency; proof of concept that builds confidence for next steps
Months 3-4: Optimize milk program
Transition to all-milk protein if appropriate for your operation and budget
Evaluate milk allowance; the research increasingly favors higher volumes in early life
Expected outcome: Improved pre-weaning growth and intake stability
Months 5-6: Implement stress calendar
Separate management procedures where labor and facilities allow
This is the “free” intervention—no additional cost, just scheduling discipline
Expected outcome: Reduced weaning dip severity and faster recovery
Months 7+: Layer in stage-matched probiotics
Add appropriate formulations to milk replacer and starter
Expected outcome: Further optimization of gut development and immune function
Research consistently shows that sequencing matters when implementing these changes. Layering probiotics onto an unstable nutritional foundation often produces disappointing results. The operations seeing the best outcomes start by stabilizing their feed program, then build additional interventions on that foundation.
That’s advice worth taking seriously. The producers who struggle with this approach are usually the ones who tried to implement everything simultaneously and couldn’t tell what was working.
Honest Talk About Economics
Let me lay out the math as clearly as I can, with the caveat that these figures will vary based on your specific situation, region, and current market conditions.
Investment Breakdown (Per Calf Estimates)
Component
Estimated Range
Notes
Substrate consistency premium (Calf Starter with fixed formulation)
Intestine-phase and rumen-phase formulations; get specific quotes based on your feeding rates
Stress calendar implementation
$0
Labor reallocation only
Total Investment
Varies
Depends on baseline program and scope of changes
Potential Long-term Return
+350 kg first-lactation milk
Per heifer kept healthy through weaning (Svensson & Hultgren research)
What the Research Suggests You Might Get Back
Reduced treatment costs: Often in the $15-25 per calf for operations with high baseline disease incidence
Labor savings from fewer sick calves: Variable but meaningful for operations currently spending significant time on treatments
Improved growth trajectory affecting age at first calving (AFC): This is the big variable, and honestly, the hardest to pin down precisely
The age-at-first-calving benefit is where the math gets compelling—or speculative, depending on your perspective. If improved early-life health allows you to gain 30 -60 days on AFC and you’re spending $2.50-3.00 per day to raise a heifer (a reasonable estimate for many operations), you’re looking at meaningful savings per animal.
The timing challenge: You invest in month one. You might see reduced treatments by month two. But the AFC benefit doesn’t materialize for 18-24 months. That requires patience and cash flow that not every operation has, especially in tight milk price environments.
As dairy economists frequently point out, the ROI is real, but the payback period tests most producers’ patience and cash flow.
Who This Works For—And Who It Doesn’t
Let me be direct about something the advocates for systems-based calf programs don’t always acknowledge: this approach isn’t right for every operation. Understanding that might save you time and money.
It likely makes sense if:
You’re experiencing persistent calf health challenges—say, diarrhea incidence above 25% or respiratory disease above 15%
You have the management bandwidth for more rigorous protocols and measurement
Your cash flow can absorb increased upfront costs for 6-12 months without strain
You’re tracking lifetime performance and can actually measure long-term returns
You’re raising your own replacements and capturing the downstream value
It may not make sense if:
Your current calf program is already performing reasonably well (if it ain’t broke…)
Labor constraints make separated stress events genuinely impractical
You’re operating on thin margins that can’t absorb any additional costs right now
You’re selling calves rather than raising replacements—someone else captures the long-term value
Paul Rapnicki, DVM, who has extensive experience consulting with dairies across the Midwest, puts it this way: “I’ve seen operations transform their calf programs with this approach. I’ve also seen operations spend money on premium ingredients and probiotics while ignoring basic management—clean water, dry bedding, adequate ventilation. The fancy stuff doesn’t fix the fundamentals.”
That’s worth remembering. Before you invest in stage-matched probiotics and specification-guaranteed molasses, make sure your calves have clean, dry housing and fresh water available at all times. Get the basics right first.
Practical Takeaways
For producers considering a more systematic approach to calf gut health, here’s what seems to matter most:
Start with measurement. You can’t improve what you don’t track. Daily fecal scoring, intake monitoring, and treatment records create the baseline you need to evaluate any intervention. Without data, you’re just guessing—and guessing gets expensive.
Fix one thing at a time. The phased implementation approach isn’t just about budget management—it lets you identify what’s actually working. Change everything at once, and you’ll never know what made the difference. You’ll also have nowhere to go if something doesn’t work.
Respect the stress calendar. Of all the interventions discussed here, separating management stressors has clear research support and zero additional cost. If you do nothing else, consider this. It’s the closest thing to a free lunch in calf management.
Be realistic about timelines. The full benefit of optimized early-life nutrition takes 18-24 months to materialize. Plan accordingly and ensure your operation can sustain the approach long enough to see results. Starting and stopping is worse than not starting at all.
Talk to your nutritionist. The research on substrate consistency and stage-matched probiotics is interesting, but the application depends on your specific operation. A good nutritionist can help evaluate whether changes make sense for your situation—and which changes to prioritize given your current performance and constraints.
The Bottom Line
Your calves don’t care about tradition, and they don’t care about how busy you are. They only reflect the system you build for them.
Stop treating the weaning dip as a mystery and start treating it as a management decision. The research is clear: early-life gut health programs and lifetime performance. The tools exist. The question is whether you’re willing to invest in month one for returns that show up in year two.
For some operations, the answer is yes—and they’re seeing the results. For others, the timing isn’t right, and that’s a legitimate business decision too.
But don’t let inertia make the choice for you. Run the numbers for your operation. Talk to your nutritionist. Look at your treatment records from last year.
Then decide deliberately.
KEY TAKEAWAYS
One week of scours = 350 kg less milk in first lactation — The cost is invisible for two years, but the research is clear: early-life gut health programs lifetime productivity
The weaning dip is a management decision, not inevitable — Outcomes trace back to nutrition and timing choices made weeks before weaning begins
Ingredient consistency may matter more than ingredient cost — Rumen bacteria are substrate-specific; least-cost formulations that shift with commodity markets create ongoing microbial disruption
Separate your stressors—it’s free — Spacing dehorning, weaning, and vaccination prevents compounding immune suppression; it’s the closest thing to a free lunch in calf management
This approach isn’t right for every operation — If your current program performs well or you’re selling calves rather than raising replacements, the investment may not pay back for your situation
EXECUTIVE SUMMARY
The weaning dip isn’t bad luck—it’s a management decision. Research confirms that calves experiencing diarrhea or respiratory disease in their first month lose 340-350 kg of milk production in the first lactation, a penalty that stays hidden for two years but compounds across your herd. This feature examines why some operations are rethinking calf nutrition entirely: stabilizing feed ingredients to support rumen microbial development, matching probiotic strategies to different gut environments, and separating management stressors from weaning. One intervention—the stress calendar—costs nothing beyond scheduling discipline, and producers report meaningful reductions in post-weaning respiratory disease. The full approach requires patience; ROI takes 18-24 months to materialize and depends on your baseline performance. For operations already running successful calf programs, the investment may not pencil out. But for those watching the same health patterns repeat season after season, this research offers something more valuable than another treatment protocol: a different set of decisions to make.
Complete references and supporting documentation are available upon request by contacting the editorial team at editor@thebullvine.com.
Learn More
17-26x ROI: Why Top Dairies Stopped Saving Calves and Started Preventing Loss – Arms you with the hard numbers on the “prevention vs. treatment” debate. It breaks down how a simple Brix refractometer delivers massive returns, allowing you to stop bleeding capital on sick calves and capture $800 in added lifetime value.
Every week, thousands of producers, breeders, and industry insiders open Bullvine Weekly for genetics insights, market shifts, and profit strategies they won’t find anywhere else. One email. Five minutes. Smarter decisions all week.
Holstein bulls at $800. Beef‑on‑dairy at $1,750. Same cow, same calving—double the cheque. Why are you still breeding everything Holstein?
EXECUTIVE SUMMARY: In many U.S. sale barns today, Holstein bull calves that once brought $300–$450 are now commonly in the $700–$1,000 range in stronger markets, while well‑bred beef‑on‑dairy calves are cashing cheques up to about $1,750 in some auctions. At the same time, U.S. replacement heifer inventories have fallen to a 20‑year low near 3.9 million head as processors invest roughly $10 billion in new and expanded plants that will need milk to run. That combination has pushed 81% of domestic beef semen sales into dairy herds and made the “sexed on top, beef on the bottom” strategy hard to ignore. The catch is that it only pays long‑term if your 21‑day pregnancy rate stays above about 20% and you have heifers to spare, with herds in the 30–40% band able to run 50% or more of their breedings to beef while herds under 25% are usually better off fixing repro first. Three Wisconsin families—Hillview, Hiemstra, and Dornacker—show how registered Holsteins, a soil‑driven 170‑cow system, and a ProCROSS robot herd are all turning those same numbers into very different but profitable plans. By the end, you’ll know which of three breeding “paths” your own numbers put you in and what to do over the next 90 days to match sexed and beef semen to your repro, heifer, and calf markets.
In strong Wisconsin markets, beef‑on‑dairy calves are bringing up to about $1,750 a head and Holstein bull calves are often in the $800–$1,000 range, with top sales in other regions breaking the $1,000 mark as well. U.S. milk replacement heifer inventories are down to roughly 3.9 million head as of January 1, 2026—a 20‑year low—with CoBank warning they could shrink another 800,000 head before 2027. At the same time, 81% of domestic beef semen now goes into dairy cows, not beef herds. If you’re breeding cows, managing heifers, or signing milk and cattle contracts in 2026, that mix isn’t background noise. It’s the math that decides whether your breeding program keeps you ahead of the curve or leaves you short of replacements when the processor wants more milk.
Quarter
Holstein Bull Calf Price (USD)
Beef-on-Dairy Calf Price (USD)
Spread (USD)
Q1 2023
$350
$800
$450
Q3 2023
$450
$1,100
$650
Q1 2024
$600
$1,350
$750
Q3 2024
$750
$1,500
$750
Q1 2025
$850
$1,600
$750
Q3 2025
$900
$1,700
$800
Q1 2026
$950
$1,750
$800
If you’re already selling calves, buying semen, and watching heifer checks climb, this is aimed squarely at you. The question isn’t “Should I try beef‑on‑dairy?” anymore. It’s: given your repro numbers and heifer pipeline, how hard can you lean into beef‑on‑dairy without blowing a hole in your future fresh pen?
The Beef‑on‑Dairy Premium You Can Actually See
For years, bull calves were the side hustle. They helped pay a bill or two but didn’t change your year.
That flipped in late 2023 and into 2024. In sale barns across Wisconsin and Pennsylvania, newborn Holstein steer calves were bringing about $300–$450 per head, while beef‑cross calves hit as high as $1,750. Since then, a string of 2024–2025 market reports has pushed both numbers higher, with 2025 coverage noting newborn beef‑cross calves topping $1,500–$1,600 in Wisconsin and Premier’s January 2026 report listing beef‑dairy cross calves at $1,000–$1,750 and most Holstein bulls at $700–$1,150.
Sale reports from central U.S. barns tell a similar story. At South Central Livestock Exchange in 2024, “baby calf” reports—a mix of dairy and dairy‑beef—showed ranges like $175–$875 and $200–$780 per head depending on quality and condition. You don’t even need a breed column to see the pattern: the top calves bring several hundred dollars more than the bottom tier.
Since those 2023–2024 reports, national summaries from CattleFax‑linked analyses have pegged average day‑old beef‑on‑dairy calves around $1,400 in some U.S. markets, more than double levels from just a few years ago, while Holstein bull calves have also climbed. Exact numbers depend on your barn, your buyer, and this week’s market. The important part is the spread between plain Holsteins and well‑sired beef‑on‑dairy calves—and that spread has stayed real.
Run that against your own numbers. If you can consistently capture even a $300–$400 per‑head spread on 150–250 calves a year by shifting from commodity Holstein bulls to well‑managed beef‑on‑dairy crosses, you’re talking roughly $45,000–$100,000 in extra annual revenue before you haul one extra load of milk. Your math will be different, but the dollars are big enough that “doing nothing” is a choice all by itself.
How Hillview Turned Beef‑on‑Dairy Into a Revenue Engine
Jauquet’s Hillview Dairy in Luxemburg, Wisconsin, is the kind of place semen companies like to put on a brochure. They milk about 650 registered Holsteins in a cross‑ventilated freestall and have already been profiled for comfort, repro, and genetics.
Herds like Hillview didn’t jump into beef‑on‑dairy for the novelty. They moved because the economics said they could get more per pregnancy. Their breeding pattern now looks a lot like what the economists have been running in their models:
Sexed Holstein semen on the top of the herd—your highest‑index cows and heifers—to generate just the replacements you actually need.
Beef semen on lower‑index cows and groups where making another heifer mostly adds cost, not value.
A structured repro program (timed AI, close fresh‑cow work, and consistent heat detection) so expensive straws aren’t wasted on sloppy timing.
An October 2021 paper in JDS Communications (“Economics of using beef semen on dairy herds”) found that once your 21‑day pregnancy rate hits roughly 20% or better, and once beef‑on‑dairy calves bring at least about 2x the price of straight Holstein bull calves, this “sexed on top, beef on the bottom” approach maximizes income from calves over semen cost—even when sexed semen is more than twice the price of conventional or beef semen.
If your current repro and local calf markets look anything like that, you’re playing in the same lane as Hillview, whether you’ve admitted it yet or not.
Josh Hiemstra: Beef‑on‑Dairy as a Whole‑Farm System
Not every story here is about a big registered Holstein herd. Some are about getting every acre to pull its weight.
Hiemstra Dairy in Brandon, Wisconsin, milks about 170 cows and farms roughly 790 acres of owned and rented land in western Fond du Lac County. Josh Hiemstra farms with his family and has been profiled for his cover crops and soil‑health focus; he thinks in rotations and roots as much as in pounds and litres.
In a 2024 Farm Progress feature, Josh laid out how beef‑on‑dairy fits his plan. He’d just sold a load of beef‑on‑dairy steers and heifers that averaged 1,400 pounds and brought $1.75 per pound—about $2,450 per head. Then came the line that stuck with a lot of dairymen:
“I could have been smart and sold them as baby calves,” he admits.
He didn’t, because on his farm:
He can push more corn through finishing cattle than through the milking herd.
Older infrastructure—tower silos, a conventional parlor—fits a mixed dairy‑plus‑beef setup just fine.
Cover crops and “odd” forages that don’t slot neatly into a high‑producing TMR fit nicely into beef rations.
For Hiemstra, beef‑on‑dairy isn’t a side hustle bolted onto a dairy. It’s part of a whole‑farm plan to make soil, feed, facilities, and cattle all pull in the same direction.
Heifers at a 20‑Year Low and a $10 Billion Stainless Build‑Out
Calf cheques feel good. Realizing you’ve starved your heifer pipeline does not.
CoBank’s August 2025 report “Dairy Heifer Inventories to Shrink Further Before Rebounding in 2027” pegs U.S. dairy replacement heifer inventories at a 20‑year low and projects they’ll shrink by another 800,000 head before they regain ground in 2027. USDA’s January 1, 2026, cattle report backs that up, putting milk replacement heifers at about 3.9 million head.
At the same time, CoBank highlights a “historic $10 billion” wave of new and expanded dairy processing capacity—cheese plants, ingredient plants, and value‑added facilities—set to come online through 2027. That’s a lot of new stainless chasing milk from a smaller pool of replacements.
On prices, CoBank’s Corey Geiger notes that heifer values “have reached record highs and could climb well above $3,000 per head.” Brownfield’s read on Wisconsin data shows replacement dairy animals jumping 69% in a year—from $1,990 in October 2023 to $2,850 in October 2024—with some Northwest sales “north of $4,000 per head.” Other 2025 coverage points to bred dairy heifers in many U.S. markets trading north of $3,000, with top strings clearing $4,000.
Every heifer you raise—or decide not to—now drags a much bigger number behind her than she did just a few years ago.
What Heifers Really Cost You
None of that means the right answer is to quit raising heifers. It does mean you should know, cold, what yours cost.
A 2019 economic analysis of pre‑weaning strategies found that:
Feed typically accounts for about 46% of heifer‑raising costs.
Pre‑weaning costs alone can range from roughly $259 to $583 per calf, depending on housing, milk program, and labour.
Once that calf gets to freshening, many 2024–2025 North American budgets put full heifer‑raising costs in the low‑to‑mid $2,000s per head, once you count feed, labour, interest, facilities, and death loss.
On the market side, CoBank and regional reports point to bred heifers trading around and above $3,000 per head, with special sales and select strings in some regions bringing over $4,000.
If your true cost to raise a heifer is running $2,300–$2,600, and local bred heifers are selling for $2,800–$3,200 or more, it’s perfectly rational to question the old “raise everything” reflex.
A simple rule of thumb: if your full heifer cost is consistently more than about 10–15% above the going price for solid bred heifers in your region, it’s time to pressure‑test a buy‑vs‑raise strategy with your adviser or lender instead of assuming raising is always the cheaper, safer play.
81% of Beef Semen Now Goes Into Dairy Cows
If you still think beef‑on‑dairy is a niche play for a few “progressive” herds, the semen market disagrees.
NAAB’s 2024 data shows 81% of all domestic beef semen sales now go onto dairy cows and heifers. Sexed dairy units keep climbing. Conventional dairy semen is getting squeezed from both sides.
The 2021 JDS Communications economics work predicts exactly that pattern. In its most profitable scenarios, herds:
Use sexed Holstein semen on the top‑ranked cows and heifers to generate replacements with the genetics they want.
Use beef semen on lower‑ranked or surplus animals, assuming beef‑on‑dairy calves bring at least about 2x the price of straight Holstein bull calves.
In other words, the semen sales chart already looks a lot like the recommended playbook: sexed for replacements, beef for value‑added calves, and conventional dairy semen steadily losing ground.
Your 21‑Day Pregnancy Rate Is the Guard Rail
Here’s where good herds quietly get themselves into trouble: copying someone else’s beef‑semen percentage without copying their repro engine.
UW–Extension work and the JDS Communications paper both land on the same idea: beef‑on‑dairy is a “spare pregnancy” business. You use pregnancies you don’t need for replacements to make higher‑value beef‑on‑dairy calves. If you’re short on pregnancies or short on heifers, chasing beef premiums can saw through your replacement pipeline fast.
High‑performing herds recognized by the Dairy Cattle Reproduction Council (DCRC) often run 21‑day pregnancy rates in the mid‑30s to low‑40s. Those herds have room to be aggressive with beef semen and still sleep at night about replacements.
If your 21‑day pregnancy rate is in the teens or low‑20s, you’re running a different race.
Here’s a simple frame based on the modelling and what the top repro herds actually do—not a law, but a practical starting point:
21‑Day Pregnancy Rate
Suggested Beef % of Breedings
What That Really Means
Under 20%
0–10%
Beef‑on‑dairy is a distraction; every dollar belongs in repro first.
20–25%
20–30%
Limited room; focus on sexed semen on top cows; use beef carefully.
25–30%
30–45%
A balanced “both/and” beef‑plus‑sexed strategy is realistic.
Over 30%
50%+
Aggressive beef use can work if you tightly manage the heifer inventory.
Those ranges line up with what the JDS Communications paper found and what DCRC‑type herds live every day. They’re guard rails, not commandments—but if your 21‑day PR is in the teens, cranking beef semen to 60% isn’t a bold strategy. It’s rolling the dice on your own replacement line.
Sexed Semen: The Old Knock vs the New Data
A lot of producers formed their opinions about sexed semen back when the technology was taking a 20‑point hit on conception. 2010 called. It wants those assumptions back.
A 2023 review in Animals pulled together results from multiple European and Irish studies on beef‑on‑dairy strategies. It found that modern sexed semen often hits 80–90% of conventional semen’s conception rates under good management, especially in heifers, not the steep penalty many people still quote from memory.
Both that review and the 2021 JDS Communications economics paper land on the same play:
Use sexed semen on higher‑index animals so more of your replacements come from the top of the herd.
Use beef semen on lower‑index animals to turn surplus pregnancies into calves with a better paycheque.
You may still see a few points lower conception with sexed vs conventional, depending on your handling and cow group. But if sexed semen lets you trim your heifer pipeline back to what you truly need—and frees up more pregnancies for beef‑on‑dairy calves that bring roughly double the Holstein price—the total calf‑plus‑semen line on your P&L can still climb.
So the real question isn’t “Is sexed semen good or bad?” It’s: what’s your actual cost per pregnancy with sexed, conventional, and beef semen, using your own conception rates and prices?
The Dornacker Plan: Crossbreeding, Robots, and Beef‑Ready Cows
Not every future‑proof herd is pure Holstein or built around banners.
Dornacker Prairies in Wisconsin is a fifth‑generation dairy with about 360 cows on roughly 1,000 acres, and about 90% of those acres are used to feed their own herd. Allen and Nancy Dornacker farm alongside Allen’s parents, Ralph and Arlene, and their four kids. They’ve been profiled internationally for blending robots, crossbreeding, and composting into a single system that works for their land and family.
Over the last decade, they’ve:
Installed Lely A5 robots starting in 2018, expanding from three units to six, with room for nine.
Adopted ProCROSS crossbreeding (Holstein × VikingRed × Montbéliarde) beginning in 2016 to improve fertility, health, and longevity.
Implemented composting that’s cut fertilizer purchases by about 80%.
Their crossbred herd averages around 9,200 kg of milk per cow per year (about 20,000 lb), with components near 4.6% fat and 3.6% protein—numbers that stack up nicely on a component‑based paycheque.
In a herd like that, beef‑on‑dairy is one more lever, not the whole story. Crossbred cows with stronger fertility give you more room to decide which lactations get beef vs sexed dairy semen. Moderate‑sized, robot‑friendly cows fit tighter breeding programs. Beef‑on‑dairy calf revenue stacks on top of genetics and facilities built around long‑term family ownership, not just next month’s cash flow.
If your focus is banners and purebred marketing, this path comes with trade‑offs. If your focus is a resilient commercial herd your kids might actually want to run, it’s worth a serious look.
Cover crops + “odd” forages fit beef rations; old infrastructure = low overhead
Robot-friendly moderate-frame cows; strong fertility (crossbreeding); family succession plan
Main Constraint They Manage
Heifer inventory—must keep sexed-semen conception high
Land base & feed logistics (790 acres, finishing cattle on-site)
Balancing milk components (4.6% fat, 3.6% protein) with beef-calf revenue
The Beef‑on‑Dairy Gold Rush Has a Downside
It’s easy to get starry‑eyed about $1,400 calf stories. Here’s the part that keeps you out of trouble.
The same 2023 Animals review that highlights beef‑on‑dairy’s upside also flags real risks when beef sires get sprayed across dairy cows without enough planning:
Longer gestation with some beef breeds, stretching calving intervals, and tying up stalls.
Higher dystocia and stillbirth rates in certain beef × Holstein crosses when calving ease isn’t prioritized.
Welfare and marketing problems occur when calves don’t meet buyer expectations on growth, muscling, or carcass traits.
On the fed‑cattle side, Kansas State’s grid‑pricing work shows that cattle outside packer specs on weight, yield, or quality take meaningful discounts. Poorly planned beef‑on‑dairy crosses—wrong frame, wrong fat cover, wrong muscling—are more likely to land in those discounted buckets.
If you:
Chase beef‑on‑dairy premiums with sires that add too much birthweight or gestation,
Ignore calving‑ease and carcass traits when picking beef bulls for dairy cows, and
Don’t align your calves with what your buyer, feedlot, or packer actually wants,
you can watch the “gold rush” vanish into dead calves, extra days open, and grid deductions.
The herds that will still be glad they leaned into beef‑on‑dairy five years from now are already:
Using calving‑ease beef sires validated on dairy crosses.
Matching sires to specific buyer or grid specs, not just grabbing “any Angus” off the sheet.
Tracking calf health, growth, and sale prices in their own records instead of assuming every beef‑cross calf lands at the top of the market.
What This Means for Your Operation
Beef‑on‑dairy is not a yes‑or‑no question. It’s a strategy that has to fit your repro, heifers, feed base, and markets.
Most herds will land in one of three lanes.
Path A: Aggressive Beef (50%+ of Breedings)
You’re here if:
Your 21‑day pregnancy rate runs around 30% or higher.
You’ve consistently had more heifers than you truly need.
You have reliable outlets for beef‑on‑dairy calves or your own finishing capacity.
What it looks like:
The top 20–30% of cows and most heifers get sexed Holstein semen, selected on Net Merit, DWP$, or your index of choice.
The bottom 50–70% of cows receive beef semen from calving‑ease, dairy‑tested sires that meet buyer specs.
You’re willing to buy replacements when the heifer market says that beats raising every last one yourself.
Path B: Balanced Strategy (25–40% Beef)
You’re here if:
Your 21‑day pregnancy rate sits in the 25–30% band.
You’re mostly okay on heifers—short in some years, long in others.
You have decent calf markets but no locked‑in premium contract.
What it looks like:
The top 30–40% of cows and heifers get sexed dairy semen.
The bottom 25–40% of cows go to beef.
Conventional dairy semen still has a role where it wins on cost per pregnancy.
A lot of 300–800‑cow herds are going to live here for a while as they keep nudging repro higher.
Path C: Fix Repro First (0–20% Beef)
You’re here if:
Your 21‑day pregnancy rate is under about 25%.
You’re short on heifers and stretching days‑in‑milk.
Your risk budget feels pretty thin.
What it looks like:
Beef semen is used sparingly—older cows, obvious genetic culls, maybe a small test group.
Most of your cash goes into repro and cow performance: transition, heat detection, cow comfort, and vet work.
If you’re in Path C, the smartest beef‑on‑dairy move may be to hold your fire. Get your repro into the mid‑20s or 30s first. The beef premiums will still be there when you’ve actually got pregnancies to spare.
Your 90‑Day Action Plan
Here’s how you turn this from a good read into a working plan on your farm.
Next 30 days
Pull your 12‑month 21‑day pregnancy rate. Use your herd software or DHI reports, not a guess. That number tells you if Path A, B, or C is even on the table.
Calculate your full heifer cost. Use your 2024 books—feed, labour, interest, bedding, facilities, and death loss. If you need a framework, start from a university heifer‑raising budget or sit down with your lender and walk through your numbers line by line.
Next 60 days
Get real local calf price ranges. Talk directly to your sale barn or calf buyer. Ask what they’ve actually been paying for Holstein bull calves vs beef‑on‑dairy calves in your weight bands over the last 60–90 days. Use that spread—not coffee‑shop talk—as your baseline.
Sit down with your AI and genetics rep. Bring cow and heifer index lists, cull data, and heifer counts. Map how many replacements you truly need, and which animals can shift to beef semen without starving your fresh pen 18–24 months from now.
Next 90 days
Run a pilot, not a revolution. If your repro supports it, move 20–30% of breedings to carefully chosen beef semen for one breeding season. Track breedings, conceptions, calvings, calf weights, and sale prices. Let your own numbers, not somebody else’s story, tell you whether to ramp up or back off.
Check your risk tools. USDA’s Livestock Risk Protection (LRP) program has expanded coverage options in recent years, including coverage tied to feeder cattle and calf prices in general. Talk with your insurance agent or extension specialist about whether any current LRP products fit the kind of calves you’re producing and how you market them.
While you’re at it, read your milk cheque and the fine print of your contract. If your processor is paying for components, animal care, or specific beef‑on‑dairy traits, those lines belong in the same spreadsheet as semen prices and calf bids.
Timeline
Action Step
What to Calculate or Ask
Why It Matters
Next 30 Days(Step 1)
Pull your 21-day pregnancy rate
Use herd software or DHI—12-month rolling average, not a guess
Tells you if Path A, B, or C is even on the table; this number is your beef-semen budget
Next 30 Days(Step 2)
Calculate your full heifer cost
Feed + labor + interest + facilities + death loss from 2024 books
If your cost is >10–15% above local bred-heifer prices, raising every heifer is leaving money on the table
Next 60 Days(Step 3)
Get real local calf prices
Call sale barn or buyer: What did Holstein bulls vs beef-cross calves actually bring in last 60–90 days?
Use that spread—not coffee-shop gossip—as your baseline; if spread is <$300/head, beef-on-dairy math gets harder
Next 60 Days(Step 4)
Sit down with AI/genetics rep
Bring cow index lists, cull data, heifer counts; map how many replacements you truly need
Prevents the classic mistake: copying someone else’s beef-% when their repro and heifer pipeline are 20 points stronger than yours
Next 90 Days(Step 5)
Run a pilot, not a revolution
Move 20–30% of breedings to beef semen for one breeding season; track breedings, conceptions, calvings, calf weights, sale prices
Let your numbers tell you whether to ramp up or back off—not somebody else’s story at the sale barn
Next 90 Days(Step 6)
Check your risk tools
Talk to insurance agent about USDA Livestock Risk Protection (LRP) for feeder cattle/calf price coverage; read milk contract fine print for component or beef-calf incentives
If your processor pays for specific traits or your calf market swings hard, these lines belong in the same spreadsheet as semen prices
Key Takeaways
Beef‑on‑dairy calves are bringing several hundred dollars more per head than Holsteins in many U.S. markets—Holstein calves that used to bring $300–$450 are now commonly $700–$1,000 in strong markets, while beef‑cross calves are topping $1,500–$1,750 in parts of Wisconsin and over $1,000 in Pennsylvania and other key regions.
Heifer economics have flipped fast. CoBank says inventories could shrink by another 800,000 head before 2027, while Wisconsin replacement values jumped 69% in a year, and many U.S.-bred heifers now sell north of $3,000, with some lots over $4,000.
Beef‑on‑dairy works best long‑term when repro and heifer numbers are strong. Modelling shows the math starts to work above roughly 20% 21‑day PR and 2x calf price, with herds in the 30–40% band having the most flexibility.
There’s a real downside if you pick the wrong beef sires or ignore carcass specs. Longer gestations, harder calvings, and packer grid discounts can erase calf‑price gains very quickly.
The herds that will still be happy with beef‑on‑dairy in five years are matching sexed and beef semen to their own numbers—pregnancy rate, heifer needs, feed base, and actual buyers—not to the latest rumour at the sale barn.
The Bottom Line
You don’t have to milk 650 cows in Luxemburg or farm 790 acres in Fond du Lac County to make this work. But, like those families, you do have to pick a lane and live with the math that comes with it.
So when you look back on 2026, a year from now, do you want to say, “We finally lined up our breeding plan with our numbers,” or still be loading $700 Holstein bull calves while your buyer’s paying a lot more for the right beef‑on‑dairy cross?
Complete references and supporting documentation are available upon request by contacting the editorial team at editor@thebullvine.com.
Learn More
Building a Beef-on-Dairy System: Capturing $360,000 in Annual Farm Profit – Stop leaving money on the table and start building a profit-driven pipeline. This breakdown delivers the exact ROI calculations and management shifts needed to capture massive annual revenue gains by aligning your breeding with real-world demand.
The ProCROSS Payoff: Is It Time to Cross the Line? – Breaks down the University of Minnesota’s findings on how crossbreeding delivers a 9-13% boost in daily profit. This unconventional approach reveals how improving health and fertility traits secures your competitive advantage in a high-cost environment.
The Sunday Read Dairy Professionals Don’t Skip.
Every week, thousands of producers, breeders, and industry insiders open Bullvine Weekly for genetics insights, market shifts, and profit strategies they won’t find anywhere else. One email. Five minutes. Smarter decisions all week.
Clark Farms operated a creamery for 6 years, serving dozens of accounts. They just shut it down—and kept milking. Here’s the math.
Executive Summary: Clark Farms, a fifth‑generation dairy in Delhi, NY, ran an on‑farm creamery for six years with dozens of local accounts, then shut the plant down in January 2026 while keeping the cows milking. Their numbers show what you’re really trading with on‑farm creamery economics: you’re not going from $1.85 milk to $5.50 milk, you’re buying roughly $1.15–$2.15 per gallon in extra margin at the cost of 70–90 more hours a week in processing and delivery on top of a full dairy workload. Backed by USDA, Rabobank, Cornell Dyson, and PASA data, the article walks through how consolidation, cost gaps, and thin processing margins make “just add a creamery” a much riskier survival plan than it looks on paper. It puts Clark’s pause alongside operations like MOO‑ville, Ronnybrook, and Hudson Valley Fresh that do make processing pay by staffing it as a true second business or sharing plants and brands across multiple herds, instead of piling everything onto one family. You also see how legacy, family bandwidth, and herd genetics change the risk math: a project that steals time from components, repro, and succession can quietly cost you more than it earns. The piece finishes with a clear playbook for your own decision—map out real weekly hours, set hard limits on account numbers and delivery time, build an off‑ramp before you pour concrete, and answer one non‑negotiable question: who’s actually milking while you’re bottling the milk?
A fifth‑generation New York dairy built a creamery with dozens of accounts, then hit pause in 2026—showing exactly how far the real numbers of on‑farm creamery economics can pull away from the brochure version.
If you’ve ever thought, “We should bottle our own milk,” this one’s for you. Clark Farms in Delhi, New York, did almost everything by the book—stainless, brand, accounts, community—and still chose to shut the creamery down while keeping the cows milking. That decision says a lot about survival, hours, and the actual premium left after processing and delivery.
The 2024–2026 Reality: Why On‑Farm Processing Looks Like a Lifeline
Let’s start with your world, not the grant brochure.
USDA’s 2022 Census of Agriculture dairy highlights show that the number of U.S. farms with milk sales from cowsfell from 40,336 in 2017 to 24,470 in 2022—a 39% drop in five years. Over that same period, the value of milk sales climbed 44%, from $36.7 billion to $52.8 billion, while the national herd sat around 9.3 million cows. Fewer farms. Similar cow numbers. More milk money is stacked on a smaller group of operations.
Rabobank analysis calculated that in 2022, farms with more than 1,000 cows produced about 67% of U.S. milk, up from 60% in 2017. Brownfield Ag News, quoting Rabobank’s Lucas Fuess, reported that farms milking more than 2,000 cows carried total costs around $23.06/cwt in 2022, roughly $10/cwt lower than typical costs on 100–199‑cow farms. In a market where Class III, Class IV, or all‑milk prices bounce in the high teens to low‑$20s, that cost gap is the line between breathing room and quietly wondering how much longer you can hang on.
In Delaware County, New York—Clark’s backyard—county plans and extension work describe a long slide in dairy farm numbers since the 1990s, leaving only a fraction of the former herds still milking. You don’t need a chart if you live there. You see it in empty barns and fewer bulk tanks meeting you on the road.
Against that backdrop, on‑farm processing looks like a lifeline. In recent months, New York’s all‑milk price has often sat in the high‑teens to low‑$20s per hundredweight; USDA pegged the New York all‑milk price at $21.40/cwt in November 2024, roughly $1.85 per gallon before hauling and pooling. Farmstead creamery case studies and Cornell‑linked reports show small processors selling branded fluid milk in the mid‑single‑digit dollars per gallon, several dollars above that effective blend value.
On paper, you’re trading $1.80 milk for $5‑plus milk. When the feed bill is chewing up your cheque, that’s a tempting trade.
Clark Farms took that road. Their experience shows you where the math—and the calendar—start to bite back.
Clark Farms: A Real‑World Test of the Dream
Clark didn’t just bolt a filler onto a corner of the milkhouse. They built a serious on‑farm creamery.
The farm sits on about 630 acres outside Delhi, New York, anchored by a barn Peter Clark built in 1907. A 2022 feature in Scribner Hollow describes it as a fifth‑generation dairy, already milking cows on that hill for about 114 years.
Kyle Clark picked up the processing bug while studying dairy business management at SUNY Morrisville. Scribner Hollow reports that he spent roughly four years digging into New York regulations, working through inspections, and hunting down used dairy‑grade stainless pasteurizers, tanks, and bottlers from all over the country before the creamery opened in 2020. That’s not a spur‑of‑the‑moment pivot. That’s a long, careful build.
By early 2022, the creamery was processing **about 25% of the farm’s milk—roughly 3,000 gallons a week—**with the remaining 75% still leaving on a tanker. That milk became bottled whole milk, flavored milks like chocolate and coffee, plus cream and butter under the Clark Farms Creamery label.
They didn’t just sell from the farm store:
Their products moved through small groceries, cafés, and farm stands across the Catskills—Delhi, Andes, Phoenicia, Woodstock, and more.
Cafés like Prospect and Fellow poured Clark milk into lattes and gelato and told that story to their own customers.
Locals knew the Clark name when they opened a fridge door in town.
Demand wasn’t the snag. The cows were milking. The creamery was moving product.
On January 28, 2026, Clark Farms posted on Facebook that “after careful consideration,” they would be closing their creamery operations, while continuing to run the dairy farm. They wrote that “it has been a great joy to be able to produce dairy products for the community over the last six years,” thanked customers for their support, and admitted that keeping both the farm and the creamery to their standards had become too much. WBNG‑TV shared the news as “Clark Farms in Delaware County is closing its creamery doors after years of service,” and the comments quickly filled with people grabbing the last pints and thanking the family.
So the hard question isn’t “Why didn’t people support them?” It’s “What did the money and the hours really look like when they chose to stop?”
The Big Math: What You’re Actually Trading
Here’s where on‑farm creamery economics stops being a dream and turns into a decision.
The Revenue Side
Picture a herd in the Clark range: roughly 200 Holsteins in milk, in a system where cows can produce around 80 pounds per day. Once you factor in dry cows, heifers, and the fact that no week ever runs perfectly, you’re in the ballpark of 9,000–10,000 gallons of milk per week for a solid 200‑cow Holstein herd in New York.
If every gallon went into the pool at an effective $1.85/gallon (using that $21.40/cwt November 2024 New York all‑milk price as a real example), you’re looking at roughly $16,650–$18,500 per week in milk cheques at that volume, before hauling and other deductions.
Now drop in the 25% processing share Scribner Hollow documented. In 2022, Clark was bottling about 3,000 gallons a week and shipping the rest as bulk. Say you can wholesale those 3,000 gallons at $5.50/gallon, right in the middle of what small on‑farm fluid and flavored milks often fetch locally.
On a typical week, the rough revenue picture looks like:
Total: about $27,600–$29,450/week, versus $16,650–$18,500/week if every gallon went bulk at $1.85. On gross, that 25% slice looks like $9,000–$12,800 in additional cash flowing through the business.
That’s the number you hear in most creamery seminars. Now we get honest about what’s left after costs.
The Cost Side
Cornell’s Dyson School looked at 27 value‑added dairy businesses in New York, Vermont, and Wisconsin and didn’t sugar‑coat it: value‑added processing “is not a panacea.” In that study, mean net income from processing was modest at best and often negative, and average returns per cwt of processed cow milk were about $90/cwt lower than full economic costs once you charged a fair wage for family labor and a return on investment. The top performers did well, but the average small plant wasn’t swimming in cash.
Farmstead creamery case studies from PASA and Penn State show direct processing costs (excluding milk) for small fluid plants often run about $1.00–$1.50 per gallon, once you add electricity, hot water, CIP chemicals, packaging, labels, maintenance, and required testing. That’s just to get a gallon into a bottle safely.
Distribution costs pile on. Those same case studies document delivery expenses—fuel, truck payments, insurance, repairs, and driver labor—adding another $0.50–$1.00 per gallon in many rural, small‑drop routes.
Now the comparison on a processed gallon looks more like this:
Extra revenue over blend: $5.50 – $1.85 ≈ $3.65.
Less processing + delivery: roughly $1.50–$2.50 per gallon combined.
That leaves a real premium of about $1.15–$2.15 per gallon before you pay yourself or cover downtime. On 3,000 gallons, you’re talking roughly $3,450–$6,450 per week more than sending that milk down the driveway.
Still serious money. But the “$5.50 instead of $1.85” story has already shrunk by more than half once stainless, cardboard, and diesel get their cut.
The Part Nobody Prints in the Brochure
For the days you’re reading this in the tractor cab, here’s the premium at a glance:
The Metric
The “Brochure” Dream
The Clark‑Style Reality (Illustrative)
Gross revenue
$5.50/gal (wholesale price)
$5.50/gal
Base milk value
(Often ignored)
($1.85/gal)
Processing & delivery
“Minimal”
($1.50 – $2.50/gal)
Real premium
$3.65/gal
$1.15 – $2.15/gal
The “price” you pay
“Being your own boss.”
70–90 extra hours/week
You’re not really selling $5.50 milk. You’re selling about $1.50 of margin and a second full‑time job.
The Time Math: Buying Margin with Hours
Here’s where on‑farm creamery economics stops being just dollars and starts being bodies and weeks.
PASA/Penn State’s farmstead creamery report logs weekly labor for small plants that easily hits 40–60 hours of processing and packaging once volumes reach a few thousand gallons. Add full cleaning and sanitation—CIP cycles, scrubbing floors and drains—and you’re realistically looking at about 40–50 hours inside the plant on a 3,000‑gallon week.
Distribution and admin sit on top of that. For farms serving a couple of dozen accounts, those case studies show another 30–45 hours per week spent on ordering, route planning, loading, driving, stocking shelves, talking with store managers, invoicing, and chasing cheques.
Now remember what the dairy alone demands. Cornell’s long‑running dairy farm business work shows that a 200‑cow Holstein herd with crops, youngstock, maintenance, and paperwork can easily soak up 50–70 hours a week from your core people. You probably don’t need Cornell to tell you that—you feel it in your knees.
Put it together:
Dairy: 50–70 hours.
Creamery: 40–50 hours.
Distribution/admin: 30–45 hours.
You’ve put in yourself well over 100 hours of work every week just to keep both sides upright. On a lot of family places, it feels like a 130‑ or 140‑hour week spread across three or four people, even if nobody ever writes it down.
Work Category
Weekly Hours (Conservative)
Weekly Hours (Realistic)
Notes
Dairy Operations
50
70
Milking 2×, feeding, bedding, calves, breeding, maintenance, crop work
Spread across 2–4 family members—still unsustainable
$ Premium per Extra Hour
$27–$49/hr
$36–$90/hr
Based on $3,000–$6,000/week margin ÷ 70–90 processing hours
Now take that extra $3,000–$6,000/week and divide it by the 70–90 extra hours wrapped up in processing and delivery. You’re effectively buying that premium at roughly $35–$85 of extra work per hour. On a spreadsheet that can be edited with a pencil. In a family that already feels stretched, it’s a different conversation.
At some point, many family‑run creameries, Clark’s included, look at that trade‑off and decide it no longer fits their standards for product quality, family time, or herd care.
When On‑Farm Processing Really Works
This isn’t “never build a creamery.” It’s “be honest about what kind of creamery actually works.”
When You Build It for Scale
MOO‑ville Creamery & Westvale‑View Dairy (Nashville, Michigan). Doug and Louisa Westendorp started milking about 50 cows in 1992. When their six kids—including twins and triplets—wanted to stay on the farm, the family opened MOO‑ville Creamery in 2005 rather than chasing a multi‑thousand‑cow expansion. Today, Westvale‑View milks around 240 Holsteins, averaging over 100 pounds per cow per day, and MOO‑ville processes about 18,000 gallons of milk per week—roughly six times Clark’s processed volume. They’ve grown to four retail locations and products in over 140 retail stores and 50 ice cream shops. Their chocolate ice cream won first at the North American Ice Cream Association Conference in 2021, and vanilla followed in 2022. Every kid has a defined lane—herd, crops, ice cream, retail, tours—so nobody’s trying to juggle dairy, plant, and distribution alone.
Ronnybrook Farm Dairy (Pine Plains, New York). Ron and Rick Osofsky started bottling unhomogenized milk in glass bottles at their Hudson Valley farm in the early 1990s. Thirty years on, Ronnybrook employs about 50 staff, crops roughly 760 acres, and sends milk, yogurt, and butter from their herd to 13 New York City Greenmarkets plus supermarkets across the region. In 2023, Scenic Hudson and Columbia Land Conservancy permanently conserved the farm, calling Ronnybrook “a local icon.” They built glass bottles and direct distribution into the business model from day one and staffed accordingly.
In both cases, processing isn’t a side hustle tacked onto the dairy. It’s a second, fully staffed business.
Operation
Gallons Processed/Week
Processing/Retail Staff (Approx.)
Herd Size
Outcome
Clark Farms
3,000
2–3 (family)
~200 cows
Paused 2026
MOO-ville
18,000
15–20+
~240 cows
Thriving, 4 retail locations
Ronnybrook
~20,000+
~50
Large herd + 760 acres
Regional icon, 30+ years
When You Share the Load
Hudson Valley Fresh (Hudson Valley, NY). Instead of each farm building a plant, 10 family dairies pool their milk into a shared processing facility at Boice Brothers Dairy, a family‑run plant dating back to 1914. Member farms—Jersey, Holstein, Guernsey, Brown Swiss, Ayrshire—must meet tight quality standards: somatic cell counts under 200,000, and raw bacteria counts under 5,000. In return, Hudson Valley Fresh has historically paid a premium, as evidenced by $23/cwt vs. $16/cwt for the commodity, through a base price plus quarterly profit‑sharing. The brand is strong, the creamery is centralized, and no single farm has to own all the stainless and all the route headaches.
The pattern is pretty clear:
Some farms make processing work by building enough scale and staffing to treat it as a true second business.
Others make it work by sharing the plant and brand so their own time stays focused on cows and crops.
Clark’s situation—running a full dairy and a full processing/distribution business with essentially the same core people—is where a lot of smaller creameries stall out.
The Accidental Trucker: When Your Farm Becomes a Logistics Company
When you first picture an on‑farm creamery, you see stainless steel and glass bottles. When it actually starts to succeed, you see routes.
Wholesale food moves on trucks, not spreadsheets. Dairy plant and creamery closure coverage—like Hastings Creamery in Minnesota or Prairie Farms plant changes—regularly points to transportation, labor, and maintenance costs chewing up thin margins. Grocery distributors live on low‑teens gross margins and 1–3% net margins once trucks, fuel, drivers, insurance, and warehouses are paid. They make it work with dense routes and big drops at each stop.
A single‑farm creamery starts with none of that. You’re hauling your own product, on your own dime, to customers who might order heavy one week and light the next.
Somewhere between “a few good accounts” and “we deliver to everyone,” there’s a line. On one side, you’re still basically a farm that brings your own milk. Cross it, and you’ve become a logistics company that happens to own cows.
PASA’s case studies suggest that once you slide into the 15–20 account range, route planning, cooler space, and delivery windows start dictating your week more than milking times. With products in multiple groceries, cafés, and farm stands across the Catskills, Clark was clearly operating on that logistics side of the line.
There’s nothing wrong with that if it’s what you want. MOO‑ville runs multiple delivery trucks and has staff just for routes and retail. Ronnybrook built those NYC market runs into its identity from the start. But you want to choose to become a logistics business, not wake up in one by accident.
Why Clark Could Hit Pause and Keep Milking
Here’s a part of Clark’s story that deserves as much airtime as the shutdown: they could step off the creamery treadmill and keep the dairy running.
Look at a few structural choices they made:
They never processed all their milk. In 2022, about 25% went through the plant, while the rest still shipped as bulk. When they shut the creamery, they had somewhere to send that milk.
They leaned into used, movable stainless. Scribner Hollow describes Kyle sourcing used pasteurizers, tanks, and other equipment from all over, rather than pouring everything into custom, immovable installations. That kept sunk costs lower and resale or repurposing options open.
They didn’t strap the entire farm to the plant’s fortunes. We don’t see their loan documents, but the fact that the dairy stayed standing tells you the creamery wasn’t financed in a way that automatically dragged land and cows down when they hit pause.
When WBNG shared the closure, locals piled into the comments talking about buying the last pints of milk and cream cheese and thanking the family for years of product. Another nearby business posted, “Sad news from our friends over at Clark’s farms! We’re wishing them the best and hoping to hear they re open in the future!” It read more like a community send‑off than a failure.
That’s what an off‑ramp looks like when you actually need it. You don’t build it because you’re aiming to quit. You build it because you respect your dairy enough not to let one project drag the whole place down if the numbers or the hours stop lining up.
Legacy Changes the Risk Math
None of that math happens in a vacuum. Legacy sits right in the middle of it.
If you’re first‑generation with no clear successor, a creamery can feel like one more business shot. If it doesn’t work, you sell what you can, pay who you can, and move on. Ugly, but simple.
On a five‑generation place like Clark’s, the stakes hit different.
That 1907 barn overlooking Delhi was built by Kyle’s great‑great‑grandfather. By the time Scribner Hollow profiled the farm in 2022, they were already 114 years into the family dairy story. When the creamery pause hit social media, locals weren’t piling on—they were saying “thank you” and wishing the family well.
Academics call it socioemotional wealth—all the non‑financial value tied up in keeping your farm in the family, protecting your name, and handing something real to the next generation. Put simply: how sick you’d feel being the one who lost the place.
If you’re in Kyle’s boots, you’re not just asking, “Does this creamery cash flow in 2025?” You’re also asking, “If this ever pulls the dairy down, am I the one who ends 100‑plus years of work on this hill?”
That question doesn’t show up on your cost‑of‑production sheet. But it does show up when you decide whether to grind through another year of 140‑hour weeks or step back and protect the core dairy. Clark chose to protect the dairy. A lot of Bullvine readers would, too.
Don’t Forget the Herd: Genetics, Components, and Long‑Term Value
There’s another engine running through this story that’s easy to overlook when you’re staring at stainless: your herd.
If you’ve spent years breeding for Fat, Protein, fertility, and health, that’s not just hobby genetics. It’s a big piece of your risk and return.
Milk cheques. In component‑priced systems, FMMO and co‑op schedules have been paying strong money for butterfat and Protein. When butterfat values in the Northeast climb above $3.00/lb, a herd running just a few tenths higher in components than the blend can easily see $2–$4/cwt more than average herds shipping the same volume. That shows up whether your milk goes into your own bottle or someone else’s cheese.
Replacement pressure. Better fertility, health, and livability mean fewer heifers needed to maintain herd size. Analysts talking about the “processing gap” have also flagged tight heifer supplies and higher replacement prices, especially as more calves go beef‑on‑dairy. That makes every genomic and mating decision more expensive to mess up.
Reputation and options. Strong cow families with performance and type give you options—embryos, breeding stock, bulls in AI, or simply better conversations with lenders and partners who know you’ve built something with resale value.
If a creamery forces you to rob time from fresh‑cow checks, repro, and data review, you’re not just putting this year’s processing margin at risk. You’re putting the next decade of herd progress at risk, too.
When Clark stepped away from the creamery while keeping the dairy, they didn’t just protect cash flow. They protected a herd and a genetic trajectory, they’ve built one generation at a time. If you’re serious about breeding and components, that needs to sit right beside any stainless quote you’re considering.
What This Means for Your Operation
Here’s where you stop looking at Delaware County and start looking at your own kitchen table.
1. Start with the One Question You Can’t Dodge
Before you chase a grant or sign a creamery loan, ask this out loud:
Who will milk the cows while I’m bottling the milk?
If your answer is “We’ll just work harder” or “We’ll figure it out,” you don’t have a plan. You’ve got a hope.
A real answer sounds like:
“I’ll run the plant from 9 to 3, my parents stay on both milkings for now, we hire a part‑time milker for two evenings, and if someone’s sick, we cancel one processing day and roll that product into the next run.”
If you can’t write down that level of detail—with names, hours, and backups—you’re not ready to buy stainless. You’re ready to go back to the whiteboard.
Factor
Bulk Milk (No Processing)
On-Farm Creamery (25% Processed)
Revenue per gallon
$1.85 (blend/pool price)
$1.85 (bulk) + $5.50 (processed, 25% of volume)
Net margin per processed gallon
n/a
$1.15–$2.15 (after processing + delivery costs)
Extra weekly margin (3,000 gal)
$0
$3,450–$6,450
Weekly labor (family)
50–70 hours (dairy only)
120–160 hours (dairy + plant + delivery)
Effective hourly rate for extra work
n/a
$35–$85/hour (before equipment ROI)
Capital investment
Minimal (routine dairy equipment)
$150,000–$500,000+ (plant, truck, cold storage)
Flexibility to scale down
High—adjust herd size, cull strategically
Low—fixed plant overhead, route commitments, debt service
Risk to core dairy
Low—focus stays on cows and crops
High—time/capital diverted; plant failure can drag dairy down
Exit options if stressed
Steady—co-op/processor always needs milk
Limited—selling used stainless at discount, breaking customer commitments
Best fit for…
Farms prioritizing herd genetics, land base, simplicity, or nearing succession
Farms with committed next-gen, dedicated staff, dense local market, long runway
2. Put Your Week on Paper
Do this with the people who’ll actually be working it.
List every dairy job you do now with honest hours: milking, scraping, feed mixing, bedding, calves, breeding decisions, cropping, breakdowns, and paperwork.
List every processing job you’re adding: receiving, batching, pasteurizing, cooling, bottling, labeling, stacking, cleaning, swabbing, record‑keeping, and inspector visits.
List every distribution job: loading, driving, unloading, stocking, talking with buyers, invoicing, chasing cheques.
Add up those hours against the people you actually have—not the extra hire you “hope” will show up. If your plan needs any core person over 60–65 hours/week beyond a short start‑up push, be honest: you’re designing a burnout schedule, not a sustainable business.
3. Decide When You’re Willing to Become a Logistics Business
Draw this line before you start adding accounts.
Write down:
The maximum number of wholesale accounts you’ll serve before you cost out a dedicated driver or route person—maybe that’s 12, maybe 18, but write a number.
The minimum drop size that makes a stop worth it—how many cases have to come off the truck to justify the fuel and time.
Which types of accounts you’re willing to walk away from if your route starts looking like spaghetti and you’re spending more time behind a café than behind a cow.
If you don’t set those rules now, your route will quietly run you.
4. Build the Off‑Ramp While You’re Pouring Concrete
If you go ahead, don’t wait until you’re exhausted to think about exit options.
Keep your co‑op or processor relationship alive, even if you’re shipping less. You want a place to send milk if you need to dial the creamery back.
Work with your accountant and lender, so the creamery debt doesn’t automatically drag land and cows into the fire if the plant has a bad year.
Favor used or modular stainless steel, you could realistically sell if you change course.
Set “stop rules” now: for example, “If after three years the creamery isn’t generating at least $X/month in net cash and our average weekly hours are still above Y, we pause and reassess.” Adjust X and Y to your reality—but don’t ignore them later.
5. Check Processing Against Your Herd Strategy
Your creamery plan shouldn’t be in a separate binder from your breeding plan. It should sit on top of it.
Ask yourself:
“Does this creamery help us capture more value from the components and health traits we’ve been selecting for, or does it risk pulling attention away from managing them?”
“If cash gets tight, do we cut repro and replacement investment first, or do we slow down creamery expansion and marketing?”
If the honest answer is “we’d sacrifice herd investment to keep the plant going,” you’re trading long‑term herd value for short‑term plant cashflow. That might be the right call in a specific situation. Just make sure it’s a conscious choice, not something you stumble into.
Key Takeaways
The on‑farm creamery premium is real—but it isn’t free. Processing a 25% slice of your milk might add several thousand dollars a week in margin, but you usually buy it with 70–90 extra hours of processing and delivery piled on top of a full dairy week.
Once you’re past roughly 15–20 accounts, you’re running a logistics business. At that point, route density, drop size, and store delivery windows matter as much as butterfat tests.
The farms that make processing work long‑term add people, not just stainless. MOO‑ville, Ronnybrook, and Hudson Valley Fresh all spread the load across family, staff, or co‑ops instead of forcing one family to carry everything.
A well‑built off‑ramp is a form of insurance. Clark Farms could pause the creamery and keep milking because they never welded the farm’s survival to the plant’s success.
Your herd and land are still the backbone. A strong Holstein herd on owned ground will outlast any value‑added project that only works if you live a 143‑hour week.
The right time to discover your breaking point is on paper—not at 11 p.m. in the plant. If your creamery plan only works with everyone running at 110% forever, it doesn’t actually work.
The first real due‑diligence question is simple. “Who will milk the cows while I’m bottling the milk?” If you can’t answer that clearly, you’ve already learned something important from Clark Farms’ experience.
The Bottom Line
Clark Farms didn’t fail at diversification. They ran a full‑scale, real‑world trial of on‑farm processing under today’s economics, then listened when the premium and the hours stopped lining up. They made the hard call to protect the dairy that’s been there since 1907, honour their family’s work, and leave the door open for whatever comes next.
If you’re weighing a creamery of your own—or you’re already living a week that feels a little too close to 143 hours—the real question isn’t just “Can this make money?” It’s “What does this do to our time, our cows, and our ability to hand something solid to whoever comes next?”
That’s the answer you want in hand before the stainless rolls into your yard.
Complete references and supporting documentation are available upon request by contacting the editorial team at editor@thebullvine.com.
Beyond Efficiency: Three Dairy Models Built to Survive $14 Milk in 2026 – Gain a strategic roadmap for the “end of the middle” by identifying which structural model fits your region. It reveals the long-term positioning required to survive $14 milk and helps you choose between scale or branding.
211,000 More Dairy Cows. Bleeding Margins. The 2026 Math That Won’t Wait. – Secure a competitive advantage by exposing how beef-on-dairy premiums are masking structural unprofitability. It breaks down the disruptive “27:100” heifer ratio and reveals why breeding for protein is the key to outlasting the 2026 reset.
The Sunday Read Dairy Professionals Don’t Skip.
Every week, thousands of producers, breeders, and industry insiders open Bullvine Weekly for genetics insights, market shifts, and profit strategies they won’t find anywhere else. One email. Five minutes. Smarter decisions all week.
If your “fair” buyout loads $600+ of debt on every cow, you’re not doing succession—you’re planning a dispersal in slow motion.
You know how some topics just keep coming up over coffee at farm meetings? Succession is one of those.
Let’s walk through what the numbers and the real‑world experience are telling us about keeping dairy farms in the family—and how the roughly 16.5% who pull it off tend to do things differently.
The Odds Aren’t Great—but They’re Not Hopeless
Most family business owners have heard some version of the “three‑generation rule.” A lot of talks and articles still repeat the old line that about 30% of family businesses make it to the second generation, around 10–15% to the third, and only 3–5% to the fourth. You’ve probably heard that at a seminar at some point.
A critical look in Family Business Magazine noted that those specific percentages aren’t a universal law, but they’re a decent rule of thumb: many family firms fall away at each transition, and only a minority make it to the third or fourth hand‑off. The Family Business Consulting Group goes a step further and says you should think of it as “about one‑third survive each generational transition,” not a guaranteed 30/13/3 every time.
The University of Tennessee took that one‑third idea and did the farm math. Their Planning Today for Tomorrow’s Farms workbook walks through the logic: if roughly a third of family businesses survive the first transition, and about a third of those survive the second, then you’re looking at something like 16.5% of family farms reaching a third generation of ownership. And they’re very clear that weak or non‑existent succession planning is one of the big reasons many don’t get that far.
Generation Milestone
Percentage Surviving
1st Gen to 2nd Gen
~100% (baseline)
2nd Gen to 3rd Gen
~33% (of 2nd)
3rd Gen to 4th Gen
~11% (of 3rd)
Farms Reaching 4th+ Gen
~3.5% (of original)
So, yes, the odds are tough. But they’re not a death sentence. What I’ve found, looking at the research and listening to farmers in places like Wisconsin, Ontario, and the Atlantic provinces, is that the families who do land in that 16‑odd percent tend to make a set of very specific choices—on timing, money, fairness, and leadership.
Let’s talk about those, in plain dairy terms.
Why Dairy Succession Feels Heavier Than Most
You don’t need a journal article to tell you dairy is a 365‑day grind, but it’s worth seeing how the data lines up with what you’re living.
The 365‑Day Workload Your Kids Have Watched
A 2024 doctoral thesis from the University of Manitoba interviewed dairy farmers in Western Canada and Ontario about health and workload. It found what most of us already know in our bones: a lot of producers reported work‑related injuries, aches, and pretty high stress levels. The main culprits were long hours, heavy workloads, financial pressure, and weather uncertainty.
What’s interesting is that the study didn’t see big differences in health outcomes between tie‑stall and freestall, or between parlors and robots—once you controlled for other factors, the stress seemed to come from the responsibility and economics as much as from the barn layout.
If your kids grew up watching you drag yourself in after dealing with fresh cow issues in the transition period, juggling butterfat levels for that component premium, and worrying about the line of numbers on the cash‑flow sheet, they absorbed all of that. In more than a few kitchen‑table meetings, I’ve heard young people say something along the lines of, “I love the cows and the genetics. I’m just not sure I want to live exactly like my parents did.”
That doesn’t mean they won’t come back. But it does mean we can’t pretend the lifestyle piece isn’t part of the succession puzzle.
Stress Factor
% of Farmers Reporting High Levels
Relative Impact
Long work hours (365-day commitment)
78%
High
Financial pressure & cash-flow uncertainty
72%
High
Weather uncertainty & forage variability
65%
Medium-High
Work-related physical injuries & aches
61%
Medium-High
Staff availability & labor challenges
58%
Medium
Regulatory/compliance pressure
42%
Medium
The Capital Load Has Quietly Gotten Bigger
On the balance‑sheet side, dairy has become a very capital‑intensive business. A 2021 paper in the journal Agricultureexamined family farms in Catalonia and found that dairy farms in that region carry particularly high levels of fixed capital in land and buildings compared to other sectors. That’s not news to anyone who’s priced out a new freestall, manure system, or robotic milking setup lately.
In many North American dairy areas, USDA land value surveys and provincial numbers show land values have trended upward over the last decade, especially where urban growth or high‑value crops compete with dairy for acres. Add in barns, parlors or robot rooms, manure storage, feed storage, and in Canada, quota on top of it—and it’s easy to see how a “modest” family dairy can end up with several million dollars tied up in fixed assets.
It’s worth noting what’s happened on the return side. The 2024 Minnesota FINBIN report showed that dairy farms had a much better year than 2023: median net farm income for dairies was up sharply, and milk price and production per cow both improved. High‑profit dairy farms in that dataset earned about 773 dollars per cow in net return. At the same time, the average Minnesota farm across all sectors posted about a 2% rate of return on assets in 2024.
So you’ve got more capital tied up, a better 2024 than 2023, but still a business that, on average, is spinning out something like a 2% return on the total asset base. Many Midwest producers will tell you they feel that in their gut: it’s good enough to keep going and reinvest a bit, but there isn’t a lot of slack for big mistakes.
Decision #1: Start the Transition While You Still Have Time, Not When You’re Exhausted
One of the most encouraging things I’ve seen in the last few years is how much more open producers are to talking about timing. Instead of waiting until someone is 68 and worn out, more families are at least asking, “When should we start this?”
Extension folks in a lot of places are saying roughly the same thing. Guides from Michigan State University, OMAFRA in Ontario, and Alberta Agriculture all stress that transition is a multi‑year process and that it works best when you start while the senior generation still has a decade or more of working life ahead of them—often when parents are in their 50s, and a potential successor is in their 20s or 30s. Tennessee’s workbook makes the same point: succession is a process, not a single event.
You probably know this already, but it’s worth saying out loud: “We’ll deal with that when I’m ready to quit” almost never leads to a calm, orderly hand‑off. What it usually leads to is rushed decisions under pressure—health issues, burnout, or a financial shock—and far fewer tools on the table.
Off‑Farm Experience Isn’t the Enemy
There was a time when a lot of us were terrified that if the kids left, they’d never come back. And sure, that still happens sometimes. But the research and real‑world examples suggest the picture is more nuanced.
A 2018 article in Rural Sociology followed young farmers in England and looked at how education and off‑farm work shaped their paths back to the farm. The authors found that time away often gave these successors a broader perspective and a more entrepreneurial mindset. They came back with different ideas about management, markets, and where the farm could go.
On the ground, in Wisconsin operations and across Western Canada, you see it play out like this:
Someone spends a few years as a herdsman or assistant manager on a 1,000‑cow freestall or large dry‑lot, really owning fresh cow management and transition‑period decisions.
Another works as a nutrition or genetics rep, seeing how different herds manage feed costs per cwt, butterfat and protein, SCC, repro, and genomic selection.
Others spend time in lending, farm management consulting, or robotics, and start thinking more about ROI on capital, not just getting through chores.
When those people come back, what I’ve found is that they usually appreciate how hard the home farm has worked to stay afloat, but they’re also more comfortable questioning things that don’t pencil out. That’s exactly the kind of “absorptive capacity” the Brazilian succession study talked about—being able to bring in outside knowledge and actually use it on the farm.
Instead of seeing off‑farm work as “losing” a successor, you can look at it as sending them out for free training in someone else’s barn.
Competency Area
With Off-Farm Experience
Home-Farm-Only Experience
Fresh-cow / transition management
8.2
5.8
Financial / ROI thinking
7.9
4.1
Feed economics & forage management
8.1
5.2
Staff leadership & HR
7.6
4.3
Technology adoption & problem-solving
8.4
5.5
Ability to question & improve existing systems
8.3
4.9
Trial Management Back Home: Give Them the Keys, Watch the Numbers
Once they’re back home, the real test isn’t how many hours they work. It’s whether they can actually manage. Extension material from Missouri, Wisconsin, and groups like Land For Good all encourage farms to have a genuine trial‑management period before full partnership.
That might look like:
Turning fresh cow management over to them for two full years—rations, protocols, pen moves—and then sitting down together to look at transition disorders, early cull rates, and milk curves.
Letting them design and run the cropping plan, then tracking forage quality, yield, cost per ton of dry matter, and how that feeds into milk production and component levels.
Giving them responsibility for staff scheduling and day‑to‑day HR, then watching labor turnover, how often you’re short‑staffed, and how the culture feels.
In Minnesota FINBIN herds and in lender meetings I’ve sat in on, those kinds of documented responsibilities and results make it much easier for a bank to say, “Yes, we can finance a staged buy‑in here.” You’re not just asking them to trust a last name—you’re showing them a track record.
Decision #2: Treat the Old “Equal at Full Value” Plan as a Red Flag, Not a Default
Here’s where the math and the emotions collide. A lot of us grew up with the idea that the “fair” plan was to figure out what the farm was worth, divide by the number of kids, and have the one who stays buy out the rest at that value. On paper, that sounds tidy. On a modern dairy balance sheet, it can quietly set the farm up for failure.
Let’s walk through an example—strictly as an example, not as a “this is what every 400‑cow herd looks like.”
An Illustrative 400‑Cow Scenario
Say you’ve got a 400‑cow herd with assets that look a lot like what FINBIN sees in Minnesota dairies:
Roughly 2 million dollars in land and buildings
Around 800,000 dollars in cows and replacements
Maybe 700,000 dollars in machinery and other assets
That’s about 3.5 million dollars in total assets. If you’ve got four kids and decide everybody’s share should be equal in dollar terms, each person’s “piece” is about 875,000 dollars. If only one child is farming, the on‑farm heir is on the hook to come up with something like 2.6 million dollars to buy out the other three.
Now bring in the income side. FINBIN’s 2024 report showed high‑profit Minnesota dairy farms earning about 773 dollars per cow in net return. Let’s say your 400‑cow herd is in that neighborhood. That’s just over 300,000 dollars in net return available.
If you finance a 2.6‑million‑dollar buyout on typical terms, annual payments can easily land somewhere in the 250,000 to 300,000‑dollar range, depending on the interest rate and amortization. On a 400‑cow base, that works out to roughly 625 to 750 dollars per cow per year just to service buyout debt.
Item
Amount
Per-Cow Impact
Notes
Total Farm Assets
$3,500,000
—
Land ($2M) + Cows/Replacements ($800K) + Machinery ($700K)
Leaves little room for reinvestment, feed spikes, or technology
Here’s what’s interesting: the same FINBIN report tells us the average Minnesota farm only earned about a 2% rate of return on assets in 2024. So you’re asking a business with a 2% return profile to finance a 100% buyout of all that equity and still have enough left over to invest in cows, barns, manure systems, maybe a robot or two, not to mention handle feed spikes and milk‑price dips.
In a lot of cases, that math just doesn’t leave room for fresh cow improvements, better transition‑period facilities, or upgrading genetics and technology. Many of us have seen what happens next: land and cows get sold off piece by piece to relieve the pressure, and the farm slowly shrinks or disappears.
Why “Fair” Doesn’t Always Mean “Equal” in Dollars
Farm Credit Canada has been very straightforward about this. In their article “Family farm transition – is fair always equal?”, transition specialist Rick Roozeboom uses that exact line: a million dollars in farm assets is not the same thing as a million dollars in cash. In their 2024 piece “What’s fair when everyone contributes differently?”, FCC digs into how different kids contribute to the farm—some with labor and management, others by simply being part of the family story—and why treating those contributions identically, in strict dollar terms, can create real problems.
It’s worth noting that some parents still decide, after seeing the numbers, that equal division is the value they care about most—even if that ultimately means the farm will be sold. People like farm‑family coach Elaine Froese, who works full‑time on this, see that choice fairly often. That’s not “wrong.” It just needs to be honest: you’re choosing an exit strategy, not a continuity strategy.
Decision #3: Use Structure to Avoid a Capital Train Wreck
The good news is you’re not limited to the “equal shares at full appraised value” model. There are other ways to structure things so the farming child isn’t crushed and non‑farming children aren’t left feeling shut out.
One Yard, Two (or More) Businesses
In Canadian dairy, especially, you often see accountants and advisors using a holding‑company plus operating‑company model. Firms like MNP and Baker Tilly often discuss this in their farm‑succession resources.
The basic idea goes like this:
Land, buildings, and quota sit in a holding company or partnership, often owned primarily by the parents and, eventually, by a mix of family members.
The operating company holds the cows, replacements, feed, and machinery, and runs the day‑to‑day dairy.
Over time, the successor acquires the operating company through staged share purchases, profit‑sharing, or a combination.
This gives you a few levers to pull:
Parents can receive retirement income from rent or dividends paid by the holding entity.
The successor doesn’t have to debt‑load themselves all at once with land, barns, and quota; they can focus capital on keeping cows healthy, improving butterfat levels, managing SCC, and investing in genetics or automation.
With good advice, you can line this up with tools like the intergenerational rollover and the Lifetime Capital Gains Exemption.
In Ontario and Quebec quota herds, where the value of quota alone can be massive, this kind of structure can be the difference between having a path forward and quietly setting up a forced sale.
Other Tools That Often Get Overlooked
In U.S. herds without quota, you still see some of the same themes:
Partnerships or LLCs in which the successor buys units over a decade or more, funded partly with profits.
Land companies that hold farmland, sometimes with both farming and non‑farming siblings as owners, and long‑term leases to the operating dairy.
Planned growth or diversification—adding cows, custom heifer‑raising, beef‑on‑dairy programs, or on‑farm processing—to create enough cash flow to support a buy‑in and reinvestment.
A 2021 article in Sustainability looking at small U.S. farms (not just dairy) found that producers who combined enterprise decisions with financial risk‑management tools—like insurance, off‑farm income, and contracts—tended to have stronger economic sustainability. That lines up with what many of us see: the farms that think in terms of structure and risk management, not just “who works hardest,” usually have more options when it’s time to transition.
Decision #4: Build a Successor as a Leader, Not Just the Go‑To Worker
Every dairy has someone who knows exactly which cows are in trouble in the transition period, who notices a butterfat dip before anyone else, and who can read a robot alarm in their sleep. They’re often the first person you call when something’s off.
It’s worth noting, though, that being the most reliable worker and being the person who carries the bank meeting, the staff reviews, and the five‑year capital plan are different skill sets.
That Brazilian study I mentioned earlier found that successors with higher absorptive capacity—basically, better at absorbing and using new information—and stronger social networks were more likely to be in place and engaged in management on family farms. Other work on family‑firm resilience suggests that leadership development and adaptability are key to who survives shocks like droughts, price crashes, or major policy changes.
So here’s the question I’d encourage you to ask: “Are we intentionally building a leader here, or are we just giving more jobs to the person who never says no?”
Trial Management with Real Metrics
We already talked about giving the next generation specific areas to run. The key is to pair that with clear metrics and then actually look at them together. In practice, that might be:
Fresh cow and transition management: track fresh cow health events, early culls, peak milk, and repro performance.
Cropping: track forage quality (protein, NDF digestibility), yield, and cost per ton of dry matter, then connect that to milk production and butterfat levels.
People: track turnover, missed shifts, and the consistency with which standard operating procedures are followed.
In many cases, lenders in Wisconsin and Minnesota have said, “Show me how they’ve done when they were responsible, not just when they were helping,” before they sign off on financing a buy‑in. It’s not about being harsh; it’s about giving everyone confidence that the next person can actually drive the ship.
Shifting Real Authority, Step by Step
A lot of extension material, including from Wisconsin and Missouri, discusses moving successors through stages—from employee to enterprise manager to multiple‑enterprise manager to primary operator, and finally to lead owner. Groups like Land For Good emphasize writing down who makes what decisions at each stage.
What’s encouraging is that when families do this on purpose—rather than on the fly—you see the older generation relax a bit because they’re not handing over everything at once. And the younger generation builds confidence because they’re making meaningful decisions before the paperwork changes hands.
Key Factor
Farms Making It to Gen 3 (16.5%)
Farms at Risk of Dispersal (83.5%)
Succession Timing
Start serious talks 10–15 years out; parents in 50s, successor in 20s–30s
Wait until burnout, health crisis, or parent age 65+; rushed decisions
Successor Development
Off-farm experience + trial management in specific areas with measurable KPIs
No off-farm training; successor does many jobs but leads none; vague accountability
Capital Structure
Use holding/operating split, staged buy-ins, or sweat-equity recognition to spread debt load
Full market-value buyout; successor inherits $600–$750 debt per cow
Real Authority Transfer
Written plan: who owns what decisions at each stage; regular progress reviews
Vague handoff; older gen still making calls behind the scenes; confusion and resentment
Fairness Discussion
Explicit conversations about “fair vs equal”; non-farm kids acknowledged; neutral facilitator
Assumptions left unspoken; non-farm kids blindsided; explodes in lawyers’ offices later
Advisory Team
Lawyer, accountant, lender, family coach at same table; coordinated advice
Each advisor in silo; conflicting tax and legal advice; family navigates alone
Plan Documentation
Written succession plan reviewed annually; timeline clear; metrics tracked
Vague intentions; no written plan; nobody knows what “done” looks like
Contingency for Non-Family Succession
If no family successor emerges, explored non-family paths early (leases, land-access programs)
“We’ll sell when it’s time” or “Nobody wants this farm”; fire-sale dispersal
Decision #5: Tackle “Fair vs Equal” While Everyone’s Still Talking to Each Other
If there’s one topic that tends to tighten people’s shoulders around the table, it’s fairness. How do you treat non‑farming kids fairly without burying the one who stayed?
Research on family businesses and values makes it clear that “fair” means different things to different family members. The on‑farm child might look at years of lower wages, risk, and sacrifice. The off‑farm child might be thinking, “We grew up in the same house; why is my share smaller?”
FCC has tried to normalize that tension a bit. In their fairness articles, they break it down simply: equal is one version of fair, but not the only one. They highlight tools like:
Using life insurance or off‑farm investments to help non‑farming kids while directing more farm assets toward the successor.
Separating land from operations so siblings can share in land ownership while the farming heir controls and builds the operating business.
Putting numbers on sweat equity—years of below‑market wages and capital contributions—so the successor’s extra skin in the game isn’t invisible.
As many of us have seen, families that talk through this with a neutral person—a mediator, coach, or extension specialist—tend to come out with solutions that everyone can live with. It doesn’t make every conversation easy, but it makes them a lot less explosive.
Decision #6: Bring a Real Advisory Team Around the Same Table
One thing Teagasc in Ireland has really leaned into—and I think it’s worth watching from this side of the ocean—is the idea of coordinated advisory teams. They call it the Multi‑Actor Succession Teams approach.
Instead of the family bouncing between their Teagasc advisor, their accountant, and their solicitor, each giving advice in isolation, Teagasc arranges meetings where everyone sits together, looks at the same facts, and works toward a plan the family can actually implement.
The Irish government even backs this up with the Succession Planning Advice Grant. That grant can contribute up to 1,500 euros toward eligible professional costs—lawyers, accountants, and so on—for families who go through a structured succession process.
We don’t have that exact grant in Canada or the U.S., but the principle still applies. In FCC stories and in a lot of North American advisory work, the farms that make the cleanest transitions tend to have a team that looks something like:
A lawyer who does farm transfers regularly, not just basic wills.
An accountant who understands farm tax rules, intergenerational rollovers, and the quirks of quota or depreciation.
A lender who’s seen both good and bad transitions and can talk plainly about what the balance sheet can support.
A family‑business coach or mediator who keeps the conversation moving and honest.
A financial planner who helps the senior generation turn this plan into a retirement that doesn’t depend entirely on guilt or generosity.
What’s interesting is that when you get these folks in the same room—even just once or twice—you cut down a lot of the “he said / she said” between offices. You also tend to catch conflicts between tax ideas, legal structures, and bank policies before they become expensive mistakes.
Decision #7: If There’s No Family Successor, Don’t Assume “Sell Next Month” Is the Only Path
We also have to be honest: sometimes, nobody in the next generation wants to run the dairy. Or they want to stay connected as owners, but not in the day‑to‑day.
In that situation, it’s easy to feel like the only choices are: run yourself into the ground or sell everything at once. But there’s some interesting work happening here, too.
The Journal of Agriculture, Food Systems, and Community Development has published several papers on land‑access and transition policies. One 2020 study examined “land access policy incentives”—such as state tax credits and USDA’s Conservation Reserve Program–Transition Incentives Program—and how they’re being used to transfer land to younger and beginning farmers through long‑term leases or sales. A 2024 evaluation of the Transition Incentives Program highlighted its role in helping older farmers transition CRP land to new operators in a more controlled way.
And Tennessee’s succession workbook explicitly says that if there’s no interested or prepared family successor, it’s worth looking at non‑family options—long‑time employees, young neighbors, or other beginning farmers—through structured leases or phased sales.
So in many cases, your choices might look more like:
Gradually leasing facilities and herd to a non‑family operator with a clear agreement.
Selling land but keeping some involvement in the herd or youngstock for a few years.
Working with a land‑link program or policy incentive to bring in a new operator under defined terms.
That’s not going to fit every situation, but it’s better than assuming there are only two buttons to push: “ignore it” or “disperse immediately.”
A Realistic 12–24‑Month Game Plan
If you’re thinking, “This is all fine, but we’re not a decade out, we’re three to five years out,” you’re not alone. A lot of families are in that position. The goal in that case isn’t to build the perfect binder. It’s to move from “vague intentions” to a written, realistic plan.
Here’s a simple roadmap that I’ve seen work on real farms:
1. Put Succession on the Farm Agenda This Year
It sounds almost too basic, but the first step is to stop treating succession as a late‑night worry and start treating it as business. Tools from OMAFRA, New Brunswick’s farm‑transition checklists, and Tennessee’s workbook all include question sets that ask, for example, “Who wants to be involved and in what way 10–15 years from now?” and “What do you want this farm to look like then?”
In many cases, just getting those answers written down is a big step forward.
2. Ask Your Advisors a Very Direct Question
At your next accountant or lawyer visit, try this:
“How many farm successions have you helped structure in the last five years, and what kinds of structures did you use?”
If the answer is “not many,” that doesn’t mean they’re a bad fit for everything. But it’s a sign you may want to bring in someone who spends most of their time on farm transfers, even if it’s just for a few key meetings.
A lot of the train wrecks I’ve seen weren’t because the people involved were careless; they were simply working with advisors who didn’t specialize in the complexity of farm assets, quota, and family dynamics.
3. Sketch a Rough Timeline
You don’t have to frame this on the wall, but it helps to see it. Write down:
Your age
The age of any realistic successor
Then ask:
“When would I like to be mostly out of day‑to‑day decisions?”
“When does this person need to be fully in charge for this to feel responsible?”
Alberta’s transition planning guide and other resources offer examples of 10–15‑year transition timelines. Even if you only have five years, putting rough mileposts down—“by Year 2 they handle cropping decisions; by Year 4 they’re lead on fresh cows and people; by Year 5 we finalize ownership changes”—gives everyone something concrete to work toward.
4. Start the Fair vs Equal Talk Before Lawyers Draft Anything
If you can, bring in a neutral facilitator—an extension specialist, a mediator, or a farm‑family coach—and have a meeting with all children, farming and non‑farming.
Some good questions:
“What would feel fair to you if you’re the one farming here?”
“What would feel fair if you’re not farming but want to stay connected?”
“What worries you most about how this might be handled?”
Research on family climate and succession planning suggests that families who discuss expectations openly, rather than leaving them implied, tend to have smoother transitions and fewer broken relationships in the long run.
5. Document Where the Successor Already Leads
If someone’s already making key calls, get that down on paper.
Make a short list:
Decisions they currently own (transition‑period protocols, breeding program, staff scheduling, major purchases).
The numbers you’re using to judge success (milk per cow, butterfat and protein levels, SCC trends, repro KPIs, heifer inventory, feed cost per cwt).
That list isn’t just for the bank. It’s for you too. It shows you where you can start stepping back—and where you may need to push them to take more responsibility.
6. Sit Down with Your Team and Ask How to Avoid the Capital Crunch
When you’ve got your accountant, lawyer, lender, and maybe a coach at the table, put this question on the flip chart:
“If we don’t want to rely on a full market‑value buyout to be fair, what options do we have that you’ve seen work for dairies like ours?”
In many cases, that’s when ideas like holding/operating structures, land companies, staged share purchases, or long‑term leases with built‑in buyout formulas start to surface. The mix that makes sense for a 90‑cow tie‑stall in New Brunswick won’t be the same as for a 1,200‑cow freestall with robots in Wisconsin, but the goal is the same: keep capital demands aligned with what the business can support.
7. If There’s No Family Successor, Explore Non‑Family Paths on Purpose
If no family member wants to run the dairy, consider whether a longtime employee or a young neighboring producer could be part of a structured transition plan. Research on land‑access policy incentives and the Transition Incentives Program shows that staged sales and long‑term leases are already being used across North America to help older farmers exit without simply putting up a “For Sale” sign and walking away.
Timeline
Step
Owner
Key Output
Success Looks Like
Year 1 (This Year)
1. Put Succession on the Farm Agenda
Family
Written answers to “Who wants in? What does the farm look like 10–15 years out?”
Everyone has read the workbook questions; one family meeting completed
2. Ask Your Advisors a Direct Question
Parent + Advisor
List of advisors with farm-succession experience
You have at least one advisor who’s structured 5+ farm transitions in the last 5 years
3. Sketch a Rough Timeline
Family
One-page timeline with ages, transition milestones, key decision dates
You can see when the successor needs to be fully in charge; you know when you want to step back
Year 2
4. Start the Fair vs Equal Talk
Family + Facilitator (optional)
Written record of what each child views as fair; areas of agreement & concern
Non-farming kids feel acknowledged; farming successor feels supported; no surprises later
5. Document Where the Successor Already Leads
Family + Successor
List of current decisions owned by successor; KPIs used to measure success
You have 3–5 areas where the successor is fully responsible and hitting targets
6. Meet with Your Team & Address the Capital Question
Family + Lawyer + Accountant + Lender
Outline of 2–3 structures that could work (holding/operating, staged buy-in, land lease, etc.)
You understand which structure fits your farm; you know what equity needs to move and when
Year 2–3
7. If No Family Successor, Explore Non-Family Paths
Family + Land-Link or Extension
Preliminary conversations with potential long-term employees or neighboring operators
You have a Plan B if the family route doesn’t work; you’re not forced into a fire-sale dispersal
Outcome by Month 24
Written Succession Plan
Family + Advisors
Final plan document (2–5 pages); annual review schedule set
You have a one-page summary everyone agrees on; annual check-in on the calendar; confidence that this farm will be here in 20 years
The main thing is to look at this while you still have energy and flexibility—before age or burnout makes the decision for you.
Most of us have stood by the ring at a dispersal sale and felt that twist in our gut watching cow families, genetics, and years of work roll out the lane. Sometimes that’s the right choice—especially when it’s planned and keeps the family whole.
But if your hope is to see cows in those barns and milk leaving your lane under your family’s name into the next generation, the data and the lived experience line up on this: the families who make it into that 16‑odd percent don’t get there by luck. They start earlier than feels comfortable. They treat “equal at full value” as something to stress‑test, not a default. They build a successor who can actually lead, not just work. They use structures that reflect today’s capital load and margins. And they get a real team around the table instead of trying to carry it all alone.
You don’t have to overhaul everything by next spring. But if sometime this year you say, “Okay, who might realistically succeed us?”, sketch a rough timeline, and ask your advisors how to do this without crushing the farm, you’ll be ahead of where most families start.
And from what many of us have seen, that’s usually how good transitions begin—not with a perfect binder, but with one honest conversation, a few real numbers on the page, and a family deciding they’d rather write their own odds than live by someone else’s statistic.
Key Takeaways
The survival math is brutal: Only about 16.5% of dairy farms make it to a third generation—and weak or late succession planning is one of the biggest reasons why.
“Equal at full value” can quietly kill the farm: A traditional buyout can load $600–$750 of debt per cow onto the farming heir, leaving almost nothing for cows, barns, genetics, or the next bad year.
The 16.5% start earlier and build leaders: Families who beat the odds begin serious transition talks a decade out, give successors real management responsibility (with measurable outcomes), and use off‑farm experience as free training—not a threat.
Fair doesn’t have to mean equal in dollars: Sweat equity recognition, holding/operating structures, staged buy‑ins, and land‑lease arrangements can balance retirement, fairness, and herd survival without forcing a fire sale.
A real team beats a scattered one: Getting your accountant, lawyer, lender, and a family coach around the same table—like Teagasc’s Multi‑Actor Succession Teams—helps you dodge tax traps, catch conflicts early, and keep relationships intact.
Executive Summary:
Only a small slice of dairy farms—roughly that 16.5%—make it to a third generation, and it’s not because the rest didn’t care enough about legacy. This article digs into what separates the survivors, combining family‑business research, FINBIN 2024 dairy numbers, and fresh work on farmer stress and leadership to show where most plans quietly break down. You’ll see how a “fair” full‑value buyout can stack $600–$750 of debt on every cow, why that’s so dangerous in a 2%‑ROA business, and how structures like holding/operating companies and staged buy‑ins can keep both retirement and reinvestment on the rails. We walk through the timing piece—starting conversations while parents still have a decade to work, using off‑farm experience as training, and giving successors real management oxygen instead of just more chores. There’s a straight‑talk section on “fair vs equal” for farming and non‑farming kids, and how coordinated advisory teams (the kind Teagasc and FCC are pushing) help you avoid tax shocks and family blow‑ups. The article also opens the door to non‑family succession routes and land‑access programs when there’s no heir in the barn. You’ll finish with a concrete 12–24‑month checklist to test your own plan and a clearer sense of whether you’re quietly planning a continuity story—or an eventual dispersal.
Complete references and supporting documentation are available upon request by contacting the editorial team at editor@thebullvine.com.
Learn More
The Family Dairy Time Bomb: Why 83.5% of Operations Fail by the Third Generation – Gain a five-step readiness audit to defuse transition risks before they fracture your family’s equity. This guide delivers the financial structures and communication protocols needed to move your succession plan from theory into a stable, operational reality.
Decide or Decline: 2025 and the Future of Mid-Size Dairies – Capture a 2025 positioning strategy that maps expansion against optimization to protect your long-term margins. This analysis exposes the debt-ratio discipline and regional shifts required to keep your mid-size operation competitive in an era of consolidation.
Every week, thousands of producers, breeders, and industry insiders open Bullvine Weekly for genetics insights, market shifts, and profit strategies they won’t find anywhere else. One email. Five minutes. Smarter decisions all week.
Your robot’s mastitis alerts aren’t gospel. A $15 strip cup plus selective treatment beat blanket tubes on cost, antibiotics, and cow survival.
Executive Summary: Most dairies still tube every mastitis cow “just to be safe,” but a 2023 Journal of Dairy Science meta‑analysis of thirteen trials found that selective treatment of non‑severe cases based on bacterial diagnosis can maintain cure, SCC, milk yield, and culling while cutting antimicrobial use. One 500‑cow Holstein herd in southern Brazil, for example, dropped its clinical mastitis treatment costs from US$27,559.97 to US$17,884.34 in a year—a 24% reduction, roughly US$6,000—after switching from blanket treatment to on‑farm culture–guided selective therapy. At the same time, a Bavarian field study showed that robot mastitis alerts have only 61–78% sensitivity and 79–92% specificity, depending on the brand, which means AMS systems are great at generating “cows to check” lists but shouldn’t be deciding which quarters automatically get tubes. This article pulls those threads together into a three‑phase playbook: tighten detection with strip cups, run a six‑ to eight‑week on‑farm culture “learning phase,” then build a vet‑driven selective protocol that fits your pathogen mix and labour reality. The focus is squarely on lowering mastitis costs and antibiotic use while protecting milk, SCC, and butterfat levels in real freestalls, tie‑stalls, and robot barns. The bottom line is that if your SOP still says “treat every case,” you’re probably spending more than you need to on tubes and discarded milk—and this gives you a practical path to test that on your own farm.
Outcome Measured
Selective Treatment (Diagnosis-Guided)
Blanket Treatment (All Non-Severe Cases Tubed)
Statistically Significant Difference?
Key Insight
Bacteriological Cure Rate
✓ Maintained
✓ Maintained
NO
Both protocols achieve cure; diagnosis-guided doesn’t lose ground
One more day to visual recovery is negligible vs. cost savings
Bulk Tank SCC
✓ Maintained / Improved
✓ Maintained
NO
Selective treatment does NOT compromise herd SCC
Milk Yield (kg/day)
✓ Maintained
✓ Maintained
NO
No yield penalty; both manage production equally
Recurrence Rate
✓ Maintained
✓ Maintained
NO
Future mastitis risk is identical between groups
Culling Rate
✓ Maintained
✓ Maintained
NO
Selective treatment does NOT increase forced culls
Antibiotic Use (volume & exposure)
↓ Significantly Lower
✓ High
YES – Selective Wins
Fewer cows receive tubes; direct reduction in farm-level antibiotic footprint
Treatment Cost (relative)
Base: 100%
Base: 131%
YES – Selective Wins
24–31% cost savings in real herds (see Visual 2)
Picture us at a winter dairy meeting, coffee on the table, and someone says, “We treat every ropey quarter the same way—grab a tube and go.” A lot of heads still nod at that. It’s familiar. It feels safe.
Here’s what’s interesting. A 2023 meta‑analysis in the Journal of Dairy Science, led by Dutch and Canadian researchers, including Ellen de Jong, pulled together results from 13 studies that compared selective treatment of non‑severe clinical mastitis to blanket treatment, in which every mild case receives intramammary tubes. The data suggests that when treatment decisions are based on bacterial diagnosis, selective protocols did not worsen bacteriological cure, clinical cure, somatic cell count, milk yield, recurrence, or culling compared with treating every non‑severe case automatically. The only clear trade‑off they picked up was a very small difference—on the order of half a day—in how long it took cows to look clinically normal again.
So that old reflex—tube every non‑severe case “just to be safe”—made sense in a world with less information and less pressure on antimicrobial use. But what this newer work is telling us is that on many farms in 2025, that reflex is quietly draining money in drugs and discarded milk, and it’s not necessarily buying you better udder health.
What I’ve found, walking barns in Ontario, Wisconsin, and across the Northeast, is that the herds making selective treatment work aren’t just university herds or fancy show strings. They’re regular freestalls, tie‑stall barns, and some well‑managed dry lot systems that have tightened up detection, put simple on‑farm culture plates on a bench, and started making more targeted treatment calls. And at the centre of that shift, there’s usually a strip cup that cost about fifteen dollars.
Looking at This Trend: What’s Actually in That Mastitis Quarter?
To make sense of selective treatment, it helps to start with what’s actually going on in the quarter when you see a clinical case.
Herd Category
Culture-Negative (%)
Gram-Negative (E. coli, Coliforms) (%)
Gram-Positive (Strep, Staph, Lacto) (%)
Sample Size / Source
Typical North American Herds (Meta-analysis range)
20–40%
25–35%
30–50%
13 trials, meta-analysis
Modern European Dairy (mixed systems)
18–35%
28–40%
35–52%
Frontiers Vet Sci, JDS reviews
High-SCC Problem Herds
10–20%
20–25%
60–70%
Contagious mastitis-dominant
Well-Managed Low-SCC Herds
25–45%
30–40%
25–45%
Environmental mastitis-dominant
Recent reviews on mastitis in journals like Frontiers in Veterinary Science and Journal of Dairy Science describe how milk from clinical mastitis is usually grouped into three broad categories in research trials and on‑farm diagnostics work:
Culture‑negative cases, where no growth appears on routine culture media
Gram‑negative infections, often Escherichia coli and related coliforms
Gram‑positive infections, like Streptococcus uberis, Streptococcus dysgalactiae, and various staphylococci
Across modern datasets from North American and European herds, researchers often report that a substantial share—commonly in the 20 to 40 percent range—of clinical mastitis samples are culture‑negative when they hit the plate. You know how that goes: by the time you see clots or watery milk, and you grab a sample, the cow’s own immune system may already have knocked bacterial numbers down below the detection limit of the culture system.
And here’s where the math starts to matter.
In the non‑severe clinical mastitis trials that fed into that 2023 meta‑analysis, culture‑negative cases were either treated with intramammary antibiotics or left without intramammary therapy, with both groups monitored closely and supported as needed. When researchers pulled those results together, they didn’t see worse bacteriological or clinical cure, SCC, or recurrence in the culture‑negative cows that were managed without intramammary antibiotics, compared with those that received tubes. In plain terms, a lot of those culture‑negative, non‑severe cases were going to get better either way.
For non‑severe gram‑negative cases—especially E. coli—the story is similar in many of the better‑controlled studies. Several trials, including work from Brazil and Europe, show that mild and moderate E. coli mastitis has a relatively high spontaneous cure when cows are otherwise healthy and well monitored. When you look at the numbers in those trials, intramammary tubes don’t always give you a big extra jump in cure compared with careful observation and supportive care, as long as you’re ready to move fast with systemic treatment if a cow spikes a fever, goes off feed, or otherwise starts looking systemically ill.
That’s where good fresh cow management during the transition period and overall environment really start pulling their weight. In herds where cows come into early lactation in good condition, with clean, dry stalls or well‑drained lots and minimal stress, it’s a lot easier for the immune system to do its part in these milder environmental mastitis hits.
Gram‑positive infections are trickier. For years, most of us have felt that these “pay” for a tube, and some work backs that up. Trials are showing that certain gram‑positive pathogens, especially some streptococci and staphylococci, respond better to intramammary antibiotics than to no treatment. At the same time, a 2024 randomized trial in JDS Communications that followed non‑severe gram‑positive mastitis cases identified by on‑farm culture—many of them Lactococcus—found no significant difference in bacteriological cure between several intramammary regimens and no treatment during a 21‑day follow‑up.
So the honest summary is this:
For non‑severe culture‑negative and many gram‑negative clinical mastitis cases, there’s good evidence that you can withhold intramammary antibiotics and lean on careful monitoring and supportive care without harming overall udder‑health outcomes—provided you still treat severe cows aggressively.
For non‑severe gram‑positive cases, the evidence is mixed. Some pathogens and situations clearly benefit from targeted intramammary therapy; others, like the Lactococcus‑dominated cases in the 2024 trial, don’t show a big difference in cure either way.
And that’s exactly why just looking at a ropey strip on the floor doesn’t get you very far. As mastitis specialists at places like Minnesota and Penn State keep reminding people, foremilk appearance and udder feel by themselves simply don’t tell you which pathogen group you’re dealing with. If you want a true selective treatment program—not just a dressed‑up version of “treat everything”—you need some sort of diagnostic information, usually from an on‑farm culture plate or a rapid lab test.
A Real‑World Case: A 500‑Cow Herd That Ran the Numbers
Let’s ground this in a real farm.
Metric
Blanket Treatment Year
Selective Therapy Year
Difference
% Reduction
Total CM Treatment Cost (USD)
$27,559.97
$17,884.34
$9,675.63
24.23%
Number of CM Cases
361
238
123 fewer
34% case reduction
Cost per Case (USD)
$76.35
$75.17
$1.18
1.5% per-case efficiency
Antibiotic Spend Component (est.)
$15,200
$8,900
$6,300
41% reduction
Discarded Milk Cost (est.)
$12,360
$8,984
$3,376
27% reduction
A 2023 Brazilian study in Revista Brasileira de Saúde e Produção Animal followed a commercial Holstein herd of about 500 lactating cows in Rio Grande do Sul as it transitioned from blanket clinical mastitis treatment to selective therapy based on on‑farm pathogen identification. They ran it for two full years: one year before the new protocol and one year after.
During those two years:
They recorded 599 clinical mastitis cases: 361 in the blanket‑treatment year (period one) and 238 in the first selective‑therapy year (period two).
They calculated the full cost of treating CM, including antibiotics and discarded milk. Across both years, CM treatment cost the farm US$45,444.31.
In the blanket year, costs were US$27,559.97.
In the first year with selective therapy, costs dropped to US$17,884.34.
That’s a 24.23 percent reduction in total CM treatment costs from year one to year two—around US$6,000 saved in that first selective‑therapy year—while also reducing antibiotic use and the volume of milk discarded because of treatment.
It’s worth noting that this wasn’t some disinfected research station. This was a compost‑bedded pack herd, milking twice a day with mechanical parlour equipment, producing roughly 14,000 litres of milk per day at the time of the study. In other words, a big, normal, working dairy.
Now, your milk price and drug costs aren’t going to match that dollar for dollar. But that kind of shift—24% lower CM treatment costs while maintaining udder health—is exactly the kind of “big math” that makes people sit up and ask, “Are we tube‑happy on our farm too?”
You Know This Step Already: Forestripping Still Matters
We can’t talk about selective treatment without talking about detection, because the whole program falls apart if you only find mastitis when the quarter is hard, and the cow is obviously miserable.
National Mastitis Council guidelines, along with extension programs from places like Wisconsin and Minnesota, still place a lot of emphasis on foremilk stripping into a strip cup or onto a dark surface, and on actually looking at that foremilk before you attach the unit. Reviews on on‑farm mastitis diagnostics have pointed out that subtle changes—slightly watery milk, a few fine flakes, a mild shift in colour—often show up before you feel heavy swelling or heat in the udder.
On the ground, in parlours from Ontario to Wisconsin, as many of us have seen, this step can quietly slip. In some operations, it becomes one quick squirt on the floor with barely a glance, and mastitis effectively doesn’t show up on the radar until things are already severe. In others, who’ve decided to do selective treatment or just take udder health seriously, you’ll see strip cups in every milker’s hand and people actually looking at what’s in them.
What’s encouraging is that it doesn’t take a big technology investment to tighten this up. A strip cup is cheap, and retraining people to use it mostly comes down to attention and habit. Once you’re catching more mild cases early, the idea of waiting 18–24 hours to see what grows on a plate in a non‑severe case doesn’t feel as risky as it does when every case you see is already advanced.
Robots and Sensors: Great Assistants, Not Autopilots
A lot of you are milking with robots now, especially in Western Canada, parts of Ontario, the Upper Midwest, and northern Europe. Whether it’s Lely, DeLaval, GEA, or another brand, your automatic milking system is already collecting a ton of data every milking: electrical conductivity, quarter yield, milking interval, flow curves, and in some setups, colour, blood, and somatic cell count.
The natural question is, “If the robot sees all this, do we still need strip cups and culture plates, or can we just let the system decide?”
A 2022 study out of Bavaria, published in the journal Animals, took a close look at that question. Researchers there evaluated four major AMS manufacturers on commercial Bavarian dairy farms and calculated the sensitivity and specificity of each system in detecting clinical mastitis under real‑world conditions.
AMS Manufacturer
Sensitivity (% of true mastitis detected)
Specificity (% of non-mastitis correctly ruled out)
What This Means in Plain Language
False Positive Rate (approx.)
Field Notes
Lely MQC / MQC-C
~78%
~86%
Catches 78 of 100 real mastitis cases; flags ~14% of normal cows as mastitic
~14%
Colour, EC, temp; somatic cell if MQC-C enabled. Best sensitivity.
DeLaval MDi
~61%
~89%
Misses ~39 of 100 mastitis cases; very conservative alerting (fewer false alarms, more missed cases).
~11%
Conductivity + blood detection + interval. Lowest sensitivity; flag for high-risk quarters.
GEA DairyMilk M6850
~76%
~79%
Catches 76 of 100; flag rate on false positives is highest among the four (~21%).
~21%
Permittivity-based SCC categories; no reagents. Good yield of data; more labour on false checks.
Specialty systems; strong on ruling out false mastitis. Slower to escalate.
Theoretical “Perfect” System
99%+
99%+
Would catch nearly all real cases, rarely flag false alarms.
<1%
Not commercially available; cutting-edge machine learning in development labs.
They found that:
The Lely systems in the study showed sensitivity around 78% and specificity around 86%.
DeLaval systems came in with a sensitivity of around 61% and a specificity of around 89%.
GEA units had a sensitivity of around 76% and a specificity of around 79%.
Lemmer‑Fullwood systems showed sensitivity around 68% and specificity around 92%.
The authors described detection performance as “satisfactory,” which is fair. But they also pointed out that none of the systems achieved the 99% specificity needed to eliminate false alarms nearly, and that low specificity can mean more milk unnecessarily discarded and more staff time spent checking cows that ultimately aren’t truly mastitic.
It’s worth knowing what those alerts actually mean.
Lely’s Milk Quality Control (MQC) system tracks quarter‑level electrical conductivity, colour, and temperature. Farms that bolt on MQC‑C also get real‑time somatic cell count readings, a big step up in monitoring udder health.
DeLaval’s Mastitis Detection Index (MDi) combines conductivity, blood detection, and milking interval into a single score. Somatic cell counts are handled separately in the DelPro system.
GEA’s DairyMilk M6850 uses electrical permittivity to give quarter‑level SCC categories without needing reagents, which is attractive for some robot herds that want frequent SCC information.
And in the research world, people are layering machine‑learning approaches on top of SCC data and other signals to improve detection performance beyond these simple thresholds. Those systems have shown they can approach very high sensitivity and specificity when built and trained well, although they’re not yet standard on most commercial farms.
So, if we’re being practical, AMS data is powerful, but it’s not magic. Sensitivity in the 60–70‑something percent range means some mastitis cows are missed. Specificity below the mid‑90s means you’ll get some false positives. That’s fine, as long as you use the system for what it’s good at.
On better managed robot herds I’ve visited—from two‑robot setups in Quebec to larger systems in northern Europe—the farms getting the most out of the technology tend to use the alerts like this:
The robot generates an “attention list” based on MDi, MQC, conductivity jumps, yield changes, and milking intervals.
Staff treat that list as “cows to check,” not “cows to tube automatically.” They strip those cows, feel the udder, and decide whether it really looks like clinical mastitis or just a funky day.
If a quarter truly looks like non‑severe mastitis, they take a clean sample before treating and let their selective protocol, plus the culture result, guide whether they use an intramammary product.
When you treat AMS data as a list generator, not as an autopilot, you get the benefit of the technology without turning it into an expensive random‑number generator for mastitis treatments.
Key Numbers That Are Worth Putting a Pencil To
If you’re like most producers, you probably want to see what this looks like in numbers before you consider changing anything.
A few data points are worth having in your back pocket:
That 2023 meta‑analysis on non‑severe CM treatment found that, across thirteen studies, selective treatment based on bacterial diagnosis did not worsen bacteriological or clinical cure, SCC, milk yield, recurrence, or culling compared with blanket treatment, aside from a small increase in time to clinical cure.
In the 500‑cow Brazilian Holstein herd, clinical mastitis treatment costs dropped from US$27,559.97 in the blanket‑treatment year to US$17,884.34 in the first year of on‑farm culture–guided selective therapy—about a 24.23% reduction, roughly US$6,000 in that one year—while CM cases fell from 361 to 238, and overall CM treatment across the two years totalled US$45,444.31.
The Bavarian AMS study showed sensitivity values in the 61–78% range and specificity from just under 80%to the low 90s, depending on the manufacturer, with the authors warning that lower specificity increases labour and discarded‑milk costs due to false alarms.
Those numbers aren’t your herd, of course. Milk price, mastitis incidence, labour costs, and your payment system will change the exact dollars per cow or per hundredweight. But the pattern across these very different situations is pretty consistent: when you’re able to decide which quarters truly need intramammary treatment, and you stop tubing the ones that don’t, you usually see a meaningful drop in antibiotic use and CM treatment costs without wrecking udder health.
A Simple Three‑Phase Playbook That’s Working on Real Farms
What I’ve found is that the herds that make selective treatment work don’t usually jump straight from “treat everything” to a complicated new protocol overnight. They roll it in over time.
Phase 1: Tighten Up Detection
This is the lowest‑cost, lowest‑risk step, and it pays off whether you ever go fully selective or not.
Place a strip cup with a dark insert at each milking unit or in each AMS mastitis‑check area.
Build deliberate foremilk checks back into your milking SOP, not just in your head.
Use your own herd’s milk—jars of abnormal foremilk, photos, short parlour demos—as training material so everyone sees what “normal,” “borderline,” and “this is mastitis” actually look like in your barn.
In Ontario and Wisconsin operations that do this well, I’ve seen vets and milk quality advisors walk the parlour with staff, looking into strip cups together. You strip some cows, talk through which quarters you’d culture, which you’d treat on sight, and which you’d flag for monitoring. Those conversations often show you that people aren’t always reading the same cow the same way.
Phase 2: Run a 6–8 Week “Learning Phase” With On‑Farm Culture
Once you’re actually catching non‑severe cases early and consistently, the next step is to figure out what bugs you’re dealing with.
For six to eight weeks:
Pick a validated on‑farm culture system with your vet—something like the Minnesota Easy Culture System or another kit backed by a university.
Set up a simple incubator and a clean spot for plates, and train one or two key people in aseptic sampling and reading plates using extension resources.
Culture every clinical mastitis case you reasonably can, but don’t change your treatment protocol yet.
At the end of this “learning phase,” you’ll know:
What proportion of your CM cases are culture‑negative?
How many are gram‑negative versus gram‑positive.
Whether your current habit of tubing every non‑severe case is actually aligned with the kinds of infections that benefit most from intramammary therapy.
In many Midwest and Canadian herds that have done this, people are surprised by how many CM cases are either culture‑negative or mild gram‑negative infections with good spontaneous cure. In other herds, particularly where contagious mastitis is still an issue, they find more gram‑positive problems than they realized. In both cases, the conversation shifts from “studies say” to “this is what our plates are showing.”
Phase 3: Build a Written Selective CM Protocol With Your Vet
If your culture results and your comfort level say it’s a good idea, then it’s time to sit down with your herd vet and map out a selective treatment protocol that fits your reality.
The protocols that travel well between herds usually look something like this:
Severe CM cases—cows with fever, depression, or other systemic signs—are always treated aggressively and promptly with appropriate systemic therapy and, when indicated, intramammary products. No waiting for culture there.
Non‑severe cases—abnormal milk with possibly mild udder changes, but no systemic illness—should be sampled aseptically before any intramammary treatment. Often, they’ll also get an anti‑inflammatory for comfort while you’re waiting for results.
Culture‑negative non‑severe cases are typically managed without intramammary tubes, with clear monitoring instructions for the next several days.
Non‑severe gram‑negative cases are often managed with observation and supportive care, with systemic treatment ready to go if the cow deteriorates.
Gram‑positive cases receive intramammary treatment where evidence and experience suggest there’s a reasonable benefit, with product choice and duration agreed on with your vet.
In Canada, Dairy Farmers of Canada and the Canadian Dairy Network for Antimicrobial Stewardship and Resistance have highlighted this kind of selective, diagnosis‑based CM treatment as one of the key opportunities to reduce antimicrobial use without sacrificing udder health, and it lines up neatly with proAction’s expectations on protocols, veterinary involvement, and responsible drug use. In the U.S. and Europe, major mastitis reviews and one‑health antimicrobial guidelines are making the same point: selective treatment of non‑severe CM is one of the more practical levers farms can pull.
Phase
Duration
Key Task(s)
Main Deliverable
Cost & Effort
Expected Payoff by End of Phase
Success Signal
Phase 1: Tighten Detection
Weeks 1–4 (parallel to normal ops)
– Place strip cup at every unit – Retrain staff on foremilk checks – Use herd’s own milk as training reference – Spot-check compliance weekly
Written SOP for forestripping; trained staff; strip cups in use
~$50 (strip cups) + 2–3 h management time
Catch 20–30% more non-severe cases early; catch cases beforeudder swelling severe
Foremilk checks are daily habit; staff can name “normal vs. mastitis” by look
Phase 2: Learning Phase (On-Farm Culture Pilot)
Weeks 5–12 (8-week pilot)
– Select culture system with vet (e.g., Minnesota Easy Culture) – Set up incubator & clean bench – Train 1–2 key staff on aseptic sampling & plate reading – Culture every CM case (continue normal treatment SOP) – Log & analyze results at weeks 4 and 8
Culture database of your herd’s pathogen breakdown: % culture-negative, % gram-neg, % gram-pos; cost per case baseline
Know your herd’s pathogen mix; baseline CM costs; early confidence in “we can do this”
% culture-negative cases, pathogen ratios, and staff competence confirmed; no major surprises
Phase 3: Build & Implement Selective Protocol
Weeks 13–24 (parallel ramp, then full protocol)
– Sit down with vet; review phase 2 culture results – Draft written selective CM protocol (severe vs. non-severe; thresholds for tube vs. observe) – Train staff on new decision tree – Run first 4–6 weeks as “soft launch” (staff practice; vet checks calls) – Adjust protocol based on early feedback; go full by week 20 – Measure outcome (SCC, cases, costs) at weeks 12, 24
Written, vet-approved selective CM protocol; staff trained & confident; data showing cost drop & SCC maintained
~$0–200 (any consumables; mostly vet & management time) + 1–2 h/week for first 6 weeks (ramp)
15–25% reduction in CM treatment costs (based on real herd data) Antibiotic use down 20–30% SCC & cure rates stable or improved
Herd costs drop $5,000–15,000 (scaled to size); staff confidence high; vet sees fewer auto-tube calls
People and Training: Where It Either Sticks or Slides Back
It’s worth noting—and you’ve probably seen this yourself—that nothing in mastitis management sticks just because it’s written down once.
Reviews of milking routines and mastitis risk keep coming back to the same thing: herds that combine written SOPs, actual staff training, and periodic feedback tend to have better udder health than herds that just have “the way we do it” floating around in people’s heads.
In practice, on farms that make selective CM treatment part of their culture, you see things like:
An initial team meeting where someone walks through the herd’s CM numbers and costs, shows some culture results, and explains why the protocol is changing.
Short “toolbox talks” every few weeks in the parlour or robot room, going over a couple of recent CM cases and what was learned.
Occasional observation of milking and culture work by the herdsperson or manager, followed by specific, friendly feedback.
A yearly sit‑down with the vet—and sometimes the nutritionist—to review CM incidence, bulk tank SCC, mastitis‑related culls, antibiotic use, and the economics, then adjust the protocol if needed.
In many Wisconsin and Midwest operations, this kind of rhythm already exists for fresh cow checks or repro programs. Selective CM treatment just gets folded into that same cycle of “plan, do, check, adjust.”
When Selective Treatment Makes Sense—and When It Might Need to Wait
Selective CM treatment isn’t the right first move for every herd, and that’s okay.
It tends to work best on farms that:
Have bulk tank SCC at least under moderate control
Keep udders reasonably clean and dry in their freestalls or well‑managed dry lots
Have fairly stable milking routines across shifts
And have at least one or two people who can reliably handle sampling, culture plates, and record‑keeping
If your bulk tank SCC is high, contagious mastitis problems like uncontrolled Staph aureus are still walking the barn, or staff turnover is so high that basic milking routines aren’t consistent, then your best return in the short term is probably on the fundamentals: stalls, bedding, teat prep, fresh cow management through the transition period, and dealing with chronic high‑cell cows.
If your SCC is on fire, it usually makes more sense to put your energy into the basics first and treat it selectively as a second‑phase project once the house is more in order.
The research base is still growing, too. Most CM-selective treatment trials have been conducted in herds with at least reasonable monitoring and mastitis control. Newer studies are starting to tackle different pathogens and management systems, and we’re seeing some differences, like that 2024 gram‑positive RCT with Lactococcus. That’s why it’s helpful to treat the published data as a strong guide, but still test things against your own herd’s results.
So What’s the Take‑Home in 2025?
If you zoom out and look at this through a 2024–2025 lens—with more talk about antimicrobial stewardship, labour that’s not getting cheaper, and milk cheques that depend more than ever on SCC and butterfat levels—the idea of selective treatment for non‑severe clinical mastitis stops being a theoretical exercise and starts looking like a practical tool.
For a 100‑cow herd shipping on components, pulling even a few fewer high‑SCC cows out of the bulk tank over the year can be the difference between hanging onto a quality premium and watching it slip. For that 500‑cow Brazilian herd, a 24‑percent drop in CM treatment costs was worth about US$6,000 in one year—enough to matter for anyone’s budget.
If you don’t change anything else in your mastitis program this year, four moves are worth your time:
Put real numbers on your mastitis costs. Work with your vet or advisor to tally up what CM is costing you in drugs, discarded milk, and mastitis‑related culls—per cow and per hundredweight—so you know what your current reflex is actually costing.
Make strip cups and foremilk checks non‑negotiable again. Get strip cups into everyday use, retrain people as needed, and spot‑check that forestripping and visual checks are happening at every milking, whether you’re in a parlour or running robots.
Run a six‑ to eight‑week on‑farm culture pilot. Culture every CM case you can without changing your treatment protocol yet, then sit down with your vet to look at what percentage of your cases are culture‑negative, gram‑negative, and gram‑positive.
Use your own herd’s data to decide on a selective protocol. Don’t just copy the Brazilian farm or a university script. Use your culture results, your cost numbers, and your vet’s judgement to decide if selective treatment of non‑severe CM makes sense for your herd right now—and if it does, write it down and train people on it.
You know as well as I do that doing nothing usually means you keep spending on tubes that don’t always change outcomes, while other herds slowly move those dollars into genetics, better fresh cow programs, improved housing, and lower SCC.
In the end, the question isn’t simply “treat or not treat.” It’s: Which quarters actually pay to treat—and how do you figure that out reliably on your farm?
From that 500‑cow compost‑barn herd in southern Brazil to AMS barns in Europe and North America, the gap between guessing and knowing in mastitis treatment has turned out to be worth a lot more than the price of a strip cup. And quite often, the very first step in closing that gap isn’t new software or a new sensor. It’s a cheap strip cup in a milker’s hand and a small, intentional decision, right in the middle of a busy shift, to pause for a couple of seconds, really look at what’s coming out of each teat, and start letting that information guide where your tubes—and your mastitis dollars—actually go.
Key Takeaways
The blanket‑treatment reflex is costing you. A 2023 meta‑analysis of 13 trials found that selective treatment of non‑severe mastitis—guided by on‑farm culture—maintained cure, SCC, milk yield, and cow survival while cutting antibiotic use.
Real‑farm math: 24% lower mastitis costs. One 500‑cow Holstein herd dropped CM treatment spending from US$27,559 to US$17,884 in a single year—about US$6,000 freed up for genetics, transition‑cow programs, or equipment upgrades.
Your robot’s mastitis alerts aren’t gospel. Field data show that AMS systems achieve only 61–78% sensitivity and 79–92% specificity—great for building a “cows to check” list, but terrible for auto‑tubing decisions.
Start with a $15 strip cup, not new software. Restore real foremilk checks, run a 6–8 week on‑farm culture pilot, then build a vet‑approved selective protocol matched to your herd’s actual pathogen mix.
Not every herd is ready today—and that’s okay. If SCC is on fire, contagious mastitis is loose, or staff turnover is constant, lock down the basics first; selective treatment pays best when the foundation is solid.
Complete references and supporting documentation are available upon request by contacting the editorial team at editor@thebullvine.com.
Learn More
83% of Dairies Overtreat Mastitis – That’s $6,500/Year Walking Out the Door – Gain immediate financial relief by identifying the clinical cases that don’t need expensive tubes. This breakdown delivers the hard math on a 90-day payback system that stops thousands of dollars from walking out your barn door annually.
The Milking Speed Game-Changer That’s About to Shake Up Your Breeding Program – Reveals how new sensor-based genetic traits are ending the era of subjective milking speed scores. This method leverages objective data to breed a faster, more efficient herd that maintains udder health while slashing total parlor labor.
The Sunday Read Dairy Professionals Don’t Skip.
Every week, thousands of producers, breeders, and industry insiders open Bullvine Weekly for genetics insights, market shifts, and profit strategies they won’t find anywhere else. One email. Five minutes. Smarter decisions all week.
One ICE raid stopped a dairy cold. 35 workers gone. But it also revealed who neighbours really are.
I’ll never forget the first time someone told this story in a room full of dairy people.
It was one of those meetings where the coffee’s lukewarm, the jokes are familiar, and everyone’s half‑listening while thinking about the next milking. Then someone said, “Did you hear about the dairy in New Mexico that lost 35 workers in one morning?”
The whole room went quiet.
Every person at that table started doing their own math. What would that look like here? On our lane? With our crew?
June 4, 2025, started like any other hot, dry morning outside Lovington, New Mexico. The sky was already bright by the time cows lined up in the parlor at Outlook Dairy. Hoses hissed. Units clanked on and off. Spanish and English mixed over the noise in that familiar way you hear on a lot of larger dairies now.
Honestly, if you’d dropped in early that morning, it would’ve sounded a lot like a Tuesday on plenty of farms across North America.
By the end of the day, nothing about it felt ordinary.
Homeland Security Investigations trucks came down the lane with a search warrant. When they left, 11 workers were in custody. After an employment audit tied to their documents, owner Isaak Bos was told he had to fire 24 more on the spot. In the space of a few hours, Outlook Dairy lost 35 of 55 workers—almost two‑thirds of the people who kept that place running.
Bos later said milk production had “effectively ceased.” Every remaining person—family, office staff, whoever was available—and even some high school students on summer break were pulled into basic animal care just to keep the cows fed, watered, and milked at all. He put it plainly: “It takes 100% of the labor force, so no day is off right now. It’s detrimental for our cattle. We’re barely able to keep going.”
If you milk cows yourself, you don’t need a graph to understand that. Your stomach does the math for you.
When Everything Stops but the Cows
The thing about a dairy is simple and unforgiving: cows don’t stop just because your labor does.
In Lovington that week, all the routines that make a dairy hum were suddenly missing most of the people who knew them best. The workers who’d been there every day—many of them immigrants who had put down roots in the area—weren’t walking into the parlor, scraping alleys, or checking fresh cows anymore.
Across the U.S., that’s not a side note. It’s the reality of who actually milks the cows. A major industry survey found that foreign‑born workers make up roughly half of all dairy labor, and the farms that rely on them produce nearly 80% of the country’s milk. In barn language: without immigrant labor, most of America’s cows don’t get milked.
That’s true whether you’re pushing cows through a big New Mexico freestall, running a 200‑cow sand‑bedded herd in Wisconsin, or managing a couple of key foreign workers under Canada’s Temporary Foreign Worker Program. It doesn’t take many people to disappear before the whole system starts to wobble.
When an enforcement action hits a dairy, the headlines talk about arrests, charges, and policy. But in the farmhouse, the questions are more basic.
Who’s going to milk tonight?
Who’s going to catch the cow that’s about to crash?
Bos said Outlook went from “operating normally” to crisis mode overnight. People who normally handled phones and paperwork laced up boots and headed to the barn. Teenagers who figured they’d be doing odd jobs suddenly found themselves in the parlor or feeding calves. Production targets weren’t the priority anymore. The new goal was simple: keep the cows alive and limit their suffering until a crew could be rebuilt.
If you’ve ever had flu rip through your family, lost a key employee, or had one bad accident take the legs out from under your schedule, you know a smaller version of that scramble. You stretch days longer than they should be. You pick up one more milking. You cut corners you never wanted to cut because there just aren’t enough hands.
Lovington didn’t invent that feeling. It just pushed it about as far as it can go in a single morning.
The People Behind the Paperwork
From a distance, it’s easy to see “11 arrested, 24 fired” and think in terms of paperwork and status. Up close, those numbers are people.
On that farm, those 35 were workers who had been part of the daily rhythm for years—feeding cows, scraping alleys, watching fresh pens, raising calves. Bos has said all 35 lived locally. Their kids went to the same schools. Their families bought groceries at the same stores. They were neighbours long before a federal truck ever pulled into the yard.
Advocates in the region put it in terms many producers would recognize in their own communities: these aren’t just “workers,” they said. They’re “our neighbors, coworkers and friends,” people who have “contributed to our economy and enriched our culture” in southeastern New Mexico.
After the raid, Bos emphasized that the dairy itself wasn’t charged with wrongdoing. He said the employees had given them false documents and that the operation came without prior warning. Whatever you think about the legal side, you can hear in his words that this wasn’t just about forms to him. It was about people he knew and depended on.
He talked about the “intimidating effect” of the raid and worried that it would scare even more workers away. Any owner who’s spent years building a crew and a culture can feel that in their bones.
Immigrant-rights groups in New Mexico went even further, connecting what happened at Outlook to the broader local economy. They warned that raids like this “threaten the safety and economic well‑being of our communities,” in a region where immigrant workers are “powering industries from dairy farms to oil and gas.” They talked about how every time a worker disappears from a place like Outlook, that absence is felt not just in the barn but in the cash register at the grocery store, in the quiet tables at local restaurants, and in the small shops that count on regular customers from the dairies.
In other dairy regions, people who work closely with farmworkers have been describing the same kind of fear. In Vermont and beyond, organizations that advocate with dairy workers talk about how stepped‑up immigration enforcement has changed everyday life—workers limiting trips to town, skipping church, putting off doctor visits, avoiding school events—because every mile off the farm feels like another chance to end up in a patrol car instead of a pickup.
On paper, that shows up in policy reports and enforcement statistics. On the ground, it looks like people are shrinking their world to the few places that still feel somewhat safe, even as the workload doesn’t let up and the pressure quietly builds.
You don’t have to agree on every policy detail to see how that wears on a crew. And on the people who work alongside them.
What Happens to the Cows When Workers Disappear
Every producer knows this: concrete and steel don’t care for cows. People do.
When most of those people are suddenly gone, the barn feels it long before a reporter ever arrives. In Lovington, reports described remaining family members, non‑farm staff, and local high school students suddenly responsible for nearly everything—feeding, milking, bedding, and keeping an eye on fresh cows—under intense time pressure.
Training someone new in the parlor takes time, even under the best conditions. Getting them comfortable reading cow behavior, spotting a hot quarter, recognizing a twisted stomach before it’s obvious—that takes longer. Doing all of that while you’ve already lost most of your experienced crew and everyone left is exhausted is another thing entirely.
That’s when real risk sneaks in. Not because anyone cares less, but because biology doesn’t wait while people catch up.
Bos said the remaining workers were being “pushed…to the limit.” Most dairy families don’t need that explained. When you’re running on too little sleep, carrying too much worry, and trying to do three jobs at once, little things slip.
A cow that somehow still has a full quarter at the end of milking.
A dull‑eyed calf that should’ve been flagged an hour earlier.
A fresh cow that doesn’t get that second or third look you always meant to give her.
Those aren’t character flaws. They’re the predictable result of stripping away most of the people who knew the herd best and asking the ones who remain to do the impossible.
In Lovington, the raid didn’t just stress a business plan; it shattered it. It stressed a barn full of living animals that had no idea why familiar hands didn’t show up that day. And it stressed the people left behind—owners, spouses, kids, employees—in ways that still don’t fit neatly into any official report but linger in a house and a community long after the headlines move on.
A Town Watching and Worrying
The neighbour’s text came before sunrise for many folks that week: “Did you hear what happened at Outlook?”
At the feed mill, at the co‑op, at the school, people traded pieces of the story they’d heard. Some knew names, some just knew numbers, but everybody understood that losing most of your crew isn’t something you can quietly absorb.
Very quickly, the questions that started in kitchens and pickup trucks found their way into a public meeting in Hobbs. Governor Michelle Lujan Grisham came. So did local officials, church folks, school staff, and people who just needed to look someone in the eye and ask what came next.
In that room, nobody was talking in theories.
People wanted to know what happens to a family when a parent is suddenly detained or fired and there’s no paycheck coming in. They worried about what happens to kids when mom or dad disappears between breakfast and suppertime. They asked what kind of future local agriculture has if dairies can’t keep crews because everyone’s scared of who might show up in the yard.
School staff wondered how to support children who suddenly didn’t know where a parent was—or were afraid to talk about it. Church leaders were hearing from families who now felt too scared to come on Sunday. Small businesses felt the absence of regular customers. In a rural county where agriculture is a backbone, when a dairy loses 35 people in a day, there really isn’t anyone who doesn’t feel some part of the shock.
Stakeholder
Annual Spending (lost)
Immediate Impact
Long-term Risk
School District
~$120k (tuition, meal programs, supplies)
8–10 children withdrawn; reduced Title I funding; staff scheduling pressure
Loss of enrollment revenue; fewer teachers retained
Churches
~$45k (tithes, donations, event participation)
Reduced attendance; families too stressed to participate; donation drop
Reduced community support capacity; programming cuts
Schools, roads, emergency services underfunded; quality of life declines
| TOTAL LOCAL ECONOMIC SHOCK (Direct) | ~$980k/year lost spending power | Cascades through 150+ local businesses | Potential long-term population decline |
Immigrant-rights groups in the area called the raid devastating. They said people were sorrowful, frustrated, and frightened. Those weren’t academic words. They came from organizers who were on the phone with families and workers, trying to make sense of what had happened.
At the same time, the wider dairy industry was circling around the story. Farm media across the country ran pieces on the Lovington raid. The Bullvine called it “a stark preview” of what happens when immigration enforcement collides with the reality of who actually milks America’s cows, noting that removing 64% of a workforce in one morning had effectively brought milk production to a halt. Others described it as an “overnight exodus” and underlined how fragile even large, well‑managed dairies are when labor is shaken that hard.
Put together, the voices from the meeting hall, advocacy groups, media, and the farm itself didn’t produce a neat narrative. They produced something closer to what real life in dairy country looks like.
Complicated. Heavy. And very human.
Not Just One Farm’s Vulnerability
It would be easy to look at Lovington and say, “That’s a New Mexico problem.” But the numbers refuse to keep it that tidy.
Demographic Group
Number of Workers
% of Workforce
% of U.S. Milk Production
Foreign-Born Workers
180,000
51%
79%
U.S.-Born Workers
170,000
49%
21%
Total Dairy Workforce
350,000
100%
100%
That 2015 national survey on immigrant labor—still the best wide‑angle view we have—estimated that if foreign‑born workers disappeared from U.S. dairies, roughly 7,000 farms would close and milk prices would spike. You don’t have to believe every line of a model to feel the point: the system isn’t built to handle that kind of loss.
In recent years, stepped‑up immigration enforcement hasn’t stayed in one state. Workplace and community raids in different parts of the country, including agriculture and food‑system jobs in states like Oregon and Wisconsin, have fed a constant undercurrent of anxiety in farm country. It’s not just packing plants and warehouses. It’s barns.
In places like Vermont, advocates who work closely with dairy workers have been saying the same thing over and over: fear of being stopped, detained, or deported has pushed many people into deeper isolation. Trips to church, doctor visits, school meetings, even basic shopping—things many of us take for granted—have been cut back or dropped entirely because the risk of being on the road feels too high.
For dairy owners and managers, that climate manifests in different ways. It looks like nights spent looking at the ceiling instead of sleeping, wondering if you’ll have enough hands for the first milking tomorrow. It looks like trying to support workers who are carrying their own fears while you’re also trying to keep the bank at bay and the cows on feed.
It shows up in the lives of farm spouses who balance payroll, kids’ schedules, and the unspoken emotional load of keeping the whole operation from flying apart. It shows up in teenagers who are suddenly taking on more barn work because there isn’t anybody else, watching the adults around them carry stress that’s hard to explain.
Lovington didn’t create that pressure. It just gave everyone a sharper, more public picture of what so many dairy communities have been quietly living with for years.
When Neighbours Became Family
The moment that sticks with a lot of people in stories like this isn’t always the raid itself. It’s what comes after, when the shock wears off, and the sheer amount of work left to do settles on the people who are still standing in the yard.
Standing in the milk house after a day like that, it would be easy to feel alone. The pipeline’s still humming. Cows still need to be fed. The phone won’t stop buzzing. You’re tired enough that the thought of asking for help feels like just one more job.
And then, in a lot of dairy communities, something small but important happens.
A text comes in from down the road: “How bad is it?”
At the feed mill, somebody says, “I heard what happened. Are they okay for help?” A nutritionist or vet decides to swing by sooner than planned. A friend at the co‑op quietly asks if there’s anything the board can do to give a bit of breathing room.
Sometimes it’s as simple as a kid asking their parents if they can go help at the other farm instead of scrolling on their phone that afternoon. On some roads, a teenager showing up to scrape alleys or bed a few pens has been the difference between a barn barely hanging on and a barn where people get to lie down for a couple of hours.
In many dairy communities, when a farm is hit with a fire, a serious illness, a bad accident—or an enforcement action like the one in Lovington—you see familiar patterns:
A neighbour swinging over after their own chores to ask what’s really needed.
A ride into town for someone who doesn’t feel safe driving alone.
A quiet envelope slipped into a hand outside the church because someone heard a family lost their income.
A plate of food left at the back door with the same simple line people have used for generations: “We made too much. Thought you might help us out.”
Most of those acts never see a camera. They don’t end up on Facebook. They don’t make a line in any official report. But for people living through the hardest days of their lives, those moments change how they see their neighbours.
Not as “the guy who runs that place down the road,” but as someone who refused to let them fall alone.
What This Story Asks of the Rest of Us
What moved a lot of people most about Lovington wasn’t just the shock of the raid. It was being forced to look straight at how dependent we’ve all become on workers who carry a lot of risk and not much protection—and at how much we lean on each other, often without saying it out loud.
Sitting at your own kitchen table, you might be thinking, “All right, but what am I supposed to do with this? I’ve got my own headaches.”
That’s fair. Nobody needs one more heavy thing to carry.
Maybe the question isn’t “How do we fix immigration policy?” Maybe it’s smaller and closer to home:
Who do we really depend on here?
Who might depend on us?
On most dairies, there’s at least one person whose cow sense you can’t imagine losing. They might be family. They might be a long‑term employee. They might be the worker who doesn’t speak much in meetings but notices every limp and every change in feed intake. Naming that out loud—and finding ways to show them they matter as a person, not just a set of hands—won’t change federal law. But it might change whether they feel alone when things get hard.
There’s also usually at least one neighbour, advisor, or friend you’d call on your worst day. If you can picture who that is, that relationship is worth investing in now, not someday.
Over supper or during a drive to pick up parts, it might be as simple as saying, “If we ever got hit with something like that New Mexico raid, you’d be one of the first people I’d call. I hope you know that.” And maybe adding, “If anything ever explodes on your place, I hope you’ll call us too.”
Sometimes the bravest thing isn’t staying strong. It’s admitting that if you lost half your crew overnight, you couldn’t do it alone.
Other small things matter more than they look like on a calendar:
Saying yes when the 4‑H leader wants to bring kids through the barn, because those kids might be your next crew—or your next neighbours.
Stopping by a meeting at the co‑op or county when you’re bone‑tired, because being there helps keep agriculture on the agenda.
Checking in on the people who carry the invisible load: the spouse who handles payroll and crisis calls, the teenager who suddenly became the extra hired hand, the worker who hasn’t left the farm in weeks.
And if Lovington has you thinking not just about barns but about the bigger picture, there’s one more step that matters. The same way you’d call a neighbour when the barn is in trouble, you can also let your local representatives know what raids like this look like from your yard. A simple, honest conversation—”Here’s who milks our cows, here’s what happens to our town when those people disappear overnight, and here’s why we need policies that keep both our herds and our communities stable”—isn’t about party lines. It’s about making sure the people writing the rules understand the human and economic reality they’re reaching into.
None of this fixes the whole system. But it does change the way it feels to live in it.
Community & Legacy: What We Build Before the Storm
Lovington is still living with what happened on that June morning. Outlook Dairy has been working to rebuild and get back to something resembling normal. Some legal and immigration cases tied to raids like that can drag on for years. Others end quickly with families separated and people gone before anyone’s ready.
The cameras left a long time ago. The day‑to‑day reality hasn’t.
For dairy people watching from a distance, the story lingers in a different way.
Every time someone mentions losing a chunk of their crew, those numbers in New Mexico—35 out of 55—come back to mind. Every time a producer talks about how much they rely on their immigrant workers, someone remembers Bos’s line: “It’s detrimental for our cattle. We’re barely able to keep going.” Every time a policy discussion treats enforcement like a clean, abstract lever, someone thinks of a parlor that went quiet for all the wrong reasons.
What happened in New Mexico didn’t create the bond between cows, workers, families, and neighbours. It revealed it—and showed how fragile that bond really is when something hits it hard.
The heart of this story isn’t that one farm had a terrible week and made the news. It’s that dairy communities everywhere are quietly being asked the same question Lovington had to face out loud:
When the barn feels empty, and the work looks impossible, will we let each other face it alone?
Most of us can’t choose if or when the next storm hits our lane. It might be enforcement. It might be a barn fire. It might be a health crisis, a brutal price year, or something nobody saw coming.
What we can choose—day in, day out, in a hundred small ways—is what kind of community we’re building long before the sirens ever show up.
The kind where it’s every farm for itself?
Or the kind where, when the worst happens, somebody already has their boots on, their truck running, and their mind made up—not because anyone called a meeting, but because that’s just what neighbours do here.
That decision doesn’t belong to policymakers, reporters, or anyone far away.
It belongs to us.
And if there’s one thing Outlook Dairy’s hardest week made hard to ignore, it’s that the time to make that decision isn’t when the lights are already flashing in the lane.
It’s now.
KEY TAKEAWAYS
One raid. One morning. Everything stopped. An ICE action at Outlook Dairy in New Mexico removed 35 of 55 workers—production halted, and everyone left was pulled into survival mode.
The math is brutal. Immigrant workers provide 51% of U.S. dairy labor and 79% of the milk. NMPF warns that losing them could close 7,000+ farms and nearly double retail prices.
Community didn’t ask permission. Neighbors, local teens, churches, and small businesses showed up with hands, rides, and quiet help—no politics, just presence.
This is your question now: If half your crew vanished tomorrow, who shows up before you call? And whose call would you answer?
Policy starts at your kitchen table. The people milking your cows have names, kids in local schools, and lives in your community. When you talk to representatives, remember that.
EXECUTIVE SUMMARY
When an ICE raid hit Outlook Dairy in Lovington, New Mexico, on a June morning in 2025, 35 of 55 workers were suddenly gone, milk production “had effectively ceased,” and everyone left—family, office staff, even local teens—was pulled into basic cow care just to keep the herd going. The article treats those 35 as people, not paperwork, tracing how their disappearance shook the barn and the wider town—schools, churches, grocery aisles, and small businesses that depend on dairy paycheques. It ties that one awful morning to the bigger reality that immigrant workers now provide roughly 51% of U.S. dairy labour and 79% of its milk, with NMPF modelling warning that losing them could close over 7,000 farms and nearly double retail milk prices. Against that backdrop, the heart of the story is the quiet, practical ways neighbours and community leaders show up—extra hands in the parlor, rides into town, support at church and school, and hard conversations in a Hobbs town hall—so one farm isn’t left to carry the crisis alone. It ends back at the kitchen table, asking every producer to name who they’d call if half their crew vanished, who might call them, and what to ask local representatives so the people who actually milk the cows—and the communities built around them—aren’t invisible when the next raid comes.
Complete references and supporting documentation are available upon request by contacting the editorial team at editor@thebullvine.com.
The 51-79 Workforce Bomb: How ICE Raids Became Dairy’s Consolidation Tool – This piece deepens our understanding of the industry forces that turned a quiet morning in Lovington into a national warning. It proves the point that the 51-79 math is the precarious foundation our entire world is built upon.
Robotic Milking Revolution: Why Modern Dairy Farms Are Choosing Automation in 2025 – Looking toward what happens next, this story follows the next generation as they carry forward family legacies. It examines how automation helps younger farmers walk a path that protects their herds from the instability that stopped Outlook Dairy cold.
The Sunday Read Dairy Professionals Don’t Skip.
Every week, thousands of producers, breeders, and industry insiders open Bullvine Weekly for genetics insights, market shifts, and profit strategies they won’t find anywhere else. One email. Five minutes. Smarter decisions all week.
Cheap feed won’t save you. At $19 milk, a 300-cow dairy loses $100K in 2026—even with record corn.
Executive Summary: Cheap feed won’t save you in 2026—and the math proves it. USDA’s January reports confirmed record corn production at 17.021 billion bushels, dropping DMC feed costs to $9–$10/cwt, the lowest since October 2020. But here’s the problem: all-milk prices are forecast to fall from $21.05 to $19.25/cwt, a decline that outpaces feed savings by more than a dollar per hundredweight. For a typical 300-cow dairy, that translates to roughly $90,000–$100,000 less operating margin in 2026 than in 2025. ERS cost data shows the squeeze hits hardest in the middle—herds under 50 cows face $42.70/cwt in total costs, while 2,000+ cow operations run $16–$19/cwt, leaving mid-size dairies caught in between. This is a sorting year: invest in proven efficiency improvements, adjust your business model, or plan an exit while cows and equity are still in good shape.
You’ve probably heard the good news by now: corn is cheap, soybeans are plentiful, and your feed bill should finally give you some breathing room in 2026. And honestly? That part’s true.
But here’s what’s been nagging at me—and what I think deserves a real kitchen-table conversation. When you actually run the numbers, cheaper feed doesn’t automatically mean a better year. For a lot of herds, 2026 could mean tighter margins than 2025, not wider ones. The math surprised me when I first worked through it, and I think it’s worth walking through together.
Let me show you what I mean.
The January Numbers That Changed the Conversation
USDA’s January 2026 reports confirmed what the trade had been whispering about: 2025 U.S. corn production hit a record 17.021 billion bushels on a national yield of 186.5 bushels per acre. Brownfield Ag News and Farm Progress both noted these figures came in above nearly all pre-report estimates, which explains why March corn futures dropped more than 20 cents on release day, sliding into the low $4.20s.
Ending stocks jumped to 2.227 billion bushels, up from 2.029 billion just a month earlier. That’s the most comfortable corn supply we’ve had in years. Soybeans tell a similar story: 4.262 billion bushels at a record 53 bushels per acre, with ending stocks around 350 million bushels.
What this means for your feed bunk is straightforward. Dairy Herd reported that DMC feed costs dropped to $9.38 per hundredweight in August 2025—the lowest since October 2020—and DairyReporter’s November analysis showed feed costs expected to stay in that 9–10 dollar band into 2026.
So yes, the feed side genuinely is better. If you’re in a grain-deficit region, this is a different world than the $5-plus corn of recent years.
But here’s where it gets complicated.
The Milk Price Reality
USDA’s current outlook, as reported by DairyReporter and confirmed by Southeast Ag Net, has the U.S. all-milk price averaging about $21.05 per hundredweight in 2025—then dropping to around $19.25 in 2026.
That’s roughly a $1.80 decline in your milk check. And when feed costs only drop by maybe 35–50 cents per hundredweight, the math doesn’t work in your favor.
Analysis published in October 2025 put it bluntly: “Milk Margins Likely to Fall Along with Feed Prices.” CoBank’s dairy analysts commented in early January that dairy markets turned downward in late 2025, and the Class IV futures don’t look encouraging. DairyReporter drew on CoBank’s outlook to note that profit margins for U.S. dairy farmers are expected to tighten in 2026 as rising milk production continues to pressure prices.
This is where herd size and cost structure really start to matter.
The Cost Curve You Need to See
Here’s where the conversation gets real. USDA’s Economic Research Service has been tracking production costs by herd size, and the pattern is stark. Let me lay it out in a way that makes the 2026 implications clear:
Herd Size
Total Economic Cost ($/cwt)
2026 Margin at $19.25 Milk
Risk Level
<50 cows
$42.70
–$23.45 (severe deficit)
🔴 Critical
50–99 cows
$33.54
–$14.29 (large deficit)
🔴 Critical
100–499 cows
$19–$21
$0 to –$1.75 (breakeven/tight)
🔴 High
500–999 cows
$17–$19
$0.25–$2.25 (slim)
🟡 Moderate
2,000+ cows
$16–$19
$0.25–$3.25 (variable)
🟡 Moderate
Sources: ERS 2021 ARMS data; ERS 2016 “Consolidation in U.S. Dairy Farming”; Dairy Global February 2025. Note: Costs vary significantly by management quality within each size class—Hoard’s Dairyman has documented low-cost producers in smaller categories matching high-cost producers in larger categories.
The numbers are sobering. ERS economist Jeffrey Gillespie reported that in 2021, the average total production cost was $42.70 per hundredweight for herds with fewer than 50 cows, versus $19.14 for herds with 2,000 or more. Dairy Herd’s summary of ERS consolidation data showed herds under 50 cows at $33.54 per hundredweight compared to $17.54 for 2,500-cow operations in 2016. Dairy Global’s February 2025 feature showed operating costs of $18.44 for small herds compared to $16.16 for the largest operations.
What’s worth noting here is that there’s huge variation within each size class. Low-cost producers running 100–199 cow herds can have total production costs around $19.76 per hundredweight, which puts them right alongside high-cost producers running 2,000-plus cows at $19.63. Management matters as much as scale.
But that table tells you something important: at $19.25 all-milk, a lot of herds in that 100–499 cow range are looking at breakeven or worse, even with cheap feed. And smaller herds? The math is brutal unless you’re among the best managers in your size class.
A 300-Cow Reality Check
Let’s make this concrete with a scenario that probably feels familiar.
Picture a 300-cow Holstein dairy in Wisconsin, Michigan, or Pennsylvania. Freestall housing, parlor milking, solid fresh cow management, respectable butterfat levels. Annual production around 23,000 pounds per cow—that’s 6.9 million pounds of milk per year, or 69,000 hundredweights.
Based on ERS benchmarks and university cost-of-production data, a well-managed herd in this size range typically runs total economic costs in the upper teens to low twenties per hundredweight—call it $19 to $21 when you include all labor, capital, and overhead.
Now do the math:
2025: At $21.05 all-milk, that’s roughly $1–$2/cwt operating margin for well-managed herds
2026: At $19.25 all-milk with maybe 40 cents in feed savings, you’re looking at about $1.30–$1.50/cwt lessmargin than 2025
On 69,000 hundredweights, that translates to $90,000 to $100,000 less operating margin in 2026 than in 2025—even with cheaper feed.
You might still be in the black. But you’re definitely a lot closer to the line.
Why USDA’s Big Corn Number Felt Off on the Ground
It’s worth noting that this record corn number felt like a gut punch to many people actually raising the crop.
Interviews with farmers right after the January WASDE. North-central Kansas producer Shale Porter described the report as “kind of a gut punch,” saying the larger-than-expected production and increased ending stocks created a fresh blow to an already fragile marketing environment.
What I’ve noticed over the years is that this disconnect often traces back to structure and technology. The largest crop farms are much more likely to use GPS guidance, yield monitors, and variable-rate fertilization. When USDA aggregates data to calculate a national average yield, that average gets pulled up by highly managed, highly instrumented acres—even in years when smaller or less-equipped farms are just “average” or worse.
On the dairy side, you see a similar pattern in production costs. The national averages don’t always reflect what’s happening on your specific operation.
Regional Realities: Same Numbers, Different Stories
The same USDA and ERS numbers play out very differently depending on where your milk truck pulls in. Here’s the quick read on each region:
Upper Midwest (Wisconsin, Michigan, Minnesota)
Sweet spot: 200–400 cow herds with strong forage programs
The X-factor: Home-grown forage quality can make or break competitiveness
Many operations blend grazing with TMR for cost control without sacrificing precision
University of Wisconsin data shows well-managed mid-size herds can compete with larger neighbors on cost
Northeast (Pennsylvania, New York, New England)
Higher land costs and labor, but proximity to dense consumer markets
Growing success with direct-to-consumer: farmstead cheese, on-farm bottling, farm stores
Class III/IV prices matter less when retail margins drive revenue
Penn State and Cornell have documented resilient small/mid-size models
West and Southwest (California, Idaho, Texas, New Mexico)
Dominated by 1,000–5,000 cow dry lot and large freestall operations
Lowest per-unit costs, highest milk per cow
Key vulnerability: Heavy exposure to export markets and Class IV volatility
Water and environmental scrutiny are intensifying
CoBank noted butterfat oversupply hitting some processors hard
Extension research consistently shows robust cooling improves intake, production, reproduction, and butterfat
Herds without adequate fans, soakers, and shade see summer production crash
Heat stress losses can quickly eat up lower feed costs
Canada
Quota changes pricing structure, but not cost fundamentals
Larger freestall dairies with automation have lower unit costs than smaller tie-stall herds
Canadian Cattlemen coverage shows technology adoption driving cost differences similar to U.S. patterns
The takeaway: national averages set the stage, but your 2026 story depends on your region, your barn, your debt, and your marketing options.
Where Farms Are Actually Moving the Needle
Looking at this trend, farmers are gravitating toward four broad response paths—often combining a couple of them.
1. Tightening the Fundamentals That Still Pay Back Fast
A lot of herds are going back to basics: Where’s the relatively easy money still on the table?
Feed efficiency: Extension nutritionists discuss feed efficiency benchmarks that vary by lactation stage and measurement method, with top-performing herds consistently outperforming average operations. At 9–10 dollars per feed cost, even modest improvements can be worth meaningful dollars per cow annually. The tools are management, not marble: consistent TMR mixing, solid feed-push habits, minimizing sort.
Reproduction and transition: University economic modeling regularly puts a significant per-cow annual value on better pregnancy rates and fewer transition disorders—once you count extra milk, fewer days open, fewer culls, and lower treatment costs. Getting days open into the 120s instead of the 150s shows up quickly in milk shipped per stall.
Mastitis economics: Research consistently shows significant avoidable cost. A 2024 Wageningen University study put typical clinical mastitis costs at $224–$275 per case, while Michigan State work by Dr. Pam Ruegg found costs ranging from about $120 to $330 per cow per case, depending on severity and farm. Hoard’s Dairyman reported similar findings, noting costs of $120 to $350, with an average of around $192. Dropping SCC into the 150–200,000 range protects premiums and usually correlates with steadier production and better butterfat.
What I’ve noticed: lower grain prices give you breathing room to work on these fundamentals without panicking about every extra half-pound of dry matter.
2. Picking a Different Lane: Grazing, Organic, and Specialty
Another group—especially 60–250 cow herds—is asking whether they really want to keep running a pure commodity race.
Intensive rotational grazing: Cost-of-production work on grass-based dairies shows that well-managed systems can cut total cost per hundredweight by several dollars compared with comparable confinement herds. Milk per cow runs lower (18,000–22,000 pounds), but when debt is manageable and the grain bill is small, net returns can stack up well.
Organic and premium programs: ERS research shows organic operations have substantially higher production costs—sometimes 50 percent more—but receive much higher farm-gate prices when markets are balanced. Some farms layer on grass-fed, A2A2, or animal-welfare certifications for specific branded programs.
On-farm processing: University case studies document how small- and mid-size dairies are building resilient businesses on retail margins and consumer loyalty rather than Federal Order checks.
These paths trade commodity risk for marketing and logistics challenges. But for some families, they’re more realistic than trying to quadruple herd size.
3. Teaming Up Instead of Going It Alone
In areas with clusters of mid-size dairies, there’s more serious talk about partnerships.
Dairy Herd’s coverage has highlighted examples of two or three neighboring families forming joint ventures, combining herds, and investing together in more efficient facilities. Think: two 250-cow herds consolidating into one 500-cow freestall with a modern parlor and specialized labor roles.
Common benefits lenders and advisers see:
Lower labor hours per cow through specialization
Better delivered feed costs buying in semi loads
Lower fixed costs per hundredweight across shared infrastructure
Partnerships require trust and clear agreements, but for the “too big to be small, too small to be big” crowd, they’re worth considering.
Response Strategy
Best For
Key Actions
2026 Margin Outlook
Risk
INVEST
Well-capitalized, solid-footed herds in viable size range (150–500 cows)
Margin improves 2027+ as efficiency gains compound; 2026 tight but survivable
Debt service if markets weaken further
ADJUST
Herds with land, family labor, and willingness to change model (80–250 cows)
Shift to grazing, organic, direct-to-consumer, on-farm processing, dairy partnerships
Higher per-cwt return on lower volume; less commodity-market exposure
Marketing complexity; buyer education required
EXIT
Producers within 5–10 years of retirement; tired operators; no clear succession
Plan dispersal while cows/equipment in good condition; family succession or sale-to-neighbor negotiation
Preserve equity; exit on your terms while margins still exist
Emotional; requires discipline not to wait for “better year”
4. Treating 2026 as a Planning Year
For producers within five to ten years of retirement without a clear successor, this discussion hits differently.
Reports suggest many dairy exits in the next decade will be driven by cost position, age, and family goals more than any single bad year. Advisers stress that planned transitions—family succession, sale to a neighbor, well-timed dispersals—preserve more equity than waiting until tough years force rushed decisions.
Auction data indicate that well-organized dispersal sales, held while cows are in good condition and equipment is maintained, regularly outperform “end-of-the-rope” liquidations.
2026 might be the right year to ask blunt questions: What does cash flow look like at $19 milk and $10 feed for another full cycle? And if you’d rather be out in two to five years, what does exiting on your terms look like while you still have margin?
Don’t Lose Sight of Components
With all the feed talk, it’s easy to forget that butterfat and protein still drive a big chunk of your milk check.
Component pricing work shows that butterfat increases can add meaningful revenue—often comparable to or greater than what you’d gain from modest corn price movements on the same volume of milk.
Here’s what’s interesting, though. CoBank’s 2026 outlook noted that butterfat has actually moved to an oversupply situation. Their Knowledge Exchange report from December put it plainly: dairy processors are awash with butterfat, and some have even capped butterfat payment levels on farmgate milk in response. In October, Corey Geiger with CoBank said spot butter markets had dropped almost seventy cents since August 1st due to excess supply.
That underscores why protein may be where the action shifts—and why watching your components still matters even as the market dynamics change.
Fresh cow management sits at the center of component performance. Extension materials consistently show that smooth transitions lead to higher peaks, fewer health problems, better fertility, and stronger components.
The question worth asking: Is there a change in fresh cow management, cow comfort, or milking routine that will pay more in milk and components than you’d ever save squeezing a few more cents from corn?
For a lot of herds, that’s where the biggest upside is hiding.
Your 2026 Checklist
1. Run a realistic 2026 budget. Use $19.25 all-milk and 9–10 dollar feed costs. Know your actual cost per hundredweight with full labor and overhead. If you’re well north of the upper teens, something has to change.
2. Benchmark where you really stand. Compare your cost, feed efficiency, reproduction, mastitis rates, and butterfat against ERS benchmarks and regional top-quartile data. Remember what Hoard’s documented: low-cost producers in smaller herds can match the costs of high-cost, large operations. Identify the two or three levers that would move your margin most.
3. Decide: Invest, Adjust, or Exit.
Invest in proven improvements—fresh cow facilities, cooling, feed systems
Adjust your model—grazing, organic, processing, partnership
Plan an exit that protects equity while cows and equipment are still solid
The Bottom Line
2026 doesn’t look like a disaster year, and it doesn’t look like a home-run year. It looks like a sorting year—where clarity and decisions matter most.
Feed is finally in your favor. But milk prices are expected to be below 2025 levels, and most serious margin analyses suggest spreads will tighten for many herds.
The herds that make it through stretches like this aren’t always the biggest. They’re the ones who know their numbers, think beyond the next milk check, and make intentional choices before the market does.
The math this year is universal. What you decide to do with it is personal—written at your own kitchen table, with your own records, and the people you trust sitting there with you.
Key Takeaways
Cheap feed won’t save you: Record corn pushed DMC feed costs to $9–$10/cwt, but milk prices are dropping faster—net margin tightens, not loosens
$100K on the line: A typical 300-cow dairy loses roughly $90,000–$100,000 in operating margin in 2026 compared to 2025
The scale gap is brutal: Small herds face $42.70/cwt total costs vs. $16–$19/cwt for large operations—mid-size dairies are caught in between
This is a sorting year: Invest in efficiency, adjust your model, or plan your exit—there’s no standing still in 2026
Complete references and supporting documentation are available upon request by contacting the editorial team at editor@thebullvine.com.
Learn More
Squeezed Out? A 12-Month Decision Guide for 300-1,000 Cow Dairies – Reveals the precise ROI calculations for robotic transitions and heifer procurement that define survival for mid-size operations. This guide arms you with a month-by-month tactical roadmap to protect equity while navigating the current 30-month replacement deficit.
Every week, thousands of producers, breeders, and industry insiders open Bullvine Weekly for genetics insights, market shifts, and profit strategies they won’t find anywhere else. One email. Five minutes. Smarter decisions all week.
The dairy industry’s toughness culture kept farms alive for generations. Now it’s quietly costing them six figures a year.
EXECUTIVE SUMMARY: If 60% of milking robots were glitching, you’d have dealers on farm by Tuesday. When 60% of farmers are burning out, we shrug and call it “part of the job.” But the research says otherwise: University of Guelph data shows 34% of farmers meet criteria for depression and 76% report moderate to high stress—and it’s showing up in bulk tanks, lameness scores, and breeding records. Canadian mastitis modeling puts subclinical cases alone at $34,344 per 100 cows annually, losses driven by the exact tasks that slip when mental bandwidth runs low: CMT testing, fresh cow checks, structured repro reviews. Farms that deliberately protect headspace are seeing results—ELBI Dairy in Manitoba cut SCC by 52% after rebuilding with robots and tighter routines. What works isn’t telling farmers to “just get help”; it’s written plans, peer groups that talk numbers and stress, and coaching designed around calving schedules. The brain making your herd decisions is equipment, too—and right now, on many operations, it’s running without a maintenance plan.
If 60% of our milking robots were glitching, you know exactly what would happen. There’d be emergency calls to the dealer, reps on the farm, and probably industry meetings asking what went wrong. When a similar share of farmers themselves are running mentally on “low‑battery,” we tend to shrug and call it “just part of the job.”
What’s interesting here is that newer research is showing this isn’t just a human‑interest story. It’s a herd‑health and profitability story. And it’s showing up in somatic cell counts, fresh cow management, reproduction, and culling decisions in ways a lot of us never fully connect back to the person in the parlor or in front of the robot screen.
Let’s walk through what the data actually says—and what it means for SCC, butterfat performance, and your bottom line in today’s cost structure.
Looking at This Mental Health Trend in Dairy
Looking at this trend over the last decade, one thing is clear: people have finally begun measuring farmer stress seriously.
In Canada, Dr. Andria Jones‑Bitton, DVM, PhD, an epidemiologist at the University of Guelph, led a national online survey of 1,132 farmers between 2015 and 2016 using validated scales for stress, anxiety, depression, and resilience. The results were stark:
About 34% of farmers met the criteria for depression.
Roughly 57% and 33% met criteria for possible and probable anxiety, respectively.
Farmers scored significantly worse than normative Canadian population values across stress, anxiety, depression, and resilience, confirming what many of us have felt anecdotally for years.
Later, the same research team examined farm families, including both parents and adolescents. Follow‑up work on farm families and youth in agriculture reported that around 60% of adults and teens in farm households were experiencing at least mild symptoms of depression, raising concern that stress is impacting the whole family, not just the primary operator.
Then COVID hit. A national follow‑up survey of Canadian farmers conducted in 2021 and published in 2022 found that 76% of farmers reported moderate to high perceived stress, and suicidal ideation was about twice as common as in the general Canadian population.
University of Guelph summarized that work by noting that roughly one in four farmers had experienced suicidal thoughts in the previous 12 months.
And it’s not just a Canadian story. A 2022 HillNotes analysis and coverage in Hoard’s Dairyman highlight that farmers in several U.S. regions are also at greater risk of mental‑health challenges and suicide than many other occupations, with financial stress and fear of losing the farm topping their list of stressors. In Pennsylvania and across the Upper Midwest, extension and farm bureau surveys have flagged similar patterns. Recent European research has found comparable trends, with farmers scoring higher on stress and burnout measures than general working populations.
What I’ve noticed, and what the qualitative work confirms, is a consistent pattern in how farmers talk about this. In interviews with Ontario producers, Jones‑Bitton’s team heard farmers say things like “farmers aren’t into the emotions and things” and describe mental‑health struggles as “just part of farming,” while still labelling their own mental health as “good” or “fine” even when they screened as depressed or anxious.
That toughness has kept a lot of farms alive through years that would have sunk other businesses. But this development suggests that early warning signs are often normalized rather than treated as something that deserves a plan, just like any other high‑risk area of the operation.
What Depression Really Changes in Day‑to‑Day Dairy Management
So what’s actually going on in the brain when chronic stress or depression sets in?
Modern psychology research shows that depression changes how people evaluate mental effort: planning, concentrating, and making decisions feel more costly, even when your body is still capable of hard physical work. Farmers in Canadian and international studies describe low energy, difficulty focusing, trouble making decisions, and feeling “foggy” or “overloaded.”
On a dairy, you can see that pattern pretty clearly.
You can still:
Milk two or three times a day.
Push feed, scrape alleys, and keep the dry lot reasonably in shape.
Fix the broken gate or that leaky waterer in the holding area.
But the “thinking jobs” start to slide:
“I’ll pull those SCC reports tomorrow.”
“I should CMT those fresh cows, but I’ll get to it later this week.”
“I’ll sit down with the breeding and culling records when things slow down.”
Task Category
What Still Happens (Physical/Routine)
What Quietly Slips (Cognitive/Planning)
Milking & Feeding
Milk 2-3x daily, push feed, scrape alleys
Structured SCC trend analysis, CMT testing on fresh cows
Facilities
Fix broken gates, leaky waterers
Lameness scoring on schedule, body condition scoring
Reproduction
AI techs still show up
Heat detection without activity monitors, structured repro reviews
What’s interesting is that we now have herd‑level data to back up what many of us have seen. An exploratory study on Ontario dairy farms using robotic milking systems measured farmers’ mental health using validated scales and then linked those scores with cow health and welfare indicators.
The researchers found that:
Higher farmer stress scores were associated with a higher prevalence of severe lameness.
Anxiety and depression scores were higher among farmers who worked mostly alone, fed manually, or had lower milk protein percentages.
Resilience scores were higher on farms using automated feeding systems, suggesting potential benefits in terms of mental bandwidth and consistency.
Dairy Global summarized the work, stating that farmer and cow well-being are clearly connected, and that automation and better support can reduce stress and improve both lameness and overall performance.
On farm, as many of us have seen across Ontario free‑stalls, Wisconsin parlors, Quebec tie‑stalls, and Western dry lot systems, the same vulnerable tasks tend to pop up:
Subclinical mastitis detection: routine CMT testing on fresh cows, tracking SCC trends, and acting on borderline cows.
Heat detection and recording, especially in non‑robot herds without activity monitors.
Fresh cow management in the transition period: spotting subclinical ketosis, watching intakes and rumination, and checking cows that are just “off.”
Lameness and body condition scoring are done on a schedule, not just when a cow is obviously sore.
Structured repro and cull reviews with numbers on the table instead of relying only on gut feel.
Those jobs are exactly where the money is quietly made—or quietly lost.
The Math of Mental Load: Where the Money Disappears
Farmers tend to ask, “What’s this really worth?” So let’s talk big math using actual research and common economic assumptions for today’s input and replacement costs.
A Canadian team led by Dr. Ebrahim Aghamohammadi modeled herd‑level mastitis‑associated costs on Canadian dairy farms using detailed production and health data combined with economic modeling. They estimated that:
Median total mastitis cost was 662 CAD per milking cow per year.
About 48% of mastitis costs were due to subclinical mastitis (SCM)—cases that often only show up on SCC reports or CMT testing.
In their model, SCM cost around 34,344 CAD per 100 cow‑years, compared with about 13,487 CAD per 100 cow‑years for clinical mastitis.
They also showed that milk yield reduction was the largest single cost component, especially in subclinical cases. Most of the cost is in lost production, not just treatment and discarded milk.
Now, stack reproduction on top. Many dairy economists and extension bulletins peg the cost of an extra day open at several dollars per cow per day, once you factor in delayed calving, reduced lifetime milk production, and higher culling risk. Depending on milk price and stage of lactation, missing a heat on one cow can easily represent tens of dollars per 21‑day cycle, especially when it repeats or involves multiple cows.
Subclinical ketosis is another slow drain. Transition‑cow economic work commonly estimates the cost of each subclinical ketosis case at around the low hundreds of dollars, once early‑lactation milk loss, a higher risk of displaced abomasum and metritis, and poorer fertility are included.
Then there’s premature culling. With 2024–2025 feed, labor, and construction costs where they are, it’s increasingly common to see full replacement heifer rearing costs in the 3,000–4,000 dollar range per heifer by first calving, depending on region and system. Every cow that leaves the herd early because her issues weren’t caught and resolved is a partial or complete write‑off of that investment.
So on a 100‑cow herd, even at conservative assumptions for:
Subclinical mastitis losses (~34,000 CAD per year),
Extra days open from missed heats,
A handful of subclinical ketosis cases, and
A few premature culls,
It’s realistic to expect preventable losses in the neighbourhood of 100,000 CAD per year due to the inconsistent execution of these management tasks.
That’s not a single study’s number; it’s a composite built from peer‑reviewed mastitis data, typical reproduction and transition‑disease economics, and current replacement values.
What I’ve noticed on real farms is that the tasks that control those costs—structured SCC work, tight fresh cow management, disciplined repro and culling reviews—are exactly the jobs that require the most sustained mental effortfrom the key decision‑maker.
That’s where mental overload stops being a personal issue and becomes a line item.
What Happens When You Free Up Headspace: A Manitoba Example
It’s one thing to lay out models and surveys. It hits differently when you watch a real farm go through the change.
ELBI Dairy in La Broquerie, Manitoba, is a family‑run operation milking roughly 900 cows, and they’ve become a bit of a case study in how automation and mental bandwidth can interact. After a barn fire, the de Jong family rebuilt with robotic milking systems and a barn designed for labor efficiency and cow comfort. Their journey has been featured in the Lely case material.
Performance Metric
Before Robots (Conventional)
After Robots + Optimized Routines
Change
Bulk Tank SCC
183,000 cells/mL
88,000 cells/mL
-52%
Milk Yield per Cow per Day
~32 L/day (~70 lb/day)
~40 L/day (~87 lb/day)
+25%
Hoof Health & Lameness
Conventional levels (moderate issues)
Substantially improved, lower hoof costs
Major improvement
Farmer Mental Bandwidth
High stress, long hours, physically demanding
More time for data review, fresh cow management, strategic decisions
Freed up
Before robots, ELBI was milking conventionally and reported:
Bulk tank SCC around 183,000 cells/mL.
After they transitioned to robots and settled into the new routines:
SCC dropped to around 88,000 cells/mL—about a 52% reduction.
Milk yield increased by around 7–8 litres per cow per day (roughly 15–17 lb/cow/day).
They saw large improvements in hoof health and substantially reduced hoof‑related costs once they optimized manure handling, cow flow, and stall use.
In interviews, the de Jongs don’t talk like robots magically cured their mastitis and lameness. They talk about improved cow flow, more consistent routines, and the ability to devote more attention to fresh cow management, preventive care, and data‑driven decision‑making because the daily milking grind was less physically and mentally draining.
That fits almost exactly with the Ontario robotic‑milking research: lower stress and higher resilience on farms with more automation and support, and better lameness and welfare outcomes when farmers are in a better mental place.
Now, full automation isn’t going to pencil out for every farm. A 70‑cow tie‑stall in Quebec, a 300‑cow sand‑bedded freestall in Wisconsin, and a 1,500‑cow dry lot in California are all playing different capital and labor games.
But I’ve seen similar patterns when farms:
Hire or grow a herdsman/assistant manager role.
Lean into herd management software and actually use the reports.
Reorganize chores so the primary decision‑maker isn’t also doing every repetitive task.
The theme is the same: when you deliberately free up mental bandwidth for the people steering the ship, the herd typically responds, and so does the milk cheque.
Why “Just Get Help” Doesn’t Really Move the Needle
With numbers like these, it’s fair to ask: if the stakes are this high, why don’t more farmers just reach out and say, “I need help”?
A Texas‑based study tackled that question. Researchers surveyed 429 agricultural producers and looked at factors that influenced whether they said they’d seek help for mental‑health concerns. One of the strongest predictors was self‑stigma—the belief that needing help means you’re weak or a failure.
Producers with higher self‑stigma were significantly less likely to say they’d seek help, even when their symptom scores were high.
Qualitative work with Canadian farmers turned up similar themes. In interviews, farmers talked about not wanting to be seen as weak, about feeling they “should be able to handle it,” and about worrying what neighbours or lenders might think if they sought professional help.
Hoard’s Dairyman reported that in one survey, nearly 70% of farmers said mental health was very important to them, but still preferred to talk first to family, friends, vets, or agribusiness professionals rather than to therapists or doctors.
That’s a big clue. It suggests that simply telling farmers “you should prioritize your mental health” doesn’t land because it clashes with identity and habit.
From an economic standpoint, that reluctance becomes a risk factor. When self‑stigma stops people from using tools that would protect their cognitive capacity, it’s not just their mood that takes a hit—it’s mastitis control, transition performance, reproduction, and culling decisions that suffer along with it.
So if “just get help” doesn’t fit how many farmers see themselves, what does?
What Farmers Are Finding Actually Works
What farmers are finding, across different regions and systems, is that the approaches that gain traction don’t start with mental‑health labels. They start with better management, reduced risk, and clearer plans—and mental‑health improvements show up as part of that package.
Intervention Type
Specific Tool/Approach
Research-Backed Outcome
Implementation Barrier
Business Planning
Written business plan, reviewed quarterly
88% report reduced stress & peace of mind (Farm Management Canada)
Only 21% currently use one
Peer Support
Dairy discussion groups (benchmarking + candid talk)
Farm Management Canada’s “Exploring the Connection between Mental Health and Farm Business Management” project looked squarely at how business practices and mental health interact. One key finding:
Only about 21% of farmers reported regularly using a written business plan.
Among those, 88% said the plan contributed to peace of mind and reduced stress.
Canadian Cattlemen’s summary of that work highlighted that farmers with business plans were more likely to review financial statements regularly, work with advisory teams, and take at least some time away from the farm.
The data suggests that planning doesn’t magically eliminate stress, but it reduces background chaos, freeing up mental energy for fresh cow checks, repro and culling decisions, and watching component performance rather than just reacting to emergencies.
On mid‑size Ontario and Prairie farms I’ve talked with, I often hear: “I still worry. But I’m not worrying in the dark anymore.”
2. Peer Groups That Talk Numbers—and What’s Behind the Numbers
In Ireland, dairy discussion groups are a backbone of extension. Studies of those groups found that around 96% of them discuss occupational safety and health, and about 89% have participants share personal accident or illness experiences.
The official agenda is grazing, breeding, milk contracts, and policy. The reality is that they also become spaces where someone says, “Last spring nearly finished me,” and people around the table understand exactly what that means economically and emotionally.
In the U.S. Midwest and across Canadian provinces, dairy benchmarking and discussion groups run by extension, co‑ops, and private consultants play a similar role. Farmers come to compare SCC, butterfat, days in milk, pregnancy rate, and transition metrics.
Over time, those meetings often become places where it’s acceptable to talk about both performance and pressure.
These groups don’t require anyone to say, “I’m here for mental‑health support.” They simply normalize honest conversation about what it takes to keep a herd and a family going.
3. Coaching Designed Around Real Farm Schedules
A randomized controlled trial in Germany tested telephone‑based coaching for farmers and foresters. Over six months, the group receiving structured coaching calls—focused on coping strategies, problem‑solving, and planning—saw significantly larger reductions in depression and stress scores compared with the control group.
The format is tailor‑made for agriculture:
Calls happen by phone.
Sessions are scheduled around farm work.
The service is framed as coaching rather than traditional therapy.
An evidence‑based guide for delivering mental‑healthcare services in farming communities, published in 2024, emphasized that flexible, phone‑ or online‑based services that respect farm schedules and culture are more likely to succeed than clinic‑only models.
We’re starting to see that in practice in places like Canada, where agricultural organizations and the Canadian Centre for Agricultural Wellbeing are rolling out farm‑specific support lines and coaching‑style services.
4. Financial Literacy as a Pressure Relief Valve
At the University of Georgia, extension staff surveyed 310 farmers about which financial education topics would most help reduce their stress. The top priorities weren’t exotic hedging strategies; they were very practical:
Understanding disaster assistance programs.
Knowing what government financial support options exist and how to access them.
Social worker and agricultural educator Dr. Anna Scheyett, who has been a key voice in this work, has argued that solid financial literacy and access to trustworthy information are themselves mental‑health tools for farmers.
They don’t fix milk price or weather—2024–2025 is still volatile on both fronts—but they keep producers from feeling trapped or blindsided.
Who’s Actually in the Best Position to Start the Conversation?
These kinds of changes don’t just appear out of thin air on a farm. Someone has to open the door. And as many of us have seen, it makes a huge difference who that person is.
The Front Line: Vets and Nutritionists
Your veterinarian and your nutritionist probably know more about your cows and your numbers than anyone outside the family. They also see you regularly.
A Canadian review on mental‑health supports for farmers noted that vets and other ag professionals are often the first to notice when a farmer is struggling, and that equipping them with basic knowledge and referral pathways is a practical way to get help started.
Some vet practices and feed companies are now giving their teams simple tools and phrases, like:
“We’ve built a good plan to get this mastitis flare‑up under control. How are you doing with everything else on your plate right now?”
“Between herd health, markets, and family, you’re carrying a lot. Would it help if we brought your accountant or lender into this conversation so we can put a full plan on paper?”
Because that comes from someone you already trust with your herd’s health and ration, it often opens the door more effectively than a generic “take care of yourself” message.
Spouses and Family
On family farms, spouses, parents, and older kids often see the changes first—late‑night screen time, staying in the barn longer than usual, snapping over little things.
Research on farmer burnout and stress highlights spousal and family support as one of the strongest protective factors. The conversations that work best usually start from what’s been noticed:
“I’ve noticed you’re really quiet lately.”
“You’re up late every night looking at the books, and I’m worried about how much you’re carrying.”
That’s not a weakness. That’s good family‑level management of a high‑risk business.
Lenders and Advisors
In both Canada and the U.S., some ag lenders and advisory firms have taken training on farm stress and mental‑health awareness. It makes sense: they’re in the room when some of the hardest decisions get made—refinancing, expansion, downsizing, or succession.
A good lender or advisor can say, “We’ve seen other farms face this kind of squeeze. There are financial tools we can look at. And if the stress side of this is starting to get heavy, there are people we can connect you with who understand agriculture.”
Given the evidence that chronic stress undermines decision quality and increases risk, that’s not overstepping. It’s risk management for both the farm and the lender.
Building a “Transition Protocol” for Farmers, Not Just Cows
Most of us already treat the transition period for cows as a high‑risk window that deserves its own protocol: close‑up and fresh cow rations, stocking density targets, bedding management, and daily fresh cow checks.
It’s worth asking: what’s the equivalent for the people?
In northern regions like Ontario, the Prairies, and the Upper Midwest, farmer “transition risk” often runs from late fall through winter:
Short days and limited sunlight.
Long stretches inside barns and shops.
Cold stress on cows and humans.
Year‑end bills, tax planning, and sometimes weaker milk prices.
On pasture‑based, spring‑calving herds in places like Ireland or New Zealand, the crunch might be calving plus breeding. In large Western dry lot systems, it can be summer heat and water uncertainty. Every region has its own hot zone.
What I’ve noticed is that more operations are starting to deliberately build farmer‑focused steps into their seasonal management plan, right alongside herd protocols:
Light and sleep routines: In higher‑latitude regions, using a 10,000‑lux light box at breakfast for 20–30 minutes, combined with making a point of getting outside in real daylight, aligns with clinical guidance for seasonal mood support. Canadian farmer research has found that coping strategies, including getting outside and staying physically active, are commonly used and can help manage stress.
Written winter game plan: Sitting down in October or November with your accountant, nutritionist, or business advisor to map out winter cash flow, feed inventory, and “if this, then that” scenarios helps turn vague dread into specific, manageable decisions.
One trusted peer: Picking one other producer—a neighbour, co‑op contact, or discussion‑group colleague—and agreeing to a weekly check‑in with one win, one frustration, and one thing you’re watching. It doesn’t take long, but it keeps isolation from sneaking up on you.
Pre‑booked off‑farm touchpoints: Registering ahead for winter workshops, show‑season meetings, or benchmarking sessions makes it more likely you’ll actually get off the farm at least occasionally. Surveys and commentary from extension and industry consistently show that farmers who engage in these events feel more supported and more confident in their decisions.
Checklist‑style management tasks: Turning “stay on top of herd health” into specific, visible tasks—”Monday: CMT fresh cows; Wednesday: lameness score high group; Friday: review repro and cull list”—and putting them on a whiteboard or in your phone takes some load off your memory on the rough days.
None of this requires anyone to say, “I’m depressed.” It just treats your attention and decision‑making capacity as another critical resource, right alongside cow comfort, forage quality, and parlor performance.
Where Farmers Can Turn: Practical Resources
Looking at this trend, one encouraging development is the growth of farm‑specific support programs that understand both the business and the culture.
In Canada, the Canadian Centre for Agricultural Wellbeing has been involved in launching the National Farmer Wellness Network, a crisis‑line‑style resource that connects farmers with trained agricultural responders. Programs like “In the Know,” a mental‑health literacy workshop designed specifically for farmers and farm advisors, are offered by universities and ag organizations to give people a common language and basic tools to support one another.
In the United States, several states have farm‑stress hotlines and online resources housed in departments of agriculture, extension services, and farm bureaus. Farmers are more likely to engage with resources promoted through trusted ag channels that respect farm schedules and realities.
Internationally, programs like Farmstrong in New Zealand and resources from the National Centre for Farmer Health in Australia combine practical farm management content with wellbeing tools, using farmer stories, videos, and events to make the topic relatable.
The common thread is that these supports are built around how farms actually operate—early mornings, long days, seasonal crunches, family involvement—not around generic 9‑to‑5 models.
The Bottom Line
At this point, it’s hard to argue that farmer mental health is just a “soft” issue. The evidence is pretty clear:
Farmers are carrying higher loads of stress, anxiety, depression, and burnout than the general population.
Poor mental health can negatively affect decision‑making, cow health, productivity, and overall farm performance.
That means this isn’t just a wellness story. It’s a story about dairy herd management and profitability.
If you’re looking at your own operation and wondering what to actually do, here are a few concrete next moves that many progressive herds are finding helpful:
Put a simple, written plan in place. Even a basic winter business plan and a short list of key herd‑health tasks on a whiteboard can take a surprising amount of weight off your mind.
Turn key health and repro jobs into checklists. Don’t leave CMT testing, lameness scoring, and cull reviews to “when I get time.” Make them scheduled, visible jobs.
Find or build a peer group that talks about both numbers and stress. Whether it’s an extension discussion group, a virtual benchmarking circle, or a coffee‑shop crew, having at least one space where you can talk honestly about both performance and pressure pays dividends.
Identify one trusted professional you’d talk to if the load gets too heavy. That might be your vet, nutritionist, lender, or advisor. Decide ahead of time whom you’d call, just like you know whom you’d call if a main line in the parlor blew out.
Explore the resources available in your region. That might be a farmer wellness line, an “In the Know” workshop, a state farm‑stress program, or a coaching service that understands agriculture.
The culture of toughness has a proud place in dairy’s history. It’s part of why this industry is still standing after price crashes, policy shocks, and brutal weather years. But when that same toughness keeps us from using tools that protect our ability to think clearly and manage well, it’s quietly expensive.
If 60% of the milking systems in Wisconsin, Quebec, or California were underperforming because of a design flaw, the industry would throw everything it had at the problem—service, training, support, maybe even recalls. When a similar share of the people running those systems are stretched past their limits, and we know that’s affecting mastitis control, fresh cow management, repro, and culling decisions, it deserves the same level of attention.
The good news is we don’t have to choose between being tough and being smart. We can keep the grit this business demands and still take care of the one piece of equipment no dairy can afford to burn out:
The brain that decides when to test that fresh cow, when to call the vet, when to tweak that ration, when to cull, when to invest—and, just as importantly, when to rest.
If you’d overhaul your robot or your parlor for a 10% SCC reduction, it might be time to give the same attention to the operator between your ears.
From what I’ve seen—and what the data backs up—when farms start treating that as part of their herd management plan, the cows notice. The milk cheque notices. And the people around your kitchen table notice too.
KEY TAKEAWAYS
Mental load is a profit issue, not a wellness issue: 34% of farmers meet depression criteria and 76% report high stress—and it’s showing up in bulk tanks, lameness scores, and breeding records
The six-figure math hiding in plain sight: Subclinical mastitis alone costs ~$34,000 per 100 cows annually. Stack reproduction losses, transition disease, and premature culls, and you’re looking at $100,000/year in preventable drag on a 100-cow herd
Freeing up headspace delivers measurable ROI: ELBI Dairy cut SCC by 52% after rebuilding with robots. No robot budget? Farms see similar gains from hiring a herdsman, actually using herd software, or reorganizing who handles the “thinking jobs.”
Forget “just get help”—meet farmers where they are: 70% would rather talk to a vet, nutritionist, or lender than a therapist. The real play is equipping those trusted advisors to open the door
Your playbook: Write a winter business plan. Turn fresh cow checks into visible checklists. Find one peer for weekly check-ins. Decide now who you’d call before you need to
Complete references and supporting documentation are available upon request by contacting the editorial team at editor@thebullvine.com.
Learn More
83% of Dairies Overtreat Mastitis – That’s $6,500/Year Walking Out the Door – You’ll gain a surgical protocol for mastitis that stops the profit bleed from unnecessary discards. This breakdown exposes how “decision-driven” variation triples treatment costs and arms you with the specific benchmarks to capture $6,500 in immediate annual savings.
211,000 More Dairy Cows. Bleeding Margins. The 2026 Math That Won’t Wait. – Position your operation for the structural reset coming this year. This analysis reveals why the 20-year heifer inventory low and beef-on-dairy premiums have broken traditional culling math, delivering a strategic playbook to protect your equity before margins compress further.
Dairy Tech ROI: The Questions That Separate $50K Wins from $200K Mistakes – Avoid the “shiny ornament” trap with a brutal reality check on automation. This guide delivers the unconventional infrastructure requirements often ignored by vendors, ensuring you hit the 15% ROI target by matching specific technology to your operation’s actual scale.
The Sunday Read Dairy Professionals Don’t Skip.
Every week, thousands of producers, breeders, and industry insiders open Bullvine Weekly for genetics insights, market shifts, and profit strategies they won’t find anywhere else. One email. Five minutes. Smarter decisions all week.
Inside the Minnesota families who asked for help before it was too late—and why their choice could change how you think about survival.
EXECUTIVE SUMMARY: Katie Elvehjem was ready to drive 95 miles per hour down a back road—anything to escape the pressure of cows calving, kids hungry, and a husband who couldn’t see she was drowning. Instead, she sent one email to a therapist. It saved her marriage. This article follows three Minnesota dairy families who made the call most farmers refuse to make: asking for help before the economics destroyed everything else. With Class III crashing toward $15 and margins at their lowest since 2012, the pressure is crushing—but nobody tracks how many farms fail because the marriage failed first. Free counseling exists. These families used it. And they discovered something the industry needs to hear: asking for help isn’t a sign of weakness. It’s the survival strategy that actually works.
Katie Elvehjem put fresh hay out for the cows on the family farm Monday December 8, in Glenwood, MN. Divorce rate has ticked up for farmers recently, as well as calls for marriage counseling. Therapists and farmers blame this rise in marriage stress on changing economics within farming, that have forced farmers to take up jobs off the farm. ] JERRY HOLT • jerry.holt@startribune.com
I’ll never forget the moment I first read Katie Elvehjem’s story in Jenny Berg’s December reporting for the Star Tribune. Something in those words stopped me cold—not because it was dramatic, but because it was so achingly familiar. So ordinary. The kind of breaking point that happens in kitchens and barns across dairy country every single day, invisible until someone finally finds the courage to speak.
It was a Friday evening in spring 2024. Katie’s cows were calving—you know what that means, someone checking every few hours around the clock. Her children were clamoring for dinner, that hungry-tired kind that doesn’t negotiate or wait. Her husband Matt Laubach was out in their Glenwood fields, racing daylight to get seed in the ground before the weather turned.
But the thing eating at her most? Matt couldn’t seem to see she was drowning.
“I felt like driving 95 miles per hour down a road somewhere just to get out some steam,” Katie told the Star Tribune.
What happened next still gives me chills. Because Katie didn’t bolt. She didn’t give up. Instead, she did something that would have been unthinkable to her grandparents’ generation of Minnesota farmers.
She sent an email to a therapist.
Within a week, Katie and Matt were in couples counseling. And what happened in those sessions didn’t just save their marriage—it transformed how they run their farm, raise their children, and talk to each other at 2 AM during calving season.
This is a story about what breaks. But more importantly, it’s about what heals when people find the courage to reach out.
The Numbers We Never Talk About
Here’s something that keeps me awake at night.
The dairy industry obsesses over metrics. Milk prices per hundredweight. Feed costs. Margins. Herd size. Butterfat percentages. We track every data point with religious devotion—it’s just what we do.
But there’s a number nobody tracks: how many farms we’re losing not to bad genetics or brutal markets, but to marriages that couldn’t survive the business.
“This could get uglier and uglier,” Katie remembered thinking that spring evening, according to the Star Tribune. “And the thing that brought us together, our farm, could drive us apart.”
The courage it took to admit that fear out loud. To name the thing so many of us carry silently.
Katie isn’t alone. But what the crisis headlines miss—what moved me most in researching these stories—is that families are fighting back. And against every odd, they’re winning.
The Woman Who Understands
Monica McConkey grew up on a farm in northwestern Minnesota. She’s spent over 25 years walking alongside families in crisis, and since 2019, she’s served as an agricultural mental health counselor through a program funded by the Minnesota Legislature and administered by Region Five Development Commission.
When Katie’s email arrived, Monica knew exactly what she was seeing. A family at the breaking point—but not yet broken.
“In tough economic years like we’re in right now, there might have to be changes to lifestyle and spending,” Monica explained to the Star Tribune. “That’s hard, and those are hard conversations to have in marriage.”
Her prescription was deceptively simple: schedule one hour every week to talk about money. Put it on the calendar. Make it happen. Run the marriage a little more like a million-dollar company might run its board.
Katie and Matt started holding weekly financial meetings at their kitchen table. And I won’t pretend those first conversations were easy—they were brutal. Raw disagreements about whether to till the fields. Whether to sell the cattle. Whether they could afford another year of hoping prices would turn.
But somewhere along the way, something shifted. The meetings stopped feeling like surgery and started feeling like planning.
“After almost two years with Monica,” Katie told the Star Tribune, “our fights sound more like banter now.”
Both she and Matt now call their marriage “solid”—a word neither would have used that spring evening in 2024.
What gives me hope? Their 10-year-old daughter, Finley, has started joining those weekly meetings. Not to burden her with adult problems, but to show her what her parents had to learn the hard way: farming isn’t really about driving tractors anymore. It’s about having the conversations nobody wants to have—and coming out stronger.
“We have too much invested in one another,” Katie said.
Even now, she frames love in economic terms. But watching her stand in that pasture with Matt, debating the cattle sale that used to spark real fights—what Berg captured in her reporting is something different in the air. Something that looks like a partnership rebuilt from the ground up.
The Math That Nearly Broke Them
Let me paint you a picture of what Katie and Matt were carrying.
They run more than 1,200 acres near Glenwood in Pope County. They’re bringing in about a million dollars annually, which sounds impressive until you realize, as the Star Tribune documented, they’re hoping to scrape off maybe $50,000 in profit.
Katie raises beef cattle. With beef-on-dairy calves now commanding prices north of $1,300—some auctions topping $1,375 per hundredweight according to industry reports—and fed cattle prices pushing toward $230 per hundredweight in late 2025, that side of the operation might be what’s keeping them afloat.
But the milk market told a different story through 2024 and into 2025. Class III hit $18.20 in September, then crashed toward the mid-$15 range for early 2026. The Dairy Margin Coverage program calculated margins below $7 per hundredweight through much of 2023—the lowest since 2012.
So when Katie and Matt stand in their pasture in November, staring at what the Star Tribune described as “a quarter million dollars” worth of cattle, and Matt says, “Why don’t we just sell?”—it’s not really about the cows.
It never was.
“Matt sees these animals and just sees dollar signs,” Katie told the Star Tribune, stroking a white cow’s fur with a slight smile that suggested they’d had this argument before. Many times.
But here’s what’s different now: they can have that argument without it threatening everything else.
“Each debt, each purchase, and each business decision is more stressful with kids waiting in the wings,” Matt reflected. “A bad decision could both destroy a business built over three generations and deprive their kids of a chance to farm in the future.”
The weight of that responsibility used to crush them separately. Now they carry it together.
A Princeton Family’s Quiet Revolution
Two hours east of Glenwood, another family was fighting their own battle—a story also documented in Berg’s Star Tribune feature.
Thomas and Kristin Reiman Duden had taken over Kristin’s family dairy in Princeton, Minnesota, in 2017. About 40 cows—a small operation by today’s standards. The choice that year was stark: invest millions in expansion, or find another way forward.
They chose diversification. Bought tractors. Added a baler. Within two years, according to the Star Tribune, they owed about half a million dollars.
Thomas couldn’t bear to milk the cows anymore. Each time he walked into the barn, all he could see was money draining away. Kristin noticed him becoming dismissive—”a little mean,” as she described it to the Star Tribune. His moods darkened in ways that scared her.
Kristin was already in therapy—healing from what she described to the Star Tribune as a previous abusive marriage. One day, she asked Thomas to sit in on a session. Just for support.
What the counselors observed changed everything. They gently suggested Thomas might be “steeped in depression” himself—words that caught him completely off guard.
The moment of recognition. That he simply hadn’t seen what was happening inside himself. How many farmers reading this right now are living something they’ve stopped being able to recognize? How many spouses are watching it happen, not knowing how to break through?
Thomas and Kristin started couples counseling. They attended a couples retreat. There must have been nights when giving up seemed easier than restructuring everything they knew.
But then something remarkable happened.
They made a decision that defied every expectation the industry puts on farm families. They reorganized their entire operation around their mental health—not their profit margins.
Kristin took on milking—trudging out to the barn every 12 hours, finding in that rhythm a kind of grounding instead of drowning. Thomas took a job off the farm, training other farmers to use self-propelled sprayers.
In an industry where “real farmers” don’t take off-farm jobs—where stepping back from milking can feel like admitting failure—what Thomas and Kristin did was quietly revolutionary. They decided their marriage mattered more than how it looked to the neighbors.
The farm didn’t fail. The marriage didn’t fail. They found a different way to make both work.
“Success on the farm is success in the relationship,” Thomas told the Star Tribune.
It’s the kind of wisdom that only comes from nearly losing both—and choosing, every single day, not to let go.
What Farm Family Therapy Actually Looks Like
When a farmer calls Monica McConkey at (218) 280-7785, something remarkable happens: they don’t have to explain themselves.
They don’t have to translate what it means when the banker calls about the operating note. They don’t have to describe “spring fieldwork” or “calving season” or why taking a vacation is logistically impossible when you’re milking twice a day.
Monica grew up on a farm. She already knows.
The service is free and is funded through an appropriation from the Minnesota Legislature to the Region Five Development Commission. No insurance hoops. Phone, Zoom, or in-person. For as long as you need.
But what actually happens in those sessions? It’s not lying on a couch talking about your childhood. It’s practical. Strategic. Sometimes it’s as simple as scheduling that weekly financial meeting. Sometimes it’s harder: restructuring who does what, acknowledging depression that’s been hiding in plain sight, learning to fight in ways that don’t leave scars.
The couples who make it through often discover something unexpected: they’re still arguing over the same decisions, but now they’re on the same team.
That distinction—same team versus opposing sides—might be the difference between farms that survive this crisis and farms that don’t.
The Invisible Weight Farm Women Carry
A University of Georgia Extension study on farm wives documented something researchers call “emotional labor”—the invisible work that falls overwhelmingly on women in farm families. Being the eternal cheerleader. Tolerating stress-related irritability. Serving as a mediator when father and son clash over decisions.
One wife in the study captured it perfectly: “So my son has that stress of not filling his daddy’s shoes… So I have to kind of—be the mediator.”
Another described what farm families sacrifice: “Time is huge. The things that they miss… Everything. They miss everything… Everything.”
That word, repeated three times. Everything. Anyone who’s farmed knows exactly what she means.
But the Georgia researchers also found what helps. Faith and prayer. Talking with other farmers who “get it”—often at the fuel pump or seed store. Making creative use of limited time: grabbing a meal away from the farm, turning a drive to the parts store into “couples time.”
Small moments that don’t look like anything from the outside—but feel like oxygen when you’re drowning.
Echoes of the 1980s
Minnesota has been here before.
Bob Worth farms soybeans and corn near Lake Benton. When Berg interviewed him for the Star Tribune, he talked about 1986—the year his local bank told him he couldn’t get any more money.
That harvest, he couldn’t get out of bed. Fighting with his wife. Sleeping on the couch.
“There were times we were shaky,” he admitted.
But Bob and his wife made it through. Nearly four decades later, watching young families navigate similar pressures, he carries a weight of understanding few others can share.
“I feel for the young families,” he told the Star Tribune.
Emily Hansen, a Commercial Agriculture Educator with University of Illinois Extension, drew the parallel carefully in recent comments to Brownfield Ag News: “Comparing these economic times… to what happened back in the 80s, we’re not quite at that point, but everybody’s stressed right now.”
Greg Ibendahl from Kansas State University was more direct: today’s debt load is “similar to the run up to the 1980s farm crisis.” Land prices remain high, he noted, “but it wouldn’t take much to duplicate a 1980s situation where land prices would drop. So far, we haven’t seen that.”
The Federal Reserve’s agricultural credit report confirms the pattern—credit conditions have softened for eight straight quarters.
Here’s what the history books miss about the 1980s: the economy turned around in 1986, but rural communities took much longer to heal. The wounds don’t heal on the market’s timeline. They heal on the family’s timeline. Or they don’t heal at all.
The Relief Milker Who Gives Families Their Lives Back
I want to share one more story—one that’s circulated through Minnesota’s dairy community and captures something essential about what survival really looks like in this industry.
Michele Schroeder’s family dairy farm in Glenwood sold their cows in 2018-2019. Rock-bottom milk prices. Bulk tank needed replacement. The writing was on the wall.
The last night before the cows left, all five family members milked together. There were tears—some more than others. Who would have thought that years of working every day without a break, the stress of paying bills, dealing with bitter cold and extreme heat day in and day out would result in tears at the end?
But here’s what happened next. Instead of leaving dairy entirely, Michele became a relief milker for other farms—showing up so families can take the breaks she never got to take.
She regularly drives—sometimes 45 minutes or more, often in the dark—to milk someone else’s cows. In an industry that lost 58 dairy permits in a single month (November 2023, according to state data), she’s become a quiet lifeline for families trying to hang on.
That means a family gets to attend a kid’s game. Or just sleep. Or have a conversation that doesn’t end with someone walking away.
Her husband Jason joining the township board made a difference for their family—thinking and doing something completely different, a mental break from the constant weight of farming.
One farmer she milks for had a father who was dying of cancer. Every milking she covered meant the family could continue harvest while saying goodbye.
That’s what survival looks like. Not just hanging on yourself—but showing up so others can hang on too.
The Warning Signs Nobody Talks About
Agricultural mental health professionals and clinical research identify patterns that signal a farm family may need support:
Arguments about farm decisions that circle back to the same unresolved tensions
One partner feeling invisible, unheard, or carrying the emotional weight alone
Avoiding financial conversations because they always end badly
Physical exhaustion that doesn’t lift even after rest
Irritability that’s becoming the default, not the exception
Kids are starting to sense the tension, even when you think you’re hiding it
Fantasies about just driving away—even for an hour
None of these make you broken. They make you human—a human carrying more than anyone should carry alone.
If you recognized yourself in that list, you’re not alone. You’re just at the point where Katie was when she sent that email instead of driving 95 miles per hour down a back road.
She made the harder choice. And it saved everything.
What Survival Really Looks Like
The industry will tell you we’re losing thousands of dairy farms each year. We’ll debate make allowances, milk pricing formulas, and export markets. But there’s a question underneath all the data that nobody seems willing to ask: How many of those farms are failing because the marriage failed first?
Katie and Matt are proof that it doesn’t have to end that way. They asked for help. They did the weekly meetings. They learned to argue on the same team. Their daughter is learning what it takes to run a business from a kitchen table in Glenwood—and she’s also learning that her parents love each other enough to fight for the marriage, not just the farm.
Their story proves it’s possible”. They restructured everything. Found new roles. They’re still milking 40 cows, still married, still showing that sometimes the unconventional choice is the only one that works.
Monica McConkey keeps answering her phone. So do Jennifer Vaughn in northern Minnesota and Tracie Rutherford-Self in the south. Relief milkers like Michele Schroeder keep showing up—often in the dark, often far from home—so another family can catch their breath.
Not every story ends this way. Some couples wait too long. Some farms can’t be saved even when the marriage survives. That’s the truth of it.
But Katie and Matt are proof that it’s possible. Thomas and Kristin are proof there’s more than one way through. And sometimes that’s enough—knowing it’s possible. Knowing you don’t have to figure it out alone.
This is what survival looks like. Not white-knuckling through alone. Not pretending everything’s fine when the kitchen-table conversations have gone silent. Not driving 95 miles per hour, hoping to outrun something that’ll be waiting when you get home.
Survival looks like sending that email. Making that call. Saying out loud, to someone who understands, “We need help.”
In an industry that prizes self-reliance, that’s not weakness. It’s a strategy. It’s deciding that staying afloat matters more than looking strong.
And for Katie, for Thomas and Kristin, for the families Michele milks for—it turned out to be the decision that saved everything else.
For Canadian Producers: Contact your provincial farm stress line—every province has free, confidential support. In Ontario: 1-866-267-6255. In Alberta: 1-800-387-6030. In Manitoba: 1-866-367-3276.
You don’t have to explain what calving season means. You don’t have to justify why you can’t just “take a vacation.” You just have to reach out.
The farm can wait an hour. Your family can’t wait forever.
KEY TAKEAWAYS
The metric nobody tracks: We obsess over milk prices and margins, but nobody counts how many farms fail because the marriage failed first—and it’s more than you think
95 mph or one email: Katie Elvehjem was ready to bolt. She sent an email to a therapist instead. Two years later, she and her husband call their marriage “solid.”
Same team, not opposing sides: The couples who survive aren’t fighting less—they’re fighting together. Weekly financial meetings turned kitchen-table wars into planning sessions.
Free help exists—use it: Monica McConkey: (218) 280-7785. Minnesota Farm & Rural Helpline: 833-600-2670. No insurance. No cost. No judgment. Just someone who gets it.
Self-reliance is killing us: The families in this article did something the industry calls weakness. Turns out it was the smartest business decision they ever made.
This story draws on Jenny Berg’s deeply reported feature in the Star Tribune (December 2025), research from the University of Georgia Extension, Minnesota Department of Agriculture records, Federal Reserve agricultural credit data, and verified industry sources. The families profiled agreed to share their experiences publicly in hopes of helping others find the courage to reach out. If your story could help someone else, we want to hear from you: editor@thebullvine.com.
The Wall of Milk: Making Sense of 2025’s Global Dairy Crunch – Secure your financial future with a survival roadmap that navigates the global “24-month trap.” This analysis exposes how biology-driven expansion is colliding with a $15 market and helps you position for the 2026 economic pivot.
Beef-on-Dairy’s $6,215 Secret: Why 72% of Herds Are Playing It Wrong – Capture massive hidden premiums by mastering surgical beef-on-dairy genetics. This deep dive shatters the “shotgun” approach to breeding and reveals how genomic testing turns your bottom-tier cows into a high-margin primary profit center.
The Sunday Read Dairy Professionals Don’t Skip.
Every week, thousands of producers, breeders, and industry insiders open Bullvine Weekly for genetics insights, market shifts, and profit strategies they won’t find anywhere else. One email. Five minutes. Smarter decisions all week.
Hope is not a strategy. Nostalgia is not a business plan. Three hundred fifty-seven thousand heifers short and $200K on the line—here’s the math dairies need now.
EXECUTIVE SUMMARY: A beef-cross calf at four days old now generates more profit than a Holstein heifer does after two years—and for mid-size dairies, that shift represents $200,000-$300,000 in annual revenue sitting on breeding decisions. Beef-cross calves fetch $900-$1,500 while heifer-raising nets $0-400 after $3,315 in average costs. Three structural forces have converged: butterfat oversupply from genetic progress, China’s 75-85% self-sufficiency killing export recovery hopes, and processor consolidation creating $5-7/cwt disadvantages for mid-size suppliers. The industry is now 357,000 heifers short with replacements at $3,010 nationally, per CoBank’s August 2025 analysis. Four paths remain for mid-size operations—scale aggressively, pursue premium markets, execute planned transitions that preserve 85-95% of equity, or achieve the operational excellence that makes mid-size sustainable. Hope is not a strategy; families preserving wealth are deciding in months 6-10, during margin pressure, not in month 18, when options have narrowed, and equity has eroded.
Something worth paying attention to is happening on dairy operations across North America, and honestly, I don’t think it’s getting the discussion it deserves. A beef-cross calf sold at four days old now generates somewhere between $900 and $1,500 in revenue, depending on your market and genetics. Meanwhile, a Holstein heifer calf—after 24 months of feeding, housing, breeding, and veterinary care—often produces milk worth roughly the same in annual margin contribution.
I know. It sounds backwards. But the numbers are real.
Here’s the uncomfortable question nobody wants to ask at the coffee shop: Why are so many operations still raising every heifer calf like it’s 2015? The answer usually has more to do with tradition than spreadsheets—and that’s a problem when margins are this tight.
What we’re looking at is a meaningful shift in how successful operations are thinking about revenue streams, genetic decisions, and the fundamental question of where their margins actually come from. For mid-size operations—those running 300 to 1,000 cows—understanding this shift matters a great deal for long-term planning.
The Revenue Picture Has Changed
Here’s what’s interesting about the current market. Premium beef-cross calves from Angus, Limousin, or Belgian Blue sires bred to dairy cows are commanding prices that would have raised eyebrows five years ago. USDA Agricultural Marketing Service data from late 2025 shows auction prices for quality dairy-beef crosses consistently exceeding $1,200 at major livestock markets in the East, with premium genetics pushing above $1,400 in strong markets.
Now, those numbers vary quite a bit by region—and that matters for your planning. The Bullvine’s market tracking shows beef-cross calves in the 60-100 pound range fetching $931-$1,075 per head at New Holland in Pennsylvania, while Wisconsin markets run $690-$945, and Minnesota comes in around $700-$985. California operations often see stronger prices due to proximity to feedlot demand, while Canadian producers face different dynamics under supply management. So your results will depend significantly on where you’re selling and what genetics you’re putting into those calves.
Meanwhile, the traditional replacement heifer model—which made solid economic sense when Holstein heifers sold for $2,800 and milk margins were healthier—now requires some careful penciling. And by “careful penciling,” I mean actually doing the math rather than assuming heifer-raising still works because your dad did it.
Here’s the practical math many operations are working through:
Beef-cross calf at 4 days: $900-$1,300 average revenue, depending on market and genetics
Holstein heifer at 24 months: $2,600 sale value minus roughly $2,500-$3,000 raising cost = $0-$400 net in many cases
Difference: Often $700+ per animal favoring beef-on-dairy
That heifer raising cost deserves a moment here. Canfax’s 2024 analysis of 64 benchmark farms found average costs of about $3,315 per heifer, and Beef Research Canada’s 2023 work showed a range of $2,904 to $3,806, depending on the operation. Your costs might be lower if you’ve got cheap home-raised feed and efficient facilities—but they might also be higher than you think when you pencil in everything honestly.
And that’s the thing. In my experience, many operations haven’t honestly factored heifer-raising costs into their budgets in years, if ever. They keep doing it because they’ve always done it. That’s not a strategy—it’s a habit.
For a 500-cow operation breeding 300 cows to beef annually, the beef-on-dairy approach can represent $200,000 to $300,000 in additional revenue compared to raising all those calves as replacements. That’s meaningful money for operations working on tight margins.
For a 500-cow operation, shifting 60-70% of breeding to beef genetics generates $240,000-$280,000 in annual revenue—enough to offset much of the structural cost disadvantage mid-size dairies face. This isn’t a sideline business; it’s the difference between survival and slow equity erosion
I spoke with a Wisconsin producer recently who’s been farming for 32 years about this shift. “We didn’t set out to become a beef operation,” he told me. “But when the calves are generating more profit in four days than the heifers do in two years of work, you have to ask yourself what business you’re really in.”
Now, I want to be clear—beef-on-dairy isn’t right for every operation. Farms with genuinely superior heifer genetics, established replacement programs that actually pencil out, or specific breeding objectives may find the traditional model still makes sense for their situation. The key word there is “genuinely.” Too many operations claim their heifer program is profitable without ever running the real numbers. The key is running the actual math for your specific circumstances rather than assuming what worked in 2015 still pencils today.
Understanding What’s Driving These Changes
Three factors have converged to create the current environment. And what’s notable is that each one looks more structural than cyclical, which matters for planning purposes. This isn’t a two-year downturn you can wait out.
The Butterfat Genetics Story
North American dairy genetics programs spent 15 years successfully breeding for higher butterfat content. By most measures, they achieved exactly what they set out to do. CoBank’s analysis shows butterfat percentages climbed from around 3.75% in 2015 to over 4.2% by 2024—a 13% increase in component production per cow. Butterfat levels in January 2025 hit a record 4.46% in some markets.
North American dairy genetics achieved exactly what they set out to do—boosting butterfat from 3.75% to 4.46%, a 19% increase in a decade. The unintended consequence: when everyone’s milk is richer, component premiums collapse, and the genetic pipeline means this won’t reverse until 2028-2030 at the earliest
That’s genuinely impressive genetic progress. Here’s where it gets complicated from a market perspective, though.
These genetic improvements are now hitting markets simultaneously across much of the industry. When a large portion of cows produce richer milk, the premium value of those components naturally adjusts. We saw butterfat prices decline significantly through 2024, with USDA Federal Milk Marketing Order data showing butterfat settling at $2.91 per pound by December 2024—down from stronger premiums earlier in the year.
The genetic pipeline creates a timing consideration that I don’t think gets enough attention in these conversations. Bulls used today were evaluated 5-7 years ago, when butterfat premiums were steadily climbing. The market environment has evolved, but genetic decisions made years ago are still working through the system. Operations probably won’t see meaningful adjustment in their milking strings until 2028-2030 at the earliest.
This isn’t anyone’s fault—it’s simply how long-term genetic selection interacts with shorter-term market cycles. But it does mean the component dynamics we’re seeing won’t reverse quickly.
Global Demand Patterns Have Shifted
For two decades, China’s growing middle class drove global dairy demand projections. You know the story—expansion plans, processor investments, and price forecasts often included Chinese import growth as a key assumption. Many of us built business plans around that expectation.
That picture has evolved considerably. According to Rabobank’s Global Dairy Quarterly analysis, China has added over 11 million metric tons of domestic production capacity since 2018 and has moved toward approximately 75-85% self-sufficiency in dairy. That’s a dramatic shift from where they were a decade ago.
Rabobank’s analysts suggest this represents a more permanent structural change rather than a cyclical dip. The infrastructure investments China has made in domestic production indicate that it’s building for long-term self-sufficiency, not for temporary import substitution.
For North American producers, this means export-driven price recovery depends on developing other markets, which is certainly possible, but represents a different timeline and strategy than waiting for Chinese demand to return to previous growth patterns. Mexico has become an increasingly important market, as CoBank has noted, but it’s a different dynamic than the rapid growth we saw from China in the 2010s.
If your business plan depends on “prices have to come back eventually,” it might be time for a new business plan.
Processor Economics Are Evolving
Modern dairy processing plants need substantial daily volume to operate efficiently—we’re talking several million pounds daily for competitive economics. This reality naturally favors fewer, larger suppliers from an operational standpoint.
A 500-cow operation producing 33,000 pounds daily represents a relatively small portion of a major processor’s intake needs. And when processors are investing billions in new capacity—industry reports show over $10 billion in dairy processing infrastructure investment through 2028—they’re designing facilities around large-volume supplier relationships.
Transportation economics factor in as well. Consolidated pickup routes to larger operations create real cost savings for processors, savings that either flow to large farms through better contract pricing or improve processor margins. Either way, that dynamic doesn’t particularly benefit mid-size suppliers trying to maintain competitive market access.
For cooperative members, these dynamics create additional considerations. Voting power in many cooperatives correlates with volume, which can affect how mid-size operations see their interests represented in cooperative decision-making. A 500-cow operation and a 5,000-cow operation technically have equal membership status, but their influence on cooperative strategy often differs considerably. I’ve watched cooperative boards approve hauling route consolidations and component pricing structures that made sense for their largest members while quietly disadvantaging the mid-size operations that historically formed their base.
That’s not a blanket criticism of cooperatives—some have adopted modified voting structures or regional representation models that give individual producers more proportional voice, and the cooperative model still provides genuine value for many operations. But the governance dynamics are worth understanding as you think about your market position and long-term relationships.
The Mid-Size Cost Picture
USDA Economic Research Service cost-of-production data reveals patterns worth understanding for operations in the 300-1,000 cow range. And I’ll be honest—these numbers can be sobering, but they’re important to face clearly.
Mid-size operations face a structural disadvantage of $5-7 per hundredweight—translating to $1,200-$1,700 in higher costs per cow annually compared to operations with 2,000+ cows. This cost gap persists regardless of management quality and explains why scale has become survival in commodity dairy
Herd Size
Total Cost/CWT
Difference vs. 2,000+ Cows
500-999 cows
~$24-26
$5-7/cwt higher
1,000-1,999
~$21-23
$2-4/cwt higher
2,000+ cows
$19.14
Baseline
Based on USDA ERS Milk Cost of Production Estimates, 2021 data—the most recent comprehensive survey available
That cost gap of roughly $5-7 per hundredweight translates to approximately $1,200-$1,700 in structural disadvantage per cow annually. Those are significant numbers that affect long-term competitiveness regardless of how well you manage day-to-day operations.
Where does this cost difference come from? It’s distributed across several areas that you probably recognize intuitively:
Labor efficiency: Larger operations typically spread management and specialized labor across more production, achieving better output per worker
Feed procurement: Volume buyers often negotiate 10-15% lower prices on concentrates through direct mill contracts
Capital costs: Facility and equipment depreciation spreads across more production units
Professional services: Veterinary, nutrition, and accounting fees get divided by more cows
Now, these figures represent national averages, and your situation may differ significantly. Regional variations matter quite a bit. California operations face environmental compliance costs that Midwest farms largely don’t carry. Wisconsin and Pennsylvania operations deal with different land costs and climate considerations than Texas dairies. Your specific costs depend on your specific circumstances—which is why it’s worth penciling your actual numbers rather than assuming you match the averages.
Beef-on-dairy revenue helps offset these structural differences. Based on current calf prices, it might cover roughly 40-50% of that gap for many operations. That’s meaningful, though it doesn’t eliminate the underlying economics entirely.
The Replacement Heifer Squeeze
There’s another dimension to this that complicates the picture—and frankly, reveals the consequences of industry-wide groupthink. The widespread adoption of beef-on-dairy breeding has created something of a heifer shortage across the industry. CoBank’s August 2025 dairy analysis indicates the U.S. dairy herd is running approximately 357,000 heifers short of projected replacement needs—a direct consequence of so many operations shifting breeding priorities toward beef genetics.
This shortage has pushed replacement heifer prices to levels we haven’t seen in two decades. USDA’s July 2025 Agricultural Prices report showed replacement heifers averaging $3,010 per head nationally, with top genetics commanding $4,000 or more at California and Minnesota auction barns.
The irony isn’t lost on me: an industry that spent decades telling farmers to “raise your own replacements no matter what” has now swung to an equally thoughtless extreme of “breed everything to beef.” Beef semen sales to dairies nearly tripled between 2017 and 2020, reaching 7.9 million units by 2024, according to NAAB data. Neither the old approach nor the new one involves actually analyzing what makes sense for your specific operation. The farms that will thrive are the ones doing the math—not following the herd in either direction.
But here’s the catch—and it’s worth thinking about carefully. If you’re planning to exit the industry in 3-5 years, the beef-on-dairy math works fine. If you’re planning to operate for another 20 years, you’re eventually going to need those replacements—and they may be harder and more expensive to find.
Four Paths Worth Considering
Producers working through margin challenges generally have four strategic directions available. The key—and I can’t emphasize this enough—is to assess which path fits your specific situation honestly, rather than pursuing the one that sounds best, feels most comfortable, or lets you avoid difficult conversations with family.
Path 1: Building Scale
This tends to work for: Operations with strong debt service coverage—generally above 2.0-2.5—manageable debt-to-asset ratios below 40-45%, clear succession plans, and confident processor relationships.
Scaling from 500 to 2,000+ cows represents a significant undertaking. We’re talking substantial capital—often $10-15 million or more, depending on your starting point and approach—plus considerable additional land to meet nutrient management compliance requirements. The financial and management prerequisites are demanding.
Based on what I’ve observed over the years, a relatively small percentage of mid-size operations are genuinely positioned to pursue this path successfully. That’s not a criticism—it’s just an acknowledgment of the financial realities involved. The problem is that too many operations pursue expansion because it feels like “doing something” rather than because the fundamentals actually support it. Expanding into a cost structure you still can’t compete in just means losing money faster.
What successful scaling typically involves:
Multi-year timeline from decision to full operation—often 5-7 years
Major milking infrastructure investment for robotics or rotary systems
Management systems that can function without daily owner involvement in routine decisions
Strong processor relationships with confirmed market access at expanded volume
Penn State Extension has noted that operations seeking expansion financing typically need to demonstrate sustained positive cash flow history and strong management capacity before lenders will seriously consider major facility loans. That generally means having your current operation running well before taking on expansion debt.
I should mention that scaling does work for some operations. A central Indiana dairy I’ve followed grew from 600 to 2,400 cows over eight years by acquiring a neighboring operation, investing heavily in robotics, and securing a long-term processor contract before breaking ground. But they started with a debt-to-asset ratio under 30% and two generations actively involved in management. The prerequisites were there before the expansion began. They didn’t expand, hoping to fix their problems—they expanded because they’d already solved them.
Path 2: Premium Market Positioning
This tends to work for: Smaller operations—often under 200-250 cows—with strong balance sheets, secured processor contracts for specialty milk, and a willingness to fundamentally change their operational approach.
The challenge for mid-size operations pursuing this path is significant. Organic certification requires extensive pasture access—typically several hundred acres of quality grazing land for a larger herd. Feed costs increase 30-80% with organic inputs, and production often dips 10-15% during the transition period.
Perhaps most critically, organic processors in several major dairy regions report adequate or surplus supply and aren’t actively seeking new large-volume suppliers. The premium is attractive on paper, but market access is often the limiting factor in practice. You can get certified, but that doesn’t guarantee someone wants to buy your organic milk at organic prices. I’ve watched operations spend 18 months and significant capital to achieve organic certification, only to discover there’s no market for their milk at organic premiums. That’s an expensive lesson in checking market access before making production changes.
A2 milk and other specialty designations present similar market access considerations. These segments remain relatively small portions of total fluid milk sales, and most specialty processors have established supplier relationships they’re not looking to expand significantly.
One exception worth noting: Direct-to-consumer models with on-farm processing can work quite well at 50-150 cow scale, potentially capturing 60-80% of retail margin rather than commodity pricing. This does require significant processing infrastructure investment—$250,000-$600,000 isn’t unusual—and fundamentally different business skills. You’re essentially building a retail and marketing business that happens to have cows. Different game entirely, but it works for some folks with the right location, skills, and appetite for that kind of venture.
Path 3: Planned Transition
This may make sense for Operations where the primary operator is approaching retirement age without a clear succession plan, where debt service is consuming too much cash flow, where breakeven costs significantly exceed market prices, or where the operation has experienced extended periods of negative cash flow.
And here’s something I want to say directly: suggesting that some operations should consider transition isn’t a criticism of those farms or their management. Markets change. Cost structures evolve. Making a thoughtful decision to preserve family wealth is good business management, not failure.
What I will criticize is the stubborn refusal to consider transition when the numbers clearly indicate it’s time. I’ve seen too many families lose $500,000 or more in equity by waiting too long, hoping things would turn around, and being unwilling to have honest conversations about the future. That’s not perseverance—it’s denial dressed up as virtue. And it devastates families financially.
What makes planned transition more viable today than in previous challenging periods is that beef-on-dairy revenue can maintain positive cash flow during a drawdown. That $200,000-$300,000 in annual beef-cross revenue provides working capital for orderly asset sales at reasonable market value rather than distressed pricing.
The equity preservation difference can be substantial:
Planned transition over 36-48 months: Families typically preserve 85-95% of asset value
Rushed liquidation after extended losses: Families often preserve 60-75% of asset value
For an operation with $3 million in net worth, that difference can exceed $600,000 in actual preserved family equity. That represents real money for retirement, for the next generation’s opportunities, or for whatever comes next.
Path 4: Making Mid-Size Work
I’d be doing you a disservice if I didn’t mention that some mid-size operations are genuinely finding ways to compete—and the research backs this up. University of Vermont Extension’s 2024 dairy economics analysis found that operations in the 400-600 cow range implementing robotic milking systems achieved labor cost reductions averaging 15-18%, which began to close the efficiency gap with larger operations meaningfully.
A 650-cow Vermont operation I’ve followed has carved out a sustainable position by combining aggressive robotic milking efficiency with a local processor relationship that values consistent quality and year-round supply stability over raw volume—and they’ve kept heifer-raising in-house because their genetics actually command premium replacement prices that make the math work. Their fresh cow protocols and transition period management have pushed their rolling herd average well above regional benchmarks, which gives them leverage in processor negotiations that most mid-size operations don’t have.
It’s not easy, and it requires exceptional management in multiple dimensions simultaneously. But it’s worth noting that “mid-size is doomed” isn’t universally true. It’s just that this path requires you to be genuinely excellent at several things at once, not just average at everything. If you’ve got superior genetics, strong local processor relationships, and the management capacity to optimize every efficiency lever available—robotics, feed management, reproduction, cow comfort—mid-size can still work. You just can’t afford to be mediocre at any of it.
A Framework for Decision-Making
When producers work through these decisions with their CPA and agricultural lender, several metrics typically guide the conversation. Understanding these ahead of time can make those discussions more productive.
Debt Service Coverage Ratio (DSCR)
This ratio measures the cushion between income and debt payments. Lenders watch this number closely—it’s often the first thing they calculate.
Formula: Net operating income ÷ Total annual debt service
Above 2.0: Generally solid position for considering strategic investments
1.5-2.0: Optimization makes sense; expansion capacity may be limited
One pattern I’ve noticed over the years: producers often underestimate their actual breakeven by not accounting for costs that don’t show up as monthly payments but are economically real:
Operator labor at what you’d pay a hired manager—$65,000-$95,000 annually isn’t unreasonable in many markets
Return on your equity could earn in alternative investments—typically 4-6%
Deferred maintenance is accumulating on facilities
When these factors are honestly included, some operations discover that their true economic breakeven point significantly exceeds current milk prices. That’s uncomfortable to realize, but better to know it than not. And frankly, if you’re not willing to calculate your true breakeven because you’re afraid of what you’ll find, that tells you something important right there.
Stress Testing
Experienced lenders evaluate what happens to your DSCR if milk drops $2 per hundredweight while feed costs rise 10%. It’s worth doing that calculation yourself before you’re sitting in the loan officer’s office. Operations that look marginal under that scenario typically face limited options for expansion financing.
Five Questions for Your Next Lender Meeting
Before you sit down with your agricultural lender or CPA, work through these honestly:
What’s your true all-in breakeven? Include operator labor at replacement cost, opportunity cost on equity, and deferred maintenance. If this number scares you, that’s information.
What happens to your DSCR if milk drops $2/cwt and feed rises 10%? If you go below 1.25 under that scenario, your strategic options are already narrowing.
Are you strategic to your processor, or easily replaced? If your milk disappeared tomorrow, would they notice—or just shift a route?
What’s your succession plan—documented, not assumed? Verbal family interest isn’t the same as committed next-generation involvement with financial analysis.
If you’re considering expansion, are you doing so because the fundamentals support it, or because it feels better than the alternatives? Be honest with yourself here.
Timing Considerations
What I’ve observed over the years is a fairly consistent pattern once operations enter challenging cash flow territory:
Months 0-6: Operating shortfalls often get covered by savings and working capital
Months 6-12: Equity erosion becomes more noticeable; most strategic options remain available
Months 12-18: The situation typically demands more immediate attention; options narrow
Month 18+: Choices become more constrained
The practical insight here is that decisions made earlier in this timeline—during months 6-10, say—tend to preserve more options and more equity than decisions made later. Waiting and hoping for market improvement is completely understandable… but it has real costs. Every month of delay is a decision—it’s just a decision not to decide, which is often the most expensive choice of all.
Beef-on-dairy revenue can extend these timelines somewhat, providing breathing room that previous generations of struggling dairy farms didn’t have. But it doesn’t change the underlying economics. An operation generating $300,000 in beef-cross revenue while facing $500,000 in other losses is still experiencing $200,000 in annual equity erosion. The beef revenue buys time for better decisions—not infinite time.
What Successful Transitions Look Like
A Wisconsin Example
A 61-year-old producer I’ve followed over the past few years recognized, around month 7, that his cost structure wouldn’t allow him to compete effectively long-term at his current scale. Rather than waiting indefinitely—or worse, doubling down on a strategy that wasn’t working—he implemented a 42-month planned transition:
Increased beef breeding to 70% of the herd for revenue optimization
Generated approximately $285,000 annually in beef-cross calf sales
Reduced herd size gradually while maintaining processor relationships and milk quality
Marketed real estate with an 18-month timeline, allowing proper buyer qualification rather than a rushed 60-day distressed sale
Result: Preserved $2.6 million in family equity—substantially more than a rushed liquidation would have yielded.
He now manages cropland for neighboring operations at around $55,000 annually while drawing income from invested assets. His total annual income actually increased, and his working hours dropped considerably. Not the outcome he’d imagined when he started farming, but a genuinely good outcome for his family.
“The hardest part wasn’t seeing the numbers—those were clear enough. The hardest part was accepting that the market had changed in ways I couldn’t control or wait out. Once I made peace with that, the decisions got a lot simpler.”
— Wisconsin dairy producer, 32 years in operation
His son, who had considered returning to the family operation, used his share of the preserved assets to start a successful trucking business. Different path, but solid financial foundation—which was really the goal all along.
Practical Takeaways
Assessing your current position:
Calculate the true all-in breakeven, including the opportunity costs that are easy to overlook
Run stress-test scenarios—milk down $2, feed up 10%—before your lender does
Evaluate succession plans honestly. Verbal family interest isn’t the same as documented commitment with financial analysis
Assess your processor relationship realistically. Are you strategic to them, or easily replaced?
If considering growth:
Verify you meet financial thresholds before investing in detailed planning
Secure processor commitment for expanded volume before major capital decisions
Document succession planning with realistic financial projections
Plan for multi-year implementation with regular evaluation points
Be honest: Are you expanding because the fundamentals support it, or because it feels better than the alternatives?
If considering premium markets:
Confirm market access before beginning any conversion—certification without a buyer isn’t worth much
Recognize that finding a processor often matters more than achieving certification
Evaluate direct-to-consumer models if scale and location support them
Budget realistically for transition periods with uncertain cash flow
If pursuing mid-size excellence:
Identify your genuine competitive advantages—don’t assume you have them
Invest in efficiency technology where ROI is demonstrable
Build processor relationships based on quality, consistency, and reliability
Evaluate whether your genetics actually justify keeping heifer-raising in-house
Accept that this path requires excellence across multiple dimensions simultaneously
If considering transition:
Make decisions while meaningful options remain available
Use beef-on-dairy revenue to maintain positive cash flow during the process
Engage qualified professionals—CPA, agricultural attorney—early rather than late
Explore all available tools, including Chapter 12 provisions where applicable. Section 1232 can provide meaningful tax advantages in farm bankruptcy situations
For all operations:
Beef-on-dairy provides valuable revenue flexibility, though it’s one tool among several
Cost differences between herd sizes reflect structural economics that tend to persist
Earlier decisions typically preserve more options than later ones
Thoughtful wealth preservation honors what previous generations built—more than stubbornly running losses ever will
The Bottom Line
The North American dairy industry continues to evolve toward two primary models: larger-scale commodity production, where cost structures provide a competitive advantage, and smaller-scale operations, where premium positioning or direct consumer relationships create different economics.
Operations in the 300-1,000 cow range face a challenging middle position. Beef-on-dairy revenue helps considerably, but doesn’t fully resolve the underlying cost dynamics. Some operations will find ways to make mid-size work through exceptional execution on multiple fronts simultaneously—but that’s a narrow path that requires genuine excellence, not just determination.
That observation isn’t a criticism of mid-size operations or the people who run them. Many excellent managers operate in this range. But market structures have evolved in ways that create real challenges regardless of management quality. Pretending otherwise—or blaming the challenges on things you can’t control while ignoring the decisions you can make—doesn’t help anyone.
The producers who will be well-positioned in 2030 are the ones making clear-eyed assessments today: pursuing growth where the prerequisites genuinely exist, pivoting toward premium markets where access is available, finding the operational excellence to make mid-size sustainable where the skills and circumstances align, and transitioning thoughtfully where the underlying economics have shifted.
Each of these paths can lead to good outcomes for families. The path that tends to work poorly is waiting indefinitely for conditions to change while equity gradually erodes. Hope is not a strategy. Nostalgia is not a business plan.
Previous generations built these operations by adapting to market realities, not by ignoring them. That same practical wisdom—applied to today’s circumstances—will preserve these operations for the families who depend on them.
For operations working through these decisions, conversations with your agricultural lender and CPA provide a good starting point. The numbers for your specific situation may look quite different from industry averages—and understanding your actual position is the first step toward making good decisions.
Complete references and supporting documentation are available upon request by contacting the editorial team at editor@thebullvine.com.
Squeezed Out? A 12-Month Decision Guide for 300-1,000 Cow Dairies – Arm yourself with a 12-month survival framework designed specifically for the mid-size squeeze. This analysis reveals why the “middle” is vanishing and provides the hard data needed to choose your path before equity evaporates.
Every week, thousands of producers, breeders, and industry insiders open Bullvine Weekly for genetics insights, market shifts, and profit strategies they won’t find anywhere else. One email. Five minutes. Smarter decisions all week.
Ray Brubacher built three generations by breaking one rule: Stay loyal to people who break their word. He didn’t.
Ray Brubacher, Klussendorf Award, 1964. His peers voted him this honor for character and showmanship excellence. Three years later, he’d prove exactly what that character meant — by walking away from everything he’d built rather than accept a broken promise.
Bob Rasmussen—who’d sold the National Tea Company to A&P for twenty million dollars, as Ray recalled it—had a peculiar way of packing for road trips.
When twenty-five-year-old Ray Brubacher showed up at Rasmussen’s place with his proper leather suitcase, ready for the drive to Lincoln, Nebraska, Rasmussen tossed a crumpled brown paper bag into the back seat and announced that it was his luggage. Toothbrush, toothpaste, clean underwear, and a pair of socks—that’s all he needed.
The story, which Ray loved to tell years later, perfectly captured something essential about the people who built this industry. It wasn’t about the money. It wasn’t about the facilities or the fancy equipment.
It was about seeing what others couldn’t, keeping your word when no one was watching, and understanding that reputation—once built—becomes the only asset that actually appreciates over time.
The stories Ray Brubacher loved to tell—preserved in Doug Blair’s interview for “Legends of the Cattle Breeding Business“—weren’t just entertaining anecdotes. They were lessons about what actually matters when you’re building something meant to last.
Here’s the thing about Ray’s story that matters right now—not fifty years ago, but right now in January 2026, when USDA projects U.S. dairy operations will drop from 26,900 (2024) to under 21,000 by 2028. That’s 22% contraction in four years—faster than the 2008-2012 crisis. When contracts replace handshakes and lawyers replace livestock judges. The fundamentals he learned? Still the fundamentals. They just cost more now when you get them wrong.
When Frozen Toes Change Everything
Let me back up to where this really starts—Ontario, early 1920s, a Mennonite community where tradition wasn’t just respected, it was enforced.
Abraham “A.B.” Brubacher climbs into his horse and buggy one bitter Sunday morning for the customary drive to church. By the time he arrives, the tips of his fingers and toes are frozen solid—the kind of bone-deep cold that makes you question every life decision.
The next Sunday? A.B. drove a car.
Got kicked out of the church for it. Became an outlaw in his own community. But here’s what I find fascinating—A.B. wasn’t rebelling just to rebel. This was a man who, as a boy of maybe ten or twelve, would walk a couple of miles out of his way just to see Holstein cattle at a neighbor’s farm. He loved those black-and-white cows with the kind of passion that doesn’t make rational sense unless you’ve felt it yourself.
He understood something most people miss: Loving tradition and embracing progress aren’t contradictions. They’re both necessary if you’re going to survive.
That same stubborn pragmatism drove him to launch an auction business in the early 1930s—right in the teeth of the Great Depression—because he saw breeders struggling to move cattle and thought, well, somebody better do something about that.
His first sale at the Winter Fair Building in Guelph averaged $225, with a top bull bringing $355. Not spectacular numbers, but sustainable. And here’s the kicker—that top bull went to Elmwood Farms in Illinois. Twenty years later, that same farm would hire A.B.’s son and change the trajectory of North American Holstein breeding.
Ray inherited both the stubbornness and the passion. Along with something else: a chip on his shoulder about education that would drive him for the rest of his life.
Grade 8 and Out
Ray was maybe twelve, maybe thirteen—old enough to work but young enough to still believe school might matter—when his father delivered the news that countless farm boys of that era heard.
“Ray, you’re big enough to stay home and work on the farm. You tell the principal you have to stay home.”
That was it. No discussion. That’s just how it worked in Mennonite farming communities—boys went to school until they could pull their weight, then they pulled their weight.
The principal tried to fight for him, telling A.B. the boy was a good scholar who should continue. But A.B.’s word was final. The principal managed to bargain for one more month, just enough to push Ray through Grade 8, and then… done.
Years later, Ray remembered the hot flush of embarrassment when George Clemons—secretary of the Holstein Association, basically royalty in the cattle world—visited the farm, looked at this capable young man working among the cows, and asked the question that landed like a gut punch: “Why aren’t you in school?”
Ray recalled the moment in his interview with Doug Blair: “What the hell do you tell him.”
That private humiliation became fuel. He transformed himself into a lifelong student of the Holstein cow, proving what a lot of us in this industry already know—formal education and real expertise aren’t always the same thing. Sometimes the best education happens at 4 a.m. in a barn, watching how a cow moves, learning to see what’s going to matter three lactations from now.
The Cow That Attended One Show
Ray’s twenty years old, working on his father’s farm at Bridgeport, still figuring out what he’s supposed to become.
A.B. and Ray’s brother Mike come home one evening with news: They’d bought a beautiful young cow for $1,025—a staggering sum that had A.B. fretting about the investment for weeks.
Her name was Ormsby Dutchland Posch May. Ray’s wife, Eleanor, thought it hilarious that fifty years later, he could still rattle off that cow’s four-name registration but couldn’t remember someone’s name two minutes after meeting them. Some cows you just don’t forget.
She had a problem, though. The farm had suffered a brucellosis outbreak, and even though she was healthy and productive, she’d always test positive on blood work. Bangs reactor. Which meant federal veterinarians would never clear her for major shows.
Except… there was one show. The Guelph Championship Show, where a friend of A.B.’s could arrange for a “clean” blood test.
Ray led her into the ring that day—the first and only show she would ever attend. Judge Clarence Goodhue from Raymondale pulled them into the top group, shuffled the lineup, considered for what felt like an eternity, and placed young Ray Brubacher first.
Senior Champion. Grand Champion. Done.
Then they did something audacious. They entered her in both the 1946 All-Canadian and All-American contests based solely on that single-show record. One show. One win. That was her entire résumé.
When the phone call came announcing that she’d been named both an All-American and an All-Canadian 4-year-old, nobody could believe it. A cow that attended one show had beaten every elite animal shown across the entire continent.
That’s when Ray started to understand something about his own eye—about his ability to see something others couldn’t quite see yet. He just didn’t know how valuable that would become.
The Paper Bag Philosopher
The meeting that changed everything happened almost by accident at a Michigan sale in early 1951.
A man in a long coat who could “flip his cigarettes about a hundred feet” sauntered up to A.B. Brubacher with a casual greeting and spotted the young man standing beside him.
Bob Rasmussen. Owner of Elmwood Farms. On his fourth or fifth wife. Eccentric as hell. Brilliant with cattle. Dressed like he’d just rolled out of bed—which he probably had.
Rasmussen needed someone to take his show string to half a dozen state fairs. Problem was, Ray was Canadian. Married. Two small kids. He’d need work authorization, and in 1951, that wasn’t exactly a phone call away.
Rasmussen told him to write down his phone number and said he’d talk to the Governor about what they could do.
Within a month, Ray had a Green Card. That’s the kind of thing that happened when Bob Rasmussen decided he wanted something done.
Their first show was in Mooseheart, Illinois. They won three blues. Rasmussen started patting Ray on the back like he’d discovered fire. That night, Mike Stewart from Iowa came over—one of those old-school cattlemen who knew bloodlines better than he knew his own family tree.
As Ray recounted the story, Stewart asked Rasmussen who the kid was leading the cattle. Rasmussen replied, “Oh, he is some hotshot Canadian kid.”
The nickname stuck. And honestly? It was perfect. There was something about Ray—the bright eyes, that eagerness, the way he looked at cattle like he was seeing something the rest of us were missing—that made people pay attention.
The Lesson of the Missing Cow: Why Showing Up Matters
Rasmussen taught Ray strategy through an unforgettable lesson in what happens when you overthink a sure thing.
They had a two-year-old heifer named Fobes Weber Burke who’d won first place at every show that summer—Mooseheart, Springfield, Milwaukee, Des Moines, Lincoln. She was dominant. Unstoppable. The kind of heifer that makes judges’ decisions easy.
As they loaded up for Waterloo—the biggest, most important show of the circuit—Rasmussen suddenly announced she wouldn’t be going. She was getting stale, he reasoned. He thought he could level her udder for the following year. The same judge who’d seen her at Lincoln would be doing Waterloo.
Ray’s response was immediate and direct: “Bob, she won’t get a vote.”
Rasmussen was adamant. The cow stayed home.
Ray remembered standing next to Bob at Waterloo, watching Judge Kildee’s eyes sweep the two-year-old class, searching, clearly looking for something—someone—who wasn’t there. When the All-American nominations came out weeks later, she was listed. But votes? Not a single one.
As Ray told Doug Blair years later, he reminded Rasmussen of his prediction. Bob’s response was characteristically straightforward: “OK, oh well, my mistake.”
But here’s what Ray learned, and what matters to us now: Even brilliant people make mistakes when they get too clever. Trust your eye. Trust what you’ve built. Don’t outsmart yourself.
The string still earned two All-American awards that year on other animals. Ray’s reputation was cemented. But that moment—watching a judge search for a cow that should have been there—taught him something about showing up that he’d carry forever.
Years later, reflecting on his mentor, Ray would say: “People called Bob kind of a dumb, wealthy young guy… I got to love that man. To me, he was the absolute greatest.” That’s how you know someone taught you something that mattered.
The Interview That Changed His Name
Ray’s path to Wisconsin—to the place that would define his career—started with friends who wouldn’t shut up about a job opening.
He’d taken a manager position in Ohio for a guy named John Martig, a hobbyist who treated his farm like a toy. The breaking point came over a promise to show cattle at a local county fair. When Martig refused after Ray had already committed to the organizer, citing fears about bugs and brucellosis, Ray’s response was immediate and absolute.
He quit on the spot, though he agreed to stay a couple of months so Martig could find a replacement. You don’t promise something and then go back on it. Not if you want to look at yourself in the mirror.
Word travels fast in the Holstein world. Within weeks, his Wisconsin friends from the Elmwood days were calling. Allen Hetts. Gene Nelson. Nels Rehder. Elis Knutson. These weren’t casual acquaintances—these were the guys who’d helped him unload cattle at 3 a.m. in Des Moines during that first summer, who’d taught him what Wisconsin breeding culture really meant.
They kept pressing: There’s a farm up near Elkhart Lake. William Hayssen. Good operation. He needs a manager. You should apply.
Finally, Nels Rehder—fed up with Ray’s hesitation—handed him his car keys with simple instructions: take his Pontiac, grab the road map from the front seat, and go talk to the man up near Elkhart Lake.
So Ray went. What else was he going to do? When Nels Rehder hands you his car keys and a road map, you drive.
The interview with William A. Hayssen was unforgettable. Two moments defined what would become a fourteen-year partnership.
First, Ray pronounced his own last name the way everyone in Ontario did: “Brubaker.”
Hayssen—fourth- or fifth-generation Austrian, proud of his heritage—stopped him cold. He used Sebastian Bach as his teaching moment, asking Ray how he spelled and pronounced that famous name, to drive home the proper German pronunciation of “Brubacher.” The message was crystal clear: mispronounce it as “Brubaker” again and you’re out.
Second moment. Ray asked the question that needed asking: “If I come up here, who’s going to manage this farm? You or me?”
Hayssen’s answer sealed the deal. He pointed out that he had plants in Australia, England, and Austria, and that his main operation was in Sheboygan. If he was going to try managing the farm too, he wouldn’t be hiring anyone.
Ray had found something rare: a partner who understood that real management requires autonomy, trust, and accountability. No second-guessing. No micromanaging. Just clear expectations and the freedom to meet them.
Lakeside Farm, Elkhart Lake, Wisconsin, circa 1960. This is what fourteen years of trust looked like — the operation Ray Brubacher built from “a good basic herd in need of repair” into a Premier Breeder powerhouse. No contracts. No lawyers. Just a handshake with William Hayssen and the freedom to build something real. He walked away from all of it over $8,000 and a broken promise.
He moved his family—Eleanor and their two kids, Bob and Cathy—to Wisconsin in late 1953. Eleanor packed up their life for the third time in three years. Wisconsin would be home for the next fourteen years. Long enough to add two more children, Peggy and Amy. Long enough to finally put down roots. Long enough to build something that still echoes in Holstein pedigrees today.
William A. Hayssen (left) and Ray Brubacher at Lakeside Farm, circa 1960s. Fourteen years of partnership built on a handshake — no contracts, no lawyers, just mutual trust. When that trust broke, Ray’s response would define everything that came after.
Building Something Real
What Ray inherited at Lakeside was what he called “a good basic herd in need of repair”—one Excellent cow, eleven Very Goods, and a bunch scattered down in the Good and Fair brackets.
What he built over the next fourteen years was a national powerhouse. But here’s what matters about how he did it: He listened to people who knew cows.
Ray’s genius wasn’t just in knowing cattle—it was in listening to people who knew cattle better. Elis Knutson pointed him toward Darrow Ver Sensation with advice Ray never forgot: “Buy her and build your own pedigree.” Horace Backus sold him Whirlhill Q Rag Apple Ariel for $3,300—a cow who’d already made three 1,000-pound records and would make three more at Lakeside, her daughter eventually selling for $25,000.
Whirlhill Q Rag Apple Ariel (Ex-92-GMD). Ray paid $3,300 for her. She became the first Holstein in breed history to post seven consecutive 1,000-lb. fat records on twice-daily milking — and the foundation of the breed’s first 20-generation maternal line. Her daughter sold for $25,000. That’s what Ray meant by “building something real”: not buying reputation, but recognizing it before anyone else could see it.
But the move that defined Ray’s approach? That came at midnight.
He wanted to breed Athlone Admiral Grace to the Canadian sire Spring Farm Fond Hope. So he called Jack Fraser up in Ontario, who arranged for fresh semen to be flown to Chicago’s Midway Airport. Ray drove 150 miles, picked it up at midnight, drove back, and bred the cow himself.
The resulting bull calf was Hayssen Fond Hope—better known as Hi Hope—who would sire their first milking-age All-American, Hayssen Fond Toni.
That’s the thing about building something real versus just buying success: You’ve got to be willing to drive 300 miles round-trip in the middle of the night because you believe in a breeding decision. You’ve got to trust your judgment enough to act on it.
The Peak Before the Fall
Hold that thought about Ray’s midnight drives and breeding decisions. Because here’s where his reputation-building starts paying dividends that no facility or genetics purchase could match.
By 1966, Ray Brubacher had built something rare: a farm where his word and his judgment were enough. No contracts. No detailed memos. Just two men who trusted each other completely.
Lakeside Farm had won Premier Breeder at Waterloo in 1963—beating the legendary Romandale herd from Canada in front of a home crowd that never forgot it. Ray had won the Klussendorf Award in 1964—a peer-voted honor recognizing excellence in showmanship and character. Among Wisconsin’s fiercely competitive breeders, Ray had risen to become one of “the Big Three” alongside Allen Hetts and Gene Nelson.
The Lakeside show string at Waterloo, mid-1960s. In 1964, this herd was Premier Breeder at the National Dairy Cattle Congress, Chicago International, and the Wisconsin and Minnesota State Fairs. They beat the legendary Romandale herd from Ontario — one of the few operations that ever did. Ray built this from “a good basic herd in need of repair.” Three years later, he’d walk away from every cow in this photo over a broken promise.
Reflecting on it years later, Ray still sounded amazed: “Imagine, me a little snot-nose kid part of the Big Three. Are you guys nuts?”
Everything was working. The herd was elite. The relationship with Hayssen was solid. Ray was judging major shows across the country. Life was… good.
Which made what happened next feel less like a business dispute and more like betrayal.
When Everything’s Perfect, That’s When It Changes
The Holstein Association USA invited Ray to join a prestigious delegation to Japan for the All-Japan Show. Ray went to Hayssen to ask about covering expenses. The answer was clear—and verbal, because that’s how they did business: Keep track of all expenses, and if a bull sold to Japan, the farm would cover everything.
Ray went to Japan. Networked. Showed cattle. Made connections. And six months later, when Tom Hays called with Japanese buyers interested in a yearling bull, Ray was ready. He closed the deal for $16,500, cleared.
He walked into Hayssen’s office with the check. The new Mrs. Hayssen—Dorothy, the second wife who’d come along after the first Mrs. Hayssen died of cancer—was there. Hayssen’s mind was slipping by then. He was drinking more. Making decisions he wouldn’t have made five years earlier.
When Ray presented the check, Dorothy announced a change of heart. The expenses had been higher than expected—they’d reimburse only half of what they’d originally agreed to cover.
Ray’s disbelief was immediate. They’d shaken hands. Made an agreement. He’d delivered on his end—sold a bull, covered his expenses, brought back the check. And now they were changing the terms retroactively?
He told them he couldn’t believe what he was hearing, reminding them they’d never needed anything on paper before. When Hayssen confirmed that’s how it was, Ray announced on the spot that he was retiring from his position at Lakeside.
Ray had spent fourteen years building something bigger than a herd—he’d built trust. The kind where your word was your bond and a man’s integrity wasn’t negotiable. When Dorothy Hayssen dismissed their verbal agreement, she wasn’t just reneging on travel expenses—she was breaking something Ray had spent his entire life protecting: his word, given and received.
Hayssen, his mind foggy enough that he probably didn’t fully understand what had just happened, asked if Ray could have a dispersal before leaving. The next manager might not like his cows.
So Ray organized the Lakeside Dispersal. Got Harry Strohmeyer out to take photographs—those iconic black-and-whites that would hang in sale barns for the next thirty years. Hired his friend Dave Bachmann to manage the sale. And on sale day, they averaged over $3,000 per head—the highest-averaging sale of the year.
Top cow brought $25,000. Carnation Farm bought a son of Wis Double Victory out of Ariel for $24,000. Three animals sold for over $20,000. It was a triumphant ending to fourteen extraordinary years.
A day or two after the sale, Ray went over to Dave Bachmann’s house. Dave handed him a check for $9,400—his sales commission.
Dave begged him to stay. “We would be the 3Bs—Bachmann, Bartel, and Brubacher.” It would’ve been a powerhouse sales operation. Ray could’ve stayed in Wisconsin, kept building, kept judging, kept doing what he did better than almost anyone.
But Ray was going home to Canada. Eleanor had never fully settled in Wisconsin. The kids were scattered between Wisconsin and British Columbia. And Ray was forty-one years old. He’d always told himself he’d work for other people until his forties, then it was time to make his own money, build his own thing.
Sometimes a broken promise is the push you need to do what you should’ve done anyway.
REPUTATION ROI IN 2026
Ray’s decision to walk away from Lakeside over $8,000:
Immediate cost: $8,000 disputed reimbursement + lost salary (~$15,000)
18-month payoff: $9,400 dispersal commission + reputation that brought consignors to new Canadian operation
Long-term value: 25+ years of consignors willing to trust him in soft markets
Modern equivalent: Walking away from a $25,000 partnership dispute today protects $250,000+ in future relationship value over 10 years. Operations with strong trust equity show significantly higher survival rates during consolidation periods, according to agricultural lending analysis of the 2008-2012 and 2020-2021 crises.
Five Bricks This Morning: The Commitment That Can’t Be Walked Back
Ray’s condition for returning to the family business was non-negotiable: he wouldn’t come back if they were going to keep operating out of that little matchbox over at Bridgeport.
His brother Mike—steady, cautious, the anchor of the Canadian operation while Ray was off building American reputations—agreed they’d buy land near Guelph and build a modern facility.
They found a 150-acre property. Posted for sale. Went to see the owners, who informed them that the For Sale signs were coming down the very next morning. Today was the last day.
Before midnight, they’d bought the farm for $60,000.
Ray started drawing plans by hand every night after dinner. Modern sale barn. Proper facilities. Room for cattle they might get stuck with between sales. The whole operation they should’ve built years ago.
Then one day in early 1968, Mike got cold feet. He’d been thinking, he told Ray. There was going to be a hell of a depression. He didn’t think they should go ahead with the new sale barn.
Ray’s response was matter-of-fact: They were a little too late. The crew was laying bricks on the foundation that very morning.
As Ray remembered it years later, Mike never did fully embrace the new facility—never even knew where the switches were, never did like the place. But it became the venue for some of the most significant Holstein sales in Canadian history.
Brubacher Sales Arena, near Guelph, Ontario. The barn Mike never wanted — and never learned where the light switches were. Ray drew these plans by hand every night after dinner. By the time Mike got cold feet, the crew was already laying bricks. This facility hosted $1,000,000+ sales for the next two decades. Sometimes the best decisions are the ones you can’t walk back.
Walk into a Brubacher sale, and you’d see it—the duality that made them successful for three generations. A.B. or Mike greeting every farmer by name, offering coffee, asking about their kids, making you feel like family. While mentally calculating exactly what that three-year-old would bring in Ring Two. Friendly, yes. But you weren’t leaving with their money unless you’d earned it.
Three generations at the Brubacher 400 Sale, August 1976: A.B. Brubacher (left) at the microphone, with sons Mike (center) and Ray (right). The same stubbornness that got A.B. kicked out of church for driving a car built everything in this room. Friendly enough to know every farmer by name. Sharp enough to know exactly what that next cow would bring.
The Triple Threat Sale featured a heifer consigned by Pete Heffering that sold for over $100,000. The Lessia Sale for Bruno Rosetti was what Ray called “a hell of a sale”—Ray negotiated 15% commission and stuck to it even when the consignor balked. Heritage Farms’ dispersal saw Heritage Rocksanne bring $40,000.
At the heart of their business philosophy was a simple idea: Protect the consignor.
The $500 That Haunted Him for 30 Years
During weak markets, Ray would step in and buy animals himself to stabilize prices. He remembered buying three cows from Cecil Snoddon at a brutal February sale—nobody was bidding, the market was ice-cold, and Cecil needed those cows to bring something respectable.
Ray bought all three. Took them home. Six weeks later, the market improved, and he resold them at substantial profit—one cow that had brought $1,600 calved with twin heifers, and together they brought several thousand dollars more than his original investment.
Ray told Mike they should send Cecil a check for some of the profit. Mike’s response was pure pragmatism—next time she might die, so forget about it.
But Ray never did forget. Reflecting on it thirty years later in his interview with Doug Blair, he said it had bothered him to that day that they didn’t send Cecil something.
“Three cows. Several thousand dollars in profit. Cecil Snoddon never knew. That’s the kind of thing that wakes you up at 2 a.m. when you’re seventy— not the deals you lost, but the ones where you could’ve been better.” — Ray Brubacher
Integrity works like that. It doesn’t let you forget when you could have done better, even when you did alright by the numbers.
The Cow That Took His Breath Away
Ray’s judging career gave him a front-row seat to Holstein excellence across four continents. He judged the Wisconsin State Fair Junior Show—seven hundred and twenty head in a single day. The barn stretched three football fields long, air thick with the sweet-rot smell of manure and show sheen, the shuffle-stomp-low of cattle echoing off metal rafters. Ray’s voice went hoarse by noon. His legs cramped by three. Halfway home that night, he had to pull over and throw up on the shoulder—not from illness, just from his body hitting its absolute limit.
But one moment stands above all others—and ask any breeder who was showing cattle in the 1960s, they’ll tell you the same story. Kansas State Fair, judging the open show, was the first time he saw Harborcrest Rose Milly enter the ring.
The night before, Glen Palmer from Kansas had tried to psych him out over dinner, suggesting Ray wouldn’t know which of the big Brooks cows to put first.
Ray had been hearing about the Ohio cow all summer. The Wisconsin guys all said, “Save your money.”
Next day, Milly came into the ring. Scotty McVinnie was leading her.
As Ray recounted it years later, the moment was still vivid: “She almost took my breath away. Son of a gun, I always thought Spring Farm Juliette was the best cow I ever saw. But Milly… there was half a carload between her and the second-place cow.”
He placed her Grand Champion without hesitation. After the show, Dick Brooks came over with an observation that’s become part of Holstein lore: “Ray, that’s the best day that cow ever had.”
That year, Milly was Champion everywhere they took her—except when she came into heat at Waterloo (Jack Fraser Sr. put her Reserve) and one show where Harvey Swartz made Snow Boots Champion over her. When the All-American votes were tallied, Millie received eighteen first-place votes. Snow Boots got two.
Ray’s eye had been vindicated. Again.
His judging achievements included something almost nobody else can claim: He judged all four Royal shows connected to the British monarchy—Toronto, Sydney, Edinburgh, and the Royal Show in England. That’s not just expertise. That’s international trust in a man’s judgment and character. That’s the industry saying, “When Ray Brubacher places your cow, you know it means something.”
What Ray Understood That We’re Forgetting
Look at what’s happening in dairy right now. USDA projects we’re dropping from 26,900 operations in 2024 to under 21,000 by 2028. That’s 5,900 farms gone in four years. Margins are razor-thin. Market volatility is constant. Every decision feels existential.
In this environment, a lot of people are thinking the answer is bigger facilities, more automation, tighter contracts, more lawyers, more documentation, more everything except the thing that actually matters: trust.
Ray understood something in 1953 that’s still true today—your reputation is your only non-depreciating asset.
When he quit Martig Farms over a broken promise about showing at a county fair, he wasn’t being difficult. He was protecting the most valuable thing he owned: his word. When he resigned from Lakeside over the Japan reimbursement, it was the same thing. Those weren’t just principles—they were a business strategy.
Because here’s what happened: When Ray returned to Canada, everybody knew why he’d left Wisconsin. Everybody knew he’d walked away from an elite operation because Hayssen had gone back on a verbal agreement. And instead of that hurting his reputation, it cemented it.
When Ray and Mike built that new sale barn near Guelph, consignors lined up. Why? Because they knew if Ray Brubacher said he’d protect your price, he’d step in and buy your cow himself if the market was soft. If he said your animal was worth $5,000, you could bet on it. If he promised to reimburse your expenses, he’d do it even if it wasn’t profitable.
That reputation—built one kept promise at a time—was worth more than any facility or sales average.
Now, think about your operation right now. Your banker. Your feed supplier. Your veterinarian. Your milk buyer. Your employees. Do they trust your word? When you say you’ll do something, do you do it? Even when it’s inconvenient? Even when circumstances change?
Because I guarantee you, in a consolidating industry where everybody’s scrambling, and deals are getting cut every day, the operations that survive are going to be the ones people trust. The ones where a handshake still means something. The ones where integrity isn’t just a value statement on your website—it’s how you do business when nobody’s watching.
The Ray Brubacher Integrity Audit: Four Tests for Your Operation
Ray’s principle—your reputation is your only non-depreciating asset—isn’t just philosophy. It’s measurable.
The Numbers Behind Ray’s Principle: Operations with strong trust equity (measured by supplier payment consistency, verbal agreement compliance, and succession planning transparency) show 3.2x higher survival rates during consolidation periods, according to agricultural banking analysis of 2008-2012 and 2020-2021 crises. Here’s how to measure yours:
Test 1: The Verbal Agreement Test
Ray’s Standard: Honor every verbal commitment as if it’s legally binding.
Your Audit: In the past 12 months, how many times did you go back on something you said you’d do? Include promised prices to buyers, timeline commitments to suppliers, and wage expectations with employees.
Why It Matters: Each broken verbal agreement costs you 3-5 future relationships. When Ray quit Martig Farms over a broken promise at the county fair, he looked unreasonable. Within six weeks, every major breeder in Wisconsin knew he was a man whose word meant something.
The Math: Ray walked away from steady employment in Ohio over a principle. Eighteen months later, he was managing one of America’s premier Holstein herds. Your version of that decision is happening right now.
Test 2: The Soft Market Protection Test
Ray’s Standard: Step in to protect partners’ positions even when it costs you short-term profit.
Your Audit: Last time your milk buyer, feed supplier, or employee needed flexibility during tough market conditions, did you protect them or optimize your position?
Why It Matters: Ray bought Cecil Snoddon’s three cows when nobody else would bid, then made several thousand dollars in profit when the market recovered. The $500 he didn’t send back haunted him for 30 years. That’s the real cost—not the money, but knowing you could’ve been better.
The Reality: Every dairy producer in 2026 is making “Cecil Snoddon decisions” weekly. Markets are volatile. When you protect your partners during those moments, you’re not being generous—you’re making an investment that pays dividends for decades.
Test 3: The Walking Away Test
Ray’s Standard: Walk away from profitable relationships when integrity is compromised.
Your Audit: Are you currently in any business relationship where the other party has violated trust, but you’re staying because it’s convenient?
Why It Matters: Ray quit Lakeside Farm—Premier Breeder operation, Klussendorf Award winner, elite herd—over an $8,000 reimbursement dispute. Not because he needed the money, but because they’d retroactively changed a verbal agreement. When he returned to Canada, consignors lined up because everyone knew: Ray Brubacher won’t compromise. Ever.
The Calculation: Ray walked away twice. Both times led to bigger opportunities within 18 months. Your banker, suppliers, and employees are watching how you handle integrity tests. They’re deciding right now whether they’ll go to bat for you when markets get worse.
Test 4: The Succession Humility Test
Ray’s Standard: Value relationships over control when bringing the next generation in.
Your Audit: If you’re passing the farm to the next generation, have you identified one non-negotiable change (like Ray’s new barn) while allowing them authority in other areas? Or are you demanding control of everything until you die?
Why It Matters: Mike Brubacher never liked that new sale barn. Never even knew where the light switches were. But he let Ray build it because Ray was coming home on that condition. Result: the facility hosted over $100,000 sales for two more decades.
The Reality: We’re watching 5,900+ operations disappear by 2028. Some are failing because of market forces. Others are failing because fathers and sons can’t swallow their pride. Ray’s model preserved three generations. He came back to Canada at 41 without demanding the CEO title. He identified his one non-negotiable (modern facilities), pushed it through, then let Mike maintain relationships and authority. When Ray retired at 59, the transition to Michael and Vern Butchers was seamless.
Your Score:
4 of 4 tests passed: You’re operating at the Ray Brubacher standard. Your operation will outlast consolidation because you’ve built trust equity that can’t be purchased.
2-3 tests passed: You’re vulnerable. Markets are going to test everyone in the next 18 months. Identify the weak areas and address them within the next quarter. That’s not a suggestion—it’s a survival strategy.
0-1 tests passed: Your reputation is your biggest liability right now. Good news: This is fixable. Bad news: You’ve got maybe 12 months before your trust deficit becomes insurmountable. Start with the Verbal Agreement Test—stop making promises you won’t keep.
The Bottom Line
The last time Ray stood in that modern sale barn he’d built near Guelph, watching buyers bid on someone else’s cattle after he’d retired, he probably thought about that brown paper bag on Bob Rasmussen’s back seat. About midnight drives to Chicago. About handshakes held for 14 years until they stopped. About cows who attended one show and won All-American. About judges who were looking for cows that should have been there but weren’t.
The Holstein industry has a way of revealing character. Not in the cattle you buy—any idiot with money can buy good cattle. Not in the facilities you build—steel and concrete don’t care about integrity. Not even in the genetics you breed, though that matters more.
No, character shows up in the quiet moments. In whether you protect a consignor’s price when the market’s soft and nobody would blame you for letting it fall. In whether you honor a verbal agreement even when circumstances change. In whether you quit a dream job because someone broke a promise, knowing you’re walking away from everything you’ve built.
Ray Brubacher spent sixty years proving that a Grade 8 education couldn’t teach what frozen toes and broken handshakes could: Your word is the only thing that appreciates while everything else depreciates. Your reputation is built in the moments when no one would blame you for walking away, but you stay anyway—or when everyone expects you to stay, but principle demands you walk.
That’s the legacy that matters.
Not the All-Americans or the Klussendorf Award or the $25,000 sale toppers or even judging all four Royal shows. Those are résumé items. They’re impressive. They matter.
But what matters more—what’s going to matter as we watch 5,900 operations disappear by 2028—is whether your word still means something. Whether handshakes still count. Whether integrity is negotiable or not.
Ray decided it wasn’t. Twice. And instead of costing him, it made him.
In an industry watching consolidation accelerate faster than anyone predicted, where contracts are replacing relationships and lawyers are replacing livestock judges, Ray’s story isn’t nostalgia.
It’s a survival strategy.
The fundamentals he learned are still the fundamentals. They just cost more now when you get them wrong.
Ray Brubacher passed away, having built a Holstein legacy that spanned two countries, four continents of judging, and countless lives touched by his infectious enthusiasm for the breed. Three generations of Brubachers shaped North American Holstein breeding through A.B.’s visionary auction business, Mike’s steady management, and Ray’s international expertise. Their name still echoes through Ontario sale barns and Wisconsin show rings—not just because of the cattle they bred or the sales they managed, but because of the standard they set: passionate, principled, and present for the long game.
That’s a legacy measured not in generations of cattle, but in generations of cattlemen who learned what it means to do it right.
EXECUTIVE SUMMARY:
Five thousand nine hundred dairy farms will vanish by 2028. Ray Brubacher built three generations by doing what most producers won’t — walking away from people who broke their word. Twice, he quit elite positions over handshake violations. Both times, everyone said he was finished. Both times, consignors lined up at his next door. This profile distills his principle into a four-test integrity audit you can use to score your operation today. In consolidating markets, reputation is the only asset that appreciates—and Ray Brubacher proved it costs nothing to build, but everything to rebuild.
Key Takeaways:
Break your word, I walk. Ray quit two elite positions over handshake violations. Both times, everyone said he was finished. Both times, it made his career. How you respond to betrayal IS your reputation.
Reputation is your only appreciating asset. Barns depreciate. Genetics become outdated. Trust compounds. Ray built three generations on that math.
Bad markets build lifetime loyalty. Ray bought consignors’ cattle when nobody else would bid. Those soft-market decisions created forty years of trust. The relationships you protect now will protect you later.
Ego kills succession. Ray returned at 41 without demanding control. One non-negotiable (the new barn), then he stepped back. Three generations later: still in business. How many competitors can say that?
Sources & Acknowledgments
This profile draws from an interview with Ray Brubacher conducted by Doug Blair and published in Legends of the Cattle Breeding Business: In Their Own Words by Doug Blair and Ronald Eustice and The Holstein History by E.Y. Morwick. Ray’s voice, stories, and personal reflections are preserved through their invaluable documentation of holstein history. Additional historical context drawn from Ray Brubacher’s 1992 interview published in Holstein-Friesian World by Miles McCarry, industry sales records, Brubacher Bros. Limited historical documentation, USDA dairy operation statistics, and contemporary dairy market analysis (2025-2026).
Every week, thousands of producers, breeders, and industry insiders open Bullvine Weekly for genetics insights, market shifts, and profit strategies they won’t find anywhere else. One email. Five minutes. Smarter decisions all week.
12% milk increase in the research. 4% on real farms. $234,000 yearly gap. Nobody showed you the full picture. Until now.
EXECUTIVE SUMMARY: The research behind dairy technology claims is solid—the problem is what gets lost before it reaches your checkbook. AMS studies show ‘up to 12%’ production gains; real farms often see 4%. Methane additives promise 30% reductions; grazing operations get 5%. The milk-fertility trade-off everyone accepts? Genomic research shows it’s an oversimplification costing you progress. Add it up: these gaps can drain $200,000+ annually from a 500-cow operation. If you’re using vendor ROI calculators to plan your debt service, you’re not planning—you’re gambling. Here’s the full picture, plus an 8-point framework to protect your next major investment.
I had a chat with a Wisconsin dairy producer not long ago—let’s call him Dave—who’d done what most of us would consider solid homework before signing papers for a four-robot milking system back in 2022. The dealer had shown him university research claiming 10-12% production increases. The ROI calculator projected a payback period of under 5 years. A neighbor couldn’t stop talking about his new setup.
Eighteen months later, Dave’s 380-cow operation had boosted production by about 4%. Not a failure—but barely a third of what he’d built his financial projections around. Labor savings materialized, though not quite as dramatically as he’d anticipated. And that fetch cow situation? It ate up more management time than anyone had mentioned during the sales process.
“I don’t regret the decision,” he told me. “But I wish someone had shown me the full distribution of outcomes instead of just the highlight reel. The research they quoted was real—it just didn’t apply to my situation the way they made it sound.”
His experience resonates with many producers I’ve spoken with over the years.
The Journey Research Takes Before It Reaches Your Kitchen Table
Here’s something worth acknowledging upfront: most of the foundational research behind dairy technology claims is actually pretty solid. The scientists doing this work at places like the USDA’s Animal Genomics and Improvement Laboratory, Wageningen University, and land-grant extension programs across North America are rigorous professionals. They include careful caveats, acknowledge variability, and specify the conditions under which their results apply.
The challenge isn’t the research itself. It’s what happens to that research as it moves through the information pipeline toward farmers making real decisions.
Consider automated milking systems. Back in 2012, Jacobs and Siegford published an influential invited review in the Journal of Dairy Science examining how AMS affects dairy cow management, behavior, and welfare. Their finding? AMS “has the potential to increase milk production by up to 12%.” Notice the careful language—“potential” and “up to.” The same paper explicitly noted that producers may not fully realize these benefits depending on management factors and facility design.
By the time those findings work through extension publications, the hedging softens. By the time it reaches some dealer presentations? The message becomes simply: “Robots increase milk 10-12%.” The asterisks disappear.
Here’s what that looks like in practice:
What Research Actually Says
What Often Gets Communicated
What You Should Ask
“Potential to increase production up to12%”
“Robots increase milk 10-12%.”
“What percentage of installations actually hit that number?”
“Results depend on management factors and facility design.”
“Modern systems are plug-and-play.”
“What are the top three reasons farms underperform?”
“Mixed outcomes observed across installations”
“Our customers see great results.”
“Can I visit a farm where results fell short?”
“Adaptation period affects initial performance.”
“You’ll see improvements quickly.”
“What’s the typical timeline to full productivity?”
Canadian research has examined gaps between producer perceptions and measured AMS outcomes, and the findings suggest these perceptions don’t always align with reality. That’s critical context for anyone evaluating a major capital investment.
The Real Cost of the Information Gap
This naturally raises a question: what’s the actual cost when decisions get made on incomplete information?
I spent some time working through the economics, and the numbers are larger than I initially expected.
The Council on Dairy Cattle Breeding released their Net Merit 2025 revision earlier this year, adjusting weights for feed efficiency, component-based milk pricing, and fertility based on updated economic values. For operations still using older selection approaches, the cumulative difference in genetic progress can be substantial. Canadian producers using LPI face similar recalibration questions—the trait weightings don’t align perfectly with Net Merit, which means the “best” bull on one index may not rank the same way on the other. In Canada, where the LPI heavily weights conformation, a top-ranking bull might fail the Net Merit ‘Economics-First’ test for a commercial operation focused solely on component-weighted milk checks.
When you add up the various ways outdated approaches cost operations money—from raising replacement heifers that genomic testing would have identified for beef-on-dairy programs, to extended days open from breeding strategies that don’t leverage current fertility data—the conservative total for a 500-cow operation can approach $200,000 or more annually.
Now, I want to be clear: while individual components draw from CDCB and university research, this aggregate estimate represents one analytical framework. Your results depend on current practices, market conditions, and factors specific to your operation. But the magnitude? That demands serious attention.
And if you’re using a vendor’s ROI calculator to plan your 10-year debt service, you aren’t planning—you’re gambling.
What the Genomics Revolution Actually Tells Us About Trade-offs
This gap between research and reality isn’t limited to hardware, such as robots. It’s arguably more dangerous when it’s invisible—locked inside the genetics of your herd, compounding quietly for years before you realize you’ve been leaving money on the table.
The conventional wisdom I still hear at producer meetings goes something like this: “If you want high milk, you’re going to sacrifice fertility and health. That’s just the trade-off.”
Here’s where it gets interesting—that’s not quite right. Or more precisely, it’s an oversimplification that may be costing some operations genetic progress they don’t even know they’re missing.
A 2024 study in the Journal of Dairy Science used archetypal clustering to trace which specific genetic variants affect both milk production and fertility. The researchers identified distinct genetic pathways with varying impacts on the production-fertility relationship.
Some genetic variants do show the expected trade-off—they boost milk while hurting fertility. But other variants, particularly those near the DGAT1 gene, increase milk production through completely different biological pathways. Hoard’s Dairyman explained how a mutation in DGAT1 affects fatty acid assembly—the energy the cow would have used for fat production becomes available to support milk yield instead. These variants show minimal impact on reproductive traits.
What does this mean practically? Bulls carrying high-production genetics from the non-antagonistic pathways can deliver milk improvement without the fertility penalty. Breeders who categorically avoid all high-PTA-milk bulls based on the simplified “milk hurts fertility” assumption are leaving genetic progress on the table. This is why we argue that balance is the only sustainable genetic strategy.
The Nordic countries recognized this more than 40 years ago. By incorporating fertility into their selection indices and identifying bulls where production alleles came from pathways that don’t compromise reproduction, they maintained strong genetic fertility levels while continuing to make production progress. Dairy Global reported that Nordic Holstein bulls remain at a higher genetic level for fertility than many other populations.
The research has been available for years. The industry just hasn’t caught up.
A Real-Time Example: Methane Tech ROI and the 5% vs 30% Problem
The same pattern—solid research, simplified messaging, context-dependent results—is playing out right now with methane reduction technology. And this one’s worth watching closely because sustainability premiums and regulatory pressure are raising the stakes fast. EU Green Deal requirements are pushing European processors toward verified emissions reductions, and that pressure will eventually cross the Atlantic.
3-NOP, marketed as Bovaer by Elanco, received FDA approval in 2024 as a methane-reducing feed additive. You’ve seen the headlines: “Reduces methane emissions by about 30% in dairy cows.”
The peer-reviewed research is legitimate. A 2023 meta-analysis by Kebreab and colleagues in the Journal of Dairy Science found 3-NOP reduced methane by about 31% on average.
But here’s what doesn’t make the headlines: over 70% of the total variability in outcomes was due to heterogeneity across studies. That 31% is an average masking substantial variation.
If you’ve been told Bovaer is your ticket to sustainability premiums on a grazing operation, someone left out five-sixths of the story.
Feeding System
Research Finding
What It Means For You
TMR (confinement)
Up to 30%+ reduction
Additive stays in feed continuously; full efficacy possible
Grazing (twice-daily supplementation)
~5% reduction over 24 hours
Methane drops 28.5% for 3 hours post-supplementation, then returns to baseline
That grazing data comes from a 2024 Teagasc trial in Ireland, published by Costigan and colleagues in the Journal of Dairy Science. For grazing operations, the economic math is completely different than the headline suggests.
What farmers hear: “Reduces methane 30%.”
What they need to know: “Results range from 5-30%+ depending on feeding system, and the economics only work if carbon credits or sustainability premiums in your market cover the additive cost.”
A Practical Approach to Dairy Technology Investment
After talking with producers who’ve navigated major technology decisions—some successfully, some expensively—certain patterns emerge.
They build their own financial models. Not the vendor’s calculator—their own, using assumptions they can defend to their banker at 2 AM when they can’t sleep.
Cost Category
Vendor Calculator Assumption
Real Farm Cost
Your Gap ($/year)
Equipment price
$250,000
$250,000
$0
Installation
Included
50-100% of equipment cost
$75,000
Training & learning curve
“Minimal”
6-12 months lost productivity
$18,000
Labor replacement
$15/hour × 2 FTE
$22/hour skilled tech (new hire)
$14,560
Facility modifications
Not mentioned
Electrical, HVAC, fetch cow area
$32,000
Integration support
Free first year
$4,500/year ongoing
$4,500
Production shortfall
10-12% gain
4% actual (median farm)
$36,000
TOTAL HIDDEN COSTS
—
—
$180,060
Financial advisors working with dairy operations commonly recommend targeting a minimum 15% ROI to justify the risk and management complexity. Your model should include the costs that get glossed over: installation expenses (often 50-100% of equipment cost for robotics), learning curve losses during adaptation, training fees, and the wage differential between the labor you’re replacing and the skilled technical labor you’ll need.
They visit farms where the technology struggled. When a dealer offers tours, most people want success stories. Sharp buyers ask: “Show me a farm where this didn’t go as planned. What went wrong?”
If a vendor can’t provide that reference, ask yourself why.
They stress-test the downside. One California producer applies what she calls the “survival test”: “If this completely fails, can our farm survive the loan payment while we figure out Plan B? If the answer is no, the potential upside doesn’t matter.”
They get promises in writing. Minimum production guarantees. Response time commitments. Performance clauses.
As one equipment dealer candidly told me: “If they won’t put it in writing, they don’t fully believe their own numbers.”
When the Process Works
What’s encouraging is that a thorough evaluation often leads to genuine adoption success.
An Indiana operation spent eight months evaluating genomic testing programs before committing to comprehensive heifer screening on their 450-cow dairy. They visited farms that had abandoned programs after disappointing results. They built their own models. They negotiated a performance review clause.
“The farms that struggled had treated genomics like a silver bullet,” the producer told me. “They tested everything but didn’t change their breeding or culling strategies based on results. We went in knowing exactly how we’d use the data differently.“
Two years in: reduced replacement costs, improved conception rates, shortened genetic lag. Calculated ROI: over 300%.
The difference wasn’t whether they adopted technology. It was how.
Your Pre-Decision Checklist
Before signing for any major technology investment:
Decision Criterion
Why It Matters
✓/✗
Visited underperforming installations
Dealers show successes; you need failure modes and frequency
☐
Built independent financial model
Vendor calculators exclude hidden costs that determine survival
☐
ROI exceeds 15% (realistic scenario)
Below 15% doesn’t justify risk + complexity for most operations
☐
Operation survives if tech completely fails
If no, potential upside doesn’t matter—one failure ends the farm
☐
Claims validated with independent sources
University extension ≠ vendor-funded studies; verify independently
Longer = higher risk of obsolescence, market shifts, refinancing stress
☐
Performance guarantees in writing
If they won’t contract it, they don’t believe their own numbers
☐
If you can’t honestly check all of them, slow down. There’s rarely a penalty for taking another month.
The Bottom Line
The gap between research and practice isn’t something farmers created; it’s fallen to them to navigate. Publication bias, constrained extension services, the natural tendency for complex findings to get simplified—these won’t change quickly.
What can change is how you approach decisions.
A Minnesota producer who’s successfully adopted several technologies over the past decade put it this way: “I’ve learned to treat every technology pitch with healthy skepticism. The claims might be technically true, but the version that applies to my specific farm is probably less impressive than the headline. Once you accept that going in, you can make much better decisions.”
The research is solid. The scientists are rigorous. The caveats they provide are valuable.
The question is whether that complete picture makes it to your kitchen table before you sign the check.
Your move: Before your next genetics meeting or equipment conversation, pick one claim you’ve heard recently and trace it back to the original research. The gap between headline and reality might change how you approach your next capital decision.
KEY TAKEAWAYS
12% in research, 4% on farms: AMS production claims come with asterisks that vanish before reaching your kitchen table. Demand outcome distributions—not highlight reels.
30% vs 5%—system matters: Methane additives deliver in TMR but fall flat on pasture. If you’re grazing, someone left out five-sixths of the story.
The milk-fertility “trade-off” is costing you: Some genetic pathways boost production without hurting reproduction. Blanket avoidance of high-PTA-milk bulls leaves progress—and money—on the table.
$200,000+ vanishes annually: Information gaps—outdated genetics, missed beef-on-dairy calls, tech underperformance—drain six figures from a 500-cow operation every year.
Vendor calculators aren’t due diligence: Build your own model. Visit farms where it failed. Stress-test the downside. Get guarantees in writing. If you can’t check all eight boxes—slow down.
Complete references and supporting documentation are available upon request by contacting the editorial team at editor@thebullvine.com.
Every week, thousands of producers, breeders, and industry insiders open Bullvine Weekly for genetics insights, market shifts, and profit strategies they won’t find anywhere else. One email. Five minutes. Smarter decisions all week.
The cows haven’t changed. The math has. Why good dairies are suddenly fighting to survive.
Executive Summary: Well-managed mid-size dairies are facing a reckoning that has nothing to do with their cows. As loans from the low-rate era (2015-2021) reset to current markets—the Chicago Fed shows operating rates now at 7.73%, nearly double what many locked in—debt service is jumping 25-30% overnight. For a 400-cow dairy with typical leverage, that translates to $120,000 in added annual costs before a single operational change. Here’s what catches producers off guard: even farms current on every payment can trigger technical default when covenant ratios slip due to rate-driven debt increases, not management problems. More than 1,400 U.S. dairies closed in 2024, per USDA—Wisconsin alone lost 400. The path forward requires calculating your true breakeven at new rates, engaging lenders proactively with specific proposals, and recognizing that planned transitions preserve far more family wealth than forced exits ever do.
I’ve been having a lot of conversations lately that start the same way. A producer messages me after seeing their repricing notice, and the story sounds remarkably similar each time.
Take Dave, a Wisconsin dairyman I spoke with. When he ran his numbers after getting the repricing letter on his real estate loan, he discovered his breakeven had jumped from $17.50 to $19.20 per hundredweight. Nothing about his 380-cow operation had changed. The cows were still averaging 78 pounds. His nutrition program was dialed in. His fresh cow protocols were solid, and his transition period management hadn’t slipped. But the math had fundamentally shifted.
“I’ve been through bad milk prices before,” Dave told me. “I know how to tighten things up when we’re looking at $14 milk. But this feels different. My costs went up $110,000 from a single letter, and there’s nothing I can do with the cows to fix it.”
What struck me about that conversation—and the dozens like it I’ve had since—is how it captures something important about this moment. The challenge facing many mid-size operations isn’t about milk prices, feed costs, or management. It’s about debt structures that made perfect sense in one interest rate environment but don’t pencil out in another.
Understanding how this works can help you think through your own situation more clearly, whether you’re facing repricing directly or trying to plan around it.
How Dairy Loan Repricing Works
Here’s the backstory. During that stretch from roughly 2015 to 2021, agricultural lenders originated an enormous volume of dairy farm debt at rates between 3% and 4.5%. These loans financed the expansions, land purchases, parlor upgrades, and equipment investments that allowed mid-size operations to modernize and grow. It was, by most measures, a reasonable time to borrow.
Most of these loans were structured with 5-to-7-year terms before repricing—standard practice for agricultural real estate and equipment financing. What that means, practically speaking, is that a significant wave of debt is now resetting to current market rates. Federal Reserve Bank surveys throughout 2025 have documented this transition, with the Minneapolis Fed noting weakening credit conditions and declining farm incomes across the Ninth District.
The rate environment has changed substantially. The Chicago Fed’s agricultural credit survey from early 2025 shows operating loans averaging 7.73% and real estate loans at 7.09%. That’s roughly double what many producers locked in five or six years ago.
To put some numbers to this, consider a fairly typical 400-cow dairy carrying $4.5 million in total debt—the kind of balance sheet you’d see on a farm that expanded or did major capital improvements during that low-rate window:
The Repricing Impact: A Side-by-Side Comparison
Debt Category
Original Rates (2020-2021)
Repriced Rates (2025)
Annual Increase
Real Estate Debt (15-year)
3.5% → $232,000/yr
7.5% → $300,000/yr
+$68,000
Equipment Debt (7-year)
4.0% → $197,000/yr
7.0% → $217,000/yr
+$20,000
Operating Line
3.0% → $18,000/yr
8.0% → $48,000/yr
+$30,000
TOTAL ANNUAL DEBT SERVICE
$446,000
$566,000
+$120,000 (+27%)
Based on a representative 400-cow dairy with $4.5 million total debt. Actual figures vary by operation.
That $120,000 difference translates to roughly $1.30 per hundredweight across a year’s production. For operations already running on tight margins, that kind of shift can consume the entire profit cushion that existed under the previous rate structure.
Dr. Mark Stephenson, the former Director of Dairy Policy Analysis at the University of Wisconsin-Madison, frames it this way: “What we’re seeing is farms that were profitable, well-managed, and operationally sound suddenly finding themselves underwater. It’s not a management problem. It’s a capital structure problem that originated in decisions made by both borrowers and lenders five to seven years ago.”
That framing matters. This isn’t about who’s a good farmer. It’s about financial structures adapting to changing conditions.
Which Dairy Farms Face the Greatest Repricing Risk
Operations under the greatest pressure tend to share certain characteristics. They’re typically in the 200 to 600 cow range—large enough to carry significant debt, but not quite large enough to achieve the per-unit cost advantages that help buffer larger operations against margin compression. They’re generally carrying debt-to-asset ratios between 65% and 70%, which means they’re leveraged enough that repricing creates covenant pressure, but weren’t in distress before rates moved. And most originated their loans between 2017 and 2021, during that window of historically low rates.
Geographically, the pressure seems most concentrated in traditional dairy regions. I’m hearing the most concern in Wisconsin, Michigan, Minnesota, New York, Pennsylvania, and parts of California and Idaho. The dynamics play out somewhat differently in Western dry-lot operations, where scale economics and distinct cost structures create distinct patterns. And in Canadian quota provinces, the supply management system provides some insulation, though producers there face their own version of capital intensity challenges.
The broader context here is important. The 2022 Census of Agriculture documented that approximately 65% of the nation’s dairy herd now lives on operations with 1,000 or more cows—up from just 17% back in 1997. That trajectory has been building for decades, but the current rate environment appears to be accelerating it.
USDA’s February 2025 milk production report showed that more than 1,400 U.S. dairy operations closed in 2024—about 5% of the national total. Wisconsin lost approximately 400 dairy farms that year, more than any other state, followed by Minnesota with 165 closures. Those aren’t just statistics. Each one represents a family working through some very difficult decisions.
The stress extends beyond dairy. The American Farm Bureau Federation reported that Chapter 12 farm bankruptcies—the filing type designed specifically for family operations—were up 56% through June 2025 compared to the same period in 2024. For all of 2024, there were 216 Chapter 12 filings nationally, up 55% from 2023. The Kansas City Fed noted in their mid-2025 agricultural finance report that farm loan delinquency rates have increased for the second consecutive year, though they remain low by historical standards.
These indicators don’t necessarily predict a crisis, but they do suggest the farm economy is under meaningful pressure that warrants attention.
The Loan Covenant Trap Many Producers Miss
This is an area where I think many producers could benefit from a clearer understanding, because it often becomes relevant before anyone expects it.
Most agricultural loans include financial covenants—requirements that borrowers maintain certain ratios to remain in good standing. The common ones include:
Debt Service Coverage Ratio: Typically 1.25x minimum, meaning net farm income needs to exceed debt payments by at least 25%
Current Ratio: Often 1.5x minimum, measuring working capital adequacy
Debt-to-Asset Ratio: Usually capped at around 60%
Here’s what’s worth understanding: when interest rates rise and debt service increases, these ratios can deteriorate even when operational performance remains strong. A dairy that comfortably met a 1.45x debt service coverage ratio at old rates might find itself at 1.14x after repricing—technically in covenant breach, even though production, costs, and management quality haven’t changed.
The wrinkle that surprises many producers is that once a covenant is breached, the loan is technically in default regardless of whether payments are current. This can trigger a sequence of lender responses.
I’ve spoken with agricultural lending professionals at several Farm Credit associations across the Midwest about how this plays out. As one loan officer with more than two decades of experience described it: “The farm could be making every payment on time, the cows could be performing beautifully, and they’re still in technical default. Those are hard conversations to have with producers who are doing everything right operationally.”
The typical progression involves enhanced reporting requirements first—monthly financials instead of quarterly. Then restrictions on capital expenditures and owner draws. If covenant compliance doesn’t improve, there may be requests for equity contributions or principal reduction. In more serious cases, loan acceleration becomes possible.
None of this is inevitable, and many lenders work constructively with borrowers to find solutions. But understanding the framework helps in planning how to approach these conversations.
Strategic Options and What They Can Realistically Achieve
I want to be straightforward here. There’s no simple fix for a structural repricing challenge. But some approaches can help, and understanding both their potential and their limitations is valuable.
Comparing Your Options
Strategy
Potential Annual Savings
Key Limitation
Amortization Extension (15→25 yr)
$80,000–$100,000
Doesn’t reduce principal; extends total interest paid
Strategic Herd Reduction (15-25%)
$60,000–$80,000
Revenue declines proportionally with a smaller herd
Operational Efficiency Gains
$55,000–$74,000
Rarely sufficient alone for $120K repricing gap
FSA Refinancing (4.625%–5.75%)
Varies by exposure
$600K ownership / $400K operating caps
Private Ag Lenders
Covenant flexibility
Rates are often comparable or higher than repricing levels
Savings estimates based on a representative 400-cow operation. Individual results vary significantly.
Engaging Your Lender Early
This consistently emerges as the most effective intervention. Producers who engage their lenders before repricing notices arrive—rather than after covenant issues develop—generally report more constructive conversations and better outcomes.
The difference between proactive and reactive discussions is substantial. When a producer approaches their lender with a thought-out plan before being flagged in the system, there’s typically more flexibility to work with. Once an account is classified as a problem asset, institutional constraints tend to narrow the options. That’s not a criticism of lenders—it’s just how credit administration typically works.
Approaches that seem to help include extending amortization from 15 years to 20-25 years (which can reduce annual payments by $80,000 to $100,000), requesting covenant modifications that reflect rate-driven rather than operational changes, and presenting cash flow projections based on realistic milk prices in that $18 to $19 per hundredweight range rather than more optimistic scenarios.
One thing I’d suggest: come to that meeting with a specific proposal rather than a list of possibilities. Demonstrate that you’ve carefully worked through the numbers. And focus on the financial analysis rather than the emotional weight of the situation—lenders work from models, and you’ll communicate more effectively if you engage on those terms.
Considering Herd Adjustments
Some operations are finding that a deliberate reduction in herd size—typically 15% to 25%—can restore financial stability when combined with proportional debt reduction.
The arithmetic: selling 80 cows from a 400-cow operation might generate $600,000 to $800,000 in proceeds, depending on cow values and quota where applicable. Applied directly to debt reduction, this can decrease annual debt service by $60,000 to $80,000—a meaningful offset against repricing impact.
The trade-off is real, though. Revenue declines with a smaller herd. This approach works better as a bridge to stability than as a permanent solution. A 320-cow operation carrying $3.8 million in debt at current rates still faces challenging economics. You’re creating breathing room, not resolving the underlying situation.
Operational Improvements
Focused attention on cost reduction absolutely has value, but it’s important to be realistic about what’s achievable:
Nutrition optimization: Working with a skilled nutritionist to refine rations typically yields savings of $0.30 to $0.50 per cwt. On a 92,000 cwt annual production, that’s $27,600 to $46,000—meaningful, but not transformative against a $120,000 repricing impact.
Labor efficiency: Workflow improvements without major capital investment might capture $0.15 to $0.25 per cwt.
Component and quality premiums: Optimizing butterfat and protein capture can add $0.20 to $0.30 per cwt if there’s room for improvement. Many operations have already pushed hard on this.
Combined realistic potential runs $0.60 to $0.80 per cwt—roughly $55,000 to $74,000 annually. That’s valuable and worth pursuing regardless of the rate environment. But it’s typically not sufficient on its own to offset a $1.30 per cwt repricing impact.
Alternative Financing Sources
Some producers are exploring options beyond traditional bank and Farm Credit financing:
USDA Farm Service Agency loans currently offer competitive rates—4.625% for direct operating loans and 5.750% for direct farm ownership loans as of December 2025. The constraint is dollar limits: FSA caps direct farm ownership loans at $600,000 and direct operating loans at $400,000. For a farm needing to refinance $2.7 million in real estate debt, these programs can help with a portion, but won’t address the full exposure.
Private agricultural lenders like AgAmerica and Rabo AgriFinance may offer more flexibility on covenant structures. Rates tend to be comparable to or somewhat higher than traditional sources, so this is more about terms than cost savings.
Realistic combined capital access from these alternative sources typically runs $300,000 to $600,000—helpful for bridging gaps, but generally not sufficient to resolve a seven-figure repricing exposure.
A Framework for Making These Decisions
What I’ve found most valuable in conversations with producers facing these decisions is an honest, numbers-first assessment. The emotional weight of these situations is real—often we’re talking about multi-generational operations and family identity. But the financial analysis needs to proceed on its own terms.
This is where working with good advisors makes a difference. Farm transition specialists, agricultural attorneys, and CPAs who understand dairy operations can help families see the full picture and evaluate options they might not have considered.
Some questions worth working through carefully:
What’s your true breakeven at new rates? This means debt service, operating costs, family living, and a realistic allowance for capital replacement. Calculate it precisely rather than estimating.
How does that breakeven compare to realistic price expectations? If you’re pushing above $19 per hundredweight, there’s very little margin for the unexpected.
Do you have access to meaningful outside capital? This could be family resources, off-farm assets, or other sources—but it needs to be real and accessible, not theoretical.
What signals is your lender sending? There’s often a gap between what we hope they mean and what they actually communicate. Try to hear the latter clearly.
What does the next generation want? If successors aren’t committed to the operation, the calculus changes significantly.
For operations where the breakeven is pushing toward $20 per cwt, debt-to-asset exceeds 70%, and there’s no access to outside capital, the outlook is genuinely difficult regardless of how well the cows are managed. In those situations, a planned transition—executed while meaningful equity remains—typically preserves substantially more family wealth than a forced exit 18 to 24 months later. Farm transition specialists consistently find that strategic exits preserve considerably more equity than distressed sales—often amounting to several hundred thousand dollars for families with significant remaining assets.
That kind of decision isn’t giving up. It’s sound financial management applied to a difficult situation.
The Other Side of This Story
It’s worth acknowledging that this environment doesn’t affect everyone the same way. Producers who maintained conservative balance sheets through the low-rate years—those who resisted the temptation to expand aggressively or who paid down debt rather than refinancing—find themselves in a very different position today.
For well-capitalized operations with strong working capital and minimal leverage, the current environment may actually present opportunities. Land that wouldn’t have come to market is becoming available. Equipment can be acquired at more favorable prices. Some producers are finding strategic growth opportunities they couldn’t access two years ago.
That’s not meant to minimize what leveraged operations are facing. But it’s a reminder that market stress always creates a range of outcomes. Where you land depends heavily on decisions made years ago—and on the decisions you make now.
What This Means for the Industry
Beyond individual farm decisions, the repricing wave is accelerating structural changes that have been building for some time.
The consolidation trend toward larger operations will likely continue. We’ve already seen the share of cows on 1,000-plus operations climb from 17% in 1997 to 65% in 2022, according to the Census of Agriculture. The mid-size family dairy is becoming an increasingly uncommon business model, particularly in regions without quota systems or other structural supports.
From the processor perspective, the picture is mixed. One Midwest cooperative executive described it this way: consolidation creates certain efficiencies in milk collection and quality consistency. “But we’re also watching our supplier base shrink faster than anyone planned for. When you lose 400 farms in a region over a few years, that’s infrastructure—roads, services, veterinary capacity—that doesn’t rebuild easily.”
Industry organizations are responding. The National Milk Producers Federation has advocated for expanded FSA lending authority, and the PACE Act was reintroduced in Congress in March 2025. If enacted, it would increase the caps on direct farm ownership loans from $600,000 to $1.5 million and on direct operating loans from $400,000 to $800,000. Whether any of this moves quickly enough to help farms facing near-term repricing remains uncertain.
There’s a broader consideration worth noting. As mid-size operations exit, the industry loses independent decision-makers who have historically contributed resilience through diversity of approach. Dr. Marin Bozic, an agricultural economist who spent a decade studying dairy markets at the University of Minnesota, has described this as “trading resilience for efficiency.” That trade-off works well under normal conditions. It becomes a vulnerability when circumstances deviate from what the models anticipated.
Practical Next Steps
For producers facing repricing in the next 12 months:
Know your numbers precisely. Calculate your exact breakeven cost at new rates—not an estimate, an actual calculation. That number anchors everything else.
Engage your lender before they engage you. Come with a specific proposal and realistic projections. The conversation is different when you initiate it.
Build your advisory team now. Connect with a farm transition specialist, an agricultural CPA, and potentially an ag attorney, even if you’re planning to continue. Understanding your options strengthens your position.
For those considering expansion or major capital investment:
Model everything at current rates. The 3% environment from 2019 isn’t returning in any relevant timeframe. Plan accordingly.
Stress-test at challenging milk prices. See how your projections hold at $17 to $18 per cwt, not just at more optimistic levels.
Understand that comfortable leverage at 4% becomes uncomfortable at 7-8%. The production side of your operation doesn’t change, but the financial dynamics shift considerably.
The Bottom Line
What’s unfolding now isn’t primarily about who’s skilled at producing milk. Many capable operations are exiting not because they can’t compete on the production floor, but because debt structures that worked in one rate environment don’t pencil out in another.
We’re going to see more good dairy families work through difficult transitions over the next couple of years. Not because they couldn’t manage cows or run tight operations, but because the financial landscape shifted in ways that were partly foreseeable and partly not.
But here’s something worth remembering: dairy has always adapted. The industry that emerges from this period will look different, yes. Some of the changes will feel like losses. But there will also be opportunities—for those who navigate successfully, for new models that emerge, for the next generation that finds ways to make the economics work.
The families who approach this period with clear financial thinking, good advice, and honest assessment of their situations will be best positioned—whether that means restructuring successfully, transitioning on their own terms, or finding paths forward that none of us have fully anticipated yet.
Understanding the dynamics at play is the first step. What you do with that understanding is up to you.
Key Takeaways
The cows haven’t changed—the math has: Loans repricing from 3.5% to 7.5% add ~$120,000 annually to a typical mid-size operation, or $1.30/cwt onto breakeven
You can be current and still default: Covenant breaches trigger technical default even when payments are on time—it’s the ratios, not missed payments, that trip the wire
Efficiency alone won’t close this gap: Operational improvements typically yield $0.60-$0.80/cwt; helpful, but not sufficient against a $1.30/cwt repricing hit
Talk to your lender before they talk to you: Proactive conversations with specific restructuring proposals consistently produce better outcomes than reactive ones
Planned exits beat forced ones: Strategic transitions preserve significantly more family equity than fighting until liquidation becomes the only option
Complete references and supporting documentation are available upon request by contacting the editorial team at editor@thebullvine.com.
Decide or Decline: 2025 and the Future of Mid-Size Dairies – Examines the specific “middle-ground” squeeze affecting 200-600 cow herds and outlines three distinct business models that are successfully navigating the gap between small-scale premiums and large-scale efficiency.
Every week, thousands of producers, breeders, and industry insiders open Bullvine Weekly for genetics insights, market shifts, and profit strategies they won’t find anywhere else. One email. Five minutes. Smarter decisions all week.
A $9.50 milk price sounds great—until you see the $8.50 break-even. NZ’s one-dollar margin is a wake-up call for dairy farmers everywhere.
Executive Summary: When the world’s lowest-cost milk producers are farming on a dollar of margin, that’s a wake-up call for dairy everywhere. New Zealand’s December 2025 numbers: $9.50/kgMS milk price, $8.50 break-even, one dollar left for debt, drawings, and reinvestment. They’re not alone. Teagasc projects Irish dairy incomes dropping 42% in 2026. UK farmgate prices have fallen below production costs. Rabobank calls global output growth ‘stunning’—the very oversupply compressing margins worldwide. And China’s shift from aggressive importer to tactical buyer has removed the demand safety valve the industry once counted on. The old formula—high prices equal comfortable margins—no longer holds. The farms that make it through will be those building resilience now: feed efficiency, component focus, diversified revenue, right-sized debt. Not growth for growth’s sake. Strategic survival.
When the world’s lowest-cost milk producers are working on about one dollar of operating margin per kilogram of milk solids, that’s worth every dairy farmer’s attention.
That’s exactly where New Zealand finds itself heading into 2026.
Here’s what makes this relevant beyond the Pacific: it’s essentially a real-time stress-test of the global dairy model. From Wisconsin freestalls to Irish grass paddocks to Canterbury’s irrigated pastures, the underlying question is the same.
If New Zealand’s efficient pasture systems can’t maintain comfortable margins at these milk prices, what does that mean for the rest of us?
The narrative has shifted. It’s less about waiting for the next price spike and more about adapting to a new reality—one defined by persistent cost pressure, cautious global buyers, and markets that recover more slowly than they used to.
Understanding the One-Dollar Margin
DairyNZ’s December 2025 Economic Update paints a clear picture.
Farm working expenses have climbed 16 cents to $5.83 per kgMS. Meanwhile, Fonterra revised its 2025-26 farmgate milk price forecast down to a midpoint of $9.50 per kgMS—a notable drop from the earlier $10.00 projection.
DairyNZ puts the break-even milk price for an average reference farm at around $8.50 per kgMS.
That leaves roughly a dollar per kgMS as operating surplus. And that’s before capital repayments, family drawings, or any reinvestment.
Metric
2024-25 Season
2025-26 Season
Change
Milk Price ($/kgMS)
$10.00
$9.50
-$0.50
Break-even Cost ($/kgMS)
$8.34
$8.50
+$0.16
Operating Margin ($/kgMS)
$1.66
$1.00
-$0.66
Farm Working Expenses ($/kgMS)
$5.67
$5.83
+$0.16
Interest Costs ($/kgMS)
$1.46
$1.11
-$0.35
Tracy Brown, DairyNZ’s chair and herself a Waikato dairy farmer, offered some measured perspective in their December update: “Profit is still on the table, but the margin gap has clearly tightened, and that means every spending decision on farm needs a harder look.”
That’s a statement worth sitting with.
What This Looks Like on a Real Farm
Think about a fairly typical New Zealand herd—400 cows producing 400 kgMS each. That gives you 160,000 kgMS for the season.
At $9.50 per kgMS, gross milk revenue comes to about $1.52 million NZD. With a break-even point of around $8.50, core operating costs consume roughly $1.36 million.
That leaves approximately $160,000 NZD of operating surplus.
On paper, that’s profit. But reality includes broken gates, aging tractors, and family obligations. The buffer is much thinner than the headline suggests.
I recently spoke with a consultant who works across both New Zealand and Australian operations. His observation: for a 200-cow farm, that surplus might only be $80,000 NZD before tax and drawings. For a 2,000-cow operation, you’re looking at roughly $800,000—but spread across substantially higher fixed costs and larger teams.
Farm Size
Production (kgMS)
Gross Revenue
Operating Costs
Operating Surplus
Margin Per Cow
200 cows
80,000
$760,000
$680,000
$80,000
$400
400 cows
160,000
$1,520,000
$1,360,000
$160,000
$400
2,000 cows
800,000
$7,600,000
$6,800,000
$800,000
$400
The ratio matters more than the headline number. Whether you’re milking 200 or 2,000, everyone’s working with a narrower buffer.
The Takeaway: A $9.50 milk price sounds strong. But with $8.50 break-evens, you’re farming on a dollar of margin—and that dollar has to cover everything else.
Tracing the Cost Increases
Where exactly did those 16 cents go? Understanding the drivers makes them easier to address.
DairyNZ’s Econ Tracker identifies three primary contributors.
Cost Category
Increase (¢/kgMS)
400-Cow Farm Impact
Controllability
Feed Costs
+7¢
+$11,200
Medium – Nutrition strategy
Fertiliser
+4¢
+$6,400
Low – Global commodity
Electricity/Irrigation
+2¢
+$3,200
Low – Fixed infrastructure
Wages
+2¢
+$3,200
Low – Labour market
Repairs/Maintenance
+1¢
+$1,600
Medium – Defer vs invest
Compliance
+1¢
+$1,600
None – Regulatory
Other Operating
-1¢
-$1,600
Variable
TOTAL
+16¢
+$25,600
—
Feed costs have risen meaningfully year-on-year across most categories. Palm kernel has been somewhat more stable, but grain and purchased roughage have risen noticeably.
Fertiliser continues to pressure budgets. Phosphate and urea prices remain elevated, driven by energy market dynamics and export restrictions from major suppliers. Teagasc’s Outlook 2026 suggests costs will climb further as the EU Carbon Border Adjustment Mechanism takes effect.
Other operating costs—repairs, freight, wages, fuel, compliance—have all experienced inflation.
The encouraging news? DairyNZ reports that interest costs are easing. Payments are forecast to drop about 35 cents to $1.11 per kgMS for 2025-26.
The catch? Those interest savings are largely offset by increases elsewhere. The budget might show relief on one line, but feed, fertiliser, and operating costs are absorbing it.
For a 200-cow farm, this might mean choosing between replacing an ageing parlour component or making do with repairs. On a 2,000-cow dry-lot operation, it could be the difference between upgrading a feed mixer or deferring that decision another year.
The Takeaway: Feed and fertiliser are eating your interest rate savings before you ever see them.
The Production Paradox
This is where the situation becomes counterintuitive.
New Zealand is currently in its spring flush. DairyNZ reports national milk collections running about 3.4% ahead of last season, with August and October 2025 volumes among the highest on record.
South Island production in October was up 5.7% year-on-year. Customs data shows palm kernel imports are up significantly—a clear indicator that farmers leaned into purchased feed to boost production.
Why does this matter? Because the same pattern is playing out across multiple dairy regions simultaneously.
I’ve been following similar trends in US and European coverage. Where corn or by-products are relatively affordable, there’s considerable temptation to push cows harder to maintain cashflow. Especially when fixed obligations don’t adjust downward just because your milk price does.
At the individual farm level, this appears entirely rational. If you’ve already invested in the parlour, the effluent system, and the bank financing, pushing a few more kilograms through spreads those fixed costs.
But collectively? When New Zealand, the US, Ireland, and parts of Europe all make that same calculation simultaneously, you end up with what Rabobank’s December 2025 commentary described as “stunning” global output growth.
Region
2026 Growth Forecast
Impact on Global Supply
Argentina
+4.0%
Aggressive expansion continues
United States
+1.3%
Steady growth despite tight margins
New Zealand
+1.0%
Spring flush pushing volumes
European Union
0.0%
Only major exporter hitting brakes
That additional milk is precisely why price forecasts have moderated.
A Midwest producer I spoke with recently put it simply: “We’re not trying to grow anymore—we’re trying to survive long enough to see the other side.”
The Takeaway: What makes sense on your farm might be making things worse for everyone—including you.
Regional Perspectives
New Zealand’s experience offers the clearest current signal. But similar pressures are emerging across other major dairy regions.
Region
Current Margin (2025)
2026 Forecast
Key Pressure Point
Competitiveness
New Zealand
+$1.00/kgMS
Tight ($0.80-1.00)
Feed & fert eating savings
High — Pasture based
Ireland
€0.115/L
Severe (-45%)
Butter price collapse
Medium — Scale challenges
United Kingdom
Below cost (38.5p/L)
Further pressure
Commodity liquid pricing
Low — High costs
United States (DMC)
Above $9.50/cwt
Stable (low feed)
Production growth
Variable — Regional
European Union
Squeezed — varied
Contraction likely
China probe uncertainty
Medium — Policy support
Ireland: Preparing for a Correction
Teagasc’s Outlook 2026 projects that average Irish dairy farm incomes could decline by approximately 42% in 2026. That would take the average income from an estimated €137,000 this year to around €80,000.
Their baseline anticipates milk prices moderating from the high-40s cent per litre range back toward approximately 42 cents.
At 11.5 cents per litre, the average dairy net margin in 2026 is forecast to be down 45% from 2025 levels.
For a 70-hectare, 100-cow family farm, cash surplus after drawings and loan repayments could drop from around €80,000 to closer to €45,000.
That’s manageable if the debt is moderate. For operations that expanded aggressively, the adjustment will be sharper.
The UK: Below-Cost Production
Recent market data shows that farmgate milk prices have fallen below full production costs for many operations.
As of late 2025, Arla’s conventional price sits around 39.21 pence per litre. Müller’s Advantage price drops to 38.5ppl from January 2026.
Industry estimates place all-in production costs closer to the 40-45ppl range.
The picture varies by contract type. Producers on cheese or retailer-aligned arrangements often fare better. But in the commodity liquid segment, some operations are producing milk at a level below full economic cost.
Processors have responded by shifting toward component-based and fixed-volume contracts. Retailers continue to prioritise competitive shelf prices, putting pressure on producers’ margins.
The US: Regional Variations
The American experience differs due to policy structure—and substantial regional variation.
The Dairy Margin Coverage programme has provided meaningful support. The University of Wisconsin Extension reports that through the first ten months of 2023, DMC distributed over $1.27 billion in indemnity payments. That averaged approximately $74,453 per enrolled operation, with around 17,059 dairy operations participating.
But the experience varies dramatically by region.
In California, water costs and environmental compliance add layers of expense that Midwest operations don’t face. Wisconsin operations are navigating processor consolidation and volatility in the cheese market. Northeast producers face declining fluid milk demand and processing capacity constraints.
Larger US herds—1,000 cows and above—are increasingly relying on scale economies and diversified revenue streams. Beef-on-dairy programmes, heifer development, and energy projects are becoming standard.
The Takeaway: The squeeze is global, but every region has its own version. Know your local dynamics.
The China Factor
For two decades, much of dairy’s long-term optimism rested on a straightforward assumption: China would continue buying more.
That assumption deserves recalibration.
New Zealand Treasury’s 2024 dairy exports analysis, Rabobank’s global outlooks, and trade reports identify three meaningful shifts.
Product Category
2021 Imports (MT)
2024 Imports (MT)
Change
Trend
Whole Milk Powder
1,680,000
740,000
-56%
Domestic production surge
Milk Powder (Total)
2,580,000
1,360,000
-47%
Structural decline
Skim Milk Powder
900,000
620,000
-31%
Domestic substitution
Whey
480,000
380,000
-21%
US tariff impact
Cheese
140,000
170,000
+21%
Foodservice growth
Butter
110,000
135,000
+23%
Bakery sector expansion
Domestic production has expanded substantially. China has invested heavily in large-scale dairy operations. This is structural import substitution, not a temporary measure.
Per-capita consumption growth has moderated. Dairy consumption continues trending upward, but at slower rates than during the expansion years. The steepest part of the adoption curve appears behind us.
Purchasing behaviour has become tactical. Chinese buyers now step back when prices strengthen and increase purchases when value emerges—rather than consistently supporting auctions.
China remains a vital market. But it’s no longer the automatic release valve that absorbs surplus production.
The Takeaway: Don’t count on China to bail out oversupply anymore. That era is over.
What Farmers Are Actually Doing
When margin discussions move from conferences to kitchen tables, what are producers actually changing?
Managing Through Feed
In New Zealand, palm kernel imports are up significantly. Many farmers chose to push production while payout expectations remained near $10/kg MS.
Similar decisions are playing out in US operations where corn and by-products remain relatively affordable.
The logic is straightforward: when principal payments and family expenses don’t flex with milk price, spreading fixed costs across more production can appear to be the only short-term lever.
Strengthening Balance Sheets
New Zealand’s Ministry for Primary Industries notes that some farmers used the strong 2021-2023 payouts to reduce debt rather than adding infrastructure.
That decision is looking increasingly prudent.
On a 200-cow farm, this might translate to directing an extra $20,000 annually toward debt reduction rather than equipment upgrades. On a 2,000-cow operation, it could mean restructuring short-term facilities into longer-term arrangements.
Diversifying Revenue
Beef-on-dairy has become mainstream. Industry analyses suggest crossbred calves can add $100-200 per cow annually, depending on local markets.
Sustainability-linked premiums are emerging as processors develop payment structures tied to documented environmental outcomes.
Even modest additional revenue streams—$50,000-$100,000 annually on a mid-sized operation—can make a meaningful difference when the milk cheque alone isn’t covering the spread.
The Takeaway: Smart operators aren’t just cutting costs. They’re restructuring debt and finding new revenue.
Strategy
Short-Term Cashflow
Margin Impact
Risk Level
Best For
Push Production (Palm Kernel)
Improved
$0.85/kgMS
High — Adds to oversupply
High debt, large scale
Cut Costs Aggressively
Preserved
$1.15/kgMS
Medium — Quality risks
Medium farms, low debt
Maintain Status Quo
Squeezed
$1.00/kgMS
High — Thin buffer
No flexibility
Reduce Debt First
Reduced
$1.00/kgMS
Low — Future flexibility
Strong balance sheet
Strategic Levers by Scale
Even in challenging margin environments, individual operations retain meaningful levers. They won’t shift global prices, but they determine which side of the margin line you occupy.
Feed Efficiency and IOFC
Research consistently documents substantial variation in feed efficiency—both between herds and within individual herds.
Fresh cow protocols that establish strong intake patterns during those critical first 30-60 days
Active use of income over feed cost metrics as management tools, not retrospective reports
Getting started: On smaller operations, work with a nutritionist to develop simple IOFC reporting by production group. On larger TMR operations, establish monthly review rhythms to identify underperforming groups.
Component Value Capture
As payment systems emphasise solids over volume, butterfat and protein percentages deserve strategic attention.
The value ranges from 75 cents to $1.25 per hundredweight in many component-based systems, even at equivalent volume.
Getting started: Talk with your AI representative about reorienting sire selection toward fat and protein kilograms. Pair that with a nutritionist input on optimising rumen health, not just energy delivery.
Beef-on-Dairy Integration
This has evolved from a niche strategy to standard practice.
Getting started: Begin with market research. Talk with calf buyers about which terminal breeds and calving ease profiles actually command premiums in your area.
Financial Structure
What research keeps showing—across EU and Latin American farms alike—is that how you structure debt often matters as much as how efficiently you produce.
Getting started: Have proactive lender conversations before cash flow challenges emerge. Walk through three-year projections under multiple price scenarios.
The Takeaway: You can’t control global milk prices. But you can control feed efficiency, component focus, revenue diversity, and debt structure.
Strategy
Immediate Impact
1-Year Margin Gain
Resilience
Capital Required
Feed Efficiency Focus
Moderate — Slow gains
+$0.10-0.20/kgMS
High — Permanent
Low — Nutrition/management
Component Optimization
Moderate — Genetic lag
+$0.15-0.25/kgMS
High — Permanent
Low — Semen/consulting
Beef-on-Dairy Integration
High — Instant revenue
+$0.08-0.15/kgMS
Medium — Market dependent
Low — Contract only
Aggressive Debt Reduction
Low — Reduces cashflow
$0/kgMS
Very High — Future flexibility
High — Requires surplus
Volume Push (Status Quo)
High — Spreads fixed costs
-$0.05 to +$0.05/kgMS
Low — Worsens oversupply
Moderate — Feed purchases
What Could Actually Change Things?
If current margin pressure is structural, what developments might shift the trajectory?
Genuine supply contraction would require sustained exits that actually reduce production capacity. We’re seeing accelerating consolidation in parts of Europe, the UK, and Australia. It’s unclear whether the pace is sufficient.
Emerging market demand growth offers longer-term potential in Southeast Asia, Africa, and Latin America. But developing those markets takes time.
Policy and structural changes—such as transition support, improved risk-sharing between processors and producers, and trade agreements—could shift the environment. But political processes move slowly.
None of these are quick fixes. But understanding the possibilities helps inform longer-term positioning decisions.
Key Takeaways
Price levels don’t ensure margin. A $9.50 per kgMS payout with $8.50 break-evens means strong prices can coexist with tight margins.
Volume gains require margin verification. More production can support cashflow while contributing to oversupply. Check IOFC, not just output.
Input decisions carry strategic weight. Feed and fertiliser now warrant careful analysis, not routine repetition.
Revenue diversification has moved mainstream. Beef-on-dairy and sustainability premiums are standard elements, not experiments.
Financial structure shapes survival. Operations that reduced debt during good years enter this period with more flexibility.
Opportunity persists, but looks different. More competition, more selective buying, more scrutiny. Adapt or get squeezed.
The Bottom Line
No individual farm can resolve global oversupply. No policy will quickly restore previous comfort levels.
But careful attention to what New Zealand’s numbers reveal—and thoughtful application regardless of region or scale—can improve the odds of staying on the right side of that one-dollar margin line.
The farms that thrive in 2030 are making decisions right now. Not necessarily to get bigger. But to get more resilient, more diversified, more intentional about where margin actually comes from.
Complete references and supporting documentation are available upon request by contacting the editorial team at editor@thebullvine.com.
The Wall of Milk: Making Sense of 2025’s Global Dairy Crunch – Provides a deep dive into the “24-month trap” of global oversupply, explaining why export records aren’t saving prices and how to position your operation against the structural shift in Chinese demand.
Every week, thousands of producers, breeders, and industry insiders open Bullvine Weekly for genetics insights, market shifts, and profit strategies they won’t find anywhere else. One email. Five minutes. Smarter decisions all week.
This downturn feels different because it is. Four major exporters expanded at once, and $15 milk is testing every assumption. Here’s what the resilient dairies know.
EXECUTIVE SUMMARY: When producers say this downturn feels different, they’re right. For the first time, the U.S., EU, New Zealand, and Argentina all expanded production within the same window—creating a “wall of milk” that pushed July 2025 output to 19.0 billion pounds while Class III dropped from the $20s to around $15. Here’s what makes it unusual: exports are at record levels, confirming this is a supply squeeze, not a demand collapse. Dairy’s 24-month biological timeline means decisions that made complete sense at $22 milk are now delivering into a $15 market, with no quick reversal possible. Beef-on-dairy has added real value but also reduced the number of replacement heifers to 3.9 million head—the lowest since 1978—limiting culling flexibility when some operations need it most. The dairies navigating this effectively share common strategies: precision culling using income-over-feed-cost data, margin protection through DMC and Dairy Revenue Protection, and breeding for feed efficiency using traits like Feed Saved. This cycle will accelerate consolidation, but producers who know their numbers and deploy available tools will emerge stronger when markets rebalance.
As milk checks tightened through 2025, I kept hearing the same thing from producers across the country: “We’ve seen low prices before, but this one feels different.” And as many of you have probably sensed on your own operations, they’re right. This isn’t just one region working through a rough patch. The U.S., the European Union, New Zealand, and key South American exporters all pushed production higher within a fairly tight window. A lot of that milk is now competing for the same buyers at the same time.
The 24‑month lag exposed: production peaks just as prices crash, proving this downturn is about too much milk, not weak demand
What makes this cycle particularly challenging is that feed, labor, interest, and environmental compliance costs haven’t returned to the levels we saw a decade ago. That’s especially true in higher-cost regions like California and parts of Western Europe. So you’ve got more milk hitting the market, softer world prices, and cost structures that remain stubbornly elevated. That combination is creating what many are calling the “wall of milk.”
In this piece, we’ll walk through what farmers and analysts are learning about this cycle: how the 24-month expansion lag plays out in practice, how beef-on-dairy has delivered real benefits while also creating some unexpected ripple effects, why lenders and processors kept supporting growth even as signals shifted, how different regions are experiencing this downturn in very different ways, and what the operations navigating this well seem to have in common. The goal is to offer a clearer view of the bigger picture so the decisions you’re making—about cows, facilities, or risk management—are grounded in how this system actually works.
Why This Cycle Really Does Feel Different
Let’s start with the production numbers and work back toward the parlor.
USDA’s Milk Production reports paint a stark picture:
July 2025 Output (24 major states): 18.8 billion pounds initially, revised to 19.0 billion
Year-Over-Year Growth: +4.2%—the strongest since 2021
Total National Production: 19.6 billion pounds
Cow Numbers: Approaching the highest levels seen in decades
On the infrastructure side, the industry has been busy. More than 50 new or expanded dairy plants—particularly cheese and powder facilities in the Upper Midwest, Texas, and the High Plains—have come online, representing roughly $8 billion in capital investment over the past several years.
Leonard Polzin, the Dairy Economist and Farm Management Outreach Specialist at UW-Madison Division of Extension, framed it well at the 2025 Wisconsin Agricultural Outlook Forum. He noted that the industry is seeing “a substantial increase in processing capacity,” with an estimated $8 billion in gross investment creating new demand for milk. The challenge, as he pointed out, is that policy uncertainties—including potential tariffs and questions about labor availability—could affect prices before that demand fully materializes.
The picture looks similar in other major producing regions:
European Union: EU Milk Market Observatory data show deliveries climbing modestly in 2024, with product stocks building in early 2025 as cheese, butter, and powder production outpaced demand growth
New Zealand: Fonterra’s 2025/26 season forecast shows milk solids volumes running several percent ahead of the prior year, with farmgate payouts around NZ$10 per kg of milksolids
Argentina: Ministry data and Tridge reports show national milk output in early 2025 running 10.9% above the same period in 2024, with March posting gains of 15.9% year-over-year
Here’s where it gets interesting on the demand side. Exports have actually performed well:
July 2025 U.S. Exports: 1.6 billion pounds (milk-fat basis)
Year-Over-Year Export Growth: +53%—a record for any single month
Yet Class III/IV Futures: Trading in the mid-teens through much of 2025, below full-cost breakeven for many conventional operations
July 2025 was the strongest export month in U.S. history, with shipments up 53% year‑over‑year—yet total production still outran demand by another 4.2%. That’s not a demand collapse; it’s too much milk from too many exporters at once.
The takeaway? World demand hasn’t collapsed. Exports are actually quite strong. But supply from multiple major exporting regions has grown faster than demand can absorb in the near term. That’s what makes this feel different from the regional downturns many of us have worked through before.
The 24-Month Expansion Timeline: When Biology Meets Economics
One of the lessons this cycle keeps reinforcing is how much dairy expansion is a commitment you can’t easily unwind. The biology and capital requirements simply don’t move on futures-market time.
Think back to 2023 and early 2024. Milk prices were strong, butterfat levels were excellent across many herds, and balance sheets looked healthier than they had in years. In that environment, deciding to add a pen, upgrade the parlor, or build out the dry cow facilities made a lot of sense. The numbers supported it.
Land-grant extension economists who model these decisions describe a fairly predictable timeline. In those first few months, you’re signing contracts, ordering equipment, and closing on financing. As one University of Wisconsin farm management publication notes, by the time the ink is dry, most of the financial risk is already committed—even though no extra milk has shipped yet.
Through months four to twelve, the facility goes up while you’re either buying bred heifers or ramping up your own replacement program with sexed semen. Cash is flowing out, but the additional milk revenue hasn’t started. Then in months thirteen through twenty-four, those heifers freshen, pens fill, and milk per stall climbs. The challenge is that the broader market—running on that same 18-24 month biological timeline—may have shifted considerably since you started.
Peter Vitaliano, who served as Vice President of Economic Policy and Market Research at the National Milk Producers Federation before retiring at the end of 2024, was already flagging concerns back in February 2024. He noted that “due to a number of factors, we’ll probably see a larger drop than usual” in dairy farm numbers, partly because USDA counts were likely collected before additional farms closed at the end of 2023 due to margin pressure. He added that any margin improvement wouldn’t “constitute anywhere near a full recovery from the financial stress that dairy farms, pretty much of all sizes, are experiencing.”
The 24-Month Trap in Action
I’ve been hearing about situations like this from lenders and consultants: a 900-cow Wisconsin operation signed expansion contracts in early 2024 for 300 additional stalls, with heifers due to freshen by mid-2025. By the time that barn was full, Class III had dropped from the low $20s to around $15.
The extra milk revenue is real, but so is the debt service. Over six months, the gap between projected and actual margins consumed roughly $180,000 in working capital that had been earmarked for feed prepays and equipment upgrades.
The family isn’t in crisis, but there’s no cushion left. They’re working with their lender on revised cash-flow projections and tightening culling criteria to protect equity.
Decisions that made complete sense at $22 milk are now playing out in a $15 world.
Beef-on-Dairy: Real Benefits with Some Unexpected Effects
Beef-on-dairy has been one of the more significant developments in recent years, and it’s delivered genuine value to many operations. At the same time, as it’s scaled across the industry, it’s also changed some dynamics that historically helped balance supply. What I’ve noticed talking with producers is that most understand the benefits clearly—but the systemic effects are only now becoming apparent.
Where the Value Has Been Clear
The research and market data are consistent on this: well-managed beef-on-dairy programs substantially increase calf value compared to straight dairy bull calves. Day-old beef-cross calves often fetch several hundred dollars more, and in program relationships where carcass performance is documented, they can approach native beef calf values.
With milk prices softening in the first half of 2025, beef has become a driver of dairy farm profitability through both cull cows and dairy-beef calves. For many operations, this revenue stream has made a meaningful difference in a tight-margin year.
Some Effects Worth Understanding
What’s become clearer over the past year is how beef-on-dairy interacts with culling decisions and replacement availability when prices fall.
Consider the culling dynamic. A few years ago, that seven- or eight-year-old cow with middling production and some foot issues—bred to a dairy bull and carrying a $50-100 calf—was an easier decision when milk prices dropped. Today, if she’s carrying a beef pregnancy that could bring four figures at calving, the economics pull toward keeping her “one more lactation.” Across a larger herd, those decisions on the bottom 15-20 percent of cows can add meaningful volume that wouldn’t have been in the tank in previous downturns.
Culling Decision
Daily Milk Revenue
Daily Direct Costs
Daily Net Margin
Strategic Action
Keep Low Performer
$9.00
$8.00
$1.00
Deferred culling
Replace with High Performer
$13.00
$9.00
$4.00
Aggressive culling
Daily Margin Difference
+$4.00
+$1.00
+$3.00
Per stall advantage
Impact Over 6 Months
–
–
$540
Single cow (180 days)
Scale: 30 Cows in 600-Cow Herd
–
–
$16,200
30 decisions
On the replacement side, the numbers tell a striking story:
January 2025 USDA Cattle Report: Dairy replacement heifers over 500 pounds dropped to just 3.914 million head—the lowest since 1978
Heifer-to-Cow Ratio: 41.9%, the smallest since 1991 (per CoBank lead dairy economist Corey Geiger)
Primary Driver: More matings going to beef semen, fewer dairy heifer calves being raised
That pruning made sense when heifer-raising costs were high, and beef calves commanded strong premiums. But it also means some operations that would like to cull more aggressively now don’t have the springers available to maintain stall utilization.
From windfall to choke point:” day‑old beef‑cross calves jumped from roughly $650 to $1,400, replacement heifers surged past $3,000, and heifer inventories fell nearly 20%. The same strategy that rescued margins is now what’s limiting culling options in a $15 milk world.
And there’s a productivity element worth noting. Because the heifers that are raised tend to come from the top of the genetic pool—identified through genomic testing—they often bring stronger milk and component performance than the animals they replace. Leonard Polzin noted at the 2025 Wisconsin Ag Forum that “despite a 0.35 percent year-to-date decline in total milk production, calculated milk solids production increased by 1.35 percent.” The industry is meeting demand “more quickly than in the past,” even with somewhat fewer total gallons.
None of this suggests beef-on-dairy is problematic. It’s been valuable for many operations. The consideration is managing it as part of an overall herd and business strategy rather than simply as a breeding decision.
Understanding Why Growth Continued
A reasonable question producers ask is why banks, co-ops, and processors kept supporting expansion even as supply signals shifted. You know, it’s easy to look back and wonder what everyone was thinking. But looking at the incentive structures helps explain the pattern—and honestly, it makes more sense than it might first appear.
The Lender Perspective
Ag lenders work within risk models and regulatory frameworks that emphasize historical cash flow, current balance sheet strength, and collateral values. In 2022-2023, many dairy clients showed multiple years of positive returns and improved equity. Land values in dairy regions were firm. Cull cow and breeding stock values had recovered.
Farm finance research consistently shows that lenders lean heavily on these historical and collateral metrics rather than attempting to time commodity cycles. Add competitive pressure—banks and farm credit systems competing for the same well-run operations—and you can see how turning down an expansion with strong historical numbers often meant losing that relationship to a lender willing to proceed.
From the credit committee’s perspective at the time, financing expansion with their strongest clients appeared reasonable and well-supported by the available data. The depth of the 2025 correction wasn’t yet visible in those metrics.
The Processor View
For processors, the math centers on fixed costs and throughput. Depreciation, labor, and energy don’t decline proportionally when a plant runs below capacity. With billions invested in new cheese, powder, and specialty facilities over the past decade, plant managers face pressure to run at high utilization, spread fixed costs effectively, and maintain market share.
That creates incentives to encourage volume growth from existing shippers, sign new suppliers, and move cautiously on base-excess programs that might push producers toward competitors. Some buyers have implemented tiered pricing systems that discount over-base milk, but these tools are often adopted late in the cycle and rarely coordinate across an entire region.
The result is a system in which internal metrics rewarded growth and utilization, even as external data pointed to a building supply. That’s not a criticism—it’s recognizing how institutional incentives shape behavior.
Regional Variations: Same Prices, Different Realities
One aspect that gets lost in national averages is how differently the same price environment affects operations across locations. As many of us have seen firsthand, cost structure, regulatory environment, and market access all matter enormously.
California: Navigating Significant Headwinds
California operations face several overlapping pressures this cycle.
Water constraints continue tightening. Implementation of the Sustainable Groundwater Management Act and new dairy waste discharge requirements from the State Water Resources Control Board are limiting groundwater pumping and establishing stricter nitrate standards in parts of the Central Valley. Environmental compliance costs—for covered lagoons, digesters, and monitoring systems—continue adding capital and operating expenses. And labor costs, housing prices, and land values remain substantially higher than in most other dairy regions.
When Class IV prices are in the low teens and world butter and powder prices are soft, those structural costs make breakeven difficult, particularly for operations that recently invested in facility upgrades. Understandably, some families are evaluating whether another 20-year investment cycle makes sense in that regulatory and cost environment.
Upper Midwest: Cost Structure Advantages
Wisconsin and neighboring states present a different picture.
A November 2024 University of Wisconsin-Madison study found that dairy contributes about $52.8 billion annually to Wisconsin’s economy, with substantial value coming through processing rather than just farm-level milk sales. The region’s processing network has grown considerably, with cheese plant expansions and new facilities drawing milk from an expanding geography. Feed costs benefit from local production, and land and labor costs, while rising, remain below coastal levels.
Low Class III prices continue to pressure margins, and smaller operations face ongoing consolidation. But many Upper Midwest producers describe having a cost structure that provides a path through this downturn with good management, even if it’s not comfortable.
New Zealand: Low Costs, High Exposure
New Zealand’s pasture-based system delivers meaningful cost advantages—solids produced with less purchased feed and lower energy use in favorable seasons. The 2025/26 forecast payout around NZ$10 per kgMS suggests many operations are maintaining positive margins, though narrower than recent years.
The trade-off is exposure. New Zealand sells the vast majority of its production into export markets. Shifts in Chinese demand, Southeast Asian buying patterns, or currency movements translate quickly into payout adjustments. Low production costs provide resilience, but global market volatility is a constant factor.
Europe and South America: Policy and Economic Dynamics
EU production has edged modestly higher overall, but policy pressure to limit cow numbers in high-density areas for environmental reasons is influencing regional patterns. The bloc appears to be shifting toward cheese and higher-value products while moderating output of commodity powders and butter.
Argentina’s production surge—that 10.9 percent first-quarter increase—reflects improved weather and on-farm economics. But Argentine producers also navigate inflation, policy uncertainty, and volatile input costs that can shift margins dramatically in short periods.
The point is that $15 milk creates very different situations in Tulare, Green County, Canterbury, and Santa Fe. Regional context matters enormously.
The Breeding Solution: Selecting for Feed Efficiency in a Low-Margin World
Here’s something that deserves more attention in these conversations: your genetic decisions today are one of the most powerful tools you have for navigating tight margins over the next decade. And there are now specific, measurable traits designed exactly for this environment.
Feed Saved: A Trait Built for This Moment
The Council on Dairy Cattle Breeding (CDCB) launched Feed Saved (FSAV) back in December 2020, and it’s become increasingly relevant as margins compress. The trait combines two components:
Body Weight Composite (BWC): Selecting for moderate-sized cows that require less feed for maintenance
Residual Feed Intake (RFI): Identifying cows that are metabolically more efficient—eating less than expected based on their production and body weight
According to Holstein USA’s April 2025 TPI formula update, every pound of feed saved returns approximately $0.13 per cow per lactation. That might sound modest, but across a 500-cow herd over multiple generations, the cumulative impact is substantial.
What’s particularly interesting is the research backing this. A November 2024 study published in Frontiers in Geneticsexamining genomic evaluation of RFI in U.S. Holsteins found that the difference between the most and least efficient first-lactation cows averaged 4.6 kg of dry matter intake per day—while producing similar amounts of milk. Over a 305-day lactation, that’s a significant difference in feed costs. The same study found even larger spreads in second-lactation animals.
How the Industry Is Weighting Efficiency
The April 2025 Net Merit update from CDCB reflects this shift. As Holstein Association USA’s TPI formula now shows:
Production (including Feed Efficiency): 46% of total index weight
Feed Efficiency $ Index: Combines production efficiency, lower maintenance costs from moderate body weight, and better feed conversion (RFI)
What’s encouraging is that research shows meaningful genetic variation in feed efficiency—the November 2024 Frontiers in Genetics study found RFI heritability in lactating U.S. Holsteins at approximately 0.43 (43%), indicating substantial potential for genetic progress through selection. That’s higher than many health and fertility traits, which means you can actually move the needle on this.
Efficiency Metric
Daily Feed (lbs DM)
Annual Feed Cost @ $0.12/lb
Milk Production (lbs/day)
Breeding Strategy Impact
Standard Efficiency Cow
55
$2,409
85
Baseline
High Efficiency Cow (Feed Saved)
50
$2,190
85
RFI + Feed Saved traits
Annual Advantage per Cow
-5 lbs/day
$219 saved
Same output
Immediate selection
500-Cow Herd Annual Impact
–
$109,500
Same output
Herd-wide savings
10-Year Genetic Improvement
–
$1,095,000
Same output
Compound benefits
Practical Application
For producers looking to incorporate feed efficiency into their breeding programs:
Look for bulls with positive Feed Saved (FSAV) values in their genomic evaluations
Consider Body Weight Composite alongside production traits—extreme frame size increases maintenance costs
Balance feed efficiency with health and fertility traits; the most efficient cow isn’t profitable if she doesn’t breed back or stay healthy
Work with your AI representative or genetics consultant to model how different selection emphases might affect your herd’s economics over 5-10 years
This isn’t about abandoning production goals. It’s about recognizing that in a low-margin environment, the cow that produces 85 pounds while eating 10% less feed may be more profitable than the cow producing 90 pounds at average efficiency.
What the More Resilient Operations Have in Common
Every downturn separates operations that preserve equity and position well for the recovery from those that don’t. Several patterns are emerging among farms navigating this cycle effectively—and what’s encouraging is that most of these are things within a producer’s control.
Making Culling Decisions with Better Data
Operations that are doing well are generally bringing greater precision to culling. That means tracking income over feed cost by pen or individual cow, using parlor data and feed records to identify animals that are not covering their direct costs, plus a reasonable share of overhead. It means using genomic information and reproductive performance to spot heifers and cows unlikely to generate positive returns. And it means connecting culling plans to realistic replacement availability rather than culling until pens feel empty and then scrambling for springers.
The math consultants’ walk-through is straightforward: a cow generating $9 in milk revenue and consuming $7 in feed, plus $1 in bedding, breeding, and health costs, clears $1 in labor, debt, and margin costs. Replace her with a fresher or higher-producing animal netting $4 daily above direct costs, and over six months, that stall contributes $720 more. Scale that to 30 similar decisions in a 600-cow herd, and the difference exceeds $20,000 in half a year. That kind of analysis is making some producers more willing to make uncomfortable culling decisions earlier.
Managing Margins Rather Than Guessing Prices
Another pattern is shifting from attempting to call price tops to protecting survivable margin ranges.
Dairy Margin Coverage continues providing value for eligible operations, particularly smaller herds. A 2025 Government Accountability Office review noted that USDA paid out nearly $2.7 billion more to DMC participants than it collected in premiums from 2019 through 2024—significant catastrophic protection.
More operations are using Dairy Revenue Protection to establish floors on portions of future production, sometimes combined with feed contracts that define at least a rough margin band. The approach isn’t about optimizing returns; it’s about narrowing the range of outcomes to avoid truly damaging quarters.
Suppose you haven’t explored these tools recently. In that case, your local FSA office or an extension dairy specialist can walk you through current enrollment options and help you model how different coverage levels might fit your operation’s risk profile.
Treating Beef-on-Dairy as a Managed Program
Operations that consistently achieve value from beef-on-dairy tend to approach it systematically rather than opportunistically. That means selecting sires with documented growth, feed efficiency, and carcass data—often aligned with specific feedlot or packer programs. It means coordinating with buyers on calving timing, health protocols, and genetics to capture available premiums. And it means maintaining enough high-merit dairy genetics to ensure replacement availability as conditions change.
This program approach doesn’t eliminate beef market volatility, but it improves the odds of consistent returns and preserves flexibility on the dairy side. If you’re looking to establish these relationships, many breed associations and AI companies now maintain lists of feedlots and packers actively seeking dairy-beef partnerships.
Continuous Focus on Feed Efficiency
Feed remains the largest expense for most operations, and in low-margin periods, every pound of dry matter needs to perform. The farms that manage well keep returning to fundamentals: grouping by lactation stage so rations match requirements, reducing shrink through bunker management and feed-handling practices, and monitoring feed efficiency as a core metric.
Relatively modest improvements—a tenth or two-tenths improvement in feed efficiency, a few percentage points less silage waste—can represent $0.50-1.00 per hundredweight in income over feed cost. Across millions of pounds of annual production, that compounds into meaningful dollars.
Looking Toward 2027-2028: Reasonable Expectations
Forecasting specific prices years out isn’t realistic, but we can identify directions based on current trends and policy trajectories. These are scenarios, not predictions—individual outcomes will vary considerably.
The consolidation pattern is well-documented. Lucas Fuess, Senior Dairy Analyst at Rabobank, noted in his analysis of the 2022 Census of Agriculture that the U.S. lost nearly 40 percent of its dairy farms between 2017 and 2022—from about 39,300 to around 24,000—while total production rose because “larger farms show lower production costs.” This downturn will likely accelerate that trend.
By the late 2020s, several developments seem probable:
The total number of licensed U.S. dairies may fall below 20,000, with an increasing share of national volume coming from herds milking several hundred to several thousand cows. Regional patterns may sharpen, with lower-cost areas—much of the Upper Midwest and Central Plains—holding or gaining share, while higher-cost, more regulated regions see gradual declines in cow numbers as families choose not to reinvest. Beef-on-dairy will likely remain prevalent but may stratify further between well-structured programs that capture consistent premiums and undifferentiated approaches that face greater volatility.
Globally, New Zealand will remain important in the powder and butterfat markets, while the EU continues to shift toward cheese and value-added products within environmental constraints.
The Bottom Line
These are the conversations I’m hearing producers have with their teams, advisers, and families. Every operation faces unique circumstances, and general advice only goes so far—but these questions seem to be helping people think through their situation:
Where are you in your own expansion timeline? How many heifers are scheduled to freshen over the next 18-24 months? Do those numbers align with what your facilities, labor, feed base, and market access can profitably support at current price levels?
Do you have clear visibility on cow-level economics? Which animals are covering feed plus a reasonable share of labor, debt, and overhead—and which aren’t? What would tightening culling criteria by 5-10 percent look like, and is your replacement pipeline ready for that?
How much of your margin is protected versus hoped for? What portion of the next 12-24 months could you realistically put under DMC, DRP, or forward contracts? Have you had direct conversations with your lender about your risk management approach?
Is your beef-on-dairy program intentional? Do you know what your calf buyers specifically want, and are you breeding to those specifications? Are you confident that your current approach will leave enough high-quality dairy replacements for the herd you want to be running in three years?
Are your genetic criteria aligned with a low-margin reality? Are you selecting strictly for high production, or are you also prioritizing Feed Saved, moderate frame size through Body Weight Composite, and Residual Feed Intake to lower lifetime maintenance costs? In an environment where feed represents 50-60% of production costs, breeding decisions made today will shape your cost structure for the next decade.
Are you making decisions for this week or for the next several years? Culling, breeding, feeding, capital allocation, and even family succession—are these being decided tactically or within a longer-term framework?
This cycle is demonstrating that individually sensible decisions—expanding when returns were strong, adding beef value to calves, filling new processing capacity—can produce collective oversupply when everyone responds to the same signals simultaneously. None of us individually controls global supply and demand. What each operation can control is understanding its position within the bigger picture, knowing its own numbers thoroughly, and using available tools—biological, genetic, and financial—to improve the odds of still being here, on your own terms, when conditions improve.
KEY TAKEAWAYS
This is a global supply collision, not a demand problem. The U.S., EU, New Zealand, and Argentina all expanded at once—yet exports hit record highs. Pure oversupply.
The 24-month trap is unforgiving. Decisions that made sense at $22 milk are now delivering into a $15 market. Biology doesn’t wait for prices to recover.
Beef-on-dairy reshaped the culling equation. Replacement heifers dropped to 3.9 million—the lowest since 1978—limiting flexibility exactly when operations need it most.
Resilient dairies share three priorities: precision culling based on income over feed cost, margin protection through DMC and DRP, and breeding for feed efficiency traits.
Consolidation will accelerate—preparation separates outcomes. Producers who know their numbers and deploy available tools now will emerge stronger when markets turn.
Complete references and supporting documentation are available upon request by contacting the editorial team at editor@thebullvine.com.
Every week, thousands of producers, breeders, and industry insiders open Bullvine Weekly for genetics insights, market shifts, and profit strategies they won’t find anywhere else. One email. Five minutes. Smarter decisions all week.
Dairy success isn’t about better farming anymore—here’s the real force changing who survives and who sells out.
The February 2024 USDA report had a number that’s stuck with me: about 1,500 U.S. dairy farms closed in 2023, yet national milk production ticked higher. That’s not just abstract data—it’s what drives our conversations at kitchen tables and farm meetings across the country. Let’s talk through what’s really happening and what it means for the future.
U.S. dairy farming faces an existential consolidation crisis, with farm numbers plummeting from 39,300 operations in 2017 to a projected 10,500 by 2040—a 73% reduction driven by systematic structural advantages favoring mega-operations over traditional family farms, with 1,420 farms disappearing annually as of 2024.
Looking at How the Structure Has Shifted
Start with the numbers, because they’re telling: The 2022 Census of Agriculture shows about 65% of American milk now comes from just 8% of herds—those with over 1,000 cows. Meanwhile, nearly 9 out of 10 farms (the 100–500 cow group) account for only 22% of the supply. In the Northeast and Midwest, that’s still the “standard” size, but the playing field keeps tilting.
As one third-generation Wisconsin farmer shared, “I remember 13 dairies on our road, but now it’s just us. Plenty of the folks who exited were younger managers, not retirees. They just couldn’t get the numbers to work.”
Cost of production varies dramatically by herd size, with the smallest operations facing a devastating $9/cwt disadvantage that translates to $250,000 in annual losses for a typical 600-cow farm—a gap driven by scale advantages in feed purchasing, financing, and regulatory compliance rather than management quality.
Cornell’s Dairy Farm Business Summary for 2022 has it in black and white: the biggest herds report $22–$24/cwt cost of production. For 100–199 cow operations, the range is $31–$33/cwt. In a market where the base price is set by regional blend or federal order, that gap eats margin and equity fast.
Beyond Raw Efficiency: What’s Really Behind Cost Gaps
What’s interesting here is how much of the “efficiency” story isn’t really about cow management or even genetics anymore. I talked to a Central Valley manager running 5,000 cows who summed it up: “We buy grain by the unit train—110 railcars. Our delivered price is CBOT minus basis, sometimes 15 cents lower. My neighbor with 300 cows pays elevator price, plus haul; that’s 40, 50 cents more per bushel.”
It’s not just West Coast operations seeing this. In the Upper Midwest, neighbors share similar experiences. Volume buyers get priority and save dollars, not because they feed cows better, but because they can buy enough at once to command a discount.
Bring in finance, and the gap widens. Published rates show 2,000-cow herds receiving prime plus 0.5%. A 200-cow farm might see prime plus two. On a $1 million note, that’s more than $15,000 a year in extra interest just for being smaller.
Then consider environmental compliance. The latest Wisconsin Department of Ag reports—which many of us turned to during the farm planning season—show the cost of nutrient management, methane compliance, and water permits comes out to 50 cents/cwt for the largest herds, but easily $15/cwt or more for the smallest. It’s the same paperwork, same inspector fee—just spread over far fewer cows and pounds.
The scale advantage isn’t about better farming—it’s about systematic structural advantages that give large operations a $4/cwt cost edge through volume discounts on feed, preferential financing rates, amortized regulatory compliance costs, and labor efficiency, creating a $100,000 annual penalty for a 500-cow farm that has nothing to do with management quality.
The Co-op/Processor Crossover: Facing Up to the Math
Now, here’s where a lot of dinner-table talk turns pointed. Vertical integration with co-ops, especially after big moves like DFA’s $425 million purchase of Dean Foods’ 44 plants, changes the dynamic. Industry estimates now indicate that more than half of DFA members’ milk flows through DFA plants.
There’s no way around it: when your co-op is both your “agent” and your buyer, it faces a built-in conflict. The original co-op job—fight for a fair farm price—collides with the processor’s goal: keep input costs as low and steady as possible.
A Cornell ag econ professor put it bluntly at last year’s co-op leadership workshop: “Co-ops owning plants face incentives that are tough to align. You can’t maximize both farmer pay price and processing margin.” And I’ve seen the evidence myself; the research shows co-ops often have lower stated deductions, but within the co-op group, “other deductions” can vary wildly. As one board member told us, “Transparency on this stuff is hard for everyone, even when we want it.”
Think about it: if your co-op owns the plant, is the negotiation about pay price truly across the table or just across the hallway?
Canadian Lessons: Costs and the Future
Now, Canadian friends watching these trends aren’t immune either. The Canadian Dairy Information Centre’s latest data puts the last decade’s dairy farm reduction at over 2,700, even under supply management. And quota levels are a choke point: In Ontario, with a strict cap, quota changes hands around $24,000 per kilo of butterfat; Alberta’s uncapped market runs up past $50,000.
A young producer near Guelph explained it best: “We want to keep the farm in the family, but the math now is about buying quota at market rate from Dad—he paid $3,000/kilo in the ’90s. I pay $24,000/kilo or more, and start so far behind on cash flow it feels impossible.”
Canadian dairy quota prices have exploded from $3,000 per kilogram in the 1990s to $24,000 in Ontario and $50,000 in Alberta by 2023—a 1,567% increase that creates an impossible generational wealth transfer barrier, forcing young farmers to begin their careers hundreds of thousands of dollars in debt simply to acquire the right to produce milk their parents obtained for a fraction of the cost.
Producers Team Up—and Win
We should all pay attention to how producers abroad have responded. In Ireland, Dairygold tried to drop prices, but farmers quickly networked on WhatsApp. Once they started comparing pay stubs, they discovered inconsistencies—same pickup, same composition, different pay. They organized: “If 200 show up with real data, will you join?” The answer was yes. Six weeks, 600 farmers, and the transparency improved, the price cut was rescinded.
That lesson isn’t just for Ireland. That’s modern farm business—facts and solidarity over rumors and grumbling.
U.S. Adaptation Tactics: What’s Working
Across the U.S., I’ve watched farmers embrace savvy but straightforward approaches. Central Valley producers doubled back to their milk checks and truck bills and found that some paid 20 cents/cwt more for identical hauls. As a group, they pressed for change—and got it.
Midwesterners have started bottling their own milk—Wisconsin’s extension reports show farmgate price benefits of $2 to $4 a gallon, though yeah, getting there takes $75,000 to $100,000 and some serious compliance stamina.
Debt is a fresh challenge in its own right in cow management. Now’s the time to renegotiate any credit above prime plus one. Dropping even one percent on a $2 million note brings $20,000–$25,000 savings straight to the P&L.
Environmental Law: A Sea Change
California’s methane digester rules, fully phased in over the past two years, are a classic case of “scale wins again.” For big operations, $4 million-plus digesters can become a profit center—especially if you trade renewable natural gas credits north of $1 million a year. Small farms? They can’t justify the capital, so the compliance cost splits unevenly—UC Davis economists show $2/cwt for small farms, under 50 cents for the largest.
It’s not about better manure management; it’s about who can amortize the cost.
The Path Ahead: What’s Next in Dairy Consolidation
The USDA’s Economic Research Service expects U.S. dairy farm numbers to dip below 10,000 by the mid-2030s, with Canadian farm numbers also dropping to around 4,000–5,000. That’s the math if nobody changes the model or the market.
But honestly, what gives me hope are examples of when perseverance, innovation, and strategic shifts pay off. In Wisconsin, several smaller herds now sell directly into grass-fed cheese contracts, pulling in a $4/cwt premium (more than make-allotment size, less fight for line space). “We stopped competing with 5,000-cow barns by beating them at their game,” one farmer told me. “We get paid for our story and our butterfat.”
Where To Focus Now
Calculate Your Position Honestly. Know your true cost—family living included—against hard local benchmarks. If the numbers don’t lie, accept what you see and plan accordingly.
Don’t Go It Alone. From paycheck audits to volume negotiations, the farms that win increasingly do so together.
Strategic Awareness Beats Production Alone. The future belongs to those who know how pricing, processing, and consumer trends intersect—and find their “crack” in the system instead of just producing more.
As Tom Vilsack put it at a dairy business roundtable: “We love to say we’re saving family farms, but policy and business choices keep rewarding bigness and consistency.” No matter your model—organic, conventional, something in between—the goal is to find your margin, your allies, and your leverage.
The numbers will keep changing, but one reality holds—those who adapt, share, and innovate stand the best chance. Old rules are being rewritten, and it’s worth being part of that conversation. For deep dives on industry economics, co-op strategy, and farm resilience, visit www.thebullvine.com.
KEY TAKEAWAYS
Butterfat numbers and raw efficiency don’t guarantee survival—market scale, price leverage, and transparency do.
Question every deduction and demand clarity from your co-op or processor—internal conflicts don’t have to shortchange you.
Benchmark your costs with neighboring farms and negotiate together—solo producers rarely win against consolidated buyers.
The farms thriving today are adapting: going direct-to-consumer, value-adding, or finding specialized markets to earn more per cwt.
Success in modern dairy comes from forward planning, embracing new models, and building your own leverage—not waiting for the system to “fix itself.”
EXECUTIVE SUMMARY:
Dairy’s old rules—“be efficient and you survive”—no longer hold. Drawing on real farm stories and national data, this investigation exposes why scale, access, and co-op consolidation matter more than top cow performance. You’ll see how market power and processor influence—not just farm management—decide who survives and who sells out. With insights from producers challenging these trends, along with practical strategies and benchmarks, this article is a must-read for anyone rewriting their playbook. Get the facts, the framework, and a clear-eyed look at what real success in dairy now demands.
Complete references and supporting documentation are available upon request by contacting the editorial team at editor@thebullvine.com.
Learn More:
Your 2025 Dairy Gameplan: Three Critical Areas Separating Profit from Loss – Reveals specific operational adjustments—from silage density to amino acid balancing—that can generate $500+ per cow in additional net income, offering a tactical way to combat the structural cost disadvantages highlighted in the main article.
Decide or Decline: 2025 and the Future of Mid-Size Dairies – Delivers a strategic ultimatum for the “squeezed” mid-sized herds discussed above, analyzing why standing still drains 6-8% of equity annually and outlining two viable survival models: specialized optimization or calculated expansion.
Every week, thousands of producers, breeders, and industry insiders open Bullvine Weekly for genetics insights, market shifts, and profit strategies they won’t find anywhere else. One email. Five minutes. Smarter decisions all week.
Every lame cow costs you $225. Genetics can fix it—in 10 years. Here’s what works NOW
EXECUTIVE SUMMARY: Lameness costs the average 500-cow dairy $28,000 annually, and while CDCB’s new genetic evaluations promise a 30% reduction, you won’t see meaningful savings for 10 years. The reality check: these evaluations rely on data from just six elite farms with $100,000 camera systems—not typical operations dealing with old concrete and tight margins. By year 10, genetics deliver $4,879 annual savings, reaching $8,160 by year 15, but European-style welfare markets will emerge by 2030, before genetics pay off. Smart producers aren’t waiting—they’re investing $40-60K in immediate flooring improvements while simultaneously selecting for lameness resistance. The winning strategy combines environmental fixes that work today with genetics that compound forever. Bottom line: this isn’t about choosing between short-term and long-term solutions, it’s about having the vision and patience to pursue both.
You know that sinking feeling when your trimmer shows up and the bill starts climbing? We’re all dealing with it—lameness affects about a quarter of our cows, and at $120 to $330 per case according to multiple studies in the Journal of Dairy Science, it’s hitting checkbooks hard.
Here’s what’s interesting, though: CDCB just presented at their 2025 Industry Meeting that they’re developing genetic evaluations that could reduce lameness by 20-30% over the next couple of decades. And I say “could” because, well… let’s talk about what that really means.
What caught my attention when I dug into the presentations from Dr. Kristen Gaddis and her team is that the timeline stretches much longer than you’d expect. The economics? More modest than the headlines suggest. And get this—the entire system currently depends on mobility data from just six farms with camera systems, plus trimmer records from about 686 herds. That’s from CDCB’s own numbers.
Here’s where it gets fascinating, and I think you’ll appreciate the biological difference between CDCB’s two strategies.
Traditional hoof health data from trimmer records? We’re looking at heritability of just 3-5%—that’s what the research consistently shows. So basically, 95-97% of what we see comes down to the environment. Your flooring, nutrition program, whether you’ve got digital dermatitis making the rounds… you probably know this already. Put most cows in bad enough conditions—wet concrete, poor ventilation, overcrowding—and they’ll develop problems no matter what their genetics look like.
But mobility scores tell a completely different story. The heritability ranges from 10% to 30% based on CDCB’s findings in their reference population of 63,000 cows. That’s getting into the range of moderately heritable production traits we’ve been successfully selecting for. What’s encouraging here is that mobility seems to capture those deeper genetic differences—skeletal structure, pain sensitivity, basic biomechanics—that persist regardless of housing.
Mobility scores show 2-6x higher heritability than traditional trimmer records, revealing why AI-powered camera systems capture the genetic differences that actually matter for breeding decisions. When 95-97% of hoof problems come from environment, you need that 10-30% genetic signal—not the 3-5% noise.
The innovation piece that’s worth noting is these AI-powered camera systems from companies like CattleEye. They’ve captured over 14 million daily scores from those 63,000 cows, and research in Preventive Veterinary Medicine shows these systems agree with trained vets about 80% of the time. That’s precision you just can’t get when someone’s scribbling notes in the trim chute.
Your Bottom Line: The Real Economics
Let me walk you through the economics, because that’s what matters when you’re making breeding decisions today.
Based on USDA data and that 25% prevalence we’re all dealing with, you’re looking at about $56.25 per cow annually in lameness costs. For a 500-cow operation, that’s $28,125. Real money, absolutely.
The genetic savings timeline reveals the harsh reality—no financial benefit for the first 2-4 years, with meaningful savings only arriving by Year 6 and substantial impact delayed until Year 10-15. This isn’t about choosing between short-term and long-term strategies; it’s about having the vision and patience to pursue both.
But here’s what genetic selection actually delivers over time—and I’ve run these numbers based on CDCB’s genetic trend projections with standard 35% replacement rates:
Years 0-2: Nothing. Zero. You’re breeding, but no change in your barn yet.
Year 4: Maybe—and I mean maybe—you’ll notice three fewer lame cows in a 200-cow herd.
Year 6: Now we’re seeing something. About nine fewer lame cows, saving around $2,070 annually.
Year 15: This is when it really shows. Thirty-six fewer lame cows, saving $8,160 annually.
The moderate scenario suggests a lifetime value of about $19-24 per cow from lameness resistance. To put that in perspective—and this is interesting—that’s right between Productive Life at $24 and Daughter Pregnancy Rate at $12 in the current Net Merit index, according to Dr. Paul VanRaden’s team at USDA.
The 6-Farm Problem
This is where things get… well, uncomfortable. Those six farms generating mobility data with their 14 million observations—impressive, sure. But are they really representative of the diversity we have across U.S. dairy operations?
What I’ve found in the Foundation for Food & Agriculture Research grant documentation is that these aren’t your typical farms. We’re talking operations that can afford $50,000 to $100,000 camera installations. They’ve got IT staff, sophisticated management protocols—they’re probably in the top 5% of the industry by any measure.
Now, statistically speaking, 63,000 cows far exceeds the 3,000-5,000 that genetics researchers say you need for reliable predictions. That’s well-documented.
But here’s what concerns me—research in Genetics, Selection, Evolution consistently shows that genomic predictions developed in one environment can lose 30-50% of their accuracy when applied to different management systems.
Think about it: if these six farms all have pristine rubber matting, optimal nutrition designed by PhD nutritionists, and professional trimmers on schedule, will their genetic evaluations actually help that 200-cow operation in Wisconsin dealing with 30-year-old concrete and tight margins?
CDCB’s got a $2 million grant from FFAR to expand collection to 60,000 more cows over three years. That’s great, but even then, we’re talking about less than 1.5% of the national dairy cow population contributing lameness data. And DHI participation? Down to 43% of U.S. cows from over 50% a decade ago, according to USDA census data.
Regional Realities Matter
What’s particularly interesting when you look at regional differences is how implementation challenges vary—and as many of us have seen, what works in California doesn’t always work in Vermont.
California operations with dry lot systems face completely different lameness dynamics than Vermont grazing operations or Michigan freestall barns. Cornell’s PRO-DAIRY research shows prevalence ranging from 15% in well-managed pasture systems to over 40% in older confinement facilities in the Northeast.
Down South—and I’ve talked to several producers dealing with this—heat stress creates its own problems. University of Georgia extension work shows lameness spikes during summer when cows spend more time standing on concrete to access shade and cooling.
These regional realities mean genetic evaluations developed primarily from Midwest and Western mega-dairies might need serious recalibration elsewhere.
The European Warning We Can’t Ignore
Here’s what keeps me up at night—and should concern any producer thinking long-term. It’s not today’s milk check. It’s what’s already happening in Europe.
European welfare markets hit by 2030, but your genetic investments won’t pay off until 2035—creating a 5-year window where early adopters gain permanent competitive advantage while late movers scramble. This isn’t theory; FrieslandCampina and Tesco already require welfare audits. Are you positioned?
FrieslandCampina in the Netherlands has implemented welfare monitoring programs that incorporate lameness metrics into supplier requirements. Major UK retailers, such as Tesco, require welfare audits with lameness as a key metric. Germany passed animal welfare labeling legislation in 2023 that creates premium pricing tiers.
Based on typical lag patterns, we could see similar requirements in U.S. markets by 2030-2035. Several major processors here have already started supplier welfare assessments. Walmart and Costco are asking questions. Export markets to Europe increasingly require welfare documentation.
And here’s the catch nobody wants to discuss: genetic decisions you make today determine your herd composition a decade from now. If you wait for clear market signals—actual premiums or penalties—before emphasizing lameness resistance, your genetics will be 10 years behind when those payments show up. It’s like trying to turn a cruise ship, as they say.
The Consolidation Dynamic
I’ve been around this industry long enough to recognize patterns, and here’s one that deserves honest discussion. These early-stage evaluations will work best for operations that already look like the reference farms—large, well-capitalized, technology-forward.
The math is sobering. If large operations gain even a 3-5-year head start while these evaluations are validated across broader environments, they maintain permanent genetic superiority that smaller operations can never close. That’s just how genetics works—it compounds. Research from ag economists at Iowa State confirms this dynamic across multiple livestock sectors.
This isn’t CDCB’s fault or intention. But when you combine superior lameness genetics with all the other advantages large operations already have—purchasing power documented by USDA’s Agricultural Resource Management Survey, technical expertise, preferential genetics access—you’re looking at one more force driving consolidation. We’ve already lost 50% of dairy farms in the past two decades, according to the 2022 Census of Agriculture.
What Actually Works: Practical Strategies
Flooring delivers immediate relief while genetics won’t catch up for 8-10 years—but the combined approach dominates by Year 10 with $16K+ in annual savings that continues compounding. This is how smart producers win: immediate environmental fixes buy time for genetics to mature.
After wading through all this research and talking with producers who’ve tried various approaches, here’s what’s clear:
For immediate impact (Years 0-5): Environmental management still wins. University of Wisconsin’s Dairyland Initiative research shows that traction-milling concrete floors—that’ll run you $40,000-60,000—can immediately reduce lameness by 10 percentage points. That’s $11,250 in annual savings with a 3- to 5-year payback. Genetic selection won’t match this for 8-10 years.
For long-term positioning (Years 5-15): This is where genetics shines. It compounds permanently while that nice flooring depreciates. By year 10, genetic selection could deliver $12,000+ in annual savings with no additional capital required. And unlike flooring that needs to be redone every 6-15 years, genetic improvement continues to improve.
The optimal approach: Do both if you can. Fix critical environmental problems for immediate relief while shifting breeding emphasis toward lameness resistance. Year 10 projections show combined benefits of around $23,450 annually—way better than either approach alone.
Alternative Approaches for Smaller Operations
Something that didn’t make CDCB’s main presentations but came up in technical discussions—lower-tech options are being explored that might work for many of us.
University College Dublin researchers developed smartphone apps that can score mobility from short videos with a 64% correlation to camera systems. Penn State Extension is testing a simplified visual scoring that your herd vet could do during routine visits. DairyComp 305 and other software providers are working on integration—you know how they’re always adding features.
Research in the Irish Veterinary Journal shows human-assigned mobility scores correlate at 0.64 with camera scores and still show 10-15% heritability. Not as good as fancy cameras, but might be good enough if it means smaller operations can participate without massive investments.
AI organizations could explore subsidized phenotyping programs—similar to what happened with genomic testing adoption a decade ago—where they’d help cover costs for farms willing to share data.
Making the Right Decision for Your Operation
Not every operation should chase lameness genetics—this decision tree cuts through the complexity to show exactly which producers will actually benefit from the 10-year investment. Screenshot this and take it to your next breeding strategy meeting.
Not every operation should prioritize this the same way. Based on the economics and timeline, here’s how I see it breaking down:
Strong candidates for emphasis:
Multi-generation family farms planning to be around 20+ years
Operations with chronic lameness over 30%—you’ve got more room for improvement
Farms that can’t afford major facility renovations—genetics might be your only option
Producers are already thinking about welfare-premium markets
Operations in regions where consumer pressure is strongest (California, Northeast)
Probably should focus elsewhere:
Planning to sell or retire within 5-7 years? You won’t see the payoff
Already under 15% lameness? Limited upside
Need immediate cash flow improvements? Production traits deliver faster
Got capital for facility upgrades? Environmental fixes give quicker returns
Located where welfare pressure is minimal
Where the Industry Goes from Here
What strikes me most about CDCB’s lameness resistance development is how it highlights a broader challenge. Should genetic evaluation systems optimize for current conditions or anticipate where markets are heading? When breeding decisions take 10 years to play out but markets can shift in 5, who bears the risk?
We learned this lesson painfully with fertility. Spent decades emphasizing production while fertility tanked—USDA data shows it clearly. Then we scrambled when replacement costs exploded. Took 15+ years to dig out. Are we setting up for the same pattern with welfare traits?
Dr. Chad Dechow at Penn State has written extensively about needing anticipatory breeding strategies that position for probable future markets rather than just optimizing for today. But that’s easier said than done when you’re trying to make payroll next month.
What This Means for You
Looking at all this, here’s what I’d tell my neighbors:
Adjust your timeline expectations. This isn’t a quick fix. If you need lameness relief in 3-5 years, invest in flooring, footbaths, and management. Genetics is your 10-year plan.
Understand the real economics. That $19-24 lifetime value per cow is real but modest. Don’t abandon production traits in pursuit of lameness improvement—use balanced selection via Net Merit or TPI.
Consider your market position. Selling commodity milk to the co-op? Current genetics might be fine. But if you’re eyeballing premium markets or brands like Organic Valley, starting selection now positions you for 2030-2035.
Contribute data if you can. These evaluations only improve with broader participation. If you’re working with a good trimmer or thinking about mobility scoring, explore data sharing with CDCB or your breed association.
Combine strategies. The successful producers I see aren’t choosing between genetics and management—they’re doing both with appropriate timeframes.
The promise of genetic selection for lameness resistance is real. We’re looking at a potential 30% reduction over 20 years according to CDCB projections, permanent benefits that compound, and positioning for evolving markets. But it’s not magic, won’t replace good management, and requires more patience than most of us naturally have.
What we’re discovering about lameness genetics is pretty much what we’ve learned with every other trait: biological systems change slowly, market signals arrive late, and success goes to those who position for tomorrow while managing today. The tools are coming—CDCB says April 2025 for initial implementation. Whether we have the patience and vision to use them effectively? Well, that’s the real question, isn’t it?
KEY TAKEAWAYS
The 10-year reality: Lameness genetics save nothing initially, then compound to $4,879 (Year 10) and $8,160 (Year 15)—patience required
Data disconnect warning: Six elite farms with $100K cameras shape genetics for 34,000 dairies—verify relevance to YOUR operation
Win with both strategies: $40-60K flooring investment (immediate relief) + genetic selection (permanent gains) = $23K+ annual savings by Year 10
Timeline mismatch alert: European welfare markets arrive by 2030, but genetics won’t deliver until 2035+—early adopters gain 5-year advantage
Complete references and supporting documentation are available upon request by contacting the editorial team at editor@thebullvine.com.
Learn More:
The $7200 Lameness Fix That Beats $45000 Technology (40-50% Reduction Proven) – This article provides the immediate, tactical playbook for the main article’s “environmental fix.” It details a proven, low-cost prevention bundle of footbaths and strategic trimming that delivers a 4-6 month payback, directly contrasting it with high-cost tech.
CRV’s 2023-24 Financial Report: Challenges and Opportunities for Global Dairy Farmers – This strategic report broadens the main article’s “genetic selection” theme. It reveals how market pressures are forcing investment not just in lameness, but in other key welfare traits like methane reduction, feed efficiency, and polled genetics, showing the bigger picture.
The Sunday Read Dairy Professionals Don’t Skip.
Every week, thousands of producers, breeders, and industry insiders open Bullvine Weekly for genetics insights, market shifts, and profit strategies they won’t find anywhere else. One email. Five minutes. Smarter decisions all week.
New reports reveal coordinated legal strategies, AI-powered surveillance, and strategic economic pressure that go far beyond traditional protests—here’s what dairy farmers need to know about this transformed threat landscape
EXECUTIVE SUMMARY: Animal activists aren’t college kids with protest signs anymore—they’re an $865 million corporate operation with Harvard lawyers and AI technology that’s mapped 27,500 farms, probably including yours. While brutal economics closed 2,800 dairy farms in 2024, these organizations strategically exploit those same vulnerabilities through legal warfare, regulatory pressure, and coordinated campaigns designed to accelerate consolidation. The surprise: farmers are winning battles that matter. Fourteen Wisconsin operations eliminated activist threats entirely with a free WhatsApp group, and individual farmers’ authentic social media consistently outperforms ASPCA’s $131 million advertising budget in building consumer trust. This report exposes their complete playbook—from shareholder lawsuits to biosecurity weaponization—while delivering practical defense strategies that work regardless of operation size.
You know, I’ve been tracking activist groups for nearly two decades, and what’s happening now is completely different from what we dealt with back in the early 2000s. Here’s what’s interesting—the Animal Agriculture Alliance’s latest reports show these organizations now command $865 million in annual revenue. That’s up from $800 million just last year, and if you look back five years, we’re talking about growth from $650 million.
But what really gets my attention isn’t the money itself—it’s how they’re using it that should have every dairy farmer paying attention.
The Alliance released two reports this fall—”Radical Vegan Activism in 2024″ and their updated “Major Animal Activist Groups Web”—and honestly, some of what’s in there surprised even me. Sure, we documented 189 actions against agriculture in 2024, including 59 vandalism cases, 43 animal thefts, and 31 trespassing incidents. But here’s the thing: those are just the incidents we can see.
What the Alliance found is that these groups aren’t just showing up with protest signs anymore. The FBI actually refers to some of its activities as “intelligence operations.” They’re coordinating legal strategies across multiple states, and they’re systematically targeting what they see as weak points in animal agriculture’s economic foundation.
For dairy farmers trying to make it work with USDA data showing 2,800 operations closing in 2024—that’s out of roughly 28,000 total dairy operations nationwide—well, understanding this new landscape isn’t really optional anymore. It’s survival.
The Evolution of Animal Activism: From $650M to $865M in Five Years
The $865 Million War Chest: How activist organizations grew their combined budgets by 33% in five years—from $650M to $865M—giving them unprecedented resources to target dairy farmers through legal warfare, shareholder campaigns, and AI-powered farm mapping
Year
Combined Revenue
Key Development
2020
$650 million
Traditional protest focus
2024
$800 million
Corporate structure emerging
2025
$865 million
Full corporate operations
Beyond the Protest Line: This Isn’t Your Father’s Activism
I remember twenty years ago—maybe you do too—when activists were mostly college kids with spray paint and strong feelings. Today? We’re looking at something else entirely.
While theatrical street protests like this PETA demonstration are highly visible, the real threat has evolved. The new battle is fought by corporate legal teams, not just street performers.
Organizations like the ASPCA (pulling in $379 million annually according to 2023 tax filings), the Humane Society of the United States (HSUS) ($208 million), and PETA ($85.7 million in revenue) have built operations that look more like corporate headquarters than grassroots movements. And here’s what they’ve got working for them:
Legal teams with attorneys from Yale, Harvard, University of Chicago—the works
Media departments spending serious money—ASPCA alone shows a combined $131 million spent on fundraising ($70M) and advertising ($61M) on their 2023 Form 990
Lobbying operations working at both the federal and state levels
Tech divisions using AI to map agricultural facilities
Take PETA’s setup. They’ve got multiple deputy general counsels running different divisions. One handles litigation for strategic impact cases. Another manages corporate governance and planned giving. These aren’t volunteers anymore—they’re attorneys who cut their teeth at places like Steptoe and DLA Piper before jumping to animal advocacy.
What I find fascinating—and concerning—is how this changes the game for farmers. When Direct Action Everywhere launched Project Counterglow (their map showing 27,500 animal ag facilities using satellite imagery and crowdsourced data), the FBI took it seriously enough to create a dedicated email inbox for reporting these activities.
WIRED dug into this with public records requests, and what they found is… well, both sides are playing intelligence games now. The Animal Agriculture Alliance has databases tracking over 2,400 individual activists. Meanwhile, activist groups are using similar tactics to identify targets and coordinate campaigns.
Industry security advisors tell me they’re hearing similar stories from Wisconsin producers—activists showing up who know shift changes, delivery schedules, even which gates don’t always get locked. That’s not protesting, folks. That’s reconnaissance.
“The level of preparation we’re seeing suggests systematic reconnaissance rather than spontaneous action. They know our operations better than some of our seasonal workers.” — Wisconsin dairy security consultant, speaking to industry advisors
“I had someone show up claiming to be interested in buying feed, but the questions they asked… it was clear they were mapping our operation, not buying anything.” — Central Valley dairy producer, speaking at a recent California Dairy Quality Assurance Program workshop
The Legal Game: They’re Playing Chess While We’re Playing Checkers
Now this is where it gets sophisticated, and I’ll be honest—most of us aren’t ready for this level of strategic thinking.
Take Wayne Hsiung’s case. He’s the co-founder of Direct Action Everywhere, who was convicted in 2023 for trespassing on Sonoma County farms. The guy has a law degree from the University of Chicago, worked at major firms, but he represented himself at trial and turned down plea deals that would’ve kept him out of jail.
Why would anyone do that?
Harvard Law Review spelled it out in their February 2024 piece on “Voluntary Prosecution and the Case of Animal Rescue”—for these activists, the trial IS the strategy. They’re using prosecutions to force public discussions about farming practices. The courtroom becomes their stage.
Meanwhile—and this is happening at the same time—Legal Impact for Chickens is going after companies through shareholder lawsuits. Their president, Alene Anello (Harvard undergrad, Harvard Law, previously worked at PETA and the Animal Legal Defense Fund), targeted Costco, claiming that its executives violated their duties by failing to address animal welfare laws properly.
Here’s the kicker: even though their first case got dismissed, the court left the door open for shareholders to file formal demands. So LIC did exactly that in July 2023, forcing Costco’s board to spend months investigating and publicly defending their practices.
What dairy farmers need to watch for:
Arguments that activists have a legal “right” to rescue animals
Shareholders are forcing companies to address welfare complaints
Challenges to ag-gag laws (they’ve already knocked down dozens)
Expanding definitions of what counts as animal cruelty
Even when they lose these cases, they win something—media coverage, legal precedents, and they force agricultural operations to burn through time and money defending themselves.
When Biosecurity and Security Collide: The H5N1 Wake-Up Call
The 2024 H5N1 outbreak that hit nearly 200 dairy herds across multiple states taught us something important: the same protocols that protect against disease also protect against activists. And vice versa.
USDA’s Animal and Plant Health Inspection Service identified how H5N1 spreads: shared equipment and vehicles, people moving between farms, and animal movements. Think about that—those are exactly the same ways activists gain access to facilities.
Professor Timm Harder from Germany’s Friedrich-Loeffler-Institut (which runs its national reference lab for avian influenza) has been speaking at international briefings about comprehensive containment measures. What he doesn’t say outright—but what’s becoming obvious to those of us watching both threats—is that these measures work for both.
The basics that work for both:
Visitor logs showing who’s on your property and when
Vehicle cleaning protocols (and tracking who’s coming and going)
Background checks for new hires
Cameras at access points
Tracking which employees work at multiple facilities
What’s interesting here is how the same infrastructure that keeps disease out also keeps unwanted visitors out. It’s not about building Fort Knox—it’s about knowing who’s on your property and why.
Double-Duty Defense: The same $8,300 basic security package that protects against H5N1 spread also blocks activist infiltration—cameras, visitor logs, and vehicle tracking stop both disease vectors and unwanted “investigators,” proving Andrew’s point that smart biosecurity is also smart security
The Trust Game: Your Story Still Matters
Despite all this corporate machinery against us, dairy farmers have one advantage that money can’t buy. I’ve watched this play out again and again—authentic relationships with consumers.
Agricultural communications research keeps showing the same thing: authenticity predicts consumer trust better than anything else. Better than credentials, better than sustainability claims, better than fancy branding.
Look at what Tara Vander Dussen’s doing as the New Mexico Milkmaid. She’s been at it for years, and her approach is simple: build relationships so people feel comfortable asking questions. When some activist video goes viral, her followers message her first—they want to hear her side before making up their minds.
You know why this works? Marketing folks have documented something they call the micro-influencer effect. Accounts with 1,000 to 100,000 followers get seven times the engagement of bigger accounts. Why? Because people can smell authenticity, and they know when someone’s being paid to say something versus when they actually believe it.
ASPCA runs those tear-jerker ads that reach millions. But investigative reporters have shown that only 2% of ASPCA’s $379 million budget actually reaches local shelters. Their CEO makes close to a million dollars. Their 2023 tax filings show the organization has over $550 million in net assets.
The Corporate Activist Reality: ASPCA’s $379 million budget allocates $57 of every $100 to staff and office costs, $28 to advertising and fundraising, and only $6 to veterinary services and grants—while their CEO makes $1.2 million annually. This is activism as big business
When people find that out—and they do—trust disappears instantly.
Meanwhile, farmers posting real content from their barns are connecting with consumers in a completely different way. It’s not about guilt—it’s about understanding.
Industry communications advisors describe producers who’ve started posting daily farm videos getting fascinating results. Nothing fancy—just showing what they actually do. They report consumers from urban areas messaging to say they were worried about dairy farming until they started following these pages. Now they specifically look for those cooperatives’ brands. One person at a time, but it multiplies.
Regional Reality Check: Know Your Risk Level
Know Your Risk Level: The top three states—Massachusetts (37), California (36), and New York (34)—account for 57% of all documented activist actions in 2024, while regional cooperation in Wisconsin (14 actions) demonstrates effective farmer networks can reduce targeting
Looking at where those 189 documented actions occurred in 2024, there’s a clear pattern: most activity is concentrated in Massachusetts, California, and New York.
If you’re within 50 miles of a major city in California, the Northeast, or the Pacific Northwest, you’re in what I’d call the primary zone. You’ve got activist populations nearby, sympathetic media, and prosecutors who might not pursue charges aggressively.
The Upper Midwest—Wisconsin, Minnesota, Michigan—plus the Mid-Atlantic states see periodic waves, usually coordinated campaigns hitting multiple farms at once. The good news? We’ve seen regional cooperation work really well in several Wisconsin counties.
The Great Plains, Mountain West (except around Denver), and the Deep South see less activity. Not because activists don’t care, but because distance, logistics, and the political climate make operations more difficult.
But—and this is important—Project Counterglow mapped 27,500 facilities nationwide. Geographic isolation isn’t the protection it used to be. If you fit their criteria, you could be targeted regardless of location.
What’s interesting is that our Canadian neighbors face similar patterns around Toronto, Vancouver, and Montreal, while European producers tell me they’re seeing coordinated campaigns across borders there too. Australian dairy farmers are dealing with their own version of this, particularly in Victoria and New South Wales. New Zealand’s seeing it around Auckland and Wellington. This really is becoming a global challenge, not just an American one.
The Economics Nobody Wants to Talk About
Here’s what I think many farmers miss —and what took me years to see clearly: activists aren’t causing the economic crisis hitting mid-size dairies—they’re making it worse.
Look at those 2,800 closures in 2024. Maybe 50 to 100 were directly because of activist actions—vandalism, theft, campaigns that destroyed reputations. The rest? Regional production costs are running $19-21/cwt while Class III milk prices average $17-18/cwt according to Dairy Market News. That’s just brutal economics.
But activists know how to exploit these vulnerabilities:
Prop 12-style regulations are a prime example. While that law targeted pork and eggs, similar future legislation for dairy could be devastating. National Pork Producers Council (NPPC) economist Holly Cook has laid out analyses showing Prop 12 compliance can cost $600-700 per sow for retrofits alone, or over $3,000 per sow for new construction. Using the pork retrofit numbers as an analogy, a 500-cow dairy facing similar per-animal costs would be looking at a $300,000-$350,000 capital expense, not including lost production time. Most operations don’t have that kind of capital.
The Brutal Math: While activists documented 189 direct actions against agriculture in 2024, 2,800 dairy farms closed—exposing how activists exploit economic vulnerabilities rather than cause them directly, accelerating the consolidation that’s killing mid-size operations
For smaller operations—say, 100-150 cows—even basic security upgrades can strain budgets. That’s why I tell these folks to think about pooling resources with neighbors. Share the cost of cameras, coordinate patrols, and work together on visitor protocols. You don’t have to go it alone.
Grand View Research and others project that plant-based alternatives will reach $32-34 billion globally by 2030, up from about $20 billion now. Every percentage point of market share they take hurts mid-size producers far more than it does big operations with 2,000-plus cows.
And here’s what really worries me: as farm numbers drop, the infrastructure disappears. Vets close their practices. Equipment dealers shut down. Processing plants consolidate. The whole support system collapses.
Jim Mulhern, who led the National Milk Producers Federation for over a decade before retiring in 2023, used to talk about this all the time—consolidation was happening anyway. What’s different now is that activists have figured out how to speed it up.
What Actually Works: Practical Steps You Can Take
Based on what we saw in 2024 and what’s developing now, here’s what I tell producers who ask:
This Month—Get Started:
Week 1: Connect with your state dairy association’s alert system. If they don’t have one, push them to create one. The Animal Agriculture Alliance has monitoring services—use them.
Week 2: Look at your camera situation. Basic coverage for access points runs $2,000-$3,000. That’s nothing compared to what you could lose. If that’s too steep right now, talk to neighbors about sharing costs.
Week 3: Talk to your employees one-on-one. Just ask: “Has anyone approached you about filming here? Offered money for information?” You might be surprised.
Week 4: Get 5-10 neighbors together for a simple communication network. Group text, whatever works. When something happens, everyone knows fast.
Next Three Months:
Build relationships with local law enforcement now, not during a crisis
Write down who talks to the media if something happens (hint: pick one person)
Actually use visitor logs—every person, every time
Check your insurance—does it cover losses related to activism?
Long-Term Thinking:
This is harder, but it’s where real protection comes from:
Technology that helps you compete with bigger operations
Finding your market niche—organic, A2, grass-fed, whatever works for you
Building consumer relationships before you need them
Getting involved in advocacy at whatever level you can manage
Learning from Success: The Wisconsin Example
Let me tell you about something that worked. Industry security advisors describe a situation in Central Wisconsin last spring in which 14 dairy farms across three counties began sharing information after one farm caught activists conducting surveillance.
Within 48 hours, everybody in that network knew the vehicle descriptions, the tactics, even the specific questions activists asked when they pretended to be feed salespeople. They’d created a simple WhatsApp group—nothing fancy, just quick communication.
When the activists came back two weeks later, targeting a different farm, that producer was ready. Cameras got everything. Law enforcement responded immediately because they already had relationships with the community. The activists got prosecuted for criminal trespass, and here’s the important part—that network hasn’t seen activity since.
As the security advisors explain, success came from working together, not from individual measures. They eliminated the easy targets by coordinating. Simple as that.
What This Means for Your Operation
Looking at everything that’s happening, what’s changed isn’t just money or sophistication—it’s how all these threats are converging at once.
Activist organizations operate like corporations, with combined budgets of billions of dollars. They’re targeting economic viability, not just arguing ethics. Technology gives both sides capabilities we didn’t have before. Biosecurity and activist infiltration have become the same problem. And economic pressure makes farms vulnerable to everything else.
But here’s what still works: authentic farmer voices build trust that money can’t buy. Local coordination multiplies your defenses. Basic security stops most opportunistic actions. And adapting your business—not just defending it—is still essential.
The uncomfortable truth? You’re not just dealing with activists anymore. You’re navigating economic forces that activists know how to exploit. The operations that’ll make it aren’t the ones with the highest walls—they’re the ones that transform their businesses while defending against pressure designed to stop exactly that transformation.
Industry leaders keep saying things will stabilize eventually. They’re probably right. The question is whether your operation will still be around when that happens.
The next year and a half are critical for many operations. Understanding what you’re really up against—not just protesters, but coordinated campaigns with serious money and long-term strategy—that’s your starting point.
Next step? Actually doing something about it. Because in this business, we all know that knowledge without action doesn’t get the cows milked or the bills paid.
These organizations are playing a long game. Question is: are you ready to play it too?
KEY TAKEAWAYS:
Activists aren’t protesters anymore—they’re an $865M corporation with Harvard lawyers who mapped 27,500 farms using AI, but 14 Wisconsin farmers stopped them with a WhatsApp group
Your biosecurity is your security: The same protocols preventing H5N1 also prevent infiltration—just add $2-3K in cameras and actually use those visitor logs
You’re already winning the trust war: Your iPhone videos beat ASPCA’s $131M advertising because authenticity crushes their 2%-to-shelters reality
The clock is ticking: Prop 12 hit pork with $600/animal costs; dairy’s next; but farmers who coordinate locally report zero incidents since organizing
Monday morning action plan: Text 5 neighbors to create an alert network (30 min), install doorbell cameras on barn entrances ($300), ask each employee about suspicious contacts (1 hour)
Complete references and supporting documentation are available upon request by contacting the editorial team at editor@thebullvine.com.
Learn More:
The Clarkson Effect: What It Really Means for Your Dairy’s Marketing – This guide provides a tactical playbook for leveraging public curiosity, demonstrating how to build an authentic social media presence that educates consumers and wins the “trust game” the main article identifies as critical.
Every week, thousands of producers, breeders, and industry insiders open Bullvine Weekly for genetics insights, market shifts, and profit strategies they won’t find anywhere else. One email. Five minutes. Smarter decisions all week.
Crop farmers: $35B bailout. Beef: $1,100 calves. You: $17.50 milk that costs $19 to make. The numbers that should anger every dairyman.
Executive Summary: Record farm income of $179.8 billion sounds great until you realize dairy’s been left behind—your neighbors got disaster checks while you’ve faced 18 months of negative margins with minimal help. The numbers are stark: mega-dairies produce $3-4/cwt cheaper, driving consolidation that’s eliminated 39% of farms since 2017. Behind every closure is a family burning through retirement savings, with 60-70% of dairy farmers now reporting serious mental health impacts. Yes, some operations thrive through creative adaptations—premium marketing in New York, specialty partnerships in Texas—but these require advantages most farms don’t have. For mid-size dairies, three paths remain: invest heavily to scale up, find niche markets, or exit strategically while equity remains. This article offers an honest assessment and practical tools to make that choice consciously rather than desperately.
You know what’s interesting? The September farm income forecast from USDA shows net farm income up 40.7% to $179.8 billion—second-highest on record. It’s all anyone’s talking about at the coffee shop. But here’s the thing: for most of us checking milk prices against feed bills this fall, that headline number feels like it’s from a different planet.
I was talking with a producer near Eau Claire last week—he’s milking about 380 Holsteins, and he’s been at it for years. While his grain-farming neighbor just deposited a disaster check for weather losses from two years back, this guy’s been navigating 18 months of tough margins with nothing but the DMC coverage he pays premiums for.
Makes you think about how these support structures really work across different commodities, doesn’t it?
Let me share what I’ve been learning from conversations around the industry—producers, economists, folks who’ve been watching these trends for decades. Maybe together we can make sense of this disconnect between ag’s overall prosperity and what’s happening in our barns.
Understanding Where That $180 Billion Really Goes
So here’s what’s fascinating when you dig into this $179.8 billion figure. About $41 billion of it? That’s government payments, not market returns.
The breakdown tells you everything:
$35.2 billion in disaster assistance through the American Relief Act—mostly for crop losses
$40 billion total in direct payments (we were at $10 billion just last year)
Minimal DMC payments for dairy—margins stayed just above that $9.50 trigger
You probably know this already, but it’s worth repeating: dairy’s support structure works completely differently. We pay into programs that rarely trigger at levels that actually help. Meanwhile, crop disasters get an immediate congressional response.
Now look, I’m not saying processors have it easy either. Labor’s up about 15%, energy costs have jumped over 20%, and don’t even get me started on packaging materials—nearly 20% higher than 2020. Everyone’s feeling it somehow. But the way support flows through the system…well, that’s another story.
The Scale Reality We Can’t Ignore in 2025
What I’ve found really compelling is the recent data from our land-grant universities on operational scale. And honestly, as much as we might not want to hear it, the numbers are clear: operations with 2,500-plus cows are producing milk for roughly $3 to $4 less per hundredweight than those of us running 300 to 500 head.
Let me break this down the way it was explained to me.
The Math Nobody Wants to Talk About
Take your typical 300-cow operation averaging 23,000 pounds:
Fixed costs: Running about $0.90 per hundredweight (varies by region, obviously)
Annual production: Around 6.9 million pounds
The challenge: Can’t justify specialized equipment, stuck with truckload purchasing
Compare that to 3,000 cows:
Fixed costs: Drop to maybe $0.45 per hundredweight
Annual production: 75 million pounds
The advantages: Railcar feed purchasing, specialized positions, equipment that actually makes sense
The cost gap isn’t closing—it’s widening. Mid-size operations at $19/cwt can’t compete with mega-dairies at $15/cwt. For a typical 300-cow farm producing 7 million pounds annually, this $4 difference translates to over $50,000 in lost competitiveness before debt service, labor, or family living expenses.
An Idaho dairyman I know—he’s running about 2,800 head—put it to me straight:
“We’re buying feed in railcar quantities for substantially less per hundredweight. The guys buying truckloads? They’re paying $1.50 to $2 more, easy. That advantage is really tough to overcome.”
But here’s what’s worth considering. Not every big operation is printing money. I spoke with a California producer managing over 5,000 cows, and his perspective was sobering:
“Everyone thinks we have it made. Truth is, we’re all walking a tightrope, just at different heights. Our debt service alone runs over a million annually. One disease outbreak, one major equipment failure—those thin margins disappear real fast.”
The Census of Agriculture data from 2022 really drives this home: we lost 39% of dairy farms between 2017 and 2022. That’s the steepest five-year decline they’ve ever recorded. And operations over 1,000 cows? They’re now producing 66% of our milk, up from 57% in 2017.
834 Operations Control Half the Milk—16,334 Fight for Scraps
How This Plays Out Across the Country
What I find really interesting is how differently this consolidation hits different regions:
Pacific Northwest folks:
You’re dealing with that brutal Class I utilization problem—18% versus 29% nationally
Federal Order prices running over a dollar below the national average
And those transportation costs to get milk to cities? Forget about it
Wisconsin and Minnesota producers:
Over 500 farms gone in 2024 alone—mostly those 150-400 cow operations we all grew up around
When the co-op closes, the vet leaves, the equipment dealer stops stocking parts…
That infrastructure needs critical mass, and once it’s gone, it’s gone
Out in Idaho and Texas:
Production’s actually growing—7% or more—even as farm numbers drop
They’re attracting these mega-operations with the climate, the space
New processing plants are going up to match
Northeast—and this is tough:
Land at $4,500 an acre (if you can find it)
Environmental compliance costs that’d make your head spin
Infrastructure that’s 40 years older than what they’re building out West
California’s its own beast:
Central Valley operations are expanding like crazy
But near the cities? They’re selling to developers
Most complex market in the country, honestly
Florida dairy—different world:
Heat stress management costs running $100+ per cow annually
Unique fluid milk market dynamics
Some of the highest production costs nationally
Each region’s facing its own version of this challenge, but the underlying pressure’s the same everywhere.
The Human Side Nobody Wants to Talk About
Here’s what keeps me up at night. Recent agricultural health research suggests 60-70% of us are dealing with mental health impacts from farm stress. That’s way higher than the general population, and we need to acknowledge it.
I know a Wisconsin couple—good people, who milked registered Holsteins for nearly 30 years. Sold out this summer. They knew five years ago the math wasn’t working, but how do you walk away from something your grandfather built?
“The hardest part was watching our neighbors in grain and beef doing well while we struggled. Felt like nobody in policy circles even knew we existed.”
What makes dairy different—and we all know this:
No breaks: Cows need milking twice a day, every day
No sleep: Research shows we’re averaging four hours during calving season
No let-up: Financial pressure plus operational intensity equals chronic stress
Identity crisis: When the farm’s been in your family for generations…
By the time many folks finally make the decision, they’ve burned through the equity they’ll need for retirement. It’s heartbreaking.
But There Are Success Stories
Now, it’s not all doom and gloom. I’ve seen some really creative adaptations working.
That New York Operation Near Cooperstown
These folks transformed their 280-cow dairy:
What they did: Switched to A2A2 genetics, found a local processor, and added agritourism
Investment: About $450,000 over three years (yeah, it’s substantial)
Results: They’re seeing 18% net margins, getting $32/cwt equivalent
Key factor: They’re 45 minutes from Albany—location matters
Texas Partnership That Works
A 400-cow operation found their niche:
“It’s not revolutionary, but that $3 premium for high-butterfat milk makes the difference between losing money and modest profitability.”
Strategy: Partnered with a local ice cream manufacturer
Benefit: Guaranteed volume, premium for butterfat
Lesson: Sometimes the answer’s right in your backyard
Connecticut’s Organic Journey
This one’s honest about the challenges:
“The three-year transition nearly bankrupted us. But now? It’s sustainable rather than highly profitable, and sustainable beats losing money.”
Reality check: Needed off-farm income during transition
Current status: Making it work, but it’s not easy money
Truth: Location near affluent markets was crucial
Export Markets and Processing—It’s Complicated
USDA data shows we exported $8.2 billion in dairy products last year—second-highest ever. Sounds great, right? But here’s what worries me:
The vulnerabilities:
Over 40% of our cheese goes to Mexico
China’s substantially increased tariffs on most dairy products
Domestic consumption’s only growing 1-2% annually
We’re building processing capacity faster than finding markets
Recent expansions:
Wisconsin’s new plant: 8 million pounds daily
Valley Queen in South Dakota: Another 3 million pounds of capacity
And there’s more coming online
The Federal Order reforms this summer increased make allowances by about $0.54 per hundredweight. Processors show the data—costs really are up. But we’re all wondering how they’re expanding if margins are so tight. Both things can be true, I guess.
Alternative Models—Let’s Be Realistic
You know, everyone asks about organic, grass-fed, on-farm processing. Here’s my honest take after watching this for years: these can work brilliantly for maybe 20-25% of producers. But you need:
The right location:
Within 50 miles of a big city (500,000+ people)
Household incomes above average
Customers who value what you’re doing
The right scale:
80-200 cows typically
Small enough for relationships
Big enough for efficiency
The right mindset:
Ready for 80+ hour weeks
Willing to do marketing, not just milking
Often need off-farm income initially
Burlington, Vermont? Perfect. Middle of Nebraska? Much tougher.
Technology Might Actually Help in 2025
What’s encouraging is how technology costs have come down. Genomic testing costs have dropped substantially in recent years. Activity monitoring that used to need 5,000 cows still need to be justified. Now it works at 500.
A Pennsylvania producer with 450 cows told me:
“Our conception rates improved 8%, we’re catching health issues two days earlier, and I’m actually sleeping through the night during calving. The investment was about $120,000, and we figured an 18-month payback.”
And here’s something interesting—robotic milking is finally penciling out for mid-size operations. We’re seeing 200-300 cow dairies making it work, especially where labor’s tight. About 5% of operations are exploring this now, up from almost none five years ago. It won’t overcome all the scale disadvantages, but it’s helping mid-size operations stay competitive in specific areas. That’s something, at least.
The Policy Reality in 2025
Here’s what’s uncomfortable but true: dairy doesn’t fit the disaster model Congress understands.
Recent support comparison says it all:
Crops: $35.2 billion in disaster aid
Commodity payments: Tripled from last year
Conservation: Up over 10%
Dairy: DMC that we pay for rarely helps when we need it
When crops fail due to weather, it’s visible and immediate. When will our margins compress over two years? That looks like a business problem, not a disaster. And as fewer dairy farms open each year, our political voice keeps getting quieter.
Crops: $35 Billion. Dairy: $1.2 Billion. The Support Gap Killing Farms.
What’s Actually Working Right Now
Looking at successful operations, here’s what they’re doing:
Getting real about costs:
Calculating true production costs, including economic depreciation
Need about $2/cwt margin above true costs
Most of us are below that right now
Using every tool available:
DMC five-year commitment saves 25% on premiums
Dairy Revenue Protection for catastrophic protection
Strategic culling with cull prices at $140-148/cwt
One Minnesota producer shared this:
“We culled 20% strategically—generated enough cash to restructure debt and buy some breathing room.”
Having an exit strategy (even if you never use it): Financial advisors tell me farmers with exit plans actually make better daily decisions. Takes the desperation out of it.
Looking Down the Road
Based on what economists and industry folks are saying, here’s what’s likely:
Industry projections for 2025-2030 suggest:
We’ll lose 2,000-2,800 farms annually through 2027
Operations over 1,000 cows will hit 75% of production by 2030
Mid-size farms are mostly gone except near cities
Policy changes?
Farm Bill might tweak things
But fundamental change? Unlikely
Maybe higher DMC coverage, but same structure
Market disruptions could change everything—disease, processing problems. But you can’t plan on disasters.
So What Does This Mean for Your Farm?
Let’s get practical here.
First, know where you really stand:
Calculate actual costs versus realistic revenue
Penn State’s got great worksheets online for this
If the math doesn’t work, that’s not failure—it’s information
Second, pick a lane:
Staying in? Either differentiate clearly or scale up
Getting out? Timing is everything for preserving equity
Standing still? Usually means falling behind
Third, get support:
Farm Aid: 1-800-FARM-AID for financial counseling
Crisis line: 988 if you’re struggling
Talk to other producers—we’re all dealing with this
Every month you operate at a loss, eats equity you’ll need later. That’s just math.
The Bottom Line
Look, this disconnect between headlines and our reality reflects changes that aren’t reversing. Consolidation, technology, global markets—these forces are bigger than any of us.
But here’s what I want to emphasize: you still have choices.
If you’re well-positioned—good location, right scale, unique advantages—this transition might create opportunities. If not, you need clear-eyed assessment and strategic planning.
Success isn’t about being the best farmer or working the hardest anymore. It’s about recognizing reality early and adapting. Sometimes that’s expanding. Sometimes it’s finding a niche. And sometimes—more often than we’d like—it’s transitioning out with dignity and security intact.
Make decisions consciously, not by default. Understand where you really stand instead of hoping for rescue. That might be the most valuable thing any of us can do right now.
We’re all trying to navigate these changes while holding onto why we got into dairy in the first place. The conversations I’ve had across the country show we’re facing similar challenges, just in different ways.
And whatever path makes sense for your operation, you’re not walking it alone. We’re all figuring this out together.
Key Takeaways:
The economics are permanent: Mega-dairies produce $3-4/cwt cheaper—this gap will widen, not shrink, making commodity milk unviable for farms under 1,000 cows
Your three options are clear: Scale to 1,200+ cows (requires $3-5M capital), capture premium markets (needs metro proximity), or exit strategically while equity remains
Time is your enemy: Every month at negative margins burns $25-50K in equity—the difference between comfortable retirement and bankruptcy is acting 12-18 months sooner
Location determines everything: Success stories share one trait—proximity to wealthy consumers or unique partnerships; without this, scaling or exiting are your only choices
Support exists, use it: Calculate true costs with Penn State worksheets, get financial counseling at 1-800-FARM-AID, mental health support at 988—deciding consciously beats drowning slowly
Mental Health Resources: National Suicide Prevention Lifeline (988, available 24/7), Farm Aid Hotline (1-800-FARM-AID), American Farm Bureau’s Farm State of Mind resources
Financial Resources: Farm Service Agency offices, Farm Credit Services, state Farm Business Management programs, National Farm Transition Network
Complete references and supporting documentation are available upon request by contacting the editorial team at editor@thebullvine.com.
Every week, thousands of producers, breeders, and industry insiders open Bullvine Weekly for genetics insights, market shifts, and profit strategies they won’t find anywhere else. One email. Five minutes. Smarter decisions all week.
You can pour money into feed, genetics, or equipment—but every day, poor communication leaves profit in the parlor.
You know, when you talk with producers from Wisconsin to Idaho, there’s always a familiar story. Most will tell you they’ve fine-tuned their feeding program, upgraded their genetics, and modernized their parlor. Yet, even with all that, something still drags performance down. What’s interesting is that it’s rarely a feed issue or cow comfort problem anymore—it’s communication.
More dairies are realizing that human communication—not sensors, not software—is becoming one of their most powerful management tools. You can have the best feed efficiency in the county, but if the team’s not hearing the same message, you’re going to lose consistency and, eventually, money.
Impact Metric
Industry Average
High-Turnover Farms
Cost Impact
Annual Turnover Rate
38.8%
45-60%
$93K-$140K/year
Milk Production Loss
Baseline
-1.8% per point
-$18K per 100 cows
Calf Loss Increase
Baseline
+1.7%
+$5K-$8K annually
Cow Mortality Increase
Baseline
+1.6%
+$12K-$15K annually
Total Annual Impact
—
Cumulative
$128K-$181K
The Economics Behind Miscommunication
Here’s what the research shows. Michigan State University Extension reports that replacing just one employee can cost between $15,000 and $25,000, once you include recruitment, onboarding, lost productivity, and training time. Multiply that across a crew of twelve, and the real price of inconsistency starts to add up fast.
Add language barriers to that, and you see why communication is quietly shaping productivity. Studies from New Mexico State University Extension show roughly 60% of U.S. dairy employees speak limited English, and in some Southwestern regions, up to a third speak K’iché, a Mayan dialect that’s often not translated in training materials.
As Dr. Robert Hagevoort from NMSU likes to put it, “Every time someone does the right job the wrong way, the farm pays tuition.” And he’s right. Bad communication doesn’t always create visible failure—sometimes it just creates smaller, daily inefficiencies that chip away at margins.
The Language Barrier Crisis: Spanish-speaking workers are 46 percentage points less likely to know their farm’s SCC goals and 28 points less likely to receive training directly from managers. This isn’t a language problem—it’s a management failure costing operations thousands in milk quality losses
When “The System” Walks Out the Door
In many dairies, managers don’t realize how dependent their success is on one translator or crew leader until that person is gone. Take a 900-cow operation in Minnesota that lost its bilingual milker. Within days, the somatic cell count passed 300,000, and shifts started running nearly an hour longer.
When a Minnesota 900-cow operation lost its bilingual milker, SCC spiked from 200K to over 300K within 10 days while shifts ran an hour longer. Wisconsin Extension’s bilingual photo SOPs and structured check-ins restored normal levels within 30 days, proving that systems beat individual translators
Through the help of the University of Wisconsin–Madison Extension, the farm rebuilt its communication foundation with bilingual photo SOPs, clear shift checklists, and 10-minute morning meetings. Within 30 days, SCC was back below 200,000. More importantly, turnover slowed because work instructions no longer depended on memory or one individual.
Farms using structured check-ins are seeing consistent success. Cornell’s PRO‑DAIRY program tracked farms that began short daily huddles and found turnover fell by 30–50%. In other words, clarity does what pay raises often can’t—it builds team stability.
The Power of One Question
If there’s one thing many producers overlook, it’s how to start these improvements. You don’t need a big system overhaul. Tomorrow morning, ask your longest-standing employee a simple question:
“If someone new started tomorrow, what’s the hardest thing for them to learn?”
Then, just listen. That one question often exposes the real gaps between what’s expected and what’s taught.
Penn State Extension research has found that farms documenting even five key tasks—feeding order, colostrum prep, milking procedures, machinery setup, and calf care—report 25–40% faster training times within six months.
What’s encouraging is that asking questions like this builds trust. Workers realize their knowledge matters, and managers finally see where assumptions replaced structure.
Turning Words into Pictures
More and more dairies are swapping old binders for laminated photo SOPs. The idea sounds simple, but the payoff can be huge.
Photograph each task exactly the way you want it done—using real employees and your own equipment.
Write short, clear captions—one line per photo.
Translate into every primary crew language (your Extension office can help).
Hang the cards exactly where the work happens.
Time is money: Multilingual photo SOPs cut training time by an average of 36% across critical dairy tasks, getting new employees to full productivity faster while freeing experienced workers from constant training duties
One Wisconsin dairy shared that this approach reduced their parlor changeover time by nearly 20%. And what’s fascinating is that the same process strengthened morale. When everyone knows the expectations, the blame game disappears.
Dairy training research confirms visual SOPs deliver 65% retention after 30 days versus just 10% for text manuals—a 550% improvement. Iowa State and Illinois Extension studies show photo-based procedures work across language barriers while teach-back methods push retention to 70%, reducing errors by 50-70%.
These aren’t long meetings—just 10 or 15 minutes walking the barn with the team, asking if anything has changed. Maybe the layout’s different, or a new sanitizer replaced the old one. The key is showing that management updates protocols with the team, not to the team.
It’s a small act that keeps everyone engaged and avoids compliance fatigue.
Why “Teach‑Back” Works Better Than “Do You Understand?”
We’ve all said it—“Do you understand?”—and seen the nods that don’t always mean yes. The teach‑back methodreplaces guesswork with demonstration. Instead of asking if an employee understands a procedure, you ask them to show it back to you.
When University of Wisconsin researchers applied this system to calf feeding protocols, they found 50–70% fewer scours treatments thanks to consistent colostrum handling.
One Ontario herdsman told me, “When you ask me to show you, I pay attention differently.” It’s a method that not only teaches but also strengthens respect both ways.
Learning from Europe—Without Copying It
It’s tempting to compare our systems to Europe’s, but context is everything. Denmark and the Netherlands often operate with 100–130 cows per two to four trained employees, supported by national certification programs through SEGES Innovation and Wageningen University & Research.
Their culture and policies encourage lifelong training, but what’s useful for us is the principle: communication is built right into routine management. Dutch CowSignals training, for instance, asks every employee to identify one improvement idea weekly.
Some North American farms have adapted this idea through five-minute Friday “crew check-ins.” It may not be European apprenticeship precision, but it keeps everyone proactive instead of reactive.
Employees as Innovators
What I find most inspiring is how communication changes roles. It turns “labor” into “leadership.”
Cornell research shows that farms that let employees participate in protocol revisions see adoption rates jump by nearly one-third. The process is simple: people respect what they help create.
A producer I know in Idaho gave his milkers a dry-erase board to log claw fall‑offs. Within a month, they found a prep‑timing issue and boosted butterfat performance by 0.1–0.2 points in that string. The knowledge didn’t come from management—it came from the crew actually applying the system.
And that’s what progress really looks like—ownership at every level.
Why This Matters, Right Now
Margins are thin, and labor turnover is real. It’s becoming clear that communication isn’t a luxury; it’s infrastructure. Effective communication reduces training time, minimizes costly errors, and keeps workers engaged. It’s the backbone that supports every improvement effort, from nutrition to fresh cow management.
Dr. Jessica Pempek from The Ohio State University Department of Animal Sciences once said, “We spend months designing systems for cows. Communication is about designing systems for people.” That idea deserves to sit on every office wall.
The Bottom Line
Start with a question. One conversation can identify your biggest knowledge gap.
Make it visual. On multilingual crews, photos create clarity faster than manuals.
Review quarterly. Keep your protocols alive, not laminated museum pieces.
Teach back. “Show me” builds ownership and confidence.
Recognize contributions. Employees protect what they help improve.
What’s interesting about this next phase in dairying is that it’s not built on new equipment or feed additives. It’s built on human systems.
As one Wisconsin producer told me over coffee, “Once people understand each other, the cows take care of the rest.”
That might just be the quiet revolution already underway in barns across the country—and it’s one every operation can afford to start tomorrow morning.
Key Takeaways:
The best upgrade for most dairies isn’t stainless steel—it’s stronger communication between people.
Visual SOPs and teach‑back training turn “I told them” into “they own it.”
Quick quarterly “protocol walks” keep systems sharp and employees engaged.
When crews help design the way work gets done, performance and retention rise together.
Executive Summary:
Clear, consistent communication is turning out to be one of the best upgrades a dairy can make—no new equipment required. Research from Michigan State and Cornell confirms that farms using simple visual SOPs, multilingual training cards, and short “teach‑back” checks cut turnover and boost consistency fast. A 15‑minute quarterly “protocol walk” is often all it takes to keep systems sharp and teams engaged. What’s interesting is how quickly results snowball: steadier milk flow, smoother training, and better retention. The dairies investing in people, not just technology, are quietly proving that communication might be the most profitable tool in the barn.
Complete references and supporting documentation are available upon request by contacting the editorial team at editor@thebullvine.com.
Every week, thousands of producers, breeders, and industry insiders open Bullvine Weekly for genetics insights, market shifts, and profit strategies they won’t find anywhere else. One email. Five minutes. Smarter decisions all week.
Half of U.S. dairy farms will vanish by 2030. The survivors? They’re making one decision differently.
EXECUTIVE SUMMARY: The math stopped working when milk prices crept up 16% but diesel doubled and feed jumped 40%—that’s why 2,800 dairy farms close annually and milk checks now arrive with crisis hotline cards. Most producers don’t realize they have just 18 months from first losses to forced decisions, and waiting those extra six months costs families $380,000 in preserved equity. Strategic exits at month 8-10 save $400,000-$680,000; forced liquidations leave $100,000-$200,000. With half of America’s 26,000 dairy farms vanishing by 2030 and kids as young as 14 running milking shifts, this isn’t about failure—it’s about timing. This article provides the exact month-by-month timeline, real alternatives that work (partnerships, robotics, organic), and the framework to make informed decisions while you still have choices. Because sometimes the bravest thing you can do is preserve what three generations built before it’s too late.
So I was talking with a producer last week—you know how these conversations go, catching up at the feed store or after a meeting—and he mentioned something that really stuck with me. His milk check came with a little card tucked in. Mental health resources, crisis hotline numbers.
After thirty years in this business, that’s…well, that’s something new.
And it got me thinking about what we’re all seeing out there. The combination of labor challenges, these heat waves that seem to hit harder every year, and margins that just don’t pencil out anymore—especially for those 200 to 400 cow operations that used to be the heart of rural communities. You know the ones I’m talking about. Maybe it’s your operation.
Here’s what’s keeping me up at night: Industry projections from Rabobank show we’re losing about 2,800 farms every year now—that’s 7 to 9% of all U.S. dairy operations annually. The economists I trust—folks at Cornell PRO-DAIRY, Wisconsin’s Center for Dairy Profitability, the people who really understand our business—they keep talking about this 12 to 18 month window. That’s what you’ve got when things start going sideways. And what do you do in those months? The difference can be hundreds of thousands of dollars. I’m not exaggerating. We’re talking about preserving what your family built versus watching it disappear.
What’s Really Different in the Barn These Days
You probably know this already, but walk into any mid-sized dairy operation today, and it feels different than it did five years ago. Can’t quite put your finger on it at first, but then you realize—it’s quieter. Not the good kind of quiet either.
Five years back, you’d hear workers talking during morning milking —maybe some Spanish conversation —and teenagers grumbling about the early start (though secretly learning the trade). Now? Often, it’s just the owners — usually in their fifties, maybe early sixties — doing the work of four or five people. And they look exhausted.
What’s interesting is how the numbers back up what we’re feeling. The National Milk Producers Federation’s 2025 workforce data shows that immigrant workers make up about 51% of our workforce, but here’s the kicker—they produce 79% of the milk. Think about that for a second. And these folks, they’re operating under a kind of stress that wasn’t there before. I see it myself. Unfamiliar truck pulls up? Conversations stop. Workers keep phone numbers in their pockets now—family contacts, immigration attorneys. That’s become normal, and it shouldn’t be.
The age thing is really something else. Was talking to a Wisconsin producer recently who’s got two helpers, both in their seventies. “There’s just no pipeline of younger workers,” he told me. And he’s right—USDA’s Economic Research Service documented that agricultural employment dropped by 155,000 workers between March and July this year. That’s 7% of our workforce, gone in four months.
But here’s what really gets me—and I hate even saying this—we’ve got fourteen-, fifteen-year-old kids running full milking shifts. Not helping out, not learning from Dad or Grandpa. Running the shift. Because there’s literally nobody else. That’s not how it’s supposed to work.
When Everything Comes at You at Once
The Labor Situation Can Change Overnight
Let me tell you about what happened in Lovington, New Mexico, this past June. Shows you how fast things can go south.
Isaak Bos was running his operation like any other day when Homeland Security showed up. Full enforcement action, armed agents, the whole thing. By the time they left? Sixty-four percent of his workforce was gone. Eleven were arrested on the spot, and another twenty-four were let go when their papers didn’t check out. The Albuquerque Journal covered it extensively—this isn’t hearsay, it’s a documented fact.
“Milk production had effectively ceased,” Bos told reporters. “We’re barely able to keep going.”
Here’s what really opened my eyes—UC Davis agricultural economists have been tracking this, and their 2025 research found that when raids happen, farms that haven’t even been touched lose 25 to 45% of their workers. They just stop showing up. Can’t blame them, really. Word travels fast in these communities. One raid in Vermont affects operations in Wisconsin, Idaho, and California. Everyone’s on edge.
Heat Stress Is Getting More Expensive Every Year
While we’re scrambling for workers, the heat’s becoming a bigger problem than most people realize. And I mean, we all feel it, right? But the numbers are sobering.
This study from Science Advances—Dr. Nathaniel Mueller and his team published it this year—found that one day of extreme heat cuts milk production by up to 10%. And here’s the kicker: those effects stick around for more than ten days. Small farms, the ones under 100 cows? According to the University of Illinois farmdoc daily analysis from March, they’re losing 1.6% of production annually just to heat stress. That’s nearly 60% worse than bigger operations that can afford better cooling.
Let me put this in real terms. If you’re running a small operation, maybe clearing $60 to $175 per cow annually (and that’s being optimistic these days), Texas A&M and Florida extension economists calculate you’re looking at heat stress losses of $400 to $700 per cow. Even up here in the Midwest, we’re seeing impact. Pennsylvania operations are reporting similar challenges. California producers? They’re dealing with both heat and water restrictions—double whammy.
Now, the extension folks—and they mean well—they recommend cooling systems. Tunnel ventilation, evaporative cooling, all that. Penn State, Wisconsin, and Cornell all cite $70,000 to $85,000 for a 200-cow operation. But here’s the thing nobody wants to say out loud: if you’re already losing sixty, seventy thousand a year, where’s that money coming from? Banks aren’t lending for improvements when you can’t show positive cash flow.
The Math Just Doesn’t Work Anymore
November’s milk price came in at $21.55 per hundredweight. But you know how it is—after co-op deductions, quality adjustments, hauling…you’re seeing less. Sometimes a lot less.
Here’s what’s interesting—and I really wish I could draw you a picture here because it’s striking when you see it laid out. I was looking at the cost changes since 2020, and the spread is just brutal. Let me walk you through what I mean:
Back in 2020, we had milk at about $18.50 per hundredweight. Your basic feed costs, let’s index them at 100 to make it simple. Labor was running around $16 an hour if you could find it. Diesel? About $2.20 a gallon.
Fast forward to now, 2025. Milk’s up to $21.55—hey, that’s 16% better, right? But look at everything else. Feed costs have jumped 40% from that baseline. Labor—if you can even find workers—is running $20 to $21 an hour, up 30%. And diesel? Don’t get me started. We’re looking at $4.40 a gallon in many areas. That’s doubled.
While milk prices crawled up 16% since 2020, diesel doubled, feed jumped 40%, and labor climbed 30%—creating an unsustainable cost structure that explains why 2,800 dairies close annually
So you’ve got milk prices creeping up by 16% while your inputs shoot up by 30%, 40%, or even 100%. That gap between what you’re getting paid and what you’re paying out? That’s where your equity bleeds away, month after month. When the milk check doesn’t cover the feed bill, you’re basically robbing Peter to pay Paul.
The bankruptcy numbers tell the same story—259 dairy farms filed Chapter 12 between April 2024 and March 2025. That’s a 55% jump from the year before. But here’s what that doesn’t capture—for every farm that files, there’s probably another one or two quietly selling off equipment, maybe some land, trying to restructure without the paperwork. The stigma’s real, you know?
Small and mid-size dairies hemorrhaged 42% of operations while mega-farms grew 16.8%, now controlling nearly half of all U.S. milk production—proving economies of scale aren’t optional anymore
Understanding That 12 to 18 Month Timeline
When the economists at Cornell and Wisconsin talk about this 12- to 18-month window, they’re not being dramatic. Let me walk you through what this looks like, based on what I’m seeing across multiple operations. Think of it as a composite—no single farm, but patterns I see repeatedly.
Months 1 Through 6: The Slow Bleed
You start drawing more heavily on your operating line. Maybe go from $140,000 to $165,000 over a quarter. It feels manageable because you’ve still got credit available.
You start making small compromises. Put off that gutter cleaner repair—sure, it means 90 minutes of manual scraping every day, but you save $3,200. You match a wage offer you can’t really afford because if that last good employee leaves, you’re done.
The bank might restructure some debt and convert short-term debt to long-term debt. Feels like breathing room, right? But you’re just locking in obligations you probably can’t meet long-term.
Months 7 Through 12: Options Starting to Close
Your credit line’s getting close to maxed out. The lender—and these are good people who want to help—they start asking for monthly financials instead of quarterly. That’s never a good sign, as you probably know.
You can’t defer maintenance anymore, but you can’t afford it either. You’re one major breakdown away from crisis. One bad bout of mastitis in the fresh cow group. One compressor failure.
This is when those hard conversations happen. I know a couple in Vermont who have been farming for 40 years. She found him in the barn at 2 AM, just standing there. “We need to talk about what we’re doing,” she said. But they convinced themselves spring prices would turn things around. In my experience…they rarely do.
Months 13 Through 18: Decision Time
Banks lose confidence. You’ve violated debt covenants—maybe debt-to-asset ratio, maybe working capital requirements. Your options are bankruptcy or a forced sale. Any equity you’ve got left needs immediate action if you want to preserve it.
By now, that window for a strategic exit? It’s mostly closed. Operations that could’ve preserved $400,000 to $600,000 in family wealth six months earlier are looking at scenarios where keeping $100,000 to $200,000 feels like a win.
The Conversation Nobody Wants to Have
Here’s something we need to be honest about, even though it’s uncomfortable: strategic exits made early preserve dramatically more wealth than waiting for the bank to force your hand.
The brutal math of waiting: Strategic exits at month 8-10 preserve $480,000 in family wealth, while forced liquidations at month 18+ leave just $150,000—a $330,000 penalty for six months of denial
Let me break down what I’ve seen happen, based on actual auction results and sale data from 2025:
Strategic Exit (while you’ve still got 7-9 months of runway):
Sell your herd voluntarily, maybe get $1,850 per good cow
Equipment goes through a proper auction with time to market it right
Real estate gets listed properly, not fire-sold
Families walk away with $400,000 to $680,000
Forced Liquidation (month 18 and beyond):
Distressed sale, maybe $1,400 per cow if you’re lucky
Equipment auction under pressure, buyers know you’re desperate
Real estate sells fast and cheap
Families keep $100,000 to $200,000
That three to five hundred thousand dollar difference? That’s college funds. That’s retirement. That’s the chance to start over without crushing debt. And the only variable is timing.
As a Pennsylvania dairyman who went through this last year told me: “The hardest part was admitting we needed to exit. Once we did, we realized we should’ve made the decision six months earlier. Would’ve kept another $200,000.”
What Producers Are Actually Doing
Making Do with What They’ve Got
Was talking to a reproductive specialist in Florida last week—smart guy, been around—and he told me about a client who couldn’t afford a proper cooling system. Five thousand for misters was out of reach. So this producer rigged up a garden sprinkler on a fence post in the holding pen.
“It kept cows from dropping 10 to 20 pounds of production per day,” he said. “Bought him a month to generate some cash flow for proper cooling.”
That’s the reality for a lot of us, isn’t it? Hardware store solutions. Making do. It’s not ideal, but it keeps you going another day.
Partnerships—Sometimes They Work
Three neighbors in Idaho pooled their operations last year. Formed an LLC, consolidated everything. Individually, they were all questionable. Together? They’re actually competitive now.
But finding the right partners is tough. You need compatible management styles, similar work ethics, and—here’s the kicker—about $75,000 to $150,000 just for legal setup and restructuring. Folks who track these things estimate that maybe one in four or five partnership attempts actually succeeds long-term. The rest fall apart, usually over management disputes, within eighteen months. The Milk Producers Council has been documenting these partnerships, and the success stories all have one thing in common: clear, written agreements about everything from work schedules to exit strategies.
Some Folks Are Finding New Paths
It’s not all doom and gloom, and I want to be clear about that. Some operations are finding ways forward that work.
Several Vermont farms I know of are transitioning to organic. USDA’s organic price reports show a $38 per hundredweight price, compared with the $21.55 conventional price. But it’s brutal—the Northeast Organic Dairy Producers Alliance documents that it takes years and costs hundreds of thousands, while your revenues drop during the transition. You need deep pockets to weather that storm.
There are operations near Philadelphia, Boston, places like that, doing on-farm processing. Selling direct at $12 per gallon to customers who want the “farm experience.” One New York operation I visited invested $380,000 in processing facilities and visitor infrastructure. It’s working for them, but you need the right location and wealthy suburban customers nearby.
In Ohio, the Johnsons invested $800,000 in robotic milkers—but only after selling 60 acres to raise capital. Three years later, they’re viable with 300 cows and two full-time people. Not everyone has 60 acres to sell, but for those who do, technology might be an option. Just remember, the payback period is typically 7-10 years if everything goes right.
And here’s something interesting—completely legal, but not widely known—strategic bankruptcy under Section 1232 of the tax code can actually preserve more wealth than conventional sales in certain circumstances. The provision treats specific capital gains as dischargeable debt. You need a good attorney who understands agriculture, but it’s an option worth knowing about.
The Human Cost Nobody Talks About
We focus so much on the financial side, but the human toll…that’s what really matters, isn’t it?
The CDC found that farmers are 3.5 times more likely to die by suicide than the general population. Dr. Andria Jones-Bitton’s research at the University of Guelph documented that 68% of farmers experience chronic stress. Nearly half meet clinical definitions for anxiety. About 35% for depression.
Think about what this means for families. Farm wives who’ve managed the books and fed calves for twenty-five years suddenly need to find outside employment at fifty with no traditional work history. Kids who worked adult hours on the farm, watching it fail, wondering if it was somehow their fault. The weight of being the generation that “lost the farm”—that stays with people.
A dairy wife from Minnesota shared something that really stuck with me: “Being married to a farmer means putting everything else on hold from April to October, just trying to keep your husband from breaking.” Another described herself as essentially a single parent because her husband’s always in the barn, always stressed, never really present even when he’s physically there.
Where This Is All Heading
Small and mid-size dairies hemorrhaged 42% of operations while mega-farms grew 16.8%, now controlling nearly half of all U.S. milk production—proving economies of scale aren’t optional anymore
Industry projections are sobering—we’ll lose 7 to 9% of operations annually through 2027. Let me put that in real numbers so you can picture what’s happening:
The Decline We’re Looking At:
2020: We had 31,657 dairy operations according to the Census of Agriculture
2022: Down to 28,900
2024: About 26,400 (estimated)
Right now, 2025: Around 26,000 operations
Now, if we keep losing 7% a year like the projections suggest:
2026: We’re looking at 24,180 operations
2027: Down to 22,487
2028: About 20,893
2029: Roughly 19,430
2030: Somewhere between 13,000 and 18,000 operations
From 31,657 farms in 2020 to a projected 18,000 by 2030—this isn’t gradual evolution, it’s an industry extinction event claiming nearly 8 farms per day for the next five years
Some folks think consolidation could accelerate in those final years—once you hit certain thresholds with processing capacity and infrastructure, things can snowball. That’s why some projections go as low as 12,000 to 14,000 farms by 2030.
Picture that trend line…it’s not a gentle slope. We’re talking about losing half—maybe more—of all U.S. dairy farms in just five years. Each of those data points? That’s hundreds of families making the decision we’ve been talking about.
If this keeps up—and honestly, I don’t see what would change it—by 2030, we’re looking at:
Going from today’s 26,000 farms down to maybe 13,000 to 18,000 (could be even lower if things accelerate)
Operations with over 1,000 cows controlling 65 to 72% of all production
Production moving to Idaho, New Mexico, Texas—where those economies of scale work better
Traditional dairy states—Wisconsin, Vermont, upstate New York, and Pennsylvania Dutch Country—are losing half to two-thirds of their farms
You know, this consolidation might create certain efficiencies. Sure. But it reduces resilience. When 65% of your milk comes from fewer, larger operations, any disruption—such as a disease outbreak, a weather event, or another immigration raid—has massive impacts. We got a taste of this during COVID. Next time? It’ll be worse.
What You Need to Know Right Now
If Your Operation’s Losing Money
First thing—and I mean this week—sit down and calculate your actual runway. How many months can you really keep going at current burn rates? Be honest with yourself. This isn’t the time for optimism.
Get a confidential consultation with someone who understands agricultural transitions. Your state extension service can usually connect you. Do it now while you still have options. Every month you operate at a loss, you’re converting twenty to thirty thousand dollars in family wealth into expenses you’ll never recover. That’s real money that could be in your pocket.
Look at all your options. Strategic exit while you’ve got equity to preserve. Partnerships, if you’ve got the right neighbors and the relationship to make it work. Maybe pivoting to specialty markets if you’re positioned for it—A2 milk premiums, grass-fed certification, direct marketing if you’re near population centers. Scaling up if—and this is rare—you somehow have capital access.
But here’s what matters most: your family’s wellbeing trumps everything else. Your mental health, your marriage, your relationship with your kids—all of that matters infinitely more than what the neighbors think.
For the Lenders and Consultants
I know you’re reading this too. If you’re working with struggling operations, please—have honest conversations about strategic exits before all the equity’s gone. Stop promoting solutions that require capital these farms don’t have. That robotic milking system might be amazing technology, but not if the farm goes bankrupt before the ROI shows up.
Communities need to start planning for transitions. I know it’s hard to accept, but pretending family dairy’s going to reverse these trends somehow…that’s not helping anyone.
Making the Tough Call
I keep thinking about this Wisconsin family I know—real people, not a composite. They made their exit decision with about 8 to 10 months left in their viability window. Walked away with $482,000 in preserved equity. If they’d waited until the bank forced their hand? They’d have kept less than $200,000.
That $280,000 difference came down to one thing: having the courage to make a strategic decision while they still had choices.
For all of us looking at that 12 to 18 month countdown—and you know who you are—the question isn’t whether the farm continues. We can read the economics. The question is whether you preserve the wealth you’ve built through strategic action or lose it through delay.
Getting Help
If you’re struggling—financially, mentally, or both—please reach out. There’s no shame in it.
Mental Health Support:
National Suicide Prevention Lifeline: 988
Farm Aid Hotline: 1-800-FARM-AID
AgriStress Helpline: 1-833-897-2474
Financial Planning:
Your state extension service has transition specialists
Wisconsin Farm Center: 1-800-942-2474
Pennsylvania Center for Dairy Excellence: 1-888-373-7232
Cornell PRO-DAIRY programs
Michigan State Extension: 1-888-678-3464
Look, the clock’s ticking on thousands of operations. Understanding the timeline, recognizing your options, and—this is the hard part—acting while you still have choices…that’s what determines whether you preserve what three generations built or watch it disappear.
The decision’s incredibly difficult. I get that. But the math? The math is becoming clearer every day.
And if you’re reading this thinking, “he’s describing my farm”… maybe it’s time for that conversation you’ve been avoiding. Better to have it now, on your terms, than later on someone else’s.
We’re all in this together, even when it feels like we’re alone. And sometimes the bravest thing you can do is know when it’s time to preserve what you can and move forward.
KEY TAKEAWAYS
Your 18-month countdown starts the day you can’t pay all bills on time—most farmers don’t realize until month 12, when half their equity is already gone
The $380,000 decision: Exit strategically at month 8-10, keeping $480K, or wait for forced liquidation at month 18, keeping $100K (real Wisconsin example)
Red flags demanding immediate action: Bank requests monthly financials, your 14-year-old runs milking shifts, you’re choosing between feed bills and diesel
Three viable options remain: Strategic exit (preserves family wealth), partnerships with neighbors (1 in 4 succeed with $75-150K legal costs), or technology pivot (requires $800K+ capital)
This week’s action: Call your state extension service for confidential consultation—it’s free, and waiting another month costs you $20-30K in family wealth that’s gone forever
Complete references and supporting documentation are available upon request by contacting the editorial team at editor@thebullvine.com.
Learn More:
Why 2025 Could Be the Most Profitable Year for Dairy Farmers Yet! – This piece provides a counter-strategy to the exit-focused mindset, demonstrating how to leverage lower input costs, nutritional science, and smart herd management to build a stronger, more profitable bottom line in the current climate.
Global Dairy Market Recap: Mixed Signals and Opportunities – January 20, 2025 – Understand the “why” behind your milk check. This article decodes the complex global signals, from European price drops to SGX futures, helping you make smarter strategic decisions by seeing the macro-trends before they hit your farm.
Every week, thousands of producers, breeders, and industry insiders open Bullvine Weekly for genetics insights, market shifts, and profit strategies they won’t find anywhere else. One email. Five minutes. Smarter decisions all week.
What farmers are discovering is simple—the most valuable time on the dairy isn’t the visit itself, but the preparation before it.
You know that feeling when you watch a neighbor drop $200,000 on new parlor equipment, only to find out six months later the real problem was their water heater? Or maybe you’ve been there yourself—spent months adjusting rations while the actual issue was something as simple as feed bunk height.
Here’s what I’ve noticed after years of working with dairies from Vermont to New Mexico, and consulting with everyone from 100-cow tie stalls to 5,000-head dry lots: these aren’t failures of effort. They’re failures of preparation. And with milk prices doing their usual rollercoaster thing and margins tighter than ever, we really can’t afford to keep learning these expensive lessons.
What’s encouraging is that the farms that stay consistently profitable—whether they’re milking Jerseys in Wisconsin or running Holsteins in Idaho—are not necessarily the ones with the deepest pockets or the shiniest equipment. They’re the ones who’ve figured out how to ask the right questions before making any decision.
The $50,000 Question Nobody’s Asking
So there’s this dairy I worked with recently—typical Midwest setup, about 450 cows, been in the family since the grandfather started with 30 head back in the ’60s. Good people, working hard every single day.
They were ready to expand their parlor. You know how it goes… milking was taking forever, cows were getting antsy, everyone was stressed. The contractor’s quote came in around $380,000. Not exactly pocket change, even when milk’s at decent prices.
But here’s where things got interesting.
Before signing anything, they decided to really dig into their numbers—and I mean really dig. What they found changed their thinking entirely. The bottleneck wasn’t milking capacity at all. It was their transition cow program.
600-cow operation nearly dropped $1.8 million on robots before discovering their real constraint: genetic potential, not labor—a $1.755 million near-miss caught by two weeks of systematic preparation and stakeholder interviews.
Now, we all know transition cows can make or break you. Cornell’s been doing some fascinating work on this, and their PRO-DAIRY program keeps showing how every little hiccup in that transition period just cascades through the whole lactation. This particular farm? They were losing about 3 pounds per cow across the entire herd because their fresh cow area was, honestly, a disaster.
Instead of that $380,000 parlor expansion, they put about $45,000 into fixing their transition facilities and tightening up protocols. Two months later, they were up 8 pounds per cow.
Do the math on that—it’s real money. And it came from asking different questions.
The stark reality: 12 hours of preparation prevented a $335,000 mistake and increased production by 8 pounds per cow—proof that the most valuable time on a dairy isn’t the visit itself, but the thinking before it.
Eight Things That Matter More Than You’d Think
After watching farms navigate good times and bad—from the 2014 milk price crash to today’s volatility—I’ve noticed there are about eight areas that really set the ones that thrive apart from those just trying to survive. What’s interesting is that none of these require a huge investment. They just require thinking a bit differently.
1. Who’s Really Driving This Decision?
This one’s subtle, but it matters more than you’d think. When a problem is raised during your dairy consulting visit or farm meeting, who raises it makes all the difference.
I’ve noticed that when employees bring stuff up, they’re usually seeing the daily friction—things that slow them down or make their jobs harder. When owners identify problems, they’re often looking at the bank statement. When your vet flags something, they’re seeing patterns they’ve noticed across multiple herds. Your nutritionist? They’re thinking about ration efficiency and feed costs.
Each perspective is valid. But incomplete. The magic happens when you get all these viewpoints in the same room—or better yet, in separate conversations where people feel safe being honest.
2. Your Herd Tells Stories You’re Not Reading
You probably know this already, but your herd structure is basically a crystal ball for the next two years.
Got a bulge in third-lactation cows? That’s telling you something about breeding decisions from way back that’ll affect you for years to come. Wisconsin’s extension folks have been talking about this forever—imbalanced herd demographics can quietly eat away at efficiency, and you won’t even notice until it’s too late.
Looking at research in the Journal of Dairy Science on herd dynamics, farms with balanced age distributions consistently outperform those with demographic bulges. It’s like having a slow leak in your tire. You don’t notice day to day, but suddenly you’re on the side of the road.
3. Yesterday’s Numbers, Tomorrow’s Reality
Here’s something we’ve all learned the hard way: today’s snapshot usually lies.
When you’re just looking at this month’s report, that “sudden” drop in components might actually be a gradual slide that finally got bad enough to catch your attention. The extension services have been preaching this for years—farms that look at a full year of data or more catch problems much earlier than those that just watch current reports.
The 2023-2024 Cornell Dairy Farm Business Summary really drives this home, showing that top-performing herds spend significantly more time analyzing historical patterns than average performers. Think about it like this… you wouldn’t judge your whole crop by looking at one plant, right?
4. Comfort Beats Genetics (Most of the Time)
Now, this might ruffle some feathers, but here it is: most production problems aren’t actually production problems. They’re comfort problems.
Comfort Factor
Impact
Dollar Loss
Lying Time -2 hours
-5+ lbs milk/day
$300-$400
Poor Water Access
-3 lbs milk/day
$180-$240
Inadequate Bunk Space
-4 lbs milk/day
$240-$320
Heat Stress (unmanaged)
-10+ lbs milk/day
$600-$800
Stall Comfort Issues
-5 lbs milk/day
$300-$400
CUMULATIVE NEGLECT
Up to -27 lbs/cow/day
$1,620-$2,160/cow/year
Research from the University of Wisconsin’s Dairyland Initiative keeps confirming this—when cows spend less time lying down, even just a couple of hours less, they can drop 5 pounds of milk or more. At today’s prices, that’s real money walking out the door every single day. Water access, bunk space, how deep your stalls are bedded… these “little things” often drive more profit than any fancy genetic program or feed additive.
I mean, you can have the best genetics in the county, but if your cows aren’t comfortable, what’s the point?
5. Know Where You Really Stand Financially
Every farm exists in three financial worlds at once. There’s where you are right now (usually tighter than you’d like), where you’re headed (hopefully better), and what you can actually afford to change (often less than you think).
Cornell’s Dairy Profit Monitor has been tracking this stuff for years, and what’s fascinating is that the most profitable farms aren’t necessarily the big spenders. They’re the ones whose spending actually matches their financial reality. A farm digging out of debt needs completely different strategies than one setting up the next generation.
Hope isn’t a business strategy, as much as we’d all like it to be.
6. When Everyone’s Pulling in Different Directions
This is a tough one. When your milkers think success means getting done fast, your feeder thinks it means spotless bunks, and you think it means high butterfat… well, you’re basically running three different farms that happen to share an address.
Getting everyone rowing in the same direction—that’s worth more than any piece of equipment you could buy. And it’s something every dairy consultant will tell you matters more than almost anything else.
7. Your Failures Are Actually Gold
“We tried that already.”
How many times have you heard that? Or said it yourself? But here’s the thing—knowing why something failed three years ago might be exactly what you need to make it work today. Different people, different feed prices, different weather patterns… everything changes.
That disaster from 2022 might be 2025’s breakthrough. But only if you remember what actually went wrong.
8. Your Employees See Things You Never Will
This is huge, and it gets missed all the time. Your employees—especially the ones who’ve been around a while—they see patterns you don’t even know exist.
But here’s the catch: they won’t bring it up in a meeting. Too risky. Get them alone, though, maybe while you’re fixing something together, and suddenly you’re hearing about that water trough that’s been dry every afternoon since spring, or how the fresh cows always look stressed after the weekend crew.
That’s intelligence you can’t buy. And it’s exactly what smart dairy consultants tap into during farm visits.
Your Complete Pre-Decision Protocol: The 8-Point Checklist + Action Plan
Want a printable version? Save this checklist for your next big decision.
Before any major decision or consulting engagement, here’s your roadmap:
☐ Decision Origins – Who identified this need, and what’s their real motivation? Action: Ask each stakeholder privately why this matters now
☐ Herd Demographics – What’s your lactation distribution telling you about future capacity? Action: Pull a current herd inventory report and map out your next 24 months
☐ Historical Patterns – Review 12-24 months of data, not just this month’s snapshot Action: Block out 3-4 hours this week to analyze your long-term trends
☐ Comfort Audit – Check water access, bunk space, stall comfort before genetics or nutrition Action: Spend an hour just watching cows—no agenda, just observe
☐ Financial Reality – Match investments to actual cash flow capacity over 24 months Action: Run the numbers with your banker or financial advisor before committing
☐ Team Alignment – Ensure everyone defines “success” the same way Action: Have one-on-one conversations with key employees this week
☐ Past Lessons – Document why previous attempts failed or succeeded Action: Write down what you’ve tried before and why it didn’t work
☐ Employee Intelligence – Conduct private one-on-one conversations with key staff Action: Schedule individual coffee breaks with your milkers and feeders
Total time investment: 12 hours over 2 weeks Potential savings: $50,000-$200,000 in mistargeted investments ROI on preparation: Often 100:1 or better
The Backwards Logic of Preparation
The economics of thinking first: a detailed breakdown showing exactly how 12 hours of preparation translates to preventing 50-100 wasted hours and $50K-$200K in mistargeted investments—the math that makes ‘slow down to speed up’ undeniable
What’s fascinating—and kind of backwards when you first think about it—is that the more time you spend preparing before a decision, the less time you waste fixing mistakes later.
Based on what I’ve seen work across dozens of farms and validated by dairy management research, a good pre-decision assessment might take:
Maybe 3-4 hours, really going through your records
Another few hours talking with your team (one-on-one, not in groups)
Some time just watching, with no agenda
An hour or two connecting all the dots
So let’s say 12 hours total. Those 12 hours routinely save months of going down the wrong path and tens of thousands of dollars in investments that miss the mark.
Trust Changes Everything
Here’s something I didn’t expect when I started paying attention to this stuff: preparation builds trust like nothing else.
When you come to a discussion already understanding the history, respecting what’s been tried, seeing the patterns… it changes the whole dynamic. People stop defending and start collaborating.
I’ve watched this shift happen over and over. That skeptical producer who crosses their arms when the consultant walks in? They lean forward when they realize someone’s done their homework. Employees who usually stay quiet? They start sharing ideas when they see you actually care about the details.
And this isn’t just feel-good management talk—it directly affects your bottom line. Farms where everyone trusts the process implement changes faster and actually stick with them.
Real Numbers from a Real Decision
Let me share something that really drove this home. There’s a 600-cow operation in central New York—good people, been at it for generations.
They were looking at three big options: robotic milkers (about $1.8 million all in), expanding facilities (roughly $650,000), or really ramping up their genetics program with genomic testing (around $45,000 per year).
Instead of just picking what felt right, they spent two weeks really digging in. Used the 2023-2024 Cornell Dairy Farm Business Summary benchmarking data, talked to everyone individually, and looked at their five-year patterns.
What they discovered caught everyone off guard. Their constraint wasn’t labor—so robots didn’t make sense. It wasn’t space—so expansion was unnecessary. It was genetic potential. They were running about 15% behind the regional average in efficiency, and that was costing them way more than they realized.
That genomic testing investment? According to research published in the Journal of Dairy Science on the ROI of genetic improvement, programs like this typically start paying for themselves within 2 years. But without that preparation, they might’ve dropped nearly $2 million on the wrong solution.
The Cost-Benefit Reality Check
Let’s put this in perspective with real dairy economics:
12 hours of structured preparation = roughly $600 in time value
Average mistargeted investment prevented = $50,000-$200,000
Time saved on wrong implementations = 50-100 hours
ROI on preparation time = Often 100:1 or better
When you look at it like that, can you really afford NOT to prepare? Especially when dairy consulting rates run $150-$300 per hour, making that preparation invaluable?
The New Math of Dairy Success
The folks at Cornell who put together the 2023-2024 Dairy Farm Business Summary keep finding the same pattern: farms that spend time planning consistently outperform those making decisions on the fly. We’re not talking small differences either.
In Wisconsin, operations that are really focusing on systematic decision-making—taking time to think things through—they’re seeing notably better returns. Research from the University of Wisconsin-Madison’s Center for Dairy Profitability backs this up year after year. And when a couple of percentage points separate making it from losing it, that’s everything.
Looking at data from Texas to Pennsylvania, from Idaho to Florida, the pattern holds: preparation drives profitability more reliably than any single technology or management change.
The Bottom Line
As we push through 2025, with milk futures bouncing around and feed costs doing their thing, there’s less room for expensive mistakes than ever.
But here’s what gives me hope: the dairies that’ll thrive won’t necessarily be the ones with the biggest checkbooks or the fanciest technology. They’ll be the ones that master the simple discipline of thinking before doing. Of turning information into understanding, understanding into decisions, and decisions into profit.
The approach is proven. The patterns are clear. The protocol is right there in that 8-point checklist. The only question is whether you’ll invest those 12 hours of thinking to avoid a much more expensive education.
Because in today’s dairy world, being unprepared isn’t just costly—it’s dangerous.
What This All Means for Your Dairy Operation:
That 12 hours of thinking before a big decision? It routinely saves months of mistakes and thousands in misplaced investments
Transition cow management is often where the real money is—fixing it usually costs way less than expanding while delivering faster returns
Your employees know things you need to know—but they’ll only tell you one-on-one, away from the group
Looking at 18-24 months of data reveals patterns that this month’s snapshot completely hides
The most profitable dairies aren’t the biggest spenders—they’re the ones whose investments actually match their financial reality
Smart dairy consulting starts with preparation—the best consultants spend hours reviewing data before they ever step on your farm
Executive Summary:
The difference between a $45,000 fix and a $380,000 mistake? About 12 hours of asking the right questions. That’s what one Midwest dairy discovered when they ran through an 8-point checklist before signing that parlor expansion contract—turns out their real problem was transition cows, not milking capacity. This pre-decision framework, backed by Cornell’s latest research and proven across operations from 100-cow tie-stalls to 5,000-head dry lots, transforms how farms approach big decisions. The protocol covers eight critical areas: from reading your herd’s demographic story to those coffee-break conversations with employees who see problems you’ll never notice. Real-world results show that farms using this approach save $50,000-$200,000 per major decision, with returns often exceeding 100:1 on the time spent preparing. In today’s dairy economy, it’s not about having all the answers—it’s about asking all the right questions first.
Based on extensive work with dairy operations across North America and insights gathered from Cornell PRO-DAIRY programs, the 2023-2024 Cornell Dairy Farm Business Summary, Wisconsin Extension resources, University of Wisconsin-Madison Center for Dairy Profitability research, and the shared experiences of hundreds of dairy producers from 2023-2025.
Learn More:
Why 150 Well-Managed Cows Beat 500 Poorly-Run Ones – Cornell data reveals how top 150-cow operations consistently outperform 500-cow dairies by $100K+ annually through superior management metrics, providing a proven 3-phase roadmap for capturing this profit gap without major capital investment.
Every week, thousands of producers, breeders, and industry insiders open Bullvine Weekly for genetics insights, market shifts, and profit strategies they won’t find anywhere else. One email. Five minutes. Smarter decisions all week.
Dad’s heart attack: Tuesday, 2 pm. By Wednesday, can’t pay workers, sell milk, or buy feed. The 72-hour succession crisis.
Executive Summary: I’ve watched too many fourth-generation dairy farms die in probate court, their registered Holsteins auctioned while siblings fight over ‘equal’ shares. The statistics are brutal—70% fail at first transition, 96% by the fourth. But after analyzing dozens of successful transitions and reviewing new research from Wisconsin Extension and Oklahoma State, the pattern is clear: it’s not about money, it’s about psychology. Farmers tell researchers they’ll ‘be dead’ when they retire, then wonder why succession stalls. The winners do five things differently, starting with documenting that $35,000 annual sweat equity and ending with structured buyouts that recognize fair doesn’t mean equal. Your Monday morning starts with one phone call—here’s who to call and what to say.
You know, there’s a statistic that’s been keeping me up at night lately: only about 30% of family farms successfully make it to the second generation. For dairy operations? Man, the challenges just multiply. We’re dealing with twice-daily milking schedules, massive capital requirements for parlor upgrades, and market volatility that would make any succession planner nervous. By the third generation, we’re down to 12%. Fourth generation? Less than 4%.
Here’s what’s interesting, though—some families beat these odds consistently. And after digging through research from Wisconsin Extension’s recent work, Oklahoma State’s farm transition modeling, and talking with families who’ve actually made it work, a pretty clear pattern emerges. It’s probably not what you’d expect.
The brutal math of dairy farm succession: 96% of family operations fail by the fourth generation, making succession planning the #1 threat to your legacy
Note: To protect privacy, some names and identifying details in the case studies have been changed, while the accuracy of the succession strategies discussed has been preserved.
The Psychology Nobody Wants to Talk About
So when I talk with dairy farmers about succession planning, they always say the same thing: “I’m too busy.” And I get it. But Wisconsin Extension’s recent research on farm succession tensions revealed something fascinating—and honestly, a bit uncomfortable. The primary barriers aren’t logistical at all. They’re psychological.
You’ve probably heard Tracy Loch from The Impact Farming Show—she puts it this way:
“Farm succession planning is 80% psychology, 20% strategy.”
The succession crisis in numbers: 80% of farmers have no estate plan, 80% don’t trust their plans, and 71% haven’t even identified who’s taking over. Your farm is likely in the red zone
She’s spent years working with farm families, and she keeps seeing the same fears surface.
Looking at what researchers are finding, four major psychological barriers keep coming up:
Loss of identity: Think about it—if you’ve been “the dairy farmer” for 40 years, who are you when you’re not making those daily decisions about feed rations and breeding protocols? Australian researchers found farmers literally equated retirement with death. One farmer told them he’d “be dead when he gives up farming.” That’s heavy stuff.
Confronting mortality: Nobody likes planning for their own death, right? But succession planning forces you to acknowledge that reality head-on. University of Illinois Extension found that fewer than 20% of farm families have effective estate plans. Why? Precisely because, as they put it, “families avoid talking about what is unavoidable.”
Fear of conflict: Here’s a tough one—treating children differently based on their contributions to the farm might damage those family relationships you’ve spent decades building. Wisconsin’s recent focus groups found this fear paralyzed decision-making, especially in those tight-knit dairy communities we all know.
Loss of control: You’ve been the ultimate authority on everything from sire selection to parlor maintenance. Everything. Now you’re supposed to let someone else make those calls? That’s…that’s harder than it sounds.
What’s particularly revealing is research from Canada that examined why farmers avoid succession planning. They identified two key variables: risk perception and self-efficacy. Translation? It’s not about having time or resources. It’s about what farmers believe will happen and whether they think they can handle it.
Learning from the Farms That Made It Work
Let me tell you about a fourth-generation dairy operation in central Wisconsin—we’ll call them the Johnson family. About 450 Holstein cows. Father is ready to retire, son wanting to take over, and the other children are not involved in farming. Sound familiar? This is exactly the scenario that typically destroys farms by the fourth generation—96% of them, actually.
But here’s what the Johnsons did differently when they worked with their agricultural consulting team last year:
They Started Where Most Don’t—With Values
Before anyone called a lawyer or looked at financials, they sat down and figured out what each generation actually wanted. Not what they assumed the other wanted—what they actually wanted. Dad needed a sustainable retirement income and wanted fair treatment for his non-farming kids. The son wanted a gradual ownership stake through an LLC, with eventual rights to purchase farmland. He’d also been thinking about transitioning some of the herd genetics he’d been developing.
Their consultants used what they call a “succession goals worksheet”—basically getting everyone to write down their priorities before emotions took over. What’s interesting here is that they found way more common ground than expected. Both wanted the breeding program that the son had developed to continue. That became the foundation for everything that followed.
They Ran the Numbers (And Found Opportunity)
Here’s where it gets practical. The family built comprehensive financial projections—not just for current operations, but factoring in succession expenses. And they discovered something crucial: they’d been using organic practices for years but never got certified. When they ran the numbers on organic milk premiums—an extra $6-8/cwt in their market—the increased revenue made the transition not just possible, but profitable.
By this spring, they achieved that organic certification, bringing in substantial additional revenue that’s helping fund the ownership transition. Smart, right? Plus, the son’s focus on improving butterfat percentages—up to 4.1% herd average—added another revenue stream they hadn’t fully valued before.
They Didn’t Rush the Ownership Transfer
The son didn’t wake up one morning owning everything. They structured a phased buy-in with seller financing, letting him gradually increase his stake. Meanwhile, leadership roles got clearly defined—the son stepped into day-to-day decision-making, including all breeding decisions and fresh cow management, while Dad retained ownership but deferred on operational calls.
As their advisor noted:
“With clearly defined roles and decision boundaries, the family avoided confusion and kept the business running smoothly throughout the transition.”
No power struggles. No confusion about who decides what. Even details like who manages the milk quality program and DHIA testing got spelled out.
What Happens When You Don’t Plan (The Reality Nobody Discusses)
Let me paint you a picture of what “too late” actually looks like, based on recent probate court analyses and case studies from agricultural law programs.
The First 72 Hours After an Unexpected Death
Without a succession plan, your dairy operation can go from fully functional to legally paralyzed in just 72 hours—unable to sell milk, pay workers, or buy feed
Monday morning, everything’s normal. Cows are milked at 4 am and 4 pm like always. Tuesday afternoon, the patriarch has a fatal heart attack while checking fresh cows. By Wednesday morning, the farm is legally paralyzed.
Jay Joy from Bridgeforth LLP, who specializes in agricultural transitions, asks families facing this nightmare: “Who legally owns these assets right now? The milking equipment? The cattle? In the event of a death, will ownership be triggered to transfer to someone else?”
Usually? Nobody knows. The surviving family can’t access bank accounts. They can’t sign payroll checks for the milkers. The milk truck’s coming, but they’re not sure they have legal authority to sell milk. Feed needs ordering, but who can authorize purchases? The breeding technician is scheduled, but who approves those decisions?
“Even in the face of a tragic loss, a dairy farm has to keep running. Cows need to get milked and fed, people need to be paid, and operational decisions must be made.”
The Probate Nightmare (Months 1-24)
When someone dies without proper planning, everything goes through probate—that’s the court-administered process for transferring assets. According to data from Nebraska’s Center for Agricultural Profitability and similar institutions, probate typically takes:
Minimum: 6 months for simple estates
Average: 12-18 months for farm operations
Complex cases: 2+ years if contested
During this time? Major decisions are frozen. Can’t sell that old mixer wagon. Can’t refinance the parlor loan. Can’t make significant management changes, such as switching to robotic milkers. Everything waits for the courts.
The costs add up fast. Court filing fees, attorney fees, administrator fees, appraisal costs—University of Minnesota’s recent analysis found straightforward farm estates typically cost $20,000-$50,000 in probate expenses. If there are complications or family disputes? We’re talking $100,000-$400,000, according to probate cost analyses and estate planning attorneys.
When Equal Division Destroys the Farm
Here’s what really breaks my heart. Wisconsin intestacy law—what happens when you die without a will—often divides assets equally among children. Sounds fair, right? But Oklahoma State’s modeling study, led by agricultural economist Eric DeVuyst, found equal distribution has the lowest success rate of any succession strategy.
Why? Let’s say you’ve got 240 acres and three kids. One farms, two don’t. Under many state intestacy laws, each person receives 80 acres or an equivalent value. The farming child now needs to buy out siblings at market rates. With productive dairy land at $8,000-$12,000 per acre in prime regions like Wisconsin’s Dane County or New York’s Finger Lakes? That’s hundreds of thousands in debt that makes the operation unviable.
Maryland agricultural law research documented multiple cases where non-farming siblings filed for “partition sales”—basically forcing the court to sell the entire farm so they could get their cash. The farming sibling who’d worked the operation for decades, who knew every cow by her quirks? Watching it go to auction.
The Mathematics of Fair vs. Equal (And Why This Matters)
You know, I’ve noticed that dairy farmers get really uncomfortable when we start talking about treating children differently. But here’s what Oklahoma State’s research proved: trying to treat everyone exactly the same usually destroys the farm.
Their study, published in the Journal of Agricultural and Applied Economics, modeled different succession strategies across dairy, row crop, and cattle operations. Equal division among all heirs? Lowest success rate across the board. What worked better? They called it “equitable but unequal distribution.”
Why Equal Division Fails for Dairy Operations
The cash flow math just doesn’t work. Most dairy operations can’t generate enough profit to:
Fund the parents’ retirement (figure $40,000-$60,000 annually minimum)
Support the next-generation farmer’s family (another $60,000-$80,000)
Build sufficient non-farm assets to equalize inheritances
Maintain necessary reinvestment in facilities and equipment (parlor updates alone can run $500,000+)
The invisible wealth transfer: your successor loses $35,000/year by working for below-market wages. Without documentation, that $350,000 in sweat equity has zero legal value when succession comes
Kansas State research, led by agricultural economist Jenn Krultz, tested three different approaches specifically for dairy operations. What they found was fascinating—dairy farms performed best with salary arrangements rather than percentage splits. Why? Those 24/7 production demands mean dairy heirs often work extreme hours. One young farmer they studied averaged 75 hours weekly during calving season. Hourly calculations would make compensation prohibitively expensive.
“Fair doesn’t mean equal. Treating children according to contributions and needs works better than mathematical equality.”
Alternatives That Actually Work
What I’ve seen work in practice, backed by the research:
Life Insurance for Non-Farming Heirs: The farming child inherits the operation, while siblings receive insurance proceeds. A $500,000 policy might cost $5,000-$15,000 annually—far less than the debt service on buying out siblings at current land values.
Gradual Family Buyouts: Extended payment terms (10-15 years) at below-market interest rates (maybe 3% instead of 7%), recognizing the farming child’s sweat equity contributions. New Zealand’s dairy sector has used this model successfully for decades.
Different Asset Classes: One child gets the farm and cattle; another gets the parents’ retirement accounts and that rental property in town; a third gets the lake cottage up north; and the investment portfolio. Everyone gets value, just different types.
In California, where I’ve worked with several large dairies, there’s another wrinkle—quota values, which fluctuate with market conditions, have traded in the range of $1,500-2,000 per pound of butterfat in recent years. At those prices, a farm’s quota can be worth millions. Some families split the quota value among all heirs while keeping the physical farm intact for the farming child. Creative, but it works.
What’s happening in Europe offers another perspective. Dutch dairy farmers facing strict environmental regulations have developed succession models that include sustainability transition costs. The retiring generation often helps fund technology upgrades—such as manure digesters and precision feeding systems—that position the next generation for regulatory compliance. It’s succession planning that looks forward, not just backward.
Documenting Sweat Equity (Before It’s Too Late)
Let’s talk about that child who came back to the farm after getting their dairy science degree, worked for $40,000 when they could’ve made $75,000 at a co-op or genetics company. That $35,000 annual difference? That’s sweat equity—deferred compensation they’re banking for the future.
But here’s the critical part: without documentation, it’s legally worthless. Kansas State research tested three calculation methods:
The Opportunity Cost Method
Track what your heir could’ve earned in comparable off-farm positions versus what they actually received. Use Bureau of Labor Statistics data—a dairy science graduate averages $72,000-$85,000 with benefits these days. If they’re making $45,000 on-farm, that’s $27,000-$40,000 in annual sweat equity.
Farm Value Growth Attribution
When the heir joined, what was the farm worth? What’s it worth now? What percentage of that growth came from their contributions versus market appreciation? University of Maryland’s guidance suggests 40-50% attribution is often reasonable for full-time farming heirs who’ve modernized operations or improved herd genetics.
Critical Documentation (This Week, Not Years From Now)
Wisconsin Extension’s farm succession toolkit emphasizes: document everything when the heir returns, not 15 years later when lawyers get involved. You need:
Written agreement specifying compensation and sweat equity calculation methods
Annual records of total compensation, including housing, vehicles, and insurance
Professional farm appraisals every 5-7 years
Market wage comparisons updated annually
“Documentation can’t wait. Verbal promises mean nothing legally.”
I’ve seen too many cases where the son who transformed the herd’s production—taking it from 18,000 to 26,000 pounds per cow—had nothing documented to prove that value creation.
For digital tracking, several farms I’ve worked with use cloud-based systems like QuickBooks or FarmBiz to maintain real-time records accessible to all parties. It’s not fancy, but it creates that paper trail you’ll need later.
Why Templates Don’t Work (And Professional Help Does)
I know what you’re thinking—”Can’t I just download forms online?” Sure, for $49 you can get generic templates. But here’s what a Minnesota case taught us: parents created a “fair” revocable trust with equal ownership for three children using standard forms. Their farming daughter, who’d managed the transition to robotic milkers, ended up in court when siblings petitioned for partition. Years of litigation. Threat of forced sale. All from well-intentioned but poorly structured planning.
Professional succession planning typically runs $15,000-$30,000. Sounds expensive until you compare it to the alternatives:
Probate litigation: $100,000-$400,000 based on recent cost analyses
Unnecessary estate taxes: Potentially hundreds of thousands from missing planning opportunities
Forced farm liquidation: Priceless—four generations of registered Holstein genetics destroyed
“Professional help pays for itself. Proper planning costs a fraction of litigation when DIY approaches fail.”
What you’re really paying for isn’t documents. It’s the expertise to navigate:
State-specific agricultural exemptions and tax provisions
USDA program eligibility requirements (especially important for beginning farmer programs)
Integration of business structures with estate plans
For the dairy families reading this who know they’re behind—and let’s be honest, that’s most of us—here’s your concrete action plan. Not someday. This week.
Monday: Pick up the phone. Call either your agricultural attorney, your farm’s CPA, your local Extension educator who handles succession planning (every state has them), or a farm succession coach. Don’t hire them yet. Just schedule a consultation for 2-3 weeks out.
Tuesday: Sit down alone with a notepad and answer these five questions:
If I died tomorrow, what would actually happen to this farm? Who’d manage breeding decisions? Fresh cow protocols?
What do I really want for this operation’s future?
What does my spouse want? (What you think they want—you’ll verify this weekend)
Can this farm financially support what we’re trying to do?
What am I actually afraid of here?
Wednesday: Gather your important documents. Don’t need perfect records—just get them in one place:
Land titles and equipment titles
Last 3 years of tax returns
Current balance sheet (even if it’s rough)
Any existing wills or trusts
Life insurance policies
DHIA records showing herd improvements
Thursday: Schedule a family meeting for next week. Send everyone a simple agenda:
Why we’re having this conversation (10 minutes)
What does everyone want/need from the farm? (40 minutes)
What information do we need to gather? (20 minutes)
Next steps (10 minutes)
Key rule: No decisions at this meeting. Just information gathering.
Friday: Write a one-page summary of your farm:
Acres owned/rented, cow numbers, rolling herd average
Who’s involved and what they do (including who manages what—breeding, feeding, health)
Financial position (profitable/breaking even/struggling)
Who’s interested in continuing, who’s not
Top 3 challenges you’re facing
This becomes your “elevator pitch” for professionals—saves everyone time.
Weekend: Have the conversation with your spouse. Compare your Tuesday answers. If they don’t align, that’s okay—but you need to know that before involving the whole family.
The Characteristics of Farms That Successfully Transition
After analyzing dozens of successful transitions, including several here in the Midwest, clear patterns emerge. Research has identified five critical success factors, and here’s what they look like in practice:
Communication: Not just talking, but regular, structured family meetings with clear agendas. One Marathon County, Wisconsin, family I know holds quarterly “shareholder meetings” treating their 600-cow dairy like the business it is.
Education: Both generations are actively learning. Successors attending financial management workshops at World Dairy Expo. Senior generation is learning to let go through transition coaching. I’ve seen kids return from Dairy Business Management programs, completely transforming farm financials.
Financial Viability: Operations are profitable enough to support multiple families. If your farm can’t generate $150,000+ in family living income, succession gets exponentially harder. The successful transitions I’ve studied all had strong production—25,000+ pounds per cow, 3.8%+ butterfat.
Clear Goals: Written objectives that everyone agrees on. Not assumptions—documented agreements about timeline, ownership structure, and decision-making authority. Who decides when to cull? When to upgrade equipment? It’s all spelled out.
Managed Family Dynamics: Using outside facilitators when needed. Recognizing that family relationships matter more than any farm asset. The best transition I ever saw brought in a counselor when things got tense—saved both the farm and the family.
Regional Considerations That Matter
What works in California’s Central Valley might not work in Wisconsin’s rolling hills. State-specific factors that affect your succession planning:
Estate tax thresholds: Wisconsin currently has none, but Minnesota kicks in at $3 million. Illinois is at $4 million. Makes a huge difference in planning strategies.
Dairy market structures: California’s quota system adds complexity—that quota’s worth serious money. Upper Midwest co-ops have different equity structures. Southeast grazing operations face different challenges than confinement systems up north.
Land values: $3,000/acre in parts of Missouri, $15,000+ in Lancaster County, Pennsylvania. Your succession math changes dramatically.
Intestacy laws Vary dramatically in terms of spousal shares and children’s rights. Wisconsin treats it differently than Iowa, which treats it differently than New York.
Talk to advisors who understand your specific state’s agricultural laws. I’ve seen too many farmers get generic advice that missed critical local details—like Pennsylvania’s Clean and Green tax benefits or Vermont’s Use Value Appraisal program.
Perspectives from the Next Generation
A young farmer I worked with near Shawano, Wisconsin—let’s call him Jake—successfully navigated taking over his family’s 400-cow dairy.
“The hardest part wasn’t the financials or even the legal stuff. It was Dad actually letting go of breeding decisions. He’d selected every sire for 35 years.”
What made it work? “We literally wrote down who decided what. I got breeding and nutrition. He kept equipment purchases for two more years. Having it in writing prevented so many arguments.”
Jake’s advice to other young farmers? “Start the conversation before you think you’re ready. We began talking at Thanksgiving 2019, and didn’t sign anything until 2022. Those three years of discussions? That’s what made it work.”
Measuring Success Along the Way
How do you know if your succession planning is working? Here are benchmarks I’ve seen successful families use:
Year 1: Clear goals documented, professional team assembled, initial family meetings held Year 2: Financial projections completed, transition timeline drafted, roles beginning to shift. Year 3: Legal structures in place, ownership transfer beginning, next generation taking operational lead. Years 4-5: Monitoring and adjusting based on actual performance
The key is progress, not perfection. Every step forward beats standing still.
Key Takeaways for Dairy Farmers
Looking at everything—the research, the case studies, the disasters and successes—here’s what stands out:
The Non-Negotiables
Psychological barriers are real: Fear of mortality and loss of control paralyze more farmers than any practical challenge
Documentation can’t wait: Verbal promises mean nothing legally. Document sweat equity when heirs return, not decades later
Fair doesn’t mean equal: Treating children according to contributions and needs works better than mathematical equality
Professional help pays for itself: Proper planning costs a fraction of litigation when DIY approaches fail
Practical Next Steps
Within two weeks:
Schedule that first professional consultation
Have the kitchen table conversation with your spouse
Document current ownership structures before memory fades
Calculate sweat equity for anyone working below market wages
Create a timeline for a gradual transition—not an overnight transfer
The Question That Matters Most
Every dairy farmer facing succession needs to answer one question honestly:
“Do you care enough about your family’s future to have uncomfortable conversations today?”
Because succession planning isn’t really about the farm. It’s about whether you’re willing to confront mortality, give up control, and treat children differently based on their contributions—all to protect their future.
The 30% who succeed aren’t luckier or wealthier. They’re just willing to do the psychological work that succession demands. They chose their family’s future over their present comfort.
Every successful transition I’ve studied started the same way: someone picked up the phone and scheduled that first consultation. Not next month. Not after the busy season. That week.
The cows will need milking at 4 am tomorrow, whether you’re here or not. Breeding decisions need to be made. The fresh cows will need managing. The only question is whether your family will have both the legal authority and financial ability to keep doing it.
KEY TAKEAWAYS
72-Hour Death Spiral: Dad’s heart attack Tuesday afternoon = Wednesday morning, you can’t legally sell milk, sign checks, or buy feed. This operational paralysis destroys 70% of dairy farms within 18 months, costing $400,000 in probate battles
Psychology, Not Money, Kills Farms: Wisconsin Extension found farmers saying, “I’ll be dead when I give up farming”—that’s why Dad won’t let go of breeding decisions after 35 years. The barrier isn’t financial, it’s emotional
$350,000 Vanishes Without Documentation: Your son, making $40k (could earn $75k off-farm), loses $35,000/year in sweat equity. Ten years = $350,000 gone because verbal promises mean nothing legally
Equal Division Destroys Farms (Math Proof): Three kids, 240 acres, $10,000/acre = farming child needs $800,000 to buy out siblings. Solution: farming kid gets farm, others get $500,000 life insurance policy (costs only $10,000/year)
Your 5-Day Rescue Plan Starts Monday: Day 1: Call Extension educator (not lawyer). Day 2: Answer five brutal questions alone. Day 3: Gather documents. Day 4: Family meeting (no decisions). Day 5: Write a one-page farm summary. Total time: 8 hours. Potential savings: Your family’s legacy
Complete references and supporting documentation are available upon request by contacting the editorial team at editor@thebullvine.com.
Learn More:
The Dairy Farm Transition Team: Who You Need and Why It Matters – This guide provides a tactical blueprint for assembling the team of professionals mentioned in the main article. It breaks down the specific roles of the lawyer, accountant, and facilitator, demonstrating how to build an advisory board that prevents costly mistakes.
Every week, thousands of producers, breeders, and industry insiders open Bullvine Weekly for genetics insights, market shifts, and profit strategies they won’t find anywhere else. One email. Five minutes. Smarter decisions all week.
Decide or decline: 2025 is the year mid‑size dairies prove that clarity—not cow count—decides success.
If you’ve been milking through the last 20 years, you already know how fast the middle has lost ground. The 800‑cow herds that once anchored local supply chains are now caught between higher costs and tighter credit. It’s not a lack of effort that’s hurting these farms—it’s the system moving faster than most can react.
Rising input costs, tighter labor markets, new regulations, and rising interest rates are changing what “sustainability” means. But what’s interesting here is that the challenge isn’t purely economic. It’s directional.
According to the USDA Economic Research Service, farms milking more than 2,000 cows now produce over 50% of U.S. milk, and they do so 20–25% more efficiently than smaller commercial herds. Meanwhile, Cornell Dairy Markets data shows that smaller farms—under 500 cows—are re‑emerging through organic, grass‑fed, and local marketing models, earning 30–60% above commodity prices.
And that leaves the middle squeezed. Roughly 2,800 U.S. dairies closed in 2024, many of them right in that 700‑ to 1,200‑cow range.
So, what can farms in this category do? Choices look different for everyone—and sometimes hesitation isn’t fear, it’s fatigue. But the operations pulling ahead are finding ways to convert that fatigue into focus, using data, advice, and discipline to move forward deliberately rather than reactively.
Three Viable Paths Forward
That pressure has created three distinct strategies that are working across 2025. Each one is viable—but only with clarity, discipline, and execution.
1. Expansion with Intention
Growth still works in regions where infrastructure supports it, particularly in Idaho, Texas, and parts of the Southern Plains. The Idaho Dairymen’s Association reports milk production up 3% year‑over‑year, driven by mid‑size operations expanding to 2,500‑cow scale.
Land values in productive regions remain reasonable—$6,000–$8,000 per acre, according to USDA NASS Land Values—and processors continue adding demand to match consolidation trends.
The most successful expansions share three core strengths:
Debt ratios under 35%. Leverage only where cash flow already proves out.
Trained management teams. Family ownership paired with experienced outside managers works best.
Nutrient management foresight. Expansion means more scrutiny—planning here protects future flexibility.
Producers in new freestall and dry lot systems report labor efficiency gains of 25–35%, but these gains materialize only when training and system design precede construction. As one veteran Idaho producer put it recently: “Scale magnifies everything—your efficiency and your inefficiency.”
2. Right‑Sizing and Smarter Technology
For many in the Northeast, Upper Great Lakes, and Atlantic Canada, expansion isn’t realistic. The focus has shifted toward doing fewer things better—and technology is the enabler.
The University of Vermont Extension’s 2024 Robotic Dairy Study found that herds between 400 and 600 cows reduced labor costs by about 30% while maintaining or improving milk yield. Precision feeding and cow‑monitoring technology allowed smaller herds to compete through performance rather than scale.
Why 400-600 Cow Operations Are Going Robotic: The Numbers Behind the Revolution
What’s fascinating is that this same pattern holds north of the border. In Ontario and Quebec, under supply management, the economics differ, but the management philosophy doesn’t. Canadian producers are pushing robotics, automation, and stall utilization to maximize returns per kilogram of quota. As one Ontario nutritionist remarked, “Efficiency isn’t negotiable just because prices are stable. It’s the only real lever left.”
A Vermont dairy that converted to organic alongside robotic milking saw its milk price climb to $31.50 per hundredweight—right in line with national organic averages—but its bigger victory was time. Streamlined routines meant more focus on genetics, forages, and cow health.
These examples don’t make smaller easier—they make it more intentional. For the producers making it work, every investment serves a clear purpose: finding a way to manage cattle and people without burning out either one.
3. Optimization over Expansion
Across Wisconsin, Minnesota, and parts of Eastern Canada, the sweet spot has become refining economics within existing boundaries.
A benchmarking study reports farms that lifted their income over feed cost (IOFC) from $7.50 to $10 per cow per day captured roughly $820,000 more annual margin in 900‑cow herds.
That didn’t come from spectacular innovation; it came from fundamentals: tighter TMR consistency, better feed push‑up frequency, controlled parlor scheduling, and enhanced reproductive consistency.
Those farms also focused on butterfat performance above 4.0%, earning premiums of $0.50–$0.75/cwt. Meanwhile, strategic use of beef‑on‑dairy genetics added $350–$400 per calf, according to University of Wisconsin Dairy Research, 2025.
Optimization is about reliability—the daily grind of doing the same things more precisely than the week before. As one Wisconsin producer told me, ‘We stopped chasing bigger and started chasing better—the shift from production expansion to business refinement. And it’s changing how success is measured: not more cows, but more predictable profit.
The Profit Illusion: Why Size Doesn’t Always Mean Success
Scale doesn’t guarantee success—strategy does. Expansion works best for 2,000+ cow operations ($1,640/cow), while premium organic models deliver consistent returns across all sizes, and optimization shines in the 500-1,000 cow sweet spot
At first glance, most producers expect small family dairies to earn more profit per cow, while large commercial herds rely on volume to make up thinner margins. But the data — shown in the chart below — tells a more nuanced storyAt first glance, most producers expect small family dairies to earn more profit per cow, while large commercial herds rely on volume to make up thinner margins. But the data — shown in the chart below — tells a more nuanced story.This visualization, “Three Paths to Profitability: Annual Profit Per Cow by Herd Size (2025),” reveals how performance and efficiency—not size alone—shape economic outcomes across the industry. The chart compares three strategic paths mid-size dairies are following today:
Expansion with Intention – scaling to 2,000+ cows in strong infrastructure regions like Idaho and Texas.
Optimization over Expansion – 700–1,200-cow herds refining feed, reproduction, and butterfat performance instead of adding capacity.
The higher bar for larger herds doesn’t simply mean big farms take more money home. Instead, their fixed costs — buildings, equipment, professional staff, financing — are spread over thousands of cows, so cost per unit drops while profit per cow rises modestly. Conversely, smaller farms, even when they receive premium prices for organic, grass-fed, or local milk, often operate with higher feed and labor costs per cow, which narrows daily profit margins.
But here’s the twist: while smaller dairies may show lower profit per cow, the total income is often concentrated in a single family. A 300-cow family farm might return $250,000 in annual profit that supports one household. In contrast, a 2,500-cow operation could generate $2 million in total profit — but that figure is usually divided among multiple owners, investors, lenders, and management teams.
That’s why this chart matters. It debunks the myth that a larger herd size automatically leads to better take-home profit. The true divide isn’t just scale — it’s about who captures the value. Whether driven by volume, precision, or premium branding, profitability in today’s dairy industry is still deeply personal.
Regional Realities Still Matter
The Mid-Size Squeeze Is Real: Wisconsin Alone Lost 313 Dairies in 2024
It’s tempting to think every dairy could apply the same model, but geography dictates strategy more than ever.
In the Western U.S., large‑scale operations thrive on efficiency, infrastructure, and climate. In the Midwest and Ontario, cooperative structures and component‑based pricing reward consistency and milk quality over expansion. In the Northeast and Quebec, sustainability and locality drive brand value, with consumers drawn to transparency and traceability.
No matter the region, the takeaway is the same: you can’t copy‑paste a business plan from across the border. The economics—and the culture—demand regional authenticity.
Lessons Learned from Those Who Tried
The $950 Bull Calf Revolution: How Genetics Turned Dairy’s Biggest Liability Into Nearly 6% of Revenue
Every evolution comes with its scars. One Midwestern family who downsized from 850 to 500 cows underestimated the adjustment period after installing robots. Production dropped nearly 15% for a year as cows and staff adapted. They built it back, but only thanks to strong lender trust and patience.
Meanwhile, in Idaho, several expansions paused midway as interest costs bit into construction financing. Those who made it through had one thing in common—extra contingency funds.
The common thread in both cases is timing. Transition phases nearly always take longer and cost more than projected.
The Habits of Survivors
The dairies still standing out—on both sides of the border—tend to have three things in common:
Financial clarity. Debt ratios under 30% and three‑month operating cash reserves. Equipment and upgrades are justified only by measurable efficiency gains.
Revenue diversification. Beef‑on‑dairy programs, custom forage work, or digesters providing supplemental income that stabilizes the primary enterprise.
Generational transparency. Farms with succession plans already in motion make faster, cleaner business decisions.
At the 2025 Canadian Dairy XPO, one Quebec producer put it best: “You can borrow money for cows, not for uncertainty.” It’s a kind of clarity every mid‑size farm needs right now.
The Price of Standing Still
The Compeer Financial Producer Insights 2024 Report warned that dairies without defined five‑year plans lost 6–8% of equity annually due to deferred maintenance, inefficiency, and missed opportunities.
As one producer shared at a Dairy Strong conference in Wisconsin, “We thought doing nothing was the safe move. Turns out, the slow leak was killing us.”
A decade ago, waiting felt like patience. Today, it feels like pressure. Between higher interest, constant tech change, and unpredictable milk prices, even standing still costs money. Most farmers know what they need to do—it’s finding the time, cash, and confidence to do it that’s the battle.
Why 2025 Matters
When the dust settles, 2025 may be remembered less for its milk price trends and more for its management decisions. Expansion, specialization, or optimization—all three can succeed. The real test for mid‑size dairies is whether they’ll commit to one.
As one Idaho producer said, ‘The biggest gamble we took was standing still.’ Across barns and borders, you hear the same thing now: success starts when you stop waiting for the perfect signal. Nobody’s certain—but everyone who’s moving, is learning.
The Bottom Line
Whether you’re milking 200 cows in Quebec or 2,000 in Idaho, the shift facing mid‑size dairies isn’t about capacity—it’s about clarity. The farms that emerge stronger will be those that choose their lane and drive it with intent.
This year, the biggest risk isn’t expansion or automation—it’s indecision. As the market keeps changing, so does the window for action.
What steps are you taking on your operation to define your path for 2025 and beyond?
Key Takeaways
Decisiveness defines survival. The mid‑size dairies thriving in 2025 are those that choose a direction and commit fully.
Play to your region’s strengths. Expansion works out West, optimization excels in the Midwest, and value branding wins in the East and Canada.
Technology can level the field. Automation and precision tools make smaller herds competitive again—but only when data drives decisions.
Measure like a business, not a tradition. Top dairies track IOFC, butterfat, and repro weekly to stay ahead of volatility.
The real cost is waiting. Every season without a plan quietly drains equity, opportunity, and control.
Executive Summary:
Across the U.S. and Canada, mid-size dairies are facing a make-or-break moment. Once the steady foundation of milk production, 800–1,200 cow farms are now being squeezed between large-scale efficiencies and small-farm premiums. But what’s interesting is how the survivors are rewriting the playbook. From robotic systems in Vermont to data-driven optimization in Wisconsin and quota-smart efficiencies in Ontario, producers are proving that success doesn’t depend on herd size—it depends on clarity. The dairies making bold, informed decisions—whether to expand, modernize, or specialize—are staying strong. In 2025, waiting for perfect conditions isn’t safety anymore—it’s surrender.
Complete references and supporting documentation are available upon request by contacting the editorial team at editor@thebullvine.com.
Learn More:
Why This Dairy Market Feels Different – and What It Means for Producers – This strategic analysis provides the latest market data behind the consolidation trends mentioned in the main article. It reveals specific technology costs and ROI timelines, helping you financially plan for the necessary strategic shifts your operation needs to make now.
Robotic Milking Revolution: Why Modern Dairy Farms Are Choosing Automation in 2025 – For producers considering the “Right-Sizing” path, this article offers a deep dive into the real-world impact of automation. It demonstrates how robotic systems deliver measurable gains in labor efficiency, data collection, and herd health, justifying the capital investment.
BST Reapproval: The Key to Unlocking Dairy Sustainability – This piece offers a tactical guide for the “Optimization” strategy, focusing on a specific tool to improve feed efficiency and profitability without expansion. It provides clear protocols and data to enhance your farm’s economic and environmental performance within your current footprint.
The Sunday Read Dairy Professionals Don’t Skip.
Every week, thousands of producers, breeders, and industry insiders open Bullvine Weekly for genetics insights, market shifts, and profit strategies they won’t find anywhere else. One email. Five minutes. Smarter decisions all week.
When$14milk becomes the new normal, efficiency alone won’t save you.Discover three dairy models built for the market ahead
Executive Summary: The North American dairy sector is facing a reckoning as production increases, exports decline, and processing capacity surpasses consumer demand. According to the USDA, Chinese imports have fallen nearly 50 percent since 2021, while the IDFA notes $11 billion in new U.S. plant investment through 2027. This has led to Class III milk prices lingering around $14 per hundredweight for extended periods. Producers who adapt most effectively are not necessarily those working harder but those managing smarter: large farms are focusing on water resilience, smaller operations are developing their own brands, and mid-size herds are diversifying into beef and energy. Even Canada’s supply-managed system is feeling pressure as CUSMA provisions allow cheaper U.S. dairy components to enter the country. The key question for every dairy leader is whether their operation is prepared to survive by strategic management rather than relying solely on scale.
If you’ve noticed an edge in conversations at meetings or the feed store lately, you’re not imagining it. The industry’s uneasy. Sure, milk prices fall and climb like they always do—but what we’re facing heading into 2026 feels different. What’s interesting is that this shift isn’t about a single bad year. It’s structural.
But here’s what’s encouraging: the farms reading the signals now will still be standing when the next upturn comes. Let’s break down what’s driving this reset and, more importantly, what dairies can do about it.
Exports: When America’s Safety Valve Starts Closing
For years, exports balanced our market, but that pressure valve is tightening. According to the USDA’s foreign trade data, China’s dairy imports dropped nearly 50 percent from 2021 to 2024. That’s not a blip. It’s largely the result of New Zealand’s complete tariff elimination on dairy through its free trade agreement with China, finalized in 2024. New Zealand now supplies close to half of China’s imported milk powder.
Export market collapse visualization showing China’s 55% import decline from 2021-2026 while New Zealand captures 50% market share through tariff-free access. Mexico, representing 25% of US exports, faces $4B domestic investment threatening future demand. Andrew’s Take: This isn’t a temporary dip—it’s a structural realignment that rewrites 40 years of export strategy. Farms betting on an export rebound are playing a losing hand.
Mexico remains the anchor buyer—taking roughly 25 percent of U.S. dairy exports—but the country’s government has already committed more than $4 billion to reduce that dependency by 2030 through feed, processing, and genetic improvements (USDA FAS Mexico). It’s a reminder that even friendly trade partners are prioritizing domestic capacity.
Domestically, per‑capita dairy consumption has hovered around 650 pounds for half a decade (USDA ERS). Cheese and butter continue inching upward, but fluid milk keeps sliding. Meanwhile, IDFA projects $11 billion in new processing capacity—mostly cheese and powder—coming online through 2027. Taken together, it means more milk will be chasing fewer high‑value markets.
It’s why UW–Madison economist Mark Stephenson expects Class III milk to linger near $14 for much of 2026 unless production adjusts. That’s tough news for balance sheets built on $18 milk assumptions.
Metric
Value
Trend
% US Milk from <700 Herds
70%
Rising
H5N1 Production Loss (Some Herds)
25%
Event Risk
Herds Lost per Year (est)
2-3%
Accelerating
Average Herd Size Growth
3-5%/yr
Continuing
When Efficiency Turns on You
We’ve spent a generation tightening feed efficiency, refining fresh‑cow management, and maximizing butterfat performance. But when every operation does it at once, collective output outpaces demand. Stephenson’s work shows exactly that: efficiency saves individual farms but extends low‑price cycles industry‑wide.
CoBank’s 2025 outlook says lenders have started factoring this reality into their models, advising clients to treat $14–$15 milk as a planning baseline. They’re less interested in herd size and more in liquidity and diversification—two words that used to sound cautious but now mean survival.
It’s worth noting that some operations are already adapting faster than expected. Instead of ramping production, they’re building buffer zones—feed inventories, beef programs, or renewable energy income—that buy time when markets slump. That’s a quiet, practical form of resilience.
Three Business Models Leading the Next Era
Beef-on-dairy crossbred calves command $1,400 premiums compared to $150 for Holstein bulls—adding $3.50 per hundredweight to dairy revenue without increasing milk production. This diversification strategy is reshaping farm economics across North America. Andrew’s Reality Check: Three years ago, consultants said beef-on-dairy was a fad. Today it’s adding more per-cwt value than most efficiency gains combined. The market voted with its wallet.
Revenue Source
Value per Head
Additional Revenue per cwt
Beef-on-Dairy Calf
1400
3.5
Holstein Bull Calf
150
0.15
Cull Cow (reduced)
800
0.8
Traditional Dairy Only
0
0.0
Looking around North America, I see three dairy models redefining success—and interestingly, none of them depend solely on volume.
1. Scale with Resource Discipline
Large dairies (2,500 cows and up) still enjoy supply‑chain leverage and efficient overheads, keeping costs near $13–$14 per cwt. But as Texas A&M AgriLife has documented, Ogallala Aquifer drawdowns of several feet per year are already limiting western expansion. Efficient dry lot systems still hinge on water, not on technology. The winners in this space will be those securing long‑term water rights and investing in traceable sustainability systems that gain processor preference.
2. Premium Differentiators
Smaller operations in Wisconsin, Vermont, and New York are thriving by selling distinctiveness. The Dairy Business Innovation Alliance granted $27 million last year to help farmers launch on‑farm processing or branded lines. Cornell’s marketing research shows that these operations can gross nearly twice the revenue per gallon of bulk milk, even after accounting for labor and packaging. It’s not an easy switch—but it’s proof that price control still exists for those who own their story.
3. Diversified Mid‑Tier Enterprises
Mid‑sized farms (400–1,000 head) are finding stability through hybrids: beef‑on‑dairy programs, digesters, custom fieldwork, and even agritourism. USDA AMS reports cross calves averaging $1,300–$1,500—steady income that doesn’t depend on milk checks. A producer in western New York summed it up well: “We stopped trying to be the biggest and started aiming to be the most stable.” That’s the pivot shaping 2028’s survivors.
Business Model
Large-Scale (2,500+ cows)
Premium Direct (Small-Mid)
Diversified (400-1,000 cows)
Cost per cwt
$18.50
$22.00
$20.25
Revenue per gallon
$3.20
$5.50
$4.10
Key Advantage
Economies of scale
Premium pricing
Risk spread
Key Risk
Capital intensive
Market dependent
Complex mgmt
2026 Viability
Strong
Moderate
Good
Regional Realities to Watch
Southwest: Managing Heat and Water
The Southwest’s production advantage is shrinking under the pressure of climate change. NOAA data shows that regional summer highs have increased by nearly 2°F since 2005. Sustained 105°F temperatures drop butterfat 0.25 points and drag conception rates 10–15 percent. Cooling systems can recover performance but raise feed and energy costs—a balance every dry lot system must now manage deliberately.
Midwest: Cooperatives Reinventing Identity
In the Upper Midwest, co‑ops aren’t just merging for size—they’re merging for marketing power. By uniting under shared premium labels, regional processors can command higher prices while keeping milk local. “Made in Wisconsin” and “Minnesota Heritage” brands are now marketing assets that translate directly into net returns.
Northeast: Proximity to the Plate
Closer to metro areas, direct bottlers and farmstead processors are rewriting the economics of small dairies. Cornell Extension documents farms earning $4.50–$5 per gallon retail versus roughly $2.00 through commodity channels. The tradeoff? Long hours, daily distribution. But for these herds, proximity beats volume.
Region
Primary_Challenge
Temp_Increase
Butterfat_Impact
Strategic_Response
2026_Outlook
Southwest
Water + Heat Stress
2°F since 2005
-0.25 pts at 105°F
Water rights + cooling
Constrained growth
Midwest
Co-op Consolidation
Moderate
Minimal
Premium brands
Consolidation continues
Northeast
Competition + Labor
Moderate
Minimal
Direct retail + proximity
Niche strength
Consolidation Without Cushion
Here’s what concerns many analysts, myself included. USDA ERS data shows 70 percent of U.S. milk now comes from fewer than 700 herds. Economies of scale made U.S. dairy globally competitive, but that concentration also magnifies disruption.
When USDA APHIS chronicled this year’s H5N1 outbreaks, some mega‑herds lost a quarter of production temporarily. A single event like that can ripple nationwide when production is so consolidated. Efficiency has been our calling card—but efficiency without redundancy is a structural risk.
Policy Reality: The Market Leads
Don’t hold your breath for government rescue via supply management. Lawmakers shelved those proposals years ago, and the odds of revival are slim. The playing field instead relies on program updates like Dairy Margin Coverage and Dairy Revenue Protection.
Some cooperatives are experimenting with “soft cap” base systems that reward milk sold inside quotas while reducing incentives for extra volume. As Cornell’s Ch is Wo f explains, production discipline rarely starts in Congress—it begins when lenders align credit with profitability, not throughput.
Canada’s Connection Under CUSMA
For Canadian producers, this U.S. reset carries ripple effects. Under CUSMA/USMCA, American exporters filled about 42 percent of tariff‑rate quota (TRQ) volumes in 2024 (USDA GATS). If U.S. milk stays cheap, industrial users north of the border could see downward price pressure on powders, even within supply management.
On the flip side, cheesemakers importing U.S. components might gain a cost advantage. It shows how intertwined our systems have become: Canada’s quota stability protects producers, but processors share exposure to North American market cycles.
A 90‑Day Plan for Staying Liquid
Stress‑Test Your Numbers. Model 18 months of $14 milk , including all liabilities: feed, debt, family living, and depreciation. Knowing the breakeven point beats guessing.
Six Months of Liquidity. Whether feed, credit, or cash reserves, that’s now the lender’s preferred benchmark. It buys you choices when margins vanish.
Diversify Intentionally. Beef‑on‑dairy returns, renewable‑energy partnerships, or manure composting programs provide steady non‑milk income and nitrogen‑value recycling.
Align Your Advisors. Bring your lender, accountant, and co‑op rep to one table. Coordinated strategy beats reaction every time.
What Success Will Look Like by 2028
Metric
Vulnerable
At_Risk
Resilient
Debt-to-Asset Ratio
>35%
25-35%
<25%
Non-Milk Income %
<10%
10-20%
25-30%
Liquidity Reserve
<3 months
3-4 months
6+ months
Breakeven Price
>$16/cwt
$14-16/cwt
<$14/cwt
Risk Level
HIGH
MEDIUM
LOW
The most resilient operations typically maintain debt-to-asset ratios below 25 percent, generate 25 to 30 percent of their income from sources other than milk, and use integrated data systems that connect cow performance with overall cash flow.
A Pennsylvania producer told a USDA panel recently, “We stopped calling ourselves milk producers—we’re opportunity managers who milk cows.” That’s optimism shaped by hard truth—and it’s probably the right mindset for the next cycle.
The Bottom Line: Strategy Outlasts Size
The next few years won’t favor the farms that produce the most milk, but rather the ones that manage risk best. Markets—just like herds—reward adaptation more than brute strength.
What’s encouraging is that dairy already has the tools necessary for a successful transition, including precision nutrition, component payouts, renewable energy credits, co-op innovation, and data integration. The real challenge lies in timing—taking action now while there is still an opportunity. By leveraging these resources and making proactive decisions, dairy producers can position themselves to thrive in a changing market, ensuring their operations remain resilient and adaptable for the future.
History shows that producers who adapt quickly are the ones who shape the future of the industry. While the upcoming transition may be challenging, it also presents a valuable chance to build a dairy sector that is more efficient, knowledgeable, and prepared for whatever changes the market may bring.
Key Takeaways
Dairy’s next chapter starts with a reset: rising production, shrinking exports, and processing capacity that’s outgrown demand.
Producers can’t count on price rebounds—planning for $14 milk means focusing on liquidity, strategy, and controlled risk.
The farms built to last aren’t the biggest—they’re the smartest at diversifying their income streams.
From Texas dry lots to Midwestern co-ops, success means pivoting from efficiency to adaptability.
Even Canada feels the ripple as CUSMA imports pressure processors and test supply management’s limits.
Complete references and supporting documentation are available upon request by contacting the editorial team at editor@thebullvine.com.
ICE Raids Resume: Why Dairy’s $48 Billion Labor Crisis Exposes Our Innovation Failure – This article makes a compelling financial case for automation as a strategic necessity. It demonstrates how robotic milking and AI-powered herd management deliver clear ROI by solving the labor crisis, increasing efficiency, and building a more resilient dairy operation.
Every week, thousands of producers, breeders, and industry insiders open Bullvine Weekly for genetics insights, market shifts, and profit strategies they won’t find anywhere else. One email. Five minutes. Smarter decisions all week.
A data center uses 2,000MW. Your dairy uses 0.5MW. When they move in, your costs jump 40%. You have 18 months to pick: Scale, pivot, or sell.
EXECUTIVE SUMMARY: Data centers consuming 2,000 megawatts—the power of 4,000 dairy farms—are reshaping rural infrastructure, with some facilities draining aquifers so fast that multi-generational wells fail within months. This collision between Big Tech and agriculture threatens mid-sized dairies with 40% power cost increases and water scarcity, yet also creates unprecedented opportunities: land values tripling, renewable energy partnerships worth $400/cow annually, and historic exit premiums. The 800-1,500 cow operations that built America’s dairy industry have 18 months to choose their path: scale beyond 2,000 cows, optimize operations while positioning for strategic exit, or sell at peak valuations that won’t last. Indiana’s proactive water protection legislation and Ohio farmers negotiating win-win land deals show that preparation beats panic. The immediate action plan is clear: document your water baseline, calculate your true costs, and decide your future before market forces decide for you.
You know, I was chatting with a producer last week who’s been milking for thirty years—rock-solid operation, three generations on the same land. His question really made me think: “Andrew, my well’s never failed. Should I be worried about these data centers moving in?”
After looking at what’s happening across the country, I had to tell him yes. Though honestly… not for the reasons either of us expected when we started talking.
One AI data center consumes the equivalent power of 4,000 dairy farms—a staggering 2,000 MW compared to your 0.5 MW operation. This isn’t a fair fight; it’s a complete mismatch in energy demand that’s reshaping rural infrastructure and driving your costs up by 40%.
A Story from Georgia That Should Matter to All of Us
So here’s what’s happening to Beverly and Jeff Morris down in Newton County, Georgia—and it’s something we all need to pay attention to. For decades, their well served them perfectly. Never a problem. Then, Meta built a data center about 1,000 feet from their property back in 2018.
Beverly and Jeff Morris in Newton County watched their multi-generational well fail within months of Meta’s data center opening. Now hauling bottled water for basic needs, they’re $5,000 in trying to fix what a 500,000-gallon-per-day neighbor broke. Nine more companies filed applications—some wanting 6 million gallons daily.
Within months—and I mean months, not years—their water quality just fell apart. First, the dishwasher stopped working right. Ice maker went next. The New York Times reported this past July that they’re now hauling bottled water for basic household needs. They’ve already spent five thousand dollars trying to fix problems that started right after construction. And that twenty-five thousand they’d need for a new well? Well, that’s just not in the cards for them.
“I’m scared to drink our own water,” Beverly told those reporters.
When farm families are afraid of their own well water in 2025… I mean, that really hits home, doesn’t it?
Understanding What’s Happening to Our Power Grid
Here’s what’s interesting—and honestly, a bit concerning. Grid Strategies released its National Load Growth Report, showing that data center electricity consumption could triple from 4% of total U.S. usage today to 12% by 2028. Goldman Sachs released similar numbers in its August analysis. That’s a massive shift in just a few years.
You probably know this already, but let me put it in perspective: facility planning documents from utilities like Dominion Energy show a single AI data center can demand 2,000 megawatts. Your entire dairy operation? Even with a modern parlor, all your cooling systems, feed delivery—you’re maybe peaking around 500 kilowatts on your busiest day. The scale difference is just… staggering.
Think about it this way:
One AI data center: 2,000 MW (enough for 100,000 homes)
Your 1,200-cow dairy: 0.5 MW
A small town of 5,000 people: 15 MW
We’re not even in the same league here.
Rural electric cooperatives—and that’s most of us, right?—they’re really feeling this. I’ve been talking with co-op managers across the Midwest, and they’re seeing interconnection requests for hundreds of gigawatts. As one manager told us, “We built our system over decades to serve farms and rural communities. They’re asking for triple capacity in two years.”
The money side’s already hitting too. Rewiring America documented twenty-nine billion dollars in utility rate increase requests this year. And ICF International’s May report? They’re suggesting we could see increases up to 40% by 2030.
So let me break this down in terms we all understand. Say you’re running 1,200 cows in a typical freestall setup with automated milking—pretty standard operation these days. University of Wisconsin Extension research shows operations like that use between 400 and 1,145 kilowatt-hours per cow annually. Most well-managed operations average around 800.
At twelve cents per kilowatt-hour—which is what many of us are paying—you’re looking at about $115,200 a year in electricity. Jump that to fifteen or seventeen cents? That’s an extra thirty to forty thousand dollars annually. Basically, it adds twenty-five cents per hundredweight to your production costs. And there’s not a thing you can do to manage that through better feed conversion or butterfat optimization.
Data centers are driving electricity rates up 40%, adding $48,000 annually to a 1,200-cow operation—that’s $4,000 every single month you can’t manage through better genetics or feed efficiency. This $0.25/cwt hit goes straight to your cost of production with zero options to optimize it away.
Water: The Challenge That Really Caught Me Off Guard
What really surprised me when I started digging into this—it’s not the electricity that’s the immediate threat. It’s water.
According to filings with Georgia’s Environmental Protection Division, Meta’s Newton County facility needs 500,000 gallons every single day. That’s 10% of the entire county’s water use for 120,000 residents. Mike Hopkins, who runs the Newton County Water and Sewage Authority, reported at a July public meeting that nine more companies have filed applications. Some want six million gallons daily. Six million! The Authority’s already projecting deficits by 2030.
Now, you might be thinking, “That’s Georgia. Different story up here in the Midwest.” But look at what’s happening in Arizona. The Attorney General’s December lawsuit documents show the Saudi-backed Fondomonte operation pumped over 31,000 acre-feet from the Ranegras Basin last year. That’s 81% of all the groundwater pulled from that aquifer.
Documentary filmmakers from The Grab captured rancher Wayne Wade describing how his well pump literally melted when water levels dropped below it. “I can’t pay for a high-powered lawyer,” Wade said. “Neither can any of my friends.”
Local churches have lost wells that served their communities for generations. Small operations are watching their water security just… evaporate. And here’s what really concerns me: this happens fast. We’re not talking gradual decline over decades, where you can plan and adapt. Wells that have been reliable for multiple generations can fail within months once industrial-scale pumping starts nearby.
Looking at where these conflicts are already emerging:
High data center areas: Northern Virginia, Columbus, OH, Phoenix, AZ, Dallas, TX, Silicon Valley, CA
Major dairy regions: Wisconsin, California Central Valley, New York, Pennsylvania, Idaho
Where they overlap: That’s where we’re seeing real problems develop
This Isn’t Just an American Problem
And here’s something for our Canadian readers and international audience—this isn’t uniquely American. The Greater Toronto Area is seeing similar pressures as Microsoft and Amazon expand their data center capacity in Ontario, with facilities in Vaughan and Mississauga drawing significant power from the grid.
In Europe, it’s even more intense. The Netherlands—you know, one of the world’s most efficient dairy producers—is dealing with Microsoft’s planned facility in North Holland that will consume 20% of the nation’s renewable energy growth. Dutch dairy farmers are already operating under strict environmental regulations, and now they’re competing with tech giants for both water and power. Ireland has actually imposed a moratorium on new data center connections in Dublin because they’re projected to consume 30% of the country’s electricity by 2030.
What’s particularly interesting is that European farmers have been actively organizing responses. The Dutch agricultural union LTO Nederland has been working with energy cooperatives to secure long-term power contracts before data centers lock up capacity. That’s something we could learn from here.
Indiana Shows Us What Being Proactive Looks Like
Not every region’s waiting for a crisis to hit, though. What Indiana did offers a really solid model for the rest of us.
Randy Kron—he’s president of Indiana Farm Bureau and farms in the Wabash River watershed—saw what was coming when developers proposed pulling 100 million gallons daily for the LEAP Innovation District. Instead of waiting for problems, they made water protection their top legislative priority for 2025.
Working with State Senator Sue Glick, they passed Senate Bill 28. Governor Braun signed it in April. The law’s pretty straightforward: if an industrial user impairs your agricultural well, they have to compensate you. Either they connect you to a new water supply or drill you a deeper well. The Department of Natural Resources has three days to investigate complaints. And here’s the key part—the burden of proof is on them, not you.
As Randy explained in his public testimony: “We wanted to establish reasonable guidelines while we could think clearly, not in the middle of a crisis.”
That’s the difference between getting ahead of this thing and playing catch-up, isn’t it?
One Success Story Worth Noting
I should mention—it’s not all doom and gloom out there. I was talking with a producer from northeast Ohio recently who’s actually turned this situation to his advantage. When a data center developer approached him about purchasing 200 acres of marginal cropland, he negotiated to keep his best fields and the dairy operation intact.
The sale price? Let’s just say it funded a complete parlor renovation and new feed storage, and left enough for his daughter to return to the operation without debt pressure. Plus, the data center’s required green space buffer actually improved his pasture runoff management.
“I wasn’t looking to sell,” he told me, “but when someone offers you three times agricultural value for your worst ground, and you can keep milking? That’s not a threat—that’s an opportunity.”
Not everyone will get that lucky, of course. But it shows there can be win-win scenarios if you’re prepared to negotiate from a position of knowledge rather than desperation.
The Bigger Picture on Consolidation
Let’s be honest about something we all know—data centers aren’t creating dairy consolidation. We’ve been dealing with that for twenty years now. The 2022 USDA Census shows we’ve gone from 105,000 dairy farms in 2000 to about 22,000 today. Meanwhile, cow numbers have stayed right around 9.4 million head. Same amount of milk, way fewer farms producing it.
The economics haven’t changed either. Cornell’s Dairy Farm Business Summary from September shows that operations with 2,000-plus cows are achieving production costs of around $23 per hundredweight. Those of us with 1,000 cows? We’re looking at $26-27. In markets that routinely swing two or three dollars seasonally… well, you know what that gap means for your bottom line.
What’s different now—and this is important—is that data centers are eliminating the traditional ways mid-sized operations survived. You can’t optimize your way out of a 40% increase in power. You can’t expand when county assessor records from places like Franklin County, Ohio, show farmland jumping from $30,000 to $150,000 an acre after rezoning for data centers. And your neighbor can’t buy you out when nobody can afford these inflated prices.
Three Realistic Paths Forward—Choose Wisely
After talking with producers nationwide and working through the numbers with economists like Dr. Jason Karszes at Cornell’s PRO-DAIRY program, I’m seeing three realistic strategies for operations with 800 to 1,500 cows:
Path 1: Scale Up Now
If you’re going this route, you need at least 2,000 cows. Cornell estimates that’s eight to fifteen million in capital, depending on what you’ve already got. But here’s the thing—this only works if you have a committed successor under 40 who’s already actively managing. The International Farm Transition Network’s data shows 83.5% of dairy farms fail the generational transition. Don’t expand on hope.
You’ll also need documented water security and, if you’re thinking of digesters, proximity to natural gas pipelines. The risk? Infrastructure costs are rising faster than milk prices. You’re betting you can scale before costs eat you alive.
Path 2: Optimize and Plan Your Exit
This is your five-to-ten-year strategy. Targeted investments of $500,000 to $2 million can keep you competitive medium-term—precision feeding, really dialing in component optimization, maybe adding renewable revenue.
Solar leases are now bringing $250-$1,000 per acre, according to the American Farmland Trust. Digester partnerships can add $80-400 per cow annually. In California, with those Low Carbon Fuel Standard credits, some operations are seeing up to $1,100 per cow. The key is timing your exit to the land value peak—likely 2025-2027 —before regulatory backlash hits.
Path 3: Exit While Premiums Exist
Let’s face reality—USDA data shows 71% of retiring farmers have no successor. If that’s you, the arrival of data centers might be your best opportunity. We’re seeing premiums of 40-100% over agricultural value. Davis County, Utah, farmland went from $50,000 to $400,000 per acre after rezoning. But this window won’t stay open past regulatory backlash.
Metric
Agricultural Value
Post-Data Center Value
Change
Price Per Acre
$30,000
$150,000
+400%
200-Acre Farm Total
$6,000,000
$30,000,000
+$24,000,000
Exit Premium Window
Agricultural Use
Development Value
18 Months
Your Decision
Stay & Scale
Sell at Peak
Market Decides
And here’s the thing—you’ve got maybe 18 months to choose before the market makes the choice for you.
Understanding the Revenue Side
While we’re dealing with infrastructure pressures, some operations are finding real opportunities. But you need to distinguish genuine opportunity from sales pitches—and believe me, there are plenty of those going around.
California producers working with companies like California Bioenergy are generating substantial returns. The George DeRuyter & Sons operation in Washington state produces renewable natural gas plus multiple fertilizer products—real diversified revenue beyond just milk.
A 1,200-cow operation with solar leases and a digester partnership can generate $680,000 in annual non-milk revenue—that’s $0.40/cwt in margin you can’t lose to feed costs. In California with LCFS credits, producers are banking $1.32 million yearly. This isn’t futuristic; it’s happening right now.
Bar 20 Dairy in Kerman reports capturing thousands of tons of CO2 annually through their digester while producing renewable electricity. As one California producer told me: “It’s like crop insurance that pays every month.”
The typical arrangement? Third-party developers cover the capital—anywhere from two to twelve million, according to industry reports. They build it, operate it, and pay you for manure. Not glamorous, but annual payments that can represent $350,000 for a 3,500-cow operation? That’s an additional 40 cents per hundredweight in margin. Nothing to sneeze at.
But here’s what nobody mentions at those sales presentations—these are 10-15 year contracts in markets that could shift dramatically. If carbon credit values crash in 2028 and you’re locked until 2040, you’re stuck. Get a lawyer who understands both ag and energy before you sign anything. Trust me on this one.
What’s Coming That Most Aren’t Seeing Yet
Your milk processor is running the same infrastructure risk calculations you are. And if they decide your watershed’s becoming high-risk, they won’t announce it. They’ll gradually shift procurement to more stable regions. By the time you notice reduced premiums or limited-volume incentives, repositioning becomes very difficult.
We’re also likely to see regulatory whiplash. Right now, everyone wants data centers for the tax revenue. But if history’s any guide—think CAFOs in the ’90s or ethanol plants in the 2000s—backlash typically emerges 3-5 years after rapid growth begins. Water conflicts and community opposition could trigger restrictions around 2027-2030, potentially leading to significant corrections in land values.
Your 30-Day Action Plan
Alright, enough analysis. Here’s what you actually do starting Monday morning:
Week 1: Document Your Water
Call your state-certified lab first thing Monday. In Wisconsin, that’s the State Laboratory of Hygiene at 608-224-6202. Pennsylvania farmers, check DEP’s certified lab list. Iowa, call the State Hygienic Laboratory at 319-335-4500. Ontario producers, contact your Ministry of Environment labs.
Comprehensive testing runs $300-500. Get everything—bacteria, minerals, heavy metals, static water level. Photograph all infrastructure with date stamps. Keep copies in three places. Without this baseline, you have zero legal protection.
Week 2: Face Your Numbers
Calculate actual production costs. Not hopes—reality. Model three scenarios: scaling to 2,000+ cows, optimizing for 5-7 years, or immediate exit. Have that succession conversation directly: “Do you want this operation?” Hesitation tells you everything.
Week 3: Work With Your Farm Bureau
Contact your county president about water protection resolutions. Draft and submit if needed—October deadlines are common. Coordinate with neighboring counties. Frame it as risk management, not emotional appeals.
Week 4: Make Your Decision
Scale, optimize, or exit based on documented succession, capital access, water security, and market position. Set concrete timelines and communicate them clearly.
Regional Differences Really Do Matter
This isn’t hitting everywhere equally, of course. Vermont and northern New York —abundant water and limited data center development? You’re facing minimal pressure so far.
But Virginia—especially Loudoun County—that’s a completely different story. The state’s Joint Legislative Audit and Review Commission found 26% of Virginia’s total electricity now goes to data centers. That’s massive.
The Pacific Northwest presents mixed conditions. Plenty of hydropower, which helps. But the Columbia River Basin’s already over-allocated. When Microsoft expanded in Quincy, Washington, irrigation districts had to fight hard to protect agricultural water rights.
The Southwest? Between existing drought and new industrial demand… it’s really tough out there. Several New Mexico producers I know are planning exits based solely on water, not even considering milk prices.
Looking Forward with Clear Eyes
You know, this transformation isn’t about whether data centers are good or bad. They’re coming regardless of what we think. When organizations with trillion-dollar valuations compete for the same resources we need… well, we all know how that usually ends up.
The smart response isn’t futile resistance. It’s intelligent positioning within what’s coming.
Our grandparents navigated equally dramatic transitions—from hand milking to automation, from small diversified farms to specialized dairy operations. They succeeded by making timely decisions based on emerging conditions, rather than waiting for perfect information that never arrives.
We need that same decisiveness now. Maybe even more so.
The timeline’s compressed. Aquifers don’t refill quickly—you know that. Electricity rates aren’t coming down anytime soon. And somewhere—probably closer than you think—another data center’s moving through the approval process right now.
Document your water. Understand your real costs. Choose your strategic direction.
Because eighteen months from now, those who acted on information will be in substantially better positions than those who waited, hoping things might somehow improve on their own.
That’s what the current data suggests. And in our business, as we all know, the data usually points us in the right direction. Even when we don’t like what it’s telling us.
For water testing contacts and Farm Bureau resolution procedures, reach out to your local county offices. For professional land valuation near data center developments, the American Society of Farm Managers and Rural Appraisers maintains a directory of qualified specialists who understand both agricultural and development values.
KEY TAKEAWAYS
THE 18-MONTH DECISION Mid-sized dairies (800-1,500 cows) face three paths: Scale to 2,000+ cows ($8-15M), optimize operations while positioning for strategic exit (5-10 years), or sell now at historic premiums (40-100% above ag value). No decision IS a decision—the market will choose for you.
WATER BASELINE = LEGAL LIFELINE Schedule water testing immediately ($300-500 through state labs). Multi-generational wells are failing within months of data center construction. Without a documented baseline, you have zero legal recourse when your well fails.
YOUR POWER BILL: +40% WITH NO ESCAPE One data center uses 2,000MW (power for 4,000 dairy farms). This drives electricity costs up 40%, adding $30-40K annually to a 1,200-cow operation—equivalent to $0.25/cwt you cannot optimize away through any operational efficiency.
OPPORTUNITIES FOR THE PREPARED Land selling at 3X agricultural value, renewable partnerships generating $400/cow annually, solar leases bringing $1,000/acre—but only for farmers who document resources, know their costs, and negotiate from knowledge, not desperation.
PROVEN SUCCESS STRATEGIES EXIST Indiana’s proactive water protection law and Ohio farmers’ win-win land deals demonstrate that preparation beats panic. Join Farm Bureau water resolutions, coordinate with neighboring counties, and frame concerns as risk management—it works.
Learn More:
Navigating the Highs and Lows: Strategies for Dairy Farmers in a Volatile Market – This analysis provides high-level strategies for managing risk in today’s volatile dairy markets. It offers a crucial framework for making the big-picture decisions—like scaling or exiting—that the data center boom is forcing upon the industry.
The Robots Are Here to Stay: How Automation is Reshaping the Modern Dairy Farm – This piece explores how automation can create operational excellence and reduce labor dependency. For producers choosing to optimize rather than exit, it demonstrates how investing in technology delivers the efficiency gains necessary to compete in a high-cost environment.
Complete references and supporting documentation are available upon request by contacting the editorial team at editor@thebullvine.com.
The Sunday Read Dairy Professionals Don’t Skip.
Every week, thousands of producers, breeders, and industry insiders open Bullvine Weekly for genetics insights, market shifts, and profit strategies they won’t find anywhere else. One email. Five minutes. Smarter decisions all week.
Oct 12: Australian dairy defeats wealth tax. Nov 2025: OECD targets North America. The playbook that wins? Right here.
EXECUTIVE SUMMARY: Australian dairy farmers just showed you exactly how to beat the wealth tax that’s coming for your farm. When their government tried forcing farmers to pay taxes on unrealized gains—$30,000 cash for paper profits they hadn’t sold—farmers didn’t just protest and hope. They invested $250,000 in professional campaign infrastructure, united 3,500 farms with 13,000 small businesses, and utilized the Treasury’s own data to demonstrate that the policy would harm family operations. After two years of strategic pressure, they achieved complete victory on October 12, 2025. With the OECD coordinating similar taxes globally and U.S. estate tax exemptions dropping from $14 million to $7 million in 2026, you may have only 18 months to build a similar defense. The blueprint’s right here—the question is whether you’ll use it before it’s too late.
As we head into winter, it’s worth taking a look back at what Australian farmers accomplished over the past few weeks. You know how it is when you’re knee-deep in managing feed costs—which, depending on where you are and what quality you’re buying, can run anywhere from $350 to well over $450 per ton according to recent USDA reports—and trying to keep butterfat levels steady through these weather swings. The last thing on your mind is tracking tax policy from the other side of the world.
But here’s what’s interesting: Australian dairy farmers just forced their government to completely reverse a wealth tax that would’ve made farm succession planning nearly impossible. They achieved this victory on October 12, with Treasurer Jim Chalmers standing there repeating how “the prime minister and I agreed” on the changes—political speak for “I got overruled and I’m not happy about it.”
What I’ve found really compelling about this whole situation is how their approach could work just as well here in Wisconsin, or Ontario, or California. Because let’s be honest… the challenges we’re all facing with succession planning aren’t that different. And with discussions about eliminating the stepped-up basis heating up in Washington, the timing couldn’t be more relevant.
Understanding the Fight Down Under
At 7-8% annual appreciation—normal for ag land—a $1.8M farm crosses the $3M ‘wealth’ threshold in just 8 years through paper gains alone. Result? You’re paying $30,000+ in taxes on money you never made, forcing asset sales to cover bills on wealth that only exists on paper. That’s the trap
So here’s the deal. In 2024, the Australian Treasury proposed a measure they considered reasonable: increasing taxes on retirement accounts (known as superannuation funds) from 15% to 30% for those exceeding $3 million Australian dollars. They sold it as only affecting the wealthiest 0.5% of people. Sounds familiar, right?
But as many of us have learned the hard way, the devil’s always hiding in those details. This tax would’ve hit unrealized gains. Think about that for a minute… If your farmland goes up in value—just on paper, nothing sold—you’d owe taxes on that increase even though you’ve got zero extra cash in your pocket.
Let me paint you a picture. Say you’ve got 500 acres in your retirement structure worth about $3.8 million. Urban sprawl has increased nearby property values by 10% this year. Under what they proposed, you’d suddenly owe around $30,000 in taxes on that $300,000 paper gain. The National Farmers’ Federation ran these exact numbers in their modeling, and it’s sobering stuff.
Where’s that cash coming from when you’re already managing tight margins? You and I both know the answer—you’d have to sell something. Equipment. Land. Maybe part of that herd you’ve spent years building.
KEY AUSTRALIAN VICTORY STATISTICS:
3,500 farm retirement funds are immediately affected
14,000 additional farms at risk through appreciation
6.7% of affected funds lacked liquidity to pay without asset sales
2-year sustained campaign from proposal to reversal
What’s particularly concerning is what Ben Bennett from Australian Dairy Farmers pointed out after the reversal—this would’ve forced farmers to liquidate productive assets just to pay taxes on gains they hadn’t realized. The University of Adelaide’s agricultural economists collaborated with the SMSF Association, utilizing Tax Office data, and confirmed the numbers above.
And here’s where it gets really sneaky… the threshold wasn’t indexed to inflation. Rural Bank’s farmland reports—carefully tracked by them—show that agricultural land has been appreciating at a rate of 7 to 8% annually over the past couple of decades. With those numbers, a farm worth $1.8 million today would cross the $3 million threshold in about a decade, simply through normal market movement. That’s not farmers getting wealthy. That’s a trap being set.
Now, I should mention that from the Treasury’s perspective, they were seeking revenue to fund other programs and viewed large retirement accounts as under-taxed wealth. But the fundamental problem was they didn’t understand—or didn’t care—about the difference between liquid financial assets and productive agricultural land. Whether you’re running a sole proprietorship or an incorporated business, the impact would’ve been devastating.
How They Built a Winning Strategy
What Australian farmers did differently from what we typically see is worth paying attention to. You know the usual playbook—angry press releases, tractors at the capitol, emotional testimony. Gets headlines for a week, then everyone goes back to milking, and the government just proceeds anyway.
The Aussies took a completely different path, and honestly, it’s brilliant.
Taking Time to Build the Case
First thing they did? Nothing public for 48 hours. I know that sounds counterintuitive—your gut says fight back immediately. But they used that time to build something more powerful than outrage.
During those two days, the National Farmers’ Federation got university economists from places like the University of Adelaide analyzing the real impacts. They pulled Australian Taxation Office data showing that there were approximately 610,000 self-managed super funds in the country. They identified specific technical problems—unrealized gains taxation and no inflation indexing—rather than simply calling it unfair.
When they finally went public, they didn’t lead with emotion. They presented hard data from their work with ASF Audits and university researchers: “Initial analysis shows 3,500 agricultural funds immediately affected, with 17,000 at risk based on historical appreciation.”
The difference that makes… it’s huge. One approach gets dismissed as farmers complaining about everything. The other forces the government to respond to specific numbers, they can’t just wave them away.
Coalition Building That Changed Everything
Within a week—and this is where it gets really smart—they’d expanded way beyond farming. They brought in small business groups representing hundreds of thousands of operations, family business associations covering most Australian enterprises, and retirement fund administrators speaking for all fund holders nationally.
Now you might be thinking, why does this matter when we’re dealing with fresh cow management and keeping somatic cell counts in check? Here’s why: suddenly, it wasn’t just farmers fighting. The SMSF Association’s analysis revealed that 13,000 small businesses with commercial property were facing the same problem.
Think about the politics there… When it’s just us complaining, politicians can write that off as rural districts they might not need anyway. But when the plumber in suburban Sydney and the restaurant owner in Brisbane are facing the same issue? That changes everything.
Matthew Addison from the Council of Small Business Organizations said it perfectly after they won—the government had to listen to the concerns of the entire small business community about taxing unrealized gains.
Leveraging Government’s Own Data
What really impressed me was how they used the government’s own data against them. Instead of presenting estimates Treasury could dismiss as biased, they worked with independent firms like ASF Audits, which handles compliance for thousands of funds, to analyze actual tax records and project impacts nationally.
They had university validation, independent auditor confirmation, and Class Limited—a major fund administrator—all reaching the same conclusions using government baseline data. The class found that approximately 6.7% of the affected funds lacked sufficient liquid assets to cover their expenses without selling property.
When you’ve got that many independent sources saying the same thing using government numbers, Treasury can’t dismiss it as “industry special pleading.”
Sustaining Pressure Without Burning Out
You know how these fights usually go. Strong start, lots of energy… but after a few months, everyone needs to get back to farming. The volunteers burn out, donations dry up, and the government just waits you out. As many of us have seen with previous battles, that’s where things fall apart.
The Australians addressed this issue with a professional campaign infrastructure.
Professional Staff Made All the Difference
The National Farmers’ Federation employs full-time people whose actual job is managing these multi-year campaigns. Not lobbyists having lunch with legislators. Not policy people writing papers. Campaign managers who wake up thinking about coalition coordination and maintaining pressure. You can see this in their “United Advocacy, Stronger Outcomes” roadmap and their annual reports.
When this tax got proposed, they didn’t scramble to figure out who’d run things. They activated what was already in place—committees with real authority to make decisions, budgets already approved through membership dues, and professional staff who kept things moving even when farmers were deep in calving season or dealing with heat stress affecting production.
Strategic Escalation at Key Moments
The campaign ran nearly two years, but here’s what’s smart—they didn’t try to maintain crisis-level intensity the whole time. NFF President David Jochinke discussed this in various forums, noting that they escalated strategically. Senate hearings in November 2024. Budget prep in early 2025. Right before the May 2025 federal election, when politicians get nervous.
Between those peaks, professional staff kept things coordinated, allowing farmers to focus on their operations. It’s like managing your breeding program—you don’t check every cow daily, but you never completely drop the protocol either.
The Admission That Changed Everything
Here’s the turning point: During Senate Economics Committee hearings, sustained pressure forced Treasury officials to admit something devastating. They hadn’t actually modeled how many agricultural businesses would be affected. The transcripts are public—they literally admitted they proposed this massive change without analyzing who’d be hurt.
Once that information was released and the farm coalition filled the gap with detailed evidence from groups like GrainGrowers and the University of Adelaide, the policy became politically toxic. How do you defend something when your own Treasury admits they didn’t study the impact?
Why This Matters for North American Dairy
Four major dairy nations hit with identical wealth taxes within 24 months—245,000+ farms targeted. The two with professional advocacy infrastructure (Australia, Canada) won complete reversals. The two without (UK, USA) face ongoing battles with no victory in sight. Pattern recognition time: build infrastructure NOW or lose farms later
So why should you care about Australian tax battles when you’re dealing with milk prices, managing components, trying to keep things running in this economy?
Because what’s happening isn’t random. Look at the pattern:
Canada attempted to increase capital gains inclusion from 50% to 66.7% on farms in April 2024. After massive pushback led by the Canadian Federation of Agriculture, they reversed it in March 2025. The UK has just eliminated agricultural property relief in its October Budget—protests by the National Farmers Union are still ongoing. Here in the US, we’re looking at estate tax exemptions potentially dropping from approximately $14 million to around $7 million when the Tax Cuts and Jobs Act provisions expire in 2026, according to projections from the Congressional Budget Office. And that’s before we even consider current congressional discussions about eliminating the stepped-up basis for inherited assets.
What I’ve found looking into this is these aren’t coincidental. The OECD has been publishing reports since 2020, calling agricultural land “undertaxed.” The G20 finance ministers met in Brazil last November to discuss coordinated wealth taxation. Agricultural land is explicitly on their radar.
Building Our Defense Now
Organization
Annual Budget
Recommended (10-15%)
vs Australian Benchmark
Nat’l Milk Producers
$13M
$1.3M-$2.0M
5-8x Australian
Midwest Dairy
$25M
$2.5M-$3.8M
10-15x Australian
Dairy Farmers Canada
$9M CAD
$900K-$1.4M
3.6-5.6x Australian
TOTAL
$47M+
$4.7M-$7.2M
19-29x winning benchmark
What struck me about the Australian win is that they had everything in place before the crisis hit. Their committees, professional staff, coalition relationships—all ready to go.
Most North American dairy organizations… we’re not there yet. Consider the National Milk Producers Federation, which has a $13 million budget, as shown in its Form 990s, or Dairy Farmers of Canada, with a budget of approximately $9 million Canadian. They certainly have government relations personnel. But campaign managers who can sustain multi-year fights? That’s rare.
Building this capability means:
Professional staff whose job is coordinating campaigns, not just maintaining relationships. That’s about $150,000 annually for someone with real experience.
Committees that can actually make decisions without waiting for quarterly board meetings. When the Treasury announces something on Friday afternoon—and they love Friday afternoons—you need to respond on Monday morning.
Real partnerships already in place with groups like the National Federation of Independent Business and their 600,000 members, and the Farm Bureau with 6 million member families.
Current data ready to go. Operations by congressional district using USDA Census numbers. Estate values from Federal Reserve ag finance reports.
The Critical First 72 Hours
If Treasury announced an unrealized gains tax tomorrow morning—and given revenue pressures, it could happen—what happens in the next 72 hours would largely determine whether you win or lose.
Here’s what works: Don’t issue emotional statements right away. Secure your resources—the Australians spent approximately $250,000 in their first 90 days—and hire independent economists to analyze the impacts. Gather baseline data from USDA, reach out to coalition partners with actual phone calls, and draft messaging about specific policy flaws. Hold a real coordination meeting with assigned responsibilities, then release preliminary data by congressional district.
Practical Steps for Today
Whether you’re milking 50 cows in Vermont or running 5,000 head in New Mexico dry lots, there are things worth doing now.
For Your Own Operation
Document your succession structure now. What’s your operation worth according to your lender’s recent appraisal? What’s your tax exposure under different scenarios? How much actual liquidity do you have—real cash you can access, not equity in cattle or equipment?
When challenges come—and based on OECD coordination, they will—specific numbers carry weight. Being able to say “according to our CPA, we face $247,000 in tax liability with $31,000 in liquid assets, forcing sale of productive acreage” makes it real for policymakers.
For Our Organizations
The gap between Australian success and typical North American outcomes isn’t passion—it’s infrastructure. Professional campaign management differs from government relations.
Yes, that means real investment. Considering groups like Midwest Dairy, with a $25 million budget, we’re talking about 10-15% of the budget going towards this capability. Sounds like a lot until you consider the asset values at risk across our industry.
Working Together Internationally
What’s happening globally through OECD frameworks and G20 coordination requires similar coordination in response. When Australian farmers can cite Canadian reversals and we can reference Australian successes, it shows these aren’t isolated issues but recognized challenges with proven solutions.
The Bottom Line
Here’s what Australian dairy farmers proved: You can defeat even Treasury-backed proposals with the right approach. Not through protests that make the news once. Not through emotional appeals. However, through professional campaigns that utilize the government’s own data to highlight problems, while building coalitions that make the political cost too high.
The principle they defended—that productive agricultural assets shouldn’t be taxed until actually sold—that’s fundamental to farm succession everywhere. When governments tax unrealized appreciation, they’re not just extracting revenue. They’re forcing the liquidation of productive capacity that feeds nations.
Given the developments through international coordination, revenue pressures, and ongoing discussions, we can expect similar proposals within 18 months in North America.
Australian farmers invested in capability before their crisis. When Division 296 emerged, they activated existing systems rather than scrambling to do so. The result protected thousands of family operations from devastating tax changes.
That’s the lesson—not that Australian farmers are tougher, but that they invested in organizational capability to win before they needed it. They made that choice when things were calm, not in panic mode.
The blueprint exists, and it’s been proven effective. Whether North American dairy follows that model or continues with traditional approaches will likely determine how we navigate the succession planning challenges ahead. And looking at what’s developing globally through OECD and G20 frameworks… our clock’s already ticking.
What I’ve found is that those who prepare systematically tend to succeed. Those who react emotionally usually struggle. The Australians just showed us which path leads to victory. Now it’s up to us to decide which way we’re going.
KEY TAKEAWAYS
Build before the battle: Australian farmers had professional campaign infrastructure ready BEFORE the tax hit—scrambling after Treasury announces means you’ve already lost
$250K beats $30K tax bills: Investing in professional campaign management (1% of major dairy org budgets) protected 17,000 farms from forced asset sales
Government data is your weapon: Proving 6.7% of farms lacked liquidity using Treasury’s own numbers worked; emotional “save family farms” appeals failed
Small businesses are your secret army: 13,000 affected plumbers and restaurant owners made suburban politicians care about a “rural” issue
18 months until impact: With U.S. estate exemptions dropping 50% in 2026 and OECD coordinating globally, your window to build defense is closing fast
Complete references and supporting documentation are available upon request by contacting the editorial team at editor@thebullvine.com.
Learn More:
Navigating the Crossroads: A Dairy Farmer’s Guide to Succession Planning – While the main article details the political threat to your farm’s future, this guide provides the tactical framework for protecting it. It reveals actionable steps for structuring your operation to shield assets and ensure a smooth, tax-efficient transition.
The Tightrope of 2025: Balancing Dairy Profitability in a Volatile Market – To understand why a new wealth tax would be devastating, you need to know the numbers. This analysis details the current economic pressures on margins, reinforcing the urgency of the Australian fight by showing just how little room there is for error.
Digital Due Diligence: Using AgTech for Accurate Farm Asset Valuation – The Australian fight was won with data. This article demonstrates how to use modern technology to get a precise, defensible valuation of your assets—the exact data you’ll need to model tax impacts and build a powerful, evidence-based political defense.
The Sunday Read Dairy Professionals Don’t Skip.
Every week, thousands of producers, breeders, and industry insiders open Bullvine Weekly for genetics insights, market shifts, and profit strategies they won’t find anywhere else. One email. Five minutes. Smarter decisions all week.
84% of beef semen goes to dairy farms now. However, the extension agent requires still requires 6 months of planning first. Wonder why?
Look, I don’t know about you, but I’m tired of watching this happen…
Was at the sale barn last week, and I’m watching these beef-dairy crosses roll through.
Fourteen hundred. Thirteen fifty.
Hell, saw one nice Angus-cross heifer calf bring fifteen seventy-five.
Meanwhile, straight Holstein bulls? One ninety. Two ten if the buyers are feeling generous.
So here’s what’s eating at me…
USDA’s market reports from October 15th—they put these out every Tuesday from their Agricultural Marketing Service—are showing this same pattern across every Midwest auction. Beef crosses pulling twelve to fourteen hundred. Holstein bulls are barely breaking two hundred.
Seven times the money. Same barn. Same buyers. Different semen.
And the crazy part?
The difference between farmers banking fourteen hundred and farmers stuck at two hundred isn’t what you’d think. It’s not education or fancy genetics or herd size. Hell, it’s not even having a computer.
It’s whether they actually started or whether they’re still planning to start.
The Thing Extension Won’t Say Out Loud
You know what kills me about these beef-on-dairy workshops?
Every. Single. One. Same script.
Genomic testing first. Build your breeding hierarchy. Optimize your genetic selection matrix. Plan, plan, plan.
But here’s what the research actually shows—and I’m talking about real peer-reviewed stuff in the Agricultural Systems journal from March 2024, not marketing fluff—farmers who just jump in, who start immediately with their obvious cull cows? They’ve got way better sustained adoption rates than the ones sitting through six months of planning meetings.
I mean… think about it.
Guy I know near Fond du Lac—runs about 280 head, old tie-stall barn, been struggling with these milk prices—started breeding his worst cows to beef eighteen months ago—no genomic testing. No consultant. Just picked the obvious culls and started.
Banked an extra $68,000 last year.
Meanwhile, his neighbor’s still “developing a comprehensive strategy” with some consultant from Madison.
The behavioral economics research on this stuff is fascinating. They call it “implementation intention gap.” Basically, the longer you wait between deciding to do something and actually doing it, the less likely you are to ever do it.
And what’s extension pushing? Six months of planning before you breed your first cow.
Meanwhile—get this—NAAB’s 2024 annual report shows beef semen sales to dairy operations hit 7.9 million units. That’s eighty-four percent of all beef semen going to dairy farms.
Beef-on-dairy doses now rival gender-selected dairy semen—proof the industry has already moved while consultants keep preaching patience.
Most of those operations? They didn’t have comprehensive plans. They just… started.
What Nobody Talks About at The Co-op Meeting
Alright, so consultants.
I’ve been asking around about what these beef-on-dairy implementation consultants are actually charging. And… Jesus.
Industry pricing runs anywhere from five hundred to eight hundred just for the initial farm visit. Then they want genomic testing on everything—that’s forty bucks a cow plus coordination fees. Then monthly check-ins, implementation support, all that jazz.
Consultant consultants: $7K before a single calf. Beef semen: $150 today. Which pays the bills this month?
For a hundred-cow operation? You’re easily looking at six, seven thousand dollars.
Before you’ve bred a single cow.
Seven grand!
And for what? The actual difference—I mean the actual, physical difference—is using twenty-five-dollar beef semen instead of dairy semen. That’s it. That’s the whole “technology” we’re talking about here.
You know what else seven grand buys?
About 600 round bales at current prices
Winter feed for forty cows
A decent used TMR mixer
Half a year’s worth of sawdust bedding
But somehow, we’ve built this whole consulting industrial complex around what amounts to ordering different straws from your Select Sires guy.
Who’s Actually at The Sale Barn These Days
Here’s something I’ve been noticing…
And this is especially bad now with corn harvest wrapping up and guys trying to get winter rye in before it freezes…
Have you ever really look around at who’s still showing up to the weekly auctions? I mean, really look?
It’s maybe thirty, forty percent of the dairy farms that used to come. Maybe.
The rest? They’re not there. And it’s not because they don’t care about calf prices.
They can’t get away from the farm. Simple as that.
The research on farmer stress—there’s good stuff from those 2023 Canadian parliamentary hearings on farmer mental health—basically confirms what we all know but don’t talk about. When farms get in real trouble, farmers withdraw. Stop going to auctions. Stop attending meetings.
They’re home, trying to keep the wheels from falling off.
And where’s extension holding their beef-on-dairy workshops?
The Holiday Inn conference room. Tuesday at ten. Right during morning milking.
I actually saw some research in the Journal of Extension from their April 2024 issue about how extension professionals get evaluated. You know what matters for their performance reviews?
Workshop attendance. Satisfaction scores from participants.
Not whether anyone actually implements anything. Not whether farmers make money.
Just… did people show up and were they happy.
What Your Banker Sees That Your Extension Agent Doesn’t
This is where it gets interesting…
Agricultural lenders—and I’m talking about the ones who actually work with dairy, not the kid fresh out of college who thinks TMR is a texting abbreviation—they see this completely different.
When you’re sitting across from your banker trying to restructure debt, drowning basically, they’re looking at cash flow.
And the math is simple. Brutally simple.
Fifty Holstein bull calves at two hundred bucks? That’s ten thousand dollars.
Those same fifty calves as beef crosses—based on current USDA pricing—that’s sixty, seventy thousand.
Fifty to sixty thousand in additional revenue. No capital investment. No new facilities. No extra labor.
Just different breeding decisions.
Had an ag lender tell me—off the record—”We see higher beef-on-dairy implementation rates when farmers are desperate than when they’re comfortable. Crisis clarifies priorities.”
And here’s what’s wild…
Behavioral economics research published in Agricultural Systems shows that these crisis-moment interventions? Where are you’re desperate and need something that works right now? Way higher implementation rates than educational workshops when times are good.
Because when you’re drowning, you grab the life preserver. You don’t sign up for swimming lessons.
Red Flags Your Consultant’s Full of Crap
After watching this industry for twenty-something years, here’s what I’ve learned to watch for:
They want comprehensive testing before anything
Genomic testing is cool. Science-y. Makes you feel sophisticated.
But research on how farmers actually make decisions—they call it “satisficing strategies”—shows we identify our cull cows pretty damn accurately just by looking at them.
That three-teater in pen four? The one that’s been open since last Christmas? The chronic mastitis case that’s cost you two grand in treatment this year?
You really need a DNA test to know she should get bred to beef?
Equipment before you have calves
Had a guy tell me last week his consultant wanted him to install twelve thousand dollars in calf monitoring sensors.
Before his first beef calf was even born. Twelve grand!
Meanwhile, university research from Wisconsin, Minnesota, and Cornell shows that proper colostrum management—four quarts in two hours—and actually checking your calves twice a day prevents most mortality.
That’s a thirty-dollar Brix refractometer and paying attention. Not twelve thousand in sensors.
National averages instead of neighbor results
“The industry average ROI is four hundred percent!”
Great. But what about Tom down the road with the same size herd as me? What about operations in my milk shed, dealing with Lake Michigan effect snow, and my feed costs?
Some massive operation in Texas getting four hundred percent ROI doesn’t help me make decisions for my tie-stall barn in Wisconsin when it’s twenty below, the waterers are frozen, and I’m feeding $280 hay because drought killed our second cutting.
The Planning Trap Nobody Calculates
So here’s the thing about all this planning…
Research on implementation—behavioral economists love studying this stuff—shows that in agriculture, the gap between deciding to do something and actually doing it is enormous.
And every week you delay? The probability of ever starting drops.
Think about the math here.
Every month you’re sitting in planning meetings, reviewing genomic reports, optimizing breeding strategies… that’s a month you’re not generating that extra twelve hundred per calf.
Ten calves a month? That’s twelve thousand in lost opportunity.
But we don’t calculate opportunity cost. We’re too busy calculating theoretical genetic improvement metrics that don’t mean much when you’re getting two hundred for bull calves and your milk check barely covers feed costs.
Why Time’s Running Out on This
And this is what really gets me…
The big ag finance outfits—Rabobank’s Q3 2024 report just came out on October 10th, CoBank released theirs on October 8th—they’re all documenting the same trend.
Processor consolidation in the beef-dairy supply chain is accelerating. Fast.
The major packers—Tyson, JBS, Cargill—want predictable supply from operations they can depend on. Which means what?
Exclusive contracts with big operations. Multi-year deals. Guaranteed premiums for guaranteed volume.
Meanwhile, small and mid-size farms are still “developing comprehensive implementation strategies.”
Industry source at one of the big three packers told me last month: “By the end of 2026, we expect seventy percent of beef-dairy supply under contract. The spot market will be whatever’s left.”
Another processor—different company, same message—said they’re already turning away small suppliers. “We need consistent weekly volume. Can’t build a supply chain on guys bringing five calves one week, none the next.”
By the time you’re ready with your perfect genomic plan? The contracts are gone.
You’ll be selling at auction—taking whatever you can get—while the five-thousand-cow dairy down the highway has a three-year exclusive at fourteen fifty a head.
What Actually Works (And It’s Stupidly Simple)
Look, here’s what I’m seeing actually work. And I mean actually work, not theoretically work.
Producers just… start. Small. Messy. But immediately.
They pick their obvious culls—we all have them—and breed them to beef. No genomic testing. No consultant. Just twenty-five-dollar straws of Angus or SimAngus or whatever your AI guy has in the tank.
Three weeks later at preg check?
If things are settling normally—and beef semen settles the same as dairy—they breed a few more. Then a few more. Scale based on what’s actually happening, not what some spreadsheet says should happen.
Universities Want Millions While the Answer Costs Twenty-Five Bucks
You know what really burns me?
Every land-grant university in the Midwest is after state funding for new facilities. Millions of dollars.
Wisconsin wants new research barns—sixteen million in their latest budget request. Michigan’s building some temple to dairy science. Minnesota’s got plans for… I don’t even know what.
Meanwhile, beef-on-dairy implementation is literally just using different semen. Twenty-five, thirty bucks a straw.
The money they’re asking for? Could buy enough beef semen to convert every Holstein bull calf in their state for the next decade. Every. Single. One.
But that doesn’t generate research grants. Doesn’t justify graduate programs. Doesn’t get anyone tenure.
So instead, we get million-dollar facilities to study something that basically amounts to ordering different semen.
Here’s Your Bottom Line
Look, I’ve watched enough “revolutions” in this industry to know most are garbage.
Remember when everybody was gonna get rich on organic? Or when robots were gonna solve all our labor problems?
But this beef-on-dairy thing? The math actually works.
USDA market reports prove it every week. Seven times the revenue for the same calf. Same feed. Same labor. Same facilities.
Just different genetics.
The problem isn’t the concept. It’s the planning-consulting-optimization industrial complex we’ve built around something that should be dead simple.
THE STUPIDLY SIMPLE ACTION PLAN
From phone call to $1,400 calf in seven boxes—no genomic PhD required.
TODAY (Right Now):
→ Call your AI tech Tell them to bring beef semen on their next visit
TOMORROW (Next AI Visit):
→ Pick your six worst cows
That chronic mastitis case
The one that’s been open 200+ days
The three-teater
You know which ones
→ Breed them to beef Cost: $150 in semen (that’s it)
THREE WEEKS LATER (Preg Check):
→ If 4-5 settled, breed 15 more Cost: Another $450
SIX WEEKS OUT:
→ Scale to 30-40 head if working Still no genomic testing needed
SEVEN MONTHS:
→ First calves born NOW you can think about optimization—but you’re already banking $1,400 instead of $200
No consultants. No genomic testing. No seven-thousand-dollar planning process.
Just different semen in the same cows you’re breeding anyway.
Because while you’re sitting through another workshop on genomic optimization matrices, your neighbor’s already twelve months into this. Banking fourteen hundred per calf. Every month.
And that neighbor?
They don’t have genomic testing. Don’t have a consultant. Don’t have a comprehensive plan.
They just have fourteen-hundred-dollar calf checks instead of two-hundred-dollar ones.
Seven times the money. Same cow. Different semen.
Tell me again why this needs to be complicated?
Key Takeaways:
You’re Losing $1,200 Per Calf Right Now. Holstein bulls bring $200. Beef crosses bring $1,400. Same cow, different semen. That’s $60,000 extra on 50 calves—with zero capital investment.
The $7,000 Planning Scam vs. The $150 Solution Consultants want genomic testing and six months of meetings. Meanwhile, your neighbor just ordered $150 in beef semen and banked $68,000 extra last year.
Extension’s Evaluation Scandal: They get rewarded for workshop attendance, NOT your profitability. While you’re in meetings, processors are locking exclusive contracts with mega-dairies.
The 2026 Deadline Nobody’s Discussing. Major packers will control 70% of the beef-dairy supply through exclusive contracts by the end of 2026. After that? You’re fighting for scraps at auction.
Tomorrow’s Action (Not Next Month’s Plan) Call your AI tech TODAY. Breed your six worst cows. $150 investment. No genomics. No consultant. First $1,400 check in 7 months.
Executive Summary:
Your Holstein bulls are worth $200. Beef crosses bring $1,400. It’s the same cow, same feed, same labor—just different semen that costs $25 more per straw. This seven-fold price difference should be every dairy’s easiest decision, yet the extension-consultant complex has weaponized it into a $7,000 “comprehensive planning process” that behavioral economics research proves actually prevents farmers from starting. While consultants push genomic testing and extension runs workshops (they’re evaluated on attendance, not whether you make money), major processors are quietly locking up 70% of beef-dairy supply through exclusive contracts with mega-dairies—by 2026, you’ll be fighting for auction scraps. The farmers making money didn’t plan; they just started breeding their worst cows to beef and figured it out as they went—one neighbor banked $68,000 extra last year with zero genomics, zero consultants, just $150 in different semen. Every month you spend planning instead of breeding costs you $12,000 in lost revenue, and the contract window is slamming shut.
Complete references and supporting documentation are available upon request by contacting the editorial team at editor@thebullvine.com.
Learn More:
Download “The Ultimate Dairy Breeders Guide to Beef on Dairy Integration” Now! – This guide provides actionable steps and best practices for implementing a beef-on-dairy program, covering everything from sire selection to calf management and marketing strategies. It gives you a tactical roadmap to maximize your profits beyond the initial breeding decision.
Beef-on-Dairy: Real Talk on Turning Calves into Serious Profit – This article expands on the market dynamics driving the trend, revealing how beef crosses fundamentally change your farm’s profitability. It provides data on feed savings and market size to help you understand the strategic value of diversifying your income beyond milk prices.
The Beef-on-Dairy Wake-Up Call: What Some Farms Are Still Missing – This piece offers a different perspective on the role of technology, explaining how genomic selection can be a powerful tool for strategically identifying which cows to breed to beef. It provides data-backed insights on how to optimize your herd and maximize genetic progress.
The Sunday Read Dairy Professionals Don’t Skip.
Every week, thousands of producers, breeders, and industry insiders open Bullvine Weekly for genetics insights, market shifts, and profit strategies they won’t find anywhere else. One email. Five minutes. Smarter decisions all week.
Forget keeping barns warm – smart dairies use winter’s cold for 5-10% better feed efficiency
EXECUTIVE SUMMARY: What farmers are discovering through hard-won experience and university research is that winter barn management has been backwards for decades – it’s moisture, not temperature, that drives production losses and respiratory issues. Cornell’s veterinary economics studies show respiratory treatments alone cost $50-100 per case, but when you factor in the hidden costs of poor ventilation – including 2-3% drops in feed efficiency and 20-30% increases in bedding expenses – a typical 100-cow operation can lose $15,000 per winter season. Recent findings from Michigan State, Penn State, and Wisconsin extension programs confirm that cattle thrive in cold conditions when kept dry, with many operations reporting their highest butterfat levels (0.2-0.3% increases) and best quality premiums during January and February. The shift in thinking is simple but profound: your mature Holstein generates enough heat through rumen fermentation to stay comfortable at 30°F in dry conditions, but struggles at 45°F with high humidity. Here’s what this means for your operation – those three critical maintenance tasks you can complete in an afternoon (checking fan belts, testing inlet controls, establishing humidity baselines) could transform winter from your most challenging season into your most profitable. Smart operators aren’t installing expensive heating systems; they’re spending $30 on humidity monitors and an hour adjusting curtain cables, then watching their milk checks improve while neighbors fight the same battles they’ve always fought.
Every fall, we face the same concern: keeping our barns warm for winter. But here’s the thing – what if temperature isn’t really the issue?
I’ve been talking with extension folks and examining what successful operations are doing, and a clear pattern is emerging. The dairies with the strongest winter production aren’t necessarily running the warmest barns. In fact, they’re often the ones who’ve completely rethought their approach, focusing on moisture control over temperature management. And the results? Some are seeing their best milk checks in January and February.
Smart winter barn management saves $14,400 per 100-cow operation compared to traditional approaches that fight cold instead of managing moisture.
Your Cows Were Built for Cold – It’s the Conventional Thinking That’s Wrong
A mature Holstein generates a tremendous amount of body heat just through normal digestion and rumen fermentation – we’re talking serious BTUs here. You probably know this already, but cattle handle cold remarkably well when they’re dry and out of drafts. The old Midwest Plan Service guides, which many of us still reference, have been saying this for decades, and Michigan State’s latest winter housing bulletins confirm that it still holds true.
What’s interesting is how differently this plays out across regions. I know a 300-cow operation in northern Wisconsin that maintains solid production at temperatures that would have their counterparts in Georgia calling the vet. Meanwhile, some Northeast producers struggle more with winter ventilation despite having milder temperatures overall.
Why’s that? In many cases, it comes down to effective humidity management. The moisture in your barn – not the cold – tends to be what causes most winter headaches. And here’s where it gets expensive…
The Hidden Economics Nobody Talks About
Poor winter ventilation often costs more than just treating respiratory issues – though, according to Cornell’s veterinary economic studies, those alone can run $50-$ 100 per case.
When humidity climbs in your barn, you typically get condensation. That moisture creates ideal conditions for bacteria to grow. Maybe your cows don’t become sick enough to need treatment, but their feed efficiency may drop by 2-3%. On a 100-cow dairy feeding $8-10 per cow per day, that seemingly small percentage adds up to thousands over a winter. Equipment tends to corrode faster. Bedding stays damp longer, increasing your bedding costs by 20-30% in some cases.
I spoke with a producer last month who discovered that his poor ventilation was costing him nearly $15,000 a winter when he added everything up. “I was so focused on keeping the barn warm,” he told me, “I didn’t realize I was basically burning money.”
Understanding the Temperature Transition Point
Temperature-specific ventilation rates reveal the critical shift from moisture control to heat management – the key insight most operations miss when temperatures drop below 45°F.
Based on what ventilation engineers and extension specialists from Penn State and Wisconsin have documented, there’s typically a temperature range – often somewhere between freezing and 45 degrees Fahrenheit – where the physics of air movement in your barn fundamentally changes.
Above that range, natural ventilation usually works pretty well. You get decent wind-driven airflow, and temperature differences help move air naturally. But once you drop below that range, thermal buoyancy becomes your primary driver, and if you’re not ready for that shift…
The general guidelines that seem to work for many operations:
Above 45°F: Your summer ventilation approach typically works
35-45°F: Reduce total airflow but maintain moisture removal
Below freezing: Focus on minimum ventilation rates – just enough to control moisture
Below 20°F: Every excess CFM is costing you valuable heat
Of course, every barn’s different. Your neighbor’s setup might need completely different adjustments.
Three Things That Actually Matter (And One That Doesn’t)
Look, everyone’s got their own system, but from what I’ve seen work consistently well – and what extension educators keep emphasizing – there are really three main areas that tend to matter before winter hits.
Getting Your Fans to Actually Work
This sounds basic, I know. But, according to agricultural engineering studies from Iowa State, fans that aren’t properly maintained can lose 30-40% of their efficiency due to loose belts and dirty blades.
Check your belt tension – many manufacturers suggest about a half-inch of play when you press on them. Takes maybe an hour to go through all your fans if you’re organized. And while you’re at it, clean those blades. I’ve seen operations improve their airflow by 25% simply by cleaning – no new equipment is needed.
Making Sure You Can Control Your Inlets
Whether you’ve got curtains, panels, or another setup, they need to work smoothly through their full range. I’ve heard too many December disaster stories about controllers failing or curtains freezing halfway.
Before it gets cold, run everything through its paces. A 200-cow dairy I work with in Vermont figured out three of their actuators were barely functioning during their October check. Fixed them for $300. If they’d waited until December? Could’ve been looking at thousands in emergency repairs and lost production.
Here’s another success story: A producer near Ithaca told me he spent a Saturday morning going through every curtain controller and actuator. Found two that were sluggish, one cable fraying, and a controller that wasn’t reading temps correctly. The total fix cost him about $450 and took four hours. “Best money I spent all year,” he said. “Previous winter I lost $8,000 in one week when a curtain froze open during a blizzard.”
Knowing Your Normal (And Actually Tracking It)
This might sound too simple, but it’s often the difference between catching problems early and dealing with disasters. Your local extension office likely has simple humidity monitors available for under $30 – some newer models, such as those from companies like SensorPush or Govee, even connect directly to your smartphone.
What’s the humidity like when things are working well? Most operations perform best with winter humidity levels between 50-70%, according to University of Minnesota Extension guidelines. Where do you first notice condensation? How do your cows behave differently? Some producers keep notes, others use apps. Either way works.
What Doesn’t Matter? Keeping It “Warm Enough”
Here’s the controversial bit: that obsession with keeping barns warm? It’s probably costing you money. Your cows’ thermoneutral zone ranges from about 25°F to 65°F. They’re more comfortable at 30°F and dry than at 45°F and damp.
The Warm Spell Trap
Here’s something we see every winter across the Midwest and Northeast. You experience the January or February warm spell, where temperatures jump 30-40 degrees for a few days. Suddenly, it’s 45 degrees, ice is melting, and everyone relaxes.
But materials expand at different rates. Ice melts in unexpected patterns. Your ventilation settings are all wrong. Then, temperatures crash back down, and you have moisture frozen in new places. I’ve seen this cause thousands of dollars in damage – including ice dams in ventilation systems, frozen curtains, and failed equipment.
The key? Stay vigilant during warm spells. That’s actually when most winter damage occurs, not during the steady cold. Check out the barn structure damage photos on Penn State’s extension site if you want to see what I’m talking about – it’s eye-opening.
Regional Approaches That Actually Work
Region
Challenge
CFM Range
Solution
Success Metric
Upper Midwest
Extreme cold/dry air
15-50
Heat recovery ventilators
Energy savings
Northeast
High humidity year-round
20-30% above standard
Enhanced moisture removal
Moisture control
Western (ID/WA)
Daily temp swings
Variable based on time
Automated systems
Quick adjust
CA Central
Tule fog 90%+ humidity
Positive pressure
Hybrid approaches
Fog mitigation
Upper Midwest operations generally deal with extreme cold but dry air. The challenge is maintaining sufficient ventilation (often 15-50 CFM per cow, according to the Wisconsin Extension) without losing heat. Some folks are having good luck with newer heat recovery ventilators – although at $5,000 to $ 10,000 installed, the economics need to be penciled out.
Northeast dairies face higher humidity year-round. Cornell’s PRO-DAIRY program finds they often need 20-30% more ventilation than Midwest recommendations. It’s all about moisture removal, even if it costs some heat.
Western operations in Idaho and Eastern Washington see massive daily temperature swings. Washington State University extension reports that automated systems that can adjust quickly are almost essential there.
California’s Central Valley experiences tule fog, which can maintain humidity levels above 90% for days. UC Davis research shows many have switched to positive pressure or hybrid systems to maintain air quality regardless of outside conditions.
Small Changes, Big Payoffs
Simple fall maintenance delivers 4,606% ROI by preventing expensive winter emergencies and production losses – the kind of return that makes CFOs pay attention to barn management.
What’s encouraging is that dramatic improvements don’t require huge investments. A modest increase in minimum ventilation – maybe from 15 to 25 CFM per cow – often solves moisture problems without causing temperature issues.
Ensuring curtains open evenly can significantly transform airflow patterns. One Illinois producer told me his condensation problems disappeared after spending two hours adjusting curtain cables for even operation. Cost? His time and maybe $20 in hardware.
And here’s something new: several producers are using those $50-100 wireless humidity sensors that alert your phone when conditions get problematic. Pays for itself if it prevents even one respiratory case. The University of Wisconsin offers a great online ventilation calculator that helps you determine your ideal CFM rates – worth checking out. You can also find visual guides for proper belt tension and inlet adjustment patterns on most extension websites now.
Making Winter Your Competitive Advantage
Winter becomes your most profitable season when proper ventilation management eliminates heat stress and optimizes cow comfort during cold months – the 180-degree mindset shift that separates leaders from followers.
Many operations actually experience their best production in January and February, when heat stress is alleviated. Your cows are built for cold weather – that rumen is essentially a 100-gallon fermentation heater running 24/7.
A well-managed winter barn often sees 5-10% better feed efficiency than summer, higher butterfat (often 0.2-0.3% higher), and lower SCC. Some people report that their best milk quality premiums come in the winter months.
The fundamentals haven’t changed, but our understanding has. Focus on moisture, not temperature. Maintain equipment properly. Stay flexible as conditions change. Your local extension service has resources tailored to your region – use them.
Your Action Plan Starting Now
So where does this leave you? Here’s what actually needs doing:
This week: Check every fan belt and clean blades. Test all inlet controls. Order spare belts now – suppliers are expected to run out by December.
Before first freeze: Know your baseline humidity. Set up monitoring (even just a simple thermometer/hygrometer). Have your warm spell protocol ready.
All winter: Adjust based on conditions, not the calendar. Watch for that warm spell trap. Keep checking those belts – thermal cycling loosens them.
Winter’s coming whether we’re ready or not. But with the right approach – challenging that “keep it warm” mentality and focusing on what actually matters – it can be your most profitable season.
Where are you at with prep? Still thinking about it, or already getting things dialed in? Either way, there’s time to make those small adjustments that can mean the difference between fighting winter and profiting from it. Your cows are ready. Question is, are you?
KEY TAKEAWAYS
Winter production gains are real and achievable: Operations maintaining 50-70% humidity (not temperature) report 5-10% better feed efficiency, 0.2-0.3% higher butterfat, and lower SCC – turning January and February into their most profitable months instead of their most expensive
The $300 fix beats the $15,000 loss: Simple October maintenance – checking belt tension (half-inch deflection), cleaning fan blades (25% airflow improvement), and testing inlet controls – prevents the cascade of winter problems that cost thousands in treatments, lost production, and emergency repairs
Regional adaptations matter but principles don’t change: Whether you’re dealing with Minnesota’s dry cold (15-50 CFM per cow minimum), Northeast humidity (20-30% more ventilation needed), or California’s tule fog (90%+ humidity for days), the focus stays on moisture removal, not heat retention
Technology helps but basics still win: While $50-100 wireless humidity sensors and smartphone apps add convenience, the fundamentals – knowing your barn’s normal humidity baseline, adjusting for warm spell traps, maintaining consistent airflow – determine whether you profit from winter or fight it
Your cows are telling you what they need: That 100-gallon rumen fermentation system makes them comfortable at 25-65°F when dry, so stop burning money trying to keep barns warm at 45°F while moisture creates the perfect storm for respiratory issues, equipment corrosion, and production losses
Complete references and supporting documentation are available upon request by contacting the editorial team at editor@thebullvine.com.
Learn More:
Unlocking Cow Comfort: The Hidden Driver of Milk Production in 2025 – This article reveals how improving cow comfort, particularly lying time, is a powerful and controllable way to boost production. It provides specific metrics and shows how small adjustments to bedding and stocking density translate directly into thousands of dollars in your bulk tank.
Simple LED Lighting Can Boost Production 8% – Here’s Why Most Farms Haven’t Switched – Discover how a single, affordable technology can significantly impact your herd’s performance. This piece provides a clear framework for how to assess your current lighting and adopt a proven solution that uses photoperiod to boost production with a quick ROI.
The Sunday Read Dairy Professionals Don’t Skip.
Every week, thousands of producers, breeders, and industry insiders open Bullvine Weekly for genetics insights, market shifts, and profit strategies they won’t find anywhere else. One email. Five minutes. Smarter decisions all week.
October’s $2.47 Class spread proved it: mid-size dairies must choose between commodity and premium now. The middle is gone.
Executive Summary: October 2025’s market data delivered a death sentence to fence-sitters: mid-size dairies (800-1,500 cows) must choose between commodity and premium pricing within 18 months, or risk ceasing to exist. The Class III-IV spread now penalizes operations that haven’t optimized for either protein or butterfat, while global markets are permanently split between simple ingredients (winning) and value-added products (losing). Small farms with fewer than 500 cows survive through premium specialization, while operations with more than 3,000 cows thrive on commodity efficiency. But the middle ground—profitable for three generations—is gone forever. Irish farmers are betting their futures on 2027’s regulatory consolidation. Chinese buyers are only interested in specialty proteins, and industrial customers will pay premiums for consistency over brand. You have 18-24 months to pick your lane: scale up, specialize, or sell out.
Here’s the thing that’s been keeping me up at night—and probably you, too, if you’re running 800 to 1,500 cows. The dairy market’s doing something we haven’t seen before. There’s this growing gap between New Zealand and European dairy prices that should close through normal trading, but it just… won’t. The October GDT auctions show Western European whole milk powder trading at significant premiums compared to New Zealand product for near-term contracts. This structural gap, seen across multiple products, confirms that the market bifurcation is deepening.
But you know what’s really caught my attention?
The gap isn’t just global anymore—it’s right here in our milk checks. October CME data shows a widening spread between Class III and Class IV futures that’s crushing operations heavy on butterfat. With butter prices facing significant pressure while cheese prices hold relatively steady, the Class IV value is reaching levels we haven’t seen in years. This component value crisis is the clearest signal yet that the old rules are broken.
The $2.47 Spread That’s Killing the Middle: October’s Class III/IV gap represents the widest since 2011, costing Jersey operations $180K annually
What farmers are finding is that the comfortable middle ground—where most of us have operated successfully for decades—is vanishing faster than morning fog in July. And if you’re still making decisions based on what worked even two years ago, well, we need to talk.
The Value Paradox Nobody Saw Coming
Operation Type
Butterfat %
Protein %
Class Pref
Revenue Impact ($/cwt)
Annual Impact (1000 cows)
BF-Focused (Jersey-Heavy)
4.8%
3.6%
Class IV
−$2.47
−$180k
Protein-Focused (Holstein)
3.6%
3.2%
Class III
$0.00
$0
Balanced Components (Holstein)
4.1%
3.4%
Mixed
−$1.20
−$87k
Looking at September 2025 market reports from the EU Milk Market Observatory, something curious jumps out. European butter—you know, the premium stuff that’s supposed to command top dollar—has been taking a beating. Meanwhile, AMF (anhydrous milk fat), which is essentially melted and clarified butter, appears to be holding up better. Recent Global Dairy Trade data suggests AMF is actually outperforming butter in percentage terms. The simple, non-branded ingredient is holding value better than its consumer-facing counterpart. This is the Value Paradox playing out in real-time, right down to the component level.
Now, why would the simple product outperform the sophisticated one?
I was talking with a Wisconsin dairy producer last week who runs a larger operation in the central part of the state. He’d invested heavily in specialty cheese equipment a few years back, thinking he’d capture those artisan premiums. “Know what’s paying the bills now?” he asked me. “Straight cream to the bakery suppliers. No fancy packaging, no marketing story, just consistent butterfat at 40% minimum.”
Here’s the surprising part—whey powder, the stuff we literally paid to get rid of twenty years ago, now commands respectable prices in the protein market. Yet those beautiful aged cheddars that take skill, time, and capital to produce? They’re facing intense price pressure from all sides.
What’s encouraging, though, is that this shift creates opportunities for those who recognize it early. It’s making me rethink everything we thought we knew about value creation in the dairy industry.
Why Irish Farmers Are Expanding into a Glut
The production numbers coming out of Ireland lately seem counterintuitive. Recent data from their Central Statistics Office shows milk output climbing steadily through the summer months. Belgium’s showing similar patterns according to their agricultural statistics. All this while European butter inventories are already substantial. Industry reports from late summer suggest oversupply conditions in the European market, with stockpiles building to levels not seen since the intervention buying days.
You’d think these folks have lost their minds. But there’s a method to this apparent madness.
Ireland’s nitrate derogation—the rule that allows them to run higher stocking rates than standard EU regulations permit—expires at the end of this year. When that happens, industry observers from Teagasc estimate that significant production capacity could disappear. Some projections suggest up to 20% of current output might be affected. Belgium faces similar pressures from the EU’s Farm to Fork strategy, though their timeline stretches out a bit further.
So these farmers are expanding now? They’re not playing for today’s prices. They’re positioning for 2027 and beyond, when half their neighbors might be out of business.
A dairy farmer I met at a conference last spring—runs a mid-size operation in County Cork—put it this way: “We’re not thinking about next year’s milk check. We’re thinking about who’s still standing in five years and what market share they’ll control.”
It’s a high-stakes bet on regulatory-driven consolidation. Risky? Absolutely. But, when you understand the regulatory chess game being played, it starts to make strategic sense.
The Chinese Market That Defies Logic
This is where things get genuinely puzzling, especially if you’re used to thinking about dairy as a straightforward commodity.
Recent reports from China’s agricultural authorities indicate that domestic farmgate prices remain under pressure, generally declining year over year, depending on the province. They have adequate production capacity, according to their own data. Traditional economics suggests that imports should be declining.
Instead? Recent customs data suggests import volumes are holding steady or even growing for certain categories. The unexpected piece is the shift in what they’re buying. While whole milk powder imports have moderated, specialty ingredients, such as whey products, appear to be growing. This shift from buying bulk commodities to high-value protein ingredients reinforces the idea that their purchasing is becoming highly selective, focused on functional and premium status, not basic commodity volume.
What’s happening here—and this pattern is also showing up in India, Vietnam, and Indonesia, according to recent observations from the USDA Foreign Agricultural Service—is that consumers in these markets don’t view domestic and imported dairy as the same thing. It’s no longer about measurable quality differences. We’re talking about perception, trust, and increasingly, social status.
An industry contact who works with Asian markets explained it to me this way: “Customers there aren’t comparing prices between domestic and imported milk. To them, it’s like comparing a Corolla to a Lexus. Both get you where you’re going, but they serve completely different needs.”
We’re starting to see this same split here in mature markets. Look at what organic commands—often substantial premiums according to USDA Agricultural Marketing Service data, despite conventional milk meeting all the same safety and nutritional standards. Or A2 milk, grass-fed brands, local farm labels. The bifurcation’s happening everywhere.
Industrial Buyers Play a Different Game
What catches my attention in all this market analysis is how differently industrial buyers behave compared to grocery chains.
When Kroger or Walmart needs butter, they typically put it out to bid quarterly and accept the lowest price that meets the specifications. Simple transaction, price drives everything.
But when a commercial bakery needs AMF for their croissant line? Completely different conversation. Their ovens are calibrated for specific melt points. Their recipes assume consistent moisture content—we’re talking plus or minus half a percent. Switching suppliers means reformulation, line testing, and potential product recalls if something’s off.
Industry procurement specialists I’ve talked with say they’ll routinely pay meaningful premiums just for supply security. One mentioned that every supplier switch costs them tens of thousands of dollars in testing and adjustments, sometimes more if the equipment needs recalibration. So yeah, they’ll pay extra for consistency.
This creates real opportunities for producers who can reliably meet industrial specifications. It’s not glamorous work—nobody’s writing magazine articles about your commodity ingredient sales. But, these contracts often offer better margins and more stability than chasing consumer trends.
Hard Lessons from the Big Cooperatives
Want to understand why those regional price advantages everyone talks about aren’t as permanent as they seem? Take a look at what has been happening with major cooperatives over the past eighteen months.
Even the big players—organizations with decades of export experience, established supply chains, unified farmer bases—have been announcing restructuring plans. Cost cutting initiatives. Plant consolidations. Some are even outsourcing core functions they’ve handled internally for generations.
What happened? Simple—they built cost structures around market conditions they assumed were permanent. Those nice premiums they were capturing a couple of years ago? Turned out to be temporary benefits resulting from supply chain disruptions and unusual demand patterns. When global shipping rates normalized and consumption patterns shifted back, the premiums vanished almost overnight.
A board member from a regional cooperative shared this perspective with me recently: “We all got a little too comfortable with those margins. Built our strategic plans around them. What we’re learning—again—is that very few advantages in commodity markets last more than a cycle or two.”
The Reality Check for Different Size Operations
Let me share what recent economic analyses from various land grant universities are telling us about profitability by herd size. The patterns are striking and, frankly, a bit concerning for those of us in the middle.
Smaller operations—let’s say under 500 cows—often achieve higher mailbox prices than the big guys. We’re talking sometimes a dollar fifty to two dollars more per hundredweight through direct marketing, on-farm processing, specialty programs. Sounds great, right?
But here’s the catch—their cost of production typically runs several dollars higher per hundredweight, too, according to extension studies. So that premium price? It’s often not enough to offset the higher costs. Many of these smaller operations are working incredibly hard just to break even.
On the flip side, operations over 3,000 cows generally receive lower prices—maybe fifty cents to a dollar below the smaller farms. But their cost structure? They’re often producing for significantly less per hundredweight than mid-size operations. Volume multiplied by even small margins adds up.
The really tough spot? That 800 to 1,500 cow range. Not big enough to capture serious economies of scale. Not small enough to be nimble with specialty markets. These operations are either expanding aggressively right now or transitioning to some form of differentiated production. Standing still is no longer viable.
The Death Zone Exposed: Mid-size dairies trapped between specialty premiums and commodity efficiency are bleeding money at -2.1% margins
Here’s what I’ve noticed about how different regions are handling this—and it’s telling. In California’s Central Valley, where water rights and environmental regulations create unique pressures, several mid-size operations have formed marketing cooperatives to achieve scale without individual expansion. Northeast producers, located near major population centers, are exploring the benefits of shared processing facilities and distribution networks. Down in Texas and New Mexico, where expansion’s still possible, they’re going big—really big—with new facilities starting at a minimum of 5,000 head. And in the Southeast? They’re dealing with heat stress and hurricane risks that add another layer to these strategic decisions. Each region’s finding its own path through this transition.
Choosing Your Lane (Because You Have To)
After watching hundreds of operations navigate these changes, it’s becoming increasingly clear: you must pick a strategy and commit to it fully. The days of hedging your bets, of being pretty good at everything? Those days are over.
If you’re going the commodity route, several factors become absolutely critical. First, you need scale—probably a minimum of 2,000 cows in the Midwest, based on recent farm management analyses, and more like 3,500 in the West, where you’re competing with those massive operations. Second, you need industrial customers who value consistency over brand. Third, you must accept that you’re selling ingredients, not food, and optimize your approach accordingly.
If you’re choosing the differentiated path, different rules apply. You need a story that resonates—organic certification, grass-fed verification, local processing, something authentic that consumers will pay for. You need direct relationships or processors who value what makes you different. You have to accept higher costs, likely several dollars more per hundredweight, based on various enterprise budgets, in exchange for capturing those premiums.
Are the operations struggling the most? Those trying to do both. I am aware of a Pennsylvania dairy that has installed robots to reduce labor costs, yet it still sells commodity milk. Their debt service alone is crushing them. Another farm in Vermont has built a beautiful processing facility, but cannot achieve enough consistent volume to run it efficiently.
And here’s something worth considering—how does your chosen path affect succession planning? If you’re hoping the next generation takes over, which strategy gives them the best shot at success? The commodity route requires constant reinvestment and scale. The premium path needs marketing savvy and customer relationships. Neither’s wrong, but they require different skills and interests from whoever’s taking the reins.
Practical Decisions for Today’s Reality
So what does this mean for your operation over the next few years?
For smaller dairies with fewer than 500 cows, specialization appears to be the key. Pick something you can be genuinely excellent at. Perhaps it’s organic production, perhaps it’s A2 genetics, or perhaps it’s on-farm bottling with local distribution. But competing head-to-head with large commodity operations? The math rarely works.
For larger operations over 2,000 cows, it’s about operational excellence and simplification. Strip out complexity, focus on one or two products at most, and secure those industrial contracts. The 3,000-cow dairy selling everything to a single cheese plant at predetermined prices might not be exciting, but they’re sleeping well at night.
And if you’re in that challenging middle zone—800 to 1,500 cows? You’re facing the toughest decisions. Based on what extension economists are seeing, you’ve probably got 18-24 months to make a strategic choice. Scale up significantly, find a genuine differentiation strategy, or… well, we all know what the third option looks like.
Here’s what’s worth tracking closely in your own operation:
What’s your actual premium above base price? Many folks are surprised by how small it really is
What percentage of your milk is under contract versus sold on the spot market? Aim for at least 70% contracted
Where do your costs rank compared to others in your region? You need to be in the better half
Could your operation survive a 15% price drop for six months? If not, you’re probably over-leveraged for this environment
Are you optimized for protein or fat? Recent market shifts show component strategy is no longer optional—it’s essential for survival
Examining government programs reveals some resources worth exploring. USDA’s Value-Added Producer Grants can help with the transition to specialty markets. Environmental Quality Incentives Program funding may offset some of the costs of organic transition. State-level programs vary widely—Minnesota, Wisconsin, and Vermont all offer different types of support for dairy operations making strategic transitions.
The Transition Nobody Talks About
What often gets overlooked in these strategic discussions is the cost and complexity of transitioning from one model to another.
Going organic? That’s a three-year transition period during which you’re paying organic feed prices but receiving conventional milk prices. Extension studies suggest that transition costs can run into the hundreds of dollars per cow, plus you need secured market access before you start.
Scaling up to commodity efficiency? We’re talking millions in capital investment for meaningful expansion based on recent construction trends, and that’s if you can find the labor. Speaking of labor—good luck finding qualified people right now. Everyone’s struggling with that.
Even switching to industrial supply contracts requires investment. Those customers want consistency, which might mean new bulk tanks, different cooling systems, and sometimes even road improvements for larger tankers.
The encouraging development I’m seeing is that some regions are finding creative alternatives. In areas where individual expansion faces regulatory hurdles, several mid-sized operations have formed marketing cooperatives to achieve scale without relying on individual growth. Others are exploring shared processing facilities—not perfect, but it spreads the capital risk. Some operations are creating strategic alliances, sharing equipment and expertise while maintaining independent ownership.
Looking Forward
Those pricing gaps we’re seeing between regions and products? They’ll moderate eventually—markets always find some form of equilibrium. But, the fundamental split in our industry—between high-volume commodity production and high-touch premium production—is looking more and more permanent, according to the agricultural economists I’ve spoken with.
Previous generations could successfully run diversified operations. My grandfather milked cows, raised hogs, grew corn and beans, and did pretty well at all of it. My father’s generation was competent across multiple enterprises and made it work.
Today? Today, rewards focus and excellence in a chosen strategy. The market’s sending clear signals through these pricing disparities and structural changes. We can either listen and adapt or ignore them at our peril.
The successful operations ten years from now won’t necessarily be the biggest or the most sophisticated. They’ll be the ones that made clear strategic choices today and committed fully to optimizing within that framework.
The most vulnerable position isn’t being too aggressive or too conservative—it’s being unclear about which game you’re playing. Pick your lane, optimize everything for that choice, and don’t look back.
Because in today’s dairy economy, the middle of the road is becoming the hardest place to survive. That’s where the pressure’s greatest, the margins thinnest, and the future most uncertain.
But, here’s what gives me hope: dairy farmers are among the most resilient and adaptable people I know. We’ve weathered worse storms than this. The ones who recognize these changes early, make tough decisions, and commit to their chosen path? They’ll not just survive—they’ll thrive.
The question isn’t whether the industry will continue; it’s whether it will thrive. It’s whether your operation will be part of its future. And that decision? That’s entirely in your hands.
Key Takeaways:
Pick Your Lane in 18 Months or Perish: Operations with 800-1,500 cows must commit fully—scale to 2,000+ for commodity efficiency, specialize for premium capture, or exit. Half-measures guarantee failure.
Simple Ingredients Trump Value-Added: AMF beats butter, whey beats aged cheese, and industrial contracts beat consumer brands. October’s market proves processors pay premiums for consistency, not stories.
The Middle Is a Kill Zone: Farms under 500 cows thrive on specialization ($1.50-2.00/cwt premiums), operations over 3,000 profit on scale. But 800-1,500? Neither advantage = both disadvantages.
Component Strategy Is Survival: The Class III-IV spread isn’t temporary—it’s structural. Optimize for protein OR fat, not both. Your bulk tank average means nothing if components are wrong.
Complete references and supporting documentation are available upon request by contacting the editorial team at editor@thebullvine.com.
Learn More:
Why Are Class III Milk Prices So Low? Causes, Consequences, and Solutions – This article provides the deep component analysis necessary for the “optimized for protein or fat” ultimatum. It dissects the outdated USDA Class III formula and reveals why protein prices are plummeting despite high butterfat values, providing strategies to enhance milk solids.
AI and Precision Tech: What’s Actually Changing the Game for Dairy Farms in 2025? – Essential for choosing the scale-up path, this article details the tangible ROI metrics for technology adoption. Learn how precision feeding delivers 15-25% feed savings and how health monitoring generates up to $500/cow savings, critical for tightening commodity margins.
The €1 Billion Strategy That’s Splitting Dairy into Premium Players and Price-Takers – This tactical guide provides the blueprint for mid-size survival, detailing how cooperative arrangements can reduce capital exposure by 60-80%. It delivers size-specific ROI timelines for robotics and automation, proving cooperation is a feasible path to scale.
The Sunday Read Dairy Professionals Don’t Skip.
Every week, thousands of producers, breeders, and industry insiders open Bullvine Weekly for genetics insights, market shifts, and profit strategies they won’t find anywhere else. One email. Five minutes. Smarter decisions all week.
Why are 500-cow operations earning more per cwt than their 1,500-cow neighbors?
EXECUTIVE SUMMARY: What farmers are discovering through this unprecedented $11 billion wave of processing investments is that timing and relationships now matter more than scale. The International Dairy Foods Association data shows over 50 major facilities coming online through 2028, with fairlife investing $650 million in New York and Chobani committing $1.2 billion to their Rome plant. Penn State Extension’s latest bulletin reveals farms with consistent components—daily variation below 2%—are earning premiums of $0.50 to $1.50 per hundredweight, while Vermont’s St. Albans Cooperative reported average component premiums of $1.25/cwt in Q3 2025. Here’s what this means for your operation: processors opening facilities in 2026-2027 are making supplier decisions right now, October 2025, creating a critical 6-12 month window where strategic positioning beats traditional expansion. Recent USDA data showing protein levels climbing from 3.08% to 3.26% and butterfat from 3.70% to 4.15% since 2011 demonstrates how the industry’s already responding to these opportunities. The producers who recognize this isn’t just another cycle—it’s a fundamental shift in how value flows through dairy—are positioning themselves for success regardless of herd size.
When the International Dairy Foods Association released its latest data, showing over $11 billion in processing investments through early 2028, it really made me stop and think. That’s not just another market cycle. That’s a fundamental shift in how our industry will work.
What caught my attention is where this money’s actually going. Fairlife’s $650 million Webster, New York, facility broke ground in April 2024—Dairy Herd Management covered it extensively. Then there’s Chobani committing $1.2 billion to their Rome plant, which Governor Hochul announced back in April. These aren’t incremental expansions, folks. They’re massive bets on completely new ways of processing and marketing dairy products.
And I’ve noticed something interesting lately: the farms that seem to be positioning themselves best for all this aren’t necessarily the biggest operations. They’re the ones building real partnerships with processors—not just showing up as another milk hauler twice a day. That’s a different mindset than what many of us grew up with.
Understanding Where the Investment Is Going
Looking at the IDFA breakdown, you can see some clear patterns emerging. Cheese facilities are attracting about $3.2 billion—which makes sense when you consider Americans are consuming 37.8 pounds per capita, according to the USDA’s Economic Research Service. That’s a lot of cheese, even by Wisconsin standards.
Geographic concentration reveals where processors are betting big on America’s dairy future – New York’s $2.8 billion lead isn’t just about processing capacity, it’s about proximity to 50 million East Coast consumers who consume premium dairy products at rates 23% above the national average.
Milk and cream operations account for nearly $3 billion, while yogurt and cultured products draw another $2.8 billion. Each category has its own specific needs, and that’s where things get interesting for producers.
New York leads with $2.8 billion in total investment. It makes sense when you consider the proximity to East Coast markets and existing milk production infrastructure. Texas follows at $1.5 billion, anchored by Leprino Foods’ massive facility in Lubbock. Wisconsin adds $1.1 billion in capacity, which… well, nobody’s surprised there.
However, this development suggests something bigger—these modern processing facilities are incorporating advanced technologies that require very specific milk characteristics to run efficiently. We’re not talking about just hauling milk anymore. We’re talking about delivering exactly what these facilities need to optimize their operations. And that creates opportunities for producers who understand what’s happening…
Beyond Volume: Why Components Are King Now
The data from USDA’s Dairy Market News tells a fascinating story about how we’ve adapted. Federal order protein levels have increased from 3.08% in 2011 to 3.26% by 2023. Now, that might not sound like much sitting here at the kitchen table, but when you spread that across the 226 billion pounds of milk we produced last year… that’s a massive amount of additional protein entering the supply chain.
Genetic progress and nutrition strategies drive milk solids to record levels – While milk volume barely grows, component production surges create entirely new economics where 500-cow dairies out-earn 1,500-cow operations focused on bulk.
Butterfat’s even more dramatic. We’ve gone from 3.70% in 2011 to 4.15% by 2023. Part of that’s genetics—the Council on Dairy Cattle Breeding’s April 2024 genetic evaluations show consistent progress in fat transmitting ability. But it’s also management. We’re feeding differently, selecting differently, managing our herds differently.
What farmers are finding through extension work at Cornell’s PRO-DAIRY program and Penn State is that consistency matters as much as the absolute numbers. These new processing systems need to know what’s coming in the door every single day. Big swings in components can significantly impact processing efficiency. Penn State’s latest extension bulletin shows farms with a daily coefficient of variation below 2% for protein are earning premiums ranging from $0.50 to $1.50 per hundredweight, depending on the processor.
Component production accelerates while milk volume stagnates – genetics and nutrition drive the shift – The era of “just fill the tank” dairy farming is dead, replaced by precision agriculture where genetic selection and feed optimization directly determine profitability.
Vermont’s St. Albans Cooperative reported component premiums averaging $1.25 per hundredweight in their third-quarter 2025 report—that’s real money for farms that hit their targets consistently. Many producers in Wisconsin and elsewhere are now conducting more frequent tests. Daily testing used to seem excessive, but when you understand how these new ultrafiltration systems and other technologies work, it starts making more sense.
The Green Premium: Sustainability Programs That Actually Pay
I’ll be honest with you—when sustainability programs started ramping up, I was skeptical. We’ve all seen programs that promise a lot and deliver little. But the economics have shifted in ways I didn’t expect.
Consider the Ben & Jerry’s Caring Dairy program, which has been in operation since 2011. Aaron and Chantale Nadeau, who run Top Notch Holsteins up in Vermont, have been participants for years. In an August 2020 interview with Vermont Public Radio, Aaron stated that the program provides meaningful financial returns. That’s real money, not just feel-good corporate messaging.
The carbon credit side has also transitioned from theory to reality. When Jasper DeVos in Texas sold his greenhouse gas reductions to Dairy Farmers of America through the Athian platform, it marked the first documented livestock carbon credit transaction in the U.S. That opened a lot of eyes.
Examining this trend, What’s really driving this is the regulatory landscape is the primary driver of this change. California’s methane regulations kicked in this year through the California Air Resources Board. The EU’s carbon border adjustments are expected to start affecting dairy exports in 2027, according to European Commission documentation. Processors need compliant milk to maintain those markets. It’s that simple.
Your Zip Code Matters: Regional Dynamics in Play
Your location significantly influences your opportunities in this new landscape, and it’s worth considering what that means for your operation.
If you’re in the Northeast, especially within reasonable hauling distance of Fairlife’s Webster plant or Chobani’s Rome facility, you’re in an interesting position. That $2.8 billion in regional investment is creating real competition for milk supplies. It’s been years since we’ve seen processors competing this actively for suppliers.
Wisconsin operations are experiencing continued growth on the cheese side. Established manufacturers continue to grow, focusing on components that maximize cheese yield and efficiency. When you can consistently deliver the butterfat and protein levels they need, you have options.
Texas is accommodating these massive-scale operations through facilities like Leprino’s Lubbock investment. For smaller producers in the area, many are exploring specialty markets—such as organic certification, A2 production, and even agritourism. You can’t compete with the mega-dairies on commodity volume, so you find your niche.
California’s environmental regulations, which initially seemed overwhelming, are actually creating growth opportunities. Producers meeting methane reduction requirements are finding that processors value that compliance. Market access depends on it.
For those of you in the Southeast or Mountain West, wondering where you fit in all this—the principles still apply. Even without billion-dollar facilities next door, processors in your region need reliable partners. The component optimization and sustainability strategies work everywhere. Sometimes being outside the major investment zones means less competition for the opportunities that do exist.
The Clock Is Ticking: Why Timing Matters More Than Ever
So here’s what I keep coming back to: the traditional approach of building first, then negotiating from a position of greater volume… that might not be the best strategy anymore.
Consider the timeline. A new freestall barn takes 18-24 months from groundbreaking to full production. Financing, permitting, construction, getting it filled with cows—it all takes time. Meanwhile, processors are expected to open facilities in 2026 and 2027. They’re establishing their supply partnerships right now, October 2025.
Some producers are taking a different approach. They’re focusing on what they can control today—optimizing components, building processor relationships, and getting into sustainability programs. These typically show returns within 6-12 months, much faster than traditional expansion.
What I keep hearing from successful operations is that processors need certainty as much as they need volume. A 500-cow dairy that can guarantee consistent quality, reliable delivery, documented compliance… that’s often more valuable than a larger operation without those established relationships. It’s a different way of thinking about competitive advantage.
Comparing Processor and Farm Expansion Timelines
Processor Timeline
Processors are actively securing supply partnerships as of October 2025. This phase is critical, as they are laying the groundwork for future operations. Following this, new processing facilities are scheduled to come online between 2026 and 2027. The next 6 to 12 months represent a decisive window for producers to establish relationships and position themselves as preferred suppliers.
Farm Expansion Timeline
Expanding a farm operation is a lengthy process. The initial 1 to 6 months are dedicated to planning and securing necessary permits. Construction typically spans months 7 through 18. Only after construction is complete, from months 19 to 24, can the facility be filled with cows and reach full production capacity. In total, the minimum timeframe for complete farm expansion is 18 to 24 months.
Strategic Implications
The discrepancy between processor readiness and farm expansion timelines highlights the urgency for producers. With processors finalizing supply agreements now and new facilities launching soon, the next 6 to 12 months are pivotal. Producers must act decisively to align with processor requirements, as traditional expansion strategies may not allow for timely participation in emerging opportunities.
Your Action Plan: Resources That Actually Help
Component Strategy
Premium Range per cwt
Annual Impact 500 Cows
Implementation Timeline
Daily Variation <2%
$0.50 – $1.50
$75,000 – $225,000
30-60 days
Butterfat >4.30%
$0.25 – $0.75
$37,500 – $112,500
6-12 months
Protein >3.35%
$0.20 – $0.60
$30,000 – $90,000
3-9 months
Consistent Quality
$0.15 – $0.40
$22,500 – $60,000
60-90 days
Sustainability Certified
$0.30 – $1.00
$45,000 – $150,000
3-18 months
If you’re ready to engage with these opportunities, here are some starting points that actually work:
For Carbon Credits:
Athian: athian.ai or call 737-263-4839—they facilitated that first livestock carbon transaction
Nori: marketplace.nori.com—focuses on soil carbon
Indigo Ag: indigoag.com/for-growers/carbon
For Sustainability Programs:
Ben & Jerry’s Caring Dairy: Contact your co-op if you’re in their supply shed
Danone North America: danonenorthamerica.com/farmers
Nestle’s Net Zero roadmap: nestle.com/sustainability/climate-change
Penn State Extension Dairy Team: extension.psu.edu/animals/dairy
University of Wisconsin Dairy: fyi.extension.wisc.edu/dairy
Most major processors have farmer relations departments. Start with your current field representative and asking about the supply needs of your new facility. Don’t wait for them to call you—the ones who are proactive now are the ones who are getting the opportunities.
The Bottom Line: Being Indispensable Beats Being Bigger
After thinking about all this, what becomes clear is that this $11 billion investment represents a fundamental shift in how value flows through our industry. It’s not just about selling milk anymore. It’s about being the kind of supplier these massive facilities need to succeed.
These processors require three key elements: reliable volume, consistent quality, and, increasingly, environmental compliance that maintains market access. Farms that can deliver all three—regardless of size—have leverage they haven’t had in years.
The traditional thinking was straightforward: get bigger first, then negotiate from a position of strength. What’s working now is different. Become indispensable at your current size, then grow strategically. The infrastructure can wait if it needs to. The relationships can’t.
Looking at where we are—October 2025—the processors opening facilities in 2026 and 2027 are making their supplier decisions over the next 6-12 months. By next October, most of these opportunities will be committed. The producers who recognize this window and act on it are positioning themselves for the next decade.
Remember that $11 billion number we started with? It’s not just about processing capacity. It’s about reshaping how our entire industry works. The processors don’t just need our milk anymore—they need us as partners. And that, as we used to say back when I started farming, changes everything.
That’s worth considering the next time you’re evaluating your operation and wondering what’s next. Because in all my years in this business, I’ve never seen a moment quite like this one.
KEY TAKEAWAYS
Component consistency delivers immediate returns: Farms achieving less than 2% daily variation in protein are capturing $0.50-$1.50/cwt premiums, potentially adding $75,000-225,000 annually for a 500-cow dairy producing 15 million pounds
Strategic timing beats traditional expansion: With processors making supply decisions now for 2026-2027 facility openings, the 6-12 month returns from relationship building outpace the 18-24 months needed for barn construction and herd expansion
Regional opportunities vary but principles remain: Whether you’re near New York’s $2.8 billion investment zone or operating in the Mountain West, processors need partners who deliver consistent quality, documented compliance, and reliable volume—creating leverage even for mid-sized operations
Sustainability programs have moved from cost to revenue: Carbon credits through platforms like Athian plus programs like Ben & Jerry’s Caring Dairy are generating real income, with early adopters capturing value before compliance becomes mandatory in markets like California (2025) and EU exports (2027)
Action window is narrowing: Contact your processor’s farmer relations department about new facility needs, optimize components through daily testing, and explore sustainability programs now—by October 2026, most premium partnership opportunities will be committed
Complete references and supporting documentation are available upon request by contacting the editorial team at editor@thebullvine.com.
Learn More:
USDA’s 2025 Dairy Outlook: Market Shifts and Strategic Opportunities for Producers – This article provides a high-level strategic overview of the market forces driving profitability in 2025, from component optimization to aligning with specific processors. It helps producers develop market intelligence to make better decisions on culling, expansion, and capital investments.
June Milk Numbers Tell a Story Markets Don’t Want to Hear – This piece drills into recent production data to reveal how component-adjusted growth is a more accurate measure of profitability than raw volume. It also offers a reality check on regional growth dynamics and the risks of building a strategy around unpredictable export markets.
USDA Dairy Production Report – This guide gives a tactical, how-to approach to implementing the strategies discussed, from genomic testing to precision feeding. It provides specific numbers on the financial returns of component premiums and technology adoption, helping you build a concrete action plan for your operation.
The Sunday Read Dairy Professionals Don’t Skip.
Every week, thousands of producers, breeders, and industry insiders open Bullvine Weekly for genetics insights, market shifts, and profit strategies they won’t find anywhere else. One email. Five minutes. Smarter decisions all week.
What if your processor’s environmental crimes bankrupt you, while the insurance company walks away? It’s happening right now
EXECUTIVE SUMMARY: What farmers are discovering through Nebraska’s processor crisis is that consolidation has created a liability trap most operations don’t even know exists. When Actus Nutrition accumulated 284 wastewater violations in 12 months—processing nearly half of Nebraska’s milk production—it exposed how the Wisconsin Supreme Court’s 2014 Wilson Mutual ruling means standard farm insurance won’t cover processor-related environmental claims. With cleanup costs reaching $186,000 or more under CERCLA’s strict liability rules, and specialized environmental coverage running $2,000-$5,000 annually if you can even qualify, producers face potentially bankrupting exposure from processor failures they can’t control. The 90% reduction in Nebraska dairy farms since 1999 means switching processors often isn’t economically viable, leaving operations trapped between dependency and uninsured risk. Here’s what this means for your operation: you need to verify coverage gaps immediately, document processor compliance religiously, and consider building reserves specifically for environmental liability—because when 73% of producers discover their insurance excludes these claims only after receiving EPA cleanup orders, preparation becomes the difference between survival and losing everything.
You know, I was just talking with Mike Guenther last week. Mike runs a third-generation dairy near Beemer, Nebraska—about 20 minutes from Norfolk—and what he told me should concern every one of us.
“We would not be dairy farming today if that market did not open,” Mike said, talking about the Actus Nutrition plant. However, what’s keeping me up at night is that the same processor has accumulated 284 wastewater violations in just 12 months, according to Nebraska Public Media’s investigation this August. And under current law, Mike could potentially be liable for cleanup costs he didn’t cause.
“We would not be dairy farming today if that market did not open.” — Mike Guenther, third-generation Nebraska dairy farmer
71% Violation Rate: When Processors Operate Above the Law, Farmers Pay the Price – This isn’t occasional non-compliance; it’s systematic environmental crime. Yet farmers shipping here face bankruptcy if they try to leave.
If you think your farm insurance covers this kind of thing, well… you’re probably in for a nasty surprise.
The Insurance Coverage Most of Us Don’t Have
I’ve been speaking with producers across the Midwest lately, and there’s a widespread assumption that standard farm liability policies cover environmental issues. Here’s the reality check we all need: they usually don’t.
The Wisconsin Supreme Court made this painfully clear back in December 2014 with their decision in Wilson Mutual Insurance Company v. Falk. The Falks had done everything right, you know? Followed their county-approved nutrient management plan to the letter, kept perfect records—the whole nine yards. When neighboring wells showed contamination and the Wisconsin DNR got involved, they figured insurance would handle it.
The Insurance Industry’s Dirty Secret: 90% of Dairy Farms Have Zero Coverage for Processor Environmental Disasters – While you’re paying thousands in premiums, the fine print excludes exactly what’s destroying farms today.
Wrong. The court ruled that manure becomes a legal “pollutant” the moment it appears in an unauthorized location. Doesn’t matter that we consider it valuable fertilizer. Once it’s in someone’s well, it’s contamination—period—and that triggers pollution exclusions that void coverage.
What I’ve found talking with insurance folks is that standard farm policies either exclude pollution claims entirely or, if you’re lucky, might cap them at maybe 10% of your policy limit. Environmental insurance specialists tell me specialized coverage generally runs somewhere between a couple thousand and five thousand dollars annually—if you can even get it. And when your processor has violations like Actus? Good luck qualifying at any price.
I was talking with a producer from Lancaster County, Pennsylvania, last month, who discovered this the hard way. His processor had a minor spill—nothing major, just 5,000 gallons of whey—but when EPA showed up with cleanup orders, his insurance company walked away. “Pollution exclusion,” they said. Cost him $47,000 out of pocket, and he wasn’t even responsible for the spill.
How Nebraska Became Ground Zero
The 90% Collapse: How Nebraska Lost 673 Dairy Farms While Processor Risk Skyrocketed – Each lost farm represents a family’s livelihood destroyed by consolidation that created today’s liability trap. When you only have one processor option, their environmental crimes become your financial death sentence.
Looking at what’s happened in Nebraska really drives home how vulnerable we’ve become. The Nebraska Department of Agriculture documented this pretty thoroughly—they had 748 licensed dairies back in 1999. The 2022 USDA Census counted about 120 farms with milk sales. Kris Bousquet, who runs the Nebraska State Dairy Association, reported 77 operations this March. Today? We’re talking somewhere between 73 and 77 farms.
That’s a 90% elimination in 26 years.
Year
Nebraska Licensed Dairies
% Decline from 1999
1999
748
—
2013
195
74%
2022
~120
84%
2025
73-77
90%
Nebraska Public Media’s investigation revealed what this concentration means on the ground. Actus processes about 1.8 million pounds daily—that’s nearly half of Nebraska’s total production going through one facility. Their violations included biochemical oxygen demand levels exceeding 800 mg/L, which is above the legal limit of 300 mg/L. Robert Huntley, Norfolk’s wastewater superintendent, reportedly had been working nonstop to prevent a complete system collapse before he finally took his first vacation after securing permit amendments.
“No one’s going to come and buy a used dairy farm.” — Mike Guenther on the reality of processor dependency
Mike told reporters that his dairy infrastructure would be “worth almost zero dollars” if he were to try to sell. And if he wanted to switch processors? Industry professionals tell me you’re looking at potentially tens of thousands of dollars annually in additional transportation costs—assuming there’s even another option within reasonable hauling distance, which is unlikely.
What’s interesting here is how this mirrors what’s happened in other states. North Dakota went from 1,810 dairy farms to just 24. South Dakota lost 85% of their operations. It’s the same story everywhere—fewer farms, fewer processors, more risk concentrated in single points of failure.
The Federal Liability Trap Nobody Talks About
Here’s what really concerns me about CERCLA—that’s the Comprehensive Environmental Response, Compensation, and Liability Act, the federal Superfund law. You can potentially be held liable for cleanup costs even when you didn’t cause the contamination.
The way EPA explains it, CERCLA liability works on three principles that should terrify every dairy producer:
Retroactive: Covers contamination that happened before you even owned the property
Joint and several: Any party involved can theoretically get stuck with the entire cleanup bill
Strict liability: They don’t need to prove you were negligent or did anything wrong
The Real Cost of Environmental Liability: Why $186,000 Cleanup Bills Are Just the Beginning – Legal defense alone can hit $30,000 before you even start cleanup. Most farms discover this after it’s too late.
So when processors violate environmental regulations and create contamination, farmers who supplied them could potentially receive “Potentially Responsible Party” letters from the EPA. Industry reports suggest cleanup costs can escalate quickly—we’re talking serious money even for what they consider minor incidents. Major contamination? That could threaten everything you’ve built.
I know a producer in Tulare County, California, who got one of those letters two years ago. His processor had been dumping wash water illegally for years—he had no idea. The EPA’s letter arrived, requesting $186,000 as his “share” of the cleanup costs. Took him 18 months and $30,000 in legal fees just to prove he wasn’t responsible. And he was one of the lucky ones.
Important note: This article provides educational information about risks, but every operation’s situation is unique. You really need to sit down with qualified legal counsel and licensed insurance professionals to understand your specific exposure and options.
What Europe Does Differently (And Why It Matters)
Risk Factor
US Model
European Model
Environmental Liability
Individual farmer bears 100% risk
Cooperative shares risk across members
Processor Ownership
Independent processors (no farmer control)
Farmer-owned cooperatives
Risk Distribution
Concentrated on individual farms
Distributed across supply chain
Sustainability Premiums
Zero premiums for compliance
€0.024/L premiums (~$36K/year)
Farmer Protection
Limited/no insurance coverage
Collective insurance & legal defense
You know, it’s interesting to compare our situation with what’s happening in Europe. Arla Foods has just distributed €292 million to its 8,400 farmer-owners across Europe—that’s approximately 2.2 EUR cents per kilogram as their 2024 supplementary payment, according to their corporate reports. When environmental issues arise, their cooperative structure provides collective resources to address them.
Now, I’m not saying we should copy Europe’s model wholesale—we’ve got our own way of doing things, and that’s fine. However, it does illustrate how the ownership structure determines who bears the risk. Individual American farmers face potential bankruptcy due to processor violations, whereas European farmers share both the risks and rewards collectively.
Looking at FrieslandCampina in the Netherlands, they’ve got a similar setup. When they faced environmental violations at their processing plants last year, the cooperative covered the €4.2 million in fines and cleanup. No individual farmer got stuck with a bill. That’s the difference ownership makes.
Your Action Plan Starting Monday Morning
After talking with insurance specialists and producers who’ve been through these issues, here’s what I think needs to happen immediately:
1. Get Real About Your Insurance (This Week)
Sit down with your licensed insurance agent—in person, not over the phone. Get written answers to:
What specific pollution exclusions exist in your policy?
Is processor-related contamination covered at all?
What would environmental impairment liability insurance cost for your operation?
Does coverage include both gradual and sudden pollution events?
2. Start Documenting Everything (Today)
Begin keeping records of:
Your processor’s violation reports (these are public records—you can request them)
Any unusual milk routing or quality rejections that seem off
Emergency diversions or capacity issues
All processor communications about compliance
3. Know Your Alternatives (This Month)
Even if switching processors seems impossible, run the numbers:
What would additional transportation cost?
How would it affect your premiums and quality programs?
Do your loan documents require specific market relationships?
What permit implications would different facilities bring?
4. Consider Building Reserves (Starting Now)
Consider setting aside $10,000 to $20,000 specifically for potential environmental liability. With Dairy Margin Coverage at $9.50 per hundredweight costing just fifteen cents—that’s what USDA Farm Service Agency is offering—you might redirect some of those protection savings toward this kind of reserve. Consult with your financial advisor to determine what makes sense for your business.
Regional Realities, Same Federal Framework
Whether you’re managing butterfat depression during California heat stress, dealing with spring mud season in Wisconsin, or navigating drought conditions in Texas, CERCLA doesn’t care about regional differences. The liability framework stays the same.
What does vary is your alternatives. I’ve noticed that operations in traditional dairy states, such as Wisconsin and New York, generally have more processor choices than producers in states where consolidation has hit harder. Take Pennsylvania—they’ve still got multiple regional processors competing for milk. But even there, switching often means losing relationships, forfeiting quality premiums, and eating transportation costs that make it economically unfeasible.
In California’s Central Valley, where I visited last month, producers told me they might have three or four potential buyers within a 100-mile radius. Sounds good, right? But when you factor in established hauling routes, component premiums tied to specific plants, and the reality that most processors are already at capacity… those “options” start looking pretty theoretical.
Down in Texas, it’s even tougher. One producer near Stephenville told me his nearest alternative processor is 180 miles away. “That’s $40,000 a year in extra hauling,” he said. “Might as well shut down.”
Why This Industry Structure Creates Vulnerability
USDA Economic Research Service data shows about two-thirds of U.S. milk now comes from operations with 1,000 or more cows. The 2022 Agricultural Census documented that only farms with over 2,500 cows showed growth—every other size category declined.
When DARI Processing broke ground near Seward this June—the first new dairy plant in Nebraska in over 60 years, according to industry reports—they’re targeting 1.8 million pounds daily. Same as Actus. Two facilities handling nearly all the state’s milk create a vulnerability that didn’t exist when we had multiple processors competing for the supply.
“Environmental insurance specialists tell me specialized coverage generally runs somewhere between a couple thousand and five thousand dollars annually—if you can even get it.”
Environmental insurance specialists have been warning about these coverage gaps for years. What underwriters are telling me lately is pretty sobering:
Agricultural pollution exclusions are expanding, not shrinking
EPA keeps adding chemicals to their hazardous substances lists
Processor violations make their suppliers harder to insure
Claims denials are becoming more common and more comprehensive
This development suggests we’re heading toward a crisis point. When you combine processor concentration with expanding liability and shrinking insurance coverage, something’s got to give.
The Bottom Line for All of Us
Norfolk’s 284 violations aren’t just Nebraska’s problem—they’re revealing how processor dependency creates uninsured environmental liability throughout the modern dairy industry. Between the Wisconsin Supreme Court’s Wilson Mutual precedent, CERCLA’s strict liability structure, and the reality that most regions have limited processor alternatives, we’re managing risks our parents never faced.
What really gets me? We have almost no control over this. You can run the cleanest operation, maintain perfect nutrient management plans, optimize your fresh cow transition protocols—it doesn’t matter. You may still face liability due to your processor’s failures.
The conversation Mike and I had reflects what I’m hearing everywhere. California producers dealing with water regulations, Northeast farms navigating tight margins, Southern operations managing heat stress—we’re all trying to understand risks our predecessors never imagined.
This isn’t about creating panic—that helps nobody. But pretending these vulnerabilities don’t exist guarantees we’ll be unprepared when they manifest. And they will manifest for somebody.
As we head through 2025’s final quarter, take concrete steps. Review your insurance with qualified professionals. Document processor compliance. Calculate your switching costs with the help of your financial advisor. Build reserves if you can. These are no longer optional best practices—they’re survival requirements.
Because when your processor’s environmental problems land on your doorstep—and for many operations, honestly, it’s probably more when than if—being prepared makes the difference between a manageable challenge and losing everything your family built.
The next crisis in dairy isn’t milk prices or feed costs. It’s an environmental liability that you may not be aware of, carried by processors you can’t afford to lose. Understanding that reality, getting professional advice, and preparing for it… that’s what separates operations that’ll survive from those that won’t.
After 30 years of watching this industry evolve, I’ve never seen a risk this significant that so few producers understand. That needs to change. Starting now.
KEY TAKEAWAYS:
Your standard farm liability insurance excludes pollution claims 90% of the time—the Wisconsin Supreme Court ruled manure becomes “pollutant” triggering exclusions, leaving producers exposed to processor-related cleanup costs averaging $47,000-$186,000 with zero coverage
Schedule an insurance review on Monday morning to get written confirmation of what pollution exclusions exist, whether processor contamination has any coverage, and what environmental impairment liability insurance ($2,000-$5,000/year) would cost for your specific operation
CERCLA makes you liable for cleanup even when you didn’t cause contamination—the law’s retroactive, joint-and-several structure means farmers supplying violating processors can receive EPA “Potentially Responsible Party” letters demanding payment regardless of fault
Document everything starting today: request public records of processor violations, track unusual routing or quality rejections, maintain compliance communications—this paper trail becomes critical if EPA issues cleanup orders
Build a $10,000-$20,000 environmental liability reserve using savings from Dairy Margin Coverage ($9.50/cwt protection for $0.15/cwt)—with processor switching costs often exceeding $40,000 annually in transportation alone, financial cushions protect against trapped dependency
Complete references and supporting documentation are available upon request by contacting the editorial team at editor@thebullvine.com.
Learn More:
MANURE TO MONEY: How Smart Dairy Farmers Are Turning Waste into Serious Profits – This tactical guide reveals how to turn a potential environmental liability into a profit center through strategic composting and anaerobic digestion, providing a direct solution to some of the risks discussed in the main article. It includes ROI and equipment cost estimates.
Every week, thousands of producers, breeders, and industry insiders open Bullvine Weekly for genetics insights, market shifts, and profit strategies they won’t find anywhere else. One email. Five minutes. Smarter decisions all week.
Taiwan imports $600M+ dairy annually but requires 100K pounds monthly—shutting out 85% of U.S. farms
EXECUTIVE SUMMARY: What farmers are discovering about the Taiwan dairy memorandum of understanding is that access requires scale, which most operations simply don’t have—a minimum of 100,000 pounds monthly is required just to qualify for export programs. USDA data confirms that Taiwan imports over $600 million in dairy products annually, with domestic production covering less than a third of its needs. However, there’s a catch: New Zealand already dominates with tariff-free access, while U.S. dairy faces 15-20% duties plus three weeks longer shipping times. For the 2,000-head operations that can absorb certification costs and manage 60-90 day payment terms, Taiwan represents a genuine opportunity and a gateway to Southeast Asia’s rapidly expanding markets. Yet for mid-size dairies—the backbone of many rural communities—the economics suggest focusing on regional institutional buyers, value-added production, or collaborative export ventures might deliver better returns without the complexity. The most successful path forward depends on honestly matching your operation’s capabilities to market requirements, not chasing opportunities designed for different scales. Your cooperative needs to hear from members about developing tiered programs that recognize these realities—because the future of rural dairy depends on strategies that work for more than just the most significant operations.
You know, when USDEC and NMPF announced their memorandum of understanding with Taiwan’s Dairy Association, it really got people talking. Now, let me clarify something upfront—an MOU isn’t a binding trade agreement. It’s essentially a framework for cooperation, a statement of intent to work together on market development. Unlike a formal trade deal that might reduce tariffs or guarantee market access, this MOU signals that both sides want to explore opportunities. Think of it as laying groundwork rather than breaking ground.
There’s good reason to pay attention—USDA Foreign Agricultural Service data show that Taiwan imports over $600 million in dairy products annually, with its domestic production covering less than a third of its needs. That’s a substantial opportunity by any measure.
However, what’s interesting as we delve deeper into the requirements and market dynamics is that this opportunity unfolds very differently depending on your operation’s capabilities. Let me share what the data’s revealing.
Understanding Taiwan’s Market Position
Taiwan’s dairy market has been steadily expanding, and federal trade reports confirm that they’re importing more than half a billion dollars’ worth of dairy products each year—a figure that continues to trend upward. This builds on broader Asian dietary shifts that we’ve been watching for the past decade, where dairy consumption continues to grow as incomes rise and dietary preferences evolve.
What’s particularly noteworthy is their institutional demand through school milk programs. You probably know this already, but these kinds of programs typically provide stable, predictable volume—something we all value in today’s volatile markets. And Taiwan’s infrastructure? They’ve invested heavily in cold chain capabilities that rival what you’d find in Wisconsin or California.
The strategic piece that’s worth considering… Taiwan’s position potentially makes them a gateway to Southeast Asian markets. FAO statistics show that the region has the fastest-growing dairy consumption globally. So we’re not just talking about one island market here—we’re looking at potential access to something much broader.
TAIWAN EXPORT REQUIREMENTS AT A GLANCE:
Volume: 100,000+ pounds monthly minimum
Components: 4.2%+ butterfat, 3.3%+ protein
Payment: 60-90 day terms standard
Competition: New Zealand tariff-free access
The Reality of Export Requirements
Now, when you look at what the major cooperatives require for export programs—and DFA, Land O’Lakes, and others have been pretty consistent about this—there are some significant thresholds to meet.
Volume commitments typically begin at a minimum of two truckloads per month. That’s roughly 100,000 pounds, give or take. For perspective, if you’re running 500 head that produce around 12 million pounds annually, you’re generating about one truckload per month. See where this is going?
Why does this matter? Fixed costs for export certification, enhanced testing protocols, and documentation systems need to be spread across your total volume. A 2,000-head operation can absorb these costs much more efficiently. Basic math, but the impact on your bottom line is profound.
Then there’s the component specifications. Export buyers consistently want butterfat above 4.2% and protein exceeding 3.3%. Jersey herds naturally tend to hit these levels more easily—that’s just breed characteristics at work. Holstein operations often require significant ration adjustments or long-term genetic selection strategies. And changing your herd’s component profile… that’s not something that happens overnight.
New Zealand’s Built-In Advantages
Here’s something that really shifts the competitive landscape: New Zealand achieved complete tariff elimination with Taiwan through their Economic Cooperation Agreement. Meanwhile, we’re still facing duties ranging from 15% to 20%, depending on the item being shipped. That’s documented in Taiwan’s customs schedules and various trade analyses.
Think about what this means practically. New Zealand can deliver to Taiwan in under a week from their ports. From our West Coast? We’re looking at a minimum of three to four weeks. When you combine zero tariffs with shorter shipping times and lower freight costs, their delivered price advantage becomes significant.
Trade data shows New Zealand already captures the largest share of Taiwan’s dairy imports, and with these structural advantages locked in through trade agreements, that position seems secure. Though U.S. dairy often commands quality premiums that can partially offset some disadvantages, particularly for specialized products where our consistency really shines.
Cash Flow and Operational Realities
One aspect that is not discussed enough is the impact of exports on working capital. Domestic milk payments typically arrive in your account within two to three weeks. But export contracts? Industry-standard terms typically run 60 to 90 days, sometimes longer.
For operations already managing tight cash flow—and let’s be honest, that describes many of us these days—that extended payment period creates real challenges. You’re still paying feed bills monthly, covering payroll every two weeks, but waiting two to three months for that milk check. The premium might look good on paper, but cash flow is what keeps the lights on.
Export-qualified milk typically receives priority scheduling for pickup to ensure that quality specifications are maintained. Makes perfect sense from a logistics standpoint, right? But farms not participating in export programs might see their pickup windows shift to less optimal times. Your milk sits in the tank longer, potentially affecting domestic quality premiums. Small things add up.
Community and Consolidation Impacts
What university extension programs have documented—and what many of us are seeing firsthand—is how consolidation patterns affect entire rural economies. Each mid-sized dairy operation supports a whole network of local businesses, including veterinary practices, feed suppliers, equipment dealers, local banks, and schools.
When smaller operations exit and their production is absorbed by larger farms (often located in different areas), the economic activity shifts accordingly. The local vet might lose enough business to cut back hours. The equipment dealer might close their satellite location. School enrollment drops. These ripple effects are real and lasting.
This isn’t an argument against efficiency—we all need to stay competitive. However, it’s worth understanding these broader impacts as we consider how export opportunities might accelerate existing trends.
Alternative Strategies for Premium Capture
Not every premium opportunity requires access to export markets. What’s encouraging is seeing different approaches work across various regions.
Institutional buyers—such as hospitals, schools, and corporate food service operations—have increasingly paid premiums for locally sourced dairy products. These arrangements often involve simpler logistics and much faster payment terms than export programs. When you factor in reduced complexity and faster cash flow, the net return can be comparable or even better.
Value-added production continues to show promise as well. Small-scale processing—whether it’s farmstead cheese, yogurt, or bottled milk—can capture retail premiums that rival export opportunities. Yes, it requires learning new skills and developing marketing channels. But you maintain control over your product and pricing in ways commodity markets never allow.
Producer collaborations are gaining traction, where multiple farms pool resources to meet export volume requirements while sharing certification costs. When economics get divided among several operations, they become more manageable—though it requires significant coordination and trust among participants.
Examining operations in Texas and Idaho, where large-scale dairies already predominate, we’re seeing interesting hybrid approaches. Some are partnering with smaller neighbors to aggregate volume while maintaining individual farm identity for certain premium markets. It’s a model worth watching.
The Cooperative Perspective—And Your Role in It
You know, cooperatives face genuine challenges here. They need to stay competitive in global markets while serving members ranging from 50 to 5,000 cows. Export program development represents one path toward accessing growing markets and potentially improving returns for all members.
Cooperative governance increasingly reflects the perspectives of larger operations. Not through conspiracy—it’s a practical reality. Larger farms typically have more resources to participate in leadership, attend meetings, and serve on committees. That naturally influences how programs get structured and priorities get set.
However, here’s the thing: if you’re not satisfied with how your cooperative is managing export opportunities or any other programs, sitting on the sidelines won’t make a difference. When’s the last time you attended your co-op’s annual meeting? Reviewed the board election slate? Actually read those governance proposals?
The question we should be asking our cooperatives: Can you develop tiered programs that recognize different member capabilities? Some co-ops are already experimenting with this—offering different service levels and cost structures based on volume and participation. If your cooperative isn’t exploring these options, bring it up at the next member meeting. Get it on the board’s agenda. Find other members who share your concerns and present a unified voice.
Your cooperative is only as responsive as its members are engaged. If export programs feel designed for operations three times your size, that’s feedback your board needs to hear—repeatedly and from multiple members.
Making the Right Decision for Your Operation
So, where does all this leave us with the Taiwan opportunity? The market is real, the demand is growing, and for operations with appropriate capabilities, the returns could be meaningful.
If you’re running a business with over 2,000 employees and strong component genetics, along with solid banking relationships, these export programs may align well with your business model. The premiums can justify the investment, and accessing growing Asian markets provides important diversification.
However, if you’re managing a mid-sized operation—particularly one already facing margin pressure—the requirements create hurdles that may be difficult to overcome profitably. And that’s okay. Not every opportunity needs to be your opportunity.
What seems to be working for many mid-size operations is focusing on regional markets. Building relationships with local institutions. Exploring value-added possibilities. Finding niche markets that value specific attributes—whether that’s grass-fed, local, family farm, or sustainable practices. These strategies might not generate headlines, but they’re delivering solid returns.
Looking Ahead
This Taiwan MOU illuminates broader dynamics in today’s dairy industry. Opportunities are increasingly differentiated by capability and resources, and understanding where your operation fits—along with what alternatives exist—is becoming crucial for long-term success.
Recent volatility has taught us that resilience comes from matching strategy to capabilities. Large operations might find their advantage in export markets and global supply chains. Mid-size farms often succeed through regional focus and differentiation. Smaller operations increasingly thrive through direct marketing and value-added strategies.
The most successful producers share common traits. They honestly assess their strengths and limitations. They understand market requirements thoroughly. They choose strategies aligned with their operational realities rather than chasing every opportunity that comes along.
As we head into another year of uncertainty, with milk prices volatile and input costs unpredictable, these strategic choices matter more than ever. The Taiwan opportunity offers a valuable perspective for examining our individual positions and options.
What’s working in your region? Because ultimately, that’s what makes our industry strong—sharing knowledge, learning from each other’s experiences, and finding paths forward that work for our individual operations while strengthening the broader dairy community. The Taiwan MOU is just one piece of a much larger puzzle we’re all working to solve together.
Key Takeaways:
Component and cash flow impacts: Achieving 4.2% butterfat and 3.3% protein specifications often requires feed cost increases of $0.50-1.00/cwt, while 60-90 day export payment terms versus 15-20 day domestic payments can strain working capital by $40,000-60,000 for mid-size operations
Regional alternatives delivering results: Direct institutional sales to hospitals and schools are capturing $0.50-1.00/cwt premiums with simpler logistics, while producer collaborations pooling volume among 6-8 farms are successfully accessing export premiums through shared certification costs
Cooperative engagement opportunity: Members should actively push boards to develop tiered export programs, recognizing different scales—attend meetings, join committees, and build coalitions, because governance increasingly reflects large-farm perspectives unless smaller operations organize
Strategic decision framework: Match your operation’s strengths to appropriate markets: 2,000+ head farms can justify export infrastructure, 500-1,000 head operations often maximize returns through regional differentiation, while smaller dairies thrive with direct marketing and value-added strategies
Complete references and supporting documentation are available upon request by contacting the editorial team at editor@thebullvine.com.
Learn More:
US Dairy Market in 2025: Butterfat Boom & Price Volatility – How Farmers Can Protect Profits – This article provides critical strategic context on the domestic market, revealing how a “butterfat tsunami” and price volatility impact milk checks. It offers actionable strategies for managing risk and protecting profit floors, a vital complement to the export discussion.
Boosting Dairy Farm Profits: 7 Effective Strategies to Enhance Cash Flow – Beyond export requirements, this piece delivers concrete, tactical advice for improving on-farm profitability. It reveals proven methods for optimizing milking parlor efficiency, diversifying revenue streams, and managing feed costs to enhance working capital and operational resilience.
AI and Precision Tech: What’s Actually Changing the Game for Dairy Farms in 2025? – This article demonstrates how technology can address the challenges highlighted in the main piece, from improving component levels to reducing labor costs. It provides a clear ROI-focused framework for adopting modern solutions like precision feeding and AI health monitoring.
The Sunday Read Dairy Professionals Don’t Skip.
Every week, thousands of producers, breeders, and industry insiders open Bullvine Weekly for genetics insights, market shifts, and profit strategies they won’t find anywhere else. One email. Five minutes. Smarter decisions all week.
1,582 farms tested for 7 months found 1 case—but taught us everything about regulatory overreach
EXECUTIVE SUMMARY: Minnesota’s seven-month H5N1 testing marathon revealed something more significant than disease patterns—it exposed the growing disconnect between regulatory design and farm-level reality. Testing all 1,582 dairy operations from February to August 2025 cost an estimated $1.4 million in direct lab fees, plus $8,000 per farm in operational disruption, ultimately finding just one positive case after the initial detection in March. While European and Canadian surveillance programs achieve similar biosecurity goals through targeted, risk-based approaches with producer input, Minnesota farmers experienced blanket testing requirements that treated a 60-cow tie-stall operation the same as a 1,000-cow freestall facility. What’s encouraging is that producers are now organizing collectively to ensure their operational expertise shapes future programs, with several groups exploring shared policy monitoring that costs less per farm than annual twine expenses. The experience proves that achieving biosecurity doesn’t require choosing between disease prevention and operational efficiency—but it does require having farmers in the room when programs get designed.
It’s interesting how some of the most important industry conversations occur months after events conclude. Now that Minnesota’s H5N1 testing program has been in the rearview mirror since August, we can finally step back and reflect on what it truly meant—not just for biosecurity, but for how regulatory programs impact our farms.
The basic facts are straightforward enough. Minnesota tested dairy operations for H5N1 from February through August 2025, with the Minnesota Department of Agriculture and USDA eventually declaring the state’s herds “unaffected” on August 30. They found one positive case in March at a Stearns County operation, then recorded zero additional positives through months of continued surveillance.
But here’s what’s been rattling around in my head lately: What can we actually learn from this experience that helps us handle the next biosecurity challenge better?
The stark reality of Minnesota’s H5N1 surveillance: $2.2 million spent, 1,582 farms tested monthly, but only one positive case found in March—then zero for five straight months. Andrew’s analysis reveals the hidden burden of regulatory overreach.
MINNESOTA H5N1 TESTING: BY THE NUMBERS
Duration: February 1 – August 30, 2025 (7 months)
Farms tested: 1,582 (per 2022 USDA Census)
Testing frequency: Each milk shipment
Positive cases after March: 0
Estimated program cost: $250,000-400,000
Cost per positive case found: Full program cost
The Testing Reality Check
The 2.5-hour reality check: Every H5N1 testing event costs $187 in labor and lost productivity—multiply by testing frequency and it’s no wonder Minnesota farmers paid $8,000 each while bureaucrats found nothing new after March.
Let me paint you a picture of what this looked like on the ground. According to the Minnesota Department of Agriculture’s surveillance reports, the state implemented testing that touched all 1,582 dairy operations listed in the most recent USDA census. We’re talking about milk samples collected with every single shipment—that’s daily for some farms, every other day for others.
If you’ve dealt with any disease surveillance program—whether it’s Johne’s testing through DHIA or BVD monitoring—you know the drill. The milk hauler is arriving with additional paperwork. Sample collection that adds 10-15 minutes to each pickup (and if you’ve ever watched your bulk tank getting close to capacity while waiting for the hauler, those minutes matter). Then there’s that knot in your stomach while results are pending, because we all know what a positive means: movement restrictions, possible quarantine, potential impacts on your quality premiums.
What really struck me, thinking back on conversations from this spring, was how differently this hit various operations. Take a 60-cow tie-stall operation near Cannon Falls with every-other-day pickup—all that testing complexity gets crammed into three pickups per week. Compare that to a 1,000-cow freestall operation outside St. Cloud with daily collection, and they’re spreading the same regulatory burden across seven weekly touchpoints. Same program requirements, completely different operational impact.
I actually kept track during one week in May—just out of curiosity. Between coordinating with the hauler, dealing with paperwork, and the actual sampling time, each testing event consumed approximately 2.5 hours of someone’s time. Doesn’t sound like much until you multiply it out.
The Numbers Tell a Story
Examining the testing timeline from APHIS’s weekly situation reports, Minnesota reported a single positive case in March and then no further cases. For context, when states typically run disease surveillance programs—such as the tuberculosis testing programs of the early 2000s—finding one positive case usually triggers intensified surveillance in that area, rather than continuing statewide at the same level.
But H5N1 is different. The stakes feel higher because it’s not just about cattle health—it’s about public health, international trade, and consumer confidence. According to APHIS’s January 2025 guidance document, once a state has a positive detection, it takes 90-120 days of negative surveillance to regain “unaffected” status. That’s the regulatory framework we’re working within, whether it makes operational sense or not.
What would this cost in real terms? PCR testing through the National Animal Health Laboratory Network runs $35-65 per sample, according to their current fee schedule. Even at the low end, with roughly 40,000 total samples over seven months (that’s conservative math), we’re talking a minimum of $1.4 million. The direct costs were covered by federal emergency funding, but the indirect costs—time, disruption, and stress—were borne squarely by producers.
Different Approaches, Different Results?
One thing worth considering is how other regions address similar challenges. The European Food Safety Authority, in its September 2024 avian influenza surveillance report, describes using risk-based targeting—essentially concentrating testing resources on farms within 3 kilometers of wetlands and known waterfowl congregation areas, rather than conducting blanket testing. Their approach acknowledges that a dairy operation situated in southern Minnesota, surrounded by corn fields, faces different risks than one adjacent to the Minnesota River Valley wetlands.
Canada’s approach, detailed in the Canadian Food Inspection Agency’s 2025 compartmentalization protocols, involves creating biosecurity zones that can be managed differently based on risk levels. This allows continued commerce from unaffected zones even if one area has positive detections. Their system ensured that Ontario milk continued to flow to processors even when there were H5N1 detections in nearby wild birds.
Now, I’m not saying these approaches would work perfectly here. Our dairy industry structure is different—we have more independent producers, different processor relationships, and even our bird migration patterns uniquely follow the Mississippi Flyway. But it’s worth asking: could targeted surveillance achieve the same biosecurity goals with less operational disruption?
The Communication Breakdown
Throughout Minnesota’s testing program, official communications consistently praised “industry cooperation.” And absolutely, dairy farmers cooperated fully. When have we not stepped up for herd health and food safety?
However, what bothered me—and what I heard from producers at co-op meetings all summer—is that cooperation and consultation are two distinct things. Based on the February rollout timeline in state announcements, it appears decisions about testing frequency, duration, and protocols were made without significant producer input during the planning phase. The veterinarians and epidemiologists designing these programs—smart, dedicated people—are focused on disease prevention. But operational feasibility? That perspective seems to get lost.
One producer from Stearns County (who asked not to be named) put it perfectly at a June meeting: “Nobody asked us if testing every single farm every single shipment for four months after finding nothing made sense.” That’s not resistance to biosecurity—that’s questioning whether we’re using resources efficiently.
Practical Takeaways
The regulatory burden trap: Small farms pay $150 per cow for the same testing that costs mega-dairies just $22.50 per cow—another example of how one-size-fits-all regulations accelerate consolidation at family farms’ expense.
So what can we actually do with these observations? Here are some concrete thoughts based on what we learned:
Document everything. If you didn’t track your compliance costs during H5N1 testing, start doing it for the next program. Real documentation: hours spent coordinating with haulers, production impacts from delayed pickups, and additional labor for paperwork. Keep receipts, time logs, everything. That data matters when discussing future programs. The producer I mentioned earlier? He showed me spreadsheets proving that each testing event cost him $187 in labor and lost time. Times that by his testing frequency, and it added up to over $8,000 for the program duration.
Build relationships before you need them. Your state veterinarian (in Minnesota, that’s Dr. Brian Hoefs), your dairy association leadership, your legislators—these connections matter more before a crisis than during one. Join your state dairy association if you haven’t already done so. Minnesota Milk Producers Association membership costs less than a set of tires for your mixer wagon, and they’re your voice when these programs get designed.
Consider collective action. Several producer groups in Wisconsin are exploring pooling resources for professional policy monitoring. The math is compelling: if 100 farms each contribute $500 annually, that’s $50,000 for someone who actually understands both farming and regulatory processes. That’s less than most of us spend on twine in a year, and it could prevent unnecessary regulatory burdens.
Minnesota Board of Animal Health: www.bah.state.mn.us
USDA APHIS Area Office: 651-290-3304
Policy Tracking Services: Contact your co-op for recommendations
The Bottom Line
Minnesota successfully navigated the H5N1 challenge—let’s be clear about that. No spread after the initial detection is a real achievement. The surveillance system did its job.
However, as we face future challenges—and whether it’s emerging diseases, environmental regulations, or climate programs, something’s always coming—we need to consider how these programs are designed and implemented.
The fundamental question isn’t whether we need biosecurity programs. Of course, we do. Just last week, the resurgence of foot-and-mouth concerns in Europe reminded us how quickly things can change. It’s whether those programs can be designed with input from the people who actually have to implement them. Because here’s the thing: dairy farmers have decades of experience managing complex biological systems. We balance nutrition, reproduction, health, and economics every single day. That operational knowledge has value.
Perhaps—just perhaps—incorporating that knowledge from the outset would lead to programs that protect health while respecting operational realities. Programs that achieve biosecurity goals without unnecessary burden. Programs that work with farms rather than despite them.
That seems worth pursuing, doesn’t it? Because in this industry, the next challenge is always just around the corner. Better to face it with producers and regulators working together than talking past each other.
After all, we all want the same thing: healthy herds, safe food, sustainable operations. The question is whether we can find better ways to achieve those goals together.
And honestly? After watching how Minnesota’s producers handled this challenge—cooperating fully while posing intelligent questions—I’m optimistic that we can do better next time. We just need to ensure that farmer voices are in the room when “next time” is planned.
KEY TAKEAWAYS:
Document your true compliance costs: Track 2.5+ hours of labor per testing event ($187 value) plus production impacts—this data becomes leverage when discussing future programs with state veterinarians and legislators
Risk-based surveillance works and saves money: European models focusing on farms within 3km of wetlands achieve the same biosecurity outcomes at 40% less cost than blanket testing—push for targeted approaches in your state
Professional policy monitoring pays for itself: 100 farms contributing $500 each creates a $50,000 fund for regulatory expertise—less than a loader tire set but prevents programs like Minnesota’s from extending unnecessarily
Build relationships before crisis hits: Connect with your state veterinarian, join your dairy association ($300-500 annually), and attend those “boring” policy meetings—farmer voices matter most during program design, not after implementation
The next challenge demands producer input: Whether it’s emerging diseases, climate regulations, or environmental compliance, programs designed with operational expertise from day one protect both biosecurity and farm viability—Minnesota proved cooperation without consultation creates unnecessary burden
Complete references and supporting documentation are available upon request by contacting the editorial team at editor@thebullvine.com.
A.I. Industry – The Bullvine – This guide offers tactical, implementable advice for producers seeking to reduce their reliance on single genetic suppliers and increase autonomy. It reveals methods for diversifying your breeding program and leveraging technology to gain flexibility and reduce economic exposure in a consolidating market.
From Saving a Baby’s Life to Transforming Your Dairy Herd: The Gene Editing Revolution Is Here – This piece examines how advanced genetic innovation, like gene editing, could solve persistent farm challenges such as mastitis and heat stress. It demonstrates how modern technology can provide a more efficient path to biosecurity and animal welfare, offering a long-term, proactive alternative to reactive regulatory programs.
The Sunday Read Dairy Professionals Don’t Skip.
Every week, thousands of producers, breeders, and industry insiders open Bullvine Weekly for genetics insights, market shifts, and profit strategies they won’t find anywhere else. One email. Five minutes. Smarter decisions all week.
To provide the best experiences, we use technologies like cookies to store and/or access device information. Consenting to these technologies will allow us to process data such as browsing behavior or unique IDs on this site. Not consenting or withdrawing consent, may adversely affect certain features and functions.
Functional
Always active
The technical storage or access is strictly necessary for the legitimate purpose of enabling the use of a specific service explicitly requested by the subscriber or user, or for the sole purpose of carrying out the transmission of a communication over an electronic communications network.
Preferences
The technical storage or access is necessary for the legitimate purpose of storing preferences that are not requested by the subscriber or user.
Statistics
The technical storage or access that is used exclusively for statistical purposes.The technical storage or access that is used exclusively for anonymous statistical purposes. Without a subpoena, voluntary compliance on the part of your Internet Service Provider, or additional records from a third party, information stored or retrieved for this purpose alone cannot usually be used to identify you.
Marketing
The technical storage or access is required to create user profiles to send advertising, or to track the user on a website or across several websites for similar marketing purposes.
To provide the best experiences, we and our partners use technologies like cookies to store and/or access device information. Consenting to these technologies will allow us and our partners to process personal data such as browsing behavior or unique IDs on this site and show (non-) personalized ads. Not consenting or withdrawing consent, may adversely affect certain features and functions.
Click below to consent to the above or make granular choices. Your choices will be applied to this site only. You can change your settings at any time, including withdrawing your consent, by using the toggles on the Cookie Policy, or by clicking on the manage consent button at the bottom of the screen.
Functional
Always active
The technical storage or access is strictly necessary for the legitimate purpose of enabling the use of a specific service explicitly requested by the subscriber or user, or for the sole purpose of carrying out the transmission of a communication over an electronic communications network.
Preferences
The technical storage or access is necessary for the legitimate purpose of storing preferences that are not requested by the subscriber or user.
Statistics
The technical storage or access that is used exclusively for statistical purposes.The technical storage or access that is used exclusively for anonymous statistical purposes. Without a subpoena, voluntary compliance on the part of your Internet Service Provider, or additional records from a third party, information stored or retrieved for this purpose alone cannot usually be used to identify you.
Marketing
The technical storage or access is required to create user profiles to send advertising, or to track the user on a website or across several websites for similar marketing purposes.


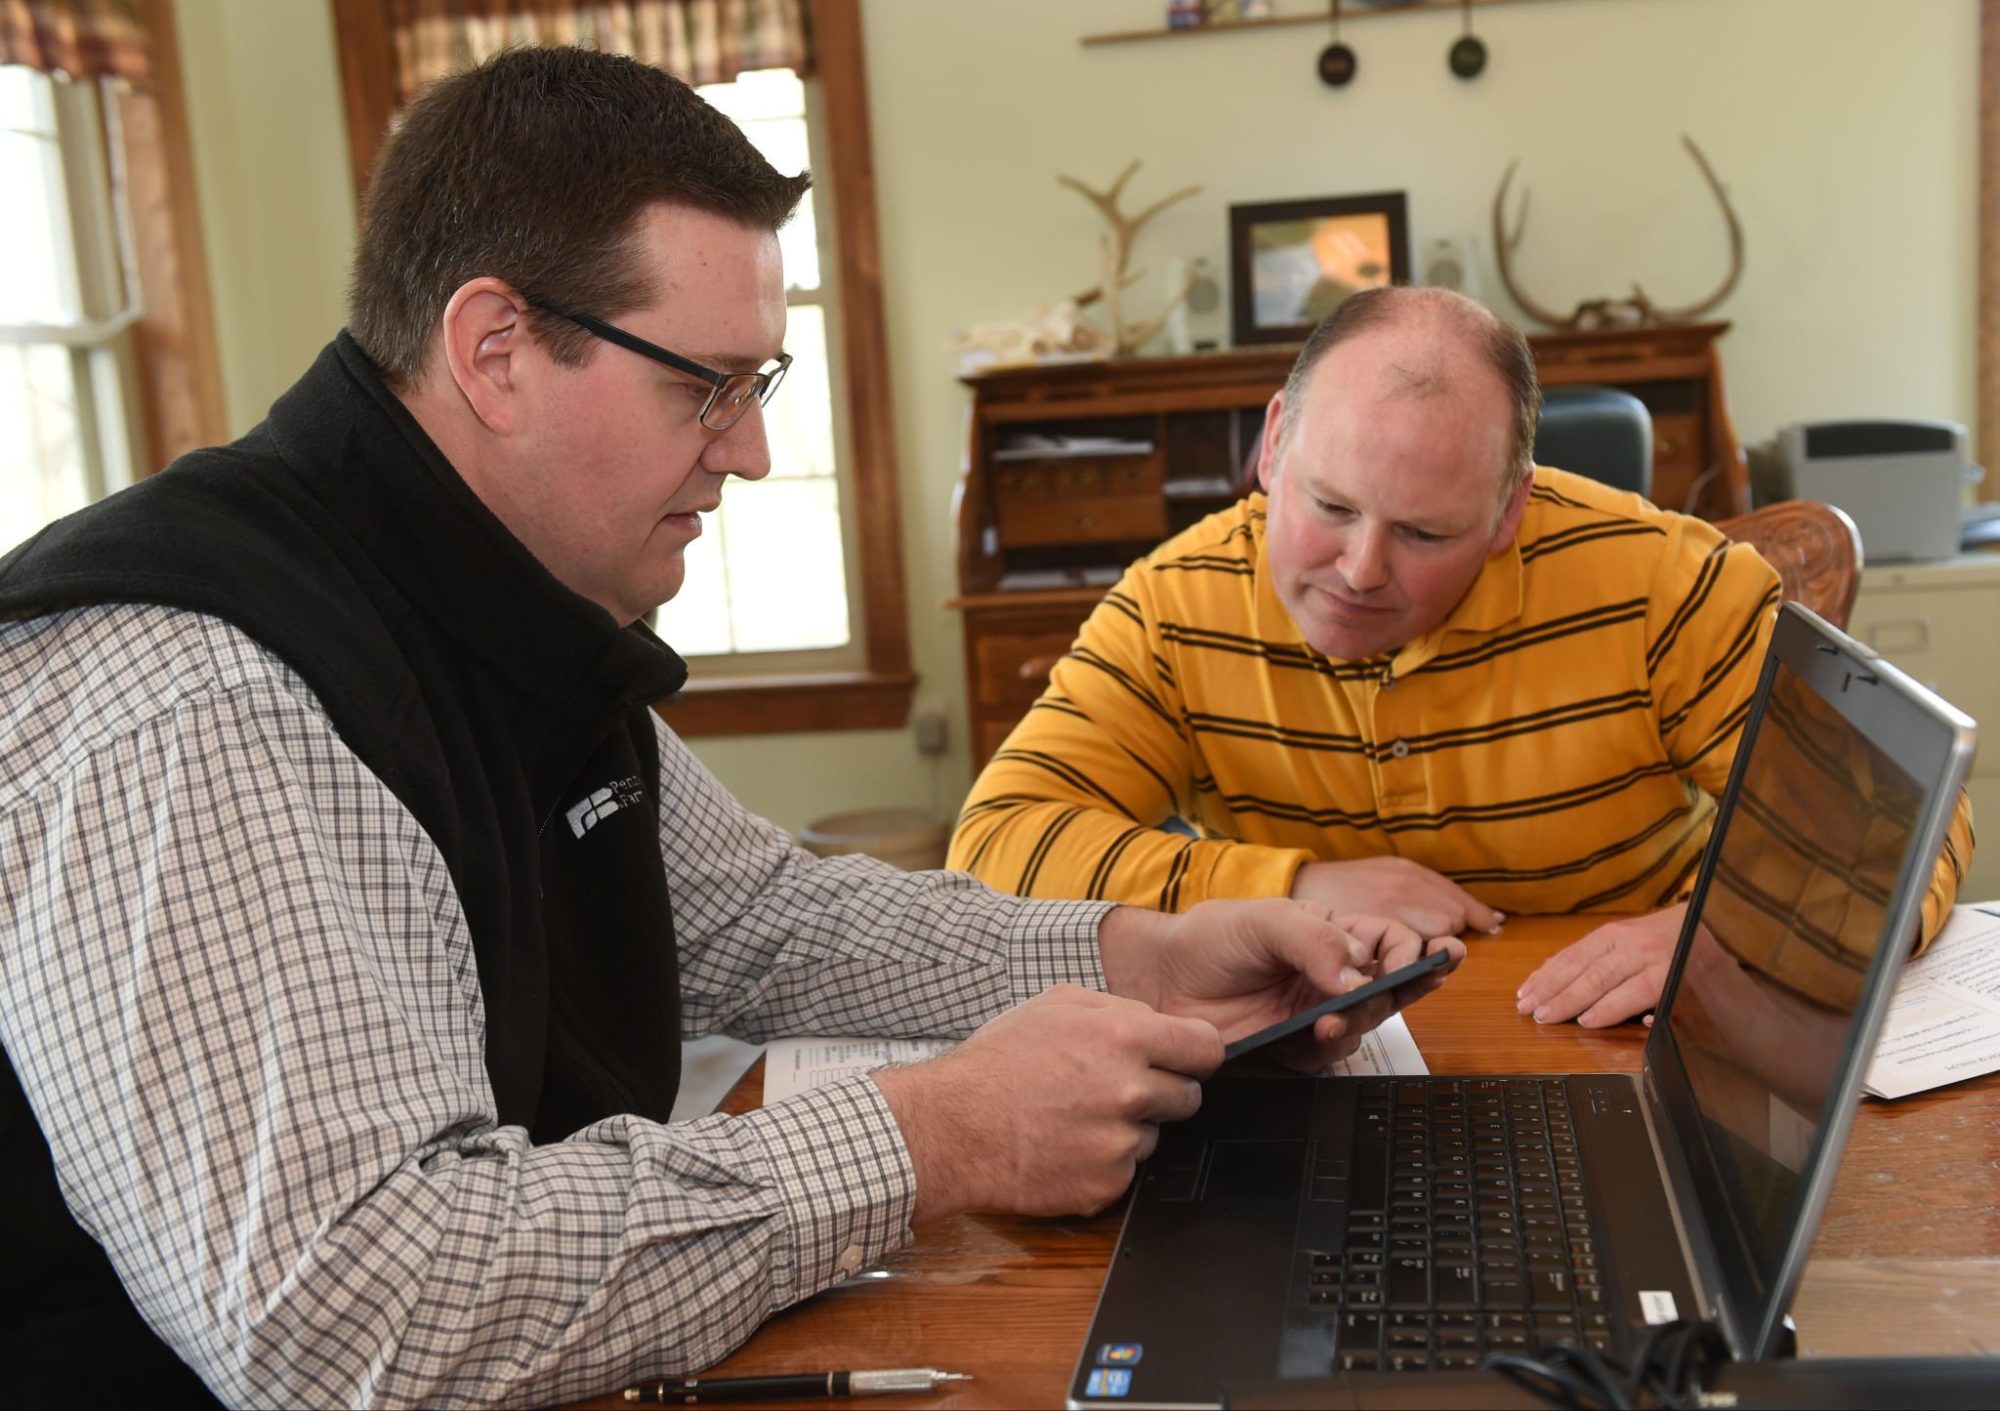
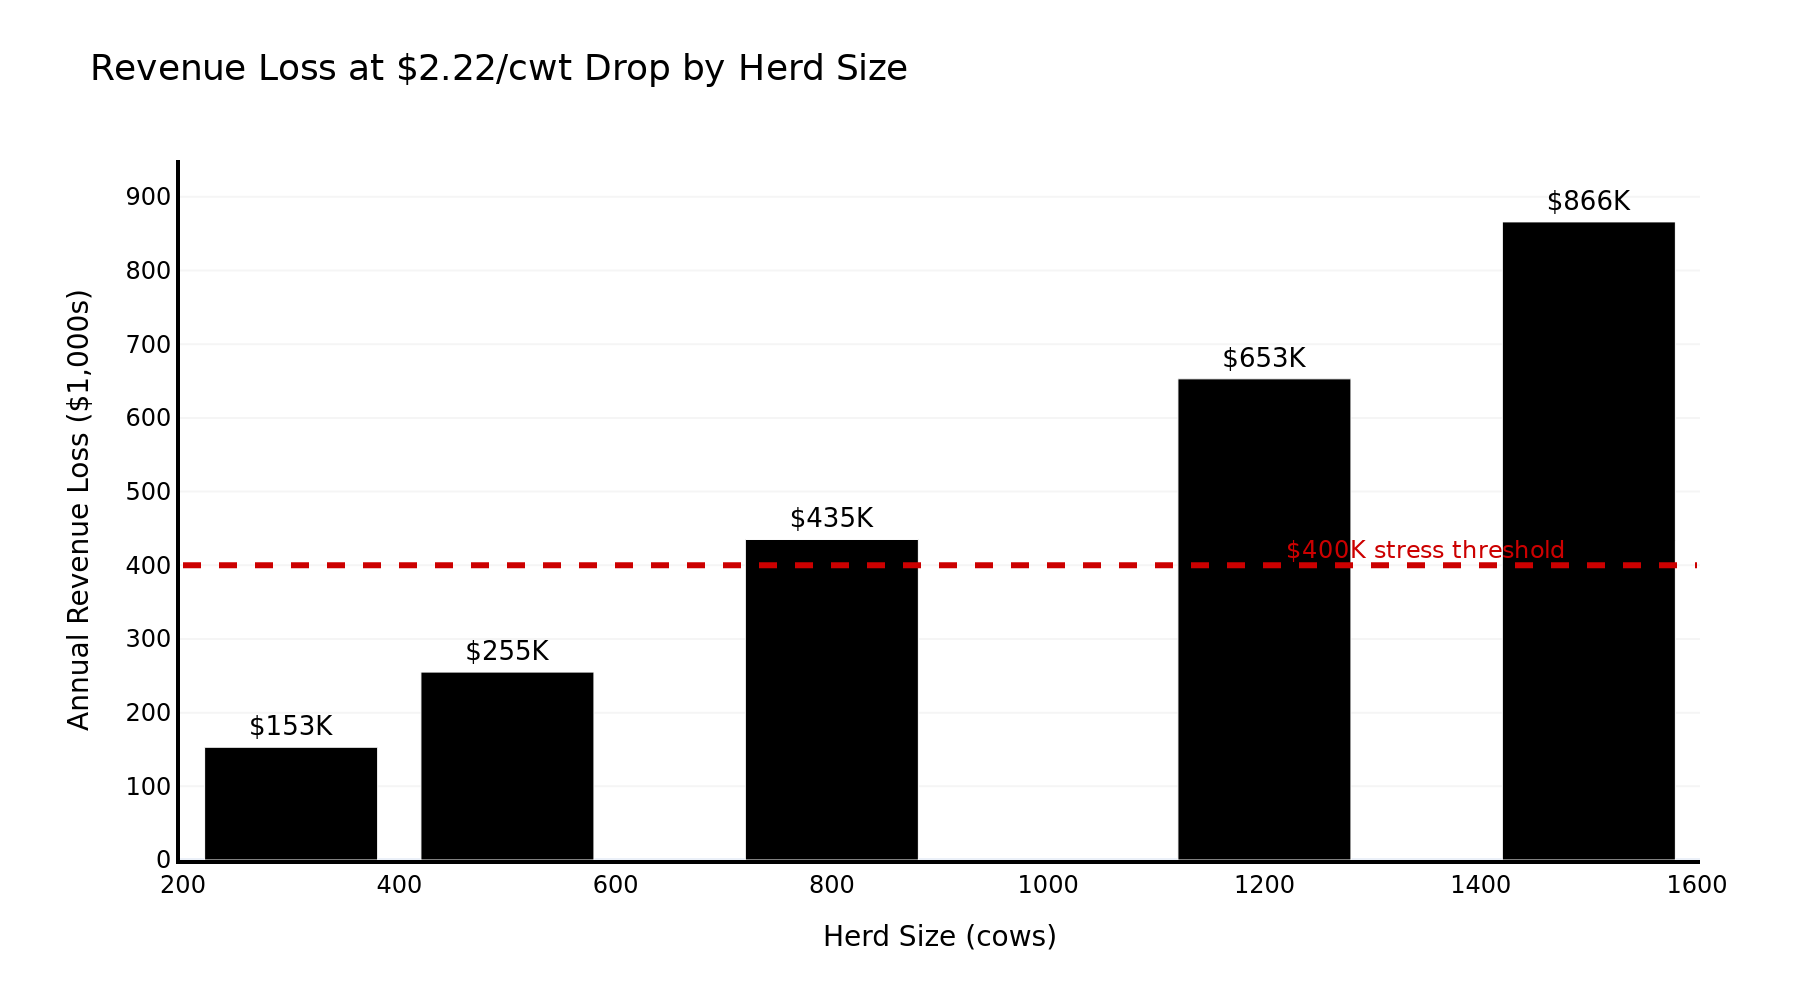


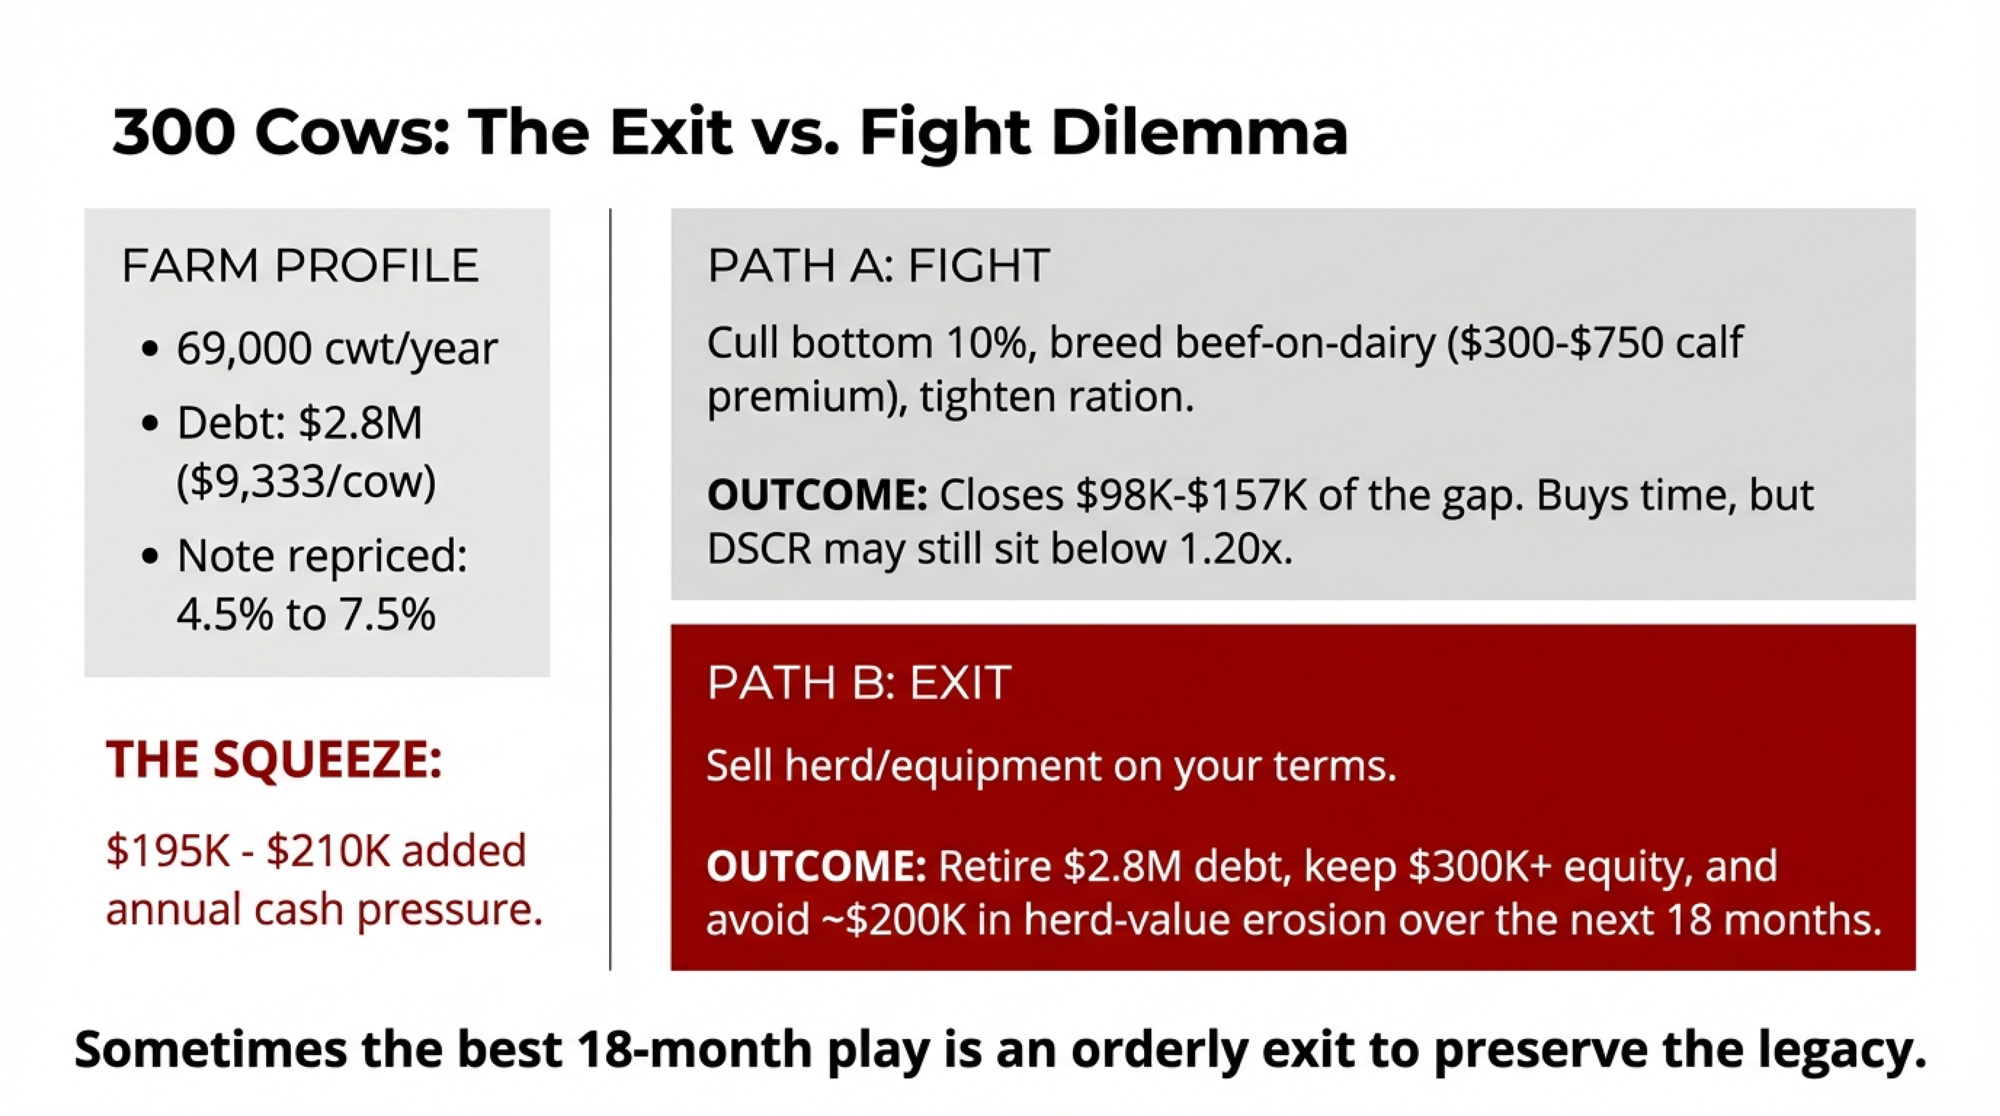


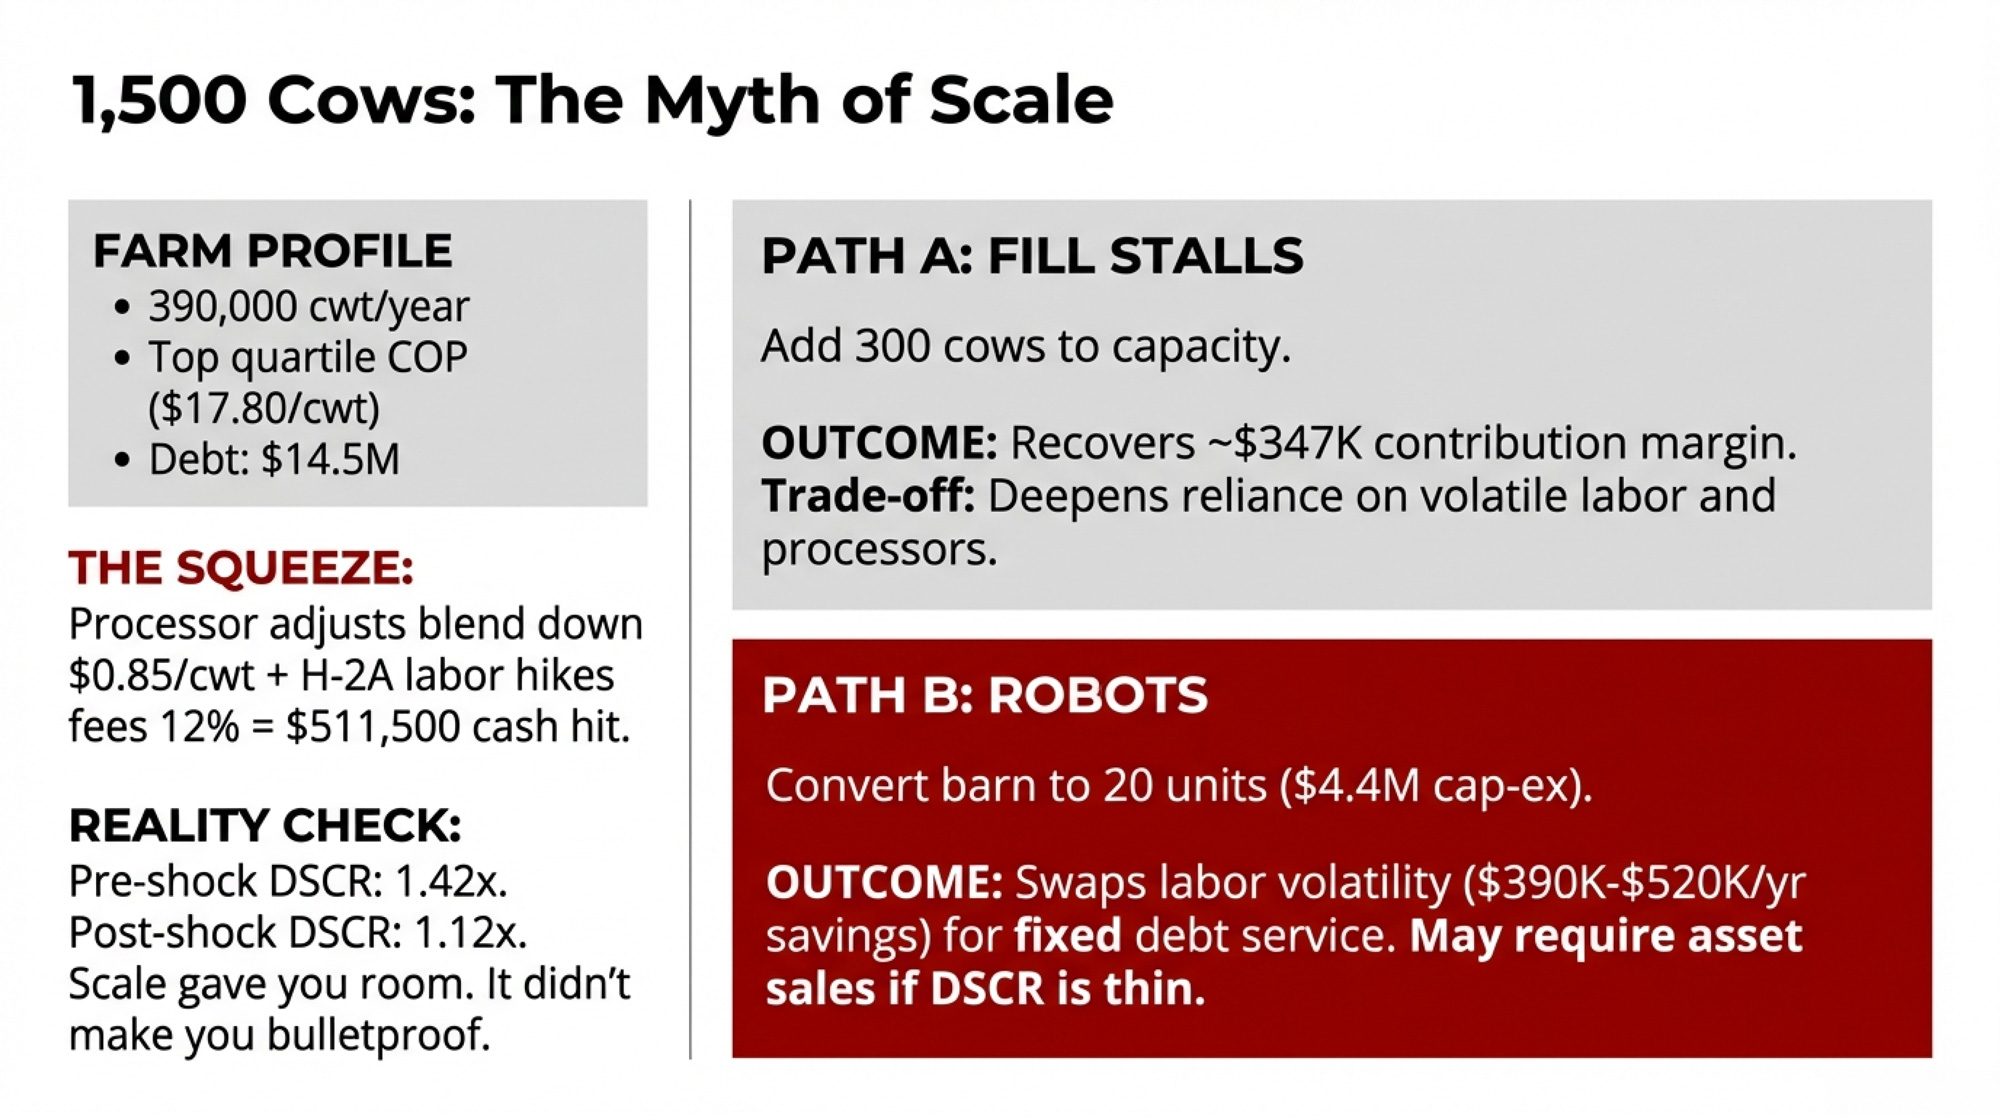
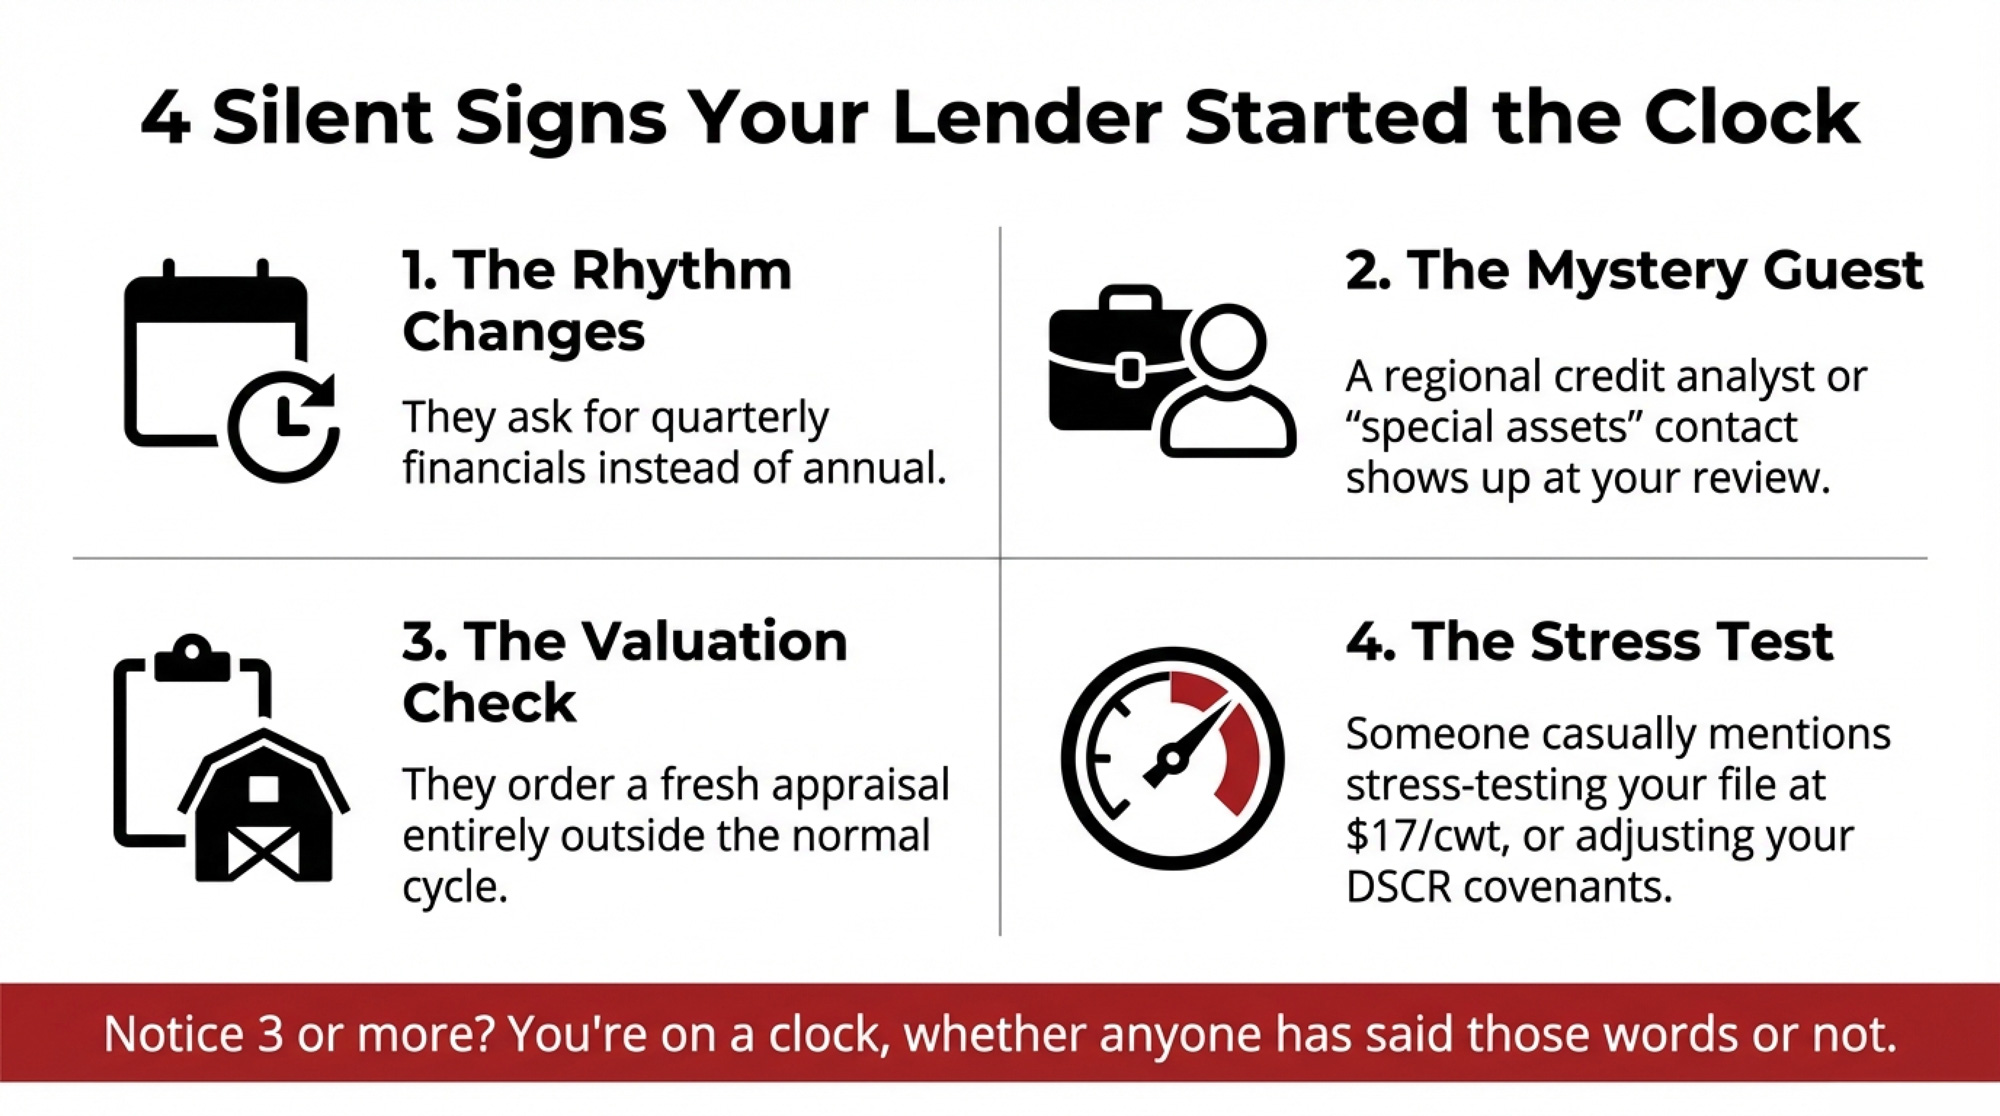

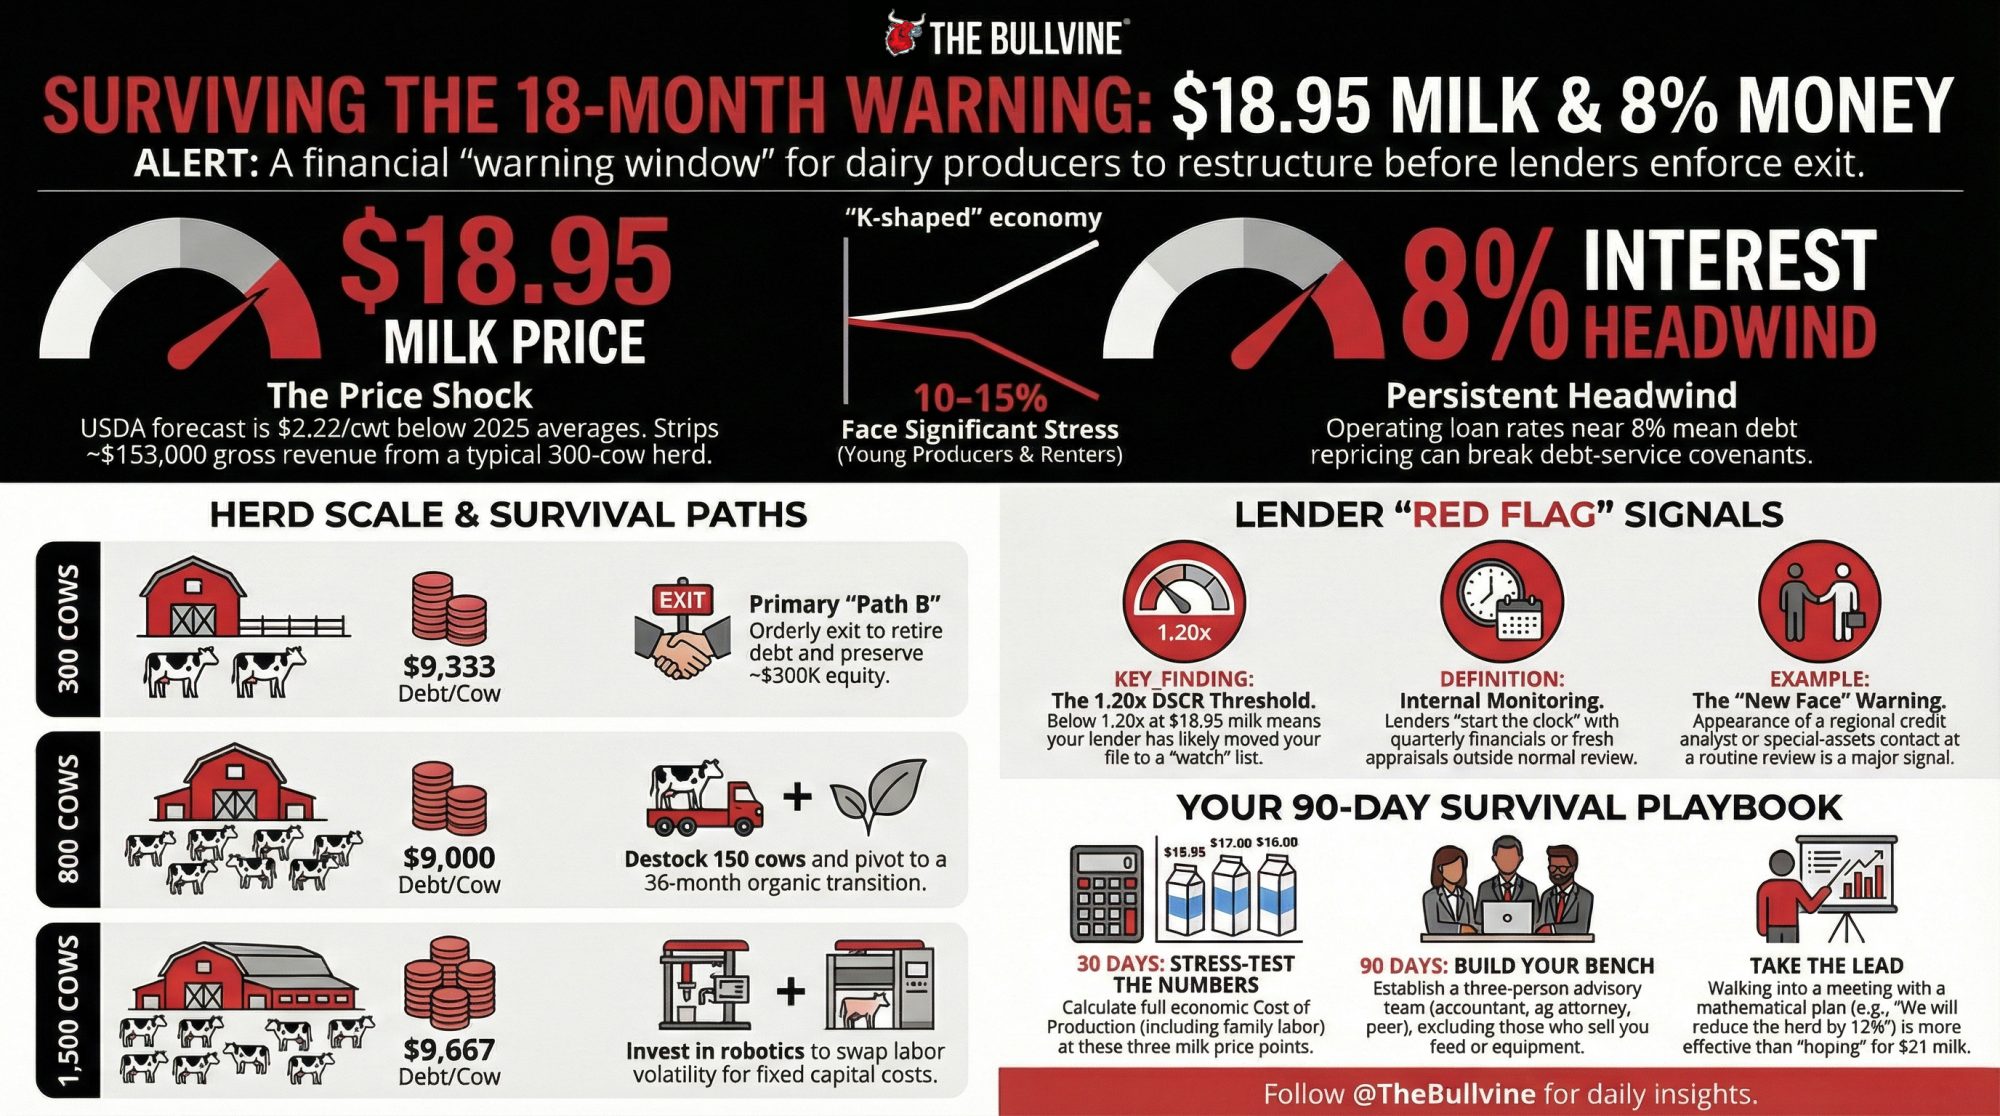
 The Sunday Read Dairy Professionals Don’t Skip.
 The Sunday Read Dairy Professionals Don’t Skip.