Archive for dairy profitability – Page 3

$850 Million Dairy Standoff: What U.S. and Canadian Farmers Need to Know Before July 2026

Canada won the trade panel. The U.S. has the sunset clause. July 2026 decides who blinks first in the $850M dairy standoff.

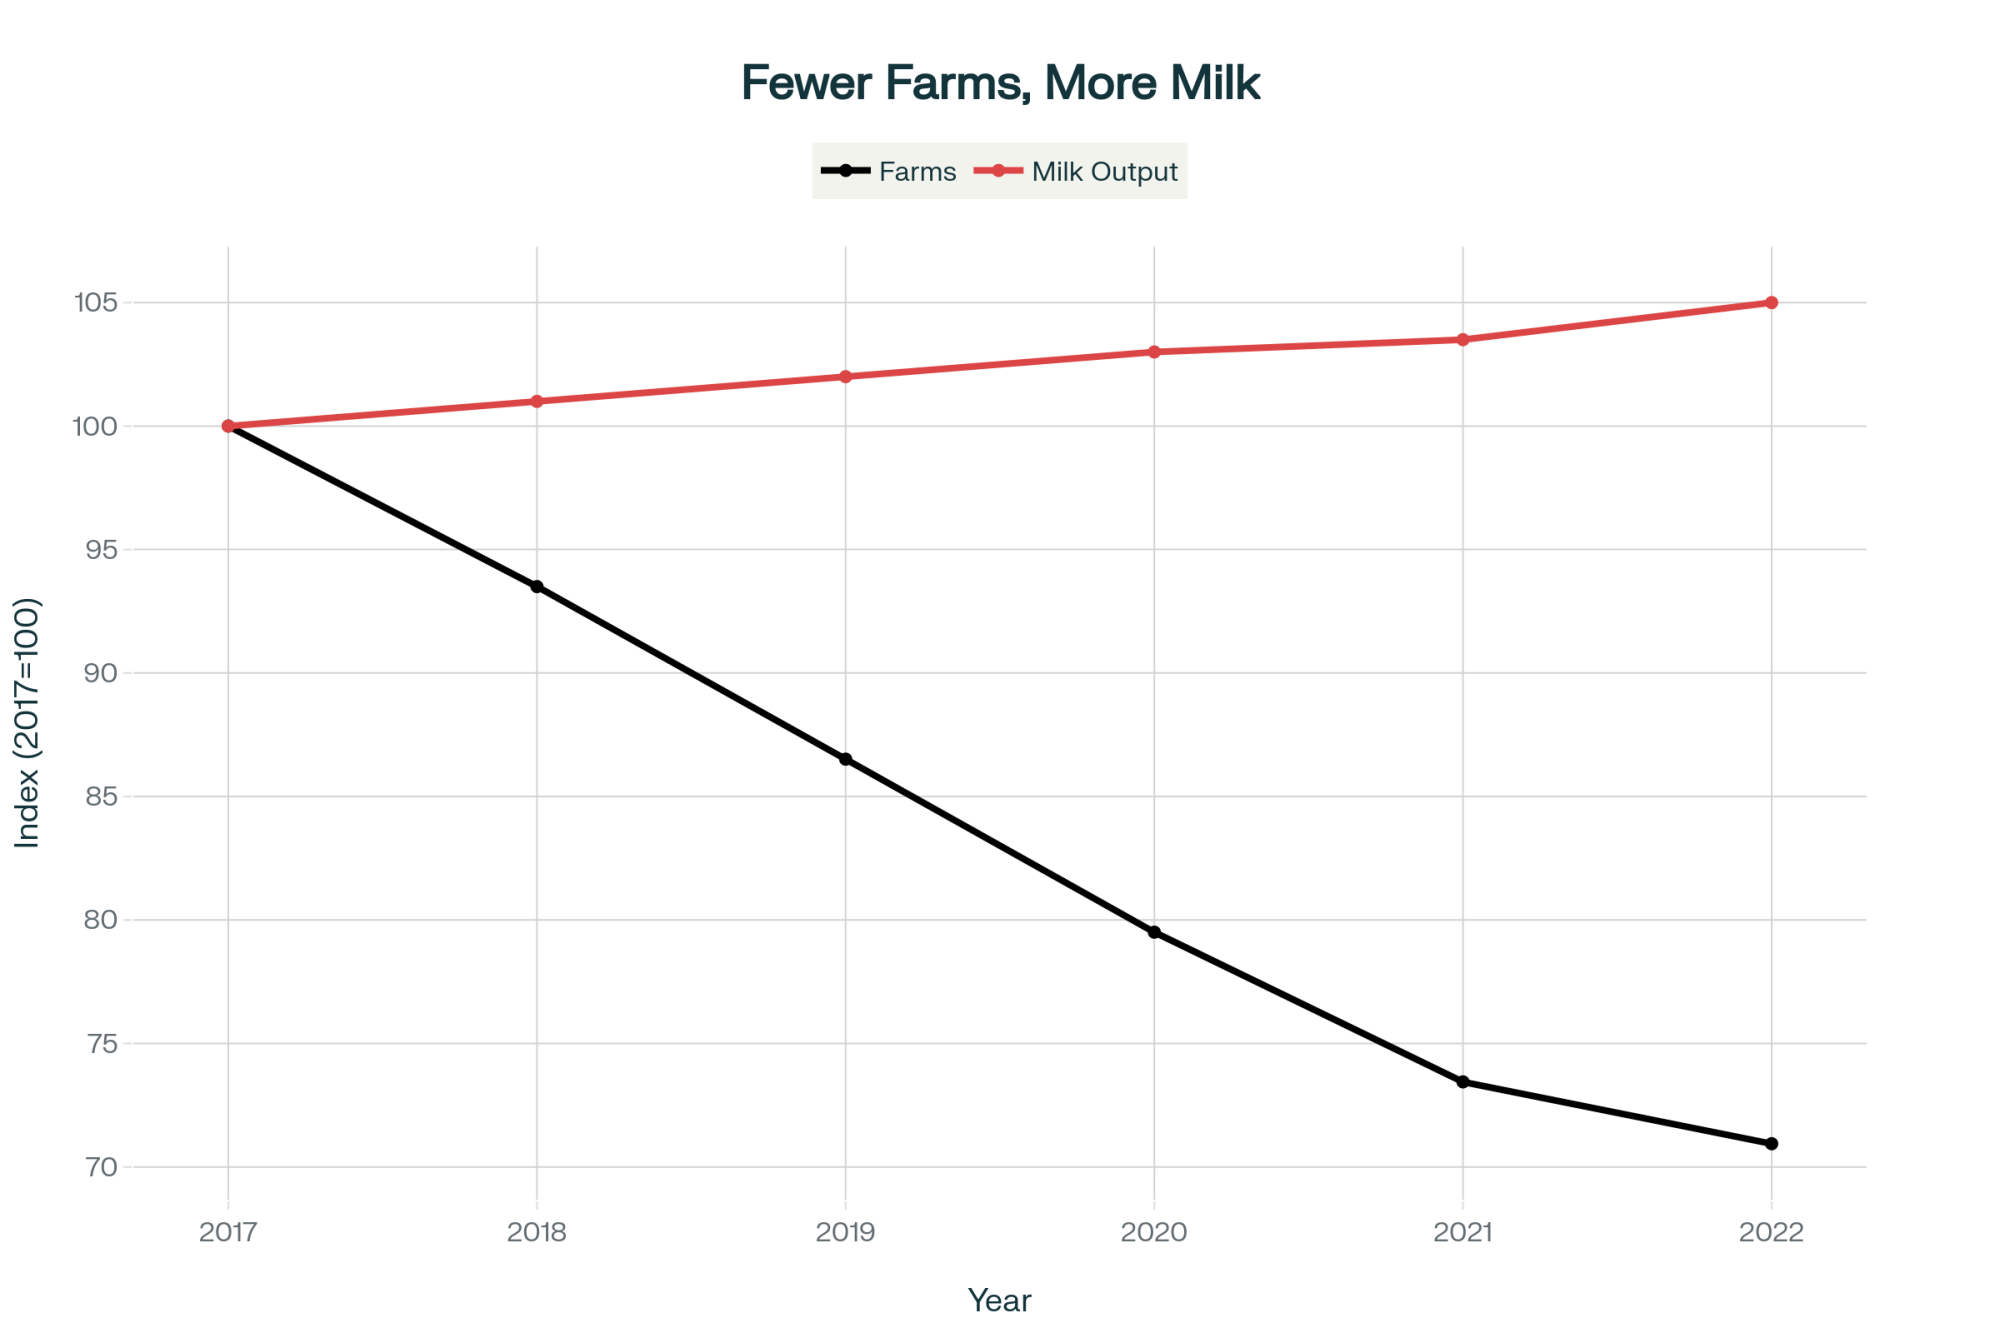
EXECUTIVE SUMMARY: Wisconsin dairy farmers are asking a simple question: Where’s the Canadian market access USMCA promised five years ago? The U.S. industry says Canada blocked $850 million in opportunities by allocating import quotas to processors who won’t use them, keeping fill rates at just 42%. Canada counters they’re following the rules—winning a November 2023 panel to prove it—and argues American dairy simply isn’t competitive in their market. With 1,420 U.S. farms closing last year while Canadian producers protect quota investments worth $30,000 per cow, both sides face existential stakes. July 2026 changes everything: the USMCA sunset clause means all three countries must actively agree to continue, or $780 billion in annual trade enters dangerous uncertainty. This analysis presents both perspectives fairly and provides specific strategies based on your farm size—because regardless of who “wins,” every North American dairy operation needs to prepare for what comes next.

USMCA dairy review

As we approach the July 2026 USMCA review, the U.S. dairy industry is building their case while Canada defends its position. Here’s what both sides are saying—and why it matters for dairy farmers across North America.

You know what’s interesting? When you talk to Wisconsin producers these days, there’s this deep frustration that just keeps coming up. Five years after the USMCA promised meaningful Canadian market access, they’re still waiting. And it’s not just Wisconsin—this sentiment’s spreading across the entire U.S. dairy belt, setting up what could be quite a showdown come July 2026.

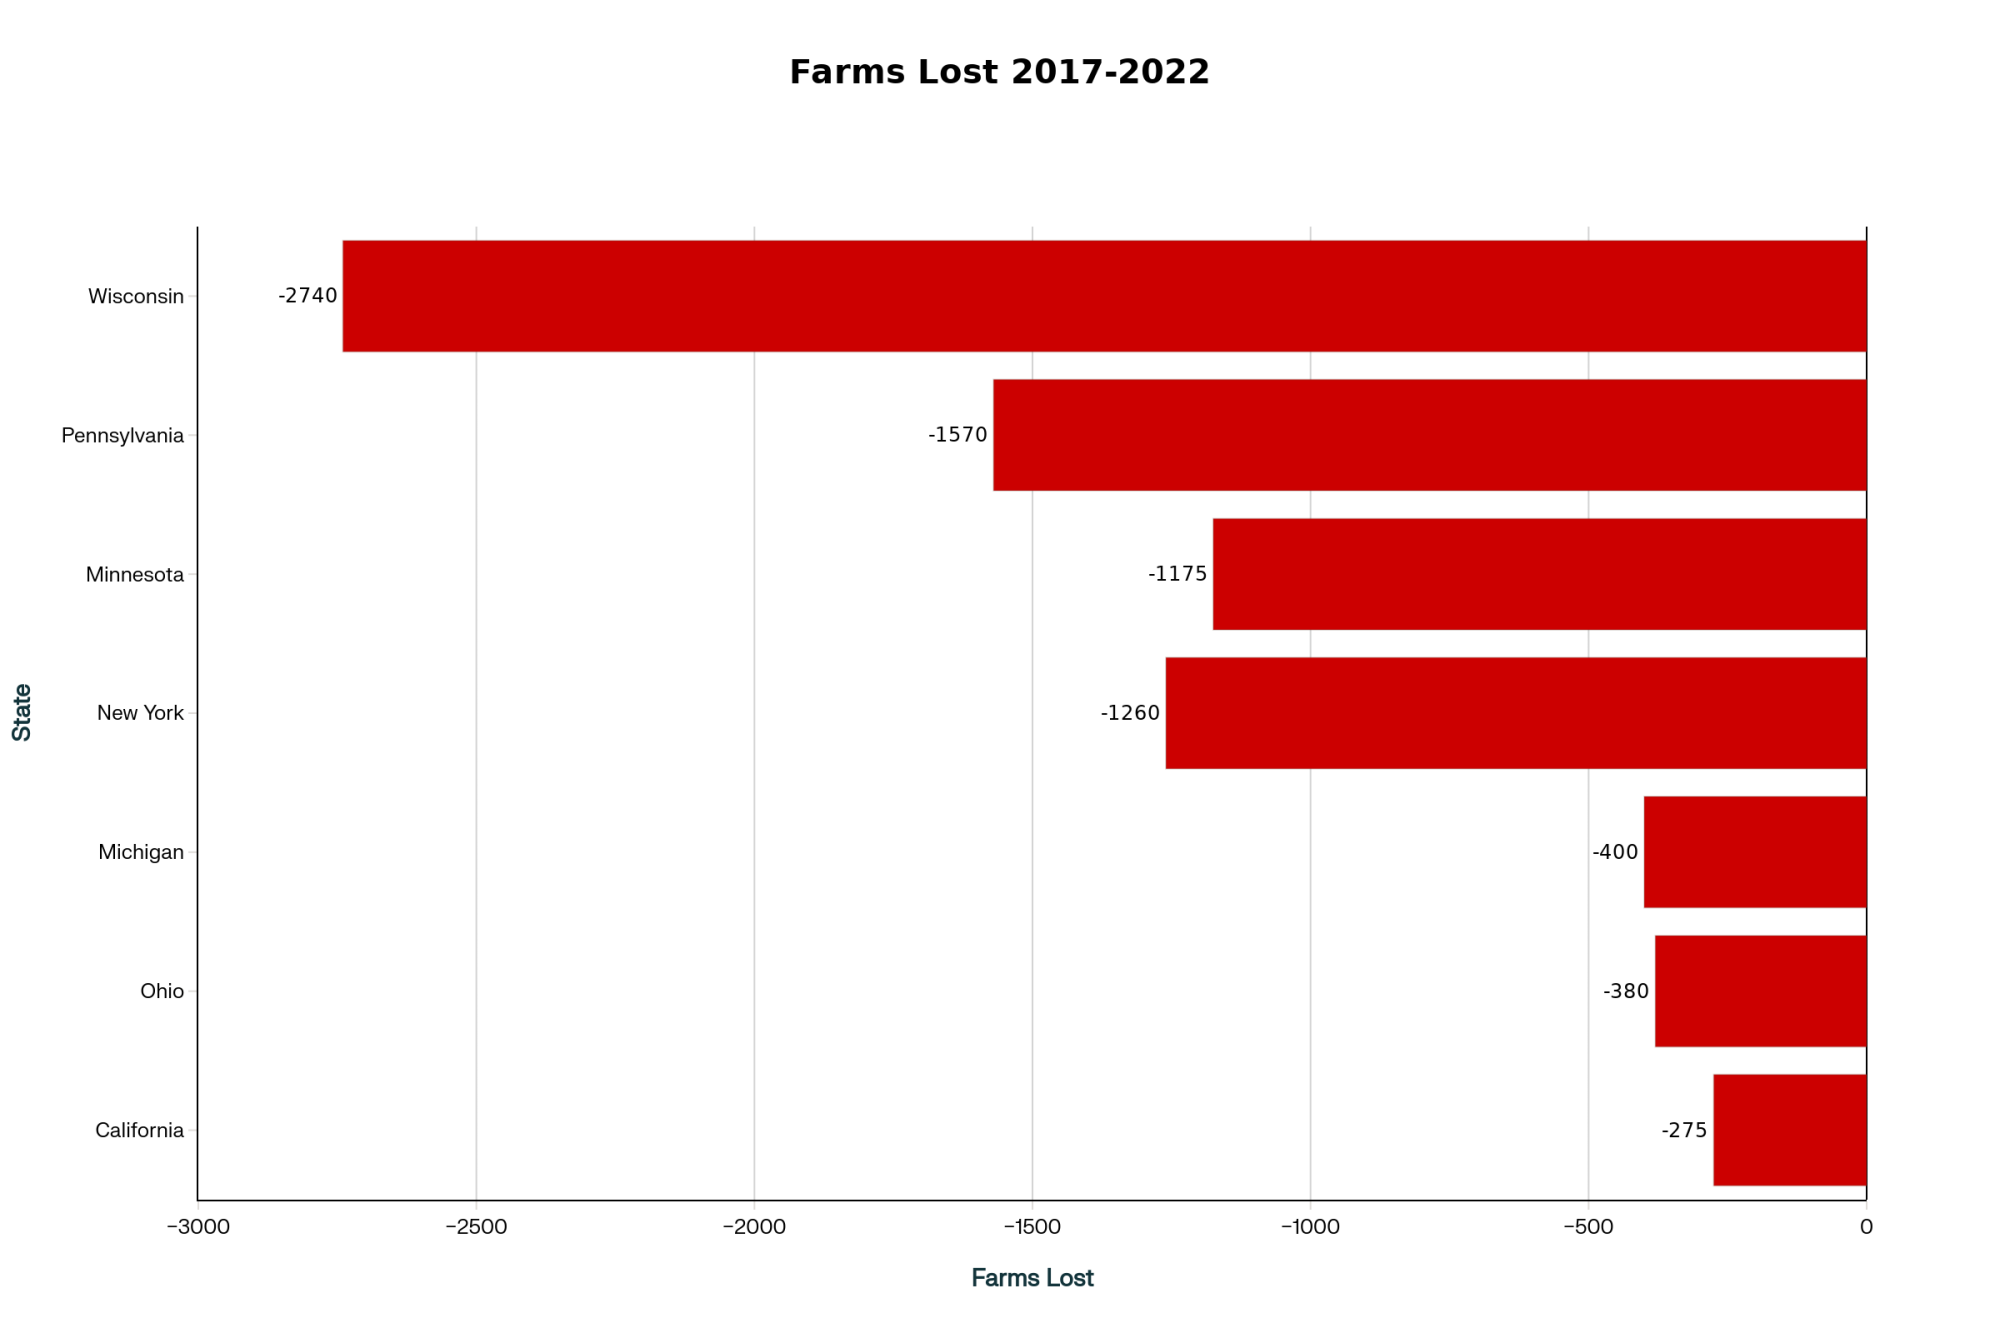
So here’s what’s happening. The International Dairy Foods Association filed this formal complaint in October to the Trade Representative, and when you combine that with five years of trade data from both USDA and Canada’s Global Affairs department… well, the U.S. industry’s making a pretty specific case. They’re talking about roughly $850 million in export opportunities that haven’t materialized, all while 1,420 American dairy operations shut down last year, according to the USDA’s count.

But here’s the thing—and this is important—Canada sees this completely differently. They won that November 2023 dispute panel, and they’re saying they’re following the agreement just fine. Understanding both perspectives has become essential for anyone trying to make sense of what’s coming.

What the U.S. Industry Says Was Promised vs. What They Got

Let me walk you through the American dairy sector’s position. It starts with the International Trade Commission’s 2019 assessment, which projected we’d see about $227 million in additional annual exports under USMCA’s dairy provisions.

The way U.S. producers see it, they were expecting:

  • Access to 3.6% of Canada’s dairy market through 14 different quota categories
  • Complete elimination of those Class 6 and 7 pricing schemes within six months
  • Export caps keeping Canadian skim milk powder and milk protein concentrates at 35,000 metric tons annually
  • Import quotas going to actual importers, not Canadian processors

Now, according to Canada’s own Global Affairs data and those USMCA panel findings, what actually happened looks quite different.

What were the average quota fill rates from 2022 to 2023? Just 42% across all categories. Nine of those 14 categories never even hit 50% utilization. And that January 2022 USMCA panel—they found that Canada had allocated between 85% and 100% of its quota shares to Canadian processors. American farmers argue these processors have about as much incentive to import competing U.S. products as… well, let’s just say not much.

Here’s what really gets American producers going—this Class 7 pricing business. Sure, Canada technically eliminated it like they promised. But then—and the University of Wisconsin’s dairy economists have documented this—similar pricing dynamics popped up under Class 4a. The U.S. sees that as a way to get around its USMCA commitments.

“You get on a phone conversation with some of these folks that have been farming for five and six generations. How do you say I can’t help you? That becomes very tough.” – Bill Mullins, Mullins Cheese

Quick Reference: Understanding Key Trade Terms

TRQ (Tariff Rate Quota): Think of it as a two-tier system. A certain amount gets in at low or zero tariffs. Above that? You’re looking at 200-315% tariffs for Canadian dairy.

Supply Management: Canada’s comprehensive dairy system since 1972—combines production quotas, price supports, and import controls.

Class Pricing: Canada’s milk classification system that sets different prices based on how the milk’s used—and this is where things get contentious.

Why Canada Defends Supply Management So Fiercely

You know, when you really look at Canada’s dairy system, you start to understand why they’re so protective of it. Agricultural economists at Université Laval have documented how it works through three integrated pieces:

First, there’s production quotas that limit what each farmer can produce. Then you’ve got price supports keeping farmgate values at about 1.5 to 2 times what we see in the U.S. And finally, those import barriers—we’re talking 200% to 315% on anything over quota.

This whole framework’s supporting about 9,000 Canadian dairy operations that generate close to CA$20 billion in annual economic activity, according to Dairy Farmers of Canada’s latest report.

Mark Stephenson over at UW-Madison’s dairy policy program explains it well: “The fundamental incompatibility is that supply management requires import control to function. Asking Canada to provide meaningful market access is essentially asking them to dismantle the system piece by piece. From their perspective, that’s existential.”

And here’s something to consider—Canadian producers have invested around CA$30,000 per cow in quota value according to their provincial milk boards. That’s not just an operating expense. That’s retirement savings, succession planning, and their kids’ inheritance. No wonder they defend it so fiercely.

How American Farmers See the Economic Stakes

For U.S. producers, the Grassland Dairy situation from 2017 is still a really raw issue. It kind of exemplifies their broader concerns about Canadian trade practices.

When Canada introduced that Class 7 pricing targeting ultra-filtered milk, Grassland Dairy had to terminate contracts affecting about a million pounds of daily production across 75 Wisconsin farms. Bill Mullins from Mullins Cheese—he took on eight of those displaced operations even though his plants were already near capacity. His words still resonate.

Here’s what keeps U.S. producers up at night:

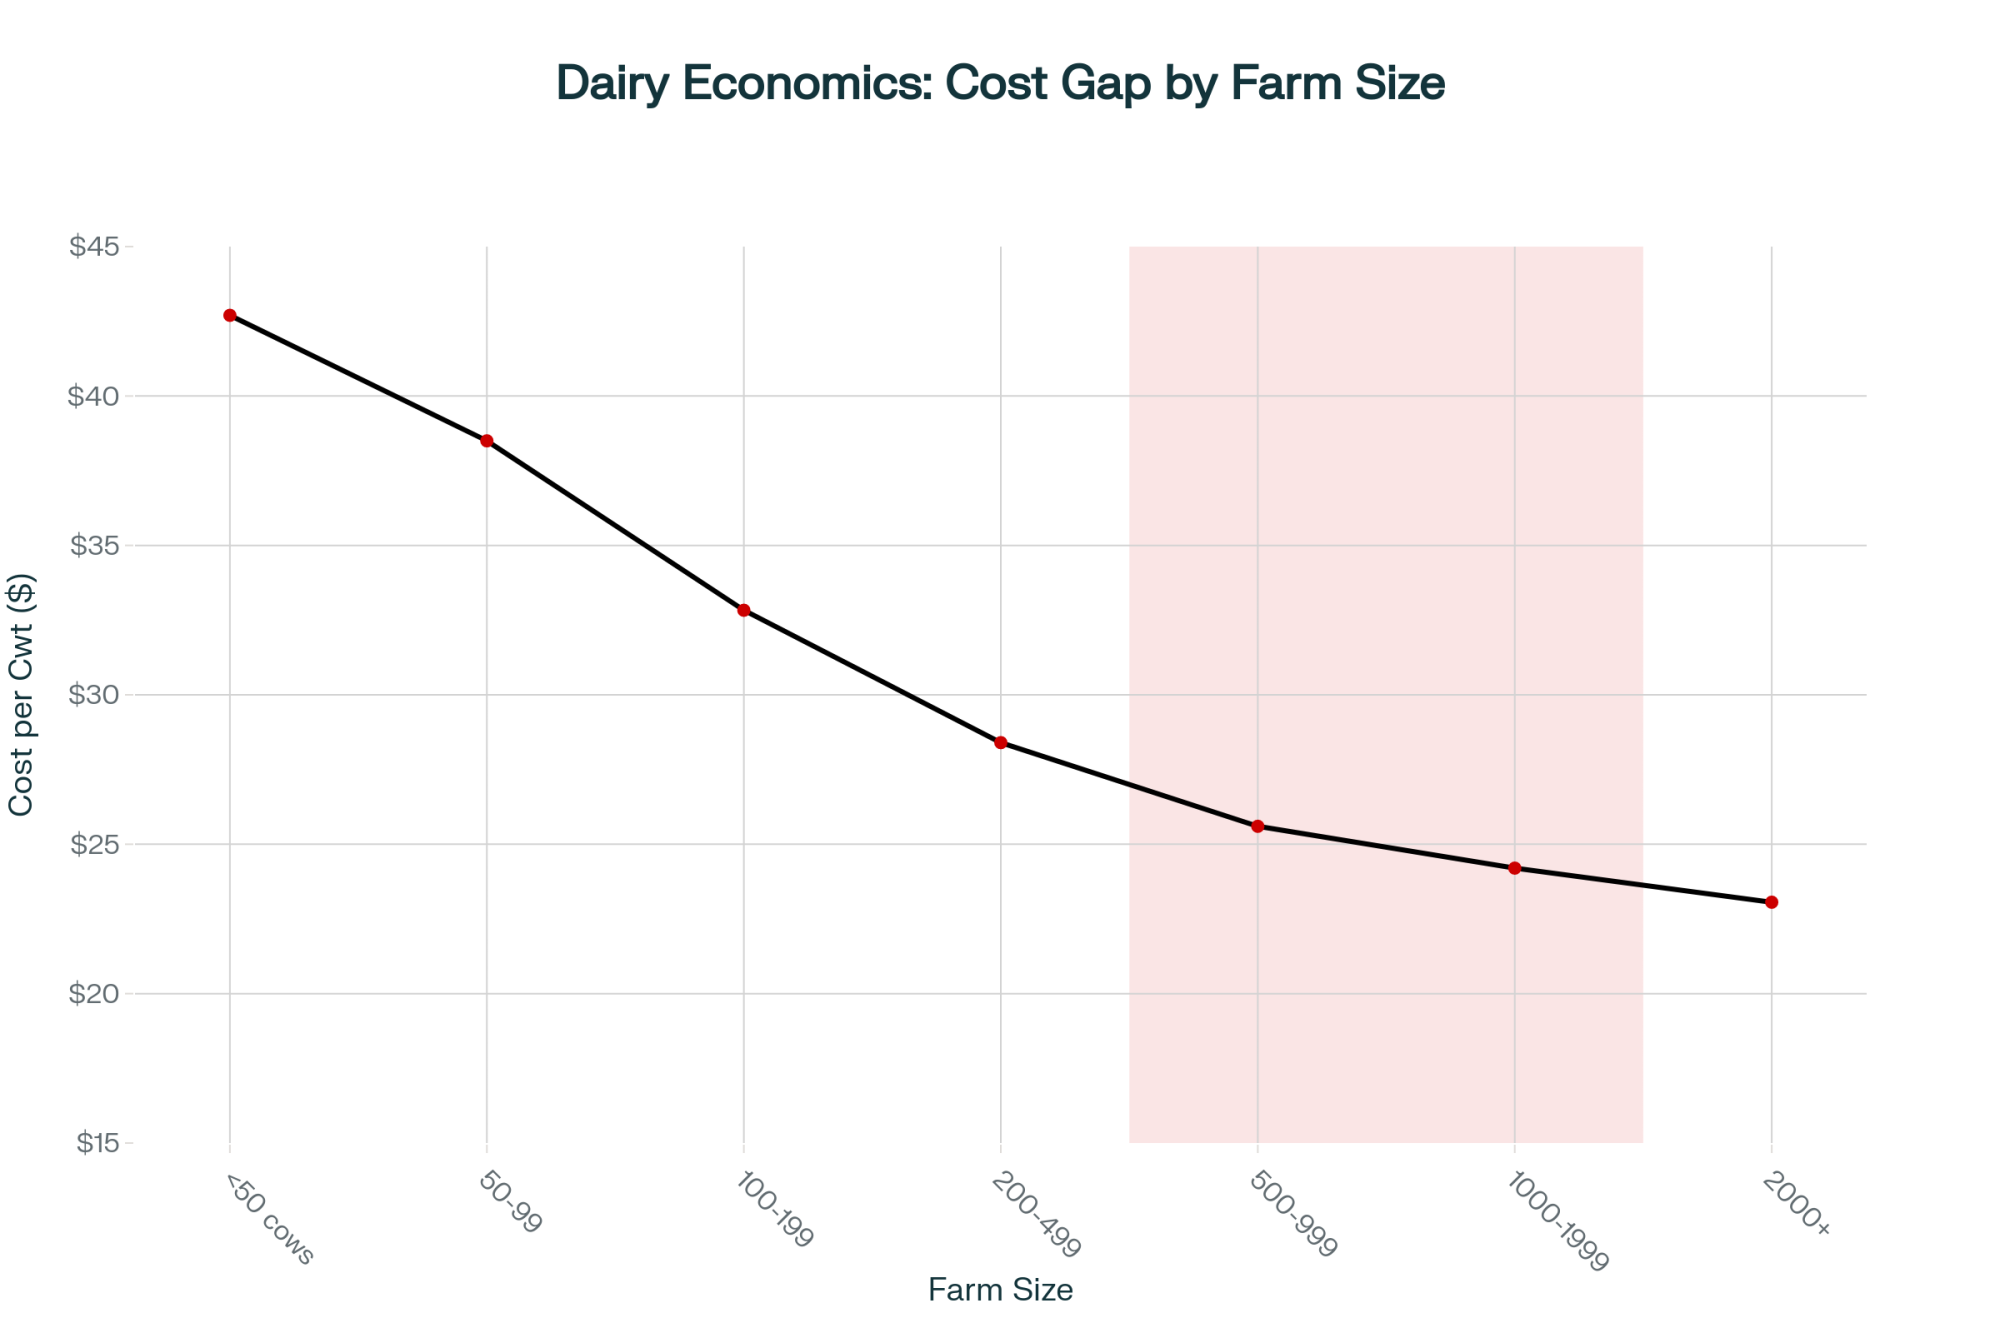
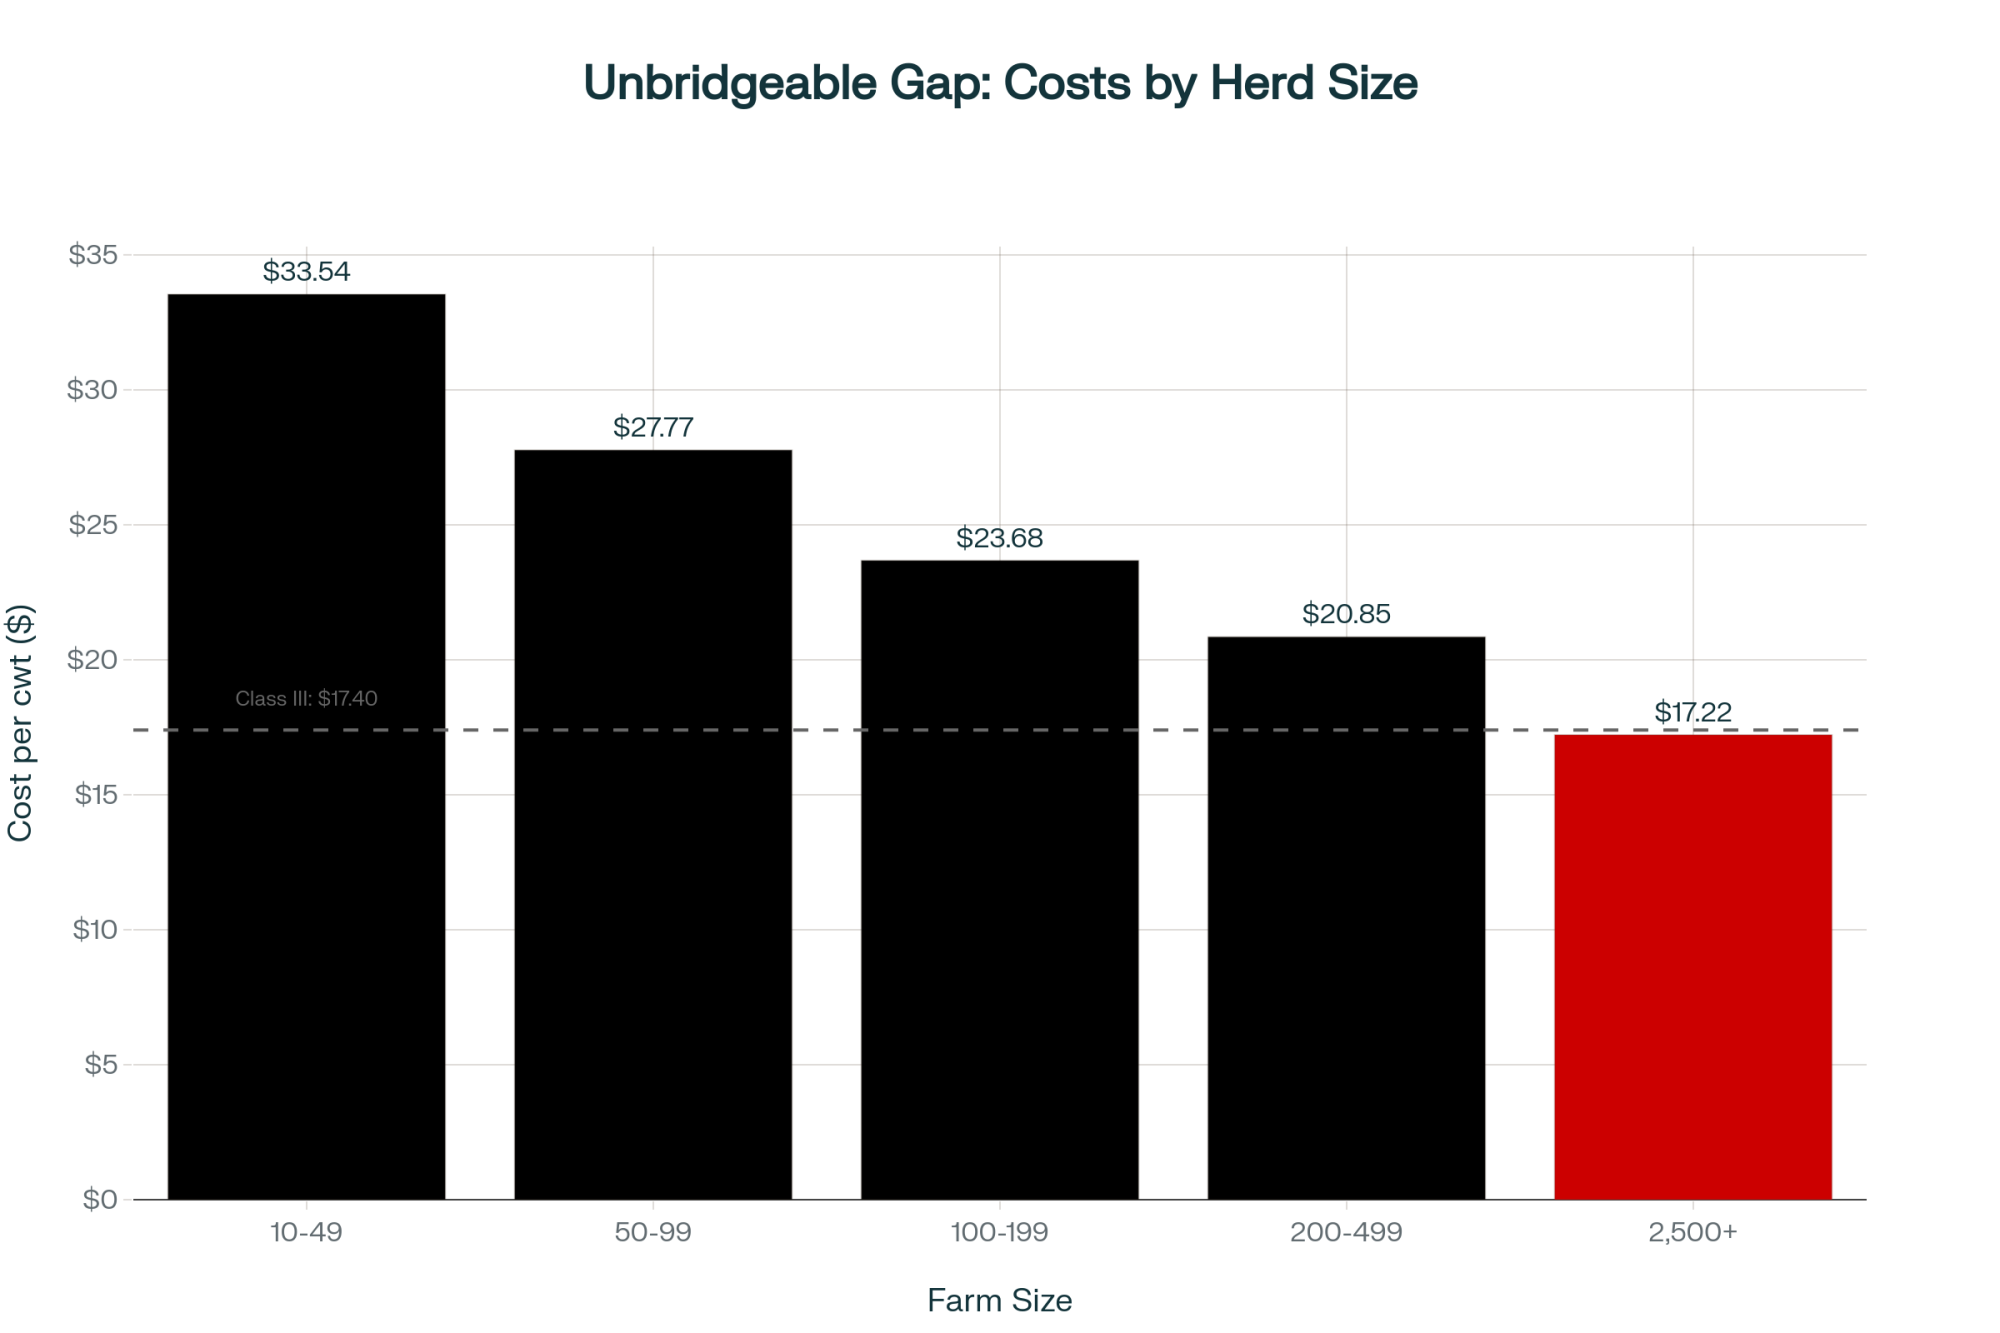
Wisconsin Center for Dairy Profitability data shows your average 200-cow operation generates about $87,000 in annual net income. If you lost $56,000 in potential export revenue—that’d be each farm’s theoretical share of that $850 million—you’re looking at a 64% income hit.

The numbers that really worry them:

  • Chapter 12 farm bankruptcies jumped 55% in 2024, hitting 259 filings
  • Wisconsin dairy operations averaged just $0.87 per hundredweight in net margins during 2023
  • At those margins, farms facing reduced market access could hit insolvency within 30 months

New York dairy producers have been pretty vocal about their frustration, arguing they’re seeking the market access they were promised, not handouts. One Cayuga County operator mentioned how expansion decisions are basically on hold until there’s clarity about Canadian market availability.

Canada’s Counter-Argument: Why They Say They’re Complying

Now here’s where it gets really interesting—Canada’s perspective on USMCA compliance is fundamentally different from the U.S.’s.

First off, Canada won that November 2023 USMCA dispute panel ruling. The panel found 2-1 that Canada’s revised allocation methods based on market share didn’t violate USMCA provisions. That’s a big deal—it validated Canada’s position that their implementation, while maybe not what the U.S. expected, technically complies with the agreement.

The way Canadian officials see it, several key points counter U.S. arguments:

On those low quota fill rates, they argue this reflects market conditions and U.S. producers’ inability to meet Canadian market requirements, not administrative barriers. They say importers are free to source from the U.S. if the products are competitive.

On processor allocations: Canada maintains that allocating quotas based on historical market activity is legitimate and non-discriminatory. It doesn’t explicitly exclude any type of importer.

On Bill C-202: Rather than overplaying their hand, Canada sees that June 2025 legislation—where 262 of 313 MPs voted to prohibit dairy concessions—as a democratic expression of national consensus. All parties supported it. From their perspective, that’s sovereign policy choice, not a negotiating tactic.

Dairy Farmers of Canada has consistently maintained that supply management represents more than just an economic system—they see it as ensuring food security and stable farm incomes across rural Canada. Pierre Lampron, who served as DFC president through 2024, expressed confidence at their annual meeting that the government understands this broader context.

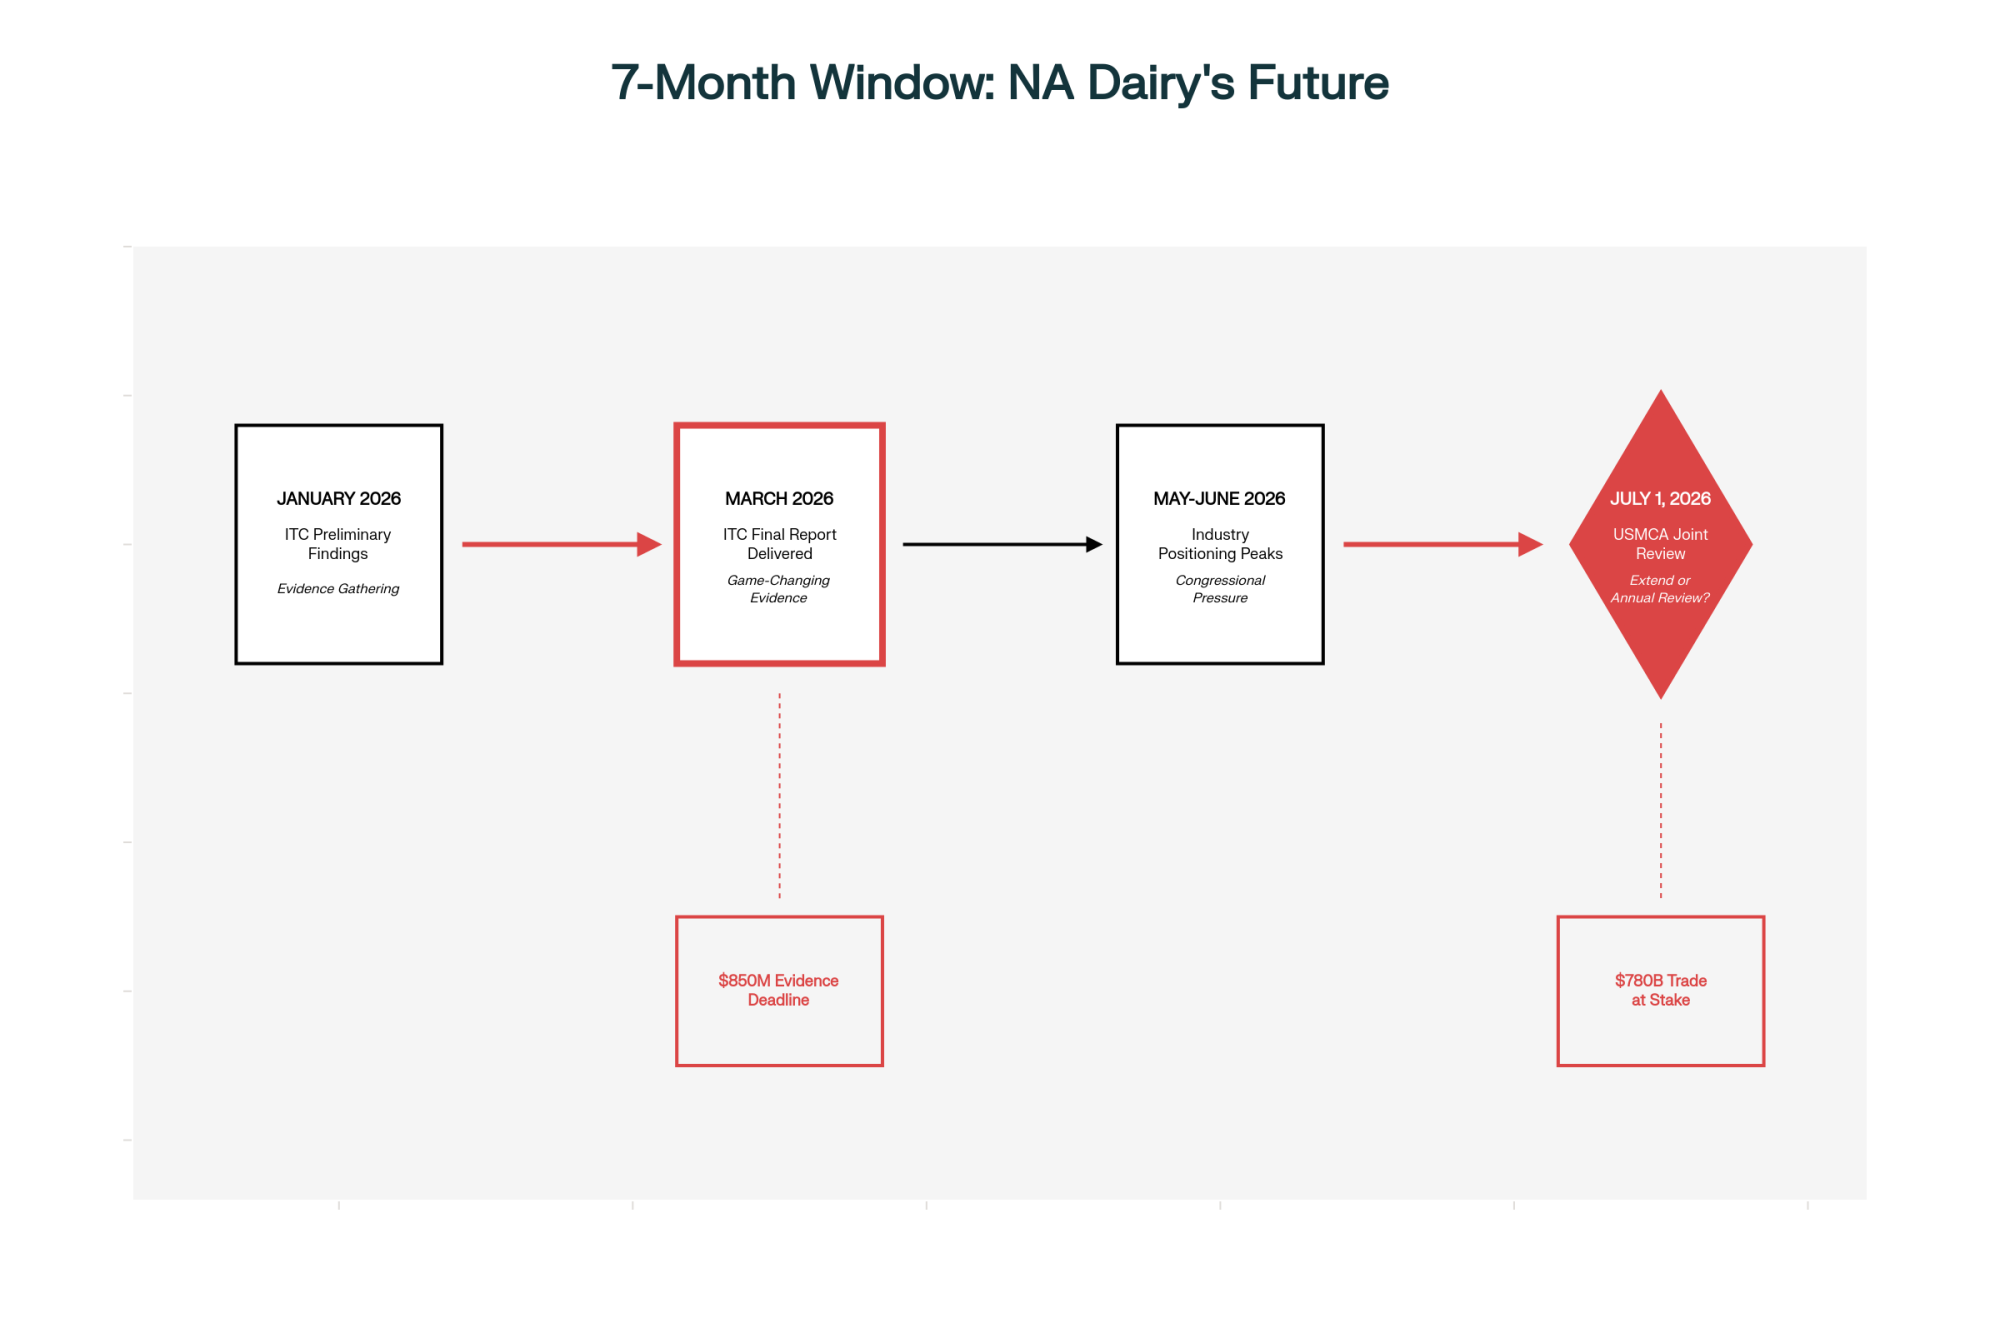
Timeline: Key Dates Leading to July 2026 Review

January 2026: Monitor for ITC preliminary findings on protein dumping investigation

March 2026: ITC final report delivers—this could be game-changing evidence

May-June 2026: Industry positioning intensifies, Congressional pressure peaks

July 1, 2026: USMCA joint review—decision on extension or annual review mode

Here is the data from the image converted into a table:

Two Countries, Two Systems

AspectU.S. SystemCanadian System
Farm Closures (2024)1,420 operations (5% decline)Stable/protected
Quota Investment per Cow$0$30,000
Price StabilityVolatile (market-based)Guaranteed (1.5-2x U.S. prices)
Market Access BarriersNone domesticallyHigh tariffs (200-315%)
Export OpportunitiesGrowing but constrained by CanadaLimited by supply management

The Political Leverage Game for 2026

Both sides are positioning themselves for July 2026 with some distinct strategic advantages.

What the U.S. Industry Has Going For It

The timing of the ITC investigation is no accident. The International Trade Commission investigation into Canadian dairy protein dumping delivers findings in March 2026. That’s just four months before the review—giving U.S. negotiators the federal agency documentation they need right when they need it.

The sunset clause creates real pressure. USMCA requires all three countries to actively confirm they want to extend the agreement in July 2026. If they don’t, we’re looking at uncertainty over $780 billion in annual bilateral trade.

Congressional backing matters. Bipartisan pressure from dairy-state legislators provides the U.S. industry with political support to push enforcement demands.

Canada’s Strategic Position

Legal victories count. That November 2023 panel ruling provides Canada with legal cover for its current practices. They can say, “Look, we went through dispute settlement and won.”

Political unity is powerful. Bill C-202’s overwhelming parliamentary support shows that protecting supply management goes beyond party politics in Canada.

The broader relationship provides leverage. Canada can point to integrated North American supply chains—especially in automotive and energy—to resist dairy-specific pressure.

Three Scenarios and What They Mean for Different Farm Sizes

Supply management has survived 30+ years of trade fights. Betting the farm on a breakthrough? That’s a 30% probability play. Smart money plans for the 45% scenario: more paperwork, same barriers, modest improvements at best

Looking at how things are shaping up, here’s what seems most likely and what it means for your operation:

Scenario 1: More Incremental Changes (45% probability, if you ask me)

Canada agrees to better reporting and maybe some monitoring mechanisms, but keeps its fundamental allocation approaches. The U.S. claims progress, Canada keeps supply management intact. Quota fill rates? They probably stay about the same.

What this means by farm size:

Under 100 cows: Focus on local markets and direct sales. Canadian access won’t materialize in meaningful ways for you anyway. Consider value-added products where you control the whole chain.

100-500 cows: Keep flexibility for quick pivots. Maybe maintain current production, but don’t expand based on export hopes. Watch Southeast Asian opportunities instead.

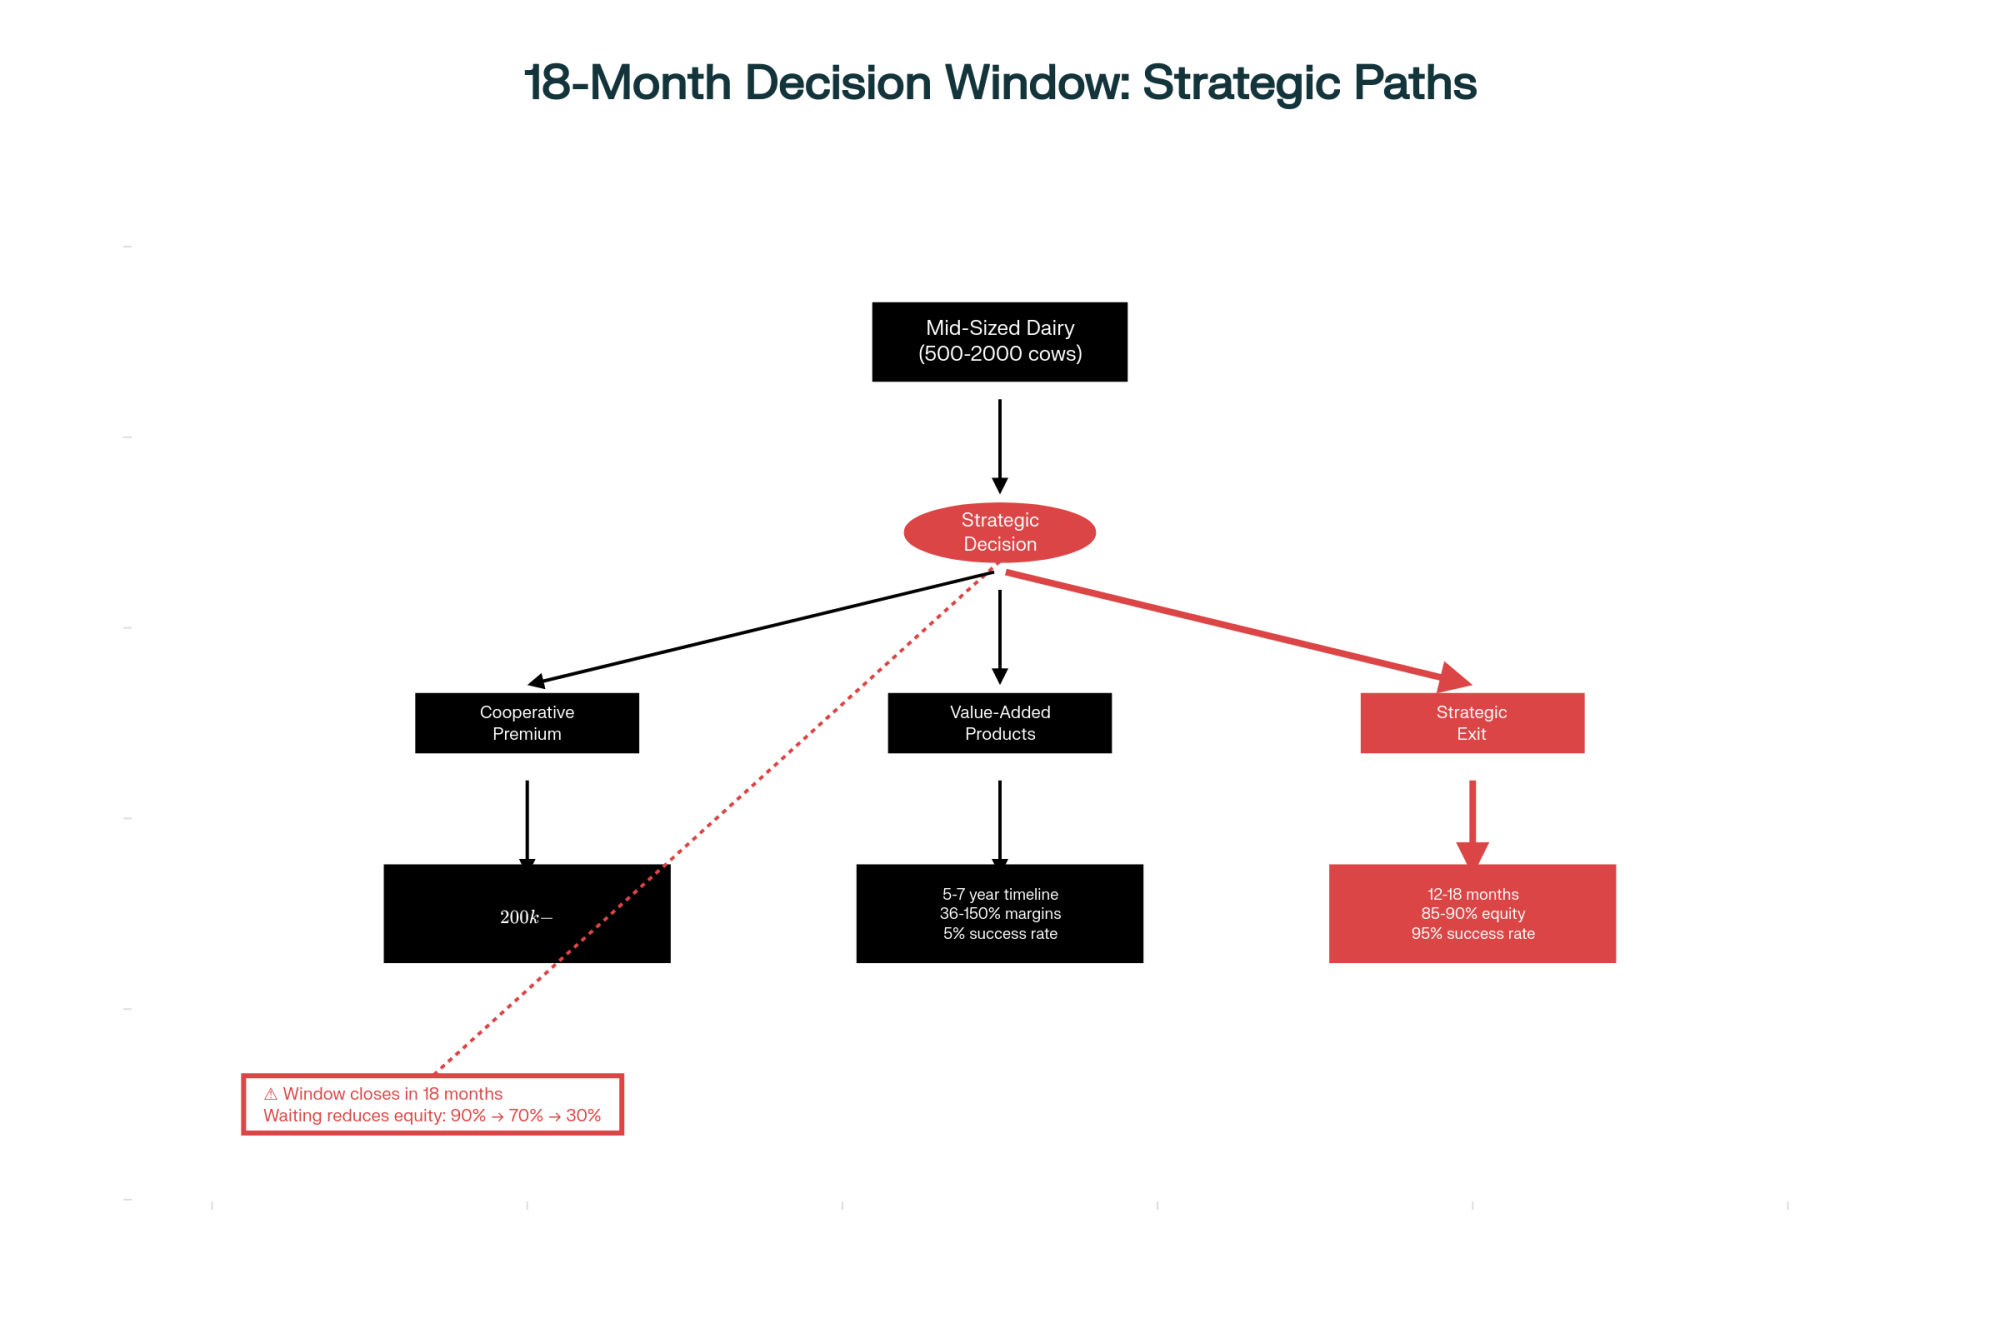
500+ cows: You’ve got scale to weather this, but don’t count on Canadian markets in your five-year plans. Consider leading industry advocacy efforts—you’ve got the most to gain if something breaks loose.

Scenario 2: Real Enforcement Mechanisms (30% probability)

If those ITC findings are compelling and U.S. negotiators credibly threaten not to renew, Canada might accept automatic penalties for under-utilization or mandatory non-processor allocations. That could deliver partial yet meaningful improvements in access.

Preparation steps if this happens:

  • Get your export documentation systems ready now
  • Build relationships with potential Canadian buyers
  • Understand Canadian labeling and standards requirements
  • Consider partnerships with existing exporters to learn the ropes

Scenario 3: A Standoff (25% probability)

Neither side budges much. The agreement goes into annual review mode, creating ongoing uncertainty but avoiding immediate disruption. Both industries operate under this cloud of potential future changes.

Risk management if we hit a standoff:

  • Maximum Dairy Margin Coverage enrollment becomes essential
  • Lock in feed costs wherever possible
  • Diversify buyer relationships domestically
  • Don’t make major capital investments based on export assumptions

Who’s Pushing for What: The Players Making Things Happen

Let me tell you about the organizations driving this whole thing, because understanding who’s involved helps make sense of the dynamics.

On the U.S. side, you’ve got some heavy hitters:

The International Dairy Foods Association—they’re the ones who filed that October 2025 complaint. They represent processors, and they’re pushing hard for what they call an end to protectionist measures. They want binding enforcement, and they want it now.

National Milk Producers Federation lobbied hard for that ITC investigation. They’re your farmer cooperatives, and they keep hammering on automatic penalties for non-compliance. They’ve got members losing money, and they’re not shy about saying so.

The U.S. Dairy Export Council is more technical—they document barriers, provide negotiating support, and help with the nuts and bolts. Edge Dairy Farmer Cooperative represents those Midwest producers, and they’re great at putting farm-level impacts front and center.

On Canada’s side, it’s equally organized:

Dairy Farmers of Canada maintains they’re fully complying with USMCA. They’ve got a consistent message: supply management is legitimate policy, and they’re following the rules.

Les Producteurs de lait du Québec—now these folks have serious clout. They represent Quebec’s 4,877 dairy farms, and in Canadian federal elections, Quebec matters. A lot.

Provincial marketing boards coordinate the defense while implementing those quota allocation systems that the U.S. finds so frustrating.

Market Alternatives: What Some Smart Operators Are Doing

While this U.S.-Canada dispute dominates headlines, some American producers are zigging, while others are zagging. Take this example—a California operation recently told me they doubled their Vietnam exports in 18 months. “The middle class there is exploding,” they said. “They want quality dairy, and there’s no quota games to navigate.”

Industry data from USDEC backs this up—U.S. dairy exports to Vietnam and other Southeast Asian countries keep climbing year over year. Vietnam, Thailand, and the Philippines—they’re importing more dairy each year. No supply management system to work around. Just straightforward business based on quality and price.

You know what’s interesting about these markets? They’re growing fast enough that even mid-size operations can find niches. Specialty cheeses, high-quality milk powders, and even fluid milk in some cases. The logistics are getting better every year, too.

Seven months. Four critical milestones. $780 billion in annual trade hanging in the balance. This is how the March 2026 ITC report becomes the leverage point that forces Canada’s hand—or blows up USMCA

The Bottom Line: No Easy Resolution in Sight

That $850 million figure the U.S. dairy industry keeps citing? That’s their calculation of lost opportunities. Canada disputes both the number and the whole premise. Five years of USMCA implementation have revealed fundamental disagreements about what the agreement actually requires and what compliance entails.

Canada’s supply management system has survived more than 30 years of trade negotiations. Honestly? It’ll probably survive this challenge too. The question isn’t whether USMCA will fully open Canadian dairy markets—nobody really expects that. It’s whether the 2026 review might produce some incremental changes that partially address U.S. concerns while keeping Canada’s core system intact.

The way American producers see it, success means binding enforcement mechanisms with automatic penalties. The way Canada sees it, success is maintaining supply management’s essential structure while offering enough procedural adjustments to avoid a broader trade confrontation.

Come July 2026, we’ll see whether these positions can be reconciled—or whether North American dairy trade stays defined by promises unfulfilled and expectations unmet. Either way, it’s going to be interesting to watch. And whatever happens, we’ll all need to adapt our operations accordingly.

One thing’s for sure—whether you’re milking 50 cows or 5,000, whether you’re in Wisconsin or Quebec, this dispute affects the entire North American dairy landscape. Understanding both sides helps us all prepare for whatever comes next.

Resources for Following This Issue:

Trade Documentation:

Research Centers:

The Bullvine continues tracking developments from both perspectives as we approach the July 2026 USMCA review. For ongoing analysis, visit www.thebullvine.com.

KEY TAKEAWAYS

  • Both sides have valid arguments: U.S. proves Canada allocates 85% of quotas to processors who won’t import (42% fill rate); Canada’s November 2023 panel win says that’s technically legal
  • Real farms, real consequences: 1,420 U.S. operations closed waiting for promised access, while Canadian farmers defend $30,000/cow quota investments—everyone has skin in this game
  • July 2026 is unprecedented leverage: The sunset clause means all three countries must actively agree, or $780B in trade enters chaos—first time the U.S. can credibly threaten the whole relationship
  • History suggests incremental change: Supply management survived 30+ years of trade fights; expect minor adjustments, not market revolution
  • Your operation, your strategy: Under 100 cows = stay local; 100-500 = maintain flexibility; 500+ = lead advocacy while developing Asian markets where actual growth exists

Complete references and supporting documentation are available upon request by contacting the editorial team at editor@thebullvine.com.

Learn More:

The Sunday Read Dairy Professionals Don’t Skip.

Every week, thousands of producers, breeders, and industry insiders open Bullvine Weekly for genetics insights, market shifts, and profit strategies they won’t find anywhere else. One email. Five minutes. Smarter decisions all week.

NewsSubscribe
First
Last
Consent

Concrete, Air, and Shade: The Real Drivers Behind Milk Yield

Your biggest ROI isn’t in feed—it’s in airflow, space, and shade. Comfort is still the cheapest form of nutrition.

You know, it’s easy to see why so many of us start with feed when we think about performance. Feed costs take up the biggest line in most of our budgets — and it’s the part of management we can see, mix, and adjust every day. But what I’ve found, after years of walking barns across Wisconsin and talking with producers from Ontario to Idaho, is that sometimes the problem isn’t in the ration. It’s in the roof, the floor, and the airflow.

You can’t fix nutrition in a broken barn. And once you understand the biology behind that statement, it changes everything about how you think about profitability.

The Rest-Revenue Multiplier: Every additional hour of cow rest time generates 2-3 lbs more milk daily, translating to $4,380+ annual revenue per cow—making comfort your highest-ROI investment

The $50 Fix That Unlocks 3.5 Pounds of Milk

Research is clear on this one — comfort is milk in the tank. The University of Wisconsin’s Dairyland Initiative and William H. Miner Agricultural Research Institute have both documented that every additional hour a cow spends lying down yields 1.7 to 3.5 pounds more milk each day (UW Dairyland Initiative and Miner Institute Cow Comfort Resources).

Here’s what’s interesting: the fix for poor comfort isn’t always expensive. I visited a mid-sized herd near Ripon, Wisconsin, that simply raised neck rails by four inches and deepened bedding. The cows immediately started using the stalls properly, adding almost 2.5 hours of rest per day. “Same cows, same feed,” the producer told me. “We gained six pounds of milk just by fixing the structure.”

It makes sense when you look at history. Freestall dimensions built before 2010 were designed for smaller Holsteins, around 1,100–1,300 pounds. Modern cows average closer to 1,500–1,600 pounds, which means their natural movement is restricted in older stalls. Adjusting neck rails to 48–52 inches high and 68–70 inches from the curb better fits today’s herds.

Investment TypeCost Per StallPayback PeriodMilk Gain (lbs/day)Annual ROI
Neck Rail Adjustment$503 months2.0-3.5360%
Bedding Deepening$754 months1.7-3.0280%
Fan Repositioning$0-251-2 months2.5-4.0450%
Stall Width Increase$1506 months3.0-4.5320%

Cornell Pro‑Dairy economic modeling shows that small structural corrections like these deliver consistent three‑month paybacks with average returns of 360%. The investment? About $50 per stall, mostly in tools and labor (Cornell Stall Design & Economics Tools).

Heat Stress Isn’t Just a Southern Problem

Heat Stress Strikes at 68°F: Most producers think heat stress begins at 80°F, but research proves milk loss, fertility decline, and reduced feed intake start at just 68 THI—a game-changing revelation for northern dairies

A lot of northern producers still assume heat stress doesn’t affect them — but science and data say otherwise. Dr. Geoff Dahl, professor of animal sciences at the University of Florida, has shown that cows begin to decline in performance when the Temperature‑Humidity Index (THI) exceeds 68, roughly 70°F with 60% humidity (University of Florida – Heat Stress Research).

The Silent Inheritance: One summer without cooling dry cows costs $1,200-1,800 per animal across multiple generations—proving that heat stress during the dry period is the most expensive 46 days on your dairy

What’s really eye‑opening is that heat stress during the dry period doesn’t just affect current milk yield. It alters calf development in utero, setting those heifers up for life‑long performance losses. Dahl’s studies have shown that heifers born from heat‑stressed dry cows produce 5‑11 pounds less milk during their first lactation — a penalty that carries on through adulthood.

Even in the Upper Midwest and Ontario, weather-tracking from UW‑Extension shows that cows experience that threshold for 50–90 days per year, depending on ventilation and humidity. The solution doesn’t always mean a major retrofit — just adjusting fan direction or installation height to maintain 300‑400 feet per minute of airflow at cow levelcan significantly change outcomes.

At one Ontario farm, redirecting fans over feed alleys rather than back walls completely flattened milk yield swings. The owner laughed when he said, “We didn’t add fans — just turned them the right way.” That small shift eliminated bunching, improved feed intake, and kept butterfat performance steady all summer.

When Infrastructure Outperforms Feed

Investment CategoryTypical CostPayback TimeMilk ResponseWorks 24/7Risk Level
Stall Modification$50-150/stall3-6 months2-4 lbs/dayYesLow
Cooling System$200-500/cow6-12 months3-5 lbs/dayYesLow
Nutrition Additive$0.20-0.50/dayContinuous0.5-2 lbs/dayNoMedium
Premium Feed$50-100/tonContinuous1-3 lbs/dayNoMedium

Let’s talk numbers, because that’s where the case for infrastructure gets serious. Studies from Cornell Pro‑DairyUniversity of Wisconsin, and Kansas State University show the ROI on barn improvements consistently competes with — and often beats — nutrition investments.

One 450‑cow herd in western New York implemented these upgrades and dropped its cull rate by 10% while cutting hoof‑trimming costs by a quarter. Herd average climbed five pounds — all from removing the bottlenecks stalls created. The farm’s owner summed it up well: “I used to buy almost every nutrition additive out there. Now my barn does most of the work.”

Why Improvements Still Lag

If the data is so compelling, what holds farms back? Psychologists — and farm economists like Dr. Cameron King of the University of Guelph — believe it’s about visibility. As King puts it: “Producers invest where they can see results fast. Feed changes give immediate feedback. Infrastructure improvements return slower, even though the payoff is bigger.”

That rings true. With a slight tweak to the ration, you can check the milk weights the next morning. But it’s harder to measure peace, comfort, and stability — the quiet gains of removing friction from cow behavior. What’s encouraging is that the operations making these investments are often the same ones noticing calmer cows, fewer metabolic issues, and a stronger transition period before any milk data even comes in.

From Managing to Designing Systems

There’s a shift happening that’s worth watching. Instead of “managing stress,” many top herds are designing barns so that stress never builds in the first place. In a series of case studies, Cornell Pro‑Dairy and Kansas State Universityfound that herds that improved stall space, bedding, and airflow gained 2 hours of rest per cow daily, resulting in 8–9 pounds more milk per cow without changing feed.

Cows weren’t “pushed” to perform; their biology was finally allowed to express what the ration and genetics were already capable of. Transition cows handled fresh periods more smoothly, fertility improved, and energy balance stabilized.

One Minnesota dairy manager put it perfectly during a University of Minnesota Extension discussion: “We quit trying to ‘manage’ around cow comfort. Now, the management kind of takes care of itself.”

Five Quick Ways to Gauge Comfort

Your Monday Morning Diagnostic: This simple decision tree helps producers systematically identify barn comfort bottlenecks before spending another dollar on feed—potentially unlocking 2-3.5 lbs more milk per cow daily

If you want to know where your barn performance really stands, start with these simple checks:

  1. Monitor THI at the cow level. Anything above 68 calls for immediate cooling actions.
  2. Try the 25‑second knee test. Kneel in a stall for half a minute. If it’s painful or wet, it’s failing your cows.
  3. Look mid‑day. At least 80–85% of your cows should be lying down comfortably after feeding.
  4. Start small. Neck rails, fans, and bedding deliver immediate ROI—and can fund larger phases later.
  5. Recalibrate your ration. Once comfort improves, cows eat differently — work with your nutritionist to reflect that change.

The Foundation That Never Takes a Day Off

I remember something Dr. Mike Hutjens once told a group of producers: “Infrastructure never takes a day off.” And it stuck with me. A properly fitted stall or well‑placed fan doesn’t clock out when you do; it’s the one system on the farm that works 24/7 without supervision or overtime.

What’s important—and, frankly, encouraging —is that comfort strategies aren’t limited to freestall setups. Tie‑stall and dry lot systems achieve similar returns when cow biology drives design rather than human habit. Sand or dry bedding, airflow direction, and clean water space work for dairies of every scale and layout.

If there’s a single takeaway here, it’s this: foundation before feed. The barn sets the biological ceiling, and the feed fills the space below it. Get that order right, and suddenly everything else — the ration, the reproduction, the milk components — starts falling into place naturally.

Further Reading and Resources

Key Takeaways:

  • Every extra hour cows rest can earn roughly 3.5 lbs of milk—comfort converts directly into production.
  • Feed can’t fix a poorly built barn. Airflow, shade, and stall comfort determine how well the feed performs.
  • Simple $50 stall fixes often deliver a 300% ROI—before your next feed bill even prints.
  • Heat stress begins at a THI of 68 °F, not 80. Early cooling preserves milk yield and fertility.
  • Infrastructure pays you every day—it never takes a day off.

Executive Summary

Most producers focus on feed when milk performance stalls — but new research shows the real ceiling may be in the barn, not the bunk. Studies from Wisconsin, Florida, and Cornell link each extra hour of cow rest to 1.7–3.5 lbs of milk per day, with simple $50 comfort fixes delivering triple‑digit ROI. Heat stress starts earlier than we think — at just 68 °F THI — quietly costing milk, fertility, and even the next generation’s output. What’s encouraging is how quickly these investments pay back, often inside one season. Across freestalls, tie‑stalls, and dry lots, the takeaway is the same: infrastructure is the quiet partner that lets nutrition, genetics, and management finally show their full potential.

Complete references and supporting documentation are available upon request by contacting the editorial team at editor@thebullvine.com.

Learn More:

The Sunday Read Dairy Professionals Don’t Skip.

Every week, thousands of producers, breeders, and industry insiders open Bullvine Weekly for genetics insights, market shifts, and profit strategies they won’t find anywhere else. One email. Five minutes. Smarter decisions all week.

NewsSubscribe
First
Last
Consent

Is Stray Voltage Stealing 20 Pounds Per Cow from Your Dairy?

Cows avoiding water? Nervous in the parlor? Production dropping? You’re not imagining it—20% of dairies have stray voltage that utilities can’t detect.

You know, I spoke with a producer from Minnesota who shared something that many of us might recognize: her best cow had died unexpectedly after a completely normal 70-pound milking. Every consultant she’d brought in confirmed her management was exemplary. Yet cows kept declining, and nobody could explain why.

This was Jill Nelson from Olmar Farms in Sleepy Eye, and her eight-year journey to discover what was affecting her elite registered Holstein herd reveals an issue that—honestly—deserves more attention than it gets. After installing an isolated transformer to separate her farm from utility electrical infrastructure (we’re talking about an investment approaching $100,000 here), production increased by nearly 20 pounds per cow per day. And this happened during summer 2017, when most of us are just trying to maintain production through heat stress.

What’s particularly noteworthy is that Nelson’s experience aligns with estimates from that old USDA Agriculture Handbook 696—you might have seen it referenced—suggesting that up to 20% of dairy operations may encounter some level of stray voltage issues. While the data is still developing on the exact prevalence, this potential scope… well, it merits serious consideration as we evaluate those unexplained herd health and production challenges we all see from time to time.

Here’s what’s interesting from an economics standpoint: With a 20-pound daily increase on 150 cows at current milk prices, Nelson’s investment paid for itself in approximately six months. Not many farm improvements deliver that kind of return, right?

Understanding the Technical Challenge

So here’s where things get a bit complicated—but stick with me because this matters.

The complexity of stray-voltage diagnosis begins with how we measure it. Standard utility testing protocols use a 500-ohm resistor to simulate your cow’s electrical resistance. This standard, believe it or not, was established in that 1991 USDA handbook I mentioned. And it’s still what utilities use when they come out to test your farm today.

The Testing Gap reveals why 20% of dairies struggle with hidden electrical issues—utilities test at 500 ohms, but real cows measure 109-400 ohms, experiencing double to quadruple the current that standard tests report as “safe.”

What makes this significant? Well, field research from agricultural electrical consultants has documented dairy cattle with actual body resistance ranging from approximately 100 to 400 ohms—substantially lower than what the testing standard assumes. Dr. Richard Norell, who’s the Extension dairy specialist up at the University of Idaho, has examined electrical resistance in dairy cattle as part of broader agricultural electrical research, and his work contributes to our understanding of this variation.

The practical implications… they deserve consideration. You probably remember Ohm’s Law from somewhere—current equals voltage divided by resistance, right? Well, if the testing equipment assumes 500 ohms but the actual cow resistance is closer to 200 ohms, the measured current significantly underestimates what your animals actually experience. It’s somewhat like calibrating feed measurements with equipment that doesn’t account for actual dry matter intake—the numbers look fine, but reality’s telling a different story.

When utilities measure, say, 1.0 volts using standard protocols, they calculate approximately two milliamperes of current flow—within accepted guidelines, according to veterinary references such as the Merck Manual. But here’s the thing: cattle with lower resistance are experiencing higher current levels proportionally. Norell’s research and data collected at UW–Madison showed cows reacted to current at the lowest tested levels—just 0.25 milliAmps, which is eight times lower than the standard utilities use to define possible harm to cattle. In fact, 25% of cows in those studies showed behavioral responses at only 0.25 mA, much lower than the traditional 2 mA threshold long reported in the industry.You can see the problem here.

Learning from Progressive Operations

What I find valuable about the Olmar Farms case is that they followed best management practices—and still got hammered.

Their operation, which received Holstein Association USA’s Elite Breeder Award in 2017, maintained a rolling herd average of 26,192 pounds before encountering these challenges. They’d invested in modern facilities, including equipotential planes (you know, those conductive grid systems designed to prevent electrical differentials), tunnel ventilation, sand-bedded freestalls—basically everything we’re told makes a difference.

Nelson brought in respected consultants. Dr. Tom Oldberg analyzed nutrition. Dr. Reid evaluated the milking systems. Dr. Gary Neubauer, a well-known dairy veterinarian, was also part of the diagnostic team. Each one confirmed management met or exceeded industry standards. As many of us have experienced, sometimes you can do everything right and still have problems.

Yet the herd exhibited concerning behavioral changes. Previously calm animals became difficult to handle during milking. Some cows required leg restraints for safe milking—and that’s unusual for well-managed herds, wouldn’t you say? Mastitis incidence increased despite proper protocols. Water consumption patterns changed dramatically, with cows hesitating at troughs or displaying unusual lapping behaviors rather than normal drinking.

⚠️ Warning Signs We Should All Watch For:

  • Cows hesitating or “dancing” at water troughs
  • Unusual lapping instead of normal drinking
  • Parlor nervousness is developing in previously calm animals
  • Drinking from puddles while avoiding standard waterers
  • Multiple health issues appearing simultaneously without a clear cause
  • High producers are dying unexpectedly without an obvious illness

Standard utility testing repeatedly showed “acceptable” voltage levels. The graphs looked normal, measurements within guidelines. This continued for eight years—eight years!—until 2016, when Nelson connected with an electrical specialist with specific experience in agricultural applications. Using equipment capable of millisecond-resolution recording (typically from manufacturers such as Fluke or Dranetz) and testing with more representative resistance values, this specialist documented electrical issues throughout the facility, including outdoor water systems.

Olmar Farms’ dramatic recovery after resolving stray voltage—production crashed 978 pounds during their 8-year battle, then surged 3,295 pounds above baseline after a $100,000 isolated transformer installation that paid for itself in just six months

Court records from July 2019 confirm the operation converted to three-phase power with an isolated transformer installation on May 1, 2017. There was a reported an 18-pound increase in production during the subsequent summer months, with current production exceeding 30,318 pounds rolling herd average as of March 2025. That’s quite a turnaround.

The Biological Response to Chronic Electrical Exposure

Here’s something that really fascinates me about this whole issue—the biology behind it.

Research from institutions like the University of Wisconsin-Madison helps explain what’s happening at the biological level. Doug Reinemann and co-researcher Dr. Louis Sheffield, both with Wisconsin’s biological systems engineering department, have published on how electrical stress affects dairy cattle biology. And what he’s found… it’s eye-opening.

This research shows that repeated low-level electrical exposure triggers cortisol release—the primary stress hormone. While acute stress responses serve important biological functions (we’ve all seen how a fresh cow reacts to a single stressor during transition), chronic exposure can maintain elevated baseline cortisol levels, which can affect multiple body systems. This builds on what we’ve learned about other chronic stressors in dairy production.

The cascade effects are fascinating… and concerning. We’re talking suppressed immune function, with reduced T-cell production and weakened antibody responses. This explains the varied symptoms Nelson observed: treatment-resistant mastitis in some cows, reproductive failures in others, sudden production crashes or unexpected mortality in high producers.

As Nelson put it—and I think this really captures the frustration—”It looked like we were failing at everything simultaneously. Nutrition problems AND health problems AND reproduction problems AND behavior problems all at once.” Makes perfect sense when you understand it’s all coming from the same electrical source, doesn’t it?

Research in veterinary literature also documents transgenerational effects, with calves from electrically stressed dams showing reduced immune competence, impaired vaccine responses, and various developmental issues. Nelson reported observing congenital disabilities and cardiac abnormalities during the most challenging period. That’s something that really makes you think about the long-term implications for your replacement program.

Distinguishing Source and Responsibility

Alright, so here’s where things get complicated—and expensive. The source of electrical issues fundamentally determines resolution approaches and costs.

On-farm sources (damaged motor insulation, corroded connections, inadequate grounding) typically cost between $800 and $10,000 to address, depending on scope. Any qualified agricultural electrician can handle these repairs. That’s manageable for most operations.

But utility-source issues? That’s a different story altogether.

Every North American farm connects to multi-grounded neutral systems—the National Electrical Safety Code requires it. The utility-neutral conductor is repeatedly grounded between the substation and your farm, with your farm’s electrical systems bonded to this neutral at the transformer. You probably know this already, but it’s worth reviewing.

Under ideal conditions, this system works well. But when utility neutrals can’t adequately carry return current—maybe due to undersized conductors for modern loads, deteriorated connections from age, or phase imbalances—that current seeks alternate paths through earth ground. And since your farm’s grounding system is bonded to theirs… well, that current can flow right through your agricultural facilities.

The primary solution is to install isolated transformers to create electrical separation between the farm and utility systems. Based on documented cases, these installations can cost $50,000 to $100,000 or more. The Nelson operation’s investment approached $100,000, including a three-phase power installation located more than 100 yards from the buildings. And despite the problem originating from utility infrastructure, farms often bear these costs themselves. That still frustrates me when I think about it.

The financial fork in the road—on-farm electrical issues cost under $10K and resolve quickly, while utility-source stray voltage demands $50-100K investments that take months but pay back in 6-12 months through production recovery

What about insurance? Most standard farm policies generally don’t specifically address stray voltage losses, though some carriers now offer specialized riders. I always tell producers: verify coverage with your agent rather than assuming protection exists. Better to know before you need it.

Best Practices from Affected Operations

Looking at successful resolutions, I’m seeing consistent patterns that are worth sharing.

Documentation proves crucial. Producers who achieve resolution create comprehensive evidence before engaging utilities or consultants. This includes video documentation of behavioral changes—hesitation at water sources, unusual drinking patterns, and parlor nervousness. They maintain detailed production records showing systematic changes despite consistent management. Health events, treatments, mortality patterns—it all merits careful tracking.

Paul Halderson’s Wisconsin operation, which prevailed in litigation against Xcel Energy, maintained decades of documentation. This record proved invaluable when addressing utility claims about management deficiencies. The lesson here is clear: document everything, even if it seems minor at the time.

Independent testing before utility engagement often proves worthwhile. Specialists familiar with agricultural electrical systems, using appropriate protocols and resistance values, typically charge $3,000 to $5,000 for a comprehensive assessment. While that’s significant, this investment can prove valuable if negotiation or—God forbid—litigation becomes necessary.

Understanding state-specific standards helps producers navigate the system. Wisconsin and Minnesota use 1-volt or 2-milliamp action thresholds. Knowing these standards—and their basis in that 500-ohm testing protocol we discussed—helps you advocate for appropriate testing when utilities respond.

Regional Variations and Current Context

The 2025 dairy economy makes hidden production losses particularly challenging, doesn’t it? While feed costs have moderated from recent peaks (thankfully), maintaining production efficiency remains crucial for profitability. A 15% production loss from undiagnosed electrical issues—not uncommon based on documented cases—that can determine operational viability.

I’ve noticed regional patterns emerging from infrastructure age and agricultural practices. Wisconsin and Minnesota operations, particularly those served by infrastructure dating back 40-50 years, report more utility-source issues as equipment struggles with modern electrical loads. Similar patterns appear in Vermont and upstate New York, especially where utility consolidation has deferred infrastructure updates.

Newer dairy regions present different challenges. Texas and Idaho operations may have more modern infrastructure, but they face issues stemming from shared distribution lines used by center pivot irrigation systems. Seasonal voltage fluctuations during peak irrigation can affect nearby dairy facilities. And Southeastern operations? They contend with how seasonal variations in ground moisture affect current flow through the soil—I heard about this recently from a Georgia producer dealing with mysterious summer production drops.

California’s large-scale operations, with their substantial electrical loads for cooling and milk processing, sometimes encounter unique challenges when utility infrastructure hasn’t kept pace with dairy consolidation and expansion. It’s a different set of problems, but the underlying issue remains the same.

Recognition and Response Strategies

Based on documented cases and producer experiences, if you’re seeing behavioral changes at water sources—hesitation, unusual lapping behaviors, complete avoidance despite obvious thirst—that’s particularly telling. Same with parlor nervousness that develops in previously calm animals, especially during milking preparation.

For producers observing these patterns, here’s what works: Begin with thorough documentation using available technology—smartphones can capture behavioral evidence effectively these days. Engage independent testing through specialists who understand agricultural applications. Eliminate on-farm sources by systematically evaluating motors, connections, and grounding systems. Only then engage utilities, preferably in writing, with documentation already assembled.

Budget considerations should include $3,000-$5,000 for comprehensive independent testing. If utility infrastructure proves problematic, resolution costs can reach $50,000 to $100,000 or more for isolated transformer installation. Yes, that’s significant. But remember Nelson’s six-month payback period. Sometimes the investment, painful as it is, makes sense.

Industry Evolution and Future Considerations

Recent legal precedents suggest evolving recognition of these challenges. The Iowa Supreme Court’s June 2024 decision upholding Vagts Dairy’s verdict against Northern Natural Gas for pipeline-related electrical issues establishes important precedent for infrastructure liability. That’s encouraging, at least.

Most producers won’t pursue lengthy litigation—and shouldn’t have to. Practical solutions matter more than legal victories. That’s why farmers like Jill Nelson are developing resources to share knowledge. Her website, strayvoltagefacts.com, provides research and guidance based on her direct experience. It’s worth checking out if you’re dealing with unexplained issues.

What’s encouraging is how the industry conversation has evolved. A decade ago, debates centered on whether stray voltage even existed. Today’s discussions focus on identification and mitigation strategies. This represents meaningful progress, even if implementation remains inconsistent.

Nelson’s operation now maintains a rolling herd average of over 30,318 pounds on twice-daily milking, according to March 2025 data. While genetics were damaged during the affected period, the operation survived and recovered. As Nelson has shared in various forums, early recognition of testing limitations and documentation requirements might have shortened their eight-year challenge considerably.

Given the substantial number of operations potentially experiencing some level of electrical issues, it is important to acknowledge that “acceptable” testing results may not ensure the safety of sensitive animals. Just as we’ve embraced precision management for nutrition and reproduction, electrical safety may require similar individualized approaches.

Dairy farmers are winning big in court—$32+ million awarded across four major cases from 2010-2024, with the June 2024 Iowa Supreme Court ruling establishing critical precedent that negligence isn’t required to prove nuisance from stray voltage

This builds on what we’ve learned about variation in biological systems—what works for the average may not protect the sensitive. Until testing protocols better reflect this reality, those of us who combine careful observation with independent verification will be best positioned to protect our herds.

The Bottom Line

You know, the difference between management challenges and electrical issues can be subtle but significant. Understanding this distinction—and knowing how to investigate it properly—that’s valuable knowledge for any operation experiencing unexplained herd challenges.

Sometimes what appears to be a management problem stems from infrastructure issues that standard testing protocols weren’t designed to detect. And that’s not a failure of management—it’s a limitation of how we’ve been measuring things.

What’s your experience been with unexplained herd health or production challenges? Have you noticed behavioral changes that didn’t quite fit typical patterns? The conversation continues as we work together to understand and address the complex interactions between modern dairy operations and aging electrical infrastructure.

For more resources and to share experiences, visit strayvoltagefacts.com or reach out through The Bullvine’s producer network. Because sometimes the best solutions come from farmers sharing what they’ve learned the hard way. And that’s how we all get better at this business we’re in.

KEY TAKEAWAYS:

  • If cows are hesitating at water or dying unexpectedly, it’s likely stray voltage—affecting 1 in 5 dairy farms, not management failure
  • Standard utility testing misses the problem: They test at 500 ohms resistance when actual cow resistance is 200-400 ohms, underreporting exposure by half
  • Your documentation strategy determines your outcome: Video behavior changes, track production/health data, get independent testing ($3-5K) BEFORE calling utilities
  • Resolution costs vary wildly: On-farm electrical fixes are manageable (under $10K), but utility-source problems requiring isolated transformers can hit $100K—though payback can be swift (20 lbs/cow/day gains)
  • You’re not imagining it: Courts are awarding millions in stray voltage cases, proving this hidden problem is real and fixable when properly diagnosed

EXECUTIVE SUMMARY: 

Your cows avoiding water troughs and dying after perfect production days might not be a management problem—it’s likely stray voltage, a hidden electrical issue affecting up to 20% of dairy operations nationwide. The crisis stems from a fundamental testing flaw: utilities measure using 500-ohm resistance standards established in 1991, but research shows dairy cattle actually average 200-400 ohms, meaning your animals experience double the electrical current that standard tests report as “safe.” Jill Nelson’s award-winning Minnesota Holstein operation suffered eight years of mysterious losses before discovering this truth—her $100,000 investment in an isolated transformer delivered 20 pounds of milk per cow per day, paying for itself in six months. The difference between financial recovery and bankruptcy often comes down to recognizing symptoms early (behavioral changes at water sources, parlor nervousness, unexplained deaths) and getting independent testing with proper equipment. While on-farm electrical fixes typically cost under $10,000, utility-source problems can exceed $100,000, making documentation and proper diagnosis critical before accepting utility test results that miss what’s really happening to your herd.

Complete references and supporting documentation are available upon request by contacting the editorial team at editor@thebullvine.com.

Learn More:

The Sunday Read Dairy Professionals Don’t Skip.

Every week, thousands of producers, breeders, and industry insiders open Bullvine Weekly for genetics insights, market shifts, and profit strategies they won’t find anywhere else. One email. Five minutes. Smarter decisions all week.

NewsSubscribe
First
Last
Consent

The $380,000 Question: How Florida Dairy Farmers Beat 4 Hurricanes in 13 Months

Your dairy loses $13,400/month after a hurricane. Government aid takes 12 months. Do you have 6 months reserves? Because 30 days isn’t enough anymore.

Executive Summary: Four hurricanes in 13 months taught Florida dairy farmers what $500,000 buys: survival. The farms still standing had six months of cash reserves and could afford solar backup, hurricane-proof construction, and layered insurance—everyone else is bleeding $13,400 monthly or already gone. This exposed a brutal truth: mid-size family dairies can’t afford climate resilience but can’t compete without it. They face three stark options: scale up past 1,000 cows, find premium niche markets, or exit while there’s still equity to preserve. The math is unforgiving—strategic exit at month 8 saves families $380,000-$580,000 compared to forced liquidation at month 18. With government aid covering just 22% of losses and mutual aid networks exhausted, Florida’s experience reveals the future of farming: only operations with capital access survive repeated climate disasters.

Dairy Risk Management

You know that feeling when you walk through your barn after a storm and everything’s different? Jerry Dakin had that moment last year, standing in his Myakka City dairy farm looking at 250 dead cows scattered across his pastures after Hurricane Ian hit in September 2022. He’d spent decades building Dakin Dairy up to 3,100 head—good genetics, solid facilities, everything running like it should.

Here’s what nobody saw coming, though. Ian was just the start. We had Idalia, then Debby, then Helene, and finally Milton—all hitting through October 2024. Suddenly, resilience wasn’t just something we talked about over coffee at the co-op. It became what decided who’d still be milking come next season.

Four hurricanes. 13 months. $570 million in dairy losses. After Ian devastated the industry in 2022 ($500M), Florida farmers faced three more major storms in rapid succession—Idalia, Debby, Helene, and Milton—with as little as 1 month between impacts. When disasters strike faster than recovery cycles, only farms with deep capital reserves survive.

What’s really interesting—and this caught my attention when the November data came out from USDA—is that the Southeast actually lost fewer dairy herds than anywhere else in the country during all this. We’re talking 100 farms, compared to over 200 in other regions, according to Progressive Dairy. So what made the difference? The strategies that worked tell a story we all need to hear.

“The difference between making a strategic decision at month 8-10 versus being forced out at month 18? We’re talking $380,000 to $580,000 in what the family keeps.”

The math is brutal: Strategic exit at month 8-10 preserves $380k-$580k in family wealth, but waiting until forced liquidation at month 18 leaves farmers with nothing. Government aid arrives at month 12 but only covers 22% of losses—far too little, far too late.

The Real Timeline of Financial Recovery (It’s Not What You Think)

You know how we usually handle disasters? Fix what’s broken, get the power back on, clean up the mess, and move forward. But what I’ve learned talking to farmers who’ve been through this is that the real challenge isn’t the hurricane. It’s what happens to your cash flow over the next 18 months.

Take Philip Watts at Full Circle Dairy near Mayo. Hurricane Helene knocked down three-quarters of their free-stall barn and damaged 12 of their 16 pivots. Bad enough, right? But here’s what really hurt—their production dropped 10-15% and just stayed there for months. The Florida Department of Agriculture documented this in their October assessments. Average dairy was losing $13,400 a month in operational costs while waiting for help that… well, it takes time.

What I’ve found is there’s a pattern here that we need to understand…

The Numbers We Need to Talk About:

So government assistance—and I’m not pointing fingers, just stating facts—covered about 22% of actual losses. Commissioner Simpson announced those block grants in July 2025, totaling $675.9 million. Sounds like a lot until you realize the damage from four hurricanes topped $3 billion.

Meanwhile, working capital’s bleeding out at $13,400 a month for a mid-size operation. That’s based on what United Dairy Farmers of Florida found in a survey of its members early in 2024. Real money, real fast.

And here’s something agricultural economists have figured out—the difference between making a strategic decision at month 8-10 versus being forced out at month 18? We’re talking $380,000 to $580,000 in what the family keeps. That’s college funds, retirement, the next generation’s chance to start over.

Johan Heijkoop put it pretty bluntly after Idalia hit his two Lafayette County farms: “We don’t have a year to get help from this. We need action. We need it immediately.” A month after that storm, he still had eight burn piles going. His cows? Still way off their normal production.

Financial analysis backs this up—operations with minimal reserves face insolvency within 12-18 months after major disasters. The farms with 6-12 months of operating reserves? They made it. Those running on the traditional 30-60-day cushion —we’ve always thought was fine? Different story.

What’s Actually Working Out There (Real Farms, Real Solutions)

Let me share what farmers are actually doing—not what some manual says they should do, but what’s happening on real operations right now.

Getting Off the Grid (At Least Partially)

Here’s something that got everyone talking. Duke Energy’s Lake Placid solar farm took a direct hit from an EF2 tornado during Hurricane Milton. Four days later, it’s back online. Four days! That changed how a lot of us think about solar.

What’s encouraging is that farms are putting together complete systems now. We’re seeing 50-100kW solar arrays handling daytime loads—critical for cooling in Florida’s heat. Battery storage in the 100-200kWh range keeps the parlor running at night, keeps those bulk tanks cold. And yeah, you still need standby generators with at least 2 weeks of fuel. USDA’s hurricane guide got that part right.

Climate resilience costs $500,000 upfront. Solar systems, hurricane-proof barns, layered insurance, 6-month feed reserves—this is the price of survival. Mid-size dairies grossing $900k/year with 6% margins can’t swing it. Only operations over 1,000 cows have the scale to afford what climate change now demands.

The investment? You’re looking at $150,000 to $200,000 for a mid-size place. I know, I know—that’s serious money. But REAP program data shows you’re getting that back in 6-8 years just on electricity savings. And when the next storm knocks the grid out for a week? Priceless.

Building Different (Because We Have To)

The Watts family—they zip-tied 900 fans before Helene hit. That’s dedication. But when they rebuilt that barn, they did it right.

Florida’s 2023 building code—the 8th edition for those keeping track—changed the game. We’re talking 140+ mph wind ratings now. Hurricane clips on every truss. Electrical panels must be at least 3 feet above flood stage. And those pivots? Quick-disconnects that cut removal time from two hours to maybe 20 minutes.

Some of my friends up in Wisconsin think this is overkill. Then again, they’re not dealing with Category 4 storms.

Here’s why dairy farmers are bleeding out: Traditional insurance covers 86% of infrastructure damage but only 10% of lost production over 18 months—the single largest cost at $241k. Government aid? 22% of total losses, arriving 12 months late. Farmers are left holding 78% of disaster costs with no safety net.

Insurance That Actually Works

With Risk Management Agency data showing that 53% of ag damage falls outside traditional coverage, Florida producers got creative. Had to.

Ray Hodge over at United Dairy Farmers walked me through what’s working. You layer it up: Whole Farm Revenue Protection at that new 90% level (used to be 85%). Dairy Margin Coverage at $9.50—it’s triggered payments 57% of the time over the last few years. Hurricane wind index insurance that pays automatically when winds hit certain speeds—no waiting for adjusters. And business interruption coverage for lost income during recovery.

A producer near Okeechobee said it best: “Building $300,000 in diversified revenue protection beats hoping for $25 milk.” Can’t argue with that.

Quick Reference: Insurance Layering Strategy

  • Base Layer: Whole Farm Revenue Protection (90% coverage)
  • Margin Protection: Dairy Margin Coverage ($9.50/cwt level)
  • Catastrophic Coverage: Hurricane Insurance Protection-Wind Index
  • Income Protection: Business Interruption Insurance
  • Combined Result: Closes most of the 53% coverage gap

When Everyone Needs Help at the Same Time

You probably heard about Willis Martin bringing 40 Mennonite volunteers down from Pennsylvania to rebuild Jerry Dakin’s barns after Ian. One week, they got it done. Over 100 locals showed up too—clearing debris, helping with vet work, keeping those cows milked. Dakin’s café became the community hub. It was something to see.

But by the time Milton hit—that’s the fourth major storm in thirteen months—everybody was exhausted. You could feel it.

How Things Are Changing:

What I’m seeing now is farms getting formal about what used to be handshake deals. Equipment sharing with actual legal agreements. Labor exchanges spelled out—who helps who, when, for how long. Feed purchasing co-ops with locked-in emergency prices so nobody gets gouged when disaster hits. Even evacuation partnerships with farms in Georgia and Alabama, complete with health papers ready to go.

Sara Weldon’s story from her Clermont farm during Milton really stuck with me. She spent three days prepping—brought the donkeys and goats in the house (yeah, in the house), turned the bigger animals loose in back pastures, and stockpiled everything. All her animals made it. But you could hear it in her voice afterward—the exhaustion from going through this again and again.

Florida Farm Bureau’s February 2025 mental health report hit hard: 67% of farmers reporting depression, 9% having suicidal thoughts. These are the people who make mutual aid work, and they’re running on empty.

The Hard Truth About Scale

So here’s where it gets uncomfortable. All these solutions that work—solar systems, hurricane-proof barns, feed reserves, comprehensive insurance—you’re talking about $500,000 upfront for a mid-size dairy. That’s the reality.

Jerry Dakin with 3,100 cows and $8-10 million in revenue? Plus on-farm processing? He can probably swing it. But that 300-cow family operation grossing $900,000, maybe netting $50,000-$80,000 in a good year? The math doesn’t work, and pretending it does doesn’t help anybody.

The brutal economics of climate change: Mid-size dairies with $900k revenue and 6% margins earn $54k/year—nowhere near the $500k needed for climate resilience. Meanwhile, mega-dairies with 2,500+ cows gross $25M with 15% margins. Consolidation isn’t a trend—it’s climate-driven selection pressure.

Three Ways This Is Playing Out:

Based on what Cornell’s been documenting the last few years, here’s what’s happening:

Getting Bigger (1,000+ cows): When you spread that $500,000 investment over enough production, the per-hundredweight cost becomes manageable. Plus—and we need to be honest here—these are the operations processors want to work with.

Finding Your Niche (<200 cows): Organic’s working for some folks—USDA data confirms those 50-75% premiumsare real. Grass-fed, direct sales, agritourism. But you need the right location. Affluent customers nearby. Rural Okeechobee doesn’t have that market.

Making the Hard Decision: Some are choosing to exit while they still have equity. It’s not giving up—it’s protecting what the family’s built over generations.

What doesn’t work? Trying to stay mid-size without access to capital. We lost 1,420 dairy farms in 2024—about 5% of what’s left. At this rate, projections suggest we’ll be down to 12,000 operations by 2035. That’s a conversation we need to have.

What’s interesting here is how this mirrors what’s happening in Texas coastal dairy regions. After Hurricane Harvey in 2017, they saw similar consolidation patterns—the operations that could afford flood mitigation survived, the rest didn’t. It’s not just a Florida story anymore.

The Part Nobody Talks About

Behind every spreadsheet, a farmer is asking themselves: “If I’m not doing this, who am I?”

Dr. Rebecca Purc-Stephenson, up at the University of Alberta, studies this stuff. She explained it to me once—farming isn’t a job, it’s your whole life. Your identity. Hard to separate who you are from what you do.

For families that have been farming for generations—and that’s most of Florida dairy—it’s even harder. Your grandfather made it through the Depression. Your dad survived the ’80s farm crisis. Now you might be the one who has to walk away because of hurricanes? Even when it’s not your fault, that leaves marks.

One Florida farmer—he asked me not to use his name—described the stages. First, you deny it’s that bad. Then you’re confused when routines disappear. Angry at banks, government, anybody who can’t help fast enough. Guilty about what you should’ve done different. And sometimes, depression that gets dangerous.

“When those cows are gone and everything stops,” he said, “it feels like someone in the family died.” But asking for help? That goes against everything we’ve been taught about being self-reliant. It’s a trap where the folks who need help most are least likely to ask for it.

What the Rest of Us Can Learn

After spending time with these Florida farmers, three big lessons stand out:

First: Financial Resilience Is Everything

Build 6-12 months of operating capital. I know that’s way more than the 30-60 days we’ve always managed on, but it matters. Layer your insurance to close gaps—and actually read those policies. Set up credit lines with disaster triggers before you need them. And decide your exit criteria now, while you’re thinking clearly.

Second: Formalize Your Networks Before Crisis

Get agreements in writing—handshakes don’t hold up under this kind of stress. Fund coordinator positions to prevent volunteers from burning out. Build relationships with farms in different climate zones. And integrate mental health support before people need it—because by then, it’s often too late.

Third: Accept That Some Things Can’t Be Fixed

Sometimes a region’s climate changes beyond what certain types of farming can handle. Better to choose proactively between scaling up, finding a niche, or transitioning than to have the market force it on you. Push for policies that help all farm sizes, not just the biggest. And consider that a managed transition might beat chaotic collapse.

Where We Go from Here

The numbers don’t lie: 16,103 dairy farms vanished between 2017-2024 (a 41% decline) while farms with 1,000+ cows captured an ever-larger share of milk production—now 72% of the U.S. total. Climate disasters are accelerating what economics started. By 2030, projections suggest just 15,000 farms will remain, with mega-dairies controlling 80% of production.

What Florida dairy farmers learned the hard way is that climate patterns are changing faster than we can adapt to them. Four hurricanes in thirteen months isn’t bad luck—NOAA’s 2024 reports make it clear this is the new pattern.

The farms surviving aren’t always the best managed or the ones with the strongest communities—though both matter. More and more, they’re the ones with capital access and enough scale to justify big infrastructure investments. That’s accelerating consolidation, whether we like it or not.

But here’s what gives me hope: Florida farmers have innovated like crazy. Solar systems that keep operations running when the grid fails. Formal mutual aid replacing informal arrangements. Risk management strategies that actually work. These are blueprints other regions can use.

Commissioner Simpson got it right, talking to the Cattlemen’s Association: “Food production is not just an economic issue, it’s a matter of national security.” The question is: will we learn from Florida’s experience, or wait for our own disasters to teach us the same lessons?

What You Can Do Right Now

If you’re farming today: Check your working capital. Less than six months? Building reserves beats any expansion plan. Review every insurance policy for gaps—especially business interruption and parametric products. Get your mutual aid relationships on paper. Define your triggers: What would make you exit? What would force it?

Planning ahead: Figure out if your operation size sets you up for long-term success. Look at cooperative approaches to share infrastructure costs. Build relationships outside your climate zone. And consider revenue beyond just milk—diversification is adaptation, not defeat.

Long-term thinking: Accept that some regions might not support certain farming anymore. Understand that resilience might mean transition, not staying put forever. Know that climate adaptation favors bigger, better-funded operations. Plan for weather volatility as the new normal.

Florida’s dairy farmers deserve more than just credit for resilience. Through incredible hardship, they’ve given the rest of us a real education in what climate adaptation actually costs—in dollars and in human terms.

We can learn from what they’ve been through, or we can learn it the hard way ourselves. Unlike the weather, at least that choice is still ours to make.

Key Takeaways: 

  • Your survival number is 6-12 months reserves, not 30-60 days: Florida farms with deep reserves weathered $13,400 monthly losses for 18 months. Everyone else is gone.
  • Climate resilience costs $500K (solar, construction, insurance): Operations that can’t afford it have three options—scale up past 1,000 cows, find premium niches under 200 cows, or exit now.
  • The $380,000 decision window: Exit strategically at month 8-10 and preserve family wealth, or watch it evaporate by month 18 in forced liquidation.
  • Mutual aid has limits—formalize before you need it: After four hurricanes, volunteer networks are exhausted, and 67% of farmers report depression. Written agreements and funded coordinators beat handshakes.
  • Florida’s present is agriculture’s future: Every region facing climate intensification will see this same pattern—only capitalized operations survive repeated disasters.

Complete references and supporting documentation are available upon request by contacting the editorial team at editor@thebullvine.com.

Learn More:

The Sunday Read Dairy Professionals Don’t Skip.

Every week, thousands of producers, breeders, and industry insiders open Bullvine Weekly for genetics insights, market shifts, and profit strategies they won’t find anywhere else. One email. Five minutes. Smarter decisions all week.

NewsSubscribe
First
Last
Consent

The $20,000 Fresh Cow Feeding Mistake Most Dairies Make (And How Michigan State’s Research Can Fix It)

Your nutritionist has you feeding three fat sources to fresh cows? Michigan State just proved that one works identically. Same 5-6 kg ECM boost. Same health. $20,000 less cost. The biology is eye-opening.

Executive Summary: You’re probably feeding multiple fat sources to fresh cows and wasting thousands each year—Michigan State just proved that one source works just as well. Dr. Adam Lock’s research shows that single-source supplementation at 3% dietary fat produces the same 5-6 kg ECM boost as expensive 4.5% combinations, but costs $0.42 less per cow per day. Why? Fresh cows have biological ceilings on fat processing—their intestines, rumens, and livers can only handle so much, making extra supplementation literally worthless. Choose whole cottonseed for high-starch rations or calcium salts for strong forage programs, but stop combining them—you’re throwing $20,000 yearly (500-cow herd) into the manure lagoon. The ROI difference is staggering: 228% for single-source versus 118% for combinations. Bottom line: More fat doesn’t mean more milk—it just means more cost.

dairy fat supplementation

So I was having coffee with a producer outside Madison last week, and he said something that really stuck with me. “Twenty years ago,” he told me, “my nutritionist had me feeding one fat source. Today? I’m feeding three different ones and honestly can’t tell you if they’re all necessary.”

You know, that resonates across the industry right now. Walk through most feed centers these days and you’ll find whole cottonseed, palmitic acid supplements, maybe some bypass fats… it’s basically a nutritional insurance policy that’s getting more expensive every year. And here’s what’s interesting—we’re all wondering whether this approach is actually delivering returns or just adding complexity.

Michigan State proved the controversial truth: single-source at 3% dietary fat produces identical milk as expensive 4.5% combinations—same 5-6 kg ECM boost, $20K less cost

Recent work from Dr. Adam Lock’s team up at Michigan State offers some compelling insights that might reshape how we think about all this. Their research, published in the Journal of Dairy Science in 2023 (Volume 106, pages 8667-8680), found something that really challenges what we’ve been doing. Turns out, cows fed a single fat source at 3% total dietary fatty acids produced 5-6 kg more energy-corrected milk daily compared to controls. But here’s the kicker—that’s exactly what cows receiving those expensive combination approaches at 4.5% total fat achieved too. Same results, but we’re paying for 50% more fat supplementation.

ROI comparison reveals single-source fat supplementation delivers 228% return versus just 118% for expensive combinations—nearly double the profitability for identical milk production

Understanding the Biological Framework

You know how the traditional thinking goes—fresh cows face massive energy deficits, fat provides concentrated energy, so more fat sources should help bridge that gap. Makes sense, right? It’s driven our supplementation strategies for decades.

But Dr. Lock, who’s spent over a decade investigating fatty acid metabolism at Michigan State’s Department of Animal Science, suggests we might be looking at this all wrong. “What we’re seeing,” he explains, “is that fresh cows aren’t simply energy-deficient—they’re processing-limited. Their intestinal absorption, rumen fermentation, and liver metabolism create biological ceilings that we can’t simply override with more inputs.”

This builds on what many of us have observed in the field for years. We’ve watched producers add supplemental fat sources, maintain stable production, yet see feed costs steadily climb. The cows appear healthy, milk flows well, but margin pressure… well, it quietly intensifies.

The Three Processing Bottlenecks

Here’s what the research identifies: three critical constraints that help explain why additional supplementation doesn’t necessarily translate into better performance.

So first, consider intestinal absorption capacity. Work from multiple research groups—including foundational studies by Doreau and Chilliard back in 1997, as well as more recent confirmations by Lock and Bauman—demonstrates that fatty acid digestibility follows a predictable pattern. At moderate intake levels, we’re seeing 80-85% digestibility. But push total dietary fat above 5-6% of dry matter, and that drops to 65-75%.

Intestinal capacity limits hit hard above 5% dietary fat—digestibility plummets from 82.5% to 70%, wasting 30% of expensive supplements in the manure lagoon

Why does this matter? Well, the small intestine requires bile salts and lysolecithin to form micelles—think of them as molecular structures that transport fatty acids across the intestinal wall. There’s a finite capacity here. And when we exceed it? Those expensive supplements we’re feeding end up contributing more to manure nutrient value than milk production.

The second constraint involves our rumen microbial populations. Research published in Animal Feed Science and Technology demonstrates that excessive unsaturated fatty acid loads force bacteria to shift their metabolism. Instead of following normal trans-11 biohydrogenation pathways, they switch to trans-10 pathways that produce compounds that actively suppress milk fat synthesis. It’s actually counterproductive.

And then there’s the third bottleneck at the liver. Fresh cow hepatic metabolism is already under tremendous strain. Drackley’s work from 1999, along with more recent studies by Ospina and colleagues in 2010, shows plasma NEFA concentrations spiking to 0.8-1.0 mEq/L in early lactation—that’s a four- to five-fold increase from the pre-calving baseline. When you add substantial dietary fat loads on top of endogenous mobilization, you’re asking the liver to exceed its metabolic capacity.

Quick Decision Guide: Cottonseed vs. Calcium Salts

Decision FactorChoose Whole Cottonseed When:Choose Calcium Salts When:
Base Ration StarchExceeds 26-28% of dry matterControlled below 26% of dry matter
Forage QualityLimited access to quality foragesExcellent forage program (peNDF >22%)
Heat StressTHI is regularly above 72Moderate climate conditions
Storage InfrastructureAdequate commodity handling is availableLimited storage capabilities
Milk PricingComponent pricing is moderateButterfat premiums >$2.50/lb over base
Fiber NeedsNeed additional effective fiberBase ration of fiber is already adequate
Primary GoalStabilize rumen functionMaximize milk fat synthesis

Economic Realities in Today’s Market

Let’s translate this biology into economics. Current market conditions—and I’m looking at USDA Agricultural Marketing Service data from October 2025—show whole cottonseed trading at around $220-250 per ton, though prices vary considerably by region and quality. California producers might see the lower end, while operations in the Northeast often face the higher range due to transportation costs.

Calcium salts of palmitic and oleic acids… that’s a different investment level entirely. We’re typically looking at $1,800-2,200 per ton, depending on volume and supplier relationships. Some operations negotiate better rates, but these figures represent what most producers encounter.

The Michigan State research suggests that the combination approach costs approximately $0.42 more per cow per day than single-source supplementation, with no production advantage. So for different herd sizes, the annual implications become pretty substantial:

You’ve got a 100-cow operation? That’s roughly $4,000 in additional cost. Scale that to 300 cows, and we’re discussing $12,000. For 500-cow dairies—which are increasingly common as consolidation continues—that’s $20,000. And larger operations feeding 1,000 cows or more? They could be looking at $40,000 annually.

Annual savings scale with herd size: 500-cow operations save $20,000 yearly by ditching combination feeding for strategic single-source supplementation

What’s particularly striking in the data is how return on investment shifts. Single-source strategies in the Michigan State trials delivered 228-231% ROI. The combination approach? Just 118%, despite requiring greater investment.

“What surprised us was discovering our combination feeding approach was actually driving higher NEFA concentrations. We thought more energy supplementation would reduce body fat mobilization, but we were creating metabolic stress instead.” – Central Valley dairy producer implementing monitoring protocols

Strategic Selection: Matching Supplement to System

Here’s the thing—the choice between whole cottonseed and calcium salt supplements isn’t about which is inherently superior. It’s about matching the tool to your specific situation.

When Cottonseed Fits Best

I spoke recently with a producer near Green Bay who made an important observation. His operation was pushing starch levels near 30% of dry matter, trying to maximize energy density. “Adding calcium salts to that situation,” he explained, “was like adding fuel to a fire that was already burning too hot. Cottonseed gave us energy but also brought fiber that helped stabilize the whole system.”

And this aligns with the biological understanding. Operations running higher starch levels—approaching 28-30% of dry matter—often benefit from cottonseed’s dual contribution. The intact seed coat provides a time-release mechanism, delivering oil gradually over 12-24 hours rather than flooding the system. Plus, that effective fiber component helps maintain rumen mat integrity and supports more stable fermentation.

Heat stress considerations matter significantly, too. Research from Lock’s group indicates that whole cottonseed maintains feed intake more effectively during heat-stress periods because its lower fermentation rate generates less metabolic heat. For operations in Arizona, New Mexico, or even during increasingly hot summers in traditional dairy regions, this becomes critical when the temperature-humidity index regularly exceeds 72.

And you can’t overlook storage infrastructure either. Cottonseed requires proper commodity storage—covered, well-ventilated, with moisture control. Operations lacking these facilities might find the handling challenges outweigh potential benefits.

When Calcium Salts Excel

On the flip side, operations with strong forage programs often maximize returns from calcium salt supplementation. If you’re maintaining physically effective fiber above 22% with quality alfalfa or grass hay, you don’t need cottonseed’s fiber contribution—you need concentrated, targeted energy delivery.

The fatty acid profile matters here. Most commercial calcium salt products feature a 60:30 palmitic-to-oleic ratio, which Lock’s recent research suggests offers specific advantages. Palmitic acid directly drives milk fat synthesis, while oleic acid helps maintain insulin sensitivity and moderates body condition loss during early lactation.

Component pricing drives this decision, too. With the Federal Milk Marketing Order adjustments that went into effect June 1st, 2025, we’re seeing shifts in how components are valued. When processors pay strong butterfat premiums—and some regions are seeing $2.50-3.50 per pound over base—the enhanced milk fat response from palmitic acid supplementation can justify the investment. Provided you’re operating within biological capacity limits, that is.

Monitoring What Matters

Making the transition from combination to single-source supplementation requires systematic monitoring to validate outcomes. And progressive operations are tracking several key metrics.

Body condition score change remains fundamental. You want to target less than 0.5 units of loss from calving through day 21. Ospina’s research showed cows exceeding this threshold face 61% higher hyperketonemia risk, while Shin documented five-fold increases in pregnancy loss rates. If your supplementation strategy drives excessive mobilization, you’re creating cascading problems throughout lactation.

The milk fat-to-protein ratio at the first test provides valuable insight, too. Ratios exceeding 1.5-1.6 suggest a severe negative energy balance was occurring 10-14 days prior, according to University of Wisconsin Extension guidelines. Now, this lag means you’re always looking backward, but patterns across fresh pen groups reveal systemic issues versus individual cow problems.

Blood NEFA testing at days 3-6 postpartum offers an early warning system. Cornell University’s Animal Health Diagnostic Center has long recommended targeting below 0.6 mEq/L, with concern rising when more than 10% of sampled cows exceed 0.7 mEq/L.

Blood NEFA levels reveal metabolic stress: fresh cows spike 4-5x above baseline, and exceeding 0.7 mEq/L triggers 61% higher ketosis risk—combination feeding often makes this worse

A Central Valley producer I work with implemented these monitoring protocols last year. “What surprised us,” she noted, “was discovering our combination feeding approach was actually driving higher NEFA concentrations. We thought more energy supplementation would reduce body fat mobilization, but we were creating metabolic stress instead.”

Broader Industry Context

You know, this research emerges at a particularly relevant time. Milk price volatility combined with elevated feed costs—just look at the latest USDA Economic Research Service reports from October 2025—means efficiency increasingly determines profitability rather than pure production volume.

Dr. Lock frames it well: “We’ve moved past the era where simply adding expensive ingredients guarantees returns. Biology has limits, and understanding those limits separates thriving operations from those merely surviving.”

The science continues evolving, too. Michigan State’s work with high-oleic soybeans offers intriguing possibilities for operations growing their own feedstuffs. These varieties contain 75-80% oleic acid, compared with conventional soybeans’ 50% linoleic acid profile, potentially providing homegrown solutions for optimizing fatty acid supplementation.

Looking forward, precision feeding technologies will enable even more targeted supplementation. Several research institutions are field-testing sensors measuring milk fatty acid profiles at each milking, with automatic supplementation adjustments based on individual cow needs. Sure, it sounds futuristic, but remember—robotic milking seemed equally far-fetched just two decades ago.

International Perspectives Worth Considering

What’s fascinating is seeing how different production systems worldwide approach fat supplementation through various lenses. Pasture-based systems, in particular, have discovered that timing often matters more than source selection. They’re using milk fatty acid profiling to guide supplementation decisions during transitions between grazing and stored feeds—insights that are applicable to any operation managing seasonal feed changes.

European operations, particularly in regions with strict nutrient management regulations, have focused intensively on efficiency rather than maximization. Their experience suggests single-source supplementation matched to specific production phases often delivers superior economic and environmental outcomes.

Key Takeaways for Implementation

So several principles emerge from both research and field experience:

First, respect biological processing limits. The Michigan State data clearly indicates that pushing beyond 3% total dietary fat often means paying for supplements that deliver no additional benefit. This isn’t about feeding less—it’s about feeding smarter.

Second, match your strategy to your system. Either cottonseed or calcium salts can deliver excellent returns when properly implemented. The combination approach appears to waste resources while producing identical results. Base your choice on ration composition, infrastructure capabilities, and component pricing rather than following generic recommendations.

Third, consider timing carefully. Lock’s team has shown that delaying high-palmitic supplementation until after day 21-28 postpartum can prevent excessive body condition loss while still capturing milk fat benefits. Fresh cow nutrition isn’t just about what to feed, but when to feed it.

Fourth, invest in monitoring. Don’t wait for monthly test days to reveal problems. Systematic tracking of body condition, metabolic markers, and milk components catches issues while there’s time for correction. The testing investment pays dividends through prevented metabolic crises.

And finally, evaluate true economics. Look beyond ingredient cost per ton to assess income over feed cost, factoring in component premiums, health outcomes, and reproductive impacts. That “expensive” single-source strategy might actually reduce total cost when all factors are considered.

The Path Ahead

What’s encouraging is that the Michigan State research provides clarity in an area often clouded by conflicting advice. Strategic single-source fat supplementation respects the biology of the fresh cow while delivering strong economic returns.

For a typical 500-cow dairy, transitioning from a combination to a single-source supplementation system could yield $20,000 in annual savings without sacrificing production. As margins continue tightening industry-wide, these are opportunities worth serious consideration.

And here’s what I find particularly encouraging—implementation doesn’t require new technology or infrastructure investment. It’s about understanding biological constraints and making more informed decisions with familiar ingredients.

The operations that’ll thrive in 2026 and beyond are those that embrace evidence-based nutrition strategies. The kitchen-sink approach served its purpose when we understood less about the metabolism of fresh cow milk. But now that we know better, we can do better.

The fundamental question has evolved, you know? It’s no longer whether to supplement fat to fresh cows—that value is established. The question now is which source, at what inclusion rate, during which timeframe, and within what biological constraints. Answer those questions correctly, and you’re not just feeding cows… you’re optimizing a complex biological system for maximum efficiency and profitability while respecting the fundamental limits that govern metabolic function.

This represents a more sophisticated approach to dairy nutrition—one that acknowledges that more isn’t always better, that biology has boundaries, and that respecting those boundaries often leads to superior outcomes both economically and metabolically.

Key Takeaways:

  • One fat source = Same milk, less cost: Single-source supplementation (3% dietary fat) matches combination results (4.5%) while saving $20,000/year per 500 cows
  • Biology has limits—respect them: Fresh cows max out fat processing at intestines (digestibility drops 85%→65%), rumen (bacteria shift to harmful pathways), and liver (NEFA overload)
  • Choose based on your ration: Cottonseed for high-starch operations needing fiber; calcium salts for strong forage programs chasing butterfat premiums—but never both
  • ROI tells the story: Single-source delivers 228% return vs. 118% for combinations—that’s nearly double the profitability for identical production

Complete references and supporting documentation are available upon request by contacting the editorial team at editor@thebullvine.com.

Learn More:

The Sunday Read Dairy Professionals Don’t Skip.

Every week, thousands of producers, breeders, and industry insiders open Bullvine Weekly for genetics insights, market shifts, and profit strategies they won’t find anywhere else. One email. Five minutes. Smarter decisions all week.

NewsSubscribe
First
Last
Consent

China’s 42 Million Tonne Milk Mountain: What Every Dairy Farmer Needs to Know About the Industry’s Biggest Shift Since Mechanical Milking

Your banker knows. Your co-op won’t say it. China’s birth crisis means your 300-cow dairy has 90 days to decide its fate. Here’s how.

EXECUTIVE SUMMARY: China’s 42 million tonne milk mountain isn’t temporary—it’s the product of a 48% birth rate collapse that permanently eliminates demand for 5% of global milk production. If you’re running a 200-500 cow dairy, this structural shift means you’re losing $359,609 annually compared to 2,000-cow operations, a gap that superior management cannot close. With milk prices locked at $16.50-18.00/cwt through 2027, you have exactly three viable options: borrow $8-15 million to scale beyond 1,500 cows, pivot to premium markets with guaranteed contracts (organic, A2, grass-fed), or execute a strategic exit that preserves your equity. The difference between acting now and waiting is stark—strategic exit today nets 70-85% of equity ($1.5M), while forced liquidation in 12 months recovers just 30-50% ($700K). Every month of indecision bleeds $23,000-55,000 through operating losses and accelerating asset depreciation. Your Q1 2026 decision isn’t about whether you’re a good farmer—it’s about whether you’ll control your family’s financial future or let market forces decide for you.

dairy farm business strategy

Let me share something that’s been on my mind lately—and I think it deserves careful attention from every dairy farmer reading this. China’s sitting on 42 million tonnes of surplus milk, based on their agriculture ministry’s September reports. That’s roughly 5% of global production, just… sitting there. And here’s what’s interesting: this isn’t your typical market cycle that we’ve all weathered before.

You know, I’ve been digging through the data, talking with economists at Cornell and Wisconsin’s dairy programs, and what’s emerging is a picture that’s fundamentally different from anything we’ve navigated since—well, probably since we all switched from hand milking to mechanical systems. Understanding why this time really is different —and knowing what steps to take right now —could make all the difference for your operation over the next 24 months.

Why This Crisis Breaks All the Old Patterns

So I was looking back at my notes from the 2009 downturn the other day. Remember that one? USDA data shows all-milk prices bottomed out at $11.30 per hundredweight in July 2009, then bounced right back within 12 months. The 2016 slump—you remember, when Russia imposed an embargo and the EU eliminated quotas—that stabilized within 18-24 months, according to the dairy network analysis I’ve been reviewing. Even COVID, for all its disruption, saw our sector adapt remarkably well within months. There’s actually some fascinating research in the Journal of Dairy Science from 2021 documenting how quickly we pivoted.

But China? This is something else entirely.

What farmers are discovering—and China’s National Bureau of Statistics backs this—is that we’re dealing with a demographic reality nobody can fix. Their birth rate collapsed from 12.43 per 1,000 people in 2016 to just 6.39 in 2023. That’s a 48% decline, folks. The population of kids aged 0-3… you know, the ones drinking all that infant formula? Down from 47 million to 28 million in just five years. Those babies don’t exist and won’t magically appear if milk prices recover.

The numbers don’t lie: China lost 19 million formula consumers (40% decline) while birth rates crashed 48%. This isn’t a cycle—it’s permanent demand destruction that eliminates 5% of global milk consumption. Your 2027 milk price depends on markets that will never return.

Here’s what happened: After that horrific 2008 melamine scandal—six babies died, 300,000 were hospitalized according to World Health Organization reports—Beijing went all-in on dairy self-sufficiency. The Chinese began importing hundreds of thousands of Holstein cattle in 2019, according to the customs data I’ve been reviewing. Average herd sizes grew 40% year-over-year through late 2023, if you can believe it. They hit 85% self-sufficiency, up from about 70%—exactly what they wanted. Problem is, they built all this capacity assuming demand would keep growing.

Now here’s where it gets really unusual. Chinese raw milk prices have been underwater for over two years—sitting at 2.6 yuan per kilogram against production costs of 3.8 yuan, based on China Dairy Industry Association data from October. Farmers there are literally paying to produce milk. Yet production continues, propped up by government subsidies, soft loans from state banks, and political imperatives that… well, they just don’t follow normal market rules.

The Hard Math Behind Mid-Size Dairy Challenges

USDA’s Agricultural Resource Management Survey data reveal a stark cost differential across farm sizes. And this isn’t about who’s a better farmer—it’s about structural economics that management alone can’t overcome.

Looking at production costs per hundredweight from the USDA’s dairy cost and returns estimates:

  • Farms with fewer than 200 cows: generally running $23.68-33.54/cwt
  • 200-499 cows: around $20.85/cwt
  • 500-999 cows: typically $18.93/cwt
  • 1,000-1,999 cows: averaging $17.39/cwt
  • 2,000+ cows: down to $16.16/cwt
The brutal economics of scale: Mid-size operations face an automatic $4.69/cwt cost disadvantage ($359,609 annually for a 300-cow dairy) that no amount of management skill can overcome. Market prices lock them into structural losses through 2027.

With USDA’s World Agricultural Supply and Demand Estimates showing milk prices at $16.50-18.00/cwt through 2026-2027, you can see the problem pretty clearly. A 300-cow operation faces production costs about $4.69/cwt higherthan a 2,000-cow operation. On annual production of, say, 76,650 cwt, that’s a $359,609 competitive disadvantagebefore you even wake up in the morning.

What’s really interesting is research by agricultural economists at Wisconsin showing that management quality accounts for only about 22% of the variance in profitability. The other 78%? That comes from herd size and the resulting cost structure. Labor costs alone create roughly a $2.60/cwt difference between mid-size and large operations. Fixed overhead adds another $3.33/cwt disadvantage. Even feed costs—where you’d think everyone’s buying the same corn—show about a $1.40/cwt advantage for large operations through volume purchasing and precision nutrition programs.

You just can’t manage your way out of that kind of structural disadvantage, no matter how good you are. And believe me, I’ve seen some excellent managers struggle with this reality.

Three Paths Forward: Finding Your Best Option

After talking with farm management specialists at Penn State Extension and Farm Credit consultants across the Midwest, three viable paths keep emerging for dairy operations facing this transformation. Each has specific requirements that need honest evaluation.

Path 1: Scale to Competitive Size (1,500-2,500+ cows)

I’ve noticed that farmers considering expansion need to tick quite a few boxes before this makes sense. Agricultural lenders at CoBank and Farm Credit are generally looking for:

  • Debt-to-asset ratio below 40% before you even start
  • At least $300,000-600,000 in working capital reserves (expansion disrupts cash flow for 12-24 months, as many of us have learned the hard way)
  • Access to $8-15 million in financing
  • Another 500-800 acres of land are available
  • Confirmation from your processor that they can handle the additional volume

As consultants like Tom Villenga in Wisconsin often explain, it typically takes 18-24 months from groundbreaking to positive cash flow. And farmers need to understand—you’re not really farming at that scale anymore. You’re managing 8-15 employees and running a business. It’s a completely different skill set.

Path 2: Pivot to Premium Markets

This development suggests a real opportunity for the right operations. Organic milk premiums are running $8-12/cwt over conventional, based on CROPP Cooperative’s October market reports. But location matters enormously here.

Economists at Cornell’s Dyson School have documented that you need to be within 75 miles of a metro area with a population of 250,000+ to make premium markets work. The affluent consumers who pay those premiums are concentrated in specific geographic areas—that’s just the reality of it.

What farmers are finding crucial: secure your premium buyer contracts before beginning any conversion. I keep hearing stories—you probably have too—of operations that completed expensive organic transitions only to discover no premium buyers existed in their region. That’s a tough spot to be in.

The conversion timeline’s no joke either. It’s a full three years before you see those organic premiums, based on USDA’s National Organic Program guidelines. During that time, you’re incurring organic costs while still selling at conventional prices. Budget $50,000-100,000 for a 300-cow operation to make that transition, based on case studies from Vermont’s sustainable agriculture program.

Path 3: Strategic Exit While Preserving Equity

Nobody likes talking about this option, but sometimes it’s the smartest move. Industry consultants like Gary Sipiorski at Vita Plus, who’s been working with dairy operations for decades, often point out that strategic exit while you’re solvent preserves 70-85% of equity. Forced liquidation after covenant violations? You’re looking at 30-50% if you’re lucky.

Here’s something most farmers don’t know about: Section 1232 of the bankruptcy code can save substantial capital gains taxes for farmers with highly appreciated land. Agricultural bankruptcy attorneys who specialize in this area explain that if appropriately executed before selling assets, farmers can save $200,000-500,000 in capital gains taxes through a strategic Chapter 12 filing. It’s worth understanding these provisions even if you hope never to use them.

The indicators suggesting this path include working capital trending below 6 months of operating expenses, being 55+ without a committed next generation, or simply having no viable path to profitability at forecast milk prices.

The Asset Value Reality Nobody Discusses

What’s particularly concerning—and I don’t hear this discussed nearly enough at co-op meetings—is how quickly farm asset values deteriorate when a region’s dairy sector struggles.

Mark Stephenson at Wisconsin’s Center for Dairy Profitability has done extensive work on this. When dairy becomes structurally unprofitable in a region and multiple farms exit simultaneously, those anticipated liquidation values farmers count on for retirement… they simply evaporate.

Think about it. Land you believe is worth $9,000 per acre based on that sale down the road last year? When 8-12 dairy farms in your county hit the market simultaneously with no qualified buyers, you might see $6,000-6,500. I’ve watched it happen in several Wisconsin counties over the past three years, and it’s heartbreaking.

Equipment values face the same compression. That 2018 John Deere you figure is worth $75,000? When six similar tractors are at auction within 50 miles, you might get $48,000. And dairy-specific infrastructure—milking parlors, freestall barns—they become nearly worthless without other dairy farmers to buy them.

Based on Farm Financial Standards Council accounting principles, farms in declining dairy regions face combined monthly wealth destruction of $23,000- $ 55,000 from operating losses and asset depreciation. Your farm’s value isn’t static—it’s changing every month based on regional dynamics.

Time destroys wealth faster than you think. A 300-cow operation valued at $1.5M today becomes $322K in 12 months—78% wealth destruction. Strategic exit today preserves $1.16M (77.5%). Forced liquidation after covenant violations leaves you with $323K (21.5%). That’s a $839,700 difference for waiting one year.

What Co-ops Are Saying vs. Market Reality

Comparing cooperative messaging against actual market data reveals… well, let’s call it a disconnect.

When co-ops say “market conditions will stabilize by late 2026,” they’re technically correct—USDA projects Class III prices around $18-19/cwt. But here’s what they’re not emphasizing: that’s still below breakeven for operations under 1,000 cows while remaining profitable for 2,000+ cow operations. In other words, “stabilization” actually accelerates consolidation rather than providing relief.

This disconnect partly stems from structural conflicts within the cooperative model itself. Market analysts like Phil Plourd at Blimling and Associates have documented how co-ops need maximum milk volume to spread fixed processing costs. They have an incentive to keep members producing, even at a loss—it’s just the nature of the cooperative structure.

What really caught my attention was data from the National Milk Producers Federation showing that DFA lost over 500 member farms in 2023. They’re anticipating shrinking from current levels to around 5,100 farms by 2030. That’s roughly a 9-10% annual attrition rate among their membership. If co-ops are successfully supporting family farms, why are 280+ farms leaving each year?

Looking Ahead: The 2028 Dairy Landscape

Based on consolidation trends documented by Rabobank’s dairy research group and factoring in China’s sustained market pressure, here’s what I think we’re looking at:

Total U.S. dairy farms will likely decline from today’s roughly 31,000 to somewhere around 20,000-22,000 by 2028—that’s a 29-35% reduction. But the distribution shift is even more dramatic.

Operations with 2,000+ cows, currently about 800 farms producing 46% of U.S. milk, will probably expand to 1,200-1,400 farms producing 60-65%. Meanwhile, that middle tier—200-999 cow operations in commodity production—faces a 75-85% reduction. It’s stark, but that’s what the data suggests.

What’s emerging are essentially three viable farm types:

  1. Industrial-scale operations (2,000-5,000+ cows) competing on efficiency
  2. Premium/niche producers (100-800 cows) capturing substantial price premiums
  3. Lifestyle farms (<100 cows) subsidized by off-farm income

The middle? It’s disappearing. And that’s a huge change for our industry.

Your Action Plan: Practical Steps for Right Now

For farmers reading this in late 2025, your window for strategic decision-making is measured in months, not years. Here’s what I’d suggest doing immediately:

This week: Calculate your true working capital per cow. Take current assets minus current liabilities, divide by cow count. If you’re below $800 per cow, you need to act fast.

Schedule a frank conversation with your banker about exactly where you stand relative to loan covenants. Don’t wait for them to call you—be proactive about it.

Have an honest family discussion about the farm’s actual financial position. I know these conversations are tough, but they’re essential.

And listen, if stress is affecting your sleep, relationships, or wellbeing, please reach out for help. The National Suicide Prevention Lifeline at 988, Farm Aid at 1-800-FARM-AID, and Iowa Concern at 1-800-447-1985 all have counselors who understand what you’re going through. There’s no shame in needing support—we all do sometimes.

Within 30 days: Engage an independent agricultural consultant—not your co-op field rep—for an honest viability assessment. Yes, it’ll cost $2,000-5,000, but it could save you hundreds of thousands in the long run.

Meet with an agricultural attorney who understands Section 1232 provisions and strategic options. Get real liquidation values for your assets from agricultural appraisers, not optimistic book values.

Develop three scenarios with your family: scale up, premium pivot, or strategic exit. Run the numbers on each. Be honest about what’s realistic for your situation.

The Success Story: Learning from Those Who’ve Navigated Change

Let me share a story about a family I’ll call the Johnsons—they represent what I’m seeing across eastern Iowa and similar situations throughout the Midwest. Third-generation dairy farmers with 380 cows faced this exact decision in early 2024, when working capital started to dwindle.

After careful analysis with their consultant, they executed a strategic exit in May 2024, using Section 1232 provisions to preserve an additional $180,000 in capital gains taxes. Today? They’re debt-free. The husband works as a herd manager for a 2,500-cow operation nearby. They kept their house and 40 acres. Their adult daughter started veterinary school this fall.

But let me be honest about something—when he talked with me about it, he said it was the hardest year of his life. “Watching that auction… seeing our cows loaded on someone else’s trailer… I couldn’t watch. Had to walk away.” His voice caught a bit. “Four generations of Johnsons milked those cows. Four generations.”

The identity crisis is real. The sense of failure—even when you’re making the smart financial decision—it’s overwhelming. He told me he didn’t go to the coffee shop for three months because he couldn’t face the questions. Couldn’t face being “the Johnson who lost the farm,” even though he’d actually saved his family’s financial future.

“But you know what?” he continued, “Looking at our grandkids playing in the yard, knowing they’ll have college funds, knowing we can sleep at night without worrying about milk prices… we made the right call. Hardest thing I ever did. Also, the smartest.”

That’s the kind of brutal honesty we need right now. Strategic exit isn’t failure—it’s protecting what matters most. But that doesn’t make it easy.

Key Takeaways for Your Decision

What this all boils down to is understanding that we’re experiencing a structural transformation, not a typical cyclical downturn. China’s demographic shift and production surplus represent permanent changes to global dairy demand—at least for the foreseeable future.

The $3-5/cwt cost advantage that 2,000+ cow operations enjoy over 200-500 cow farms simply can’t be overcome through better management. It’s structural, and we need to accept that reality.

Every month of delay in stressed markets costs not just operating losses but also substantial asset-value deterioration—that hidden wealth destruction that nobody talks about at the coffee shop.

Three paths remain viable for most operations: scaling to 1,500+ cows if you have the resources, pivoting to premium markets with guaranteed contracts, or executing a strategic exit while preserving equity.

The window for making these decisions strategically rather than under duress is closing. Industry dynamics suggest farmers need to commit to their chosen path by the end of Q1 2026.

And please, remember this: with farmer suicide rates running 3.5 times the national average according to CDC data, no amount of farm equity is worth sacrificing your wellbeing or family relationships. Your family needs you more than they need the farm.

The dairy industry’s undergoing its most significant transformation in generations. Like that shift from hand milking to mechanical systems, this change will determine which farms exist in 2028 and which become memories. The farmers who acknowledge this reality and act decisively—whether scaling up, pivoting to premium, or strategically exiting—will be the ones sharing stories of resilience rather than regret.

The choice, and the timeline, are yours. But that window for making the choice? It’s closing faster than most of us realize. What matters now is making an informed decision while you still have options.

KEY TAKEAWAYS:

  • This is structural, not cyclical: China’s 42 million tonne surplus reflects permanent demand loss from a 48% birth rate collapse—recovery isn’t coming
  • Your management can’t fix physics: 300-cow dairies face an automatic $359,609 annual disadvantage versus 2,000-cow operations at any skill level
  • Three paths remain viable: Scale past 1,500 cows ($8-15M investment), pivot to premium markets with secured contracts, or execute strategic exit today at 70-85% equity (vs. 30-50% in forced liquidation)
  • Every month costs $23,000-55,000: Operating losses plus hidden asset depreciation are turning $1.5M farms into $700K distressed sales
  • Control your exit or it controls you: Make your decision by Q1 2026 while you have options—after that, loan covenants decide your fate

Complete references and supporting documentation are available upon request by contacting the editorial team at editor@thebullvine.com.

Learn More:

The Sunday Read Dairy Professionals Don’t Skip.

Every week, thousands of producers, breeders, and industry insiders open Bullvine Weekly for genetics insights, market shifts, and profit strategies they won’t find anywhere else. One email. Five minutes. Smarter decisions all week.

NewsSubscribe
First
Last
Consent

Cut Lameness 50% in 12 Months: The $95,000 Strategy Top Dairies Use (But 80% Still Ignore)

Your competition is turning $67,400 lameness losses into $348,000 gains. They’re using three strategies you’re probably ignoring.

EXECUTIVE SUMMARY: While the average dairy hemorrhages $67,400 annually from 20% lameness rates, top operations have cracked the code—transforming this drain into $348,000 in captured value through improved cow longevity, reproduction, and feed efficiency. The winning formula combines three proven strategies: a hybrid trimming model (professional expertise plus in-house response) that costs $62,700 but eliminates expensive treatment delays, strategic timing that generates an extra $308 per cow simply by trimming after 110 DIM, and—most powerfully—paying employees bonuses tied directly to lameness reduction. One Wisconsin operation invested $65,000 in a dedicated Hoof Health Coordinator position and saved $95,000 within 12 months by dropping lameness from 24% to under 10%. With modern Holsteins experiencing 50% longer recovery times than their 1990s predecessors and professional trimmers booked 3-4 months out, the economics are clear: operations modernizing their approach now will dominate, while the 80% clinging to “industry average” lameness face competitive extinction. The $37,000-45,000 first-year investment pays for itself within 8-12 months, making this the highest-ROI improvement available to dairy operations today.

We all know that number—$337 per case of lameness. The University of Wisconsin published this figure in their 2024 research, and it’s become almost a shorthand in our industry conversations. What’s particularly noteworthy, though, is how this familiar statistic represents just one dimension of a much larger economic picture.

I’ve been observing an interesting trend across dairy operations, from the established herds in Wisconsin to the larger facilities out West. A widening gap is developing between operations that have modernized their approach to hoof health and those that maintain traditional practices. And here’s what’s fascinating—this difference extends well beyond simple lameness rates. It’s actually shaping the fundamental competitiveness of these operations for years to come.

Let me share some insights from producers who’ve successfully transitioned from reactive to proactive hoof health management. Experiences from different regions—Wisconsin’s family operations, British Columbia’s progressive farms, even some of the larger-scale dairies in Idaho and New Mexico—offer valuable lessons for the rest of us.

Understanding the Complete Economic Picture

Looking at a typical 1,000-cow dairy operation in the Midwest—could be around Eau Claire, maybe closer to Green Bay—with the industry average 20% lameness rate, you’re facing direct annual costs of approximately $67,400 based on that Wisconsin research. These are the visible costs we track in our accounting systems.

Most dairies bleed money through lameness. Fix these five leaks and you’ll capture $348,000—while your competition’s still asking what hit them.

[Economic Impact Breakdown – 1,000 Cow Dairy]

Direct Costs (What You See):

  • Lameness treatment: $67,400/year
  • Based on 20% lameness rate × $337/case

Hidden Value Captured by Reducing Lameness to 10%:

  • Longevity gains: 2.8 → 4.8 lactations average
  • Reproduction improvement: 21-day pregnancy rate increases from 18% to 26%
  • Feed efficiency: 8% improvement from normalized eating patterns
  • Replacement savings: $280,000/year from reduced heifer purchases

Total Annual Opportunity: $348,000+

Now, what’s particularly interesting is how this breaks down. The latest Wisconsin research shows that the direct treatment savings alone from reducing lameness from 20% to 10% equals about $34,000 annually for a 1,000-cow herd (or $68,000 for a 2,000-cow operation). Initially, most of us think that’s the whole story—fewer vet bills, less medication, reduced labor. But that $34,000 in direct savings? It’s actually just the tip of the iceberg.

The real economic transformation—that full $348,000 opportunity—comes from several interconnected areas that you might not immediately consider:

Cow longevity shows remarkable improvement, extending from an average of 2.8 lactations in high-lameness herds to 4.8 lactations when lameness drops below 10%. Cornell’s PRO-DAIRY program has been documenting these patterns across multiple operations for years now.

Reproductive performance improves significantly—we’re talking 21-day pregnancy rates climbing from 18% to 26% when lameness is properly controlled. The University of Minnesota’s reproduction studies have consistently demonstrated this connection.

Feed efficiency gains of approximately 8% occur simply through normalized eating patterns. Think about it—when cows aren’t shifting weight off painful feet, they’re actually eating properly. Michigan State’s research provides compelling evidence on this relationship.

Perhaps most striking are the replacement cost savings—potentially $280,000 annually for a 1,000-cow operation, simply from reduced heifer purchase requirements at current market prices.

As industry consultants tracking outcomes across multiple operations report: “Operations approaching hoof health as an integrated system rather than isolated trimming events are discovering value streams they hadn’t recognized before. It’s essentially recovering losses they didn’t realize were occurring.”

CharacteristicTop 20% (Modernized Approach)Bottom 80% (Traditional Approach)Competitive Gap
Lameness Rate8-10%20-25%2.5x worse outcomes
Average Cow Longevity4.8 lactations2.8 lactations71% more productive life
Trimmer Response Time24 hours (hybrid model)3-4 months (professional wait)$180/cow/day × delays
Annual Lameness Costs$34,000 (1,000 cows)$67,400 (1,000 cows)$33,400 competitive disadvantage
Total Captured Value$348,000 annually$0 (unrealized)$348,000 advantage
Replacement Rate28% (longevity-driven)36-40% (forced culls)$280,000 annual savings
21-day Pregnancy Rate26%18%Faster herd turnover
Implementation Cost$37,000-45,000 first year$0 (but opportunity cost massive)8-12 month payback

Three Management Models in Practice

What farmers are finding is that three distinct management approaches have emerged as operations adapt to these economic realities. Each offers advantages, though I’ve noticed implementation quality determines outcomes more than model selection.

Management ModelAnnual Cost (1,500 cows)Key AdvantagesCritical Pitfalls
Professional Contract~$75,000–  Expert technique guaranteed-  No labor management required-  Consistent quality–  3-4 month booking delays-  $180/cow lost per day of delayed treatment-  No emergency response capability
In-House Program~$35,000–  Immediate response capability-  Lower direct costs-  Complete schedule control–  $15,000-30,000 equipment investment-  Failure rate when trimmer lacks protected time-  Risk of 50% lameness increase if poorly trained
Hybrid Model~$62,700–  Professional expertise for maintenance-  24-hour emergency response-  Reduces treatment delays by $180/case–  Requires strong coordination-  Need clear role definition-  Training investment essential

Professional Contract Services: The Traditional Approach

Most dairy operations continue to rely on professional trimmers who visit quarterly or monthly. Industry surveys indicate costs ranging from $15 to $40 per cow per trim. So for a 1,500-cow operation, annual investment typically reaches $75,000.

The emerging challenge—particularly in dairy-intensive regions like Wisconsin, Idaho, and California—isn’t actually cost. It’s availability. Professional trimming services report booking schedules extending 3-4 months, with many turning away multiple prospective clients for each new account they can accommodate.

Consider the practical implications here: you discover a lame cow on Tuesday morning, but your trimmer isn’t scheduled for three weeks. University of Minnesota research indicates this delay costs approximately $180 in lost production per affected cow. These costs accumulate quickly across even modest lameness rates.

In-House Programs: Promise and Pitfalls

Some operations figure they’ll internalize all trimming activities, anticipating cost savings. And theoretically, expenses can decrease to approximately $35,000 annually for that same 1,500-cow herd.

But here’s where it gets tricky. Successful execution presents significant challenges.

Professional-grade equipment requires an investment of $15,000 to $30,000 for quality hydraulic chutes from manufacturers like Riley Built or Comfort Hoof Care. Staff need proper Dutch 5-step method certification—and I mean comprehensive training costing $1,000 to $3,000, not informal learning.

The critical success factor that everyone overlooks? Protected time. At least 1-2 hours daily that absolutely cannot be redirected to other tasks. Training programs nationwide report the same pattern: in-house trimming programs most commonly fail when designated trimmers lack sufficient protected chute time. They’re constantly being pulled to help with breeding, fix equipment, or move cows.

Hybrid Models: Finding Balance

What’s really interesting is how successful operations are increasingly combining professional expertise with in-house response capabilities. For a 1,500-cow dairy, this approach typically costs $62,700 annually while delivering superior outcomes.

This model features monthly professional trimmer visits for maintenance and complex cases, supplemented by trained on-farm staff who can apply blocks, address digital dermatitis, and respond to emergencies within 24 hours.

Dr. Gerard Cramer’s extensive research at the University of Minnesota demonstrates that each 24-hour reduction in treatment response time saves approximately $180 per case. When your on-farm staff can apply a block on Tuesday afternoon rather than waiting three weeks, those savings directly impact profitability.

The Timing Revolution Nobody Saw Coming

This development still surprises experienced producers when I share it. Recent research challenges everything we thought we knew about optimal trimming schedules.

Traditional protocols recommended trimming at fresh check, typically 3-4 weeks post-calving. Makes sense, right? Cows are already restrained for health checks. But the production data reveals a completely different optimal approach.

Timing beats technique—trimming after 110 days unlocks +11 lbs/day and a $308/cow advantage, while old-school early trims lock in losses.

[Milk Production Impact of Trimming Timing]

Days in Milk at Trimming → Peak Milk Production Impact

  • Trimming < 110 DIM: -8 lbs at peak, losses persist through 200 DIM
  • Trimming > 110 DIM: +3 lbs at peak, advantage maintained throughout lactation
  • Net Difference: 11 lbs/day = $308 per cow per lactation

Based on converging research from Wisconsin, Minnesota, and Cornell universities

Converging research from Wisconsin, Minnesota, and Cornell demonstrates that cows trimmed after 110 days in milk produce significantly more milk than those trimmed earlier.

The differences are substantial:

Trimming before 110 DIM results in an 8-pound loss at peak milk, with impacts persisting through 200 DIM. Meanwhile, trimming after 110 DIM yields a 3-pound gain at peak and maintains this advantage throughout lactation. The net economic difference? $308 per cow simply through timing adjustment.

Why does timing matter so significantly? Well, it comes down to metabolic stress patterns. Research from Dr. Nigel Cook at Wisconsin demonstrates that fresh cows experiencing severe negative energy balance are already mobilizing 75-100 pounds of body tissue to support production. When you add trimming stress—which research shows increases cortisol levels 10-fold—during this vulnerable period, you’re compounding metabolic challenges that delay recovery.

I spoke with a reproduction manager operating near Kaukauna who adjusted protocols two years ago with notable results: “We extended our voluntary waiting period from 60 to 94 days specifically to avoid trimming during peak metabolic stress. First-service conception improved from 28% to 41%—that wasn’t what we expected, but we’ll certainly take it.”

Technology Integration: A Nuanced Decision

Let’s talk about those automated lameness detection systems prominently featured at every trade show. Manufacturers accurately claim their AI-powered cameras can identify lameness 23 days before visual detection, achieving 81-86% agreement with veterinary assessment.

And you know what? The technology actually performs as advertised. But whether it makes economic sense for your operation depends heavily on specific circumstances.

Systems from companies like CattleEye or IDA require an initial investment of $45,000 to $73,000, plus $8,000 to $12,000 in annual subscription fees.

The value proposition varies considerably:

Automation particularly benefits:

  • Operations with robotic milking systems, where individual cow movement eliminates natural observation points
  • Facilities exceeding 1,500 cows, where comprehensive visual observation becomes impractical
  • Herds with baseline lameness above 25% requiring systematic problem identification

Now consider this alternative perspective from a producer near Marshfield managing 800 cows. He reduced lameness from 24% to 14% investing just $7,200 in disciplined footbath protocols and strategic trimming, achieving $20,000 annual savings.

As he explained: “Technology vendors promoted cameras and sensors extensively. But our challenge wasn’t identifying lame cows—it was preventing lameness initially. That $7,200 investment in copper sulfate and consistent protocol implementation outperformed any $45,000 system for our situation.”

Training: The Foundation of Success

Here’s an uncomfortable reality that deserves discussion: operations using inadequately trained in-house trimmers can experience a 50% increase in lameness, resulting in $84,000 in additional annual losses compared to professional trimming. Think about that—inadequate training often produces worse outcomes than no trimming at all.

[The Dutch 5-Step Method – Critical Execution Points]

Step 1: Judge & Measure Inner Hind Claw

  • Target: 7.5-8cm toe length from the coronary band
  • Critical error: Measuring from the wrong reference point

Step 2: Trim Inner Claw to Correct Dimensions

  • Maintain a minimum 5mm sole thickness
  • Critical error: Over-trimming below safe threshold

Step 3: Model/Dish Out the Sole

  • Transfer weight from ulcer-prone zones to the wall/heel
  • Critical error: Creating a flat sole instead of a proper concavity

Step 4: Balance to Outer Claw

  • Match bearing surfaces for even weight distribution
  • Critical error: Using diseased outer claw as reference

Step 5: Remove Loose Horn & Apply Blocks if Needed

  • Clear all the undermined horn to prevent abscess formation
  • Critical error: Leaving loose horn creates infection pockets

Proper training requires 3-5 days of instruction + 6-12 months of supervised practice

Common critical errors I see repeatedly include:

  • Over-trimming soles below the 5mm safety threshold, essentially exposing sensitive tissue
  • Cutting toes shorter than 7.5cm, exposing the corium—that’s the living tissue within the hoof
  • Creating flat soles that concentrate pressure precisely where ulcers develop

Proper Dutch 5-step training—originally developed by Toussaint Raven and adapted for modern housed Holstein management—requires 3-5 days of intensive instruction plus 6-12 months supervised practice. This investment of $1,000 to $2,000, along with time, is essential.

Training programs consistently observe that well-intentioned but inadequately trained individuals can inadvertently create lameness through excessive trimming depth. Good intentions simply cannot compensate for technical skill deficits.

StepCritical ActionTarget SpecificationCommon Critical ErrorFinancial Impact of Error
1Judge & Measure Inner Hind Claw7.5-8cm toe length from coronary bandMeasuring from wrong reference pointFoundation failure – affects all subsequent steps
2Trim Inner Claw to Correct DimensionsMinimum 5mm sole thickness maintainedOver-trimming below 5mm thresholdExposes corium (living tissue) = immediate lameness
3Model/Dish Out the SoleTransfer weight from ulcer zones to wall/heelCreating flat sole instead of concavityConcentrates pressure exactly where ulcers develop
4Balance to Outer ClawMatch bearing surfaces for even distributionUsing diseased outer claw as referencePerpetuates imbalance and accelerates deterioration
5Remove Loose Horn & Apply BlocksClear all undermined horn completelyLeaving loose horn creates infection pocketsAbscess formation requires extended treatment
OUTCOMEProfessional Training vs. Inadequate Training3-5 days instruction + 6-12 months supervisedInformal learning without certification$84,000 annual difference: 8% vs 28% lameness

Integration: The Distinguishing Factor

What differentiates operations achieving 5% lameness from those accepting 25% isn’t superior equipment or newer facilities. It’s genuine integration—coordinated systems rather than periodic meetings.

Consider the contrast:

Typical farm communication: Monthly meetings where trimmers report “some sole ulcers,” veterinarians acknowledge concerns, nutritionists inquire about pen locations without specific data, and everyone agrees to monitor the situation.

Effective integration: Shared digital dashboards are updated in real time. When trimmers identify multiple sole ulcers in specific pens, automated alerts notify nutritionists who immediately analyze ration composition. Within 48 hours, they’ve identified and corrected nutritional imbalances.

Research comparing operations using integrated systems versus traditional communication found that the integrated farms achieved 35% better lesion identification accuracy and 48% faster treatment response. Most importantly, they prevented problems rather than simply accelerating treatment.

Biological Changes in Modern Dairy Cattle

This is crucial: today’s Holstein producing 95 pounds daily is fundamentally different from the 65-pound producer of 1995. The differences extend far beyond milk yield.

The biological adaptations are remarkable:

The digital cushion—that fat pad providing shock absorption beneath the pedal bone—now thins by 15-30% during early lactation compared to just 10-12% in the 1990s, as documented through UK ultrasound studies.

Negative energy balance now persists 100-140 days rather than the historical 60-80 days, according to metabolic research.

Chronic inflammation markers remain elevated throughout lactation, not merely during transition periods.

Genetic selection has inadvertently reduced digital cushion thickness (with heritability of 0.28-0.44) while pursuing production gains.

What required 21-28 days for healing in 1995 now takes 42-56 days, with some cows never achieving complete recovery. Even a perfect trimming technique must work within these biological constraints.

Biological Metric1990s Holstein2025 Modern HolsteinThe Critical Difference
Daily Milk Production65 lbs/day95 lbs/day+46% production
Digital Cushion Thinning (early lactation)10-12% loss15-30% loss2.5x worse shock absorption
Negative Energy Balance Duration60-80 days100-140 days75% longer metabolic stress
Healing Time for Hoof Lesions21-28 days42-56 days2x longer to heal (or never)
Chronic Inflammation DurationTransition period onlyThroughout lactationChronic inflammation = vulnerability

Creating Accountability for Results

Among all factors contributing to successful hoof health transformation, one stands out consistently: linking compensation directly to measurable lameness outcomes.

This means genuine financial accountability—not peripheral evaluation criteria or vague performance considerations, but direct compensation tied to specific results.

Successful implementations typically establish:

  • A Hoof Health Coordinator position with $45,000-55,000 base salary
  • Performance bonuses up to $20,000 based on quarterly lameness measurements
  • Clear performance scales: 18% lameness = $5,000 bonus, scaling to $20,000 at 8% lameness
  • Full authority over detection protocols, treatment coordination, and footbath management

One producer implementing this system reported: “Linking compensation directly to lameness outcomes transformed everything immediately. Footbaths operated precisely on schedule. Data entry became instantaneous. Early problem detection became standard. We invested $65,000 in the position and saved $95,000 through reduced lameness costs within twelve months.”

Practical Implementation Timeline

$65,000 is just the beginning—here’s when, where, and how the savings hit your bottom line in a single year.

For operations ready to modernize their approach, here’s what successful transitions typically look like based on observed implementations:

Months 1-2: Establish Baseline Reality

Comprehensive lameness scoring often reveals actual rates of 22-28% rather than the estimated 10%. Define responsibilities clearly and secure current trimmer support for transition plans.

Months 3-4: Infrastructure and Training

Budget $16,400-27,100 for equipment (quality used hydraulic chutes can reduce costs by 40%). Ensure designated staff receive proper Dutch 5-step certification and document all protocols comprehensively.

Months 5-6: Supervised Implementation

In-house staff work alongside professionals during each visit, building both skills and data systems while measuring all relevant metrics.

Total first-year investment typically ranges from $37,000 to $45,000, with most operations achieving break-even between months 8-12 as lameness decreases and savings accumulate.

Regional Adaptation Strategies

Successful protocols in Wisconsin may need to be modified for operations in New Mexico or Idaho. Climate variations, housing systems, and labor availability all influence optimal approaches.

California’s Central Valley operations manage heat stress that exacerbates lameness—cows stand longer attempting to cool, increasing pressure on compromised feet. Meanwhile, Northeast grazing operations might experience less concrete-related lameness but face increased challenges from infectious diseases due to higher moisture levels.

Labor availability varies dramatically, too. Wisconsin producers typically access trimmers within 50 miles, while Wyoming or Montana operations may require service calls of 200+ miles, fundamentally altering economic calculations.

Looking Ahead: The Widening Industry Gap

As we approach 2030, I’m seeing the dairy industry diverge into distinct operational tiers. And here’s what’s fascinating—it’s not about scale. I’ve observed 400-cow operations outperforming 4,000-cow facilities on lameness metrics. The distinction lies in management philosophy.

The 15-20% of operations modernizing their hoof health management are building compounding advantages: extended cow longevity (4.8 versus 2.8 lactations), reduced replacement costs, enhanced reproduction, and improved employee recruitment through professional operation standards.

The remaining 80% continue cycling through recurring problems, accepting 20-25% lameness as “industry standard” while costs escalate and competitors advance.

When producers ask about affording modernization of hoof care, I pose a different question: What’s the cost of maintaining the status quo? Each year of delay widens the competitive gap. This extends beyond the $337 per case—it determines competitive viability in five years.

Strategic Considerations for Your Operation

After observing numerous transitions, several principles emerge consistently:

The economics are compelling, but success requires systems thinking. That $337 per case represents merely the starting point—cascade benefits through reproduction, longevity, and efficiency create the real value.

Model selection should reflect operational constraints rather than theoretical preferences. Base decisions on trimmer availability, labor resources, and current lameness status.

Timing optimization can surpass technique perfection. Moving trimming after 110 DIM may improve outcomes more than flawless execution at suboptimal timing.

Professional training represents an essential investment. The difference between proper certification and informal learning literally separates 8% from 28% lameness rates.

Technology amplifies existing management quality but cannot remediate fundamental deficiencies. Establish solid foundations before pursuing technological solutions.

Most critically, linking compensation to outcomes drives genuine change. Other approaches merely hope for improvement.

Common Implementation Challenges and Solutions

What farmers are finding as they implement these changes:

Challenge: Protected time for the in-house trimmer is constantly compromised.
Solution: Schedule trimming as “first priority” morning task before other activities begin

Challenge: Data entry and tracking becomes inconsistent
Solution: Simple digital forms on tablets at chute-side, automatically syncing to management software

Challenge: Resistance from long-time employees to new protocols
Solution: Include them in training sessions, emphasize how changes make their jobs easier

Quick Start Checklist

For operations ready to begin:

☐ Score all cows for lameness to establish a true baseline
☐ Calculate your current cost per case (likely exceeding $337)
☐ Evaluate trimmer availability in your region
☐ Assess labor resources for potential in-house component
☐ Budget for equipment and training investment
☐ Define a clear accountability structure
☐ Document all protocols before implementation
☐ Establish measurement and tracking systems

The framework exists. Economic benefits are documented. Early adopters are already realizing returns. The question isn’t whether investment makes sense—it’s whether you’ll implement changes while maintaining a competitive position.

That $337 per case remains constant. But an increasing number of operations are discovering that transforming hoof health from an unavoidable cost to a managed system creates a sustainable competitive advantage.

Milk production continues regardless. The distinction lies in whether profits accumulate in your account or walk away on compromised feet.

We’d appreciate hearing about your experiences with hoof health programs—successes, challenges, and lessons learned. Please share your insights at editor@thebullvine.com to benefit the broader dairy community.

KEY TAKEAWAYS

  • The Hidden Goldmine: Every 1% reduction in lameness captures $17,400 in value. Top dairies achieving <10% lameness gain $348,000 annually through improved longevity (4.8 vs 2.8 lactations), reproduction (+8% pregnancy rate), and feed efficiency.
  • The Proven Formula: Hybrid model (monthly professional + daily in-house response) @ $62,700/year + Trimming after 110 DIM (+$308/cow) + Pay-for-performance bonuses = 50% lameness reduction in 12 months.
  • Fast Payback: Initial investment of $37,000-45,000 breaks even in 8-12 months. Wisconsin farm example: Spent $65,000 on a dedicated position, saved $95,000 in year one.
  • The 2030 Reality: With trimmers booked 3-4 months out and modern cows requiring 2x recovery time, the 20% of operations modernizing NOW will dominate. The 80% accepting “industry average” lameness face competitive extinction.
  • Your Starting Point: Score all cows (your “10%” is likely 22-28%), calculate your true cost (it’s 5x the $337 you think), then implement accountability-based compensation. This single change drives all others.

Learn More:

The Sunday Read Dairy Professionals Don’t Skip.

Every week, thousands of producers, breeders, and industry insiders open Bullvine Weekly for genetics insights, market shifts, and profit strategies they won’t find anywhere else. One email. Five minutes. Smarter decisions all week.

NewsSubscribe
First
Last
Consent

CDCB’s December ‘Housekeeping’ Is Actually Preparing Dairy Breeding for an AI Revolution

As CDCB implements data quality improvements this month, industry experts see preparations for a fundamental shift in how genetic evaluations could work within three years

EXECUTIVE SUMMARY: Tuesday’s genetic evaluation delivers four technical changes that signal dairy breeding’s shift from traditional statistics to artificial intelligence. CDCB is eliminating seven years of duplicate health records and 1.1 million outdated type evaluations—data quality issues that have subtly influenced every breeding decision since 2018. While most PTAs will barely budge (0.97-0.99 correlations), producers using bulls whose daughters transfer between elite herds should expect adjustments, especially for milk fever resistance. The February 2026 mandatory switch to HTTPS authentication isn’t just a security upgrade—it’s infrastructure for AI systems that need controlled data access. These December modifications, following April’s disruptive base changes, confirm that genetic evaluations are being systematically rebuilt for machine learning integration that industry experts project will revolutionize breeding accuracy by 2028.

AI in dairy genetics

You know, Tuesday’s December triannual evaluations from CDCB will bring more than just updated rankings and PTAs. Here’s what’s interesting—when you dig into these “operational efficiency improvements” they announced on November 5th, there’s something bigger happening beneath the surface.

The changes themselves sound routine enough. They’re eliminating duplicate health records, removing 1.1 million outdated type evaluations, optimizing data pipelines, and transitioning from anonymous FTP to secure HTTPS access. But after talking with folks across the industry and really examining the details, what I’ve found is we’re seeing essential groundwork being laid for machine learning systems that could reshape how we make breeding decisions in the next few years.

THE FOUR KEY CHANGES:

  • Duplicate health records eliminated
  • 1.1 million pre-1998 type records removed
  • Pipeline processing optimized
  • FTP to HTTPS transition (Feb 2026)

KEY DATES TO REMEMBER

  • Dec. 10, 2025: December genetic evaluation release
  • Feb. 2, 2026: Anonymous FTP access ends
  • 2026-2028: Projected AI implementation timeline (based on current research trends and industry analysis)

Understanding December’s Technical Changes

So here’s the thing—the CDCB December 2025 genetic evaluation changes include four primary modifications that the CDCB team—Kristen Gaddis, Sam Comstock, Jason Graham, Ezequiel Nicolazzi, Jay Megonigal, and Frank Ross—describe as refinements to improve data quality and system efficiency. Let me walk you through what’s actually happening and why it matters for your breeding decisions.

Health Record Deduplication

What’s particularly interesting about this first change is that CDCB discovered cows transferring between herds during lactation were generating duplicate health records, artificially influencing disease resistance PTAs for their sires. Makes sense when you think about it—when a cow moved from one farm to another mid-lactation, both DHI systems could report the same health events. Double-counting in the national database.

Testing with August 2025 data revealed correlations between old and new health PTAs ranging from 0.97 for milk fever resistance to 0.99 for displaced abomasum and metritis. Now, while these correlations suggest minimal population-level impact, individual bulls whose daughters frequently transfer between elite herds may see more significant adjustments. Worth checking if you’re using popular genomic young sires.

You know what I find fascinating? Milk fever showed more variation than other traits, and there’s a biological reason. Research by Santos and colleagues published in the Journal of Dairy Science shows that subclinical hypocalcemia affects up to 60% of dairy cows in the first three days postpartum. That 0-4 day window—when cows are coming fresh and hypocalcemia typically occurs—coincides precisely with when many elite heifers transfer between herds. And with multiparous cows experiencing such high incidence rates, plus elite genetics programs routinely testing blood calcium levels… well, these duplicate records really messed with milk fever evaluations more than other health traits.

Historic Type Record Removal

This one’s interesting when you understand the history. Holstein Association USA and CDCB are removing 1.1 million animals born before 1998 from genomic type evaluations. These animals never qualified for traditional type evaluation but remained in the system through “supplementary evaluations”—basically, statistical adjustments that provided slightly better predictions than parent averages alone.

Now, in the pre-genomic era, these supplementary evaluations made perfect sense. They added real value. But today? With Holstein’s type reference population exceeding 750,000 animals and genomic predictions achieving 60-70% reliability without any phenotypic data, these outdated records just contribute noise. Testing showed a 99.99% correlation between evaluations with and without these records. So their removal won’t disrupt your breeding program.

Pipeline Modernization

I know this sounds technical, but bear with me—it actually matters. Recent updates to Interbull’s international evaluation schedule now deliver MACE (Multiple-trait Across Country Evaluation) results on Day 1 of CDCB’s genomic cycle, rather than partway through the cycle. So basically, CDCB can now eliminate redundant processing steps and incorporate international data earlier in the evaluation sequence.

Testing showed correlations exceeding 99.9% across all traits and breeds between old and new pipelines. Most of the variation came from slightly fresher international data influencing domestic evaluations—which is actually an improvement if you’re using international genetics, as many Upper Midwest operations are these days. Those Pennsylvania tie-stall operations importing Canadian genetics will particularly benefit from this fresher data integration.

Access Control Implementation

Starting February 2, 2026, CDCB will discontinue anonymous FTP access and require all users to authenticate via HTTPS. Sure, it provides enhanced encryption and improved access control. But here’s what matters for us as producers: CDCB will now know exactly who’s accessing genetic evaluation data, when, and how frequently.

If you’re using any third-party services that pull CDCB data—and let’s face it, most progressive operations are—you’ll want to verify they’ve secured authenticated access before February. I’ve been hearing from several consultants who haven’t even started this transition yet. A Wisconsin producer mentioned his consultant hadn’t even heard about the HTTPS change yet, so don’t assume anything.

The AI Transformation Timeline: From Data Cleanup to Machine Learning Dominance (2025-2028) | December’s so-called “housekeeping” isn’t routine maintenance—it’s the first domino in a four-year transformation that will make AI the primary breeding evaluation method by 2028. While CDCB talks operational efficiency, they’re systematically eliminating data contamination that machine learning can’t tolerate

The Timing Strategy: Why December, After April’s Major Changes

You might be wondering—I certainly was—why CDCB is implementing more changes in December, eight months after April’s significant genetic base change and Net Merit formula revision already shook things up.

Here’s what I’ve learned: April 2025 delivered the most comprehensive changes to U.S. evaluations we’ve seen in years. CDCB’s documentation shows PTAs reset to 2020-born cow averages, resulting in drops of 50 pounds of fat, 30 pounds of protein, and 2.5 months of productive life. And simultaneously, Net Merit weights shifted substantially—butterfat emphasis increased 11%, feed efficiency jumped 48%, protein emphasis dropped 33%.

So why add more changes now? The pattern suggests several strategic objectives:

  • Separating data quality improvements from formula changes prevents confusion about what caused specific ranking shifts
  • We had eight months to adapt to new Net Merit weights and base adjustments before facing additional modifications
  • CDCB likely used the April-December period to identify and resolve issues that only became apparent after the base change

What We Learned from April’s Reset

You know, watching bulls that showed +2500 milk in December 2024 evaluations suddenly display +1800-1900 in April 2025 was jarring for everyone. Same genetics, completely different numbers after the base reset. It took months to retrain our eyes about what “good” looks like.

The Net Merit formula revision proved equally challenging. Bulls that ranked highly under the old system’s protein emphasis suddenly fell behind competitors with superior butterfat and feed efficiency profiles. What we all learned—sometimes the hard way—is that genetic merit isn’t absolute. It reflects current economic priorities that change with market conditions.

And different operations are adapted differently, as you’d expect:

  • Large-scale operations in California and the Southwest, focused on component production, generally transitioned smoothly to the butterfat emphasis
  • Grazing-based operations in Vermont and Wisconsin that traditionally prioritized protein for cheese market premiums had to reconsider their breeding strategies completely
  • Those New York and Michigan operations with mixed market contracts found themselves recalibrating somewhere in between

These regional differences still matter as we navigate the changes in December.

What These Changes Reveal About Data Quality

Looking at December’s modifications, what strikes me is how long these data quality issues persisted before being addressed.

Duplicate health records from herd transfers have apparently influenced evaluations since the launch of health traits in 2018. That’s seven years of subtle contamination affecting our breeding decisions on disease resistance. Similarly, pre-1998 type records influenced genomic predictions throughout the genomic era from 2009 to 2025, affecting every breeding decision that incorporated type traits via Net Merit, TPI, or custom indices.

“Genetic evaluation systems are inherently conservative about implementing changes, even when problems are suspected. Given the stakes—every evaluation affects thousands of breeding decisions worth millions of dollars collectively—this caution makes sense. But it also means known issues can persist for years before resolution.”

The Hidden Story: Preparing for AI-Powered Evaluations

Here’s what I think many of us are missing: December’s changes serve a dual purpose beyond correcting historical problems. They’re establishing infrastructure for artificial intelligence and machine learning systems that could transform genetic evaluations sooner than we think.

Clean Data for AI Training

Having worked with data scientists on various projects, here’s what I’ve learned—machine learning algorithms need pristine training datasets. The duplicate health records being eliminated? They’d propagate errors exponentially in AI models. Those 1.1 million outdated type records would introduce inconsistencies that deep learning systems just can’t tolerate.

Dr. Victor Cabrera from UW-Madison’s Dairy Brain Initiative has some fascinating perspectives on this. Modern neural networks for genomic prediction show promise for improved accuracy compared to traditional methods—there’s a 2023 review in Frontiers in Genetics by Chafai and colleagues exploring various machine learning models, though specific performance improvements vary by trait and population.

“What CDCB calls ‘operational efficiency improvements’ are actually essential preprocessing for AI implementation. Data quality is everything.”

Real-Time Evaluation Infrastructure

The pipeline optimization isn’t just about speed. It’s about enabling continuous-learning AI systems that can update predictions in real time as new data flows in. Companies like EmGenisys are already demonstrating this with AI-powered embryo viability evaluation. CDCB’s infrastructure changes create similar potential for genetic evaluations.

Controlled Access for AI Development

The shift from anonymous FTP to authenticated HTTPS gives CDCB visibility into who’s developing AI models with their data. With over 11 million genotypes in the National Cooperator Database as of June 2025 and roughly 100 million lactation records… that’s extraordinary value for machine learning applications. Controlled access becomes essential for both security and potential commercialization.

Industry Perspectives and Cost Considerations

The reactions I’m hearing from industry stakeholders have been really interesting:

  • Data service providers are emphasizing the technical challenges—hundreds of automated scripts need rewriting for the authentication transition
  • Advisory services, especially smaller consultants who’ve relied on simple FTP downloads, worry about increased administrative requirements
  • Academic researchers note that graduate students who previously accessed data instantly now need formal data-use agreements

Looking at what this might mean for your operation, industry sources suggest these changes could involve various costs—though actual expenses will vary significantly:

  • HTTPS authentication setup: $500-1500 in one-time programming costs if you’re working with a consultant transitioning from FTP
  • AI-literate genetic advisors: Generally commanding 15-25% premium over traditional advisors—roughly $150-200 additional per consultation
  • Future AI evaluation subscriptions: Based on similar ag-tech services, we’re probably looking at $50-150 monthly for basic access to $500+ for premium predictive analytics

WHAT THIS MEANS FOR YOU The real question isn’t whether these changes matter—it’s how quickly you can adapt to maintain your competitive edge as genetic evaluations evolve from traditional calculations to AI-powered predictions.

Practical Implications by Operation Type

Let me break down what December’s changes mean for different types of operations:

Elite Genetics Programs

If you’re marketing high-genomic females, using contract heifer growers, or exporting genetics internationally, you likely had higher exposure to duplicate health record issues. Bulls heavily used in these programs may show more variation in health PTAs this December—on top of adjustments you’re still processing from April.

What you should do:

  • Compare December health PTAs against both pre-April and post-April baselines to understand cumulative impacts
  • Pay particular attention to milk fever resistance (which showed the most variation during testing)
  • Success here means maintaining your genetic progress rates despite evaluation adjustments

Data-Dependent Operations

Farms relying on third-party software, consultants, or services that access CDCB data via FTP need immediate action.

Your action items:

  • Verify providers have secured HTTPS access before February 2026
  • Don’t assume compliance—I know several consultants who haven’t started the transition
  • Document current data access methods as backup

Technology-Forward Operations

Progressive dairies should recognize December’s changes as early indicators of the AI transformation coming to genetic evaluations.

What to focus on:

  • Build relationships with AI-literate genetics advisors now
  • Invest in farm data quality—every accurate record improves future AI predictions
  • Start budgeting for potential AI evaluation subscription costs

Understanding the Broader Context

December’s refinements are happening within a rapidly evolving dairy genetics landscape that’s still adjusting to April’s disruptions. Genomic testing volume continues to expand—CDCB processed its six millionth genotype in February 2022, and by January 2023, the database contained over 7 million genotypes. What’s really interesting? 92% of those are from females.

Novel traits like feed efficiency and methane emissions gained real prominence following April’s 48% increase in Feed Saved emphasis. International competition keeps intensifying as global genetics companies leverage advanced analytics. And technology adoption—sensors, robotics, precision management systems—is becoming standard on progressive operations from California’s Central Valley to Pennsylvania’s tie-stall barns.

These trends are creating demand for sophisticated evaluation systems that can integrate diverse data streams and deliver real-time insights. Traditional linear models can’t provide these capabilities, but AI systems potentially can. The genetic evaluations we rely on today may look primitive compared to what’s coming.

Looking Ahead: The Next Three Years

Based on current research trends and what I’m seeing in the industry, here’s what we might expect:

2026: Foundation Building

  • We’ll likely see continued data quality improvements framed as technical maintenance
  • First commercial AI tools for specific traits—mastitis prediction, feed efficiency optimization—should hit the market
  • Universities will start publishing research using CDCB’s cleaned datasets for deep learning models

2027: Parallel Systems

  • I expect AI evaluations will run alongside traditional models for validation
  • Early adopters will begin incorporating AI predictions into breeding decisions
  • CDCB might announce pilot programs for enhanced evaluations, following patterns from their Producer Advisory Committee, founded in 2019

2028: The Transition

  • AI predictions could become primary, with traditional models serving validation roles
  • Genomic prediction accuracy is potentially improving significantly, with preliminary machine learning studies showing trait-specific gains
  • At that point, evaluation interpretation will require specialized expertise that most of us don’t currently have

As Dr. Cabrera suggests, producers who understand this trajectory and begin preparing now will likely maintain competitive advantages.

Key Takeaways for Dairy Producers

As we approach Tuesday’s evaluation release and continue adapting to April’s major changes, here’s what I think matters most:

Immediate Actions

  • Check high-value animals: Compare December PTAs against both pre- and post-April baselines to understand cumulative impacts
  • Verify data access: Confirm all third-party software and consultants have secured HTTPS access before the February deadline
  • Document current PTAs: Track how successive changes affect your genetics

Strategic Considerations

  • Invest in data quality: Research from Weber and colleagues demonstrates that data quality is the primary factor determining AI model accuracy
  • Build technology literacy: Understanding AI basics will likely become as essential as understanding EPDs became in the 1990s
  • Maintain flexibility: April showed us that long-standing assumptions can change rapidly

Long-Term Planning

  • Accept temporary stability: Technology and economics drive continuous change in evaluations
  • Focus on principles: Genetic principles matter more than specific numerical values
  • Prepare for subscriptions: AI-powered evaluations probably won’t remain free public services forever

The Bottom Line

As these CDCB December 2025 genetic evaluation changes take effect, dairy breeding decisions will increasingly rely on clean data and sophisticated analysis. These changes represent more than routine maintenance—they’re essential preparations for what could be a fundamental transformation in dairy breeding. While CDCB frames these as “operational efficiency improvements,” coming eight months after April’s disruptive base change and Net Merit revision, the pattern seems pretty clear: the industry is systematically upgrading infrastructure for next-generation evaluation systems.

For those of us still adjusting to April’s new reality—where historical benchmarks shifted dramatically, and component emphasis changed substantially—December’s modifications might feel like one more thing to deal with. But you know what? These changes are actually stabilizing forces, addressing long-standing data quality issues while preparing systems for future improvements.

What strikes me most is that success in this evolving environment won’t require becoming a computer scientist. But it will demand openness to continuous change, investment in data quality, and strategic partnerships with advisors who understand both traditional genetics and emerging technologies.

The December 2025 evaluation changes, following April’s significant adjustments, confirm that transformation is accelerating—not slowing. Those who recognize this trajectory and adapt accordingly will discover opportunities within the evolution. The future holds exciting possibilities for operations ready to embrace precision breeding powered by AI-enhanced evaluations.

The opportunity—and the responsibility—rests with each of us as dairy producers. We need to embrace change while maintaining focus on what matters most: breeding better cows for profitable, sustainable dairy farming in an era of continuous innovation. That’s what I’m taking away from all this, and I hope it helps you navigate these changes in your own operation successfully.

KEY TAKEAWAYS:

  • URGENT: Verify all genetics services have HTTPS authentication before February 2, 2026—failure means lost data access
  • PTAs TUESDAY: Most bulls unchanged, but check elite sires with transferred daughters for milk fever adjustments
  • HIDDEN FIXES: CDCB eliminated 7 years of duplicate health records + 1.1M obsolete evaluations contaminating your decisions
  • FUTURE READY: December’s cleanup enables AI breeding systems projected to boost prediction accuracy 10-25% by 2028

Complete references and supporting documentation are available upon request by contacting the editorial team at editor@thebullvine.com.

Learn More:

The Sunday Read Dairy Professionals Don’t Skip.

Every week, thousands of producers, breeders, and industry insiders open Bullvine Weekly for genetics insights, market shifts, and profit strategies they won’t find anywhere else. One email. Five minutes. Smarter decisions all week.

NewsSubscribe
First
Last
Consent

The Hidden Contract Clause That Could Cost Your Dairy $55,000 in 2026

WARNING: Your 2026 dairy contract has unlimited liability clauses. 500-cow farms face $55K in new costs. Check these three things before signing →

EXECUTIVE SUMMARY: Dairy farmers signing 2026 contracts now are discovering unlimited liability clauses that hold them responsible for allergen incidents—even those that occur at the processor. These new terms, triggered by California’s July 2026 allergen law, could cost a typical 500-cow operation between $15,000 and $55,000 annually in testing, infrastructure, and insurance. That’s up to 44% of net profit gone. With December 31 deadlines approaching, farmers face three paths: scale up to 1,500+ cows for efficiency, pivot to premium markets with $5-10/cwt premiums, or exit strategically while preserving wealth. The harsh reality is that 500-cow commodity dairies are becoming economically obsolete—caught between mega-farms operating at $3/cwt lower costs and premium producers capturing higher margins. Your decision in the next 90 days isn’t just about a contract; it’s about whether your farm exists in 2030.

Dairy Contract Risk

You know, I’ve been talking with a lot of dairy farmers lately—folks running anywhere from 300 to 800 head—and the same topic keeps coming up over coffee.

These new contracts are landing on kitchen tables across the country right now? They’re different.

And I don’t mean different like when they tweaked the somatic cell premiums a few years back. I mean, fundamentally different.

One Wisconsin producer I know pretty well—let’s call him Tom to keep things simple—he runs about 500 Holsteins outside Eau Claire. Last Tuesday, he opens his December 2025 contract renewal expecting the usual adjustments. Maybe a change in butterfat differential or a new hauling schedule.

Instead, he finds himself staring at 15 extra pages of allergen management requirements. Language about “unlimited liability.” Clauses saying he has to defend his processor against claims he didn’t even cause.

“The efficiency gains are real—our cost per hundredweight dropped by nearly three dollars. But this wasn’t just about surviving allergen costs. We saw where the industry was heading and decided to get ahead of it.”
— A Wisconsin dairy producer who expanded from 600 to 1,800 cows last year

And here’s what’s interesting—Tom’s not alone. From the Texas Panhandle to Vermont’s Northeast Kingdom, down through the Georgia dairy belt and out to Idaho’s Magic Valley, producers are discovering their 2026 contracts contain terms nobody’s ever seen before.

Now, California’s allergen labeling law takes effect on July 1, 2026—that’s the official reason. But what I’ve found is that processors are using this regulatory change as the mechanism for something much bigger.

They’re fundamentally restructuring how risk flows through the dairy supply chain.

Let me walk you through what’s actually happening, because once you understand the pieces, the decisions you need to make become a lot clearer.

What Is California’s Allergen Law?

Starting July 1, 2026, California requires restaurant chains with 20+ locations nationwide to label major food allergens on menus. While this sounds limited to restaurants, processors are using it to justify comprehensive supply chain allergen controls—pushing liability and costs upstream to dairy farms through new contract requirements.

Why These Contract Changes Hit Different

I’ve been looking at dairy contracts for going on two decades now, and what’s landing on farm desks this quarter is genuinely unprecedented.

You probably saw the FDA’s recent data from their Reportable Food Registry—dairy products accounted for nearly 30% of all food recalls in the first quarter of 2025. That’s almost 400 recalls from our industry alone.

And when you dig into those numbers, undeclared allergens are driving a huge chunk of them, with milk proteins topping the list.

The Grocery Manufacturers Association conducted research in 2022 that showed food recalls average around $10 million in direct costs. And that’s just pulling product, investigating, notifying regulators.

Doesn’t even touch brand damage, lost sales, or legal fees. You’re looking at exposure that could bankrupt a mid-sized processor, which is why they’re scrambling to push that risk elsewhere.

What’s the target? Your farm.

What I’m hearing from agricultural attorneys who specialize in dairy contracts—and there aren’t that many of them, as you probably know—is that processors aren’t just updating compliance language.

They’re fundamentally restructuring who bears risk when something goes wrong. California’s July 1, 2026, deadline? It’s the perfect justification.

Here’s the really clever part, or concerning part, depending on where you sit. Most dairy contracts run calendar year, right? So farms need to sign their 2026 agreements right now, in Q4 2025.

By the time California’s law kicks in and everyone understands what these terms really mean, you’ll already be locked into a 12-month commitment.

Timing’s not an accident.

What Your Contract Might Look Like Now

Here’s what producers from Pennsylvania to Idaho to the Florida Panhandle—even down in Mississippi, where my cousin runs 400 head—are finding buried in their contracts:

  • Testing requirements where the processor decides frequency, but farmers pay 100% of costs—we’re talking $55 to $80 per sample for standard allergen tests, based on what companies like Neogen are charging these days.
  • Infrastructure modifications requiring capital investments of $50,000 to $250,000. Cornell Extension’s been helping farmers price this out, and those are real numbers.
  • Insurance minimums are jumping from your typical $2 million general liability to $5-10 million specifically for allergen incidents. I’ve talked to insurance agents we work with—Nationwide, American National, some of the bigger ag insurers—and they’re all saying premiums are up 30 to 50 percent for this coverage.
  • And then there’s the real kicker: unlimited indemnification clauses that make farmers liable for downstream incidents “regardless of origin.” Think about that. Even if contamination happens at the processor, you could be on the hook.

The Real Numbers for Your Operation

Let’s talk specifics for a typical 500-cow dairy producing around 10 million pounds annually—that describes a lot of operations in the Upper Midwest and down through Oklahoma and Arkansas.

I’ve been running these numbers with farm financial consultants, and here’s what the math looks like.

Compliance LevelAnnual TestingInfrastructureInsurance IncreaseDocumentation/TrainingTotal New CostsProfit Impact
Minimal(2¢/cwt)$1,700$5,000$4,000$2,500$15,00012%
Mid-Level(8¢/cwt)$7,000$10,000$8,000$9,500$34,00028%
High (15¢/cwt)$13,000$15,000$12,000$15,500$55,00044%

That’s a 12% hit to your bottom line if you’re running decent margins on the minimal path. Not great, but manageable for efficient operations.

Mid-level? That’s 28% of your profit gone. The difference between paying bills on time and stretching payables, as many of us know all too well.

At the high end? 44% of the net income was lost. For a lot of 500-cow operations, that’s the difference between viable and not.

The Cost Gap That’s Already There

What makes this particularly challenging is the existing cost structure gap. USDA’s Economic Research Service published their cost of production data in March 2024, and here’s the reality:

Farm SizeAverage Cost per cwt
2,000+ cows$17
100-500 cows$20+

That’s more than a three-dollar disadvantage before you add a penny of allergen compliance costs.

Already Behind Before Allergen Costs: 500-cow dairies face $3.37/cwt higher costs than 1000-cow operations and $8.48/cwt higher than mega-dairies—BEFORE adding $0.02-0.15/cwt allergen compliance. On 10 million lbs annually, that’s $337,000-$848,000 structural disadvantage you can’t manage away

Understanding the Bigger Picture

Here’s where things get really interesting—and by interesting, I mean concerning if you’re a mid-sized dairy like most of us.

The consolidation trends were already stark before these contract changes. The 2022 Census of Agriculture, released in February 2024, shows that we lost 39% of U.S. dairy farms between 2017 and 2022.

Dropped from over 39,000 to about 24,000 operations. Yet—and here’s the kicker—milk production actually increased 5% over that same period according to the USDA’s National Agricultural Statistics Service.

Think about that for a minute. Fewer farms, more milk. The math only works one way, doesn’t it?

Today, according to the same Census, 65% of the U.S. dairy herd lives on farms with 1,000 or more cows. The 834 largest dairies—those with 2,500 or more head—they control 46% of production by value.

These aren’t future projections, folks. This is where we are right now.

I was talking with a senior ag lender recently—manages a portfolio north of $400 million in dairy loans—and he was remarkably candid about it.

“We’re not trying to prevent consolidation. We’re positioning our portfolio to be on the right side of it. Managing 50 medium-sized dairy loans requires far more oversight than five large ones with professional CFOs and management teams.”
— Senior agricultural lender with $400M+ dairy portfolio

The September 2025 lending data from agricultural finance institutions shows that smaller ag lenders—those under $500 million in loans—they absorbed 75% of the increase in farm lending during 2024.

Meanwhile, the big players with over a billion in ag loans? They contributed just 10% to that increase.

The sophisticated lenders they’re already pulling back from medium-sized operations. Makes you think, doesn’t it?

The Numbers Don’t Lie: Since 2017, America lost 15,000 dairy farms (39%) while milk production INCREASED 5%. By 2030, another 7,000 operations will disappear. This isn’t a downturn—it’s systematic elimination of mid-size dairies. Where does YOUR farm fit?

Three Paths Forward (And Why You Need to Choose Now)

After talking with dozens of farmers facing these decisions and running scenarios with financial advisors, I’m seeing three viable strategies emerge.

The key is picking the right one for your specific situation—not what worked for your neighbor, not what your grandfather would’ve done.

Path 1: Scale Up to Survive

Who should consider this path? Well, if you’re under 45 with kids who genuinely want to farm—and I mean really want it, not just feel obligated—this might be your route.

You need a debt-to-equity ratio under 2.0, preferably lower. You should already be in the top 25% for efficiency, meaning your cost of production is under $19 per hundredweight.

You’ve got to have the land base or be able to acquire it. And honestly? You need to actually enjoy the business side of dairy, not just working with the cows.

What’s it take? University of Wisconsin Extension’s been helping folks price out expansions, and you’re looking at $3.5 to $5 million in capital investment.

That’s an 18 to 24-month timeline just for permits and construction. You’ll be managing employees, not just family labor. And you need the stomach for significant debt and risk.

The payoff? Production costs drop two to three dollars per hundredweight at scale—USDA data’s pretty clear on this—which more than covers new allergen compliance costs.

You become the type of operation processors want to work with long-term. But it’s a big leap, no doubt about it.

Path 2: Exit Commodity, Enter Premium

What’s encouraging is that producers from North Carolina to Kansas to New Mexico are finding similar success with premium markets.

This path works if you’re within 60 miles of a decent-sized population center—100,000 people or more. You or your spouse actually has to enjoy marketing and talking to customers. Can’t stress that enough.

You’ll be working farmers markets, doing farm tours, and managing social media. As you’ve probably experienced yourself, it’s exhausting but can be rewarding.

Your location needs affluent consumers who value local food. And you’ve got to handle the three-year organic transition financially—that’s no small feat.

What’s it take? Organic certification under the USDA’s National Organic Program is a 36-month process, as you probably know.

If you’re adding processing, budget $150,000 to $300,000 for a small facility—USDA Rural Development has some grant programs that can help with this.

Plan on 15 to 20 hours per week just on marketing. It’s a completely different mindset about what you’re selling.

The payoff? Premium markets can deliver five to ten dollars per hundredweight above commodity prices—USDA tracks these premiums pretty consistently.

“We realized we couldn’t compete with mega-dairies on cost. But we could compete on story, quality, and customer connection. Our milk price went from $21 to $28 per hundredweight, and our yogurt adds another eight to ten dollars per hundredweight equivalent.”
— Vermont dairy family who transitioned to organic with on-farm processing

But more importantly, you’re building direct relationships that give you control over your price. You’re not just waiting for the monthly milk check to see what you got.

Path 3: Strategic Exit While You Can

This is the path nobody wants to talk about, but research on farm transitions suggests that strategic exits can preserve significantly more wealth than distressed sales.

Sometimes 25 to 40 percent more.

Who should consider this? If you’re over 55 without a successor who’s passionate about dairy—and I mean passionate, not just willing—this might be your reality.

If your debt-to-equity exceeds 2.5, if your cost of production is over $21 per hundredweight, if you’re emotionally exhausted from the volatility… well, it’s worth considering.

Especially if you have other interests or opportunities.

What’s it take? Good transition planning, starting 12 to 18 months out. Realistic asset valuations—don’t kid yourself about what things are worth.

Emotional readiness to close this chapter. And a clear plan for what comes next.

The payoff? Preserving capital while land values remain strong—and they won’t forever, we all know that.

Avoiding slow wealth erosion. Maybe transitioning to less-stressful agricultural enterprises, such as cash crops or custom work.

It’s not giving up; it’s making a strategic business decision.

The Supply Chain Dynamics You Need to Understand

To negotiate effectively, you need to understand what’s driving processor behavior. From their perspective, this isn’t about hurting family farms—it’s about survival in a world where one allergen incident can trigger catastrophic losses.

RaboResearch’s food industry analysis from this past summer suggests processors face an impossible situation. Their insurance companies are demanding comprehensive allergen controls.

Regulators are increasing scrutiny. Consumer lawsuits are proliferating. They’re pushing liability upstream because they genuinely don’t see another option.

What’s particularly telling is that processors actually prefer consolidation. Think about it from their shoes: Managing 200 large suppliers instead of 2,000 small ones.

Professional management teams they can work with. Sophisticated quality systems and documentation. Resources to implement new requirements properly. Lower transaction costs across the board.

This isn’t a conspiracy—it’s economics. And understanding these dynamics helps you negotiate more effectively because you know what processors actually value.

Worth noting, too, that some processors are working with their farmers through this transition. A couple of the smaller regional processors in Ohio and Pennsylvania have offered 40-60% cost-sharing arrangements with phased implementation schedules over 18 months.

They’re the exception, not the rule, but it shows there’s some recognition of the burden these changes create.

Regional Factors That Change Everything

Geography’s becoming destiny in dairy. What I’m seeing is a real divergence driven by water availability and the regulatory environment.

Water-secure regions—the Upper Midwest, Northeast, and parts of the Southeast, like northern Georgia—are seeing renewed interest from both expanding local operations and relocating Western dairies.

Dairy site selection consultants tell me they’ve never been busier. Every conversation starts with “Where can we find reliable water for the next 30 years?”

Water-stressed areas—the Southwest, parts of California—that’s a different story. University of Arizona research on aquifer depletion shows that some dairy-intensive areas are experiencing annual water-table drops of several feet. Water costs in these regions have doubled or tripled in the past decade.

That’s not sustainable, and everyone knows it. These operations face a double whammy—new allergen costs plus rising water expenses.

This Isn’t Happening Everywhere Equally: Wisconsin hemorrhaged 2,740 farms—more than the next three states combined. Pennsylvania, Minnesota, and New York each lost 1,000+ operations. Meanwhile, California (the largest dairy state) lost just 275. Geography matters, but the trend is universal

Negotiation Strategies That Actually Work

After watching dozens of these negotiations, here’s what’s actually effective:

  • Form an informal buying group. You don’t need a formal cooperative structure—just five to ten neighbors agreeing to push for the same contract terms. When six farms representing 3,000 cows approach a processor together, they listen differently than when you come alone.
  • Use professional help strategically. Yes, agricultural attorneys cost money. But spending $5,000 on contract review could save you $50,000 annually in bad terms. Frame it as the bad cop: “I’d love to sign this, but my attorney insists on liability caps…”
  • Offer trades, not just demands. “I’ll implement comprehensive testing protocols if you’ll split the costs 50/50 and cap my liability at one year’s gross revenue.” Processors respond better to negotiation than ultimatums.
  • Know your walkaway point. If you have alternative buyers—even if they’re 50 miles further—that knowledge changes how you negotiate. Do the math beforehand: What’s the worst deal you can accept and still stay viable?

Technology as a Survival Tool

The farms that are successfully adapting aren’t doing so through willpower alone. They’re leveraging technology to make compliance manageable.

What’s encouraging is that agricultural technology providers report dairy operations implementing digital documentation systems are seeing significant reductions in administrative burden.

Automated testing protocols are lowering sampling costs. Real-time environmental monitoring can prevent contamination incidents before they become recalls.

For example, farms using systems like DairyComp 305’s newer modules or Valley Ag Software’s compliance-tracking are finding the documentation requirements much more manageable than those trying to handle them with spreadsheets.

The upfront cost—usually $5,000 to $15,000 for implementation—pays for itself in reduced labor and avoided compliance violations. One Kansas operation told me they cut documentation time by 60% after implementing digital tracking, saving nearly $20,000 annually in labor costs alone.

Technology isn’t optional anymore. What is the difference between farms crushing under compliance costs and those managing them? Usually comes down to whether they’ve invested in the right systems.

What Dairy Looks Like in 2030

Based on everything I’m seeing, here’s my best projection for where we’re heading:

We’ll probably have 15,000 to 20,000 dairy farms by 2030, down from today’s 24,000. But—and this is important—they won’t all be mega-dairies.

I’m expecting maybe 12,000 to 15,000 large-scale commodity operations, another 3,000 to 5,000 premium or specialty farms serving local and niche markets, and 2,000 to 3,000 transitional operations finding unique market positions.

Agricultural economists analyzing dairy consolidation trends suggest we’re not witnessing the death of dairy farming. We’re seeing differentiation.

The 500-cow commodity model is becoming obsolete, yes. But opportunities are emerging for farms willing to adapt strategically.

The 25-Year Transformation: In 1997, just 17% of dairy cows lived on 1,000+ cow farms. Today? 65%. By 2030? Projected 75%. Meanwhile, farms under 100 cows dropped from 39% to 7% and are heading toward extinction. This isn’t gradual change—it’s systematic restructuring

Making Your Decision: A Practical Framework

So what should you actually do? Here’s the framework I’m suggesting to farmers facing these contracts:

Your 30-Day Action Plan

  • Calculate your true cost of production—don’t guess, know it
  • Review your current contract for existing allergen language
  • Get insurance quotes for the new liability levels
  • Talk honestly with family about succession plans
  • Research premium market opportunities in your area

Key Decision Factors

  • If you’re under 45 with strong succession and sub-$19 per hundredweight costs, consider scaling. The economics work if you can handle the risk.
  • If you have marketing skills and you’re near population centers, explore premium markets. The margins are there for those who can sell.
  • If you’re over 55 and without succession, and your costs exceed $21 per hundredweight, plan your exit. Preserving wealth beats slow erosion.
  • If you’re in between? You’ve got 90 days to figure out which direction you’re heading. Drifting is the only wrong answer.

The Reality We Need to Discuss

Here’s what I think a lot of folks know but aren’t saying out loud: The 500-cow commodity dairy is structurally obsolete in the emerging market environment.

Not because farmers aren’t working hard enough. Not because they’re bad at what they do. But because the economics have shifted in ways that make that scale unviable for commodity production.

Dairy transition specialists tell me that every farmer they work with wishes they’d made their decision 2 years earlier.

Whether that’s expanding, transitioning to premium, or exiting—acting decisively preserves more wealth and creates more options than hoping things improve.

Final Thoughts

The 2026 allergen requirements are real, and they’re going to hurt. But they’re also just accelerating changes that were already underway.

The farms that recognize this—that see these contracts as a catalyst for strategic decision-making rather than just another compliance burden—are the ones that’ll still be farming successfully in 2030.

The dairy industry has weathered countless storms over the generations. This one’s different, not in its severity, but in its permanence.

The sooner we accept that and act accordingly, the better positioned we’ll be for whatever comes next.

You know, at the end of the day, it’s not about whether to sign or not sign a contract. It’s about what kind of dairy farmer you want to be—or whether you want to be one at all—in the industry that’s emerging.

And that’s a decision only you can make for your operation.

KEY TAKEAWAYS:

  •  Immediate action required: Review your contract for unlimited liability clauses before December 31—signing locks you into potentially business-ending terms through 2026
  • Real costs revealed: $15,000 (minimal) to $55,000 (high compliance) in new annual expenses = 12-44% of typical 500-cow dairy profits gone
  • Only three viable paths: Scale to 1,500+ cows for efficiency ($3/cwt savings), pivot to premium markets ($5-10/cwt premiums), or exit strategically, preserving 25-40% more wealth than distressed sales
  • Negotiation leverage exists: Form buying groups with neighbors, demand 50/50 cost sharing, cap liability at one year’s revenue—processors need milk and will negotiate
  • The uncomfortable truth: The 500-cow commodity dairy is structurally obsolete—not because you’re failing, but because the economics permanently shifted against mid-size operations

Complete references and supporting documentation are available upon request by contacting the editorial team at editor@thebullvine.com.

Learn More:

The Sunday Read Dairy Professionals Don’t Skip.

Every week, thousands of producers, breeders, and industry insiders open Bullvine Weekly for genetics insights, market shifts, and profit strategies they won’t find anywhere else. One email. Five minutes. Smarter decisions all week.

NewsSubscribe
First
Last
Consent

Lameness Costs You $28,000 Yearly. Genetics Can Fix It – But not for 10 Years. Here’s Your Strategy

Every lame cow costs you $225. Genetics can fix it—in 10 years. Here’s what works NOW

EXECUTIVE SUMMARY: Lameness costs the average 500-cow dairy $28,000 annually, and while CDCB’s new genetic evaluations promise a 30% reduction, you won’t see meaningful savings for 10 years. The reality check: these evaluations rely on data from just six elite farms with $100,000 camera systems—not typical operations dealing with old concrete and tight margins. By year 10, genetics deliver $4,879 annual savings, reaching $8,160 by year 15, but European-style welfare markets will emerge by 2030, before genetics pay off. Smart producers aren’t waiting—they’re investing $40-60K in immediate flooring improvements while simultaneously selecting for lameness resistance. The winning strategy combines environmental fixes that work today with genetics that compound forever. Bottom line: this isn’t about choosing between short-term and long-term solutions, it’s about having the vision and patience to pursue both.

Dairy Lameness ROI

You know that sinking feeling when your trimmer shows up and the bill starts climbing? We’re all dealing with it—lameness affects about a quarter of our cows, and at $120 to $330 per case according to multiple studies in the Journal of Dairy Science, it’s hitting checkbooks hard.

Here’s what’s interesting, though: CDCB just presented at their 2025 Industry Meeting that they’re developing genetic evaluations that could reduce lameness by 20-30% over the next couple of decades. And I say “could” because, well… let’s talk about what that really means.

What caught my attention when I dug into the presentations from Dr. Kristen Gaddis and her team is that the timeline stretches much longer than you’d expect. The economics? More modest than the headlines suggest. And get this—the entire system currently depends on mobility data from just six farms with camera systems, plus trimmer records from about 686 herds. That’s from CDCB’s own numbers.

Click the link to view the presentation: Improving the Wheels on the Car: Hoof Health and Mobility
Ashley Ling, Ph.D., CDCB Support Scientist Slides

The Science: Two Very Different Traits

Here’s where it gets fascinating, and I think you’ll appreciate the biological difference between CDCB’s two strategies.

Traditional hoof health data from trimmer records? We’re looking at heritability of just 3-5%—that’s what the research consistently shows. So basically, 95-97% of what we see comes down to the environment. Your flooring, nutrition program, whether you’ve got digital dermatitis making the rounds… you probably know this already. Put most cows in bad enough conditions—wet concrete, poor ventilation, overcrowding—and they’ll develop problems no matter what their genetics look like.

But mobility scores tell a completely different story. The heritability ranges from 10% to 30% based on CDCB’s findings in their reference population of 63,000 cows. That’s getting into the range of moderately heritable production traits we’ve been successfully selecting for. What’s encouraging here is that mobility seems to capture those deeper genetic differences—skeletal structure, pain sensitivity, basic biomechanics—that persist regardless of housing.

Mobility scores show 2-6x higher heritability than traditional trimmer records, revealing why AI-powered camera systems capture the genetic differences that actually matter for breeding decisions. When 95-97% of hoof problems come from environment, you need that 10-30% genetic signal—not the 3-5% noise.

The innovation piece that’s worth noting is these AI-powered camera systems from companies like CattleEye. They’ve captured over 14 million daily scores from those 63,000 cows, and research in Preventive Veterinary Medicine shows these systems agree with trained vets about 80% of the time. That’s precision you just can’t get when someone’s scribbling notes in the trim chute.

Your Bottom Line: The Real Economics

Let me walk you through the economics, because that’s what matters when you’re making breeding decisions today.

Based on USDA data and that 25% prevalence we’re all dealing with, you’re looking at about $56.25 per cow annually in lameness costs. For a 500-cow operation, that’s $28,125. Real money, absolutely.

The genetic savings timeline reveals the harsh reality—no financial benefit for the first 2-4 years, with meaningful savings only arriving by Year 6 and substantial impact delayed until Year 10-15. This isn’t about choosing between short-term and long-term strategies; it’s about having the vision and patience to pursue both.

But here’s what genetic selection actually delivers over time—and I’ve run these numbers based on CDCB’s genetic trend projections with standard 35% replacement rates:

  • Years 0-2: Nothing. Zero. You’re breeding, but no change in your barn yet.
  • Year 4: Maybe—and I mean maybe—you’ll notice three fewer lame cows in a 200-cow herd.
  • Year 6: Now we’re seeing something. About nine fewer lame cows, saving around $2,070 annually.
  • Year 10: Clear improvement. Twenty-two fewer lame cows, saving $4,879 annually.
  • Year 15: This is when it really shows. Thirty-six fewer lame cows, saving $8,160 annually.

The moderate scenario suggests a lifetime value of about $19-24 per cow from lameness resistance. To put that in perspective—and this is interesting—that’s right between Productive Life at $24 and Daughter Pregnancy Rate at $12 in the current Net Merit index, according to Dr. Paul VanRaden’s team at USDA.

The 6-Farm Problem

This is where things get… well, uncomfortable. Those six farms generating mobility data with their 14 million observations—impressive, sure. But are they really representative of the diversity we have across U.S. dairy operations?

What I’ve found in the Foundation for Food & Agriculture Research grant documentation is that these aren’t your typical farms. We’re talking operations that can afford $50,000 to $100,000 camera installations. They’ve got IT staff, sophisticated management protocols—they’re probably in the top 5% of the industry by any measure.

Now, statistically speaking, 63,000 cows far exceeds the 3,000-5,000 that genetics researchers say you need for reliable predictions. That’s well-documented.

But here’s what concerns me—research in Genetics, Selection, Evolution consistently shows that genomic predictions developed in one environment can lose 30-50% of their accuracy when applied to different management systems.

Think about it: if these six farms all have pristine rubber matting, optimal nutrition designed by PhD nutritionists, and professional trimmers on schedule, will their genetic evaluations actually help that 200-cow operation in Wisconsin dealing with 30-year-old concrete and tight margins?

CDCB’s got a $2 million grant from FFAR to expand collection to 60,000 more cows over three years. That’s great, but even then, we’re talking about less than 1.5% of the national dairy cow population contributing lameness data. And DHI participation? Down to 43% of U.S. cows from over 50% a decade ago, according to USDA census data.

Regional Realities Matter

What’s particularly interesting when you look at regional differences is how implementation challenges vary—and as many of us have seen, what works in California doesn’t always work in Vermont.

California operations with dry lot systems face completely different lameness dynamics than Vermont grazing operations or Michigan freestall barns. Cornell’s PRO-DAIRY research shows prevalence ranging from 15% in well-managed pasture systems to over 40% in older confinement facilities in the Northeast.

Down South—and I’ve talked to several producers dealing with this—heat stress creates its own problems. University of Georgia extension work shows lameness spikes during summer when cows spend more time standing on concrete to access shade and cooling.

These regional realities mean genetic evaluations developed primarily from Midwest and Western mega-dairies might need serious recalibration elsewhere.

The European Warning We Can’t Ignore

Here’s what keeps me up at night—and should concern any producer thinking long-term. It’s not today’s milk check. It’s what’s already happening in Europe.

European welfare markets hit by 2030, but your genetic investments won’t pay off until 2035—creating a 5-year window where early adopters gain permanent competitive advantage while late movers scramble. This isn’t theory; FrieslandCampina and Tesco already require welfare audits. Are you positioned?

FrieslandCampina in the Netherlands has implemented welfare monitoring programs that incorporate lameness metrics into supplier requirements. Major UK retailers, such as Tesco, require welfare audits with lameness as a key metric. Germany passed animal welfare labeling legislation in 2023 that creates premium pricing tiers.

Based on typical lag patterns, we could see similar requirements in U.S. markets by 2030-2035. Several major processors here have already started supplier welfare assessments. Walmart and Costco are asking questions. Export markets to Europe increasingly require welfare documentation.

And here’s the catch nobody wants to discuss: genetic decisions you make today determine your herd composition a decade from now. If you wait for clear market signals—actual premiums or penalties—before emphasizing lameness resistance, your genetics will be 10 years behind when those payments show up. It’s like trying to turn a cruise ship, as they say.

The Consolidation Dynamic

I’ve been around this industry long enough to recognize patterns, and here’s one that deserves honest discussion. These early-stage evaluations will work best for operations that already look like the reference farms—large, well-capitalized, technology-forward.

The math is sobering. If large operations gain even a 3-5-year head start while these evaluations are validated across broader environments, they maintain permanent genetic superiority that smaller operations can never close. That’s just how genetics works—it compounds. Research from ag economists at Iowa State confirms this dynamic across multiple livestock sectors.

This isn’t CDCB’s fault or intention. But when you combine superior lameness genetics with all the other advantages large operations already have—purchasing power documented by USDA’s Agricultural Resource Management Survey, technical expertise, preferential genetics access—you’re looking at one more force driving consolidation. We’ve already lost 50% of dairy farms in the past two decades, according to the 2022 Census of Agriculture.

What Actually Works: Practical Strategies

Flooring delivers immediate relief while genetics won’t catch up for 8-10 years—but the combined approach dominates by Year 10 with $16K+ in annual savings that continues compounding. This is how smart producers win: immediate environmental fixes buy time for genetics to mature.

After wading through all this research and talking with producers who’ve tried various approaches, here’s what’s clear:

For immediate impact (Years 0-5): Environmental management still wins. University of Wisconsin’s Dairyland Initiative research shows that traction-milling concrete floors—that’ll run you $40,000-60,000—can immediately reduce lameness by 10 percentage points. That’s $11,250 in annual savings with a 3- to 5-year payback. Genetic selection won’t match this for 8-10 years.

For long-term positioning (Years 5-15): This is where genetics shines. It compounds permanently while that nice flooring depreciates. By year 10, genetic selection could deliver $12,000+ in annual savings with no additional capital required. And unlike flooring that needs to be redone every 6-15 years, genetic improvement continues to improve.

The optimal approach: Do both if you can. Fix critical environmental problems for immediate relief while shifting breeding emphasis toward lameness resistance. Year 10 projections show combined benefits of around $23,450 annually—way better than either approach alone.

Alternative Approaches for Smaller Operations

Something that didn’t make CDCB’s main presentations but came up in technical discussions—lower-tech options are being explored that might work for many of us.

University College Dublin researchers developed smartphone apps that can score mobility from short videos with a 64% correlation to camera systems. Penn State Extension is testing a simplified visual scoring that your herd vet could do during routine visits. DairyComp 305 and other software providers are working on integration—you know how they’re always adding features.

Research in the Irish Veterinary Journal shows human-assigned mobility scores correlate at 0.64 with camera scores and still show 10-15% heritability. Not as good as fancy cameras, but might be good enough if it means smaller operations can participate without massive investments.

AI organizations could explore subsidized phenotyping programs—similar to what happened with genomic testing adoption a decade ago—where they’d help cover costs for farms willing to share data.

Making the Right Decision for Your Operation

Not every operation should chase lameness genetics—this decision tree cuts through the complexity to show exactly which producers will actually benefit from the 10-year investment. Screenshot this and take it to your next breeding strategy meeting.

Not every operation should prioritize this the same way. Based on the economics and timeline, here’s how I see it breaking down:

Strong candidates for emphasis:

  • Multi-generation family farms planning to be around 20+ years
  • Operations with chronic lameness over 30%—you’ve got more room for improvement
  • Farms that can’t afford major facility renovations—genetics might be your only option
  • Producers are already thinking about welfare-premium markets
  • Operations in regions where consumer pressure is strongest (California, Northeast)

Probably should focus elsewhere:

  • Planning to sell or retire within 5-7 years? You won’t see the payoff
  • Already under 15% lameness? Limited upside
  • Need immediate cash flow improvements? Production traits deliver faster
  • Got capital for facility upgrades? Environmental fixes give quicker returns
  • Located where welfare pressure is minimal

Where the Industry Goes from Here

What strikes me most about CDCB’s lameness resistance development is how it highlights a broader challenge. Should genetic evaluation systems optimize for current conditions or anticipate where markets are heading? When breeding decisions take 10 years to play out but markets can shift in 5, who bears the risk?

We learned this lesson painfully with fertility. Spent decades emphasizing production while fertility tanked—USDA data shows it clearly. Then we scrambled when replacement costs exploded. Took 15+ years to dig out. Are we setting up for the same pattern with welfare traits?

Dr. Chad Dechow at Penn State has written extensively about needing anticipatory breeding strategies that position for probable future markets rather than just optimizing for today. But that’s easier said than done when you’re trying to make payroll next month.

What This Means for You

Looking at all this, here’s what I’d tell my neighbors:

  • Adjust your timeline expectations. This isn’t a quick fix. If you need lameness relief in 3-5 years, invest in flooring, footbaths, and management. Genetics is your 10-year plan.
  • Understand the real economics. That $19-24 lifetime value per cow is real but modest. Don’t abandon production traits in pursuit of lameness improvement—use balanced selection via Net Merit or TPI.
  • Consider your market position. Selling commodity milk to the co-op? Current genetics might be fine. But if you’re eyeballing premium markets or brands like Organic Valley, starting selection now positions you for 2030-2035.
  • Contribute data if you can. These evaluations only improve with broader participation. If you’re working with a good trimmer or thinking about mobility scoring, explore data sharing with CDCB or your breed association.
  • Combine strategies. The successful producers I see aren’t choosing between genetics and management—they’re doing both with appropriate timeframes.

The promise of genetic selection for lameness resistance is real. We’re looking at a potential 30% reduction over 20 years according to CDCB projections, permanent benefits that compound, and positioning for evolving markets. But it’s not magic, won’t replace good management, and requires more patience than most of us naturally have.

What we’re discovering about lameness genetics is pretty much what we’ve learned with every other trait: biological systems change slowly, market signals arrive late, and success goes to those who position for tomorrow while managing today. The tools are coming—CDCB says April 2025 for initial implementation. Whether we have the patience and vision to use them effectively? Well, that’s the real question, isn’t it?

KEY TAKEAWAYS

  • The 10-year reality: Lameness genetics save nothing initially, then compound to $4,879 (Year 10) and $8,160 (Year 15)—patience required
  • Data disconnect warning: Six elite farms with $100K cameras shape genetics for 34,000 dairies—verify relevance to YOUR operation
  • Win with both strategies: $40-60K flooring investment (immediate relief) + genetic selection (permanent gains) = $23K+ annual savings by Year 10
  • Timeline mismatch alert: European welfare markets arrive by 2030, but genetics won’t deliver until 2035+—early adopters gain 5-year advantage

Complete references and supporting documentation are available upon request by contacting the editorial team at editor@thebullvine.com.

Learn More:

The Sunday Read Dairy Professionals Don’t Skip.

Every week, thousands of producers, breeders, and industry insiders open Bullvine Weekly for genetics insights, market shifts, and profit strategies they won’t find anywhere else. One email. Five minutes. Smarter decisions all week.

NewsSubscribe
First
Last
Consent

Sensor Data Worth Thousands: How the 42% Heritability Milking Speed Breakthrough Changes Your Breeding Decisions

CDCB’s August release proved sensor data beats subjective scoring by 2X. Smart producers are already adjusting breeding strategies. Are you?

EXECUTIVE SUMMARY: Your parlor sensors just revealed a genetic goldmine: 42% heritability for milking speed that breeds twice as fast as milk yield. This breakthrough—requiring unprecedented data sharing among 10 competing manufacturers—can save $70/cow annually when managed correctly. But there’s a critical trade-off: faster-milking cows tend to have higher somatic cell counts, making balanced selection essential for long-term profitability. The U.S. now leads with sensor-based evaluations while other countries cling to subjective scoring, fracturing international genetics markets and potentially isolating American genetics globally. Robot dairies must wait until 2030 for reliable evaluations, and the entire system depends on fragile manufacturer cooperation that could collapse if even one major player withdraws. Smart producers will adjust breeding strategies now to capture benefits while managing risks, because sensor genetics isn’t just another trait—it’s the future running through your parlor today.

sensor-based milking speed

You know that morning routine—standing in the parlor at 4:30 AM watching your third group come through, and you’re thinking there’s got to be a better way to breed for efficiency.

Well, CDCB just handed us something worth talking about over coffee.

When those Milking Speed PTAs came out in August, my first reaction was pretty much like yours probably was: “Great, another number to track.” But here’s what’s interesting—we’re looking at a heritability of 42%. That’s double what we typically see with milk yield at around 20%. And it absolutely dwarfs productive life or mastitis resistance, which hover down around 8% and 3% respectively, based on CDCB’s official genetic parameters.

What I’ve found is this isn’t just another incremental improvement. Those inline sensors sitting in parlors from California’s Central Valley to the family farms across Wisconsin and Minnesota… turns out they’ve been collecting incredibly valuable genetic information for years. We just didn’t know how to use it properly until now.

Dr. Kristen Parker Gaddis, CDCB’s Genetic Evaluation Research Scientist, summed it up well during their October industry meeting at World Dairy Expo. She mentioned that the really exciting part—at least from a geneticist’s perspective—is that it has really high heritability. Because what that leads to is even with their fairly modest dataset of 146,000 records, they’re getting relatively high reliabilities right from the start.

Click the link to view the presentation: Calculating Milking Speed (MSPD) PTAs Using Sensor Data
Kristen Gaddis, Ph.D., CDCB Geneticist Slides

But as many of us have seen with new technology, there’s always more to the story than those headline numbers…

Quick Facts: MSPD at a Glance

  • Heritability: 42% (vs. 20% for milk yield)
  • Dataset: 146,517 lactation records from ~132,000 cows
  • Herds: 215 participating farms
  • Manufacturers: 10 equipment companies sharing data
  • Development: 2021-2025 (4 years)
  • Release: August 2025
Milking Speed’s 42% heritability is unprecedented – more than double milk yield and six times higher than most health traits. This means genetic progress happens FAST

Behind the Curtain: The Infrastructure Battle Nobody Talks About

Looking at what it actually took to get this trait to market, I’m honestly amazed it happened at all. You had USDA’s Animal Genomics and Improvement Laboratory working with CDCB, plus Dairy Records Management Systems, a specially-formed Milking Speed Task Force, 215 participating herds across the country, and—this is the part that gets me—10 different milking equipment manufacturers actually agreeing to share data. The official presentations reference those 10 original manufacturers, though folks in the industry tell me 11 were ultimately involved.

Now, if you’ve ever tried getting your DeLaval system to talk to your Boumatic feed software, or your GEA equipment to play nice with your herd management program, you know exactly what I’m talking about. These companies spent decades—I mean decades—building systems explicitly designed NOT to share information. Classic vendor lock-in that drives us all crazy, right?

People who were close to those negotiations tell me they had to create entirely new frameworks that nobody had really tried before:

So they developed Format 8—basically a standardized data specification that lets different systems finally speak the same language. About time, honestly.

They also had to hammer out legal agreements ensuring manufacturers couldn’t use the genetic evaluation data to trash their competitors. You can imagine how fun those conversations were…

And they built data-sharing structures that protect our ownership—because, let’s be clear, it’s our data—while still enabling the research we need.

Now get this—and this is what really blows my mind—they started with over 50 million sensor observations from those 132,000 cows. After quality control? They aggregated all that down to 146,517 lactation-level records. We’re talking about averaging hundreds of individual milkings per cow into usable genetic data.

Makes you wonder what else might be hiding in all that sensor information we’re collecting every single day, doesn’t it?

The Economics: When Faster Milking Actually Costs You Money

Your herd’s current udder health status determines whether speed selection saves you $26K annually or costs you money. The bottom-right cell is the danger zone – aggressive selection with existing mastitis problems destroys profitability

Let me walk you through a scenario that’s probably pretty familiar. Say you’re running 1,000 cows through a double-12, milking three times daily like many Wisconsin operations do now. The economic modeling around sensor-based genetic evaluation suggests that if selection bumps your average speed up by just half a pound per minute—it doesn’t sound like much, does it?—you’re looking at tens of thousands in annual labor savings. And that’s using typical labor costs around $16 per hour, though I know plenty of folks paying more than that.

Sounds great. Sign me up, right?

But wait a minute.

What CDCB deliberately left out of Net Merit—and they actually had solid reasoning here—is that Milking Speed shows a positive genetic correlation of 0.37 with Somatic Cell Score. Plus, it’s negatively correlated with Mastitis Resistance at -0.28, based on CDCB’s published genetic parameters.

CDCB’s data reveals the hidden cost: bulls with the fastest genetics (+8.5 lbs/min) tend to pass on weaker udder defense. The sweet spot sits around 7.5-8.0 lbs/min where you gain efficiency without destroying mastitis resistance

So in plain English? Genetically faster-milking cows tend to have weaker udders. There’s your trade-off.

I’ve been running numbers for different scenarios, and the differences are really eye-opening:

For herds with solid udder health—I’m talking around 15% clinical mastitis and 8% subclinical, which is pretty typical for well-managed operations in the Midwest:

  • That moderate half-pound per minute improvement? You’re looking at substantial annual savings
  • Push it to a full pound per minute? Even better returns

But if you’re already fighting mastitis—and I know plenty of good managers dealing with this, especially with environmental challenges where you’re seeing 35% clinical and 25% subclinical rates:

  • That same moderate improvement? Your returns drop way down
  • Try for aggressive selection? You’re really walking a tightrope there

What the data suggests—and this is crucial—if your clinical mastitis rate’s already pushing 40% annually, even moderate selection for milking speed can trigger what the veterinary folks call cascading health problems. At that point, the math just doesn’t work anymore.

Heritability Comparison: How Traits Stack Up

TraitHeritabilityRelative Response
Milking Speed (MSPD)42%2.1x faster
Milk Yield20%1.0x (baseline)
Productive Life8%0.4x slower
Mastitis Resistance3%0.15x slower

Source: CDCB genetic parameters, 2025

The International Split That’s Developing

Evaluation AspectUS Sensor-Based (MSPD)International SubjectiveWinner/Risk
Data SourceInline sensors, 50M+ observationsClassifier observations, scored 1-9US (objective)
Heritability Estimate42% (EXTREME)14-28% (Moderate)US (2X higher)
Genetic Progress Rate2.1X faster than milk yieldSlower, less predictableUS (much faster)
International CompatibilityIncompatible with subjective systemsCompatible across countriesINTERNATIONAL (compatibility)
Cost to ImplementHigh (requires manufacturer cooperation)Low (existing appraisal systems)INTERNATIONAL (lower barrier)
Data QualityObjective, continuous measurementSubjective, infrequentUS (more accurate)
Update FrequencyReal-time, every milkingOnce or twice per lactationUS (real-time)
Market ImpactMay isolate US genetics globallyMaintains global trade compatibilityRISK (market fracturing)

Here’s something that worries me for anyone selling genetics internationally—and that’s a lot of us these days. While we’re moving to these sensor-based evaluations with that impressive 42% heritability, other countries are still using subjective scoring systems. They’re generally getting heritabilities ranging from 14% to maybe 28%, depending on their approach.

A colleague of mine who’s involved with international genetic evaluation coordination—they asked not to be named, given the sensitive negotiations going on—put it pretty bluntly: “We’re basically creating incompatible systems here. International evaluations typically need substantial genetic correlations between countries—usually 0.70 or higher—to make those conversion equations work properly. Early indications? We might not hit that threshold.”

Think about what this actually means for your breeding program:

  • Your U.S. bulls might not have converted milking speed values for those export markets
  • That fancy European genetics you’ve been considering? No MSPD predictions are coming with them
  • We could see the global Holstein population basically fragment into sensor-based and subjective-scoring camps

It’s not ideal—I’ll be the first to admit that. But honestly? The alternative was sticking with subjective scoring that doesn’t really deliver meaningful genetic improvement. Sometimes you’ve got to pick your path and commit to it.

Why Robot Dairies Are Still Waiting

If you’re running robots—and more Midwest producers are every year—I’ve got news that requires some patience. CDCB openly acknowledges that extending MSPD to automatic milking systems is their biggest challenge right now. They’ve got about 20,000 AMS cow-lactations in their database. Compare that to 146,517 from conventional parlors, and you see the problem.

But it’s not just the sample size that’s the real issue here. What’s fascinating—at least to those of us who geek out on this stuff—is that robots fundamentally change what we’re actually measuring.

In your conventional parlor, everybody milks on schedule. Three times daily means roughly every eight hours, nice and standardized. But with robots? Research on voluntary milking behavior shows some cows visit 2.2 times daily while their pen-mates are hitting the box 3.5 times.

That variation comes from all sorts of factors, as you probably know:

  • Individual cow motivation—some just handle udder pressure differently than others
  • Your pellet allocation strategy (I’ve seen everything from half a kilo to 8 kg, depending on what the nutritionist recommends)
  • Whether you’re running free-flow or guided traffic systems

So here’s the million-dollar question that’s keeping the geneticists up at night: Is a cow milking 3.5 times at 6 pounds per minute genetically equivalent to one milking 2.5 times at 7 pounds per minute when they’re both putting the same total pounds in the tank?

Nobody knows yet. Based on what we’ve seen with similar trait development, we’ll probably need 50,000 to 80,000 AMS lactations to sort this out properly. At current adoption rates? You’re realistically looking at 2030 to 2032 before robot dairies get reliable MSPD evaluations.

Looking Ahead: The 3-5 Trait Reality

Let’s have an honest conversation about what’s actually possible versus what the tech companies are promising. CDCB and USDA combined have the capacity to develop maybe—and I’m being optimistic here—3 to 5 new sensor traits per decade. That’s just the reality of resource constraints.

MSPD took 4 years from the time they formed the task force to release. You do the math. We’re limited in what we can realistically accomplish.

Based on current research priorities, here’s what I think we’ll actually see:

Near-term stuff (2025-2028):

  • Activity and rumination from those neck collars that many of us are already using
  • Robot-specific evaluations for box time and actual flow rate

Medium-term possibilities (2028-2032):

  • Feed intake consistency—research herds are building those datasets now
  • Milk spectral traits that might predict efficiency
  • Heat tolerance based on how activity changes with temperature (and boy, do we need that one)

The real challenge? Technology cycles every 5 to 7 years. By the time we validate these traits, the sensors themselves might be obsolete. It’s like chasing your tail sometimes.

The Real Economics Behind Development

It’s worth understanding what this whole MSPD development actually cost. Industry estimates suggest we’re talking millions in development costs, with annual operating expenses running in the hundreds of thousands. And the direct value capture? It barely breaks even, if that.

Makes you wonder why they did it, right?

Well, here’s the thing—the alternative was watching companies like DeLaval and Lely build their own proprietary genetic evaluation systems. Can you imagine? We’d have ended up with five different “milking speed” scores that don’t compare, and you’d be getting your genetic information from equipment dealers rather than breed associations. Agricultural economists who’ve examined this estimate say that such market fragmentation would cost our industry tens of millions of dollars annually in lost efficiency. Sometimes you’ve got to spend money to save money, I guess.

The Governance Tightrope

What really concerns me—and this is based on conversations with folks who work closely with the system—is just how fragile this whole arrangement is. These equipment manufacturers had never been part of dairy’s traditional cooperative data structure before. Why would they be? They just made the equipment. They didn’t control the data.

But inline sensors changed everything, didn’t they? Suddenly, these companies are sitting on absolute goldmines of genetic information. Getting them to share required some pretty creative solutions that, frankly, might not hold long-term:

The agreements need renewal every few years—nobody’s locked in forever here. Any company can basically walk away whenever they want. There are these non-disparagement clauses preventing anyone from publishing performance comparisons between manufacturers. And the proprietary algorithms? They stay secret. Manufacturers only share the processed data.

“The trust holding this together is tissue-paper thin. One major player pulls out, and it could all unravel.”

That’s from a technical specialist I trust who works closely with the system. And honestly? It keeps me up at night.

What This Means for Your Operation Today

After really digging into all this (probably spending way too much time on it, my wife would say), here’s my practical take for different types of operations:

If You’re Running a Conventional Parlor

With good udder health (meaning your SCC is under 150,000 and clinical mastitis below 20%):

  • Look for bulls with MSPD values running +0.5 to +1.0 lb/min above breed average
  • You should see meaningful per-cow savings annually within 5 to 7 years
  • But keep tracking that bulk tank SCC quarterly—if it starts creeping up faster than you expected, ease off the gas

If mastitis is already giving you headaches (SCC over 250,000, clinical cases above 30%):

  • Keep your MSPD selection modest—no more than +0.3 to +0.5 lb/min maximum
  • Focus on fixing that udder health situation first (you know you need to anyway)
  • Only chase milking speed after you’ve got mastitis under control

For Robot Operations

  • Don’t expect MSPD evaluations for your system until 2030 at the earliest—I’m being realistic here
  • Current conventional parlor values might not predict robot performance well at all
  • For now, focus on temperament and milking frequency genetics—that’s what’s going to matter in your system

If You’re Marketing Genetics

  • Bulls with exceptional MSPD values—anything over +1.0 lb/min—have real domestic marketing potential
  • But those international markets? They might not recognize these evaluations. Keep that in your back pocket
  • You’ll want to maintain balance with traditional traits if you’re selling globally

The Big Picture: Where We’re Really Headed

The August 2025 MSPD release is more than just another number showing up on bull proofs. What we’re witnessing—and I really believe this—is the opening move in a complete transformation of how dairy genetics works. And between you and me? It’s going to get messier before it gets clearer.

Here’s what I think really matters:

We’ve been sitting on high-heritability goldmines in our sensor data for years without realizing it. That 42% heritability for milking speed? It suggests other valuable traits are probably hiding in those data streams. If you’re already collecting comprehensive sensor data, you’re well positioned for whatever comes next.

The economics, though—they’re not as straightforward as the headlines suggest. Yes, faster milking saves labor. No argument there. But if it compromises your udder health, you’re going backwards fast. Every farm’s break-even point is different. You’ve really got to run your own numbers carefully here.

For those of you in global genetics markets—and I know there are many—the international market’s fracturing. The U.S. bet big on precision dairy genetics while others stuck with cheaper subjective scoring. Neither approach is wrong, necessarily, but they’re becoming increasingly incompatible. This matters now, not five years from now.

I also think we need to acknowledge that cooperative genetics faces a real existential moment. The structures that barely got MSPD across the finish line… well, they’re held together with baling wire and good intentions. Within 5 to 10 years, we might be receiving evaluations from multiple competing platforms rather than a single national system. That’s not necessarily bad, but it’s definitely different from what we’re used to.

And finally—technology moves way faster than validation. By the time sensor traits get through that development pipeline, the technology itself often changes fundamentally. We need to accept that some infrastructure investments just won’t pay off the traditional way. That’s the new reality.

What gives me hope is that MSPD proves sensor-based evaluation actually works. It delivers exceptional heritability and integrates into our existing breeding programs. But it also reveals these tensions between our cooperative traditions and commercial realities that, frankly, we haven’t figured out yet.

Progressive producers who understand both the opportunities and the limitations—they’ll navigate this transition just fine. Those expecting sensor genetics to plug into existing systems like traditional traits simply always have? Well, they’re in for some surprises.

The revolution isn’t coming—it’s here, running through your parlor every single day. MSPD opened that door. What comes through next will reshape dairy breeding for generations. The question isn’t whether to embrace sensor-based genetic evaluation. It’s how to use it intelligently while the ground shifts beneath the entire industry.

And that’s something we’ll all be figuring out together, one breeding decision at a time.

KEY TAKEAWAYS 

  • $70/cow awaits—with conditions: Select bulls +0.5 to +1.0 lb/min above breed average for milking speed, but ONLY if your herd maintains SCC under 150,000 and clinical mastitis below 20%
  • Speed kills udder health: The 42% heritability is a double-edged sword—aggressive selection (+1.0 lb/min) without monitoring SCC quarterly could trigger cascading mastitis problems costing more than you save
  • Your system determines your timeline: Conventional parlors can profit NOW from MSPD, but robot dairies must wait until 2030 for reliable evaluations—plan breeding strategies accordingly
  • International genetics just got complicated: U.S. sensor-based evaluations won’t translate to countries using subjective scoring—if you export genetics, maintain traditional trait balance or risk losing global markets
  • The revolution is fragile: This entire system depends on 10 manufacturers continuing to share data voluntarily—smart producers will capture benefits while preparing for potential fragmentation

Complete references and supporting documentation are available upon request by contacting the editorial team at editor@thebullvine.com.

Learn More:

The Sunday Read Dairy Professionals Don’t Skip.

Every week, thousands of producers, breeders, and industry insiders open Bullvine Weekly for genetics insights, market shifts, and profit strategies they won’t find anywhere else. One email. Five minutes. Smarter decisions all week.

NewsSubscribe
First
Last
Consent

This Isn’t Your Normal Dairy Downturn – Here’s Your 60-Day Action Plan

What current structural changes mean for dairy operations, plus proven strategies successful producers are using right now

EXECUTIVE SUMMARY: Wisconsin dairyman, 10:30 PM, spreadsheet still open: ‘These numbers can’t be right.’ They were. Five permanent shifts are reshaping dairy: China’s 36% import cut (they’re self-sufficient), $8 billion in plants needing milk regardless of demand, aging populations abandoning fluid milk, currency math you can’t beat, and $4,000 springers versus $2,800 cull cows. But here’s what’s working: organic premiums at $32/cwt, three-family partnerships each clearing $200K+, and component focus adding $820K yearly without expansion. The math is brutal but clear—if you’re within $2/cwt of breakeven, optimize hard. If you’re $3-5 away, something fundamental must change. Beyond $5? Every 60 days of waiting costs you serious equity. This weekend, run your real numbers and make the call.

Dairy Action Plan

Here’s something that stopped me cold last week. A Wisconsin dairyman called at 10:30 PM, spreadsheet still open on his computer. “I’ve run these numbers twelve different ways,” he said, managing 450 cows like his family has for generations. “They keep telling me the same thing, and I don’t like what I’m hearing.”

You know what? He’s not alone. I’ve had variations of that conversation with producers from Tulare to Lancaster County these past few weeks. Even down in Georgia and the Carolinas, where heat stress adds another layer of complexity, folks are wrestling with the same fundamental questions.

The latest FAO Dairy Price Index dropped again, for the fourth month straight, down 3.4% in October to 142.2 points. And the Global Dairy Trade auction keeps sliding, too. Six consecutive drops through November 4th. Whole milk powder’s sitting at $3,503 per tonne. Butter’s off 4.3%. Even cheddar dropped 6.6%, which caught a lot of us off guard.

But what’s really got me thinking is how different this feels from 2009, different from 2015. After talking with producers, looking at what’s happening globally, and honestly, lying awake at night thinking about my own operation, I’m convinced we’re seeing something more fundamental than just another price cycle.

China’s Not Coming Back (And We Built Everything Assuming They Would)

China’s self-sufficiency surge eliminated 36% of milk powder imports in just 5 years, wiping out demand that American dairy expansion plans were built around

So let’s have the conversation nobody wants to have. Remember five years ago when every dairy meeting, every expansion plan, every processing investment was built around Chinese import growth? Made sense at the time, right?

Well, here’s where we are now. China’s domestic production increased by 11 million metric tons between 2018 and 2023—that’s according to USDA’s latest Foreign Agricultural Service data. They’re hitting 85% self-sufficiency now. Up from 70% just five years back.

And their whole milk powder imports? Down from averaging 670,000 metric tons during 2018-2022 to about 430,000 tons in 2023. That’s not a blip, folks. That’s a 36% structural change that Rabobank and other analysts are calling permanent.

I’ve been talking with producers who built their entire business models around Chinese demand. One guy told me, “We retooled everything—bred for higher components, invested in new equipment, built our five-year plan around powder exports. Now what?”

What makes it worse—and I don’t think many people are connecting these dots yet—is the demographics. China’s birth rate fell from 12.43 per thousand in 2017 to 6.39 in 2023. That’s their National Bureau of Statistics, not speculation. Fewer babies means less formula. Aging population means less fluid milk, more medical nutrition products. It’s a completely different market.

These New Plants Need Milk, Whether the Market Wants It or Not

With $8-11 billion in new processing capacity carrying $24-30M annual fixed costs per plant, processors will pay premium prices to hit 85-90% utilization rather than explain idle capacity to their boards

Now, let’s talk about something that’s creating real pressure right now. Between 2023 and 2027, our industry’s building $8-11 billion in new processing capacity. I’ve walked through some of these facilities. They’re incredible. Leprino’s billion-dollar cheese plant in East Lubbock. Fairlife’s $650 million facility in Rochester. Great Lakes Cheese is putting over half a billion into Franklinville, New York.

What’s crucial here—and this is what keeps plant managers up at night—is that these facilities need to run at 85-90% capacity just to break even. CoBank’s analysis shows that clearly. Drop below 75%? You’re hemorrhaging money.

Think about it. A $300 million cheese plant carries maybe $25-30 million in annual fixed costs. Debt service, insurance, baseline staffing—those bills come due whether you’re running one shift or three.

What’s interesting here is what plant managers are telling me. When you’ve got $2 million in monthly debt payments, you’ll pay whatever premium it takes to keep milk coming in the door. Running at breakeven beats explaining to your board why the plant’s sitting idle. Kind of puts you between a rock and a hard place, doesn’t it?

So what happens? Plants keep bidding for milk to hit utilization targets. We see those premiums and keep producing. The oversupply continues. Prices stay low longer than anybody expects. It’s a cycle that feeds itself.

The University of Wisconsin’s dairy program has highlighted something crucial—most of this capacity was planned when we were seeing 1-2% annual production growth. Now we’re actually seeing slight declines. Somebody’s going to end up with very expensive, very empty stainless steel.

The Customer Base Is Aging Out (And Nobody Wants to Talk About It)

Youth aged 6-19 who drive bulk dairy consumption are shrinking from 18% to 13% of the population while low-consuming seniors 70+ explode from 6% to 17% by 2050—a customer base transformation few producers have factored into long-term planning

Here’s a demographic reality that caught me completely off guard. Two-thirds of the world’s population now lives in countries where birth rates are below replacement level. UN Population Division data, not opinion.

By 2050, people aged 70 and older will make up 11% of the global population. Today it’s 6%. By 2100? We’re looking at 17%. These aren’t people buying gallons for the kids anymore. They’re buying high-protein shakes, maybe some yogurt, portion-controlled products.

What really drives this home? Cornell’s extension folks have shared data showing that about 25% of all U.S. cheese consumption happens through pizza. Guess who’s eating that pizza? Mostly 6-to-19-year-olds. That age group is shrinking while the over-60 crowd—who eat maybe a slice a month—is exploding.

The analysis suggests the only real growth market for traditional dairy consumption is sub-Saharan Africa. And let’s be honest, that’s not exactly where we’re set up to compete.

What’s interesting is that we’re seeing different dynamics across regions. India’s consumption is still growing, but their production’s growing faster. The EU’s dealing with aging farmers, tighter environmental rules, and the same consolidation pressures we have. Out in the Mountain West, producers tell me water rights are becoming as valuable as the cows themselves. Up in the Pacific Northwest, organic operations are finding their niche markets getting crowded as more producers make the transition. Nobody’s immune to these shifts.

Currency Is Killing Us, And There’s Nothing We Can Do About It

Alright, let’s talk about something we have zero control over but affects everything—currency.

When New Zealand’s dollar weakens by 10%, their milk powder gets 10% cheaper for international buyers overnight. Doesn’t matter if you’re the most efficient producer in Wisconsin or Idaho. You can’t compete with currency math.

Argentina eliminated their dairy export taxes last year. Their peso’s weak. Production jumped 11% in just Q1 2025. Meanwhile, we’re looking at Chinese tariffs of 84% to 125% on various dairy products, plus a strong dollar that makes our stuff expensive before those tariffs even kick in.

The Europeans? Same game, different currency. Plus, they get government support we can only dream about.

I heard someone from the International Dairy Foods Association talking about “market diversification opportunities.” Come on. That’s just fancy talk for “our traditional customers found cheaper suppliers and we’re scrambling.”

The Heifer Shortage That’s Creating a One-Way Door

This situation with replacement heifers—man, this is brutal. We’ve been breeding beef-on-dairy pretty heavy, right? Made sense with those calf prices. But now, the dairy heifer inventory over 500 pounds is at its lowest since the 1970s. USDA says 3.914 million head.

You know what’s happening at auctions across Wisconsin? Recent sales show springers going for $3,000-3,500. Really nice ones are hitting $4,000. Meanwhile, cull cows are bringing $2,800-3,100 because beef prices are still strong.

As one producer put it to me: “I can ship my bottom 20% tomorrow for $2,800 each. But if I want to buy replacements next spring? That’s $3,500 minimum, probably four grand for anything decent. So either I shrink forever or I keep milking marginal cows and hope something changes.”

That’s the trap. Easy to exit—back the trailer up, load them out. But getting back in? Most guys can’t afford it. Used to be you could cull hard, rebuild when prices recovered. Not anymore.

Who’s Actually Making This Work (And how)

Three proven strategies generating $280K to $820K in additional annual income—component optimization, family partnerships, and organic premiums all deliver measurable results without adding a single cow

Despite all this doom and gloom, I’m seeing operations that are absolutely thriving. Their approaches are worth paying attention to.

There’s an organic operation in Lancaster County, Pennsylvania—about 280 cows, family-run. They transitioned five years ago. Yeah, it cost them around $150,000 and three years of lower production during transition. But they’re getting $32.69 per hundredweight through their organic cooperative right now, while their neighbors are looking at $19.50 per hundredweight for conventional.

The owner told me straight up: “We quit trying to compete with New Zealand on price. We’re selling to people who want to know the cows’ names and see our pastures on Instagram. Currency rates don’t matter when you’re selling a story.” The hardest part? Learning to market themselves, not just their milk. They had to become storytellers, photographers, social media managers—skills they never thought they’d need.

Here’s another interesting model. Three farm families in Wisconsin merged their operations a few years back. They were running 350, 400, and 425 cows separately. Combined everything into one 1,175-cow setup with robots. Took about eighteen months of planning, lots of lawyer fees, and some serious family meetings—including one that almost ended the whole thing over whose barn to use as headquarters.

But listen to this—they went from around $17.80 per hundredweight when operating separately to $16.20 when operating together. Each family’s clearing $200,000 to $250,000 now. One of the partners told me, “The Hardest part was giving up being my own boss. But the reality is, I took my first real vacation in fifteen years last month. My partners covered everything.”

What’s also working for some folks is getting laser-focused on components. Jim Ostrom at HighGround Dairy has been working with producers who’ve moved their income-over-feed-cost from $7.50 to $10 per cow per day. Just better rations, tighter fresh-cow management, and pushing butterfat when the premiums are there. That’s $820,000 more per year on 900 cows without adding a single animal.

Down in the Southeast, where summer heat stress can knock 15-20 pounds off daily production, I’m seeing producers invest in cooling systems that pay for themselves through maintained components even when volume drops. One Florida dairyman told me, “I stopped chasing gallons and started chasing butterfat. Changed everything.”

The Risk Management Tools We’re Not Using (But Should Be)

Here’s what drives me crazy. We’ve got better risk management tools than ever, but most of us—myself included—don’t use them properly.

Dairy Margin Coverage at that $9.50 tier? Farms that enrolled got close to $150,000 in payments last year. If you’re under 5 million pounds annually, it’s dirt cheap. But I talk to guys who won’t sign up because “it’s a government program.” Meanwhile, they’re losing two bucks a hundredweight and burning through equity that DMC would’ve protected.

Dairy Revenue Protection paid out over $500 million in 2023. Phil Plourd at Ever.Ag calls it subsidized insurance, and he’s right. You’re protecting your downside while keeping upside potential. But we still think of it as gambling rather than management.

And futures markets—Ohio State’s research shows it takes 6-9 months for margins to recover after a big shock. That means you need to be positioning that far out. Companies like StoneX offer programs tailored for smaller operations, but most of us wait until we’re already underwater before we consider them.

What I’ve noticed talking to bankers lately—they’re actually looking more favorably at operations with risk management in place. As one lender put it, “I’d rather finance someone with DMC and DRP than someone with 200 more cows.” Several banks are even offering slightly better rates to operations that demonstrate comprehensive risk management. Makes sense when you think about it—they’re protecting their loans too.

KEY NUMBERS TO TRACK

  • Your true break-even cost (including family living)
  • Debt-to-asset ratio compared to last year
  • Working capital months at current burn rate
  • Income-over-feed-cost daily average
  • Cull cow value vs. replacement cost spread

Decisions You Need to Make in the Next 60 Days

Three distinct pathways based on your true breakeven gap—within $2/cwt means optimize through it, $3-5/cwt demands fundamental transformation, beyond $5/cwt requires hard conversations before equity evaporates in the next 60-90 days

Let’s get practical here. If you’re sitting there wondering what to actually do, here’s what I’m seeing for the next couple of months.

Cull cow prices right now—November 2025—are running $2.00 to $2.24 per pound. Good fleshy cow weighing 1,400 pounds? That’s $2,800 to $3,100. But here’s what’s worth considering. Historical patterns suggest—and this is just based on past cycles—these could drop 15-25% by February if Brazilian beef tariffs change or everybody starts culling at once.

A producer recently ran this math for me. His bottom 40 cows shipped now generate $112,000. Wait until February, if prices drop to $1.70? That’s $95,200. The $16,800 difference might be the difference between making it and not making it.

But you’ve got to know your real breakeven. Not the one you tell the neighbors. The real one. With family living, debt service, and all that maintenance you’ve been putting off.

Three Paths Forward (Based on Where You Really Stand)

After all these conversations, here’s the framework I’m using:

If you’re within $2 of breakeven: You can optimize through this. Cull hard, focus on components, tighten everything up. Markets will give you room eventually.

If you’re $3-5 away from breakeven: Something fundamental has to change. Maybe that’s finding partners, maybe it’s transitioning to a premium market, maybe it’s restructuring debt. But status quo ain’t gonna cut it.

If you’re more than $5 from breakeven: Time for the hard conversation. And I mean really hard. But saving $400,000 in equity beats losing everything in six months.

Where This Is All Heading

Look, I don’t have a crystal ball. But if current consolidation trends continue—and we lost 39% of dairy farms between 2017 and 2022—we could potentially see another significant reduction by 2030.

What’s emerging are three models that seem to work: The 5,000-plus-cow operations that run like factories. The 50-to-300-cow premium operations selling stories and values. And these multi-family partnerships running 800-2,000 cows together.

Is that traditional 300-to-600-cow family dairy competing on commodity milk? That’s getting harder and harder to pencil out. Not because those folks aren’t working hard—they’re working harder than ever. The economics just aren’t there anymore.

Though the reality is, there’s always room for creative thinking. I’ve heard about young producers buying smaller dairies at auction, converting to specialty genetics like A2, and selling everything at a premium to regional processors. They’re not getting rich, but they’re making it work through pure creativity and willingness to adapt.

The Bottom Line

The conversation that matters most is the one you have with yourself and your family about where you really stand. I’ve talked to too many people who waited six months hoping things would improve, only to watch significant equity disappear.

This weekend, run your real numbers. All of them. Family living, debt service, everything. Compare that to realistic milk prices, not wishful thinking.

Then have the conversation those numbers demand. With your spouse, your kids, your banker, potential partners—whoever needs to be part of it. Because the difference between choosing your path and having it chosen for you is usually about 90 days and a whole lot of family wealth.

These structural shifts—China going self-sufficient, too much processing capacity, aging populations, currency games, heifer shortages—they’re not going away. The industry that emerges from this won’t look like the one we grew up in.

But here’s what I know after decades of watching this industry evolve. The operations that’ll thrive in 2030 won’t necessarily be the biggest or have the most capital. They’ll be the ones that saw reality clearly, made hard decisions early, and adapted to what is rather than wishing for what was.

We’re all in this together, navigating waters none of us have seen before. The data’s telling us something important. Question is, are we ready to listen? And more importantly, are we ready to act on what we’re hearing?

Remember, every crisis creates opportunity for those willing to see it and seize it. This one’s no different. The dairy farmers who make it through this will be stronger, smarter, and more resilient than ever.

KEY TAKEAWAYS:

  • This downturn breaks all the rules: Five permanent forces (China self-sufficient, plants needing milk, customers aging, currency killing us, heifers gone) mean waiting for “normal” is a losing strategy
  • The $16,800 decision can’t wait: Culling 40 cows today nets $112,000. By February? Maybe $95,200. That difference could determine whether you’re still farming in 2026
  • Three strategies actually work: Get premium prices like that $32/cwt organic farm, share costs like those Wisconsin partners each banking $200K+, or maximize components for $820K more without adding cows
  • Your breakeven tells you everything: Less than $2/cwt away? You’ll make it with adjustments. $3-5 gap? Time for radical change. Over $5? Every month you wait costs serious family wealth
  • The survivors aren’t the biggest—they’re the ones deciding NOW: This weekend, calculate your true all-in costs, pick your path, and act. The difference between choosing and being forced is about 90 days

Complete references and supporting documentation are available upon request by contacting the editorial team at editor@thebullvine.com.

Learn More:

The Sunday Read Dairy Professionals Don’t Skip.

Every week, thousands of producers, breeders, and industry insiders open Bullvine Weekly for genetics insights, market shifts, and profit strategies they won’t find anywhere else. One email. Five minutes. Smarter decisions all week.

NewsSubscribe
First
Last
Consent

Fertility Bulls Failing? Your PTAs Are 30% Inflated – Here’s the Fix

31% of dairy services now use beef semen. Fertility evaluations? Still pretending it’s 2005. No wonder your PTAs don’t work.

Executive Summary: If you’ve spent years selecting elite fertility bulls with zero improvement, you’re not alone—and you’re not failing. The genetic evaluation system has been broken for 20 years, inflating fertility PTAs by an estimated 25-30% based on the timing bias and management misalignment Dr. McWhorter described and costing the average 500-cow dairy $25,000 annually. Modern management broke the system: it assumes you breed at 50 days when the industry average is 67.5, can’t account for 31% of services using beef semen, and actively punishes progressive practices like extended VWP as genetic deficiencies. CDCB admits the problems and promises fixes in 2026, but smart producers aren’t waiting—they’re already discounting elite PTAs by 25-30%, trusting proven bulls with 750+ daughters, and spreading services across 8-12 sires. Your cows aren’t broken, your management isn’t failing—the measurement system just hasn’t caught up to how modern dairies actually operate.

Inflated Fertility PTAs

You know, I’ve been having the same conversation at every producer meeting lately—from Wisconsin to Pennsylvania, even down in Georgia where—let’s be honest, the heat stress alone should explain everything. Folks who’ve spent five to ten years selecting top-tier fertility bulls are seeing pregnancy rates that just… aren’t budging.

Here’s what’s interesting: the disconnect between what the PTAs promise and what shows up in the tank has left many questioning their management. But after sitting through Dr. Taylor McWhorter’s presentation at World Dairy Expo this year—and digging into the research behind it—I’m convinced we’ve been measuring the wrong thing, in the wrong environment, for about two decades now.

What Dr. McWhorter laid out at Madison this October were nine major updates to fertility evaluations scheduled for 2026. And while CDCB is presenting these as routine improvements, if you read between the lines… well, they’re quietly acknowledging that our fertility evaluations have been systematically miscalculating genetic merit for herds using modern management practices.

The economic modeling CDCB has done suggests we’re looking at tens of millions in foregone genetic progress over the past decade. That’s real money left on the table.

Click the link to view the presentation. Modern Herds, Modern Hurdles: Aligning Fertility Evaluations Taylor McWhorter, Ph.D., CDCB Geneticist Slides

The Hidden Cost of Assumptions That No Longer Match Reality

So here’s how something as basic as your voluntary waiting period created this mess.

For over 20 years, the genetic evaluation system has assumed that everybody’s breeding cows at 50 days after calving. Made perfect sense back when that’s what we all did, right? I remember my dad’s operation in the ’90s—50 days was gospel.

But here’s the thing: CDCB’s own data shows that by 2020, the actual industry average VWP had crept up to 67.5 days. And I know operations pushing 80-85 days, especially those high-producing herds out West trying to let cows get their metabolic act together before breeding. Even smaller operations I work with in the Northeast are extending to 70 days based on their vets’ recommendations.

As Dr. McWhorter explained it—and this really hit home for me—the evaluation methodology was assuming all cows had the opportunity to become pregnant starting at 50 days in milk. But when you’re actually waiting 70 days, there’s this phantom 20-day window where cows physically can’t be pregnant, yet the evaluation expects them to be.

What this means for your breeding decisions is pretty straightforward, and honestly, kind of frustrating. Bulls whose daughters were in extended-VWP herds looked artificially poor for fertility. Not because the daughters weren’t getting pregnant—they just couldn’t even be bred during the timeframe the evaluation was looking for.

The economic modeling suggests this mismatch alone costs an estimated $50 per cow annually based on CDCB economic modeling of missed genetic progress in distorted selection decisions and missed genetic progress. You do the math on your herd… for a 500-cow operation, that’s $25,000 every single year. It adds up fast.

Time PeriodIndustry Average VWP (Days)Evaluation System AssumptionTiming Gap (Days)Annual Cost Per Cow
1990s-200550500$0
201052502$5
201558508$15
202067.55017.5$50
2024 (Progressive Herds)75-855025-35$75-100

When Beef-on-Dairy Changed Everything We Thought We Knew

But the VWP issue? That was just the warm-up act.

You probably know this already, but the beef-on-dairy explosion happened faster than anyone expected. The National Association of Animal Breeders’ data shows beef semen sales to dairy farms hit 7.9 million units in 2023—that’s 31% of all semen sold to dairies. Five years ago? That number was basically nothing.

Holstein semen dropped from complete market dominance to just 43% of cow services by 2024, with Angus alone accounting for nearly 29% according to CDCB’s April evaluation summary. I mean, that’s a fundamental shift in what we’re doing reproductively.

The beef-on-dairy explosion happened faster than anyone predicted—Holstein semen dropped from 95% market dominance to just 43% in five years, while Angus alone captured 29% of dairy services by 2024

And it’s not just a market trend—it’s changed what “fertility” even means in a modern breeding program.

The research McWhorter presented from her University of Georgia work shows Angus semen produces slightly different conception rates than Holstein semen—we’re talking 33.8% versus 34.3% in lactating cows. But here’s what really matters: beef semen gets used strategically on problem breeders, averaging a service number of 3.04, compared to Holstein’s 2.13.

Conception rates look nearly identical—Angus at 33.8%, Holstein at 34.3%. But the story’s in the service numbers. Beef semen goes to problem breeders averaging 3.04 services, nearly 50% higher than Holstein’s 2.13. When 30% of your services use beef strategically on cows that already failed dairy breeding, the evaluation system can’t tell the difference. It attributes all that reproductive struggle to the dairy bull’s genetics. Bulls in heavy beef-on-dairy herds look artificially poor—even when their actual dairy daughters are doing just fine.

What I’ve found is that when 40-50% of services in a herd use beef semen—and those services concentrate on cows that already struggled with dairy breeding—the evaluation system can’t tell the difference. It attributes all of that to the dairy bull’s genetics.

So bulls in herds doing extensive beef-on-dairy look artificially poor for fertility, even when their actual dairy-breeding daughters are doing just fine.

The Five Games: When One Size Doesn’t Fit Anyone

Here’s what’s become crystal clear from analyzing all that data in the National Cooperator Database—you know, that massive collection of over 100 million lactation records we all contribute to…

“Fertility” has basically fragmented into at least five distinct biological processes. And each one selects for different genetic capacities.

Modern dairies aren’t playing one fertility game—they’re juggling five distinct breeding strategies simultaneously. With genetic correlations of only 0.65-0.75 between these systems, a bull ranking top 10% for elite replacements might rank bottom 30% for problem breeders. The evaluation system averages them all together and calls it “fertility merit.” No wonder your PTAs don’t work.

Think about it this way:

The elite replacement game. These are your nucleus herds using sexed Holstein semen on high-merit heifers and first-lactation cows at optimal timing. They’re pushing for maximum conception rates to produce superior replacements. Based on DHI participation patterns, about 20% of herds operate primarily this way.

You know the type—those big registered operations in Wisconsin and New York.

Commercial dairy breeding. Your typical commercial operation using conventional semen on mid-tier cows after standard VWP. This probably represents 35% or so of operations, based on what CDCB sees in their herd management surveys. Most of the 200-500 cow herds across the Midwest fall here.

Problem breeder salvage. We’ve all been there—service number four or five, just trying to get that cow pregnant before you have to cull her.

The Wisconsin research suggests this affects about 30% of the breeding-eligible population at any given time.

Beef-on-dairy terminal breeding. Strategic use of beef genetics on lower-genetic-merit cows to maximize calf value. NAAB data shows this grew from basically zero to representing 15-20% of breeding decisions in just five years. And it’s still growing.

The ET programs. Elite genetics multiplied through embryo transfer, bypassing natural breeding entirely. Small percentage overall, but concentrated in high-value genetics.

Now, current evaluations average performance across all five of these “games” into a single Daughter Pregnancy Rate or Cow Conception Rate score. But—and this is where it gets really interesting—the genetic correlations between these management systems have dropped to 0.65-0.75, based on recent genotype-by-environment research.

What’s that mean in plain English? A bull ranking in the top 10% for elite replacement production might rank in the bottom 30% for problem breeder management. Same genetics, completely different outcomes depending on which game you’re playing.

What Progressive Producers Are Learning the Hard Way

I was talking with a producer managing about 1,800 cows in Wisconsin—he’d been selecting exclusively on top-tier genomic bulls for fertility since 2019. His pregnancy rate? Still stuck around 28%.

He told me, “I kept thinking we were screwing something up with our management. We extended VWP to 72 days based on the University of Wisconsin recommendations for better first-service conception. We adopted beef-on-dairy for inventory control—now using about 35% beef semen. Everything the consultants said should help.”

What he didn’t realize—and what nobody was really talking about clearly—was that his progressive management practices were systematically penalized by the evaluation methodology.

Here’s the kicker that CDCB research has shown: high-fertility daughters enter genetic databases 6-12 months before low-fertility daughters. It’s this timing bias thing. Young bulls get their first evaluations based predominantly on their best-performing daughters. The PTAs look fantastic initially, then drift downward as more complete data rolls in.

Young bulls enter the market with fertility PTAs inflated by 25-30% because high-fertility daughters report 6-12 months earlier than struggling daughters. It’s like judging a pitcher’s ERA by only counting scoreless innings—the evaluation looks fantastic until complete data rolls in. By month 36, that elite +3.0 PTA has eroded to +2.0. Your breeding decisions weren’t wrong. You were sold incomplete scorecards.

Kind of like judging a pitcher’s ERA after only counting the scoreless innings, you know?

And it’s not just one or two operations seeing this. I’ve heard similar stories from California to Idaho—producers who thought they were doing something wrong when, in reality, the evaluation system wasn’t capturing what they were doing right.

One producer near Boise who made the shift told me his pregnancy rates reportedly improved notably after he started ignoring genomic fertility PTAs and selecting more on within-herd performance. Sometimes going backwards is actually going forwards.

Practical Steps for Managing Through the Uncertainty

What I’ve noticed is that savvy producers aren’t waiting for the 2026 updates. They’re already adjusting their selection strategies based on what they’re seeing in their own barns.

After talking with consultants and progressive producers across the country, several strategies keep coming up.

First, you’ve got to discount those sky-high PTAs. Many consultants I work with are recommending haircuts of 25-30%on top-ranked fertility PTAs. A large-herd manager I know in Idaho put it pretty bluntly: “A bull showing +3.0 DPR? We treat him like he’s maybe a +2.0, +2.2 at best for our operation.” It’s not perfect, but it’s more realistic.

Trust proven bulls for fertility. Dr. Kent Weigel at Wisconsin-Madison has published extensively on this—progeny-proven bulls with 750+ daughters have already been through the timing bias wringer. While their genetics may be a generation older, their fertility predictions have proven more reliable in field conditions.

Match your bulls to your management. If you’re running an extended VWP with substantial beef-on-dairy, bulls evaluated in traditional 50-day VWP environments may underperform pretty dramatically. With those genetic correlations of 0.65-0.75 between evaluation and deployment environments, you’re looking at only 65-75% of predicted gains actually showing up.

And don’t ignore your own data. For herds that are substantially different from national averages, selecting replacement heifers based on actual performance in your environment may outperform genomic predictions. A heifer that conceives on first service in your system? She’s carrying genetics that work for you, regardless of what her genomic PTA says.

I know one producer in Pennsylvania who’s been tracking this meticulously—he’s seen better results selecting on within-herd performance than chasing high genomic PTAs for fertility. Sometimes the old ways still work.

They’re also diversifying bull selection. Rather than putting all their eggs in 3-5 elite bull baskets, they’re spreading services across 8-12 sires. When top-ranked bulls prove overestimated—which history suggests some will—the damage is contained.

Many are building custom indices, creating herd-specific selection criteria that weight production traits (where evaluations remain pretty accurate) more heavily than fertility traits (where accuracy has… degraded).

Producer networks are sharing real outcome data. “This bull delivered, that one didn’t”—the kind of real-world validation that matters more than PTAs sometimes.

Keep in mind, with generation intervals what they are, you’re looking at 2-3 years before these breeding strategy adjustments really show up in your pregnancy rates. It’s a marathon, not a sprint.

Selection StrategyOld Approach (Pre-2024)New Reality (2024+)Impact
Trust Top Genomic PTAsUse +3.0 DPR at face valueTreat +3.0 as +2.0-2.225-30% inflation risk
Apply 25-30% DiscountNot appliedApplied to all elite PTAsMore realistic expectations
Young Bulls (<750 daughters)Primary selection poolHigh risk for inflationTiming bias exposure
Proven Bulls (750+ daughters)Considered “”outdated genetics””More reliable predictionsAlready corrected
Bull Diversification3-5 elite bulls8-12 bulls minimumRisk mitigation
Selection Weight on Fertility35-40% of TPI weight15-20% of custom indexReduce unreliable traits
Custom Index ApproachStandard TPI/NM$Production-heavy weightingWeight what works

Industry Trends Reshaping How We Think About Fertility

The changes coming in 2026 aren’t happening in a vacuum. They’re responses to massive shifts that caught the evaluation system flat-footed:

You’ve got management fragmentation—DHI data shows VWP now ranges from 50 to 85+ days across herds, compared to that narrow 45-55 day range we had two decades ago.

The beef integration explosion is real. NAAB reports show that 7.9 million units of beef semen were produced in 2023, up from 7.6 million the previous year. That’s not a trend anymore—it’s the new normal.

Then there’s the problem of missing data. CDCB estimates that about 6.6% of breedings have unknown or unrecorded service sires. Hard to evaluate what you can’t even identify, right?

Technology adoption is huge, too. The 2024 National Dairy FARM Program data suggests that around 68% of herds with 500 or more cows now use some form of automated heat detection. That’s creating management variation that the evaluations just can’t capture yet.

And here’s what really accelerates everything: generation intervals have collapsed from about 7 years pre-genomics to 2.5 years now, according to Holstein Association USA genetic trend reports. So evaluation errors multiply through breeding pyramids faster than… well, faster than the system can correct them.

What’s Actually Changing in 2026 (If Everything Goes Through)

Dr. McWhorter outlined nine specific updates at World Dairy Expo, pending Interbull validation this January. Let me break down what actually matters for us:

They’re finally going to adjust for variable VWP, accounting for herd-specific waiting periods from 50 to 85 days. About time, right?

Service sire breed effects will be adjusted for differences in conception rates between dairy and beef semen. That should help with the beef-on-dairy distortion.

There’s a 36-month age restriction coming to prevent that timing bias from early-reporting daughters I mentioned.

They’re introducing First Service to Conception as a new trait that measures only the post-breeding interval. That’s actually pretty clever—sidesteps a lot of the VWP confusion.

The variance components are being updated using the most recent 10 years of data rather than… well, let’s just say, much older averages.

Plus improvements to genomic validation, methods for handling those unknown service sires, some tweaks to the Early First Calving trait, and better modeling across multiple lactations.

If these pass Interbull validation in January, we’ll see implementation in April 2026 evaluations at the earliest. Miss that window? Add another 6-12 months minimum. So don’t hold your breath.

The Bigger Picture: Why Change Takes Forever

You might wonder why it takes 20 years to fix problems everyone can see. I’ve been asking the same question for… well, a long time.

The answer lies in how genetic evaluation governance works. CDCB operates through consensus among groups with very different priorities. Breed associations worry about the continuity of genetic trends. AI studs are protecting bull valuations. Data providers are managing costs. Getting them all to agree? It’s challenging, to put it mildly.

As Dr. Paul VanRaden explained at his retirement seminar last year, the system is designed for stability and credibility, not rapid adaptation. That served us well when management practices changed slowly. But when beef-on-dairy transforms the industry in 5 years, our 15-20 year update cycle just can’t keep pace.

What’s fascinating—and maybe a bit frustrating—is that this governance structure is working exactly as designed. It just wasn’t designed for the pace of modern dairy innovation.

Looking Ahead: What This Means for Different Operations

The impact varies quite a bit depending on your operation. And our friends north of the border in Canada are dealing with similar challenges through their own evaluation system—affecting international semen trade in ways we’re just starting to understand.

Smaller herds—say, under 200 cows—are often less affected because many still operate closer to traditional management. But those adopting beef-on-dairy to capture calf premiums? They face the same evaluation distortions as anyone.

Large Western dairies have been hit hardest. They led beef-on-dairy adoption and VWP extension. Their progressive management gets penalized most severely by these outdated evaluation assumptions.

In the Southeast, heat stress complicates everything, making it harder to separate management effects from genetic merit. The evaluation updates may actually help these herds most by reducing some of those confounding factors.

And grazing operations? That’s a different ballgame entirely. Seasonal breeding and pasture-based systems create genotype-by-environment interactions that the evaluation system barely acknowledges. Many have already moved to within-herd selection just out of necessity.

For seasonal calving systems in places like New Zealand or Ireland? They’re playing an entirely different game that the evaluation system barely recognizes.

Key Takeaways for Your Breeding Program

After all this, several lessons really stand out:

  • Your management wasn’t failing—the measurement was. If fertility hasn’t improved despite selecting high-PTA bulls for years, evaluation bias likely explains most of that gap. So you can stop second-guessing yourself.
  • Progressive practices have been getting penalized. Extended VWP, beef-on-dairy integration, those individualized strategies that actually improve fertility? They can make genetic evaluations look worse. The system has been interpreting sophistication as genetic failure.
  • Production traits remain reliable, thankfully. Milk yield, components, and type evaluations maintain high accuracy with genetic correlations above 0.90 across different management systems, according to recent published research. So focus your genetic selection firepower there.
  • For fertility specifically? Proven beats potential right now. Young bulls’ fertility PTAs are most inflated. Bulls with large progeny groups provide predictions you can actually bank on.
  • And honestly? Local performance beats global predictions. For traits with high management sensitivity, your herd’s actual outcomes predict future performance better than national evaluations that measure different environments.
  • Change is coming—slowly. The 2026 updates will help, but won’t fully resolve the fragmentation across management systems or the historical bias already baked into current breeding pyramids.

Fertility by the Numbers: A Quick Review

  • Discount elite fertility PTAs by 25-30%
  • Prefer bulls with 750+ daughters for fertility
  • Spread services across 8-12 bulls
  • Genetic correlation between evaluation and your environment: 0.65-0.75
  • Cost of VWP mismatch: $50/cow annually

For now, those of us who understand these limitations can make smarter breeding decisions: discounting inflated predictions, preferring proven performance, and trusting our own herds’ outcomes when genomic promises don’t match what we see in the barn.

The evaluation system is adapting, just at a pace that ensures progressive producers will keep operating at least one management revolution ahead of the genetic measurements trying to catch up. But that’s not necessarily a crisis; it’s just the new reality we need to factor into our breeding decisions.

After all, we’ve been dealing with the difference between promise and performance since the first bull stud opened, and we’ll figure it out, like we always do.

Complete references and supporting documentation are available upon request by contacting the editorial team at editor@thebullvine.com.

Learn More:

The Sunday Read Dairy Professionals Don’t Skip.

Every week, thousands of producers, breeders, and industry insiders open Bullvine Weekly for genetics insights, market shifts, and profit strategies they won’t find anywhere else. One email. Five minutes. Smarter decisions all week.

NewsSubscribe
First
Last
Consent

One Positive Swab Cost This Wisconsin Dairy $900,000 – Here’s the 90-Day Fix That Turned Everything Around

6:47 AM: Routine swab positive. Thursday: FDA shuts three lines. Cost: $900K. But this Wisconsin dairy recovered in 90 days. Here’s how.

EXECUTIVE SUMMARY: A routine Tuesday morning swab changed everything for a Wisconsin dairy family—one positive result near (not in) their product triggered FDA intervention, shut three production lines, and cost $900,000 despite 50 years of perfect inspections. They’re not alone: dairy now leads global food recalls with 400 incidents in Q1 2025, each averaging $10 million in direct costs. Here’s the uncomfortable truth: your current monitoring program likely misses 70% of contamination, your ATP testing can’t detect allergen proteins that trigger anaphylaxis, and your paper documentation could turn a routine audit into business extinction. Yet operations that invest $75,000-100,000 annually in comprehensive monitoring are transforming their risk profile in just 90 days—one Idaho dairy’s $42,000 investment yielded $280,000 in new contracts after eliminating all contamination. The fix starts with a two-hour facility walk that typically reveals 30-50 blind spots you’re not testing. In today’s enforcement environment, you’re either systematically finding problems or waiting for regulators to find them for you.

You know that feeling when a routine phone call changes everything? That’s what happened to a Wisconsin processing family at 6:47 on a Tuesday morning. One environmental swab—the kind they’d been taking every week for years—came back positive for Listeria. Not in the product, thankfully. Not even on food contact surfaces. Just one positive from a motor housing on their filling line, maybe eight inches from where the product flowed.

By Thursday afternoon? Well, their whole world had shifted. The FDA audit team is walking the floor. Three production lines shut down. Nearly $900,000 in inventory is sitting in quarantine. And here’s what really gets me—their largest customer, representing 40% of their volume, suspended shipments pending resolution.

The 70% Detection Gap: Why conventional 25-site monitoring programs miss most contamination—and what comprehensive testing reveals about your facility’s blind spots

What’s particularly troubling about this story —and why I’m sharing it with you —is that it wasn’t some corner-cutting operation. These folks passed every annual inspection. Their SQF certification was current. Customer audits? Clean as a whistle. They genuinely believed—as many of us do—that their food safety program was bulletproof.

But what they discovered over the next 90 days… well, it’s reshaping how dairy operations across North America are thinking about the gap between compliance and actual protection. And if you’re sitting there thinking “we’re different,” I get it. That’s exactly what they thought, too.

The Numbers We Need to Talk About

The $254 Million Question: One positive swab cascades into direct recall costs, multiplied indirect expenses, insurance spikes, lost contracts, shareholder panic, and permanent brand erosion—all preventable with proactive monitoring

Let me tell you what’s happening out there right now. The data from FDA’s Q1 2025 recall analysis—Food Safety magazine pulled it all together in May—shows dairy products leading all food categories in recall volume. We’re talking nearly 400 recalls out of 1,363 total food recalls tracked globally. Not meat, folks. Not produce. Dairy.

And the financial side? It’s brutal. The Consumer Brands Association’s research from their 2024 recall impact study puts the average cost of a food recall at $10 million just in direct expenses. That’s before you factor in lost business, damaged reputation, all that.

The Dairy Recall Explosion: From 85 incidents in Q1 2020 to 400 in Q1 2025—a 371% surge making dairy the food industry’s #1 recall category, accounting for 29% of all global food safety failures

But here’s what really keeps me up at night: Remember the 2008 Canadian Listeria outbreak at Maple Leaf Foods? Fifty-seven confirmed cases, 24 people lost their lives, and according to the Public Health Agency of Canada’s economic analysis, the final price tag hit $242 million. For one facility. We’re not talking about quality hiccups anymore—these are business extinction events.

I’ve noticed that there’s this disconnect between what operations think they’re monitoring and where contamination actually lives. It’s like we’ve been looking for our keys under the streetlight because that’s where the light is good, not because that’s where we dropped them.

Three Blind Spots Every Operation Has (Yes, Even Yours)

The Hidden Zone: Zone 2 surfaces—equipment housings, motor casings, frameworks just inches from food contact—harbor 8% contamination rates, yet most programs barely test there

Environmental Monitoring: The 60% You’re Not Testing

So there’s this fascinating research from Dr. Matthew Stasiewicz at the University of Illinois. His team spent 18 months implementing environmental monitoring programs in eight small-to-medium dairy facilities across Illinois and Wisconsin—and published the results in early 2024. I bet you’ve noticed what they found hits home: Listeria species showed up in 13% of environmental samples. Across all facilities.

But here’s the kicker that really made me rethink everything: Pre-operation sampling—after cleaning and sanitation—showed 15% positive rates. Mid-operation? 17%. Virtually identical. The cleaning between shifts wasn’t eliminating the problem; it was just… moving it around.

A PCQI-certified consultant I’ve worked with—she’s been auditing Midwest dairy facilities for two decades—put it this way: “Conventional monitoring programs catch maybe 30-40% of actual contamination. The rest is hiding in places standard HACCP plans never even consider.”

Think about your own facility for a minute. When’s the last time you swabbed:

  • That floor-wall junction where water always seems to pool during washdown?
  • Inside those equipment legs that—surprise!—might actually be hollow?
  • The overhead condensation points that drip onto your Zone 2 surfaces?
  • Those cable conduits and junction boxes hanging above your production lines?

A 2024 study published in the Journal of Food Protection tracked Listeria in cheese processing facilities for 3 years. Same genetic strain, living in the same drains and floor cracks, for three straight years—despite aggressive cleaning protocols and regular staff training. That should terrify all of us.

Allergen Control: Why ATP Testing Gives You False Confidence

Here’s a story that played out last September. HP Hood had to recall 96-ounce containers of Lactaid milk across 27 states. The issue? Potential almond contamination was discovered during routine maintenance, according to the FDA recall notice. Not during production. Not through finished product testing. During maintenance.

Now, that facility was running cleaning validations between allergen and non-allergen runs. They had ATP testing showing surfaces were “clean.” Everything looked good on paper. But—and this is crucial—ATP testing measures organic residue and microbial load. It doesn’t specifically detect allergen proteins.

Dr. Joseph Baumert, who co-directs the Food Allergy Research and Resource Program at the University of Nebraska-Lincoln, explains it well: “You can have a microbiologically spotless surface, passes ATP with flying colors, and still harbors enough milk protein to trigger anaphylaxis. Milk proteins, especially casein, bind to stainless steel and can persist through standard CIP cycles.”

The UK Food Standards Agency’s 2024 audit data really drives this home—dairy allergen compliance rates were just 51%, compared to 73% for other allergens. The main problem? Improperly cleaned equipment that passed microbial testing but retained allergen proteins.

What’s interesting here is the aerosol issue in powder operations. You’re blending milk powder in one room, thinking your allergen-free products in the next room are protected by a wall. But those particles? They become airborne, travel through doorways, and settle on equipment, packaging, and even workers’ clothing. Your “dairy-free” line isn’t dairy-free anymore.

I visited an operation down in Texas that learned this the hard way. Mid-size facility, producing both regular and plant-based products on separate lines, on different days even. Still had cross-contamination through their shared air-handling system. Cost them $180,000 in recalls and two major contracts. And as robotic milking systems become more common, we’re seeing new environmental monitoring challenges around them too—condensation in different places, changing traffic patterns, and new dead zones that didn’t exist in conventional parlors.

Documentation: The Gap That Turns Routine into Crisis

Now this one… this hits close to home for a lot of us. Back in 2019, British Columbia’s Ministry of Environment audited dairy processors, and what they found was eye-opening: all seven facilities with site-specific permits had compliance violations. Not because of contamination. Not because of poor sanitation. Documentation gaps.

Missing monitoring records. Late annual reports. Required testing that happened but wasn’t documented properly. These aren’t food-safety failures—they’re paperwork problems that turn routine inspections into comprehensive investigations.

A senior insurance underwriter who’s been specializing in food industry coverage for over 15 years with one of the major carriers told me something that stuck: “The difference between operations that survive recalls and those that don’t often comes down to one thing—can you prove you were finding and fixing problems proactively? Because if your documentation shows you avoided comprehensive monitoring not to find contamination, that’s willful blindness in court.”

The Insurance Reality Nobody Wants to Talk About

Let’s be real about insurance coverage for a minute. Your standard Commercial General Liability policy? It explicitly excludes most recall-related costs. Product retrieval, disposal, business interruption, crisis management—none of that’s covered unless you’ve added specific endorsements.

Even with Product Contamination Insurance—and that’s a separate policy, not just an add-on—coverage depends on demonstrating comprehensive preventive controls. Several major carriers are now conducting their own facility risk assessments. If your environmental monitoring program covers 25 sites when industry best practice suggests 80-100, I’ve noticed what happens next: Your premium doubles. Sometimes triples. Or they just decline to renew.

CRC Group published guidance in October specifically for dairy producers, noting that recall events can trigger losses far exceeding policy limits. They’re seeing claims where actual costs hit 3-4 times what operations thought they were covered for.

What Successful Operations Are Actually Doing

Looking at operations that are thriving versus those that are struggling, what’s interesting is that it’s not about size or budget. It’s about mindset.

I know a producer in northern Wisconsin—150 cows, small processing operation, been in the family since 1962. Three years ago, after a near-miss with a Zone 3 positive, they completely overhauled their approach. Went from 22 sampling sites to 87. Found contamination in places they’d never looked—inside hollow table legs, above the homogenizer where condensation collected, in that floor crack under the bulk tank nobody thought about.

The initial findings were rough—23 positives in the first month. But here’s what matters: they documented everything, implemented targeted fixes, and verified effectiveness. By month six? Down to zero positives. Their insurance premium dropped 30%. And they picked up two new contracts from processors looking for reliable suppliers with robust food safety programs.

It works for even smaller setups, too. Take a southern Idaho operation with just 85 cows—they invested $42,000 in comprehensive monitoring, went from 18 sites to 72, and saw an initial spike of 19 positives in the first 60 days. Now? Zero positives for 8 months, insurance down to $12,000 annually from $18,000, and new contracts worth $280,000 a year from 7 processors, including national brands. That kind of ROI shows even modest operations can transform their risk profile.

Compare that to operations still running minimal programs because “we’ve never had a problem.” They’re testing the same 25 sites they’ve tested for a decade. Getting the same negative results. Thinking they’re safe. Meanwhile, research consistently shows 60-70% of contamination lives in places they’re not even looking.

Out west, there’s a 2,500-cow operation in California’s Central Valley that took a different approach. Brought in UC Davis Extension specialists to map their entire facility. Found 112 potential harborage sites. The owner told me, “We’d been so focused on the milking parlor and tank room, we completely missed the processing area risks.”

And I’ve seen similar transformations out east, too. A processor in Vermont—a family operation since the 1970s—discovered contamination in their aging facility’s infrastructure that newer buildings wouldn’t have. Different regions, different challenges, same fundamental issue: we’re not looking everywhere we need to look.

The Math That Matters: Real dairies, real numbers—$42K to $95K investments delivering 3x to 9.5x returns within 90 days through prevented recalls, new contracts, and insurance savings

What You Can Do Starting Tomorrow: The 90-Day Transformation

Here’s what I tell every producer who calls: You don’t need to solve everything at once. You need to start finding out what you don’t know.

Week One: The Reality Walk

Get your whole team together—I mean ownership, operations, QA, maintenance, everyone—and walk your facility during production. Don’t send them a report. Don’t show them those slides. Just walk the floor together.

Everyone brings their phones. Take pictures of every place where water pools, every piece of equipment in a dead zone, and every condensation drip point. Most operations identify 30-50 unsampled locations in a two-hour walk.

A quality manager at a 500-cow operation in upstate New York described their walk to me: “My operations manager saw water pooling at a floor-wall junction we’d never sampled. Maintenance pointed out three hollow equipment legs—we had no idea they were there. When you see 40 potential contamination sites that aren’t in your monitoring program, you can’t unsee it.”

Weeks 2-4: Zone 2 Expansion

Start simple. Add 10-15 sampling sites within 12 inches of your current Zone 1 testing points. These Zone 2 areas—equipment housings, control panels, adjacent floors—that’s where contamination migrates to the product.

Budget impact? Maybe $2,000-3,000 for a month of additional testing. That’s nothing compared to a recall. But it tells you whether contamination is living right next to your food contact surfaces.

A creamery operator in Minnesota started with 12 additional Zone 2 sites. Found positives in four locations the first week—the motor housing on the separator, framework under the filler, two spots on the floor within inches of equipment legs. They’d been testing two feet away and missing all of it.

Months 2-3: Building the System

Once you know where problems hide, you can build systematic solutions. This is when you expand to comprehensive coverage—those 80-100 sites the research suggests. Implement allergen-specific testing if you’re running both allergen and allergen-free products. Transition from paper logs to digital documentation systems.

The cost sounds prohibitive until you do the math. Cloud-based food safety management systems cost $200-500 per month. Expanding to 80 sampling sites could add $30,000-40,000 in annual testing costs. Combined with improvements to allergen validation and documentation, you’re looking at an annual investment of $75,000-100,000.

Compare that to the average recall cost of $10 million. Or the 40% revenue loss when your largest customer suspends shipments. Or the insurance claim denial because you couldn’t demonstrate comprehensive preventive controls.

I’ve watched operations in Oregon, Idaho, and New Mexico make this transformation. Different climates, different challenges—summer condensation in the Pacific Northwest, dust infiltration in the Southwest—but the same systematic approach works.

The Choice Every Operation Faces Right Now

I’ve been around this industry long enough to see patterns. Are the operations thriving today? They made a decision years ago: invest in finding problems before customers or regulators do. They’re not perfect—nobody is. But they’ve built systems that demonstrate continuous improvement.

Are the operations struggling? They optimized for compliance minimization. Did the bare minimum to pass inspections. Assumed their historical track record would continue forever. Now they’re scrambling to implement improvements under external pressure—customer ultimatums, insurance threats, regulatory enforcement.

As we sit here in November 2025, with dairy leading global recall statistics and enforcement intensifying monthly, that assumption has become the costliest bet in our industry.

The Bottom Line

Remember that Wisconsin family I started with? They invested $95,000 over 90 days. Expanded monitoring from 25 to 92 sites. Found contamination they’d never suspected. Fixed it systematically. Documented everything.

Today, 18 months later? They’re running at capacity with a waiting list of customers who value suppliers that take food safety seriously. Insurance costs dropped 25%. That the large customer who suspended shipments? They’re back, with a longer-term contract and 10% volume increase.

Most importantly, they sleep at night knowing a routine swab won’t destroy three generations of hard work.

The gap between passing inspections and being protected isn’t about perfection. It’s about systematically finding and fixing problems before they find you. In today’s dairy industry, with the stakes this high, that’s not just good business—it’s survival.

Making the Numbers Work: A Reality Check

What You InvestAnnual CostWhat It Prevents
Expanded monitoring (80 sites)$35,000-40,000Contamination reaching the product
Allergen-specific testing$15,000-20,000Undeclared allergen recalls
Digital documentation$2,400-6,000Legal/insurance claim denials
Mock audits (quarterly)$12,000-16,000Surprise inspection failures
Total Prevention$75,000-100,000Potential $10M+ recall

Based on current industry pricing and FDA/Consumer Brands Association 2024-2025 recall cost data

Where to Get Help:

  • FDA’s got comprehensive environmental monitoring guidance at FDA.gov/food-safety
  • The Innovation Center for U.S. Dairy has excellent pathogen control resources
  • Your state’s dairy extension specialists—for example, producers can contact their local university extension office (like UW-Madison Extension) for guidance
  • The National Milk Producers Federation has member resources that really help

Look, I’ve spent 15 years working with dairy operations across North America on food safety implementation. I’ve seen both sides—the devastating impact of recalls and the transformative power of proactive monitoring programs. The difference between the two? Usually, about 90 days of focused work and the willingness to look where you haven’t been looking.

What’s your next step going to be?

KEY TAKEAWAYS

  • You’re Testing Wrong: Conventional 25-site programs miss 70% of contamination hiding in hollow equipment legs, floor-wall junctions, and condensation zones—expand to 80-100 sites or stay vulnerable
  • ATP Testing Won’t Save You: It detects organic residue, not the allergen proteins that trigger recalls—HP Hood’s 27-state recall proved “clean” ATP results mean nothing for allergen control
  • Small Operations Are Proving the Math: 85-cow Idaho dairy: $42K investment → zero contamination → $280K new contracts. ROI in under 12 months beats hoping you’re not next
  • Your Monday Morning Assignment: Two-hour facility walk with ops/QA/maintenance teams, photograph every water pooling spot and equipment dead zone—expect to find 30-50 blind spots
  • The Bottom Line Choice: Invest $75-100K annually in comprehensive monitoring now, or lose $10M+ when one swab destroys three generations of work

Complete references and supporting documentation are available upon request by contacting the editorial team at editor@thebullvine.com.

Learn More:

The Sunday Read Dairy Professionals Don’t Skip.

Every week, thousands of producers, breeders, and industry insiders open Bullvine Weekly for genetics insights, market shifts, and profit strategies they won’t find anywhere else. One email. Five minutes. Smarter decisions all week.

NewsSubscribe
First
Last
Consent

China’s 500,000-Cow Farms and Lab-Grown Milk: Your Dairy’s 18-Month Decision Window

Your grandfather milked 50. You milk 500. China milks 500,000. This ends one of three ways.

Having spent the better part of two decades analyzing dairy production trends, I can tell you that what we’re witnessing today represents a fundamental shift in how milk is produced globally. The International Farm Comparison Network’s latest 2024 data reveals something remarkable: five of the world’s ten largest dairy operations are now Chinese-owned. Modern Dairy, for instance, manages nearly half a million cows across 47 farms—a scale that would have been unimaginable just a generation ago.

What’s particularly noteworthy is Almarai’s achievement in Saudi Arabia. They’re consistently hitting 14 tonnes of milk per cow annually in desert conditions where summer temperatures routinely exceed 50°C. That level of production in such challenging conditions offers valuable lessons for operations everywhere, from California’s Central Valley to the arid regions of Arizona and even parts of Texas experiencing increasing drought pressure.

This transformation comes at a time when mid-sized dairy operations across North America are evaluating their strategic options. The conversations happening at farm meetings and extension workshops reflect genuine uncertainty about the path forward. Should an 800-cow operation expand to 2,500? Can family farms find sustainable niches in this changing landscape? These aren’t abstract questions—they’re daily realities for thousands of producers.

The Geographic Realignment of Global Dairy Production

Looking at this trend, what strikes me most is how quickly the center of gravity has shifted eastward. The 2024 data from IFCN paints a clear picture: China’s five largest operations—Modern Dairy with 472,480 cows, China Shengmu with 256,650, Yili Youran with 246,000, and Huishan with 200,000—represent impressive numbers. They reflect a deliberate national strategy.

Dr. Jiaqi Wang at the Chinese Academy of Agricultural Sciences provides important context here. Following the 2008 melamine incident that affected hundreds of thousands of infants, Chinese dairy companies fundamentally restructured their approach to prioritize supply chain control. This builds on what we’ve seen in other industries where food safety crises prompted systemic changes.

MetricChina EliteChina AvgUS MidwestUS Mega
Herd Size472k (Modern)8k-15k1k-5k10k-30k
Yield/Cow (t)9.5-12.09.611.0-13.011.8-13.4
Feed Conv Ratio1.4:11.6:11.5:11.4:1
Self-Suffic85% (170%)73%100%100%
Tech Invest LvlVery HighHighModerateVery High

China’s agricultural policy documents outline ambitious targets: achieving 70% milk self-sufficiency by 2030, with intermediate goals potentially pushing toward 75-85% over time. They’re also targeting annual yields exceeding 10 tonnes per cow—a significant leap from current averages. This aligns with their broader strategy of reducing import dependence across agricultural commodities.

Why does this matter for North American and European producers? Well, the USDA Foreign Agricultural Service reports that China’s dairy imports have exceeded $10 billion annually in recent years. As Rabobank’s 2024 quarterly analysis shows, China added 11 million metric tons of production between 2018 and 2023, already displacing approximately 240,000 tonnes of whole milk powder imports. For regions that have counted on Chinese demand as a growth driver—particularly New Zealand and Australia—this represents a significant market shift requiring strategic recalibration.

Understanding Productivity Variations Across Mega-Dairies

Desert dairy operation in Saudi Arabia achieves 82% higher productivity than China’s largest farm despite having 6x fewer cows—proving management beats scale in global dairy competition

One of the most intriguing findings from analyzing global mega-dairy performance is the substantial productivity variation even among the largest operations. Consider the range based on 2024-2025 company data: Almarai achieves 14.00 tonnes per cow annually; Rockview Dairies in California produces 11.80 tonnes; Modern Dairy in China averages 9.53 tonnes; and Huishan manages 7.70 tonnes.

This 82% productivity gap between the highest and lowest performers—both operating at massive scale with significant capital resources—challenges assumptions that scale automatically drives efficiency. What accounts for these differences?

Anthony King, who oversees operations at Almarai’s Al Badiah facility, shared insights at the International Dairy Federation’s 2024 World Dairy Summit about their management approach. The attention to detail is extraordinary: maintaining barn temperatures at 21-23°C year-round despite extreme external heat, providing 300 liters of water per cow daily, and implementing precision feeding protocols that optimize every nutritional variable.

The USDA Economic Research Service’s comprehensive 2023 analyses (their most recent full report) support what many progressive producers have long suspected: management sophistication and technological integration matter more than scale alone. Well-managed 500-cow operations implementing advanced protocols often outperform poorly-managed facilities ten times their size.

In Idaho, a 600-cow dairy was achieving 13,000 kilograms per cow through exceptional management, while a nearby 5,000-cow facility struggled to reach 11,000 kilograms. The difference? Attention to transition cow management, consistent fresh cow protocols, and meticulous record-keeping at the smaller operation.

The Economics Driving Industry Consolidation

The relentless math of consolidation: Smaller operations face $9.77/cwt higher costs than mega-dairies, translating to nearly $1 million in annual structural disadvantages for 1,000-cow farms that excellent management cannot overcome

What farmers are finding is that consolidation isn’t really about wanting to get bigger—it’s about the relentless mathematics of fixed costs. USDA’s 2024 cost of production data reveals the economics clearly: operations with 2,000+ cows average $23.06 per hundredweight in total costs, while farms with 100-199 cows face costs of $32.83—a difference of $9.77 per hundredweight.

What’s revealing here is the breakdown. The University of Wisconsin’s Center for Dairy Profitability research, led by Dr. Mark Stephenson, indicates that feed cost differences account for only about $2.50 of that gap. The remaining differential? It stems from spreading fixed infrastructure investments across production volume.

As Dr. Stephenson articulated in his January 2024 market outlook presentation: when fixed costs exceed variable costs in a commodity market, smaller operations face structural disadvantages regardless of management quality. For a representative 1,000-cow Upper Midwest operation producing 23 million pounds annually, this translates to $690,000 to $920,000 in additional costs compared to larger competitors—often exceeding total profit margins.

This economic reality helps explain why we’re seeing continued consolidation despite many producers’ preference for maintaining traditional farm sizes. The economics are pushing the industry in one direction, even as community ties, lifestyle preferences, and succession-planning challenges pull it in another.

Technology Adoption: Promise and Complexity

This development suggests that technology alone won’t solve dairy’s challenges—it’s how that technology is managed that matters. Beijing SanYuan exemplifies what’s possible, achieving 11,500+ kg per cow annually—matching Israel’s national average—through systematic adoption of Israeli dairy management systems since 2001, according to their published operational data.

But here’s the challenge. Professor Li Shengli at China Agricultural University identifies a critical constraint in his 2024 research published in the Journal of Dairy Science China: human capital. Chinese Ministry of Human Resources data from 2024 indicates that only about 7% of the country’s 200 million skilled workers possess the high-level capabilities needed to manage complex dairy systems effectively.

This creates an interesting paradox we see globally. Operations with capital for advanced technology often lack the expertise to optimize it, while highly skilled managers at smaller operations can’t access these tools. I know a manager in Pennsylvania running 600 cows who could likely double productivity with access to advanced monitoring systems and automated feeding technology. Meanwhile, I’ve toured 5,000-cow facilities with million-dollar technology packages operating well below potential due to management constraints.

Environmental Management: Challenges and Opportunities

The environmental dimension presents both challenges and unexpected opportunities—and it’s more nuanced than many discussions suggest. EPA calculations show that a 2,000-cow operation generates approximately 87.6 million pounds of manure annually—that’s 240,000 pounds daily, which require sophisticated management.

The World Resources Institute’s 2024 analysis highlights how scale affects these choices. Larger operations typically implement liquid storage systems for operational efficiency, but these generate substantially more methane than the daily-spread approaches common on smaller farms. This creates environmental trade-offs worth considering.

What’s encouraging is that at sufficient scale—typically around 5,000+ cows based on current feasibility analyses—biogas digesters become economically viable. These systems, which require investments of $2-5 million, can generate 5 million cubic meters of biogas annually. Youran Dairy in China operates nine such facilities, each producing approximately this volume according to their 2024 sustainability reports.

These operations are transforming waste management from a cost center into revenue through electricity generation, fertilizer sales, and carbon credit programs. The capital requirements mean this solution remains out of reach for most mid-sized operations, though, creating another scale-dependent advantage.

It’s worth noting explicitly that while larger farms may achieve better emissions intensity per unit of milk produced, smaller farms often have lower absolute emissions overall—a nuance that deserves more attention in environmental policy discussions. A 200-cow grass-based operation in Vermont creates different environmental impacts than a 10,000-cow facility in New Mexico, even if the per-gallon metrics favor the larger operation.

Strategic Options for Mid-Sized Operations

Three survival strategies for operations caught between mega-dairy economics and precision fermentation disruption—with Strategic Exit preserving 85-90% equity versus 20-30% in forced liquidation after prolonged losses

For the 500-2,000 cow operations that form the backbone of American dairy, three strategic paths show promise based on extension research and producer experiences:

Strategic Options for the Mid-Sized Dairy

PathPotential BenefitTimeline / Requirement
Cooperative Premium8-12% price advantage ($200k-$300k/yr for 1,000 cows)Requires strong co-op selection & management
Value-Added Path36-150% margin improvement (cheese, yogurt, direct sales)5-7 year development; high marketing & business skill
Strategic ExitPreserve 85-90% of farm equityRequires proactive timing before major losses

Maximizing Cooperative Benefits

Cornell’s Dyson School research from 2023, led by agricultural economist Dr. Andrew Novakovic, demonstrates that well-managed cooperatives deliver 8-12% price premiums through collective bargaining compared to independent sales to investor-owned processors. For a 1,000-cow operation, this represents $200,000 to $300,000 in additional annual revenue.

The key lies in cooperative selection. Strong downstream market positioning and professional management make the difference. Cornell’s pricing analysis found some underperforming cooperatives actually paying 3.5% less than investor-owned processors, underscoring the importance of due diligence.

Value-Added Diversification

European research examining 265 dairy farm diversification efforts, published in the Agricultural Systems journal, found compelling margins: cheese production generated €0.688 per liter more than fluid milk, while yogurt generated €1.518 more. Direct sales improved margins by an average of 36%.

These numbers look attractive, but Ireland’s Nuffield scholarship research from Tom Dinneen provides important context: approximately 95% of dairy farmers lack the marketing and business skills needed for successful value-added transitions. The typical path to profitability takes 5-7 years—requiring substantial patience and capital reserves.

Strategic Transition Planning

A Wisconsin dairy case study: Strategic exit today preserves $765k versus $255k after forced liquidation—that’s $510,000 destroyed by waiting for market conditions that won’t improve for mid-sized operations

Wisconsin Extension’s 2024 farm financial analyses, compiled by agricultural economist Dr. Paul Mitchell, reveal the importance of timing. Producers making strategic exit decisions while maintaining strong equity positions typically preserve 85-90% of their farm’s value. Waiting 12-18 months reduces this to 70-80%. Those forced to exit after several years of losses might retain only 20-30% of their equity.

Extension specialists share examples of successful transitions. One documented case from southern Wisconsin involved a producer with $850,000 in equity who transitioned strategically, preserving over $700,000 for retirement and new ventures. These aren’t failure stories—they’re examples of astute business management in changing markets.

The Precision Fermentation Revolution

With $840 million invested in 2024 and price parity projected for 2027-2028, precision fermentation threatens to capture 25% of commodity dairy protein markets by 2035—while you’re planning 20-30 year infrastructure investments

While consolidation reshapes current production, precision fermentation represents a potentially transformative disruption. The Good Food Institute’s 2025 market analysis tracks growth from $5.02 billion currently toward projected valuations of $36.31 billion by 2030—representing 48.6% annual growth.

Companies like Perfect Day already produce commercial-scale whey and casein proteins identical to dairy-derived versions. Consumers are purchasing products containing these proteins—Brave Robot ice cream, California Performance Co. protein powders, and even Nestlé’s new plant-based cheese line using precision fermentation proteins—often without realizing the proteins come from fermentation rather than cows.

Investment tracking from PitchBook and Crunchbase shows over $840 million from major investors, including Bill Gates’ Breakthrough Energy Ventures, flowing into these technologies, with $50+ billion projected across the sector by 2030. Cost curves suggest price parity with conventional dairy proteins by 2027-2028, potentially capturing 25% of commodity protein markets by 2035.

This doesn’t spell immediate doom for traditional dairy, but when you’re planning infrastructure investments with 20-30 year depreciation schedules, these technology trends deserve serious evaluation. I’ve noticed that younger producers are particularly attuned to these disruption risks when making expansion decisions.

International Regulatory Pressures

European developments offer insights into potential regulatory futures—and they’re moving faster than many realize. The EU’s Farm to Fork Strategy targets 25% organic production by 2030, while nitrate directives and evolving welfare requirements fundamentally alter production economics.

The Netherlands allocated €25 billion for livestock farm buyouts near environmentally sensitive areas—a scale of intervention that would have seemed impossible just years ago. German regulations now require specific space allocations (6 square meters indoor plus 4.5 square meters outdoor per cow) for certain certifications, fundamentally changing the economics of the confinement system.

These aren’t just European issues. Similar discussions around environmental impact, animal welfare, and production intensity are emerging across North America. California’s evolving regulations often preview broader U.S. trends. Whether through regulation or market pressure, these factors will likely influence future production systems globally.

Envisioning 2035: A Transformed Industry

Based on IFCN projections, FAO’s 2024 agricultural outlook, and technology trends, the 2035 dairy landscape will likely differ dramatically from today. Current projections suggest that approximately 40% of global production will come from 300-500 industrial mega-dairies, concentrated in the U.S., China, and the Middle East. Another 35% would come from South Asian smallholders—primarily the millions of households in India and Pakistan that maintain 2-5 animals. Precision fermentation might capture 25% of commodity protein production, with less than 5% from premium niche operations serving specialty markets.

The “missing middle”—operations between 500-2,000 cows—faces the greatest pressure in this scenario, unable to achieve mega-dairy economies or premium market positioning. This isn’t predetermined, but current trends point strongly in this direction.

Practical Considerations for Today’s Decisions

Looking at all this data and these trends, what should producers consider?

For operations under 500 cows, differentiation becomes essential. Whether through premium market positioning, exceptional management within strong cooperatives, or direct marketing, competing in commodity markets against mega-dairies appears increasingly challenging. I’ve seen success with A2 milk premiums (30-50% price advantage), grass-fed certification (40-60% premiums), and local brand development—but each requires commitment beyond production alone.

Operations in the 500-2,000 cow range face time-sensitive decisions. The window for strategic transitions that preserve equity is narrowing—probably 12-18 months based on current market dynamics. Waiting for ideal conditions that may never materialize risks substantial equity erosion.

Those considering expansion should carefully evaluate whether achieving a 2,500+ cow scale is realistic given capital and management resources. Partial expansions that don’t achieve efficient scale often compound problems rather than solving them. I’ve watched too many 1,500-cow expansions create more debt without solving the fundamental economic problems.

Everyone should monitor precision fermentation developments. This technology will impact commodity markets within the decade, requiring strategic adaptation across the industry.

Key Takeaways 

  • The 82% productivity gap proves scale doesn’t guarantee success: Saudi Arabia’s desert dairies outperform China’s mega-farms—it’s management and technology integration, not cow count, that wins
  • Mid-sized farms (500-2,000 cows) have three options, not four: Scale to 2,500+, find a $300K premium niche, or exit strategically—”staying the course” is slow-motion bankruptcy
  • Your equity has an expiration date: Exit now, preserving 85%, wait 18 months for 70%, or lose 60-80% fighting the inevitable—the clock started when you opened this article
  • Lab-grown milk isn’t a future threat—it’s a current reality: $840M invested, identical proteins in stores now, price parity by 2027—plan infrastructure accordingly
  • Winners already chose their lane: 300 mega-dairies will dominate commodities, 2,000 niche farms will own premiums, everyone else disappears—which are you?

EXECUTIVE SUMMARY: 

  • China’s Modern Dairy runs 472,480 cows, while Silicon Valley grows identical milk proteins without cows—your 800-cow operation is caught between these extremes. Mid-sized farms (500-2,000 cows) now face $9.77/cwt cost disadvantages that excellent management cannot overcome, translating to nearly $1 million in annual structural penalties. Three proven escape routes remain: joining strong cooperatives for immediate 8-12% premiums, developing value-added products for 36-150% margin improvements, or executing strategic exits that preserve 85% of equity versus 20% after prolonged losses. With precision fermentation achieving price parity by 2027 and China eliminating import markets, the decision window has narrowed to 18 months. The industry will split into 300 mega-dairies, 2,000 premium niche operations, and precision fermentation facilities—the 15,000 farms in between will vanish.

Complete references and supporting documentation are available upon request by contacting the editorial team at editor@thebullvine.com.

Learn More:

The Sunday Read Dairy Professionals Don’t Skip.

Every week, thousands of producers, breeders, and industry insiders open Bullvine Weekly for genetics insights, market shifts, and profit strategies they won’t find anywhere else. One email. Five minutes. Smarter decisions all week.

NewsSubscribe
First
Last
Consent

Cornell Study Proves Less Is More: Why Modern Colostrum Needs Just 2.5 Liters, not 4

Testing colostrum takes 30 seconds. Saves $20/calf immediately. Adds $350 lifetime. Why isn’t everyone doing this?

EXECUTIVE SUMMARY: For 20 years, we’ve been overfeeding colostrum without realizing it—and it’s been hurting both calves and profits. Modern dairy genetics have quietly doubled colostrum antibody concentration from 50 to 90 grams per liter, but we’re still feeding volumes designed for our grandparents’ cows. Cornell’s groundbreaking 2024 study shows that feeding just 2.5 liters of today’s high-quality colostrum works better than 4 liters, improving absorption efficiency by 24% while eliminating painful colic symptoms in calves. The economics are compelling: precision feeding saves $20 per calf immediately and adds $300-350 through increased first-lactation milk production. Implementation couldn’t be simpler—a $200 refractometer and 30-second test tells you exactly what each cow produces, letting you bank excess premium colostrum while optimizing calf health. Smart producers are already making the switch, treating colostrum like the liquid gold it’s become. The science is clear: less really is more when you’re feeding modern colostrum.

Precision colostrum feeding

You know how sometimes a piece of information hits you and suddenly everything makes sense? That’s exactly what happened to me at a University of Wisconsin extension meeting this fall. Dr. Donald Sockett—who’s been around calves longer than most of us have been farming—showed us data from the latest Cornell research that basically turned my understanding of colostrum feeding upside down.

What caught me off guard was this: we’re still feeding colostrum like it’s 2004, but our cows? They’re producing something completely different now. And some of the calves we thought were thriving… well, turns out they might actually be uncomfortable from what we’ve been doing to them.

The Quality Jump That Snuck Up on Us

The brutal truth about colostrum management: while dairy genetics quietly doubled antibody concentration from 50 to 90 g/L over four decades, we kept force-feeding calves volumes designed for cows that no longer exist. It’s like running premium fuel through a carburetor designed in 1980—wasteful, painful for calves, and economically stupid.

So I’ll admit it—I feel a bit foolish for not noticing this sooner. While we’ve all been focused on pushing production records, tracking genomic gains, watching butterfat levels climb… our cows have been quietly revolutionizing their colostrum quality right under our noses.

The numbers tell quite a story. Back when I started farming (and don’t ask me exactly when that was), average colostrum measured around 50 grams per liter of IgG. That’s what all the feeding guidelines were based on.

Today? Well, the data compiled by Wisconsin’s veterinary team, along with studies from Bielmann’s group and more recent work by Conneely, shows we’re routinely seeing 75 to 95 grams per liter.

Let that sink in for a minute. That’s nearly double the antibody concentration. Double.

Dr. Miriam Weber Nielsen from Michigan State put it perfectly when she told me that these modern cows aren’t just making more milk—they’re making fundamentally different colostrum. The whole biological system has upgraded.

What drove this change? A bunch of things came together, really.

You probably remember when genomic selection took off around 2009. The Council on Dairy Cattle Breeding’s data shows it basically doubled our rate of genetic gain. And what’s fascinating is that health traits improved right alongside production. Better udder health naturally means better antibody production. Makes sense when you think about it.

Then there’s dry period management. Remember when everyone was trying shortened dry periods or even continuous milking? Yeah, that didn’t work out so well. Canadian research confirmed what many of us learned the hard way—those traditional 50 to 60-day dry periods really do optimize antibody transfer. Most of us have gone back to standard dry periods, and wouldn’t you know it, colostrum quality improved.

Sandra Godden’s work has shown us something else, too—when you really dial in that dry cow nutrition, especially energy and protein balance, colostrum IgG concentration responds beautifully. Today’s TMR formulations have basically optimized this in ways we couldn’t achieve before.

And timing… oh boy, timing matters more than I realized. Research has documented that IgG concentration in colostrum can drop by about a third in the 14 hours after calving. Most of us now harvest within 2 to 6 hours. When I started, 12 to 24 hours was pretty normal. That change alone makes a huge difference.

When Cornell Proved We’ve Been Overdoing It

Alright, so the Cornell study—this is where things get really eye-opening. S.E. Frederick and Dr. Sabine Mann’s team fed 88 Holstein heifer calves colostrum at 6%, 8%, 10%, or 12% of their birth body weight. Really controlled conditions. And what they found in a recent Journal of Dairy Science paper (2024)? It challenges pretty much everything I was taught.

Cornell’s groundbreaking 2024 research reveals the shocking truth: feeding calves the traditional 4 liters (12% body weight) actually reduces IgG absorption efficiency by 24% compared to precision feeding at 6-8% body weight, while leaving more colostrum stuck in the stomach where it can’t be absorbed.

The calves getting 12% of body weight absorbed IgG at only 36.3% efficiency. The ones getting 6%? They hit 47.8% efficiency. So we’re literally getting less bang for our buck by feeding more.

But what really made me pay attention—and this is clever—they used acetaminophen as a marker to track how fast things moved through the gut. Eight hours after feeding, those high-volume calves still had 65.5% of that marker sitting in their abomasum. The lower-volume group? Only 50.4%.

That colostrum wasn’t even getting to the small intestine, where it needs to be absorbed.

And—this is the part that bothers me—those high-volume calves were clearly uncomfortable. The ones getting 10% and 12% of body weight showed abdominal kicking. Classic colic behavior. The 12% group kicked 40 times during observation. You know how many times the 6-8% groups kicked? Zero. Not once.

The hidden cost of “more is better”: Cornell researchers documented zero colic behavior in calves fed 6-8% of body weight, but calves force-fed the traditional 4 liters (12% BW) kicked 40 times in 12 hours—clear evidence of abdominal pain that’s been normalized for decades.

Dr. Ryan Breuer from Wisconsin explained it in a way that finally made it click for me: those intestinal cells that absorb IgG through pinocytosis? They’ve got limits. Feed more than they can handle, and you basically create a traffic jam in the gut. The IgG can’t get absorbed, the calf feels lousy, and you’ve wasted good colostrum.

Quality Wins Every Time

While Cornell was documenting the problems with overfeeding, the University of Montreal team was out there proving what actually works. Their 2021 study in the Canadian Journal of Animal Science followed 818 calves across 61 Quebec Holstein farms. Real farms, real conditions—not some pristine research facility.

Montreal researchers tracking 818 calves across 61 farms proved what we’ve been getting wrong: colostrum quality (easily measured with a $200 refractometer in 30 seconds) matters nearly twice as much as feeding more volume—yet most producers still focus on the wrong variable.

What they found was crystal clear: calves getting colostrum that tested at 24.5% Brix or higher were nearly three times more likely to achieve adequate passive transfer compared to calves getting lower-quality colostrum. Three times!

To put that in perspective, quality mattered more than anything else they looked at. Feeding more volume? That only gave you 2.6 times better odds. Earlier timing? 1.6 times. Bottle versus tube feeding? Just 1.4 times. Quality beat everything.

And this really made me think—those Quebec farms fed a median volume of just 2.8 liters at first feeding. That’s way less than the 4 liters we’ve been told to feed. Yet 68% of those calves achieved adequate passive transfer. Why? Because their median colostrum quality was 23.5% Brix, well above what we used to consider good enough.

A Producer’s Guide: Precision Colostrum Feeding

Stop feeding by tradition. Start feeding by science.

Calf Birth WtHigh Quality (≥25% Brix)Medium Quality (22-24% Brix)Traditional (outdated)
40 kg (88 lb)✓ 2.5 L (6.3% body wt)△ 3.4 L (8.5% body wt)✗ 4.0 L (10.0% body wt)
35 kg (77 lb)✓ 2.2 L (6.3% body wt)△ 3.0 L (8.6% body wt)✗ 4.0 L (11.4% body wt)
30 kg (66 lb)✓ 1.9 L (6.3% body wt)△ 2.6 L (8.7% body wt)✗ 4.0 L (13.3% body wt)

Banking Tips:

  • Freeze in 1-liter bags for easy thawing
  • Label with date and Brix score
  • Use within 6 months for best quality

Making This Work on Real Farms

So you’re probably thinking what I thought: “Okay, interesting research, but how do I actually do this?” Fair question. Let me share what I’ve learned from folks who’ve successfully made the switch.

First thing—you’ve got to know what you’re working with. Get yourself a Brix refractometer. They run about $200 from most dairy suppliers. The digital ones are nice if you want to splurge, but honestly, the optical ones work just fine. Takes maybe 30 seconds to test once you get the hang of it.

And that brings me to banking, which I think is one of the most underutilized tools we have. When you test a cow at 28% Brix and only need to feed 2.5 liters to her calf, you might have 2 to 3 liters of premium colostrum left over. Freeze it! That’s your insurance for when a heifer freshens with poor colostrum or you get surprise twins.

Now, I’ll be honest—not everyone sees immediate benefits. A neighbor of mine with 60 cows tried this for three months and said the extra testing time didn’t pencil out for him. Fair enough. But most operations I’ve talked with find the time investment pays off pretty quickly, especially once employees get into the routine.

This past spring calving season really drove it home for me. We had two heifers freshen the same night with colostrum testing at 18% Brix—way below what we needed. But because we’d been banking all winter, we had plenty of high-quality colostrum ready to go. Those calves got what they needed, and both are thriving now.

The Economics Make Sense

Here’s why every dairy should own a refractometer: that $200 device pays for itself with the very first calf tested, then delivers $370 in returns per calf through immediate health savings, reduced replacer waste, and a whopping 626kg more milk in first lactation. The breakeven isn’t measured in months—it’s measured in hours.

Let’s talk money, because that’s what it comes down to for most of us. Current colostrum replacer runs $35 to $45 per bag—and that makes about 3 liters. So every liter of high-quality colostrum you bank is worth $12 to $15. Start banking 1.5 liters from 40% of your fresh cows, and it adds up fast.

Then there’s growth. Calves with optimal colostrum gain an extra 0.24 pounds per day preweaning. Doesn’t sound like much? Over 60 days, that’s 14 pounds. At a typical feed conversion, that’s another $20 per calf.

And this is what really gets me—those same calves produce 626 kilograms more milk in their first lactation. At current prices of around $21 to $24 per hundredweight, we’re talking $300 to $350 in additional revenue per animal. From decisions you made in the first 12 hours of life.

Though I should mention, labor is a consideration. Training employees takes time, and if you’re dealing with high turnover, that’s a real cost. Some operations find that factor alone makes traditional protocols more practical for them.

Extended Feeding: The Next Frontier

What’s got me really interested lately is what happens when you keep feeding colostrum or transition milk beyond that first day. Most of us switch calves straight to milk replacer or whole milk, but there’s growing evidence that this is leaving gains on the table.

Michigan State published fascinating work in 2020. Calves fed transition milk for just three days after colostrum weighed 6.6 pounds more at weaning. The extra energy in transition milk accounted for only about 1.5 pounds of that. The rest? Enhanced gut development.

An Iranian-German team took it further, supplementing calves with 700 grams of colostrum daily for two full weeks. They saw significantly fewer days with diarrhea, less respiratory disease, and better feed efficiency throughout the preweaning period. Published in the Journal of Dairy Science in 2020, and it’s got a lot of us rethinking our protocols.

For operations with automated calf feeders, this gets interesting. You can program different feeding curves based on colostrum quality scores. Some larger dairies are already doing this, though the complexity of the setup means it’s not for everyone.

Different Regions, Different Challenges

Looking at how this plays out across the country, implementation varies quite a bit depending on where you farm. Many Upper Midwest producers I’ve talked with notice higher colostrum quality during fall and winter—probably because there’s less heat stress during the dry period. Southern producers often report the opposite pattern, especially during those brutal August dry periods.

Out in California’s Central Valley, those large-scale operations have had to get creative with banking systems. Smaller bags for faster thawing, dedicated freezers in climate-controlled rooms. Makes sense when you’re dealing with their volumes and temperatures.

The grazing operations in the Northeast face their own challenges. Pasture-based dry cow management can produce exceptional colostrum quality, but volume tends to be more variable. These folks really benefit from having robust banking systems to buffer that natural variation.

And smaller operations—those milking under 100 cows—might actually have some advantages here. You know your cows better, can track individual quality easier, and have more flexibility in your protocols. When you’re only calving a few cows a week, building and managing a colostrum bank is pretty straightforward.

That said, some small producers tell me the return on investment just isn’t there for them. When you’re already achieving decent passive transfer rates and labor is tight, sticking with what works makes sense.

Common Mistakes to Avoid

I’ve watched quite a few farms try to make this transition, and there are definitely some pitfalls to watch out for.

The biggest mistake? Testing colostrum but not actually changing anything. I know it sounds ridiculous, but I’ve seen it happen multiple times. Farms buy the refractometer, test every batch, write down the numbers… and then keep feeding 4 liters because that’s what feels safe. The data just piles up on clipboards without driving any decisions.

Consistency is crucial, too. If your weekend crew is still doing things the old way, you won’t see the benefits. Make it visual—post a laminated chart showing exactly how much to feed based on Brix reading and calf size. Take the guesswork out of it.

And don’t forget about those smaller calves. Jersey calves, twins, that occasional small Holstein heifer—they need proportionally less. A 30-kilogram calf getting 4 liters is receiving 13% of its body weight. No wonder some of these calves look uncomfortable after feeding.

The Organic Angle

This precision approach is especially valuable for organic producers. With a limited treatment toolbox, the prevention provided by excellent passive transfer is critical, and many organic farms report substantial reductions in calf health issues after making the switch.

Where This Is All Heading

Looking ahead, I think precision colostrum management will likely follow the same path as genomic testing. Five years ago, plenty of folks were skeptical. Today? It’s just how we do things on progressive farms.

The Council on Dairy Cattle Breeding recently announced genomic evaluations for calf wellness. The heritability for calf serum total protein (a measure of passive transfer) is around 0.17—that’s workable for genetic selection. Some farms are already starting to select for colostrum quality.

And extended feeding protocols? I think that’s the next big shift. Once producers see the growth and health benefits from feeding transition milk for 3 to 7 days, it’ll likely become more common. We’re just scratching the surface there.

What’s interesting is how this connects to everything else we’re doing. Better genetics leading to better colostrum. Better colostrum management leading to healthier calves. Healthier calves are becoming more productive cows. It’s all connected, and we’re finally starting to see the whole picture.

The Bottom Line

Look, I get that change is hard. Especially when what you’ve been doing seems to work okay. But the thing is—the colostrum our cows produce today is fundamentally different from what it was 20 years ago. We’ve improved the genetics, nutrition, and management… but not the feeding protocols.

The research from Cornell, Montreal, and Michigan State—it’s all pointing in the same direction. Quality matters more than quantity. Precision beats volume. And what worked for 50 g/L colostrum just doesn’t make sense for 90 g/L colostrum.

You don’t have to change everything overnight. Start by testing your colostrum for a week. See what you’re actually dealing with—I’ll bet you’ll be surprised. Then gradually adjust volumes based on quality. Bank the excess. Track your results.

The tools are simple—a $200 refractometer and a scale for calves. The protocol is straightforward. And the payoff? Healthier calves, better growth, improved lifetime production, and a freezer full of insurance for when you really need it.

This isn’t about being revolutionary. It’s about good management catching up with good genetics. The cows changed. The colostrum changed. Maybe it’s time our feeding protocols caught up too.

And honestly? Once you see those calves thriving on less volume of better-quality colostrum, with none of that post-feeding discomfort we used to think was normal… you’ll wonder why we didn’t figure this out sooner.

KEY TAKEAWAYS 

  • Modern colostrum is 2X stronger—Test quality with a Brix refractometer ($200, takes 30 seconds) to avoid overfeeding calves with volumes designed for 1990s genetics
  • Feed by quality, not tradition—High-quality colostrum (≥25% Brix): 2.5L | Medium (22-24% Brix): 3.3L | Low (<22% Brix): Don’t use for first feeding
  • Bank the surplus—When premium colostrum only needs 2.5L instead of 4L, freeze the excess as insurance for when heifers deliver poor-quality batches
  • The math is compelling—Precision feeding returns $20/calf immediately in health savings, plus $300-350 through 626kg more milk in first lactation
  • Implementation is simple—Most farms see ROI within 60 days using just a refractometer and a laminated feeding chart in the calf barn

Complete references and supporting documentation are available upon request by contacting the editorial team at editor@thebullvine.com.

Learn More:

The Sunday Read Dairy Professionals Don’t Skip.

Every week, thousands of producers, breeders, and industry insiders open Bullvine Weekly for genetics insights, market shifts, and profit strategies they won’t find anywhere else. One email. Five minutes. Smarter decisions all week.

NewsSubscribe
First
Last
Consent

The End of Universal Dairy Advice: How Precision Strategies Deliver $425-700 More Per Cow

1,500 cows. 19 studies. One conclusion: Following ‘standard’ dairy advice leaves $425-700 per cow on the table. Michigan State & Cornell just proved why context beats convention every time.

Executive Summary: The dairy industry’s universal playbook is dead—and farms still following it are leaving $425-700 per cow on the table. Michigan State’s analysis of 1,500 cows just proved palmitic acid increases fiber digestibility by 4.5%, completely reversing 70 years of established nutrition science. Meanwhile, Cornell research shows that the “optimal” 27% starch diet crushing it in Wisconsin could tank your butterfat and profits in Arizona’s heat. Is the beef-on-dairy gold rush paying $150-350 premiums today? History says you’ve got two years before the cycle turns. Smart operators aren’t copying neighbors anymore—they’re implementing precision strategies matched to their specific conditions, capturing those higher returns through customized nutrition, strategic breeding, and targeted technology adoption. The question isn’t whether to adapt, but whether you’ll lead the change or chase it.

Precision Dairy Profitability

You know how sometimes research comes along that makes you reconsider everything you thought you knew about dairy farming? Well, a recent issue of the Journal of Dairy Science is one of those moments. What’s particularly noteworthy is how these studies—from teams at Michigan State, Cornell, and universities across Europe—all point to the same conclusion: what works brilliantly for your neighbor might not work for you. And that’s actually okay.

I’ve been digging through these analyses, and there’s a consistent theme emerging. Success in modern precision dairy farming increasingly depends on matching strategies to your specific operation rather than following those universal recommendations we’ve all grown up with. It’s a shift we’ve been seeing gradually over recent years—this move from standardized protocols toward more nuanced, operation-specific dairy management strategies.

Here’s what’s encouraging: the economics actually support this individualized approach. Based on Michigan State’s modeling of fatty acid supplementation strategies, operations implementing production-level-specific feeding programs could capture $250-350 per cow annually during favorable milk price periods (you know, those $18-20 per hundredweight times we all hope for). Similarly, research on strategic breeding programs suggests returns of $100-200 per cow from well-managed beef-on-dairy programs—though let’s be honest, these figures assume you’ve already got proper replacement management systems in place.

The $425-700 Opportunity: Combined Precision Strategy Impact – How elite operations achieve 4-9x returns versus basic implementation through systematic integration

Reconsidering Fat Supplementation: When Conventional Wisdom Meets New Data

So here’s what’s interesting about fat supplementation. For literally decades—since the 1950s—we’ve operated on the principle that dietary fat reduces fiber digestibility. This wasn’t just some random idea someone had. Legitimate studies showed vegetable oils decreased cellulose breakdown, and every nutritionist learned it, taught it, and formulated around it.

Then Adam Lock’s research team at Michigan State published their meta-analysis in a recent Journal of Dairy Science, covering 19 studies and nearly 1,500 individual cow observations. And what they found? Palmitic acid (that’s C16:0 for those keeping track) actually enhances neutral detergent fiber digestibility by 4.5 percentage points. Not decreases—increases. The mechanism, as it turns out, involves the selective enhancement of specific fiber-digesting bacteria that produce propionate and valerate. It’s essentially the opposite of what we’ve been teaching for generations.

Production LevelOptimal StrategyFiber Digestibility ChangeAnnual Return Per Cow
Low Producers (<99 lbs/day)High Palmitic (80-85% C16:0)+4.5%$250-350
High Producers (>99 lbs/day)Oleic Blend (60% palmitic, 30% oleic)+2.8%$200-280

What makes this particularly relevant for operations today is the research’s clear production-level differentiation. Cows producing below 45 kilograms daily—about 99 pounds—show optimal response to high-palmitic supplements containing 80-85% C16:0. But your high producers? Those pushing over 45 kilograms daily? They actually do better with oleic-enriched blends, something like 60% palmitic and 30% oleic acid.

I recently spoke with a nutritionist managing several large herds who’s been implementing these differentiated strategies. What they’re finding is that fresh cows get oleic blends to support intake during the transition period, mid-lactation animals get high-palmitic supplements to support production, and late-lactation cows go back to oleic blends for body condition recovery. Yeah, it’s more complex than just buying one fat supplement for everyone. But the economic modeling suggests potential returns of $250-350 per cow annually at favorable milk prices, with $200-320 returns even during those challenging price periods we all dread.

“The biggest shift we’re seeing is accepting that every recommendation needs context-specific qualifications. What works brilliantly for one operation might actually lose money for another.”

Starch Management: Finding the Balance Between Efficiency and Components

The Cornell team’s investigation into dietary starch levels presents an interesting challenge that I think many of us are grappling with. Their comparison of 21% versus 27% starch content—achieved by replacing soy hulls with high-moisture corn—revealed improved feed efficiency of 5% and reductions in methane emissions of 6% at the higher inclusion rate. Sounds great, right?

But here’s where it gets complicated. That same higher starch level decreased milk fat concentration by 0.16-0.19 percentage points. Now, you might think that’s not much, but let’s walk through what this means economically. For a 1,000-cow herd averaging 80 pounds of daily production, a 0.17 percentage point drop is 0.136 pounds of fat per cow, per day. With butterfat prices at $3.00 per pound (a conservative figure for many markets as of November 2025), that’s an annual loss of nearly $150,000.

This aligns with what operations are seeing when they push starch levels above 27% without exceptional forage quality. These farms frequently report butterfat percentages declining to the 3.4-3.5% range, consistent with the Cornell findings. One California operation I’m familiar with learned this the hard way—they pushed starch to 28% to maximize efficiency and maintain milk volume, but when butterfat tanked and their processor was paying heavy component premiums, they actually lost money despite producing milk more “efficiently.”

Regional variations play a crucial role here, as many of us have learned through experience. Upper Midwest operations working with corn silage at 42% starch and highly digestible alfalfa NDF? They can often successfully maintain 26-27% starch. But Southwest producers dealing with variable forage quality and extended heat-stress periods—we’re talking eight months annually in some areas—typically find that 23-24% represents their practical ceiling before experiencing component depression.

What’s particularly interesting is how Southeast producers have adapted seasonally. During cooler months (November through April), they’ll maintain 25% starch when cow comfort is optimal. As summer heat stress increases, they back off to 22% to protect butterfat levels. It’s a practical adaptation to regional conditions that makes sense. And Pacific Northwest operations? With their consistent moderate temperatures, excellent forage quality from all that rain, and proximity to export markets, they’re finding they can maintain 25-26% starch year-round with minimal impact on components. Different strokes for different folks, as they say.

RegionStarch RangeButterfat RiskKey Challenge
Wisconsin (Cool)26-27%LowForage quality mgmt
Arizona (Heat)21-24%High above 24%150+ heat stress days
California (Variable)23-25%ModerateVariable forage qual
Southeast (Seasonal)22-25% (seasonal)Moderate-HighSummer heat adaptation

Methane Mitigation: Economics Versus Environmental Goals

The discussion around 3-nitrooxypropanol—3-NOP for short—really exemplifies the tension between environmental objectives and economic reality that we’re all facing. Research from Wageningen University, published in a recent issue of the Journal of Dairy Science, confirms the compound works—achieving 25-35% methane reduction under various conditions.

Why is this significant? Well, let me break down the economics in simpler terms. Current voluntary carbon markets (as of November 2025) typically value agricultural credits at $10-40 per ton of CO2 equivalent, though there’s considerable variation based on program requirements. Meanwhile, 3-NOP costs $0.15-0.30 per cow daily according to the research data.

Here’s the thing: 3-NOP reduces methane emissions by about 100 grams per cow per day. That translates to roughly 2.5 kg of CO2-equivalent when you factor in methane’s warming potential. At $30 per ton carbon pricing, that 2.5 kg reduction is worth about 7.5 cents daily—well below the 15-30 cent additive cost. For the economics to work out, carbon pricing would need to be substantially higher than current rates—probably in the $60-120 per ton range, depending on your specific costs and methane reduction achieved.

Grazing systems present additional complexity. While achieving a 34% reduction in methane emissions, Wageningen Research documented concurrent declines of 2.3 kilograms daily in fat-and-protein-corrected milk production. That’s over a dollar per cow in daily lost revenue, on top of the additional cost.

Currently, methane mitigation functions primarily as a cost center rather than a profit opportunity. Most operations I talk to are developing various scenarios, but without carbon credits approaching $100 per ton or regulatory mandates, the economic justification just isn’t there yet. This doesn’t diminish the environmental importance—we all want to do our part—but it does explain why adoption remains limited among operations focused on near-term profitability.

While methane mitigation awaits better economics, there’s another strategy delivering immediate returns that deserves our attention.

Strategic Breeding: Navigating the Beef-on-Dairy Opportunity

The beef-on-dairy phenomenon represents one of the most significant shifts in dairy breeding strategies I’ve seen in my career. National Association of Animal Breeders data indicates substantial increases in beef semen sales to dairy operations over the past five years, with industry surveys suggesting widespread adoption across the sector. Current crossbred calf premiums of $150-350 over Holstein bull calves (as of November 2025) create compelling economics that are hard to ignore.

Research from University College Dublin, published in a recent issue of the Journal of Dairy Science, provides valuable insights into optimal implementation strategies. What’s encouraging is that the most successful programs aren’t simply throwing beef semen at every cow—they’re taking strategic approaches.

The framework that seems to work best involves using sexed dairy semen on your top 40-50% of cows ranked genomically, breeding the bottom 20-30% to beef genetics, and maintaining conventional dairy semen for the middle tier as a buffer. This approach, according to the Irish modeling, accelerates genetic progress while capturing crossbred premiums, since your dairy replacements come exclusively from superior genetics.

“During strong beef markets, breed 35-40% to beef. When premiums compress, reduce to 20-25%. This adaptive approach provides revenue optimization while maintaining operational flexibility.”

But—and this is important—historical patterns suggest we need to be cautious. Beef markets have consistently demonstrated cyclical behavior over multiple decades. We’re currently about five to six years into an upward price cycle. Historical precedent suggests that two more years of strong premiums may be needed before a market correction occurs. Operations going all-in on beef breeding today might face challenges when the cycle reverses.

Beef-on-Dairy Premium Cycle: The $1,400 Peak and Coming Correction – Historical patterns suggest 2-year window before market normalization begins

I recently discussed this with a producer who’s been through multiple beef cycles. His approach involves maintaining flexibility—adjusting beef breeding percentages based on market signals rather than committing to a fixed strategy. Smart thinking, if you ask me.

Technology Implementation: The Management Factor

The University of Guelph team’s research on automated activity monitoring provides insights that I think many of us need to hear. Their study of 4,578 Holstein cows across three commercial herds demonstrated that animals expressing estrus within 41 days in milk achieved 20% higher pregnancy rates and experienced 21-26 fewer days open. The technology clearly works.

Economic analyses suggest that properly implemented automated monitoring systems can generate returns of $75-150 per cow annually through improved reproduction and labor efficiency. For a 500-cow operation, that’s $37,500-75,000 in potential annual returns. Not pocket change by any means.

Yet success varies dramatically between operations, and here’s what I’ve noticed: it’s not about the technology sophistication. It’s about management infrastructure.

Successful implementations share common characteristics. They designate specific personnel to check alerts at specific times—typically 6 AM and 2 PM. They have established protocols for breeding within 12 hours of heat detection. And critically, they’ve integrated everything with their existing herd management software. These operations treat the technology as a management tool requiring daily engagement, not a set-it-and-forget-it solution.

On the flip side, operations where “everyone” shares responsibility for monitoring—which effectively means no one takes ownership—or where systems don’t integrate with breeding records, or where poor transition cow health suppresses cycling? They see minimal returns despite significant investment. It’s a reminder that technology amplifies good management but can’t replace it.

Recognizing the Shift: From Universal to Contextual

After reviewing this collective body of research, what’s becoming clear to me is that operations capturing maximum value from modern dairy advances and precision dairy farming approaches share a common philosophy. They’ve shifted from asking “What’s recommended?” to asking “What works for our specific situation?”

Take palmitic acid supplementation. While research indicates that high producers benefit from oleic blends, Arizona operations that face 150 days of heat stress annually may see different results than Wisconsin farms. Similarly, milk pricing that heavily weights protein versus fat components yields different optimization calculations. It’s all about context.

This represents a fundamental shift in how we approach dairy management strategies. Nutritionists increasingly recognize—and I think we all need to accept—that recommendations require context-specific qualifications. Every suggestion, whether it’s starch at 27%, fat at 5%, or breeding 30% to beef, requires consideration of multiple operation-specific variables.

Practical Implementation Framework

For operations looking to implement these precision dairy farming approaches, here’s what I’ve seen work:

First, identify the area offering the greatest leverage for improvement. If feed accounts for 55% of your costs and continues to rise, fatty acid optimization becomes a priority. Pregnancy rates below 18%? Fix reproduction first. Raising 130 replacement heifers for a 100-cow herd? Beef-on-dairy makes immediate sense. Losing component premium money? Look at your starch levels or supplementation strategies.

Second—and this is crucial—establish measurement systems before implementing changes. I see too many operations invest in technology or new supplements without baseline performance data. Track your current metrics for at least three months. Otherwise, how do you know if it worked?

Third, think in terms of acceptable ranges rather than fixed targets. Starch might range from 21% to 27% depending on forage quality, season, and component pricing. Beef breeding could range from 20% to 45% based on market conditions and heifer inventory. Fatty acid programs adjust with production level and lactation stage. Technology adoption depends on existing management infrastructure. It’s about flexibility, not rigidity.

The Opportunity Cost of Waiting

Here’s something that doesn’t show up in any research paper, but every farmer knows: the cost of doing nothing. While you’re waiting for the perfect time to optimize nutrition or the ideal moment to start beef-on-dairy, your neighbors are already gaining experience and capturing returns.

Producers implementing new dairy management strategies consistently report learning curves of 12-18 months before achieving full benefits. Returns typically progress from break-even in year two to $250-350 per cow by year three. Delaying implementation means you’re not just forgoing immediate returns—you’re also missing out on the learning that enables future optimization.

Regional and Seasonal Considerations

Geographic location significantly influences strategy selection, as we all know from experience. Arizona operations facing 120+ days above 95°F operate under fundamentally different constraints than Minnesota farms. The University of Florida’s heat tolerance research, identifying biomarkers like 3-methoxytyramine with 88% screening accuracy, has profound implications for Southwest operations but limited relevance in regions experiencing minimal heat stress.

Similarly, pasture verification technology using FT-MIR spectroscopy creates opportunities in regions with established grass-fed premium markets—Vermont, California’s North Coast, and Wisconsin’s grazing regions. For Texas Panhandle operations? Probably not your biggest priority.

And Pacific Northwest dairies deserve special mention here. With their unique combination of moderate climate, excellent forage quality, and proximity to export markets, they face different optimization calculations than their Midwest counterparts. These operations often find they can push both production and components harder than farms in more extreme climates, but they also face higher land costs and environmental regulations that affect their strategy choices.

Looking Forward: Emerging Trends

Several trends appear increasingly clear from current research trajectories, and I think we need to be preparing for them:

Carbon pricing mechanisms will likely evolve from voluntary to mandatory in many regions. Operations currently modeling $50-100 per ton CO2 equivalent scenarios will be better positioned than those ignoring this possibility.

Beef-on-dairy premiums will moderate but remain meaningful. While current premiums won’t persist indefinitely, the documented efficiency and carcass-quality advantages suggest $150-250 differentials may represent a sustainable, long-term level.

Component-based pricing will increasingly influence nutritional decisions. As processors develop targeted products requiring specific component profiles, operations capable of manipulating fat and protein through nutrition will capture premiums.

Technology adoption will accelerate, but success will depend on the quality of integration rather than the quantity of technology. Leading operations won’t necessarily have the most technology—they’ll have the best alignment between technology and management systems.

Key Economic Summary

Based on research-validated modeling from the Journal of Dairy Science studies:

  • Fatty Acid Optimization: $250-350 per cow annually
  • Strategic Beef-on-Dairy: $100-200 per cow annually
  • Improved Reproduction (via technology): $75-150 per cow annually
  • Combined Potential: $425-700 per cow annually*

*Results vary significantly based on implementation quality, market conditions, and operation-specific factors

Precision Strategy Economic Impact Comparison – Individual strategy returns and implementation priorities for maximizing per-cow profitability

The Bottom Line

The research presented in a recent issue of the Journal of Dairy Science makes one thing abundantly clear: the era of universal dairy management recommendations is evolving toward more nuanced, context-specific approaches. This isn’t about abandoning proven principles—it’s about recognizing that optimal application varies significantly across individual farms.

Operations that have successfully implemented these precision dairy farming approaches understand that optimization requires matching strategies to specific situations. Not your neighbor’s situation. Not state averages. Your actual, measured, specific circumstances.

Look, this transition isn’t always comfortable. Following established protocols is simpler than understanding underlying principles and making contextual adjustments. But the economic evidence is compelling. Research modeling suggests operations successfully implementing multiple precision strategies could achieve combined returns of $425-700 per cow annually, though results vary considerably based on implementation quality and market conditions.

The scientific foundation exists. Economic validation is documented. The remaining question for each operation is whether to continue asking “What should we do?” or transition to asking “What’s optimal for our specific situation?”

In today’s dairy economy, that distinction increasingly separates operations that thrive from those that merely survive. And I think we all know which side of that line we want to be on.

Key Takeaways:

  • The $425-700 opportunity is real—but only if you stop following “standard” advice and match strategies to YOUR farm’s specific conditions (location, forage quality, component pricing)
  • Palmitic acid bombshell: After 70 years of being wrong, we now know it INCREASES fiber digestibility by 4.5%—switch to high-palmitic supplements for cows under 99 lbs/day, oleic blends for high producers
  • Your optimal starch isn’t their optimal starch: 27% works in Wisconsin’s cool climate but crashes butterfat in Arizona heat—find YOUR range (21-27%) based on regional conditions
  • Beef-on-dairy clock is ticking: Current $150-350 premiums have 2 years left based on historical cycles—breed 35-40% to beef now, but be ready to pull back when markets turn
  • Technology ROI requires management discipline: Automated monitoring returns $75-150/cow IF someone checks alerts at 6 AM and 2 PM daily—no designated person = no return

Complete references and supporting documentation are available upon request by contacting the editorial team at editor@thebullvine.com.

Learn More:

  • What Separates Top Beef-on-Dairy Programs from Average Ones – This article provides the tactical guide for executing the beef-on-dairy strategy, revealing how to add $300 per head through specific documentation, sire selection, and early nutrition protocols that capture the full value from your crossbred calves.
  • Cheese Yield Explosion: How Dairy Farmers Can Reclaim Billions in Lost Component Value – This piece breaks down the market economics behind component pricing. It explains exactly why protecting your butterfat is critical, demonstrating how processor demands for cheese yield and new Federal Order rules are creating massive profit opportunities for component-focused producers.
  • How AI is Banking Dairy Farmers an Extra $400 Per Cow – Moving beyond simple activity monitoring, this article details the ROI of advanced AI management systems. It demonstrates how integrating health, production, and feed data provides actionable insights that boost milk production by 8% and cut vet bills by 20%.

The Sunday Read Dairy Professionals Don’t Skip.

Every week, thousands of producers, breeders, and industry insiders open Bullvine Weekly for genetics insights, market shifts, and profit strategies they won’t find anywhere else. One email. Five minutes. Smarter decisions all week.

NewsSubscribe
First
Last
Consent

Feed Inventory Reality Check: Top Dairies Discover $200,000 They Didn’t Know Was Missing

How Measurement Errors Cost Dairy Farms $200,000 Annually—And What to Do About It

Executive Summary: Here’s the uncomfortable truth: most dairy operations are losing $200,000 annually to feed shrink they can’t see because traditional measurement methods are off by 15-30%. This hidden crisis came to light when Dean DePestel applied mining industry drone technology to his Minnesota dairy’s silage inventory, discovering discrepancies that are now being confirmed across the industry. While the Statz Brothers’ transformation—cutting shrink from 10% to 2-3% and saving $500,000 yearly—demonstrates the potential, you don’t need their million-dollar infrastructure. Five targeted improvements (face management, scale calibration, ingredient tracking, right-sized bunkers, and refusal optimization) can recover $100,000+ annually for an investment of under $20,000. Drone measurement services at $2,000-5,000 per year deliver quarterly measurements accurate to 1-2%, replacing guesswork with data. Any operation can start with a free 30-day test—tracking mixer output, bunks, and pile faces—to identify their gap. With industry consolidation accelerating and processors demanding sustainability documentation, farms that can’t measure and prove their efficiency won’t just lose money—they’ll lose market access.

Dairy Feed Shrink

I recently spoke with a producer in central Wisconsin who discovered something that made both of us pause. After twenty-five years of dairy farming, he finally measured his silage inventory with precision technology and found he had 23% less feed than his calculations suggested. That’s not a rounding error—that’s planning for April and running out in February.

This builds on what we’ve been seeing across the industry. Recent studies show that drone feed measurements reveal errors ranging from 15% to over 30% between traditional estimation methods and actual silage inventory. The financial implications are substantial, yet many operations haven’t recognized this as a solvable problem.

What’s particularly noteworthy is how this revelation emerged from an unexpected source. Dean DePestel, who farms at Daley Farms in Lewiston, Minnesota, happens to be a mechanical engineer. When he read about mining companies using drone technology to measure tailings piles with remarkable accuracy, he wondered if the same approach could work for silage inventory. As documented in a 2022 Ag Proud article, his curiosity led to discoveries that are reshaping how progressive operations think about feed management.

Traditional feed measurement methods are off by 15-30%, while drone technology achieves 1-2% accuracy—the difference between guessing and knowing where $200,000 disappeared

Understanding Where Traditional Methods Fall Short

The dairy industry has relied on tape measures, wheel measurers, and visual estimates for generations. Derek Wawack from Alltech captured it well in a recent Dairy Herd interview when he described these as “about everything to guess what was in forage piles.” These methods served us adequately when margins were wider and feed costs were lower. Current conditions demand better precision.

Harrison Hobart’s work with Alltech’s Aerial Inventory Program reveals why our traditional approaches struggle. Over two years of measuring corn silage density across multiple operations, he documented variations from 12 pounds to 24 pounds of dry matter per cubic foot within drive-over piles. This aligns with what many nutritionists have suspected but couldn’t quantify.

Consider the economics: A typical 1,000-cow operation today faces daily feed costs of $7 to $8 per cow—roughly $2.5 to $2.9 million annually. When research from land-grant universities, including recent work from Hubbard Feeds and Amelicor, shows shrink rates between 5% and 15% on farms without systematic measurement protocols, the financial exposure becomes clear. At 8% shrink—a conservative estimate for many operations—that represents $204,400 annually on a 1,000-cow dairy.

The Compound Nature of Measurement Errors

Pennsylvania State research offers insight into why single-point measurements mislead us. Their work found bunker density averaging 15.5 pounds of dry matter per cubic foot at the bottom, while the top averaged just 11.2 pounds—a 38% variation within the same structure. When we take one or two core samples and extrapolate, we’re essentially guessing.

This variation extends beyond density. I’ve observed haylage piles where dry matter content ranges from 25% to 55% across different sections. These aren’t poorly managed operations—they’re typical farms dealing with the realities of weather windows, equipment limitations, and labor constraints during harvest.

A Wisconsin Case Study in Transformation

The Statz Brothers operation near Marshall, Wisconsin, offers valuable lessons for the industry. This family has been dairy farming since 1966 and currently manages 4,400 cows across two locations. By any conventional measure, they were successful. Yet they faced a challenge many producers will recognize: feed inventory that seemed to disappear faster than expected.

The Statz Brothers dairy slashed feed shrink from 10% to 2.5%, documenting over $500,000 in annual savings—and you don’t need their million-dollar feed center to capture similar gains.

Todd Follendorf, their nutritionist from Cornerstone Dairy Nutrition, quantified what they suspected. As he explained to Dairy Global, “Before, we had shrink percentages of around 10% every single day.” For an operation of their size, that translated into over $1.28 million in annual feed losses.

Their response during a 2015 expansion was instructive. Rather than replicating existing infrastructure, they partnered with Mike Greene, a feed management specialist who had developed the TMR Audit system. Together, they designed a 36,600-square-foot fully enclosed feed center—not simply a commodity shed with walls, but a purpose-built facility that protects feed from placement to feeding.

The documented results speak to what’s possible: shrink rates dropped from 10% to 2%-3%. Even conservative calculations suggest annual savings exceeding $500,000, with the investment paying for itself in under three years.

Yet—and this is crucial for most operations—you don’t need their scale of infrastructure to capture significant benefits.

Practical Improvements That Deliver Returns

Five operational improvements can recover $100,000+ annually for under $20,000 in total investment—no million-dollar feed centers required, just systematic measurement and management.

Through conversations with producers and nutritionists across different regions—from California’s Central Valley to Vermont’s grazing operations—I’ve identified five changes that consistently deliver returns without requiring major capital investment:

1. Optimizing Silage Face Management

Research from UC Davis, widely shared through extension programs, demonstrates that oxygen penetrates up to 3 feet into well-packed silage. When removal rates are too slow—say, 4 inches daily instead of the recommended 6 to 12 inches—that creates an active spoilage zone.

Wisconsin and Penn State extension specialists recommend removing 6 to 12 inches daily in winter, increasing to 10 to 12 inches during warmer months. The technique matters too: scraping from top to bottom rather than digging underneath prevents cracks that increase surface area by 9% or more.

I recently visited a 1,500-cow operation in northeastern Wisconsin that implemented these changes without any equipment purchases. Their estimated savings: $6,000 to $8,000 annually from reduced spoilage alone. A similar operation in California’s San Joaquin Valley reported even higher savings due to the year-round heat stress on exposed faces.

2. Addressing Mixer Scale Accuracy

This issue deserves more attention than it typically receives. Ohio State researchers evaluated mixer wagon scales on 22 dairy farms and found that only half were functioning within acceptable tolerance. A 2% systematic error across all ingredients—easily overlooked in daily operations—costs a 1,000-cow dairy approximately $54,750 annually.

The solution is straightforward: quarterly calibration checks using certified truck scales. The process takes an afternoon, costs $500 to $1,500 for professional calibration if needed, and can identify problems before they compound into significant losses.

3. Ingredient-Specific Shrink Management

Different feedstuffs have dramatically different shrink characteristics, yet many operations apply a uniform percentage across all ingredients. Cornell’s economic analysis and recent coverage in Hoard’s Dairyman highlight this opportunity.

Cottonseed might experience 4% shrink while fine distillers grains can reach 12% to 15%. One documented case at Cornell showed that relocating high-shrink ingredients closer to mixing areas substantially reduced handling losses—a simple change with a meaningful impact.

4. Right-Sizing Face Width to Removal Capacity

Many operations built bunkers for anticipated expansion that hasn’t materialized. An 80-foot-wide bunker makes sense for 2,000 cows, not 1,200. When removal rates are too slow for bunker width, the outer portions essentially compost while you work across.

Penn State’s bunker silo research confirms this is widespread. The solution doesn’t require construction—work bunkers in sections, covering inactive portions. For future construction, consider narrower drive-over piles that match actual removal capacity.

5. Refining Refusal Management

Multiple feeding studies demonstrate that well-managed operations can reduce refusals from 5% to 2% while maintaining or improving intake. On a 1,000-cow dairy, that 3% difference represents $40,000 to $70,000 annually.

This requires discipline: pushing feed every two hours, training someone to read bunks consistently, and finding productive uses for quality refused feed rather than composting it. Yes, labor is challenging, but the returns justify the effort.

The Implementation Journey

When operations begin measuring feed inventory precisely with drone technology or other precision tools, the journey typically follows a predictable pattern. The initial measurement often reveals significantly less inventory than expected—it’s common to discover you’re 15% to 20% short of calculations. This can be unsettling, but it’s also the beginning of improvement.

After the initial surprise, patterns emerge. Operations start connecting measurement data with daily observations. Perhaps loads from one supplier are consistently light, or the mixer has been overfeeding certain pens. By month six, farms implementing systematic changes typically see 2 to 5 percentage points of shrink reduction—not from major investments, but from addressing previously invisible problems.

What I find encouraging is how feed management software integration is evolving to support these efforts. Modern systems can now incorporate drone measurement data directly into inventory tracking, creating real-time dashboards that flag anomalies before they become crises.

The Human Element in Feed Management

Technology alone doesn’t reduce shrink—people using technology systematically do. Successful implementation requires clear ownership and accountability.

The operations achieving the best results designate one person whose primary responsibility (representing 70% to 80% of their time) is feed management. Not someone who feeds when they’re done milking, but someone whose success is measured by feed efficiency and shrink reduction.

Your nutritionist plays a crucial role through weekly or biweekly visits, but they’re designing rations and troubleshooting, not managing daily operations. The distinction matters. Meanwhile, owners or managers need to invest 3 to 5 hours weekly reviewing data and making strategic decisions. This team approach, documented in Michigan State Extension research and Bovine Practitioner guidelines, consistently outperforms fragmented responsibility.

Understanding the Limitations

Professional integrity requires acknowledging the constraints of this technology. Weather presents the primary challenge—most agricultural drones can’t operate in rain or winds exceeding 20 mph. The battery provides 15 to 30 minutes of flight time in good conditions, with less in cold weather.

Since inventory measurement typically occurs quarterly rather than daily, finding suitable flying conditions within a reasonable window is rarely a problem. The 2021 Scientific Reports global drone flyability study confirms this pattern.

Vertical silos present a different challenge—drones can’t see through concrete, so traditional measurement methods remain necessary for these structures. Operations with limited internet connectivity should work with service providers who process data off-farm rather than attempting to manage large file uploads themselves.

Where the Economics Change

Not every operation will benefit equally from precision measurement. A 400-cow grazing operation in Vermont with minimal stored feed faces different economics than a 2,000-cow confinement operation in Wisconsin storing nine months of inventory.

Similarly, Southeast operations practicing rotational grazing might store only 3 to 4 months of silage. For these situations, traditional methods may provide adequate accuracy given the lower total investment in stored feed.

One producer who evaluated but decided against drone measurement made a valid point: “With only 600 cows and buying most of our grain as-needed, the $3,000 service would save us maybe $8,000 annually. That math works, but there are other investments with better returns for our operation right now.” This kind of thoughtful analysis respects that every operation has unique priorities.

Regional Variations and Support Programs

Implementation patterns vary significantly by region. Upper Midwest operations storing 8 to 10 months of feed see the highest returns from precision measurement. California’s large dairies benefit differently—they’re identifying shrink in real time on substantial commodity purchases rather than on stored forage.

What many producers don’t realize is that support exists for adopting these technologies. Multiple states offer cost-share programs through NRCS or state agricultural departments. Wisconsin provides reimbursement for up to 50% of precision agriculture technology costs. Minnesota offers grants for adopting data-driven management systems. These programs, detailed in 2024-2025 announcements from state offices, can significantly improve the economics of adoption.

Looking Ahead: The Strategic Implications

The industry landscape is shifting in ways that make precision feed management increasingly important. Major processors, including Nestlé and Danone, are implementing sustainability documentation requirements. By 2030, operations with 5 years of precision data will have distinct advantages in verifying feed conversion efficiency and optimizing resource use.

These sustainability programs currently offer premiums ranging from $0.50 to $1.50 per hundredweight—significant revenue when applied across annual production. Early adopters are positioning themselves for these opportunities, while others are still evaluating the technology.

The 2030 industry divide is forming right now: Early adopters will have 5+ years of sustainability data, premium payments, and better lending rates, while late adopters scramble to prove efficiency they should have been documenting since 2025.

The labor dynamic adds another dimension. Operations reinvesting feed savings into automation report 30% to 40% reductions in labor requirements while maintaining production levels. With quality labor increasingly difficult to find and costing $20 to $25 per hour, these efficiencies matter.

Financial institutions are also taking notice. Lenders recognize that operations with precision management systems demonstrate better margins and lower default risk, translating to more favorable terms and rates.

USDA projections suggest the U.S. dairy industry will consolidate from approximately 35,000 farms today to between 24,000 and 28,000 by 2030. The operations that thrive won’t necessarily be the largest—they’ll be those that combine appropriate scale with operational efficiency.

A Practical Test for Your Operation

The uncomfortable truth: A simple 30-day tracking test reveals most dairies are missing 8-15% of their calculated feed inventory—that’s $72,000 to $135,000 disappearing annually on a 1,200-cow operation.

For producers interested but not yet convinced, I suggest a simple 30-day evaluation. Track three metrics daily: what your mixer scale indicates you fed, bunk appearance before the next feeding, and visual assessment of pile face movement.

After 30 days, compare purchase records with calculated usage. Most operations discover an 8% to 15% gap that they cannot explain. For a 1,200-cow dairy, that gap represents $72,000 to $135,000 in annual costs at current feed prices.

This evaluation costs nothing but time and reveals whether precision measurement would benefit your operation. If your numbers align within 3% to 5%, this may not be urgent. But if you discover a significant gap—as most do—the investment case becomes clear.

Practical Perspectives for Decision-Making

After examining data from operations across the country and discussing experiences with producers who’ve implemented these changes, several principles emerge:

First, determine whether you have a problem worth solving. The 30-day tracking exercise provides that answer without requiring any investment.

Second, you don’t need to revolutionize your entire feeding system. The five operational improvements outlined earlier can deliver $100,000 or more in annual savings for less than $20,000 in total investment.

Third, for most operations, service arrangements make more sense than equipment ownership. At $2,000 to $5,000 annually for drone measurement services, you access the technology benefits without the complexity.

Fourth, assign clear responsibility. Feed management as a secondary responsibility inevitably underperforms dedicated oversight.

Finally, consider the compound benefits. Early adopters are building advantages in sustainability documentation, labor efficiency, and capital access that extend well beyond immediate feed savings.

The discovery we’re making across the industry is that our traditional “good enough” approach has been far more expensive than we realized. Once operations identify where losses are occurring, they can’t return to the previous level of uncertainty.

For an industry facing continued margin pressure and evolving market demands, the ability to measure and manage precisely may determine who remains competitive. The question isn’t whether perfect measurement exists—it doesn’t. The question is whether three to four accurate measurements annually provide better decision-making than twelve months of estimation.

From my perspective, having watched operations transform their economics through systematic measurement, there’s a substantial opportunity hiding in plain sight on many dairy farms. The challenge—and opportunity—is deciding whether to pursue it.

KEY TAKEAWAYS:

  • You’re losing $200,000 annually—and don’t know it – Traditional feed measurements are off by 15-30%, hiding massive shrink on typical 1,000-cow dairies
  • Test yourself free in 30 days – Track three numbers daily (mixer output, bunk status, pile face movement); most farms discover 8-15% gaps worth $72-135K yearly
  • Five simple fixes deliver $100K+ – Face management ($6-8K), scale calibration ($25-55K), ingredient placement ($30-40K), bunker sizing ($6-8K), refusal optimization ($40-70K)—total investment under $20K
  • Rent accuracy, don’t buy it – Drone services at $2-5K/year provide quarterly measurements within 1-2% (versus 20-40% error with traditional methods)
  • The 2030 divide is forming now – Early adopters secure sustainability premiums ($0.50-1.50/cwt), better lending rates, and processor partnerships, while others scramble to catch up

Complete references and supporting documentation are available upon request by contacting the editorial team at editor@thebullvine.com.

Learn More:

The Sunday Read Dairy Professionals Don’t Skip.

Every week, thousands of producers, breeders, and industry insiders open Bullvine Weekly for genetics insights, market shifts, and profit strategies they won’t find anywhere else. One email. Five minutes. Smarter decisions all week.

NewsSubscribe
First
Last
Consent

What Separates Top Beef-on-Dairy Programs from Average Ones

New data: 80% of dairy producers optimize beef sires for convenience, not value. It’s costing them $300/calf.

EXECUTIVE SUMMARY: Your beef-cross calves should be worth $1,400. If you’re getting $700, you’re not alone—but you’re fixable. After analyzing operations from Wisconsin to California, the pattern is clear: successful beef-on-dairy programs aren’t built on superior genetics but on three systematic differences—documentation protocols that add $300 per head, early nutrition investments that return 4:1, and buyer feedback loops that enable continuous improvement. The data is compelling: 20% of beef bulls that excel on beef cows fail on dairy, high-protein milk replacer ($25-40 investment) delivers $100-150 at harvest, and managing liver abscesses (50-60% in dairy crosses vs 30% in native beef) through adjusted feeding saves $50 per head. But here’s the critical warning: replacement heifers now cost $3,800-4,000, meaning over-aggressive beef breeding creates a three-year financial time bomb. This guide provides the exact 90-day implementation framework and performance benchmarks that separate operations earning $200,000+ annually from those barely covering costs.


I recently visited two dairy operations in south-central Wisconsin, both breeding beef-on-dairy calves, both using similar Angus genetics, both selling day-old calves. The first operation consistently receives $1,400 per calf. The second? They’re fortunate to clear $700—barely above straight Holstein bull prices.

This $700 gap has become one of the most discussed topics at producer meetings this year. After analyzing operations from the Central Valley to the Northeast, talking with feedlot buyers from Texas to Nebraska, and reviewing university research on crossbred performance, a pattern emerges. The operations capturing premiums approach to beef-on-dairy views it as a data-driven enterprise. Those settling for commodity prices treat it as a convenient alternative for breeding.

Understanding Today’s Beef-on-Dairy Market Dynamics

The Beef-on-Dairy Market Explosion charts a 3,000% growth trajectory from barely 100,000 calves in 2015 to 3.1 million projected for 2026, now representing 15% of fed cattle as the beef cow herd shrinks to 1960s levels—a fundamental industry transformation

The landscape for dairy-beef crosses has shifted dramatically. According to the USDA’s latest cattle inventory analysis, we’re producing 2.92 million dairy-beef calves in 2025, with industry projections suggesting continued strong growth exceeding 3 million by 2026. What’s particularly noteworthy is these animals now represent 12% to 15% of annual fed cattle slaughter—a remarkable transformation from virtually nothing a decade ago.

This growth coincides with historically low beef cow inventories. USDA’s National Agricultural Statistics Service reports the smallest beef herd since the early 1960s, while Rabobank’s global beef outlook indicates a roughly 1% decline in global beef supply this year. The beef industry needs these dairy-origin cattle to maintain supply.

Yet despite strong demand, price variation for seemingly comparable calves regularly exceeds 100%. At a recent Pennsylvania auction, I observed crossbred calves from different operations sell for $650 and $1,350 within the same hour. Why such disparity? The answer lies in documentation quality, genetic verification, and established performance history.

It’s also worth noting that seasonal patterns affect pricing. Spring calves typically command premiums of $50 to $100 over fall-born animals due to feedlot timing preferences. Gender matters too—steers generally bring $50 to $100 more than heifers in most markets, something to consider when using sorted semen.

Quick Reference: Key Numbers at a Glance

Premium Targets:

  • Beef calf premium: $700-900 per head
  • Revenue per cwt milk: $4.00-5.50
  • Beef income goal: 15-20% of total farm revenue

Investment Guidelines:

  • High-protein milk replacer (27-30%): +$25-40 per calf
  • Genomic testing: $40-60 per animal
  • Expected return on nutrition: $100-150 at harvest

Performance Benchmarks:

  • Difficult calvings: <3%
  • Pre-weaning mortality: <3%
  • Liver abscess target: 30-35% (down from 50-60%)
  • Documentation completion: >95%

Sire Selection: Where Value Creation Begins

Michigan State University’s October 2024 beef-on-dairy survey reveals an interesting disconnect. Most dairy producers prioritize conception rate (78% of respondents), calving ease (67%), and semen cost (58%) when selecting beef sires. These are certainly important considerations for dairy management. But the traits that create downstream value—ribeye area, marbling score, frame size, growth rate—receive far less attention. Only 22% consider the ribeye area. Just 14% evaluate marbling potential.

This focus on convenience over calf value represents a fundamental misalignment. As Wisconsin dairy specialists often observe, many producers are optimizing for dairy operational efficiency rather than beef chain requirements. That disconnect typically costs $200 to $300 per calf in lost premiums.

ABS Global’s Real World Data program, which analyzed over 50,000 beef-on-dairy calvings, uncovered something every producer should understand: approximately 20% of bulls performing well for calving ease in beef herds fail to meet acceptable thresholds when bred to dairy cows. The biological differences between beef and dairy females—particularly pelvic structure and gestation length—make dairy-specific performance data essential.

I spoke with a Central Valley dairyman who learned this lesson expensively. He’d selected an Angus bull with excellent traditional EPDs and strong calving ease predictions. After losing three Holstein heifers to calving difficulty within a month, he pulled that bull from the rotation. Those weren’t just calf losses—those were future productive cows eliminated from the herd.

The most successful beef-on-dairy programs I’ve studied work exclusively with AI organizations offering dairy-validated sire data. Companies including Select Sires (NxGEN program), Alta Genetics (BULLSEYE platform), and Semex (XSire portfolio) maintain databases tracking the actual performance of beef bulls on dairy females. This distinction matters more than many producers realize.

What’s encouraging is that beef breed associations are increasingly recognizing this need, developing dairy-specific EPDs and working with AI companies to validate performance on dairy females. This industry-wide collaboration benefits everyone. Some producers are also experimenting with SimAngus and even Charolais crosses for specific markets, though Angus remains the predominant choice for good reason—market acceptance and predictable performance.

Regional Market Variations Shape Opportunities

What works in California’s integrated systems may not translate directly to Midwest cooperative structures or Northeast family operations. Understanding these regional dynamics is crucial for program success.

California’s Central Valley features vertical integration, with established calf ranches maintaining direct relationships with dairies. These operations know their genetic preferences and pay accordingly for documented quality. Wisconsin and Minnesota producers often market through cooperative structures where calves are pooled. In these systems, individual documentation becomes even more critical for capturing premiums above pool averages.

Texas presents yet another model. Major feedlots, including Friona Industries and Cactus Feeders, operate procurement programs that contract directly with dairies, sometimes months before calves are born. These arrangements often specify genetic requirements and health protocols in exchange for premium pricing.

Smaller dairy regions—Vermont’s hillside farms, Idaho’s Magic Valley operations, New Mexico’s desert dairies—each face unique challenges. Vermont producers might focus on grass-finished programs for local markets. Idaho operations often integrate with nearby feedlots. New Mexico dairies face water constraints that affect their feeding strategies. Each region requires adapted approaches.

Even within regions, smaller operations are finding success. A 60-cow organic farm in Vermont recently told me they’re getting $1,200 for grass-fed beef-cross calves sold to local finishers—not quite the $1,400 conventional premium, but exceptional for their scale and market.

The Critical First Eight Months

Every calf has an 8-week biological window that closes permanently. Feed high-protein milk replacer ($40 extra cost) during this period and you’ve locked in 4.8 extra pounds that compound to 50-100 additional pounds at harvest—worth $100-150. Miss this window with standard nutrition and no amount of expensive finishing ration recovers the loss. Yet 80% of operations still feed beef-cross calves like unwanted Holstein bulls.

Here’s a biological reality that fundamentally shapes beef-on-dairy economics: muscle fiber numbers and intramuscular fat cell populations are established during the first eight months of life. After this developmental window closes, you’re working with what you’ve got. No amount of superior finishing nutrition can compensate for deficiencies during this critical period.

When beef-cross calves receive standard 20% to 22% protein dairy heifer milk replacer—the formulation most farms already stock—they’re being nutritionally shortchanged. Research from Texas Tech University’s animal science department demonstrates that calves fed 27% to 30% protein milk replacers gain an additional 4.8 pounds by eight weeks and develop 14% larger muscle fiber cross-sectional area. While 4.8 pounds may seem modest, this advantage compounds throughout the feeding period, translating to 50 to 100 pounds of additional carcass weight at harvest.

The economics are compelling. Higher-protein milk replacer costs approximately $25 to $40 more per calf based on current industry pricing from major manufacturers. Feedlot performance data suggests returns of $100 to $150 per head from improved muscling and marbling development—a strong return on investment.

Yet university surveys indicate only about 20% of operations use 28% or higher protein formulations for beef-cross calves. Most producers inadvertently limit genetic potential during the most critical developmental phase.

I should note that several successful operations achieve excellent results with standard protein levels by compensating through higher feeding rates (8 quarts daily vs. the standard 6), superior colostrum management, and comprehensive stress-reduction protocols. A Jersey operation in Oregon feeds standard protein but delivers 10 quarts daily in three feedings, achieving exceptional growth rates. Multiple pathways can lead to success, but the biological principle remains constant: early nutrition establishes lifetime performance potential.

Addressing the Liver Abscess Challenge

The Liver Abscess Crisis exposes dairy-beef crosses’ 55% abscess rate versus 30% in native beef—costing operations $45,000 annually per 1,000 head and risking $3,000-per-minute processing shutdowns until Kansas State research proved 45% forage diets solve the problem without sacrificing gains

Liver abscess incidence presents a significant yet often overlooked challenge in beef-on-dairy production. Dr. T.G. Nagaraja from Kansas State, with four decades of research in this area, reports native beef cattle typically show 30% abscess rates, while dairy-beef crosses reach 50% to 60%. Some operations experience rates approaching 70%.

Beyond direct economic losses from condemned organs and reduced performance (approximately $30 to $50 per head based on packer data from National Beef and Cargill), there’s operational risk at processing facilities. A ruptured abscess can contaminate equipment, requiring line shutdown and intensive cleaning. Based on industry estimates from multiple major processors, these stoppages cost approximately $3,000 per minute in lost throughput. The Packers remember which cattle sources cause these disruptions.

Recent findings from the USDA Agricultural Research Service’s Lubbock Livestock Issues Research Unit reveal that bacterial colonization pathways are more complex than previously understood. Dairy-influenced cattle appear particularly susceptible, possibly due to inherited differences in gut architecture—larger digestive capacity from Holstein genetics combined with lifetime exposure to high-concentrate diets.

Progressive feedlots have adapted their protocols accordingly. Rather than pushing traditional 90% concentrate rations to maximize gains, they’re incorporating 20% to 45% forage. They’re limiting starch to 45% to 55% rather than 60% or higher. They’re ensuring consistent provision of 10% to 12% effective fiber.

Kansas State research demonstrates that increasing corn silage from 15% to 45% of the ration significantly reduces abscess incidence without compromising performance—same daily gains, equivalent feed efficiency, healthier livers. This builds on what we’ve learned about the unique nutritional requirements of dairy-beef crosses.

External factors can complicate management, too. Drought conditions affecting forage quality, international trade disruptions impacting grain prices, and even weather extremes during the feeding period—all influence liver health outcomes. Successful operations build flexibility into their feeding programs to adapt to these variables.

Looking ahead, some operations are exploring carbon credit opportunities for efficiently raised beef-on-dairy cattle, particularly those with lower methane emissions from optimized feeding strategies. While still developing, this could add another revenue stream for well-managed programs.

The Replacement Heifer Cost Consideration

The Replacement Heifer Crisis shows how heifer costs exploded 164% from $1,140 to $3,900 while beef calf values declined, creating a devastating $2,860 per-head margin collapse that transformed profitable programs into financial disasters

Perhaps no factor has surprised more producers than replacement heifer economics. Many operations that aggressively shifted to beef breeding in 2022-2023, motivated by $1,400 crossbred calves and $1,140 replacement costs, now face what economists term a “replacement inventory crisis.”

USDA’s January data shows national heifer inventory at 3.914 million head—the lowest since 1978. California’s major auction markets, including Producers Livestock in Tulare and Overland Stockyards in Fresno, report springer heifer prices of $3,800 to $4,000. That represents a 164% increase over three years—a change few operations anticipated in their financial modeling.

I’ve worked with several 500-cow Midwest operations facing this reality. They projected $700 premiums per beef-cross calf with 65% of the herd bred to beef, assuming $2,200 replacement costs based on 2023 prices. They anticipated $210,000 in additional annual revenue.

Current reality? Replacement heifers at $3,800 represent an additional $1,600 per head. For 150 annual replacements, that’s $240,000 in unplanned expense. Net result: negative $29,000 rather than the projected profit.

Dr. Victor Cabrera from Wisconsin’s Center for Dairy Profitability recommends limiting beef revenue to 10% of total farm income, maintaining strategic heifer inventory through balanced breeding (typically 35% to 40% dairy genetics, 60% to 65% beef), and utilizing the USDA’s Livestock Risk Protection insurance now available for beef-on-dairy calves.

International factors add complexity. Export demand for U.S. beef, Mexican cattle import policies, and even global grain markets influence both beef calf values and replacement heifer costs. Producers must consider these macro factors when planning breeding strategies.

Building Performance Feedback Systems

What truly distinguishes operations capturing consistent premiums is their commitment to performance tracking and continuous improvement. These producers document comprehensive data from birth through harvest, share information with buyers to build premium relationships, and—critically—obtain feedlot and carcass performance data to refine their programs.

Consider Cogent’s UK Beef Breeding Programme, which partners with Pathway Farming to track calves from birth through retail placement. With over 318,000 data points collected since 2021, they’ve achieved remarkable results: average days to slaughter of 512 (versus 580+ UK average), 87.4% achieving target fat grades, and 97% meeting conformation standards. The program produced the top 11 Angus bulls for intramuscular fat in recent UK breed evaluations—all through systematic data collection and analysis.

Most U.S. operations lack this feedback loop. They breed, sell, and move forward without learning whether their genetic selections performed, which bulls consistently underperform, or why their calves command different prices than neighboring operations.

A Practical 90-Day Implementation Framework

For producers initiating or refining beef-on-dairy programs, the first 90 days establish the foundation for long-term success. Here’s what I’ve seen work across different operation sizes and regions.

Days 1-30: Strategic Planning

Begin with replacement heifer modeling. A 500-cow operation with 30% annual turnover requires 150 replacements. Calculate backwards to determine sustainable beef breeding percentages without creating future heifer shortages. Remember to factor in conception rate differences—beef semen typically runs 8% to 12% below conventional dairy semen.

Model financial scenarios, including worst-case projections. What happens if beef prices decline to $1,000 while heifer costs reach $4,500? Build sufficient financial reserves to weather market volatility. Consider the impacts of drought on feed costs, potential trade disruptions, and even local packing plant closures.

Establish buyer relationships before breeding. One California producer I know invested three weeks contacting calf ranches and feedlots, securing written pricing commitments from two buyers before ordering beef semen. When calves arrived nine months later, marketing was predetermined.

Complete genomic testing if it has not already been implemented. At $40 to $60 per animal through providers like Zoetis CLARIFIDE or Neogen Igenity, this investment identifies which females should produce replacements versus beef calves. Using top genetic females for beef production because they didn’t conceive to dairy semen reverses proper selection logic.

Days 31-60: Infrastructure Development

Source appropriate milk replacer formulations for beef-cross calves. The 27% to 30% protein products cost more but deliver measurable returns through improved muscle development—unless you’ve developed proven compensatory management systems.

Implement documentation systems, whether through existing software like DairyComp 305 or simple spreadsheets. Track sire identity, dam information, birth metrics, colostrum quality (invest in a Brix refractometer if you don’t have one), health interventions, and growth measurements. An Oregon producer recently showed me three years of data revealing conception rates, calving ease scores, and buyer feedback for every sire used.

Develop buyer documentation packages. Providing genetic background, health protocols, and performance data transforms commodity calves into documented products that command premiums of $200 to $300, according to Kansas State agricultural economics research.

Days 61-90: Strategic Execution

Select sires using dairy-validated performance data. Target bulls in the top third for calving ease (verified on dairy, not beef females), top 70% for marbling, positive ribeye area EPDs, and moderate frame scores. Consider seasonal breeding patterns—some producers use different sires for spring versus fall calvings based on anticipated marketing conditions.

Monitor all metrics systematically. Track conception rates by sire, document calving ease, and identify patterns. When bulls consistently underperform despite favorable EPDs, remove them from rotation. Your herd’s actual performance supersedes population predictions.

Benchmarks for Year Three Success

Well-executed programs demonstrate clear performance indicators by year three:

Financial metrics include consistent $700 to $900 calf premiums regardless of market cycles, $4.00 to $5.50 revenue per hundredweight of milk produced, beef income representing 15% to 20% of total farm revenue (enough to matter without creating dangerous dependency), and twelve months of operating reserves accumulated.

Production achievements show difficult calvings below 3% (versus 5% to 8% industry average per the National Association of Animal Breeders), pre-weaning mortality under 3%, quality grades of 80% to 85% Choice or better when receiving carcass data, and liver abscess rates reduced to 30% to 35% from initial 50% to 60% levels.

Operational excellence is demonstrated by 95% complete documentation for all calves, carcass performance data received for 80% of animals sold, and 60% to 80% of production committed through established buyer relationships.

The resilience test came in October 2025, when beef markets declined 7% following new tariff-rate quotas on Argentine beef imports, as reported by DTN livestock analyst ShayLe Hayes and confirmed by Farm Bureau reporting. Well-managed programs absorbed $30,000 to $50,000 impacts while continuing operations. Poorly positioned operations incurred substantial losses, casting doubt on the program’s viability.

Essential Principles for Success

Several key insights emerge from analyzing successful beef-on-dairy enterprises across diverse operational contexts:

Documentation creates more value than genetics alone. Average genetics with complete documentation consistently outsell superior genetics lacking paperwork by $300 per head. Every time.

Early nutrition establishes lifetime potential. The first eight weeks prove especially critical. Biological development windows close permanently—feed beef-cross calves as the premium products they represent, not as unwanted byproducts.

Liver abscesses respond to adjusted feeding strategies. Dairy-beef crosses require more forage, moderate starch levels, and gradual transitions. This reflects biological differences, not management preferences.

Replacement heifer planning cannot be deferred. Problems arise not from selecting incorrect sires but from overcommitting to beef breeding without modeling future replacement needs. The three-year lag between breeding decisions and heifer availability catches many operations unprepared.

Performance feedback enables continuous improvement. Each breeding cycle without carcass data represents a missed opportunity for refinement. Today’s leading programs resulted from three years of systematic improvement based on actual performance data, not theoretical projections.

Success requires adopting a beef producer mindset while maintaining dairy operational excellence. This shift from viewing calves as byproducts to managing them as products transforms every decision from genetics through marketing.

Looking Forward

The $700 premium gap between successful and struggling beef-on-dairy programs reflects systematic execution differences, not market luck. These crossbred animals require specialized management acknowledging their unique biology—neither purely dairy nor purely beef.

With beef cattle inventories at historic lows and dairy-origin cattle becoming a foundational part of the U.S. beef supply—exceeding 3 million head annually per USDA Economic Research Service projections—the opportunity remains substantial. However, easy premiums have disappeared. As more producers enter this market and buyers become increasingly selective, only operations with documented genetics, proven health protocols, optimized nutrition, and continuous improvement systems will capture maximum value.

The path forward is clear: invest 90 days building proper infrastructure before breeding, or spend three years wondering why neighbors receive double your calf prices. Having observed both approaches across numerous operations from small Vermont hillside farms to large New Mexico desert dairies, the successful path is evident.

Markets compensate documented, predictable, continuously improving performance—not good intentions or fortunate genetics. Producers understanding this principle generate $200,000 or more annually from beef-on-dairy enterprises. Others barely cover costs while blaming market conditions.

The framework exists. Research from land-grant universities supports it. Successful examples multiply monthly across every dairy region. As you plan next season’s breeding strategy, consider which approach aligns with your operational goals and risk tolerance.

Because ultimately, this isn’t about choosing between dairy and beef production—it’s about optimizing both within your unique operational context. The producers who understand this are building sustainable, profitable enterprises that strengthen both their operations and the broader beef supply chain.

KEY TAKEAWAYS

  • Documentation > Genetics: Complete health and breeding records add $300/head to any calf—superior genetics without paperwork sell at commodity prices
  • Invest $40 in the first 8 weeks, harvest $150 in value: High-protein milk replacer (27-30%) during early development creates permanent muscle and marbling advantages
  • Liver abscesses aren’t inevitable: Increase forage from 15% to 45% in finishing rations—same gains, 50% fewer condemned livers
  • The 65% Rule: Never breed more than 65% of your herd to beef—replacement heifers at $3,800-4,000 will destroy three years of premiums
  • No feedback = No improvement: Top operations track performance from birth to harvest and adjust quarterly; average operations repeat the same mistakes annually

Complete references and supporting documentation are available upon request by contacting the editorial team at editor@thebullvine.com.

Learn More:

The Sunday Read Dairy Professionals Don’t Skip.

Every week, thousands of producers, breeders, and industry insiders open Bullvine Weekly for genetics insights, market shifts, and profit strategies they won’t find anywhere else. One email. Five minutes. Smarter decisions all week.

NewsSubscribe
First
Last
Consent

The $43,800 Hidden in Your Water: How Top Dairies Gain 6 Pounds More Milk Daily

You invested $2M in facilities but never spent $50 to test what’s costing you $43,800 every year

EXECUTIVE SUMMARY: While dairy producers invest millions in genetics and technology, contaminated water silently steals $43,800 annually from the typical 100-cow operation. Penn State’s study of 243 farms revealed the stunning truth: water quality alone accounts for a 6-pound daily production gap, with clean-water operations hitting 62 pounds per cow versus just 56 for those with contamination. This isn’t just about lost milk—contaminated water creates a devastating cascade of mastitis, reproductive failure, and premature culling that costs $63,000-74,500 in just six months of delay. The solution is surprisingly accessible: a $50 test identifies problems, and treatment systems ranging from $1,300 for iron removal to $25,000 for comprehensive purification pay for themselves within 6-12 months. Leading operations have already transformed water from an overlooked utility into a managed production input, gaining compound advantages while their competitors wonder why they can’t hit benchmarks. The question facing every producer is simple: Will you keep letting water constrain your operation’s potential, or will you join the 26% who’ve discovered this hidden profit opportunity?

Dairy Water Quality

You know what’s interesting? Producers across the industry commonly report investing millions in new parlors, upgraded genetics, and precision feeding technology—but when you ask about water testing protocols, there’s often that long pause. “We’ve been meaning to get to that,” they’ll say.

Sound familiar?

This disconnect between our investment in visible technology and invisible fundamentals is costing dairy operations more than we realize. Pennsylvania State University’s comprehensive study tracking 243 farms across 41 counties discovered something remarkable: farms with water quality problems averaged 56 pounds of milk per cow daily, while those with clean water hit 62 pounds. Six pounds difference. Every single day.

And here’s what that means in real terms—run the numbers on that gap: six pounds per cow, 100 cows, 305-day lactation, twenty dollars per hundredweight, and you’re looking at $43,800 annually walking out the door. Or more accurately, never walking in at all.

Phil Elkins, a veterinarian who’s spent years researching water quality after founding FarmWater Ltd., describes it perfectly: “Water flows through every dairy operation like blood through a body. You can’t see it working when everything’s right, but when it’s wrong, the whole system crashes.”

The 6-pound daily production gap revealed in Penn State’s 243-farm study: clean water operations hit 62 lbs/cow while contaminated water farms plateau at 56 lbs—a difference worth $43,800 annually per 100 cows.

Understanding the Production Gap: It’s More Complex Than We Thought

What I’ve found digging into the biological mechanisms behind these production differences is genuinely fascinating. This isn’t just about cows drinking less water—though that certainly happens. We’re looking at multiple cascading effects that compound throughout the animal’s system.

Consider iron contamination first. The USDA’s National Animal Health Monitoring System documented iron exceeding 0.3 parts per million on 40% of dairy operations surveyed. Now, that might not sound dramatic, but here’s what happens: cows detect that metallic taste and reduce water consumption. Michigan State research confirms that each 1% drop in water intake corresponds to a 0.5-1% reduction in dry matter intake. Less feed means less milk. Simple as that.

But the story gets more interesting. Iron in water exists primarily as ferrous or ferric ions—highly bioavailable forms that absorb rapidly in the rumen. Unlike the iron bound in organic compounds in feed, this water-borne iron creates oxidative stress through the Fenton reaction. More concerning still, it antagonizes copper absorption by more than 50%, according to Cornell’s trace mineral research team.

Nutritionists working across the Midwest commonly report seeing operations triple their copper supplementation, adding expensive organic minerals to the ration, and still not getting the response they expect. Then they test the water and find iron at 2-3 ppm. Suddenly, everything makes sense.

Sulfate presents its own challenges, particularly in regions with certain geological formations. Wisconsin, South Dakota, parts of Minnesota—these areas commonly see sulfate levels exceeding 1,000-1,500 ppm in well water. In the rumen, that sulfate converts to sulfide, which then binds copper, selenium, zinc, and other trace minerals into complexes that the animal can’t absorb.

Dr. William Weiss from Ohio State, who led the National Research Council’s revision of mineral requirements for dairy cattle, has documented this extensively. His research shows that high-sulfate water essentially forces producers to double or triple dietary copper supplementation just to maintain marginally adequate levels. Even then, the antagonism often wins.

What’s particularly noteworthy for operations in limestone regions—and I’m thinking especially of Pennsylvania and parts of Wisconsin here—is how geology creates perfect conditions for both iron and manganese contamination. Meanwhile, western operations face different challenges with high total dissolved solids from mineral-rich aquifers. California producers frequently report TDS running 4,500 ppm during drought years, forcing them to blend multiple water sources. Each region has its own unique water-quality fingerprint.

Are you in the 26%? Penn State’s 243-farm study found one in four operations losing 6 pounds daily per cow to water contamination—while three in four test clean and produce at peak levels.

Down in the Southeast, operations in Georgia often find the challenge is bacterial contamination from warm, humid conditions that promote biofilm growth. Producers in the region commonly describe cleaning troughs on Monday and finding them coated again by Friday. The heat and humidity just accelerate everything.

A Case Study That Changed Perspectives

Let me share what happened on a 260-cow operation in Somerset, England. This story has made waves across the industry because it clearly demonstrates what we might be missing.

The farm had actually abandoned one of its boreholes five years earlier—workers had been getting sick from the water. Yet despite excellent management and hygiene protocols, they continued battling chronic mastitis, elevated somatic cell counts, and persistent calf health issues.

Phil Elkins was consulting on the farm and suspected water might be the missing piece. Testing revealed something interesting: colony forming units ranged from zero at the source to 176 cfu/ml at various troughs. Classic biofilm contamination throughout the distribution system.

They installed a chlorine dioxide treatment system specifically designed to penetrate and eliminate biofilm. No other management changes were made during the study period—same feeding program, identical milking procedures, no facility modifications. Just treated water.

The 12-month results, published in Veterinary Record:

  • Mastitis cases dropped from 27 to 17 per 100 cows annually (37% reduction)
  • Bulk tank somatic cell count fell from 119,000 to 86,000 cells/ml
  • Samples exceeding 100,000 cells/ml dropped by 69%
  • Bactoscan readings plummeted from 86,000 to 16,000/ml
The Somerset proof: one water treatment intervention slashed mastitis by 37% and dropped somatic cell counts from 119,000 to 86,000—with payback in 60 days and zero other management changes

Producers involved in similar water-quality improvements consistently reflect on how they changed teat dips, replaced milking liners, and adjusted dry cow therapy protocols—nothing made a real difference until they addressed the water. The frustrating part, they say, is how simple the solution was once they identified the actual problem.

Economically, the system paid for itself in about 60 days. Treatment costs were approximately £2 per cow per month, while the combination of reduced mastitis treatment, elimination of milk quality penalties, and improved production delivered immediate returns.

The Compounding Cost of Delay

This is where the economics become truly sobering. The University of Wisconsin’s School of Veterinary Medicine recently analyzed the full cost of delaying water quality interventions. Their findings suggest that six months of procrastination on a 100-cow operation costs between $63,000 and $74,500.

Every month of procrastination multiplies your losses: what starts as $7,500 in month one compounds to $63,000-$74,500 by month six—more than double the cost of comprehensive treatment.

Why such dramatic numbers? Because water-quality problems cause cascading failures throughout your operation.

Start with the obvious: direct production loss. Six pounds per cow daily over 180 days equals 108,000 pounds of lost milk—about $21,600 at current market prices. That’s just the beginning.

Contaminated water harbors what microbiologists term a “persistent pathogen reservoir.” Research from the University of Guelph, published in the Journal of Dairy Science in 2023, calculated mastitis costs averaging $662 per cow annually when bulk tank counts hover around 184,000 cells/ml. Nearly half of these costs come from subclinical infections that never receive treatment.

Wisconsin producers frequently share experiences of treating mastitis case after case, burning through antibiotics, and losing quarters. It often never occurs to them that cows are essentially re-infecting themselves every time they drink.

Then consider reproduction. Water with nitrate-nitrogen above 10 mg/L correlates with increased services per conception, lower first-service conception rates, and extended calving intervals. Sulfate-induced trace mineral deficiencies contribute to retained placentas, early embryonic death, and repeat breeding.

The economic analysis from UW-Madison and Penn State Extension puts numbers to these problems: retained placentas cost around $300 each, pregnancy losses run $600-1,000, and each additional day open costs $2-5. Over six months, reproductive losses alone can reach $9,450 on a typical 100-cow dairy.

Perhaps most concerning is accelerated culling. Cows suffering from chronic mastitis, reproductive failure, and immune suppression from trace mineral deficiencies leave the herd prematurely. USDA data suggests that if poor water quality increases involuntary culling from 18% to 25% annually, those seven additional culls cost $14,000 in replacement expenses alone, plus lost production from younger animals.

How Progressive Operations Are Responding

The most successful operations I’ve observed aren’t simply installing treatment systems and moving on. They’re fundamentally reconsidering water as an actively managed production input.

Take continuous monitoring, for instance. Systems developed in the Netherlands, in collaboration with Wageningen University, now provide 24/7 water-quality surveillance across over 500 European dairy farms. When contamination appears or flow rates drop, producers receive immediate alerts.

ATP rapid testing offers another tool. This technology, borrowed from food processing, detects biofilm in seconds. Dutch Animal Health Service research shows that maintaining ATP levels below 100 relative light units is associated with sustained daily milk yield increases of 2.87 pounds per cow.

Michigan producers managing larger herds commonly describe their approach: monthly ATP testing takes five minutes and costs thirty dollars. It alerts them to biofilm development before it becomes a mastitis outbreak. The economics are obvious.

Individual cow water tracking represents another frontier. UC Davis researchers have developed systems integrating RFID ear tags with flow sensors to monitor individual drinking behavior. Penn State Extension recommends installing water meters—available from various suppliers for a few hundred dollars—to establish baseline consumption patterns.

Many producers discover something unexpected: trough cleaning schedules can actually suppress water intake. By avoiding cleaning during the hour after milking—when 30-50% of daily consumption occurs—operations frequently report gaining 3 pounds of milk per cow per day.

The real breakthrough comes from integration. Platforms combining water data with activity sensors, milk meters, and rumination monitors can identify problems days before clinical signs appear. Dr. Jeffrey Bewley at the University of Kentucky, who’s extensively researched precision dairy technologies, explains: “Water intake often provides the first indication something’s wrong—preceding milk drop, visible illness, everything else.”

Regional Considerations Shape Treatment Approaches

Geography matters tremendously in water quality management. What works in Wisconsin might not apply in New Mexico or Ontario.

Limestone regions across Wisconsin, Pennsylvania, and parts of Ontario commonly face challenges with iron and manganese. The bedrock chemistry creates conditions that mobilize these minerals. Hydrogen peroxide injection systems work particularly well here—typically around $1,300 installed, plus about $800 annually for chemicals. Systems require minimal maintenance beyond annual pump inspection and occasional filter changes.

Western states deal with different issues. High total dissolved solids from mineral-rich aquifers often require reverse osmosis or blending with municipal water when TDS exceeds 3,000-5,000 ppm. These systems represent larger investments but may be the only viable solution. Membrane replacement runs every 3-5 years, depending on water quality and pretreatment.

The Corn Belt faces nitrate contamination from both point and non-point agricultural sources. Since nitrate removal is complex and expensive, deeper wells or alternative water sources often prove more practical. Test in late summer, when nitrate levels typically peak.

In the Pacific Northwest, operations commonly deal with seasonal variations tied to snowmelt and rainfall. Oregon producers report that iron levels have tripled during spring runoff, requiring seasonal adjustments to their treatment protocols. Testing in March and September captures both extremes.

Drought-prone regions see seasonal concentration effects. Texas operations typically experience sulfate levels doubling in summer. Many blend purchased water during the worst months—costs run about $200 a day, June through September—but it’s far cheaper than the production losses. August testing reveals peak contamination levels.

For organic operations, treatment options become more limited. While mechanical filtration and certain oxidation methods are permitted, many chemical treatments aren’t. Vermont organic producers often invest heavily in multiple filtration stages and UV treatment to meet both certification requirements and water-quality standards. Some equipment suppliers offer financing options, and USDA programs may assist qualifying operations with water quality improvements.

Making the Investment Decision: A Clear Cost-Benefit Analysis

Let’s address the economics directly. For a farm facing typical contamination—say iron at two ppm, sulfate at 1,200 ppm, TDS at 3,500 ppm—here’s the investment landscape:

Water Treatment Investment Breakdown (100-cow herd):

Hydrogen peroxide injection for iron removal: roughly $1,300 in setup costs and $800 in annual operating costs. This converts soluble iron into forms that precipitate, eliminating both the taste issue and oxidative stress. Filter replacement runs quarterly at about $50 each.

Reverse osmosis for high TDS and sulfate: $15,000-25,000 for agricultural-scale systems, plus $2,000-4,000 annually for membranes and electricity. While expensive, it’s a proven technology that removes 80-90% of dissolved solids. Membrane replacement every 3-5 years costs $3,000-5,000.

Chlorine dioxide for biofilm control: about $8,000 for generator equipment, $2,400 yearly for chemicals. This addresses distribution system contamination—critical because even perfect source water can be compromised as it passes through biofilm-laden infrastructure. Monthly chemical adjustments take 30 minutes.

Combined investment for comprehensive treatment: approximately $29,300 upfront, $6,200 annual operating costs. Against $43,800 in annual production losses, the math becomes straightforward.

Wisconsin producers consistently describe their decision process similarly: when they see iron at three ppm and sulfate over 1,500, that $25,000 for treatment suddenly looks like a bargain. Many realize they’re already spending more than that on trace mineral supplementation that isn’t working.

Lightning-fast payback periods for water treatment investments: even the comprehensive $29,300 system pays for itself in under 5 months against $43,800 in annual losses—making delay the costliest decision.

Understanding the Psychology of Inaction

Purdue University’s agricultural economics team has researched why producers delay addressing water quality issues despite compelling economic incentives. Their findings offer insights worth considering.

We all exhibit what behavioral economists call visibility bias—prioritizing obvious over hidden factors. New genetics produce visible offspring. Robotic milkers operate in plain sight. Water quality improvements occur underground, making returns feel less tangible even though they are measurably higher.

There’s also uncertainty aversion at play. Installing proven technologies like automated feeding systems feels predictable. Water quality investment raises questions: Will testing reveal problems? Will treatment deliver results? This uncertainty drives status quo bias—maintaining current practices even when change would clearly benefit the operation.

The industry itself bears some responsibility. Technology companies effectively market milk yield increases and labor savings. Water quality gets framed as compliance or problem-solving rather than a profit opportunity, despite superior ROI.

ContaminantSafe LevelProblem LevelImpact on ProductionTreatment SolutionEst. Cost
Total Dissolved Solids (TDS)<1,000 ppm>3,000 ppmReduced intake, dehydrationReverse osmosis$15k-$25k
Iron (Fe)<0.3 ppm>2 ppm6 lb/day milk loss, oxidative stressHydrogen peroxide$1,300
Sulfate (SO4)<500 ppm>1,500 ppmMineral antagonism, reduced copper absorptionRO or blending$15k-$25k
Nitrate-Nitrogen<10 mg/L>20 mg/LReproductive failure, conception issuesDeeper well or alternative sourceVariable
Bacteria/Biofilm0 CFU>100 CFU/mlMastitis, immune suppressionChlorine dioxide$8,000
Chloride (Cl)<250 ppm>500 ppmSalty taste, reduced intakeAlternative sourceVariable

Practical Steps Forward: Your 60-Day Action Plan

For producers ready to address water quality, here’s a systematic approach:

Week 1-2: Test comprehensively. Contact Midwest Laboratories (402-334-7770) or Penn State’s Agricultural Analytical Services Lab (814-863-0841). A livestock suitability test runs $43-75 and should include TDS, pH, sulfate, chloride, iron, manganese, nitrate, sodium, hardness, and bacterial counts. Sample where animals actually drink, not just at the source. Best testing months vary by region: August in Texas (peak drought), March in Oregon (spring runoff), September in the Corn Belt (nitrate peak).

Week 3-4: Understand the thresholds. Based on National Research Council guidelines, watch for TDS above 1,000 ppm (serious above 3,000), sulfate above 500 ppm (critical above 1,500), iron above 0.3 ppm, nitrate-nitrogen above 10 mg/L, and any coliform presence.

Week 5-6: Get treatment quotes. Prioritize based on your specific contamination profile. Iron responds well to hydrogen peroxide injection. High TDS and sulfate require reverse osmosis or water blending. Bacterial contamination needs chlorine dioxide treatment throughout the distribution system. Many suppliers offer financing options, and USDA conservation programs may provide cost-share assistance.

Week 7-8: Begin monitoring. Install flow meters to track consumption patterns. Use monthly ATP testing to detect biofilm development. Document pre-treatment production metrics to establish a baseline for ROI calculations.

Most operations see measurable improvements within 30-60 days of implementing treatment. The key is to start the process rather than wait for the “perfect” time.

The Bottom Line

After extensive research and conversations with producers nationwide, several principles have become clear.

The production gap is real and measurable. That six-pound daily difference translates to $43,800 annually on a 100-cow herd, before considering cascading effects on health, reproduction, and longevity.

Testing represents the highest-ROI decision available. A $50 water test reveals whether you’re among the 26% of operations losing money to contamination, based on Penn State’s multi-year survey data.

Treatment systems pay for themselves rapidly. Whether $1,300 for hydrogen peroxide or $20,000 for reverse osmosis, documented payback periods typically range from 6 to 12 months.

Delay multiplies losses exponentially. Six months of procrastination costs $63,000-74,500—more than double the treatment investment. Biology doesn’t pause for our decision-making.

Integration amplifies returns. Operations combining water treatment with comprehensive monitoring and management platforms report transformational improvements across all metrics.

What’s encouraging is that the dairy industry has made tremendous strides in genetics, nutrition, and reproductive management over the past decade. Water quality remains the overlooked variable—the hidden constraint preventing thousands of operations from reaching their genetic and management potential.

Progressive operations recognizing this opportunity aren’t just solving problems; they’re creating value. They’re building competitive advantages that compound annually. Better water enables healthier animals, supporting improved reproduction, extended productive life, and sustained production gains.

The fundamental question facing every dairy producer is straightforward: Will you continue assuming water quality is adequate while competitors who test and treat build increasing advantages? Or will you invest that $50 in testing to potentially transform your operation’s trajectory?

The science provides clear answers. The economics are documented. The only remaining variable is whether this knowledge drives action—or whether another year passes with water silently constraining your operation’s potential, one gallon at a time.

Key Takeaways:

  • 6 pounds of milk per cow daily vanishes due to water quality—Penn State proved it across 243 farms ($43,800/year for 100 cows)
  • Every month you delay costs $10,500-12,400 in cascading losses from mastitis, reproduction failures, and culling
  • ROI exceeds 700% within year one after investing $1,300-25,000 in treatment (depending on your contamination type)
  • Testing costs $50. Not testing costs $43,800. Call Midwest Labs (402-334-7770) or Penn State (814-863-0841) today
  • Leading operations gain compound advantages by managing water as a production input—while competitors blame genetics

Complete references and supporting documentation are available upon request by contacting the editorial team at editor@thebullvine.com.

Learn More:

The Sunday Read Dairy Professionals Don’t Skip.

Every week, thousands of producers, breeders, and industry insiders open Bullvine Weekly for genetics insights, market shifts, and profit strategies they won’t find anywhere else. One email. Five minutes. Smarter decisions all week.

NewsSubscribe
First
Last
Consent

Beyond the Milk Check: How Dairy Operations Are Building $300,000 in New Revenue Today

Milk at $20. Costs at $22. Some dairies are panicking. Others are building $300K in new revenue. The difference? Three moves you can make today.

Executive Summary: The $20 milk check that sustained dairy operations for years now falls $2 short of covering real production costs—and that gap isn’t closing. But while many producers wait for $25 milk that isn’t coming, successful operations are actively building $300,000 in new annual revenue from resources they already have. Beef-cross calves are commanding $1,600 each (up from $400 in 2019), feed shrink costing most farms $60,000 annually can be cut in half with basic management changes, and the Dairy Margin Coverage program is paying 495% returns to those who enroll. The catch? This window closes fast—operations implementing these strategies in Q1 2025 will capture $250,000 more value than those waiting until Q3. Based on verified data from USDA, and progressive dairy consultants, this report provides a proven 90-day roadmap that’s already helping operations transform their financial position. The difference between thriving and merely surviving isn’t about farm size or waiting for markets to improve—it’s about acting on these opportunities now.

You know that feeling when something you’ve counted on for years suddenly isn’t enough? That’s exactly where many of us find ourselves with milk prices right now.

Gary Siporski, the dairy financial consultant from Wisconsin who’s been looking at balance sheets for decades, saw this coming. His data tells quite a story. Back in 2016, his Midwest clients were breaking even around $16.50 per hundredweight. By late 2023? That number had climbed to $20.25. And now—here’s where it gets interesting—operations from California to Vermont are reporting production costs north of $22 when you factor in everything… depreciation, heifer raising, the whole nine yards.

What’s encouraging, though, is that the operations finding their way through this aren’t just sitting around waiting for milk prices in 2025 to bounce back. They’re actively building what amounts to $180,000 to $340,000 in improved financial position through some pretty creative approaches to dairy profitability.

The widening gap between production costs and milk prices reveals why traditional approaches are failing—costs have jumped $5.50 per hundredweight while prices lag behind

Understanding What’s Really Driving Costs

Here’s what the latest University of Illinois Farmdoc Daily and USDA reports are showing us. Feed costs—you know, that 30 to 50 percent chunk of everyone’s budget—have actually come down from those crazy 2022-2023 peaks. Corn’s projected at $4.60 per bushel for 2025, down from $4.80. Soybean meal dropped from $330 to $290 per ton. Alfalfa? Down from $201 to $159.

Sounds like good news, right? Well… hold on a minute.

Everything else keeps climbing. Labor costs are up 3.6 percent for 2025, according to USDA’s agricultural labor report—we’re talking a record $53.5 billion across agriculture. And if you’re in Texas or other areas where the energy sector is hiring? Good luck keeping experienced workers without matching those oil field wages. Producers in these regions report wage competition they never imagined dealing with.

Then there’s interest. After hitting 16-year highs in 2023-2024, according to Federal Reserve data, borrowing costs have fundamentally changed the game. Think about it—if you’re running a 500-cow operation with somewhere between $1.2 and $1.5 million in operating loans (pretty typical these days), that four percentage point jump from 2020 means an extra $48,000 to $60,000 annually just in debt service. That’s nearly fifty cents per hundredweight before you even start milking.

And equipment? The Association of Equipment Manufacturers’ 2024 report shows machinery prices jumped 30 percent in four years. The average new tractor now costs $491,800, up from $363,000 in 2020. Some specialized equipment? We’re talking $1.2 to $1.4 million.

Brad Herkenhoff from Compeer Financial, who works with operations all across Minnesota and Wisconsin, doesn’t mince words: “There won’t be enough to cover depreciation, so capital improvements won’t be made. Bills will stretch beyond 30 days, and every month becomes a financial strain.”

What we’re dealing with is what economists call a “ratchet effect”—costs rise quickly but resist coming down. You can’t undo wage increases once they’re in place. Interest on existing debt? That’s locked in. And you’re still depreciating that nearly half-million-dollar tractor at 2023 prices. This reality is reshaping dairy profitability 2025 in fundamental ways.

The Beef-on-Dairy Window: Real Opportunity or Hype?

Now, let me share something that might be the biggest dairy profitability opportunity I’ve seen in twenty years. And I really mean that.

CattleFax and USDA’s July 2025 cattle inventory reports point to a 3- to 5-year window in which beef-on-dairy returns make extraordinary financial sense. We’re not talking about incremental improvements here—this could be transformative for milk prices in 2025.

Right now, in November 2025, day-old beef-cross calves are bringing $900 to $1,600 at auctions from Pennsylvania to Minnesota. Compare that to the $350 to $400 they brought in 2018-2019, according to USDA’s Agricultural Marketing Service data. That’s a premium that makes you rethink beef-on-dairy returns.

Beef-cross calves now command $1,600—quadruple the 2019 price—turning what was once a disposal problem into a $100,000+ annual revenue stream for mid-size operations

But here’s why this isn’t just a temporary spike. The U.S. cattle inventory is at a 64-year low—we haven’t seen numbers like this since 1951, per USDA’s latest report. Meanwhile, the National Association of Animal Breeders tells us nearly 4 million crossbred calves were born in 2024, and Beef Magazine projects that could hit 6 million within two years.

You might be thinking, “Won’t that flood the market?” Here’s the thing—beef production is actually declining. USDA projects it’ll drop 4 percent in 2025 and another 2 percent in 2026. The beef industry desperately needs these dairy-beef crosses just to maintain supply.

Herkenhoff’s analysis shows producers are seeing a $2.50 to $4 per hundredweight boost from the combination of better cull cow values and beef-cross calf sales. Think about what that means for dairy profitability in 2025. Data shows that, before this beef market rally, milk checks accounted for about 93 percent of total farm income. Now? That’s down to 75 to 80 percent, with cattle sales making up 20 to 25 percent.

The numbers are pretty striking when you dig in. Revenue contribution jumping from $1.12 per hundredweight in 2022 to $2.57 in 2024. That’s a 130 percent increase in two years.

Traditional vs. Diversified: The Numbers Tell the Story

Quick Financial Comparison:

Here’s what we’re seeing:

  • Traditional Single-Revenue Operation (500 cows):
  • Milk revenue: 93% of income
  • Cattle sales: 7% of income
  • Breakeven: $22-24/cwt
  • Annual volatility: $150,000-$300,000
  • Diversified Multi-Revenue Operation (500 cows):
  • Milk revenue: 75-80% of income
  • Beef-cross cattle sales: 20-25% of income
  • Additional streams: 5-10% of income
  • Breakeven: $18-20/cwt
  • Annual volatility: $75,000-$150,000

Bottom line difference: About $200,000 in improved annual cash flow with significantly reduced risk exposure.

Diversified operations cut volatility in half while lowering breakeven costs by $2-4 per hundredweight—making 20% from beef-cross cattle creates a financial buffer traditional dairies don’t have

Feed Efficiency: The Money You’re Already Losing

Here’s something that still surprises me after all these years. Producers will negotiate feed contracts for hours, tweak rations endlessly, but meanwhile… many operations are unknowingly losing $50,000 to $180,000 annually through feed shrink and excessive refusals.

Penn State Extension and University of Wisconsin research show that average U.S. dairy silage shrinkage runs 10 to 20 percent. Poorly managed bunkers? Can hit 25 percent. And those feed refusals—should they be 2 to 3 percent, according to Journal of Dairy Science studies? I see operations running 4 to 6 percent all the time.

Real Dollar Impact per 100 Cows:

  • Silage shrink reduction (15% to 10%): Saves $9,000-$18,000 annually
  • Refusal reduction (5% to 3%): Recovers $5,000-$10,000 annually
  • Daily face management: Cuts spoilage by 50%
  • Oxygen barrier films: Pay for themselves in 6-8 months

Sources: Cornell Cooperative Extension, University of Minnesota dairy extension, Lallemand Animal Nutrition research

The key insight—and nutritionists keep hammering this point—isn’t about cutting feed quality. That’s a disaster. It’s about not throwing away the good feed you already bought.

For a 500-cow operation, even modest management improvements—basic stuff, really—can return $45,000 to $60,000 annually. That’s real money from things you’re already doing, just doing them better. This directly impacts dairy profitability in 2025 outcomes.

Most operations throw away $45,000-$60,000 annually in feed waste—money that’s already been spent on feed you never actually fed. Basic management changes recover this immediately

Government Programs: Setting Aside the Politics

I know, I know. Half of you are already skeptical when I mention government programs. But hear me out—the USDA Farm Service Agency data on Dairy Margin Coverage is pretty compelling for dairy profitability in 2025.

In 2023, producers enrolled at the $9.50 level paid about $1,500 in premiums per million pounds. What’d they get back? According to FSA payment data, $8,926.53 per million pounds. That’s a 495 percent return. On paperwork.

While 25% of producers left money on the table, those who enrolled in DMC at the $9.50 level saw 495% returns—$8,927 back for every $1,500 paid in 2023

DMC by the Numbers:

A 500-cow operation producing 11 million pounds:

  • Paid: $16,500 in premiums
  • Received: $98,192 in payments
  • Net benefit: $81,692

The program distributed over $1.27 billion through October 2023, with the average enrolled operation receiving $74,453. About 17,059 operations participated—that’s 74.5 percent of those eligible. Which means roughly a quarter of producers left that money on the table.

Katie Burgess from Ever.Ag’s risk management team notes that DMC has triggered payments 57% of the time over the past 42 months at the $9.50 level. That’s better than a coin flip, and when it pays, it pays big.

The mistake I see most often? Producers are choosing catastrophic coverage at $4.00 to save on premiums. Sure, it costs less upfront, but you’re leaving massive money on the table. The $9.50 level costs more, but historically returns five to ten times as much during tight margins.

The Human Side: Why Change Is So Hard

You know, research from agricultural psychology studies—the kind published in journals like Applied Farm Management—reveals something we probably all know deep down. Resistance to change isn’t really about the data. It’s about identity.

We don’t just run dairy operations. Being a “dairy producer” is part of who we are. So when someone suggests beef-on-dairy returns or revenue diversification, it can feel like they’re asking us to fundamentally change who we are. That’s not easy.

The generational piece makes it even tougher. Iowa State Extension’s succession planning research shows 83.5 percent of family dairy operations don’t make it to the third generation. First to second generation? Only 30 percent succeed. Second to third? Just 12 percent.

We’ve all seen this—Dad won’t let go because that means confronting his own mortality, and the kids can’t make changes without feeling like they’re disrespecting everything their parents built. Meanwhile, equity slowly bleeds away.

Research from agricultural universities in New Zealand and Europe shows we’re all influenced by what our neighbors do. Nobody wants to be first, but nobody wants to be last either. So everyone waits…

I’ve heard from plenty of producers who understood the financial benefits of beef-on-dairy perfectly well but worried what the coffee shop crowd would think. Were they giving up on “real” dairy farming?

A Practical 90-Day Framework for Dairy Profitability 2025

Alright, let’s get down to brass tacks. Based on what’s working for operations that are successfully navigating this transition, here’s a framework that can improve your financial position in three months:

Month 1: Immediate Actions for Cash Flow

Week 1: Know Your Numbers

First thing—and I mean within 48 hours—calculate your working capital per cow. Current assets minus current liabilities, divided by herd size. Then figure your monthly burn rate from the last 90 days. This tells you exactly how much runway you’ve got.

If you’ve got genomic test results, pull them now. If not, consider ordering tests. Yes, it’s $40 to $50 per head—about $12,000 to $15,000 for 300 head. But you’ll know within 2 to 3 weeks exactly which cows should get beef semen for optimal beef-on-dairy returns.

Order 150 to 200 units of beef semen right away. Angus and Limousin consistently perform well in feedlots. That’s an investment of $2,250 to $5,000. Contact three calf buyers to ensure competitive pricing. Got beef-cross calves ready? Selling them this week could bring $3,600 to $6,400 in immediate cash.

DMC Enrollment: Don’t Wait

Call your FSA office—actually call them, don’t just email. The $9.50 coverage on Tier 1 (first 5 to 6 million pounds) at 95 percent often makes the most sense. Larger operations might consider catastrophic on Tier 2 to manage costs. For a 250-cow operation, you’re looking at about $7,225 in costs, with potential returns of $35,000 to $80,000 in tight-margin years.

Week 2: Strategic Culling Decisions

Review your IOFC reports, SCC data, and Days Open. Identify your bottom 10 to 15 percent—chronic health issues, SCC over 200,000, Days Open beyond 150.

With cull prices averaging $145 per hundredweight according to the USDA, strategically marketing 25 cows averaging 1,400 pounds could generate $50,000 to $62,500. Direct that straight to your operating line.

Month 2: Building Operational Efficiency

Labor Optimization

Progressive Dairy’s benchmarking shows that top operations maintain over 65 cows per full-time worker and produce over 1 million pounds of milk per worker annually. If you’re at 45 cows per worker… well, there’s your opportunity.

Energy Efficiency Quick Wins

Energy typically runs 400 to 1,145 kWh per cow annually. Quick improvements:

  • LED lighting: 60% electrical reduction
  • Variable frequency drives: 20-30% fan energy savings
  • Heat recovery systems: $20-40 per cow annual savings

A 100-cow operation can save $2,000 to $4,000 annually in energy costs alone.

Component Production Focus

Here’s what’s interesting—DHI data shows operations producing over 7 pounds of components per cow daily generate about $3 more per cow at similar costs. That flows straight to the bottom line—potentially $547,500 annually for 500 cows.

Work with your nutritionist on butterfat performance and protein, not just volume. Especially valuable in the Northeast, where component premiums are strong, or the Southwest, where cheese plants pay big butterfat bonuses.

Month 3: Strategic Positioning

Additional Revenue Streams

By month three, explore these opportunities:

  • Digesters: EPA’s AgSTAR database shows 270+ on dairy farms generating ~$100/cow annually
  • Solar leases: $500-1,500 per acre annually in suitable locations
  • Carbon credits: $10-30 per cow, emerging market

University extension case studies document operations pulling $300,000 to $400,000 annually from combined energy contracts, beef-cross premiums, and environmental programs.

Risk Management Layers

Layer additional coverage atop DMC:

  • Dairy Revenue Protection for Tier 2 production
  • Livestock Gross Margin for Margin Protection
  • Forward contracting on favorable component premiums

Build that safety net while you can afford it.

90-Day Roadmap Summary Box:

By Day 90, a 500-cow operation typically achieves:

  • Strategic culling cash: $50,000-$62,500
  • Feed efficiency savings: $45,000-$60,000 (annualized)
  • Beef-on-dairy pipeline: $60,000-$80,000 (9-month revenue)
  • Component optimization: $30,000-$50,000 (annualized)
  • DMC protection: $35,000-$80,000 (potential in tough years)

Total improved position: $220,000-$332,500 within 12 months

Within 90 days, a 500-cow operation can improve its financial position by $220,000-$332,000 without adding debt or expanding—just managing smarter across five key areas

Regional Realities: From the Plains to the Coasts

These strategies play out differently depending on where you farm, and that’s important to understand.

Regional Strategy Highlights:

  • California: Smaller feed efficiency gains but higher beef-on-dairy returns near feedlots
  • Wisconsin: Focus on forage quality optimization over shrink reduction
  • Northeast: Component premiums crucial—can’t match Western volume but butterfat pays
  • Southeast: Triple cooling costs vs. Wisconsin—every energy efficiency gain magnified
  • Plains States (Kansas/Nebraska): Uniquely positioned near feedlots AND grain—seeing the strongest beef premiums with lower feed costs
  • Mountain West: Altitude affects production, but proximity to Western beef markets creates beef-on-dairy opportunities

Timing matters too. Implementing beef-on-dairy in November versus March affects breeding cycles and calf markets. Spring calves bring premiums in some areas, fall calves in others.

But the fundamental principle—diversified revenue beats single-source dependency—that holds everywhere.

What We’re Learning Industry-Wide

University extension services and farm consultants are documenting consistent patterns. Operations implementing beef-on-dairy in early 2024 project $100,000 to $150,000 additional annual revenue from crossbred calves. Those focusing on feed efficiency report recovering $50,000 to $60,000 annually. DMC participants collected $40,000 to $80,000 in 2023, depending on size and coverage.

What’s encouraging is these aren’t just huge, sophisticated operations. They’re regular farms that recognized the shift early and acted. While transitioning from traditional dairy to a diversified operation can feel uncomfortable initially, the financial results tend to validate the decision quickly.

The Bottom Line for Dairy Producers

Accept the New Reality Production costs have shifted from $16.50 per hundredweight in 2016 to over $22 today. This is structural, not temporary. Earlier acceptance means more options for dairy profitability in 2025.

Diversification Is Essential. Successful operations are building $180,000 to $340,000 in improved position through beef-on-dairy ($100,000 to $200,000 annually), feed efficiency ($45,000 to $60,000 annually), and risk management ($35,000 to $80,000 in challenging years).

Time Matters The beef-on-dairy window extends 3 to 5 years based on cattle cycles, but peak premiums are now. DMC has fixed deadlines. Feed savings compound daily. Every month of delay costs money and options. This isn’t about panic—it’s about positioning.

Small Changes, Big Impact. You don’t need revolution. Reducing silage shrink 5 percent and refusals by 2 percent can generate $45,000 to $60,000 annually. These are management tweaks, not overhauls.

Use Your Network. The most resilient operations leverage their networks. Engage lenders proactively. Work with nutritionists. Use FSA resources. Going it alone makes everything harder.

Looking Ahead: Key Indicators to Watch

As we approach 2026, watch these indicators:

USDA’s quarterly cattle inventory reports matter. If beef cow numbers grow faster than Rabobank’s projected 200,000 head annually through 2026, the premium window might compress. But current dynamics suggest that’s unlikely.

Monitor your basis—what plants pay above Class III or IV. Over $5 signals strong demand. Under $2 means tight margins ahead.

The One Big Beautiful Bill Act extended DMC through 2031 and increased Tier 1 coverage to 6 million pounds starting in 2026. Details matter, so stay engaged with your co-op and industry groups.

Watch seasonal patterns. Upper Midwest operations should track winter energy costs. Southwest producers need to monitor the impacts of heat stress on components. These create opportunities for prepared operations.

The Path Forward: Your Decision Point

After looking at all the trends and talking with producers who are making it work, one thing’s clear: The operations thriving in 2028 won’t necessarily be the biggest or most sophisticated. They’ll be the ones that recognized the shift early and acted on the dairy profitability 2025 opportunities.

They understood that building $300,000 in diversified revenue through strategic changes beat waiting for $25 milk prices in 2025. They pushed through the psychological barriers and evolved from traditional dairy farmers to agricultural entrepreneurs who happen to produce milk.

The tools exist. The programs are available. The opportunities—especially beef-on-dairy returns—are real. But here’s the thing—implementing changes in Q1 2025 versus Q3 2025 could mean a $242,500 to $362,500 difference over three years. That’s not marginal. That’s the difference between thriving and surviving.

What it comes down to is this: Operations that accept reality quickly maintain options. Those waiting for more confirmation may find their options have expired when they’re ready to act.

The clock’s ticking. Beef-on-dairy returns, DMC enrollment, feed efficiency—they’re all time-sensitive. The question isn’t whether change is necessary, but whether you’ll drive it or have it forced on you.

What is the difference between those paths? About $300,000 and possibly your operation’s future.

Key Takeaways:

  • Your Milk Check Will Never Be Enough Again: Production costs hit $22/cwt while prices hover at $20—this isn’t temporary, it’s the new reality requiring immediate action
  • $300,000 in Hidden Revenue Exists in Your Operation Today: Beef-cross calves bringing $1,600 (vs. $400 in 2019) + recovering $60,000 in feed waste + DMC paying 495% returns = game-changing income
  • The 90-Day Window That Changes Everything: Operations implementing these strategies Q1 2025 will capture $250,000 more value than those waiting until Q3—procrastination literally costs $20,000/month
  • You Don’t Need Capital, You Need Courage: No expansion, no debt, no new equipment required—just the willingness to manage differently and diversify beyond the milk check
  • The Math is Proven, The Choice is Yours: 500-cow operations following this roadmap achieve $220,000-$332,500 improved position in 12 months—the only variable is when you start

Complete references and supporting documentation are available upon request by contacting the editorial team at editor@thebullvine.com.

Learn More:

The Sunday Read Dairy Professionals Don’t Skip.

Every week, thousands of producers, breeders, and industry insiders open Bullvine Weekly for genetics insights, market shifts, and profit strategies they won’t find anywhere else. One email. Five minutes. Smarter decisions all week.

NewsSubscribe
First
Last
Consent

Farm Income Soars to $180B in 2025 – But Not for Dairy

Crop farmers: $35B bailout. Beef: $1,100 calves. You: $17.50 milk that costs $19 to make. The numbers that should anger every dairyman.

Executive Summary: Record farm income of $179.8 billion sounds great until you realize dairy’s been left behind—your neighbors got disaster checks while you’ve faced 18 months of negative margins with minimal help. The numbers are stark: mega-dairies produce $3-4/cwt cheaper, driving consolidation that’s eliminated 39% of farms since 2017. Behind every closure is a family burning through retirement savings, with 60-70% of dairy farmers now reporting serious mental health impacts. Yes, some operations thrive through creative adaptations—premium marketing in New York, specialty partnerships in Texas—but these require advantages most farms don’t have. For mid-size dairies, three paths remain: invest heavily to scale up, find niche markets, or exit strategically while equity remains. This article offers an honest assessment and practical tools to make that choice consciously rather than desperately.

dairy profitability strategies

You know what’s interesting? The September farm income forecast from USDA shows net farm income up 40.7% to $179.8 billion—second-highest on record. It’s all anyone’s talking about at the coffee shop. But here’s the thing: for most of us checking milk prices against feed bills this fall, that headline number feels like it’s from a different planet.

I was talking with a producer near Eau Claire last week—he’s milking about 380 Holsteins, and he’s been at it for years. While his grain-farming neighbor just deposited a disaster check for weather losses from two years back, this guy’s been navigating 18 months of tough margins with nothing but the DMC coverage he pays premiums for.

Makes you think about how these support structures really work across different commodities, doesn’t it?

Let me share what I’ve been learning from conversations around the industry—producers, economists, folks who’ve been watching these trends for decades. Maybe together we can make sense of this disconnect between ag’s overall prosperity and what’s happening in our barns.

Understanding Where That $180 Billion Really Goes

So here’s what’s fascinating when you dig into this $179.8 billion figure. About $41 billion of it? That’s government payments, not market returns.

The breakdown tells you everything:

  • $35.2 billion in disaster assistance through the American Relief Act—mostly for crop losses
  • $40 billion total in direct payments (we were at $10 billion just last year)
  • Minimal DMC payments for dairy—margins stayed just above that $9.50 trigger

You probably know this already, but it’s worth repeating: dairy’s support structure works completely differently. We pay into programs that rarely trigger at levels that actually help. Meanwhile, crop disasters get an immediate congressional response.

Now look, I’m not saying processors have it easy either. Labor’s up about 15%, energy costs have jumped over 20%, and don’t even get me started on packaging materials—nearly 20% higher than 2020. Everyone’s feeling it somehow. But the way support flows through the system…well, that’s another story.

The Scale Reality We Can’t Ignore in 2025

What I’ve found really compelling is the recent data from our land-grant universities on operational scale. And honestly, as much as we might not want to hear it, the numbers are clear: operations with 2,500-plus cows are producing milk for roughly $3 to $4 less per hundredweight than those of us running 300 to 500 head.

Let me break this down the way it was explained to me.

The Math Nobody Wants to Talk About

Take your typical 300-cow operation averaging 23,000 pounds:

  • Fixed costs: Running about $0.90 per hundredweight (varies by region, obviously)
  • Annual production: Around 6.9 million pounds
  • The challenge: Can’t justify specialized equipment, stuck with truckload purchasing

Compare that to 3,000 cows:

  • Fixed costs: Drop to maybe $0.45 per hundredweight
  • Annual production: 75 million pounds
  • The advantages: Railcar feed purchasing, specialized positions, equipment that actually makes sense
The cost gap isn’t closing—it’s widening. Mid-size operations at $19/cwt can’t compete with mega-dairies at $15/cwt. For a typical 300-cow farm producing 7 million pounds annually, this $4 difference translates to over $50,000 in lost competitiveness before debt service, labor, or family living expenses. 

An Idaho dairyman I know—he’s running about 2,800 head—put it to me straight:

“We’re buying feed in railcar quantities for substantially less per hundredweight. The guys buying truckloads? They’re paying $1.50 to $2 more, easy. That advantage is really tough to overcome.”

But here’s what’s worth considering. Not every big operation is printing money. I spoke with a California producer managing over 5,000 cows, and his perspective was sobering:

“Everyone thinks we have it made. Truth is, we’re all walking a tightrope, just at different heights. Our debt service alone runs over a million annually. One disease outbreak, one major equipment failure—those thin margins disappear real fast.”

The Census of Agriculture data from 2022 really drives this home: we lost 39% of dairy farms between 2017 and 2022. That’s the steepest five-year decline they’ve ever recorded. And operations over 1,000 cows? They’re now producing 66% of our milk, up from 57% in 2017.

834 Operations Control Half the Milk—16,334 Fight for Scraps

How This Plays Out Across the Country

What I find really interesting is how differently this consolidation hits different regions:

Pacific Northwest folks:

  • You’re dealing with that brutal Class I utilization problem—18% versus 29% nationally
  • Federal Order prices running over a dollar below the national average
  • And those transportation costs to get milk to cities? Forget about it

Wisconsin and Minnesota producers:

  • Over 500 farms gone in 2024 alone—mostly those 150-400 cow operations we all grew up around
  • When the co-op closes, the vet leaves, the equipment dealer stops stocking parts…
  • That infrastructure needs critical mass, and once it’s gone, it’s gone

Out in Idaho and Texas:

  • Production’s actually growing—7% or more—even as farm numbers drop
  • They’re attracting these mega-operations with the climate, the space
  • New processing plants are going up to match

Northeast—and this is tough:

  • Land at $4,500 an acre (if you can find it)
  • Environmental compliance costs that’d make your head spin
  • Infrastructure that’s 40 years older than what they’re building out West

California’s its own beast:

  • Central Valley operations are expanding like crazy
  • But near the cities? They’re selling to developers
  • Most complex market in the country, honestly

Florida dairy—different world:

  • Heat stress management costs running $100+ per cow annually
  • Unique fluid milk market dynamics
  • Some of the highest production costs nationally

Each region’s facing its own version of this challenge, but the underlying pressure’s the same everywhere.

The Human Side Nobody Wants to Talk About

Here’s what keeps me up at night. Recent agricultural health research suggests 60-70% of us are dealing with mental health impacts from farm stress. That’s way higher than the general population, and we need to acknowledge it.

I know a Wisconsin couple—good people, who milked registered Holsteins for nearly 30 years. Sold out this summer. They knew five years ago the math wasn’t working, but how do you walk away from something your grandfather built?

“The hardest part was watching our neighbors in grain and beef doing well while we struggled. Felt like nobody in policy circles even knew we existed.”

What makes dairy different—and we all know this:

  • No breaks: Cows need milking twice a day, every day
  • No sleep: Research shows we’re averaging four hours during calving season
  • No let-up: Financial pressure plus operational intensity equals chronic stress
  • Identity crisis: When the farm’s been in your family for generations…

By the time many folks finally make the decision, they’ve burned through the equity they’ll need for retirement. It’s heartbreaking.

But There Are Success Stories

Now, it’s not all doom and gloom. I’ve seen some really creative adaptations working.

That New York Operation Near Cooperstown

These folks transformed their 280-cow dairy:

  • What they did: Switched to A2A2 genetics, found a local processor, and added agritourism
  • Investment: About $450,000 over three years (yeah, it’s substantial)
  • Results: They’re seeing 18% net margins, getting $32/cwt equivalent
  • Key factor: They’re 45 minutes from Albany—location matters

Texas Partnership That Works

A 400-cow operation found their niche:

“It’s not revolutionary, but that $3 premium for high-butterfat milk makes the difference between losing money and modest profitability.”

  • Strategy: Partnered with a local ice cream manufacturer
  • Benefit: Guaranteed volume, premium for butterfat
  • Lesson: Sometimes the answer’s right in your backyard

Connecticut’s Organic Journey

This one’s honest about the challenges:

“The three-year transition nearly bankrupted us. But now? It’s sustainable rather than highly profitable, and sustainable beats losing money.”

  • Reality check: Needed off-farm income during transition
  • Current status: Making it work, but it’s not easy money
  • Truth: Location near affluent markets was crucial

Export Markets and Processing—It’s Complicated

USDA data shows we exported $8.2 billion in dairy products last year—second-highest ever. Sounds great, right? But here’s what worries me:

The vulnerabilities:

  • Over 40% of our cheese goes to Mexico
  • China’s substantially increased tariffs on most dairy products
  • Domestic consumption’s only growing 1-2% annually
  • We’re building processing capacity faster than finding markets

Recent expansions:

  • Wisconsin’s new plant: 8 million pounds daily
  • Valley Queen in South Dakota: Another 3 million pounds of capacity
  • And there’s more coming online

The Federal Order reforms this summer increased make allowances by about $0.54 per hundredweight. Processors show the data—costs really are up. But we’re all wondering how they’re expanding if margins are so tight. Both things can be true, I guess.

Alternative Models—Let’s Be Realistic

You know, everyone asks about organic, grass-fed, on-farm processing. Here’s my honest take after watching this for years: these can work brilliantly for maybe 20-25% of producers. But you need:

The right location:

  • Within 50 miles of a big city (500,000+ people)
  • Household incomes above average
  • Customers who value what you’re doing

The right scale:

  • 80-200 cows typically
  • Small enough for relationships
  • Big enough for efficiency

The right mindset:

  • Ready for 80+ hour weeks
  • Willing to do marketing, not just milking
  • Often need off-farm income initially

Burlington, Vermont? Perfect. Middle of Nebraska? Much tougher.

Technology Might Actually Help in 2025

What’s encouraging is how technology costs have come down. Genomic testing costs have dropped substantially in recent years. Activity monitoring that used to need 5,000 cows still need to be justified. Now it works at 500.

A Pennsylvania producer with 450 cows told me:

“Our conception rates improved 8%, we’re catching health issues two days earlier, and I’m actually sleeping through the night during calving. The investment was about $120,000, and we figured an 18-month payback.”

And here’s something interesting—robotic milking is finally penciling out for mid-size operations. We’re seeing 200-300 cow dairies making it work, especially where labor’s tight. About 5% of operations are exploring this now, up from almost none five years ago. It won’t overcome all the scale disadvantages, but it’s helping mid-size operations stay competitive in specific areas. That’s something, at least.

The Policy Reality in 2025

Here’s what’s uncomfortable but true: dairy doesn’t fit the disaster model Congress understands.

Recent support comparison says it all:

  • Crops: $35.2 billion in disaster aid
  • Commodity payments: Tripled from last year
  • Conservation: Up over 10%
  • Dairy: DMC that we pay for rarely helps when we need it

When crops fail due to weather, it’s visible and immediate. When will our margins compress over two years? That looks like a business problem, not a disaster. And as fewer dairy farms open each year, our political voice keeps getting quieter.

Crops: $35 Billion. Dairy: $1.2 Billion. The Support Gap Killing Farms.

What’s Actually Working Right Now

Looking at successful operations, here’s what they’re doing:

Getting real about costs:

  • Calculating true production costs, including economic depreciation
  • Need about $2/cwt margin above true costs
  • Most of us are below that right now

Using every tool available:

  • DMC five-year commitment saves 25% on premiums
  • Dairy Revenue Protection for catastrophic protection
  • Strategic culling with cull prices at $140-148/cwt

One Minnesota producer shared this:

“We culled 20% strategically—generated enough cash to restructure debt and buy some breathing room.”

Having an exit strategy (even if you never use it): Financial advisors tell me farmers with exit plans actually make better daily decisions. Takes the desperation out of it.

Looking Down the Road

Based on what economists and industry folks are saying, here’s what’s likely:

Industry projections for 2025-2030 suggest:

  • We’ll lose 2,000-2,800 farms annually through 2027
  • Operations over 1,000 cows will hit 75% of production by 2030
  • Mid-size farms are mostly gone except near cities

Policy changes?

  • Farm Bill might tweak things
  • But fundamental change? Unlikely
  • Maybe higher DMC coverage, but same structure

Market disruptions could change everything—disease, processing problems. But you can’t plan on disasters.

So What Does This Mean for Your Farm?

Let’s get practical here.

First, know where you really stand:

  • Calculate actual costs versus realistic revenue
  • Penn State’s got great worksheets online for this
  • If the math doesn’t work, that’s not failure—it’s information

Second, pick a lane:

  • Staying in? Either differentiate clearly or scale up
  • Getting out? Timing is everything for preserving equity
  • Standing still? Usually means falling behind

Third, get support:

  • Farm Aid: 1-800-FARM-AID for financial counseling
  • Crisis line: 988 if you’re struggling
  • Talk to other producers—we’re all dealing with this

Every month you operate at a loss, eats equity you’ll need later. That’s just math.

The Bottom Line

Look, this disconnect between headlines and our reality reflects changes that aren’t reversing. Consolidation, technology, global markets—these forces are bigger than any of us.

But here’s what I want to emphasize: you still have choices.

If you’re well-positioned—good location, right scale, unique advantages—this transition might create opportunities. If not, you need clear-eyed assessment and strategic planning.

Success isn’t about being the best farmer or working the hardest anymore. It’s about recognizing reality early and adapting. Sometimes that’s expanding. Sometimes it’s finding a niche. And sometimes—more often than we’d like—it’s transitioning out with dignity and security intact.

Make decisions consciously, not by default. Understand where you really stand instead of hoping for rescue. That might be the most valuable thing any of us can do right now.

We’re all trying to navigate these changes while holding onto why we got into dairy in the first place. The conversations I’ve had across the country show we’re facing similar challenges, just in different ways.

And whatever path makes sense for your operation, you’re not walking it alone. We’re all figuring this out together.

Key Takeaways:

  • The economics are permanent: Mega-dairies produce $3-4/cwt cheaper—this gap will widen, not shrink, making commodity milk unviable for farms under 1,000 cows
  • Your three options are clear: Scale to 1,200+ cows (requires $3-5M capital), capture premium markets (needs metro proximity), or exit strategically while equity remains
  • Time is your enemy: Every month at negative margins burns $25-50K in equity—the difference between comfortable retirement and bankruptcy is acting 12-18 months sooner
  • Location determines everything: Success stories share one trait—proximity to wealthy consumers or unique partnerships; without this, scaling or exiting are your only choices
  • Support exists, use it: Calculate true costs with Penn State worksheets, get financial counseling at 1-800-FARM-AID, mental health support at 988—deciding consciously beats drowning slowly

Mental Health Resources: National Suicide Prevention Lifeline (988, available 24/7), Farm Aid Hotline (1-800-FARM-AID), American Farm Bureau’s Farm State of Mind resources

Financial Resources: Farm Service Agency offices, Farm Credit Services, state Farm Business Management programs, National Farm Transition Network

Complete references and supporting documentation are available upon request by contacting the editorial team at editor@thebullvine.com.

Learn More:

The Sunday Read Dairy Professionals Don’t Skip.

Every week, thousands of producers, breeders, and industry insiders open Bullvine Weekly for genetics insights, market shifts, and profit strategies they won’t find anywhere else. One email. Five minutes. Smarter decisions all week.

NewsSubscribe
First
Last
Consent

Beyond Class III: Three Global Signals Predicting Your Next 18 Months      

Milk at $18. Butter at $1.50. But heifers at $3,200 tell the real story. The recovery’s already starting—if you know where to look.

EXECUTIVE SUMMARY: A Wisconsin dairy producer’s confession reveals the new reality: “I watch New Zealand milk production closer than my own bulk tank.” While traditional metrics show disaster—butter at $1.50, milk under $18, three forward signals are flashing a recovery 3-4 months out. Weekly dairy slaughter remains at historic lows (230k vs. 260k trigger) because $900-$1,600 crossbred calves are keeping farms afloat, breaking the normal correction cycle. Smart operators monitoring Global Dairy Trade auctions and $230/cwt cattle futures have already locked in $4.38 corn, gaining $1.20/cwt margin advantage over those waiting for Class III improvements. With heifer inventories at 40-year lows (3.914 million head), operations that went heavy on beef-on-dairy face a cruel irony: they survived the crash but can’t expand in recovery. The next 18 months won’t reward efficient production—they’ll reward those watching the right signals.

Dairy Market Signals

Last week, a Wisconsin producer told me something that stopped me in my tracks: “I’m watching New Zealand milk production closer than my own bulk tank readings.”

That conversation captures perfectly how dairy economics have shifted. And looking at Monday’s CME spot prices—butter hitting $1.50 a pound, lowest we’ve seen since early 2021—alongside December cattle futures losing nearly twenty bucks per hundredweight over the past couple weeks, you can see why traditional metrics aren’t telling the whole story anymore.

Here’s what’s interesting, folks… while everyone’s fixated on Class III and IV prices that essentially report yesterday’s news, there are actually three specific signals providing genuine forward-looking intelligence. I’ve been tracking these with producers across the country for the past year, and what I’ve found is that the patterns could determine which operations thrive during this transition period.

AT A GLANCE: Your Three Critical Market Signals

Three Forward Signals Dashboard provides dairy producers with actionable intelligence 90-120 days before traditional Class III prices signal recovery—those monitoring these indicators have already locked in $4.38 corn and gained $1.20/cwt margins over competitors waiting for conventional signals. This is Andrew’s edge: forward-looking data that beats reactive strategies.

📊 Signal #1: Weekly dairy cow slaughter exceeding prior year by 8-10% for three consecutive weeks
📈 Signal #2: GDT auctions showing 6-8% cumulative gains over four consecutive sales
📉 Signal #3: December cattle futures 30-day moving average crossing above 200-day at $230+/cwt

The Perfect Storm We’re Navigating Together

You’ve probably noticed this already, but what we’re experiencing isn’t your typical dairy cycle. It’s more like… well, imagine several weather systems colliding simultaneously, each amplifying the others in ways most of us haven’t seen before.

The Production Surge

So here’s what the USDA data shows—milk production increased 3.5% through July, and those butterfat tests? Katie Burgess over at Ever.Ag called them “somewhat unbelievable” in her recent market analysis, and honestly, she’s spot on. I’m seeing consistent test results of 4.2% butterfat, even 4.3%, across multiple regions—Wisconsin operations, Pennsylvania farms, and even out in California—when just two years ago, 3.9% was considered excellent.

You know what’s happening here, right? We’re all getting better at managing transition periods, feeding programs are more precise, genetics keep improving… but when everyone’s achieving similar improvements simultaneously, well, the market gets saturated. And that’s exactly what we’re seeing.

Global Supply Pressure

The Global Dairy Trade auction has declined for three straight months now, and that’s coinciding with European production recovering—you can see it in the Commission’s September data—and Fonterra announcing that massive 6.3% surge in September collections. When major exporters increase production simultaneously like this… friends, you know what happens to prices.

Domestic Demand Challenges

Meanwhile, domestic demand faces unprecedented pressure. Those SNAP benefit adjustments affecting 42 million Americans? They’re creating ripple effects throughout the retail sector. Food banks across Iowa are reporting demand increases of ten to twelve times normal—I mean, the Oskaloosa facility went from distributing 300-400 pounds typically to nearly 5,000 pounds in the same timeframe. That’s not sustainable.

A Lancaster County producer managing 750 Holsteins shared an interesting perspective with me recently:

“Component payments help, sure, but when everyone’s achieving similar improvements, the market gets saturated. And those fluid premiums we used to count on? They’re basically evaporating as processors shift toward manufacturing.”

The Broken Feedback Loop

Here’s what really caught me off guard, though—that traditional feedback loop where low prices trigger culling, which reduces supply and brings markets back? It’s broken.

With crossbred calves commanding anywhere from $900 to $1,600 at regional auctions—and I’m seeing this from Pennsylvania clear through to Minnesota based on the USDA-AMS reports—compared to maybe $350-$400 back in 2018-2019, that additional beef revenue is keeping operations afloat despite negative milk margins.

The Beef-on-Dairy Survival Paradox illustrates the cruel irony facing dairy producers: crossbred beef calves now generate 20-25% of farm revenue (at $900-$1,600 each vs. $350-$400 for dairy heifers), which kept operations afloat during low milk prices—but eliminated the heifer inventory needed for expansion when markets recover. Survival strategy becomes growth killer.

Three Dairy Market Signals Worth Your Morning Coffee

📊 SIGNAL #1: Weekly Dairy Cow Slaughter Patterns

When: Every Thursday at 3:00 PM Eastern
Where: USDA Livestock Slaughter report at usda.gov
Time Required: 5 minutes

What’s fascinating is the consistency here—dairy cow culling has run below prior-year levels for 94 out of 101 weeks through July, according to USDA’s cumulative statistics. Year-to-date culling? It’s the lowest seven-month figure since 2008, and we’ve got a much bigger national herd now.

🎯 THE KEY THRESHOLD:
Three consecutive weeks where slaughter exceeds prior-year levels by 8-10% or more

When weekly figures rise from the current 225,000-230,000 head range toward 260,000-270,000 head, that signals crossbred calf values have finally declined below that critical $900-$1,000 level where they no longer offset weak milk margins.

💡 WHY IT MATTERS:
A 600-cow operation near Eau Claire started monitoring these signals back in March, locked in feed when they saw the pattern developing, and improved margins by $1.20/cwt compared to neighbors who waited. That’s real money, folks.

📈 SIGNAL #2: Global Dairy Trade Auction Trends

When: Every two weeks, Tuesday evenings, our time
Where: globaldairytrade.info (free access)
Time Required: 15 minutes

I’ll be honest with you—for years, I ignored these New Zealand-based auctions, thinking they were too far removed from Midwest realities. That was an expensive mistake.

🎯 THE KEY THRESHOLD:
Four consecutive auctions showing cumulative gains of 6-8% or higher, with whole milk powder exceeding $3,400/MT

Katie Burgess explains it well: “GDT auction results in New Zealand influence U.S. milk powder pricing dynamics.” And the correlation is remarkably consistent—GDT movements typically show up in CME spot markets within two to four weeks.

💡 INSIDER PERSPECTIVE:
A Midwest cooperative CEO recently shared this with me—can’t name the co-op for competitive reasons—but he said: “We’ve integrated GDT trends into our pooling strategies. Sustained upward movement there typically translates to improved export opportunities within 30-45 days.”

📉 SIGNAL #3: Cattle Futures Technical Analysis

When: Daily monitoring
Where: Any free futures charting platform
Time Required: 5 minutes daily

With the National Association of Animal Breeders data showing 40-45% of dairy pregnancies now utilizing beef sires, and those calves generating 20-25% of total farm revenue, cattle market volatility directly impacts our cash flow.

🎯 THE KEY THRESHOLD:
30-day moving average crossing above 200-day moving average while December futures maintain above $230/cwt

Recent movements illustrate the impact perfectly—when cattle prices dropped in October, crossbred calf values fell by $200-$250 per head. For a 1,500-cow operation with 40% beef breeding, that’s substantial revenue reduction… we’re talking six figures of annual impact.

💡 PRO TIP:
If you’re just starting to track these signals, give yourself a full month to establish baseline patterns before making major decisions based on them. As many of us have learned, knee-jerk reactions rarely pay off.

Quick Reference: Your Market Monitoring Dashboard

MONDAY MORNING (10 minutes over coffee)

✓ Check Friday’s CME spot dairy prices
✓ Review cattle futures five-day trends
✓ Update 90-day cash flow projections

THURSDAY AFTERNOON (5 minutes)

✓ Access USDA slaughter report (3 PM ET)
✓ Calculate 4-week moving average vs. prior year
✓ Note trend acceleration or deceleration

BIWEEKLY GDT DAYS (15 minutes)

✓ Monitor GDT Price Index and whole milk powder
✓ Calculate 3-auction cumulative change
✓ Compare with NZ production reports

MONTHLY DEEP DIVE (worth the hour)

✓ USDA Cold Storage report analysis
✓ Regional milk production review
✓ Update beef-on-dairy calf values
✓ Calculate actual production cost/cwt
✓ Evaluate 2:1 current ratio benchmark

Understanding the Structural Shifts Reshaping Our Industry

The Heifer Shortage: By the Numbers

The 40-Year Heifer Crisis shows U.S. dairy heifer inventory at 3.914 million head—the lowest level since 1978—creating an expansion trap where even when milk prices recover to $22/cwt, operations can’t grow due to $3,200 heifer costs and limited availability. This isn’t a cyclical problem; it’s a structural crisis that will define the industry for years.

You know, CoBank’s August dairy report really opened some eyes—they’re projecting an 800,000 head decline in heifer inventories through 2026. And the January USDA Cattle inventory confirmed we’re at just 3.914 million dairy heifersover 500 pounds. That’s the lowest since 1978, folks.

Current Reality:

  • $3,200 current bred heifer cost (compared to $1,400 three years ago)
  • Wisconsin actually added 10,000 head
  • Kansas dropped 35,000 head
  • Idaho lost 30,000 head
  • Texas shed 10,000 head

A Tulare County producer summed it up perfectly when he told me: “The irony is crushing—beef-on-dairy revenue helped us survive the downturn, but now expansion is virtually impossible without heifers.”

SNAP Impact: The Ripple Effect

When those 42 million Americans saw their SNAP benefits cut from $750 to $375 for a family of four… the impact on dairy demand was immediate and, honestly, worse than I expected.

The Numbers:

  • 50% benefit reduction starting November 1st
  • 10-15% reduction in retail dairy orders within the first week
  • 1.4-1.6 billion pounds milk equivalent annual impact

Andrew Novakovic from Cornell’s Dyson School—he’s been studying dairy economics for decades—offers crucial context: “Dairy products often see early reductions when household budgets tighten. Unfortunately, many consumers categorize dairy as discretionary when financial pressures mount.”

Global Dynamics: The New Reality

Twenty years ago, friends, U.S. dairy prices were mostly about what happened between California and Wisconsin. Today? With 16-18% of our production going to export markets, what happens in Wellington, Brussels, and Beijing matters just as much.

Key Production Increases:

  • Ireland’s up 7.6% year-to-date through May
  • Poland’s share grew from 1.9% to 3.9% of EU production over five years
  • New Zealand hit four consecutive monthly records through September
  • China’s now 85% self-sufficient, up from 70%

Ben Laine over at Rabobank explained it well: “When major exporters increase production simultaneously while China requires fewer imports, prices have to adjust globally. These signals reach U.S. farms within weeks, not months.”

Action Plans by Operation Type

📗 For Growth-Oriented Operations

Genomic Testing ROI:

I’ll admit, spending $45 per calf for genomic testing when milk prices are in the tank seems counterintuitive. But here’s the math that convinced me:

  • Test 300 heifer calves at $45 each: $13,500
  • Apply sexed semen to top 120 at $27 extra per breeding: $3,240
  • Generate 80-100 surplus heifers worth $3,200-$3,500 each: $280,000+
  • Your ROI? About 16 to 1

University dairy economics programs have validated these projections, and frankly, those numbers work in any market.

Risk Management Stack:

You can’t rely on DMC alone—it hasn’t triggered meaningful payments in over a year according to FSA records. Smart operators are layering:

  • DMC at $9.50: ~$0.15/cwt for first 5 million pounds
  • DRP at 75-85%: Premiums run 2-3% of protected value
  • Forward contracts: 30-40% when you see $19+/cwt

📘 For Transition Candidates

Three Proven Paths:

  1. Collaborative LLC: Three farms near Fond du Lac reduced per-cow investment from $8,000 to $3,200 by sharing infrastructure
  2. Premium Markets: A2 can bring a $4/cwt premium; organic runs $20/cwt over conventional if you can secure a buyer first
  3. Strategic Exit: You preserve 80-85% of equity in a planned transition versus maybe 50% in distressed liquidation

📙 For Next Generation

If you’re under 30 and considering this industry, you need to know it’s fundamentally different from what your parents knew. University programs like Wisconsin’s Center for Dairy Profitability and Cornell’s PRO-DAIRY are developing specific resources for younger producers navigating this new environment. Use them.

Regional Snapshot: Your Competition and Opportunities

Southwest: Water costs are doubling in some areas. One Albuquerque producer told me they’re making daily tradeoffs between feed production and maintaining adequate water for the herd.

Northeast: Those fluid premiums we used to count on? They’ve compressed from $2-3/cwt down to $0.50-1.00 in many months.

Pacific Northwest: Urban pressure near Seattle and Portland—plus down in Salem—has reduced available land by 30% in five years for some operations. A Yakima producer told me they’re now focusing entirely on efficiency rather than expansion.

Upper Midwest: Generally best positioned with those heifer additions and relatively stable production costs. Wisconsin operations, particularly, are seeing benefits from their heifer inventory decisions.

The Path Forward: Your 18-Month Strategy

You know, a Turlock-area veteran told me something last week that really stuck: “We’ve shifted from watching weather and milk prices to monitoring New Zealand production and Argentine beef policy. This isn’t the dairy farming of previous generations, but it’s our evolving reality.”

The coming 18 months will challenge all of us, yet patterns remain identifiable for those watching. Markets will recover—they always do—but the question is whether your operation will be positioned to benefit from that recovery.

Looking at this trend, farmers are finding that appropriate signal monitoring, combined with decisive action, makes the difference. Your operation deserves strategic planning beyond hoping for better prices. And with the right approach, achieving better outcomes remains entirely possible.

Because at the end of the day, friends, as many of us have learned, success in modern dairy isn’t just about producing quality milk anymore. It’s about understanding global dynamics, managing risk intelligently, and making informed decisions based on forward-looking indicators rather than yesterday’s prices.

The tools are there. The signals are clear. What we do with them over the next 18 months will determine who’s still farming when this cycle turns—and it will turn. It always does.

KEY TAKEAWAYS: 

  • Monitor three signals, not milk prices: Weekly slaughter approaching 260k (currently 230k), GDT auctions gaining 6-8% over four sales, and cattle futures holding above $230/cwt predict recovery 3-4 months before Class III moves
  • The correction isn’t coming—it’s different this time: Crossbred calves at $900-$1,600 create a revenue floor keeping marginal operations alive, breaking the traditional supply response to low milk prices
  • First movers are winning now: Operations tracking these signals have locked in $4.38/bushel corn and gained $1.20/cwt margins while others wait for “normal” price recovery that follows different rules
  • The heifer shortage trap: At 3.914 million head (lowest since 1978), expansion is mathematically impossible for most—even when milk hits $22, you can’t grow without $3,200 heifers
  • Your 18-month edge: Implement Monday morning CME checks, Thursday slaughter monitoring, and biweekly GDT tracking—15 minutes weekly that separates thrivers from survivors

Complete references and supporting documentation are available upon request by contacting the editorial team at editor@thebullvine.com.

Learn More:

The Sunday Read Dairy Professionals Don’t Skip.

Every week, thousands of producers, breeders, and industry insiders open Bullvine Weekly for genetics insights, market shifts, and profit strategies they won’t find anywhere else. One email. Five minutes. Smarter decisions all week.

NewsSubscribe
First
Last
Consent

The People Side of Profit: How Strong Communication Builds Better Dairies

You can pour money into feed, genetics, or equipment—but every day, poor communication leaves profit in the parlor.

You know, when you talk with producers from Wisconsin to Idaho, there’s always a familiar story. Most will tell you they’ve fine-tuned their feeding program, upgraded their genetics, and modernized their parlor. Yet, even with all that, something still drags performance down. What’s interesting is that it’s rarely a feed issue or cow comfort problem anymore—it’s communication.

More dairies are realizing that human communication—not sensors, not software—is becoming one of their most powerful management tools. You can have the best feed efficiency in the county, but if the team’s not hearing the same message, you’re going to lose consistency and, eventually, money.

Impact MetricIndustry AverageHigh-Turnover FarmsCost Impact
Annual Turnover Rate38.8%45-60%$93K-$140K/year
Milk Production LossBaseline-1.8% per point-$18K per 100 cows
Calf Loss IncreaseBaseline+1.7%+$5K-$8K annually
Cow Mortality IncreaseBaseline+1.6%+$12K-$15K annually
Total Annual ImpactCumulative$128K-$181K

The Economics Behind Miscommunication

Here’s what the research shows. Michigan State University Extension reports that replacing just one employee can cost between $15,000 and $25,000, once you include recruitment, onboarding, lost productivity, and training time. Multiply that across a crew of twelve, and the real price of inconsistency starts to add up fast.

Add language barriers to that, and you see why communication is quietly shaping productivity. Studies from New Mexico State University Extension show roughly 60% of U.S. dairy employees speak limited English, and in some Southwestern regions, up to a third speak K’iché, a Mayan dialect that’s often not translated in training materials.

As Dr. Robert Hagevoort from NMSU likes to put it, “Every time someone does the right job the wrong way, the farm pays tuition.” And he’s right. Bad communication doesn’t always create visible failure—sometimes it just creates smaller, daily inefficiencies that chip away at margins.

The Language Barrier Crisis: Spanish-speaking workers are 46 percentage points less likely to know their farm’s SCC goals and 28 points less likely to receive training directly from managers. This isn’t a language problem—it’s a management failure costing operations thousands in milk quality losses

When “The System” Walks Out the Door

In many dairies, managers don’t realize how dependent their success is on one translator or crew leader until that person is gone. Take a 900-cow operation in Minnesota that lost its bilingual milker. Within days, the somatic cell count passed 300,000, and shifts started running nearly an hour longer.

When a Minnesota 900-cow operation lost its bilingual milker, SCC spiked from 200K to over 300K within 10 days while shifts ran an hour longer. Wisconsin Extension’s bilingual photo SOPs and structured check-ins restored normal levels within 30 days, proving that systems beat individual translators

Through the help of the University of Wisconsin–Madison Extension, the farm rebuilt its communication foundation with bilingual photo SOPs, clear shift checklists, and 10-minute morning meetings. Within 30 days, SCC was back below 200,000. More importantly, turnover slowed because work instructions no longer depended on memory or one individual.

Farms using structured check-ins are seeing consistent success. Cornell’s PRO‑DAIRY program tracked farms that began short daily huddles and found turnover fell by 30–50%. In other words, clarity does what pay raises often can’t—it builds team stability.

The Power of One Question

If there’s one thing many producers overlook, it’s how to start these improvements. You don’t need a big system overhaul. Tomorrow morning, ask your longest-standing employee a simple question:

“If someone new started tomorrow, what’s the hardest thing for them to learn?”

Then, just listen. That one question often exposes the real gaps between what’s expected and what’s taught.

Penn State Extension research has found that farms documenting even five key tasks—feeding order, colostrum prep, milking procedures, machinery setup, and calf care—report 25–40% faster training times within six months.

What’s encouraging is that asking questions like this builds trust. Workers realize their knowledge matters, and managers finally see where assumptions replaced structure.

Turning Words into Pictures

More and more dairies are swapping old binders for laminated photo SOPs. The idea sounds simple, but the payoff can be huge.

Research from Iowa State University Extension and the University of Illinois Dairy Extension confirms that visual direction significantly improves retention, especially on multilingual crews.

Here’s a proven step-by-step approach:

  1. Photograph each task exactly the way you want it done—using real employees and your own equipment.
  2. Write short, clear captions—one line per photo.
  3. Translate into every primary crew language (your Extension office can help).
  4. Hang the cards exactly where the work happens.
Time is money: Multilingual photo SOPs cut training time by an average of 36% across critical dairy tasks, getting new employees to full productivity faster while freeing experienced workers from constant training duties

One Wisconsin dairy shared that this approach reduced their parlor changeover time by nearly 20%. And what’s fascinating is that the same process strengthened morale. When everyone knows the expectations, the blame game disappears.

Dairy training research confirms visual SOPs deliver 65% retention after 30 days versus just 10% for text manuals—a 550% improvement. Iowa State and Illinois Extension studies show photo-based procedures work across language barriers while teach-back methods push retention to 70%, reducing errors by 50-70%.

Keep It from Getting Dusty

Now, even the best materials lose their spark if they’re not refreshed. Cornell University’s PRO‑DAIRY Workforce Development specialists recommend short, quarterly “protocol walks.”

These aren’t long meetings—just 10 or 15 minutes walking the barn with the team, asking if anything has changed. Maybe the layout’s different, or a new sanitizer replaced the old one. The key is showing that management updates protocols with the team, not to the team.

It’s a small act that keeps everyone engaged and avoids compliance fatigue.

Why “Teach‑Back” Works Better Than “Do You Understand?”

We’ve all said it—“Do you understand?”—and seen the nods that don’t always mean yes. The teach‑back methodreplaces guesswork with demonstration. Instead of asking if an employee understands a procedure, you ask them to show it back to you.

Studies by Michigan State University, the University of Guelph, and Cornell confirm that using teach‑back reduces repeated errors and improves training retention.

When University of Wisconsin researchers applied this system to calf feeding protocols, they found 50–70% fewer scours treatments thanks to consistent colostrum handling.

One Ontario herdsman told me, “When you ask me to show you, I pay attention differently.” It’s a method that not only teaches but also strengthens respect both ways.

Learning from Europe—Without Copying It

It’s tempting to compare our systems to Europe’s, but context is everything. Denmark and the Netherlands often operate with 100–130 cows per two to four trained employees, supported by national certification programs through SEGES Innovation and Wageningen University & Research.

Their culture and policies encourage lifelong training, but what’s useful for us is the principle: communication is built right into routine management. Dutch CowSignals training, for instance, asks every employee to identify one improvement idea weekly.

Some North American farms have adapted this idea through five-minute Friday “crew check-ins.” It may not be European apprenticeship precision, but it keeps everyone proactive instead of reactive.

Employees as Innovators

What I find most inspiring is how communication changes roles. It turns “labor” into “leadership.”

Cornell research shows that farms that let employees participate in protocol revisions see adoption rates jump by nearly one-third. The process is simple: people respect what they help create.

A producer I know in Idaho gave his milkers a dry-erase board to log claw fall‑offs. Within a month, they found a prep‑timing issue and boosted butterfat performance by 0.1–0.2 points in that string. The knowledge didn’t come from management—it came from the crew actually applying the system.

And that’s what progress really looks like—ownership at every level.

Why This Matters, Right Now

Margins are thin, and labor turnover is real. It’s becoming clear that communication isn’t a luxury; it’s infrastructure. Effective communication reduces training time, minimizes costly errors, and keeps workers engaged. It’s the backbone that supports every improvement effort, from nutrition to fresh cow management.

Dr. Jessica Pempek from The Ohio State University Department of Animal Sciences once said, “We spend months designing systems for cows. Communication is about designing systems for people.” That idea deserves to sit on every office wall.

The Bottom Line

  • Start with a question. One conversation can identify your biggest knowledge gap.
  • Make it visual. On multilingual crews, photos create clarity faster than manuals.
  • Review quarterly. Keep your protocols alive, not laminated museum pieces.
  • Teach back. “Show me” builds ownership and confidence.
  • Recognize contributions. Employees protect what they help improve.

What’s interesting about this next phase in dairying is that it’s not built on new equipment or feed additives. It’s built on human systems.

As one Wisconsin producer told me over coffee, “Once people understand each other, the cows take care of the rest.”

That might just be the quiet revolution already underway in barns across the country—and it’s one every operation can afford to start tomorrow morning.

Key Takeaways:

  • The best upgrade for most dairies isn’t stainless steel—it’s stronger communication between people.
  • Visual SOPs and teach‑back training turn “I told them” into “they own it.”
  • Quick quarterly “protocol walks” keep systems sharp and employees engaged.
  • When crews help design the way work gets done, performance and retention rise together.

Executive Summary:

Clear, consistent communication is turning out to be one of the best upgrades a dairy can make—no new equipment required. Research from Michigan State and Cornell confirms that farms using simple visual SOPs, multilingual training cards, and short “teach‑back” checks cut turnover and boost consistency fast. A 15‑minute quarterly “protocol walk” is often all it takes to keep systems sharp and teams engaged. What’s interesting is how quickly results snowball: steadier milk flow, smoother training, and better retention. The dairies investing in people, not just technology, are quietly proving that communication might be the most profitable tool in the barn.

Complete references and supporting documentation are available upon request by contacting the editorial team at editor@thebullvine.com.

Learn More:

The Sunday Read Dairy Professionals Don’t Skip.

Every week, thousands of producers, breeders, and industry insiders open Bullvine Weekly for genetics insights, market shifts, and profit strategies they won’t find anywhere else. One email. Five minutes. Smarter decisions all week.

NewsSubscribe
First
Last
Consent

One Farmer’s ‘No’ Built a Dynasty: How Plushanski Chief Faith’s Genetics Add $1,500 to Your Bottom Line

1973: Charlie refuses to sell Faith. 2025: Her genetics add $1,500/cow. Between those years? A breeding revolution nobody saw coming.

Plushanski Chief Faith, the cow whose genetics would add $1,500 per cow to your bottom line. This is the remarkable Holstein Charlie Plushanski refused to sell in 1973, setting in motion a breeding revolution that continues to save farms today. Just look at that presence—the deep body, the wide front end, and that incredible udder that defied the odds of her Chief lineage

I’ll never forget when I first heard this story—about a decision that seemed impossible at the time, yet somehow created $1,500 worth of hope for every cow in your barn today.

The moment that changed everything came on an ordinary morning in 1973. I can still picture it, the way it’s been told to me by those who remember—Charlie Plushanski standing in his Kutztown, Pennsylvania barn, watching the morning light catch the dust motes as his five-year-old Holstein, Faith, shifted her weight in the stall.

What happened next still gives me chills…

Charlie Backus had driven up from Maryland that morning with an offer that would’ve saved most farmers from their worst fears. We’re talking about enough money to buy a decent farm in Berks County—the kind of offer that makes your hands shake when you hear it. And Charlie Plushanski? He’d survived World War II as a Marine, built his farm from nothing with his boxing earnings, and knew what it meant to struggle. Family stories say he’d even sparred with champions during the war, though like many stories from that generation, the details have softened with time.

Standing there in that barn doorway, Backus was pressing hard. “Charlie, you need to let her go,” he said, watching Plushanski Chief Faith—that remarkable cow who seemed to know her own worth.

Earlier that same day—and this is what moves me most about this story—Pete Heffering had made the same journey from Ontario, trying to buy this same cow for his Hanover Hill program. Two of the biggest names in Holstein breeding, both turned away by a farmer who saw something nobody else could see.

The Pedigree That Changed Everything

For those who love breeding history, let me paint the complete picture of what made Faith so special:

Plushanski Chief Faith EX-94 4E GMD (EX-MS 96)

  • Born: November 1968
  • Sire: Pawnee Farm Arlinda Chief
  • Dam: Ady Whirlhill Frona VG-86 (Whirlhill Kingpin daughter)
  • Lifetime Production: 242,863 lbs milk, 11,353 lbs fat

What set Faith apart wasn’t just her individual achievement—it was how she transmitted. In an era before genomics, before EPDs, before any of the tools we rely on today, Faith proved that some cows simply have “it”—that indefinable ability to pass on greatness generation after generation.

The Courage It Took to Say No

Mr. and Mrs. Charles Plushanski, the visionaries behind the Faith dynasty. Their partnership and shared conviction were the foundation of the courageous decision to keep Faith when the industry came calling. This photo captures the quiet strength of the couple who chose long-term legacy over a short-term sale, proving that the greatest breeding decisions are often family decisions.

What moved me most was understanding what Charlie was really facing that day. This wasn’t just about money. This was about believing in something when everyone thought you were crazy.

The breeding community of the early 1970s was divided. You were either breeding for Chief’s incredible production or Elevation’s balanced type and longevity. But here was Charlie, who had already taken the risk of combining Chief with Kingpin genetics—a corrective mating that most breeders wouldn’t have attempted.

Charlie looked at Faith and somehow knew—in that deep, gut-level way that real farmers understand—that she carried something special in her genetics. Something that couldn’t be bought or sold. Something that would outlive them all.

“It’s not about the money,” Charlie said, according to the stories that have been passed down through breeding records and family memories. And against all odds, he was right.

That Gold Medal Dam designation Faith would earn? In the 1970s, before genomics and computers, a GMD represented the pinnacle of breeding achievement—a cow whose offspring consistently exceeded expectations across multiple herds and breeding programs. It meant you had a cow that was one in ten thousand.

The Winter That Nearly Broke Everything

Here’s where the story gets even more remarkable for those who understand breeding history. In the fall of 1965, in one of those Pennsylvania winters when everything seemed impossible, Charlie’s brother Henry called about some yearling heifers down in Perry County. A dozen Whirlhill Kingpin daughters that most breeders wouldn’t touch because of their udder problems.

Charlie bought them all. Including one special heifer—Ady Whirlhill Frona.

Nobody could have prepared him for what came next. When it came time to breed Frona, Charlie made a choice that seemed almost reckless. He bred her to Pawnee Farm Arlinda Chief—a bull whose genetics would eventually influence almost 14% of all Holstein DNA today, according to UC Davis research. But Chief came with risks. His genetics carried a lethal mutation that would cause heartbreak across the industry—over half a million lost calves worldwide. (Read more: The $4,300 Gamble That Reshaped Global Dairy Industry: The Pawnee Farm Arlinda Chief Story and Bell’s Paradox: The Worst Best Bull in Holstein History)

Charlie didn’t know about the mutation then. He just knew that sometimes, to create something extraordinary, you have to risk everything.

The Four Daughters Who Carried the Dream Forward

But then something remarkable happened that even Charlie couldn’t have imagined. Faith didn’t just excel herself—she passed on her gifts through four extraordinary daughters that would reshape breeding programs worldwide:

Plushanski Valiant Fran EX-90 35* achieved something almost unheard of in the pre-embryo transfer era. The “star” designation meant her offspring significantly exceeded the breed average. Seven went on to score Excellent. Twenty-five scored Very Good. Her 365-day record of 36,920 pounds of milk proved you could have both beauty and production. Through Fran came the show line that would eventually produce Quality BC Frantisco—Grand Champion at the Royal Winter Fair in 2004 and 2005.

Quality B C Frantisco-ET EX-96-3E 18*, a daughter Plushanski Valiant Fran-ET. Frantisco’s multiple championships at the Royal Winter Fair and her recognition as International Cow of the Year highlight the continued influence of Faith’s bloodlines, even in subsequent generations.

Plushanski Job Fancy VG-88 GMD DOM became the commercial production matriarch. The DOM (Dam of Merit) designation meant she had sons entering AI service. Through her daughter, Plushanski Neil Flute VG-87, and granddaughter Plushanski Mark Fife VG-87, this branch would spread across the globe, with bulls like To-Mar D-Fortune carrying these genetics into thousands of herds.

Plushanski Neil Flute (VG-87), the crucial link in the global dynasty. As the daughter of brood cow matriarch Job Fancy and the dam of the influential Mark Fife, Flute embodied the exceptional udder quality and commercial durability that this branch became famous for. It was through powerful transmitters like her that Faith’s genetics quietly infiltrated thousands of herds, building the foundation for the longevity advantage we see today.

Plushanski Dawn Fayne and Plushanski Star Faith rounded out this remarkable quartet, each contributing their own unique genetic gifts to the breed.

What pedigree enthusiasts will appreciate is that each daughter seemed to capture a different aspect of Faith’s genetic package—Fran got the show-ring presence, Fancy got the commercial reliability, Flute got the udder quality, and Fife got the longevity. It’s as if Faith parceled out her gifts, ensuring her influence would touch every aspect of Holstein breeding.

Contemporary Competition and Context

To understand the magnitude of Charlie’s decision, you need to know what else was happening in Holstein breeding in 1973. This was the era of legendary cow families like:

  • The Romandale Reflection Marquis family
  • The Hanoverhill lines that Pete Heffering was building
  • The emerging Elevation daughters that were revolutionizing the type

Yet Faith would outlast and out-influence many of these contemporary families. While other great cows of the era produced individual champions, Faith created entire dynasties that adapted to different breeding goals worldwide.

The Global Explosion Nobody Saw Coming

What’s fascinating for breeding historians is how Faith’s genetics adapted to completely different breeding goals around the world:

The European Production Revolution

The modern embodiment of Faith’s commercial power: De Biesheuvel Javina 50 VG-87. She is the archetype of the Javina family, the European branch of the Faith dynasty that descended through Plushanski Job Fancy. While the Frantisco line chased show-ring glory, Dutch breeders selected this line with a relentless focus on what pays the bills: production, health, and efficiency. Today, her descendants like Willem’s Hoeve 3STAR Javina 2762 dominate European genomic indexes (gNVI and gRZG), producing the next generation of elite bulls for AI studs. This is the harvest of Charlie Plushanski’s vision, proving that Faith’s genetics could be adapted to create a profitable, index-topping powerhouse for the most demanding commercial systems in the world.

The Dutch breeders working with the Javina family (Faith’s European descendants through Job Fancy) focused intensively on commercial traits. De Biesheuvel Delta Javina and her daughters consistently top the Dutch NVI rankings. These aren’t just good cows—they’re the kind that define breeding programs for decades. When families consistently produce #1 NVI sons and daughters generation after generation, you’re witnessing genetic consistency that modern genomics still struggles to predict.

Canada’s Show Ring Dynasty

The show-ring culmination of the Faith dynasty: Quality B C Frantisco-ET EX-96-3E 18* A direct descendant of Faith through her daughter Plushanski Valiant Fran, Frantisco was the masterpiece developed by Paul Ekstein at Quality Holsteins. She dominated the Canadian show circuit, capturing Grand Champion honors at the Royal Winter Fair twice (2004 & 2005) and earning the title of 5-time All-Canadian. Her reign was so complete that one of the great “what ifs” in modern show history is how she would have fared against American champions at World Dairy Expo, a showdown prevented by BSE travel restrictions. Frantisco stands as the ultimate proof of the versatility of Faith’s genetics—creating a world-class show champion more than 30 years after her famous ancestor was born.

In Canada, Paul Ekstein’s work with the Frantisco line through Valiant Fran created a show dynasty. Quality BC Frantisco’s achievements—Grand Champion at the Royal Winter Fair in 2004 and 2005, five-time All-Canadian, International Cow of the Year 2005—prove that Faith genetics could compete at the highest levels decades after her death.

Australia’s Modern Application

Ray Kitchen at Carenda Holsteins demonstrates how Faith genetics remain relevant in 2025. Their Carenda Pemberton, with 606 daughters from 79 herds, shows how these genetics adapt to modern selection tools while maintaining their core strengths.

Why This Matters for Today’s Breeders

I recently talked with a producer in Wisconsin who discovered Faith genetics in his herd almost by accident while researching pedigrees. His Faith-line cows? They’re averaging 3.8 lactations compared to the industry’s 2.8. That extra lactation—worth an estimated $1,200 to $1,500 per cow in today’s market—is the difference between profitability and struggle.

With the nearly 800,000-heifer shortage CoBank reports, quality genetics have never been more valuable. When you see names like Big Gospell, Apina Fortune, or To-Mar D-Fortune in a pedigree, you’re looking at Faith’s legacy, refined through decades of selection.

The modern face of the Faith legacy: Big Delta Anecy 1, dam of the influential AI sire Big Gospell. A direct descendant of Faith through the commercially-focused Javina family, Anecy is the proof in the pudding. She showcases the deep-ribbed, high-capacity frame and exceptional udder quality that the Faith line has transmitted for over 50 years. When you see bulls like Gospell in a catalog, you’re not just buying modern genomics; you’re investing in decades of proven, real-world durability that started with one farmer’s courageous ‘no’ back in 1973.

What Charlie Knew in His Heart

Standing there in my own barn sometimes, I think about Charlie Plushanski in that moment in 1973. The breeding community was watching. The pressure was immense. The money would have solved immediate problems.

Instead, he made the harder choice. The one that required patience, vision, and something more—faith in genetics that would prove their worth across decades and continents.

Charlie passed away in 1991, but his son Cary kept the dream alive at the Kutztown farm until his own passing just this September. Three generations of a family who understood that sometimes the best breeding decisions aren’t about today’s milk check or tomorrow’s bills. Sometimes they’re about creating genetic legacies that outlast us all.

The Echo That Still Saves Farms

Every time a Faith descendant helps a farm survive another year, navigate another crisis, or build another generation’s future, the echo of Charlie’s “no” from 1973 quietly puts hope back in someone’s barn.

For pedigree enthusiasts, Faith represents something profound—proof that individual breeding decisions can reshape an entire breed. For historians, she’s a reminder that the greatest genetic influences often come from unexpected places. For today’s breeders, she offers both practical genetics and philosophical guidance.

When you’re planning your breeding for next year, when you’re looking at those catalogs and wondering which direction to go, remember Charlie Plushanski. Remember that sometimes the hardest choice—the one that seems impossible at the time—is the one that creates miracles down the road.

That $1,500 per cow advantage from longevity? That’s not just a number. That’s the difference between surviving and thriving, between keeping the farm and losing it, between passing something on to the next generation and watching it slip away.

And somewhere, in barns across the world, Faith’s descendants are still quietly making that difference. Still carrying forward the gift of one farmer’s impossible choice.

It might as well be in your barn, creating your own harvest of hope.

Key Takeaways:

  • The Bottom Line: Faith genetics add 1+ lactation (3.8 vs 2.8 average), worth $1,200-$1,500 per cow in today’s market
  • Find Them Today: Search your pedigrees for “Javina” (commercial power), “Frantisco” (show quality), or Faith’s four daughters’ names
  • Why Now: In an 800,000-heifer shortage, cows that last five lactations instead of 3 are pure profit
  • The Lesson: Sometimes saying “no” to quick money creates generational wealth—Charlie proved it in 1973

Executive Summary:

 In 1973, Charlie Plushanski turned down enough money to buy a farm—refusing to sell a cow that would reshape dairy genetics forever. Plushanski Chief Faith (EX-94 4E GMD) didn’t just produce 242,863 pounds of milk; she founded dynasties through four daughters whose genetics now run through millions of cows worldwide. Today, Faith bloodlines deliver the industry’s most overlooked advantage: an extra lactation worth $1,200-$1,500 per cow, achieved through 3.8 lactations versus the 2.8 average. With an 800,000-heifer shortage threatening dairy’s future, these 50-year-old genetics offer what no genomic gamble can: proven longevity across every climate, every system, every market condition. The supreme irony? While the industry obsesses over the latest genomic rankings, Charlie’s half-century-old decision is quietly adding $1,500 to bottom lines worldwide. His refusal reminds us that true genetic wealth isn’t built in a sales ring—it’s built by saying “no” to quick money and “yes” to generational vision.

This narrative draws from breeding records, Holstein Association documentation, and the enduring impact of these genetics on farms worldwide. Some conversations and personal details have been reconstructed to honor the significance of these breeding decisions and the families who made them. The author extends deep gratitude to all who preserve these important agricultural stories.

Learn More:

The Sunday Read Dairy Professionals Don’t Skip.

Every week, thousands of producers, breeders, and industry insiders open Bullvine Weekly for genetics insights, market shifts, and profit strategies they won’t find anywhere else. One email. Five minutes. Smarter decisions all week.

NewsSubscribe
First
Last
Consent

Six Men Died in a Manure Pit This August. Here’s the $450 Fix That Could Have Saved Them

How the August tragedy at Prospect Valley Dairy reveals critical gaps in manure storage safety protocols—and the practical steps farms are taking to protect workers

Executive Summary: Six experienced dairy workers died in a Colorado manure pit this August—five of them trying to rescue each other, a pattern that causes 60% of confined space deaths. The tragedy exposed an uncomfortable truth: oil and gas operations face identical hydrogen sulfide hazards but prevent deaths through mandatory protocols, while dairy farms still treat these as accidents. Manure pits, especially with gypsum bedding, can produce H₂S levels that kill in seconds—up to 40 times the lethal threshold. Prevention costs less than treating mastitis: $450 for monitors, $1,800 for retrieval equipment, and free Extension training. But what actually changes behavior is asking yourself whether you’d send your own kid into that pit with your current safety measures in place. If that makes you uncomfortable, you know what needs to change today.

You know, when six men died from hydrogen sulfide exposure at Prospect Valley Dairy in Keenesburg, Colorado, on August 20, it sent a different kind of shockwave through our community. We’ve all dealt with equipment failures, weather disasters, and market crashes. But this? This hit differently.

The Weld County Coroner confirmed on October 30 what many of us suspected—all six victims died from hydrogen sulfide exposure in a confined space during what should’ve been routine maintenance work. And here’s what’s keeping me up at night: these weren’t greenhorns. We lost Ricardo Gomez Galvan, 40, the dairy manager. Noe Montañez Casañas, 32, assistant dairy manager. Jorge Sanchez Pena, 36, who managed services for High Plains Robotics. Alejandro Espinoza Cruz, 50, an experienced service technician, along with his two sons—17-year-old Oscar Espinoza Leos and 29-year-old Carlos Espinoza Prado.

What I’ve learned from sources familiar with the incident—Denver7 did some solid reporting on this—is that maintenance work was being performed on underground manure storage when a worker may have accidentally activated a valve or pump. That triggered a massive release of hydrogen sulfide. When the first person collapsed, the others rushed in attempting a rescue.

Here’s the thing that really gets me: Denver7 reported that a supervisor on-site was screaming at workers not to enter. But you know how it is—when you see someone you work with every day gasping for air, that instinct to help overrides everything. Dennis Murphy, up at Penn State, has been documenting this for years, and his research shows this “would-be rescuer” pattern accounts for about 60% of confined space fatalities nationally. Sixty percent. Think about that.

What Oil and Gas Has Already Figured Out

Safety StandardOil & Gas IndustryDairy Industry (Typical)Gap/Risk
H2S Entry Threshold<5 ppmOften not definedNo baseline safety
No Entry Above50 ppm (strict)No standard setUnlimited exposure
Gas Testing RequiredAlways mandatoryFrequently skippedWorkers unprotected
Atmospheric MonitoringContinuous real-timeRarely implementedNo early warning
Worker TrainingMandatory pre-workOften optionalLack of awareness
Rescue EquipmentRequired on-siteRarely presentNo rescue capability
Violations ConsequenceImmediate terminationWarnings onlyNo accountability

Maria Espinoza’s comment to Colorado Public Radio really stuck with me. She lost her husband, Alejandro, and both their sons in this tragedy, and she pointed out something we need to hear: her other son works in oil and gas and received extensive toxic gas training before he could even approach a wellhead. As she put it, everything they do with toxic gases is impossible to do without protection because it’s so dangerous.

So why don’t dairies have that same commitment?

I pulled up Chevron’s publicly available confined space standards—you can find them online if you’re curious—and it’s eye-opening. They require H₂S levels below five ppm for safe entry. That’s half OSHA’s standard, by the way. Above 50 ppm? No entry allowed, period. No exceptions, no “we’ll just be quick about it.”

What’s interesting is the difference isn’t technology or even cost. They’ve simply made safety completely non-negotiable. A roughneck who skips atmospheric testing gets fired, no questions asked. Can we honestly say the same on our operations? I know I couldn’t until recently.

This comparison matters because—and this is what many of us miss—oil and gas faces the exact same hydrogen sulfide hazards we do. Same deadly gas, same confined spaces. But they treat it as a predictable, manageable risk requiring systematic controls. Meanwhile, we’re still treating these incidents as unforeseeable “accidents.” They’re not.

Understanding What We’re Really Dealing With

I’ve been around manure pits my whole life, and I’ll bet many of you have, too. But what’s interesting here is how hydrogen sulfide plays tricks on our senses in ways most of us never learned about.

At low concentrations, H₂S smells like rotten eggs. We all know that smell. But once it hits about 100 parts per million, it actually paralyzes your olfactory nerves. You literally can’t smell the danger anymore. Your body’s warning system shuts off right when you need it most.

From a rotten-egg smell to unconsciousness in one breath: This is why you can’t trust your nose around manure pits. At 100 ppm, H2S paralyzes your olfactory nerves—you literally can’t smell the danger anymore, even as concentrations climb to instantly fatal levels.

The National Institute for Occupational Safety and Health has benchmarks we all need burned into memory:

  • 10 ppm: That’s OSHA’s permissible exposure limit for an 8-hour workday
  • 100 ppm: Immediately dangerous to life and health—this is where smell disappears
  • 500-700 ppm: You’re staggering and collapsing within 5 minutes
  • 700-1000 ppm: Unconscious within 1-2 breaths
  • Above 1,000 ppm: Death is nearly instantaneous

Now here’s what really caught my attention. Eileen Wheeler’s team at Penn State has been monitoring dairy farms across Pennsylvania for years, and they’ve found that manure pits—especially those containing gypsum bedding—can produce hydrogen sulfide concentrations 17 to 39 times these fatal thresholds during agitation. We’re not talking about slightly over the limit. We’re talking about concentrations that kill in seconds.

The Gypsum Connection Nobody Saw Coming

This development really surprised me when I first learned about it. Gypsum bedding has become pretty popular over the last decade, and honestly, for good reasons. It absorbs moisture like nothing else, maintains that neutral pH cows prefer, and I’ve seen operations cut their mastitis incidence dramatically after switching. Plus, with lumber prices these days, recycled wallboard gypsum can be a real money-saver. Many Wisconsin operations have been using it with great success—from a cow comfort perspective.

But here’s what Wheeler’s research team discovered that should concern all of us: farms using gypsum bedding showed dangerous levels of hydrogen sulfide during manure agitation. Farms using traditional organic bedding—sawdust, straw, that sort of thing? Almost no H₂S release at all.

The chemistry, once you understand it, makes perfect sense. Under those anaerobic conditions in your manure storage, sulfate-reducing bacteria—mainly Desulfovibrio species, if you want to get technical—convert gypsum’s calcium sulfate into hydrogen sulfide gas. Lab work has shown that adding just 1% gypsum to cattle slurry can increase H₂S levels to nearly 4,000 ppm. That’s 40 times what NIOSH considers immediately dangerous to life and health.

The cow comfort choice that’s killing workers: Gypsum bedding slashes mastitis but produces H2S concentrations 20 times higher than sawdust or straw. Pennsylvania research found gypsum-containing manure storages hitting 100+ ppm during agitation—well into the ‘immediately dangerous to life’ zone. 

Mike Hile put it simply when I talked to him about this: “Any time you work around manure storage, it is dangerous, but gypsum elevates the level of hydrogen sulfide. We want people to be aware of the hazards.”

Now, I’m not saying abandon gypsum if it’s working for your herd health. What I am saying is that if you’re using it, you need different safety protocols than your neighbor using sawdust. It’s worth noting that several insurance companies are starting to ask about bedding types in their risk assessments. That should tell us something.

Practical Steps Dairy Operations Are Taking

The agitation death window: H2S concentrations spike from 5 ppm to 120 ppm within 30 minutes of starting agitation—a 24-fold increase that turns a routine task into a lethal environment. Penn State researchers found the highest gas levels occur in the first hour, with peaks at 30 minutes. 

I’ve been talking to operations across the Midwest since August, and what’s encouraging is seeing farms take concrete action. Here’s what’s actually working:

Changes You Can Make Today—And I Mean Today

Lock Down Your Confined Spaces

Walk your operation this afternoon. I’m serious—put down this article and do it if you haven’t already. Get your supervisors together and identify every single confined space. Your underground pits, obviously, but also above-ground tanks, those old concrete silos, feed bins, and even that bulk tank if someone has to crawl inside to clean it. Mark them all.

Then make this announcement, and make it stick: “Nobody enters any confined space without my direct authorization. If someone collapses, you don’t enter. You call 911.”

I know of several operations that went through this after near-misses, and they now treat violations as immediate termination offenses. Their incident rates? Dropped from double digits down to under 4%. That’s not a typo.

Order Gas Monitors Now

I called around to suppliers this week. BW Technologies makes a four-gas monitor that runs about $450 through Grainger. The Dräger X-am 2500 is around $650. Both detect oxygen, hydrogen sulfide, carbon monoxide, and methane. Most industrial safety suppliers offer next-day shipping to dairy regions—I had mine the next afternoon.

Here’s the thing that should motivate you: that’s less than the average workers’ comp claim for agricultural injuries, which the National Safety Council puts at over $40,000. We’re talking about equipment that costs less than a decent set of tires for your mixer wagon.

For those wondering about ongoing costs, calibration gas runs about $85 per bottle and lasts 6-12 months, depending on use. Most manufacturers recommend bump testing weekly—it takes only 2 minutes. My milkers do it while they’re waiting for the parlor to fill.

Have the Hard Conversation

Gather everyone who works on your place. And I mean everyone—your milkers, your feeder, that high school kid who helps on weekends, the nutritionist who comes monthly. If they set foot on your operation, they need to hear this.

Tell them exactly what happened in Colorado. Be blunt about it. Then drill in three things:

  1. Someone down in a confined space? You don’t go in. You call 911.
  2. Nobody approaches manure storage without testing the air first.
  3. Don’t understand English? Speak up now. We’ll get Spanish training.

Tom Schaefer from the National Education Center for Agricultural Safety has been taking their confined space rescue simulator around the country for years. What he’s found—and this is crucial—is that the biggest challenge is overriding that rescue instinct. You have to give workers something else to do, like operating retrieval equipment, or they’ll go in anyway. Human nature is powerful.

Your 30-Day Action Plan

Get Your Paperwork Right

OSHA regulation 29 CFR 1910.146 requires written confined space procedures. Now, I know paperwork isn’t fun, but your Extension office has templates that make this painless. Dennis Murphy at Penn State has developed some excellent ones, and Cheryl Skjolaas at Wisconsin has materials specifically for dairy operations. Iowa State’s ag safety team has good resources, too. The key elements are atmospheric testing results, equipment checks, and rescue procedures—all documented before anyone goes in.

Buy Retrieval Equipment

Tripod and winch setups from companies like 3M Fall Protection or Miller by Honeywell run $1,500-3,000. That gets you the tripod, a 50-foot winch cable rated for 310 pounds, and a full-body harness. FallTech makes an entry-level system for about $1,800 that several Wisconsin dairies tell me works really well in our conditions.

As one safety investigator with decades of experience told me, the retrieval system lets you channel that rescue instinct into something that actually saves lives instead of creating more victims. Think about it—if High Plains Robotics had retrieval equipment staged that day, maybe we’d be telling a different story.

Schedule Real Training

Most states offer free Extension training. Wisconsin’s program through UW-Madison includes hands-on practice—they bring the equipment right to your farm. Michigan State trains hundreds of workers annually. The Texas A&M AgriLife Extension team has developed excellent bilingual training specifically for Hispanic workers, and they’ve reached thousands over the past few years.

If your state doesn’t have strong offerings—and I know some don’t—the National Safety Council offers online confined space training for around $195 per person. It’s worth every penny.

Learning from Farms Getting It Right

Let me share what I’m hearing from operations that have made safety transformation work.

One Nebraska dairy I know—they milk about 850 cows—had a near-miss a couple of years back where an employee lost consciousness near their reception pit. Fortunately, he was outside where fresh air revived him. But it was a wake-up call. They spent about $15,000 total on monitors for every building, retrieval equipment at both pits, and professional training for all 30 employees. Their insurance company—one of the big agricultural mutuals—cut their premiums substantially. The safety investment basically paid for itself in the first year.

But what really changed was the culture. They now start every shift with what they call a “safety minute”—just checking in about hazards for that day’s work. Are we agitating today? Anyone working near the pits? New people on site who need orientation? The owner tells me it’s actually made them more efficient, not less. When people feel safe, they work better. Simple as that.

Another operation I’m familiar with in Minnesota implemented what they call “Stop Work Authority” after attending a safety workshop. Any employee—from the newest hire to the herd manager—can stop any job if they see a safety issue. No questions asked, no punishment, no grief about it later. They’ve used it several times over the past couple of years, and each time it prevented what could have been serious incidents.

The Economics Nobody Wants to Discuss

Look, I know what you’re thinking. Money’s tight, milk price is volatile, and here’s another expense. So let’s be real about the numbers.

Research from the University of Texas School of Public Health lays it out pretty clearly:

  • Average dairy injury workers’ comp claim: Over $40,000
  • Cost of a workplace fatality, including indirect costs: Over $1 million
  • OSHA serious violations: Up to $161,323 as of 2025
  • Comprehensive safety program implementation: $10,000-25,000, depending on operation size
The math is brutal and simple: A $450 gas monitor costs less than treating a bout of mastitis, yet one workplace fatality runs over $1 million in direct and indirect costs. Nebraska dairy that spent $15K on full safety package? Insurance cut paid for it in 12 months.

But here’s what’s harder to quantify—can you find workers after a fatality? What happens to your milk contract if you’re shut down during an investigation? How does your community look at you?

I’ve talked to three operations that had fatalities in the last decade. They all say the same thing: finding workers afterward was their biggest challenge. One operation told me they had to increase wages significantly across the board just to get applicants. The financial hit lasted years.

What This Means for Different Types of Operations

If you’re running a smaller dairy (under 100 cows): Your close relationships with everyone on the farm are actually an advantage. The safety conversations might be easier because everyone knows everyone. But the equipment is just as necessary. And remember, OSHA’s small farm exemption only applies to operations with 10 or fewer employees—it doesn’t exempt you from liability if someone gets hurt.

For mid-size operations (100-500 cows): You’re in that tough spot where you’re too big for everyone to know everyone, but maybe not big enough for dedicated safety staff. Consider sharing resources with neighboring farms. I know of three farms in Wisconsin that went together on confined space rescue equipment they share. Cost each farm a fraction of what they’d have paid individually, and they train together quarterly.

Large dairies (500+ cows): Your challenge is consistency across shifts and with contractors. Prospect Valley had High Plains Robotics doing service work—that contractor relationship adds complexity. Every shift, every crew, every contractor needs the same standards. Consider appointing safety champions on each shift—workers who get extra training and maybe a small pay bump to help maintain standards.

Custom operators and contractors: You folks are walking onto different farms every day, each with its own hazards. You need portable equipment and—this is crucial—the authority to refuse unsafe work. Several states have developed model safety policies for custom applicators that are worth looking into.

For operations outside North America or those without strong Extension services nearby, online resources from the National Safety Council, OSHA’s website, and university programs offer downloadable materials. Many are available in Spanish, and some in other languages too.

Moving Forward: What Actually Changes Behavior

The heartbreak behind the statistics: 60% of confined space deaths are would-be rescuers who rushed in to save a coworker without proper equipment. At Colorado’s Prospect Valley Dairy, five of six victims died trying to rescue each other—the exact pattern NIOSH has documented for decades. 

After reviewing dozens of successful safety transformations, here’s what I’ve noticed actually works:

Make it personal. One milker told me, through a translator, that when his supervisor explained the retrieval equipment was so his kids wouldn’t lose their dad, like those families in Colorado, everything clicked. Safety became about family, not rules.

Start small, but start now. You don’t need a perfect system tomorrow. But you need something better than what you have today. Even just buying monitors and requiring their use is progress.

Learn from near-misses. Every farm that successfully transformed its safety culture had stories of close calls that became teaching moments rather than secrets. Create an environment where people can report near-misses without fear.

Share what works. This isn’t competitive intelligence—it’s keeping our people alive. If you find a training program that really resonates with your Hispanic workers, tell your neighbor. If a certain monitor brand holds up better in our conditions, spread the word.

Quick Reference: Resources That Can Help

For immediate help setting up protocols:

  • Your state Extension safety specialist
  • OSHA Consultation: 1-800-321-OSHA (it’s free for small businesses)
  • National Education Center for Agricultural Safety: (319) 557-0354

Equipment suppliers who understand ag:

  • Grainger: 1-800-GRAINGER
  • MSA Safety: 1-800-MSA-2222
  • Industrial Scientific: 1-800-DETECTS

Visual resources: Search online for “confined space retrieval equipment setup” or “H2S concentration effects chart” for diagrams that complement this information.

What Happens Next

The six men who died in Colorado—Ricardo, Noe, Jorge, Alejandro, Oscar, and Carlos—they weren’t statistics. They were the guys who kept operations running, who knew which cows were off feed before anyone else noticed, who could fix that temperamental mixer wagon when nobody else could.

Their deaths were preventable with technology that costs less than we spend on hoof trimming and protocols that have been available for decades. The question now is what we do with that knowledge.

You can finish reading this, feel bad for a few days, then go back to business as usual. Or you can pick up the phone, order those monitors, and start changing how your operation values safety. Not eventually. Not after you talk to your banker. Today.

Every dairy owner needs to ask themselves: would I send my own kid into that pit with our current safety measures in place? If the answer makes you uncomfortable, you know what needs to change.

The technology exists. The knowledge exists. The training exists. What’s needed now is the decision that no production goal, no maintenance deadline, no economic pressure is worth the price of someone not coming home.

That’s a decision each of us has to make. And after Colorado, we can’t pretend we didn’t know better.

Key Takeaways for Your Operation

Looking at everything we’ve learned from Prospect Valley and farms that have successfully improved their safety:

  • Every dairy with manure storage faces these hazards—size and experience don’t eliminate risk
  • Bedding choices have safety implications—if you’re using gypsum, you need enhanced protocols
  • The technology is affordable—we’re talking about monitors that cost less than a decent bull calf
  • Culture beats compliance every time—workers follow what management demonstrates, not what’s written in the manual
  • Training must be ongoing and hands-on—that safety video from 2015 isn’t cutting it anymore
  • Engineering controls beat willpower—make the safe choice the only available choice

Complete references and supporting documentation are available upon request by contacting the editorial team at editor@thebullvine.com.

Learn More:

The Sunday Read Dairy Professionals Don’t Skip.

Every week, thousands of producers, breeders, and industry insiders open Bullvine Weekly for genetics insights, market shifts, and profit strategies they won’t find anywhere else. One email. Five minutes. Smarter decisions all week.

NewsSubscribe
First
Last
Consent

December 1 Deadline: How Cutting 15% of Your Herd Could Add $40,000 to Your Bottom Line

Dairy’s best kept secret: The farms shrinking on purpose are the ones making money. Here’s the $165K proof.

Executive Summary: A Wisconsin dairy farmer cut 150 cows and made $165,000 MORE—proving that in today’s market, strategic shrinking beats growing. With mega-dairies producing at $13/cwt versus your $23/cwt, that $10 spread is mathematically insurmountable through volume. December 1’s new protein requirements (3.3% baseline) will either cost you $8,640 in penalties or earn you $40,000+ in premiums—depending on what you do in the next 31 days. The winning formula: cull your bottom 15% to cut costs immediately, then optimize components through amino acid supplementation for premium capture. This article delivers a tested 90-day playbook with specific actions, real costs, and realistic timelines that have already transformed dozens of operations. Your choice is simple but urgent: adapt now, pivot to alternatives, or exit while you still can.

Strategic Culling Dairy

Part One: The Squeeze Is Real—And Getting Worse

You know that feeling when you’re caught between a rock and a hard place? That’s exactly where mid-size dairy operations sit right now. And if you’re running 200 to 600 cows, you’re probably feeling it every time you look at your milk check.

Let me paint you a picture with some hard numbers from the USDA’s latest Census of Agriculture, released in February. Between 2017 and 2022, we lost 15,866 dairy farms. During that same time? Milk production actually went UP five percent.

How’s that math work? Well, you probably know this already, but it’s worth saying—the big got bigger. Much bigger.

The brutal math of consolidation: 15,866 farms disappeared (29% loss) while milk production rose 5%—proof that 834 mega-dairies now control nearly half of America’s milk supply

Year
FarmsChangeProduction IndexMega Share %
201754,59910042%
201851,050-3,54910143%
201947,235-3,81510244%
202043,410-3,82510345%
202140,100-3,310103.545.5%
202238,733-1,36710546%

The Brutal Economics of Scale

So I visited one of these mega-operations in Texas last spring. Twelve thousand cows. Robotic systems everywhere. The whole nine yards.

Here’s what’s interesting—their CFO, who came from the oil industry, actually, showed me their numbers. Thirteen dollars per hundredweight all-in production costs. Thirteen.

Now, I don’t know about your operation, but Cornell’s PRO-DAIRY program has been tracking costs for typical 100-200 cow herds, and they’re seeing around $23 per hundredweight. That’s… that’s a problem.

The brutal economics of scale: Mega-dairies operate at $13-17/cwt while mid-size farms struggle at $23/cwt—a $10 gap that volume alone cannot bridge

Farm Size
Cost/CWTStatus
10-49 cows$33.54Loss
50-99 cows$27.77Loss
100-199 cows$23.68Loss
200-499 cows$20.85Loss
2,500+ cows$17.22Profit

At today’s Class III price—what was it this morning, $17.40 on the CME?—smaller operations are losing close to six bucks per hundredweight. Meanwhile, these mega-dairies? They’re making over four dollars.

That’s a ten-dollar spread, folks. Ten dollars!

“I realized I was trying to compete on volume with operations ten times my size. Can’t win that game. So I changed the game—focused on profit per cow, not gallons in the tank.” — Wisconsin dairy farmer who cut his herd from 1,200 to 1,050 cows

And here’s the thing that keeps me up at night—it’s not that these big operations are doing anything wrong. They’re just playing a different game entirely. Feed costs alone, they’re saving $2-3 per hundredweight through direct commodity purchases. Labor efficiency? Another couple of bucks saved. It adds up fast.

The Geographic Earthquake Nobody’s Talking About

While you’re wrestling with those economics, something else is happening that’s maybe even more important. The entire industry map? It’s being redrawn under our feet.

You’ve probably heard about the new processing capacity—Rabobank’s September report put the investment range at $8 to $11 billion. Biggest buildout since the 1990s. But here’s the kicker that nobody really wants to talk about—these plants aren’t where the milk traditionally has been.

Take Hilmar’s new Dodge City facility out in Kansas. Or Valley Queen’s expansion up in South Dakota. These aren’t small operations, folks. They need milk—lots and lots of milk.

And where’s it coming from? Well, USDA’s latest production report tells the story:

Texas added 50,000 cows this past year. Fifty thousand! Kansas jumped by 29,000 head. South Dakota gained somewhere between 18,000 and 21,000, depending on which report you look at.

Meanwhile—and this is what Mark Stephenson, Director of Dairy Policy Analysis at UW-Madison’s Center for Dairy Profitability, calls it—older plants in Wisconsin, Minnesota, parts of New York? They’re taking “strategic downtime.” That’s a polite way of saying they can’t compete for milk at current prices.

What I’m hearing from processing plant managers and dairy economists familiar with these operations is that new facilities are running at maybe 50-70% capacity right now, varying by plant, of course. They’re still ramping up, learning their systems, building those supply chains.

But when they hit full throttle—and most analysts I talk to figure that’ll be late 2026—we’re looking at an additional billion pounds of cheese-making capacity.

Just to put that in perspective… that’s about what the entire state of Vermont produces in a year.

Now, the strategies that work in Texas, with its minimal environmental regulations, aren’t the same as those that work in California, with its water restrictions. And our friends in the Southeast, dealing with heat stress, face different challenges than folks up in Vermont, where land costs are through the roof. But the pressure? That’s universal.

Part Two: December 1—The Trigger That Changes Everything

As if the squeeze wasn’t tight enough already, here comes December 1 with Federal Milk Marketing Order changes that’ll turn chronic pressure into an acute crisis for a lot of farms.

According to USDA’s final rule that came out in October—and I spent way too much time reading through all 147 pages of it—baseline protein jumps from 3.1% to 3.3% starting December 1. Other solids move from 5.9% to 6.0%.

Now, that might not sound like much when you’re sitting at the kitchen table. But let me show you what this actually means for your milk check.

The New Component Reality

A typical 200-cow operation that’s been hitting that old 3.1% protein baseline? Come December 1, they’re suddenly eight cents under water per hundredweight. Just like that—penalty instead of baseline.

On the flip side, farms hitting 3.4% protein capture about 28 cents per hundredweight in premiums under the new formulas.

Let’s do the math here—on 200 cows averaging 75 pounds daily, that’s the difference between losing money and gaining around $8,640 annually. That’s not pocket change, as many of us have learned the hard way.

Karen Phillips, who’s an Associate Professor of Dairy Science at UW-Madison, explained something fascinating at last month’s extension meeting in Marshfield. She said cheesemakers need a protein-to-fat ratio of 0.80 for optimal yield. Know what the U.S. average is right now? We’re sitting at 0.77 according to the DHIA data from January through September.

That three-hundredths difference—it doesn’t sound like much, but it forces plants to add nonfat dry milk powder to standardize their cheese vats. Cuts right into their margins. Makes them real interested in paying premiums for the right milk.

December 1 creates a $15,500 spread between winners and losers: Farms hitting 3.4% protein gain $8,000 annually while those at 3.0% lose $7,500—all based on new FMMO baselines
ScenarioProtein/OSPayment ΔAnnual Impact (200 cows)
Below Average3.0% / 5.8%-$0.15/cwt-$7,500
Average3.1% / 5.9%-$0.08/cwt-$4,000
Above Average3.4% / 6.2%+$0.28/cwt+$8,000

December 1 Component Changes at a Glance:

  • Protein baseline: 3.1% → 3.3%
  • Other solids: 5.9% → 6.0%
  • Below baseline = penalties
  • Above baseline = premiums
  • 200-cow herd hitting 3.4% protein = ~$8,640 annual gain

Part Three: Why “Just Make More Milk” Is a Losing Game

Your first instinct might be to ramp up production, right? Get more cows. Push for higher yields. Try to compete on volume.

Don’t. Just… don’t.

Here’s why that strategy is basically suicide for mid-size operations.

You Can’t Out-Scale the Giants

Those 834 mega-dairies with 2,500-plus cows that USDA’s Economic Research Service tracked in their March 2025 report? They’re producing 46% of America’s milk now. Nearly half of our milk comes from fewer than 1,000 farms.

Think about that for a second.

They’ve got feed costs that run $2-3 per hundredweight lower than yours through direct commodity purchases—they’re buying trainloads, not truck loads. Labor efficiency through automation saves them another $2-2.50 based on university cost studies. Capital costs spread across massive production volumes? That’s another buck-fifty to two-fifty saved.

You can’t win that game. I mean, you literally cannot win it. So stop trying.

The Processing Capacity Trap

Michael Dykes, President and CEO at the International Dairy Foods Association—I had coffee with him at September’s Dairy Forum in Phoenix—he told me something really revealing. He said everyone in the industry was terrified there wouldn’t be enough milk for these new plants.

“I kept telling them,” he said, “farmers will respond to market signals.”

Well, respond they did. Boy, did they respond.

But here’s what nobody wants to say out loud at these industry meetings: The IDFA estimates we’ll have a billion pounds of new annual cheese capacity by the end of 2026. Meanwhile, domestic demand? It’s growing at about 1-2% annually, based on USDA consumption data from their July report.

You see the problem here? More milk into an oversupplied market just drives prices lower. You’re literally racing to the bottom.

Part Four: The Real Solution—Shrink to Grow

This brings me to something that happened last February that really opened my eyes. I was talking to this Wisconsin dairy farmer—let’s call him Tom to protect his privacy—standing in his freestall barn outside Shawano. And he tells me something that seemed absolutely crazy at the time.

He was cutting his herd from 1,200 to 1,050 cows. On purpose.

“You’re going backwards,” his neighbors told him at the co-op meeting.

Eight months later? His net income—not revenue, but actual net income—had jumped dramatically. The University of Wisconsin Extension has been documenting these kinds of strategic culling success stories in its dairy management programs, and the results are prompting many people to rethink everything.

Here’s the two-step strategy that’s actually working:

Step One: Strategic Culling (The Foundation)

Victor Cabrera, Professor in the Department of Dairy Science at UW-Madison, has data showing something really interesting—the average farm has 10-12% of cows that are net negative on profitability.

They’re eating feed. Taking up stall space. Requiring labor. Getting bred. But when you actually run the numbers? They’re not paying their way.

Culling these underperformers does two things immediately:

  1. Reduces your costs right away—less feed, less labor, fewer health issues
  2. Mechanically raises your herd’s average production and components

What Tom did with his 150-cow reduction was eliminate his worst performers. The 1,050 cows he kept? Higher average production. Better components. Lower costs per hundredweight. It’s not magic—it’s just math.

Step Two: Component Optimization (The Multiplier)

Once you’ve got a leaner, higher-potential herd, now you optimize for components through amino acid balancing.

Jim Paulson, Dairy Extension Educator at University of Minnesota Extension in St. Cloud—he’s been working with dairy nutrition for decades—he explains it really well: “Most farms overfeed crude protein while being deficient in the specific amino acids that actually drive milk protein synthesis.”

The fix? Rumen-protected methionine and lysine in the right ratio. The Journal of Dairy Science has published extensive research on this over the past couple of years, and the 3-to-1 lysine-to-methionine ratio keeps coming up as optimal.

Brian Perkins, Senior Dairy Technical Specialist with Vita Plus Corporation out of Madison—he’s worked with 47 different herds on this in 2025—told me: “Target a 0.15 to 0.20 percentage point protein increase. Budget $0.10–$0.15 per cow daily. Based on our field trials, you’ll see results in 8-12 weeks.”

On a now-optimized 200-cow herd, that’s maybe $7,000 annually for the supplements. But if it gets you to 3.3% protein or higher, you’re capturing those December 1 premiums we talked about.

I don’t have all the answers here, and finding qualified nutritionists who really understand amino acid balancing can be challenging in some regions. Your best bet is contacting your state Extension dairy team—they can usually connect you with someone who knows this stuff inside and out.

The Combined Effect

Simple math that works: Invest $7k in amino acids, execute strategic culling, breed 60% to beef—capture $153k in combined gains on a 200-cow operation within 12 months

Component
AmountType
Amino Acid Supplements-$7,000Cost
Component Premiums (3.3%+ protein)+$40,000Revenue
Beef-on-Dairy (60% × 120 calves)+$100,000Revenue
Cost Reduction (15% culling)+$20,000Savings
NET PROFIT+$153,000Total

* 200-Cow Operation

Here’s where it gets really interesting:

  • Culling raises your baseline—removing the bottom 15% might boost your average protein from 3.0% to 3.1% just from that alone
  • Amino acid optimization adds another 0.15-0.20 percentage points on top
  • Now you’re at 3.25-3.30% protein—above the new FMMO baseline
  • Your costs dropped through culling
  • Your revenue increased through premiums

That’s how you shrink to grow. And it’s working for operations across the country—though individual results will obviously vary based on your specific circumstances.

Part Five: Your 90-Day Survival Playbook


Phase
DaysAction FocusKey Metric
11-7Face the Truth<$19 survive / >$21 exit
28-30Execute Cull15% reduction
331-45Fix Components$0.10-$0.15/cow/day
446-60Diversify Revenue$100K+ annual
561-75Lock Premiums$40K-$140K/year
676-90Hard Decision85-95% vs 50-65%

Alright, so you understand the problem and the solution. But what do you actually DO? Like, starting Monday morning?

Here’s your tactical roadmap—and I mean this is what you actually need to do, not theoretical stuff:

Days 1-7: Face the Brutal Truth

Calculate your true all-in production cost. Brad Mitchell, Extension Agricultural Economist at Iowa State University, has this worksheet on their dairy team website that makes it pretty straightforward. Use it.

And here’s the part nobody wants to hear—include your own labor at $20 an hour minimum. That’s the median wage for dairy workers according to the Bureau of Labor Statistics as of October 2025. If you’re working 60-hour weeks—and who isn’t?—that’s $62,400 annually you’re not paying yourself.

Critical benchmarks to know:

  • Under $19/cwt: You might survive with some adjustments
  • $19-21/cwt: Major changes needed NOW
  • Over $21/cwt: You need to consider all options, including… well, including exit

Days 8-30: Execute the Cull

Time to identify your bottom 10-15% performers. Look for:

  • Chronic high SCC—anything over 400,000 consistently
  • Repeated health issues—if she’s been treated 3+ times in 90 days
  • Production under 60 pounds a day in early to mid-lactation
  • Poor components—under 2.9% protein consistently

Remove them. Yeah, I know it’s hard. Your daily tank volume will drop. But your profitability will improve immediately. Trust me on this.

Days 31-45: Fix Your Components

Call your nutritionist this week. Not next month. This week.

Tell them you need amino acid balancing targeting:

  • 0.15-0.20 percentage point protein increase
  • Rumen-protected methionine and lysine
  • That 3:1 lysine to methionine ratio we talked about

Budget $0.10 to $0.15 per cow daily. Based on what we’re seeing in the field, you’ll see results in 8-12 weeks.

For sourcing quality rumen-protected amino acids, companies like Adisseo, Evonik, and Kemin have good products—your nutritionist will have preferences based on what’s worked in your area.

Days 46-60: Diversify Revenue

If you haven’t started breeding for beef-on-dairy yet, you’re leaving serious money on the table.

Superior Livestock Auction’s video sales from October 28—I was watching them—show beef-cross dairy calves bringing around $1,400 for 400-pound steers. Straight dairy bulls? You’re lucky to get $150 at the local sale barn.

Here’s the optimal strategy:

  • Top 40% of your herd: Use sexed dairy semen for replacements
  • Bottom 60%: Beef semen all the way

Matt Akins, Beef Specialist at UW Extension’s Marshfield Agricultural Research Station, has calculated that this generates an extra $100,000-plus annually for a typical 200-cow herd. That’s real money.

The beef-on-dairy revolution: $150 dairy bulls vs $1,400 beef crosses—a $1,250 premium per calf that adds $150,000 annually to a 200-cow operation breeding 60% to beef
MetricTraditionalBeef-on-DairyDifference
Per Calf Price$150$1,400+$1,250
Annual Revenue (120 calves)$18,000$168,000+$150,000
Feed EfficiencyBaseline8-25% betterAdvantage
Finishing TimeBaseline20% faster5-26 fewer days
Carcass GradingLower15-25% Prime/ChoicePremium

200-Cow Herd (60% bred to beef)

Now, fair warning—Les Hansen, Professor Emeritus at the University of Minnesota’s Department of Animal Science, keeps reminding everyone that beef prices won’t stay this high forever. USDA’s January 2025 cattle inventory showed we’re at a 73-year lows. When rebuilding starts—probably late 2026—these premiums will shrink. So use this 18-24 month window wisely.

Days 61-75: Lock in Component Premiums

If you can hit 3.3% protein with a 0.80 protein-to-fat ratio, those new cheese plants want your milk. They really want it.

I know of several Wisconsin operations working with processors like Grande and Foremost Farms that just locked in multi-year contracts at anywhere from 40 cents to $1.40 per hundredweight above Federal Order minimums. The exact premium depends on volume commitments, location, quality history—you know, all the usual factors.

On 200 cows, even at the low end, that’s $40,000 annually. At the high end? We’re talking $140,000.

But here’s the thing—these deals are happening NOW. By January, that window probably closes.

Days 76-90: Make the Hard Decision

Look, if you’ve done all this analysis and you still can’t hit profitable benchmarks, it’s time for the conversation nobody wants to have.

Tom Peters, Senior Farm Transition Specialist at Farm Credit Services of America—he’s tracked 127 dairy transitions across the Midwest since 2020. A planned exit over 18-24 months typically preserves 85-95% of asset value. A forced liquidation in crisis? You’re lucky to get 50-65%.

On a typical $4 million operation, that’s the difference between walking away with $3.4 million or $2 million. One sets you up for retirement. The other… doesn’t.

I know this is tough to hear. But ignoring reality doesn’t change it.

Success Stories That Prove It Works

This isn’t just theory, folks. Real farms are making this strategy work right now.

I visited an operation down in Georgia that’s similar to what folks like Sarah Martinez are doing—280 cows on pasture, focused intensively on components. She’s hitting 3.45% protein consistently and has locked in premium contracts with a regional cheese maker. Her costs run about $18.50 per hundredweight—actually profitable at current prices.

“We’re not trying to compete with the big boys on volume,” she told me. “We’re competing on quality and consistency.”

Up in Vermont, I know of operations similar to the Johnson family’s that pivoted to organic about five years ago. Yeah, the transition was brutal—they lost money for three years straight. But now? They’re capturing $35 per hundredweight through Organic Valley with production costs around $28. That’s a healthy margin in anybody’s book.

And there are plenty of mid-size operations maintaining profitability through other unique strategies—direct marketing, agritourism, value-added processing. The point is, there’s more than one path forward.

Tom in Wisconsin? His remaining 1,050 cows are now averaging strong protein levels after working on amino acid balancing. He’s breeding 65% to beef. His costs dropped to about $17.80 per hundredweight after culling those 150 underperformers. At current prices, he’s actually making money. Not a fortune, but enough.

The Digital Edge You Need

What’s encouraging is the technology available now that we didn’t have even five years ago:

Penn State’s DairyMetrics offers a free component optimization app that lets you model amino acid changes before implementing them. Wisconsin’s Dairy Management website, through UW-Madison Extension, offers calculators for everything from culling decisions to heifer inventory optimization.

Several folks I know are using FeedWatch or TMR Tracker software to dial in their rations precisely. When you’re spending $7,000 on amino acids, you want to make sure they’re actually getting into the cows, you know?

And of course, USDA’s Agricultural Marketing Service and the CME Group sites let you track real-time market prices from your phone.

The Bottom Line: Choose Your Path

Look, I’ve been covering this industry for thirty years. This isn’t just another cycle. The combination of mega-dairy economics, geographic shifts, component revaluation, and processing overcapacity—it’s creating a fundamental restructuring of how this industry works.

The whey processors figured this out already. They cut commodity production by about 30%, shifted to high-value products, and created scarcity. CME spot dry whey hit 71 cents per pound last week—a nine-month high—while cheese races toward oversupply.

As Tom told me: “I realized I was trying to compete on volume with operations ten times my size. Can’t win that game. So I changed the game—focused on profit per cow, not gallons in the tank.”

He gets it. The question is, do you?

The decisions you make in the next 90 days will determine which side of 2027 you land on. For some, that means strategic culling and component optimization. For others, it means transitioning to organic or direct marketing. And yes, for some, it means a well-planned exit that preserves wealth.

What’s not an option? Not choosing. Because not choosing is still choosing—it’s just choosing to let the market decide for you.

The clock’s ticking, folks. December 1 is 31 days away.

Time to decide: Will you shift with the market, or get shifted by it?

Key Takeaways:

  • The Volume Game Is Over: With mega-dairies producing at $13/cwt versus your $23/cwt, competing on size is mathematical suicide—the $10 spread is unbridgeable
  • December 1 Deadline Creates Winners and Losers: Hit 3.3% protein to capture $40,000+ in premiums, or face $8,640 in penalties—you have 31 days to pick your side
  • Strategic Culling Pays Immediately: Your bottom 15% of cows are profit vampires—cutting them saves $20,000+ annually while raising your herd average instantly
  • Simple Math, Big Returns: Invest $7,000 in amino acids → boost protein 0.2 points → earn $40,000+ premiums PLUS add beef-on-dairy for another $100,000 = $133,000 net gain
  • Three Honest Options: Transform through the 90-day playbook (works if costs <$21/cwt), pivot to specialty markets (organic/direct), or exit strategically while assets retain 85-95% value—but decide NOW

Resources: Visit your state Extension dairy website for worksheets and calculators. Component optimization apps are available through Penn State DairyMetrics and Wisconsin Dairy Management. For amino acid suppliers, contact your nutritionist. Track markets via the USDA Agricultural Marketing Service and CME Group.

Complete references and supporting documentation are available upon request by contacting the editorial team at editor@thebullvine.com.

Learn More:

  • Navigating Today’s Dairy Margin Squeeze: Insights from the Field – This article reveals practical feed management strategies (5-15% cost cuts) and modern culling benchmarks, offering immediate, actionable tactics to improve efficiency and component production, directly complementing the main article’s 90-day playbook for cost control and herd optimization.
  • USDA’s 2025 Dairy Outlook: Market Shifts and Strategic Opportunities for Producers – Explore how USDA forecasts impact milk production and prices, and discover strategic opportunities in component optimization, processor alignment, and export markets. This provides essential broader market context and long-term planning insights to safeguard your operation’s future profitability.
  • When Butterfat Isn’t Enough: Adapting Your Dairy to New Market Realities – Delve into the role of technology and innovation in component optimization, with insights on RFID systems, automated feeding, and calculating their return on investment across various herd sizes. This article demonstrates how to leverage modern tools to achieve the profitability goals outlined in the main piece.

The Sunday Read Dairy Professionals Don’t Skip.

Every week, thousands of producers, breeders, and industry insiders open Bullvine Weekly for genetics insights, market shifts, and profit strategies they won’t find anywhere else. One email. Five minutes. Smarter decisions all week.

NewsSubscribe
First
Last
Consent

Forget Volume: China’s 18% Premium Surge Means $150,000+ More for Component-Focused Farms – But the Window Closes Fast

The surprising market shift that’s making component quality more valuable than volume—and what producers are learning about the 3-5 year window ahead

EXECUTIVE SUMMARY: China’s premium dairy surge is handing component-focused producers $150,000-$200,000 in extra annual revenue—no expansion required. While premium imports rocket up 18%, commodity imports are tanking 12%, creating a historic quality-over-quantity shift driven by 670 million Chinese middle-class consumers who prioritize safety and nutrition over price. Here’s the critical part: the 3-5 year window to lock in premium supplier status is already 40% gone, with October 2025 marking a crucial decision point. Producers implementing targeted nutrition changes see results in 12-18 months, while genomic improvements take 36-48 months—both achievable before the 2027 market saturation deadline. Right now, component-optimized milk commands $24/cwt versus $18 for commodity, a $6 gap that represents survival versus thriving. Bottom line: farms that pivot to components this winter will count premium checks in 2026, while volume-chasers will still be wondering what happened when the window slams shut.

You know, last week I was going through Chinese customs data, and something really caught my attention. China’s economy is slowing down to 4.6% GDP growth—we all know that story. But here’s what’s interesting… their dairy import patterns are telling a completely different tale, one that’s got progressive American producers rethinking how they value every pound of milk in the bulk tank.

So the USDA Foreign Agricultural Service released its May 2025 report, showing that China’s overall dairy imports grew by about 6% through September. Not bad, nothing spectacular. But when you dig into the specific categories—and this is where it gets really fascinating—premium dairy products are advancing nearly 18% year-over-year while commodity products are retreating around 12%, based on what we’re seeing in Chinese customs data and the latest Tridge market analysis. For those of us who’ve built our operations around maximizing volume for generations, well… this divergence is something we need to talk about.

Component-optimized milk commands $24/cwt versus $18 for commodity—a $6 gap that separates profitable farms from struggling ones. Right now, this premium represents the difference between counting checks in 2026 or wondering what happened.

What the latest customs reports are showing is cheese imports rising 13.5% and butter—get this—surging 72.6% year-over-year. Meanwhile, skim milk powder? That’s heading the other direction. I’ve been talking with dairy market analysts who’ve tracked this stuff for the past decade, and they’re telling me this isn’t just another market fluctuation. It looks like we’re seeing a fundamental shift in what the world’s largest dairy import market actually values.

Butter imports to China exploded 73% while skim milk powder declined 8%—proof that premium components crush commodity volume. Chinese consumers are voting with their wallets for quality over quantity.

“The premium shift isn’t temporary—it’s structural. Producers who position themselves now will capture long-term value that commodity markets simply can’t match.”

And here’s what really makes you think… China’s middle class is continuing to expand—the USDA projects they’ll add 80 million people by 2030—and we’re observing similar patterns across Southeast Asia, India, and parts of Africa, according to Rabobank’s December 2024 analysis. What I’ve found is this could represent the most meaningful value shift in global dairy markets we’ve seen in decades.

China’s dairy market is splitting in two—premium products rocket up 18% while commodity imports crater 12%. This historic quality-over-quantity shift represents survival versus thriving for global dairy exporters.

Understanding What’s Really Driving This Premium Shift

When you look at the forces reshaping China’s dairy demand, they actually make a lot of sense—wealth creation, food safety consciousness, evolving consumer preferences. Understanding these drivers helps explain why this shift feels different from the usual market cycles we’ve all ridden out before.

The Food Safety Factor That Won’t Go Away

It’s been seventeen years since that 2008 melamine incident—the World Health Organization reports documented six infant deaths and 300,000 illnesses. Yet Chinese consumers still show a strong preference for imported dairy products, especially when it comes to their kids. The China Dairy Industry Association’s data shows imports of infant formula increased from 28% of dairy imports in 2008 to 45% by 2019.

What’s particularly telling—and this surprised me—is that premium infant formula now represents 37% of market share, up from 32.8% just a year ago, according to July 2025 market research from Innova. The Chinese Academy of Agricultural Sciences recently published consumer research showing Chinese consumers prioritize nutritional value at 59%, quality at 45%, and safety at 39%. Price? That ranks at just 6% when they’re selecting a formula. That preference hierarchy creates real pricing opportunities for suppliers who can demonstrate superior quality and traceability.

How Middle Class Growth Changes Everything

The scale here is… well, it’s something else. China’s middle class expanded from 3.1% of the population in 2000 to 50.8% in 2018, according to McKinsey Global Institute data. We’re talking about roughly 670 million people joining the ranks of consumers with discretionary income. The National Bureau of Statistics of China reports per capita income grew at a 6.1% compound annual rate from 2019 to 2024, reaching 41,300 RMB—that’s about $5,792 annually.

What I’m seeing in the consumption data is these folks aren’t looking for the cheapest option on the shelf. They want Western-style products with clear quality differentiation. USDA estimates show cheese consumption alone could hit 495,000 metric tons by 2030, growing at a 9.1% compound annual rate. And here’s the kicker—60 to 75% is being consumed in foodservice settings like Western restaurants and pizza chains.

Why China Can’t Make These Premium Products Themselves

This caught me off guard when I first looked into it. China aims to achieve 75% dairy self-sufficiency under its 14th Five-Year Plan, but its domestic production focuses mainly on fluid milk and basic dairy products. The USDA’s May 2025 China dairy report shows Chinese farms are actually reducing output—down 0.5% in 2024 with another 1.5% decline forecast for 2025—as farmgate prices hit decade lows around 3.20 RMB per kilogram.

But here’s the real issue… China lacks the processing infrastructure for specialty cheese production, premium protein concentrates, and other high-value categories. The USDA report notes that while “domestic cheese production will increase gradually, with growing investment in natural cheese capacity,” current production is just 30,000 MT, compared to 178,000 MT imported.

Dr. Leonard Polzin from the University of Wisconsin’s Center for Dairy Profitability calls this “structural import dependency” for premium products—and it’s likely to persist given the technical expertise and infrastructure requirements. Makes sense when you think about it.

How Payment Systems Shape Who Wins in Export Markets

What’s really revealing about the competition between major dairy exporters is how payment structures influence what farmers produce, which ultimately determines export success. New Zealand is capturing 46% of China’s dairy imports? That’s not luck—it’s directly tied to how they pay farmers.

The Fonterra Approach Makes You Think

So Fonterra pays farmers solely on the basis of kilograms of milk solids—butterfat plus protein. Water? Doesn’t matter. Lactose? Not counted. Their 2025/26 forecast, announced in May, stands at $10.00 NZD per kilogram of milk solids.

Research published this year by dairy economics specialists shows the New Zealand payment system essentially discourages chasing volume. When volume isn’t the main metric, farmers naturally optimize for component density instead of pushing cows for maximum daily production. It’s a different mindset entirely.

What I find interesting is how this payment structure aligns farmer incentives with premium market demand almost automatically. When Chinese buyers want high-protein cheese or concentrated dairy ingredients, New Zealand farmers are already producing that milk profile—not specifically for exports, but because that’s what their payment system rewards.

Where American Payment Systems Create Challenges

And this is where it gets tricky for us. Most American cooperatives still use volume-focused payment systems with base prices per hundredweight, treating component premiums as add-ons rather than the main event. This creates an interesting situation—we’re optimizing for volume because that’s what payment systems reward most directly, even as global markets increasingly value component density.

Cornell University’s 2020 research on payment structures, led by Dr. Chris Wolf, found something eye-opening: non-cooperative handlers allocated 37% of premiums to quality incentives, while cooperatives allocated just 18% to quality. As the research shows, some cooperatives reward production excellence while others… well, they basically reward showing up.

“We spent decades asking, ‘How much milk can we ship?’ Now we ask, ‘How much value can we create?’ That change in thinking transformed everything about our operation—and our future.”

Learning from European Approaches

What’s interesting is looking at how European producers handle this. In the Netherlands, FrieslandCampina’s payment system includes substantial sustainability and quality bonuses that can add up to 15% to the base price. German cooperatives like DMK have shifted toward value-based pricing models that reward both components and environmental metrics. These systems took years to implement, but they’re now seeing the payoff in premium export markets.

What Progressive Producers Are Learning

I’ve been talking with forward-thinking dairy operations across the country, and many aren’t waiting around for payment system reform. They’re discovering that transitioning from volume to value can happen faster than we’ve traditionally thought—often with pretty encouraging financial results.

The Nutrition Strategy That Works Right Now

A Wisconsin producer I spoke with recently—runs about 500 cows near Eau Claire—told me something interesting: “We figured component improvement would take years, but our nutritionist showed us we could see real changes within a single lactation cycle.”

Based on Penn State Extension research and field trials across the Midwest, here’s what’s delivering results:

  • Amino acid balancing targeting 6.5-7.2% lysine and 2.4-2.6% methionine in metabolizable protein: University of Wisconsin trials show 0.1-0.2% protein increases are worth approximately $71,000 annually for a 500-cow operation
  • Fatty acid supplementation using rumen-protected fats: Michigan State research demonstrates 0.2-0.3% butterfat increases valued at $98,000+ annually
  • Forage quality optimization, maintaining 26-32% neutral detergent fiber: Cornell studies confirm this supports efficient rumen fermentation for better component production

Dr. Mike Hutjens, Professor Emeritus of Animal Sciences at the University of Illinois—he’s worked with dozens of component-focused operations—tells me farms are capturing $150,000 to $200,000 in additional annual revenuethrough nutrition changes alone, before even touching genetics.

How Genomics Accelerates the Timeline

The genomic testing revolution has really changed the game here. Chad Ryan, genetic programs manager at Select Sires, puts it this way: “What used to take 6-7 years now happens in 36-48 months for herds committed to change.”

The Council on Dairy Cattle Breeding reports that as of April 2025, the average Holstein heifer calf produces 45 more pounds of butterfat and 30 more pounds of protein annually compared to one born in 2015—purely through genetic selection. That’s progress.

Strategic Approaches by Farm Size

Through conversations with producers nationwide, it’s becoming clear that farms of every size can access premium value—though the best strategies vary quite a bit based on scale, location, and market access. Now, not every region has equal access to premium processors—let’s be honest about that—but opportunities are expanding faster than many folks realize.

Mid-Size Operations (300-800 cows): Finding the Balance

These operations often have that nice combination of enough scale for efficiency while maintaining flexibility to adapt. A producer milking 550 cows near Green Bay shared this with me: “We’re big enough to matter to processors but small enough to pivot when we need to.”

Wisconsin’s Department of Agriculture reports that operations focusing on cheese-quality milk are seeing annual revenue increases of $150,000-$200,000 through component optimization. You know what’s interesting about this size operation? They can often implement changes faster than larger dairies while still having enough volume to negotiate favorable terms with processors.

Large Operations (1,500+ cows): Leveraging Scale

California’s larger dairies are taking a different approach. A manager running a 2,100-cow operation in Tulare County explained their strategy: “We provide consistent, high-volume premium supply for export contracts.”

What I’ve noticed with these larger operations is that they’re often dealing with tighter margins per cow, so even small percentage improvements in components can make a huge difference to the bottom line. And with California’s ongoing water challenges and environmental regulations, maximizing value per gallon of water used is becoming critical.

Small Family Farms (Under 200 cows): The Niche Advantage

What’s been really encouraging—and honestly, kind of surprising—is how smaller farms are finding lucrative opportunities in specialty markets. A Pennsylvania family running 165 cows who switched to A2 production three years ago now gets $24 per hundredweight. “Would’ve seemed impossible five years ago,” they told me.

Penn State Extension specialist Lisa Holden confirms what we’re seeing: “Small farms using modern management systems are proving that farmstead-scale operations can achieve competitive margins. The key is identifying and serving premium niches that value authenticity and story alongside quality.”

The Window of Opportunity—And Its Limits

Dr. Mary Ledman, global dairy strategist at Rabobank, sees a clear but limited window here. “Producers have about 3-5 years to establish themselves as premium suppliers before market saturation occurs,” she explained at a recent industry conference. “China’s premium import growth won’t stay at 18% forever.”

What makes this particularly compelling is that nine out of ten emerging markets—Southeast Asia, India, Africa—are reporting double-digit gains in premium dairy demand according to IFCN Dairy Research Network data. Southeast Asia’s dairy market alone is projected to grow at 7-8% annually through 2030, according to FAO projections.

But let’s be realistic here. Not every producer has convenient access to premium processors. Transition costs can be substantial upfront. And yeah, there’s risk in shifting away from what’s worked for generations. Plus, with the way weather patterns have been changing—we all saw what happened with the flooding in California’s Central Valley last spring—maintaining consistent component levels through environmental challenges adds another layer of complexity.

Practical First Steps You Can Take

Based on everything I’ve learned researching this shift, here’s what I’d suggest doing in the next 30 days:

Week 1: Figure Out Where You Stand

  • Calculate your average components from the past year (and compare them seasonally—summer depression is real)
  • Compare your payment structure to what others in your region are getting
  • Identify processors in your area who pay component premiums

Week 2: Look at Nutrition Options

  • Set up a meeting with your nutritionist about amino acid balancing
  • Get quotes for rumen-protected fat supplements
  • Test your current forage quality—NDF digestibility, particle size, the works

Week 3: Explore Your Market

  • Call three specialty processors or cheese makers within reasonable hauling distance
  • Research what certifications the premium markets in your area require
  • Talk with your cooperative about their export programs and premium opportunities

Week 4: Build Your Plan

  • Set component targets for the next 12 months
  • Budget for genomic testing of heifer calves
  • Pick your first step—nutrition usually offers the quickest payback

Where This All Leads—And Why Time Matters Now

Looking at everything together—the data, what producers are experiencing, where markets are heading—this shift from volume to value in global dairy markets isn’t just talk anymore. It’s happening right now, and we’re seeing clear differences between those adapting and those holding steady.

What really strikes me is how China’s market is basically showing us the future. That surge of nearly 18% in premium dairy imports, while commodity products decline around 12%? That’s not just noise. We’re seeing similar patterns across emerging markets—FAO, Rabobank, and IFCN are all documenting this—which creates multiple opportunities for well-positioned suppliers.

I’ll be straight with you—the window for action feels tighter than many producers might expect. Those who establish premium positioning in the next 3-5 years will likely lock in long-term contracts and relationships. If we look at historical patterns in agricultural markets, waiting for others to prove the model usually means competing for whatever’s left in increasingly crowded markets.

And here’s the thing that should really get your attention: we’re already ten months into 2025. If that 3-5 year window started when these trends became clear in early 2024, we’re already approaching the halfway point of year two. The producers making moves now—this fall, this winter—are the ones who’ll be established when the real competition for premium contracts heats up in 2026 and 2027.

What gives me hope is that farms of every size genuinely have pathways forward. From 150-cow family operations I’ve visited who’re targeting local specialty markets to 2,000-cow enterprises supplying export containers, there are viable strategies across the board.

The window’s open right now—but with 2025 nearly in the books and premium market competition accelerating, every month of hesitation means watching another competitor lock in the contracts and relationships that could’ve been yours. Based on everything I’m seeing and hearing, by the time the 2026 harvest rolls around, the early movers will already be counting their premium checks while others are still debating whether to make the shift.

The clock is ticking. The question isn’t whether this shift will happen—it’s whether you’ll be part of it.

Key Takeaways:

  • The Opportunity: Premium dairy imports to China up 18% while commodity down 12%—this isn’t temporary
  • The Timeline: 3-5 year window to establish premium positioning before market saturation
  • The Money: $150,000-$200,000 potential annual revenue increase for 500-cow operations through component optimization
  • The Path: Nutrition changes deliver results in 12-18 months; genetic improvements in 36-48 months
  • The Reality: Not every producer has equal access to premium markets, but opportunities are expanding rapidly

Complete references and supporting documentation are available upon request by contacting the editorial team at editor@thebullvine.com.

Learn More:

The Sunday Read Dairy Professionals Don’t Skip.

Every week, thousands of producers, breeders, and industry insiders open Bullvine Weekly for genetics insights, market shifts, and profit strategies they won’t find anywhere else. One email. Five minutes. Smarter decisions all week.

NewsSubscribe
First
Last
Consent

The $7,200 Lameness Fix That Beats $45,000 Technology (40-50% Reduction Proven)

Every lame cow costs you $337. A Wisconsin farmer saves $20,000/year with footbaths, not $45,000 cameras. Here’s his exact protocol.

EXECUTIVE SUMMARY: While the industry pushes $45,000 lameness cameras, a Wisconsin farmer cut lameness by 42% for $3,100 by practicing disciplined prevention. Analysis of 600+ farms shows that the Prevention Bundle—footbaths 4x weekly, strategic dry-off trimming, and weekly scoring—reduces lameness by 40-50% for just $7,200 annually. At $337 per lame cow, this approach saves typical 350-cow operations $10,000+ yearly with a 4-6 month payback, versus 2-4 years for technology ROI. Technology excels for 1,000+ cow operations and robot barns where manual observation becomes impossible, but most farms achieve better results by solving the root problem with prevention. The industry’s ‘reality correction’ confirms what successful producers already know: you can’t detect your way out of a prevention problem—and you shouldn’t try when prevention costs 86% less.

Dairy Lameness Cost

Last February, I stood watching a young dairy farmer in Pennsylvania delete yet another unopened alert from his $52,000 lameness detection system. The dashboard showed 14 flagged cows that morning. He’d been up since 2 AM with a difficult calving, looked at the screen, and just closed it. “I’ll check them later,” he said.

You know how it goes. Later never came.

This scene’s been playing out on more farms than you’d think. AgFunder’s investment reports tell us precision livestock technology adoption has really picked up since 2023, though it’s tough to nail down what individual farms are actually spending. Meanwhile, Dr. Nigel Cook’s ongoing work at the University of Wisconsin continues to show lameness hovering around 20-25% across most operations.

What’s particularly interesting—and I’ve been thinking about this a lot—is how we’re investing heavily in detection while the actual problem isn’t getting much better. The pattern I’m seeing suggests we might be looking at this whole thing backwards.

And here’s what really gets me: the most effective solution costs about 86% less than what many of us are being told we need.

What’s the Real Cost of Each Lame Cow?

Lost milk and failed breedings devour 46% of your $337-per-case lameness cost—revealing why early detection through prevention matters more than expensive camera alerts that arrive too late to save production

So there’s this figure that keeps coming up in the research, and it’s worth paying attention to: $337 per lameness case. Robcis and colleagues nailed this down in their 2023 Journal of Dairy Science analysis, building on what Dr. Karin Dolecheck and Dr. Jeffrey Bewley developed at the University of Kentucky. Really solid economic work that actually captures what we’re dealing with.

If you’re running 350 cows with 20% lameness—and let’s be honest, that’s probably where many of us sit—you’re looking at about $23,590 in annual losses. That matches up pretty well with what producers tell me they’re seeing.

But here’s where it gets interesting…

Technology presentations often reference different numbers. Dr. Y.H. Cha’s 2010 research in Preventive Veterinary Medicine documented costs from $121 for foot rot up to $216 for sole ulcers—good, solid data. But somehow, in sales materials, these morph into $400-$533 per case. They’ll cite a 30-40% prevalence rate as the “industry standard,” which might not apply to your farm at all.

Through that lens, suddenly your 350-cow operation looks like it’s losing $60,000 or more annually. Makes that $45,000 camera system seem pretty reasonable, doesn’t it?

The Dolecheck-Bewley model from their 2018 Animal journal work breaks it down like this:

  • Milk production losses: $80-120 per case (that’s 30-35% of your total hit)
  • Reproductive impacts: $42-70 (another 20-30%)
  • Treatment costs themselves: just $40-60 (15-20%)
  • Culling risk: $25-50 (10-15%)
  • Labor and overhead: $20-40 (10-15%)

What I’ve noticed visiting farms from Wisconsin to California is that prevention effectiveness—not detection speed—drives most of these costs.

And good prevention? Well, that doesn’t require artificial intelligence.

Worth noting, though—these figures vary by region. California operations might see $380 per case with their labor costs, while Wisconsin farms might be closer to $310. But the principle stays the same.

Quick Reference: Prevention vs. Technology Investment

Prevention Bundle delivers 40-50% lameness reduction for $7,200 annually versus $45,000+ for technology systems that achieve 30% reduction—proving disciplined footbath protocols beat expensive cameras for 90% of dairy operations

Prevention Bundle

  • Annual cost: $7,200-8,200
  • Lameness reduction: 40-50%
  • Year 1 ROI: Positive $3,400-4,600
  • Break-even: 4-6 months

Technology Investment

  • Initial cost: $45,000-80,000
  • Detection advantage: 7-10 days earlier
  • Year 1 ROI: Typically negative
  • Break-even: Years 2-4

Decision Threshold: Technology makes sense for operations >1,000 cows or running AMS

What Prevention Package Actually Works?

Dr. Laura Solano’s Alberta Lameness Reduction Initiative, which she published in the Journal of Dairy Science in 2019, really opened my eyes. Combine that with Dr. Gerard Cramer’s work at Minnesota, and you see this encouraging pattern. Farms implementing what they’re calling the “Prevention Bundle” are hitting 40-50% lameness reductions for about $7,200 annually.

No fancy cameras. No algorithms. Just good management.

Now, costs vary by region—copper sulfate in Vermont costs different than Arizona, and California labor rates aren’t the same as South Dakota’s. But the principles? Those work everywhere I’ve looked.

Strategic trimming eats 44% of your $7,200 prevention budget but delivers the highest lameness reduction—invest here first, then layer on footbaths and scoring to hit that 40-50% improvement Wisconsin farmers are banking

Is Your Footbath Actually Working?

Dr. Dörte Döpfer at Wisconsin has spent decades documenting digital dermatitis control—you’ve probably seen her work in the veterinary journals. What she consistently finds is that regular footbath protocols can knock DD prevalence down 40-60% within 16 weeks.

Producer Success Story: Foundation Over Technology

Location: Near Fond du Lac, Wisconsin
Herd Size: 600 cows
Starting Lameness: 24%
Current Lameness: 14%
Time Frame: 18 months
Investment: $3,100/year in footbath protocols

This Wisconsin producer transformed his herd health without any technology investment. His approach was refreshingly straightforward.

“We treat footbaths like milking—non-negotiable, same times, same concentrations, every single week,” he explains. “That consistency matters more than any camera could.”

Key Success Factors:

  • Footbaths 4x weekly (Tuesday, Thursday, Saturday, Monday)
  • 5% copper sulfate is changed every 200 cow passes
  • Dedicated employee ownership of the protocol
  • pH monitoring to maintain effectiveness

Results: 42% reduction in lameness, saving approximately $20,000 annually based on that $337 per case figure

Here’s what’s fascinating—and Dr. Jan Shearer’s Iowa State research backs this up—the specific chemistry matters way less than consistency. Whether you’re using 5% copper sulfate, 2-5% formalin, or those newer zinc products, it’s the frequency that makes the difference.

Four times weekly beats “when we remember” every single time.

The math’s straightforward:

  • Copper sulfate: $2-3 per pound, about 22 pounds per mix
  • For 300 cows: roughly $1,200-1,500 annually in materials
  • Labor at $15-20/hour: another $1,600
  • Total commitment: $2,800-3,100 per year

Are You Trimming at the Wrong Time?

Dr. Sarel van Amstel’s research really changed how I think about trimming timing. Cows trimmed at dry-off show way fewer lesions next lactation compared to waiting until problems show up.

Dr. Gerard Cramer, who’s leading this big USDA-funded lameness project at Minnesota, puts it perfectly: “Strategic trimming at dry-off and around 100 days in milk is proactive management, not reactive.”

The economics are compelling. Multi-year projects tracking thousands of cows show that strategic trimming delivers returns several thousand dollars better than whole-herd trimming every six months.

Do You Really Need Cameras to See Lame Cows?

This might surprise you, but research comparing trained observers against automated systems shows weekly mobility scoring catches problems within 7-10 days of AI cameras.

That 23-day advantage you hear about? That’s comparing technology to casual observation at milking, not systematic weekly scoring.

A Lancaster County producer I know spent two hours with her vet learning proper scoring. Now it takes about three hours every Tuesday morning to score the whole herd.

“We catch 75% of problems before they’re severe,” she says. “For our 450 cows, that’s good enough.”

You can get free scoring guides from Wisconsin’s Dairyland Initiative, AHDB Dairy in the UK, or Cornell’s NYSCHAP program.

When Does Technology Actually Pay?

Technology’s $100,000 savings kick in only after 1,000 cows—proving 90% of dairies waste money on cameras when $7,200 prevention protocols deliver faster payback and better results for smaller operations

Now don’t get me wrong—I’m not anti-technology. I’ve seen plenty of operations where automated detection delivers real value. But specific conditions need to line up.

How Big Is Big Enough?

Dr. Marcia Endres at the University of Minnesota has modeled the economics, and automated systems typically hit positive ROI in herds of over 1,000 cows. At that scale, manual scoring becomes a logistical nightmare. Even small improvements mean big savings.

I visited a large dairy near Turlock recently—1,850 cows across two sites with both robots and conventional parlors. At 21% lameness, they’re looking at annual costs of $131,000.

A 30% improvement through earlier detection saves nearly $40,000 yearly. That justifies the technology pretty quickly.

Their herd manager made a good point: “Dedicated mobility scoring would cost us $65,000 annually in wages and benefits. The camera system costs less and runs 24/7.”

Dr. Robert Hagevoort at New Mexico State works with those massive Southwest dairies. As he says, when you’re managing multiple sites with thousands of cows, manual scoring isn’t just difficult—it’s impossible. Technology becomes essential.

What About Robot Barns?

Dr. Trevor DeVries at Guelph has documented some concerning patterns in robot herds—lame cows make fewer trips, produce less milk. These “invisible” lame cows are exactly what cameras help identify.

What’s interesting is how different robot systems integrate.

Lely’s approach differs from DeLaval’s or GEA’s, and each affects how well lameness detection meshes with your existing setup.

Technology consistently delivers value when you’ve got:

  • Over 1,000 cows where manual scoring needs dedicated labor
  • Robots where voluntary cow flow hides problems
  • Genetic selection programs needing continuous data
  • Persistent labor challenges
  • Already maximized prevention, but still over 15% lameness

An Ontario producer I know runs 2,200 cows with his brothers. “We did everything right,” he told me. “Footbaths four times weekly, strategic trimming, the works. Still had 18% lameness. The cameras showed us facility design problems we couldn’t see ourselves.”

Can You Have Both?

I should mention—some of the best results I’ve seen come from farms combining both approaches. A 1,500-cow operation in Idaho implemented the full Prevention Bundle first, reduced lameness to 12%, then added cameras to capture the remaining percentage. They’re now running at 8% consistently.

That’s the sweet spot some larger operations are finding—prevention as the foundation, technology as the refinement.

And it’s not just the big guys. I know a 400-cow registered Holstein operation in Vermont that uses cameras specifically for their high-value genetics program. With cows worth $15,000-20,000, that 7-10 day earlier detection can mean the difference between saving a valuable bloodline or losing it. For them, the technology investment makes sense even on at smaller scale.

What’s the Hidden Cost of All This Technology?

What worries me—and I hear this from Extension folks everywhere—isn’t the technology itself. It’s what happens to our ability to read cows when we let computers do all the observing.

From farm visits and conversations over the past couple of years, I’m noticing younger employees on tech-heavy farms sometimes struggle with visual problem identification. Makes sense when you think about it.

I visited a Wisconsin farm where the owner had invested heavily in monitoring—activity collars, cameras, body condition scoring, and feed monitoring.

Seven different dashboards across four platforms, none talking to each other.

“That investment taught me an expensive lesson,” he said over lunch.

Interestingly, his lameness had actually increased as he spent more time managing alerts than managing basics.

Six months later? He kept only the activity collars for heat detection and started what he called “tech-free management time”—two hours each morning spent walking pens and looking at cows. Lameness improved markedly.

When Do Alerts Become Noise?

Extension specialists keep telling me the same story: excessive alerts create decision paralysis.

You start ignoring low-priority stuff. Then moderate warnings. Eventually, you’re only responding to obvious problems—defeating the whole purpose.

A New Mexico large-herd manager described it perfectly: “Seven dashboards, four platforms, over a hundred daily alerts. I spend three hours sorting data before actual cow work begins. We’re managing information, not cattle.”

Key Questions for Technology Vendors

Before signing any purchase order, get clear answers to:

  1. What percentage of your customers achieve positive ROI within 18 months?
  2. Can you provide references from my region, my herd size?
  3. What’s the full 5-year cost, including everything?
  4. How many daily alerts should I expect?
  5. What happens if you get bought out or discontinue this product?

Your 12-Month Prevention Roadmap

If you’re sitting there wondering about that technology purchase order, here’s an alternative that’s worked for multiple operations:

Months 1-3: Build Your Foundation

Start with footbaths. Not exciting, I know. But Tuesday, Thursday, Saturday, Monday—mark it down.

Dr. Döpfer’s Wisconsin protocols say 5% copper sulfate is changed every 200 cow passes. Train multiple people on mobility scoring using those free university resources. Schedule dry cow trimming.

You’ll invest about $2,000 for training and initial supplies. Based on Alberta data, expect a 10-15% reduction in new cases.

Months 4-6: Dial It In

Monitor footbath pH—Dr. Shearer’s research shows effectiveness tanks above pH 5.5.

Start weekly systematic scoring. Add that 100 DIM trimming for fresh cows.

Investment: around $3,500. Expect another 15-20% drop in prevalence.

Months 7-12: Make It Stick

Evaluate monthly, develop your own protocols, and ensure backup training so vacations don’t derail progress.

About $1,700 more investment. You should stabilize around 12-13% prevalence—that’s 45-50% total reduction.

Total annual investment: $7,200
Expected savings at $337/case: $10,600-11,800
First-year net benefit: $3,400-4,600

Compare that to technology, where Year 1 typically shows negative returns, with break-even in Years 2-4 according to Dr. Jeffrey Bewley’s adoption models.

Your prevention investment hits break-even by month 6 while lameness drops 42%—compare this to technology’s 2-4 year payback and you’ll understand why Wisconsin’s smartest farmers aren’t waiting for AI to solve problems footbaths prevent

Is the Industry Finally Getting It?

AgFunder calls what’s happening a “reality correction.” After years of aggressive growth, investors want proof of real-world value.

Vendors are changing, too. A major camera manufacturer recently told me they’re now recommending some prospects work with Extension for 6-12 months before buying.

“Farms need foundational management before technology amplifies effectiveness,” they explained.

That’s a big shift from two years ago.

It reflects growing recognition that technology supplements good management—it doesn’t replace it.

Dr. Nigel Cook from Wisconsin, whose lameness work has shaped industry practices for decades, said it best: “Transformational results come from disciplined execution of proven prevention protocols, maintained consistently over time.”

What About Your Specific Situation?

Everything I’ve talked about needs adapting to your situation. Missouri pasture systems face different challenges than Idaho freestalls. Arizona heat stress impacts lameness differently than the Vermont mud season.

Dr. Peter Robinson at UC Davis has documented clear connections between heat stress and California lameness patterns. Meanwhile, Northeast research shows spring transitions can really spike lameness in pasture systems.

The Prevention Bundle principles stay constant, but implementation varies.

Texas operations might adjust footbaths during monsoons. Wisconsin farms see spikes during spring pasture transition. Know your specific challenges.

Check out these support programs:

  • USDA EQIP funding for infrastructure (varies by state)
  • State dairy grants in Vermont, Wisconsin, and New York
  • Extension training cost-shares

What’s Your Bottom Line?

Know Your Real Costs
Use that $337 figure from Robcis, not inflated estimates. Most farms incur annual losses of $15,000-25,000, not the $50,000-60,000 sometimes suggested.

Prevention Pays Fast
The $7,200 Prevention Bundle typically pays back within 4-6 months, based on data from Alberta and Minnesota.

Technology Has Its Place
Over 1,000 cows, running robots, doing genetic selection? Automated detection can deliver value—after you’ve nailed the basics of prevention. Even some smaller operations with high-value genetics programs find the ROI works for their specific situation.

Consider Everything
Beyond purchase price and subscriptions, think about alert management time, decision fatigue, and what happens to your team’s cow-reading skills.

Ask Yourself the Key Question
Before any technology purchase: “Would this money spent on prevention solve my lameness problem?” If yes, start there.

What’s Next for Lameness Management?

The exciting stuff I’m seeing isn’t coming from Silicon Valley—it’s coming from farms figuring out what actually works. Dr. Cramer’s USDA work at Minnesota is revealing interesting synergies between prevention strategies.

Several farms report better results combining strategic trimming with consistent footbaths than either practice alone would suggest. These are the practical insights that move the needle.

The Foundation for Food & Agriculture Research is supporting lameness research with equal focus on prevention refinement and appropriate technology development. The emphasis stays on integration, not replacement.

Making Your Decision

The path’s becoming clearer: nail the fundamentals first. Build management discipline that makes any tool work better. Then—and only then—evaluate if technology adds value for your specific situation.

This $337 reality check isn’t about rejecting innovation. It’s about aligning decisions with your farm’s actual needs, proven interventions, and management fundamentals rather than promised potential.

The fanciest detection system can’t fix prevention failures. But consistent prevention protocols, executed with discipline, can make detection systems unnecessary for many farms.

That might challenge what technology marketing tells us. But based on what I’m seeing coast to coast, it’s what’s actually working.

Your choice: invest $45,000-80,000 in cameras that might detect problems 7-10 days earlier than good observation, or invest $7,200 in prevention that stops 40-50% of problems from happening.

Each farm’s different. The question is: which approach fits yours?

Next Step: Call your Extension specialist this week to get those free scoring guides and start building your Prevention Bundle. The sooner you start, the sooner you’ll see results.

Free locomotion scoring guides are available through the University of Wisconsin’s Dairyland Initiative, Cornell’s NYSCHAP program, and AHDB Dairy UK. Prevention resources can be accessed through your state Extension dairy specialists. USDA EQIP funding information is available at your local NRCS office.

KEY TAKEAWAYS

  • The $7,200 Prevention Bundle outperforms $45,000 technology for 90% of farms—delivering 40-50% lameness reduction with 6-month ROI vs 2-4 years
  • One number changes everything: Operations under 1,000 cows achieve better results with prevention (footbaths 4x weekly, strategic trimming, weekly scoring) than cameras
  • Wisconsin farmer proves it works: Cut lameness from 24% to 14% using just $3,100 in footbath protocols, saving $20,000 annually at $337/case
  • Technology has its place: Large operations (>1,000 cows) and robot barns benefit from automated detection, where manual observation becomes impossible
  • Start tomorrow: Download free scoring guides from Wisconsin Dairyland Initiative and implement footbaths this week—prevention costs 86% less than detection

Complete references and supporting documentation are available upon request by contacting the editorial team at editor@thebullvine.com.

Learn More:

  • Is Your Footbath Protocol Actually Working? – For those ready to implement the main article’s advice, this guide provides the essential tactical details. It demonstrates how to audit your current setup, troubleshoot common failures, and maximize the effectiveness and ROI of your footbath investment.
  • The Data-Driven Culling Strategy That’s Boosting Dairy Profitability – This article expands on the financial impact of lameness by providing a strategic framework for making tough culling decisions. It reveals how to use herd data to identify which animals are hurting your bottom line, optimizing overall herd value and profitability.
  • Precision Dairy Farming: Is Your Farm Ready for the Data Revolution? – While the main article critiques a single technology, this piece offers a strategic roadmap for successful tech integration. It provides criteria to assess if your operation is culturally and logistically prepared to turn data into decisions, avoiding the common pitfalls of technology overload.

The Sunday Read Dairy Professionals Don’t Skip.

Every week, thousands of producers, breeders, and industry insiders open Bullvine Weekly for genetics insights, market shifts, and profit strategies they won’t find anywhere else. One email. Five minutes. Smarter decisions all week.

NewsSubscribe
First
Last
Consent

The Eight-Hour Breaking Point: How Immigration Politics and Biology Are Reshaping Dairy’s Future

Eight hours. That’s all it takes for a labor crisis to turn into a herd crisis—and for biology to remind us who’s really in charge.

You know, picture this for a moment: It’s 4 AM on a Tuesday in Vermont, and eight workers who’ve just finished six consecutive 12-hour shifts are arrested on their one day off. Within eight hours—not days, mind you, but hours—that dairy operation faces a biological crisis that no amount of political maneuvering can solve.

Biology doesn’t negotiate: The eight-hour timeline shows how quickly a labor crisis transforms into a herd health catastrophe—mastitis, treatment costs exceeding replacement value, and culling decisions nobody wants to make.

Since April’s enforcement actions swept through Vermont dairy country, I’ve been having some really eye-opening conversations with producers who are grappling with a reality we’ve all understood but rarely discussed openly. What Texas A&M’s research team documented is pretty sobering—immigrant workers make up roughly half our dairy workforce while producing nearly 80% of our milk supply. But here’s what’s actually keeping folks up at night… when that workforce disappears, you’ve got maybe eight hours before the biology of dairy farming collides head-on with political reality.

The 51-79 Workforce Bomb reveals dairy’s hidden dependency: immigrant workers comprise just 51% of the labor force but produce 79% of America’s milk—a vulnerability that enforcement actions instantly weaponize into a biological crisis.

The Eight-Hour Timeline Nobody Really Thought Through

During a recent industry roundtable up in Wisconsin, a producer summed it up perfectly: “You can argue politics all day long, but cows don’t care about your immigration stance—they need milking every twelve hours, period.”

What happened in Vermont illustrates this perfectly. When that farm lost eight workers in April, they didn’t just lose employees—they lost people who knew which cows kicked during fresh cow management, who could spot early mastitis symptoms before they showed up in the California Mastitis Test, who understood each animal’s quirks during the transition period. Try explaining that institutional knowledge to a temp agency. Good luck with that.

Vermont’s Agriculture Secretary has been crystal clear about the cascading effects, and it’s worth paying attention. After 24 hours without proper milking, you’re not just looking at discomfort—you’re facing potential herd-wide mastitis outbreaks. We’re talking treatment costs that can exceed replacement value, production losses that compound daily, and culling decisions nobody wants to make.

Here’s what every dairy farmer knows in their bones:

  • Cows need milking twice daily—no exceptions, no delays, no excuses
  • You’ve got an 8 to 12-hour window before udder health becomes a genuine crisis
  • Once mastitis starts spreading, you’re playing expensive catch-up
  • Animal welfare appropriately takes precedence over everything else
  • Biology doesn’t pause for paperwork or politics

“Our workers maintain six-day schedules with 12-hour shifts. They rarely take holidays. The operation demands constant attention because we’re managing living systems, not manufacturing widgets.” — Wisconsin dairy producer, Marathon County

What the Economic Models Actually Tell Us

So the Texas A&M Agricultural and Food Policy Center spent years analyzing nearly 2,850 dairy operations across 14 states, and their economic modeling—updated with current market conditions—paints a sobering picture that we really need to understand.

Texas A&M’s modeling shows the supply chain nightmare: losing immigrant workers means $7.60 milk, 7,000 farms closed, 2.1 million cows gone—effectively removing Wisconsin and Pennsylvania’s entire dairy inventory from the market.

In the complete labor loss scenario (admittedly extreme, but bear with me here), their models project we’d lose 2.1 million cows from the national herd. That’s Wisconsin and Pennsylvania’s entire dairy cow inventory, just… gone. Annual production would drop 48.4 billion pounds, effectively removing nearly a quarter of the current U.S. milk supply. About 7,000 farms would close permanently.

But here’s the number that makes everyone sit up straight: retail milk prices would jump 90%, pushing that $4 gallon to $7.60. And this isn’t wild speculation—it’s based on established supply and demand elasticity models that have proven remarkably accurate in other agricultural sectors.

Even losing half our immigrant workforce would decrease production by 24 billion pounds while increasing prices by 45%. The National Milk Producers Federation’s research confirms these workers concentrate in our most productive operations. In other words, the risk isn’t spread evenly—it’s concentrated right where it would hurt most.

KEY STATISTICS: The Labor Crisis Impact

From 6,500 advertised farm positions in North Carolina:

  • 268 people applied (0.05% of the unemployed population)
  • 163 showed up for day one
  • 7 workers remained after the season
  • 90% of Mexican workers completed the season

QUICK COMPARISON: How Others Handle Dairy Labor

Country/RegionApproachResults
CanadaTFWP allows year-round agricultural workers60,000+ TFWs annually, stable workforce
NetherlandsEU worker mobility + automation investmentLost 30% of farms in the decade, heavy consolidation
New ZealandSeasonal visa programs + pasture systemsLower labor needs but climate-dependent
United StatesInformal immigrant labor + limited automation46% of production from 834 mega-dairies

Technology: Progress and Hard Realities

Looking at automation trends, which are certainly interesting, the global milking robot market has exploded from about $2.3 billion last year to projections of $4-7 billion by 2030, according to industry analysts. Sounds promising, right?

Well, here’s what I’m actually hearing from early adopters. A Wisconsin operation near Appleton installed one of the latest automated systems last year. “We called tech support daily the first month,” the owner told me at a Professional Dairy Producers meeting. “And here’s what nobody tells you—we went from paying general workers $16-17 an hour to needing specialized techs at $24-26. That’s a massive jump in labor costs.”

University of Wisconsin research shows that these systems reduce labor time by 38-43% per cow—definitely meaningful. But that still leaves over 60% of labor needs unaddressed. And honestly, think about everything robots can’t do:

  • Managing that 10-20% of cows that never figure out voluntary traffic (we all have them, don’t we?)
  • Careful fresh cow training and acclimation
  • Those breeding decisions that need experienced eyes
  • Treatment protocols requiring real judgment
  • Your entire heifer and dry cow program

A Kansas producer shared what he called an expensive lesson about retrofitting. They tried to save on construction costs by adapting their existing freestall barn. “Big mistake,” he said. “Poor cow traffic cost us 10 pounds of milk per cow daily until we redesigned everything a year later. That’s $150,000 in lost revenue we’ll never recover.”

Current installation for a 200-cow operation? You’re looking at $500,000 to $750,000 for quality systems. Michigan State Extension’s economic analysis suggests payback periods of 7 to 10 years—assuming stable milk prices. With Class III bouncing between $16 and $20 per hundredweight this year alone, according to USDA market reports, that’s quite an assumption.

The American Worker Question We Need to Face

The North Carolina Growers Association data remains the clearest picture of domestic labor reality, and it’s… well, it’s something we need to confront honestly.

From 6,500 advertised positions in a state with nearly 500,000 unemployed residents, only 268 people applied—that’s 0.05% of the unemployed population. They hired 245, but only 163 showed up for work. After one month, more than half had quit. By season’s end? Seven workers remained. Seven.

Meanwhile, 90% of Mexican workers who started and completed the season, as documented in compliance reports to the Department of Labor.

The North Carolina data demolishes the ‘Americans will do these jobs’ argument: From 6,500 positions advertised and 268 applicants, only 7 workers completed the season—while 90% of Mexican workers finished successfully.

Cornell’s Agricultural Workforce Development program findings align with what we’re all seeing. It’s not just the pre-dawn starts or physical demands—it’s the combination with geographic isolation and, let’s be honest here, how society views agricultural work.

A Vermont producer told me something that really stuck—and he asked to remain anonymous, given current tensions—but he said, “Twenty years, two American applicants. Over a hundred immigrant applicants. Both Americans were gone within two weeks.”

Consolidation: The Trend We Can’t Stop

USDA’s Census of Agriculture data tells a story we all feel in our communities. Between 2017 and 2022, we lost 15,866 dairy farms while production actually increased 5%. How’s that for efficiency?

The consolidation trend is brutal and accelerating: small farms collapsed 42% while mega-dairies grew 17%, now controlling nearly half of U.S. milk production—and they’re the ones most dependent on immigrant labor.

The breakdown is stark:

  • Farms under 100 cows: down 42%
  • Operations with 100-499 cows: dropped 34%
  • Facilities with 500-999 cows: decreased 35%
  • Mega-dairies over 2,500 cows: UP 17%

Those 834 largest operations now generate 46% of U.S. milk production, according to an analysis by the USDA Economic Research Service. California’s average herd size has reached 1,300 cows, according to recent state reports.

USDA research confirms that smaller operations incur production costs about $10 per hundredweight above those of larger competitors. When margins run $1-2/cwt in good times, that gap is insurmountable through efficiency alone.

What’s interesting—and I’ve been tracking this—is how this mirrors global trends. Statistics Canada documents average herd growth from 85 to 98 cows recently under their supply management system. Wageningen University research shows that the Netherlands lost 30% of its dairy farms over a decade. Different policies, same consolidation pressure.

Based on what I’m seeing, we’ll probably consolidate to 15,000-18,000 operations within five to seven years, with 60-70% of production from herds exceeding 2,500 cows. That’s just the math working itself out.

Legislative Proposals: What’s Real, What’s Not

Policy FeatureCanada (TFWP)United StatesImpact on Dairy
Year-Round Dairy Access✓ Yes – Primary Agriculture Stream✗ No – H-2A excludes year-roundStable, predictable workforce
Visa DurationUp to 24 monthsSeasonal onlyContinuity for operations
Program Age50+ years operationalFragmented, inconsistentProven model
Annual Ag Workers60,000+ TFWs77,000 (51% undocumented)Formal employment
Workforce StabilityHigh – workers returnLow – enforcement disruptionReduces farm risk
Industry SupportStrong exemptionsBills stalled in committeePolicy supports sector

Let me break down what’s actually on the table, because the political noise makes it hard to see clearly.

The Farm Workforce Modernization Act proposes 20,000 year-round agricultural visas annually, with dairy potentially getting 10,000. It includes Certified Agricultural Worker status for current employees, but they’d need 10 years of agricultural work before becoming eligible for permanent residency. Wage increases would be capped at 3.25% annually through 2030.

Here’s the math problem, though: 10,000 visas for an industry employing approximately 77,000 immigrant workersaddresses just 13% of current needs.

What’s particularly frustrating—and our Canadian neighbors really have this figured out better—is the stark contrast with their system. Canada’s Temporary Foreign Worker Program allows agricultural employers to hire year-round workers through multiple streams, with over 60,000 TFWs working in Canadian agriculture annually, according to the Canadian Federation of Agriculture. Their Agricultural Stream permits employment durations up to 24 months, and the program has been operating successfully for over 50 years. Meanwhile, U.S. dairy remains excluded from comparable year-round visa access, forcing reliance on undocumented workers or the limited H-2A program, which doesn’t meet dairy’s continuous operational needs.

Representative Van Orden’s Agricultural Reform Act takes a different tack. Current workers would need to leave and return, paying a minimum fee of $2,500. Anyone entering during the current administration wouldn’t qualify. Three-year renewable visas, but most current workers wouldn’t even meet the criteria.

Both proposals sit in committee as of October 2025. Don’t expect movement anytime soon. And watching Canada’s more functional system just north of us makes the dysfunction even more apparent.

Regional Adaptations: Learning from Each Other

Different regions are finding different paths forward, and there are lessons in each approach.

Wisconsin generates over $45 billion in dairy economic activity. Some counties rely predominantly on immigrant workforces. The Farm Bureau documents 137% increases in visa program costs since 2020, yet dairy still can’t access year-round coverage. Some cooperatives are exploring shared labor arrangements—complex but promising.

Vermont faces unique pressures post-enforcement. Workers hesitate to leave farms for essential services, including medical care. Producers in the region report situations where employees have delayed prenatal care for months due to enforcement fears. That’s not just an operational issue—that’s a human issue we need to address.

Idaho has maintained relative stability. The Idaho Dairymen’s Association reports that approximately 90% of its workers are foreign-born, with local relationships helping maintain continuity. “We communicate constantly with local authorities about economic realities,” their CEO explained to me.

California confronts multiple challenges despite leading national production. Water restrictions, emissions regulations, and elevated labor costs are prompting relocations. Several operations announced moves to Texas or South Dakota this year.

The Southwest corridor—Texas Panhandle, eastern New Mexico, western South Dakota—attracts new development. South Dakota added 50,000 cows recently; Texas added 75,000 over two years. They’re creating environments where dairy can operate with fewer regulatory constraints.

Practical Guidance by Operation Size

After extensive conversations with producers and lenders, here’s my take on positioning by scale:

Operations under 500 cows: Unless you’re hitting premium markets, your window’s narrowing. University of Wisconsin research suggests that premiums of $3-4/cwt are needed to match large-scale economics. Organic transition takes three years but currently provides $8-10 premiums. Direct marketing works for some, though it requires completely different skills.

Several Vermont operations under 400 cows that I know of are succeeding with grass-fed organic, getting $8/gallon at farmers markets. But that’s a lifestyle choice as much as a business model.

500-1,500 cow operations: You’re caught in the squeeze—too big for most niche markets, too small for optimal efficiency. Successful paths include expansion to 2,500+ (requiring $3-5 million per thousand cows based on recent construction), strategic partnerships, or contract production. Standing still isn’t viable when your production costs run $18-19/cwt versus $15-16 for larger competitors.

1,500-2,500 cow operations: Decision time. Expansion to 5,000+ requires $15-20 million based on recent facility costs. Consider your state’s long-term regulatory trajectory carefully. This scale attracts serious buyers if you’re considering exit—several Wisconsin operations this size achieved favorable sales this summer.

Operations exceeding 2,500 cows: You’re positioned to weather the storm, but don’t get complacent. Invest in professional HR infrastructure, documented compliance programs, and diversified labor strategies now. Automation should target genuine efficiency gains, not promised labor savings that rarely materialize fully.

THREE FUTURES: Where This Could Go

Most Probable Scenario: Continued consolidation with 10,000-13,000 farms closing over five years. Survivors will be professionally managed operations with established political relationships. Milk supply remains adequate, prices are relatively stable, but rural communities continue hollowing out.

Growing Possibility: Foreign investment accelerates as Canadian processors, European companies, and private equity acquire distressed assets. American dairy farming becomes American dairy management—owners become employees.

High-Impact Outlier: Coordinated enforcement triggers actual supply disruption. Milk hits $7-8/gallon, cheese and butter prices double. Recovery requires 5-10 years and fundamental industry restructuring.

Success Stories Worth Studying

Not everything’s challenging—let me share what’s working according to producers and extension professionals in different regions.

Central New York producers working with Cornell Extension have reportedly developed innovative training programs. They’re bringing in community college students and offering competitive salaries of around $65,000, plus benefits, for five-year commitments. Some have successfully retained American workers beyond two years this way. That’s not a complete solution, but it’s progress.

Industry groups report that operations investing heavily in quality housing—actual apartments, not dormitories—alongside automation are seeing turnover drop from 45% to 15% annually. Treating workers well, regardless of origin, generates measurable returns.

Wisconsin cooperatives are exploring rotating labor pools, enabling actual weekends off. Workers move between farms on a scheduled rotation. Complex coordination, but those trying it report maintaining workforce stability through recent challenges.

What This Means for Consumers at the Grocery Store

Here’s something we haven’t touched on yet—what happens when consumers actually face those $7-8 gallons of milk? USDA research on price elasticity suggests demand would drop 15-20% at those levels, with lower-income families hit hardest. We’d likely see major shifts to plant-based alternatives, not because people prefer them, but because dairy becomes a luxury item.

The ripple effects go beyond milk. Cheese prices doubling means pizza costs jump. Butter at $8/pound changes baking economics. School lunch programs would need emergency funding increases. It’s not just a farm crisis—it’s a food system shock.

Looking Forward with Clear Eyes

Here’s the reality we need to accept: The industry developed around workers accepting conditions that don’t align with typical American employment expectations, at compensation levels that primarily depend on international wage differentials.

April’s enforcement actions didn’t create these dependencies—they revealed vulnerabilities we’ve been managing around for decades. That eight-hour biological timeline isn’t going away. It’s the unchanging reality of dairy production.

Will technology eventually provide comprehensive solutions? Maybe, though current projections suggest 15-20-year development timelines for systems that match human adaptability. The robots coming to market now are tools, not replacements.

Will Americans suddenly embrace dairy work? The North Carolina data says no, definitively. Even at higher wages, the lifestyle requirements eliminate most potential domestic workers.

Immigration reform will likely formalize existing relationships rather than fundamentally alter workforce composition. And honestly? That might be the best realistic outcome.

Here’s what gives me cautious optimism: Consumer demand remains strong, with Americans consuming about 650 pounds of dairy products annually, according to USDA food availability data. Production will continue. The question is which operations will provide it.

The successful operations will be those that accurately assessing current realities and adapting accordingly. They’ll build strong relationships with workers, maintain professional compliance, and position strategically for whatever comes next.

Because at the end of the day—or more accurately, at 4 AM and 4 PM every single day—those cows need milking. Biology doesn’t negotiate. And until we figure out how to change that fundamental reality, we need to work with the labor force willing to meet biology’s demands.

Plan accordingly. The fundamentals of dairy production remain sound. It’s the operational environment that requires our careful navigation. And despite all the challenges, I still believe there’s a profitable future for operations that see clearly and adapt wisely.

After all, somebody’s going to produce that milk. Might as well be those of us who understand what it really takes.

Key Takeaways:

  • Dairy’s reality is biological, not political—miss a milking, and biology wins. That’s the eight-hour breaking point.
  • Immigrant labor sustains half the U.S. workforce and nearly 80% of milk output, proving the system’s hidden dependency.
  • Automation eases routine strain but can’t replace skilled hands—robots handle less than half the work.
  • Mega-operations now produce 46% of all U.S. milk, while small farms face growing costs and tough survival math.
  • Long-term strength depends on modern workforce reform—year-round access like Canada’s TFWP could stabilize both herds and livelihoods.

Executive Summary:

In dairy, biology always wins. Lose your labor force for eight hours, and cows—not politics—set the agenda. Immigrant workers make up half of America’s dairy workforce and produce nearly 80% of our milk, according to Texas A&M research. When that labor disappears, production drops, animal welfare suffers, and consumers ultimately face $7 milk and $8 butter. Automation helps, but can’t replace skilled hands, while smaller farms keep closing as mega-dairies dominate production. Canada’s Temporary Foreign Worker Program shows how year-round access to labor stabilizes an entire agricultural system. For U.S. producers, acknowledging that biology doesn’t wait—and acting accordingly—is the only sustainable path forward.

Complete references and supporting documentation are available upon request by contacting the editorial team at editor@thebullvine.com.

Learn More:

The Sunday Read Dairy Professionals Don’t Skip.

Every week, thousands of producers, breeders, and industry insiders open Bullvine Weekly for genetics insights, market shifts, and profit strategies they won’t find anywhere else. One email. Five minutes. Smarter decisions all week.

NewsSubscribe
First
Last
Consent

Retained Placenta Rates Cut in Half: How a $10 Calcium Protocol Delivers $15,000 Annual Returns

That 10% retained placenta rate you accept as ‘normal’? It’s costing you $20,000/year. Here’s how to cut it in half for $5,000.

EXECUTIVE SUMMARY: You’re likely losing $20,000 annually to a problem you think costs $75 per case—retained placenta actually drains $389 when you count lost milk, open days, and cascade diseases. Progressive dairy operations have cracked the code, cutting rates from 10% to 4% with one simple change: dual calcium bolusing at $10 per cow. The game-changer is understanding that retained placenta isn’t mechanical—it’s an immune system failure caused by subclinical hypocalcemia, which affects 25-50% of fresh cows. Farms implementing this evidence-based protocol consistently achieve 307% ROI, banking $15,000+ net profit annually on a 500-cow operation. Research from Cornell, Wisconsin, and USDA confirms what leading producers already know: preventing retained placenta isn’t about treating problems better; it’s about stopping them before they start. With payback in under 4 months and proven results across North America, the only question is whether you’ll capture this value now or continue accepting ‘normal’ losses.

retained placenta prevention

Progressive farms are discovering that a simple calcium protocol delivers 307% ROI while cutting fresh cow disorders in half—here’s what they’re learning about transition cow economics

There’s a conversation happening in milk houses and conference rooms across the dairy industry right now, and it’s about something most of us thought we had figured out: retained placenta.

You know how it is. For generations, we’ve accepted that 8-12% of fresh cows will retain their placentas. Just another cost of doing business—like bedding expenses or fuel prices. But here’s what’s interesting: that acceptance might be costing your operation far more than you realize.

What I’ve been seeing across operations from Wisconsin to California is that retained placenta is actually running about $389 per case when you factor in all the downstream impacts. That figure comes from research published in the Journal of Dairy Science, and it’s been consistent with what Dairy Herd Management and other industry analysts have been documenting. For a typical 500-cow operation, addressing this one issue could mean the difference between breaking even and banking an extra $15,000 annually.

“We’ve spent decades selecting for higher production. Now we need to ensure our management systems support the remarkable cows we’ve created.”

The Economics Nobody’s Been Calculating

So here’s what really caught my attention. When researchers from the University of Guelph and Ontario Veterinary College dug into the true cost of retained placenta across multiple herds, they uncovered something remarkable. That immediate vet expense—the $75 bill most of us focus on—it’s just a tiny piece of the actual economic impact.

Stop Tracking the Wrong Number. That $75 vet bill you’re watching? It’s camouflage for a $389 problem. Lost milk production silently bleeds $287 per case while you’re focused on treatment costs. Progressive dairy operations banking an extra $15,000 annually know this truth: the real cost lives in what you’re NOT measuring. Time to start counting what counts.

The breakdown tells an interesting story:

  • Direct milk production losses account for $287 per case (that’s roughly 74% of your total cost)
  • Extended time to pregnancy adds another $73, about 19% of the impact
  • Increased susceptibility to other diseases contributes $25-29 per case

What’s worth noting is the loss in milk production. These cows produce 300-500 kg less milk across their entire lactation—we’re talking 660 to 1,100 pounds that never makes it to your bulk tank. At current component-adjusted prices in most regions, you’re looking at $150-250 in lost revenue per affected cow.

And the reproductive piece… well, that’s where it really adds up. Research from Tanzania and several other countries tracking dairy herds shows that retained-placenta cows average around 52 more days open than their healthy herdmates. They need about 2.9 services per conception compared to 1.9 for unaffected cows.

You probably know this already, but each open day costs between $3 and $5, depending on your market. So that extended time to pregnancy alone can run $150-260 per affected cow. These aren’t theoretical numbers—they’re showing up in actual herd records from coast to coast.

Cost Breakdown: Where Your Money Goes

For each retained placenta case:

  • Milk production loss: $287 (74%)
  • Extended days open: $73 (19%)
  • Secondary health issues: $25-29 (7%)
  • Total: $389 per case

Understanding the Biological Transformation

To really appreciate why retained placenta has become such a challenge, we need to consider how dramatically our cows have changed.

I was talking with a dairyman the other day—third generation, been in the business his whole life—and he pulled out production records from the 1980s. His grandfather’s best cows were producing 12,000-14,000 pounds per lactation. Today? His herd averages over 26,000 pounds. That’s not just more milk. That’s a complete biological transformation.

Peak production has climbed from 60 pounds daily to routinely exceeding 120 pounds in well-managed herds. And the metabolic demands this places on transition cows? They’re unprecedented in the history of dairy farming.

Here’s where the science gets really interesting. Research from Dr. Kayoko Kimura’s team at the USDA’s National Animal Disease Center in Ames has revealed something that changes our entire understanding of retained placenta. Rather than being a mechanical failure—you know, the placenta simply being “stuck”—it’s fundamentally an immune system dysfunction.

The neutrophils (those white blood cells responsible for separating placental tissue from the uterine wall) show a 41% reduced response in cows destined to retain their placentas. These same animals have interleukin-8 concentrations averaging just 51 picograms per milliliter, compared to 134 in healthy cows.

What’s that mean for us in practical terms? Well, if retained placenta results from immune dysfunction rather than mechanical attachment, then our traditional approach of manually removing these membranes… it might be misguided. In fact, recent systematic reviews suggest it could actually be counterproductive.

The Calcium Connection: A Management Breakthrough

One of the most encouraging developments in transition cow management involves our understanding of calcium’s role beyond just milk fever prevention. Research from multiple institutions shows that subclinical hypocalcemia dramatically increases the risk of retained placenta risk.

And we’re not talking about clinical milk fever, that’s obvious to spot. This is the 25-50% of fresh cows with low blood calcium who appear perfectly normal during your morning walk-through.

Dr. Jessica McArt’s work at Cornell has really helped clarify calcium’s multiple roles in the transition period. Beyond muscle contraction (which we all know about), calcium is essential for immune cell function, influences stress hormone regulation, and affects rumen motility—which directly impacts dry matter intake.

The challenge, as many of us have seen, is that as milk production has intensified, our traditional calcium management strategies haven’t kept pace. A cow producing over 100 pounds of milk daily? She’s facing metabolic demands that would’ve been unimaginable just two decades ago.

Learning from High-Performing Operations

What I find encouraging is seeing operations achieving retained placenta rates below 4%—less than half the industry average. While each farm has its unique approach, they share several management strategies worth considering.

The Evolution of Calcium Supplementation

Here’s what’s working for many operations, particularly in California and the upper Midwest. Instead of the traditional single calcium treatment at calving, they’ve implemented what’s being called a dual-bolus protocol.

The approach is straightforward: administer the first dose within an hour of calving—two boluses of calcium chloride. Then return 12-24 hours later with two more boluses. That second dose catches the delayed hypocalcemia that often triggers problems two or three days after calving.

The research supports this approach. A comprehensive meta-analysis published this year demonstrated that while single bolusing addresses immediate calcium needs, it’s the second dose that prevents the delayed hypocalcemia associated with many fresh cow disorders.

The economics work out to about $10 per cow for the protocol, and many operations are seeing retained placenta rates drop from 10-11% down to 4-5% within months of implementation. That’s a pretty solid return.

The Critical Importance of DCAD Verification

You know what’s been eye-opening? How many farms believe they’re feeding an effective negative DCAD program when they’re actually not.

I was working with a nutritionist in Wisconsin recently, and she shared her experience testing urine pH on farms claiming to run negative DCAD programs. About half the time, when they actually test urine pH, it’s running 7.5 to 8.0—nowhere near the 6.0 to 6.5 target for Holsteins (or 5.5 to 6.0 for Jerseys).

The issue often traces back to high potassium levels in forages that overwhelm the anionic salts being fed. The solution typically involves adjusting the forage base to include lower-potassium feeds. Corn silage, wheat straw, and certain grass hays—these can help achieve the mineral balance needed for effective DCAD programs.

Rethinking Stocking Density in Transition Facilities

Research from the University of British Columbia, combined with extensive field observations from Wisconsin and New York operations, has really clarified the relationship between overcrowding and fresh cow health.

Here’s what we’re seeing: operations that thought they were being efficient running close-up pens at 120% capacity often see fresh cow health issues—including retained placenta—decrease by about a third when they drop to 80% stocking density.

The most successful operations typically maintain:

  • No more than 80% stocking density based on feed bunk space
  • At least 30 inches of bunk space per cow
  • Between 100 and 160 square feet per cow in bedded pack systems

And here’s something crucial—these farms size their transition facilities for 140% of the average monthly calving rate. Because, as we all know, calvings aren’t uniform throughout the year.

Quick Reference: Dual Calcium Bolus Protocol

Initial Dose: Within 1 hour of calving

  • 2 boluses of acidogenic calcium (chloride or sulfate form)
  • Provides 50-75g elemental calcium

Follow-up Dose: 12-24 hours post-calving

  • 2 additional boluses of the same product
  • Addresses delayed hypocalcemia risk

Investment: Approximately $10 per cow Expected outcome: 40-60% reduction in retained placenta incidence

Reconsidering Traditional Treatment Approaches

Perhaps the most surprising development—at least for those of us who’ve been doing this a while—involves our understanding of how to manage retained placenta when it does occur.

Multiple systematic reviews and surveys of veterinary practices across Europe and North America are challenging the long-standing practice of manual removal. Dr. Carlos Risco’s work at the University of Florida has been documenting outcomes from what he calls conservative management.


Management Approach
Traditional ManagementEvidence-Based ProtocolImpact
PhilosophyTreat problems after they occurPrevent immune dysfunctionParadigm shift: mechanical → metabolic
Intervention TimingWait 24-48 hours post-calvingWithin 1 hour + 12-24h follow-up60% reduction in cases
Treatment ProtocolManual placenta removal + antibioticsDual calcium bolus ($10/cow)88% treatment success when needed
Target Blood CalciumAccept subclinical hypocalcemiaMaintain >8.5 mg/dL throughout50% of cows affected without symptoms
Expected RP Rate10-12%4-5%60% fewer cases = 25 cows saved/year
Annual Cost (500 cows)$19,450 in losses$15,345 net profit$34,795 total swing
ROINegative307% ($3 back per $1)Payback in 3.9 months

The approach is simple: monitor cows for signs of systemic illness—fever, depression, reduced appetite. If the cow is otherwise healthy, leave the placenta alone. About 40% resolve without any intervention, with membranes typically passing within 2-11 days.

I’ll admit, this represents a significant departure from what most of us were taught. But farms implementing this approach are reporting fewer cases of metritis and improved long-term reproductive performance. The evidence is getting harder to ignore.

Traditional vs. Conservative Treatment: Making the Choice

Looking at the comparison between approaches, the shift in thinking becomes clear:

Traditional Manual Removal:

  • Immediate intervention within 24-48 hours
  • Physical removal of retained membranes
  • Often followed by intrauterine antibiotics
  • Higher risk of uterine contamination and trauma
  • Increased metritis rates have been reported in recent studies

Conservative Management:

  • Monitor for systemic signs only
  • Leave the placenta to separate naturally
  • Treat only if fever, depression, or reduced appetite develops
  • 40% spontaneous resolution without intervention
  • Lower metritis incidence and improved fertility outcomes

The data’s compelling enough that many progressive operations are making the switch, though it does require a mindset shift for both staff and veterinarians.

Calculating Return on Investment

Let’s look at the economics using real-world data from operations that have implemented comprehensive calcium management protocols. And these aren’t just projections—these are actual results we’re seeing.

307% ROI in Under 4 Months Isn’t Theory—It’s Basic Math. Invest $10 per cow in dual calcium bolusing and watch the cascade effect: $9,725 from prevented retained placenta, $4,200 from reduced metritis, $2,820 from fewer displaced abomasums, $3,600 from crushing ketosis. The total? Bank $15,345 net profit on your 500-cow herd. Here’s the revelation: leading producers aren’t preventing one disease—they’re preventing the entire fresh cow disorder cascade. That’s the difference between targeting symptoms and fixing the metabolic foundation.

For a typical 500-cow dairy operation:

What You’ll Invest:

  • Dual calcium bolus protocol: $5,000 annually
  • Urine pH monitoring supplies: About $200
  • Staff training time: Maybe 4 hours total
  • Total investment: $5,200

What You Can Expect Back:

  • Reduced retained placenta cases (from 10% to 5%): 25 fewer cases × $389 = $9,725
  • Decreased metritis incidence: 15 fewer cases × $280 = $4,200
  • Fewer displaced abomasums: 6 cases × $470 = $2,820
  • Reduced ketosis: 18 cases × $200 = $3,600
  • Total annual savings: $20,345

Net profit increase: $15,345 Return on investment: 307% Payback period: 3.9 months

Most operations report achieving these results within their first year of implementation.

Monitoring Success: The Fresh Cow Disorder Rate

Here’s what separates successful operations from those just hoping for the best—they track what’s commonly called the Fresh Cow Disorder Rate. That’s the percentage of cows experiencing any clinical disease during the first 21 days in milk.

Top 10% vs. The Rest: The Fresh Cow Disorder Gap Is Brutal and Real. Elite operations keep disorders under 15% through aggressive calcium management and systematic prevention. Average herds struggle along at 30%, losing thousands in hidden costs. Bottom tier? Over 40% of fresh cows hit metabolic problems they could’ve prevented. The difference isn’t genetics, facilities, or luck—it’s measurement and management discipline. Track your 90-day rolling Fresh Cow Disorder Rate weekly. You’ll know within one quarter whether you’re banking profits or bleeding money. Which bar describes your herd?

Analysis of data from multiple herds reveals pretty consistent patterns:

  • Leading operations (top 10%): Less than 15% disorder rate
  • Average performance: 25-35% disorder rate
  • Operations needing improvement: Over 40% disorder rate

Track this metric weekly, calculate a 90-day rolling average, and you’ll know within one quarter whether your investment is delivering expected returns.

Regional Adaptations and Seasonal Considerations

Now, it’s important to recognize that these protocols need adjustment based on where you’re farming. What works in Wisconsin doesn’t always translate directly to Arizona or Texas.

Field observations across various regions indicate that heat stress can significantly increase the risk of retained placenta. Some operations see rates increase from 7-8% during cooler months to 13% or higher during summer heat stress. If you’re in the Southwest or Southeast, you might need more aggressive calcium supplementation during the summer months.

I’ve noticed that Florida dairies, dealing with year-round heat and humidity, often run their calcium protocols more aggressively from May through October. One producer near Okeechobee told me they actually triple-dose during their worst heat—though that’s based on their specific conditions and vet recommendations.

Feed availability varies, too. Operations in regions where corn silage is limited or expensive face additional challenges in achieving that low-potassium forage base necessary for effective negative DCAD programs. Some Western operations have found success using wheat straw or importing specific grass hays to achieve an appropriate mineral balance.

The key is adapting these principles to your specific circumstances rather than trying to apply a one-size-fits-all approach.

Emerging Technologies and Future Directions

While current calcium management strategies offer immediate opportunities, several developments promise further to transform transition cow management over the coming decade.

Research teams at the University of Wisconsin-Madison and Michigan State University have been identifying blood biomarkers that can predict retained placenta risk weeks before calving. Dr. Heather White’s group at UW-Madison reports identifying specific metabolites in blood samples collected at dry-off with approximately 85% accuracy, flagging high-risk cows.

Sensor technology continues to advance as well. The latest generation of rumen boluses continuously monitors pH, temperature, and motility patterns. When combined with machine learning algorithms, these systems can identify metabolic problems days before clinical signs appear.

Within the next 5-10 years, we’re likely to see:

  • Practical on-farm biomarker testing for under $50 per cow
  • AI-driven risk scoring based on sensor data
  • Precision interventions targeted to individual cow needs
  • Industry-wide fresh cow disorder rates below 10%

Implementation Timeline: Your 90-Day Roadmap

For those ready to capture these opportunities, here’s a methodical approach that’s been working well:

Week 1-2: Assessment Phase

  • Review records from the past 90 days
  • Calculate the current fresh cow disorder rate
  • Order calcium boluses
  • Set up tracking system (whiteboard works fine)
  • Schedule staff training

Week 3-8: Implementation Phase

  • Begin dual calcium bolus protocol
  • Start weekly urine pH testing (if feeding negative DCAD)
  • Evaluate close-up pen stocking density
  • Calculate and post weekly disorder rates
  • Monitor compliance and troubleshoot

Week 9-12: Refinement Phase

  • Compare the disorder rate to the baseline
  • Calculate cases prevented
  • Document cost savings
  • Refine protocols based on results
  • Plan additional improvements

The consistent message from successful operations: reliable execution of simple protocols outperforms sporadic attempts at complex interventions every time.

The Bottom Line: Are You Leaving Money on the Table?

As we navigate today’s challenging economic environment—volatile milk prices, rising input costs—the question isn’t whether we can afford to invest in better transition cow management. It’s whether we can afford to leave $15,000 or more in annual returns uncaptured.

The science supporting these approaches is robust, with dozens of peer-reviewed studies confirming both the biological mechanisms and economic benefits. The protocols are practical enough for any motivated operation to implement. And perhaps most importantly, these improvements align with broader industry goals around animal welfare and reduced antibiotic use.

You know, a thoughtful producer said something to me recently that really stuck: “We’ve spent decades selecting for higher production. Now we need to ensure our management systems support the remarkable cows we’ve created. This isn’t about revolution—it’s about evolution, about adapting our practices to match biological reality.”

The tools and knowledge exist today. The only variable is whether individual operations will choose to implement them. For those who do, the rewards—both financial and in terms of animal health—are substantial and sustainable.

So here’s my question for you: If you could reduce retained placenta rates by half and bank an extra $15,000 annually with a $5,200 investment, what’s stopping you from starting this week?

Implementation of these protocols should be done in consultation with your herd veterinarian and nutritionist to ensure adaptation to your specific operational circumstances. Success depends on consistent execution and systematic outcome monitoring. The research and examples cited represent common industry findings and experiences; individual results will vary based on management, facilities, and regional factors.

KEY TAKEAWAYS 

  • True Cost Exposed: Retained placenta drains $389/case in lost milk, open days, and cascade diseases—turning your “normal” 10% rate into a $20,000 annual bleed
  • The $10 Solution: Dual calcium bolusing (at calving + 12-24 hours later) cuts retained placenta rates 60%, from 10% down to 4% within 90 days
  • Guaranteed ROI: $5,000 investment returns $20,000 in prevented losses = $15,000 net profit with 3.9-month payback (307% ROI)
  • The Science: Retained placenta isn’t mechanical—it’s immune dysfunction from subclinical hypocalcemia hiding in 25-50% of “healthy” fresh cows
  • Start Monday: Order calcium boluses, schedule 4-hour staff training, implement protocol, track Fresh Cow Disorder Rate weekly—see results within 30 days

Complete references and supporting documentation are available upon request by contacting the editorial team at editor@thebullvine.com.

Learn More:

The Sunday Read Dairy Professionals Don’t Skip.

Every week, thousands of producers, breeders, and industry insiders open Bullvine Weekly for genetics insights, market shifts, and profit strategies they won’t find anywhere else. One email. Five minutes. Smarter decisions all week.

NewsSubscribe
First
Last
Consent

Why German Retailers Lose $8 on Every Pound of Butter – And How It’s Bankrupting Dairy Farms

Why would anyone sell butter at a 60% loss? Because destroying farms is more profitable than butter.

EXECUTIVE SUMMARY: That cheap butter at your store? Retailers lose $8 per pound selling it—intentionally. Four chains controlling 85% of Germany’s grocery market use algorithms that synchronize prices without human intervention, accepting dairy losses to profit from everything else in your cart. This strategy has already eliminated 28,000 German dairy farms, with 2,800 more exiting annually. By 2030, only 18,000 of today’s 47,000 farms will remain—a 60% collapse. The same algorithmic playbook is now hitting Wisconsin, California, and even Canada’s protected market. Farmers face a stark choice: adapt through diversification and collective action, or become casualties of the algorithm economy.

You know that moment when you see a price that just doesn’t make sense? I had one of those last month in Bavaria, standing in a Lidl looking at butter on promotional pricing—€1.39 for a 250-gram pack.

Now, I’ve been tracking dairy economics for about 25 years, and this stopped me cold. Because when you run the numbers… well, let me walk you through what I discovered.

THE BREAKDOWN: Where €1.39 Butter Really Comes From

The Economics of Intentional Loss: How Retailers Weaponize Butter
  • €11.50 – Raw milk cost (21.5 kg milk × €0.535/kg)
  • €1.25 – Processing (energy, labor, packaging)
  • €0.95 – Logistics & distribution
  • €13.70 – Total actual cost per kilogram
  • €5.56 – Retail selling price per kilogram
  • €8.14 – Loss per kilogram

The Math That Started This Conversation

So here’s what we all know—it takes about 21.5 kilograms of milk to make a kilogram of butter. Basic dairy conversion, right? The German Farmers’ Association reported in September that Bavarian producers were getting between €0.53 and €0.54 per kilo for their milk. Pretty standard for the region this time of year.

Quick math tells you that’s €11.50 per kilogram of butter in raw milk. Just the milk, nothing else.

But here’s where it gets interesting. I’ve been talking with folks in processing, and German processor associations are reporting their members face costs anywhere from €1.15 to €1.35 per kilogram—that’s energy, labor, packaging, the whole nine yards. Add in transportation and warehousing, and you’re looking at a total cost of around €13.70 per kilogram of butter. Minimum.

That promotional price at Lidl? Works out to €5.56 per kilogram.

That’s more than an €8 loss per kilo, folks. And this isn’t a one-off mistake—this is happening across Germany right now.

The Illusion of Choice: Market Concentration’s Death Grip

What I’ve found is that when you dig into the market structure—and the Bundeskartellamt, Germany’s federal cartel office, has documented this thoroughly—you see that four retail chains control about 85% of the German food market. We’re talking Edeka, Rewe, the Schwarz Group (they run Lidl and Kaufland), and Aldi. When you’ve got that kind of concentration… well, the dynamics change completely.

How Retail Pricing Actually Works These Days

This builds on something we’ve all been noticing—pricing isn’t what it used to be. These retailers are now using algorithmic systems —computer programs that monitor competitor prices and adjust automatically. The UK’s Competition and Markets Authority has done some fascinating work documenting this.

What happens—and university researchers at places like MIT and Carnegie Mellon have tracked this in real time—is pretty remarkable. When Lidl’s system sees Aldi drop butter to a certain price, it automatically matches or beats it. No meetings, no phone calls. Within 48 hours, sometimes less, all four major chains end up at basically the same price.

And here’s the kicker: this is completely legal under EU competition law. Article 101 requires explicit agreement for a violation, and these algorithms… they’re just responding to market conditions. Game theorists call it finding the Nash equilibrium—basically, the point where nobody benefits from changing their strategy alone.

But what’s this mean for us as dairy producers? As a processor recently told me, “We’re not really negotiating with buyers anymore. We’re dealing with machines programmed to optimize the entire shopping basket, not individual products like milk or butter.”

The Cross-Subsidization Strategy

So how can retailers lose €8 per kilo of butter and still stay in business? Well, that’s where it gets clever—and honestly, a bit frustrating if you’re on the production side.

Why Retailers Love Losing on Your Milk: The 146% Sacrifice Strategy

Market research firms like GfK have studied this extensively. When shoppers come for that cheap butter, they don’t leave with just butter. The whole shopping trip tells a different story.

Those dairy products bringing people in the door? They’re losing money. But look at what else goes in the cart. Private-label products—and industry benchmarking suggests these run at much higher margins. Store-brand pasta might hit margins of 40-45%. Their cheese? Often 50% or more. Those fresh-baked items that smell so good when you walk in? We’re talking 50-60% margins, easy.

And those middle-aisle specials Aldi and Lidl are famous for—the tools, seasonal items, random clothing? Import data suggests those can run 60-70% margins.

A typical €40 shopping trip might lose a bit on dairy but generate €15-20 in overall gross profit. The dairy loss? It’s basically their customer acquisition cost.

What really gets me—and I hear this from producers all the time—is that retailers have thousands of products to balance. We’ve got milk. When our single product gets priced below production cost, we can’t make it up by selling garden tools or Christmas decorations.

What This Means for the Next Generation

Let me share something that really brings this home. I recently spoke with a Bavarian producer—I’ll call him Johann to respect his privacy—who runs about 85 cows near Rosenheim. Good operation, been in the family for four generations.

His son was planning to come back after finishing his ag degree. “Was” being the key word.

German Farmers’ Association data shows that when milk prices drop even €0.02 to €0.03 per kilogram, operations of his size can see income swings of €35,000 to €45,000 annually. For Johann, that recent price movement? It eliminated the salary he’d planned for his son.

The kid’s studying engineering in Munich now. Can’t say I blame him.

What we’re seeing across Germany matches this perfectly. Federal statistics show they’re down to 46,849 dairy farms—that’s from about 75,000 just ten years ago. Average farmer age has crept past 52. And the Thünen Institute’s research shows that only about 37% have identified successors.

The Extinction Curve: 60% of German Dairy Farms Gone by 2030

When your margins compress below 7%—and many German operations are there right now—succession planning basically stops. Young people see their parents dealing with transition cow challenges, managing butterfat levels through these hot summers, working 70-hour weeks during calving season… all for marginal returns. They find other paths. And honestly? Who can blame them?

Two Paths Forward

Looking at where this could go by 2030, I see two pretty distinct scenarios developing.

If Current Trends Continue

Based on German federal statistics showing about 2,800 farms leaving each year, we’re looking at 18,000 to 20,000 dairy farms by 2030. That’s a 60% drop from today.

Average herd size would probably expand to 250-300 cows. Different world entirely—you’d need parlors built for that scale, different fresh cow protocols, probably shift from component feeding to TMR systems… it’s a fundamental operational change.

And here’s what concerns me: remember 2022? During those supply chain disruptions, consumer price monitoring showed German butter hitting €2.19 to €2.49 per pack in some areas. Nearly double today’s promotional prices.

Rabobank’s 2025 dairy outlook makes a solid point here—every farm that exits permanently reduces the system’s ability to respond to shocks. When the next crisis hits, whether it’s drought affecting forage quality or another geopolitical disruption, the system won’t have the capacity to respond. Prices won’t just increase—they’ll spike hard.

If Reforms Take Hold

Now, there’s another path, and we’re seeing pieces of it work in Spain and France.

Both countries introduced cost-based pricing regulations—Spain in 2013, France in 2018. According to Eurostat data, yes, their dairy prices run 8-12% higher than Germany’s. But their farm exit rates? Less than half of Germany’s, according to their ag ministries.

I’ve talked with French producers at conferences, and while it’s not perfect, they can at least plan. They know costs will be covered plus a small margin. That lets them invest—better cooling systems for heat stress, improved transition cow facilities, things that pay off long-term.

What’s encouraging is that the French Young Farmers Association reports over 1,200 new dairy operations started in 2024. Not huge numbers, but it’s growth versus decline. That matters.

What’s Actually Working Out There

After talking with producers across Europe and North America, here’s what I’m seeing work in practice.

For Younger Operations with Succession Plans

If you’re under 45 and have someone to take over someday, you’ve got options, but you need to think strategically.

Automation’s one path. Research from Wageningen University and Michigan State shows robotic milking systems can reduce labor costs 10-18%. But honestly, it’s as much about lifestyle as labor savings. Robots don’t need Christmas morning off, you know?

More important, though—join a producer organization if you haven’t already. The bigger German co-ops, their annual reports show, they’re getting 3-5% premiums over spot markets. When you’re facing these concentrated buyers, that collective voice might be your only real leverage.

What’s really interesting is operations finding ways around the commodity trap. Direct marketing, organic certification, value-added processing—anything that breaks that pure price-taker relationship.

I know several Bavarian producers who’ve shifted 30-40% of their production to on-farm processing. It’s not easy—we’re talking investments of €150,000 to €200,000, learning cheese-making or yogurt production, and dealing with food safety regulations. But they’re capturing €0.90 to €1.00 per liter equivalent versus €0.53 for commodity milk. That’s the difference between surviving and actually building something.

For Late-Career Producers

This is tough to talk about, but it needs saying. And I know it’s not easy to hear, especially if you’ve poured your life into your operation.

European Network for Rural Development research is pretty clear—farmers who make exit decisions within 18 months of sustained margin pressure typically preserve 60-80% of their equity. Those who hold on for three years or more, hoping for recovery… many lose everything.

If you’re in this position, do the math. Divide your available credit and savings by your monthly shortfall. If that number’s less than 18 months, you need to start planning now. Not next season. Now.

I understand the emotional weight of this decision. This isn’t just a business—it’s your heritage, your identity, your life’s work. But preserving what you’ve built —ensuring you have something to pass on or retire with —matters more than holding on until there’s nothing left.

Strategies That Work Regardless

No matter where you are in your career, some things just make sense.

Document your costs religiously. Everything—feed, labor, what you spent on that metritis outbreak last month, depreciation on equipment, your own time. The Dutch dairy board has excellent templates if you need them. When policy discussions happen, farmers with solid numbers have credibility.

Build relationships with your processor. FrieslandCampina’s 2024 supplier report and Arla’s recent guidelines both indicate they’re increasingly open to longer-term contracts with producers who maintain quality parameters and keep somatic cell counts in check. It won’t completely protect you from market swings, but it helps.

And please, connect with other producers. Research on agricultural mental health consistently shows that peer support makes a huge difference in stress management. Plus, collective action’s the only thing that moves policy. Look at what French farmers achieved with their early 2024 protests—they got real concessions because they worked together.

The North American Parallel

What’s happening in Germany isn’t unique. Let me give you a Wisconsin perspective, because I was just talking with producers there last month.

USDA Economic Research Service data from September shows four beef packers control 85% of U.S. processing. Different commodity, same dynamics. But in dairy, it’s playing out differently region by region.

In Wisconsin, where I spent time with a 200-cow operation near Eau Claire, the processor consolidation is real, but the retail dynamic’s different. They’ve got Kwik Trip—a regional chain that’s actually built relationships with local producers. The owner told me, “We’re getting $18.50 per hundredweight, which isn’t great, but it’s stable. The co-op knows if they squeeze us too hard, we’ve got options.”

That’s the difference—options. When you’ve got multiple buyers—even if they’re not perfect—you’ve got leverage.

Now, the Federal Milk Marketing Order system in the U.S. adds another layer of complexity. It sets minimum prices based on end use—Class I for fluid milk, Class III for cheese, and so on. But even with that safety net, when retail concentration hits a certain level, those minimums become maximums real quick.

Down in California, it’s another story entirely. The mega-dairies with 5,000-plus cows? They’re basically price-takers from the big processors. One operator near Tulare told me they’re looking at getting into renewable natural gas from manure just to diversify revenue. They’re projecting $3-4 million annually from RNG versus $12 million from milk on 6,000 cows. “Milk’s becoming a byproduct of our energy business,” he said. Wild to think about, but that’s adaptation.

Even Canada—with their supply management system that’s supposed to protect producers—the Canadian Dairy Commission’s recent quarterly report shows pressure. Retail concentration there means that even with production quotas, processors are getting squeezed, and that rolls downhill.

Innovation Born from Necessity

But here’s what gives me hope—farmers are incredibly innovative when pushed.

German agricultural organizations are documenting some fascinating adaptations. Operations near tourist areas are building serious secondary income through agritourism—farm stays, educational programs, even “adopt a cow” initiatives that create direct consumer relationships.

I visited one operation in the Black Forest region that’s pulling in €85,000 annually from agritourism versus €92,000 from milk. They’ve got six vacation apartments in a renovated barn, and offer farm breakfasts with their own products. “The cows became the attraction, not just production units,” the owner told me.

When Commodity Pricing Fails, Innovation Wins: Revenue Streams That Actually Work

Energy production’s another avenue. The German Biogas Association reports that over 3,000 dairy farms have added anaerobic digesters in recent years. Depending on whether you’re running a dry lot or free stall system, a 300-500 cow operation can generate 1.5 to 3.5 megawatts. With feed-in tariffs in some regions, that’s income that doesn’t depend on milk prices.

What’s really intriguing is watching cooperatives move beyond commodity processing. FrieslandCampina’s latest annual report shows it pushing hard into specialized nutrition—sports recovery proteins and specific components for infant formula. These aren’t commodity products. The margins are multiples of the standard milk powder price.

They’ve realized they can’t compete with retailers on commodity terms, so they’re changing the game entirely. Smart move, if you ask me.

And you know what? This innovation isn’t just happening in Europe. I’m seeing U.S. producers getting creative, too. There’s a group in Vermont making cultured butter that sells for $24 a pound at farmers markets. A Wisconsin operation partnered with a local brewery to make milk stout—they’re getting paid double for that milk. These aren’t solutions for everyone, but they show what’s possible when you think outside the bulk tank.

The Bridge to Tomorrow

Here’s something I’ve been thinking about lately—we’re in this weird transition period where the old model is clearly broken but the new one hasn’t fully emerged yet.

The consolidation in retail and processing, the algorithmic pricing, the pressure on margins… these aren’t going away. But I’m also seeing the seeds of something different. Direct-to-consumer models are enabled by technology. Energy diversification that makes farms less dependent on milk prices alone. Cooperatives are moving up the value chain into specialized products.

It reminds me of the shift from cans to bulk tanks back in the day. That transition was brutal for some, an opportunity for others. The difference now? The pace of change is faster, and the imbalance of market power is more extreme.

Questions Worth Asking Yourself

As we’re having this conversation, here are some questions every producer should be thinking about:

What percentage of your milk goes to buyers with more than 30% market share? If it’s over 70%, you’re vulnerable to these dynamics we’ve been discussing.

How would a sustained 10% price cut affect your operation? Really run those numbers—including impacts on your replacement program, equipment maintenance, everything. If the answer involves burning through savings or taking on debt just to keep going, you need a Plan B.

Are you connected with producer organizations? If not, why not? In this market structure, that collective voice might be your only leverage.

Have you calculated what your operation’s worth—both as a going concern and in a wind-down scenario? It’s not fun math, but knowing those numbers helps you make strategic decisions.

The View from Here

That €1.39 butter in Bavaria isn’t just a crazy promotional price. It’s showing us where agricultural markets are heading when retail concentration meets algorithmic coordination.

“Every farm that exits permanently reduces the system’s ability to respond to shocks. When the next crisis hits, the system won’t have capacity. Prices won’t just increase—they’ll spike hard.”

These dynamics are going to reach every commodity ag sector within the next decade—if they haven’t already. The question isn’t whether these forces will affect your market. They will.

The question is whether you’ll be ready.

The German dairy sector’s giving us all a preview. Part warning, part roadmap. The warning’s clear: traditional market relationships are being fundamentally restructured by technology and concentration. Producers who don’t recognize and adapt to these new realities face serious challenges.

But there’s also a roadmap. We’ve navigated big changes before—the shift from cans to bulk tanks, quota eliminations in Europe, multiple price cycles that tested but didn’t break us. This one’s different in its mechanisms, but it’s still calling for the same farmer ingenuity we’ve always had.

Successful adaptation means understanding these dynamics, building collective strength, exploring value-added opportunities, and—this is crucial—making decisions based on data rather than hope or tradition.

I’ve spent 25 years watching this industry evolve, and I’ve never seen changes this fundamental happening this fast. But you know what? I’ve also never seen dairy producers fail to adapt once they understand what they’re facing.

That €13.70 production cost, butter selling for €1.39? It’s not sustainable, it’s not accidental, and it won’t fix itself through normal market forces. But understanding it—really grasping what it means—that’s your foundation for not just surviving but potentially thriving despite these new realities.

TAKE ACTION THIS WEEK:

Calculate Your Runway:

  • Monthly cash burn rate ÷ available reserves = months until crisis
  • If less than 18 months, start planning NOW

Connect With Support:

  • Producer Organizations: Find yours at www.euromilk.org/members
  • Mental Health Support: Agricultural crisis hotlines available 24/7
  • Cost Tracking Tools: Free templates at www.dairynz.co.nz/business/budgeting

Build Your Network:

  • Join or form a local discussion group
  • Connect with processors about long-term contracts
  • Explore value-added opportunities with other producers

The path forward requires clear thinking, collective action, and continued innovation, which have always been the hallmarks of successful dairy operations. These are challenging times, no doubt about it. But they’re far from insurmountable for those willing to see clearly and adapt accordingly.

Stay strong, stay connected, and keep asking the tough questions. We’re going to need all three to navigate what’s ahead.

KEY TAKEAWAYS:

  • Retailers lose $8/pound on butter BY DESIGN: They profit from 40-70% margins on everything else while using dairy as bait—enabled by 85% market concentration
  • Algorithms replaced negotiations: Pricing bots at four major chains synchronize within 48 hours, creating legal coordination that individual farmers can’t fight
  • 2,800 farms vanish annually: Germany down from 75,000 to 47,000 farms in a decade—60% of survivors won’t make it to 2030 without adaptation
  • Your decision window is 18 months, not years: Exit within 18 months = 60-80% equity preserved. Wait 3 years hoping for recovery = total loss
  • Only three strategies are working: Join producer co-ops (+3-5% prices), add revenue streams ($40-120K from energy/agritourism), or time your exit strategically

Complete references and supporting documentation are available upon request by contacting the editorial team at editor@thebullvine.com.

Learn More:

The Sunday Read Dairy Professionals Don’t Skip.

Every week, thousands of producers, breeders, and industry insiders open Bullvine Weekly for genetics insights, market shifts, and profit strategies they won’t find anywhere else. One email. Five minutes. Smarter decisions all week.

NewsSubscribe
First
Last
Consent

The 920% Growth Gap: What Danone’s Asia Success Reveals About North American Dairy’s Future

31,000 farms today. 19,000 by 2035. The 920% Asia growth gap reveals exactly who survives—and how.

Executive Summary: When Danone reported 13.8% growth in Asia versus 1.5% in North America—a 920% difference—it exposed what every dairy farmer already feels: the game has fundamentally changed, and your response determines whether you’re still milking in 2035. Three paths are proving profitable today. Wisconsin farmers optimizing protein for export processors are capturing an extra $140,000-225,000 annually, while small Vermont organic operations are netting $489 per cow—six times conventional returns. Large-scale operations over 1,000 cows achieve $250,000-375,000 higher profits through efficiency, but here’s what any farm can implement tomorrow: beef-on-dairy crossbreeding delivers $122,500-183,750 extra revenue on 500 cows for just $23,500 investment. Geography now matters as much as management, with farms over 100 miles from processors facing $10,000+ annual disadvantages. December 1st’s Federal Order reforms will lock in advantages for those who’ve already optimized components, making the next 30 days critical. Of today’s 31,000 dairy farms, only 19,000 will survive to 2035—and the market is already choosing winners based on who adapts fastest to these new realities.

You know that feeling when you’re looking at your milk check and wondering if you’re missing something? I had that exact conversation with a Wisconsin dairy farmer last month—let’s call him Tom. He’s got his October statement in one hand, tablet in the other showing Danone’s latest earnings report. “Makes you wonder,” he said, pushing back from his kitchen table, “if we’re even in the same business anymore.”

Here’s what caught both our attention: Danone’s reporting 13.8% growth in their Asia-Pacific specialized nutrition business while North America’s crawling along at 1.5%. That’s a 920% difference, folks. Not a typo—920%.

And you know what? That conversation’s been rattling around in my head ever since, because it’s not really about Danone at all. It’s about what’s happening to all of us.

The stark reality: Danone’s 13.8% Asia-Pacific growth dwarfs North America’s 1.5%—a 920% differential that reveals exactly where dairy value is accumulating globally and which farmers are positioned to capture it.”

What’s Really Behind Those Numbers

So here’s what’s interesting—everyone immediately jumps to China’s infant formula market when they see these growth figures. Sure, China represents about two-thirds of the global infant formula market according to industry tracking, somewhere north of $90 billion. Can’t ignore that.

But there’s more going on here, and this is what I’ve been digging into…

The USDA’s Foreign Agricultural Service has been tracking something remarkable: 670 million people have joined Asia’s middle class since 2000. We’re talking about twice the entire U.S. population moving into dairy-consuming income brackets. And get this—another 80 million are expected by 2030.

Now, what really puts this in perspective is per capita consumption. In China, they’re consuming about 42 kilograms of dairy annually. Meanwhile, we’re sitting at 653 pounds per person here in the States according to USDA’s Economic Research Service data from 2024.

That’s… well, that’s about seven times more. Think about that for a second. Seven times more room to grow.

Meanwhile—and this is where it gets uncomfortable for those of us in North America—Dairy Management Inc.’s been tracking fluid milk consumption, and it’s declined for 70 consecutive years. Not quarters, not even decades. Seven decades straight.

The International Dairy Foods Association published some research in September showing Gen Z drinks about 20% less milk than millennials did at their age.

So we’ve got this massive growth potential over there, and over here? We’re basically rearranging deck chairs, fighting over market share in a pie that’s not getting any bigger.

I’ve been talking with economists and processor reps about this disconnect, and what keeps coming up is how differently they’re positioning themselves depending on whether they’re chasing Asian markets or focusing on domestic sales. And that positioning—here’s the kicker—directly affects what kind of milk they need from us.

Three Approaches That Are Actually Working

What I’ve found visiting farms from Vermont to California over the past few months is that there are basically three models that seem to be working. Not perfectly, mind you, and not for everyone, but they’re working.

The brutal math of survival: From 31,000 farms today to 19,000 by 2035, with conventional operations collapsing (red) while strategic ingredient suppliers (black), premium producers (dark grey), and large-scale operators (light grey) capture the future. Which category are you in?

The Strategic Ingredient Approach

I visited a 680-cow operation in Wisconsin recently where the owner showed me something that made my eyes pop. He’s pulling $3.40 per hundredweight above Federal Order minimums. Not from organic. Not from grass-fed. From protein optimization.

“Started working with the university folks on amino acid balancing,” he explained, spreading out his ration sheets on the office desk. “We’re adding about $75 per cow annually in rumen-protected lysine and methionine. But here’s the thing—we went from 3.12% to 3.38% protein in about eight weeks.”

Now, the University of Wisconsin Extension’s research backs this up. They’re showing farms implementing these protocols typically see returns of 2.5 to 1, sometimes up to 5.5 to 1, within 90 days. Income over feed cost improvements of forty to fifty cents per cow daily. That’s real money, not theoretical projections.

What’s driving this demand? Well, the U.S. Dairy Export Council’s been tracking how processors are investing in ultrafiltration systems to extract whey protein isolate. When that product’s selling for $5 to $8 per pound to medical nutrition companies in Singapore or Seoul, that extra 0.3% protein per tanker? Makes a huge difference to their bottom line.

Here’s what this looks like on the ground:

  • Getting your protein to 3.4-3.6%, butterfat to 4.0-4.2%—mostly through nutrition tweaks, not waiting for genetic progress
  • Keeping somatic cells under 100,000—Michigan Milk Producers Association’s paying forty to sixty cents per hundredweight bonuses for this
  • Finding processors who are actually investing in fractionation technology
  • Capturing $2 to $4 per hundredweight above base pricing

Premium Markets That Actually Pencil Out

I’ll be honest with you—I used to roll my eyes at some of these premium market stories. Seemed like a lot of work for uncertain returns.

Then I spent time with an 85-cow operation in Vermont that netted $489 per cow last year according to the Northeast Organic Farming Association’s financial benchmarks.

That’s… let me repeat that… nearly six times what similar-sized conventional operations are achieving.

What really opened my eyes was data from the University of Minnesota’s farm management folks showing Upper Midwest organic operations averaging $131,839 in total net farm income. This isn’t just a Vermont thing anymore. Wisconsin alone sold $125.7 million in organic milk in 2023—that’s third nationally, only behind California and New York.

“Can’t change the global market, but I can sure change how I respond to it.” —Wisconsin dairy farmer

And then there’s this A2 angle that’s fascinating. Visited a small operation in Pennsylvania—maybe 40 cows total—selling A2 milk at their farm store for $8.50 per gallon. “Testing cost us about $40 per cow through one of the genetics companies,” the farmer told me. “One-time expense. Now we’re capturing premiums that make the whole operation work.”

The market research on A2 is pretty compelling—we’re looking at a market that hit $15.4 billion last year and is projected to reach $50.9 billion by 2033. That’s over 14% compound annual growth. Not a fad when you see numbers like that.

Current premium pricing based on what I’m seeing in the market:

  • Organic’s running $31 to $39 per hundredweight versus $18 to $24 conventional
  • Grass-fed with intensive grazing: $36 to $52
  • A2 milk’s capturing 50% to 100% retail premiums
  • Direct-to-consumer: $6 to $10 per gallon versus $2 to $3 commodity

Scaling Up—If You’ve Got What It Takes

Now let’s talk about the other end of the spectrum. Visited a 2,100-cow operation in California that’s expanding to 2,800. Their production costs? $14.80 per hundredweight.

Cornell’s dairy farm business folks show 500-cow operations typically running $16.30 to $17.80. That’s… that’s a massive difference when you multiply it out over millions of pounds.

“Look, this isn’t for everyone,” the owner told me straight up, standing next to his new rotary parlor. “We’re $4.2 million into this expansion. Both my kids have advanced degrees—one’s got an MBA, the other’s a vet. Without that next generation ready and committed? I wouldn’t even consider it.”

USDA’s Economic Research Service data from September backs up what he’s experiencing—operations over 1,000 cows are capturing roughly $250,000 to $375,000 more in annual profit than 500-cow dairies. It’s mostly about labor efficiency and input cost advantages.

But man, that capital requirement…

Your Strategic Options: Side-by-Side Comparison

Business ModelInvestment RequiredTypical Annual Returns*Timeline to ProfitBest Suited For
Strategic Ingredient Supply$20,000-30,000$140,000-225,0003-6 monthsOperations near processors, 300-1,000 cows
Premium Differentiation$10,000-50,000**$130,000-245,0001-3 yearsFarms near urban markets, any size
Strategic Scale$2-5 million$250,000-500,0003-5 yearsOperations with capital access, next generation

*Returns based on actual farm performance data from University of Wisconsin Extension (ingredient supply), Northeast Organic Farming Association and University of Minnesota benchmarks (premium markets), and USDA Economic Research Service analysis (scale operations). Individual results vary based on management, location, and market conditions.

**With USDA organic transition assistance covering 50-75% of costs

The Beef-on-Dairy Opportunity (Seriously, Do This Yesterday)

If there’s one thing—just one thing—that every dairy farmer should’ve started yesterday, it’s beef-on-dairy. And I mean that literally. The economics are almost too good to believe, but the numbers absolutely check out.

UC Davis has been tracking this, and crossbred calf production’s jumped from about 50,000 head in 2014 to 3.2 million in 2024. Current market data shows these crossbred calves averaging around $1,300. Holstein bulls? You’re lucky to get $250 to $600 on a good day.

Talked with a Pennsylvania producer in October who’s all over this. “We genomic test every heifer calf—costs about $40 per head. Bottom third of our genetics gets bred to beef. Using Angus and SimAngus semen at maybe $22 per straw versus $8 for conventional Holstein. But those beef-cross calves? They’re selling for $1,400 at three days old. Three days!”

Stop leaving $131,250 on the table: Beef-cross calves at $1,300 versus Holstein bulls at $425 means a 500-cow operation captures an extra $131,250 annually for just $23,500 investment—this isn’t optional anymore.

CattleFax’s October analysis projects beef-on-dairy could represent one-sixth of the entire fed beef market within two years. Why? Because the U.S. beef cattle herd hit 73-year lows—we’re at 28.2 million head as of January 2024. That shortage isn’t fixing itself anytime soon.

Here’s your action plan—and I mean implement this now:

  • Test your herd if you haven’t already ($40 per cow, one-time expense)
  • Breed the bottom 30-35% to beef (but keep that 25-30% replacement rate)
  • Budget for $600 premiums long-term, not today’s $1,000-plus
  • On 500 cows? You’re looking at $122,500 to $183,750 in additional revenue first year
December 1st splits the industry permanently: Federal Order reforms lock in advantages for farms optimizing components now, with premiums jumping from $0 to $3.80 per CWT—this 30-day window determines who captures profit and who faces deductions.

Critical: Federal Order Changes Coming Fast

Effective December 1, 2025:

  • Protein factors jump from 3.1% to 3.3% per hundredweight
  • Other solids increase from 5.9% to 6.0%
  • If you’re below these levels, you’re facing deductions, not just missing premiums

Source: USDA Agricultural Marketing Service Final Decision

Geography Is Becoming Destiny (Unfortunately)

Your address determines your survival: From $3,600 near processors to $21,900 in remote areas, geography creates an automatic $18,300 annual disadvantage before management even matters—location is no longer just real estate

This is tough to talk about, but we need to face it—your location might matter more than your management now.

Recent research on milk hauling charges across the Upper Midwest is pretty eye-opening. Some Wisconsin counties near Madison? They’re paying less than twelve cents per hundredweight for hauling.

But if you’re in northern Minnesota or parts of North Dakota? You’re looking at fifty to seventy-three cents.

For a 500-cow operation, that’s nearly ten grand in annual disadvantage before you even start talking about market access. Distance to processing infrastructure correlates directly with profitability now. It’s not fair, but it’s real.

That said—and this is encouraging—Midwest operations are finding creative workarounds.

Visited a 240-cow grazing operation near Viroqua, Wisconsin, where they’ve really figured something out. “Our feed costs run about $4.20 per cow daily versus $6.80 for the confinement operation down the road,” the farmer explained while we watched his cows heading out to pasture. “Yeah, we produce less milk—46 pounds versus their 85—but our profit per cow? Actually higher.”

Recent grazing systems research from Missouri backs this up—their pasture-based operations are achieving $14.08 per hundredweight production costs versus $14.52 for conventional confinement. Not a huge difference, but when every penny counts…

What Your Region Means for Your Strategy

If you’re in the Northeast: You’ve got proximity to those premium markets, but land competition is absolutely brutal. Recent data shows Vermont farmland averaging around $4,100 per acre versus about $2,800 in Wisconsin. Your path probably runs through differentiation—organic, grass-fed, or direct marketing. You’ve got the population density to support it. For specific guidance, check with your state extension service—Cornell for New York, UVM for Vermont, Penn State for Pennsylvania.

Midwest folks: Feed cost advantages and land availability are your strengths. But if you’re over 100 miles from a major processor? The math gets tough. I’d be focusing hard on cutting production costs through grazing or looking at partnership models with neighbors. University of Wisconsin-Madison Extension and University of Minnesota have excellent resources on managed grazing economics.

Western operations: Scale is your game, no question. But water rights and environmental regulations keep tightening. California’s new sustainability requirements are adding compliance costs that really bite into margins. You’ve got to factor that in. UC Davis and Oregon State have been doing great work on water efficiency in dairy systems.

The Cooperative Question: Choose Your Risk Profile

When Danone terminated contracts with 89 Northeast organic farms back in August 2022, it sent shockwaves through the whole industry. According to the Northeast Organic Dairy Producers Alliance, fifteen of those farms went out of business entirely.

Organic Valley ended up absorbing 65 of them.

One affected farmer told me—and this still gets me—”We thought we had security with a big buyer. Turns out we were just suppliers they could optimize away when it suited them.”

Here’s the reality: you’re choosing between two different risk profiles. With a corporate buyer like Danone, you might get higher prices short-term, but you’re vulnerable to sudden termination when their strategy shifts. With a cooperative like Organic Valley, you get more stability through member ownership, but you’re subject to supply management decisions and triggering controls.

What’s interesting about Organic Valley’s response is their triggering system. They commit to purchasing milk one to three years before farms even finish their organic transition. Yes, they control who gets triggered based on their supply needs. But once they trigger you, they honor that commitment even when they’re in oversupply. During the 2016 organic oversupply crisis, they kept taking milk from triggered farms even while stopping new enrollments.

The Government Accountability Office did a report back in 2019 on dairy cooperatives—Senator Gillibrand requested it after getting complaints from constituents. They found that these consolidated cooperatives face what they called “competing interests that can create power imbalances” between large and small members.

Organic Valley’s at over 1,600 members now, adding about 84 farms annually. That’s 5.3% growth while overall farm numbers are declining.

The bottom line? Both models have trade-offs. Corporate buyers offer market pricing but zero governance control. Cooperatives provide member ownership but require you to work within their supply management framework. Neither is perfect, but understanding the trade-offs helps you make an informed choice based on your risk tolerance and long-term goals.

For farms considering organic transition, the smart move is securing your buyer commitment—whether cooperative or corporate—before investing in the three-year transition. That $180,000 mistake that Iowa farmer made? Completely avoidable with upfront buyer agreements.

Export Markets: Opportunity and Risk All Mixed Together

Let’s address the elephant in the room—China achieved 85% dairy self-sufficiency in 2023, a full year ahead of their own schedule.

According to Rabobank’s latest quarterly, their whole milk powder imports crashed 36% to just 430,000 metric tons. That’s the lowest since 2010.

Then came April’s tariff mess. By April 10, we hit 125% tariffs going both directions. U.S. dairy exports to China—which were $584 million in 2024—basically vanished overnight.

But here’s what’s interesting—Southeast Asia is a completely different story.

The six ASEAN countries represent 566 million people with a projected 19 billion liter dairy deficit by 2030. That’s actually bigger than China’s 15 billion liter gap, according to the International Dairy Federation’s latest global report.

Industry analysts I’ve talked with increasingly point out that farmers supplying processors focused on Southeast Asian markets have more stable growth prospects than those dependent on China. It’s that old wisdom about not putting all your eggs in one basket, but with real numbers behind it now.

Learning from What Doesn’t Work

Not every strategy succeeds, and we need to talk about that too.

One Iowa operation tried transitioning to organic back in 2019 without securing a buyer first. “We spent three years paying organic feed prices while getting conventional milk prices,” the farmer admitted when we talked. “Lost $180,000 before we pulled the plug.”

Another farm near Fond du Lac expanded from 400 to 800 cows in 2021. “We completely underestimated the management complexity,” they told me. “Thought we’d just double everything. Doesn’t work that way. We’re selling the expansion facilities and going back to 500.”

These aren’t failures of farming—they’re strategy lessons worth learning from before you make the same mistakes.

What Actually Needs to Happen Now

Looking at all this—the growth gaps, what’s working, what isn’t—certain decisions just can’t wait anymore.

If you’re under 500 cows:

Start beef-on-dairy immediately. I can’t stress this enough. The investment’s minimal—about $23,500 for a 500-cow operation. Returns come fast—$122,500 to $183,750 in the first year. And it doesn’t require changing your whole operation.

Also, be honest about your geography. More than 100 miles from processing? Over 200 from a metro area? Your options narrow considerably, and you need to face that reality.

If you’re 500 to 1,000 cows:

You’re in what I call the squeeze zone. Either commit to scaling up—if you’ve got the capital and management depth—or pivot hard to differentiation. Standing still is just slow bleeding at this size.

For everyone:

By November 30, you need to ask your milk buyer these questions:

  • What percentage of our milk goes into export products?
  • Which Asian markets are you actually targeting?
  • What component premiums will you pay after December 1?
  • Are you investing in protein fractionation capacity?

If those answers disappoint you, start exploring options. Now. Not next year.

The View from Here

Danone’s 13.8% Asian growth versus 1.5% in North America tells us exactly where dairy value is accumulating globally. That’s not changing anytime soon.

What can change is how we position ourselves in that reality.

The industry that emerges from all this transformation will have fewer farms—that’s just math. But those remaining will be more specialized, more efficient, or more strategically positioned. That’s not a judgment on anyone. It’s just the economic reality we’re all trying to navigate.

Remember that Wisconsin farmer I mentioned at the start? Tom? He’s implementing beef-on-dairy now, hired a nutritionist for component optimization, and he’s talking to Organic Valley about membership. “Can’t change the global market,” he told me last week. “But I can sure change how I respond to it.”

And that’s really it, isn’t it? The market’s sending us signals—loud ones. The question isn’t whether to adapt anymore. It’s how fast and how smart we can position ourselves for what’s already here.

For the 31,000 dairy farmers operating in North America today, these aren’t abstract discussions over coffee. They’re decisions that compound into survival or exit. Understanding what’s happening—really understanding it—that’s what separates the operations that’ll be milking in 2035 from those that won’t.

Sometimes the kindest thing we can do is be honest about hard truths. Even when they’re uncomfortable.

Especially then, actually.

Whether you’re in Vermont, Wisconsin, or Washington State, the fundamentals remain the same: position yourself strategically, move decisively, and don’t wait for the market to make decisions for you. Because it will.

Don’t wait: Federal Order reforms take effect December 1, 2025. If you haven’t evaluated your component levels and processor relationships yet, you’re already behind. The competitive advantages are about to lock in for those who moved early. Don’t get caught watching from the sidelines while others capture the premiums you could’ve had.

Resources for Next Steps

Northeast: Cornell PRO-DAIRY (prodairy.cals.cornell.edu), UVM Extension (uvm.edu/extension/agriculture), Penn State Extension Dairy Team (extension.psu.edu/animals/dairy)

Midwest: University of Wisconsin Dairy Extension (fyi.extension.wisc.edu/dairy), University of Minnesota Extension Dairy (extension.umn.edu/dairy), Michigan State Extension (canr.msu.edu/dairy)

West: UC Davis CLEAR Center (clear.ucdavis.edu), Washington State Dairy Extension (dairy.wsu.edu), Oregon State Dairy Extension (smallfarms.oregonstate.edu/dairy)

KEY TAKEAWAYS:

  • Beef-on-dairy pays for your next pickup truck: Bottom third of your herd + beef semen = $122,500-183,750 extra revenue this year (500-cow operation, $23,500 investment)
  • The 920% gap reveals three winners: Premium markets (organic/A2 earning 6x conventional), protein optimization ($140-225K extra annually), or 1,000+ cow scale—everything else is managing decline
  • Your address matters more than your management: Same exact operation, wrong zip code = $10,000+ annual penalty if you’re 100 miles from processing
  • December 1 splits the industry in two: Farms hitting 3.3% protein and 6.0% other solids capture premiums; everyone else faces deductions—this deadline won’t come again
  • 19,000 survivors from 31,000 farms: Asia’s exploding demand rewards farmers who adapt to export markets, while domestic-focused operations fight over crumbs—choose your side now

Complete references and supporting documentation are available upon request by contacting the editorial team at editor@thebullvine.com.

Learn More:

The Sunday Read Dairy Professionals Don’t Skip.

Every week, thousands of producers, breeders, and industry insiders open Bullvine Weekly for genetics insights, market shifts, and profit strategies they won’t find anywhere else. One email. Five minutes. Smarter decisions all week.

NewsSubscribe
First
Last
Consent

The $50,000 Question: Why Smart Dairies Follow This 8-Point Protocol Before Any Big Decision

What farmers are discovering is simple—the most valuable time on the dairy isn’t the visit itself, but the preparation before it.

You know that feeling when you watch a neighbor drop $200,000 on new parlor equipment, only to find out six months later the real problem was their water heater? Or maybe you’ve been there yourself—spent months adjusting rations while the actual issue was something as simple as feed bunk height.

Here’s what I’ve noticed after years of working with dairies from Vermont to New Mexico, and consulting with everyone from 100-cow tie stalls to 5,000-head dry lots: these aren’t failures of effort. They’re failures of preparation. And with milk prices doing their usual rollercoaster thing and margins tighter than ever, we really can’t afford to keep learning these expensive lessons.

What’s encouraging is that the farms that stay consistently profitable—whether they’re milking Jerseys in Wisconsin or running Holsteins in Idaho—are not necessarily the ones with the deepest pockets or the shiniest equipment. They’re the ones who’ve figured out how to ask the right questions before making any decision.

The $50,000 Question Nobody’s Asking

So there’s this dairy I worked with recently—typical Midwest setup, about 450 cows, been in the family since the grandfather started with 30 head back in the ’60s. Good people, working hard every single day.

They were ready to expand their parlor. You know how it goes… milking was taking forever, cows were getting antsy, everyone was stressed. The contractor’s quote came in around $380,000. Not exactly pocket change, even when milk’s at decent prices.

But here’s where things got interesting.

Before signing anything, they decided to really dig into their numbers—and I mean really dig. What they found changed their thinking entirely. The bottleneck wasn’t milking capacity at all. It was their transition cow program.

600-cow operation nearly dropped $1.8 million on robots before discovering their real constraint: genetic potential, not labor—a $1.755 million near-miss caught by two weeks of systematic preparation and stakeholder interviews.

Now, we all know transition cows can make or break you. Cornell’s been doing some fascinating work on this, and their PRO-DAIRY program keeps showing how every little hiccup in that transition period just cascades through the whole lactation. This particular farm? They were losing about 3 pounds per cow across the entire herd because their fresh cow area was, honestly, a disaster.

Instead of that $380,000 parlor expansion, they put about $45,000 into fixing their transition facilities and tightening up protocols. Two months later, they were up 8 pounds per cow.

Do the math on that—it’s real money. And it came from asking different questions.

The stark reality: 12 hours of preparation prevented a $335,000 mistake and increased production by 8 pounds per cow—proof that the most valuable time on a dairy isn’t the visit itself, but the thinking before it.

Eight Things That Matter More Than You’d Think

After watching farms navigate good times and bad—from the 2014 milk price crash to today’s volatility—I’ve noticed there are about eight areas that really set the ones that thrive apart from those just trying to survive. What’s interesting is that none of these require a huge investment. They just require thinking a bit differently.

1. Who’s Really Driving This Decision?

This one’s subtle, but it matters more than you’d think. When a problem is raised during your dairy consulting visit or farm meeting, who raises it makes all the difference.

I’ve noticed that when employees bring stuff up, they’re usually seeing the daily friction—things that slow them down or make their jobs harder. When owners identify problems, they’re often looking at the bank statement. When your vet flags something, they’re seeing patterns they’ve noticed across multiple herds. Your nutritionist? They’re thinking about ration efficiency and feed costs.

Each perspective is valid. But incomplete. The magic happens when you get all these viewpoints in the same room—or better yet, in separate conversations where people feel safe being honest.

2. Your Herd Tells Stories You’re Not Reading

You probably know this already, but your herd structure is basically a crystal ball for the next two years.

Got a bulge in third-lactation cows? That’s telling you something about breeding decisions from way back that’ll affect you for years to come. Wisconsin’s extension folks have been talking about this forever—imbalanced herd demographics can quietly eat away at efficiency, and you won’t even notice until it’s too late.

Looking at research in the Journal of Dairy Science on herd dynamics, farms with balanced age distributions consistently outperform those with demographic bulges. It’s like having a slow leak in your tire. You don’t notice day to day, but suddenly you’re on the side of the road.

3. Yesterday’s Numbers, Tomorrow’s Reality

Here’s something we’ve all learned the hard way: today’s snapshot usually lies.

When you’re just looking at this month’s report, that “sudden” drop in components might actually be a gradual slide that finally got bad enough to catch your attention. The extension services have been preaching this for years—farms that look at a full year of data or more catch problems much earlier than those that just watch current reports.

The 2023-2024 Cornell Dairy Farm Business Summary really drives this home, showing that top-performing herds spend significantly more time analyzing historical patterns than average performers. Think about it like this… you wouldn’t judge your whole crop by looking at one plant, right?

4. Comfort Beats Genetics (Most of the Time)

Now, this might ruffle some feathers, but here it is: most production problems aren’t actually production problems. They’re comfort problems.


Comfort Factor
ImpactDollar Loss
Lying Time -2 hours-5+ lbs milk/day$300-$400
Poor Water Access-3 lbs milk/day$180-$240
Inadequate Bunk Space-4 lbs milk/day$240-$320
Heat Stress (unmanaged)-10+ lbs milk/day$600-$800
Stall Comfort Issues-5 lbs milk/day$300-$400
CUMULATIVE NEGLECTUp to -27 lbs/cow/day$1,620-$2,160/cow/year

Research from the University of Wisconsin’s Dairyland Initiative keeps confirming this—when cows spend less time lying down, even just a couple of hours less, they can drop 5 pounds of milk or more. At today’s prices, that’s real money walking out the door every single day. Water access, bunk space, how deep your stalls are bedded… these “little things” often drive more profit than any fancy genetic program or feed additive.

I mean, you can have the best genetics in the county, but if your cows aren’t comfortable, what’s the point?

5. Know Where You Really Stand Financially

Every farm exists in three financial worlds at once. There’s where you are right now (usually tighter than you’d like), where you’re headed (hopefully better), and what you can actually afford to change (often less than you think).

Cornell’s Dairy Profit Monitor has been tracking this stuff for years, and what’s fascinating is that the most profitable farms aren’t necessarily the big spenders. They’re the ones whose spending actually matches their financial reality. A farm digging out of debt needs completely different strategies than one setting up the next generation.

Hope isn’t a business strategy, as much as we’d all like it to be.

6. When Everyone’s Pulling in Different Directions

This is a tough one. When your milkers think success means getting done fast, your feeder thinks it means spotless bunks, and you think it means high butterfat… well, you’re basically running three different farms that happen to share an address.

Getting everyone rowing in the same direction—that’s worth more than any piece of equipment you could buy. And it’s something every dairy consultant will tell you matters more than almost anything else.

7. Your Failures Are Actually Gold

“We tried that already.”

How many times have you heard that? Or said it yourself? But here’s the thing—knowing why something failed three years ago might be exactly what you need to make it work today. Different people, different feed prices, different weather patterns… everything changes.

That disaster from 2022 might be 2025’s breakthrough. But only if you remember what actually went wrong.

8. Your Employees See Things You Never Will

This is huge, and it gets missed all the time. Your employees—especially the ones who’ve been around a while—they see patterns you don’t even know exist.

But here’s the catch: they won’t bring it up in a meeting. Too risky. Get them alone, though, maybe while you’re fixing something together, and suddenly you’re hearing about that water trough that’s been dry every afternoon since spring, or how the fresh cows always look stressed after the weekend crew.

That’s intelligence you can’t buy. And it’s exactly what smart dairy consultants tap into during farm visits.

Your Complete Pre-Decision Protocol: The 8-Point Checklist + Action Plan

Want a printable version? Save this checklist for your next big decision.

Before any major decision or consulting engagement, here’s your roadmap:

☐ Decision Origins – Who identified this need, and what’s their real motivation?
Action: Ask each stakeholder privately why this matters now

☐ Herd Demographics – What’s your lactation distribution telling you about future capacity?
Action: Pull a current herd inventory report and map out your next 24 months

☐ Historical Patterns – Review 12-24 months of data, not just this month’s snapshot
Action: Block out 3-4 hours this week to analyze your long-term trends

☐ Comfort Audit – Check water access, bunk space, stall comfort before genetics or nutrition
Action: Spend an hour just watching cows—no agenda, just observe

☐ Financial Reality – Match investments to actual cash flow capacity over 24 months
Action: Run the numbers with your banker or financial advisor before committing

☐ Team Alignment – Ensure everyone defines “success” the same way
Action: Have one-on-one conversations with key employees this week

☐ Past Lessons – Document why previous attempts failed or succeeded
Action: Write down what you’ve tried before and why it didn’t work

☐ Employee Intelligence – Conduct private one-on-one conversations with key staff
Action: Schedule individual coffee breaks with your milkers and feeders

Total time investment: 12 hours over 2 weeks
Potential savings: $50,000-$200,000 in mistargeted investments
ROI on preparation: Often 100:1 or better

The Backwards Logic of Preparation

The economics of thinking first: a detailed breakdown showing exactly how 12 hours of preparation translates to preventing 50-100 wasted hours and $50K-$200K in mistargeted investments—the math that makes ‘slow down to speed up’ undeniable

What’s fascinating—and kind of backwards when you first think about it—is that the more time you spend preparing before a decision, the less time you waste fixing mistakes later.

Based on what I’ve seen work across dozens of farms and validated by dairy management research, a good pre-decision assessment might take:

  • Maybe 3-4 hours, really going through your records
  • Another few hours talking with your team (one-on-one, not in groups)
  • Some time just watching, with no agenda
  • An hour or two connecting all the dots

So let’s say 12 hours total. Those 12 hours routinely save months of going down the wrong path and tens of thousands of dollars in investments that miss the mark.

Trust Changes Everything

Here’s something I didn’t expect when I started paying attention to this stuff: preparation builds trust like nothing else.

When you come to a discussion already understanding the history, respecting what’s been tried, seeing the patterns… it changes the whole dynamic. People stop defending and start collaborating.

I’ve watched this shift happen over and over. That skeptical producer who crosses their arms when the consultant walks in? They lean forward when they realize someone’s done their homework. Employees who usually stay quiet? They start sharing ideas when they see you actually care about the details.

And this isn’t just feel-good management talk—it directly affects your bottom line. Farms where everyone trusts the process implement changes faster and actually stick with them.

Real Numbers from a Real Decision

Let me share something that really drove this home. There’s a 600-cow operation in central New York—good people, been at it for generations.

They were looking at three big options: robotic milkers (about $1.8 million all in), expanding facilities (roughly $650,000), or really ramping up their genetics program with genomic testing (around $45,000 per year).

Instead of just picking what felt right, they spent two weeks really digging in. Used the 2023-2024 Cornell Dairy Farm Business Summary benchmarking data, talked to everyone individually, and looked at their five-year patterns.

What they discovered caught everyone off guard. Their constraint wasn’t labor—so robots didn’t make sense. It wasn’t space—so expansion was unnecessary. It was genetic potential. They were running about 15% behind the regional average in efficiency, and that was costing them way more than they realized.

That genomic testing investment? According to research published in the Journal of Dairy Science on the ROI of genetic improvement, programs like this typically start paying for themselves within 2 years. But without that preparation, they might’ve dropped nearly $2 million on the wrong solution.

The Cost-Benefit Reality Check

Let’s put this in perspective with real dairy economics:

  • 12 hours of structured preparation = roughly $600 in time value
  • Average mistargeted investment prevented = $50,000-$200,000
  • Time saved on wrong implementations = 50-100 hours
  • ROI on preparation time = Often 100:1 or better

When you look at it like that, can you really afford NOT to prepare? Especially when dairy consulting rates run $150-$300 per hour, making that preparation invaluable?

The New Math of Dairy Success

The folks at Cornell who put together the 2023-2024 Dairy Farm Business Summary keep finding the same pattern: farms that spend time planning consistently outperform those making decisions on the fly. We’re not talking small differences either.

In Wisconsin, operations that are really focusing on systematic decision-making—taking time to think things through—they’re seeing notably better returns. Research from the University of Wisconsin-Madison’s Center for Dairy Profitability backs this up year after year. And when a couple of percentage points separate making it from losing it, that’s everything.

Looking at data from Texas to Pennsylvania, from Idaho to Florida, the pattern holds: preparation drives profitability more reliably than any single technology or management change.

The Bottom Line

As we push through 2025, with milk futures bouncing around and feed costs doing their thing, there’s less room for expensive mistakes than ever.

But here’s what gives me hope: the dairies that’ll thrive won’t necessarily be the ones with the biggest checkbooks or the fanciest technology. They’ll be the ones that master the simple discipline of thinking before doing. Of turning information into understanding, understanding into decisions, and decisions into profit.

The approach is proven. The patterns are clear. The protocol is right there in that 8-point checklist. The only question is whether you’ll invest those 12 hours of thinking to avoid a much more expensive education.

Because in today’s dairy world, being unprepared isn’t just costly—it’s dangerous.

What This All Means for Your Dairy Operation:

  • That 12 hours of thinking before a big decision? It routinely saves months of mistakes and thousands in misplaced investments
  • Transition cow management is often where the real money is—fixing it usually costs way less than expanding while delivering faster returns
  • Your employees know things you need to know—but they’ll only tell you one-on-one, away from the group
  • Looking at 18-24 months of data reveals patterns that this month’s snapshot completely hides
  • The most profitable dairies aren’t the biggest spenders—they’re the ones whose investments actually match their financial reality
  • Smart dairy consulting starts with preparation—the best consultants spend hours reviewing data before they ever step on your farm

Executive Summary:

The difference between a $45,000 fix and a $380,000 mistake? About 12 hours of asking the right questions. That’s what one Midwest dairy discovered when they ran through an 8-point checklist before signing that parlor expansion contract—turns out their real problem was transition cows, not milking capacity. This pre-decision framework, backed by Cornell’s latest research and proven across operations from 100-cow tie-stalls to 5,000-head dry lots, transforms how farms approach big decisions. The protocol covers eight critical areas: from reading your herd’s demographic story to those coffee-break conversations with employees who see problems you’ll never notice. Real-world results show that farms using this approach save $50,000-$200,000 per major decision, with returns often exceeding 100:1 on the time spent preparing. In today’s dairy economy, it’s not about having all the answers—it’s about asking all the right questions first.

Based on extensive work with dairy operations across North America and insights gathered from Cornell PRO-DAIRY programs, the 2023-2024 Cornell Dairy Farm Business Summary, Wisconsin Extension resources, University of Wisconsin-Madison Center for Dairy Profitability research, and the shared experiences of hundreds of dairy producers from 2023-2025.

Learn More:

The Sunday Read Dairy Professionals Don’t Skip.

Every week, thousands of producers, breeders, and industry insiders open Bullvine Weekly for genetics insights, market shifts, and profit strategies they won’t find anywhere else. One email. Five minutes. Smarter decisions all week.

NewsSubscribe
First
Last
Consent

Beef-on-Dairy Lost $196,000 Per Farm in October- Here’s How to Protect Your 2026 Revenue

Your beef-on-dairy revenue just dropped $196K. But producers who saw this coming lost only $27K. The difference? One strategy.

Executive Summary: October’s 11.5% cattle crash proved that beef-on-dairy isn’t the risk diversification producers thought it was—it’s a $196,000 lesson in modern market volatility. In just twelve days, political intervention aimed at consumer prices overwhelmed market fundamentals, dropping crossbred calf values from $1,400 to $1,239. Dairy operations with 40% beef breeding lost the equivalent of $0.54/cwt on their milk price, while Class IV simultaneously dropped $2.99. The immediate threat: Mexican cattle imports resuming could push prices down another $89 per head to $1,150. But producers who kept beef breeding at 30-35% and maintained 12-month operating reserves are weathering this storm with manageable losses. The new playbook is clear: cap beef revenue at 10% of total income, hedge everything you can’t afford to lose, and build financial reserves that assume policy shocks are when, not if.

beef-on-dairy profitability

When feeder cattle futures dropped 11.5% between October 16 and 27, Tim Clifton from Oklahoma City called it “a slap in the face” in his interview with Brownfield Ag News. That phrase keeps coming up in conversations across the dairy community. What started as this promising approach—breeding dairy cows to beef bulls to produce those valuable crossbred calves—has turned into quite an education on modern market dynamics.

Here’s what’s interesting. A typical scenario involves a 1,500-cow operation in central Wisconsin that was counting on $1,400 per crossbred calf based on late-summer conditions. Today? Those same calves are bringing $1,239 if they’re lucky. The USDA Economic Research Service has been tracking this, and we’re talking about roughly $196,088 in lost annual revenue for an operation that size. That’s basically like taking a $ 0.54-per-hundredweight hit on milk prices.

And it’s not happening in isolation. Class IV milk prices dropped $2.99 between September and October—from $19.16 down to $16.17, according to Federal Milk Marketing Order reports. So operations that thought they’d diversified their risk are discovering they’ve actually concentrated it in ways nobody really anticipated.

How Multiple Forces Converged in Twelve Days

October 16-27: The Timeline That Changed Everything

  • Oct 16: Trump announces beef prices “coming down” – futures begin dropping
  • Oct 22: Presidential social media post targets cattle prices directly
  • Oct 23-25: Argentine quota expansion announced (20,000 to 80,000 MT)
  • Oct 27: December live cattle down to $227.17 from $248.88

Let me walk through what actually happened, because the timeline reveals how several factors created this challenging situation. On October 16, President Trump announced that beef prices would be “coming down pretty soon.” The Chicago Mercantile Exchange December live cattle futures—trading at $248.875 per hundredweight that morning—started dropping immediately.

The 12-day cattle price collapse that transformed beef-on-dairy from diversification strategy to concentrated risk. Political intervention met managed money liquidation, proving policy beats fundamentals every time.

But here’s where multiple factors created this perfect storm. That same period, the latest USDA Cattle on Feed reports had been showing consistently lower placements—August placements were down 10% year-over-year according to USDA data, continuing a pattern that began when Mexican cattle imports stopped in May. This actually should have been supportive for prices, but the market was already spooked.

Meanwhile, the Conference Board’s Consumer Confidence Index had declined to 94.6 in October, down from September’s 95.6, reflecting broader economic concerns that could affect beef demand ahead. USDA Foreign Agricultural Service data shows mixed export performance, with weekly fluctuations in sales to key markets such as Japan and South Korea, adding to the uncertainty.

Then came October 22. The President posted on social media: “The Cattle Ranchers, who I love, don’t understand that the only reason they are doing so well…is because I put Tariffs on cattle coming into the United States…they also have to get their prices down, because the consumer is a very big factor in my thinking.”

CME Group data from October 27 shows December live cattle futures had fallen to $227.175—a $21.70 drop in less than two weeks. November feeder cattle contracts hit the expanded daily limit of $13.75 down. Some contracts were “locked limit down,” meaning there were sellers everywhere but no buyers at any price within the trading limits.

Austin Schroeder from Brugler Marketing & Analytics explained it perfectly: “Managed money has a huge net long in the cattle market. With all the headlines over the last week and a half, there is just some general risk-off. Everybody is wanting out, and the door is only so big.”

What made this crash particularly severe was the convergence of:

  • Political intervention signals that spooked speculative money
  • Uncertainty from conflicting supply signals—fewer cattle placed, but policy pressure ahead
  • Weakening consumer confidence affecting demand projections
  • Southern feedlots are reducing purchases after Mexican import restrictions (stopped since May 2025 due to screwworm)
  • The announcement expanding Argentine beef quotas from 20,000 to 80,000 metric tons annually
  • Managed money funds liquidating large long positions per the Commodity Futures Trading Commission reports

You know what’s worth noting? Even smaller regional processors got caught in this. They depend on a steady local cattle supply, and when auction prices went haywire, some had to reduce processing days temporarily. That ripple effect hit local producers who’d built relationships with these smaller plants.

Understanding What This Really Costs

The anatomy of a $196K hit—crossbred calves lost $87K, cull cows another $109K. That’s $130.72 per cow, or roughly what a $0.54/cwt milk price drop would cost. Diversification just became concentration.

Quick Numbers for Your Planning

  • Average annual beef revenue decline: $196,088
  • Per-cow impact: $130.72
  • Where beef breeding probably should be: 30-35% (down from 40-50%)
  • Operating reserves you need now: 12+ months (not the old 3-6 months)
  • Crossbred calf price drop: From $1,400 to $1,239 (-11.5%)

The National Agricultural Statistics Service has documented how cattle sales grew from 4% of dairy farm revenue in 2019 to 9% by 2024. That’s a share of many operations built right into financial planning—debt service, expansion plans, everything.

Take a representative Midwest operation with 40% of the herd bred to beef, producing about 540 crossbred calves annually:

Crossbred calf revenue:

  • What you planned on (at $1,400/head): $756,000
  • What you’re getting now (at $1,239/head): $669,060
  • That’s a difference of: $86,940

Plus cull cow sales—typically about 525 head at a 35% culling rate. The USDA Agricultural Marketing Service reports from late October show:

Cull cow revenue:

  • What you expected (at $165/cwt): $1,212,750
  • What you’re seeing now (at $150.15/cwt): $1,103,602
  • That’s another: $109,148 gone

Combined: $196,088 in reduced beef revenue annually, or about $130.72 per cow in the milking herd.

The breeding decisions that created these calves were made between January and March 2025, when everything looked promising. Those cows can’t be unbred. The calves entering the market from November through February will sell at whatever the market offers.

Regional differences add another layer. Border state operations have typically managed import competition differently, with many maintaining more conservative beef breeding percentages and purchasing additional risk management coverage when import restrictions created temporary market support. But the speed at which prices adjusted everywhere caught even experienced producers off guard.

What I’ve noticed is that organic and grass-fed dairy operations face a different challenge. Their premium milk markets help offset some beef revenue loss, but their crossbred calves from grass-based systems sometimes don’t fit conventional feeding programs as well. They’re having to work harder to find the right buyers who value those genetics.

The Mexican Import Question

Mexican Import Timeline – What to Expect

  • Phase 1 (Announcement): 3-5% price drop within days of reopening news
  • Phase 2 (30-60 days): Additional 2-4% decline as cattle reach U.S. feedlots
  • Phase 3 (3-6 months): Prices stabilize around $1,150/head with full integration
  • Supply gap: 855,000 head currently missing from the normal annual flow

Mexican Agricultural Minister Julio Berdegué is meeting this week with Secretary of Agriculture Brooke Rollins about reopening protocols. According to USDA Animal and Plant Health Inspection Service data, Mexico historically sends about 1.25 million cattle annually to the U.S.—worth over $1 billion. Those imports stopped in May 2025 when New World Screwworm was detected.

Through July, only about 230,000 head crossed the border according to USDA trade statistics. That leaves a supply gap of roughly 855,000 head, which has been supporting prices all year.

Mexican import resumption isn’t speculation—it’s math. 855,000 missing head means $89/calf is coming off prices in three predictable phases. Phase 1 hits within days of announcement. Most producers aren’t hedged for this.

CattleFax projections and agricultural economists suggest the reopening could play out in three distinct phases we need to prepare for.

Market Structure Lessons


Metric
September 2025October 2025DeclineRisk Status
Crossbred Calf Price$1,400/head$1,239/head-11.5%🔴 High
Class IV Milk Price$19.16/cwt$16.17/cwt-15.6%🔴 High
Combined Per-Cow Impact$0.00$130.72 lossCatastrophic🔴 Concentrated

Here’s something revealing. On October 27, while feeder cattle were locked limit down, wholesale boxed beef prices actually increased. USDA Agricultural Marketing Service data shows Choice gained $2.12 to hit $377.88 per hundredweight, and Select jumped $3.69.

One analyst noted bluntly: “Maybe the President should have attacked the packing industry for the excessively high prices they’re getting for beef.”

According to the USDA Economic Research Service’s 2024 analysis, four firms control about 85% of beef processing capacity. During disruptions, they can manage the spread between what they pay producers and what they charge retailers. For those accustomed to Federal Milk Marketing Order price transparency, this has been educational.

Strategic Response: What Successful Operations Are Doing

After extensive conversations with producers, consultants, and lenders over the past two weeks, clear patterns are emerging among operations weathering this crisis successfully.

Immediate Breeding Adjustments Operations are reducing November-December beef breeding from 40-45% down to 30-35%. As one California producer explained, “I’d rather leave $27,000 on the table than risk another $148,000 loss.” This conservative approach reflects hard-learned lessons from October’s volatility.

Looking at this trend, what farmers are finding is that flexibility matters more than maximizing any single revenue stream. Those who kept some dairy bulls for replacements are glad they did—replacement heifer prices from beef-on-dairy matings are getting expensive when you need to rebuild.

Risk Management Implementation USDA Risk Management Agency data shows LRP insurance enrollment for 2026 calf sales has increased significantly. Despite elevated premiums, setting floor prices at $1,150-$1,200 provides catastrophic loss protection. Penn State Extension’s March 2024 research demonstrates that direct relationships with feeders can yield $50-100 per-head premiums while reducing volatility exposure.

Capital Structure Reinforcement: Financial consultants at Farm Credit Services report that operations that successfully navigated this period generally maintained 9-12 months of operating capital, versus the typical 3-6 months. Agricultural lenders at CoBank are advising clients to build toward 12-month reserves. As one banker explained, “Future survivors will be distinguished by liquidity, not just production efficiency.”

Revenue Concentration Limits: If beef revenue exceeds 10% of total farm income, most consultants suggest reducing exposure to beef. Traditional cattle cycles based on biology might be less reliable as policy interventions become more common. Building operational flexibility matters more than ever.

Generational Transition Adjustments The 2022 Census of Agriculture shows the average farmer age at 58 years. Many operations built beef-on-dairy revenue into succession financing. With $196,000 in annual revenue gone, those carefully planned transitions need reassessment. Mark Stephenson, Director of Dairy Policy Analysis at the University of Wisconsin-Madison, observed in recent market commentary: “Policy-driven volatility during generational transition periods can force ownership changes that wouldn’t happen under stable conditions.”

Historical Context and Future Outlook

The Inter-American Development Bank documented Argentina’s 2005-2008 experience, in which government price controls led to a 9% decline in the national herd over three years, ultimately resulting in higher prices than the intervention was meant to prevent.

Based on CattleFax projections and agricultural economist consensus, the likely U.S. trajectory:

2026: Lower prices discourage expansion
2027: Supplies tighten, prices start recovering
2028: Possible supply shortage, crossbred calves could hit $1,800-2,200
2029: If prices reach politically sensitive levels, intervention might recur

Traditional cattle cycles followed biology—breed more when prices rise, contract when they fall. Now policy intervention creates artificial volatility. 2028’s projected $1,950 peak invites 2029 intervention. Your breeding decisions need political risk assessment now.

This policy-driven cycle differs from traditional biological cattle cycles. When you consider it, breeding decisions once focused primarily on butterfat performance and calving ease. Now they incorporate political risk assessment. That’s quite a shift.

Moving Forward with Perspective

October’s market adjustment doesn’t eliminate beef-on-dairy as a viable strategy. At $1,150-1,200 per calf, meaningful supplemental revenue remains. What’s changed is our understanding of the risk profile.

Tom Miller, operating 2,100 cows near Turlock, California, shared a valuable perspective: “My grandfather dealt with the Depression, my father with the 1980s farm crisis, and now we’re dealing with policy volatility. Every generation faces challenges that the previous one didn’t see coming. The key is adapting fast enough.”

What’s encouraging is how producers are treating this as education rather than disaster. They’re right-sizing programs, implementing risk management, and building operations that can handle volatility while capturing opportunities. Whether you’re managing transition periods with fresh cows, working through heat-stress challenges in the Southeast, or running drylot systems out West, the fundamentals still matter—we just layer risk management on top now.

This development suggests we need to think differently about diversification. It’s not just about adding revenue streams within agriculture anymore. Some operations are looking at solar leases, carbon credits, or agritourism. Others are focusing on value-added products that aren’t as exposed to commodity price swings.

October has been an expensive education. But it’s taught us something important about modern agricultural markets. Success going forward requires not just production excellence and cost management—though those remain essential—but recognizing changed market structures and adjusting accordingly.

The cattle market crash was costly tuition. The question now is whether we apply these lessons before the next cycle emerges. Because these past two weeks have made clear there will be a next time. As many have learned, being prepared makes all the difference.

Key Takeaways:

  • Beef breeding above 35% is now high-risk: October’s crash cost 40% operations $196,088—reduce to 30-35% immediately
  • Policy beats fundamentals: 12 days, one presidential tweet, 11.5% price drop—this is the new market reality
  • Cash reserves are survival: Operations with 12-month reserves survived; those with 3-6 months are scrambling
  • $1,150 calves are coming: Mexican import resumption (decision imminent) will drop prices another 7% from the current $1,239
  • The 10% rule: Successful operations cap beef revenue at 10% of total income—true diversification means multiple sectors

Complete references and supporting documentation are available upon request by contacting the editorial team at editor@thebullvine.com.

Learn More:

The Sunday Read Dairy Professionals Don’t Skip.

Every week, thousands of producers, breeders, and industry insiders open Bullvine Weekly for genetics insights, market shifts, and profit strategies they won’t find anywhere else. One email. Five minutes. Smarter decisions all week.

NewsSubscribe
First
Last
Consent

Forget Feed Costs: The 3 Survival Strategies Defining Dairy’s Future as 12,000 Farms Face Exit by 2030

As 8,000-12,000 mid-sized operations prepare to exit by 2030, successful farmers are discovering that traditional optimization strategies no longer work—and the real winners are those managing total margins, not just feed costs

EXECUTIVE SUMMARY: Wisconsin dairy farmer Dave Miller’s $180,000 investment in automation for just 1,100 cows seemed irrational—until it increased his net income by $165,000 annually and revealed why 12,000 farms face exit by 2030. The new reality: traditional feed cost optimization is obsolete, as successful producers focus on total margins, where labor exceeds $20/hour, hauling costs have doubled, and feed accounts for only 35-40% of true costs. Three models will dominate 2030: mega-operations (3,500+ cows) achieving $14.20/cwt costs through scale, niche producers capturing $35-50/cwt premiums through direct marketing, and multi-family partnerships sharing resources and risk. Mid-size single-family farms (500-700 cows) face a crushing $250,000-375,000 annual profit gap and must choose among five strategic paths immediately. As California loses 350,000 cows to water restrictions while Wisconsin gains 180,000, the geographic and economic landscape is transforming rapidly—and every year producers delay strategic decisions, they cost them $200,000-300,000 in equity.

Dairy Survival Strategies

I recently spoke with a Wisconsin dairy producer who invested $180,000 in automation technology while running only 1,100 cows in a barn designed for 1,500. His neighbors initially questioned the decision.

Three years later, he’s maintaining profitability with manageable 65-hour work weeks while operations twice his size are experiencing burnout or considering exits.

Dave’s approach reflects a broader pattern I’ve been observing across the industry. The optimization strategies we’ve relied on for decades are evolving.

And producers adapting to these new economic realities are finding sustainable paths forward.

What’s particularly noteworthy is the convergence of data we’re seeing. The USDA National Agricultural Statistics Service reports dairy cow numbers at 9.36 million head as of December 2024. University of Wisconsin dairy economic studies and Cornell’s Dairy Farm Business Summary all point to significant structural changes.

Statistics show the annual average number of commercially licensed dairy farms fell to 24,811—part of a consolidation trend that deserves careful attention.

This transformation raises important questions about operational strategies, regional dynamics, and what success looks like moving forward. The data tells a compelling story about who’s thriving, who’s struggling, and perhaps most importantly, which assumptions may need updating.

The Feed Cost Discussion: Examining Traditional Metrics

Look Beyond Feed: Feed isn’t the 55% villain it used to be—labor now devours 30% of your true cost structure. Are you tracking the right benchmarks?

For generations, we’ve focused intently on feed cost per hundredweight as a primary performance metric. The benchmarks are well-established—Cornell and Wisconsin extension programs suggest feed should account for 45-55% of total costs, and efficient operations can achieve $6.50-7.00/cwt, according to recent enterprise analyses.

This approach has served the industry well. Yet conversations with producers and emerging data suggest we might benefit from a broader perspective.

Consider the economics facing a typical 500-cow operation. They might spend $7.20/cwt on feed and achieve $0.40 savings through optimization—roughly $25,000 annually on 12.5 million pounds of production.

Meanwhile, USDA Economic Research Service data shows agricultural labor costs exceeded $53 billion in 2025, with dairy-specific wages averaging $17.55/hour—representing a 30% increase since 2021.

Transportation costs present another consideration. Producers across multiple regions report that hauling fees have increased from $0.35 to $0.65/cwt as processing plants consolidate.

Processing premiums have shifted as well, with many areas seeing reductions from $0.45 to around $0.20/cwt as competition for plant capacity evolves.

“We’re observing producers who optimize feed costs effectively but encounter challenges in overall profitability. Operations might save $0.30/cwt on rations, yet experience breeding rate declines of 3% or cull rate increases of 5%, resulting in larger losses in areas they’re monitoring less closely.”
— Dr. Mark Stephenson, University of Wisconsin’s Center for Dairy Profitability

Wisconsin’s June 2025 dairy sector assessment provides additional context: feed accounts for approximately 35-40% of total costs when debt service, family living expenses, and working capital needs are included.

These comprehensive costs often determine long-term viability. They suggest the value of holistic margin management.

Individual Cow Economics: A Developing Approach

An interesting development among progressive producers involves shifting from herd averages to individual cow economics. This approach, enabled by recently more accessible monitoring technology, reveals nuanced profitability patterns.

I visited a 1,200-cow Michigan operation using individual cow monitoring systems—technology similar to that documented by the Journal of Dairy Science in smart dairy farm analyses. Their data revealed striking variations:

  • Top 20% of cows generated $3,100 annual profit each
  • Middle 60% generated $950 profit
  • Bottom 20% showed losses of $420 per head annually

The producer—let’s call him Steve to respect his privacy—took an innovative approach based on this data.

“We reduced our herd from 1,200 to 1,050 cows by identifying chronic underperformers,” he explained during my visit. “Total milk production decreased 8%, but net income increased $165,000 because we eliminated negative-margin animals that were affecting overall profitability.”

Stop Guessing—Start Culling: The average herd hides a profit gap of $3,520 per cow. Trash the laggards, pump up the leaders, and watch your bottom line soar.

This individual-animal strategy extends beyond culling decisions. Progressive operations now adjust feeding programs, breeding protocols, and housing assignments based on profitability projections.

High-performing cows receive premium nutrition and genetic improvements. Marginal performers might receive commodity feed and beef semen—a practice that’s created its own market dynamics, with National Milk Producers Federation data showing beef-on-dairy calves commanding $1,400 premiums.

Technology Adoption: Finding Practical Solutions

While industry publications often feature multi-million-dollar robotic installations, the reality for most producers is more modest investments. NASS data indicate that approximately 70% of U.S. dairy farms operate with fewer than 200 cows and an annual capital budget of under $50,000.

Through farm visits this year, I’ve identified what many call a “minimum viable technology stack” that delivers measurable returns for mid-sized operations:

Practical Investments ($30,000-60,000 total):

  • Basic activity monitors for breeding detection: $8,000-12,000 (typical payback within 14 months through improved conception rates)
  • Used plate cooler and variable speed milk pump: $15,000-25,000 (energy cost reductions of 20-30% commonly reported)
  • Automated feed pusher: $12,000-18,000 (saves approximately 2 hours of daily labor)
  • Margin tracking systems: $0-500 (spreadsheet templates providing valuable decision support)

A 400-cow Wisconsin operation shared their experience: $45,000 in basic automation reduced labor requirements by 20 hours weekly—valued at $31,200 annually at current wages—while improving breeding rates by 15% and reducing feed waste by 8%.

“Everyone discusses robots and advanced genetics, but my most valuable investment was a $3,000 used generator for power outage protection. It’s prevented milk dumping three times this year—preserving about $40,000 in revenue. Sometimes, straightforward solutions address real challenges effectively.”
— Tom Peterson, Pennsylvania dairyman managing 380 cows

Regional Dynamics: Understanding Geographic Shifts

The geographic distribution of dairy production continues evolving, influenced by water availability, regulatory frameworks, and processing infrastructure. USDA milk production reports and state-specific data from June 2025 reveal emerging patterns worth monitoring through 2030.

Regions Experiencing Growth:

Wisconsin appears poised to add 130,000-180,000 cows between now and 2030, benefiting from factors such as water availability. University of Wisconsin studies indicate the state’s dairy industry contributes $52.8 billion in economic impact—a substantial increase from five years ago.

South Dakota represents an unexpected growth area, potentially adding 60,000-90,000 cows given favorable regulatory conditions and new processing investments.

Michigan shows expansion potential of 45,000-75,000 cows, leveraging Great Lakes water access and existing infrastructure advantages.

Regions Facing Challenges:

California confronts difficult decisions as the Sustainable Groundwater Management Act (SGMA) potentially removes 500,000 to 1 million acres from irrigation by 2040, according to UC Davis and ERA Economics research. This could result in 200,000-350,000 fewer dairy cows.

The Southwest, particularly Texas and Arizona, faces a contraction of 120,000-200,000 cows due to concerns about water scarcity.

Southeastern states continue gradual adjustments, potentially losing 50,000-90,000 cows to heat stress and feed cost pressures.

The Northeast presents an interesting case. Vermont and New York operations are finding success with value-added production and agritourism, though total cow numbers remain relatively stable.

A New York producer recently told me, “We can’t compete on volume, but our proximity to Boston and New York City markets gives us premium opportunities California can’t match.”

Coast-to-Coast Cow Shuffle: The SGMA is triggering America’s biggest dairy redraw in history. Is your state benefiting—or bleeding cows?

A Wisconsin processor shared an observation that captures the transformation: “When California loses a 5,000-cow operation, we typically don’t see a single 5,000-cow dairy relocate here. Instead, we might see three 1,500-cow operations emerge, each requiring different infrastructure support. It represents structural transformation, not simple geographic relocation.”

This fragmentation creates complex dynamics. Regions gaining production face intensified labor competition, increased regulatory attention, and community adaptation challenges.

Areas losing production experience, processor consolidation, and service reductions that can accelerate further exits.

Mid-Size Operations: Evaluating Strategic Options

The 500-700 cow operations that have long anchored American dairying face particularly complex decisions. Cornell’s Dairy Farm Business Summary and related financial analyses reveal that these farms occupy a challenging position—scale limitations for certain efficiencies, yet size constraints for niche-market approaches.

Recent extension analyses suggest that a typical 500-cow operation experiences:

  • Production costs: $16.30-17.80/cwt
  • Large-scale operations (2,500+ cows): $14.20-15.80/cwt
  • Average revenue: $20.90/cwt (based on June 2025 Class III pricing at $18.82/cwt)
  • Resulting margins: $3.10-4.60/cwt

That $2-3/cwt cost differential translates into $250,000-375,000 in annual profit lost compared to larger operations—ironically, approximately the capital needed for modernization investments.

Mid-Size Meltdown: A brutal $2.05/cwt cost gap leaves mid-size farms with a $375k annual hole—survival requires a radical pivot or exit.

Working with producers, we’ve identified five primary strategic paths:

  1. Scale expansion (to 1,500+ cows): Requires $6-8 million investment, with industry data suggesting 60-70% success rates for well-planned expansions
  2. Niche market transition (organic/direct marketing): Requires proximity to urban markets, with approximately 20-30% of attempts achieving sustainable success
  3. Efficiency optimization (robotics at current scale): $1.5 million investment potentially extends viability 8-12 years
  4. Partnership formation (combining with neighbors): Offers shared resources, though approximately 40% encounter challenges within five years
  5. Strategic exit (while retaining equity): Can preserve $2-4 million for life’s next chapter

“The most difficult conversations involve 50-year-old producers who believe market cycles will improve their situation. Each year of delayed decision-making can reduce equity by $200,000 to $ 300,000. By the time action feels necessary, options have often narrowed considerably.”
— Dr. Wayne Knoblauch, farm management specialist at Cornell University

Understanding Expansion Challenges: Learning from Experience

Industry data and lender interviews suggest 30-40% of major expansions encounter significant challenges. Through analysis of expansions from 2018 to 2023, patterns emerge that deserve careful consideration.

A typical challenge sequence often unfolds like this…

  • Initial phase (Months 1-6): Construction frequently exceeds budgets by 15-20% due to weather delays or supply chain issues, affecting working capital before operations commence.
  • Staffing phase (Months 7-12): Labor recruitment proves more difficult than anticipated. Facilities designed for eight workers might operate with four, creating unsustainable workloads.
  • Operational phase (Months 13-18): Production often falls 15-20% below projections due to transition stress, learning curves with new facilities, and management bandwidth constraints.
  • Stress phase (Months 19-24): Family and personal stress intensifies. Health impacts, relationship strains, and succession uncertainties become pronounced.
  • External pressure phase (Months 25-30): Market changes (milk price adjustments, disease challenges, equipment issues) expose accumulated vulnerabilities.
  • Resolution phase (Months 30-36): Financial covenants trigger lender discussions, though operational challenges typically preceded financial ones.

A producer who experienced expansion difficulties shared powerful insight: “The financial pressure arrives last. Before that comes health impacts, family stress, and loss of purpose. The paperwork simply documents what already occurred.”

Analysis suggests successful expansions share common elements: 20-30% budget contingencies (versus 5-10% in struggling expansions), 10-15% excess labor capacity from day one, management teams sharing responsibilities, and 10-12 months working capital reserves.

The difference often lies in maintaining adequate buffers—financial, operational, and personal.

Future Operating Models: Three Viable Paths for 2030

Looking toward 2030, current trends and economic modeling suggest three primary operating models will emerge, each with distinct characteristics.

Large-Scale Operations (3,500-8,000 cows)

These operations achieve $14.20-15.80/cwt costs through scale efficiencies and automation. Many generate $800,000-1.8 million annually from renewable energy credits via anaerobic digesters.

The investment requirements are substantial—$25-$35,000 per cow—and management resembles agricultural business leadership more than traditional farming. IDFA’s 2025 report indicates these operations collectively employ 3 million people nationally, generating nearly $780 billion in economic impact.

Premium Niche Operations (40-120 cows)

These farms capture $35-50/cwt through direct marketing, compared to $21/cwt under commodity pricing. They generate $220,000-650,000 family income with minimal debt, according to Cornell’s organic dairy studies.

Marketing and customer relations consume 25-35% of time—it’s farming combined with retail business management. Success requires proximity to metropolitan areas where customers value and can afford premium products.

USDA organic price reports from September confirm these premiums remain stable.

Strategic Mid-Scale Partnerships (800-1,800 cows)

This model involves 2-3 families collaborating to share resources and responsibilities. They achieve $200,000-250,000 income per family with 50-60 hour work weeks.

Technology adoption is selective—perhaps 50-70% robotic milking, 30-50% conventional systems. While these partnerships provide operational scale and lifestyle benefits, they haven’t eliminated all structural pressures.

Notably, the 200-700 cow single-family operations that historically defined American dairying face the most challenging path forward, caught between scale requirements and market opportunities.

ModelHerd SizeCost ($/cwt)Revenue ($/cwt)Annual IncomeCapital NeedWork Hours/WeekSuccess Factor
Mega-Operations3,500-8,000$14.20-15.80$20.90 (commodity)$800K-1.8M+$25-35KMgmt roleScale/automation/bili…
Premium Niche40-120N/A$35-50 (premium)$220K-650K<$5K60-70 hrsMetro/direct marketing
Mid-Scale Partnerships800-1,800$15.50-16.80$22-25 (value-added)$200K-250K$15-20K50-60 hrsShared resource/risk

Emerging Considerations: Factors to Monitor

While the industry focuses on immediate challenges such as labor and milk prices, several emerging factors deserve attention.

Immigration policy represents significant uncertainty. The National Milk Producers Federation estimates that 70% of dairy labor depends on immigrant workers, which could lead to disruption if policies shift dramatically.

Recent enforcement actions reported by industry media in June 2025 provided early indicators of possible impacts.

Replacement heifer availability has become constrained following years of beef-on-dairy breeding programs. Those $1,400 beef-cross calves seemed profitable, but now replacement heifers command $4,000 or more in some regions,according to recent market reports.

This affects expansion possibilities and disease recovery capacity.

Environmental regulations continue evolving. California’s experience with digester requirements and proposed discharge rules requiring 10 mg/L nitrogen limits may preview broader regulatory trends.

Compliance costs could affect financing availability for highly leveraged operations by 2028-2030.

The technical skills gap presents ongoing challenges. Operations investing in automation sometimes struggle finding qualified technicians.

I visited one farm where a $2 million robotic system remained idle for three days awaiting a specialist from Europe. This dependency represents an underappreciated vulnerability.

Practical Considerations: Strategic Planning for 2025-2030

Based on comprehensive industry analysis, producer experiences, and economic projections, several key considerations emerge for dairy farmers navigating this transition.

Decision timing matters significantly. Strategic choices about expansion, market positioning, partnerships, or transitions have relatively narrow windows.

USDA projections showing 1.1% production growth in 2025, ahead of processing capacity, suggest timing considerations remain critical.

Comprehensive margin management supersedes single-metric optimization. Wisconsin’s dairy market assessments emphasize total cost consideration, including labor (exceeding $20/hour in many markets), transportation, premiums, and capital requirements.

Scale positioning requires honest assessment. Operations with 200-700 cows lacking clear succession plans benefit from proactive transition planning.

Farms with 500+ cows and strong financials need a clear strategic direction—whether pursuing scale or niche opportunities.

Adequate reserves prove essential. Cornell studies indicate successful operations maintain 20-30% financial contingencies10-15% excess labor capacity, and 10-12 months working capital.

Monitoring emerging risks provides an advantage. Immigration policy, disease risks (particularly HPAI in dairy), replacement availability, and environmental regulations could trigger disruptions.

California’s SGMA implementation offers valuable lessons for planning.

Adapting to new models requires flexibility. Wisconsin economic impact studies show successful operations evolving into diverse models—large-scale operations function as agricultural businesses, niche producers combine farming with marketing, and mid-scale operations rely on complex partnerships.

Success depends on matching capabilities with chosen strategies.

The industry continues consolidating from approximately 35,000 farms today toward a projected 24,000-28,000 by 2030, alongside $11 billion in new processing investments. These changes create both opportunities and challenges.

What emerges from observing hundreds of operations navigating this transition is the importance of recognizing when fundamental business model evolution—not just operational refinement—becomes necessary. Producers actively adapting to new realities position themselves more favorably than those hoping traditional approaches will remain viable.

A successful producer who recently navigated significant transitions shared a valuable perspective: “The question isn’t whether traditional farming methods can continue. The question is whether we’re prepared to evolve to meet the requirements of the 2030 market. That decision—and acting on it promptly—shapes everything that follows.”

The transformation continues, and the industry’s evolution won’t pause for individual decisions. Yet within this change lies opportunity for those prepared to embrace new approaches while honoring agriculture’s enduring values.

Key Takeaways for Dairy Producers

  • Focus on total margins, not just feed costs—labor now exceeds $20/hour in many markets and represents 35-40% of true cost structure (Wisconsin Extension, June 2025)
  • Adopt individual cow economics to identify top 20% profit cows ($3,100/head) vs. bottom 20% losses ($420/head) (Cornell Dairy Farm Business Summary)
  • Invest in practical technology$30,000-60,000 stack can yield $31,200 annual labor savings (producer case studies)
  • Regional shifts are accelerating—Wisconsin is gaining 130,000-180,000 cows, while California faces 200,000-350,000 cow reductions due to SGMA (UC Davis/ERA Economics)
  • Mid-size farms (500-700 cows) face $2-3/cwt disadvantage—choose from five strategic paths with 60-70% success rates for expansions (Cornell analyses)
  • 30-40% of expansions fail—build 20-30% budget buffers and 10-12 months working capital to succeed (industry lender data, 2018-2023)
  • Three 2030 models emerge: Large-scale ($14.20-15.80/cwt costs), niche ($35-50/cwt premiums), mid-scale partnerships ($200K-250K/family income)
  • Monitor blind spots70% immigrant labor dependency (NMPF), $4,000+ replacement heifers (market reports), evolving environmental rules (California preview)
  • Act now1.1% production growth projected for 2025 leaves narrow decision windows (USDA projections)

Complete references and supporting documentation are available upon request by contacting the editorial team at editor@thebullvine.com.

Learn More:

The Sunday Read Dairy Professionals Don’t Skip.

Every week, thousands of producers, breeders, and industry insiders open Bullvine Weekly for genetics insights, market shifts, and profit strategies they won’t find anywhere else. One email. Five minutes. Smarter decisions all week.

NewsSubscribe
First
Last
Consent

H5N1 and Raw Milk Cheese: What the Science Actually Shows About Risk, Testing, and Your Operation

New research reveals surprising gaps between laboratory findings and real-world data, offering practical insights for navigating regulatory requirements while managing actual contamination risks

Executive Summary: The disconnect between H5N1 lab research and marketplace reality is costing cheese producers millions in unnecessary recalls. While Cornell’s October study found the virus can survive 120 days in experimental cheese, the same researchers discovered ferrets eating that cheese didn’t get infected—and FDA surveillance detected zero viable virus in 110+ retail cheese samples nationwide. The culprit? PCR testing that can’t distinguish between infectious virus and harmless RNA fragments, yet triggers $10+ million recall costs when it finds genetic debris. Wisconsin’s 19,000 milk samples with zero detections prove systematic surveillance works, but California’s 233 affected herds show real risk exists regionally. Smart risk management means sourcing from tested negative herds, considering pH optimization for natural protection, and avoiding voluntary testing that creates massive liability for what marketplace data suggests is minimal actual risk.

dairy profitability

You know how sometimes the headlines tell one story, but when you dig into the actual numbers, you find something entirely different? That’s exactly what’s been happening with H5N1 in cheese.

I was talking with a group of producers the other day, and one of them said something that really stuck with me: “The lab research had us all worried, but our test results keep coming back clean. What’s going on here?” It’s a fair question—and as it turns out, there’s a fascinating answer emerging from the data.

Here’s what’s interesting: We’re now at 442 affected dairy herds nationwide, according to USDA’s latest October count, with California bearing the brunt at 233 farms. Those are real numbers. But for those of us in the cheese business—especially raw milk cheese—the story gets more complex when you compare what laboratory experiments suggest could happen versus what’s actually showing up in marketplace testing.

What Cornell’s Research Really Found

So the Cornell team got this $1.15 million FDA grant last July to figure out if H5N1 could survive cheese aging. Makes sense, right? Their work, which appeared in Nature Medicine this October, involved making these tiny experimental cheeses—about 5 grams each—using milk deliberately spiked with a lab-grown virus.

Cornell’s research reveals a game-changing insight: acidification to pH 5.0 eliminates viable virus entirely. Your feta, chèvre, and fresh cheeses naturally provide protection through their production process—no additional intervention needed. Smart producers are already shifting product mix toward naturally protective varieties

Here’s where it gets interesting, though. They tested three different pH levels, and the results were pretty clear-cut. At pH 6.6 and 5.8—that’s your typical aged cheddar or gouda range—the virus did persist through 120 days of aging. But at pH 5.0? Nothing. No viable virus at all. And you know what runs at pH 5.0? Your feta, your chèvre, most of your fresh cheeses.

But wait, it gets better. When the full paper came out (not just the preprint), it revealed something crucial: they fed this contaminated cheese to ferrets. Now, if you don’t know, ferrets are basically the canary in the coal mine for flu research—they’re incredibly susceptible. And guess what? Not a single ferret got infected from eating the cheese. Not one.

Meanwhile, some ferrets drinking contaminated raw milk did get sick. The researchers think—and this makes sense when you think about it—that the solid structure of cheese might trap the virus differently than liquid milk, where it’s just floating around freely. In cheese, you’ve got this protein matrix, salt everywhere, enzymes breaking things down… it’s actually a pretty hostile environment, even if the virus technically survives.

Understanding the Testing Game: PCR vs. Viability

What I’ve found is that most producers don’t really understand the difference between PCR testing and viability testing—and honestly, why would you? But it matters enormously.

FDA’s own data exposes the PCR paradox: 17% of samples test positive for viral RNA, but viability testing reveals zero infectious virus in 110+ retail cheese samples. This gap between detection and actual risk is costing producers millions in unnecessary recalls

Quick Reference: Testing Types and What They Mean

PCR Testing:

  • Detects as few as 5-10 viral RNA copies per microliter
  • Results in 3-7 days
  • Can’t distinguish between live and dead virus
  • Like finding footprints—proves something was there, not that it’s still dangerous

Viability Testing:

  • Uses egg inoculation to grow the virus
  • Takes up to 30 days for results
  • Confirms if the virus can actually cause infection
  • The only way to know if there’s a real risk

PCR is incredibly sensitive. According to research published in the Journal of Virological Methods this September, we’re talking about detecting as few as 5 to 10 copies of viral RNA per microliter. That’s… well, that’s basically nothing. It’s like being able to find a single grain of salt in a swimming pool.

But here’s the thing—and this is crucial—PCR can’t tell you if what it’s finding is alive or dead. It’s just finding genetic material. Think of it like finding footprints in your barn. Those footprints tell you something was there, but they don’t tell you when, or if it’s still around, or if it was even a threat to begin with.

Now, the FDA has been running this massive surveillance program, and its March update revealed something really eye-opening. They found viral RNA fragments in about 17% of some dairy products they tested. Sounds scary, right? But then they took those same positive samples and did viability testing—that’s where you actually try to grow the virus in chicken eggs to see if it’s infectious—and every single sample came back negative. Every one. No viable virus.

Why does this matter? Well, Food Safety Magazine’s analysis puts the average food recall at over $10 million in direct costs alone. So if you’re destroying product based on PCR positives that turn out to be just RNA fragments… you can see the problem.

State Strategies: From Wisconsin’s Testing Blitz to California’s Realities

California’s dairy outbreak concentration reveals why risk management strategies must be regional, not national. While California battles 233 affected herds, Wisconsin’s 19,000 tested samples show zero detections—proving surveillance works and geography matters more than headlines suggest

What’s fascinating to me is how differently states are handling this. Wisconsin—and you’ve got to hand it to them—they’ve gone all-in on testing. They’re processing over 5,000 milk samples every month through their state lab. The result? As of October, they’ve tested more than 19,000 samples with zero H5N1 detections. Zero. That’s not luck, that’s systematic surveillance working.

Pennsylvania took a more measured approach. Their State Veterinarian, Dr. Hamberg, caught some flak back in March when he basically said, “Let’s wait for the full peer-reviewed study before we panic.” Looking back now? Smart move. Pennsylvania has maintained what USDA calls Stage 4 status—that is, no H5N1 present—with over 100 dairy herds. They’re actually the only state with that many herds to achieve that status.

Then there’s California. Different story entirely. With 233 of the 442 affected herds nationally—we’re talking over half the outbreak—they’re dealing with real contamination. I was talking with a Central Valley producer recently who put it this way: “We’re not worried about theoretical risk here. We’ve got affected herds all around us. Our testing is about survival, not compliance.”

And what about operations in the Southeast or Mountain West? They’re watching all this unfold, implementing practical measures based on their regional risk. A Georgia operation I heard about is focusing testing at their processing facility rather than individual farms—makes sense given their smaller dairy sector and limited resources.

The Raw Farm Story: A Cautionary Tale

The Raw Farm situation from last November and December really shows how this all plays out in real time. Santa Clara County found influenza A virus through routine PCR testing on November 24th, right before Thanksgiving—couldn’t be worse timing. This triggered recalls of everything produced after November 9th.

Now here’s what’s important: Despite multiple PCR-positive results across different products, California’s health department confirmed on December 3rd that not a single person got sick. Not one. But the damage was done—holiday sales season shot, product destroyed, consumer confidence shaken.

While Raw Farm hasn’t released exact figures, industry standards indicate that recalls of this scope typically exceed $10 million in direct costs alone. That’s before you factor in lost sales, brand damage, all of that. And remember, this happened during the peak holiday season when specialty cheese sales traditionally surge.

The Economics Nobody Talks About

Let’s get real about the numbers here. Research from the Journal of Dairy Science shows that aging facility costs range from $0.25 to $0.27 per pound for the entire aging period. So if you’ve got 10,000 pounds aging for 120 days—pretty standard for a mid-sized operation—you’re looking at $90,000 to $130,000 in product value, plus another $10,000 or so in aging costs you’ve already paid.

Key Financial Considerations for Producers

  • Aging costs: $0.25-0.27 per pound for the entire aging period
  • Product Contamination Insurance: $1,000-$20,000 annually (varies by size)
  • Voluntary testing: $50-$150 per sample
  • Average recall cost: $10+ million in direct expenses
  • Viability testing wait: Up to 30 days (during which the product is quarantined)

And insurance? Don’t get me started. Agricultural insurance data shows that Product Contamination Insurance ranges from $1,000 to $20,000 a year, depending on your size. But—and this is the kicker—standard policies usually exclude most recall costs. You need special coverage, and good luck affording it after any claims.

What’s really tough is how this hits different sized operations. If you’re running 500 cows and making commodity cheese, you can spread these costs across volume. But if you’re a 50-cow farmstead operation? These compliance costs can wipe out your entire margin.

I’ve been hearing from a lot of smaller producers who are rethinking voluntary testing. University labs charge $50 to $150 per sample—seems reasonable, right? But if you test voluntarily and get a PCR-positive result —even if it’s just dead virus fragments —you’re often required to report it. That can trigger recalls before anyone even checks whether there’s an actual infectious virus. And that viability testing? Takes up to 30 days. By then, you’re already destroyed.

Some cooperatives are starting to pool resources for testing—spreading costs across multiple small operations. It’s one way smaller producers are adapting, though it’s not yet available everywhere. The Wisconsin Cheese Makers Association has been particularly active in helping members navigate these challenges—they’re a good resource if you’re looking for guidance.

What’s Actually Working Out There

So what approaches are proving effective? From what I’m seeing across the industry, a few things stand out.

First, source control is absolutely critical now. With the USDA’s National Milk Testing Strategy mandatory since December 6th, systematic bulk tank surveillance is underway. If you’re working exclusively with tested, negative herds, you’ve got documentation and significantly lower risk.

pH management is proving to be another practical tool. The Cornell findings that pH 5.0 is protective align with what many of us have long known about acidification. I know several Vermont operations that have shifted toward more acidic varieties—their chèvre naturally hits pH 4.6, which, according to this research, provides inherent protection through normal production.

But here’s something that might surprise you: voluntary finished product testing might actually increase your risk rather than reduce it. Legal guidance emerging in trade publications suggests really thinking twice before implementing voluntary testing unless customers demand it. The liability exposure from triggering costly recalls due to RNA fragments… it’s just not worth it for many operations.

The Market Reality

Here’s what’s encouraging: Grand View Research projects that the specialty cheese market will reach $81.44 billion by 2034. Consumer demand isn’t going away. University of Vermont research from this August shows buyers will still pay good premiums for local, artisanal, traditional methods.

But—and this is important—H5N1 testing as a marketing point doesn’t work. Trade publications have been reporting that producers who try advertising their H5N1 testing actually see sales drop. It introduces a concern customers hadn’t even considered. It’s like putting “arsenic-free” on bottled water—suddenly everyone’s worried about arsenic.

Despite H5N1 headlines, specialty cheese market projections remain bullish with $81.44 billion expected by 2034. Smart producers who master risk management today position themselves for tomorrow’s premium-paying consumers who still value traditional, artisanal methods

What Europe’s Doing Differently

The European approach is worth noting. Their Food Safety Authority concluded in June that H5N1 trade risks are, quote, “a lesser concern” compared to migratory birds. They require demonstrating that actual risk exceeds thresholds before restricting traditional products.

The UK’s surveillance data backs this up. Food Standards Agency testing of 629 raw milk cheese samples found that 82% met satisfactory standards, and zero human infections were reported in their 2024 summary. They’re monitoring, not prohibiting. Different philosophy entirely.

Where This Leaves Us

After looking at all this—the research, the surveillance data, what producers are experiencing—a few things become clear.

The science suggests aged cheese poses minimal real-world risk. Cornell’s ferrets stayed healthy eating contaminated cheese. The FDA found zero viable virus in over 110 retail cheese samples. Wisconsin’s 19,000 tests came back clean. At some point, you have to acknowledge what that’s telling us.

But regulatory frameworks don’t pivot quickly. FDA’s March guidance still says aging “may not be effective,” despite their own surveillance data. That’s just how these systems work—once precautionary measures are in place, they rarely get walked back.

For those of us actually making cheese, this means developing strategies based on real risk assessment, not just regulatory compliance. Source from tested herds—that’s foundational now. Consider pH optimization where it makes sense for your products. Carry adequate insurance, but understand what it actually covers. And think very carefully about voluntary testing that could trigger massive recalls for what might be harmless RNA fragments.

Your geographic location matters enormously here. Operating in Wisconsin or Pennsylvania with comprehensive surveillance and zero detections is fundamentally different from operating in California, where outbreaks are ongoing. Know your state’s status and plan accordingly.

And if you’re a smaller operation—under 50 cows—the economics are completely different. You might need to explore cooperative testing approaches to reduce testing costs, focus on direct sales where relationships matter more than paperwork, and maintain product diversity to spread risk.

The Bottom Line

You know, the specialty cheese market’s going to keep growing. Consumer demand for quality, artisanal products isn’t disappearing. What we’re learning is that producers who understand both the science and the regulatory landscape—who can implement practical risk management based on actual rather than theoretical threats—they’re finding ways forward.

Understanding the difference between finding viral RNA and finding infectious virus, knowing what your state’s surveillance shows, making informed decisions for your specific operation—that’s what gets you through this.

The gap between laboratory worst-case scenarios and what we’re actually seeing in the field tells us something important. While it’s appropriate to be cautious with new threats, there’s a point where precaution becomes… well, maybe overcautious.

This situation’s going to keep evolving. What we know today builds on yesterday, and tomorrow will probably bring new insights. But armed with good science, awareness of regional differences, and practical approaches, we can navigate this while protecting both public health and our operations.

Every producer meeting I attend, every conversation at the co-op, we’re all trying to figure this out together. And that’s actually encouraging—we’re not just reacting anymore, we’re understanding. That’s real progress.

Key Takeaways

  • PCR’s $10 million problem: Testing detects harmless RNA fragments but can’t identify actual infection risk—triggering massive recalls for dead virus that FDA surveillance shows doesn’t exist in retail cheese
  • The data is reassuring: Cornell’s infected ferrets stayed healthy eating contaminated cheese, Wisconsin tested 19,000 samples with zero detections, and the FDA found zero viable virus in 110+ retail samples nationwide
  • Geography drives strategy: California’s 233 affected herds require aggressive risk management, while Wisconsin and Pennsylvania’s comprehensive surveillance with zero detections means regulatory compliance matters more than contamination risk
  • Your three-point action plan: Source exclusively from tested negative herds (non-negotiable), optimize toward pH 5.0 or below for natural viral inactivation, and avoid voluntary finished product testing unless customer-mandated—it creates $10M liability exposure for detecting fragments that pose no risk

Complete references and supporting documentation are available upon request by contacting the editorial team at editor@thebullvine.com.

Information current as of October 28, 2025. Regulations and surveillance data continue evolving. Always consult current USDA and FDA guidance, along with your state regulations, for the most up-to-date requirements. For more information on navigating these challenges, the Wisconsin Cheese Makers Association (www.wischeesemakers.org) and your state dairy associations can provide valuable resources and support.

Learn More:

The Sunday Read Dairy Professionals Don’t Skip.

Every week, thousands of producers, breeders, and industry insiders open Bullvine Weekly for genetics insights, market shifts, and profit strategies they won’t find anywhere else. One email. Five minutes. Smarter decisions all week.

NewsSubscribe
First
Last
Consent

The DDGS Discovery That’s Changing How Smart Producers Think About Transition Feeding

That $145/ton DDGS you’re feeding? Contains the same compounds as $20K/ton supplements. Your cows knew. Now you do too.

EXECUTIVE SUMMARY: That pile of DDGS you’re feeding at $145/ton contains the same immune-boosting compounds as supplements costing $20,000/ton—you just didn’t know it. University research reveals that distillers grains carry billions of heat-killed yeast cells packed with beta-glucans, potentially improving transition cow health and colostrum quality. Producers already report fewer metabolic issues and stronger calves when feeding DDGS, though they’ve been crediting the protein content. For a 500-cow dairy, these hidden benefits could be worth $42,900 annually. The catch: we can’t reliably test for these compounds yet, and every ethanol plant produces different levels. Until standardization develops over the next 3-5 years, you’re essentially feeding a lottery ticket—valuable, but unpredictably so.

I was having coffee with a group of nutritionists last month when someone brought up something interesting. “We’ve been feeding distillers grains for twenty years,” one of them said. “But are we really understanding what’s in them?”

You know, that question has been rattling around in my head ever since. Because what we’re starting to discover about DDGS might change how we think about this everyday feed ingredient—and maybe even how we evaluate feed efficiency in general.

The Research That’s Getting Everyone Talking

This year, new university-led research and field studies have begun examining how dried distillers grains affect the health of transition cows and calves. While early results suggest possible improvements in colostrum and calf immunity, producers should remember that more peer-reviewed research is needed before making major feeding changes.

Here’s what’s interesting: it might not just be about the protein and energy we usually focus on.

You probably know the basics of how DDGS are made—corn is fermented with yeast, the alcohol is removed as ethanol, and what’s left is dried and sold to us as feed. What I hadn’t really thought about until recently is that all those yeast cells used in fermentation? They’re still in there. Heat-killed from the drying process, sure, but their cell walls are intact.

And those cell walls… well, according to feed chemistry research from places like Cornell and Wisconsin, they contain compounds like beta-glucans and mannanoligosaccharides. If those sound familiar, it’s because they’re the same things that companies have been selling us in premium yeast supplements for years. The difference is, in DDGS, they just come along as part of the package.

Looking at the Numbers

What I’ve found particularly thought-provoking is when feed scientists analyze DDGS for these yeast components. Preliminary industry and university analyses estimate that the beta-glucan content in DDGS may range from 3 to 6 percent, though results vary widely by plant and region.

DDGS protein has become more consistent and fat content has declined over 15 years. 2021 DDGS delivers more reliable nutrition, but variability remains a challenge

Now, think about this for a minute. Many of us are spending around $20 to $25 per cow on various transition supplements—that’s based on current extension budgets from Penn State and Wisconsin. Between anionic salts, yeast cultures, protected choline, trace minerals… it adds up. I was talking with a producer from northeast Wisconsin recently who calculated he’s at about $22 per cow through the transition period. Pretty typical for folks who are serious about fresh cow management.

Meanwhile, we’re feeding DDGS at maybe 10 to 15 percent of the dry cow ration, chosen mainly because they’re economical when soybean meal gets pricey. But what if those distillers grains are doing more than we realize?

Some university field trials and producer observations suggest there might be something to this, though—and I want to be clear here—we’re still in the early stages of understanding exactly what’s happening. The mechanisms aren’t fully worked out yet. But anecdotally, producers and some university field trials have noted possible improvements in colostrum quality or calf health when DDGS are used, though comprehensive published research is still underway.

What Producers Are Noticing

This is where it gets really interesting. I’ve been making a point of asking producers about their experiences with DDGS in transition diets, and I keep hearing similar themes.

A friend who runs about 400 cows in southwestern Minnesota told me, “Our fresh cows just seem to handle the transition better when DDGS are consistent in the closeup ration. Fewer DAs, better appetites coming out of calving.” He’d always figured it was the extra energy or maybe the bypass protein.

The science is black and red: Maximum immunity for calves comes at 15% DDGS in dry cow rations. Take your passive transfer strategies to the next level and leave doubt in the dust.

I heard something similar from a larger operation in California’s Central Valley, and even a grazing dairy in Vermont mentioned that its calves seem more vigorous when DDGS are higher during the dry period. Up in the Northeast, where they’re dealing with different forage bases than we see in the Midwest, producers are still noticing these patterns.

A producer near Syracuse, New York, who’s been tracking this closely, mentioned something interesting: “We started monitoring colostrum quality more carefully last year. The weeks when DDGS inclusion was higher, our Brix readings seemed better. Could be a coincidence, but it’s got me thinking.”

Now, these are just observations—not controlled research. Every farm has so many variables at play, and we can’t draw firm conclusions from field observations. But when you hear the same things from different types of operations in different parts of the country… it makes you wonder, doesn’t it?

The Economics of It All

Let’s talk dollars and cents, because that’s what matters at the end of the day.

With current Midwest pricing from USDA reports—and you know how this changes—DDGS are running somewhere around $145 to $165 per ton, depending on your contracts and location. Soybean meal? We’re looking at $420 to $450,based on recent DTN spot prices. The economics of protein are pretty clear, which is why so many of us use these ethanol coproducts.

IngredientPrice ($/ton)Rate (%DM)Protein (%DM)Annual Cost ($)
DDGS$15512.0%30%$33,480
Soybean Meal$4308.0%48%$75,400
DDGS+Premium$23012.0%30%$49,700
Yeast Supplement$20,0000.05%50%$42,000

But here’s a thought: what if there’s additional value we haven’t been accounting for in our feed efficiency calculations?

I was working through some numbers with a nutritionist colleague, and even if—and this is purely hypothetical—standardized DDGS with guaranteed bioactive content commanded a $75 per ton premium, the math could still work when you consider potential reductions in other supplements.

Of course, that market doesn’t exist yet. And honestly, it might never fully develop given all the challenges involved.

Why This Isn’t Going to Be Simple

Before anyone gets too excited and starts changing their rations, we need to talk about the real-world challenges here.

The biggest issue? Variability. That estimated 3-6% range in beta-glucan content I mentioned? That’s a problem if you’re trying to formulate consistent rations.

And it’s well documented by groups like the U.S. Grains Council that different ethanol plants use different corn, different yeast strains, and different drying temperatures. All of that affects what ends up in your feed bunk. I was talking with a producer in Illinois who sources from three different ethanol plants depending on pricing and availability. He said the physical characteristics alone vary noticeably—color, smell, texture. If the basics vary that much, imagine the variation in these bioactive compounds we’re talking about.

Testing is another bottleneck. While there are methods to measure these compounds, they’re not something you can get from your regular feed testing lab. Most commercial labs still focus on crude protein and fiber analysis. I’ve checked with several major labs, and while they’re aware of the interest, they haven’t seen enough demand yet to add these bioactive analyses. Maybe that’ll change, but we’re not there yet.

And then there’s the regulatory side. According to the FDA Center for Veterinary Medicine and AAFCO guidelines for animal feed, companies must be very careful about health claims. An ethanol plant can’t just start marketing their DDGS as “immune-supporting” without crossing into regulated territory. They’re limited to talking about composition, not function.

What This Means for Your Operation Today

So, where does this leave us as dairy producers?

Well, first off, you can’t call up your feed dealer today and order “high-beta-glucan DDGS.” That’s not a thing yet. But understanding that DDGS might be delivering benefits beyond just protein and energy—that’s worth considering in your dairy nutrition strategy.

Here’s what I’ve been telling folks who ask about this:

Don’t change everything based on preliminary research. DDGS are still a good deal based on their traditional nutritional value alone. That hasn’t changed.

But maybe start paying closer attention. Track what happens when DDGS inclusion changes in your rations. Watch your colostrum Brix readings. Keep an eye on fresh cow health events. You might already be seeing patterns you haven’t connected.

If you can, try to source from consistent suppliers. While you can’t specify bioactive content, ethanol plants with good process control probably have more consistent products overall. A large dairy I know in Nebraska has been doing this for years—not for these functional properties we’re discussing, but just for ration consistency. Makes sense either way.

And think about where in your feeding program DDGS might offer the most value. If these functional benefits are real, transition cows would be the logical place to focus. That’s where immune support and colostrum quality matter most for long-term herd health.

Most importantly, work with your nutritionist on this. Any changes to your feeding program need to fit into your overall strategy, not work against it.

The Bigger Picture Here

What fascinates me about all this is what it says about how we evaluate feeds in general.

For decades, we’ve focused on the measurable nutrients—protein, energy, fiber, minerals. Our formulation software is really good at modeling these. But what if there’s a whole category of bioactive compounds that influence health and productivity through different pathways? Compounds we’re not routinely measuring or accounting for?

Think about it—forages have polyphenols, fermented feeds have metabolites from bacterial activity. Even regular corn silage might have functional compounds we don’t consider.

Someone made an interesting comparison at a conference recently: we might be where we were with vitamins a century ago—knowing something important is there, but not having all the tools yet to understand or use it fully.

Looking Down the Road

The dairy industry has always moved forward through careful observation, good science, and practical application. This emerging understanding about DDGS fits right into that pattern.

Will this completely change how we feed cows? Probably not. But it might add another layer to our decision-making, especially for specific times like the transition period, where these functional benefits could really matter.

We definitely need more research. Those early university findings need to be replicated and expanded. We need better, practical, affordable testing methods. And ultimately, we need larger field trials to see if these effects hold up on commercial farms.

The good news is, this work is happening. Universities have projects underway. Feed testing labs are exploring new methods as demand develops. Even some ethanol producers are starting to think differently about their product.

And it’s worth noting—this isn’t just a U.S. conversation. International markets from Mexico to Southeast Asia import substantial amounts of American DDGS. If functional properties become a selling point, that could reshape global trade patterns. European feed companies are already exploring bioactive feed ingredients more aggressively than we are in some cases.

What’s the timeline for all this? Hard to say exactly, but based on how these things typically unfold in our industry, I’d guess we’re looking at 3 to 5 years before we see meaningful market changes—if they happen at all. That’s about how long it takes for research to build up, testing infrastructure to develop, and markets to adjust.

What’s encouraging to me is that we’re not talking about adding expensive new ingredients. We’re talking about potentially getting more value from something we’re already feeding. In an industry where margins are always tight, finding hidden value in what we’re already doing… that could make a real difference.

The Bottom Line

You know, the cows probably figured this out before we did. They usually do, don’t they? They’ve been getting whatever benefits DDGS offer while we focused on the protein and energy values.

Maybe that’s the real lesson here. Sometimes the best discoveries aren’t about finding something new—they’re about better understanding what’s been right in front of us. And in this case, it’s been sitting in feed bunks across North America for the better part of twenty years.

It makes you wonder what else we might be missing, doesn’t it? But then again, that’s what keeps this industry interesting. Just when you think you’ve got it all figured out, you learn something new that makes you look at things differently.

For now, keep feeding DDGS when they make economic sense. Pay attention to how your cows respond. Stay informed as this research develops. And always remember—the best feeding decisions are the ones that work for your specific operation, with your cows, in your situation.

Because at the end of the day, that’s what really matters. Not what might be in the feed, but how your cows perform with it. And if they’re doing well with DDGS at current prices? Well, any additional benefits we discover are just icing on the cake.

The next time you’re looking at that pile of DDGS getting mixed into the TMR, maybe take a second to think about what else might be in there. We might not fully understand it yet, but your cows seem to appreciate it either way.

KEY TAKEAWAYS:

  • DDGS at $145/ton contain the same beta-glucans as $20,000/ton yeast supplements—you’ve been feeding premium immune support without knowing it
  • Producers seeing fewer fresh cow problems with DDGS now have an explanation: 3-6% yeast-derived compounds supporting immunity and colostrum quality
  • The math is compelling: $42,900 potential annual value for a 500-cow dairy, just from benefits you’re likely already getting
  • Today’s move: Track colostrum Brix and transition health against DDGS inclusion—you might already see patterns worth thousands
  • The catch: Without testing (3-5 years out) or standardization, you’re feeding a lottery ticket—valuable but unpredictable

Complete references and supporting documentation are available upon request by contacting the editorial team at editor@thebullvine.com.

Learn More:

The Sunday Read Dairy Professionals Don’t Skip.

Every week, thousands of producers, breeders, and industry insiders open Bullvine Weekly for genetics insights, market shifts, and profit strategies they won’t find anywhere else. One email. Five minutes. Smarter decisions all week.

NewsSubscribe
First
Last
Consent

Why 70% of Dairy Farms Never Make It Past Dad – The Psychology, Math, and Monday Morning Fix

Dad’s heart attack: Tuesday, 2 pm. By Wednesday, can’t pay workers, sell milk, or buy feed. The 72-hour succession crisis.

Executive Summary: I’ve watched too many fourth-generation dairy farms die in probate court, their registered Holsteins auctioned while siblings fight over ‘equal’ shares. The statistics are brutal—70% fail at first transition, 96% by the fourth. But after analyzing dozens of successful transitions and reviewing new research from Wisconsin Extension and Oklahoma State, the pattern is clear: it’s not about money, it’s about psychology. Farmers tell researchers they’ll ‘be dead’ when they retire, then wonder why succession stalls. The winners do five things differently, starting with documenting that $35,000 annual sweat equity and ending with structured buyouts that recognize fair doesn’t mean equal. Your Monday morning starts with one phone call—here’s who to call and what to say.

dairy farm succession

You know, there’s a statistic that’s been keeping me up at night lately: only about 30% of family farms successfully make it to the second generation. For dairy operations? Man, the challenges just multiply. We’re dealing with twice-daily milking schedules, massive capital requirements for parlor upgrades, and market volatility that would make any succession planner nervous. By the third generation, we’re down to 12%. Fourth generation? Less than 4%.

Here’s what’s interesting, though—some families beat these odds consistently. And after digging through research from Wisconsin Extension’s recent work, Oklahoma State’s farm transition modeling, and talking with families who’ve actually made it work, a pretty clear pattern emerges. It’s probably not what you’d expect.

The brutal math of dairy farm succession: 96% of family operations fail by the fourth generation, making succession planning the #1 threat to your legacy

Note: To protect privacy, some names and identifying details in the case studies have been changed, while the accuracy of the succession strategies discussed has been preserved.

The Psychology Nobody Wants to Talk About

So when I talk with dairy farmers about succession planning, they always say the same thing: “I’m too busy.” And I get it. But Wisconsin Extension’s recent research on farm succession tensions revealed something fascinating—and honestly, a bit uncomfortable. The primary barriers aren’t logistical at all. They’re psychological.

You’ve probably heard Tracy Loch from The Impact Farming Show—she puts it this way:

“Farm succession planning is 80% psychology, 20% strategy.”

The succession crisis in numbers: 80% of farmers have no estate plan, 80% don’t trust their plans, and 71% haven’t even identified who’s taking over. Your farm is likely in the red zone

She’s spent years working with farm families, and she keeps seeing the same fears surface.

Looking at what researchers are finding, four major psychological barriers keep coming up:

Loss of identity: Think about it—if you’ve been “the dairy farmer” for 40 years, who are you when you’re not making those daily decisions about feed rations and breeding protocols? Australian researchers found farmers literally equated retirement with death. One farmer told them he’d “be dead when he gives up farming.” That’s heavy stuff.

Confronting mortality: Nobody likes planning for their own death, right? But succession planning forces you to acknowledge that reality head-on. University of Illinois Extension found that fewer than 20% of farm families have effective estate plans. Why? Precisely because, as they put it, “families avoid talking about what is unavoidable.”

Fear of conflict: Here’s a tough one—treating children differently based on their contributions to the farm might damage those family relationships you’ve spent decades building. Wisconsin’s recent focus groups found this fear paralyzed decision-making, especially in those tight-knit dairy communities we all know.

Loss of control: You’ve been the ultimate authority on everything from sire selection to parlor maintenance. Everything. Now you’re supposed to let someone else make those calls? That’s…that’s harder than it sounds.

What’s particularly revealing is research from Canada that examined why farmers avoid succession planning. They identified two key variables: risk perception and self-efficacy. Translation? It’s not about having time or resources. It’s about what farmers believe will happen and whether they think they can handle it.

Learning from the Farms That Made It Work

Let me tell you about a fourth-generation dairy operation in central Wisconsin—we’ll call them the Johnson family. About 450 Holstein cows. Father is ready to retire, son wanting to take over, and the other children are not involved in farming. Sound familiar? This is exactly the scenario that typically destroys farms by the fourth generation—96% of them, actually.

But here’s what the Johnsons did differently when they worked with their agricultural consulting team last year:

They Started Where Most Don’t—With Values

Before anyone called a lawyer or looked at financials, they sat down and figured out what each generation actually wanted. Not what they assumed the other wanted—what they actually wanted. Dad needed a sustainable retirement income and wanted fair treatment for his non-farming kids. The son wanted a gradual ownership stake through an LLC, with eventual rights to purchase farmland. He’d also been thinking about transitioning some of the herd genetics he’d been developing.

Their consultants used what they call a “succession goals worksheet”—basically getting everyone to write down their priorities before emotions took over. What’s interesting here is that they found way more common ground than expected. Both wanted the breeding program that the son had developed to continue. That became the foundation for everything that followed.

They Ran the Numbers (And Found Opportunity)

Here’s where it gets practical. The family built comprehensive financial projections—not just for current operations, but factoring in succession expenses. And they discovered something crucial: they’d been using organic practices for years but never got certified. When they ran the numbers on organic milk premiums—an extra $6-8/cwt in their market—the increased revenue made the transition not just possible, but profitable.

By this spring, they achieved that organic certification, bringing in substantial additional revenue that’s helping fund the ownership transition. Smart, right? Plus, the son’s focus on improving butterfat percentages—up to 4.1% herd average—added another revenue stream they hadn’t fully valued before.

They Didn’t Rush the Ownership Transfer

The son didn’t wake up one morning owning everything. They structured a phased buy-in with seller financing, letting him gradually increase his stake. Meanwhile, leadership roles got clearly defined—the son stepped into day-to-day decision-making, including all breeding decisions and fresh cow management, while Dad retained ownership but deferred on operational calls.

As their advisor noted:

“With clearly defined roles and decision boundaries, the family avoided confusion and kept the business running smoothly throughout the transition.”

No power struggles. No confusion about who decides what. Even details like who manages the milk quality program and DHIA testing got spelled out.

What Happens When You Don’t Plan (The Reality Nobody Discusses)

Let me paint you a picture of what “too late” actually looks like, based on recent probate court analyses and case studies from agricultural law programs.

The First 72 Hours After an Unexpected Death

Without a succession plan, your dairy operation can go from fully functional to legally paralyzed in just 72 hours—unable to sell milk, pay workers, or buy feed

Monday morning, everything’s normal. Cows are milked at 4 am and 4 pm like always. Tuesday afternoon, the patriarch has a fatal heart attack while checking fresh cows. By Wednesday morning, the farm is legally paralyzed.

Jay Joy from Bridgeforth LLP, who specializes in agricultural transitions, asks families facing this nightmare: “Who legally owns these assets right now? The milking equipment? The cattle? In the event of a death, will ownership be triggered to transfer to someone else?”

Usually? Nobody knows. The surviving family can’t access bank accounts. They can’t sign payroll checks for the milkers. The milk truck’s coming, but they’re not sure they have legal authority to sell milk. Feed needs ordering, but who can authorize purchases? The breeding technician is scheduled, but who approves those decisions?

“Even in the face of a tragic loss, a dairy farm has to keep running. Cows need to get milked and fed, people need to be paid, and operational decisions must be made.”

The Probate Nightmare (Months 1-24)

When someone dies without proper planning, everything goes through probate—that’s the court-administered process for transferring assets. According to data from Nebraska’s Center for Agricultural Profitability and similar institutions, probate typically takes:

  • Minimum: 6 months for simple estates
  • Average: 12-18 months for farm operations
  • Complex cases: 2+ years if contested

During this time? Major decisions are frozen. Can’t sell that old mixer wagon. Can’t refinance the parlor loan. Can’t make significant management changes, such as switching to robotic milkers. Everything waits for the courts.

The costs add up fast. Court filing fees, attorney fees, administrator fees, appraisal costs—University of Minnesota’s recent analysis found straightforward farm estates typically cost $20,000-$50,000 in probate expenses. If there are complications or family disputes? We’re talking $100,000-$400,000, according to probate cost analyses and estate planning attorneys.

When Equal Division Destroys the Farm

Here’s what really breaks my heart. Wisconsin intestacy law—what happens when you die without a will—often divides assets equally among children. Sounds fair, right? But Oklahoma State’s modeling study, led by agricultural economist Eric DeVuyst, found equal distribution has the lowest success rate of any succession strategy.

Why? Let’s say you’ve got 240 acres and three kids. One farms, two don’t. Under many state intestacy laws, each person receives 80 acres or an equivalent value. The farming child now needs to buy out siblings at market rates. With productive dairy land at $8,000-$12,000 per acre in prime regions like Wisconsin’s Dane County or New York’s Finger Lakes? That’s hundreds of thousands in debt that makes the operation unviable.

Maryland agricultural law research documented multiple cases where non-farming siblings filed for “partition sales”—basically forcing the court to sell the entire farm so they could get their cash. The farming sibling who’d worked the operation for decades, who knew every cow by her quirks? Watching it go to auction.

The Mathematics of Fair vs. Equal (And Why This Matters)

You know, I’ve noticed that dairy farmers get really uncomfortable when we start talking about treating children differently. But here’s what Oklahoma State’s research proved: trying to treat everyone exactly the same usually destroys the farm.

Their study, published in the Journal of Agricultural and Applied Economics, modeled different succession strategies across dairy, row crop, and cattle operations. Equal division among all heirs? Lowest success rate across the board. What worked better? They called it “equitable but unequal distribution.”

Why Equal Division Fails for Dairy Operations

The cash flow math just doesn’t work. Most dairy operations can’t generate enough profit to:

  • Fund the parents’ retirement (figure $40,000-$60,000 annually minimum)
  • Support the next-generation farmer’s family (another $60,000-$80,000)
  • Build sufficient non-farm assets to equalize inheritances
  • Maintain necessary reinvestment in facilities and equipment (parlor updates alone can run $500,000+)
The invisible wealth transfer: your successor loses $35,000/year by working for below-market wages. Without documentation, that $350,000 in sweat equity has zero legal value when succession comes

Kansas State research, led by agricultural economist Jenn Krultz, tested three different approaches specifically for dairy operations. What they found was fascinating—dairy farms performed best with salary arrangements rather than percentage splits. Why? Those 24/7 production demands mean dairy heirs often work extreme hours. One young farmer they studied averaged 75 hours weekly during calving season. Hourly calculations would make compensation prohibitively expensive.

“Fair doesn’t mean equal. Treating children according to contributions and needs works better than mathematical equality.”

Alternatives That Actually Work

What I’ve seen work in practice, backed by the research:

Life Insurance for Non-Farming Heirs: The farming child inherits the operation, while siblings receive insurance proceeds. A $500,000 policy might cost $5,000-$15,000 annually—far less than the debt service on buying out siblings at current land values.

Gradual Family Buyouts: Extended payment terms (10-15 years) at below-market interest rates (maybe 3% instead of 7%), recognizing the farming child’s sweat equity contributions. New Zealand’s dairy sector has used this model successfully for decades.

Different Asset Classes: One child gets the farm and cattle; another gets the parents’ retirement accounts and that rental property in town; a third gets the lake cottage up north; and the investment portfolio. Everyone gets value, just different types.

In California, where I’ve worked with several large dairies, there’s another wrinkle—quota values, which fluctuate with market conditions, have traded in the range of $1,500-2,000 per pound of butterfat in recent years. At those prices, a farm’s quota can be worth millions. Some families split the quota value among all heirs while keeping the physical farm intact for the farming child. Creative, but it works.

What’s happening in Europe offers another perspective. Dutch dairy farmers facing strict environmental regulations have developed succession models that include sustainability transition costs. The retiring generation often helps fund technology upgrades—such as manure digesters and precision feeding systems—that position the next generation for regulatory compliance. It’s succession planning that looks forward, not just backward.

Documenting Sweat Equity (Before It’s Too Late)

Let’s talk about that child who came back to the farm after getting their dairy science degree, worked for $40,000 when they could’ve made $75,000 at a co-op or genetics company. That $35,000 annual difference? That’s sweat equity—deferred compensation they’re banking for the future.

But here’s the critical part: without documentation, it’s legally worthless. Kansas State research tested three calculation methods:

The Opportunity Cost Method

Track what your heir could’ve earned in comparable off-farm positions versus what they actually received. Use Bureau of Labor Statistics data—a dairy science graduate averages $72,000-$85,000 with benefits these days. If they’re making $45,000 on-farm, that’s $27,000-$40,000 in annual sweat equity.

Farm Value Growth Attribution

When the heir joined, what was the farm worth? What’s it worth now? What percentage of that growth came from their contributions versus market appreciation? University of Maryland’s guidance suggests 40-50% attribution is often reasonable for full-time farming heirs who’ve modernized operations or improved herd genetics.

Critical Documentation (This Week, Not Years From Now)

Wisconsin Extension’s farm succession toolkit emphasizes: document everything when the heir returns, not 15 years later when lawyers get involved. You need:

  • Written agreement specifying compensation and sweat equity calculation methods
  • Annual records of total compensation, including housing, vehicles, and insurance
  • Professional farm appraisals every 5-7 years
  • Market wage comparisons updated annually

“Documentation can’t wait. Verbal promises mean nothing legally.”

I’ve seen too many cases where the son who transformed the herd’s production—taking it from 18,000 to 26,000 pounds per cow—had nothing documented to prove that value creation.

For digital tracking, several farms I’ve worked with use cloud-based systems like QuickBooks or FarmBiz to maintain real-time records accessible to all parties. It’s not fancy, but it creates that paper trail you’ll need later.

Why Templates Don’t Work (And Professional Help Does)

I know what you’re thinking—”Can’t I just download forms online?” Sure, for $49 you can get generic templates. But here’s what a Minnesota case taught us: parents created a “fair” revocable trust with equal ownership for three children using standard forms. Their farming daughter, who’d managed the transition to robotic milkers, ended up in court when siblings petitioned for partition. Years of litigation. Threat of forced sale. All from well-intentioned but poorly structured planning.

Professional succession planning typically runs $15,000-$30,000. Sounds expensive until you compare it to the alternatives:

  • Probate litigation: $100,000-$400,000 based on recent cost analyses
  • Unnecessary estate taxes: Potentially hundreds of thousands from missing planning opportunities
  • Forced farm liquidation: Priceless—four generations of registered Holstein genetics destroyed

“Professional help pays for itself. Proper planning costs a fraction of litigation when DIY approaches fail.”

What you’re really paying for isn’t documents. It’s the expertise to navigate:

  • State-specific agricultural exemptions and tax provisions
  • USDA program eligibility requirements (especially important for beginning farmer programs)
  • Integration of business structures with estate plans
  • Coordination between multiple advisors (attorney, CPA, nutritionist handling feed contracts, genetics consultant)
  • Family dynamics are unique to your operation

What to Do This Week (Yes, This Week)

For the dairy families reading this who know they’re behind—and let’s be honest, that’s most of us—here’s your concrete action plan. Not someday. This week.

Monday: Pick up the phone. Call either your agricultural attorney, your farm’s CPA, your local Extension educator who handles succession planning (every state has them), or a farm succession coach. Don’t hire them yet. Just schedule a consultation for 2-3 weeks out.

Tuesday: Sit down alone with a notepad and answer these five questions:

  1. If I died tomorrow, what would actually happen to this farm? Who’d manage breeding decisions? Fresh cow protocols?
  2. What do I really want for this operation’s future?
  3. What does my spouse want? (What you think they want—you’ll verify this weekend)
  4. Can this farm financially support what we’re trying to do?
  5. What am I actually afraid of here?

Wednesday: Gather your important documents. Don’t need perfect records—just get them in one place:

  • Land titles and equipment titles
  • Last 3 years of tax returns
  • Current balance sheet (even if it’s rough)
  • Any existing wills or trusts
  • Life insurance policies
  • DHIA records showing herd improvements

Thursday: Schedule a family meeting for next week. Send everyone a simple agenda:

  • Why we’re having this conversation (10 minutes)
  • What does everyone want/need from the farm? (40 minutes)
  • What information do we need to gather? (20 minutes)
  • Next steps (10 minutes)

Key rule: No decisions at this meeting. Just information gathering.

Friday: Write a one-page summary of your farm:

  • Acres owned/rented, cow numbers, rolling herd average
  • Who’s involved and what they do (including who manages what—breeding, feeding, health)
  • Financial position (profitable/breaking even/struggling)
  • Who’s interested in continuing, who’s not
  • Top 3 challenges you’re facing

This becomes your “elevator pitch” for professionals—saves everyone time.

Weekend: Have the conversation with your spouse. Compare your Tuesday answers. If they don’t align, that’s okay—but you need to know that before involving the whole family.

The Characteristics of Farms That Successfully Transition

After analyzing dozens of successful transitions, including several here in the Midwest, clear patterns emerge. Research has identified five critical success factors, and here’s what they look like in practice:

Communication: Not just talking, but regular, structured family meetings with clear agendas. One Marathon County, Wisconsin, family I know holds quarterly “shareholder meetings” treating their 600-cow dairy like the business it is.

Education: Both generations are actively learning. Successors attending financial management workshops at World Dairy Expo. Senior generation is learning to let go through transition coaching. I’ve seen kids return from Dairy Business Management programs, completely transforming farm financials.

Financial Viability: Operations are profitable enough to support multiple families. If your farm can’t generate $150,000+ in family living income, succession gets exponentially harder. The successful transitions I’ve studied all had strong production—25,000+ pounds per cow, 3.8%+ butterfat.

Clear Goals: Written objectives that everyone agrees on. Not assumptions—documented agreements about timeline, ownership structure, and decision-making authority. Who decides when to cull? When to upgrade equipment? It’s all spelled out.

Managed Family Dynamics: Using outside facilitators when needed. Recognizing that family relationships matter more than any farm asset. The best transition I ever saw brought in a counselor when things got tense—saved both the farm and the family.

Regional Considerations That Matter

What works in California’s Central Valley might not work in Wisconsin’s rolling hills. State-specific factors that affect your succession planning:

  • Estate tax thresholds: Wisconsin currently has none, but Minnesota kicks in at $3 million. Illinois is at $4 million. Makes a huge difference in planning strategies.
  • Dairy market structures: California’s quota system adds complexity—that quota’s worth serious money. Upper Midwest co-ops have different equity structures. Southeast grazing operations face different challenges than confinement systems up north.
  • Land values$3,000/acre in parts of Missouri, $15,000+ in Lancaster County, Pennsylvania. Your succession math changes dramatically.
  • Intestacy laws Vary dramatically in terms of spousal shares and children’s rights. Wisconsin treats it differently than Iowa, which treats it differently than New York.

Talk to advisors who understand your specific state’s agricultural laws. I’ve seen too many farmers get generic advice that missed critical local details—like Pennsylvania’s Clean and Green tax benefits or Vermont’s Use Value Appraisal program.

Perspectives from the Next Generation

A young farmer I worked with near Shawano, Wisconsin—let’s call him Jake—successfully navigated taking over his family’s 400-cow dairy.

“The hardest part wasn’t the financials or even the legal stuff. It was Dad actually letting go of breeding decisions. He’d selected every sire for 35 years.”

What made it work? “We literally wrote down who decided what. I got breeding and nutrition. He kept equipment purchases for two more years. Having it in writing prevented so many arguments.”

Jake’s advice to other young farmers? “Start the conversation before you think you’re ready. We began talking at Thanksgiving 2019, and didn’t sign anything until 2022. Those three years of discussions? That’s what made it work.”

Measuring Success Along the Way

How do you know if your succession planning is working? Here are benchmarks I’ve seen successful families use:

Year 1: Clear goals documented, professional team assembled, initial family meetings held Year 2: Financial projections completed, transition timeline drafted, roles beginning to shift. Year 3: Legal structures in place, ownership transfer beginning, next generation taking operational lead. Years 4-5: Monitoring and adjusting based on actual performance

The key is progress, not perfection. Every step forward beats standing still.

Key Takeaways for Dairy Farmers

Looking at everything—the research, the case studies, the disasters and successes—here’s what stands out:

The Non-Negotiables

  • Psychological barriers are real: Fear of mortality and loss of control paralyze more farmers than any practical challenge
  • Documentation can’t wait: Verbal promises mean nothing legally. Document sweat equity when heirs return, not decades later
  • Fair doesn’t mean equal: Treating children according to contributions and needs works better than mathematical equality
  • Professional help pays for itself: Proper planning costs a fraction of litigation when DIY approaches fail

Practical Next Steps

Within two weeks:

  1. Schedule that first professional consultation
  2. Have the kitchen table conversation with your spouse
  3. Document current ownership structures before memory fades
  4. Calculate sweat equity for anyone working below market wages
  5. Create a timeline for a gradual transition—not an overnight transfer

The Question That Matters Most

Every dairy farmer facing succession needs to answer one question honestly:

“Do you care enough about your family’s future to have uncomfortable conversations today?”

Because succession planning isn’t really about the farm. It’s about whether you’re willing to confront mortality, give up control, and treat children differently based on their contributions—all to protect their future.

The 30% who succeed aren’t luckier or wealthier. They’re just willing to do the psychological work that succession demands. They chose their family’s future over their present comfort.

Every successful transition I’ve studied started the same way: someone picked up the phone and scheduled that first consultation. Not next month. Not after the busy season. That week.

The cows will need milking at 4 am tomorrow, whether you’re here or not. Breeding decisions need to be made. The fresh cows will need managing. The only question is whether your family will have both the legal authority and financial ability to keep doing it.

KEY TAKEAWAYS

  •  72-Hour Death Spiral: Dad’s heart attack Tuesday afternoon = Wednesday morning, you can’t legally sell milk, sign checks, or buy feed. This operational paralysis destroys 70% of dairy farms within 18 months, costing $400,000 in probate battles
  • Psychology, Not Money, Kills Farms: Wisconsin Extension found farmers saying, “I’ll be dead when I give up farming”—that’s why Dad won’t let go of breeding decisions after 35 years. The barrier isn’t financial, it’s emotional
  • $350,000 Vanishes Without Documentation: Your son, making $40k (could earn $75k off-farm), loses $35,000/year in sweat equity. Ten years = $350,000 gone because verbal promises mean nothing legally
  • Equal Division Destroys Farms (Math Proof): Three kids, 240 acres, $10,000/acre = farming child needs $800,000 to buy out siblings. Solution: farming kid gets farm, others get $500,000 life insurance policy (costs only $10,000/year)
  • Your 5-Day Rescue Plan Starts Monday: Day 1: Call Extension educator (not lawyer). Day 2: Answer five brutal questions alone. Day 3: Gather documents. Day 4: Family meeting (no decisions). Day 5: Write a one-page farm summary. Total time: 8 hours. Potential savings: Your family’s legacy

Complete references and supporting documentation are available upon request by contacting the editorial team at editor@thebullvine.com.

Learn More:

The Sunday Read Dairy Professionals Don’t Skip.

Every week, thousands of producers, breeders, and industry insiders open Bullvine Weekly for genetics insights, market shifts, and profit strategies they won’t find anywhere else. One email. Five minutes. Smarter decisions all week.

NewsSubscribe
First
Last
Consent

Butterfat vs. Powder: What the Great Dairy Divide Really Means for Your Bottom Line

Butterfat’s on top, powder’s under pressure—and the milk check now tells a story few saw coming

EXECUTIVE SUMMARY: Butterfat’s booming, powders are sliding, and together they’ve redrawn the dairy marketplace. This isn’t just another price cycle—it’s a lasting shift in how milk value is measured and paid. China’s preference for premium fats, new processor investments, and stronger herd genetics are driving a global realignment. Farmers who embrace component-based pricing, focused feeding, and risk protection remain profitable even as traditional markets weaken. The message heading into 2026 is clear: the future belongs to those who manage what’s inside the tank, not just how much fills it.

Walk into any farm shop or co-op office this fall, and chances are you’ll hear the same discussion. Butterfat is holding strong, while powders just can’t find their footing. The market doesn’t feel balanced anymore. What’s interesting here is that this gap doesn’t seem like a short-term pricing quirk—it looks and feels like a lasting shift in how milk value is determined.

Fat Holds Steady, Powder Loses Traction

Looking at the latest Global Dairy Trade (GDT) auctions, it’s easy to see the disconnect. The GDT index has fallen for five consecutive events, down roughly 1.4% in mid-October. Butter and anhydrous milk fat (AMF), however, remain firm, trading between $6,600 and $7,000 per tonne. Meanwhile, skim milk powder (SMP) is soft, sitting near $2,550 per tonne.

The Great Dairy Divide: Butterfat products command $6,800-7,200 per tonne while skim milk powder has collapsed to $2,550—a pricing gap that’s rewriting the economics of every dairy farm in America

That pattern isn’t isolated to one region. According to the EU Commission Market Observatory, SMP fell about 1% this month, while butter barely moved. In the United States, USDA Dairy Market News reported CME butter prices hovering around $3.15 per pound, roughly aligned with global benchmarks after accounting for shipping and grading differences.

The CoBank Dairy Outlook (October 2025) calls this “a composition-driven divergence.” In simple terms, the milk market isn’t paying for volume anymore—it’s paying for what’s inside. AMF, at 99.8% pure milkfat, is ideal for global manufacturers who need precision and performance. Butter, at 82% fat, still has a place, but powders are losing ground as demand in infant formula and rehydrated products slows.

China’s Import Strategy Speaks Volumes

The best way to understand this trend is to look at China, where import behavior has changed dramatically. The Chinese Customs Administration reported that butter imports rose 65% year over year, whole milk powder climbed 41%, and SMP dropped 12.5%.

China’s dairy import strategy reveals the future: butter imports surged 65%, whole milk powder up 41%, while skim milk powder dropped 12.5%—they’re buying precision fats and making powder at home

At the same time, the USDA Foreign Agricultural Service (FAS) confirmed that China’s milk production grew to 41.9 million tonnes in 2024, a rise of 6.7%. Those numbers sounded encouraging, but they also created oversupply at home. Processing plants are drying roughly 20,000 tonnes of milk a day, often at a loss. The OCLA Argentina Dairy Market Outlook (September 2025) estimates those losses at 10,000 yuan per tonne, or about $1,350 USD, thanks to high input and energy costs.

Here’s where things get interesting. China can produce plenty of powder. Where it struggles is in high-purity fats like AMF and industrial butter. Domestic processors lack the cream-separation and fractionation capacity found in markets like New Zealand, Europe, and the U.S. So their strategy has shifted. They’re importing what they can’t make efficiently. That choice has reinforced fat premiums in the global marketplace.

This development suggests a new normal for international trade. Countries will compete not on total milk output, but on how effectively they produce—and market—the right components.

Why U.S. Farmers Are Still Standing tall

Looking back through cycles like 2015 or 2020, it’s clear farmers have become better prepared to weather volatility. Part of that comes down to management maturity and new financial safety nets that didn’t exist a decade ago.

Risk Management Tools Are Paying Off
According to the USDA Risk Management Agency (RMA), about 35% of U.S. milk production is now protected under Dairy Revenue Protection (DRP), with participation surpassing 50% in the High Plains. Those policies are helping farms hold margins through increasingly unpredictable shifts in global pricing.

Smart farmers are protecting margins: 52% of High Plains milk production is covered by Dairy Revenue Protection, nearly double California’s 28%—proof that the best operators plan for volatility before it hits

Component Programs Reward Quality, Not Quantity
More than 90% of milk in the country is now sold under Multiple Component Pricing (MCP). Herds averaging 4.3% butterfat and 3.4% protein consistently earn $1.50 to $2.00 per hundredweight more than standard 3.7/3.1 herds, according to USDA AMS data. That’s a structural incentive, not a fad.

Genetics and Feeding Continue to Change the Curve
CoBank and USDA data show national butterfat averages rising from 3.95% in 2020 to 4.36% this year, while protein moved to 3.38%. The Michigan State University Extension (2025) recently found that feeding 5–6 pounds of high-oleic roasted soybeans per cow daily improved butterfat by 0.25–0.4 percentage points within 30 days, while enhancing rumen consistency and herd condition.

American dairy genetics are delivering: butterfat jumped from 3.95% to 4.36% in just five years while protein climbed to 3.38%—improvements that translate directly to bigger milk checks every month

What’s encouraging here is that improvements are cumulative. As one extension specialist explained during a recent producer roundtable, “The cows are doing the same work, but the milk’s worth more.” It’s proof that managing for higher components is one of the most direct paths to better returns.

The Processor Pivot: From Volume to Value

Processors are feeling this market divide just as strongly as producers are. And frankly, some are better positioned than others.

Let’s look at Darigold’s Pasco, Washington facility, which represents one of the industry’s most ambitious bets on global powder capacity. The plant—a $1.1 billion facility capable of processing 8 million pounds of milk per day—was planned to supply milk powders and butter to Southeast Asian buyers when those markets were booming back in 2019. But global dynamics changed faster than expected. Reports confirm the company had to deduct around $4 per hundredweight from producers’ milk checks this summer to offset startup losses. Powder-heavy exports aren’t what they used to be.

Contrast that with processors like Hilmar Cheese (Texas), Leprino Foods (Kansas), and Lactalis USA, which have expanded into cheese, whey protein, and AMF production. They’re diversifying toward higher-solids, higher-margin production that keeps milk geographically and economically competitive. Reports from First District Association (Minnesota) and Idaho Milk Products echo the same trend—premium payments now hinge on component tests because that’s where processors make their profit.

Here’s the hard truth: the U.S. industry is splitting not just by product, but by intent. Powder is still a volume game. Component ingredients are an efficiency game.

Could Butterfat Overshoot?

It’s a fair question to ask whether everyone aiming for higher fat could create the next surplus. CoBank’s August 2025 Outlook flagged that butterfat production might be “growing faster than demand absorption.”

But here’s where genetics help us. The USDA Agricultural Research Service (ARS) and Holstein Association USAperiodically adjust their Net Merit (NM$) and Total Performance Index (TPI) formulas to reflect changes in milk pricing. That means breed selection is constantly reweighted to economic reality. If fat premiums fall or protein values recover, herd objectives shift almost automatically.

The point is, dairy efficiency—not just butterfat—is what creates long-term stability. It’s why balance will always outlast fads.

The Metric That Matters: Component Spread

When you strip away all the noise, one figure tells the story: the component spread—the pay gap between baseline milk (3.5% fat / 3.0% protein) and high-component milk (4.4% fat / 3.4% protein).

Component pricing isn’t subtle: premium milk at 4.4% fat earns $2.00/cwt more than standard 3.7% fat milk—that’s $14,600 annually for a 100-cow herd, and the gap keeps widening

As USDA AMS Federal Order data shows, that premium has averaged more than $2 per hundredweight throughout 2025. If it holds, producers essentially have proof that processors are permanently paying for composition, not volume.

A USDA market economist summed it up best in a September forum: “When the value is tied to solids instead of water, you’re not in a price cycle anymore—you’re in a new structure.”

Practical Lessons Going Into 2026

The roadmap is clear: track components monthly, breed strategically, match your processor, feed for balance, and protect margins—five concrete moves that separate winning farms from the rest
  1. Track Your Components Monthly.
    Treat butterfat and protein performance as management metrics alongside fertility, transitions, or somatic cell counts. Precision wins.
  2. Start Small, Build Momentum.
    Genomic testing (around $40 per heifer) and ration adjustments are quick-return investments in this pricing climate.
  3. Match Your Processor Relationship.
    AMF and cheese plants prize solids. Powder plants still chase volume. Know which market pays for the milk you make.
  4. Breed and Feed for Balance.
    Fat and protein efficiency outweigh extremes. Avoid chasing a single number.
  5. Protect Margins with Modern Tools.
    DRP coverage, component contracts, and multi-year agreements keep income steady when markets fluctuate.

The Bottom Line: This Isn’t a Crisis—It’s an Adjustment

Every producer knows the milk market runs in cycles. But what’s happening right now feels different. Butterfat remains firm because the world wants quality ingredients that add value to food manufacturing. SMP is struggling because bulk reconstitution isn’t growing anymore.

For farmers, the lesson is clear: you don’t have to rebuild your entire operation to adapt—just fine-tune what you’re already measuring. Improving components, reviewing contracts, and aligning milk output with processor demand will go further than chasing volume.

The bottom line? The milk check no longer rewards gallons—it rewards balance, precision, and composition. The farms paying attention today are the ones positioning themselves to thrive long-term.

Key Takeaways:

  • Butterfat is booming while powders slide, signaling a lasting shift in dairy value and pay structures.
  • China’s strategic focus on high-fat imports and domestic powder production is reshaping global trade dynamics.
  • U.S. farmers maximizing components—and protecting with DRP—are turning market volatility into opportunity.
  • Processors investing in solids-based products like cheese and AMF are outpacing those tied to bulk powder markets.
  • Heading into 2026, milk checks will favor precision over production—the farms that measure will be the ones that win.

Complete references and supporting documentation are available upon request by contacting the editorial team at editor@thebullvine.com.

Learn More:

The Sunday Read Dairy Professionals Don’t Skip.

Every week, thousands of producers, breeders, and industry insiders open Bullvine Weekly for genetics insights, market shifts, and profit strategies they won’t find anywhere else. One email. Five minutes. Smarter decisions all week.

NewsSubscribe
First
Last
Consent
Send this to a friend