Archive for precision fermentation

Leprino, Verley, and the $80,000 Precision‑Fermented Protein Squeeze on Your Dairy

A 10% slip in protein value erases about $80,000 from a 500‑cow herd’s milk check. The real story is what that does to your DSCR when the lender runs the numbers.

Executive Summary: A 10% hit to protein value wipes roughly $80,000 a year off a 500‑cow Holstein herd’s milk check, and for many operations, that’s the difference between a 1.3x and 0.8x DSCR. Leprino’s deal for precision‑fermented casein and Verley’s FDA “no questions” letter for PF whey don’t kill conventional milk, but they give your buyers a second tap for the same proteins you ship. The article walks through barn‑level math on a 500‑cow herd at 25,000 lbs/cow, 3.3% protein, and February 2026’s $1.9373/lb protein price so you can see exactly how a PF‑style squeeze lands on your own cwt. It then shows why organic is a weak PF hedge if your all‑in costs sit in the $35–$49/cwt range against $31/cwt pay, and why your better move is breeding for +40 PTA Protein, kappa‑BB, and A2/A2. You’ll see how those genetics can claw back more than half of the modeled PF hit, and which milk markets (WPI, pizza cheese, fluid, export) are likely to feel PF pressure first. If your DSCR is under about 1.25x or you don’t know where your protein actually ends up, this is one of those pieces you read with your last three milk checks and a pen in hand.

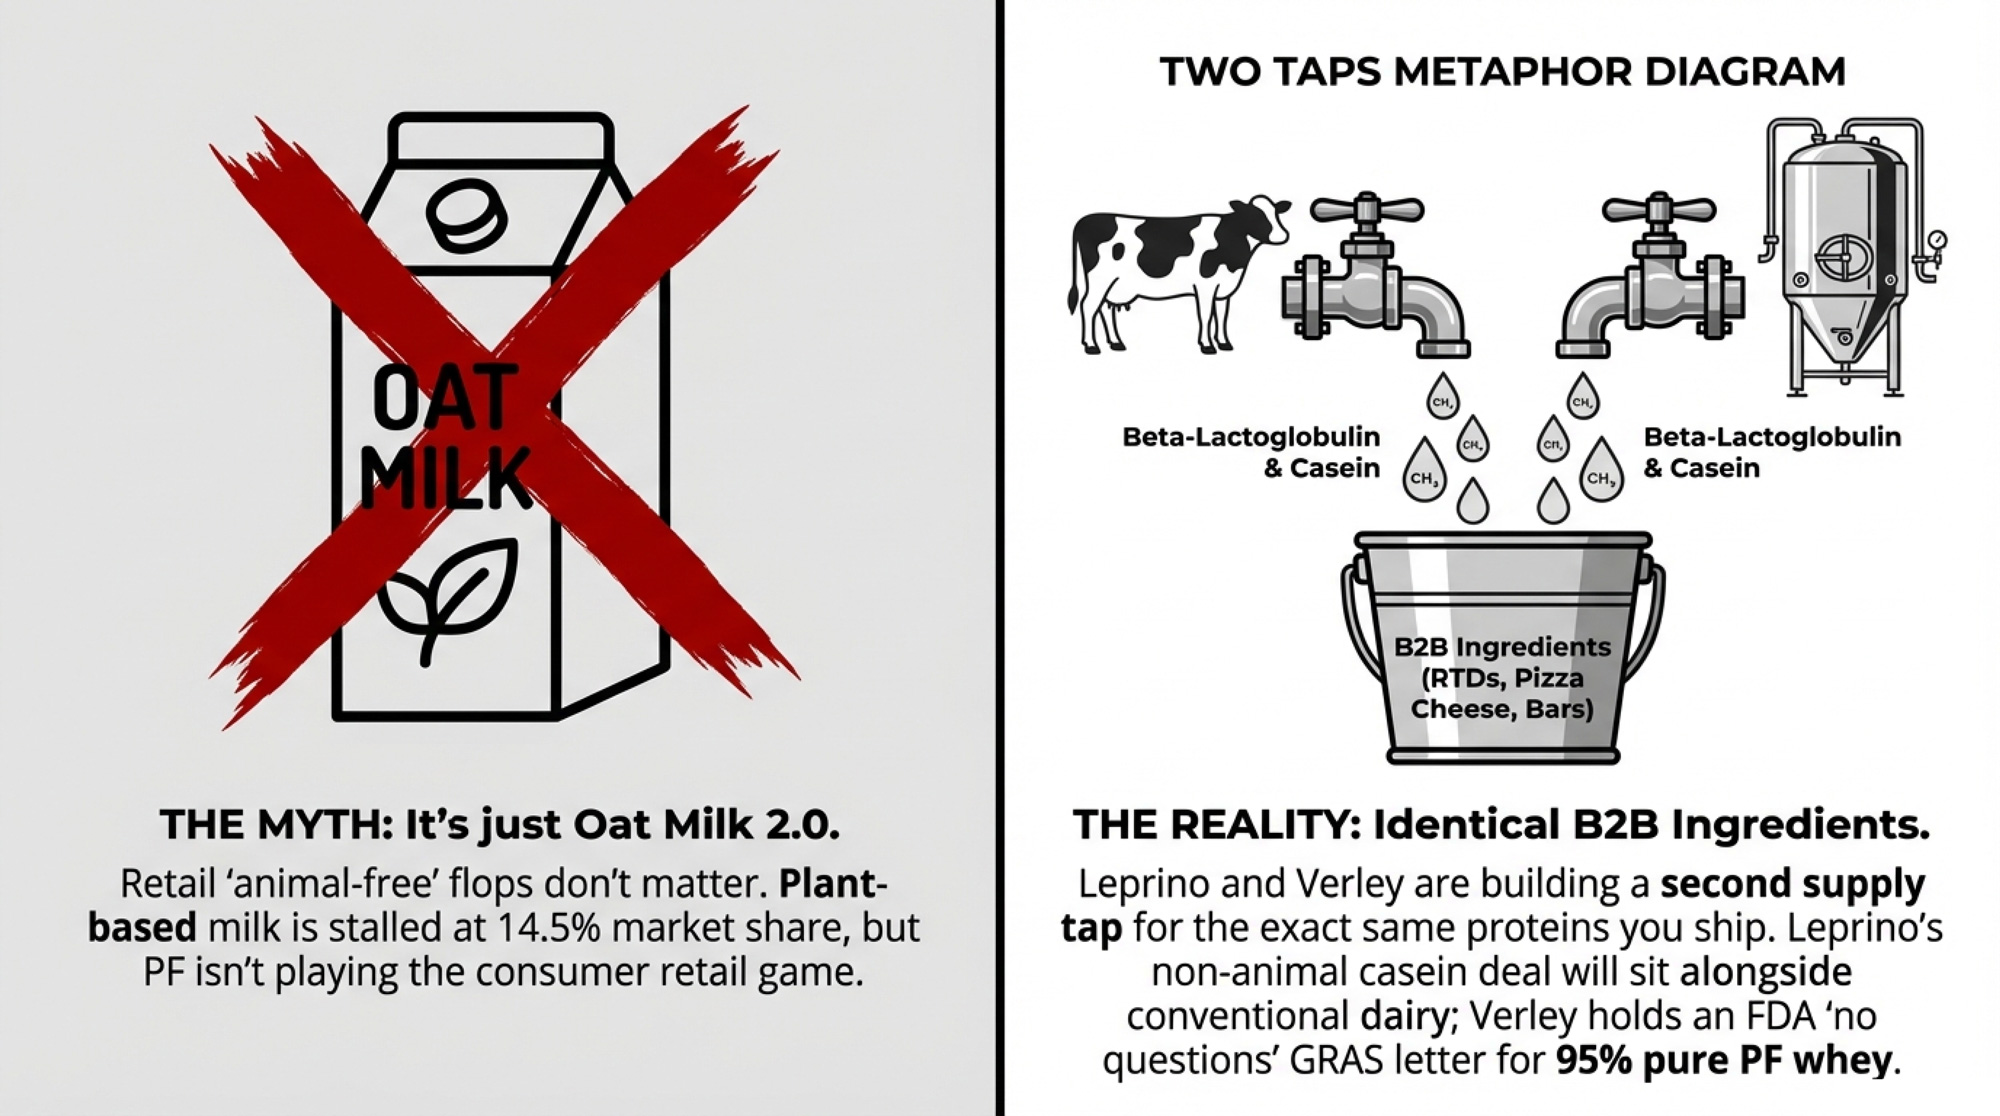
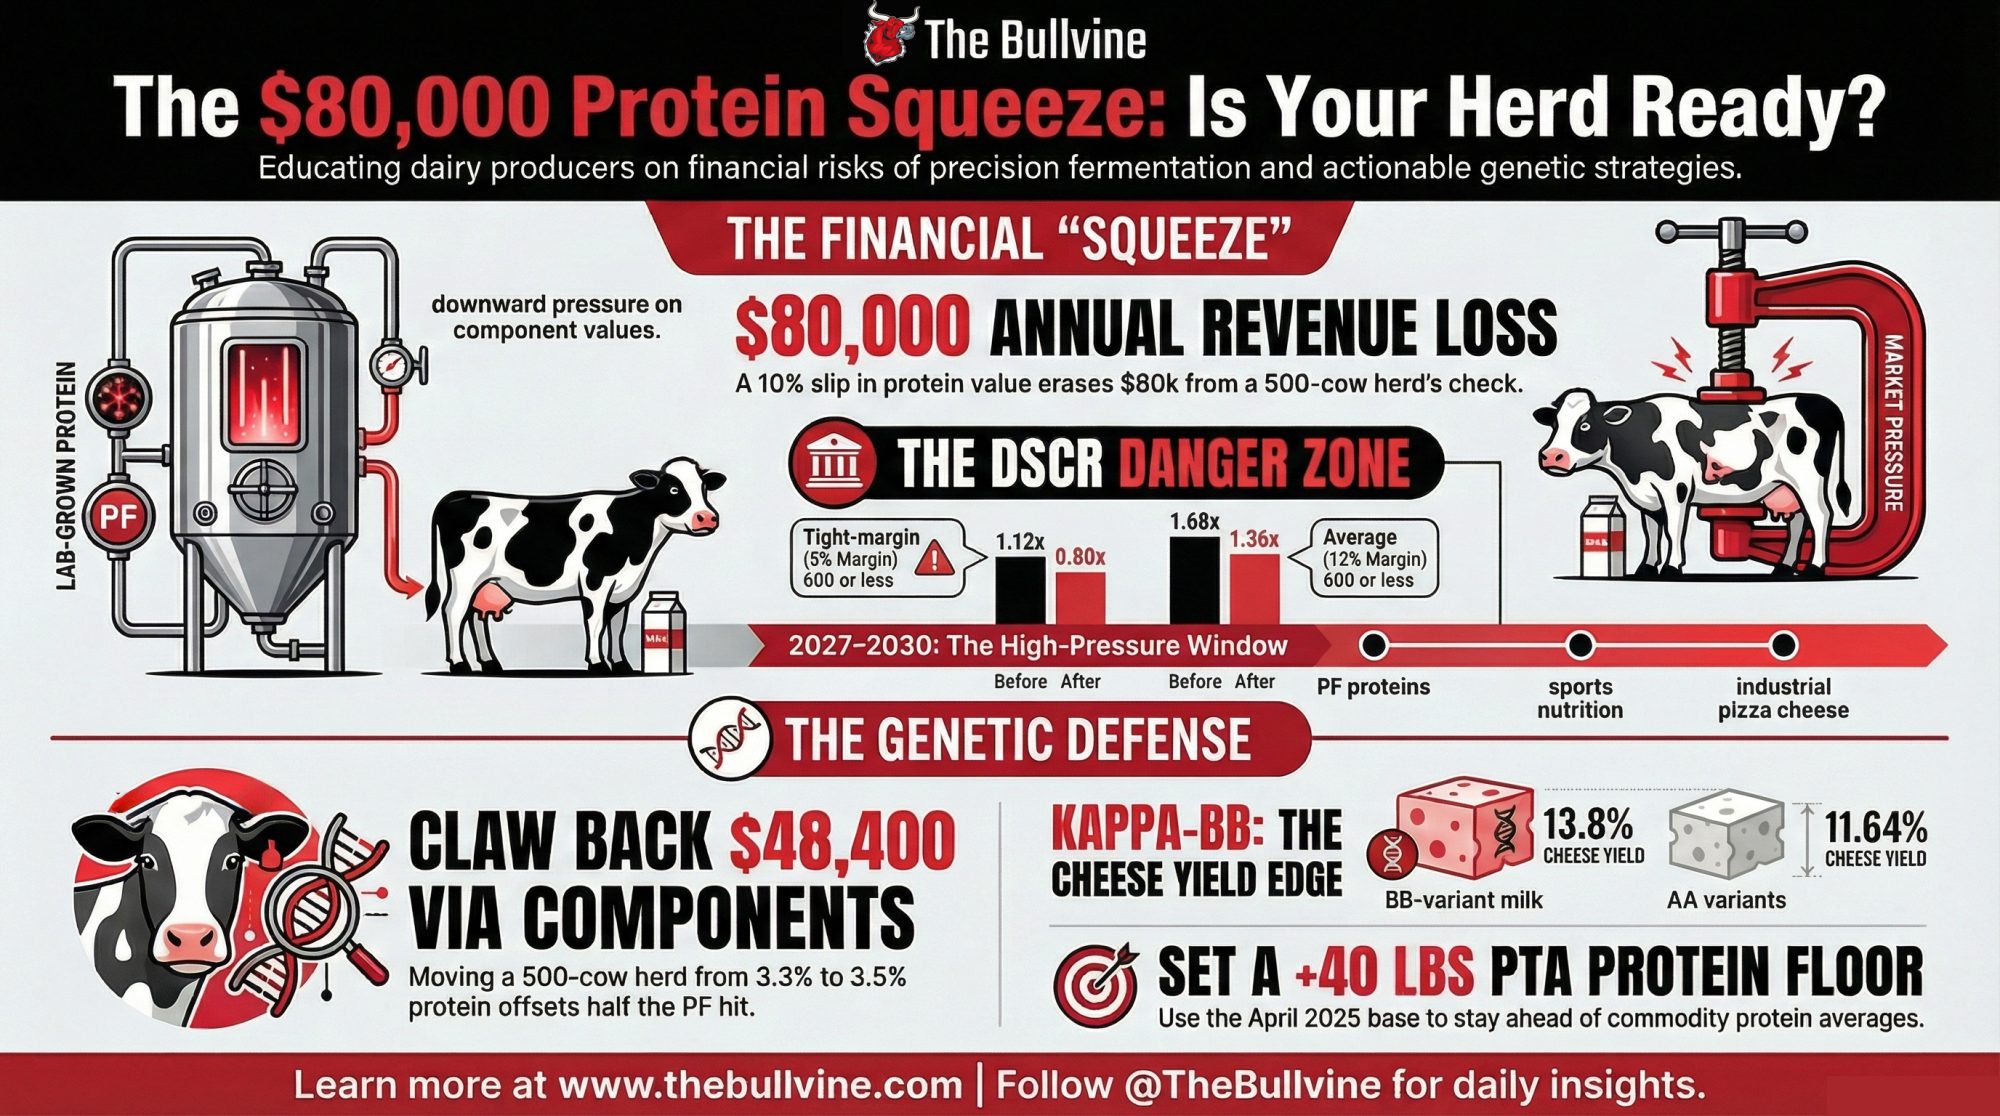
Precision‑fermented dairy proteins just moved from conference slides into your barn math. Leprino’s global non‑animal casein deal and Verley’s FDA “no questions” letter for whey open a second supply lane for the same proteins you’re shipping today — and on a 500‑cow Holstein herd, a realistic precision‑fermentation scenario points to roughly an $80,000 annual squeeze on protein revenue if component values slip about 10%.

That’s not a prediction. It’s a stress test. The question is whether you run it on your own numbers now or wait until your lender or processor does it for you.

What Leprino and Verley Just Told You About Protein

On July 15, 2024, Leprino Foods and Dutch startup Fooditive announced an exclusive global agreement to commercialize non‑animal casein made via precision fermentation. Leprino secured exclusive rights for cheese applications and non‑exclusive rights for other food uses, with president Mike Durkin saying they’d be “incorporating precision fermentation alongside our conventional dairy production” to see how this casein adds to their product portfolio.

That word — “alongside” — matters. Leprino still needs your milk. It’s buying optionality: the ability to source functionally similar casein from a fermenter when the economics, customers, or regulators make that attractive.

On the whey side, French startup Verley became the first company to receive an FDA “no questions” GRAS letter for functionalized whey proteins produced via precision fermentation in October 2025. The letter covers FermWhey Native, a whey protein composed of about 95% beta‑lactoglobulin, and FermWhey MicroStab, designed for thermal and pH stability in high‑protein shots, RTDs, and functional yogurts. CEO Stephane Mac Millan called the ruling “a springboard for growth in the US market and beyond” and made it clear they’re focused on B2B formulations where density, stability, and taste win the sale.

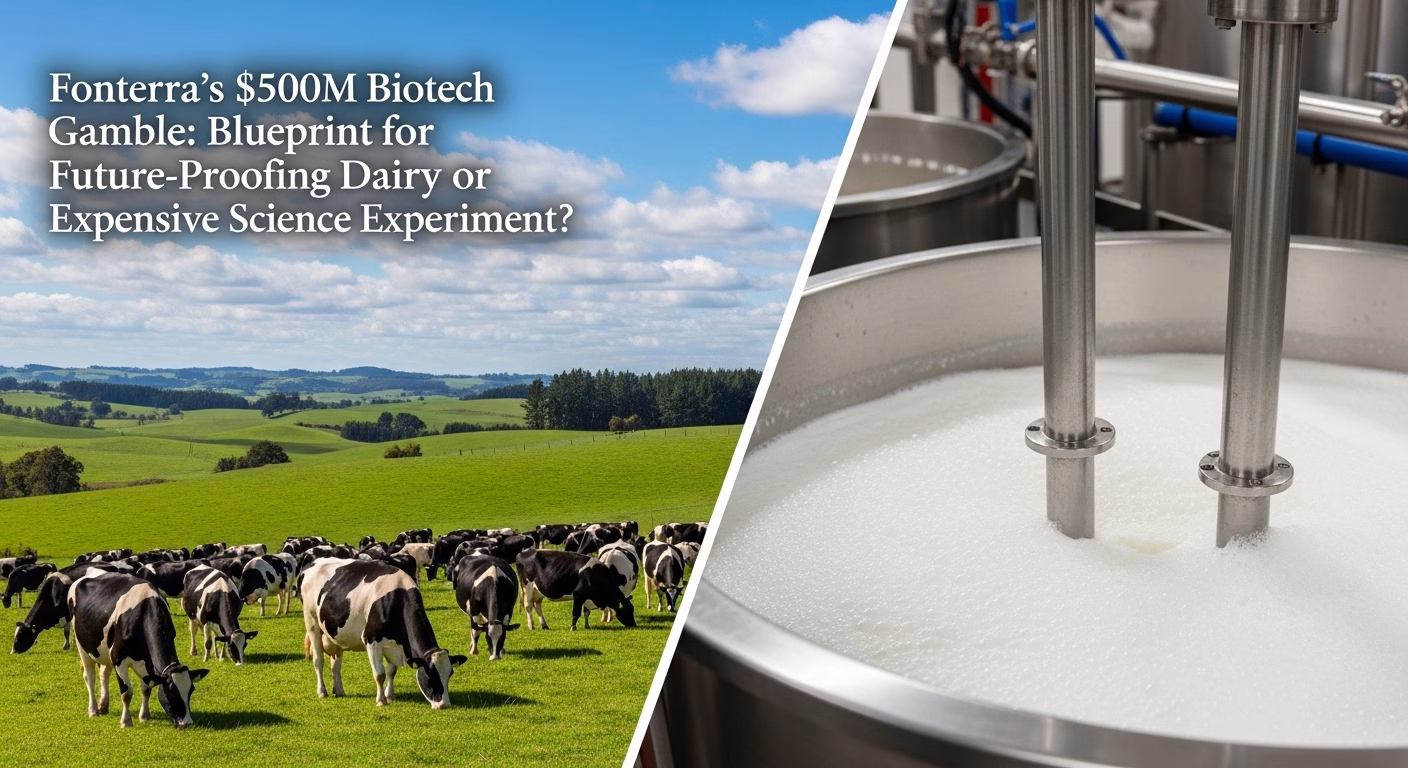
Money is lining up behind them. In the last year, Verley has raised around $38 million; Vivici about $38.4 million; Those Vegan Cowboys about $14.5 million through crowdfunding; and All G Foods around $6.6 million plus a joint venture with Savencia’s Armor Protéines. Fonterra has backed a 4‑million‑litre fermentation plant in the UAE alongside Vivici, The EVERY Company, and the Abu Dhabi Investment Office. Bel Group and Standing Ovation reported in October 2025 that they’d produced all three major caseins from cheese whey at an industrial scale using precision fermentation, with functionality described as comparable to bovine casein.

These aren’t oat‑milk startups shouting from the sidelines. They’re some of the same players already connected to your milk check, quietly building a second tap for the proteins that used to come only from cows.

Why Precision Fermentation Isn’t Just “Oat Milk 2.0”

It’s tempting to point to the plant‑based stall and call it a day. Plant‑based beverages hold about 14.5% of the U.S. fluid category after two decades, and 2024 retail sales slipped roughly 4–5%. A 2025 review said Nestlé’s Cowabunga “never hit the mainstream” and noted Straus Family Creamery had cooled on further “animal‑free” dairy launches.

Precision fermentation is playing a different game. It doesn’t try to fake dairy with oats or peas. It uses microbes to make dairy proteins — same amino‑acid sequence — in stainless steel. Verley’s FermWhey Native is 95% beta‑lactoglobulin with a clean amino‑acid profile, and FermWhey MicroStab is engineered for stability in low‑pH, high‑heat systems where conventional whey can struggle.

Bel and Standing Ovation ferment cheese whey into recombinant caseins that match bovine caseins in amino‑acid sequence and functionality. Scientists will remind you that identical sequences don’t guarantee identical post‑translational modifications, so there may be subtle differences in complex matrices and in nutrition. And right now, precision‑fermented products are individual ingredients (BLG, specific caseins, lactoferrin), not full milk with immunoglobulins and minor fractions.

For a glass of 2% at the kitchen table, that matters. For a protein bar, GLP‑1 nutrition drink, or pizza‑cheese shred that cares mainly about density, solubility, melt, or stretch? A tank full of BLG or casein that behaves like the real thing is close enough that your milk starts competing on price, logistics, and contract terms — not chemical uniqueness.

Retail “Animal‑Free” Flops Won’t Save Your Protein Check

A lot of conference chatter stops at “animal‑free dairy failed in retail, so it’s over.” The ingredient side tells a different story.

Several branded “animal‑free” launches struggled to gain traction in mainstream grocery channels, and some pulled back on consumer packs. That’s good for your fluid shelf space. But FoodNavigator‑USA’s 2025 story on Verley is blunt: their target is B2B — protein shots, RTDs, high‑protein yogurts, and medical‑nutrition formats.

Those decisions never hit the dairy case. A protein‑bar co‑packer or contract bottler cares about three things:

  • Does the protein behave in this formula?
  • Can we get it on time?
  • Does it beat our current cost per functional unit?

If the answers are “yes” and the label can still say “whey protein from fermentation,” they’re not losing sleep over which factory made the BLG.

At the same time, demand for high‑protein foods keeps climbing. A February 2026 investment feature cites data showing U.S. foods making “high‑protein” claims growing at more than 7% annually — faster than the overall food market. Co‑ops and processors are pouring money into ultrafiltered milk and whey capacity to keep up; Michigan Milk Producers Association’s $122.6 million expansion at Ovid is a good example. Even with that, some processors report that whey demand and certain protein specs are outpacing what their existing milk sheds can supply at current margins.

That’s the exact gap precision‑fermented proteins are built to fill. Not to replace dairy everywhere. To slide into high‑growth, high‑spec segments where:

  • Your region can’t expand milk and processing fast enough, or
  • Ingredient buyers want a second tap so they’re not locked into one supplier for functionality or price.

What Does a 10% Precision‑Fermentation Hit Mean for a 500‑Cow Herd?

Let’s get this off the panel slides and onto a yellow pad. You can swap in your numbers later.

Take a realistic Holstein herd:
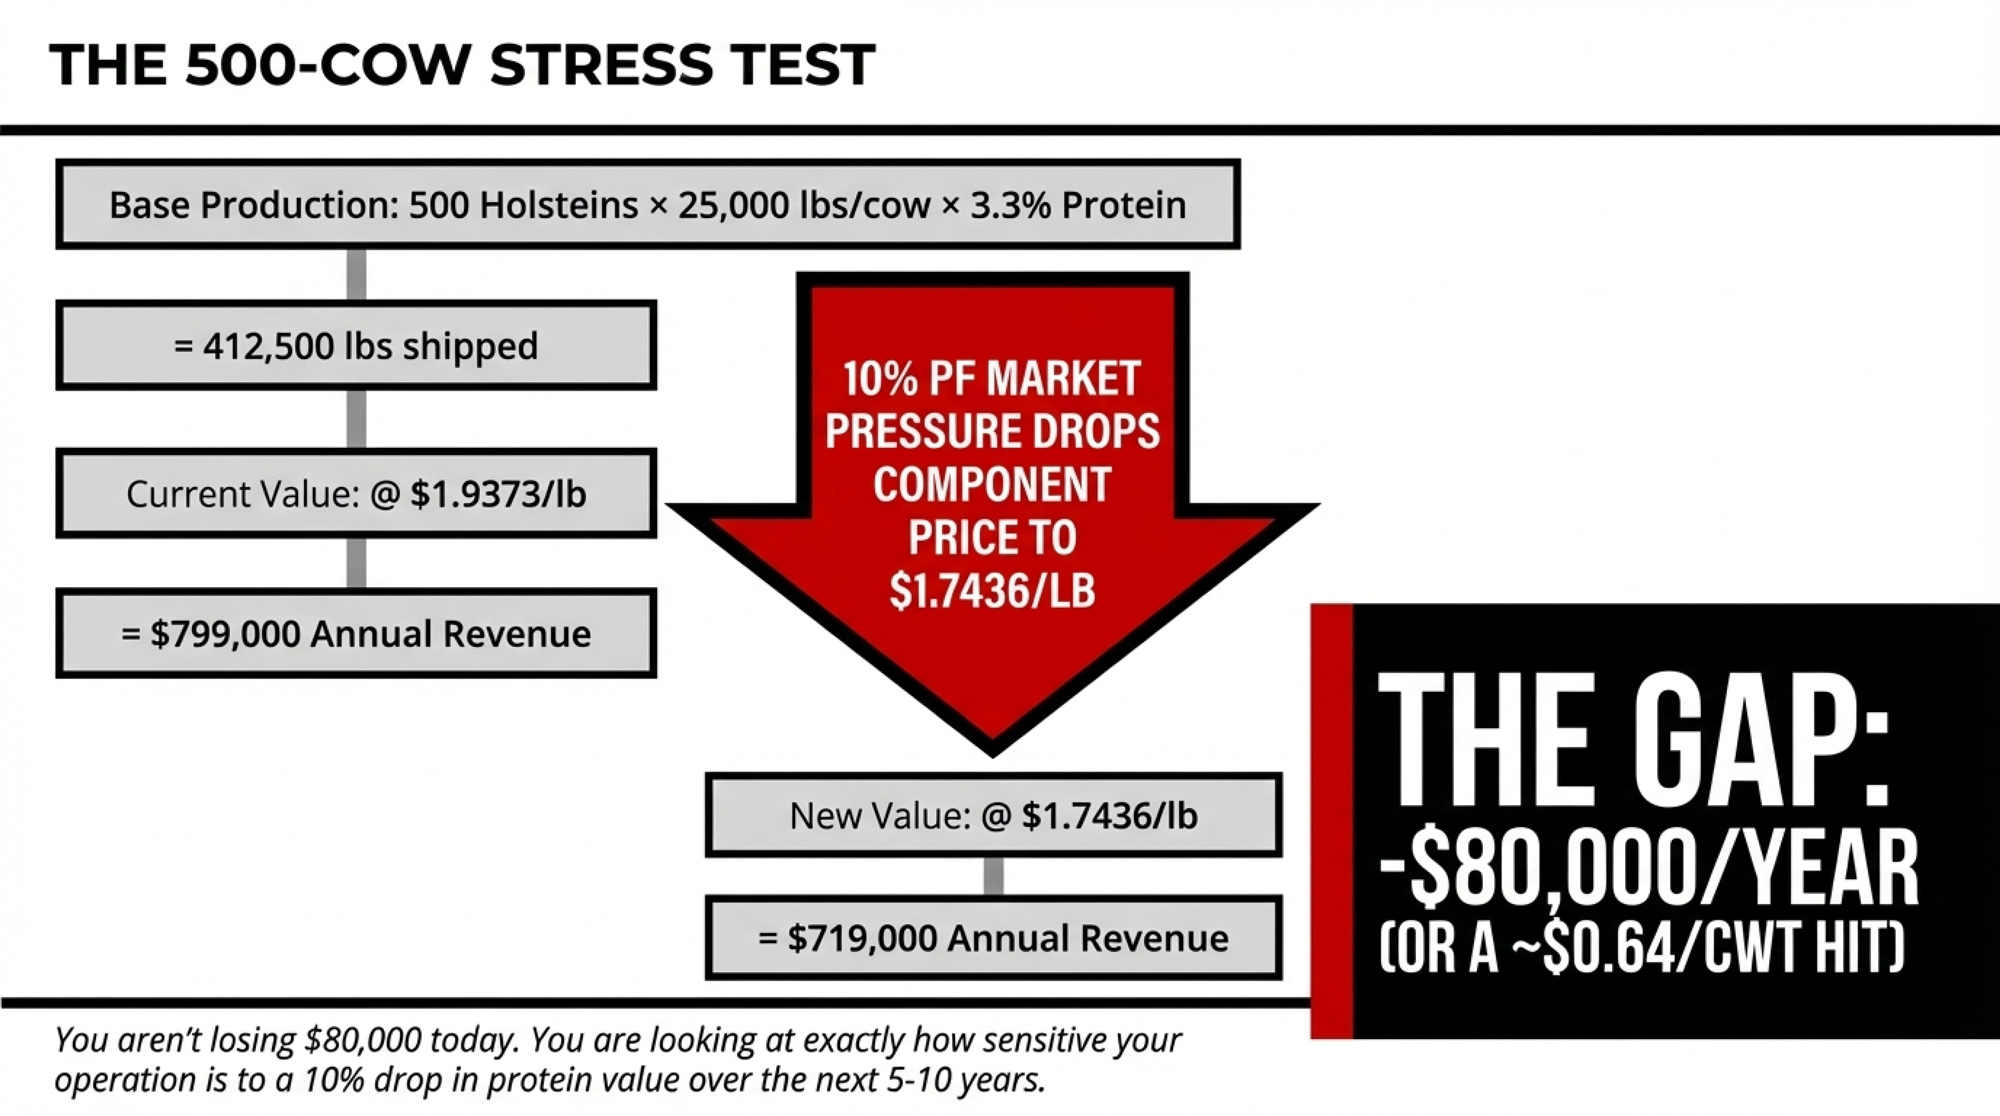
  • 500 cows
  • 25,000 lbs shipped per cow per year
  • Total milk shipped: 500 × 25,000 = 12,500,000 lbs
  • Protein test at 3.3% ⇒ 12,500,000 × 0.033 = 412,500 lbs of protein
  • February 2026 U.S. Class III protein component price: $1.9373/lb

At that price, your protein line looks like this:

412,500 lbs × $1.9373/lb ≈ = $799,000 in annual protein value. pa

Now run a scenario — not a forecast. Assume precision‑fermented proteins capture around 10% of B2B whey and casein demand in certain high‑protein categories, and that puts about 10% downward pressure on the protein component value you see in Class III.

  • Current price: $1.9373/lb
  • “10% pressure” price: $1.9373 × 0.90 ≈ $1.7436/lb
  • New protein revenue: 412,500 lbs × $1.7436 ≈ $719,000

Gap: about $80,000 per year, or roughly $0.64/cwt on this herd.

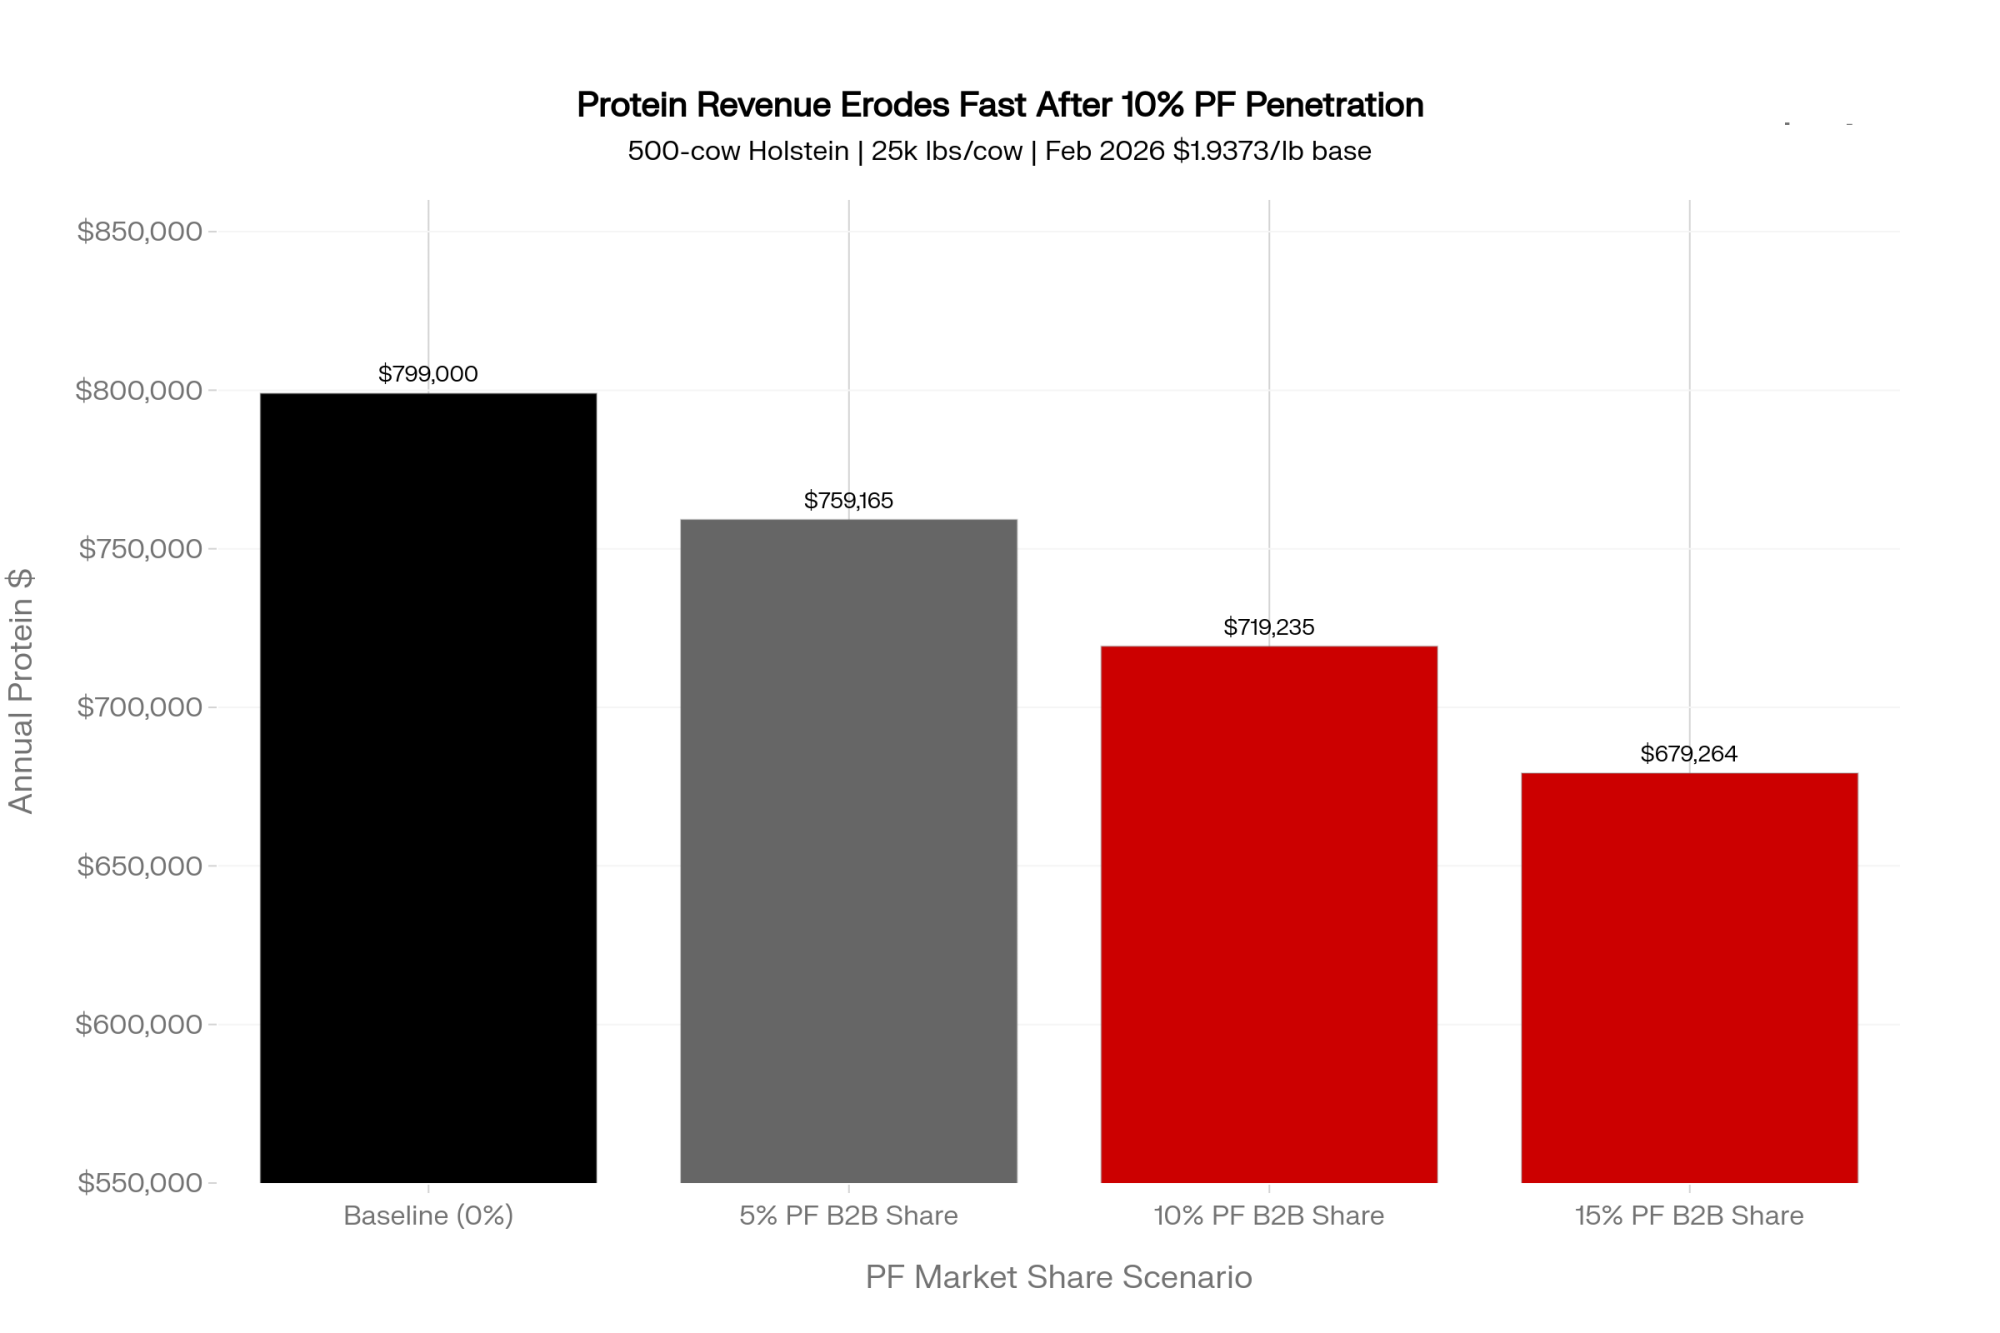
Here’s the same math at a glance across scenarios (rounded for readability):

PF B2B share (scenario)Protein price (rough)Annual protein hit (500 cows)Approx. per‑cwt impact
5%$1.94 → ~$1.84/lb~$40,000~$0.32/cwt
10%$1.94 → ~$1.74/lb~$80,000~$0.64/cwt
15%$1.94 → ~$1.65/lb~$120,000~$0.96/cwt

Two guardrails so you keep this in perspective:

  • FMMO protein values come from surveyed cheddar and dry whey prices, not Verley’s or Fooditive’s internal contracts. Any PF effect gets filtered through cheese plants, exporters, and traders first, which makes the timing and magnitude of your milk check messy and delayed.
  • Industry reviews still put precision‑fermented protein costs several times higher per kg than those of conventional whey or casein. PF doesn’t beat dairy on cost today. But every new fermenter project is backed by investors who bet that the gap will close over time.

So you’re not “losing $80,000 already.” You are seeing how sensitive your operation is to a 10% drop in your protein price over the next 5–10 years.

Where a $0.64/cwt Squeeze Hits First: Debt Service

For most herds, the first place a PF‑style squeeze really bites isn’t the milk check. It’s your DSCR and how your lender talks to you.

Farm Credit Canada defines a debt service coverage ratio (DSCR) below 1.0 as an inability to rely on net cash income to service debt; most commercial ag lenders in North America require at least 1.25x.[fcc-fac:1] That means $1.25 of cash for every $1 of principal and interest due.

Stick with our 500‑cow scenario and assume:

  • Gross revenue ≈ $3.5 million
  • Annual principal + interest = $250,000

Take three margin profiles before any PF pressure:

  • Strong: 18% net margin before debt service
  • Average: 12%
  • Tight: 8%

Here’s how the $80,000 PF‑style hit lands on each:
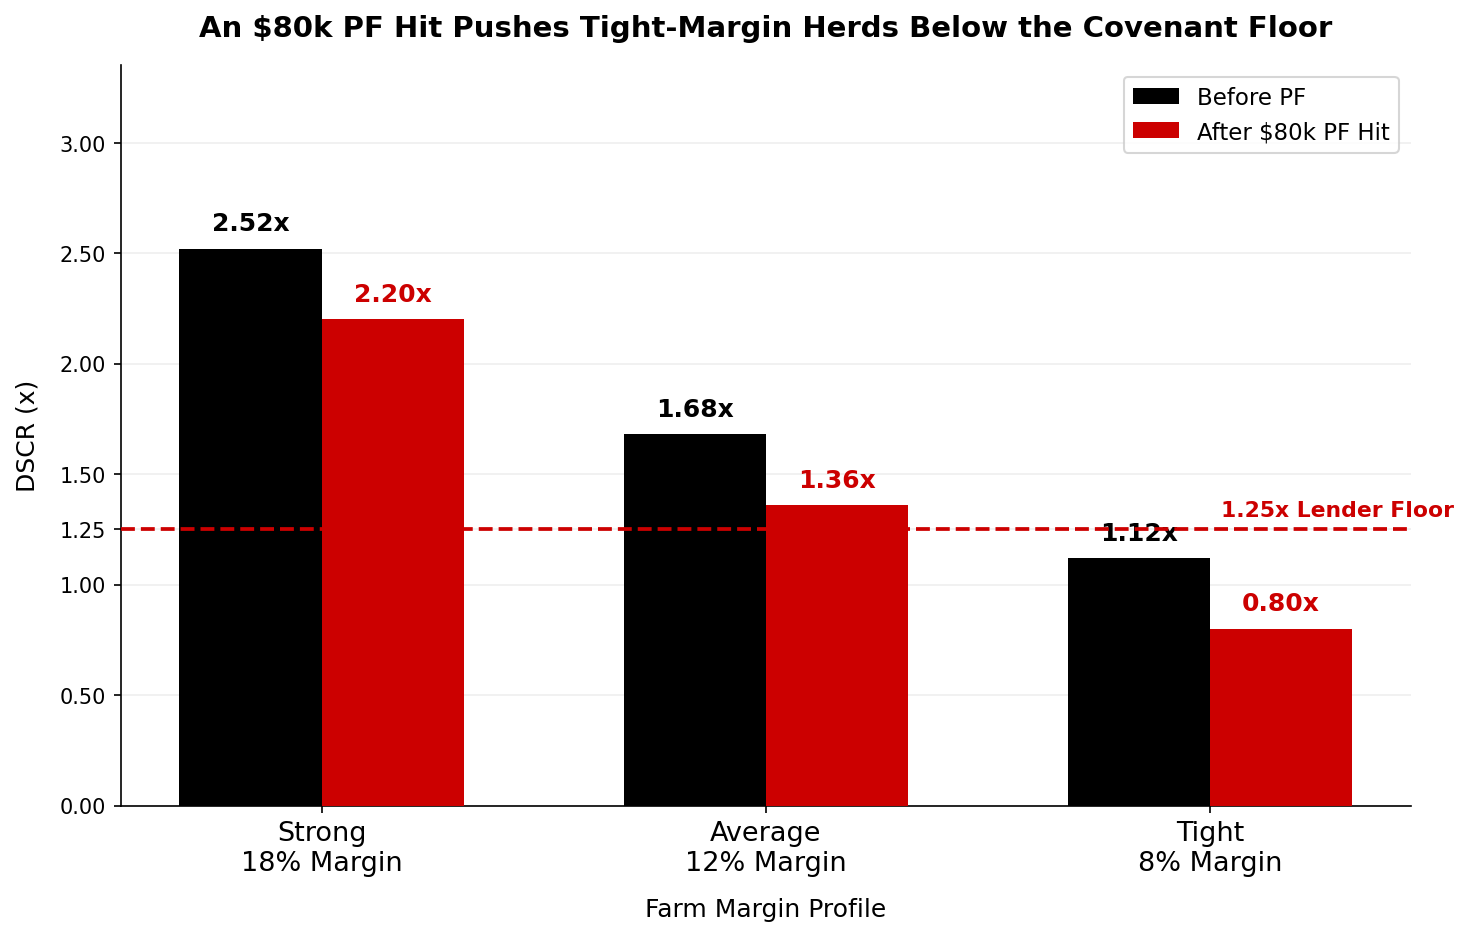
ProfileNet before debt (on $3.5M)DSCR before PFDSCR after ~$80k hitWhat that means
Strong 18%$630,0002.52x2.20xIt’s a drag, not a crisis
Average 12%$420,0001.68x1.36xMore than half your cushion disappears
Tight 8%$280,0001.12x0.80xAlready under 1.25x — and you lose recovery room

That bottom row is the one to stare at. A tight‑margin 500‑cow herd at 1.12x DSCR is already below a typical 1.25x covenant before any PF effect.[fcc-fac:1] Precision fermentation doesn’t “cause” that covenant problem. It just erases the little headroom you had to climb back above it.

For the average 12% herd, the same $80,000 squeeze takes DSCR from 1.68x to 1.36x. Nobody hits the panic button at 1.36x, but your banker’s questions change. Capex is scrutinized harder. Genetics spending gets framed in terms of payback. “What happens if components soften?” stops being hypothetical small talk.

If your DSCR sits well over 2.0x, PF is mostly a planning exercise. If you’re hovering between 1.0x and 1.4x already, you’re exactly the herd this scenario is about — whether PF shows up in your local market in three years or seven.

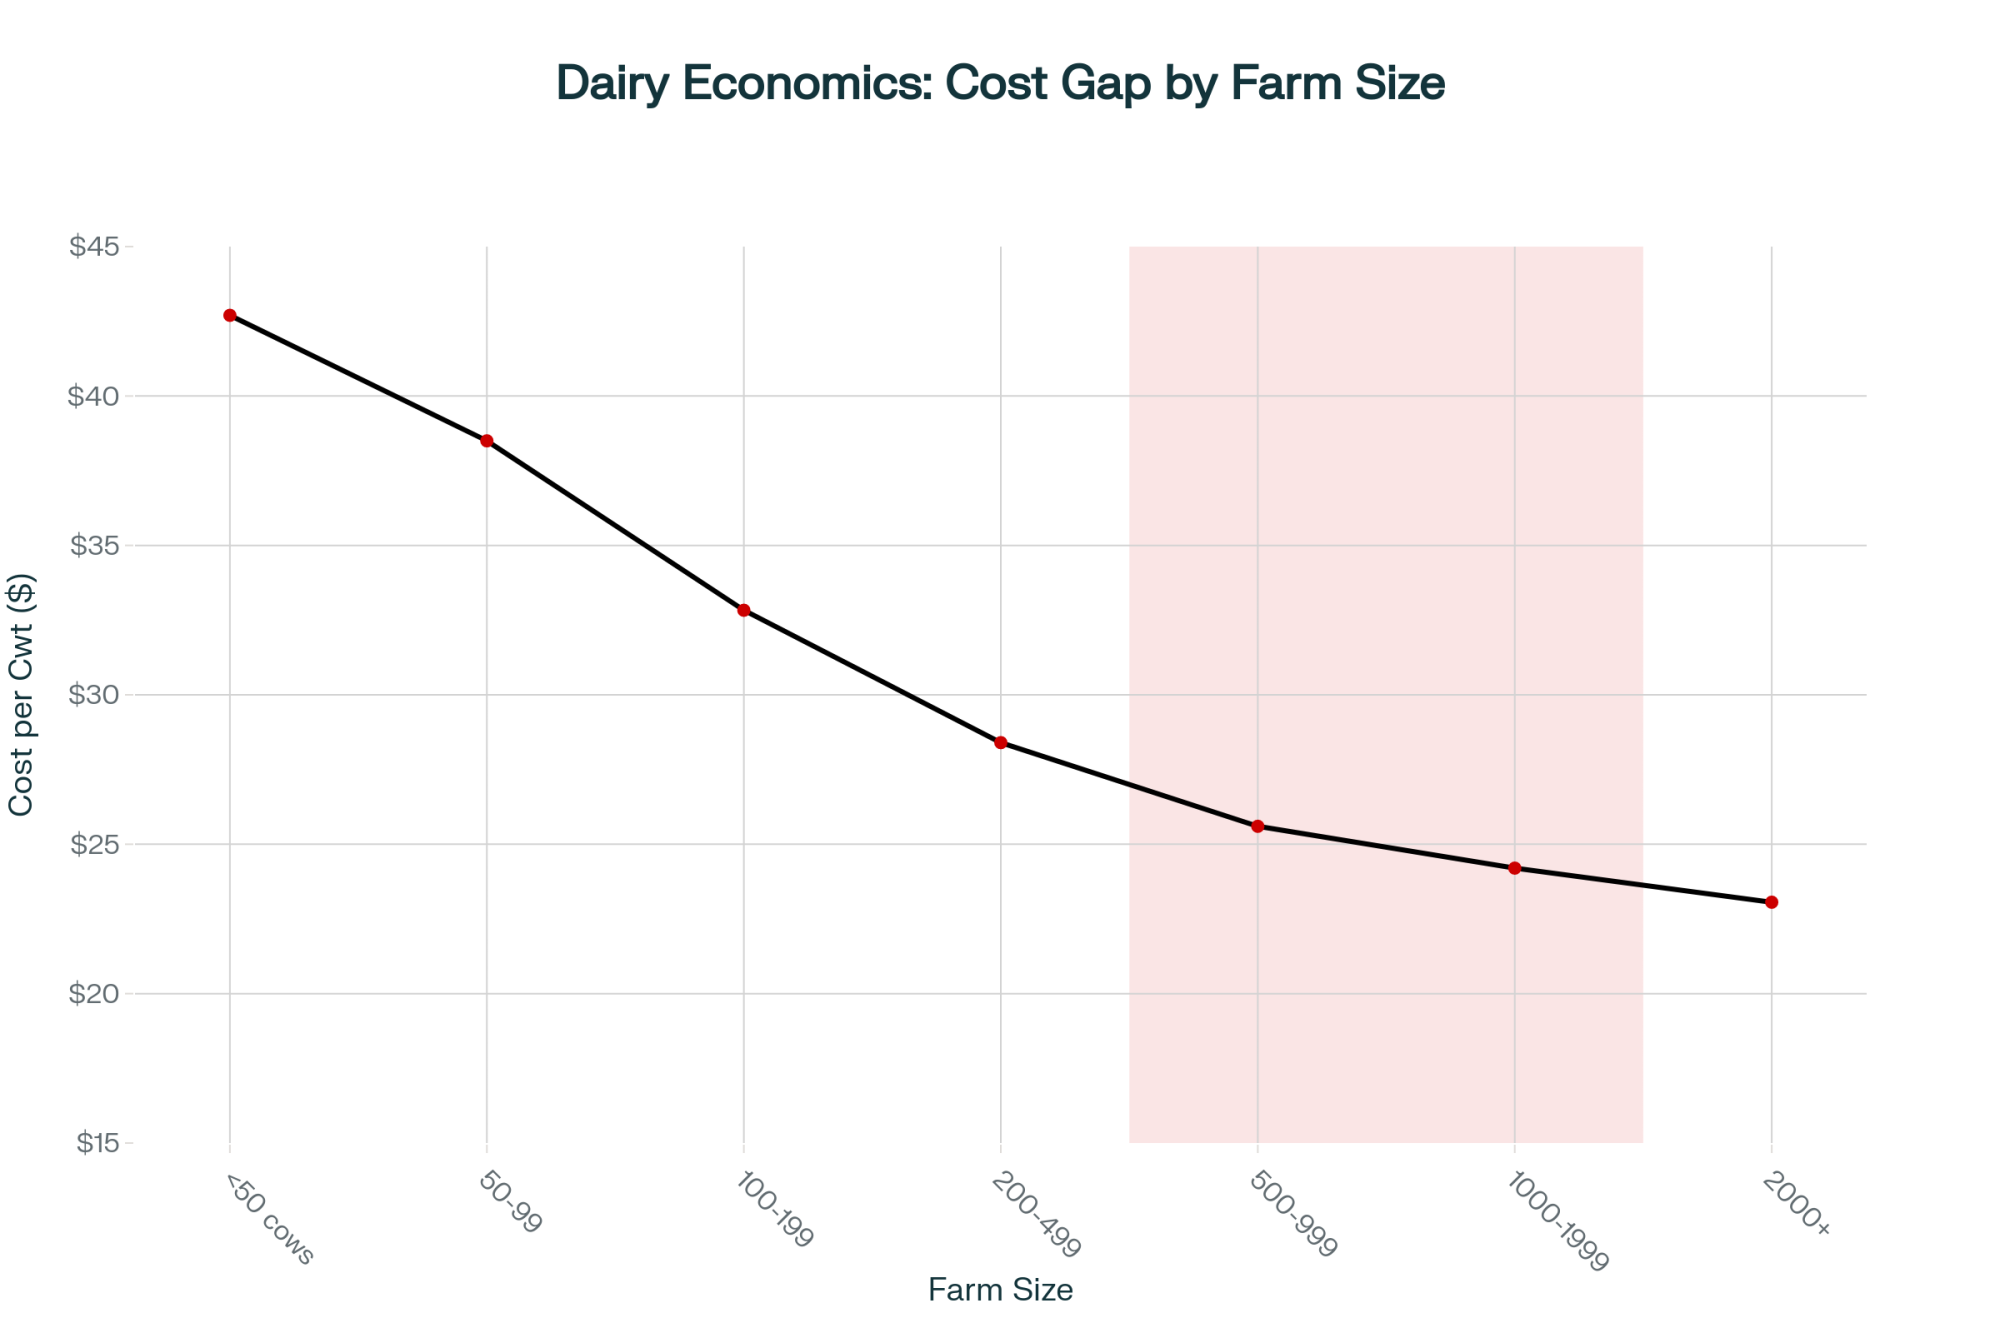
Organic’s Wall Is Real on Paper — and Tough on Math

One common comfort line is: “Precision‑fermented ingredients can’t be organic, so organic herds are safe.” There’s some truth there, but the story is more complicated — and the math is ugly for many herds.

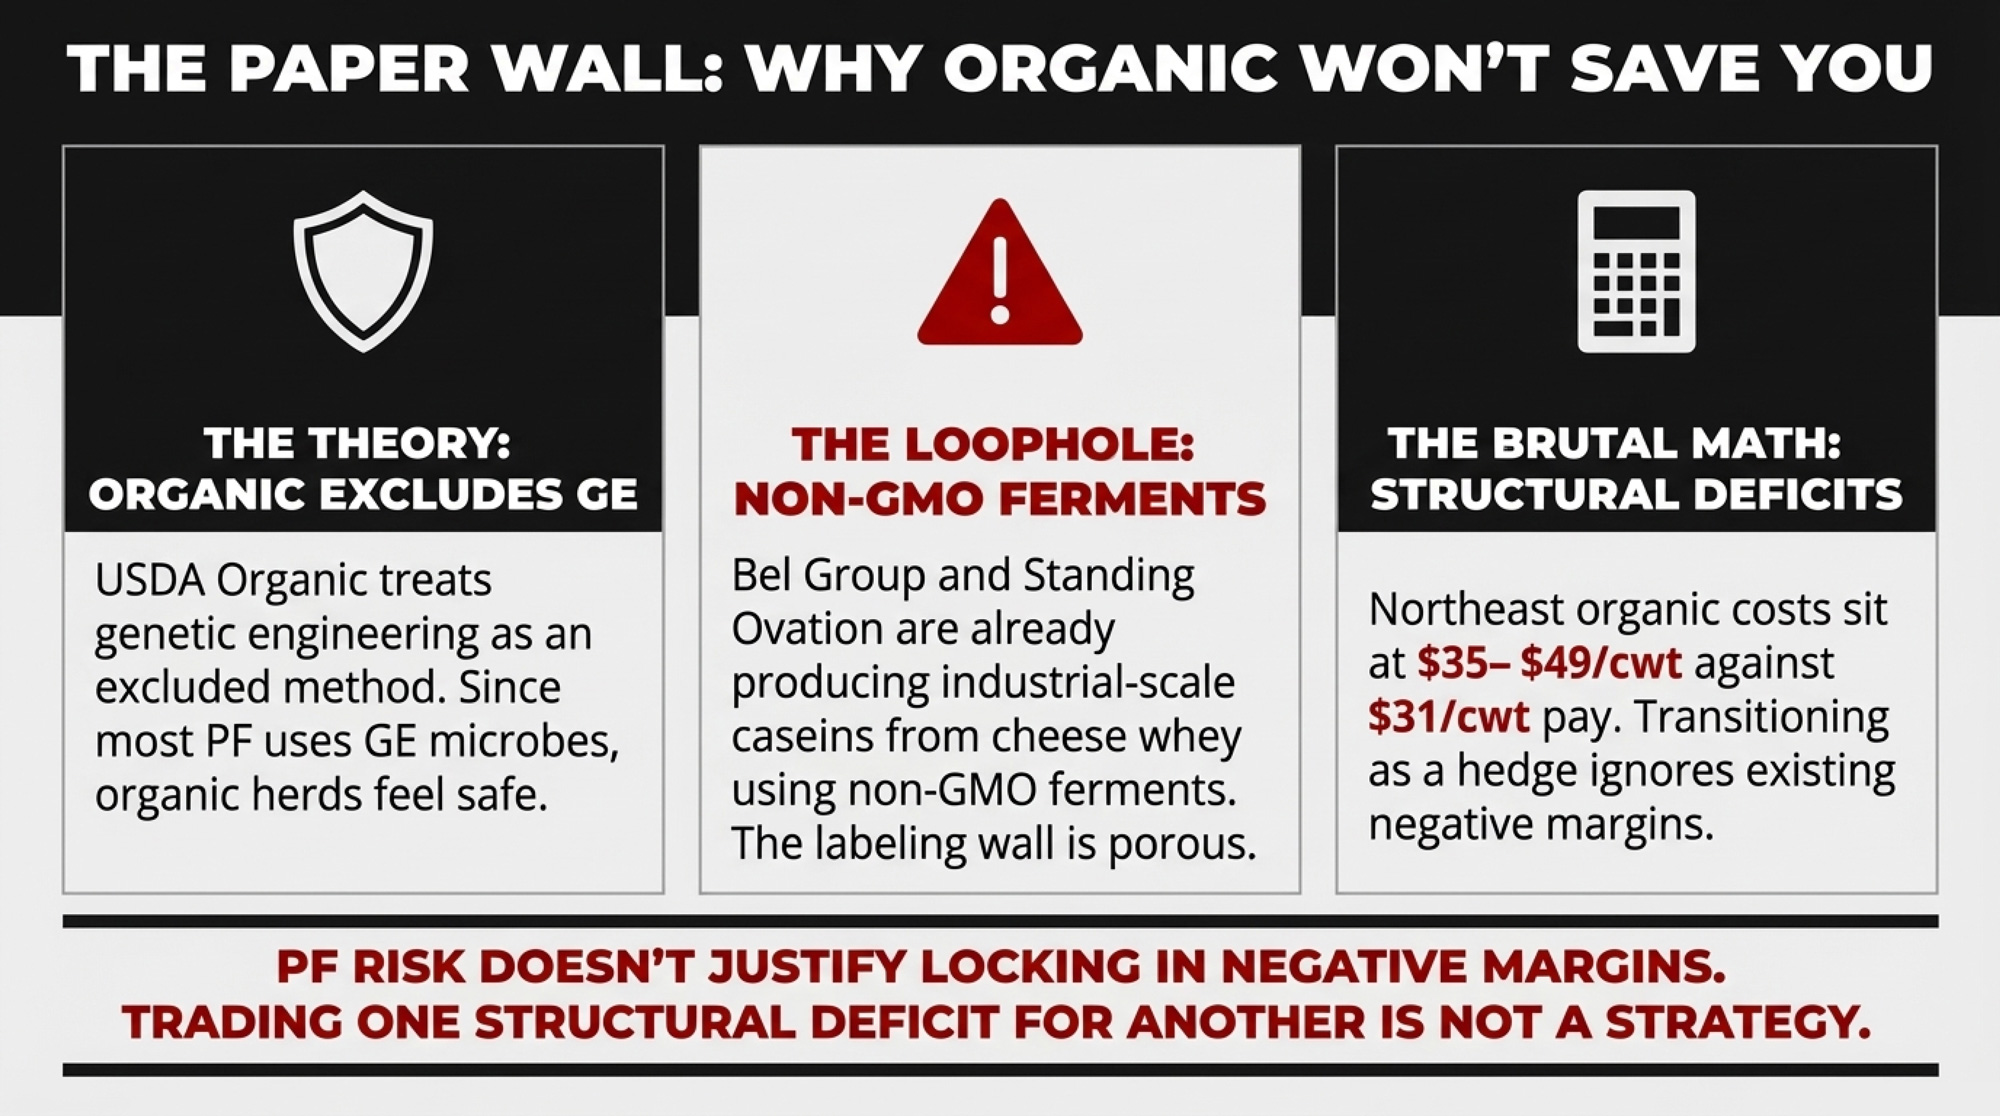
USDA Organic rules treat genetic engineering as an excluded method.[ams.usda.gov:2] Most PF companies — Verley, Perfect Day, Vivici, others — use genetically engineered microbes, so their proteins can’t appear in certified‑organic products under current rules.[ams.usda.gov:2] That’s a real labeling wall.

Bel and Standing Ovation are testing the edges. Their October 2025 announcement described producing caseins from cheese whey using non‑GMO ferments at an industrial scale. If regulators treat that as a process change to an existing dairy by‑product rather than an excluded method, it may face a different organic classification path than GE‑microbe routes. That’s still an open question — not settled law.

Meanwhile, many organic herds are already struggling to make the math work. In 2022, NODPA executive director Ed Maltby told DairyReporter: “At this time, there is no economic reason for dairies to transition to organic production.” Their 2023 Northeast organic survey showed production costs in the $35–49/cwt range, while pay prices were around $31/cwt, with about two‑thirds of grass‑fed producers facing costs above their milk price.

So yes, the organic seal blocks most GE‑based PF proteins today. But:

  • A non‑GMO PF casein route is already at industrial scale in at least one project.
  • Many organic herds are already losing money at today’s pay prices.

If your cost of production is near or above your organic pay price, transitioning as a “PF hedge” is trading one structural problem for another. The only sound reason to go organic is the old one: because your cost structure and signed contracts give you a reliable margin, not because you hope a label will shield you from PF in 2033.

The Genetics Turn: Making Your Protein Less Generic

Here’s the part of the PF story where you actually have leverage. Precision fermentation is great at pumping out standard proteins: typical BLG, typical casein. It’s not built to cheaply copy whatever stack of protein variants you decide to breed for.

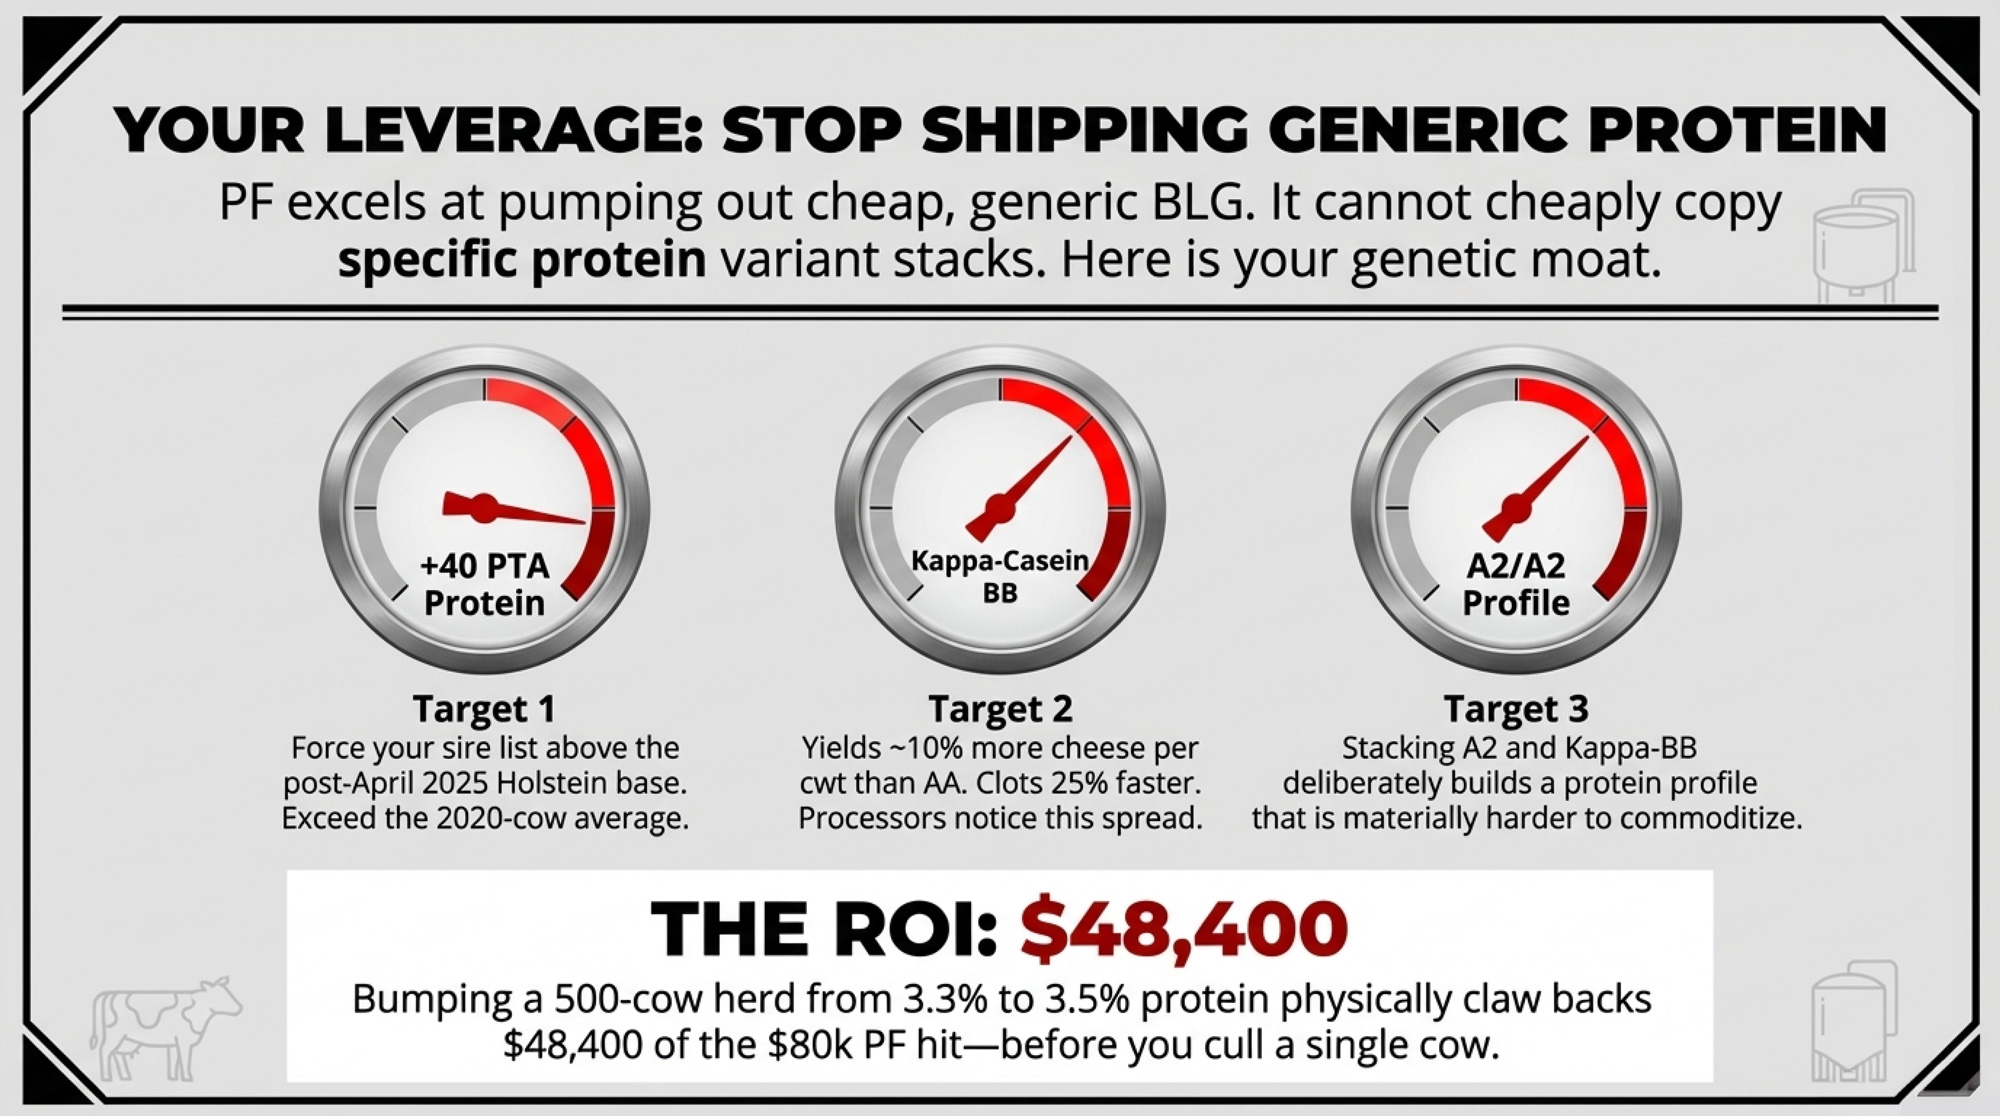
Kappa‑casein is the obvious starting point. Work under Wales’s Farming Connect program found kappa‑casein BB milk producing about 13.8% cheese yield versus 11.64% for AA — roughly a 2.2‑percentage‑point edge. Bullvine modeling on that and similar studies puts BB milk at around 10% more cheese per cwt, with BB milk clotting about 25% faster and producing cheese nearly twice as firm as AA‑heavy tanks.

Genetic TraitBaseline Herd AverageTarget (PF Defense)Processor ValuePF Resistance Logic
PTA Protein (lbs)+10 to +20 lbs+40 lbs minimumMore lbs shipped/cwtMore volume per cow, harder to cut
Kappa-Casein~60% AA, ~35% ABBB or AB target~10% more cheese/cwtBB milk clots 25% faster; 13.8% vs 11.64% cheese yield
A2/A2 Status~30–40% of HolsteinsA2/A2 priorityPremium fluid & exportDifferentiated label; not replaceable by generic BLG
Protein % (herd avg)3.3%3.5%+ targetHigher component pay25,000 extra lbs protein/yr = ~$48,400 offset
Inbreeding (F%)8–10%<8% with genomic toolsHealth, fertility, yieldHigh inbreeding cancels genetic protein gains

Processors — especially ones who also make cheese — notice that kind of spread. As PF pushes down the cost of generic protein, the premium on variant‑specific milk (A2/A2, kappa‑BB, higher protein % per pound of milk) becomes one of the few solid ways to say: “You can’t just swap me out one‑for‑one with a tank of BLG.”

Genetically, we’ve been blunt: treat +40 lbs PTA Protein on the post‑April‑2025 Holstein base as your minimum sire threshold in a PF world. It’s not magic. It’s simply forcing your sire list above the new average on protein transmission.

The April 2025 CDCB base change moved the Holstein reference from 2015‑born cows to 2020‑born cows. Bullvine’s analysis of the final base‑change values showed realized genetic progress over that window of about 29 lbs of protein, 44 lbs of fat, and 752 lbs of milk. Once inbreeding adjustments were applied, the average PTA fat rollback landed closer to 39 lbs than the headline 44 lbs.

So a +40 PTA Protein bull on the new base isn’t just a little better than zero. He’s materially ahead of the 2020‑cow average. You’re stacking advantage on top of a breed that already moved.

Now run that through barn math on our 500‑cow herd. If you move from 3.3% to 3.5% protein over time at 25,000 lbs shipped per cow:

  • Old protein shipped: 12.5 million lbs × 3.3% = 412,500 lbs
  • New protein shipped: 12.5 million lbs × 3.5% = 437,500 lbs
  • Gain: 25,000 lbs of protein per year

At $1.9373/lb, that extra 25,000 lbs is worth about $48,400 annually. You’ve just clawed back more than half of the $80,000 PF‑scenario squeeze through genetics alone, before you change a contract or cull a single cow.

Combine a +40 PTAP filter with kappa‑casein genotyping and A2/A2 selection, and you’re deliberately building a protein profile that’s harder to commoditize. Most commercial herds still haven’t screened kappa at scale. The ones that start now will be the ones who can sit across from a processor and talk about cheese yield and functionality, not just volume.

Your Milk’s Destination Sets Your Precision‑Fermentation Timeline

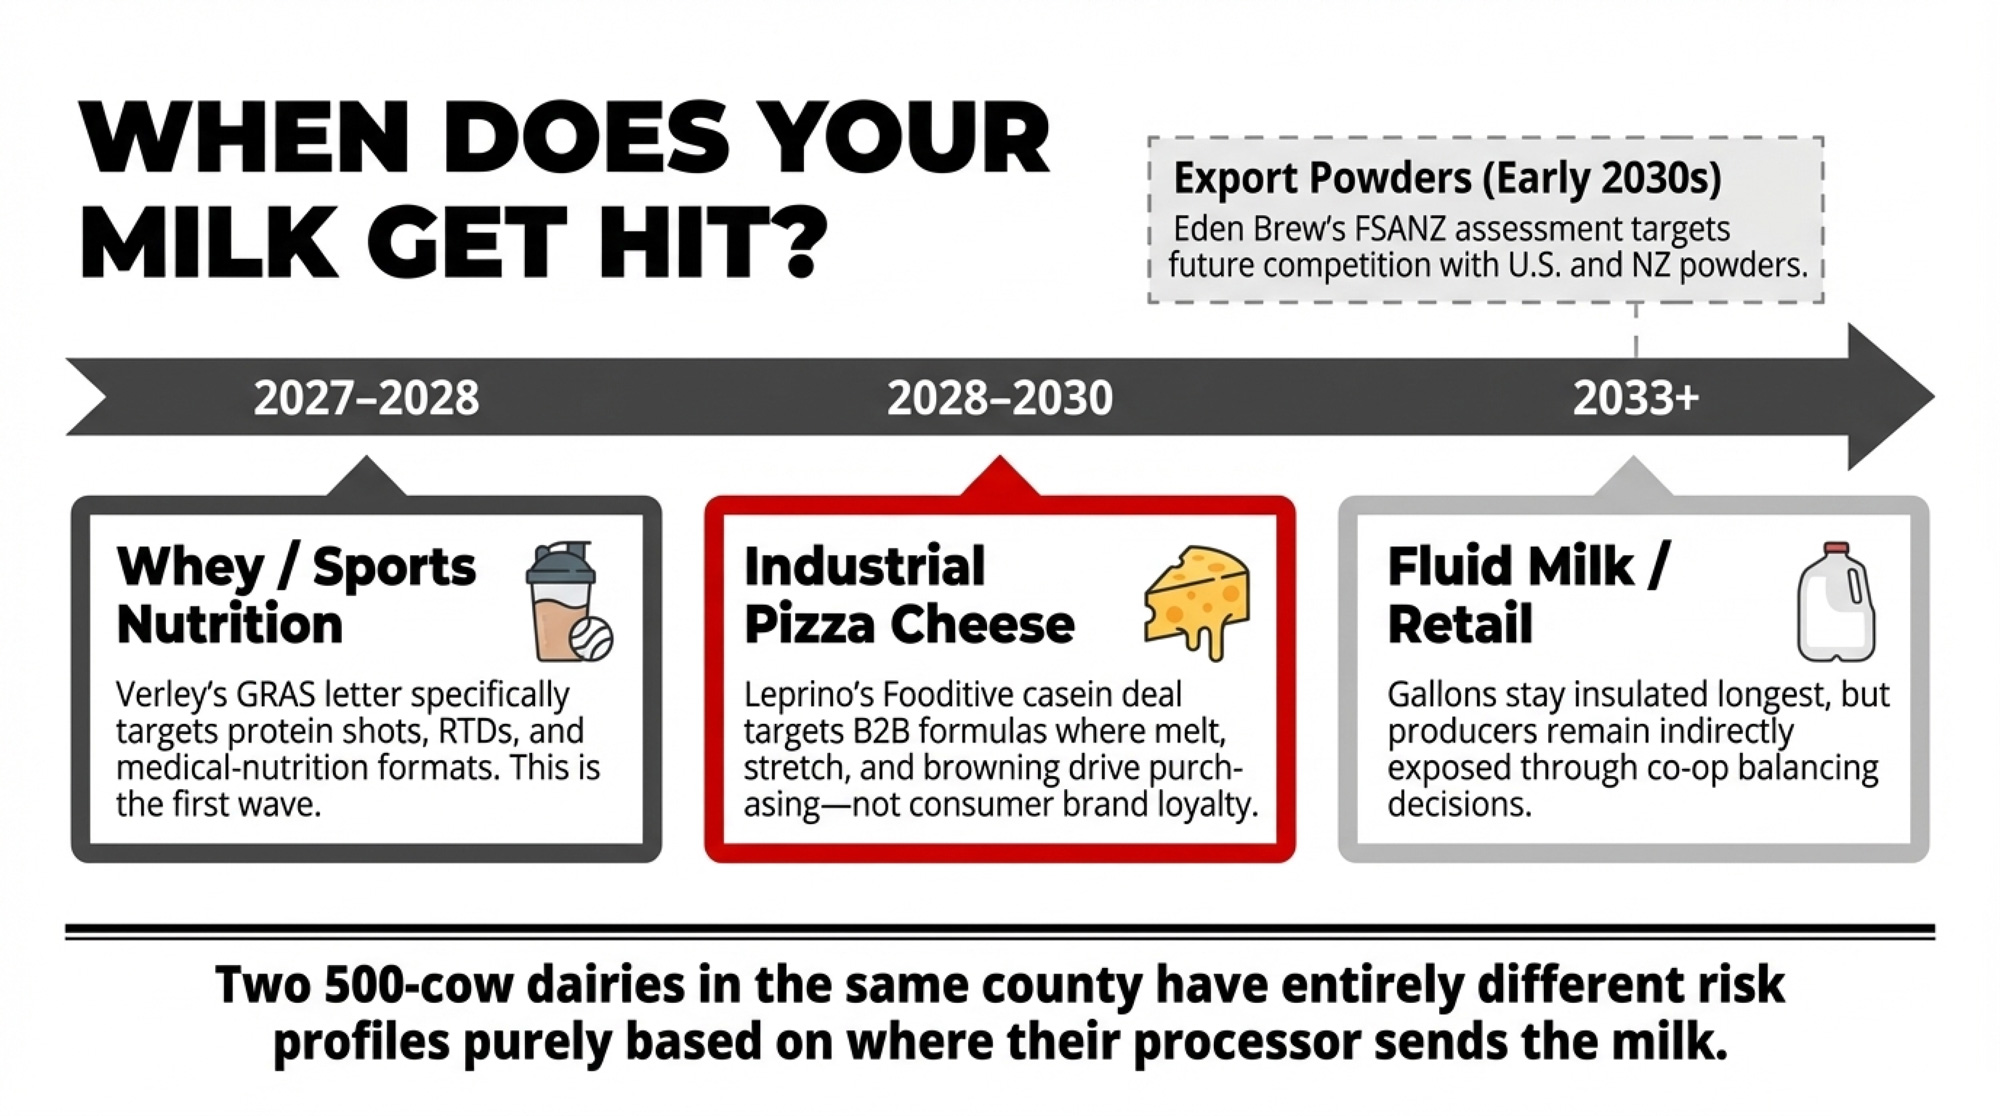
Two 500‑cow dairies in the same county can have very different PF exposure without changing a thing in the barn — purely because their processors send milk to different end markets.

Based on current announcements, regulatory filings, and public timelines, the PF pressure bands look roughly like this:

  • Whey protein isolate/sports nutrition (2027–2028). Verley’s GRAS letter explicitly positions FermWhey Native and MicroStab for protein shots, RTDs, high‑protein yogurts, and medical‑nutrition formats. If your processor sells into those categories, that’s where PF appears first as an alternative ingredient in specs.
  • Industrial mozzarella and pizza cheese (2028–2030). Leprino’s Fooditive partnership is all about casein functionality, especially for pizza cheese, where melt, stretch, and browning drive purchases. As fermenter capacity scales, it becomes easier to blend PF casein into frozen pizza and QSR formulas.
  • Fluid milk / regional retail (2033+). Fluid gallons stay insulated longer. Consumers still care about “real milk,” distribution remains local, and PF today is an ingredient business, not a branded gallon business. If most of your check comes from Class I, your PF clock is slower — but you’re still exposed indirectly through cream, concentrates, and your co‑op’s balancing decisions.
  • Export powders to Asia/Oceania (regulation‑dependent). Eden Brew’s PF dairy protein application was accepted for FSANZ assessment in December 2025, with public consultation expected in 2026 and a review period of around a year. If FSANZ and other regulators approve these proteins, PF caseins and whey start competing more directly with U.S. and NZ powders in some export channels in the early 2030s.

None of that is guaranteed. Plants slip. Regulators delay. Customers change course. But your processor already has a working view of which segments would feel PF competition first and where they’d like more bargaining power. You only see that view if you ask.

What This Means for Your Operation

This stops being an interesting article and becomes useful when you plug in your own numbers and contracts. Here’s where to start.

  • Stress‑test your DSCR this month. Grab your most recent full‑year financials. Calculate DSCR as net operating income ÷ total annual principal + interest. Then subtract a PF‑style hit from protein revenue — use roughly $0.64/cwt on your actual hundredweights shipped as a 10% scenario — and recalc.[fcc-fac:1] If you’re under about 1.25x now, you’re already in the vulnerability band this piece describes.
  • Ask your processor where your milk really goes before April 30. Don’t stop at “cheese” or “fluid.” Ask for approximate percentages of fluid, commodity cheese, whey protein, and powders. Ask which customers are asking about “whey from fermentation” or “alternative casein,” and what PF developments they’re watching. If your field rep can’t answer, that tells you something about your information gap — and maybe about how seriously your buyer is planning.
  • Audit your protein genetics. Pull your last 2–3 years of sire lists and herd‑level genetic reports. How many bulls have you used, clear +40 lbs PTA Protein, on the post‑April‑2025 Holstein base? How many cows and heifers are A2/A2 or kappa‑BB? If you don’t know, you can’t credibly argue that your protein is worth more than a commodity.
  • Genotype before your next semen order. Before you book 2026 semen, genotype a meaningful slice — ideally your whole young‑stock and cow herd — for kappa‑casein and A2 status. Use that data to: prioritize A2/A2 and kappa‑BB matings for replacements; push beef‑on‑dairy hardest on cows with weak protein variants or low PTAP; and avoid wasting sexed semen on cows that’ll never give you the protein profile your processor wants.
  • Do a hard organic math check, not a hope check. If you’ve been eyeing organic as a PF wall, sit down with your accountant and nutritionist. Map your all‑in cost of production — including unpaid labor and realistic depreciation — against actual organic pay prices you can sign in your region. If your breakeven is already near or above those pay prices, the rational move is to walk away. PF risk doesn’t justify locking in negative margins.
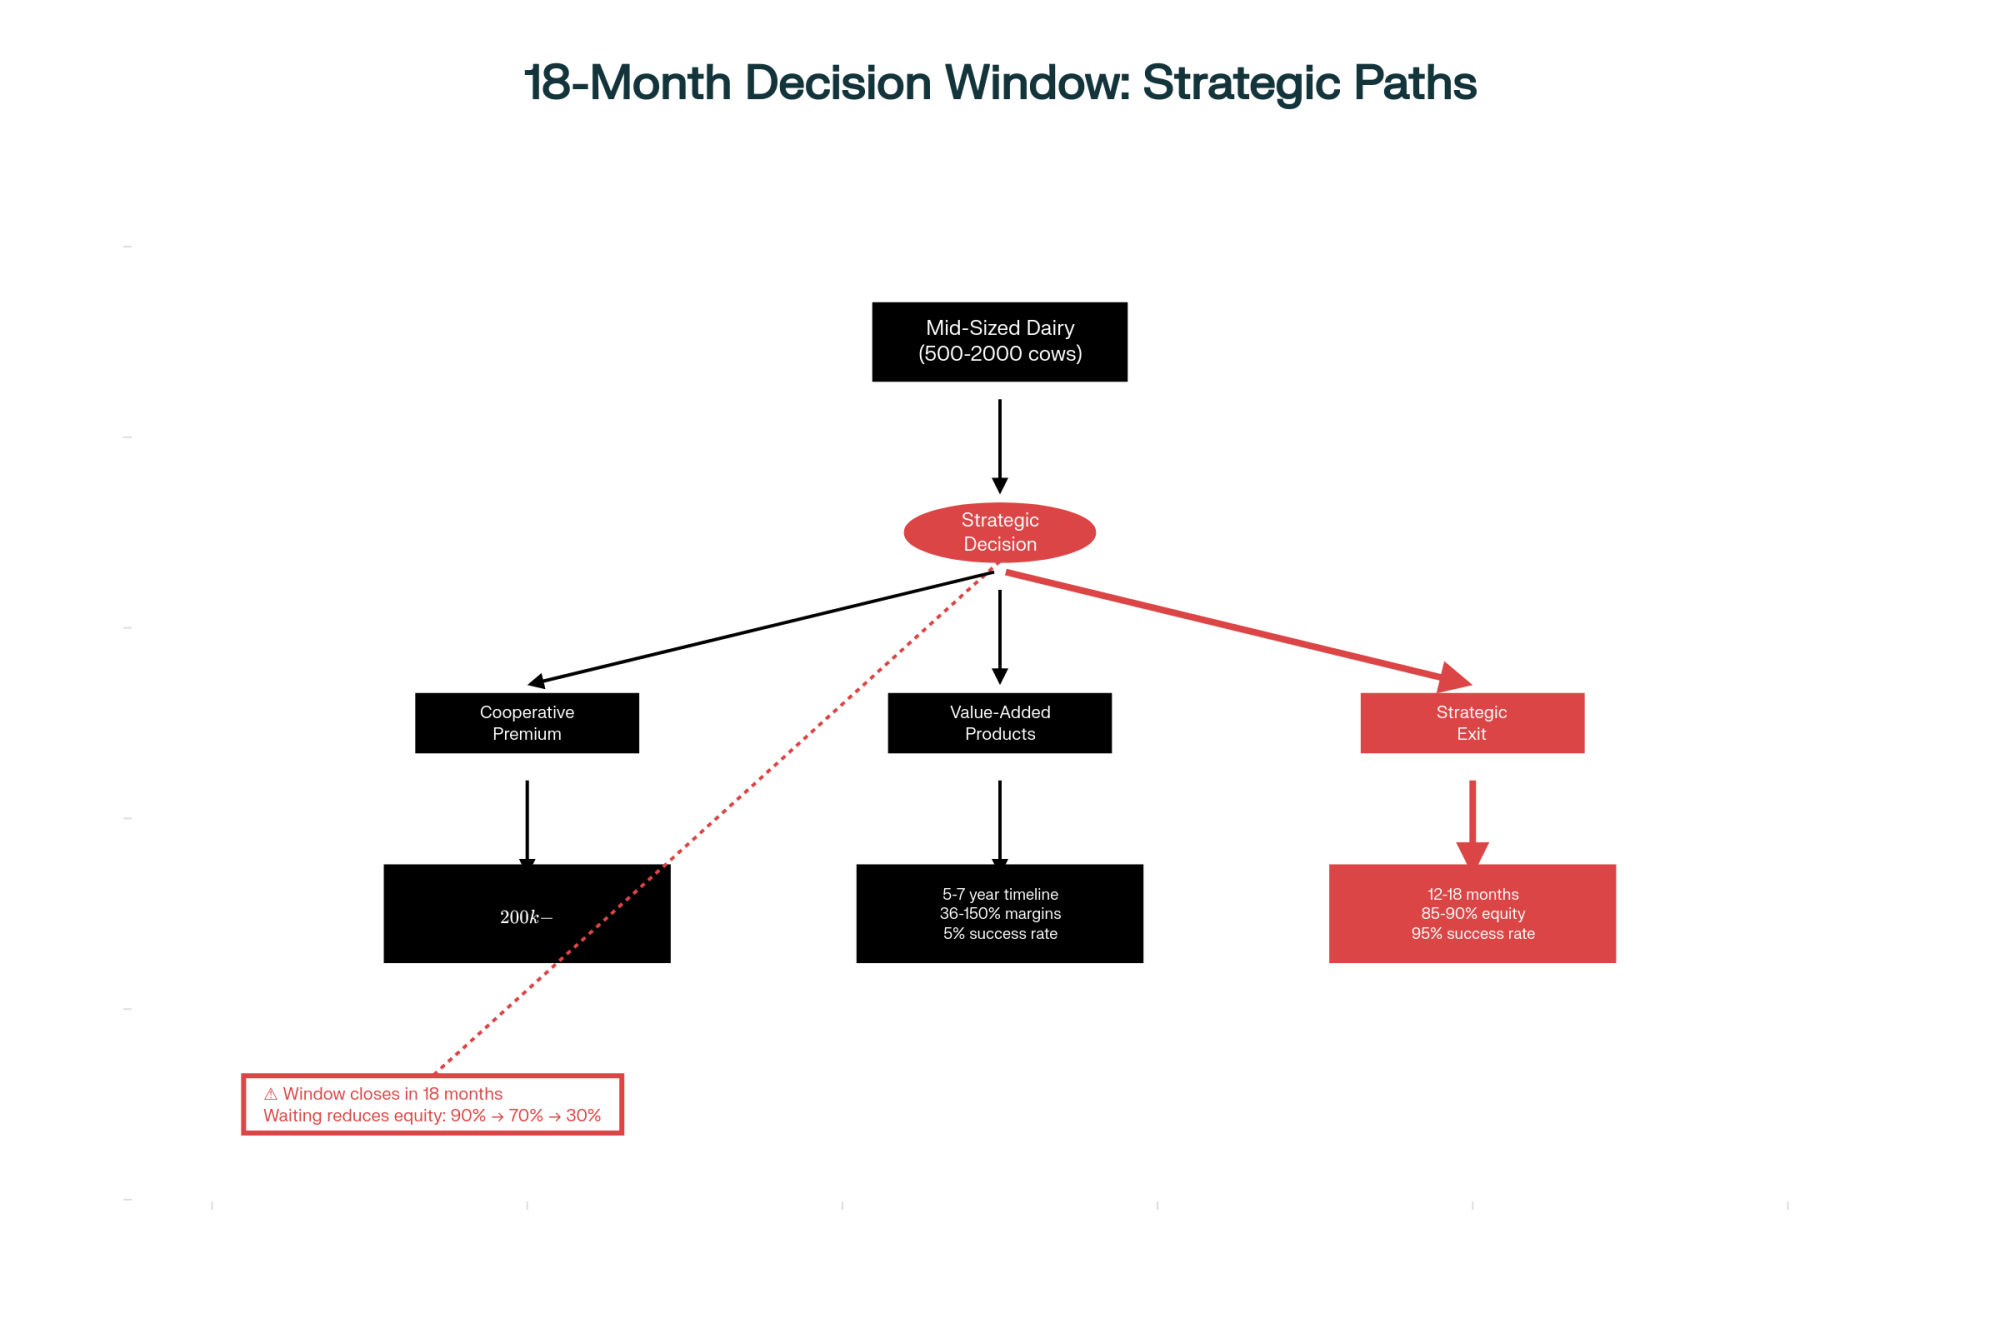
  • If exit is on your mind, let PF shape timing, not your story. If you’re over 55, have no committed successor, and your DSCR has been sliding, precision fermentation isn’t “forcing” you out. It’s one more reason to time a strategic exit while buyers still see your herd as protein production capacity, not distressed culls. The gap between a planned sale and a forced liquidation can easily reach six figures on a 500‑cow herd.
  • Block off one focused hour in the next 30 days. Grab this article, your last three milk checks, your year‑end financials, and your genetic reports. Work through the 500‑cow scenario with your actual cwt, tests, and debt service. If what you see on your own pad makes you uncomfortable, that’s your cue to change something while it’s still your choice.

Key Takeaways

  • If your DSCR sits below roughly 1.25x at today’s margins, you’re already in the danger band this precision‑fermentation scenario exposes — whether fermenters show up in your market in 2028 or 2034.[fcc-fac:1]
  • Precision fermentation is a 5–10‑year ingredient‑side pressure first, not a retail collapse next quarter. It shows up earliest in sports‑nutrition WPI, RTDs, and pizza‑cheese contracts, not in the gallon of fluid your neighbors buy.
  • Your most practical defense isn’t arguing about PF in the press. It’s breeding for higher PTA Protein, kappa‑BB, and A2/A2, so your milk’s protein profile is harder to swap out for generic BLG coming from a tank.
  • The organic seal blocks most GE‑based PF proteins on paper, but Bel’s non‑GMO casein route and the brutal organic cost structure mean “going organic to block PF” is a weak economic play unless your cost‑of‑production math already works with signed contracts.

The Bottom Line

Processors like Leprino, Bel, Fonterra, and their partners aren’t abandoning your milk. They’re adding precision‑fermented casein and whey alongside it to increase their sourcing options and leverage. Your job is to understand how that optionality affects your component price, your contracts, and your genetics plan — and to move on your own terms before a price sheet or covenant redraws the line for you.

When you look at your own herd, the real question isn’t whether PF is good or bad “for dairy.” It’s sharper: if protein gets cheaper in the markets your milk serves, are you set up as a commodity supplier fighting over pennies — or as a differentiated protein source your processor really doesn’t want to replace with what’s growing in a fermenter across town?

Complete references and supporting documentation are available upon request by contacting the editorial team at editor@thebullvine.com.

Learn More

The Sunday Read Dairy Professionals Don’t Skip.

Every week, thousands of producers, breeders, and industry insiders open Bullvine Weekly for genetics insights, market shifts, and profit strategies they won’t find anywhere else. One email. Five minutes. Smarter decisions all week.

NewsSubscribe
First
Last
Consent

China’s 500,000-Cow Farms and Lab-Grown Milk: Your Dairy’s 18-Month Decision Window

Your grandfather milked 50. You milk 500. China milks 500,000. This ends one of three ways.

Having spent the better part of two decades analyzing dairy production trends, I can tell you that what we’re witnessing today represents a fundamental shift in how milk is produced globally. The International Farm Comparison Network’s latest 2024 data reveals something remarkable: five of the world’s ten largest dairy operations are now Chinese-owned. Modern Dairy, for instance, manages nearly half a million cows across 47 farms—a scale that would have been unimaginable just a generation ago.

What’s particularly noteworthy is Almarai’s achievement in Saudi Arabia. They’re consistently hitting 14 tonnes of milk per cow annually in desert conditions where summer temperatures routinely exceed 50°C. That level of production in such challenging conditions offers valuable lessons for operations everywhere, from California’s Central Valley to the arid regions of Arizona and even parts of Texas experiencing increasing drought pressure.

This transformation comes at a time when mid-sized dairy operations across North America are evaluating their strategic options. The conversations happening at farm meetings and extension workshops reflect genuine uncertainty about the path forward. Should an 800-cow operation expand to 2,500? Can family farms find sustainable niches in this changing landscape? These aren’t abstract questions—they’re daily realities for thousands of producers.

The Geographic Realignment of Global Dairy Production

Looking at this trend, what strikes me most is how quickly the center of gravity has shifted eastward. The 2024 data from IFCN paints a clear picture: China’s five largest operations—Modern Dairy with 472,480 cows, China Shengmu with 256,650, Yili Youran with 246,000, and Huishan with 200,000—represent impressive numbers. They reflect a deliberate national strategy.

Dr. Jiaqi Wang at the Chinese Academy of Agricultural Sciences provides important context here. Following the 2008 melamine incident that affected hundreds of thousands of infants, Chinese dairy companies fundamentally restructured their approach to prioritize supply chain control. This builds on what we’ve seen in other industries where food safety crises prompted systemic changes.

MetricChina EliteChina AvgUS MidwestUS Mega
Herd Size472k (Modern)8k-15k1k-5k10k-30k
Yield/Cow (t)9.5-12.09.611.0-13.011.8-13.4
Feed Conv Ratio1.4:11.6:11.5:11.4:1
Self-Suffic85% (170%)73%100%100%
Tech Invest LvlVery HighHighModerateVery High

China’s agricultural policy documents outline ambitious targets: achieving 70% milk self-sufficiency by 2030, with intermediate goals potentially pushing toward 75-85% over time. They’re also targeting annual yields exceeding 10 tonnes per cow—a significant leap from current averages. This aligns with their broader strategy of reducing import dependence across agricultural commodities.

Why does this matter for North American and European producers? Well, the USDA Foreign Agricultural Service reports that China’s dairy imports have exceeded $10 billion annually in recent years. As Rabobank’s 2024 quarterly analysis shows, China added 11 million metric tons of production between 2018 and 2023, already displacing approximately 240,000 tonnes of whole milk powder imports. For regions that have counted on Chinese demand as a growth driver—particularly New Zealand and Australia—this represents a significant market shift requiring strategic recalibration.

Understanding Productivity Variations Across Mega-Dairies

Desert dairy operation in Saudi Arabia achieves 82% higher productivity than China’s largest farm despite having 6x fewer cows—proving management beats scale in global dairy competition

One of the most intriguing findings from analyzing global mega-dairy performance is the substantial productivity variation even among the largest operations. Consider the range based on 2024-2025 company data: Almarai achieves 14.00 tonnes per cow annually; Rockview Dairies in California produces 11.80 tonnes; Modern Dairy in China averages 9.53 tonnes; and Huishan manages 7.70 tonnes.

This 82% productivity gap between the highest and lowest performers—both operating at massive scale with significant capital resources—challenges assumptions that scale automatically drives efficiency. What accounts for these differences?

Anthony King, who oversees operations at Almarai’s Al Badiah facility, shared insights at the International Dairy Federation’s 2024 World Dairy Summit about their management approach. The attention to detail is extraordinary: maintaining barn temperatures at 21-23°C year-round despite extreme external heat, providing 300 liters of water per cow daily, and implementing precision feeding protocols that optimize every nutritional variable.

The USDA Economic Research Service’s comprehensive 2023 analyses (their most recent full report) support what many progressive producers have long suspected: management sophistication and technological integration matter more than scale alone. Well-managed 500-cow operations implementing advanced protocols often outperform poorly-managed facilities ten times their size.

In Idaho, a 600-cow dairy was achieving 13,000 kilograms per cow through exceptional management, while a nearby 5,000-cow facility struggled to reach 11,000 kilograms. The difference? Attention to transition cow management, consistent fresh cow protocols, and meticulous record-keeping at the smaller operation.

The Economics Driving Industry Consolidation

The relentless math of consolidation: Smaller operations face $9.77/cwt higher costs than mega-dairies, translating to nearly $1 million in annual structural disadvantages for 1,000-cow farms that excellent management cannot overcome

What farmers are finding is that consolidation isn’t really about wanting to get bigger—it’s about the relentless mathematics of fixed costs. USDA’s 2024 cost of production data reveals the economics clearly: operations with 2,000+ cows average $23.06 per hundredweight in total costs, while farms with 100-199 cows face costs of $32.83—a difference of $9.77 per hundredweight.

What’s revealing here is the breakdown. The University of Wisconsin’s Center for Dairy Profitability research, led by Dr. Mark Stephenson, indicates that feed cost differences account for only about $2.50 of that gap. The remaining differential? It stems from spreading fixed infrastructure investments across production volume.

As Dr. Stephenson articulated in his January 2024 market outlook presentation: when fixed costs exceed variable costs in a commodity market, smaller operations face structural disadvantages regardless of management quality. For a representative 1,000-cow Upper Midwest operation producing 23 million pounds annually, this translates to $690,000 to $920,000 in additional costs compared to larger competitors—often exceeding total profit margins.

This economic reality helps explain why we’re seeing continued consolidation despite many producers’ preference for maintaining traditional farm sizes. The economics are pushing the industry in one direction, even as community ties, lifestyle preferences, and succession-planning challenges pull it in another.

Technology Adoption: Promise and Complexity

This development suggests that technology alone won’t solve dairy’s challenges—it’s how that technology is managed that matters. Beijing SanYuan exemplifies what’s possible, achieving 11,500+ kg per cow annually—matching Israel’s national average—through systematic adoption of Israeli dairy management systems since 2001, according to their published operational data.

But here’s the challenge. Professor Li Shengli at China Agricultural University identifies a critical constraint in his 2024 research published in the Journal of Dairy Science China: human capital. Chinese Ministry of Human Resources data from 2024 indicates that only about 7% of the country’s 200 million skilled workers possess the high-level capabilities needed to manage complex dairy systems effectively.

This creates an interesting paradox we see globally. Operations with capital for advanced technology often lack the expertise to optimize it, while highly skilled managers at smaller operations can’t access these tools. I know a manager in Pennsylvania running 600 cows who could likely double productivity with access to advanced monitoring systems and automated feeding technology. Meanwhile, I’ve toured 5,000-cow facilities with million-dollar technology packages operating well below potential due to management constraints.

Environmental Management: Challenges and Opportunities

The environmental dimension presents both challenges and unexpected opportunities—and it’s more nuanced than many discussions suggest. EPA calculations show that a 2,000-cow operation generates approximately 87.6 million pounds of manure annually—that’s 240,000 pounds daily, which require sophisticated management.

The World Resources Institute’s 2024 analysis highlights how scale affects these choices. Larger operations typically implement liquid storage systems for operational efficiency, but these generate substantially more methane than the daily-spread approaches common on smaller farms. This creates environmental trade-offs worth considering.

What’s encouraging is that at sufficient scale—typically around 5,000+ cows based on current feasibility analyses—biogas digesters become economically viable. These systems, which require investments of $2-5 million, can generate 5 million cubic meters of biogas annually. Youran Dairy in China operates nine such facilities, each producing approximately this volume according to their 2024 sustainability reports.

These operations are transforming waste management from a cost center into revenue through electricity generation, fertilizer sales, and carbon credit programs. The capital requirements mean this solution remains out of reach for most mid-sized operations, though, creating another scale-dependent advantage.

It’s worth noting explicitly that while larger farms may achieve better emissions intensity per unit of milk produced, smaller farms often have lower absolute emissions overall—a nuance that deserves more attention in environmental policy discussions. A 200-cow grass-based operation in Vermont creates different environmental impacts than a 10,000-cow facility in New Mexico, even if the per-gallon metrics favor the larger operation.

Strategic Options for Mid-Sized Operations

Three survival strategies for operations caught between mega-dairy economics and precision fermentation disruption—with Strategic Exit preserving 85-90% equity versus 20-30% in forced liquidation after prolonged losses

For the 500-2,000 cow operations that form the backbone of American dairy, three strategic paths show promise based on extension research and producer experiences:

Strategic Options for the Mid-Sized Dairy

PathPotential BenefitTimeline / Requirement
Cooperative Premium8-12% price advantage ($200k-$300k/yr for 1,000 cows)Requires strong co-op selection & management
Value-Added Path36-150% margin improvement (cheese, yogurt, direct sales)5-7 year development; high marketing & business skill
Strategic ExitPreserve 85-90% of farm equityRequires proactive timing before major losses

Maximizing Cooperative Benefits

Cornell’s Dyson School research from 2023, led by agricultural economist Dr. Andrew Novakovic, demonstrates that well-managed cooperatives deliver 8-12% price premiums through collective bargaining compared to independent sales to investor-owned processors. For a 1,000-cow operation, this represents $200,000 to $300,000 in additional annual revenue.

The key lies in cooperative selection. Strong downstream market positioning and professional management make the difference. Cornell’s pricing analysis found some underperforming cooperatives actually paying 3.5% less than investor-owned processors, underscoring the importance of due diligence.

Value-Added Diversification

European research examining 265 dairy farm diversification efforts, published in the Agricultural Systems journal, found compelling margins: cheese production generated €0.688 per liter more than fluid milk, while yogurt generated €1.518 more. Direct sales improved margins by an average of 36%.

These numbers look attractive, but Ireland’s Nuffield scholarship research from Tom Dinneen provides important context: approximately 95% of dairy farmers lack the marketing and business skills needed for successful value-added transitions. The typical path to profitability takes 5-7 years—requiring substantial patience and capital reserves.

Strategic Transition Planning

A Wisconsin dairy case study: Strategic exit today preserves $765k versus $255k after forced liquidation—that’s $510,000 destroyed by waiting for market conditions that won’t improve for mid-sized operations

Wisconsin Extension’s 2024 farm financial analyses, compiled by agricultural economist Dr. Paul Mitchell, reveal the importance of timing. Producers making strategic exit decisions while maintaining strong equity positions typically preserve 85-90% of their farm’s value. Waiting 12-18 months reduces this to 70-80%. Those forced to exit after several years of losses might retain only 20-30% of their equity.

Extension specialists share examples of successful transitions. One documented case from southern Wisconsin involved a producer with $850,000 in equity who transitioned strategically, preserving over $700,000 for retirement and new ventures. These aren’t failure stories—they’re examples of astute business management in changing markets.

The Precision Fermentation Revolution

With $840 million invested in 2024 and price parity projected for 2027-2028, precision fermentation threatens to capture 25% of commodity dairy protein markets by 2035—while you’re planning 20-30 year infrastructure investments

While consolidation reshapes current production, precision fermentation represents a potentially transformative disruption. The Good Food Institute’s 2025 market analysis tracks growth from $5.02 billion currently toward projected valuations of $36.31 billion by 2030—representing 48.6% annual growth.

Companies like Perfect Day already produce commercial-scale whey and casein proteins identical to dairy-derived versions. Consumers are purchasing products containing these proteins—Brave Robot ice cream, California Performance Co. protein powders, and even Nestlé’s new plant-based cheese line using precision fermentation proteins—often without realizing the proteins come from fermentation rather than cows.

Investment tracking from PitchBook and Crunchbase shows over $840 million from major investors, including Bill Gates’ Breakthrough Energy Ventures, flowing into these technologies, with $50+ billion projected across the sector by 2030. Cost curves suggest price parity with conventional dairy proteins by 2027-2028, potentially capturing 25% of commodity protein markets by 2035.

This doesn’t spell immediate doom for traditional dairy, but when you’re planning infrastructure investments with 20-30 year depreciation schedules, these technology trends deserve serious evaluation. I’ve noticed that younger producers are particularly attuned to these disruption risks when making expansion decisions.

International Regulatory Pressures

European developments offer insights into potential regulatory futures—and they’re moving faster than many realize. The EU’s Farm to Fork Strategy targets 25% organic production by 2030, while nitrate directives and evolving welfare requirements fundamentally alter production economics.

The Netherlands allocated €25 billion for livestock farm buyouts near environmentally sensitive areas—a scale of intervention that would have seemed impossible just years ago. German regulations now require specific space allocations (6 square meters indoor plus 4.5 square meters outdoor per cow) for certain certifications, fundamentally changing the economics of the confinement system.

These aren’t just European issues. Similar discussions around environmental impact, animal welfare, and production intensity are emerging across North America. California’s evolving regulations often preview broader U.S. trends. Whether through regulation or market pressure, these factors will likely influence future production systems globally.

Envisioning 2035: A Transformed Industry

Based on IFCN projections, FAO’s 2024 agricultural outlook, and technology trends, the 2035 dairy landscape will likely differ dramatically from today. Current projections suggest that approximately 40% of global production will come from 300-500 industrial mega-dairies, concentrated in the U.S., China, and the Middle East. Another 35% would come from South Asian smallholders—primarily the millions of households in India and Pakistan that maintain 2-5 animals. Precision fermentation might capture 25% of commodity protein production, with less than 5% from premium niche operations serving specialty markets.

The “missing middle”—operations between 500-2,000 cows—faces the greatest pressure in this scenario, unable to achieve mega-dairy economies or premium market positioning. This isn’t predetermined, but current trends point strongly in this direction.

Practical Considerations for Today’s Decisions

Looking at all this data and these trends, what should producers consider?

For operations under 500 cows, differentiation becomes essential. Whether through premium market positioning, exceptional management within strong cooperatives, or direct marketing, competing in commodity markets against mega-dairies appears increasingly challenging. I’ve seen success with A2 milk premiums (30-50% price advantage), grass-fed certification (40-60% premiums), and local brand development—but each requires commitment beyond production alone.

Operations in the 500-2,000 cow range face time-sensitive decisions. The window for strategic transitions that preserve equity is narrowing—probably 12-18 months based on current market dynamics. Waiting for ideal conditions that may never materialize risks substantial equity erosion.

Those considering expansion should carefully evaluate whether achieving a 2,500+ cow scale is realistic given capital and management resources. Partial expansions that don’t achieve efficient scale often compound problems rather than solving them. I’ve watched too many 1,500-cow expansions create more debt without solving the fundamental economic problems.

Everyone should monitor precision fermentation developments. This technology will impact commodity markets within the decade, requiring strategic adaptation across the industry.

Key Takeaways 

  • The 82% productivity gap proves scale doesn’t guarantee success: Saudi Arabia’s desert dairies outperform China’s mega-farms—it’s management and technology integration, not cow count, that wins
  • Mid-sized farms (500-2,000 cows) have three options, not four: Scale to 2,500+, find a $300K premium niche, or exit strategically—”staying the course” is slow-motion bankruptcy
  • Your equity has an expiration date: Exit now, preserving 85%, wait 18 months for 70%, or lose 60-80% fighting the inevitable—the clock started when you opened this article
  • Lab-grown milk isn’t a future threat—it’s a current reality: $840M invested, identical proteins in stores now, price parity by 2027—plan infrastructure accordingly
  • Winners already chose their lane: 300 mega-dairies will dominate commodities, 2,000 niche farms will own premiums, everyone else disappears—which are you?

EXECUTIVE SUMMARY: 

  • China’s Modern Dairy runs 472,480 cows, while Silicon Valley grows identical milk proteins without cows—your 800-cow operation is caught between these extremes. Mid-sized farms (500-2,000 cows) now face $9.77/cwt cost disadvantages that excellent management cannot overcome, translating to nearly $1 million in annual structural penalties. Three proven escape routes remain: joining strong cooperatives for immediate 8-12% premiums, developing value-added products for 36-150% margin improvements, or executing strategic exits that preserve 85% of equity versus 20% after prolonged losses. With precision fermentation achieving price parity by 2027 and China eliminating import markets, the decision window has narrowed to 18 months. The industry will split into 300 mega-dairies, 2,000 premium niche operations, and precision fermentation facilities—the 15,000 farms in between will vanish.

Complete references and supporting documentation are available upon request by contacting the editorial team at editor@thebullvine.com.

Learn More:

The Sunday Read Dairy Professionals Don’t Skip.

Every week, thousands of producers, breeders, and industry insiders open Bullvine Weekly for genetics insights, market shifts, and profit strategies they won’t find anywhere else. One email. Five minutes. Smarter decisions all week.

NewsSubscribe
First
Last
Consent

Fonterra’s $500M Biotech Gamble: Blueprint for Future-Proofing Dairy or Expensive Science Experiment?

While North American dairies optimize feed ratios, Fonterra bets $500M that biotech will make traditional milk production obsolete by 2030.

EXECUTIVE SUMMARY: Most dairy producers dismiss methane-reducing feed additives as “too expensive” while missing the complete economic picture that could transform their operations. Fonterra’s systematic $500 million biotech investment reveals that FDA-approved Bovaer® delivers 30% methane reduction with potential $20+ annual returns per cow through carbon credits, plus 5-10% feed efficiency improvements. The uncomfortable truth: North American TMR systems provide a significant competitive advantage over New Zealand’s pastoral operations for biotech adoption, yet most producers approach precision fermentation and methane mitigation like optional upgrades rather than survival strategies. Research from dsm-firmenich’s Vivici joint venture demonstrates commercial-stage precision fermentation is generating revenue in specialty protein markets, while early carbon credit adopters establish baseline measurements and premium market positioning before competitors recognize the opportunity. Global dairy supply growth of 0.8% in 2025 combined with improved farmer margins creates optimal conditions for strategic biotech investment. Stop debating whether biotech will reshape dairy economics—evaluate which technologies align with your operation’s five-year strategic plan before competitors capture the compound advantages.

KEY TAKEAWAYS

  • Methane Reduction Delivers Immediate ROI: FDA-approved Bovaer® costs one tablespoon per cow daily but generates $20+ annually through carbon credits plus 5-10% feed conversion efficiency improvements—a 12-18 month break-even timeline that transforms waste into revenue streams.
  • TMR Systems Create Competitive Advantages: Unlike Fonterra’s pastoral challenges, North American Total Mixed Ration feeding systems enable precise delivery of methane additives that consistently achieve 30% emission reductions, positioning early adopters for premium market access and regulatory compliance.
  • Precision Fermentation Partnerships Require Zero Capital: Commercial-stage companies like Vivici convert low-value whey permeate ($0.02/lb) into high-value protein feedstock ($0.15-0.30/lb) through supply agreements rather than facility investments, creating new revenue from existing waste streams.
  • Technology Adoption Follows Predictable Economics: Fonterra’s tiered strategy proves biotech success depends on matching technology maturity with operational capacity—FDA-approved solutions offer immediate implementation while commercial partnerships provide medium-term diversification without massive capital commitments.
  • Early Movers Capture Compound Benefits: Carbon credit establishment, premium market positioning, and regulatory influence advantages compound over time, making delayed biotech evaluation more expensive than strategic implementation based on verified ROI calculations and proven technology pathways.
 dairy biotechnology, methane reduction dairy, precision fermentation, dairy farm profitability, TMR feeding systems

While North American dairies optimize feed conversion ratios and chase SCC targets below 200,000, New Zealand’s dairy giant is betting hundreds of millions that biotechnology will fundamentally reshape competitive advantage by 2030. Their systematic strategy reveals a roadmap that could make traditional production metrics obsolete—or create agriculture’s most expensive miscalculation.

The Uncomfortable Truth About Dairy’s Technology Revolution

Here’s what most dairy executives won’t admit: while you’re perfecting transition cow protocols and optimizing for 85-pound daily milk yields, Fonterra is building an entirely different business model. They’re not just investing in incremental improvements to boost butterfat from 3.6% to 3.8%—they’re systematically preparing for the possibility that everything we know about dairy production economics is about to change.

Think of it this way: It’s like perfecting your double-8 herringbone parlor while someone else is building robotic milking systems that make parlors obsolete. Fonterra’s Ki Tua fund evaluates over 100 companies monthly but maintains a highly selective portfolio of just 10 investments, representing the dairy industry’s most systematic attempt to future-proof against regulatory, environmental, and competitive pressures.

The problem? Most North American operations approach biotech like upgrading from 2x to 3x milking—a nice-to-have rather than a survival strategy. The stakes? Early biotech adopters could capture 15-25% cost advantages while accessing premium markets that traditional operations can’t touch. The solution? A systematic framework for evaluating biotech investments based on what Fonterra’s massive commitment reveals about dairy’s economic future.

Challenging the “Methane Additives Are Too Expensive” Myth

Why This Matters for Your Operation: The Real Economics Behind Bovaer®

Here’s where conventional wisdom gets dangerous: Most producers dismiss methane-reducing additives as “too expensive” without understanding the complete economic picture. The FDA completed its comprehensive, multi-year review of Bovaer® (3-NOP) in May 2024, determining the product meets safety and efficacy requirements for use in lactating dairy cattle.

Fonterra’s methane mitigation strategy demonstrates a critical insight North American producers are missing. Fonterra’s trials with various methane-reducing solutions revealed that Bovaer® is “currently better suited to non-pastoral farming systems not used in New Zealand”, highlighting the advantage North American TMR systems have for biotech adoption.

The economic reality for TMR operations is compelling:

Translation for your 1,000-cow operation: The controlled feeding environment that Fonterra lacks but most North American dairies possess creates a significant competitive advantage for biotech adoption. Academic research confirms that 3-nitrooxypropanol consistently decreases enteric methane production by 30% on average across multiple studies.

The Precision Fermentation Reality: Beyond Laboratory Hype

Fonterra’s €32.5 Million Validation of Commercial Viability

Let’s examine what Fonterra’s actual investments reveal about precision fermentation economics. Vivici, their joint venture with dsm-firmenich, secured €32.5 million in Series A funding led by APG on behalf of ABP, one of the largest pension funds in the world.

This isn’t science fiction—it’s generating revenue. Vivici’s isolated whey protein Vivitein BLG is the first ingredient launched under the company’s Vivitein protein platform, targeting consumers in the active nutrition category valued globally at US$28.4 billion in 2023 with 8.5% growth.

The circular economy opportunity is real: Fonterra has signed a multi-year joint development agreement with biomass fermentation startup Superbrewed Food to explore using lactose permeate, a byproduct of milk protein production, as feedstock for Superbrewed Food’s microorganisms. This transforms waste streams into valuable protein ingredients, directly enhancing returns to the traditional milk pool.

For your operation: This isn’t about replacing milk production—it’s creating new revenue streams from existing infrastructure through strategic partnerships rather than capital investment. Superbrewed Food has achieved FDA approval for its postbiotic cultured protein and has secured manufacturing partnerships.

Global Competitive Analysis: How Dairy Leaders Navigate Biotech Investment

Understanding how global competitors approach biotech reveals multiple pathways for different operation sizes and risk tolerances. Based on verified industry analysis, the strategic differences are telling:

The Strategic Divide: Enhancement vs. Transformation

Fonterra’s systematic “Enhance and Hedge” strategy contrasts sharply with competitors’ approaches:

CompanyInvestment ModelKey FocusStrategic ArchetypeVerified Investments
FonterraDual venture arms (Ki Tua, NSS)Precision fermentation, methane reductionEnhance & HedgeVivici (€32.5M), Superbrewed partnership
Arla FoodsInternal R&D centersAdvanced protein fractionationValue MaximizerLacprodan® BLG-100, Bovaer® trials
DFACoLAB Accelerator programEcosystem developmentEcosystem BuilderAg-tech startup mentoring
SaputoOperational efficiency focusNon-GMO product linesPragmatic OperatorMarket-driven approach

The lesson from this analysis: Fonterra’s approach represents the most ambitious biotech strategy among global dairy leaders, with its two distinct investment vehicles allowing both high-risk exploration and commercial scaling.

Technology Implementation Framework: Your Biotech Investment Roadmap

Based on verified industry developments and FDA approvals, here’s a practical framework for evaluating biotech investments.

Tier 1: Implement Now (FDA-Approved Technologies)

Methane-Reducing Feed Additives for TMR Systems

Advanced Genomic Selection Programs

  • Technology status: FDA issued “low-risk determination” for genome-edited cattle with slick hair coat in March 2022
  • Performance benefits: Improved heat tolerance through naturally occurring genetic traits
  • Implementation timeline: Immediate through conventional breeding programs

Tier 2: Pilot & Evaluate (Commercially Available)

Precision Fermentation Partnerships

Enhanced Environmental Technologies

Economic Impact Analysis: Verified Industry Data

Current Market Context: Real Implementation Results

Early adoption data provides concrete evidence of economic viability: Alberta dairy farms implementing methane-reducing feed additives have reported emission reductions of up to 30%, with regulatory-approved feed technology decreasing a dairy farm’s carbon footprint by approximately 25% within one year.

The economic benefits extend beyond emissions: Some additives have shown improved feed utilization, potentially reducing feed costs, while carbon markets and government incentives create new revenue streams.

Methane Reduction: The Immediate Economic Opportunity

Based on FDA-approved Bovaer® data and real-world implementation:

The competitive positioning advantage: Elanco anticipates Bovaer will generate over $200 million in revenue from the US market, indicating substantial adoption potential.

The Consumer Reality: Addressing Market Acceptance Challenges

Understanding the Bovaer® Consumer Response

Recent consumer research reveals important insights for implementation strategy: A comprehensive analysis of consumer responses to Bovaer® introduction in Europe identified four key narrative patterns: mainstream media influence, distrust in science, conspiracy theories, and consumer market responses.

The strategic implication: Organizations adopting technological solutions need to understand factors that trigger, amplify and attenuate social concern and adopt appropriate communication strategies to reduce misinformation circulation.

For North American producers: Proactive, transparent communication about feed additives will be essential for market acceptance and premium positioning.

The Bottom Line: Your Strategic Decision Framework

Fonterra’s systematic biotech investment validates that dairy biotechnology has moved from experimental to essential for competitive advantage. Their comprehensive strategy, managed through the Ki Tua fund and Nutrition Science Solutions arm, demonstrates disciplined portfolio management with strategic positioning.

Key Takeaways for Strategic Decision-Making

Technology maturity levels dictate implementation priorities. FDA-approved Bovaer® offers immediate implementation opportunities for TMR operations, while commercial-stage precision fermentation provides partnership opportunities without capital investment.

Market positioning advantages compound over time. Early adopters of methane reduction technologies will establish baseline measurements, verification protocols, and market relationships before competitors recognize the opportunity.

Consumer communication strategies are critical. Recent consumer research demonstrates the importance of appropriate communication to reduce misinformation and promote understanding.

Your Biotech Readiness Assessment

Use this framework to evaluate which technologies align with your operation’s capabilities:

  1. Assess TMR system compatibility: Evaluate current mixing systems for methane additive integration
  2. Identify partnership opportunities: Explore byproduct valorization with fermentation companies
  3. Establish baseline measurements: Begin data collection for carbon credit verification
  4. Monitor regulatory developments: Stay informed about carbon credit programs and environmental regulations
  5. Develop communication strategy: Prepare transparent messaging about technology adoption

The Strategic Questions You Must Answer

Are you positioned to implement FDA-approved methane reduction technologies in your TMR system?

Can your operation supply byproduct streams to precision fermentation partnerships?

Do you have the data infrastructure to verify and monetize environmental improvements?

Is your communication strategy prepared to address consumer concerns about feed additives?

The biotech revolution in dairy isn’t approaching—it’s here. FDA approval of Bovaer® and Fonterra’s €32.5 million investment in Vivici prove the commercial viability of technologies that seemed experimental just years ago. The question isn’t whether biotech will transform dairy economics—it’s whether your operation will lead the transformation or be disrupted by it.

Your competitive advantage depends on making that decision today, not when your competitors have already captured the benefits.

This analysis is based on verified information from FDA regulatory approvals, peer-reviewed research, and official company announcements as of June 2025. All performance claims and technology specifications have been verified through original source documentation and independent research studies.

Complete references and supporting documentation are available upon request by contacting the editorial team at editor@thebullvine.com.

Learn More:

The Sunday Read Dairy Professionals Don’t Skip.

Every week, thousands of producers, breeders, and industry insiders open Bullvine Weekly for genetics insights, market shifts, and profit strategies they won’t find anywhere else. One email. Five minutes. Smarter decisions all week.

NewsSubscribe
First
Last
Consent
Send this to a friend