39% of U.S. dairies gone in 5 years. Milk production? Still up. The survivors picked a lane. Have you?
Executive Summary: Over the last census period, nearly 40% of U.S. dairies with milk sales disappeared, even as national cow numbers and total milk production held steady – a clear sign that milk has consolidated into fewer, larger herds. The numbers now show that roughly 2,000 farms milking 1,000 cows or more produce close to two‑thirds of U.S. milk and often enjoy cost advantages of up to about $10/cwt over 100‑ to 199‑cow herds, while many smaller herds stay profitable by squeezing more milk solids, labour efficiency, and cow longevity out of every stall. Against that backdrop, the article lays out three realistic “survival lanes” – scale with discipline, an efficiency sweet spot for 150‑ to 800‑cow herds, and niche/value‑added models – and illustrates each with concrete examples from a New York tie‑stall, a Wisconsin freestall, and a New Mexico dry lot. It then dives into genetics and technology as profit levers, showing how DWP$‑driven selection can add $1,000–$1,500 lifetime income over feed cost per top‑quartile cow, and how AMS, collars, sort gates, and feed pushers can either strengthen or weaken margins depending on milk lift, labour changes, and interest costs. Labour and sustainability pressures are treated as hard economics rather than buzzwords, tying turnover, welfare metrics, and Net Zero goals back to cost per cwt and processor relationships. The piece finishes with five direct questions owners can use at the kitchen table to decide which lane they’re really in, which investments to prioritize, and where “doing nothing” might actually be the riskiest move of all.
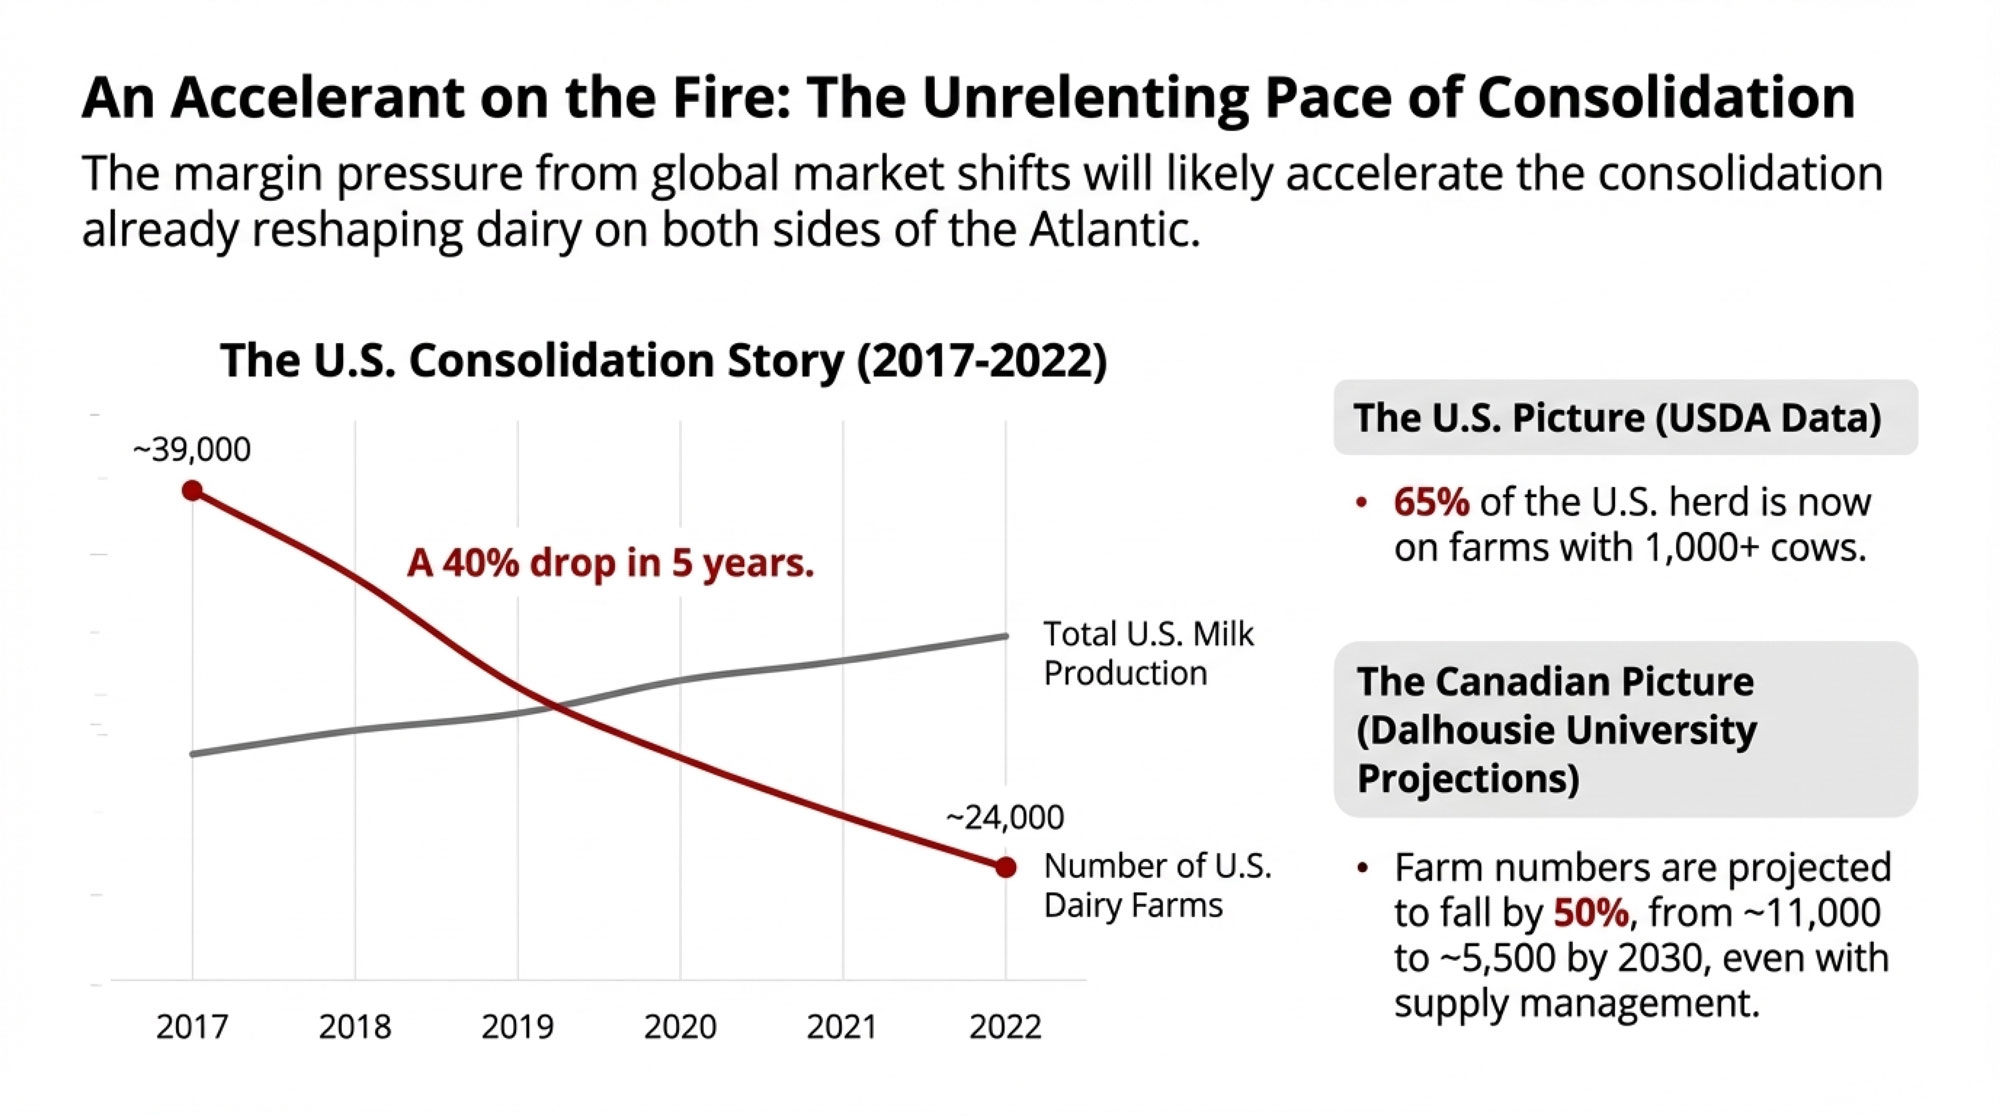
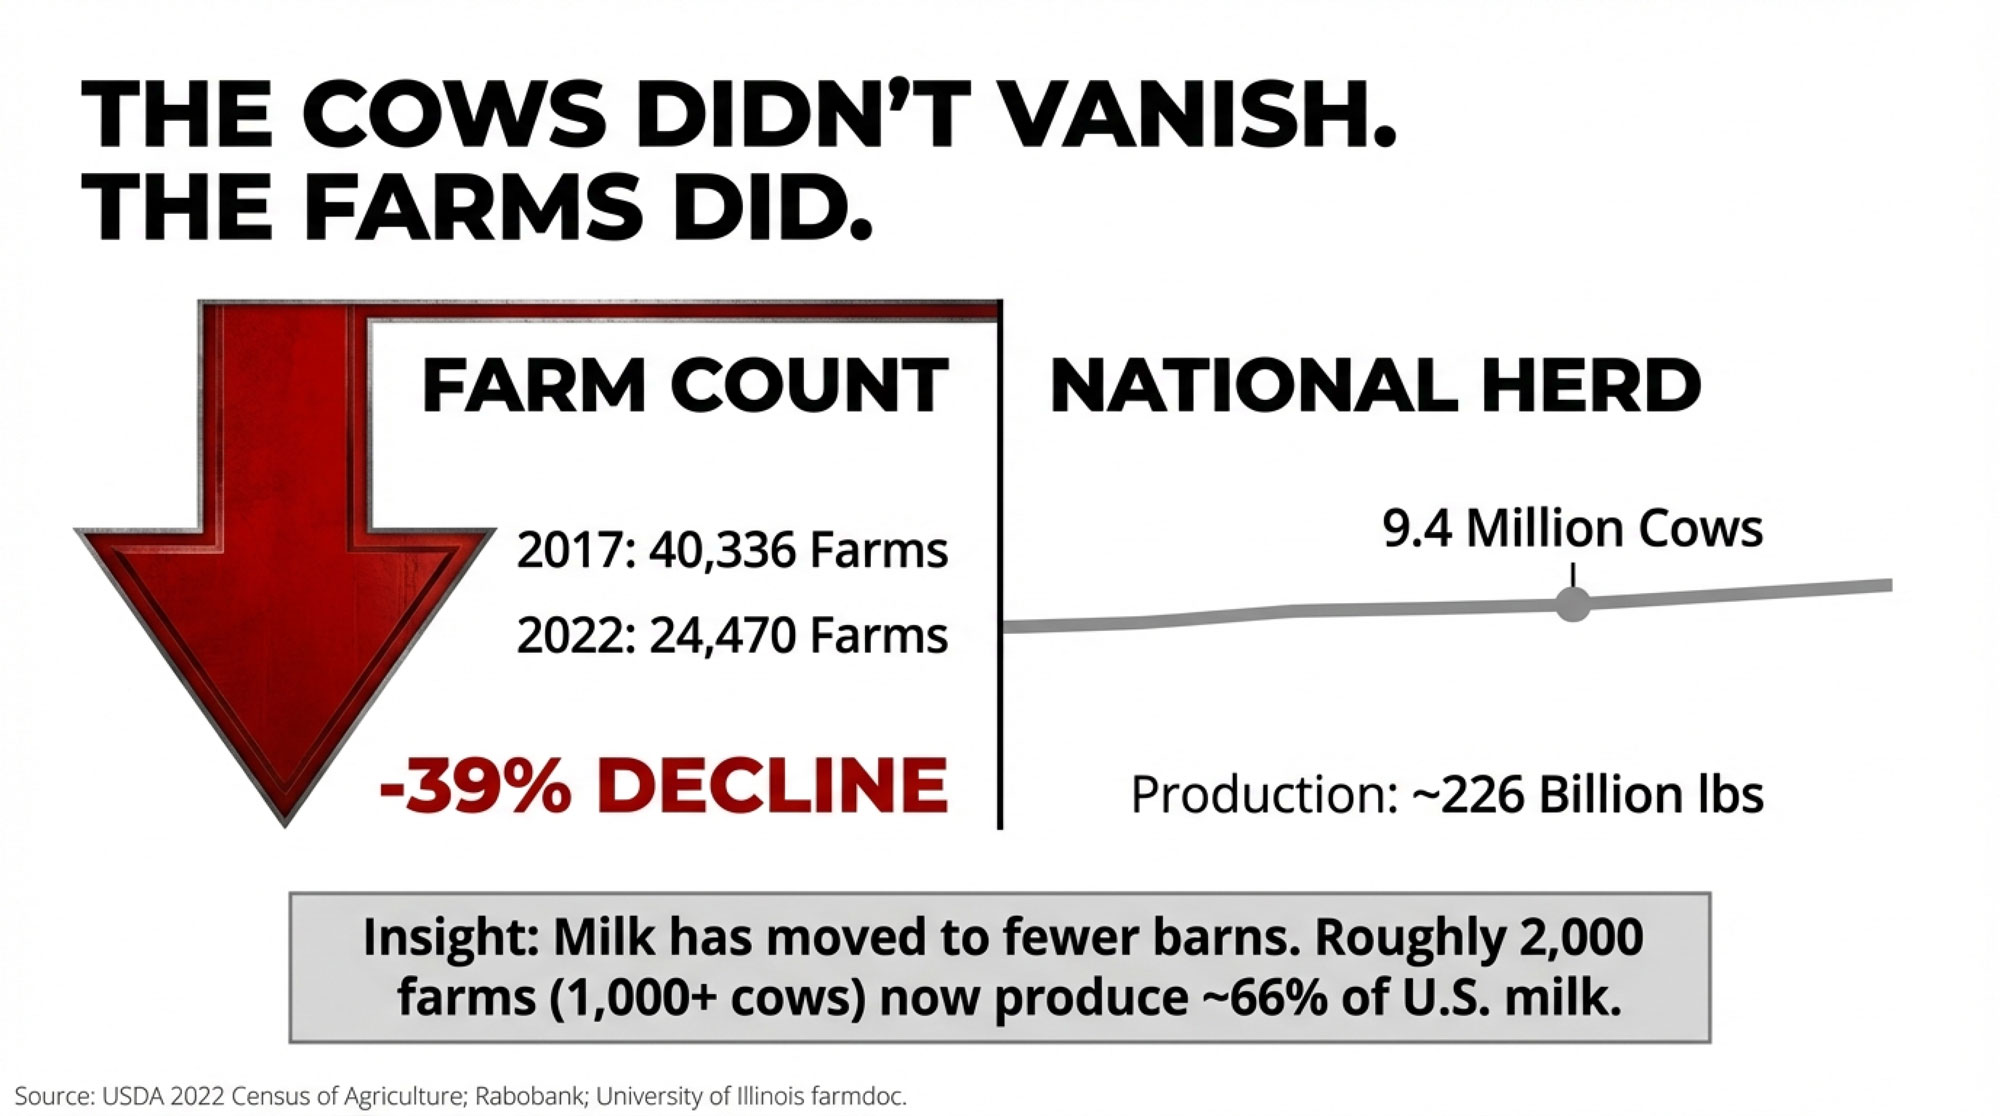
You know, in the time it took you to raise your current group of two‑year‑olds, almost four out of ten U.S. dairy farms disappeared. That’s not just coffee‑shop talk. USDA’s 2022 Census of Agriculture shows that farms with sales of milk from cows dropped from 40,336 in 2017 to 24,470 in 2022 – a 39% decline – while the national milking herd stayed close to 9.4 million cows and total milk production held in the mid‑220‑billion‑pound range in USDA and industry summaries.
So the cows didn’t vanish. The milk didn’t vanish. It just moved to fewer barns.
| Metric | 2017 | 2022 | % Change |
|---|---|---|---|
| Dairy Farms (000s) | 40.3 | 24.5 | −39% |
| Milking Cows (millions) | 9.4 | 9.4 | 0% |
| Milk Production (bn lbs) | 215 | 220 | +2.3% |
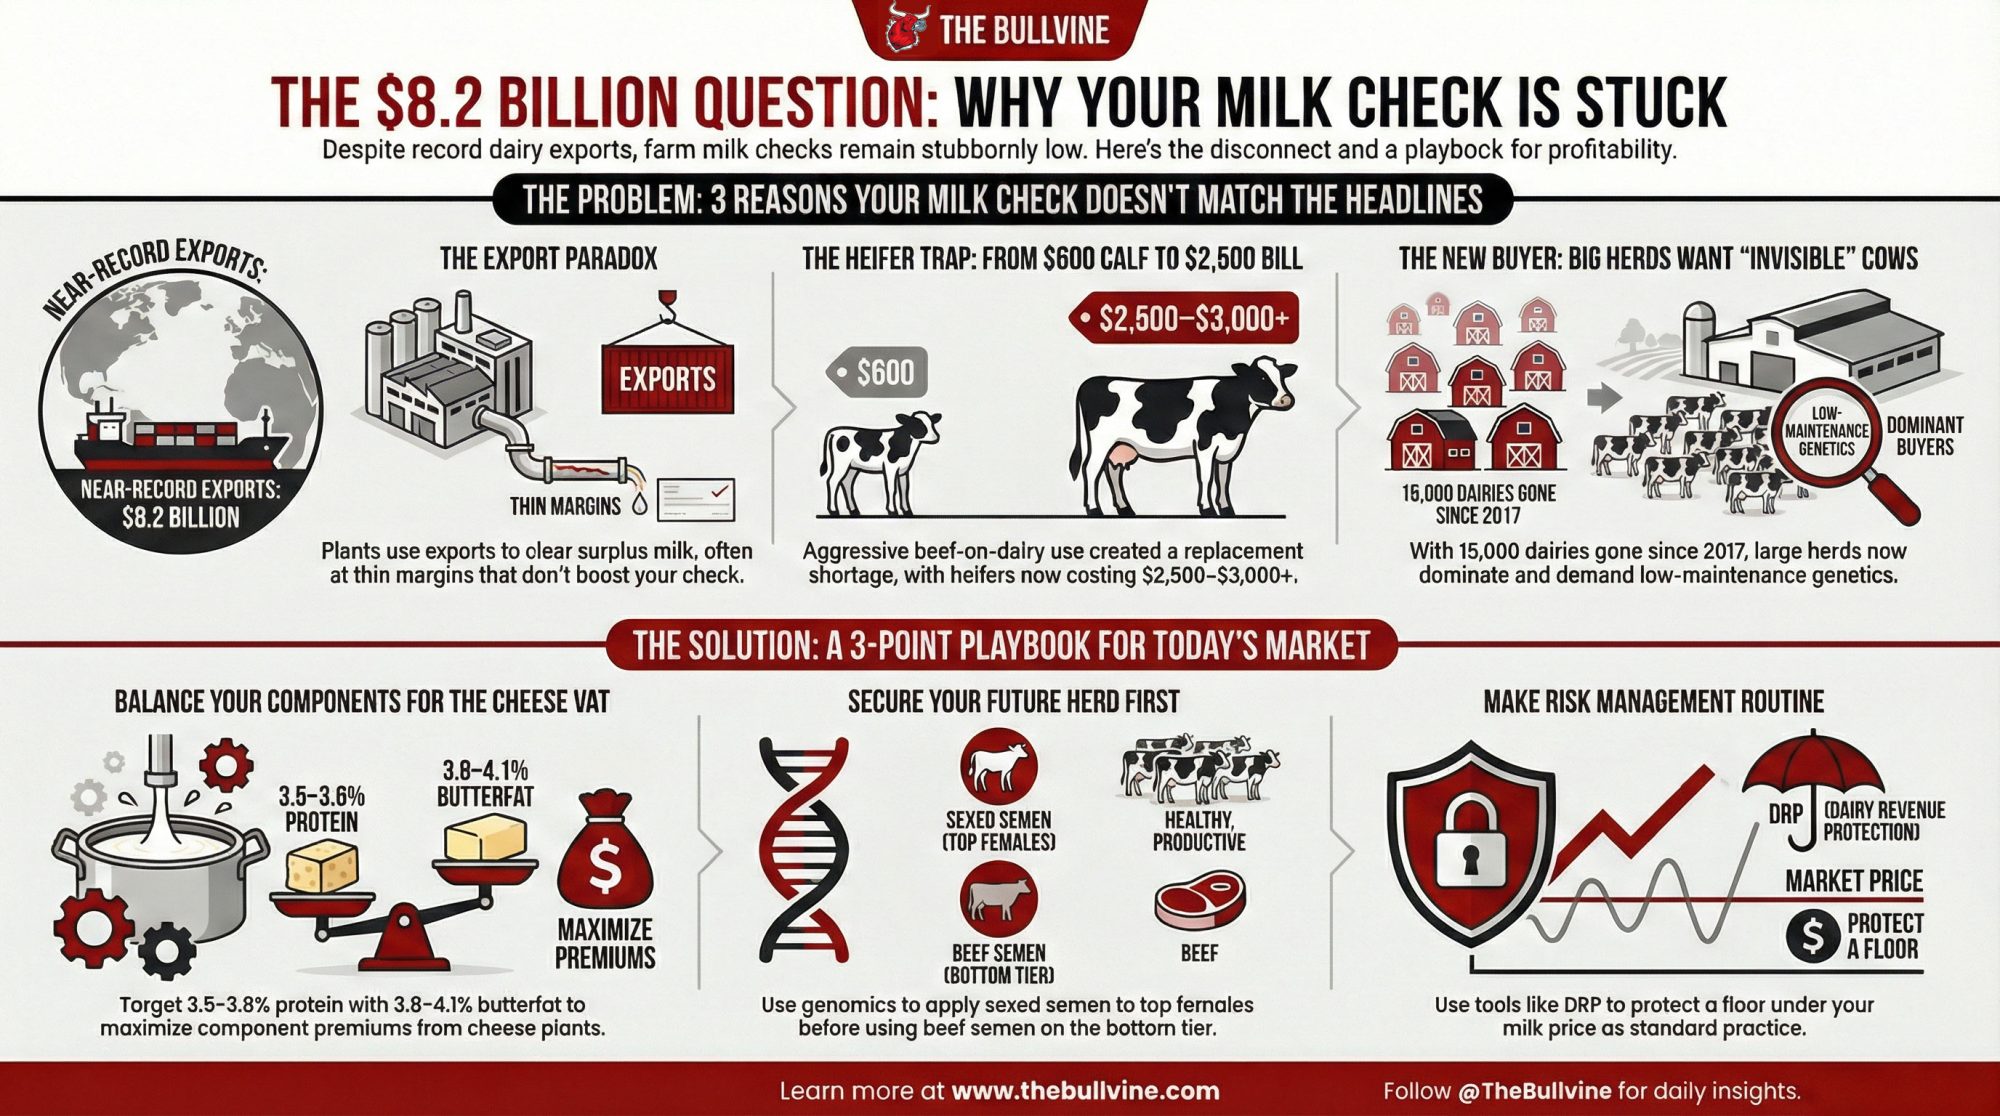
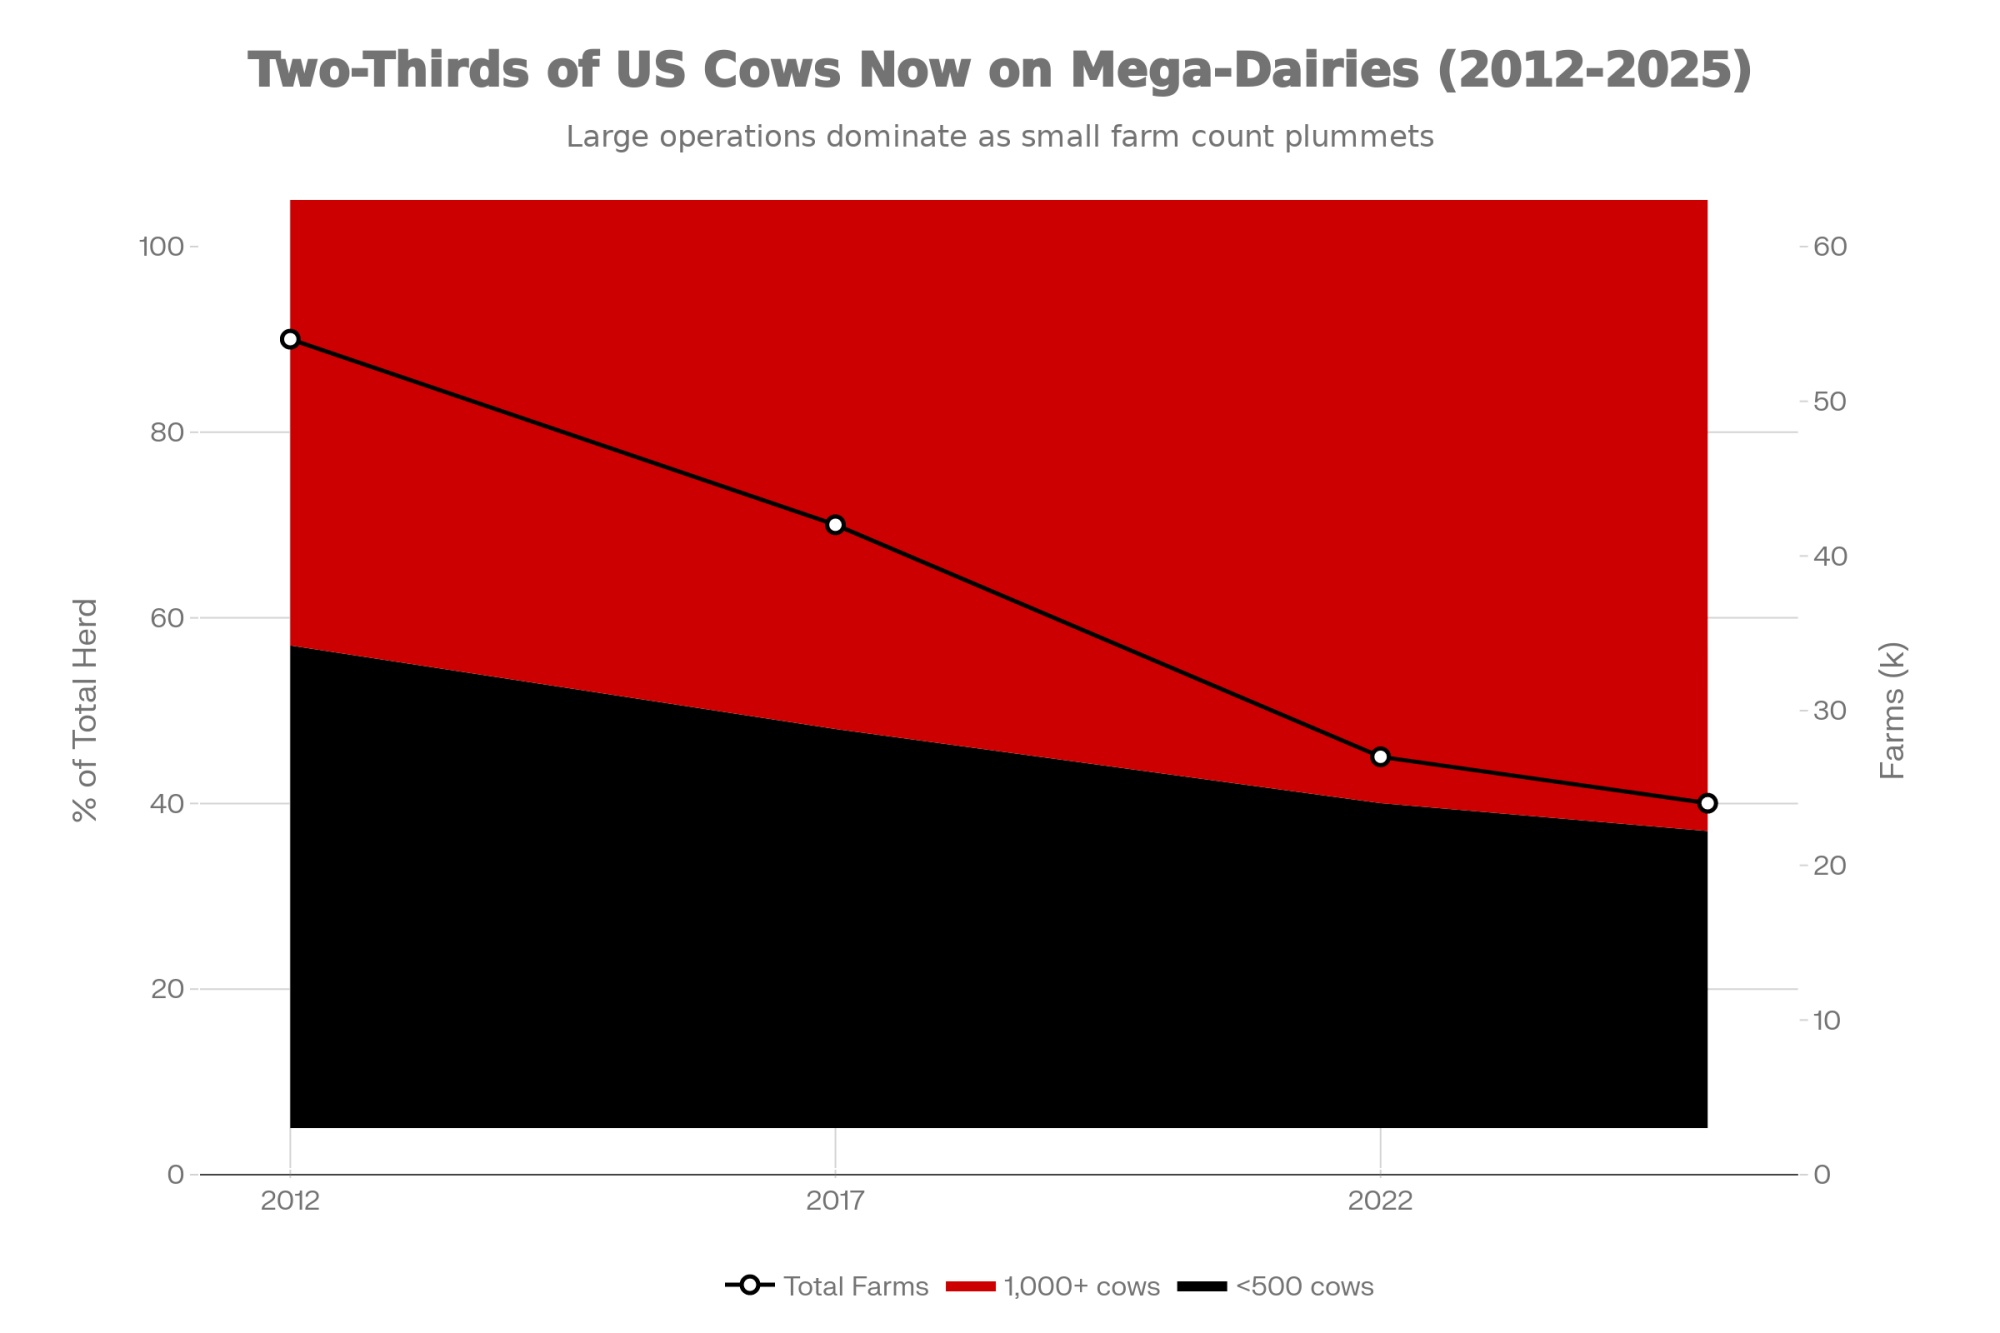
Looking at this trend, farmers are finding that the industry’s structure has quietly shifted under their feet. USDA economists, Rabobank analysts, and a detailed 2024 review from the University of Illinois farmdoc team all point out that a relatively small group of large herds – those with 1,000 cows or more – now produce roughly two‑thirds of U.S. milk by value. That farmdoc piece breaks it down very clearly: only about 2,013 farms in the 1,000‑plus‑cow category accounted for around 66% of U.S. milk sales in 2022. Dairy industry coverage of the same data has gone further, noting that roughly 65% of the nation’s dairy cows now live on farms with 1,000 cows or more.
| Herd Size | Farm Count | % of Farms | % of Milk | Visualization |
|---|---|---|---|---|
| 1,000+ cows | 2,013 | ~8.2% | 66% | Large, red-bordered segment |
| 500–999 cows | ~1,800 | ~7.4% | ~18% | Medium grey segment |
| 250–499 cows | ~3,500 | ~14.3% | ~10% | Smaller segment |
| 50–249 cows | ~16,000 | ~65% | ~6% | Remaining sliver |
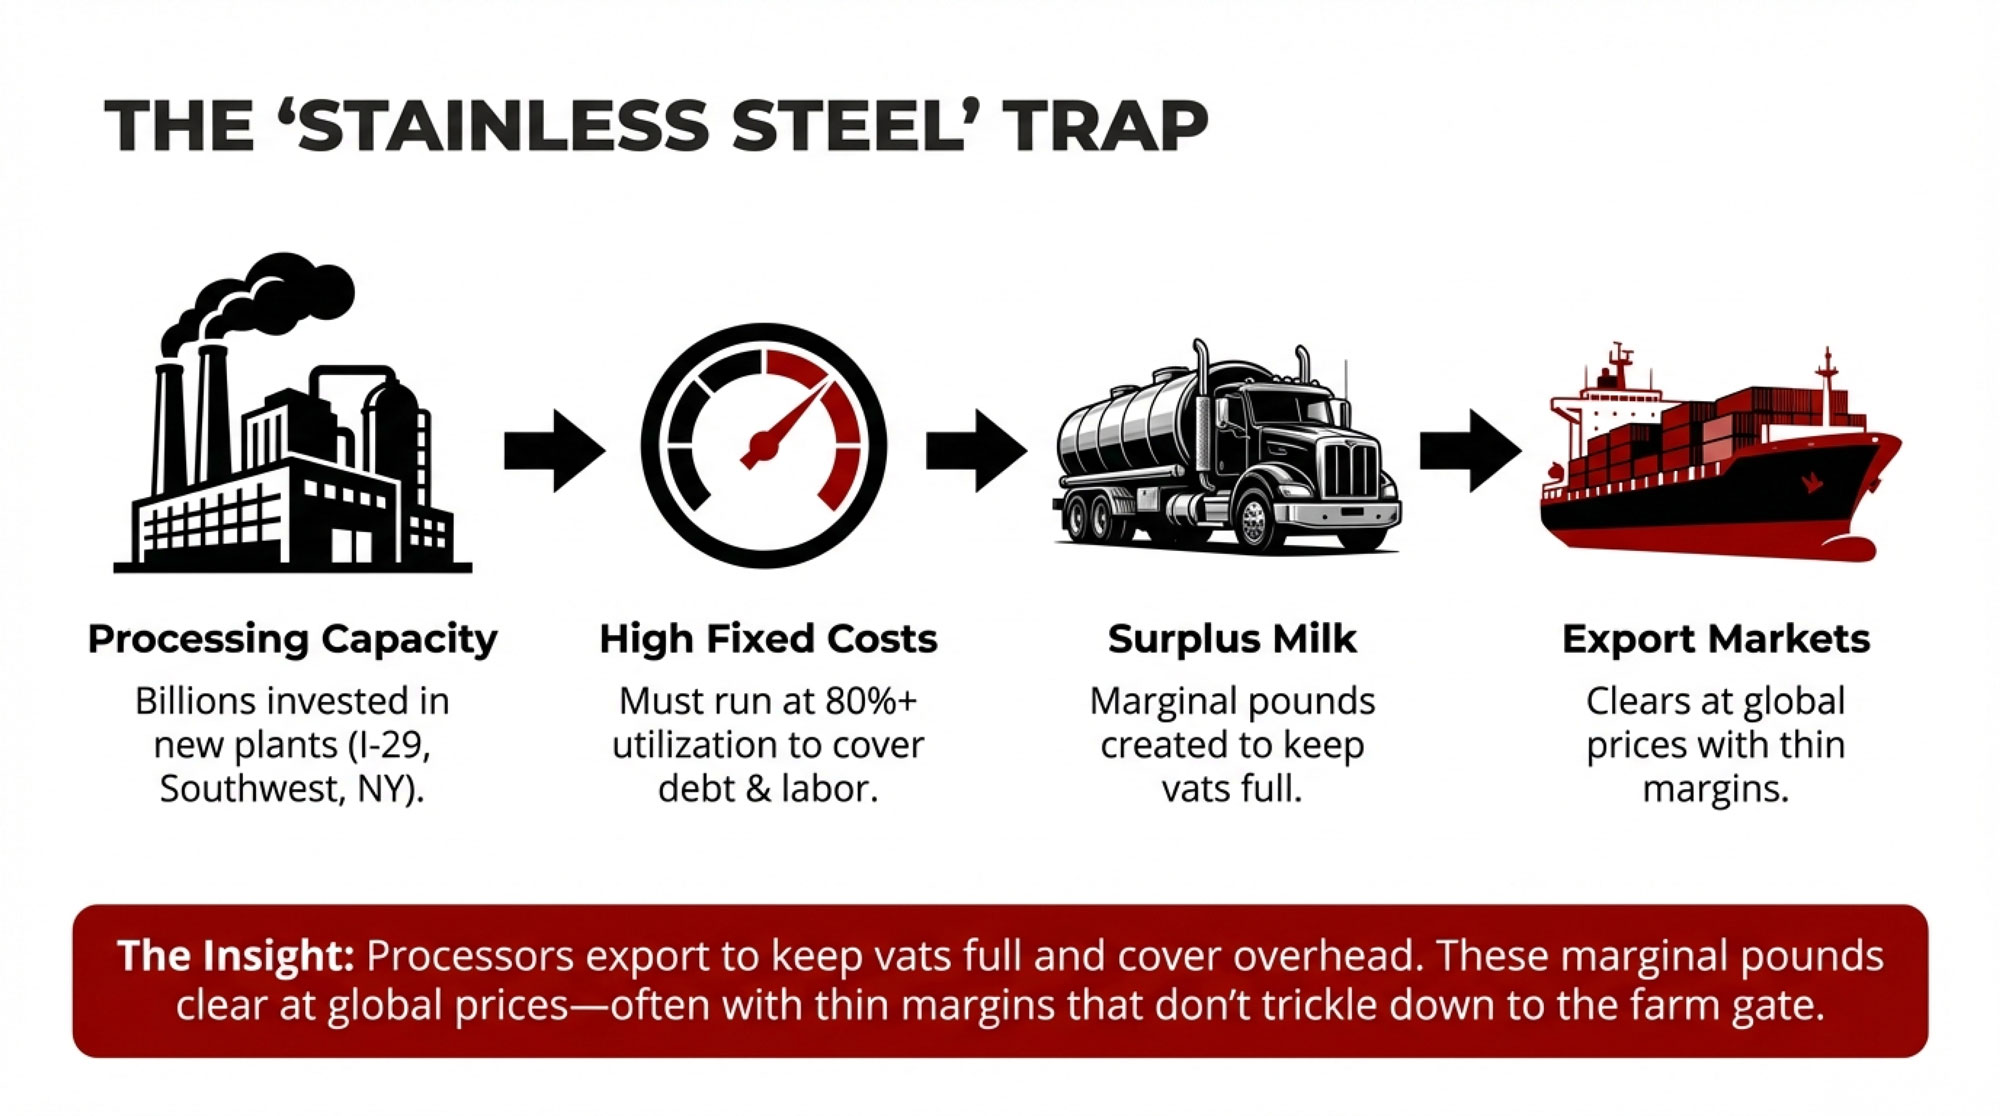
Here’s what’s interesting: while farm numbers are falling, consumer demand for dairy hasn’t collapsed. USDA per‑capita use data, summarized by industry outlets, show Americans now drink roughly 120‑plus pounds of fluid milk per person per year – that part’s been sliding for decades – but cheese consumption has climbed into the low‑40‑pound range per person, and butter use has pushed above six pounds per person, around modern‑era record levels. People haven’t walked away from dairy; they’ve just walked over to cheese, butter, and ingredients.
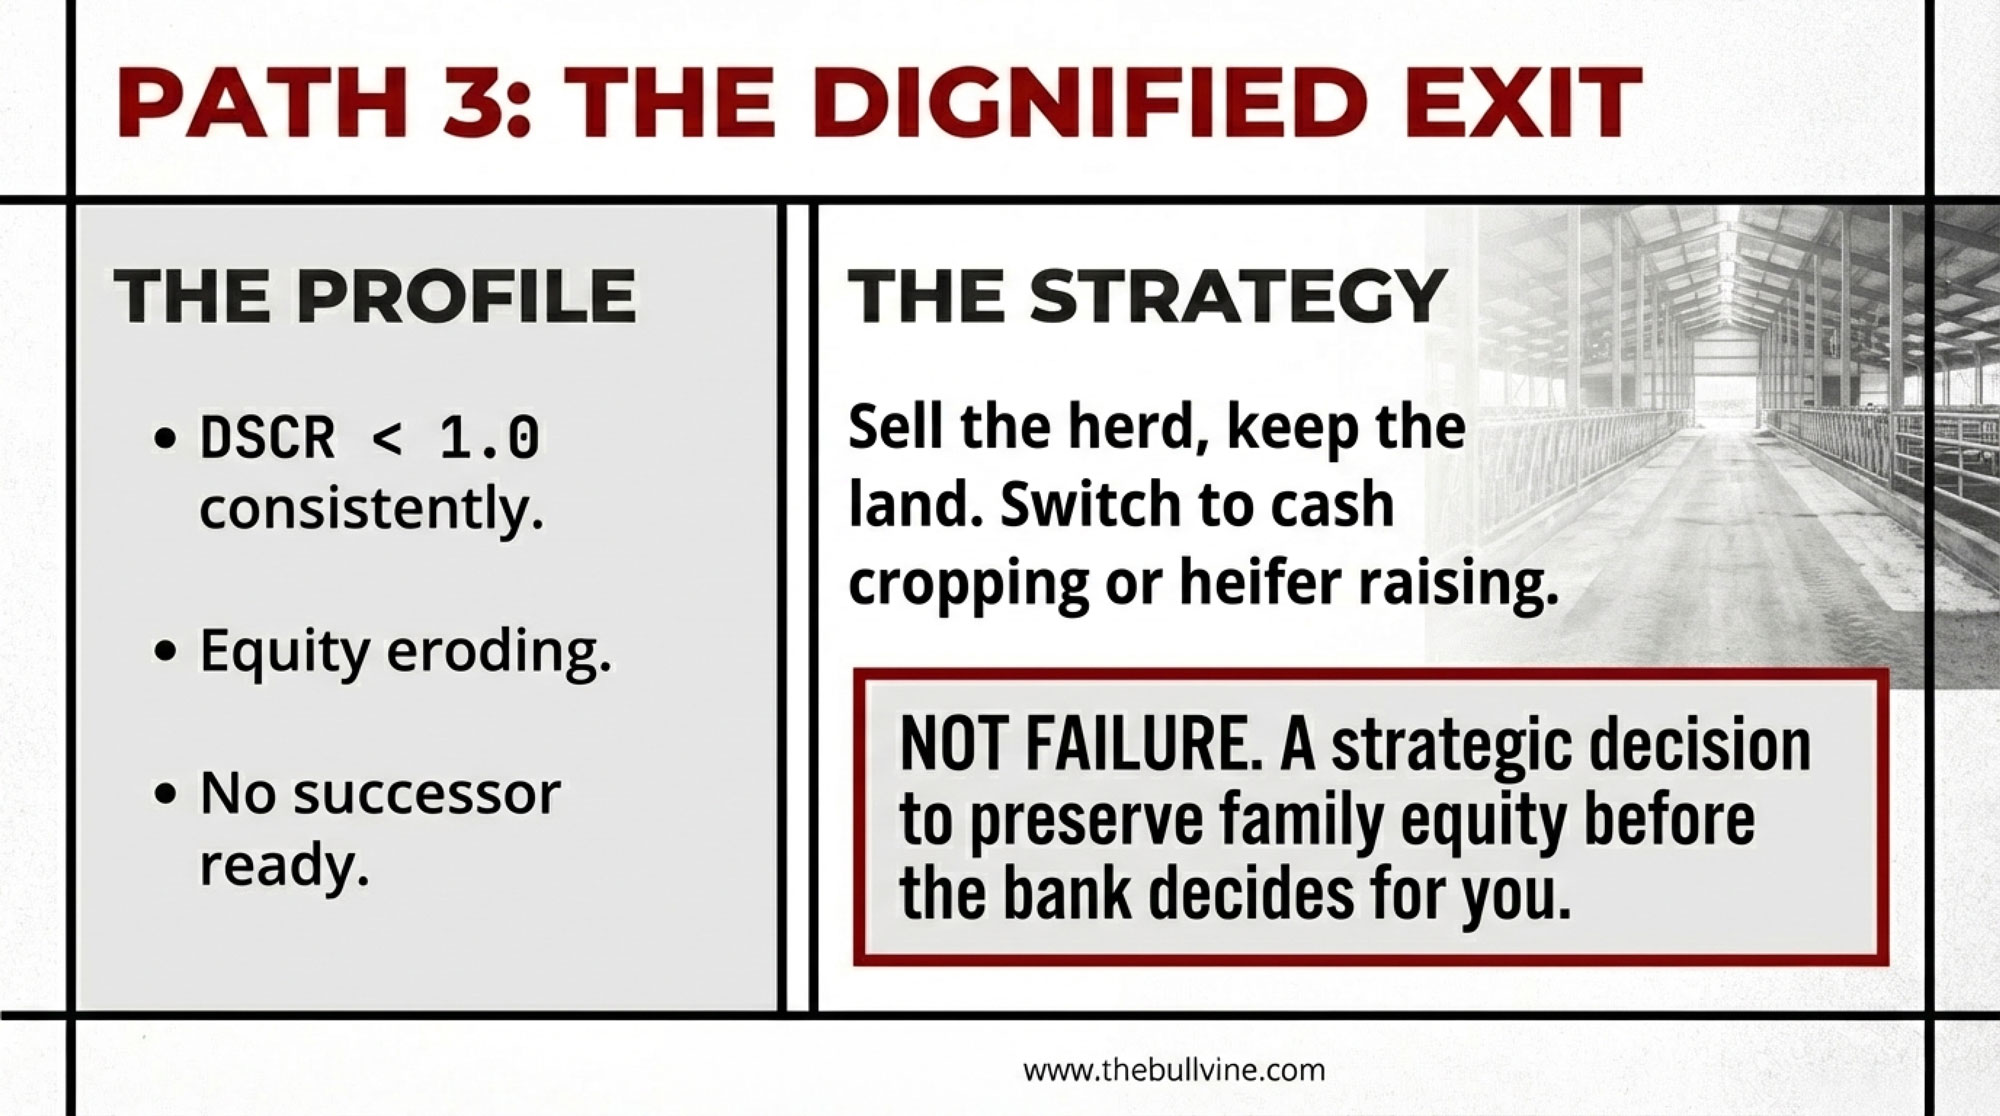
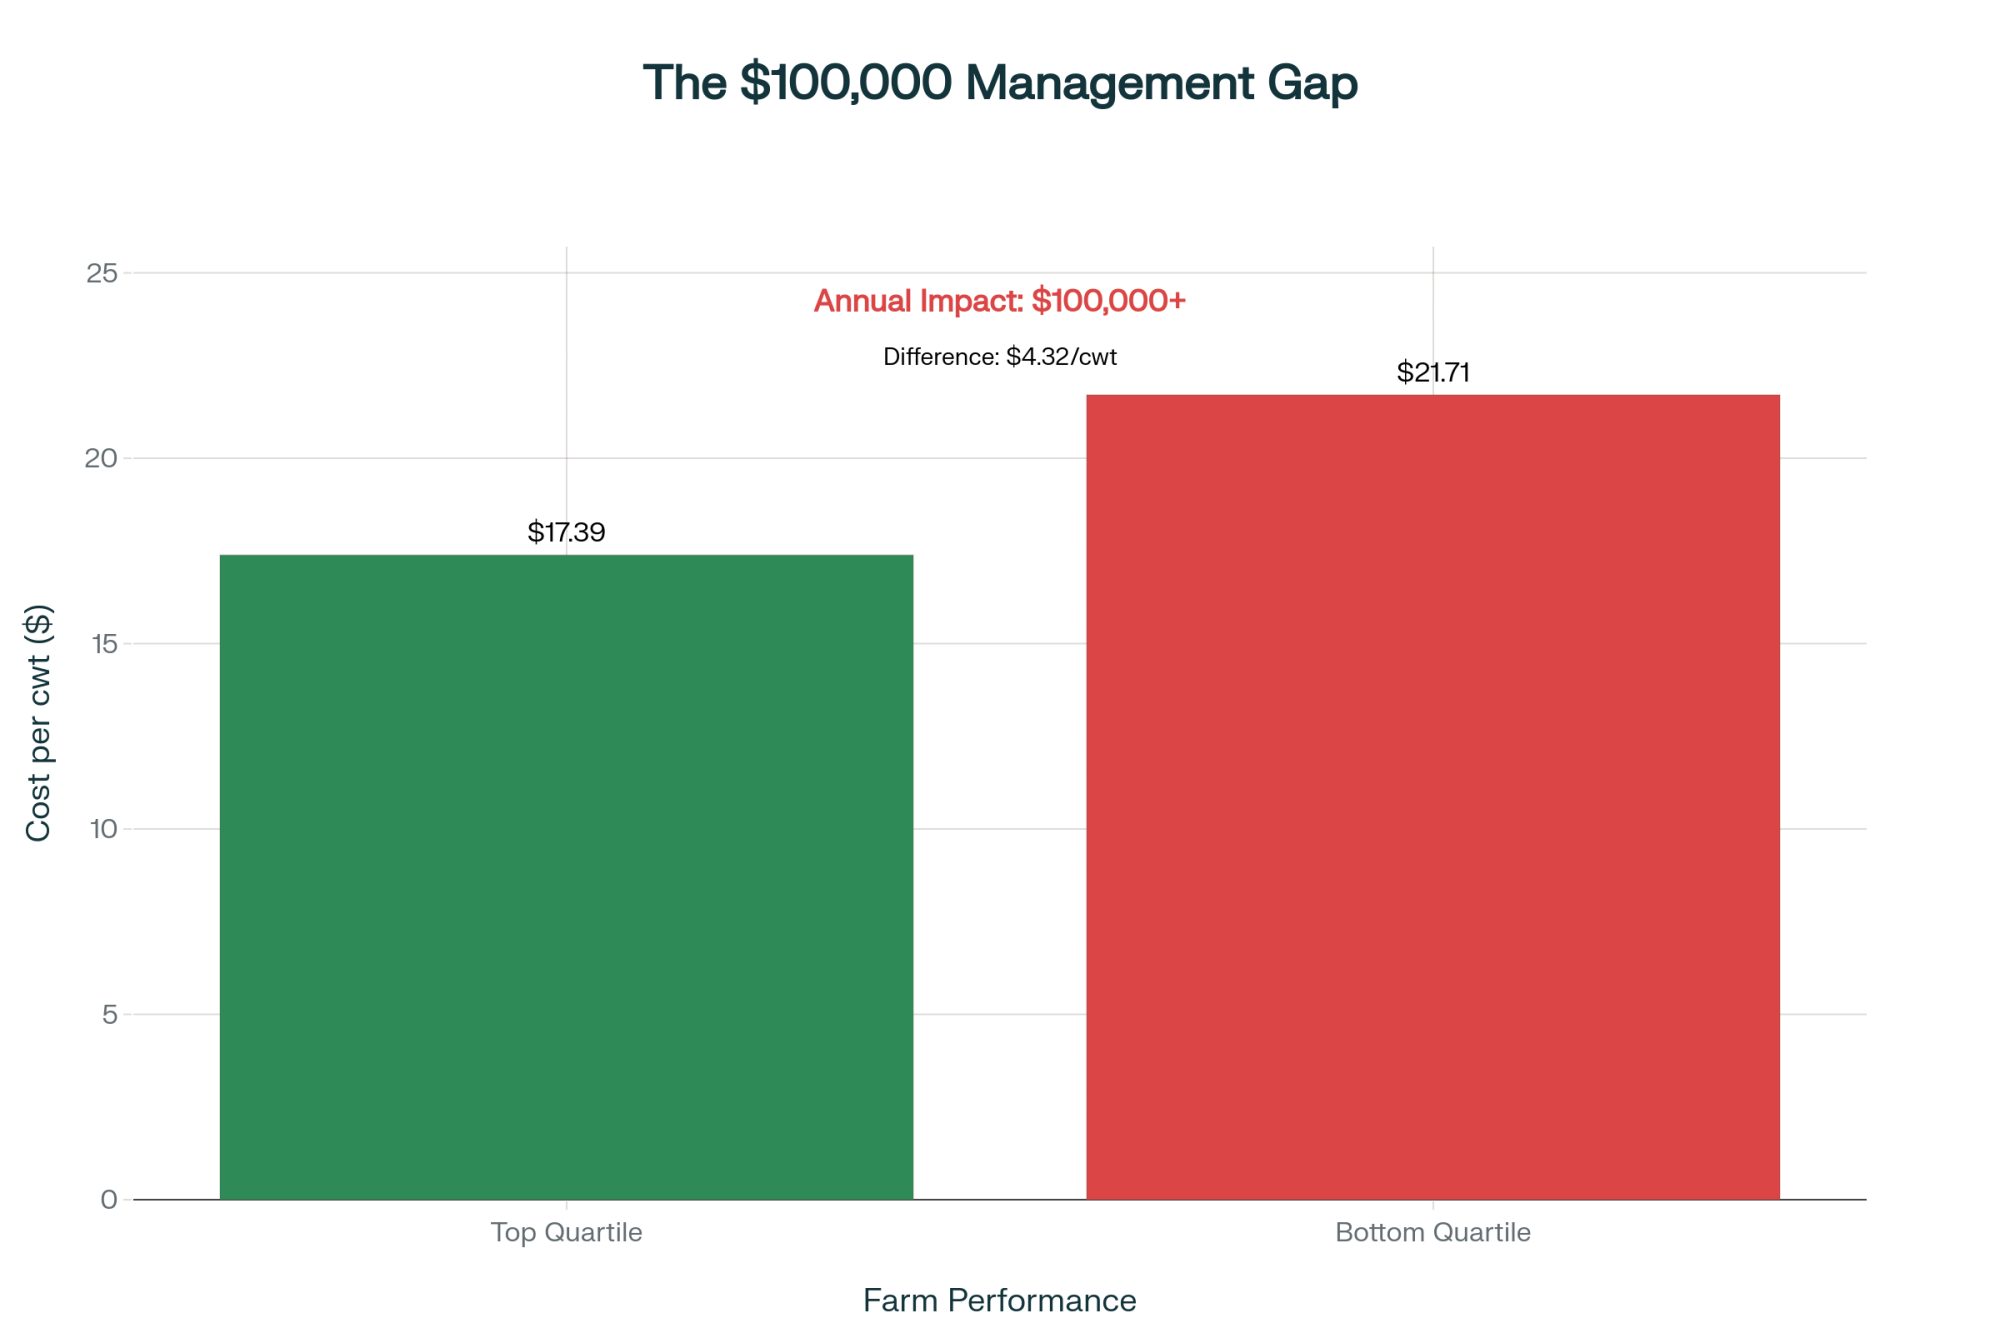
When you dig into profitability work from groups like the Kansas Farm Management Association and international dairy efficiency studies, a pattern pops out. High‑profit and low‑profit herds in the same region often receive very similar milk prices. The spread shows up in feed efficiency, butterfat performance, labour cost per hundredweight, fresh cow management in the transition period, and how effectively barns, parlours, robots, and people are actually used.
And over the last couple of years, with interest rates higher and feed and fertilizer bouncing around, those efficiency gaps have hurt. Coverage in 2023–2024 margins has highlighted how many herds – especially in higher‑cost western regions – have seen their total cost per cwt push toward or above the milk price, with some large western herds facing total costs in the $20–$21/cwt band while milk prices weren’t far above that. The room for error has gotten pretty thin.
Taken together, this development suggests something many of us already feel: the system today rewards margin per cwt and solids, not just volume, and certainly not just the fact that we’re milking cows.
That’s where this idea of “survival lanes” actually helps make sense of things.
Looking at This Trend: Three Survival Lanes Most Farms Are Already In
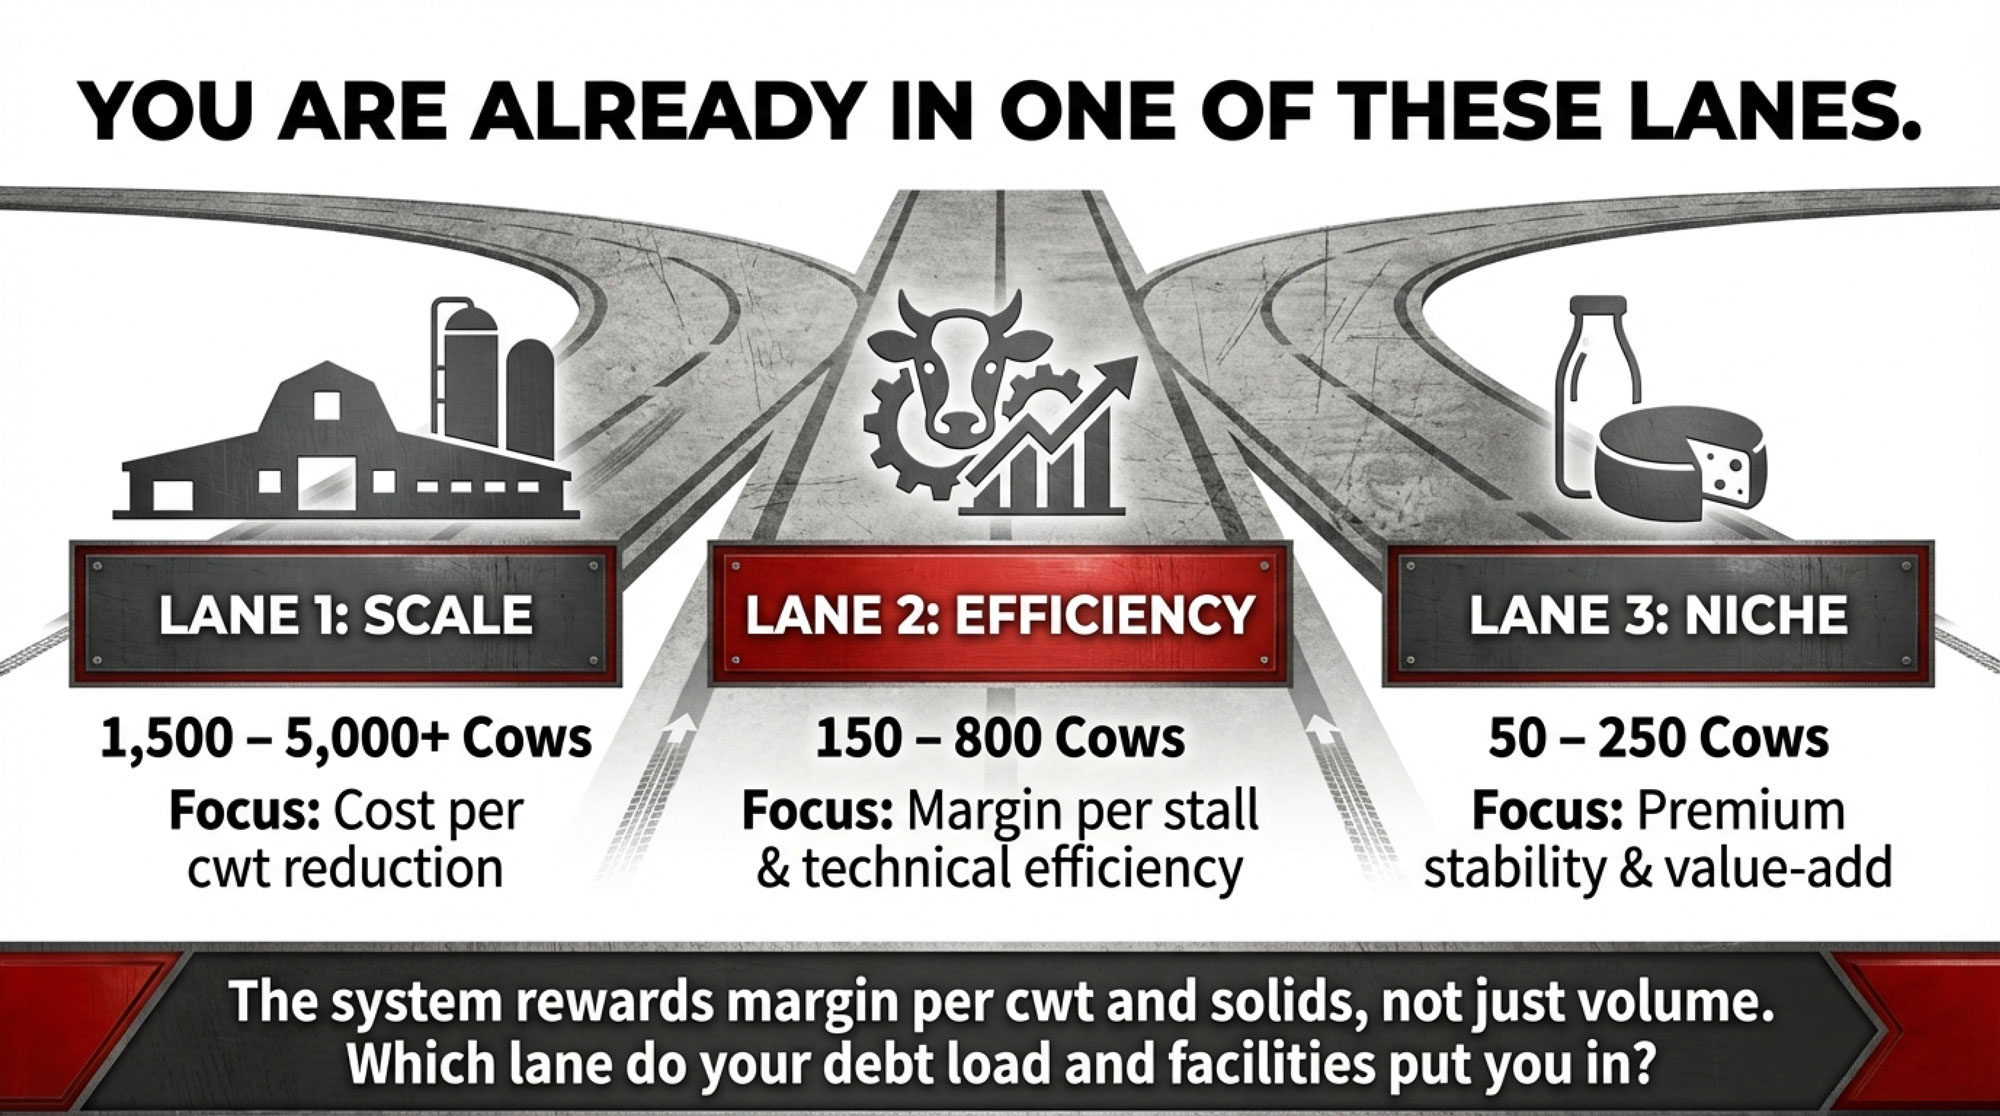
What I’ve found, looking at the Census numbers, USDA reports, Rabobank, and farmdoc analysis – and honestly, just talking with producers from California to New York – is that most viable dairies today are already drifting into one of three lanes:
- Lane 1: Scale with discipline – big herds, high throughput, a relentless cost‑per‑cwt focus.
- Lane 2: The efficiency sweet spot – mid‑size herds, sharp management, targeted tech.
- Lane 3: Niche and integrated – smaller herds leaning on premiums and value‑added strategies.
You don’t have to love those labels. But if you look around your neighbourhood and across the U.S., they’re pretty much what the numbers and the barns are telling us.
Here’s a simple way to picture the lanes while we’re topping up the coffee.
How the Three Lanes Tend to Look
| Feature | Lane 1: Scale | Lane 2: Efficiency | Lane 3: Niche/Integrated |
| Typical Herd Size | 1,500+ cows | 150–800 cows | 50–250 cows |
| Main Focus | Cost per cwt | Margin per cow & per stall | Premium stability |
| Labour Setup | Larger hired teams, formal structure | Mixed family/staff, targeted tech | Mostly owner/family, a few key hires |
| Main Risk | Policy, interest, feed & water | “Stuck in the middle,” capital creep | Market volatility, buyer dependence |
So the real question isn’t “which lane sounds nicest?” It’s “which lane do our barns, our contracts, and our debt load already put us in – whether we’ve said it out loud or not?”
Lane 1: Scale With Discipline
Let’s start with the herds that get most of the headlines. This is the lane of the 2,000‑ to 5,000‑cow operations you see in California’s Central Valley, Idaho’s Magic Valley, the Texas Panhandle, those big New Mexico dry lot systems, and along I‑29.

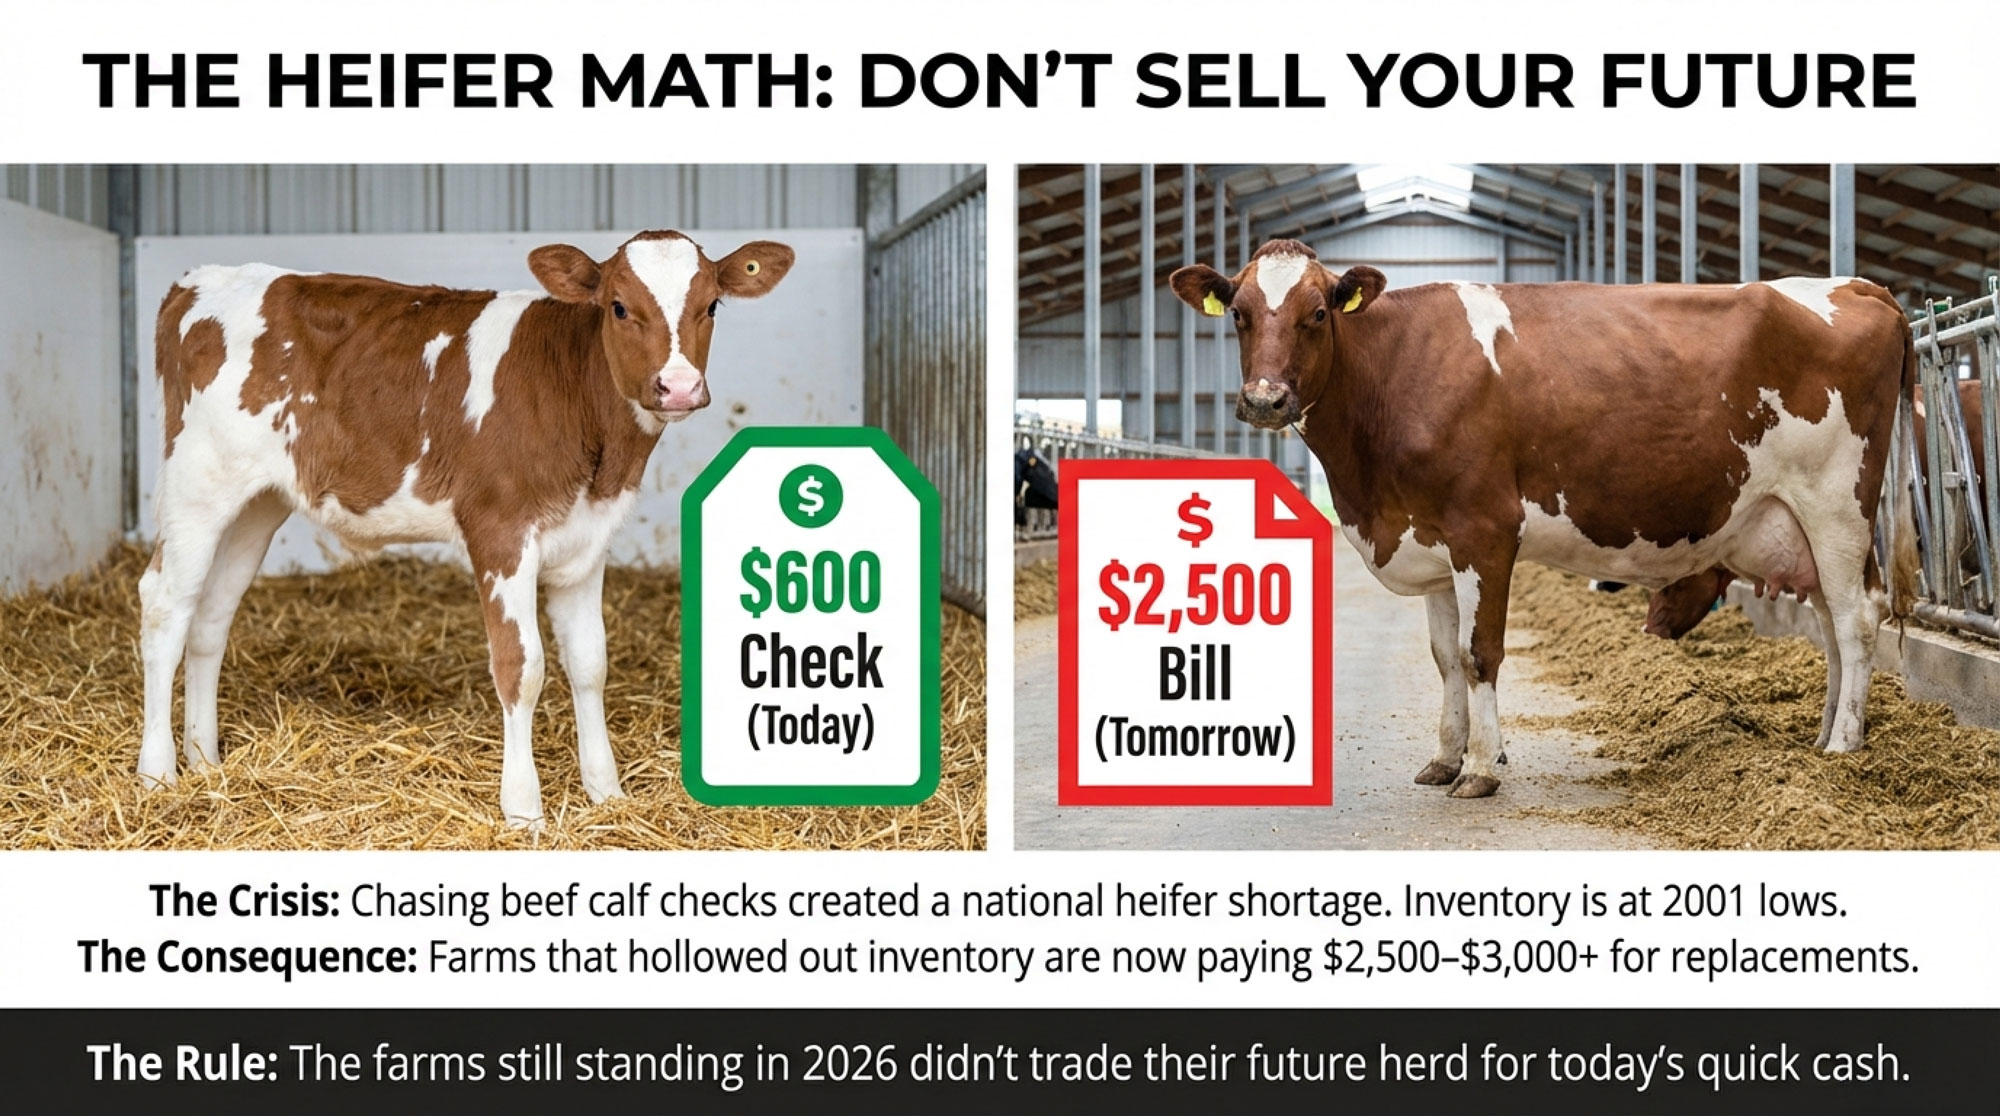
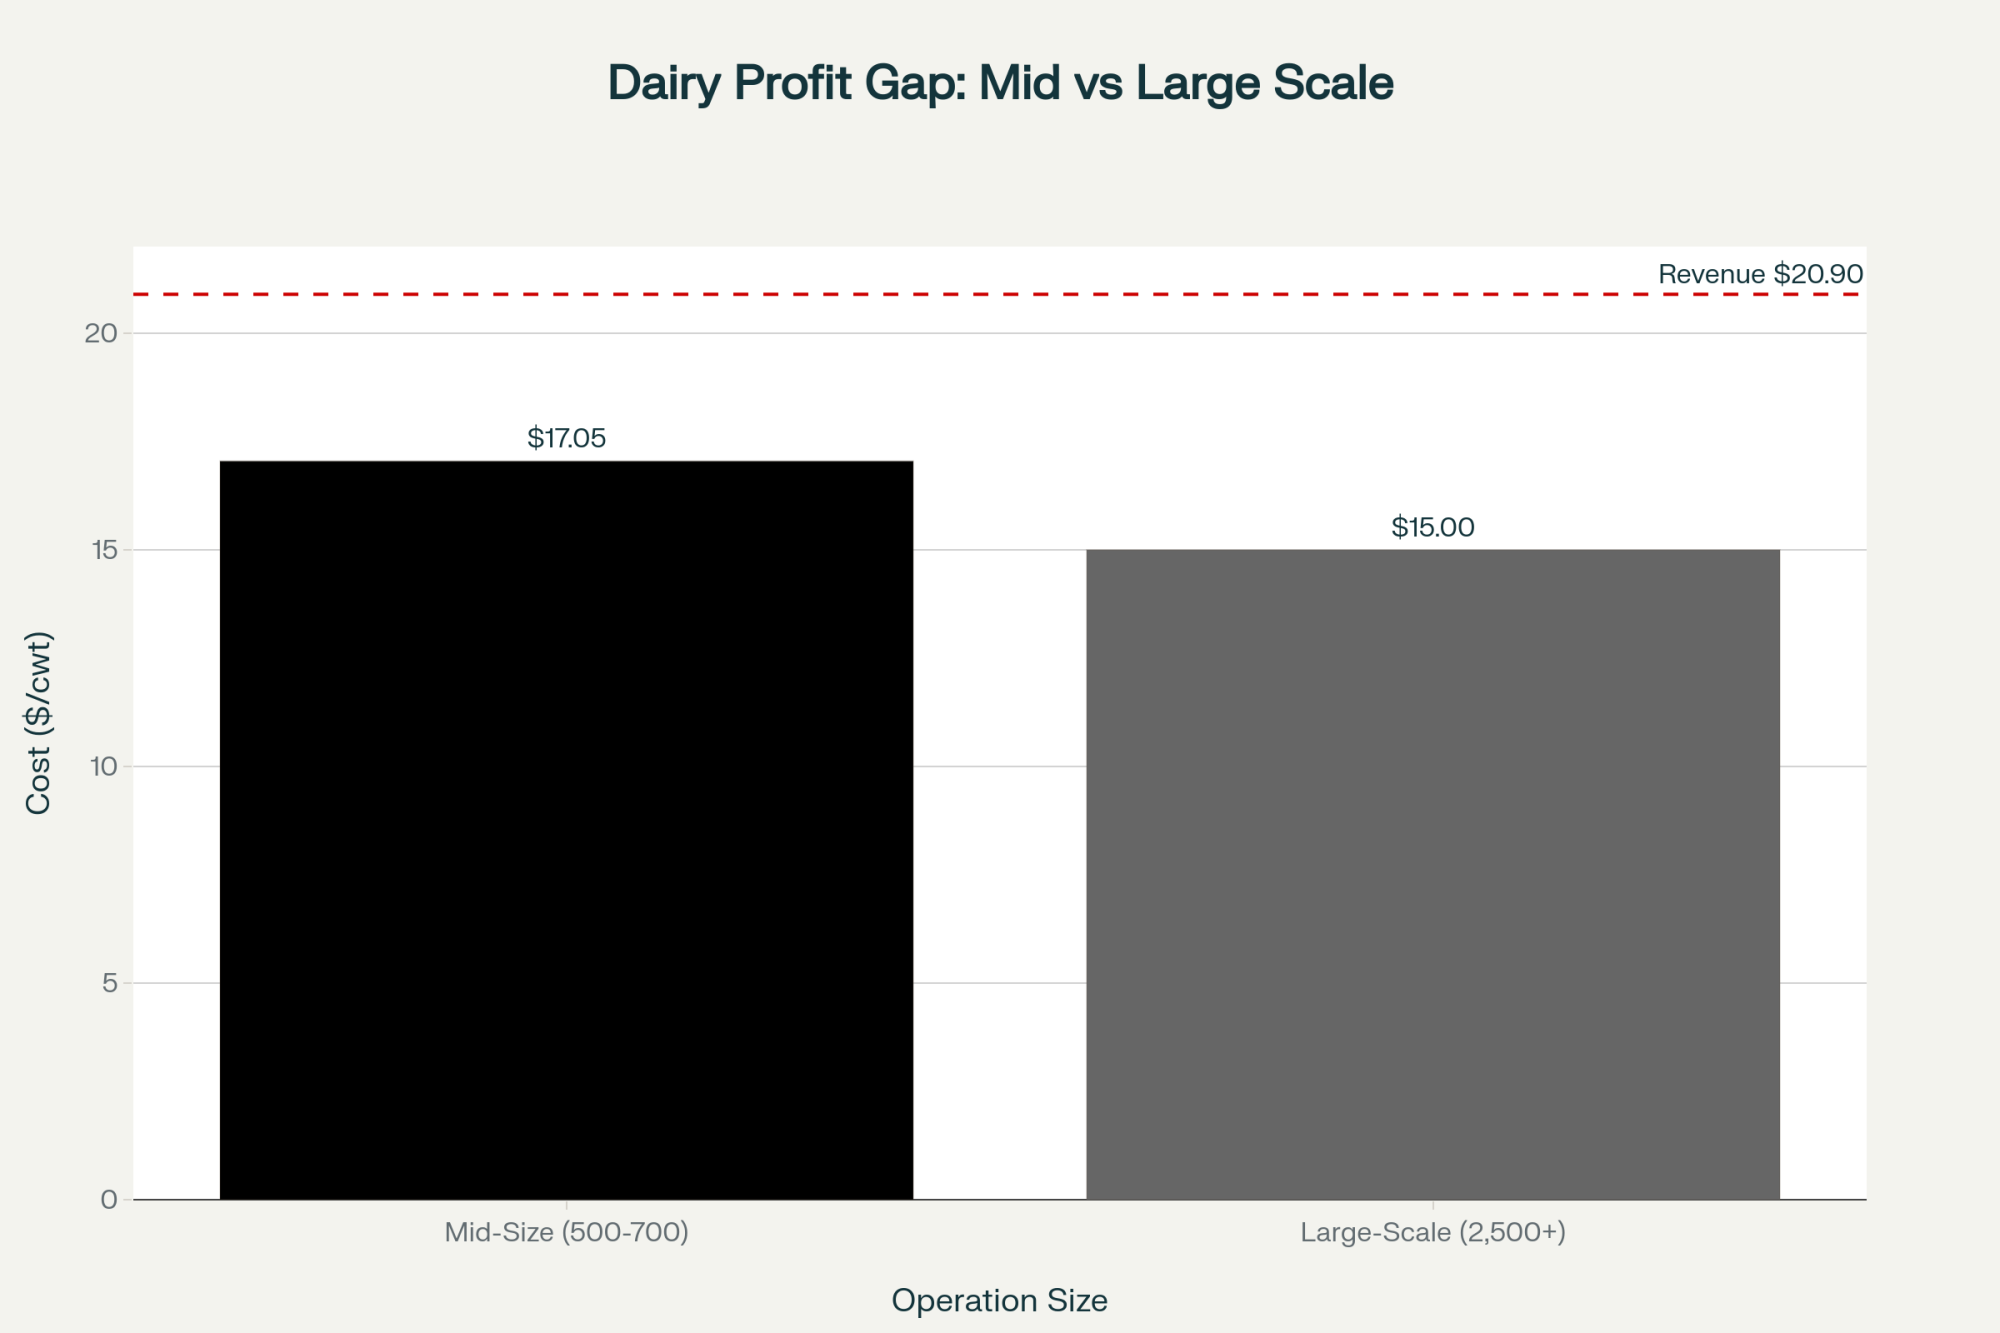
The 2022 Census, and the way farmdoc and Rabobank have unpacked it, show that the 2,500‑plus‑cow class was the only herd‑size group that actually grew in number between 2017 and 2022. Most smaller herd‑size categories shrank. Rabobank economists, leaning on USDA cost data, have highlighted that herds milking more than 2,000 cows can operate at total costs around $23/cwt and roughly $10/cwt cheaper than 100‑ to 199‑cow herds in 2022 when you look at all‑in cost per cwt. That lines up with USDA ERS work documenting that average costs tend to drop sharply as you move into the 1,000‑plus‑cow range.
Cost‑of‑production benchmarking from large western herds has shown total costs often in the low‑20s per cwt in recent years, with some examples in that $20–$21 range when feed was expensive. When milk prices were higher and costs were under control, those herds had decent margins. When milk softened, and feed stayed high, there wasn’t much cushion.
What’s interesting here is that scale really can work, but only if it’s paired with discipline and a clear view of risk. On a 2,500‑cow dry lot in eastern New Mexico or west Texas, a $2/cwt swing in margin can mean hundreds of thousands of dollars a month. Heat stress, water rights, feed price spikes, and regulatory changes all magnify at that scale. Producers in those regions consistently talk about cooling systems, water security, and manure and nutrient plans because they don’t have the luxury of ignoring those things.
In a lot of western dry lot systems, the focus tends to be on:
- Reproduction and days open, because milk per stall is everything.
- Heat abatement – fans, soakers, shades – to keep feed intake and rumination from breaking down during long, hot spells.
- Feed efficiency and shrink control, given the volume of commodities moving through the yard.
- Manure and water systems that keep regulators, neighbours, and processors onside.
So if you’re in this lane – or seriously thinking about stepping into it – the question shifts from “should we add more cows?” to “does this next big capital decision lower our cost per cwt or take a major risk off the table over the next 10 or 15 years?” New rotary? Digester? More housing? At that scale, the lens really has to be long‑term margin and resilience, not just filling an empty pad.
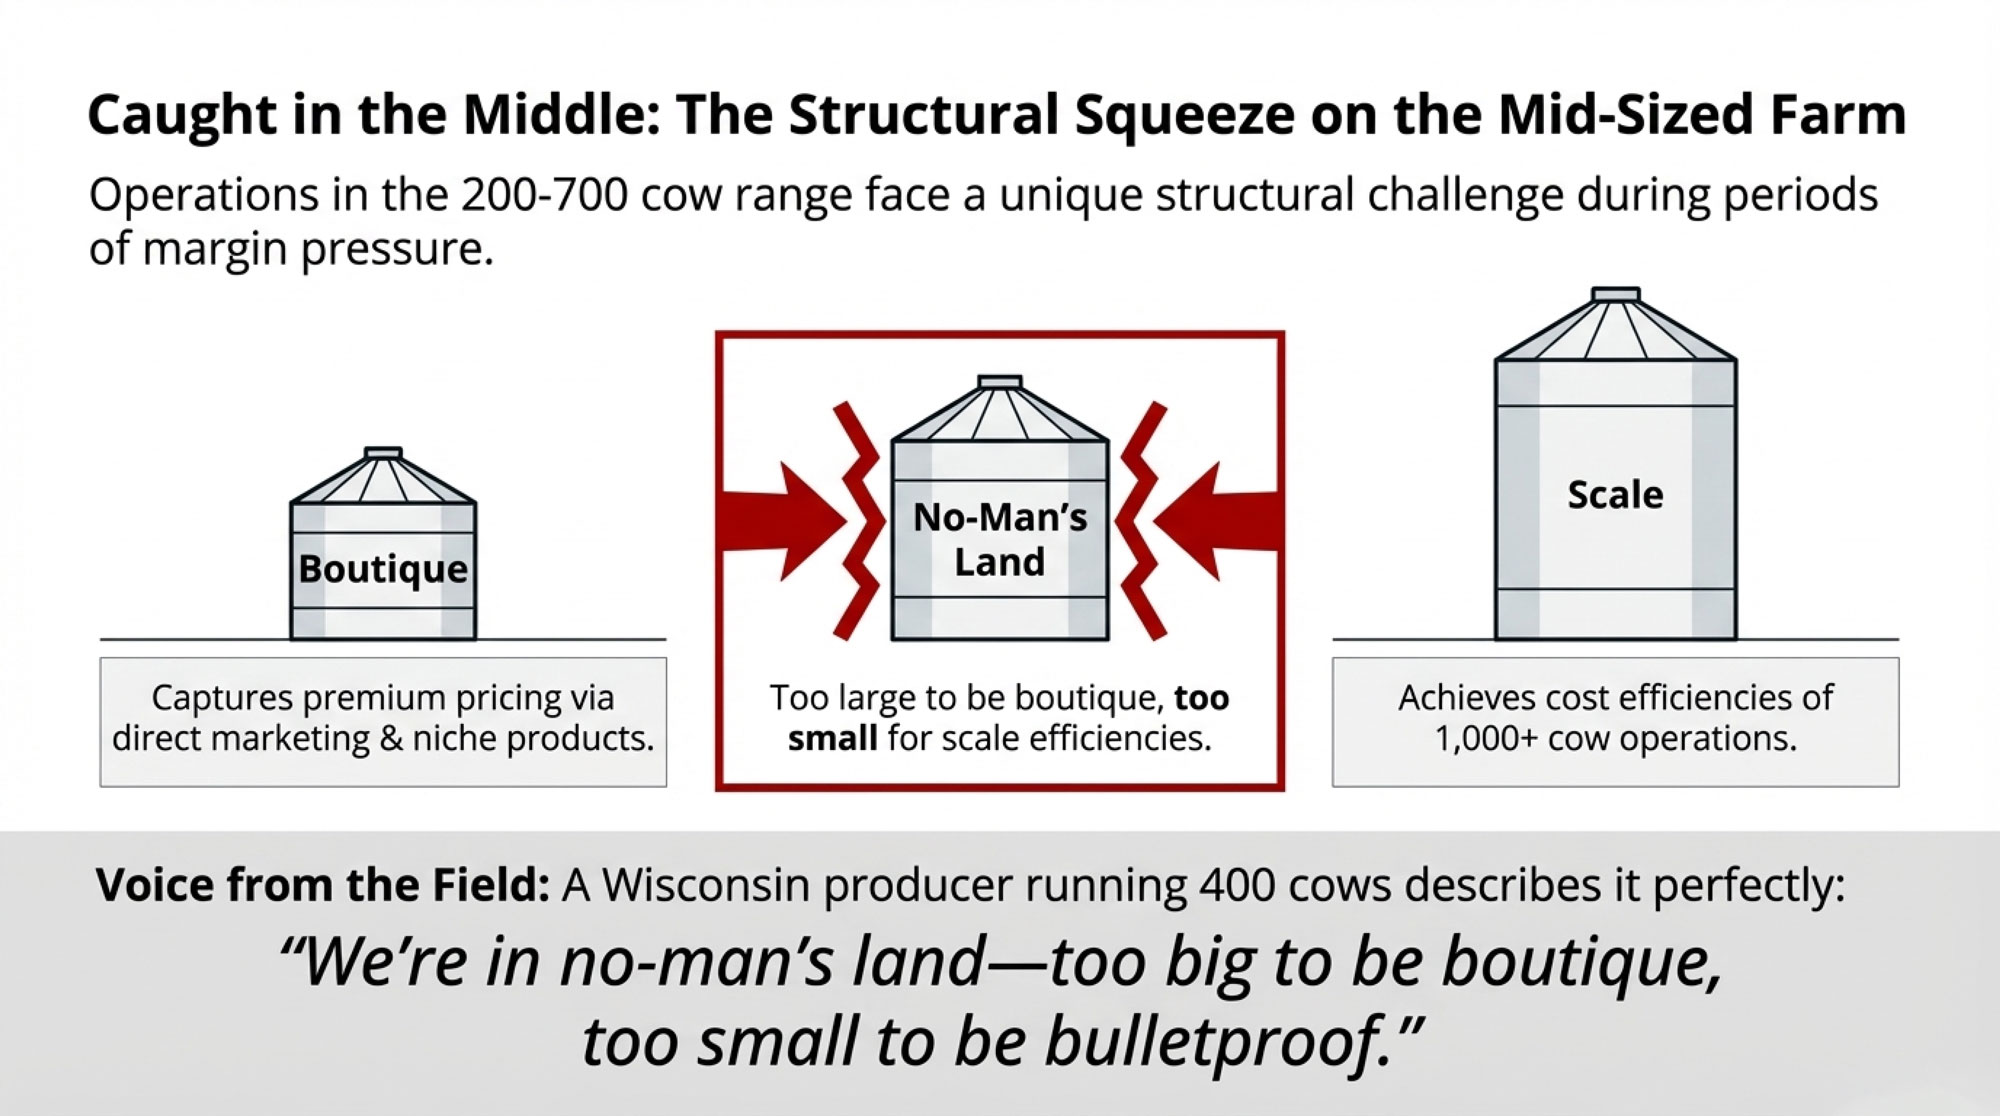
Lane 2: The Efficiency Sweet Spot
Now, let’s talk about where a lot of well‑run Midwest and Northeast herds actually live: somewhere between 150 and 800 cows. Solid freestall barns, a mix of family and hired help, and a lot of pride in butterfat performance and cow comfort.
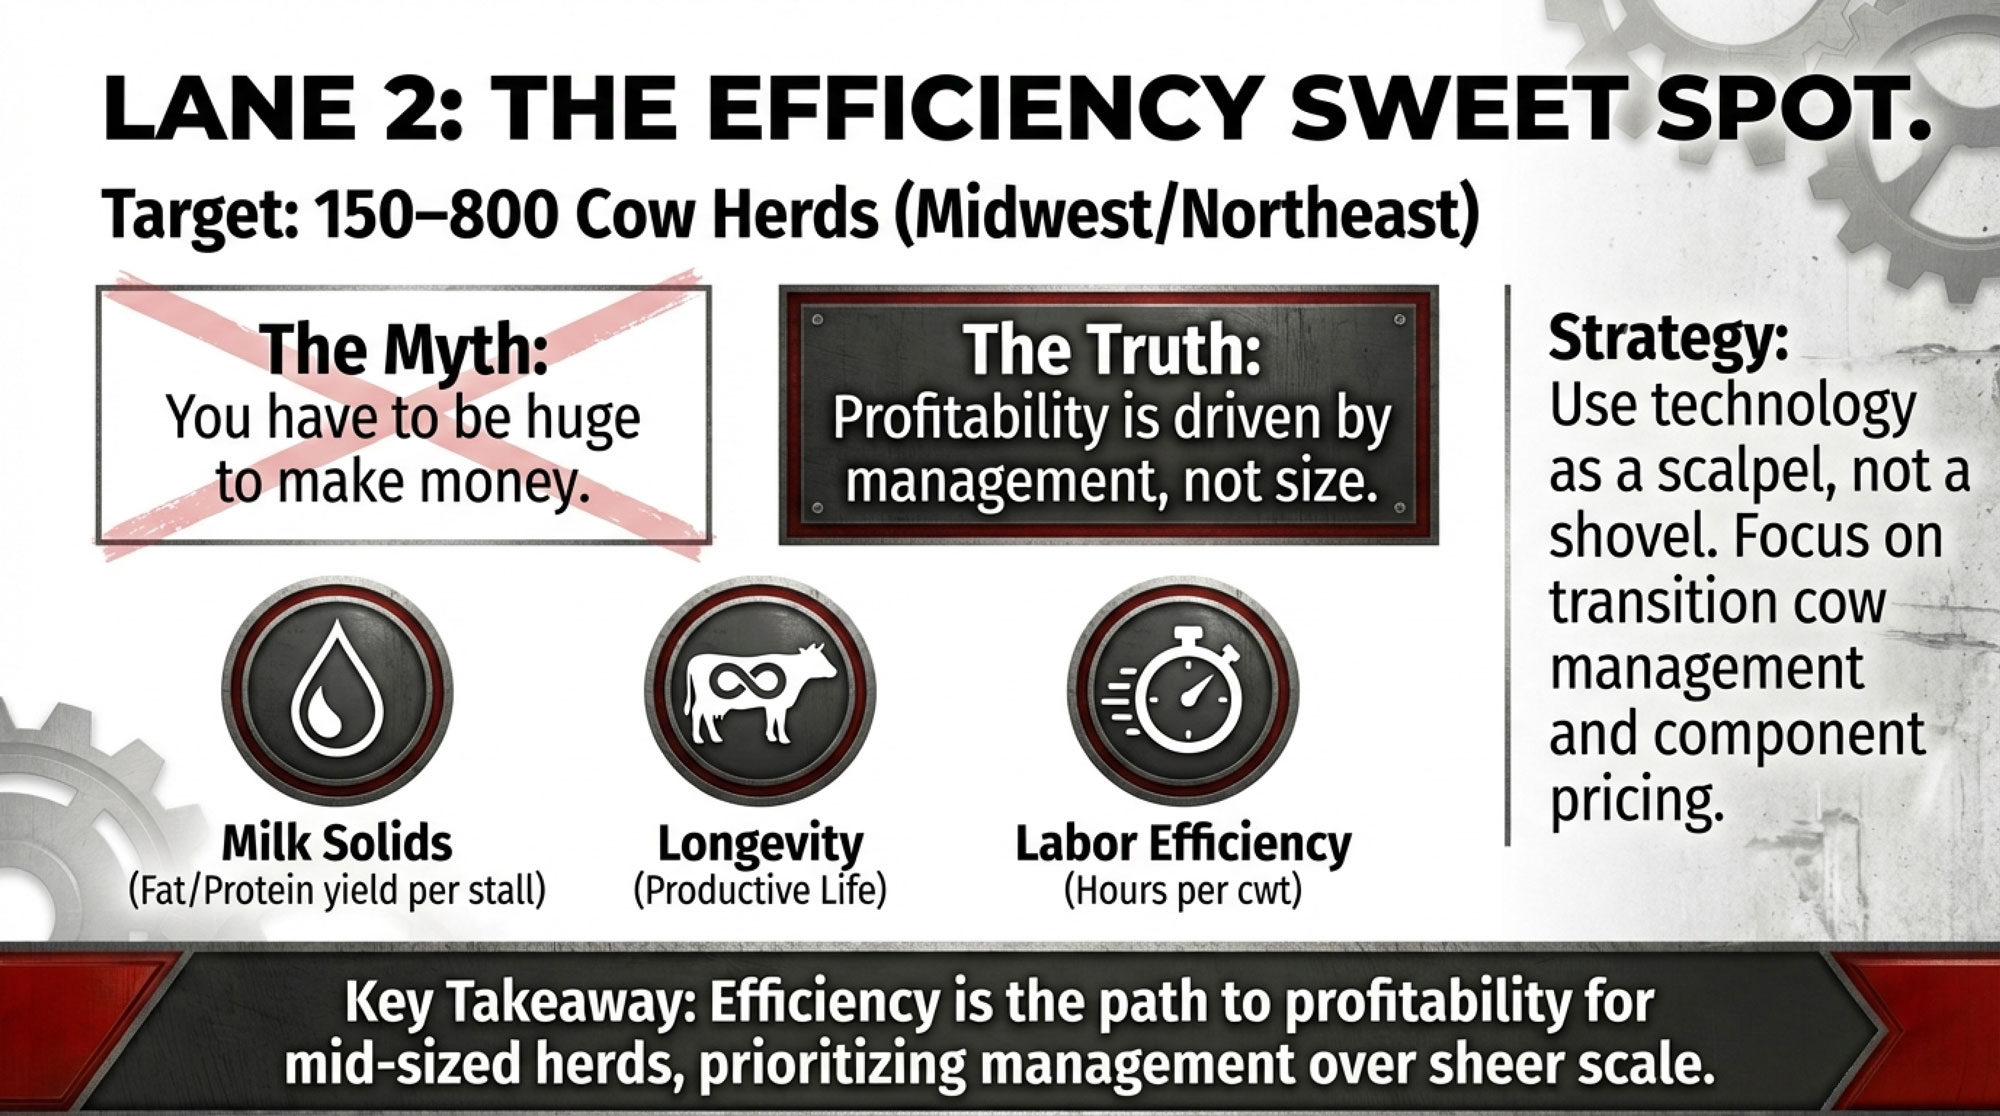
Kansas Farm Management Association comparisons of high‑, medium‑, and low‑profit dairies have shown that the most profitable herds aren’t always the biggest. They’re the ones with higher milk sold per cow, better feed conversion, fewer labour hours per cow, and controlled overhead. An international study looking at dairy farm performance across countries reached a similar conclusion: technical efficiency – things like milk per cow, feed use, and labour use – plus management decisions explain profitability differences much more than milk price alone.
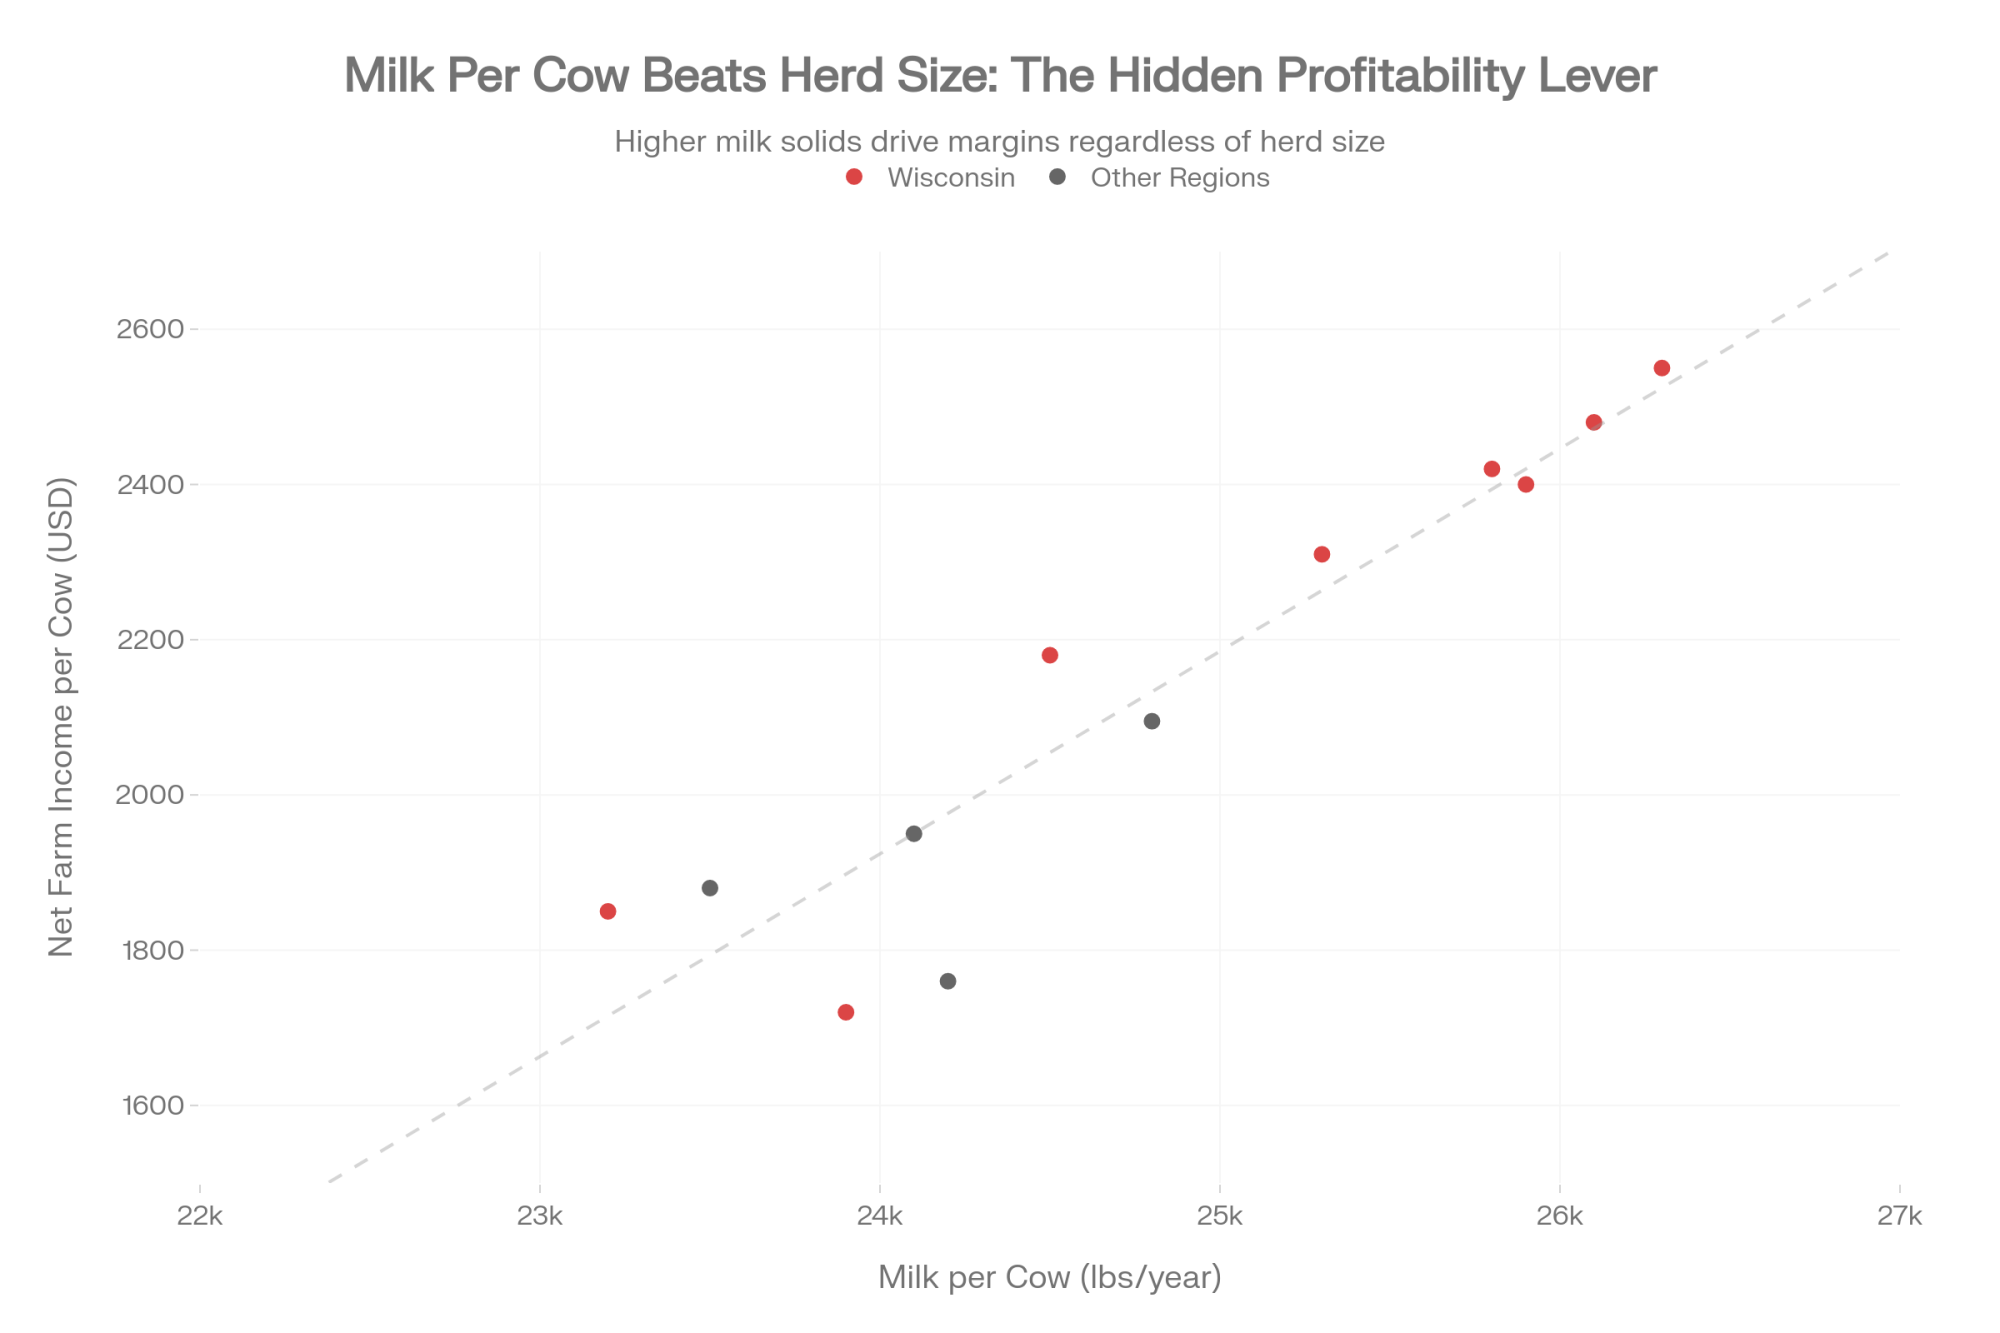
| Farm ID | Herd Size | Milk per Cow (lbs/yr) | Net Farm Income per Cow (USD) | Region |
|---|---|---|---|---|
| A | 280 | 24,500 | $2,180 | Wisconsin |
| B | 320 | 23,200 | $1,850 | Wisconsin |
| C | 450 | 25,300 | $2,310 | Wisconsin |
| D | 520 | 24,800 | $2,095 | Iowa |
| E | 380 | 26,100 | $2,480 | Wisconsin |
| F | 650 | 23,900 | $1,720 | Wisconsin |
| G | 520 | 24,100 | $1,950 | Minnesota |
| H | 420 | 25,800 | $2,420 | Illinois |
| I | 480 | 23,500 | $1,880 | Iowa |
| J | 580 | 26,300 | $2,550 | Wisconsin |
| K | 390 | 25,900 | $2,400 | Wisconsin |
| L | 610 | 24,200 | $1,760 | Minnesota |
In Wisconsin, herds shipping to cheese plants, the paycheque is built on components. Producers are getting paid for butterfat and protein, not just pounds of skim, so milk solids per cow and per stall become the key levers. Hoard’s Dairyman benchmarking and Dairy Herd coverage of component pricing have underlined that top‑profit herds in these markets tend to combine strong fat and protein yields with good herd health and reproduction.
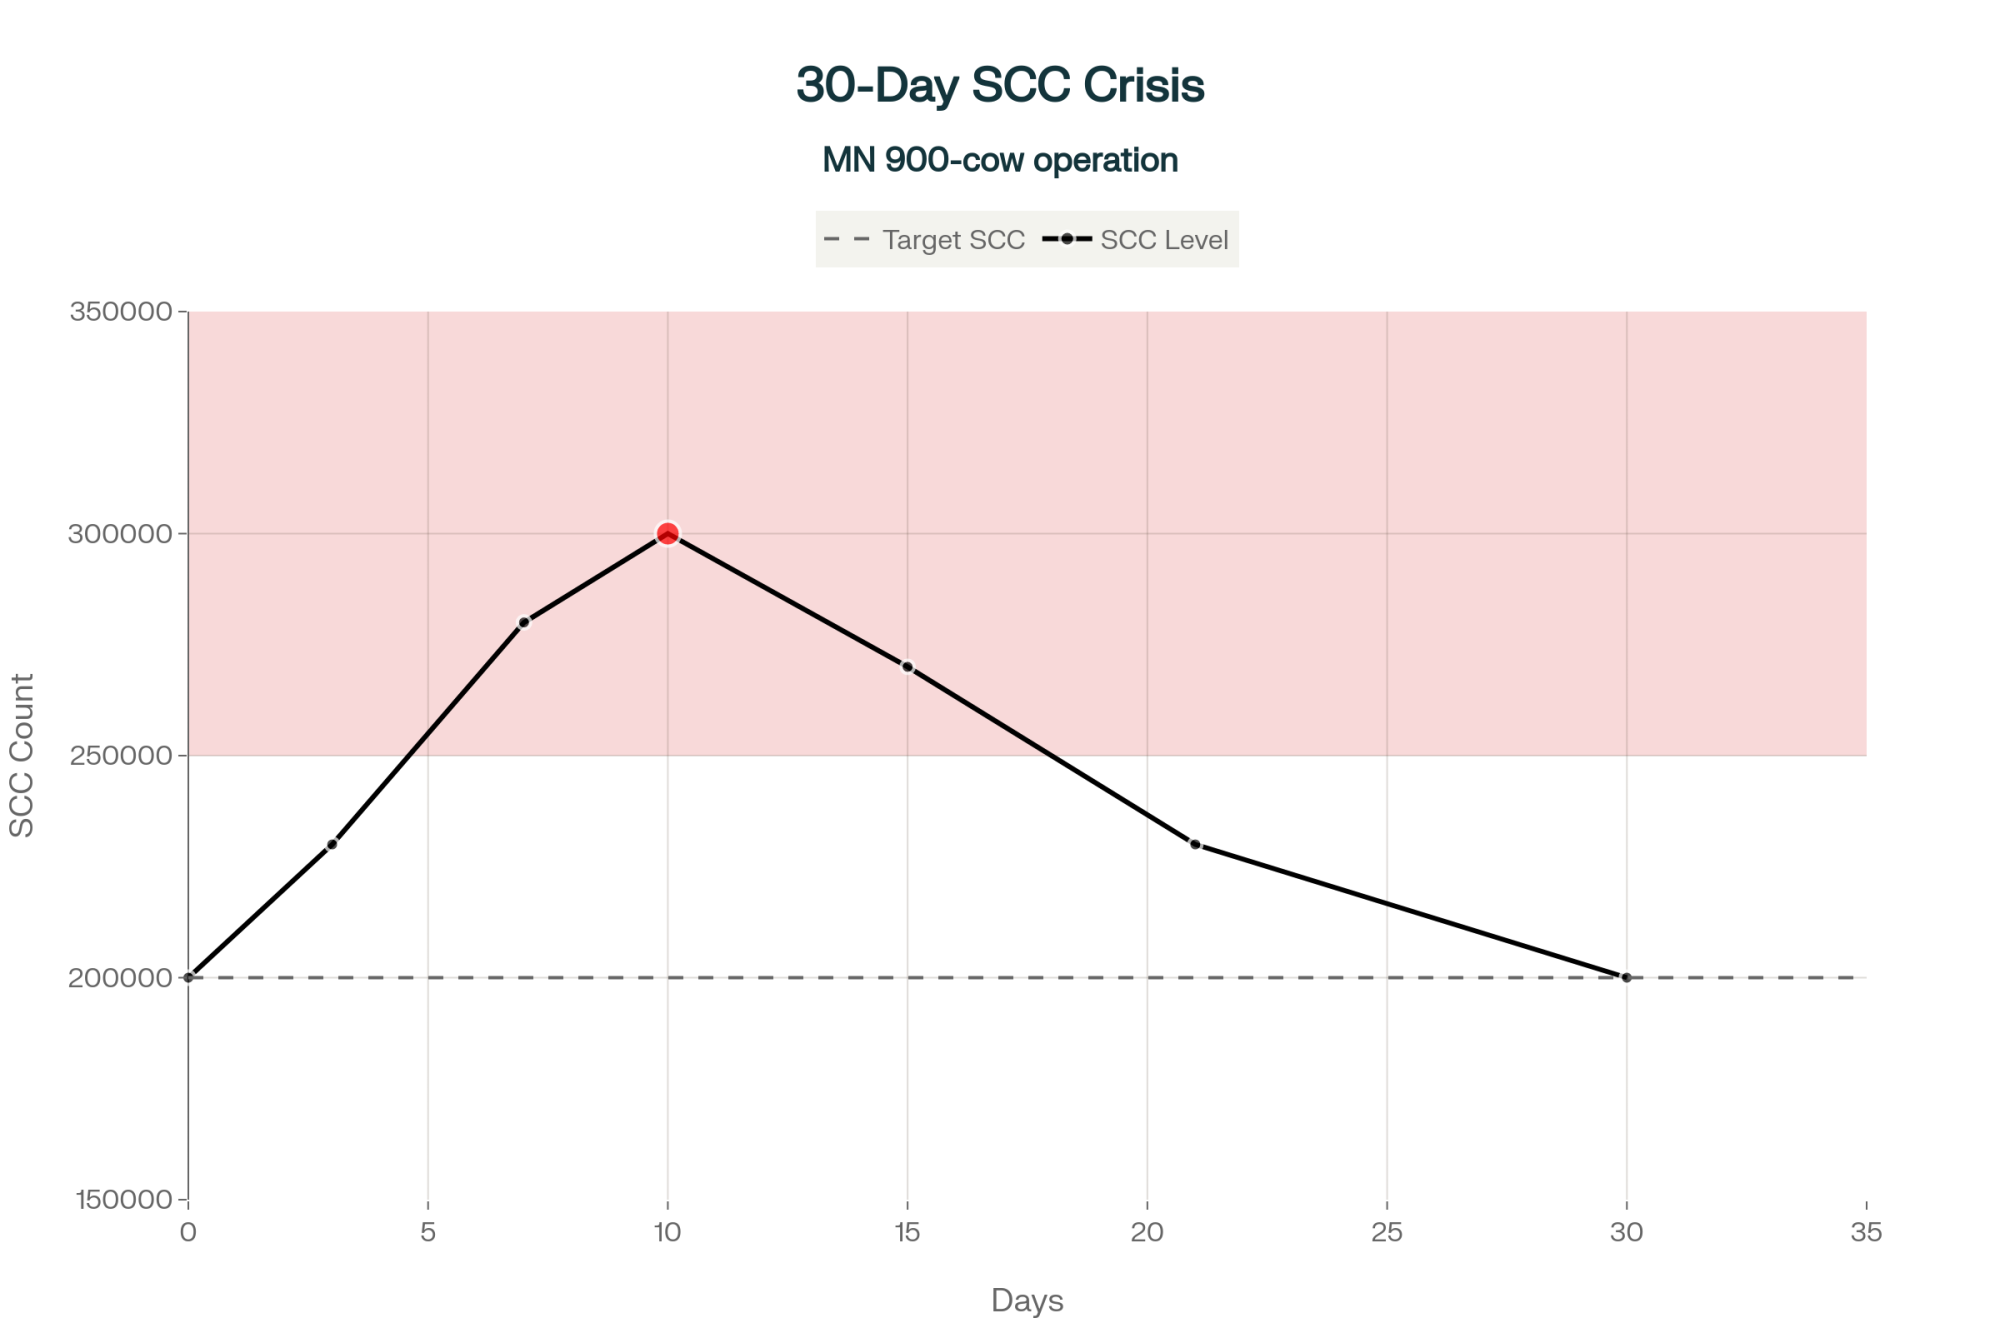
In many Northeast operations – think 80–150‑cow tie‑stalls or smaller freestalls in New York or Pennsylvania – the economics look surprisingly similar, even if the barns are older. Butterfat performance, SCC, and reproduction determine whether to stay in business or set a dispersal date. The facilities differ; the margin math stays the same.
What farmers are finding in this lane – especially in those 300‑ to 600‑cow freestalls – is that they don’t need to chase 3,000 cows to be successful. They do need to be absolutely clear about:
- Butterfat and protein yield per cow and per stall, not just tank weight.
- Fresh cow management through the transition period – calcium, energy balance, rumen health, and calm, clean calvings.
- Involuntary cull rates and how long cows stay productive in the herd.
- Labour per cwt and whether there are too many hands doing too many half‑defined jobs.
Many of the stand‑out herds in this lane use technology as a scalpel, not a shovel. You’ll see activity and rumination collars, some well‑designed sort gates, herd management software that someone actually uses, maybe a feed pusher. But the filter isn’t “is this new and shiny?” It’s “does this clearly move margin per stall and labour per cwt on our farm?”
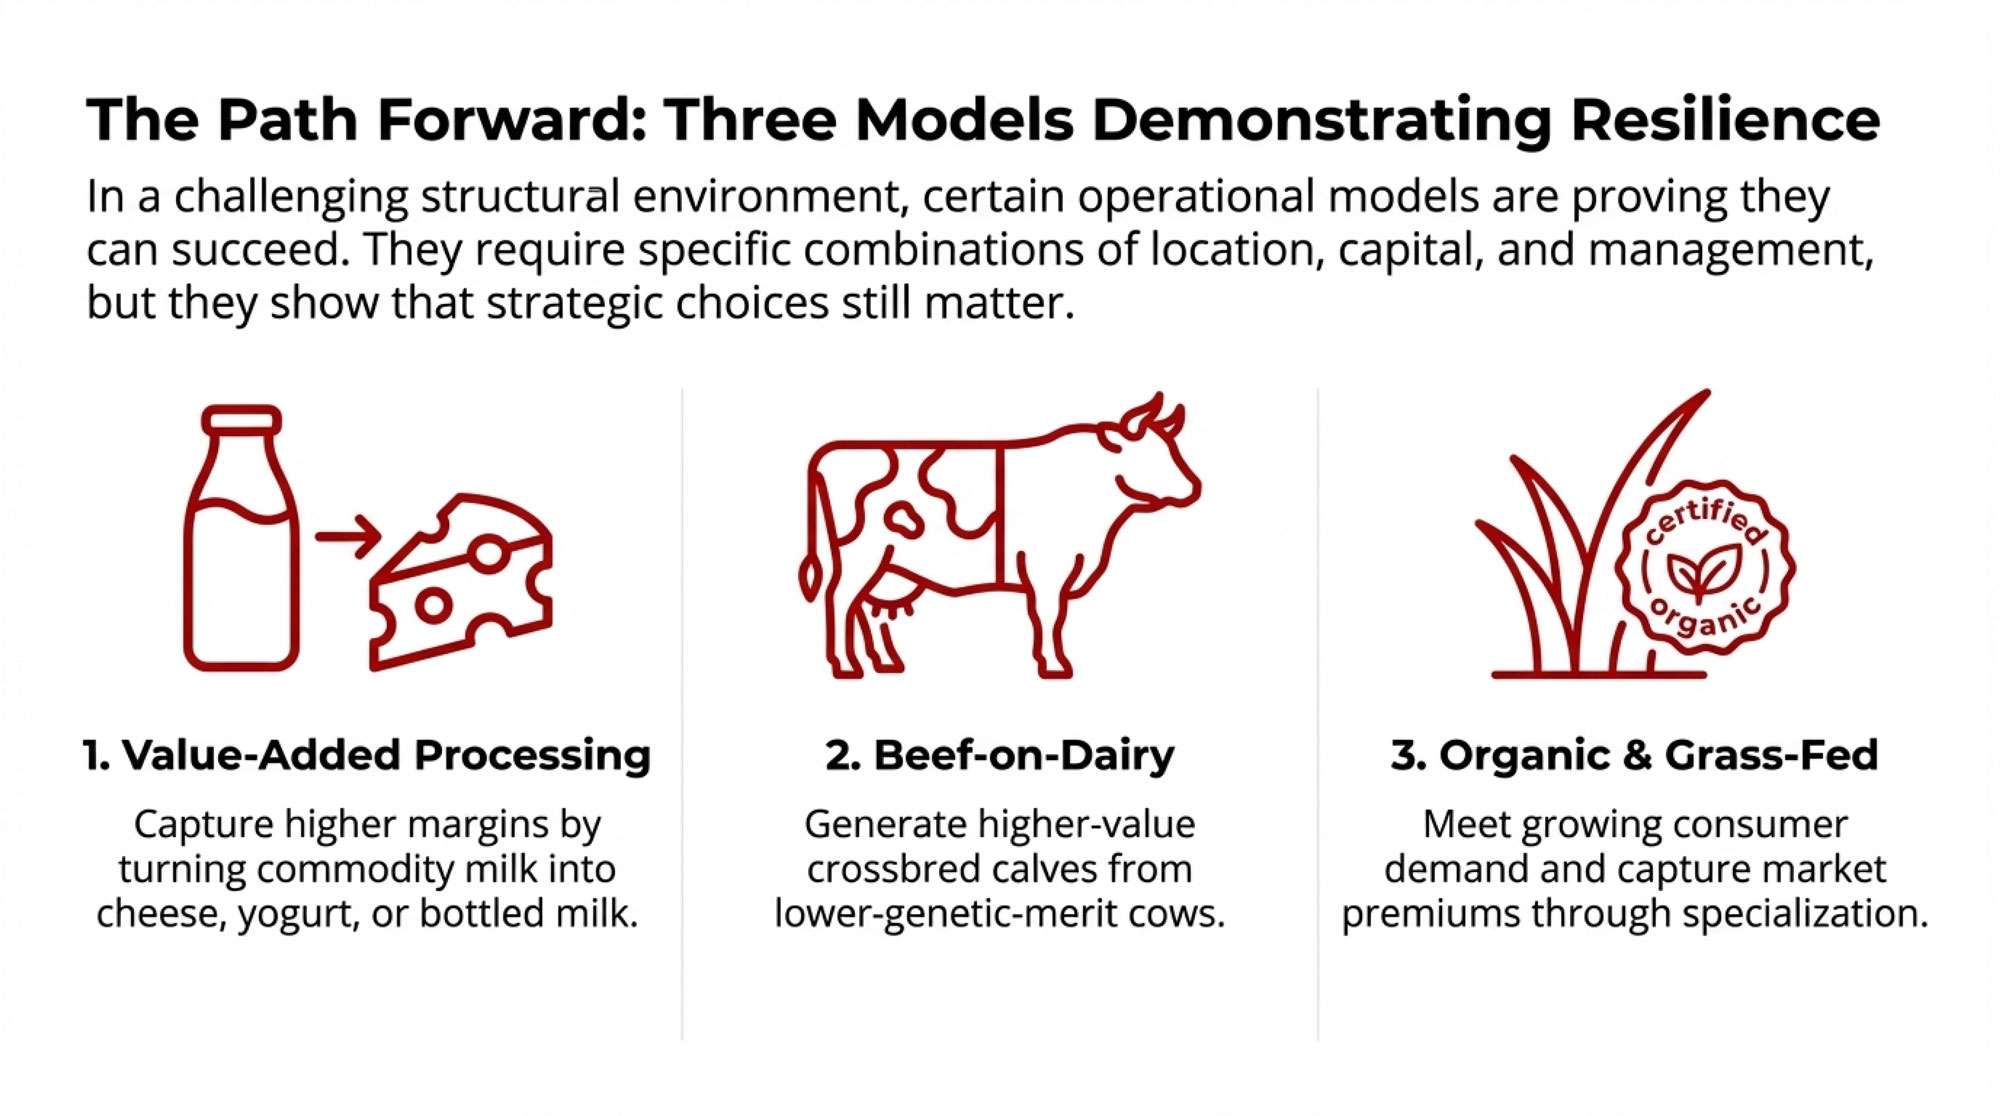
Lane 3: Niche and Integrated Models
Then there’s the lane a lot of smaller herds either already operate in or quietly eye: organic, grassfed, A2A2, farmstead cheese, on‑farm bottling, or tight specialty contracts.
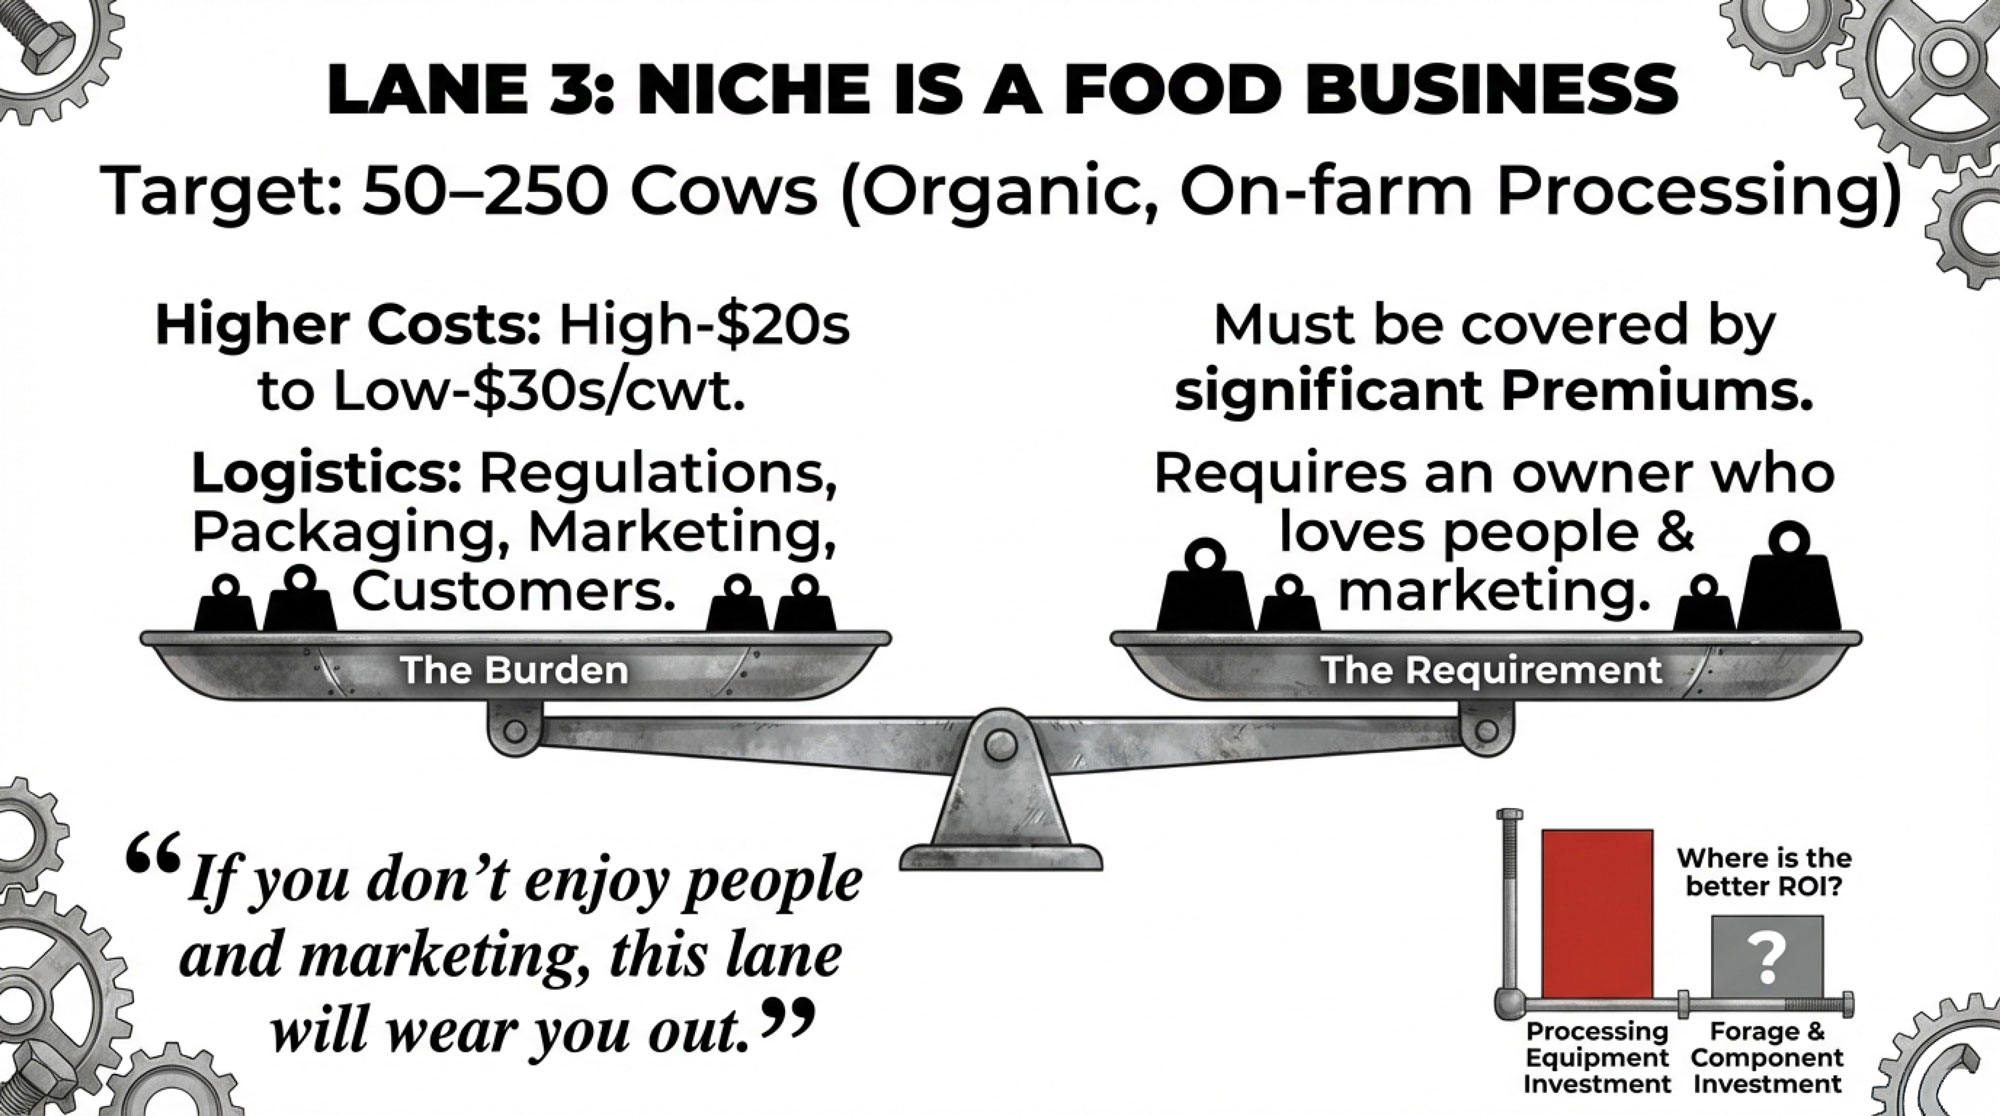
A Vermont study of organic dairies, using about ten years of farm‑level data, found that profitable organic farms tended to have strong forage management, controlled purchased feed costs, and organic milk prices that more than covered their higher expenses. Another paper looking at organic and grassfed dairy farms reported that higher‑producing grass‑based herds typically had better forage quality and more grazing management experience, which reinforces that “grassfed” doesn’t automatically mean low output.
Economic work on organic and value‑added dairy suggests something else important: these farms often generate more local economic activity per dollar of milk sold because more processing, marketing, and labour occur in the local community. That matches what many small organic and farmstead operations in Vermont, New York, and the Upper Midwest describe – more local jobs and spend, but also more work per unit of milk.
So yes, a 100‑cow organic herd in Vermont or a 70‑cow farmstead cheese operation in New York can outperform a 300‑cow conventional herd in terms of income per cwt when premiums, volume, and costs are well managed. The trade‑off is that you’re not just running a dairy – you’re running a food business with capital‑heavy equipment, regulations, labels, shipping, and customers attached.
Here’s the honest part about this lane that doesn’t always make it into the glossy stories: it’s not a magic profit button. The farmers who thrive here genuinely enjoy the marketing and relationship side – tastings, farmers’ markets, social media, restaurant accounts – not just the idea of a higher pay price. If you don’t enjoy people, paperwork, and problem‑solving beyond the farm gate, this lane can wear you out fast.
| Feature | Lane 1: Scale with Discipline | Lane 2: Efficiency Sweet Spot | Lane 3: Niche / Integrated |
| Typical Herd Size | 1,500–5,000+ cows | 150–800 cows | 50–250 cows |
| Primary Focus | Cost per cwt (volume + relentless efficiency) | Margin per cow & per stall (quality + management) | Premium stability & value-added processing |
| Labour Model | Large hired teams, formal shift structure | Mixed family + staff, targeted technology use | Mostly owner/family + 2–4 key hires |
| Tech Emphasis | Cooling, feed efficiency, herd logistics, data systems at scale | Activity collars, sort gates, feed pushers, parlour automation | Direct marketing, on-farm processing, customer relationships |
| Revenue Lever | Volume + operational discipline | Components (fat/protein) + reproductive health + longevity | Organic/grassfed/A2A2 premiums + direct sales markup |
| Main Economic Risk | Policy, interest rates, feed/water volatility → margin shrinks fast at scale | Stuck in the middle: not big enough for economies of scale, not focused enough on niche | Market volatility, buyer dependence, capital intensity of processing equipment |
| Typical Cost per cwt | $20–$23 (with discipline) | $24–$27 (depending on efficiency) | $26–$32 (offset by premiums) |
The Economics Behind the Lanes
If we step back from individual barns and look at the bigger picture, USDA’s cost‑of‑production work and ERS research on consolidation are pretty consistent: on average, total cost per cwt falls as herd size increases, at least up into the 1,000‑plus‑cow bracket. Fixed costs and specialized labour get spread over more cows. That’s a big part of why those large herds have grown their share of the milk.
At the same time, when you look inside any given size category – this shows up clearly in the Kansas data and the international comparisons – the herds at the top of the profit pile aren’t automatically the biggest ones. They’re the ones with more milk sold per cow, better feed efficiency, and leaner labour use. The laggards often have similar milk prices but higher costs per cwt due to lower yields, poor reproduction, health problems, or poorly organized labour.
On the organic and value‑added side, the Vermont research and similar studies report that total costs per cwt are usually higher – often in the high‑20s or low‑30s – but strong organic or specialty premiums can still leave attractive margins when stocking rates, forage programs, and processing capacity fit together.
And in the real‑world conditions of 2023–2025, with feed, fuel, and fertilizer on a roller coaster and interest costs higher, that margin for error has shrunk for almost everyone. Industry analysis has shown how quickly margins swung negative for many herds when feed stayed expensive, and Class III and IV prices dropped back.
So the old “get big or get out” line is too blunt. The more accurate version is probably closer to: get crystal clear on which economic lane you’re in and manage aggressively for that lane’s realities.
Genetics: Turning Genomic Numbers Into Real Barn Dollars
Let’s shift to genetics for a bit, because this is one of those levers that doesn’t shout at you day‑to‑day but quietly adds up over time.
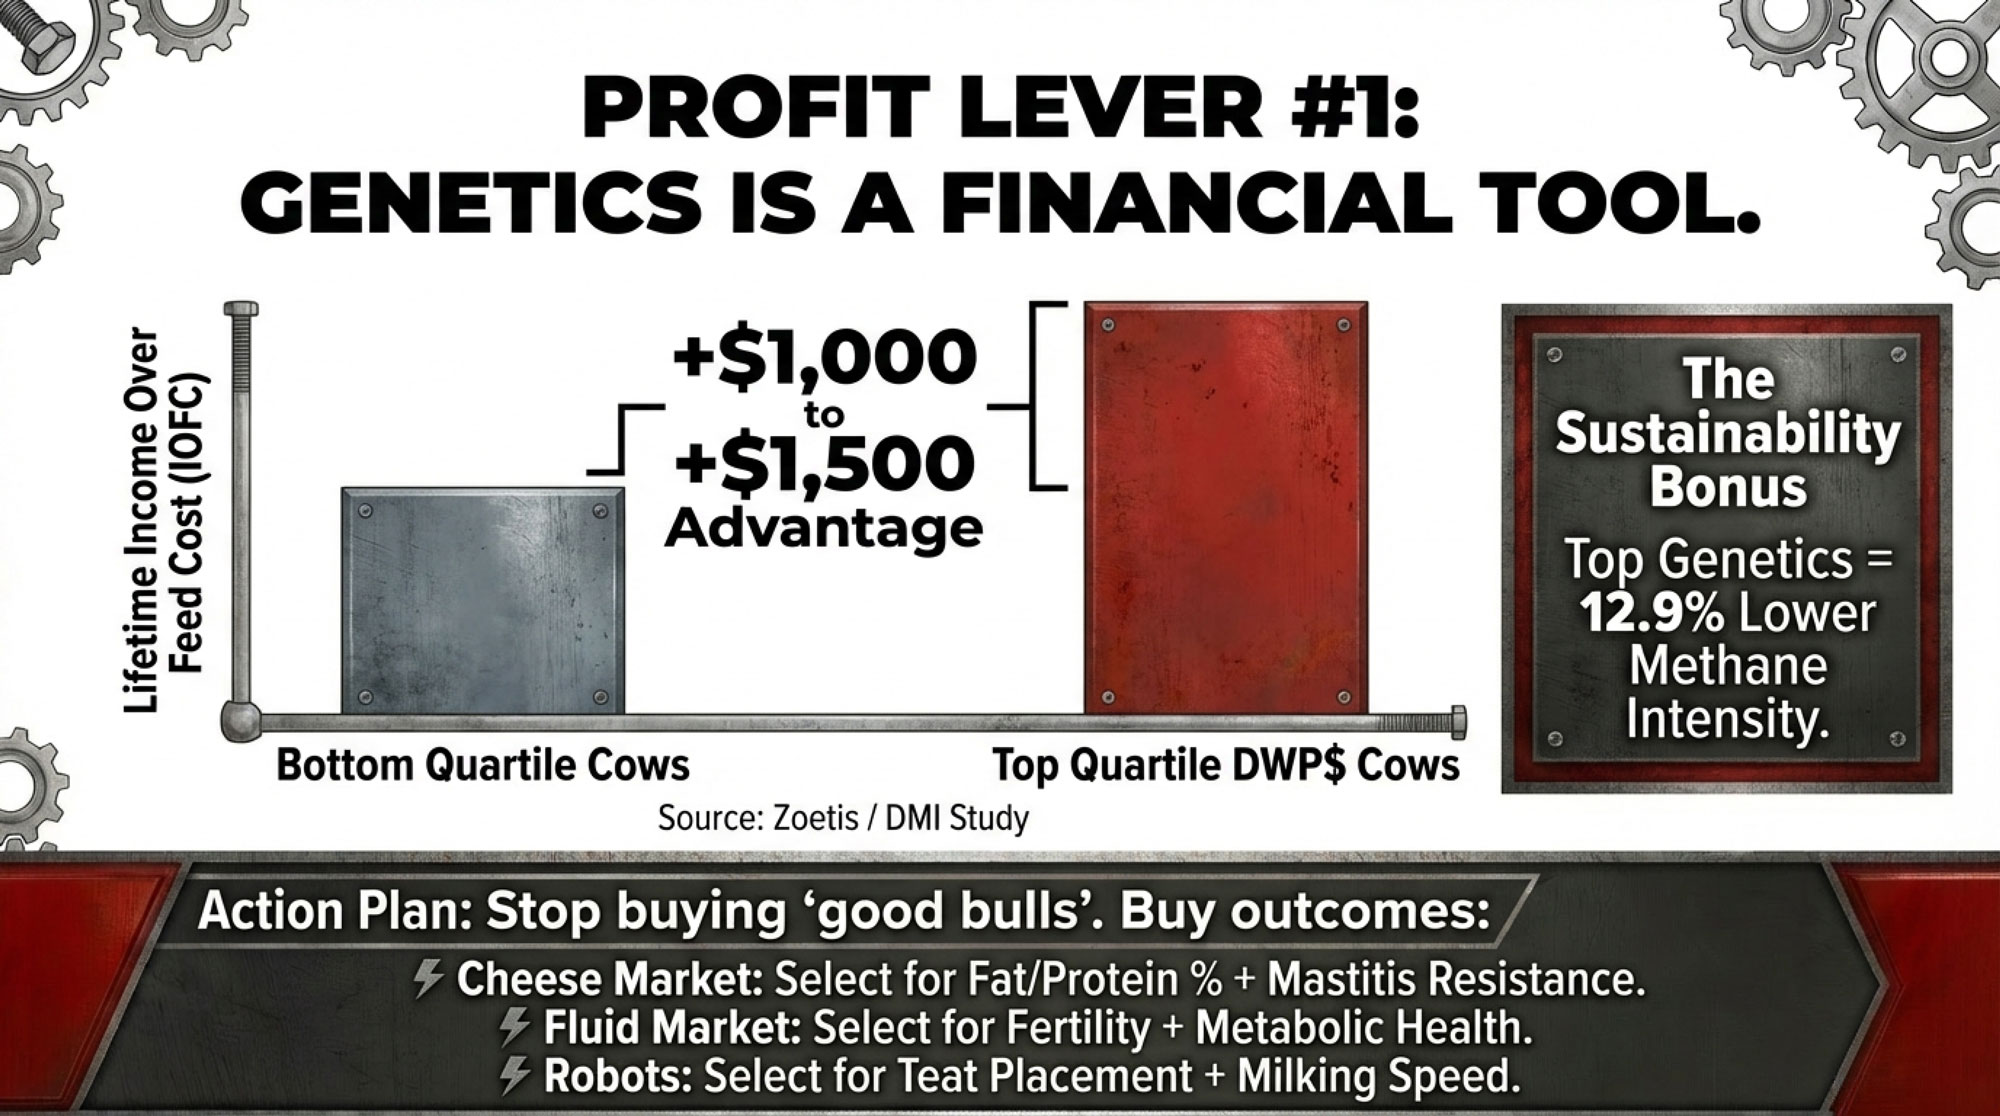
Since genomic testing really took off around 2009, geneticists and AI organizations have documented significantly faster genetic progress for traits like production, fertility, and health compared with the old, slower progeny‑test system. Peer‑reviewed work in the Journal of Dairy Science has confirmed that when you select on genomic lifetime merit indexes consistently, you see real differences in lifetime performance show up in the parlour and on the cull list.
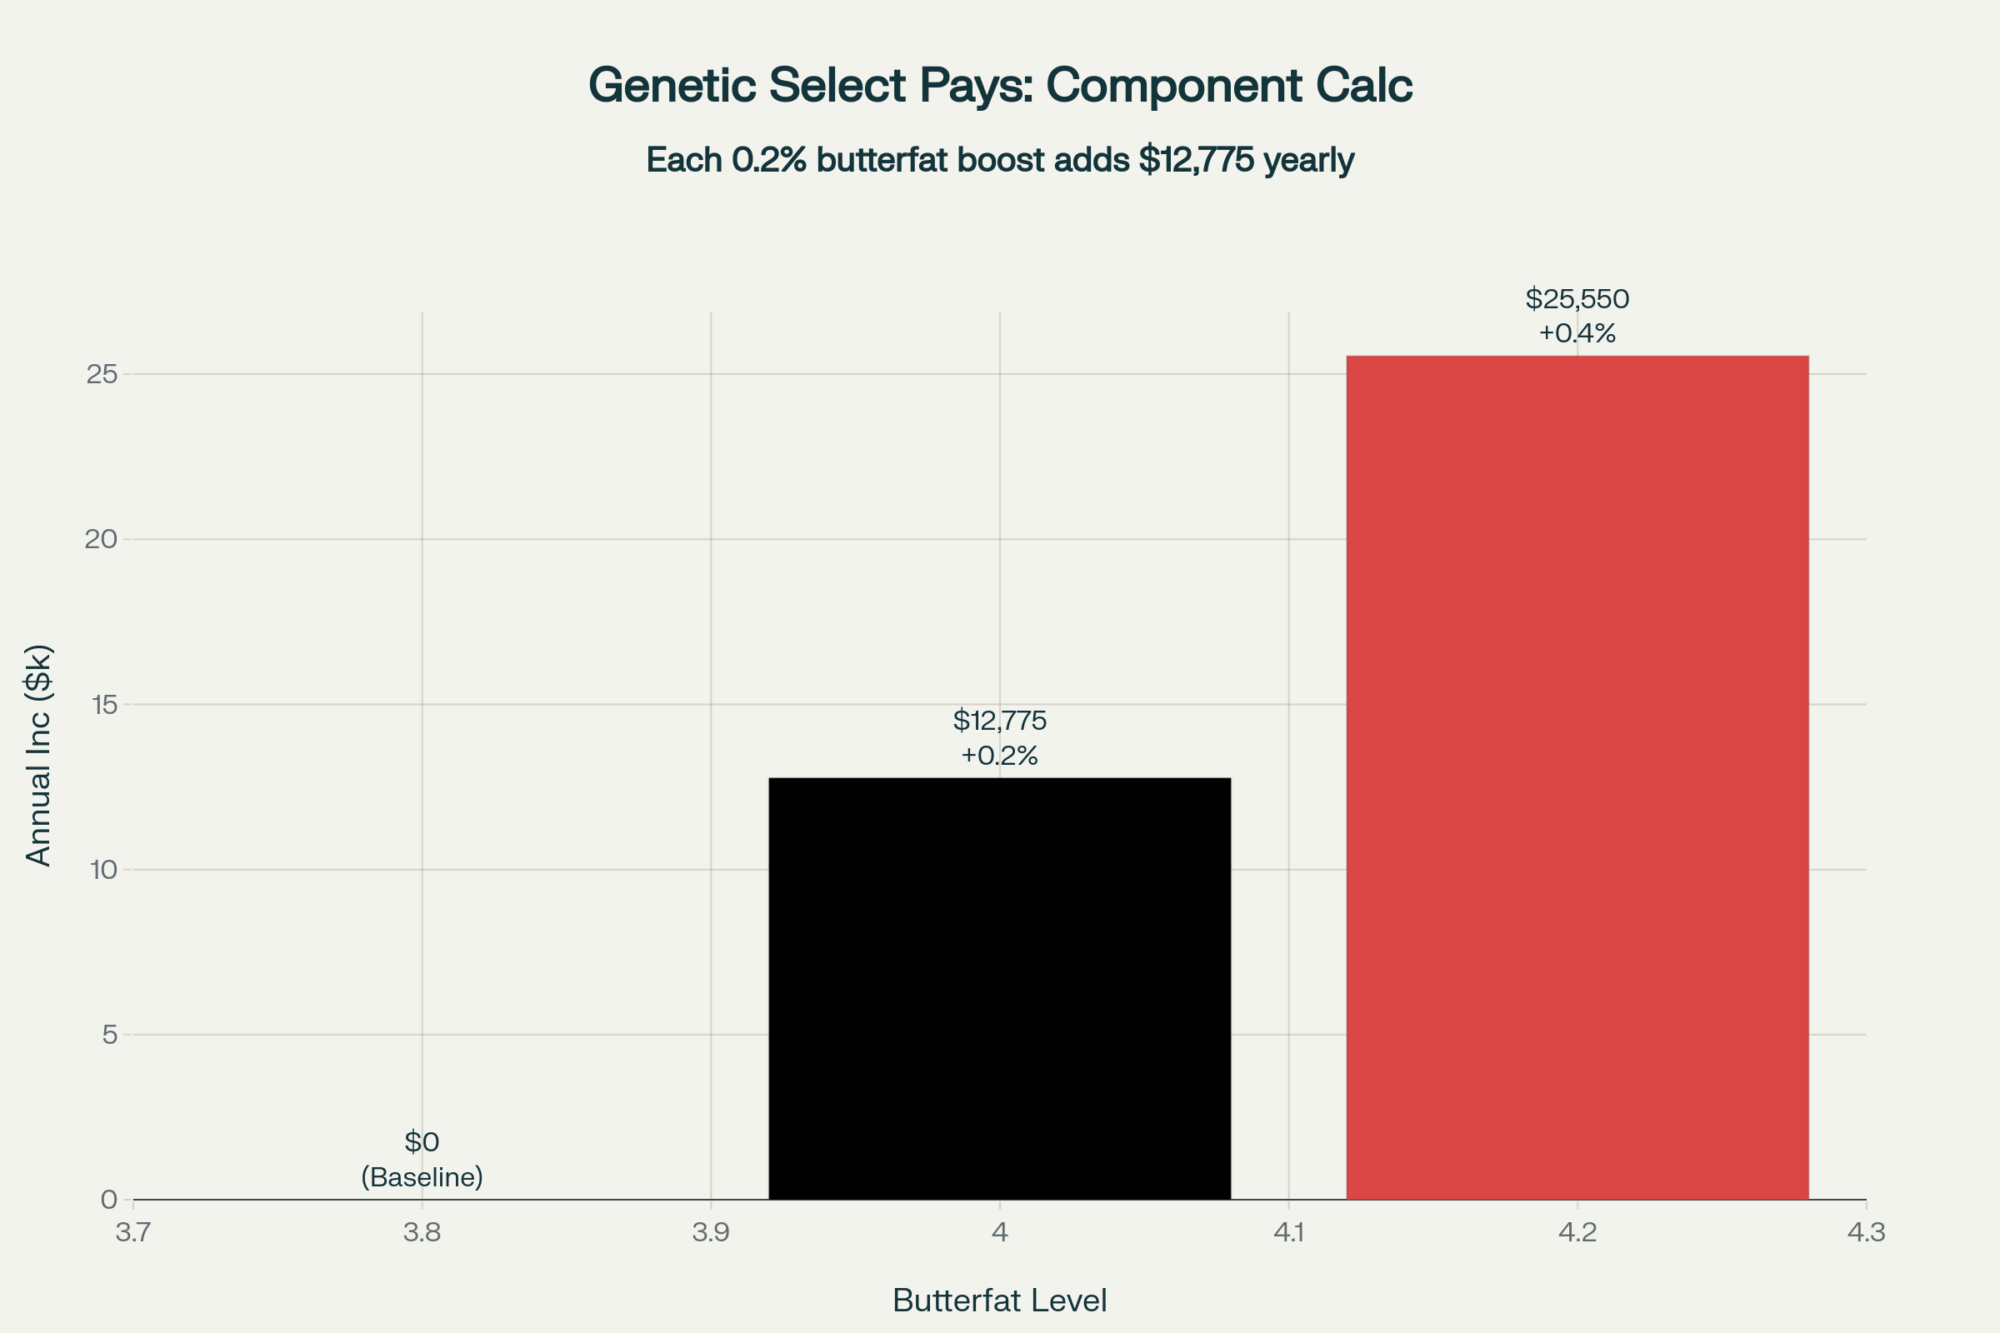
Zoetis and Dairy Management Inc. analyzed barn‑level data using the Dairy Wellness Profit Index (DWP$) and found that cows in the top 25% generated roughly £1,300 more lifetime income over feed cost than those in the bottom quartile in a UK study, and about US$1,474 more in comparable U.S. herds.
A more recent study published in the Journal of Dairy Science and summarized by Zoetis looked at 11 U.S. herds and found something that really grabs attention in 2025: cows in the top DWP$ quartile weren’t just more profitable – they also produced milk with about 12.9% lower methane intensity and roughly 9.5% lower manure nitrogen intensity per unit of milk compared with bottom‑quartile cows.
| Metric | Top Quartile | Bottom Quartile | Difference | % Advantage |
|---|---|---|---|---|
| Lifetime Income Over Feed Cost (USD) | $3,474 | $2,000 | +$1,474 | +74% |
| Lactations in Herd | 4.2 | 2.8 | +1.4 | +50% |
| Milk Solids per Lactation (lbs) | 3,240 | 2,580 | +660 | +26% |
| Methane Intensity (kg CO₂e per lb milk) | 0.92 | 1.05 | −0.13 | −12.9% |
| Manure N Intensity (g N per lb milk) | 4.8 | 5.3 | −0.5 | −9.5% |
So, when you put those pieces together, it’s reasonable – and supported by the field data – to say that in herds using DWP$ as intended, top‑quartile cows can be expected to generate somewhere on the order of $1,000 to $1,500 more lifetime income over feed cost than bottom‑quartile cows. It’s a range, not a promise, but it lines up across both UK and U.S. studies.
Now picture a 400‑cow freestall in Wisconsin turning over about 30% of its cows each year – roughly 120 heifers entering the parlour. If genomic testing and DWP$‑based selection mean 80 of those animals land in your top genetic quartile instead of being a random mix, and each of those cows brings in just $1,000 more lifetime income over feed cost, that’s about $80,000 in extra lifetime margin from that one group of replacements. That doesn’t even count the peace of mind from having fewer train‑wreck cows.
What I’ve noticed in herds that really make genetics pay is that they do three things clearly:
- Cheese‑market herds emphasize fat and protein yield, fertility, mastitis resistance, and good feet and legs because those traits show up directly in the milk cheque and cull bill.
- Fluid‑market herds in the Northeast and Upper Midwest still value volume, but they’ve learned that better fertility, lower mastitis, and fewer metabolic problems often save more money than chasing a little extra milk.
- Robot herds pay close attention to udder structure, teat placement, milking speed, and temperament because they’ve seen, the hard way, how box visits, refusals, and nervous cows turn into lost milk and burned‑out staff.
Genetics tends to work best when the herd has a simple, written plan that answers three questions:
- Which economic index—DWP$, Net Merit, Pro$, or a custom mix—actually reflects how we get paid and why we cull cows?
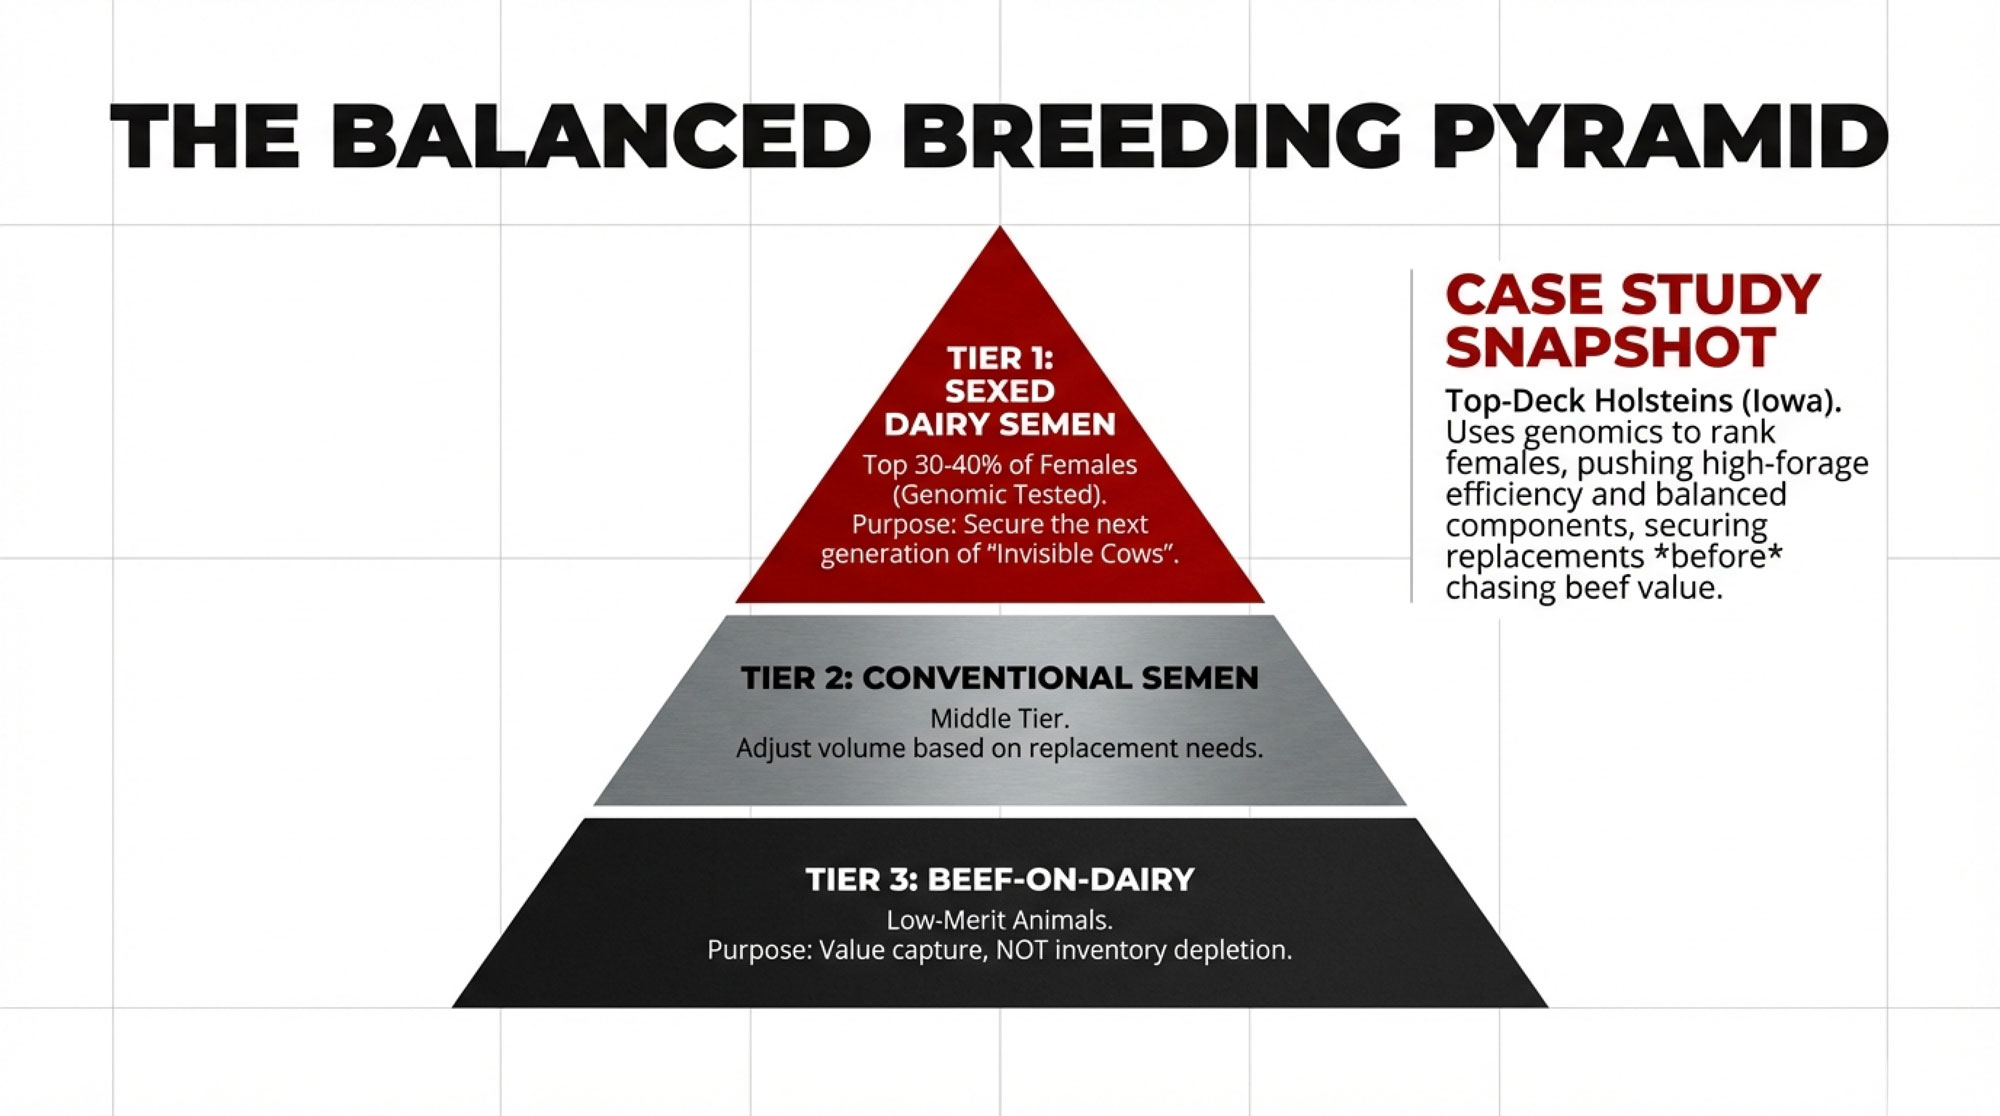
- Who gets sexed semen, who gets conventional dairy, and who gets beef‑on‑dairy, and how does that match our replacement needs and calf market?
- Where does genomic testing clearly earn its keep, and where are we comfortable making decisions without it?
When you revisit those answers once a year with your vet, nutritionist, and breeding advisor, genetic decisions stop being “we buy good bulls” and start being another tool in your profitability plan.
Robots, Parlours, and Tech That Actually Pays
Now to the topic that comes up at almost every winter meeting: robots versus parlours, and which technology actually pays.
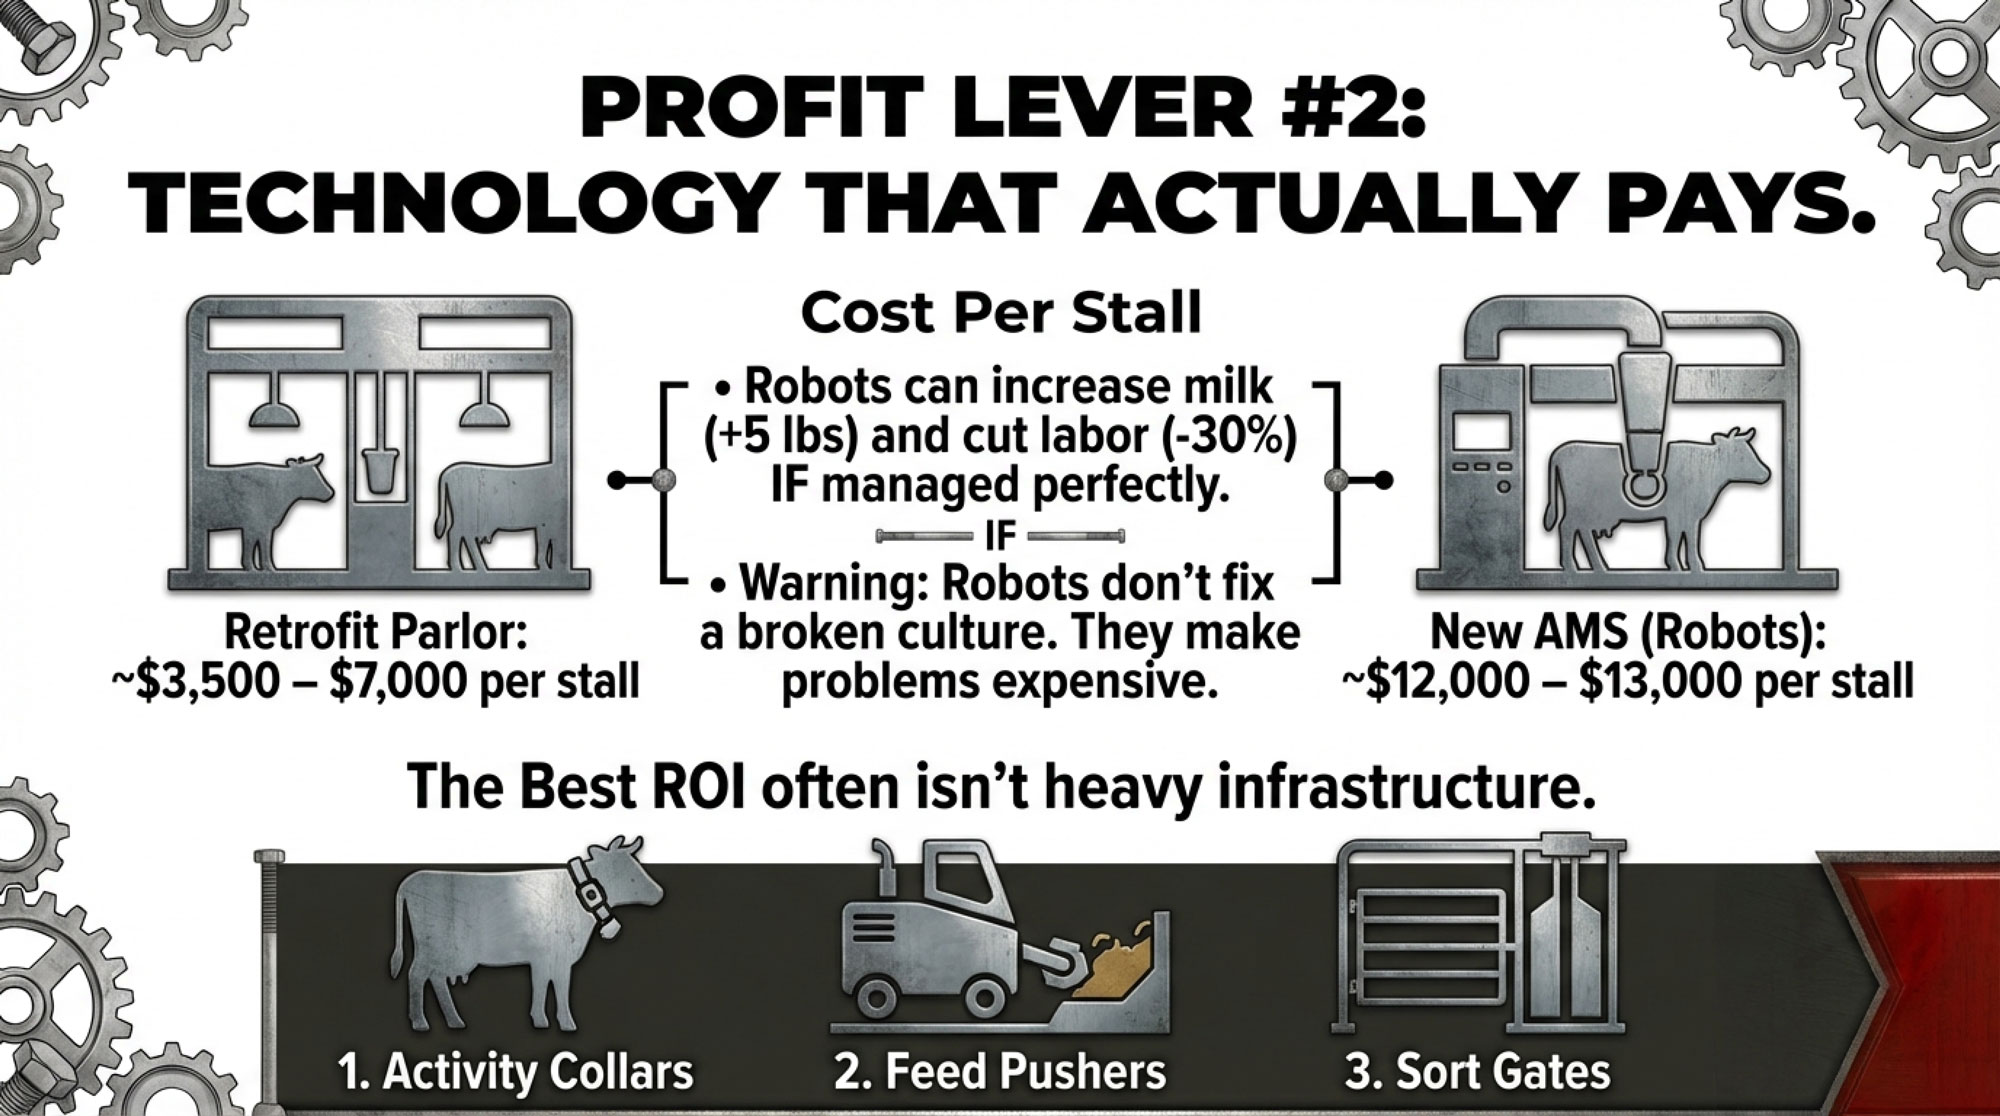
A 2022 feature pulled together several automatic milking system studies and reported that AMS can increase milk production by up to about 12% and reduce milking labour needs by as much as 30% in well‑managed herds. One of the highlighted studies showed robot‑milked cows producing roughly 2.4 kilograms – about 5.3 pounds – more milk per day than parlour‑milked cows, thanks mainly to more frequent milking and tighter routines. Other research in peer‑reviewed journals and extension materials echoes those possibilities, while repeatedly stressing that results depend heavily on barn design and management.
On the cost side, Wisconsin Extension’s 2022 “Building Cost Estimates – Ag Facilities” gives some solid ballpark figures that many lenders and consultants are using:
- Retrofitting an existing parlour typically costs $3,500 to $7,000 per milking stall.
- Building a new parlour with its own structure, concrete, utilities, and support spaces can cost $28,000 to $36,000 per stall.
- A complete AMS setup – robots, barns or major renovations, manure systems, and cow‑flow infrastructure – commonly comes in around $12,000 to $13,000 per stall when you add everything together.
Case studies presented at the Precision Dairy Conference and shared by consultants in North America often cluster AMS projects in the $11,000 to $14,000 per cow range once all related infrastructure is factored in.
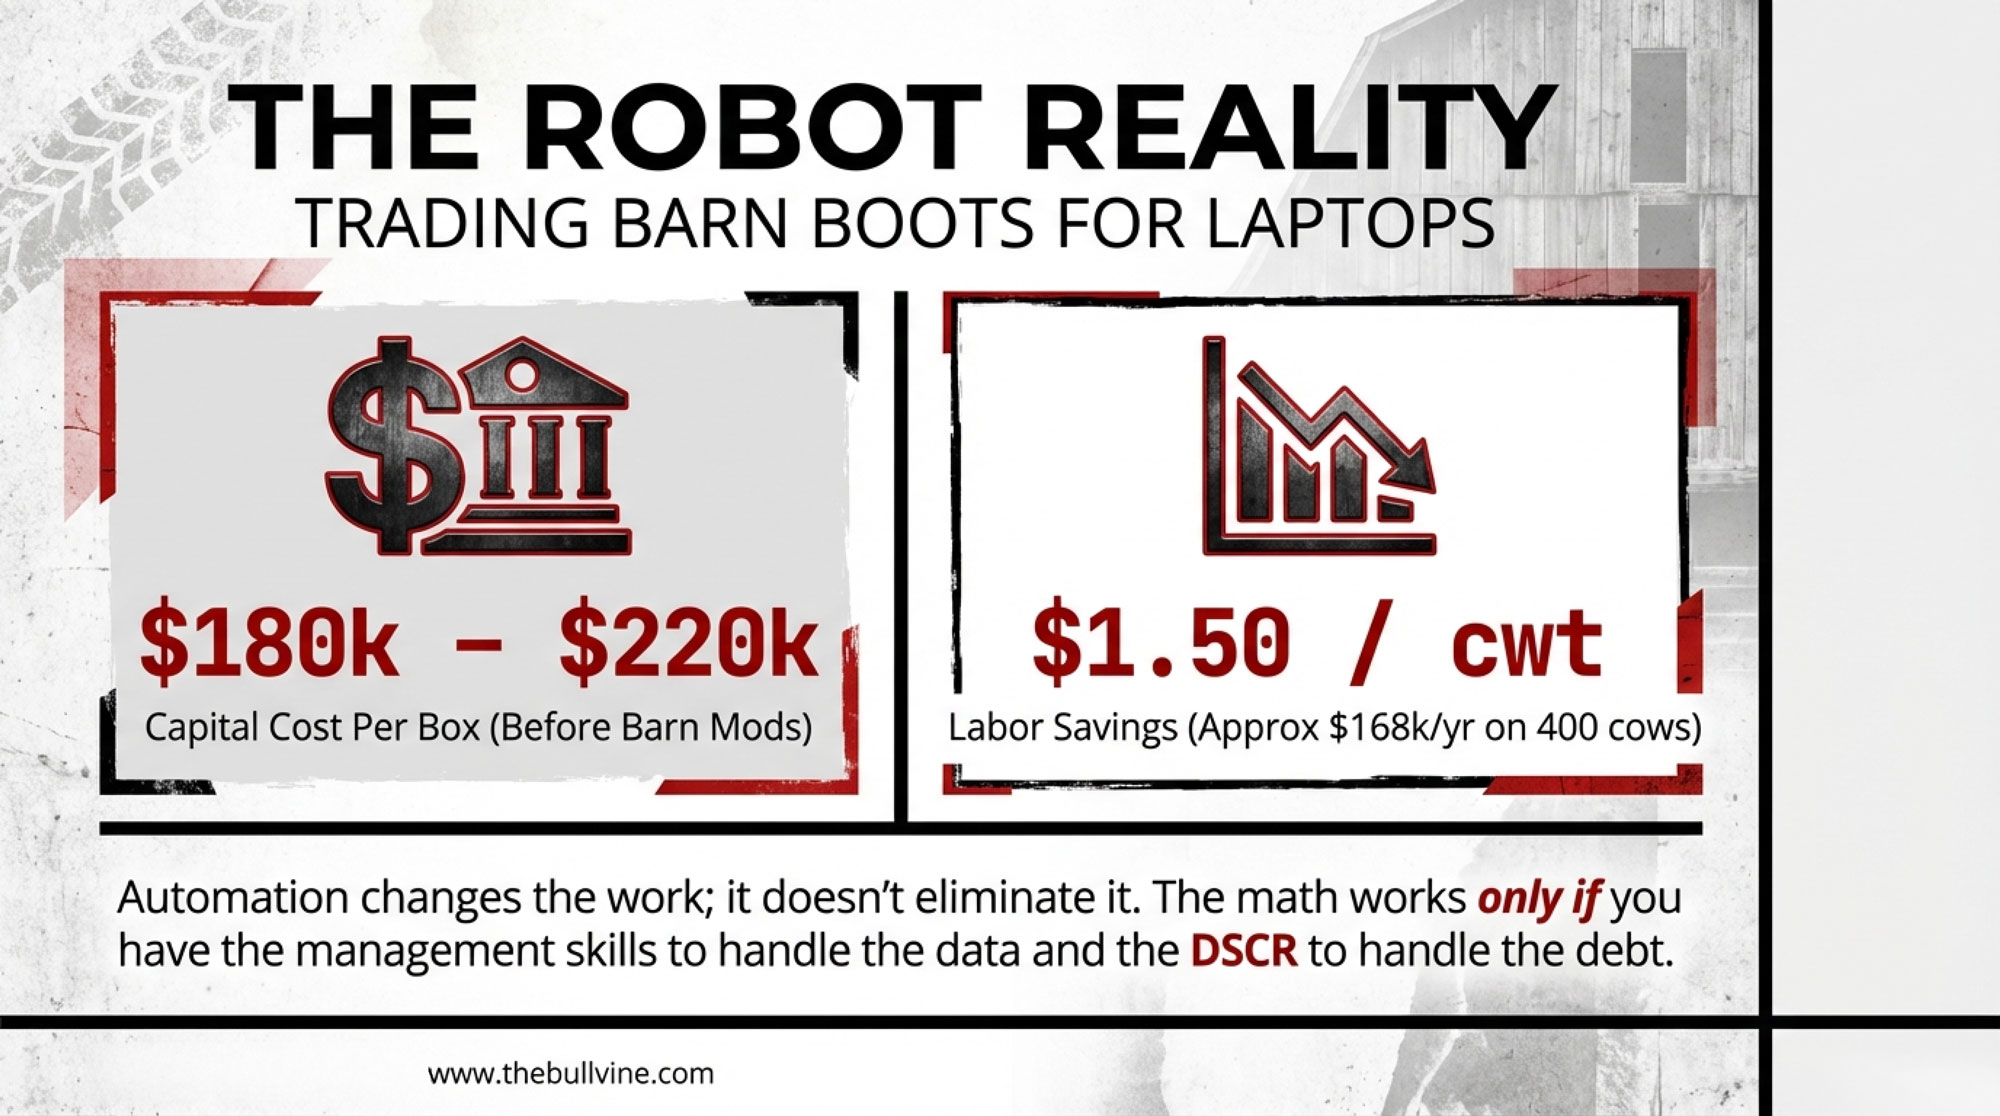
So let’s walk through a realistic example. Take a 240‑cow freestall in Wisconsin or Pennsylvania, considering four robots:
- Capital outlay: It’s not hard, once you add robots, stall work, some concrete, building adjustments, and basic manure and cow‑flow changes, to end up near $2.5 million in total capital.
- Milk lift assumption: Say an extra 5 lb per cow per day. That’s on the optimistic side but consistent with upper‑end AMS study results when barn layout and management are dialled in.
- Labour savings: If milking labour is genuinely reorganized, many case farms have reported trimming the equivalent of roughly 1.5 full‑time positions from milking chores.
- Annual benefit: With those assumptions and typical milk and wage levels, it’s reasonable to see more than $150,000 per year in combined extra income over feed cost and labour savings.
In that kind of scenario, the payback math can look pretty decent.
But here’s where a lot of producers quietly nod: in plenty of real‑world AMS installs, the milk lift ends up closer to 2–3 lb per cow, and labour doesn’t truly drop because the farm is short‑staffed elsewhere or the daily schedule never really gets redesigned. Industry case reports and extension consultants have been honest about that. In those herds, the payback stretches out and sometimes never really hits what the original spreadsheet promised.
Robots don’t fix a broken schedule or a toxic work culture. They just make those problems more expensive.
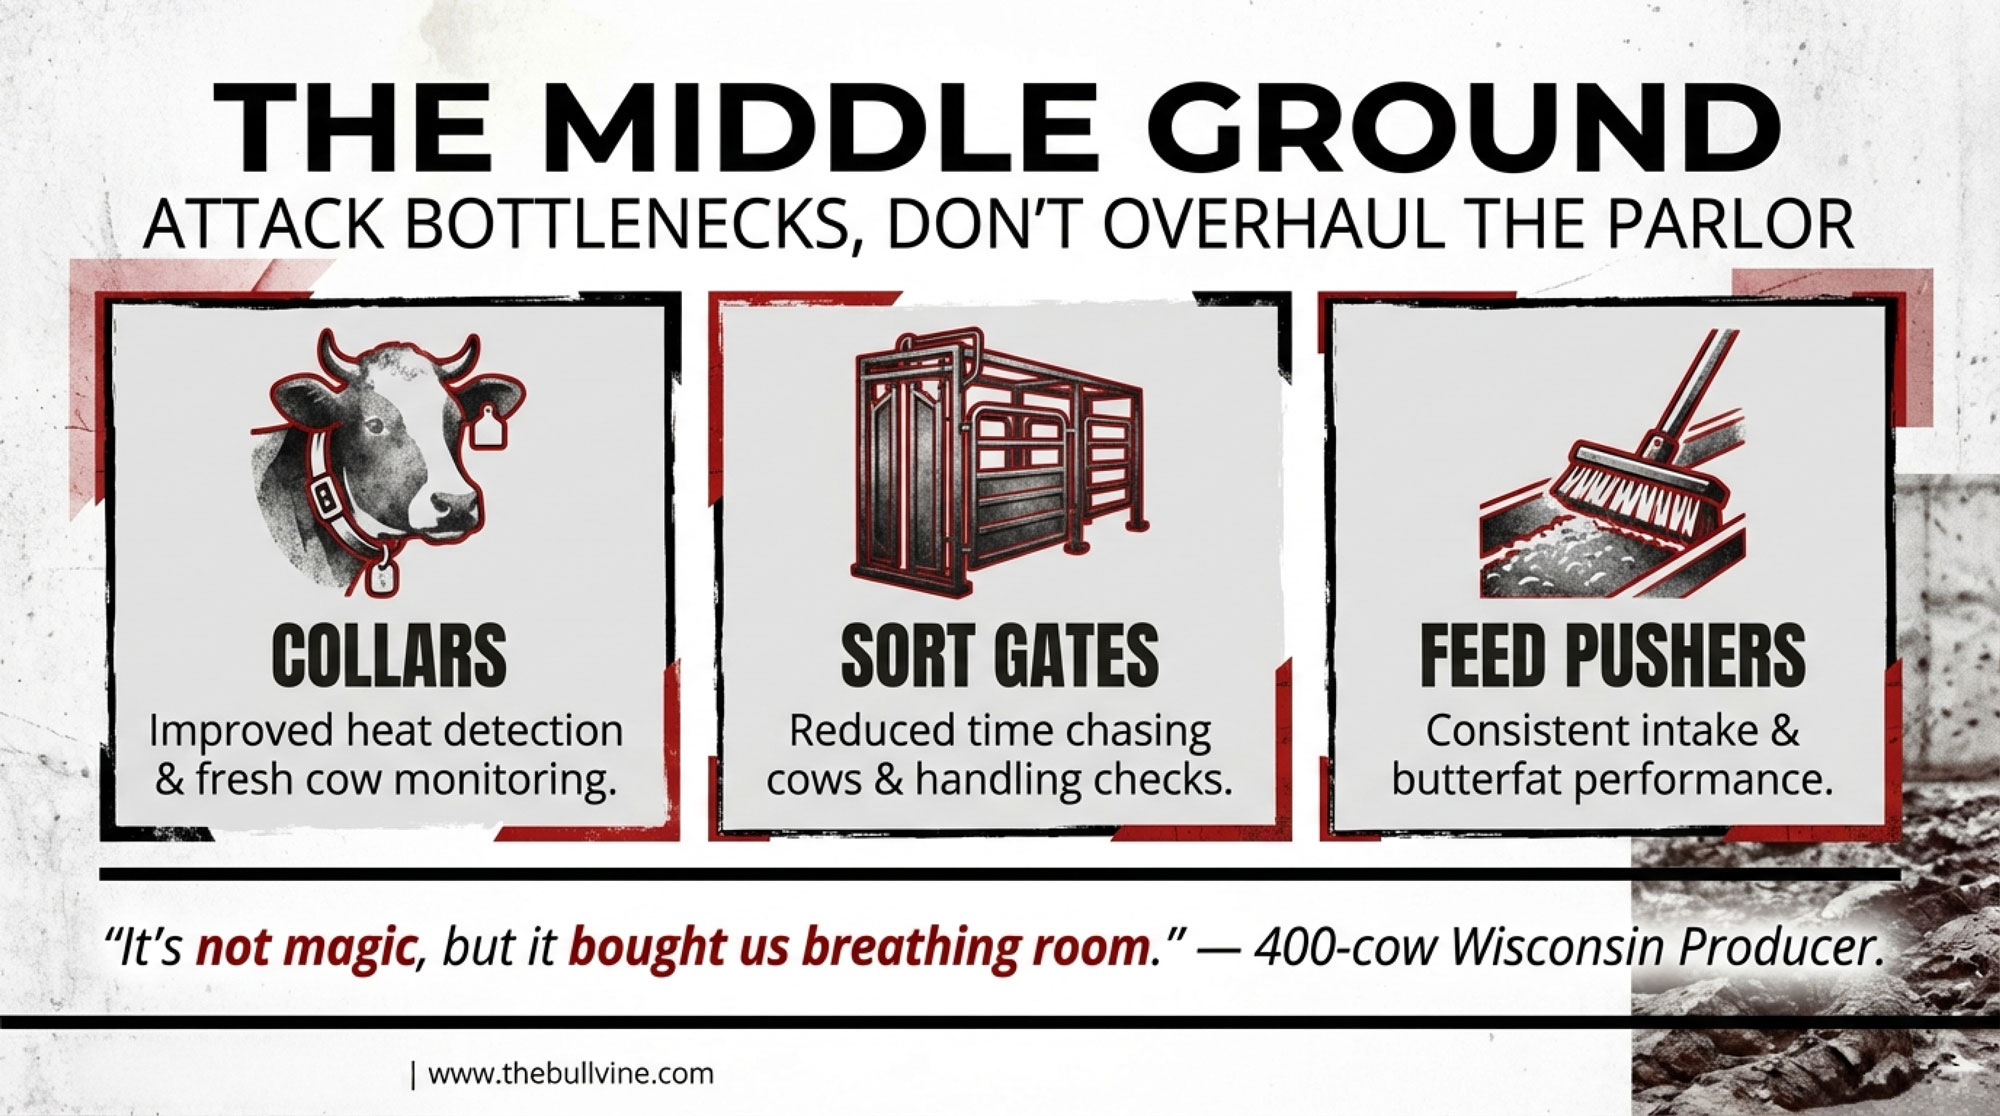
That’s why a lot of very profitable 400‑ to 600‑cow herds in the Midwest and Northeast still see their best returns coming from:
- A well‑designed, efficient parlour that cows move through calmly and quickly.
- Strong fresh cow management and transition pens that keep problems small and short.
- High‑quality forage systems and consistent feeding routines that support components.
- A handful of “workhorse” tech tools that support those systems rather than distract from them.
Those workhorse tools often include:
- Activity and rumination collars that improve heat detection and flag health issues early, which multiple studies and field reports have tied to better reproductive performance and lower disease‑related losses.
- Feed pushers that keep TMR in front of cows and frequently bump milk a couple of pounds per cow per day in both research and on‑farm results.
- Sort gates, in‑line milk meters, and mastitis sensors that make grouping, fresh cow checks, and mastitis detection more systematic and less dependent on one person’s memory.
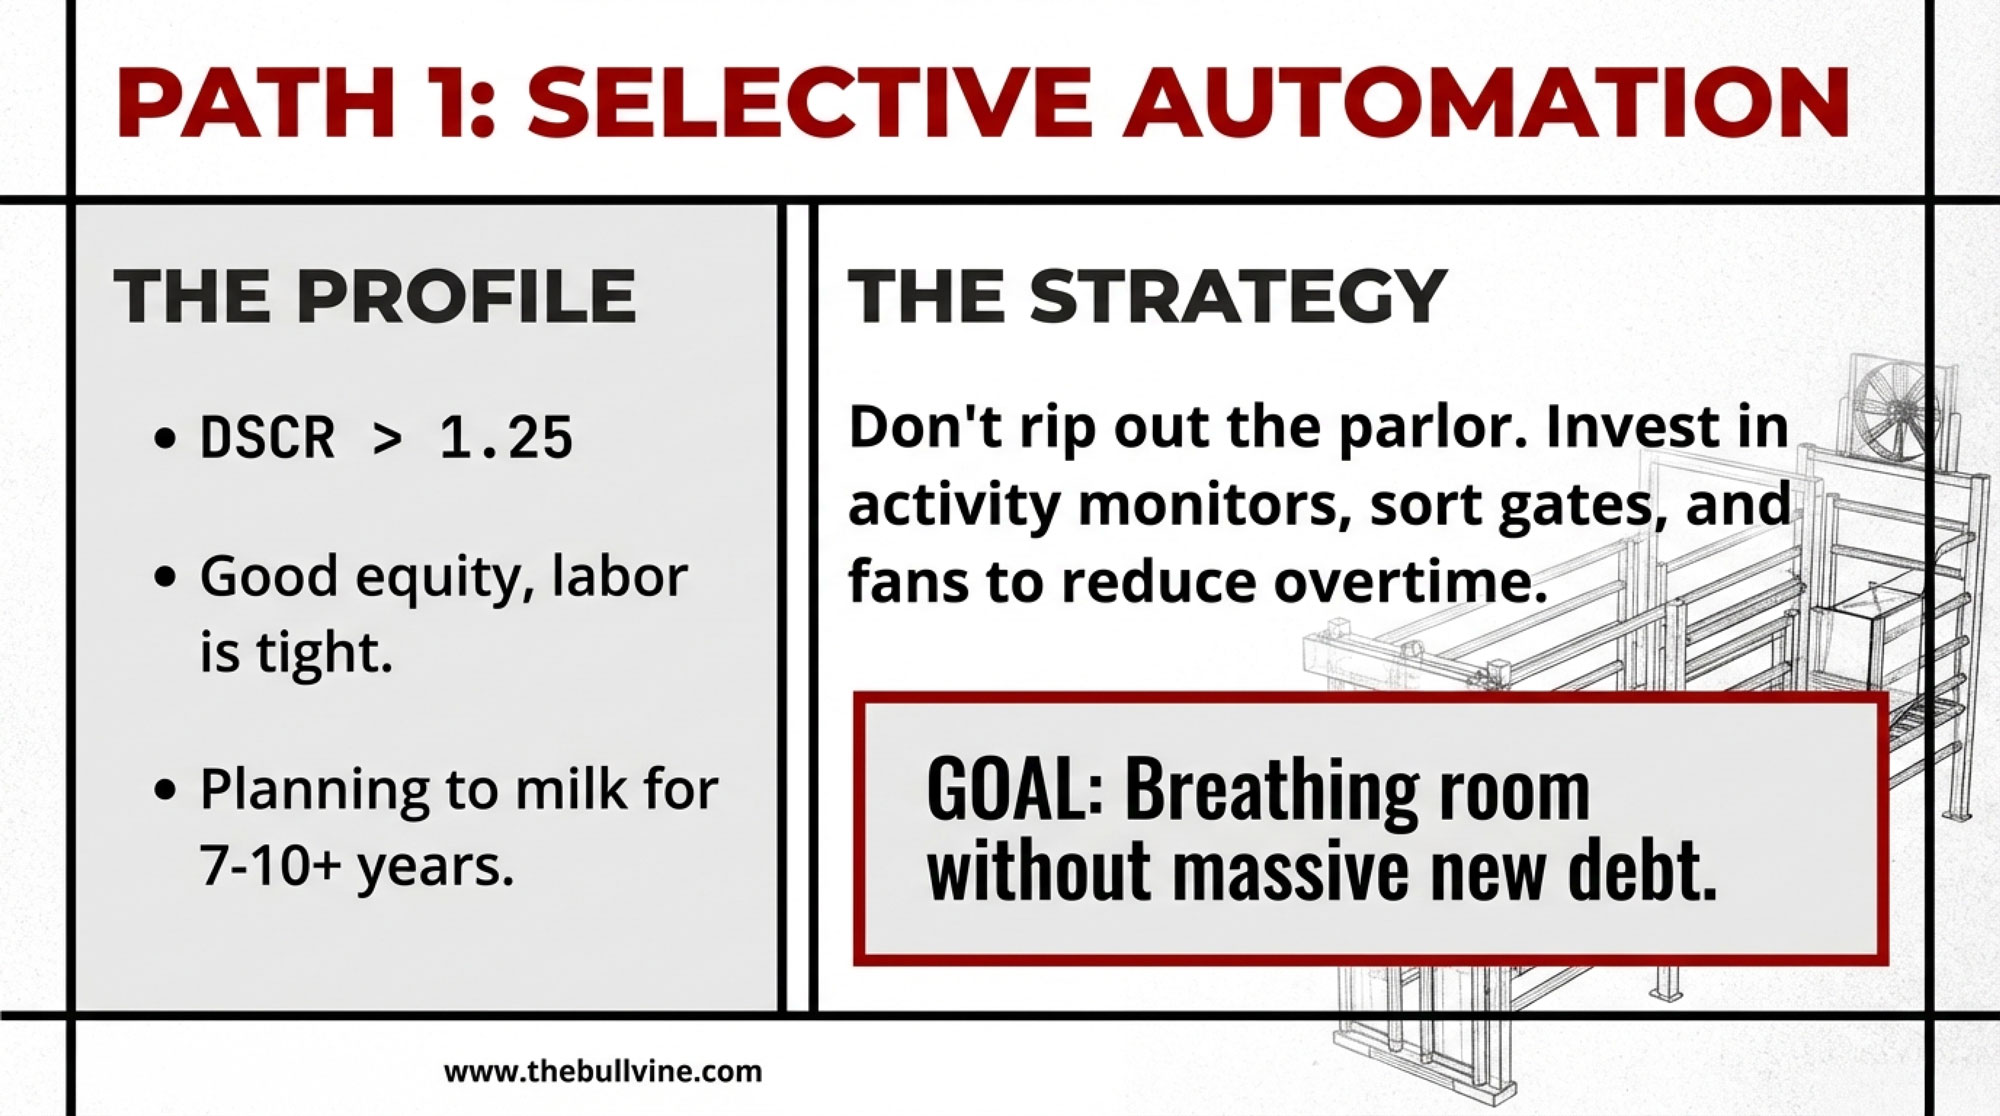
For most U.S. herds, the filter that seems to work best is simple: at conservative milk prices and realistic interest rates, can we honestly say this technology will improve dollars of margin per stall and labour per cwt on our farm? If the math only works when everything goes perfectly, it probably belongs on the “someday” list.
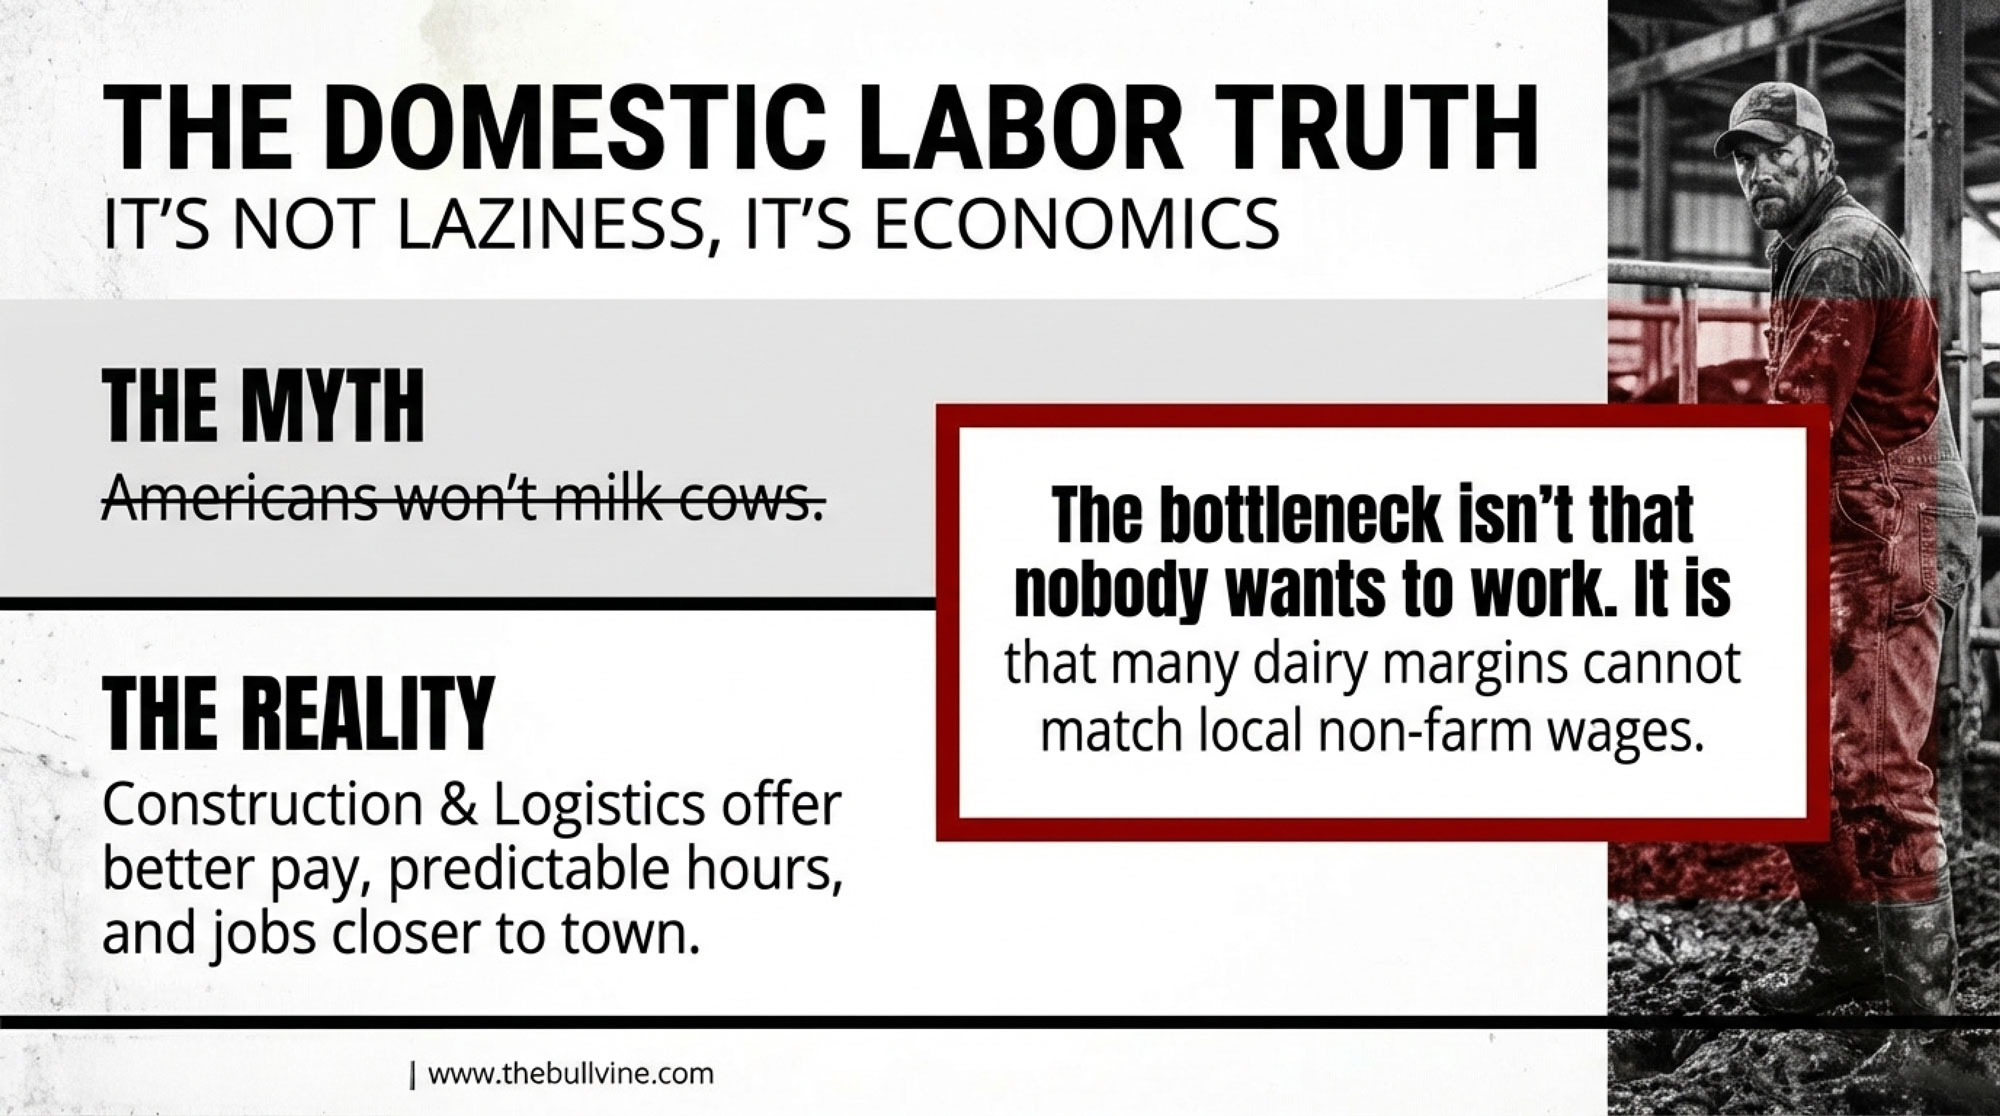
Labour: The Bottleneck Behind Everything Else
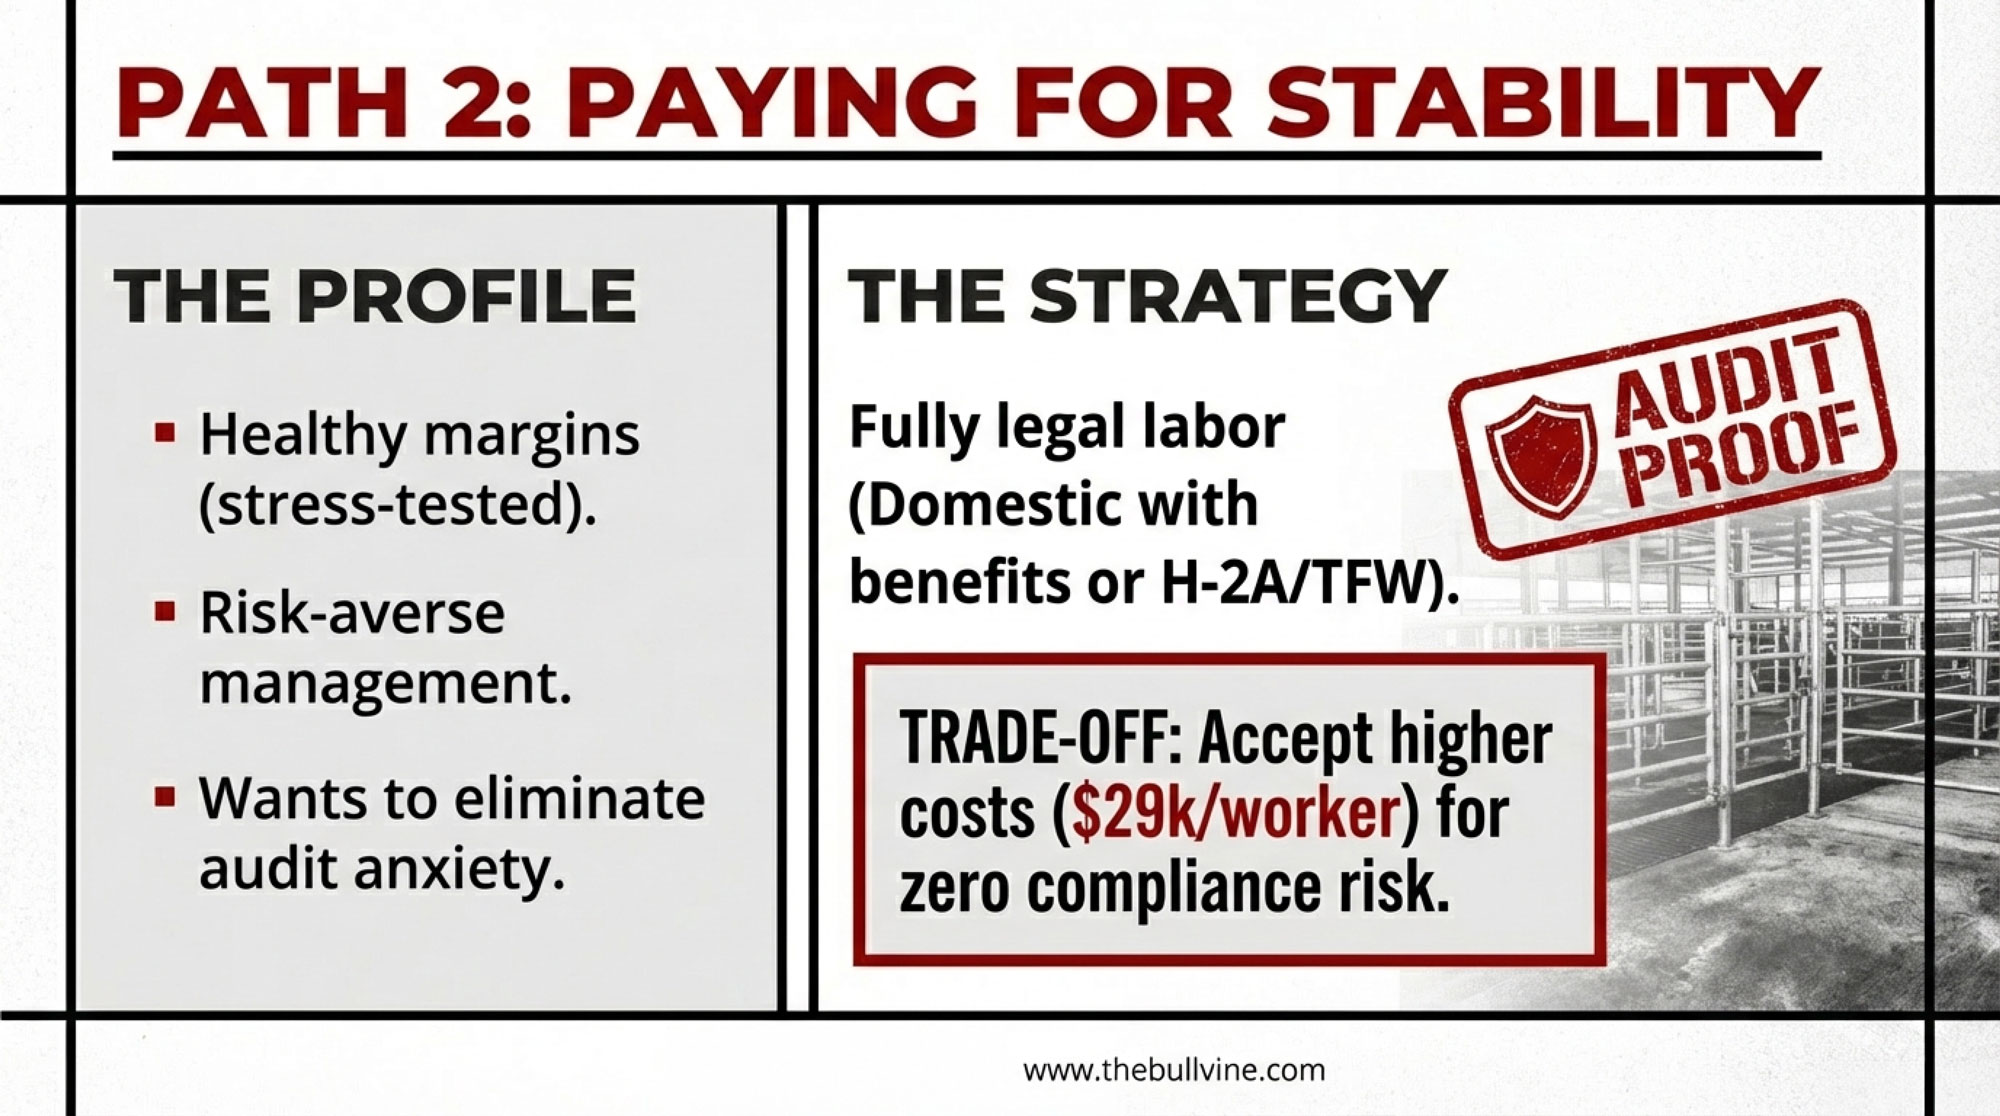
If there’s one theme that keeps coming up from New York freestalls to Idaho dry lot systems, it’s labour – finding people, keeping people, and getting consistent work from people.
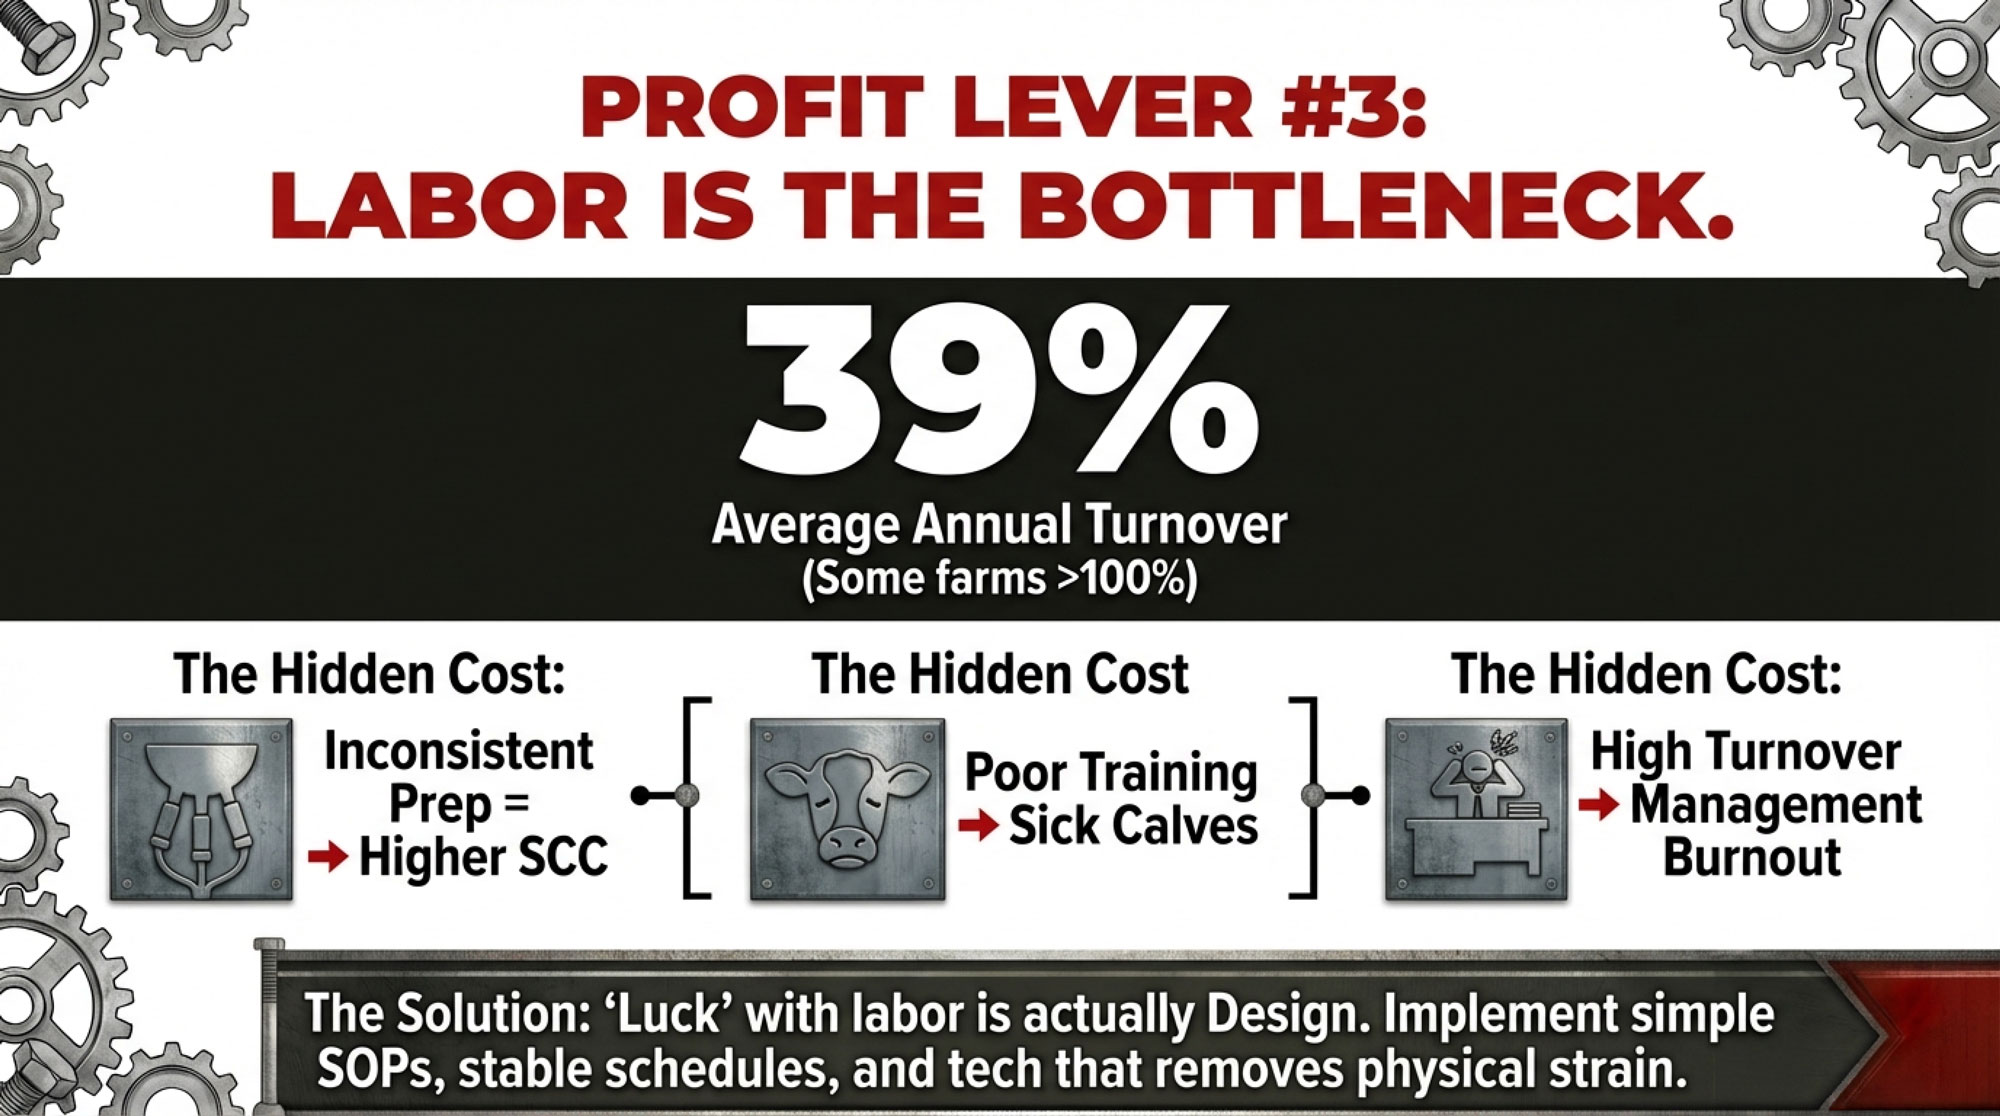
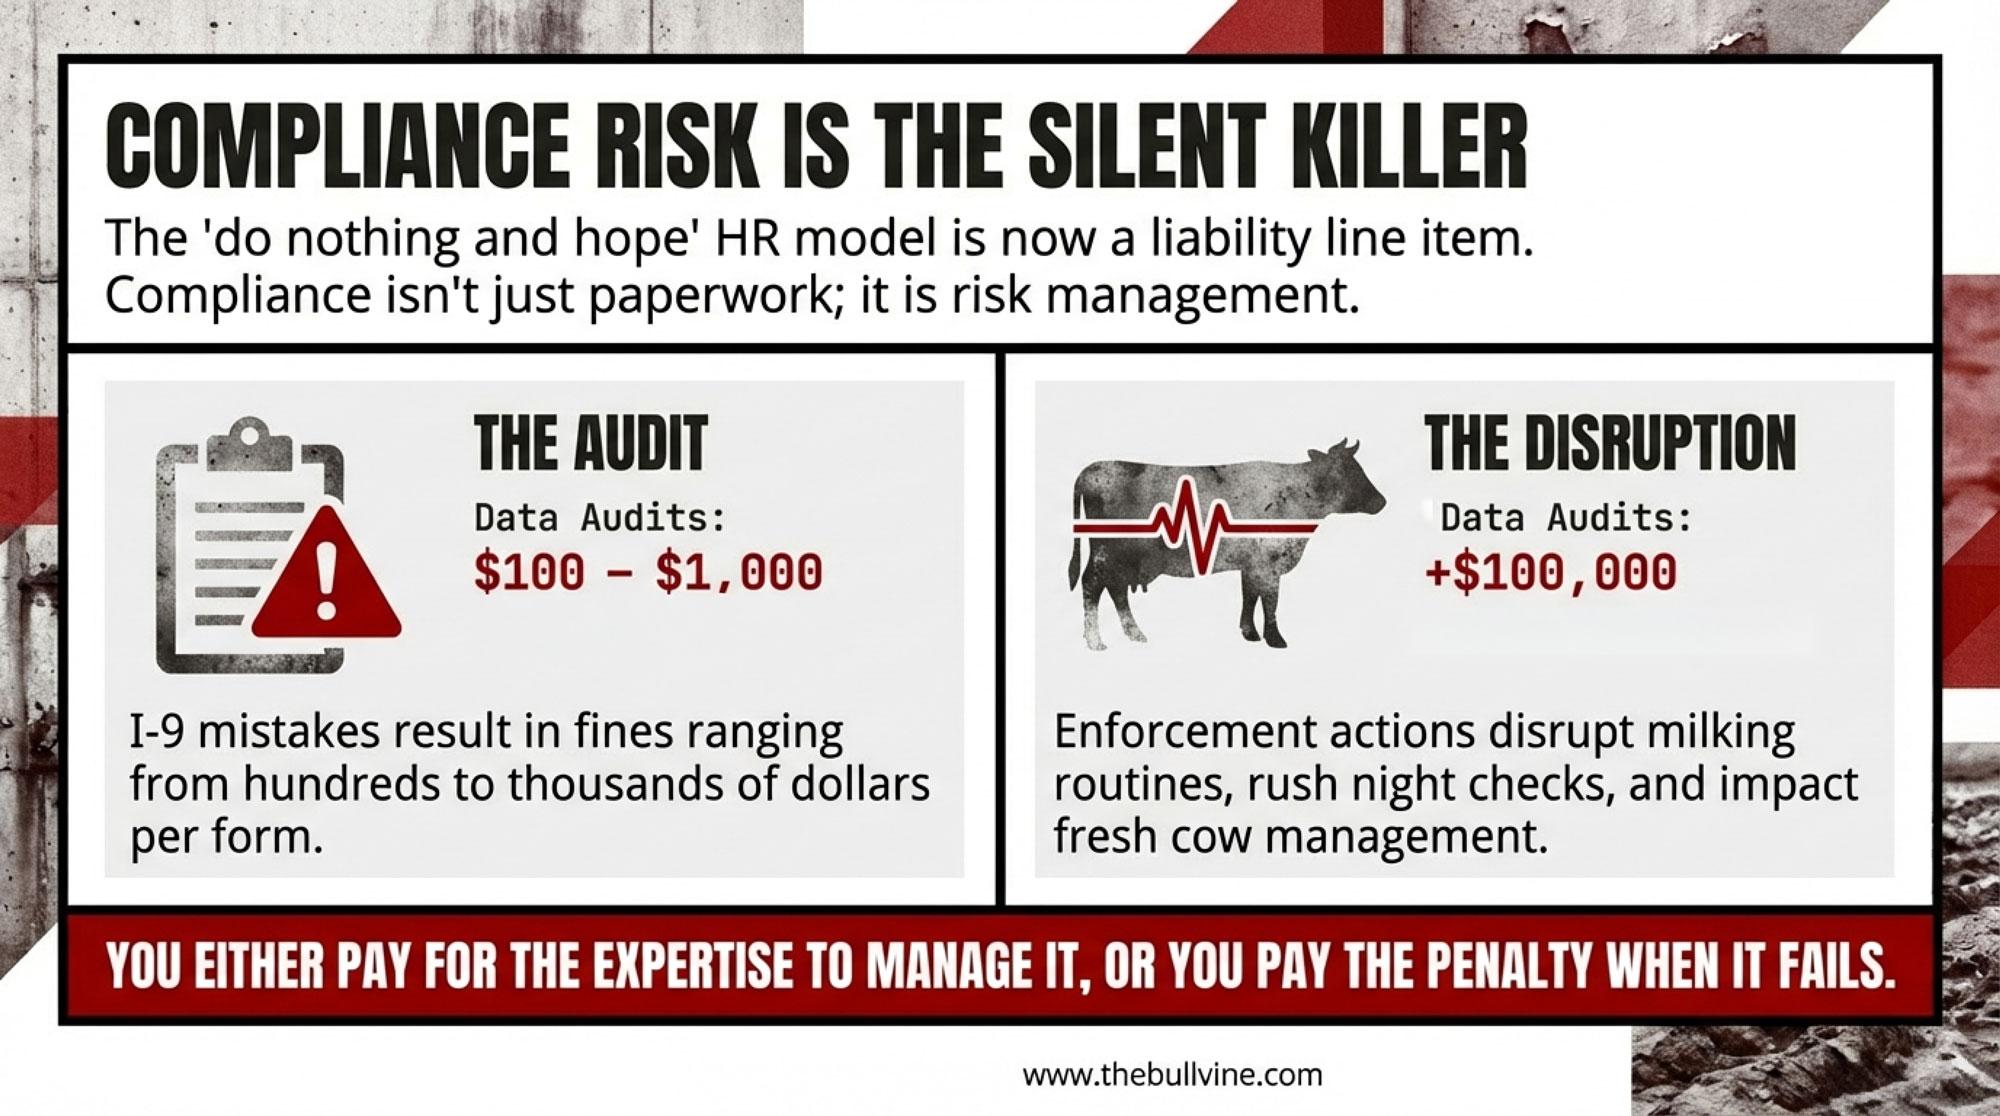
A national survey done under the National Dairy FARM Program’s Workforce Development initiative, with Texas A&M leading the analysis, surveyed more than 600 dairies and found average annual employee turnover around 38.8% on U.S. dairies. Dairy Herd’s coverage of that work noted that while this isn’t wildly different from some other private‑sector averages, it’s a major challenge for farms that struggle to find and train reliable employees.
A 2018 paper in the Journal of Dairy Science that examined employee management practices on large U.S. dairies found annual employee turnover ranging from 8% to 144%, meaning some operations were turning over more than their entire workforce in a year. That level of churn doesn’t just hurt morale. It hits milking consistency, fresh cow monitoring, calf care, and training costs in ways you feel in both the tank and the cheque.
Extension programs through Cornell PRO‑DAIRY and universities in Michigan and Wisconsin have also highlighted how heavily many dairies rely on immigrant labour, and how housing, immigration uncertainty, language support, and basic management practices influence whether good employees stay. Producers in those programs often report that high turnover shows up as:
- Inconsistent parlour prep and higher bulk tank SCC.
- Missed early signs in transition cows that later turn into expensive problems.
- Shortcuts in calf protocols and higher calf morbidity.
- Lower average milk yield and more stress for owners and managers.
| Annual Turnover Rate | Bulk Tank SCC (cells/mL) | Fresh-Cow Disease Rate (%) | Calf Morbidity (%) | Milk Loss per Cow (lbs/yr) | Est. Monthly Cost per 300-Cow Herd (USD) |
| <15% (Low) | 150K–180K | 8–12% | 5–8% | 200–400 | $2,500–$4,000 |
| 15–30% (Moderate) | 220K–280K | 15–18% | 10–12% | 600–800 | $6,500–$9,500 |
| 30–50% (High) | 320K–420K | 22–28% | 15–18% | 1,000–1,400 | $12,000–$18,000 |
| >50% (Severe) | 500K+ | 35%+ | 22%+ | 1,800–2,200 | $22,000–$35,000 |
What I’ve noticed in operations that seem “lucky” with labour is that luck usually looks a lot like design:
- Barns and work routines are set up so that on a bad day – when someone is off or quits suddenly – the system still functions safely and adequately, even if it’s not perfect.
- Core tasks like milking prep, colostrum handling, sick cow checks, and pre‑fresh monitoring have simple written SOPs, and someone actually takes time to train people on them.
- Technologies like sort gates, collars, and feed pushers are chosen not just for their ROI on paper, but because they remove repetitive or physically punishing tasks that burn people out.
So the real question for a lot of herds is this: if you put a realistic dollar value on lost milk, extra treatments, extra culls, and your own stress when turnover is high, what would it actually be worth to have a more stable, better‑trained crew? Sometimes the answer looks a lot like higher wages, better housing, more structure – and only then more gadgets.
Environment, Consumers, and Where Policy Is Pointed
Whether we like it or not, environmental and consumer expectations are part of the lane conversation now.
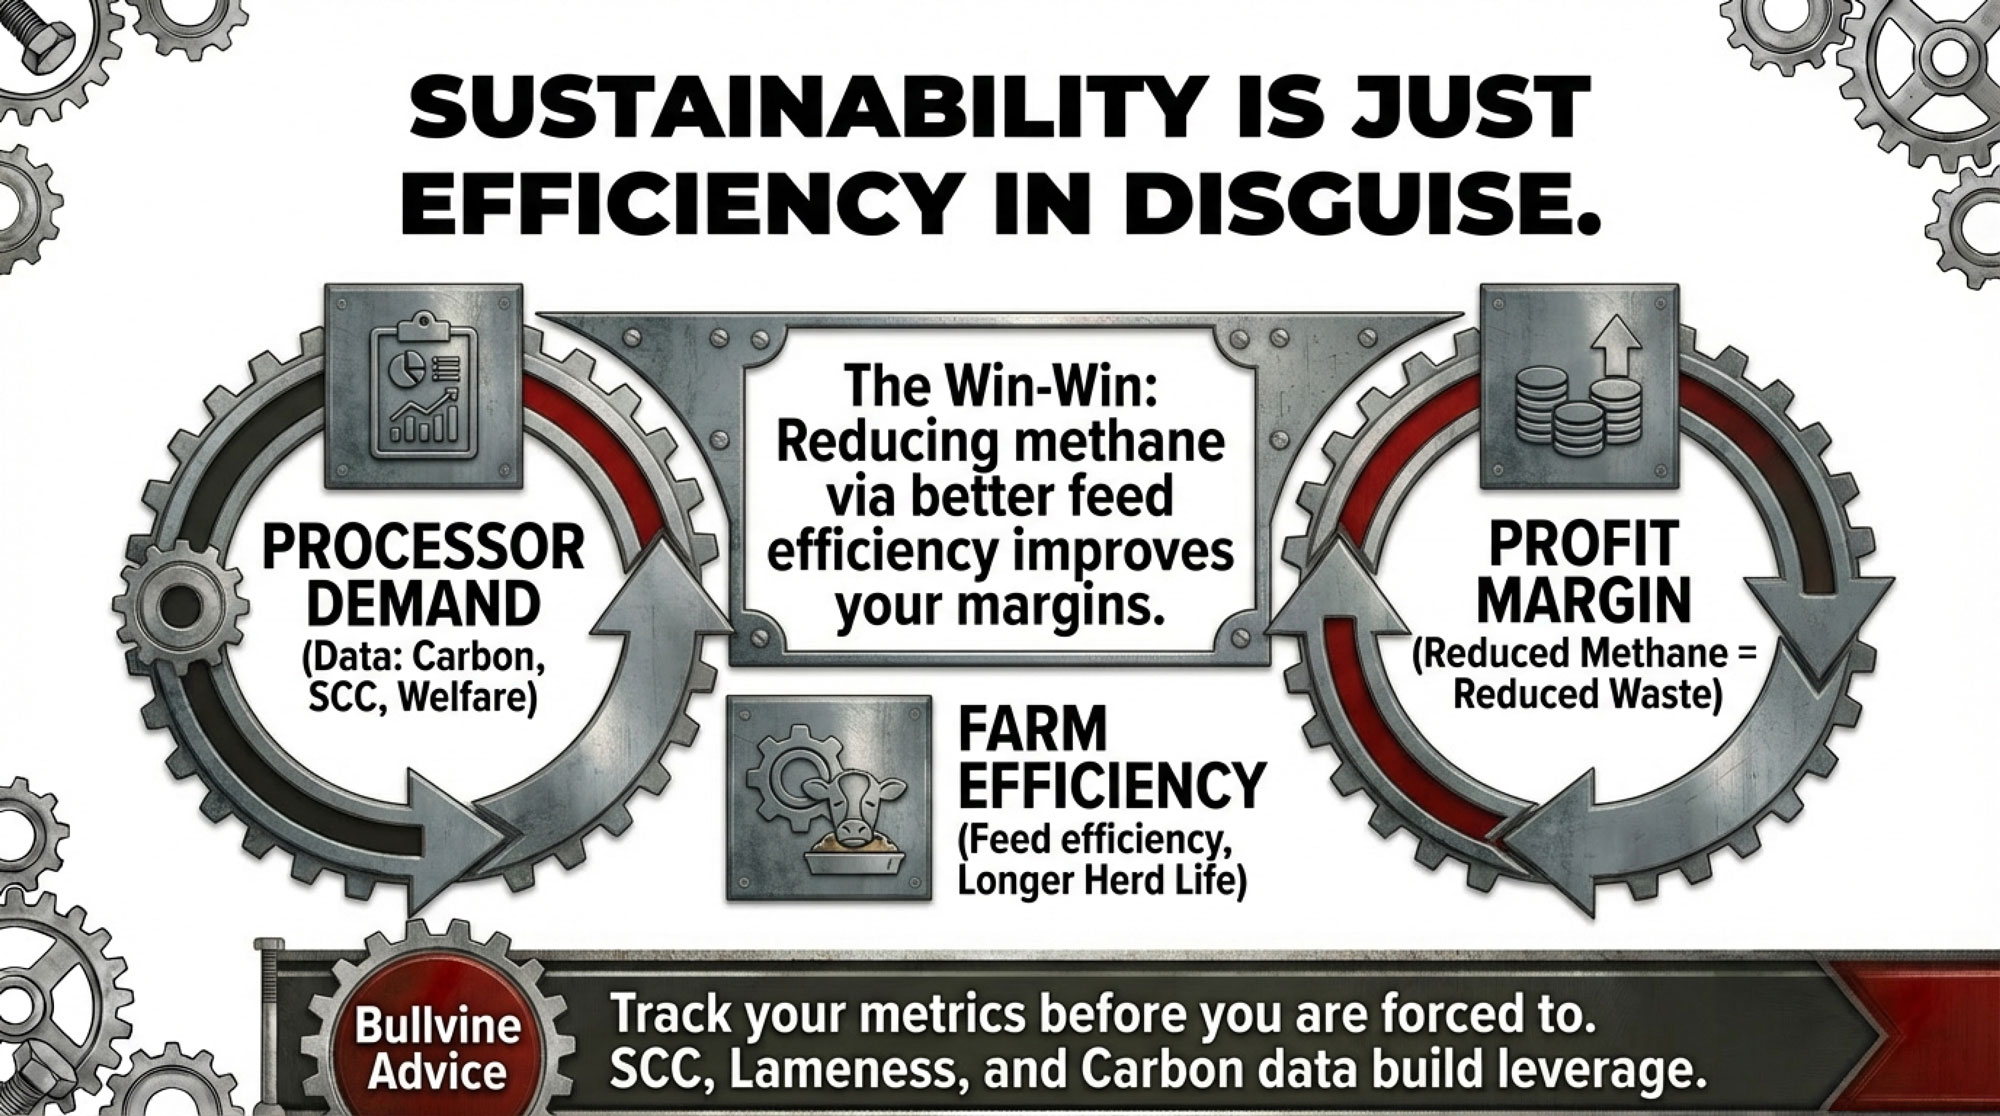
The Innovation Center for U.S. Dairy has laid out a sector‑wide goal for greenhouse‑gas neutrality by 2050 through the Net Zero Initiative, and this goal is supported by life‑cycle assessment work from universities such as Texas A&M. Those LCAs consistently show that most of dairy’s greenhouse‑gas footprint comes from feed production, enteric methane, and manure management.
What’s encouraging is that many of the steps that shrink that footprint – better feed efficiency, stronger fresh cow management, longer productive lives, fewer involuntary culls – also tend to improve cost per cwt and margins. That DWP$ study is a good example: cows selected for higher DWP$ were more profitable and produced milk with lower methane and manure nutrient intensity per unit of milk.
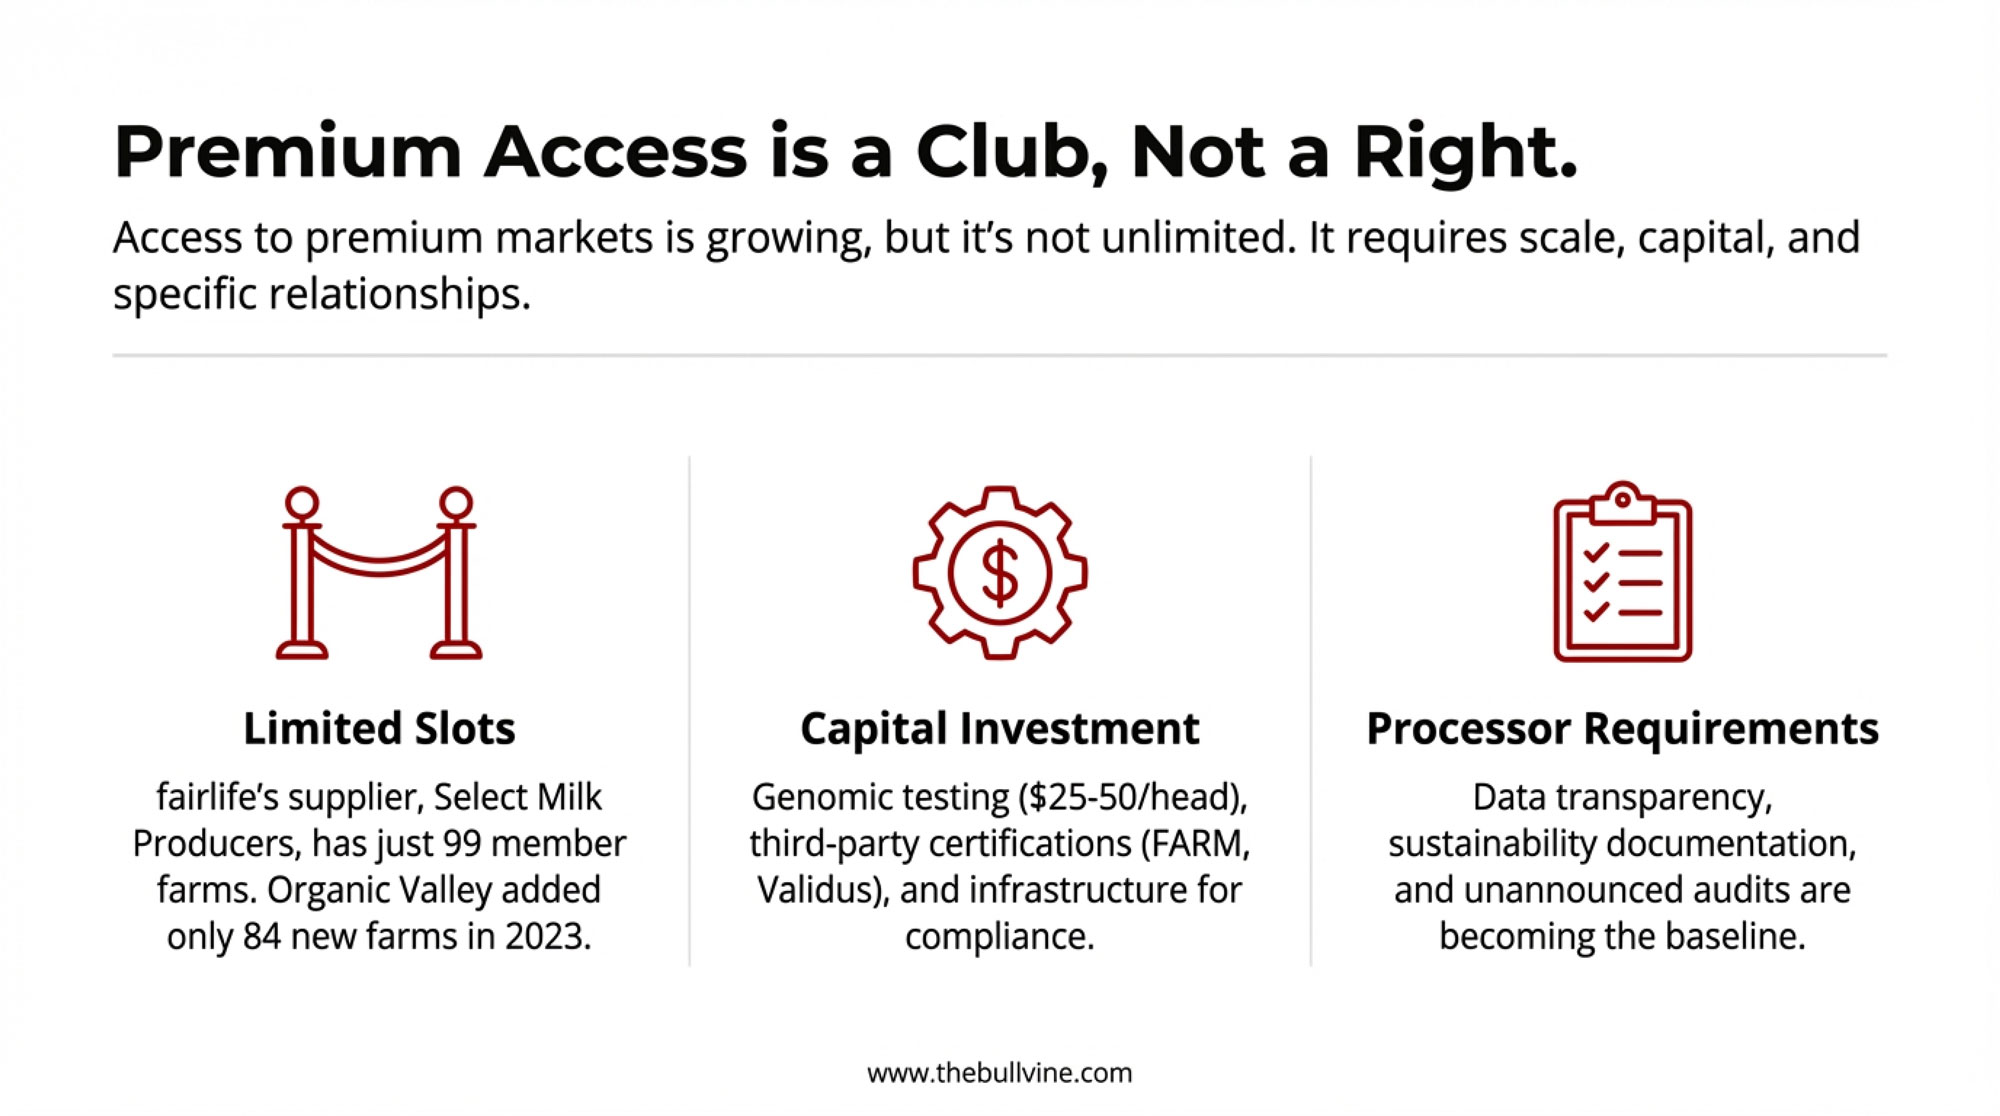
On the market side, the shift toward cheese, butter, and other ingredients is prompting more questions from processors and retailers about animal welfare, environmental impact, and traceability. In practice, that’s showing up as programs that ask farms to document things like:
- Bulk tank SCC and mastitis treatment rates.
- Lameness levels and reasons cows leave the herd.
- Transition‑cow performance, stillbirths, and overall cow mortality.
- Manure-handling practices and, in some programs, basic carbon or nutrient values.
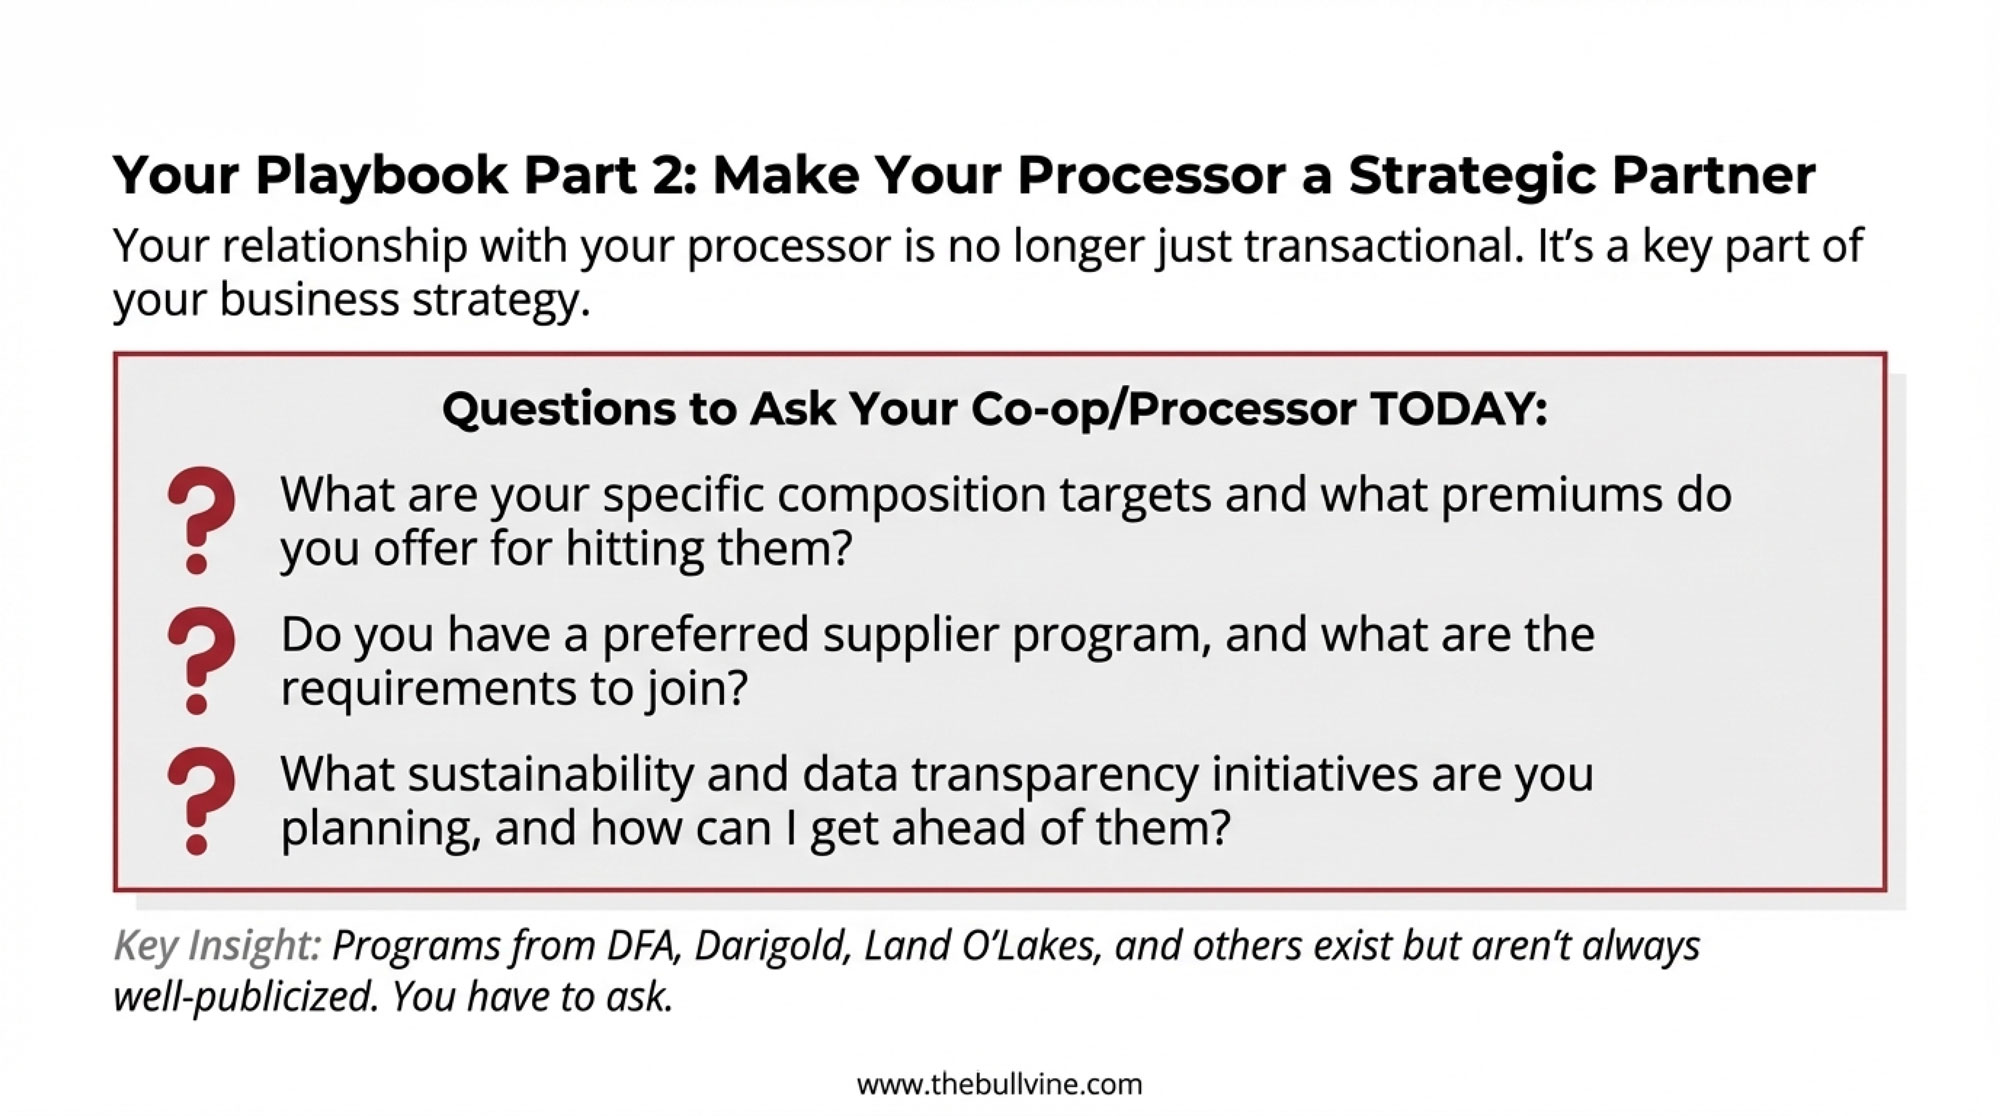
In Wisconsin and Northeastern plants supplying branded retail milk and yogurt, this is already happening through sustainability questionnaires, on‑farm audits, and sometimes through price incentives or program bonuses for certain performance levels.
It’s easy to see all of that as “one more thing.” But the flip side is that the metrics processors want to see often align with what already matters for profitability and labour sanity. Getting a handle on your SCC trends, cull reasons, lameness, and transition‑cow outcomes isn’t just for paperwork; it’s also good business.
On‑Farm Processing and Branding: Romantic and Real
For a 90‑cow tie‑stall in upstate New York or a 150‑cow herd in Pennsylvania, it’s natural to look at a successful farmstead cheese maker or local milk brand and wonder if that’s the way through.
University of Vermont and other land‑grant work has followed organic and value‑added farms that improved their financial position by adding on‑farm processing or direct marketing. When there’s strong local demand, and the owners have both the interest and the skill set, on‑farm processing can absolutely lift income per cwt.
But those same studies are pretty blunt about what it takes:
- Capital for plant renovations, pasteurizers, vats, coolers, and packaging can easily be in the hundreds of thousands of dollars, even on a modest scale.
- Owners suddenly need to learn food safety regulations, distribution logistics, branding, marketing, and customer service – on top of managing cows, crops, and people.
- Cash flow in the first few years can be tight, and success depends heavily on the local market and whether someone on the farm truly enjoys the business side.
So if you’re thinking about going down that road, it really helps to compare two honest scenarios side by side:
- Putting that capital and management energy into your own processing and marketing.
- Putting the same resources into better forage, higher butterfat performance, stronger fresh cow and calf programs, and labour and tech improvements inside your current marketing channel.
In a lot of case studies, both paths can work. The winner usually comes down to your people and your local market, not just what the spreadsheet says.
Three U.S. Farm Types, Three Practical Paths
To make this less theoretical, let’s walk through three common U.S. farm profiles and talk about where they likely sit and what that suggests.
1. A 100‑Cow Tie‑Stall in Upstate New York
- Likely lane: efficiency, with a bit of niche potential.
- Reality: smaller tie‑stall herds in the Northeast are often shipping into competitive fluid and cheese markets, where butterfat levels, SCC, and day‑to‑day consistency can make the difference between staying afloat and calling an auctioneer.
Practical focus might look like:
- Pushing butterfat performance and overall component yield through better forage quality, balanced rations, and tight fresh cow management in the weeks around calving.
- Keeping SCC low and reproduction steady to protect days in milk and minimize involuntary culls.
- If there’s strong local demand – and someone on the farm genuinely wants to deal with customers – exploring a small, manageable value‑added product like seasonal cream or limited cheese runs, with extension support on food safety and realistic capital budgets.
2. A 450‑Cow Freestall in Wisconsin
- Likely lane: efficiency sweet spot.
- Reality: shipping to a cheese plant under multiple‑component pricing, with a mix of family and hired staff and a typical Upper Midwest forage base.
Practical focus might include:
- Using a custom genetic index that emphasizes fat and protein yield, fertility, and health – potentially blending DWP$ or other health‑focused indexes with your pay price and culling patterns.
- Running a conservative AMS‑versus‑parlour comparison using Wisconsin cost benchmarks, realistic milk‑lift assumptions, and local wage and labour availability, rather than best‑case numbers from brochures.
- Prioritizing tech that clearly improves transition‑cow outcomes, labour per cwt, and data visibility – activity collars, sort gates, feeding tools – before committing to bigger, more complex systems.
3. A 2,500‑Cow Dry Lot System in New Mexico
- Likely lane: scale with discipline.
- Reality: exposed to feed cost swings, water and environmental rules, and a competitive labour market in a hot, dry climate.
Practical focus could be:
- Leaning into genetics for fertility, mastitis resistance, and moderate mature size to support longevity and milk per stall under heat stress.
- Using beef‑on‑dairy strategically to monetize lower‑end genetics, improve calf value, and avoid raising more replacements than you really need.
- Prioritizing capital for cooling, water infrastructure, feed efficiency, and manure management first – the things that hit both cost per cwt and environmental risk – before simply adding more cows.
- Building a basic set of sustainability and welfare metrics (SCC trends, cull reasons, lameness levels, manure handling) so you’re ready when processors and lenders start asking tougher questions.
None of these paths are easy. But each one looks more manageable when you’re honest about which lane you’re really in and what your main constraints actually are.

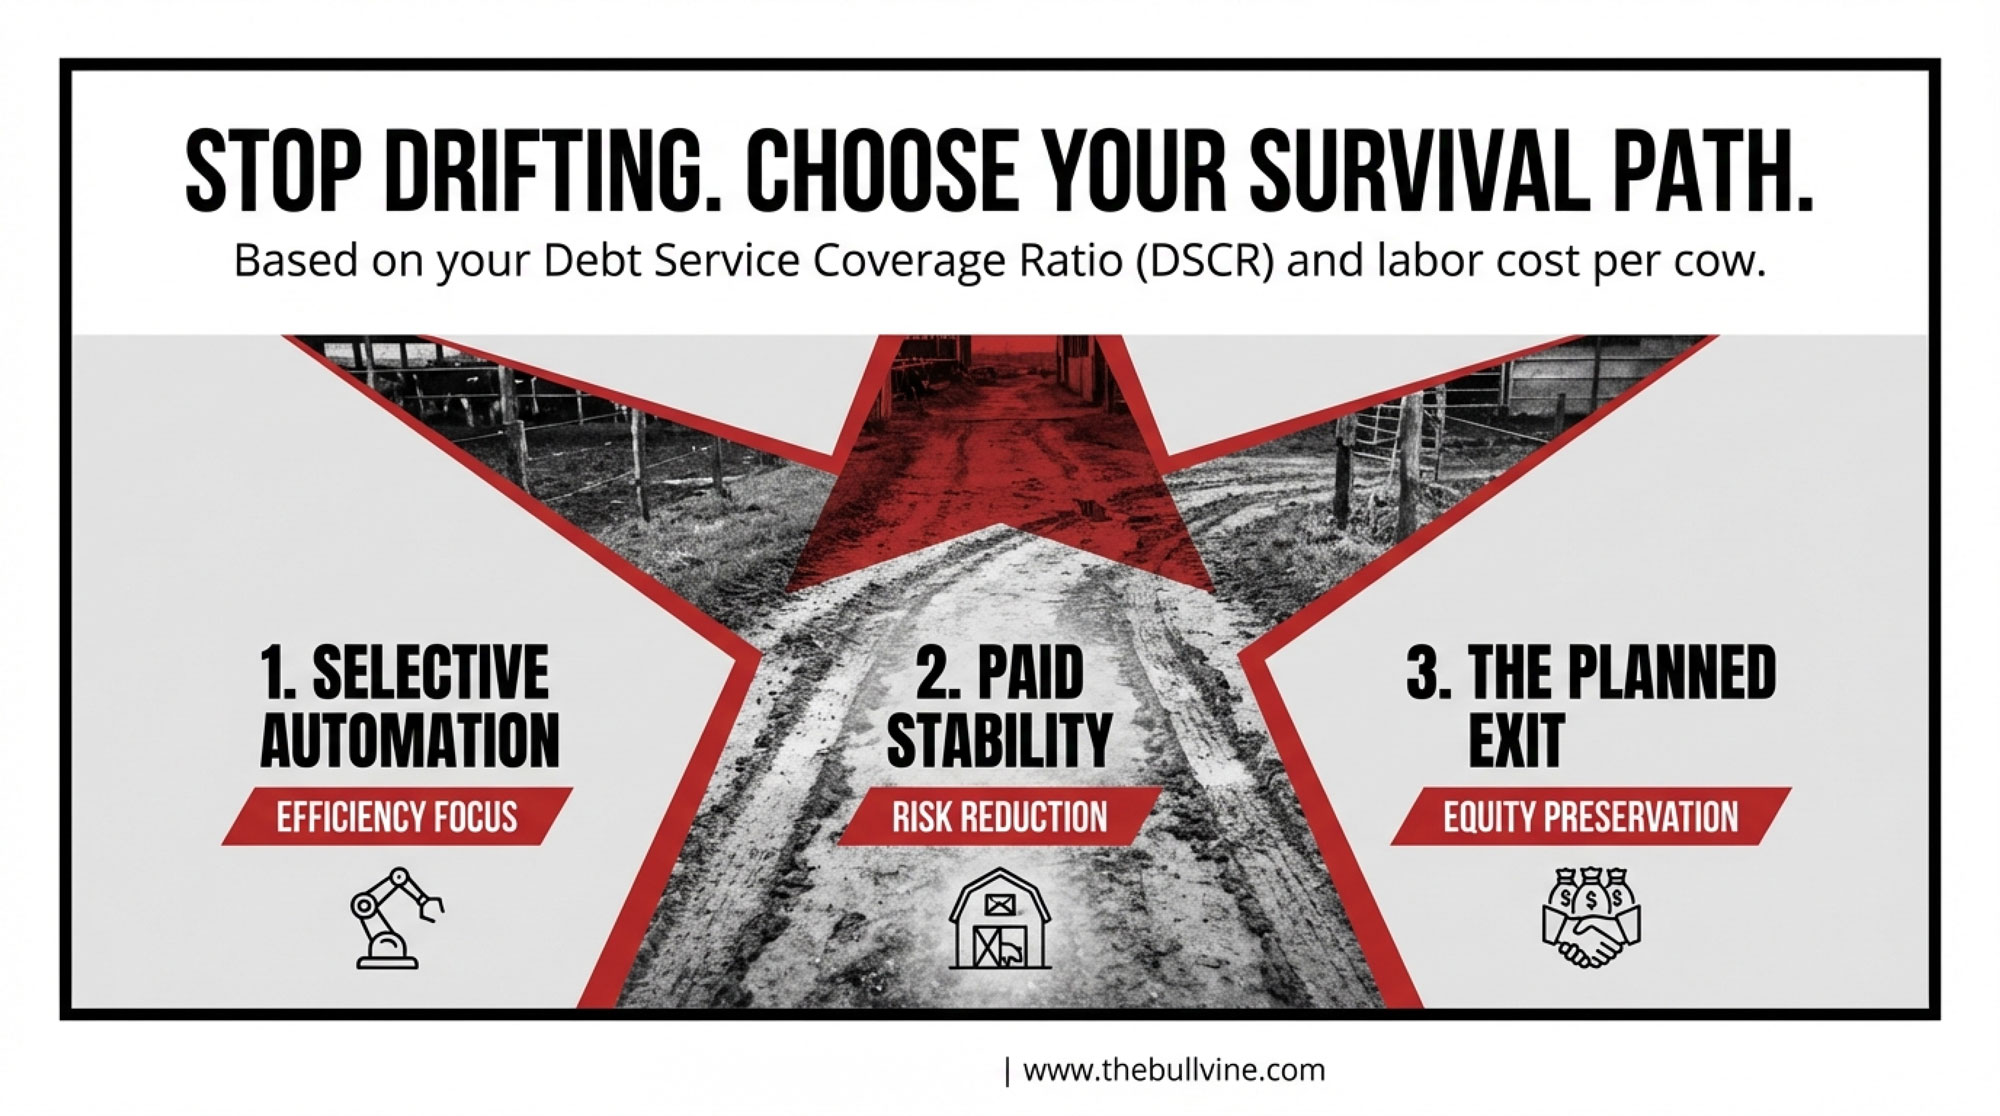
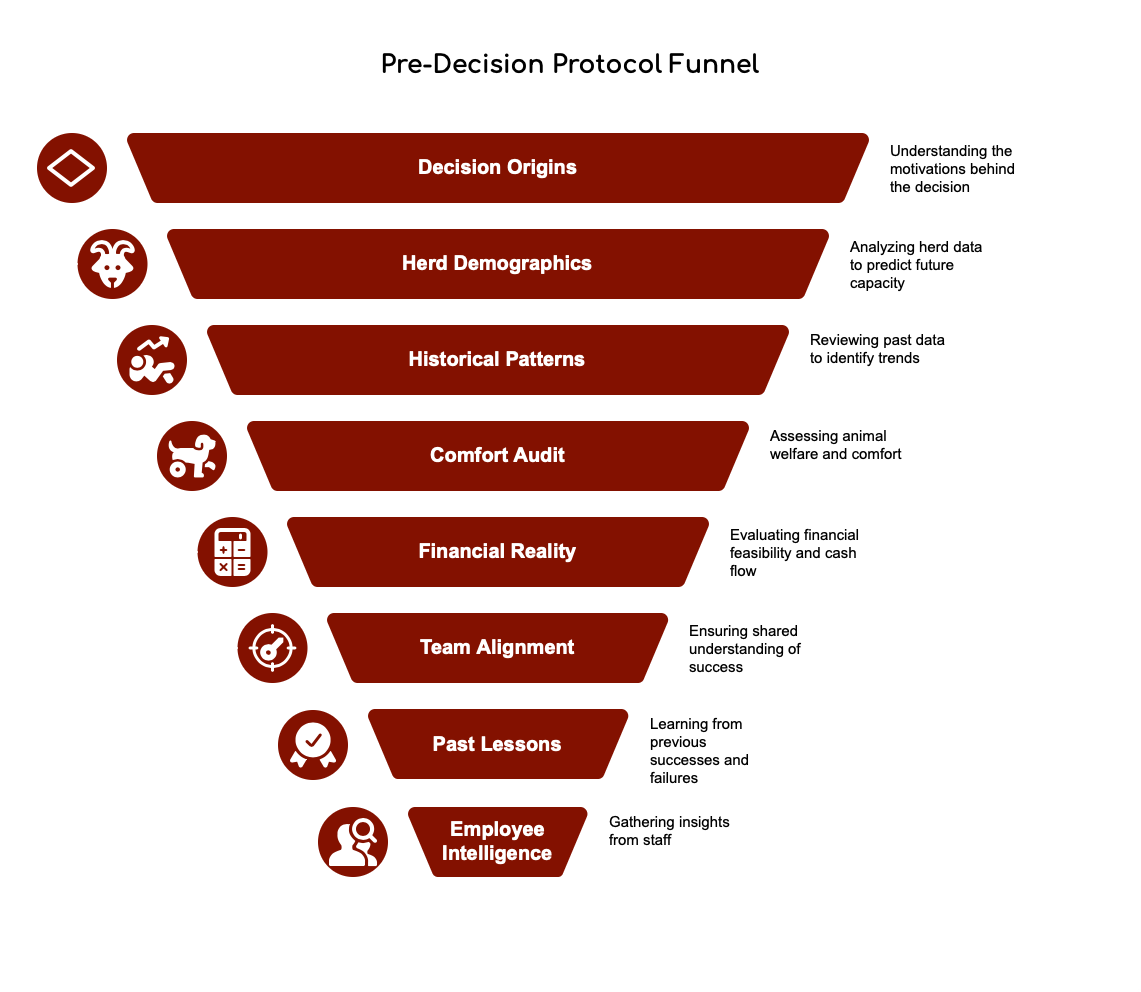
Five Kitchen‑Table Questions to Print Out
If you’re still here, you’re already thinking harder about this than most. Here are five questions you might want to print and stick on the fridge, office wall, or milkhouse door:
- Which lane are we actually in – scale, efficiency, or niche – and do our barns, labour setup, contracts, and debt load truly match that lane?
- Do our genetic goals – and how we use sexed, conventional, and beef‑on‑dairy semen – really line up with our milk cheque, our barn design, and our culling reasons, or are we just following the latest sire list?
- Which technologies on our wish list can we honestly say will improve dollars of margin per stall and labour per cwt at conservative milk prices and realistic interest rates?
- What is high staff turnover actually costing us in lost milk, health problems, training time, and stress – and what would it be worth to have a more stable, better‑trained crew?
- If our processor, lender, or a key customer asked tomorrow, what welfare, health, and environmental numbers could we share confidently – and where are the easiest improvements that would cut both costs and emissions?
In a world where nearly 40% of U.S. dairy farms disappeared in just five years, and where roughly two‑thirds of American milk now comes from 1,000‑cow‑and‑up herds, staying “as we’ve always done it” is its own kind of decision.
What’s encouraging is that the tools to make smarter decisions – good data, solid research, better genetics, and thoughtfully chosen technology – are more available than they’ve ever been. The hard part, as many of us have seen around kitchen tables, shop benches, and barn alleys, is being brutally honest about which lane we’re in, and then steering into it on purpose, with our eyes open, instead of getting dragged there by default.
And if you’re still reading at this point, you’re already acting more like an owner than a passenger. That’s a pretty good place to start.
Key Takeaways
- The shakeout is real: Nearly 40% of U.S. dairy farms vanished in five years – but the cows didn’t. They moved to fewer, bigger barns while total milk production held steady.
- Scale helps, but it’s not the only way to win: Herds milking 2,000+ cows can operate about $10/cwt cheaper than small herds, yet mid-size and niche operations stay profitable by pushing components, labour efficiency, and cow longevity harder.
- Profit separates on efficiency, not milk price: Top-profit herds at any size win on feed conversion, butterfat and protein yield, fresh cow management, and labour per cwt – the milk cheque is usually similar; the cost side isn’t.
- Genetics and tech pay only when they fit: DWP$-driven selection can add $1,000–$1,500 lifetime IOFC per top-quartile cow; AMS, collars, and sort gates strengthen margins only when milk lift, labour changes, and interest costs actually pencil.
- Inaction is a decision: Five closing questions help owners identify which survival lane they’re really in – and where standing still may be the riskiest move of all.
Complete references and supporting documentation are available upon request by contacting the editorial team at editor@thebullvine.com.
Learn More
- Cut Your Replacement Rate by 7 Points. Save $210,000. Lower Your Carbon Footprint. Here’s How. – Reclaim $210,000 in annual capital by mastering the math of replacement rate reduction. This breakdown arms you with a 90-day strategy to slash your herd’s methane load while keeping your best cows milking longer.
- From $1.5 Million to $150,000: The Dairy Genetics Shakeout and Your Next Move – Gain a strategic roadmap for the JIVET era by navigating the corporate takeover of dairy genetics. This breakdown delivers a clear-eyed perspective on shrinking breeder revenues and the emerging niches where independent operations can still win.
- €100 Billion for 6% Results: The Compliance Scam Exposed – And What Smart Dairies Do Instead – Turn your environmental footprint into a measurable market advantage by mastering sensor-based verification. This article exposes the “compliance scam” of the last decade and arms you with the data capabilities processors will demand by 2028.
 The Sunday Read Dairy Professionals Don’t Skip.
 The Sunday Read Dairy Professionals Don’t Skip.
Every week, thousands of producers, breeders, and industry insiders open Bullvine Weekly for genetics insights, market shifts, and profit strategies they won’t find anywhere else. One email. Five minutes. Smarter decisions all week.