Under 500 cows and eyeing robots? Before you sign a $1M note, answer this: Who shows up your lane when the barn goes dark?
Executive Summary: If you milk under 500 cows and you’re eyeing robots, this piece shows why a USD $1 million AMS note won’t automatically fix your labor problem—and might bury you if the math and the people aren’t there. It breaks down current immigrant‑labor dependence, Wisconsin’s drop from 16,000+ herds to just over 5,300, and what real AMS budgets and labor‑savings studies say about when robotic milking ROI actually pencils out. You’ll see a side‑by‑side look at parlor‑only, hybrid “parlor + tech,” and full AMS paths, with clear thresholds—like whether you can truly staff milking for around USD $200,000 a year—that help you decide if you should upgrade, automate, or plan a clean exit. The article also ties genomics and proofs straight to robot performance, showing why milking speed, udder traits, health, and beef‑on‑dairy decisions are now core to your AMS payback, not just nice extras. Alongside the math, it tackles storms, backup power, mental health, and the 4‑H kid with a calf who might be your next key employee or successor. You’ll walk away with a 30‑day checklist, practical questions to take to your lender and family, and one blunt test that matters more than any sales pitch: when the barn goes dark, who actually turns up your lane?
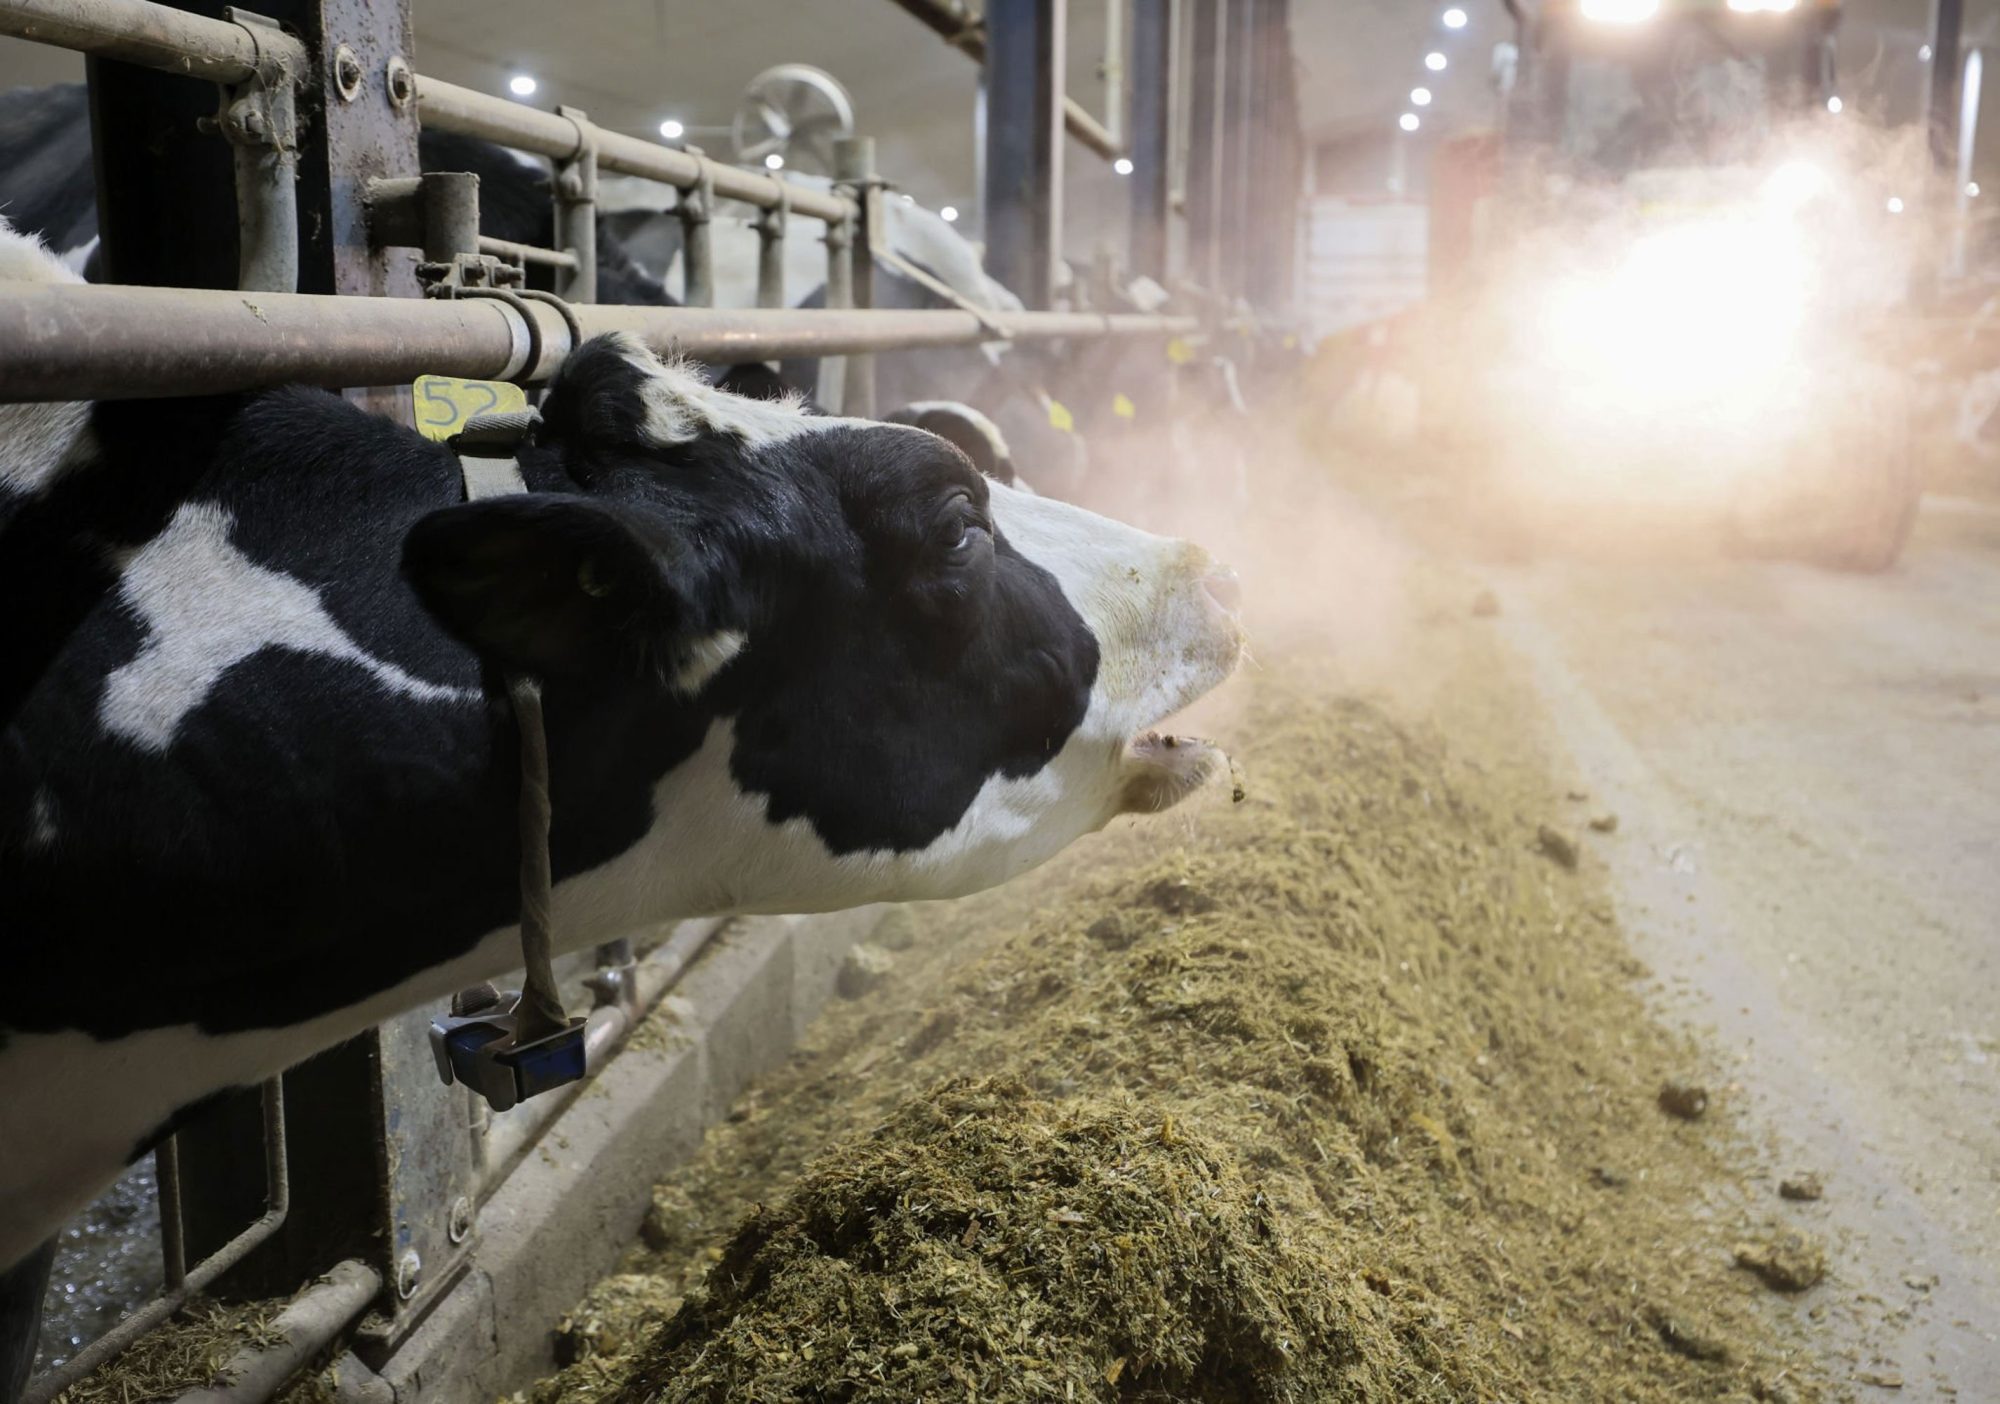
The trucks in the lane usually tell the truth before any robot ever will.
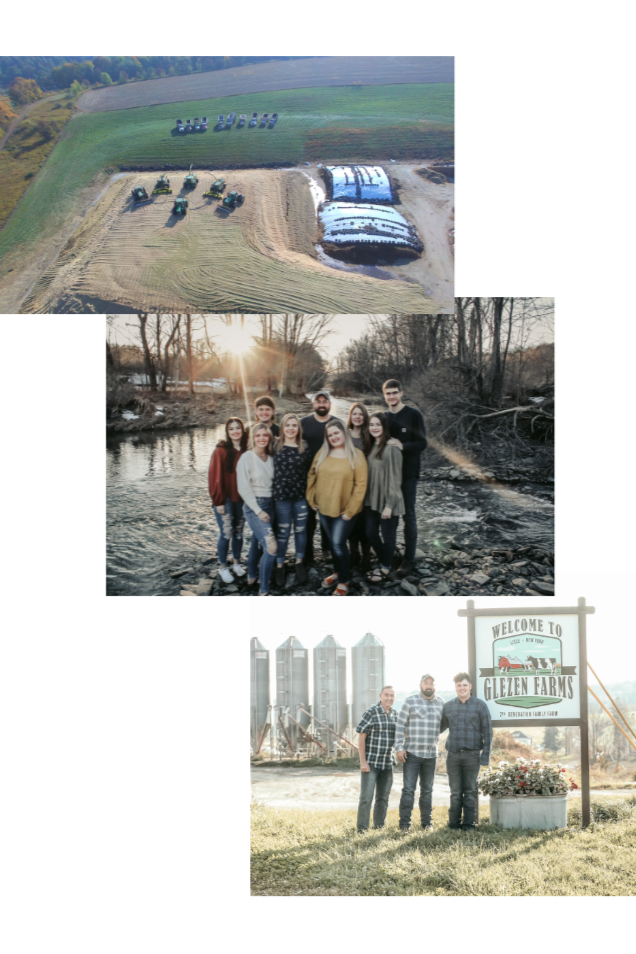
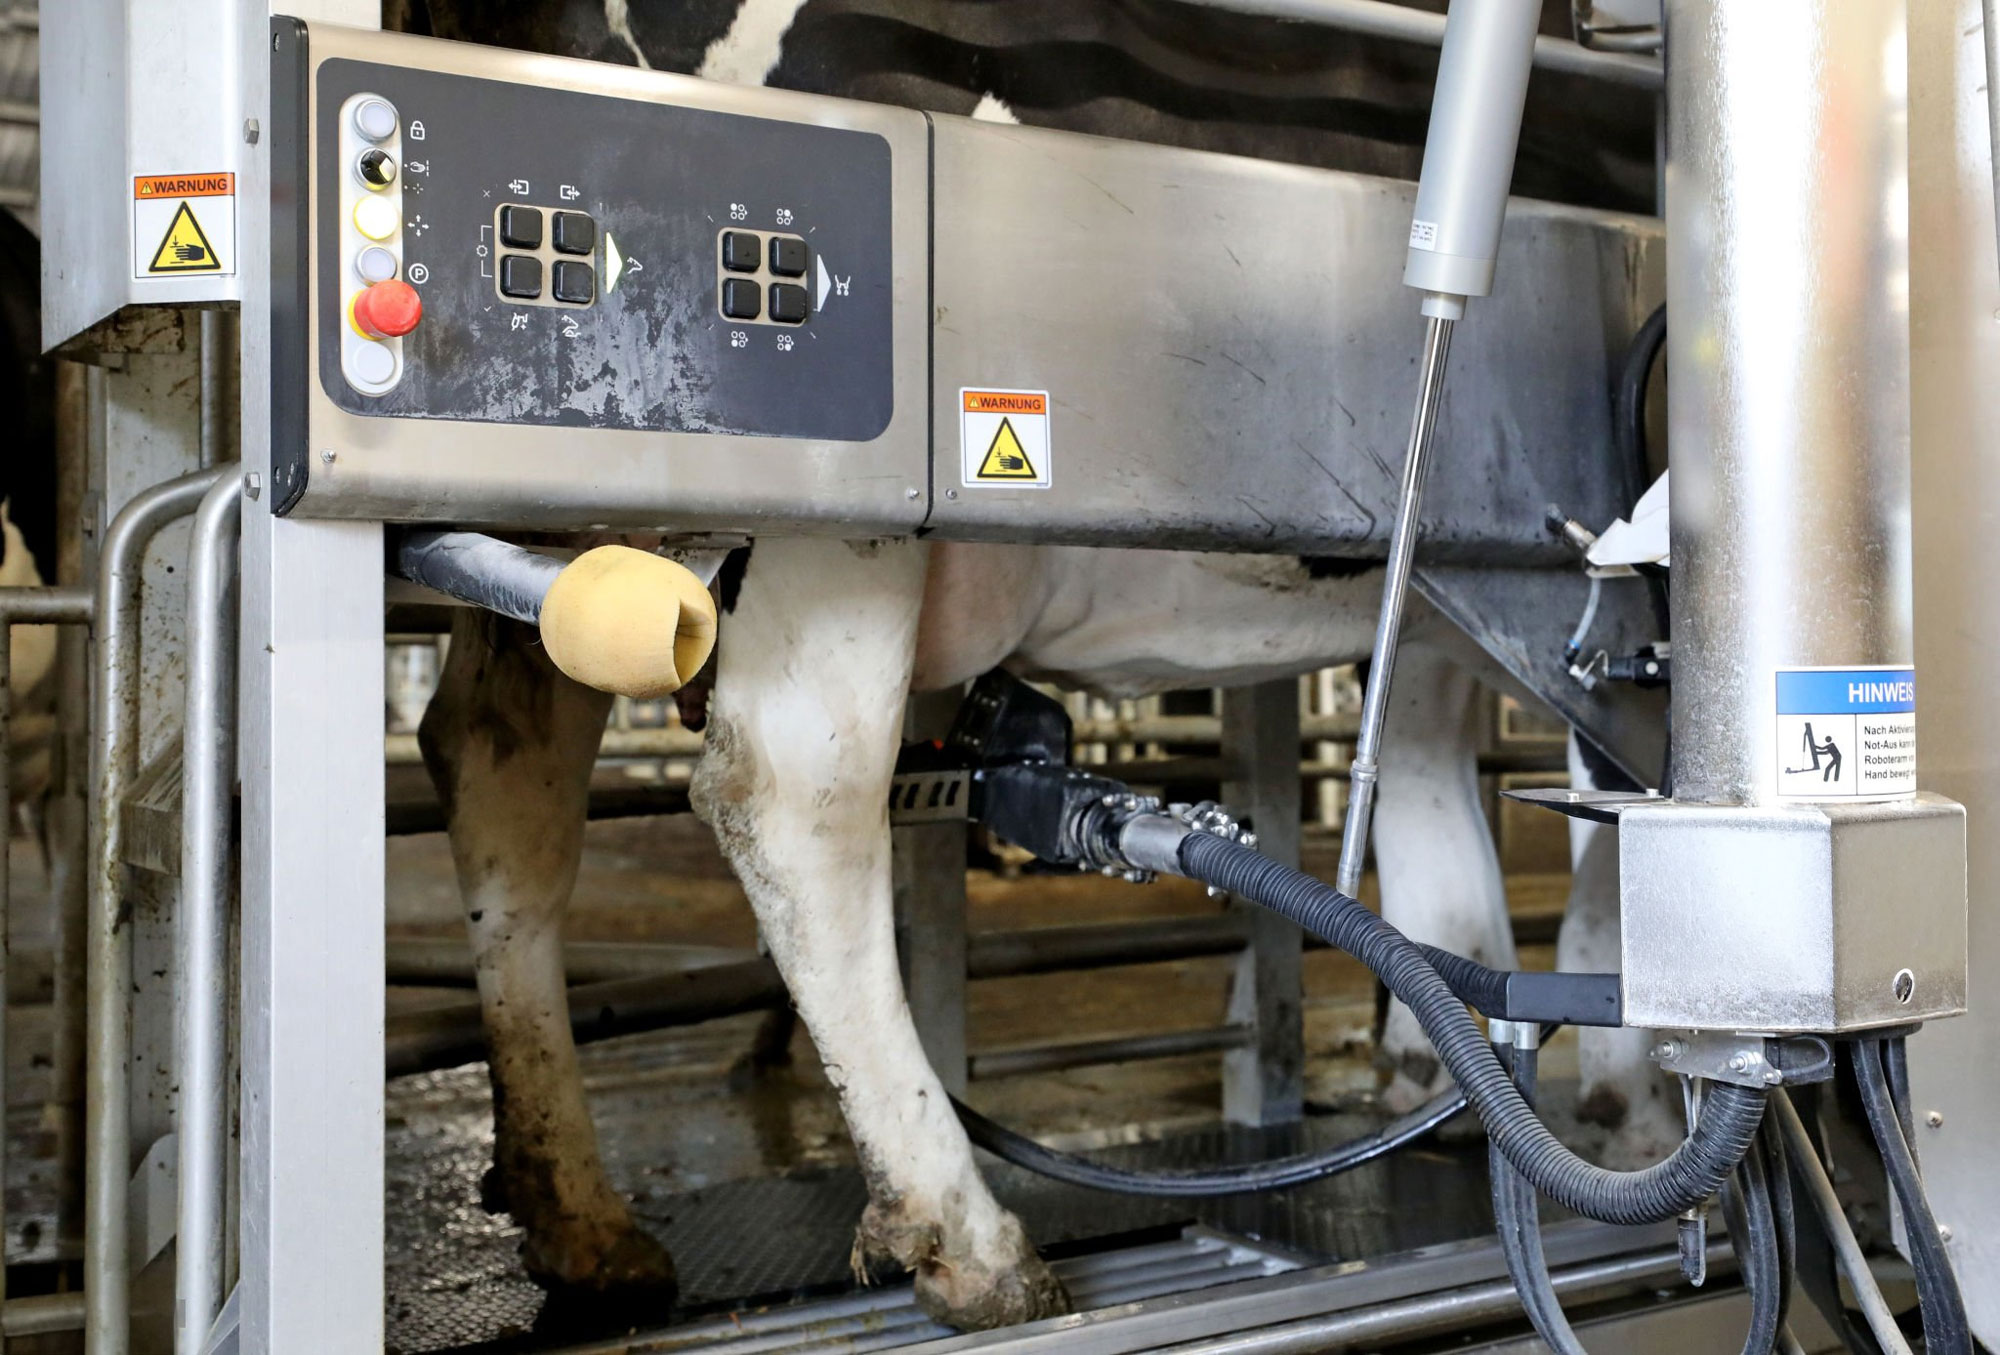
They’re strung along the driveway at a small robot barn in central Wisconsin—feed company pickups, a neighbor’s welding rig, the vet’s SUV, a church friend’s minivan. Inside, the old parlor is half‑gutted, and three new robotic milking systems sit on concrete that still looks damp. If you’re running a small or mid‑sized herd in 2024–2026 and even thinking about robots, this is your world: broken labor, big capital decisions, and a hard choice between AMS, a hybrid setup, or an exit while you’re still ahead.
This piece walks straight through that choice—the math, the decision rules, and the people around you who decide whether you’re still milking in five years or reading your own dispersal catalog.

Editor’s note: This is a composite story built from real 2023–2025 data and patterns on robot herds across Wisconsin and the Midwest—not a blow‑by‑blow profile of one specific farm. The economics and pressures are real; the names and scenes are representative.
The Labor Bomb Under a 200‑Cow Dairy
Let’s start where you actually live—at the kitchen table with a calculator and a coffee that went cold an hour ago.
By late 2023, a typical 180‑cow herd in central Wisconsin looked a lot like yours might. Margins tight. Kids in school. Parents still doing more 4 a.m. milkings than they’ll admit. And a labor situation that quietly shifted from “hard” to “not sustainable.”
A lot of herds have walked this path:
- Starting milkers at USD $16/hour with housing.
- Bumping to $18, then $20–22 with more flexible hours.
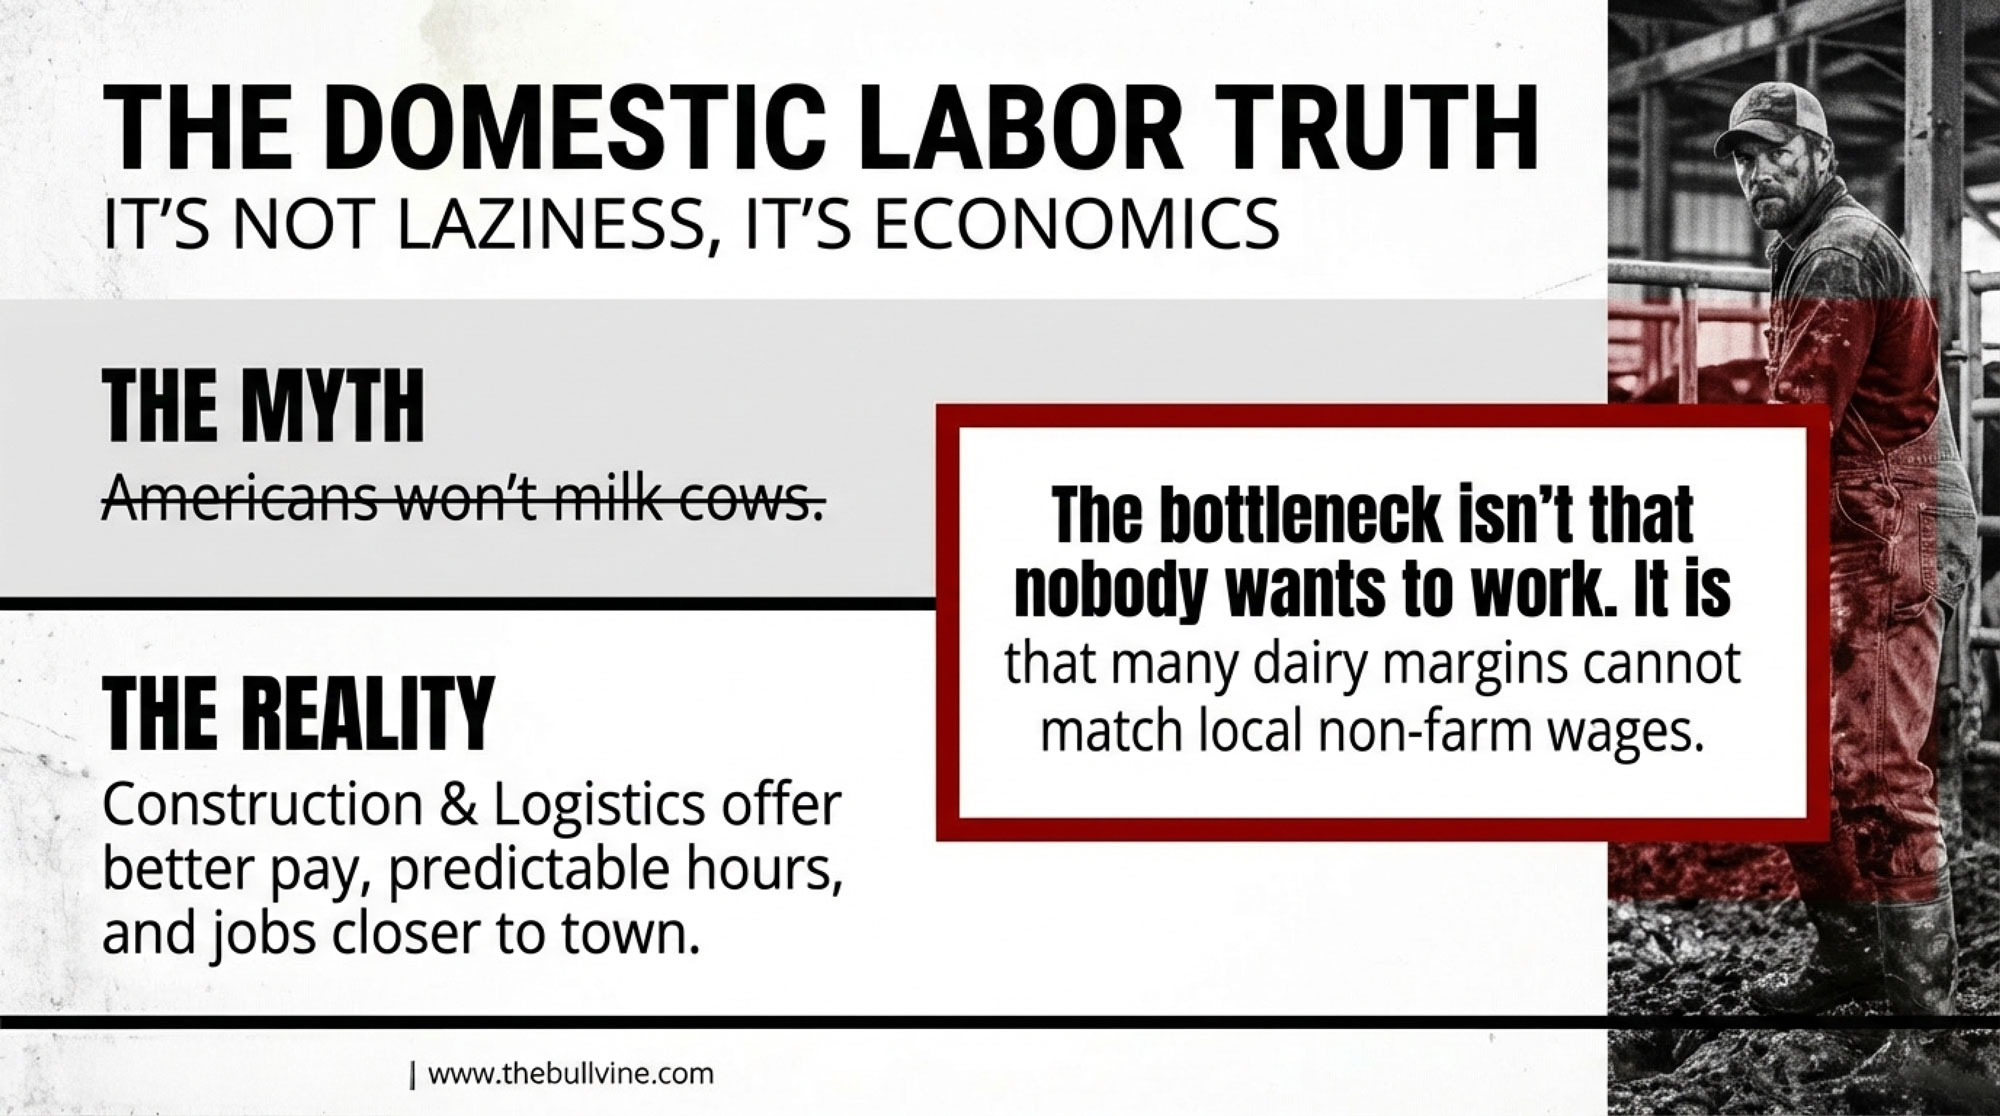
- Edging toward $24 with a decent bunkhouse and still watching people leave for climate‑controlled warehouse jobs with weekends off and no risk of a frozen yard.
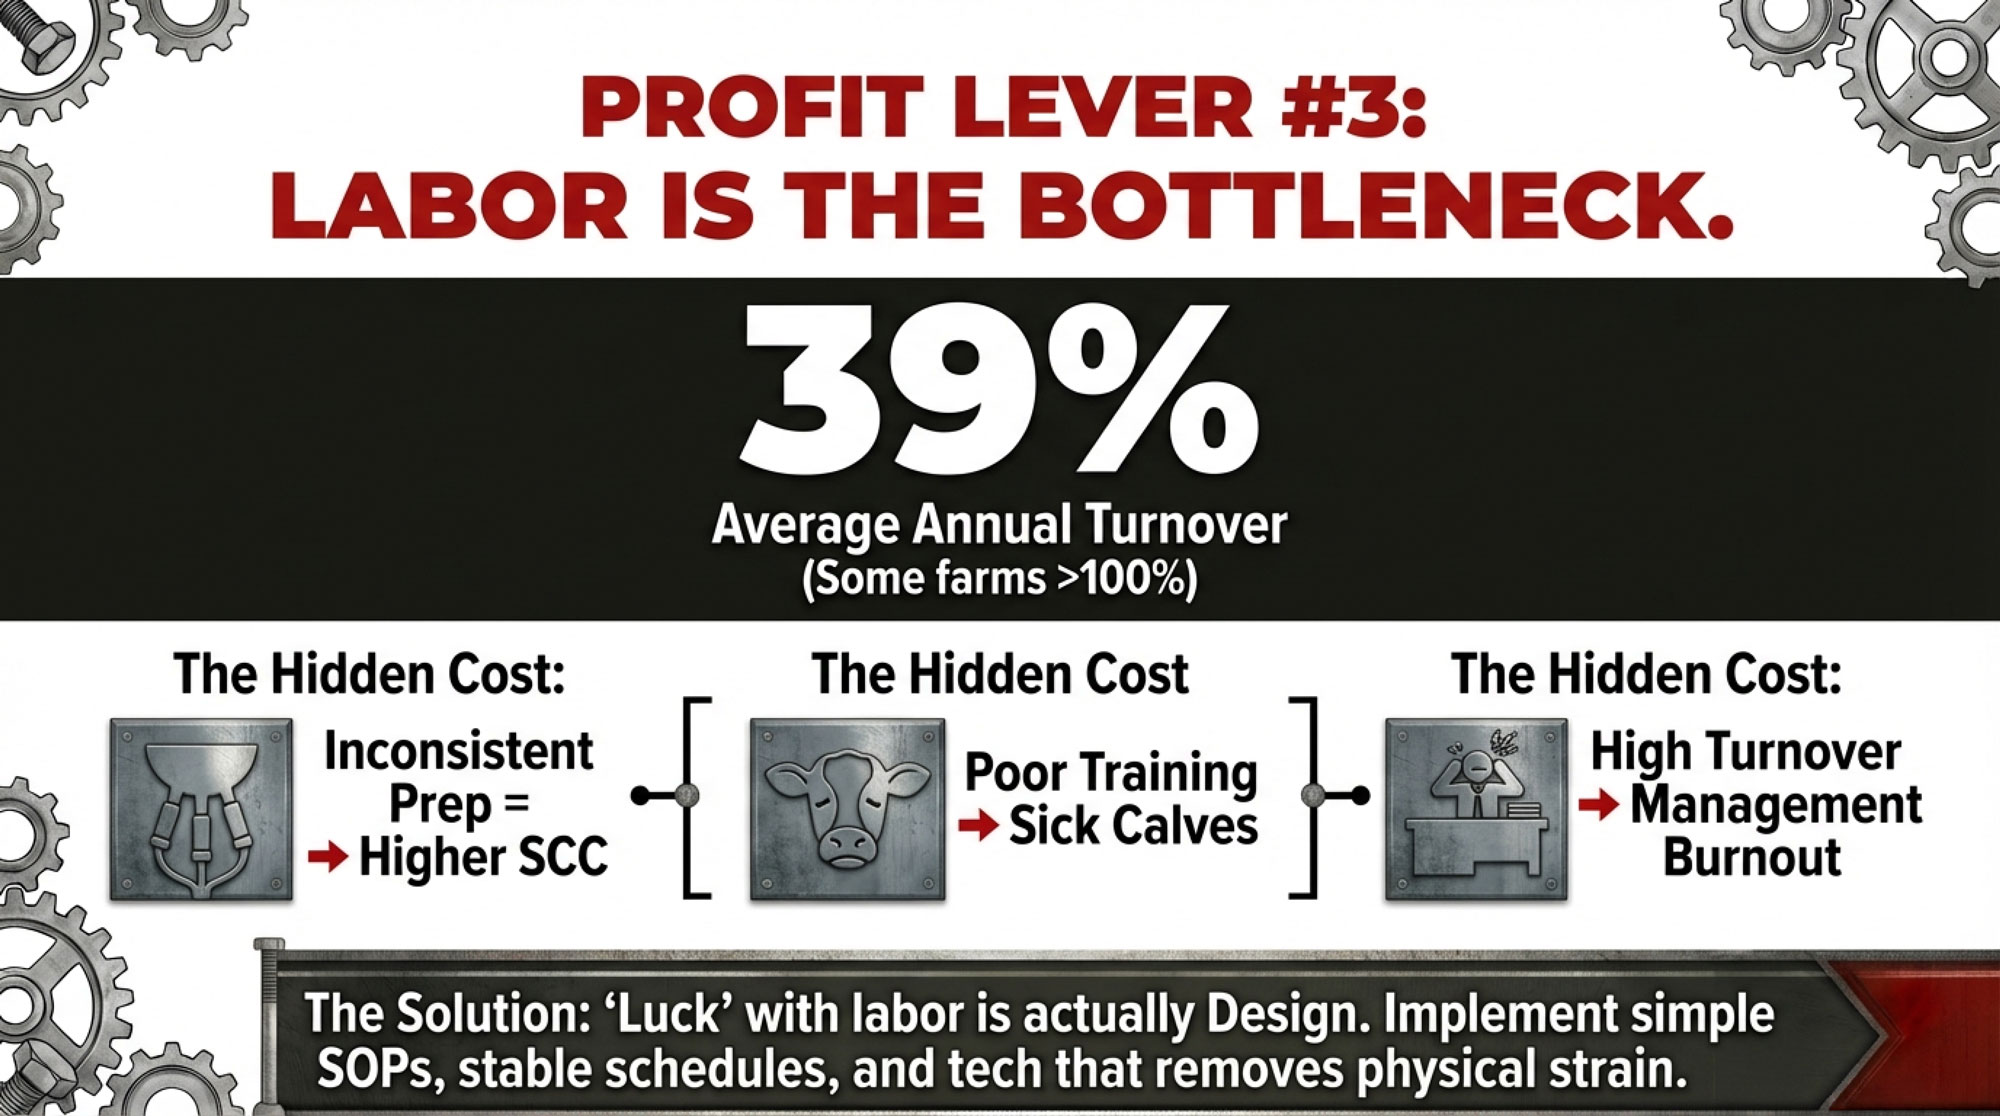
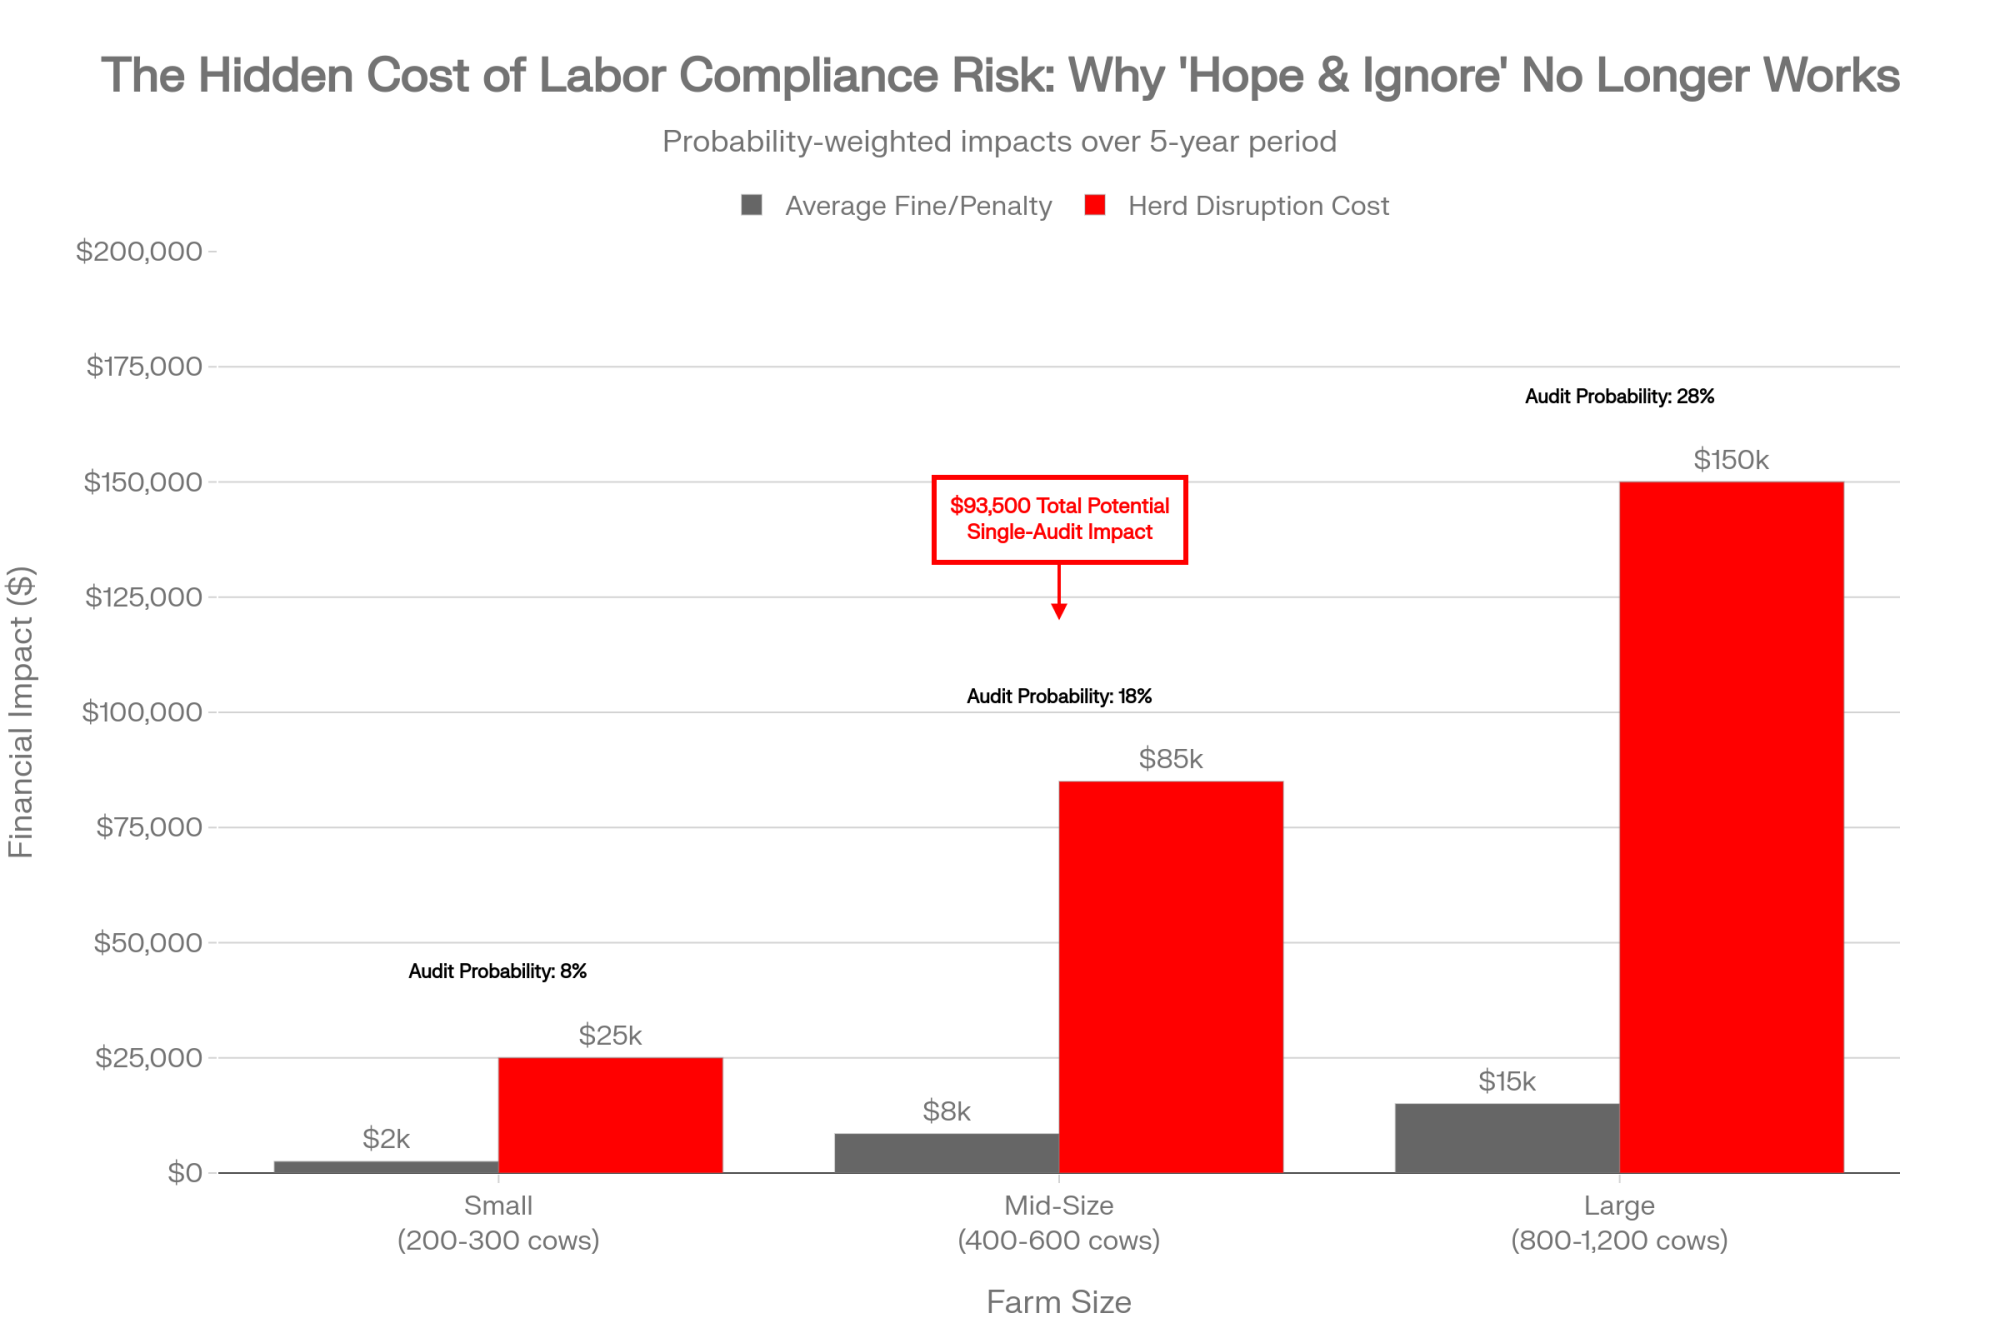
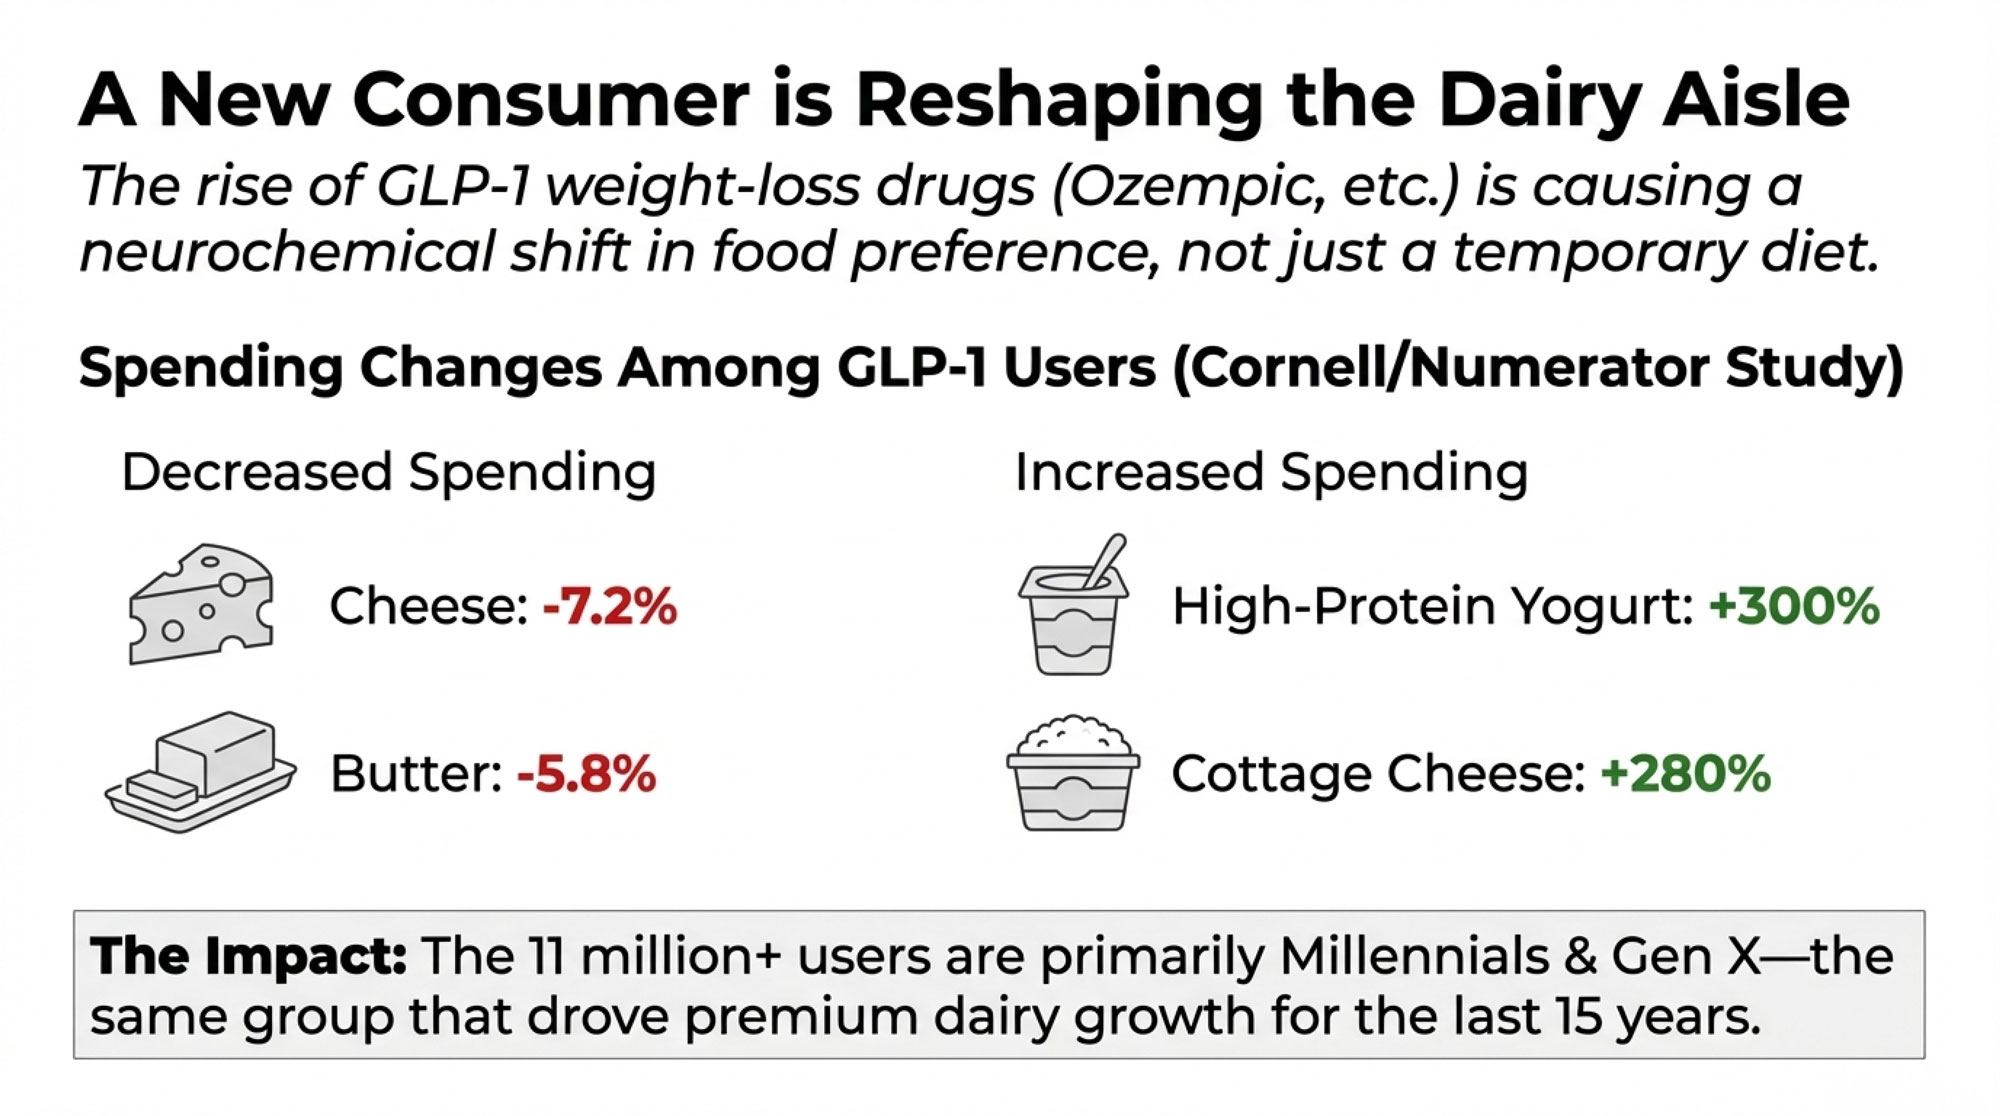
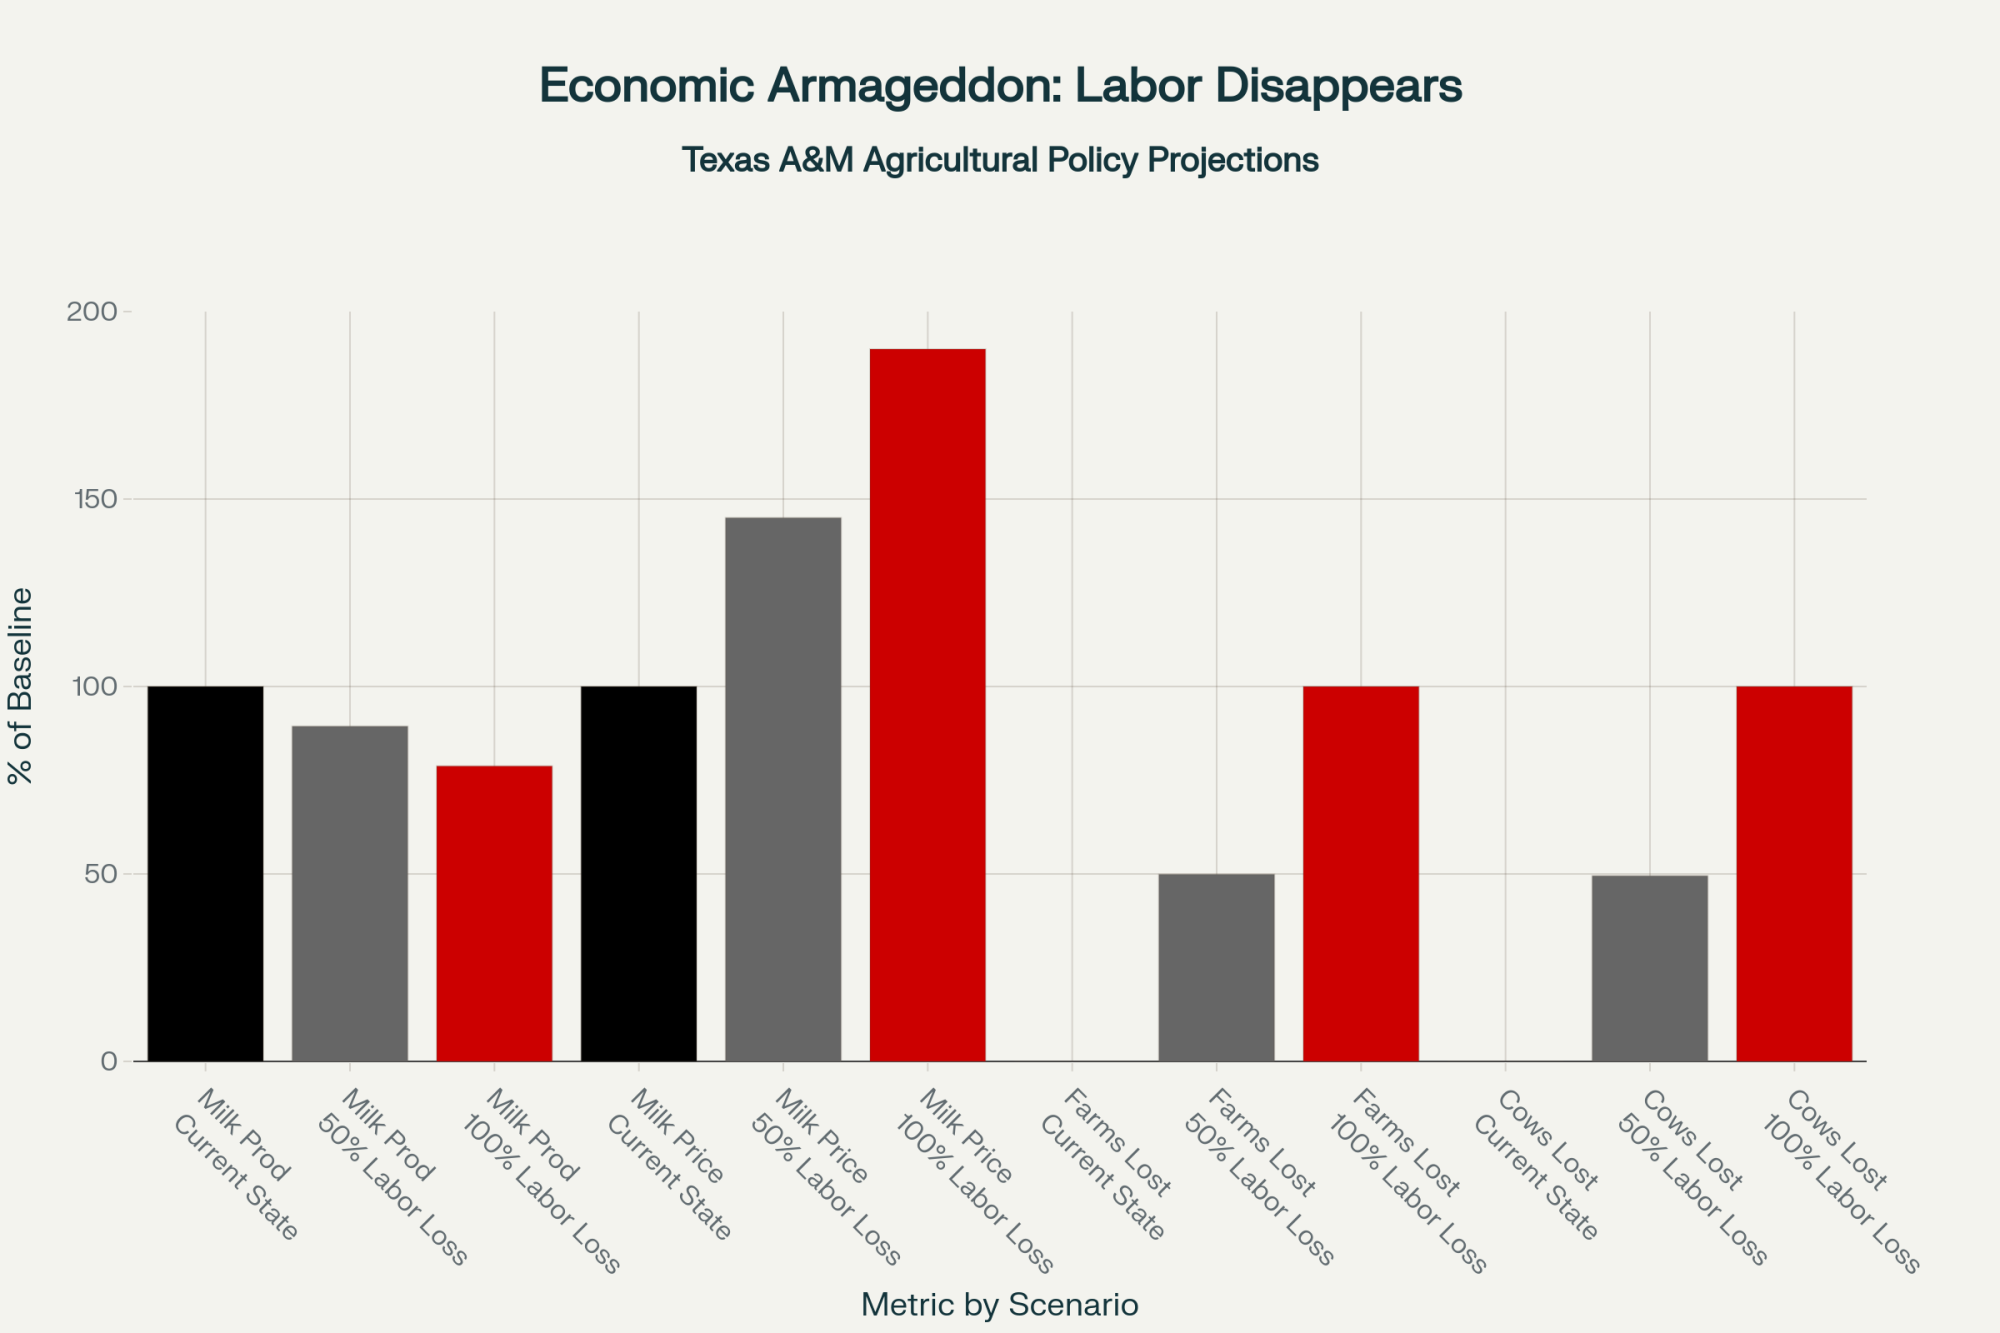
That’s not just bad luck. A National Milk Producers Federation study with Texas A&M found that immigrant workers make up about 51% of all hired U.S. dairy labor, and that farms employing them produce roughly 79% of the nation’s milk. In that same modeling work, if that immigrant workforce disappeared, more than 7,000 dairies would shut down, and retail milk prices would jump nearly 90%.

In Wisconsin, a UW–Madison School for Workers analysis—summarized in recent industry coverage—estimated more than 10,000 undocumented workers doing around 70% of the state’s dairy labor, with researchers warning that without them, Wisconsin’s dairy industry would be at serious risk of rapid collapse.

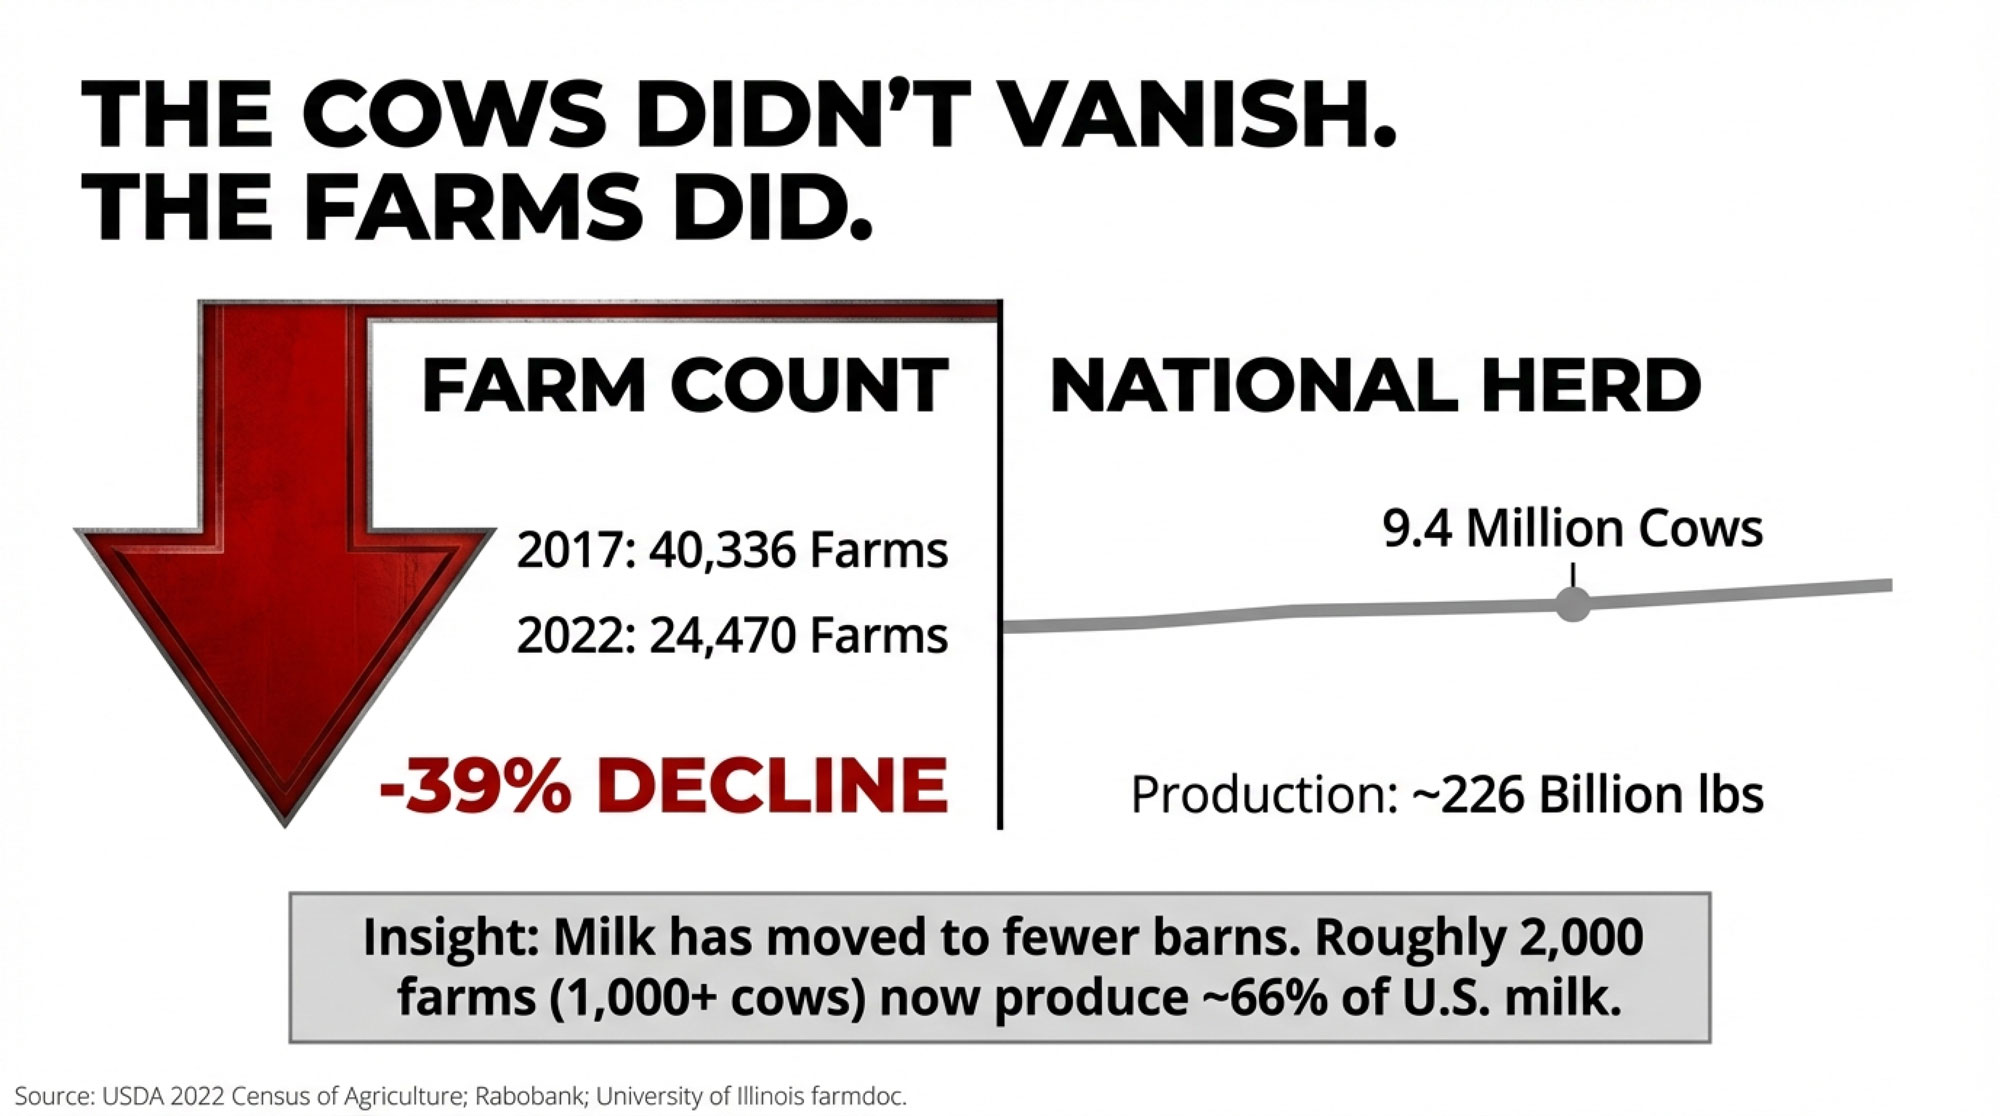
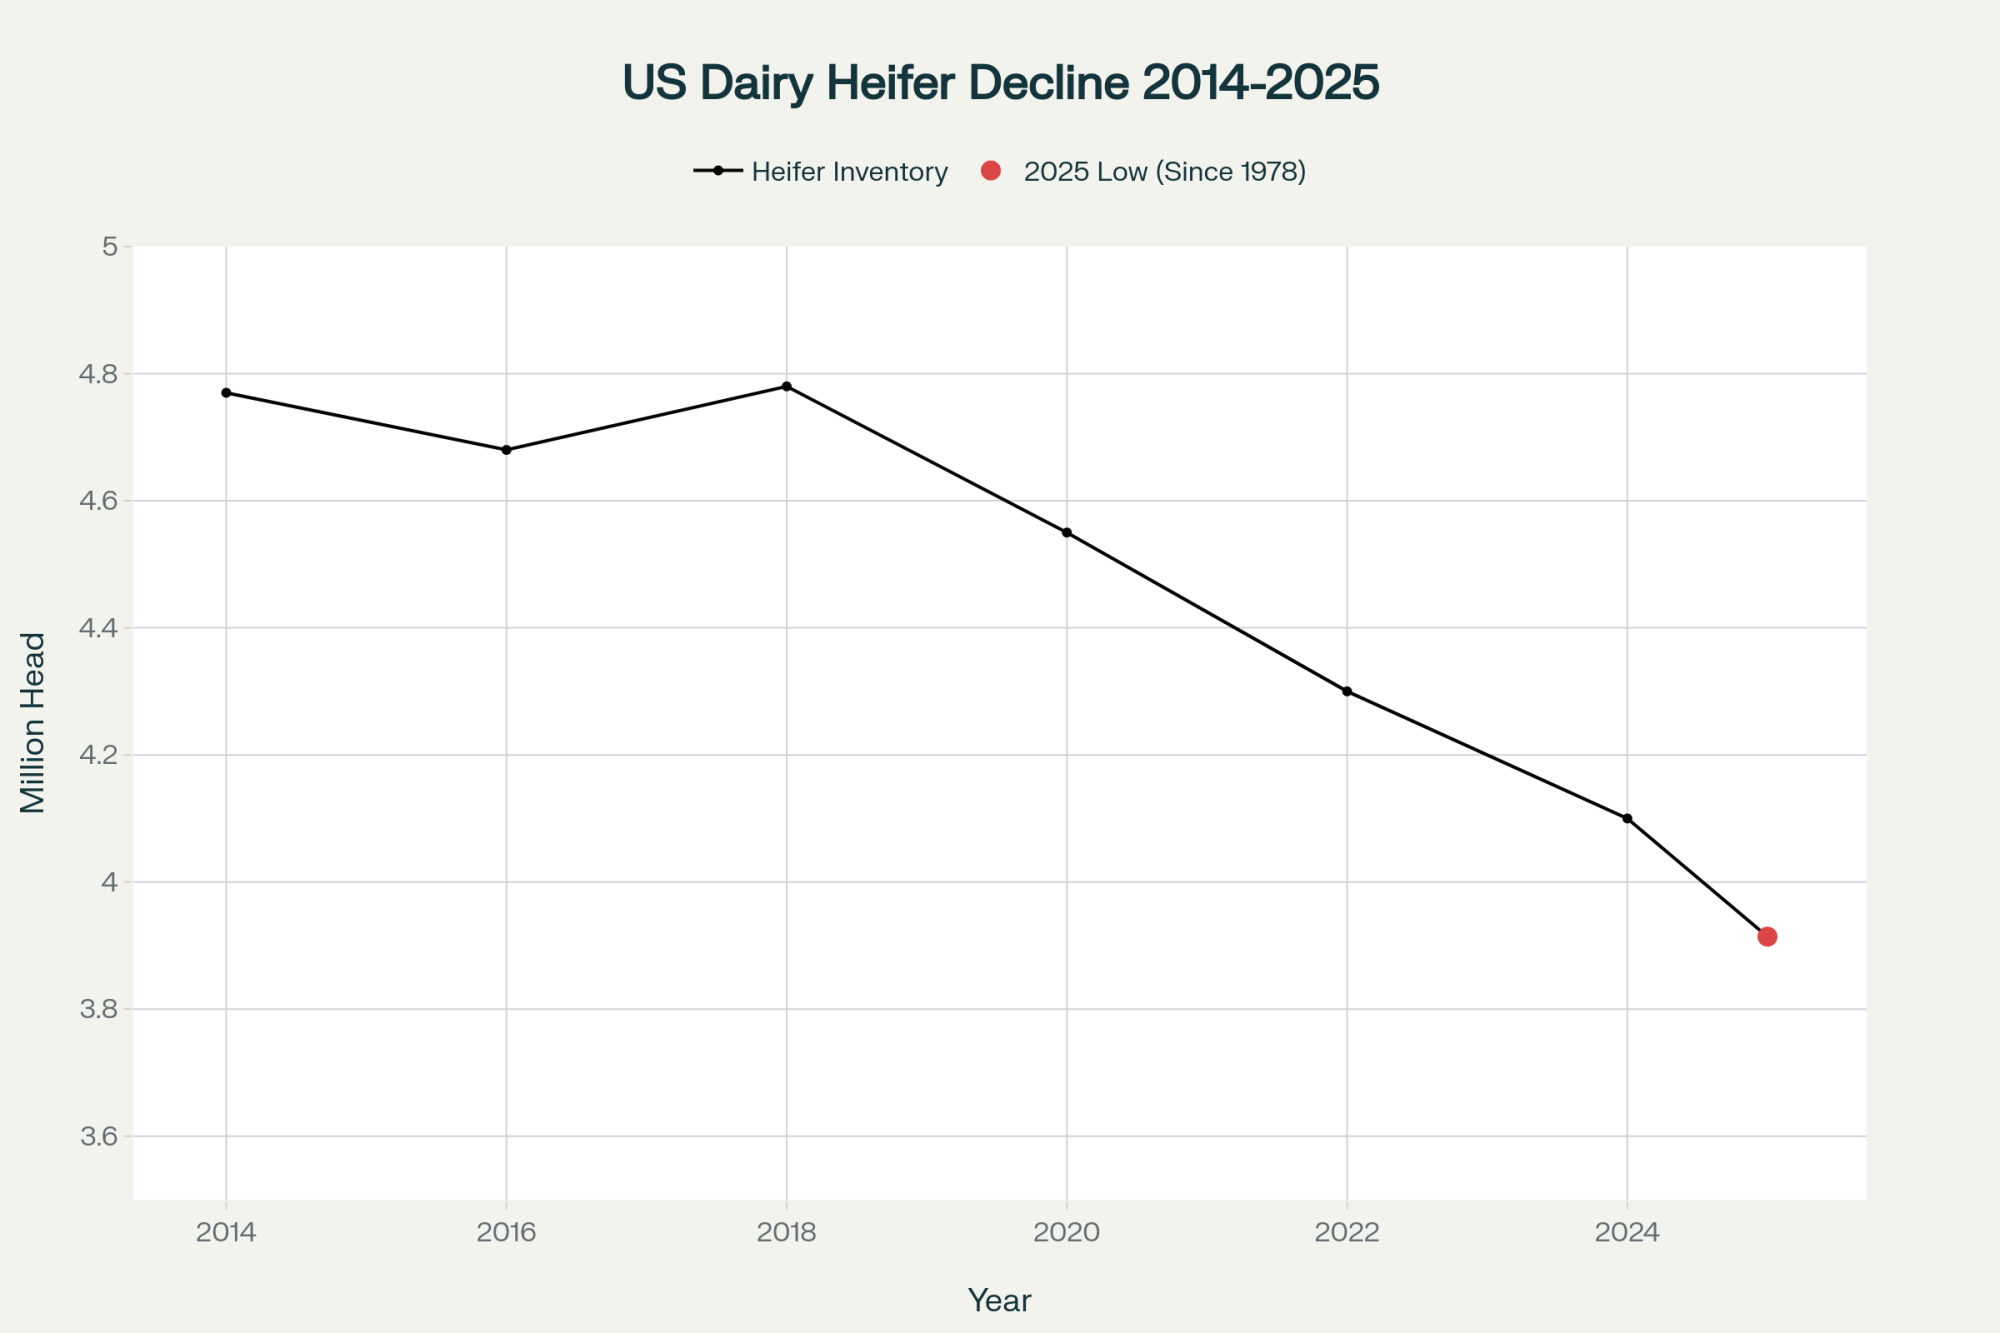
Lay that on top of herd numbers. USDA‑NASS and state data show:
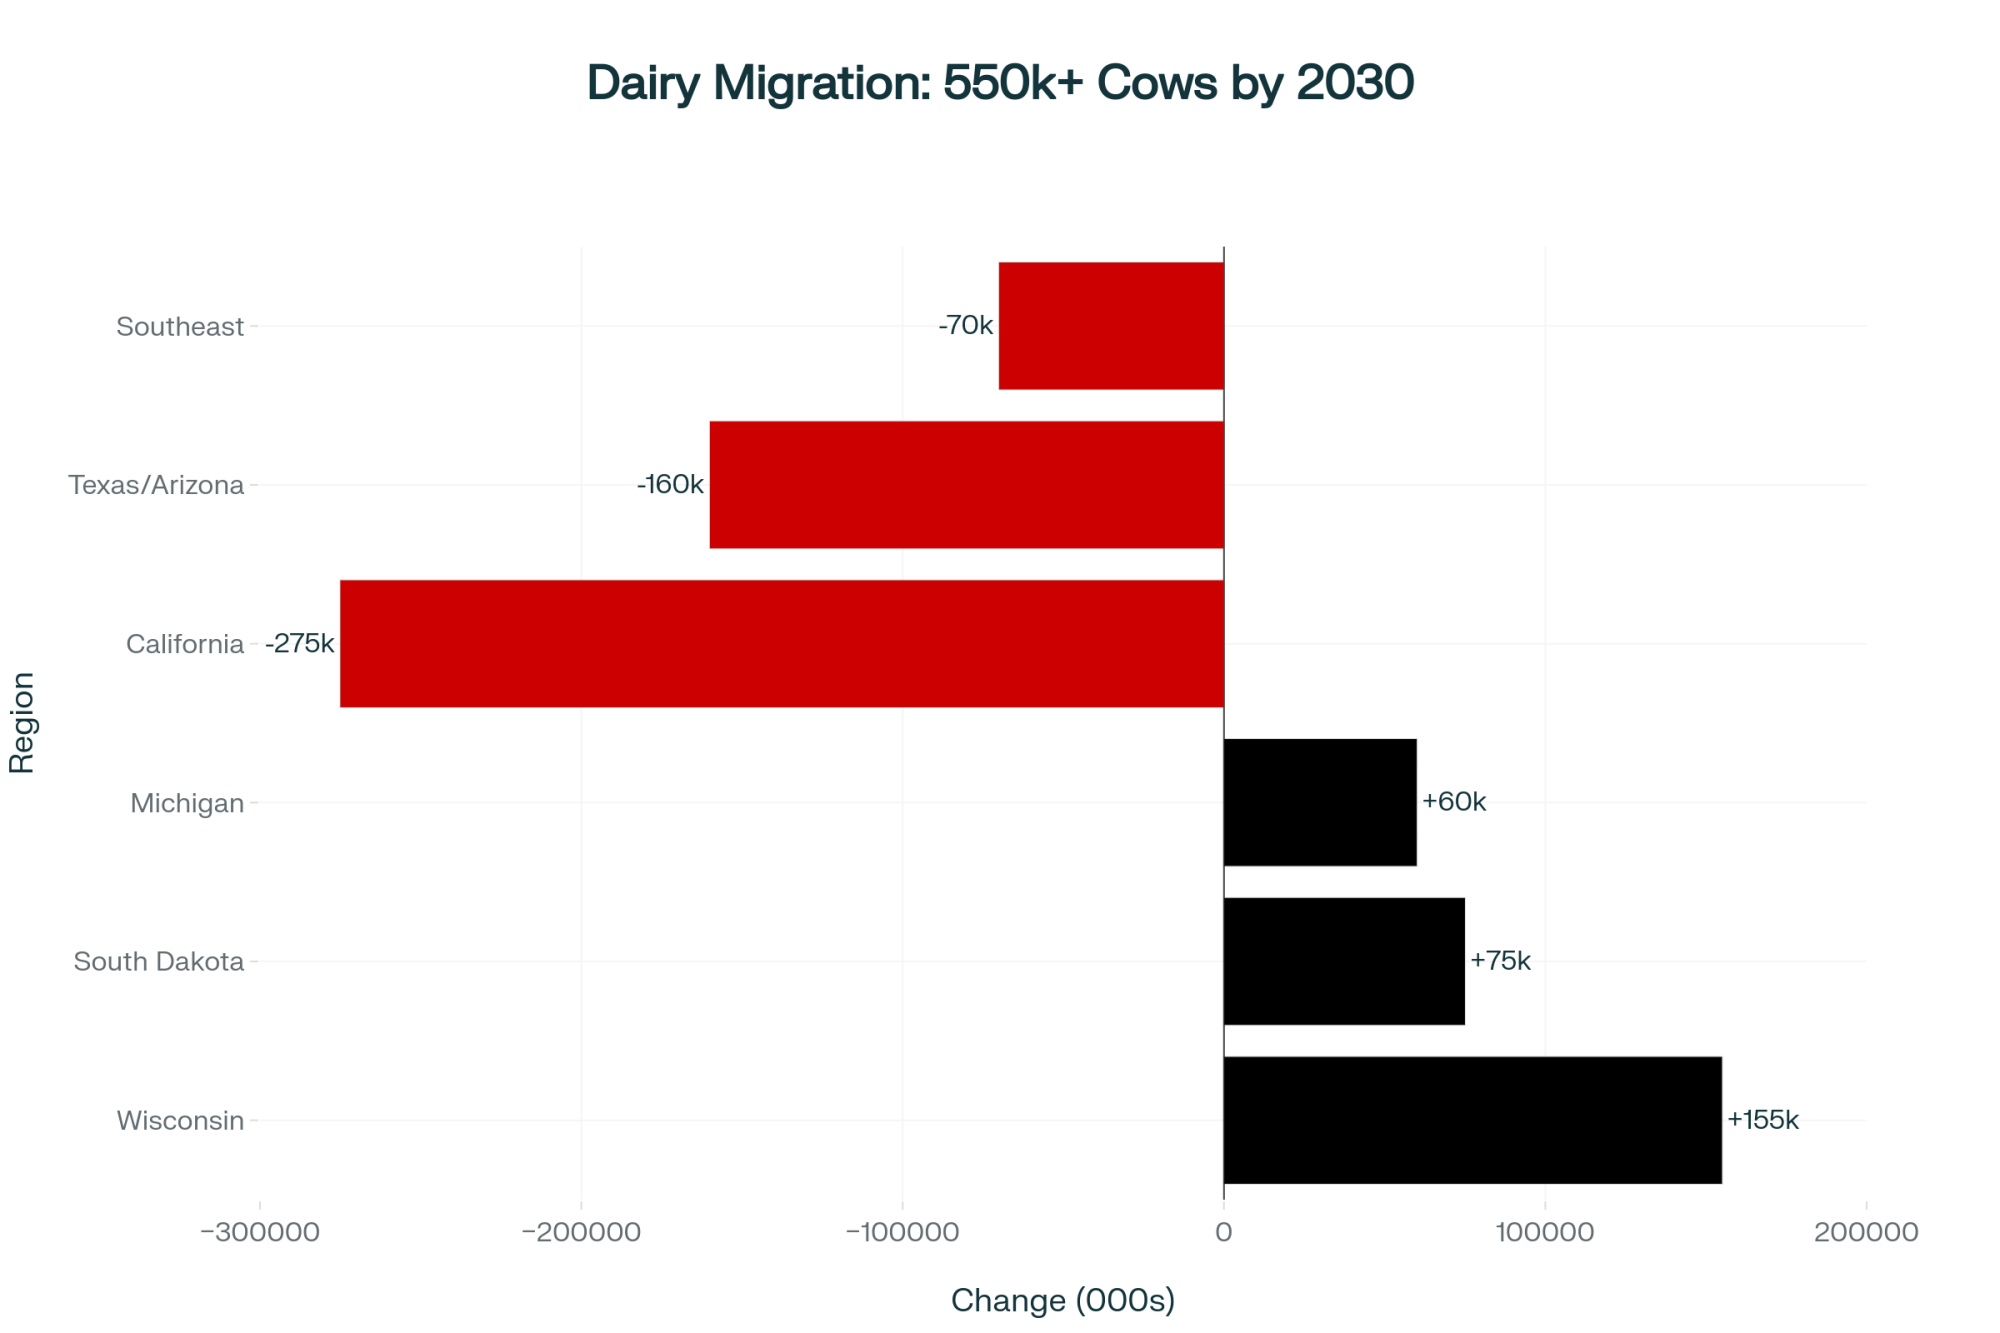
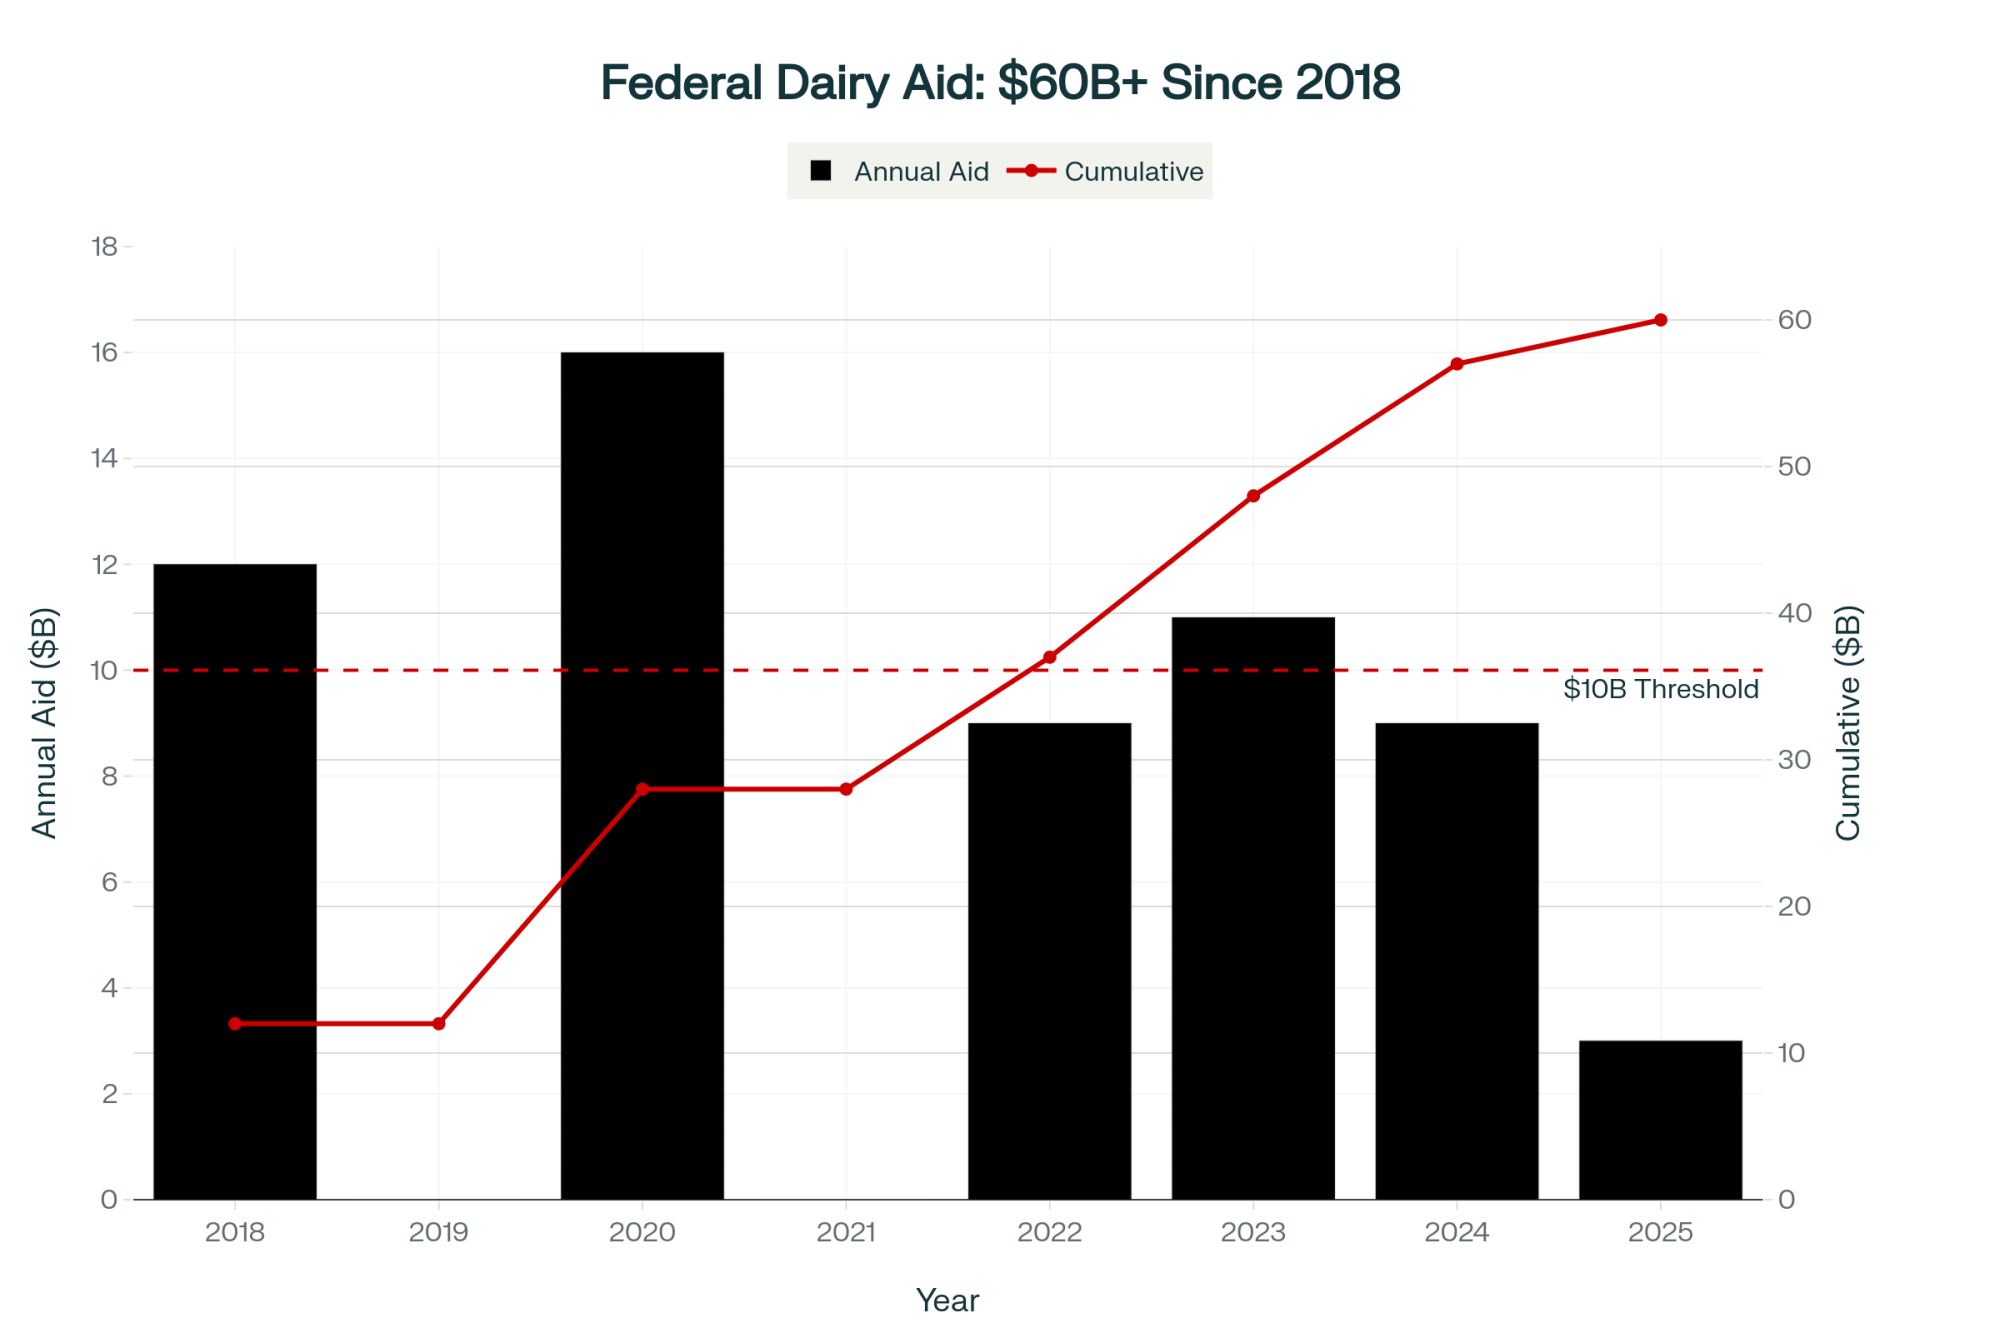
- 16,264 licensed dairy herds in Wisconsin in 2003.
- Around 6,140 herds by late 2022.
- Just over 5,300 by early 2025, with cow numbers and total milk roughly holding.
Same or more milk. Fewer families. More ground to cover with fewer people.
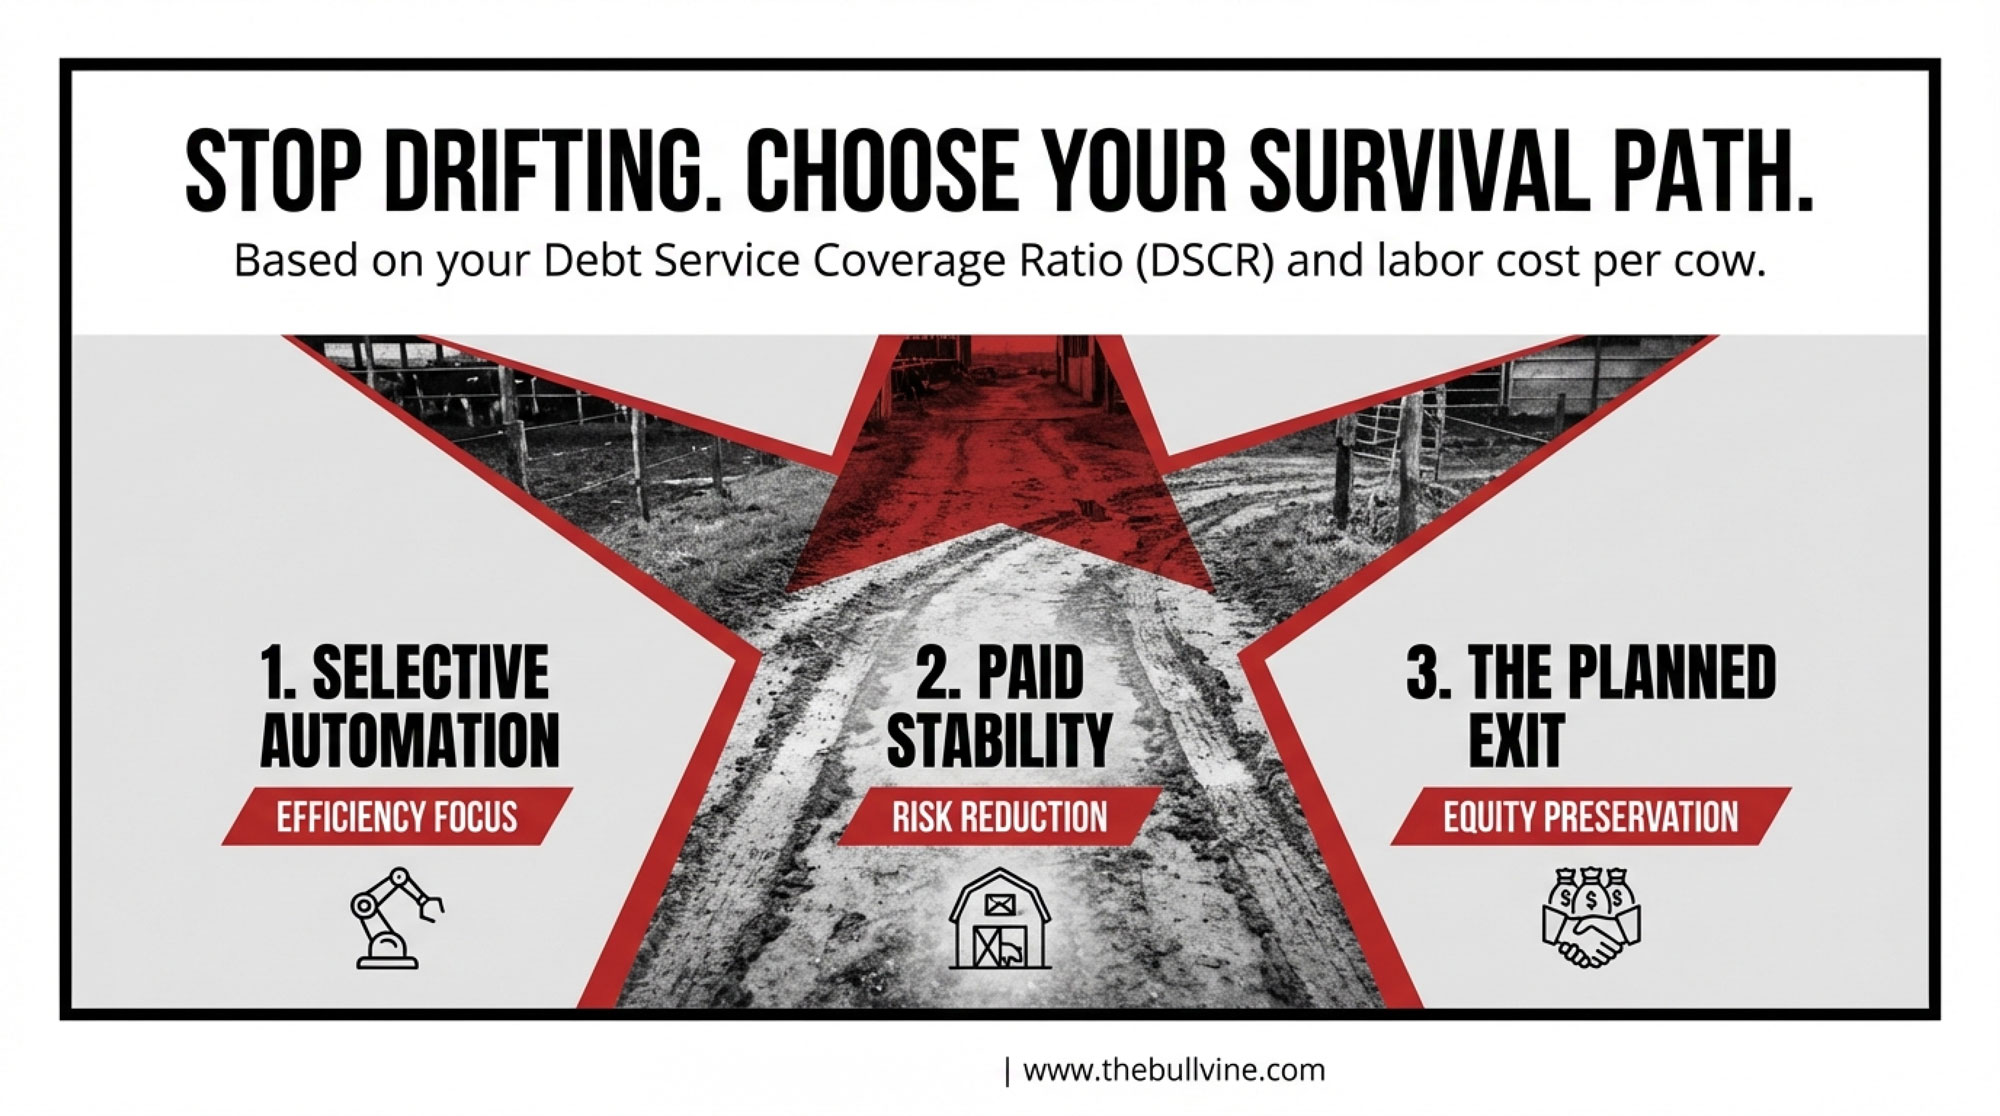
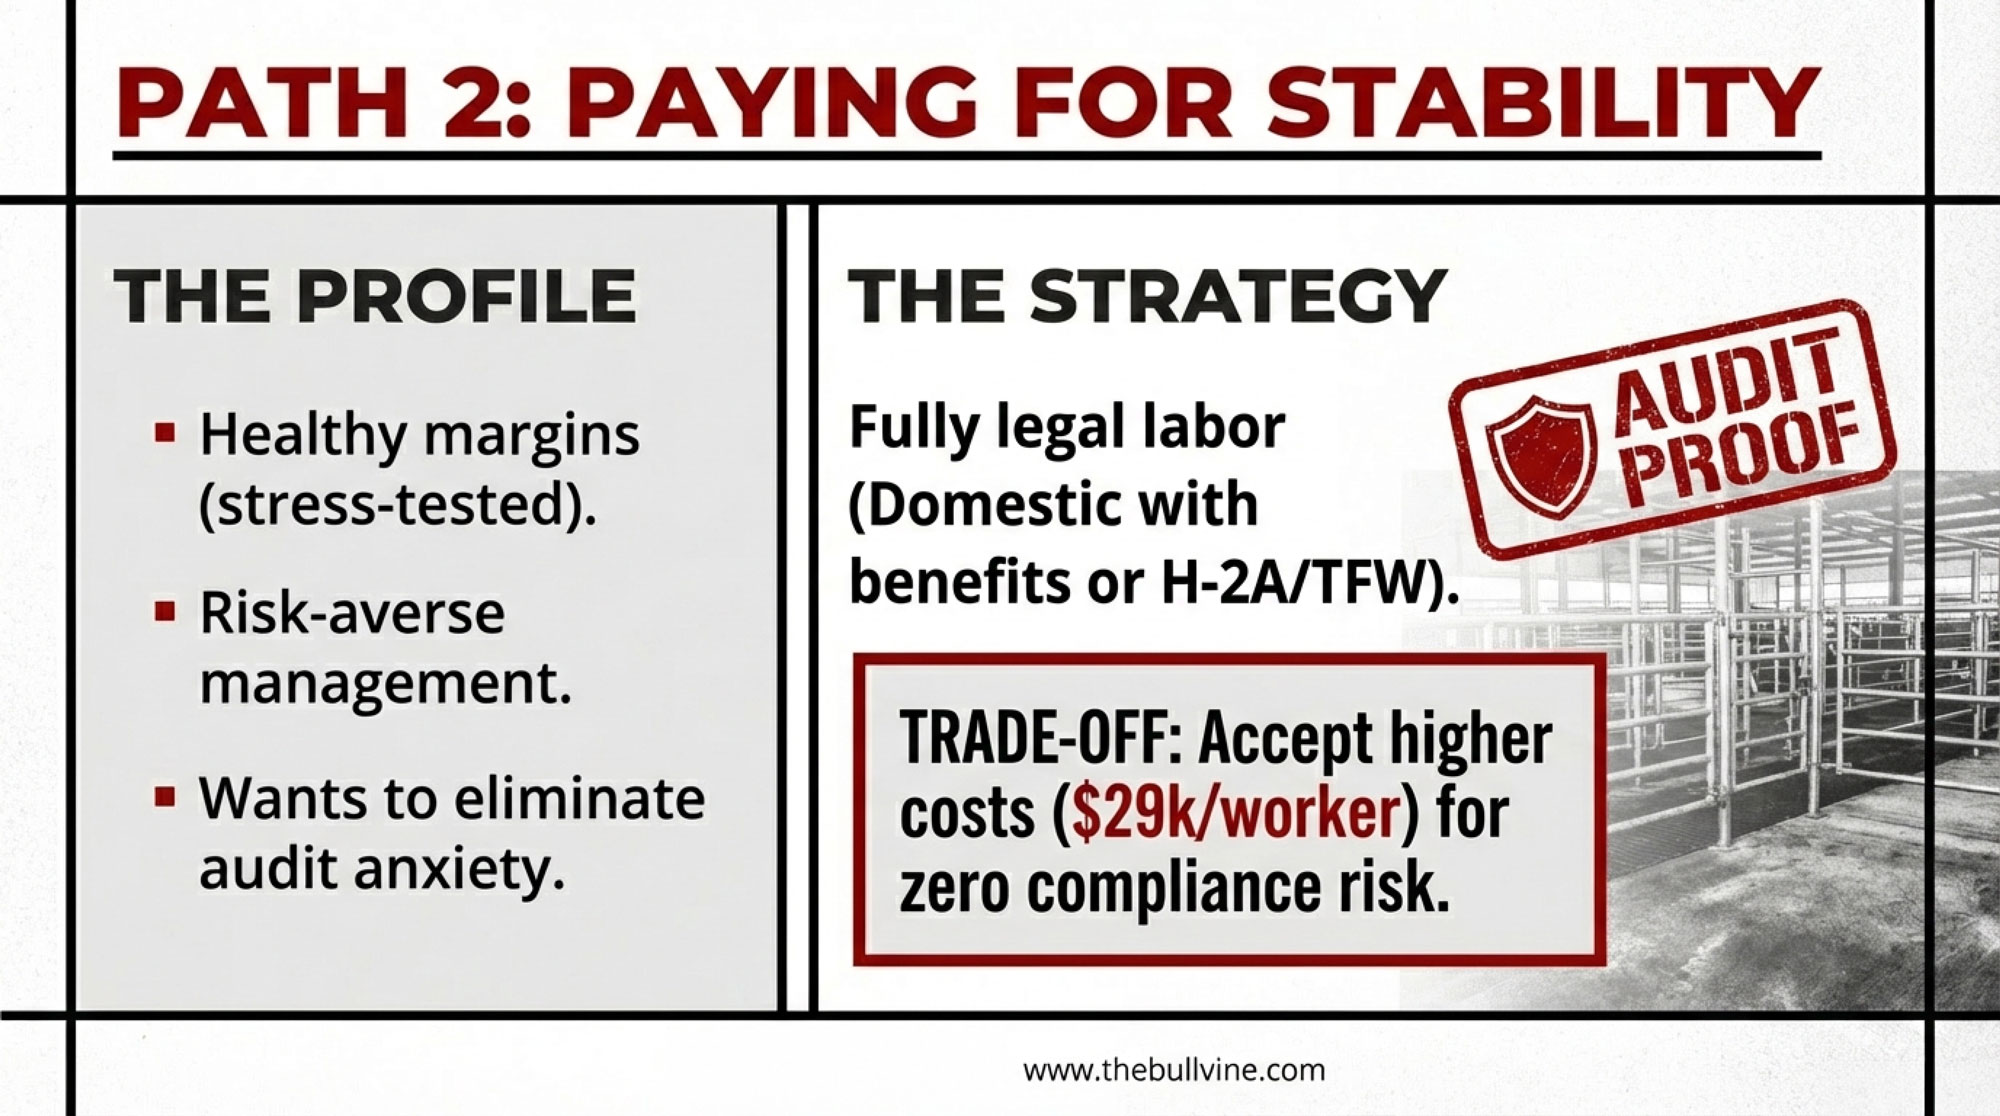
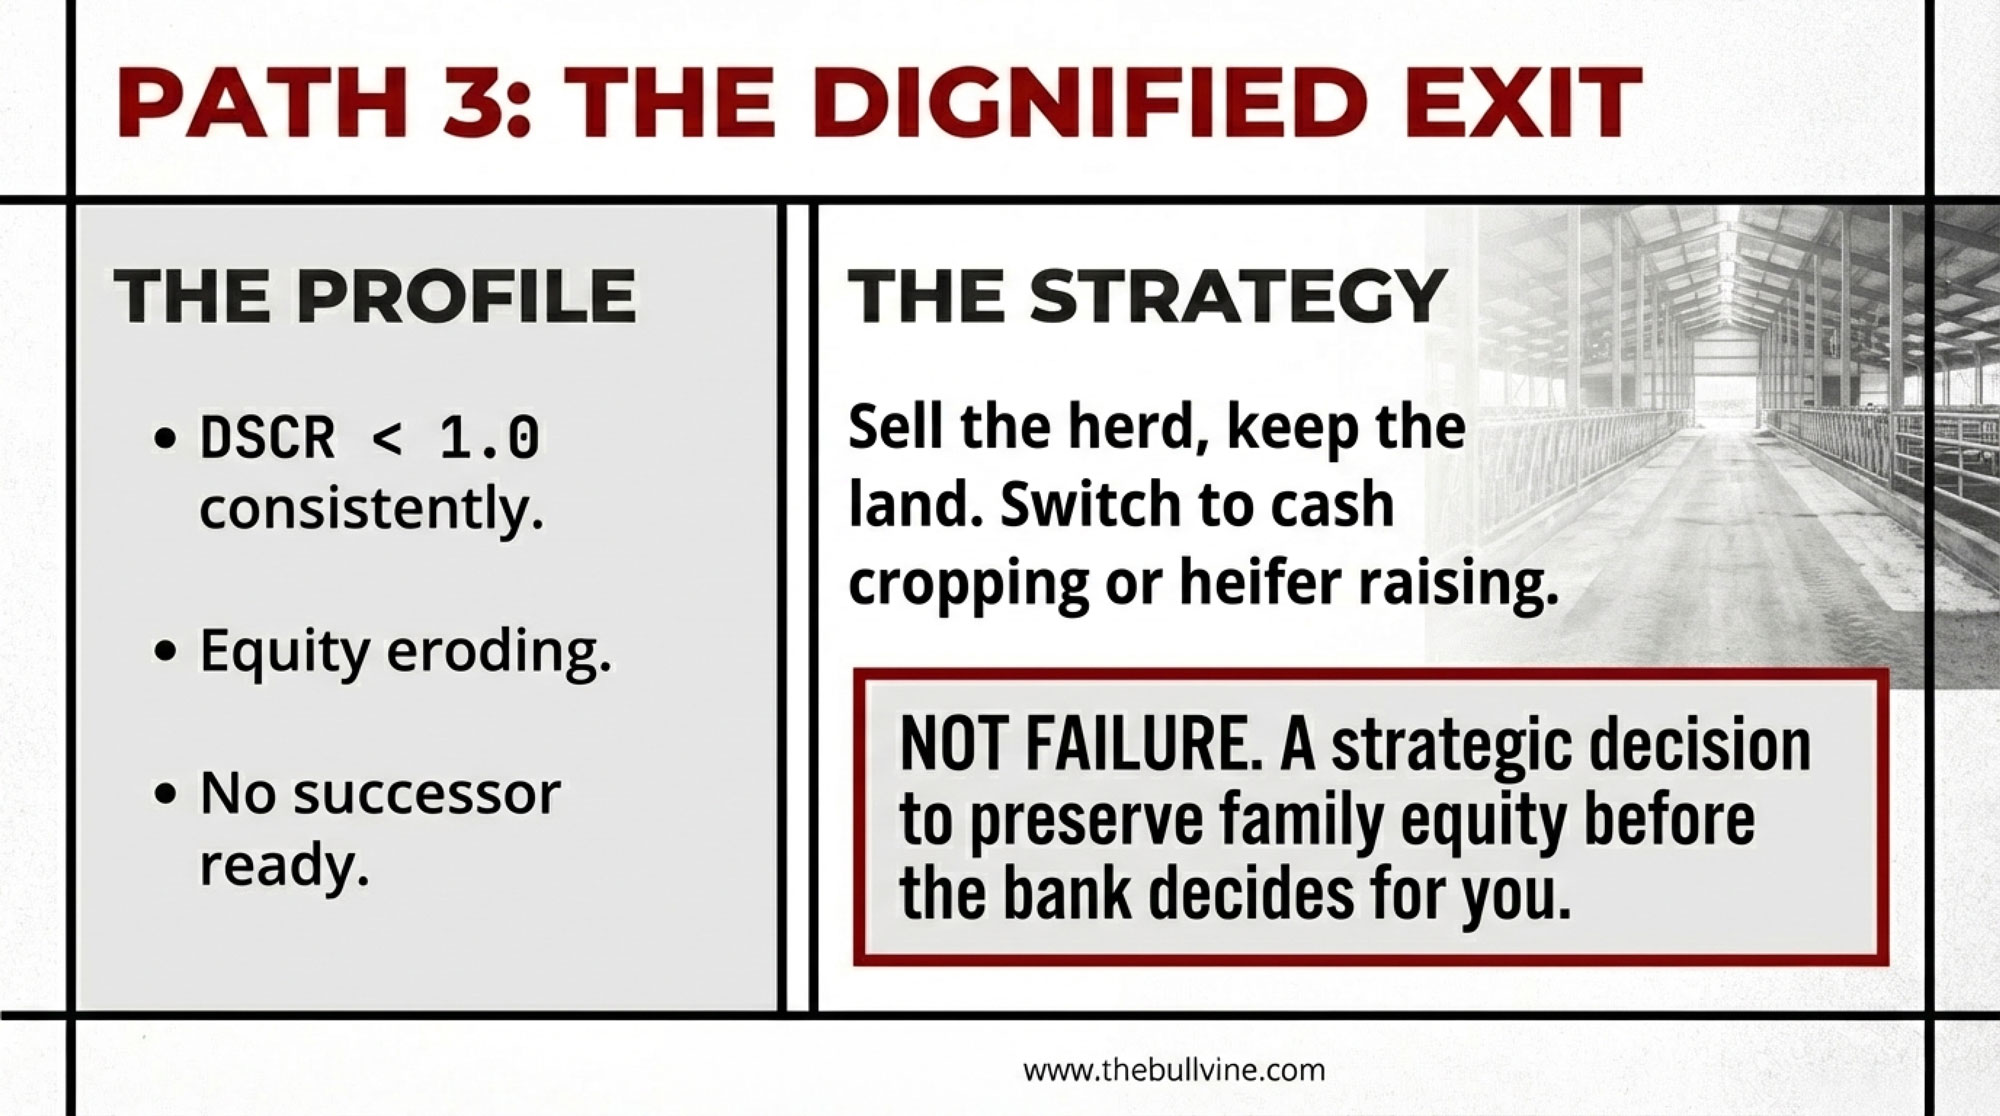
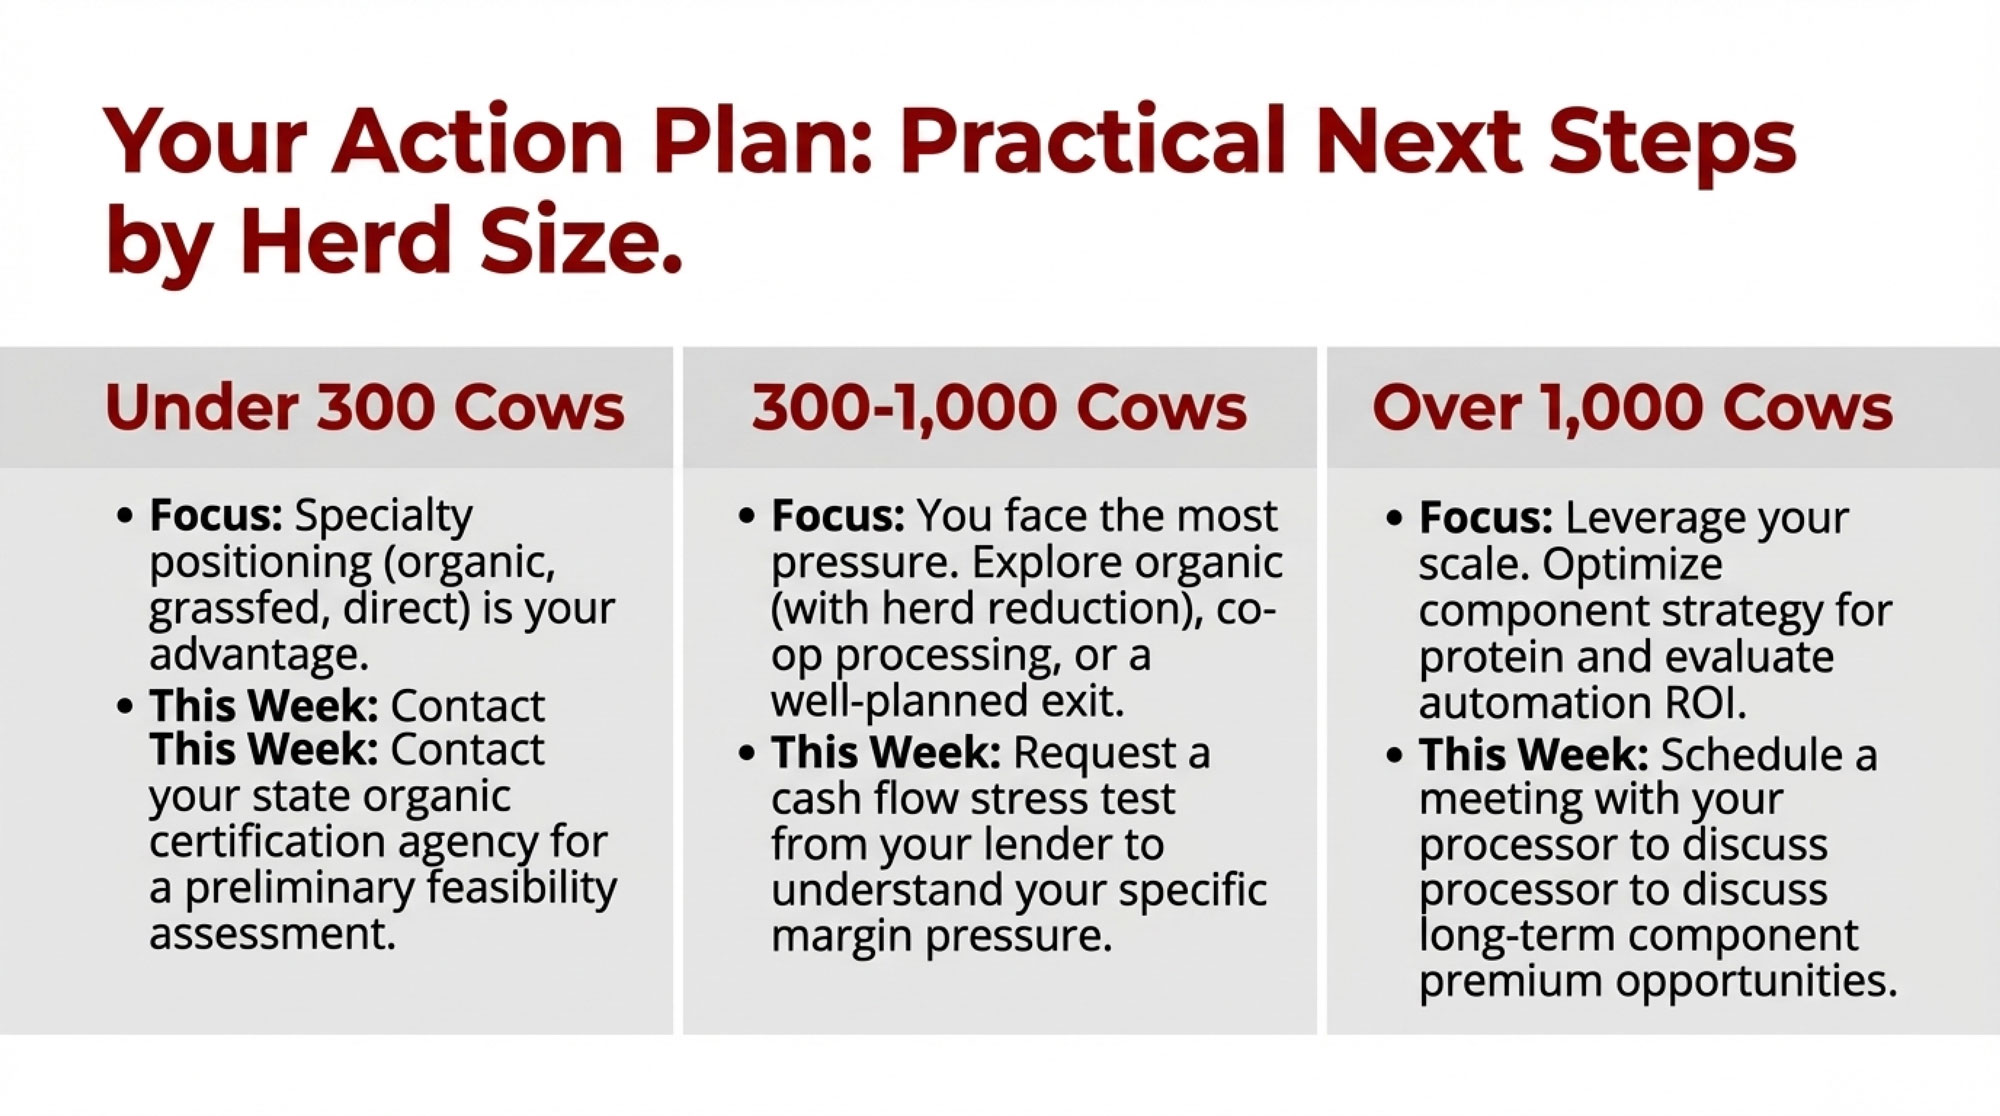
At some point, you’re down to three real options: pay legal labor what it actually costs and design your system around that, automate the hardest work, or plan a clean exit while you still have equity and energy.
Everything else is creative stalling.
The Night You Finally Say “We Can’t Keep Going Like This”
On the farms that are still breathing a few years later, the turning point is almost never a glossy robot brochure.
It’s the night someone at the table finally says, “We can’t keep going like this.”
On too many farms, that sentence dies in the kitchen. On the ones that make it, it doesn’t stay inside the house.
The smarter move we’re seeing more often now is simple but not easy: before signing an automatic milking system contract, you call the people who’ll actually be in your lane when things go sideways.
Picture a scene you’ve probably lived:
- One neighbor has toured a robot barn a county over.
- Another has a cousin on AMS in Ontario.
- A younger dairyman down the road is “robot‑curious” but still in a double‑8.
- The 4‑H leader knows half your heifers by name.
They pile into your kitchen with chili, kids, and opinions.
“We’re not sure we can do this,” you admit. “But we’re sure we can’t keep doing what we’re doing.”
On the barns that survive, that’s the moment it stops being your problem and becomes our barn.
You hear real commitments, not just sympathy:
- “I’ll cover morning feeding if construction runs long.”
- “We’ll shuffle concrete work so your robot pad gets poured before frost.”
- “When it’s time to train cows, I’ll bring the 4‑H kids—they’re not going to forget it.”
Robots stop being a lonely, high‑risk hardware purchase. They become a community project.
You’ll hear some version of this line:
“What keeps us going isn’t just the cows—it’s the people around us.”
And that’s before a single robot milks a single cow.
The $1.2 Million Question
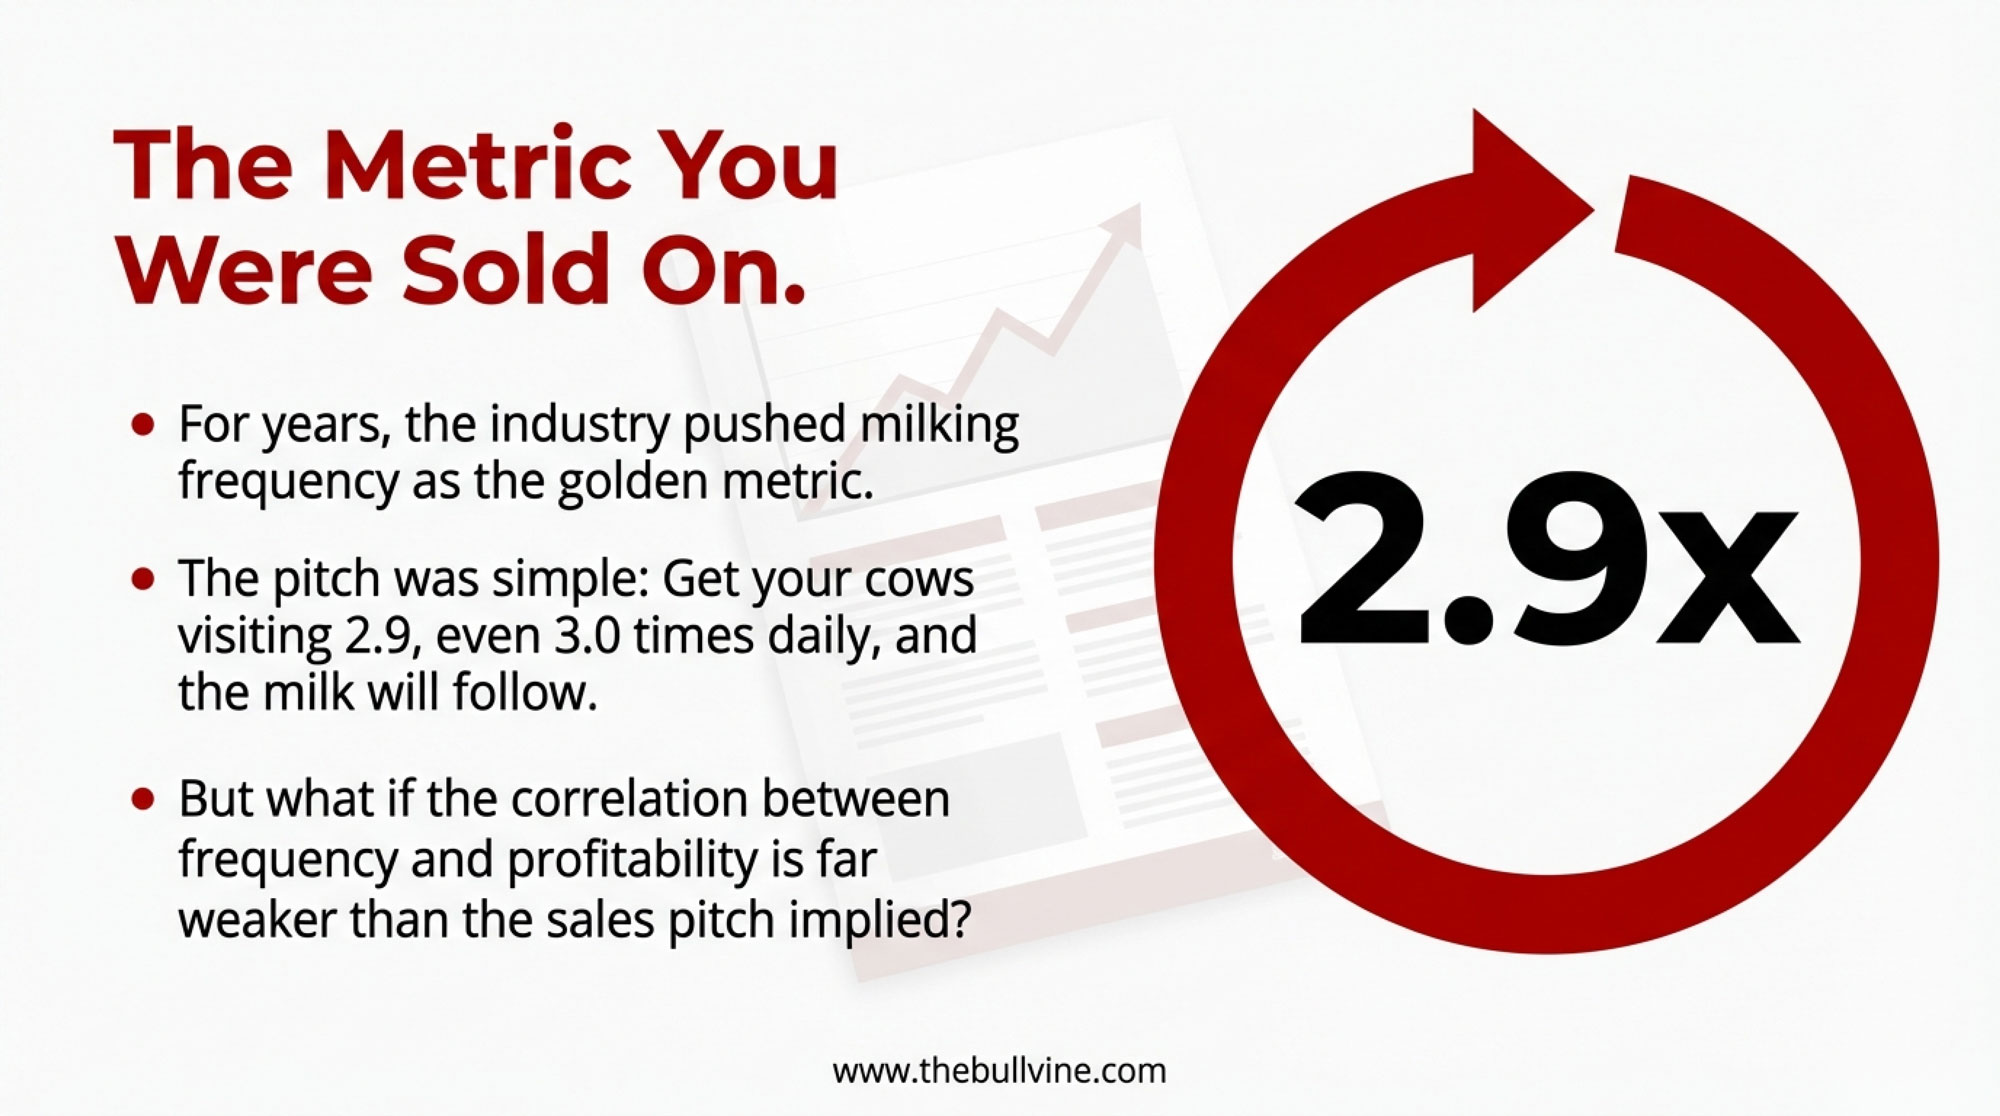
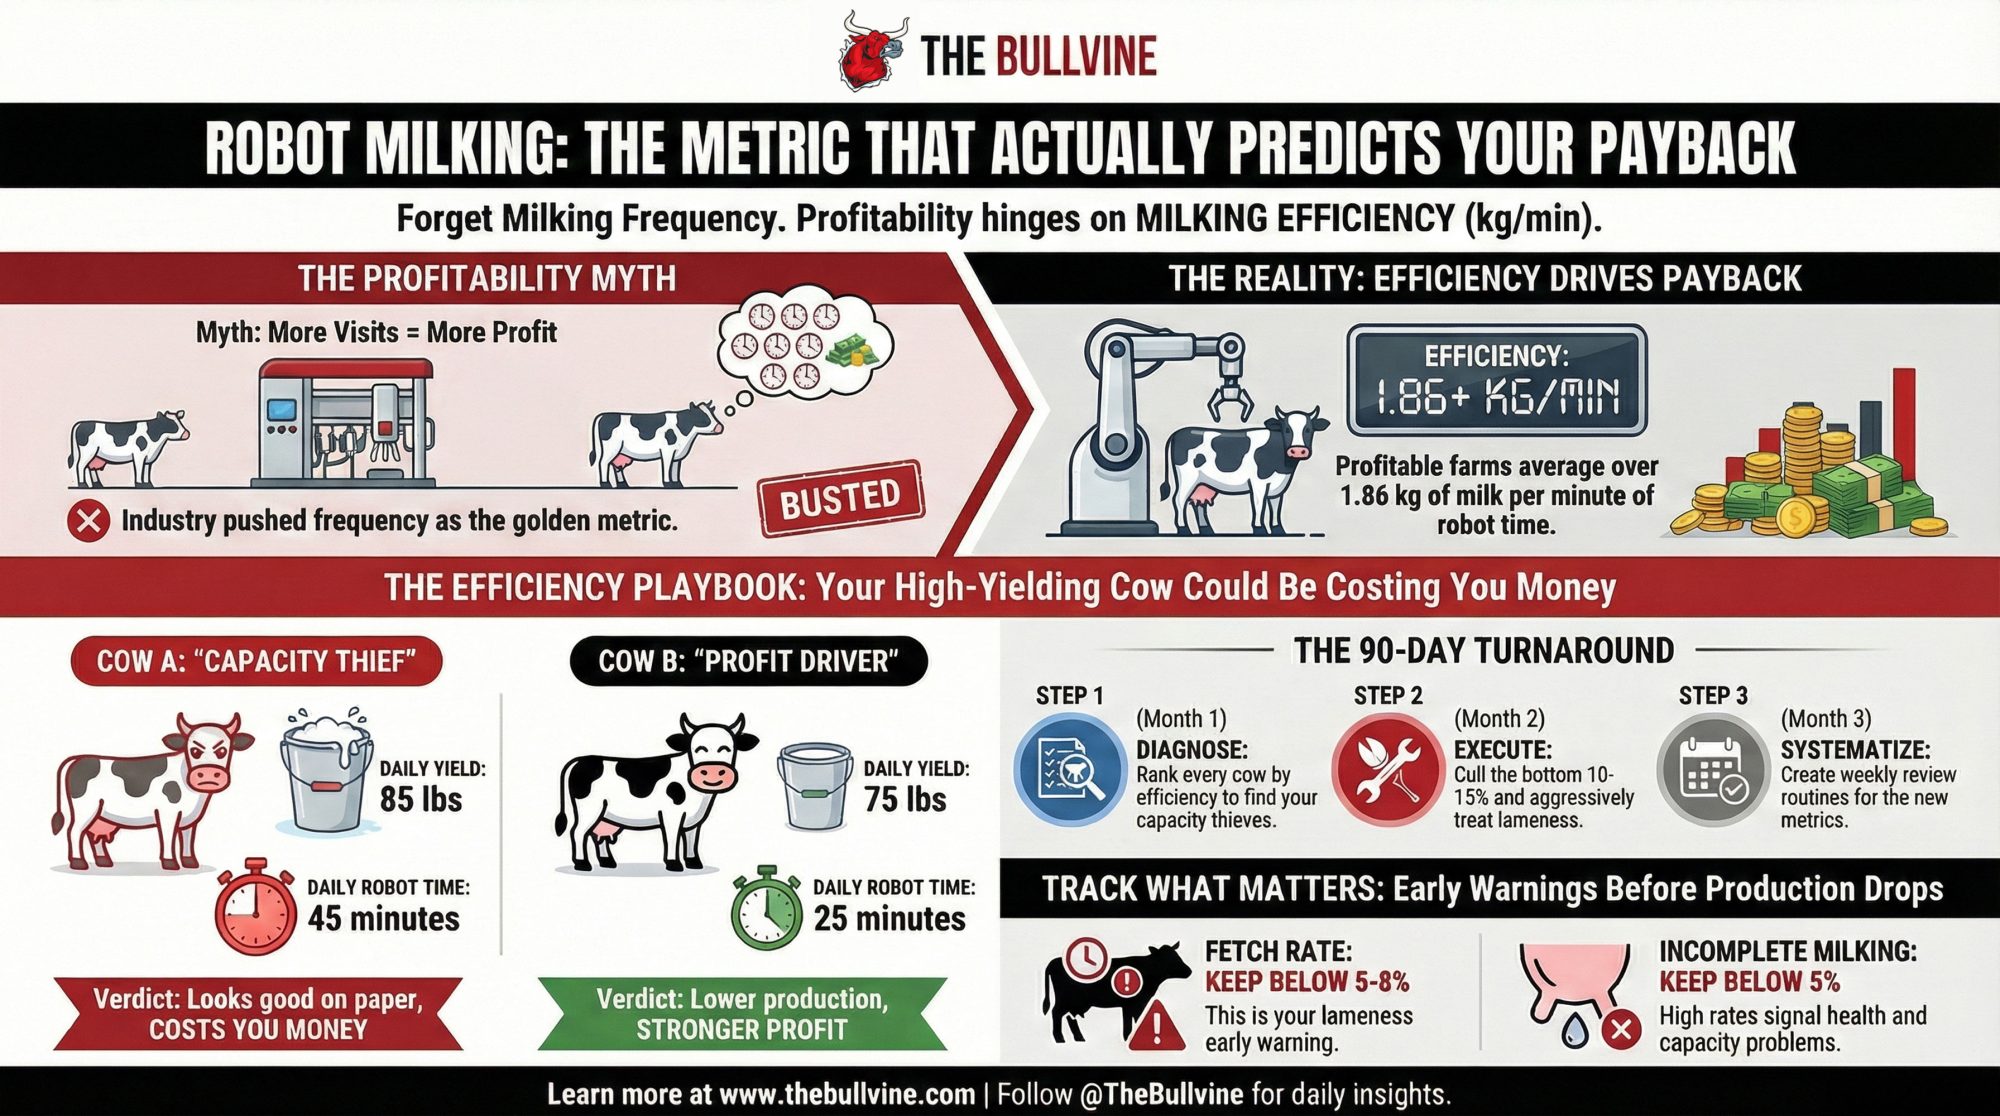
Now we get to the part most sales pitches slide past: the actual ROI of robotic milking.

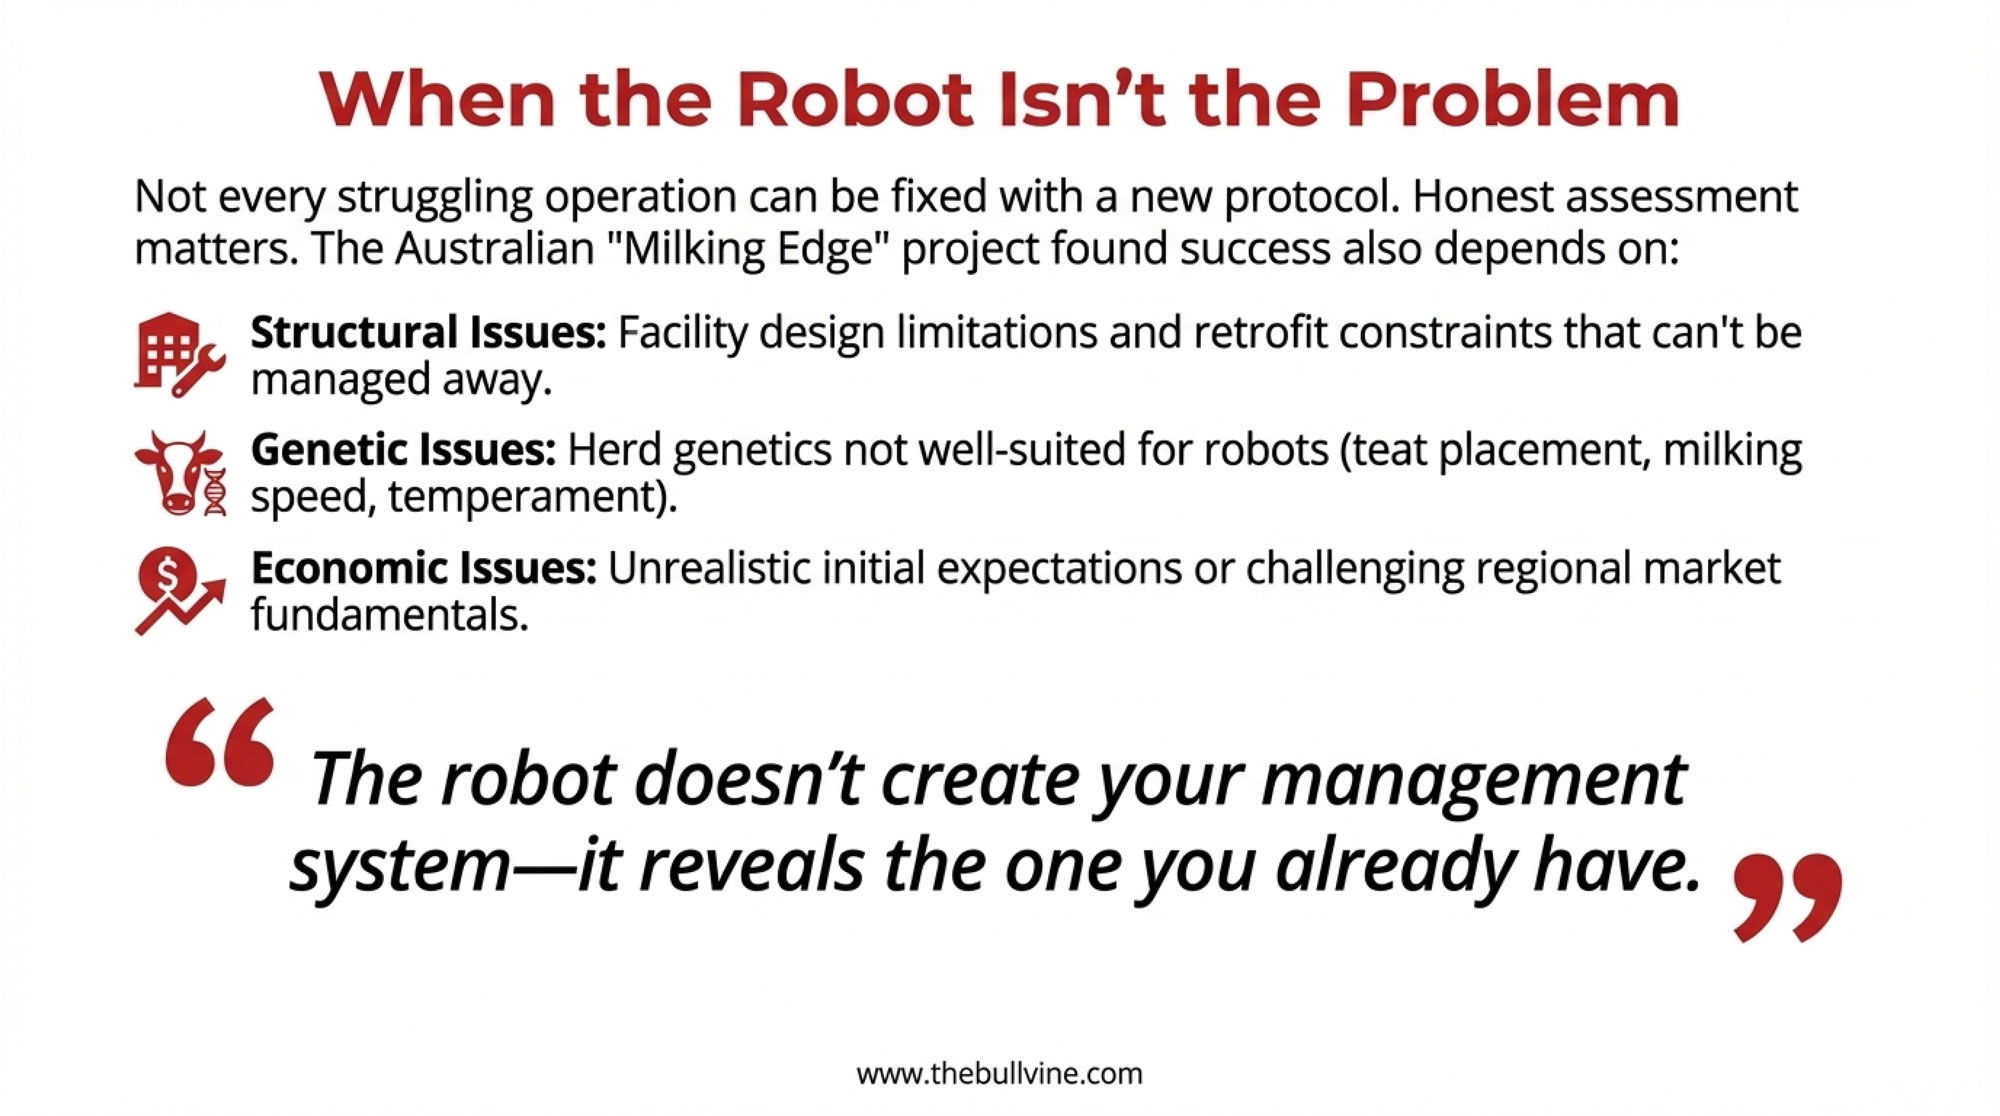
The Bullvine’s own robotics position is blunt: every robot sold under 500 cows in the U.S. is at best a dangerous luxury and at worst malpractice—unless your labor cost is insane or you literally can’t hire. That doesn’t mean no herd under 500 cows should ever go robotic. It means the automatic “yes” is gone. The default answer is “no” until your local numbers force you to “maybe.”
Here’s what typical AMS budgets look like when you strip away the sales pitch.
Capital and service costs
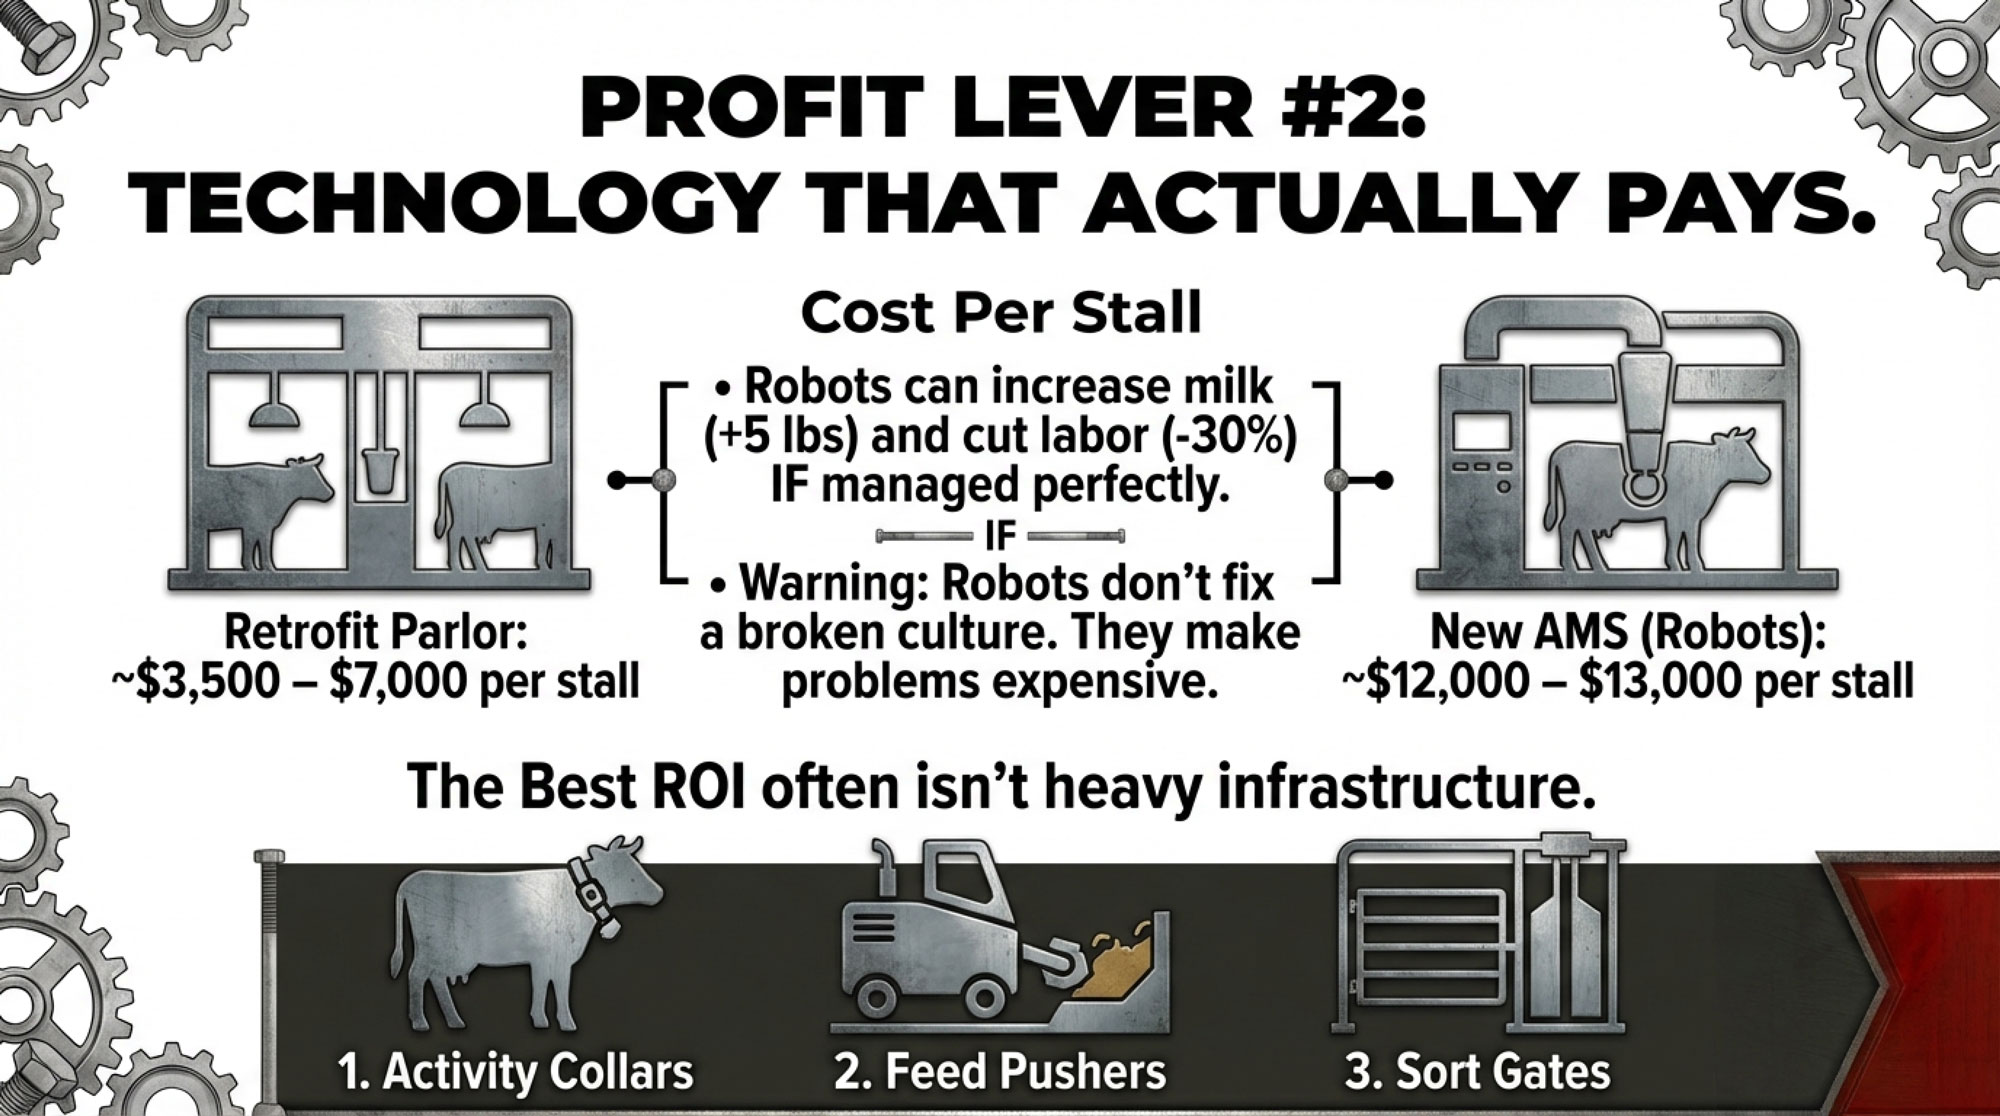
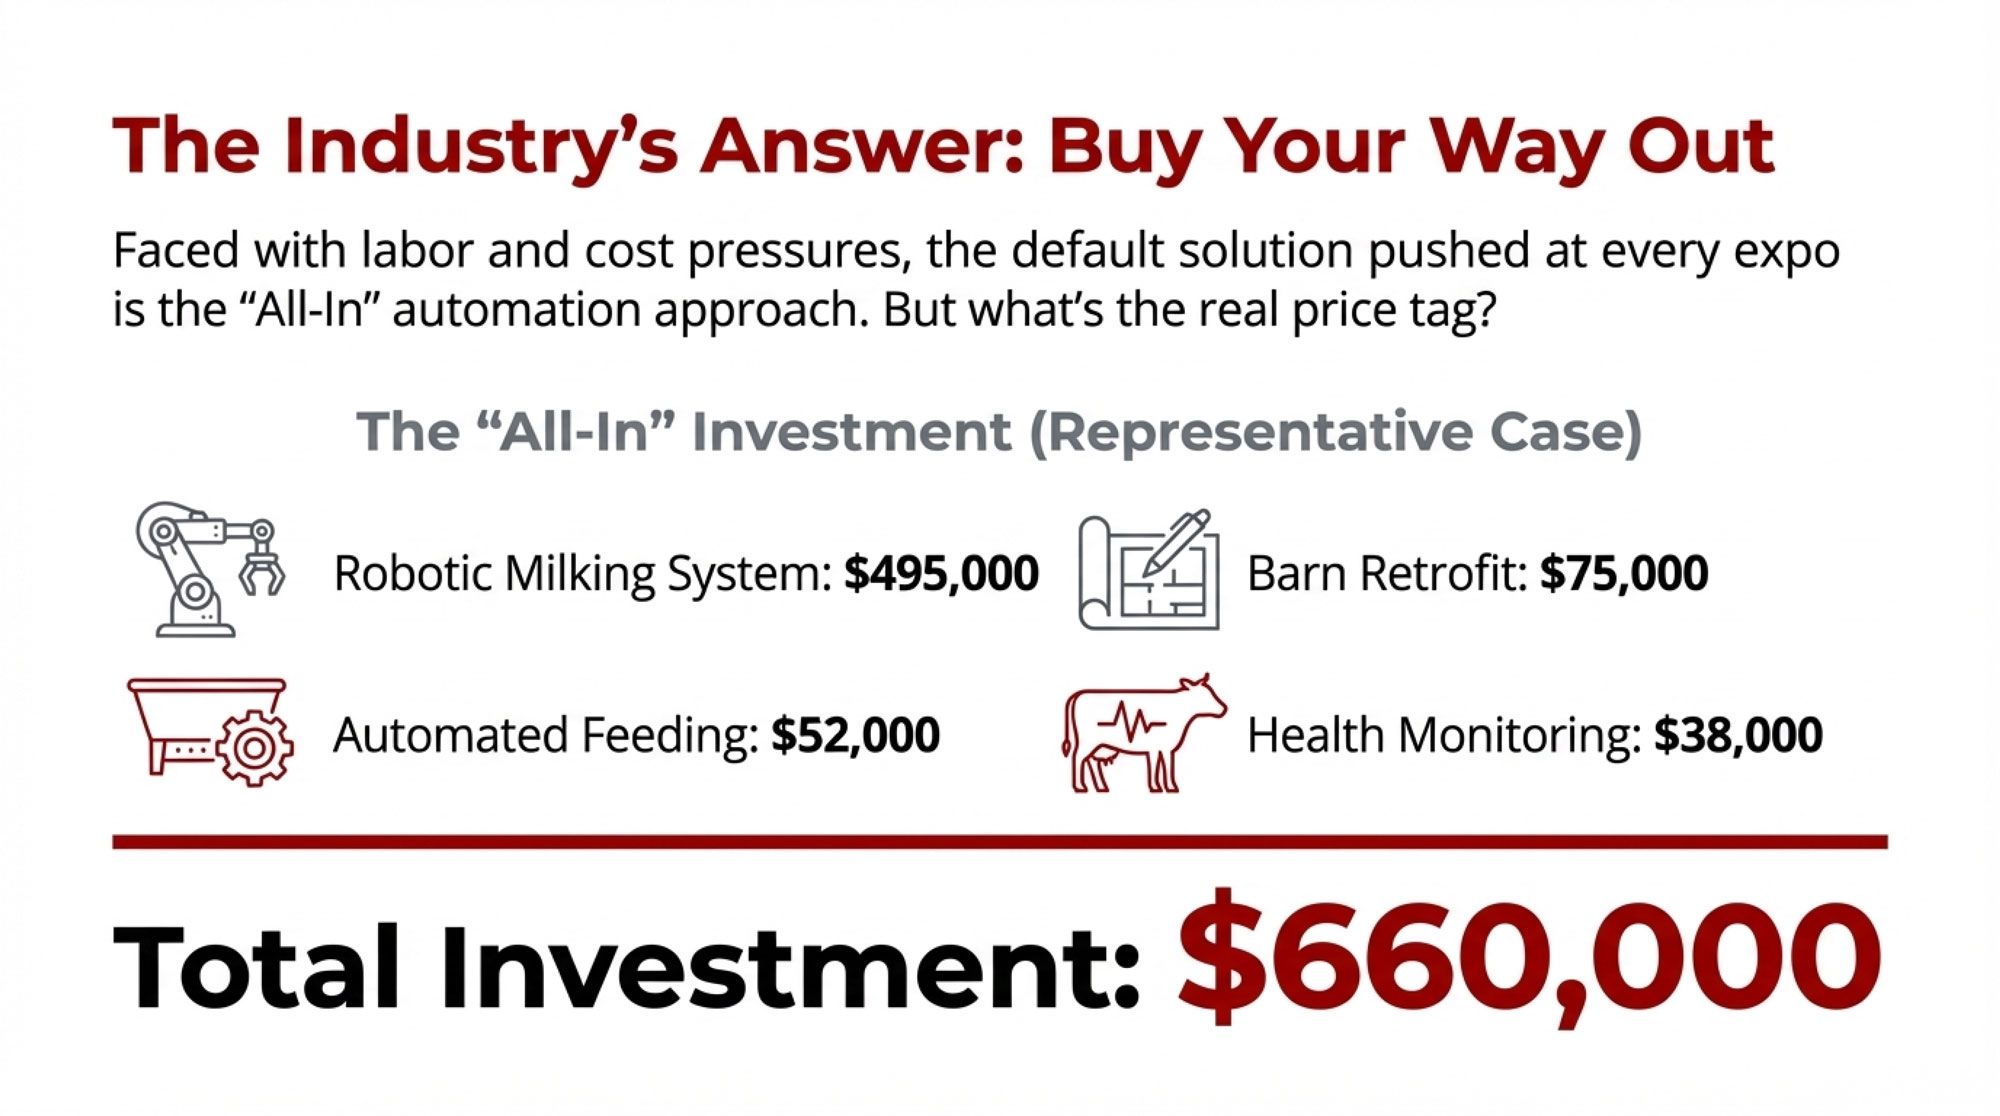
On small and mid‑sized herds in the Upper Midwest, 2023–2025 manufacturer quotes and independent budgets commonly put a three‑box install covering roughly 180–210 cows in the following ballpark:
- Robotic milking systems + installation: roughly USD $180,000–250,000 per box, including software and accessories.
- Barn modifications: often another USD $100,000–300,000, depending on how “robot‑ready” your layout is.
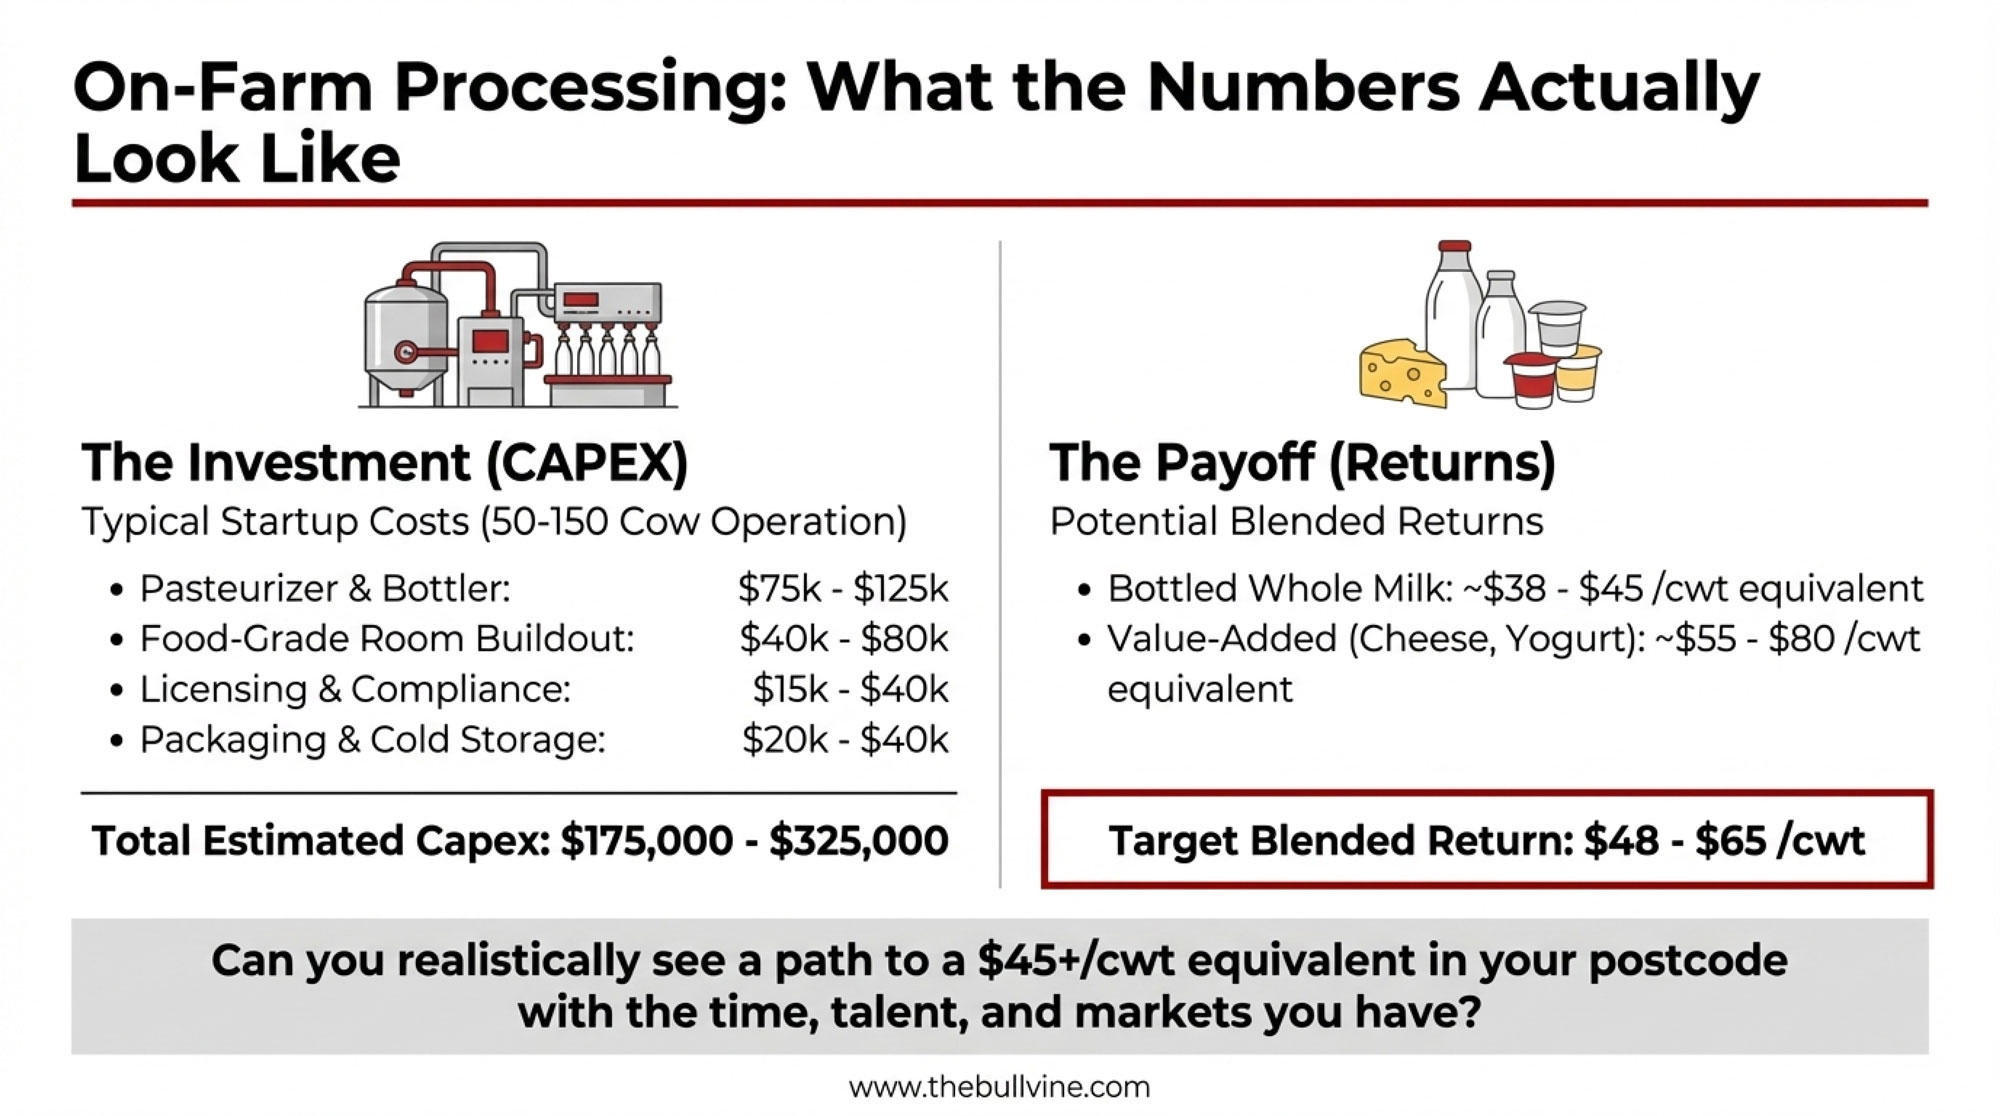
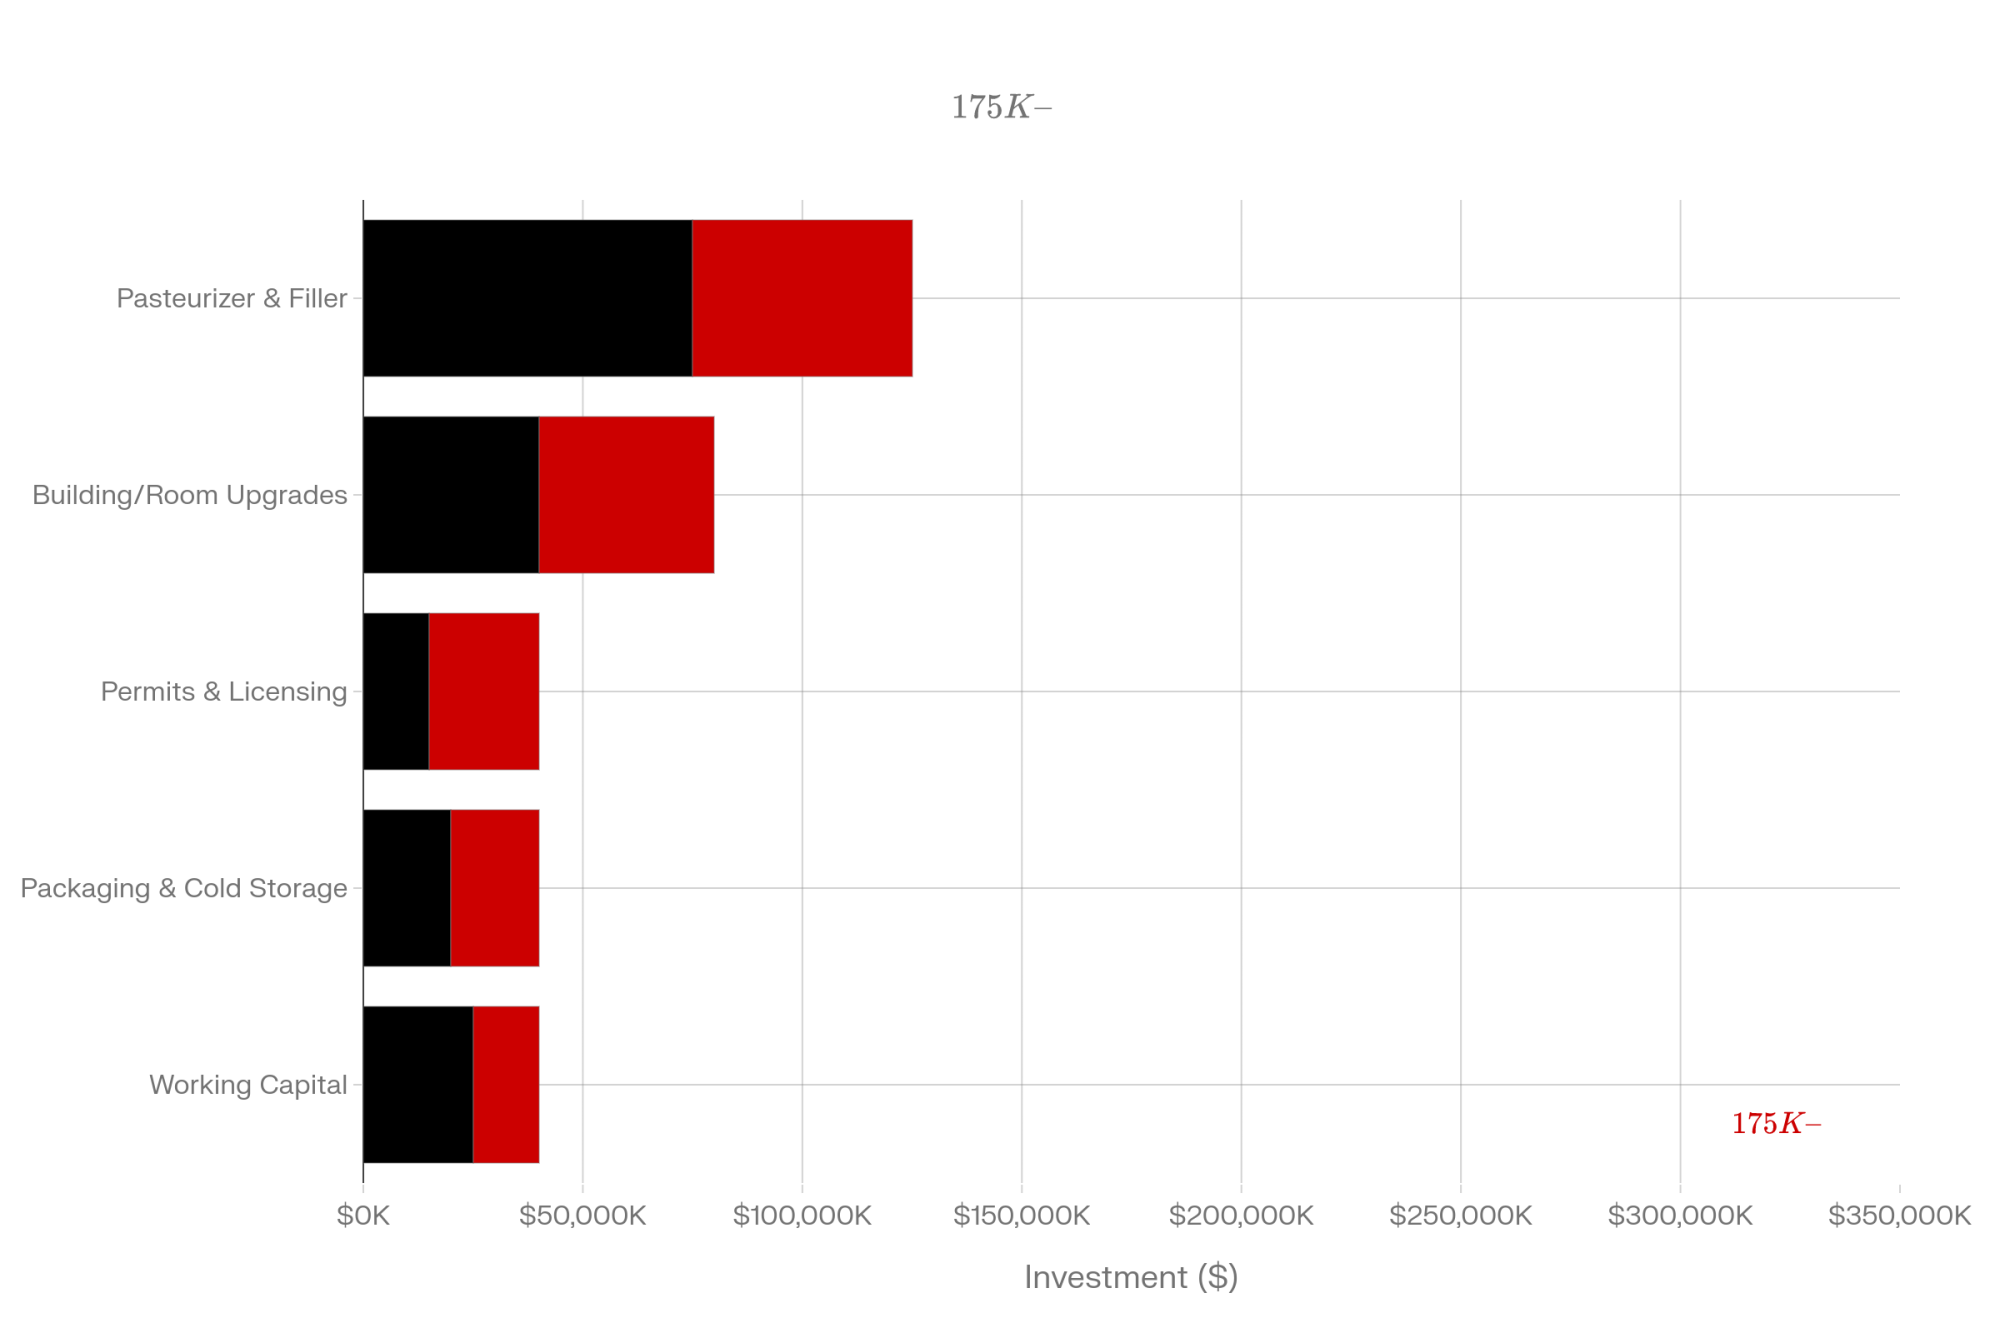
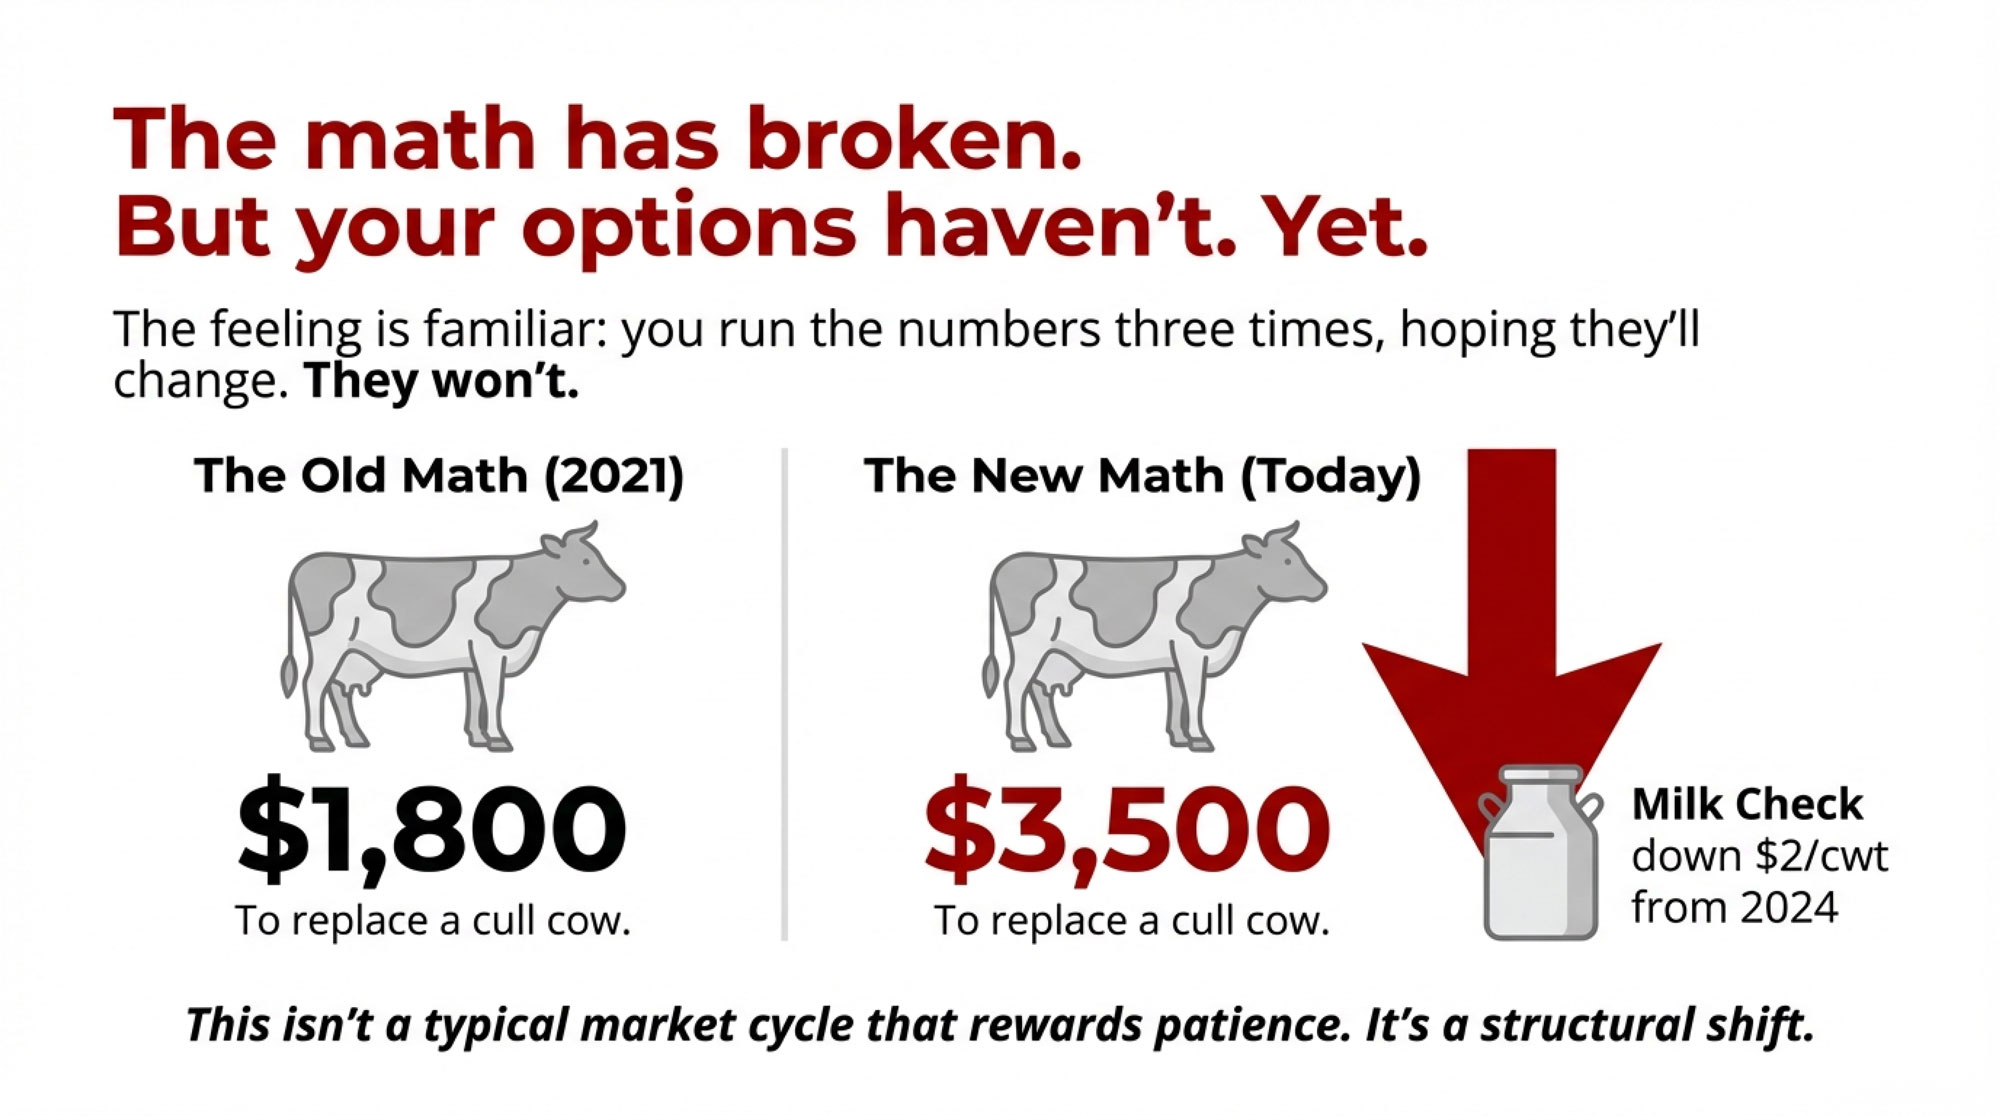
Put that together, and many 3‑box projects end up somewhere in the USD $800,000–1,200,000 range once the dust settles. Analysis notes that each automatic milking system can reasonably be assumed to cost about USD $200,000, including USD $15,000–20,000 in facility renovation per unit, numbers that align with these ranges.
Service doesn’t disappear either:
- On many farms, service contracts, parts, and callouts can cost tens of thousands of dollars per box per yearover the life of the system, totaling hundreds of thousands of dollars over a decade.
Labor savings and milk flow
On the other side of the ledger:
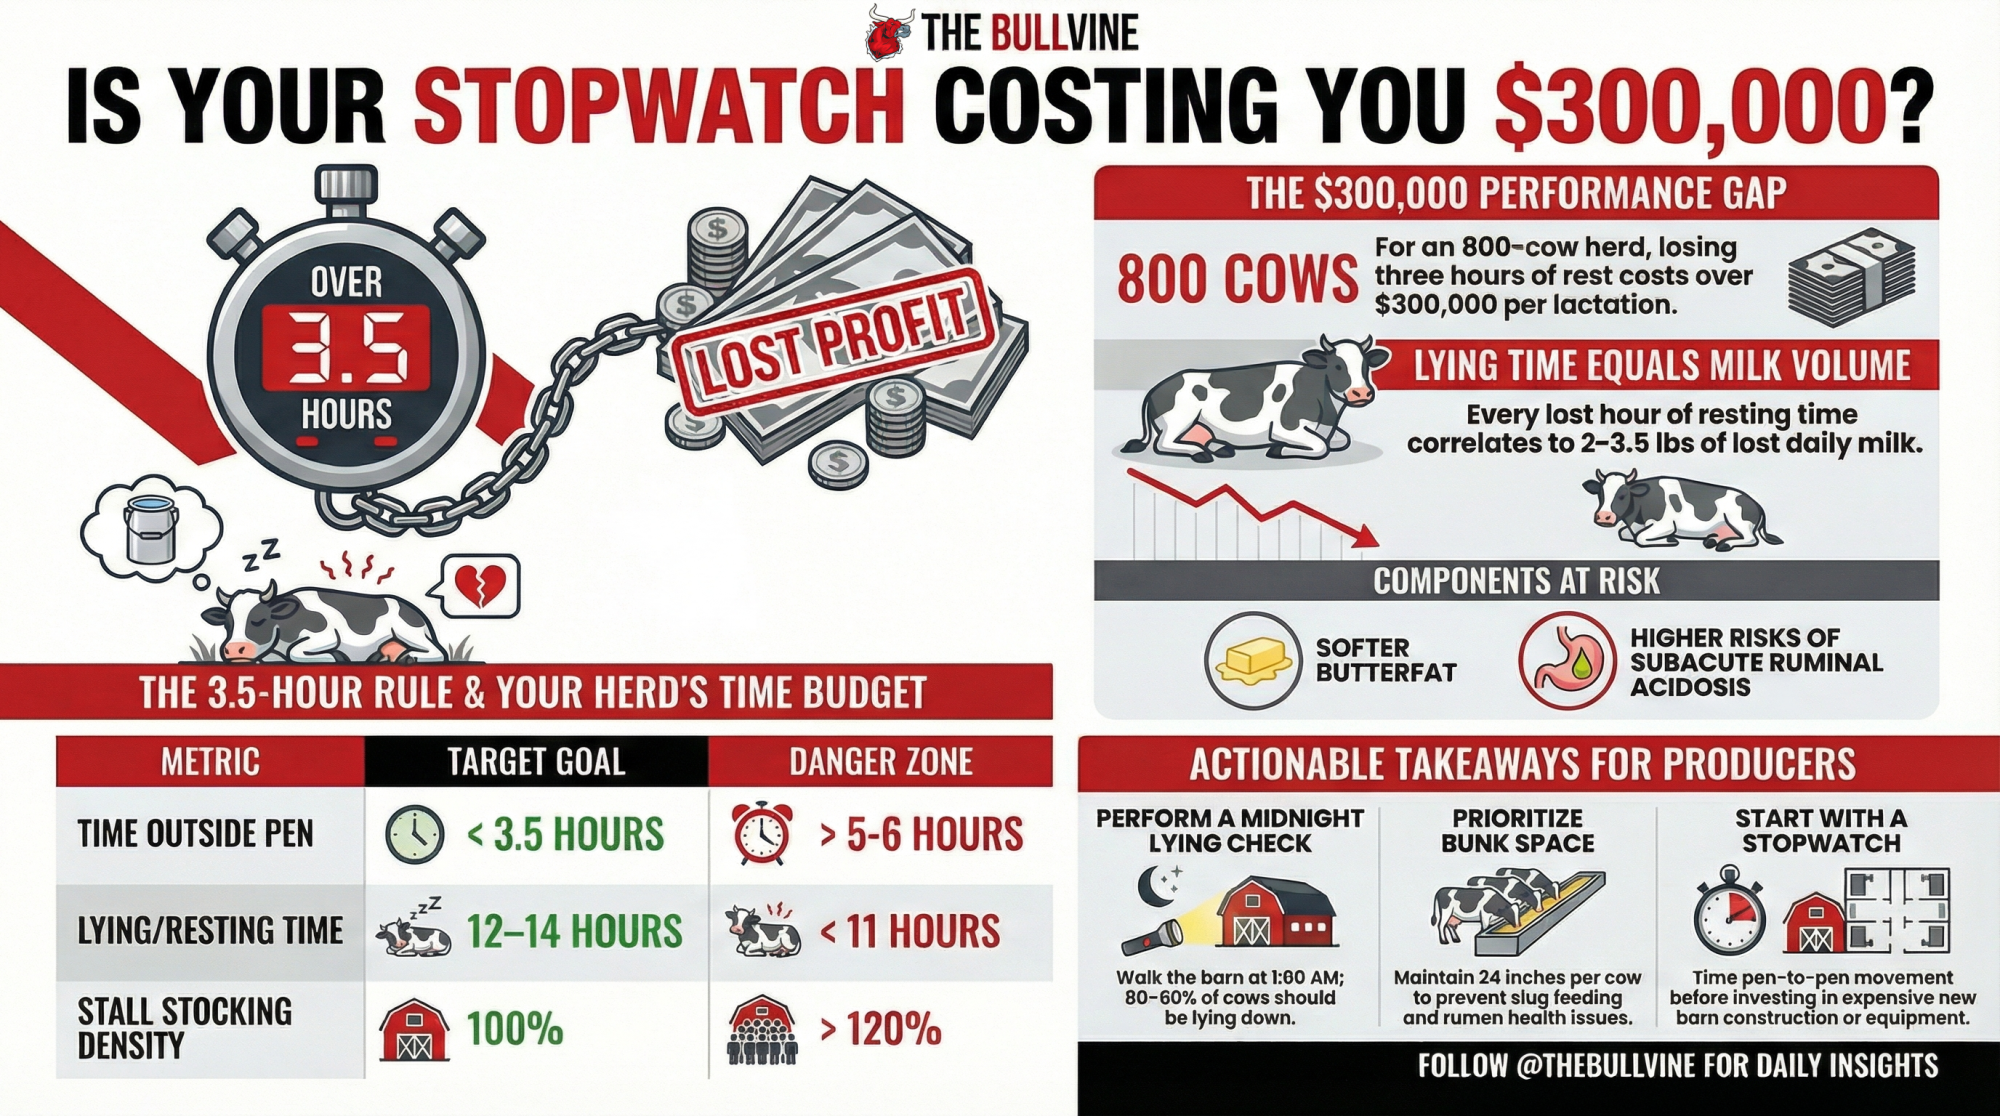
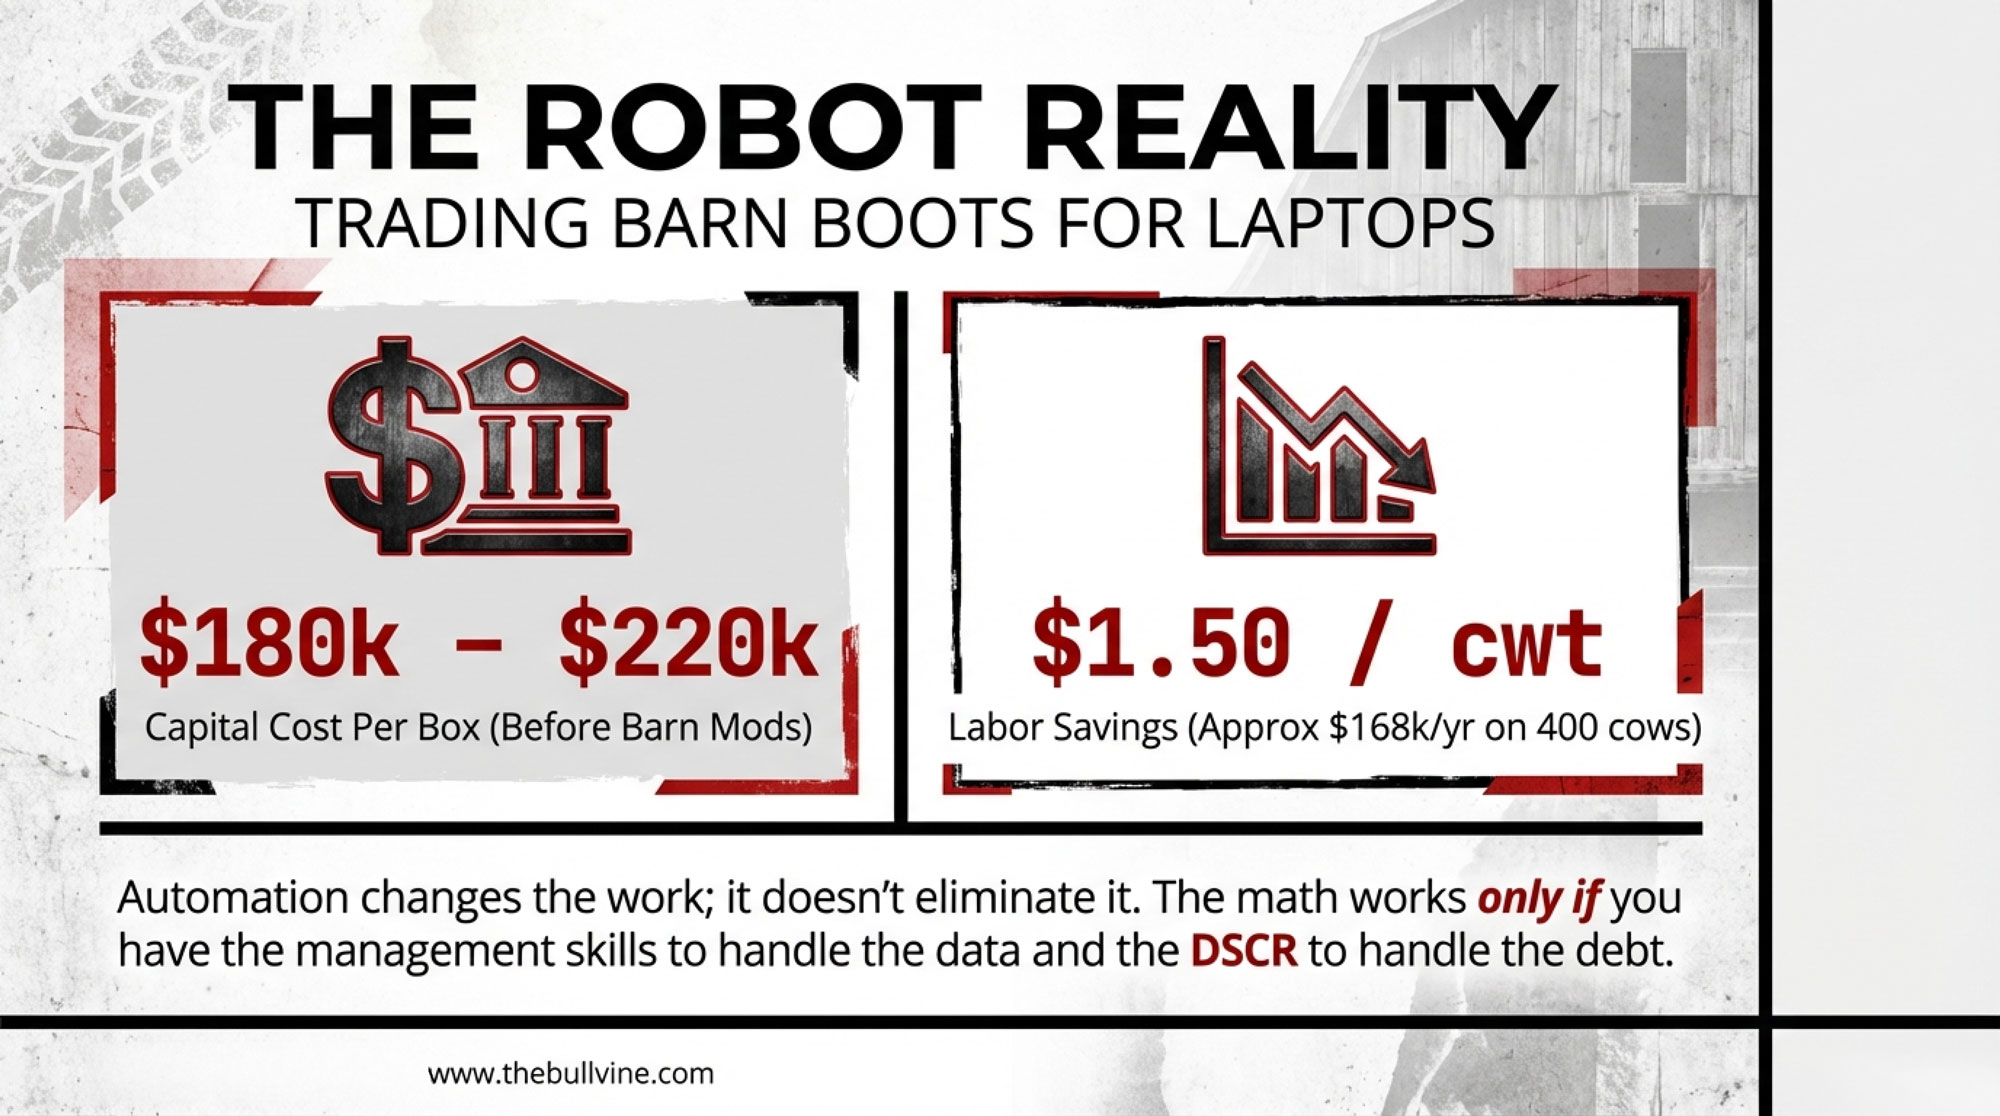
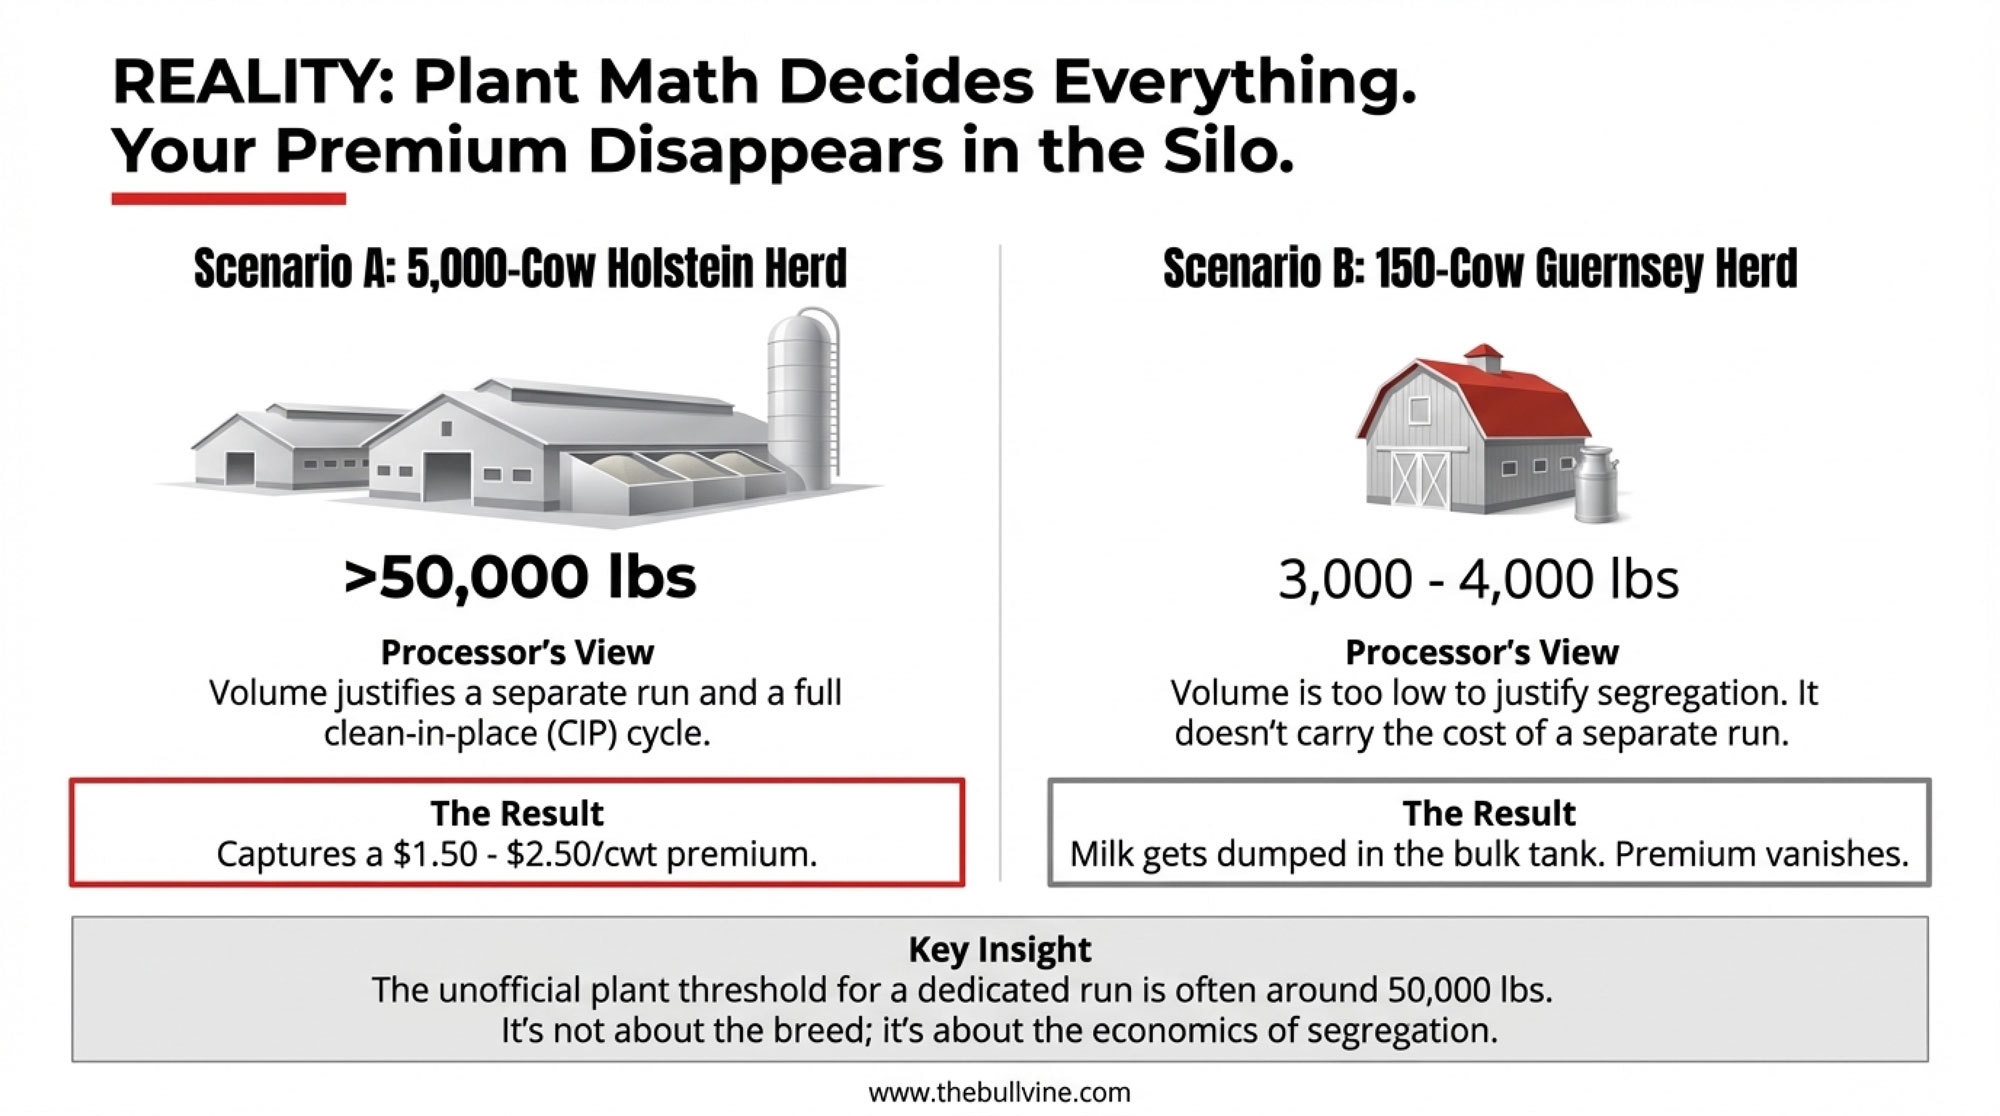
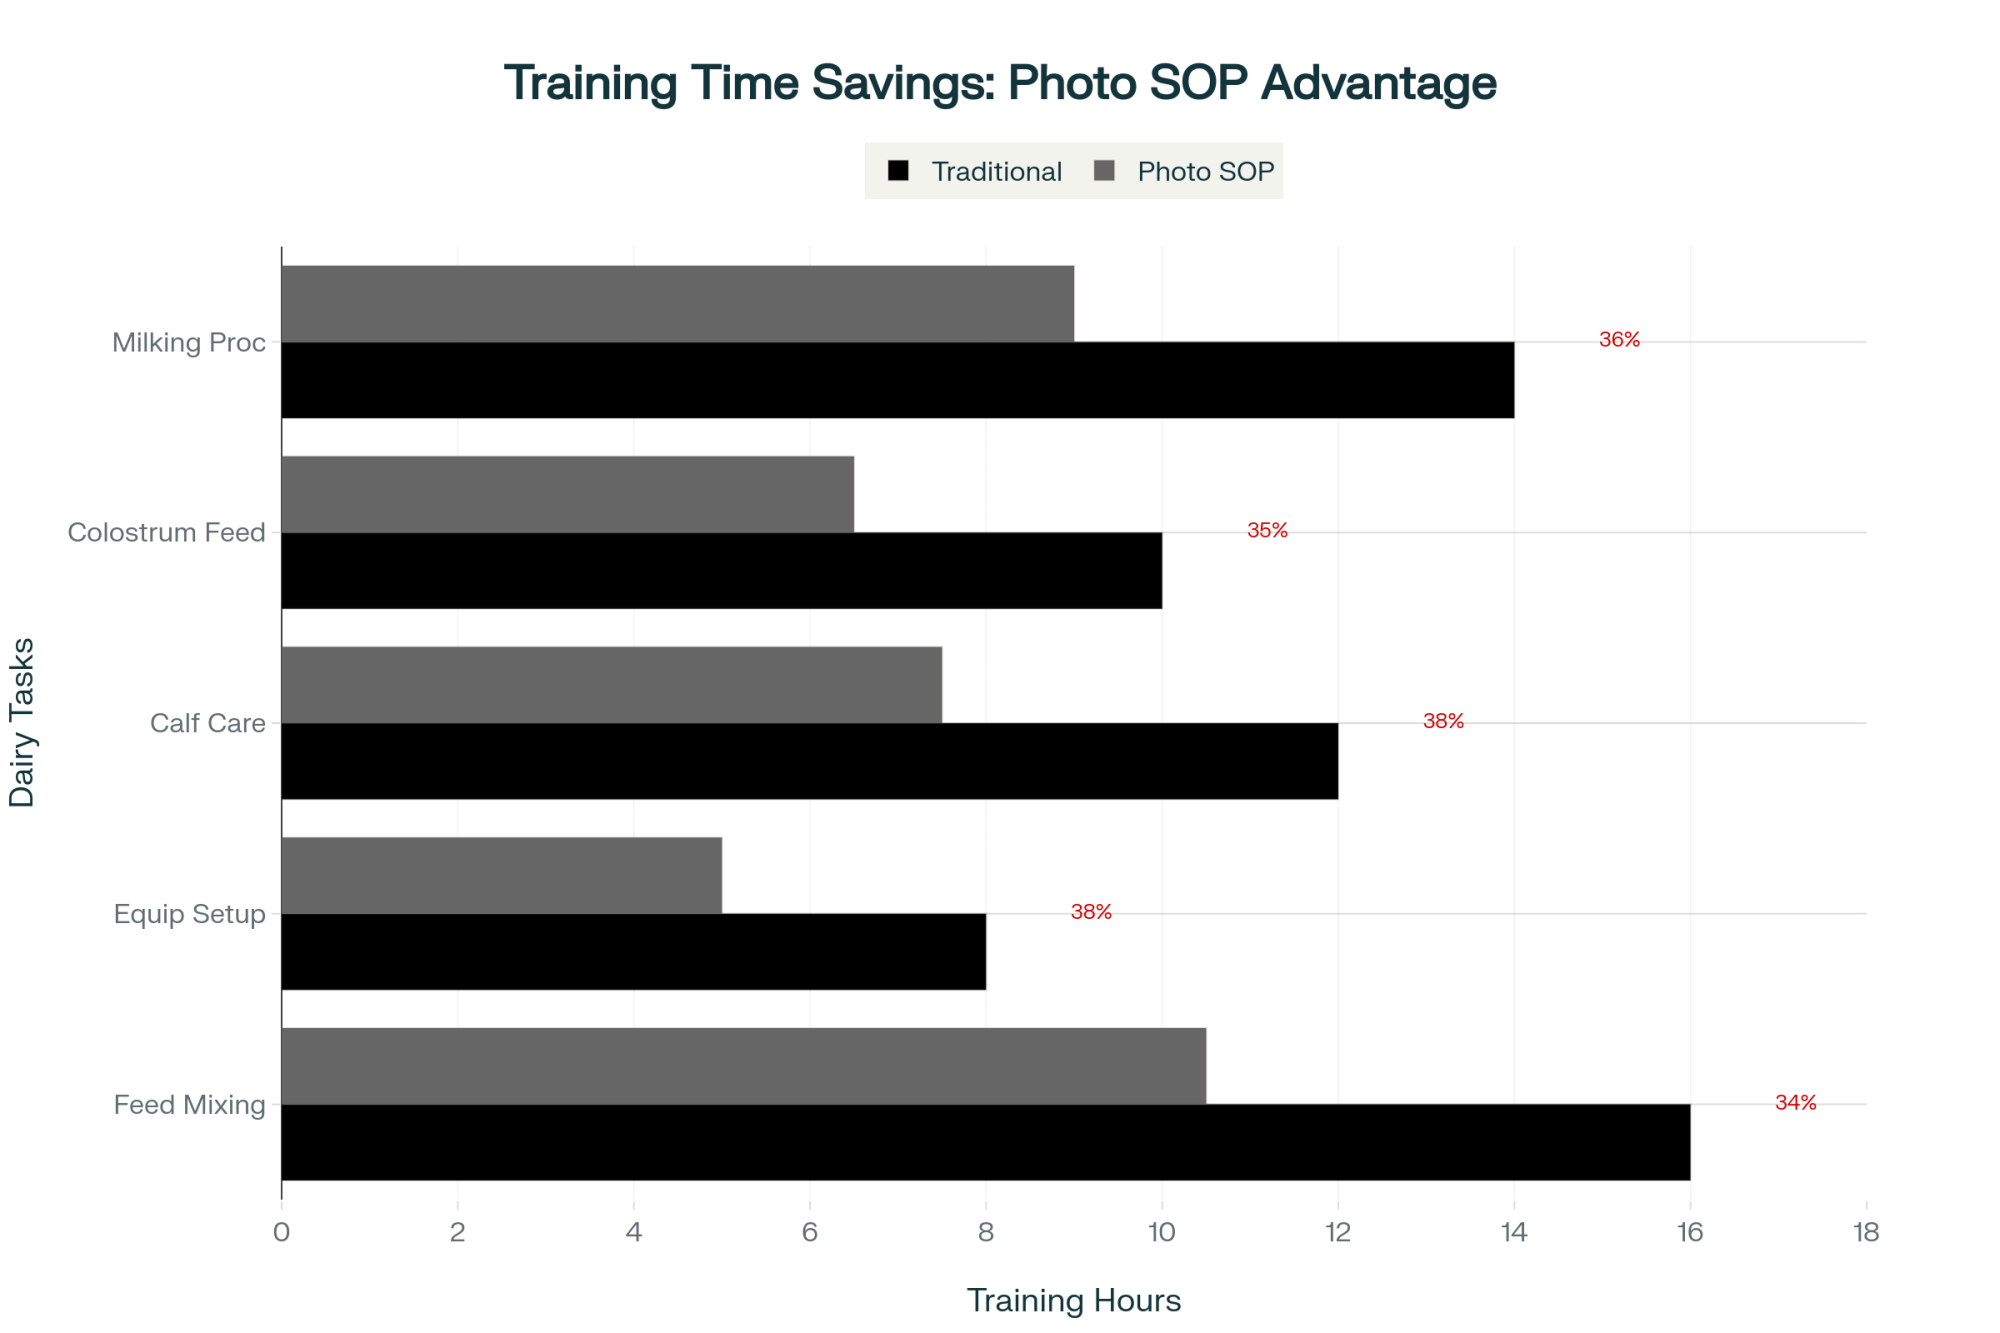
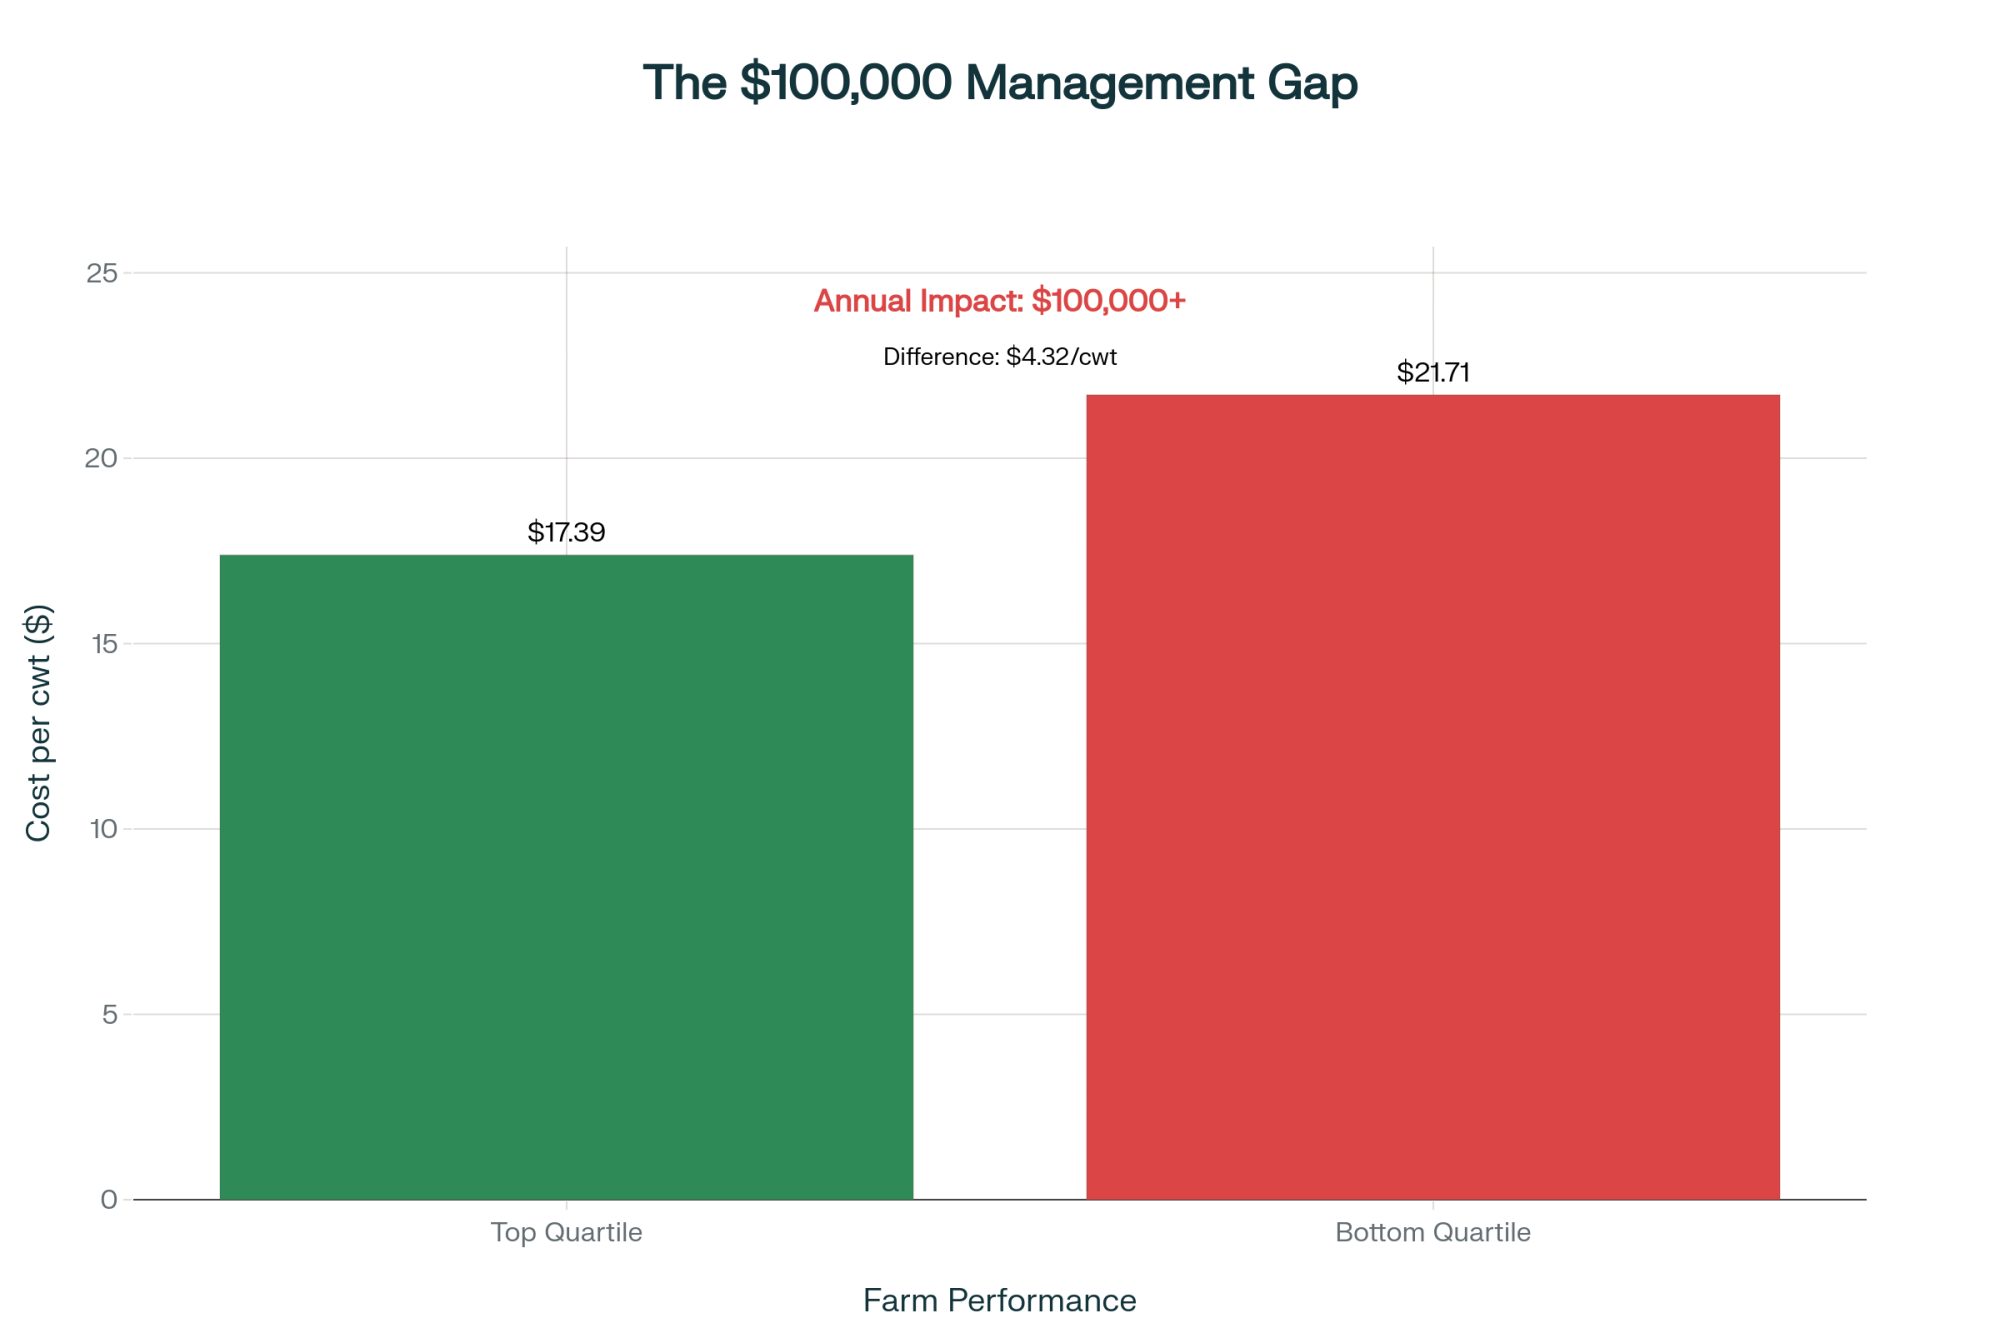
- University of Wisconsin–Madison Extension reports AMS herds in their sample saving around 0.06 hr/cow/day, which worked out to about a 38% drop in labor per cow and 43% per cwt—roughly USD $1.50 per cwt in labor savings at a USD $15/hour wage, with some farms reporting savings closer to USD $2.40 per cwt.
- A Cornell‑led multi‑state study, cited in Bullvine’s own AMS analysis, found AMS herds cutting overall labor costs by about 21%, raising milk output 3–5 lb/cow/day, and improving milk quality metrics in roughly 32% of barns surveyed. Results weren’t universal: some herds did very well, some were neutral, and a minority struggled.
This is where your robotic milking ROI either holds or falls apart.
Here’s the hard truth on that:
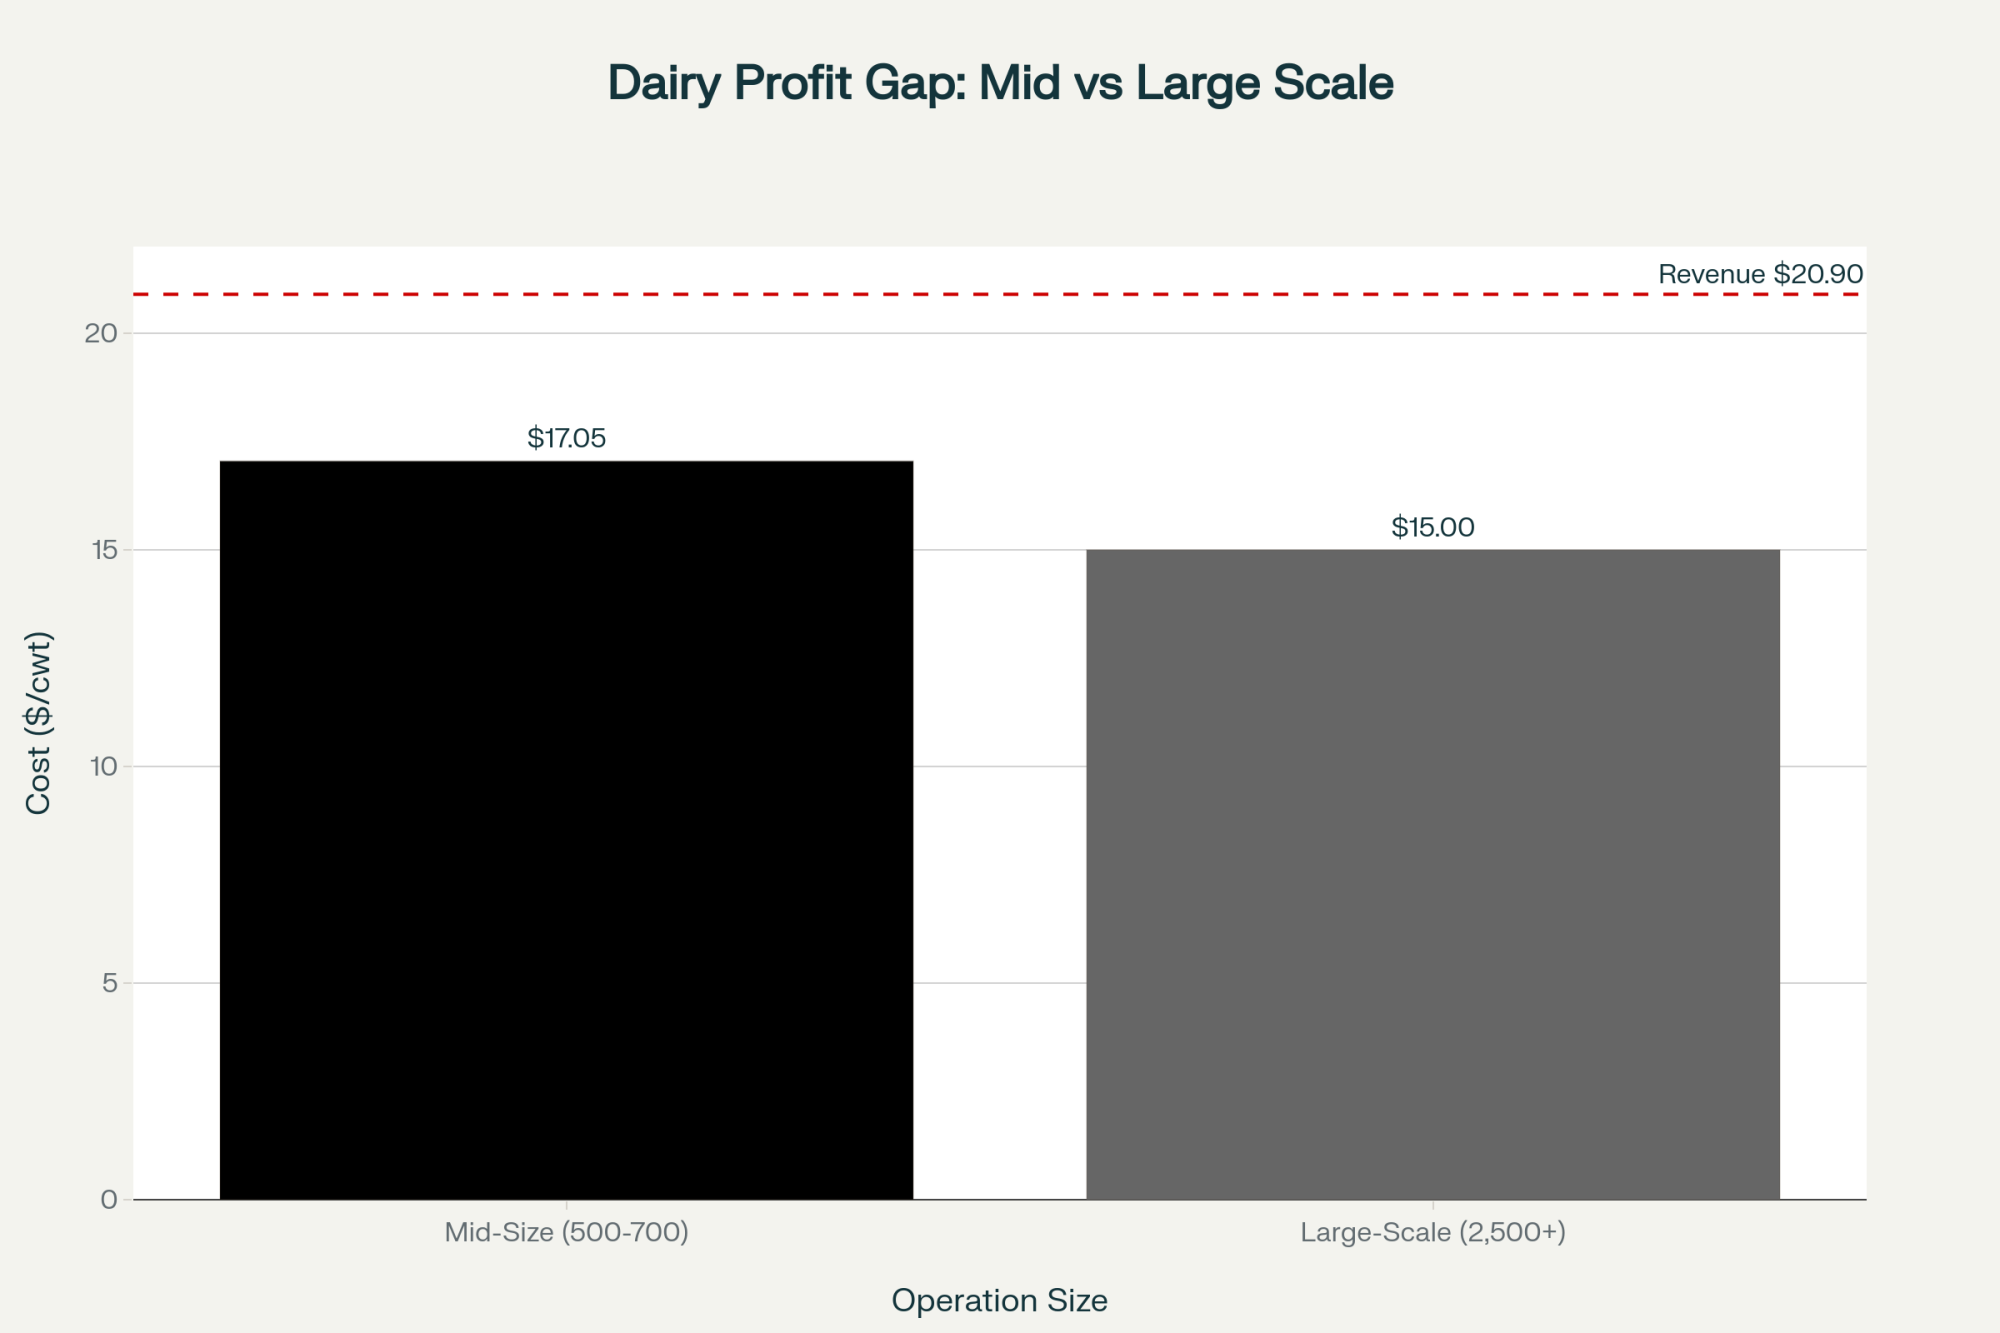
- If you’re paying USD $15–18/hour, and you can still hire decent milkers, robots are a tough sell on dollars alone.
- Once your real, legal, fully loaded milking labor cost creeps toward USD $28–35/hour, and you’re burning out trying to keep staff, AMS stops being a toy and starts looking like a survival tool.
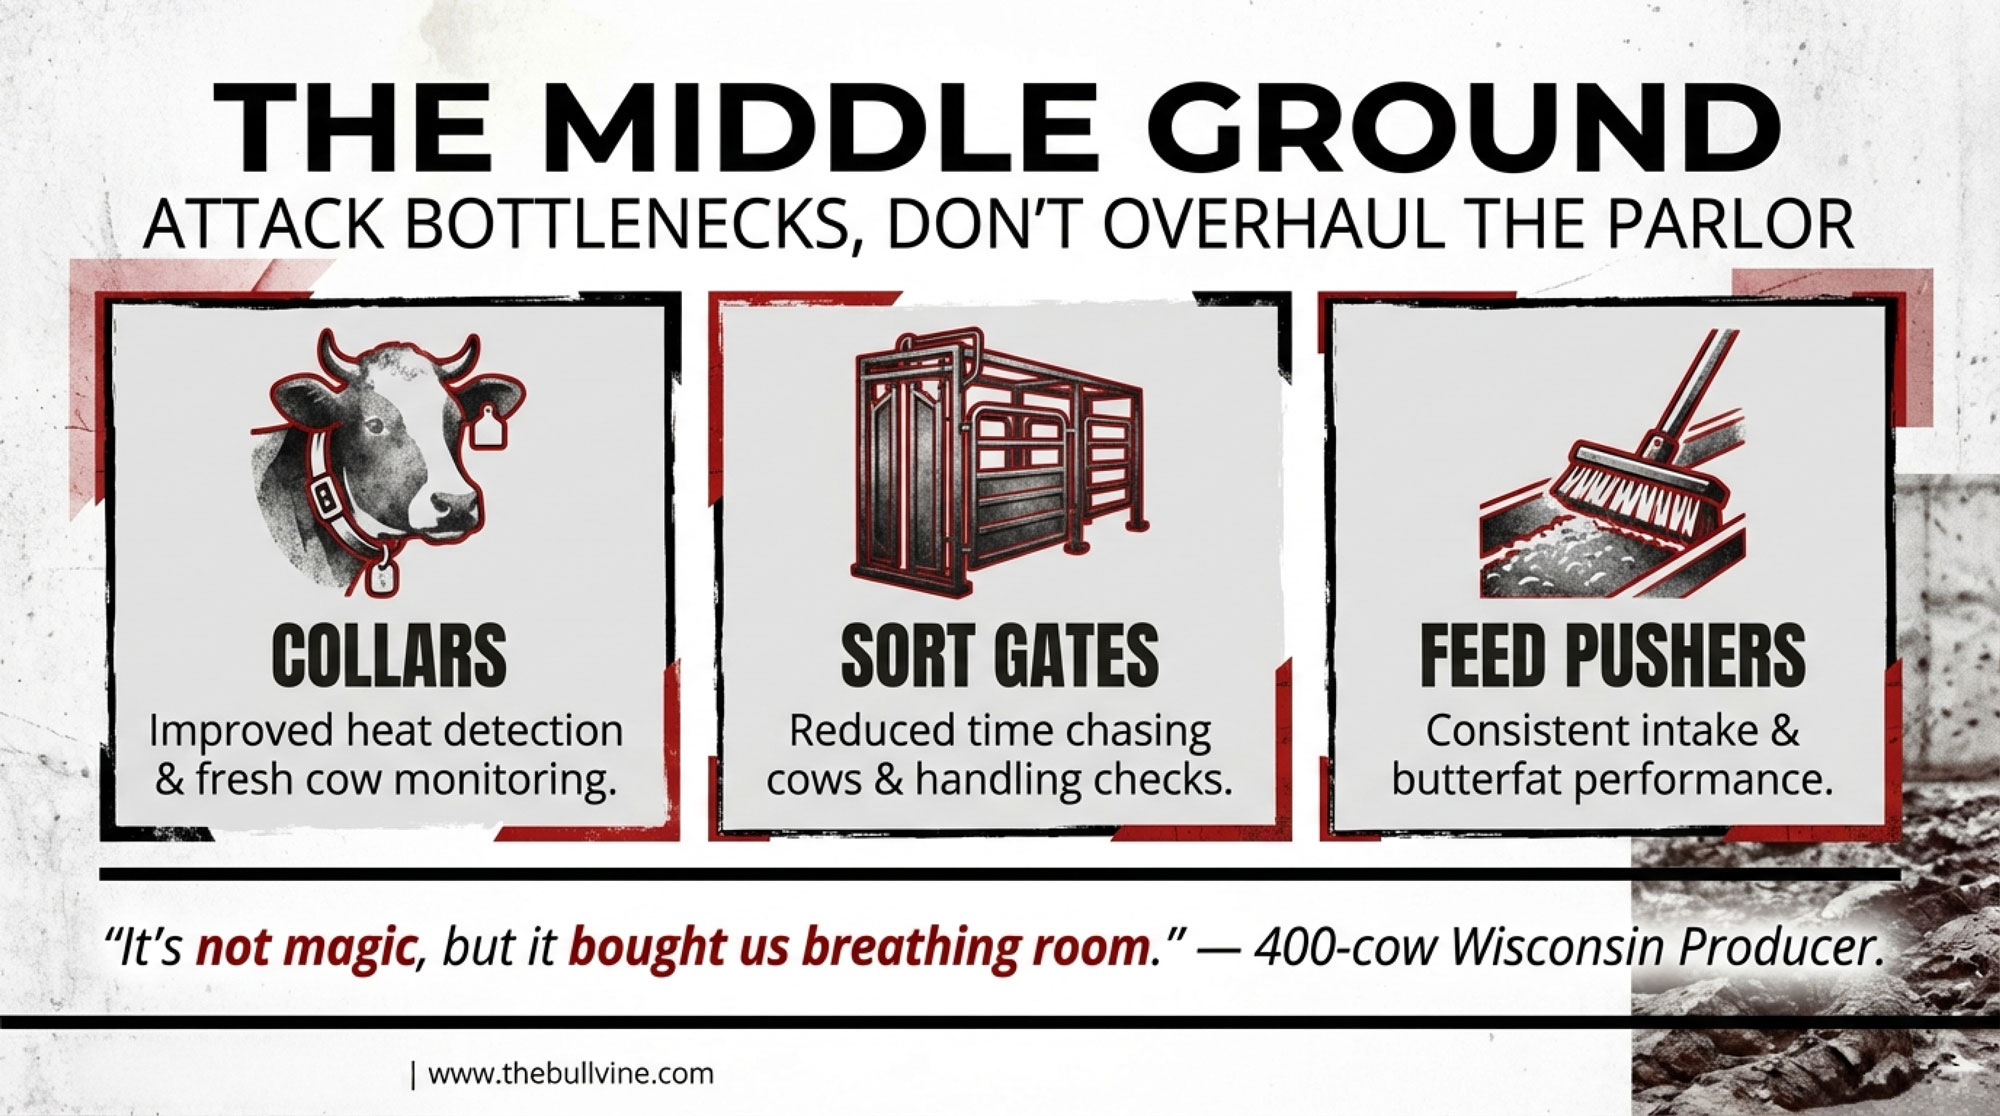
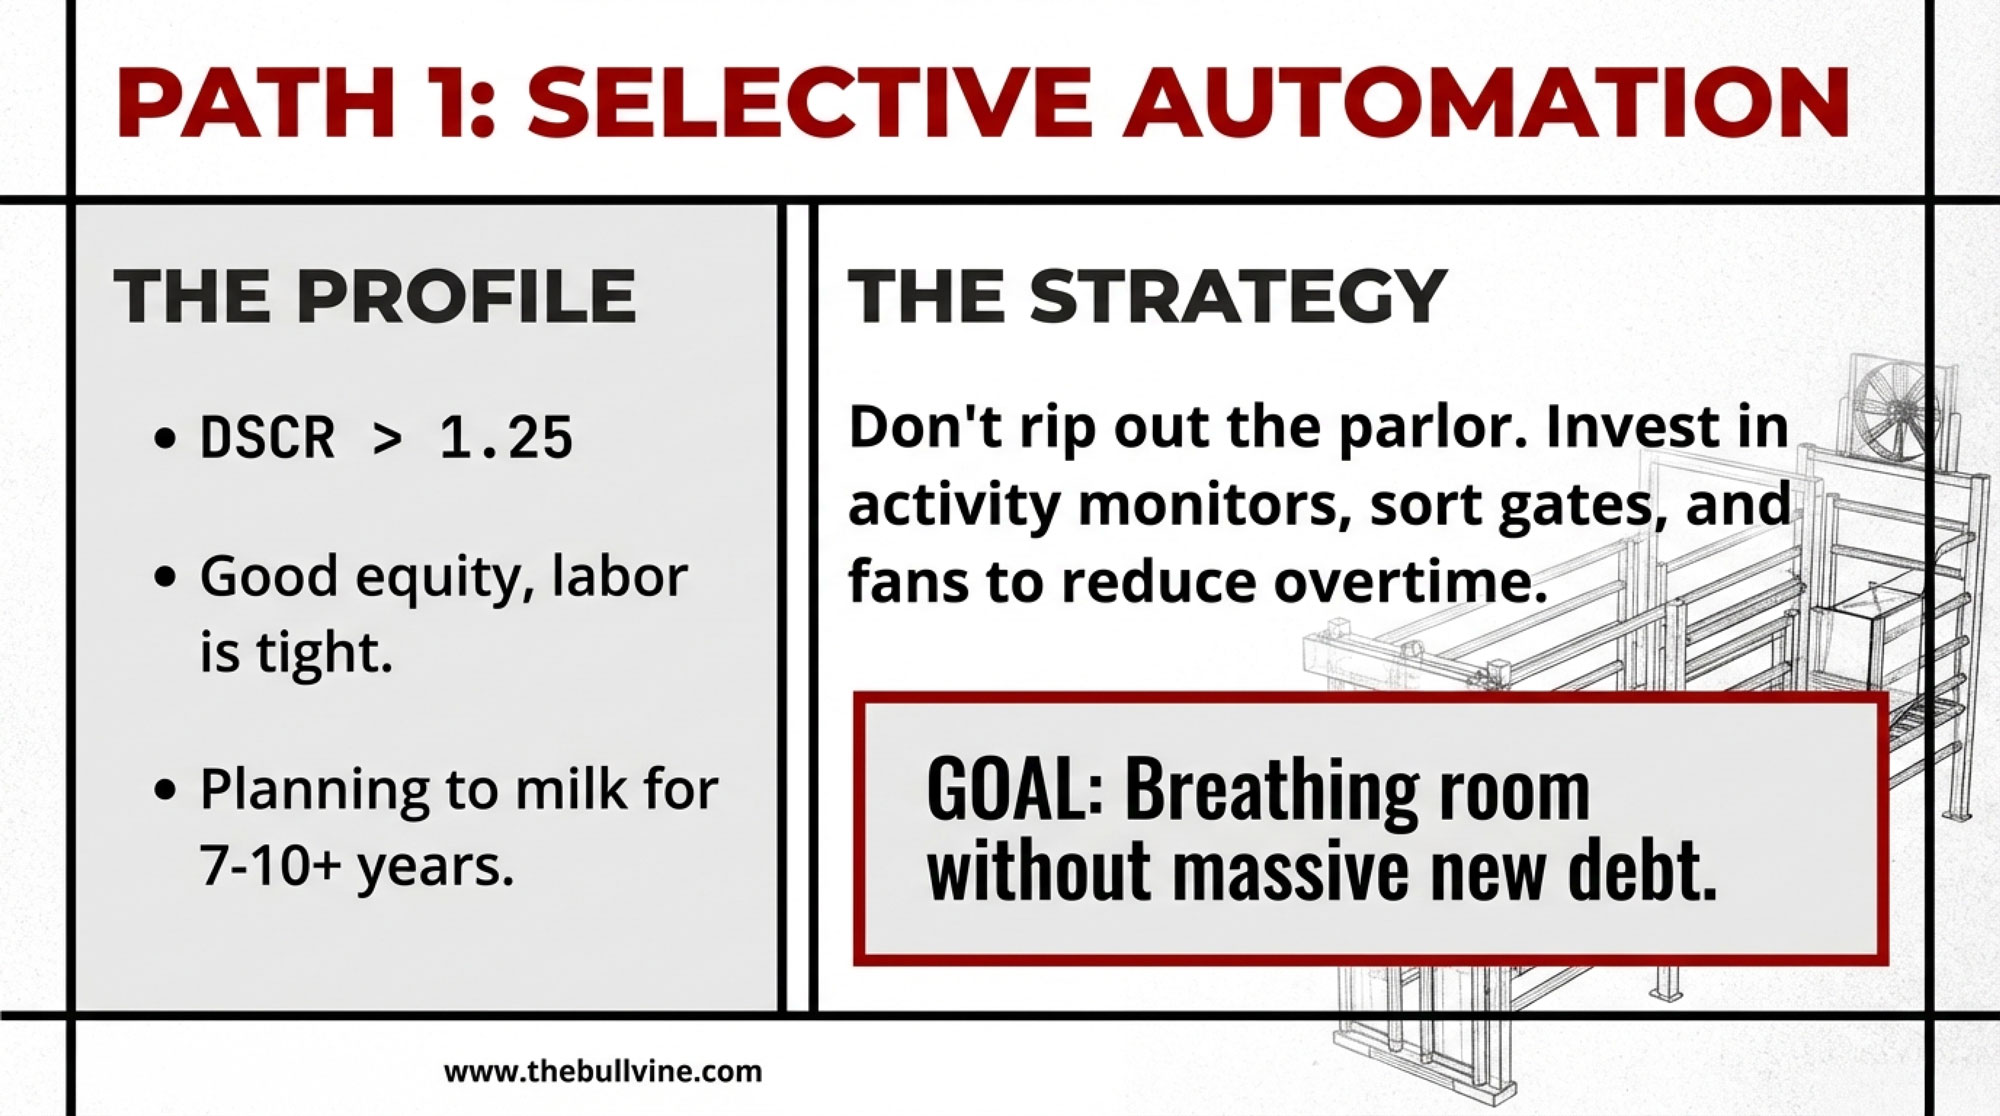
- If you’re under 250–300 cows, and you haven’t squeezed the cheap levers—activity monitors, sort gates, and feed pushers—you should be very nervous about skipping straight to robots.

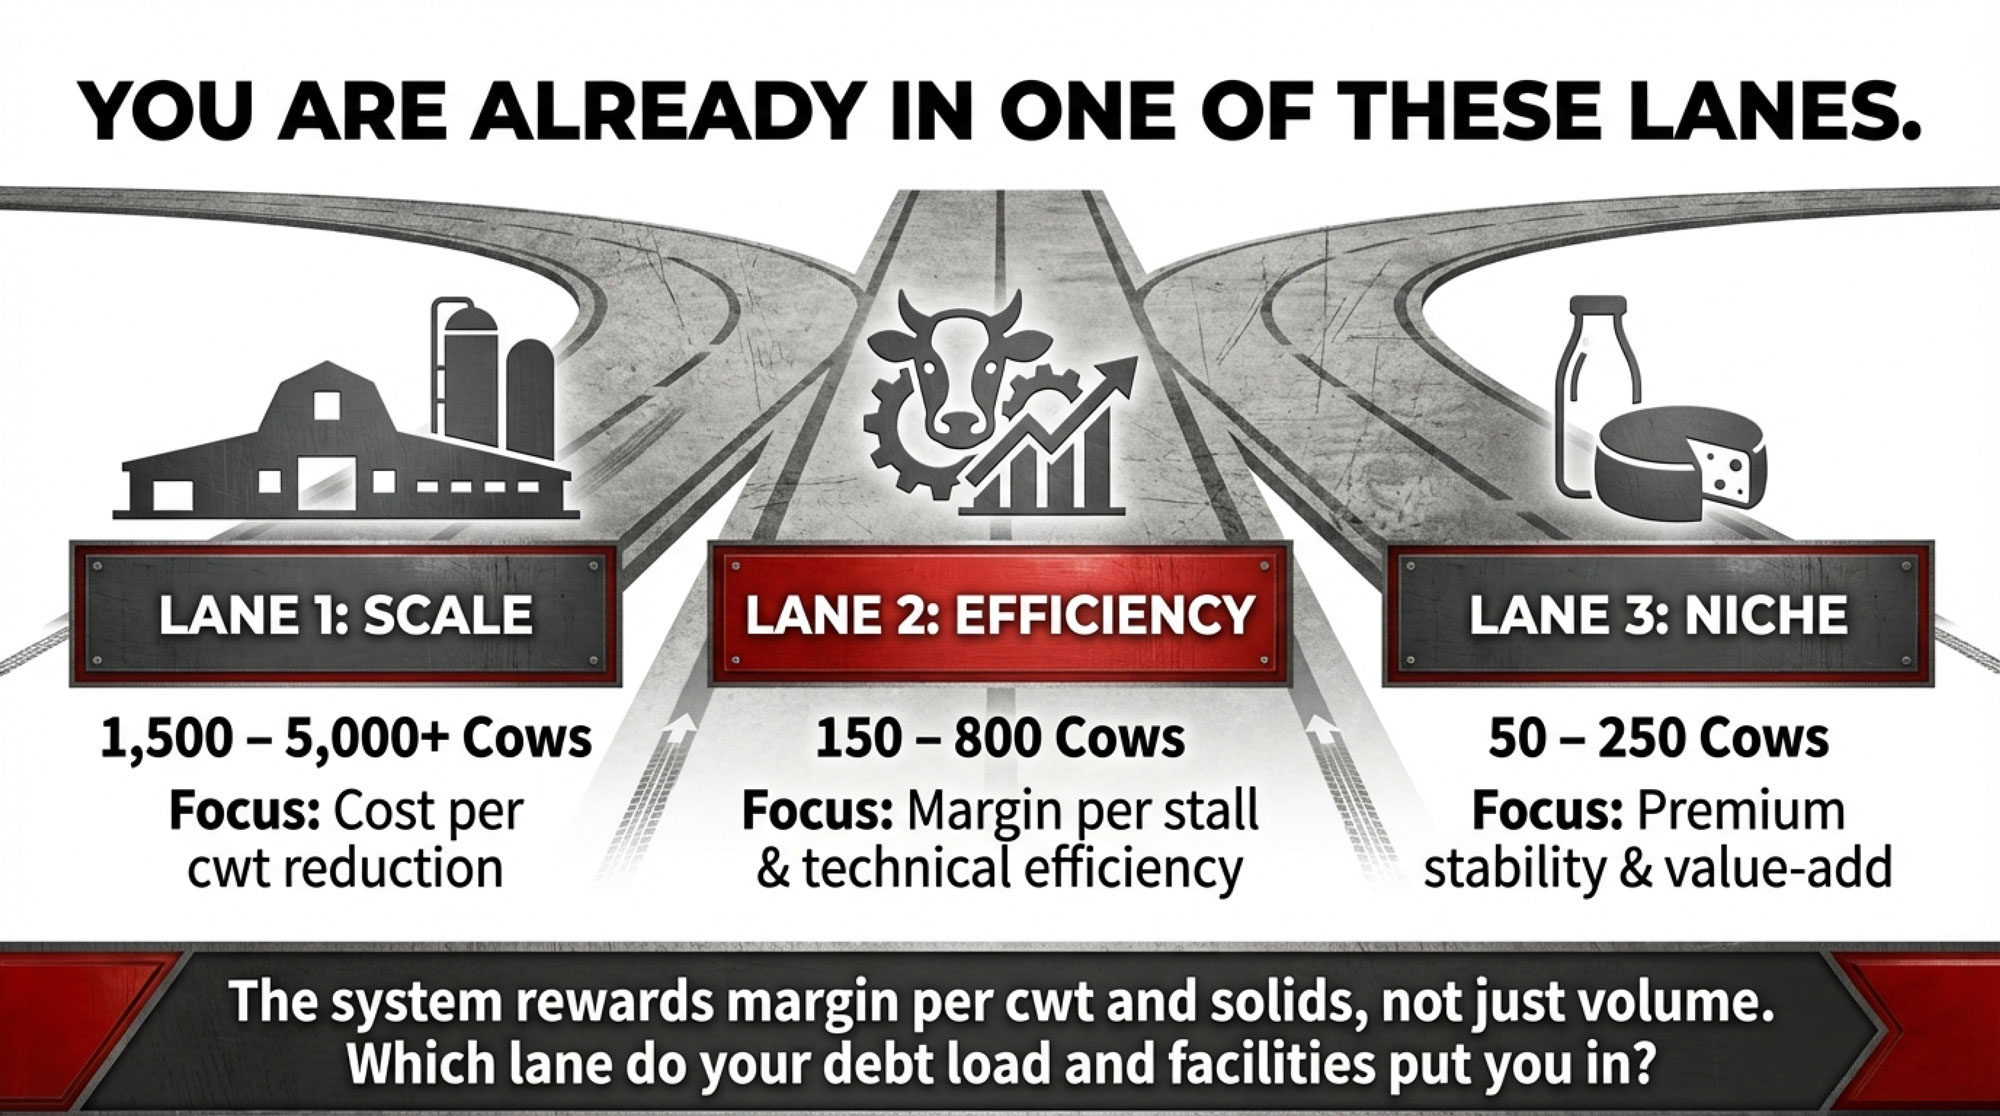
A simple comparison looks like this:

| Option | 10‑Year Capital Outlook (typical) | Labor Impact | Management Stress | Best Fit |
| Keep parlor, no tech | Lowest capital, rising repair cost | High, fixed shifts | High physical, high mental | Areas with relatively cheap, reliable labor |
| Parlor + sensors + sort gates + feed pusher | Medium capital (tens of thousands for ~180 cows, not hundreds of thousands) | 20–40% labor efficiency gain | Medium (more tech, same cows) | Herds <300 cows, labor ~USD $18–25/hr |
| Full AMS (3 boxes, 180–210 cows) | Very high capital (USD $800,000–1,200,000 + ongoing service) | 30–40% labor savings, more flexibility | Less physical, more tech and mental load | Labor USD $28+/hr or no reliable hire pool; strong management bench |
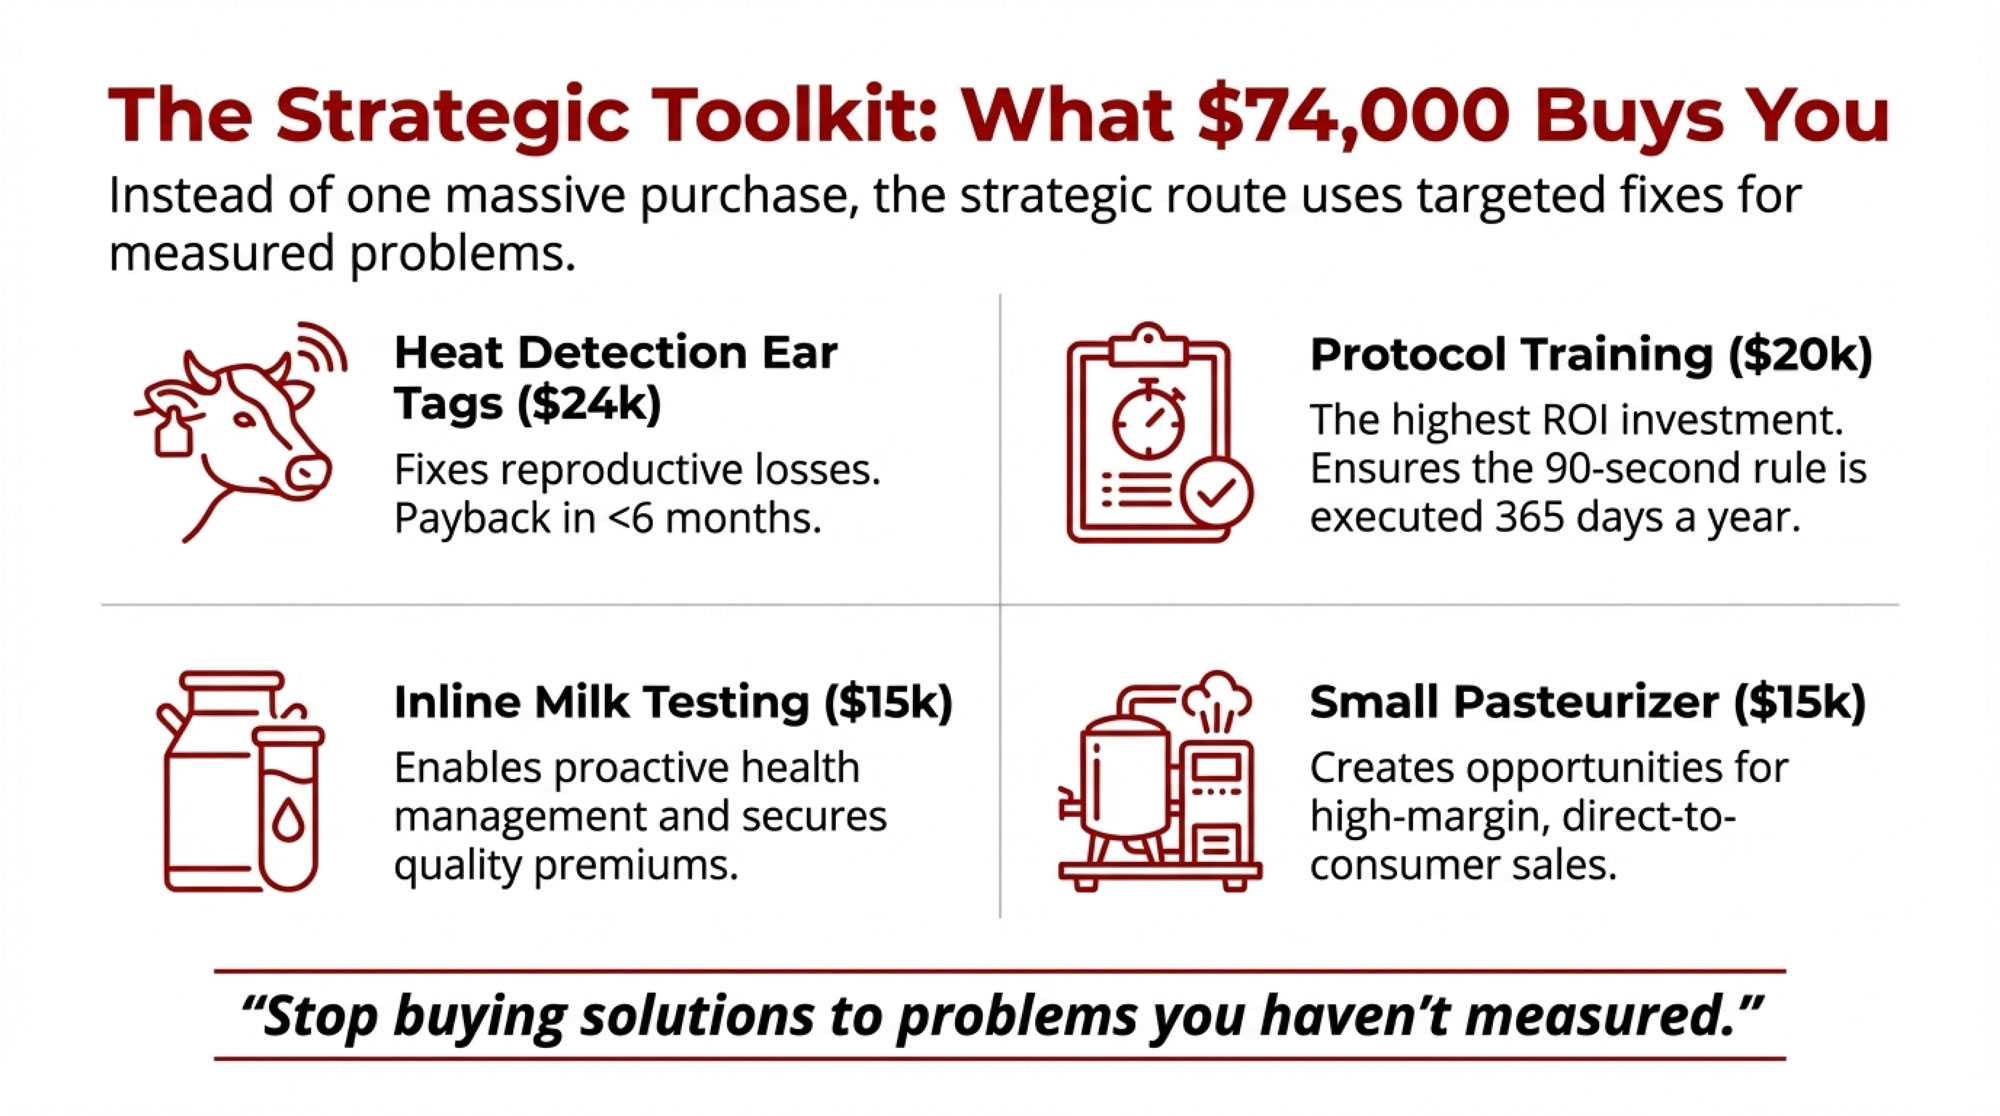
That hybrid package matters. For a lot of herds in older parlors, a mix of activity monitors, a sort gate, and a feed pusher is a tens‑of‑thousands‑of‑dollars investment instead of a million‑dollar note. On herds that actually use the data and gates, that kind of setup can free up substantial milking‑related labor and tighten up heat detection and health monitoring. It won’t take you out of the pit, but it can move your labor efficiency significantly closer to AMS levels at a fraction of the capital cost—and it buys you time to decide whether you truly need robots or just a better‑designed system.
If you’re in Canada under quota with component pricing and a more stable milk cheque, the AMS payback can look different than on a volatile U.S. Class III cheque. The same basic math still applies, but your revenue line won’t whip around as hard. You still need to plug your own numbers into a milk board or advisory cost‑of‑production sheet before you buy anybody’s ROI pitch.

Here’s a test worth running quietly with your lender and accountant:
- Can you hire and keep three reliable people to cover milking for USD $200,000/year or less total cost?
- If the honest answer is yes, humans probably still beat robots on pure economics for most sub‑500‑cow herds.
- If the answer is “no chance” and you’ve already tried, then you’re in the “AMS or exit” conversation, whether you like it or not.
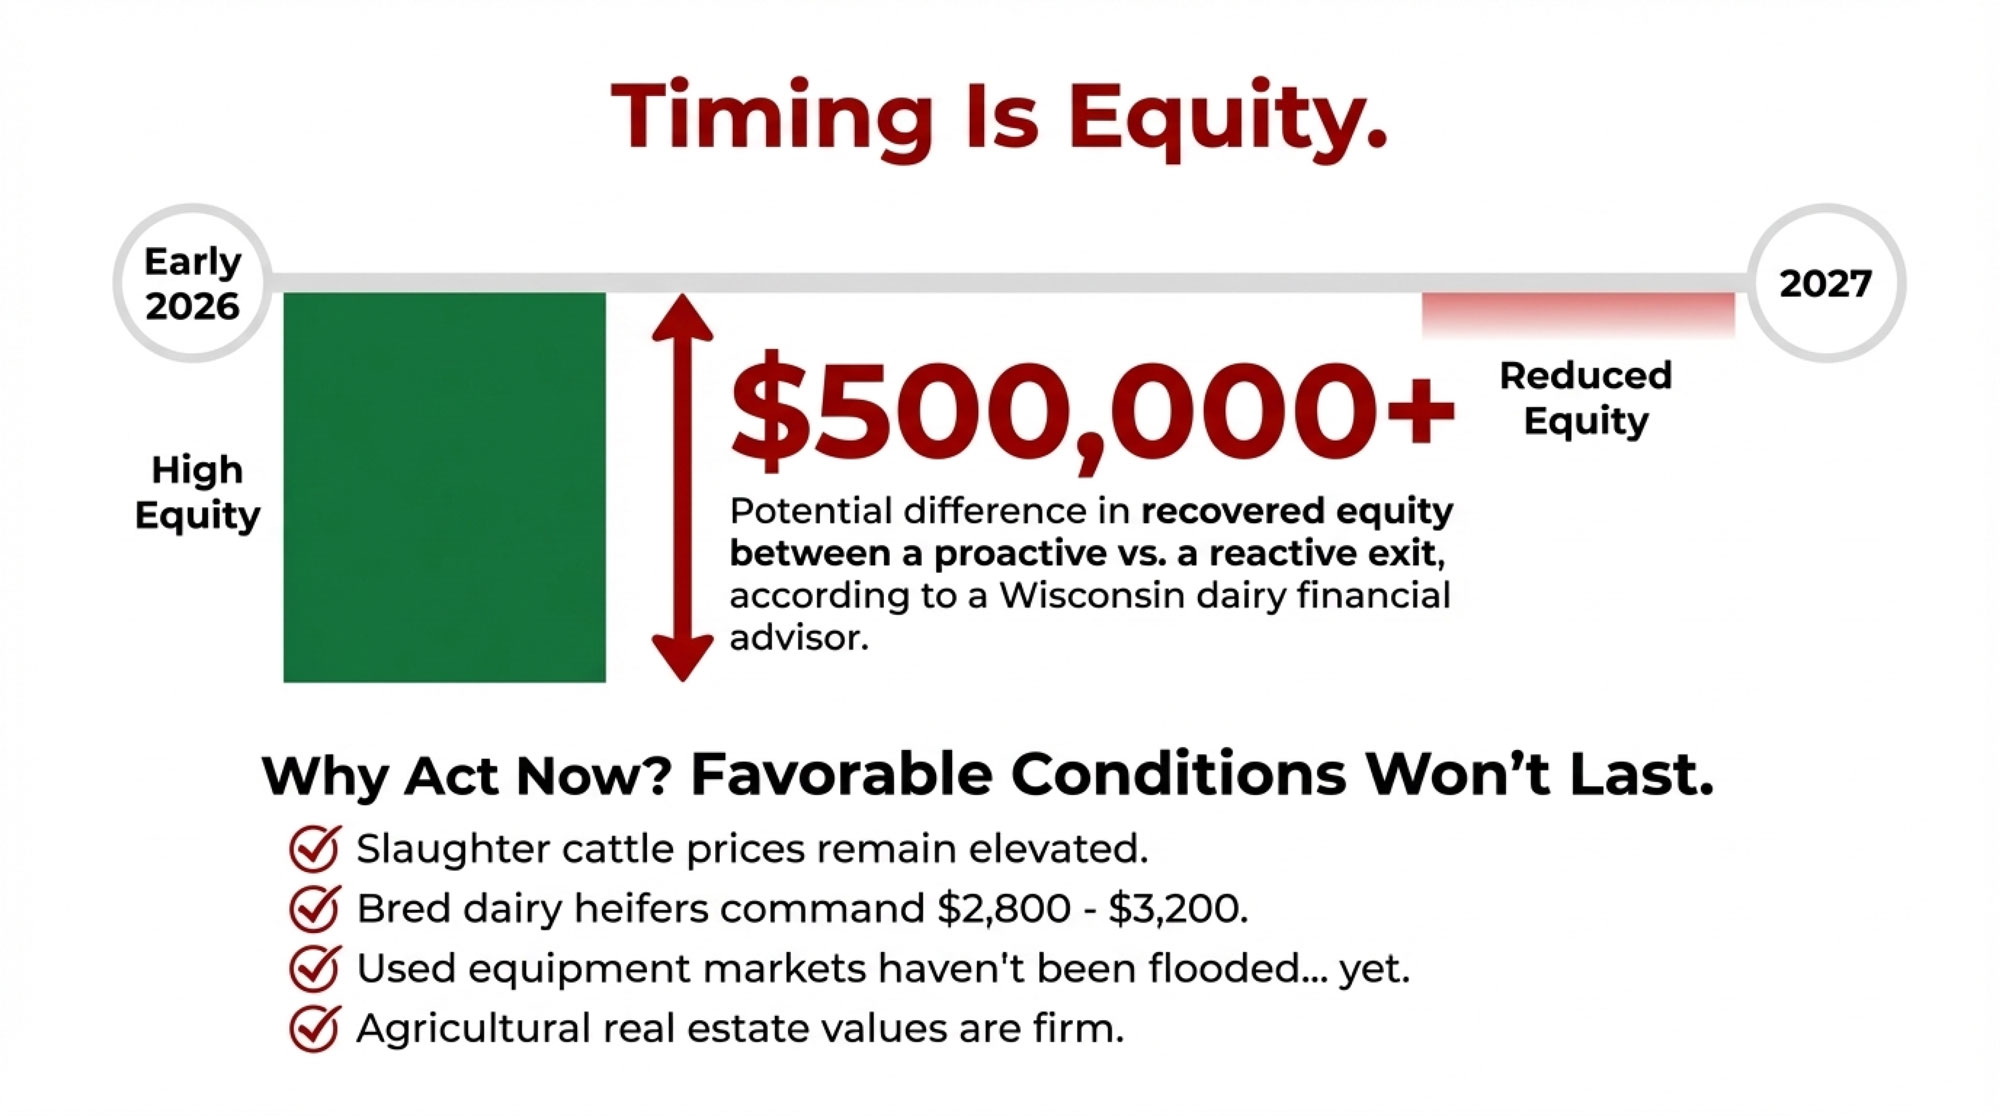
And for some small or heavily leveraged herds, the most profitable move might still be an orderly dispersal while there’s equity left—not taking on a million‑dollar note because a dealer says “everyone is going robotic.”
Mentorship, Genomics, and Cow Sense in a Robot Barn
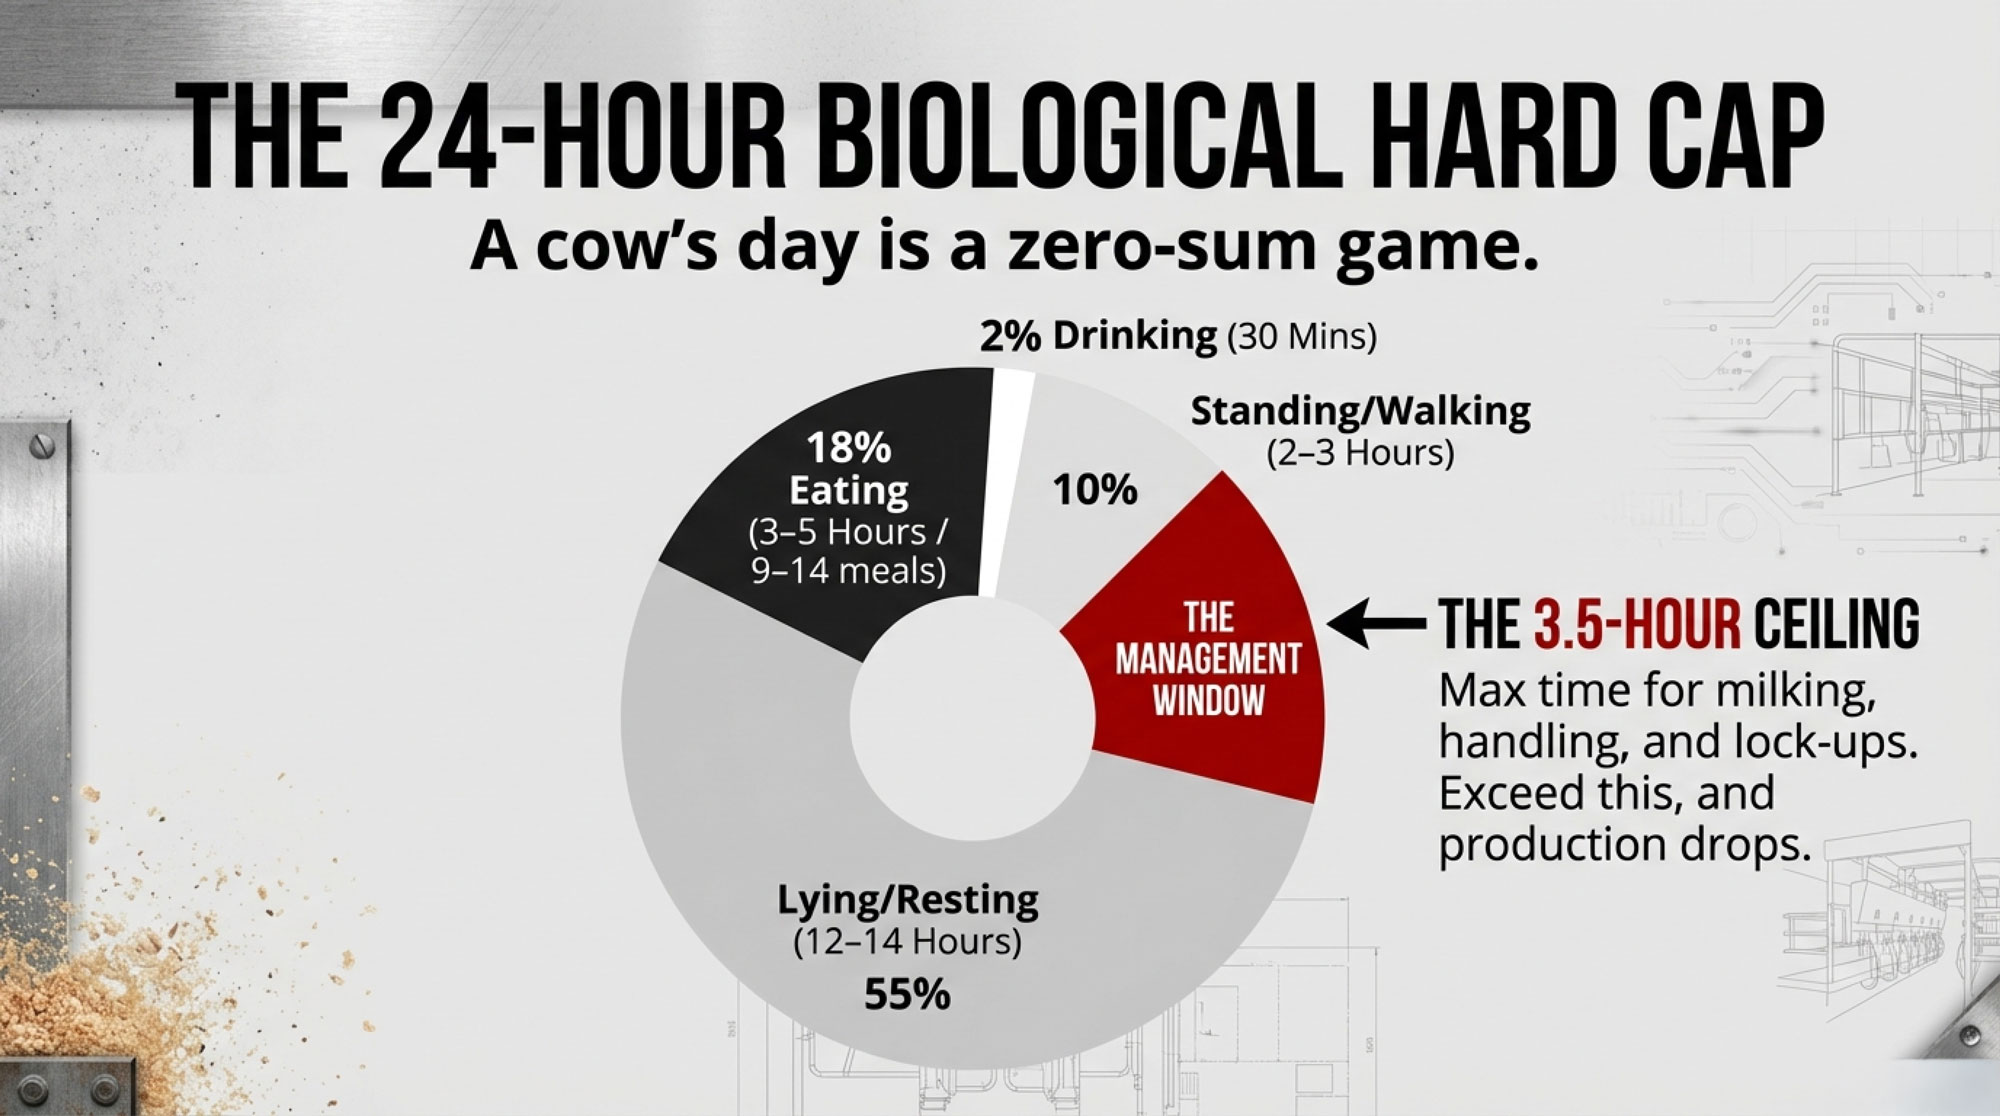
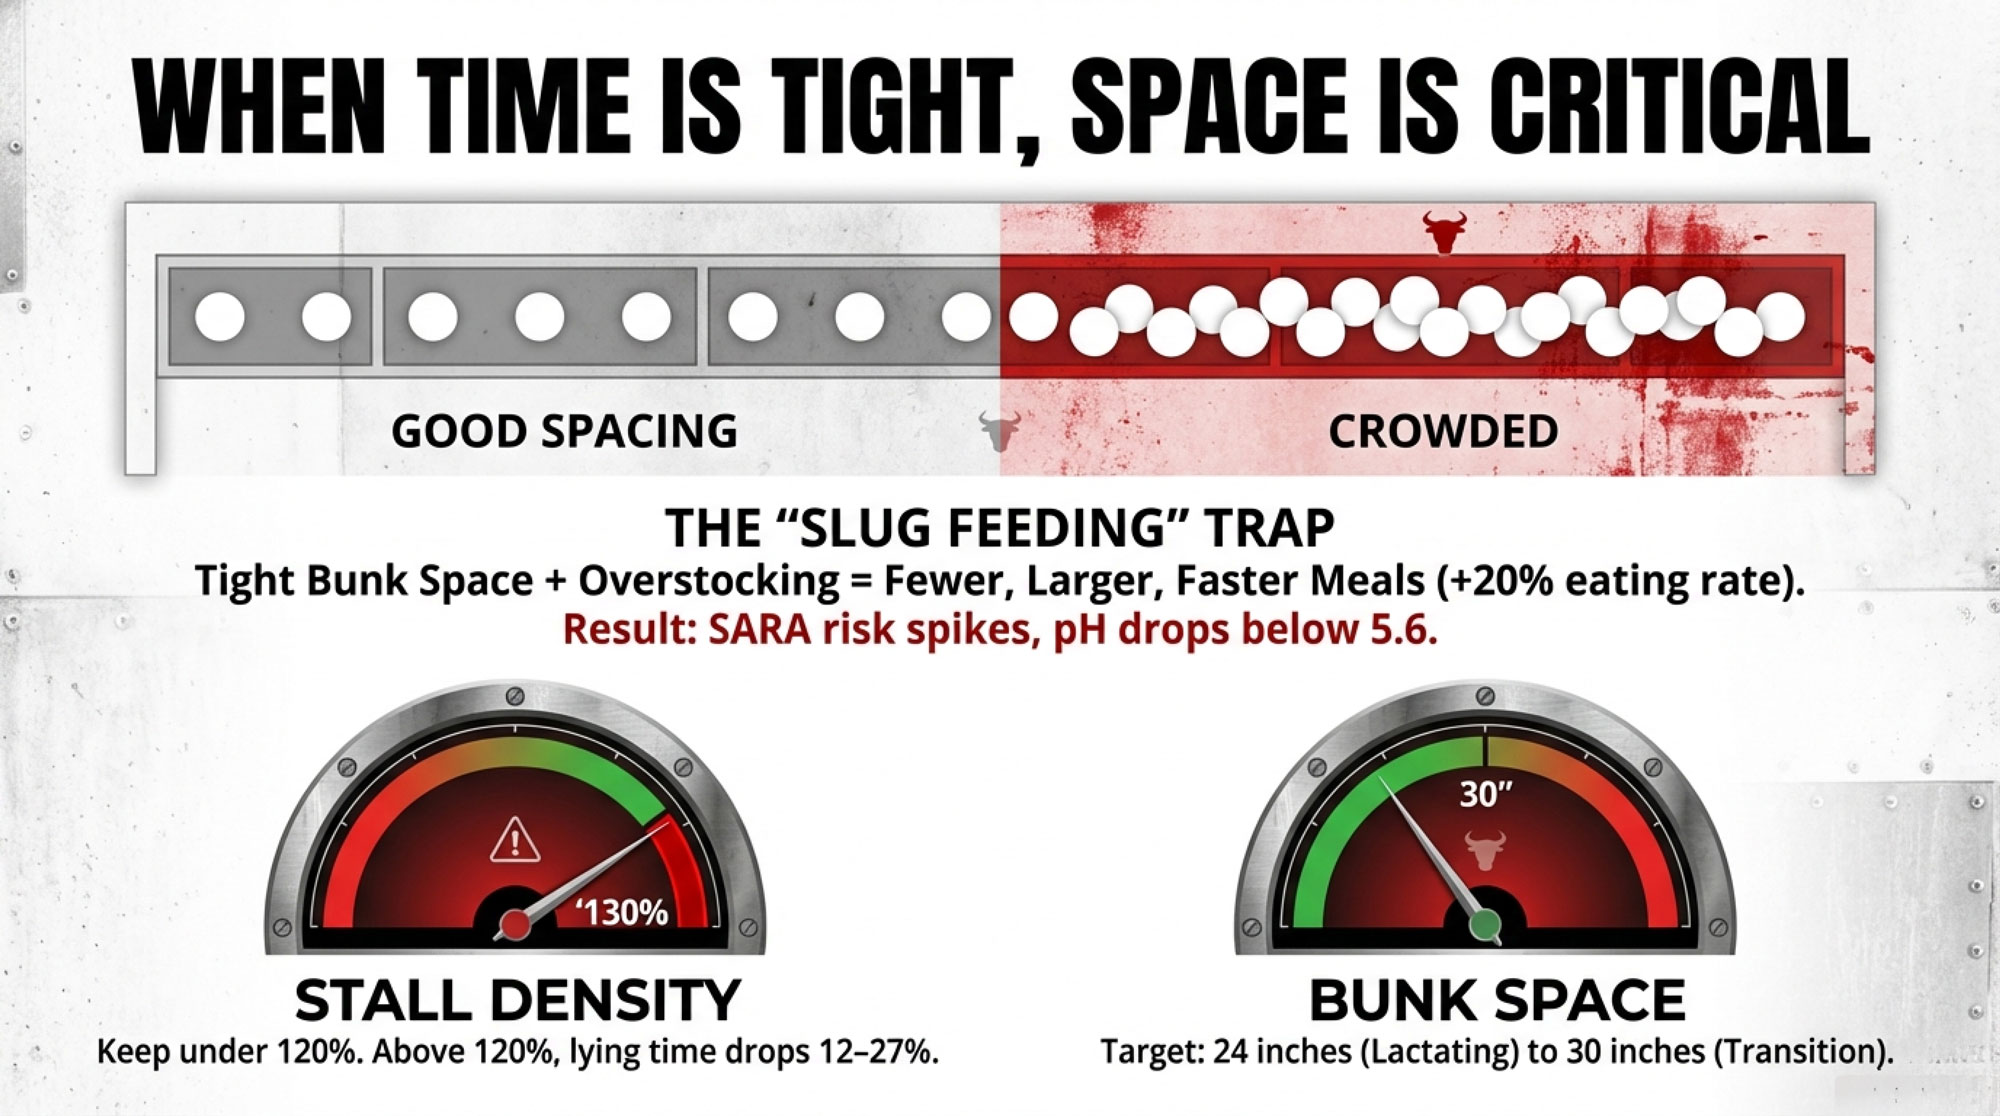
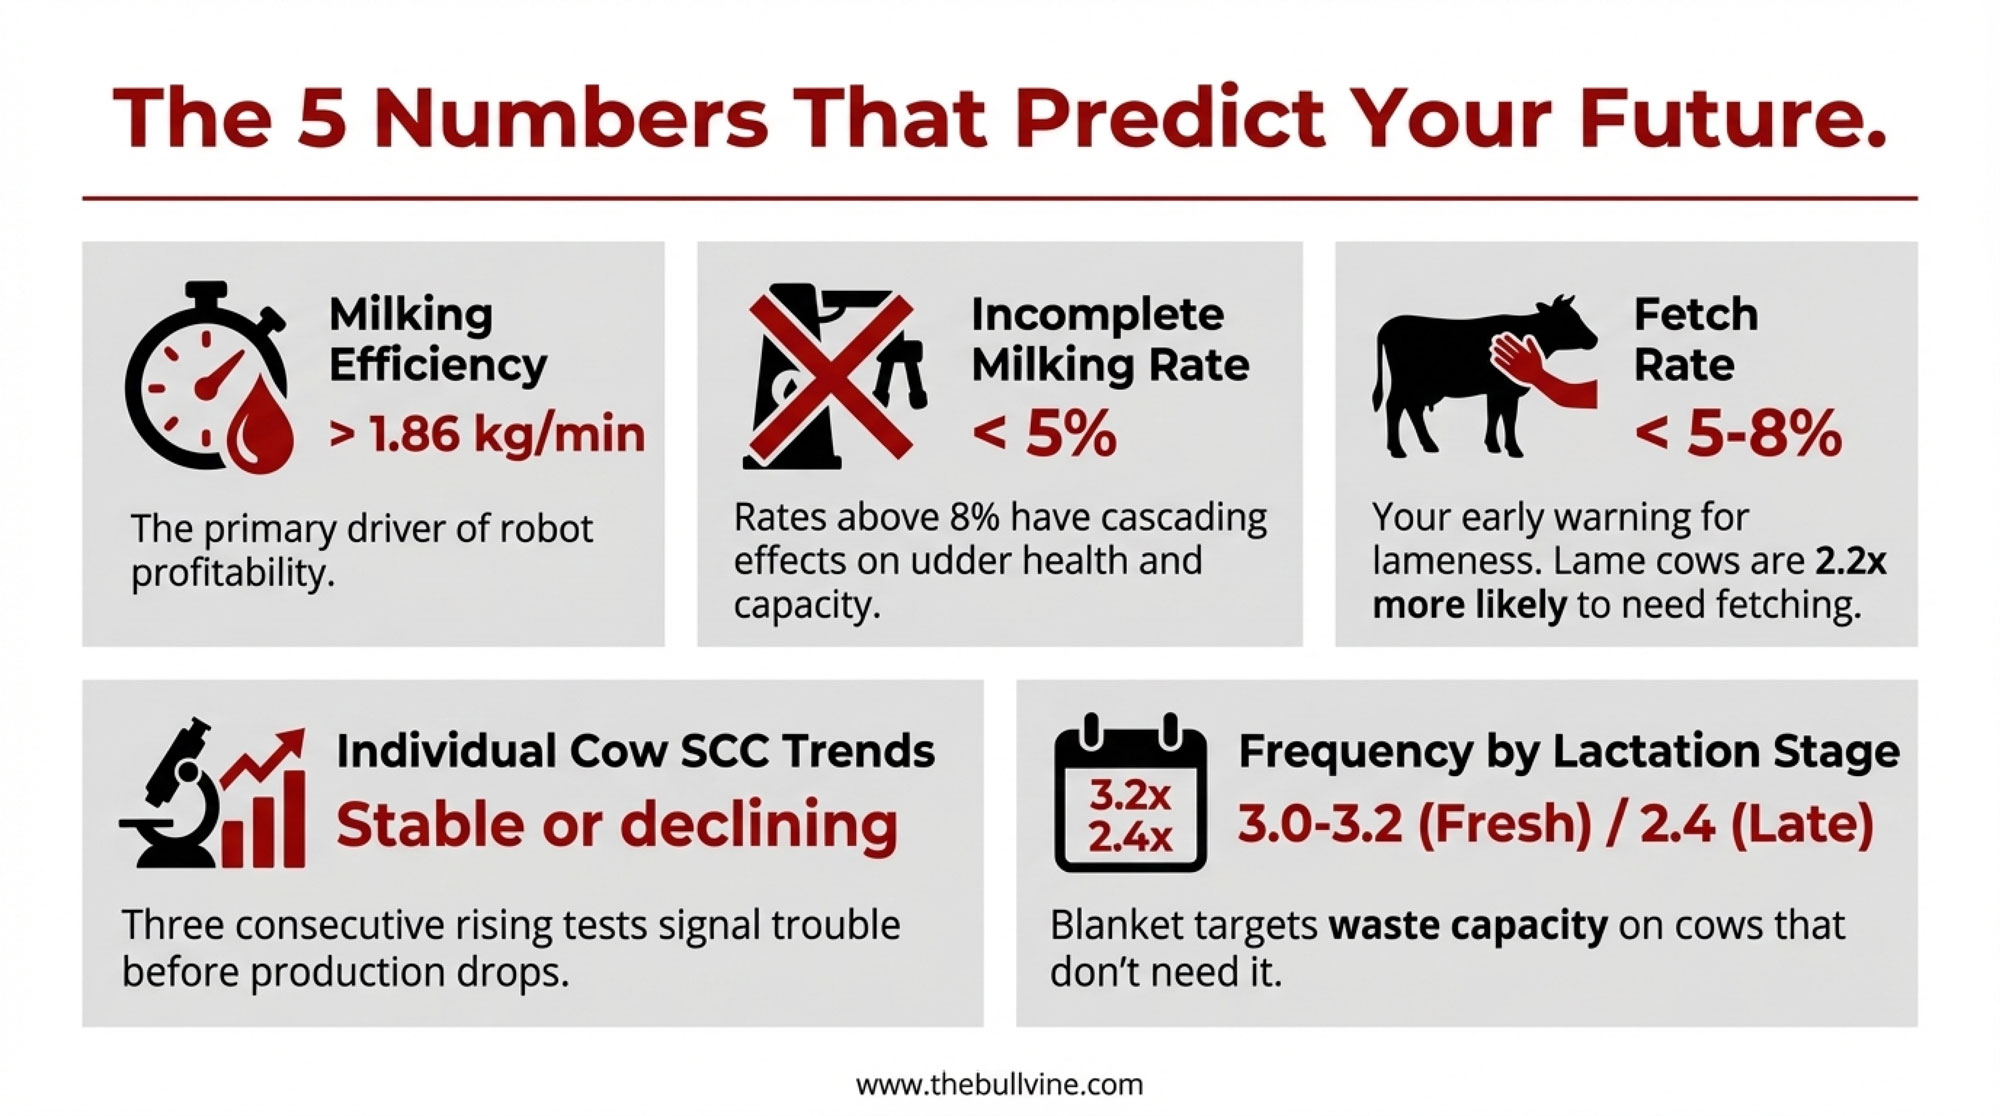
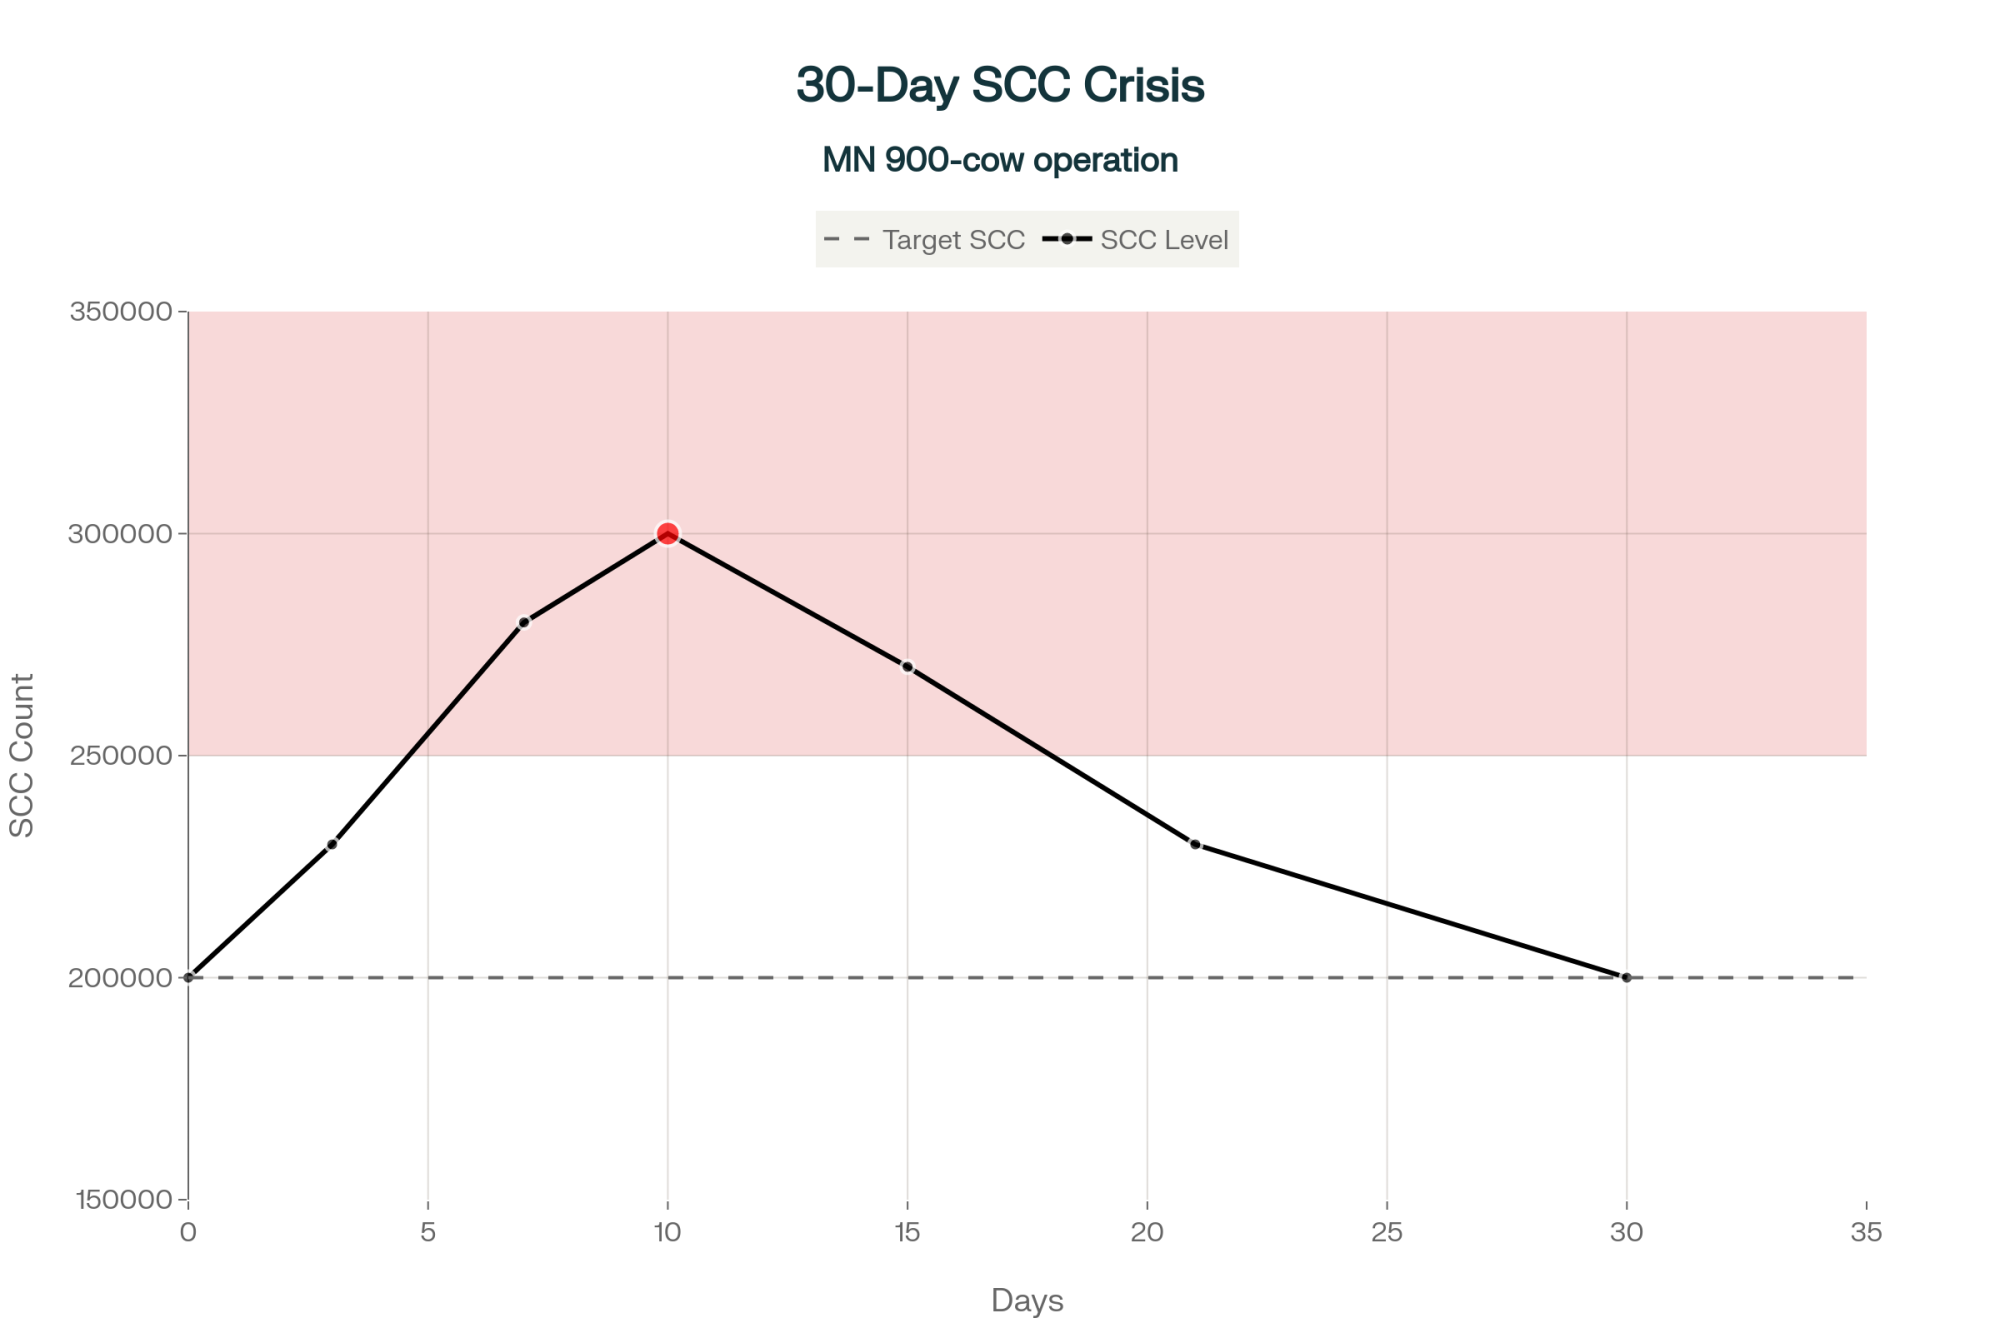
Robotic milking doesn’t change the fact that fresh cow management still makes or breaks your month, SCC still hits your milk cheque, and components still pay the bills.
It does change who is watching what.
On the best AMS herds, you see a familiar pattern with new tools:
- An older generation walks pens and spots the fresh cow whose eyes are a bit dull or whose cud is slow.
- The next generation pulls up the robot dashboard and shows that same cow’s milk visits, milking speed, conductivity, and rumination trend.
- They argue a little, walk out together, and usually both end up half right.
A 2024 U.S. AMS study reported that many owners reported labor cost reductions of 20% or more, and many reported better control of mastitis, lameness, and reproductive problems on their farms. Many of those same farmers also said robots improved their quality of life by changing when, not just how much, they worked.
This is where genomic proofs and sire lists quietly make or break your AMS ROI.
In a robot barn, you suddenly care a lot more about:
- Milking speed and temperament—slow, jumpy cows choke box capacity.
- Udder attachment and teat placement—functional PTAT, not just show‑ring pretty.
- Health and hoof traits that keep cows sound and productive long enough to pay off your capital.
| Genomic Trait | Importance in Parlor Herd | Importance in AMS Herd | Why It Matters for Robots |
| Milking Speed | Medium | CRITICAL | Slow cows choke box throughput; every extra minute per cow = fewer total milkings per box per day |
| Udder Attachment & Depth | Medium (mostly cosmetic) | CRITICAL | Poor attachment = missed teats, failed preps, and wasted robot cycles |
| Teat Placement | Low | CRITICAL | Wide, uneven, or rear teats = laser failures and manual fetch trips |
| Temperament / Docility | Medium | HIGH | Jumpy, nervous cows won’t enter box willingly; training failure = labor nightmare |
| Feet & Legs / Mobility | High | CRITICAL | Lame cows don’t visit robots voluntarily; mobility = voluntary milking frequency |
| SCC / Mastitis Resistance | High | HIGH | Still critical in AMS, but conductivity sensors catch problems faster than twice-a-day visual checks |
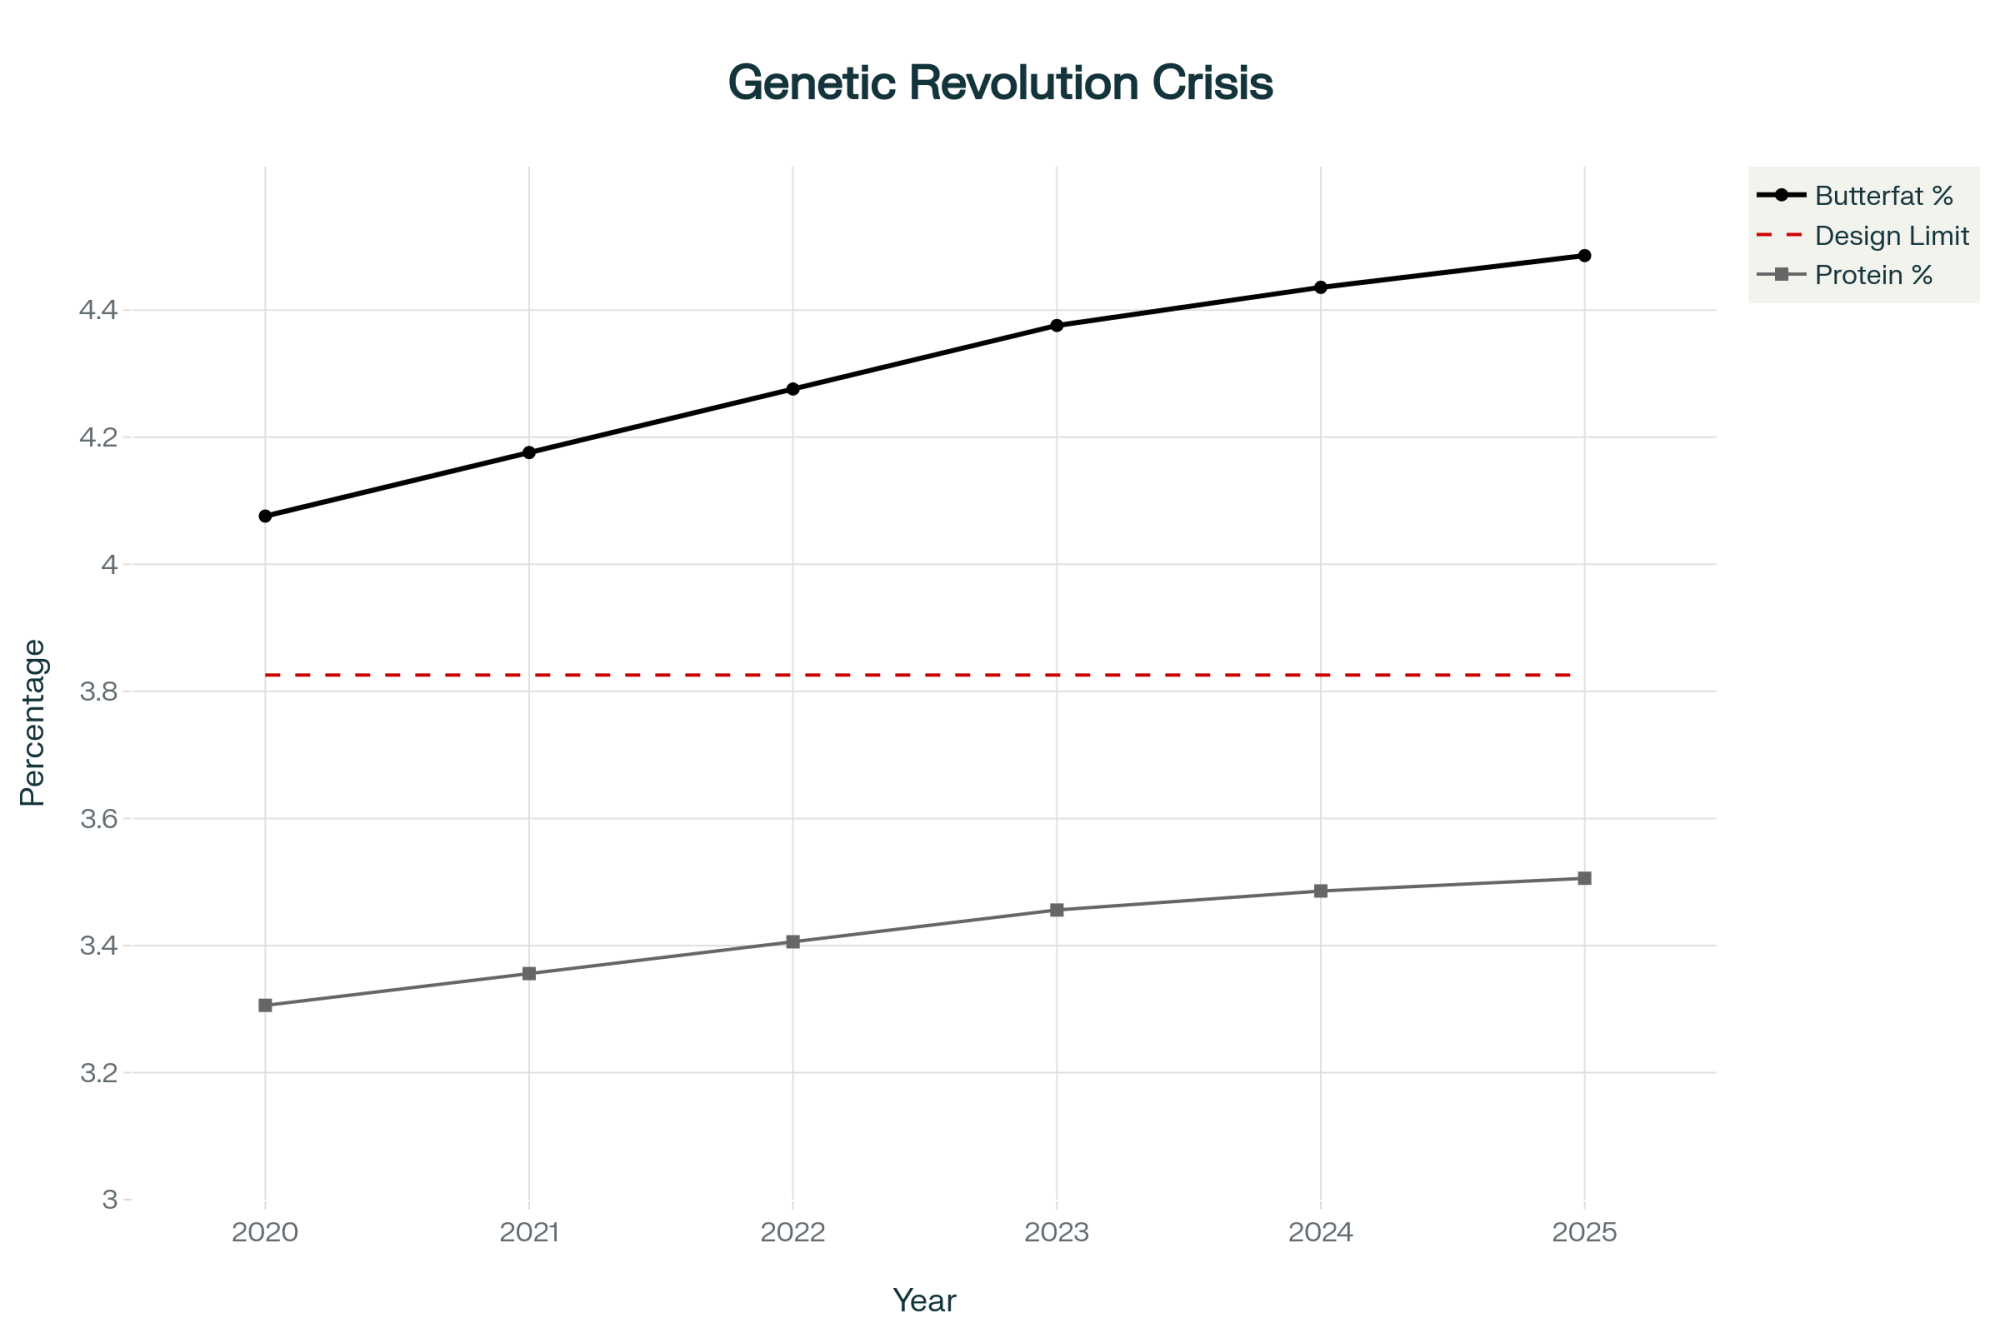
| Components (Fat/Protein %) | High (market pays you) | HIGH (market still pays you) | Higher frequency can dilute components slightly; select bulls that hold % under 3x milking |
If your sire list doesn’t reflect that, you’re breeding for the wrong barn.
Practical steps:
- Screen bulls for robot‑relevant traits—milking speed, udder depth, teat position, daughter behavior—alongside Net Merit, Pro$, or LPI, depending on where you ship.
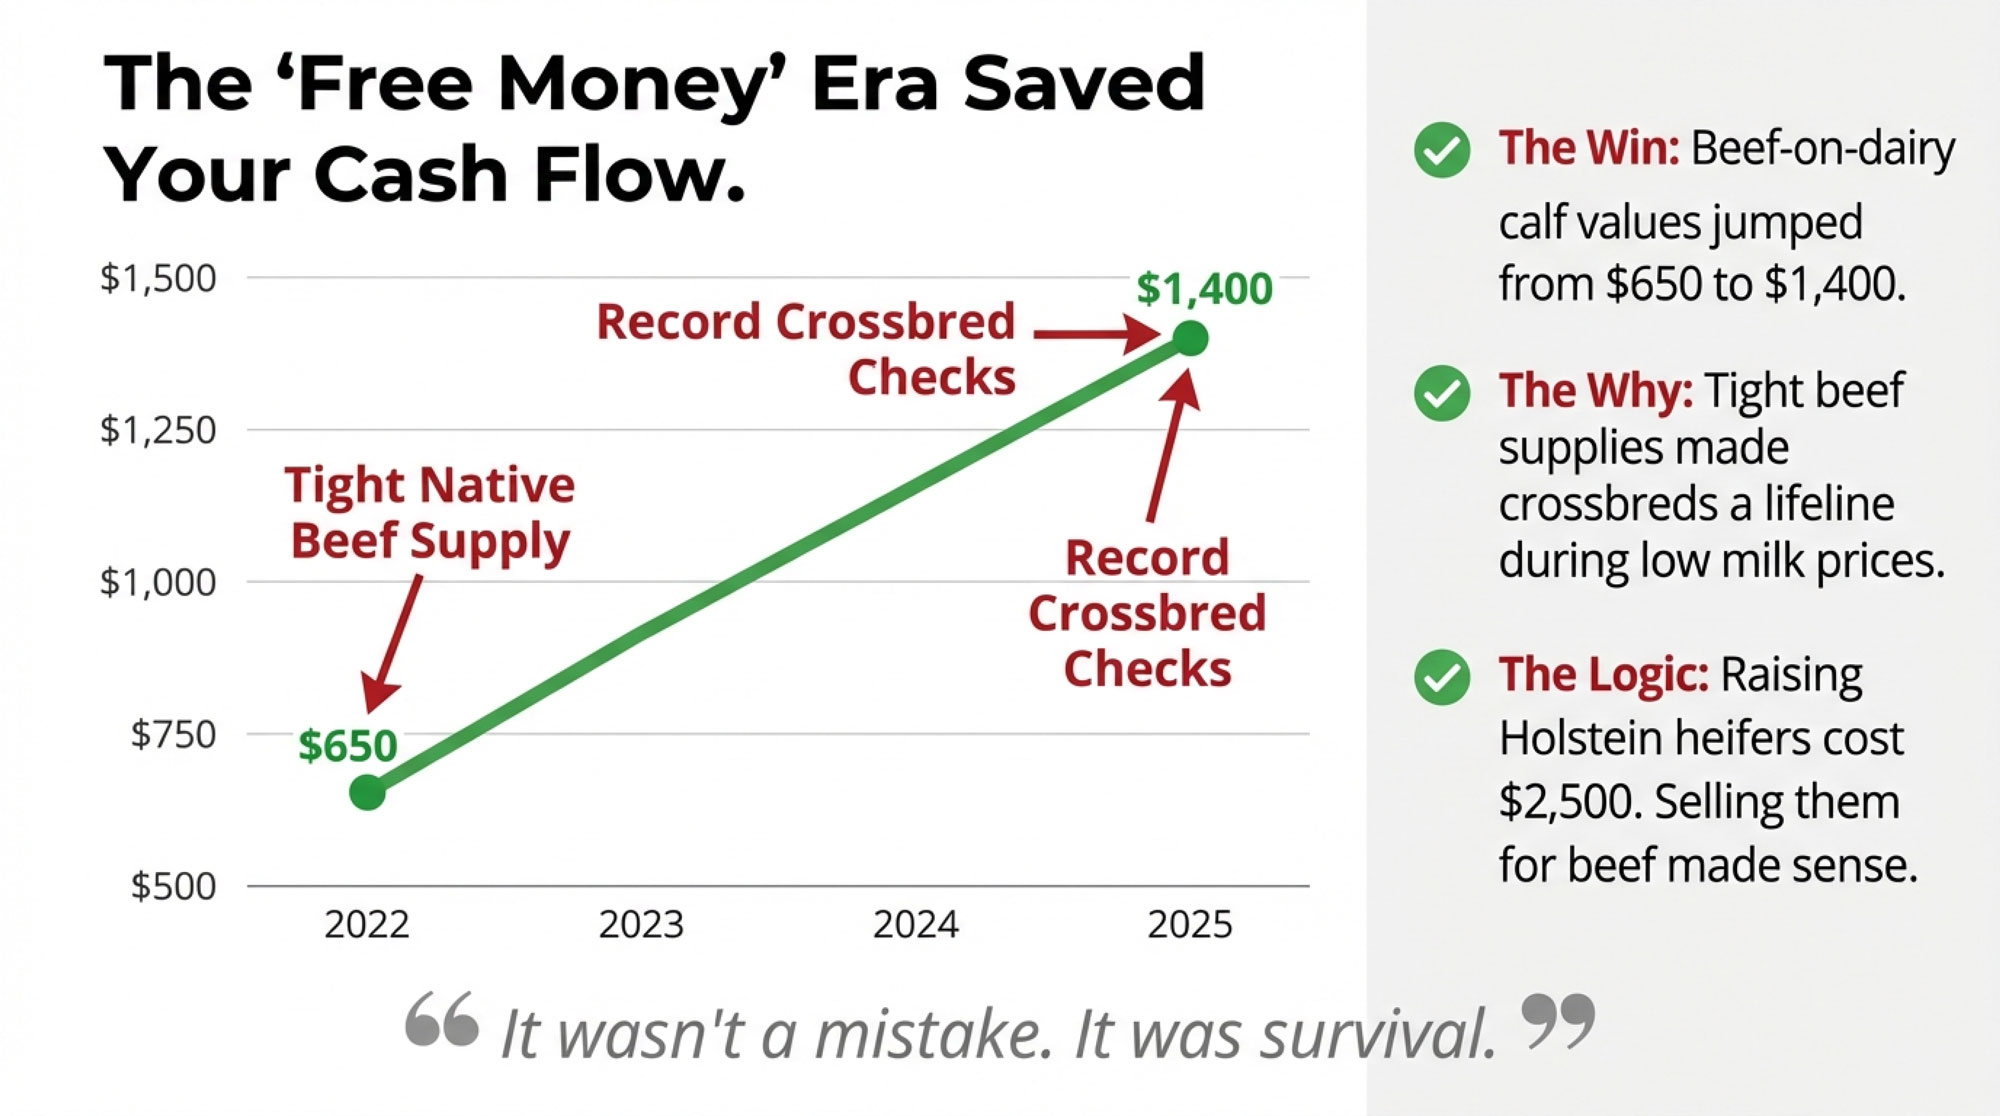
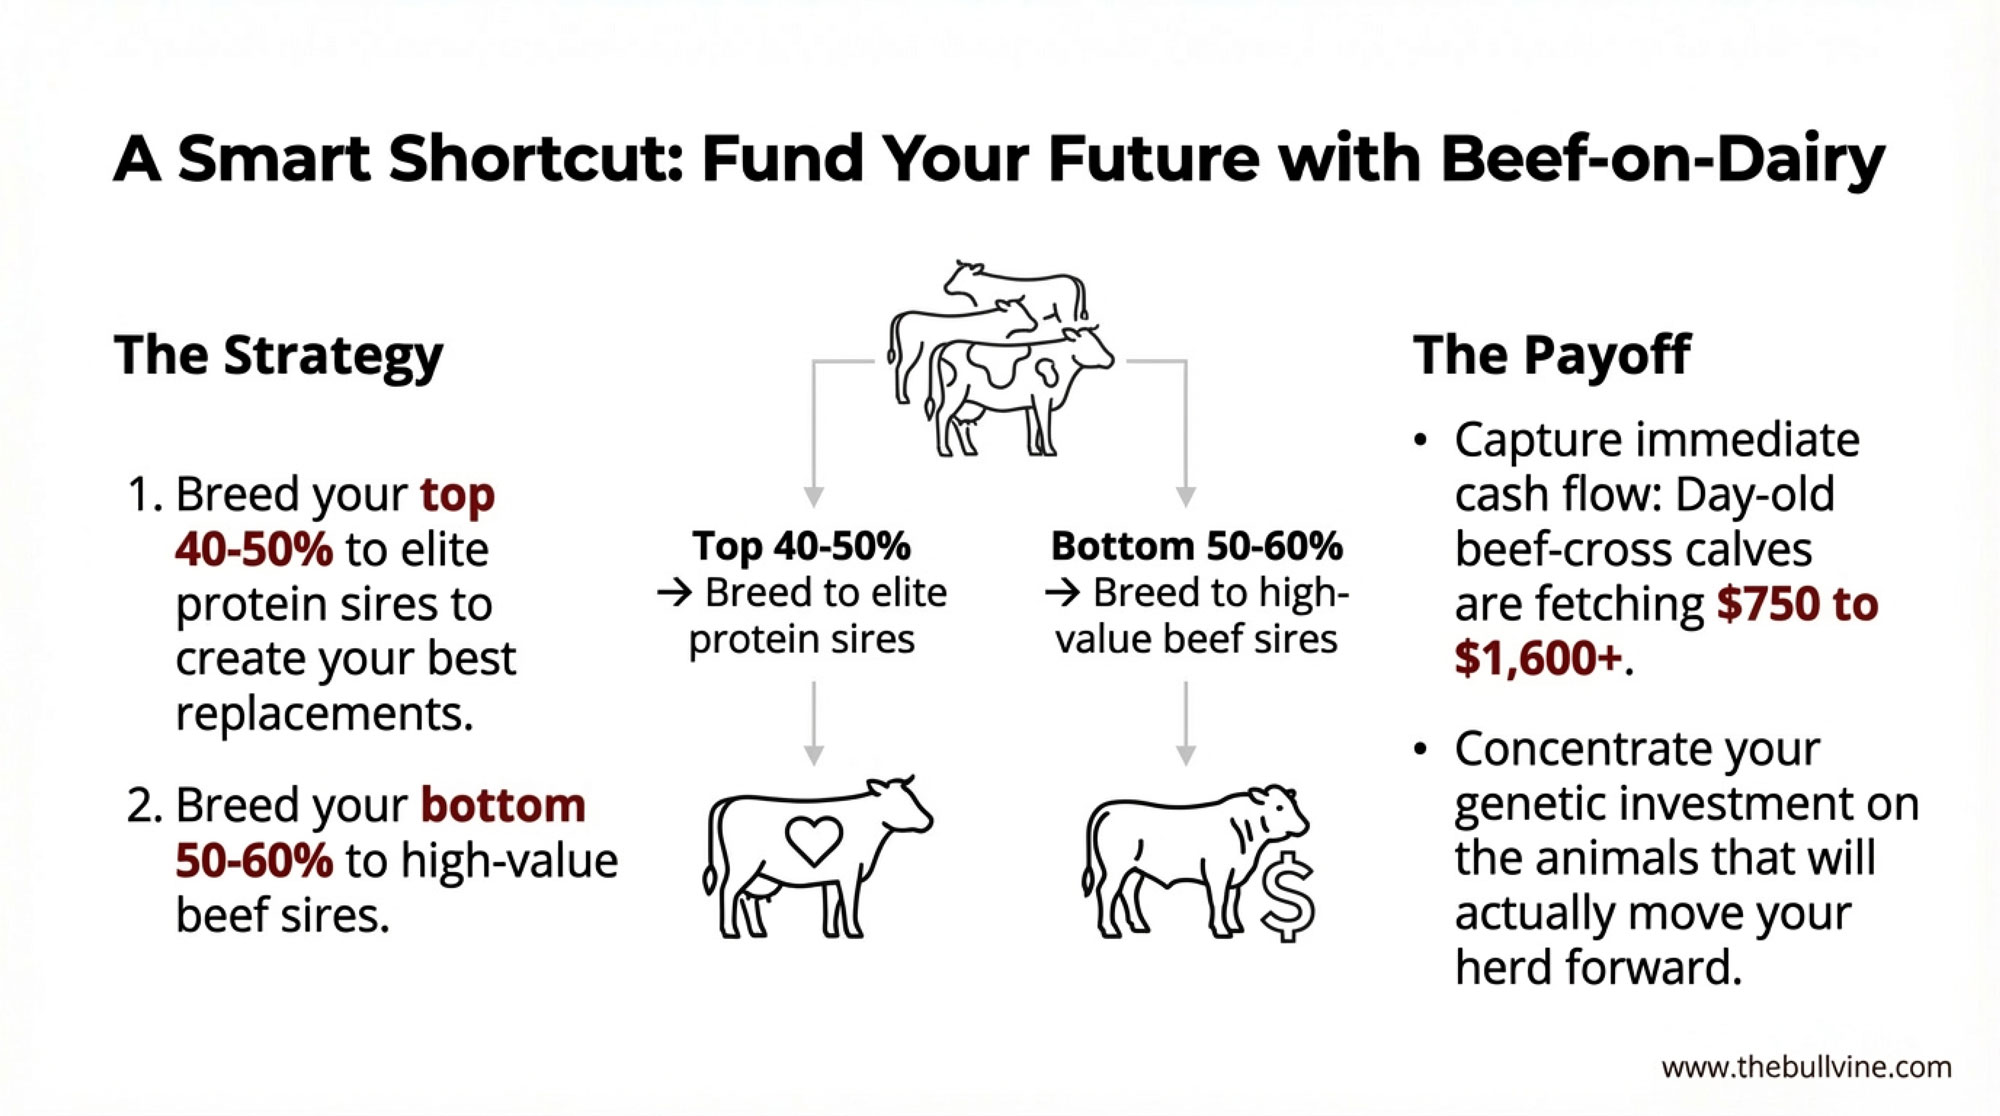
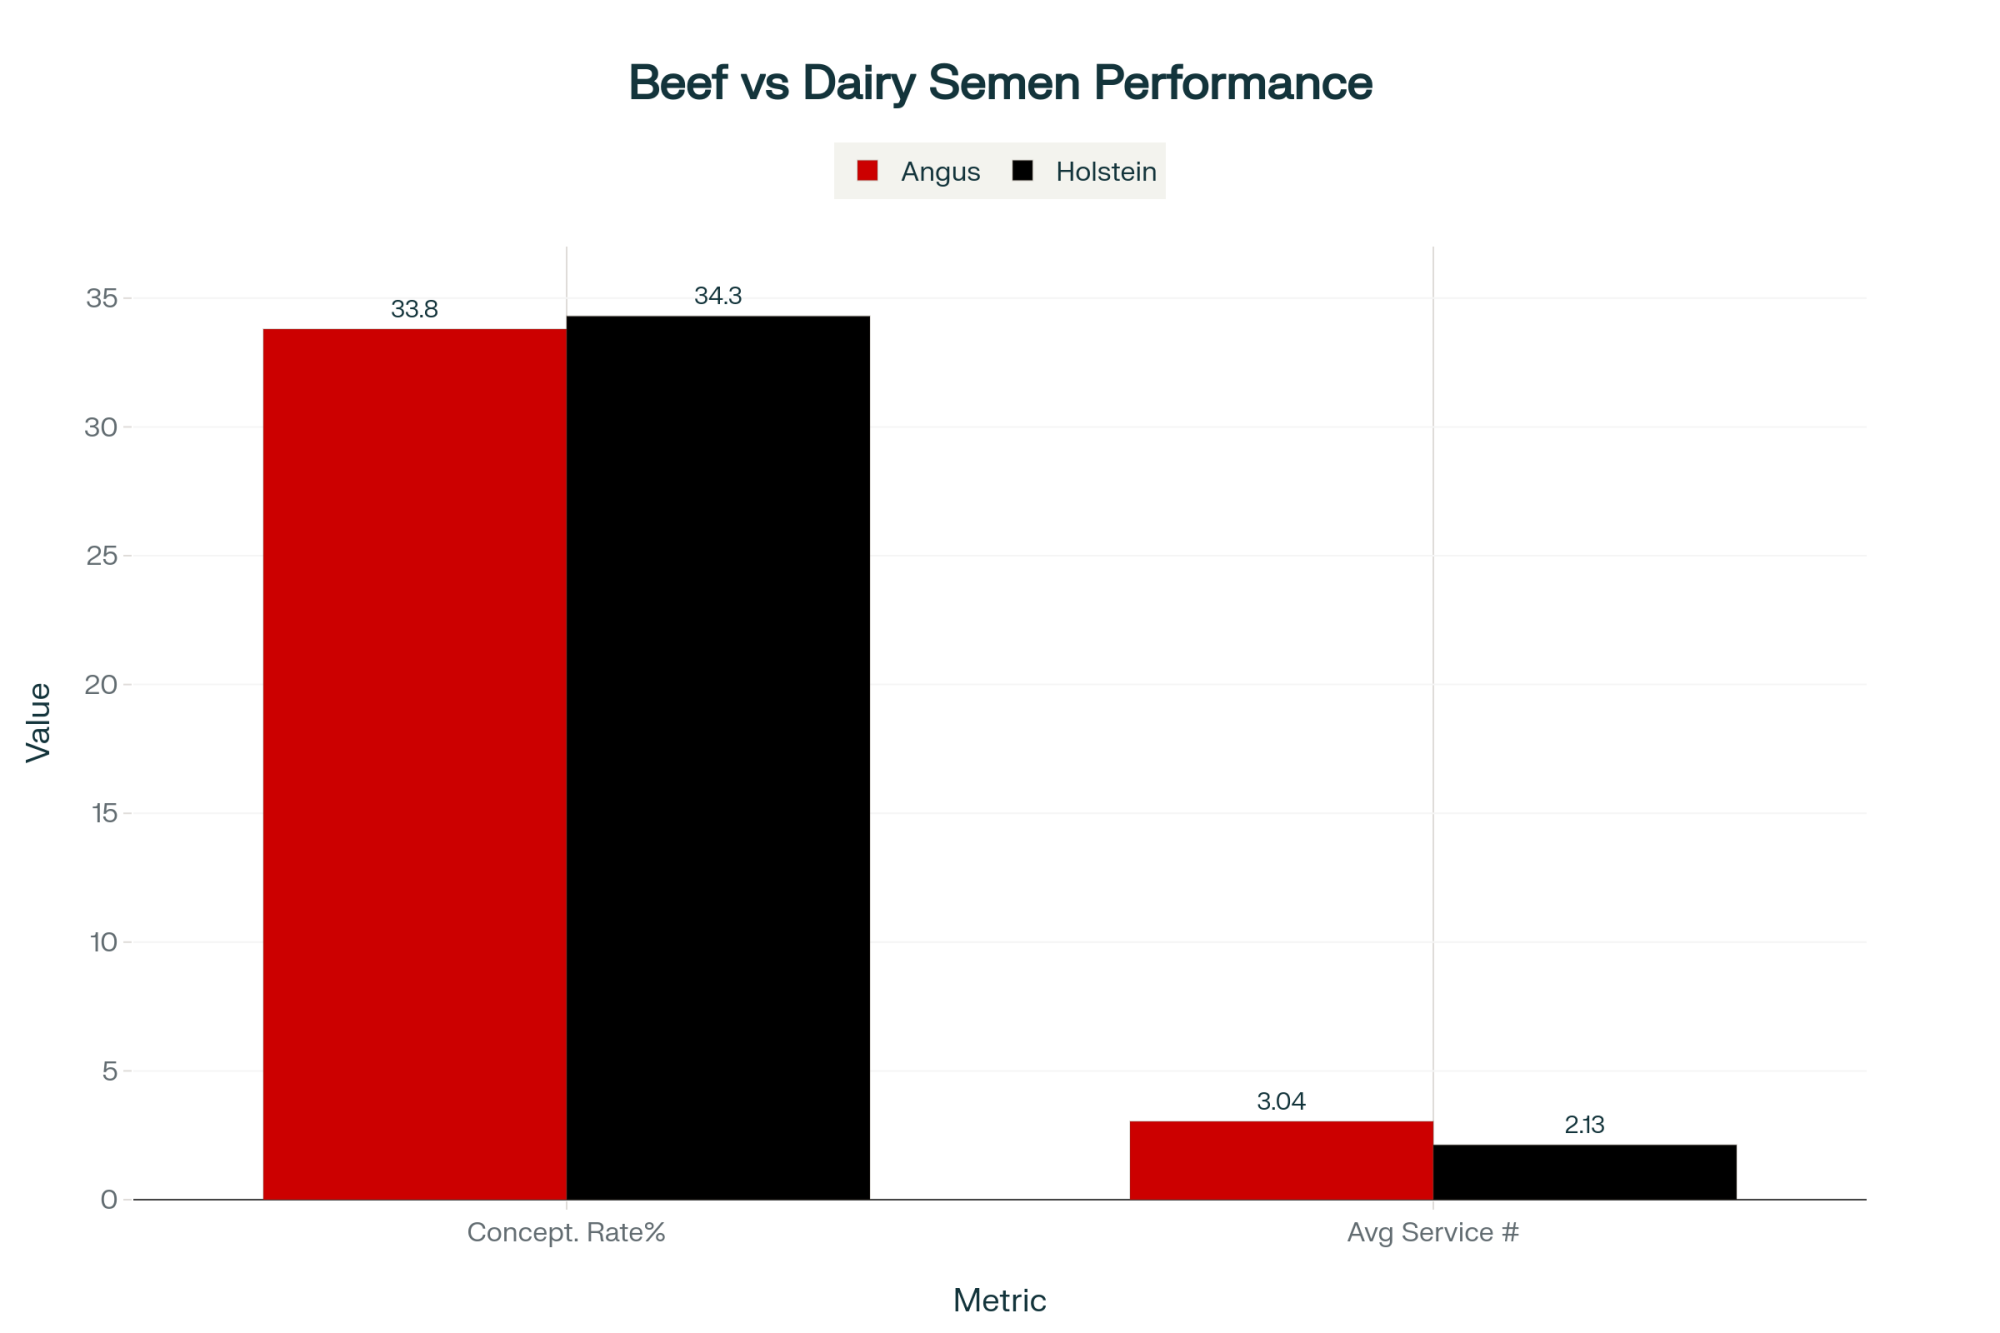
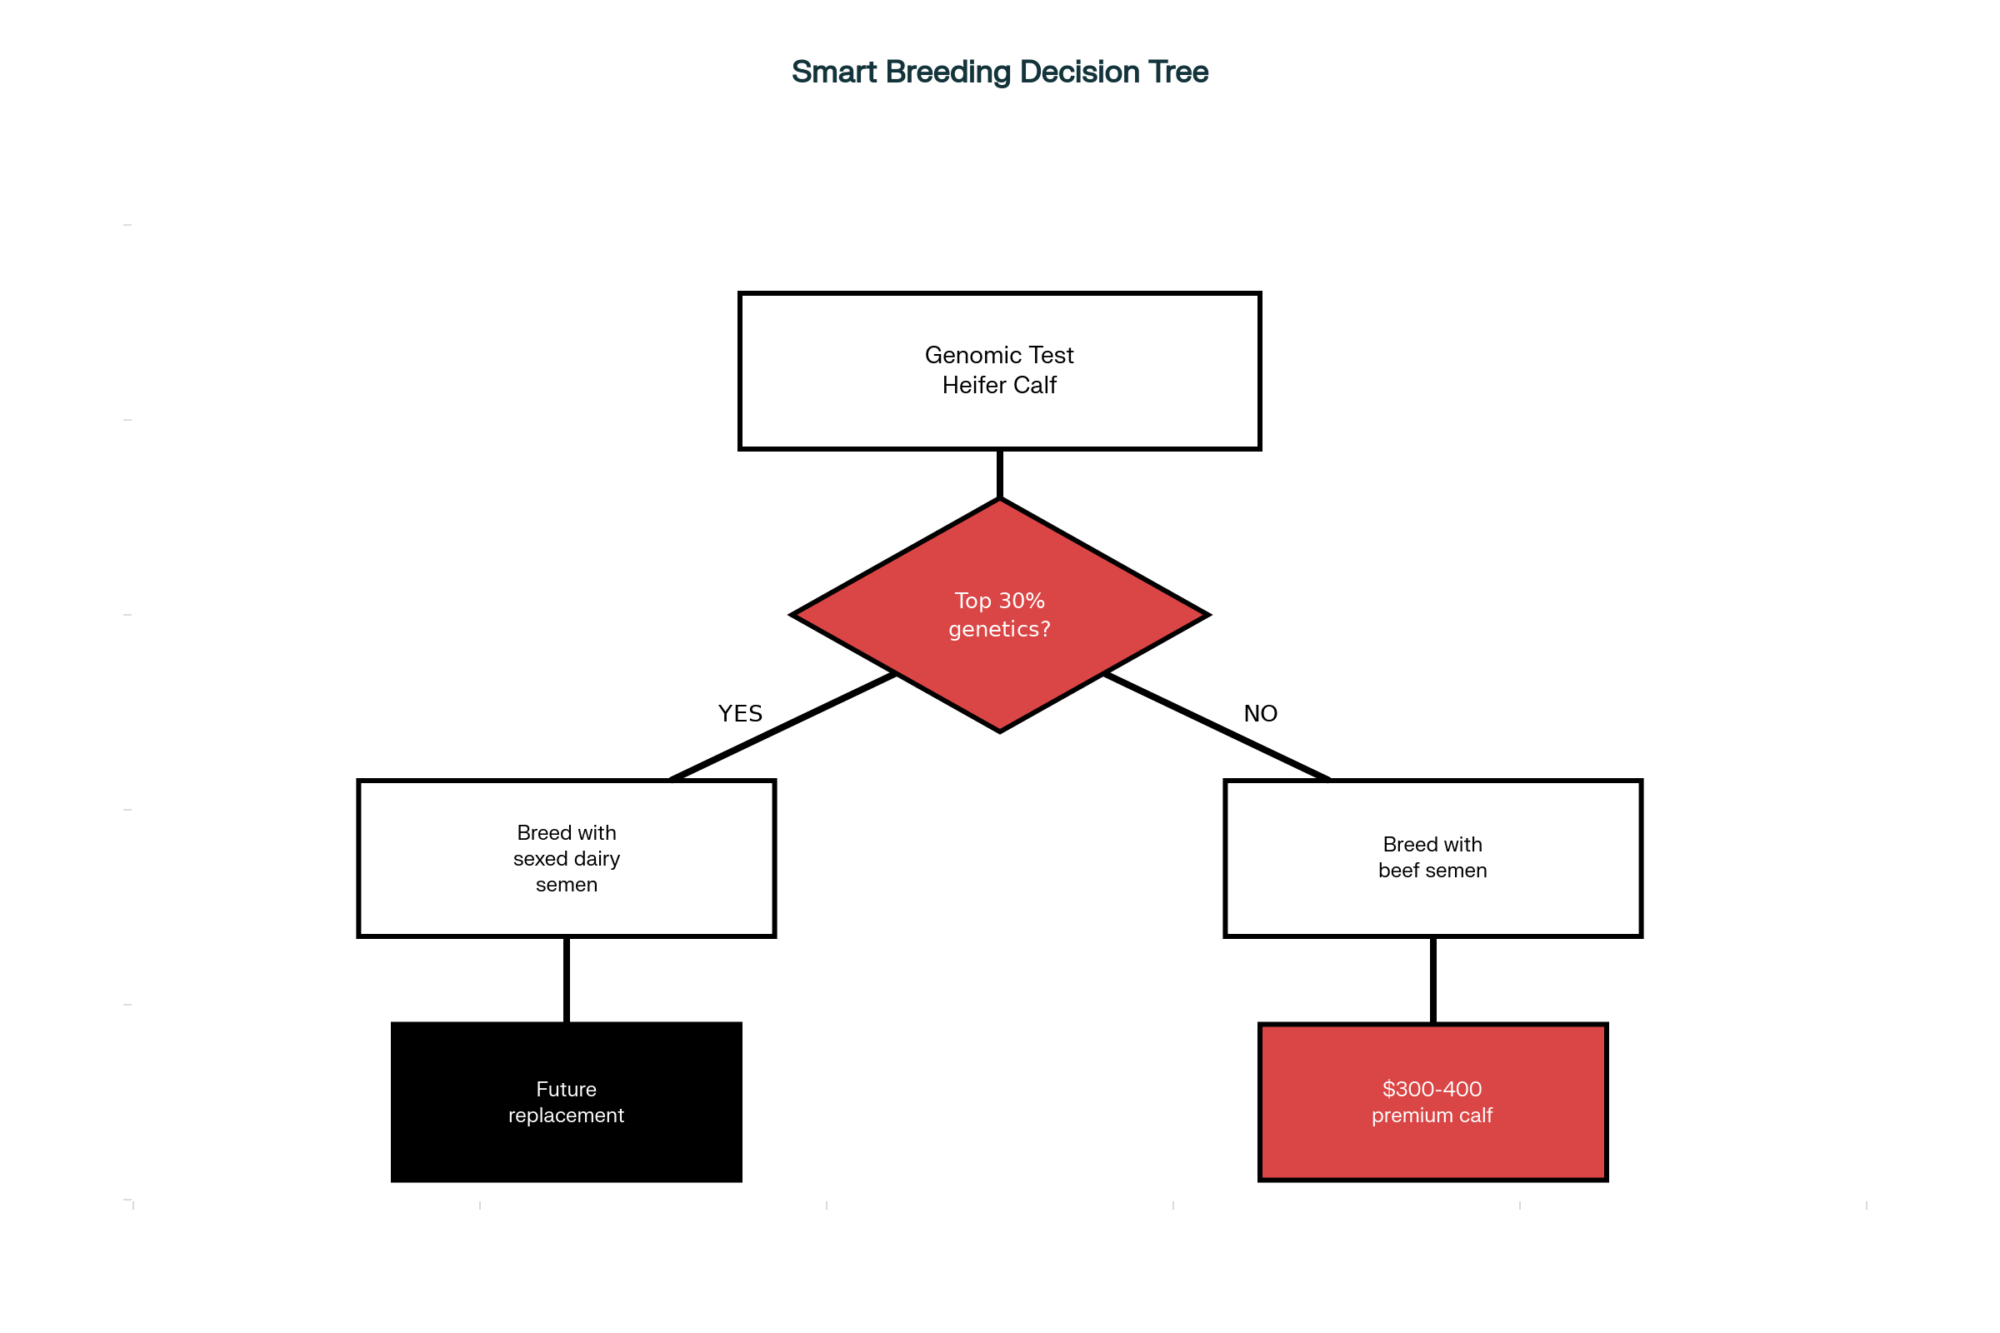
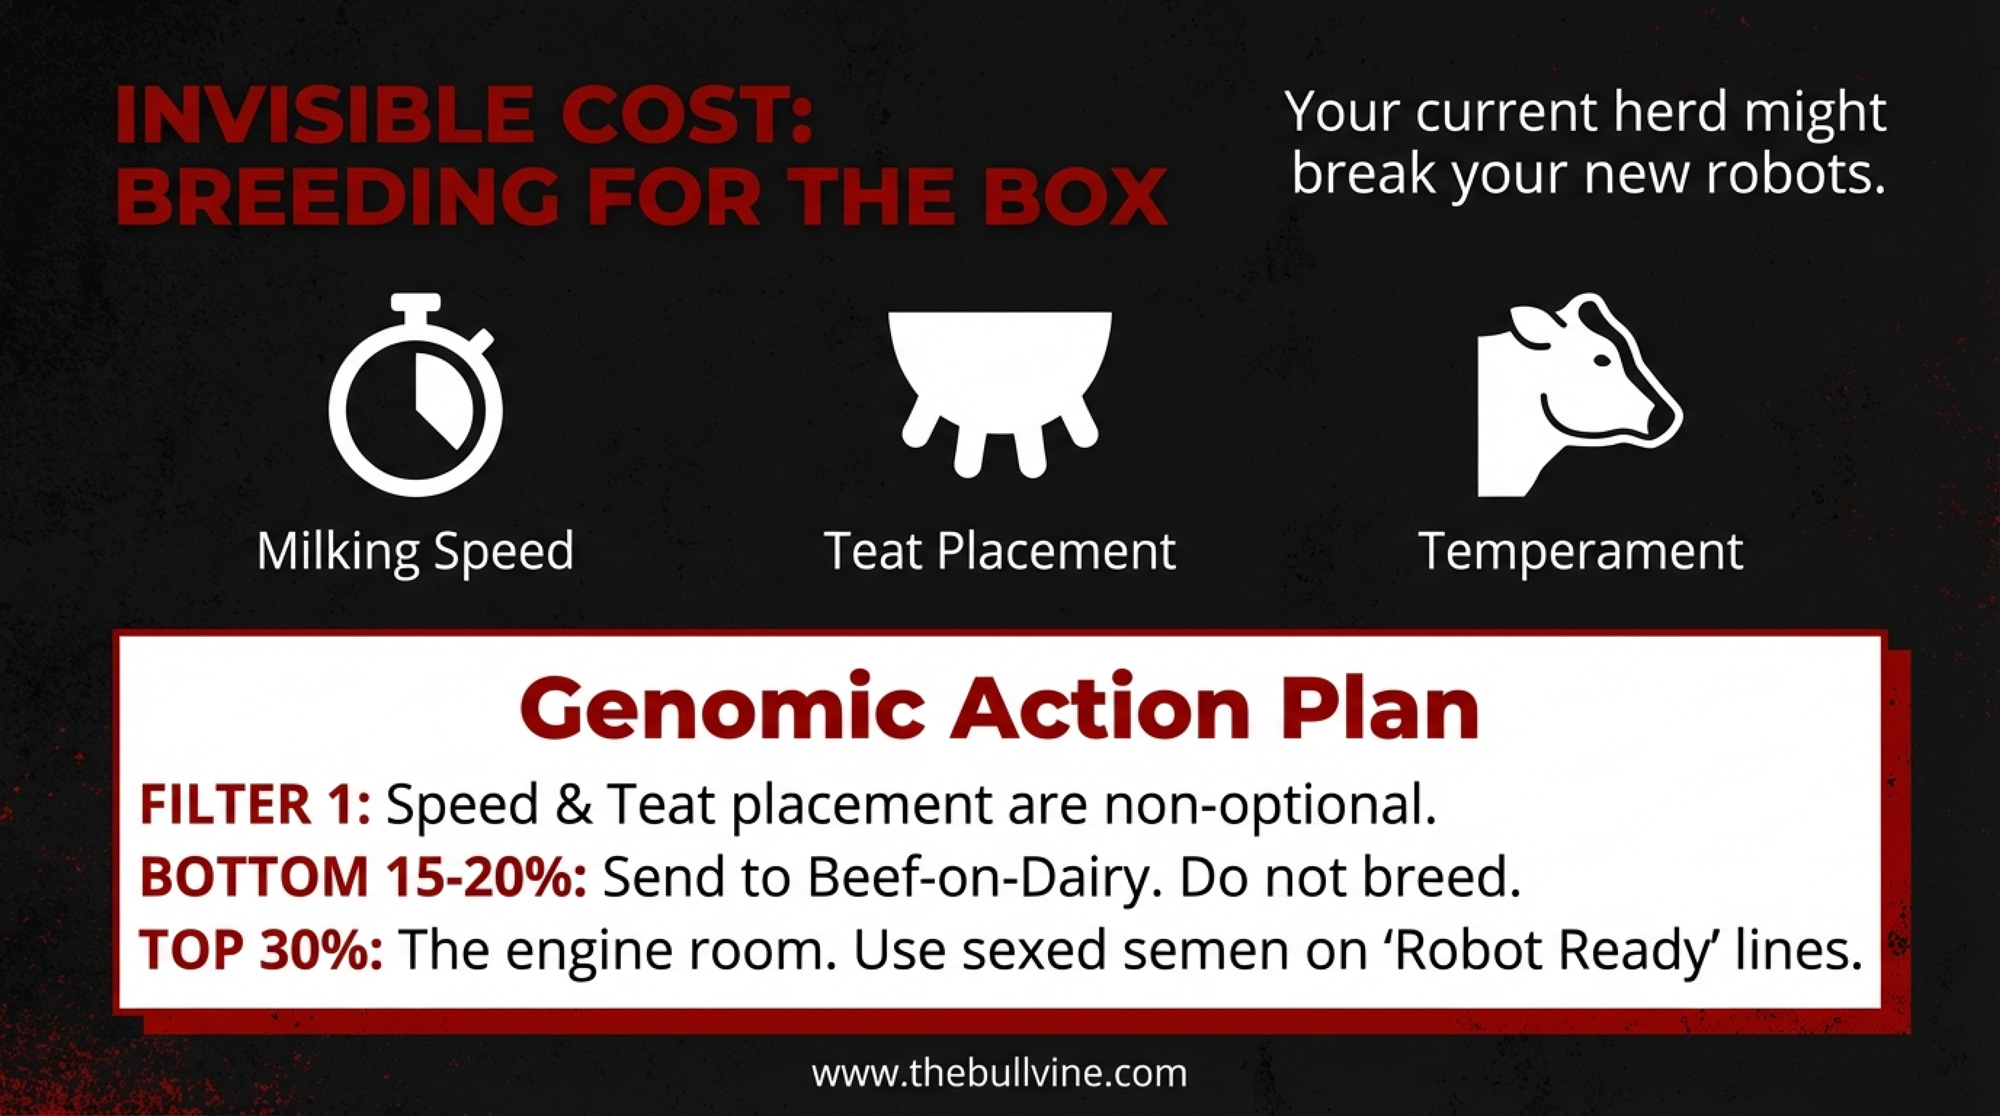
- Use genomic testing to push the bottom 15–20% of heifers straight into beef‑on‑dairy or terminal matings, not into your replacement pool.
- Treat your top 30% as the engine room: sexed semen, targeted embryo work, and matings that stack components and longevity with robot‑friendly udders.
- When you look at proof sheets, treat milking speed and udder traits as non‑optional filters for AMS herds, not “nice extras.”
If you want the next generation actually to want the keys one day, they need more than a shovel in their hands.
Give them real responsibility:
- Make a teenager or young adult responsible for one metric on the AMS or herd‑management software—SCC alerts, “red cows,” abnormal visits.
- Let them sit in on breeding and culling meetings where AMS performance, genomic proofs, and fat/protein kilos actually shape decisions.
- Ask what they see in the data that you’ve been feeling in the barn.
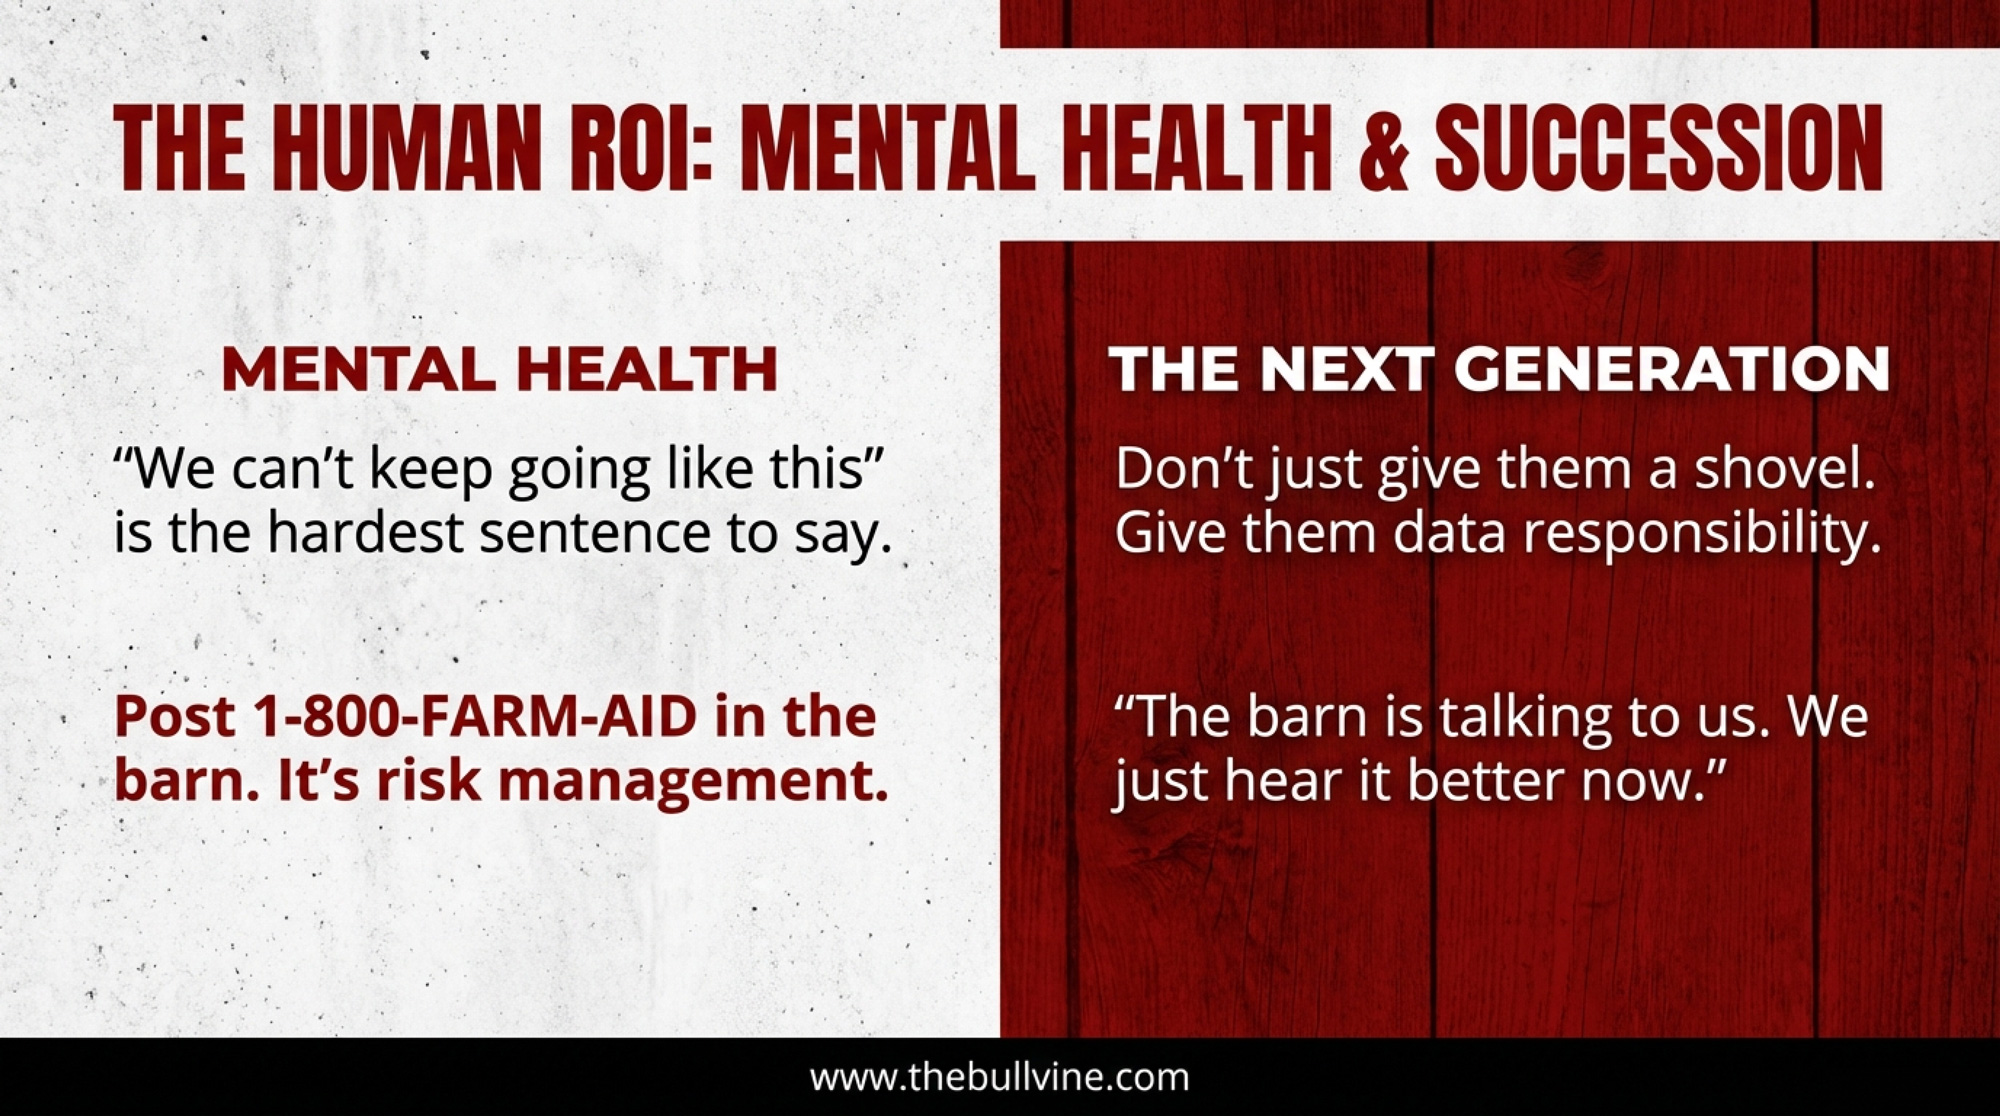
One young producer on an AMS herd put it this way to her grandfather: “The barn’s talking to us all day now.” His reply was simple: “It always was. We just hear it better now.”
Storms, Blackouts, and Who Backs a Tractor Up to Your Panel

Six months after startup, the real test on a lot of robot barns isn’t software.
It’s a thunderstorm.
A fast‑moving cell rips across the township. Trees down. Lines down. One minute, the robot room hums; the next, it’s dead. Vent fans are silent. Lights gone. Cows are mid‑cycle and starting to wonder what’s wrong.
This is where you find out if you bought machines or built a support system.
On the barns that get through nights like this without permanent damage to cows, people, or cashflow, you see the same pattern:
- Within fifteen minutes, headlights swing into the yard.
- One neighbor backs a tractor‑driven generator up to the panel like he’s done it twenty times.
- Another shows up with portable lights and coffee.
- A cousin‑electrician arrives with a headlamp and a coil of wire.
By the time the power company truck finally grinds in, the robots are already milking again. Cows are agitated but under control. Everyone is wiped. But nobody is arguing about whether automation “was the right call” anymore—because the real question was never robots vs parlor.
It was: “When the barn goes dark, who turns up your lane?”
If you can’t answer, right now, whose tractor is backing up to your panel, who milks if you land in the hospital, and who you call first in a disease outbreak or barn fire, that’s not a theoretical risk.
That’s a hole in your survival plan.
The Hardest Sentence in the Barn: “We Can’t Keep Going Like This”
We’ve all seen the mental‑health headlines. Too many of us know the families behind them.
Farmer stress and mental health aren’t side topics anymore. They sit right in the middle of whether your barn is still lit five years from now.
It’s bad enough that national and regional groups have put serious resources behind it. The Farm Aid Hotline (1‑800‑FARM‑AID) provides confidential assistance to farmers in distress or crisis, connecting them to financial, legal, and mental‑health resources. States and provinces now maintain ag‑specific counsellor lists and crisis lines. Farm organizations quietly slip those numbers into meetings and newsletters.
Robots don’t fix that. A USD $1 million AMS note and a constant stream of alerts can make your head even louder.
On the farms that actually get healthier, there’s almost always a moment before anyone signs a contract when someone finally says:
“We can’t keep going like this.”
Short‑staffed. Watching neighbors sell out. Lying awake, wondering whether your kids will resent you more for selling now or handing them a mess in ten years. Afraid that saying it out loud means you’ve failed.
On the barns that make it through, people around them don’t accept “we’re fine” as an answer.
Common patterns:
- A neighbor couple shows up most Sunday evenings during the transition, not to critique cows but to ask, “What went a little better this week? What’s still chewing on you?”
- Vets and nutritionists leave mental‑health resource cards by the computer and say plainly, “These are here for anyone on this farm. Including you.”
- Pastors, teachers, and coaches with farm roots stop by during chores, not to preach, just to sit at the table and listen.
When those farmers look back, the line that sticks isn’t about robots.
It’s some version of:
“The moment that changed everything wasn’t when the robots started. It was when we realized we didn’t have to pretend we were fine anymore.”
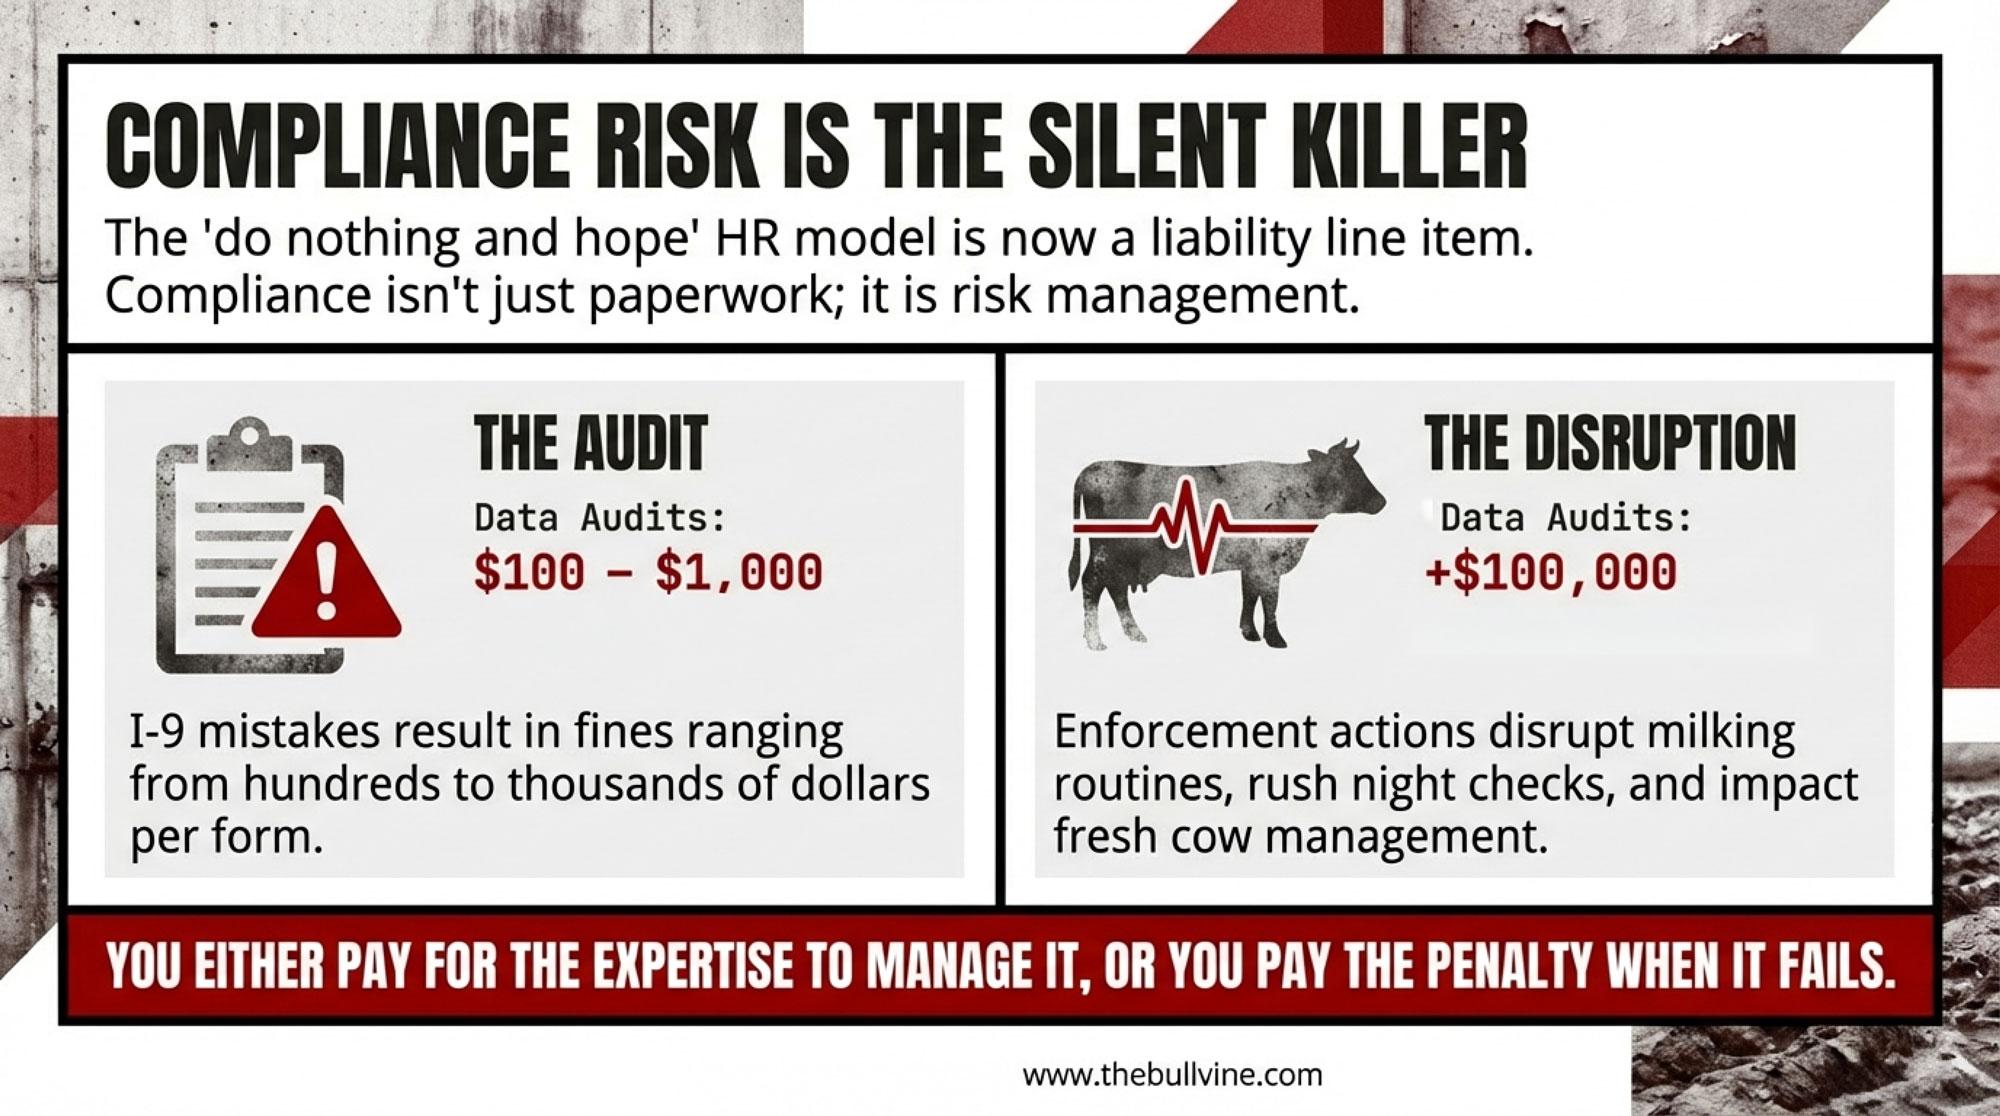
If you’re serious about staying in dairy, this isn’t fluff. It’s risk management. Cows don’t care how tough you are. Your family and your lenders care very much that you’re still here.
The 4‑H Calf That Keeps a Kid – and a Farm – Connected to Dairy
Every county has a story that quietly explains why community still matters.
A quiet kid drifts into a 4‑H dairy club meeting. No farm background. New boots, still clean. Home life? Let’s just call it complicated.
A local dairyman offers him a calf from his herd for the summer. Nothing out of the World Dairy Expo showstring. Just a decent heifer with a kind eye and a shot at VG down the road if things line up.
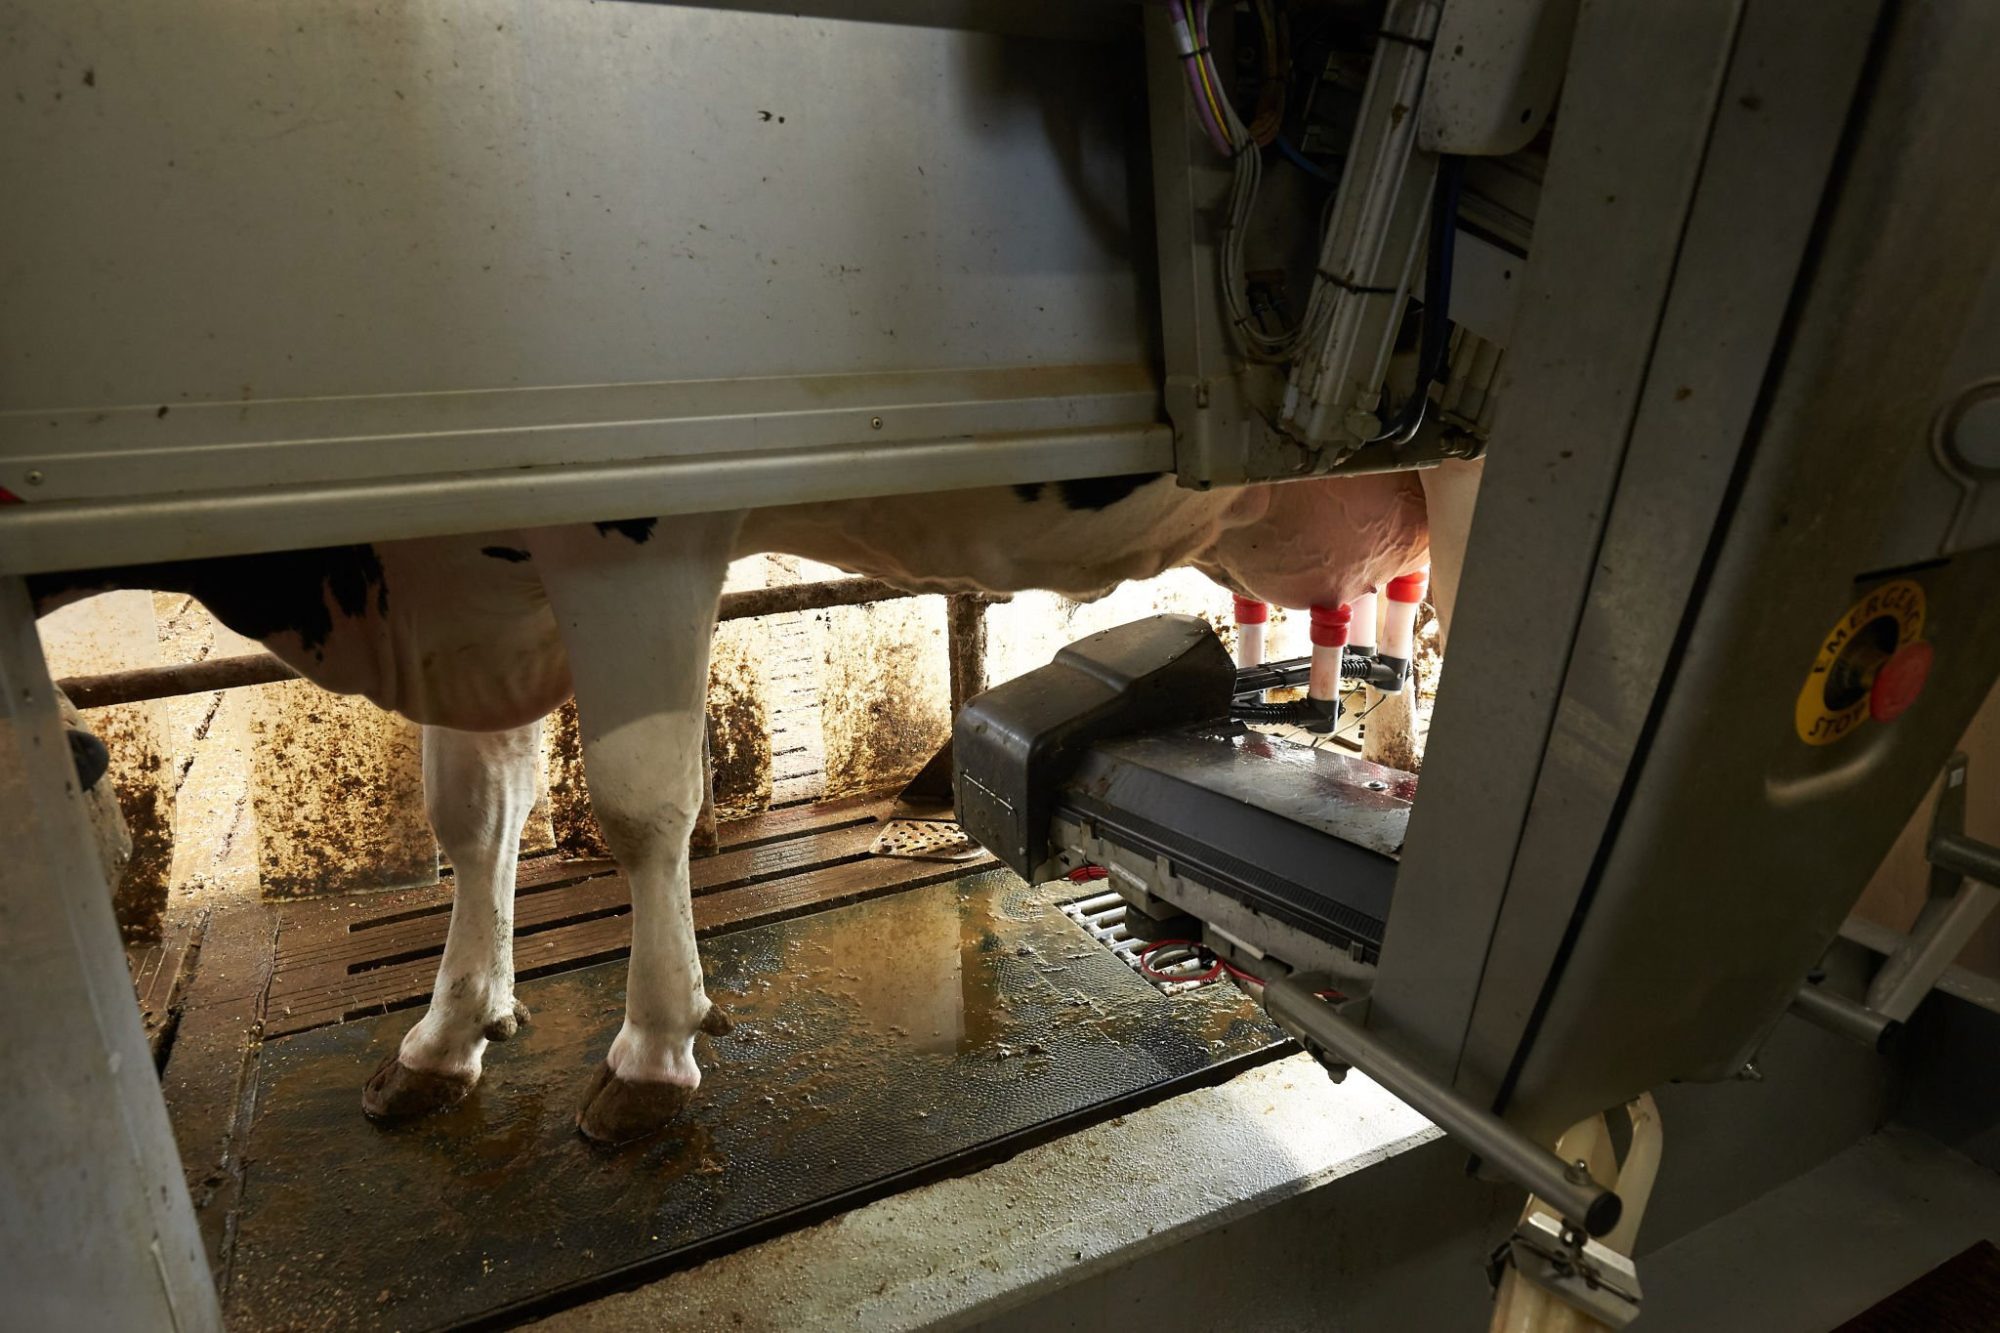
All summer, that calf gives him a reason to get up and go somewhere safe twice a day. He learns to halter, to brush, to read her moods. When she walks into the robot for the first time, he’s there with a hand on her flank, talking her through the new noise and the spray.
At the fair, they land squarely in the middle of the class. You’d think they’d just won the Supreme.
Fast‑forward a couple of years, and that “quiet kid” shows up as:
- A part‑time worker at a dairy down the road.
- A student in an ag or ag‑tech program.
- The older 4‑H’er is clipping calves and teaching younger kids how to lead a heifer without panicking.
Ask what changed his path, and he’s not going to say “robot model numbers” or “Net Merit.”
He’ll tell you, “Somebody trusted me with something that mattered.”
If you want to talk long‑term herd strategy and genetics, that’s it in one sentence. Your best cow families and proofs don’t mean much if there’s nobody young who wants to be under those cows when they calve, milk, and show.
Robots and genomics might keep your herd competitive.
Kids and the community keep it alive.
What This Means for Your Operation
This isn’t a feel‑good Hallmark story. It’s a survival checklist.

If you’re reading this with a knot in your stomach, you’re exactly who this section is for.
Run Your Robot vs Human vs Hybrid Math in $/cwt
Sit down with your lender and accountant and write it out:
- Calculate your real milking labor cost per hour—wages, housing, benefits, turnover, and your own unpaid time. Convert that to $/cwt using your shipped volume.
- Get a real AMS quote: equipment, barn modifications, and at least 10 years of service contracts.
- Price out a serious hybrid package—activity monitors, sort gates, and a feed pusher. For many 180‑cow herds, that’s a tens‑of‑thousands‑of‑dollars investment, not a million‑dollar note.
- Work out your projected $/cwt labor cost for “keep the parlor,” “parlor + tech,” and “full AMS” at five and ten years. If you’re not sure how to do that, ask your lender or extension adviser to walk you through it.
Then ask yourself:
- Can I hire and retain three reliable people to cover milking for a total cost of USD $200,000/year or less?
- If yes, humans still likely beat robots on pure economics for most sub‑500‑cow herds.
- If no, you’re in AMS‑or‑exit territory and need to treat this like the survival decision it is—not a gadget purchase.
If AMS debt would push your total farm debt service well beyond your historic cashflow comfort zone, a clean, profitable exit or a smaller hybrid investment deserves a serious look.
Build a Three‑Farm Emergency Ring
Before the next storm, disease outbreak, or health crisis:
- Sit down with two or three nearby dairies.
- Agree on who brings the tractor‑driven generator, who understands your panel, and who will show up if you’re suddenly out of commission.
- Swap cell numbers, gate codes, and panel details now, not at midnight in a blizzard.
- Write it down and post it in the office and on at least one truck.
If you don’t know whose tractor is backing up to your panel, that’s the first hole to patch.
Put Mental Health on the Wall
Take ten minutes and:
- Print the Farm Aid hotline (1‑800‑FARM‑AID) and any state/provincial ag mental‑health numbers you can find.
- Tape them where people actually look—office fridge, milk house door, robot room.
- Tell your family and crew once, “If you ever feel like you can’t keep going, you can talk to us—or you can call these numbers. Both are okay.”
It’ll feel awkward. Do it anyway.
Make Youth Part of Real Decisions, Not Just Photo Ops
If you want someone to care about your herd in 2035, give them work that matters in 2026.
- Hand a teenager or young adult a login to your robot or herd‑management software and make them responsible for one metric—SCC alerts, irregular visits, “problem cows.”
- Let them sit in on some breeding and culling discussions where AMS performance, genomic proofs, Net Merit/Pro$/LPI, and component performance actually shape the choices.
- Put a 4‑H calf or a small project in the hands of one non‑family youth and let them earn your trust.
You’re not just filling labor gaps. You’re building your successor pool.
Tie Genetics Directly to the System You Actually Run
Your sire list should match the barn and milking routine you have now, not the one you had ten years ago.
- On AMS herds, prioritize bulls with milking speed, balanced udders, good teat placement, and sound feet and legs alongside components and fertility.
- Use genomic tests to push the bottom 15–20% of heifers toward beef‑on‑dairy or terminal matings, protecting your replacement slots for daughters who fit your system.
- Treat your top 30% as the cow families that will carry your prefix forward: stack them with sires that fit your milking system, labor realities, and market.
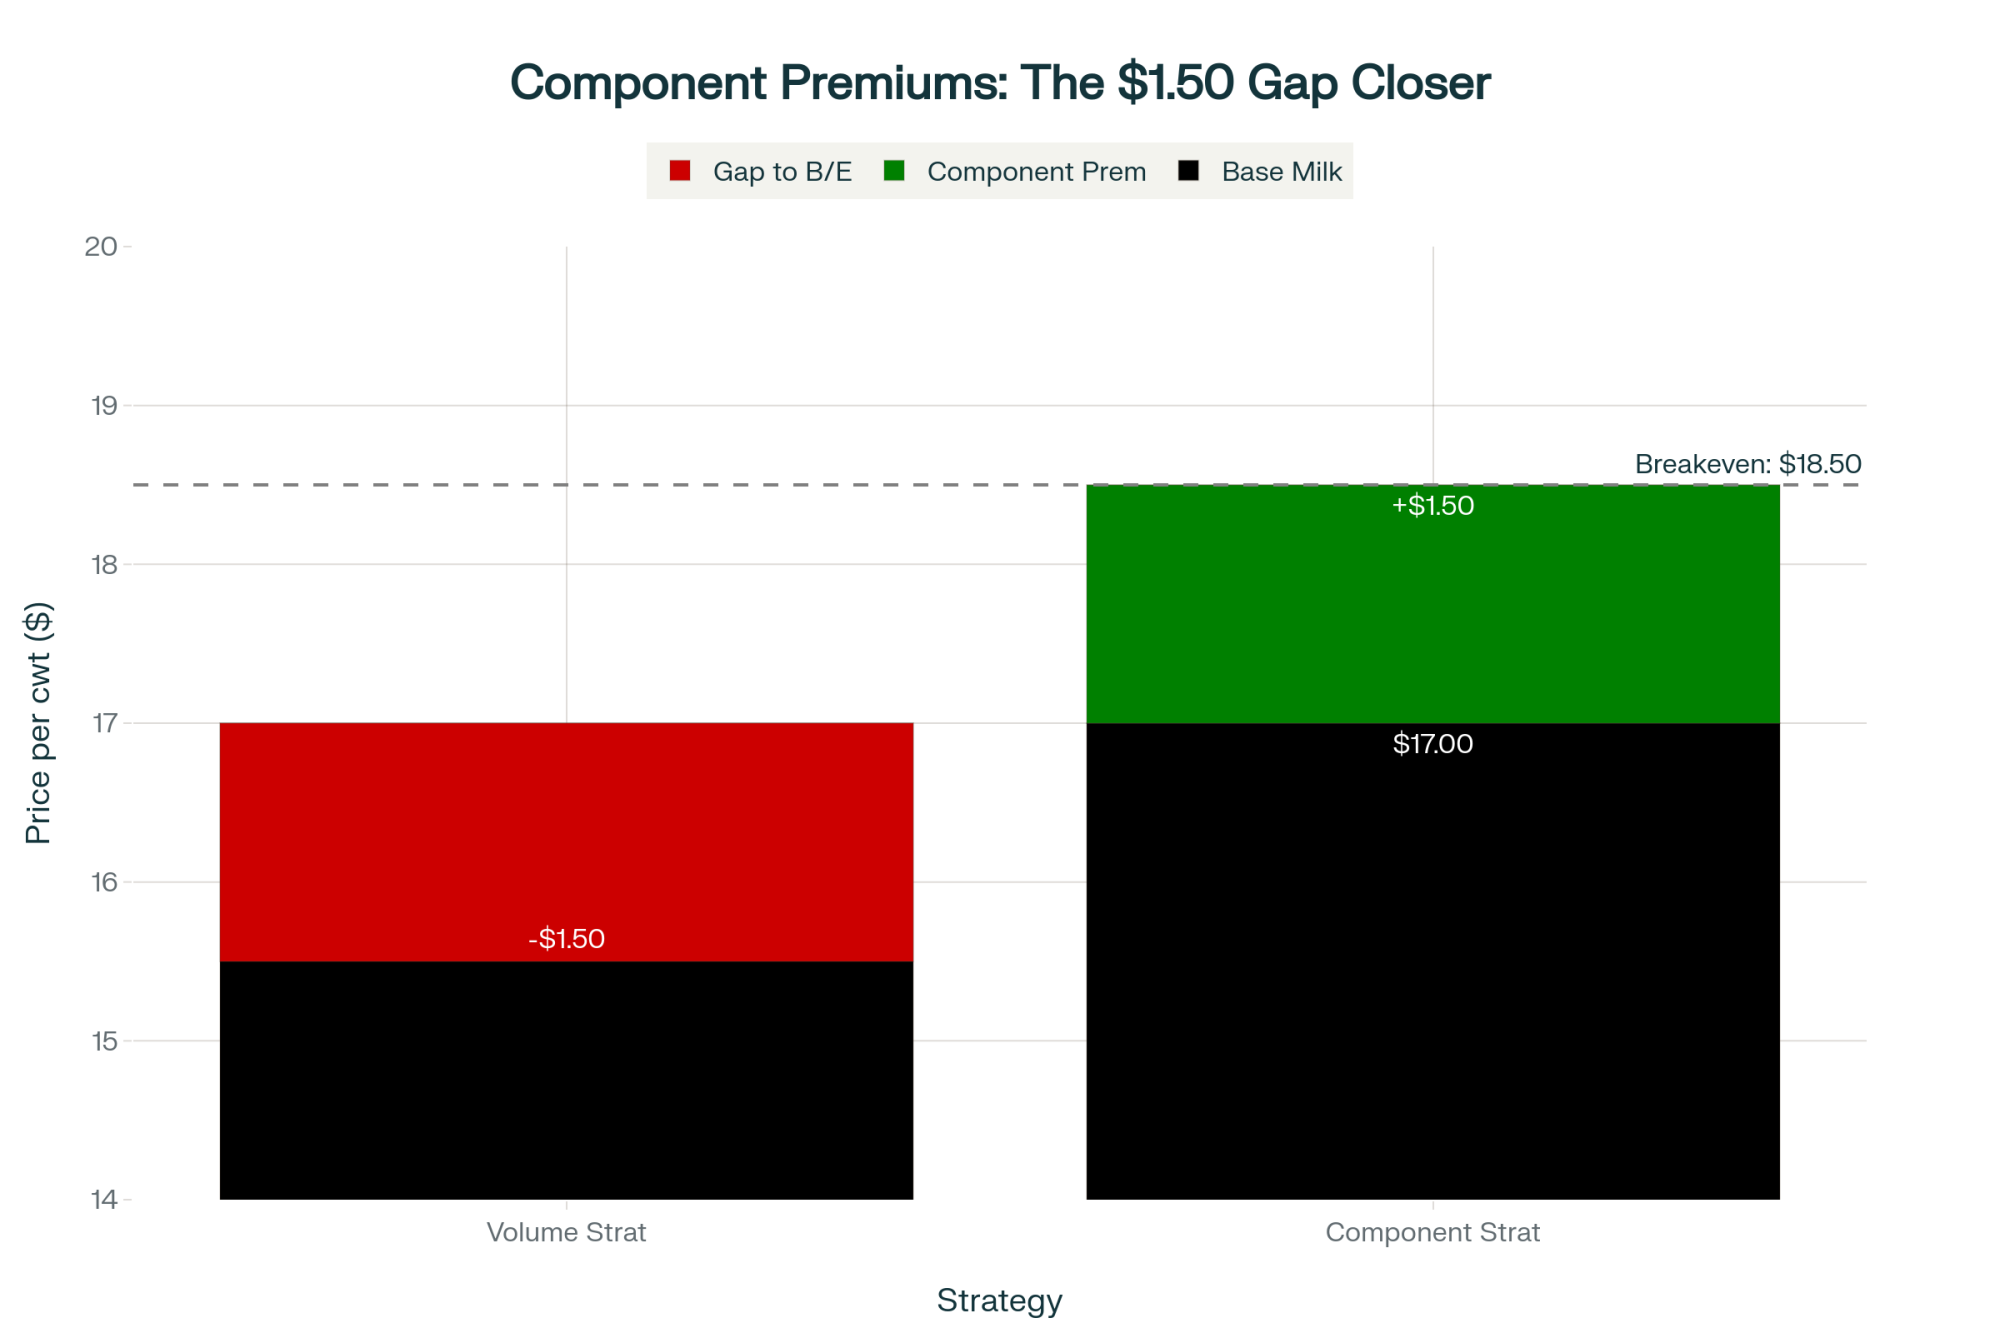
- If you’re paid on butterfat and protein, give extra weight to sires whose daughters hold components under higher milking frequency.
If you’re still using bulls that made sense for a twice‑a‑day tie stall in 2008, you’re breeding for nostalgia, not for the farm you’re trying to keep alive.
Key Takeaways
- Robots don’t replace neighbors. They raise the stakes on having the right people in your corner when things go sideways.
- Under 500 cows, AMS isn’t an automatic yes. If you can still hire and keep good milkers at an honest wage, a hybrid “parlor + tech” setup often delivers most of the benefits at a fraction of the cost.
- Your labor market decides more than your dealer does. If you genuinely can’t staff your barn, robots may be the lesser risk—but only with a strong community and management bench behind them.
- Genetics has to match your system. Milking speed, udder design, health, and hoof traits become expensive blind spots in a robot barn if you ignore them.
- Mental health isn’t soft. It’s a leading indicator of whether your family and business will still be here when the next price cycle turns.
- Youth and 4‑H aren’t side projects. They’re your succession plan, your future labor, and the bridge that keeps your best cow families relevant in 20 years.
The Bottom Line
In a world where Wisconsin has dropped from over 16,000 herds to just above 5,300, and immigrant labor holds up half of the hired workforce that keeps the milk flowing, the real question on your farm isn’t “robots or parlor.”
It’s a lot simpler, and a lot harder:
If things go sideways tonight, who is actually turning up your lane?
If you don’t have a clear answer, that’s your real project this year.
Robots might help you milk.
Your people are the reason you’ll still be here to push “start” tomorrow.
Complete references and supporting documentation are available upon request by contacting the editorial team at editor@thebullvine.com.
Learn More
- Tech Reality Check: The Farm Technologies That Delivered ROI in 2024 (And Those That Failed) – This exposes the brutal gap between glossy sales brochures and actual barn-floor returns. It arms you with verified payback periods and management thresholds, helping you filter out high-priced distractions and prioritize technology that delivers real ROI.
- 79% of U.S. Milk Runs on Immigrant Labor. If Yours Vanishes, You Have 72 Hours. – This reveals the terrifying math behind our industry’s workforce dependence and delivers a survival strategy for the first 72 hours of a labor crisis. It positions your operation to weather the coming policy and enforcement storms.
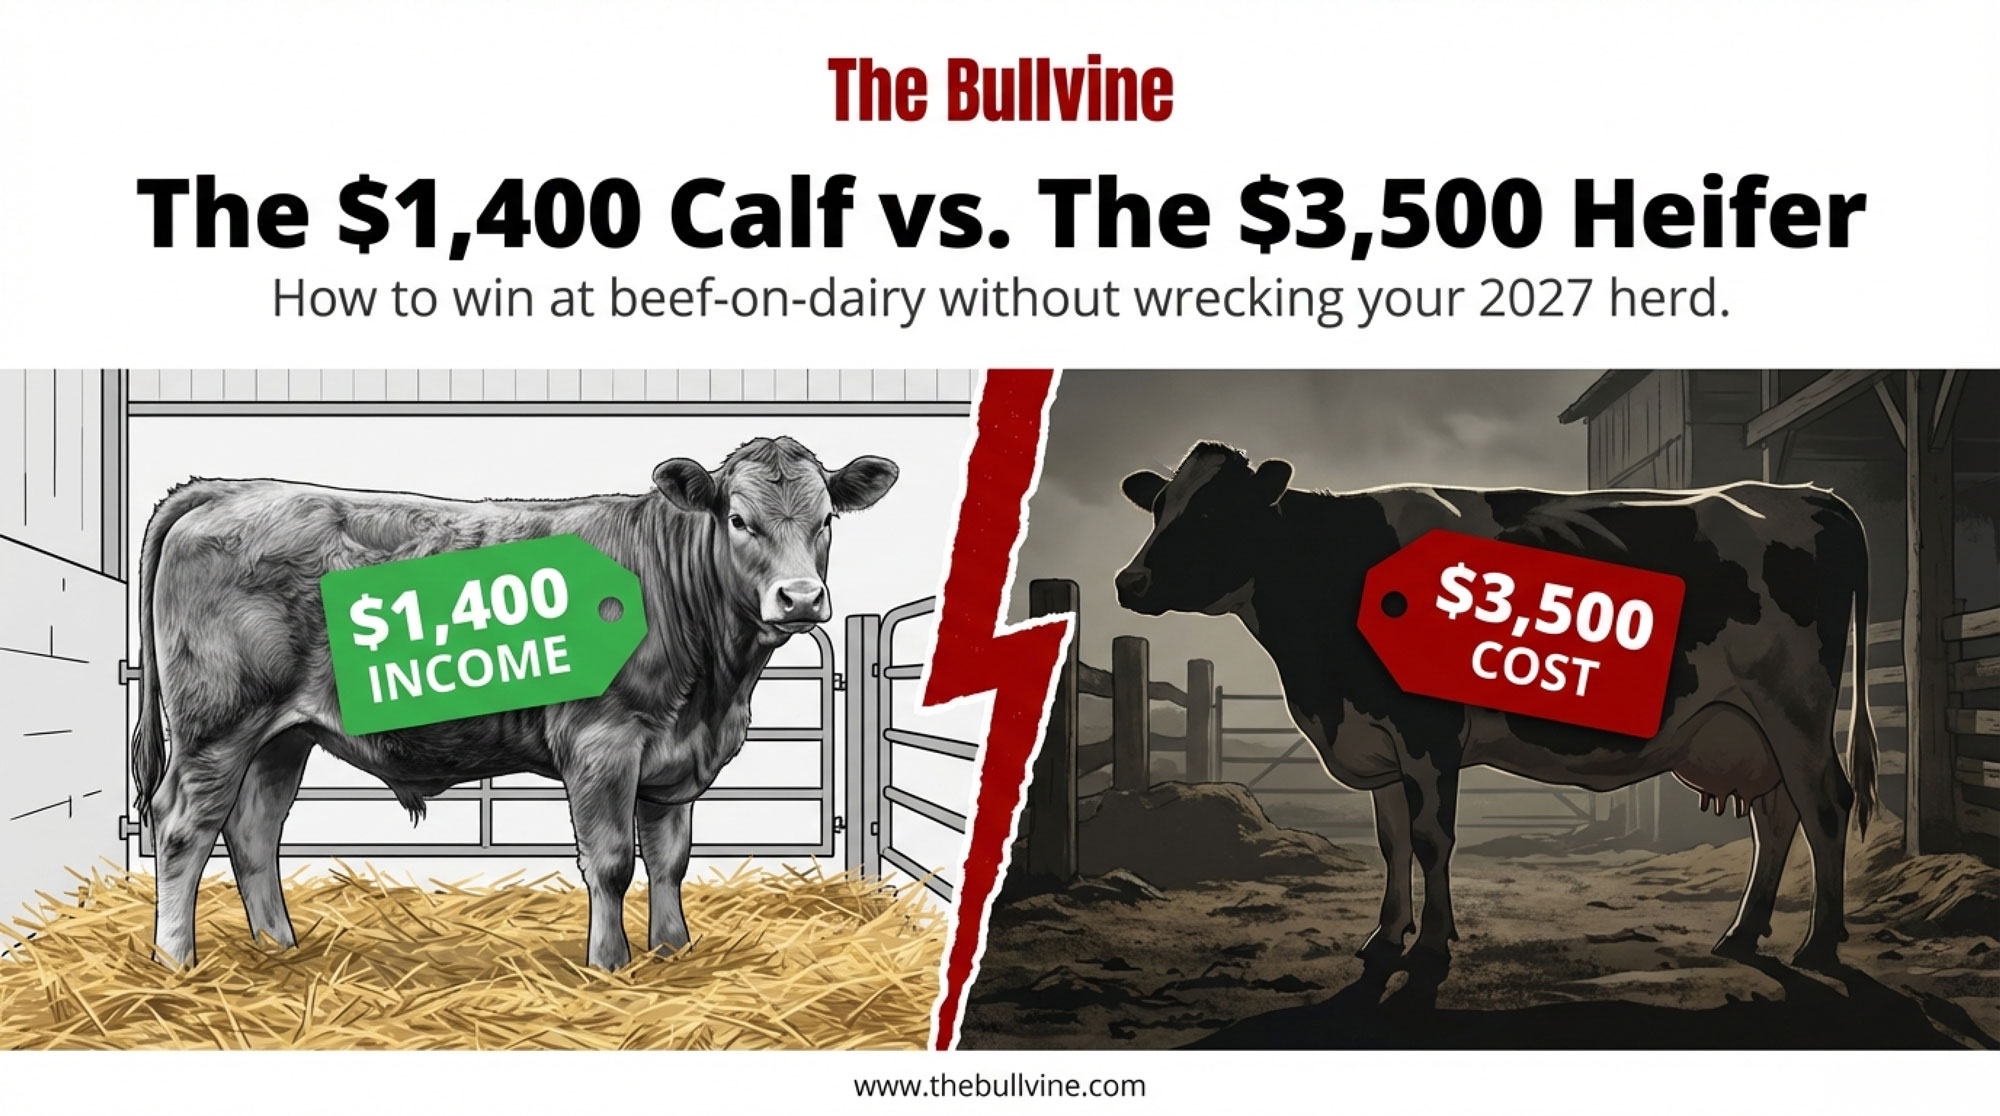
- The $1750 Calf: Is Your 2026 Breeding Plan Leaving $800 a Head on the Table? – This breaks down how to weaponize genomic data to capture massive beef-on-dairy premiums. It delivers a surgical breeding method that turns surplus pregnancies into a second, high-margin revenue stream that significantly outpaces commodity milk income.
 Join the Revolution!
 Join the Revolution!
Join over 30,000 successful dairy professionals who rely on Bullvine Weekly for their competitive edge. Delivered directly to your inbox each week, our exclusive industry insights help you make smarter decisions while saving precious hours every week. Never miss critical updates on milk production trends, breakthrough technologies, and profit-boosting strategies that top producers are already implementing. Subscribe now to transform your dairy operation’s efficiency and profitability—your future success is just one click away.