Every time you pull up a sire list, there’s one question you almost never ask: what am I not measuring that’s already costing me money?
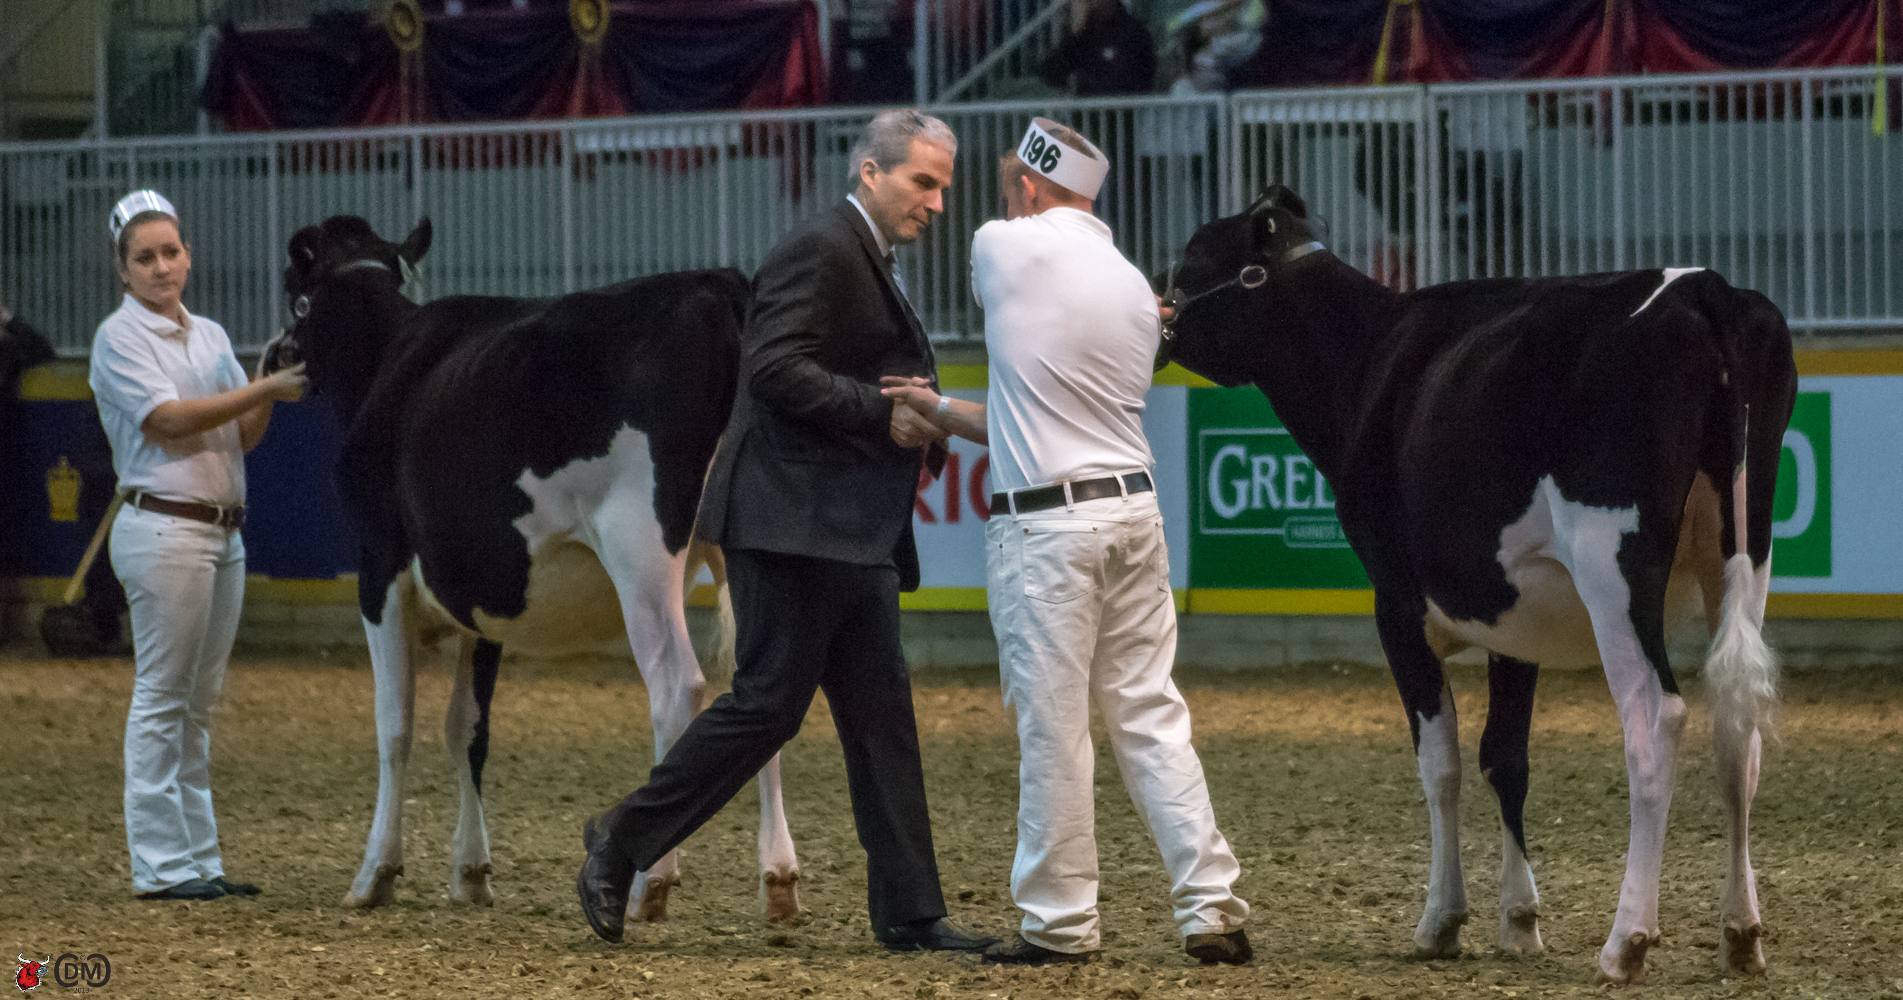
February 2003. Snow coming down sideways in a drafty barn at the Wisconsin Holstein Convention Sweetheart Sale. Experienced breeders — guys who’d driven hours through a Wisconsin winter to be there — were heading for the exits. The auctioneer’s voice was getting that tired, frustrated edge as bidding stalled out on a five-year-old Holstein whose rump “wasn’t entirely balanced.”
Matt Steiner called in from Pine-Tree Dairy in Ohio. He’d never laid eyes on the cow in person. Her second lactation ran 31,880 pounds at 4.1% fat and 3.2% protein — respectable, not revolutionary. He bid $8,100 for what everybody else in the room saw as just another decent cow past her prime.
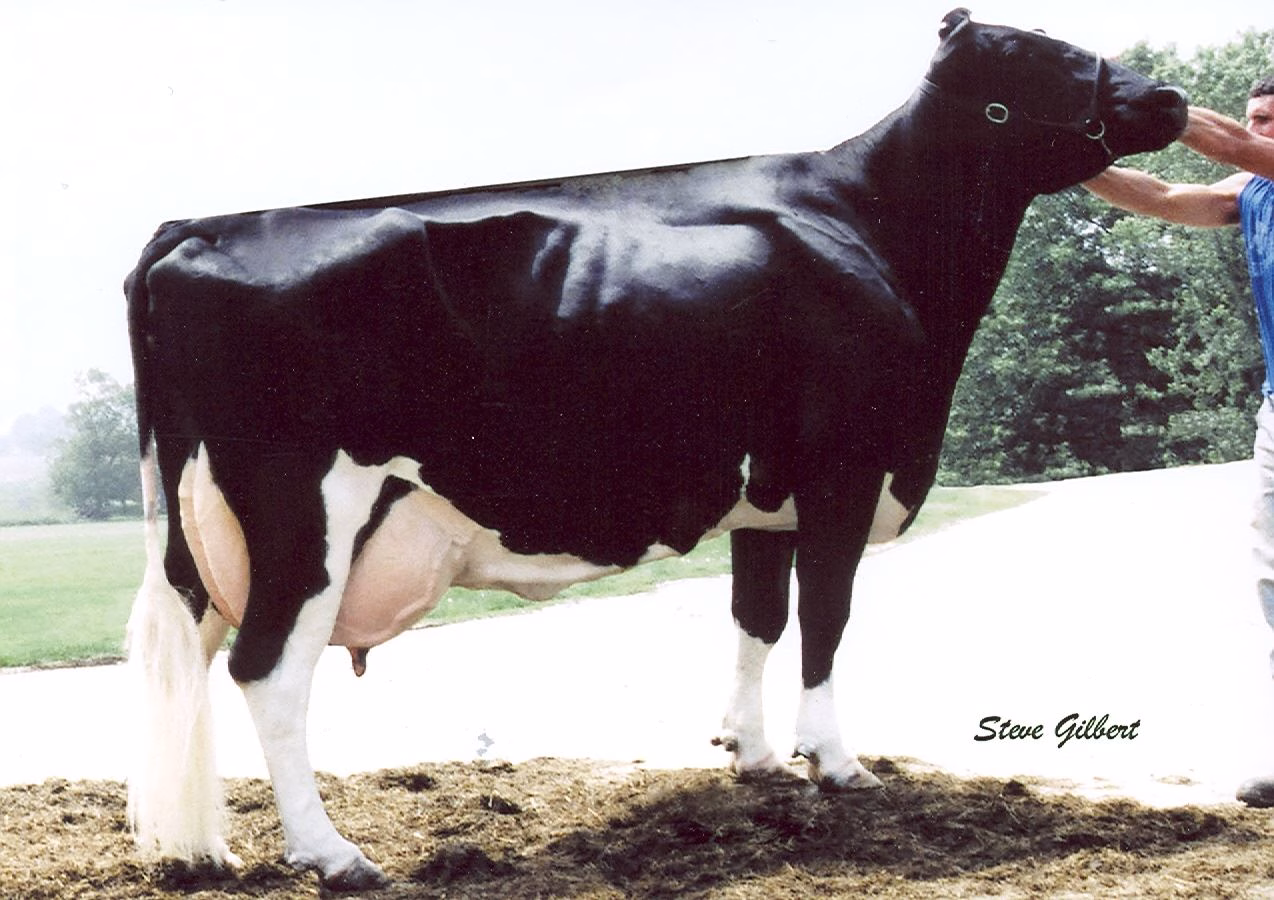
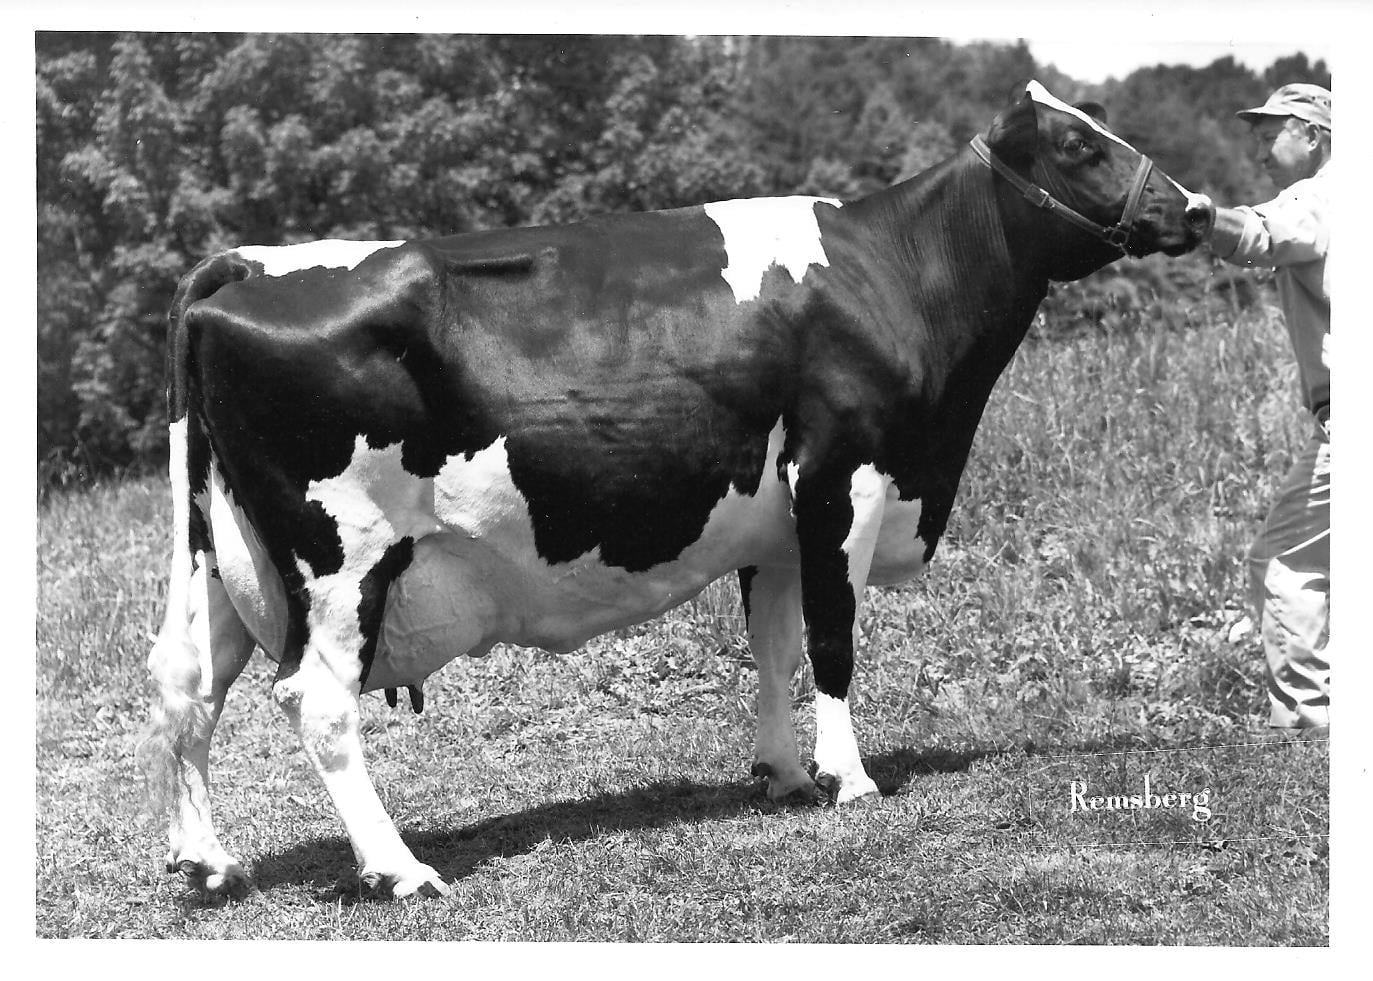
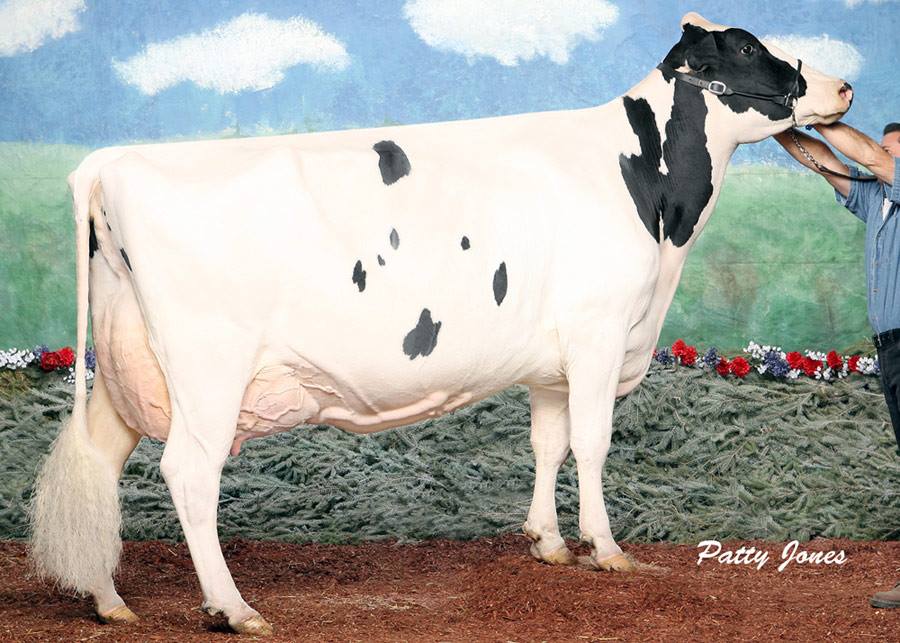
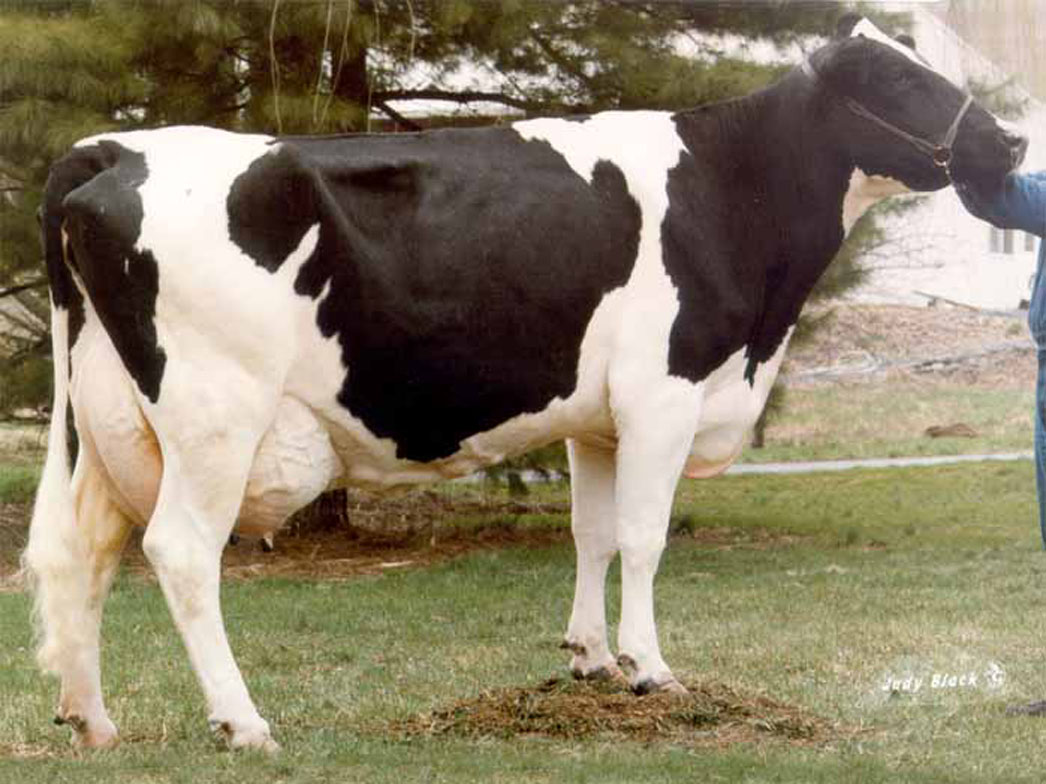
Wesswood-HC Rudy Missy-ET EX-92 — the “unbalanced” Wisconsin sale cow whose $8,100 phone bid quietly rewrote Holstein genetics for the next 20 years.
That cow was Wesswood-HC Rudy Missy. And Steiner’s gamble would reshape the Holstein breed for the next two decades. (Read more: The Phone Call That Built a Genetic Empire: The Wesswood-HC Rudy Missy Story and The Room Went Quiet. Everyone Left. Then an $8,100 Phone Call Changed Holstein History Forever.)
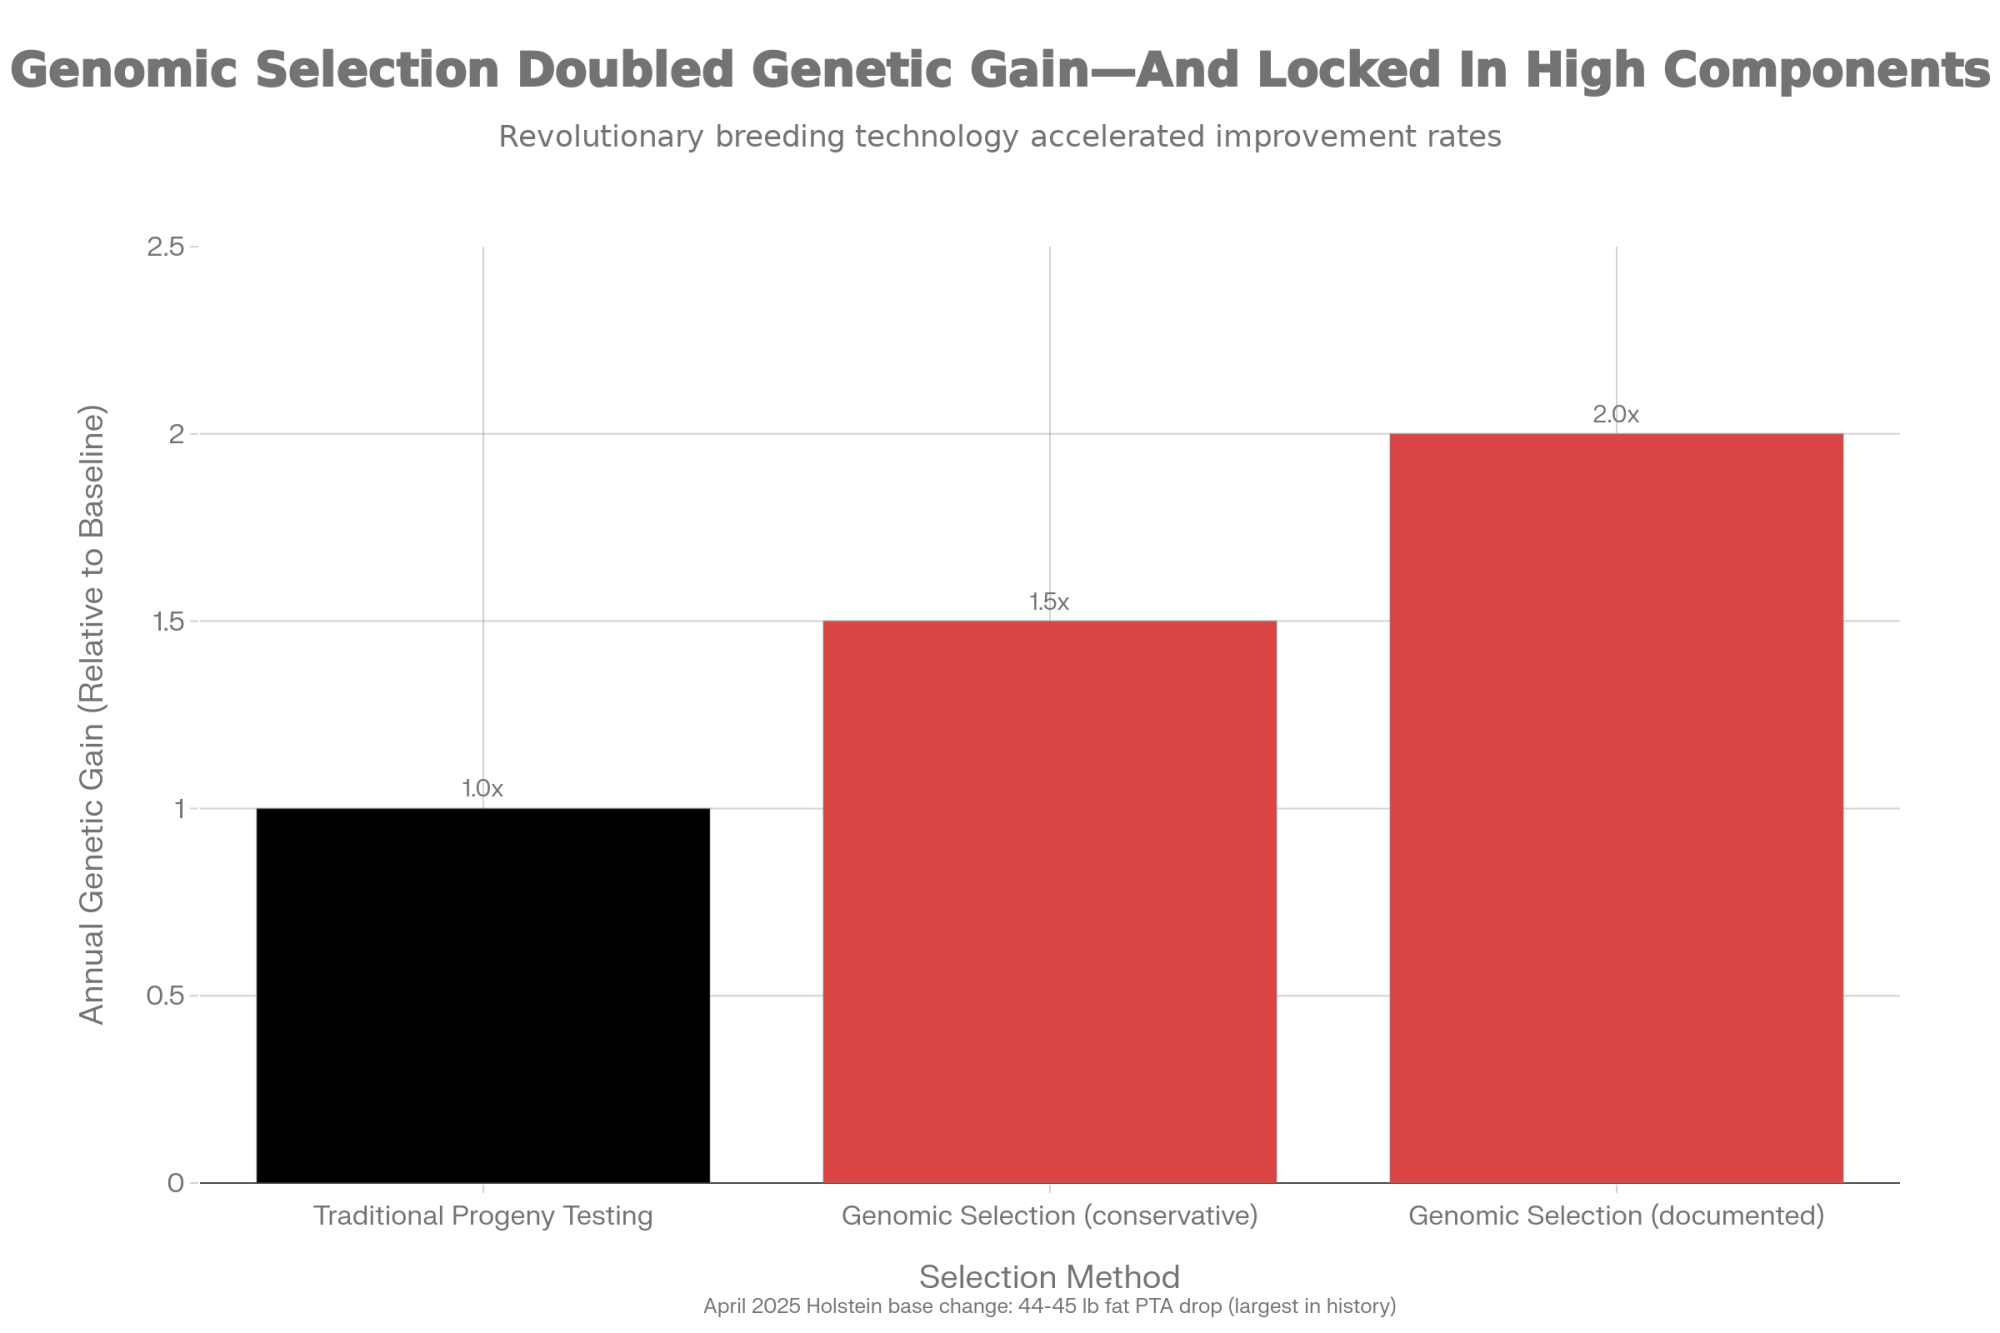
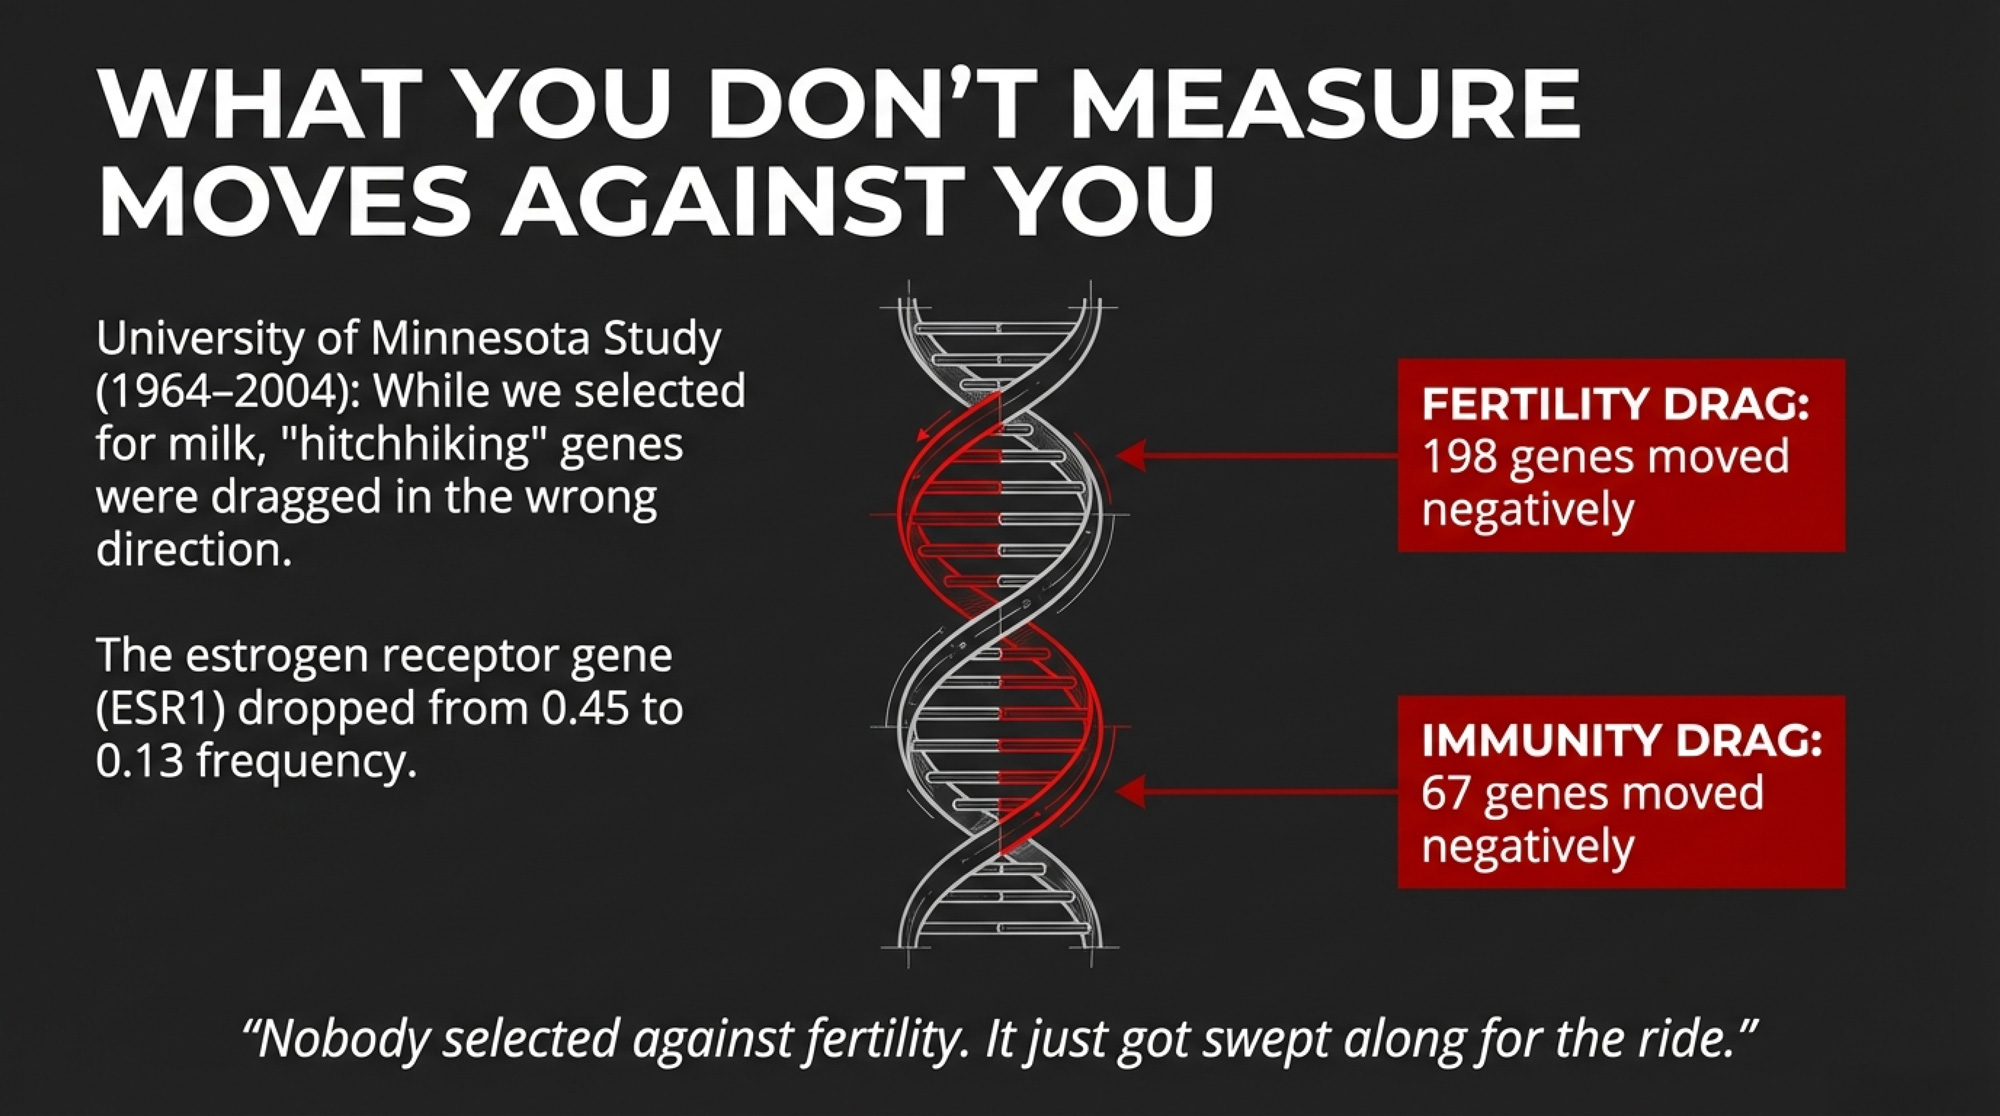
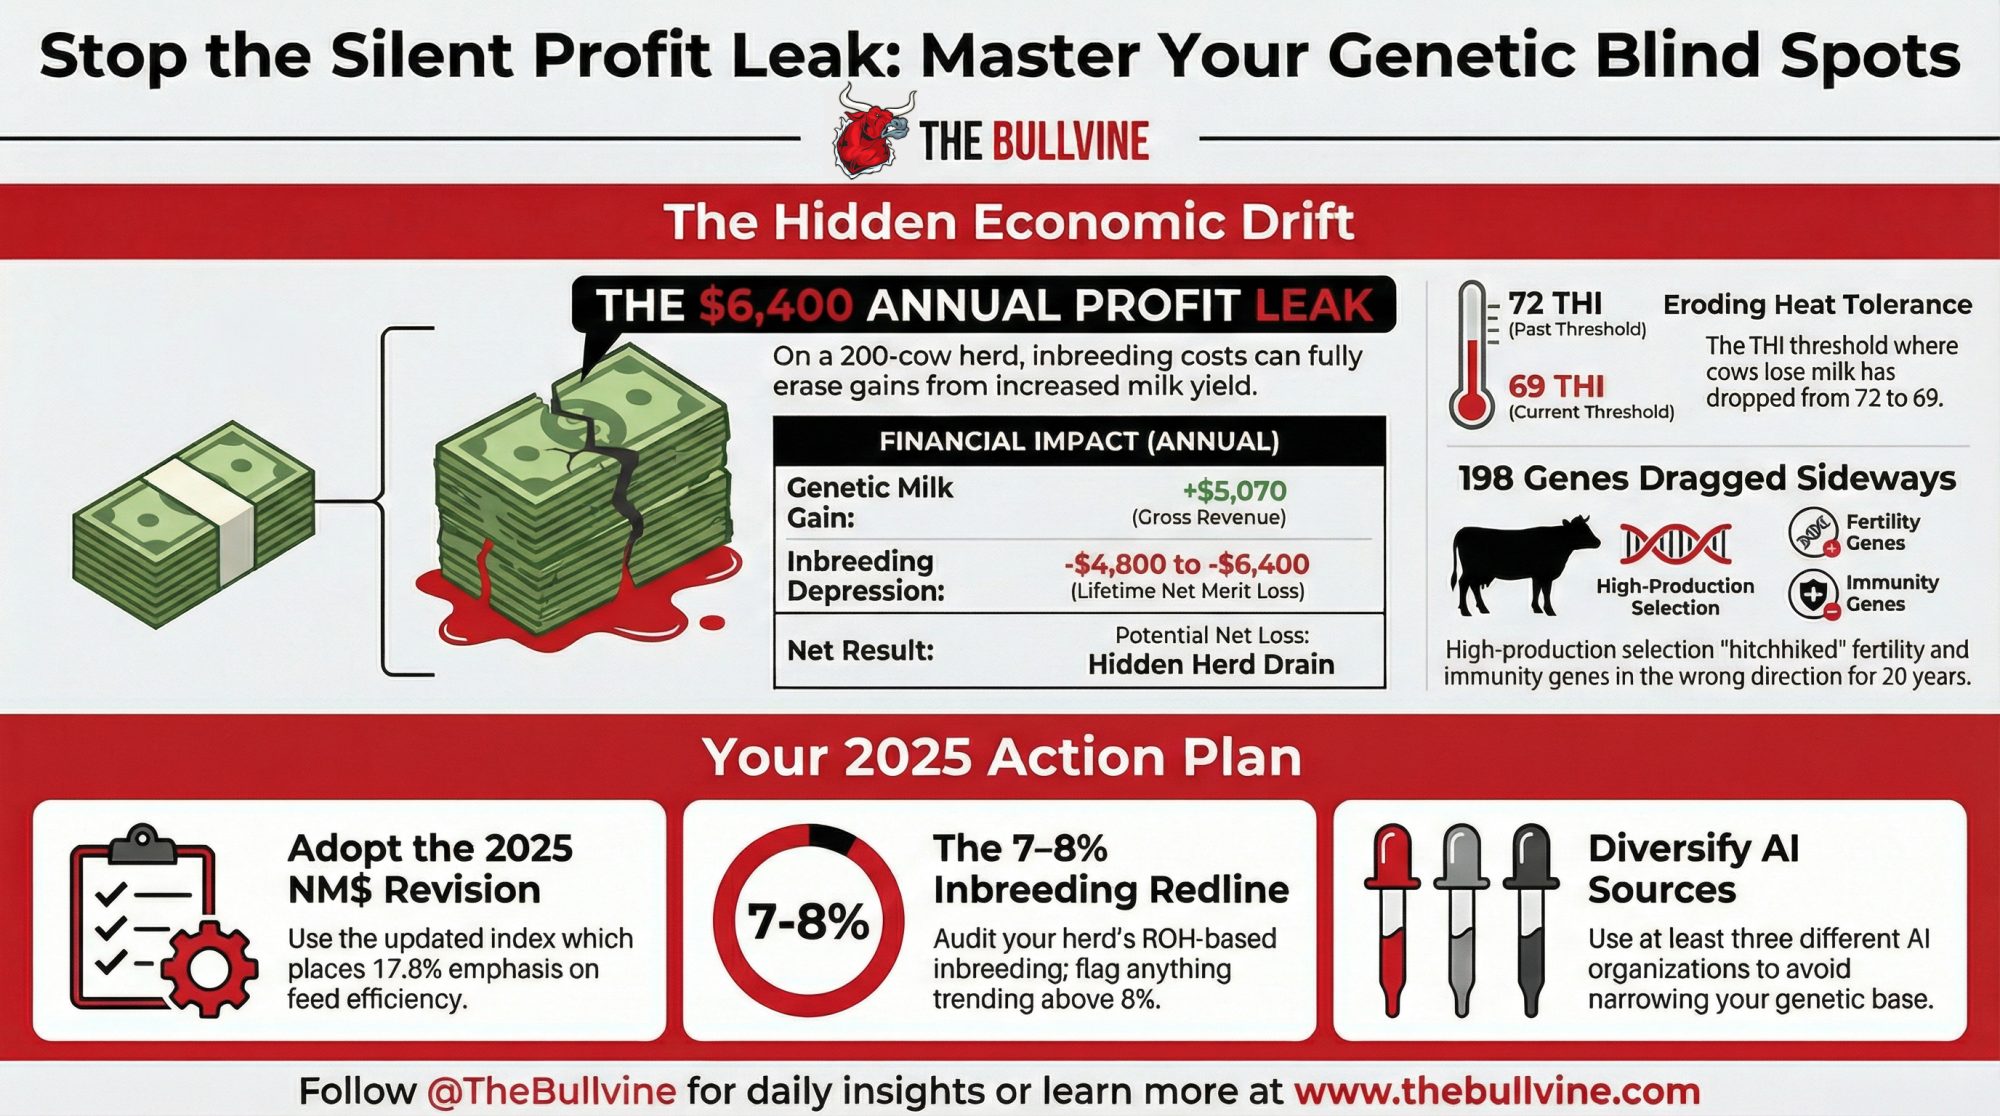
But here’s the part of that story nobody tells. The same breeding system that produced Missy — the same genomic toolkit that doubled annual genetic gain to 109 kg/year for milk in registered Holsteins (García-Ruiz et al., 2016, PNAS) — was simultaneously dragging 198 fertility genes and 67 immunity genes in the wrong direction. For 20 years. And the industry didn’t catch it.
The question that should bother you: what’s getting dragged sideways in your herd right now?
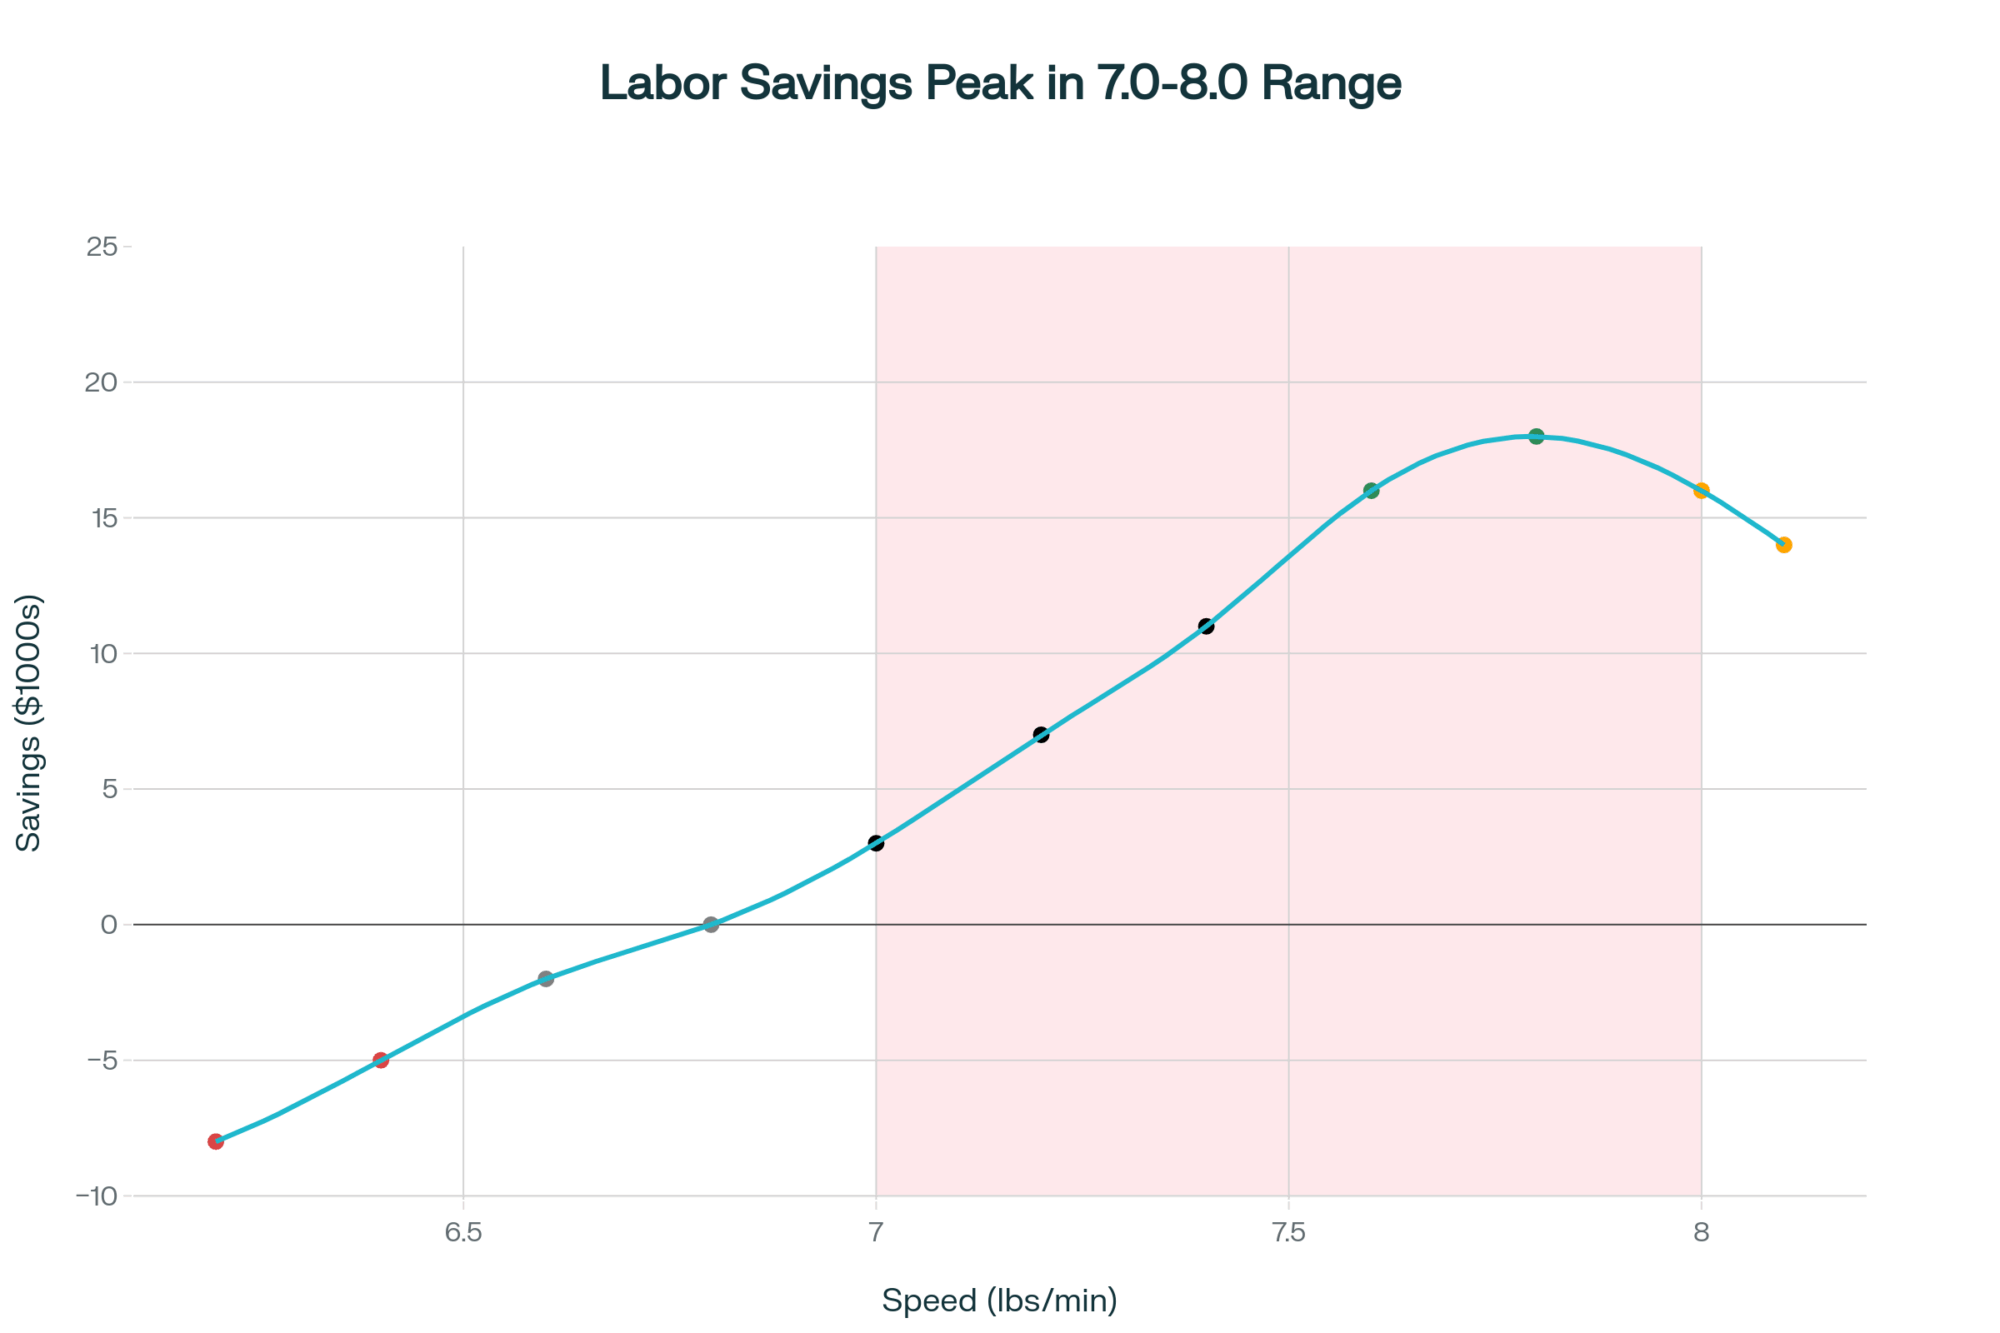
How Fast the Engine Actually Runs
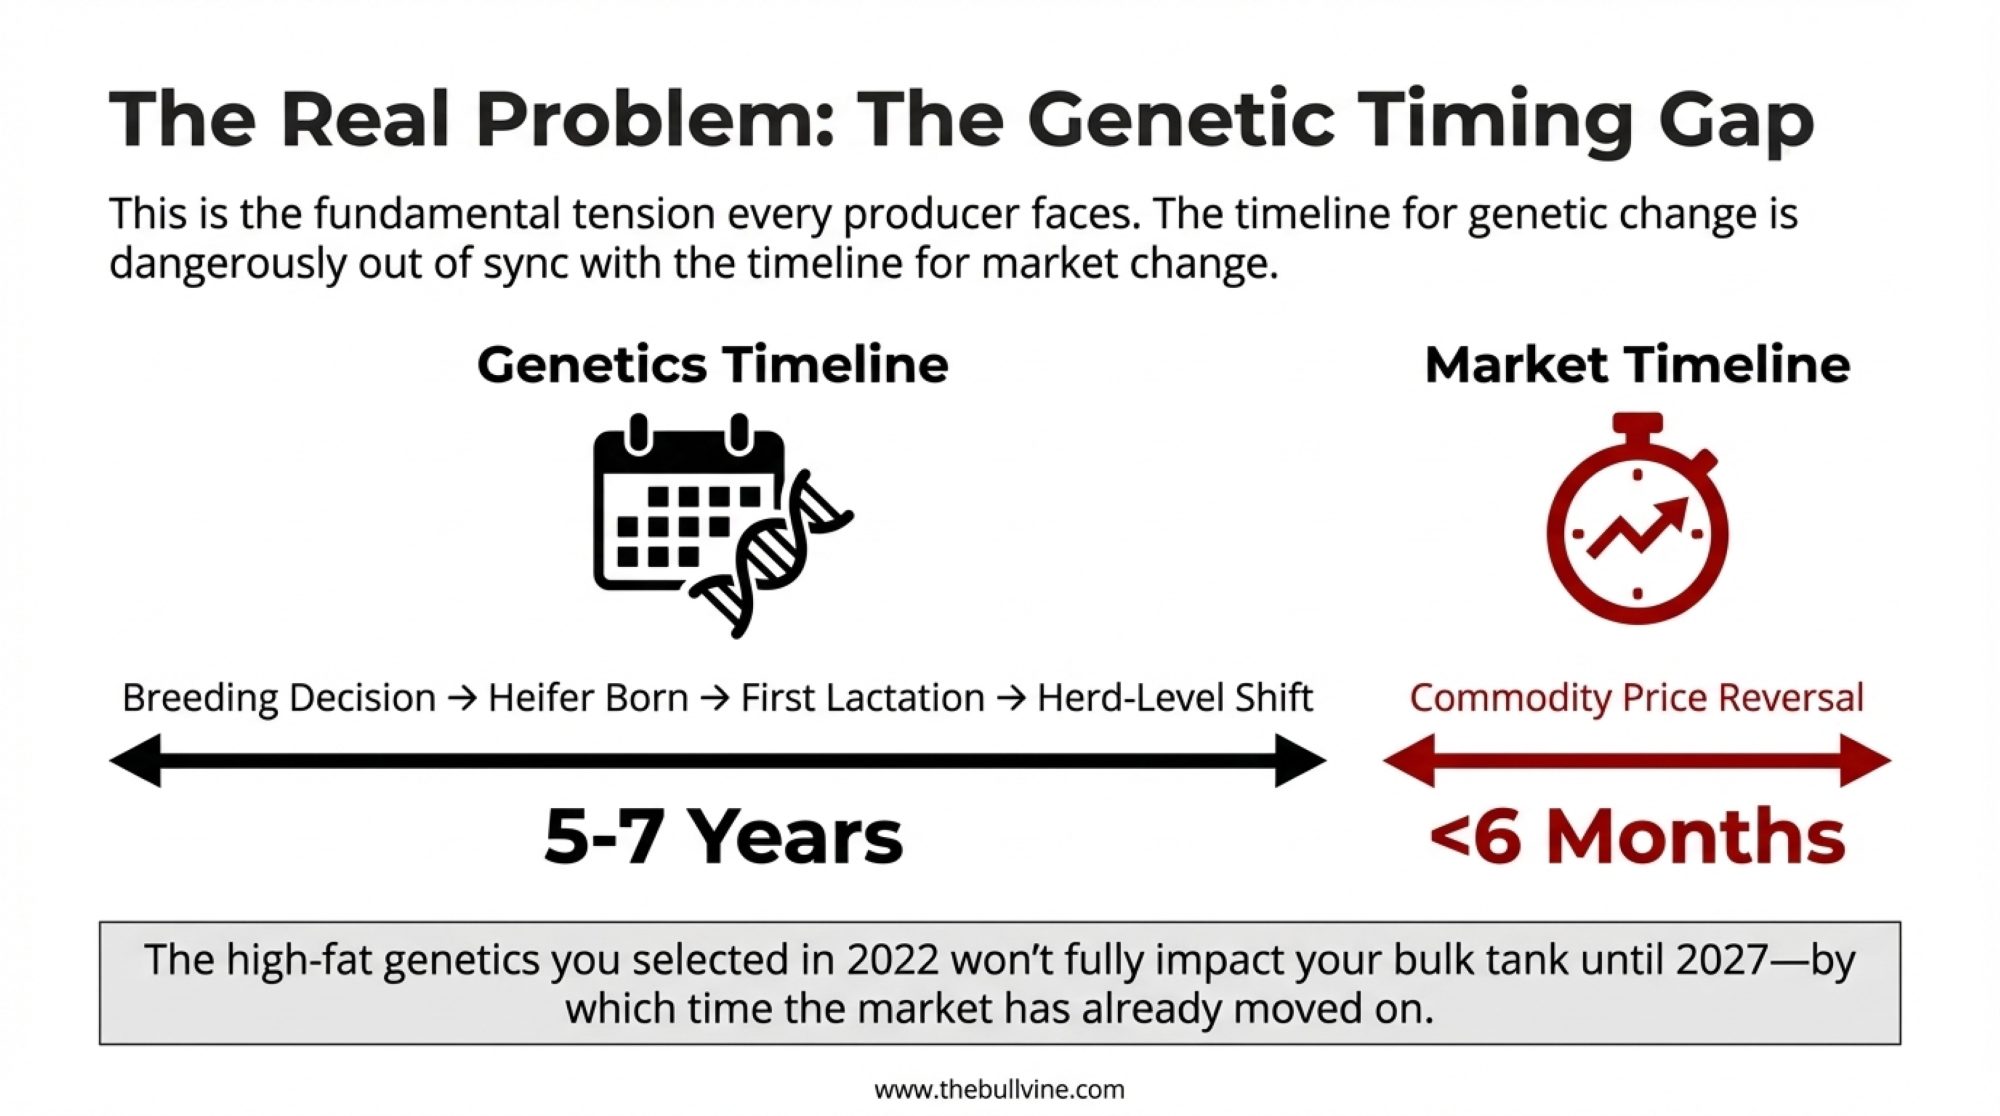
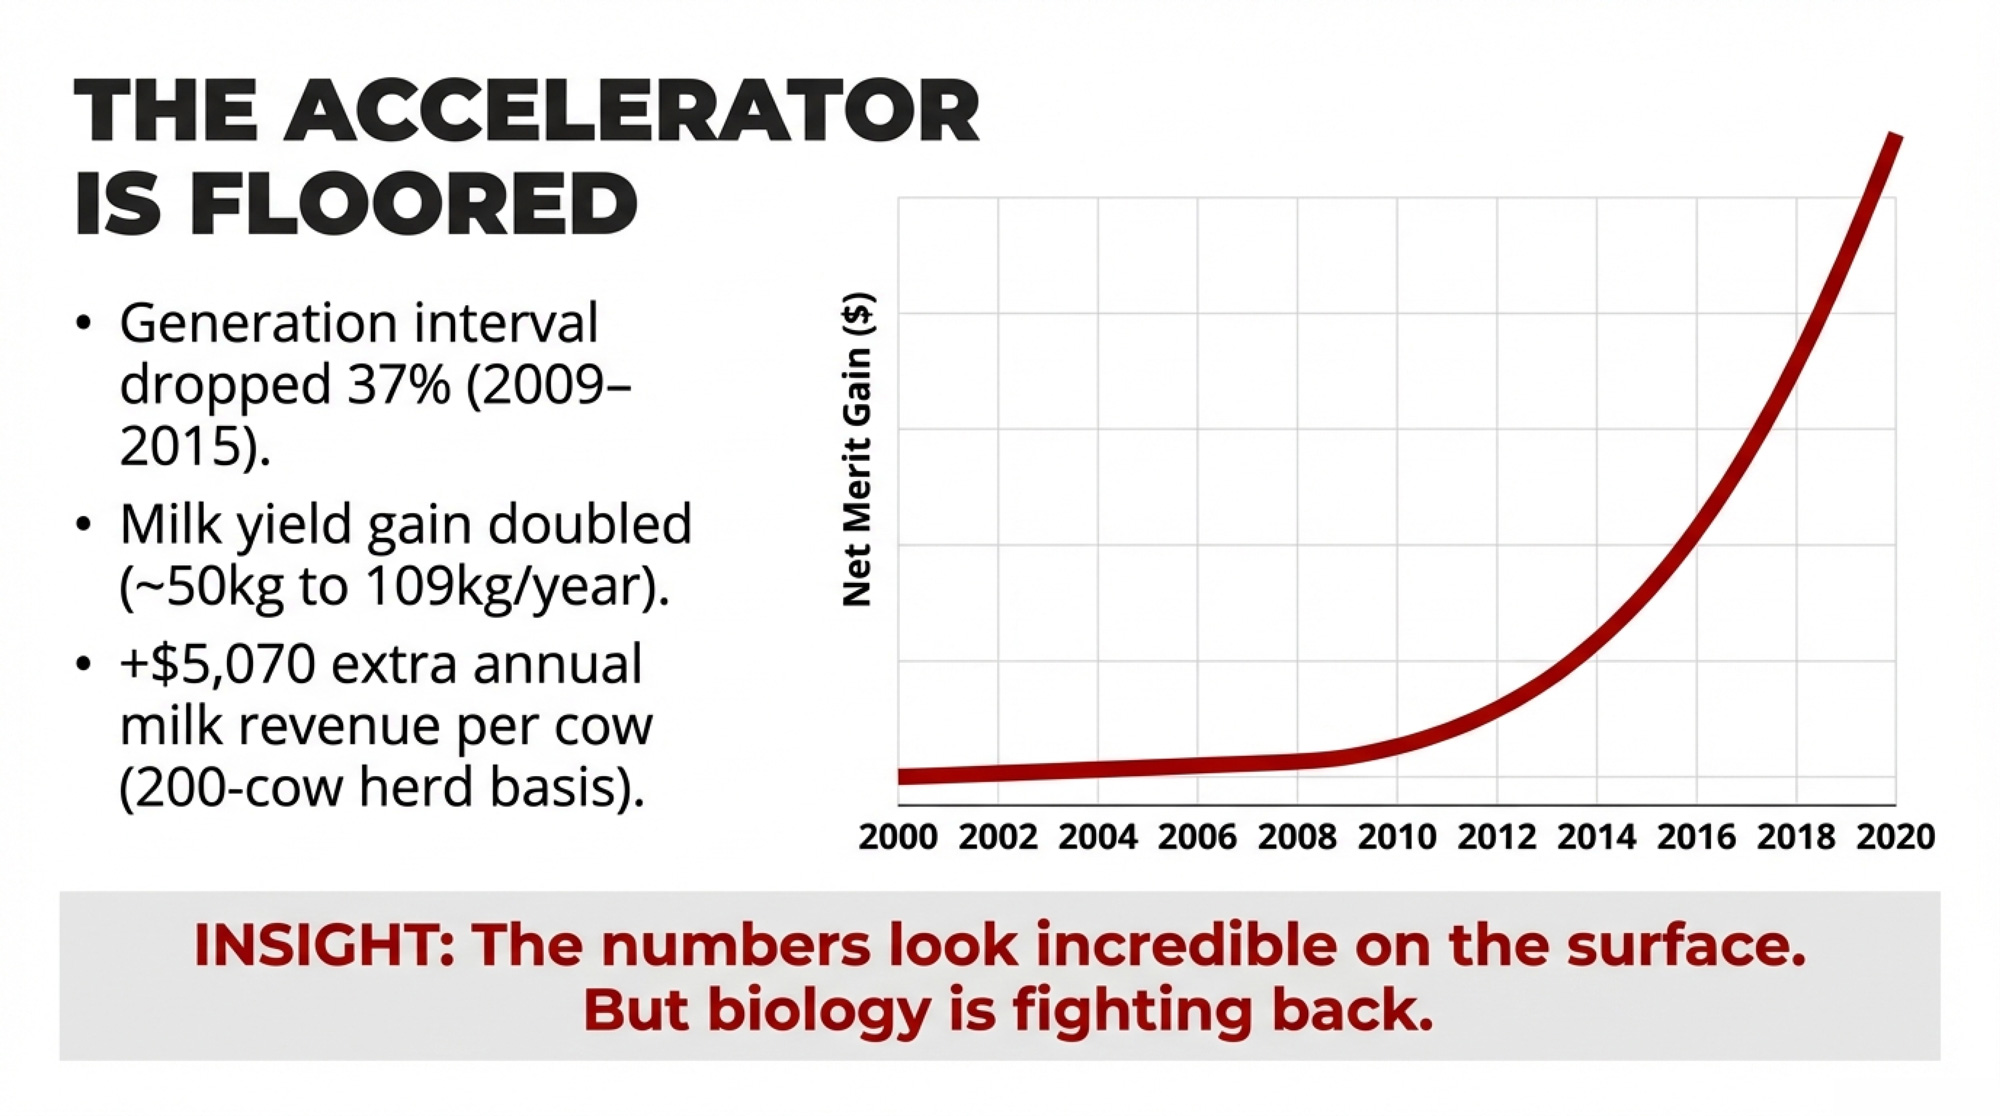
Before 2009, you waited five to seven years for a bull’s daughters to start milking before you knew if he was any good. Genomic selection rewired that math completely. Paul VanRaden and colleagues at USDA helped architect a system that estimates merit at birth, and the speed gain was dramatic. Across all four selection pathways that drive Holstein genetics (sire-of-bulls, sire-of-cows, dam-of-bulls, dam-of-cows), the combined generation interval dropped from 21.4 years in 2009 to 13.5 years by 2015 — a 37% reduction in just six years (García-Ruiz et al., 2016, PNAS). The sire-of-bulls pathway collapsed the fastest, from about 7 years to under 2.5.
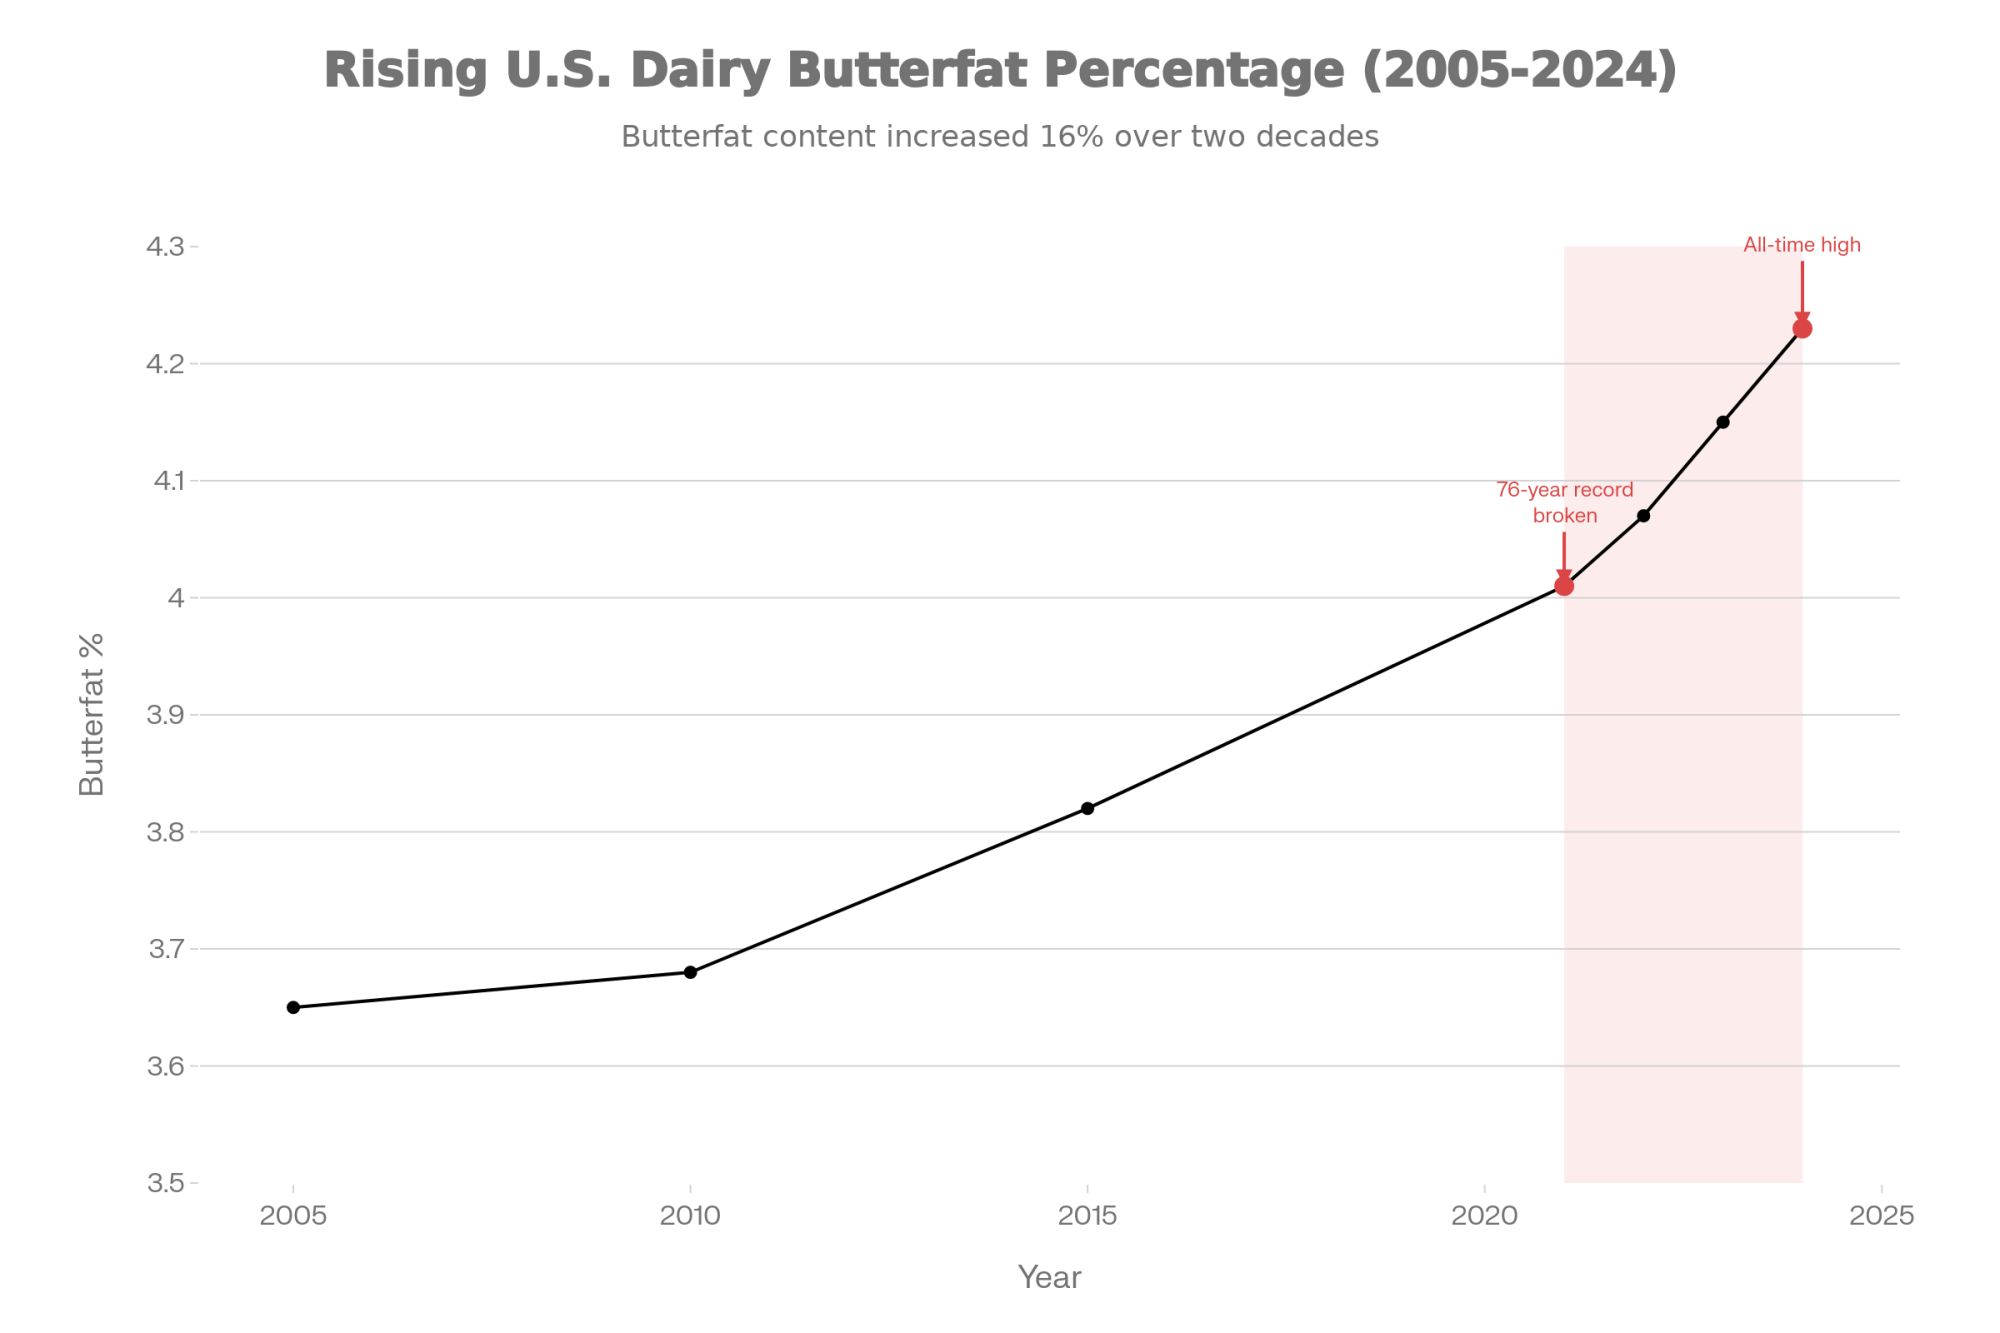
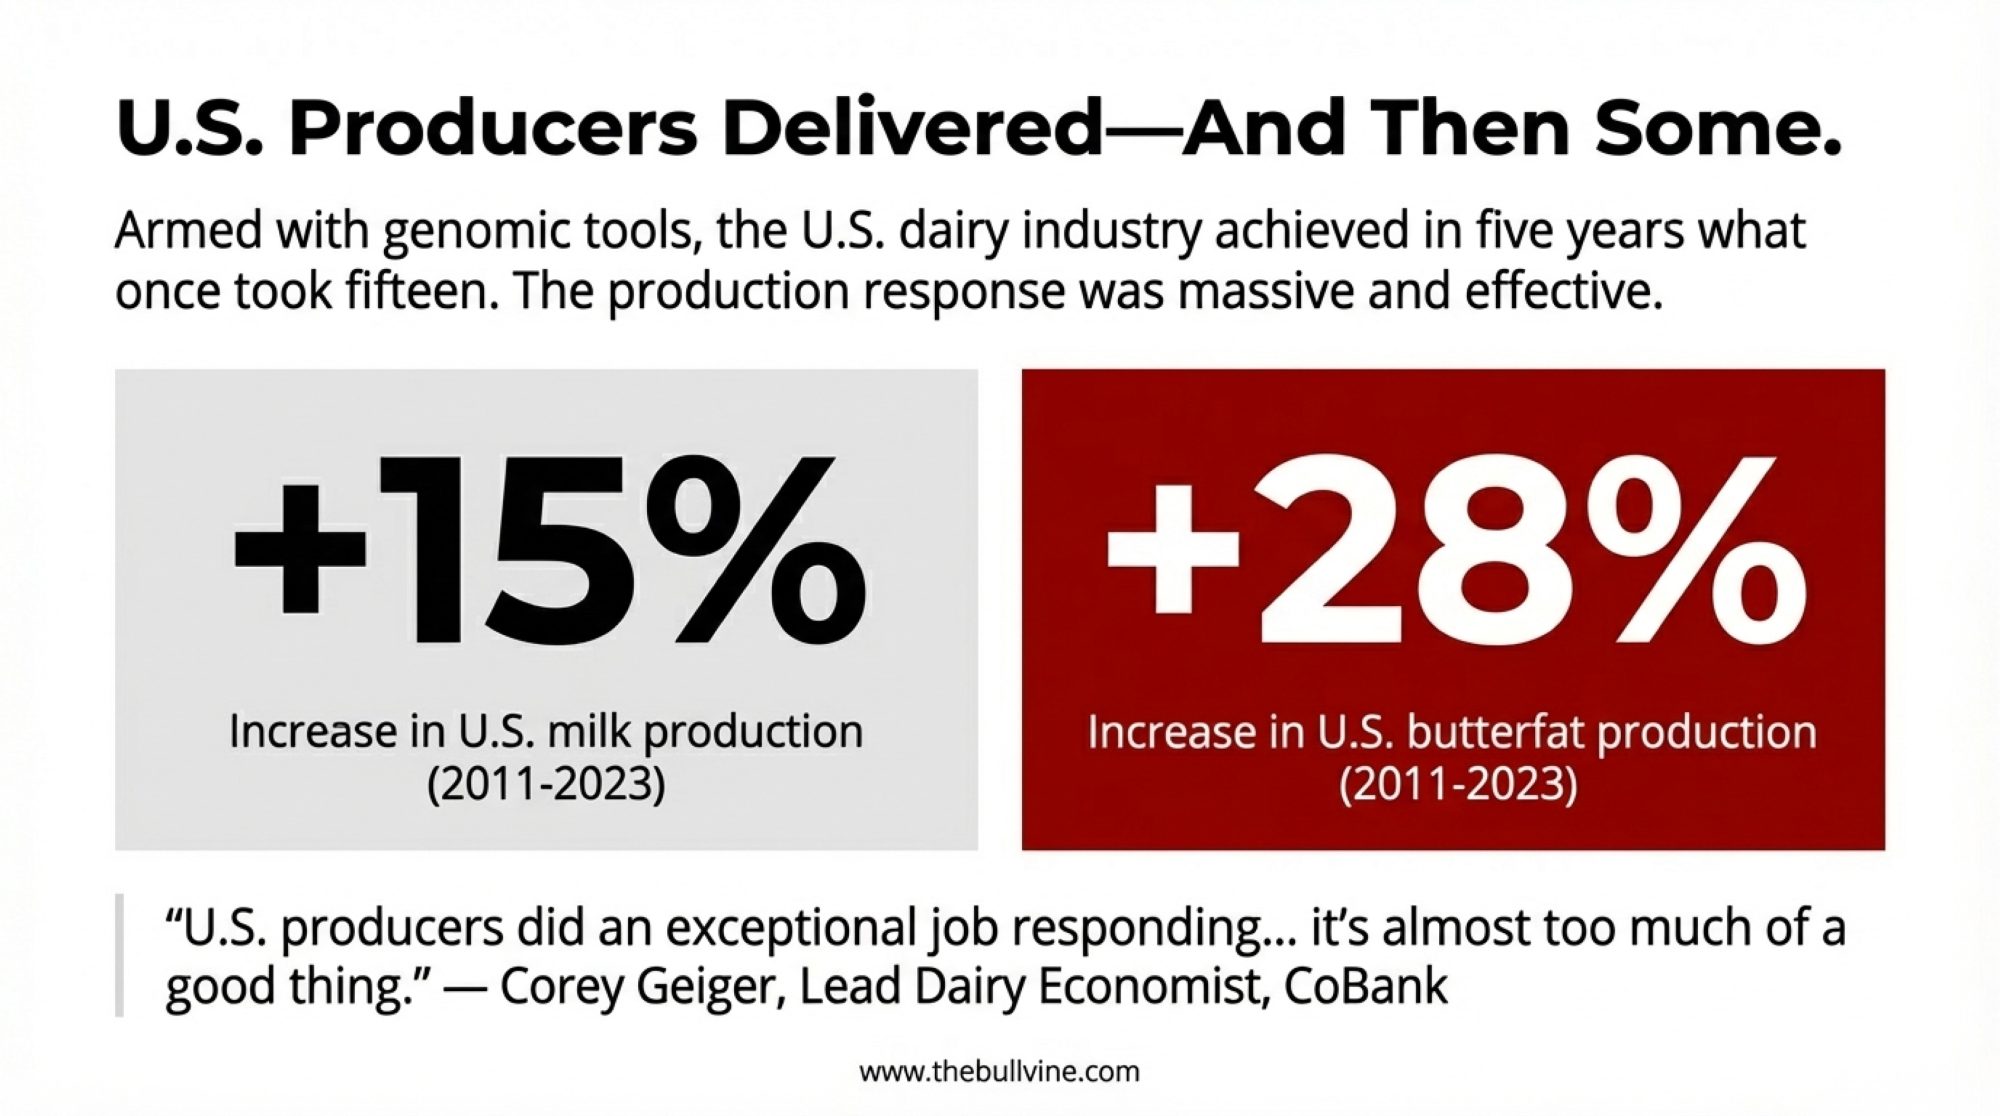
Financially, the results are hard to argue with. Annual Net Merit gains climbed from $13 during 2000–2004 to more than $85 after 2010 (nominal dollars). Fat yield accelerated 173%. Protein yield, 156%. And the daughter pregnancy rate — which had been flat or declining for decades — finally reversed direction, rising to +0.26% per year.
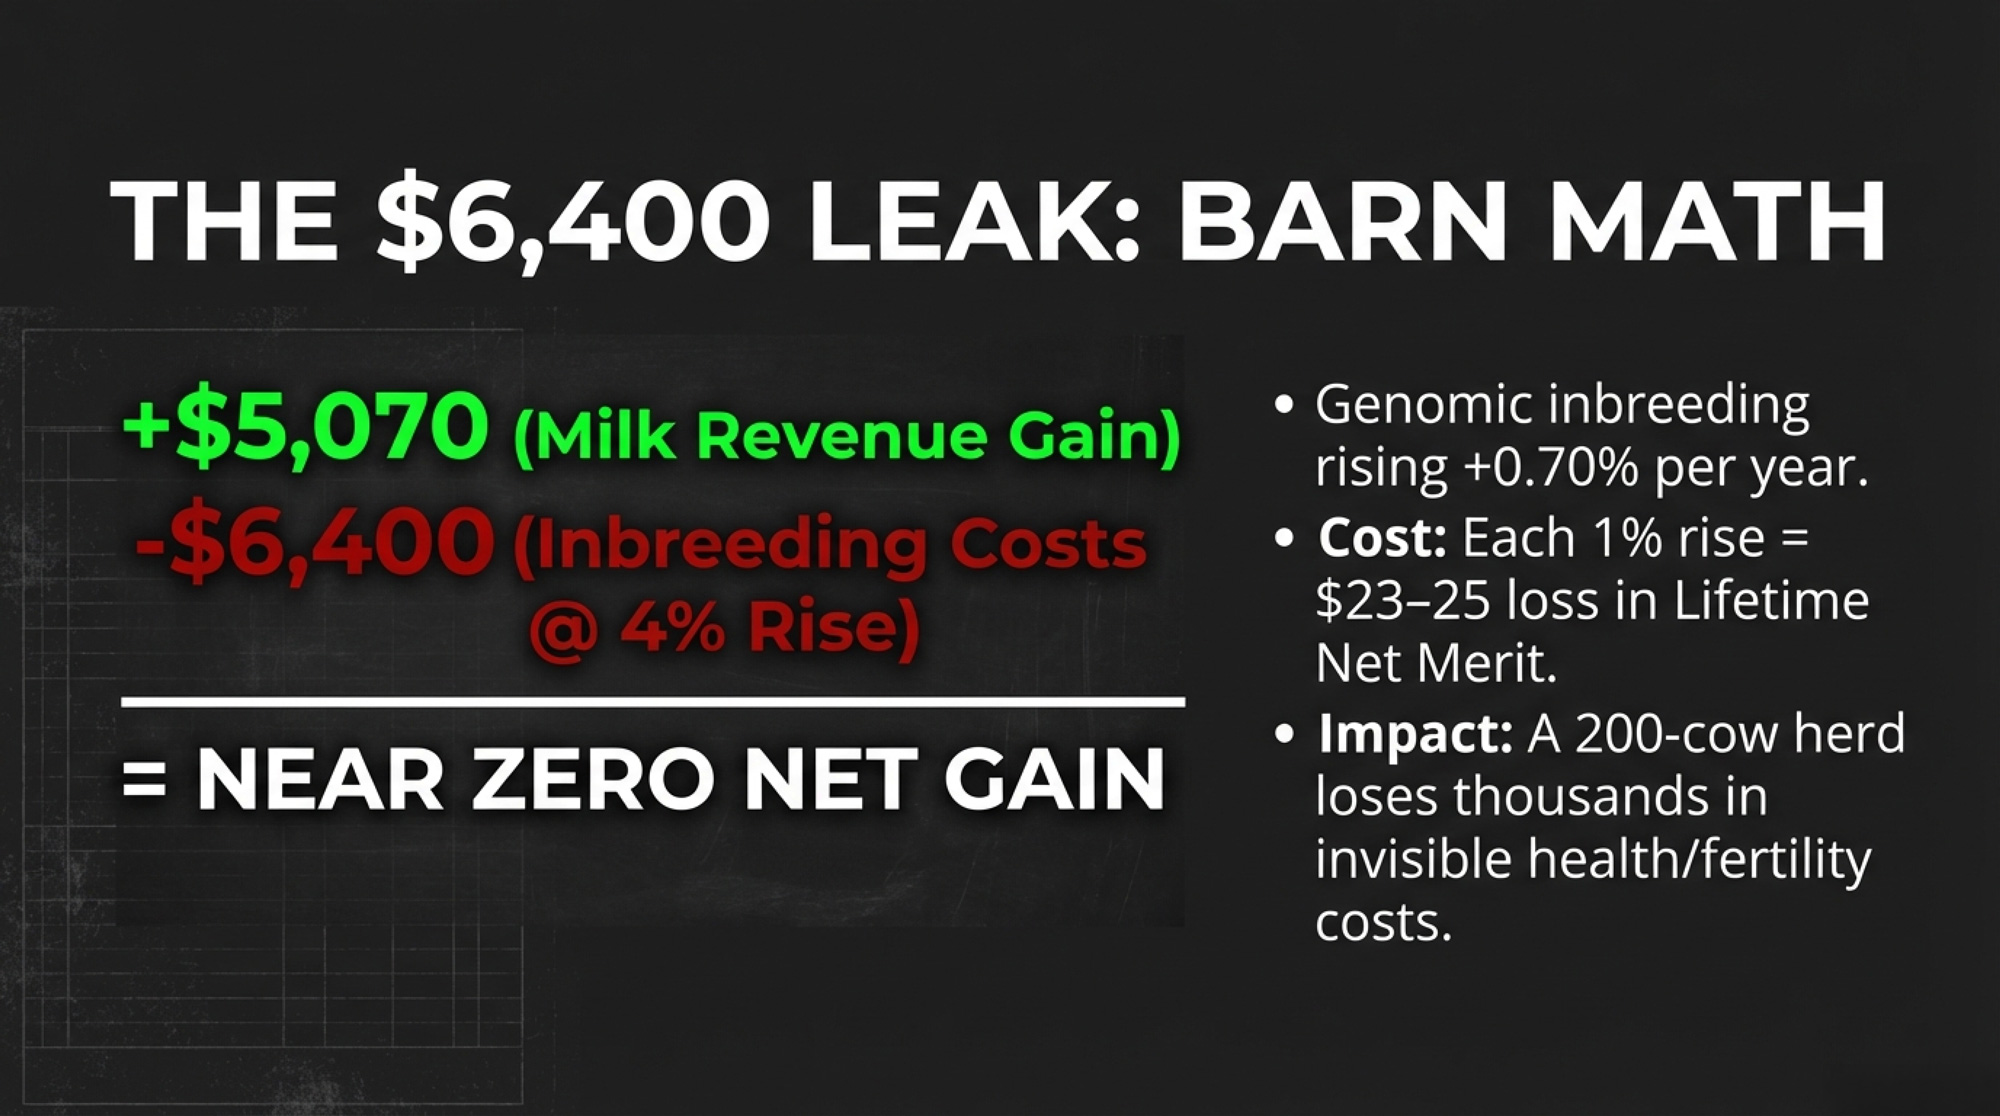
Here’s a way to feel that in your bulk tank. On a 200-cow herd averaging 85 lbs/day, the post-genomic milk yield acceleration alone (from ~50 kg/year to 109 kg/year for registered Holsteins) translates to roughly an extra 130 lbs of milk per cow per year in genetic potential over what the old system would have delivered. At a $19.50/cwt mailbox price, that’s about $5,070 in additional gross milk revenue across your herd annually — and it compounds every generation. Adjust that number for your regional mailbox price, but the scale holds. The record-breaking component shifts reshaping dairy’s economics are a direct product of this acceleration.
But the engine has a blind spot. And it’s biological, not mathematical.
What Happened When Nobody Was Measuring Fertility
The University of Minnesota’s research herd at the Southern Research and Outreach Center in Waseca did something nobody else bothered to do: they maintained an unselected Holstein control line alongside the commercially selected national population from 1964 onward. Same management. Same feed. Different genetics.
By 2004, the selected population had increased milk yield by 79%, from 6,309 kg to 11,324 kg. It had also lost roughly 30 additional days for successful conception compared to the control cows living right next door (Ma, Cole, Da & VanRaden, 2019, BMC Genomics 20:128).
That fertility decline wasn’t nutrition. Wasn’t repro protocols. Purely genetic. A breeding consequence nobody planned for.
The genome-level analysis revealed the mechanism. Within 234 chromosome regions shaped by four decades of milk selection, researchers found 198 genes involved in reproduction and 67 genes involved in immune function whose allele frequencies had shifted as collateral damage. The estrogen receptor gene ESR1 decreased from 0.45 to 0.13. The MHC region on chromosome 23 — the heart of immune diversity — showed significantly decreased heterozygosity.
| Category | Count |
|---|---|
| Fertility genes negatively affected | 198 |
| Immunity genes negatively affected | 67 |
| Total chromosome regions under selection | 234 |
Nobody selected against fertility or immunity. Those genes just happened to sit near milk-boosting alleles on the same chromosomes, and they got swept along for the ride. Geneticists call it hitchhiking. Producers who lived through the collapse in conception rates in the 1990s just called it expensive.
(This hitchhiking analysis comes from a single study using the unique Minnesota control line — the only unselected comparison herd of its kind. The broader fertility decline is independently confirmed across both the U.S. and Israeli dairy populations.)
Is the Same Thing Happening to Heat Tolerance Right Now?
The fertility crash is old news — the industry course-corrected, and genomic selection actually reversed the decline. The real question: where is the same pattern building today?
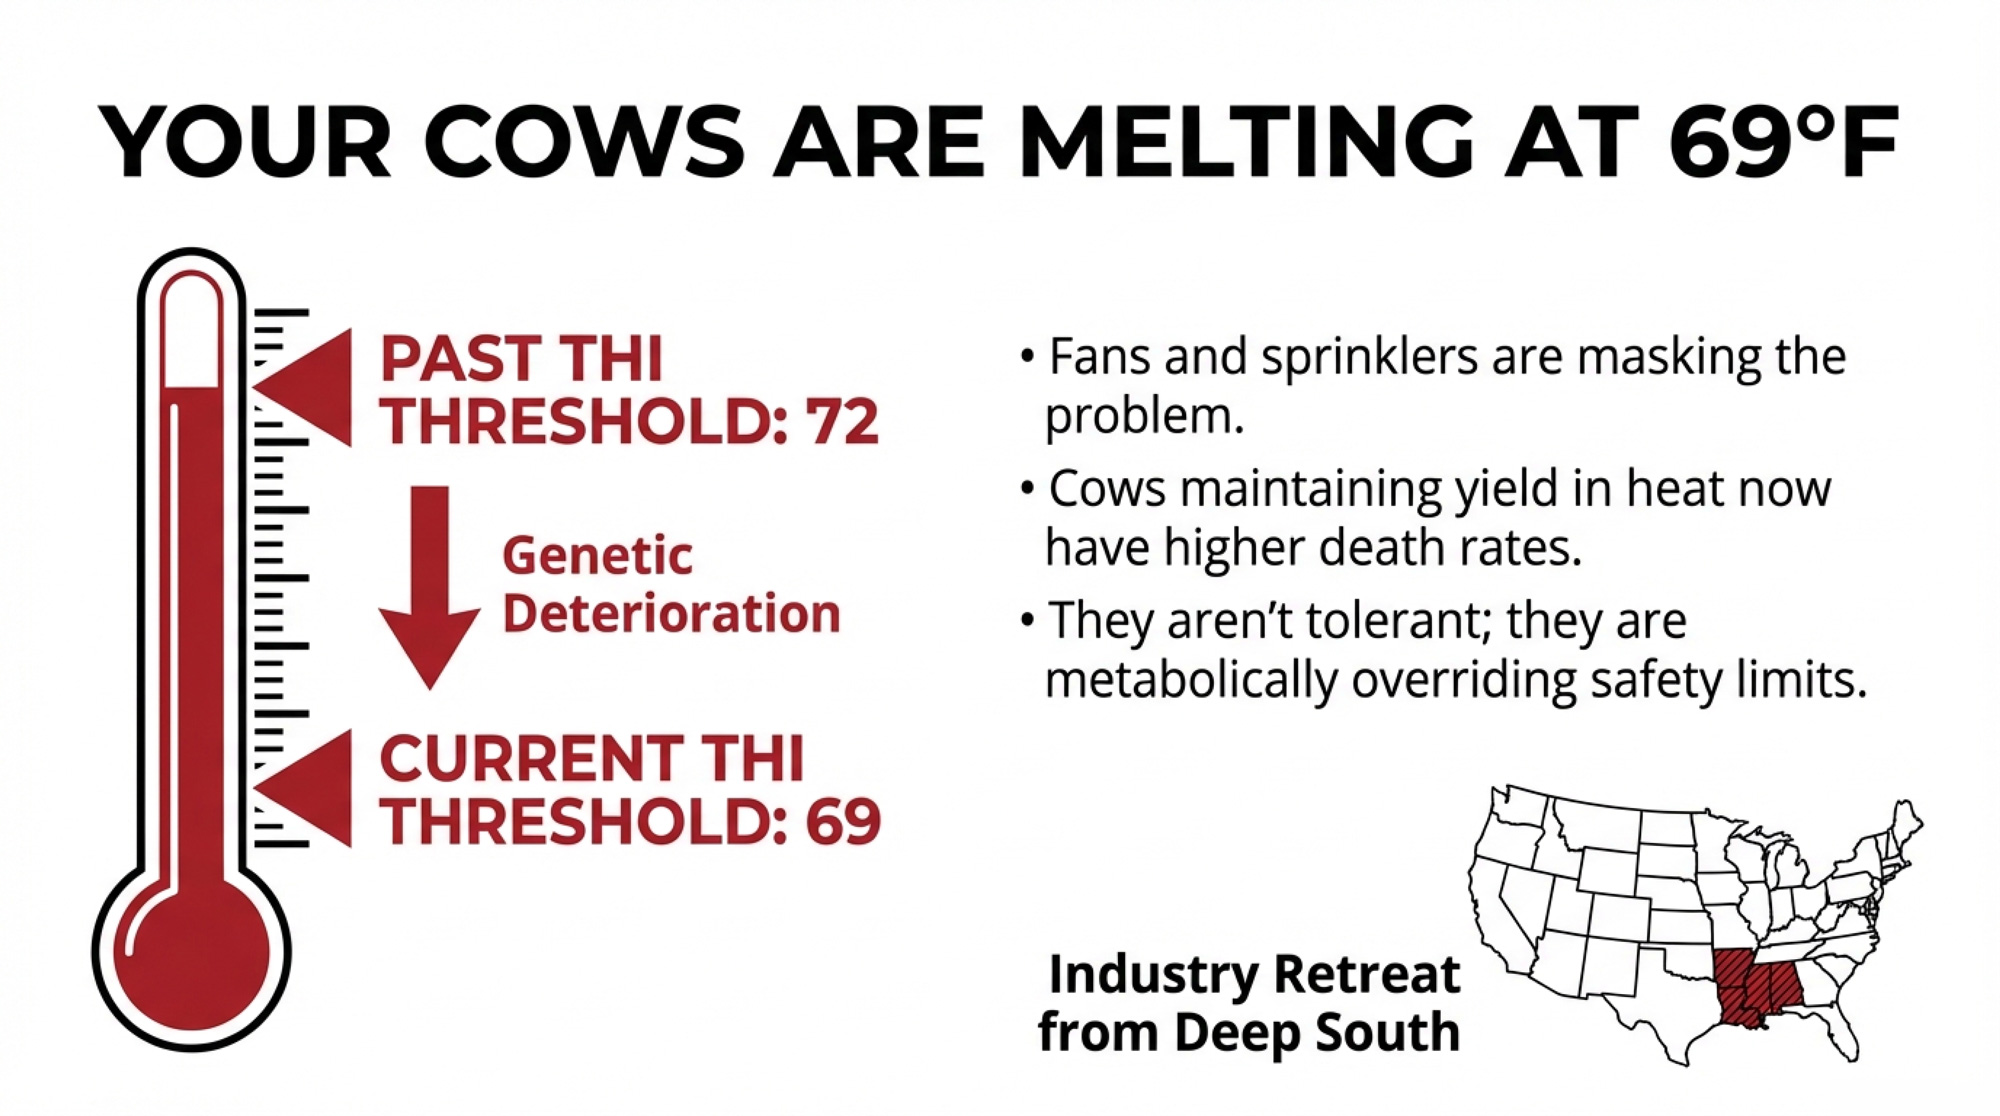
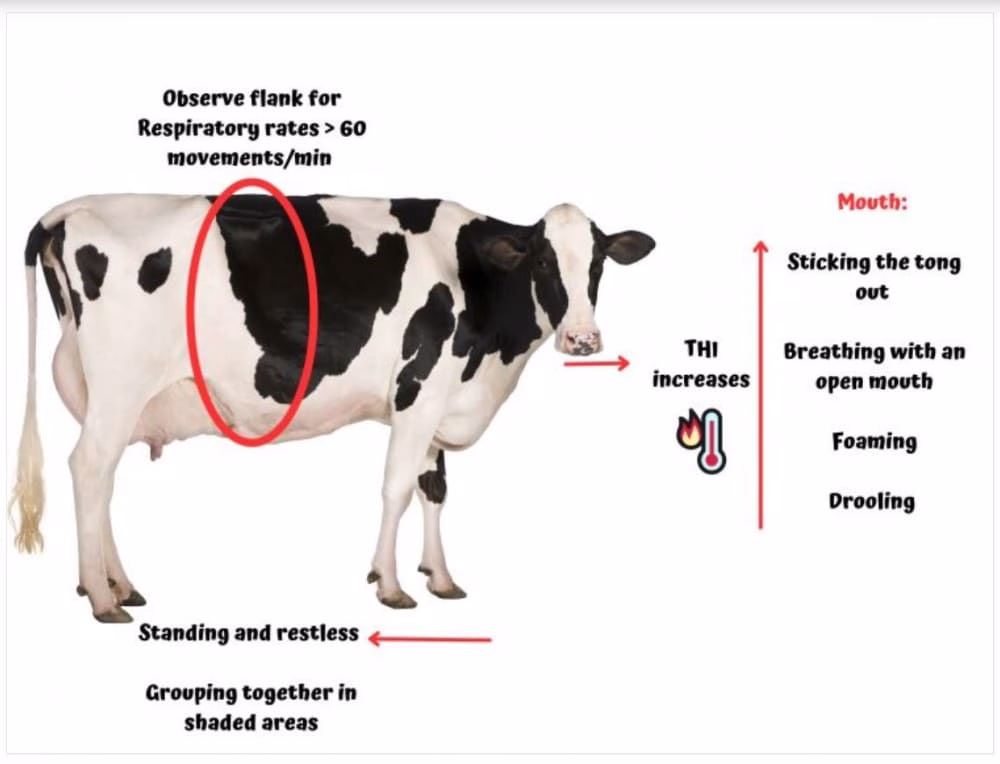
Heat tolerance is eroding, and almost nobody is selecting against it. Research led by Ignacy Misztal at the University of Georgia and Luiz Brito at Purdue found that the temperature-humidity index (THI) threshold where Holsteins start losing production has dropped from 72 to 69 over the past two decades (Misztal, Brito & Lourenco, 2024, JDS Communications 6(3):464–468). Your cows start suffering heat stress at lower temperatures than cows bred a generation ago.
And the grim part: cows that maintain production during heat stress peaks show an increased likelihood of death. They’re not tolerating the heat. They’re metabolically overriding their body’s protective shutdown. The authors note that better fans, sprinklers, and tunnel ventilation may actually be masking an even larger genetic deterioration underneath.
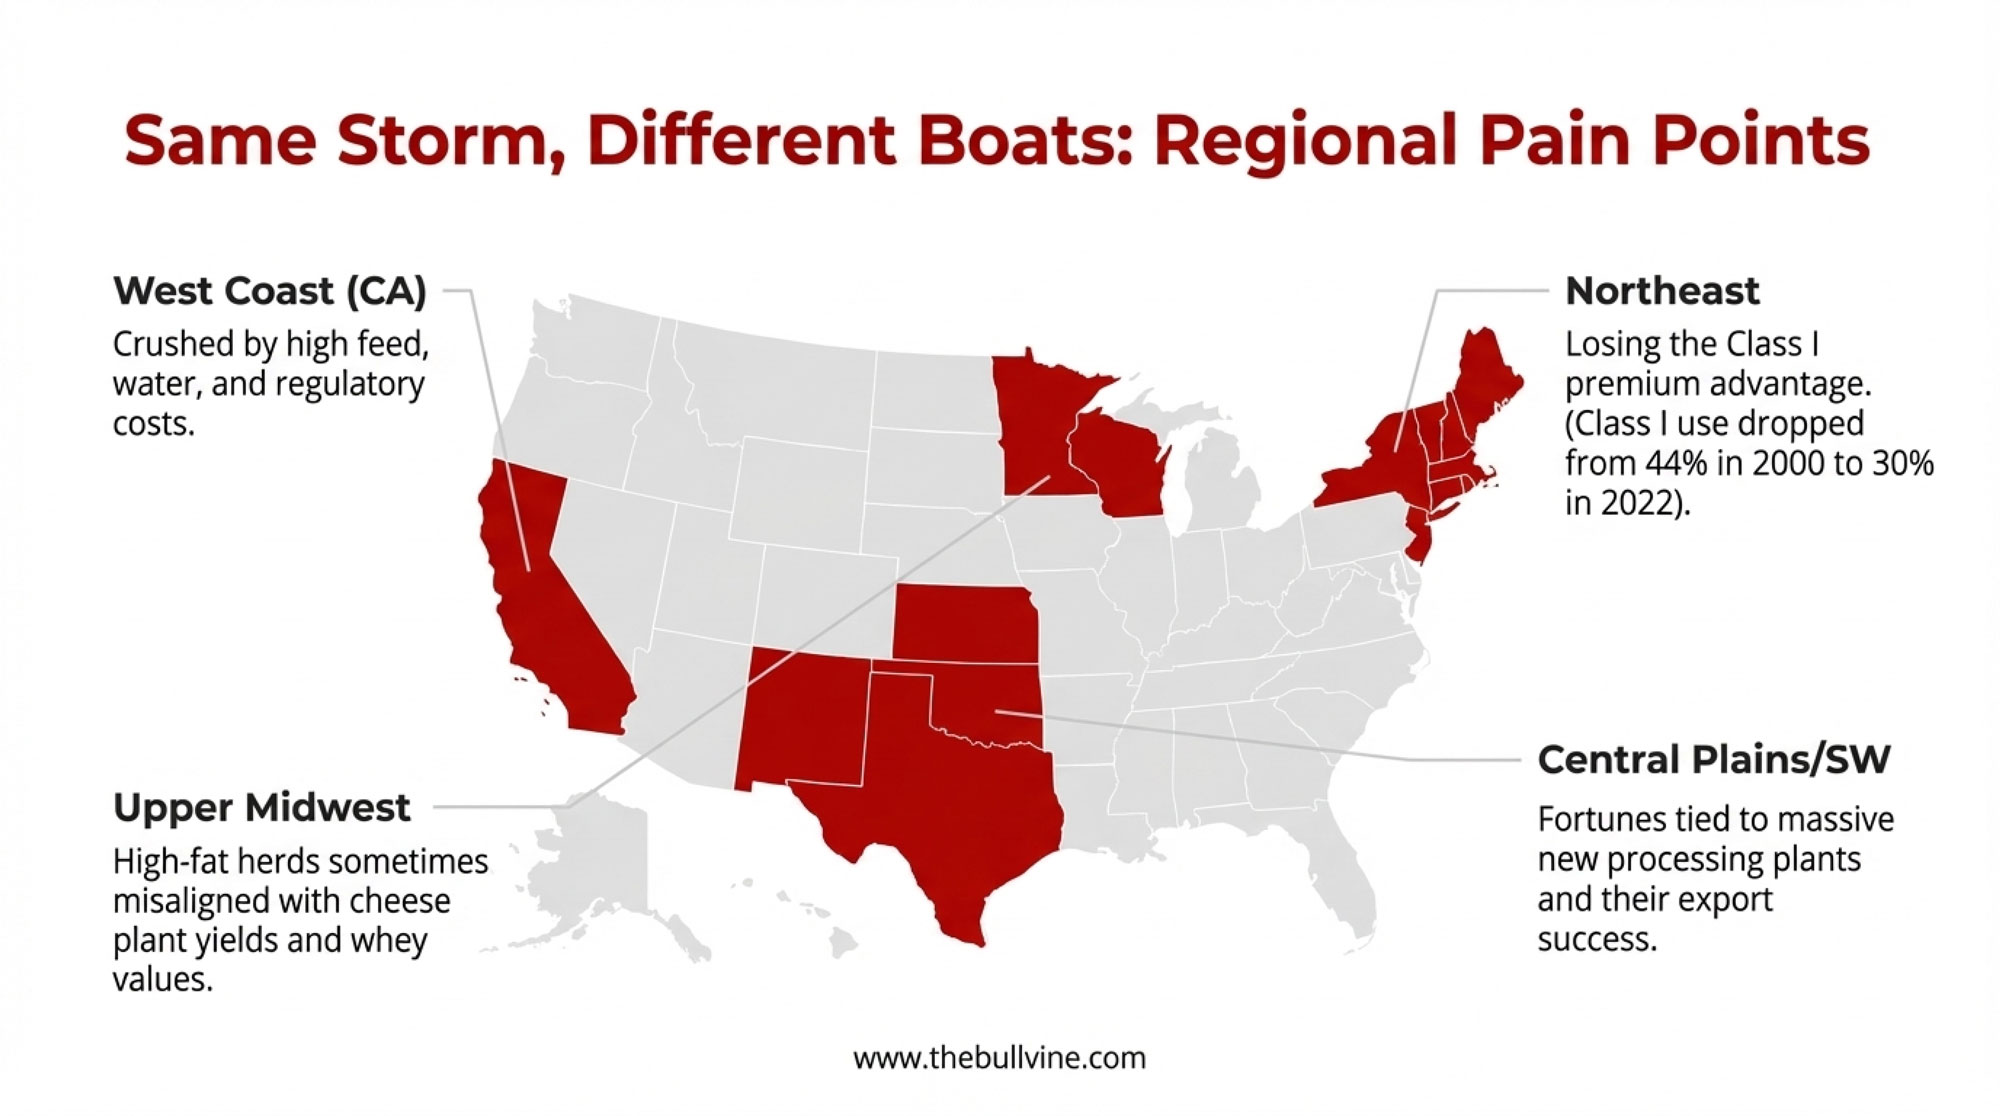
With the exception of Australia, dairy cows are not directly selected for improved heat tolerance anywhere in the world. In Alabama, Mississippi, and Louisiana, dairy has already become economically unviable — these states don’t even appear in the 24 major dairy states NASS tracks monthly (Misztal et al., 2024). A quiet testament to how completely the industry has retreated from the Deep South.
If your herd faces more than 60 days per year above THI 68, this isn’t an abstract research finding. It’s your next fertility crash in slow motion.
The Inbreeding Bill Coming Due
Genetic diversity is narrowing faster under genomics, not slower. A study of 74,485 Italian Holstein cows found the annual inbreeding rate based on runs of homozygosity (ROH) was +0.32% per year before genomic selection. After genomic selection took hold, it jumped to +0.70% per year (Ablondi et al., 2022, Frontiers in Veterinary Science8:773985). That’s above the 1% per generation threshold FAO considers critical for long-term sustainability.
| Category | Value |
|---|---|
| Pre-Genomic Annual Rate (Italy) | 0.32% |
| Post-Genomic Annual Rate (Italy) | 0.70% |
| U.S. Cumulative Increase 2010–2020 | 168% |
It isn’t just an Italian problem. U.S. Holstein inbreeding climbed from about 5.7% in 2010 to 15.2% by 2020 — a 168% jump — with CDCB analysis putting the cumulative cost to the national herd at an estimated $6.7 billion (The Bullvine, 2025 year-end review).
| Metric | Annual Impact (200-cow herd) | What’s Driving It |
|---|---|---|
| Extra Milk Revenue (Genomic Gain) | +$5,070 | 109 kg/year genetic gain vs. 50 kg/year pre-genomic (registered Holsteins, $19.50/cwt) |
| Inbreeding Drag (4% increase) | −$4,800 to −$6,400 | $23–25/cow lifetime NM$ loss per 1% inbreeding, annualized over 3–4 year turnover |
| Net Realized Gain (Conservative) | +$270 to +$1,070 | On fast-turnover herds, inbreeding wipes out nearly all the genomic advantage |
| Net on Fast-Turnover Herds | −$1,330 (loss) | Herds replacing >35% annually can lose more than they gain |
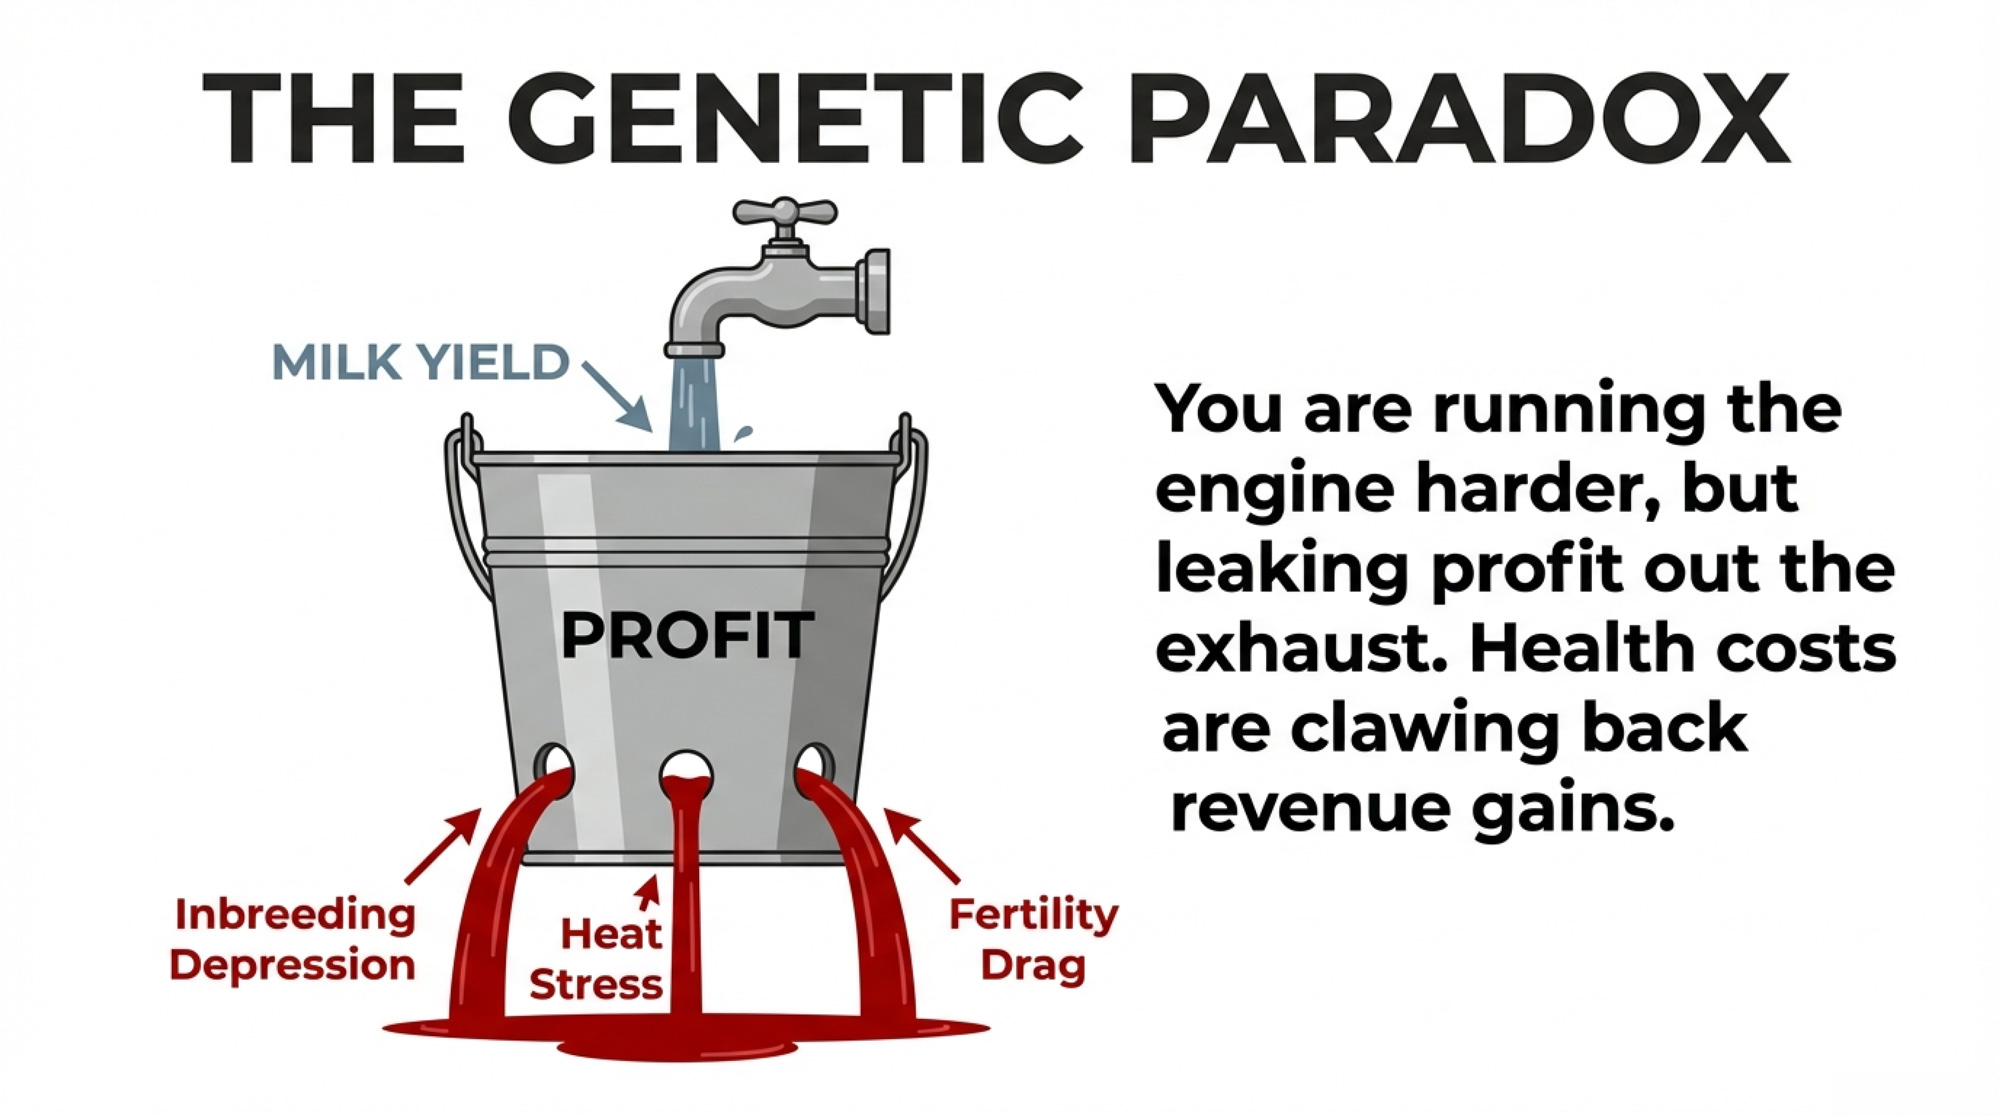
Here’s where the barn math gets uncomfortable. Each 1% increase in inbreeding costs roughly $23–25 off a cow’s lifetime Net Merit (USDA-ARS, 2025 NM$ revision). Go back to that 200-cow herd. If your average genomic inbreeding crept up 4 percentage points over the past decade — and given that the national average jumped 9.5 points in ten years, 4% is conservative — that’s about $96 per cow in lifetime profit quietly erased. Spread across a herd that turns over every three to four years, you’re looking at roughly $4,800 to $6,400 per year leaking out through health costs, fertility failures, and shortened productive life, depending on your actual turnover rate. Remember that $5,070 in extra annual milk revenue from faster genetic gain? At most turnover rates, inbreeding depression is clawing back nearly all of it — and on herds that turn over faster, the loss actually exceeds the gain. You’re running the genetic engine harder, and a big chunk of what it produces is leaking out the other side.
(Note: the $5,070 figure is gross milk revenue at $19.50/cwt; the $4,800–$6,400 range is annualized lifetime Net Merit loss, which captures health, fertility, and longevity effects beyond milk alone. They’re not identical units, but the scale of the offset is real — and the barn-math range depends on how quickly your herd turns over.)
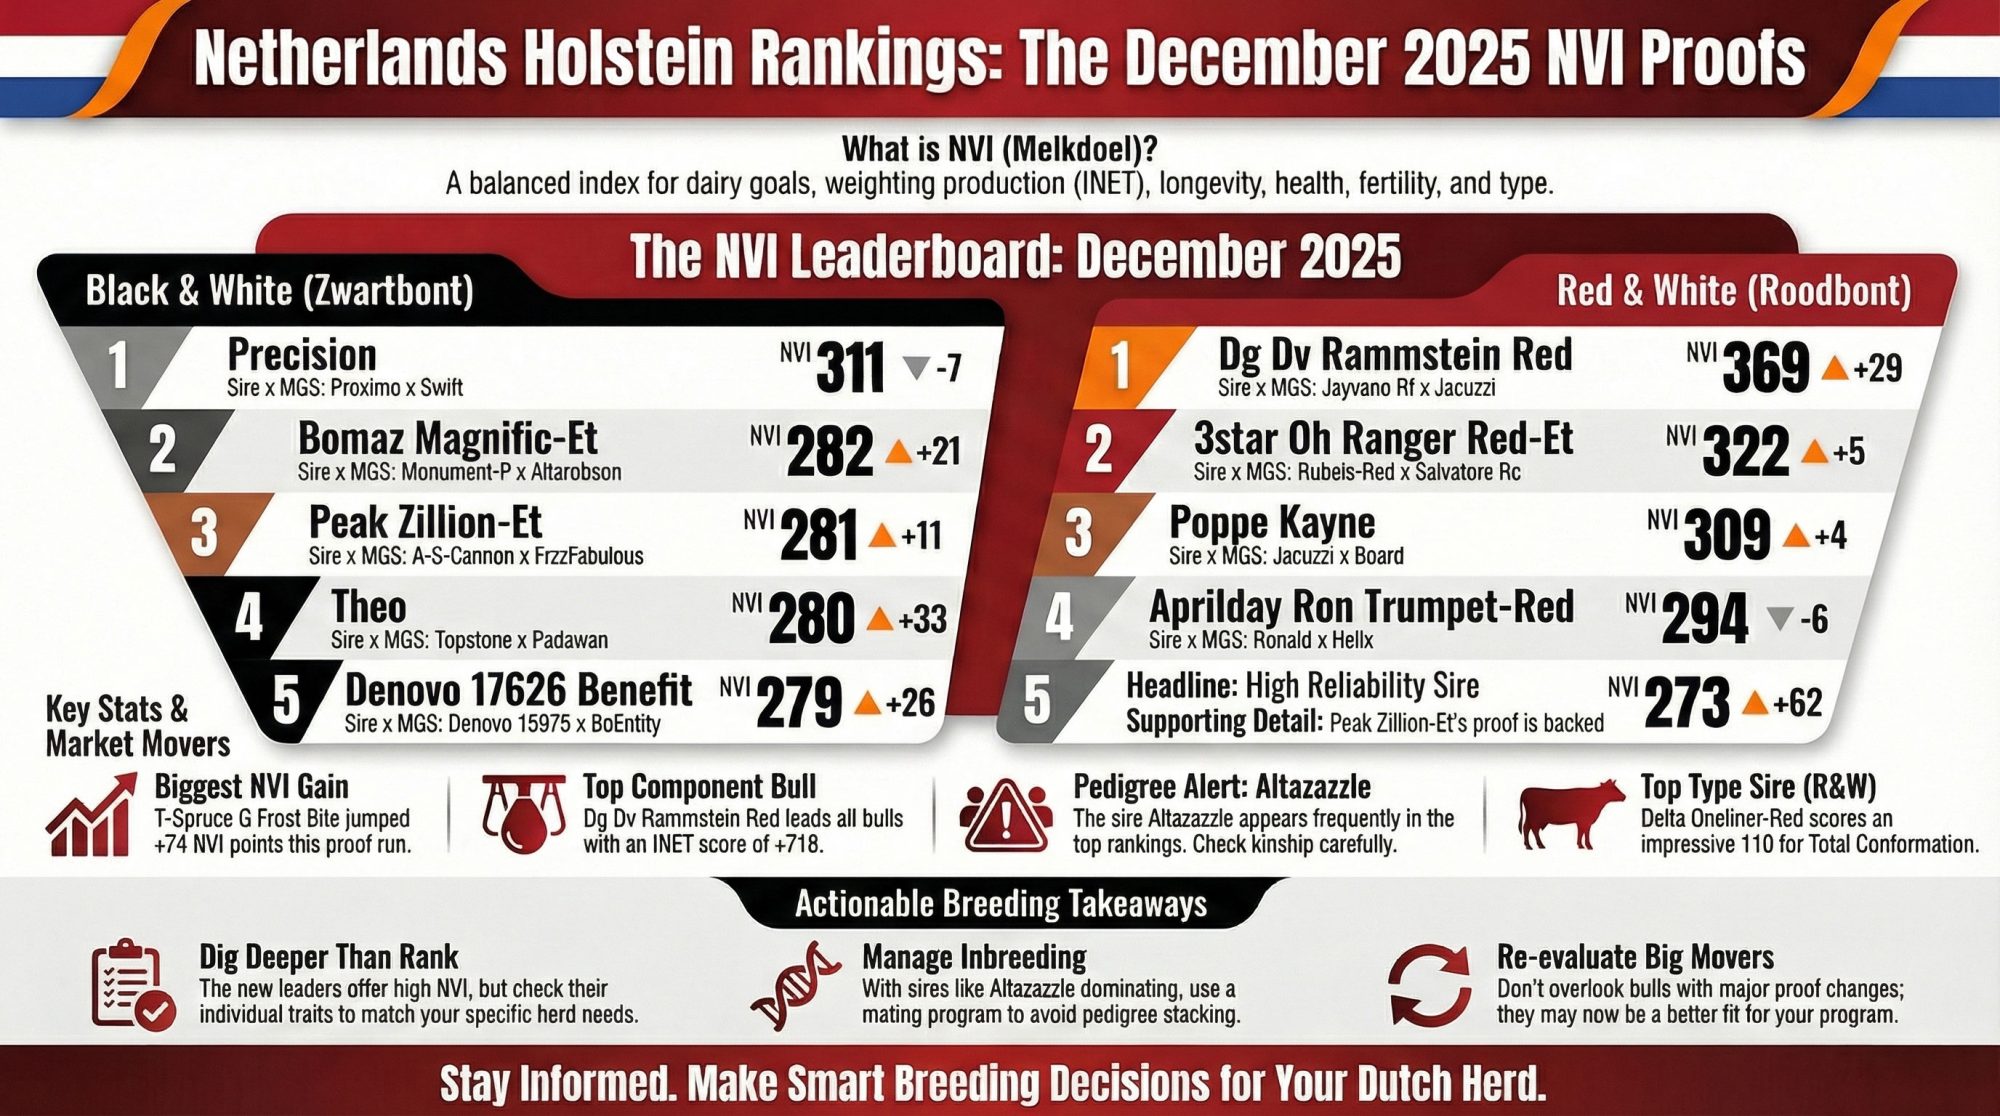
The December 2025 evaluations showed what concentrated genetics look like in practice. When 22 of the top 30 NM$ bulls come from one program, you’re getting results and concentrating the gene pool simultaneously. Understanding how inbreeding affects milk production, fertility, and health is the other half of this equation.
Options and Trade-Offs for Your Next Breeding Decisions
The fertility crash lasted 20-plus years because nobody measured the trait being eroded. Heat tolerance, inbreeding, and resilience are in a similar position today. Here’s what you can actually do about it — with the honest trade-offs attached.
| Action | When to Act | What You’re Hedging Against | Trade-Off |
|---|---|---|---|
| ROH Inbreeding Audit | If genomic inbreeding >7–8% | $23–25 lifetime NM$ loss per 1% increase; $4,800–$6,400/year drag on 200-cow herd | Restricting matings may slow genetic progress 5–15% |
| Weight Productive Life + Livability | If you face 60+ days above THI 68 | Heat tolerance declining; THI threshold dropped from 72 to 69 over 20 years | May sacrifice 3–5% genetic gain on other traits |
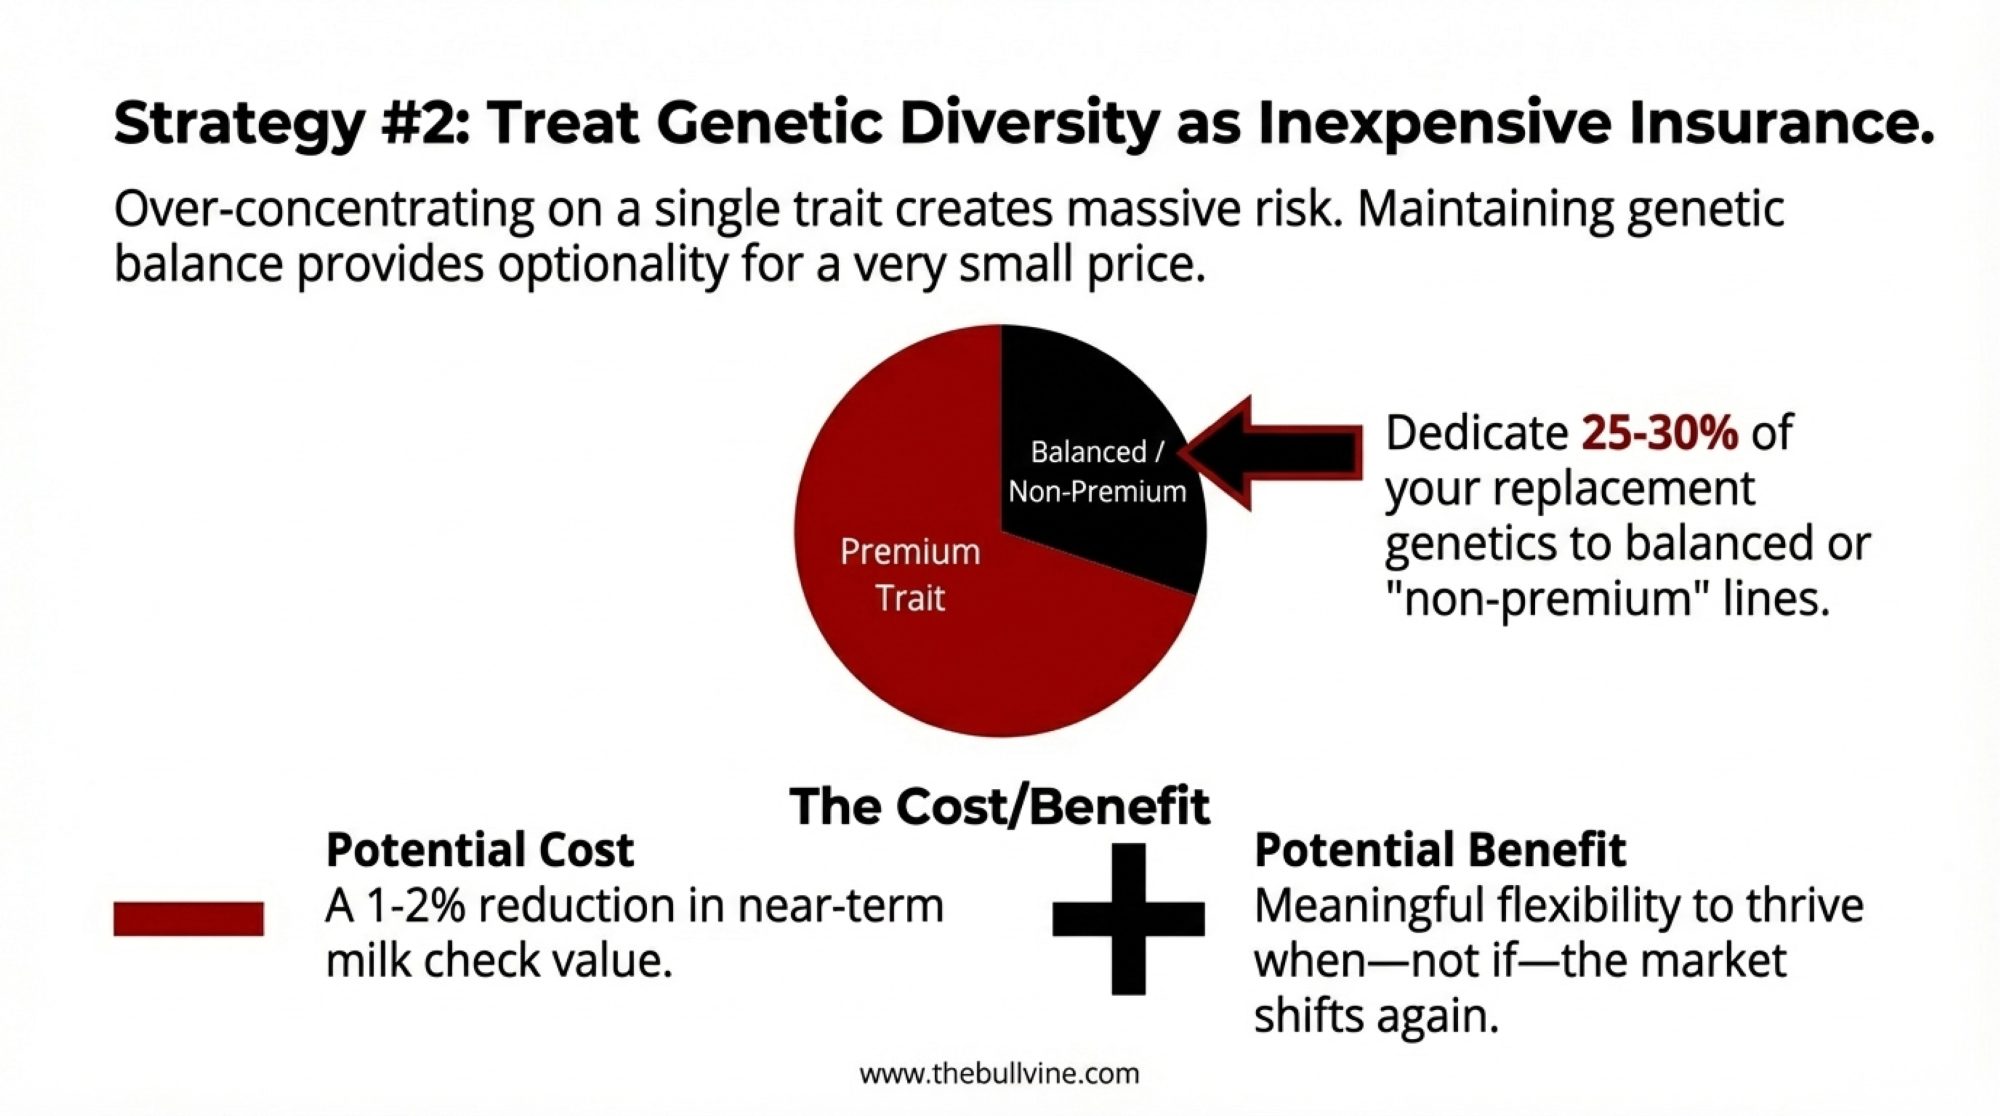
| Diversify Across 3+ AI Programs | If top 5 bulls all trace to one program | Genomic inbreeding rising 0.7%/year; 22 of top 30 NM$ bulls from one program (Dec 2025) | Aggressively avoiding related matings costs ~5–15% progress |
| Contribute AMS/Activity Monitor Data | If you’re running precision dairy tech | Next hitchhiking problem: feeding the reference population so crashes get caught in 5 years, not 20 | Consistent data entry discipline required |
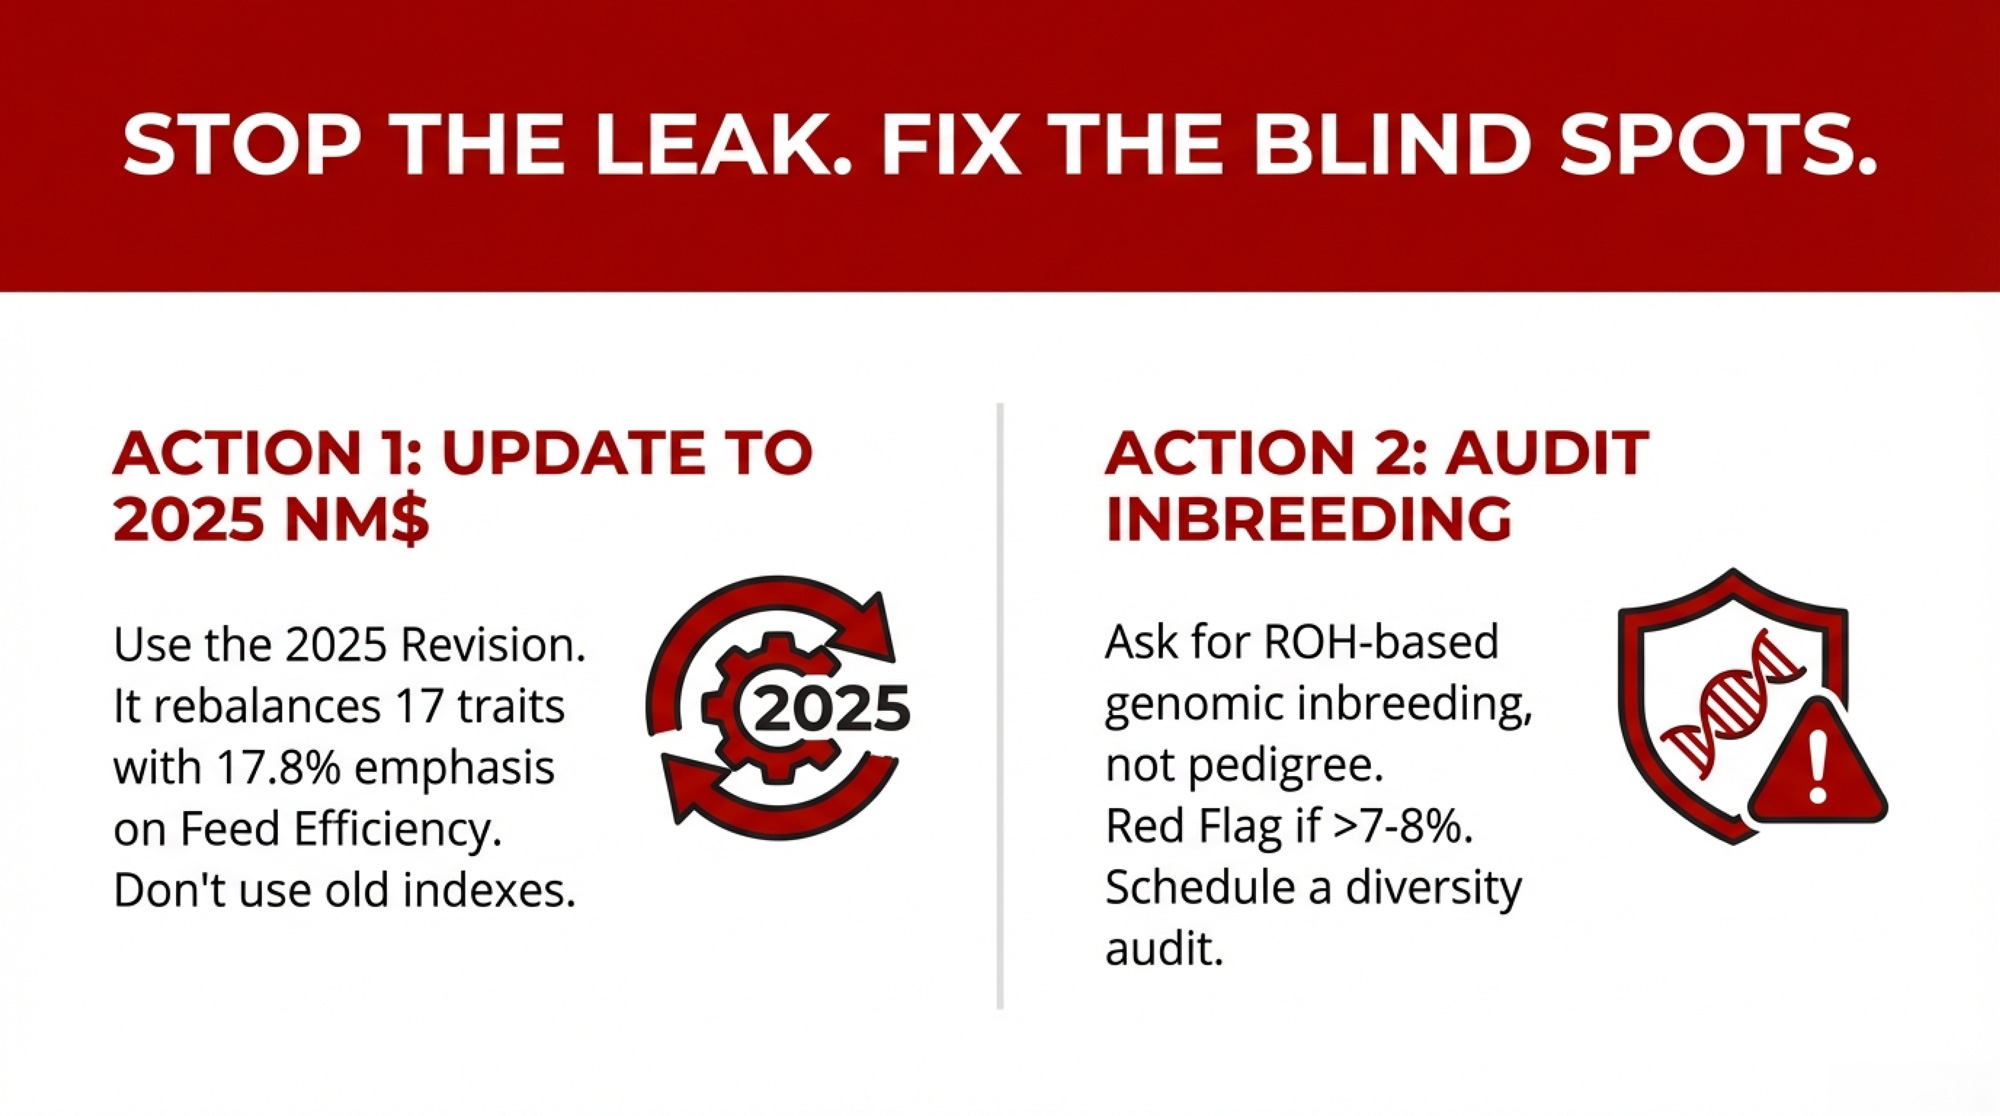
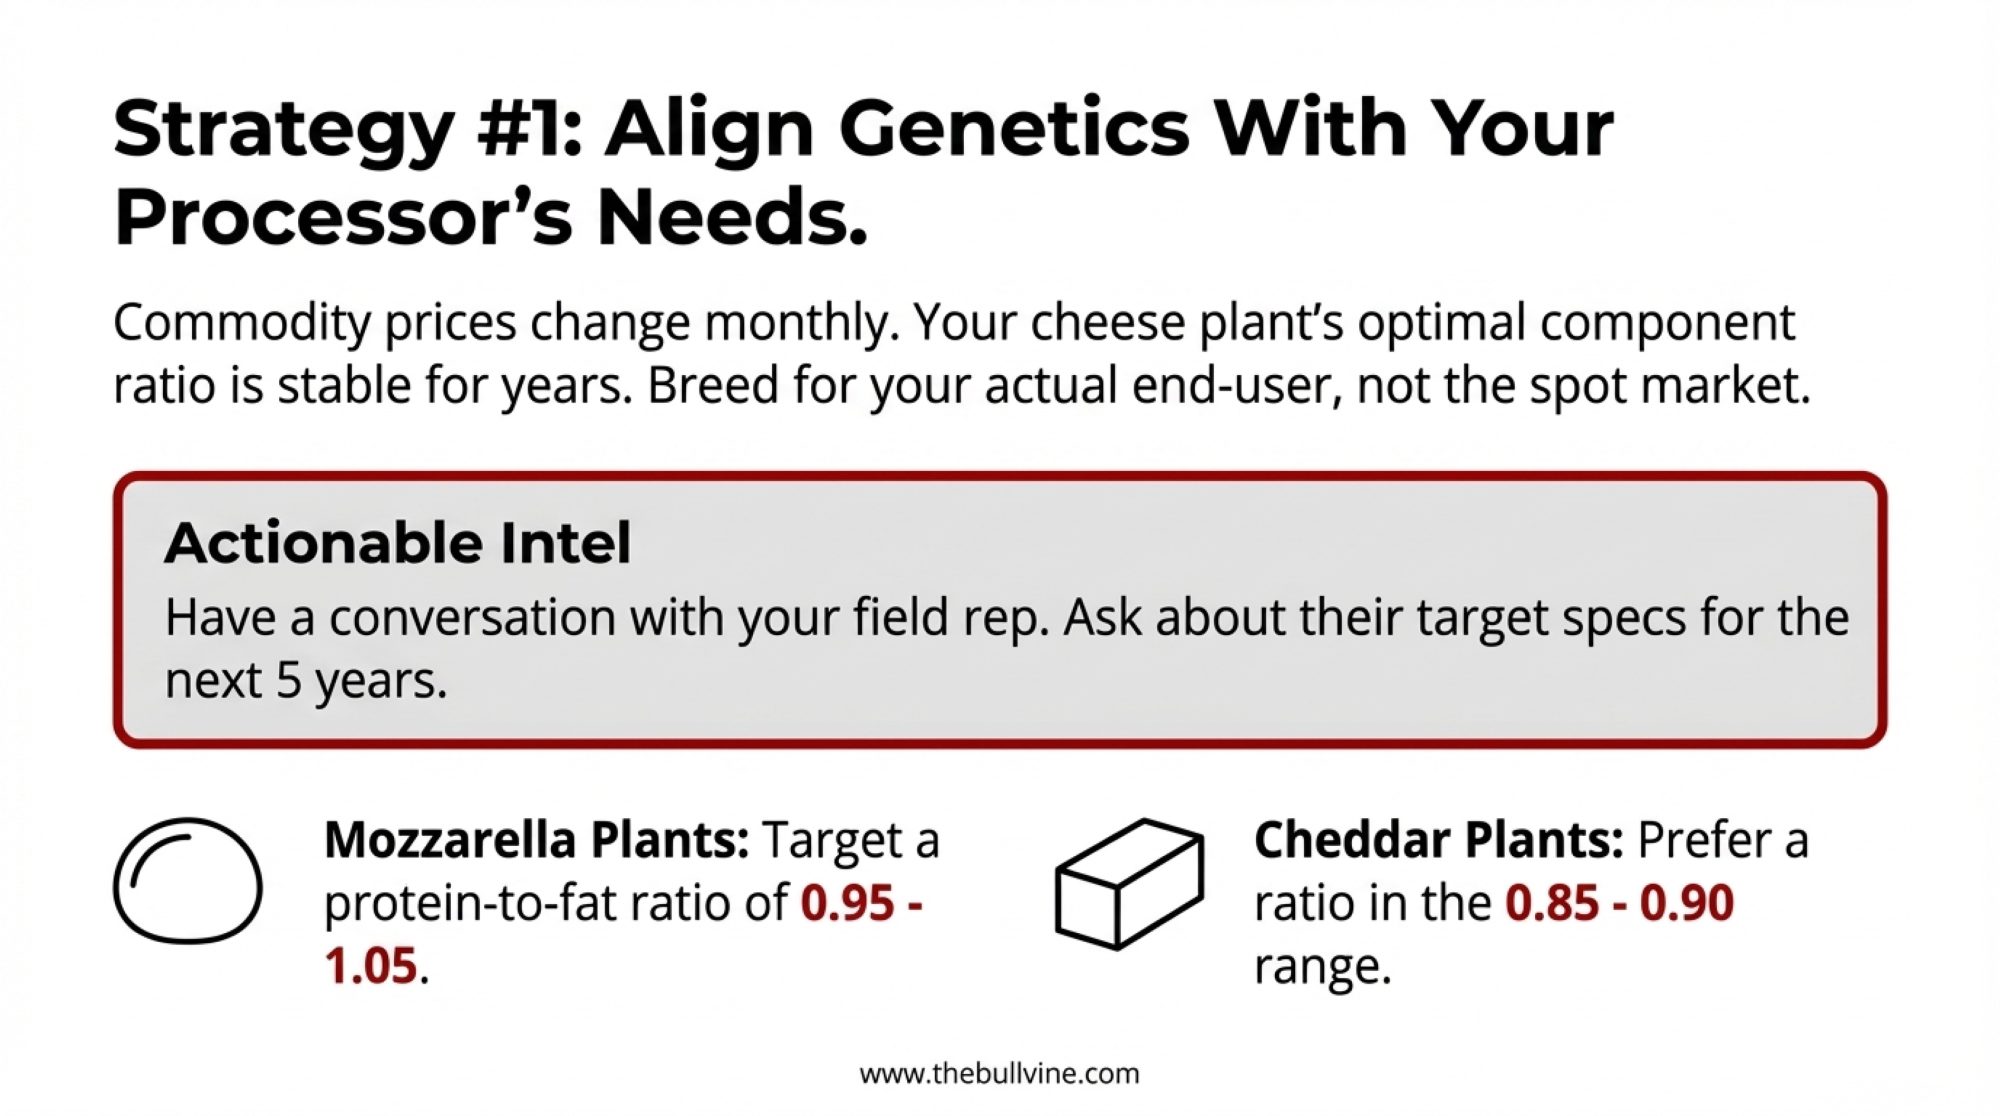
Confirm you’re using CDCB’s 2025 NM$ revision — and don’t override it. The updated index rolled out alongside the April 2025 base change. It now balances 17 traits for lifetime profitability, with feed efficiency (FSAV) carrying 17.8% of total emphasis — a substantial shift from prior weightings. If your genetics provider hasn’t updated to the 2025 revision, it’s worth a quick conversation; the trait emphasis shifted enough that older weightings are optimizing for a different market than the one you’re selling into. But even the right index can’t save you from yourself: if your top five bulls all rank in the top 20 for a single component while sitting below breed average for productive life, you’re running a single-trait program no matter what the index says. David Dyment at AG3 has built his program on exactly this principle — “consistency over unpredictability,” as he puts it — betting that balanced functional genetics outlast flavor-of-the-month rankings. The trade-off: you’ll pass on some high-component bulls that look great on paper. The fertility crash is what happened when the industry overrode balanced selection often enough.
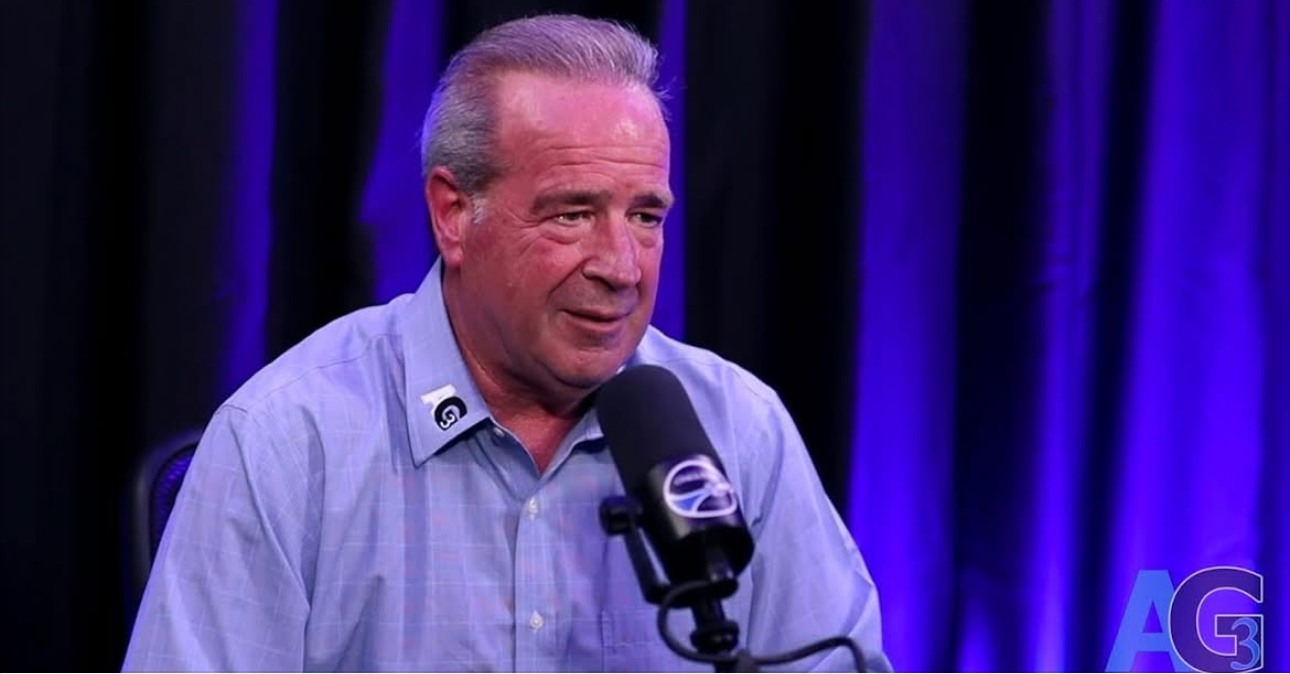
David Dyment of AG3 built his breeding program on “consistency over unpredictability,” betting that balanced functional genetics will outlast the flavor-of-the-month sire list. (Show Ring Legend to Industry Innovator: The David Dyment Story)
Ask your genetics advisor for your herd’s ROH-based genomic inbreeding — this month. Pedigree coefficients underestimate actual homozygosity. In Italian Holsteins, pedigree inbreeding averaged 0.07 while genomic inbreeding was more than double at 0.17 (Ablondi et al., 2022). As a general rule of thumb, many geneticists start flagging concern when genomic inbreeding crosses 7–8% for Holsteins — there’s no official industry threshold, but herds above 9% should seriously consider a diversity audit. CDCB provides genomic inbreeding estimates — if your genetics provider isn’t using ROH-based calculations in mating plans, you’re flying partly blind. Diversify your sire lineup across at least three AI organizations. The trade-off: aggressively avoiding related matings can slow genetic progress — estimates vary, but the general range is somewhere around 5–15% depending on how restrictive you get. That’s a real cost. But inbreeding depression quietly eating your gains from the inside is worse — and that $4,800-to-$6,400-a-year leak on a 200-cow herd is real money.
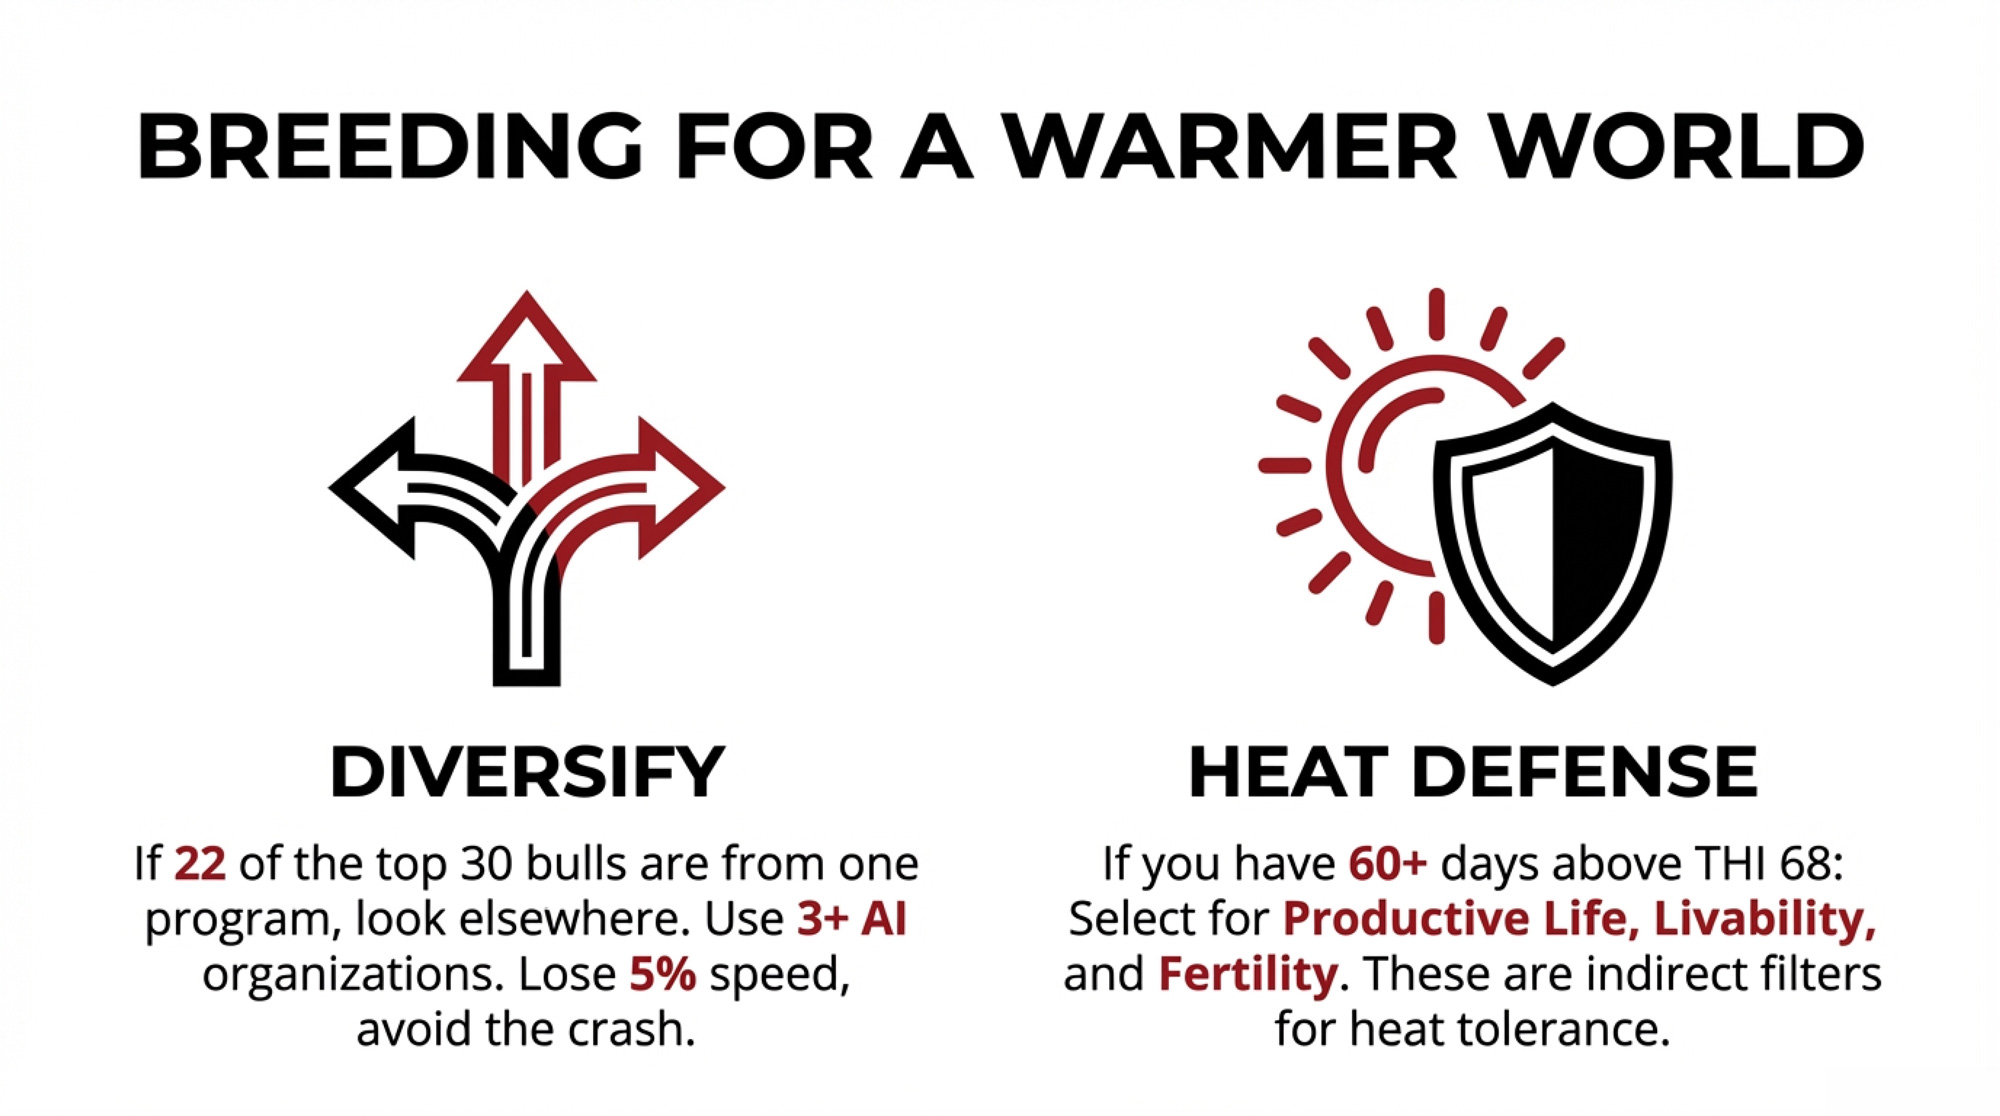
If you’re in a heat-stress region, start weighting for it now. Increasing emphasis on productive life, livability, and fertility provides indirect selection pressure for thermotolerance — these traits correlate positively (Misztal et al., 2024). The trade-off: you may sacrifice 3–5% of genetic gain on other traits. In a warming climate, that’s a hedge worth paying for. If you’re south of the Mason-Dixon or running herds in the Central Valley, this isn’t optional — it’s self-defense.
Contribute the data you’re already collecting. If you’re running activity monitors, AMS systems, or feed intake tracking, those records can help build the reference populations for tomorrow’s evaluations. Contact CDCB or your breed association — in Canada, Lactanet already accepts health event and AMS data. The trade-off: consistent data entry takes discipline. But incomplete data contributed widely still beats perfect data that never leaves the farm. And it’s how the next hitchhiking problem gets caught in five years instead of twenty.
Key Takeaways
- If your herd’s ROH-based genomic inbreeding is trending above 7–8%, schedule a diversity audit before your next mating run. Each 1% of inbreeding costs $23–25 off lifetime NM$ per cow, and on a 200-cow herd, a 4% accumulation translates to $4,800–$6,400 a year in hidden drag, depending on your turnover rate.
- If you face 60+ days above THI 68, add productive life and livability emphasis to your sire selection now. Heat tolerance is declining genetically, even as heat abatement technology improves — the infrastructure is masking the problem.
- If your genetics provider hasn’t updated to the 2025 NM$ revision, have that conversation this week. The updated index rebalanced 17 traits and added feed efficiency with an emphasis of 17.8%. Older weightings mean you’re optimizing for a market that’s already shifted.
- If all your top sires trace to the same program, diversify across at least three AI organizations. Genetic gain means nothing if you’re narrowing the base that sustains it.
- Before your next mating run, ask one question your genetics advisor probably won’t raise on their own: “Which traits am I not measuring that might be shifting in the wrong direction?” That’s the question the fertility crash should have taught us to ask in 1985.
The Bottom Line
Steiner’s $8,100 gamble in that drafty Wisconsin barn wasn’t a bet on a cow. It was a bet on seeing what the data couldn’t yet show him. Twenty-three years later, the tools are sharper than they’ve ever been — genomic testing at birth, AI-driven mating plans, embryo tech that was science fiction in 2003. The engine runs faster every year.
But the biology is still messier than the model. And the gap between what you’re optimizing and what you’re actually affecting is where unintended consequences compound. Silently. Generationally. The only question worth asking every time you pull up a sire list: What am I not measuring that I’m going to wish I had?
Editor’s Note: Genetic gain data from García-Ruiz et al. (2016, PNAS); the 37% generation interval reduction refers to the combined total across all four selection pathways (sire-of-bulls, sire-of-cows, dam-of-bulls, dam-of-cows), not any single pathway. Hitchhiking analysis from Ma, Cole, Da & VanRaden (2019, BMC Genomics 20:128), using the University of Minnesota unselected control line at Waseca, MN. Heat tolerance data from Misztal, Brito & Lourenco (2024, JDS Communications 6(3):464–468). Inbreeding data from Ablondi et al. (2022, Frontiers in Veterinary Science 8:773985), based on 74,485 Italian Holstein cows. U.S. inbreeding trends from CDCB analysis as reported in The Bullvine (December 2025). Barn-math calculations use $19.50/cwt mailbox price; inbreeding annualization assumes 3–4 year herd turnover and should be adjusted for your operation’s actual replacement rate. Per-trait figures are for registered Holsteins; all-cow population gains were approximately half this magnitude. NM$ figures are nominal. Missy auction details from The Bullvine’s Wesswood-HC Rudy Missy feature (July 2025), cross-referenced with the Wisconsin Holstein Association’s 2020 convention report.
Executive Summary:
Genomic selection has more than doubled Holstein genetic progress, but it also proved something you feel in your own breeding records: traits you don’t measure still move, and sometimes they move against you. The same engine that helped make Wesswood-HC Rudy Missy a global brood cow quietly dragged 198 fertility genes and 67 immunity genes the wrong way for about 20 years before anyone caught it. Over those same decades, the THI threshold at which cows start losing milk slipped from 72 to 69, yet almost no one outside Australia selects directly for heat tolerance, even as better fans and sprinklers mask how fragile the genetics underneath have become. On the inbreeding side, genomic homozygosity in Holsteins is rising around 0.7% per year in some populations, and each 1% costs roughly $23–25 in lifetime Net Merit per cow — enough for a 200-cow herd to quietly leak $4,800–$6,400 a year, which can wipe out almost all of the roughly $5,070 in extra milk revenue from faster gain. You’ll see how those blind spots developed. You’ll see how those blind spots developed, then get concrete next steps: stick with the 2025 NM$ revision instead of custom tweaking, ask your genetics provider for ROH-based genomic inbreeding for your herd, and spread risk across multiple AI programs instead of loading your list from just one. If you’re staring down 60+ days above THI 68, it also explains how to lean harder on productive life, livability, and fertility as indirect heat-tolerance filters while feeding good data back into the system so the next crash is spotted in years, not decades. Underneath it all is one question this article keeps pushing you to ask every time you open a sire catalog: what am I not measuring that I’m going to wish I had?
Complete references and supporting documentation are available upon request by contacting the editorial team at editor@thebullvine.com.
Learn More
- Stop Breeding by Color: Genomics, Heat Stress and Beef‑on‑Dairy Math That Can Add Over $4/cwt to Holstein Margins – Exposes the financial drainage of visual-only selection and delivers a step-by-step roadmap for a 12-month genomic trial. It arms you with the specific beef-on-dairy tiers needed to capture an immediate $4/cwt margin advantage.
- 211,000 More Dairy Cows. Bleeding Margins. The 2026 Math That Won’t Wait. – Breaks down the structural reset facing the U.S. herd and reveals why current beef-calf premiums are masking a dangerous replacement shortage. It prepares you to navigate a $2.00–$4.00/cwt breakeven gap before the 2027 heifer crunch arrives.
- Slick Genetics Revolution: How One Gene Could Save Dairy Farmers $5,000 Per Cow Lifetime – Reveals the internal “thermal management system” that infrastructure can’t match, delivering a permanent 50–70% reduction in heat stress. You’ll gain the competitive edge to trade expensive fans and sprinklers for heritable, internal resilience that protects your production year-round.
 Join the Revolution!
 Join the Revolution!
Join over 30,000 successful dairy professionals who rely on Bullvine Weekly for their competitive edge. Delivered directly to your inbox each week, our exclusive industry insights help you make smarter decisions while saving precious hours every week. Never miss critical updates on milk production trends, breakthrough technologies, and profit-boosting strategies that top producers are already implementing. Subscribe now to transform your dairy operation’s efficiency and profitability—your future success is just one click away.