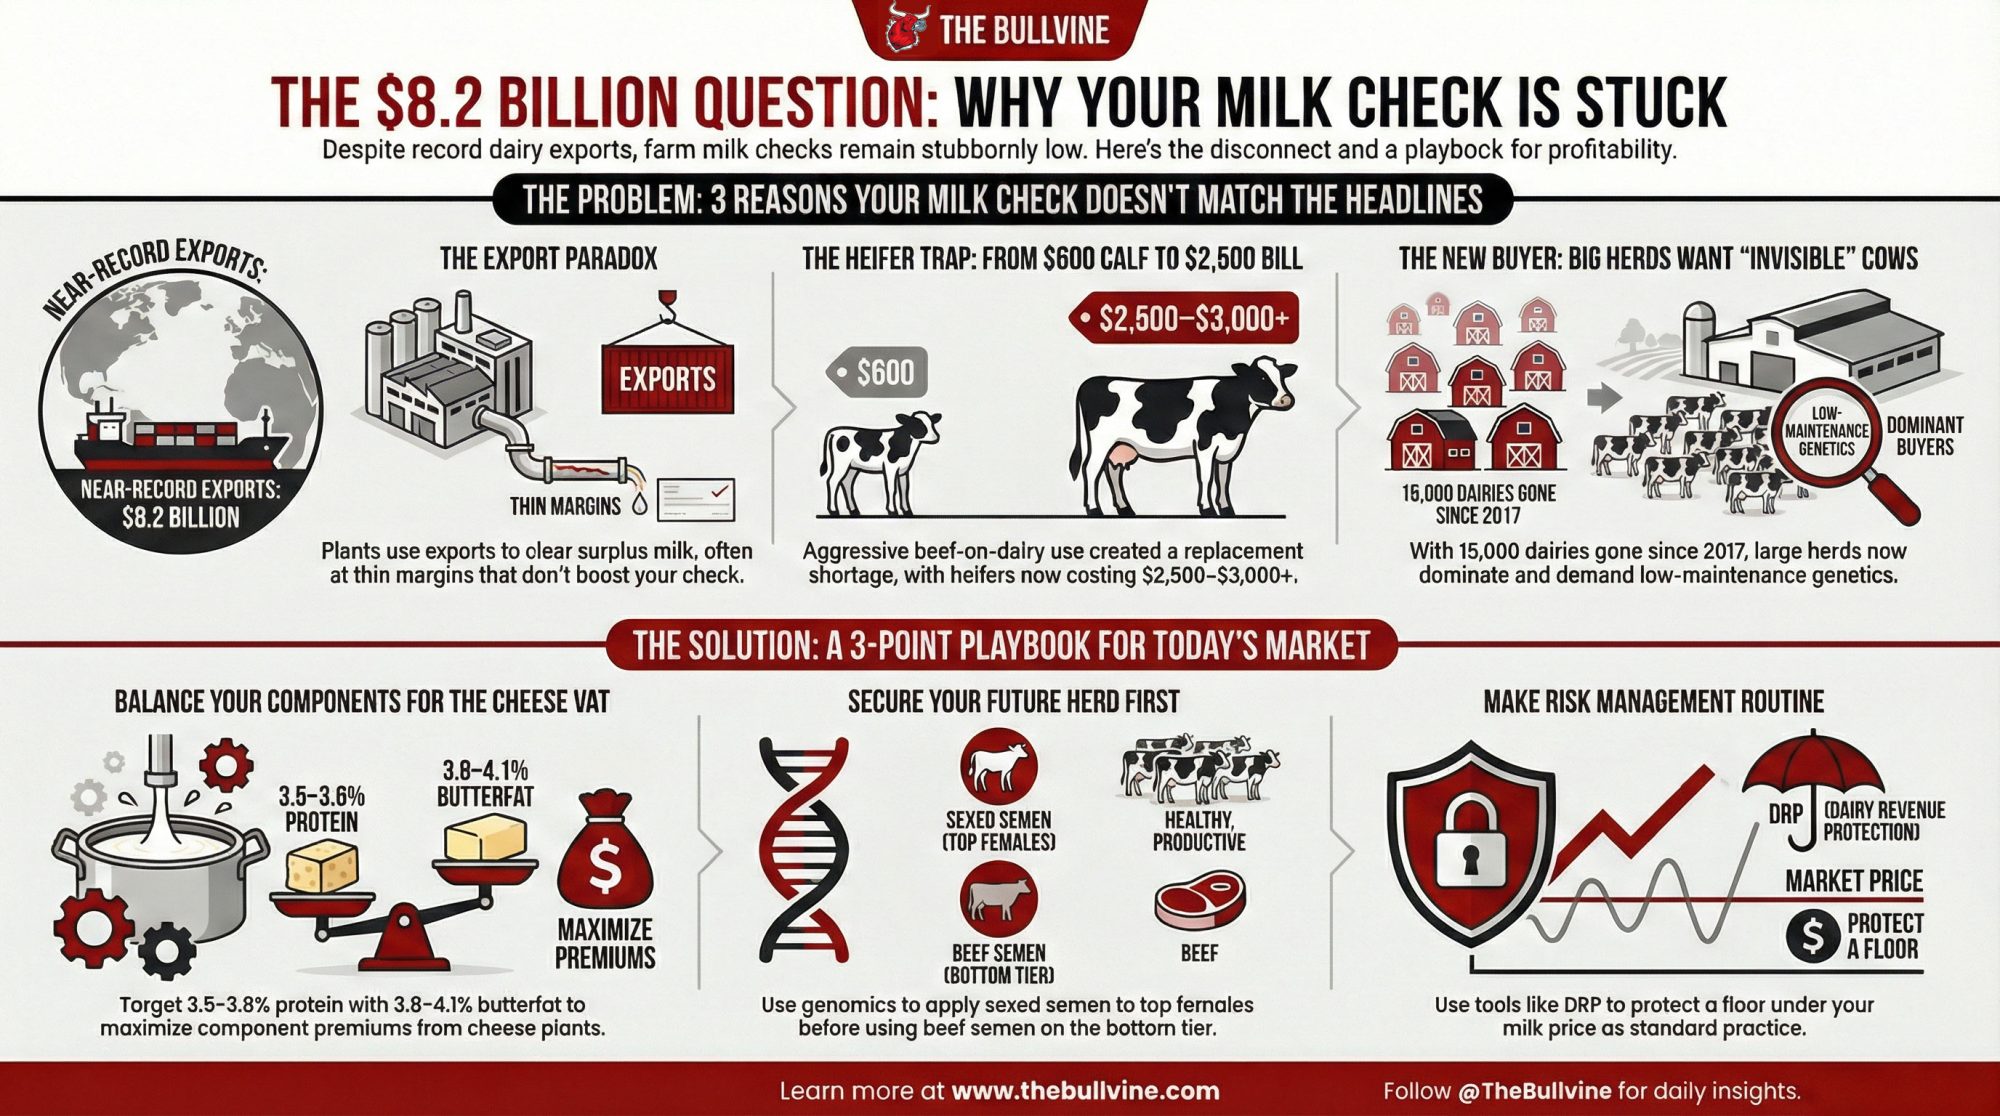
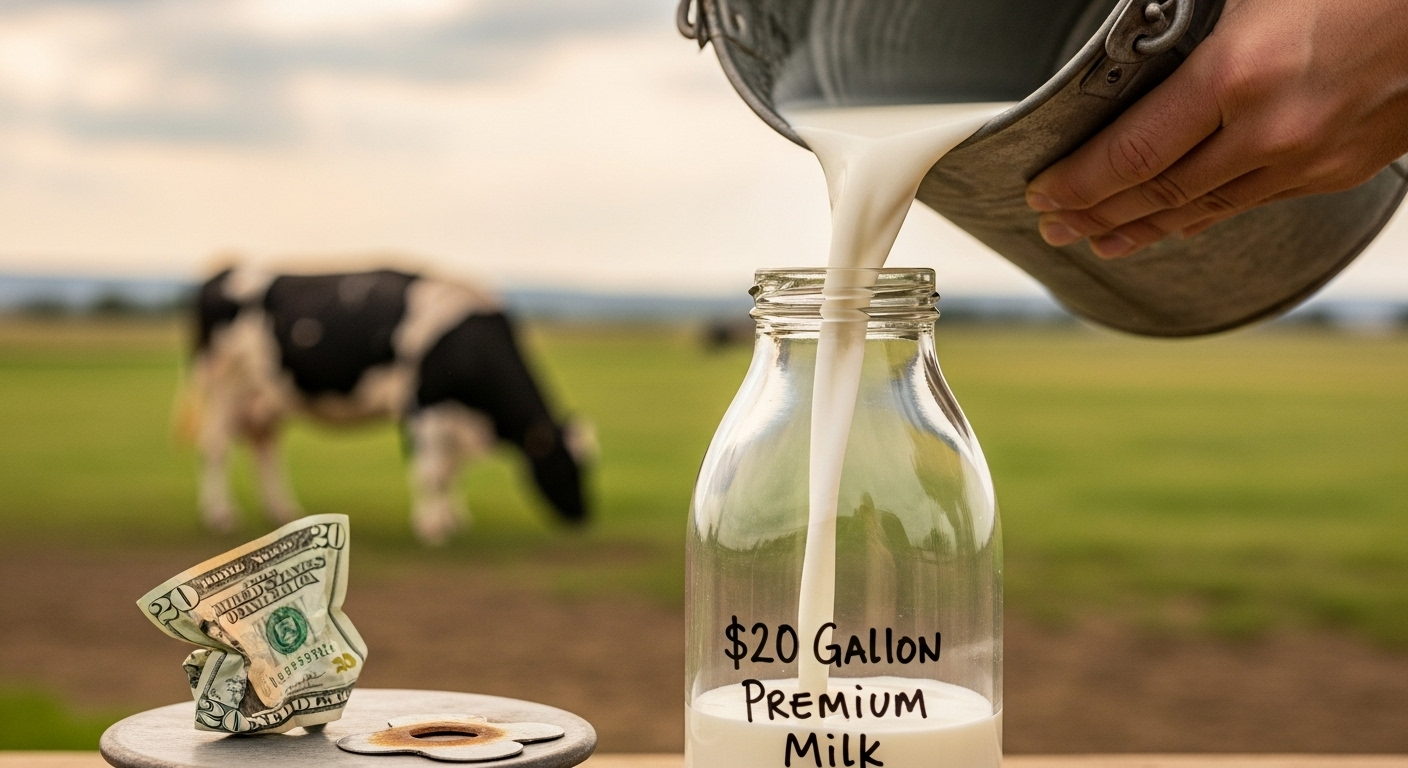
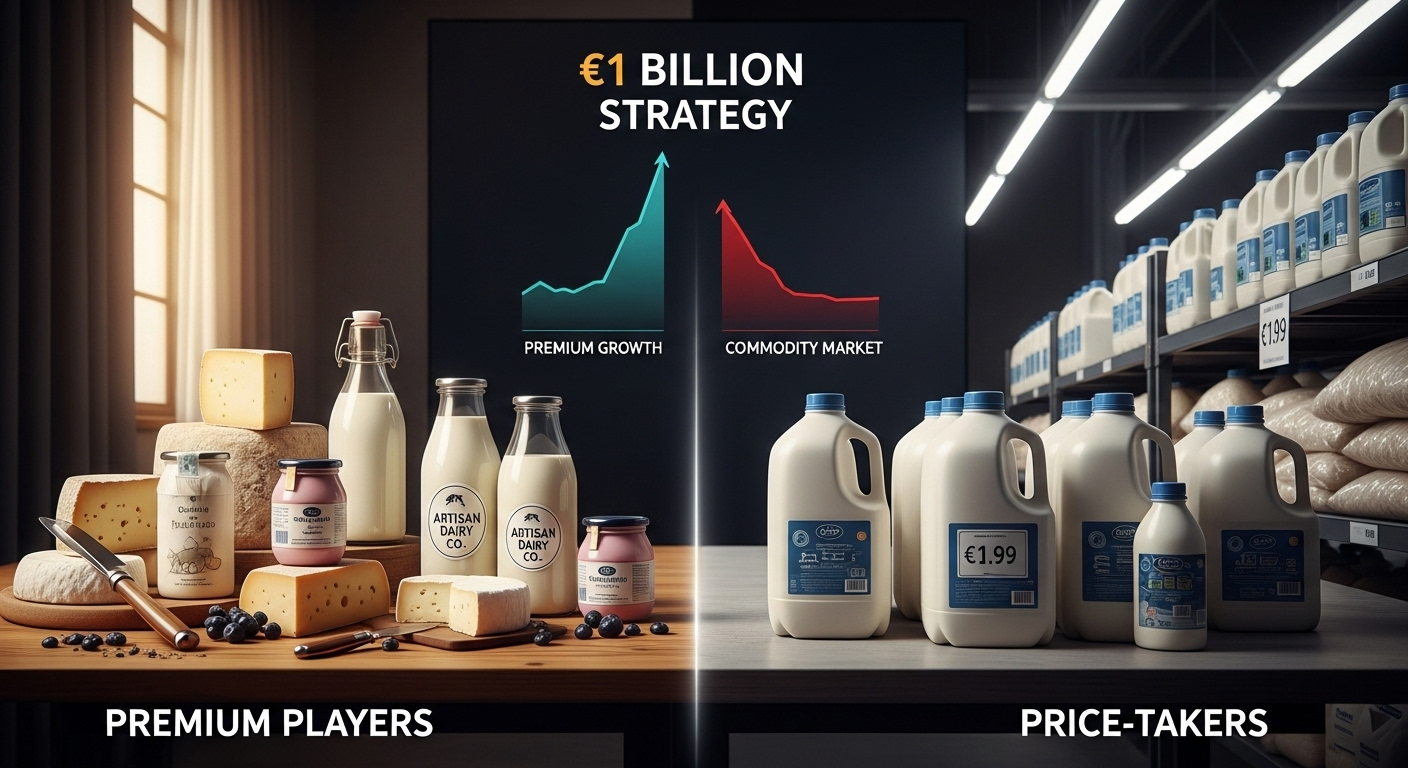
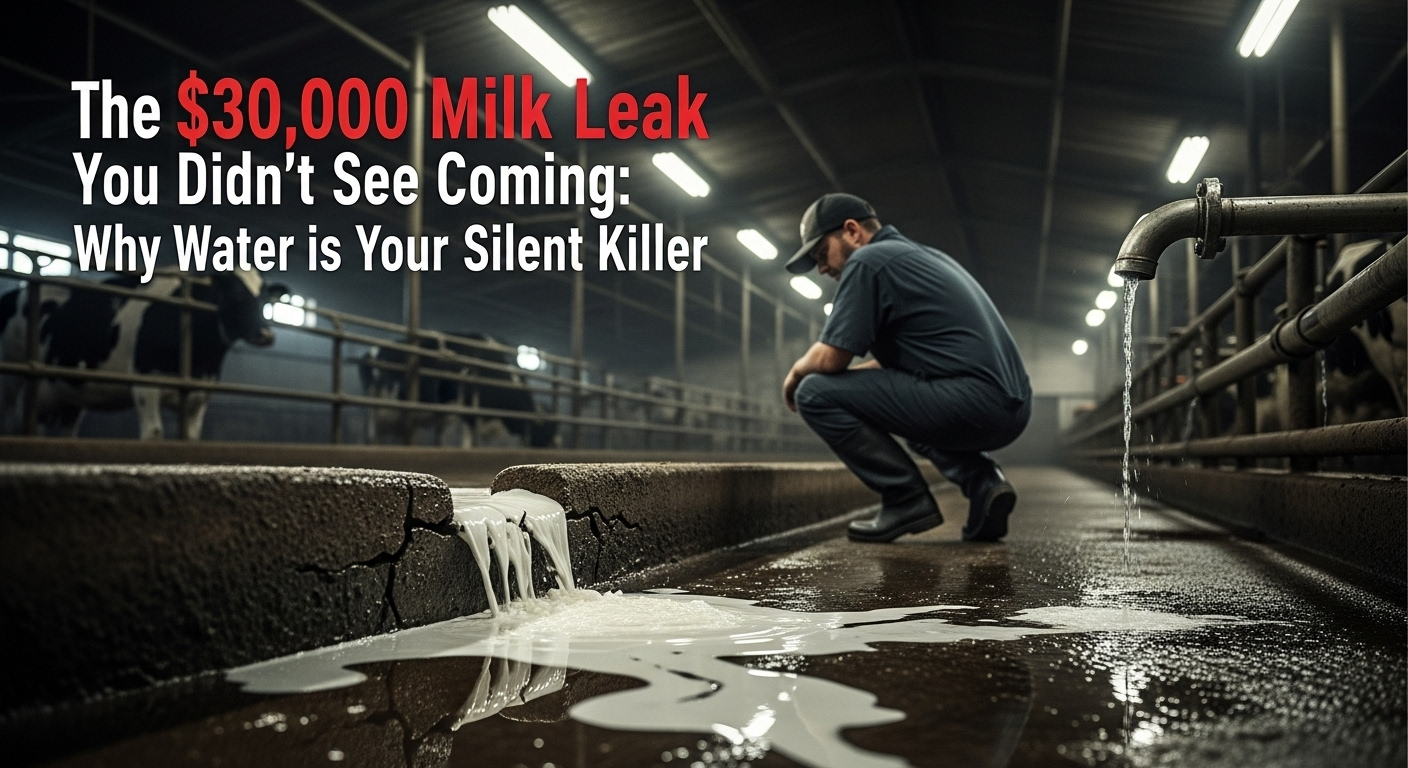
TikTok butter boards, protein lattes, a $500M cottage cheese brand — all funded by your 15¢/cwt. But does any of it hit your milk check?
Executive Summary: Every month, your milk check skims off 15¢/cwt into a $121.4 million Dairy Management Inc. budget that helped bankroll TikTok butter boards, protein lattes at Starbucks and Dunkin’, and a $500 million cottage cheese brand. This feature puts three real farmers at the center of the fight over that money: DMI chair and 800‑cow producer Marilyn Hershey, former Dairy Board member Sarah Lloyd, and Supreme Court challenger Brenda Cochran. DMI points to 18.5 billion extra pounds of dairy sold through McDonald’s, Taco Bell, and Domino’s, and research claiming a $3.50 return for every checkoff dollar, while Lloyd and Cochran argue the gains pool in processors and mega-herds as four U.S. farms a day still disappear. The article connects those big marketing wins straight to your breeding and milk check math, showing how a 0.1% protein test bump on a 300‑cow herd is worth roughly $17,900 a year — more than the same herd pays into checkoff. From there, it hands you a simple playbook: audit your last three milk checks for component payments, re-run your sire choices for protein-heavy markets, and press your checkoff reps to explain exactly how influencer and QSR spending shows up in your own numbers. It’s a story about who controls demand, who captures the margin, and whether your 15¢/cwt is a smart bet or just another line on the deduction list.
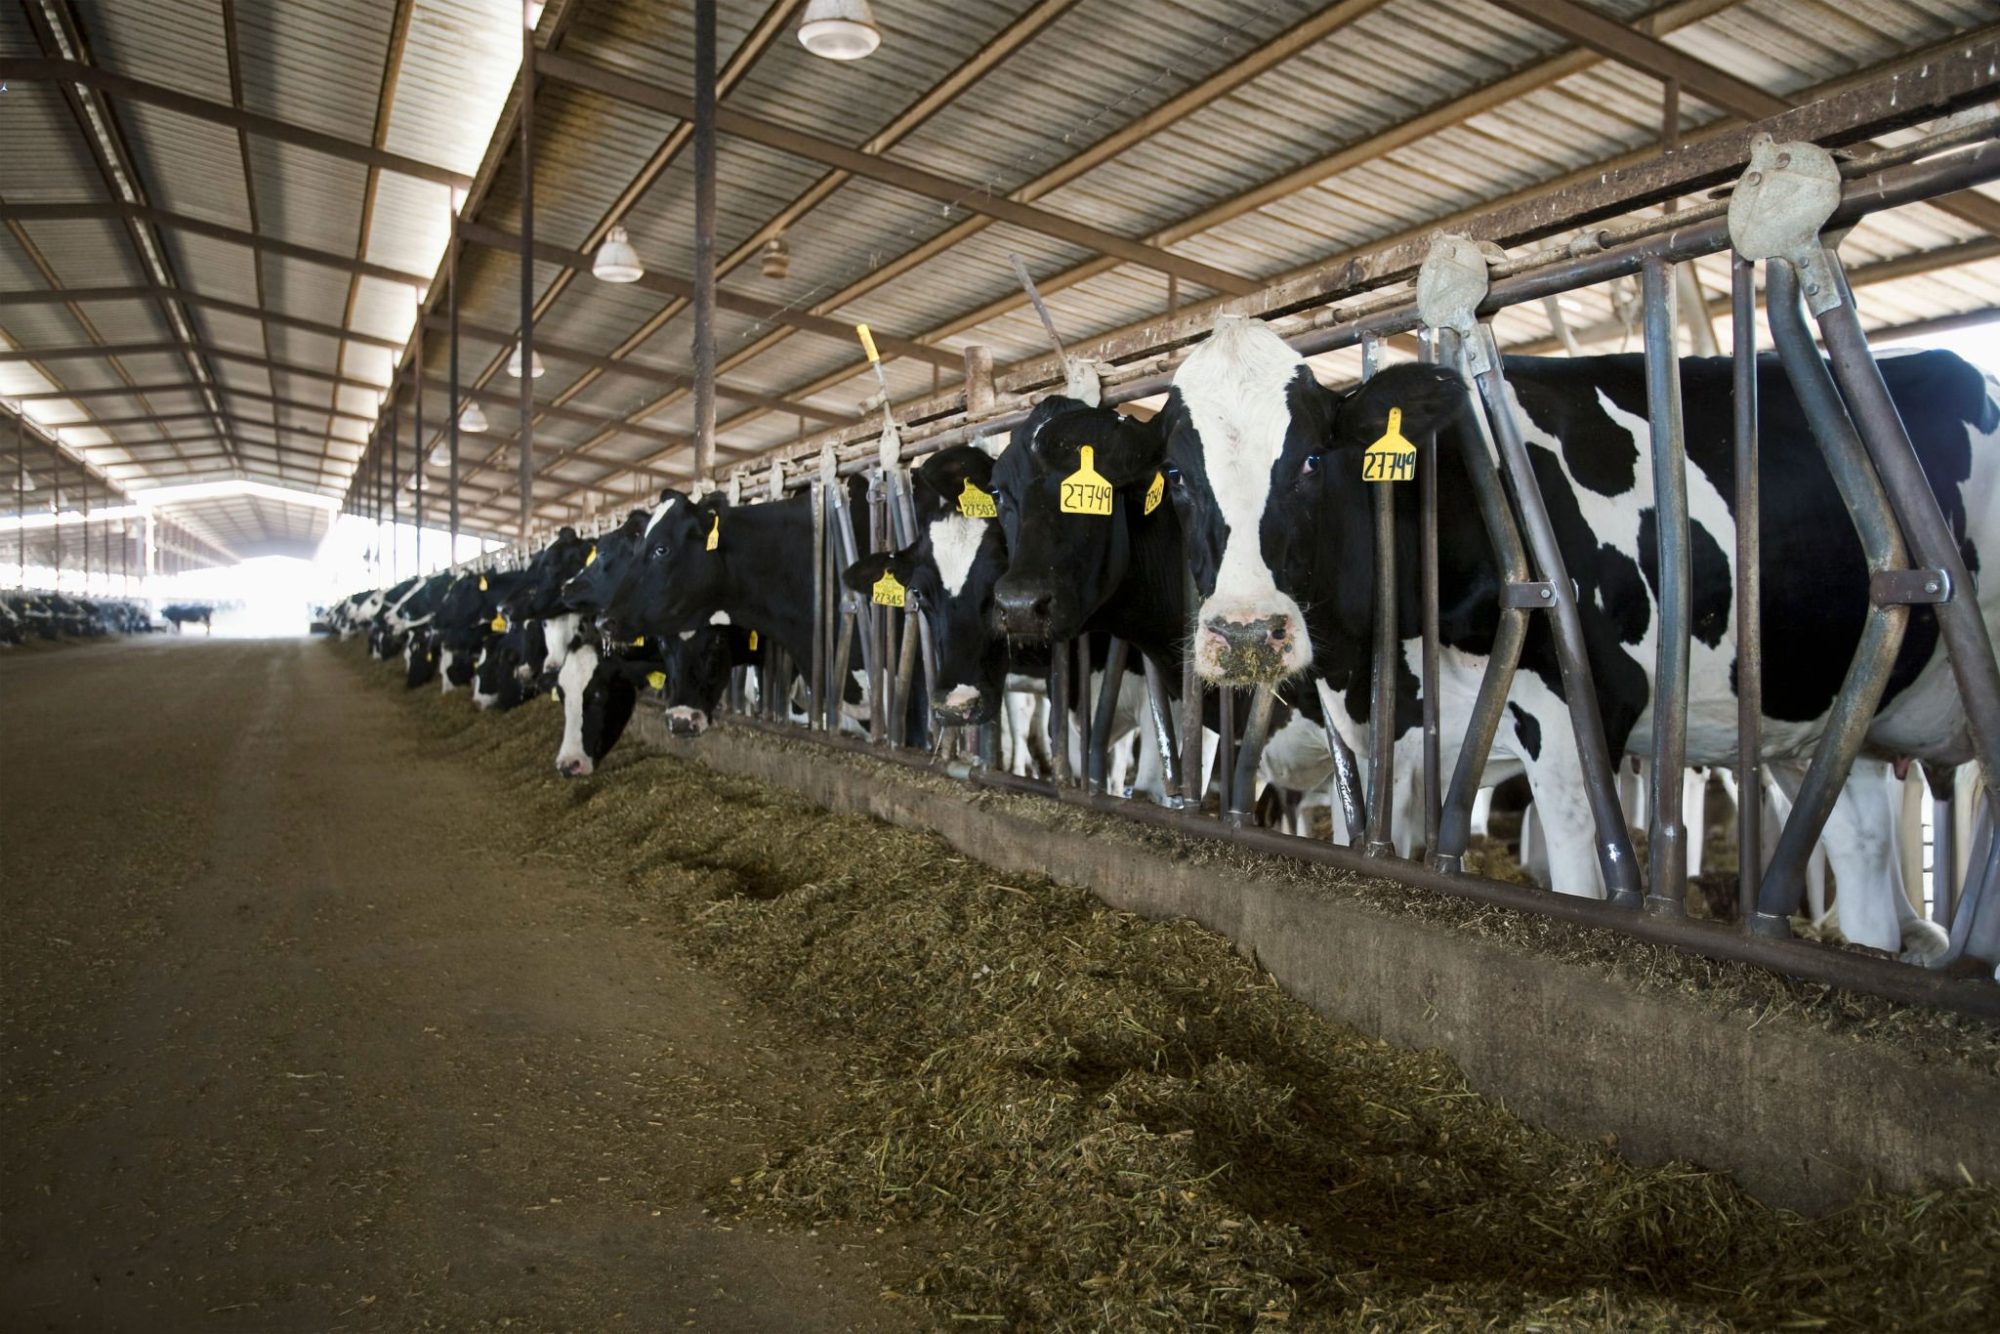
Marilyn Hershey milks about 800 cows on 550 acres in Cochranville, Pennsylvania — about an hour west of Philadelphia. She’s also the chair of Dairy Management Inc., the organization that decides how to spend more than $200 million in annual checkoff collections from dairy farmers and milk processors nationwide. In a 2022 blog post, Hershey flagged what she saw as a massive untapped opportunity: 80% of the 2 billion chicken sandwiches sold in America each year lack a slice of cheese.
The checkoff, she wrote, was working with Chick-fil-A, Raising Cane’s, and McDonald’s to change that.
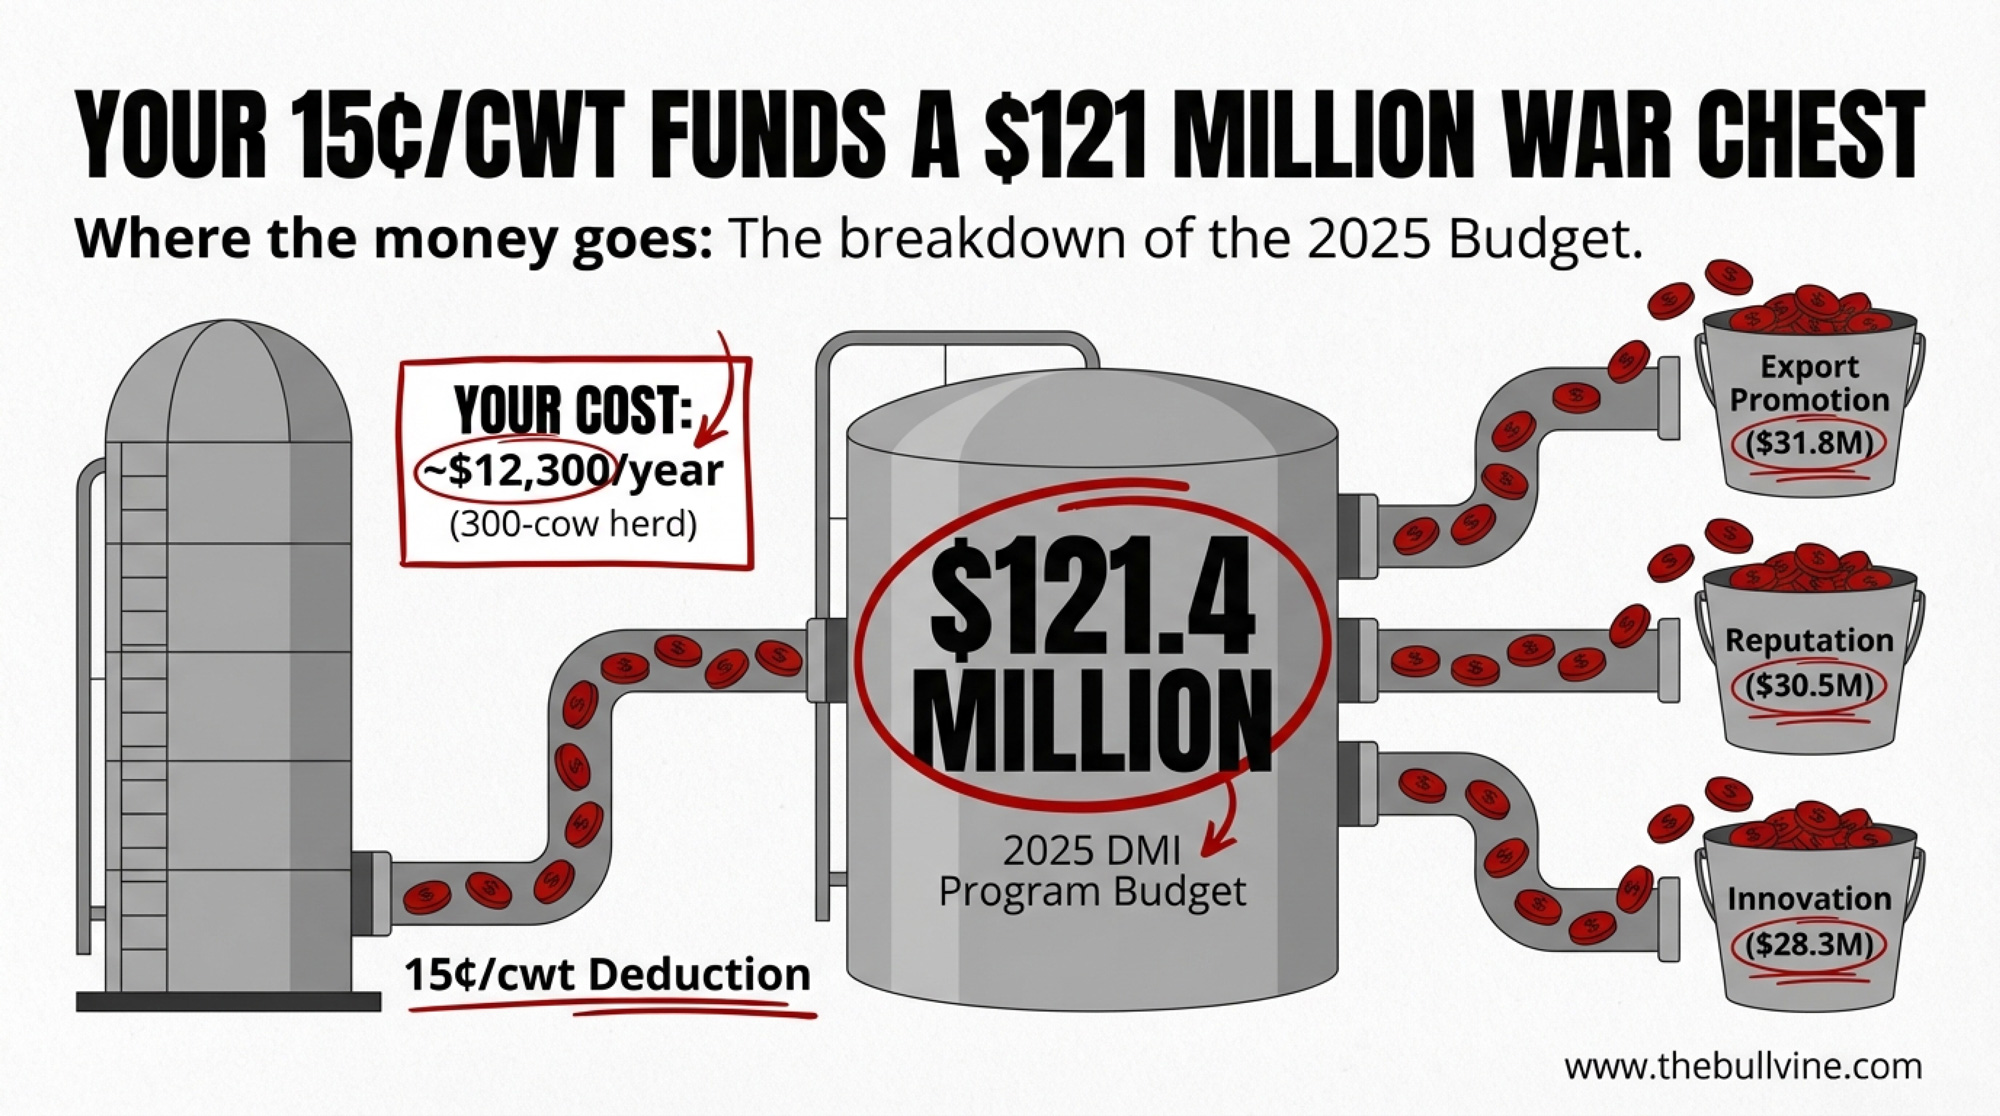
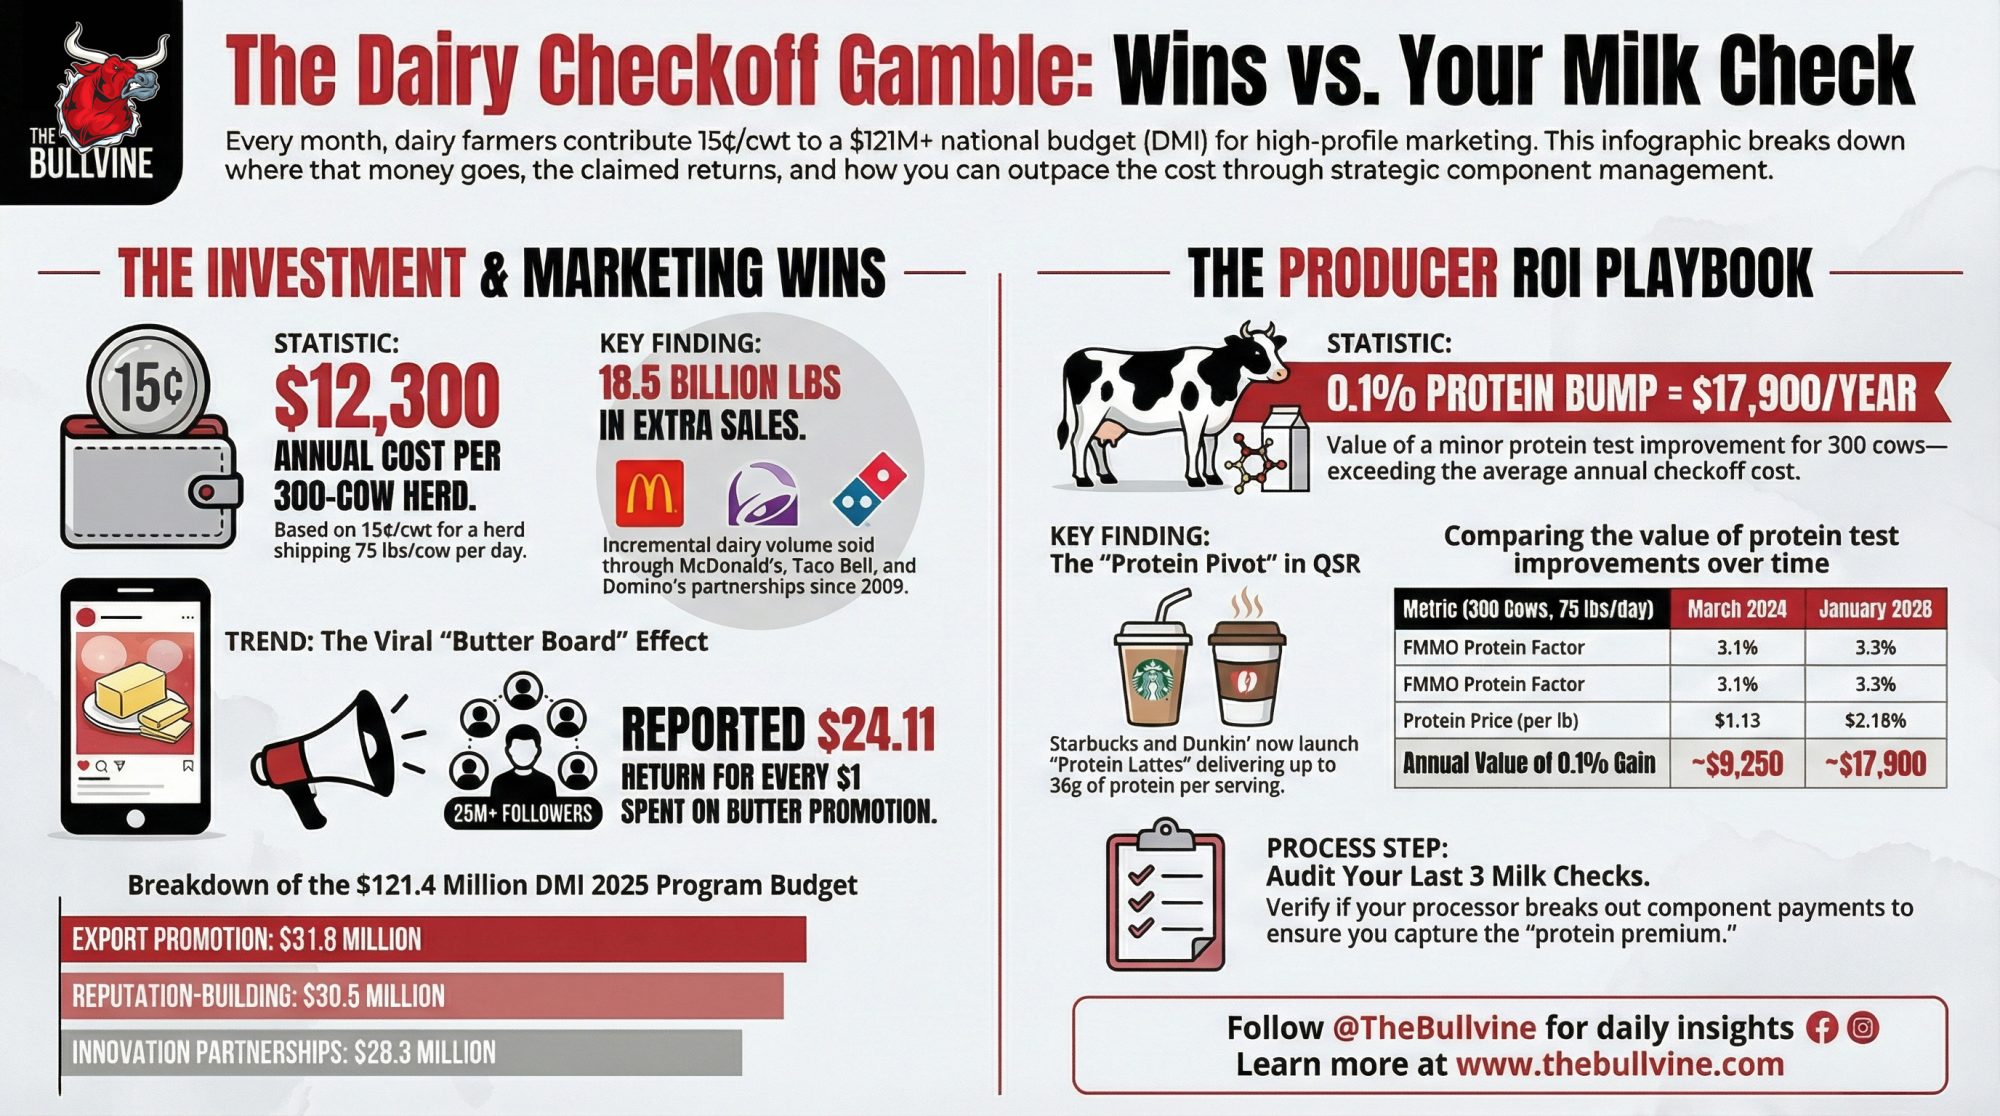
That’s the scale of ambition behind your 15¢/cwt. Mandated by Congress under the Dairy Production Stabilization Act, the assessment doesn’t just fund “Got Milk?” reruns. It bankrolls paid influencer networks, food scientists embedded inside fast-food headquarters, and QSR partnerships designed to bake more dairy into every menu in America. DMI’s 2025 program budget alone sits at $121.4 million (compared with $165.7 million in total organizational expenses in 2024, per the Ernst & Young audit filed May 8, 2025), with the largest shares going to export promotion ($31.8 million), reputation-building campaigns ($30.5 million), and innovation partnerships ($28.3 million). We broke down those audited financials — and what they reveal about where every cent goes — earlier this year.
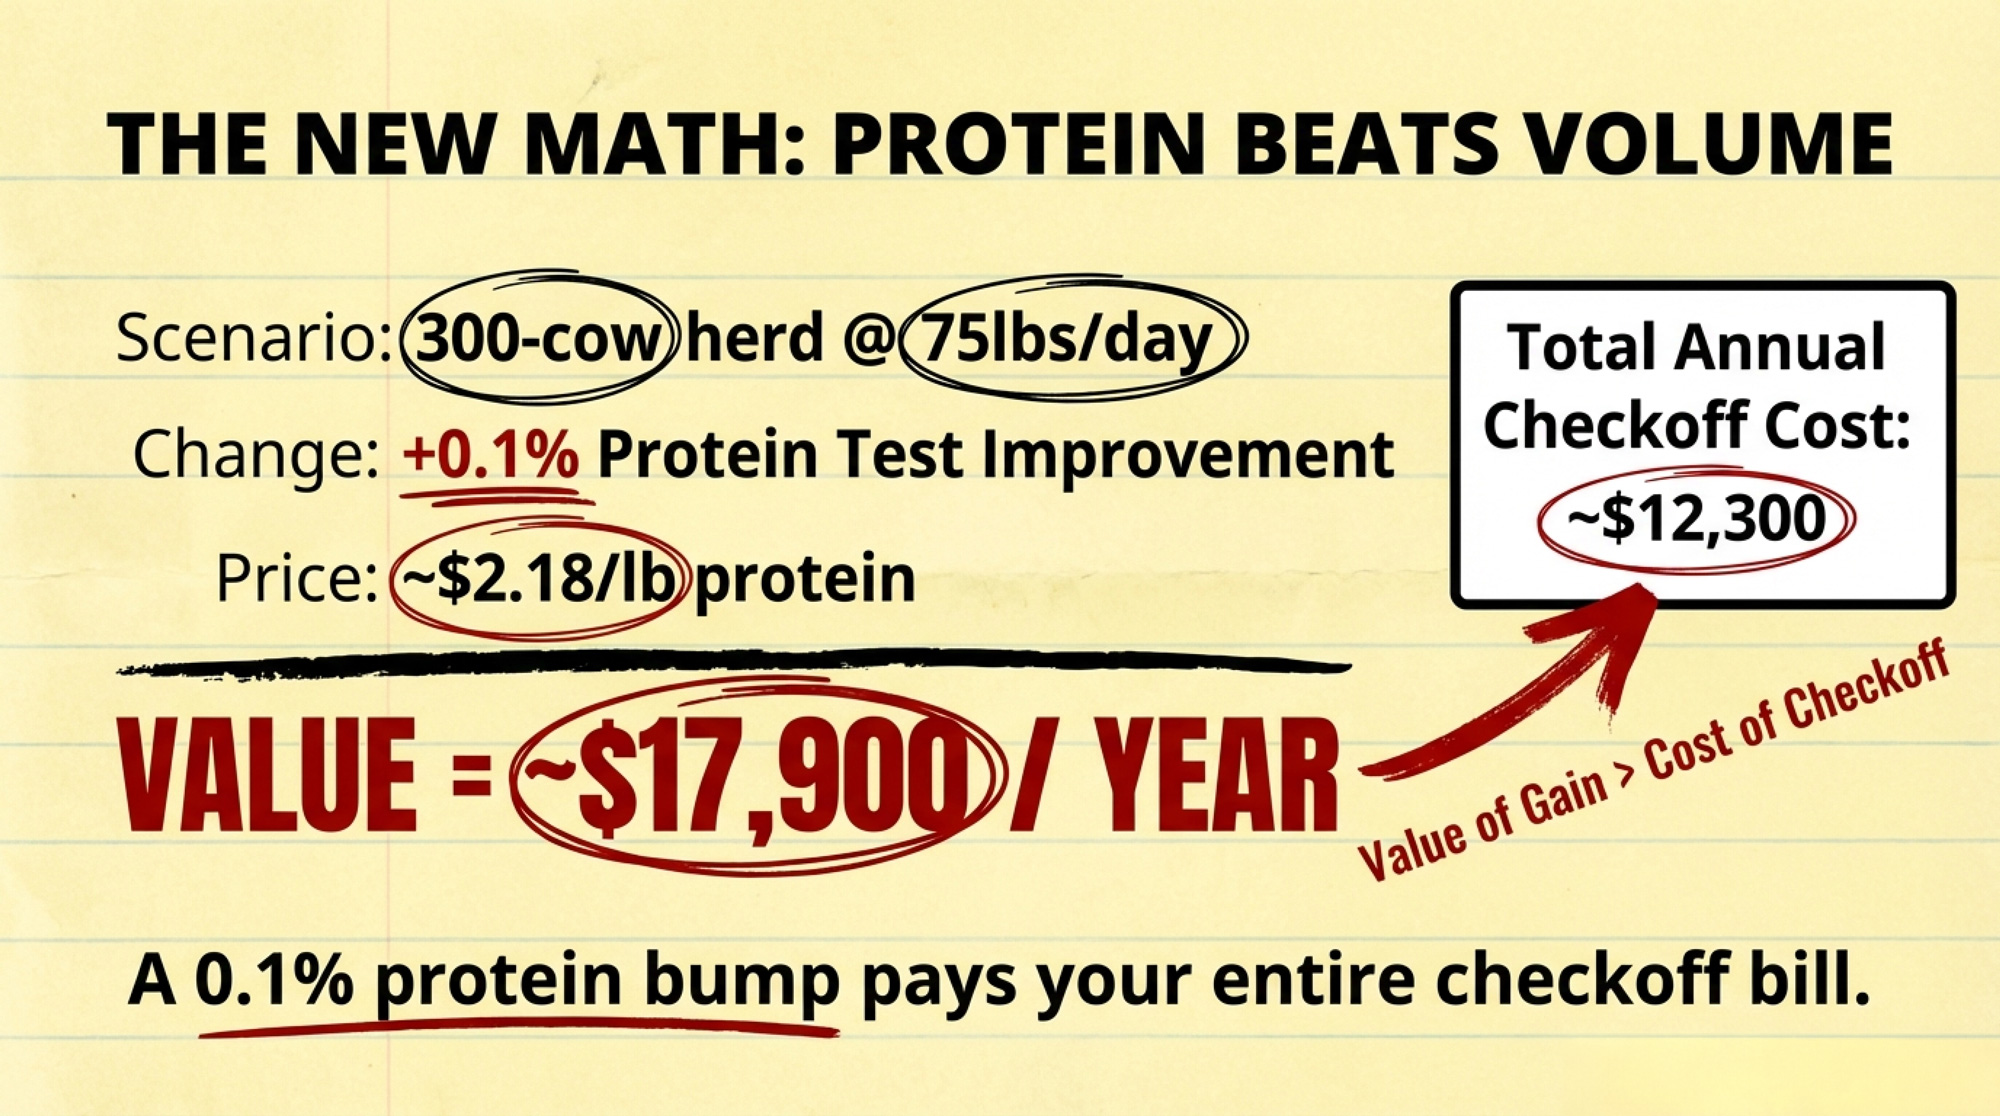
On a 300-cow herd shipping about 75 lbs per cow per day — roughly 82,000 cwt of marketable milk annually — you’re sending approximately $12,300 per year into checkoff programs at 15¢/cwt. That’s real money. And it pools into a war chest that’s reshaping how the world eats dairy — often through channels you’d never expect.
The $24.11 Gamble: Did TikTok Really Sell Your Butter?
The butter board didn’t happen by accident.
In September 2022, influencer chef Justine Doiron posted a TikTok video of herself slathering two sticks of butter directly onto a wooden cheese board — seasoning the thick layer with flaky sea salt and lemon zest, arranging torn herbs and red onion across the surface, finishing with flower petals and a drizzle of honey. The video hit escape velocity. The New York Times, CNN, and the Today Show all covered it. High-end restaurants rolled out $38 tableside “butter service.”
DMI claimed credit in industry press almost immediately — and here’s why they could. Doiron was a member of DMI’s paid “Dairy Dream Team,” a network that, according to DMI, commands a combined 25 million social media followers, plus another 100-plus influencers working with state and regional checkoff teams. In 2026, that’s a larger promotional footprint than most cable networks deliver.
Doiron had posted a clearly labeled DMI advertisement just two days before the viral butter board video. DMI told Grist that the butter board itself wasn’t technically part of the paid partnership — and Doiron’s contract has since expired, according to DMI. That timeline raises a question the checkoff hasn’t fully answered: when an influencer on your roster goes viral with dairy content between paid posts, where exactly does the sponsorship end and the organic moment begin?
For producers, there’s a number worth knowing from USDA’s 2020 Report to Congress on the Dairy Promotion and Research Program: for every dollar spent on demand-enhancing activities for butter, the estimated return was $24.11. But here’s the asterisk. In 2019, less than 2% of total checkoff funds were spent on butter promotion — meaning the high return may reflect a fast-growing category that would have surged regardless of the spending. A prior evaluation using data through 2019 had calculated the fluid milk return at $3.26 per dollar — nearly double the $1.91 figure that emerged when pandemic-year data from 2020 were included. Whether those aggregate returns translate to your individual milk check is a different question. One we’ll come back to.
From Diet Food to a $500 Million Brand: The Cottage Cheese Comeback
If butter was the checkoff’s viral showpiece, cottage cheese is where the market data really moved.
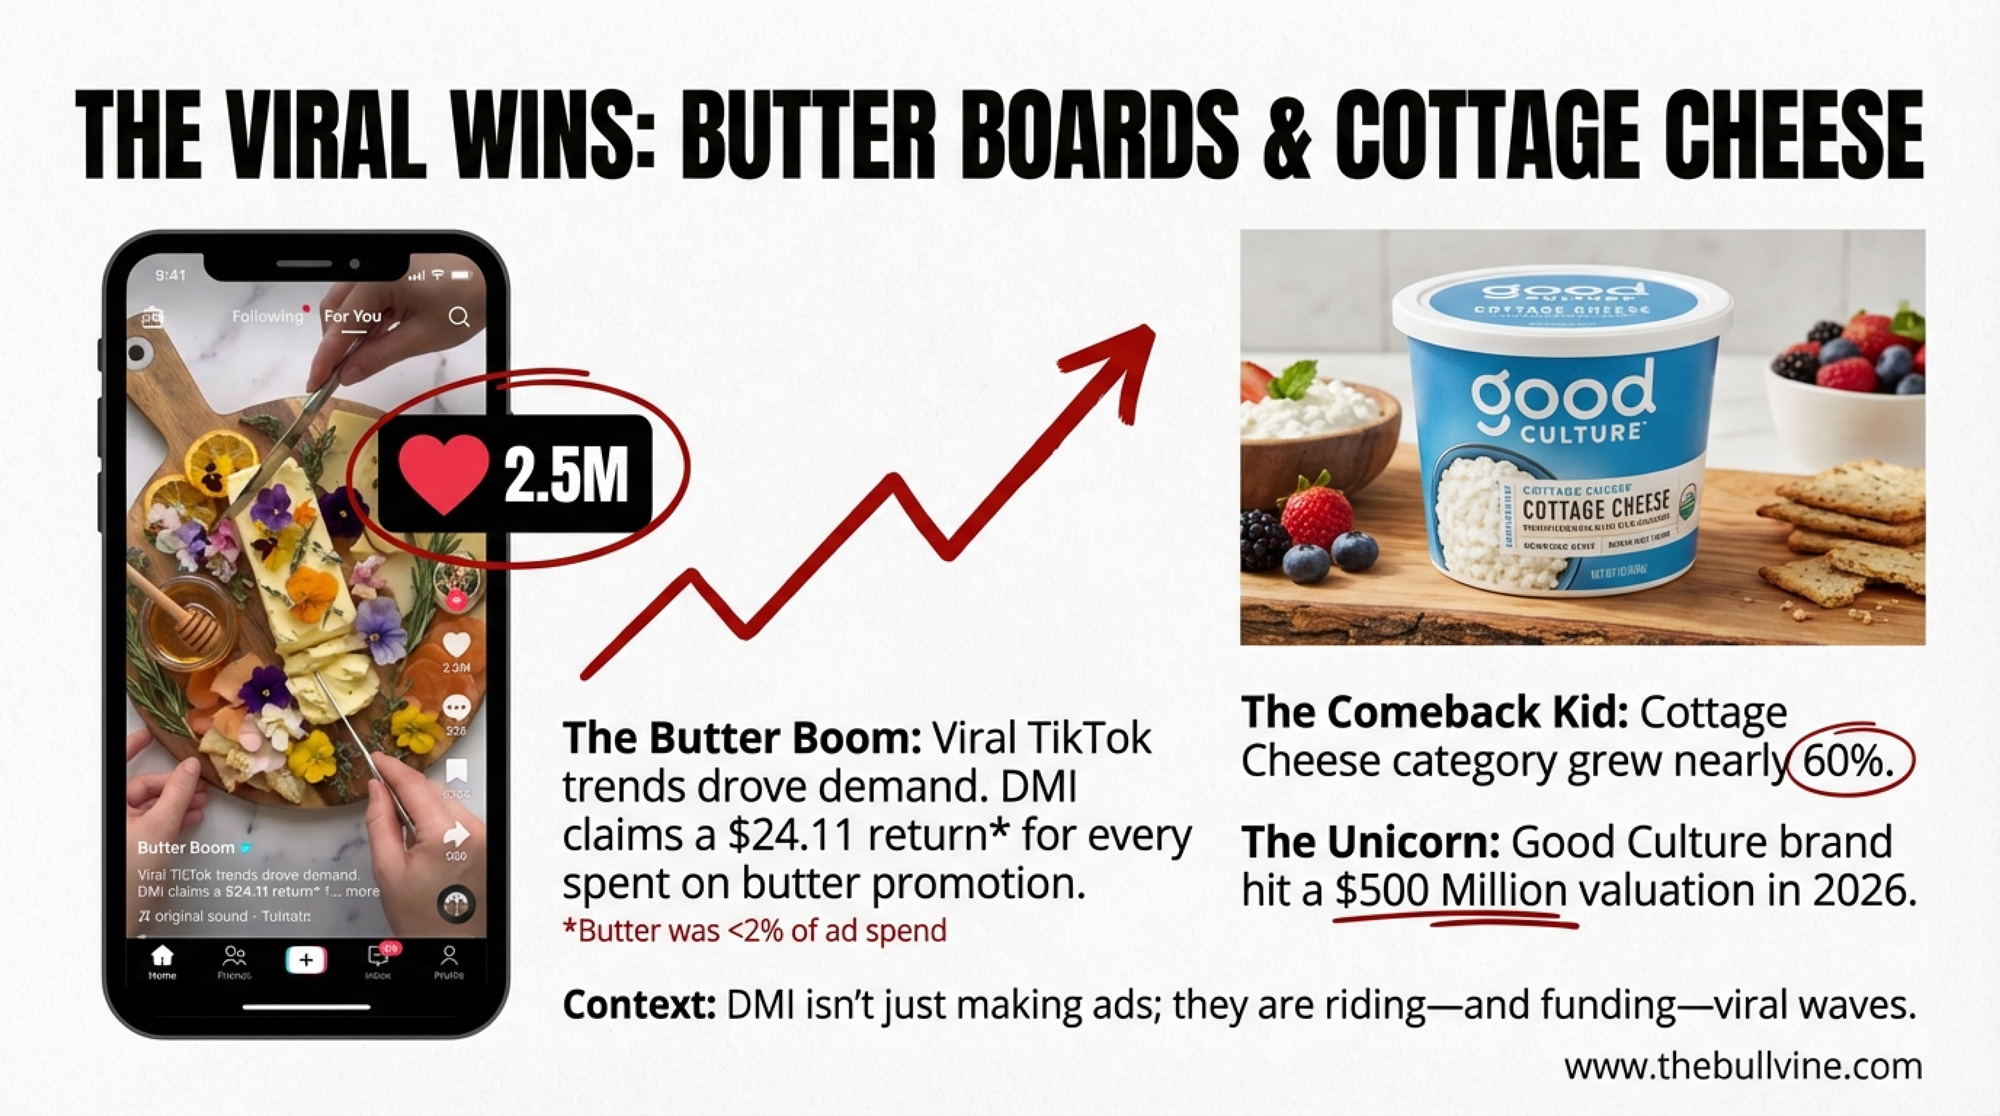
Good Culture — co-founded by Jesse Merrill and Anders Eisner in 2015, headquartered in Austin, Texas — bet on clean labels, modern branding, and higher-welfare sourcing through its partnership with Dairy Farmers of America’s Path to Pasture program. The brand hit $100 million in revenue in 2023 and nearly doubled that in 2024, according to Forbes. In January 2026, private equity firm L Catterton acquired a controlling stake for more than $500 million, with Good Culture raising an additional $55 million from SEMCAP Food & Nutrition the following month. The broader cottage cheese category grew nearly 60% over that same period.
The engine behind that growth? TikTok recipes that repositioned cottage cheese from frumpy 1970s diet food into a high-protein base ingredient — cottage cheese “ice cream,” high-protein pancakes, flatbreads. “It was about a $1.1 billion category when I entered the space… the category growth was kind of flat or in decline for decades,” Merrill told Fast Company. “I just saw that as a huge opportunity.” Each viral recipe effectively increased the serving size per use — exactly what drives volume growth for processors.
If your processor pays on components, that cottage cheese boom translates directly into demand pressure on the protein fraction of your milk check. We dug into why that protein shift matters for your breeding program in “The $97,500 Protein Shift.”
The Genetic Signal in the Checkoff Data
Here’s the part that connects DMI’s viral success to your breeding barn.
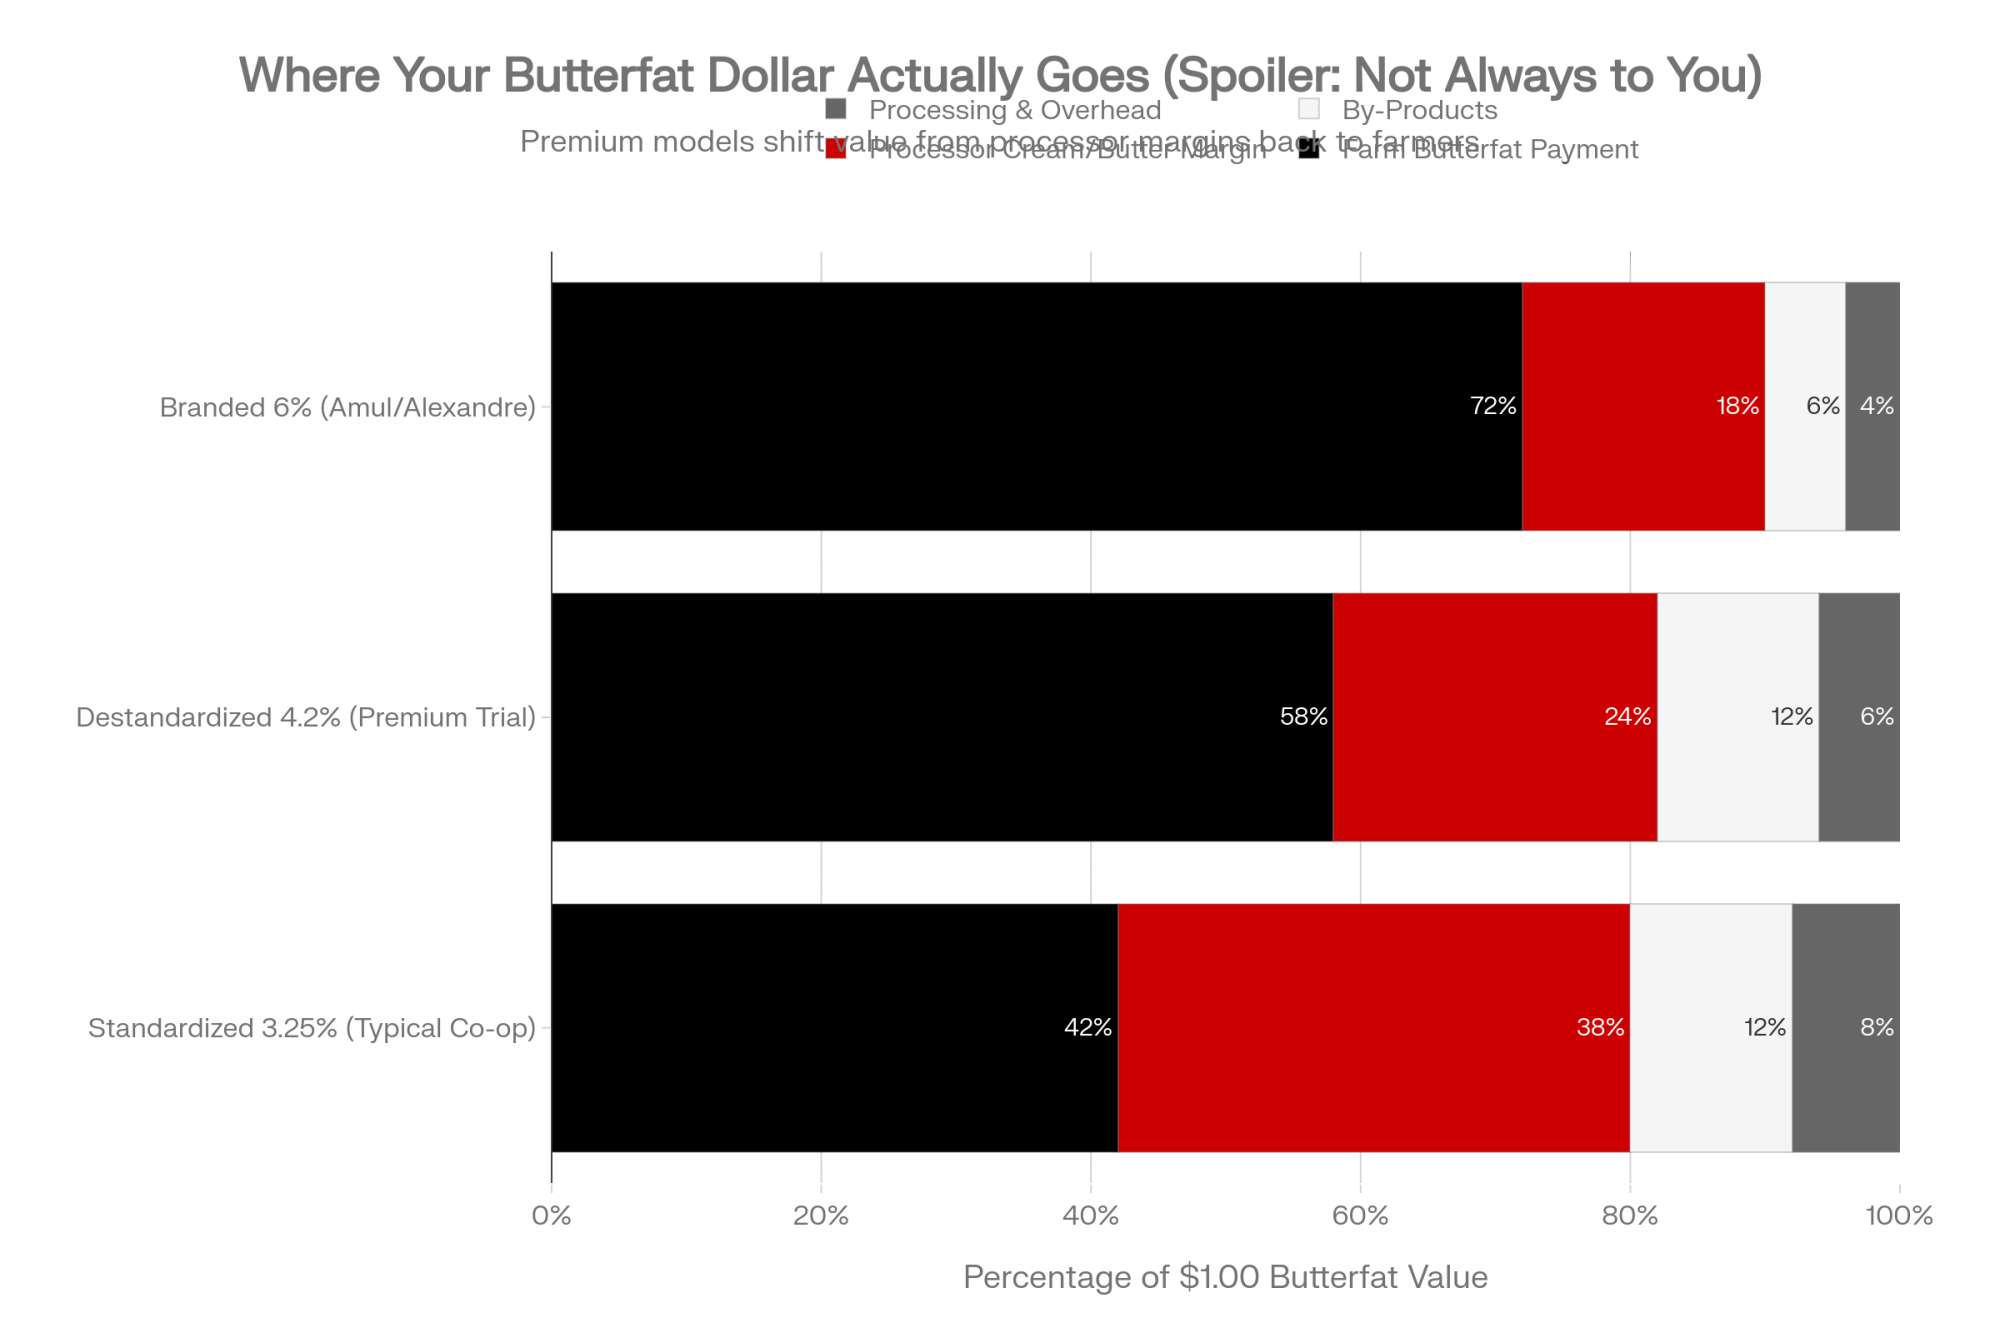
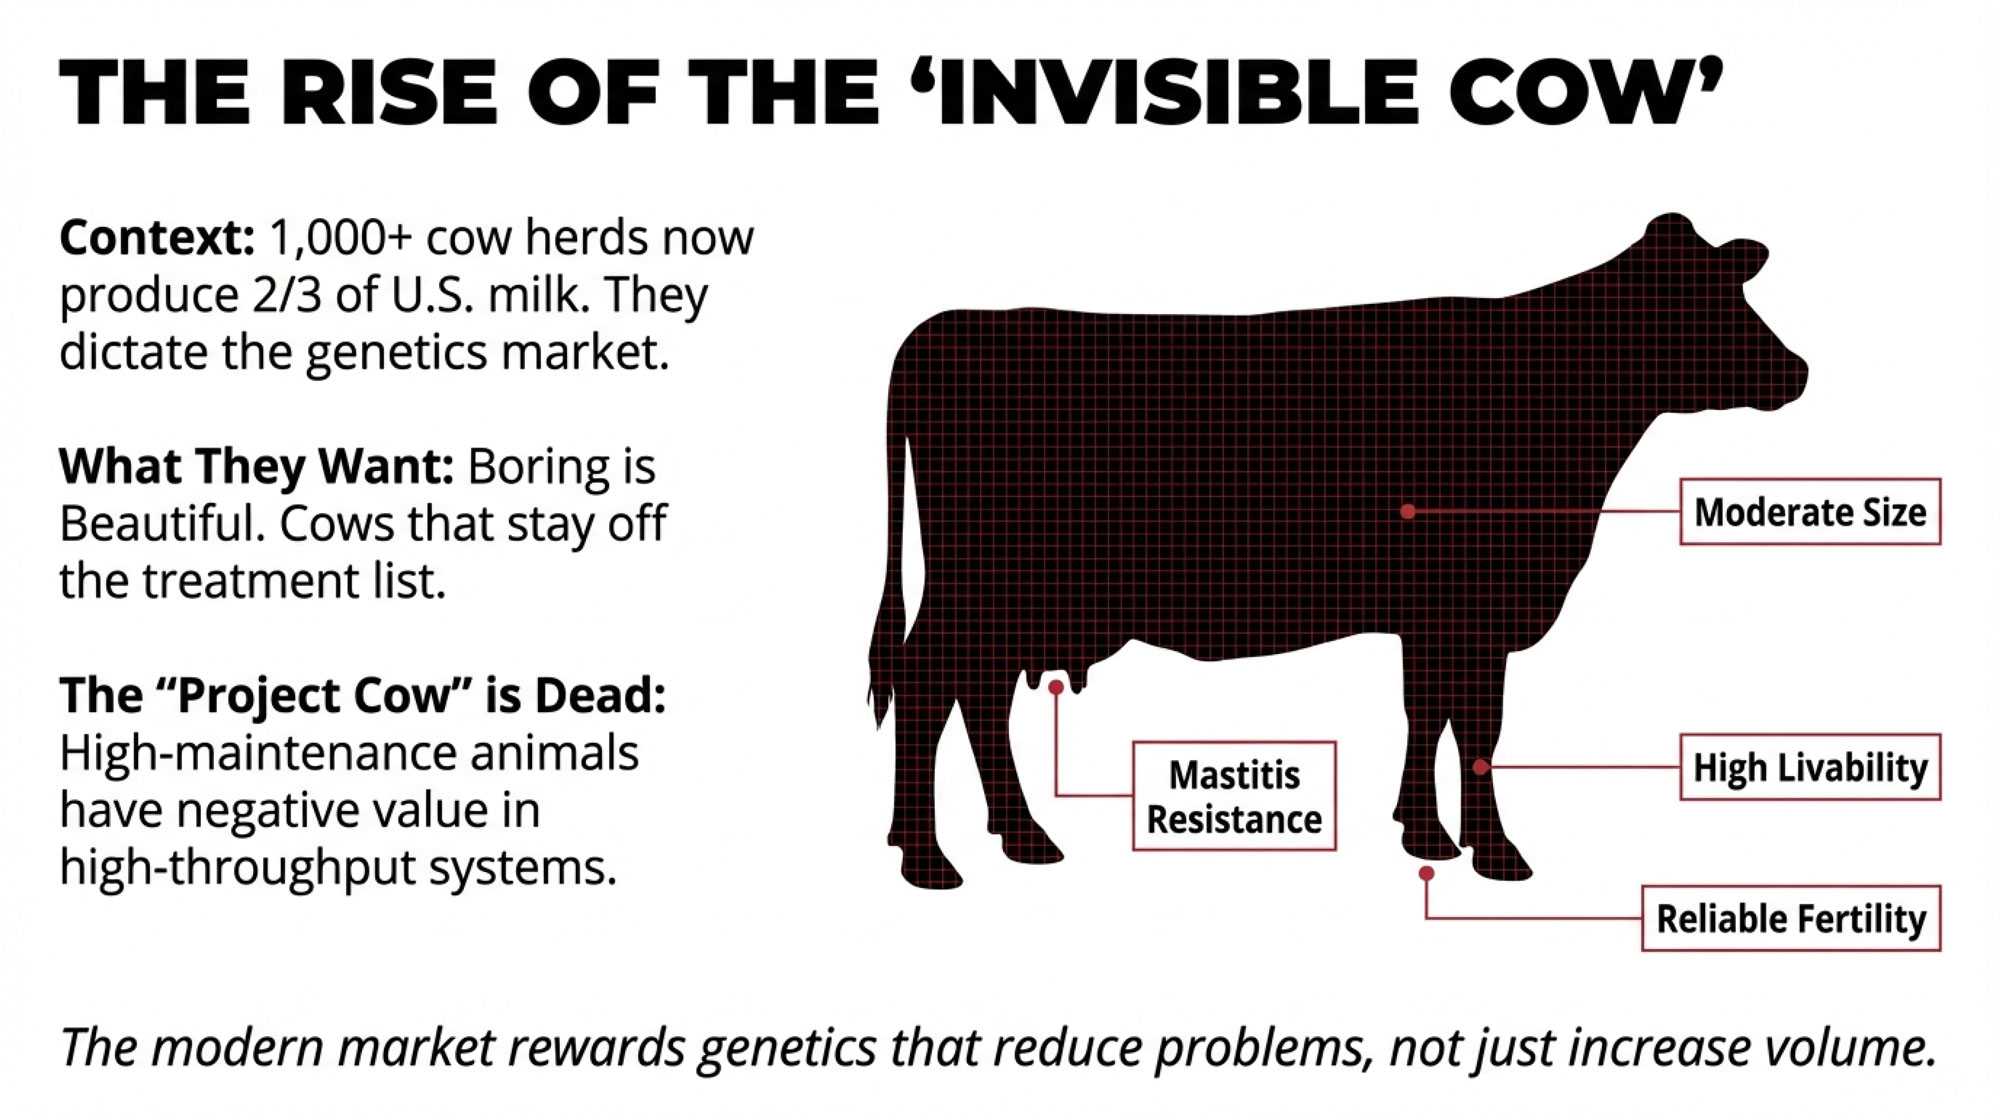
Every one of these demand wins — protein lattes, cottage cheese, ultra-filtered milk — rewards milk for what’s in it, not how much of it there is. If DMI is genuinely succeeding at repositioning dairy as a protein ingredient rather than a commodity fluid, that’s not just a marketing shift. It’s a direct economic challenge to the volume-first Holstein model that still dominates most North American breeding programs.
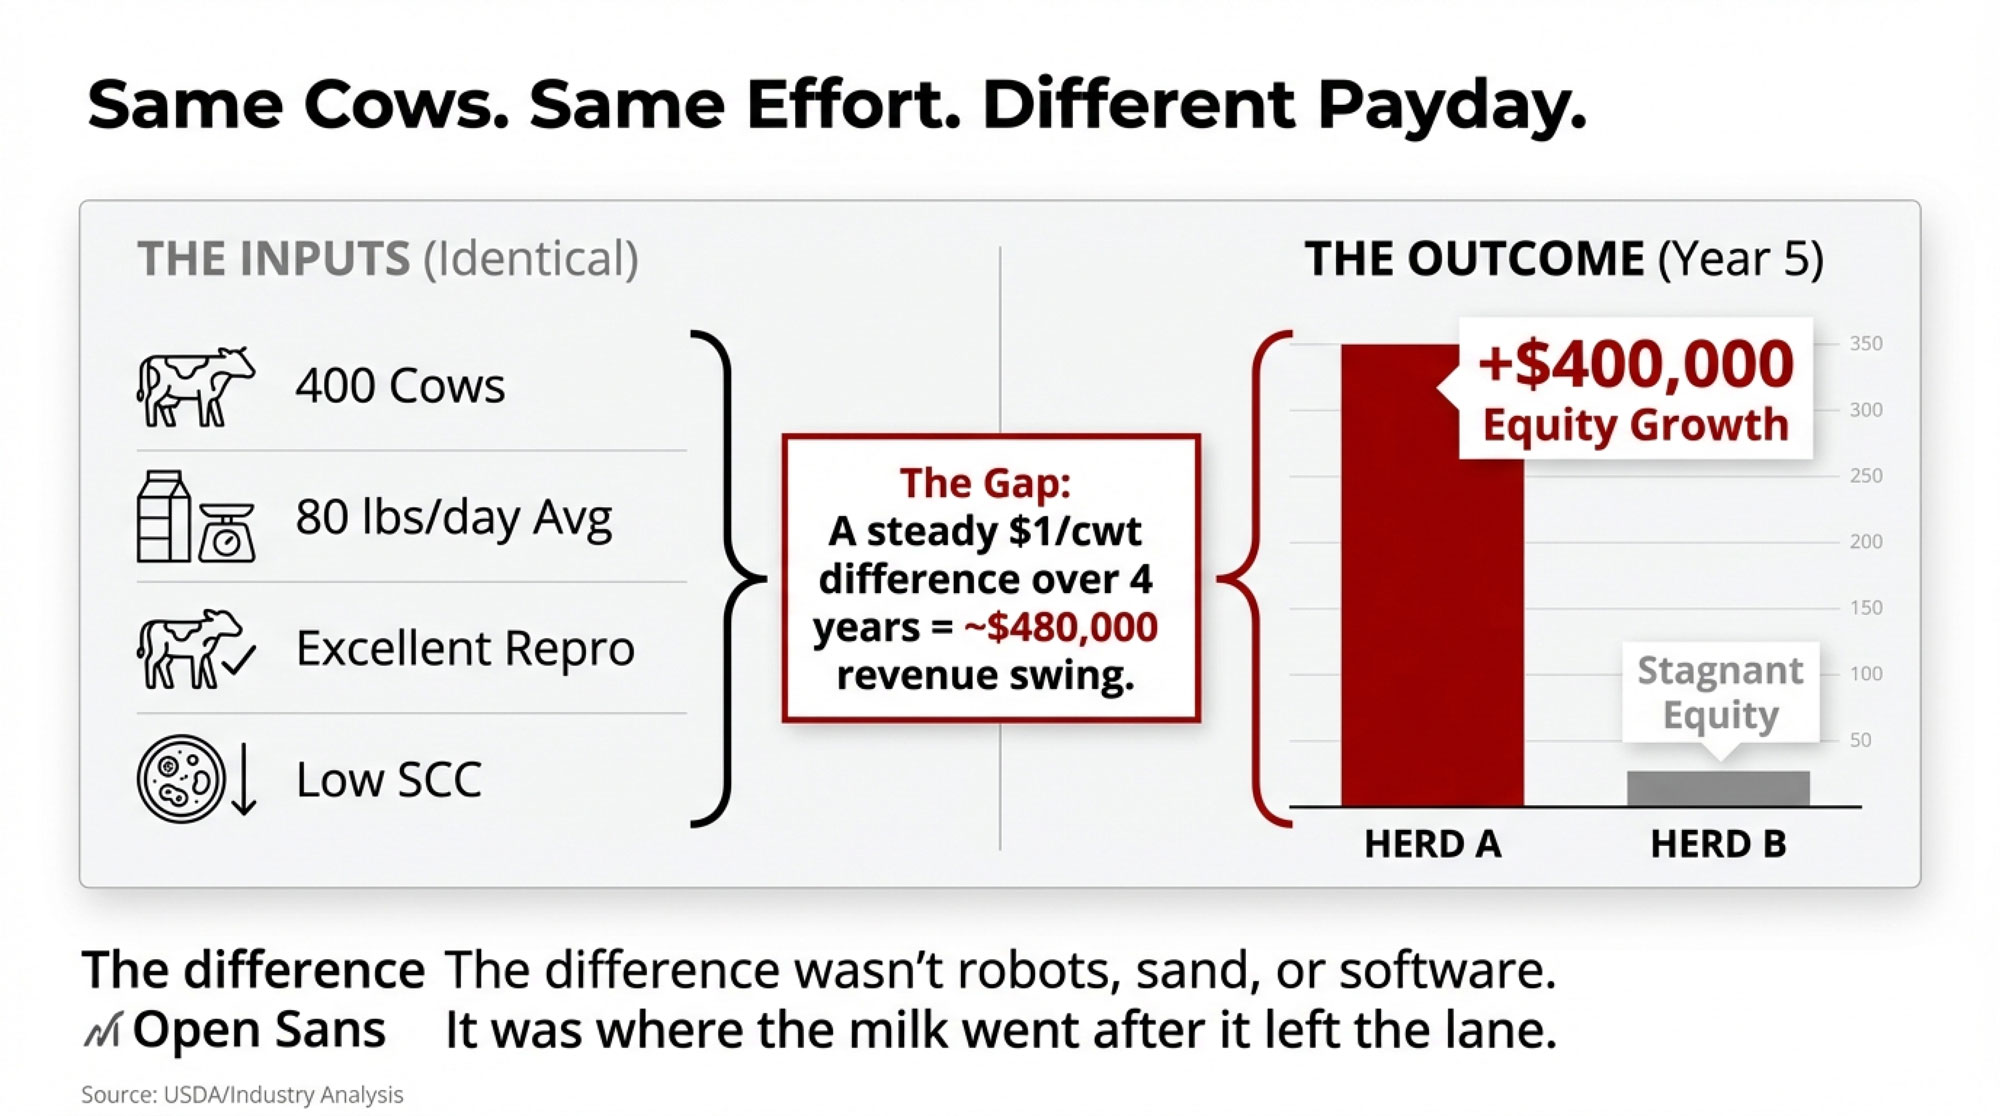
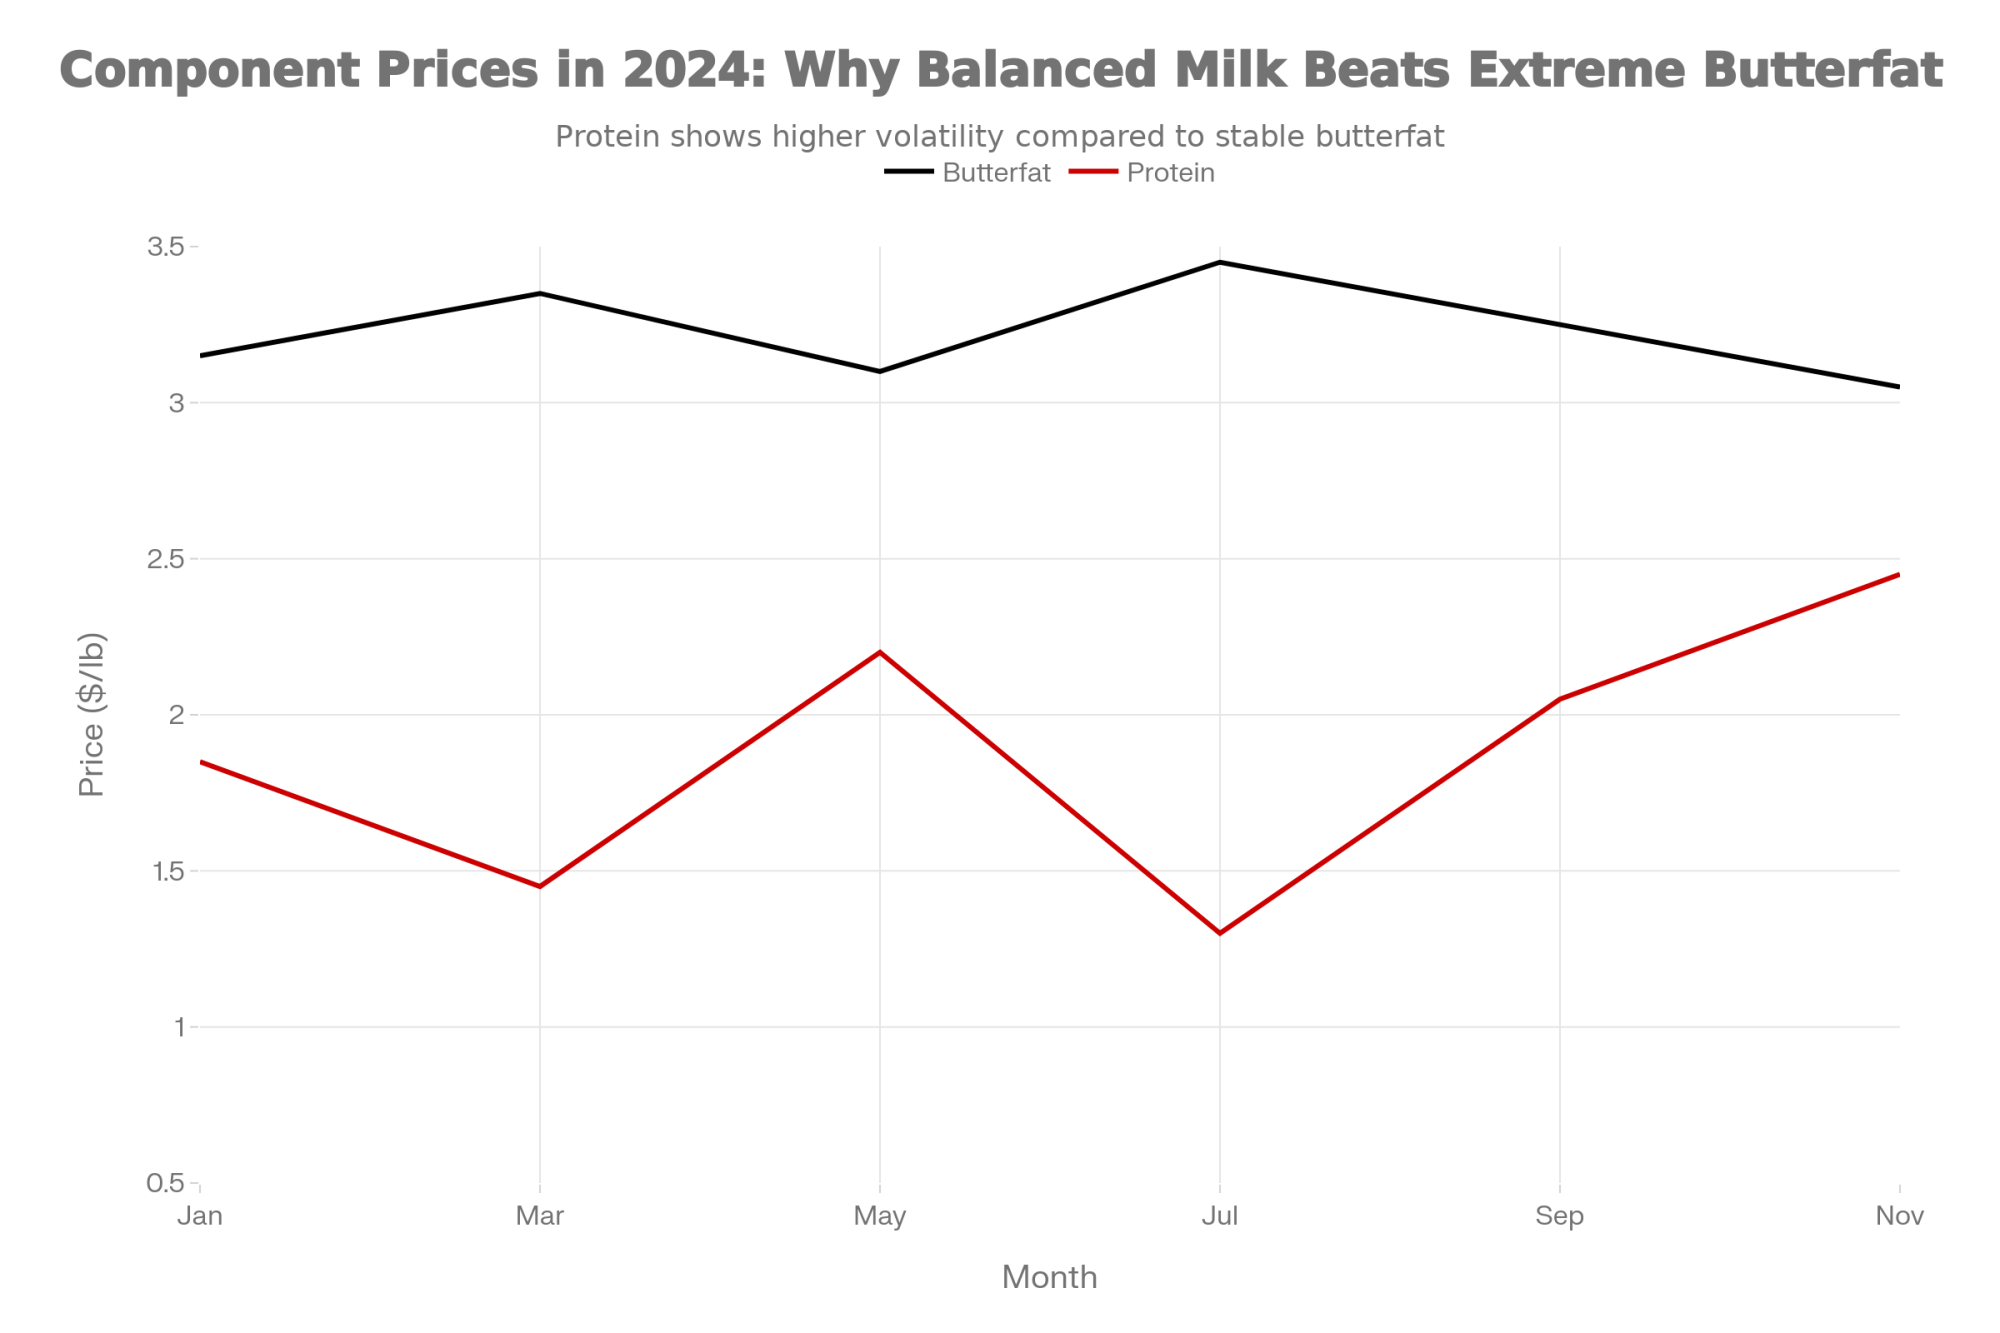
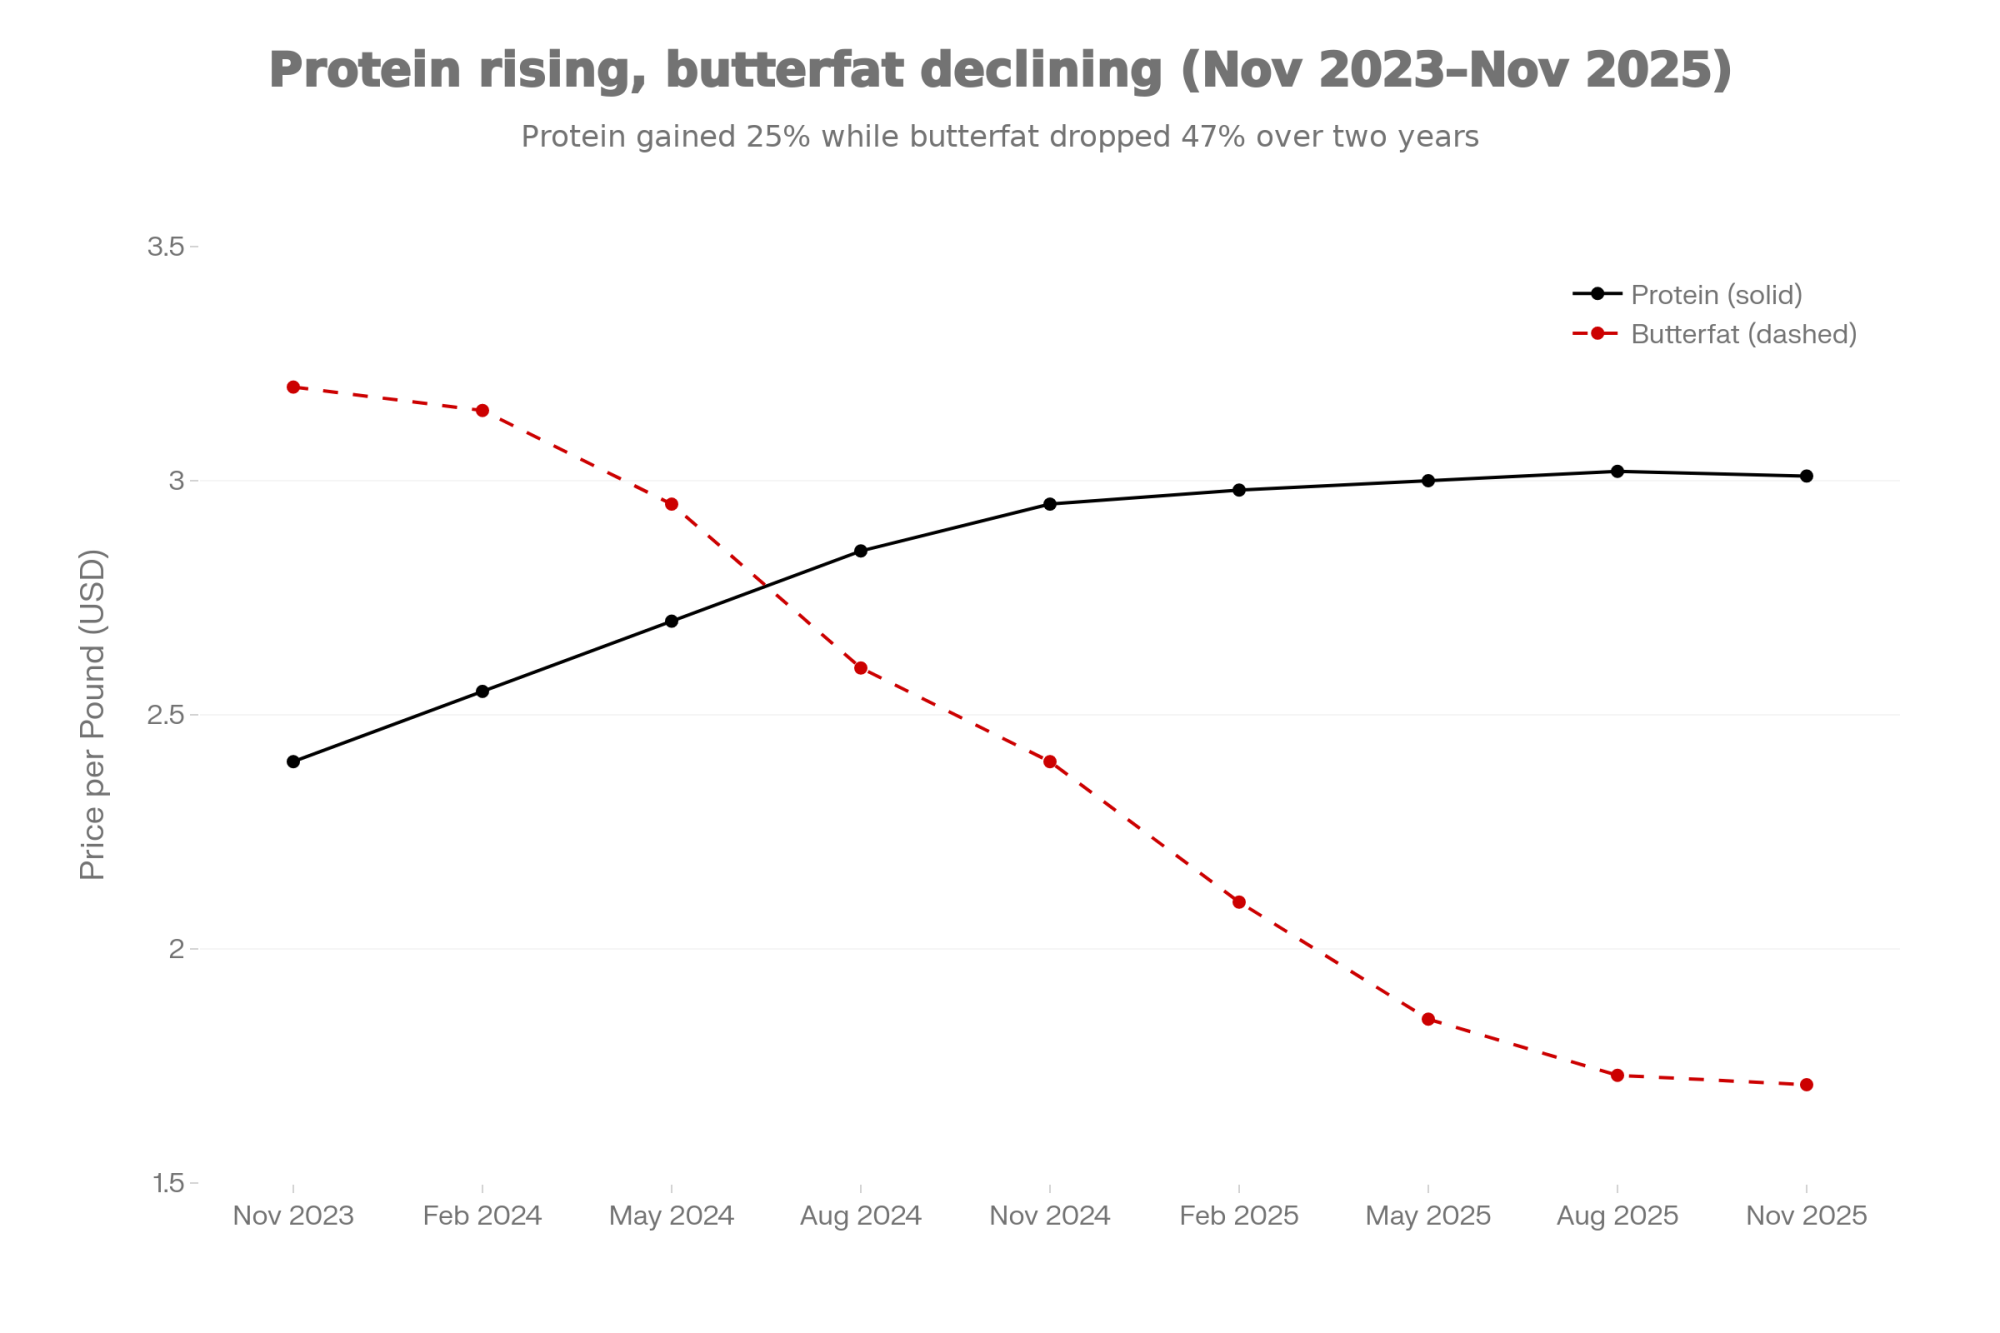
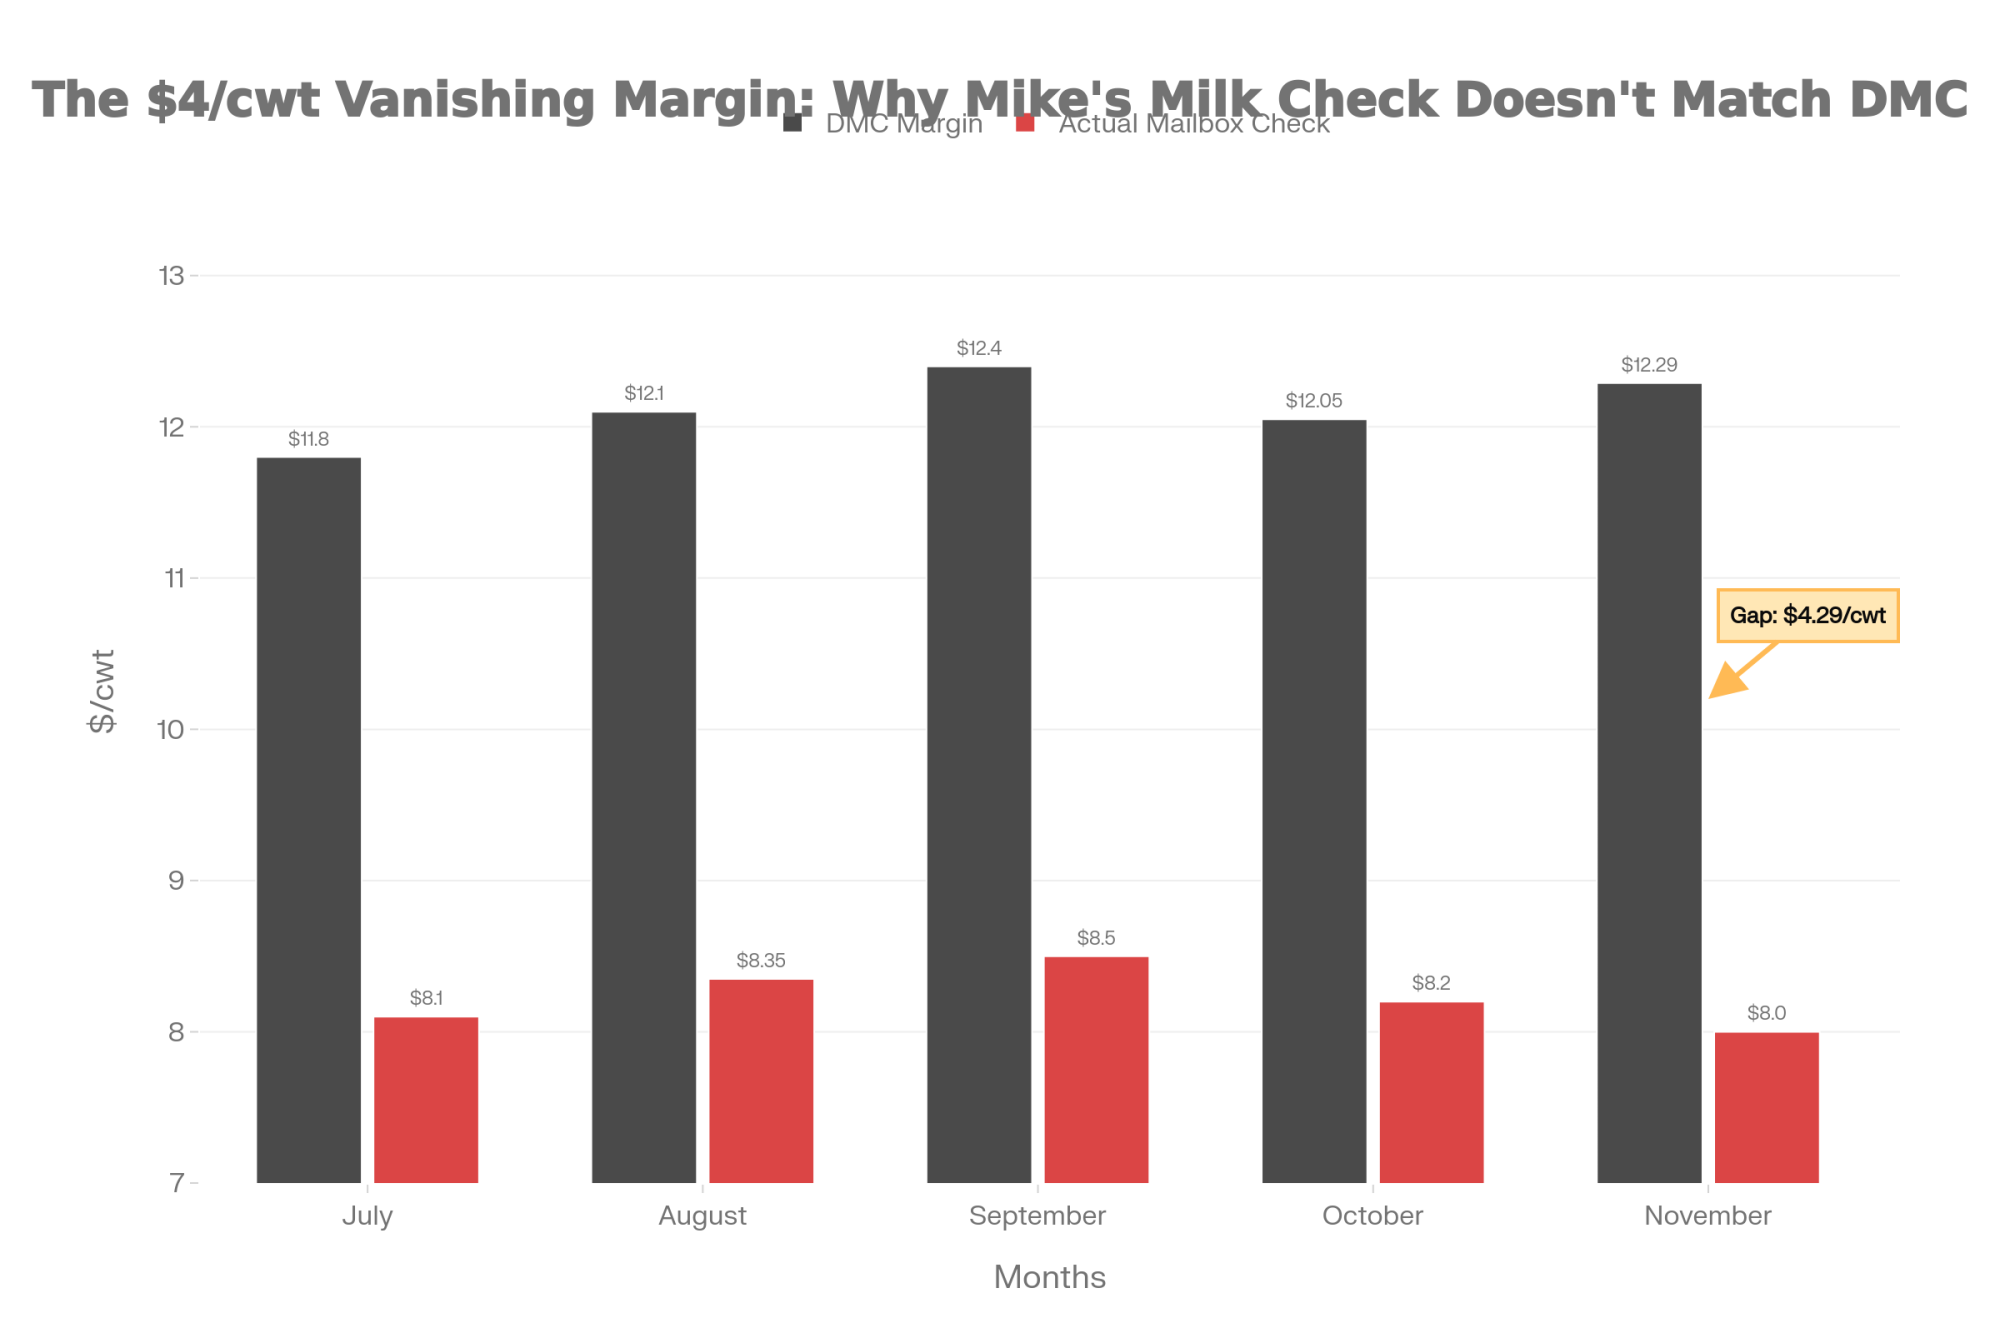
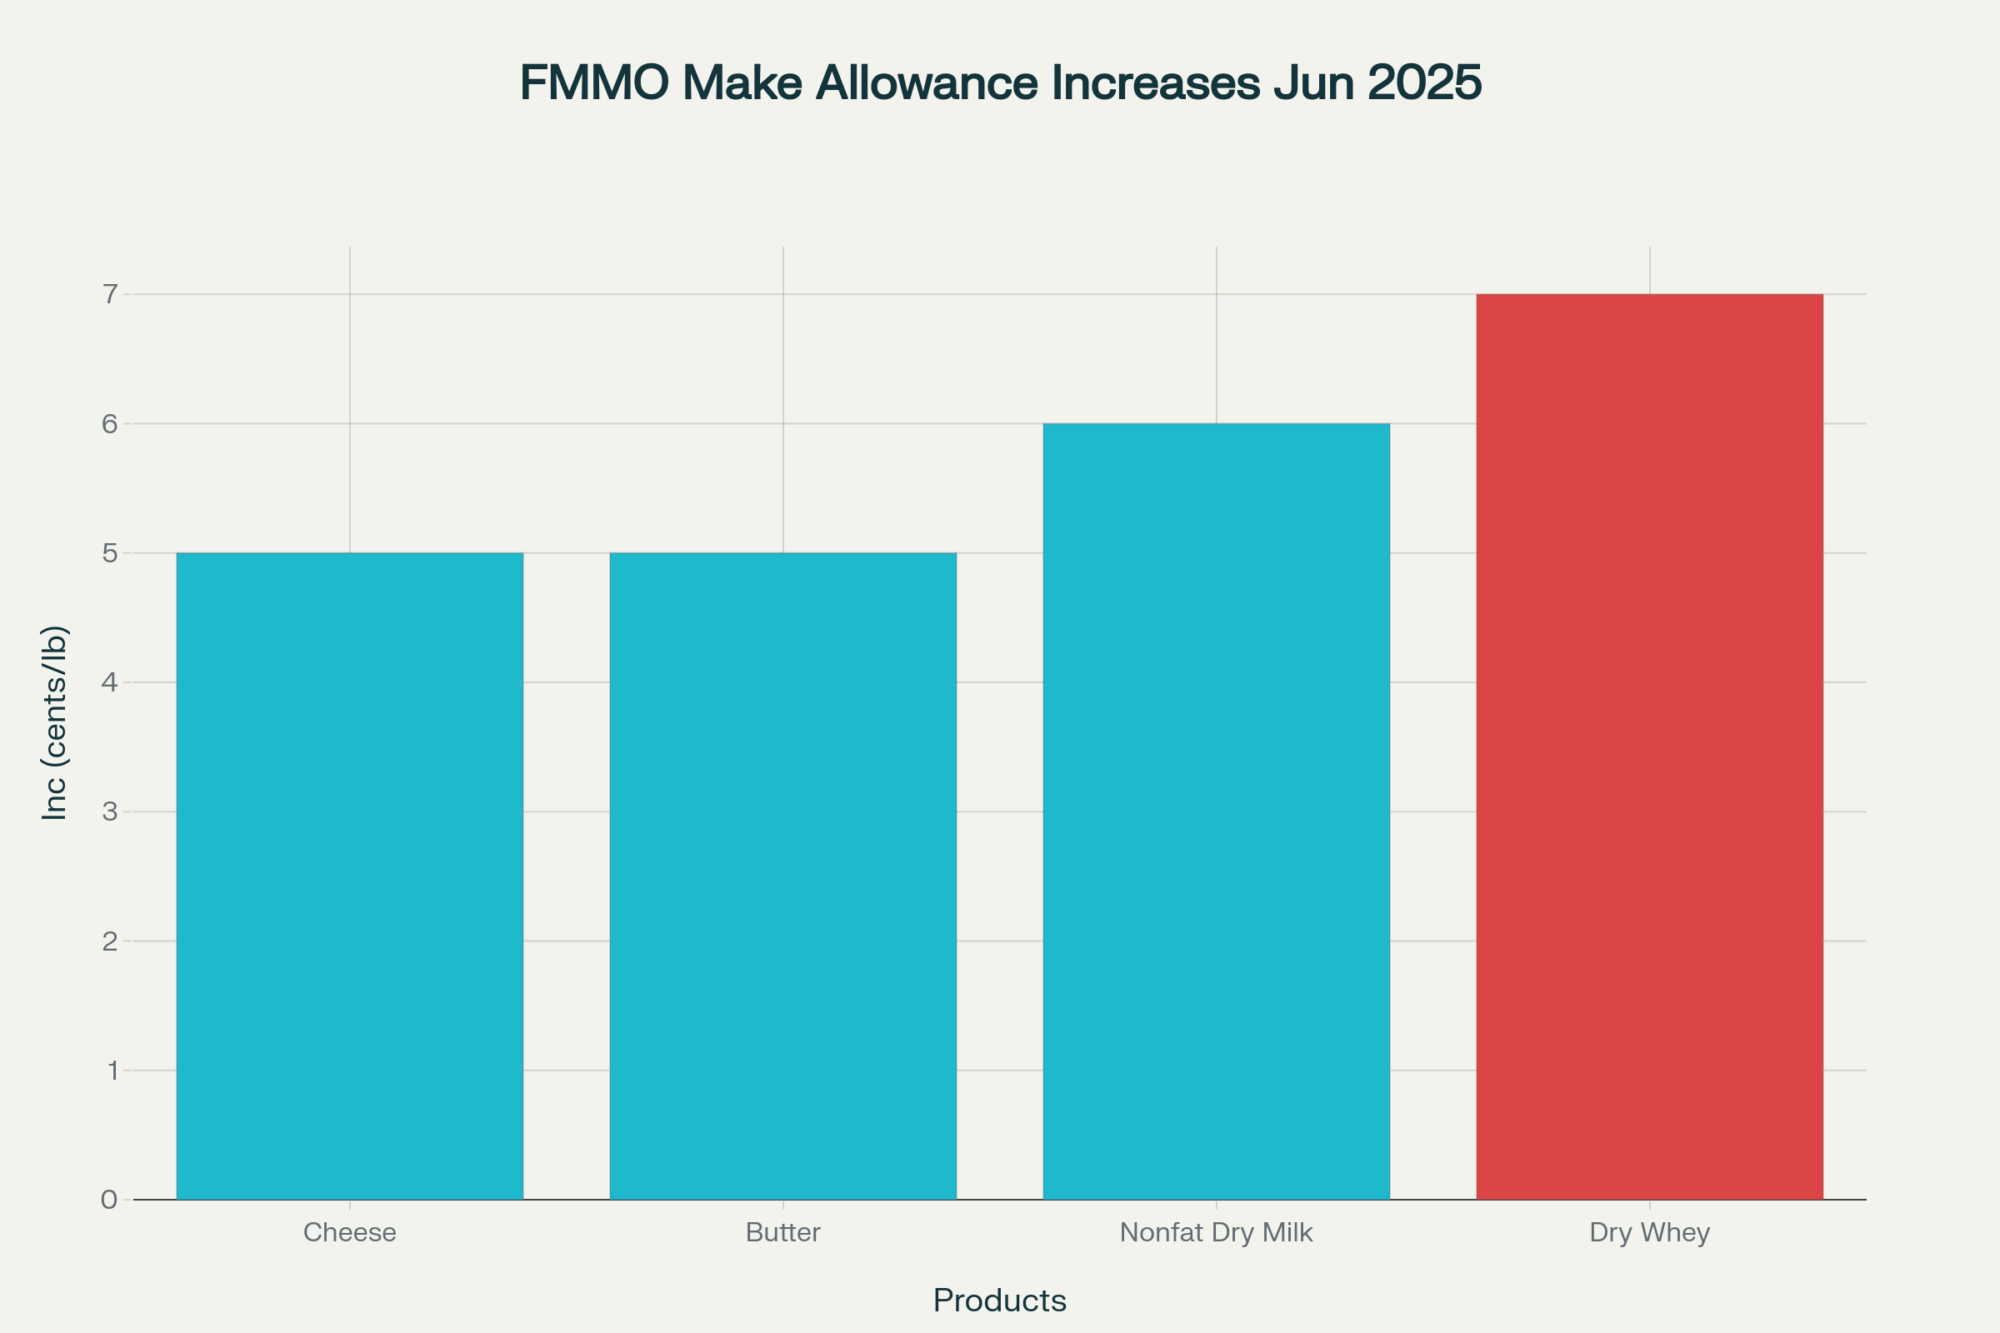
The math is blunt. Under the updated FMMO formula (effective with the FMMO reform final rule published in early 2025), the Class III skim milk price now uses a 3.3% protein factor — up from 3.1%. That change amplifies every tenth of a point in your protein test. And when you pair the factor change with where protein prices have actually been, the gap between volume-bred and component-bred herds widens fast:
Protein Revenue Impact: What 0.1% Protein Test Is Worth (300 cows, 75 lbs/day, component pricing)
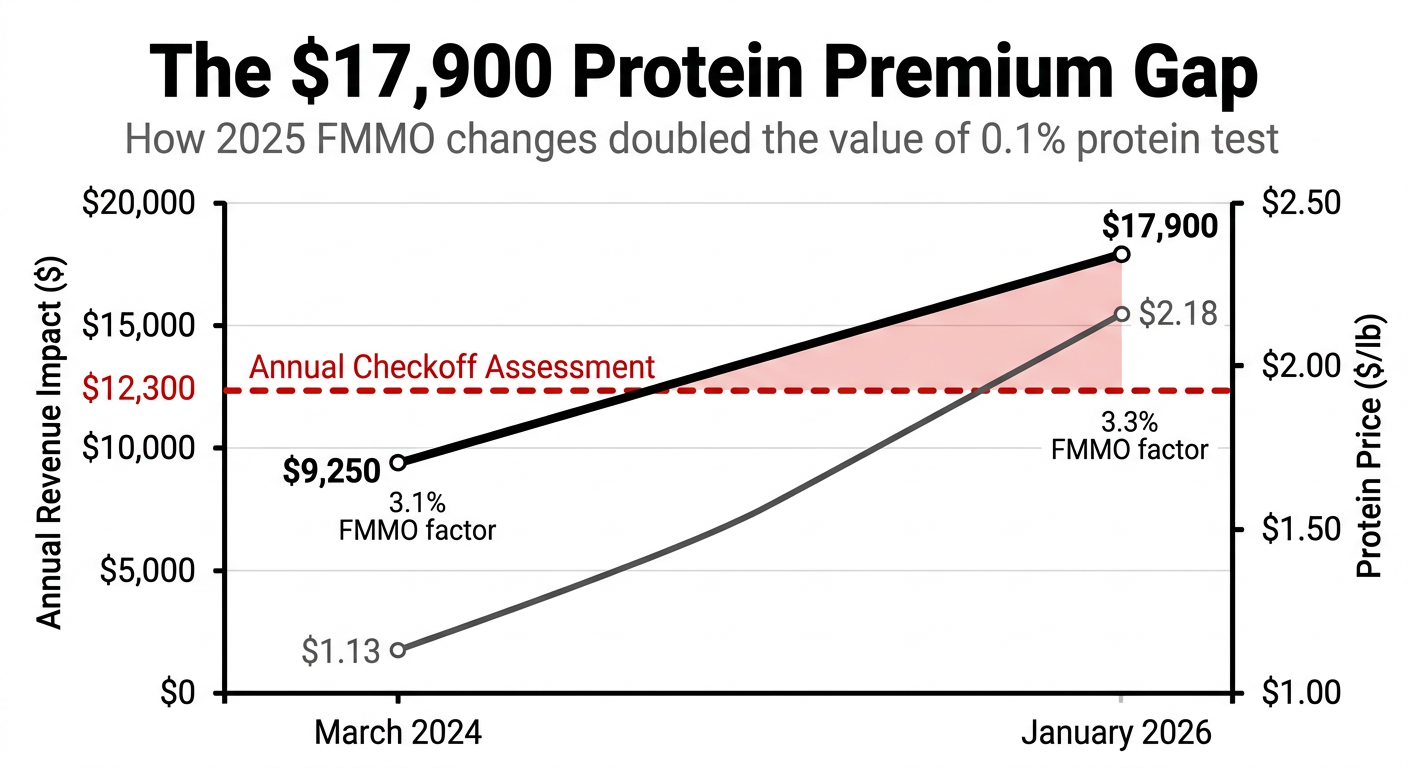
| Metric | March 2024 | January 2026 |
|---|---|---|
| FMMO Protein Factor | 3.1% | 3.3% |
| Protein Price ($/lb) | $1.13 | $2.18 |
| Annual value per 0.1% test (300 cows, 75 lb/day) | $9,250 | $17,900 |
| Annual checkoff assessment (300 cows) | $12,300 | $12,300 |
| Excess value above checkoff | −$3,050 | +$5,600 |
Sources: USDA AMS Announcement of Class and Component Prices, FCPO-0324 (April 2024) and CLS-0126 (February 2026). Protein prices are volatile — the 2024 FMMO protein price ranged from $1.13/lb to a peak of $3.32/lb, and the 2025 average was $2.45/lb. The near-doubling in value shown here is driven primarily by the increase in protein prices; the change in the factor (3.1% → 3.3%) separately affects how protein value flows through Class III blend prices.
That’s not a rounding error. At January 2026 prices, $17,900 per year from a 0.1% protein test improvement exceeds your $12,300 annual checkoff assessment, from one-tenth of a percentage point. If you’re still selecting bulls primarily on milk volume and ignoring protein test, you’re breeding for yesterday’s market while DMI spends your checkoff dollars building tomorrow’s.
This doesn’t mean volume is irrelevant. A 300-cow herd that gains 2,000 lbs per cow on the next generation but drops 0.15% protein may still come out ahead — depending entirely on your federal order, your processor’s product mix, and your contract structure. The point is that you need to run both sides of that equation now, not five years from now.
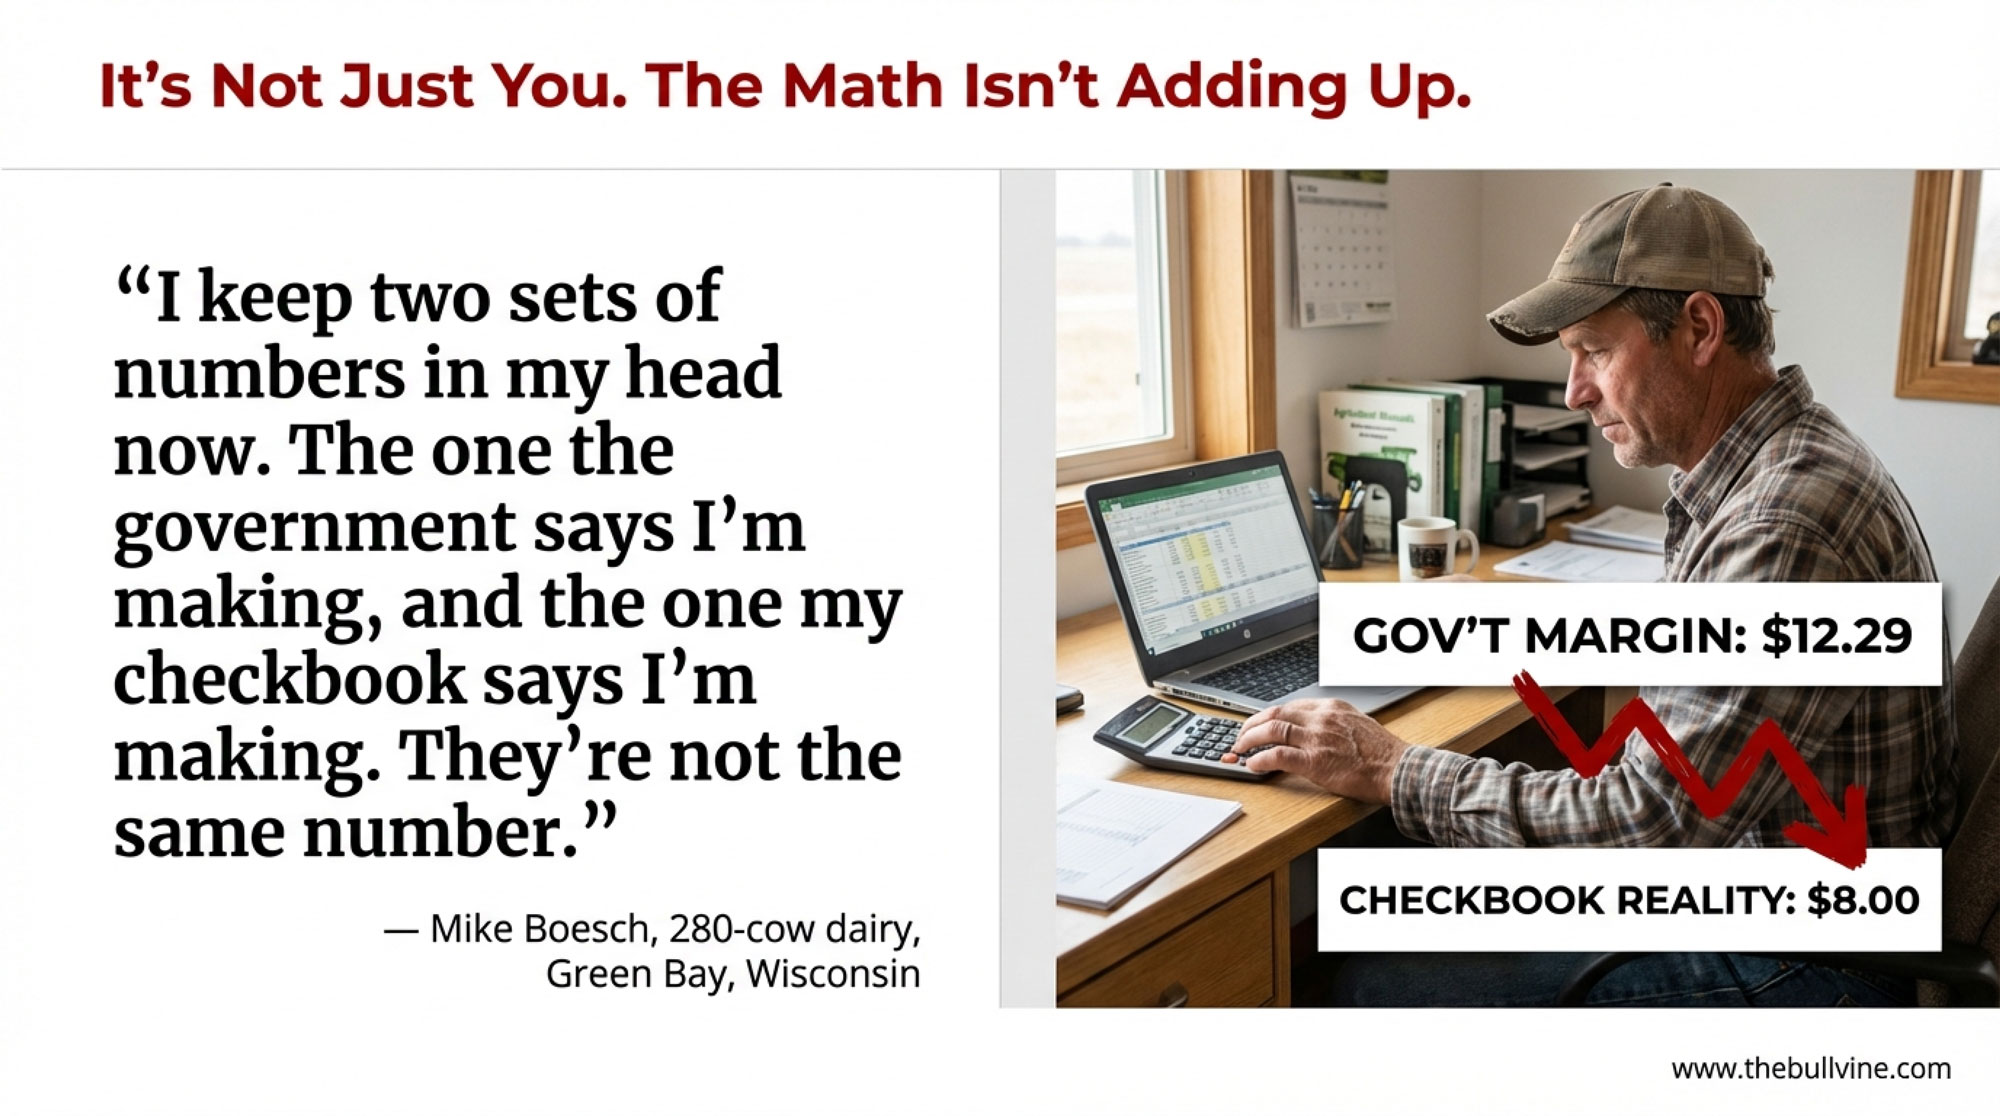
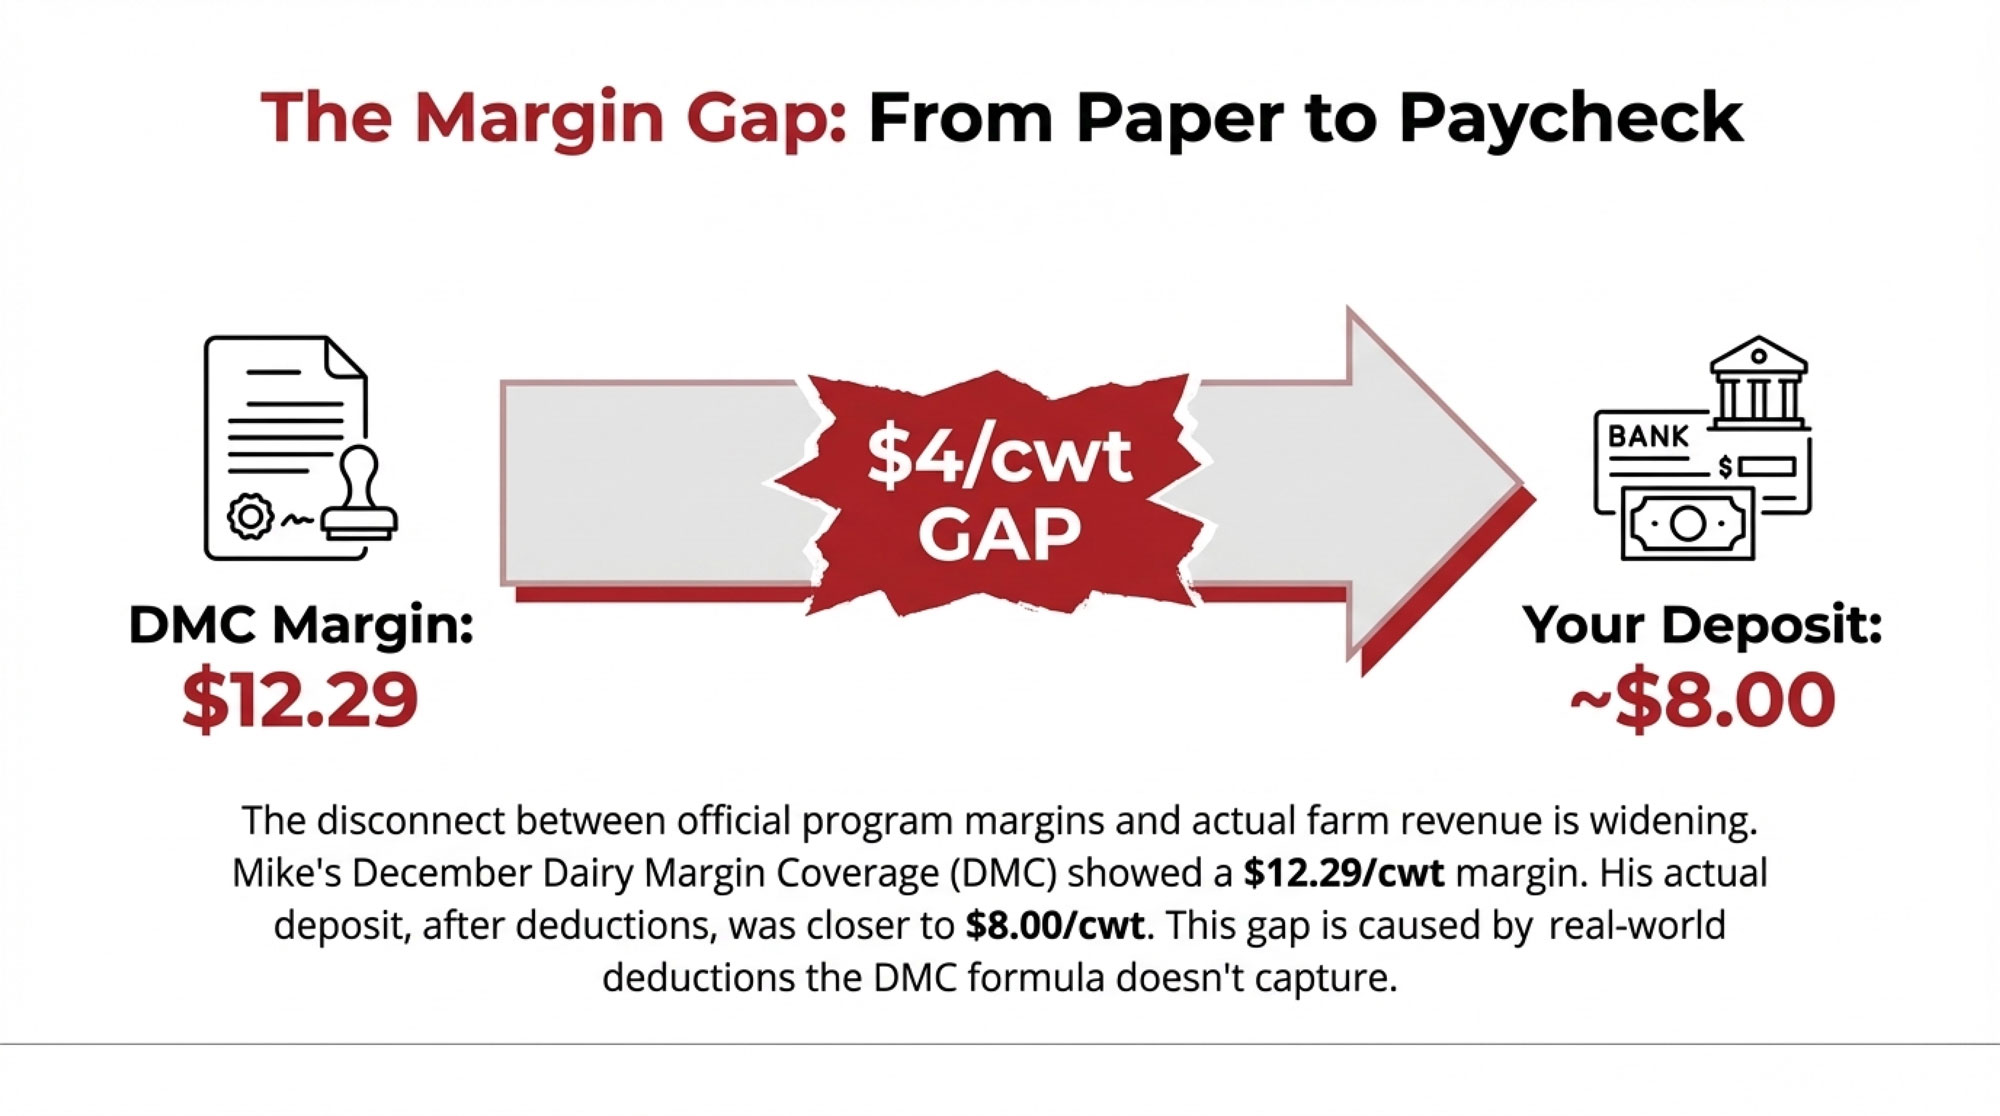
Is Your Checkoff Actually Delivering?
Not every producer is convinced the math works out. And some of the sharpest critics have seen the program from the inside.
Sarah Lloyd farms in Columbia County, Wisconsin. She served on the national Dairy Board from 2013 to 2016, milking 350 to 400 cows on the Nelson family operation near Wisconsin Dells. She’s since begun transitioning that farm toward conservation and new agricultural enterprises — but her critique of the checkoff hasn’t softened.
“It’s set up to be entirely demand-side,” Lloyd told Grist. “You’re not allowed to talk about price, you’re not allowed to talk about supply. It’s a wasted effort.”
Lloyd told Grist she’d watched a neighboring dairy operation quadruple in size to supply mozzarella to a nearby frozen pizza factory — and that local water quality had suffered as a result. “It’s a real crisis right now on all the legs of sustainability: ecologically, socially, economically.” In a separate interview with the Milwaukee Journal Sentinel, she was more pointed about the structural problem: “I can’t do the wheeling and dealing to directly line up milk to the supply chain that is benefiting from the marketing dollars. I need to rely on the trickledown.”
Lloyd isn’t alone. Brenda Cochran milked in Tioga County, Pennsylvania, and took the checkoff fight all the way to the Supreme Court — arguing the mandatory assessment was compelled speech that violated her First Amendment rights. “For years, the forced deductions from our milk checks being used to finance the generic dairy checkoff program have exceeded $4,500 annually,” Cochran wrote for the Organization for Competitive Markets in 2017, “which is a huge financial loss from our already insufficient milk income.” We told Cochran’s full story — and the $352 million question it raises — last month.
Hershey sees it differently. Those chicken sandwiches without cheese, the Starbucks protein lattes — these are macro demand plays that individual farms can’t execute alone. At DMI’s November 2025 annual meeting, she emphasized that “national programs rely on local engagement, and local programs depend on unified national priorities that make every farmer dollar work harder.”
The tension among Lloyd, Cochran, and Hershey reflects something checkoff defenders rarely address head-on: growing total demand doesn’t necessarily protect the individual farm, especially when that demand is captured primarily by large-scale operations with processor relationships that smaller herds can’t access. That’s the rub: a mandatory, farmer‑funded checkoff grows its budget with milk volume, not milk price. So how, exactly, is it supposed to prove farm‑level return?
What Did $875 Million in QSR Partnerships Actually Build?
DMI’s answer to the skeptics lives inside fast-food headquarters — literally.
Since 2009, DMI has placed dairy food scientists directly inside McDonald’s corporate offices. By 2015, McDonald’s was using 14% more dairy (in milk-equivalent pounds) than at the start, according to DMI. Porter Myrick, one of those on-site scientists, described the arrangement in a 2018 Dairy Foods Magazine announcement: “We work here every day alongside the McDonald’s culinary staff, and we very much feel like one team.”
Their work has been specific and measurable: white cheddar cheese slices more than 30% larger rolled out across 14,000 restaurants, reformulated chocolate milk with 25% less sugar for Happy Meals, and the dairy-heavy menu infrastructure that was already in place when the Grimace Shake went viral in 2023. DMI CEO Barb O’Brien put it directly on a December 2023 podcast: “My hope is that farmers, when they see a new milkshake or a new McFlurry at McDonald’s, that they know that it’s their new product.”
The most recent numbers back up the scale. According to DMI’s November 2025 economic impact report, the foodservice strategy across McDonald’s, Taco Bell, and Domino’s contributed 18.5 billion additional pounds of dairysold at retail between 2009 and 2024 — generating $875.9 million in incremental farmer revenue and a return of $3.49 for every dollar invested.
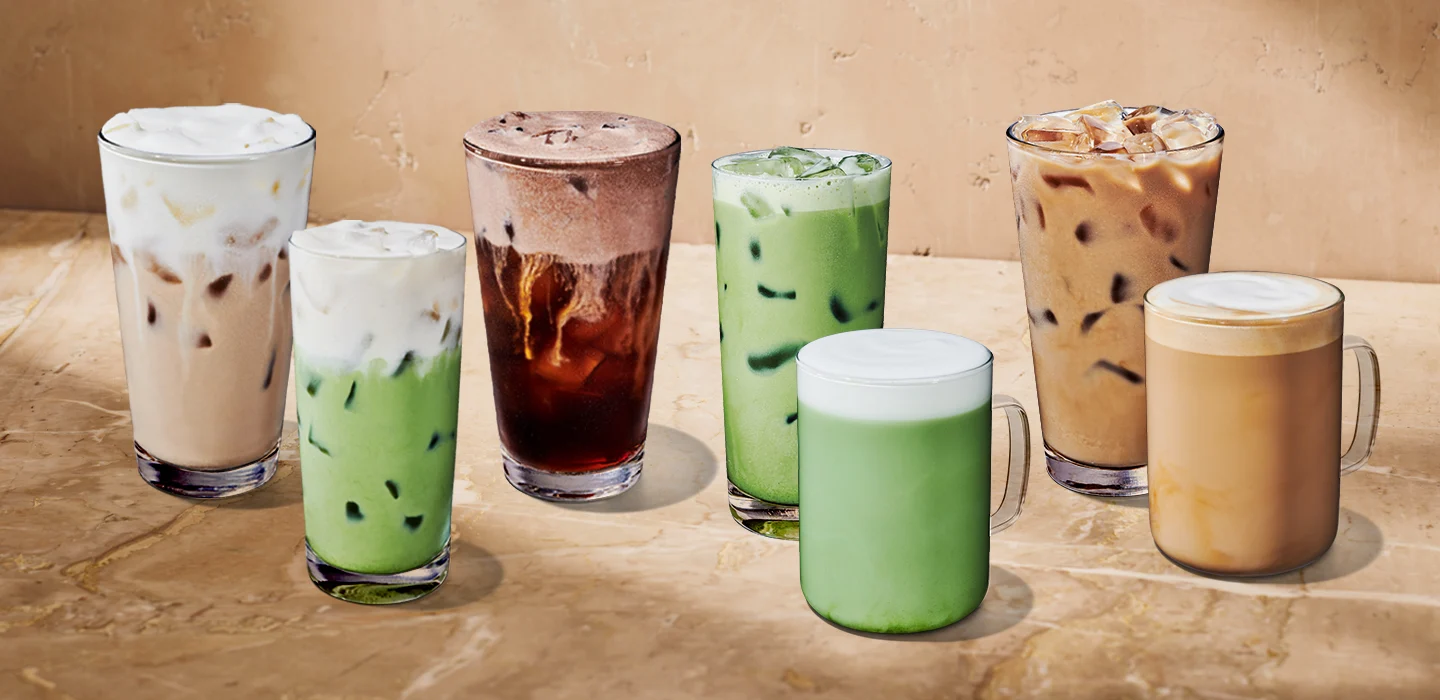
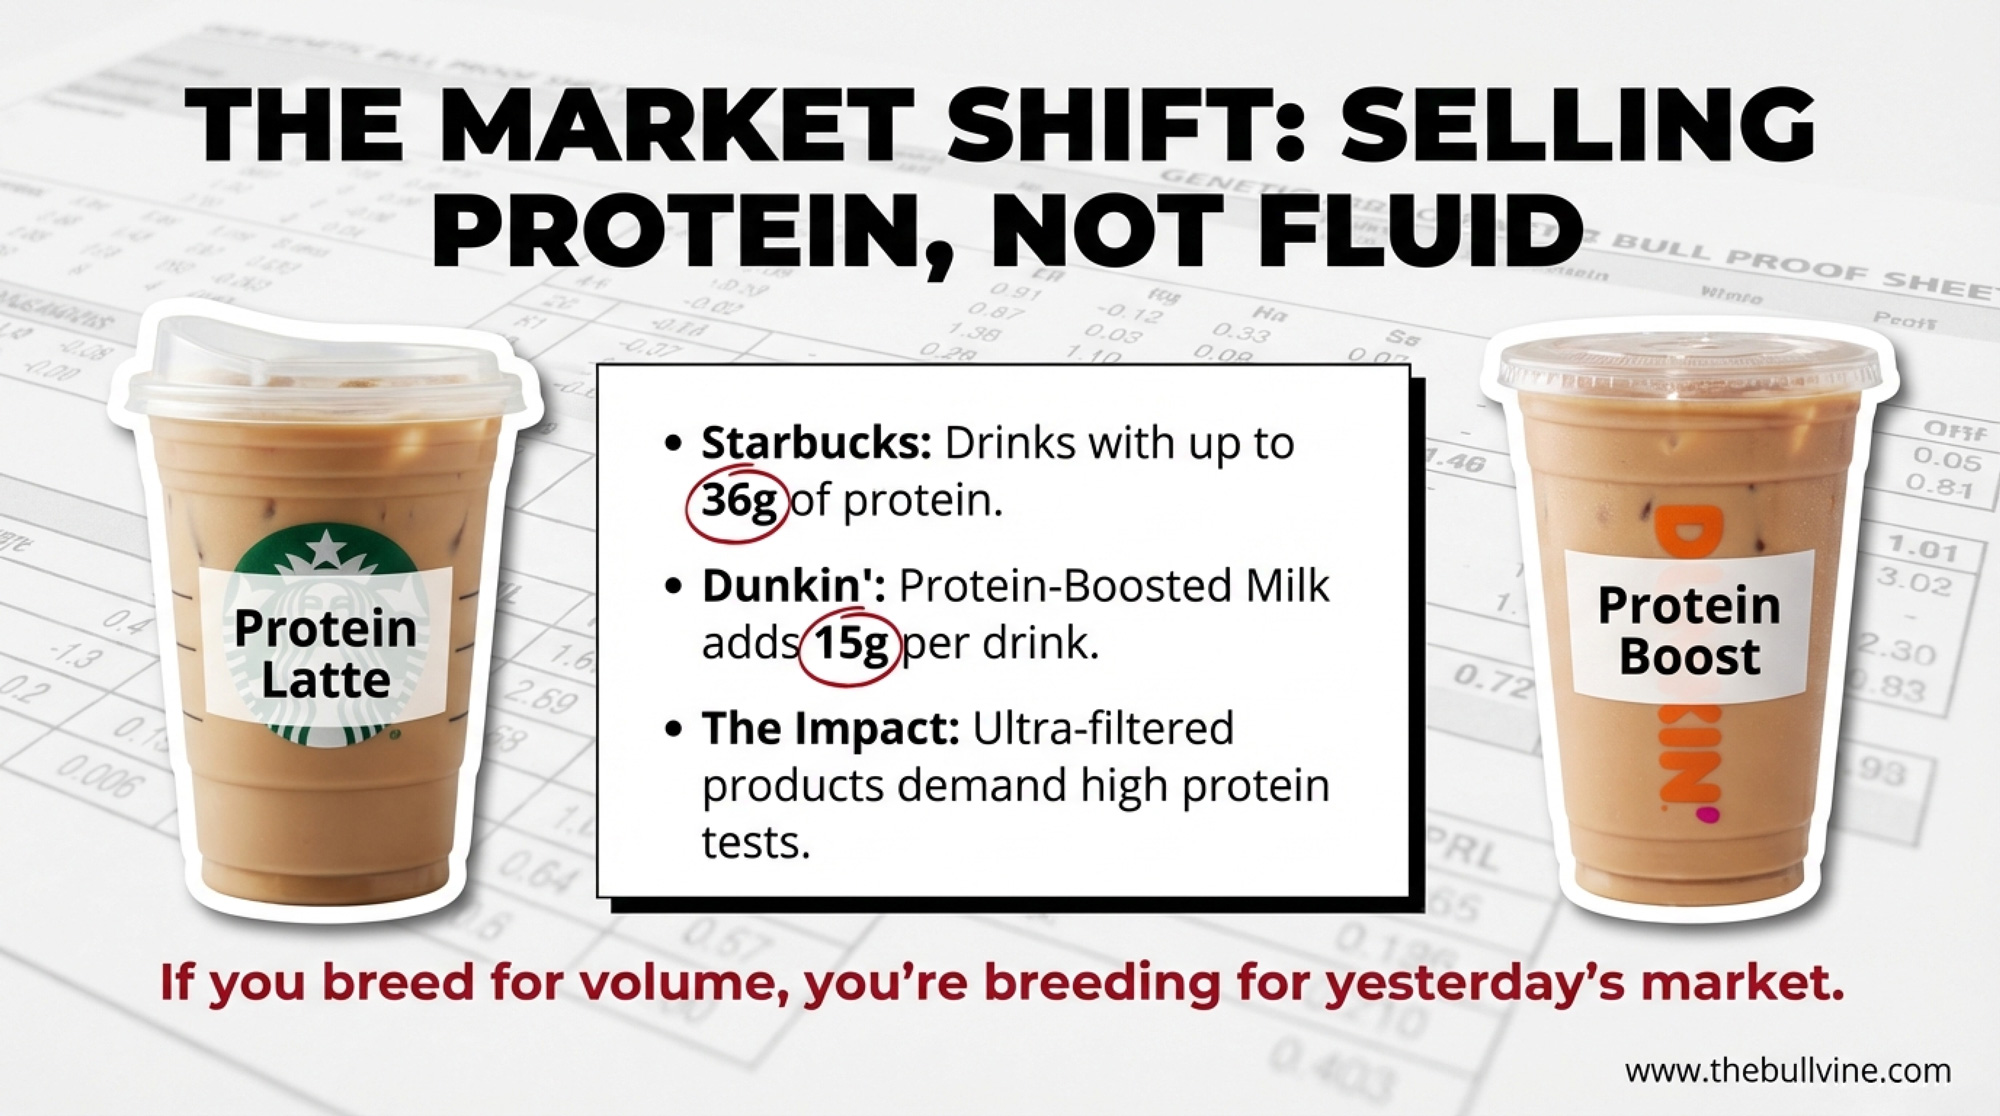
Why Are Starbucks and Dunkin’ Betting on Your Milk?
Protein has moved from the gym to the coffee counter. And dairy is winning.
| QSR Chain | Product Launch | Protein Content | Why It Matters to Your Breeding Strategy |
|---|---|---|---|
| Starbucks | Protein Lattes & Cold Foam (Sept 2025) | 19–36 grams per grande | Ultra-filtered/protein-boosted formulations require high-protein milk — processors will pay premiums for 3.3%+ test herds |
| Dunkin’ | “Protein Milk” Line (Jan 2026) | 15 grams per medium | Partnered with Megan Thee Stallion for launch; protein-forward menu expansion signals sustained QSR demand |
| McDonald’s | White Cheddar Slices (rolled out 2015–present) | N/A (solid cheese) | DMI-embedded scientists upsized slices 30%+ across 14,000 restaurants — cheese demand directly rewards butterfat & casein |
| Taco Bell | Ongoing Dairy Partnerships (DMI-supported) | N/A (multi-product) | Part of 18.5B-pound demand increase 2009–2024; volume plays favor mega-herds, but component premiums can level playing field |
| Raw Milk (Control Group) | No checkoff support | N/A | 21–65% sales surge (2024) despite FDA warnings — consumer demand ≠ checkoff dependence |
In late September 2025, Starbucks launched protein lattes and protein cold foam nationally, with some drinks delivering up to 36 grams of protein per grande using a “Protein-Boosted Milk” blend of 2% milk and unflavored dairy protein. CNBC reported that protein options would span both hot and iced beverages, with protein cold foam add-ons delivering 19 to 26 grams of protein per grande across the menu. On January 7, 2026, Dunkin’ followed with its own “Protein Milk” — adding 15 grams of protein per medium drink — alongside new Protein Refreshers and Protein Lattes, partnering with Megan Thee Stallion for the launch campaign.
Those protein lattes don’t make themselves. Ultra-filtered and protein-boosted formulations need milk that tests high on true protein — and processors are starting to pay accordingly. As more QSR volume shifts to protein-forward formulations, expect your processor to pay closer attention to your protein test. If you’re selecting genetics primarily for volume and fat right now, this demand shift is worth factoring into your breeding decisions over the next proof cycle.
That’s the case for the money working — 18.5 billion additional pounds through restaurant partnerships, a $500 million cottage cheese brand, influencers with 25 million followers turning butter into lifestyle content. But all those aggregate billions didn’t stop four farms from going under every day. Consider the raw milk market as a kind of control group: according to NielsenIQ data reported by PBS NewsHour, weekly raw cow’s milk sales surged 21% to 65% above the prior year during key weeks in 2024, even as the FDA ramped up H5N1 warnings, with zero checkoff dollars behind it. How much of the butter board boom and the cottage cheese comeback would have happened without DMI? Nobody has a clean answer. But it’s worth asking before you decide whether your $12,300 is money well spent.
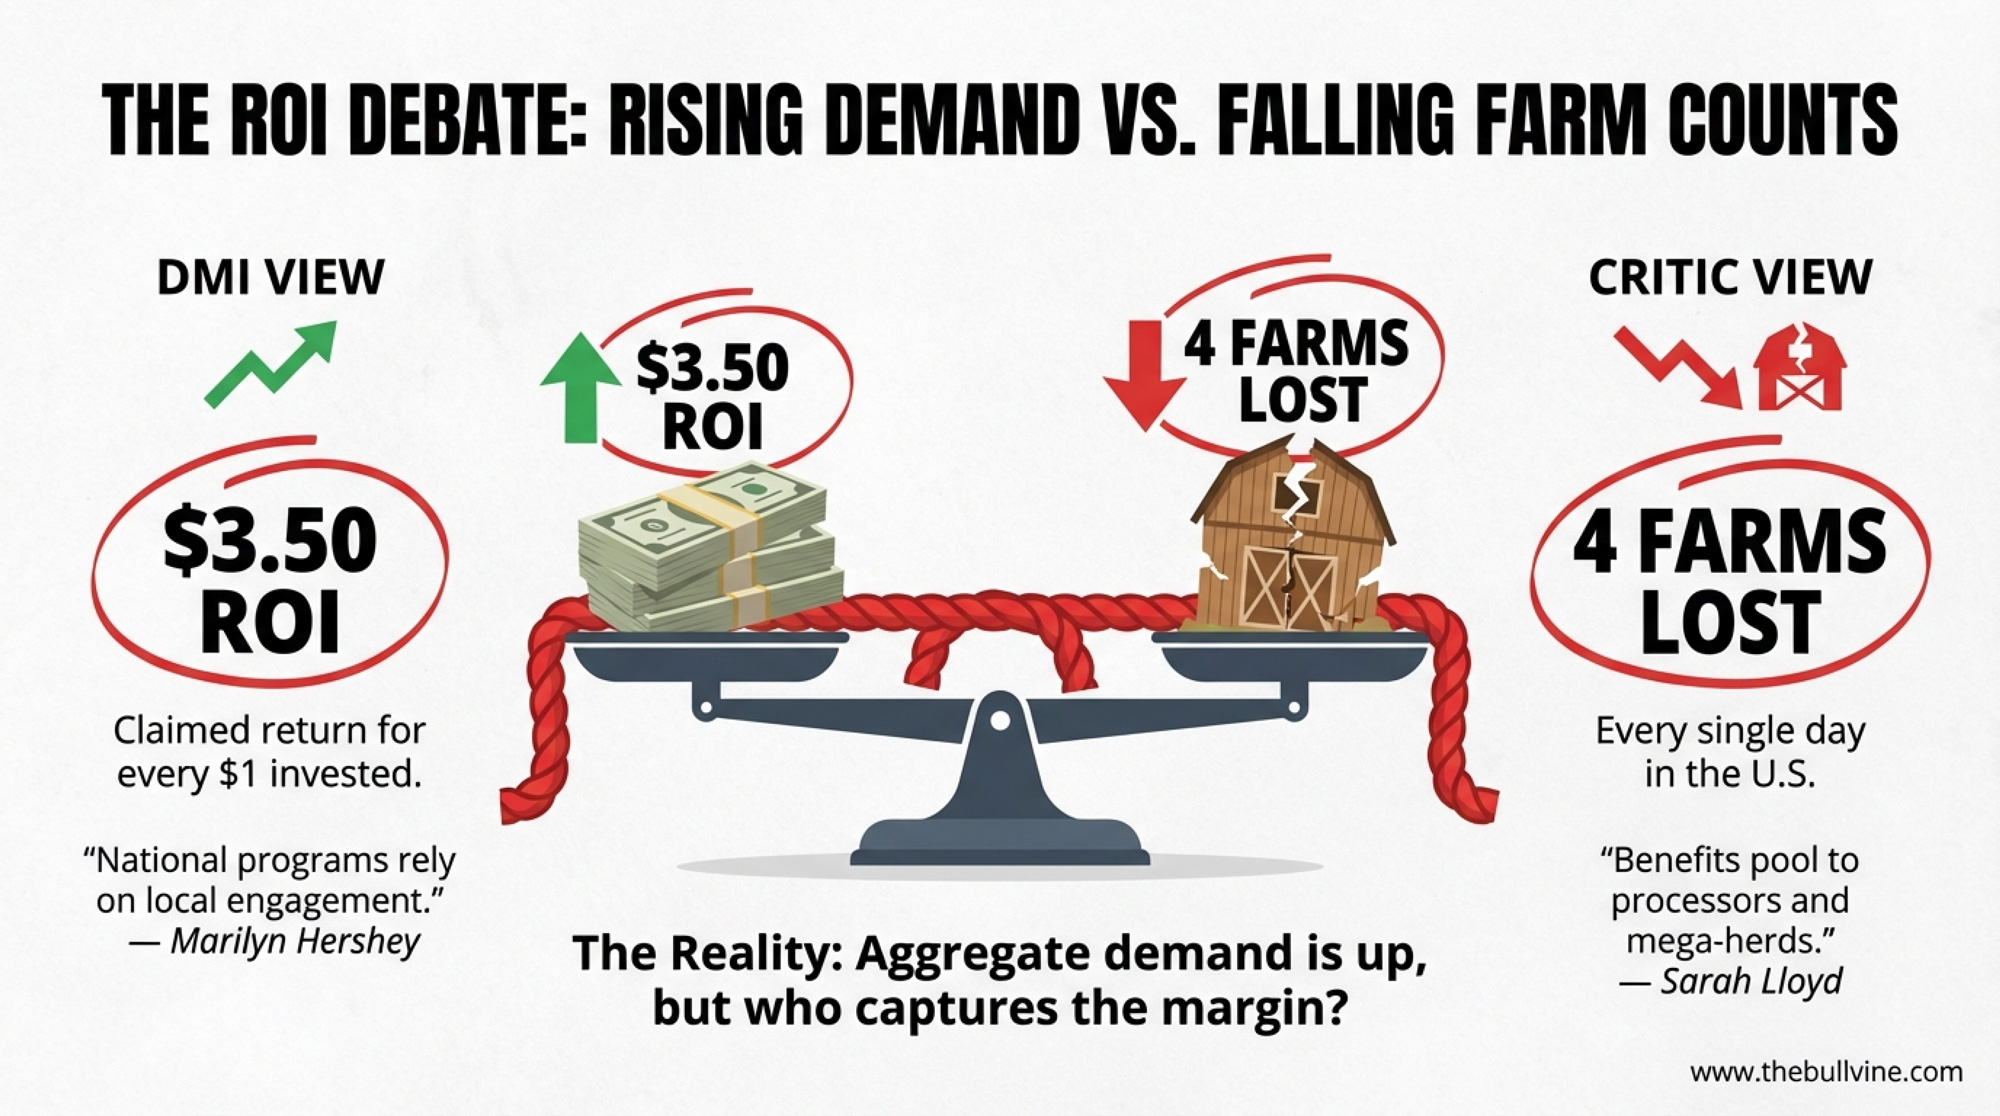
DMI’s counter-argument, supported by USDA-commissioned research led by Dr. Oral Capps Jr. at Texas A&M University, is that the return on investment is measurable: $1.91 per dollar on fluid milk promotion, $3.27 for cheese, and $24.11 for butter, according to the 2020 Report to Congress. The evaluation methodology was reviewed by the Government Accountability Office (GAO-17-188). A more recent DMI-commissioned analysis pegged the overall return at $3.50 per checkoff dollar invested, suggesting milk prices would be roughly $1 per hundredweight lower without the program. Both sides have data. What neither side has is a clean answer to the question that matters most to the 300-cow operator: does that $12,300 you send every year come back to your milk check, or does it come back to the industry’s aggregate numbers while your margins stay flat?
| Metric | DMI’s Aggregate Claim | 300-Cow Farm Reality | The Gap |
|---|---|---|---|
| ROI per dollar invested | $3.50 | Unknown — not broken out by farm size or processor type | Aggregate ≠ individual |
| Annual checkoff assessment | Scales with volume (15¢/cwt) | $12,300 (300 cows, 82,000 cwt/year) | Fixed cost regardless of milk check stability |
| Claimed annual return (at $3.50 ROI) | $43,050 total | $43,050 theoretically | Where does it show up? |
| Actual milk check impact (Lloyd, Cochran) | “Industry demand up 18.5B lbs” | “Forced deductions exceed $4,500 annually” (Cochran, 2017) | Trickledown doesn’t reach small/mid herds |
| Farm exits (2015–2025) | — | ~4 farms/day nationwide | Demand growth didn’t stop consolidation |
| Protein premium shift (2024–2026) | Positioned dairy as protein ingredient | $17,900/year per 0.1% test (Jan 2026) | Only realized if breeding strategy adjusted |
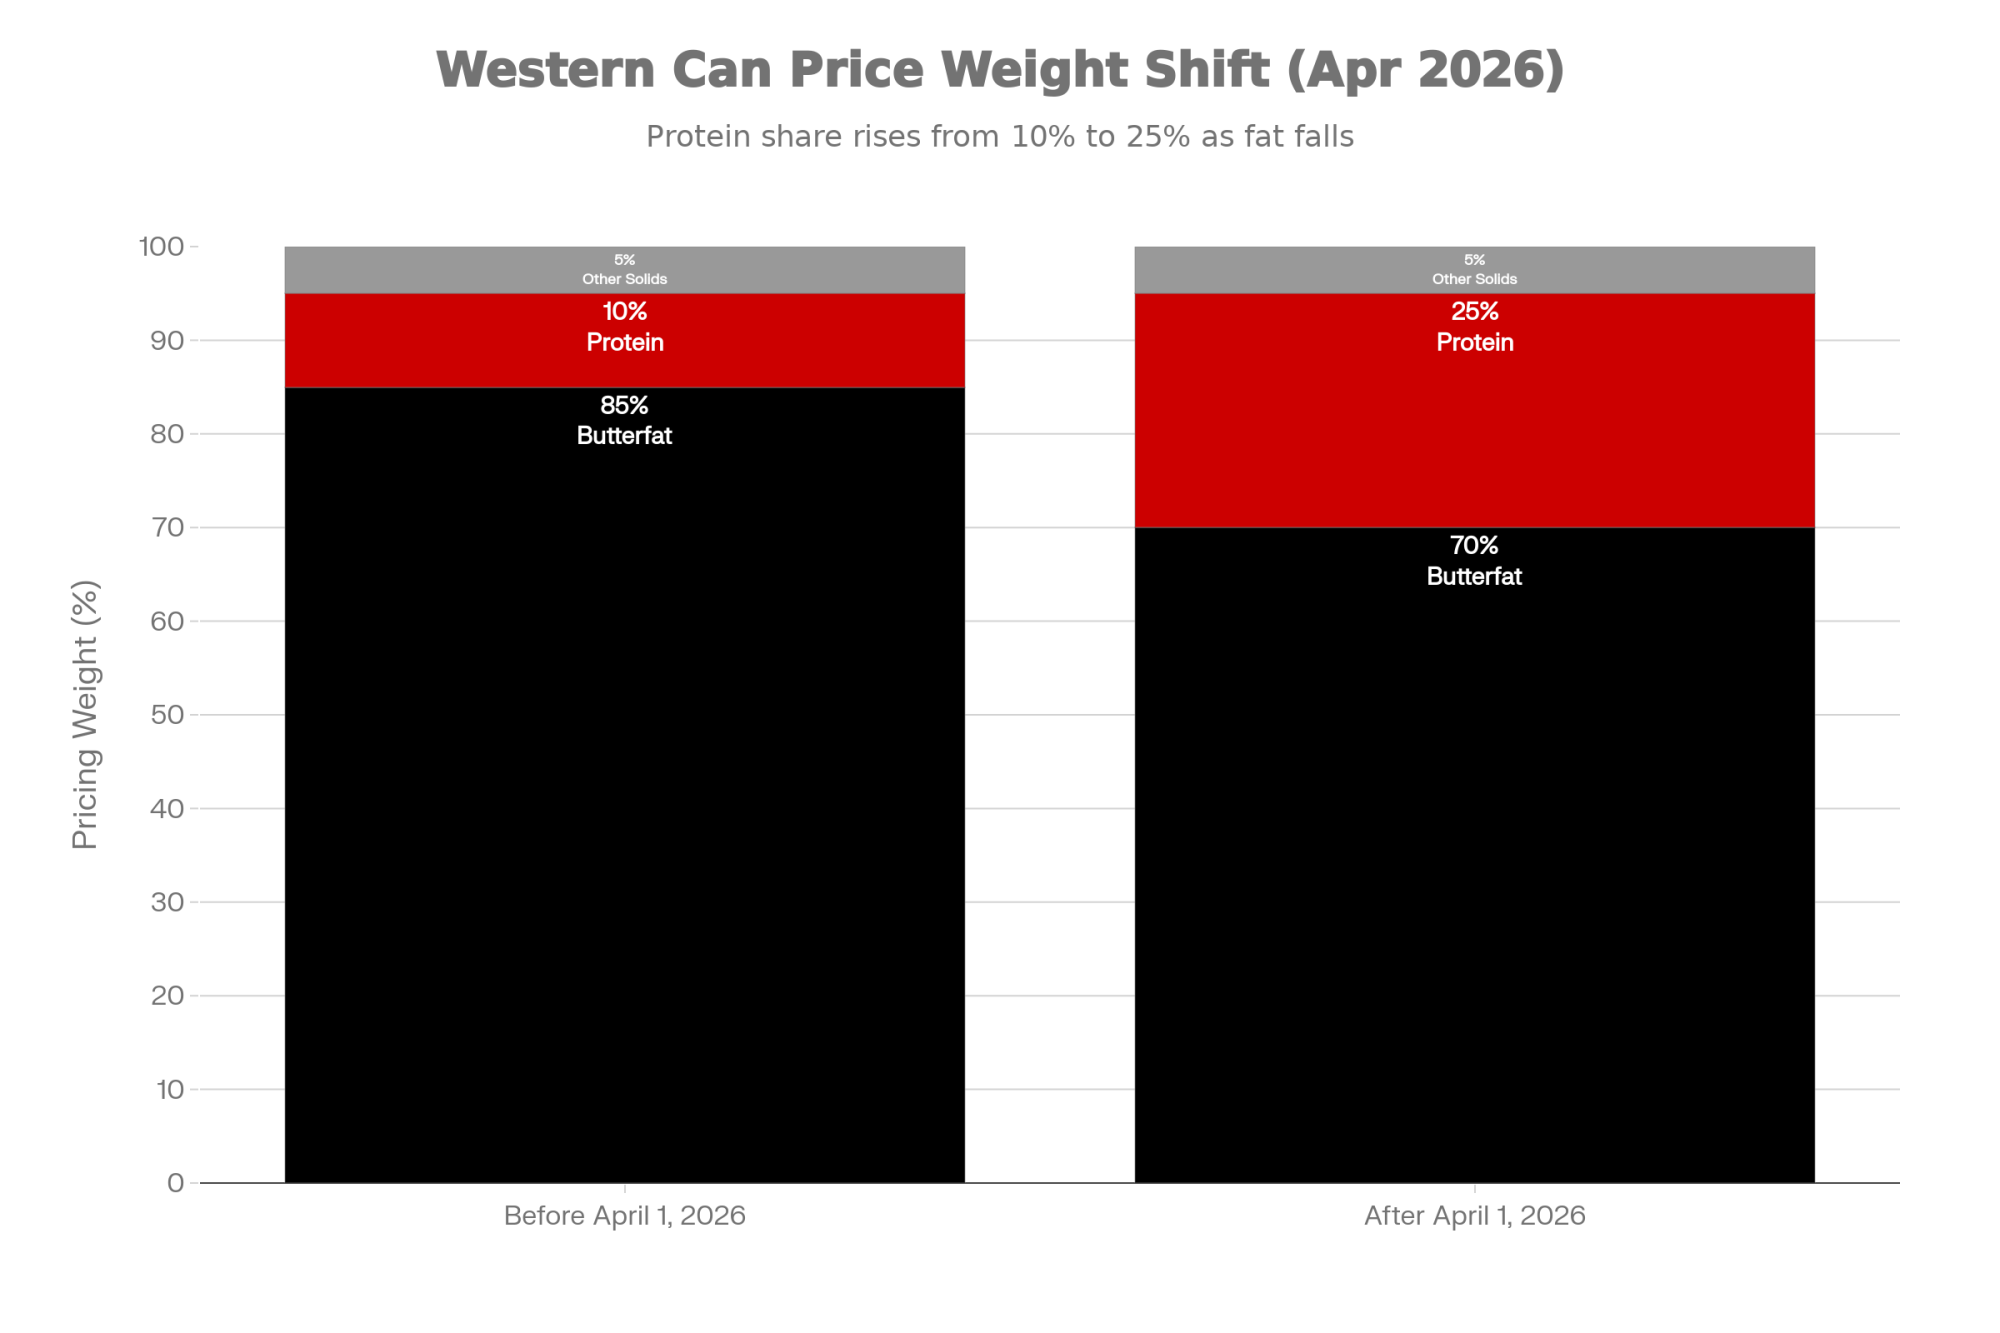
That consolidation story — and what it means for how your processor’s product mix shapes your payday — runs deeper than any single checkoff campaign. And when you look at where 76% of checkoff spending actually lands — cheese and exports — the disconnect between the marketing and the milk check gets sharper.
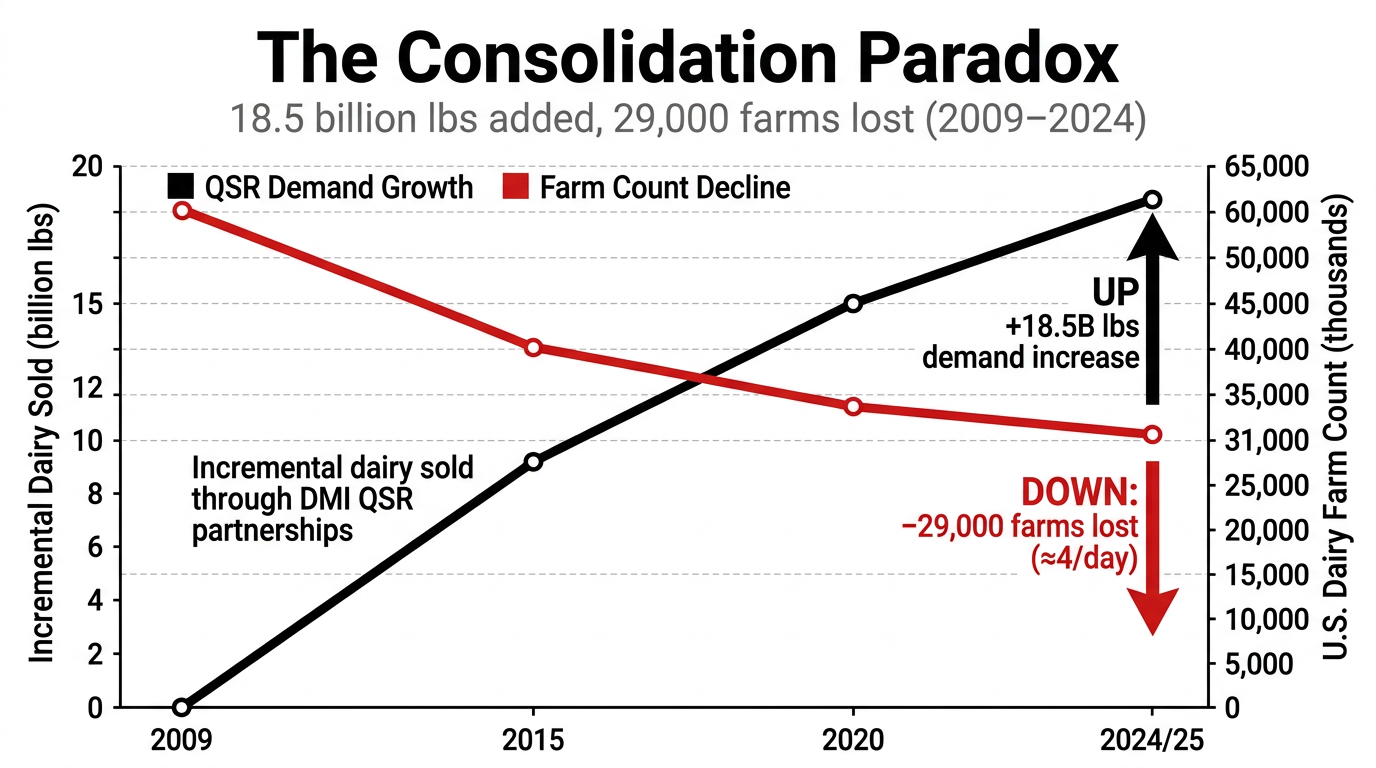
| Year | Incremental dairy sold (billion lbs) | U.S. dairy farm count (thousands) |
|---|---|---|
| 2009 | 0 (baseline) | ~60,000 |
| 2015 | ~9.0 (estimated midpoint) | ~45,000 |
| 2020 | ~15.0 (estimated) | ~35,000 |
| 2024/25 | 18.5 | ~31,000 |
Options and Trade-Offs for Producers
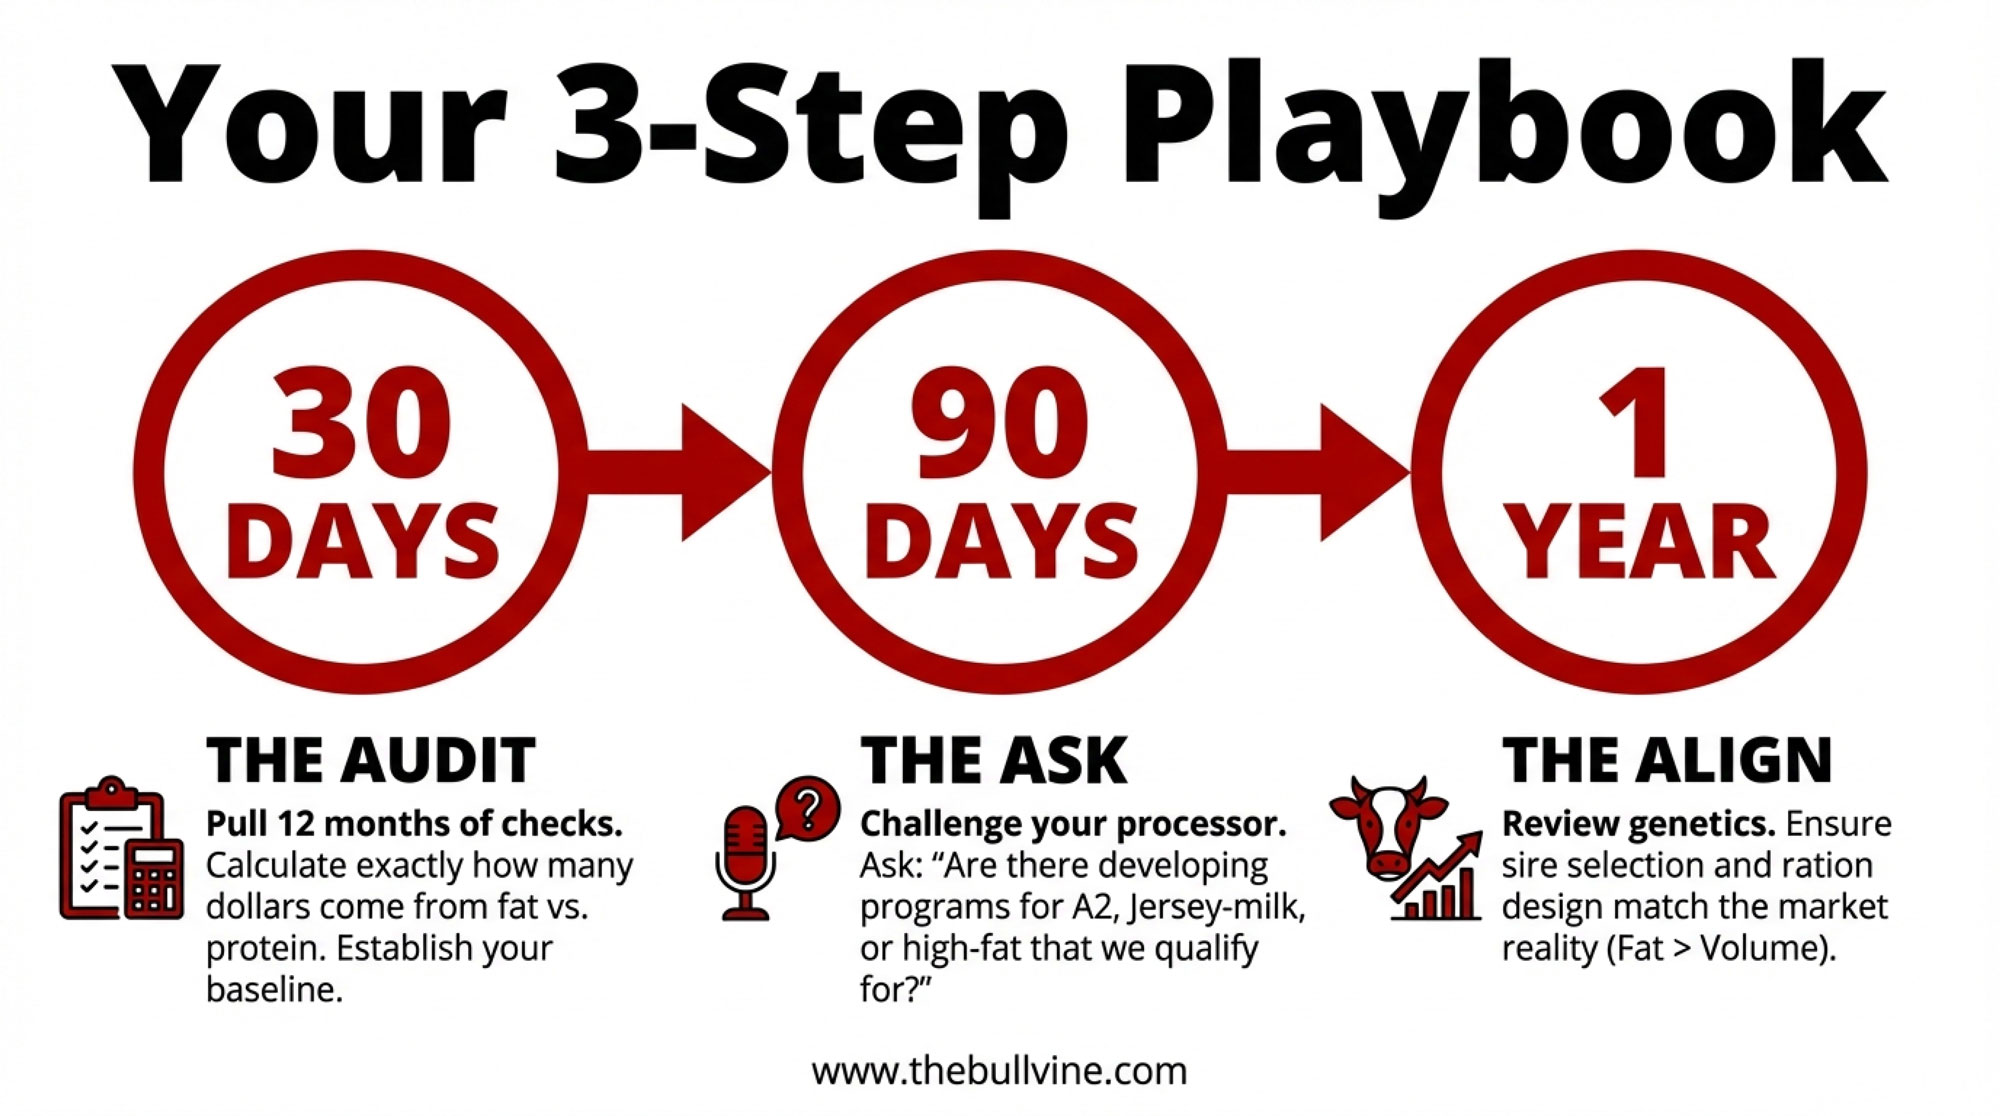
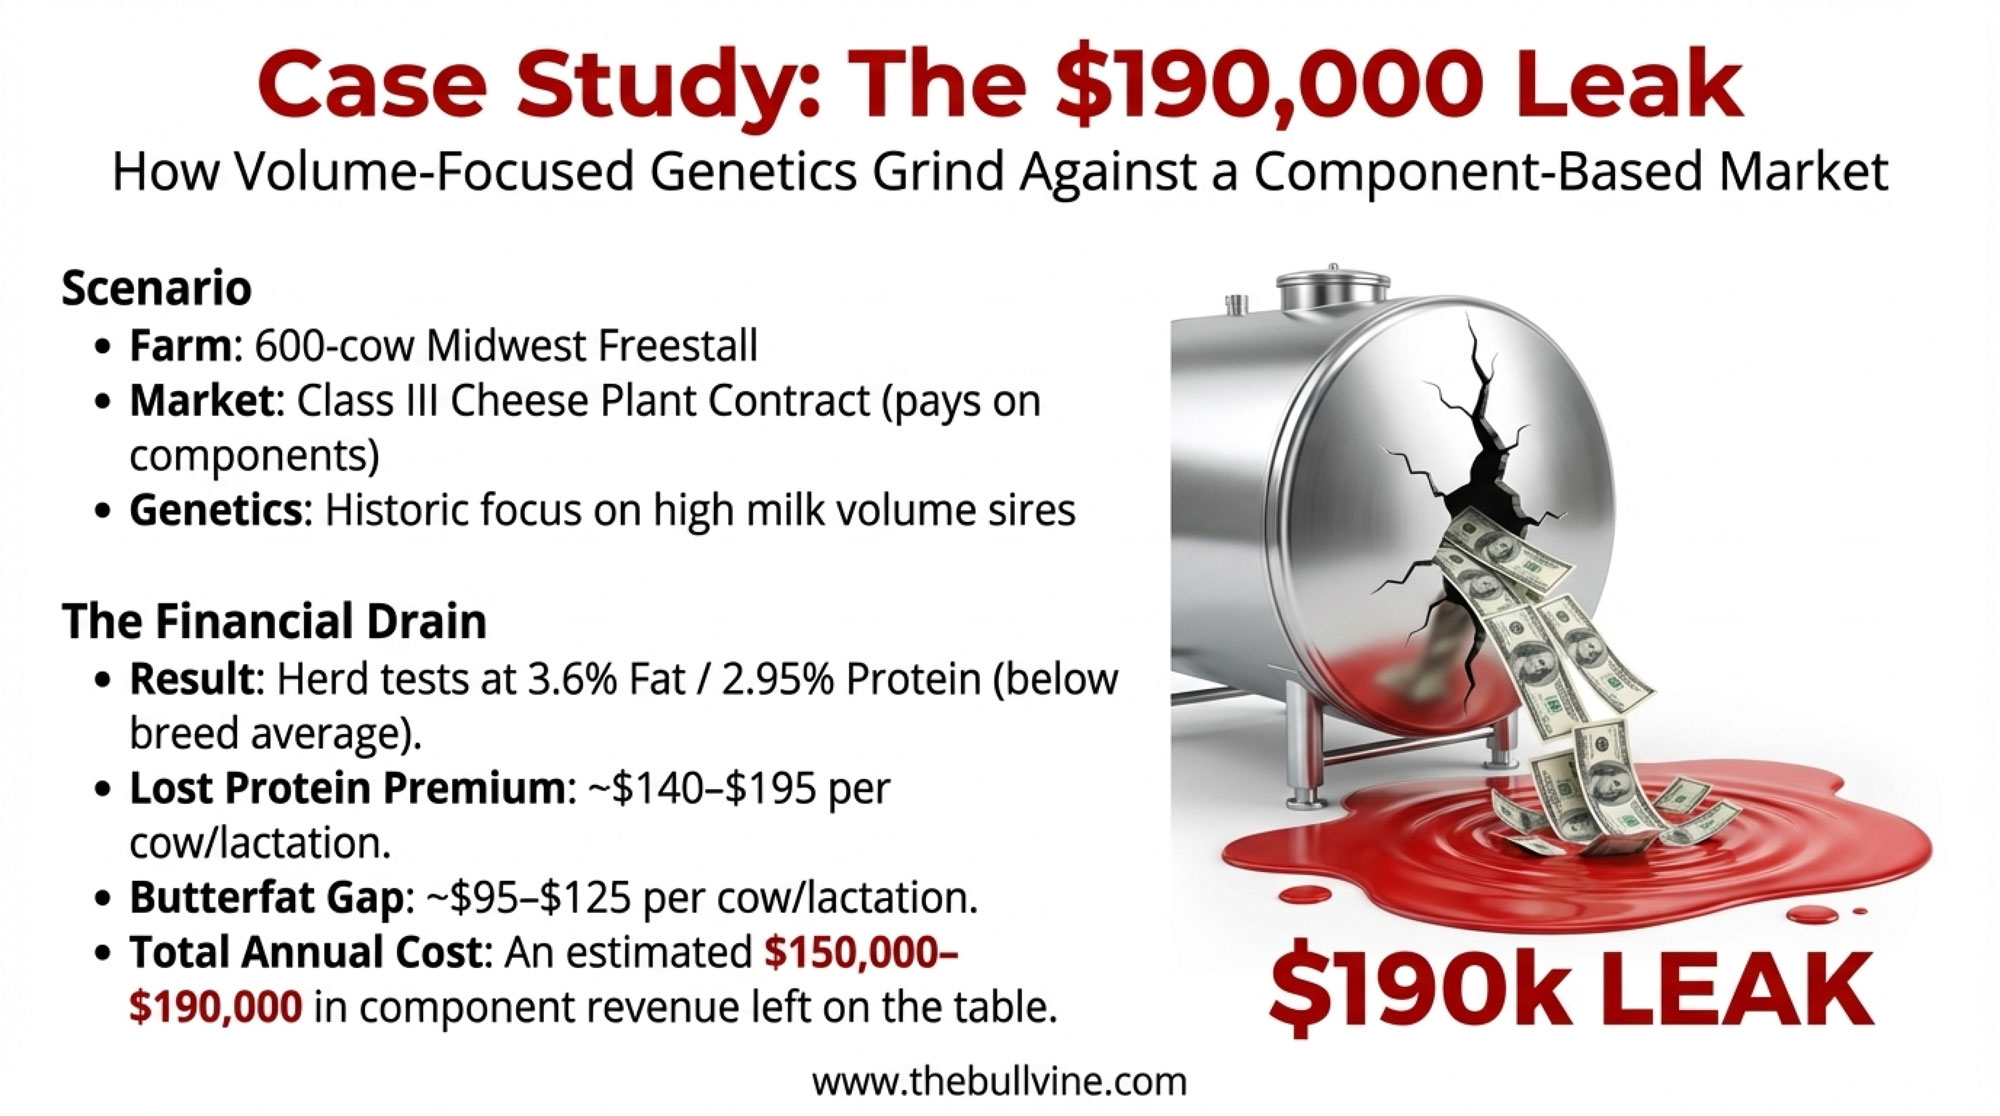
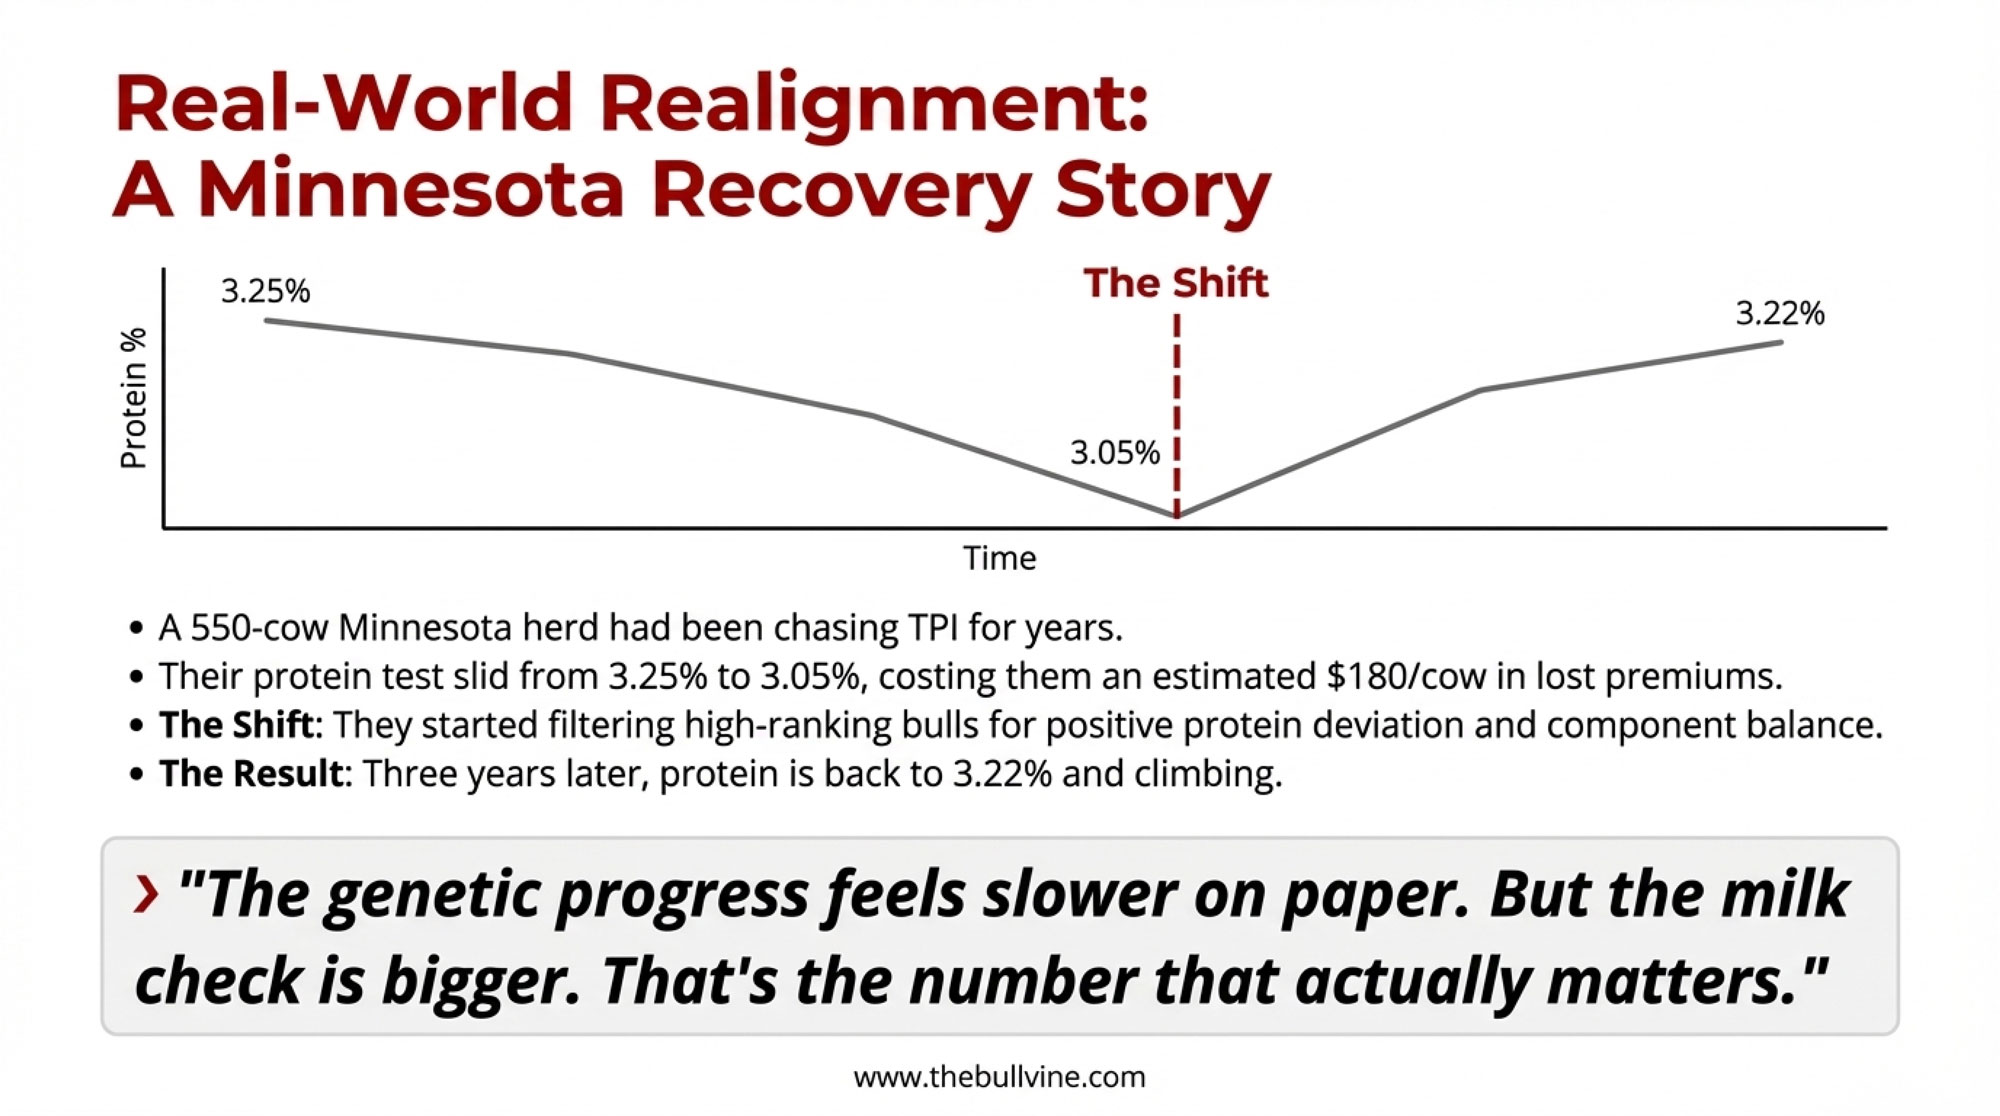
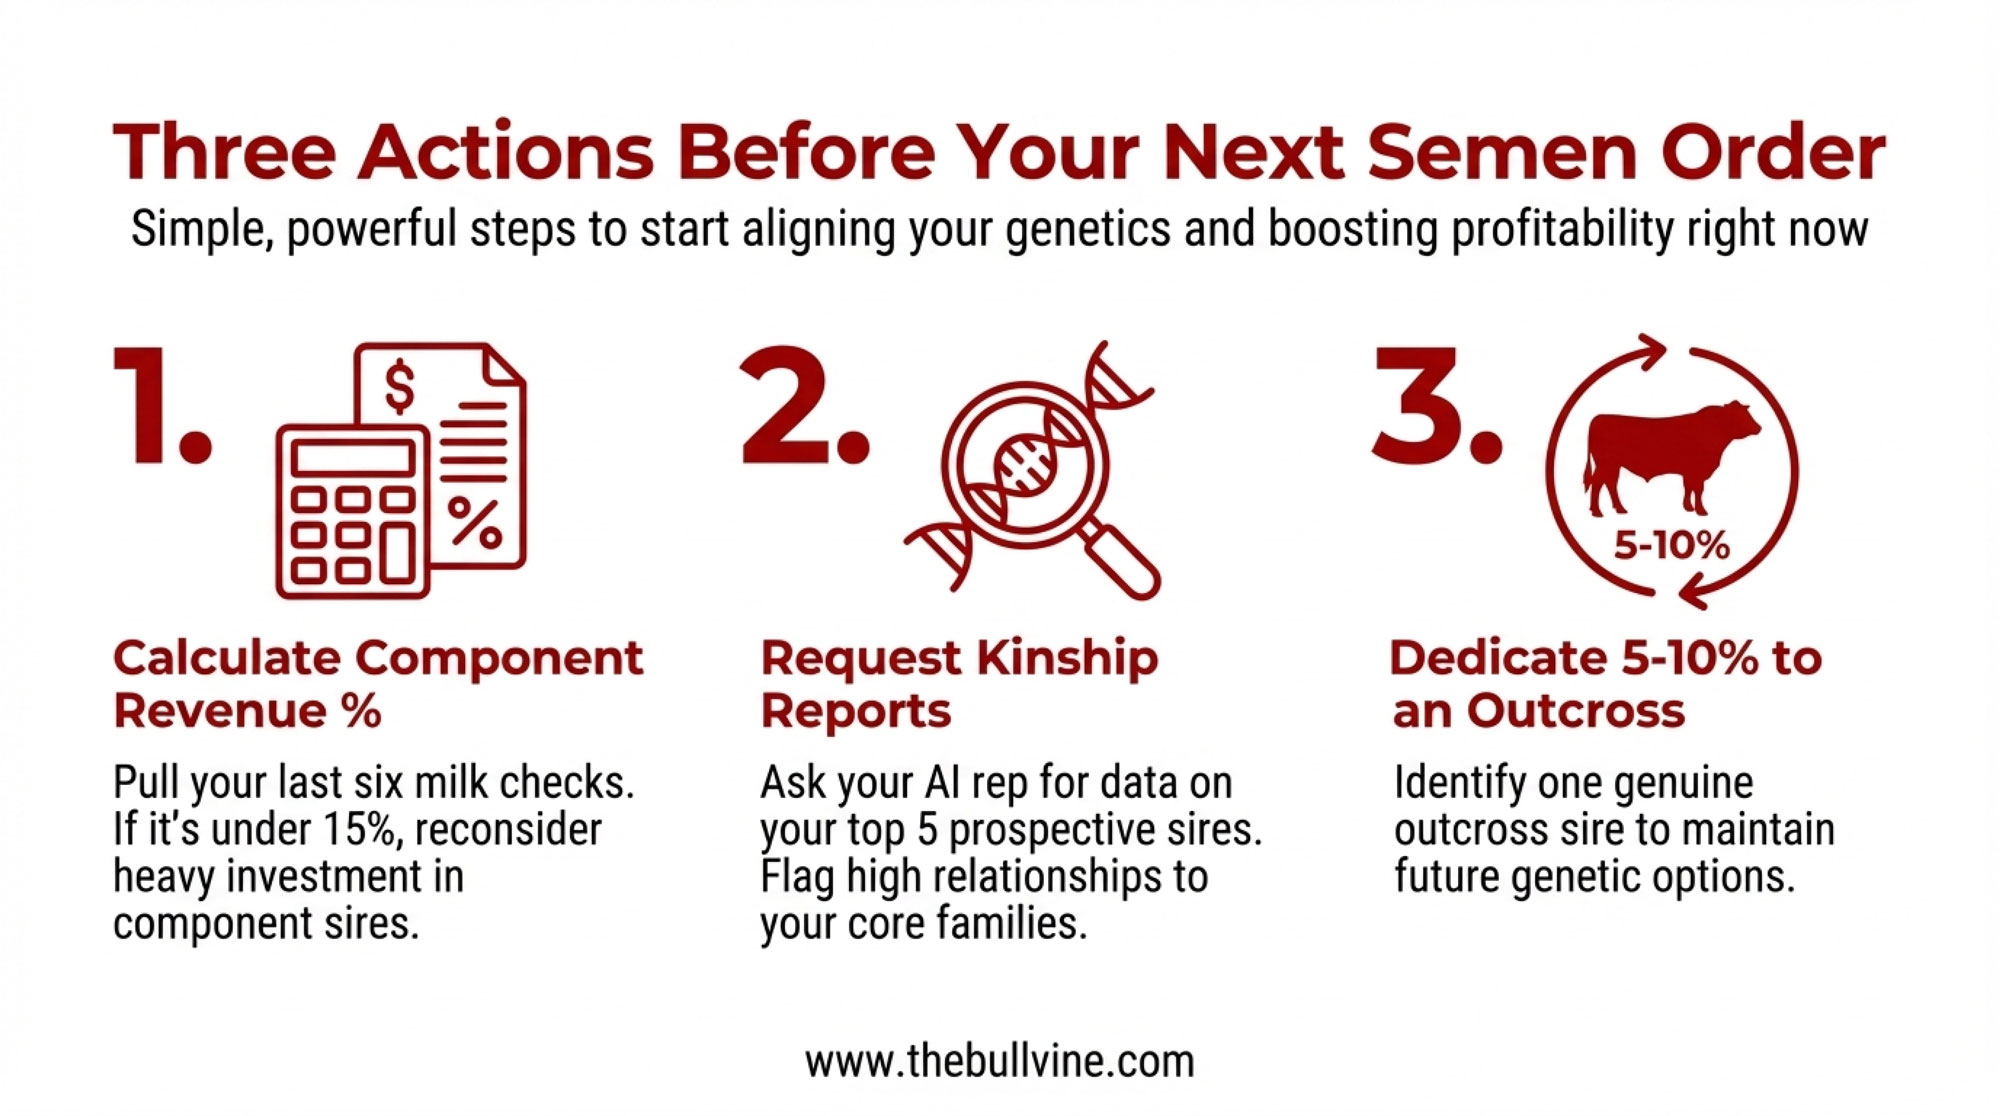
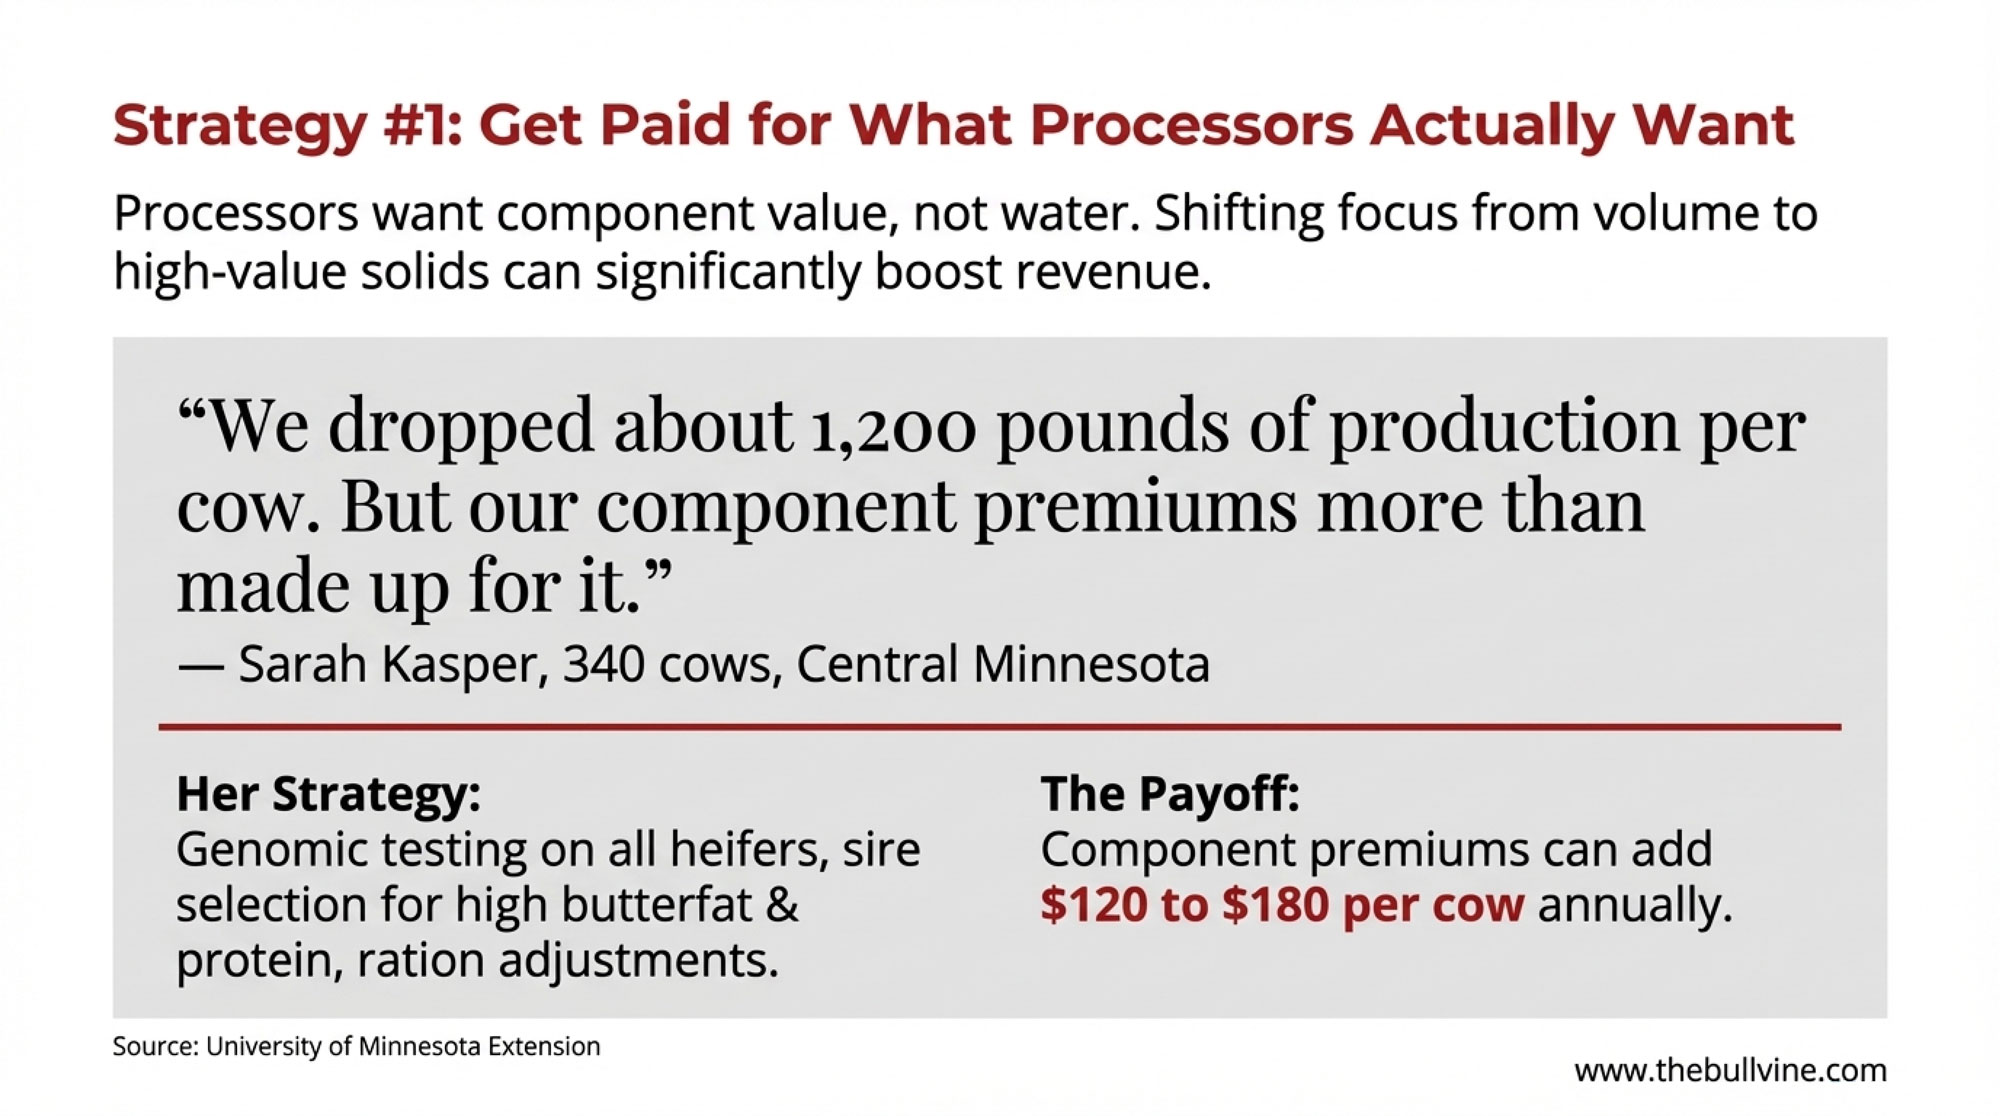
Is your processor even breaking out components? (30 days) Pull your last three milk checks and look at what you’re actually being paid for butterfat and protein separately. If those lines aren’t there — or if the breakdown isn’t clear — call your co-op or processor this week and ask. At January 2026’s FMMO protein price of $2.18/lb, a 0.1% improvement in your herd’s protein test on 300 cows shipping 75 lbs/day works out to roughly $17,900 per year in additional component value. That’s more than your annual checkoff assessment, from one-tenth of a percentage point.
$17,900 says your genetic strategy deserves a second look. (90 days) If your breeding program is optimized purely for volume, run the numbers on component-weighted selection before your next sire order. You might sacrifice some total pounds per cow, but the revenue per hundredweight could more than compensate — especially now that USDA’s updated FMMO formula uses a 3.3% protein factor (up from 3.1%), amplifying the revenue impact of every tenth of a point. We walked through that math in “Component Gold Rush.”
Good Culture didn’t need the checkoff to build a $500 million brand — but they needed a story. (6–12 months)The cottage cheese, artisan butter, and raw milk booms all show consumer willingness to pay premiums for products with narrative. If you’re within a reasonable distance of a metro market, co-packing partnerships or farm-branded products are worth penciling out. The risk is real: startup capital, regulatory compliance (which varies dramatically by state), and the reality that marketing requires a completely different skill set than dairy farming.
Can’t opt out? Then show up. (Ongoing) Whether you think DMI’s $121.4 million is well spent or not, it’s your money. Review their annual budget at dairycheckoff.com and attend a farmer relations meeting. Ask specifically how influencer and QSR partnership spending translates into demand that reaches your milk check — not just national consumption statistics. “I want farmers to know that I know who I work for,” O’Brien told Dairy Herd Management. Take her up on it.
Key Takeaways
- If your processor pays component pricing, the butter/protein/cottage cheese demand surge matters directly to your revenue — check whether your fat and protein tests are trending in line with the market’s reward. At January 2026’s FMMO protein price of $2.18/lb, each 0.1% protein test improvement is worth roughly $60/cow/year.
- If you’re selecting genetics primarily for volume, the protein-forward product boom is a signal to re-evaluate — run your component-weighted revenue per cow against your current selection index before your next breeding cycle.
- If you’re considering raw milk or value-added as a revenue play, the consumer demand is real, but so is the liability — price your regulatory and insurance costs before you price your product.
- If you can’t articulate what your $12,300/year bought this year, attend your next checkoff farmer relations meeting and ask. DMI publishes its full budget at dairycheckoff.com — the data is there. Whether the return reaches your operation is a question only your own numbers can answer.
The 30-Day Checkoff ROI Audit: 5 Questions to Ask Your Milk Check (and Your Co-op) This Month
| Audit Question | Why It Matters | Where to Find the Answer | Red Flag / Green Flag |
|---|---|---|---|
| 1. Does my processor pay component pricing? | At $2.18/lb protein (Jan 2026), 0.1% test improvement = $17,900/year on 300 cows | Last 3 milk checks: look for separate butterfat & protein lines | Red: No component breakdown → you’re subsidizing QSR protein demand without capturing premium |
| 2. What’s my herd’s protein test trend (last 12 months)? | DMI positioned dairy as protein ingredient; if your test is flat/declining, breeding strategy isn’t aligned | Herd management software or DHI reports | Red: <3.2% protein average → leaving $17,900+ on table vs. 3.3% herds |
| 3. How much did I pay into checkoff last year? | 15¢/cwt × annual marketable milk = your investment; need baseline to evaluate return | Milk check deduction line (usually labeled “Promotion & Research”) | Red: Can’t find deduction amount → demand transparency from processor |
| 4. Can my checkoff rep explain how QSR/influencer spending reaches my milk check? | DMI claims $3.50 ROI, but aggregate ≠ individual; force explanation of trickledown mechanism | Attend regional DMI farmer relations meeting or email state/regional checkoff contact | Red: Answer is “industry-wide demand lifts all boats” → press for farm-size, processor-type ROI breakout |
| 5. What’s my processor’s product mix (fluid vs. cheese vs. exports)? | 76% of checkoff goes to cheese & exports; if your processor is fluid-heavy, you’re funding demand for someone else’s product | Call co-op/processor field rep directly or check annual reports | Green: Cheese/export processor → your checkoff aligns with spending; Red:Fluid-heavy → structural mismatch |
The Bottom Line
Your 15¢/cwt built the butter board moment, put scientists inside McDonald’s, and helped engineer protein into every Starbucks in America. Pull up your last milk check. Look at the checkoff line. Then look at your component premiums. Can you see the return?
Complete references and supporting documentation are available upon request by contacting the editorial team at editor@thebullvine.com.
Learn More
- Robots Won’t Save Your Dairy If You’re Alone: 5 Hard Truths About Labor and Robotic Milking ROI Under 500 Cows – Gain a brutal reality check on your labor strategy before signing a million-dollar note. This guide delivers a side-by-side comparison of automation versus traditional staffing, arming you with the specific ROI thresholds needed to decide between upgrading or exiting.
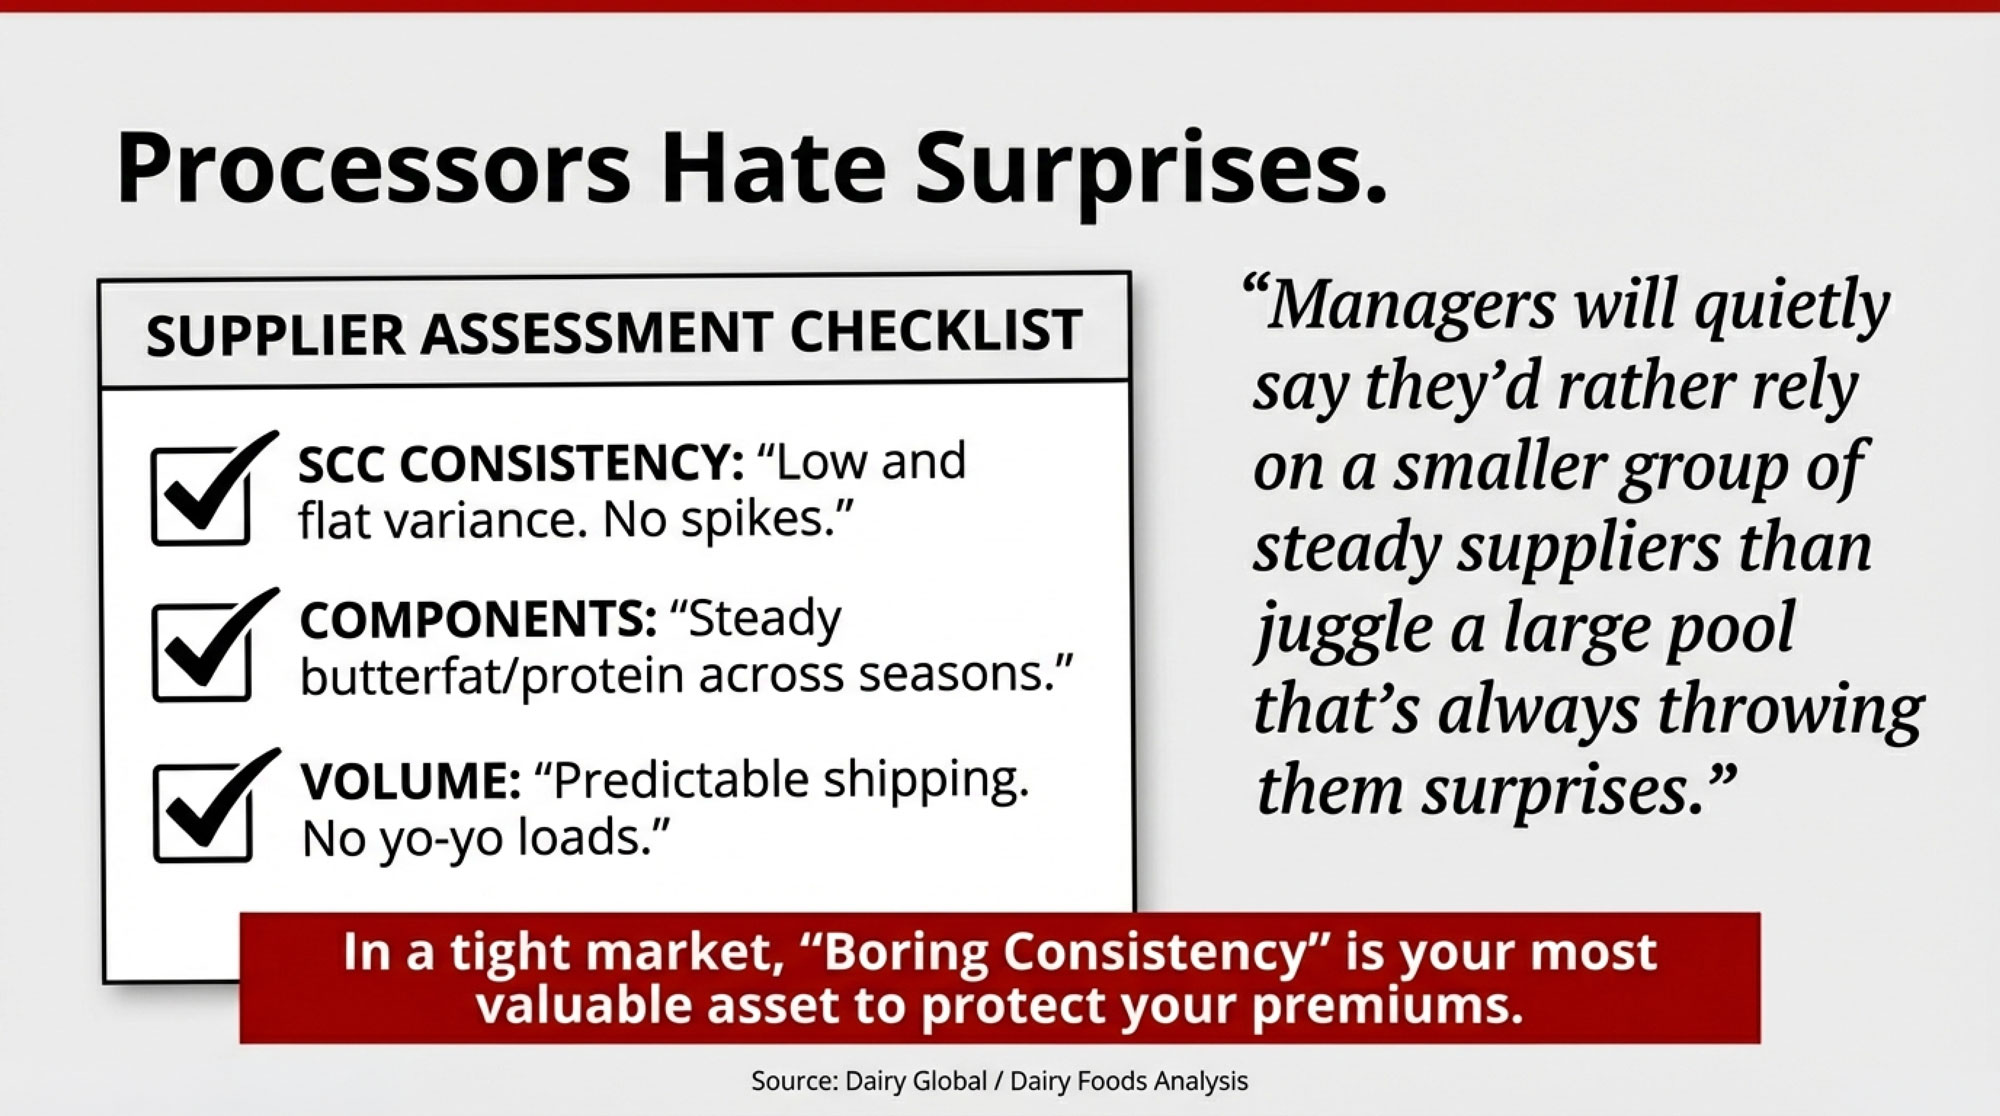
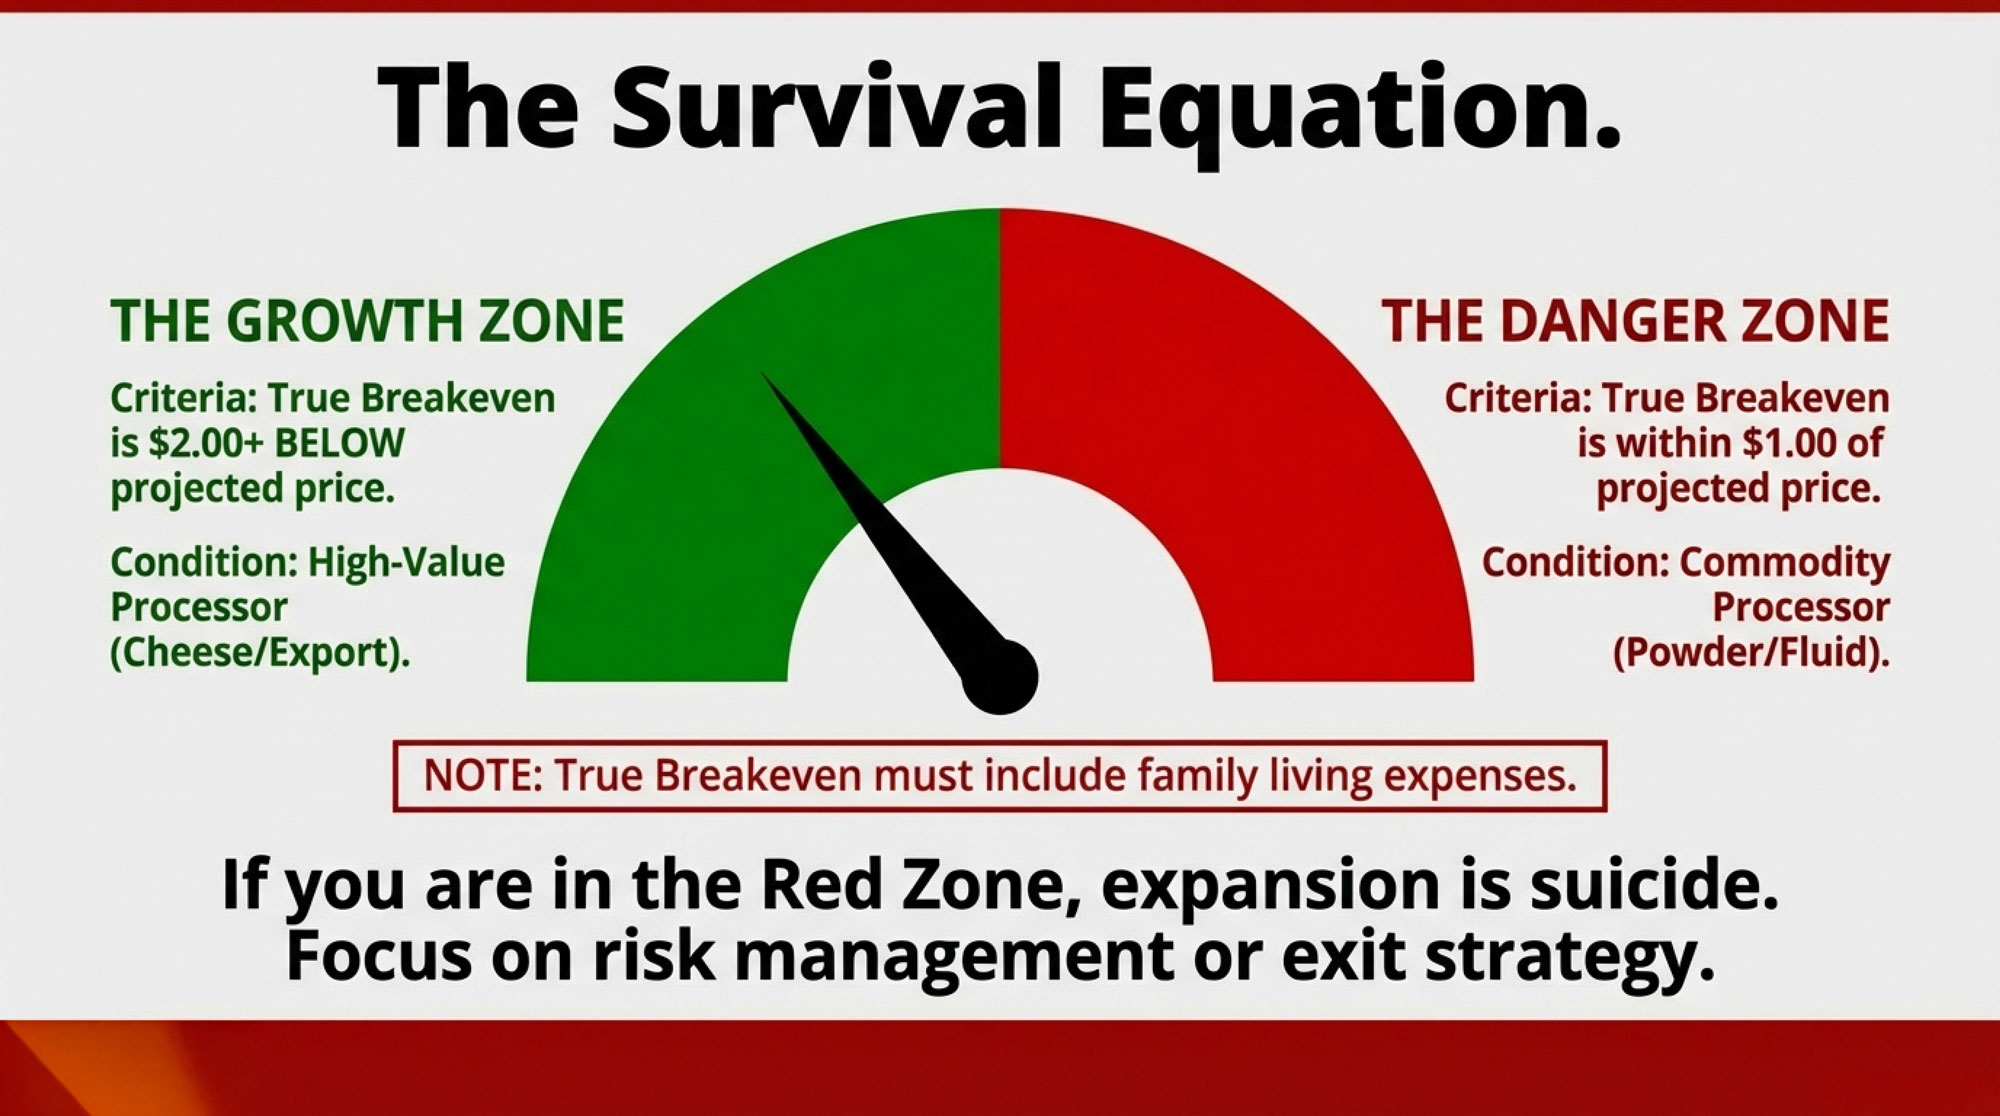
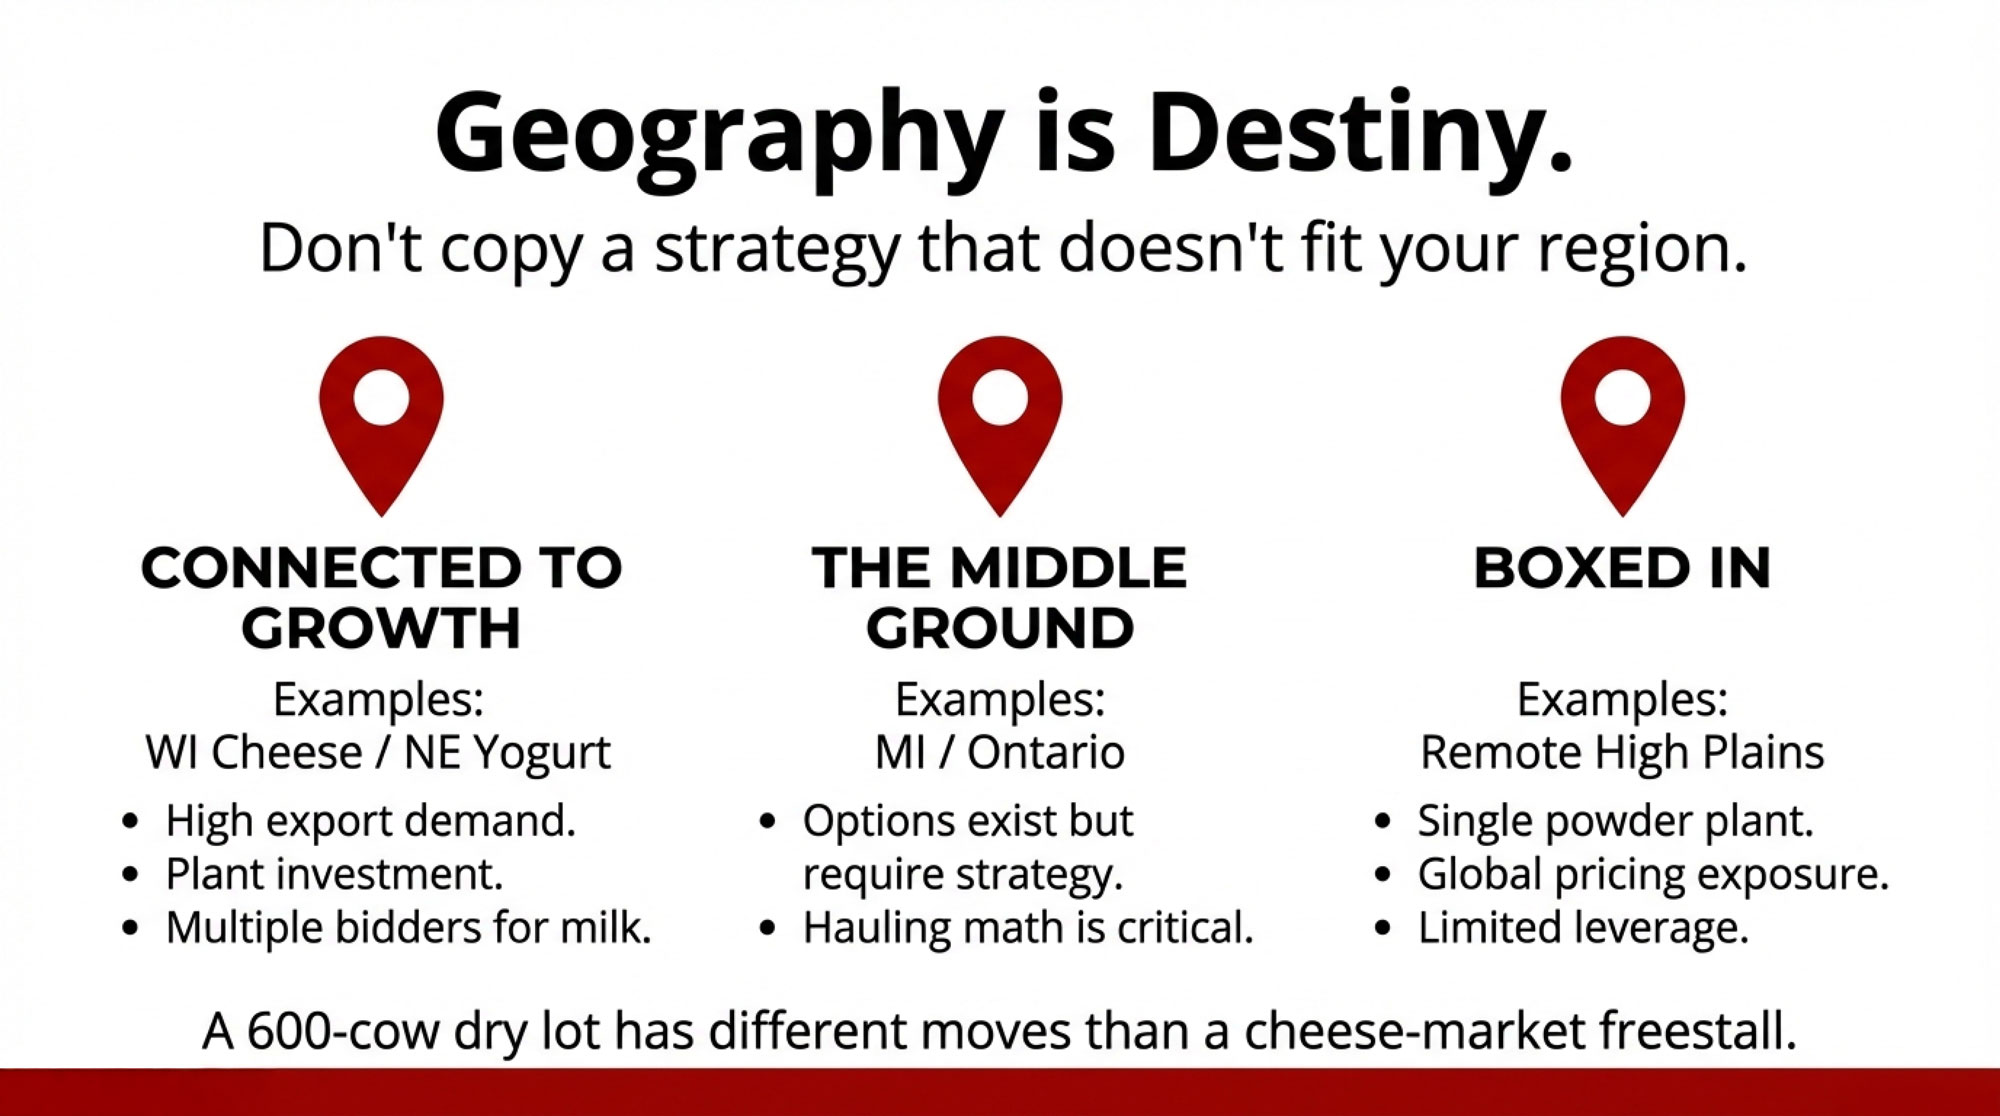
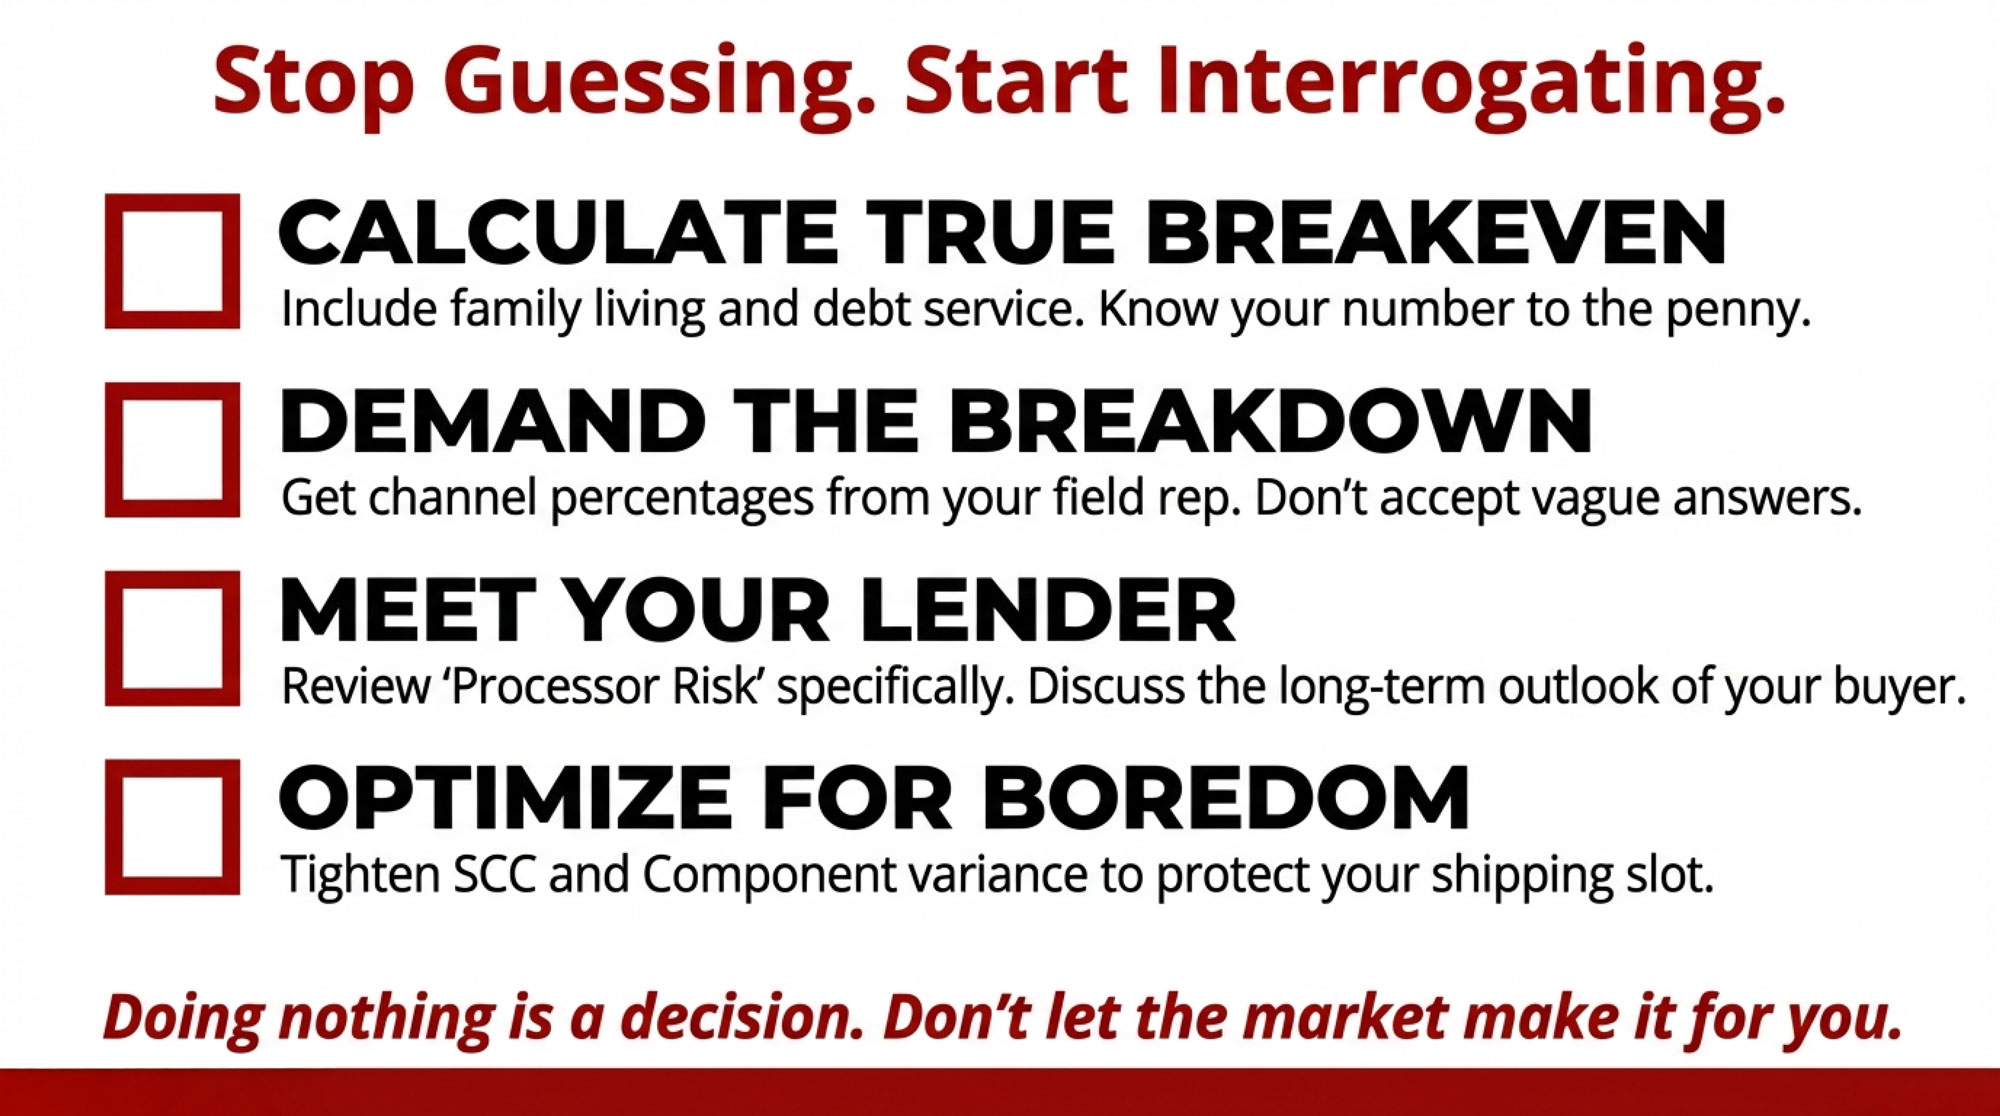
- Four Farms Exit Daily: The $100K Decision Reshaping Dairy Survival – Expose the “processor risk” fault line that is claiming four dairies a day. This analysis delivers a four-question audit of your cash runway and milk-check concentration, arming you with the strategic advantage of a 72-hour survival plan.
- Beef-on-Dairy’s $6,215 Secret: Why 72% of Herds Are Playing It Wrong – Break down the genomic multipliers that turn surplus pregnancies into a high-margin second revenue stream. This deep dive weaponizes your data to capture massive premiums, revealing why most herds are leaking profit and how to dominate the new beef-on-dairy landscape.
 The Sunday Read Dairy Professionals Don’t Skip.
 The Sunday Read Dairy Professionals Don’t Skip.
Every week, thousands of producers, breeders, and industry insiders open Bullvine Weekly for genetics insights, market shifts, and profit strategies they won’t find anywhere else. One email. Five minutes. Smarter decisions all week.