One month of DMC at $9.50 could pay several years of premiums. The deadline is Wednesday. Have you actually run the math?
Executive Summary: January’s Class III price fell to $14.59/cwt while March Class IV futures climbed to $19.50, creating a $2.99/cwt spread that works out to about $382,000/year on a 500‑cow herd shipping 70 lbs/cow/day. That gap sits atop June 2025 make‑allowance changes that already skimmed roughly 90¢/cwt from producer checks and is being widened by a global butterfat shortage, a tight U.S. powder market, and a new $75 million USDA butter buy. At the same time, the U.S. dairy herd has grown to 9.58 million cows, the largest in more than 30 years, setting up a spring flush that could pressure prices unless Section 32 purchases and exports keep absorbing product. The one clear positive is Dairy Margin Coverage: with a projected January margin of $7.52/cwt, $9.50 coverage throws off about $1.98/cwt on Tier 1 milk, so a single month’s payment can cover several years of premiums. For a 500‑cow dairy, each combined 0.1% gain in butterfat and protein now adds roughly $46,400/year, making components one of the few levers that improve cash flow without new capital. This article doesn’t just recap those numbers; it walks through barn‑level math and a 30/90/365‑day playbook for lining up DMC enrollment, DRP weighting, component strategy, and Section 179 planning with $16–$17 Class III, not a rosy futures average. It ends with a hard question every producer has to answer: where does your breakeven sit relative to $16.51 Class III, and what are you going to do about it before the DMC window closes?
January’s FMMO Class III price landed at $14.59/cwt — down $1.27 from December and the lowest since July 2023’s $13.77. Part of that’s structural: USDA’s June 2025 make-allowance increases shifted roughly 90¢/cwt from producer checks to processor cost recovery. But the bigger story is what happened on the other side of the class divide.
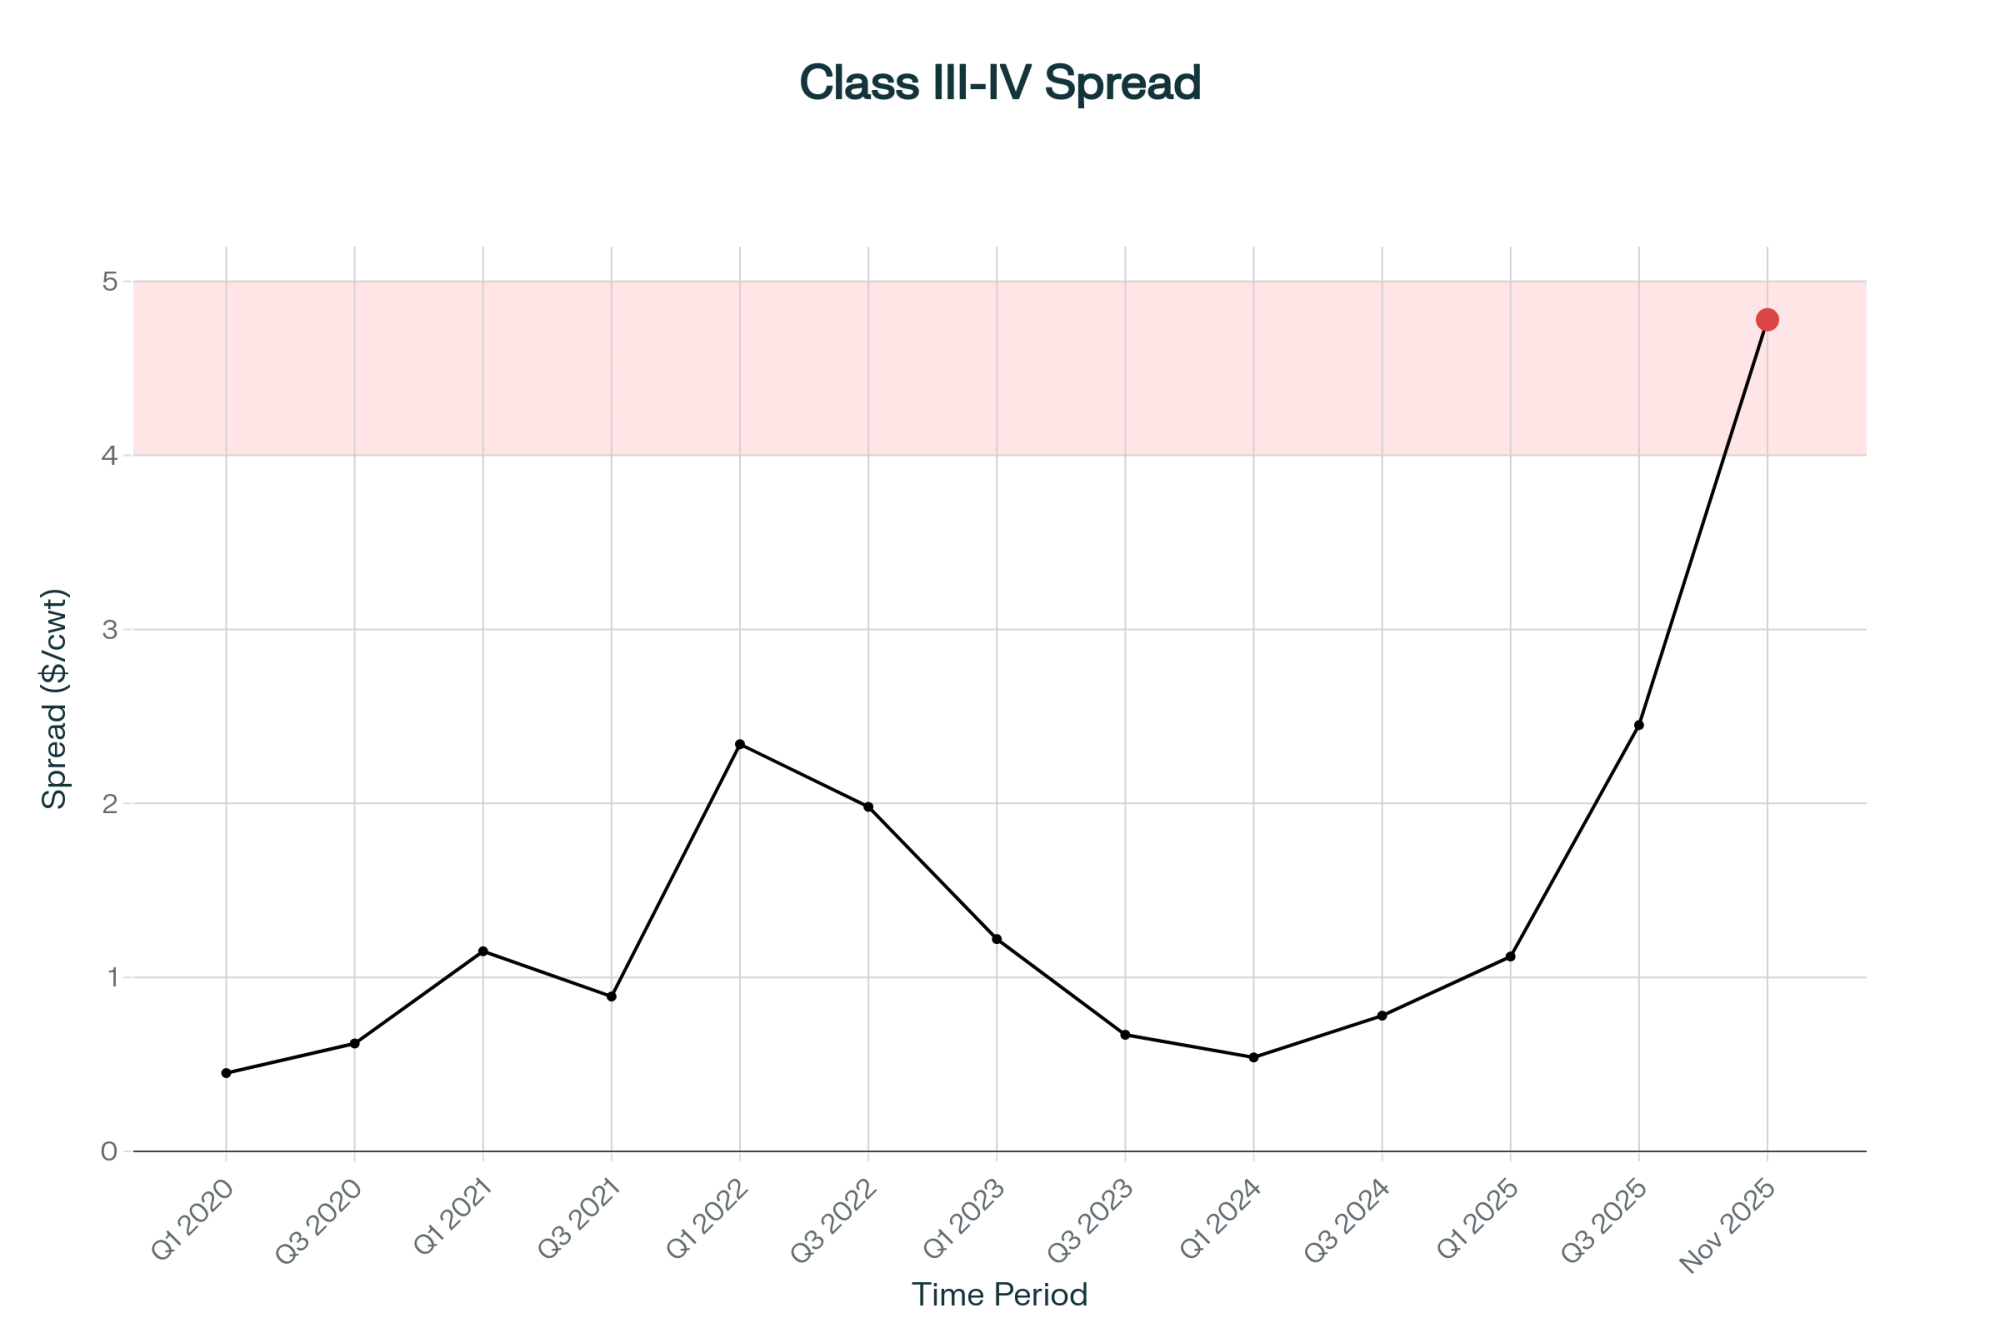
March Class IV futures settled at $19.50/cwt on February 20 — the same day March Class III settled at just $16.51. That’s a $2.99/cwt same-month spread. Nearly three dollars separating what your milk is worth as butter and powder versus cheese, on the same contract month.
That kind of gap doesn’t just show up on a chart. It shows up on your milk check, your DRP election, and your cash-flow projections for the next 90 days.
Consider a 500-cow freestall shipping 70 lbs/cow/day — the kind of Upper Midwest operation that entered 2026 staring at roughly $90,000 less operating margin than it had the year before. That was before the Class IV spread blew open. Now the question isn’t just “are margins tight?” It’s “which side of the Class III/IV line is your milk landing on?”
$263 Million in Section 32 Purchases — and the Spread Just Got Wider
For that 500-cow operation already staring at a $2.99 class gap, USDA just added fuel to the fire.
On February 19, Secretary of Agriculture Brooke Rollins announced a $263 million Section 32 purchase of dairy and agricultural products. Of that, $148 million goes to dairy — matching the number NMPF requested in late 2025.
The dairy breakdown:
$75 million in butter — the first major USDA butter purchase in five years
$32.5 million in Cheddar cheese and cheese products
$10 million in Swiss cheese
$20.5 million in fresh fluid milk
$10 million in UHT milk
Traders pushed several CME butter contracts to their daily upper limits on Thursday and Friday. The irony isn’t subtle: a program designed to improve food affordability could temporarily tighten commercial butter supplies and push prices higher. Rush the purchases, and you squeeze an already tight market. Spread them out, and the impact fades. Either way, it lit a fire under Class IV futures that isn’t going out this week.
What Does a $2.99/cwt Class Spread Mean for a 500-Cow Dairy?
The headline number means nothing without per-cow math. So let’s walk it.
A 500-cow herd averaging 70 lbs/cow/day ships roughly 255.5 cwt/cow/year, or about 127,750 cwt annually for the operation.
At March Class IV of $19.50/cwt, that’s approximately $2,491,000 in gross milk revenue annualized at that price. At March Class III of $16.51, it’s roughly $2,109,000.
The same-month gap: $382,000/year. About $31,800/month. $63.66/cow/month.
April’s spread narrows. April Class III settled at $17.30 on February 20, while April Class IV held at $19.50 — a $2.20/cwt spread, or about $281,000 annualized. The futures curve expects some Class III recovery. But March is what’s hitting checks right now.
And no herd receives a pure single-class check. Your milk check is a blend, weighted by your handler’s utilization decisions and the pool. When Class IV runs this far above Class III, depooling accelerates — handlers pull Class IV milk out of the pool because it’s more profitable outside. In Federal Order 30 (Upper Midwest), pooled Class IV producer milk totaled just 1.4 billion pounds in 2025, even as butter and powder production ran strong. Handlers kept that high-value milk outside the pool, and the blend price for everyone who stayed pooled took the hit.
Metric
March Class III ($16.51/cwt)
March Class IV ($19.50/cwt)
Annual Production (500-cow herd, 70 lbs/day)
127,750 cwt
127,750 cwt
Gross Milk Revenue (annualized at this price)
$2,109,000
$2,491,000
Annual Revenue Gap
—
+$382,000 🔴
Monthly Revenue Impact
$175,750
$207,583
Monthly Gap
—
+$31,833 🔴
Per-Cow Monthly Revenue
$292.92
$345.14
Per-Cow Monthly Gap
—
+$52.22 🔴
Run your own numbers. If the gap between your handler’s blend and what you’d get at pure Class IV pricing is more than $1.50/cwt, the rest of this article matters more to your operation than most.
Three Forces That Won’t Let the Spread Self-Correct
For that 500-cow operation watching the spread widen, three structural drivers suggest it isn’t cooling off by April.
Global fat shortage. GDT Event TE398 — the fourth consecutive price increase — saw butter jump 10.7% to $6,347/MT. Anhydrous milk fat climbed 3.8% to $6,751/MT. Butterfat is tight worldwide, not just in the U.S.
U.S. powder premium over world price. CME spot NDM surged to $1.685/lb during the week ending February 20 — the highest since mid-2022. That sits well above the GDT SMP equivalent of roughly $1.44/lb protein-adjusted. The U.S. powder market is especially tight, and it’s dragging Class IV higher.
Government demand is stacked on top. The Section 32 butter buy adds $75 million in new purchasing power to a market already rationed by price. That’s demand creation at the worst possible moment for anyone hoping Class IV cools off.
CME spot butter jumped 16.5¢ to $1.87/lb for the week, a five-month high. Spot cheddar blocks rose 11¢ to $1.4975/lb — competitive, but nowhere near the butterfat rally. Whey fell 4¢ to $0.68/lb, bucking the trend entirely.
The Spring Flush Math Just Got Worse
That same 500-cow herd’s spring production ramp is about to collide with the largest national herd in over 30 years.
USDA’s January Milk Production report, released February 20, showed total U.S. production at 19.8 billion pounds, up 3.2% year-over-year. The herd itself reached 9.58 million head — up 189,000 cows from January 2025, up 14,000 from December, and the highest total since 1993.
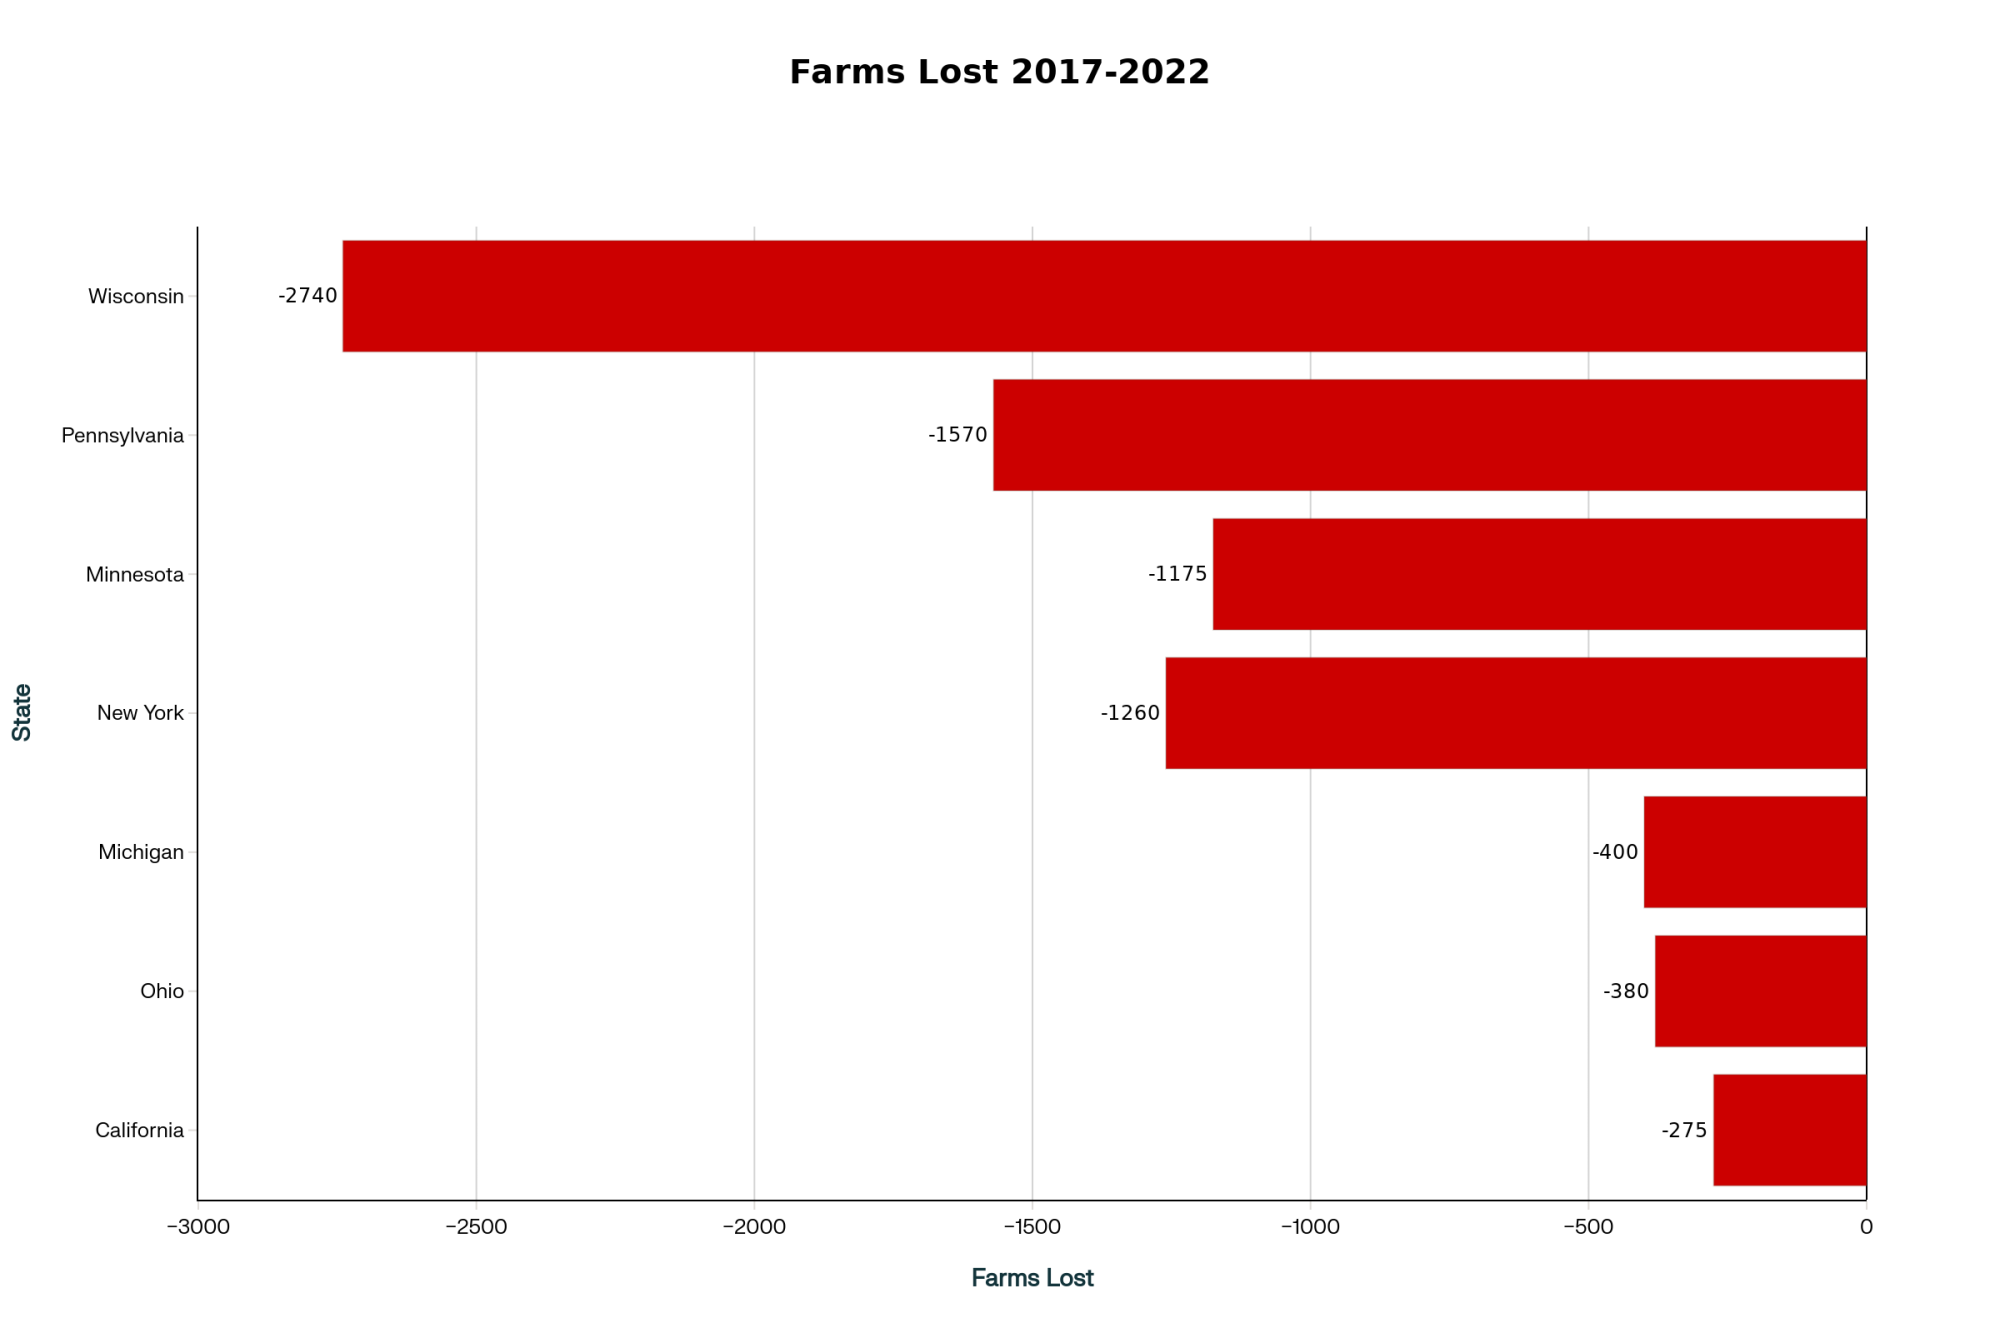
Growth concentrated in the Great Lakes, Texas, and the Northern Plains. Kansas alone added 45,000 cows year-over-year. Wisconsin added 20,000, Idaho 22,000, and Michigan 15,000. On the other side: Washington lost 17,000, Pennsylvania shed 11,000, and New Mexico dropped 8,000. California’s per-cow yields surged 4.6% — from 1,960 to 2,050 lbs/cow in January — with avian influenza fully cleared.
More milk hitting the market should, in theory, ease commodity prices. But the butterfat complex isn’t responding to supply signals the way cheese is. If Section 32 purchases and export demand don’t absorb the extra volume, the futures curve’s $19+ Class IV projection gets tested hard by May, and the spread could narrow from the wrong direction.
But One Thing Already Broke in Their Favor: DMC
Here’s the turn for that 500-cow operation. The safety net they may have treated as an afterthought in 2025 just became the most important enrollment of the decade.
December 2025’s Dairy Margin Coverage margin came in at $9.42/cwt, triggering the first and only payment of 2025 — a thin $0.08/cwt. January doesn’t look thin.
The Center for Dairy Excellence projects the January margin at $7.52/cwt. At $9.50 coverage, that’s a $1.98/cwt indemnity. On 5,000 cwt of monthly Tier 1 production (a 6-million-pound annual allocation), that’s roughly $9,900 in a single month — enough to cover the full year’s premium several times over.
NMPF’s William Loux confirmed the direction: he expects DMC payments through the first quarter and probably through the first half of the year.” USDA projects margins below $9.50/cwt through July.
Enrollment closes February 26. Under the One Big Beautiful Bill Act:
Tier 1 expanded from 5 million to 6 million pounds — covering herds up to roughly 250–350 cows at the $0.15/cwt premium for $9.50 coverage.
Highest production year from 2021–2023 becomes your new baseline.
The trade-off is real. You’re committed through 2031 regardless of where margins go. If margins recover to $12+ by 2027, you’re paying premiums on coverage you won’t trigger. But at $7.52 projected margins in January, the payback math is aggressive. If you haven’t enrolled, the decision framework is here.
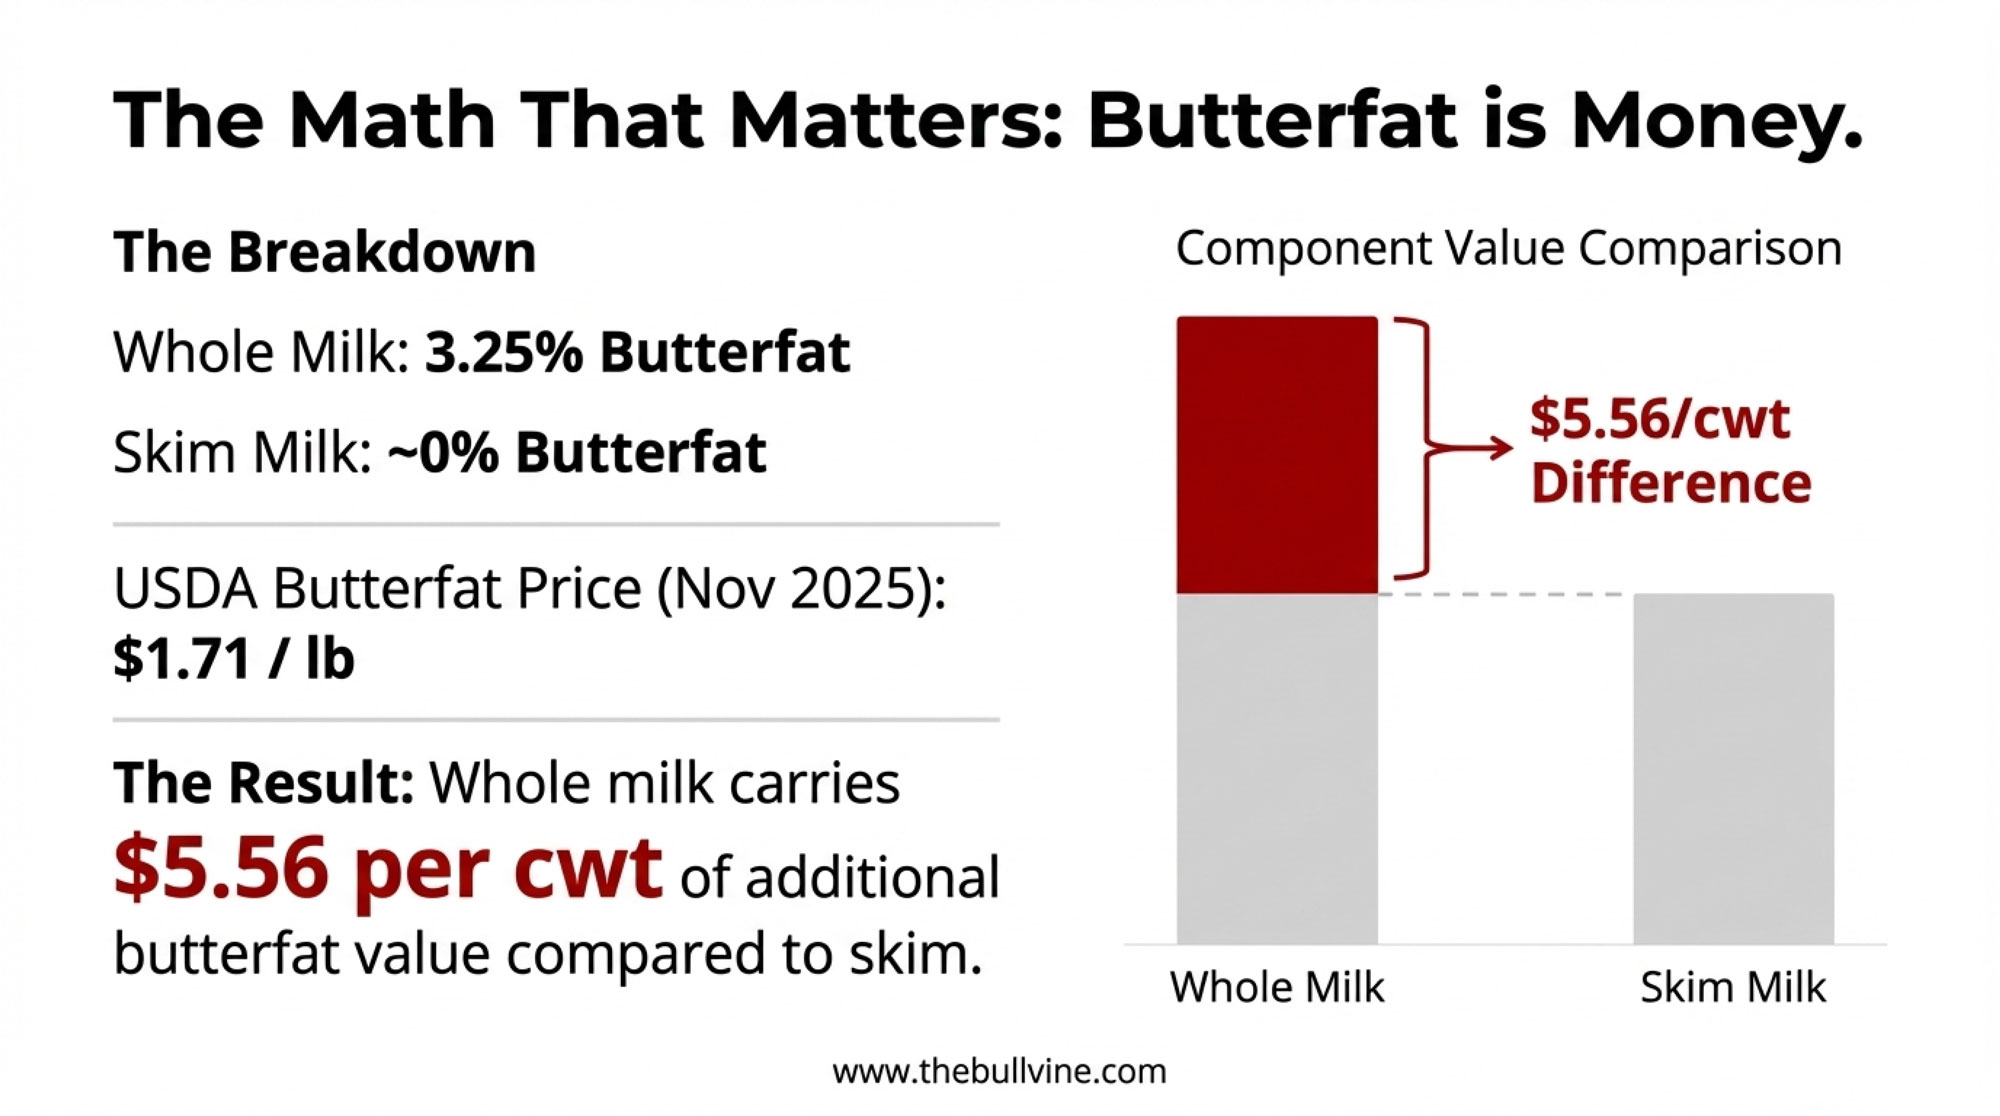
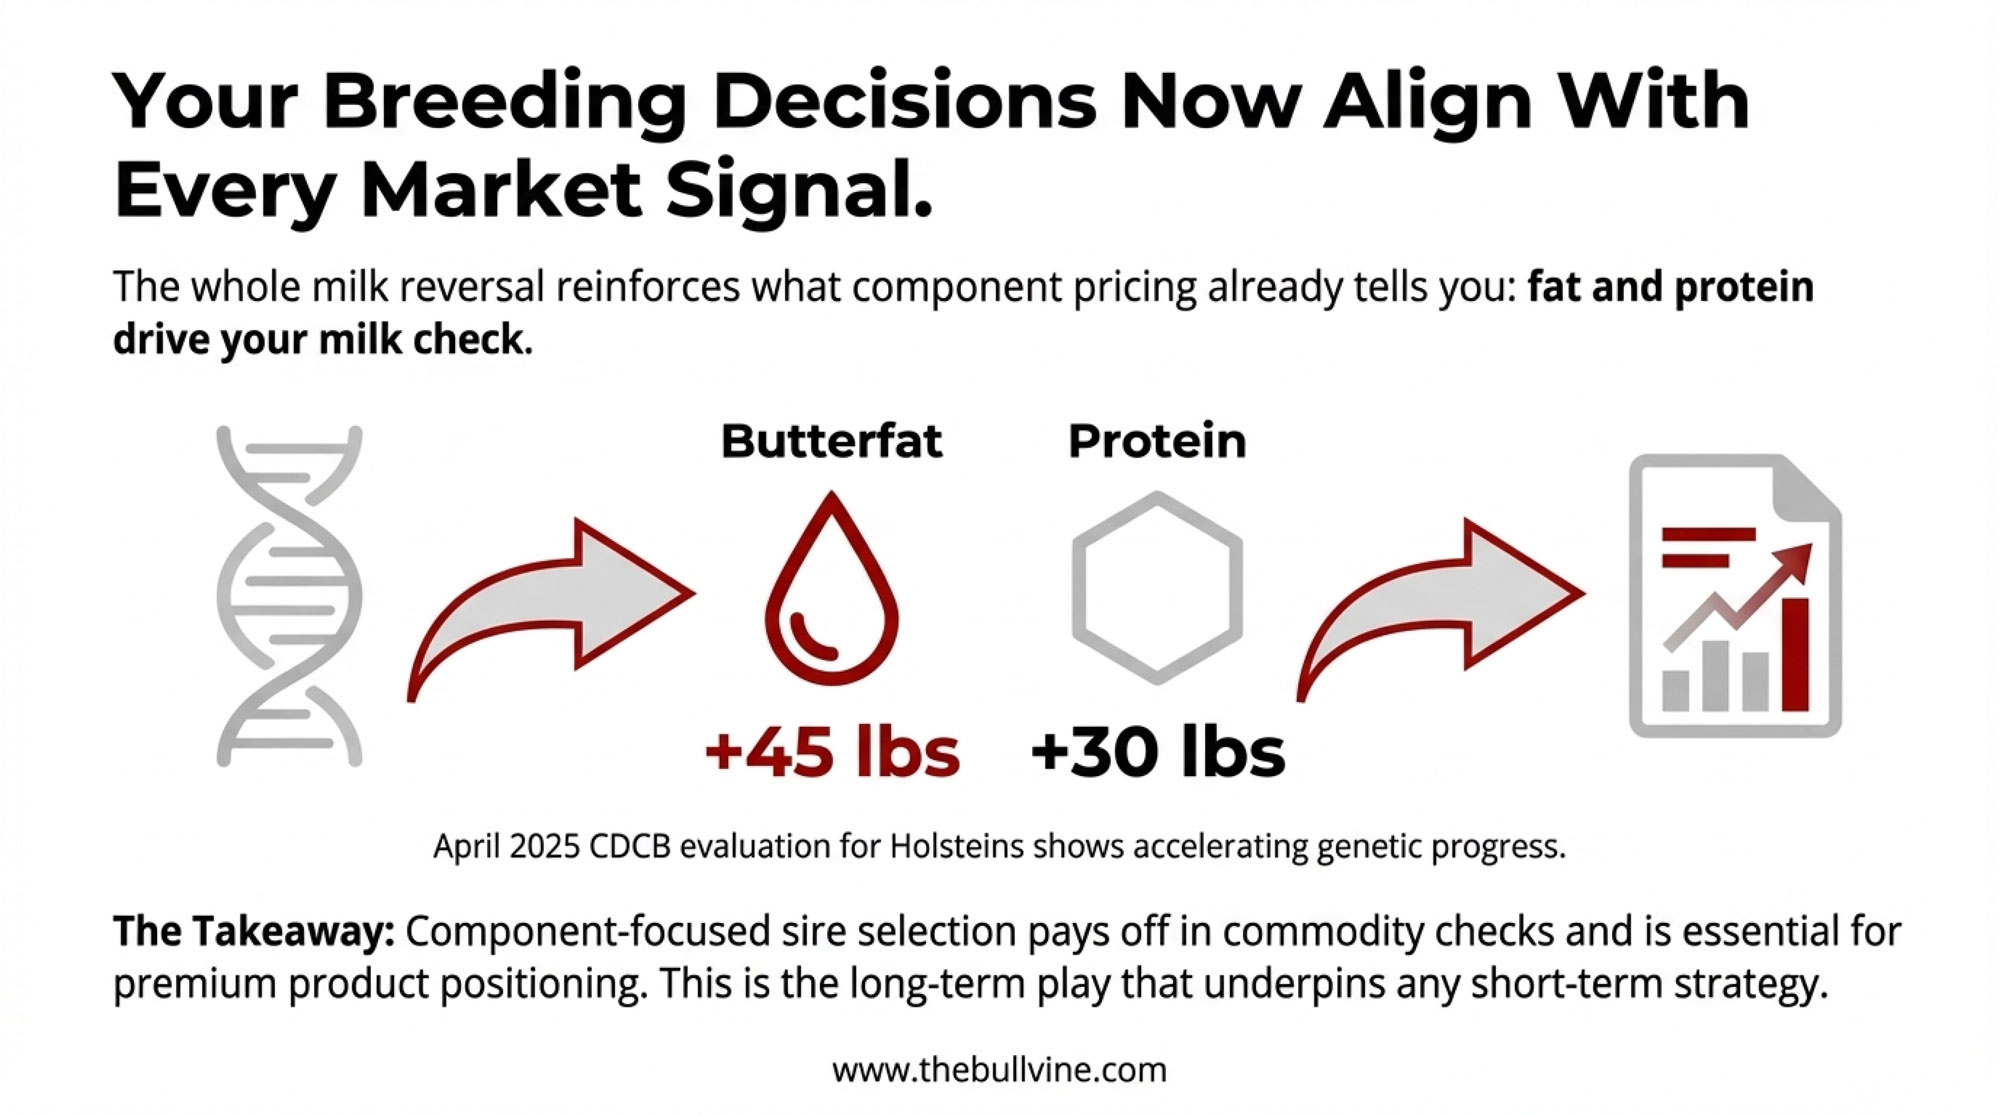
Components: Where the Real Money Hides at $14.59 Milk
January FMMO component prices tell the story: butterfat at $1.4525/lb and protein at $2.1768/lb. In a $14.59 Class III environment — made worse by the June 2025 make-allowance hike that shifted roughly 90¢/cwt to processor cost recovery — components are the difference between breaking even and bleeding cash.
Component Improvement
Additional Production (lbs/year)
FMMO Price ($/lb)
Annual Revenue Gain
0.1% Butterfat
12,775 lbs
$1.4525/lb
+$18,556 🔴
0.1% Protein
12,775 lbs
$2.1768/lb
+$27,809 🔴
Combined 0.1% BF + Protein
25,550 lbs
—
+$46,365 🔴
Per-Cow Monthly Impact (500-cow)
—
—
+$7.73/cow 🔴
Here’s the math on a 500-cow herd shipping 12.775 million lbs/year:
Each 0.1% protein improvement: 12,775 lbs additional protein × $2.1768/lb = $27,809/year
Combined 0.1% gain in both: roughly $46,400/year — or $7.73/cow/month
If you’re below 4.0% fat and 3.1% protein, talk to your nutritionist this week. The herds making component gains aren’t spending more per cow — they’re tightening transition protocols, adjusting TMR formulations, and managing bunk time. Those are $46,000 improvements at the cost of management attention, not capital.
What This Means for Your Operation
This week — before February 26:
DMC enrollment. At the projected January margin of $7.52/cwt, one month’s indemnity at $9.50 coverage equals $1.98/cwt across your Tier 1 production. USDA projects margins below $9.50 through July. The deadline is Wednesday.
DRP weighting review. With a $2.99/cwt same-month Class III–IV spread, your election weighting is the single highest-dollar decision you’ll make this quarter. Call your risk management advisor this week.
Next 90 days — through the spring flush:
Model cash flow at $16–$17 Class III, not the $18.95 annual WASDE average. Your March and April checks reflect January and February commodity prices, which were ugly. If your all-in cost of production sits above $18/cwt, model your cash reserve at $16 Class III for Q1 and count the months of runway.
Pull your handler’s utilization report. In Federal Order 30, Class IV depooling thinned the pool all through 2025. If you don’t know where your milk is classified, you can’t evaluate whether this spread is working for or against you.
Push components hard. At January’s $1.4525/lb butterfat and $2.1768/lb protein, each tenth of a percent in BF and protein combined is worth $46,400/year on a 500-cow herd. Talk to your nutritionist about transition cow protocols and bunk management — that’s where the cheapest gains live.
By year-end:
Section 179 planning. The OBBBA raised Section 179 expensing to $2.5 million with 100% bonus depreciation through 2030. But borrowing to buy equipment to save on taxes only works if you can service the debt at $16 milk. Run those numbers with your accountant before your lender does.
Watch the July USMCA review. The mandatory six-year joint review hits July 1, 2026. Canada and Mexico bought $3.6 billion in U.S. dairy in 2024 — roughly 44% of the $8.2 billion total export value that year. In 2025, U.S. dairy exports surged to a confirmed $9.51 billion, nearly matching the $9.54 billion record set in 2022. But Canada’s TRQ fill rates still average just 42%. NMPF’s Shawna Morris argues that Canada remains “technically compliant with USMCA’s text, commercially limiting in practice.” If you’re in a co-op with significant North American export exposure, the July outcome shapes your 2027 milk price more than anything on the CME right now.
Key Takeaways
If your handler’s blend is more than $1.50/cwt below a pure Class IV value, this spread is actively costing your herd real money.
At $7.52/cwt projected January margin, one DMC indemnity month at $9.50 can pay several years of premiums on your Tier 1 volume — but only if you’re enrolled before February 26.
Each combined 0.1% gain in butterfat and protein is worth about $46,400/year on a 500-cow herd at today’s component prices.
The Bottom Line
The futures curve says relief is coming. Your January check says it hasn’t arrived yet. That 600-cow Wisconsin freestall operation profiled in The Bullvine’s January analysis — the one facing a $250,000 margin gap between full cost of production and what 2026 futures actually deliver? They stress-tested at $16 milk, trimmed 50–75¢/cwt from their breakeven through tighter heifer programs and lease renegotiations, and showed their lender a plan built off conservative numbers. The lender, seeing they were budgeting off realistic prices and actively adjusting, worked with them on amortization flexibility.
The producers who come out of this spring in good shape won’t be the ones who waited for $19. They’ll be the ones who ran their numbers at $16 and made decisions accordingly.
Where does your breakeven sit relative to $16.51 Class III? That’s the only number that matters this week.
Complete references and supporting documentation are available upon request by contacting the editorial team at editor@thebullvine.com.
Dairy Tech ROI: The Questions That Separate $50K Wins from $200K Mistakes – Cut through the trade-show hype and discover which innovations actually move the needle. This guide exposes the $200,000 mistakes in automation, arming you with the scale-specific ROI benchmarks that separate profitable disruptors from the struggling.
The Sunday Read Dairy Professionals Don’t Skip.
Every week, thousands of producers, breeders, and industry insiders open Bullvine Weekly for genetics insights, market shifts, and profit strategies they won’t find anywhere else. One email. Five minutes. Smarter decisions all week.
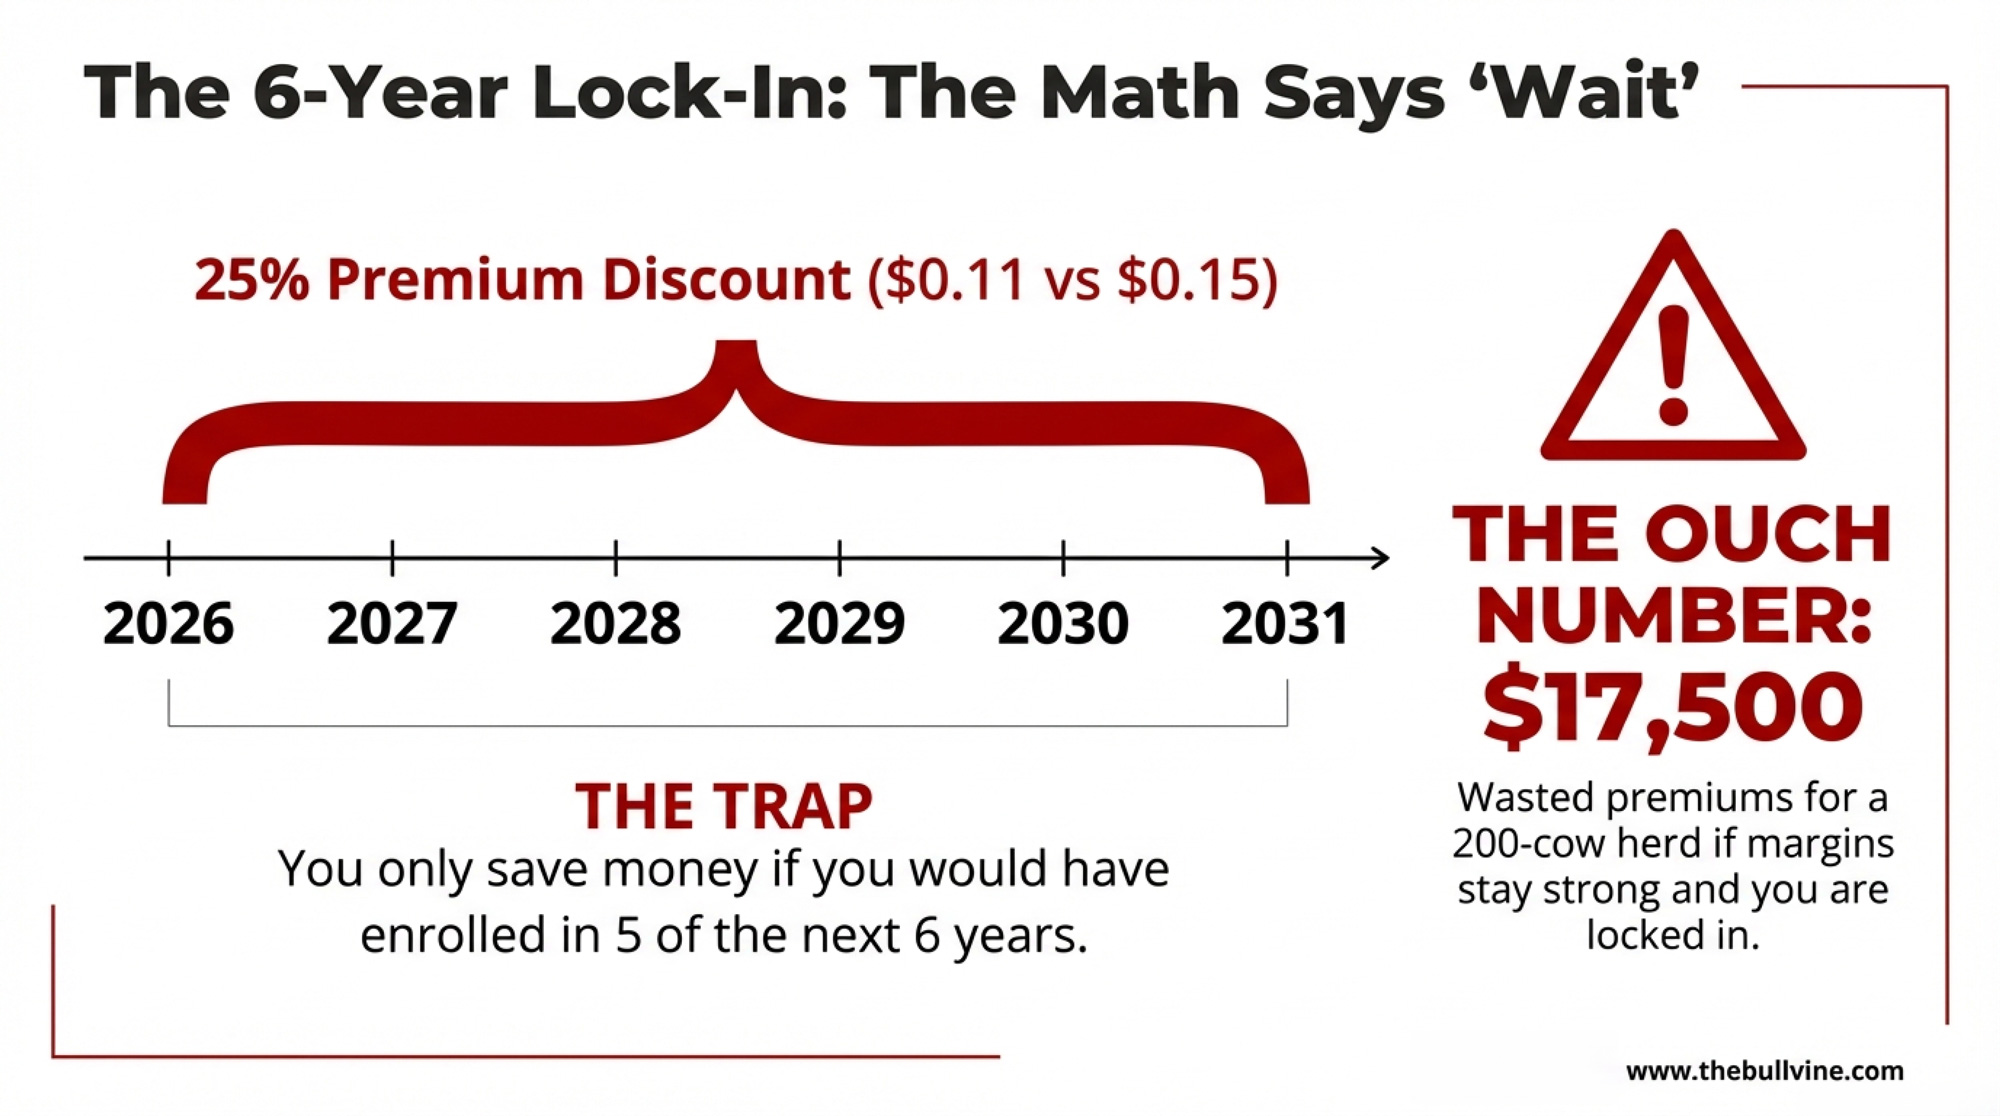
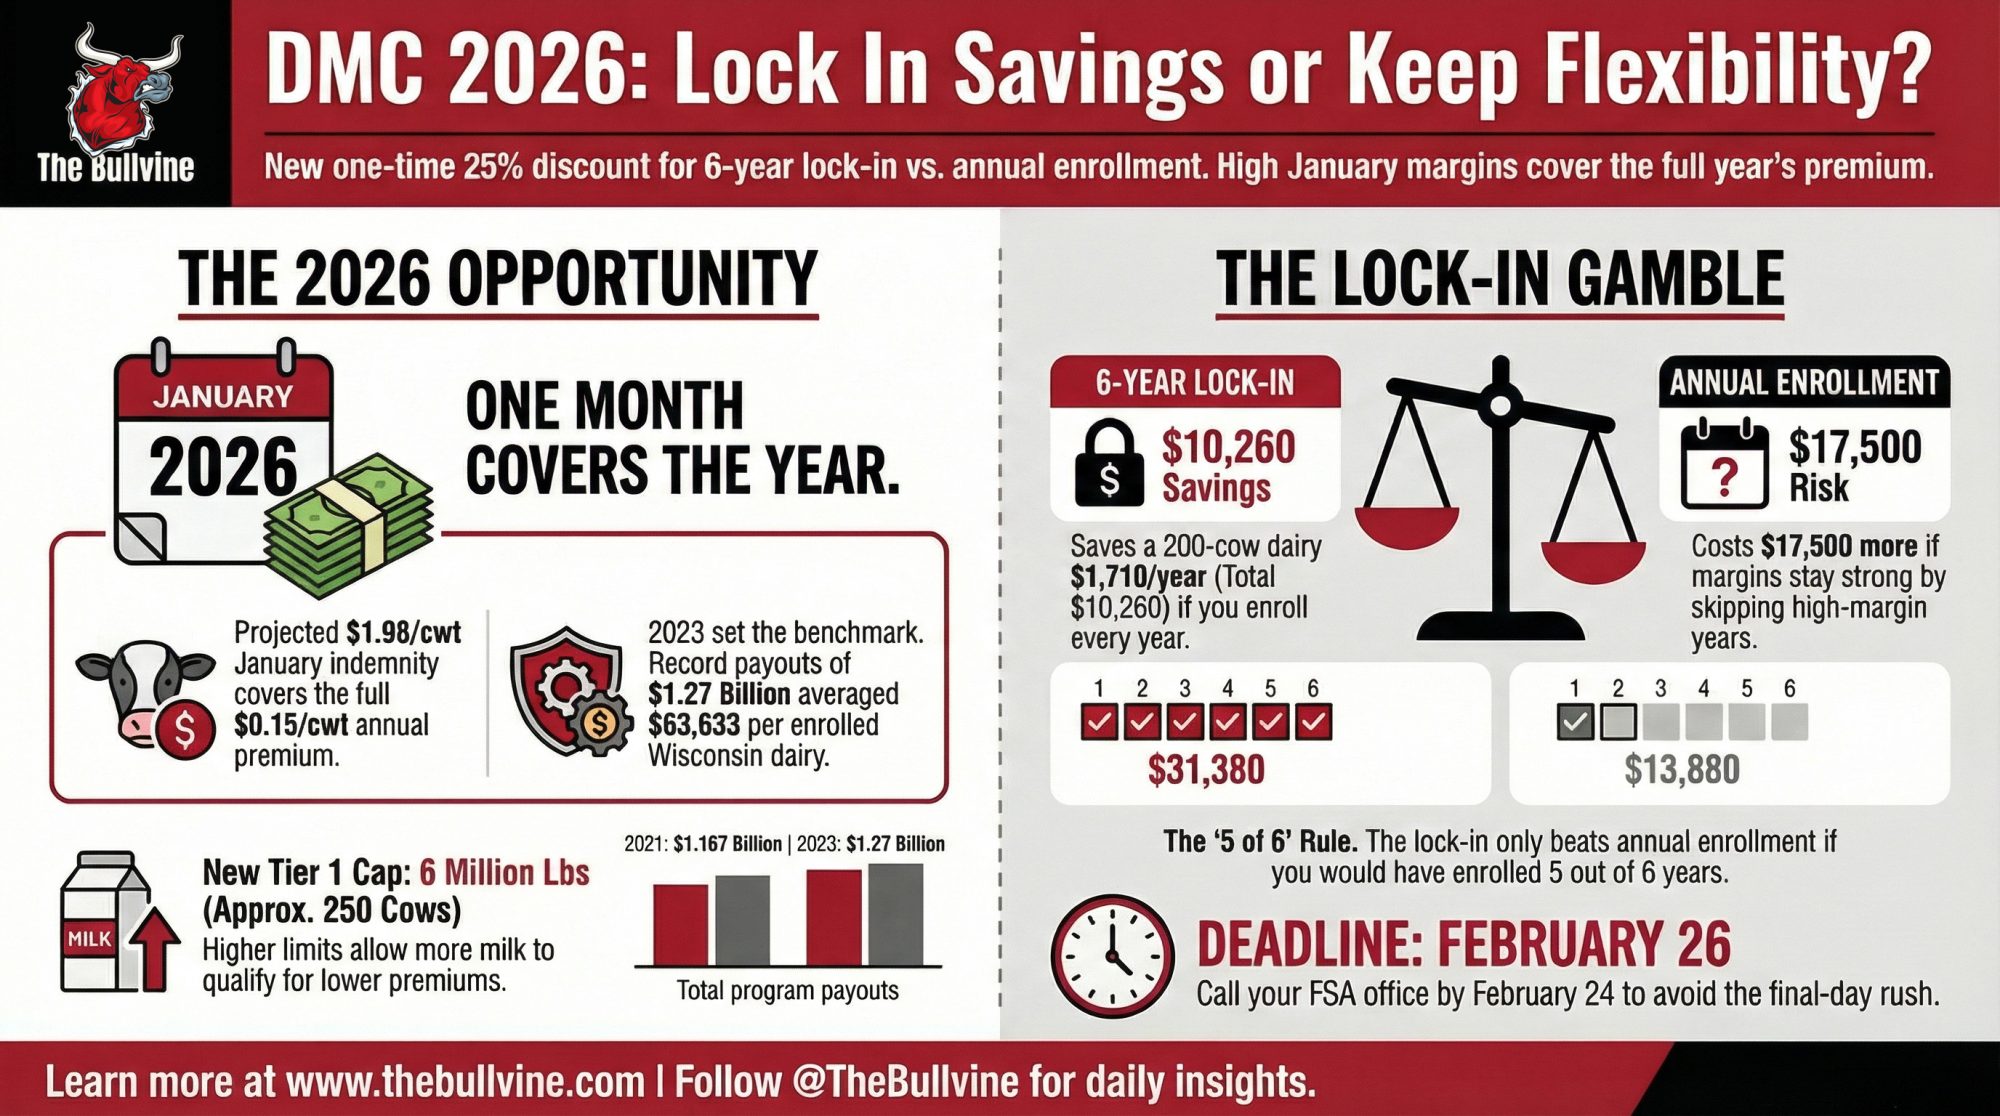
USDA’s 25% premium discount only pays off if margins stay compressed five of the next six years. That’s never happened.
Executive Summary: Wisconsin dairies are a week from the 2026 Dairy Margin Coverage deadline, and 68% still aren’t enrolled even though January’s projected DMC margin of $7.52/cwt would generate about $1,564 per million pounds — enough to cover a full year of Tier 1 premiums at $9.50. The article breaks down how the new 6‑year lock‑in, with its 25% premium discount, only comes out ahead if you’d enroll in at least five of the next six years, and how locking in anyway can turn into a $17,500 premium drag for a 200‑cow herd when margins stay strong in four of those years. ⚡ But that analysis comes with an important caveat: at $0.15/cwt, the enrollment hurdle is low enough that a rational producer looking at futures would likely have enrolled in most years — which makes the lock‑in more defensible than it first appears. The article walks through full barn math for 200‑ and 500‑cow operations, shows how the 6‑million‑pound Tier 1 cap leaves half the milk on a 500‑cow herd uncovered, and puts 2023’s record $1.27 billion in DMC payouts — $63,633 per enrolled Wisconsin dairy — in context as the benchmark for what this program delivers when margins compress. Instead of generic advice, you get four specific paths — annual DMC, 6‑year lock‑in, lower‑tier coverage, or skipping DMC and leaning on DRP/LGM for the rest of your milk — with clear trade‑offs spelled out for each. The playbook is simple: pull your 2021–2023 milk marketings, run the USDA DMC calculator with your actual cwt, and call FSA by February 24, so you know exactly what you’re betting before you sign a contract that runs through 2031.
January 2026 Class III settled at $14.59/cwt — the weakest month since early 2024. And as of February 17, roughly 3,500 Wisconsin dairy operations still hadn’t enrolled in Dairy Margin Coverage for 2026. Katie Detra at Wisconsin’s Farm Service Agency shared that just 1,616 producers had completed DMC signup — only 31.5% of the state’s 5,116 licensed dairy farms. The deadline is February 26.
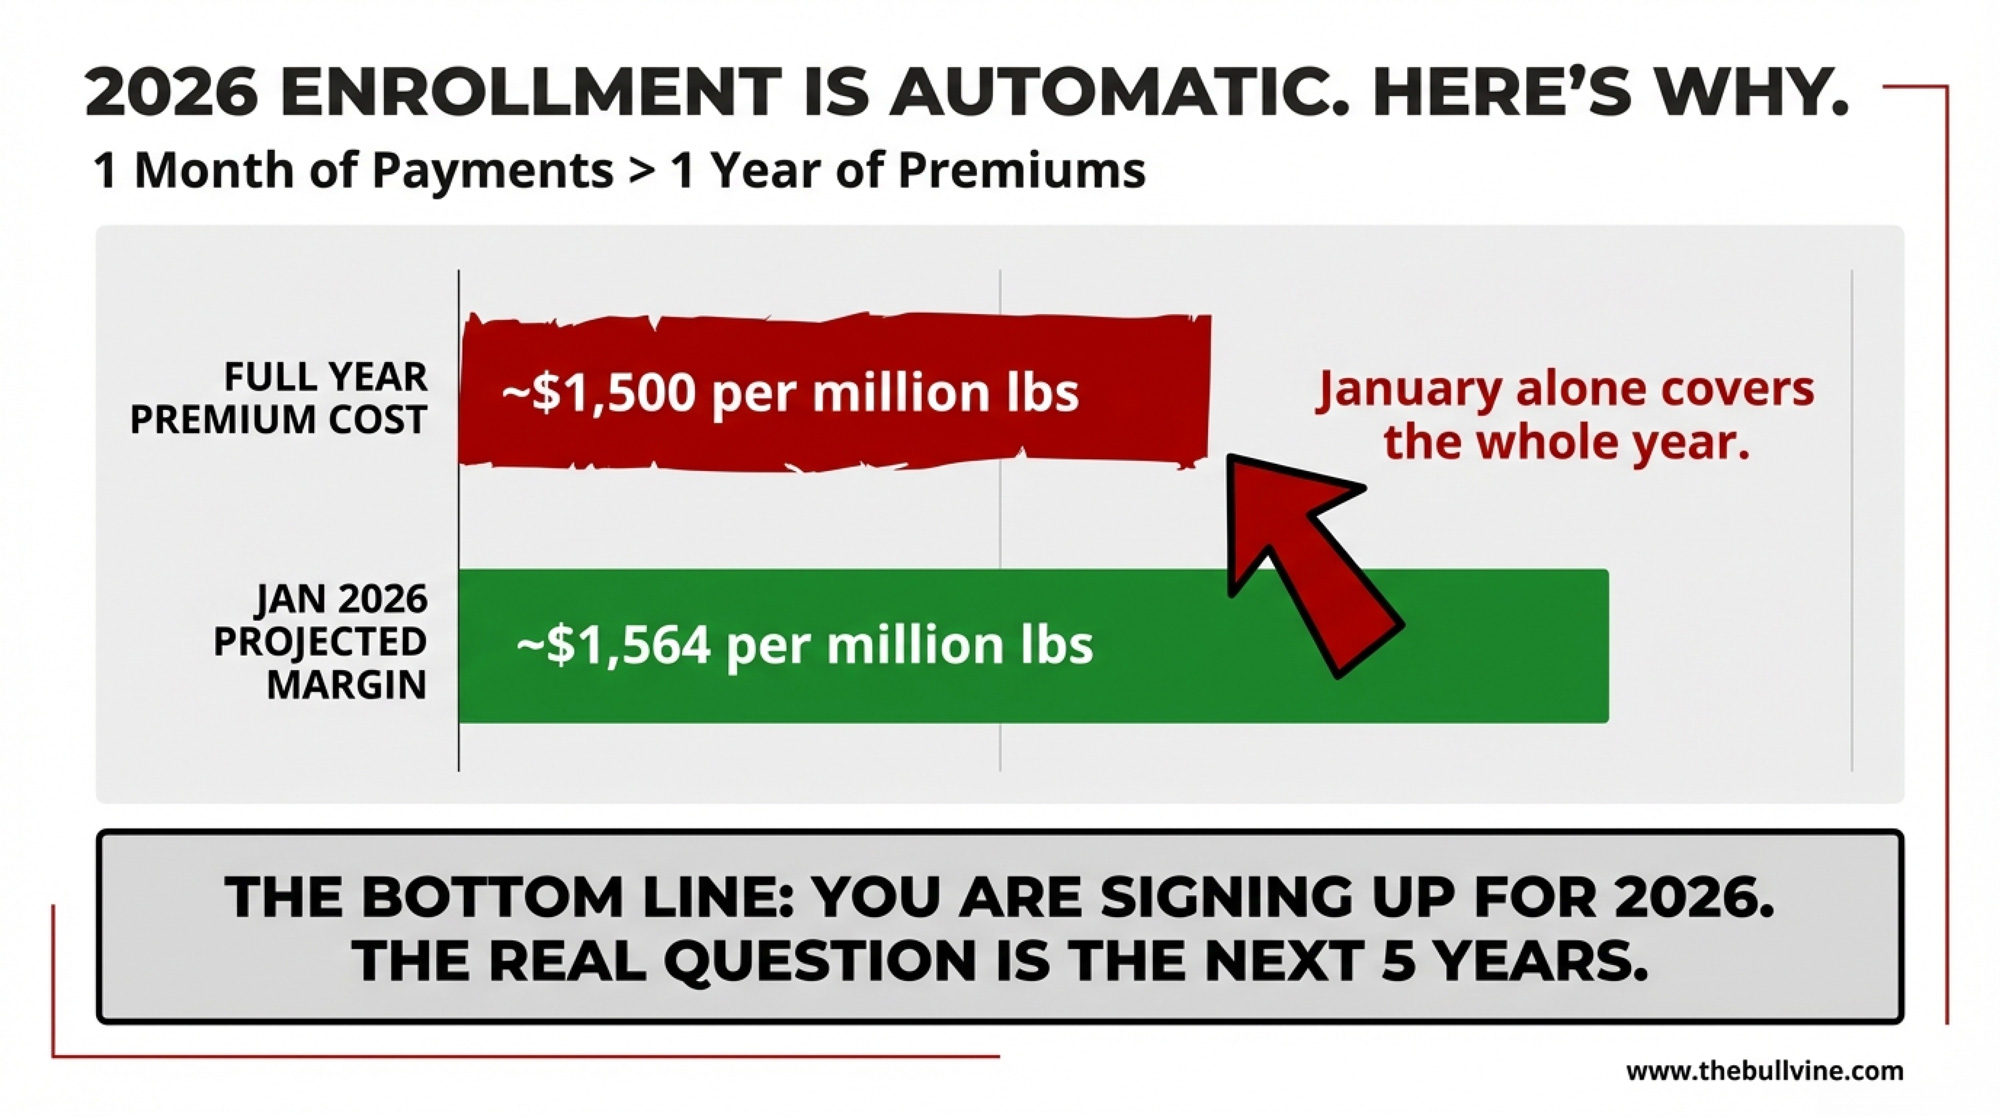
DMC doesn’t use Class III directly. The program’s margin formula takes the national All-Milk price and subtracts a standardized feed cost. But the pressure is running in the same direction. As of February 2, the Center for Dairy Excellence projected the January 2026 DMC margin at $7.52/cwt. At $9.50 coverage, that’s a $1.98/cwt indemnity — and CDE noted that January alone would produce “about $1,564 on a million pounds of production covered under Tier 1, which would cover premium costs” for the entire year.
One month’s payment covers your annual premium. For 2026, the enrollment decision is close to automatic. The six-year lock-in checkbox sitting next to it on the form? That’s a different conversation entirely—and nobody’s walking producers through the math.
From 80% to 31% — What Happened in Wisconsin?
Here’s the part that doesn’t add up. As of early 2024, 80 percent of Wisconsin dairy farmers were enrolled in DMC — the highest participation rate in the country, per Wisconsin Farm Bureau Federation. WFBF President Brad Olson called it “a critical farm safety net program during tough times.”
Fair warning on the comparison: that 80% figure was a final-year enrollment count. The current 31.5% is a mid-signup snapshot with six days left. Deadline rushes always close the gap. But even so, the pace is way off.
Some of the lag is structural. Wisconsin lost 545 dairy operations between January 2024 and today — down from 5,661 to 5,116. Some of those lost farms were DMC enrollees. Others are mid-transition, selling cows or passing the herd to the next generation, and a six-year commitment is the last thing they want. Still others have built hedging programs around Dairy Revenue Protection and see DMC as redundant on their first 6 million pounds.
But the margin picture has shifted underneath all of them. December 2025’s DMC margin came in at $9.42/cwt — just barely triggering the year’s first and only payment, a thin $0.08/cwt. That was the warm-up act. CDE’s January 14 outlook projects the full-year 2026 average margin at $8.51/cwt, starting at $7.37 in January and not climbing above $9.50 until November. If that forecast holds, ten months trigger payments — a total net indemnity of $8,300 per million pounds of Tier 1 covered production, after premiums but before sequestration.
Katie Burgess, director of risk management at Ever.Ag, projected “payouts of more than $1 per hundredweight for January through April, and then some smaller payments for May through July as well.” Mike North, also at Ever.Ag, as been blunt with producers: just “get it.”
They’re right about 2026. The harder question is whether you should lock your elections through 2031.
What 2023 Should Remind Every Producer About DMC
Before digging into the lock-in math, it’s worth anchoring on what DMC actually delivers when margins compress hard — because the numbers aren’t theoretical.
In 2023, DMC triggered payments in 11 of 12 months at $9.The 50 coverage. At the level of average enrolled dairy, received indemnity payments of $2.80/cwt per month. Through the first nine months alone, total program payouts reached $1.27 billion — surpassing the previous annual record of $1.187 billion set in 2021. Wisconsin led all states at $272.2 million, averaging $63,633 per enrolled operation.
July 2023 hit the floor: a $3.52/cwt margin, the lowest in DMC history. At $9.50 coverage, that was a $5.98/cwt indemnity in a single month.
Put that in barn math for a 200-cow herd at 95% Tier 1: one month at $5.98/cwt on 3,800 covered cwt = roughly $22,724 from one month of milk. The annual premium was about $6,840. One July check covered three years of premiums.
Here’s the full payout history at $9.50 Tier 1 coverage:
Year
Months Triggered
Total Payouts
Avg Per Enrolled Dairy
2019
7 of 12
$451.6M
$19,306
2020
5 of 12
$234.0M
$17,324
2021
11 of 12
$1.187B
$62,214
2022
2 of 12
$83.7M
$4,656
2023
11 of 12
$1.27B+
$74,553
2024
~5 of 12
$36.9M est.
$2,356 est.
2025
1 of 12
Minimal
~$0.08/cwt (Dec only)
Two things jump out. First, the big-payment years are massive — 2021 and 2023 alone combined for roughly $2.46 billion in indemnities. A single year of compression can dwarf a decade of premiums. Second, the non-payment years (2022, 2024, 2025) are real. At $0.15/cwt, you’re not losing much in those years — but you are paying premiums for coverage that didn’t trigger.
That second point matters for the lock-in question. More on that below.
What Changed Under the New Law
The One Big Beautiful Bill Act, signed July 4, 2025, reauthorized DMC through 2031 with three changes that shift the math.
Tier 1 coverage went from 5 million to 6 million pounds. A 250-cow herd shipping 24,000 lbs/cow now fits entirely inside Tier 1. Every operation gets a fresh production history based on the highest annual marketings from 2021, 2022, or 2023. And the new wrinkle: lock your elections for all six years and get a 25% premium discount.
FSA program manager Doug Kilgore confirmed this lock-in is a one-time election — available only during 2026 enrollment. Skip it now, and it’s gone for the life of the program.
Sandy Chalmers, Wisconsin’s FSA State Executive Director, outlined the base case on February 17: “At $0.15 per hundredweight for $9.50 coverage, risk protection through Dairy Margin Coverage is a cost-effective tool to manage risk and provide added financial security for your operations.”
At fifteen cents a hundredweight, she’s right. That’s the easy part.
How Much Does DMC Actually Pay a 200‑Cow Dairy?
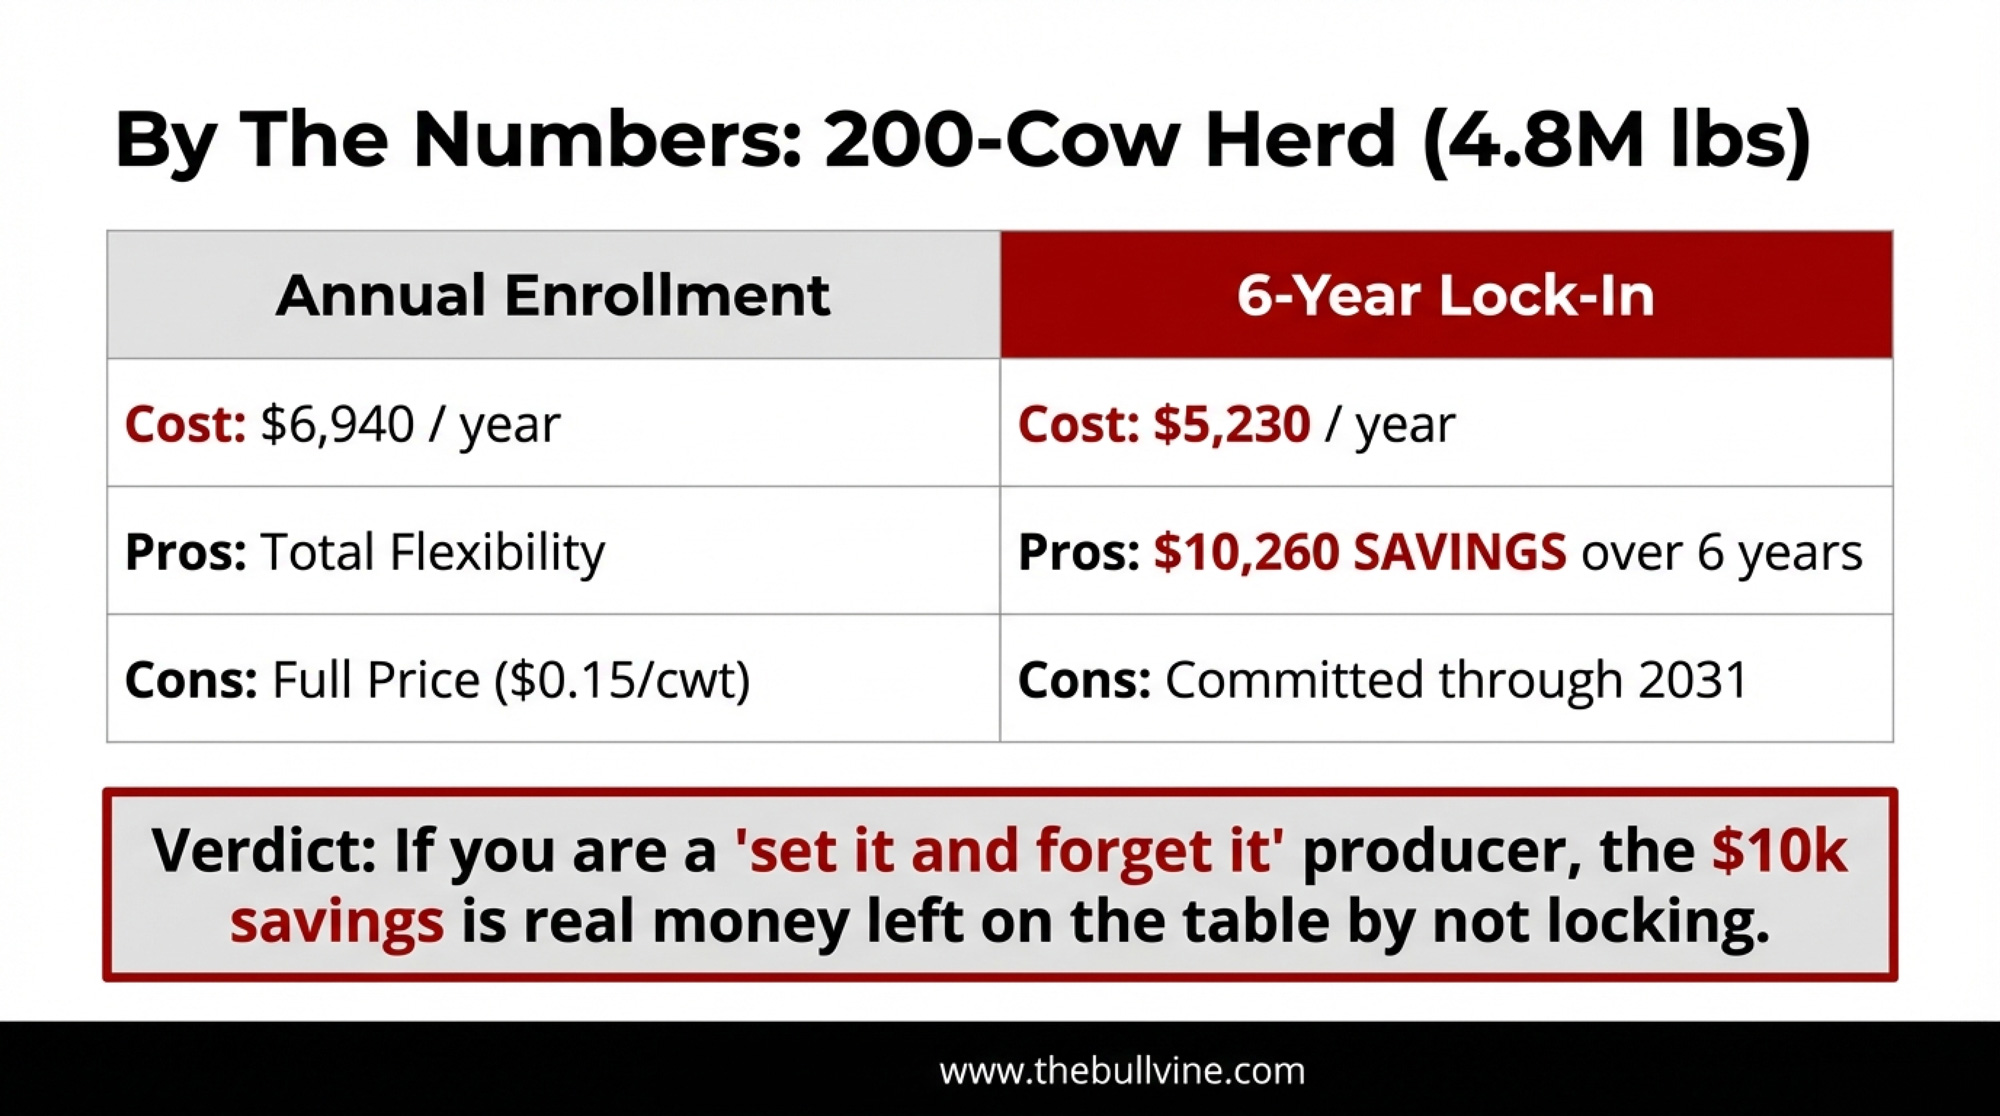
A 200-cow operation averaging 24,000 lbs/cow ships 4.8 million pounds — comfortably inside the 6-million-pound Tier 1 cap. At $9.50 coverage and 95% enrollment, the premium is $0.15/cwt.
Annual savings from the lock-in: $1,710/year, or $10,260 over six years.
Now look at January alone. CDE’s $1.98/cwt projected indemnity on that 200-cow herd: 3,800 cwt of monthly covered production × $1.98 = roughly $7,524 on one month’s milk. That single payment exceeds the entire annual premium.
If margins track CDE’s January 14 forecast for the full year, total net indemnity on 4.56 million covered pounds would land around $37,800 for 2026. That’s a projection, not a guarantee — forecasts shift month to month. But it shows the scale of what’s sitting on the table.
And on a 500‑Cow Operation?
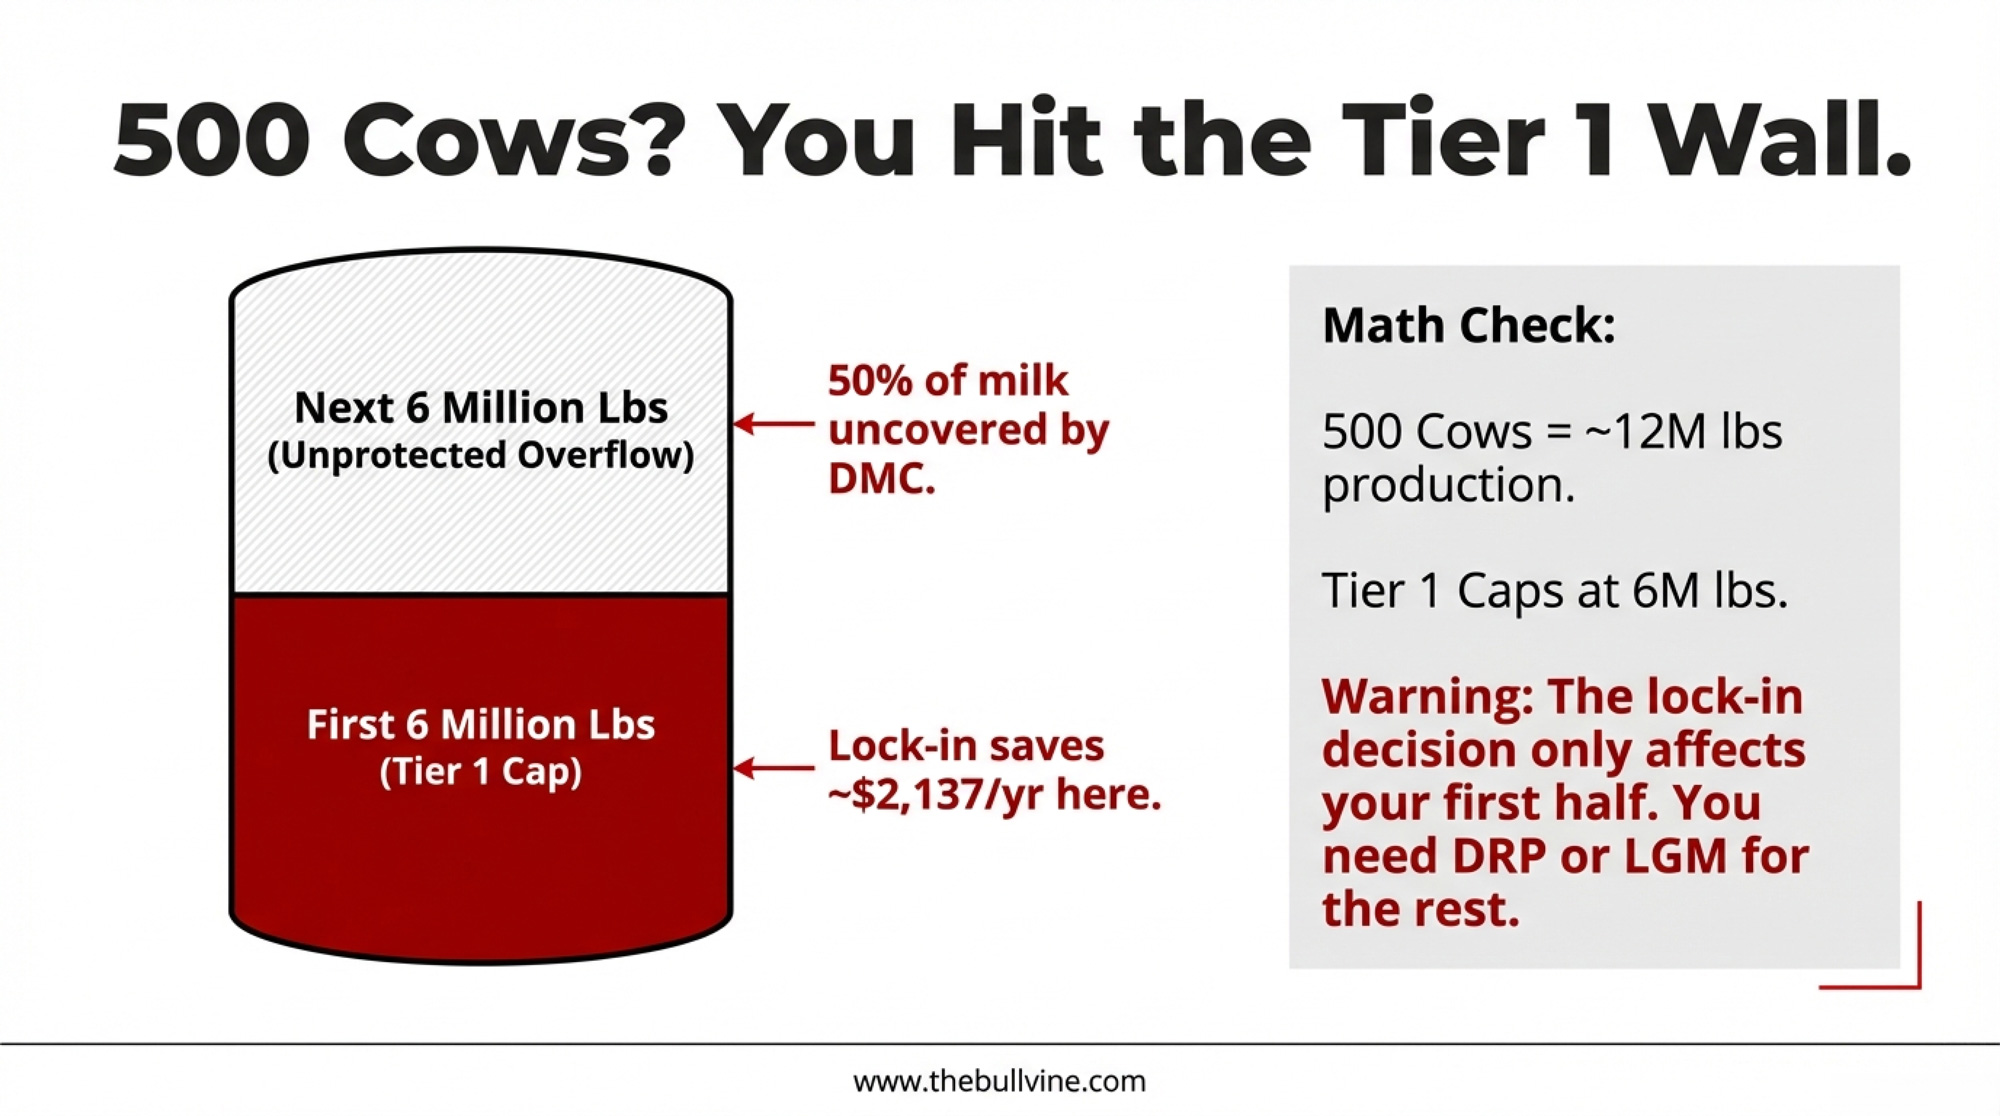
Scale up, but know where the wall is. A 500-cow dairy at 24,000 lbs/cow produces 12 million pounds. Tier 1 caps at 6 million. Half of your milk is unprotected.
January’s projected indemnity: 4,750 monthly cwt × $1.98 = $9,405. One month covers the premium. Scale CDE’s full-year projection the same way — $8,300 per million covered pounds × 5.7 million — and you’re looking at roughly$47,310 in net indemnity for 2026 on the Tier 1 portion alone.
But the other 6 million pounds? Nothing. Tier 2 premiums jump to a maximum of $8.00 coverage with rates running dramatically higher — that’s why most advisors treat DMC as a Tier 1 play and layer DRP on top for the rest.
William Loux, senior vice president of global economic affairs at the National Milk Producers Federation, put it this way: “The uncertainty in dairy markets is not going away anytime soon. So DMC, DRP — these are great programs to utilize.”
Should You Lock In DMC for 6 Years?
This is where the 25% discount starts to get complicated. Leonard Polzin, dairy markets and policy specialist at UW–Madison Extension, ran the margin history, and his numbers frame the decision.
The lock-in only beats annual enrollment if you’d sign up in at least 5 of the 6 years. Here’s what that looks like for a 200-cow dairy:
Scenario
Lock-In Cost (6 yrs)
Annual Cost
Differencefor
Enroll all 6 years
$31,380
$41,640
Lock-in saves $10,260
Enroll 5 of 6
$31,380
$34,700
Lock-in saves $3,320
Enroll 3 of 6
$31,380
$20,820
Annual savings are $10,560
Enroll 2 of 6
$31,380
$13,880
Annual saves $17,500
That bottom row. You’ve paid $17,500 in premiums for coverage that barely triggered.
So how often do margins actually compress for five or six straight years? Polzin checked. From 2019 through 2025, 39 of 84 months fell below $9.50. Payment runs averaged 4.88 months. Non-payment runs averaged 4.33 months. As his analysis notes, “margins tend to move in episodes rather than in isolated one-month shocks” — and “the relevant risk is frequently the duration of tight margins and the associated working-capital strain, not only whether a single-month payment occurs.”
The margin oscillates. It doesn’t stack up in neat multi-year compression streaks.
But Here’s the Honest Counterpoint: What Did Futures Show at Decision Time?
The table above assumes you’d skip enrollment in years when margins ended up running above $9.50. That’s hindsight. You don’t have hindsight at enrollment time — you have futures.
And here’s what producers actually knew at each deadline:
Enrollment Year
Deadline Window
Market Signal at Signup
Would a Rational Producer Enroll?
Actual Result
2019
Early 2019
Tight margins expected
Yes
7 months triggered; $19,306/op
2020
Late 2019
Uncertain; premium cheap
Probably
5 months; $17,324/op
2021
Early 2021
Feed costs rising
Yes
11 months; $62,214/op
2022
Late 2021
Milk recovering, feed high
Uncertain — but $0.15/cwt is cheap insurance
2 months; $4,656/op
2023
Extended to January 31, 2023
FSA Administrator: “early projections indicate payments are likely for the first eight months”
Absolutely
11 months; $74,553/op
2024
February 28 – April 29, 2024
Jan margin hit $8.48, first payment triggered before enrollment opened
Probably
~5 months; $2,356/op
2025
January 29 – March 31, 2025
Futures projected ~$12.50/cwt average margins
Maybe skip — but premium is just $0.15/cwt
1 month; ~$0.08/cwt
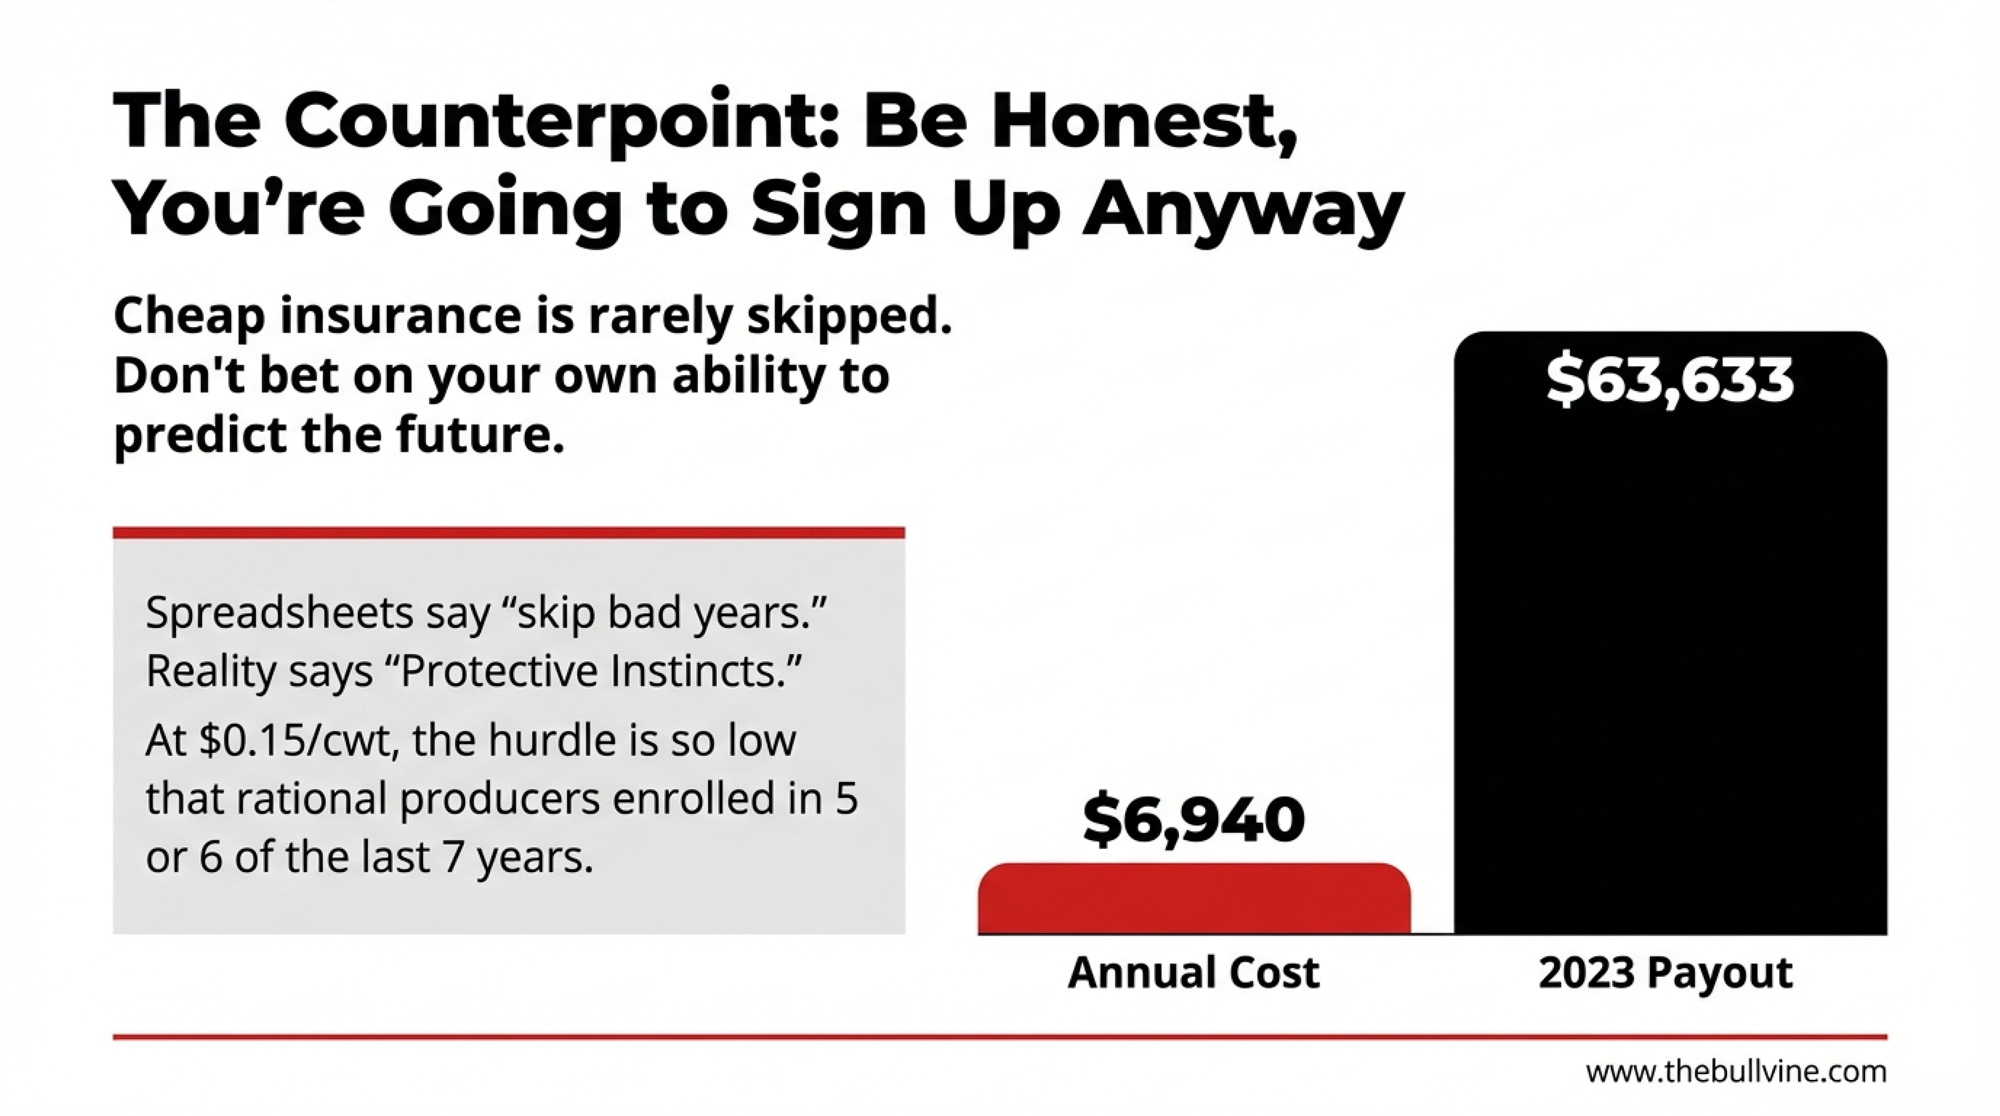
At $0.15/cwt, the enrollment hurdle is remarkably low. A 200-cow herd pays $6,940 for a full year of $9.50 coverage. In 2023, that $6,940 returned roughly $63,000. Even in the weakest year on record — 2022 — the premium amounted to about $1.44/cow/year. Most producers would enroll on cheap-insurance logic alone in all but the most obviously strong-margin years.
Look at that column honestly: a rational producer reviewing futures at each enrollment deadline would likely have enrolled in five or six of the last seven years. Only 2025 gave a clear “skip” signal — and even then, some producers enrolled because the premium was effectively a rounding error against downside protection.
That changes the lock-in math. If you’re the kind of operator who enrolls most years anyway — and the historical enrollment rate of 73–80% of eligible dairies suggests most producers are — the lock-in’s $10,260 in savings over six years is real money you’d leave on the table by staying annual.
The lock-in loses when you’re disciplined enough actually to skip enrollment in good-margin years. Polzin’s data shows that the years 2022, 2024, and 2025 all had weak or zero payouts. But the question isn’t whether good-margin years exist. It’s whether you’d actually sit out when the premium is $0.15/cwt and the downside is missing a 2023-style year.
Loux captured the tension: “It’s good that DMC is paying out, but it’s almost always better for prices, and better for dairy farmers, if they don’t.”
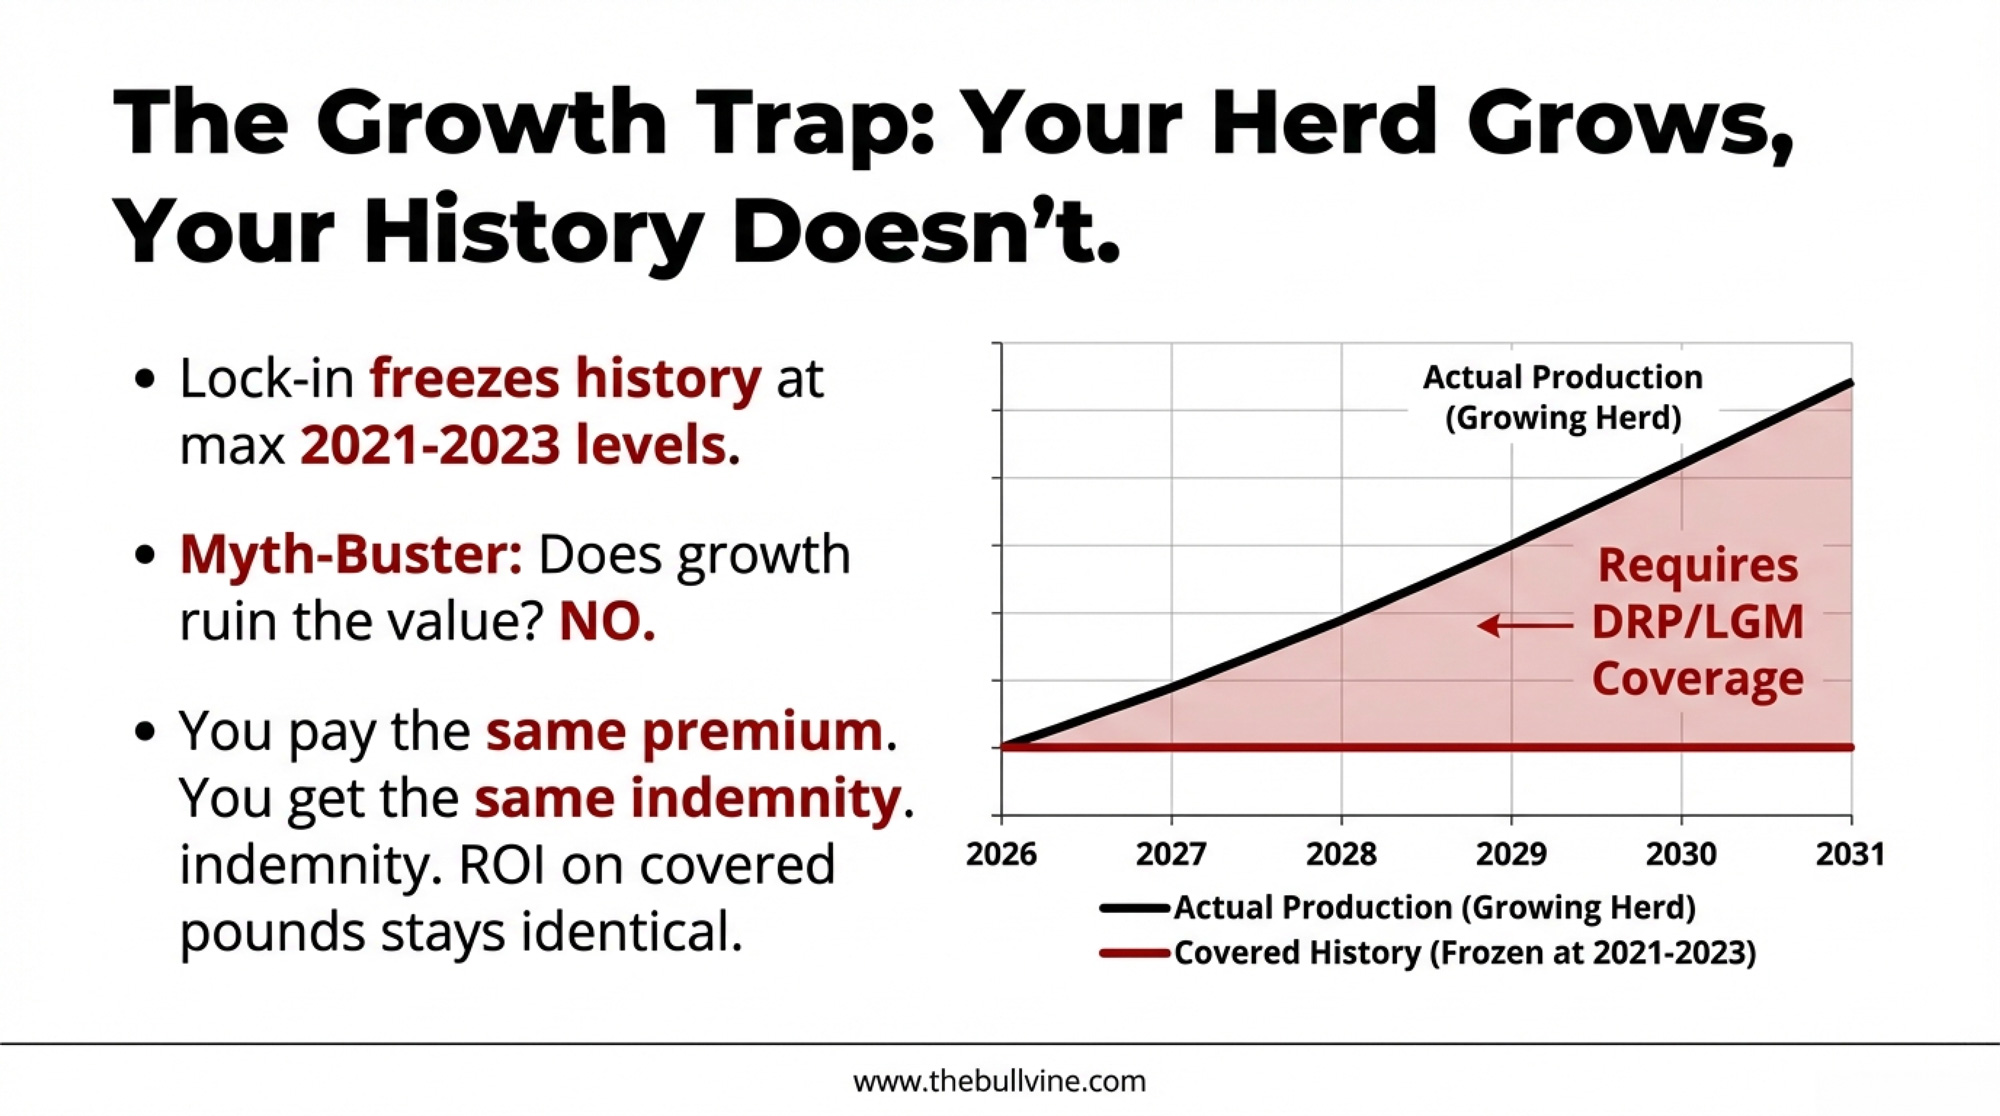
What Happens When Your Herd Outgrows Your History?
Lock in for six years, and your production history freezes at your best year between 2021 and 2023. Your herd doesn’t.
Say your best history year was 170 cows. You’re milking 200 now. That history — 4,080,000 lbs at 95% enrollment — gives you 3,876,000 covered pounds. Here’s the part that trips people up: the dollars don’t change as you grow. The premium stays the same. The indemnity payment stays the same. You’re buying coverage on a fixed number of pounds — same check out, same check in, regardless of what’s happening with your actual herd size.
What does change is the share of your total production that has margin protection underneath it:
Year
Actual Production
Covered Lbs
% Covered
Annual Premium
Indemnity per $1/cwt Trigger
2026
4,800,000 (200 cows)
3,876,000
80.8%
$5,914
$38,760
2028
5,198,000 (217 cows)
3,876,000
74.6%
$5,914
$38,760
2031
5,845,000 (244 cows)
3,876,000
66.3%
$5,914
$38,760
Notice the last two columns — they’re identical every row. The DMC math on your covered pounds doesn’t erode. You pay the same premium. You get the same indemnity. The ROI on the covered portion is unchanged whether you’re milking 200 cows or 244.
The real issue is what’s growing outside that coverage. By 2031, a third of your actual production has zero margin protection. That milk generates revenue in good months and unprotected losses in bad ones. It’s not that DMC got worse — it’s that your unprotected exposure got bigger, and you need to manage it separately.
For a 500-cow herd, this gap exists from day one. You’re producing 12 million pounds and covering 6 million — half your milk is already outside DMC, regardless of herd growth.
The practical question isn’t “is my DMC eroding?” — it’s “what am I doing about the growing share of milk that DMC was never designed to cover?” That’s where DRP, LGM, or self-insurance need to enter the conversation. Kilgore confirmed: locked-in operations must pay premiums annually and certify they’re commercially marketing milk every year. There’s no pause button and no off-ramp — but the coverage you’re paying for delivers the same dollar protection it always did.
Four Paths Before February 26
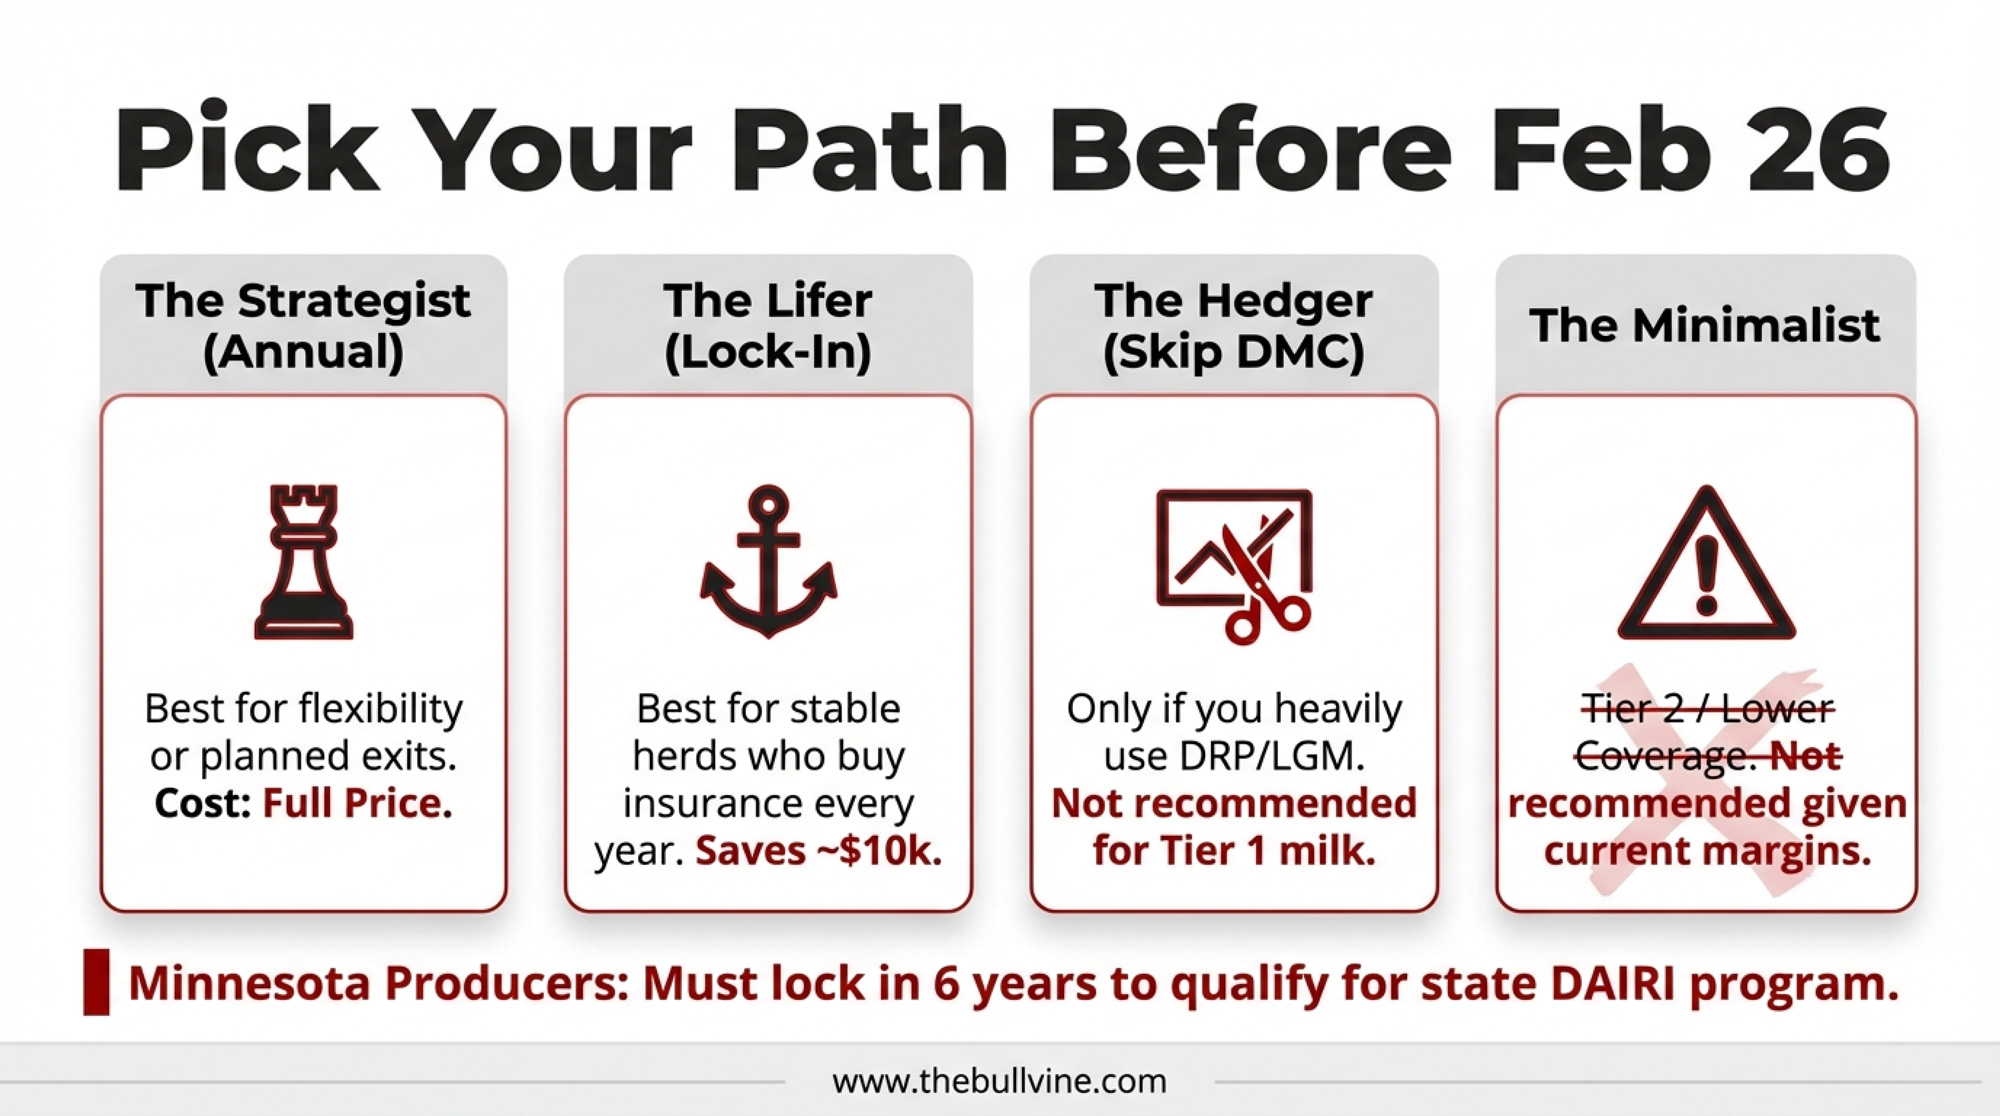
Path 1: Annual enrollment at $9.50, Tier 1. No lock-in. Best for growing herds, operations expecting margin recovery within 2–3 years, or anyone facing a major change before 2031. Cost: $6,940/year (200-cow) or $8,650/year (500-cow), paid only in the years you choose. You sacrifice $1,710–$2,137/year in premium savings. You keep full flexibility.
Path 2: The stable-herd lock-in. Fits operations that closely match their 2021–2023 history, plan to milk through 2031, and would realistically enroll most years anyway, which the enrollment history suggests is most producers. Savings: $10,260–$12,825 total. But it can’t be reversed. Premiums are due by September each year, regardless of conditions. If 2028 turns out to be a $12 margin year, you’re still writing that check. ⚡
Think you’ll weigh the lock-in decision next year? You won’t have the option. This election is only available during the 2026 enrollment. Miss it, and it’s gone permanently.
Path 3: Enroll at a lower coverage tier. Dropping from $9.50 to $8.00 cuts your Tier 1 premium and reduces your exposure if margins recover faster than expected. But it also slashes your indemnity in the months that matter most. Run both scenarios at dmc.dairymarkets.org with your actual production numbers before deciding.
Path 4: Skip DMC entirely. Only makes sense if you’re running active DRP or LGM hedging and are comfortable walking away from the cheapest margin protection available on your first 6 million pounds. Note: operations with unpaid 2025 premiums can’t get a 2026 contract until the balance clears.
Minnesota producers — one more variable. Your state’s DAIRI program requires a 6-year DMC commitment to qualify for state-level dairy assistance. That alone could tip the math.
What This Means for Your Operation
Pull your 2021–2023 milk marketings now. Your production history is the highest of those three years. If it sits well below current output, know that your DMC coverage on those pounds still delivers the same dollar protection — but you’ll need DRP or LGM for the uncovered portion. ⚡
Be honest about your enrollment behavior. How many of the last seven years would you have enrolled? Not in hindsight — looking at what futures showed at each enrollment deadline. At $0.15/cwt, most producers enrolled in five or six of seven. If that’s you, the lock-in’s $10,260 in savings is real. If you’re disciplined enough to skip when futures signal strong margins, annual gives you that optionality.
Remember what 2023 delivered. Wisconsin dairies enrolled in the program averaged $63,633 in indemnity payments. Those that weren’t? Zero. At $0.15/cwt, the annual cost of not being covered in a compression year dwarfs a decade of premiums.
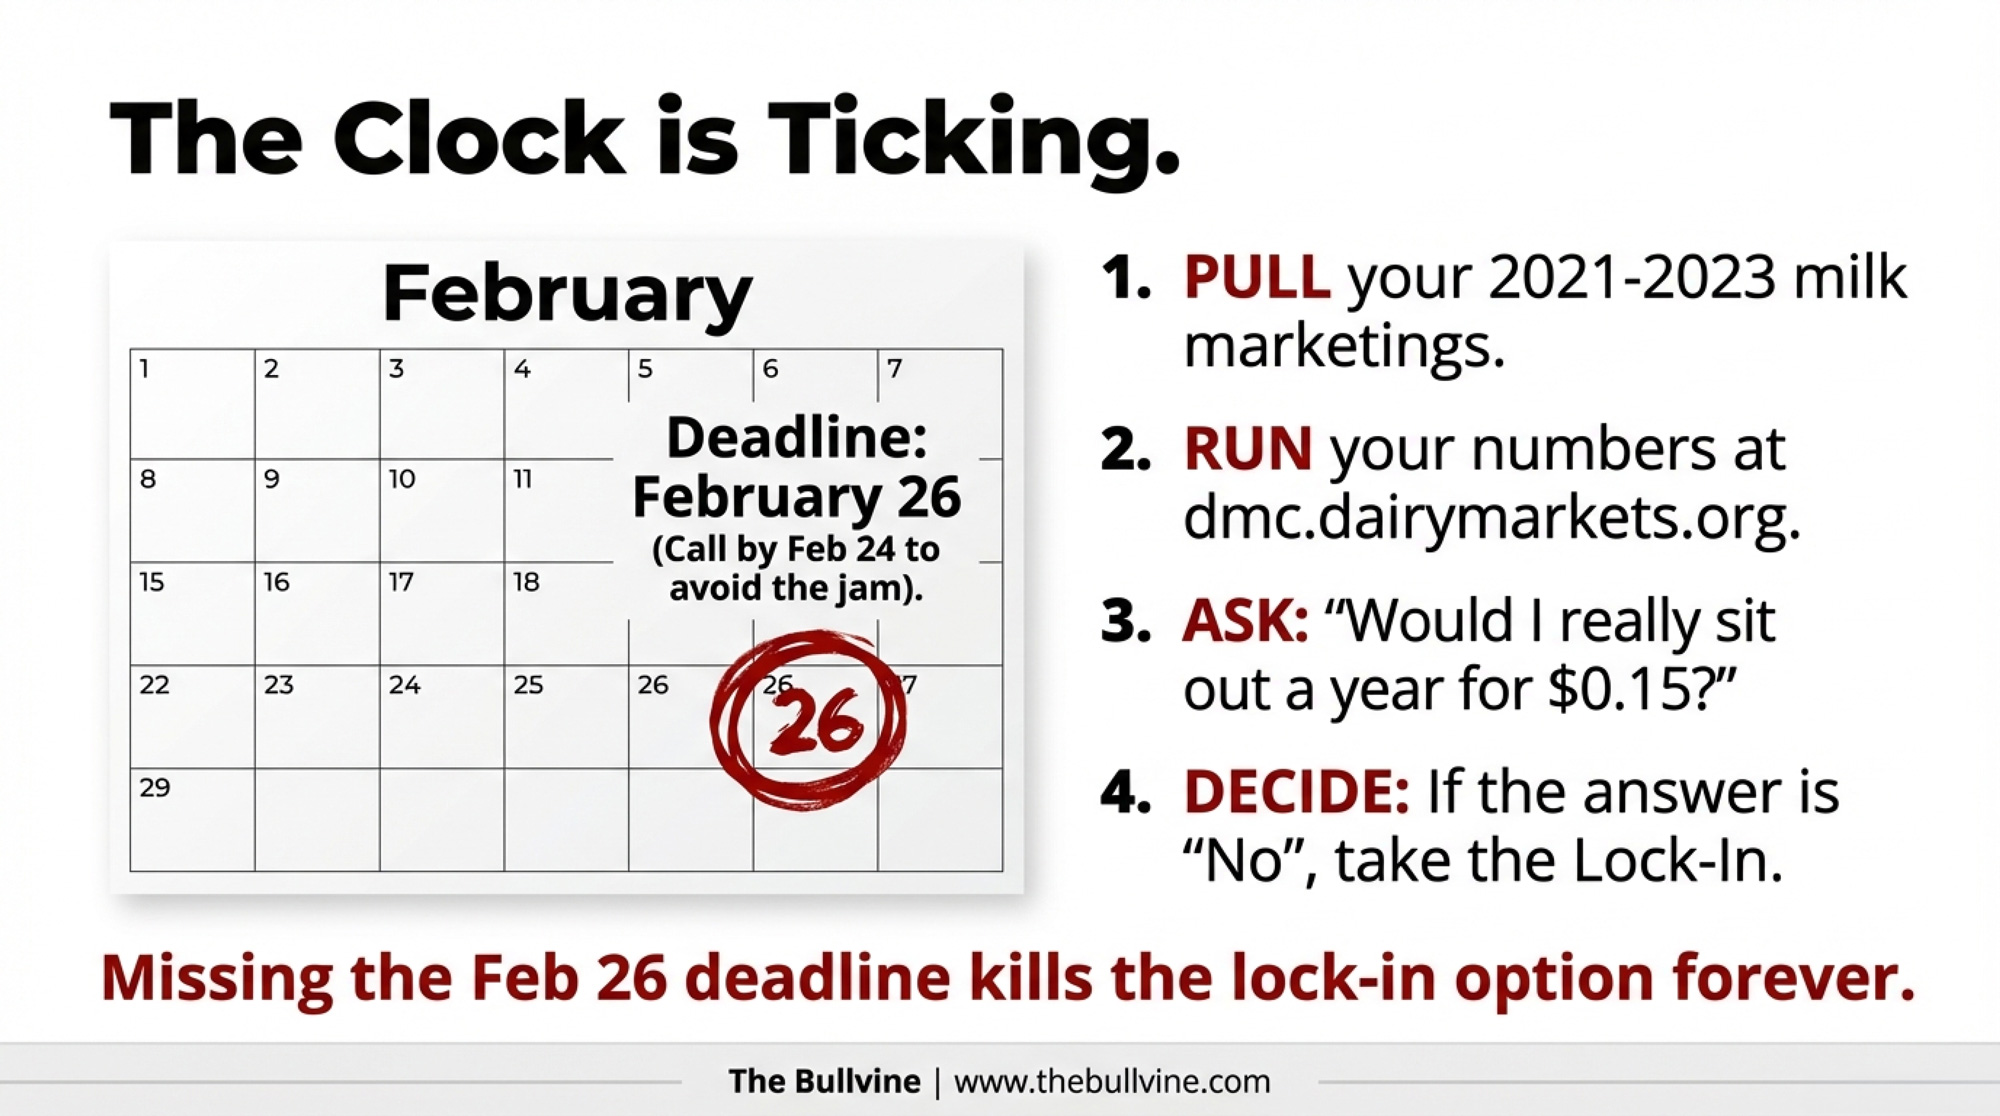
Call your local FSA office by February 24—not the 26th. Phone lines jam on deadline day. Paperwork takes longer than you expect. Find your office at farmers.gov/service-locator.
DMC payments are taxable income and are subject to a 5.7% sequestration, per OMB’s FY2026 report. On a $1.98/cwt January indemnity, that shaves roughly $0.11/cwt before the check hits your account. Plan with your accountant.
Within 3–5 years of a transition? A six-year commitment may outlast your timeline. Annual enrollment preserves every option.
Key Takeaways
If you’d realistically enroll most years anyway — and at $0.15/cwt, the enrollment history suggests most producers would — the lock-in saves $10,260 on a 200-cow herd. The 25% discount represents genuine savings if your enrollment behavior aligns with historical norms.
If you’re disciplined enough to skip enrollment when futures signal strong margins, annual enrollment preserves that optionality. Polzin’s data shows margins ran above $9.50 for all or most of 2022, 2024, and 2025 — skipping those years saves more than the lock-in discount.
Growing herds don’t lose DMC value on covered pounds — same premium, same indemnity, same ROI. But the uncovered share of your total production continues to grow each year. If current production exceeds your 2021–2023 high by more than 15%, layer DRP or LGM on the exposed portion now.
If your debt-service coverage ratio sits below 1.3, the lock-in’s predictable cost may matter more to your lender than flexibility. Have that conversation before the 26th.
The six-year election disappears after 2026 enrollment. Annual is the default. After February 26, the option is permanently gone.
The Bottom Line
Pull your milk statements. Plug your numbers into the USDA calculator — yours, not the ones in this article. And before you check that lock-in box, answer one question honestly: in the last seven years, how many times would you have sat out enrollment at $0.15/cwt?
If the answer is one or two, the lock-in probably makes sense. If you’d have skipped three or more annual wins.
Make the call before February 24. When January’s official DMC margin drops, you’ll know exactly what your decision was worth.
We’ll have that scorecard next month.
Complete references and supporting documentation are available upon request by contacting the editorial team at editor@thebullvine.com.
The 90-Day Reckoning: What Your Milk Check Is Really Saying About 2026 – Delivers a strategic playbook for the upcoming consolidation period by revealing structural shifts in 2026 budgets. It helps you calculate your true “red line” to keep you solvent and liquid while peers face the exit.
Every week, thousands of producers, breeders, and industry insiders open Bullvine Weekly for genetics insights, market shifts, and profit strategies they won’t find anywhere else. One email. Five minutes. Smarter decisions all week.
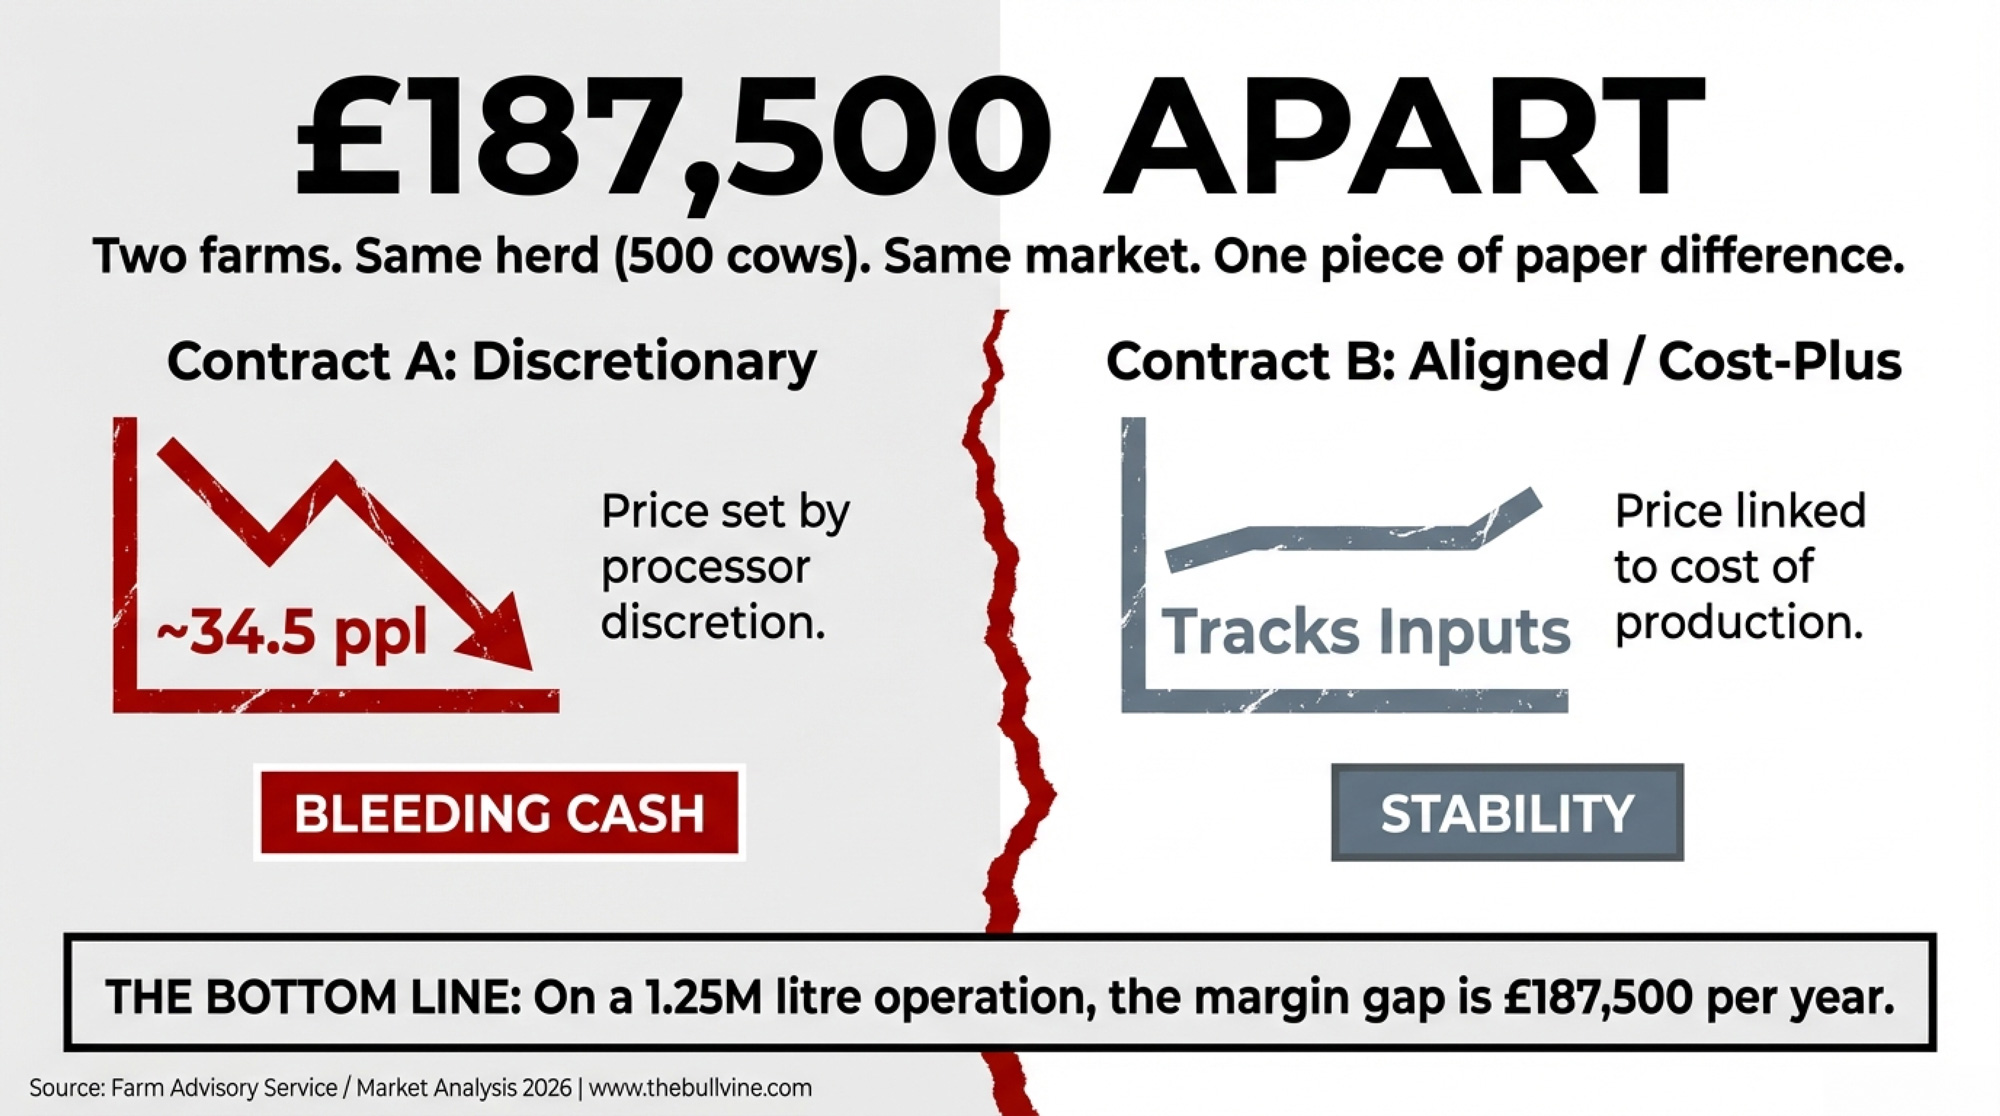
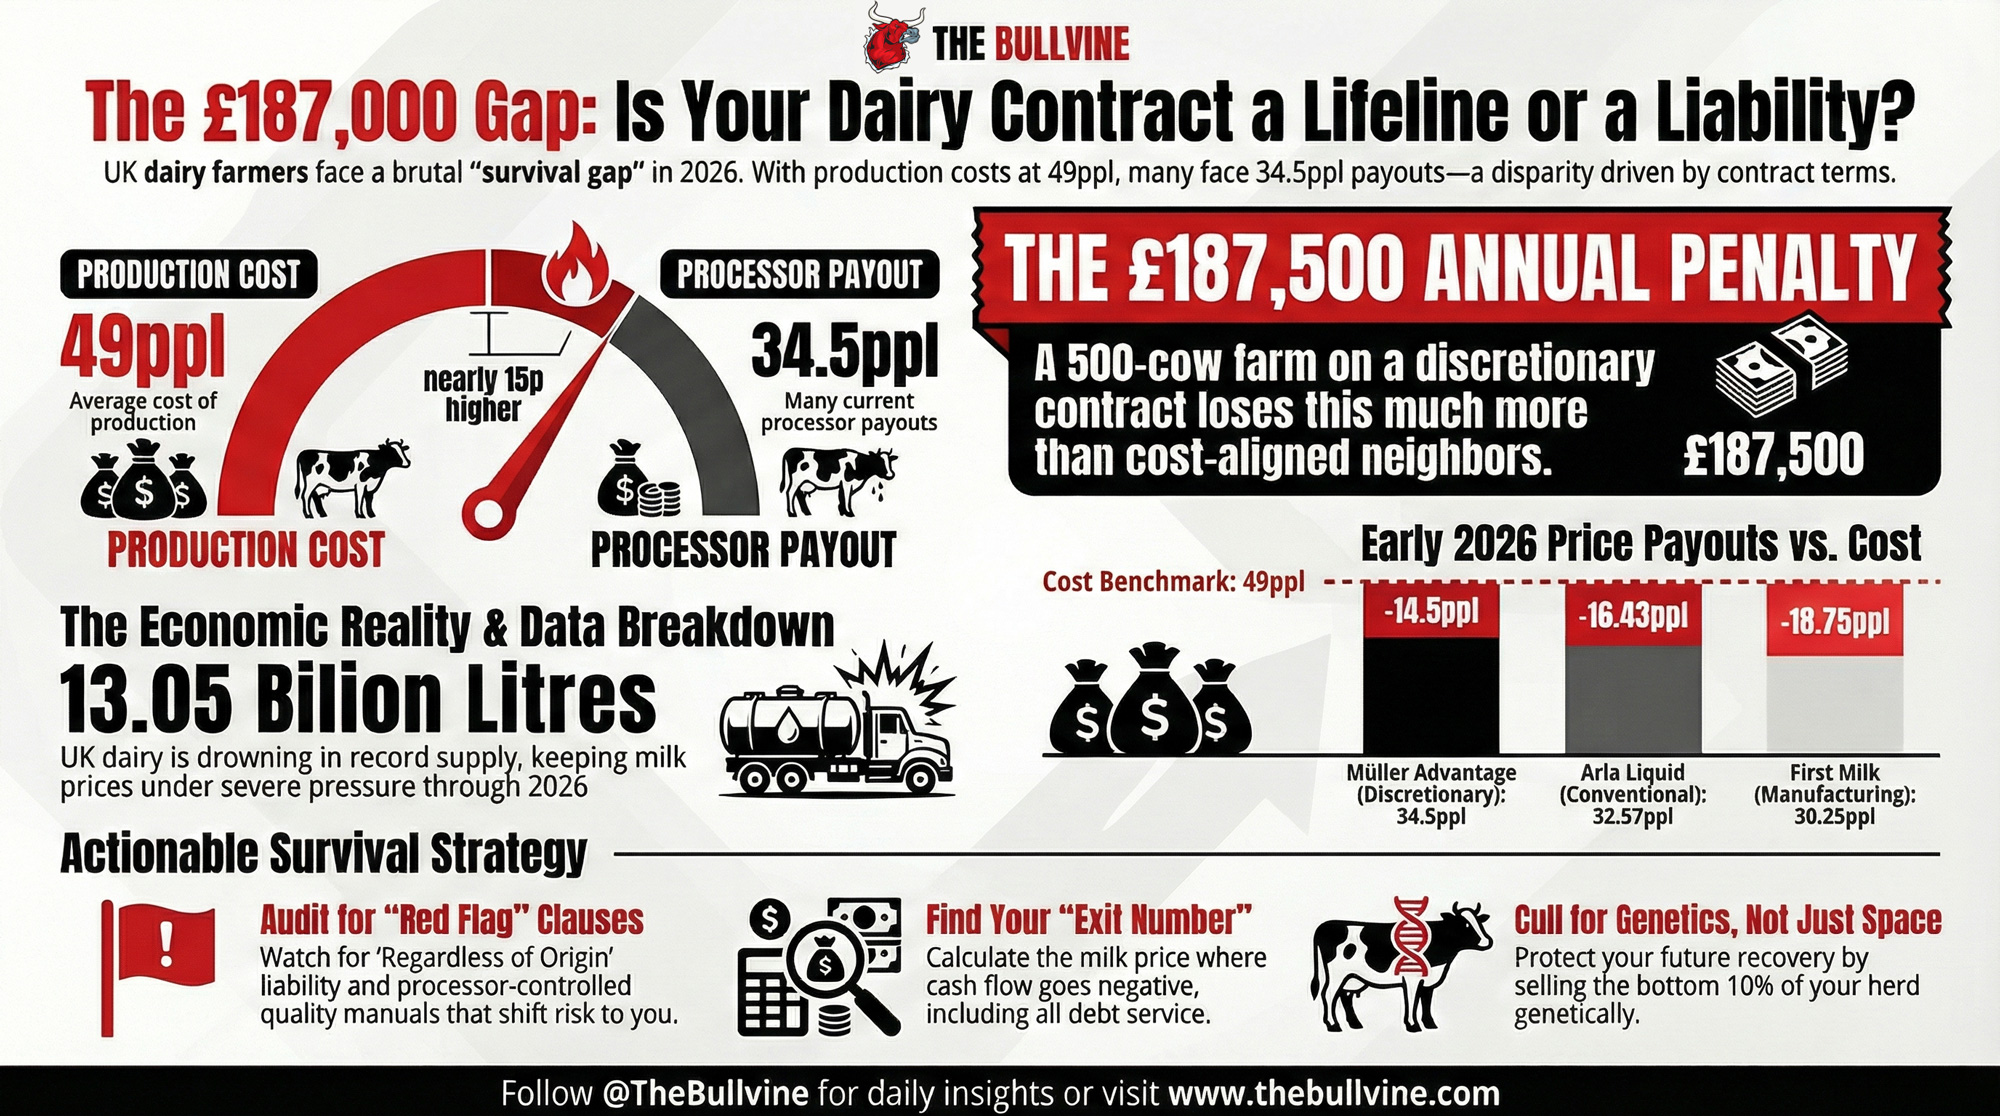
When milk is worth 34.5ppl, and it costs close to 49ppl to produce, your contract decides whether you survive this squeeze or bleed cash until the bank decides for you.
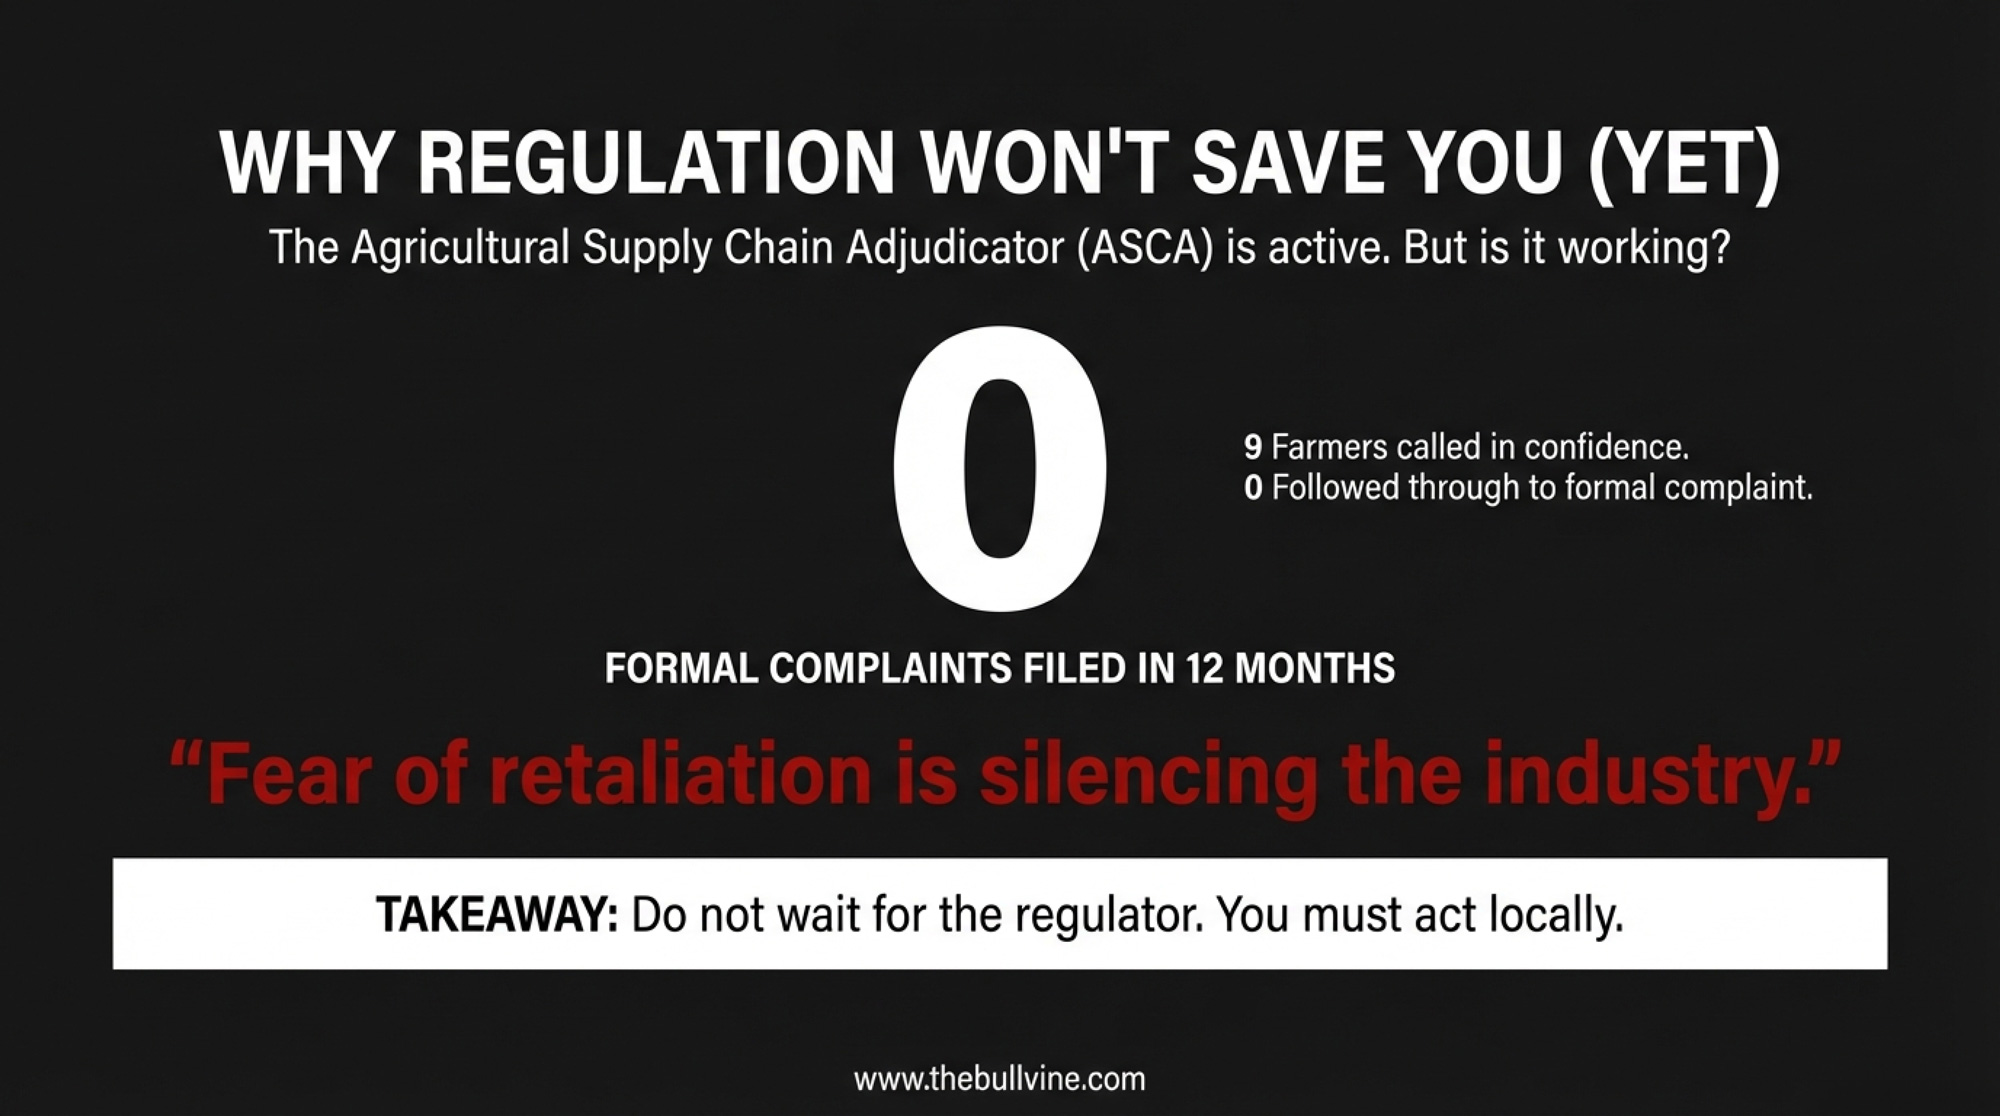
EXECUTIVE SUMMARY: Two farms. Same county. Same herd size. One loses £187,500 more this year—the only difference is the contract. UK milk sits at 34.5ppl while production costs hit 49ppl (FAS Scotland, January 2026), leaving farmers on processor-discretionary deals 14-15ppl underwater on every litre. AHDB forecasts no relief until H2 2026 at the earliest. Seven contract clauses are doing the damage—from indemnification language that pins processor-facility contamination on you, to volume traps that trigger clawbacks when drought cuts your output. The UK’s Fair Dealing regulations gave farmers a complaints process, but in ASCA’s first twelve months, not one producer filed formally; nine called in confidence, then went silent. For non-aligned operations with less than six months of cash, the decision window isn’t approaching—it’s here.
Two farms. Same county. Same herd size. Same brutal market.
One loses close to £190,000 more this year than the other.
The difference isn’t just Müller’s March 2026 price cut to 34.5ppl. It’s not only the record milk glut or the butter crash. It’s what’s written in the contract—specifically, which operation bears the downside when processors slash farmgate prices, and which has terms that track costs and provide a floor.
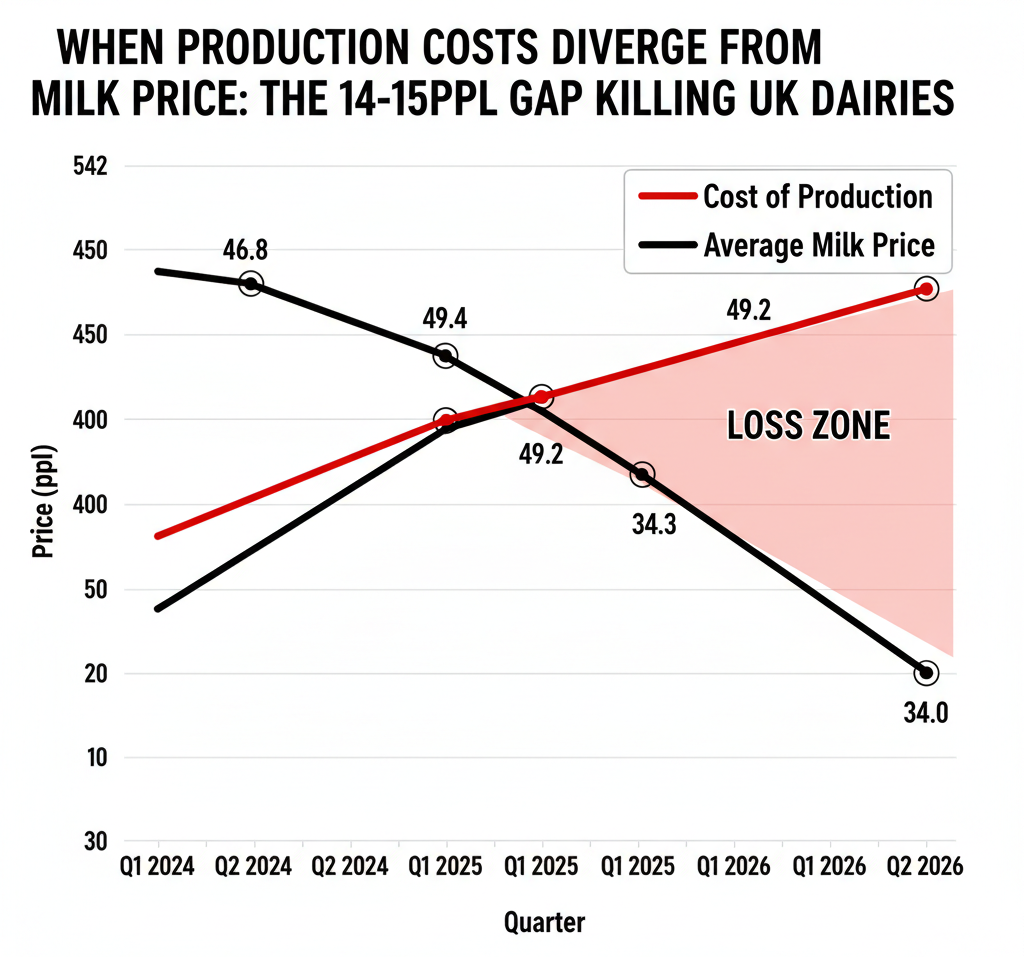
Aligned retail contracts held steady in January 2026. Processor-discretionary deals dropped 1-4ppl. Meanwhile, The Dairy Group—reporting through Scotland’s Farm Advisory Service in January 2026—put the average cost of production at 48.5ppl for 2024/25, with a forecast of 49.2ppl for 2025/26. That means many non-aligned farms are now producing milk for roughly 14–15ppl more than they’re being paid.
On a 500-cow operation producing 1.25 million litres annually, that 14–15ppl gap represents roughly £175,000–£187,500 per year in lost margin compared with a neighbour on a cost-of-production-linked contract facing the same market.
Farm Parameter
Farm A (Non-Aligned)
Farm B (Aligned Retail)
Difference
Herd Size
500 cows
500 cows
—
Annual Production
1.25M litres
1.25M litres
—
Milk Price (Early 2026)
34.5 ppl
48.5 ppl
+14.0 ppl
Cost of Production
49.2 ppl
49.2 ppl
—
Margin per Litre
-14.7 ppl
-0.7 ppl
+14.0 ppl
Annual Loss/Profit
-£183,750
-£8,750
£175,000
“Prices are falling fast while costs remain high,” said Bruce Mackie, chair of NFU Scotland’s Milk Committee, in December 2025. “Processors must communicate clearly and fairly with suppliers.”
The UK now has regulatory teeth—the Fair Dealing Obligations (Milk) Regulations 2024 and the Agricultural Supply Chain Adjudicator to enforce them. But in ASCA’s first 12 months, not a single formal complaint landed across the entire industry. Nine farmers rang up in confidence. None followed through.
Is the regulation toothless, or are farmers too terrified of their milk buyer to bite back?
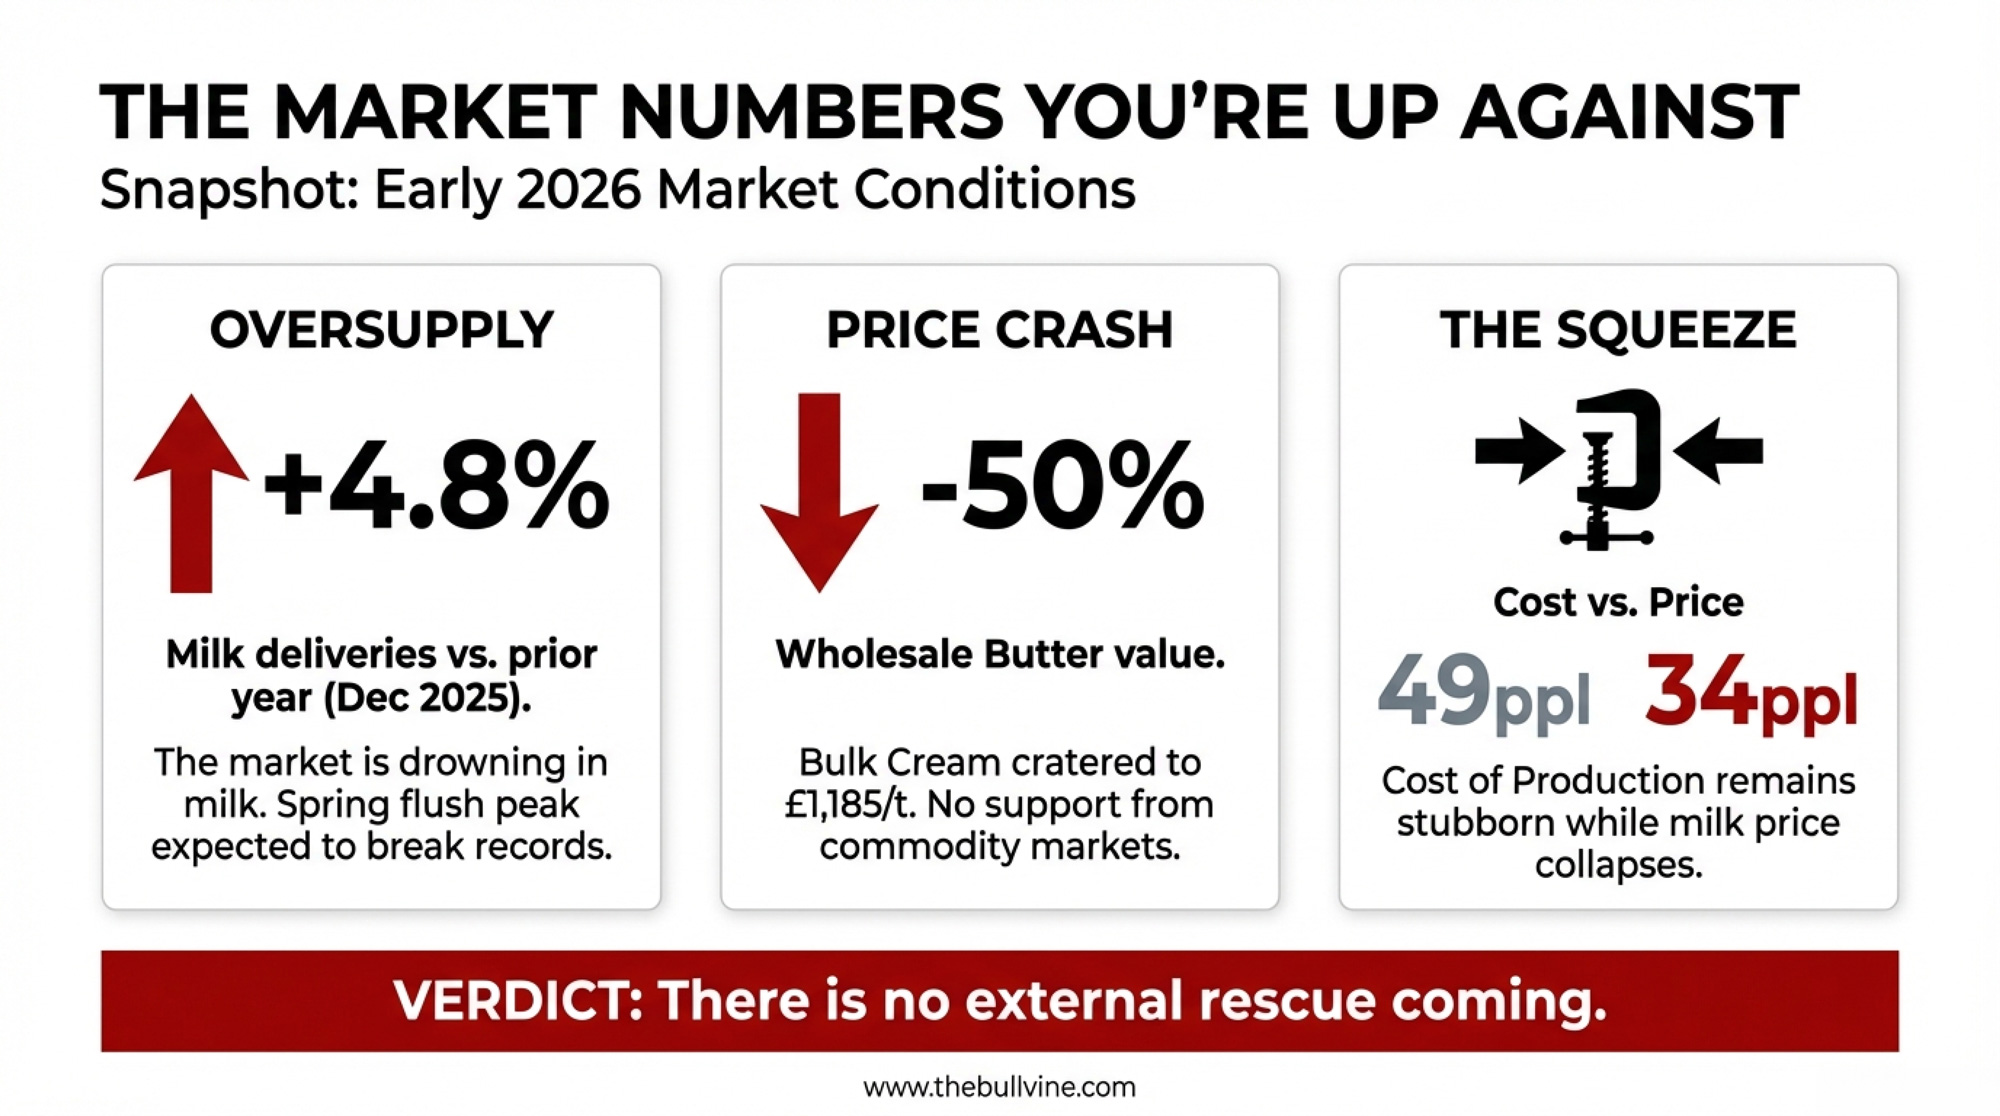
The Market Numbers You’re Up Against
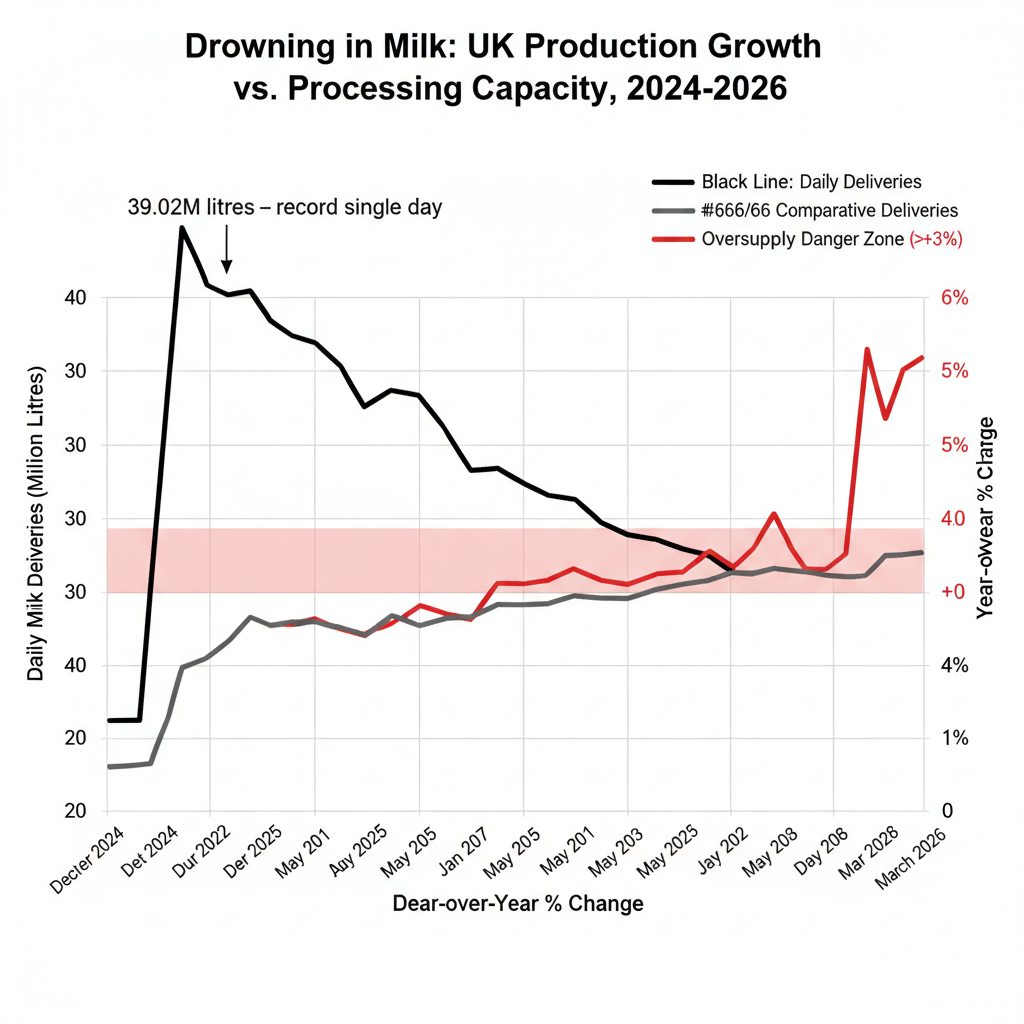
UK dairy entered 2026 drowning in milk. December 2025 deliveries averaged around 35.6 million litres daily—4.8% above the prior year, according to AHDB. Total GB production for 2025/26 is forecast at a record 13.05 billion litres. Spring flush 2025 peaked at 39.02 million litres on May 4—the highest single-day volume ever recorded.
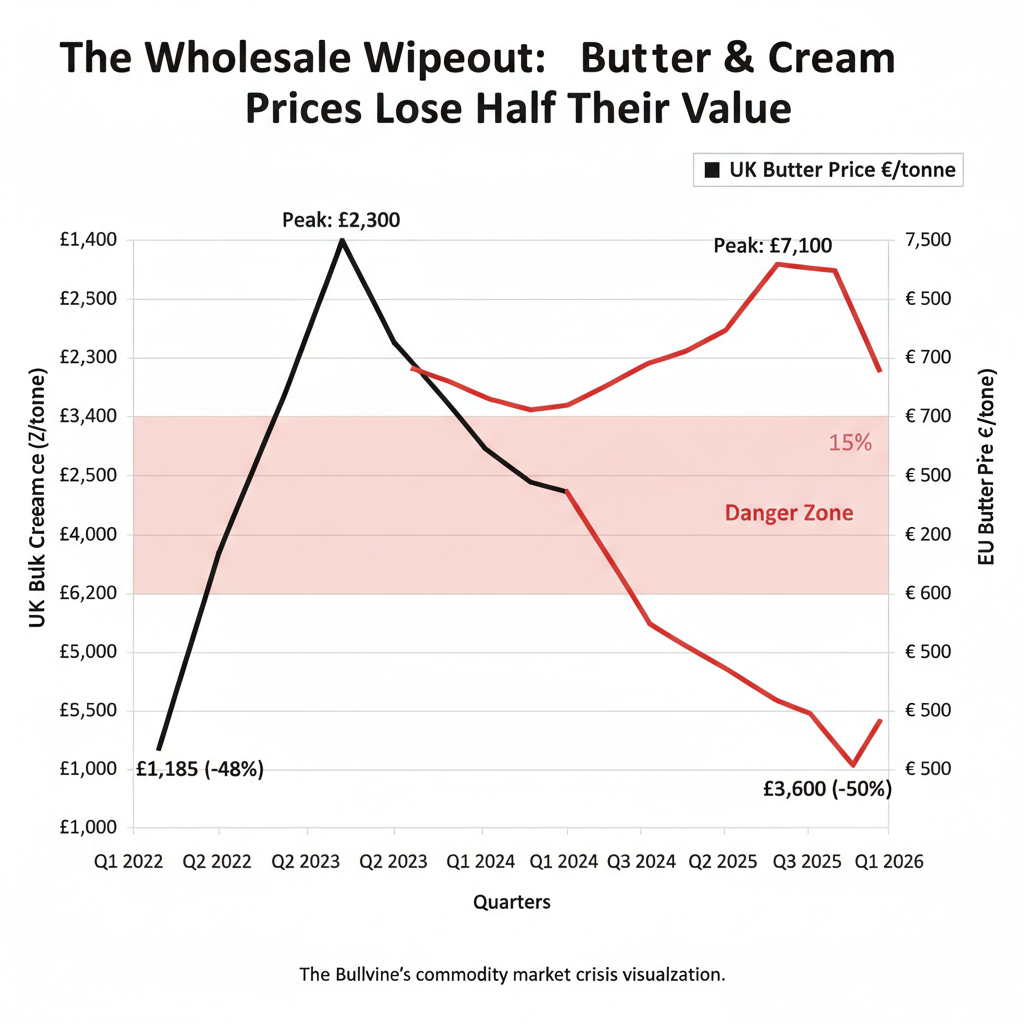
Wholesale markets buckled. Bulk cream cratered to £1,185 per tonne in January 2026, down 10% from December, per AHDB. UK wholesale butter averaged £3,600 per tonne for the month—AHDB notes it “has now lost over half of its value since the peak.” European butter slid below €4,000 per tonne in late January, down from over €7,000 at the 2022 high.
AHDB’s January 2026 outlook didn’t mince words: milk prices are “set to stay under pressure through the first half of 2026” with only “modest improvement” expected later. Rabobank’s Q4 2025 update pegs global supply growth at just 0.12% for 2026, with actual decline not expected until the first half of 2027.
FAS Scotland confirms it plainly: milk price was below the cost of production for most of 2025 and remains so heading into spring.
If your contract amplifies downturns, you’re staring down at least six more months of pain with no structural relief on the horizon.
A Global Problem, Not Just a UK One
While this analysis focuses on UK contracts and FDOM regulations, producers across the globe are fighting the same battle between discretionary and formula-based pricing.
In the US, the gap between Federal Milk Marketing Order Class III prices and actual processor pay has sparked renewed debate about order reform—with some co-ops offering cost-plus contracts while others stick to commodity-based formulas. EU producers face similar tensions as intervention prices sit well below production costs in many member states. The contract structures differ, but the fundamental question is identical: who absorbs the pain when markets turn?
UK farmers have FDOM. American producers have FMMO reform debates. EU farmers have CAP negotiations. None of these frameworks have yet solved the core imbalance: processors can pass risk down; farmers can only absorb it or exit.
Where the Money Actually Lands
The split between contract types has become stark.
Sainsbury’s Sustainable Dairy Development Group suppliers operate under cost-of-production models that flex with input costs. When feed and energy prices spike, the farmgate price rises. When wholesale markets collapse, the formula cushions the fall. These suppliers saw modest price bumps in early 2026.
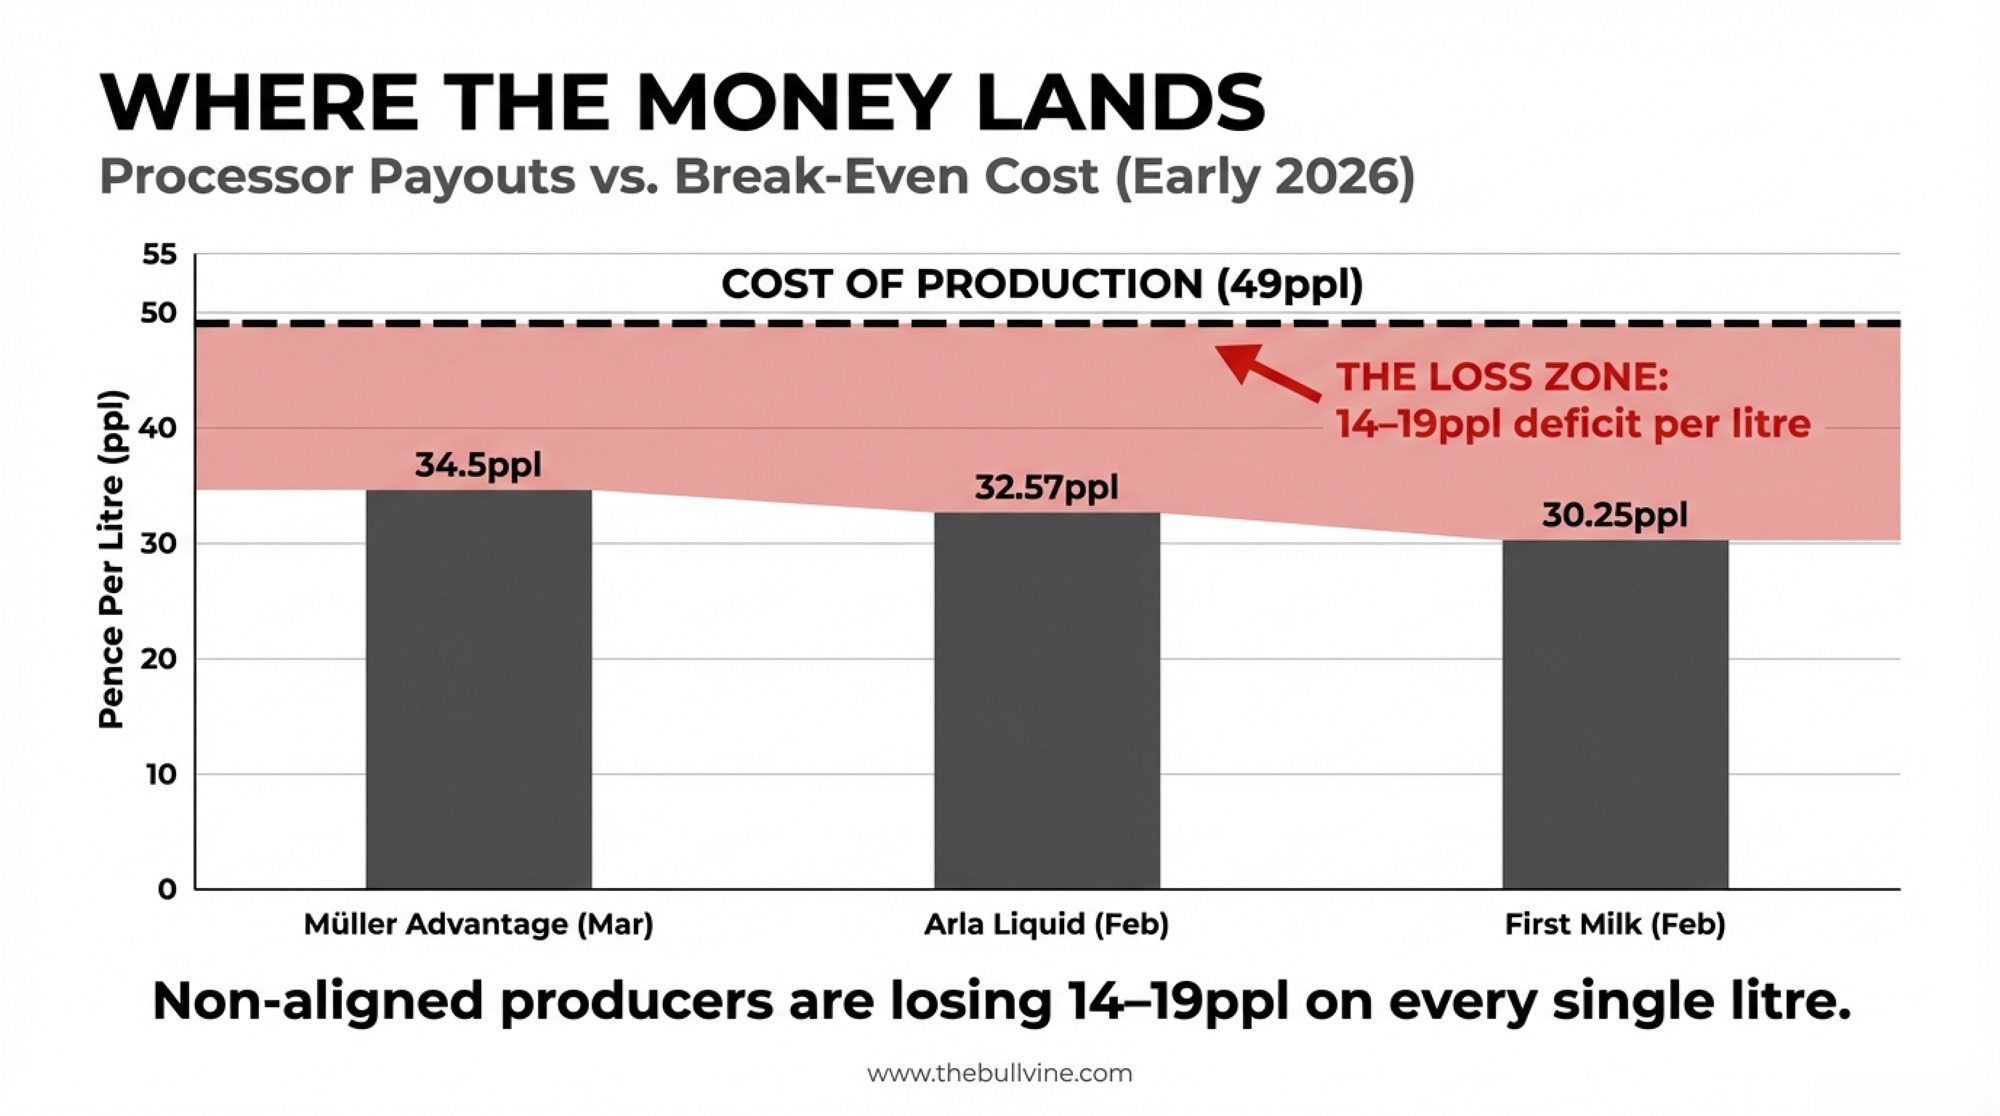
Farmers locked into processor-discretionary deals—where pricing follows wholesale swings or processor margin targets—caught the full blow:
Processor
Contract Type
Early 2026 Price
Müller Advantage
Manufacturing (March)
34.5ppl
First Milk
Manufacturing (February)
30.25ppl
Arla
Liquid (February, GB conventional)
32.57ppl
Set those against a cost of production near 49ppl, and many non-aligned producers are losing 14–19ppl on every litre.
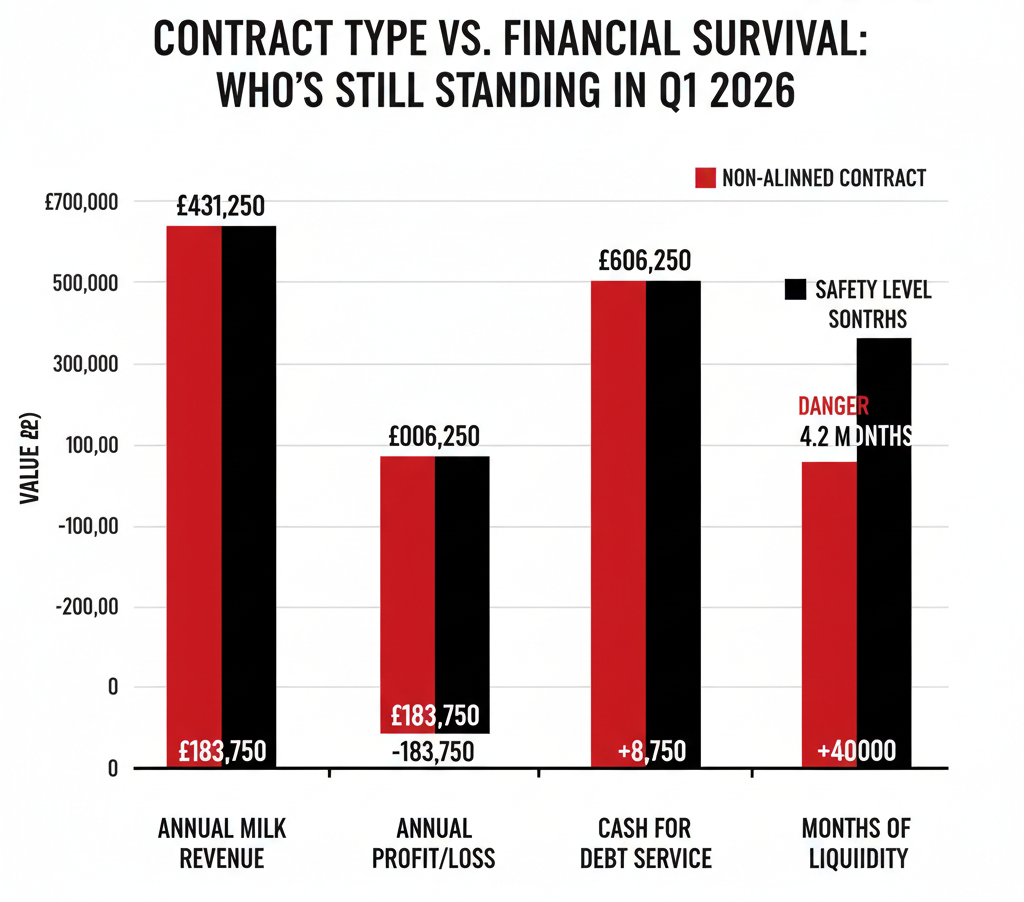
Metric
Non-Aligned (Red)
Aligned Retail (Black)
Annual Milk Revenue
£431,250
£606,250
Annual Profit/Loss
-£183,750
-£8,750
Cash Available for Debt Service
-£50,000
+£40,000
Months of Liquidity Remaining
4.2 months
18+ months
On 1.25 million litres, a farm stuck at 34.5ppl instead of cost-linked pricing is effectively giving up £175,000–£187,500per year compared with a neighbour whose contract moves with costs. At 1.5 million litres and a 14ppl loss, you’re looking at roughly £210,000 in negative margin before you pay a penny on capital or debt.
Switching sounds nice. But with synchronized cuts across processors, alternatives aren’t materially better for most farms right now. And FDOM’s 12-month notice requirement means any move you make today won’t take effect until 2027.
Producers from Southwest England to Yorkshire are living the same reality: identical market conditions, wildly different cheques depending on what they signed 12–24 months ago.
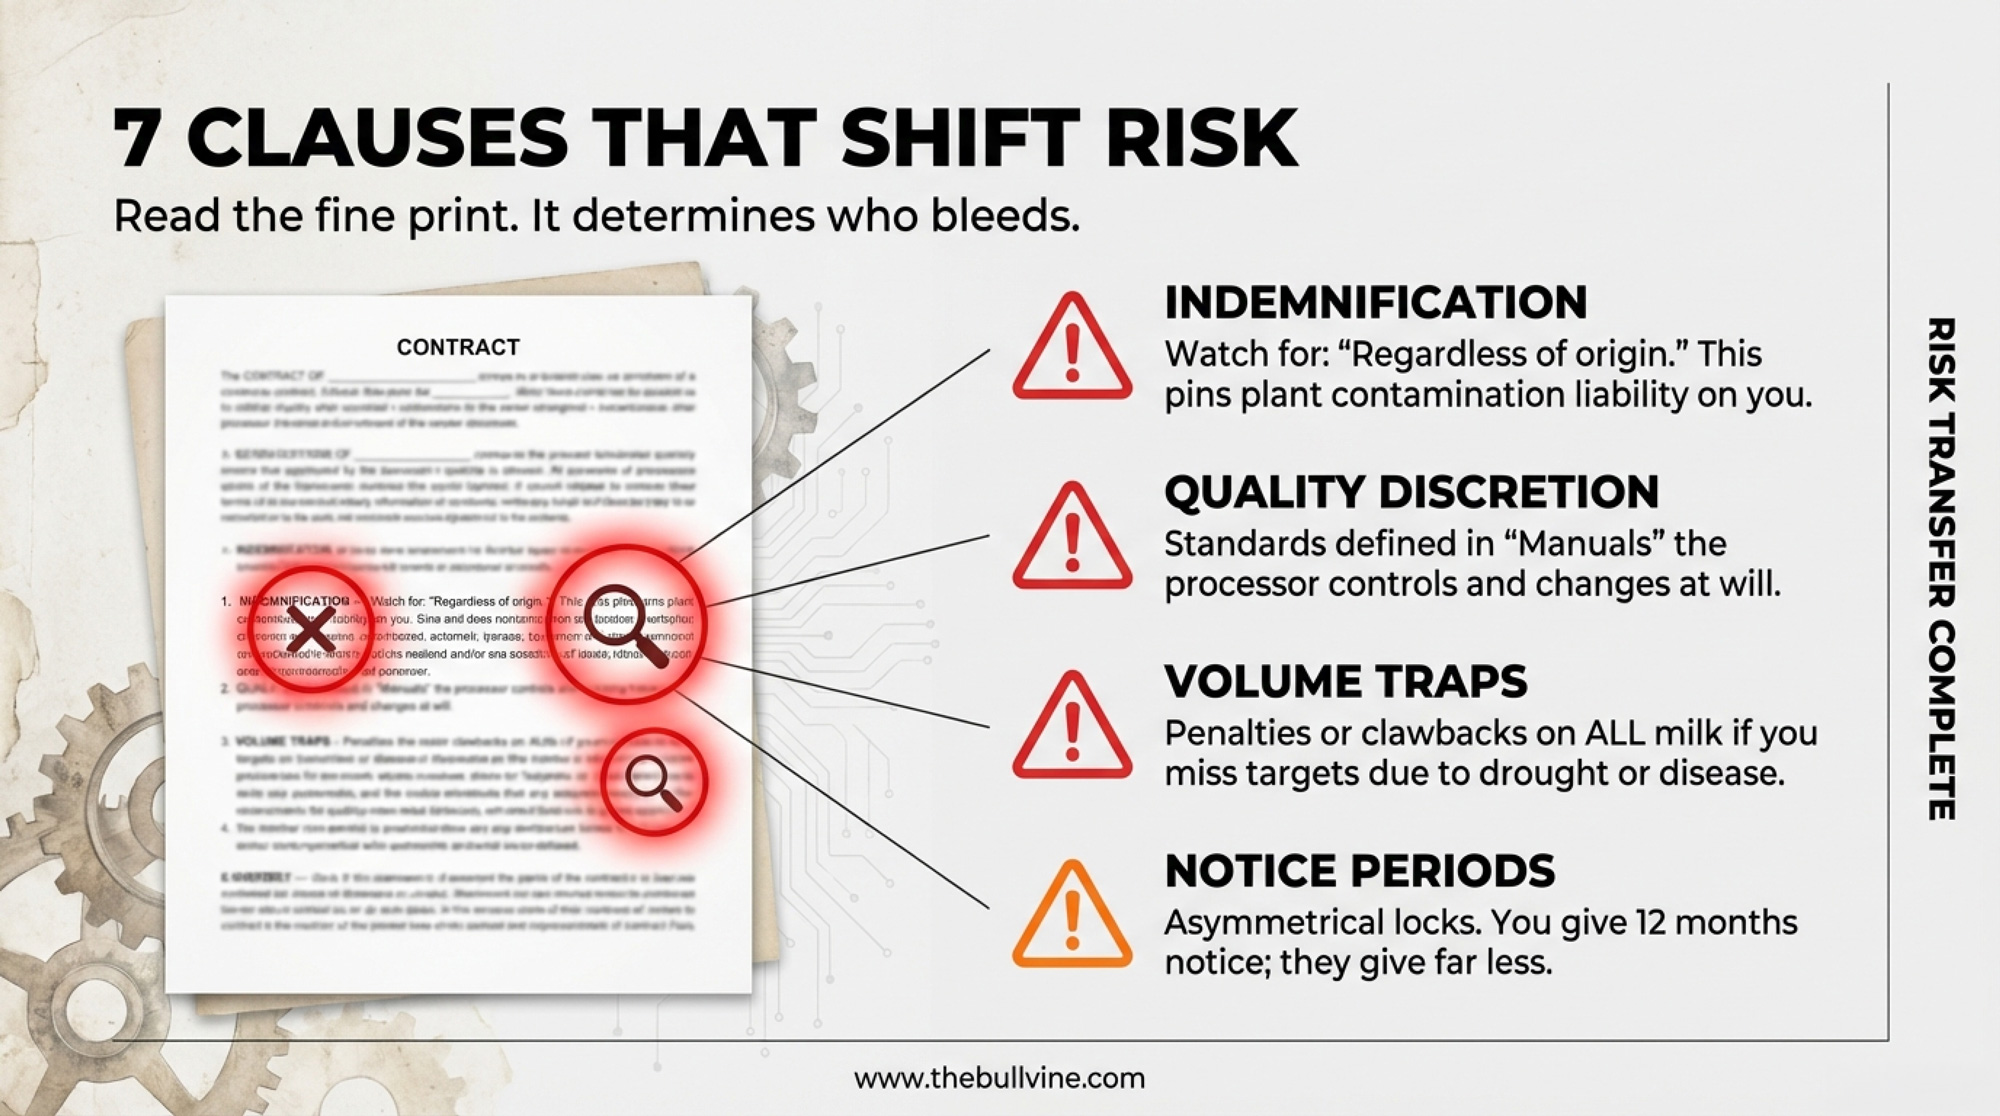
Seven Clauses That Shift Risk Onto Your Back
What separates a protective contract from a loaded gun isn’t the headline price. It’s the fine print.
Clause
The “Red Flag”
Risk Level
Indemnification
“Regardless of origin.”
High
Quality Discretion
Processor-controlled manuals
High
Volume Traps
Clawbacks on total delivery
High
Delayed Payments
Loyalty bonuses forfeited on exit
Medium
Confidentiality
No carve-outs for advisors
Medium
Notice Period
12-month asymmetrical locks
Medium
Dispute Resolution
Multiple steps before external review
Medium
Indemnification scope is where real damage hides. Standard language covers losses from your breach or negligence—fair enough. Expanded versions using “regardless of origin” or “arising from or related to the milk supplied” can pin liability for contamination at processor facilities squarely on your operation.
Agricultural attorney Ross Janzen, dissecting US contracts for Progressive Dairy in 2018, flagged this pattern: direct-buy contracts may hold producers “directly liable, not only for their own milk, but milk from other producers or the entire plant.” The mechanics apply similarly to UK contracts.
Quality standard discretion creates similar exposure. If your contract defines requirements by referencing a “Quality Manual,” the processor can rewrite whenever they like, and your pricing can shift mid-term without triggering any formal amendment clause.
Volume commitment traps bite hardest during downturns. What happens when you fall short? Some contracts treat under-delivery—even from drought or disease—as a material breach, triggering price clawbacks on all milk delivered.
Contract Clause
The “Red Flag” Language
Risk Level
What It Means When Prices Fall
Indemnification Scope
“Regardless of origin” or “arising from or related to”
HIGH
You’re liable for contamination at processor facilities—not just your milk, potentially entire plant batches. Legal exposure can exceed annual revenue.
Quality Discretion
“As defined in Quality Manual” (processor-controlled)
HIGH
Processor can rewrite quality standards mid-contract, triggering price penalties or rejection without contract amendment. Zero farmer input.
Volume Traps
Clawbacks or penalties on “total delivery” if minimums missed
HIGH
Miss volume targets (drought, disease, market exit)? Processor claws back pricing on all milk delivered, not just shortfall.
Delayed Payments
Loyalty bonuses or “end-of-year” payments tied to contract completion
MEDIUM
Walk away mid-contract? You forfeit 6–12 months of accrued payments—effectively a financial hostage clause.
Confidentiality
No carve-outs for “advisors,” “legal counsel,” or “lenders”
MEDIUM
Can’t share terms with solicitor, accountant, or bank without breach. Makes informed decision-making nearly impossible.
Notice Period Asymmetry
12-month producer notice, 30–90 day processor notice
MEDIUM
You’re locked in for a year; they can exit or cut pricing in 90 days. Risk runs one direction.
Dispute Resolution Barriers
“Escalation process” requiring processor internal review first
MEDIUM
Multiple hoops before external adjudication. Designed to exhaust you before you reach ASCA or legal remedy.
Your Contract Audit Checklist
Before your next contract conversation, nail down these eight items:
[ ] Indemnification scope: Does the clause include “regardless of origin” or similarly broad language?
[ ] Quality standards: Defined in the contract, or in external manuals, that the processor controls?
[ ] Volume commitment remedies: What happens if you miss minimums due to factors outside your control?
[ ] Payment timing: What chunk of your stated price depends on future behaviour?
[ ] Notice period symmetry: How much warning do you owe versus what they owe you?
[ ] Title transfer point: When does ownership move, and who carries risk during haulage?
[ ] Confidentiality carve-outs: Can you share terms with your solicitor, accountant, and lender?
[ ] Dispute resolution path: How many hoops between “I have a problem” and external review?
Four Realistic Paths Forward
You’re not going to strong-arm better terms out of your processor. Academic research on dairy supply chains shows that farmers’ bargaining power is well below that of processors. A 500-cow unit doesn’t rewrite standard contract language.
So what can you actually do?
Path 1: Audit for Intelligence
Contract auditing isn’t about renegotiating—it’s about knowing your exposure before the next price cut lands. Map how clauses interact. What happens if you trip the quality threshold while also missing the volume threshold?
Best for: Anyone who hasn’t done this in the last 12–18 months. Requires: 2–3 hours with your contract and a calculator. Downside: None—this is baseline due diligence
Path 2: Find Your Exit Number
Your exit price isn’t simply the cost of production. Cornell economists have shown the rational exit threshold often sits below variable cost because of “option value”—the potential gain from hanging on and catching a recovery. But debt changes that math fast.
The number that matters: At what milk price does cash flow go negative, including debt service? That’s your hard line.
Best for: Non-aligned contract holders carrying significant debt. Requires: Honest cash flow work with your accountant. Downside: Waiting for “confirmation” while cash drains out
Path 3: Position Without Committing
There’s groundwork you can lay before triggering any notice clock:
Talk to other processors. Exploring alternatives doesn’t breach exclusivity—shipping milk elsewhere does. Options are thin in early 2026. But knowing that is intelligence.
Run lender scenarios. “What happens if prices stay here through Q3?” Their answer tells you how much runway you actually have.
Compress costs strategically. NFU Scotland, in a November 2025 advisory, encouraged farmers to “reduce output slightly—selling poorer performing cows while cull prices remain high” to ease cost pressure. But don’t just sell cows—sell your bottom 10% genetically to protect future recovery. When margins turn negative, the embryo budget and top-tier semen are often the first casualties. Make culling decisions that preserve your genetic trajectory, not just your tank space.
Best for: Producers with 6–12 months of cash left. Requires: Uncomfortable conversations with lenders. Downside:Cut too deep, and you hobble your recovery capacity
Path 4: Build a Paper Trail
If pricing looks opaque or inconsistent, document everything. Under FDOM, processors must respond to pricing queries within 7 working days. If they don’t, that’s something concrete for ASCA.
Best for: Anyone who suspects their contract breaches FDOM rules. Requires: Systematic logging of every price notification and query. Downside: The confidential route may produce no visible outcome; the formal route puts you on their radar
Signals to Watch Through Q3 2026
Bulk cream leads the farmgate by 2–3 months. January’s £1,185/tonne—down 10% month-on-month—signals near-term pressure continues. AHDB sees “positive movements” starting but warns fats remain under “severe pressure.”
SMP and cheddar show early stabilisation. AHDB reports SMP up £80 (5%) to £1,810/tonne in January; cheddar recovered £30 to hit £2,860/tonne. But AHDB cautions that “stabilisation should not be mistaken for recovery.”
Milk deliveries versus year-ago gauge supply-side pressure. With volumes running nearly 5% above the prior year heading into spring flush, processing capacity stays strained through May.
ASCA activity tells you whether the regulator has any bite. If formal complaints stay in single digits through April while prices sit below the cost of production, the framework isn’t working as Parliament intended.
Why Nobody’s Talking
Here’s the part that doesn’t show up in market reports: why you’re not hearing individual farmers’ stories.
The producers getting hit hardest—the ones sliding toward exit—are the least likely to speak publicly. In farming culture, financial distress still feels like personal failure. Going on record about contract pressure invites lender scrutiny, community judgement, and processor retaliation.
As NFU Scotland’s Bruce Mackie put it in December 2025: “The dairy supply chain depends on farmers being able to plan and invest with confidence. Sudden, unjustified price drops damage that confidence and threaten not just individual businesses but the resilience of Scotland’s rural economy and food security.”
ASCA built confidential channels precisely because farmers fear reprisals. That’s the right protection—but it also keeps the pain invisible. Processors see aggregate data across their supplier network. Individual farmers see only their own situation and wonder if they’re alone.
You’re not. The aggregate numbers—nearly 5% oversupply, butter down more than half, costs near 49ppl against prices in the low-to-mid 30s—represent thousands of operations running the same brutal calculations.
What This Means for Your Operation
If you’re on an aligned retail contract: Your immediate exposure is limited. Don’t waste the breathing room. Build cash reserves and pay down debt—the cushion you create now determines your options when conditions shift.
If you’re not aligned with 6+ months of cash, you’ve got time to watch. Track these triggers:
Bulk cream dropping toward £1,000/tonne signals more farmgate pressure
UK deliveries staying 5%+ above year-ago into spring signals capacity strain
AHDB language shifting from “pressure” to “recovery” signals inflection
Book your lender scenario conversation before April 1.
If you’re non-aligned and have less than 6 months of cash on hand, the math is unforgiving. Run your exit threshold calculation this week. Have the lender conversation now. If two warning signs fire together—cash flow negative, cream still sliding, deliveries elevated—your decision window is closing fast.
Key Takeaways
At current price and cost levels, the gap between aligned and non-aligned contracts can reach 14–15ppl—roughly £175,000–£187,500 a year for a 500-cow, 1.25M-litre operation.
Contract auditing is intelligence, not leverage. You may not change the terms, but you can understand where the landmines are.
Risk is shifted onto your books across seven areas: indemnification, quality discretion, volume penalties, delayed payments, confidentiality, notice asymmetry, and dispute barriers.
Exit decisions come with a 12-month lag under FDOM notice rules. Staging preparation preserves options without starting the clock.
Every credible forecast points to H2 2026 at the earliest for meaningful recovery. AHDB: stabilisation “should not be mistaken for recovery.”
When culling to compress costs, cull genetically—not just economically. Protect your herd’s trajectory for the recovery.
Cash runway is the bottom line. Under six months at current prices means fundamentally different choices.
Your contract didn’t create this oversupply. It didn’t crash butter prices. But it decides which side of that £175,000–£187,500 divide you’re standing on while you wait for conditions to turn.
Pull out your contract this week. Work through the checklist.
Which side of the gap are you on?
Complete references and supporting documentation are available upon request by contacting the editorial team at editor@thebullvine.com.
Every week, thousands of producers, breeders, and industry insiders open Bullvine Weekly for genetics insights, market shifts, and profit strategies they won’t find anywhere else. One email. Five minutes. Smarter decisions all week.
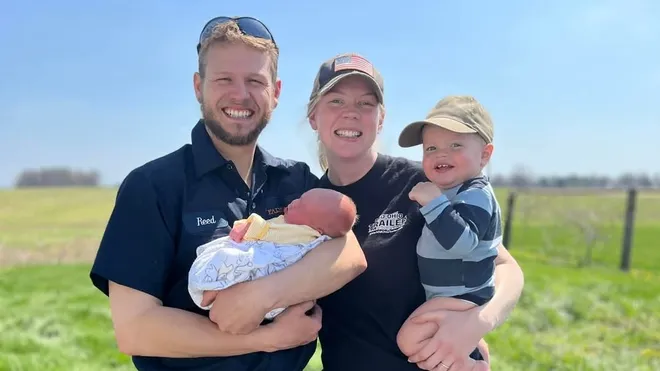
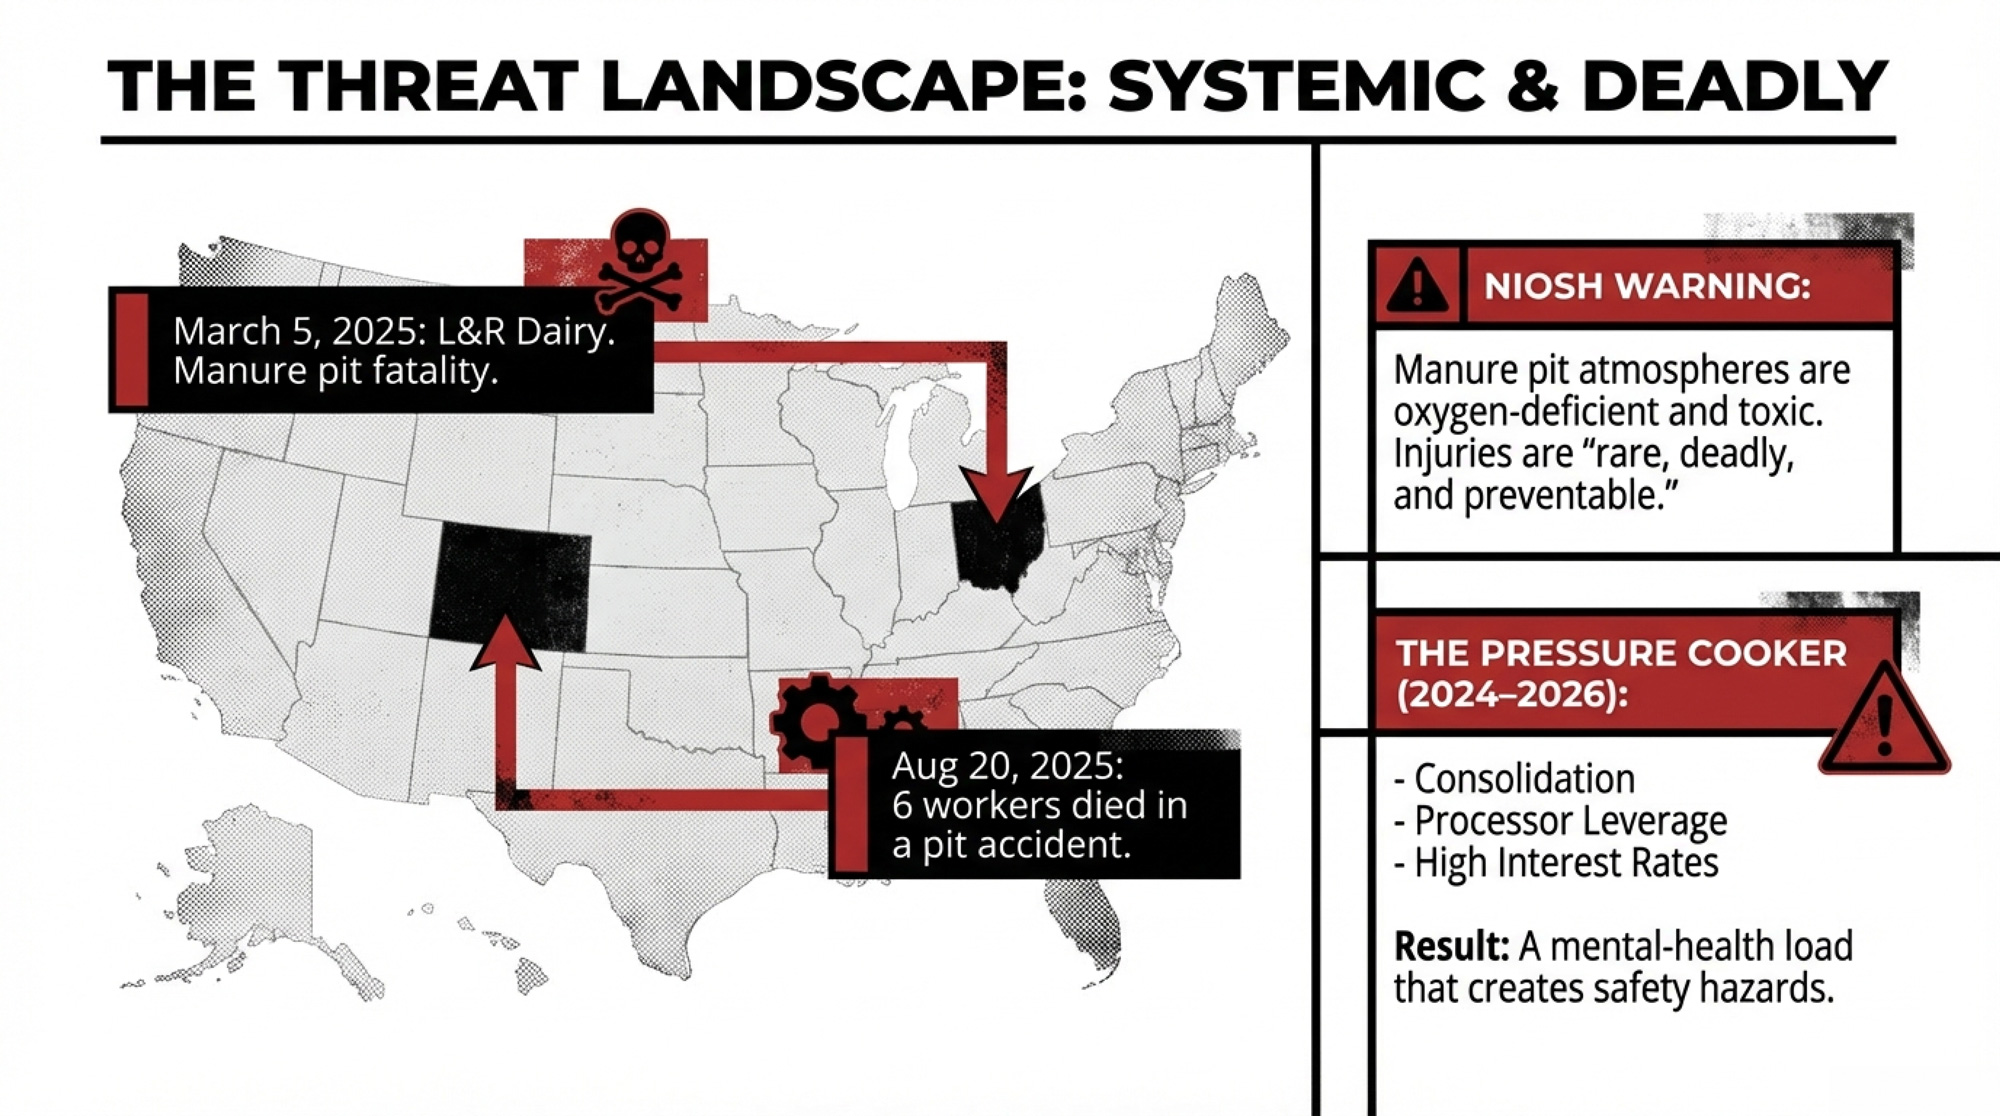
One year after Reed Hostetler’s death at L&R Dairy in Ohio, his community is still proving what farm safety and resilience look like when farmers refuse to let one of their own stand alone.
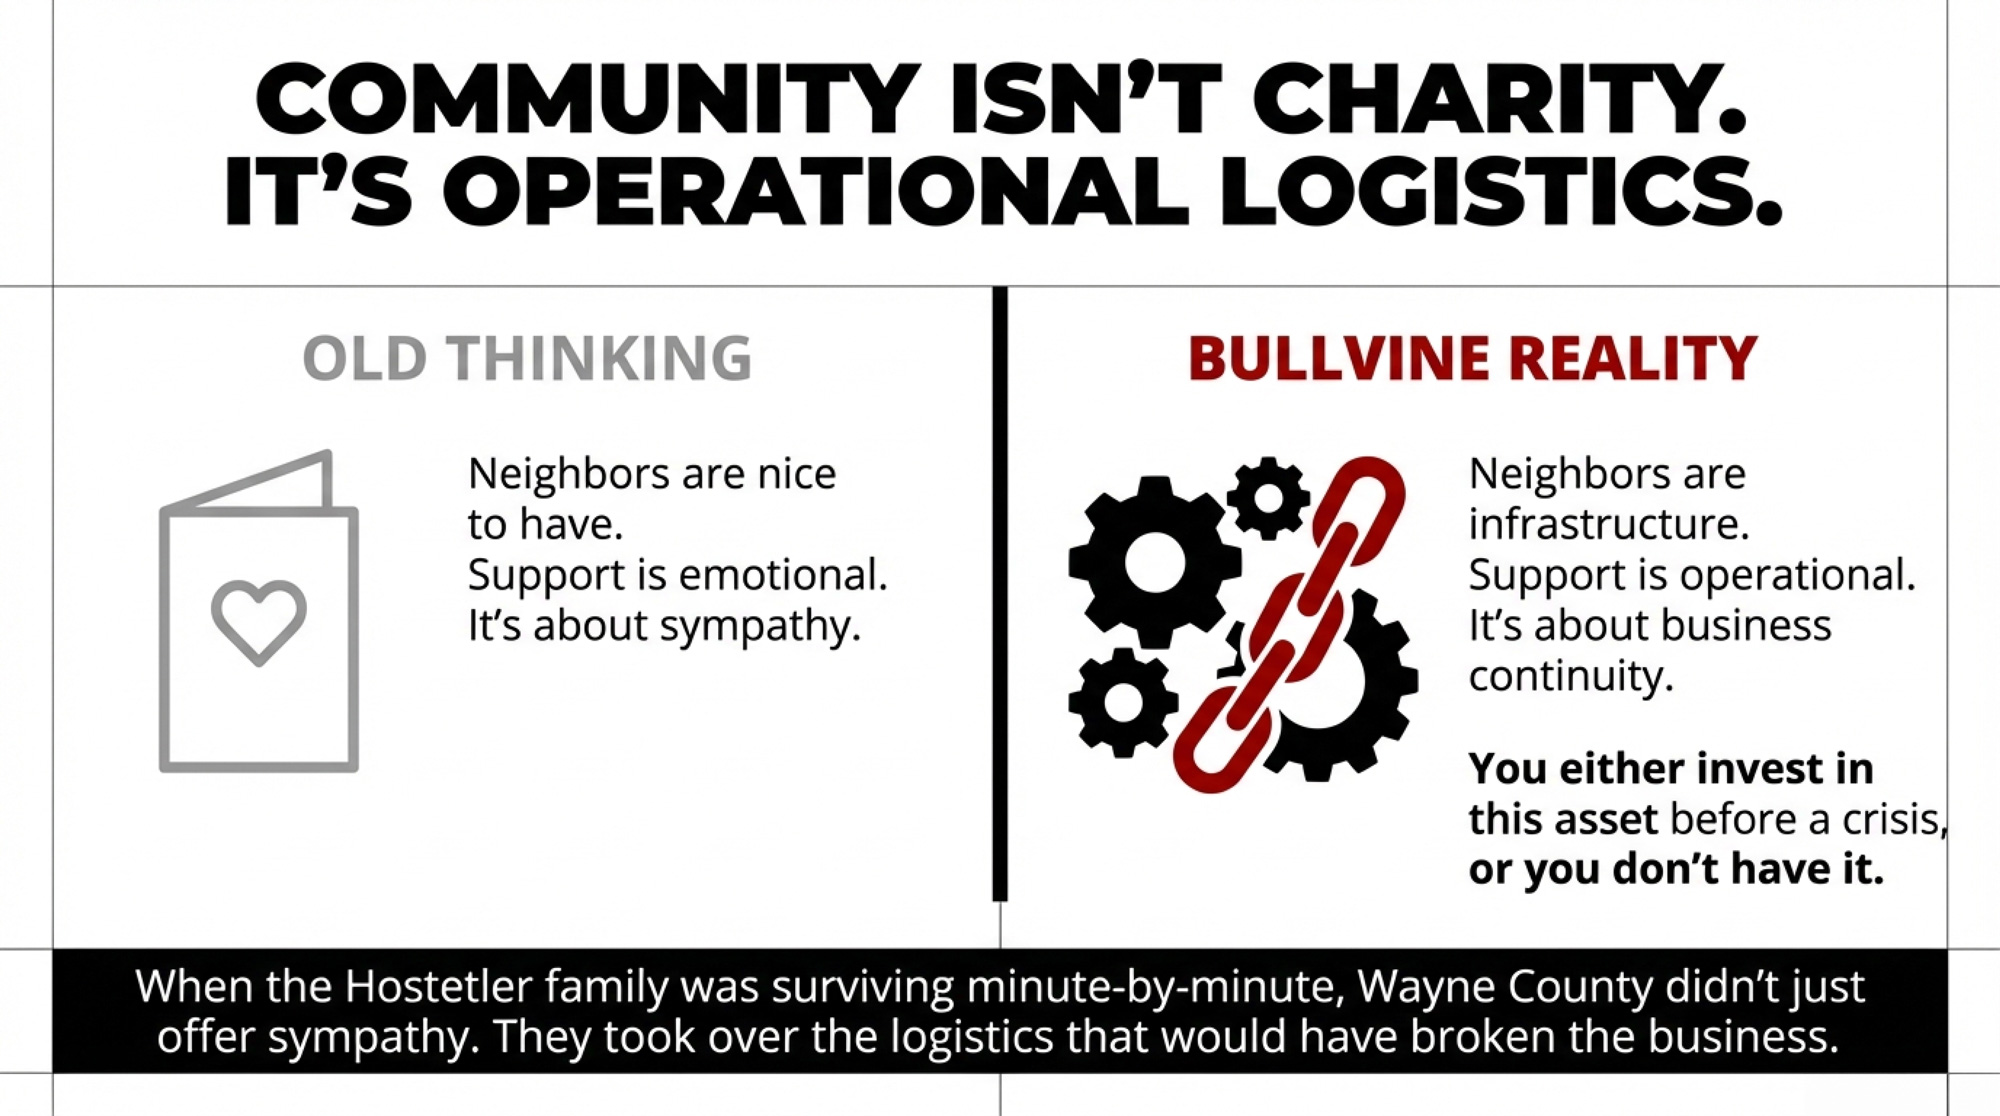
Executive Summary: Reed Hostetler was 31, co-owner of L&R Dairy in Ohio, and father of three when his tractor tipped into the manure pit on March 5, 2025. He didn’t survive. What his community built in the year since—a barn transformed into a funeral venue, tractors lined up in tribute, months of meals, chores, and quiet financial support that never stopped—is a blueprint every dairy should steal. This article connects Reed’s death to the systemic pit risks that killed six at a Colorado dairy five months later, and to the margin and mental-health pressures squeezing farm families through 2024–2026. It delivers a concrete playbook: phone trees, neighbor check-ins, youth crisis roles, safety protocols that don’t vanish when one person does. The core argument is blunt—community is infrastructure, and the operations that have it recover faster when everything falls apart. Nearly one year later, the only question is whether your road is ready.
The faces behind the “Lead Like Reed” legacy: For the Hostetler family, community isn’t just a sentiment—it is the vital human infrastructure that ensures no dairy operation has to face its darkest day alone.
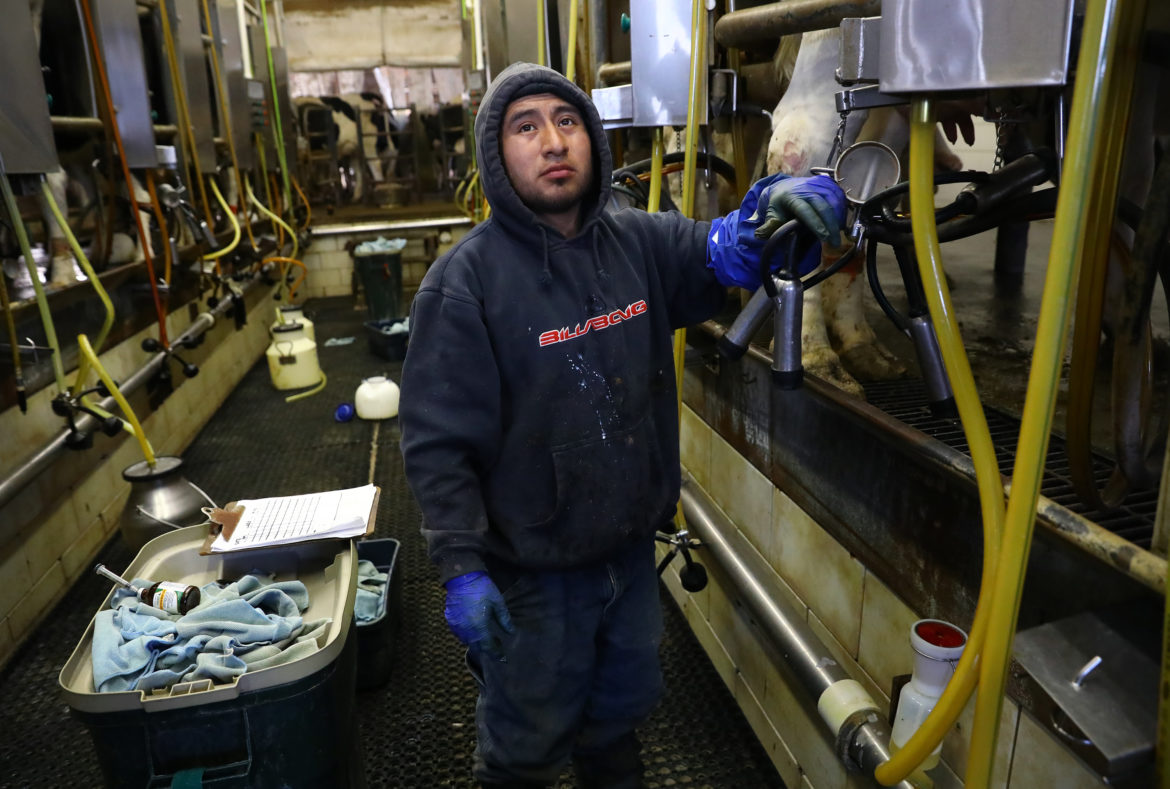
On March 5, 2025, a 31-year-old dairy farmer drowned after his tractor tipped into the manure pit at L&R Dairy in Marshallville, Ohio. Reed Hostetler was a husband, a father of three young kids, and co-owner of the family operation. He was also, by every account, the kind of guy who showed up when his neighbors needed help.
Almost a year later, his community is still showing up for his family. And that’s the part of this story you can actually copy.
You’re not getting a safety manual here. You’re getting something harder to build and more important to have: a real-world playbook for community resilience and dairy farm safety, forged in the worst possible way.
From Barn Wedding to Barn Funeral
Years before the accident, Reed and Abby Hostetler were married in the main barn at L&R Dairy. Same beams. Same alley. Same cows shuffling in the background.
In March 2025, that same barn became the gathering place for family and friends to say goodbye.
Hosting a large crowd in a working dairy barn isn’t just sweeping the alley and stacking a few straw bales. It’s parking logistics, liability questions, shuttle coordination, sound systems, seating, and making sure the space looks like a celebration of a life, not a Tuesday afternoon herd check.
The Hostetlers didn’t have to figure any of that out on their own.
Neighbors and friends showed up days ahead to pressure-wash walls, scrape alleys, and transform the barn into a place where a casket and grieving family could stand with some dignity. Local companies and neighbors brought gravel and equipment to shore up the lane before vehicles started rolling in. Shuttle buses ran from Marshallville Park, so the yard and road didn’t lock up.
While the family was just trying to survive minute by minute, the community quietly handled the logistics that would have broken them.
Reed and Abby’s three kids—Baer (4), Claire (2), and Axe (1) at the time—were too young to remember most of it. But they’ll hear it for the rest of their lives: the barn was full. People came. We weren’t alone.
That’s not sentimental. That’s an asset. You either have it before a crisis—or you don’t.
The Tractor Line That Said What Words Couldn’t
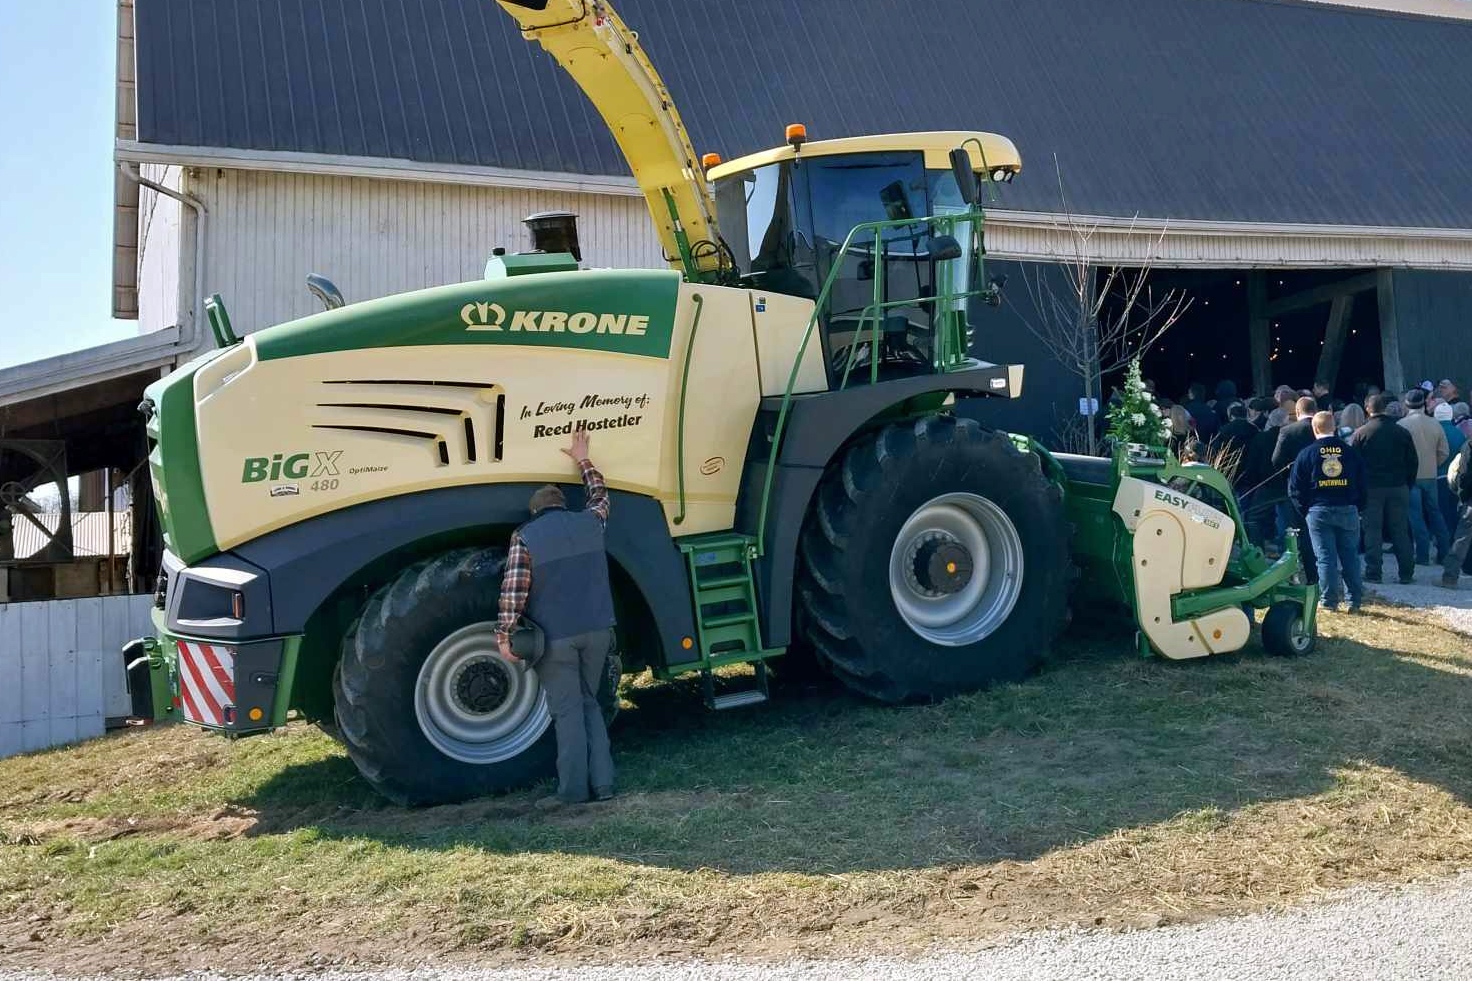
A mourner puts their hand on a forage harvester parked outside Reed Hostetler’s funeral service, which was held at his family dairy farm March 12. Reed died March 5 after an accident at the farm (Jane Schmucker photo).
There’s a sound you don’t forget: a line of tractors and semis idling in low gear outside a church or a farm. Not parade noise. Heavier. Slower. You feel it in your chest.
At Grace Church in Wooster, where the reception was held, tractors, semis, trucks, and implements lined the parking lot and road as a silent, steel-and-diesel guard of honor.
Local equipment dealers, co-ops, and farmers coordinated the lineup. Once the first few units were committed, the rest followed. Some of the tractors were polished. Others still carried field mud and manure dust. That mix mattered. It wasn’t a show. It was the working dairy community saying, “He was one of ours.”
As one neighbor put it, it was the hardest funeral they’d ever been to—not just because of who they lost, but because of what they watched happen around the family.
Among friends and neighbors, a simple phrase started making the rounds:
“Lead like Reed.” If something needed doing—hay to chop, kids to watch, cows to milk—people asked, “What would Reed do?” and then they just did it. No committee. No sign-up sheet. Just action.
You don’t get that kind of reputation overnight. You build it one favor, one late-night call, one “yeah, I’ll be there” at a time.
When Our Community Needs Help, Help Comes
Most tragedies follow a pattern: three days of intensity, three weeks of fading attention, and then a long, quiet stretch where the family is expected to “get back to normal” while everything inside them is still upside down.
That’s not how this played out.
Weeks and months after the funeral, people kept showing up: groceries, diapers, dinners; neighbors stepping in for chores unannounced; friends checking in not once but over and over.
Abby has said that seeing people show up changed how she thinks about community—and how she plans to show up the next time someone else needs help. That shift, from “How will we survive this?” to “How do we pay this forward?” is the proof that community isn’t just nice. It’s infrastructure.
The support didn’t stop at the farm gate.
Green Elementary’s PTO organized a “Dine to Donate” night at a local Applebee’s, using a “student day off” incentive to bring in more families and raise money for the family. The dollars helped. The message mattered more: “Your school sees what your family is going through. You’re not invisible.”
A crowdfunding campaign drew donations from people who knew the Hostetlers well and from others who only knew them as “the young dairy family in Ohio.” It turned years of quiet relational equity into real, practical support when the family needed it most.
Someone told Abby that because of the way Reed lived, he’s still taking care of his kids even after his death. In strictly financial terms, that’s true. But the bigger truth is this: he’d invested in people, and when it all went sideways, those people cashed that investment in for his family.
Who Reed Was—and Why It Matters Now
Reed wasn’t just “helping out” on the home farm. He was co-owner of L&R Dairy, part of the next generation taking over and pushing the operation forward.
He’d hiked the entire Appalachian Trail. He’d ridden bulls. He’d done mission work in Thailand. Back home, he was the guy who could fix nearly any piece of machinery on the place and still make time to talk with a neighbor in the yard. Neighbors remember him as the kind of person you’d see under a mixer wagon at 11 p.m. and then at someone else’s place the next morning, making sure their chopper started.
Like most dairy producers, Reed knew manure pits are dangerous spaces. He wasn’t inexperienced or careless around equipment. But as this tragedy shows, sometimes the margin between “busy day” and “life-changing day” is just physics and bad timing.
At home, Reed and Abby were in the same season a lot of you are in right now: three little kids, a 24/7 operation, and a calendar that only worked because somebody gave up sleep. Abby picked up nursing shifts at the hospital and was learning more of the farm side to help cover when family needs shifted.
They were raising calves, raising kids, and—often without noticing—raising the bar on what it means to be part of a community.
The wave of support after the accident didn’t appear out of nowhere. It came from years of small decisions: taking a call instead of letting it go to voicemail, showing up with a skid steer when a neighbor’s barn burned, buying a few extra tickets for a school fundraiser, saying yes when something needed doing.
None of those actions looked like “strategy” at the time. Together, they’re the reason people felt personally responsible for being in that barn and that driveway when everything fell apart.
You can’t fake that after the fact. You either build it before you need it, or you don’t have it.
Why One Ohio Manure-Pit Accident Should Change How Your County Shows Up
It’s tempting to file this under “heartbreaking story from another state” and move on. That’d be a mistake.
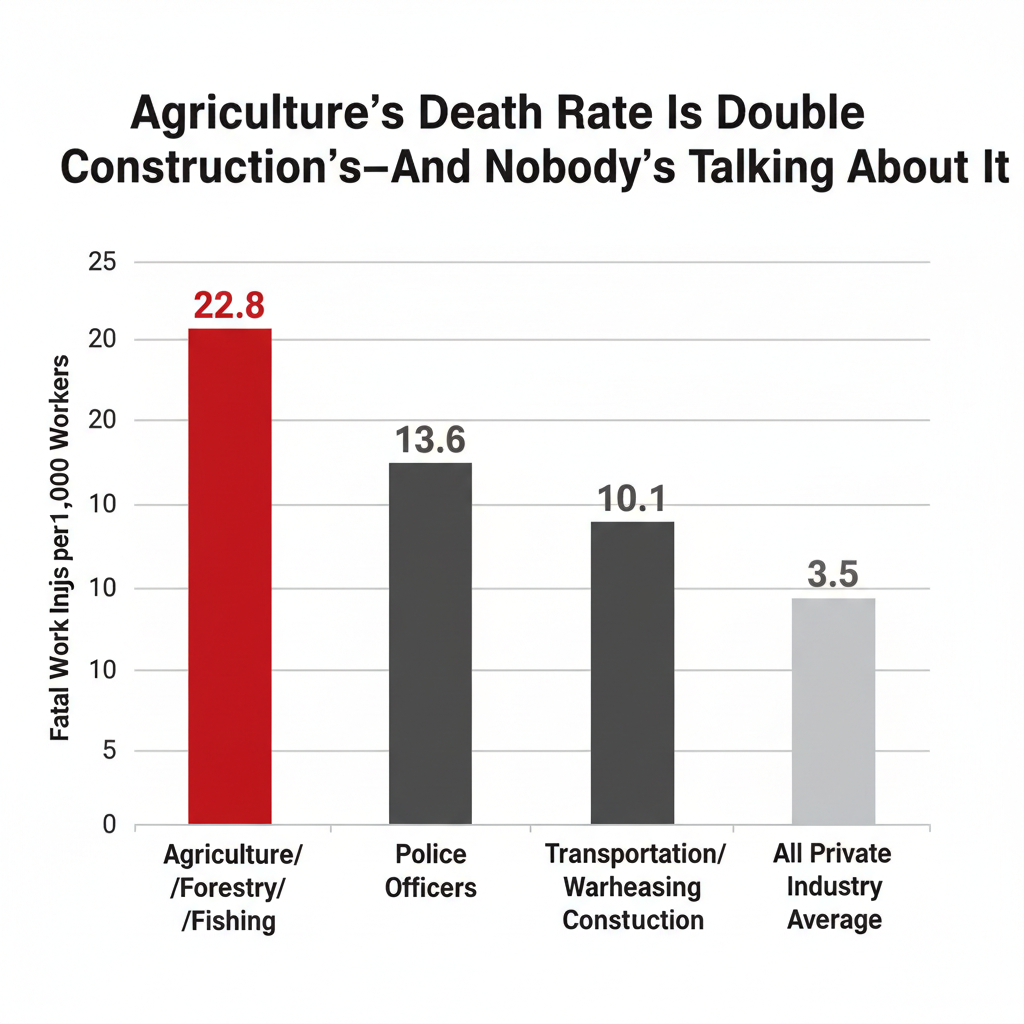
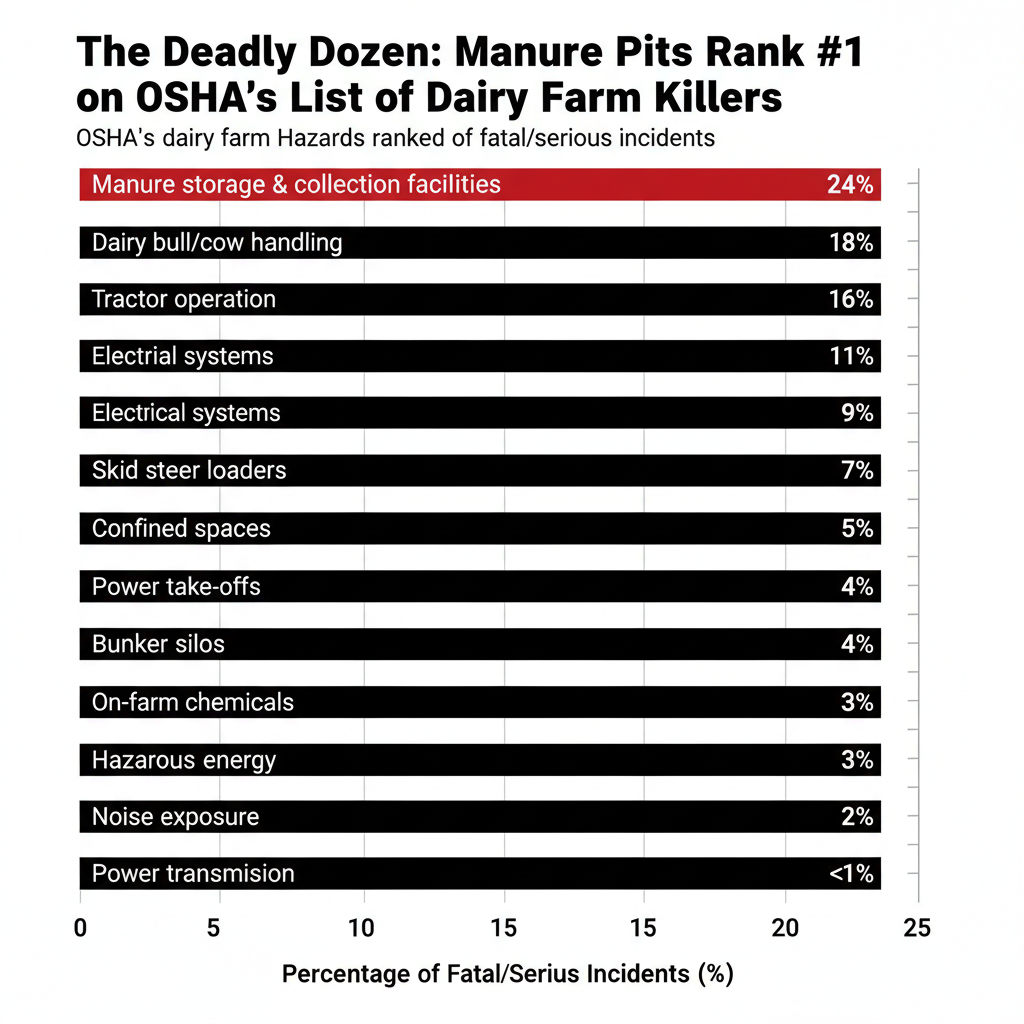
Manure pits have been recognized as a deadly hazard for decades. In a 1993 bulletin titled “Manure Pits Continue to Claim Lives,” NIOSH warned that the oxygen-deficient, toxic atmosphere in manure pits has “claimed many lives” and that hydrogen sulfide, methane, and other gases can overcome workers within seconds when conditions line up the wrong way. A 2012 clinical review published in the Journal of Agromedicine described manure-pit injuries as “rare, deadly, and preventable,” noting that while these incidents don’t happen often compared to other farm injuries, the fatality rate is extremely high once something goes wrong.
And it’s not just Ohio.
On August 20, 2025, six workers—including a 17-year-old—died in a manure-pit accident at Prospect Valley Dairy in Keenesburg, Colorado. Investigators and local reports indicate that a contractor doing routine work likely triggered a hydrogen sulfide release and was overcome almost immediately. Five other workers went in after him in attempts to rescue him. None of them came back out.
When The Bullvine looked back at 2025’s defining dairy stories, Reed’s death in Ohio and the Colorado tragedy both made the list for the same reason: they exposed how thin the margin really is between an ordinary workday and a permanent hole in a family, a workforce, and a local dairy economy. These aren’t freak one-offs. This is systemic risk we’ve tolerated for too long.
Now layer that on top of 2024–2026 realities—consolidation, processor leverage, stubborn input costs, labor shortages, and interest rates that haven’t dropped the way anyone hoped. You’ve got a mental-health load that doesn’t show up on your milk check but absolutely shows up in your barn and your house.
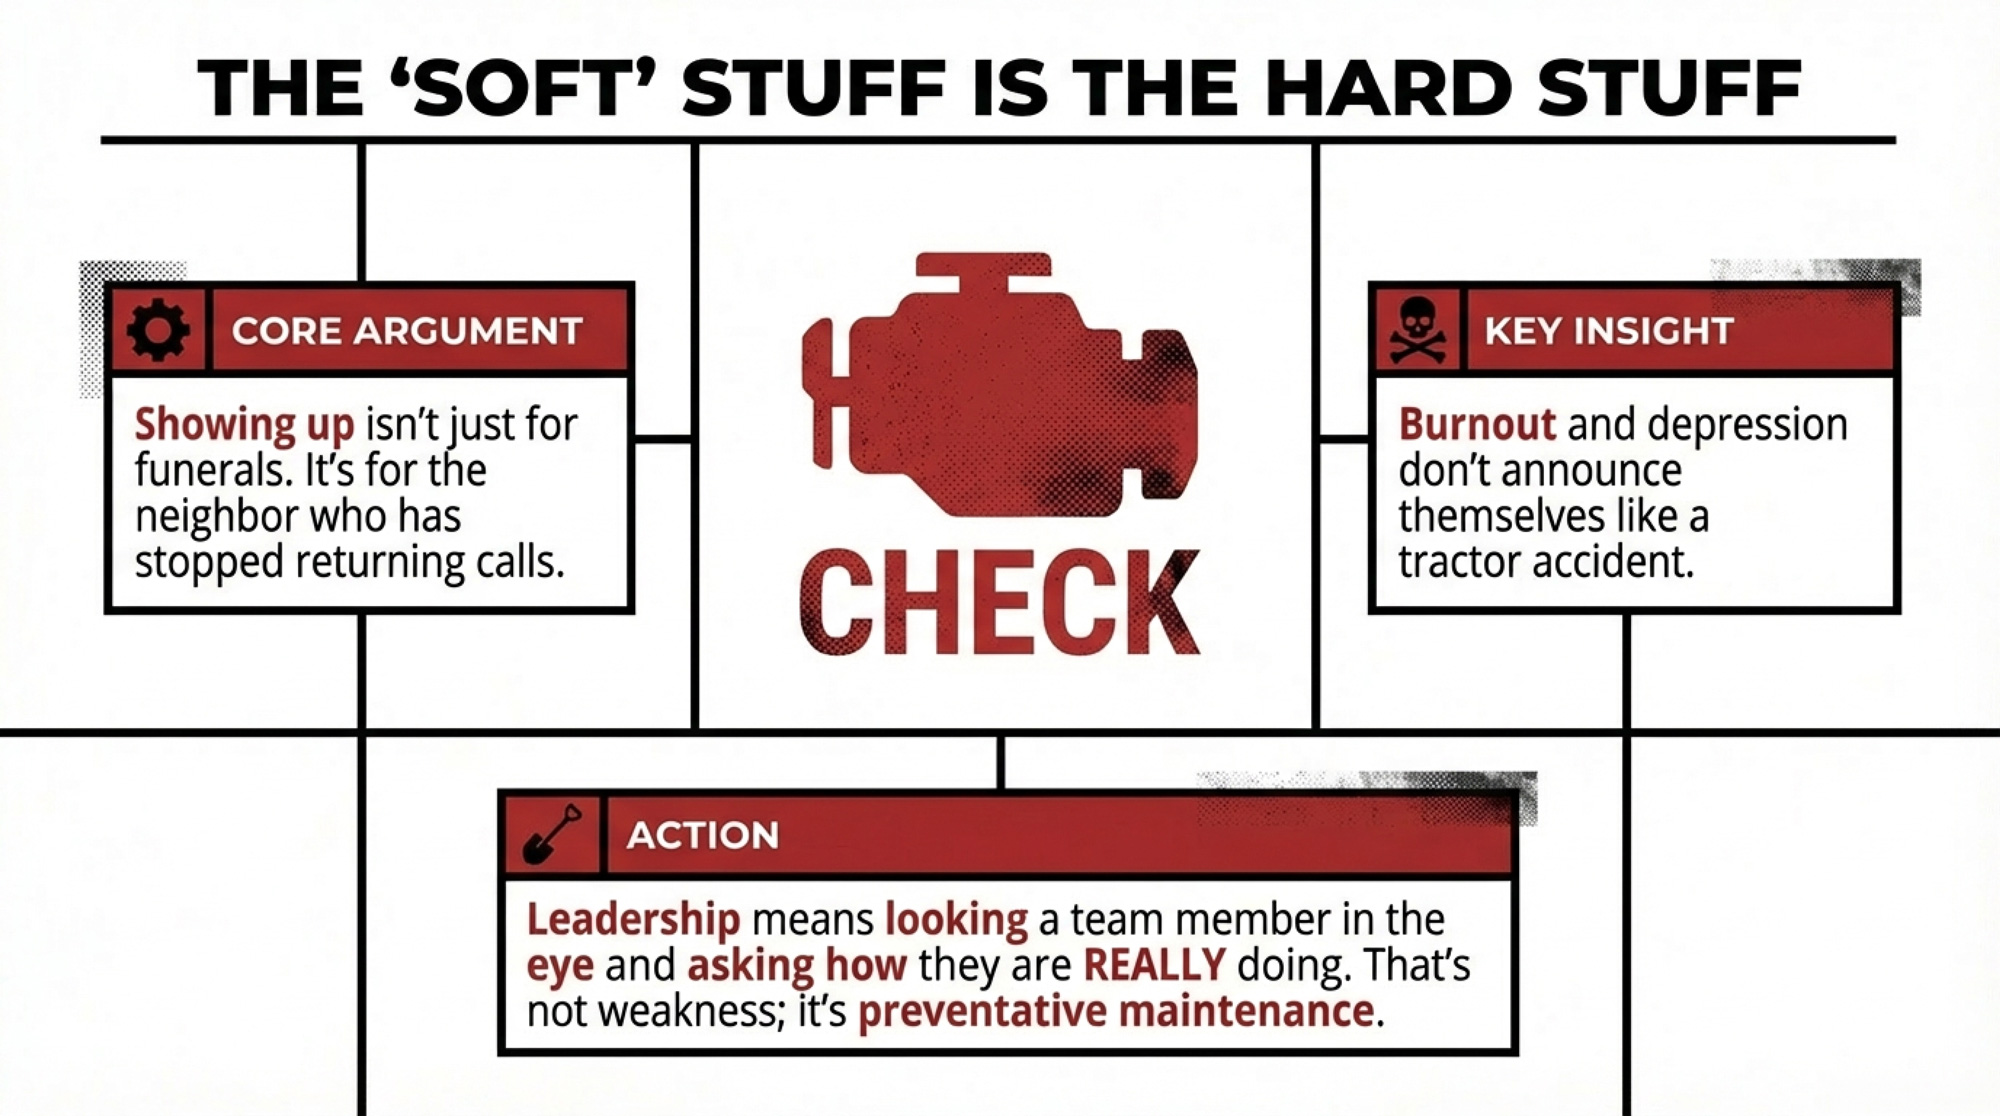
You know people in this business who are running close to the edge—physically, mentally, and financially. “Showing up” can’t just mean after a visible accident. It has to include watching for the quieter stuff: the guy who stops returning calls, the coworker making more mistakes than usual, the family where one bad month of prices seems to hit harder than it should.
Mini-Moments That Show What “Showing Up” Actually Looks Like
Big headlines are built from small, unglamorous decisions. A few details from Wayne County are worth stealing outright.
The food. Abby jokes that Wayne County people sure know how to cook. For weeks, the kitchen counters stayed full: hot casseroles, snack trays, grab-and-go items for the kids. The food itself wasn’t the point. The point was the message: “You don’t have to think about supper tonight. We’ve got that piece.”
The quiet chores. One neighbor made a habit of showing up early, doing a full round of chores, and leaving before anyone could say thank you. Calves fed, pens cleaned, gates latched. No Facebook post, no photo, no public pat on the back. Just work done when the farm needed fewer decisions, not more.
The school connection. Green Elementary’s PTO could’ve checked the “we sent a sympathy card” box and moved on. Instead, they organized the restaurant fundraiser and used a “student day off” incentive to bring in more families. They told the kids, in actions: “Your school sees what your family is going through. You’re not invisible.”
The tractors. Those machines parked outside the church didn’t fix anything on paper. What they did was silently tell Reed’s kids: “Your dad mattered to a lot of people.” Ten years from now, those kids will remember that wall of iron as clearly as any words they heard.
None of these actions use the word “community.” They don’t have to. They define it.
What This Means for Your Operation
If you strip away the emotions, what Wayne County proved is simple: community is infrastructure. You either invest in it before you need it, or you find out what it costs not to have it when everything goes wrong.
Farm families that aren’t alone recover faster—financially and operationally—because chores, crops, and kid logistics don’t collapse alongside grief. That’s not soft thinking. That’s business continuity.
Here are the hard questions worth asking this month:
If a tractor rolled or a fire started on your place tomorrow, who are the first three people who would be in your yard without being asked?
If it happened to a neighbor instead, would anyone automatically assume you were one of those three?
If you had to line up 20 tractors and trucks as a sign of respect, who would answer that call—and who wouldn’t notice?
Who on your team or in your circle has been quieter, shorter-tempered, or more withdrawn than usual lately—and when was the last time you looked them in the eye and asked how they’re really doing?
If you can’t rattle off names without thinking too hard, you don’t have a phone tree. You have a hope and a prayer.
And if you sign the checks or make the schedule, you’re the one who can change that.
What You Can Actually Do This Month
If you’re wondering where to start, here’s the short list.
Build a simple phone tree now. Don’t overcomplicate it. Aim for at least 8–10 key people on your road, in your church, and in your school community. Decide who calls whom in the first 15 minutes if there’s an accident, sudden death, major health crisis, or barn fire. Write it down where people can actually see it—in the milk house, office, or group chat.
Pick three farms to check on. Not with a text. With a quick call or visit. Ask, “How are you doing—really?” and be ready for the answer to take longer than you planned.
Involve your youth on purpose. 4-H and FFA clubs can own “comfort” jobs in a crisis: cards, posters, freezer meals, calf chores. Give them clear roles so they grow up knowing how to show up instead of watching from the sidelines.
Talk about mental health out loud. Put it on the agenda at your discussion group, local dairy association meeting, or men’s breakfast. Share one real story, even if it’s uncomfortable, and be the one who goes first. Make it normal to say, “I’m not okay right now,” before someone breaks. That’s not weakness; it’s maintenance. If you or someone on your team feels overwhelmed, talk to your doctor, a trusted advisor, or a local mental-health provider.
Practice before the crisis. Help each other with harvest, planting, big herd moves, or barn clean-outs, so you already know how to work together. You’ll spend a few hours now—or you’ll scramble from zero on your worst day.
Tie safety and support together. As you review protocols around pits, lagoons, and confined spaces—gas monitors, ventilation, entry rules—ask yourself: “Who else knows this? Who would enforce it if I’m not here?” If there’s any task on your farm that only one person can do safely, that’s a red flag. Train at least one backup and write down the protocol. Safety that only lives in your head isn’t safety.
None of this replaces hard safety work around manure pits, lagoons, and confined spaces. You still need lock-out/tag-out, proper equipment, training, and clear protocols.
But when safety systems fail, insurance is slow, milk prices are tight, and official help ends—this is what catches people.
Key Takeaways
Community doesn’t appear out of thin air in a crisis. It’s built on years of small, quiet favors when nothing is on fire.
Kids are watching. Who shows up, who kneels down to their level, who keeps coming back after the casseroles are gone—that’s what they’ll remember long after the details fade.
Leadership on a dairy isn’t just about numbers and banners. It’s about who you are when someone down the road is in trouble.
“Showing up” includes the quiet stuff. Burnout, withdrawal, depression—these don’t announce themselves the way a tractor accident does. Check on your people before they break.
Safety that lives only in your head is a liability. If nobody else on your operation knows your protocols or would enforce them without you, that’s a gap you can fix this week.
Lead Like Reed
Underneath all the grief, this is a story about assets—just not the kind your accountant can depreciate.
On the hard-numbers side, you chase efficiency, butterfat, component premiums, and labor stability because the economics of 2024–2026 don’t leave much slack. If you’re not on top of genetics, feed, and contracts, you get run over. We all know that.
On the human side, there’s another question that matters just as much to long-term survival: when—not if—something goes very wrong, is your farm part of a community that knows how to respond?
That’s not a feel-good side issue. It’s about whether your family, your workforce, and your local dairy ecosystem can take a hit without collapsing.
So here’s the challenge, almost a year after Reed’s accident:
Look at your own road. Who would need you if something happened tomorrow?
Look at your own barn. Who would you call first if it was your tractor in the pit, your fire, your heart attack in the parlor, or your brain finally saying “enough” after too many bad months in a row?
Look at your own kids and grandkids. What stories do you want them telling 10 years from now about how your community handled hard things?
Reed didn’t get a vote on what happened on March 5, 2025. His brothers did everything they could in a window that physics, machinery, and toxic gas had already stacked against them. His wife, kids, and parents didn’t choose any of it.
What they did get—and what they’re still getting a year later—is a community that decided they weren’t going to carry it alone. A community that turned a barn into both a wedding hall and a sanctuary of grief. A community that lined up tractors, cooked meals, ran fundraisers, and kept showing up long after the news cycle moved on.
Support Type Wayne County Response Typical Farm Crisis Response Immediate Response (0-3 days) 20+ neighbors in yard day 1, full chore coverage Family handles alone, maybe 1-2 calls Funeral/Memorial Logistics Barn transformation, shuttle buses, tractor line, parking coordination Funeral home handles, family figures out details Food/Meals Weeks of daily hot meals, grab-and-go for kids, coordinated delivery 3 days of casseroles, then silence Financial Support Crowdfunding, school fundraiser ($5,000+), sustained donations Maybe a GoFundMe, no follow-up Chore/Labor Coverage Daily unannounced chore coverage for weeks, crop/haying help 1 week if lucky, then “back to normal” School/Kids Support PTO-organized fundraiser, student engagement, visible recognition Sympathy card, kids expected to cope alone Long-Term (3+ months) Ongoing check-ins, continued meals, relationship maintenance “How are you holding up?” texts, no action Phone Tree/Coordination Pre-existing relationships, clear roles, no central organizer needed Confusion, duplicate efforts, gaps in coverage Mental Health Follow-Up Community members trained to recognize signs, ongoing support “Let us know if you need anything” (passive) Business Continuity Farm operations maintained, no production loss, equity preserved Operations suffer, milk quality drops, financial losses compound
You can’t control every accident or every market swing. You can control whether anybody in your circle ever has to face one alone.
So the next time you hear about a farm accident, a diagnosis, or a sudden death—whether it’s in your county or three states away—don’t just shake your head and scroll on.
Ask yourself, honestly: “What would ‘lead like Reed’ look like where I live?”
Then do one concrete thing this month to make sure no farmer on your road has to stand alone when their barn—or their mind—goes dark.
Week
Action Item
Output/Deliverable
Time Required
✓
Week 1
Build your phone tree
List of 8-10 names: neighbors, church, school contacts who would respond in first 15 minutes if something went wrong
2 hours
☐
Week 2
Make 3 farm check-ins
Call or visit 3 farms in your area—ask “How are you doing, really?” and be ready for the answer to take longer than you planned
3 hours
☐
Week 3
Assign youth crisis roles
Meet with local 4-H/FFA club—define specific “comfort jobs” (cards, posters, freezer meals, calf chores) youth can own during next community crisis
1.5 hours
☐
Week 4
Put mental health on agenda
Add mental health discussion to your next dairy association meeting, men’s breakfast, or discussion group—share one real story and go first
1 hour
☐
BONUS: Practice Before Crisis
Help a neighbor with harvest, planting, big herd move, or barn cleanout so you already know how to work together when everything falls apart
Completed joint work project with neighboring farm
4-6 hours
☐
Complete references and supporting documentation are available upon request by contacting the editorial team at editor@thebullvine.com.
Digital Dairy: The Tech Stack That’s Actually Worth Your Investment in 2025 – Exposes the tech-stack hype and highlights the predictive analytics and sensor fusion actually boosting bottom lines in 2026. Gain a competitive advantage by identifying the specific integrations that turn raw barn data into profitable management decisions.
The Sunday Read Dairy Professionals Don’t Skip.
Every week, thousands of producers, breeders, and industry insiders open Bullvine Weekly for genetics insights, market shifts, and profit strategies they won’t find anywhere else. One email. Five minutes. Smarter decisions all week.
79% of U.S. milk runs on immigrant labor. One Idaho dairy lost a third of its crew in 3 weeks—no raid, just fear from one 50 miles away. You have 72 hours.
Executive Summary: Seventy-nine percent of U.S. milk comes from farms that depend on immigrant labor. When that labor vanishes, you don’t have weeks to pivot—you have 72 hours before milking intervals stretch, SCC climbs, and fresh cows slide into DAs and metritis while you’re too short-staffed to catch them. A Texas A&M modeling study found that losing half of immigrant dairy workers would eliminate 1.04 million cows and 24.2 billion pounds of milk, causing $16 billion in economic damage. One Idaho dairy saw a third of its crew disappear in three weeks—not from a raid on their farm, but from fear after enforcement hit a plant 50 miles away. For a 450-cow herd at $18/cwt Class III, losing 5 lb/cow/day for two weeks means $5,670 off the milk check before you count the fresh cows that went south. This article delivers a working 72-hour contingency plan: map your weak spots, quantify your labor exposure, stress-test your AMS assumptions, build a crisis reserve, and get your vet, nutritionist, and lender in the same room before you need them.
Armando, a Mexican employee at Rosenholm Farm in Cochrane, Wis, works in the milking parlor. He asked that his last name not be used because of his immigration status. Armando is among the estimated 51 percent of all dairy workers nationwide who are immigrants. His boss, John Rosenow, says that if his foreign-born employees were deported, or decided to look for work elsewhere, Americans would lose their jobs too, because the farm would be forced to shut down.
If you’re milking cows in 2026, the fact that immigrant workers provide about 51% of hired dairy labor and help produce roughly 79% of U.S. milk isn’t an academic statistic—it’s the foundation of your pay price. When that foundation cracks, you don’t have months to pivot. You have a 72-hour window before your herd health and your balance sheet start taking hits.
How Exposed Is Your Operation?
The Texas A&M AgriLife Center for North American Studies surveyed 973 dairies across 18 states to quantify who’s actually doing the work on U.S. farms. Their findings still anchor most labor discussions:
Immigrant labor accounts for about 51% of all dairy labor.
Farms employing immigrant workers ship nearly 80% of the U.S. milk supply.
Compared with earlier surveys, both the immigrant share of the labor force and milk production had increased, not decreased.
That’s the national backbone. How it lands on your farm depends on where you milk and how you’re set up.
Wisconsin: Fewer Herds, More Cows Per Farm
Wisconsin had about 5,661 licensed dairy herds as of January 2024—down from 9,304 in 2017 and roughly 29,000 in 1995. Average herd size climbed from roughly 138 cows in 2017 to about 224 cows in 2023.
That’s 86 more cows per farm in six years. Nobody added 86 new family members to the payroll.
Consultants working with 300–600-cow freestall dairies in the Fox Valley and central Wisconsin see a consistent pattern: farms that used to run on family plus a couple of locals now rely heavily on immigrant workers. The larger ones simply don’t operate without them.
Northeast: Smaller Herds, Same Reliance
In New York and Vermont, herd sizes tend to run smaller on average, but labor dependence looks familiar once you hit commercial scale. Research on Latino dairy workers in both states shows they’re concentrated in milking, cow-side treatment, bedding, and health-spotting roles.
Vermont-focused studies estimate roughly 1,000–1,200 Latinx immigrant farmworkers support that state’s dairy sector at any given time.
Those workers don’t show up in your DHIA printout. They show up in whether the parlor, fresh pen, and calf barn stay on schedule when somebody disappears.
West and Southwest: Thousands of Cows, 24/7 Systems
In Texas, Idaho, New Mexico, and Arizona, many dairies run herds in the thousands across multiple sites. Multi-shift parlors, feed centers, and hospital pens operate around the clock. Foreign-born workers sit at the center of that system.
Take that labor away, and the math turns ugly fast.
Bottom Line: If immigrant labor wobbles, it doesn’t just hit someone else’s mega-dairy. It hits the backbone of the U.S. milk supply and any herd depending on hired help to keep parlors, fresh cows, and calves on schedule.
The Big Math
Texas A&M stress-tested what would happen if immigrant labor dropped. Here’s what the models show:
Scenario
Cows Lost
Milk Production Change
Economic Hit
Retail Impact
50% labor loss
1.04 million
−24.2 billion lb (−11.7%)
−$16 billion
Moderate increase
100% labor loss
Not modeled
Farm sales down $11.6B
−$32.1 billion total
Prices nearly double
These are modeled scenarios, not guarantees. But they frame what’s on the line when policy shifts—or enforcement heats up.
Your Parlor, Your Numbers
Say you’re milking 450 cows at 80 lb/cow/day. A labor shock doesn’t close your doors, but it drags your routine enough to cost you 5 lb/cow/day for two weeks:
450 cows × 5 lb × 14 days = 31,500 lb less milk
31,500 lb ÷ 100 = 315 cwt
Herd Size
Lost Milk (cwt)
Milk Price ($/cwt)
Milk Check Loss
300 cows
210
$18.00
−$3,780
450 cows
315
$18.00
−$5,670
1,000 cows
700
$18.00
−$12,600
The November 2025 Class III price hit $17.18/cwt, $2.77 below the November 2024 price. The 2025 benchmark Class III averaged about $18.01/cwt. At $18:
315 cwt × $18 = $5,670 off your milk check in 14 days
That’s just the volume loss. It doesn’t count fresh cows sliding into DAs or metritis while you were short-staffed, or calves getting shorted on bedding.
Bottom Line: The national models tie immigrant labor to millions of cows and tens of billions of dollars. At the farm level, a modest production slip in a 450-cow herd means a four-figure hit in two weeks—before you count health and calf costs.
When Enforcement Heats Up: The Fear Effect
A working paper on 2025 ICE raids in California’s Oxnard/Ventura County estimated what happens when immigration enforcement ramps up in an agricultural region:
20–40% reduction in available agricultural workers
$3–$7 billion in modeled crop losses
5–12% retail price increases for some produce
Those are estimates, not line-by-line ledgers. But they match what farmworker researchers describe as the “chilling effect.” Once enforcement becomes visible—raids, news footage, community chatter—workers don’t just leave the farm that got visited. They leave the region, the sector, or the country.
The total workforce loss ends up being multiple times the number of people actually detained.
A nutritionist servicing several 1,000-cow freestalls in Jerome County, Idaho, reports one client saw its workforce shrink by roughly a third within three weeks of a high-profile enforcement action at a nearby packing plant. Nobody came to the dairy. Workers simply decided the risk picture had changed.
You don’t need flashing lights in your driveway to wake up short-handed.
Even if agents never set foot on your yard, enforcement actions in your region can strip out a big share of the labor pool in weeks. Your exposure is bigger than the names on your own payroll.
Why 72 Hours Is the Breaking Point
On a well-run herd, milking locks in at 12-hour intervals for 2× herds, or tighter for 3× herds. Push high-yield cows beyond that, and you pay with SCC, mastitis risk, and lost milk.
Vets and consultants who’ve walked herds through blizzards, flu waves, and bad luck report a similar 72-hour patternwhen crews shrink faster than you can replace them:
0–24 hours: Scrambling, but intact. Every pen still gets milked and fed. Shifts run long. Fresh checks get rushed. Calf feeding technically happens, but not how you’d like. You’re triaging, but your system is still recognizable.
24–48 hours: Cracks appear. Some pens stretch to 16–18 hours between milkings. Over-full udders and milk leakage show up. SCC creeps. Fresh cows that were “a bit off” yesterday now have fevers or poor appetite, and you don’t have enough eyes to sort through them. Calf hygiene slips.
48–72 hours: You’re not running the same herd. Low-priority groups can slip beyond 24 hours between milkings if you’re not ruthless about priorities. Untreated fresh cows slide into full-blown metritis, severe ketosis, or DAs. Calf scours or pneumonia spikes.
Those three days are the difference between “we had a brutal week” and “we’re still digging out a year later.”
Then there’s welfare and legal risk. States like California and Wisconsin have clear animal care standards. If a vet or inspector walks in on day three and sees over-distended udders, untreated down cows, and underfed calves, they’re not seeing a rough patch. They’re seeing whether you had a plan.
You don’t control when a labor crisis hits. You control whether those first 72 hours are organized around a written plan—or around panic and hope.
Robots: Strong Tools, Not Magic Exits
Whenever labor risk comes up, robots aren’t far behind. The real question: what can automatic milking systems (AMS) actually do in a 72-hour crisis—and what can’t they do?
What the Data Shows
A University of Wisconsin Extension survey of 50 U.S. farms that installed AMS found:
Labor hours per cow dropped by about 38% on average
Labor hours per cwt dropped by about 43%
At $15/hr, that’s roughly $1.50/cwt in labor savings
But the same work shows wide variation:
Around 8% of respondents reported no labor savings—maintenance and management ate the gains
About 25% reported savings above $2.40/cwt at $15/hr
Producer comments make the point bluntly: “Still need experienced labor to keep robots running” and “AMS is not stress free… mentally stressful.”
Robots don’t replace management. They expose it.
The Capital Side
AMS projects can run into the high six- to low seven-figure range once you factor in robots, construction, electrical, and barn changes. Divide by cows, and you’re often looking at several thousand dollars per head.
For a modern 500–1,000-cow freestall with good records and a lender who understands dairy, AMS often pencils as a labor tool. For a 150–250-cow herd in an older barn, the math is tighter—those projects hinge as much on succession and lifestyle as on pure labor savings.
In a 72-hour crisis, robots keep milking. But they don’t fix weak fresh-cow protocols, poor cow traffic, or a lack of cross-training on feeding and troubleshooting. They lower your day-to-day labor needs. If you lose the few people who understand the system, the risk just changes shape.
Robots take real pressure off labor in milking, but they shift risk to capital and technical management. They’re a tool in your labor strategy, not an escape hatch.
Region by Region: Same Biology, Different Wrappers
The biology doesn’t care where you live. The economics and options do.
Upper Midwest and Northeast: Many herds run 50–300 cows in older barns that have been upgraded over time. Deep processor relationships, tight land limits, and a mix of family and hired labor, where losing two or three key people can cripple the system. Their questions: How do we stay resilient without overleveraging? Where do we modernize without betting the whole place?
Southwest and Mountain West: Larger herds, often multiple sites and shifts. Heavy reliance on immigrant crews. Strict water and environmental rules. Their playbook leans into formal HR and immigration counsel, larger capital projects, and multi-site risk management.
Canada: Supply management and quota, with Temporary Foreign Worker (TFW) and provincial nominee programs. Federal and provincial reports show livestock sectors rely significantly on temporary foreign workers and wrestle with housing, retention, and program uncertainty. For an Ontario herd under quota, the labor crunch might first show up as missed butterfat targets and under-used quota days.
Quota or not, 50 cows or 5,000—the labor risk lands the same way. If key people vanish, you’re fighting biology and welfare expectations on a short clock.
Region
Typical Herd Size
Labor Dependence
Policy/Program Tools
Risk Level
Upper Midwest / Northeast (WI, NY, VT)
50–600 cows
Moderate to high; mix of family + immigrant workers
Limited H-2A access; state labor regs vary
High
Southwest / Mountain West (TX, ID, NM, AZ)
500–5,000+ cows
Very high; multi-shift operations heavily reliant
Some H-2A use; strict environmental/water rules
Very High
Canada (ON, QC, AB)
50–300 cows (quota)
Moderate; TFW + provincial nominees fill gaps
TFW program, provincial nominees; quota stability
Moderate
California
1,000–10,000+ cows
Extremely high; industrial-scale reliance
H-2A limited for dairy; strict labor + animal welfare laws
Extreme
The 72-Hour Contingency Plan
Treat this as a working plan, not just a read.
Map your weak spots. Write out: if three core workers didn’t show tomorrow, which cows, pens, and tasks would be at risk within 72 hours? Make sure at least two people besides you know that plan and where it’s kept.
Size your exposure. Look at how many critical roles are held by immigrant workers versus others. You don’t need to label anyone’s status—just understand where your labor risk actually lives.
Run the math with your numbers. Plug your herd size, production, and current pay price into the 5 lb/cow/day scenario. If that milk-check hit makes you flinch, that’s your starting point for crisis-reserve and staffing goals.
Treat AMS as one option, not salvation. If you’re considering robots, insist on farm-specific budgets, conservative labor-savings assumptions, and a clear plan for who will manage the system on day 1, day 100, and day 1,000.
Use your advisory team together. Bring your vet, nutritionist, and lender into one conversation. Lay out your 72-hour plan, your crisis-reserve goals, and your automation ideas. Ask them where they see your blind spots.
Benchmark by region and system, not emotion. Compare your staffing and cows-per-worker to operations like yours—same region, similar size and system—not just the biggest herd in the next state.
Key Takeaways
Your labor risk isn’t theoretical. Immigrant workers are behind about half of the hired dairy labor and nearly 80% of U.S. milk. When enforcement heats up, that dependence can translate fast into fewer cows, less milk, and higher prices.
The 72-hour window is real. Within two to three days of losing key workers, biology and welfare rules start calling the shots more than your intentions do.
Robots lower labor, not responsibility. AMS can significantly reduce milking labor on average, but some farms see no savings, and many need more skilled staff.
A crisis reserve buys decisions, not miracles. Money set aside for labor and legal shocks doesn’t guarantee a soft landing. It buys choices—legal help, overtime, temporary support—so you’re not making bad decisions because the account is empty.
Cross-training and culling are cheap, powerful levers. Teaching extra people to handle key tasks and moving out cows that don’t fit your system cost far less than a new barn or robots.
The Bottom Line
A third-generation dairyman from Clark County, Wisconsin—someone who’s lived through the 1980s interest squeeze, the 2009 crash, and 2020’s chaos—put it this way at a winter meeting: he can’t control Washington or Ottawa, but he can control how hard his own farm is to knock over.
You don’t get to choose when the phone rings with bad news about your crew. You do get to choose whether that call lands on a blank slate—or on a 72-hour contingency plan, some cash in reserve, and a herd that actually fits the people you have.
Complete references and supporting documentation are available upon request by contacting the editorial team at editor@thebullvine.com.
How Holstein USA’s Million-Cow Study Should Change Your Linear Type Strategy – Exposes the critical genetic link between linear type choices and robot efficiency. You’ll gain a high-impact framework to breed the “functional cow” required to maximize your automation investment and eliminate technical drama in the parlor.
The Sunday Read Dairy Professionals Don’t Skip.
Every week, thousands of producers, breeders, and industry insiders open Bullvine Weekly for genetics insights, market shifts, and profit strategies they won’t find anywhere else. One email. Five minutes. Smarter decisions all week.
Your 72-Hour Playbook—Generators, Fuel, Water, and the MLP Paperwork That Actually Pays Back
EXECUTIVE SUMMARY: Winter Storm Uri saw Texas dairies dump over 1,800 semi-loads of milk, resulting in $14 to $21 million in losses in a single week. For a 200-cow herd, three days without power means roughly $10,000 in dumped milk before equipment failures or dead animals add to the toll. The math is simple: $1,000 in diesel keeps your generator running; skipping it risks ten times that down the drain. This playbook covers the 72 hours before a major storm hits—generator sizing, fuel planning, water backup, cold-stress feeding, staffing decisions, and the H5N1 biosecurity realities now complicating neighbor-to-neighbor mutual aid. It also details the USDA Milk Loss Program paperwork (dates, volumes, written reasons) that can recover 75-90% of your losses—but only if records exist before the bulk tank overflows. From 70-cow Ontario tie-stalls to 2,000-cow Texas dry lots, the dairies that survive these storms aren’t lucky—they’re the ones who ran the numbers while the sky was still clear.
So here’s a question I’ve been asking farmers lately, and you know, most don’t have a great answer: how many days can your operation actually run if the grid goes down and stays down?
I bring this up because big winter storms aren’t rare “acts of God” anymore. They’re stress tests—of your barns, your people, and honestly, your balance sheet. When Winter Storm Uri slammed Texas in February 2021, agricultural economists with Texas A&M AgriLife Extension estimated initial losses at more than $600 million. And here’s what stuck with me: AgriLife Extension director Jeff Hyde, Ph.D., warned those costs could “plague many producers for years to come.” That wasn’t just a bad week. That was a structural blow to many good operations.
Let me bring that down to a scale we can actually picture. Say you’re milking 200 cows, averaging around 80 lb per cow per day. That’s 16,000 lb daily, or about 160 cwt. At 20 dollars per cwt—your number might be higher or lower depending on components and premiums—one day of completely dumped milk means roughly 3,200 dollars in gross revenue gone. Three days? You’re staring at nearly 10,000 dollars, and that’s before we even talk about butterfat levels or quality premiums you’re losing.
During Uri, Darren Turley—he’s the executive director of the Texas Association of Dairymen—told Brownfield Ag News that Texas dairies ended up dumping over 1,800 semi loads of milk in roughly a week. Plants couldn’t process it, trucks couldn’t move, and power and natural gas were just gone. Dairy market analyst Sarina Sharp, estimated the regional total at 2,000 to 3,000 loads. If you put even a conservative value of 7,000 dollars per load on that, we’re talking 14 to 21 million dollars of milk literally washed down the drain.
Here’s what’s encouraging, though: policy actually reacted. In 2023, USDA’s Farm Service Agency rolled out the Milk Loss Program—MLP for short—to compensate dairy operations for milk that got dumped or removed from commercial markets due to qualifying natural disasters. The program covers events from 2020, 2021, and 2022, and the rules are pretty specific: eligible dairies can claim up to 30 days of lost milk per year, with payments at 90 percent of the calculated loss for underserved producers and 75 percent for everyone else.
So looking ahead to the next named winter storm, the real question becomes: in the 72 hours before it hits, what can you do on your dairy—right here, with your labor, cash flow, and setup—to keep the next storm from erasing months of hard-won margin?
Key Numbers Worth Keeping in Your Head
Before we get into the details, here are the figures I’d jot on a notepad:
30–50 gallons/cow/day — typical water intake for lactating cows, according to Penn State Extension
2–4 gal/hour — approximate fuel burn for a 40 kW diesel generator, depending on load, per industry fuel consumption data
5–7 gal/hour — fuel consumption range for larger 100 kW units at working capacity
About 1% per °F — added maintenance energy demand once cattle drop below their lower critical temperature, per SDSU and NDSU Extension
2–25% — range of intake increases you might see in cold-stressed cattle when forage quality allows, again from SDSU
30 days — maximum MLP coverage per year
75% / 90% — MLP payment rates for standard producers versus underserved producers
$3.6 billion — estimated uncovered U.S. farm losses from 2020 natural disasters alone, according to American Farm Bureau Federation analysis
$21+ billion — crop and rangeland losses from 2022 severe weather events, per AFBF
A 10-Minute “If You Don’t Do Anything Else” Checklist
You know, what I’ve found talking to producers is that you don’t need a thick binder to be materially more ready. You need a few focused moves. If you only have ten minutes this week, I’d put them here.
Run the generator under real load. Start it, switch through the transfer switch, and put actual critical loads on it: vacuum pump, milk pump, cooling, one well pump, and key lights. Let it run 30–60 minutes. The true test—and every farm electrical guide will tell you this—is whether it can start and carry those motors without sagging or tripping. Running smooth with no load? That tells you almost nothing.
Know your fuel math, not just your tank size. Industry fuel consumption charts show that a 40-kilowatt diesel generator under decent load burns about 2–4 gallons of fuel per hour, while a 100-kilowatt unit typically requires 5–7 gallons an hour at working capacity. Run that 40 kW set at around 3 gal/hour for 72 hours straight, and you’re at roughly 215 gallons. At 4 dollars per gallon, that’s about 860 dollars of diesel. Now put that against one 25,000-liter load of dumped milk—around 700–800 cwt—at 20 dollars per cwt. That’s 14,000 to 16,000 dollars gone. Three days of fuel starts looking like pretty cheap insurance.
Stage three to five days of water access. Penn State Extension notes that lactating dairy cows typically drink 30–50 gallons of water per day, with most of that from drinking rather than from feed moisture. Use 35–40 gallons as a planning number, and that same 200-cow herd needs 7,000–8,000 gallons a day. Over three days, you’re north of 20,000 gallons. Nurse tanks, overhead storage, and extra troughs positioned now give you a buffer if lines freeze or a pump fails.
Walk every water line and heated waterer. In colder regions—and this is consistently shown in livestock water system bulletins from Ontario and the northern U.S. states—self-regulating heat cable rated for potable water is recommended for exposed or problem lines. It adjusts its output based on temperature and is considered safer than constant-wattage tape. Flip breakers, feel heaters, check thermostats, and look hard at elbows, risers, and any line you’ve “meant to insulate later.”
Look at rations through a cold-stress lens. SDSU Extension and NDSU both use a practical rule of thumb: once cattle are below their lower critical temperature, maintenance energy requirements rise by about 1% for every degree Fahrenheit below that point. They also report that cattle under cold stress often increase intake by 2 to 25 percent when forage quality allows, with the higher end of that range kicking in when effective temperatures drop below about 5°F. So if cows are effectively 18°F below LCT, you could be looking at around 18 percent more energy demand. On a 200-cow herd feeding 50 lb/head/day, that’s an extra 9 lb/head/day—1,800 lb of TMR daily. At 8 cents per lb of dry matter, that’s roughly 144 dollars per day. Over three days, call it 400–500 dollars in extra feed. Put that against the risk of losing 3–4 lb of milk per cow per day over three days—2,400–3,200 dollars at 20 dollars per cwt—and the math very clearly favors feeding for the cold.
Get brutally honest about who can actually reach the farm. Farm emergency planning tools in British Columbia and the Prairie provinces encourage mapping where employees live and how storms affect their routes. More dairies now designate one or two core people—often the owner and a key herdsman or herdswoman—as “on-farm no matter what,” and set clear thresholds beyond which staff farther away are told not to risk the roads. That clarity saves accidents and, indirectly, protects the herd.
Talk to your milk hauler and your co-op or processor. Brownfield’s coverage of Uri showed how chaotic those first days were for plants, haulers, and farms. Many processors in Texas, the Upper Midwest, and the Northeast now have more defined storm protocols. This is the time to ask, “If the plant is down or roads are closed for two days, what happens to my milk?” Their answer will tell you whether your real risk is a full tank or a dead tank.
Post an emergency contact sheet where everyone can see it. Vet clinic, hauler dispatch, field rep, electric and gas utilities, fuel supplier, FSA office, insurance agent, and a couple of neighbors—that’s the bare-bones list most farm emergency guides recommend. Tape it in the milk house. When phones die or get lost, that paper is still there.
Add bedding and wind protection for outside groups. Cold-stress articles from NDSU, Wisconsin, and others note that effective windbreaks and deep, dry bedding can substantially reduce energy requirements and help cattle maintain condition during severe cold. Straw, stalks, bale stacks, and panel lines are low-tech, high-ROI tools to stage before the weather hits.
Turn documentation into a habit, not a scramble. The MLP fact sheet emphasizes that producers must document dates and volumes of dumped or removed milk, provide marketing statements, and describe the qualifying event and how it prevented normal marketing. Similar documentation underpins the Livestock Indemnity Program, ELAP, and the Emergency Conservation Program. Jotting a quick note—”PM milking, Jan 10, ~150 cwt dumped, hauler cancelled, plant closed”—and snapping a photo can be worth thousands later.
If that’s all you manage before the next big system, you’re still a long way ahead of where many good dairies found themselves going into Uri or the big High Plains and Dakota blizzards.
72–48 Hours Out: Getting Real About Power and Water
Looking at post-storm reports across Texas, the High Plains, and eastern Canada, the pattern is pretty consistent: herds with even basic backup power and water plans had miserable days, but they stayed in the game. Herds with no plan? They jumped straight to crisis.
Sizing Backup Power for the Farm You Actually Run
In many Ontario tie-stalls and Wisconsin freestalls, as well as smaller parlors in New York and Vermont, backup power usually means a PTO generator or an older diesel tied into the parlor and one well. In larger dry lot systems in New Mexico or the Texas Panhandle, you’ll more often see big automatic units, but you know, many 500–1,000 cow herds still depend on PTO sets.
Generator sizing guides from provincial ministries and suppliers generally start the same way:
List your “must-run” loads: vacuum pump, milk pump, plate cooler or bulk tank compressor, at least one deep-well pump, and minimum lighting.
Convert motor horsepower and amps to kilowatts and total your running load.
In their worked examples, modest parlor setups often fall in the 25–40 kW range for true critical loads. Once you add larger parlors, multiple compressors, robot systems, sand separation, and more ventilation, those examples quickly move into the 75–150 kW band or higher, depending on what’s bolted to the floor.
And here’s the catch that bites a lot of people: motors don’t draw their running amps when they start. Electrical references and generator manuals consistently note that induction motors can draw 2 to 3 times their running current at start-up. That’s why most electricians and sizing tools push you to build serious headroom above that neat running-load number.
So if you and your electrician calculate a critical running load of about 60 kW, it’s common to recommend a generator in the 80–90 kW range to handle multiple motors starting without constant tripping. One pattern I keep seeing: when producers balk at the bigger unit, it’s usually because they’re thinking about “amps right now,” not “worst-case start-up” during a blizzard.
Tier & Critical Load
Est. kW Running
Recommended Gen Size
Typical Cost
Fuel/72hr @ $4/gal
What’s Covered
Tier 1: Parlor + Well + Cooling
25–40 kW
40–50 kW
$12,000–$18,000
$860–$1,440
Milking, water, bulk tank cooling
Tier 1+2: + Lighting + Manure
45–65 kW
75–90 kW
$20,000–$32,000
$1,440–$2,160
+ Alley lights, pump-out capability
Full Farm (Rare)
80–120+ kW
120–150+ kW
$35,000–$60,000+
$2,160–$3,600+
Everything except non-essential loads
Undersized (60 kW / no headroom)
60 kW listed
Often fails under real load
$15,000–$22,000
$1,080/72hr
Risk: motors trip/stall at startup
PTO Gen (Tractor-Driven)
Variable (20–40 kW typical)
Depends on tractor
$8,000–$15,000
Fuel from tractor tank
Limited to parlor + one well; no automatic failover
Put some dollars on this. Say upgrading from a marginal 60 kW unit to a properly sized 90 kW backup costs around 25,000 dollars. One full 25,000- to 30,000-liter load of dumped milk, at 20 dollars per cwt, is roughly 14,000–16,000 dollars. Two loads in a week and you’ve essentially burned the cost of that larger unit—without actually owning it.
One non-negotiable point: safety. Every electrical safety sheet from utilities and farm safety programs says the same thing—use a proper transfer switch that isolates your system from the grid when the generator runs. Backfeeding through improvised cords isn’t just illegal; it’s dangerous for line crews and for your own family.
For many small and mid-size herds, especially in the Northeast and Upper Midwest, the practical goal is tiered backup, not full-farm coverage. Farm emergency templates often describe it like this:
Tier 1: Milking system and one dependable water source.
Tier 2: Parlor and key alley lighting, one manure system, minimal fans in tight barns.
Tier 3: Calf housing and non-critical loads, only if capacity allows.
The farms that revisit this after a bad outage usually say the same thing: “We didn’t need everything backed up—we just needed Tier 1 rock-solid and Tier 2 clearly mapped.”
Fuel: How Long Can You Really Keep Running?
Here’s a question worth asking in a quiet moment: “If we had to run this generator almost continuously, how long would our fuel actually last?”
As we covered, a 40 kW diesel set under good load burns about 2–4 gallons an hour; a 100 kW unit typically requires 5–7 gallons an hour. At 3 gal/hour, 72 hours straight is roughly 215 gallons. At 4 dollars per gallon, you’re near 860 dollars in fuel.
Hours
40kW @ 3 gal/hr (500-gal tank)
40kW @ 3 gal/hr (800-gal tank)
100kW @ 6 gal/hr (500-gal tank)
0
500
800
500
24
428
728
356
48
356
656
212
72
284
584
68
96
212
512
(empty)
120
140
440
(empty)
Cold-climate extensions like NDSU often use a three- to five-day window for worst-case winter planning. Not every farm can or should store five days’ worth of diesel on-site—fire code and risk are real—but knowing you can cover at least three days, and that your supplier has an emergency plan with you, moves you from “wishful thinking” to “managed risk.”
The herds that treat “fuel days on hand” as seriously as “days of feed on the pit” tend to sleep a bit better when the lines start buzzing.
Water: The Other Utility You Can’t Fake
If there’s one thing every dairy nutritionist agrees on, it’s that water drives intake. Penn State’s “Value of Water” bulletin says lactating cows typically drink 30–50 gallons a day, with most of their requirement met through drinking water. And here’s the part that matters for storm planning: cows typically drink 30–50 percent of their daily water within an hour after milking, according to both Penn State and Michigan State. So if your waterers go down right after milking, you’re hitting them at the worst possible time.
For a 2,000-cow freestall herd, using that verified 30–50 gallons per cow per day just for drinking, total daily drinking water needs could range from 60,000 to 100,000 gallons—and that’s before accounting for wash water.
When it comes to water, most resilient farms lean on three basics:
Keeping lines from freezing. Adequate burial depth for your local frost line, insulation on exposed runs, and self-regulating heat cable on vulnerable sections are all standard recommendations in winter watering guides from Ontario, the Prairies, and northern U.S. states.
Keeping drinkers ice-free. Heated waterers, sheltered troughs, and constant-flow systems that use ground heat are among the winter advice from the extension offices in Ohio, Minnesota, and Wisconsin. Shielding tanks from wind and checking them more frequently can be as important as the hardware itself.
Having backup supply options. Nurse tanks on running gear, portable troughs, and valves that let you re-route water if a main line or pump fails are common suggestions in Purdue and similar extension resources.
In many Wisconsin and Ontario herds I’ve walked, the operations that ride out January cold best treat water almost like feed: they build in redundancy and know exactly where the weak points are.
48–24 Hours Out: Feed, People, and Communication
Once you’ve shored up power and water as best you can, the next day is really about three levers: how you feed through the cold, who’s actually going to be on site, and whether the right conversations have happened before the snow flies.
Feeding Cows Through Cold Without Trashing the Ration
You probably know this already, but the research backs it up nicely. SDSU Extension’s winter feeding guidance uses the rule of thumb we mentioned: once cattle are below LCT, maintenance energy needs increase by about 1% per degree Fahrenheit. And according to their data, cold-stressed cattle may increase intake anywhere from 2–25 percent if the ration allows it, with the lower end of that range (2–5%) occurring at milder cold (41–59°F), and the upper end (8–25%) kicking in once effective temperatures drop below about 5°F.
So let’s walk through the math. If cows are effectively 18°F below LCT, that guideline implies an additional 18 percentin energy demand. On a 200-cow herd feeding 50 lb/head/day, you might bump to 58–60 lb/head/day for a few days—an extra 1,600–2,000 lb of TMR daily. At 8 cents per lb of dry matter, that’s roughly 128–160 dollars per day. Over three days, call it 400–500 dollars in extra feed.
Scenario
Extra TMR/Day
3-Day Cost
Protected Milk Income
Net ROI
Do Nothing (18°F below LCT)
0 lb
$0
$0 (lose 3–4 lb/cow/day)
–$2,400–$3,200
Modest Bump (5 lb/head/day)
1,000 lb
$240
$2,400–$3,200
+$2,160–$2,960
Aggressive Bump (10 lb/head/day)
2,000 lb
$480
$2,400–$3,200
+$1,920–$2,720
Feed Waste Scenario (20% spoilage)
1,000 lb
$300 (with waste)
$2,400–$3,200
+$2,100–$2,900
If you avoid losing 3–4 lb of milk per cow per day across that period, you’re protecting roughly 2,400–3,200 dollars of milk. When you see it that way, feeding for the cold isn’t charity—it’s risk management.
What stands out in herds that ride these spells out well is a consistent pattern:
They consciously bump TMR for high groups during the worst cold—5–10 lb/head/day is common—and then dial back once temperatures normalize.
Their nutritionist adjusts energy sources, nudging rations toward more digestible forage and carefully managed by-products or fats, while keeping an eye on starch intake so it doesn’t wreck rumen health or butterfat levels.
They give extra attention to fresh cow management and cow comfort during the transition period, not just in mid-lactation pens, because those cows are already under stress.
On the calf side, calf welfare research and industry pieces in Hoard’s Dairyman note that dairy calves can begin experiencing cold stress at temperatures just below 50°F, especially in damp or drafty housing. That’s why jackets, deep straw packs, and draft control in hutches and calf barns are basically standard from late fall into spring in many Midwest and Northeast herds.
Staff and Family: Who Will Actually Be There?
Talking with producers from Vaughan across Ontario, through Wisconsin, and down into New Mexico, this is often where the conversation turns very real. It’s one thing to say “we all pitch in,” and another to say, “I don’t want my feeder on 45 minutes of black ice at 4 a.m.”
Farm emergency plans in British Columbia and Alberta encourage producers to structure staffing the way they structure power—deliberately and in tiers. Many dairies are doing something like this:
Identifying one or two core people—often a family member and the lead herdsman or herdswoman—who will be on-farm if conditions demand it.
Setting clear thresholds—snowfall, ice, visibility, road closures—beyond which staff who live farther away are told to stay home.
Defining “must do” vs “can wait” tasks, so limited labor can focus on milking, feeding, water, and fresh cows first.
What’s interesting is that when farms communicate this clearly, it tends to build—not erode—trust. People like knowing that their safety matters as much as getting the third milking in.
Communication and Mutual Aid
In the Upper Midwest and eastern Canada, you’re seeing more talk of mutual aid between farms. After big blizzards and ice storms, USDA field staff and co-op reps have noted that herds with pre-storm conversations about sharing capacity—tank space, generator power, even labor—had more options than those trying to negotiate in real time.
Those conversations usually revolve around questions like:
If a neighbor’s bulk tank fails, can anyone else take a load, subject to the processor’s rules and biosecurity requirements?
If one generator dies and another farm has spare capacity, is there a safe way to power a well or a small barn temporarily?
But here’s where things get more complicated in 2025 and 2026—and you probably know where I’m going with this. Biosecurity concerns have intensified dramatically since highly pathogenic avian influenza H5N1 was first detected in U.S. dairy cattle on March 25, 2024. The CDC confirmed that initial Texas case, and by late 2025, according to Dairy Reporter, the virus had spread to dairy herds across 16 or more states, with California hit particularly hard.
The European Food Safety Authority published a detailed assessment in December 2025, noting that transmission within farms is primarily driven by contaminated milk and milking procedures, while farm-to-farm spread is mainly linked to cattle movement and shared equipment.
What does that mean for mutual aid during a storm? A few practical realities:
Tank sharing is much trickier now. Mixing milk from different herds—even temporarily—creates traceability headaches and potential exposure to disease. Before you assume a neighbor can take your load, talk to your processor and your state or provincial veterinarian about what’s actually permitted. USDA’s Federal Order, effective April 29, 2024, requires that lactating dairy cattle receive a negative test for Influenza A virus at an approved laboratory before interstate movement.
Shared equipment is a known risk factor. EFSA’s assessment specifically identifies shared equipment and contact with external personnel as risk factors for between-farm spread of HPAI. If you’re borrowing a loader, a pump, or even a set of milking claws, the expectation now is that equipment gets properly cleaned and disinfected before it crosses property lines—something that’s harder to manage in the middle of a blizzard. If equipment must move between properties, ensure a 10-minute contact time with an EPA-registered disinfectant effective against Influenza A (H5N1) before it touches your driveway.
Isolation protocols matter more than ever. Biosecurity surveys have consistently found that many U.S. dairy operations lack formal quarantine facilities or protocols for introduced cattle—a gap that USDA and state veterinarians have identified as a significant risk factor for disease spread. The National Milk Producers Federation’s biosecurity guidance recommends isolating newly introduced or returning cattle for at least 30 days and limiting livestock movement. Their guidance also notes potential risk when feeding unpasteurized dairy products to cattle and recommends heat treatment or pasteurization of milk from sick cows to help inactivate H5N1.
None of this means mutual aid is dead—it just means the conversations need to happen earlier and with more detail. When a cluster of farms, their fieldman, and their hauler sit down in November instead of mid-January, and when they explicitly address biosecurity alongside logistics, it turns vague goodwill into usable options that won’t blow up in anyone’s face come spring.
And it’s worth noting that the American Farm Bureau Federation estimates farmers had at least 3.6 billion dollars in uncovered losses across all sectors from 2020 natural disasters alone, and more than 21.4 billion dollars in crop and rangeland losses from 2022 severe weather—losses not fully insured or compensated. Those numbers should make all of us a bit more interested in neighbors, paperwork, and plans—even when the rules around sharing have gotten stricter.
24–0 Hours: Animal Comfort and Final Checks
As the radar colors get louder and the start time firms up, you’re out of the “build new systems” phase and firmly in “put animals where they’ll cope best and tighten the loose ends.”
Understanding Cold Limits in Real Barns
Decades of extension work basically backs up what you already know: a mature cow with a dry winter coat and decent condition can tolerate surprisingly low air temperatures if she’s out of the wind and staying dry. A wet, wind-blasted cow at the same temperature is a different story entirely.
Livestock extension materials often use approximate LCT values around the high teens Fahrenheit for cattle in full winter coat, and much higher thresholds—mid-40s up toward about 59°F—for animals with wet or thin coats. The exact number doesn’t matter as much as the principle: wind and moisture move the goalposts.
From there, your tool kit is familiar but powerful:
Windbreaks that actually work. Barn walls, shelterbelts, trees, bale stacks, and panel/tarp setups can all reduce wind speed, lowering energy demand and helping cows maintain body condition.
Deep, dry bedding. Enough straw or stalks so cows can nest and stay off frozen concrete or mud. Producers on both sides of the border report better production and fewer sick cows when they treat bedding like feed during a cold snap.
Timing higher-energy feeding. Beef work from Kansas State and others has shown benefits from timing higher-energy feeding so peak fermentation and heat production align with the coldest period of the night. Dairy herds with some scheduling flexibility can apply the same concept to TMR delivery.
For calves, the margin is tighter, which is why jackets, deep straw, closing drafts, and sometimes bumping milk solids a bit in prolonged cold show up in calf-management guidance.
A Deliberate Walk-Through Before It Hits
In the last 12–24 hours, a lot of seasoned producers do a slow walk-through that looks a lot like a pre-flight check:
Start the generator, switch through the transfer switch, and listen and watch as motors start and stop.
Fill overhead tanks, nurse tanks, and portable troughs so a single pump hiccup doesn’t immediately turn into a water crisis.
Top up fuel in loaders, skid steers, and tractors so feed doesn’t stop when a machine runs out of fuel.
Look up at roofs, trees, and attachments near parlors, calf barns, and feed sheds for obvious ice-load or wind risks—something producers in the Northeast and Quebec remember all too well from past ice storms.
More farms are also adding one simple item to that checklist: “How and when are the people staying on-farm going to rest?” When you read post-storm write-ups in regional farm media, a surprising number of costly mistakes come down to fatigue, not a lack of knowledge.
During the Storm: Triage and the Milk That Might Not Move
Once the storm is fully on top of you, you’re not building resilience—you’re deciding what to protect first and what can wait without breaking the operation.
Most farm emergency plans—and a lot of producer stories—in the extension literature boil priorities down roughly like this:
People first. No extra scraping or third milking is worth a serious injury on ice or under a stressed roof.
Water and basic feed next. Cows handle dirty alleys better than empty bunks or dry waterers.
Milking frequency and fresh cows after that. In some storms, temporarily moving from 3x to 2x milking makes sense to protect staff and equipment. That’s a decision to make with your vet and adviser because it affects udder health, production, and butterfat performance.
Everything else, as conditions allow. Manure handling, bedding changes, and non-critical repairs are “do when it’s safe,” not “do at all costs.”
You can’t be everywhere, so many herds settle into a rhythm: quick checks every couple of hours on generator output, fuel, main waterers, bulk tank temperature, and vulnerable groups (fresh, hospital, calves), plus broader walks every four to six hours to look at feed access, drifting, and overall stress.
And if the milk has nowhere to go?
Uri made the picture painfully clear. Turley’s 1,800 dumped semi-loads in Texas and Sharp’s estimate of 2,000–3,000 dumped loads regionally weren’t projections—they were full tanks washed away. That’s exactly the kind of loss the Milk Loss Program was created to soften.
According to the FSA fact sheet, to claim MLP, you’ll need to file Form FSA-376, supply milk marketing statements from the month before and the month of the loss, and provide a written description of the qualifying event and how it prevented normal marketing.
Dumped milk daily: date, volume, cause (hauler cancel, processor closure)
Keep with farm records
Up to 30 days/year covered
Hauler/Processor Notice
Screenshot/save texts/emails from milk hauler and processor explaining disruption
Email or text, saved
Supports “prevented normal marketing” proof
Photo Documentation
Photos of generator running (if applicable), drifts blocking milk house, any visible stress or dead stock
Take during event
Visual evidence of qualifying disaster
FSA-376 Filing
Milk marketing statements (month before, month of loss); written description of event and impact
File with FSA within 60 days of loss
75% standard / 90% underserved producers
Claim Processing
FSA calculates loss based on milk price (announced price, not spot), volume, and payment tier
FSA review period ~60–90 days
Max claim: 30 days of milk loss per claim year
MLP Check Arrives
Payment issued; typically 75–90% of documented loss value
Processed after FSA approval
75–90% of loss recovered
So in the middle of the storm, if you’re forced to dump, two small habits make a big difference later:
Note the date, milking (AM/PM), and approximate volume dumped, plus the reason (no pickup, plant down, no power to tank).
Save any texts, emails, or written notices from haulers or processors explaining the disruption.
Those details are what convert a five-figure loss from “total write-off” into something MLP can at least partially cover.
After the Storm: Counting the Cost and Closing the Gaps
When the storm passes, and the lights stay on, the instinct is to jump straight into fixing. Some repairs can’t wait. But USDA disaster guidance and provincial emergency manuals keep returning to the same message: document first, then repair when you can.
On the documentation side, that usually means:
Taking photos of damaged barns, parlors, calf barns, feed sheds, and manure storage from multiple angles.
Recording equipment failures—generators, pumps, bulk tanks, robots, feeders—with make and model when possible.
Logging livestock losses with dates, numbers, and veterinary input when available.
Keeping a simple log of dumped milk: dates, milking times, approximate amounts, and reasons.
Those records are the backbone of claims not only for MLP, but also for the Livestock Indemnity Program (for eligible livestock deaths beyond normal mortality), ELAP (for certain feed and water-related costs), and the Emergency Conservation Program (for land, fence, and structure repair). They also give you numbers you can take to your lender and insurer.
Let’s circle back to the bigger math. That same 200-cow herd dumping a full 7,000-gallon load is losing something like 1,600 cwt of milk. At 20 dollars per cwt, that’s 32,000 dollars in gross revenue. Under MLP, a standard producer might recoup around 75 percent of that, about 24,000 dollars, assuming full eligibility and no caps. That still leaves roughly 8,000 dollars uncovered—and that’s before any building damage, dead cows, or feed spoilage.
The American Farm Bureau Federation’s analysis of 2020 disasters estimated at least 3.6 billion dollars in uncovered farm losses that year, and their 2022 assessment put crop and rangeland losses from severe weather at over 21.4 billion dollars—losses not fully covered by insurance or disaster programs. The takeaway is pretty clear: insurance and disaster programs matter, but they rarely make you whole. Planning and documentation are what turn “disaster” into “serious but survivable.”
Then there’s the debrief. A week or two after the dust settles, when you’re not running purely on adrenaline, is the time to ask with your family or team:
What worked the way we hoped?
What failed—or almost failed—and why?
If this exact storm hit again next winter, what would we want in place before it started?
Sometimes the answers are big—new generator, roof work, major drainage, or windbreak projects. More often, they’re a string of smaller but powerful changes: upping minimum fuel days on hand, adding one more nurse tank, tightening fresh cow protocols when storms are forecast, or agreeing that any dumped milk or unusual death gets logged the same way, every time. Those steady, unglamorous moves are what keep a bad week from becoming a bad year.
Four Decisions That Belong on Every Dairy’s List
So, from a practical standpoint, what moves belong on almost every dairy’s list? I’d argue at least these four:
Know your generator math. Work with your electrician to nail down your true Tier-1 load and the cost to back it up properly. Then calculate how many hours or days of fuel you can reliably cover.
Set a simple documentation standard. Decide that any dumped milk or unusual livestock loss gets a date, volume/count, reason, and a couple of photos recorded the same way every time. That’s your ticket into MLP, LIP, ELAP, and a more intelligent discussion with your lender.
Put your own number on a lost load. Use your current milk check—price, components, any premiums—and put a real dollar figure on one full lost load for your herd. Write that number at the top of your storm plan. It will change how you view fuel, backup power, and staff rest.
Pick one program to understand truly. Whether it’s MLP, LIP, ELAP, or the Emergency Conservation Program, spend 10–15 minutes on the phone with your local FSA office or provincial counterpart to clarify how it actually works and what records they need before you ever file a claim.
From Ontario to the Upper Midwest and down into the High Plains, resilience rarely comes from one big, dramatic project. It comes from stacking a series of honest conversations and incremental decisions: a better transfer switch here, an extra tank there, a cleaner staffing plan, a habit of writing things down. That’s how you end up on the right side of the $3.6 billion gap between disaster and survival.
The storms aren’t going away. The cows aren’t going to stop milking. The leverage for all of us, season by season, is making sure the systems and numbers around those cows are just a little more ready each time the sky turns that particular shade of winter grey.
What’s the one piece of equipment—or one decision—that saved you in the last big blow? Drop it in the comments. Whether it was a generator that finally paid for itself, a nurse tank you’d almost sold, or just having the right people on site, your experience might be exactly what another producer needs to hear before the next storm rolls in.
KEY TAKEAWAYS
Three days without power = ~$10,000 in dumped milk for a 200-cow herd—before equipment failures or dead animals add to the toll.
$1,000 in fuel or $10,000 down the drain. A 40 kW generator burns roughly 215 gallons over 72 hours. That’s a 10:1 return you can’t afford to gamble.
MLP recovers 75-90% of milk losses—but only with paperwork. Document dates, volumes, and reasons as you dump. No records, no payment.
H5N1 rewrote mutual aid rules. Since March 2024, sharing tanks or equipment carries real biosecurity risk—have those neighbor conversations now, not when the snow’s flying.
Survival isn’t luck—it’s math. Generator sizing, fuel reserves, water backup, and one simple documentation habit separate a tough week from a devastating year.
Complete references and supporting documentation are available upon request by contacting the editorial team at editor@thebullvine.com.
Learn More
Dairy Management in the Face of Adversity: Focus on What You Can Control – Safeguard your margins by mastering the variables within your fence line. This breakdown identifies critical management levers that minimize losses during volatility, ensuring your operation remains profitable regardless of the weather or market shocks hitting your neighbors.
The Future of Dairy Policy: Navigating Evolving Disaster Support – Arms you with the intelligence needed to navigate shifting federal disaster relief and insurance frameworks. Discover how evolving support structures provide new financial layers of protection, securing your operation’s longevity against increasingly frequent and severe climate events.
Off-Grid Resilience: Integrating Renewable Energy on the Modern Dairy – Delivers a blueprint for technical and financial independence through on-farm energy production. Explore how solar and biogas integration creates a resilient safety net, eliminating grid dependency while slashing long-term overhead and boosting your farm’s sustainability profile.
The Sunday Read Dairy Professionals Don’t Skip.
Every week, thousands of producers, breeders, and industry insiders open Bullvine Weekly for genetics insights, market shifts, and profit strategies they won’t find anywhere else. One email. Five minutes. Smarter decisions all week.
Congress just reversed the whole milk ban—$4.3 billion and 13 years after dairy farmers first called it out. But here’s the uncomfortable truth: the farms best positioned to profit aren’t the ones that fought for it. Your 90-day playbook to change that.
Executive Summary: Whole milk won—13 years and $4.3 billion too late. Congress reversed school milk restrictions in December 2025, finally acknowledging what a 28-study meta-analysis proved in 2020: children who drink whole milk have a 40% lower risk of obesity than those who drink skim. The catch for most producers: school contracts require 500+ gallons daily, effectively locking out two-thirds of U.S. dairy farms. But the opportunity is real if you know where to look—mid-sized operations should be pushing cooperatives toward whole milk school packaging lines, smaller farms can tap a $2.15 billion premium market where marketing fat as a feature beats hiding it, and component-focused genetics now align with both institutional and consumer demand signals. This playbook segments 90-day action steps by herd size because the market opportunity from this shift is unevenly distributed. The lesson that outlasts whole milk: surviving in dairy means building operations resilient enough to weather the years between when science proves you right and when policy finally catches up.
Thirteen years of watching kids push away skim milk cartons. $4.3 billion in estimated industry losses. Roughly one-third of U.S. dairy farms are gone.
And now, finally, whole milk is coming back to schools.
The U.S. Senate passed the Whole Milk for Healthy Kids Act by unanimous consent on November 20, 2025. The House followed on December 15. But before you celebrate, here’s the uncomfortable truth: the farms best positioned to capture this win aren’t necessarily yours—unless you’re running several thousand cows or you’ve already built direct consumer relationships.
So what can the rest of us actually do with this?
The Policy Shift at a Glance
2012 Restrictions
2025 Reversal
Flavored milk
Fat-free only
Whole and 2% permitted
Unflavored milk
Fat-free or 1% only
All fat levels permitted
Saturated fat rules
Milk counted toward weekly limits
Milk exempted from sat-fat caps
Scientific basis
1980s-era low-fat consensus
A 2020 meta-analysis showing 40% lower obesity risk with whole milk
Market access
Favors large processors
Still favors large processors
The Component Math: Why This Actually Matters to Your Milk Check
Let’s talk numbers—because this is where the policy shift translates into real economics.
Whole milk contains 3.25% butterfat. Skim milk? Essentially zero. That’s a 3.25-pound butterfat difference per hundredweight.
According to the USDA’s November 2025 component price announcement, butterfat is currently priced at $1.71 per pound. That means whole milk in school channels carries approximately $5.56 per cwt additional butterfat valuecompared to skim.
Milk Type
Butterfat %
Nov 2025 Value/cwt
Jan 2025 Peak Value/cwt
Skim milk
0.0%
Baseline ($0)
Baseline ($0)
1% milk
1.0%
+$1.71
+$2.95
2% milk
2.0%
+$3.42
+$5.90
Whole milk
3.25%
+$5.56
+$9.59
Here’s where it gets interesting: butterfat prices have been volatile this year. Earlier in 2025, butterfat ran as high as $2.95 per pound back in January, which would put that same differential at roughly $9.59 per cwt. Even at today’s lower prices, the component value difference is meaningful.
Quick ROI comparison—Premium Channel Economics:
Channel
Price per cwt
Annual Revenue (100 cows, 23,000 lbs/cow)
Commodity (Class III, Nov 2025)
~$17.18
~$395,140
Premium direct/organic (based on Intel Market Research organic grass-fed pricing, typically 2-3× conventional)
~$40-50
~$920,000-$1,150,000
Difference
$525,000-$755,000
The math explains why producers willing to build direct relationships are capturing fundamentally different economics—even if the transition requires significant upfront investment.
The Genetics Connection: Breeding for a Whole Milk Future
Here’s something worth considering for those of you making breeding decisions right now: the whole milk policy shift adds another data point to an already strong case for component selection.
According to CDCB, the April 2025 genetic base evaluation showed unprecedented gains—Holsteins improved by 45 pounds for butterfat and 30 pounds for protein. The butterfat number’s almost double any number that’s taken place in the past.
The drivers are clear: genomic testing has improved selection accuracy, and multiple-component pricing allocates the majority of milk check value to butterfat and protein—the two components that drive your check under current FMMO formulas. With 61% of all dairy semen sold in the U.S. now coming from sexed categories, producers can accelerate genetic progress by creating heifer calves from top-component females while using beef semen on the rest.
Industry analysts projects that genetic selection could push average butterfat content above 5% within the next decade if herd nutrition can keep pace with genetics.
The practical takeaway for breeding programs: The whole milk policy shift reinforces demand signals that already favor component-focused genetics. If you’re not already emphasizing butterfat and protein in your sire selection, the economics increasingly favor that direction. Top Holsteins are now adding 45 lbs butterfat per genetic base reset—that’s real money showing up in component checks.
How We Got Here
The original policy wasn’t arbitrary. When the Healthy, Hunger-Free Kids Act passed in 2010, policymakers were responding to real concerns—childhood obesity had tripled since the early 1970s, climbing from around 5% to 15% by 2000, according to CDC data.
And you know what? The people who designed these policies weren’t acting in bad faith. They were working within the scientific framework available at the time. The problem? That framework had blind spots that dairy farmers spotted immediately.
Kids stopped drinking the milk. Schools added sugar to improve palatability. The anticipated health benefits never materialized.
When we chatted with a producer who runs a 650-cow operation near Fond du Lac, Wisconsin—who is a third generation on his family’s farm—he put it to me pretty directly: “We knew something was off within the first year. You’d watch the trash cans fill up with barely-touched cartons. The nutritionists were telling us fat was the problem, but we could see with our own eyes that kids just wouldn’t drink the stuff. My dad used to say the same thing about the low-fat push in the ’80s—consumers know what tastes right.”
It’s a sentiment I’ve heard echoed across dairy country, from Vermont to California.
What the Research Actually Found
The turning point came in February 2020. Dr. Jonathon Maguire, a pediatrician at the University of Toronto’s St. Michael’s Hospital, led a meta-analysis published in the American Journal of Clinical Nutrition that encompassed 28 studies across seven countries.
The findings were striking:
Children drinking whole milk had 40% lower odds of being overweight or obese
Not a single study showed that reduced-fat milk is associated with a lower obesity risk
The biological mechanism makes intuitive sense: dietary fats support satiety; remove them, and kids end up consuming more calories elsewhere
What I found particularly frustrating in this research was the timing. A 2013 University of Virginia study had already pointed in this direction—preschoolers who drank 1% or skim milk had higher odds of being overweight than peers who drank whole milk.
That study came out just one year after the restrictions took effect. It took seven more years for the Toronto meta-analysis and five more for the policy reversal.
Which raises an uncomfortable question many of us have asked ourselves: how many farms might still be operating if the policy had responded to evidence more quickly?
The Economic Damage
The American Farm Bureau’s analysis documents the consumption collapse pretty clearly:
School milk use fell from 4.03 cartons per student per week (2008) to 3.39 (2018)—a 15% drop
Rate of decline accelerated 77% after the 2012 rule change compared to the years before
An industry analysis by The Bullvine estimated a total economic impact of around $4.3 billion (though, like any economic model, that involves assumptions about multiplier effects and competitive dynamics)
“A policy that takes 13 years to correct can put an operation out of business long before the evidence wins out.”
The farm-level damage has been severe. USDA analyses show licensed U.S. dairy farms have fallen by roughly one-third over the past decade. You probably know some of those families personally.
Wisconsin: Steady reduction throughout the decade, particularly among smaller herds
California: Fewer but larger operations capturing an increasing production share
Canadian producers operate under different economic conditions—quota systems insulate them from some commodity volatility but create constraints on fluid milk innovation. The whole milk policy shift is a U.S.-specific development, but Canadian producers watching cross-border trends should note the demand signals. If American consumers are increasingly seeking full-fat dairy products, that sentiment doesn’t stop at the border. Some Ontario and Quebec processors are already watching U.S. premium channel growth with interest, and there may be lessons here for Canadian direct-market producers positioning their own operations.
A third-generation Vermont producer who transitioned to organic during this period described the frustration I’ve heard from many in the region: the school milk situation was just one piece of the economic pressure, but it was the piece that felt most frustrating because producers could see with their own eyes it wasn’t working.
What the Reversal Actually Means for Markets
Here’s where we need to be realistic with each other.
The Farm Bureau projects whole milk could shift 2-3% of U.S. butter production into higher-value bottled milk channels. That’s meaningful volume—but it’s not transformational on its own.
The adoption timeline is going to stretch out:
Early 2026: Districts start releasing procurement RFPs
Spring 2026: Contract bids due
July 1, 2026: First-wave contracts begin
Year 1: Maybe 40-50% district adoption, realistically
Year 3: Perhaps 50-60% adoption
School milk procurement requires a minimum of 500 gallons per day and favors operations that can consistently meet volume and delivery demands. For herds under 300 cows—roughly two-thirds of remaining U.S. dairy farms—direct school contracts just aren’t realistic. The logistics don’t pencil out.
The “Missing Middle” Problem—And What to Do About It
If you’re running 300 to 1,000 cows, you’re in a tough spot. Too small for institutional school contracts. Too large (and too busy) for a farmers’ market stand on Saturday mornings.
But you’re not without options. And frankly, your cooperative’s board probably isn’t thinking about this as hard as you are. That’s your job to push them.
Pressure your cooperative to innovate. Farmers own their co-ops—you can sit on the board, attend meetings, and push for change. Major cooperatives, including DFA, Land O’Lakes, and California Dairies, all offer forward contracting and risk management programs for members. Land O’Lakes launched its Dairy 2025 Commitment, a sustainability and processing innovation initiative. Some specific asks worth raising at your next member meeting:
School-specific packaging lines for whole milk that your co-op can bid on district contracts
Higher-fat fluid product development—the demand signal from this policy shift is clear
Regional processing partnerships that keep more value closer to member farms
Consider cooperative processing arrangements. One Minnesota cooperative involving four farms with a combined 1,800 cows reports routing 25% of collective production through a small processing facility they financed together, according to a recent Bullvine analysis of mid-sized farm strategies. That portion generates roughly twice the commodity price. The remaining 75% continues through traditional channels, so they’re not betting the whole operation on one approach.
“We didn’t have the scale individually to make processing investment work,” one participating farmer explained. “Together we did.”
This isn’t quick or easy—figure 24-36 months for facility build-out and $200,000-$500,000 in shared investment. But for operations with geographic proximity and complementary goals, it’s worth having a feasibility conversation over coffee with neighboring farms.
What if you do nothing? Let’s run those numbers honestly. If you’re in the 300-1,000 cow range, shipping commodity milk at ~$17/cwt while premium channels deliver $35-50/cwt, every year of inaction leaves roughly $200,000-$400,000 on the table (depending on herd size and component production). Over a five-year window, that’s potentially $1-2 million in foregone revenue—capital that could have funded the very infrastructure needed to access premium markets. The cost of waiting isn’t zero, even if it feels safer in the short term.
Advocate for policy that helps mid-sized operations. The school milk win came from organized industry pressure sustained over the years. The same approach applies to FMMO reform, processing infrastructure grants, and cooperative development programs. Individual voices get lost; collective voices get heard.
Your 90-Day Action Checklist
For operations under 300 cows (direct-to-consumer potential):
[ ] Contact your state dairy promotion board about marketing support programs—Midwest Dairy, American Dairy Association Northeast, Southeast Dairy Association, and regional councils often have resources specifically for small-scale direct marketing
[ ] Research farmers’ market requirements and seasonal milk subscription models in your region
[ ] Calculate your break-even point for premium channel investment (licensing, packaging, refrigeration)
Direct school district contracts + institutional positioning
Contact cooperative about 2026 school RFPs; request school milk bid timeline; explore branded whole milk partnerships
Immediate (contracts start July 1, 2026); leverage existing volume
The Premium Opportunity: Marketing the Fat
Here’s where smaller operations have a genuine advantage—if they understand what’s actually working out there.
Market research from Intel Market Research estimates the U.S. organic grass-fed milk market at $2.15 billion in 2025, projected to reach $3.28 billion by 2032 at roughly 7.3% annual growth. Subscription-based delivery models grew 92% over the past year alone.
But here’s what I’ve noticed watching the producers winning in this space: they’re not just producing premium milk. They’re marketing the fat. That’s a meaningful distinction.
Take Painterland Sisters, a fourth-generation Pennsylvania organic dairy. According to a recent Forbes profile, co-founder Stephanie Painter puts it directly: “We aimed to change the narrative surrounding milk fat.”
Their skyr yogurt contains 6% milkfat—double cream. According to Dairy Processing, each 5.3oz container holds the equivalent of four cups of milk. The sisters have emphasized that those healthy fats are central to their product’s nutritional profile—it’s a feature, not something to minimize or apologize for.
The result? Over 6,000 stores in all 50 states, including Whole Foods, Sprouts, and Publix. Forbes’ “30 Under 30” list. The fastest-growing yogurt brand in the natural foods space.
Their insight is instructive: the whole milk vindication isn’t just about returning to what was—it’s about actively marketing fat as a feature.
“Our story is what sets us apart on the shelves,” they told in a recent interview. “Every detail on the cup is designed to tell a story, bridging the gap between the farm and the fridge.”
For farms considering this pathway: launching farmers’ market sales, subscription programs, or an on-farm store requires real investment in licensing, packaging, and refrigeration. Your state dairy promotion board or cooperative extension office can connect you with producers who’ve made similar transitions in your region.
The honest question to ask yourself: Do you have the temperament for direct customer relationships, the capital for infrastructure, and the patience to build a brand? It’s not for everyone—and that’s okay. But for farms that fit the profile, the whole milk story provides a ready-made narrative that consumers genuinely want to hear right now.
Why Policy Correction Takes So Long
Understanding this dynamic helps prepare for whatever comes next—methane regulation, climate requirements, antibiotic restrictions. There’s always something on the horizon.
Research published in 2022 in the journal Public Health Nutrition examined the Dietary Guidelines Advisory Committee. The finding: 19 of 20 members (95%) had at least one documented financial or professional relationship with actors in the food or pharmaceutical industries.
Now, this doesn’t mean committees are corrupt or that members are consciously biased. What it illustrates is something more structural: these committees naturally draw from pools of credentialed experts who’ve built careers within existing consensus frameworks. Challenging established positions carries professional risk. Confirming them is safer. The incentive structure doesn’t reward rapid revision, even when new evidence accumulates.
The result? A system that changes slowly, regardless of how compelling the contradicting evidence becomes.
For producers, the takeaway isn’t that experts can’t be trusted. It’s that policy timelines operate on a different clock than farm economics. Plan accordingly.
Practical Lessons for What Comes Next
Build flexibility into your revenue structure. The farms that survived the last 13 years weren’t entirely dependent on a single market channel. Diversification provides a cushion when policy shifts unexpectedly against you.
One California producer I spoke with recently—running about 2,200 cows in the Central Valley—described it as “not putting all your milk in one tank.” He’s got relationships with three different buyers, plus a small direct-sales operation his daughter runs. When one channel gets disrupted, the others absorb the shift. It’s not complicated, but it requires intentionality.
Consider your story as an asset. If you’ve been farming through these years, you have credibility with consumers who’ve grown skeptical of institutional guidance. A farm that can authentically say “we knew whole milk was nutritious when experts said otherwise” has differentiation that larger operations simply can’t replicate.
Engage policy discussions before consensus hardens. The dairy industry’s organized response to school milk restrictions gained real momentum only after substantial damage had already accumulated. For emerging issues—such as methane regulation and climate requirements—earlier engagement yields better outcomes.
Plan for policy timelines, not evidence timelines. You might be right about the science for years before policy catches up. Your operation needs to survive that gap. That means capital reserves, operational flexibility, and revenue diversification that doesn’t depend on regulatory environments being rational.
The Bottom Line
The immediate market impact from whole milk’s return will be modest—a few percentage points of butterfat utilization, phased in over several years as districts convert.
But the broader lessons apply to whatever comes next:
Policy corrections take longer than farm economics can absorb. Build flexibility to survive the gaps.
Being right doesn’t automatically translate to market benefit. Thousands of farms closed while dairy farmers were correct about whole milk.
Market opportunity distributes unevenly. Large operations win on institutional contracts; small operations can win on premium positioning; mid-sized farms need cooperative innovation or collective processing strategies.
Direct consumer relationships provide policy insulation. And marketing the fat—not just producing it—is what’s actually working in premium channels.
Genetics reinforce the direction. Component-focused sire selection aligns with both premium market demand and institutional whole milk needs—top Holsteins are now adding 45 lbs butterfat per genetic base reset, and that’s real money showing up in component checks.
And honestly, that’s what this whole 13-year story comes down to. The farms that thrive going forward will likely be those that learned from this experience: not just that whole milk was right, but that surviving in this industry requires building operations resilient enough to weather the gaps between when evidence emerges and when policy finally responds.
That’s the real lesson here. Not just vindication—preparation.
We’ll be tracking school district adoption rates and Class I utilization by FMMO region throughout 2026—watch for quarterly updates on how whole milk demand is actually showing up in producer checks.
KEY TAKEAWAYS
$4.3 billion too late: Whole milk won in December 2025—but one-third of U.S. dairy farms closed during the 13 years policy ignored the science that proved them right
School milk isn’t your opportunity (yet): Contracts require 500+ gallons daily, locking out two-thirds of farms. Push your cooperative to bid on school packaging—that’s how mid-sized herds access this market
Your 90-day move by herd size: Under 300 cows → premium direct channels (organic grass-fed is $2.15B, growing 7.3%). 300-1,000 cows → cooperative pressure + shared processing ($200K-$500K). 1,000+ cows → 2026 school RFPs start soon
Butterfat math favors whole milk: At $1.71/lb, whole milk carries $5.56/cwt more value than skim. Top Holsteins now add 45 lbs butterfat per genetic base reset—component breeding pays regardless of channel
Build resilience before the next policy fight: Thirteen years between science and policy correction is normal, not unusual. Methane rules, climate mandates, antibiotic restrictions—your operation needs to survive the next gap, not just celebrate this win
Complete references and supporting documentation are available upon request by contacting the editorial team at editor@thebullvine.com.
Learn More
Whole Milk is Back in Schools. Here’s Why Only 834 Dairy Farms Will Really Win. – Exposes the brutal administrative reality of school contracts and delivers a segmented ROI analysis. This breakdown arms you with specific volume thresholds to determine if institutional bidding actually pencils out for your specific herd size.
$2 Milk or $20 Milk: The Simple Testing Strategy Creating 1000% Premiums – Breaks down the unconventional testing protocols that allow smaller herds to unlock thousand-percent price premiums. It delivers a proven blueprint for transforming regulatory transparency into a high-margin brand that completely bypasses the commodity price squeeze.
The Sunday Read Dairy Professionals Don’t Skip.
Every week, thousands of producers, breeders, and industry insiders open Bullvine Weekly for genetics insights, market shifts, and profit strategies they won’t find anywhere else. One email. Five minutes. Smarter decisions all week.
The hacker never entered his barn. Never touched a cow. But when ransomware encrypted his robot’s health data, a pregnant cow’s distress went invisible. She died. Cyber risk just hit the transition pen.
Executive Summary: A hacker never touched his cows—but a pregnant one died anyway. When ransomware encrypted a Swiss dairy farmer’s robotic milking system in 2024, the health data that could have flagged her distress went dark. By the time anyone noticed, she and her calf were gone. This is dairy’s new vulnerability: ransomware attacks on agriculture doubled in early 2025, now comprising 53% of cyber threats targeting the food industry. As digital tools increasingly drive fresh cow management, disease detection, and breeding decisions, cyber risk has become a transition pen issue—not just an IT problem. The encouraging news? Protecting your herd doesn’t require an IT department. Here’s a practical six-step framework, the questions to ask your technology partners, and what cooperatives and Congress are doing to help.
You know, a decade ago, the riskiest “system crash” on most dairies was a parlor vacuum pump going down right in the middle of milking. Today—and this has taken a lot of us by surprise—a growing number of those failure points live in software, routers, and cloud accounts.
Here’s what brought this home for me. Back in 2024, a Swiss dairy farmer named Vital Bircher had his robotic milking system encrypted by hackers. They demanded about $10,000 in ransom. The physical robots kept milking—teat cups attaching, vacuums cycling normally—but he suddenly lost access to all the data that actually helps you manage cows. The health alerts, the conductivity readings, the reproduction flags. Without that information, a pregnant cow’s condition deteriorated before anyone caught it. Both she and her calf were lost. CSO Online and several European outlets covered the story, and it’s stuck with me ever since.
What’s sobering is that this isn’t an isolated incident. Jonathan Braley, director of the Food and Ag-ISAC, reported that ransomware attacks on food and agriculture more than doubled in early 2025 compared to the same period last year—84 incidents in just the first quarter. He presented those findings at the RSA Conference this past spring. Ransomware now accounts for roughly 53% of all cyber actors targeting the food industry.
So here’s what many of us are starting to realize: once your milking, feeding, and herd records move onto networks and into the cloud, dairy farm cybersecurity isn’t just “an IT problem” anymore. It becomes part of herd management, animal welfare, and business continuity.
The Digital Barn Is Already Here
Walk into most progressive operations today—whether that’s a 200-cow freestall in Wisconsin, a large drylot in the Central Valley, a grazing operation in the Pacific Northwest, or a mega-dairy in the Texas Panhandle—and you’ll see it. Robotic milkers, activity collars, sort gates, in-parlor ID, and environmental controllers. At least one computer screen is glowing somewhere in the office. The digital dairy isn’t some future concept. It’s daily life.
A research team published a comprehensive roadmap earlier this year in Frontiers in Big Data—titled “Safeguarding Digital Livestock Farming”—and put dairy right at the center of this transformation. Sensors, automation, and AI are now embedded throughout milking, feeding, and health monitoring on commercial operations worldwide.
The benefits are real, and most of us have seen them firsthand. We’re catching mastitis earlier by monitoring milk conductivity. Activity and rumination data can flag fresh cow problems during that critical transition period—often 24 to 48 hours before you’d see clinical signs with your eyes. There’s solid research on this from Cornell and in journals like Nature Scientific Reports. Labor flexibility has improved with robots handling overnight milkings. Butterfat performance gets better when ration and intake data actually talk to each other.
But here’s the flip side that same Frontiers paper points out: as these systems have come online, the “attack surfaces” have multiplied. Vulnerabilities in barn controllers, herd software, and cloud services can now impact animal care and milk flow as surely as a broken pipeline once did.
The technology and threat curves are rising together. That’s simply the reality we’re operating in now.
When a Cyberattack Actually Reaches the Cows
Let me walk through what happened in Switzerland, because it illustrates how digital problems connect to cow comfort in a very concrete way.
When hackers encrypted Vital Bircher’s robotic milking system, the physical equipment kept running. Teat cups still attached. Vacuums still cycled. But suddenly, he couldn’t see quarter-level milk yield and conductivity, changes in milking duration and flow rate, temperature and milk quality indicators, or health and reproduction flags tied to individual cows.
If you’ve worked with robotic systems—whether Lely, DeLaval, GEA, or others—you know how much you come to rely on that information for daily management decisions. Several controlled studies have shown that milk conductivity, yield deviations, and rumination data can flag subclinical mastitis, ketosis, and other issues a day or two before a cow shows obvious clinical signs. In a fresh cow management context, that head start matters enormously.
What’s worth noting here is that, in Bircher’s case, the cows, the feed, and the barn didn’t change fundamentally. What changed was his ability to see trouble coming. Once that data stream stopped, the margin for error around sick cows and high-value pregnancies narrowed fast.
He didn’t pay the ransom. But his total losses—vet costs, a new computer, the animals—ran around 6,000 Swiss francs. More than the money, though, it shook his confidence in systems he’d built his operation around.
“When you’ve structured your fresh cow protocols around digital data, losing access to that data isn’t just inconvenient—it fundamentally changes how you can care for your animals.”
That’s the part that resonates with a lot of producers. When you’ve built your health monitoring and fresh cow management around digital data, losing access isn’t a minor setback. It changes your entire approach to animal care.
Who’s Actually Paying Attention to Agriculture?
It’s fair to ask: “Am I really on anybody’s radar with 200 cows in a freestall?” The evidence suggests the answer is yes—though the motivations vary quite a bit.
Ransomware operators have definitely noticed agriculture. In 2021, the FBI, CISA, and NSA issued a joint advisory warning that ransomware groups were targeting the food and agriculture sectors. They’d hit two U.S. food and ag organizations with BlackMatter ransomware. Then, in April 2022, the FBI issued another bulletin warning that attackers might time their hits to planting and harvest seasons—when downtime hurts most, and there’s pressure to pay quickly. Brownfield Ag News reported that at least seven grain cooperatives had already suffered ransomware attacks in the fall of 2021.
Since then, we’ve seen plenty of real-world examples. In June 2025, multiple Dairy Farmers of America manufacturing plants got hit with ransomware. The Play ransomware gang later claimed responsibility, and according to reporting in The Record, data from over 4,500 individuals was compromised. DFA worked through recovery—and credit to them for being relatively transparent about what happened—but it showed how a single upstream compromise can ripple through plants, routes, and eventually farm milk checks.
Incident
Category
Cost/Impact
Swiss Farmer (Vital Bircher)
Ransom Demanded (unpaid)
$10,000
Swiss Farmer (Vital Bircher)
Veterinary Costs
$2,304
Swiss Farmer (Vital Bircher)
New Computer
$1,000
Swiss Farmer (Vital Bircher)
Lost Animals (cow + calf)
$2,696
Swiss Farmer (Vital Bircher)
TOTAL OUT-OF-POCKET
$6,000
DFA Cooperative Attack
Plants Disrupted
Multiple facilities
DFA Cooperative Attack
Individuals Compromised
4,546 people
DFA Cooperative Attack
Payment Processing Delays
17 days
DFA Cooperative Attack
Estimated Revenue Impact
Systemic – milk checks delayed
Nation-state actors appear to be playing a longer game. This is the part that can feel a bit surreal to discuss at a farm level, but cybersecurity analysts increasingly point out that countries like China, Russia, and North Korea view food and agriculture as strategic infrastructure. A Forbes analysis last fall by Daphne Ewing-Chow noted that the FBI identifies four major threats to agriculture: ransomware attacks, foreign malware, theft of data and intellectual property, and bio-terrorism. FBI Special Agent Gene Kowel was quoted as saying that “foreign entities are actively seeking to destabilize the U.S. agricultural industry.”
For dairy, that could mean interest in genomic data, feeding strategies tied to high components, or disease management approaches. The goal isn’t a quick ransom—it’s gaining competitive advantage by shortcutting years of R&D. From our perspective on the farm, this kind of data theft can be nearly invisible. Whether it’s a significant risk for individual operations or primarily affects larger genetics companies and cooperatives is still being understood.
There’s also an emerging activist angle. Dr. Ali Dehghantanha—he holds the Canada Research Chair in Cybersecurity and Threat Intelligence at the University of Guelph—has been tracking a newer trend. His lab worked on a case involving an Ontario hog operation that was hit with ransomware, but the attackers didn’t want money. They wanted a public confession of animal cruelty. The Western Producer covered the story earlier this year.
As Dr. Dehghantanha put it, “As activists educate themselves on cyberattack techniques, they are becoming a significant, emerging risk in agriculture.” It’s a different motivation than the ransomware gangs, but it’s part of the picture worth being aware of.
Where the Practical Vulnerabilities Are
Most of us don’t have time to become network engineers. So let me walk through the concrete weak spots that keep showing up in farm-focused cybersecurity assessments. These are things you can actually check on your own operation.
Factory-default passwords remain surprisingly common. You know how your router probably came with “admin/admin” as the login? A lot of barn cameras, remote-access modules, and some equipment controllers ship the same way. Those defaults are published in manuals and all over the internet. If nobody ever changes them, automated scanning tools can find and access those devices pretty quickly.
Security assessments consistently identify unchanged default credentials as one of the most common vulnerabilities on farm systems. It’s understandable—we’re focused on the cows, not the router password—but it’s also one of the easiest openings to close.
Everything often runs on one network. On many operations—I’ve seen this pattern from Wisconsin tiestalls to California drylots to Northeast grazing dairies—the setup looks like this: one router from the ISP, a few switches, and everything plugged in together. Robots, office computers, herd software, phones, cameras, tablets. All on the same network.
Security professionals call this “flat networking,” and they consistently flag it as a significant risk. Here’s why it matters: once an attacker gets into any device—say, a poorly protected camera—they can potentially move sideways to more critical systems. Your herd management server. Your robot controls. Your financials.
Firmware updates often get skipped. Just like your phone receives updates, so do routers, controllers, and automation components. Those updates frequently contain security fixes. But on farms, updating firmware often requires a technician visit or carries the risk of breaking something that’s working fine. So a lot of equipment runs older, vulnerable software versions long after fixes are available.
Single passwords often protect critical accounts. Most herd management and financial portals now support multi-factor authentication—that extra code sent to your phone. But as both Hoard’s Dairyman and Dairy Herd Managementhave noted, plenty of producers still rely on just a password. Given how many password databases have been breached over the years, that’s a real exposure worth addressing.
Defense Step
Cost
Time Investment
Impact Level
Protects Against
1. Change Default Passwords
$0
1 hour
HIGH
Automated scans, default exploits
2. Enable Multi-Factor Authentication
$0
2 hours
HIGH
Stolen password attacks
3. Create Offline Backup System
$100-150
4 hours setup + monthly backups
CRITICAL
Complete data loss, ransom pressure
4. Segment Your Networks
$500-2,000
1 day + IT consultant
HIGH
Lateral movement after breach
5. Train Your Team
$0-500
2-4 hours annually
MEDIUM-HIGH
Phishing, social engineering
6. Document Incident Response Plan
$0
4 hours
CRITICAL
Chaos during active attack
What’s Actually Working: A Practical Framework
The encouraging news—and there is encouraging news here—is that you don’t need an IT department to improve your farm data security meaningfully. Extension work in Canada, federal guidance from CISA, and sector-specific research all point to a straightforward staged approach that makes a real difference.
Start by taking inventory of your digital barn. This sounds basic, but it matters. Walk the farm and list everything that’s connected to it. Robots, feed systems, herd management computers, environmental controllers, cameras, office machines, and cloud accounts for herd data or milk marketing. For each one, note what it does, who uses it, and whether it touches herd data, financials, or insurance information.
It’s a bit like walking pens for fresh cow checks—you can’t manage what you don’t know is there.
Then close the obvious doors. Several defenses cost little or nothing. Change those default passwords on your router, cameras, and remote-access logins. Use strong, unique passwords—and if a password manager feels like overkill, a written log kept in a locked filing cabinet works fine. It’s far better than using the same password everywhere.
Turn on multi-factor authentication wherever you can. Cloud herd software, email, banking—they almost all support it now. It adds a small step to logging in, but it makes stolen passwords significantly less useful to attackers.
Here’s something simple that security professionals recommend: restart your phones and tablets regularly. It helps get updates applied and clears temporary data where some malware operates. Not a bad habit to pair with morning coffee.
Make sure you can recover offline. When ransomware hits, one of the first things it typically does is look for and encrypt any backups it can reach. That’s why Agriculture and Agri-Food Canada’s cyber security toolkit and programs like CSKA—the Cyber Security Knowledge Alliance—recommend having at least one offline backup. A copy of key data that’s physically disconnected from the network most of the time.
On a 200-cow dairy, a practical routine might look like this: buy an external hard drive—good options run $100 to $150. Once a month, connect it to a trusted office computer and copy critical data, including herd records, breeding and genomic information, ration files, and accounting records. Then disconnect it and store it in a safe, dry place.
If the worst happens, you might lose a few weeks of recent notes. But you won’t lose years of herd history or your entire genetic program.
Consider segmenting your networks. This is where a local IT consultant can really help, but the concept is straightforward. Instead of running everything through one router, you split traffic into separate lanes:
Office network: business computers, maybe a dedicated herd management PC
Guest network: phones, visitor WiFi, cameras, and less critical devices
Modern small-business routers from companies like Ubiquiti or Cisco can create separate virtual networks, with rules specifying which devices can talk to which. Devices on the guest network can reach the internet, but can’t communicate with your robot controller.
What this accomplishes is similar to what a good pen layout does: it limits how far a problem can spread. If a phone or camera gets compromised, that doesn’t automatically provide a path to your herd management server.
Bring your team into the conversation. Cyber awareness training doesn’t have to mean long courses. Dr. Dehghantanha’s work at Guelph and several farm-focused consulting groups have found that a short, plain-language briefing makes a meaningful difference.
Cover phishing—show examples of suspicious emails that pretend to be from a bank, supplier, or milk buyer asking for login credentials. The key message: don’t click links in unexpected emails. Go directly to the site you already know, or pick up the phone and call. Discuss password practices—no sharing, no sticky notes on the robot room computer. And make sure everyone understands: if something looks weird, say something. Many breaches escalate simply because nobody wanted to raise a concern.
Have a basic plan for when something goes wrong. Just like every farm has a plan for a parlor breakdown or power outage, it’s worth writing down a one-page playbook for suspected cyber incidents. Who gets called first—IT support, equipment dealer, co-op field rep, insurance agent, maybe a law enforcement contact. How to isolate an affected system without shutting down equipment in ways that could harm animals. Where the offline backups are stored and who can authorize a restore.
Think of it like a herd health protocol—you may refine it over time, but having something written down keeps everyone from improvising during a stressful situation.
Questions Worth Bringing to Your Vendors and Co-ops
One positive shift I’ve noticed recently is that producers are no longer simply assuming their technology partners have security covered. More farmers are asking direct—but fair—questions of dealers, software providers, and cooperatives.
For equipment dealers and OEMs, questions like these are reasonable to ask:
How are passwords and remote access handled on this system? Can factory defaults be changed easily?
Does communication between controllers and robots use encryption, or does it travel as plain text on the network?
How often do you release security updates, and what’s the process for applying them?
If a vulnerability is discovered, how will you notify customers?
For herd management and cloud software providers:
Where is my herd data physically stored—what country, what type of data center—and how is it protected?
Is multi-factor authentication available for my account?
Do you have a documented incident response plan? Will I be notified if my data is accessed inappropriately?
For co-ops, processors, and lenders:
Do you offer cybersecurity programs or shared services that member farms can access?
Are there minimum security practices you expect from suppliers?
Is cyber coverage available as part of broader farm risk insurance, and what does it require?
These aren’t adversarial questions. They’re the same kind of due diligence we already practice around milk quality testing, residue protocols, or animal care standards. Vendors who take security seriously generally welcome the conversation.
How the Broader Industry Is Responding
To be fair, the industry hasn’t been asleep at the wheel here. Several encouraging developments are worth knowing about.
That Frontiers in Big Data roadmap I mentioned earlier was developed by academic, industry, and policy experts specifically to give dairy and poultry clearer guidance on security. Organizations like the Food and Ag-ISAC have grown substantially to help producers and processors share threat information.
What’s particularly interesting is what rural electric cooperatives have accomplished. Through NRECA’s Rural Cooperative Cybersecurity Capabilities program—known as RC3—more than 500 co-ops have built stronger cybersecurity programs by pooling resources. Training, monitoring, and incident response—capabilities no single small utility could afford alone.
Several dairy and crop cooperatives are now studying that model. What might it look like applied to our sector? A regional cooperative could potentially offer shared threat monitoring, collective incident response capabilities, vendor vetting, and centralized training for member farms. Cost might run $50 to $100 per month through the milk check—but the benefit would be access to security resources that no individual 200-cow operation could afford on its own.
On the policy front, Congress introduced the Farm and Food Cybersecurity Act in February 2025, in both the House and the Senate. The legislation aims to give USDA and CISA clearer authority and funding to develop sector-specific guidance. Whether it passes with meaningful resources remains to be seen, but it signals that agriculture has finally gotten the attention of federal cybersecurity agencies.
Bringing It All Together
Looking at everything we’ve covered, the core lessons for most dairy operations come down to a few practical points.
Your digital systems have become as operationally critical as your physical infrastructure. Robotic milkers, activity collars, and herd software are already shaping daily decisions around fresh cow protocols, reproduction timing, and treatment interventions. Protecting those systems is part of protecting the herd.
Most attackers look for easy targets, not sophisticated defenses. The majority of successful attacks in agriculture still exploit basic gaps—default passwords, missing multi-factor authentication, flat networks, and inadequate backups. Addressing those fundamentals won’t make any operation bulletproof, but it creates meaningful separation from operations that haven’t done the work.
A practical dairy farm cybersecurity program can be built through consistent habits rather than massive investments. Know what’s connected on your operation. Improve your password practices and enable MFA where available. Maintain at least one offline backup. Separate barn systems from guest WiFi if feasible. Give your team basic awareness training. Document a simple incident response plan.
None of this requires becoming a full-time IT specialist. It’s the same disciplined approach we already bring to biosecurity protocols or fresh cow management: identify vulnerabilities, apply reasonable controls, review periodically, and work with trusted partners where it makes sense.
What this suggests is that as dairy continues to embrace digital tools for component performance, labor efficiency, and animal care, cyber hygiene will quietly join feed cost management, reproductive programs, and milk quality as one of the background disciplines that distinguish resilient operations from fragile ones.
It’s one more responsibility on an already full plate. But it’s also one of the few areas where a modest investment of time can protect years of breeding progress, operational data, and hard-earned equity.
On today’s digital dairies, that’s work worth prioritizing.
KEY TAKEAWAYS
Attacks doubled in 2025: Ransomware incidents in food and agriculture more than doubled this year. 53% of cyber actors targeting the industry now use ransomware
Cyber risk hit the transition pen: When hackers encrypted a Swiss farmer’s robot data, health alerts went dark. A pregnant cow’s distress went unseen—she and her calf were lost
Attackers exploit basics, not sophistication: Default passwords, flat networks, and missing backups are the doors they walk through. These gaps are fixable
Protection costs less than you think: An external drive runs $100-150. Multi-factor authentication is free. Network segmentation pays for itself in risk reduction
Three steps to start this week: Change default passwords on routers and cameras. Enable MFA on herd software and banking. Create your first offline backup
Complete references and supporting documentation are available upon request by contacting the editorial team at editor@thebullvine.com.
Learn More:
The Tech Reality Check: Why Smart Dairy Operations Are Winning While Others Struggle – Essential reading for producers installing new systems. This guide reveals the “hidden costs” of technology adoption and provides a specific readiness checklist—including critical cybersecurity protocols like network segmentation—to ensure your investment delivers ROI rather than risk.
Decide or Decline: 2025 and the Future of Mid-Size Dairies – Strategies for the 200-500 cow herd manager. This analysis demonstrates how “doing nothing” drains equity and provides a financial roadmap for mid-size operations to survive consolidation by treating data and planning as core business assets.
Every week, thousands of producers, breeders, and industry insiders open Bullvine Weekly for genetics insights, market shifts, and profit strategies they won’t find anywhere else. One email. Five minutes. Smarter decisions all week.
4.2 million on GLP-1 drugs just shifted dairy demand. Yogurt up 3x. Cheese down 7%. Your protein premiums won’t last past 2027.
EXECUTIVE SUMMARY: Right now, the same tanker of milk earns $10,755 more monthly at a cheese plant than a butter plant—that’s the historic $4.78 Class III-IV spread talking. Here’s why it matters: processors invested $10 billion in capacity designed for 3.35% protein milk, but they’re getting 3.25%, forcing them to import protein at $6.50/lb while offering domestic producers $3-5/cwt premiums. Smart farms are already cashing in through amino acid programs (paying back in 60 days), beef-on-dairy breeding ($950 extra per calf), and direct processor contracts. Add 4.2 million new GLP-1 patients needing triple the yogurt, and this protein shortage has legs through 2026. But genetics will catch up by 2027, making this an 18-month window. Your first move: enroll in DMC by December 20th—$7,500 buys up to $50,000 in margin protection when Class III corrects.
Monday morning’s USDA Milk Production Report delivered some surprising news that I think reveals one of the most significant opportunities we’ve seen in years. You know how September production hit 18.99 billion pounds—up 4.2% from last year? Well, our national herd expanded by 235,000 head to reach 9.58 million cows, which is the largest we’ve had since 1993.
And here’s what caught my attention: within 48 hours of that report, December through February Class III contracts on the CME dropped toward $16 flat, yet whey protein concentrate is holding steady at $3.85 per pound according to the latest Dairy Market News.
What I’ve found, analyzing these component value spreads and the processing capacity situation, is that we’re looking at opportunities worth hundreds of millions of dollars across the industry. The farms recognizing these signals over the next year and a half… well, they could find themselves in much stronger positions than those who don’t.
When Component Values Don’t Make Sense Anymore
Let me share what’s happening with the Class III-IV spread—it hit $4.78 per hundredweight this week. That’s the widest gap we’ve ever had in Federal Order history, based on the CME futures data from November 13th.
You probably already know this, but for a 1,000-cow operation averaging 75 pounds daily, that’s a $10,755 monthly difference in revenue. Just depends on whether your milk heads to cheese or butter-powder processing. We’re talking real money here.
What’s even more dramatic is the component breakdown. USDA’s weekly report from November 13th shows whey protein concentrate at 34% protein trading at $3.85 per pound. But WPC80 instant? That’s commanding $6.35 per pound, and whey protein isolate reaches $10.70. Meanwhile—and this is what gets me—CME spot butter closed Friday at just $1.58 per pound.
I’ve been around long enough to remember when these components traded pretty much at parity. This protein-to-fat value ratio of about 2.44:1… that’s not your normal market fluctuation. It’s fundamentally different.
Here’s what the dairy market’s showing us right now:
Class III futures sitting at $16.07-16.84/cwt through Q1 2026
Class IV futures stuck in the mid-$14s
That record $4.78/cwt Class III-IV spread
Whey products are at historically high premiums
Butter near multi-year lows, even with strong exports
The Processing Puzzle: Creating Opportunities
What’s interesting here is that between 2023 and 2025, processors committed somewhere around $10-11 billion to new milk processing capacity across the country—the International Dairy Foods Association has been tracking all this. We’re seeing major investments: Leprino Foods and Hilmar Cheese each building facilities to handle 8 million pounds daily, Chobani’s $1.2 billion Rome, NY plant, which they announced in 2023, plus that $650 million ultrafiltered dairy beverage facility Fairlife and Coca-Cola broke ground on in Webster, NY, last year.
Now, these plants were all engineered with specific assumptions about milk composition. The equipment manufacturers—Tetra Pak, GEA, those folks—they design systems expecting milk with 3.8-4.0% butterfat and 3.3-3.5% protein. That’s what everything was sized for.
But what’s actually showing up at the dock? Federal Order test data from September shows milk testing 4.40% butterfat but only 3.25% protein. That 17% deviation from design specs creates all sorts of operational headaches.
You see, cheese yields suffer because the casein networks can’t trap all that excess butterfat during coagulation—there’s been good research on this in the dairy science journals. One Midwest plant manager I spoke with—he couldn’t go on record, company policy—but he mentioned they’re dealing with reprocessing costs running $150,000-200,000 monthly, depending on facility size.
The result? According to USDA Foreign Agricultural Service trade data from July, U.S. imports of skim milk powder jumped 419% year-over-year through the first seven months of 2025. Processors are literally importing milk protein concentrate at $4.50-6.50 per pound—paying premium prices for components that domestic milk isn’t providing in the right concentrations.
The GLP-1 Factor Nobody Saw Coming
Looking at Medicare’s new GLP-1 coverage expansion, they enrolled 4.2 million patients in just two weeks after announcing medication prices would drop from around $1,000 monthly to $245 for Medicare Part D participants. The Centers for Medicare & Medicaid Services released those enrollment numbers on November 14th.
These medications—Ozempic, Wegovy—they dramatically change what people can tolerate eating. Consumer tracking research shows cheese consumption drops around 7% in GLP-1 households, butter falls nearly 6%, but yogurt consumption? It runs three times higher than the typical American rate. These patients, they can’t physically handle high-fat foods the way they used to.
The nutritional requirements are pretty specific, too. Bariatric surgery guidelines recommend patients get 1.0-1.5 grams of protein per kilogram of body weight daily to preserve muscle mass during weight loss. For someone weighing 200 pounds, that’s 91-136 grams of protein every day.
With potentially 6.7 million Medicare beneficiaries eligible, according to Congressional Budget Office projections, we’re looking at roughly 38 million pounds of additional whey protein demand annually. And that’s just from this one demographic.
What’s Working for Farms Right Now
Quick Wins (Next 60 Days)
What I’m seeing with precision amino acid balancing is really encouraging. Dr. Charles Schwab from the University of New Hampshire has been recommending targeting lysine at 7.2-7.5% of metabolizable protein and methionine at 2.4-2.5%. Farms implementing this are seeing 0.10-0.15% protein gains within 60-75 days—that’s based on DHI testing data from operations in Wisconsin and New York.
For your typical 200-cow herd in the Upper Midwest or Northeast, that translates to about $2,618-3,435 monthly in improved component values at current Federal Order prices. Plus, you avoid those Federal Order deductions when the 3.3% protein minimum kicks in on December 1st.
The cost? It costs about $900-1,500 per month for rumen-protected amino acids from suppliers like Kemin, Adisseo, or Evonik. Pretty straightforward return on investment if you ask me.
On the calf side, beef-on-dairy’s generating immediate cash. The Agricultural Marketing Service reported on November 11th that crossbred calves are averaging $1,400 at auction while Holstein bulls bring $350-450. So a 200-cow operation breeding their bottom 35%—that’s 70 cows—captures an additional $70,000 annually.
Several producers I know in Kansas and Texas are forward-selling spring 2026 calves at $1,150-$1,200, with locked prices. That provides working capital for other investments, which is crucial right now.
Strategic Medium-Term Moves
What’s proving interesting is how some farms approach processors directly rather than waiting for co-op negotiations. I know several operations in Vermont and upstate New York that secured $18.50-20.00/cwt contracts for milk testing above 3.35% protein. That’s a $3.00-5.50 premium over standard Federal Order pricing.
The genetics side is evolving quickly, too. Select Sires’ August proof run data shows that farms using sexed semen from A2A2 bulls with strong protein profiles—+0.08 to +0.12%—are well positioned for the late-2027 market when these animals enter production. Bulls like 7HO14158 BRASS and 7HO14229 TAHITI combine A2A2 status with solid protein transmission according to Holstein Association genomic evaluations.
Out in New Mexico, one producer working with a regional yogurt processor mentioned they’re getting similar premiums for consistent 3.4% protein milk. “The processor needs reliability more than volume,” she told me. “They’re willing to pay for it.” That Southwest perspective shows these opportunities aren’t just limited to traditional dairy regions.
The Jersey Question
Now, I realize suggesting Jersey cattle to Holstein producers usually gets some eye rolls. But here’s what successful operations are doing—they’re not converting whole herds. They’re introducing 25-50 Jersey or Jersey-Holstein crosses as test groups.
One Vermont producer I talked with added 40 Jerseys last year and is seeing interesting results. These animals naturally produce 3.8-4.0% protein milk and carry 60-92% A2A2 beta-casein genetics according to Jersey breed association data.
Yes, Jerseys produce 20-25% less volume. But they also eat 25-30% less feed based on university feeding trials. When you run the full economic analysis—feed costs, milk volume, component premiums—several farms report net advantages of $1.90-3.30 per cow daily.
Of course, results vary by region. What works in Vermont might not pencil out in California’s Central Valley or Idaho. You’ve got to run your own numbers.
A central Wisconsin producer running 600 Holsteins told me last week: “I’ve got too much invested in facilities and equipment sized for Holsteins to start mixing in Jerseys. For my operation, focusing on amino acids and genetics within my Holstein herd makes more sense.” And that’s a valid perspective—it really does depend on your specific situation.
Down in Georgia, another producer with 350 cows mentioned they’re seeing entirely different dynamics. “Our heat stress issues mean Jerseys actually perform better than Holsteins during summer months,” she said. “The component premiums plus heat tolerance make them work for us.” Regional differences matter.
Timing the Market: When Windows Close
Beef-on-Dairy Reality Check
Here’s something to watch carefully. Patrick Linnell at CattleFax shared projections at their October outlook conference showing beef-on-dairy calf numbers reaching 5-6 million by 2026. That would be 15% of the entire fed cattle market, up from essentially zero in 2014.
October already gave us a warning when USDA-AMS reported that prices had dropped from $1,400 to $1,204 per head in just a few weeks. Linnell tells me the premium, averaging $1,050 per calf, will likely shrink significantly as supply increases. His advice? Lock forward contracts now at $1,150-1,200 for 2026 calf crops. Once the market gets oversupplied, we could see prices settling at $900-1,050 by late 2026. Still better than Holstein bull prices, but not today’s windfall.
The Heifer Shortage Nobody’s Prepared For
Ben Laine, CoBank’s dairy economist, published some concerning modeling in their August 27th outlook. We’re looking at 796,334 fewer dairy replacement heifers through 2026 before any recovery begins in 2027.
This creates an interesting dynamic in which beef calves might be worth $900-1,050, while replacement heifers cost $3,500-4,000 or more. For a 200-cow operation needing 40 replacements annually, that’s $150,000 for heifers, while your beef calf revenue only brings in $136,500. That’s a $13,500 gap that really squeezes cash flow.
Farms implementing sexed semen programs now can produce their own replacements for $45,000-60,000 in raising costs, according to University of Wisconsin dairy management budgets. Those still buying heifers in 2027? They’ll be paying premium prices that could strain even healthy operations.
Why European Competition Isn’t the Threat
With European butter storage at 94% capacity according to EU Commission data from November, and global production up 3.8% per Rabobank’s Q4 report, you might wonder—why won’t cheap imports flood our market?
Well, USDA’s Foreign Agricultural Service analysis from October shows U.S. dairy tariffs add 10-15% to European MPC landed costs. Container freight from Europe runs $800-1,200 per 20-foot unit—that’s roughly $0.04-0.06 per pound based on the Freightos Baltic Index from November. When you add it up, European MPC lands here at $4.74-5.33 per pound. Not really undercutting domestic prices.
Plus, companies like Fonterra and Arla are pivoting toward Asian markets where they get better prices without tariff hassles. Fonterra announced in August that it’s selling its global consumer business to Lactalis for NZ$4.22 billion ($2.44 billion USD) to focus on B2B ingredients for Asian and Middle Eastern markets.
Though I should mention, one California dairyman running 800 cows pointed out that trade dynamics can shift quickly. What protects us today might not tomorrow. That’s a fair perspective worth monitoring.
Surviving the Next 90 Days
With Class III futures at $16.07-16.84 according to CME closing prices from November 15th, and many operations facing breakeven costs of $13.50-15.00 based on October profitability analysis, margins are tight. Really tight.
Creative Financing That Works
FBN announced in November that they’re offering 0% interest through September 2026 on qualifying purchases—that includes amino acids and nutrition products. No cash upfront, payments due next March after your protein improvements show in milk checks. Farm Credit Canada offers similar programs with terms of 12-18 months, according to its 2025 program guidelines.
For beef-on-dairy, several feedlots are doing interesting things with forward contracts. One Kansas feedlot operator pre-sells 40-50 spring calves at $1,300 with a 50% advance payment. That generates $26,000-$32,500 in January working capital—enough for Jersey purchases or to cover operating expenses during tight months.
Some processors are even offering advances against future protein premiums. I’ve heard of deals—companies prefer not to be named—where they’ll provide $15,000-20,000 upfront against a 24-36 month high-protein supply agreement. The advance recovers through small deductions from premium payments.
Critical December Dates
Here’s what you need on your calendar:
December 1st: Federal Order 3.3% minimum protein requirement takes effect. If you’re testing below that, deductions start immediately.
December 20th: DMC enrollment deadline for 2026 coverage. Some states have earlier deadlines—check with your local FSA office this week.
December 31st: Last day to lock beef-on-dairy forward contracts for Q1 2026 delivery at most feedlots.
The One Decision That Can’t Wait: DMC Enrollment
If you take nothing else from this discussion, please hear this: enroll in Dairy Margin Coverage at $9.50/cwt before December 20th.
At $7,500 for 5 million pounds of Tier 1 coverage, DMC provides crucial protection. Mark Stephenson from the University of Wisconsin found that 13 of the last 15 years delivered positive net benefits at $9.50 coverage. With margins at $5.07-6.34/cwt based on current milk and feed prices, and production growing 4.2%, the odds of needing this protection in early 2026 are pretty high.
Think about it—if margins drop to $9.00/cwt with Class III at $15.50, you’d receive $25,000. Drop to $8.50/cwt? That generates a $50,000 payment according to the DMC calculator. When’s the last time $7,500 bought you that kind of downside protection?
Looking at the Bigger Picture
What we’re seeing here isn’t just another market cycle. Dr. Marin Bozic at the University of Minnesota characterizes these conditions as a significant structural shift—the kind that happens maybe once in a generation. You’ve got mismatched processing capacity, changing consumer preferences accelerated by weight-loss drugs, and genetics still catching up to new realities, all converging at once.
The arbitrage opportunities won’t last forever—that’s just how markets work. Current trajectories suggest beef-on-dairy saturates by mid-2026, protein premiums moderate by 2027, and heifer shortages resolve by 2028. But for producers acting strategically over the next 18-24 months, there’s a real opportunity to strengthen operations.
The November 10th production report showing 4.2% growth might seem like bad news at first glance. But understanding component economics and arbitrage opportunities actually illuminates a path forward. The math is compelling—it’s really about positioning yourself to take advantage.
Key Actions This Week
Looking at everything we’ve discussed, here’s what I’d prioritize:
This Week’s Must-Do List:
Call your FSA office about DMC enrollment—deadline’s December 20th, but varies by state
Get quotes on rumen-protected amino acids and ask about input financing terms
Contact at least three feedlot buyers about spring 2026 calf contracts
Schedule meetings with specialty processors within 50 miles
Planning Through 2026:
Target 3.35-3.40% protein through nutrition management
Consider sexed semen on your top 40% for A2A2 and protein traits
Evaluate a small Jersey trial group if facilities and regional economics align
Keep an eye on protein contract opportunities above $2.50/cwt
Risk Management Priorities:
Watch beef calf forward pricing—below $1,150 means reassessing your breeding program
Monitor heifer prices in your area—over $3,200 signals a serious shortage ahead
Track processor premium offers—lock anything over $2.50/cwt
Review component tests monthly and adjust accordingly
What other producers are telling me is that the farms coming out ahead won’t necessarily have perfect strategies. They’ll be the ones bridging the next 90 days through smart financing and risk management while these component markets sort themselves out.
DMC enrollment alone could make the difference between staying in business and having difficult conversations with your lender come February.
You know, this opportunity window is real, but it won’t stay open indefinitely. The clock’s ticking—DMC enrollment ends December 20th, and every day you wait on strategic decisions is a day your competition might be moving ahead. The question isn’t whether these opportunities exist… it’s whether you’re positioned to capture them.
And that’s something worth thinking about over your next cup of coffee.
KEY TAKEAWAYS
DMC by Dec 20 (Non-Negotiable): $7,500 premium buys $25,000-50,000 protection when Class III corrects—enrollment closes in 33 days
Protein Boost Pays Fast: Amino acids cost $1,200/month, deliver 0.15% protein gain in 60 days, return $3,000+ monthly for 200 cows
Beef-on-Dairy Has 12-Month Window: Today’s $1,400 calves drop to $900-1,050 by late 2026—lock $1,150+ contracts now
Chase Processor Premiums: Direct contracts pay $3-5/cwt for 3.35%+ protein milk, but only through 2027 as capacity fills
The Math Is Clear: $4.78 Class III-IV spread = $10,755/month extra at cheese plants. This historic gap closes within 18-24 months.
Complete references and supporting documentation are available upon request by contacting the editorial team at editor@thebullvine.com.
The GLP-1 Gold Rush: Why Dairy Protein is Pharma’s New Best Friend – Dives deeper into the “GLP-1 Factor,” showing how new consumer health trends are creating a massive protein market and why selecting for specific genetic traits like A2A2 and high protein deviation is the key to capturing premiums.
The Sunday Read Dairy Professionals Don’t Skip.
Every week, thousands of producers, breeders, and industry insiders open Bullvine Weekly for genetics insights, market shifts, and profit strategies they won’t find anywhere else. One email. Five minutes. Smarter decisions all week.
WARNING: Your 2026 dairy contract has unlimited liability clauses. 500-cow farms face $55K in new costs. Check these three things before signing →
EXECUTIVE SUMMARY: Dairy farmers signing 2026 contracts now are discovering unlimited liability clauses that hold them responsible for allergen incidents—even those that occur at the processor. These new terms, triggered by California’s July 2026 allergen law, could cost a typical 500-cow operation between $15,000 and $55,000 annually in testing, infrastructure, and insurance. That’s up to 44% of net profit gone. With December 31 deadlines approaching, farmers face three paths: scale up to 1,500+ cows for efficiency, pivot to premium markets with $5-10/cwt premiums, or exit strategically while preserving wealth. The harsh reality is that 500-cow commodity dairies are becoming economically obsolete—caught between mega-farms operating at $3/cwt lower costs and premium producers capturing higher margins. Your decision in the next 90 days isn’t just about a contract; it’s about whether your farm exists in 2030.
You know, I’ve been talking with a lot of dairy farmers lately—folks running anywhere from 300 to 800 head—and the same topic keeps coming up over coffee.
These new contracts are landing on kitchen tables across the country right now? They’re different.
And I don’t mean different like when they tweaked the somatic cell premiums a few years back. I mean, fundamentally different.
One Wisconsin producer I know pretty well—let’s call him Tom to keep things simple—he runs about 500 Holsteins outside Eau Claire. Last Tuesday, he opens his December 2025 contract renewal expecting the usual adjustments. Maybe a change in butterfat differential or a new hauling schedule.
Instead, he finds himself staring at 15 extra pages of allergen management requirements. Language about “unlimited liability.” Clauses saying he has to defend his processor against claims he didn’t even cause.
“The efficiency gains are real—our cost per hundredweight dropped by nearly three dollars. But this wasn’t just about surviving allergen costs. We saw where the industry was heading and decided to get ahead of it.” — A Wisconsin dairy producer who expanded from 600 to 1,800 cows last year
And here’s what’s interesting—Tom’s not alone. From the Texas Panhandle to Vermont’s Northeast Kingdom, down through the Georgia dairy belt and out to Idaho’s Magic Valley, producers are discovering their 2026 contracts contain terms nobody’s ever seen before.
Now, California’s allergen labeling law takes effect on July 1, 2026—that’s the official reason. But what I’ve found is that processors are using this regulatory change as the mechanism for something much bigger.
They’re fundamentally restructuring how risk flows through the dairy supply chain.
Let me walk you through what’s actually happening, because once you understand the pieces, the decisions you need to make become a lot clearer.
What Is California’s Allergen Law?
Starting July 1, 2026, California requires restaurant chains with 20+ locations nationwide to label major food allergens on menus. While this sounds limited to restaurants, processors are using it to justify comprehensive supply chain allergen controls—pushing liability and costs upstream to dairy farms through new contract requirements.
Why These Contract Changes Hit Different
I’ve been looking at dairy contracts for going on two decades now, and what’s landing on farm desks this quarter is genuinely unprecedented.
You probably saw the FDA’s recent data from their Reportable Food Registry—dairy products accounted for nearly 30% of all food recalls in the first quarter of 2025. That’s almost 400 recalls from our industry alone.
And when you dig into those numbers, undeclared allergens are driving a huge chunk of them, with milk proteins topping the list.
The Grocery Manufacturers Association conducted research in 2022 that showed food recalls average around $10 million in direct costs. And that’s just pulling product, investigating, notifying regulators.
Doesn’t even touch brand damage, lost sales, or legal fees. You’re looking at exposure that could bankrupt a mid-sized processor, which is why they’re scrambling to push that risk elsewhere.
What’s the target? Your farm.
What I’m hearing from agricultural attorneys who specialize in dairy contracts—and there aren’t that many of them, as you probably know—is that processors aren’t just updating compliance language.
They’re fundamentally restructuring who bears risk when something goes wrong. California’s July 1, 2026, deadline? It’s the perfect justification.
Here’s the really clever part, or concerning part, depending on where you sit. Most dairy contracts run calendar year, right? So farms need to sign their 2026 agreements right now, in Q4 2025.
By the time California’s law kicks in and everyone understands what these terms really mean, you’ll already be locked into a 12-month commitment.
Timing’s not an accident.
What Your Contract Might Look Like Now
Here’s what producers from Pennsylvania to Idaho to the Florida Panhandle—even down in Mississippi, where my cousin runs 400 head—are finding buried in their contracts:
Testing requirements where the processor decides frequency, but farmers pay 100% of costs—we’re talking $55 to $80 per sample for standard allergen tests, based on what companies like Neogen are charging these days.
Infrastructure modifications requiring capital investments of $50,000 to $250,000. Cornell Extension’s been helping farmers price this out, and those are real numbers.
Insurance minimums are jumping from your typical $2 million general liability to $5-10 million specifically for allergen incidents. I’ve talked to insurance agents we work with—Nationwide, American National, some of the bigger ag insurers—and they’re all saying premiums are up 30 to 50 percent for this coverage.
And then there’s the real kicker: unlimited indemnification clauses that make farmers liable for downstream incidents “regardless of origin.” Think about that. Even if contamination happens at the processor, you could be on the hook.
The Real Numbers for Your Operation
Let’s talk specifics for a typical 500-cow dairy producing around 10 million pounds annually—that describes a lot of operations in the Upper Midwest and down through Oklahoma and Arkansas.
I’ve been running these numbers with farm financial consultants, and here’s what the math looks like.
Compliance Level
Annual Testing
Infrastructure
Insurance Increase
Documentation/Training
Total New Costs
Profit Impact
Minimal(2¢/cwt)
$1,700
$5,000
$4,000
$2,500
$15,000
12%
Mid-Level(8¢/cwt)
$7,000
$10,000
$8,000
$9,500
$34,000
28%
High (15¢/cwt)
$13,000
$15,000
$12,000
$15,500
$55,000
44%
That’s a 12% hit to your bottom line if you’re running decent margins on the minimal path. Not great, but manageable for efficient operations.
Mid-level? That’s 28% of your profit gone. The difference between paying bills on time and stretching payables, as many of us know all too well.
At the high end? 44% of the net income was lost. For a lot of 500-cow operations, that’s the difference between viable and not.
The Cost Gap That’s Already There
What makes this particularly challenging is the existing cost structure gap. USDA’s Economic Research Service published their cost of production data in March 2024, and here’s the reality:
Farm Size
Average Cost per cwt
2,000+ cows
$17
100-500 cows
$20+
That’s more than a three-dollar disadvantage before you add a penny of allergen compliance costs.
Already Behind Before Allergen Costs: 500-cow dairies face $3.37/cwt higher costs than 1000-cow operations and $8.48/cwt higher than mega-dairies—BEFORE adding $0.02-0.15/cwt allergen compliance. On 10 million lbs annually, that’s $337,000-$848,000 structural disadvantage you can’t manage away
Understanding the Bigger Picture
Here’s where things get really interesting—and by interesting, I mean concerning if you’re a mid-sized dairy like most of us.
The consolidation trends were already stark before these contract changes. The 2022 Census of Agriculture, released in February 2024, shows that we lost 39% of U.S. dairy farms between 2017 and 2022.
Dropped from over 39,000 to about 24,000 operations. Yet—and here’s the kicker—milk production actually increased 5% over that same period according to the USDA’s National Agricultural Statistics Service.
Think about that for a minute. Fewer farms, more milk. The math only works one way, doesn’t it?
Today, according to the same Census, 65% of the U.S. dairy herd lives on farms with 1,000 or more cows. The 834 largest dairies—those with 2,500 or more head—they control 46% of production by value.
These aren’t future projections, folks. This is where we are right now.
I was talking with a senior ag lender recently—manages a portfolio north of $400 million in dairy loans—and he was remarkably candid about it.
“We’re not trying to prevent consolidation. We’re positioning our portfolio to be on the right side of it. Managing 50 medium-sized dairy loans requires far more oversight than five large ones with professional CFOs and management teams.” — Senior agricultural lender with $400M+ dairy portfolio
The September 2025 lending data from agricultural finance institutions shows that smaller ag lenders—those under $500 million in loans—they absorbed 75% of the increase in farm lending during 2024.
Meanwhile, the big players with over a billion in ag loans? They contributed just 10% to that increase.
The sophisticated lenders they’re already pulling back from medium-sized operations. Makes you think, doesn’t it?
The Numbers Don’t Lie: Since 2017, America lost 15,000 dairy farms (39%) while milk production INCREASED 5%. By 2030, another 7,000 operations will disappear. This isn’t a downturn—it’s systematic elimination of mid-size dairies. Where does YOUR farm fit?
Three Paths Forward (And Why You Need to Choose Now)
After talking with dozens of farmers facing these decisions and running scenarios with financial advisors, I’m seeing three viable strategies emerge.
The key is picking the right one for your specific situation—not what worked for your neighbor, not what your grandfather would’ve done.
Path 1: Scale Up to Survive
Who should consider this path? Well, if you’re under 45 with kids who genuinely want to farm—and I mean really want it, not just feel obligated—this might be your route.
You need a debt-to-equity ratio under 2.0, preferably lower. You should already be in the top 25% for efficiency, meaning your cost of production is under $19 per hundredweight.
You’ve got to have the land base or be able to acquire it. And honestly? You need to actually enjoy the business side of dairy, not just working with the cows.
What’s it take? University of Wisconsin Extension’s been helping folks price out expansions, and you’re looking at $3.5 to $5 million in capital investment.
That’s an 18 to 24-month timeline just for permits and construction. You’ll be managing employees, not just family labor. And you need the stomach for significant debt and risk.
The payoff? Production costs drop two to three dollars per hundredweight at scale—USDA data’s pretty clear on this—which more than covers new allergen compliance costs.
You become the type of operation processors want to work with long-term. But it’s a big leap, no doubt about it.
Path 2: Exit Commodity, Enter Premium
What’s encouraging is that producers from North Carolina to Kansas to New Mexico are finding similar success with premium markets.
This path works if you’re within 60 miles of a decent-sized population center—100,000 people or more. You or your spouse actually has to enjoy marketing and talking to customers. Can’t stress that enough.
You’ll be working farmers markets, doing farm tours, and managing social media. As you’ve probably experienced yourself, it’s exhausting but can be rewarding.
Your location needs affluent consumers who value local food. And you’ve got to handle the three-year organic transition financially—that’s no small feat.
What’s it take? Organic certification under the USDA’s National Organic Program is a 36-month process, as you probably know.
If you’re adding processing, budget $150,000 to $300,000 for a small facility—USDA Rural Development has some grant programs that can help with this.
Plan on 15 to 20 hours per week just on marketing. It’s a completely different mindset about what you’re selling.
The payoff? Premium markets can deliver five to ten dollars per hundredweight above commodity prices—USDA tracks these premiums pretty consistently.
“We realized we couldn’t compete with mega-dairies on cost. But we could compete on story, quality, and customer connection. Our milk price went from $21 to $28 per hundredweight, and our yogurt adds another eight to ten dollars per hundredweight equivalent.” — Vermont dairy family who transitioned to organic with on-farm processing
But more importantly, you’re building direct relationships that give you control over your price. You’re not just waiting for the monthly milk check to see what you got.
Path 3: Strategic Exit While You Can
This is the path nobody wants to talk about, but research on farm transitions suggests that strategic exits can preserve significantly more wealth than distressed sales.
Sometimes 25 to 40 percent more.
Who should consider this? If you’re over 55 without a successor who’s passionate about dairy—and I mean passionate, not just willing—this might be your reality.
If your debt-to-equity exceeds 2.5, if your cost of production is over $21 per hundredweight, if you’re emotionally exhausted from the volatility… well, it’s worth considering.
Especially if you have other interests or opportunities.
What’s it take? Good transition planning, starting 12 to 18 months out. Realistic asset valuations—don’t kid yourself about what things are worth.
Emotional readiness to close this chapter. And a clear plan for what comes next.
The payoff? Preserving capital while land values remain strong—and they won’t forever, we all know that.
Avoiding slow wealth erosion. Maybe transitioning to less-stressful agricultural enterprises, such as cash crops or custom work.
It’s not giving up; it’s making a strategic business decision.
The Supply Chain Dynamics You Need to Understand
To negotiate effectively, you need to understand what’s driving processor behavior. From their perspective, this isn’t about hurting family farms—it’s about survival in a world where one allergen incident can trigger catastrophic losses.
RaboResearch’s food industry analysis from this past summer suggests processors face an impossible situation. Their insurance companies are demanding comprehensive allergen controls.
Regulators are increasing scrutiny. Consumer lawsuits are proliferating. They’re pushing liability upstream because they genuinely don’t see another option.
What’s particularly telling is that processors actually prefer consolidation. Think about it from their shoes: Managing 200 large suppliers instead of 2,000 small ones.
Professional management teams they can work with. Sophisticated quality systems and documentation. Resources to implement new requirements properly. Lower transaction costs across the board.
This isn’t a conspiracy—it’s economics. And understanding these dynamics helps you negotiate more effectively because you know what processors actually value.
Worth noting, too, that some processors are working with their farmers through this transition. A couple of the smaller regional processors in Ohio and Pennsylvania have offered 40-60% cost-sharing arrangements with phased implementation schedules over 18 months.
They’re the exception, not the rule, but it shows there’s some recognition of the burden these changes create.
Regional Factors That Change Everything
Geography’s becoming destiny in dairy. What I’m seeing is a real divergence driven by water availability and the regulatory environment.
Water-secure regions—the Upper Midwest, Northeast, and parts of the Southeast, like northern Georgia—are seeing renewed interest from both expanding local operations and relocating Western dairies.
Dairy site selection consultants tell me they’ve never been busier. Every conversation starts with “Where can we find reliable water for the next 30 years?”
Water-stressed areas—the Southwest, parts of California—that’s a different story. University of Arizona research on aquifer depletion shows that some dairy-intensive areas are experiencing annual water-table drops of several feet. Water costs in these regions have doubled or tripled in the past decade.
That’s not sustainable, and everyone knows it. These operations face a double whammy—new allergen costs plus rising water expenses.
This Isn’t Happening Everywhere Equally: Wisconsin hemorrhaged 2,740 farms—more than the next three states combined. Pennsylvania, Minnesota, and New York each lost 1,000+ operations. Meanwhile, California (the largest dairy state) lost just 275. Geography matters, but the trend is universal
Negotiation Strategies That Actually Work
After watching dozens of these negotiations, here’s what’s actually effective:
Form an informal buying group. You don’t need a formal cooperative structure—just five to ten neighbors agreeing to push for the same contract terms. When six farms representing 3,000 cows approach a processor together, they listen differently than when you come alone.
Use professional help strategically. Yes, agricultural attorneys cost money. But spending $5,000 on contract review could save you $50,000 annually in bad terms. Frame it as the bad cop: “I’d love to sign this, but my attorney insists on liability caps…”
Offer trades, not just demands. “I’ll implement comprehensive testing protocols if you’ll split the costs 50/50 and cap my liability at one year’s gross revenue.” Processors respond better to negotiation than ultimatums.
Know your walkaway point. If you have alternative buyers—even if they’re 50 miles further—that knowledge changes how you negotiate. Do the math beforehand: What’s the worst deal you can accept and still stay viable?
Technology as a Survival Tool
The farms that are successfully adapting aren’t doing so through willpower alone. They’re leveraging technology to make compliance manageable.
What’s encouraging is that agricultural technology providers report dairy operations implementing digital documentation systems are seeing significant reductions in administrative burden.
Automated testing protocols are lowering sampling costs. Real-time environmental monitoring can prevent contamination incidents before they become recalls.
For example, farms using systems like DairyComp 305’s newer modules or Valley Ag Software’s compliance-tracking are finding the documentation requirements much more manageable than those trying to handle them with spreadsheets.
The upfront cost—usually $5,000 to $15,000 for implementation—pays for itself in reduced labor and avoided compliance violations. One Kansas operation told me they cut documentation time by 60% after implementing digital tracking, saving nearly $20,000 annually in labor costs alone.
Technology isn’t optional anymore. What is the difference between farms crushing under compliance costs and those managing them? Usually comes down to whether they’ve invested in the right systems.
What Dairy Looks Like in 2030
Based on everything I’m seeing, here’s my best projection for where we’re heading:
We’ll probably have 15,000 to 20,000 dairy farms by 2030, down from today’s 24,000. But—and this is important—they won’t all be mega-dairies.
I’m expecting maybe 12,000 to 15,000 large-scale commodity operations, another 3,000 to 5,000 premium or specialty farms serving local and niche markets, and 2,000 to 3,000 transitional operations finding unique market positions.
Agricultural economists analyzing dairy consolidation trends suggest we’re not witnessing the death of dairy farming. We’re seeing differentiation.
The 500-cow commodity model is becoming obsolete, yes. But opportunities are emerging for farms willing to adapt strategically.
The 25-Year Transformation: In 1997, just 17% of dairy cows lived on 1,000+ cow farms. Today? 65%. By 2030? Projected 75%. Meanwhile, farms under 100 cows dropped from 39% to 7% and are heading toward extinction. This isn’t gradual change—it’s systematic restructuring
Making Your Decision: A Practical Framework
So what should you actually do? Here’s the framework I’m suggesting to farmers facing these contracts:
Your 30-Day Action Plan
Calculate your true cost of production—don’t guess, know it
Review your current contract for existing allergen language
Get insurance quotes for the new liability levels
Talk honestly with family about succession plans
Research premium market opportunities in your area
Key Decision Factors
If you’re under 45 with strong succession and sub-$19 per hundredweight costs, consider scaling. The economics work if you can handle the risk.
If you have marketing skills and you’re near population centers, explore premium markets. The margins are there for those who can sell.
If you’re over 55 and without succession, and your costs exceed $21 per hundredweight, plan your exit. Preserving wealth beats slow erosion.
If you’re in between? You’ve got 90 days to figure out which direction you’re heading. Drifting is the only wrong answer.
The Reality We Need to Discuss
Here’s what I think a lot of folks know but aren’t saying out loud: The 500-cow commodity dairy is structurally obsolete in the emerging market environment.
Not because farmers aren’t working hard enough. Not because they’re bad at what they do. But because the economics have shifted in ways that make that scale unviable for commodity production.
Dairy transition specialists tell me that every farmer they work with wishes they’d made their decision 2 years earlier.
Whether that’s expanding, transitioning to premium, or exiting—acting decisively preserves more wealth and creates more options than hoping things improve.
Final Thoughts
The 2026 allergen requirements are real, and they’re going to hurt. But they’re also just accelerating changes that were already underway.
The farms that recognize this—that see these contracts as a catalyst for strategic decision-making rather than just another compliance burden—are the ones that’ll still be farming successfully in 2030.
The dairy industry has weathered countless storms over the generations. This one’s different, not in its severity, but in its permanence.
The sooner we accept that and act accordingly, the better positioned we’ll be for whatever comes next.
You know, at the end of the day, it’s not about whether to sign or not sign a contract. It’s about what kind of dairy farmer you want to be—or whether you want to be one at all—in the industry that’s emerging.
And that’s a decision only you can make for your operation.
KEY TAKEAWAYS:
Immediate action required: Review your contract for unlimited liability clauses before December 31—signing locks you into potentially business-ending terms through 2026
Real costs revealed: $15,000 (minimal) to $55,000 (high compliance) in new annual expenses = 12-44% of typical 500-cow dairy profits gone
Only three viable paths: Scale to 1,500+ cows for efficiency ($3/cwt savings), pivot to premium markets ($5-10/cwt premiums), or exit strategically, preserving 25-40% more wealth than distressed sales
Negotiation leverage exists: Form buying groups with neighbors, demand 50/50 cost sharing, cap liability at one year’s revenue—processors need milk and will negotiate
The uncomfortable truth: The 500-cow commodity dairy is structurally obsolete—not because you’re failing, but because the economics permanently shifted against mid-size operations
Complete references and supporting documentation are available upon request by contacting the editorial team at editor@thebullvine.com.
Learn More:
Robots vs. Labor: The Hard Math on Dairy Automation ROI – This article delivers the “hard math” for the “Technology as a Survival Tool” section. It provides a clear framework for calculating the ROI on automation, helping you decide if tech investment is a viable path to lowering costs.
The 2030 Dairy Farm: More Cows, More Tech, and a Whole New Business Model – This piece expands on the “Bigger Picture” analysis by detailing the business model of the future farm. It reveals the strategic drivers behind consolidation and the operational shifts required to remain profitable in the coming decade.
Every week, thousands of producers, breeders, and industry insiders open Bullvine Weekly for genetics insights, market shifts, and profit strategies they won’t find anywhere else. One email. Five minutes. Smarter decisions all week.
Cornell: 90% of herds are exposed, only 20% show symptoms. The invisible 70%? Costing you $434,683/year. Time to rethink everything
EXECUTIVE SUMMARY: A Minnesota dairy farmer’s third H5N1 outbreak in 14 months—despite perfect biosecurity—isn’t an anomaly anymore. It’s the new normal. Cornell research shows that 90% of herds carry the virus, but only 20% show symptoms, meaning traditional surveillance captures just 21% of the actual disease while farms hemorrhage $434,683 annually. The break-even point sits at 2.38 outbreaks per year, but farms in wildlife corridors now face perpetual reinfection cycles that make profitability mathematically impossible. This isn’t just about H5N1—Spain’s current battle with lumpy skin disease, which jumped containment zones overnight, proves wildlife disease has fundamentally changed the game globally. With U.S. dairy farms projected to plummet from 35,000 to as few as 12,000 by 2035, producers face a stark choice: absorb six-figure annual disease costs through scale or premium markets, or make the rational but painful decision to exit while equity remains. The old paradigm of “prevent and recover” is dead; the new reality demands either expensive adaptation or strategic retreat.
I was talking with a producer from Minnesota the other day, and what he told me really stuck with me. His operation tested positive for H5N1 in July 2024, worked through it, and got cleared by September. Then March 2025 comes around—positive again. They clear that one too, thinking they’re in the clear. September 2025? Third positive in just 14 months. And here’s what gets me—this guy does everything right. Every protocol, every biosecurity measure the vets recommend. Still keeps happening.
You know what’s interesting? Minnesota actually achieved that official “unaffected” status on August 22nd this year. Four consecutive months of negative bulk tank tests across all 1,600 dairies in the state, according to the Board of Animal Health’s surveillance program. So naturally, they reduced testing from monthly to bi-monthly—that’s the standard procedure when you’re disease-free. But within weeks, about two dozen operations were reporting new infections. Makes you think…
And it’s not just us dealing with this. Over in Spain right now, they’re trying to vaccinate 600,000 head of cattle against lumpy skin disease. The Catalan agriculture folks reported the virus jumped 40 kilometers overnight, despite what they called comprehensive containment measures. These aren’t isolated problems anymore—they’re showing us something fundamental about how diseases work when wildlife’s involved.
Here’s what the numbers are telling us:
90% of dairy cattle show H5N1 antibody exposure, but only 20% develop symptoms you can actually see
$434,683 – That’s the annual disease cost for a 500-cow operation with 20% clinical rates
2.38 – The magic number of outbreaks per year before you’re losing money
21% – What traditional barn walks actually detect of what’s really circulating
Quick Break-Even Calculator: Take your annual profit (before disease) and divide it by $217,341 (the estimated cost for a single outbreak in a 500-cow operation—that’s half the annual cost if you get hit twice). That tells you how many outbreaks you can handle per year. Less than 2? You’re in trouble with annual reinfection.
The surveillance blindspot: 90% of dairy cattle in affected herds show antibody evidence of H5N1 exposure, but only 20% develop visible symptoms—and traditional barn-walk surveillance catches just 21% of actual infections. You’re operating blind 79% of the time
The Real Financial Picture We’re Looking At
Research from Cornell’s College of Veterinary Medicine, published in September 2025, analyzing H5N1-affected dairy operations, found something that kind of changes everything. Turns out 90% of animals in affected herds show antibody evidence of exposure to H5N1, but only 20% actually look sick. Think about that. For every cow showing symptoms in your barn, there are probably four more carrying the virus that look perfectly fine.
The real cost breakdown: Of the $950 lost per clinically affected cow, milk production losses account for 92.3%—$877 per animal. For a 500-cow operation with 20% clinical rate, that’s $737,500 in just 60 days. And most operations are underestimating the full impact
What I’ve found is that traditional surveillance—you know, when the vet walks through looking for sick animals—catches maybe 21% of what’s actually going on. We’re basically operating blind most of the time.
That same Cornell research, along with economic modeling from dairy extension programs at Wisconsin and Minnesota, quantified what this really costs a typical 500-cow Midwest operation:
You’re looking at about $950 per clinically affected cow over that 60-day acute phase
Each sick cow drops about 900 kilograms in milk production
Here’s the kicker—the whole herd typically drops 15% in production for six months after an outbreak
Add it all up? $434,683 per year with a 20% clinical rate
And you know what? Even if you spend that $40,000 on early-detection systems and rapid-response setups—the kind extension’s been recommending—you might drop your clinical rate from 20% to 15%. Sounds good until you do the math. Your annual cost only drops to $401,012. That’s still an $89,012 loss every year, even after making smart investments.
The break-even math keeps me up at night sometimes. Most operations can handle about 2.38 outbreaks per yearbefore they’re underwater. But if you’re in one of those waterfowl migration corridors—and let’s be honest, many of us in Minnesota and Wisconsin are—you’re probably looking at annual reinfection as the new normal.
The long shadow of H5N1: Milk production plummets 73% within days of diagnosis (35kg to 11kg per day), and even 60 days later, affected cows still produce 5kg less than pre-outbreak levels. That 900kg total loss per cow is what’s actually destroying farm economics—not the acute phase everyone focuses on
What Spain’s Teaching Us Right Now
What’s happening in Spain offers a different perspective on all this. They detected their first lumpy skin disease case on October 1st, did everything by the book—20-kilometer protection zones, 50-kilometer surveillance areas, and immediate culling of infected herds. Standard EU protocols.
By late October, the Spanish agriculture ministry reported they’d culled over 1,500 cattle. But here’s the thing—the virus had already jumped about 40 kilometers, way beyond those protection zones. So, on November 3rd, the European Commission authorized emergency vaccination for 22 Catalan counties. We’re talking 600,000 animals.
What’s telling is how their language has been changing. Early October, Agriculture Minister Òscar Ordeig was saying “emergency measures implemented” and “situation under control.” By mid-October, after six new outbreaks, it shifted to “securing additional vaccine supplies.” Late October? They’re calling for “all Catalan veterinarians to assist.” When government officials say that, you know they’re stretched thin.
Notice what’s missing lately? No timeline for when this ends. No mention of eradication. The word “temporary” has disappeared. Catalonia’s veterinary services say they’ve administered about 100,000 vaccine doses so far, with 250,000 more to come. That’s maybe 58% coverage. But European Food Safety Authority research has shown that you actually need 80-90% coverage to stop the transmission of lumpy skin disease. At 90 animals per day—their current pace—well, do the math.
Understanding Different Perspectives Here
You know, it’s easy to get frustrated with how different groups respond to these challenges, but when you think about it, everyone’s dealing with their own pressures.
Processors need a consistent milk supply to keep plants running. The National Milk Producers Federation’s data shows we’re losing 7-8% of farms each year. Those of us still operating might have more negotiating power, but only if enough farms survive to keep the infrastructure going.
The biosecurity companies? Grand View Research valued that global market at $3.4 billion in 2024, projecting it’ll hit $7.1 billion by 2033. Endemic diseases that require constant management rather than one-time fixes create steady customers. It’s a business reality—can’t really blame them for that.
Government’s in a tough spot, too. Congress approved $31 billion in agricultural aid late last year, which sounds like a lot until you realize USDA’s own assessments show it covers maybe 10% of actual disease losses. State ag departments have to maintain market confidence while dealing with the reality on the ground. That’s a hard balance.
And our rural communities—man, this hits them hard. The Center for Rural Affairs documented last year how each farm closure triggers these cascading effects. School enrollment drops, Main Street businesses close, and property values decline. My kids’ school lost two teachers after three local dairies closed. These communities need us to survive, even when we’re struggling.
What I’ve come to realize is that everyone’s responding to their own situation. The challenge is that what’s best for the industry as a whole might not line up with what’s best for individual families facing their third outbreak in 14 months.
Success Despite the Odds—It’s Possible
Now, I don’t want to paint this as all doom and gloom. Met a producer from South Dakota last month who’s actually making this work. They’ve got about 3,500 cows, have invested heavily in automated monitoring systems, and treat endemic disease like any other operating cost. “We budget $125,000 annually for disease management now,” he told me. “It’s just part of doing business, like feed costs or equipment maintenance.”
On the other end of the spectrum, there’s this 180-cow organic operation in Vermont that’s stayed completely clear. Geographic isolation helps, but they’ve also got premium contracts paying $45 per hundredweight—nearly double conventional prices. Different model, but it works for them.
Practical Approaches That Actually Help
Run the math on YOUR operation: Most 500-cow farms can absorb 2.38 outbreaks per year before going underwater. But if you’re in a waterfowl migration corridor? You’re looking at reinfection every 6-8 months—that’s 1.5 to 2 outbreaks annually, already eating 70% of your survival buffer. Three outbreaks and you’re done
So if you’re dealing with repeated infections, here’s a framework that’s been helpful for some folks I know.
Getting a Handle on Your Real Costs
First thing—and I can’t stress this enough—document what outbreaks actually cost you. Not just the milk dump and vet bills, but also the extended impacts. Track your production for at least six months after. The University of Minnesota Extension has some really good resources for outbreak cost analysis that capture all these hidden costs.
Compare those numbers against your baseline profitability. If reinfection frequency means you’re losing money even in good milk price years, that’s information you need for planning. What I keep hearing from financial advisors is that most of us underestimate those extended impacts—that 15% herd-wide deficit for six months really adds up.
Focusing Where You Have Control
Research from veterinary colleges at Iowa State, Wisconsin, and Minnesota has helped us understand the difference between what we can control and what we can’t.
Worth your investment:
Equipment sanitation—it’s 70-90% effective against farm-to-farm transmission
Good visitor protocols with dedicated boots and coveralls
Vehicle wash stations at your entrance
Regular bulk tank testing for early detection
Probably not worth it in wildlife areas:
Trying to keep birds away from water sources (impossible)
Eliminating every insect (also impossible)
Keeping wildlife from anywhere near your operation (you see where this is going)
As one Wisconsin producer told me: “I stopped trying to bird-proof everything and started testing my bulk tank twice a week. Can’t stop the birds, but I can catch outbreaks faster.” That’s the shift we’re all making—from prevention to rapid detection and response.
I’ve also noticed that operations with good fresh cow management tend to weather these outbreaks better. Makes sense when you think about it—cows in that transition period are already stressed, and disease hits them harder. Same goes for operations that are really dialed in on their dry cow programs. A strong immune system at calving makes a difference.
Regional Differences Matter
Now, what we’re dealing with in the upper Midwest isn’t the same everywhere. California operations face the double whammy of water restrictions and disease pressure. Texas and Arizona? Managing sick cows when it’s 110°F is a whole different challenge.
A California producer shared something interesting at a conference last month: “We’re dealing with drought, disease, and regulations all at once. Sometimes I wonder if we’re fighting too many battles.” That really resonated with folks from different regions facing their own unique combinations of challenges.
Canadian producers benefit from supply management, which provides some market stability, but they’re still facing the same wildlife disease pressures. Maritime provinces might have some geographic isolation working for them. Ontario’s concentrated dairy regions look a lot like what we deal with here.
Northeast operations often have smaller herds, older facilities—biosecurity upgrades might be tougher. But they sometimes have better access to diverse markets, established processor relationships that value consistency over volume.
Those Tough Succession Conversations
This is probably the hardest part. If you’re thinking about succession, the next generation deserves to see real numbers, not wishful thinking. Show them what the 10-year outlook really looks like with realistic disease pressure based on your location and migration patterns.
One approach that’s helping some families: run three scenarios. Best, probable, and worst cases over ten years. It helps everyone understand whether continuing makes sense or if there might be better ways to preserve what you’ve built.
A financial advisor who works with several operations dealing with this put it well: “Families are having conversations they never imagined—whether strategic exit while equity remains might serve the family better than fighting diseases you can’t prevent.” That’s not giving up. It’s being realistic about uncontrollable variables.
Where This Is All Heading
Looking at projections from CoBank’s 2025 dairy outlook and research from the University of Wisconsin’s Center for Dairy Profitability, we’re probably going from about 35,000 U.S. dairy farms today to somewhere between 12,000 and 24,000 by 2035. That’s a lot of change coming.
The operations that’ll likely make it fall into two camps. Big operations with 3,000-plus cows can absorb disease costs through efficiency and scale—they’ll probably produce 70-80% of our milk by 2035. On the other end, small niche operations—50 to 200 cows selling organic, grass-fed, local branded products—might survive through premium pricing.
It’s that middle group—200 to 800 cows, the backbone of our communities—that faces the toughest road. Not enough scale to absorb six-figure annual disease costs, not positioned for premium markets. A lot of really good farms fall in that range.
Geographically, USDA’s 2025 long-range projections suggest Wisconsin, South Dakota, and Michigan will probably add capacity—water availability, and favorable regulations. California and the Southwest are scaling back, though that’s as much about water as disease.
What nobody’s saying out loud yet—though you hear it at conferences—is that “disease-free” status as we’ve known it is probably done for certain diseases. We’re moving toward something more like “controlled endemic” status. Success gets redefined as keeping clinical disease low rather than eliminating viruses. Vaccination becomes as routine as checking butterfat levels.
Finding Your Own Path Forward
The controversial truth nobody’s saying out loud: By 2035, we’re projecting 15,000 middle-sized operations (200-800 cows) will collapse to just 5,000—a 67% wipeout. Large operations will grow 67%, niche farms hold steady with premium pricing, but if you’re in that middle? You’re in the death zone. Too small for scale economies, too big for premium markets, and endemic disease costs will finish what low milk prices started
Here’s what keeps coming back to me: where your farm sits geographically might matter more than how good a manager you are when it comes to endemic disease. If you’re in a high-risk wildlife corridor, repeated reinfection might be your reality no matter what you do. That’s not your fault—it’s just biology.
The financial math is different for everyone, but the framework’s the same. Annual losses north of $114,000 from repeated infections with 20% clinical rates—that challenges most operations long-term. For some, continuing preserves tradition but destroys wealth. For others, scale or niche positioning makes adaptation work.
One thing’s crystal clear from both research and what we’re seeing in the field: when 79% of infections don’t show symptoms, negative bulk tank tests don’t mean you’re disease-free. They mean you don’t have detectable clinical disease right now. A big difference that planning needs to account for.
Every stakeholder—processors, input suppliers, government, communities—benefits from farms staying operational. That’s natural. But it means the advice you’re getting might be influenced by what others need from you, not necessarily what’s best for your family.
Moving Forward with Open Eyes
What we’re seeing isn’t a temporary problem that’ll get fixed with better biosecurity or new vaccines. It’s a big change in how disease pressure affects dairy farming. Some operations will adapt successfully—through efficiency, scale, or finding the right markets. Others will recognize that their location and economics make continuing difficult despite doing everything right.
Both paths are valid. I really mean that. A multi-generational farm choosing strategic exit while equity remains isn’t failing—they’re making a rational business decision facing uncontrollable biological variables. An operation finding ways to absorb endemic disease costs and keep producing isn’t naive—they’re adapting with full awareness of the new reality.
The next generation deserves honesty about what they’re inheriting. Managing perpetual disease pressure from wildlife is fundamentally different from what their grandparents dealt with. Some will embrace it. Others will choose different paths. Both deserve respect.
What matters now is making decisions based on what endemic disease management actually means—not what we wish it meant. Start by documenting the true costs of your next outbreak using your state extension’s templates. Schedule that financial review using these break-even frameworks. Have those succession conversations while you still have options.
Understanding the difference between the old way and this new reality—that might determine whether you preserve family wealth or watch it disappear, waiting for solutions that probably aren’t coming.
The industry will survive this transition, though it’ll look different. The question for each of us is whether weathering that transition makes sense for our specific situation, or if protecting what we’ve built means making tough choices while we still can.
And you know what? Whatever you decide, if it’s based on real information and protects your family’s future, that’s the right choice. We’re all just trying to do the best we can with a situation nobody asked for.
KEY TAKEAWAYS
Your surveillance is 79% blind: Cornell found that negative bulk-tank tests miss 4 out of 5 infected animals. Start testing twice weekly and document the true 6-month cost of every outbreak—you’re probably underestimating losses by 40%.
Run this calculation TODAY: Divide your annual profit by $217,341 (single outbreak cost). If the answer is less than 2, your farm can’t survive endemic disease at the current scale. Period.
Location now trumps management: Perfect biosecurity can’t stop migratory birds. If you’re in a waterfowl corridor, you’ll face reinfection every 6-8 months regardless of protocols. Focus resources on rapid detection, not prevention.
The conversation that matters: Show your family three scenarios—best case, probable, worst case—with real disease costs over 10 years. If strategic exit preserves more wealth than fighting biology you can’t control, that’s not giving up—it’s protecting what you’ve built.
Complete references and supporting documentation are available upon request by contacting the editorial team at editor@thebullvine.com.
Every week, thousands of producers, breeders, and industry insiders open Bullvine Weekly for genetics insights, market shifts, and profit strategies they won’t find anywhere else. One email. Five minutes. Smarter decisions all week.
New reports reveal coordinated legal strategies, AI-powered surveillance, and strategic economic pressure that go far beyond traditional protests—here’s what dairy farmers need to know about this transformed threat landscape
EXECUTIVE SUMMARY: Animal activists aren’t college kids with protest signs anymore—they’re an $865 million corporate operation with Harvard lawyers and AI technology that’s mapped 27,500 farms, probably including yours. While brutal economics closed 2,800 dairy farms in 2024, these organizations strategically exploit those same vulnerabilities through legal warfare, regulatory pressure, and coordinated campaigns designed to accelerate consolidation. The surprise: farmers are winning battles that matter. Fourteen Wisconsin operations eliminated activist threats entirely with a free WhatsApp group, and individual farmers’ authentic social media consistently outperforms ASPCA’s $131 million advertising budget in building consumer trust. This report exposes their complete playbook—from shareholder lawsuits to biosecurity weaponization—while delivering practical defense strategies that work regardless of operation size.
You know, I’ve been tracking activist groups for nearly two decades, and what’s happening now is completely different from what we dealt with back in the early 2000s. Here’s what’s interesting—the Animal Agriculture Alliance’s latest reports show these organizations now command $865 million in annual revenue. That’s up from $800 million just last year, and if you look back five years, we’re talking about growth from $650 million.
But what really gets my attention isn’t the money itself—it’s how they’re using it that should have every dairy farmer paying attention.
The Alliance released two reports this fall—”Radical Vegan Activism in 2024″ and their updated “Major Animal Activist Groups Web”—and honestly, some of what’s in there surprised even me. Sure, we documented 189 actions against agriculture in 2024, including 59 vandalism cases, 43 animal thefts, and 31 trespassing incidents. But here’s the thing: those are just the incidents we can see.
What the Alliance found is that these groups aren’t just showing up with protest signs anymore. The FBI actually refers to some of its activities as “intelligence operations.” They’re coordinating legal strategies across multiple states, and they’re systematically targeting what they see as weak points in animal agriculture’s economic foundation.
For dairy farmers trying to make it work with USDA data showing 2,800 operations closing in 2024—that’s out of roughly 28,000 total dairy operations nationwide—well, understanding this new landscape isn’t really optional anymore. It’s survival.
The Evolution of Animal Activism: From $650M to $865M in Five Years
The $865 Million War Chest: How activist organizations grew their combined budgets by 33% in five years—from $650M to $865M—giving them unprecedented resources to target dairy farmers through legal warfare, shareholder campaigns, and AI-powered farm mapping
Year
Combined Revenue
Key Development
2020
$650 million
Traditional protest focus
2024
$800 million
Corporate structure emerging
2025
$865 million
Full corporate operations
Beyond the Protest Line: This Isn’t Your Father’s Activism
I remember twenty years ago—maybe you do too—when activists were mostly college kids with spray paint and strong feelings. Today? We’re looking at something else entirely.
While theatrical street protests like this PETA demonstration are highly visible, the real threat has evolved. The new battle is fought by corporate legal teams, not just street performers.
Organizations like the ASPCA (pulling in $379 million annually according to 2023 tax filings), the Humane Society of the United States (HSUS) ($208 million), and PETA ($85.7 million in revenue) have built operations that look more like corporate headquarters than grassroots movements. And here’s what they’ve got working for them:
Legal teams with attorneys from Yale, Harvard, University of Chicago—the works
Media departments spending serious money—ASPCA alone shows a combined $131 million spent on fundraising ($70M) and advertising ($61M) on their 2023 Form 990
Lobbying operations working at both the federal and state levels
Tech divisions using AI to map agricultural facilities
Take PETA’s setup. They’ve got multiple deputy general counsels running different divisions. One handles litigation for strategic impact cases. Another manages corporate governance and planned giving. These aren’t volunteers anymore—they’re attorneys who cut their teeth at places like Steptoe and DLA Piper before jumping to animal advocacy.
What I find fascinating—and concerning—is how this changes the game for farmers. When Direct Action Everywhere launched Project Counterglow (their map showing 27,500 animal ag facilities using satellite imagery and crowdsourced data), the FBI took it seriously enough to create a dedicated email inbox for reporting these activities.
WIRED dug into this with public records requests, and what they found is… well, both sides are playing intelligence games now. The Animal Agriculture Alliance has databases tracking over 2,400 individual activists. Meanwhile, activist groups are using similar tactics to identify targets and coordinate campaigns.
Industry security advisors tell me they’re hearing similar stories from Wisconsin producers—activists showing up who know shift changes, delivery schedules, even which gates don’t always get locked. That’s not protesting, folks. That’s reconnaissance.
“The level of preparation we’re seeing suggests systematic reconnaissance rather than spontaneous action. They know our operations better than some of our seasonal workers.” — Wisconsin dairy security consultant, speaking to industry advisors
“I had someone show up claiming to be interested in buying feed, but the questions they asked… it was clear they were mapping our operation, not buying anything.” — Central Valley dairy producer, speaking at a recent California Dairy Quality Assurance Program workshop
The Legal Game: They’re Playing Chess While We’re Playing Checkers
Now this is where it gets sophisticated, and I’ll be honest—most of us aren’t ready for this level of strategic thinking.
Take Wayne Hsiung’s case. He’s the co-founder of Direct Action Everywhere, who was convicted in 2023 for trespassing on Sonoma County farms. The guy has a law degree from the University of Chicago, worked at major firms, but he represented himself at trial and turned down plea deals that would’ve kept him out of jail.
Why would anyone do that?
Harvard Law Review spelled it out in their February 2024 piece on “Voluntary Prosecution and the Case of Animal Rescue”—for these activists, the trial IS the strategy. They’re using prosecutions to force public discussions about farming practices. The courtroom becomes their stage.
Meanwhile—and this is happening at the same time—Legal Impact for Chickens is going after companies through shareholder lawsuits. Their president, Alene Anello (Harvard undergrad, Harvard Law, previously worked at PETA and the Animal Legal Defense Fund), targeted Costco, claiming that its executives violated their duties by failing to address animal welfare laws properly.
Here’s the kicker: even though their first case got dismissed, the court left the door open for shareholders to file formal demands. So LIC did exactly that in July 2023, forcing Costco’s board to spend months investigating and publicly defending their practices.
What dairy farmers need to watch for:
Arguments that activists have a legal “right” to rescue animals
Shareholders are forcing companies to address welfare complaints
Challenges to ag-gag laws (they’ve already knocked down dozens)
Expanding definitions of what counts as animal cruelty
Even when they lose these cases, they win something—media coverage, legal precedents, and they force agricultural operations to burn through time and money defending themselves.
When Biosecurity and Security Collide: The H5N1 Wake-Up Call
The 2024 H5N1 outbreak that hit nearly 200 dairy herds across multiple states taught us something important: the same protocols that protect against disease also protect against activists. And vice versa.
USDA’s Animal and Plant Health Inspection Service identified how H5N1 spreads: shared equipment and vehicles, people moving between farms, and animal movements. Think about that—those are exactly the same ways activists gain access to facilities.
Professor Timm Harder from Germany’s Friedrich-Loeffler-Institut (which runs its national reference lab for avian influenza) has been speaking at international briefings about comprehensive containment measures. What he doesn’t say outright—but what’s becoming obvious to those of us watching both threats—is that these measures work for both.
The basics that work for both:
Visitor logs showing who’s on your property and when
Vehicle cleaning protocols (and tracking who’s coming and going)
Background checks for new hires
Cameras at access points
Tracking which employees work at multiple facilities
What’s interesting here is how the same infrastructure that keeps disease out also keeps unwanted visitors out. It’s not about building Fort Knox—it’s about knowing who’s on your property and why.
Double-Duty Defense: The same $8,300 basic security package that protects against H5N1 spread also blocks activist infiltration—cameras, visitor logs, and vehicle tracking stop both disease vectors and unwanted “investigators,” proving Andrew’s point that smart biosecurity is also smart security
The Trust Game: Your Story Still Matters
Despite all this corporate machinery against us, dairy farmers have one advantage that money can’t buy. I’ve watched this play out again and again—authentic relationships with consumers.
Agricultural communications research keeps showing the same thing: authenticity predicts consumer trust better than anything else. Better than credentials, better than sustainability claims, better than fancy branding.
Look at what Tara Vander Dussen’s doing as the New Mexico Milkmaid. She’s been at it for years, and her approach is simple: build relationships so people feel comfortable asking questions. When some activist video goes viral, her followers message her first—they want to hear her side before making up their minds.
You know why this works? Marketing folks have documented something they call the micro-influencer effect. Accounts with 1,000 to 100,000 followers get seven times the engagement of bigger accounts. Why? Because people can smell authenticity, and they know when someone’s being paid to say something versus when they actually believe it.
ASPCA runs those tear-jerker ads that reach millions. But investigative reporters have shown that only 2% of ASPCA’s $379 million budget actually reaches local shelters. Their CEO makes close to a million dollars. Their 2023 tax filings show the organization has over $550 million in net assets.
The Corporate Activist Reality: ASPCA’s $379 million budget allocates $57 of every $100 to staff and office costs, $28 to advertising and fundraising, and only $6 to veterinary services and grants—while their CEO makes $1.2 million annually. This is activism as big business
When people find that out—and they do—trust disappears instantly.
Meanwhile, farmers posting real content from their barns are connecting with consumers in a completely different way. It’s not about guilt—it’s about understanding.
Industry communications advisors describe producers who’ve started posting daily farm videos getting fascinating results. Nothing fancy—just showing what they actually do. They report consumers from urban areas messaging to say they were worried about dairy farming until they started following these pages. Now they specifically look for those cooperatives’ brands. One person at a time, but it multiplies.
Regional Reality Check: Know Your Risk Level
Know Your Risk Level: The top three states—Massachusetts (37), California (36), and New York (34)—account for 57% of all documented activist actions in 2024, while regional cooperation in Wisconsin (14 actions) demonstrates effective farmer networks can reduce targeting
Looking at where those 189 documented actions occurred in 2024, there’s a clear pattern: most activity is concentrated in Massachusetts, California, and New York.
If you’re within 50 miles of a major city in California, the Northeast, or the Pacific Northwest, you’re in what I’d call the primary zone. You’ve got activist populations nearby, sympathetic media, and prosecutors who might not pursue charges aggressively.
The Upper Midwest—Wisconsin, Minnesota, Michigan—plus the Mid-Atlantic states see periodic waves, usually coordinated campaigns hitting multiple farms at once. The good news? We’ve seen regional cooperation work really well in several Wisconsin counties.
The Great Plains, Mountain West (except around Denver), and the Deep South see less activity. Not because activists don’t care, but because distance, logistics, and the political climate make operations more difficult.
But—and this is important—Project Counterglow mapped 27,500 facilities nationwide. Geographic isolation isn’t the protection it used to be. If you fit their criteria, you could be targeted regardless of location.
What’s interesting is that our Canadian neighbors face similar patterns around Toronto, Vancouver, and Montreal, while European producers tell me they’re seeing coordinated campaigns across borders there too. Australian dairy farmers are dealing with their own version of this, particularly in Victoria and New South Wales. New Zealand’s seeing it around Auckland and Wellington. This really is becoming a global challenge, not just an American one.
The Economics Nobody Wants to Talk About
Here’s what I think many farmers miss —and what took me years to see clearly: activists aren’t causing the economic crisis hitting mid-size dairies—they’re making it worse.
Look at those 2,800 closures in 2024. Maybe 50 to 100 were directly because of activist actions—vandalism, theft, campaigns that destroyed reputations. The rest? Regional production costs are running $19-21/cwt while Class III milk prices average $17-18/cwt according to Dairy Market News. That’s just brutal economics.
But activists know how to exploit these vulnerabilities:
Prop 12-style regulations are a prime example. While that law targeted pork and eggs, similar future legislation for dairy could be devastating. National Pork Producers Council (NPPC) economist Holly Cook has laid out analyses showing Prop 12 compliance can cost $600-700 per sow for retrofits alone, or over $3,000 per sow for new construction. Using the pork retrofit numbers as an analogy, a 500-cow dairy facing similar per-animal costs would be looking at a $300,000-$350,000 capital expense, not including lost production time. Most operations don’t have that kind of capital.
The Brutal Math: While activists documented 189 direct actions against agriculture in 2024, 2,800 dairy farms closed—exposing how activists exploit economic vulnerabilities rather than cause them directly, accelerating the consolidation that’s killing mid-size operations
For smaller operations—say, 100-150 cows—even basic security upgrades can strain budgets. That’s why I tell these folks to think about pooling resources with neighbors. Share the cost of cameras, coordinate patrols, and work together on visitor protocols. You don’t have to go it alone.
Grand View Research and others project that plant-based alternatives will reach $32-34 billion globally by 2030, up from about $20 billion now. Every percentage point of market share they take hurts mid-size producers far more than it does big operations with 2,000-plus cows.
And here’s what really worries me: as farm numbers drop, the infrastructure disappears. Vets close their practices. Equipment dealers shut down. Processing plants consolidate. The whole support system collapses.
Jim Mulhern, who led the National Milk Producers Federation for over a decade before retiring in 2023, used to talk about this all the time—consolidation was happening anyway. What’s different now is that activists have figured out how to speed it up.
What Actually Works: Practical Steps You Can Take
Based on what we saw in 2024 and what’s developing now, here’s what I tell producers who ask:
This Month—Get Started:
Week 1: Connect with your state dairy association’s alert system. If they don’t have one, push them to create one. The Animal Agriculture Alliance has monitoring services—use them.
Week 2: Look at your camera situation. Basic coverage for access points runs $2,000-$3,000. That’s nothing compared to what you could lose. If that’s too steep right now, talk to neighbors about sharing costs.
Week 3: Talk to your employees one-on-one. Just ask: “Has anyone approached you about filming here? Offered money for information?” You might be surprised.
Week 4: Get 5-10 neighbors together for a simple communication network. Group text, whatever works. When something happens, everyone knows fast.
Next Three Months:
Build relationships with local law enforcement now, not during a crisis
Write down who talks to the media if something happens (hint: pick one person)
Actually use visitor logs—every person, every time
Check your insurance—does it cover losses related to activism?
Long-Term Thinking:
This is harder, but it’s where real protection comes from:
Technology that helps you compete with bigger operations
Finding your market niche—organic, A2, grass-fed, whatever works for you
Building consumer relationships before you need them
Getting involved in advocacy at whatever level you can manage
Learning from Success: The Wisconsin Example
Let me tell you about something that worked. Industry security advisors describe a situation in Central Wisconsin last spring in which 14 dairy farms across three counties began sharing information after one farm caught activists conducting surveillance.
Within 48 hours, everybody in that network knew the vehicle descriptions, the tactics, even the specific questions activists asked when they pretended to be feed salespeople. They’d created a simple WhatsApp group—nothing fancy, just quick communication.
When the activists came back two weeks later, targeting a different farm, that producer was ready. Cameras got everything. Law enforcement responded immediately because they already had relationships with the community. The activists got prosecuted for criminal trespass, and here’s the important part—that network hasn’t seen activity since.
As the security advisors explain, success came from working together, not from individual measures. They eliminated the easy targets by coordinating. Simple as that.
What This Means for Your Operation
Looking at everything that’s happening, what’s changed isn’t just money or sophistication—it’s how all these threats are converging at once.
Activist organizations operate like corporations, with combined budgets of billions of dollars. They’re targeting economic viability, not just arguing ethics. Technology gives both sides capabilities we didn’t have before. Biosecurity and activist infiltration have become the same problem. And economic pressure makes farms vulnerable to everything else.
But here’s what still works: authentic farmer voices build trust that money can’t buy. Local coordination multiplies your defenses. Basic security stops most opportunistic actions. And adapting your business—not just defending it—is still essential.
The uncomfortable truth? You’re not just dealing with activists anymore. You’re navigating economic forces that activists know how to exploit. The operations that’ll make it aren’t the ones with the highest walls—they’re the ones that transform their businesses while defending against pressure designed to stop exactly that transformation.
Industry leaders keep saying things will stabilize eventually. They’re probably right. The question is whether your operation will still be around when that happens.
The next year and a half are critical for many operations. Understanding what you’re really up against—not just protesters, but coordinated campaigns with serious money and long-term strategy—that’s your starting point.
Next step? Actually doing something about it. Because in this business, we all know that knowledge without action doesn’t get the cows milked or the bills paid.
These organizations are playing a long game. Question is: are you ready to play it too?
KEY TAKEAWAYS:
Activists aren’t protesters anymore—they’re an $865M corporation with Harvard lawyers who mapped 27,500 farms using AI, but 14 Wisconsin farmers stopped them with a WhatsApp group
Your biosecurity is your security: The same protocols preventing H5N1 also prevent infiltration—just add $2-3K in cameras and actually use those visitor logs
You’re already winning the trust war: Your iPhone videos beat ASPCA’s $131M advertising because authenticity crushes their 2%-to-shelters reality
The clock is ticking: Prop 12 hit pork with $600/animal costs; dairy’s next; but farmers who coordinate locally report zero incidents since organizing
Monday morning action plan: Text 5 neighbors to create an alert network (30 min), install doorbell cameras on barn entrances ($300), ask each employee about suspicious contacts (1 hour)
Complete references and supporting documentation are available upon request by contacting the editorial team at editor@thebullvine.com.
Learn More:
The Clarkson Effect: What It Really Means for Your Dairy’s Marketing – This guide provides a tactical playbook for leveraging public curiosity, demonstrating how to build an authentic social media presence that educates consumers and wins the “trust game” the main article identifies as critical.
Every week, thousands of producers, breeders, and industry insiders open Bullvine Weekly for genetics insights, market shifts, and profit strategies they won’t find anywhere else. One email. Five minutes. Smarter decisions all week.
Strategic exit: Walk away with $1.2M. Wait 18 months: Lose everything. Hormel’s layoffs just started your countdown.
EXECUTIVE SUMMARY: Hormel’s elimination of 250 procurement positions triggers a predictable 12-18 month pattern: processor consolidation, standardized pricing, and $1.50-2.00/cwt in new deductions that destroy farm profitability. With 73% of processing options lost since 2000, most farms now have only 3-4 potential buyers—eliminating negotiating leverage exactly when Farm Bill changes, environmental compliance costs ($75,000-175,000), and heifer shortages (prices hitting $4,800) converge in 2026. Our analysis of Wisconsin and Pennsylvania exits reveals a stark reality: a strategic exit in months 8-10 preserves $1.2 million in family wealth, while waiting until month 18 results in forced liquidation and devastating losses. Of four survival paths—scaling (8% viable), differentiation (15-20% viable), strategic exit, or resilience through low-cost production—only resilience offers hope for mid-sized operations. Your 90-day window to build reserves, create information networks, and secure alternatives started Monday.
Monday’s announcement from Hormel Foods wasn’t just another corporate headline—it was a warning shot for the entire dairy supply chain. The company is cutting 250 positions, and these aren’t factory floor workers. We’re talking about headquarters and sales staff—the people who typically manage relationships with suppliers like ours.
Now, you might be thinking “that’s Hormel’s problem, not mine.” But here’s what’s interesting—Hormel owns Century Foods International up in Sparta, Wisconsin. That’s a significant dairy ingredient processor that pulls milk and proteins from farms across the Upper Midwest. When a company with $12 billion in annual revenue starts reducing procurement and relationship staff… well, that pressure has to go somewhere, doesn’t it?
What I’ve found is that this pattern keeps showing up across the industry. And understanding it might just help us prepare for what’s coming.
The Bigger Picture We’re All Dealing With
Looking at today’s consolidation, you can see it builds on changes that started decades ago. The data from USDA’s Economic Research Service and the National Milk Producers Federation is pretty sobering—we’ve lost between 65 and 73 percent of regional processing options since 2000.
From 15 Buyers to 3 in 25 Years: USDA Economic Research Service data reveals the consolidation trap—73% of processing options lost since 2000 means most farms now have only 3-4 potential buyers. You used to shop around for better terms. Now processors SET terms, and you take them or dump milk. Hormel’s 250 layoffs accelerate this pattern—fewer relationship managers, standardized contracts, zero flexibility.
Just think about that. Many of us used to have 15 or 20 potential buyers within reasonable hauling distance. Now? Three or four if we’re lucky. In some regions, it’s even tighter.
Take a look at what’s happening across different regions right now. Darigold members—about 250 farms in the Northwest—are paying a $ 4-per-hundredweight assessment. Capital Press reported back in May that $2.50 of that is going toward new plant construction in Pasco, Washington. That’s real money coming right off the milk check.
In the Upper Midwest, Foremost Farms implemented a 90-cent assessment for its patrons in September 2022. Hoard’s Dairyman covered it extensively—they cited the gap between Class III prices and what they’re actually getting for cheese. And Saputo? Food Processing magazine reported in June 2024 that they’re closing six facilities by early 2025, including operations in Wisconsin and California, to “consolidate production and reduce redundancy.”
Here’s what really caught my attention about Hormel’s restructuring. According to their November 4th investor announcement, they’re specifically eliminating corporate strategic and sales positions—these are the folks who maintain relationships with suppliers. They’re spending $20 to $25 million on severance and transition costs. That’s roughly $80,000 to $100,000 per position they’re cutting.
You don’t spend that kind of money unless you’re planning for years of pressure ahead, not just a tough quarter.
Now, it’s worth noting that processors face real challenges too. Retail consolidation means they’re dealing with Walmart, Costco, and Amazon—all of which are squeezing margins. Energy costs are up. Labor’s tight everywhere. These companies aren’t making these cuts lightly. But understanding their pressures doesn’t change what flows down to us.
The Pattern I Keep Seeing
Industry financial advisors tracking processor transitions have identified a consistent pattern that typically unfolds over 12 to 18 months. Let me walk you through what actually happens…
First Few Months: Everything Gets Quieter
Your field rep who used to manage 40 or 50 farms? Now they’re covering 150. Response times stretch from hours to days. Those quarterly visits become phone calls. As many of us have seen, when representatives manage three times as many accounts as before, personalized service just isn’t possible anymore.
Months 2-6: The Standardization Push
This is when you get that letter about “standardized pricing formulas” to ensure “fairness.” Sounds reasonable, right? But what it really means is they’re eliminating those adjustments that recognized your specific situation—your spring flush components, your consistent quality premiums, that understanding that your butterfat always runs high in October.
What’s Your Processor Really Taking? Darigold members in the Pacific Northwest face $4.00/cwt deductions—$45,000 annually for a 180-cow operation split between new plant construction and covering losses. Industry pattern averages $2.00/cwt.
Months 6-9: The Deductions Start
New fees start appearing. Processing assessments. Quality charges. Transportation adjustments. Wisconsin dairy business associations documented accumulated deductions ranging from $1.50 to $2.00 per hundredweight during 2023. For a typical 180-cow operation, that’s $2,500 to $3,300 coming off your monthly milk check.
By Month 12: You Realize Your Options Are Limited
You start looking around for alternatives, but those other processors? They’re managing their own challenges. They’re not actively recruiting. And you need daily pickup—can’t exactly store milk while you shop for a better deal.
Learning From History (Because We’ve Been Here Before)
This isn’t our first rodeo with consolidation. The USDA Economic Research Service’s 2019 report “Consolidation in U.S. Dairy Farming” documented similar patterns during the 1980s farm crisis, and its 2010 analysis covered the impacts of the 2009 financial crisis. Each time, the farms that saw it coming early and adapted survived better.
What’s different this time? The alternatives are scarcer. Back in ’09, you could still find regional processors looking to grow. Today, with interest rates where they are and construction costs through the roof—as Compeer Financial told Brownfield Ag News in October—expansion activity has basically stopped.
Southeast operations face additional challenges, with heat-stress management costs averaging $150 to $200 per cow annually, according to University of Georgia Extension research. Meanwhile, Southwest farms are dealing with ongoing water allocation issues, with Arizona and New Mexico operations seeing water costs rise by 30-40% since 2020, according to state agricultural department data. Each region has its unique pressures, but the consolidation pattern remains consistent.
The Timing Trap: Wisconsin and Pennsylvania farm financial counselors document $1.2 million wealth differences between families who exit strategically at months 8-10 versus those who wait for forced liquidation at month 18+. When Hormel cuts 250 procurement positions, your countdown starts Monday—not when you finally admit you’re trapped.
What Successful Farms Are Doing Right Now
Despite all this, I’m seeing farms navigate these challenges successfully. Their approaches are worth considering.
Building That Financial Cushion
What is the difference between farms with negotiating leverage and those without? Operating reserves. Penn State Extension’s dairy business analysis and the Center for Farm Financial Management both point to the same figure—about 90 days of operating capital makes all the difference.
For a 200-cow operation, that’s roughly $280,000. For 150 cows, about $180,000. I know those numbers sound huge, but here’s what’s working…
Farm financial management research shows that extending equipment replacement cycles by one to two years can generate significant reserve-building capacity. Several Mid-Atlantic operations have successfully banked the difference between equipment payments and increased maintenance costs. After a few years, they’ve built up enough to cover six months of expenses.
Cornell Cooperative Extension has documented that farms directing 5-10% of production to premium direct-market channels accelerate reserve accumulation without disrupting bulk sales. You’re not replacing your regular market—just capturing better margins on a small percentage of it.
Information Networks That Actually Work
You probably know this already, but the coffee shop isn’t where real information sharing happens anymore. Networks of 5 to 8 farms comparing actual numbers—payment timing, deduction patterns, alternative buyer pricing—are documenting surprising disparities.
Farm business management specialists report producer networks discovering pricing gaps of $0.60 to $1.20 per hundredweight between processors for identical milk quality. When these groups approach processors collectively with documentation, they often achieve improvements worth $0.40 to $0.65 per hundredweight.
California producers managing water costs—University of California Cooperative Extension’s 2024 cost studies show averages of $450 to $650 per cow annually in the Central Valley—face additional challenges. But similar information networks help them identify opportunities. The principle’s the same everywhere: shared knowledge beats isolation.
Getting Real Information from Your Processor
Here’s what progressive operations are asking for—and often getting:
Monthly competitive benchmarks showing what processors within 100 miles pay for comparable components. Detailed breakdowns of processing costs at their delivery facility. Inventory levels and 90-day demand projections that might signal adjustments coming.
State Extension services offer tremendous support here. Programs at Michigan State, Cornell, Penn State, UC Davis—they’ve all got dairy business specialists who can help analyze this information. That’s what our tax dollars support, after all.
The Four Strategic Paths: An Honest Assessment
Most advisors focus on three options: scale to 3,500+ cows, differentiate into premium markets, or exit strategically. But I’m seeing a fourth path among farms that consistently stay profitable even when milk drops to $17 or $18…
Path 1: Scaling Up (Works for Maybe 8% of Farms)
Let’s be honest here. Scaling to 3,500+ cows require $21 to $27 million in capital investment, according to current construction costs. You need interest rates that make sense (they don’t right now), heifer availability (scarce and expensive), and processing capacity willing to take your increased volume. If you’re already at 1,500-2,000 cows with strong financials, maybe. Otherwise? This probably isn’t your path.
Path 2: Premium Differentiation (Viable for 15-20%)
Organic, grass-fed, A2—these markets exist, but they’re not magic bullets. Organic premiums have compressed from $7-9 to $3-5 per hundredweight. You need 3-7 years to transition, specific processor relationships, and often geographic advantages. If you’re near urban markets or progressive processors, it’s worth exploring. But it’s not a quick fix.
Path 3: Strategic Exit (Sometimes the Smartest Move)
Wisconsin and Pennsylvania farm financial counselors document $800,000 to $1.2 million differences in family wealth between planned exits at months 8 to 10 versus forced liquidation at month 18 and beyond. There’s no shame in preserving what three generations built rather than losing it all trying to outlast market forces.
Path 4: The Resilience Strategy (The Surprise Option)
These operations have basically flipped the traditional production philosophy. Instead of maximizing output, they’re optimizing for consistent profitability across wide price ranges.
The Profitability Paradox: University of Minnesota and Penn State data reveal resilience farms producing 18,000-19,000 lbs/cow stay profitable at $17 milk while conventional operations bleeding at $22. Feed costs of $7.80/cwt versus $10.50/cwt. Vet bills of $42/cow versus $97/cow. The farms surviving consolidation aren’t maximizing production—they’re optimizing for volatility.
Rethinking Production Economics
University of Minnesota Extension case studies show lower-production systems—18,000 to 19,000 pounds per cow—achieving $3 to $4 per hundredweight cost advantages through reduced inputs. The 2024 Dairy Farm Business Summary shows industry feed costs averaging $10.20 to $11.50 per hundredweight. These systems? They’re at $7.80.
Vet expenses run $42 per cow annually versus the $85 to $110 industry average. They maintain a 22% replacement rate when the industry standard exceeds 33%. They’re producing 25% less milk per cow, yet their cost structure keeps them profitable at $18 milk, while others are bleeding red ink.
Research from Wisconsin’s Center for Integrated Agricultural Systems shows that well-managed grazing operations achieve production costs of $14 to $16 per hundredweight, compared to $18 to $21 for conventional confinement.
Sure, they might average 16,000 to 17,000 pounds per cow. Their facilities might look dated. But at any price above $15.50, they’re making money. When milk hit $23 early this year, they banked serious reserves. When did it dropped to $18? Still profitable.
Penn State Extension’s 2024 analysis shows dairy-beef integration programs generating $150,000 to $200,000 annually. Using sexed semen on top genetics and beef semen on lower performers, these operations accept modest production decreases for substantial supplementary income.
USDA Agricultural Marketing Service reports from October 2025 show beef-cross dairy calves bringing $750 to $950at regional auctions, with strong demand continuing. That’s meaningful diversification without new facilities or expertise.
What these farms understand is that volatility kills more operations than low prices. If you need $22 milk to break even, you’re in trouble 40% of the time. If you can profit at $17, you only struggle during true crashes.
The Critical Next 18 Months
Here’s why the period through spring 2027 matters so much…
First, we’re operating under the second Farm Bill extension, as the Congressional Research Service noted in June. When new Dairy Margin Coverage parameters roll out in spring 2026, farms already under stress might not be able to afford meaningful coverage.
Why 2026 Will Crush Unprepared Farms: The convergence isn’t theoretical. Processor deductions ($36K ongoing), environmental compliance ($75-175K mid-2026), and heifer shortages hitting $4,200-4,800/head (early 2027) create a $261K perfect storm for 200-cow operations. CoBank’s August analysis and state DNR permit timelines confirm—farms building reserves NOW survive. Everyone else liquidates.
Second, environmental compliance intensifies in mid-2026. California’s State Water Resources Control Board’s 2025 dairy regulations estimate compliance costs of $75,000 to $175,000 for facilities that require digesters or advanced nutrient management. Wisconsin’s Department of Natural Resources permit updates require similar investments. That’s hitting right when other pressures are at their peak.
Third—and this one’s flying under the radar—CoBank’s August analysis shows dairy heifer inventories hitting their lowest point in 2026. USDA Agricultural Marketing Service data from July shows current prices at $3,010 per head, up 75% from April 2023. CoBank projects they could reach $4,200 to $4,800 by early 2027.
For a 200-cow operation with typical replacement needs, that’s an extra $100,000 annually. Can you absorb that while everything else is hitting?
Your Action Plan for This Week
Given everything that’s developing, here’s what I’d be thinking about…
Monday-Tuesday: Know Your Position
Pull out your processor contract and read it carefully. Every word. Document your payment patterns over the past year—are checks posting later, even by a day or two? Calculate your actual reserves. Not estimates—real accessible capital.
Wednesday-Thursday: Build Intelligence
Call three alternative processors. Frame it as “2026 planning” rather than jumping ship. Get their pricing, their terms. If your processor has a parent company, check their recent earnings calls. Connect with 5 to 8 operations in your area to exchange information.
Friday: Make Your Decision
Honestly evaluate where you fit. Can you scale? Can you differentiate? Should you build resilience? Or is strategic exit the smartest move for your family?
Questions Worth Asking Your Processor Today
What’s your capacity utilization at our delivery facility?
Can you provide monthly competitive benchmarks against regional processors?
What are your 90-day inventory levels and demand projections?
What specific costs justify any current or planned deductions?
What’s your parent company’s debt-to-asset ratio and credit utilization?
If they won’t answer… well, that tells you something too, doesn’t it?
The Bottom Line
What Hormel’s restructuring really tells us is that financial pressure throughout the food supply chain is accelerating. And that pressure flows downstream. Always has, always will.
We’ve navigated similar transitions before—the 1980s, 2009—though current conditions present unique challenges. The farms that survive won’t necessarily be the biggest or most productive. They’ll be the ones that recognized signals early, built flexibility, demanded transparency, and made tough decisions while they had choices.
This isn’t about giving up on dairy. It’s about adapting to reality. And the reality is that processor consolidation, combined with converging pressures over the next 18 months, will fundamentally reshape American dairy.
Success in this environment doesn’t necessarily correlate with scale or production levels. Operations demonstrating financial flexibility, market intelligence, and strategic clarity position themselves best, regardless of size.
In a market that swings from $17 to $24 per hundredweight, the ability to remain profitable across that range beats maximizing profit at the top. As many successful producers have learned, producing less at lower cost can provide greater security than chasing maximum production.
The question isn’t whether change will continue—it will. The question is whether we’ll approach it prepared, with options built and information gathered, or whether we’ll take whatever’s offered because we have no choice.
Each farm’s situation is unique. There’s no universal solution. But there are universal principles: maintain flexibility, understand your market position, and make strategic decisions while you still have options.
You know, the dairy industry has always rewarded those who adapt thoughtfully to changing conditions. This period demands exactly that kind of thoughtful adaptation. And honestly? I think those of us who prepare now, who build those reserves and networks and alternatives… we’ll navigate this just fine.
The early warning signs are clear. What we do in the next 90 days determines whether we walk out of this transition on our own terms or get forced out when market pressures intensify.
I know which option I’d choose. How about you?
Key Takeaways:
Your 90-Day Action List: Read the processor contract, calculate reserves ($280K for 200 cows), call three alternative buyers, form a 5-8 farm network
The $1.2 Million Timeline: Strategic exit (months 8-10) = wealth preserved / Forced liquidation (month 18) = devastating losses
Surprise Winner: Farms producing 25% LESS milk at $7.80 feed costs beat high-producers losing money at $10.50 feed costs
Pattern Recognition: Corporate layoffs → standardized pricing → $2/cwt deductions → trapped farmers (we’ve seen this 3 times)
2026 Convergence: When Farm Bill + $175K compliance + $4,800 heifers hit simultaneously, only prepared farms survive
Complete references and supporting documentation are available upon request by contacting the editorial team at editor@thebullvine.com.
Decide or Decline: 2025 and the Future of Mid-Size Dairies – Reinforcing the main article’s “Strategic Exit” warning, this analysis explores the “mid-size squeeze.” It provides a framework for deciding whether to scale, implement precision technology, or exit while your farm’s equity is still intact.
Every week, thousands of producers, breeders, and industry insiders open Bullvine Weekly for genetics insights, market shifts, and profit strategies they won’t find anywhere else. One email. Five minutes. Smarter decisions all week.
Cheese tanked. Buyers ghosted. Farmers bleeding. Welcome to Monday in dairy.
EXECUTIVE SUMMARY: You know something’s broken when cheese crashes 10¢ on just TWO trades—that’s exactly what happened today, taking $1/cwt straight out of December milk checks. But here’s what really hurts: the Class III-IV spread hit $3.19, meaning your neighbor shipping Class III is making $45,000 more annually than Class IV shippers on the same-sized farm. We’ve got 9.52 million cows out there—most since 1993—flooding a market where Europe’s selling cheese 37% cheaper and China’s buying less. At $13.90 Class IV against $320/ton feed, even efficient operations are bleeding $2/cwt. The farms that’ll survive are doing three things right now: locking any Class III over $17, cutting cow numbers 15%, and banking six months of operating capital—because this isn’t a correction, it’s a reckoning that’ll last into 2026.
What I’ve found is these aren’t just price moves anymore—they’re survival signals. Here’s what shifted at Chicago today:
Product
Today’s Close
Change
Farm Impact
Cheese Blocks
$1.6650/lb
-10.25¢
December checks drop ~$1.00/cwt
Cheese Barrels
$1.7500/lb
-5.50¢
Processors drowning in inventory
Butter
$1.5775/lb
-3.25¢
Class IV trapped at breakeven
NDM
$1.1300/lb
-0.25¢
Export competitiveness fading
Dry Whey
$0.7100/lb
No change
The only bright spot holding
Now, what’s really telling here—and you probably noticed this too—is the volume. Or lack thereof, I should say. Nine trades total across all products. Nine! I’ve seen more action at a Tuesday card game in Ellsworth.
November 3 CME dairy price collapse shows cheese blocks plummeting 10¢ on just two trades while seven sellers found no buyers—a market not trading but capitulating in a vacuum of demand.
When blocks drop a dime on just two trades, it means the price is falling without any real buying support. Those seven offers stacked up? That’s sellers lined up at the door with no buyers in sight. The market isn’t trading; it’s collapsing in a vacuum.
Why This Class Spread Breaks Farms
You know, I’ve been tracking these markets since the ’90s, and this $3.19 gap between Class III at $17.09 and Class IV at $13.90… it’s something else entirely. Three Wisconsin cooperative fieldmen I talked with this morning—all asking to stay anonymous, naturally—painted the same picture: their Class IV shippers are hemorrhaging cash.
“Members are culling anything that looks sideways,” one told me. And at $13.90, even efficient operations lose two bucks per hundred minimum.
Here’s what makes this worse than 2016’s collapse, if you can believe it: feed costs then were 40% lower. The CME futures data shows December corn at $4.3475 a bushel and soybean meal above $320 a ton. You do that math—it doesn’t work.
The $3.19/cwt Class III-IV spread translates to a staggering $45,000 annual income gap between identical 200-cow farms—same work, vastly different survival odds.
Regional Pain Points
Wisconsin’s Double Whammy: So Wisconsin’s most recent production data—this is for September, released in October—shows 2.76 billion pounds according to USDA NASS. But here’s the kicker: regional premiums flipped from plus 40¢ in January to minus 15¢ now. That’s a 55-cent swing nobody budgeted for. And meanwhile, local plants are running four-day weeks, while Texas adds 5 million pounds of daily capacity? That’s not a market; it’s a massacre.
Texas Keeps Growing: What’s encouraging for them—not so much for us up north—is that Texas grew 10.6% year-over-year with 50,000 new cows added by April 2025. Their breakeven point is around $14.50, which means they’re still profitable while Upper Midwest farms bleed out. Different labor costs, different feed sourcing… it’s almost like two separate industries now.
California’s H5N1 Factor: Nearly 1,000 confirmed dairy herd cases across 16 states according to USDA APHIS data, with California ground zero. Production down 1.4%—and ironically, that’s the only thing keeping cheese from hitting $1.50.
The Global Picture Nobody Wants to See
Looking at this from 30,000 feet, as they say, we’re seeing convergence of every bearish factor possible. New Zealand’s production is up 2.8% according to Fonterra’s latest data from the Weekly Global Dairy Market Recap. European cheese crashed 37% year-over-year—and when EU product trades at €2,088 per metric ton, why would anyone buy American?
Four converging crises—record production, collapsing exports, crushing feed costs, and new processing overcapacity—have pushed market pressure 10% beyond crisis threshold, with no relief until 2026 at earliest.
China’s pulling back too—total imports up just 6% through July, but that’s still 28% below their 2021 peaks. They’re cherry-picking what they need: whey up, everything else sideways or down. And Mexico, our biggest customer? They’ve been discussing dairy self-sufficiency targets for 2030. That could mean 230,000 metric tons of powder exports are potentially gone.
A StoneX trader told me Friday—and I think he nailed it—”The U.S. is the Cadillac in a world shopping for Chevys.”
Feed Markets: The Other Shoe Dropping
The milk-to-feed ratio tells the whole story: 1.48 right now. You need 2.0 for decent margins, generally speaking, and 1.8 to break even.
At 1.48 milk-to-feed ratio versus the 2.0 needed for profitability, dairy farmers are bleeding $2/cwt even before paying labor, vet bills, or utilities—a 26% shortfall with no end in sight.
December corn at $4.3475 offers no relief. Western Wisconsin hay dealers? They want $280 a ton delivered for decent mixed—if they’ll even quote you. The latest WASDE Report mentions the U.S.-China trade deal promising 25 million tonnes annually, but you know, that’s maybe next year, not this month’s certain.
Processing Plants Playing Different Games
So here’s what really gets me: three cheese plants just announced 400 million pounds of new capacity for 2026. Hilmar’s Texas facility cranks up in January—5 million pounds daily. Meanwhile, Wisconsin plants run four-day weeks, managing inventory.
How’s that make sense? Well, it doesn’t—unless you realize processors profit on volume, not price. They don’t really care if cheese is $1.60 or $2.10. They care about throughput. More milk equals more margin dollars even at lower percentages. But farmers? We need price, not volume. That fundamental disconnect… that’s what’s killing us.
What Smart Operations Do Now
Here’s what the survivors are telling me, and it’s worth noting these aren’t the guys complaining at the coffee shop—these are the ones actually making it work:
Lock anything over $17 for Class III immediately. One large Wisconsin producer locked 40% of his Q1 production last week at $17.20. As he put it, “I’m not swinging for fences anymore. Singles keep you in the game.”
Cull deep, cull strategically. With springers at $2,100, that third-lactation cow with feet issues? She’s worth more as beef. Several nutritionists report their clients running 15% lower numbers—on purpose.
Component premiums still matter. Dry whey holding at 71¢ means protein still pays. Farms maximizing components—and you know who you are—they’re seeing 30-40¢ more per hundredweight. Not huge, but it’s something.
Rethink expansion completely. Pete Johnson, who ships direct to a cheese plant, told me something interesting: “My neighbor’s co-op pays $1.40 more in premiums, but after deductions, we net about the same. Difference is, I can walk if needed.”
Cooperatives Scrambling for Answers
You know, DFA’s base-excess programs start December 1st, cutting deliveries 5% from last year. Land O’Lakes is paying 25¢ per somatic cell under 100,000—quality over quantity, finally.
What’s interesting is Cornell research shows non-co-op handlers paying 37% quality premiums versus co-ops at 29%. But co-ops counter with competitive premiums, keeping members from jumping. Mixed signals everywhere you look.
The Six-Month Survival Test
Let me be straight with you: if you’re shipping Class IV milk right now, you need at least 6 months of cash reserves. December checks—and I hate to be the bearer of bad news—will drop $1.00 to $1.50 per hundredweight from November based on current futures.
The Federal Order reform coming January 1st? It’ll shift maybe 30¢ from Class I to manufacturing. That’s like putting a Band-Aid on an amputation, honestly.
California’s methane rules adding 45¢ per hundredweight compliance costs starting July… USDA projecting 230 billion pounds production for 2025 in their October forecast… We don’t need more milk, folks. We need less.
The Bottom Line
You know, standing here looking at these numbers, I keep remembering what my dad used to say: “The cure for low prices is low prices.” Eventually, enough producers quit, supply tightens, and prices recover. But how many good families lose everything getting there?
Today’s 10¢ cheese crash wasn’t a correction—it was capitulation. Blocks at $1.67 with seven offers stacked and two lonely bids? That’s not a market; it’s a distress sale. The funds have bailed, end users are covered, and producers… well, we’re holding the bag.
If you’re planning an expansion, stop. Those new parlor dreams? Shelve them. With 9.52 million cows out there—the highest since 1993, according to USDA data—we’re looking at 6 to 12 months before any real relief.
The farms that’ll make it through are the ones acting now: cutting costs aggressively, optimizing components over volume, maintaining working capital for the storm ahead. Everyone else? Well, auction barns are busy again for a reason.
Your November milk check just got lighter—that’s the reality. Tomorrow morning in the parlor, before dawn breaks and that first cup kicks in, ask yourself this: Am I farming to live, or living to farm?
Because at these prices, you better know the answer.
KEY TAKEAWAYS:
Ghost Town Trading: Cheese crashed 10¢ on just TWO trades today—when seven sellers can’t find buyers, your December check loses $1/cwt
Tale of Two Farms: Identical 200-cow operations, but Class III shippers bank $45,000 more annually than Class IV neighbors—same work, vastly different pay
Perfect Storm Brewing: Record 9.52M U.S. cows flooding markets while EU cheese trades 37% cheaper and Mexico eyes dairy independence by 2030
The $2/cwt Bleed: At $13.90 Class IV milk vs $320/ton feed, even top-tier operations lose money before paying labor, vet, or utilities
Survival Playbook: Winners are doing three things NOW—locking any Class III over $17, strategically culling 15% of herds, and banking 6+ months operating capital for the long winter ahead
Complete references and supporting documentation are available upon request by contacting the editorial team at editor@thebullvine.com.
Every week, thousands of producers, breeders, and industry insiders open Bullvine Weekly for genetics insights, market shifts, and profit strategies they won’t find anywhere else. One email. Five minutes. Smarter decisions all week.
Butter inventories: lowest since 2016. Butter prices: falling fast. Your milk check: shrinking. We connect the dots.
Executive Summary: Something broke in dairy markets this October: butter crashed to $1.60 despite the tightest inventories since 2016. Just 15 CME trades triggered the drop, opening a massive $2.47 gap between Class III and Class IV milk prices—the widest since 2011. Jersey farms shipping to butter plants now lose up to $500,000 annually, while Holstein neighbors shipping to cheese plants gain from the exact same market. Why? Algorithmic trading dominates these thin markets, punishing the high butterfat we spent decades breeding for. Smart farms are adapting fast: switching processors (6-month payback), negotiating collectively ($0.35/cwt gains), and even reducing butterfat through nutrition. The message is clear—understand these new market dynamics or get left behind.
I was chatting with a Jersey producer near Mondovi, Wisconsin—been in the business 28 years—and he told me something that’s really stuck with me. “For the first time,” he said, “I genuinely don’t understand what’s driving my milk check.”
That’s a powerful statement coming from someone who’s weathered every market cycle since the mid-90s. And he’s not alone. I’ve been hearing similar frustrations from producers all across the dairy belt lately, from the Great Lakes down through Texas.
October 2025 just matched the worst Class spread since 2011—and this time, it’s not a temporary spike. The fundamentals driving this gap are structural, not cyclical. When pricing signals stay broken this long, farms that wait for ‘normal’ to return are making a dangerous bet.
Why Are Butter Prices Falling When Inventories Are Tight?
So here’s what happened this October that’s got everyone talking. According to CME Group’s daily reports, spot butter prices fell from $1.6950 in mid-September to $1.6025 on October 9th. Pretty significant drop.
But what makes this genuinely puzzling is what else was happening. USDA’s Cold Storage report, released September 24th, showed butter inventories at 305.858 million pounds for August. That’s the tightest August inventory we’ve seen since 2016.
Tight inventories should support prices, shouldn’t they? That’s how it’s always worked. But not this time.
Here’s what’s keeping me up at night. August 2025 butter inventories sit at 305.9 million pounds—the tightest since 2016. Basic economics says tight supplies mean higher prices. Instead, butter crashed to $1.60. That’s not a market signal. That’s market failure. And your breeding decisions for the last decade just became a liability because algorithms don’t care about supply and demand.
And the timing… October is traditionally when we see butter prices strengthen. Retailers start building holiday inventory, and demand picks up through Thanksgiving. We’ve all seen that pattern. This October? Complete opposite.
What’s particularly interesting is the global picture. While our butter was trading around $1.60 in early October, industry reports suggest European prices were holding near $2.60 per pound. New Zealand’s Global Dairy Trade auction from October 1st showed butter equivalent prices in the $3.40 to $3.50 range after conversion.
That’s a massive disconnect. And according to USDA Foreign Agricultural Service data through August, it’s been driving butterfat exports way above last year’s levels—increases of over 200% in some months. You’d think that kind of export demand would support domestic prices, but apparently not in this market.
The recent trade agreements, particularly USMCA provisions, have actually made cross-border dairy movement easier, which you’d expect would help price discovery. But even with those improvements, we’re seeing these wild disconnects.
How Can 15 Trades Set Prices for an Entire Industry?
At a recent University of Wisconsin Extension meeting, several producers raised good questions about how these price movements could occur with such thin trading volume. Let me walk you through what I’ve been observing.
On October 9th, CME’s daily report showed selling pressure that drove prices down 4.75 cents in just one session. We’re talking about spot loads of 40,000 pounds each, and on a busy day, maybe 15 loads change hands. That’s 600,000 pounds of butter, setting the tone for an industry producing 1.8 billion pounds of milk daily, according to USDA production statistics.
Academic research increasingly suggests electronic trading has fundamentally changed these markets. A good chunk of trading volume in futures markets now comes from algorithmic systems rather than traditional commercial hedging. It’s not farmers hedging production or cheese plants covering forward needs anymore—it’s computers trading momentum patterns.
You can actually see it in the data. Days when butter prices drop sharply often show heavier volume—maybe 12 to 15 loads trading. But when prices try to recover? Volume frequently drops to just 5 or 6 loads. That’s not normal commercial hedging, where you’d expect consistent volume regardless of price direction.
The Class III/IV spread really tells the story. USDA’s Agricultural Marketing Service data showed that spread widening to $2.47 per hundredweight on October 9th—the largest gap since 2011. Class III milk for cheese was $17.01, while Class IV milk for butter-powder was $14.54.
In a market where butter supplies are supposedly tight, that kind of spread doesn’t make fundamental sense. I’ve been in this industry long enough to remember when a 50-cent spread was considered wide. Now we’re looking at nearly $2.50.
Who’s Getting Hit Hardest—And Who’s Finding Solutions?
What I’ve found eye-opening is how differently this affects farms depending on location and milk destination.
There’s a Wisconsin Jersey producer I work with—let’s call him Tom—who runs about 480 cows, averaging 4.8% butterfat. Beautiful production numbers. Based on Federal Order 30 component pricing, his milk should be worth significantly more than the Holstein operation down the road, which is testing at 3.8% fat.
Let’s talk real numbers. That 1,000-cow Jersey operation your family built over three generations? You’re bleeding $600,000 annually at today’s Class spread—that’s $50,000 monthly straight off the top. Meanwhile, your Holstein neighbor with the same 500 cows loses only $75,000. For the first time in dairy history, the genetics we told you to breed for are costing you a quarter-million dollars a year. And it’s not temporary
But when he’s shipping to a butter-powder plant and that Class III/IV spread hits $2.47 per hundredweight, that advantage completely reverses.
Using calculation tools from UW-Madison’s Center for Dairy Profitability (excellent resources at cdp.wisc.edu), we can quantify this. A 100-cow Jersey operation faces nearly $60,000 less income annually under these conditions. Mid-size farms with 300 cows could be down about $175,000. That 500-cow operation? Close to $300,000 annually. And if you’re running 1,000 head? Over half a million dollars in lost revenue.
These are real losses affecting real families. We’re not talking about missed opportunities here—we’re talking about actual cash flow gaps that affect everything from feed purchases to equipment payments.
But here’s what’s encouraging—creative solutions are emerging all over. A producer group in Pennsylvania negotiated a shift from shipping to a butter-powder plant to accessing a cheese cooperative. They invested in equipment upgrades to meet new specs, but told me the investment paid for itself within six months once they escaped that Class IV pricing penalty.
In California, more operations are exploring value-added opportunities. Farmstead cheese, on-farm processing, direct sales. It requires significant capital and a different business model, but those making it work see premiums of $3 to $5 more per hundredweight over commodity pricing.
And in the upper Midwest, I recently visited a 650-cow operation near La Crosse that’s taking a different approach. They’ve partnered with two neighboring farms to collectively negotiate milk marketing, giving them leverage they wouldn’t have individually. “We’re still shipping Class IV,” the owner told me, “but we negotiated quality premiums that offset about 40% of the spread disadvantage.”
Down in Texas, where I was last month, producers face different challenges. The heat stress on butterfat production actually works in their favor when these spreads widen—their naturally lower butterfat levels mean less exposure to the Class IV penalty. One producer near Stephenville told me, “We used to curse our 3.5% fat tests in summer. Now it’s actually protecting us from worse losses.”
I’ve also been talking with Holstein producers who are navigating this differently. A 1,200-cow operation in Michigan shared its strategy—they’ve actually benefited from maintaining moderate butterfat levels around 3.7% while focusing on volume. “Everyone was chasing components,” the owner explained, “but we stuck with balanced production. Now that’s paying off.”
And it’s not just Jerseys and Holsteins feeling this. A Brown Swiss producer in Vermont mentioned their breed’s protein-to-fat ratio has actually become an advantage in this market. “We naturally produce closer to what processors want,” she said. Even some Guernsey operations with their golden milk are finding niche markets that value their unique component profile beyond commodity pricing.
Why Did Everyone Breed for Butterfat If This Was Coming?
Looking at USDA National Agricultural Statistics Service data from 2014 forward, butterfat prices beat protein prices in eight of ten years through 2024. The whole industry was singing the same tune—breed for components, maximize butterfat.
I remember reading CoBank’s November 2023 report titled “The Butterfat Boom Has Just Begun.” They documented that butter consumption grew 43% over 25 years, and that cheese was up 46%; according to USDA Economic Research Service data, Americans now eat about 42 pounds of cheese per person annually. Double what we ate in 1975.
But by September 2024, CoBank published a follow-up with a different tone, warning that butterfat production might be growing too fast. According to analysis from CoBank and other industry sources, the protein-to-fat ratio in U.S. milk has shifted. It held steady around 0.82-0.84 for nearly two decades, but recent data suggests we’re now closer to 0.77.
Metric
Jersey
Holstein
Milk Production
18,000 lbs/yr
25,000 lbs/yr
Butterfat
4.8%
3.8%
Feed Efficiency
1.75 ECM/lb
1.67 ECM/lb
Feed Cost per lb Fat
$1.82
$1.97
Normal Market
-$456/yr
$0
At $2.47 Spread
-$956/yr
$0
I recently spoke with a cheese plant manager in Central Wisconsin who explained their perspective. “We’re not trying to penalize high-butterfat milk,” he said, “but our process is optimized for certain ratios. When milk comes in with too much fat relative to protein, we’ve either got to add milk protein concentrate—which isn’t cheap—or skim off cream. Either way, it’s an added cost.”
This seasonal component shift matters too. Spring flush typically brings lower components as cows transition to pasture—you know how it goes, that first lush grass drops butterfat like a rock. We’d normally see fat tests drop from 4.0% to 3.6% or lower in grazing herds. Then, fall milk traditionally shows higher butterfat as cows return to TMR and corn silage.
But with year-round confinement becoming standard in larger operations, these seasonal patterns are flattening. A nutritionist I work with in Idaho told me that their 5,000-cow clients now maintain 3.8% butterfat year-round, plus or minus 0.1%. That consistency sounds good, but processors built their systems around predictable seasonal variation. Now they’re scrambling to adjust.
What Can You Actually Do About This Right Now?
Risk management has become essential. Looking at CME quotes in late October, Class IV put options at the $14.00 strike were trading around $0.15 per hundredweight. That’s affordable insurance—maybe 6% of what you’d lose if prices really tank. Worth discussing with your milk marketing cooperative.
On the feed side, December corn futures were trading near $4.19 per bushel in early November. Given where feed markets have been, locking in at least some costs makes sense. When milk pricing is this volatile, having one side of your margin equation fixed helps you sleep at night.
Stop waiting for the market to fix itself—here are five strategies working right now on real farms. The Pennsylvania group switching to cheese plants? Six-month payback and they’re adding $2/cwt every month since. The Ohio farm reducing butterfat through nutrition? Four months to breakeven. And locking December corn at $4.19? That’s protecting your margin TODAY. These aren’t theory—these are survival tools farms are using while others are still wondering what happened.
Marketing flexibility is crucial, though limited for many. But it’s worth exploring whether you could shift even a portion of milk to different processors. Some regions have more options than folks realize—cooperatives and plants not considered because they’ve been shipping to the same place for decades.
A Northeast producer recently shared something interesting—they partnered with neighboring farms to collectively negotiate better terms with processors. Not feasible everywhere, but where geographic concentration allows, collaborative approaches deserve consideration. They told me payback on legal and consulting fees took eight months, but they’re now seeing $0.35 more per hundredweight.
I’ve also been seeing increased interest in adjusting components through nutrition. A farm in Ohio began working with its nutritionist to moderate butterfat production, reducing it from 4.1% to 3.85% through ration adjustments. Sounds counterintuitive after years of pushing components higher, but when that Class IV spread is wide, it can actually improve their milk check.
For those with Dairy Margin Coverage through FSA, it’s worth revisiting your coverage levels. The program calculations don’t fully capture these Class III/IV spread impacts, but higher coverage levels might provide some cushion when markets get this disconnected. With crop insurance interactions, some producers are finding ways to layer their risk protection more effectively.
Is This How Dairy Pricing Works Now?
October’s butter price action reveals fundamental questions about how dairy prices get discovered in modern markets.
When CME spot markets with thin daily volume—sometimes just a dozen trades—determine pricing for over 90% of U.S. milk production, the traditional relationship between supply and demand can become distorted.
Other commodities have addressed similar issues. The beef and pork industries implemented mandatory price reporting years ago, where packers report transactions to the USDA, creating broader datasets for price discovery. Some in dairy are asking whether we need something similar. Organizations like the National Milk Producers Federation have begun discussing potential reforms, and there’s growing support from state organizations as well.
The Canadian system offers an interesting contrast. They operate under supply management with administered pricing through the Canadian Dairy Commission. Their system has its own challenges—less export opportunity, higher consumer prices—but price volatility isn’t one of them. Canadian producers maintained stable component premiums throughout October while we dealt with wild swings.
Where Do We Go from Here?
Based on everything I’m seeing and hearing across the industry, here’s what we need to keep in mind:
Traditional price signals might not mean what they used to. When butter prices fall despite the USDA showing the tightest inventories in years, market structure issues go beyond normal supply and demand.
Component strategies need evolution. The protein-to-fat ratio processors want has shifted, and breeding programs might need adjustment. That feels like abandoning years of genetic progress, but markets change. The Jersey breeders I know are already talking about selecting for more moderate butterfat—targeting 4.5% instead of pushing toward 5%. Holstein operations that maintained balanced components are suddenly looking smart. Brown Swiss and Guernsey breeders are reassessing their component targets in response to processor feedback.
Risk management isn’t optional anymore. Even basic strategies like put options provide crucial downside protection. If you’re not working with someone on this, it’s time to start.
Mid-size commodity operations face the most pressure. You need either scale advantages of large operations or premium markets that reward quality differently than commodity channels.
I know this is challenging to process. Many built operations based on signals the market sent for over a decade—maximize components, breed for butterfat, invest in genetics. Now the market’s sending different signals, and adapting isn’t easy.
But dairy farmers are incredibly resilient. We’ve weathered droughts, surpluses, price crashes, and policy changes. This market structure challenge? It’s serious, but not insurmountable.
What encourages me is the innovative responses nationwide. Producers exploring new marketing arrangements, investigating value-added opportunities, and approaching risk management with fresh perspectives. A young producer in Minnesota recently told me, “My grandfather adapted when bulk tanks replaced milk cans. My father adapted when computers changed breeding programs. Now it’s my turn to figure out these new market dynamics.”
That perspective—acknowledging change while maintaining confidence—that’s exactly right.
October’s butter price action, with spot prices at $1.60 while inventories sit at six-year lows according to USDA data, shows the old rules might not apply. Understanding these new dynamics—electronic trading’s role, thin-market impacts, and the importance of component ratios—that’s crucial for smart decisions going forward.
The question isn’t whether markets return to the old ways. They probably won’t. It’s how quickly we adapt strategies to thrive where market structure matters as much as production efficiency.
We’ll figure it out. We always do. That’s what dairy farmers do—adapt, persevere, find a way forward. This time won’t be different.
For those interested in risk management tools, reach out to your cooperative or check CME Group’s educational resources. The University of Wisconsin’s Center for Dairy Profitability has excellent free tools for analyzing component pricing impacts at cdp.wisc.edu. Regional extension services provide valuable market analysis and decision-support resources tailored to local conditions. Organizations like the National Milk Producers Federation (nmpf.org) and your state dairy associations are actively working on market reform proposals worth following.
KEY TAKEAWAYS
Your milk check isn’t broken—the market is: 15 CME trades (600,000 lbs) now set prices for 1.8 billion lbs daily production
High butterfat became a liability overnight: Jersey farms lose $500K/year at current Class III/IV spreads ($2.47/cwt) while moderate-component Holsteins gain
Three farms found solutions that work: Pennsylvania group switched processors (6-month payback), Wisconsin neighbors negotiated together (+$0.35/cwt), Ohio farm reduced fat through nutrition (4.1% to 3.85%)
Risk protection costs less than you think: Class IV puts at $14 strike cost $0.15/cwt—that’s $450/month for a 500-cow dairy
This isn’t temporary: Algorithmic trading owns these markets now—farms still breeding for maximum butterfat are planning for yesterday’s market
Complete references and supporting documentation are available upon request by contacting the editorial team at editor@thebullvine.com.
Global Dairy Market Dynamics: Navigating Volatility and Strategic Opportunities in 2025 – For a strategic perspective, this piece reveals the global forces—from EU export pressures to Asian demand shifts—that influence domestic prices. It provides the crucial context for understanding why U.S. market signals are becoming disconnected from international trends.
From Milk Machines to Component Champions: How Genomics and Sexed Semen Are Remaking the Dairy Cow – This innovation-focused article details the solution to the breeding challenge highlighted in the main piece. It explains how to leverage modern genomics and sexed semen to precisely target the specific component ratios that processors now reward, moving beyond outdated volume-based models.
The Sunday Read Dairy Professionals Don’t Skip.
Every week, thousands of producers, breeders, and industry insiders open Bullvine Weekly for genetics insights, market shifts, and profit strategies they won’t find anywhere else. One email. Five minutes. Smarter decisions all week.
How the August tragedy at Prospect Valley Dairy reveals critical gaps in manure storage safety protocols—and the practical steps farms are taking to protect workers
Executive Summary: Six experienced dairy workers died in a Colorado manure pit this August—five of them trying to rescue each other, a pattern that causes 60% of confined space deaths. The tragedy exposed an uncomfortable truth: oil and gas operations face identical hydrogen sulfide hazards but prevent deaths through mandatory protocols, while dairy farms still treat these as accidents. Manure pits, especially with gypsum bedding, can produce H₂S levels that kill in seconds—up to 40 times the lethal threshold. Prevention costs less than treating mastitis: $450 for monitors, $1,800 for retrieval equipment, and free Extension training. But what actually changes behavior is asking yourself whether you’d send your own kid into that pit with your current safety measures in place. If that makes you uncomfortable, you know what needs to change today.
You know, when six men died from hydrogen sulfide exposure at Prospect Valley Dairy in Keenesburg, Colorado, on August 20, it sent a different kind of shockwave through our community. We’ve all dealt with equipment failures, weather disasters, and market crashes. But this? This hit differently.
The Weld County Coroner confirmed on October 30 what many of us suspected—all six victims died from hydrogen sulfide exposure in a confined space during what should’ve been routine maintenance work. And here’s what’s keeping me up at night: these weren’t greenhorns. We lost Ricardo Gomez Galvan, 40, the dairy manager. Noe Montañez Casañas, 32, assistant dairy manager. Jorge Sanchez Pena, 36, who managed services for High Plains Robotics. Alejandro Espinoza Cruz, 50, an experienced service technician, along with his two sons—17-year-old Oscar Espinoza Leos and 29-year-old Carlos Espinoza Prado.
What I’ve learned from sources familiar with the incident—Denver7 did some solid reporting on this—is that maintenance work was being performed on underground manure storage when a worker may have accidentally activated a valve or pump. That triggered a massive release of hydrogen sulfide. When the first person collapsed, the others rushed in attempting a rescue.
Here’s the thing that really gets me: Denver7 reported that a supervisor on-site was screaming at workers not to enter. But you know how it is—when you see someone you work with every day gasping for air, that instinct to help overrides everything. Dennis Murphy, up at Penn State, has been documenting this for years, and his research shows this “would-be rescuer” pattern accounts for about 60% of confined space fatalities nationally. Sixty percent. Think about that.
What Oil and Gas Has Already Figured Out
Safety Standard
Oil & Gas Industry
Dairy Industry (Typical)
Gap/Risk
H2S Entry Threshold
<5 ppm
Often not defined
No baseline safety
No Entry Above
50 ppm (strict)
No standard set
Unlimited exposure
Gas Testing Required
Always mandatory
Frequently skipped
Workers unprotected
Atmospheric Monitoring
Continuous real-time
Rarely implemented
No early warning
Worker Training
Mandatory pre-work
Often optional
Lack of awareness
Rescue Equipment
Required on-site
Rarely present
No rescue capability
Violations Consequence
Immediate termination
Warnings only
No accountability
Maria Espinoza’s comment to Colorado Public Radio really stuck with me. She lost her husband, Alejandro, and both their sons in this tragedy, and she pointed out something we need to hear: her other son works in oil and gas and received extensive toxic gas training before he could even approach a wellhead. As she put it, everything they do with toxic gases is impossible to do without protection because it’s so dangerous.
So why don’t dairies have that same commitment?
I pulled up Chevron’s publicly available confined space standards—you can find them online if you’re curious—and it’s eye-opening. They require H₂S levels below five ppm for safe entry. That’s half OSHA’s standard, by the way. Above 50 ppm? No entry allowed, period. No exceptions, no “we’ll just be quick about it.”
What’s interesting is the difference isn’t technology or even cost. They’ve simply made safety completely non-negotiable. A roughneck who skips atmospheric testing gets fired, no questions asked. Can we honestly say the same on our operations? I know I couldn’t until recently.
This comparison matters because—and this is what many of us miss—oil and gas faces the exact same hydrogen sulfide hazards we do. Same deadly gas, same confined spaces. But they treat it as a predictable, manageable risk requiring systematic controls. Meanwhile, we’re still treating these incidents as unforeseeable “accidents.” They’re not.
Understanding What We’re Really Dealing With
I’ve been around manure pits my whole life, and I’ll bet many of you have, too. But what’s interesting here is how hydrogen sulfide plays tricks on our senses in ways most of us never learned about.
At low concentrations, H₂S smells like rotten eggs. We all know that smell. But once it hits about 100 parts per million, it actually paralyzes your olfactory nerves. You literally can’t smell the danger anymore. Your body’s warning system shuts off right when you need it most.
From a rotten-egg smell to unconsciousness in one breath: This is why you can’t trust your nose around manure pits. At 100 ppm, H2S paralyzes your olfactory nerves—you literally can’t smell the danger anymore, even as concentrations climb to instantly fatal levels.
The National Institute for Occupational Safety and Health has benchmarks we all need burned into memory:
10 ppm: That’s OSHA’s permissible exposure limit for an 8-hour workday
100 ppm: Immediately dangerous to life and health—this is where smell disappears
500-700 ppm: You’re staggering and collapsing within 5 minutes
700-1000 ppm: Unconscious within 1-2 breaths
Above 1,000 ppm: Death is nearly instantaneous
Now here’s what really caught my attention. Eileen Wheeler’s team at Penn State has been monitoring dairy farms across Pennsylvania for years, and they’ve found that manure pits—especially those containing gypsum bedding—can produce hydrogen sulfide concentrations 17 to 39 times these fatal thresholds during agitation. We’re not talking about slightly over the limit. We’re talking about concentrations that kill in seconds.
The Gypsum Connection Nobody Saw Coming
This development really surprised me when I first learned about it. Gypsum bedding has become pretty popular over the last decade, and honestly, for good reasons. It absorbs moisture like nothing else, maintains that neutral pH cows prefer, and I’ve seen operations cut their mastitis incidence dramatically after switching. Plus, with lumber prices these days, recycled wallboard gypsum can be a real money-saver. Many Wisconsin operations have been using it with great success—from a cow comfort perspective.
But here’s what Wheeler’s research team discovered that should concern all of us: farms using gypsum bedding showed dangerous levels of hydrogen sulfide during manure agitation. Farms using traditional organic bedding—sawdust, straw, that sort of thing? Almost no H₂S release at all.
The chemistry, once you understand it, makes perfect sense. Under those anaerobic conditions in your manure storage, sulfate-reducing bacteria—mainly Desulfovibrio species, if you want to get technical—convert gypsum’s calcium sulfate into hydrogen sulfide gas. Lab work has shown that adding just 1% gypsum to cattle slurry can increase H₂S levels to nearly 4,000 ppm. That’s 40 times what NIOSH considers immediately dangerous to life and health.
The cow comfort choice that’s killing workers: Gypsum bedding slashes mastitis but produces H2S concentrations 20 times higher than sawdust or straw. Pennsylvania research found gypsum-containing manure storages hitting 100+ ppm during agitation—well into the ‘immediately dangerous to life’ zone.
Mike Hile put it simply when I talked to him about this: “Any time you work around manure storage, it is dangerous, but gypsum elevates the level of hydrogen sulfide. We want people to be aware of the hazards.”
Now, I’m not saying abandon gypsum if it’s working for your herd health. What I am saying is that if you’re using it, you need different safety protocols than your neighbor using sawdust. It’s worth noting that several insurance companies are starting to ask about bedding types in their risk assessments. That should tell us something.
Practical Steps Dairy Operations Are Taking
The agitation death window: H2S concentrations spike from 5 ppm to 120 ppm within 30 minutes of starting agitation—a 24-fold increase that turns a routine task into a lethal environment. Penn State researchers found the highest gas levels occur in the first hour, with peaks at 30 minutes.
I’ve been talking to operations across the Midwest since August, and what’s encouraging is seeing farms take concrete action. Here’s what’s actually working:
Changes You Can Make Today—And I Mean Today
Lock Down Your Confined Spaces
Walk your operation this afternoon. I’m serious—put down this article and do it if you haven’t already. Get your supervisors together and identify every single confined space. Your underground pits, obviously, but also above-ground tanks, those old concrete silos, feed bins, and even that bulk tank if someone has to crawl inside to clean it. Mark them all.
Then make this announcement, and make it stick: “Nobody enters any confined space without my direct authorization. If someone collapses, you don’t enter. You call 911.”
I know of several operations that went through this after near-misses, and they now treat violations as immediate termination offenses. Their incident rates? Dropped from double digits down to under 4%. That’s not a typo.
Order Gas Monitors Now
I called around to suppliers this week. BW Technologies makes a four-gas monitor that runs about $450 through Grainger. The Dräger X-am 2500 is around $650. Both detect oxygen, hydrogen sulfide, carbon monoxide, and methane. Most industrial safety suppliers offer next-day shipping to dairy regions—I had mine the next afternoon.
Here’s the thing that should motivate you: that’s less than the average workers’ comp claim for agricultural injuries, which the National Safety Council puts at over $40,000. We’re talking about equipment that costs less than a decent set of tires for your mixer wagon.
For those wondering about ongoing costs, calibration gas runs about $85 per bottle and lasts 6-12 months, depending on use. Most manufacturers recommend bump testing weekly—it takes only 2 minutes. My milkers do it while they’re waiting for the parlor to fill.
Have the Hard Conversation
Gather everyone who works on your place. And I mean everyone—your milkers, your feeder, that high school kid who helps on weekends, the nutritionist who comes monthly. If they set foot on your operation, they need to hear this.
Tell them exactly what happened in Colorado. Be blunt about it. Then drill in three things:
Someone down in a confined space? You don’t go in. You call 911.
Nobody approaches manure storage without testing the air first.
Don’t understand English? Speak up now. We’ll get Spanish training.
Tom Schaefer from the National Education Center for Agricultural Safety has been taking their confined space rescue simulator around the country for years. What he’s found—and this is crucial—is that the biggest challenge is overriding that rescue instinct. You have to give workers something else to do, like operating retrieval equipment, or they’ll go in anyway. Human nature is powerful.
Your 30-Day Action Plan
Get Your Paperwork Right
OSHA regulation 29 CFR 1910.146 requires written confined space procedures. Now, I know paperwork isn’t fun, but your Extension office has templates that make this painless. Dennis Murphy at Penn State has developed some excellent ones, and Cheryl Skjolaas at Wisconsin has materials specifically for dairy operations. Iowa State’s ag safety team has good resources, too. The key elements are atmospheric testing results, equipment checks, and rescue procedures—all documented before anyone goes in.
Buy Retrieval Equipment
Tripod and winch setups from companies like 3M Fall Protection or Miller by Honeywell run $1,500-3,000. That gets you the tripod, a 50-foot winch cable rated for 310 pounds, and a full-body harness. FallTech makes an entry-level system for about $1,800 that several Wisconsin dairies tell me works really well in our conditions.
As one safety investigator with decades of experience told me, the retrieval system lets you channel that rescue instinct into something that actually saves lives instead of creating more victims. Think about it—if High Plains Robotics had retrieval equipment staged that day, maybe we’d be telling a different story.
Schedule Real Training
Most states offer free Extension training. Wisconsin’s program through UW-Madison includes hands-on practice—they bring the equipment right to your farm. Michigan State trains hundreds of workers annually. The Texas A&M AgriLife Extension team has developed excellent bilingual training specifically for Hispanic workers, and they’ve reached thousands over the past few years.
If your state doesn’t have strong offerings—and I know some don’t—the National Safety Council offers online confined space training for around $195 per person. It’s worth every penny.
Learning from Farms Getting It Right
Let me share what I’m hearing from operations that have made safety transformation work.
One Nebraska dairy I know—they milk about 850 cows—had a near-miss a couple of years back where an employee lost consciousness near their reception pit. Fortunately, he was outside where fresh air revived him. But it was a wake-up call. They spent about $15,000 total on monitors for every building, retrieval equipment at both pits, and professional training for all 30 employees. Their insurance company—one of the big agricultural mutuals—cut their premiums substantially. The safety investment basically paid for itself in the first year.
But what really changed was the culture. They now start every shift with what they call a “safety minute”—just checking in about hazards for that day’s work. Are we agitating today? Anyone working near the pits? New people on site who need orientation? The owner tells me it’s actually made them more efficient, not less. When people feel safe, they work better. Simple as that.
Another operation I’m familiar with in Minnesota implemented what they call “Stop Work Authority” after attending a safety workshop. Any employee—from the newest hire to the herd manager—can stop any job if they see a safety issue. No questions asked, no punishment, no grief about it later. They’ve used it several times over the past couple of years, and each time it prevented what could have been serious incidents.
The Economics Nobody Wants to Discuss
Look, I know what you’re thinking. Money’s tight, milk price is volatile, and here’s another expense. So let’s be real about the numbers.
Research from the University of Texas School of Public Health lays it out pretty clearly:
Average dairy injury workers’ comp claim: Over $40,000
Cost of a workplace fatality, including indirect costs: Over $1 million
OSHA serious violations: Up to $161,323 as of 2025
Comprehensive safety program implementation: $10,000-25,000, depending on operation size
The math is brutal and simple: A $450 gas monitor costs less than treating a bout of mastitis, yet one workplace fatality runs over $1 million in direct and indirect costs. Nebraska dairy that spent $15K on full safety package? Insurance cut paid for it in 12 months.
But here’s what’s harder to quantify—can you find workers after a fatality? What happens to your milk contract if you’re shut down during an investigation? How does your community look at you?
I’ve talked to three operations that had fatalities in the last decade. They all say the same thing: finding workers afterward was their biggest challenge. One operation told me they had to increase wages significantly across the board just to get applicants. The financial hit lasted years.
What This Means for Different Types of Operations
If you’re running a smaller dairy (under 100 cows): Your close relationships with everyone on the farm are actually an advantage. The safety conversations might be easier because everyone knows everyone. But the equipment is just as necessary. And remember, OSHA’s small farm exemption only applies to operations with 10 or fewer employees—it doesn’t exempt you from liability if someone gets hurt.
For mid-size operations (100-500 cows): You’re in that tough spot where you’re too big for everyone to know everyone, but maybe not big enough for dedicated safety staff. Consider sharing resources with neighboring farms. I know of three farms in Wisconsin that went together on confined space rescue equipment they share. Cost each farm a fraction of what they’d have paid individually, and they train together quarterly.
Large dairies (500+ cows): Your challenge is consistency across shifts and with contractors. Prospect Valley had High Plains Robotics doing service work—that contractor relationship adds complexity. Every shift, every crew, every contractor needs the same standards. Consider appointing safety champions on each shift—workers who get extra training and maybe a small pay bump to help maintain standards.
Custom operators and contractors: You folks are walking onto different farms every day, each with its own hazards. You need portable equipment and—this is crucial—the authority to refuse unsafe work. Several states have developed model safety policies for custom applicators that are worth looking into.
For operations outside North America or those without strong Extension services nearby, online resources from the National Safety Council, OSHA’s website, and university programs offer downloadable materials. Many are available in Spanish, and some in other languages too.
Moving Forward: What Actually Changes Behavior
The heartbreak behind the statistics: 60% of confined space deaths are would-be rescuers who rushed in to save a coworker without proper equipment. At Colorado’s Prospect Valley Dairy, five of six victims died trying to rescue each other—the exact pattern NIOSH has documented for decades.
After reviewing dozens of successful safety transformations, here’s what I’ve noticed actually works:
Make it personal. One milker told me, through a translator, that when his supervisor explained the retrieval equipment was so his kids wouldn’t lose their dad, like those families in Colorado, everything clicked. Safety became about family, not rules.
Start small, but start now. You don’t need a perfect system tomorrow. But you need something better than what you have today. Even just buying monitors and requiring their use is progress.
Learn from near-misses. Every farm that successfully transformed its safety culture had stories of close calls that became teaching moments rather than secrets. Create an environment where people can report near-misses without fear.
Share what works. This isn’t competitive intelligence—it’s keeping our people alive. If you find a training program that really resonates with your Hispanic workers, tell your neighbor. If a certain monitor brand holds up better in our conditions, spread the word.
Quick Reference: Resources That Can Help
For immediate help setting up protocols:
Your state Extension safety specialist
OSHA Consultation: 1-800-321-OSHA (it’s free for small businesses)
National Education Center for Agricultural Safety: (319) 557-0354
Equipment suppliers who understand ag:
Grainger: 1-800-GRAINGER
MSA Safety: 1-800-MSA-2222
Industrial Scientific: 1-800-DETECTS
Visual resources: Search online for “confined space retrieval equipment setup” or “H2S concentration effects chart” for diagrams that complement this information.
What Happens Next
The six men who died in Colorado—Ricardo, Noe, Jorge, Alejandro, Oscar, and Carlos—they weren’t statistics. They were the guys who kept operations running, who knew which cows were off feed before anyone else noticed, who could fix that temperamental mixer wagon when nobody else could.
Their deaths were preventable with technology that costs less than we spend on hoof trimming and protocols that have been available for decades. The question now is what we do with that knowledge.
You can finish reading this, feel bad for a few days, then go back to business as usual. Or you can pick up the phone, order those monitors, and start changing how your operation values safety. Not eventually. Not after you talk to your banker. Today.
Every dairy owner needs to ask themselves: would I send my own kid into that pit with our current safety measures in place? If the answer makes you uncomfortable, you know what needs to change.
The technology exists. The knowledge exists. The training exists. What’s needed now is the decision that no production goal, no maintenance deadline, no economic pressure is worth the price of someone not coming home.
That’s a decision each of us has to make. And after Colorado, we can’t pretend we didn’t know better.
Key Takeaways for Your Operation
Looking at everything we’ve learned from Prospect Valley and farms that have successfully improved their safety:
Every dairy with manure storage faces these hazards—size and experience don’t eliminate risk
Bedding choices have safety implications—if you’re using gypsum, you need enhanced protocols
The technology is affordable—we’re talking about monitors that cost less than a decent bull calf
Culture beats compliance every time—workers follow what management demonstrates, not what’s written in the manual
Training must be ongoing and hands-on—that safety video from 2015 isn’t cutting it anymore
Engineering controls beat willpower—make the safe choice the only available choice
Complete references and supporting documentation are available upon request by contacting the editorial team at editor@thebullvine.com.
Learn More:
The Ultimate Manure Gas Safety Checklist – This tactical guide provides an actionable checklist for manure gas safety, detailing specific protocols for atmosphere monitoring, lagoon management, and equipment upgrades. It’s an essential resource for implementing the hands-on safety measures discussed in the main article.
AI and Precision Tech: What’s Actually Changing the Game for Dairy Farms in 2025? – This piece explores how innovative technologies are fundamentally reducing operational risk. It shows how AI-powered health monitoring and precision feeding not only boost yield but also minimize the need for employees to perform high-risk manual interventions on the farm.
The Sunday Read Dairy Professionals Don’t Skip.
Every week, thousands of producers, breeders, and industry insiders open Bullvine Weekly for genetics insights, market shifts, and profit strategies they won’t find anywhere else. One email. Five minutes. Smarter decisions all week.
Five years ago, these calves paid for groceries. Today, they pay for college. Tomorrow? That’s up to us.
EXECUTIVE SUMMARY: Remember when dairy bull calves brought $50 and you practically paid someone to take them? Fast forward five years: those same genetics crossed with Angus now bring $1,475, generating $360,000-500,000 annually for operations like yours. But here’s what changed this week—the Trump administration announced a potential doubling of Argentine beef imports, threatening to slash your calf values by 40% and costing you $288,000 per year. Markets immediately reacted (CME futures dropped 2.4%), and producers are running scared, with calculations showing that $1,200 calves could be worth just $720 by next year. Add in foot-and-mouth disease risks from a country vaccinating 53 million cattle twice yearly, plus four packers controlling 80% of processing who can source beef globally, and you’ve got a perfect storm threatening dairy’s most successful innovation. Wisconsin operations breeding 50% to beef face maximum exposure, while even premium local markets won’t escape commodity price pressure. The bottom line: that beef-cross revenue keeping your farm profitable and your kids interested in taking over? It’s now on Washington’s negotiating table.
You know, I was talking with a Pennsylvania producer last week who showed me his auction results on his phone—$1,475 gross for his Angus-cross calves. Impressive numbers that would make anyone smile. But then he said something that’s been on my mind ever since: “Five years ago, these same calves brought maybe $275 at the sale barn. Today, they’re covering college tuition and keeping us financially stable. But with these potential Argentine beef imports? The whole economics could shift.”
Here’s what’s interesting—and honestly, what’s keeping a lot of us up at night. This October, we’re watching international trade discussions intersect with our most successful revenue diversification strategy in ways nobody really anticipated. The speed of it all is remarkable… from the October 14th White House meeting to today’s market uncertainty, we’re talking about fundamental shifts in just over a week.
Five-year transformation showing beef-cross calf values surging from $275 to $1,475 while Holstein bulls lag far behind—illustrating the dairy industry’s most successful revenue diversification in decades
When Innovation Transformed Our Operations
Looking back at how beef-on-dairy took off, it’s one of those success stories we don’t see often in agriculture. The National Association of Animal Breeders tracked this transformation—beef semen sales to dairy farms grew from about 50,000 units in 2014 to over 3.2 million recently. That’s not just growth, that’s a complete rethinking of how we approach genetics and revenue.
Explosive growth: beef-on-dairy breeding surged 64-fold in just ten years, from 50,000 head to 3.22 million—transforming from niche experiment to mainstream profit strategy for dairy farmers nationwide
What I’ve found particularly encouraging is how this has played out financially. Farm Credit East’s profitability work shows cattle sales now contribute nearly 6% of total dairy farm revenue, up from 2% just three years back. For a typical 1,200-cow operation breeding 40% to beef—and many of you are probably in this range—we’re talking about $360,000 to $500,000 in additional annual profit. Real profit, after accounting for semen costs and those replacement heifers you’re not raising.
The elegance of this system, as many of us have discovered, is that your lower-genetic-merit cows—you know, those animals ranking in the bottom third for Net Merit, typically below , or falling under breed average for Dairy Wellness Profit Index—can produce beef-cross calves that bring $1,200 to $1,600 gross at auction. Meanwhile, you concentrate elite dairy genetics on your best animals. You’re actually improving herd quality while diversifying income.
Even smaller operations with 300-500 cows are seeing benefits, though the approach differs slightly. As a Vermont producer told me, “We can’t always get the volume premiums larger farms negotiate, but our local buyers appreciate the consistency of our beef-cross calves.”
How We’ve Made This Work
You probably know this already, but it’s worth reviewing what’s made this so successful. Most operations genomic test their herds and identify that bottom 30-40% based on genetic indexes—we’re usually looking at cows with Net Merit below $400 or Cheese Merit under $350, depending on your milk market. Then you use sexed dairy semen on your top performers for replacements, while breeding the rest to quality beef bulls—typically Angus, SimAngus, or Charolais.
The math is compelling and real-world, not theoretical. A Holstein bull calf might bring $50 to $150 gross at auction these days. That same cow bred to a good Angus bull? You’re looking at $800 to $1,600 gross for that calf. Even after the $30-35 semen cost, you’re ahead $700 or more per animal before considering marketing costs.
Quick Reference: Revenue Impact Scenarios
The financial reality: a 40% price decline from Argentine imports could slash your beef-cross profits by $288,000 annually—turning a revenue revolution into a survival challenge
Current Market (Baseline)
Gross auction price: $1,200/calf
600 calves = $720,000 gross
Net profit after all costs: $507,000
20% Price Decline
Gross auction price: $960/calf
600 calves = $576,000 gross
Net profit: $363,000 (-$144,000)
40% Price Decline
Gross auction price: $720/calf
600 calves = $432,000 gross
Net profit: $219,000 (-$288,000)
All calculations include semen costs, foregone heifer value, and 8% marketing expenses
The Trade Development That Changed Everything
So here’s where things get complicated. On October 14th, President Trump welcomed Argentine President Milei to the White House and announced a $20 billion financial support package for Argentina. Within a week—and this is what caught many of us off guard—Agriculture Secretary Rollins confirmed on CNBC that they’re exploring expanded beef imports from Argentina.
The existing trade relationship tells an interesting story. USDA’s Foreign Agricultural Service has tracked this—Argentina exports about $801 million in beef to us, while we send them roughly $7 million. That’s a massive imbalance reflecting their various import barriers.
The paradox: Argentine imports represent less than 1% of U.S. beef consumption, yet the 4x expansion to 80,000 tons triggered immediate futures crashes—proving markets react to signals, not just volume
Currently, Argentina ships about 44,000 metric tons annually under existing agreements. Word from the National Cattlemen’s Beef Association and others is that the administration is considering doubling this. And while that’s less than 1% of total U.S. consumption, as Derrell Peel at Oklahoma State’s Extension service has noted, markets react to signals as much as actual volumes.
Looking at history, this isn’t our first experience with expanded beef imports affecting prices. Back in 2003-2004, when BSE closed Canadian beef exports temporarily, U.S. cattle prices jumped 20-30%. When trade resumed in 2005, prices adjusted downward almost as quickly.
Understanding How These Trade Deals Work
Let me walk you through the mechanics here, because it matters for your operation. Argentina can currently ship 20,000 metric tons at minimal tariffs—we’re talking pennies per kilogram. Everything above that faces 26.4% tariffs according to USDA trade data. If they expand that low-tariff quota to, say, 80,000 tons, that fundamentally changes the competitive landscape.
Here’s the key point: Lower tariffs mean Argentine beef can undercut our prices while still being profitable for them. That pricing pressure flows straight back to what feedlots pay for your calves at auction. It’s not abstract; it’s direct cause and effect.
How Markets Are Already Responding
I’ve noticed that CME futures tell the story before anything else. When the Argentine import news broke on October 19th, live cattle futures dropped over 2% in one session. CME Group data shows that translates to about $100 less per finished steer.
Immediate impact: CME live cattle futures dropped $10/cwt in just nine days following Trump’s Argentine beef import announcement, with a brutal 2.6% single-day plunge showing how fast policy talk becomes market reality
A trader I’ve known for years explained it simply: “Feedlots buy dairy-beef calves based on what they expect 18-22 months out. When futures signal lower prices ahead, that immediately affects what they’ll bid at today’s auction.” Makes perfect sense, doesn’t it?
I’ve been tracking sales at Pennsylvania’s Belleville market, Wisconsin’s Equity locations, and Texas auctions—beef-cross dairy calves are bringing anywhere from $800 to $1,700 gross, depending on genetics and condition. Those premium Angus crosses with good frame scores, they’re getting top dollar. But that premium exists because beef supplies sit at just 28.7 million head, according to USDA’s July inventory—the lowest since 1961.
The Disease Risk We Can’t Ignore
Secretary Rollins acknowledged during her October 22nd CNBC interview that Argentina faces the threat of foot-and-mouth disease. This deserves our attention because the implications are serious.
The World Organization for Animal Health classifies Argentina’s main regions as “FMD-free with vaccination.” They vaccinate 53 million cattle twice yearly, according to SENASA, Argentina’s animal health service, because the disease remains endemic in neighboring countries. They haven’t had an outbreak since 2006, which is good, but those vaccination programs continue because the risk persists.
We haven’t seen FMD since 1929. We don’t vaccinate because the disease simply doesn’t exist here. USDA-APHIS’s 2024 analysis suggests an outbreak could cost between $2 billion and over $200 billion, depending on how it spreads.
For dairy operations specifically? An outbreak means movement stops. No shipping calves, no culling, potential depopulation. The UK’s 2001 experience—6 million animals destroyed, £12 billion in economic damage according to their National Audit Office—happened despite their response plans.
Who Controls the Market Matters
You probably already sense this, but the concentration in beef processing affects everything. USDA’s Packers and Stockyards Division data from 2024 shows four companies—JBS, Tyson, Cargill, and National Beef—control over 80% of processing capacity.
Market concentration reality: Just four companies—JBS, Tyson, Cargill, and National Beef—control 80% of U.S. beef processing, giving them massive leverage over what you’ll get paid for those beef-cross calves
JBS runs nine major U.S. plants while maintaining Argentine operations. Cargill’s been in Argentina since 1947 and, according to their own corporate statements, imports more products from there than anyone else. When you’ve got that flexibility, you source cattle wherever economics work best.
Brian Perkins at Kansas State’s ag econ department has observed what we all know intuitively—packers manage regardless of cattle origin. It’s producers who face the price pressure. What’s particularly interesting is that JBS announced $200 million in U.S. expansion in February 2025, despite reporting losses. Why expand when you’re losing money? Unless you expect cheaper cattle ahead…
Regional Differences Tell Different Stories
Region
Adoption Rate
Avg Herd Size
Current Calf Value
Annual Risk 40 Drop
Exposure Level
Wisconsin
50%
450
$1,285
$116K
High
Minnesota
48%
750
$1,300
$176K
High
Idaho
42%
1800
$1,250
$378K
Very High
Pennsylvania
40%
320
$1,475
$61K
Medium
California
38%
5200
$1,350
$996K
Extreme
New York
38%
280
$1,400
$47K
Medium
Texas
35%
850
$1,285
$178K
High
The impact varies dramatically by region, and understanding these differences is crucial.
Down in Texas and the Southwest, they’re already dealing with the screwworm situation that closed Mexican imports. That removed nearly a million feeder cattle, according to the Texas Cattle Feeders Association October report. Producers breeding heavily to beef report current gross auction premiums around $1,285 per calf. Add Argentine imports? As one told me, “It’s a one-two punch we didn’t see coming.”
Wisconsin and Minnesota really embraced beef-on-dairy. Extension specialists at UW-Madison report that most operations use beef semen, with many breeding 40-50% of their herds. A third-generation farmer near River Falls told me, “We went all-in because the economics were compelling. But we’re also more exposed if prices drop.”
Pennsylvania and New York operations often sell into local premium programs, which might provide some buffer. The Center for Dairy Excellence notes that many beef-cross calves stay regional. Still, even premium markets feel pressure when commodity prices shift.
California’s large operations—those with 5,000-plus cows—have financial depth but maximum exposure. When you’re breeding 38-40% to beef and generating $425 per cow in additional revenue, according to California Department of Food and Agriculture data, half-million-dollar swings become very real.
Out in Idaho, where operations average 1,800 cows, the infrastructure investment concerns me. As one Treasure Valley dairyman explained, “We built calf barns specifically for beef-cross programs. That’s capital we can’t easily redeploy.”
And let’s not forget the Southeast—Georgia, Florida, North Carolina operations. They’re dealing with heat-stress challenges but have found that beef-cross calves handle the climate better than pure Holsteins. Different market, same concerns about import pressure.
What Producers Are Doing Right Now
I’ve been talking with farmers across the country this week. Are you considering any of these strategies?
Many are accelerating breeding programs. If you planned 35% beef breeding and can push to 45% immediately, that might capture an extra $40,000-60,000 in gross revenue before markets shift. Yes, fewer replacements later, but with bred heifers at $2,800-3,200 according to Holstein Association USA October reports, you can buy them if needed.
Forward contracting’s getting serious attention. Some feedlots—Cactus Feeders in Texas, Five Rivers Cattle Feeding in Colorado—offer 6-12 month locks. As an Ohio producer with 900 cows told me, “I’d rather lock $1,100 gross now than risk $800 next fall.”
Others are reassessing everything. If the beef premium over dairy calves shrinks from $400 to $100, the math changes completely. An Illinois producer running 1,100 cows explained: “At $100 premium, I’m better breeding everything dairy and raising replacements.”
The Next Generation’s Decision
Here’s something not showing in projections but could reshape everything—succession planning.
A Minnesota producer I know well has an 850-cow operation. His daughter just finished her dairy science degree at the University of Minnesota, works full-time on the farm. But as he told me, “She’s looking at milk prices projected weak through 2026 by USDA, rising costs, potentially losing beef-cross revenue… and asking if this is viable long-term.”
When beef-cross programs generate $300,000-500,000 annually, that’s the difference between an operation worth inheriting and a marginal business. Remove that income, and that college graduate with options—she could make $65,000 starting at a dairy cooperative—reconsiders her future.
Christopher Wolf at Cornell’s Dyson School emphasizes we’re not just talking current economics. We’re discussing whether the next generation sees opportunity or a trap.
Practical Risk Management Today
For those reading this between milkings, here’s what needs attention:
Run scenarios at current gross prices, 20% lower, 40% lower. Know when pressure becomes critical. If 30% lower for 18 months creates problems, you need plans now.
Talk to your lender immediately. Discuss how beef-cross revenue affects debt coverage. Better to address issues using the available options.
Document your calf quality. Premium genetics and health protocols may maintain differentials even if commodity prices soften. Make sure buyers understand your value.
Consider risk tools seriously. Livestock Risk Protection insurance through USDA-RMA provides price floors. On 500-pound calves valued at $1,000, coverage might cost $40-80 per head for 6-month protection, depending on coverage level. CME futures work for operations selling 50-plus calves monthly. Some feedlots are exploring shared-risk models where price changes are split 50-50.
Connect with other producers. Through cooperatives, associations, or coffee shop conversations, collective voices matter.
Getting Your Voice Heard
Key organizations coordinating producer response include the National Cattlemen’s Beef Association at 303-694-0305, American Farm Bureau Federation at 202-406-3600, National Milk Producers Federation at 703-243-6111, and your state associations.
When calling representatives, be specific: employment numbers, local economic contribution, and exact revenue projections carry more weight than general concerns.
Where We Go from Here
Looking at this situation comprehensively, it demonstrates the complexity of modern dairy. We successfully innovated, creating revenue through genetics and smart adaptation. We invested in infrastructure, relationships, and profitable programs.
Now international trade and corporate dynamics threaten that progress. Not because we failed, but because Washington decisions could alter market fundamentals.
The Argentine discussion evolves daily. Producer organizations stay engaged, political pressure builds—especially in Nebraska and South Dakota—and the administration weighs factors. The implementation timeline remains uncertain, with some sources suggesting Q1 2026 and others suggesting it could move faster.
For those who’ve built successful beef-on-dairy programs, the immediate future requires navigating between protecting current revenue and preparing for shifts. Operations that’ll thrive maintain flexibility, strengthen relationships, and stay informed.
One thing’s certain—integrating dairy and beef through crossbreeding permanently changed resource utilization and profitability. Whatever happens with imports, that innovation won’t reverse. The question is whether American dairy farmers capture full value, or whether trade politics redirects benefits elsewhere.
As that Pennsylvania producer told me while we looked at his operation, “We’ll figure it out—we always do. But it would be nice if policy helped us succeed instead of making it harder.”
Watching the sun set over the hills here, thinking about all of you checking futures tonight, calculating scenarios, navigating another challenge… We’ll adapt, as we always have. The real $360,000 question isn’t just the money—it’s what it represents: our ability to innovate, diversify, and build sustainable operations for the next generation. That’s what’s truly at stake.
KEY TAKEAWAYS
Your Bottom Line: That $360,000-500,000 you’re making from beef-cross? A 40% price drop means losing $144,000-288,000 annually—run your numbers at $1,200, $960, and $720 per calf
Market Signal Already Sent: CME futures dropped 2.4% within days of announcement; feedlots adjusting bids now based on expected 2026-27 prices, not today’s market
The Risk Nobody’s Discussing: Argentina vaccinates 53 million cattle twice yearly for foot-and-mouth disease—importing from them gambles our FMD-free status maintained since 1929
Window Closing Fast: Forward contract locks available at $1,100 today vs. potential $800 spot prices tomorrow; LRP insurance still affordable at $40-80/head, but premiums will spike
Your Voice Matters: Specific calls work—tell representatives your employee count, local economic impact, and exact revenue loss (generic complaints get ignored)
Complete references and supporting documentation are available upon request by contacting the editorial team at editor@thebullvine.com.
Feed Quality and the Hidden Economics of Beef-on-Dairy Programs – Go beyond auction price with this Strategic Analysis that reveals the “Profit Paradox,” showing why high-cost, quality-focused programs achieve 30% grade improvements and long-term margins that significantly outperform minimum-effort approaches, protecting you when commodity prices fall.
AI for AI: Why Your Breeding Program Might Be Stuck in the Dark Ages – This Innovation Articledemonstrates how AI-powered genomic tools can be used to manage inbreeding risk and forecast genetic potential, helping you precisely balance beef-cross volume with the need for genetically superior replacementsto secure your long-term herd health and production capacity.
The Sunday Read Dairy Professionals Don’t Skip.
Every week, thousands of producers, breeders, and industry insiders open Bullvine Weekly for genetics insights, market shifts, and profit strategies they won’t find anywhere else. One email. Five minutes. Smarter decisions all week.
Nebraska’s dairy disaster reveals how processor compliance failures create new risks for farms—and what smart producers are doing to protect themselves.
EXECUTIVE SUMMARY: Recent investigation of Norfolk’s Actus Nutrition reveals how processor environmental failures create unprecedented business risks for dairy farms, with 284 violations in 12 months forcing municipal officials to work years without vacation to prevent system collapse. What makes this particularly concerning is that Nebraska’s consolidation from 650 farms to just 73 has created dependency relationships where producers defend violating processors rather than demand accountability. Meanwhile, European dairy farmers are turning similar compliance requirements into profit centers, with programs like Arla’s FarmAhead generating up to 2.4 Eurocents per liter for sustainability performance—proving environmental responsibility can enhance rather than threaten farm economics. Research shows that most standard farm insurance policies exclude environmental liability originating from off-farm sources, leaving producers exposed to cleanup costs that average six figures for minor incidents. The trend toward Extended Producer Responsibility in regulatory frameworks suggests farms may face increasing liability for supply chain environmental impacts they can’t control. Smart producers are already implementing five-step protection strategies: comprehensive documentation, processor transparency demands, alternative relationship development, insurance gap assessment, and information-sharing networks. Documentation beats desperation, alternatives beat dependency, and organized farms consistently outperform isolated ones in managing these emerging risks.
You know that uneasy feeling you get when something doesn’t smell right? Here’s a story that should make every dairy producer sit up and take notice.
Picture this: You’re running a clean operation, adhering to every regulation, maintaining excellent butterfat performance, and achieving solid somatic cell counts. Your processor, on the other hand, is breaking environmental laws more often than a rookie employee breaks equipment.
When the cleanup bills start rolling in—and they will—guess who might be holding the bag?
It’s happening right now in Norfolk, Nebraska, and frankly, it should be keeping all of us up at night. Actus Nutrition managed to rack up 284 wastewater violations over just 12 months, according to detailed reporting from Nebraska Public Media and Flatwater Free Press. That’s a 71% failure rate, as documented by Norfolk’s wastewater superintendent Robert Huntley.
Dairy processors generate 2.75 liters of wastewater per liter of milk—Norfolk’s 800 mg/L BOD levels are nearly triple the legal limit
Let me put that in perspective: they were violating environmental laws more often than they were following them.
The violations became so severe that Huntley worked two consecutive years without taking a vacation, as he was afraid to leave the treatment system unattended. Two years. Think about that—a municipal employee couldn’t trust a dairy processor not to destroy the city’s wastewater system while he was gone for a week.
And here’s what makes this bigger than one processor’s mess-up: those 284 violations happened while politicians called for “cooperation” and Nebraska’s 73 remaining dairy farms watched their only local market systematically break environmental laws. It’s a window into how industry consolidation has created business risks that many of us have yet to fully grasp.
Norfolk Actus Nutrition’s staggering 284 violations in one year expose how processor failures create catastrophic risks for dairy farmers. With a 71% violation rate versus industry standards of under 5%, every farm shipping there faces unprecedented business continuity risks.
When Your Lifeline Creates New Liability Risks
Mike Guenther runs a third-generation dairy operation near Beemer, and when he talked to reporters, he said something that really stuck with me: “We would not be dairy farming today if that market did not open.” His family’s operation relies entirely on a processor that fails to meet environmental compliance nearly three-quarters of the time.
But that’s not just Mike’s problem anymore. It’s becoming the new reality in regions where processing has consolidated. Nebraska went from 650 dairy farms in 1999 down to just 73 today, according to the same Nebraska Public Media investigation.
Nebraska’s brutal dairy consolidation leaves just 73 farms from 650 in 1999—and now their only processor is failing environmental compliance. This chart shows how industry consolidation creates vulnerability when processors cut environmental corners.
When those numbers shift that dramatically, the whole power relationship changes. Instead of processors competing for your milk, you’re competing for processor access.
This dynamic shifts risk away from the folks creating the problems. All that individual farm management excellence—fresh cow management protocols, transition period nutrition, dry lot systems—becomes less protective when business continuity depends on someone else’s environmental compliance.
You can run the cleanest operation in your county, but if your processor is trucking “high strength waste” to undisclosed locations (which is exactly what EPA inspectors caught Actus doing), you’re suddenly exposed to risks you never created.
Looking at what happened in Norfolk, several types of risk emerge that affect all suppliers equally:
Payment disruption becomes a real possibility when regulatory actions start affecting the processor cash flow
Environmental liability exposure creeps in when cleanup costs might exceed what processors can actually pay
Contract stability gets shaky when processors face regulatory pressure
Access restrictions emerge as more buyers want to verify environmental compliance throughout their entire supply chain
These risks persist regardless of the quality of farm management. When Actus faces $5,000 daily fines for biochemical oxygen demand violations that literally “killed the microorganisms needed to treat the city’s wastewater,” according to municipal reports, every single farm shipping there faces potential consequences.
The domino effect of processor environmental failures: From Norfolk’s 284 violations to devastating farm closures across Nebraska. This flowchart reveals how environmental compliance failures cascade through the entire dairy supply chain, creating risks most producers never see coming.
Five Essential Steps to Protect Your Operation
Your Farm Protection Blueprint – These five systematic steps create multiple layers of defense against processor environmental disasters. Documentation beats desperation, alternatives beat dependency, and organized farms consistently outperform isolated ones in crisis situations.
The producers who seem to be handling this well have developed systematic approaches focused on five main areas:
Step 1: Build Rock-Solid Documentation Systems
Create detailed records of every processor relationship and milk shipment. This becomes crucial if environmental liability issues ever arise, because you’ll need proof of exactly what materials you contributed to processor waste streams and when.
Your documentation system should include:
Complete milk shipment records with dates, volumes, and quality data
All communications with processors—emails, texts, contract modifications
Payment records and any unusual delays or adjustments
Transportation and pickup confirmations
Details about what your current insurance actually covers and what it doesn’t
Wisconsin producers who maintain monthly spreadsheets tracking payment timing across different processors can spot systematic problems weeks before farms without documentation.
Step 2: Request Complete Processor Transparency
Ask any processor receiving your milk to provide information about their environmental compliance status, current violation records (which are generally public information anyway), waste disposal documentation and permits, and treatment system capacity information.
Frame this as standard business due diligence—because that’s exactly what it is.
Processors willing to provide transparency usually have better compliance records. The ones who push back or delay responses tell you something important, too.
Step 3: Develop Alternative Processing Relationships Systematically
Identify processors accepting new suppliers in your region, research their environmental compliance track records through public records, understand pricing and terms differences, and calculate hauling costs and logistics requirements.
Norfolk shows why depending entirely on single processors creates unnecessary risk. Even when your primary relationship is working well, backup options provide crucial business continuity protection. This doesn’t mean you need to split production, but you should maintain regular communication with secondary processors about capacity and terms.
Many Midwest producers maintain relationships with two to three processors, even if they’re primarily shipping to one. Takes extra effort, but provides options when situations like Norfolk develop.
Step 4: Evaluate Your Insurance Coverage Gaps
Most standard farm policies don’t cover environmental liability that originates from off-farm sources. This creates potential gaps in coverage for situations like gradual contamination from downstream facilities, transportation-related incidents beyond your farm gates, and supply chain environmental issues.
Take a hard look at what your current farm insurance policies actually cover regarding environmental issues, and consider whether additional environmental liability protection might make sense for your specific situation.
Step 5: Join Information-Sharing Networks
Connect with other farms that ship to the same processors or face similar risks. Share information about processor performance, publicly available compliance information, payment patterns, and alternative market options.
Here’s how this works: If you’re shipping to a processor that starts delaying payments by 5-7 days, you might assume it’s a temporary cash flow hiccup. But if five other farms report the same delays, that suggests systematic problems affecting everyone. That shared information helps farms make better decisions about risk management.
What Europe’s Doing Right with Environmental Compliance
Same Industry, Opposite Outcomes – While European farmers earn up to 2.4 Eurocents per liter for environmental performance, American producers face 284 violations and $5,000 daily fines from processor failures. The difference isn’t the regulations—it’s who absorbs the costs and who shares the benefits.
While American producers face environmental liability concerns stemming from processor failures, European producers have leveraged environmental compliance into profitable opportunities. The contrast shows what’s possible when farms organize differently.
UK dairy farmers achieved an 80% participation rate in carbon footprinting programs, facilitated by cost-sharing agreements with retailers, as reported in our previous coverage of these initiatives. Instead of farms absorbing all environmental compliance costs individually, producers worked collectively to get retailers and processors to share sustainability investment costs.
Region
Company
Emissions Target
Premium
Key Program
Investment
European
Arla Foods
63% by 2030
1.5-2.4¢/L
FarmAhead Chk
Retailer part
European
FrieslandCamp.
33% scope 3
1.5¢/kg
Nutrient Cycle
$47M Mars
US
Actus Nutrit.
None
None
Compliance
284 violations
US
Typical US
Limited
Minimal
Reg minimum
Cost-cutting
Here’s what that looks like in practice:
Arla’s FarmAhead program pays farmers up to 2.4 Eurocents per liter for verified sustainability performance, according to documentation from the World Business Council for Sustainable Development
FrieslandCampina pays 1.5 Eurocents per kg when farm emissions drop below specific thresholds, as reported in industry publications
M&S recently invested £1 million in methane-reducing feed additives for their milk suppliers, according to Dairy Reporter
The key difference is that organized producers created leverage to ensure environmental improvements generate shared benefits, rather than just imposing costs on farms. When retailers profit from sustainability marketing claims, producers get compensated for generating the performance that supports those claims.
Quick-Start Protection Checklist
This Week: □ Print and organize all milk receipts from the past 12 months □ Create a digital backup of all processor communications □ Request environmental compliance records from the current processor □ Contact the insurance agent about environmental liability coverage
This Month: □ Research alternative processors in hauling distance □ Connect with 3-5 other farms shipping to the same processor □ Document current payment timing and contract terms □ Calculate costs for backup processing relationships
Next 30 Days: □ Establish monthly documentation routine □ Build information-sharing network with nearby producers □ Evaluate additional insurance coverage options □ Create emergency communication plan for processor issues
How Environmental Failures Actually Hit Your Bottom Line
The Path to Farm Failure Starts Slowly, Then Accelerates – Environmental compliance disasters don’t happen overnight. They begin with delayed payments, progress to contract instability, and end with environmental liability that can destroy operations built over generations. Norfolk’s 284 violations prove this timeline is already underway.
When Actus got caught illegally disposing of dairy waste during EPA inspections, it created immediate concerns for every supplier farm. Payment delays become possible when regulatory fines reduce the processor’s cash flow. Contract modifications or outright cancellations can happen when processors decide they need to reduce waste loads.
Documentation requests from environmental regulators begin to flow as they trace waste sources back to individual farms.
David Domina—an environmental attorney with experience in major agricultural cases, including the Keystone Pipeline litigation—noted that similar Nebraska cases involving processors exceeding wastewater capacity “resulted in consent decrees with substantial fines.” These settlements typically include ongoing compliance monitoring and financial penalties that affect processor operations for years.
Those costs ultimately impact the farms supplying them.
There’s a growing trend in regulatory frameworks toward holding various parties in supply chains responsible for environmental impacts throughout the entire production process. While this is not yet widespread in the dairy industry, the regulatory direction appears to be moving in that direction.
When Collective Action Makes Financial Sense
The most successful producer responses to processor environmental risks involve collective organization that builds information-sharing capabilities while maintaining individual farm autonomy. This addresses shared risks through coordinated action without requiring formal cooperative structures.
Pennsylvania producer groups coordinate information sharing about processor performance without forming legal partnerships. They meet monthly to share their observations on payment timing, communication quality, and operational reliability. This creates earlier warning systems and stronger documentation for addressing problems.
Environmental liability documentation efforts can be shared among multiple farms to reduce individual legal consulting costs. Processor performance monitoring across multiple farms identifies systematic issues that deserve attention. Alternative processing coordination allows producer groups to collectively explore backup options and share information about terms and capacity.
Learning From International Approaches
Canadian dairy policy includes proAction environmental requirements that create shared responsibility for environmental performance across supply chains, according to Dairy Farmers of Canada documentation. Rather than isolating environmental liability on individual farms, the system creates collective standards with shared compliance support.
These frameworks suggest approaches where environmental compliance becomes a shared responsibility of the supply chain, rather than an isolated liability of individual farms. That’s different from situations like Norfolk, where farms may absorb environmental risks for processor compliance failures they can’t control.
International approaches often yield better environmental outcomes overall because they align incentives across the entire supply chain, rather than placing all responsibility on individual farms.
Norfolk’s Actus sits in the critical risk zone with 284 violations and $5,000 daily fines—where does your processor rank? This interactive assessment tool helps dairy farmers evaluate their processor’s environmental compliance risk before it becomes their business crisis.
The Bottom Line
Norfolk’s 284 violations prove that the old model—where farms focus entirely on individual excellence while trusting processors to handle their responsibilities—no longer provides adequate protection in today’s complex regulatory and market environment.
Environmental compliance is becoming an increasingly important factor in processor relationships and market access—whether you’re in California’s Central Valley, dealing with water regulations, or in New York, managing nutrient management plans, or in Idaho, navigating air quality requirements. The specific regulations vary by region, but the trend toward supply chain accountability is a universal phenomenon.
The producers who recognize this shift and adapt their risk management approaches will be better positioned for whatever comes next.
The European examples demonstrate that environmental compliance can become a profit opportunity when supply chains effectively share responsibility. Whether American producers will develop similar collaborative approaches remains to be seen, but Norfolk’s disaster is already laying the foundation for change.
The next chapter is being written right now. The question is whether you’ll learn from Norfolk’s disaster in time to protect your operation—and maybe even turn environmental compliance into the competitive advantage it should be.
Because at the end of the day, documentation beats desperation, alternatives beat dependency, and organized farms beat isolated ones every single time.
Start with your documentation this week. Your future operation will thank you.
KEY TAKEAWAYS:
Document everything systematically – Wisconsin producers tracking payment timing across multiple processors identify systematic problems weeks earlier than undocumented farms, providing crucial early warning for business decisions
European sustainability premiums reach €96,000 annually for larger operations through programs like Arla’s FarmAhead, proving environmental compliance can generate substantial profit when supply chains share costs rather than dump them on producers
Standard farm insurance excludes processor-related environmental liability, creating coverage gaps for gradual contamination, supply chain issues, and cleanup costs that typically exceed $100,000 even for minor incidents
Alternative processing relationships provide crucial protection – Midwest producers maintaining backup relationships with 2-3 processors gain negotiating leverage and business continuity that single-source operations lack during regulatory crises
Collective information sharing creates 10x better early warning systems than individual monitoring, with Pennsylvania producer groups identifying systematic processor problems months before they affect individual farm operations
Complete references and supporting documentation are available upon request by contacting the editorial team at editor@thebullvine.com.
Learn More:
The Ultimate Guide to Contingency Planning for Dairy Farms: Why Paranoia is Your Best Friend – This tactical guide provides a detailed blueprint for building your own farm’s crisis plan. It reveals specific strategies for financial readiness and workforce redundancy, helping producers build the operational resilience needed to protect their business from both on-farm and off-farm disruptions.
Will Your Dairy Farm Survive the Next Decade? The Brutal Math of Consolidation – This strategic article delivers a stark, data-driven analysis of the industry’s accelerating consolidation. It provides a deeper understanding of the market forces that created the Norfolk disaster, outlining two primary survival strategies for farms: scaling up or pivoting to high-margin niche markets.
The Tech Reality Check: Why Smart Dairy Operations Are Winning While Others Struggle – This piece on innovation provides a crucial reality check on technology adoption. It reveals the true ROI of investments like robotic milking and automated health monitoring, helping producers avoid common mistakes and strategically implement technology to slash labor costs and improve herd efficiency.
The Sunday Read Dairy Professionals Don’t Skip.
Every week, thousands of producers, breeders, and industry insiders open Bullvine Weekly for genetics insights, market shifts, and profit strategies they won’t find anywhere else. One email. Five minutes. Smarter decisions all week.
China’s 145M-lb whey surge masks a 39% milk powder crash—here’s why that split should terrify every dairy farmer.
EXECUTIVE SUMMARY: China’s August whey imports hit 145.3 million pounds—a 30-month high that most analysts are calling a recovery, but the real story lies in what they’re not buying. While raw whey surged 31.1% from the U.S., China simultaneously slashed consumer dairy purchases by 32-37% across categories, revealing a calculated strategy that’s fundamentally reshaping global dairy trade. Recent Trade Data Monitor analysis shows that China’s combined milk powder imports dropped to a decade-low level, despite a 9.2% decline in their domestic production, indicating a willingness to sacrifice short-term efficiency for long-term control over consumer-facing dairy products. This isn’t random buying—it’s surgical selection between industrial necessities they’ll import and consumer products they’re determined to control domestically, creating what industry observers now recognize as a two-tier global supplier system. The implications extend far beyond export markets, as disrupted trade flows affect regional milk pricing from California to Vermont when excess product seeks new outlets. Forward-thinking dairy operations are already adapting by building flexible processing capabilities and diversifying market relationships, recognizing that supply reliability now often trumps cost advantages in this politically sensitive landscape.
What if China’s latest trade data isn’t a recovery, but a warning? It’s the first sign that they’re no longer playing the commodity game, and that changes everything for us in the dairy industry.
Here’s what the August numbers tell us: China’s dry whey imports hit 145.3 million pounds—the highest we’ve seen in 30 months, according to Trade Data Monitor. Most analysts are calling it a seasonal bounce-back. However, when I began investigating what else they’re purchasing (and what they’re not), a different story emerges.
The whey surge shows a 4.8% increase over last year’s already strong volumes, with U.S. shipments rising 31.1% after the temporary tariff pause following the Trump-Xi TikTok negotiations. But here’s the kicker: while raw whey imports climbed, China simultaneously slashed consumer dairy purchases. Trade Data Monitor shows whey protein concentrate with at least 80% protein dropped 32%, butter fell 37%, and cheese declined 12% compared to August 2024.
This isn’t random buying. It’s surgical. China’s making calculated choices about what it’ll depend on others for and what it wants to control itself. And that selective strategy should make every dairy producer take notice.
China’s Strategic Import Split: Raw whey imports surge to 30-month highs while consumer dairy purchases crater—revealing a calculated two-track strategy that’s reshaping global dairy trade dynamics. The August divergence isn’t seasonal recovery—it’s economic warfare disguised as commerce.
China’s Two-Track Strategy
Looking at these patterns over the past 18 months, China’s developed what you might call a dual approach to dairy imports. Once you see the logic, it’s actually brilliant from their perspective.
Track one: They’re building an iron wall around consumer dairy—milk powders, cheese, yogurt—anything where domestic consumers care about brands and food safety stories. Complete control from farm gate to grocery shelf? That’s the goal.
Track two: They’re maintaining strategic lifelines for industrial ingredients like feed-grade whey that keep their livestock machine running. What I find particularly striking is they’re not trying to replace everything. They’re cherry-picking where they want independence versus where they’ll accept managed dependence.
The data backs this up. Trade Data Monitor reports their combined whole and skim milk powder imports through August reached just over 1 billion pounds—among the lowest January-through-August totals we’ve seen in a decade, despite a modest 1.4% increase from 2024. Meanwhile, the raw whey continues to flow because they have structural protein needs in their feed chains, especially with the ongoing rebuilding of the swine herd after African Swine Fever.
Here’s the smoking gun: China Dairy Industry Association data show that their domestic milk production actually declined 9.2% year-over-year in early 2025, with farmgate prices hitting decade lows of around $19.40 per hundredweight. Yet they’re still pushing self-sufficiency programs. This isn’t market-driven consolidation—it’s a strategic purge of smaller farms while state-connected operations get the backing they need.
The Infrastructure Arms Race Nobody Saw Coming
What surprised me most while researching this piece is the dramatic shift in the rules of export success. The old playbook—seasonal contracts, futures hedging, steady customer relationships—just got torched.
European suppliers learned this the hard way during recent trade disruptions. When Beijing needed to replace American whey volumes at lightning speed, EU exporters looked golden on paper. However, industry observers report that they couldn’t pivot their processing lines and logistics quickly enough. That’s the kind of wake-up call that costs millions and rewrites your entire export strategy.
The winners these days have built what some call flexible infrastructure. From my conversations with producers across different regions, this typically includes:
Adaptable processing capabilities that can shift volumes and specifications on a dime—something many Midwest cooperatives are scrambling to build
Digital contract systems that handle real-time adjustments when trade winds shift
Multi-origin sourcing arrangements so they can blend from different locations as regulations change
Strategic storage partnerships in key trade zones
Risk monitoring systems that track diplomatic developments alongside milk futures
New Zealand’s the poster child for this approach. Industry reports indicate that their exporters have leveraged duty-free FTA access to command pricing premiums of 15-25%, while maintaining a consistent market share, even during the most severe U.S.-China trade disputes. But it’s not just about lower tariffs—it’s the supply guarantee that Chinese buyers will pay extra for when everything else feels like quicksand.
A perfect example is a Wisconsin cooperative that partnered with processing facilities in three different states, enabling them to blend products to meet shifting regulatory requirements. When one plant faced inspection delays, they pivoted production seamlessly. That kind of flexibility was unthinkable in our industry five years ago, but it’s now table stakes for anyone serious about export markets.
When Politics Hijacked Commodity Trading
Risk Category
Traditional Dairy Trading
Political-Aware Trading
Primary Concerns
Weather, Feed Costs, Milk Prices
Tariff Changes, Trade Wars
Contract Length
90+ days standard
30-60 days maximum
Price Volatility
±15% seasonal variation
±40% political swings
Success Metrics
Lowest cost per unit
Supply guarantee premiums
Infrastructure Investment
$50K-100K processing focus
$150K-400K political hedging
Market Response Time
30-60 days planning cycles
24-48 hour pivot capability
Here’s something that would’ve sounded like science fiction five years ago: major Chinese importing companies now run specialized war rooms that monitor diplomatic developments 24/7. These aren’t your grandfather’s commodity desks—they’re designed to pounce when political windows crack open.
Early intelligence suggests that when Trump and Xi reached a preliminary agreement on TikTok in September, some buyers responded with remarkable speed to secure additional whey contracts. That response time has forced exporters to tear up their traditional playbooks entirely.
Many are now offering what amounts to “political insurance policies” instead of standard long-term contracts:
Rapid-response rolling contracts that buyers can adjust monthly rather than seasonally
Price adjustment clauses that activate automatically when trade conditions shift
Option-style agreements that give buyers escape hatches without firm commitments
Risk-tiered payment structures that fluctuate with political temperature
Bottom line? Supply certainty now trumps rock-bottom pricing. If you can guarantee delivery when the diplomatic weather turns nasty, buyers will pay handsomely for that insurance.
Decoding the Import Data Tea Leaves
China’s buying patterns reveal its master plan, and understanding it matters because these ripple effects also impact domestic markets. You’ve got falling production while farmgate prices crater, yet they’re doubling down on self-sufficiency. Seems backwards until you realize their endgame isn’t maximizing every gallon—it’s owning the consumer narrative while keeping industrial lifelines they can’t easily replace.
This creates genuine opportunities if you can read between the lines. Many exporters are pivoting heavily toward industrial ingredients, such as feed-grade whey, lactose, and protein isolates. These products typically dodge political crossfire and show steadier demand patterns than consumer brands caught in the culture wars.
For most family dairies, you’re not cutting deals with Beijing directly. But grasping these dynamics helps you evaluate your cooperative’s chess moves and ask the right questions about where your milk premiums really come from. When major export channels get choked off, that milk needs somewhere to go, and it usually lands in regional markets at prices you feel.
The milk powder market tells the flip side of this story. Ever.Ag analysis shows skim milk powder imports crashed to an 11-month low at 21.8 million pounds in August—down 39% from last year. This tracks with USDA forecasts as China builds domestic capacity to strangle consumer product imports. For U.S. producers, that means excess powder that used to flow east needs new homes, creating pricing pressure from California to Vermont.
The New Geography of Dairy Power
What’s crystallizing—and the data’s still developing—is a complete redraw of the dairy trade map. The old model, based on production costs and shipping rates, has been replaced by something that resembles geopolitical chess more closely.
You’re seeing the emergence of what might be called preferred suppliers versus spot market survivors. Preferred suppliers build fortress-like relationships for essential industrial ingredients. New Zealand, with its FTA armor, select Canadian operations, and some U.S. cooperatives with the right infrastructure, earns this status. They command premium pricing and steady volumes even when diplomatic storms rage.
Everyone else is relegated to spot markets that surge and crash with the flow of political headlines. U.S. whey shipments exploded 31.1% in August, but that could evaporate overnight if negotiations derail.
This forces brutal choices for cooperatives and larger operations. Either invest heavily in the infrastructure and relationships necessary for preferred supplier status, or accept the rollercoaster ride that comes with opportunistic trading.
Even smaller operations focused on domestic markets can’t ignore these shifts. When export channels slam shut, that milk floods back into regional markets, affecting pricing and cooperative strategies across the board. Northeast operations, for instance, are finding that disrupted export flows from larger processors can create unexpected opportunities in regional specialty markets, but also pricing volatility they hadn’t planned for.
Technology as the Great Leveler
Here’s the silver lining for smaller players: technology and transparency can help narrow the gap. Digital platforms that provide real-time supply chain visibility, inventory tracking, and bulletproof quality documentation help build trust with buyers, thereby managing political risk.
Some forward-thinking operations now offer enhanced traceability using blockchain verification—not just for exports, but also for domestic premium markets. Others have built systems giving buyers instant access to shipment tracking and quality data when their primary channels face disruption.
One development that has caught my attention is that several regional cooperatives are pooling resources to create shared digital documentation systems. Instead of each co-op burning cash on expensive individual platforms, they’re creating shared systems that deliver the transparency buyers demand at a fraction of the cost. A group of Northeast cooperatives recently launched this approach, and early reports suggest it’s opening doors to specialty contracts they couldn’t access before.
Technology investments vary wildly depending on scale and ambition. But producers across different regions tell me better documentation systems help with everything from organic certification to regional branding, not just export markets.
Different Operations, Different Survival Strategies
Scale Matters: Larger dairy operations face higher volatility but gain greater access to premium opportunities, while family farms maintain more stability with fewer investment demands. Know where you stand in the new dairy trade hierarchy.
These seismic shifts hit different dairy operations in unique ways:
For family dairies (50-500 cows): You probably aren’t cutting export deals directly, but understanding these currents helps you evaluate your cooperative’s strategic positioning. When co-op leadership talks about export market development, you’ll know what hard questions to ask about infrastructure investments and political risk management.
For regional cooperatives, these changes highlight the critical importance of processing agility and market diversification. The ability to pivot between consumer products and industrial ingredients becomes a survival skill when export channels face political headwinds. The cooperatives weathering this storm best seem to be those that can dance between markets when one door slams shut but another cracks open.
For larger commercial operations, direct export opportunities exist, but they require significant infrastructure investment and sophisticated risk management. The fundamental question becomes whether you want to build those capabilities or double down on domestic market strength where you control more variables.
Early signals suggest that operations with bulletproof domestic market positions—through organic premiums, regional branding, or lean cost structures—may weather export market volatility better than those reliant on commodity export pricing.
Seasonal Rhythms and Market Timing
These trade dynamics interact with our production cycles in ways that amplify their impact. When export markets get strangled during flush season, the pricing pain cuts deeper than during lower production periods. Spring 2025 was particularly brutal when trade tensions peaked just as production ramped up across most regions.
Regional timing differences matter more than ever. California’s steadier year-round flow doesn’t face the same vulnerability to flush season as Wisconsin operations, where peak production typically occurs from April through June. Vermont and other northeastern states often peak later, from May through July, while some southern operations surge earlier. These regional patterns affect how export market disruptions ripple through local pricing.
The August whey surge hit during the sweet spot when many operations plan fall feeding programs and evaluate protein ingredient needs for the coming year. That timing likely amplified the volume response once buyers could reaccess U.S. products.
The Bottom Line
China’s whey surge isn’t just about seasonal recovery—it’s a preview of how agricultural trade has evolved into a landscape where political alliances and supply guarantees often outweigh traditional cost advantages. The old dairy trade model—built on seasonal patterns, cost advantages, and handshake relationships—has evolved into something where political awareness and supply chain agility separate winners from losers.
Those who recognize this shift and adapt accordingly will find tomorrow’s opportunities. Those waiting for yesterday’s patterns to return may find themselves managing more volatility than they bargained for. This season’s whey market performance offers a crystal ball into this transformed landscape—the key question each of us must answer is which changes actually affect our specific operation, and which ones we can safely ignore while focusing on what we do best.
KEY TAKEAWAYS
Processing flexibility pays premiums: Operations that can pivot between consumer products and industrial ingredients are commanding 15-25% higher margins during trade disruptions, as buyers prioritize supply certainty over rock-bottom pricing.
Infrastructure investment separates winners from survivors: Cooperatives building shared digital documentation systems and multi-origin blending capabilities are accessing specialty contracts worth $0.50-$1.20 per hundredweight above commodity rates while reducing political risk exposure.
Regional market diversification protects against export volatility: Dairy operations with strong domestic positions, achieved through organic premiums or regional branding, weather export market swings 40% better than those dependent on commodity export pricing.
Technology levels the playing field for smaller players: Shared blockchain traceability systems among regional cooperatives are opening doors to premium markets that were previously accessible only to large-scale exporters, while providing the transparency that buyers now demand.
Political awareness becomes essential business intelligence: Understanding diplomatic developments alongside traditional market fundamentals is helping progressive operations time contract negotiations and inventory decisions to capture opportunities when political windows open.
Complete references and supporting documentation are available upon request by contacting the editorial team at editor@thebullvine.com.
Learn More:
Why This Dairy Market Correction Feels Different – and What It Means for Our Farms – This strategic analysis reveals that the current dairy market correction is unlike previous cycles, driven by a global confluence of factors like surging New Zealand production and plummeting Chinese imports. It provides essential context on why commodity prices are so volatile and offers insights on diversification to survive this extended period of pressure.
The $8 Billion Infrastructure Trap: Why America’s Dairy Boom Could Become Its Biggest Bust – This article directly addresses the processing flexibility challenge raised in the main piece, arguing that the U.S. dairy industry’s massive infrastructure investment is a risky bet. It provides a tactical checklist for producers to evaluate their own exposure and prepare for a potential oversupply crisis.
Tech Reality Check: The Farm Technologies That Delivered ROI in 2024 (And Those That Failed) – This piece complements the discussion on technology as a leveler by providing a practical, data-driven look at which farm technologies are delivering real returns. It helps progressive producers justify investments in adaptable systems by highlighting which innovations are genuinely reducing costs and which are falling short on their promises.
The Sunday Read Dairy Professionals Don’t Skip.
Every week, thousands of producers, breeders, and industry insiders open Bullvine Weekly for genetics insights, market shifts, and profit strategies they won’t find anywhere else. One email. Five minutes. Smarter decisions all week.
Could your next feed delivery be your herd’s last? The invisible threat you can’t ignore.
EXECUTIVE SUMMARY: Here’s what we learned when 700+ cattle died across the UK from feed that came from fully certified suppliers… and it should terrify every dairy producer reading this. These weren’t backyard operations cutting corners—these were UFAS and FEMAS certified suppliers, the UK’s equivalent of our FDA standards, that delivered feed contaminated with Clostridium botulinum. The numbers are brutal: mortality rates hit 15% per operation with losses exceeding £90,000 per farm, backed by hard APHA surveillance data. What’s scarier? Current certification schemes completely miss botulism because the toxin degrades too fast for standard testing. With feed moving globally—Iowa corn feeding Scottish cattle, Brazilian soy hitting Wisconsin farms within weeks—this isn’t a UK problem, it’s everyone’s problem. The smart money’s already moving toward blockchain traceability systems and near-infrared spectroscopy for early detection, because when feed contamination hits, traditional insurance won’t save you. We’re telling every progressive producer the same thing: question everything, verify twice, and invest in prevention now—because your bottom line and your herd‘s life depend on it.
KEY TAKEAWAYS
Early Detection Tech Pays for Itself Fast – Near-infrared spectroscopy costs $15,000-$20,000 upfront, but one prevented outbreak saves tens of thousands in losses. Farms using NIR testing caught three contaminated loads before they reached cattle, proving ROI within months. Start implementing regular feed testing protocols now—waiting costs more than acting.
Blockchain Cuts Crisis Response from Days to Hours – Carrefour’s traceability system tracks contamination sources 40x faster than traditional methods, and pilot programs show 40% fewer outbreak incidents. This isn’t future tech—it’s happening now, and operations adopting these systems are building massive competitive advantages in risk management and consumer confidence.
Your Insurance Probably Won’t Cover the Real Damage – Most livestock policies cap mortality coverage at 5% annually and exclude feed contamination unless you’ve got special endorsements. With losses hitting £90,000+ per operation in the UK outbreak, that’s bankruptcy territory for most farms. Call your agent today—don’t find out your coverage gaps when you’re counting dead cattle.
Certification Schemes Have Dangerous Blind Spots – UFAS and FEMAS test for salmonella and mycotoxins, but completely skip botulism monitoring because it’s hard to detect. The bacteria survive standard pelleting temperatures and thrive in storage conditions most farms use daily. Time to audit your feed sourcing and storage practices with the skepticism they deserve.
Vaccination Adds a Critical Safety Layer – UK vets prescribe botulism vaccines that work, but they’re not magic bullets—they complement rigorous feed management, not replace it. Progressive producers are integrating vaccination into comprehensive herd health strategies because multiple defense layers are more effective than relying on your supplier to get it right.
If you think your feed’s paperwork is bulletproof protection, I’ve got news for you. This year, more than 700 cattle died in the UK after eating feed that was supposedly “safe”—coming straight from suppliers holding UFAS and FEMAS certifications.
These certifications are intended to be the gold standard, equivalent to the UK’s version of our FDA and AAFCO approvals. But this outbreak hitting Essex, Northamptonshire, and Shropshire proves that audits and clean paperwork aren’t enough when you’re dealing with Clostridium botulinum.
Standard pelleting at 185°F should kill most bugs, but botulism spores are different animals. They survive those temperatures like they’re nothing, especially when feed storage isn’t perfectly airtight.
UFAS and FEMAS focus their testing on salmonella and mycotoxins, but here’s the kicker—they don’t require botulism monitoring. Why? Because it’s a nightmare to detect. The toxin breaks down fast, meaning contaminated feed can slip right through standard testing.
That’s a regulatory blind spot that just killed 700+ cattle.
The Real Cost When Your Herd Drops Dead
Let me break this down in numbers that matter. Take a 380-cow operation losing 12% to botulism—that’s roughly 45 animals gone. Replacement costs alone hit £90,000 (about $117,000 USD). Add in lost milk production and vet bills, and you’re staring at losses north of £130,000.
Scale that across multiple farms, and you’re looking at a regional economic disaster.
Your Insurance Won’t Save You
Here’s some brutal honesty: most UK livestock policies cover maybe 5% of annual mortality, and many exclude feed contamination completely unless you pay extra for special endorsements.
Call your agent today. Find out exactly what happens when contaminated feed hits your operation. Odds are, you’re more exposed than you think.
This Isn’t Just a UK Problem
Feed moves globally now. Corn from Iowa feeds Scottish cattle within weeks. Soybeans from Brazil reach Wisconsin farms before you know it. These vulnerabilities aren’t regional—they’re systemic.
One contaminated batch can spread across continents before anyone realizes what’s happening.
Technology That Actually Works
Near-infrared spectroscopy can catch contaminated feed early, but it runs $15,000-$20,000—putting it out of reach for smaller operations.
Blockchain traceability is proving its worth, too. Carrefour’s system cuts contamination tracking from days to hours. Farms using these systems have seen contamination incidents drop by 40%.
The technology exists. The question is whether you can afford it—and whether you can afford not to have it.
Vaccines Help, But They’re Not Magic
UK vets can prescribe botulism vaccines for cattle, but don’t kid yourself—they’re not a substitute for proper feed management. They’re one layer of defense in what needs to be a comprehensive strategy.
What You Need to Do Right Now
This week:
Call your insurance agent and nail down your feed contamination coverage
Audit your suppliers beyond their certifications—demand real testing protocols
Check your feed storage conditions obsessively—temperature, moisture, sealing
This month:
Build relationships with backup suppliers
Install monitoring systems in storage areas
Create emergency response protocols
Long-term planning: If you’re running 300+ head, seriously consider investing in NIR testing equipment and blockchain traceability systems.
The Hard Truth Nobody Wants to Hear
Those UK producers trusted their suppliers’ certifications for years. Clean delivery after clean delivery, until the one that killed their cattle.
The difference between surviving and going bankrupt isn’t luck—it’s preparation. The producers who weather these crises are the ones who verify instead of trust, who invest in prevention instead of hoping for the best.
Bottom Line: Paranoia Pays
This UK outbreak is your wake-up call. Feed safety isn’t about paperwork—it’s about systems, vigilance, and redundant protections.
Stay skeptical of your suppliers. Invest in monitoring technology. Prepare for the worst-case scenario.
Because when feed contamination hits your operation, no insurance policy replaces a dead herd or prevents a bankruptcy notice.
The feed safety revolution isn’t coming—it’s here. Are you ready for it?
Complete references and supporting documentation are available upon request by contacting the editorial team at editor@thebullvine.com.
Learn More:
Precision Feeding Strategies Every Dairy Farmer Needs to Know – This article provides practical strategies for implementing the rigorous feed management called for in the main piece. It details how to use data, forage analysis, and grouping to prevent losses and maximize the value of your most significant investment.
Global Dairy Cattle Diseases Cost Farmers $65 Billion Annually – To understand the full financial risk of a feed-related disaster, this piece puts the economic threat in perspective. It reveals the staggering global cost of herd health issues, reinforcing the urgency to invest in preventative measures and secure proper insurance coverage.
5 Technologies That Will Make or Break Your Dairy Farm in 2025 – Building on the main article’s call for technological solutions, this piece explores the innovative tools defining modern dairies. It demonstrates how precision feeding systems and real-time monitoring deliver a direct ROI by cutting waste and improving herd health.
The Sunday Read Dairy Professionals Don’t Skip.
Every week, thousands of producers, breeders, and industry insiders open Bullvine Weekly for genetics insights, market shifts, and profit strategies they won’t find anywhere else. One email. Five minutes. Smarter decisions all week.
What if you could boost your payout without boosting volume? Let’s talk butterfat.
EXECUTIVE SUMMARY: Here’s the real deal: The dairy business has shifted completely. It’s no longer about how many gallons you pump out, but the value packed into your milk’s protein and butterfat. Picture this — a typical 850-cow herd producing 59,500 lbs daily can earn an extra $2,200 every single day just by pushing better components! Nationwide, we’re seeing butterfat average 4.23% and protein hit 3.29%, driving real increases in farmgate value. But it’s not the same everywhere — Texas is absolutely booming with +6% growth thanks to new cheese plants, while California’s getting squeezed by heat and water constraints. Global markets matter too — Mexico’s spending $2.47 billion on our dairy, keeping demand strong. Bottom line? If you haven’t shifted your focus to milk components and smart risk management, you’re leaving serious money on the table in 2025.
KEY TAKEAWAYS:
Component quality pays big — even bumping butterfat and protein by a tenth of a percent adds thousands to your daily revenue across the whole herd.
Genomic testing isn’t optional anymore — spending $40 per calf on testing and using high PTA bulls for fat/protein is proven ROI in today’s market.
Hedge your bets early — use Class III and IV futures plus Dairy Revenue Protection to lock in these strong margins before they disappear.
Watch global demand closely — Mexico and Southeast Asia are driving U.S. dairy prices, so track those export numbers and GDT auction results.
Don’t skimp on biosecurity or heifer strategy — with HPAI hitting 1000+ herds and replacement costs at $3000+ per head, protection is profit.
Look, if you’re still measuring success by how many gallons roll out of your bulk tank, you’re fighting yesterday’s war. The real money these days — what I call the game-changer — is swimming inside that milk: butterfat and protein. And honestly? It’s not even close anymore.
I was shooting the breeze with Jim last week. Third-generation guy up in Marathon County, Wisconsin, runs about 850 head — mostly Holsteins with some Jersey crosses thrown in for good measure. “Ten years ago, I was all about pounds per cow,” he told me, leaning against his parlor rail after evening milking. “Now? I’m laser-focused on hitting those component numbers.”
Jim’s got the goods: his milk’s testing 4.2% butterfat and 3.3% protein these days. That bump is putting serious money in his pocket every single day.
Here’s what’s really happening with production…
According to the latest USDA numbers, we’ve been on a losing streak — milk volumes dropping for 13 straight months through July 2024. Sounds scary, right? But here’s the thing that’s got everyone talking: the milk we are producing is richer than it’s ever been.
Recent data from CoBank shows butterfat levels hit 4.23% nationally in 2024, up from barely scraping 4% just a few years back. Protein’s climbing too — 3.29% average now, compared to around 3.04% back in 2004. (That’s genetic progress you can bank on, literally.)
And it’s not playing out the same everywhere…
Down in Texas, they’re singing a completely different tune. Milk production jumped 6% last year, thanks to massive cheese plant expansions in places like Amarillo and Lubbock. I’m talking facilities that are pulling milk from counties that never mattered much before — trucks running extra miles just to feed these operations.
Meanwhile, California is grappling with significant headwinds — heat stress and water restrictions that are putting a real squeeze on yields. Up here in the traditional dairy belt — Wisconsin, Minnesota, New York — we’re seeing herd contraction and flat production.
What strikes me about this shift is how it’s forcing everyone to think differently about what matters.
Let’s talk money, because that’s what pays the bills…
Here’s where the math gets really interesting. An 850-cow herd averaging 70 pounds produces 59,500 pounds of milk daily — that’s 595 hundredweight (cwt). Using current Federal Milk Marketing Order pricing, the value difference between average components and top-tier is $3.70 per cwt ($23.85 – $20.15).
Here’s the kicker: 595 cwt × $3.70 = $2,201.50 per day. Scale that over a month, and you’re looking at an additional $66,000 in revenue — a figure that changes the entire financial picture of an operation.
Take Sarah up in St. Lawrence County, New York. She’s running 280 registered Holsteins and dropping about $40 per calf on genomic testing, specifically targeting bulls with killer PTA scores for fat and protein. “Every extra tenth of a percent pays for that test ten times over,” she says. “I can’t afford not to do this anymore.”
Now, about those market moves…
As of early September, October Class III CME futures have been dancing around $20.85, with Class IV trading near $21.75. (These are approximate numbers — market prices change daily, so check with your broker for current quotes.) When Class IV trades above Class III like that, it’s the market telling you butter and powder are worth more than cheese right now.
This creates opportunities if you know how to read it. Danny, down in Green County, learned this lesson the expensive way. “I got burned waiting for better prices back in 2020,” he admits, standing in his feed alley watching the mixer wagon load up. “Now, when the spread looks good, I lock in margins with DRP. Sleep better at night.”
But let’s be real about the painful stuff too…
Replacement heifers are absolutely crushing budgets right now. The USDA reports national averages around $2,660 per head, but that’s conservative. Premium Holstein replacements are routinely hitting $3,000-plus at auctions, with some California and Minnesota sales pushing over $4,000.
Why? The beef-on-dairy trend. Using beef semen on your lower-tier cows creates a nice revenue stream from those crossbred calves, sure. But it’s also squeezed purebred heifer supplies to a 20-year low. There’s your unintended consequence.
Then there’s bird flu hanging over everything. Over 1,000 dairy herds across 17 states have dealt with HPAI this year. The farms that invested early in biosecurity — limiting visitors, boot washes, bird-proofing feed areas — they’re seeing the payoff in fewer disruptions and healthier herds.
Where’s your milk actually going?
This might surprise you, but when that semi pulls away from your farm, there’s a good chance it’s headed south of the border. Mexico bought $2.47 billion worth of U.S. dairy in 2024, making them our biggest customer by far. That’s not just a statistic — it’s cash flow that directly supports your milk price.
“I’ve completely changed how I think about our market,” says Maria, whose 650-cow operation outside Modesto produces high-component milk primarily destined for export. “We’re feeding families in Mexico City now, not just the local fluid plant. That global connection makes me more focused on consistency than ever.”
Asia’s more complicated. China’s tightening its imports as it builds domestic production, but Southeast Asian countries continue to buy steadily. Don’t sleep on those twice-monthly Global Dairy Trade auction results either — they move our futures markets more than some domestic reports.
So what’s your game plan?
From conversations I’m having with producers across the country, here’s what’s working:
Focus your genetics on PTA Fat, PTA Protein, and Net Merit when selecting sires. The extra genomic testing cost pays for itself in the first lactation — ask your AI tech about proven component transmitters.
Get serious about risk management. Work with your farm advisor to understand how futures and Dairy Revenue Protection can lock in margins when favorable spreads appear. Don’t wait for perfect conditions — they rarely come.
Start budgeting for $3,000+ heifer costs or develop internal breeding programs. The cost advantage of raising your own has never been clearer.
Double down on biosecurity. Those protocols aren’t optional anymore — simple steps like visitor logs, clean boots, and bird-proof feed storage consistently beat the cost of dealing with disease outbreaks.
Track global demand shifts, especially in Mexico and Southeast Asia. These purchases directly impact your farm’s profitability, whether you realize it or not.
Regional reality check:
Region
Production Trend
What’s Driving It
Traditional Dairy Belt
Down ~1.5%
Aging herds, flat yields, and higher costs
Texas
Up 6%
New cheese plants are creating a demand vacuum
California
Down ~2%
Heat stress, water restrictions
The bottom line?
Volume-focused dairying is becoming yesterday’s business model. Today’s winners are mastering components, managing market risks, and protecting herd health with the same intensity they once devoted to increasing pounds per cow.
The farms that understand this shift fastest are separating themselves from the competition. Jim’s already adjusting his breeding program and marketing strategy. Danny’s hedging aggressively. Sarah’s investing in genomics, just as her operation depends on it — because it does.
What’s particularly fascinating about this transition is how it’s forcing the entire industry to get smarter. The old days of just maximizing volume and hoping for the best? Those are gone.
The question isn’t whether this new reality is fair — it’s how fast you’ll adapt to stay competitive. Because in 2025, your survival depends on understanding that every tenth of a percent of butterfat and protein matters more than the extra gallon you used to chase.
The industry’s changing fast, and honestly? That’s what makes this business so interesting.
Complete references and supporting documentation are available upon request by contacting the editorial team at editor@thebullvine.com.
U.S. Dairy Industry Trends and 2025 Outlook – Get the big picture on the economic forces shaping 2025. This market analysis reveals the USDA’s price forecasts for Class III and IV milk and explores how feed costs and global trade dynamics will influence your farm’s bottom line.
Every week, thousands of producers, breeders, and industry insiders open Bullvine Weekly for genetics insights, market shifts, and profit strategies they won’t find anywhere else. One email. Five minutes. Smarter decisions all week.
57% of manure incidents end in death—let’s fix that before it hits your farm.
EXECUTIVE SUMMARY: Ever heard that farm safety is just another line item? Here’s the thing—six workers died from H₂S at a Colorado dairy this summer, and ASABE data show a staggering 57% fatality rate in manure incidents. Shortening lagoon holds from 30 to 21 days cuts gas alarms by nearly half (industry trend), saving thousands in labor downtime and potential carbon credit hits. Weekly bump-tests on monitors cost ten minutes but protect against $50,000 lawsuits or lost livestock. Skim off that foam—one Ontario farm saw a 40% drop in spikes. VR drills boost compliance above 90% globally. You should try this.
KEY TAKEAWAYS
Cutting lagoon retention to 21 days slashes H₂S alarms by ~50% (boosts uptime, lowers risk) — skim foam right after agitation.
Weekly bump-testing takes 10 minutes but prevents faulty readings — integrate into your morning safety check.
Dual-valve purge systems reduce rupture risk compared to single valves (according to Purdue Extension) — upgrade before fall agitation.
Tire pressure + controlled speed reduce slurry-trailer sway by 30% (Cornell Ext.) — check before every haul.
Confined space entry only with ventilation & SCBA drills — VR training lifts recall to 90% (SafeWork NSW), schedule annual sessions.
You ever get that nagging feeling in your gut when you’re about to pull the plug on a lagoon and see that thick crust of foam? What strikes me is how routine it’s become—like checking tire pressure—until it isn’t. This past August, six people died in Colorado from hydrogen sulfide (H₂S) exposure at a dairy. That 57% fatality rate in manure incidents, flagged by a 2021 ASABE study, isn’t just a stat—it’s a wake-up call, and it’s 100% preventable.
I’m not here to lecture. This is peer-to-peer, real-world advice drawn from the latest research and farm floor observations. Let’s dig in.
The lethal science you can’t afford to ignore
The thing about manure pits is they’re chemical mixers—H₂S, CH₄, NH₃, CO₂. Foam on top? That’s a gas trap. Puncture it and boom—either an explosive release or a silent asphyxiation hazard in seconds. According to OSHA standards, sensing 100 ppm of H₂S means your smell’s gone within minutes; at 700 – 1,000 ppm, you won’t survive long. I’ve checked it against field monitors in Idaho and Wisconsin—once you lose that rotten-egg warning, you’re in real trouble.
Managing lagoon risk: time, foam, and H₂S levels
Here’s a nugget: a 300-cow Ontario dairy cut lagoon hold from 30 to 21 days and saw a sharp drop in H₂S alarms (industry observations; shorter retention correlates with lower risk). Shorter holds—21 days in the U.S., 18 days in Canada, 14 days in New Zealand—are now widely recommended. And foam? Aggressively break it up or skim it off; keeping that surface clear is your frontline defense against hidden gas pockets.
Day-to-day protocols that save lives
Listen, a single clip-on H₂S badge is basically a smoke detector without a fire drill. Dragline crews in South Dakota swear by a scripted “Ready, Swing, Secure” sequence—they say close calls have plummeted since adoption (anecdotal, but telling). Alarm tiers need to be dialed in: 10 ppm for low alert, 15 ppm for high alert, and 100 ppm for evacuation—straight from OSHA/NIOSH guidelines. UMASH runs weekly bump tests on every monitor. Ten minutes per week. No excuses.
‘A gas monitor is only as good as the protocol it’s part of. Consistent bump testing and clear, drilled communication turn a gadget into a life-saving system.’
Embed these drills into SOPs; make them as routine as checking your morning milk.
Essential equipment upgrades: purge valves and tanker tires
Those single-valve purge systems? Purdue Extension flags them for whipping hoses that can maim. Dual-valve or electronic purge systems cost more, but they’re worth every dollar when the alternative is a break-away hose. And transport safety: skirt boards, hitch points, and—crucially—tanker tire pressure. Cornell Extension notes that correct inflation, combined with speed control, reduces sway and rollover risk (especially on uneven paddocks or in windy regions). In Montana’s blustery fall, this step is a life saver.
Valve Type
Rupture Risk
Cost
Maintenance
Single
High
~$500
Quarterly
Dual
Low
~$1,200
Quarterly
Electronic
Very Low
~$4,000
Monthly
Confined space entry: the ultimate red line
Confined-space entry into manure pits must never be taken lightly. OSHA’s 29 CFR 1910.146 and Penn State’s guidance insist on forced ventilation plus Self-Contained Breathing Apparatus (SCBA) before you even think about climbing down. VR drills from SafeWork NSW boost recall and compliance above 90%—proof that practice pays off.
The ultimate manure gas checklist
Atmosphere Monitoring: Bump-test H₂S monitors weekly; set your alarms to 10, 15, or 100 ppm.
Communication: Drill “Gas! Evacuate Now!” until it’s muscle memory.
Confined Space Entry: Lock out permits; no SCBA-free entries.
Equipment: Dual-valve purge; tire checks before every haul.
Training: Annual hands-on gas safety and rescue drills for everyone.
The Bottom Line
Safety isn’t a corporate line item—it’s what ensures your people walk home every night. This week, pick one checklist item. Schedule a 15-minute huddle. Make it real. What’s the one change you’ll drive this week? Post it in the comments—let’s keep each other honest and safe.
Complete references and supporting documentation are available upon request by contacting the editorial team at editor@thebullvine.com.
Learn More:
The Ultimate Guide to Dairy Manure Management – This guide provides practical, operational strategies for handling, storing, and utilizing manure. It’s a great next step for farms looking to implement a comprehensive system that maximizes nutrient value while minimizing environmental and safety risks discussed in our article.
Manure: Is It a Waste Stream or a Revenue Stream? – Shifting from safety to strategy, this article explores the economic potential locked in your manure. It reveals methods for turning a hazardous liability into a valuable asset through nutrient sales or energy production, offering a compelling financial incentive for better management.
Next-Generation Manure Application: The Future Is Here – Looking ahead, this piece showcases innovative technologies like manure injection and sensor-based application. It demonstrates how to leverage cutting-edge tools to enhance nutrient precision, reduce emissions, and improve both operational efficiency and long-term sustainability on your dairy.
The Sunday Read Dairy Professionals Don’t Skip.
Every week, thousands of producers, breeders, and industry insiders open Bullvine Weekly for genetics insights, market shifts, and profit strategies they won’t find anywhere else. One email. Five minutes. Smarter decisions all week.
For so many of us this past week, this hasn’t just been another news headline. It’s felt like a punch right to the gut.
On a Wednesday most folks thought would be another routine shift, six lives were cut short. The emergency calls began just before evening chores. By the time the dust settled, a tragedy reportedly linked to hydrogen sulfide gas in a confined space had left the news shattering for everyone who heard it.
Look, we toss around words like “tight-knit” a lot, but in dairying, you know it’s true. These men weren’t just coworkers. They were dads, brothers, sons.
Ricardo Gomez Galvan wasn’t just a dairy manager. Word is that he knew every cow by number and always made time to check in with new hires, just to ensure they were getting along okay.
Noe Montanez Casanas, assistant manager—everyone says he brought coffee for the crew before overtime milkings and could fix just about any leak, sometimes with nothing but a bit of wire and determination.
Jorge Sanchez Pena was the guy who’d show up to work on the latest robot, but stayed late if you needed help bleeding a line.
Alejandro Espinoza Cruz—a friend to a lot of us, and the kind of dad who never minded taking his sons, Oscar and Carlos, along to get their hands dirty and learn the trade.
Oscar Espinoza Leos, only seventeen, was just starting to dream about a future in dairying, following his dad’s footsteps.
And Carlos Espinoza Prado, twenty-nine, was his father’s right hand and already a pro with robot retrofits.
Honestly, that’s where it hits hardest. No family should have to bury so many at once. No crew can fill boots that big overnight.
What weighs on me—and on so many of us—is imagining those final moments. Reports indicate that there was confusion and fear—people trying to help, rushing in when someone else fell. That’s just who we are. When your friend’s in trouble, you don’t think. You react. But sometimes, even that courage isn’t enough.
It’s easy in dairy to breeze past safety warnings, to grumble about broken sensors or laugh off a false alarm—but this kind of heartbreak makes all that seem so small. No barn, no parlor, no job is worth what these families are facing right now.
If there’s one bright spot, it’s how the community has come together. GoFundMe pages for Oscar, Carlos, Alejandro, and Jorge quickly filled up, with friends from across the industry pitching in. I’ve seen folks from Wisconsin and Ontario—places you might never expect—offering prayers, meals, and whatever they could.
You can support the families directly through their verified GoFundMe pages:
DeLaval and High Plains Robotics both rushed to offer condolences and real help. Their words of grief aren’t just PR, they’re as real as the solidarity we see every time disaster strikes in this line of work.
And here’s where my head goes—maybe yours too. How many of us have become a little lax with checking those gas alarms, cleaning fans, ensuring there’s a real emergency protocol, and that everybody actually knows it? I read stories like this, and yeah, the usual response is, “That couldn’t happen here, our barn’s newer than theirs.” However, the evidence—what OSHA and farm safety trainers are seeing—actually suggests otherwise. Modern facilities and new technology can mask risks just as easily as they can mitigate them. All it takes is one filter gone bad, one vent jammed.
If you’re reading this and thinking, “We haven’t checked those H₂S detectors in a while,” just take a minute—right now. Call your crew. Double-check your plan. Don’t try to tough it out if you smell something off.
Nobody goes to work expecting their barn will end up as the latest headline. But after a week like this, I hope each of us pauses. Not to be scared, but to be smart—for ourselves, our teams, and all the families waiting for us to come home.
OSHA’s still piecing things together. The Bullvine will have more as this develops. For now, we hold the six lost and their families close in our thoughts, hoping we can all honor their memory by doubling down on safety and community.
From one barn to another, stay safe out there. We grieve with you.
If you’d like to share your own stories, thoughts, or how your crew handles gas hazards, our inbox is open. This is our world. Let’s keep it safe—for everyone who calls dairy home.
Learn More:
Don’t Let Your Guard Down: The Dangers Lurking in Your Manure Pit – This article provides a tactical breakdown of the specific dangers of manure gases, including hydrogen sulfide. It offers practical, immediate steps for improving ventilation and implementing safety protocols to mitigate the exact risks highlighted in the tragedy.
Building a Positive Dairy Farm Culture: It Starts with You – Moving from physical safety to team well-being, this piece explores strategic methods for fostering a workplace culture where every team member feels valued and psychologically safe. It offers insights on leadership and communication that are crucial for rebuilding team morale.
The Unblinking Eye: How Advanced Monitoring Is Transforming Dairy Safety – Looking to future solutions, this article showcases innovative sensor and camera technologies that provide real-time environmental monitoring. It reveals how forward-thinking farms are using data to proactively identify invisible threats like gas leaks, preventing tragedies before they happen.
The Sunday Read Dairy Professionals Don’t Skip.
Every week, thousands of producers, breeders, and industry insiders open Bullvine Weekly for genetics insights, market shifts, and profit strategies they won’t find anywhere else. One email. Five minutes. Smarter decisions all week.
Seven kids hospitalized from raw milk—while your insurance premiums could spike 40% if this hits your region.
EXECUTIVE SUMMARY: Listen up, because this Florida mess affects every one of us. Raw milk isn’t just a niche problem—it’s reshaping how insurers look at ALL dairy operations, and it’s hitting closer to home than you think. We’re talking 21 people sick, seven in the hospital, and insurance companies pulling back coverage faster than a fresh cow kicks. The ripple effect? Even conventional producers are seeing policy changes and tighter inspections. Here’s what’s wild—Danish research shows pathogen issues can cost you €11,000 per affected herd annually, not counting the reputation damage. With feed costs already crushing margins in 2025, you can’t afford to ignore food safety protocols anymore. The smart money is on bulletproof HACCP plans and rock-solid documentation. Trust me on this one—get ahead of it now, because the regulatory hammer is coming down hard.
KEY TAKEAWAYS:
Save your insurance rates: Review your HACCP documentation TODAY—operations with solid safety records are avoiding the 25-40% premium increases hitting sloppy farms post-outbreak
Protect your buyer relationships: Proactively share your safety certifications and testing results with buyers—processors are dropping suppliers without warning when trust erodes
Turn compliance into profit: Farms with documented microbial testing protocols are landing premium contracts while others scramble—regulatory pressure creates opportunities for the prepared
Bulletproof your reputation: With foodborne illness scares cutting category sales 8-12%, your safety story becomes your biggest competitive advantage in 2025’s tight markets
The thing about food safety in 2025? It’s anything but static. Currently, Florida’s raw milk outbreak is sparking serious concerns across dairy farms, from the Gulf Coast to Central Florida. Twenty-one people have become ill, seven of whom ended up in the hospital—including some children—and all cases are linked to a farm in Northeast/Central Florida, although the Department of Health is keeping the name confidential while investigations continue, according to the Florida Department of Health. This is a reminder that consumer trust and the sustainability of your dairy business can be fragile.
Here’s the thing, though—the political winds could shift the landscape in ways none of us fully control. Leaders with alternative views on health policies, like Robert F. Kennedy Jr., may influence how regulations evolve if they rise to key positions. It’s worth keeping tabs on how these conversations unfold.
What’s Happening on the Ground
Florida’s health authorities pinpointed a serious breakdown in sanitation protocols at the farm linked to the outbreak, according to an official bulletin. The presence of Campylobacter and shiga toxin-producing E. coli here is not something you take lightly; it’s a loud wake-up call for dairy managers everywhere—from warm winter pastures in Okeechobee to the busy dairy hubs of Dade City. We’re talking not just about sloppy procedures, but about fundamental failures in managing food safety risks.
While state law forbids the sale of raw milk to humans, sales marked for pets keep a shadow market thriving; university extension estimates put its worth at several million dollars annually, according to the University of Florida Extension. And here’s a pattern producers are noticing: following outbreaks, insurers tend to pull back, making coverage for raw milk operations scarcer and more expensive.
How This Ripples Through Your Dairy
Food safety isn’t someone else’s problem—one high SCC tank can ruin an entire load, and in today’s connected world, outbreaks can shake consumer confidence region-wide. Remember the romaine lettuce E. coli crisis from 2018? Processors took a $55 million hit, retailers another $14 million, according to California Agriculture. It’s a lesson on how trust lost at any point can spread and squeeze the entire supply chain.
And it’s not just reputation. Danish researchers tracked how Salmonella infections take a toll: farms with high infection levels face over €11,000 in extra costs annually—veterinary treatments, lost milk premiums—and even low-level infection doesn’t come cheap, costing over €6,700. That’s money out of your pocket before you even think about a recall or inspection.
Getting Control Right
The CDC flags illnesses linked to raw milk as roughly eight times more frequent than those linked to pasteurized milk, according to CDC data. Big commercial processors don’t rely on luck—they layer controls, including environmental testing and supplier checks. Raw milk farms that try to compete without these controls put themselves at a significant disadvantage.
Cornell University’s food science experts remind us that pathogen control demands near-perfect hygiene and monitoring, according to Cornell University’s Food Science. No slack, no shortcuts. And that pasteurization? It’s not red tape; it’s your best bet against disaster.
Suppose you’re hearing about the supposed nutritional benefits of raw milk. In that case, the American Academy of Pediatrics has been very clear: the risks outweigh any unproven gains, especially for children and pregnant women, according to an AAP statement.
The Regulatory Crosscurrents
Right now, 13 states legally allow retail sales of raw milk; 17 limit sales to farm-only; and the rest ban human sales altogether, according to National Raw Milk Laws. Interstate shipment is federally banned. People like Robert F. Kennedy Jr.—who are publicly skeptical of mainstream health policy—may influence future regulation, but these shifts remain to be seen.
Organic Pastures Dairy remains a heavyweight player among raw milk producers, yet national dairy groups warn that loosening these regulations risks confusing consumers and exacerbating health risks.
What Should Producers Be Doing?
More FDA inspections are expected following the outbreak, covering both raw milk and pasteurized supply chains. Operations with disciplined HACCP and microbial testing protocols are better positioned to weather the storm.
Insurance markets also split: raw milk operations face rising premiums or no coverage; conventional producers maintain relatively stable insurance profiles.
If you haven’t yet, now’s the time to review your HACCP plan, tighten microbial testing routines, and ramp up communication with your buyers—make it clear you’re serious about safety.
What Do Consumers Think?
Recent surveys indicate that approximately three-quarters of consumers prioritize safety and consistent quality over the processing methods used. Foodborne illness scares can result in an 8-12% decline in sales, affecting producers of all sizes.
The Bottom Line
Raw milk sales won’t disappear anytime soon, but every producer in this arena must navigate regulatory pressure, financial risk, and reputational challenges. Investing in tight safety controls and thorough documentation isn’t optional.
Pasteurization remains a strong shield for the dairy industry. It’s a story you need to keep telling, because trust is everything.
This Florida outbreak underscores a fundamental truth: food safety is not optional—it’s the very backbone of any successful dairy operation. Failure here threatens not just sales, but the enduring trust that keeps the industry thriving.
Complete references and supporting documentation are available upon request by contacting the editorial team at editor@thebullvine.com.
Learn More:
Sanitation: The Key to Mastitis Prevention – This tactical guide provides practical strategies for improving parlor and herd hygiene. It’s essential for lowering your SCC, preventing costly infections, and strengthening the foundational food safety protocols that protect your entire operation from risk.
Dairy Farmers Must Realize They Are No Longer Selling A Product, But Rather A Story – Moving beyond farm-gate operations, this article details the strategic importance of branding. It reveals methods for building a powerful farm story that fosters consumer trust and insulates your brand from the market fallout of industry-wide safety scares.
Precision Dairy Farming: The Future is NOW! – Explore the innovative technologies shaping modern dairy management. This piece demonstrates how to leverage automated monitoring and data analytics to enhance herd health, streamline documentation, and build a resilient, future-proof, and highly defensible operation.
The Sunday Read Dairy Professionals Don’t Skip.
Every week, thousands of producers, breeders, and industry insiders open Bullvine Weekly for genetics insights, market shifts, and profit strategies they won’t find anywhere else. One email. Five minutes. Smarter decisions all week.
New Zealand’s 65% butter surge exposes the profit paradox killing dairy margins worldwide. Why celebrating $10/kgMS might bankrupt your operation.
EXECUTIVE SUMMARY: While New Zealand farmers celebrate record $10.00/kgMS milk prices from the 65% butter price explosion, smart operators know this market shock reveals a devastating truth: 87% of increased revenue is getting devoured by input cost inflation, leaving net margins thinner than ever. This isn’t just regional volatility—it’s a global wake-up call that’s reshaping international dairy trade flows, with US butter surplus creating $2,500/MT arbitrage opportunities while European processors abandon butter for cheese production. The real winners aren’t those riding today’s high prices, but farmers implementing precision feeding systems (7-12% cost reductions), automated milking technology (5-8% yield improvements), and comprehensive risk management strategies before volatility crushes unprepared operations. With feed costs climbing 37% per tonne and geopolitical tensions driving Middle Eastern stockpiling that consumed one-third of recent Global Dairy Trade auctions, traditional market fundamentals have been obliterated. Andrew’s controversial analysis exposes why Fonterra’s export-first strategy—while generating $15 billion for New Zealand’s economy—is creating domestic affordability crises that could trigger regulatory backlash across the industry. Every dairy farmer worldwide needs to stop celebrating superficial price surges and start building systems that profit regardless of where volatile commodity markets head next.
KEY TAKEAWAYS
Implement comprehensive hedging strategies immediately: With DairyNZ’s breakeven costs hitting $8.68/kgMS (up from $8.41), farmers using Fonterra’s new Price Risk Management Services can lock Fixed Milk Prices for two seasons, protecting against the inevitable price corrections while maintaining upside potential during continued volatility.
Capitalize on precision agriculture ROI during high-margin windows: Operations investing in precision feeding systems are achieving 7-12% feed cost reductions while automated milking systems deliver 5-8% milk yield improvements—critical advantages when feed costs have spiked 6-37% per tonne and every pound of milk solids matters for survival.
Diversify market exposure through export arbitrage opportunities: US farmers with export access can exploit the $2,500/MT price differential between American butter ($5,500/MT) and New Zealand product ($7,992/MT), while international buyers must develop alternative sourcing strategies to avoid dependency on constrained New Zealand supplies.
Prepare for geopolitical demand disruption: With Middle Eastern buyers suddenly consuming one-third of Global Dairy Trade butter auctions, traditional supply-demand fundamentals no longer apply—smart farmers are building operational resilience through genomic testing programs for component optimization and activity monitoring systems to maximize breeding efficiency during high-cost periods.
Challenge the export-first profit illusion: Operations focusing solely on gross revenue from record milk prices without addressing input cost inflation are setting themselves up for devastating losses when commodity prices inevitably correct—the future belongs to farmers building systems that deliver consistent profitability regardless of market direction.
Here’s what’s got me fired up: While New Zealand butter prices exploded 65.3% and Fonterra’s celebrating $15 billion flowing into their economy, you’re about to get blindsided by the biggest dairy market upheaval in decades. And most farmers don’t even see it coming.
Listen, I’ve been tracking dairy markets for years, but this New Zealand situation isn’t just another price spike – it’s a complete game-changer that’s about to reshape how you think about risk, pricing, and profit in this business.
GDT offer volumes were stripped back significantly below 5-year averages, with WMP volumes over 40% lower than historical levels
Here’s the kicker: New Zealand butter contains 82% butterfat compared to your typical 80% US butter. When global buyers want premium quality, they’re paying premium prices.
If the world’s largest dairy exporter is rolling out comprehensive hedging tools, what does that tell you about future volatility?
The Technology Revolution You’re Missing
While you’re celebrating high milk prices, smart operators are using this window to invest in game-changing technology. Here’s what the winners are doing:
Precision Feeding Systems delivers 7-12% reductions in feed costs while improving milk components. With feed costs up 37%, that’s the difference between profit and survival.
Automated Milking Systems (AMS) show 5-8% milk yield improvements through optimized milking frequency and reduced stress. When you’re paying record-breaking breakeven costs, every pound of milk matters.
Activity Monitoring and Sensor Technology help optimize reproduction efficiency during high-cost periods. Smart farms use heat detection systems with 95%+ accuracy to maximize breeding success when every day open costs serious money.
Genomic Testing Programs for component optimization are paying dividends. Operations focusing on EBVs for butterfat percentage are capturing additional $0.15-0.25 per kgMS in premiums during current market conditions.
What You Need to Do Right Now
Stop Celebrating, Start Hedging
Get your risk management sorted immediately if you’re with Fonterra or any other processor. The farmers who’ll thrive aren’t the ones celebrating today’s prices – they’re the ones preparing for tomorrow’s inevitable swings.
Diversify or Die
That $2,500/MT price differential between US and New Zealand butter won’t last once arbitrage kicks in. Smart operators are investing in precision technologies and efficiency improvements while margins allow.
Get Your Export Game Right
US farmers with export access need to move fast. European processors prioritize cheese production over butter, creating artificial scarcity and opening market opportunities.
The Controversial Truth Nobody’s Discussing
Here’s what really pisses me off: While Fonterra reported $1.158 billion profit after tax for nine months ended April 2025 and celebrates injecting $15 billion into New Zealand’s economy, ordinary Kiwi families can’t afford butter for their toast.
This export-first mentality might maximize farmer returns in the short-term, but it’s creating domestic affordability crises that could trigger regulatory backlash. Smart processors need to balance global opportunities with local market stability – or risk political intervention that could reshape the entire industry.
The Bottom Line
New Zealand’s 65% butter price surge isn’t just regional news – it’s your wake-up call. Three critical actions you must take:
Lock in your risk management strategy – Futures, options, processor programs – get your downside protection before volatility hits your market
Invest in operational efficiency NOW – Precision feeding, automated systems, and genomic programs are your only defenses against input cost inflation
Diversify market exposure – Don’t put all your eggs in one pricing basket when geopolitics are driving commodity demand
The $15 billion flowing into New Zealand proves that high dairy prices can transform entire economies. But here’s the brutal truth: most of that windfall is getting absorbed by rising costs, and farmers who don’t adapt their risk management will get crushed when prices inevitably correct.
Your move. Make it count.
The farmers winning in this new reality aren’t hoping prices stay high forever – they’re building systems to profit regardless of where prices go next. And they’re doing it while they can still afford the upgrades.
Complete references and supporting documentation are available upon request by contacting the editorial team at editor@thebullvine.com.
5 Technologies That Will Make or Break Your Dairy Farm in 2025 – Exposes specific automation and monitoring technologies delivering measurable ROI during high input cost periods, including precision feeding systems achieving 18% waste reduction and robotic milkers boosting yields 20%.
The Sunday Read Dairy Professionals Don’t Skip.
Every week, thousands of producers, breeders, and industry insiders open Bullvine Weekly for genetics insights, market shifts, and profit strategies they won’t find anywhere else. One email. Five minutes. Smarter decisions all week.
Stop chasing milk volume. Component optimization delivers 5.3% butterfat growth while volume stagnates at 0.5%. Your margin depends on it.
EXECUTIVE SUMMARY: Forget everything you’ve been told about prioritizing milk volume – the June 17th cheese market collapse proves that smart producers who’ve pivoted to component optimization are capturing premiums while volume-focused operations face $1.50/cwt Class III losses. The data doesn’t lie: butterfat production is surging 5.3% annually while overall milk volume crawls at just 0.5%, with average butterfat levels hitting 4.40% and protein reaching 3.40% in 2025. Meanwhile, the complete absence of cheese barrel offers signals institutional liquidation patterns not seen since 2019, yet butter maintains relative strength with aggressive institutional buying. The new FMMO reforms effective June 1st are explicitly rewarding component-rich milk through updated skim milk composition factors, creating a structural advantage for farms optimizing genetics and nutrition programs. With feed costs offering unprecedented relief – corn at $4.31/bu and the milk-to-feed ratio holding strong at 2.43 – progressive producers have a 48-hour window to lock in margins while repositioning for the emerging “component economy.” Stop betting on yesterday’s volume game and start capitalizing on today’s component premiums before your competitors figure out what you already know.
KEY TAKEAWAYS
Component Optimization ROI: Farms producing 4.40% butterfat milk capture 5.3% annual growth premiums while volume-focused operations stagnate at 0.5% growth, translating to measurable income advantages as FMMO reforms reward higher-value milk through updated composition factors.
Strategic Risk Management Window: With Class III futures trading at dangerous premiums to spot fundamentals and cheese showing institutional liquidation patterns, producers have exactly 48 hours to enroll in Dairy Revenue Protection (DRP) and establish price floors before further $1.50/cwt erosion occurs.
Feed Cost Arbitrage Opportunity: Current corn prices at $4.31/bu combined with a robust 2.43 milk-to-feed ratio create immediate margin expansion potential – lock in 6-month feed contracts below $4.60/bu while this golden procurement window remains open.
Regional Competitive Advantage: Upper Midwest operations maintain 20% lower feed costs than California counterparts, while Northeast producers benefit from new $1.2 billion processing capacity investments and favorable FMMO “higher-of” Class I pricing reforms.
H5N1 Supply Disruption Hedge: With 950 herds across 16 states affected and California production down 9.2% year-over-year, biosecurity-focused operations positioned in lower-risk regions can capitalize on localized supply tightening and premium opportunities.
Today’s CME dairy markets delivered a sobering reality check for producers, with cheese prices experiencing significant weakness that directly threatens July milk checks. The complete absence of barrel buyers at the session close signals fundamental demand destruction, while butter’s modest decline suggests that the market’s “component economy” favors butterfat over protein. With feed costs remaining favorable and the milk-to-feed ratio holding at 2.43, margins face pressure primarily from revenue erosion rather than input cost inflation.
Today’s Price Action & Farm Impact
Product
Final Price
Daily Change
Weekly Trend
Trading Volume
Impact on Farmers
Cheddar Block
$1.7550/lb
-2.50¢
-9.20¢
13 trades
Direct Class III pressure of $1.25-1.75/cwt
Cheddar Barrel
$1.7700/lb
-2.00¢
-8.20¢
1 trade
Zero offers – extreme liquidity crisis
Butter
$2.5775/lb
-1.50¢
+4.50¢
5 trades
Modest Class IV support, butterfat premiums intact
NDM Grade A
$1.2650/lb
-0.50¢
Unchanged
1 trade
Stable export foundation for Class IV
Dry Whey
$0.5525/lb
+0.50¢
-1.40¢
0 trades
Minor Class III support amid weakness
Market Commentary
The cheese market’s breakdown reflects more than temporary weakness – it signals institutional liquidation patterns not seen since the 2019 market collapse. Block cheese trading volume of 13 transactions represents the heaviest selling pressure in two weeks, while the complete absence of barrel offers despite significant price declines indicates either extreme seller capitulation or a profound lack of buyers at any price level.
This divergence between futures and cash markets is particularly concerning. June Class III futures closed at $18.69/cwt, maintaining a significant premium to spot fundamentals that typically resolve with futures declining to align with cash reality. July Class III futures showed modest strength at $18.14/cwt, but this disconnect suggests either delayed recognition of fundamental weakness or temporary liquidity constraints.
The market’s shift toward a “component economy” remains evident, with butterfat demonstrating relative resilience despite today’s decline. This trend, where butterfat comprises an increasing portion of milk income, reinforces the importance of component optimization for producers seeking to maintain margins in volatile markets.
Feed Cost & Margin Analysis
Current feed market conditions provide crucial relief amid dairy price pressure, with the milk-to-feed ratio maintaining strength at 2.43 – well above the critical 2.0 threshold that typically signals margin stress.
Current Feed Costs & Trends
Corn (July): $4.3075/bu, down 3.5¢ from June 10th (-0.81%)
Soybean Meal (July): $285.30/ton, up $1.50 from June 10th (+0.53%)
Milk-to-Feed Ratio: 2.43 (favorable for producers)
Daily Margin Over Feed Cost: $3.58 per cow (based on 70 lbs production)
The combination of lower corn prices and relatively stable protein costs creates a supportive environment for dairy margins, even as milk prices face headwinds. Feed costs have provided substantial relief compared to 2024 levels, with corn prices falling nearly 30% and offering strategic procurement opportunities.
Regional feed cost advantages persist, with Upper Midwest operations benefiting from proximity to corn and soybean production areas, maintaining feed bills 20% lower than regions like California. This geographical advantage becomes increasingly important as margin pressures intensify from revenue-side challenges.
Production & Supply Insights
U.S. milk production continues expanding despite price volatility, with USDA forecasting 227.3 billion pounds for 2025 – a significant upward revision from earlier projections. This growth stems from both herd expansion (projected 9.380 million head) and modest productivity gains, though milk-per-cow growth remains below historical averages at 0.3%.
Component Production Surge
The industry’s transformation toward higher-value components continues accelerating, with butterfat production surging 5.3% annually while overall milk volume growth remains modest at 0.5%. Average butterfat levels have risen to 4.40% and protein to 3.40% in 2025, reflecting both genetic progress and strategic feeding programs focused on component optimization.
H5N1 Impact Assessment
The H5N1 virus continues affecting dairy operations, with nearly 1,000 herds across 17 states reporting infections as of June 2025. California remains heavily impacted, with approximately 650 affected herds, contributing to the state’s recent 9.2% year-over-year production decline. Mathematical modeling suggests dairy outbreaks will continue throughout 2025, with Arizona and Wisconsin identified as the highest-risk states for future outbreaks.
The emergence of the D1.1 genotype in Nevada cattle represents a concerning development, indicating multiple independent spillover events from avian reservoirs. This genetic diversity complicates biosecurity efforts and suggests the virus continues evolving within cattle populations.
Market Fundamentals Driving Prices
Domestic Demand Dynamics
The U.S. dairy market exhibits a “two-speed” demand environment that directly impacts pricing. Retail dairy sales reached approximately $78 billion in 2024, representing $2 billion growth year-over-year, driven by consumer preferences for functional dairy products enriched with protein and probiotics.
However, foodservice demand remains problematic, with restaurant sales declining from $97.0 billion in December to $95.5 billion by February 2025 – a seven-month low. This foodservice weakness significantly affects overall demand, given that 51% of American food dollars are spent outside the home.
Export Performance & Global Competition
U.S. dairy exports show mixed signals, with total trade declining 5% in April despite strong performance in specific categories. Cheese exports achieved their second-highest month ever in March, while butter exports surged 171% year-over-year, capitalizing on favorable competitive pricing.
The Global Dairy Trade index reflects global price pressure, declining 1% in recent auctions with broad-based weakness across most categories. This international softness adds downward pressure to U.S. pricing, particularly for export-dependent products like NDM and whey.
Trade policy uncertainty persists as a significant risk factor, with retaliatory tariffs from key partners like China and Canada already impacting first-quarter export performance. The industry’s ability to offset domestic demand softness relies heavily on maintaining open access to international markets.
Forward-Looking Analysis
USDA Price Forecasts & Market Outlook
The USDA’s June 2025 WASDE report projects an all-milk price of $21.95/cwt for 2025, with a slight decline to $21.30/cwt anticipated in 2026. However, current Class III futures trading significantly below these projections suggests market skepticism about achieving official price targets.
Class III milk price forecasts have been revised multiple times, from initial projections of $17.95/cwt to current estimates ranging from $18.70-19.10/cwt for 2025. This volatility in official projections reflects the challenging fundamental environment facing the sector.
Key Risk Factors
Upside Potential:
Continued strong export demand for butterfat and cheese products
Weather-related supply disruptions (heat stress can reduce production by 8-12% when temperatures exceed 85°F)
Increased domestic demand for functional dairy products
The Upper Midwest continues demonstrating competitive advantages that position the region favorably despite national market challenges. Wisconsin and Minnesota’s combined production of 42.7 billion pounds in 2024 slightly exceeded California’s 40.2 billion pounds, maintaining the region’s status as America’s dairy heartland.
Structural Advantages
The region benefits from consistent feed cost advantages, with proximity to corn and soybean production providing 20% lower feed bills compared to Western regions. This cost structure becomes increasingly valuable as margin pressures intensify from revenue-side challenges.
Federal Milk Marketing Order reforms implemented June 1st generally favor regions with higher Class I utilization, though the Upper Midwest will experience impacts from updated make allowances and Class I pricing mechanisms. The shift to “higher-of” Class I pricing may provide modest support, while increased make allowances create near-term pressure on component values.
Processing capacity expansion continues in the region, with new facilities providing additional milk outlets and potential premium opportunities for producers. This infrastructure investment signals long-term confidence in the region’s competitive position.
Actionable Farmer Insights
Immediate Risk Management Priorities
Current market conditions demand aggressive risk management action within the next 48 hours. Producers should prioritize Dairy Revenue Protection (DRP) enrollment for third and fourth-quarter production, establishing price floors before further deterioration occurs.
The recent FMMO reforms alter Class III and Class IV settlement price calculations, requiring updated hedging strategies. A prudent approach involves choosing the higher contract between Class III and Class IV to hedge the portion of milk represented by Class I prices, providing more reliable price floors.
Component Optimization Strategy
With butterfat demonstrating relative strength amid broader market weakness, optimizing for higher milk components becomes critical. Producers should immediately review genetics and nutrition programs to maximize butterfat premiums as the “component economy” continues rewarding higher-value milk.
The FMMO reforms’ updated skim milk composition factors (effective December 1st) will further reward component-rich milk, making this optimization essential for maintaining competitiveness.
Feed Cost Management
Take advantage of current corn prices below $4.31/bu by securing long-term contracts, ideally locking in costs below $4.60/bu. Soybean meal prices under $286/ton present strategic procurement opportunities before potential seasonal tightening occurs.
With above-normal temperatures expected across most of the Lower 48, implementing heat stress mitigation strategies becomes critical for maintaining production and components. Research indicates consecutive days above 85°F can reduce production by 8-12%, making cooling investments increasingly valuable.
Industry Intelligence
Federal Milk Marketing Order Implementation
The FMMO reforms implemented on June 1st represent the most significant policy changes since 2018, with additional modifications scheduled for December 1st. Key changes include the return to “higher-of” Class I pricing, updated make allowances reflecting current processing costs, and revised skim milk composition factors.
Initial impacts suggest increased Class I prices across most orders, particularly benefiting regions with high fluid milk consumption. However, higher make allowances create near-term pressure on component values, requiring strategic procurement and pricing strategy adjustments.
Technology & Innovation Trends
Industry executives report growing interest in AI applications for herd management and operational efficiency. “Face to Farm” transparency initiatives continue gaining importance as consumers demand greater supply chain visibility.
Precision fermentation technology offers potential for more efficient dairy product manufacturing, though widespread adoption remains years away. Dairy executives maintain optimism about volume growth, with 80% expecting increases exceeding 3% over the next three years.
Weekly & Monthly Context
Today’s market action continues the concerning trend that began with June 16th’s “cheese market collapse,” when blocks fell 5.75¢, and barrels declined 4.50¢ with zero trading activity. This two-day decline represents the most significant cheese weakness since the 2019 market correction.
The broader June trading pattern shows divergent performance across the dairy complex. Butter has demonstrated relative strength with modest gains earlier in the month, while cheese markets have faced persistent pressure from higher production and softer demand.
Weekly trading volumes remain below historical norms, suggesting institutional participants have stepped away from active trading pending clarity on fundamental direction. This liquidity reduction amplifies price volatility and complicates risk management decisions for producers.
Looking Ahead: The full impact of FMMO reforms will become clearer as July milk checks are calculated under new formulas. Additionally, seasonal heat stress patterns typically intensify through July-August, potentially providing supply-side support if widespread temperature extremes develop.
What’s your current hedging strategy, given today’s cheese weakness? Share your insights in our producer forum and learn from fellow farmers across the country.
Every week, thousands of producers, breeders, and industry insiders open Bullvine Weekly for genetics insights, market shifts, and profit strategies they won’t find anywhere else. One email. Five minutes. Smarter decisions all week.
Stop believing government programs are “fair game.” Wisconsin lawsuit exposes $15,000+ EQIP disparities threatening your operation’s constitutional rights.
EXECUTIVE SUMMARY: The dairy industry’s comfortable reliance on USDA programs is about to face its biggest constitutional challenge since the New Deal, potentially costing operations thousands in lost competitive advantages. Wisconsin Holstein producer Adam Faust’s federal lawsuit against USDA Secretary Brooke Rollins targets three cornerstone programs—Dairy Margin Coverage, Loan Guarantees, and EQIP—alleging they violate equal protection by offering preferential treatment worth up to $15,000 per project based solely on race and gender classifications . With DMC enrollment closing March 31, 2025, and margins averaging $11.61/cwt through 2024’s first ten months, producers face an uncomfortable reality: programs they depend on may be constitutionally vulnerable. The lawsuit builds on Faust’s successful 2021 challenge that eliminated $4 billion in race-based loan forgiveness, creating powerful legal precedent that could dismantle “up to two dozen other discriminatory programs” across USDA . While global dairy production grows 0.5% in 2025 and competitors pursue race-neutral support systems, American producers must grapple with whether demographic classifications distract from performance-based assistance that drives real operational improvements [4]. Every progressive dairy operation should immediately audit their government program dependencies and prepare contingency plans before judicial decisions reshape federal agricultural policy.
KEY TAKEAWAYS
DMC Administrative Fee Disparities Create $100 Annual Advantage: While standard producers pay $100 for identical margin protection at $0.15/cwt for $9.50 coverage, “socially disadvantaged” farmers receive the same catastrophic coverage free, multiplying across thousands of operations nationwide
EQIP Cost-Share Gaps Deliver $15,000 Project Advantages: Standard participants receive 75% cost-sharing for conservation practices like manure storage systems, while preferred classifications qualify for 90% reimbursement—creating a $15,000 disparity on typical $100,000 environmental compliance projects
Loan Guarantee Rates Affect Borrowing Power by 5%: USDA guarantees reach 95% for minority and female farmers versus 90% for others, directly impacting interest rates and lending terms on major refinancing like Faust’s $890,000 dairy operation loan
Constitutional Precedent Threatens Program Stability: The 2021 Faust v. Vilsack victory plus Supreme Court’s 2023 Students for Fair Admissions decision create powerful legal framework challenging any race-based classifications, potentially forcing Congress to restructure agricultural support around income-based or performance metrics rather than demographic categories
Global Competitors Pursue Race-Neutral Support Systems: While American dairy debates constitutional compliance, EU Common Agricultural Policy focuses on environmental outcomes and farm size, and New Zealand eliminated most subsidies decades ago, forcing efficiency improvements that strengthened international competitiveness
Wisconsin Holstein producer Adam Faust filed a federal lawsuit Monday against USDA Secretary Brooke Rollins, alleging three key agricultural programs systematically discriminate against white male dairy farmers through preferential treatment that costs operations tens of thousands of dollars annually. The case targets the Dairy Margin Coverage (DMC) program, USDA Loan Guarantee program, and Environmental Quality Incentives Program (EQIP), claiming these initiatives violate constitutional equal protection principles while creating significant financial disparities across dairy operations nationwide.
The $890,000 Question: When Program Benefits Create Market Disadvantages
Here’s the reality facing dairy producers in 2025: your race and gender now determine how much federal support you can access. Faust, who operates a 70-head Registered Holstein operation near Chilton, Wisconsin, discovered this firsthand when he refinanced his dairy farm in August 2024.
While Faust qualified for a 90% USDA loan guarantee on his $890,000 refinancing, minority and female farmers in identical situations receive 95% guarantees. That 5-percentage-point difference translates directly into borrowing power, interest rates, and your operation’s financial flexibility.
Let’s face it – in today’s capital-intensive dairy industry, every basis point matters. When feed costs remain elevated and milk prices stay volatile, access to favorable financing can determine whether you expand, maintain, or exit the business.
The $100 Administrative Fee: A Constitutional Violation in Plain Sight?
The Dairy Margin Coverage program, which protects producers when the difference between the all-milk price and the average feed price falls below a certain dollar amount selected by the producer, charges most participants a $100 annual administrative fee. However, this fee disappears entirely for farmers classified as “limited resource, beginning, socially disadvantaged, or a military veteran .”
With DMC enrollment running from January 29 to March 31, 2025, and coverage levels ranging from $4 to $9.50 per hundredweight in 50-cent increments, this isn’t pocket change we’re discussing. The program’s effectiveness has been demonstrated repeatedly – research from HighGround Dairy shows that Tier I coverage at the $9.50 margin would have triggered payments in 65% of the months over the past decade.
“Our safety-net programs provide critical financial protections against commodity market volatilities for many American farmers, so don’t delay enrollment,” said USDA Farm Service Agency (FSA) Administrator Zach Ducheneaux. “And at $0.15 per hundredweight for $9.50 coverage, risk protection through Dairy Margin Coverage is a relatively inexpensive investment in a true sense of security and peace of mind .”
But here’s what’s really concerning: Faust paid his $100 DMC administrative fee on March 25, 2025, while farmers in other demographic categories received identical coverage for free. Multiply this across thousands of dairy operations, and you’re looking at millions in differential treatment.
EQIP Conservation: When 90% vs 75% Cost-Share Creates Competitive Gaps
The Environmental Quality Incentives Program presents perhaps the most significant financial disparity. Standard EQIP participants receive up to 75% cost-sharing for conservation practices, while “socially disadvantaged, limited-resource, beginning, and veteran farmer and ranchers are eligible for cost-share rates of up to 90 percent .”
Consider the math on a typical manure storage system – exactly what Faust plans for his operation. On a $100,000 project, that 15-percentage-point difference means $15,000 more out-of-pocket expenses for some farmers compared to others. When margins are tight and environmental compliance costs continue rising, this disparity affects operational competitiveness.
The National Sustainable Agriculture Coalition confirms that these enhanced benefits extend beyond just cost-sharing rates. This same population of producers is also eligible for up to 50 percent advance payment for costs associated with planning, design, materials, equipment, installation, labor, management, maintenance, or training.
The Uncomfortable Constitutional Question: Have We Forgotten Equal Protection?
Here’s the question nobody wants to ask: When did American dairy farmers become so dependent on federal subsidies that we’ll accept constitutional violations for a $100 fee waiver?
This lawsuit exposes an uncomfortable reality about our industry’s relationship with government programs. We’ve built entire business models around accessing preferential treatment, loan guarantees, and conservation cost-shares that may fundamentally violate the principle of equal protection under the law.
Table 1: Financial Disparities in Challenged USDA Programs
Program
Standard Rate
Socially Disadvantaged Rate
Annual Difference
DMC Administrative Fee
$100
$0 (waived)
$100
Loan Guarantee Program
90% guarantee
95% guarantee
5% advantage
EQIP Cost-Share
Up to 75%
Up to 90%
15% advantage
Are we so comfortable with this system that we’ve forgotten what true market-based agriculture looks like?
Legal Precedent: The 2021 Victory That Changed Everything
Faust isn’t entering this battle unprepared. His successful 2021 lawsuit against the Biden administration halted a COVID-19 loan forgiveness program that excluded white farmers, establishing legal precedent that race-based agricultural programs violate constitutional equal protection principles.
That earlier victory, combined with the Supreme Court’s 2023 Students for Fair Admissions decision limiting race-conscious policies, creates a powerful legal foundation. The Wisconsin Institute for Law & Liberty, representing Faust, has already secured seven significant court victories challenging similar programs across 25 states.
What This Constitutional Challenge Means for Your Operation
Immediate Impact: If you’re currently enrolled in DMC, loan guarantee programs, or planning EQIP applications, understand that these policies may face significant changes. The Trump administration finds itself in the awkward position of defending programs that contradict its anti-DEI platform.
Financial Planning: Operations relying on the enhanced benefits available through “socially disadvantaged” classifications should prepare contingency plans. A successful lawsuit could eliminate preferential treatment across multiple USDA programs simultaneously.
Risk Management: With DMC proving its value through consistent performance and coverage at just $0.15 per hundredweight for $9.50 protection, the core program remains solid regardless of administrative fee structures. Don’t let policy uncertainty derail your risk management strategy.
This lawsuit targets more than three programs. The Wisconsin Institute for Law & Liberty has identified “up to two dozen other discriminatory programs” across USDA that use similar classification systems. A successful challenge could trigger comprehensive policy changes affecting:
Conservation program funding priorities
Disaster assistance distribution
Equipment purchase loan terms
Technical assistance access
Grant program eligibility
The Global Context: How Other Dairy Nations Handle Farmer Support
While American dairy farmers debate classification-based programs, international competitors pursue different approaches to farmer support. The European Union’s Common Agricultural Policy focuses on environmental outcomes and farm size rather than demographic characteristics. New Zealand eliminated most production subsidies decades ago, forcing efficiency improvements that strengthened their global competitiveness.
This raises uncomfortable questions: Are we creating the most effective support systems for American dairy farmers, or are demographic classifications distracting from performance-based assistance that drives real operational improvements?
The Constitutional vs. Practical Debate
Here’s where dairy farmers face a fundamental choice: support programs based on constitutional principles of equal treatment or accept targeted assistance that acknowledges historical discrimination in agricultural lending. The USDA’s own data shows that minority farmers historically faced higher loan rejection rates and less favorable terms.
But does addressing past discrimination through current preferential treatment create new inequities? When a Wisconsin Holstein producer pays $100 for DMC coverage while his neighbor receives it free, the constitutional argument becomes personally relevant.
Bottom Line: Preparing for Policy Uncertainty
Smart dairy managers prepare for multiple scenarios. Whether you benefit from current preferential programs or feel disadvantaged by them, policy stability remains uncertain. Here’s your action plan:
Secure Current Benefits: If you qualify for enhanced USDA programs, complete applications before potential policy changes. The DMC enrollment deadline is March 31, 2025.
Diversify Risk Management: Don’t rely solely on government programs for financial protection. While valuable at $0.15 per hundredweight for $9.50 coverage, the DMC program shouldn’t be your only margin protection strategy.
Document Everything: Whether you’re affected positively or negatively by current policies, maintain detailed records of program interactions. Policy changes may trigger retroactive adjustments.
Stay Informed: This lawsuit represents broader political movements challenging race-conscious policies across all government agencies. Monitor developments beyond agriculture that may signal wider policy shifts.
The dairy industry thrives on consistent, predictable policies that support operational efficiency and long-term planning. Whether you agree with or oppose current USDA classification systems, uncertainty helps nobody. The sooner these constitutional questions get resolved, the sooner we can focus on what really matters: producing safe, affordable milk for American families while maintaining profitable, sustainable operations.
The lawsuit’s outcome will determine whether America’s dairy support programs emphasize equal treatment or targeted assistance – a choice with implications far beyond Adam Faust’s 70-cow Holstein operation in Wisconsin.
Every week, thousands of producers, breeders, and industry insiders open Bullvine Weekly for genetics insights, market shifts, and profit strategies they won’t find anywhere else. One email. Five minutes. Smarter decisions all week.
Stop assuming your milk pickup is guaranteed forever. 1,000+ Teamsters could paralyze 29% of US milk supply—here’s your survival plan.
EXECUTIVE SUMMARY: While most dairy producers worry about feed costs and milk prices, they ignore the biggest threat to their operation: labor disputes that could shut down milk pickup overnight. Over 1,000 Teamsters working at Dairy Farmers of America facilities just authorized strikes targeting 65.4 billion pounds of annual milk production—nearly one-third of America’s total supply. DFA’s $24.5 billion in yearly revenue and strategic control of processing facilities in Colorado, California, Minnesota, New Mexico, and Utah creates a single point of failure that could force farms to dump milk within 48-72 hours of a work stoppage. The union’s demand for “automation protection” represents a fundamental shift that will influence technology adoption timelines across every dairy processor in North America, potentially delaying efficiency gains worth $0.23/cwt in feed cost savings alone. Most critically, this dispute exposes how supply chain complacency has left producers vulnerable to catastrophic losses—farms with only 1-2 days storage capacity face immediate dumping decisions, while operations with emergency contingencies could weather disruptions and maintain profitability.Smart producers are already diversifying milk marketing agreements, securing emergency storage capacity, and accelerating technology investments before labor agreements constrain automation adoption and drive equipment costs higher.
KEY TAKEAWAYS
Supply Chain Vulnerability Assessment: Farms with single-day storage capacity face immediate milk dumping at current $21+/cwt prices during any pickup disruption, while operations investing in 4-5 day emergency storage (portable tanks lease for $0.003/pound) create survival buffers worth thousands in avoided losses.
Technology Adoption Timeline Acceleration: If automation protection becomes standard in labor agreements, robotic milking systems, and precision feeding technology costs will increase while availability decreases—current AMS financing at 4.2% interest may look generous compared to future constrained supply affecting operations seeking 12-15% feed efficiency improvements.
Buyer Diversification Strategy: Producers relying on single cooperative relationships risk catastrophic exposure—split milk marketing agreements cost minimal additional handling fees compared to dumping premium milk, with current butterfat premiums of $0.15-0.25/lb and protein advantages at $3.20/lb base pricing.
Labor-Technology Nexus Impact: DFA’s financial strength ($107.9 million net income, 29% market share) enables extended negotiations, while automation protection demands could delay genetic selection progress for traits supporting robotic systems, potentially costing operations $89/cow in annual feed efficiency improvements.
Regional Concentration Risk: Colorado’s processing concentration (Henderson facility: 40% capacity increase, Fort Morgan: 2.5 million lbs/day, Greeley: 6.5+ million lbs/day combined) creates domino effects where single facility strikes immediately impact high-volume robotic operations milking 4,000+ cows with nowhere to redirect milk flow.
Here’s a wake-up call every dairy producer needs to hear: Over 1,000 Teamsters just voted to authorize strikes against Dairy Farmers of America—the cooperative that processes 29% of America’s milk supply. While you’re worried about feed costs and milk prices, the workers who actually handle your product are ready to walk off the job, potentially forcing you to dump millions of pounds of milk. Are you planning like your milk pickup is guaranteed forever?
What happens when the people who process your milk decide your cooperative doesn’t deserve their labor? You’re about to find out because more than 1,000 Teamsters working at Dairy Farmers of America facilities just authorized strikes that could paralyze nearly one-third of US milk production.
This isn’t some distant labor dispute you can ignore. This is a calculated assault on the dairy industry’s most vulnerable pressure point—and if you think it won’t affect your operation, you’re dangerously wrong.
Why Every Dairy Producer Should Be Losing Sleep Over This
Let’s cut through the noise and focus on what really matters. DFA isn’t just another milk buyer—they’re the 800-pound gorilla controlling 65.4 billion pounds of milk annually. When Lou Villalvazo, Chairman of DFA’s National Bargaining Committee, says, “Our members are ready to walk,” he’s holding a gun to the head of your entire livelihood.
Here’s the brutal math: DFA handles milk from operations across California, Colorado (Henderson, Greeley, Fort Morgan), Minnesota, New Mexico, and Utah. If even one major facility shuts down, the domino effect hits immediately. Your cows don’t care about labor disputes—they keep producing milk every 12 hours whether there’s somewhere to send it or not.
Think about your current storage capacity. How many days can you hold milk if pickup stops? Two days? Three? After that, you dump product down the drain while watching your cash flow evaporate.
The union knows exactly what they’re doing. They’ve warned that strikes at “just one or two” DFA facilities could trigger major supply chain problems. This isn’t bluffing—it’s dairy economics 101.
The Automation Demand That Changes Everything
Most coverage is missing here: This isn’t just about wages and benefits. The Teamsters are demanding “protection against job displacement caused by automation”—and that single demand could reshape how every dairy operation approaches technology for the next decade.
DFA has invested heavily in facilities like their Garden City, Kansas plant, designed for 24/7 continuous operation with minimal human intervention. If the union succeeds in securing broad automation protections, expect similar demands to ripple across every dairy processor in North America.
Why This Matters for Your Operation: Your milk buyer’s labor agreements directly impact your farm’s technology timeline. If processors slow automation adoption due to labor pressure, efficiency gains that could lower your processing costs and improve premiums for quality components are delayed.
Are you factoring labor relations into your technology investment decisions? Because you should be. The outcome of this dispute will influence everything from robotic milking adoption to automated feeding systems across the entire industry.
The Financial Reality: DFA Can Afford to Fight or Settle
Let’s examine the numbers that really matter. DFA reported $24.5 billion in net sales and $107.9 million in net income for 2022. They began in 2024, exceeding projected earnings for both January and February.
The union’s argument about DFA’s “ability to pay” is compelling. When Peter Rosales, a Local 630 shop steward, says, “We know how much money DFA makes, and we know what we deserve,” he’s pointing to over $100 million in annual net income.
But here’s the strategic calculation DFA faces: Settling quickly might resolve the immediate crisis but could set precedents for future negotiations across the entire food processing sector. Other companies are watching to see whether aggressive union tactics against financially strong cooperatives prove successful.
Why This Matters for Your Operation: Four Critical Questions
1. Supply Chain Vulnerability Assessment How many days can your operation survive without milk pickup? Most farms have 1-2 days of storage capacity. If you’re at single-day capacity, you face immediate dumping decisions during any disruption.
2. Alternative Buyer Relationships Do you have relationships with alternative milk buyers? The cost of split milk pickup is nothing compared to dumping milk worth $21+ per hundredweight.
3. Technology Adoption Timeline: Technology costs and availability will rise if automation protection becomes standard in labor agreements. Current financing at favorable rates may look generous compared to future constrained supply.
4. Contract Force Majeure Provisions Have you reviewed your milk marketing agreements for language covering labor disputes? Understanding your rights and obligations during supply disruptions could save thousands of dollars.
The Domino Effect You Can’t Ignore
Think of regional concentration as having all your breeding stock in one barn during a disease outbreak—convenient for efficiency and catastrophic for risk management.
Colorado’s dairy processing concentration creates a particular vulnerability:
Henderson DFA facility: Increased daily capacity by 40% in recent expansions
Fort Morgan operations: Processing 2.5 million pounds daily
Greeley region: Combined processing of 6.5+ million pounds daily
A Colorado strike wouldn’t just impact DFA. The state’s concentration of large-scale operations, including robotic dairies milking nearly 4,000 cows, means processing disruptions would immediately force high-volume producers to make impossible choices about where to send their milk.
What Smart Producers Are Doing Right Now
Emergency Storage Assessment: Calculate your critical storage timeline. If you’re currently at 1.5 days capacity, portable tanks can extend that to 4-5 days. They lease for approximately $0.003/pound—cheap insurance against catastrophic loss.
Buyer Diversification: Don’t put all your milk in one cooperative’s tank truck. Develop relationships with alternative buyers now, before you need them. The cost of managing split loads is minimal compared to dumping premium milk.
Technology Acceleration: If automation protection becomes standard in labor agreements, equipment costs and availability will increase. Lock in current pricing for planned investments while supply and financing remain favorable.
The Broader Industry Transformation
This dispute represents something larger than labor negotiations—it’s a defining moment for how the dairy industry balances innovation, worker rights, and operational efficiency.
The resolution will establish precedents for:
Automation implementation timelines across food processing
Worker protection models that other unions will emulate
How cooperatives balance farmer-owner interests with workforce demands
International competitors are watching closely. If US labor agreements constrain automation adoption, it hands competitive advantages to countries with more flexible technology implementation.
The Bottom Line: Prepare Now or Pay Later
The Teamsters have demonstrated they understand exactly where the dairy industry is vulnerable. Their strategic targeting of DFA’s cooperative structure, geographic concentration, and perishable supply chain shows sophisticated thinking that other unions will likely emulate.
Immediate action items for smart producers:
This Week:
Assess your emergency storage capacity and financing options
Review force majeure clauses in all milk marketing contracts
Identify and contact alternative milk buyers in your region
This Month:
Diversify milk marketing agreements to reduce single-buyer dependency
Lock in pricing for planned automation investments
Model cash flow impacts of 7-14 day milk marketing disruptions
This Quarter:
Secure credit lines for potential short-term disruptions
Hedge nearby milk prices at current levels
Evaluate labor-reducing technologies that may become costlier post-settlement
The fundamental question every dairy producer must answer: Are you planning like your milk pickup is guaranteed forever, or are you preparing for the reality that labor disputes can shut down your operation’s lifeline overnight?
Your cows are depending on you to plan ahead. The time for contingency thinking is now before the first truck stops rolling, and you’re watching liquid profit disappear down the drain.
The Teamsters have just shown you exactly how vulnerable your operation really is. What are you going to do about it?
Based on the search results provided, here’s the “Learn More” section using actual articles from The Bullvine website:
Every week, thousands of producers, breeders, and industry insiders open Bullvine Weekly for genetics insights, market shifts, and profit strategies they won’t find anywhere else. One email. Five minutes. Smarter decisions all week.
Stop ignoring trade war signals. Trump’s EU tariff threats could slash your export profits by 50% while feed costs spike—here’s your action plan.
EXECUTIVE SUMMARY: What is the biggest mistake in the dairy industry? Treating the EU-US trade standoff as “just politics” while ignoring the $6 billion profit tsunami heading for American farms. New economic projections reveal that if July 9 negotiations collapse, dairy farmers face a perfect storm: 50% tariffs crushing export opportunities, retaliatory measures targeting agricultural goods, and potential feed cost increases from supply chain disruptions. Cornell University’s Charles Nicholson warns that trade wars with our three biggest dairy export destinations could cost American dairy farmers $6 billion in profits over four years—that’s real money affecting milk prices, not abstract economic theory. The EU’s geographical indications system already locks US cheesemakers out of premium markets worth billions, while European dairy imports flood American shelves with minimal barriers. Smart dairy operations are already diversifying export markets, building domestic premium positioning, and stress-testing their supply chains against trade policy volatility. Don’t wait for politicians to solve this mess—start building a trade-war-resistant operation today.
KEY TAKEAWAYS
Export Exposure Assessment Critical: With dairy exports hitting 12.2 billion pounds (milk-fat basis) in 2025, operations dependent on international markets face immediate 50% tariff exposure—calculate your revenue vulnerability now and develop domestic premium market alternatives
Feed Cost Shock Preparation: Trade escalation could spike imported feed ingredient costs while simultaneously reducing export demand, creating a margin squeeze that demands immediate supply chain diversification and efficiency improvements
Geographic Market Diversification Strategy: EU’s geographical indications system blocks American “parmesan” and “feta” sales globally, not just in Europe—develop alternative product positioning and explore non-EU export markets before trade wars force reactive decisions
Quality Premium Positioning Advantage: European import disruptions from 50% tariffs create immediate opportunities for domestic premium dairy products—invest in organic certification, grass-fed protocols, or other differentiators that command higher margins regardless of trade policy
Policy Volatility Insurance Planning: With $3 billion in annual dairy trade deficit driving political pressure, build operational flexibility through direct-to-consumer channels, value-added processing, and crisis-resistant revenue streams that don’t depend on export market stability
The European Union just dodged President Trump’s 50% tariff threat until July 9, but don’t celebrate yet; this trade standoff could cost American dairy farmers $6 billion in profits over the next four years while fundamentally reshaping how $45.4 billion worth of dairy products move between the world’s largest markets.
The numbers don’t lie, and they’re not pretty. Cornell University’s Charles Nicholson warns that if trade wars escalate with our three biggest dairy export destinations—Mexico, Canada, and the EU, American dairy farmers face a financial bloodbath that’ll make 2009 look like a picnic.
Why Your Operation Can’t Ignore This Political Theater
Here’s the brutal reality: dairy exports aren’t just numbers on a government spreadsheet—they’re your lifeline to profitability. U.S. dairy exports hit 12.2 billion pounds on a milk-fat basis in 2025, worth billions to farm gate prices. When trade wars erupt, that export income evaporates faster than morning dew in August.
Let’s face it—we’re already seeing the damage. First-quarter 2025 dairy exports grew just 3% in March, trailing 0.5% behind 2024 levels for the year’s first three months. That’s not growth; that’s stagnation in a market that should expand.
But here’s what really should keep you up at night: the EU represents one of the world’s most valuable dairy markets, and we’re playing chicken with a 8 billion trade relationship. Are we seriously going to let politicians torpedo decades of market development for short-term political points?
The $6 Billion Question: Can American Dairy Survive a Trade War?
Charles Nicholson’s projection of $6 billion in lost dairy profits isn’t fear-mongering—it’s a mathematical reality based on what happens when you pick fights with your best customers. The combination of tariffs, potential deportations affecting farm labor, and cuts to nutrition programs creates what economists call a “perfect storm” for dairy operations.
Current tariffs already hammer our competitiveness: 25% on goods from Mexico and Canada and 10% on Chinese imports. Now imagine European retaliation targeting American dairy exports. Think your cheese can compete with European alternatives when burdened with 50% tariffs?
The European Union isn’t backing down either. They’re offering a “zero-for-zero” industrial tariff deal while simultaneously preparing retaliatory measures that could devastate American agricultural exports. Smart negotiating or economic suicide? You decide.
What This Means for Your Bottom Line
Scenario Planning Time: Let’s get practical about what these trade tensions mean for your operation:
If Trade Wars Escalate:
Export prices drop as alternative destinations flood with displaced European dairy
Domestic milk prices face downward pressure from reduced export demand
Feed costs potentially rise due to tariffs on imported ingredients
Labor costs increase if immigration policies affect workforce availability
If a Deal Gets Struck:
European market access could expand under “zero-for-zero” proposals
Increased competition from European imports in premium product segments
Potential for joint technology sharing and innovation partnerships
But here’s what you can control right now: diversification and quality positioning. Don’t put all your export hopes in one geographical basket. The data shows mixed performance across product categories—cheese exports up, dry skim milk down—suggesting market-specific strategies matter more than ever.
The Technology Angle Nobody’s Discussing
What’s missing from most trade war coverage? The innovation implications. European dairy technology partnerships, research collaborations, and knowledge sharing could become casualties of this diplomatic dysfunction.
Are we really willing to sacrifice access to European precision agriculture advances, sustainability innovations, and genetics programs for political posturing? The global dairy industry thrives on international knowledge exchange—trade wars threaten that foundation.
Your Action Plan for Navigating Trade Uncertainty
Immediate Steps (Next 30 Days):
Audit your export exposure: Calculate what percentage of your revenue depends on export markets
Review supply chain vulnerabilities: Assess dependence on imported inputs affected by tariffs
Strengthen domestic positioning: Focus on local and regional market development
Medium-term Strategy (Next 6 Months):
Invest in quality differentiation: Organic, grass-fed, or other premium certifications
Build direct-to-consumer channels: Reduce dependence on commodity export markets
Form cooperative alliances: Pool resources for market development and risk sharing
Monitor policy developments: Stay informed about trade negotiations affecting your markets
Long-term Positioning (Next 2 Years):
Develop crisis-resistant revenue streams: Agritourism, value-added processing, direct sales
Invest in efficiency improvements: Reduce per-unit costs to maintain competitiveness
Build political relationships: Engage with representatives about dairy industry needs
Plan for policy volatility: Develop flexible business models that adapt to changing trade conditions
The Bottom Line
Trade uncertainty isn’t going away, and the July 9 deadline is just the next chapter in an ongoing global economic realignment. The dairy operations that survive and thrive will be those that build resilience through diversification, quality differentiation, and strategic flexibility.
Don’t wait for politicians to solve this mess—they created it. Focus on what you can control: building a profitable dairy operation regardless of what happens in Washington or Brussels. The $6 billion question isn’t whether trade wars will hurt dairy farmers—it’s whether you’ll be ready when they do.
Trump’s Tariff Strategy: A Game-Changer for America’s Dairy Industry – Explores how forward-thinking farmers are leveraging AI technology, robotic systems, and precision agriculture to achieve 15% milk yield increases and 25% cost reductions while turning tariff pressure into innovation opportunities.
The Sunday Read Dairy Professionals Don’t Skip.
Every week, thousands of producers, breeders, and industry insiders open Bullvine Weekly for genetics insights, market shifts, and profit strategies they won’t find anywhere else. One email. Five minutes. Smarter decisions all week.
To provide the best experiences, we use technologies like cookies to store and/or access device information. Consenting to these technologies will allow us to process data such as browsing behavior or unique IDs on this site. Not consenting or withdrawing consent, may adversely affect certain features and functions.
Functional
Always active
The technical storage or access is strictly necessary for the legitimate purpose of enabling the use of a specific service explicitly requested by the subscriber or user, or for the sole purpose of carrying out the transmission of a communication over an electronic communications network.
Preferences
The technical storage or access is necessary for the legitimate purpose of storing preferences that are not requested by the subscriber or user.
Statistics
The technical storage or access that is used exclusively for statistical purposes.The technical storage or access that is used exclusively for anonymous statistical purposes. Without a subpoena, voluntary compliance on the part of your Internet Service Provider, or additional records from a third party, information stored or retrieved for this purpose alone cannot usually be used to identify you.
Marketing
The technical storage or access is required to create user profiles to send advertising, or to track the user on a website or across several websites for similar marketing purposes.
To provide the best experiences, we and our partners use technologies like cookies to store and/or access device information. Consenting to these technologies will allow us and our partners to process personal data such as browsing behavior or unique IDs on this site and show (non-) personalized ads. Not consenting or withdrawing consent, may adversely affect certain features and functions.
Click below to consent to the above or make granular choices. Your choices will be applied to this site only. You can change your settings at any time, including withdrawing your consent, by using the toggles on the Cookie Policy, or by clicking on the manage consent button at the bottom of the screen.
Functional
Always active
The technical storage or access is strictly necessary for the legitimate purpose of enabling the use of a specific service explicitly requested by the subscriber or user, or for the sole purpose of carrying out the transmission of a communication over an electronic communications network.
Preferences
The technical storage or access is necessary for the legitimate purpose of storing preferences that are not requested by the subscriber or user.
Statistics
The technical storage or access that is used exclusively for statistical purposes.The technical storage or access that is used exclusively for anonymous statistical purposes. Without a subpoena, voluntary compliance on the part of your Internet Service Provider, or additional records from a third party, information stored or retrieved for this purpose alone cannot usually be used to identify you.
Marketing
The technical storage or access is required to create user profiles to send advertising, or to track the user on a website or across several websites for similar marketing purposes.


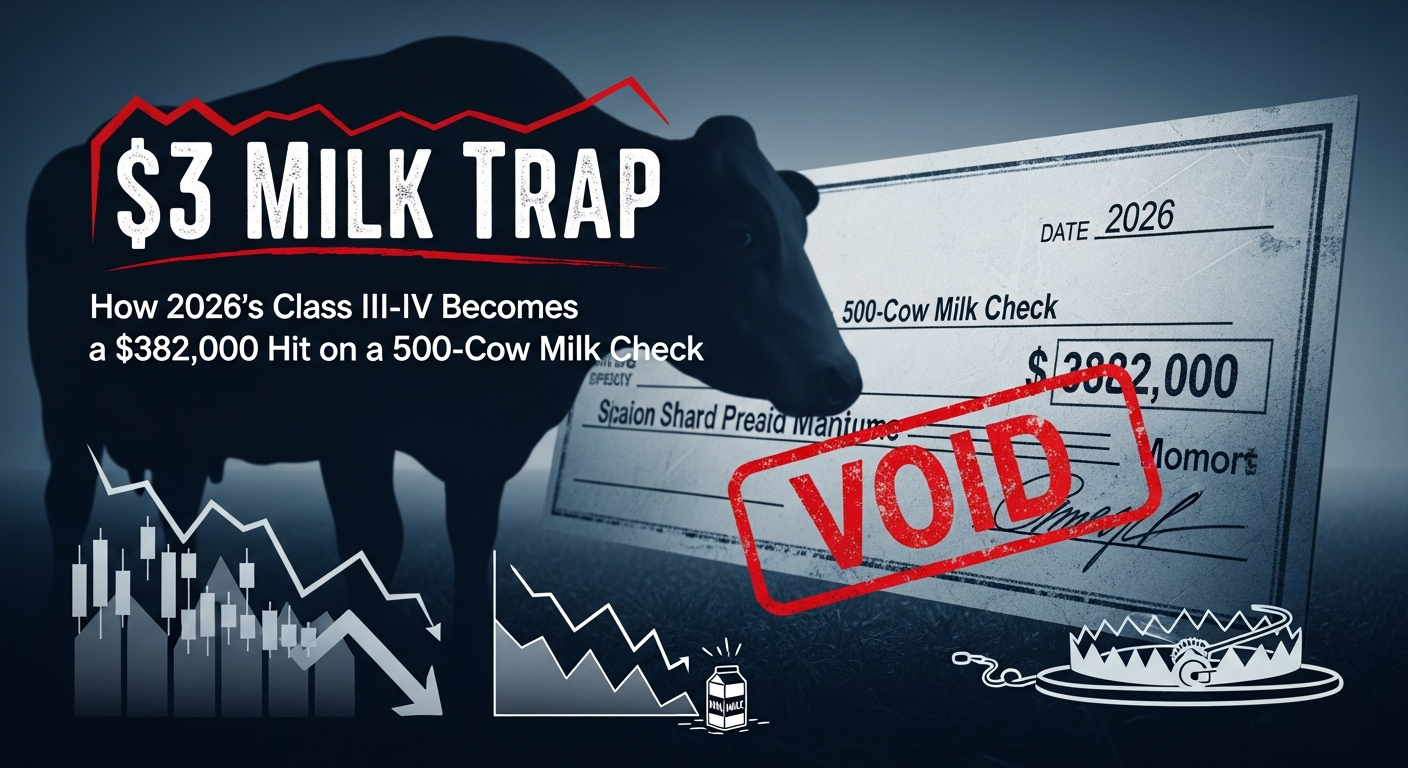
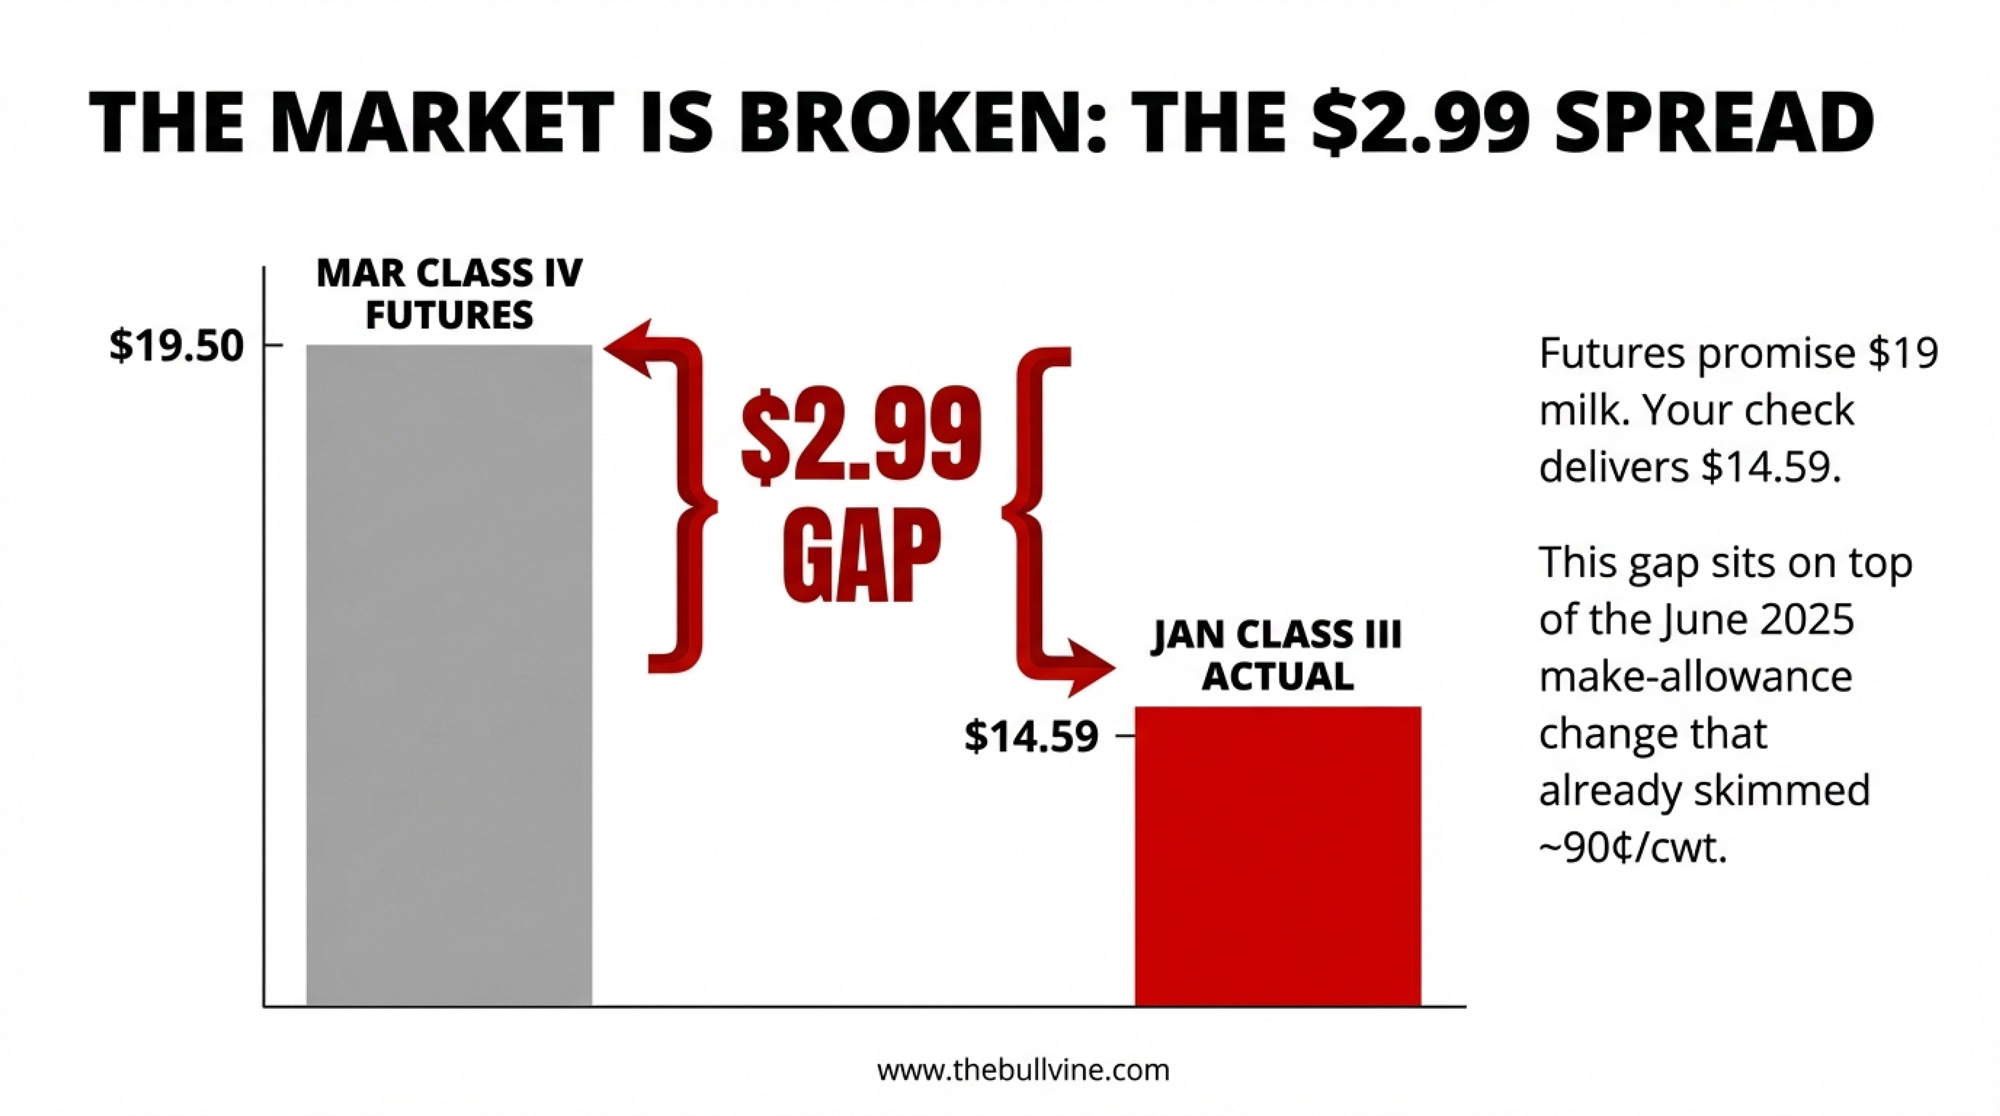
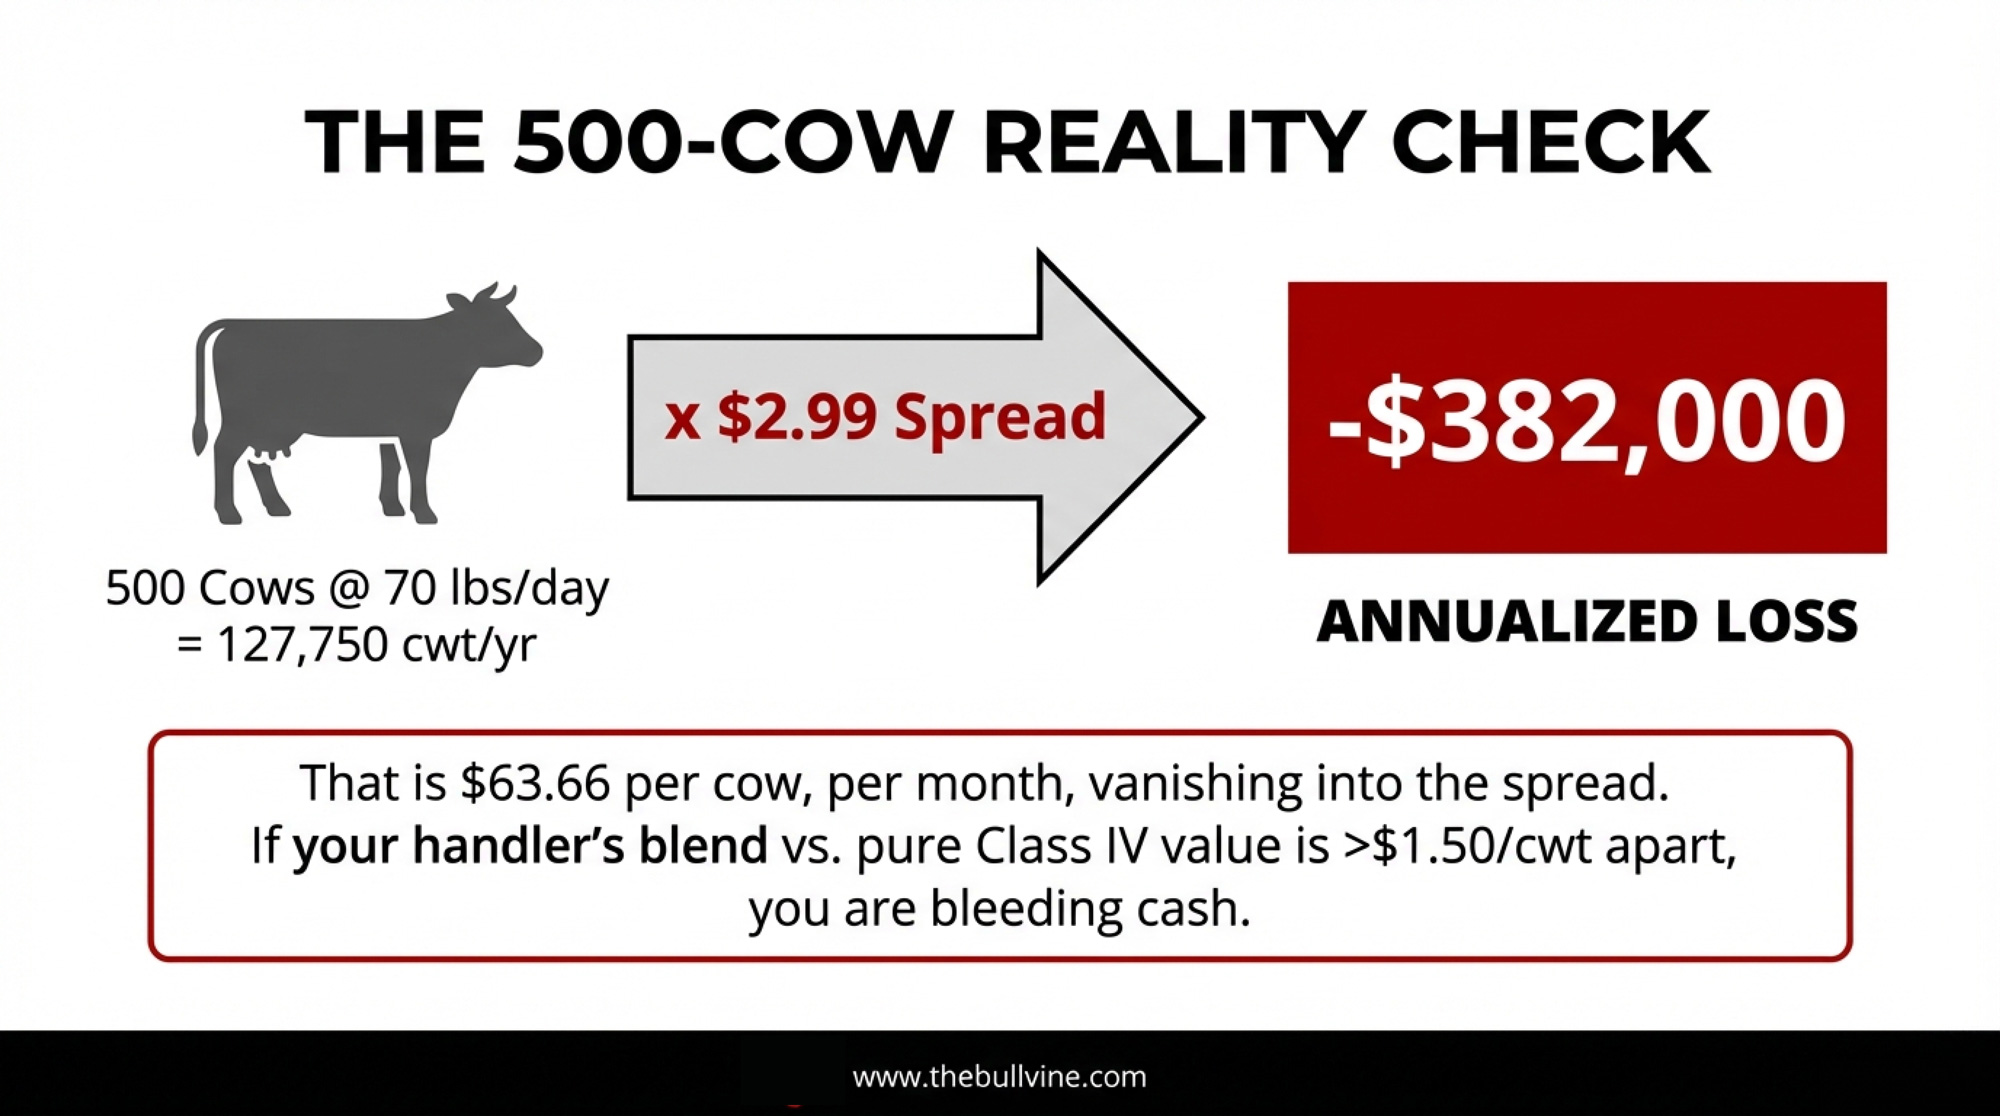
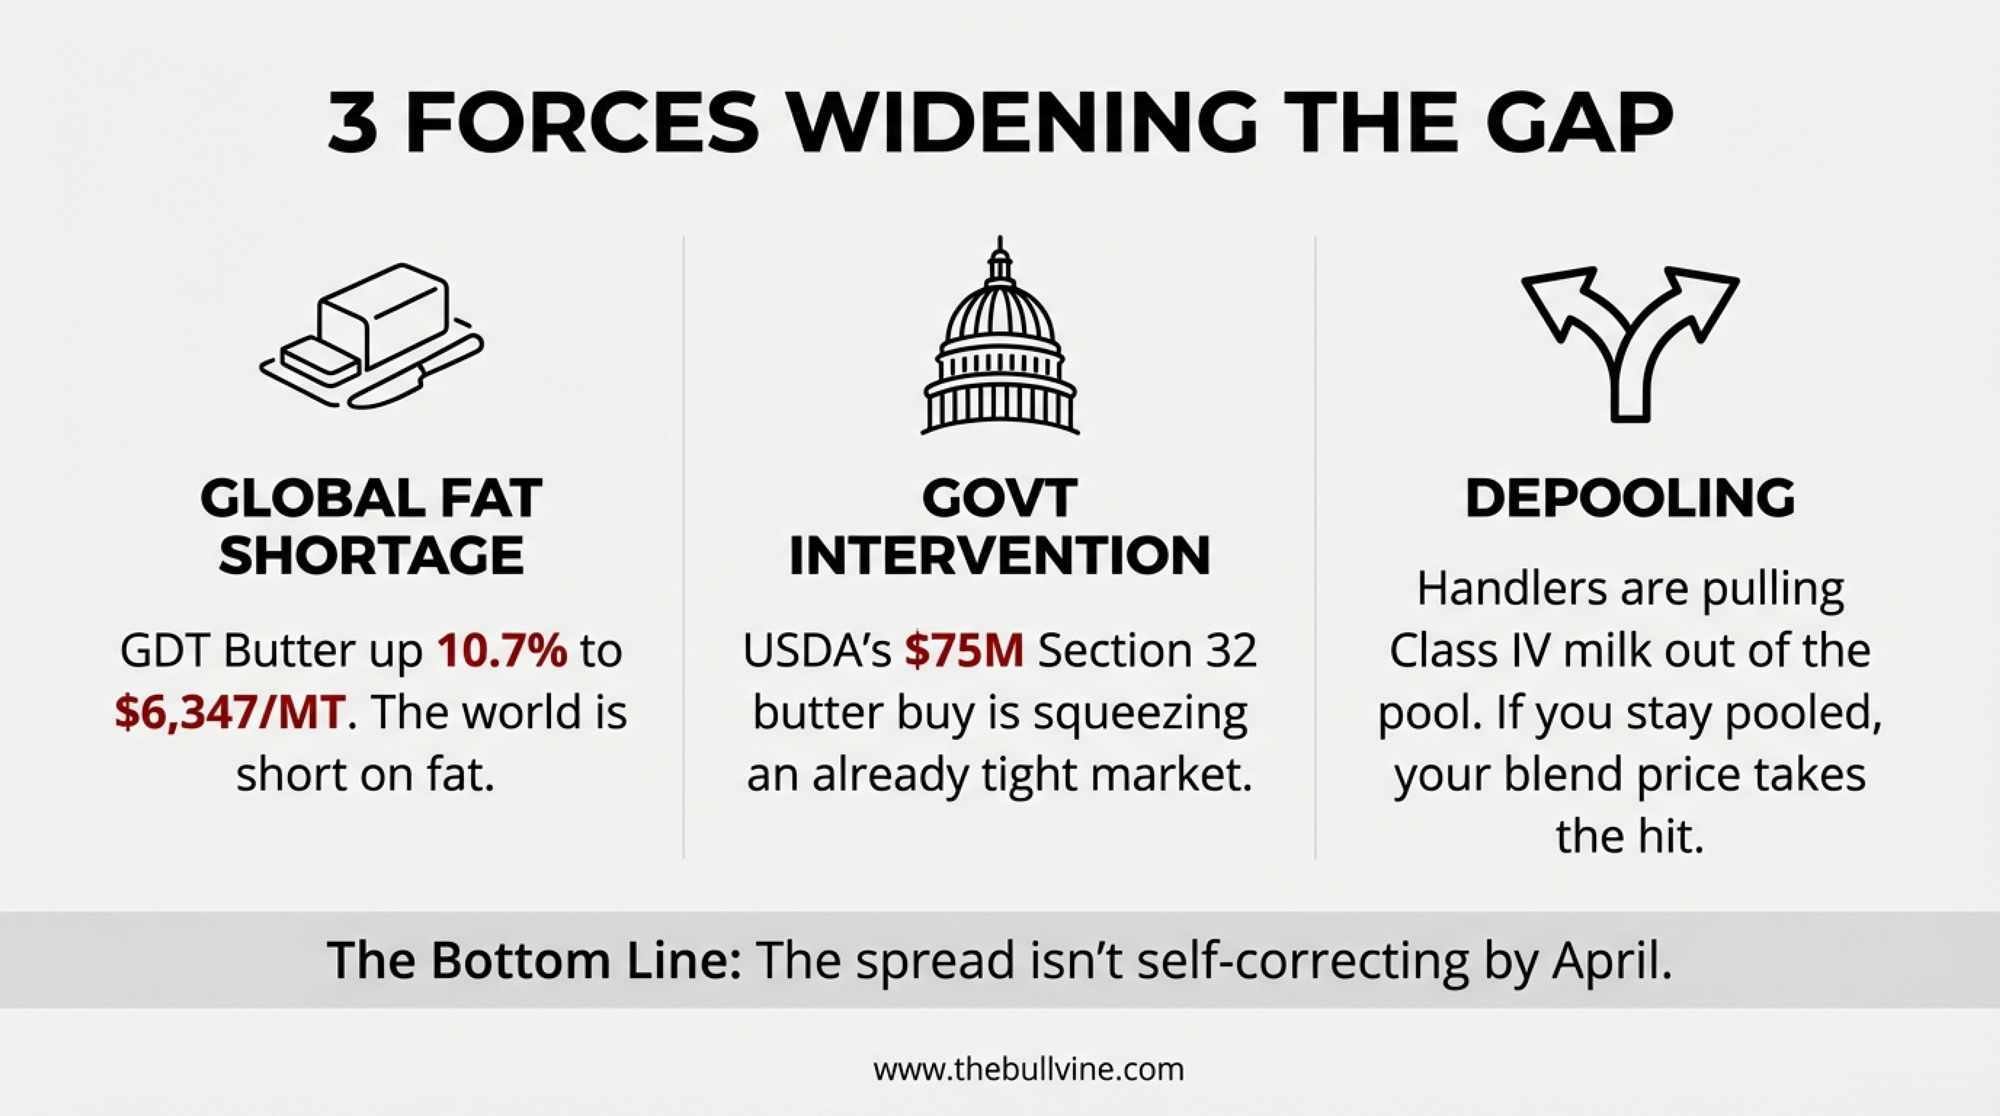
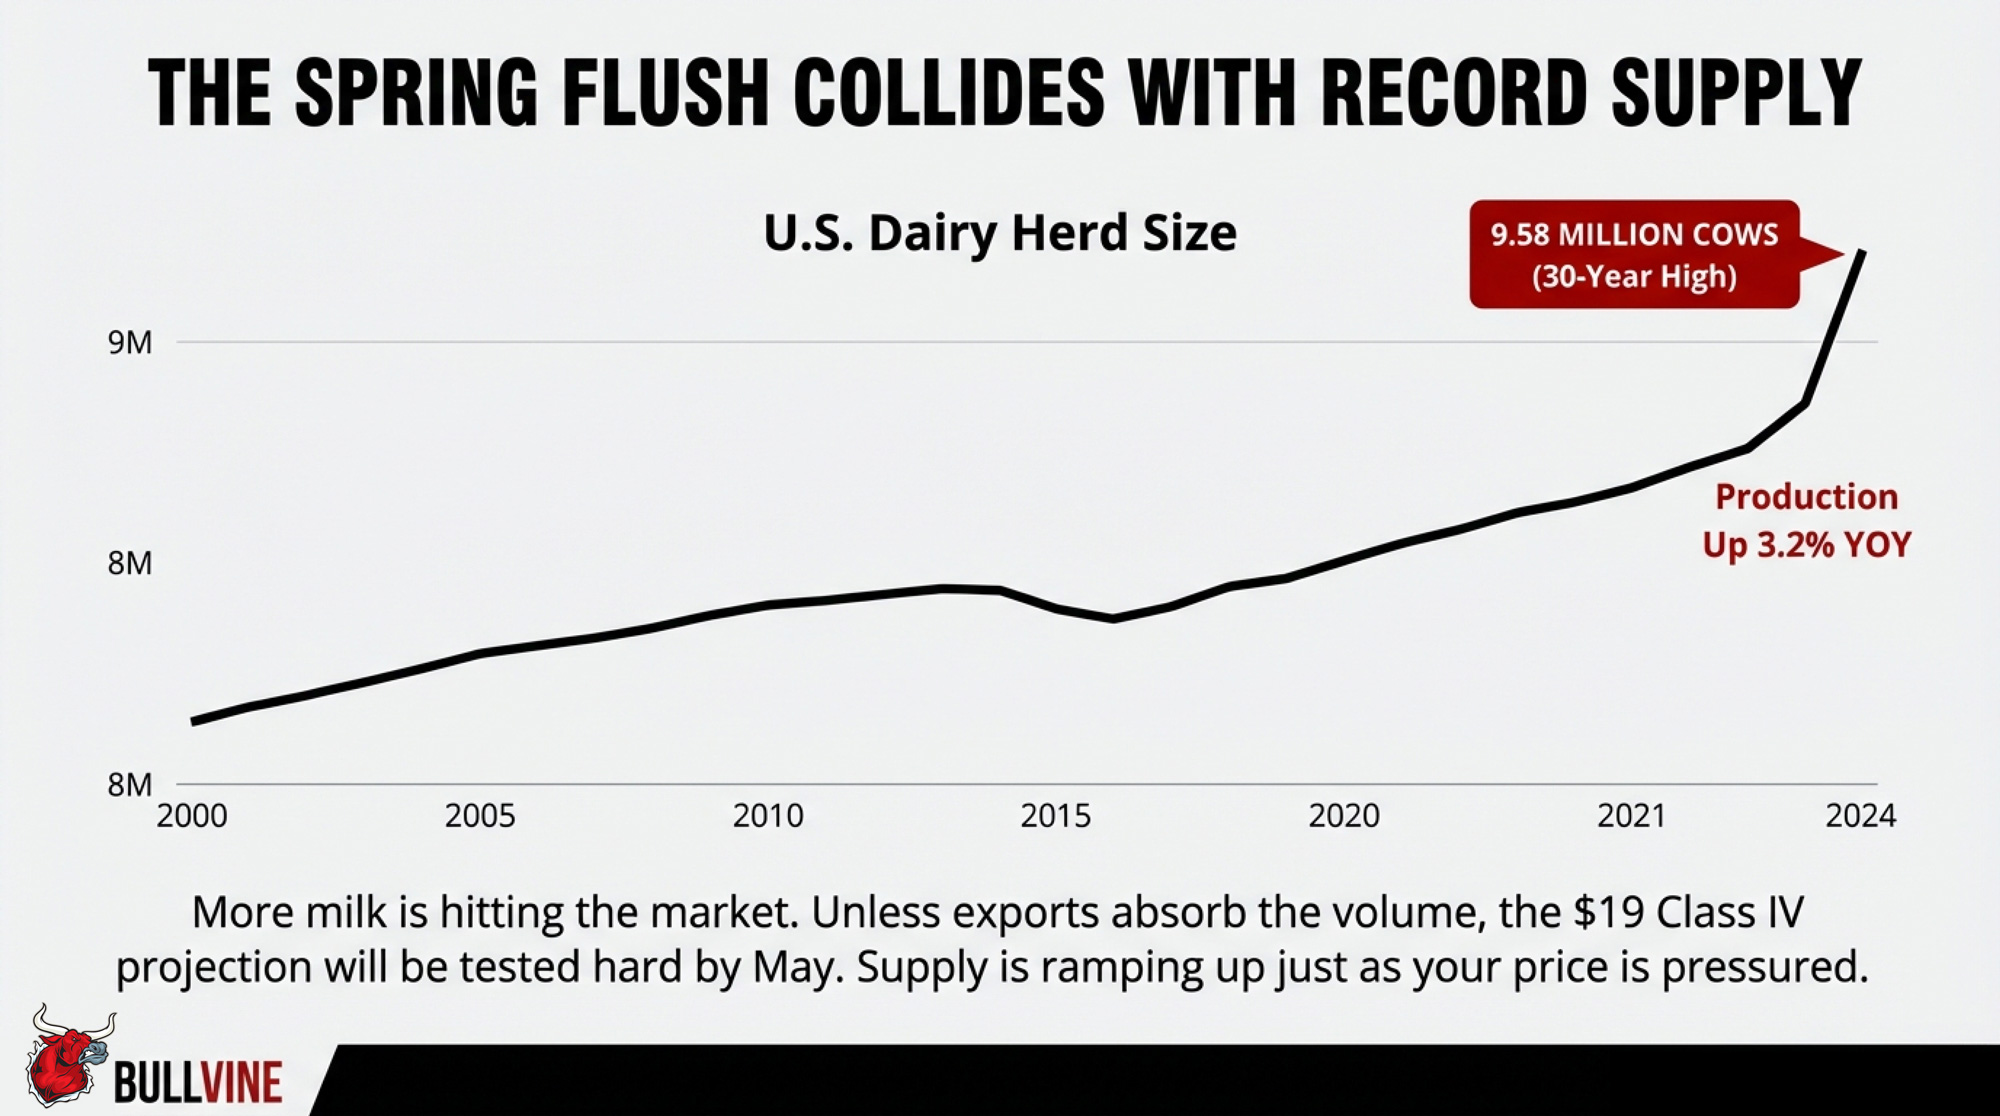
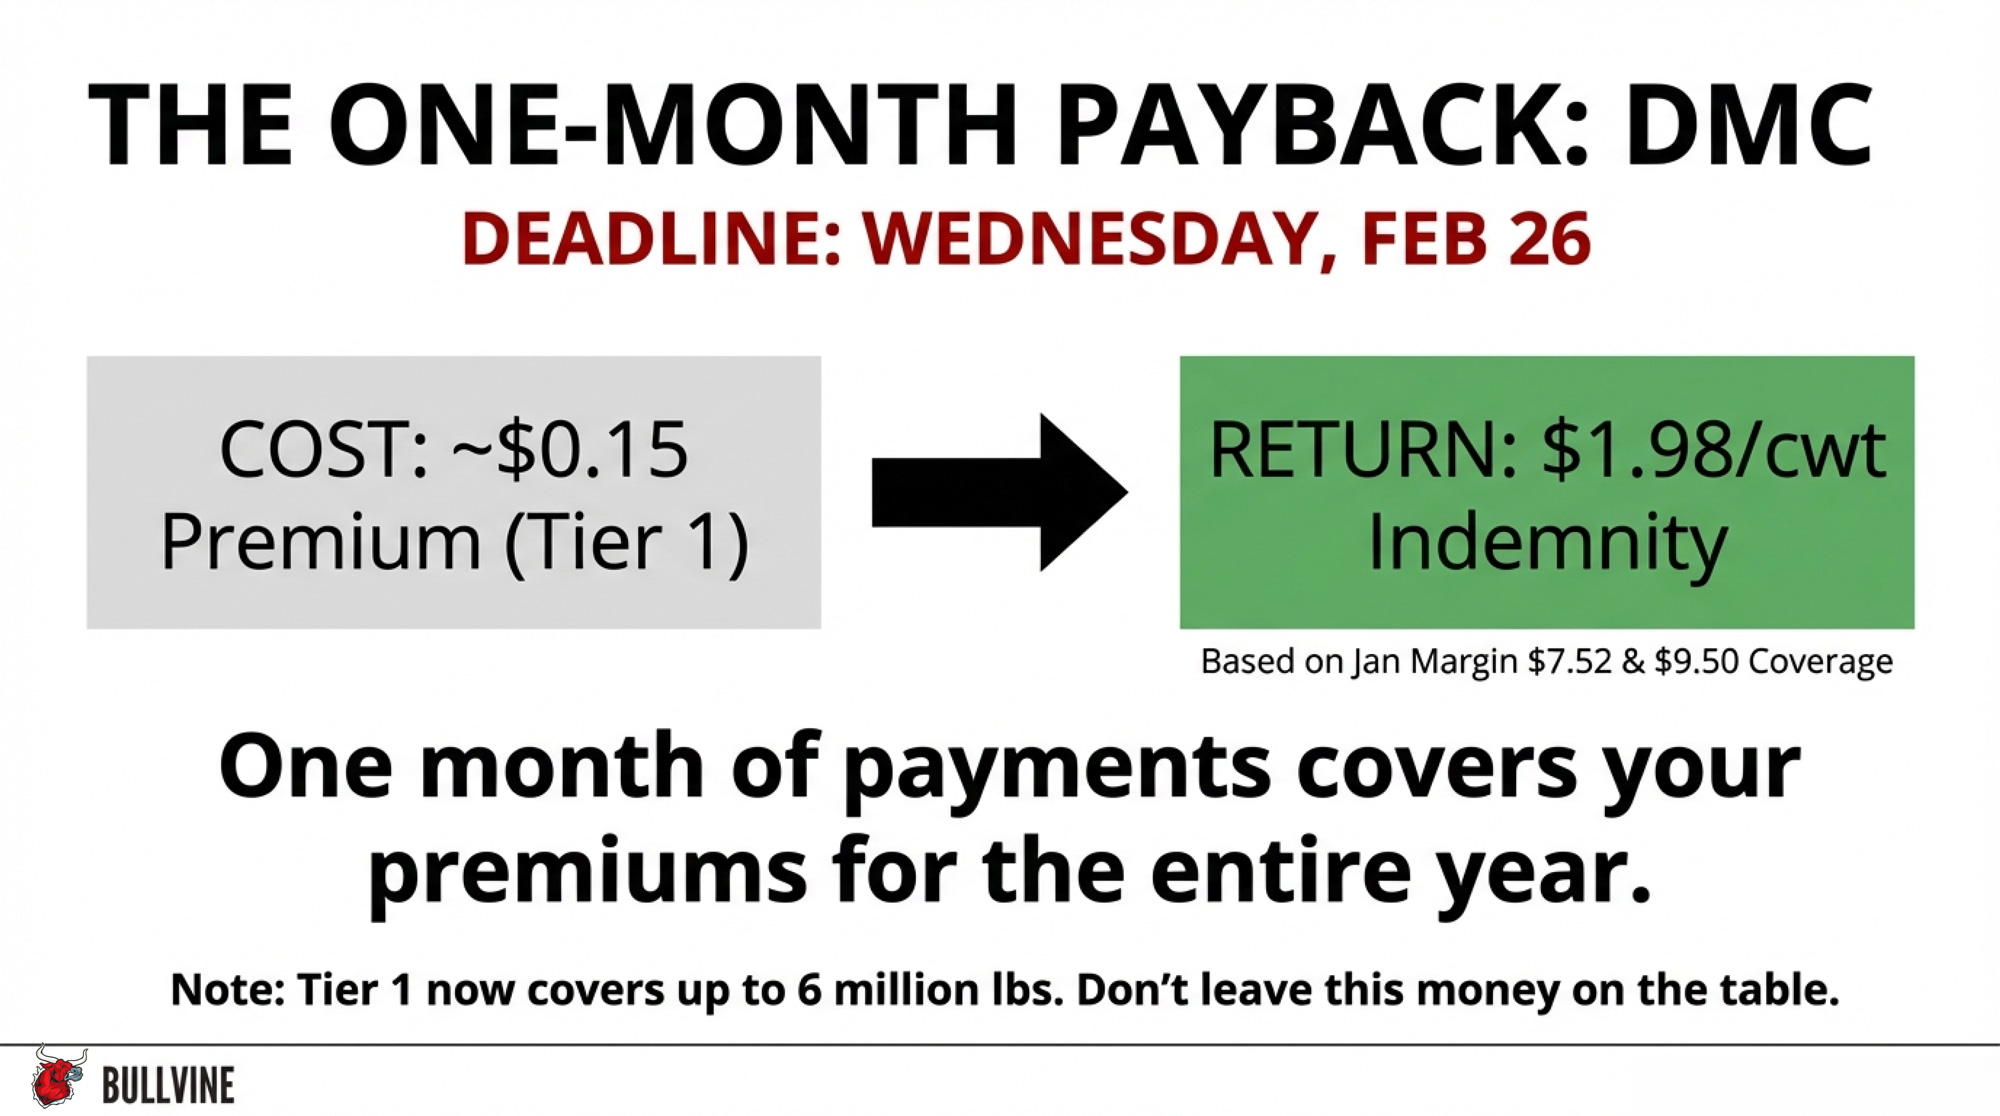
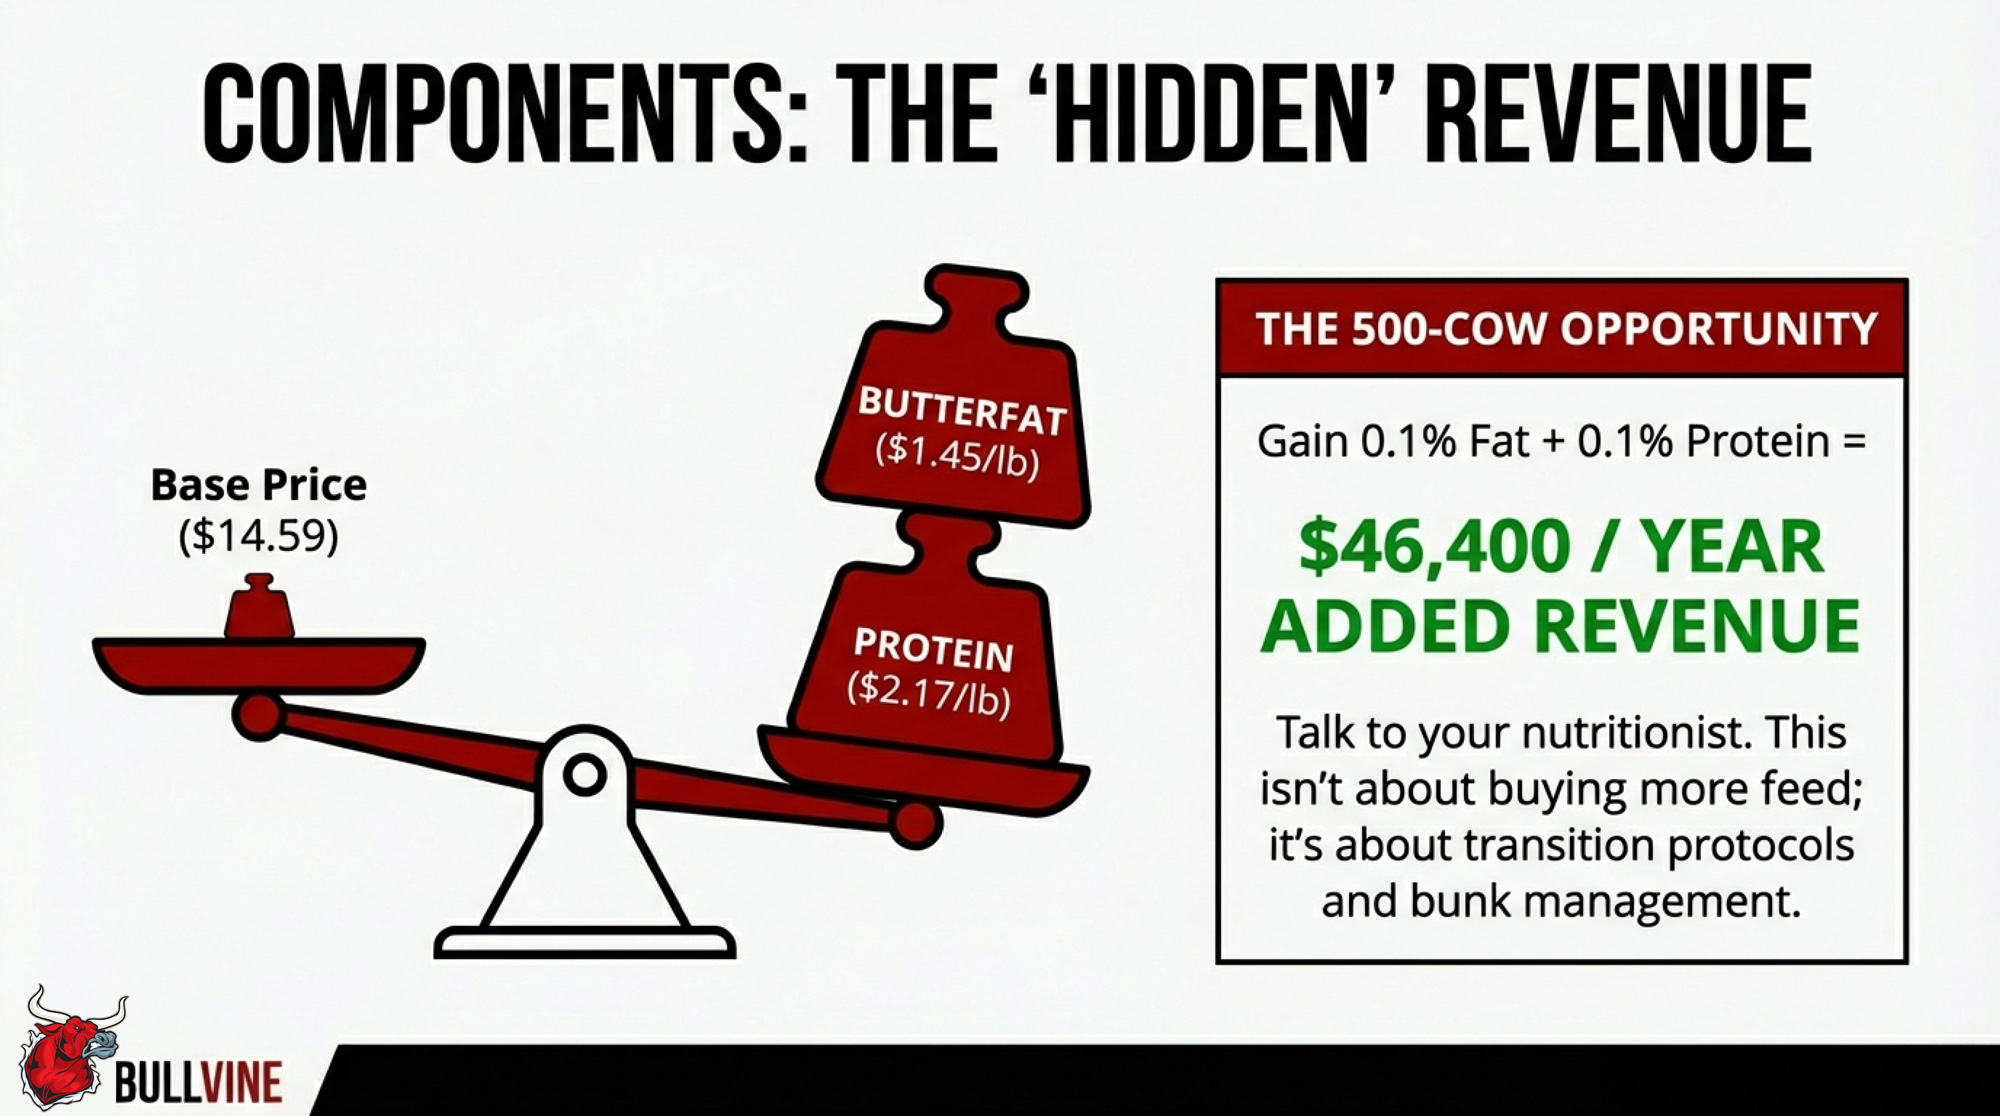
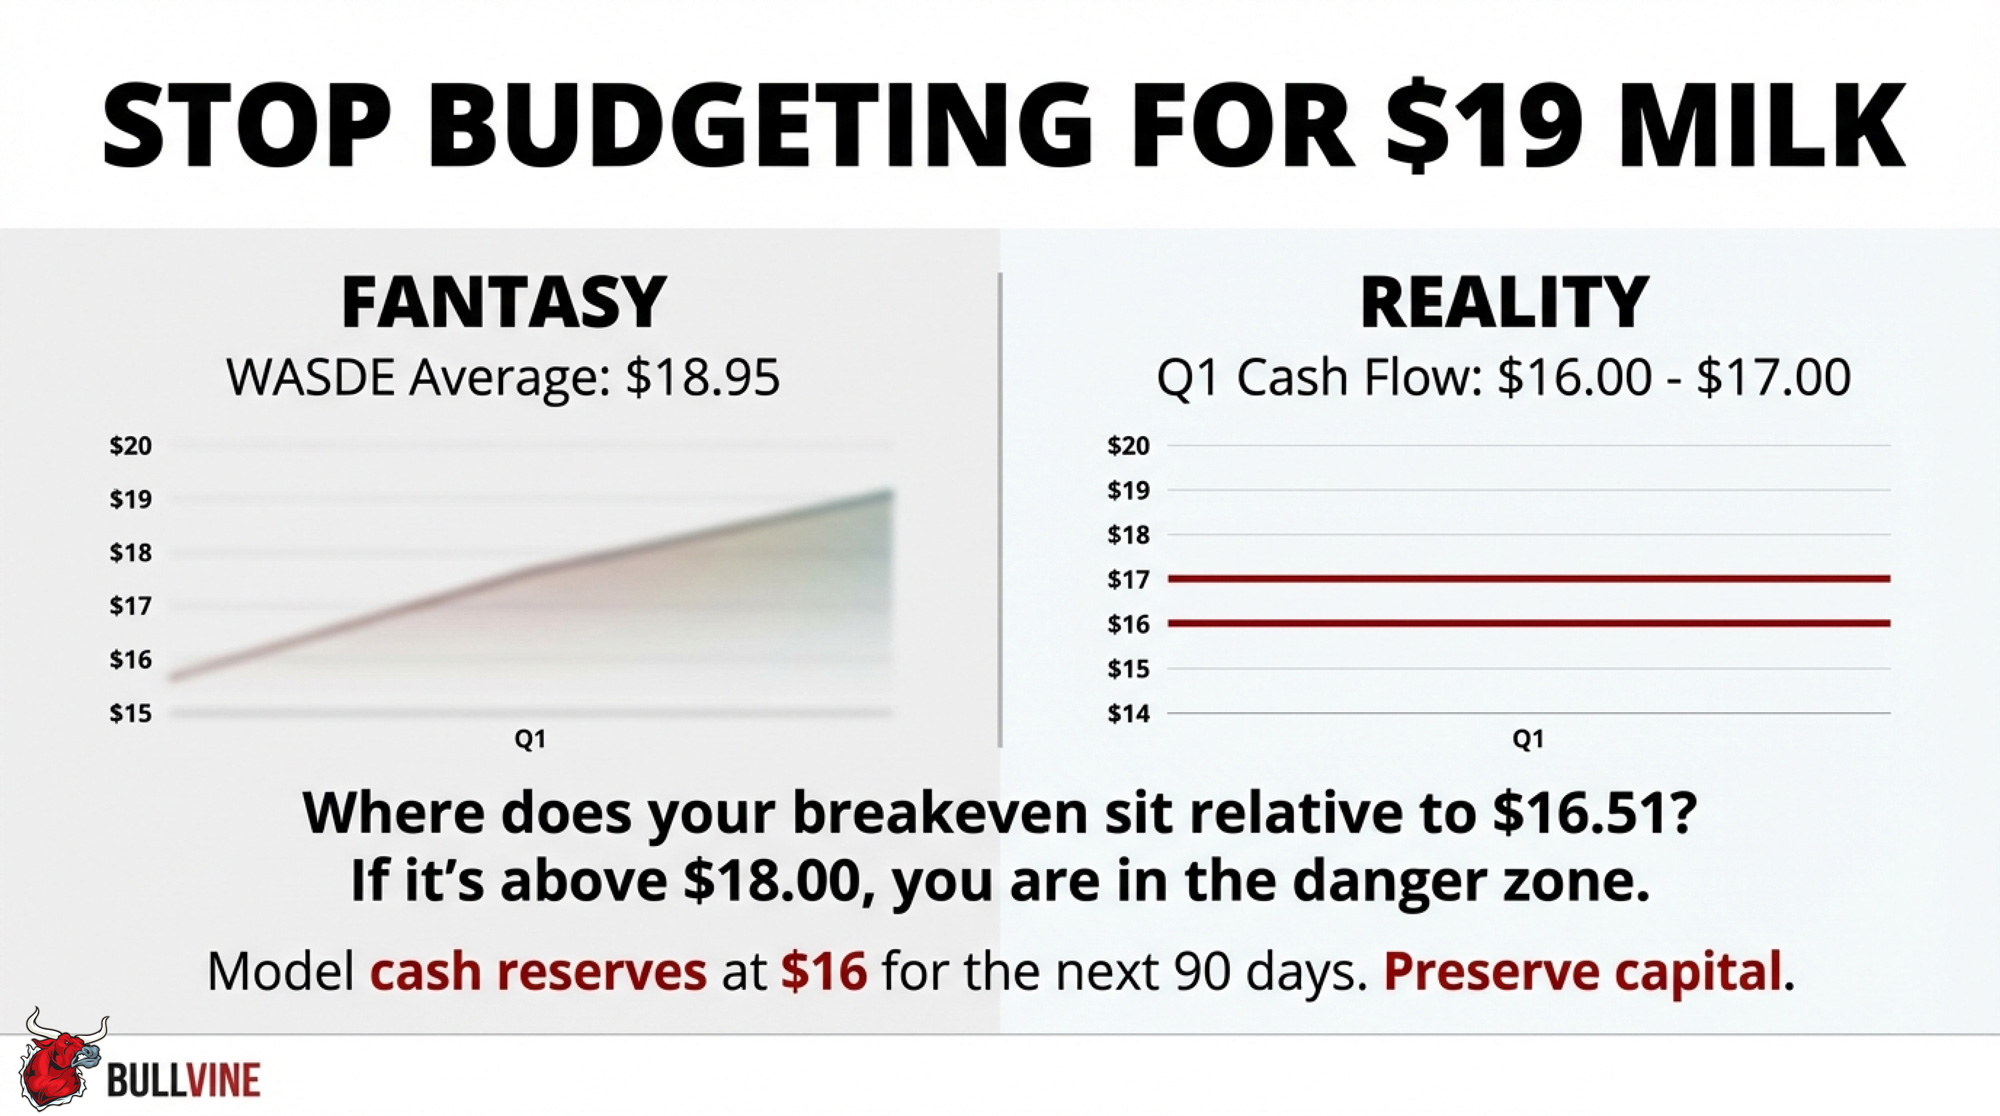
 The Sunday Read Dairy Professionals Don’t Skip.
 The Sunday Read Dairy Professionals Don’t Skip.