Sick calves can drain $27,000/year from your herd. By 2026, genomics will let you stop breeding them. Here’s the playbook.
EXECUTIVE SUMMARY: USDA research now confirms what many producers have long suspected: calf scours and respiratory disease are partly genetic—and by 2026, you’ll be able to select against them. The numbers are hard to ignore. Sick calves can drain $27,000 a year from a 1,000-cow herd, while wrong breeding calls leave another $30,000-plus on the table in missed beef-on-dairy premiums and wasted heifer slots. With replacements at a 20-year low, beef-cross calves topping $1,000, and heifers costing north of $2,500 to raise, every semen straw now carries real economic weight. This article lays out a five-step breeding playbook—genomic testing, rule-based beef-versus-dairy decisions, calf-health sire screening, calving-pressure management, and ongoing market adjustments—that forward-thinking herds are already putting to work. Producers who start now can realistically expect to shift $50,000 or more in annual herd economics within 18-24 months.
You know how the talk goes once the parlor’s washed down and the coffee’s on. Somebody mentions a nasty run of scours or a bunch of calves that just won’t quit coughing in the group pen, and five minutes later, you’re into genomics, beef‑on‑dairy, heifer prices, and whether some cows should ever see a dairy straw again. That’s not small talk anymore. That’s survival planning.
What’s interesting right now is that the genetics and the economics are finally lining up with what a lot of you have been seeing in your own hutches. Some cow families just throw tougher calves. Others seem to live in the treatment book every winter. And those sick calves quietly eat money long before they get a chance to show what they can really do on butterfat performance, fertility, or longevity.
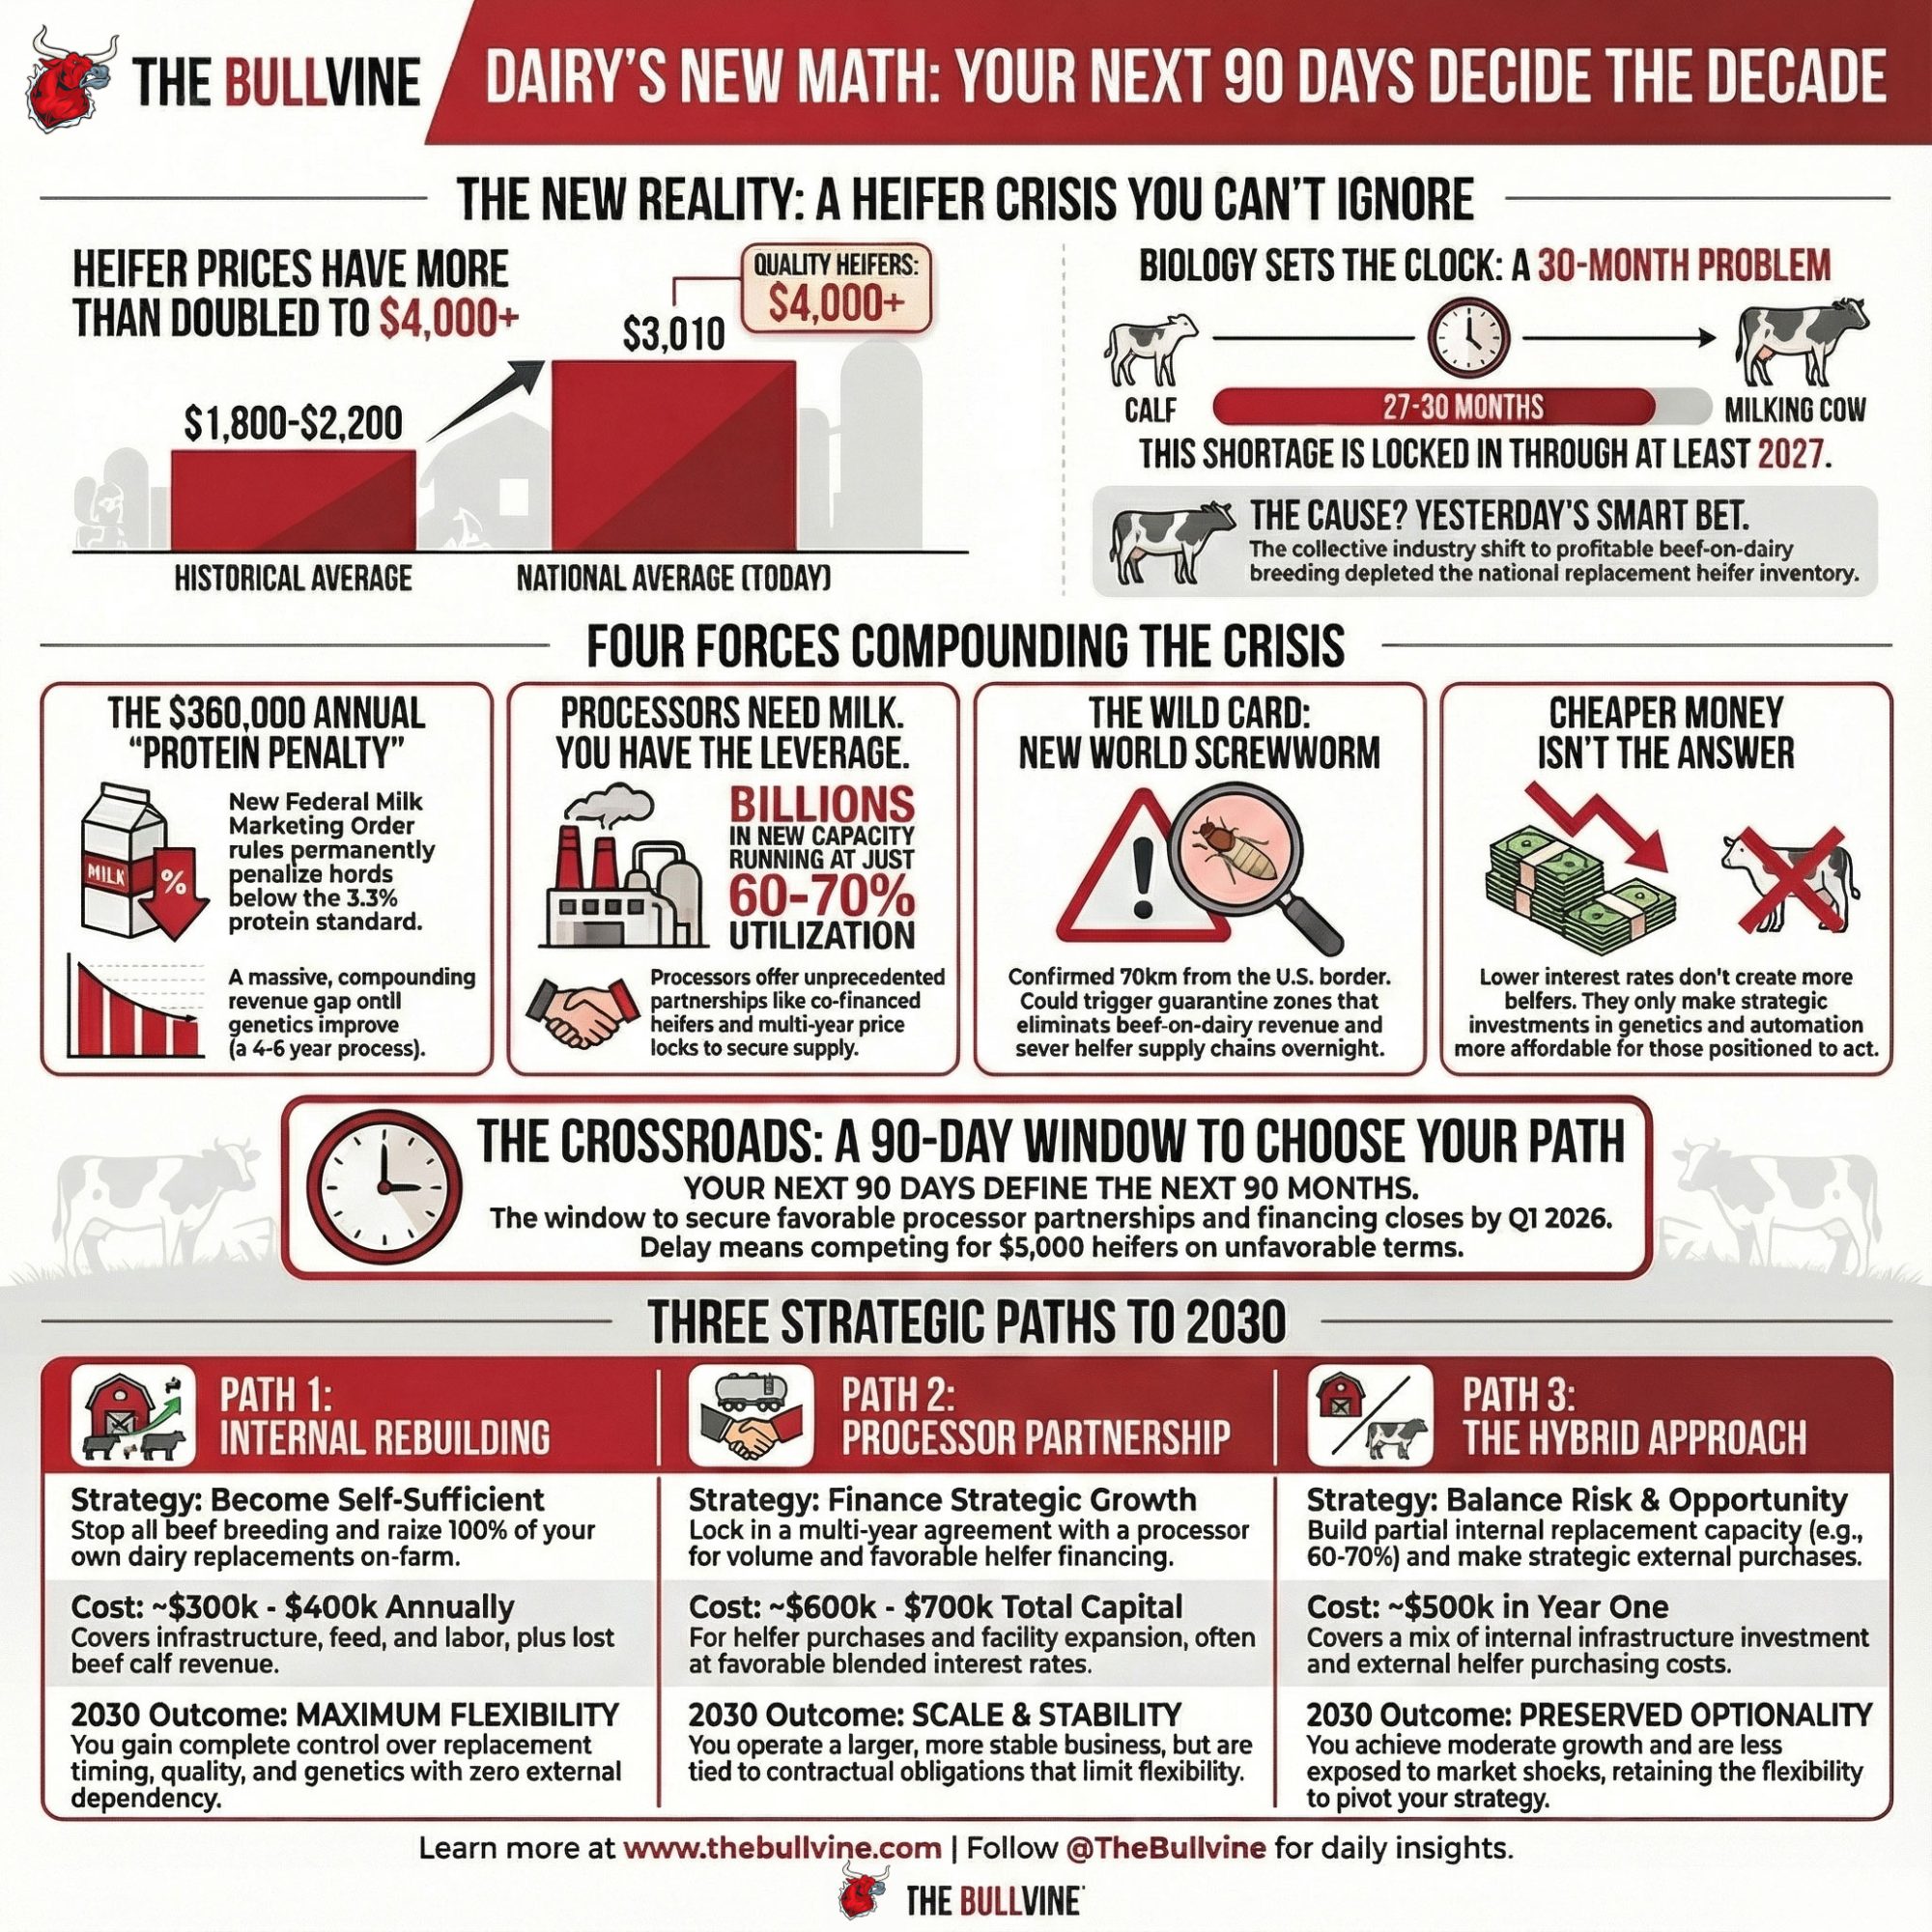
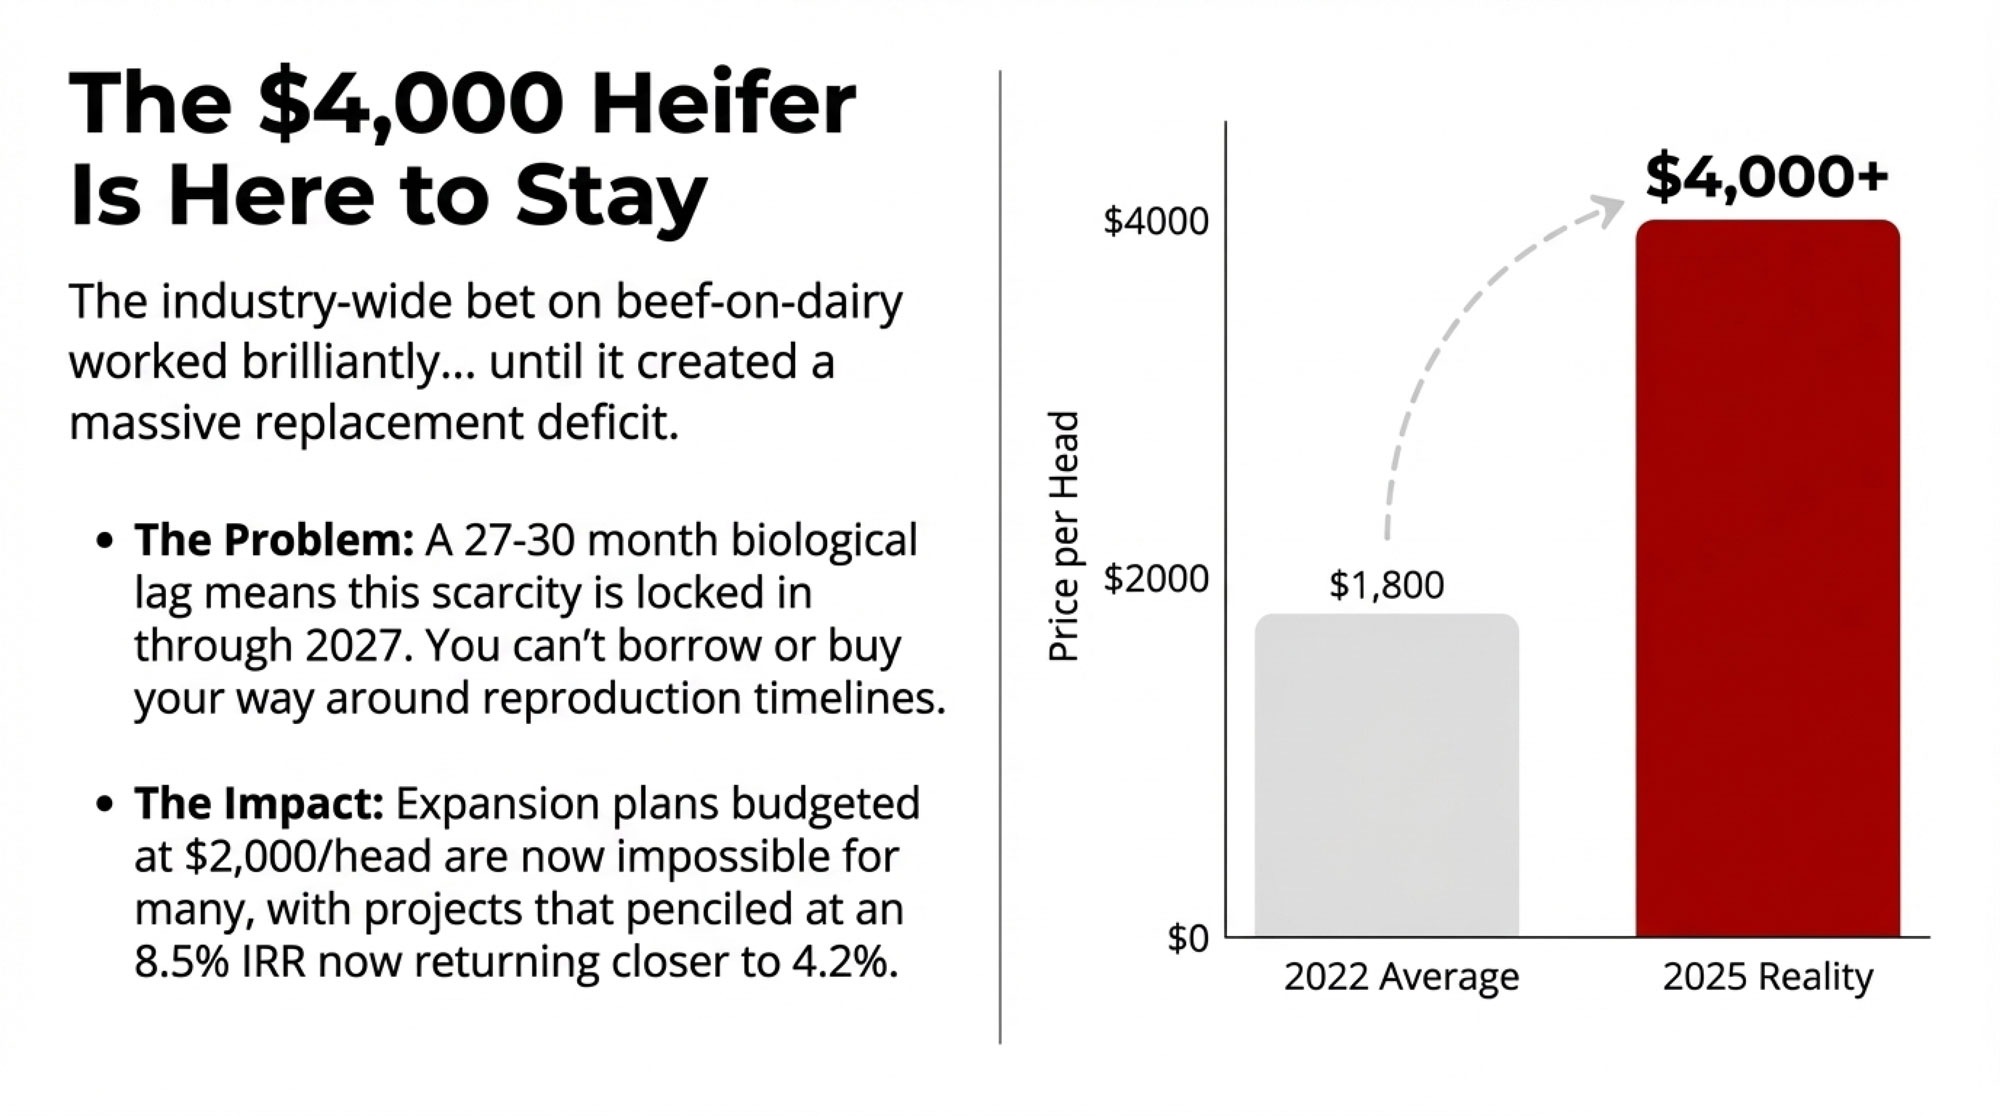
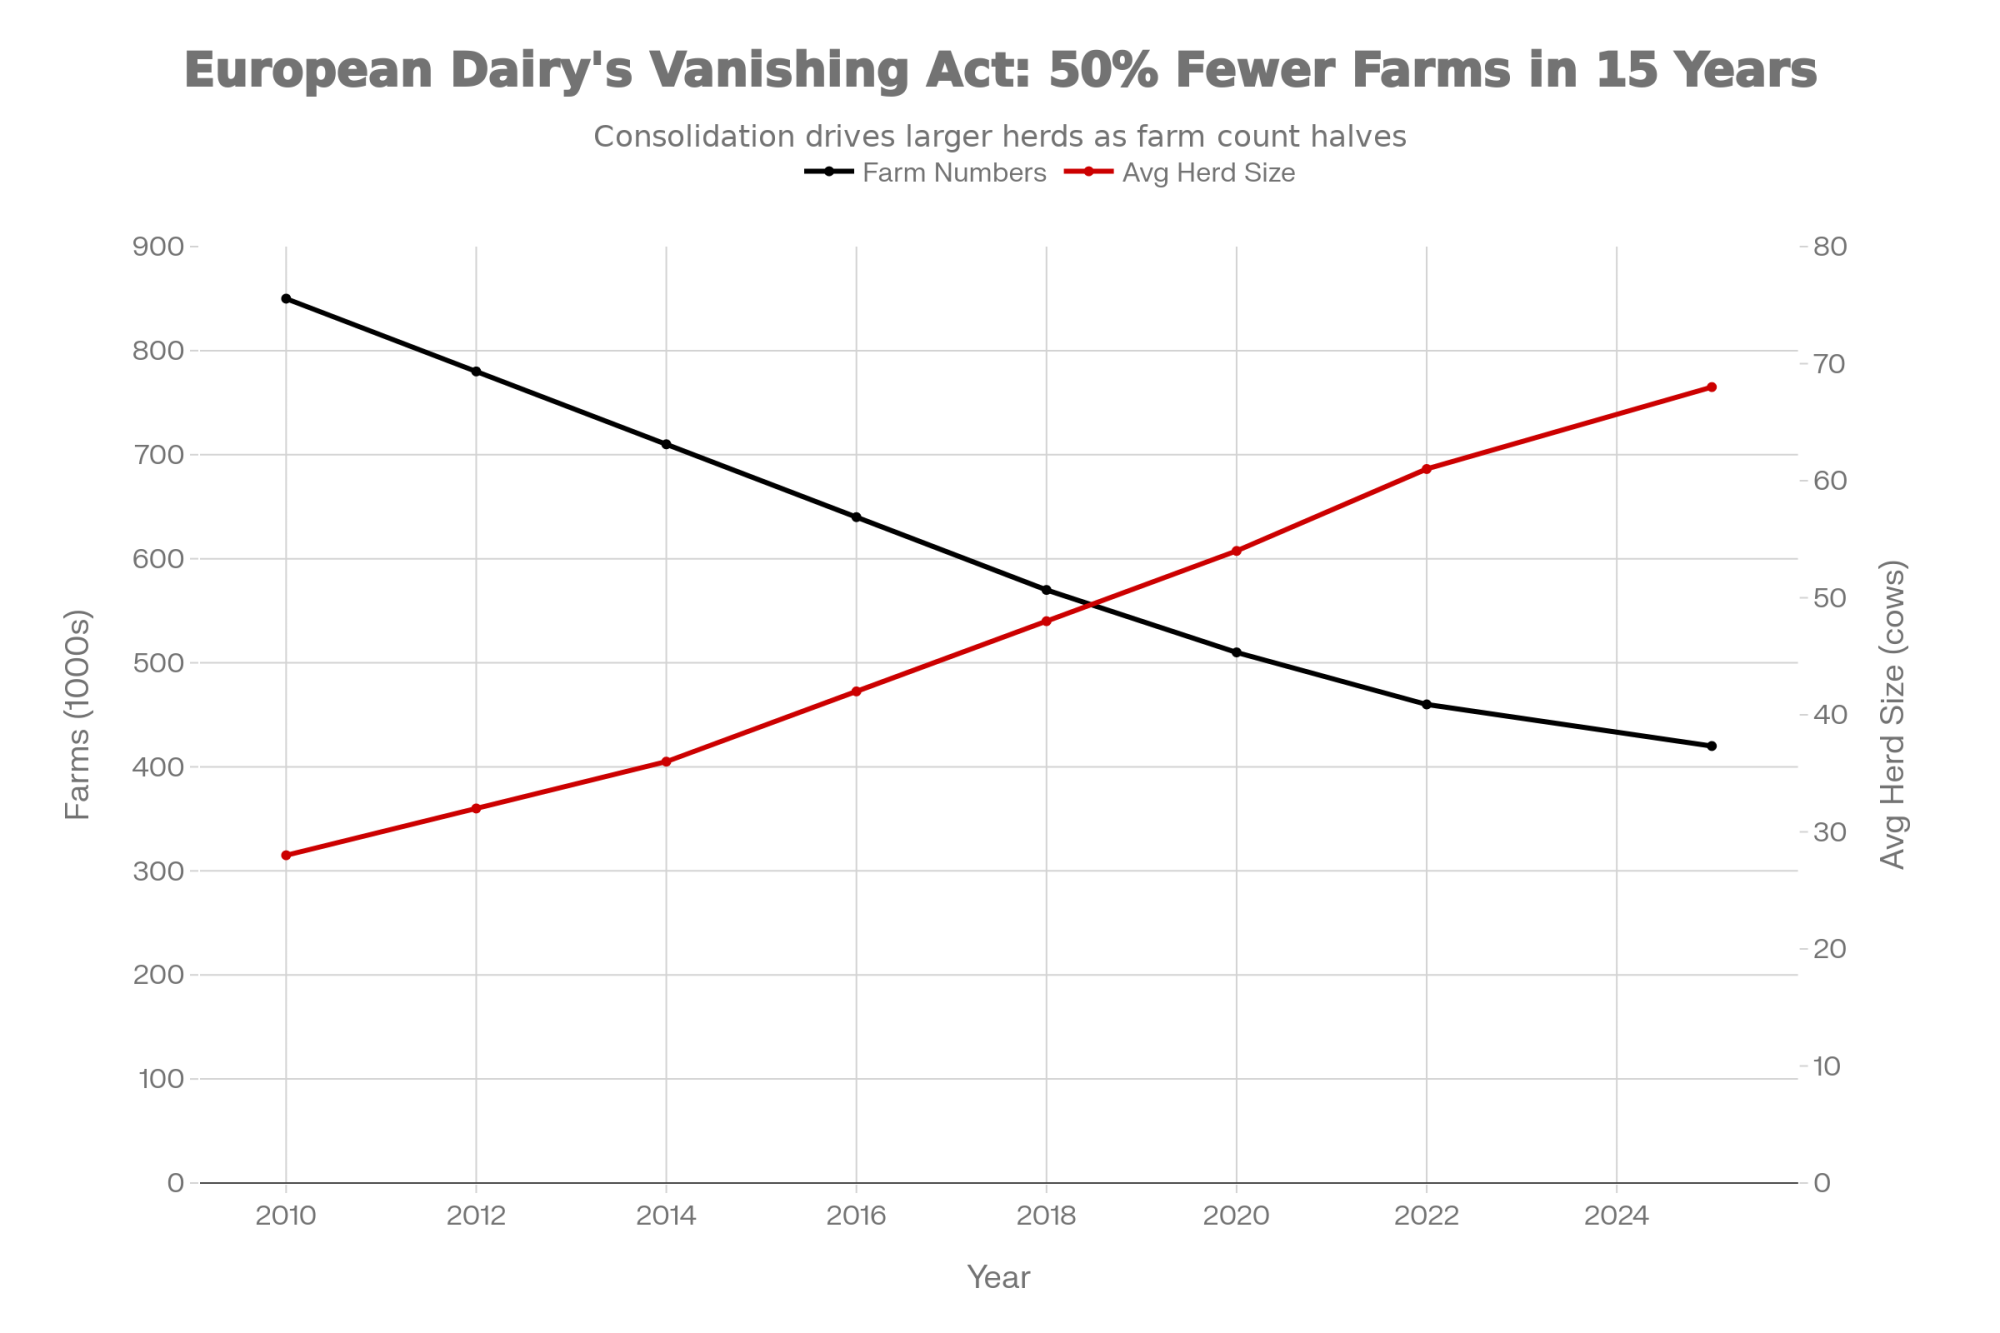
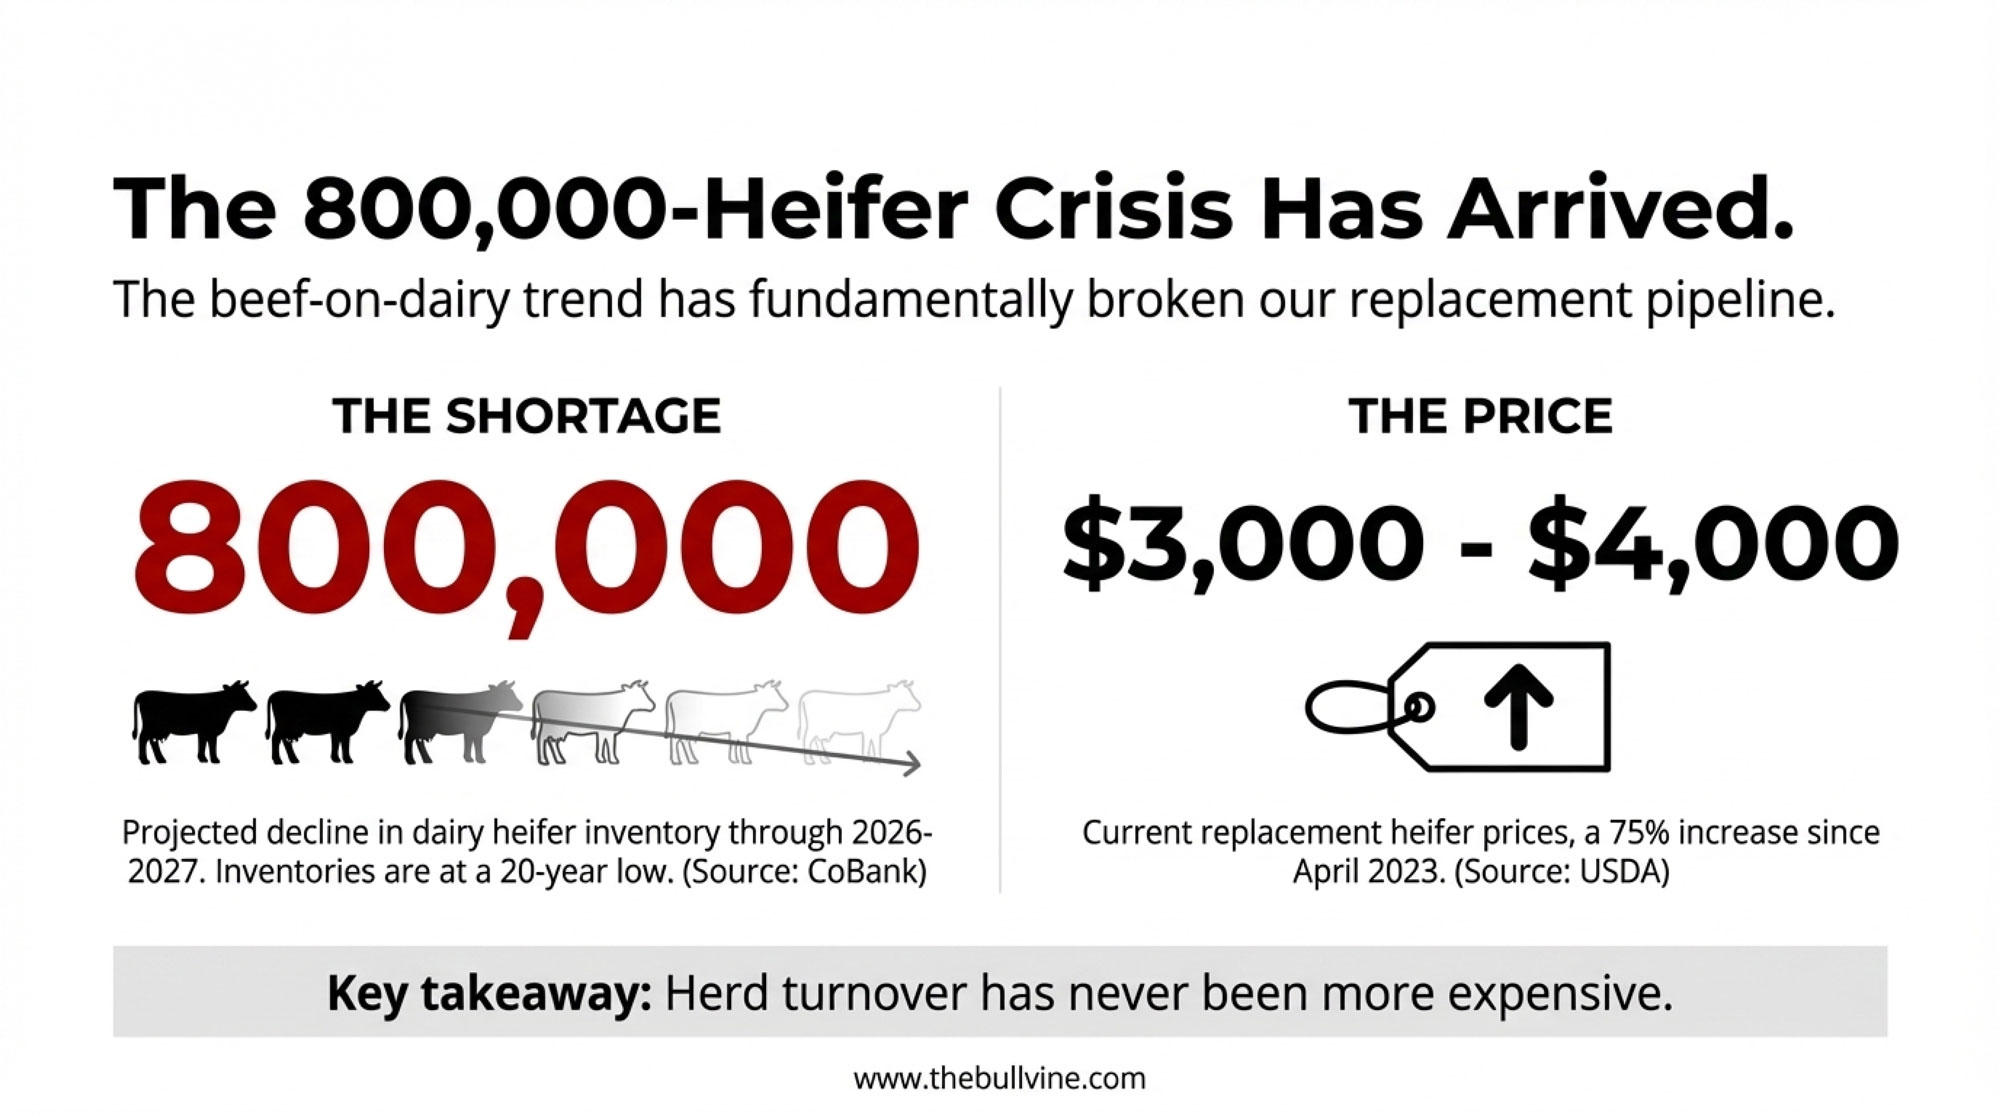
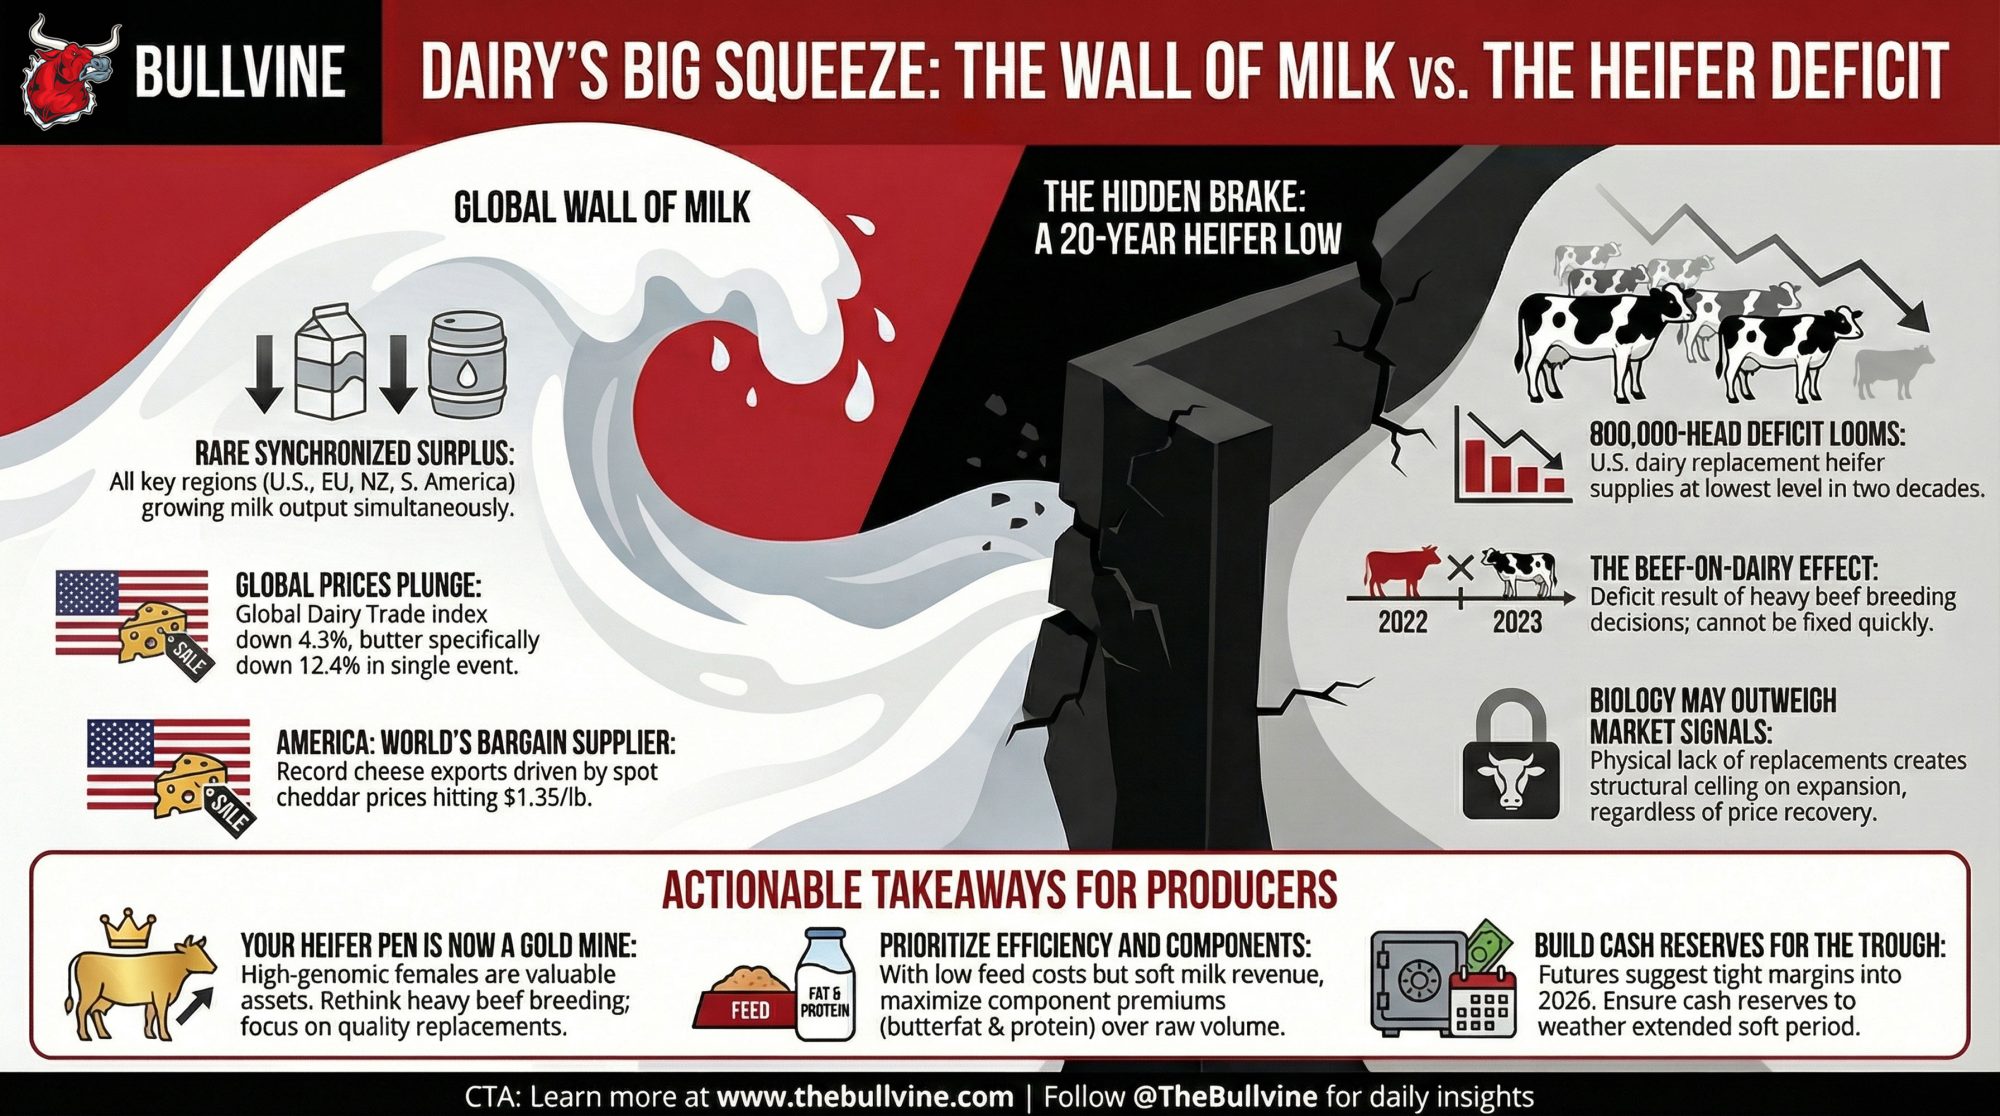
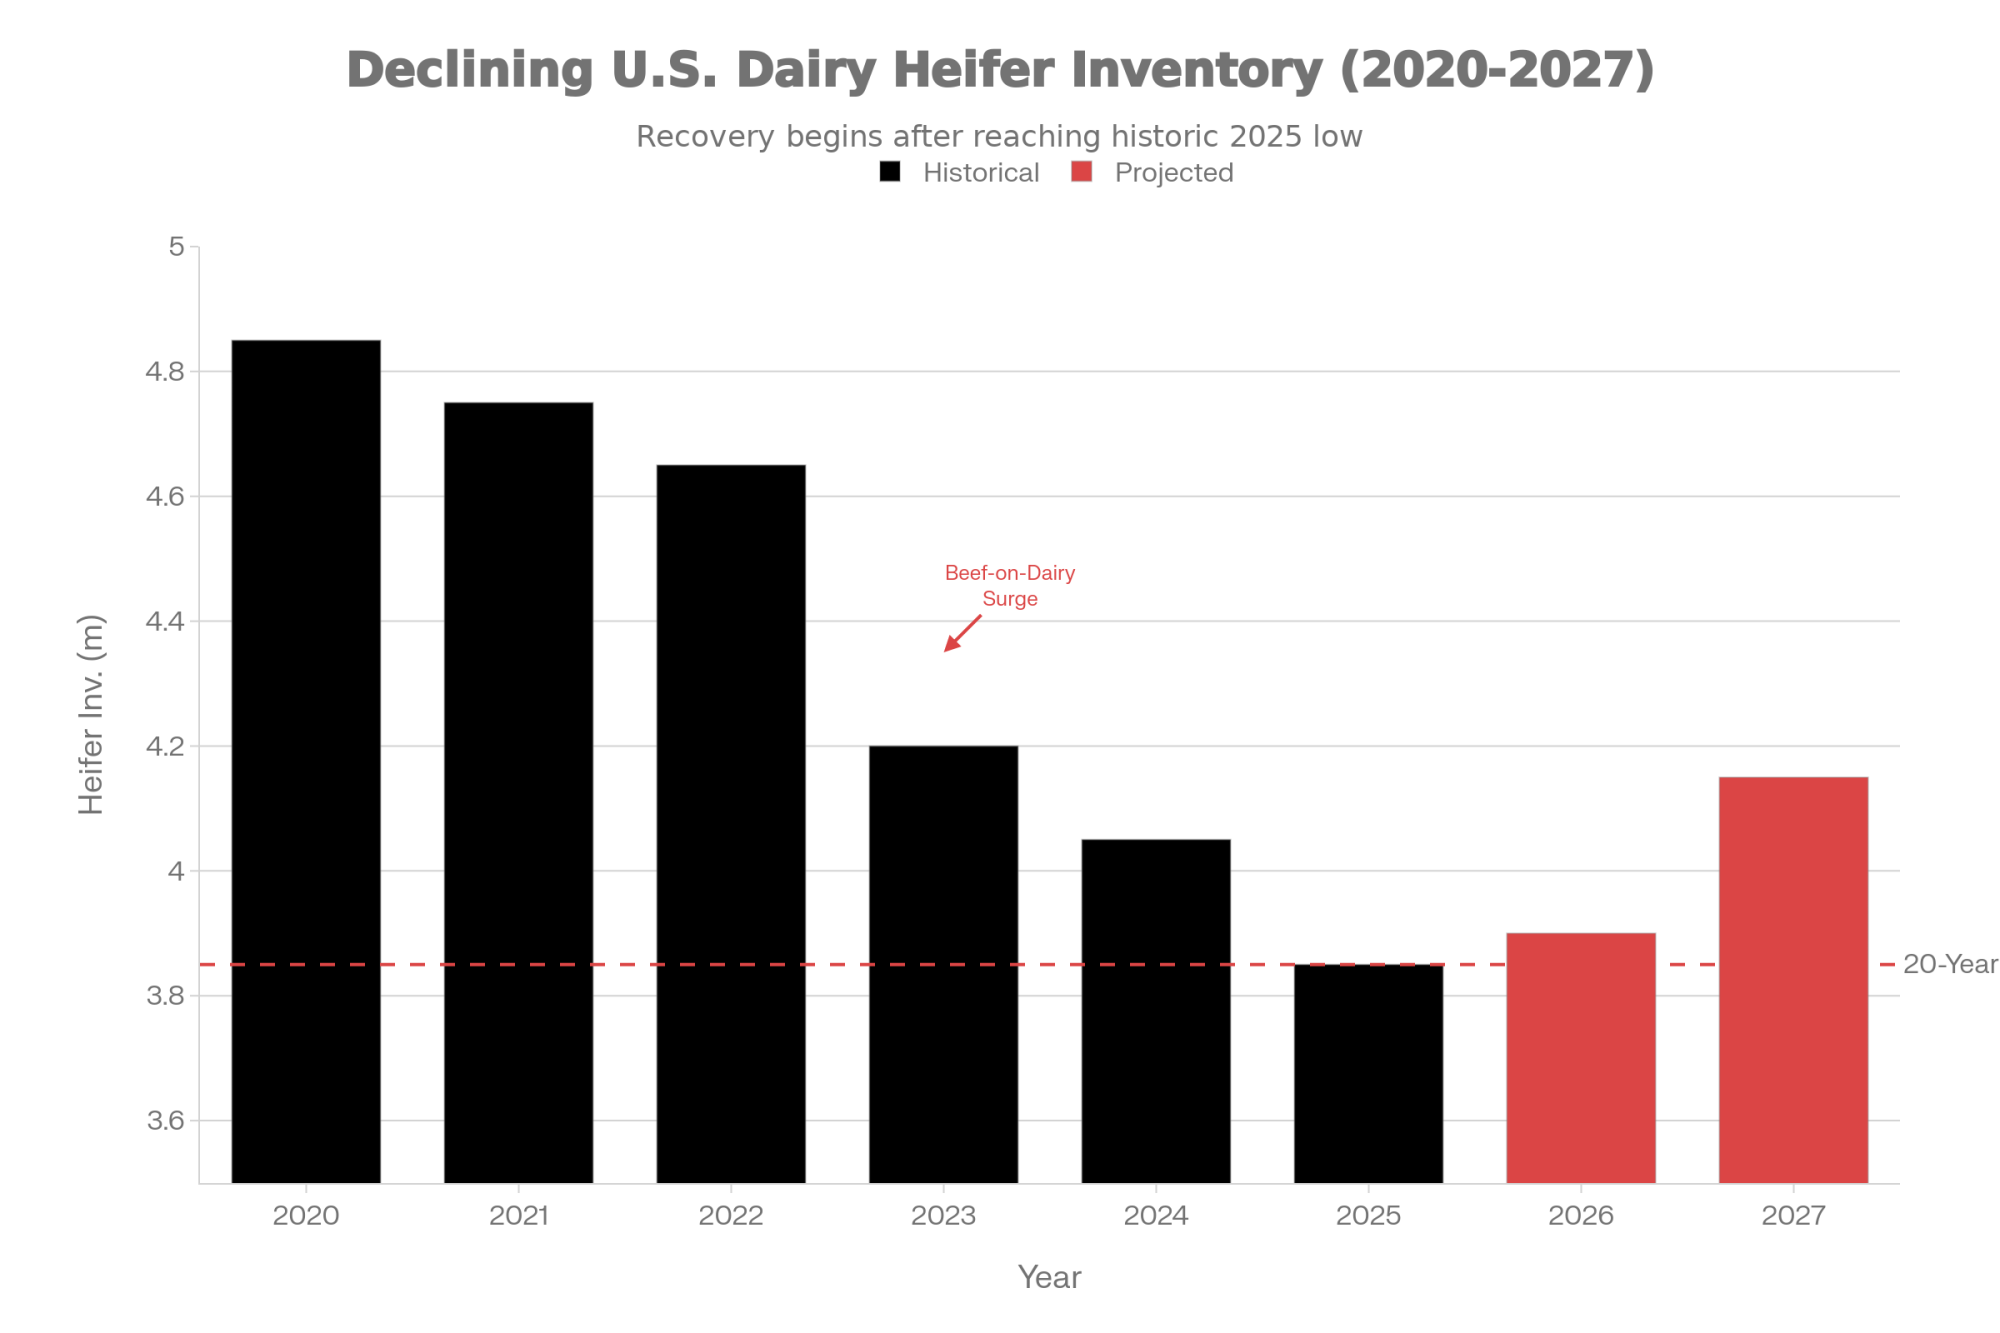
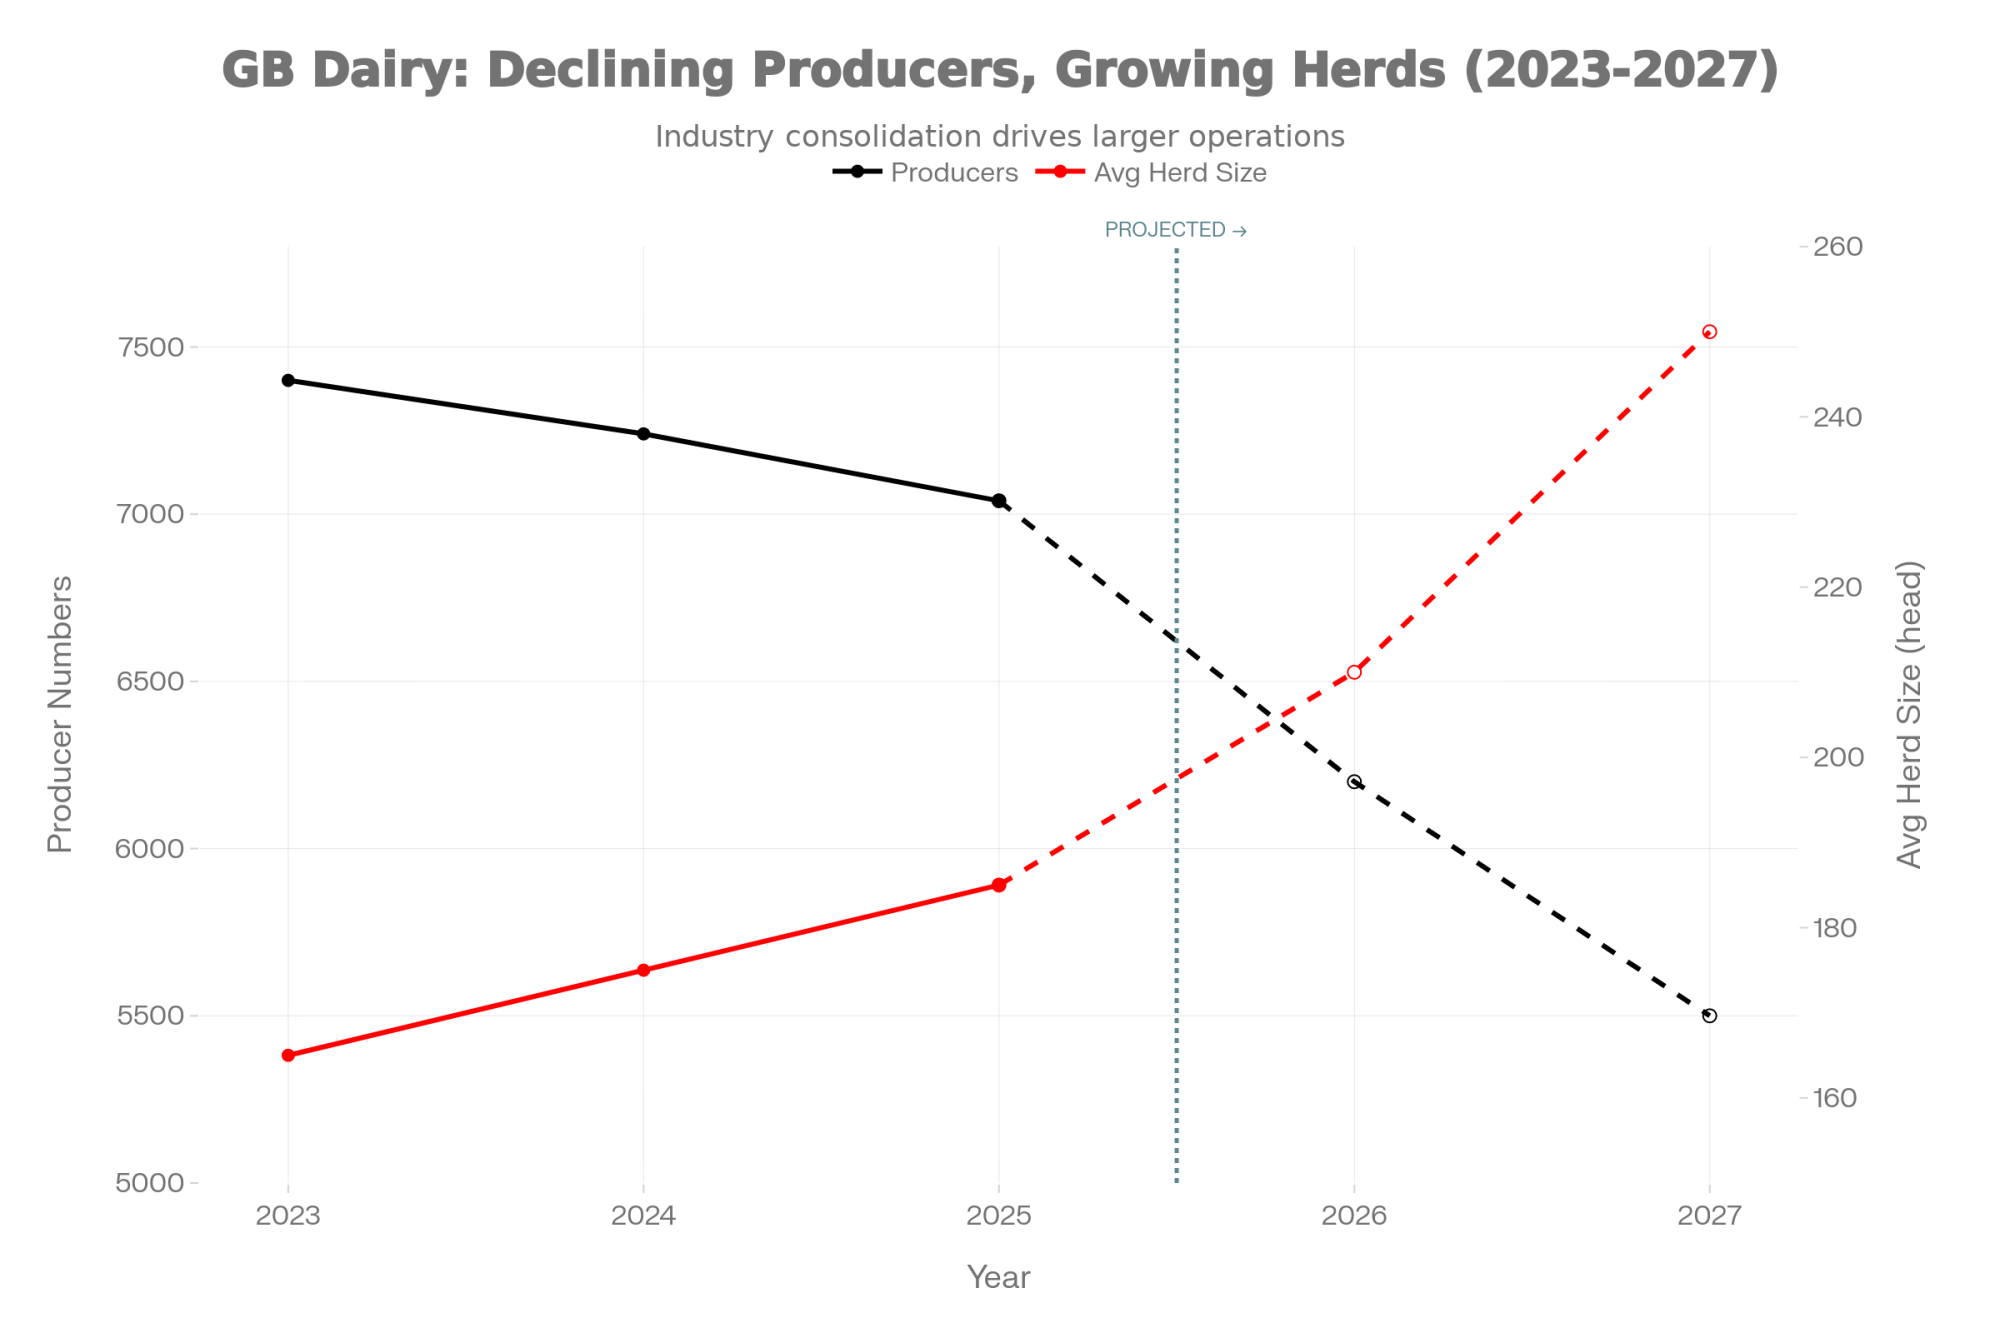
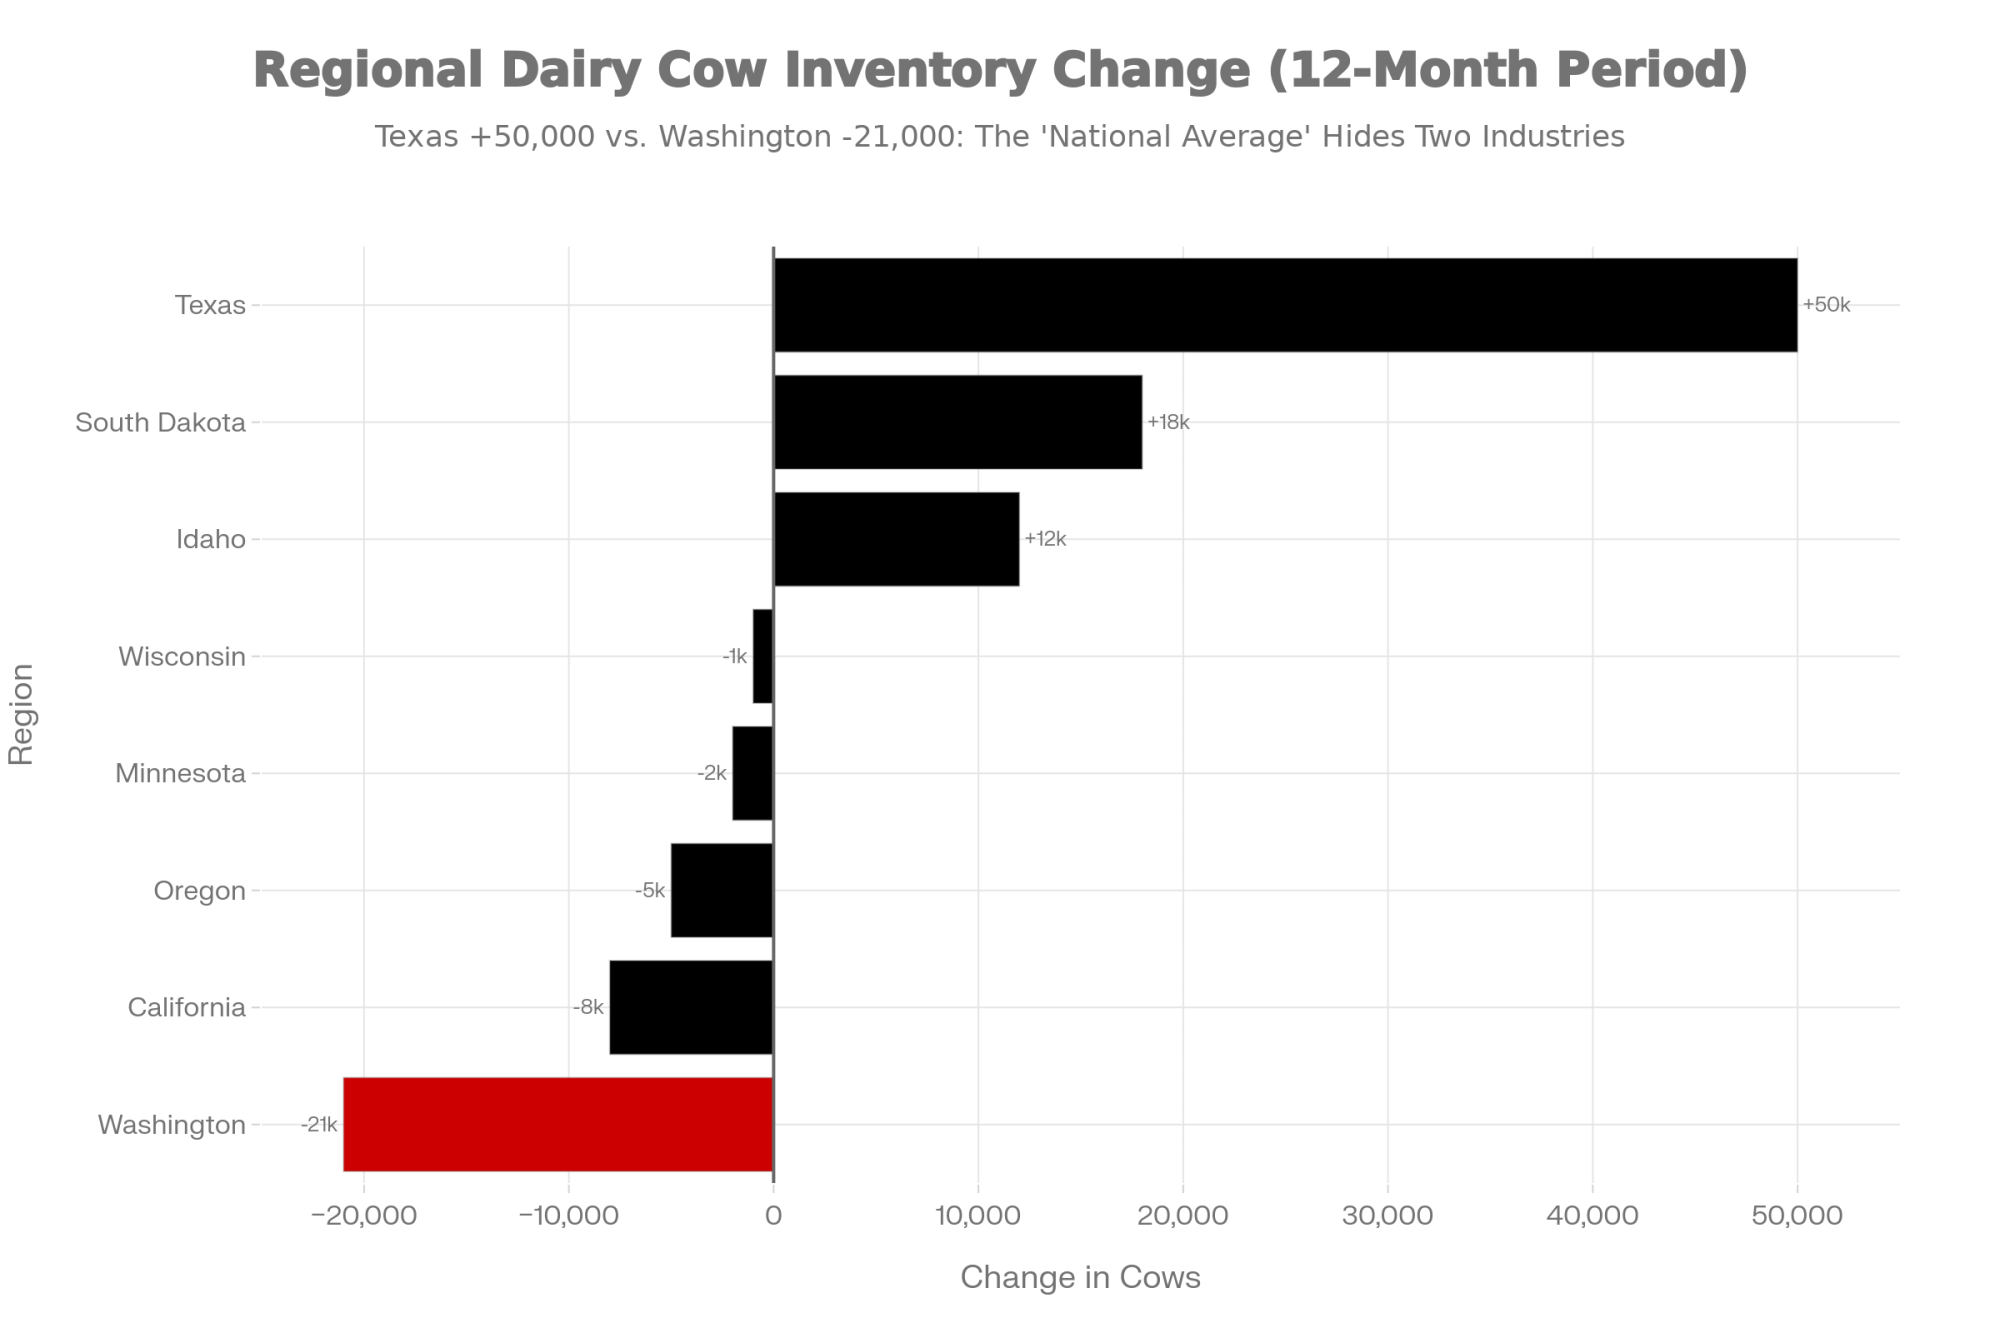
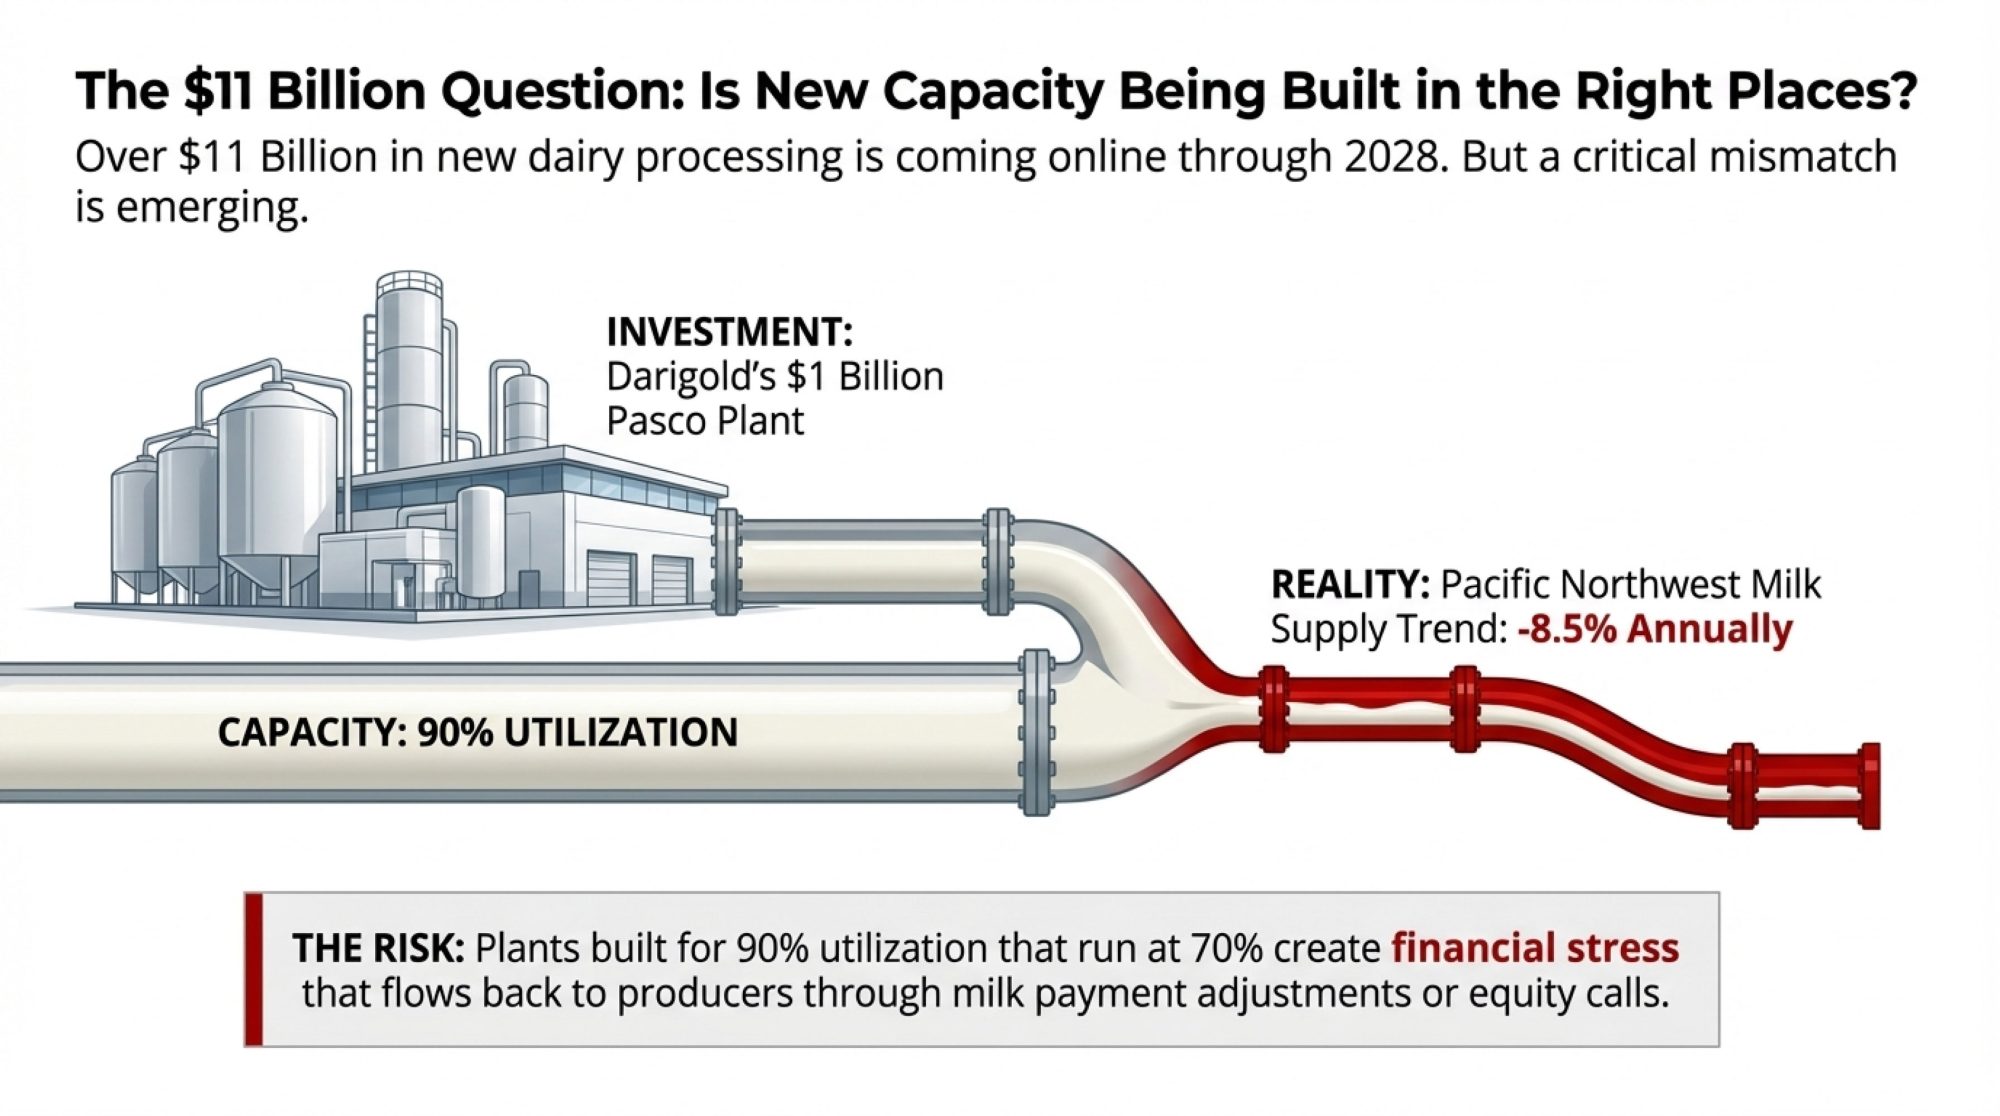
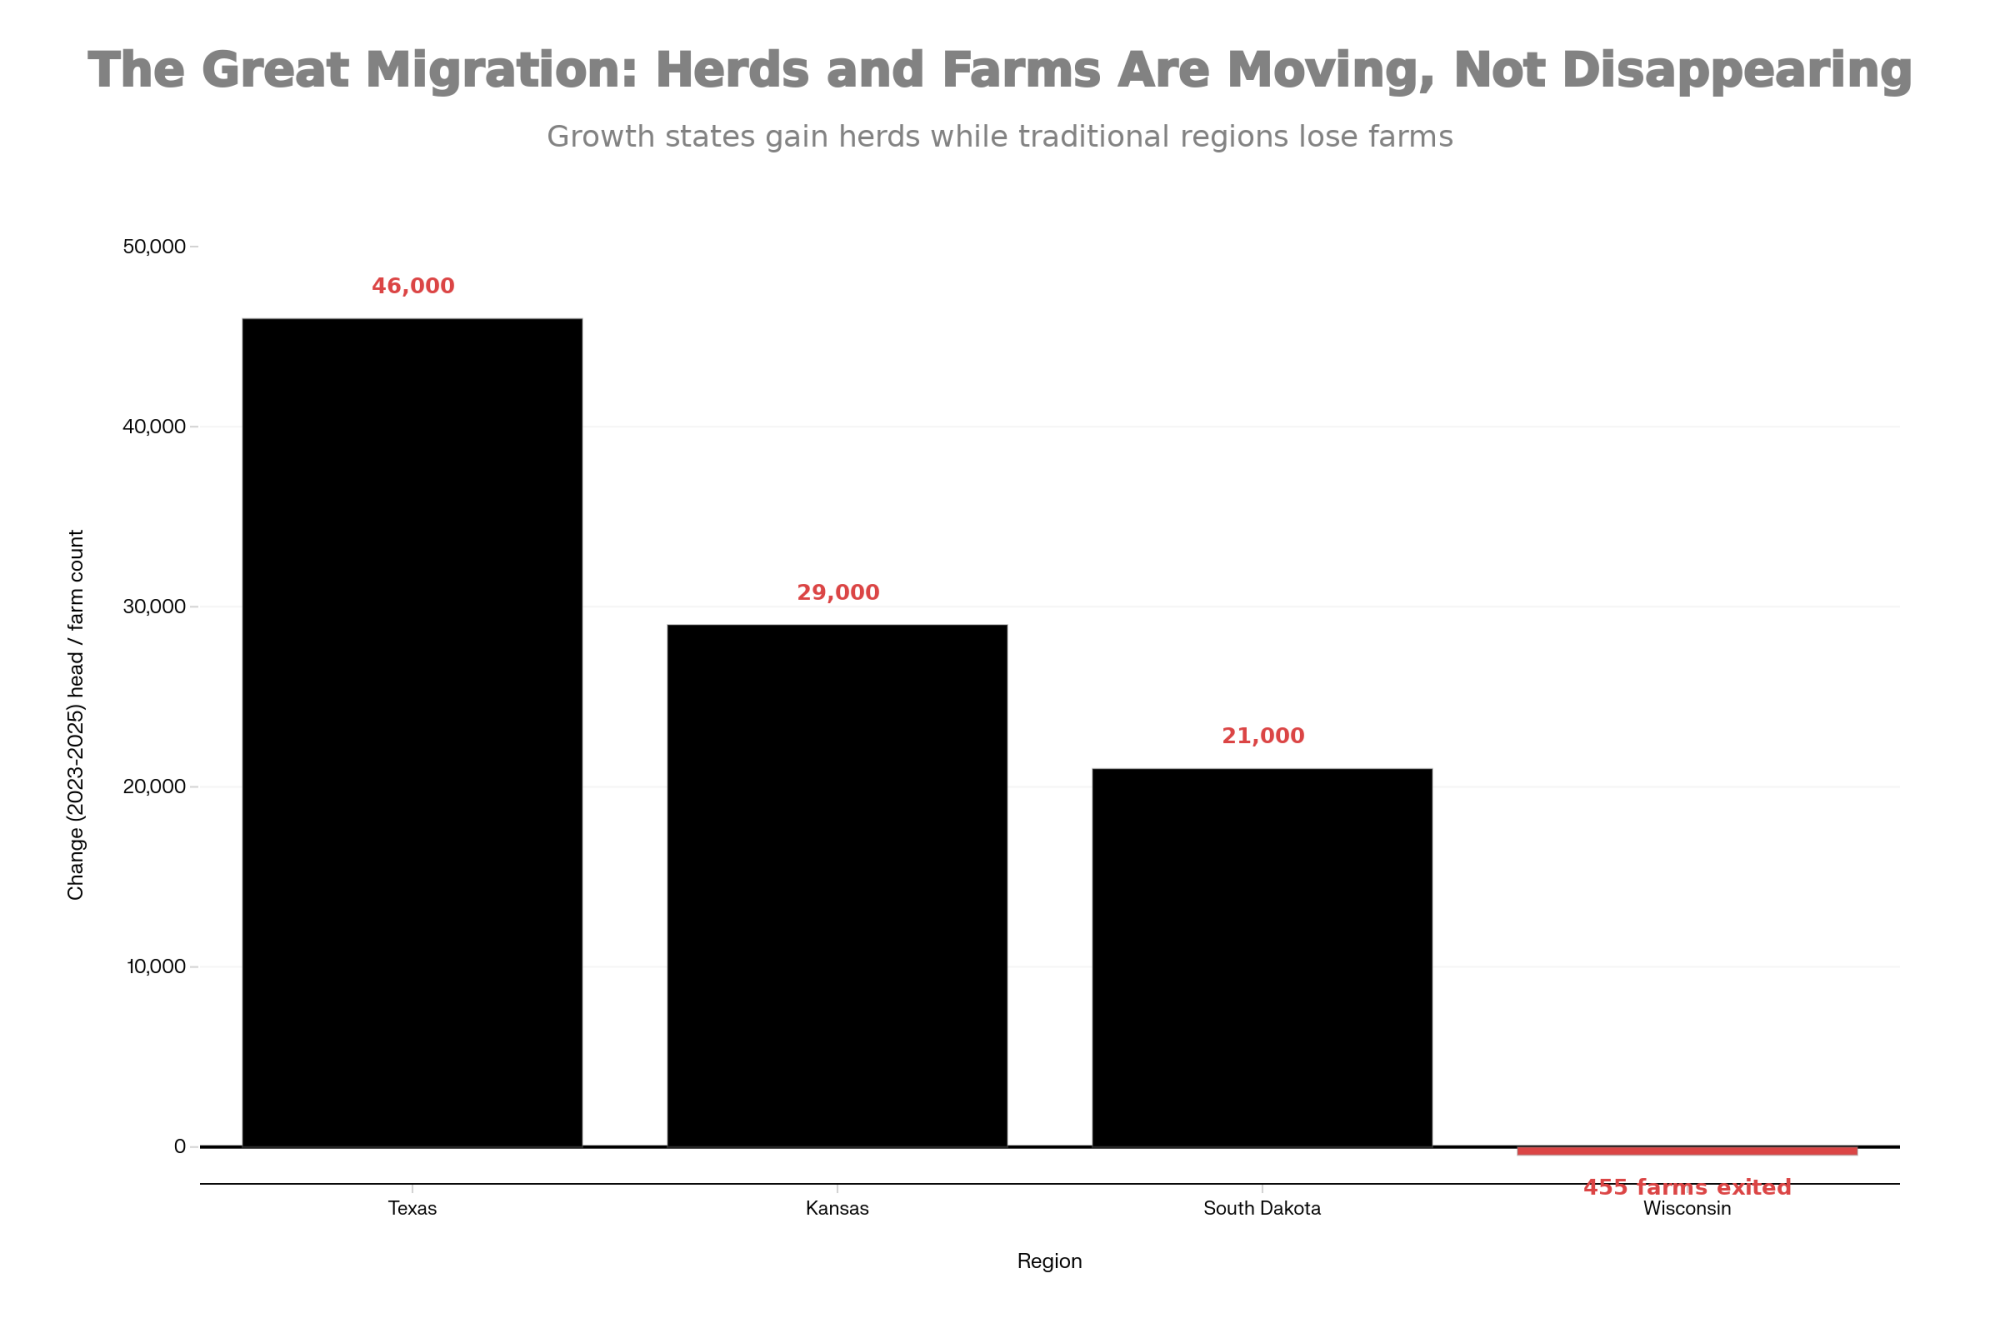
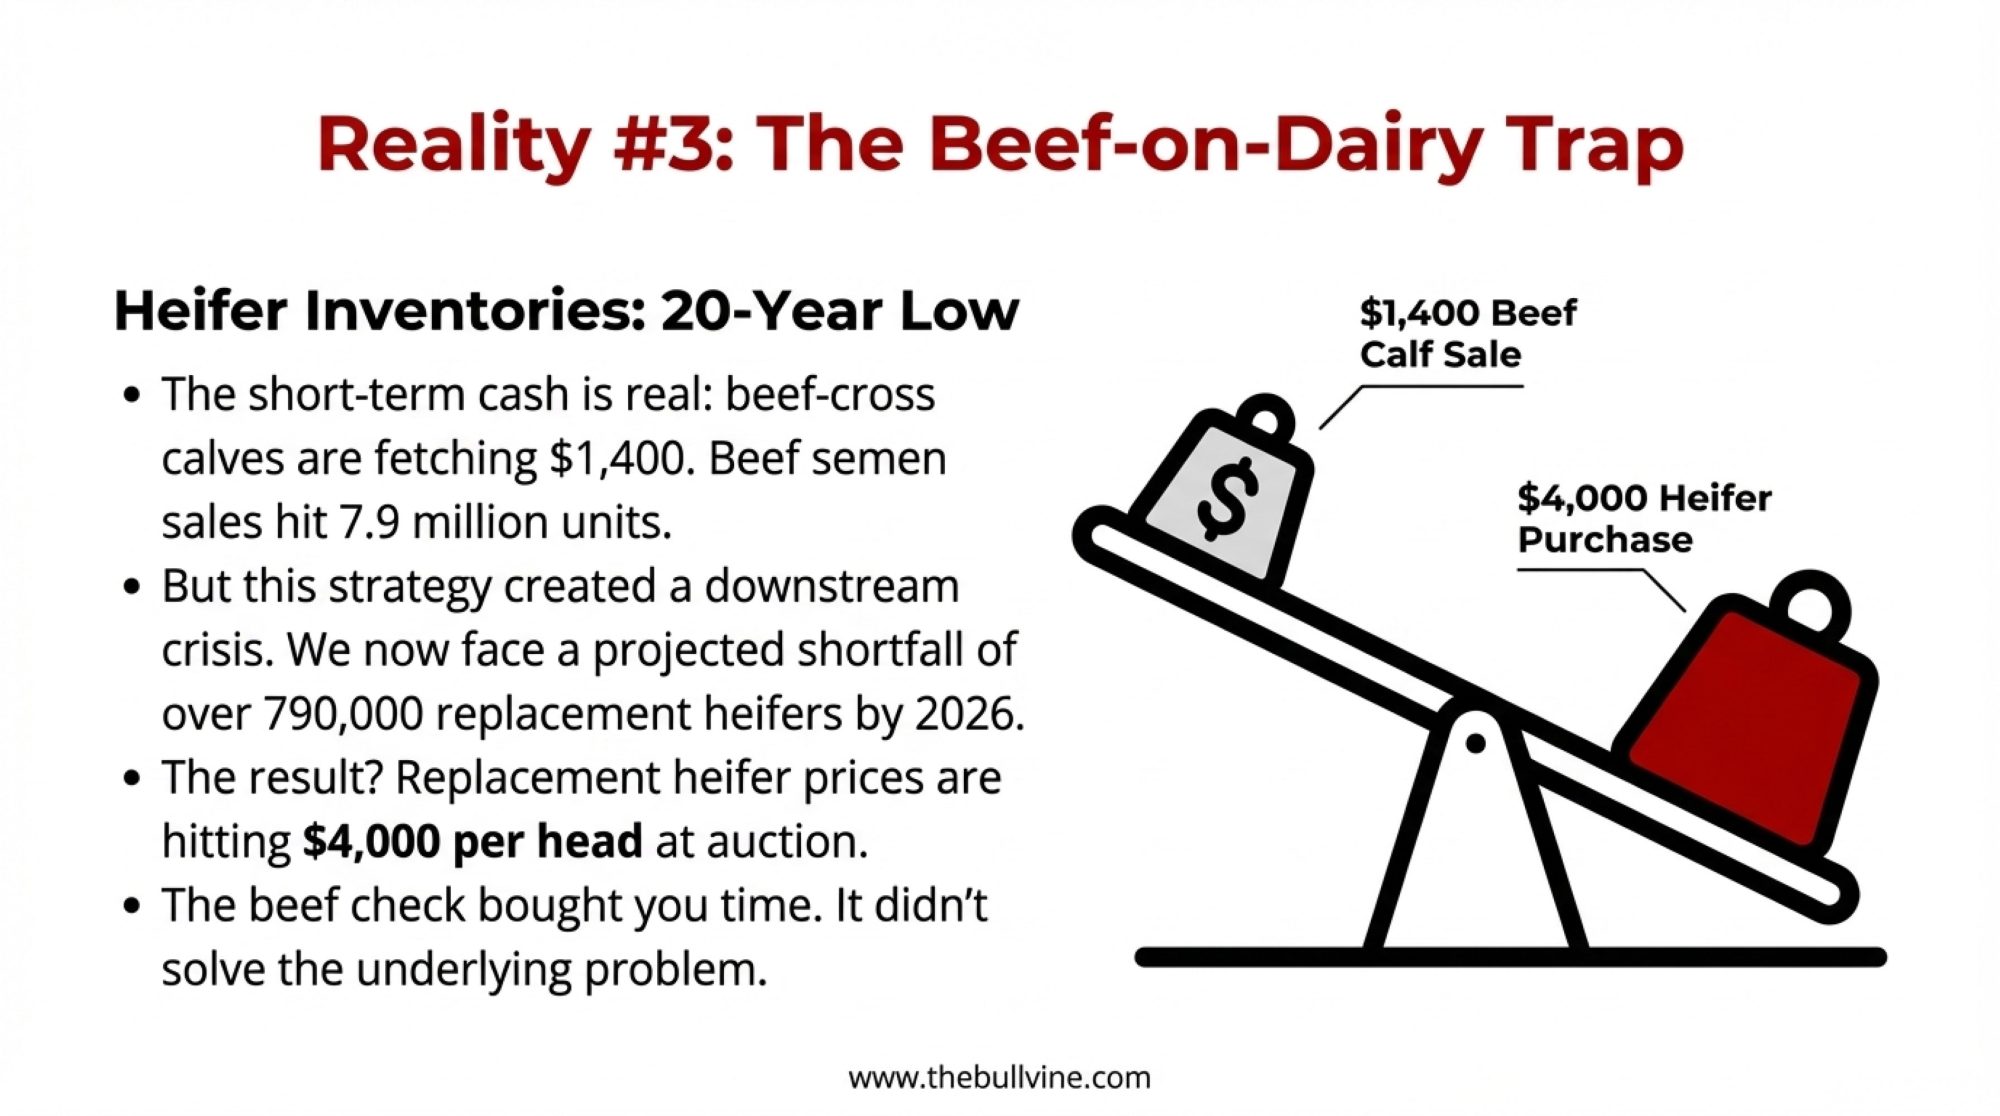
At the same time, beef‑on‑dairy has turned into serious money in a lot of sale barns and contract deals, right when replacement heifers have slid to the lowest levels we’ve seen in about 20 years and gotten expensive to either raise or buy. A 2025 CoBank report describes US dairy heifer inventories as sitting at roughly a 20‑year low and projects they could tighten by as much as 800,000 head before gradually rebounding after 2027 as roughly 10 billion dollars of new processing capacity comes online and needs milk. Analysts used USDA Cattle Inventory data to show that the number of dairy heifers over 500 pounds dropped from about 4.76 million in 2018 to roughly 4.06 million by early 2024—almost a 15% decline in the pool of future milkers.

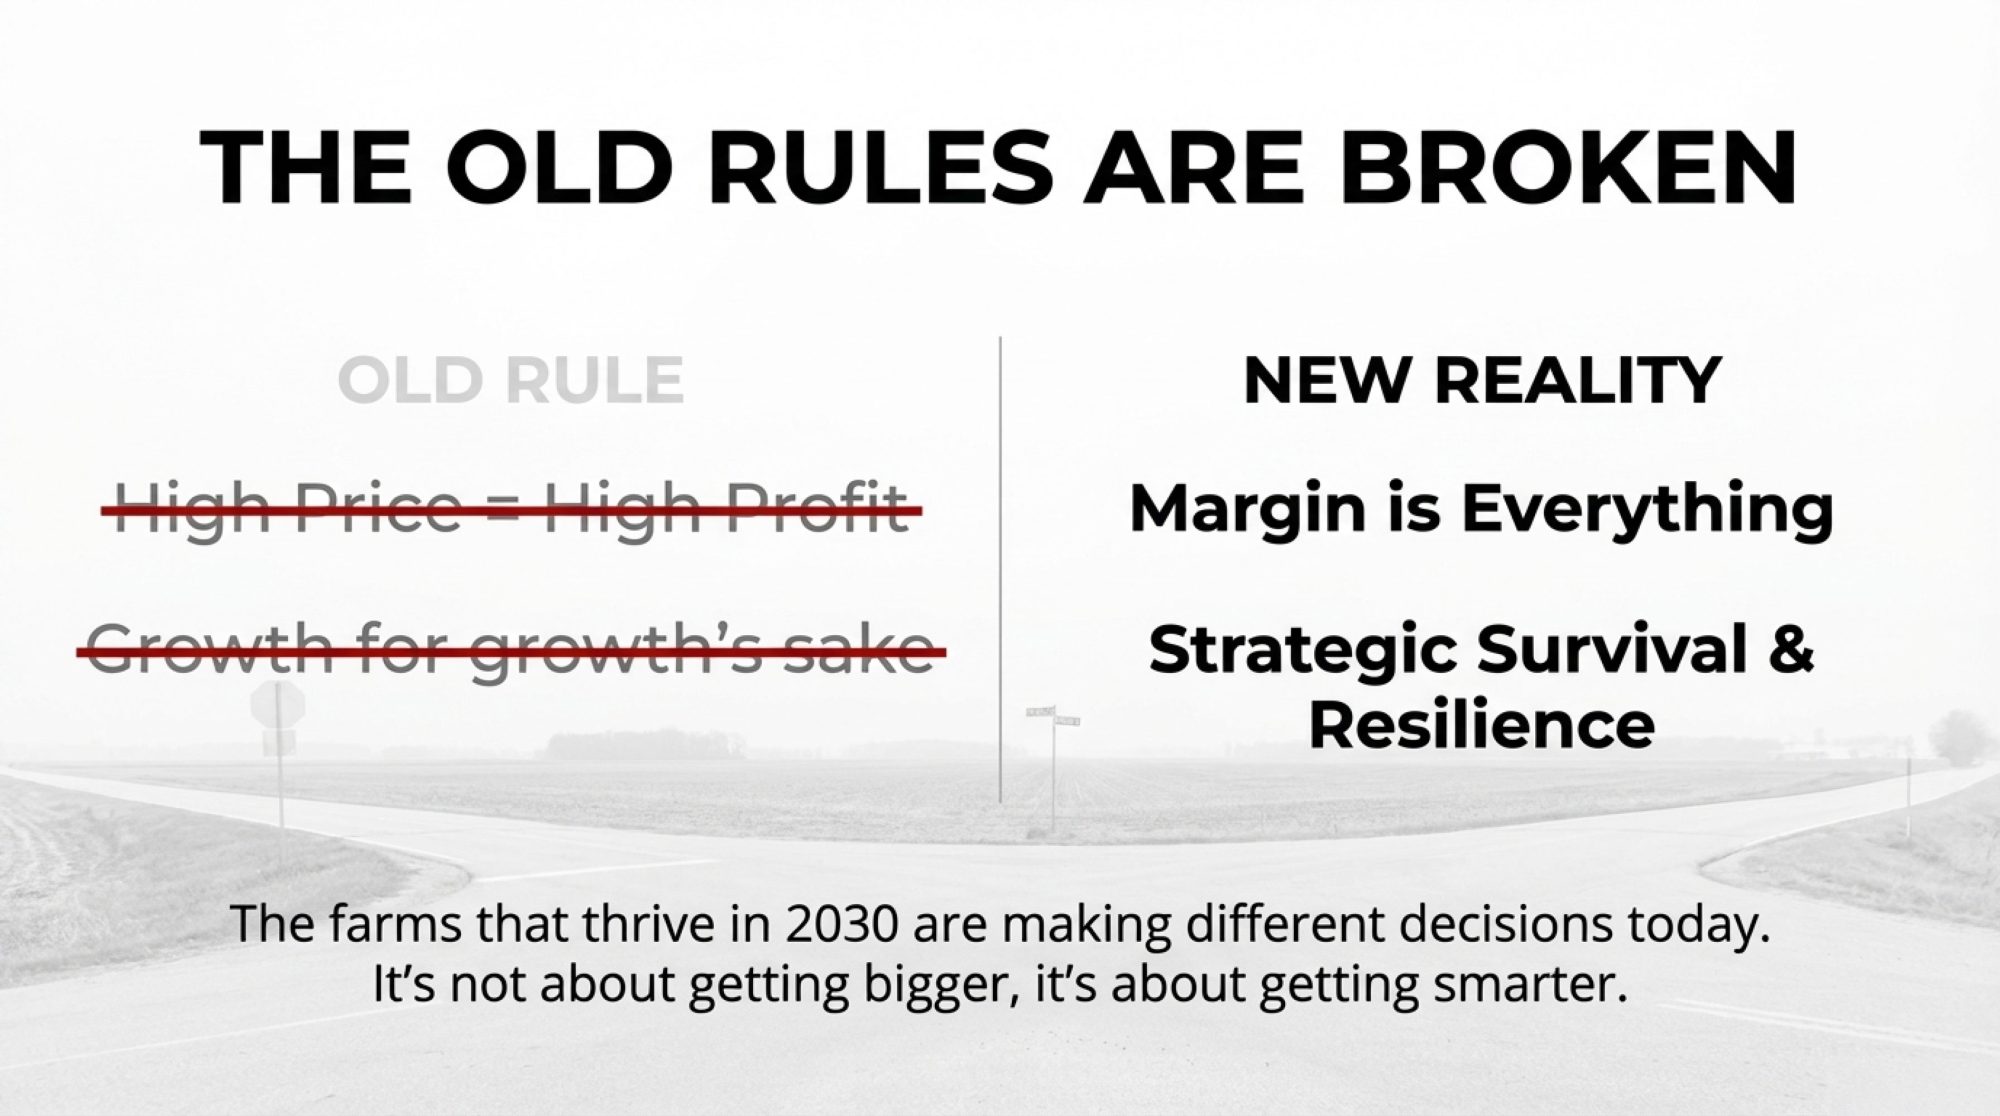
Put all of that together, and the question changes from “How do we get fewer sick calves?” to something a lot sharper:
Which calves do you actually want to be making in 2026—and which ones are you better off never creating in the first place?
Let’s walk through what the newest science says about calf‑health genetics, how it connects to beef‑on‑dairy money and replacement economics, and what a practical breeding plan looks like on real dairies.

Looking at This Trend: What the New Calf‑Health Genetics Actually Show
If you’re going to let genetics influence how you think about scours and pneumonia, the first question is simple: are these traits heritable enough to move the needle?

A 2025 paper in the Journal of Dairy Science from USDA’s Animal Genomics and Improvement Laboratory went straight at that. The team led by geneticists Babu Neupane, PhD, and John B. Cole, PhD, pulled producer‑recorded calf health data from the National Cooperator Database and built what’s probably the most comprehensive calf‑health dataset we’ve ever seen for North American Holsteins and Jerseys.
Here’s what they worked with:
- 207,602 calf records for diarrhea between 3 and 60 days of age.
- 681,741 records for respiratory disease between 3 and 365 days.
- Calves born from 2013 to 2024, with about 97.5% of the data coming from Holsteins and Jerseys.
When they summarized those records, they found that 14.46% of calves had a recorded case of diarrhea in that 3‑ to 60‑day window, and 16.05% had a recorded respiratory case between 3 and 365 days. If you’ve ever watched a damp March wind whistle through hutches in Wisconsin or Ontario, those numbers probably sound about right. Scours tends to bully the youngest calves; as they get older, respiratory problems slowly take over.
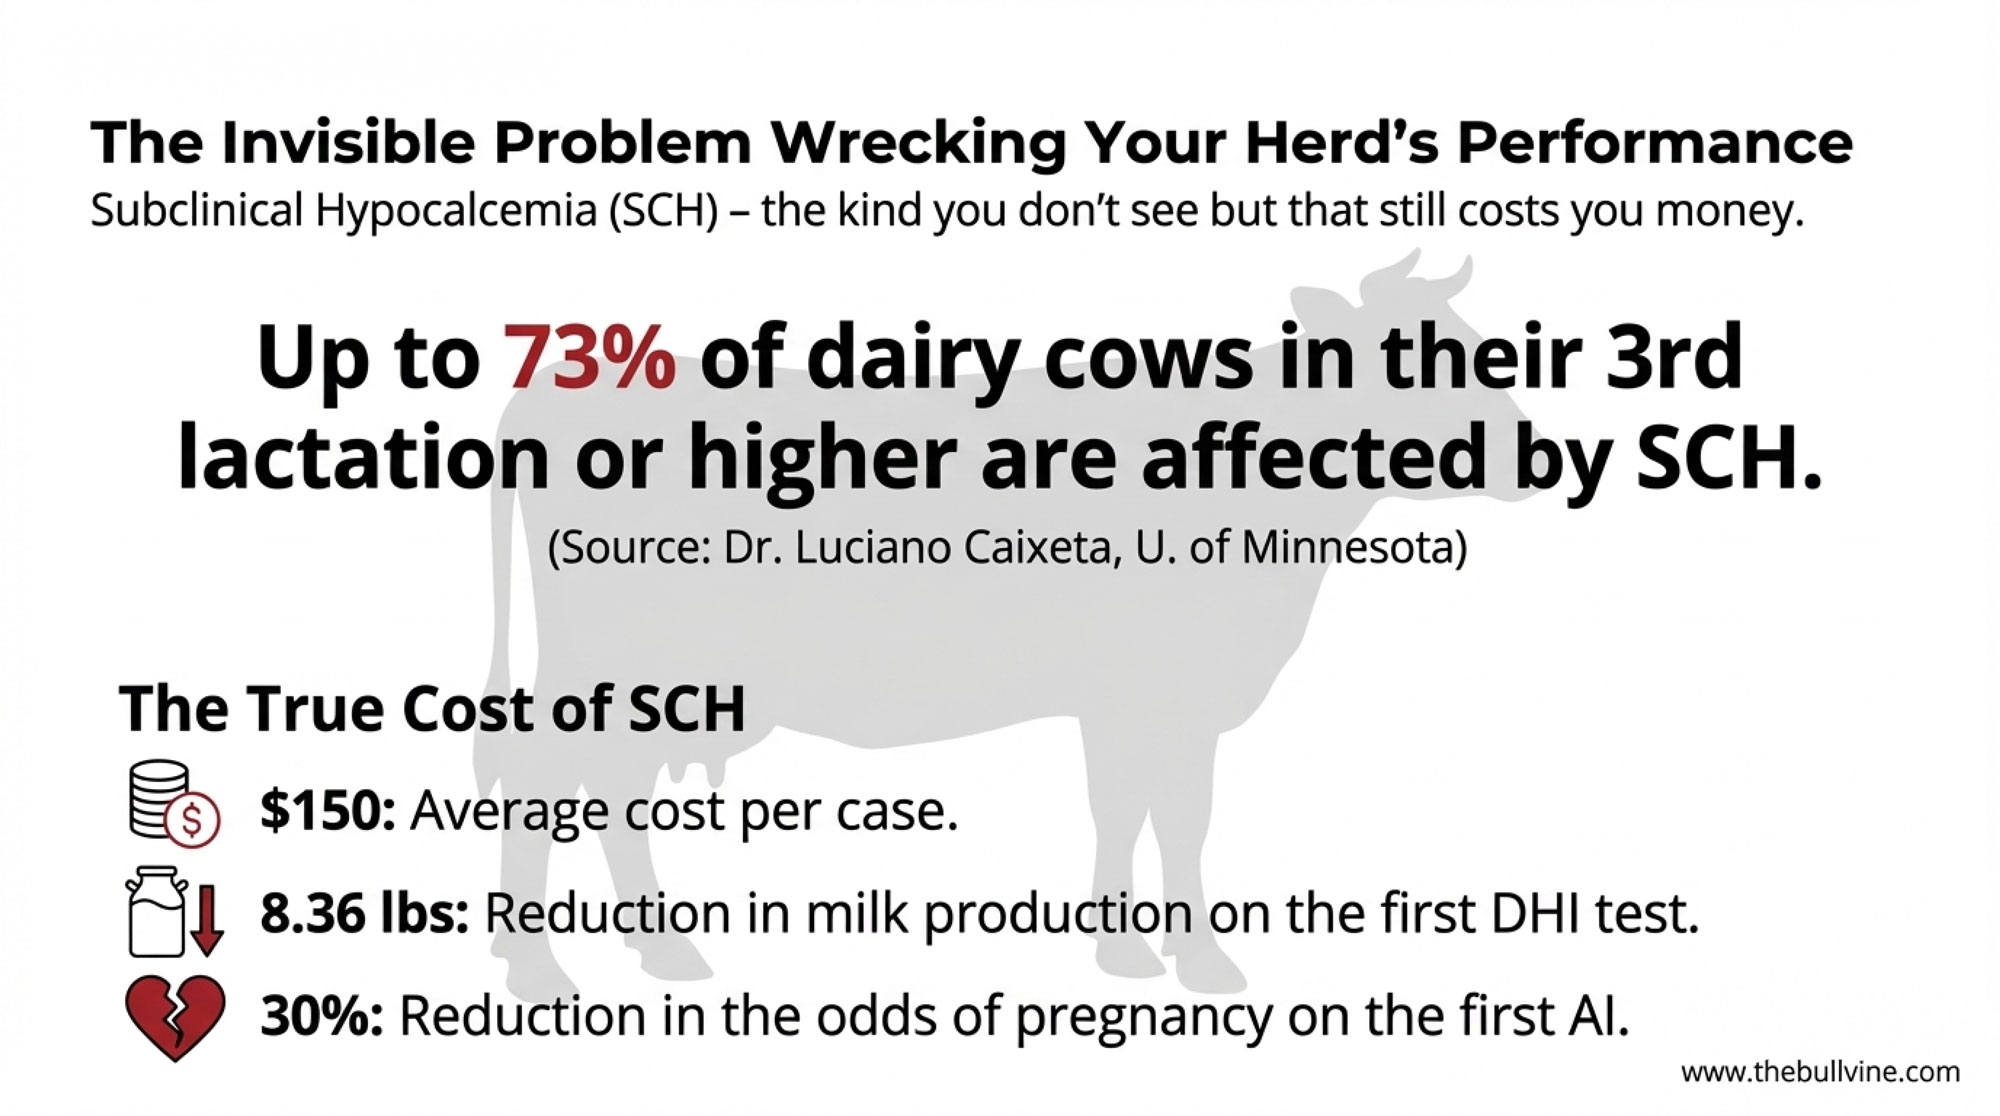
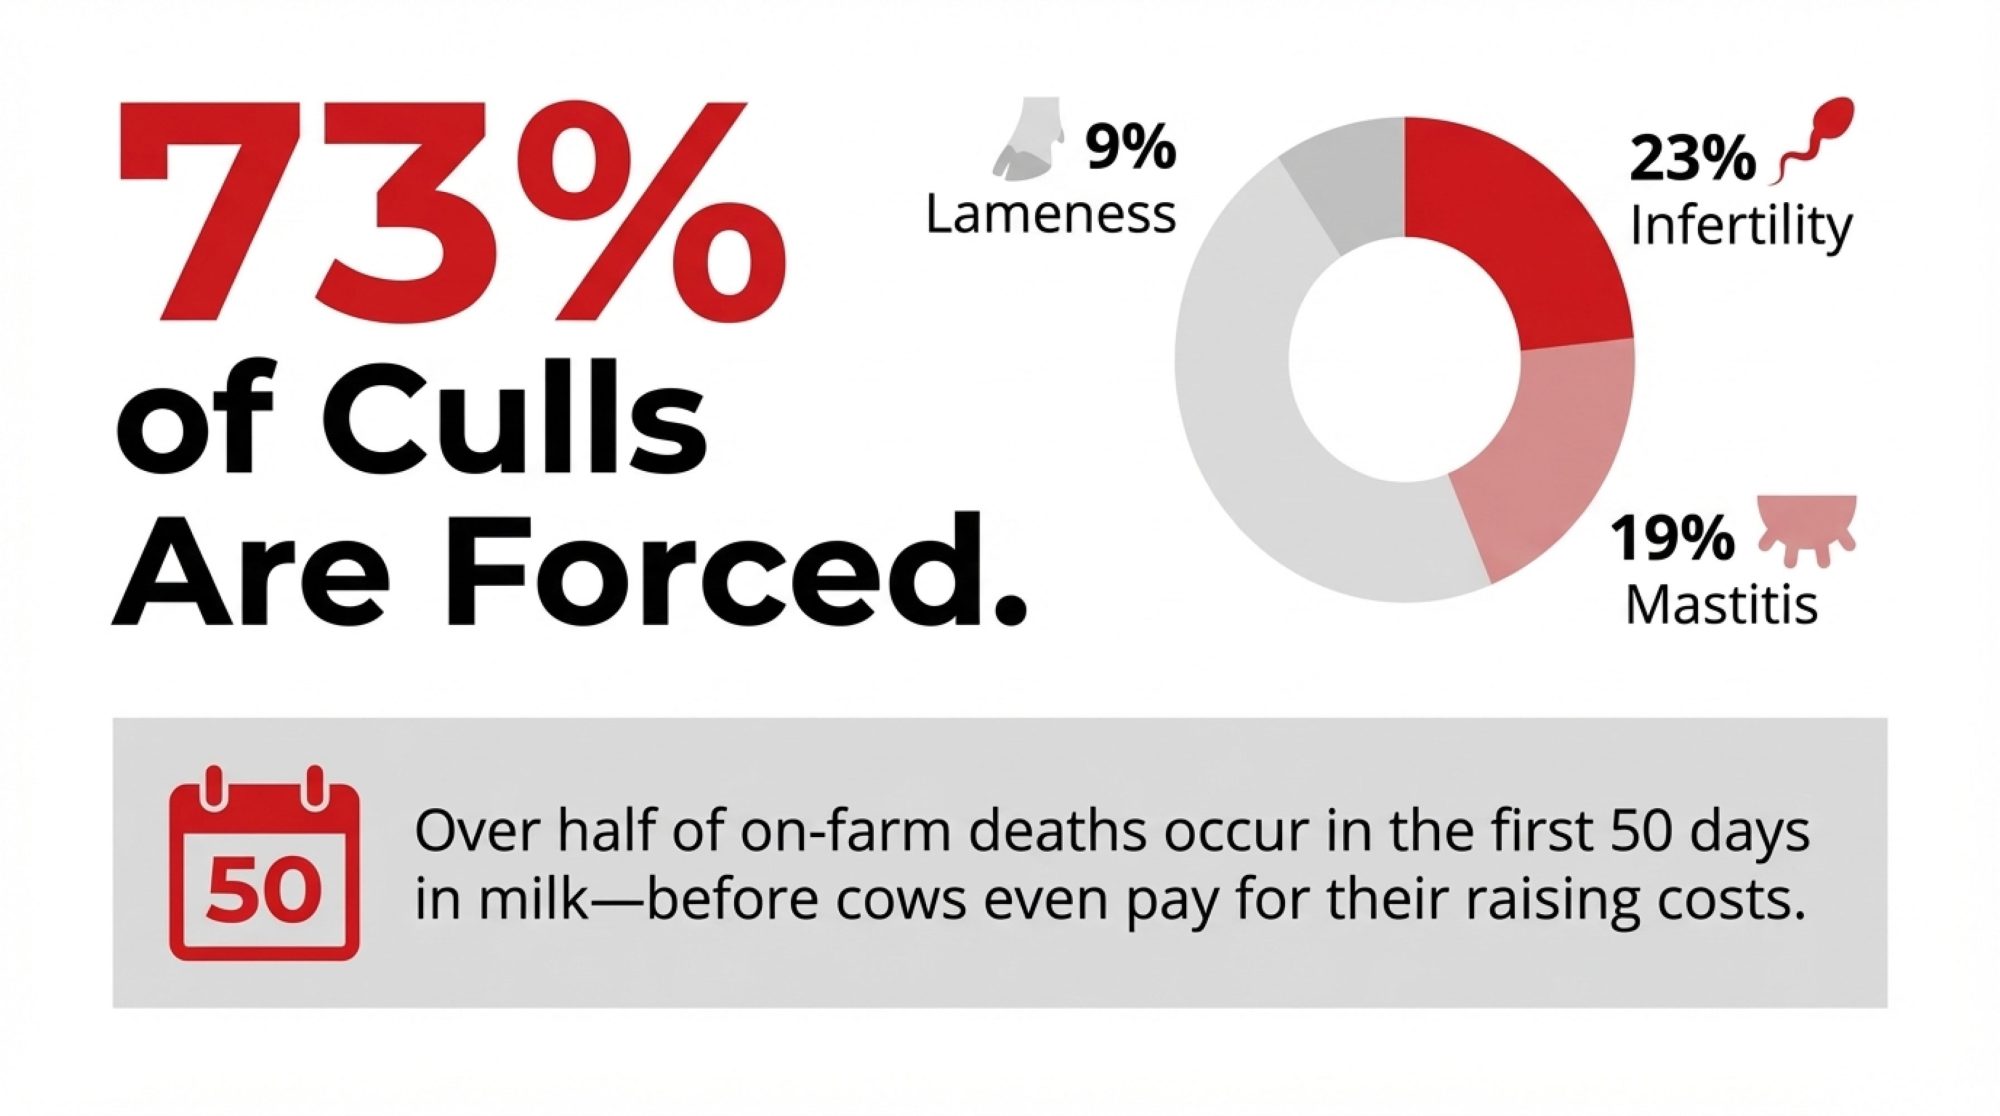
On the genetic side, they estimated heritabilities of 0.026 (2.6%) for resistance to diarrhea and 0.022 (2.2%) for resistance to respiratory disease. That’s modest, but it’s right in line with what’s been reported for cow‑health traits like clinical mastitis, metritis, and ketosis that we already include in Net Merit, Pro$, and other indexes. In plain language: calf‑health traits behave like other health traits we’re already comfortable breeding for.
| Trait | Heritability | Similar Industry Trait | Top 5% Sires (% Healthy Calves) | Bottom 5% Sires (% Healthy Calves) | Practical Implication |
| Diarrhea Resistance | 2.6% | Clinical Mastitis (1.5%–3%) | 88% | 71% | 17 percentage-point spread; top sires prevent ~200+ sick-calf events per 1,000 calves born |
| Respiratory Resistance | 2.2% | Ketosis (1–2%) | 88% | 70% | Same order of magnitude; respiratory RBV predicts > 1 fewer pneumonia case per 10–12 calves |
| Cow Mastitis | 1.5%–3% | Industry standard | ~85% | ~72% | Calf-health heritability is comparable to traits we’ve been selecting on for 20+ years |
| Genetic Correlations | 0.0 to -0.1 | Low cross-trait pull | N/A | N/A | Improving calf health does not sacrifice milk, fat, protein, or fertility gains |
What’s encouraging is that when USDA‑AGIL ran genomic evaluations for these traits, the genomic predictions were noticeably more reliable than simple parent averages, particularly for young bulls with no daughter data yet. They also found that genetic correlations between calf‑health traits and most other traits—production, fertility, cow health—were low, with only a modest link between diarrhea and respiratory resistance and very little pull against milk or component traits. That matters. It means you can add calf‑health traits into a balanced index without giving up the gains you’re making in milk, fat, protein, or cow fitness.
USDA‑ARS and the Council on Dairy Cattle Breeding (CDCB) have been presenting this work through ICAR and industry meetings. The consistent message has been that these calf‑health traits are ready for inclusion in US national genetic evaluations for Holsteins and Jerseys as soon as data quality and validation milestones are met, with 2026 targeted as the window for implementation. The exact month depends on final testing and governance, but the direction is clear.
So, from a genetics point of view, we’re not talking about “maybe someday” anymore. These are real traits with real proofs coming.
What Sick Calves Really Cost: From $25 Per Case to $27,000 Per Year
You probably don’t need a scientist to tell you that sick calves are expensive, but it helps to put some hard numbers behind your gut feel.
A 2023 study in JDS Communications examined health costs at 16 certified organic Holstein dairies in the US. The researchers, including Laura C. Hardie, MSc, used on‑farm treatment records and standardized cost estimates for veterinarian time, medications, and producer labor.
On the calf side, they found average direct costs of:
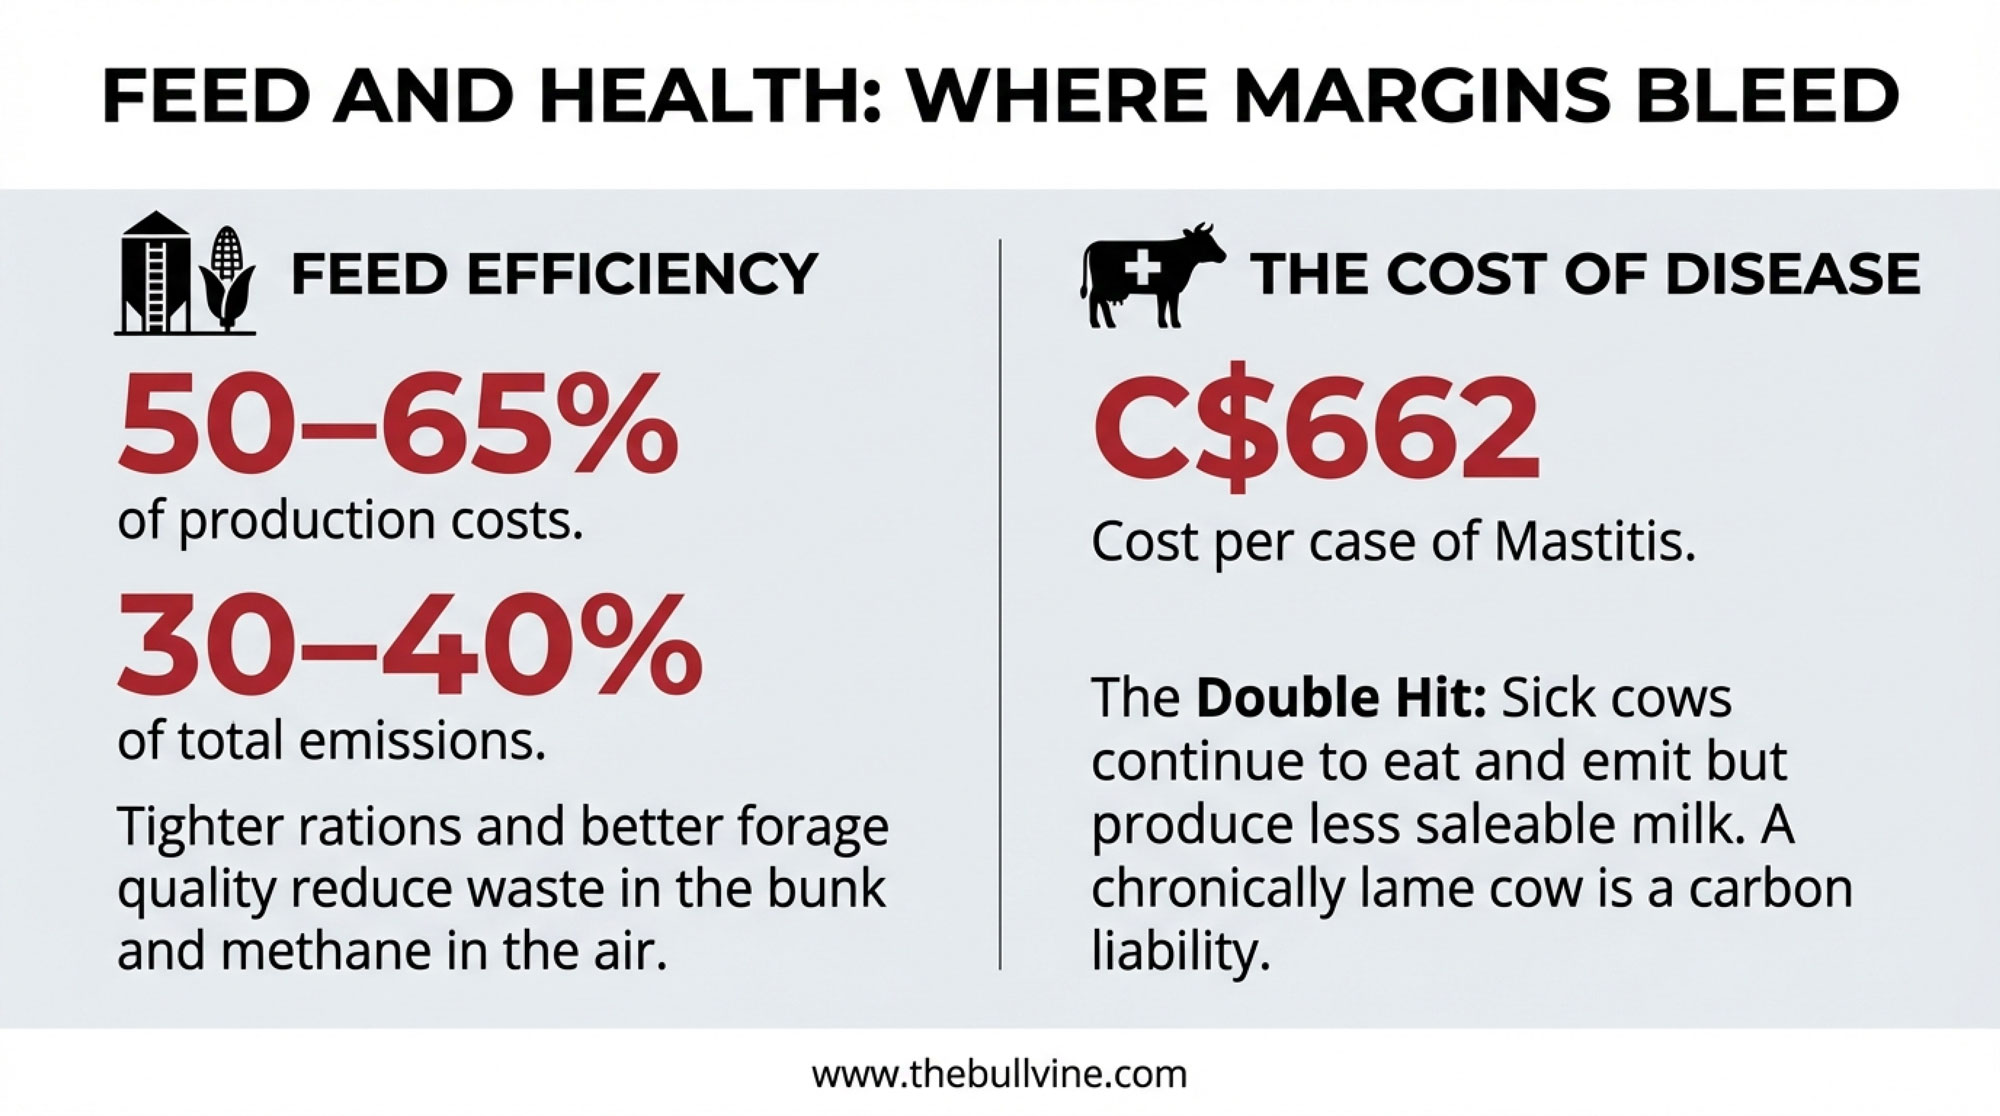
- 25.21 dollars per case of scours.
- 56.37 dollars per case of respiratory disease.
Those figures are just what you can see on the invoice—vet visits, drugs, and some labor. They don’t include slower growth, extra days on milk replacer or starter, extra days to breeding, or the way a rough start can nibble away at first‑lactation milk and component performance. Reviews on calf health and heifer rearing, along with herd‑level calf‑health investigations, keep showing what many of you have already noticed: calves that get hammered early often lag behind, even when they survive and make it into the milk string.
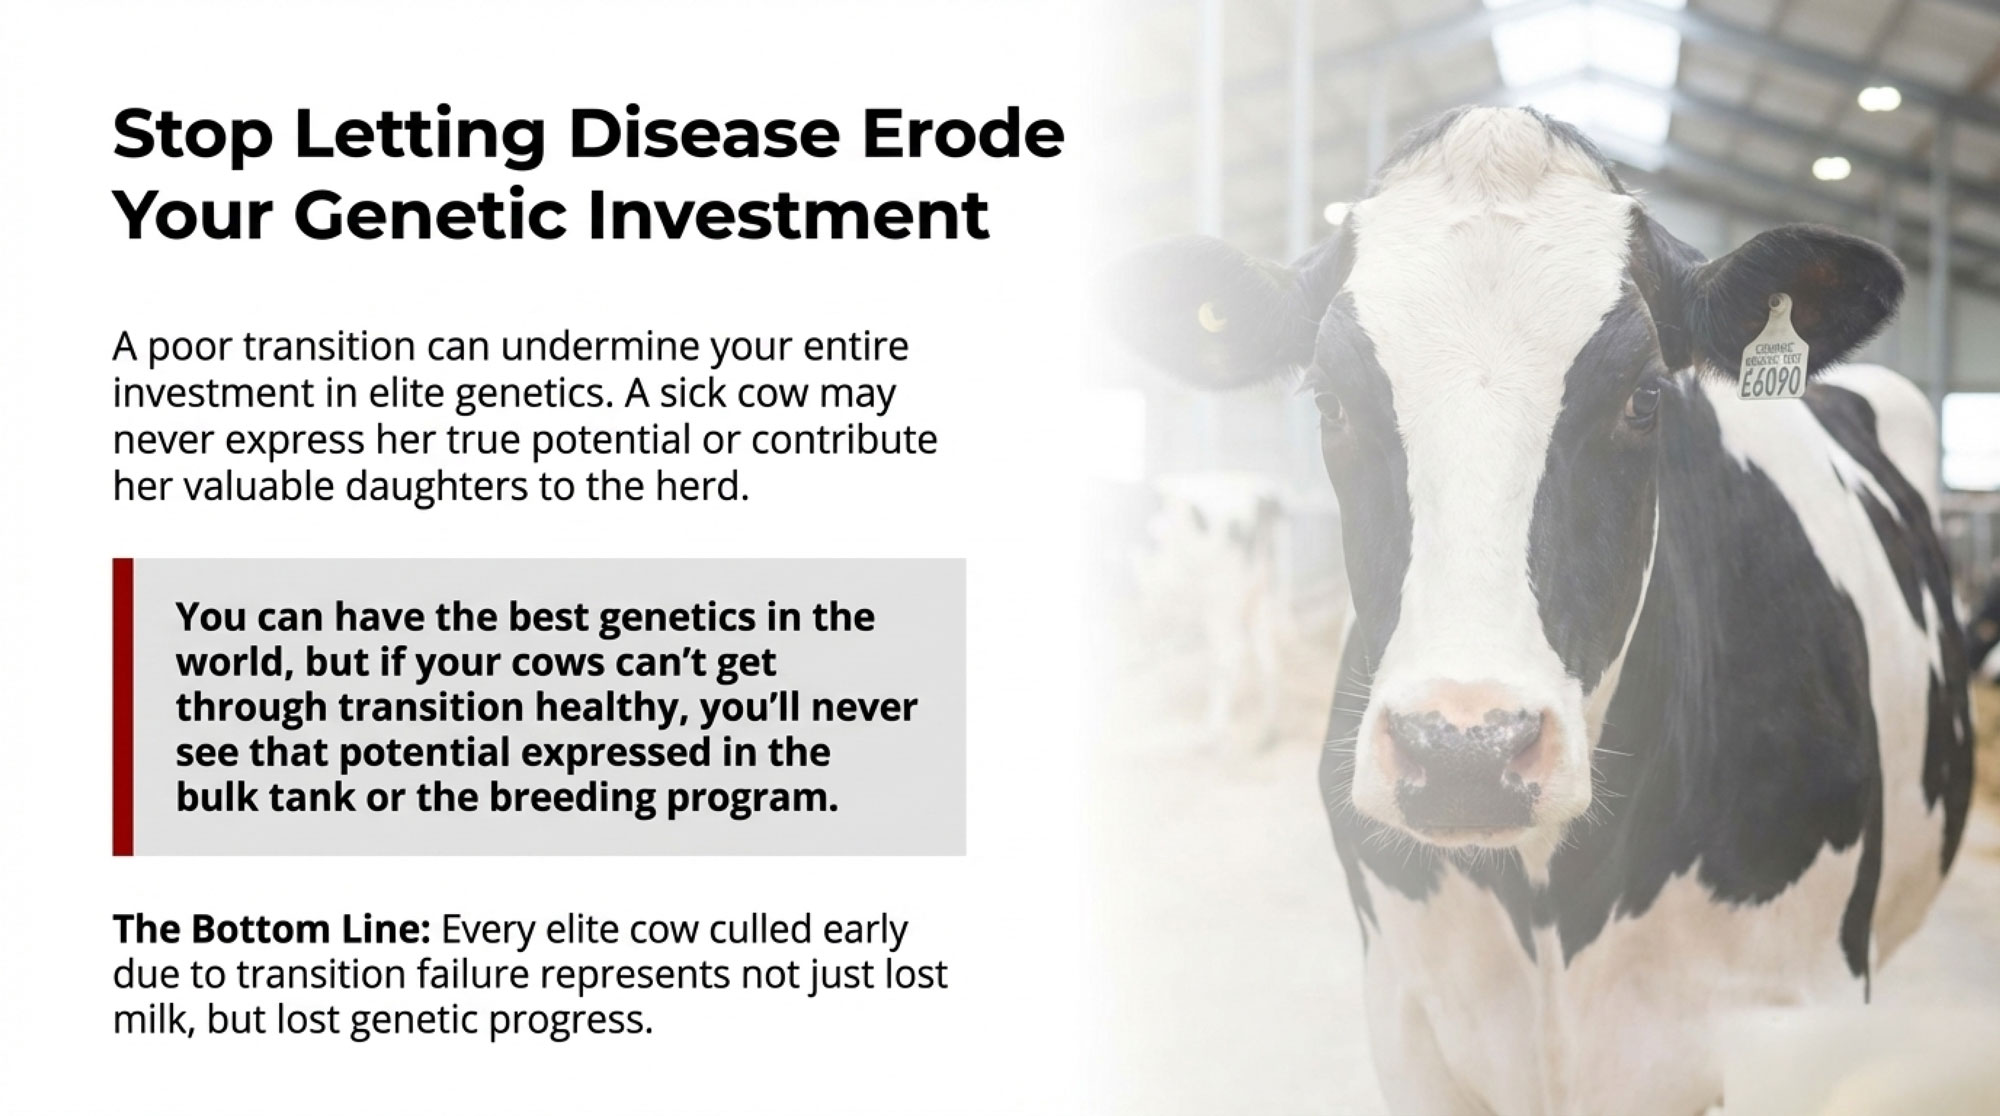
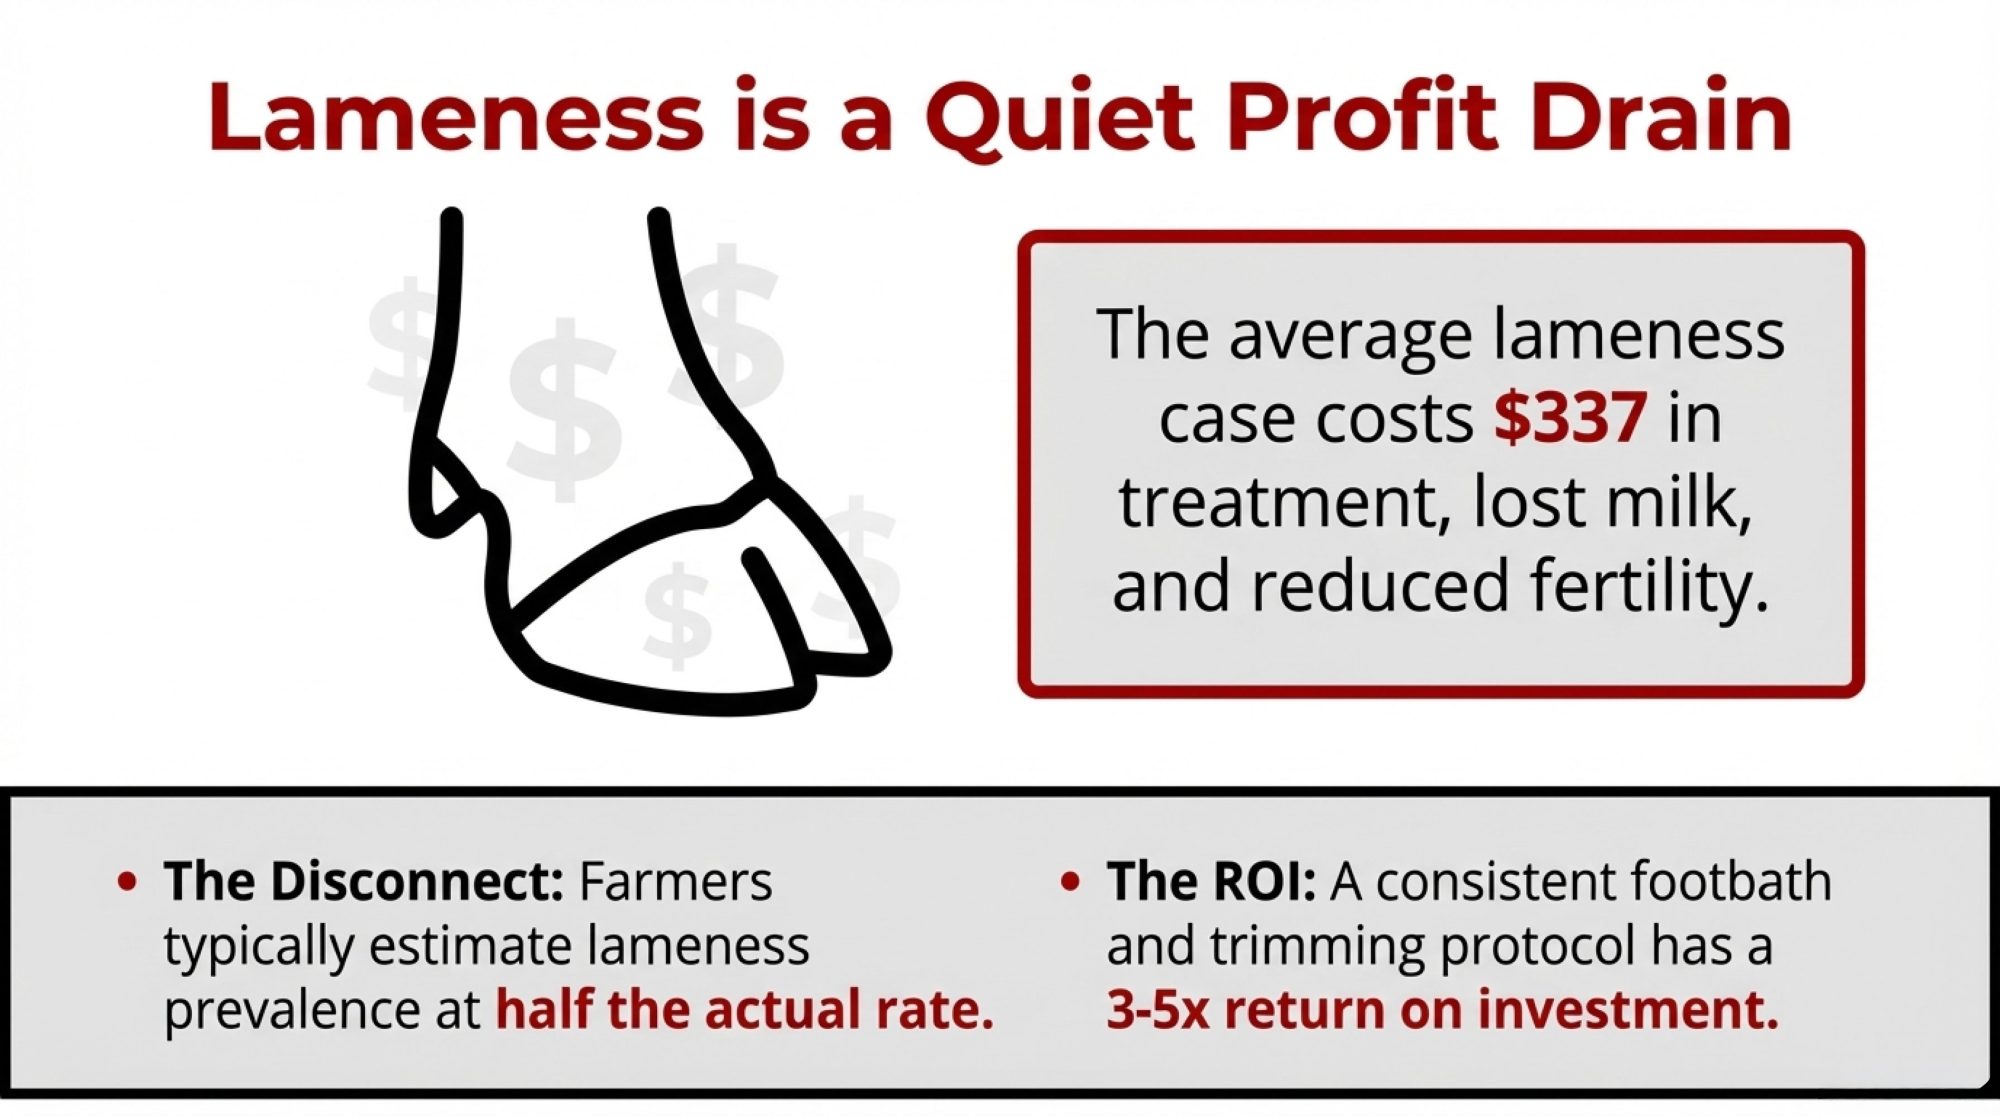
So it’s reasonable—based on those cost estimates and the documented performance impacts—to say that a serious pre‑weaning disease episode can trim a few hundred dollars off a heifer’s lifetime economic value on many farms once you add up treatment, extra rearing time, and lost milk later on. The exact figure will move with your feed costs, labor rate, housing system, and milk price, but the order of magnitude is real.
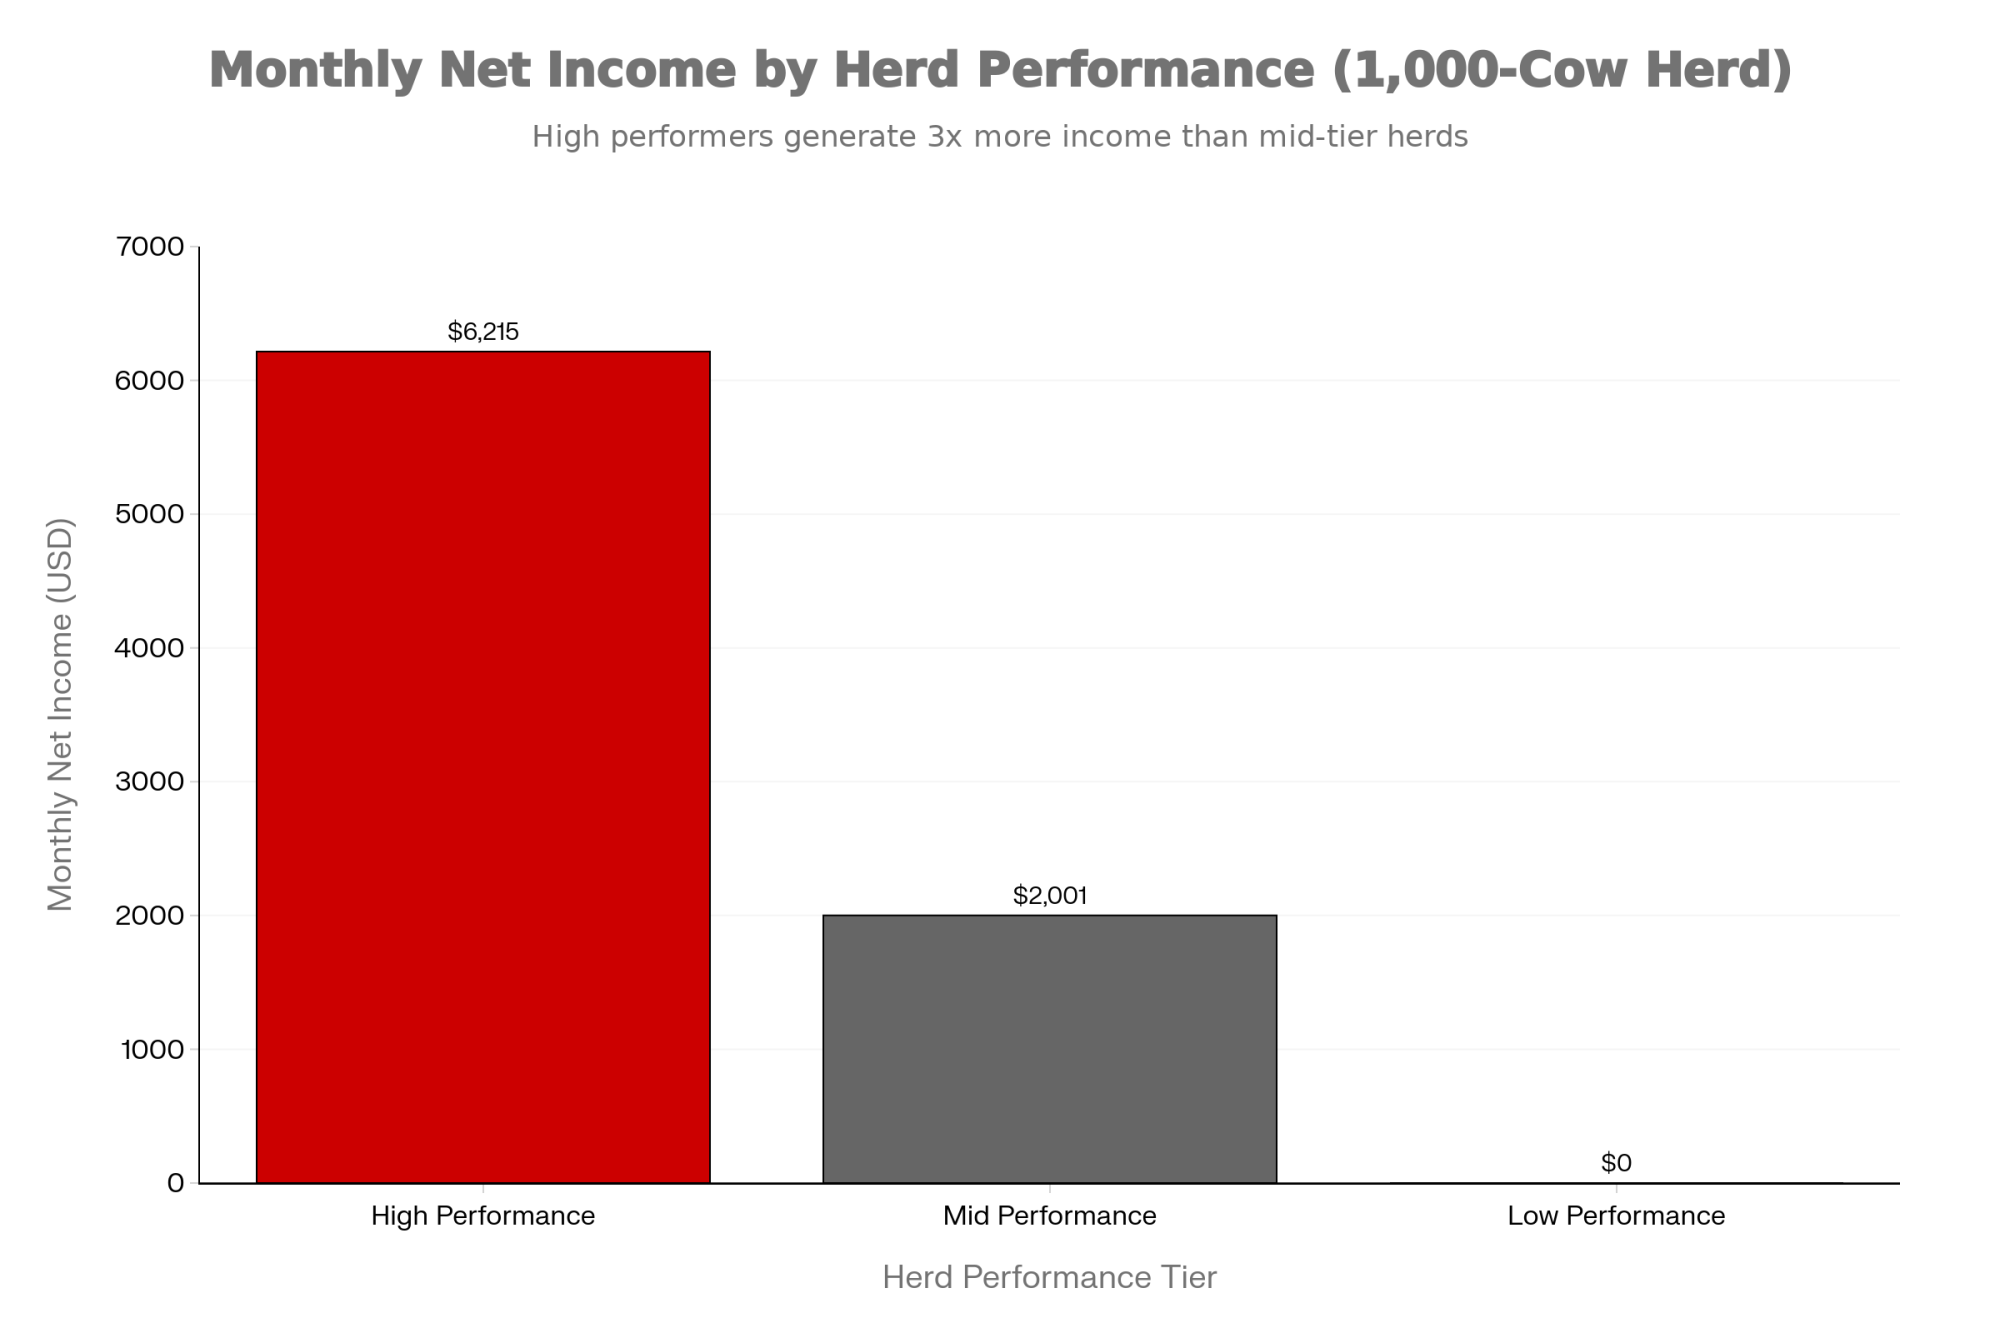
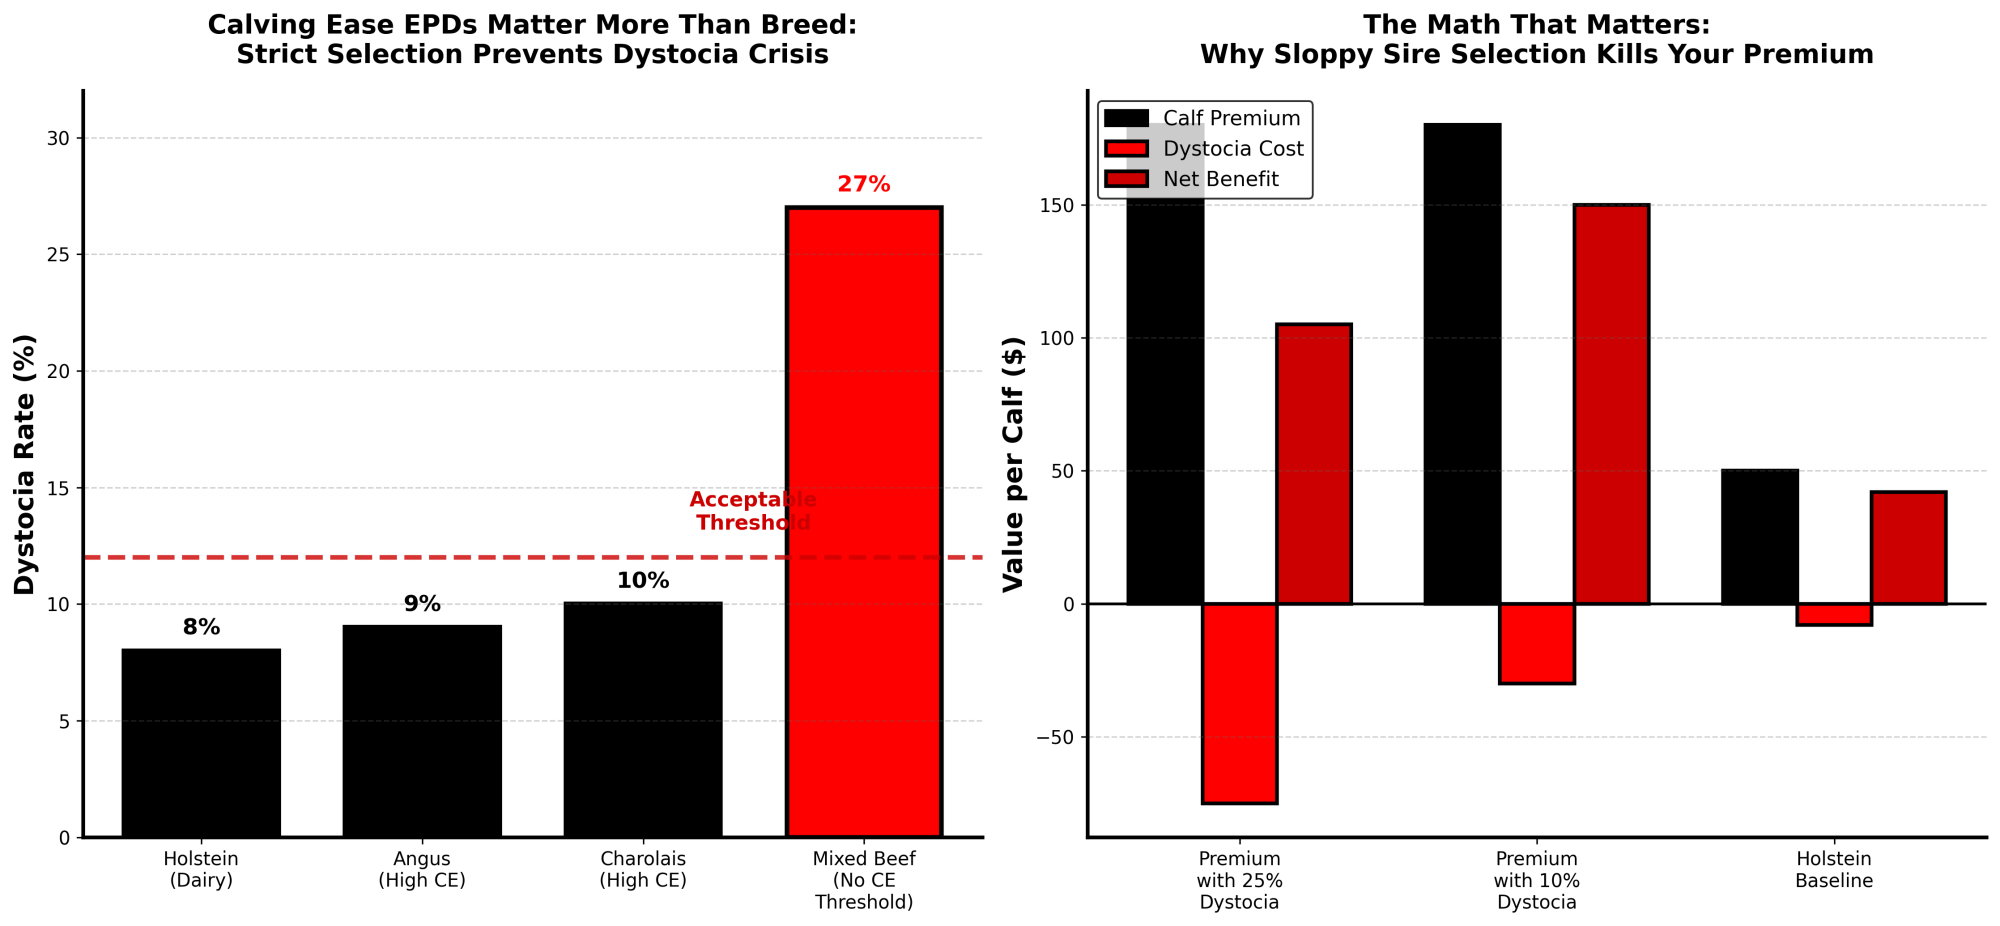
If you want to see how that plays out across a herd, let’s do some simple math. Picture a 1,000‑cow dairy calving about 900 heifers a year. Say 15% of those calves—135 animals—have a significant scours or respiratory event. If you assign a conservative 200‑dollar economic hit per case, combining Hardie’s direct treatment costs with some allowance for long‑term performance losses, you end up at:
- 135 calves × 200 dollars ≈ 27,000 dollars per year in calf‑health‑related losses.
| Cost Component | Amount (USD) | Percentage of Total |
|---|---|---|
| Direct Vet & Drug Costs | 5,100 | 19% |
| Producer Labor (extra time) | 4,050 | 15% |
| Slow Growth & Extended Rearing | 8,100 | 30% |
| Lost First-Lactation Milk/Components | 9,750 | 36% |
| Total | $27,000 | 100% |
That’s not a published national average—it’s a realistic illustrative example built from current cost data and what we know about early‑life disease. On herds with higher disease burden, more expensive inputs, or longer rearing periods, that number can easily climb into the higher tens of thousands.
And that’s before you count the extra time and stress your team spends on repeated treatments and nursing fragile calves through bad weather.
So when we say calf health isn’t a “minor line item,” that it’s a major factor in your annual profit and loss, that’s the level of math we’re talking about.
Beef‑on‑Dairy and Tight Heifer Numbers: Why Every Calf Turned Strategic
Now layer the beef‑on‑dairy story and the heifer shortage on top of that.
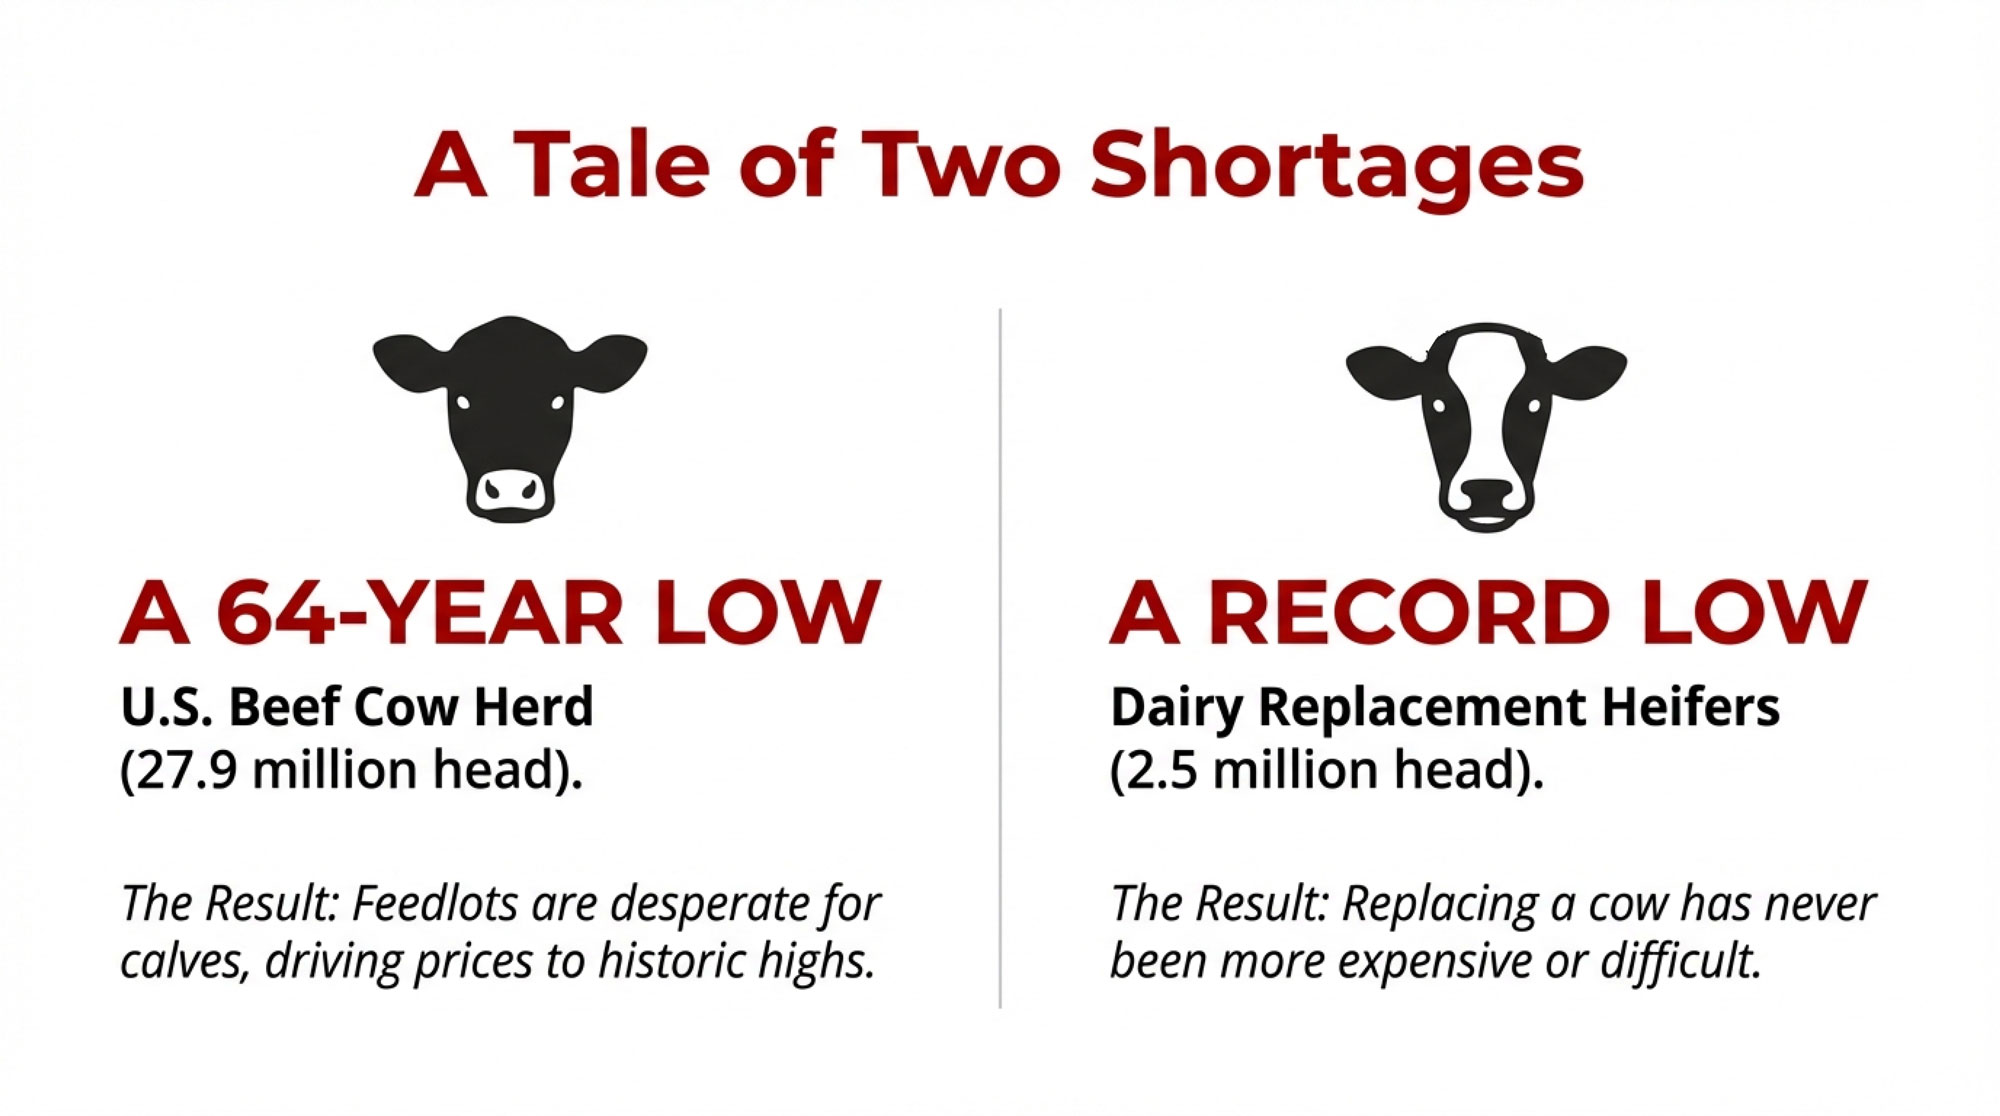
On the beef side, you’ve watched this play out: the US beef cow herd has been slow to rebuild, and beef supplies have been tight enough that packers and feedlots are looking harder at dairy‑origin cattle, especially high‑health dairy‑beef cross calves. At the same time, dairy herds have become much more consistent with reproduction—timed AI, sexed semen, improved fresh cow management through the transition period—so you have more control over whether a given pregnancy is a “dairy heifer” or a “beef‑on‑dairy” calf.
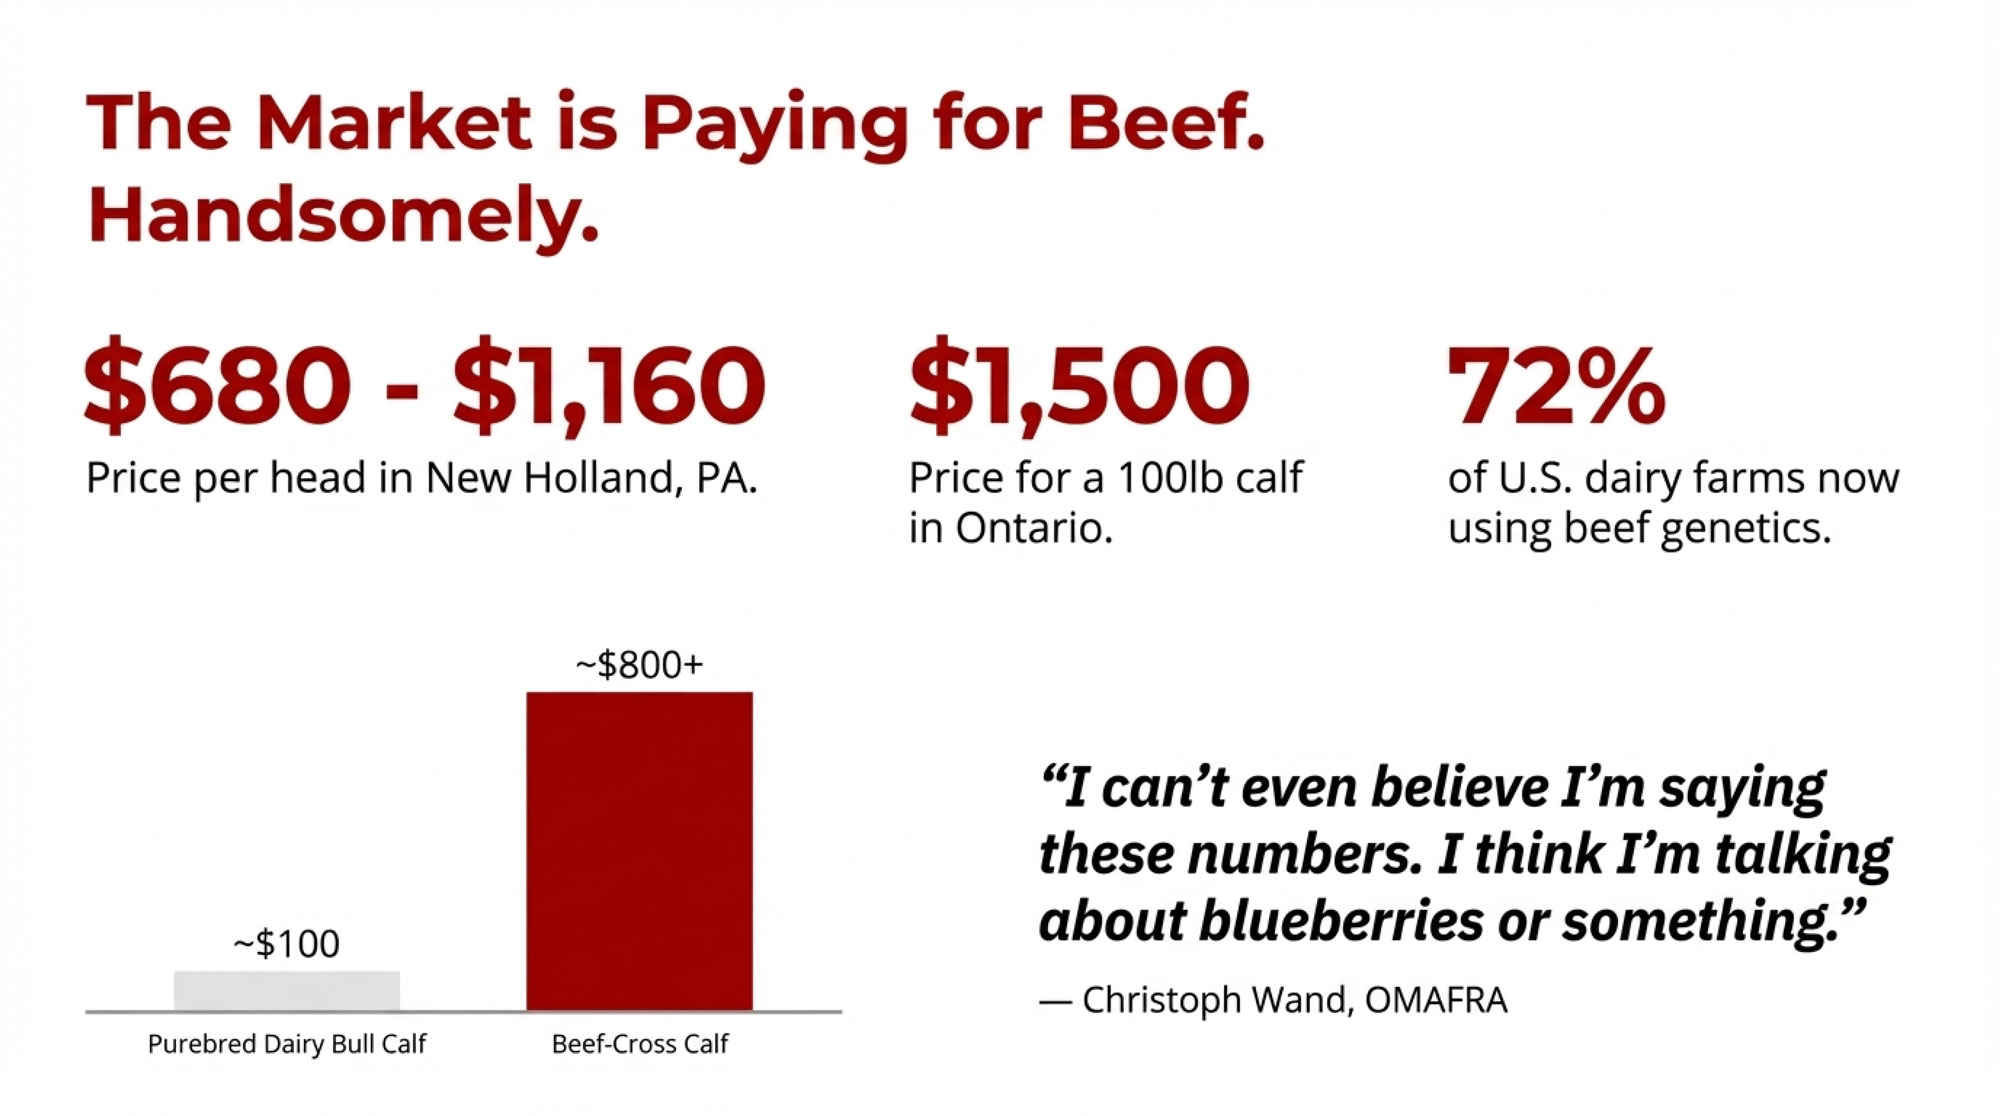
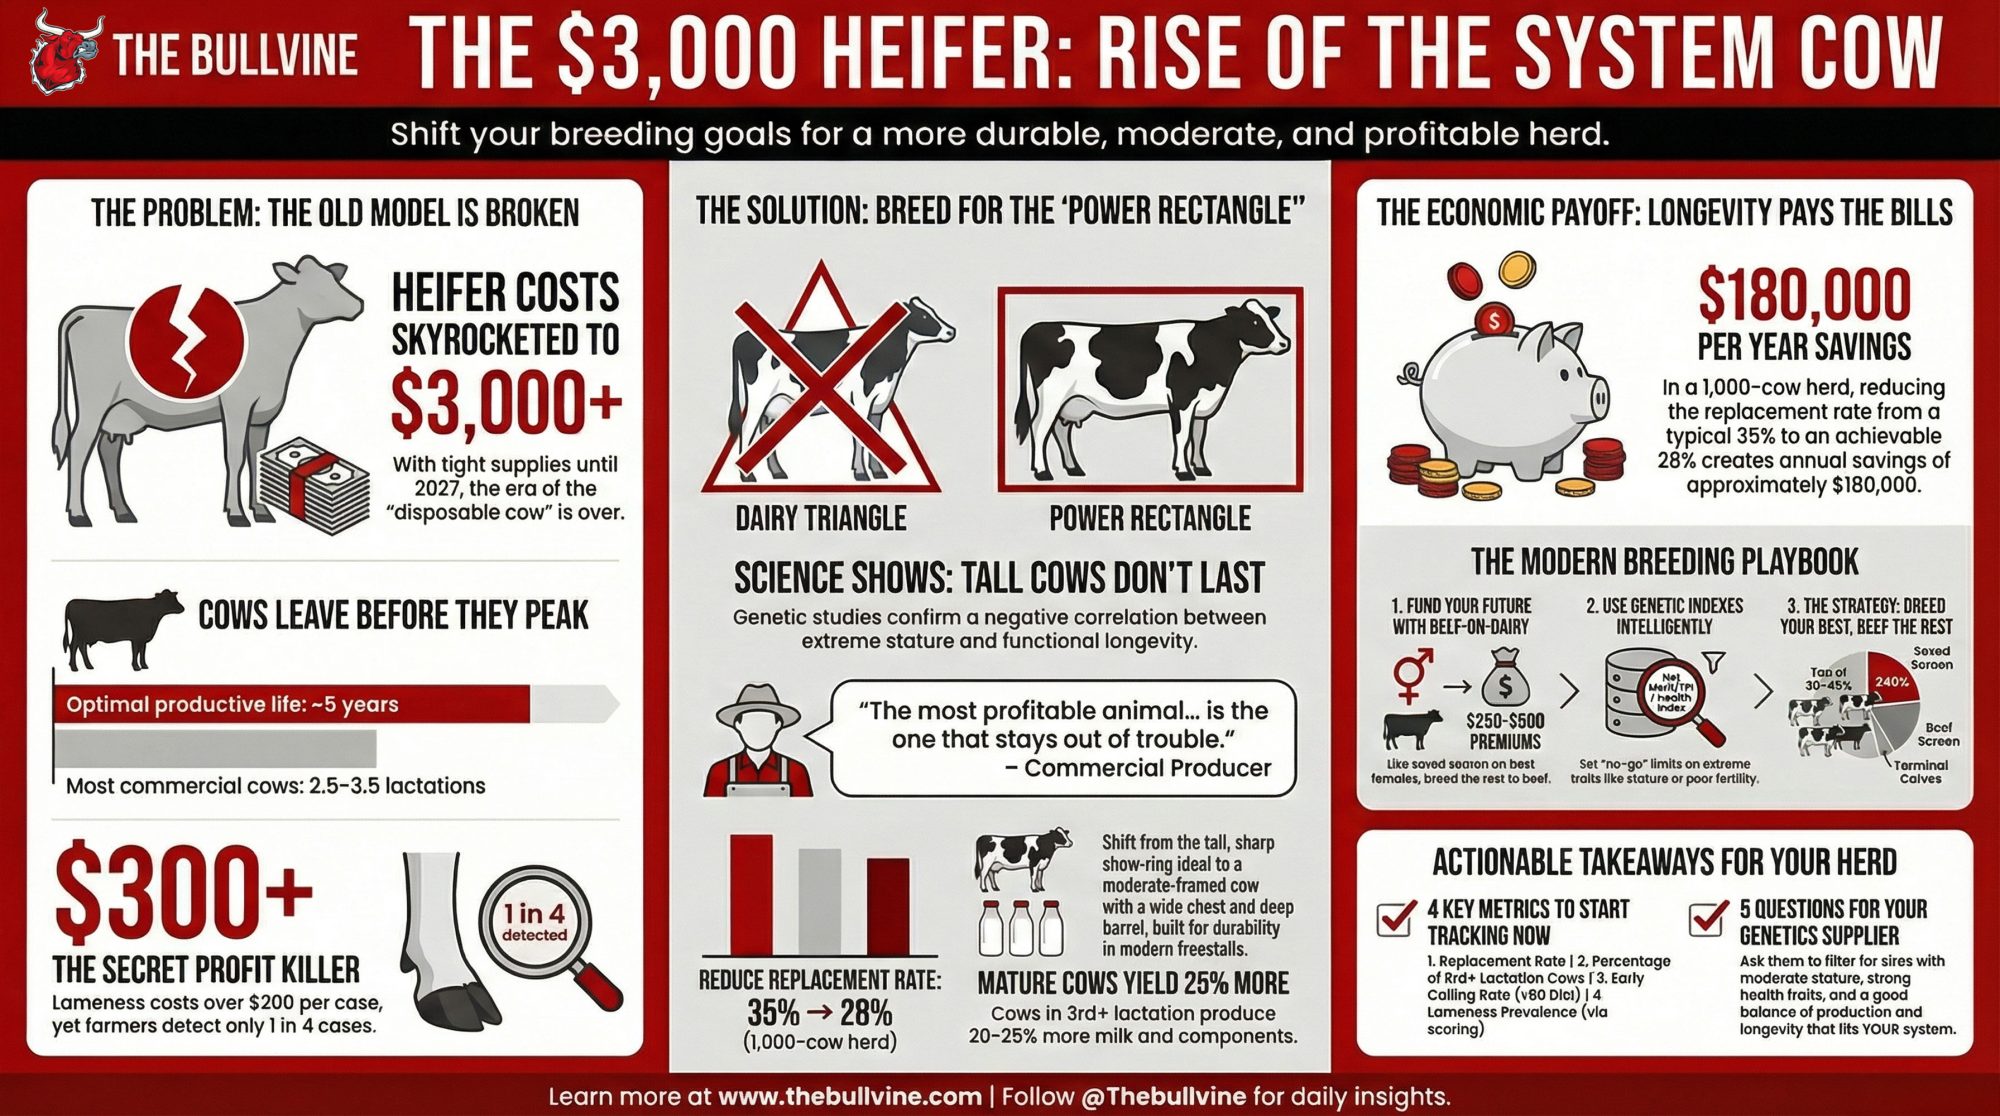
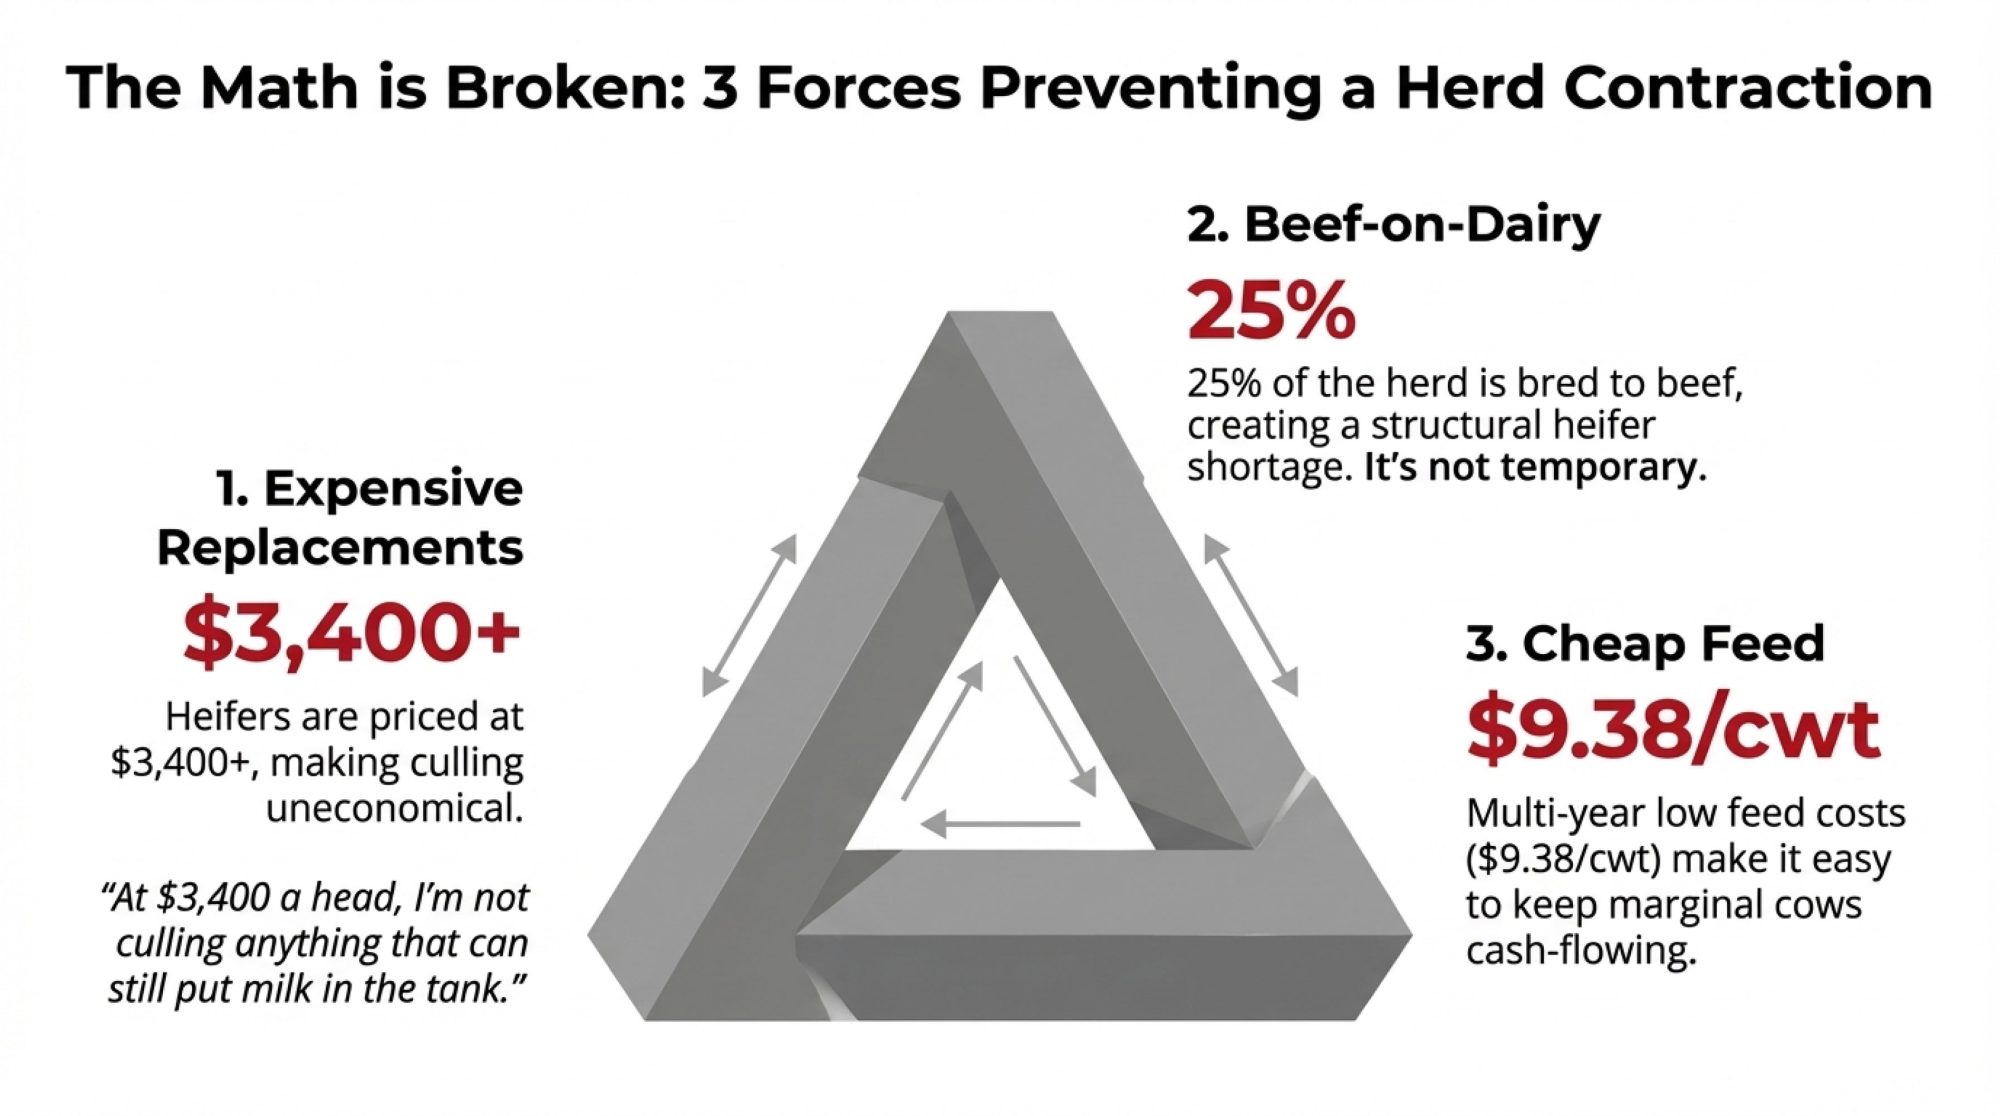
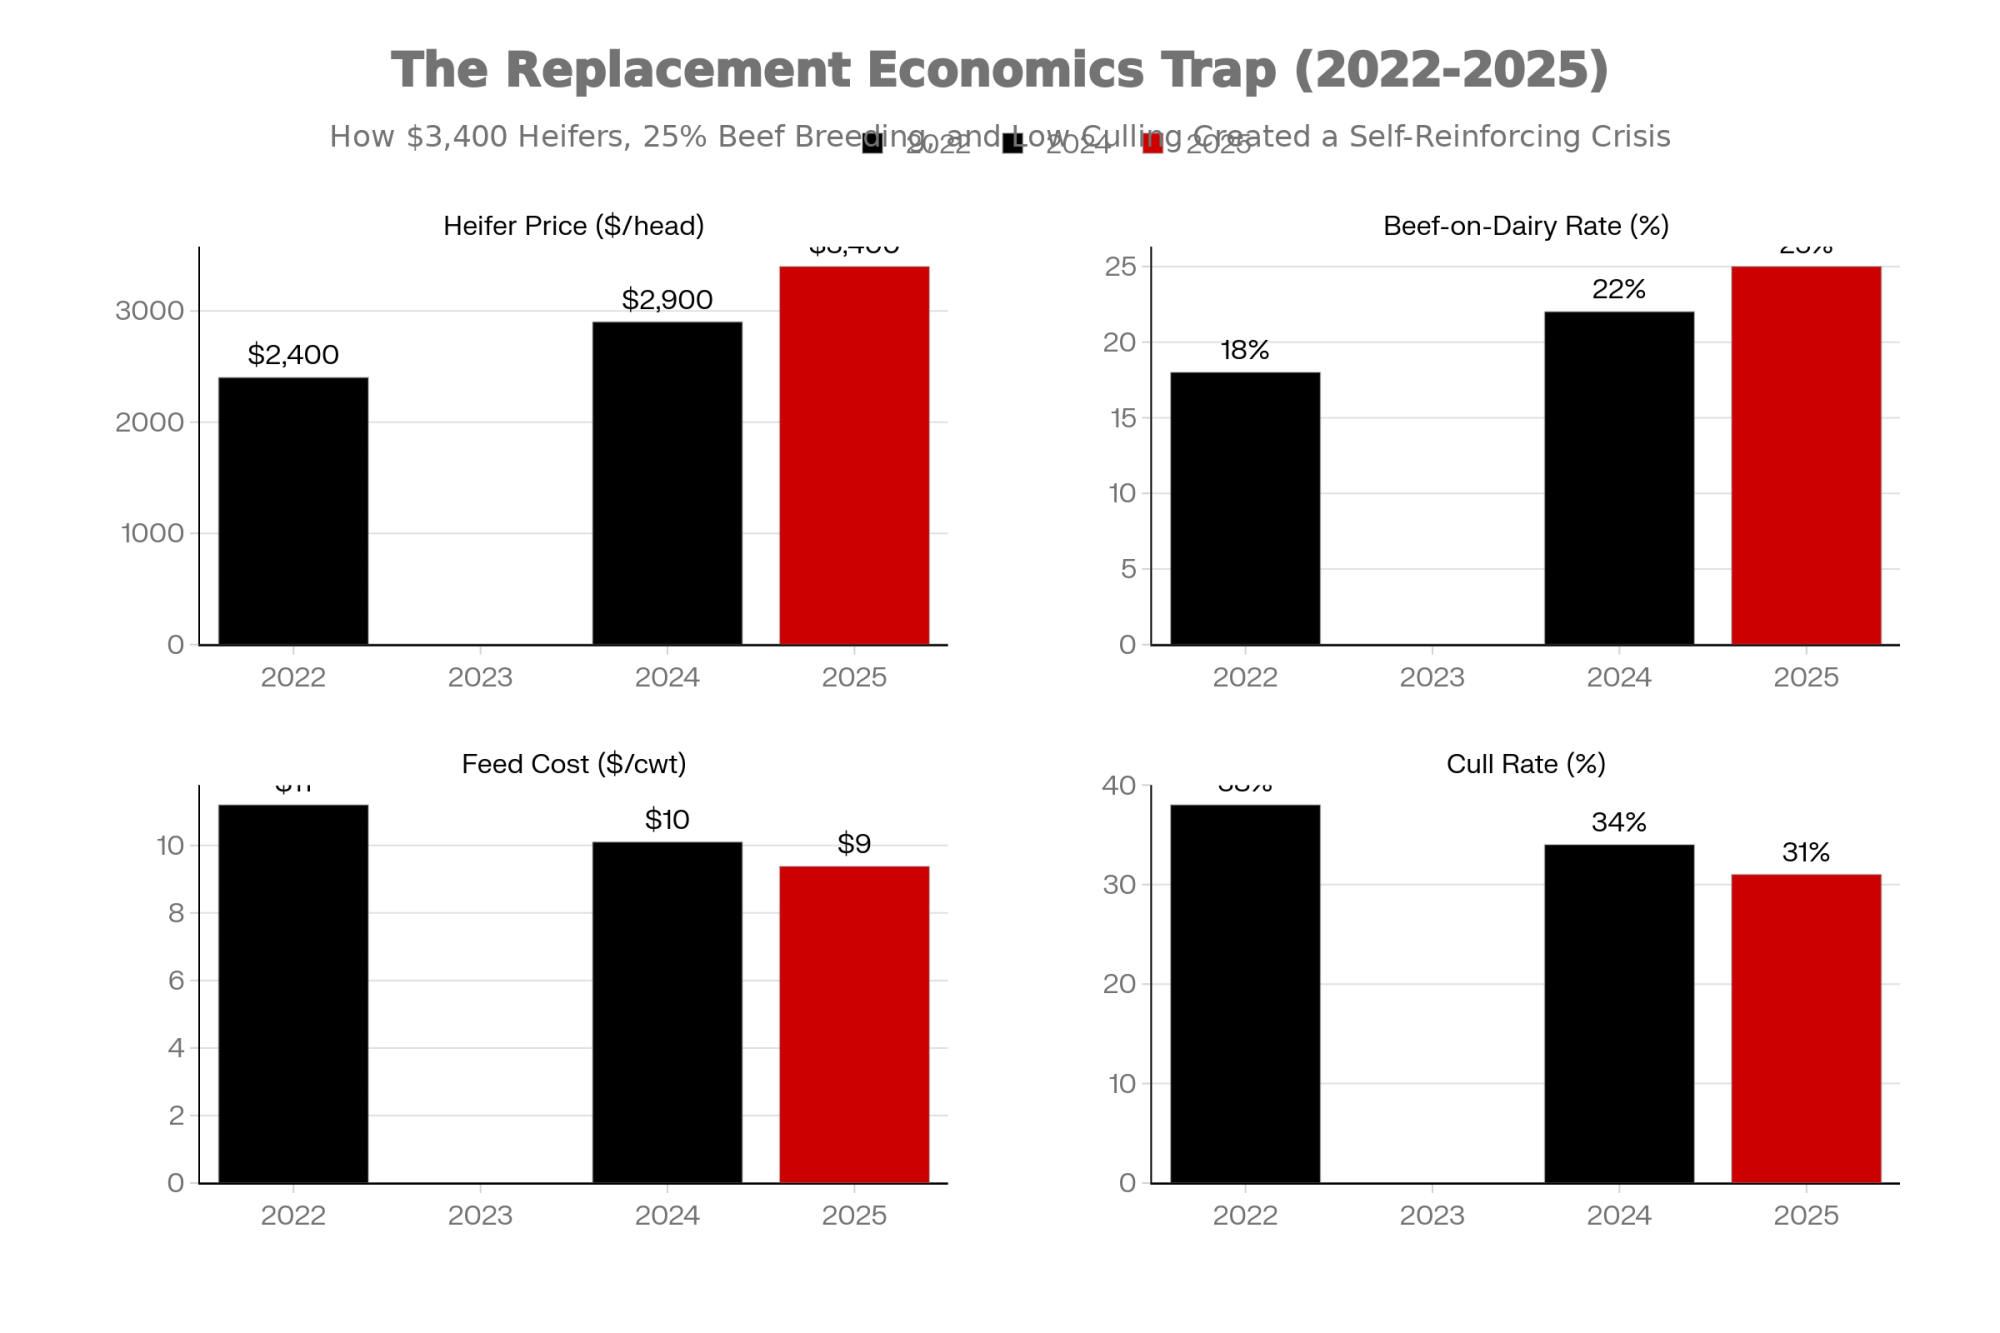
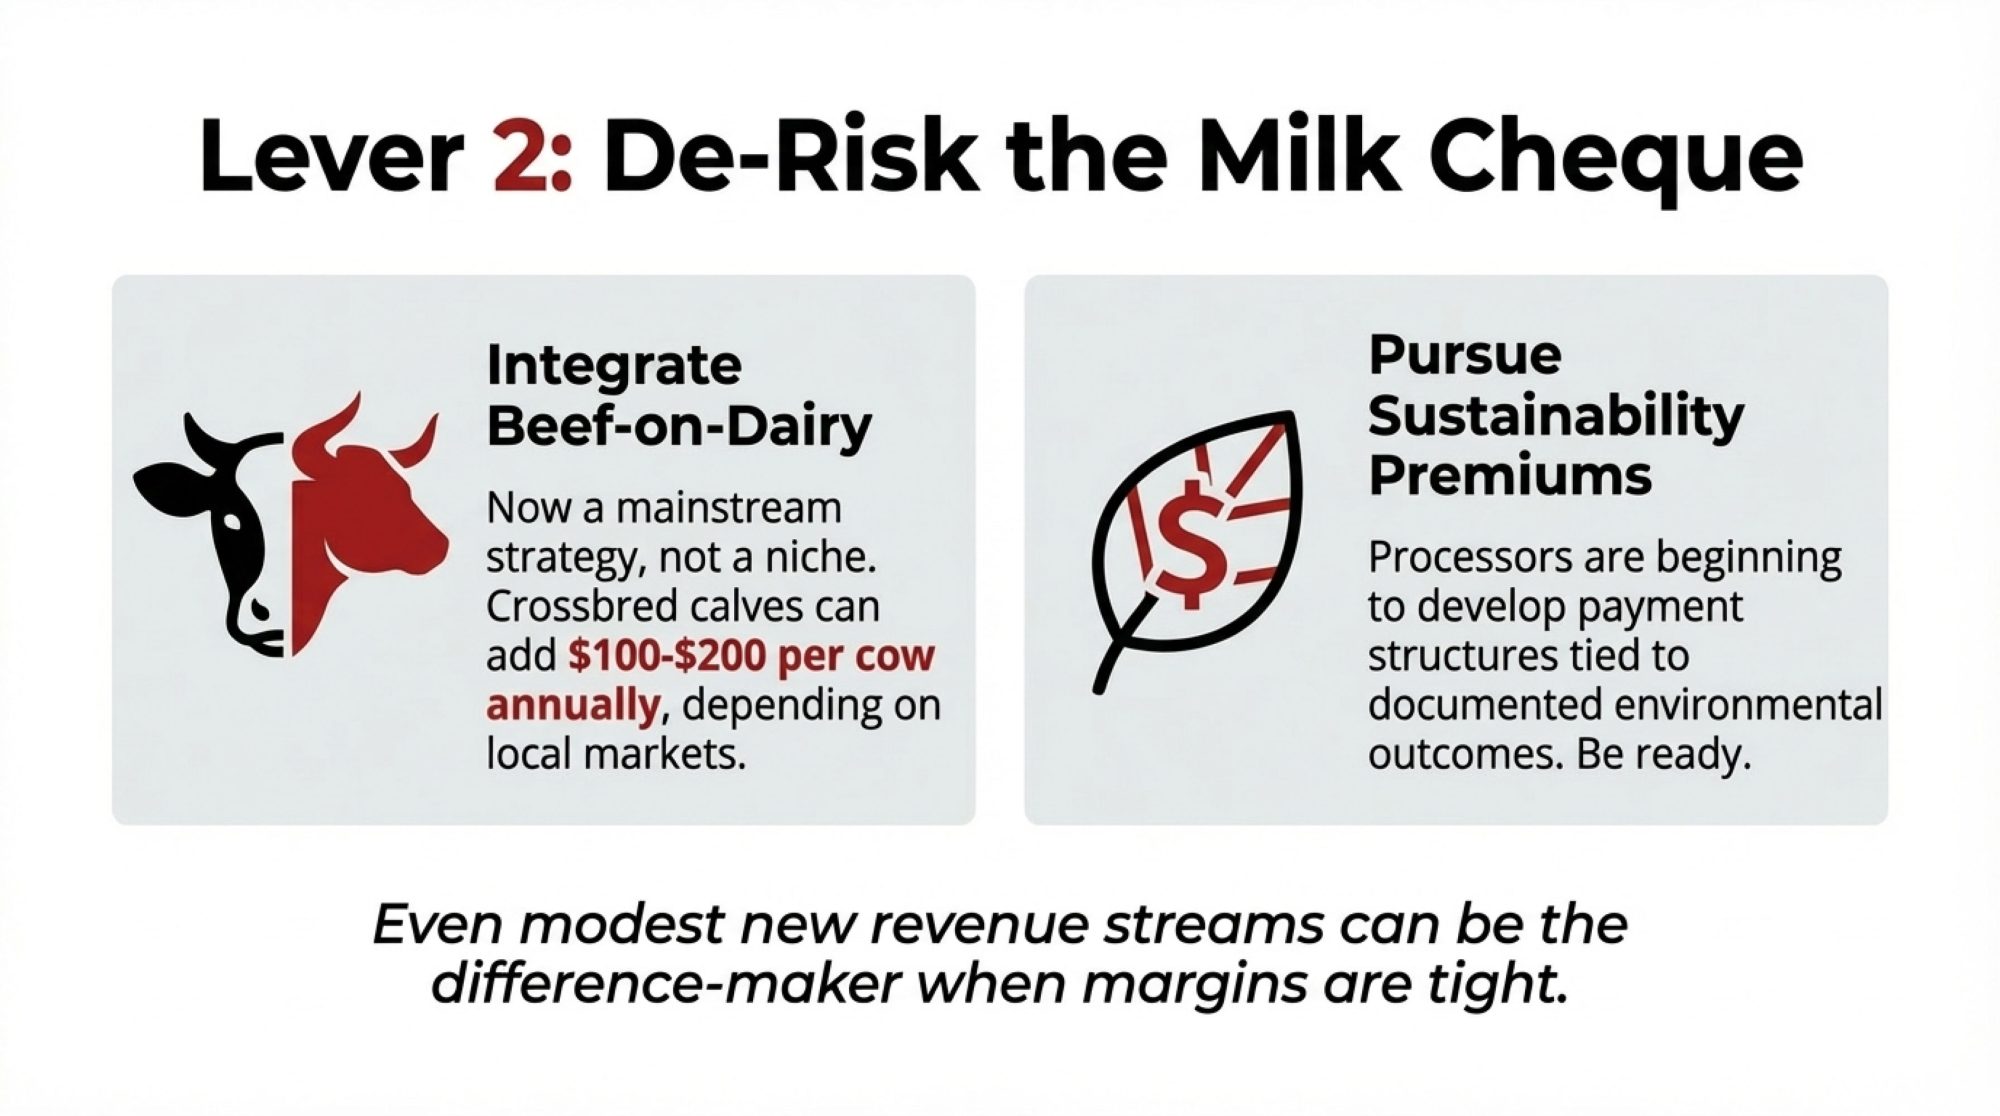
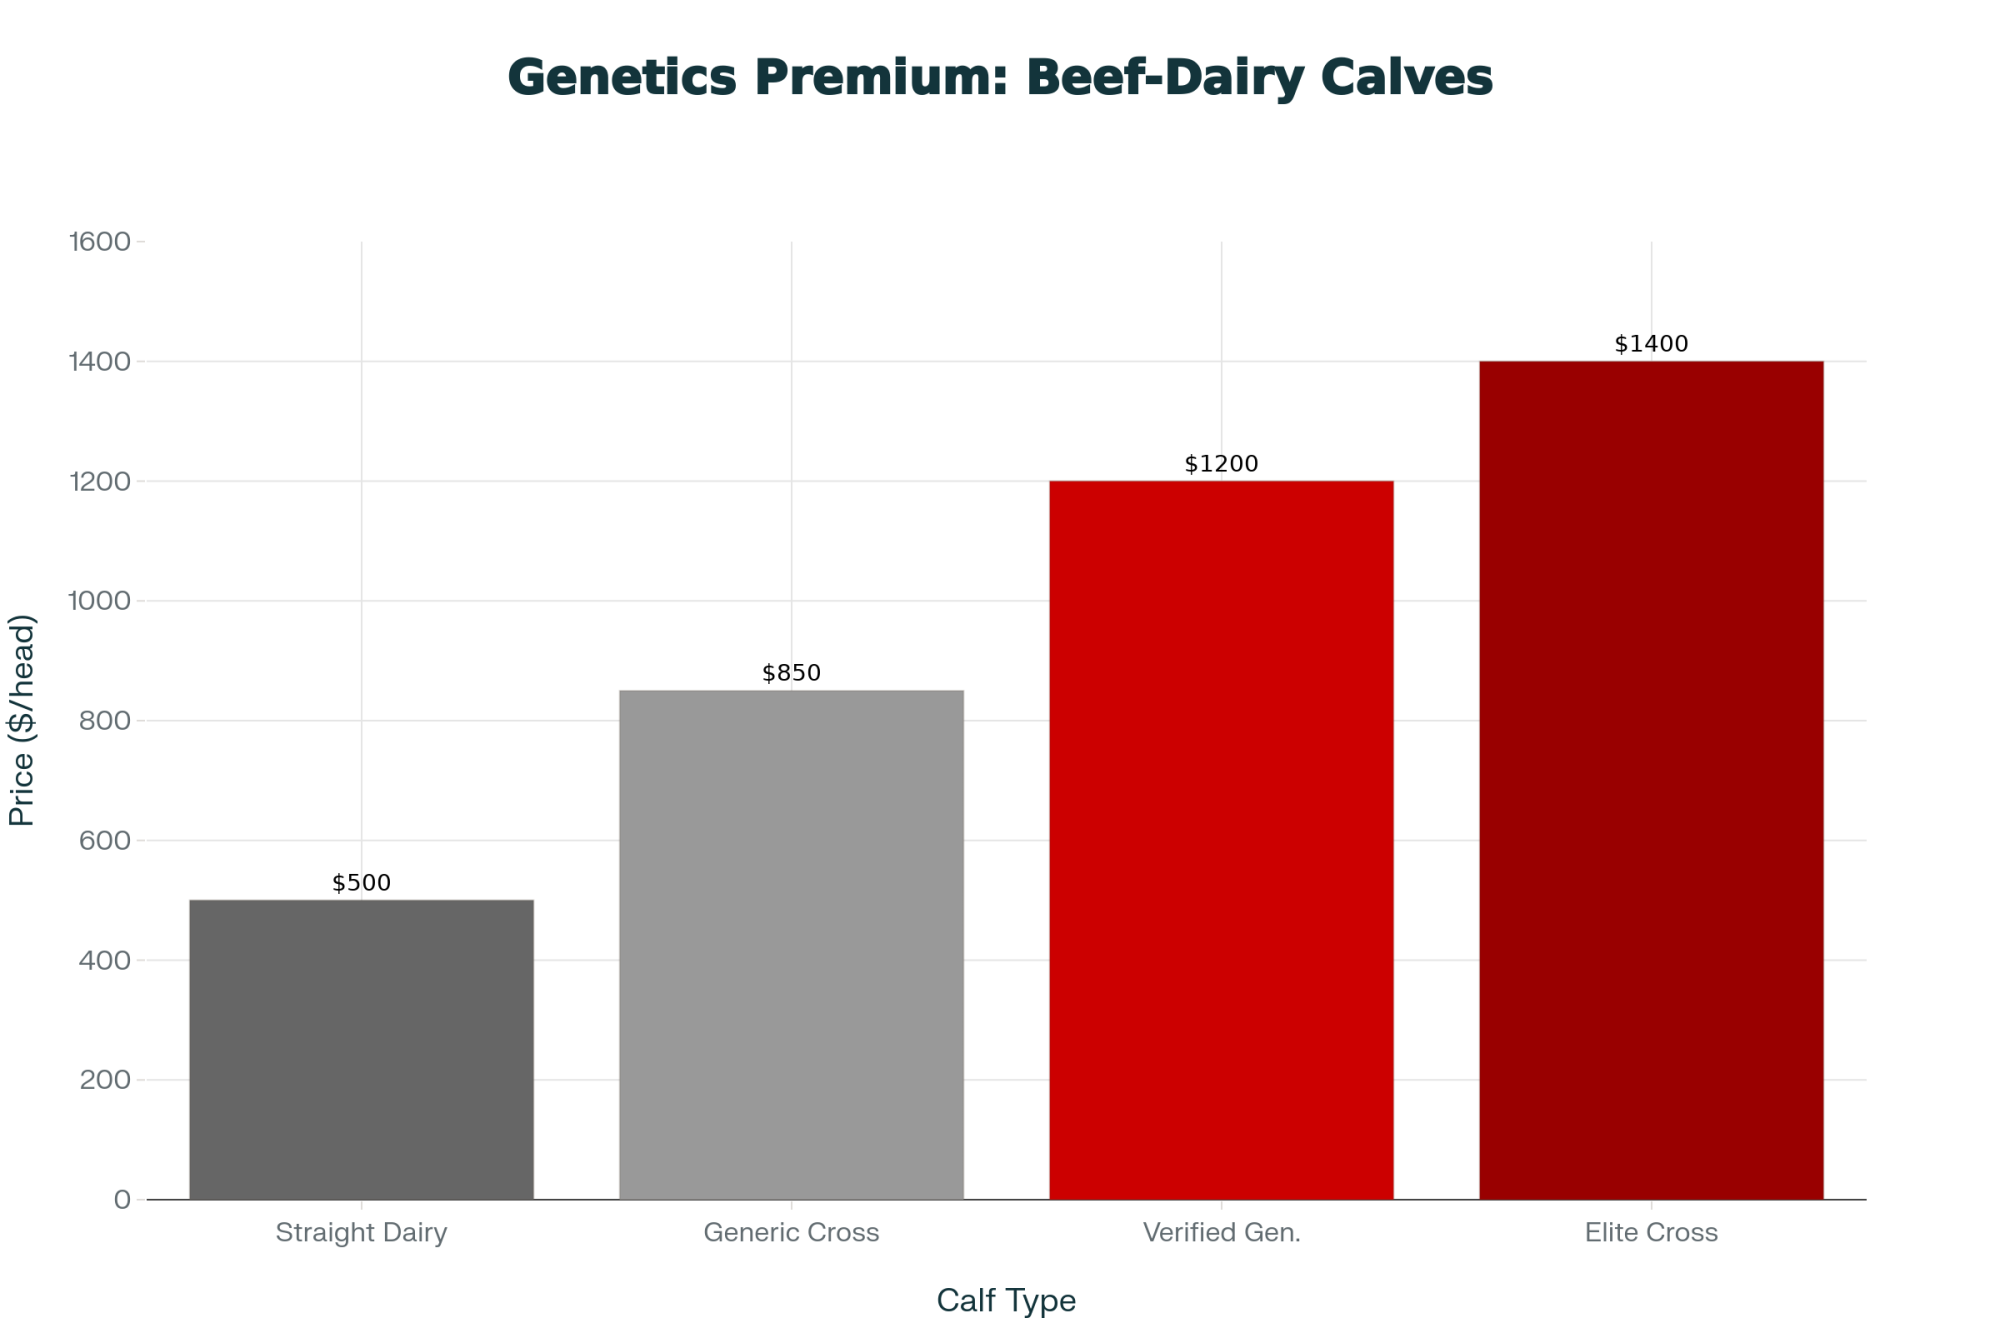
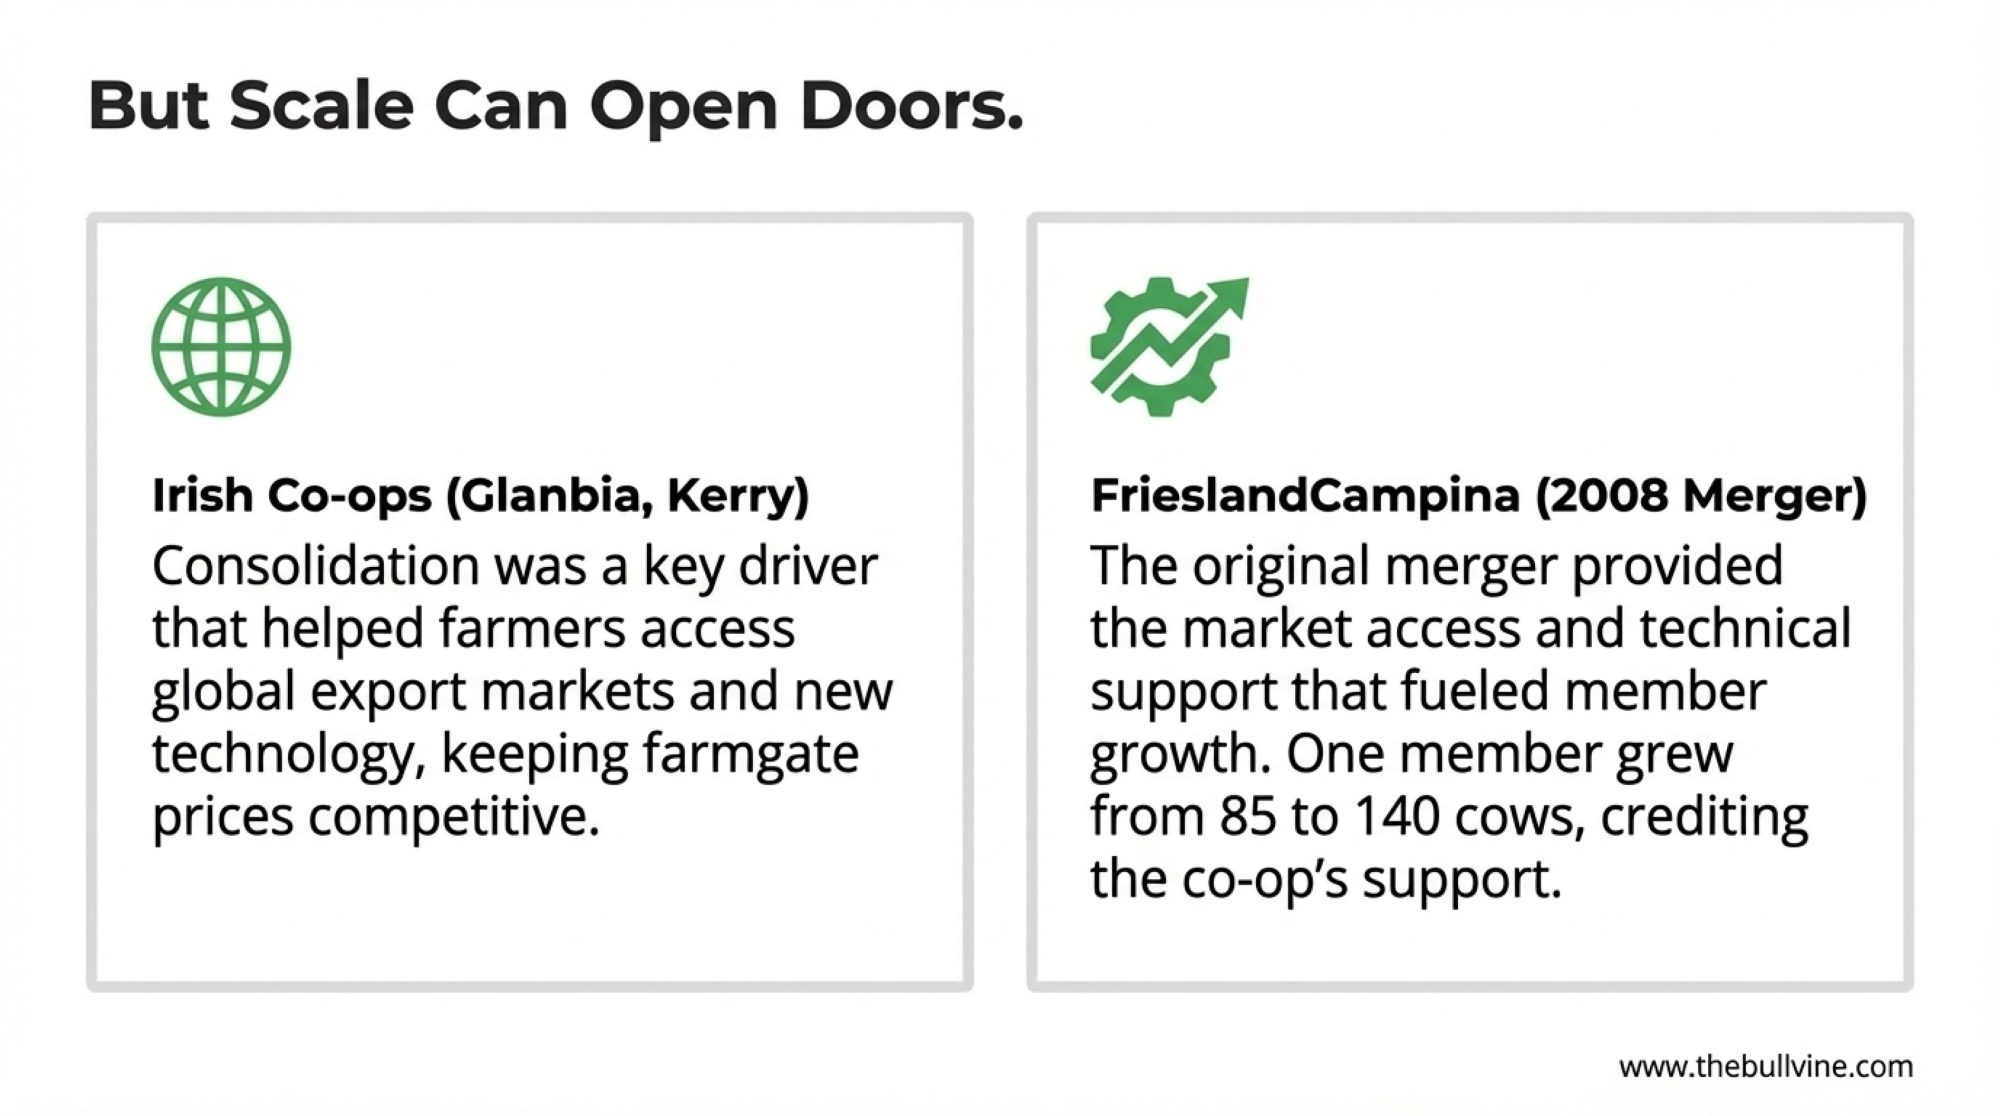
Economists who work with both dairy and beef have been frank about the impact. In a 2025 interview, Mike North, an economist and risk‑management advisor with Ever.Ag, who works with many Midwest dairies, explained that beef‑on‑dairy breeding programs are generating “upwards of two and a half dollars per hundredweight in revenue back to the farm just in beef breeding” on some operations. In that same segment, he pointed out that in the current market environment, it’s not unusual to see a well‑bred, three‑day‑old dairy‑beef cross calf bring more than 1,000 dollars at certain sales, which really changes how that calf looks compared to a straight Holstein bull calf.
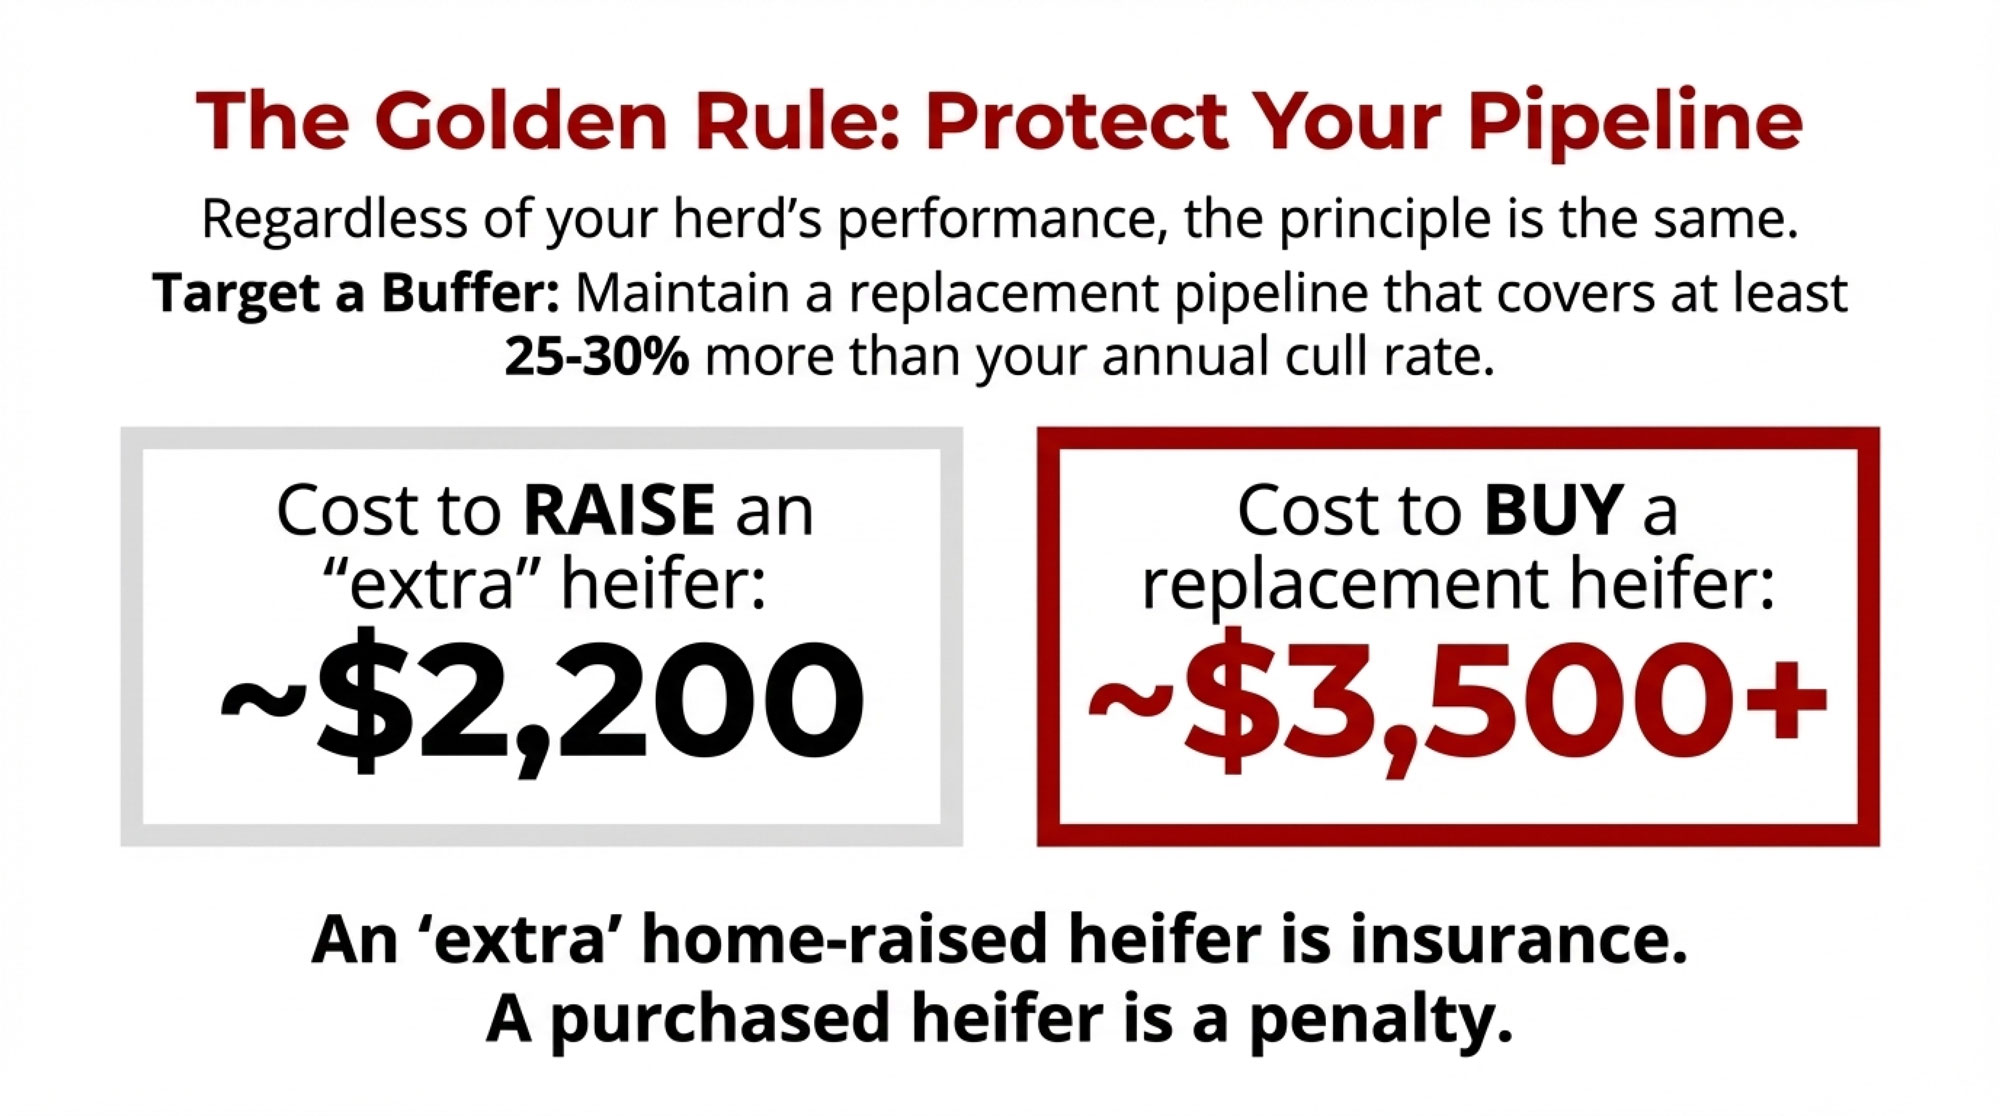
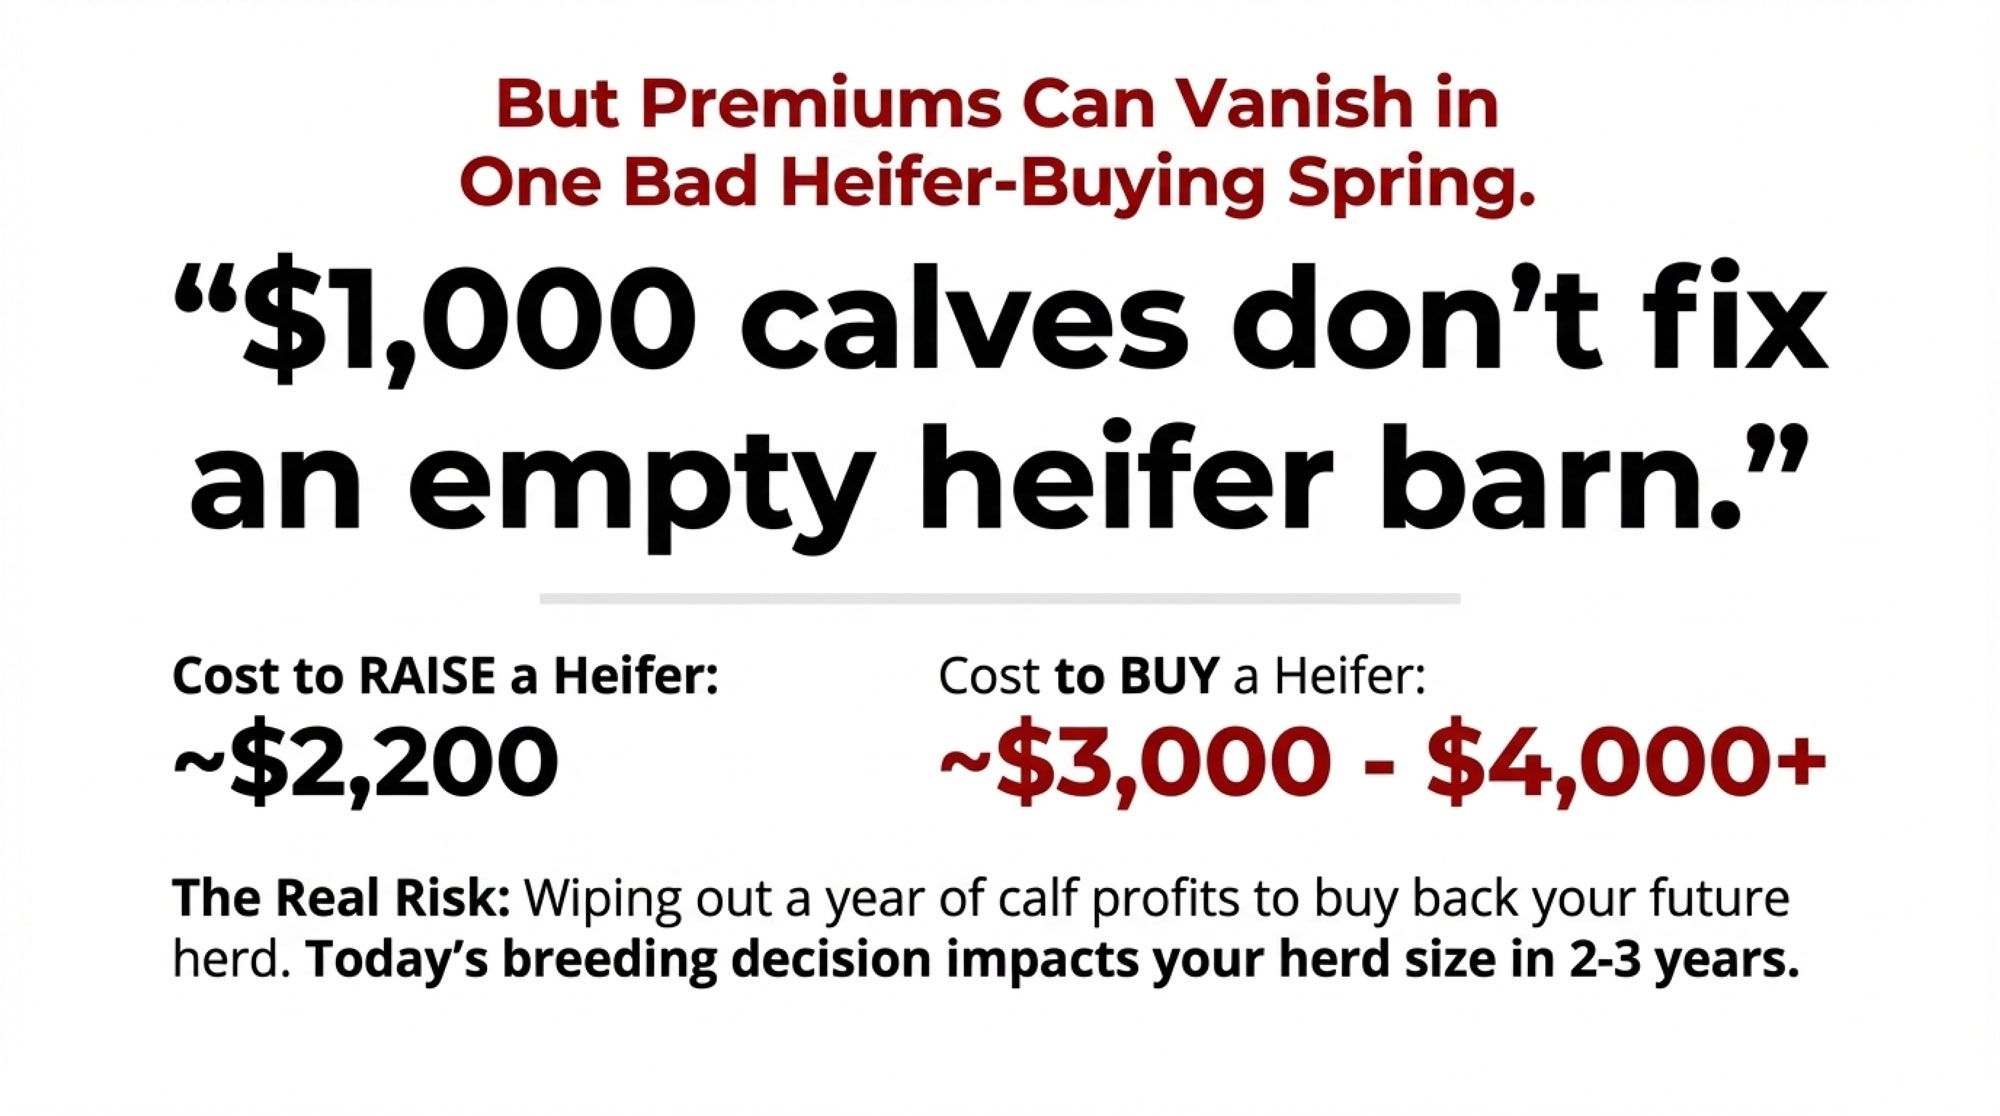
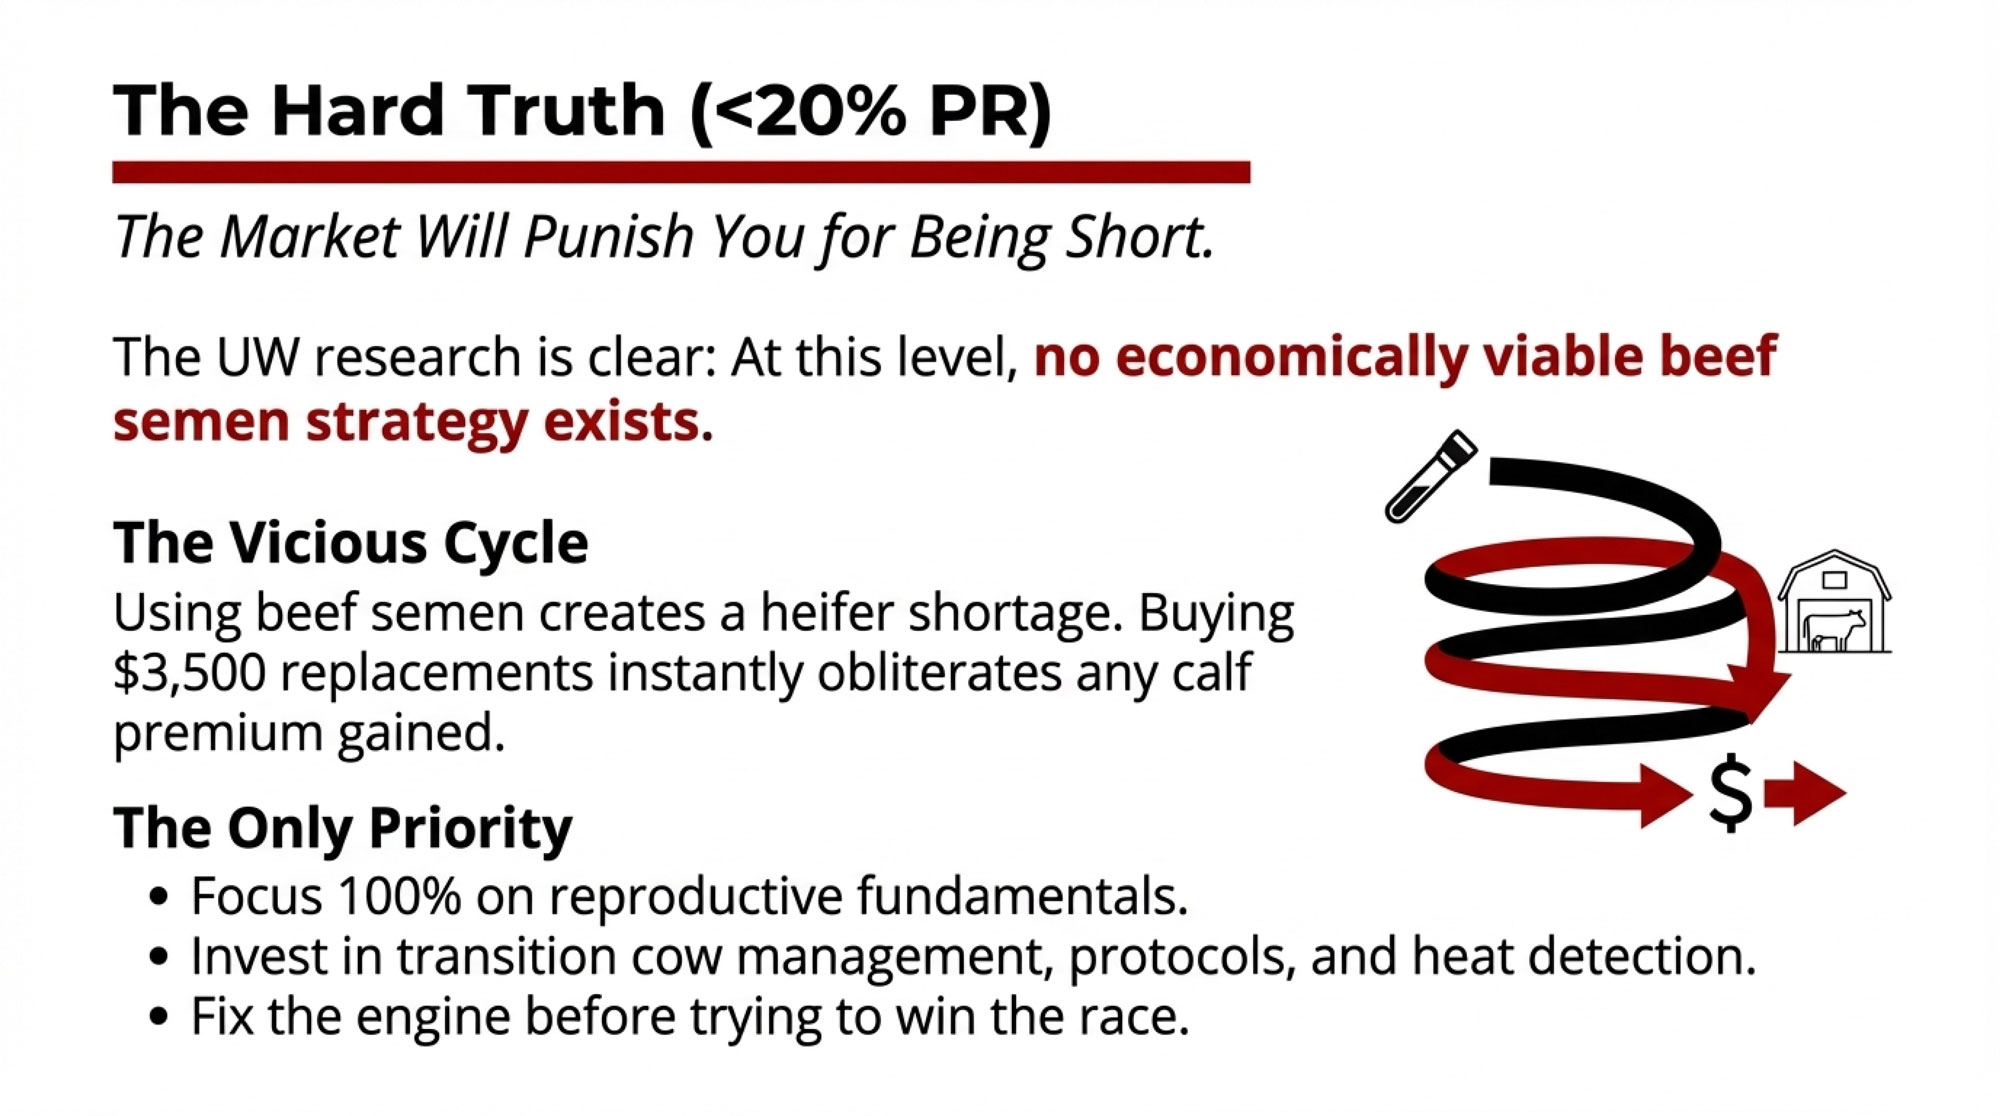
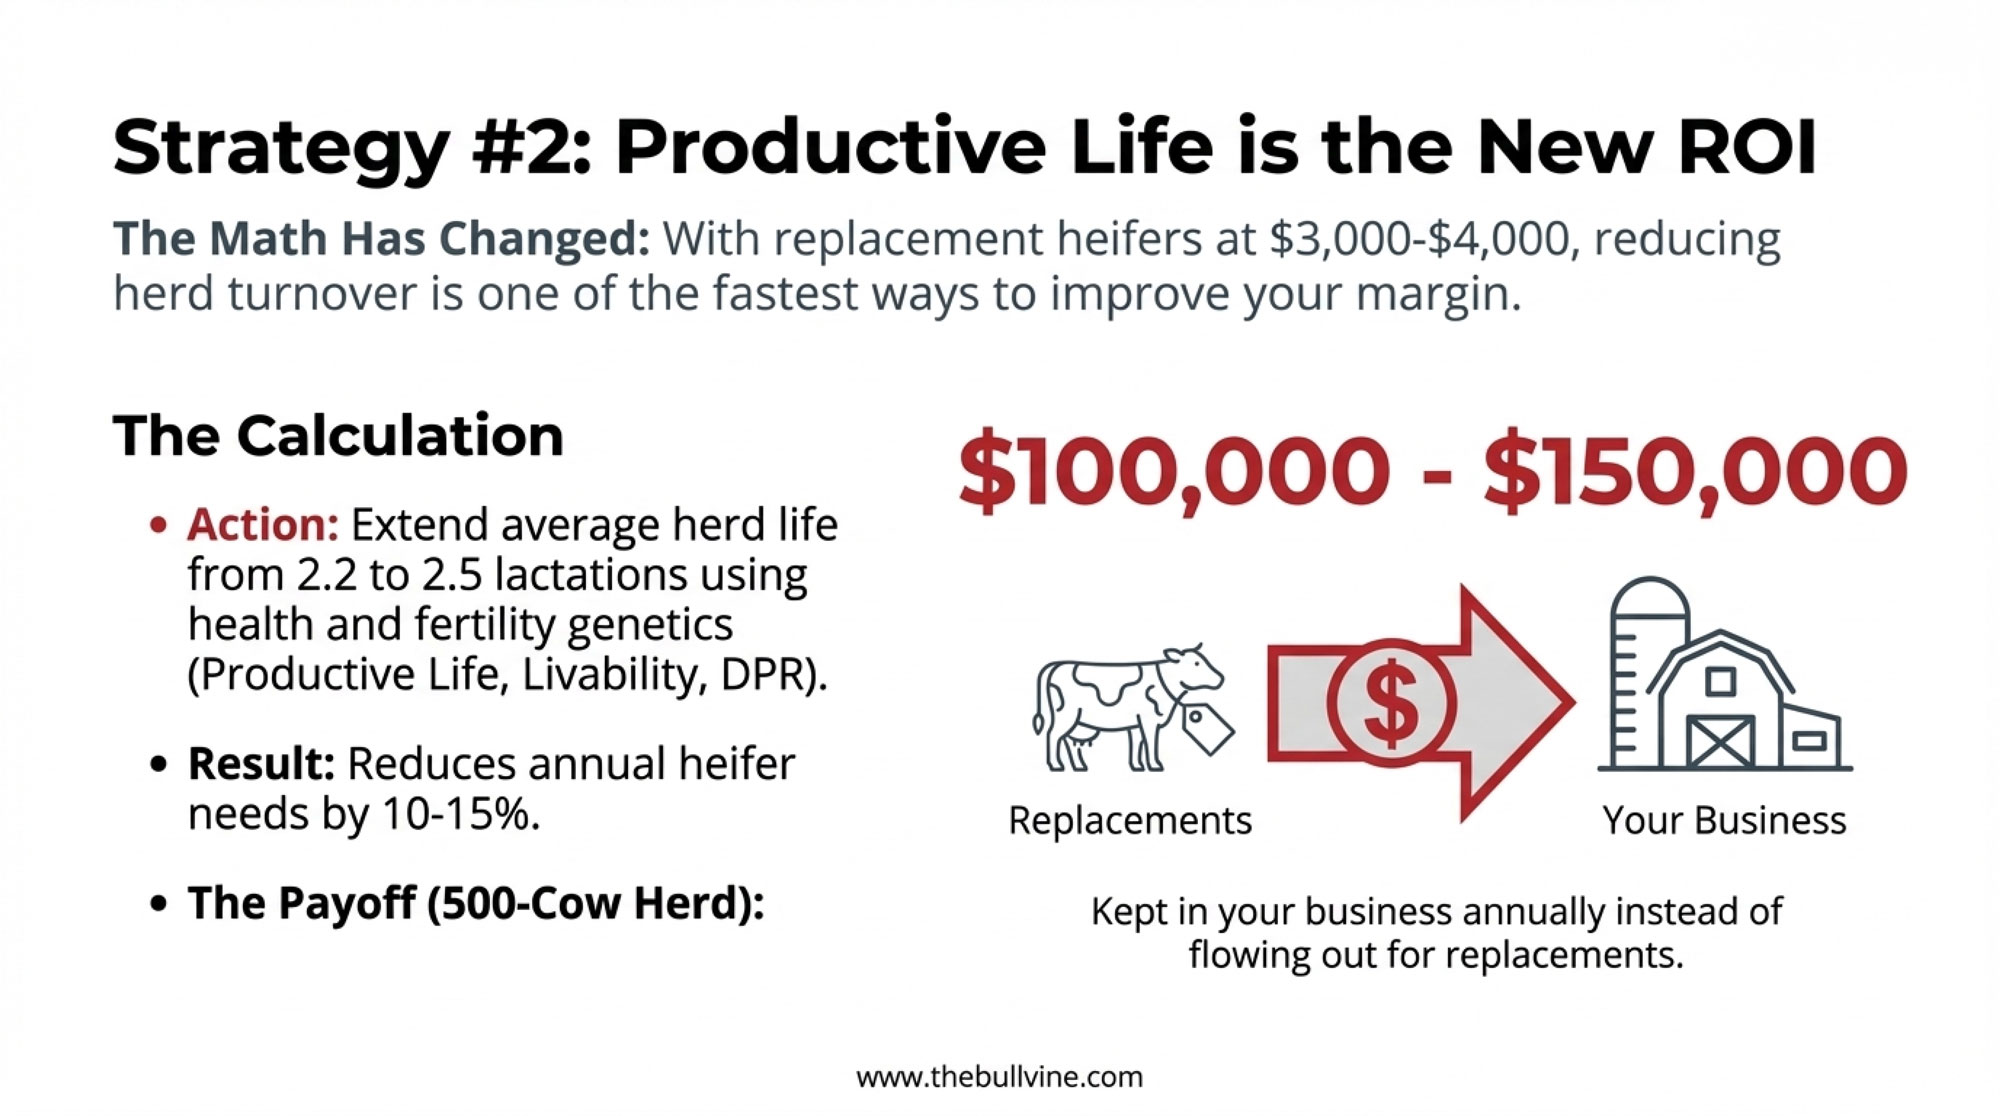
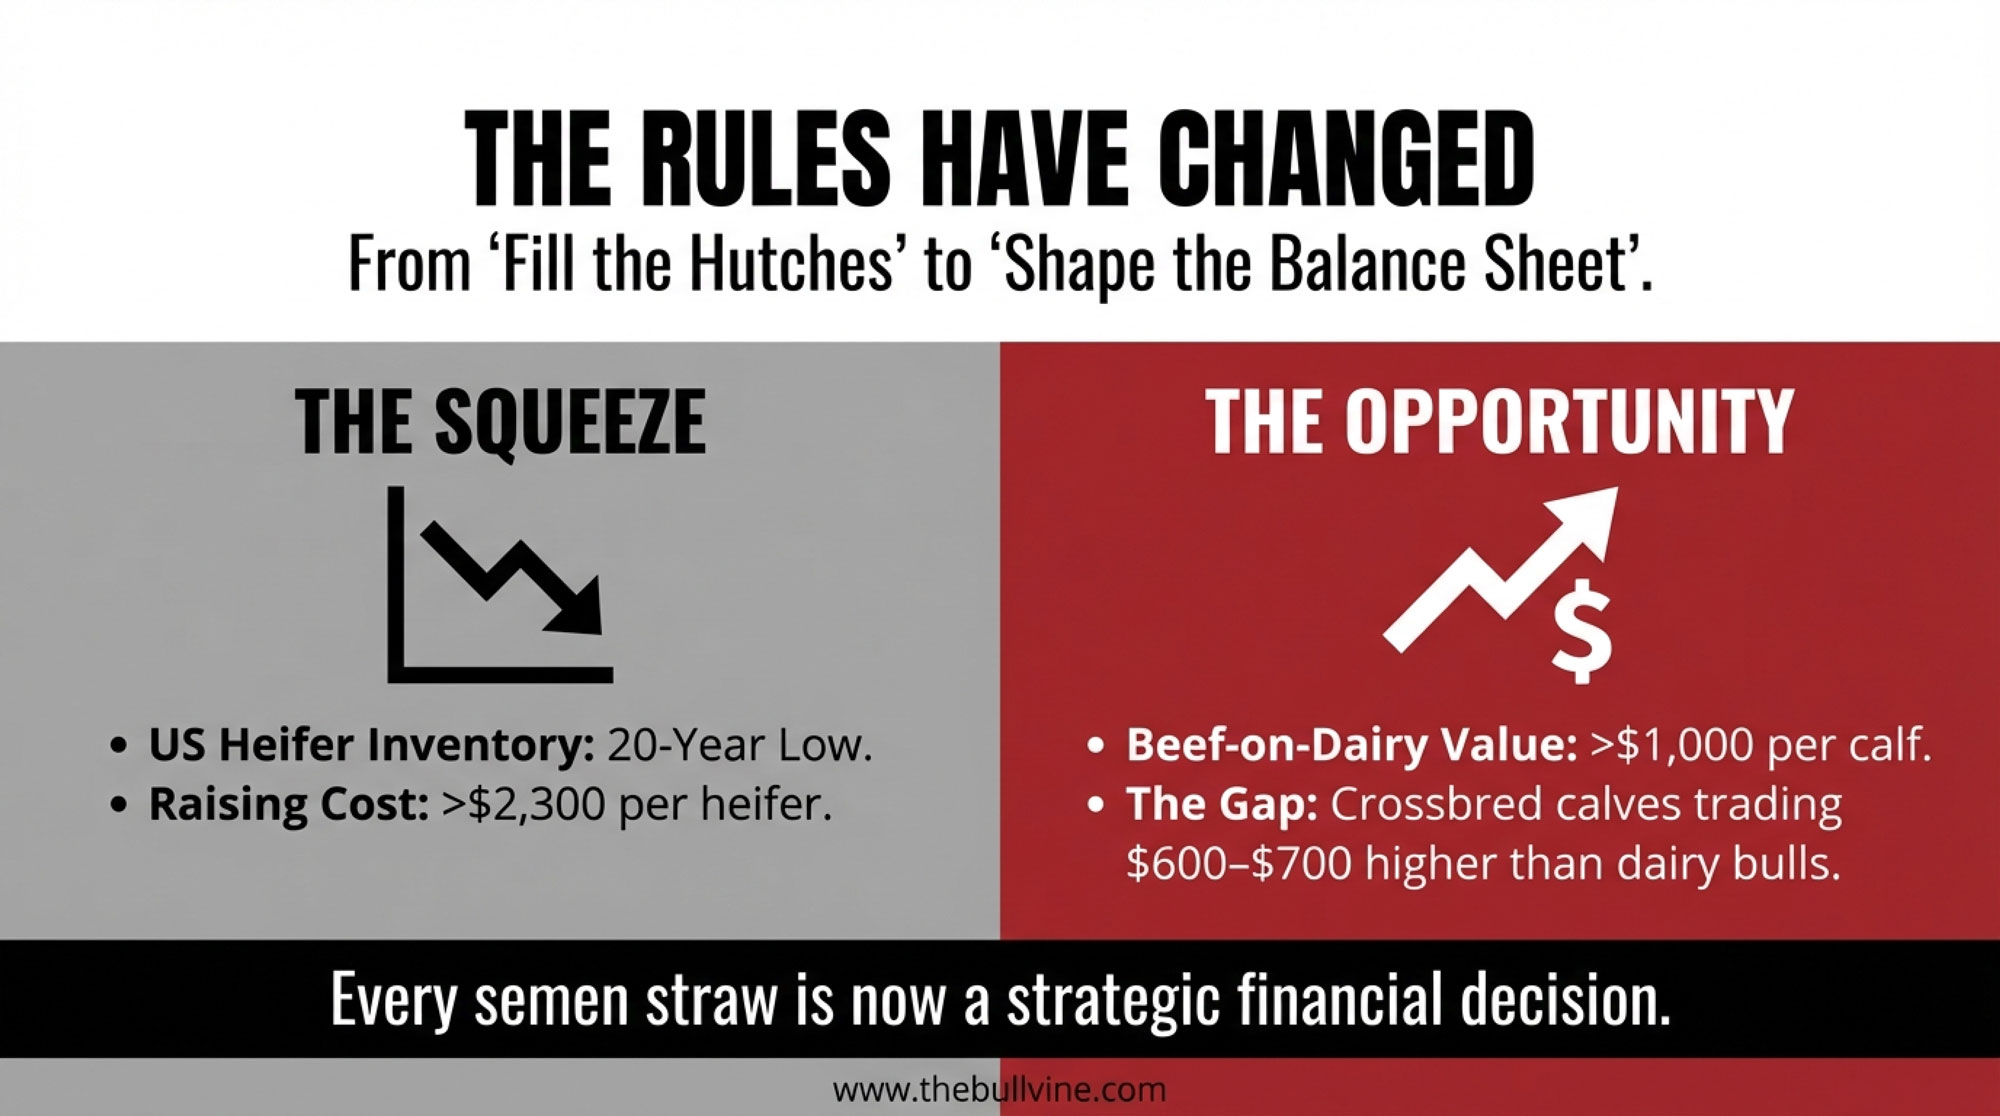
On the replacement side, CoBank’s 2025 heifer‑inventory analysis describes a sector at a “unique inflection point,” with dairy heifer numbers already at a 20‑year low and not expected to rebound until around 2027, as new processing plants draw more milk and heifer demand slowly pulls numbers up again. USDA Cattle Inventory reports shows that heifers over 500 pounds dropped from roughly 4.76 million in 2018 to 4.06 million in early 2024, while noting that stronger milk prices and processing expansion could drive replacement values higher. At the same time extension economists have pointed out that the total cost to raise a replacement heifer—from birth to first calving—often sits somewhere between 1,600 and 2,400 dollars under pre‑inflation conditions, with more recent budgets and Canadian/US benchmarking suggesting that on many units today, full economic rearing cost runs in the 2,300–3,000‑dollar range per head once you factor in feed, labor, housing, and overhead.
So across North America right now:
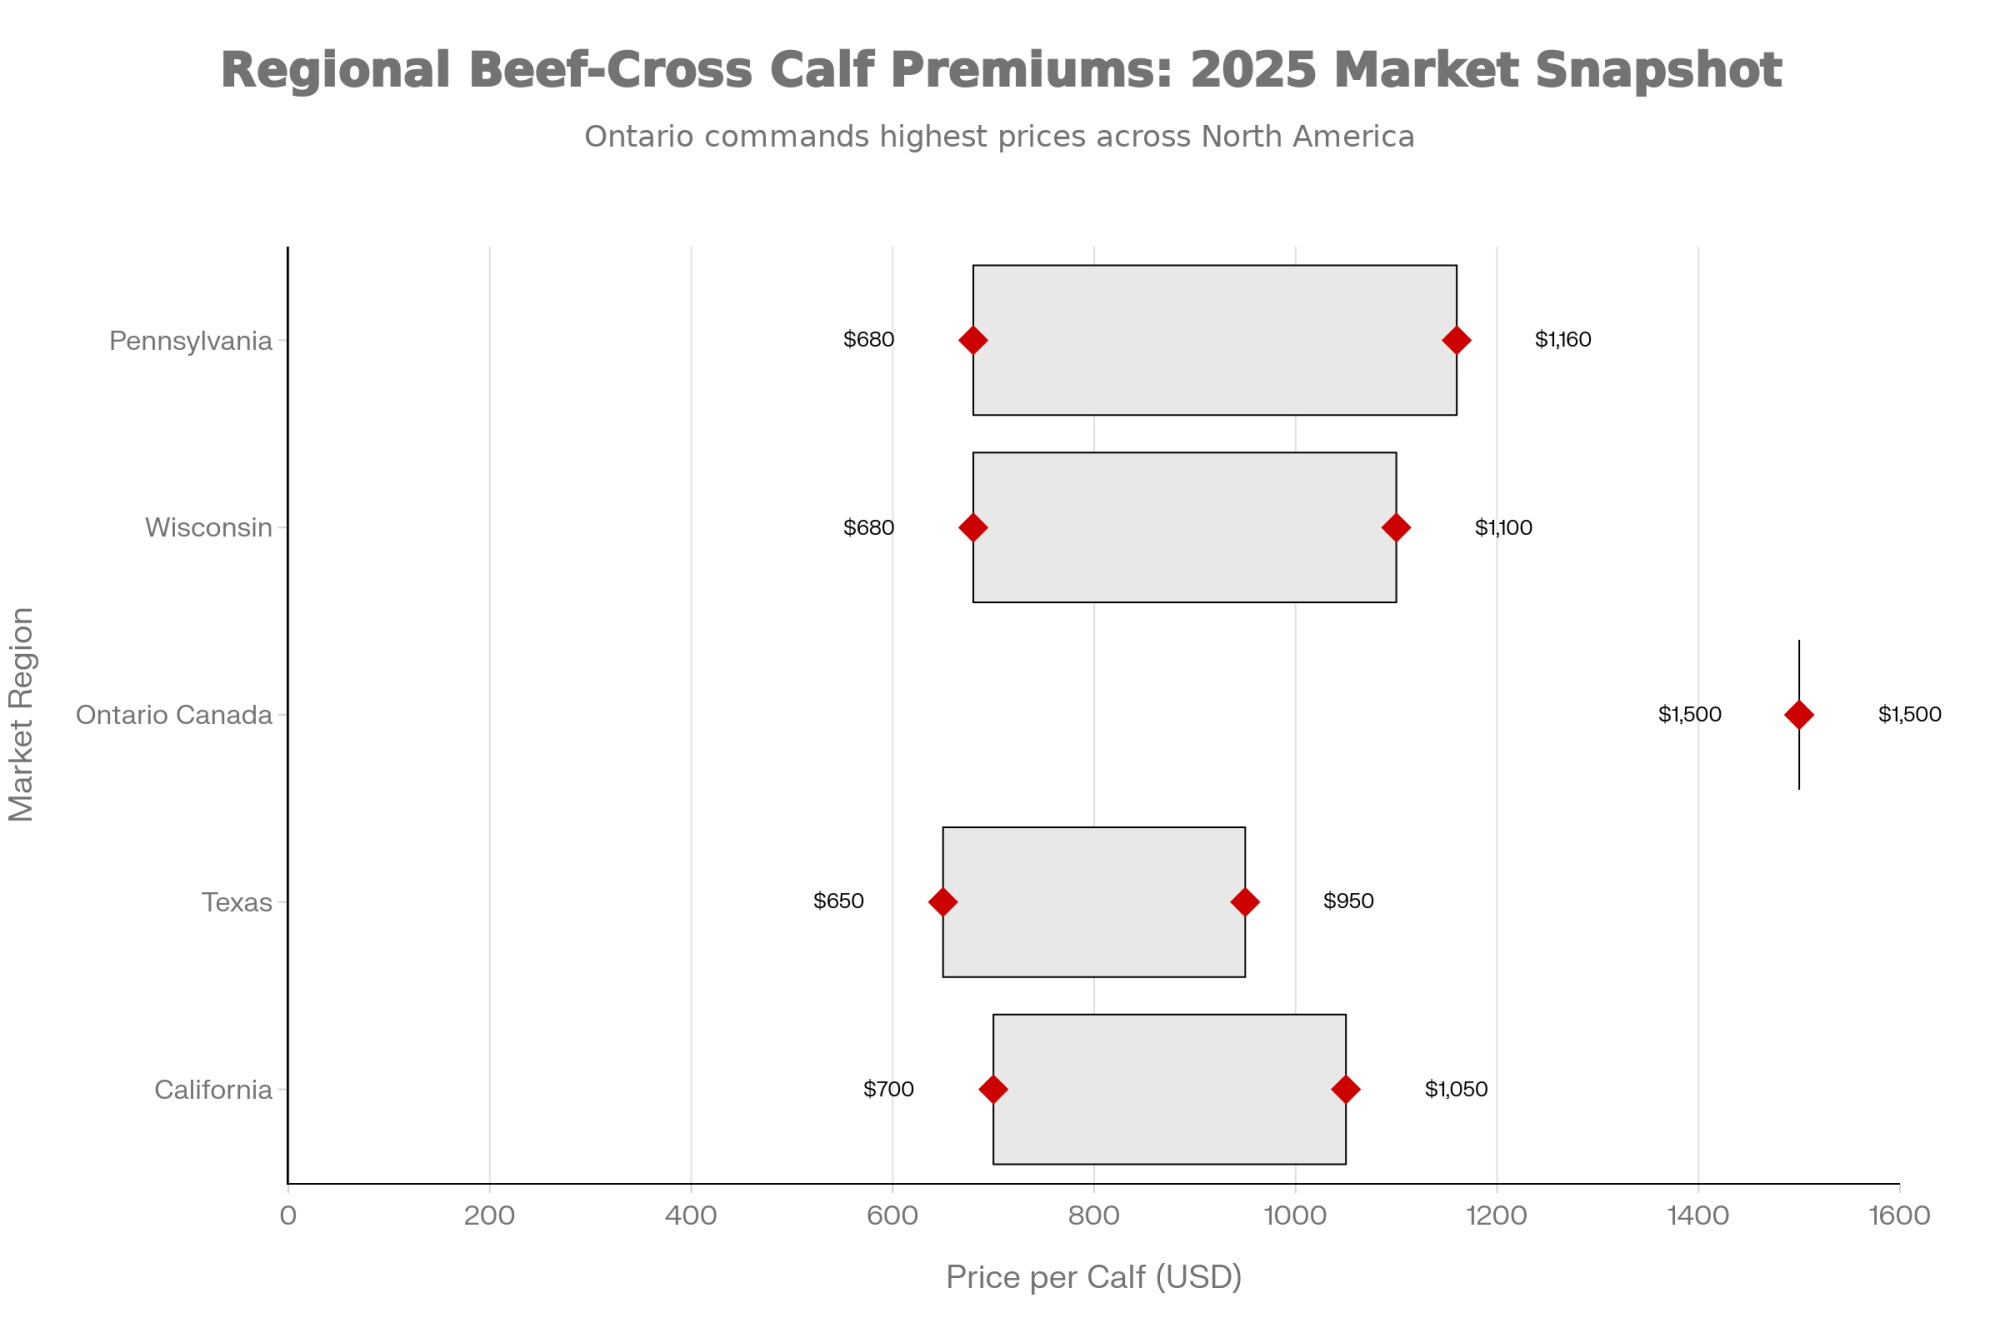
- Dairy‑beef cross calves commonly bring a few hundred dollars more than straight Holstein bull calves at auction, with recent reports showing crossbred calves trading around 600–700 dollars in some Midwest sales while conventional bull calves lag behind.
- In certain barns and weeks, especially in strong markets, three‑day‑old beef‑on‑dairy calves have topped 1,000 dollars.
- Replacement heifers are scarce and expensive by historic standards, with multiple analyses pointing to rearing costs comfortably north of 2,000 dollars per head and market values for springers often pushing into the upper‑2,000 to 3,000‑dollar range in tight regions.
This development suggests that calves have shifted from “fill the hutches” to “shape the balance sheet.” Whether a pregnancy produces a dairy heifer or a dairy‑beef calf now has a direct and significant impact on both your future herd and your short‑term cash flow.
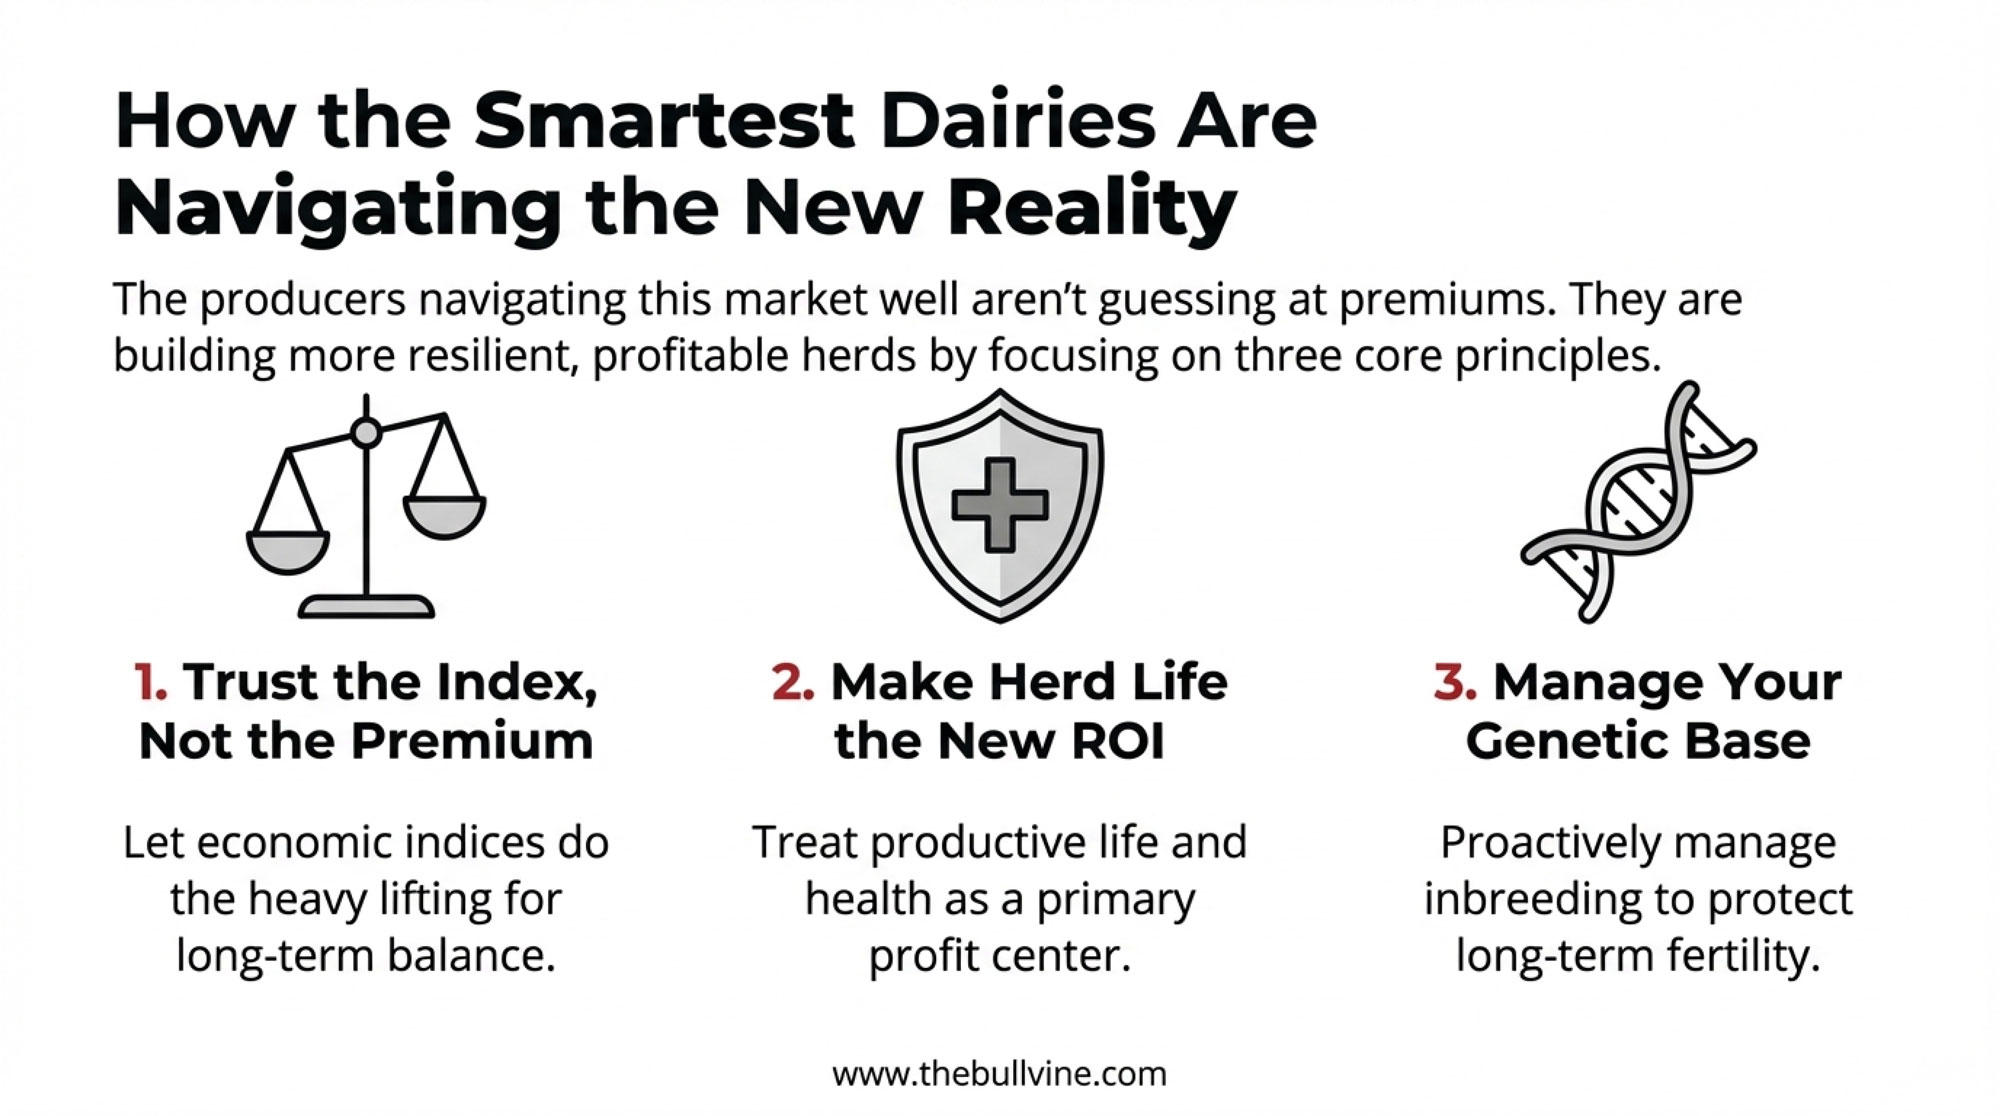
What Farmers Are Finding: A Five‑Step Breeding Framework That Actually Works
Looking at this trend across herds in Ontario, Wisconsin, California, and the Northeast, what I’ve noticed is that the operations making this work aren’t doing anything mystical. They’re just being very deliberate and consistent.
Most of them follow some version of a five‑step framework:
- Use genomics to see which cow families are truly driving your herd.
- Make a clear, rule‑based beef‑versus‑dairy decision for each breeding.
- For dairy matings, add calf‑health genetics to your sire criteria as those proofs become available.
- Factor in gestation length and calving pressure so you don’t overload high‑stress windows.
- Re‑run the economics regularly as calf prices, heifer values, and milk markets move.
Let’s unpack that in barn‑level terms.
Step 1: Use Genomics to See Which Families to Grow—and Which to Let Go
Most herds that are serious about this are genomic‑testing their heifer calves, and some have also done a one‑time pass on younger cows to avoid missing high‑value animals that might be hiding behind older genetics.
A good real‑world example comes from a 5,000‑cow Holstein herd in the western US profile in 2024. The dairy, managed by veterinarian and producer Dr. Sergio Lopes, began genomic testing heifers in 2016 when they realized they were simply overrun with replacements and needed a better way to decide which heifers were truly worth raising.
Genomic results showed them a few things very quickly:
- Some cows they had always considered “average” based on current production actually had very strong genetic merit.
- Some of their highest‑producing cows were benefiting more from management and environment than genetics.
- There were identification problems—wrong semen recorded, calves linked to the wrong dams—that genomics helped uncover and correct.
After a couple of years of working with the data, Lopes said they were confident enough to change their breeding strategy completely. They dropped conventional semen, used sexed dairy semen only on their best families, and bred the rest to beef. Today, they have a background of roughly 12,000 dairy‑beef cross animals tied to their 5,000‑cow dairy and partner herds, with beef calves and fed cattle now a major income stream alongside milk.
On a 300‑ to 600‑cow family herd—say a free‑stall in Wisconsin or a tie‑stall in Ontario—the same pattern shows up on a smaller scale. Producers genomic‑test their heifer calves, rank them on the index that matters most—Net Merit, TPI, Pro$, LPI, maybe with extra weight on health—and discover they have:
- A top group, often the top 20–30%, they absolutely want to build daughters and granddaughters from.
- A middle group they can flex up or down based on heifer inventory and cash flow.
- A bottom group that’s tough to justify raising to calving when replacements are expensive, and barn space is tight.
Once you see your herd laid out like that, it becomes a lot easier to say, “These families deserve sexed semen and more daughters,” and “These cows can contribute better through beef‑cross calves than through more low‑merit heifers.”
Step 2: Make Beef‑Versus‑Dairy Decisions Simple and Rule‑Based
Once you’ve got a handle on your cow families, the next step is to stop making beef‑versus‑dairy calls on the fly in the parlor and start following a simple rule you can execute every week.
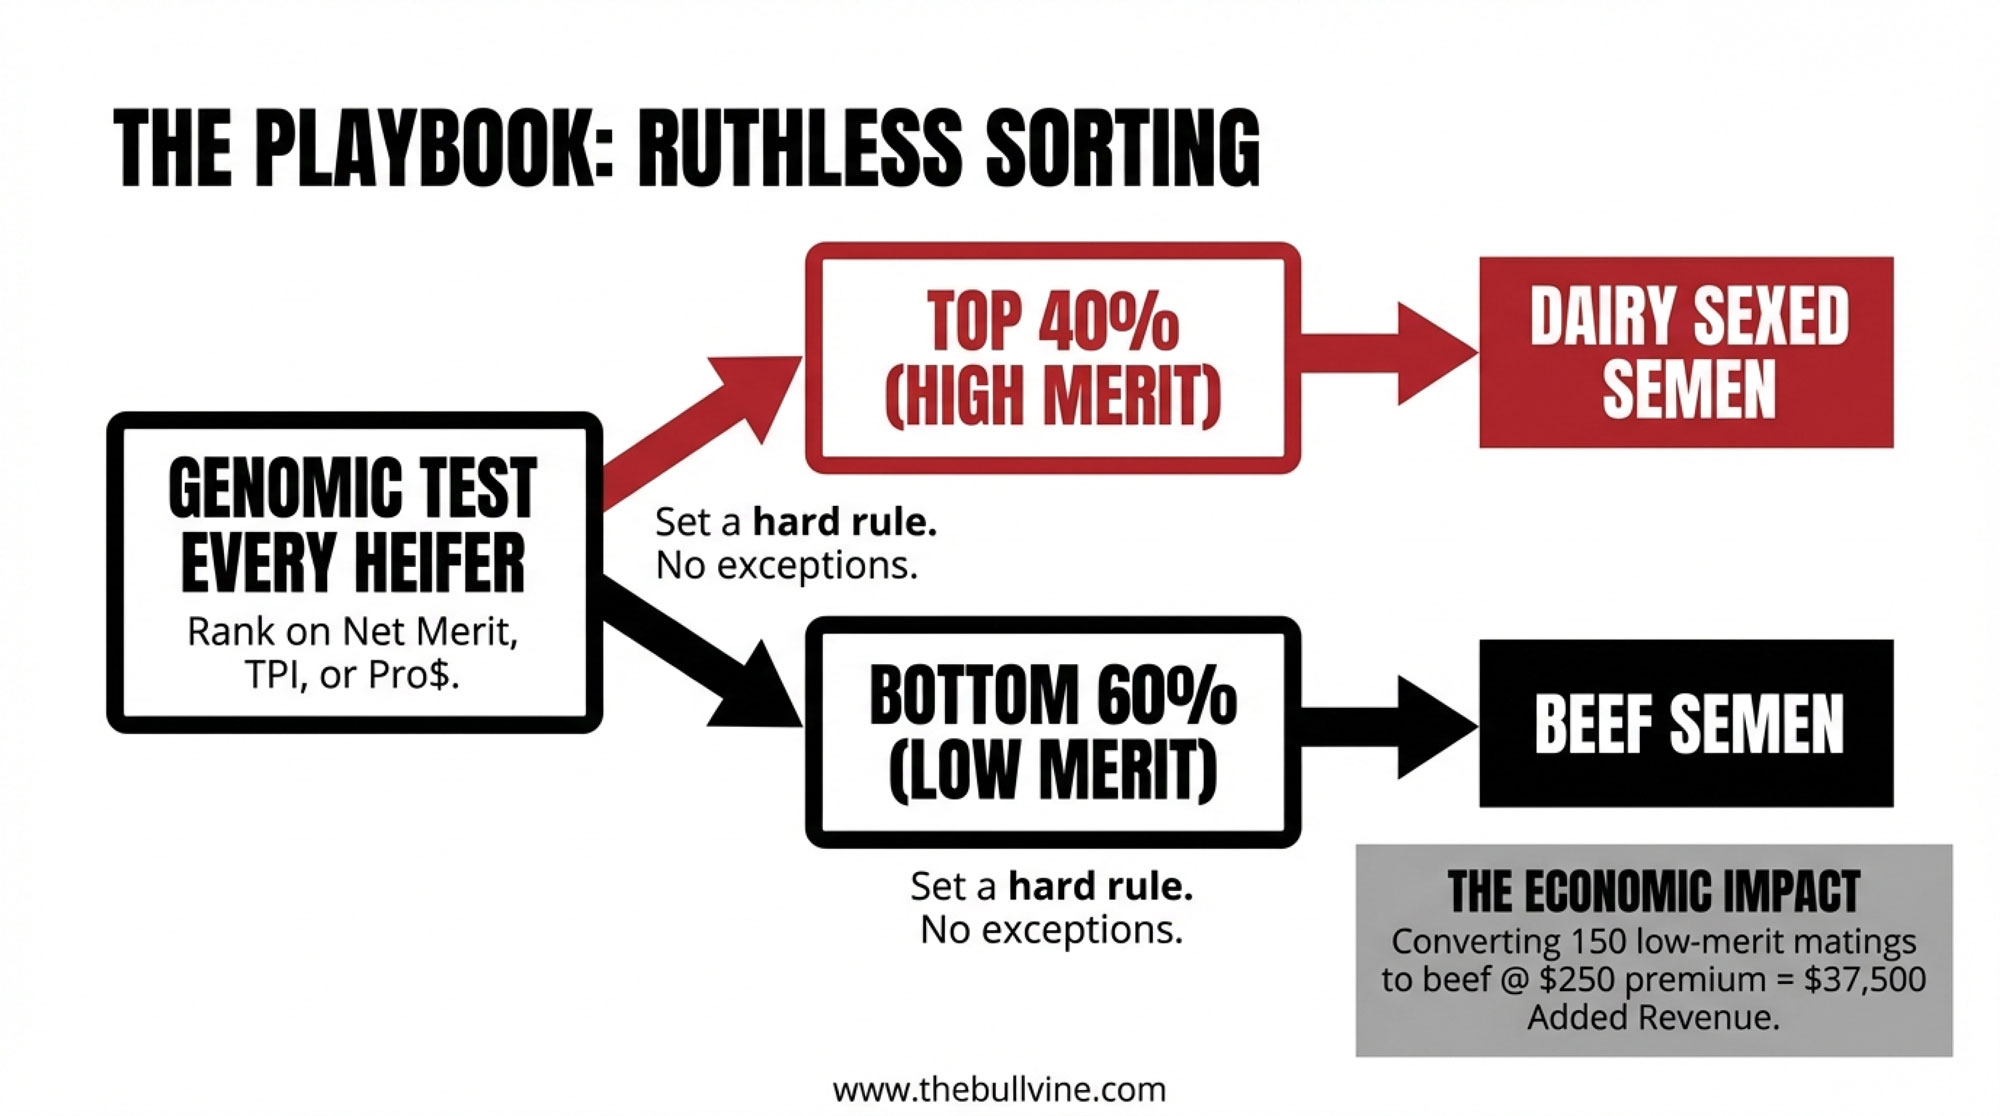
A rule that’s working on a lot of herds looks something like this:
- First‑ and second‑lactation cows whose most recent heifer ranks in the top 40% of your genomic list get bred to dairy semen, often sexed.
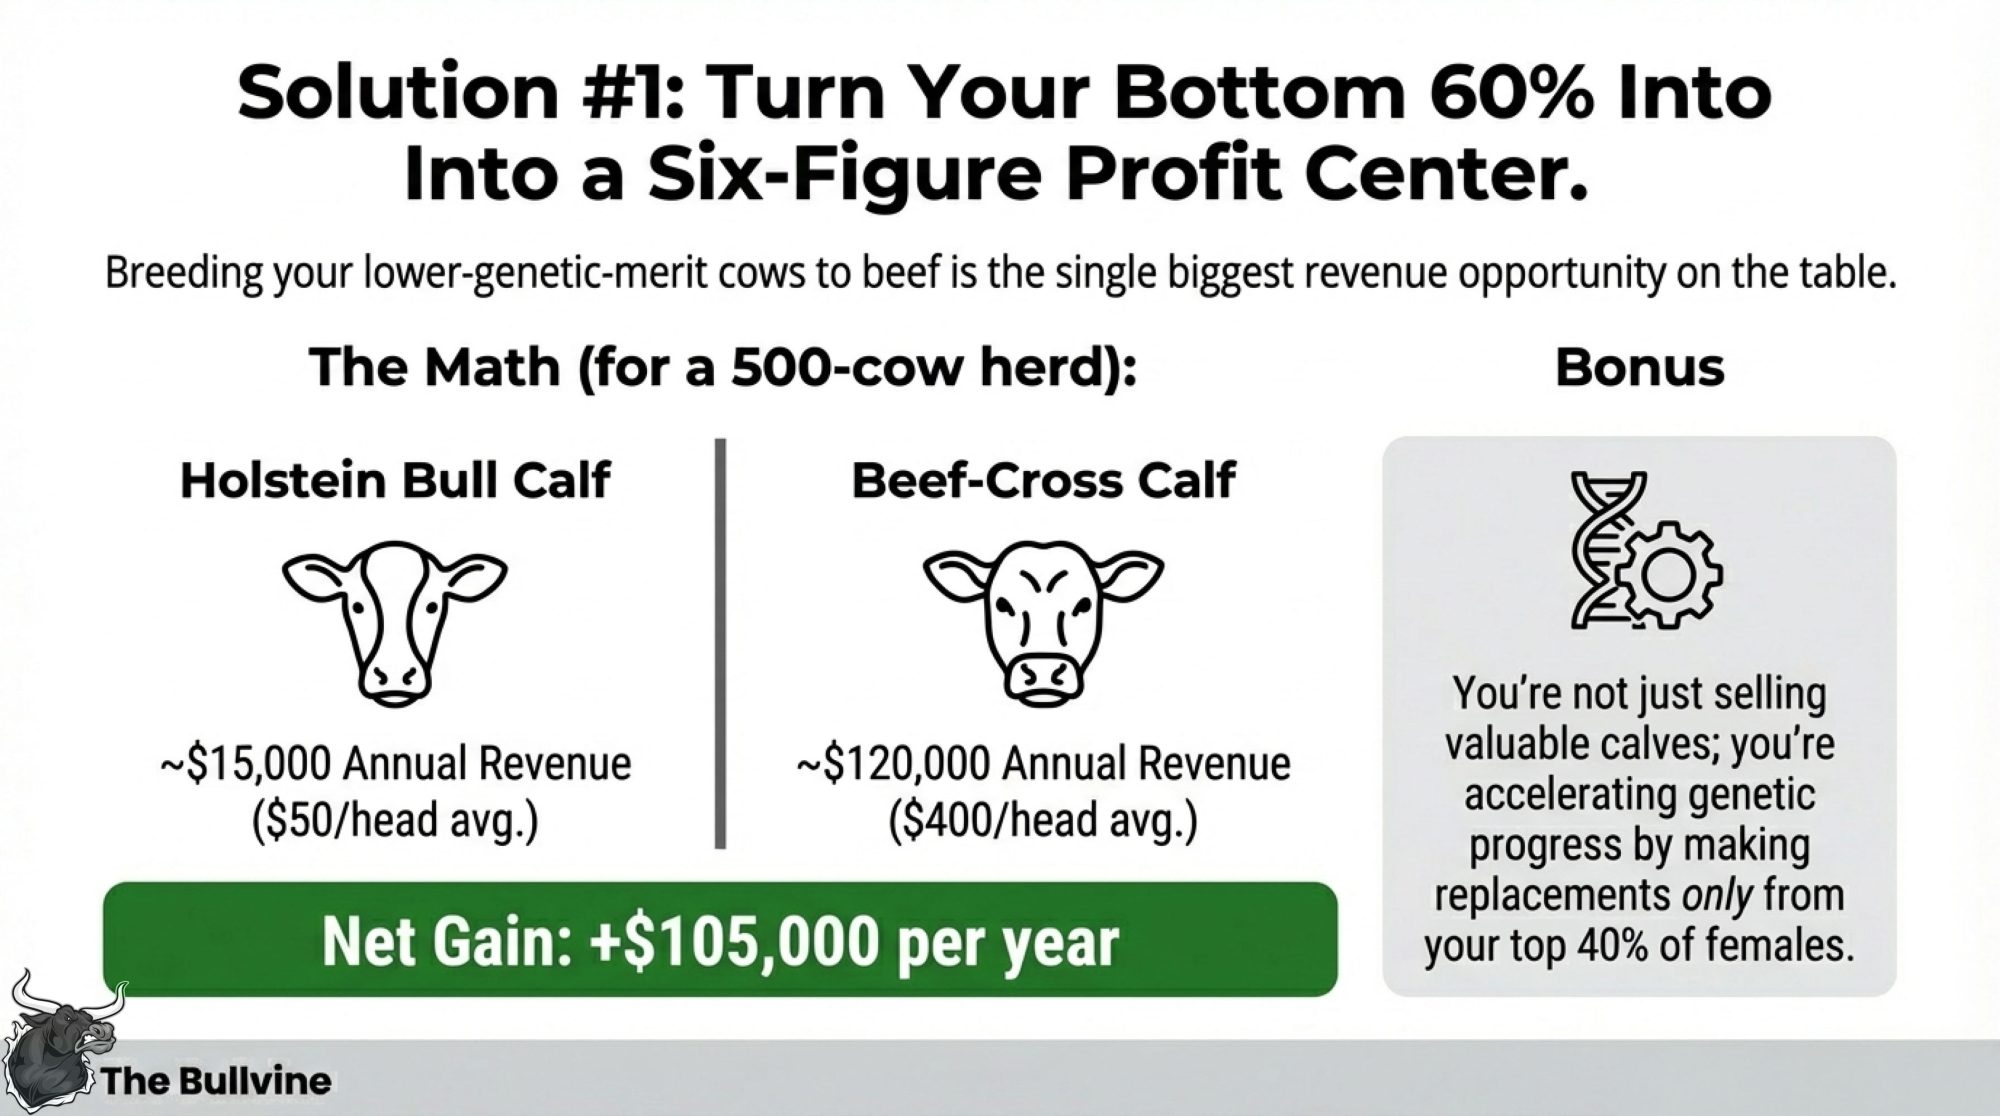
- Cows whose daughters fall below that line, plus older cows without strong family backing, get bred to beef.
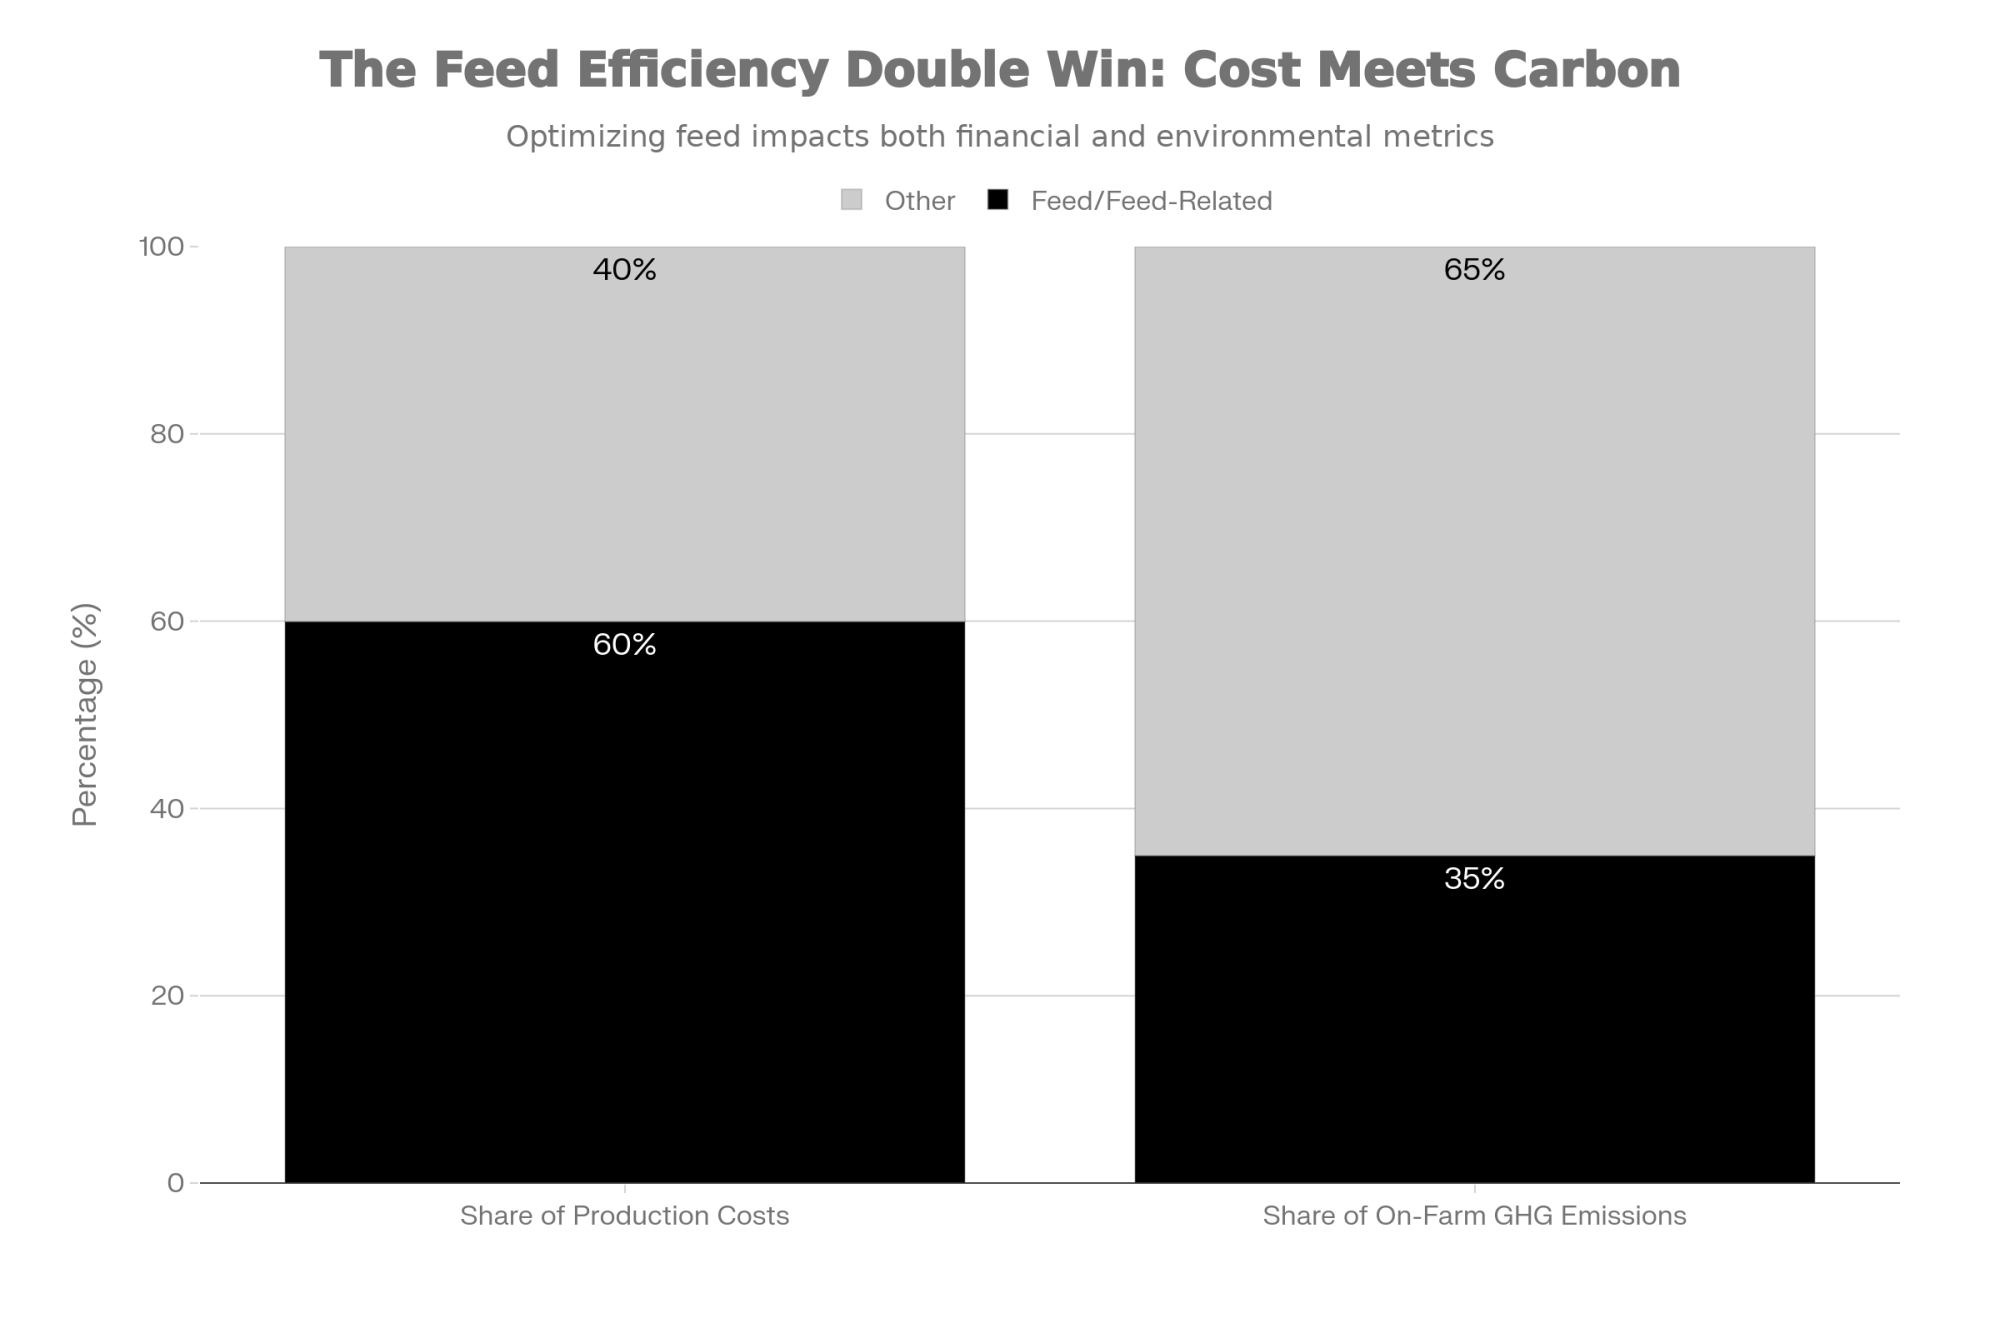
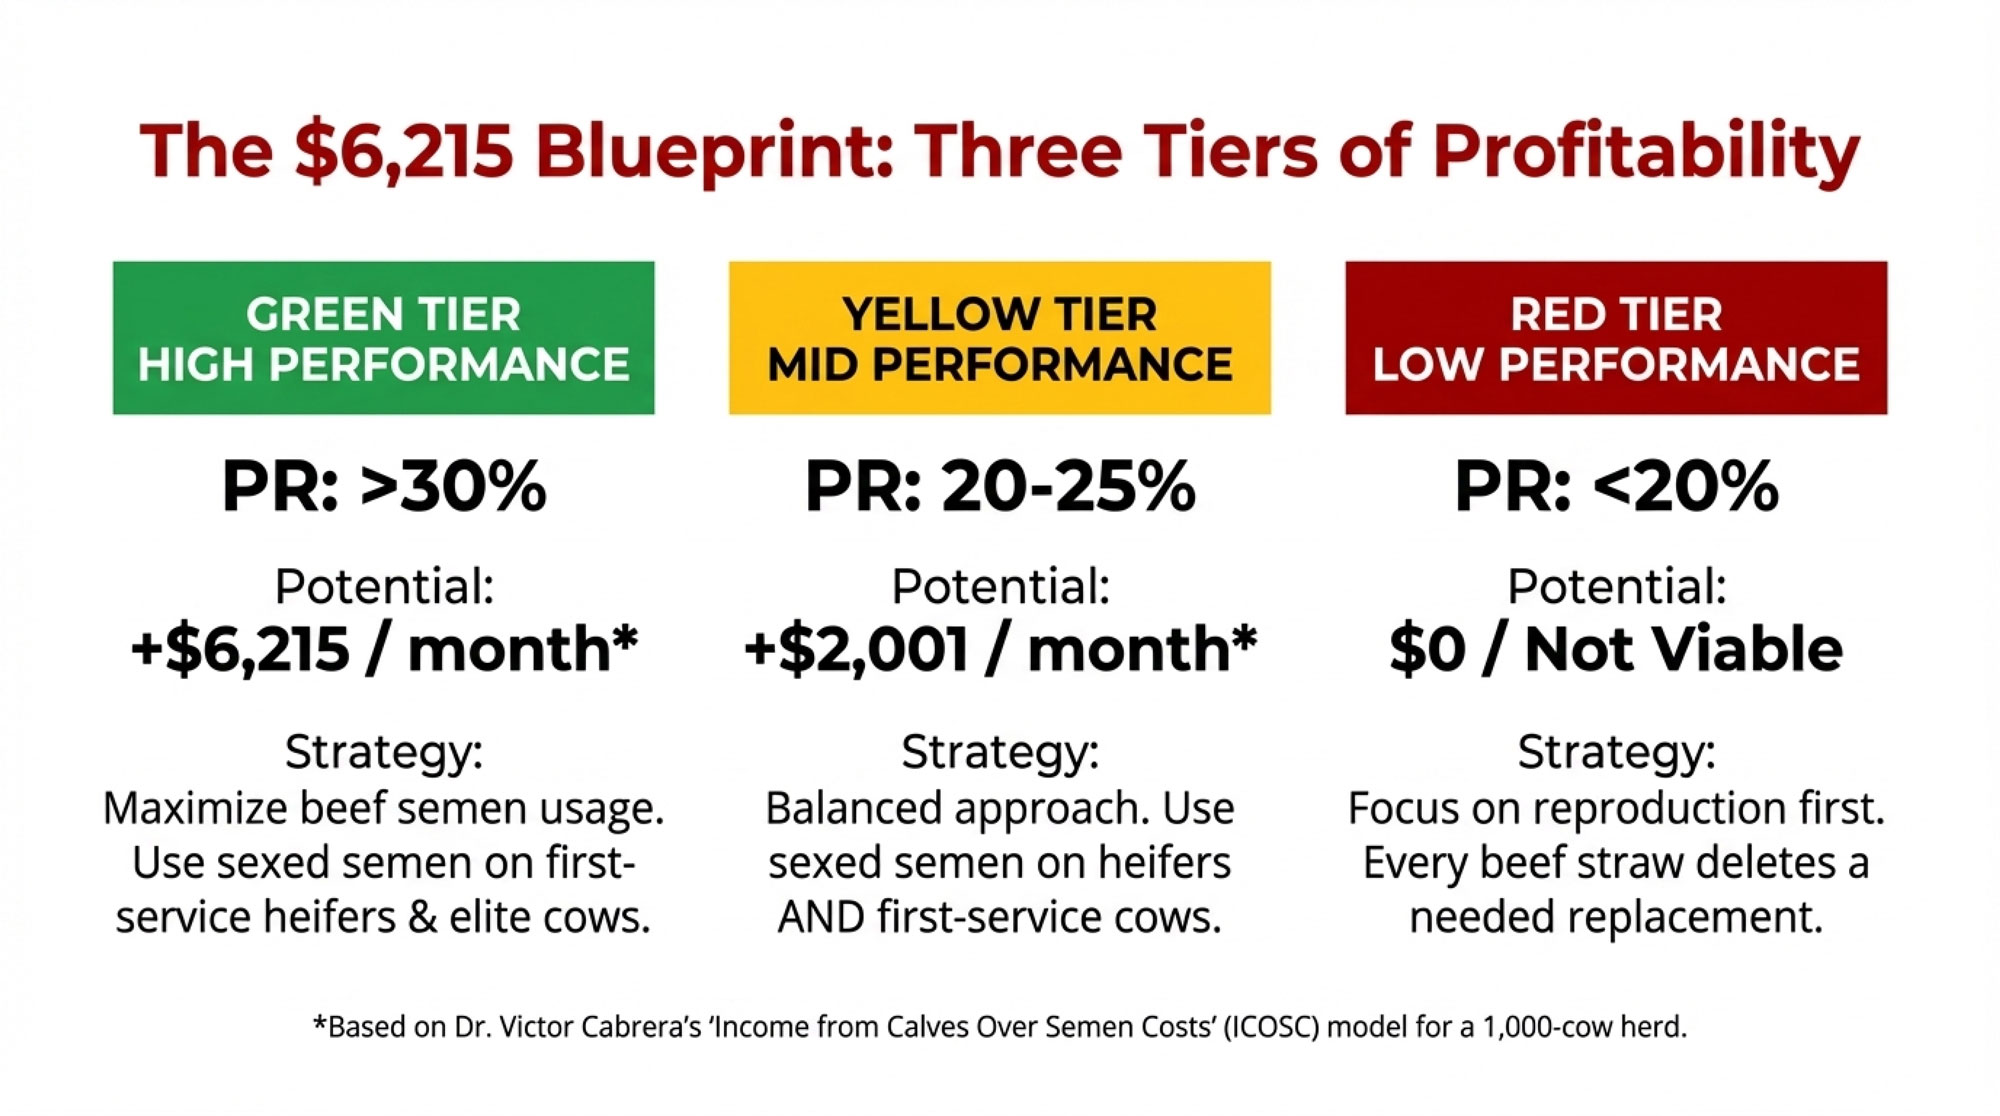
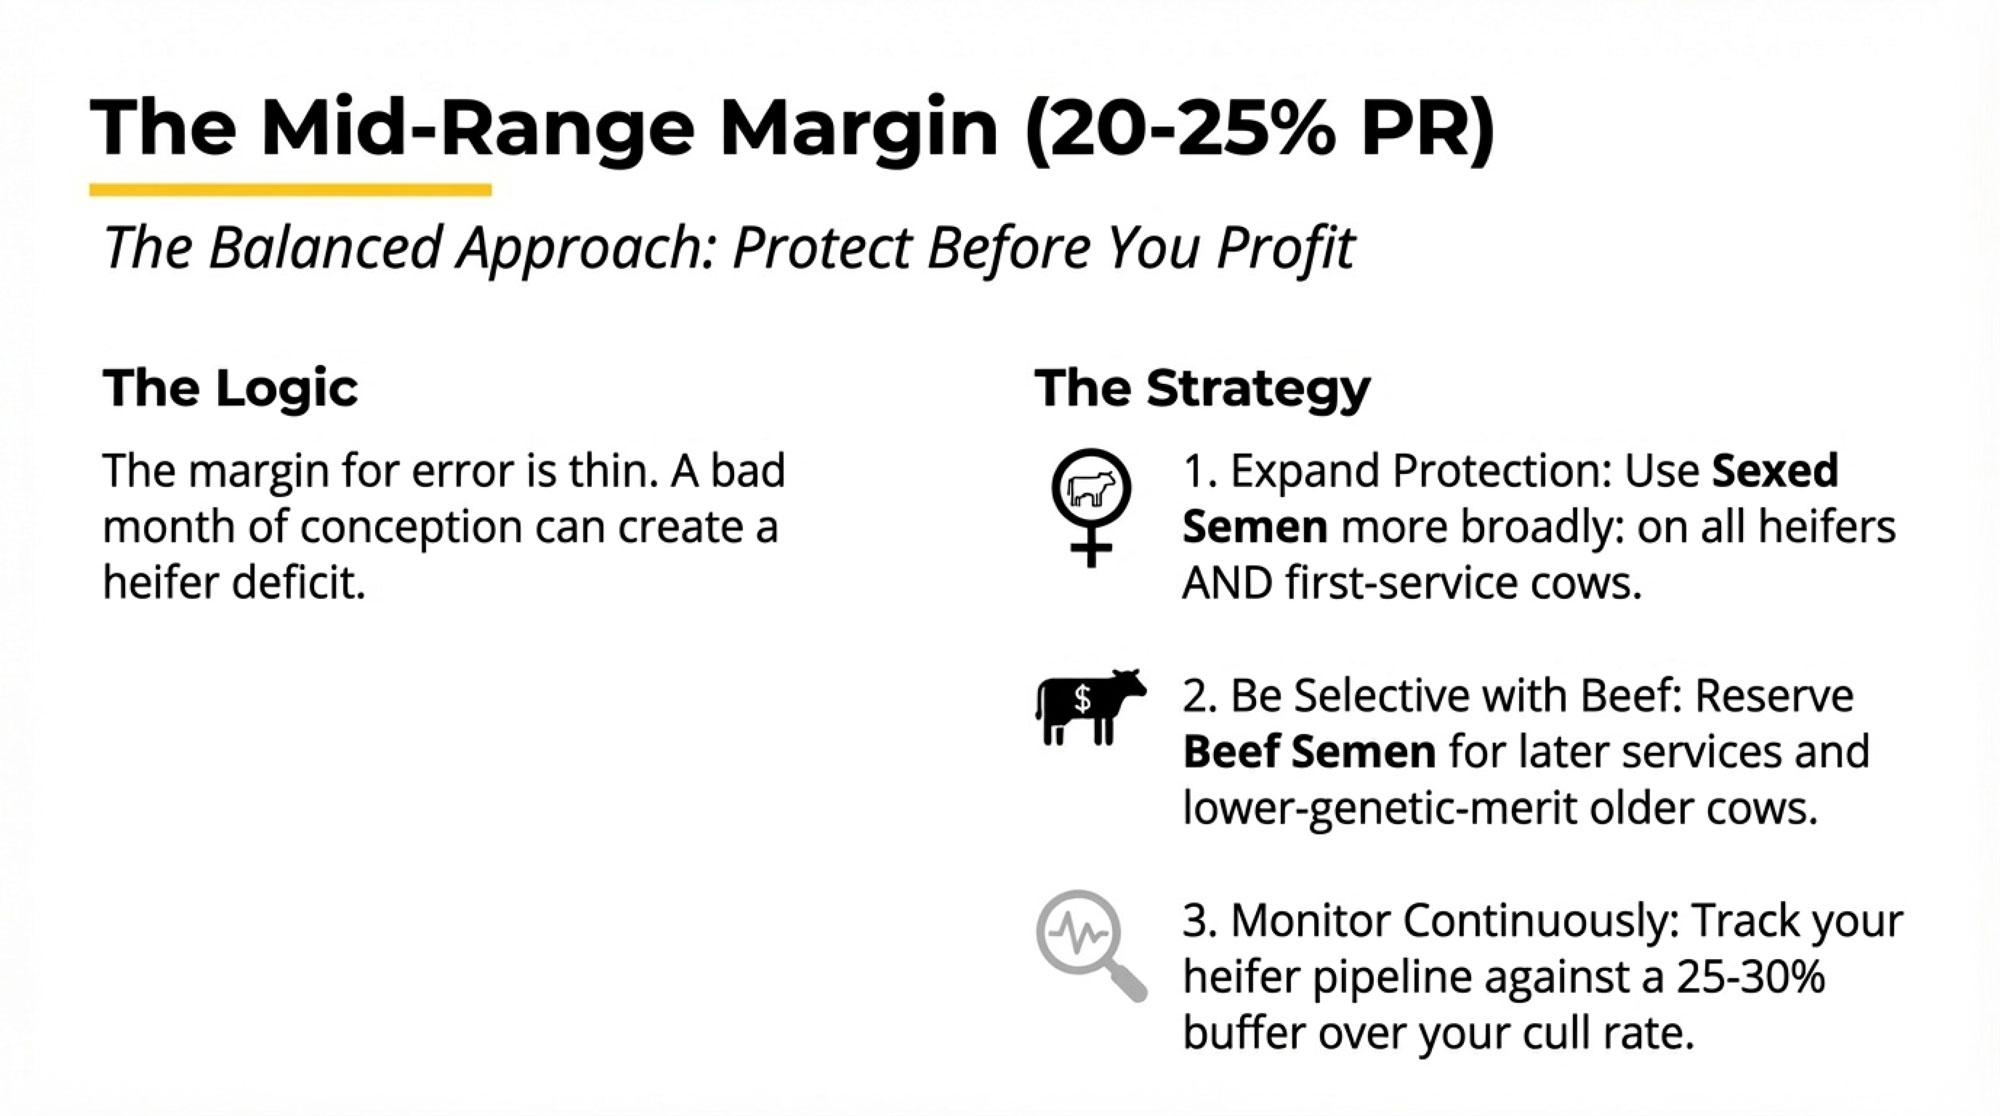
When herds stick to that for a full year, they usually end up with roughly 30–40% of cows getting dairy semen and 60–70% getting beef. That mix often covers replacement needs—because dairy semen is concentrated on the right cows—while generating a steady stream of well‑bred dairy‑beef calves.
Here’s where the big math starts to bite in your favor. In many Midwestern markets right now, it’s common to see a beef‑on‑dairy calf sell for a few hundred dollars more than a straight Holstein bull calf. For example, in early 2024, it was reported that crossbred calves were selling for around 675 dollars per head in some US sales, while conventional Holstein bull calves lagged far behind, and noted that “beef on dairy” was becoming a “big money” factor in the heifer shortage conversation. If you take 150 matings that would have produced low‑merit dairy calves and, instead, flip them to beef‑on‑dairy matings with a 250‑dollar average premium, you’re looking at:
- 150 calves × 250 dollars ≈ 37,500 dollars in added gross calf revenue.

Even if you trim that for calf‑price volatility or the occasional calf that doesn’t quite hit the premium, you’re still talking about tens of thousands of dollars per year from one simple change in breeding policy.
And on the cost side, you’re not spending all the feed, bedding, labor, and barn space to raise heifers from those bottom families. Long‑term work out of places like Cornell, Penn State, and western Canadian benchmarking suggests that when you spread all the costs out, total rearing cost per dairy heifer—from birth to first calving—often sits in the 2,000–3,000‑dollar range once you include feed, bedding, labor, health, and overhead, with the exact figure depending on system (confinement, pasture, dry lot) and region. So not raising heifers that were never likely to pay you back is a big part of this story, too.

Step 3: Add Calf‑Health Genetics to Your Dairy Sire List
Now bring calf‑health genetics back into the picture.
We’ve already seen that calf diarrhea and respiratory disease are heritable and can be evaluated genomically. Canada gives us a clear preview of how those traits can look in practice.
In August 2025, Lactanet—the national genetics and data organization for Canadian dairy producers—launched a Holstein calf‑health genetic evaluation that combines recorded cases of respiratory disease from birth to 180 days and diarrhea from birth to 60 days. The new trait is expressed as a Relative Breeding Value (RBV) centered at 100 with a standard deviation of 5. Higher RBVs indicate sires whose daughters are more likely to stay free of recorded calf‑health events in that early‑life window.
Lactanet geneticist Colin Lynch, MSc, explained in that a five‑point increase in calf‑health RBV corresponds to about 5.4% more healthy calves with no recorded diarrhea or respiratory problems. Their analysis showed that, among proven sires, the top 5% for calf‑health traits had around 88% healthy daughters, while the bottom 5% averaged closer to 70–71% healthy daughters—depending on whether you’re looking at diarrhea or respiratory disease. In real‑world terms, that’s the difference between a family where “most calves just start and go” and one where you feel like you’re forever pulling buckets and syringes.
| Sire Rank | % Calves NO Diarrhea | % Calves NO Respiratory Disease | Combined Healthy Rate (Est.) | Per 100 Calves: Sick Events | Economic Cost per Cohort (100 calves) |
| Top 5% | 92% | 90% | ~88% | ~12 sick calves | $2,400 in direct treatment + losses |
| Middle 50% | 87% | 84% | ~80% | ~20 sick calves | $4,000 in treatment + losses |
| Bottom 5% | 82% | 76% | ~70% | ~30 sick calves | $6,000+ in treatment + losses |
| Spread (Top vs. Bottom) | +10 pts | +14 pts | +18 pts | +18 more sick calves | +$3,600 annually per 100-calf cohort |
Here’s how herds are starting to use that kind of information:
- For heifers and first‑calf cows, they insist on bulls that meet their production and cow‑health criteria and also clear a minimum calf‑health RBV. Bulls with poor calf‑health scores simply don’t get used on young animals.
- For older cows, calf‑health RBV becomes a tie‑breaker among bulls with similar milk, components, fertility, and cow‑health profiles.
- In regions with tough winter respiratory seasons—Wisconsin, Minnesota, Quebec, Northern New York—some producers are deliberately matching higher calf‑health bulls to matings that will calve into late winter and early spring, when pneumonia risk is highest.
Of course, these evaluations live or die on the quality of the health records behind them. A 2023 Canadian Journal of Animal Science case study on calf respiratory illness and diarrhea recording in Ontario found that the share of milk‑recorded herds logging calf disease rose from 2.6% in 2009 to 11.1% in 2020, but also pointed out several places where data can be lost or misclassified between the farm and the national database. Neupane and Cole have likewise emphasized in USDA‑ARS communications that clear, consistent on‑farm recording of calf health is critical if we want reliable calf‑health proofs.
So one very practical step you can take this year—before US calf‑health numbers even hit your AI catalogs—is to tighten how you record scours and pneumonia. Sit down with your vet, agree on what counts as a case, and make sure those events get logged consistently in your herd software. That way, when calf‑health proofs land, you can trust them more and know your herd is contributing good data.

Step 4: Factor in Gestation Length and Calving Pressure
You don’t need a statistician to tell you that what you do with calving‑ease and gestation length can make or break certain months. Stack too many long‑gestation, big‑calf bulls on heifers or smaller cows that all calve in a tight two‑week window, and you’ll see it in stillbirths, tough pulls, exhausted staff, and shaky fresh cow performance through the transition period.
Most modern proofs include calving‑ease and stillbirth rates, and many now list gestation length as well. Genetic evaluation organizations like CDCB and Lactanet have been gradually building more of these functional traits into their indexes and tools. They may not be as glamorous as milk or fat numbers, but they matter a lot when you’re planning calving pressure.
What farmers are doing, once they’ve set beef‑versus‑dairy and calf‑health rules, is using calving‑ease and gestation length as the next filter:
- In herds with heavy winter or early‑spring calving in the Northeast, Great Lakes, and Upper Midwest, producers keep a short list of easy‑calving, shorter‑gestation bulls for dairy matings that will calve into February and March, when calving barns and fresh pens are under the most stress.
- In Western dry lot systems, where summer heat is the big enemy, producers avoid long‑gestation bulls on matings that would calve into the hottest weeks and lean instead on sires with moderate gestation and favorable calving‑ease profiles.
You don’t need a complicated spreadsheet to manage this. Just mark a handful of bulls as “tight‑window sires” based on calving‑ease, gestation length, and acceptable production and health traits, and use them where the calendar and weather suggest you can’t afford added calving problems.
Step 5: Keep Re‑Running the Math as Markets Move
The last step—and this is the one that never really ends—is to keep re‑checking whether your thresholds still make sense as markets and costs move around.
Calf prices rise and fall with the beef cycle. Replacement heifer values swing with inventory, feed costs, and interest rates. Milk prices and component premiums fluctuate with supply, demand, and processor product mix. The herds that keep these breeding strategies working don’t treat them as set‑and‑forget decisions.
In practical terms, that looks like:
- Watching local calf prices at sale barns, through order buyers, and with any calf contracts, so you know the current spread between dairy bull calves and dairy‑beef calves.
- Tracking replacement heifer prices through USDA Cattle on Feed and Cattle Inventory reports, CoBank and other industry analysis, and local auctions, and comparing those numbers against your estimated cost per raised heifer.
- Adjusting your beef‑versus‑dairy cutoff as those numbers shift. When dairy‑beef calves are bringing strong premiums and replacements are expensive, a lot of herds are comfortable breeding only the top 30% of cows and heifers (by genomic merit) to dairy semen; if the spread shrinks or they need more replacements, they might widen that to 40%.
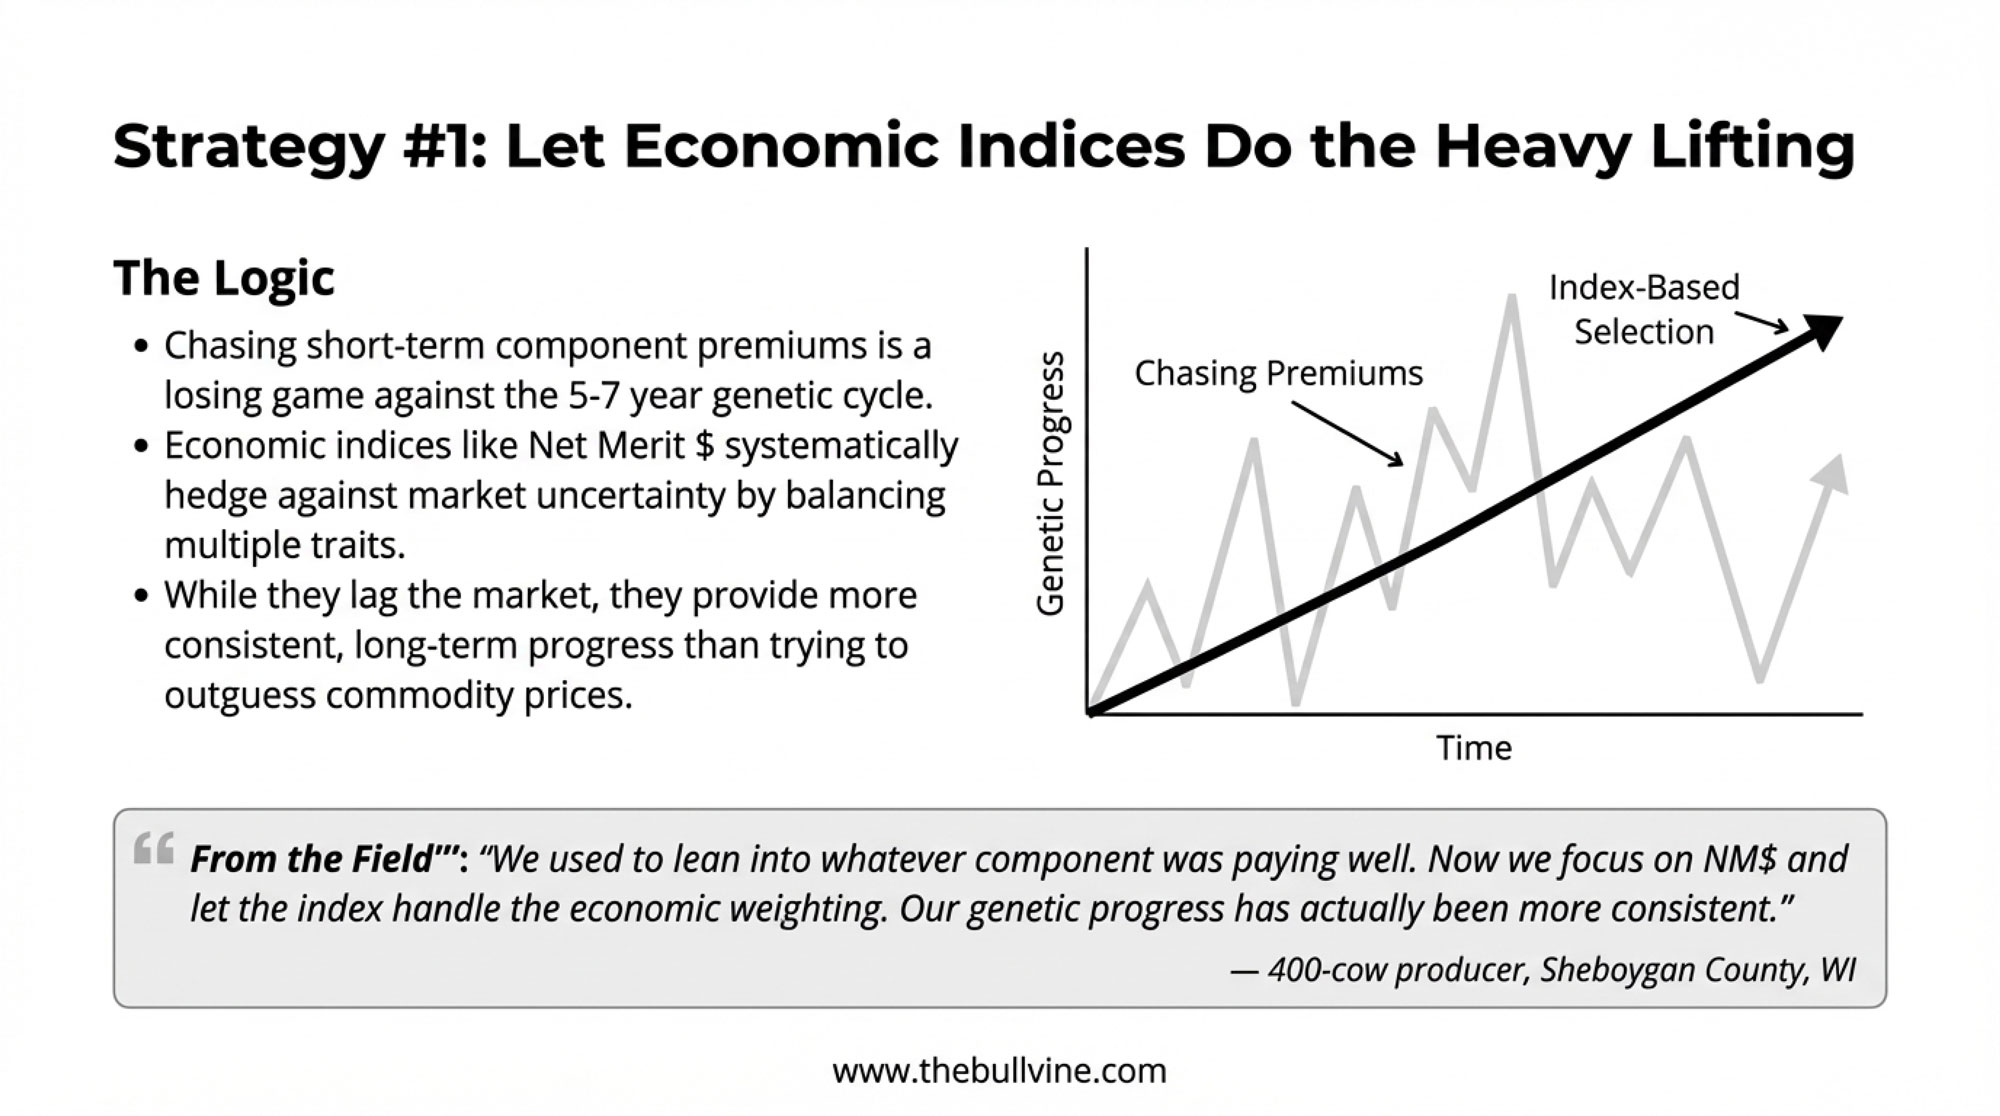
One helpful thing about the new calf‑health traits is that USDA‑AGIL has designed them to slot into the same kind of multi‑trait indexes we already use. Because genetic correlations between calf‑health traits and production or fertility are low, you can improve calf health without sacrificing milk, components, or cow survival, as long as you keep using balanced indexes instead of chasing single traits.
What Year One Really Feels Like on the Farm
On a PowerPoint slide, all of this looks tidy. On your own farm, Year One feels a little different.
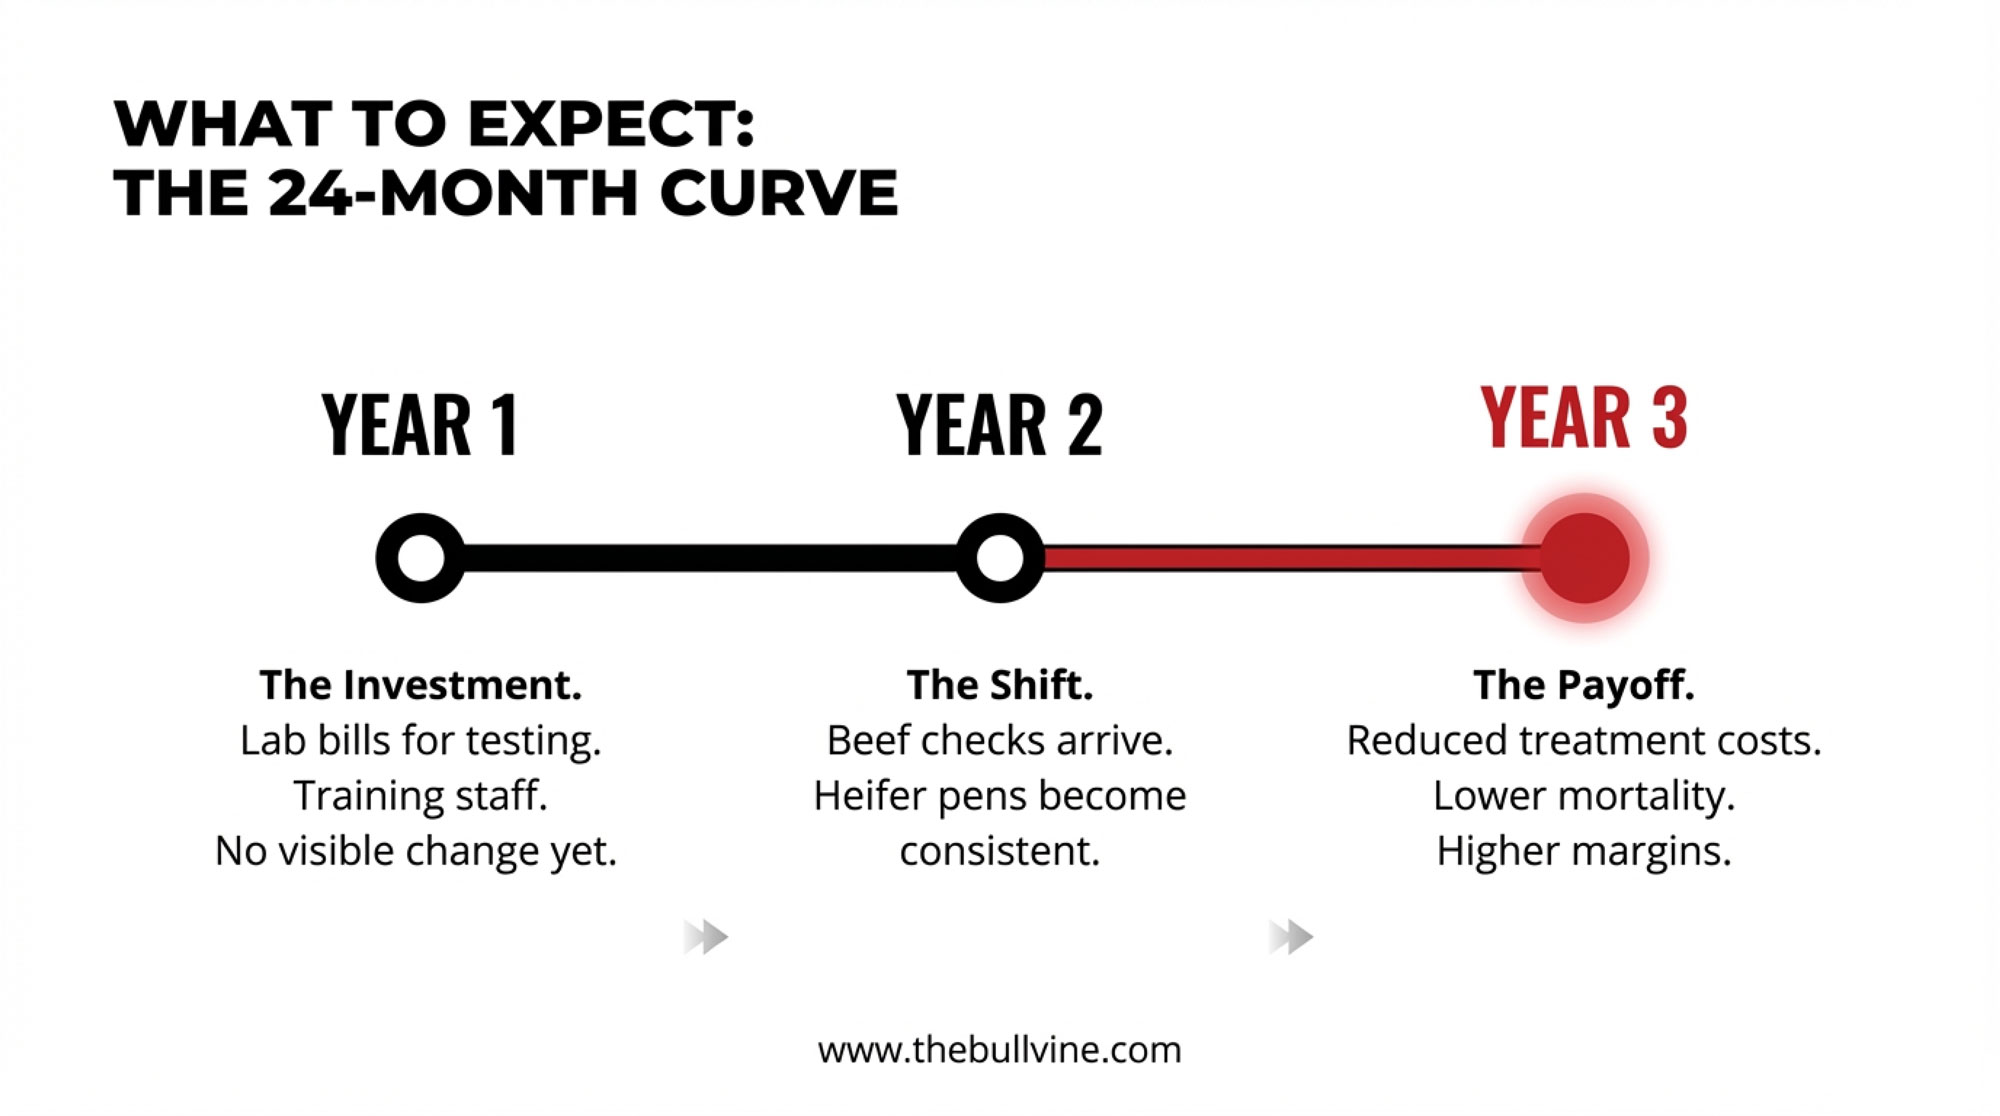
At the start, it’s mostly invoices and extra work:
- You’re genomic‑testing heifer calves, and the lab bills arrive long before any calves from your new breeding plan hit the ground.
- You’re tightening up calf‑health recording with your vet and staff, which means training, more detailed entries, and a few evenings spent cleaning up your database.
- You’re adjusting semen orders—more sexed semen on the top families, more beef semen on the bottom end, fewer “just in case” dairy breedings on cows that were never likely to give you high‑value daughters.
In the calf barn, nothing magical happens overnight. Your heifer pens still look full. Calf checks look familiar. It’s easy to wonder if the effort and expense are worth it.
By mid‑year, a few things usually start to shift:
- You may find yourself selling or culling more lower‑merit heifers earlier—especially if you’re long on replacements—which frees up feed, bedding, and barn space.
- Pregnancies conceived under the new beef‑versus‑dairy rules are in gestation, but only a handful of calves have actually hit the ground.
- On paper, your breeding lists and heifer rankings make more sense. In the parlor and calf barn, daily routines feel largely unchanged.
Late in Year One and into Year Two is where most producers say they start to feel real differences:
- Beef‑on‑dairy calves begin arriving as a more uniform, intentional group. You see stronger buyer interest, better feedback from feedlots, and often better average prices.
- Your heifer pens gradually tilt toward a more consistent, higher‑index group instead of a random mix of stars and passengers. When those heifers freshen, you notice differences in how they come through the transition period and what they do in first‑lactation milk and components.
- If you’ve matched genetics with solid colostrum management, good housing and ventilation, and steady fresh cow management, you often see calf treatment rates and pre‑weaning mortality start to trend in the right direction, similar to what regional calf‑health and barn‑fogging projects have reported when calf environments improve.
Producers highlighted in university extension projects tend to say the same thing: these strategies pay, but the payoff shows up over 18–24 months, not two pay periods. So if you’re going to go down this road, it really helps to think in years instead of months.
Looking Ahead: Getting Ready for Calf‑Health Proofs in the US
Looking at where this is heading, timing matters if you want to be ready.
The USDA‑AGIL work in the Journal of Dairy Science has already shown that calf diarrhea and respiratory traits can be evaluated at a national genomic scale, with usable heritabilities and low correlations with other key traits. USDA‑ARS publications and ICAR genetic evaluation reports have laid out the models and confirm that these calf‑health traits are being prepared for inclusion in US national evaluations for Holsteins and Jerseys.
The Council on Dairy Cattle Breeding has indicated, through meetings and industry communications, that the goal is to add calf‑health traits to the US genetic evaluation system in 2026, once data quality, validation, and governance steps are complete. The exact date will depend on final testing, but the intent is clear enough that seedstock suppliers and AI companies are already watching those traits closely.
Meanwhile, Canada is already using calf‑health RBVs in everyday breeding decisions. Lactanet launched the trait in 2025 and is working it into the Lifetime Performance Index (LPI) and other tools, so Canadian producers now see calf‑health expectations right alongside production, fertility, and cow‑health numbers when picking sires.
If you think about how quickly somatic cell score, daughter fertility, and cow‑health traits became “just part of the proof” once they were introduced, it’s reasonable to expect something similar with calf health. Early on, there will probably be bulls that are quietly excellent on calf‑health traits without a big semen price premium for that advantage. Over time, as more herds use those bulls and see calf‑barn results, market demand and pricing will adjust.
The herds that stand to benefit most from the early years of calf‑health proofs are the ones that:
- Already genomic‑test most or all of their heifer calves.
- Already have a written rule for which cows get dairy semen and which get beef.
- Already work from weekly breeding lists and can easily add one more column when calf‑health numbers show up.
A Practical Game Plan for 2025–2026
If you’re thinking, “This all adds up, but what do I actually do next?”, here’s a straightforward plan you can take back to the office or kitchen table.
1. Build your information base.
- Genomic‑test your next one or two calf crops so you can see how big the gap really is between your best and worst heifers on your preferred index.
- Sit down with your veterinarian and team and define what counts as a reportable scours case and a pneumonia case on your farm, then make sure those cases are consistently recorded in your herd software.
2. Put a simple beef‑versus‑dairy rule on paper.
- For example: “Only cows whose most recent heifer ranks in the top 40% genomically get dairy semen; the rest get beef.”
- Plan to revisit that 40% threshold once a year based on calf‑price spreads, replacement heifer values, and your own heifer needs.
3. Talk with your AI and genetics partners about calf‑health traits.
- Ask when they expect US calf‑health proofs to show up in their catalogs and computerized mating programs.
- Identify a short list of bulls that fit your production and cow‑health goals and are also likely to be above average on calf‑health traits once those numbers are official.
4. Build a weekly breeding list.
- Include cows eligible to breed, days in milk, parity, last calving date, and the genomic rank or index of their most recent heifer.
- Mark each cow as “dairy” or “beef” based on your rule, then assign bulls from a short list that meet your criteria for production, components, fertility, cow health, calf health (once proofs are live), calving ease, and gestation length.
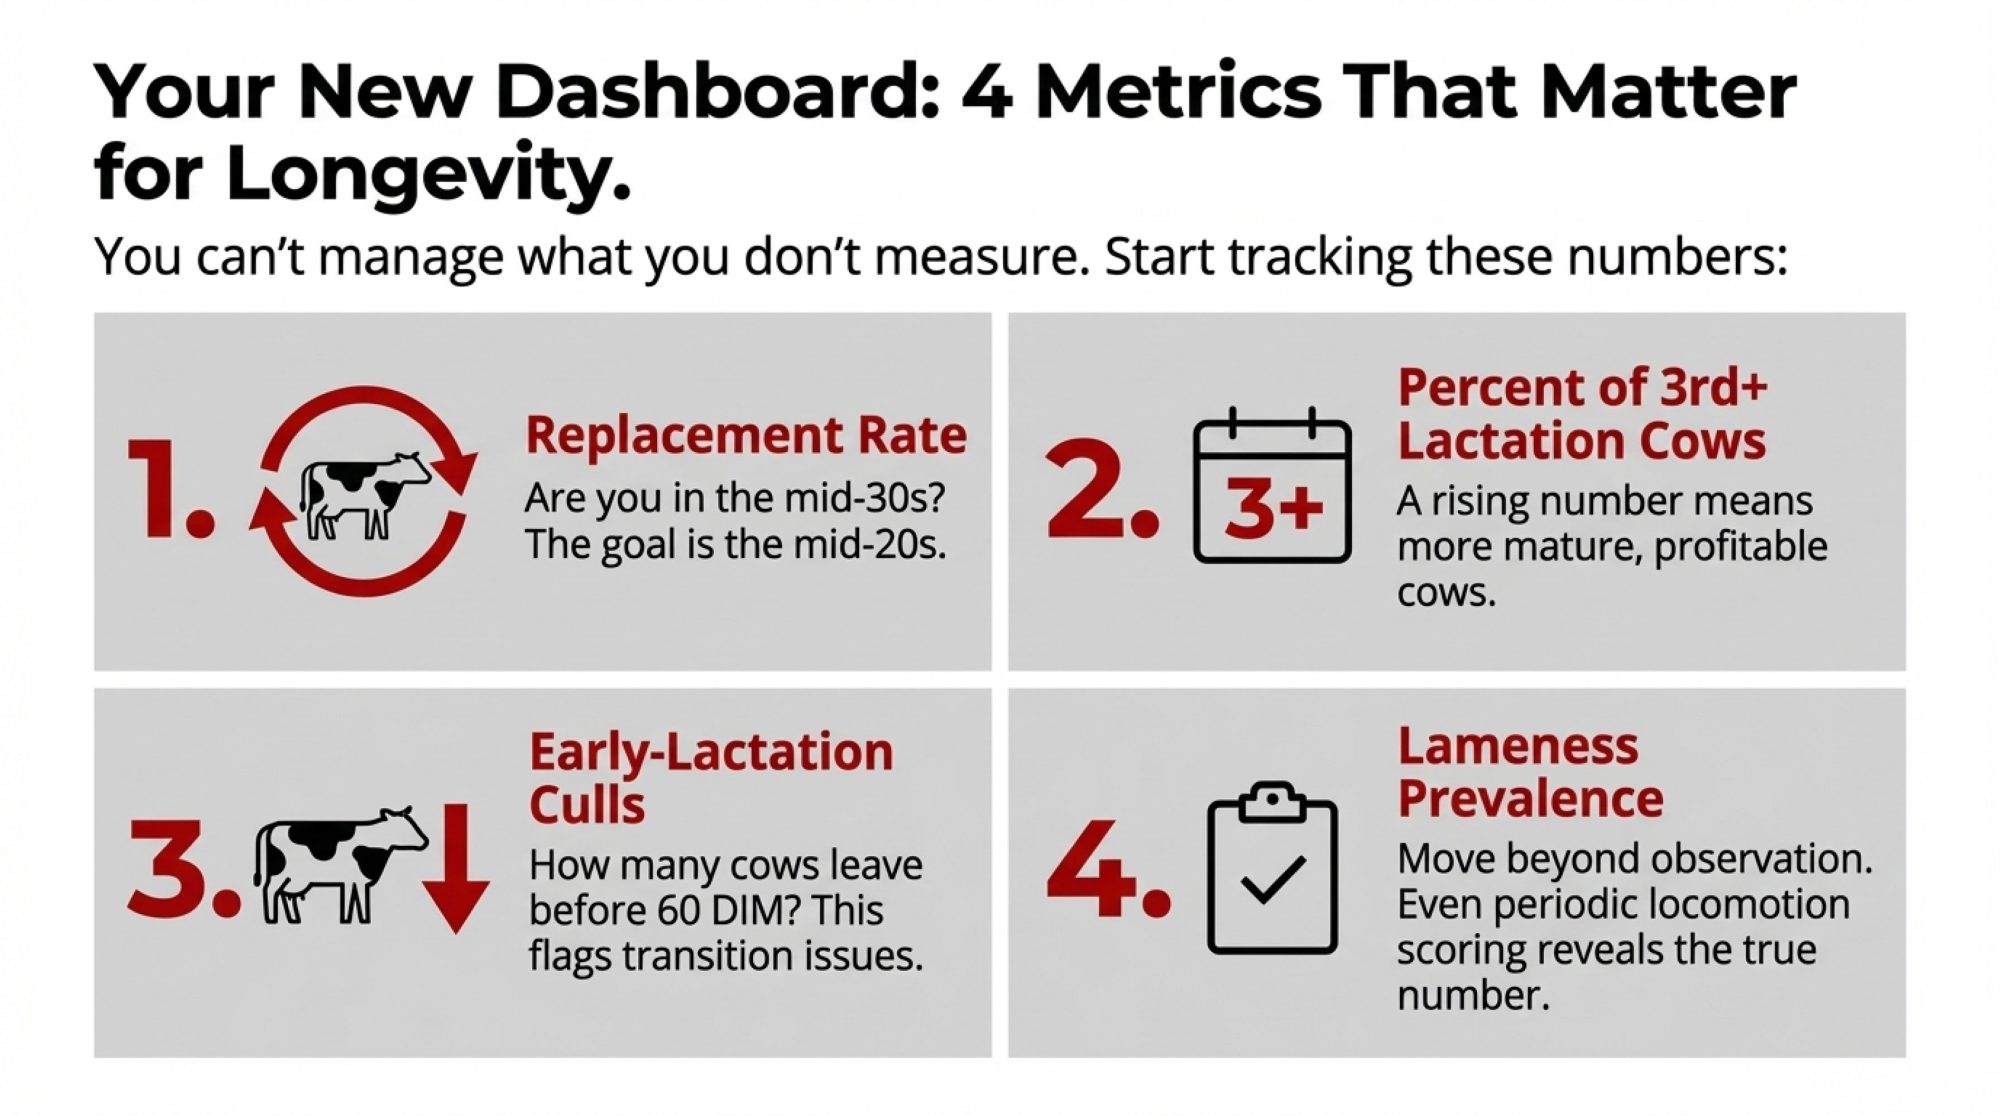
5. Track a few key metrics over the next 24 months.
- Calf diarrhea and respiratory treatment rates, ideally by season.
- Pre‑weaning mortality.
- Age at first calving for heifers bred under the new system.
- First‑lactation milk and component yield, and major health events in that first lactation.
- Number and average sale price of beef‑on‑dairy calves.
- Total heifer inventory and your best estimate of cost per raised heifer.
If you’re tracking those numbers, you’ll be able to tell whether genomics, beef‑on‑dairy, and calf‑health traits are actually changing the economics on your own farm—not just in theory, but in your barn with your markets.
Different Regions, Different On‑Ramps—Same Core Question
It’s worth saying that not every region, or every herd size, is going to use these tools in exactly the same way.
- In Wisconsin, Minnesota, and the Upper Midwest, long winters and naturally ventilated barns make respiratory disease a constant battle. Research supported by the Northern New York Agricultural Development Program and Cornell PRO‑DAIRY has shown that improvements in ventilation, barn‑fogging protocols, and calf‑barn layout can significantly reduce respiratory problems, with scours most common early in the rearing period and pneumonia more common later. Producers there are now layering calf‑health genetics on top of these management changes.
- In Ontario and Quebec, where Lactanet calf‑health RBVs are already available, and LPI updates have brought more health and functional traits into the mix, many herds are simply adding calf health to breeding programs that already lean heavily on genomics.
- In Western dry lot systems, such as those in California and the Southwest, heat and dust are greater challenges than cold. Work comparing confinement, dry‑lot, and pasture‑based heifer systems has shown that dry‑lot and pasture can lower some costs but demand strong management of shade, airflow, and group size. Producers there are combining calf‑health genetics with shade structures, better airflow, and early‑detection technologies for respiratory disease, plus close relationships with beef buyers who value uniform, high‑health dairy‑beef calves.
- On smaller family herds in the Northeast or Great Lakes region, the most realistic first step might be to genomic‑test one year’s worth of heifers, use those results to decide which families get sexed dairy semen and which get beef, and then let the AI company’s mating program start incorporating calf‑health traits as they come into US proofs.
Different barns. Different weather. Different processor relationships and quota setups. But underneath all that, the strategic question you’re trying to answer is the same.
The Bottom Line
When you strip the jargon away, here’s where all of this leads.
We now have solid data showing that calf diarrhea and respiratory disease are common, costly, and heritable enough to improve through genetics. The same infrastructure that gave us cow‑health traits in our indexes is being used to bring calf‑health traits into US proofs, with Canada already showing how calf‑health RBVs can fit alongside production, fertility, and cow‑health information on a bull card.
We also have economic work on calf health, heifer rearing, and calf markets, telling us that:
- Direct treatment costs per sick calf stack up quickly.
- Serious early‑life disease can pull heifers off their full potential in growth, age at first calving, and first‑lactation performance.
- Dairy‑beef cross calves can be a bright spot in the check when milk prices soften.
- Replacement heifers are expensive enough that raising the wrong ones is a luxury most farms can’t really afford right now.
The tools—genomics, beef‑on‑dairy, calf‑health proofs—are all coming together just as those pressures peak. And you don’t need a PhD to use them. A simple, consistent five‑step approach—test, sort, decide beef vs dairy, add calf health and calving‑ease filters, and keep re‑running the math—will get you most of the way there.
What I’ve noticed, looking at both the research and what’s happening in real barns, is that we’re moving from a world where calf health was “just management” to one where genetics, markets, and management are all pulling in the same direction.
So maybe the real question for 2026 isn’t “Should I genomic‑test?” or “Should I try beef‑on‑dairy?” Those are just tools.
The bigger question—the one that can easily swing tens of thousands of dollars a year on many dairies—is this:
Given your barns, your local markets, your cash‑flow reality, and the calf‑health genetics coming into proofs, which calves do you truly want more of—and which calves are you better off never making in the first place?
If your breeding plan can answer that clearly, and you’re willing to line up your genetics, your fresh cow management, and your calf program behind that answer, then the next few years offer a real chance to tilt the math of your dairy in your favor quietly.

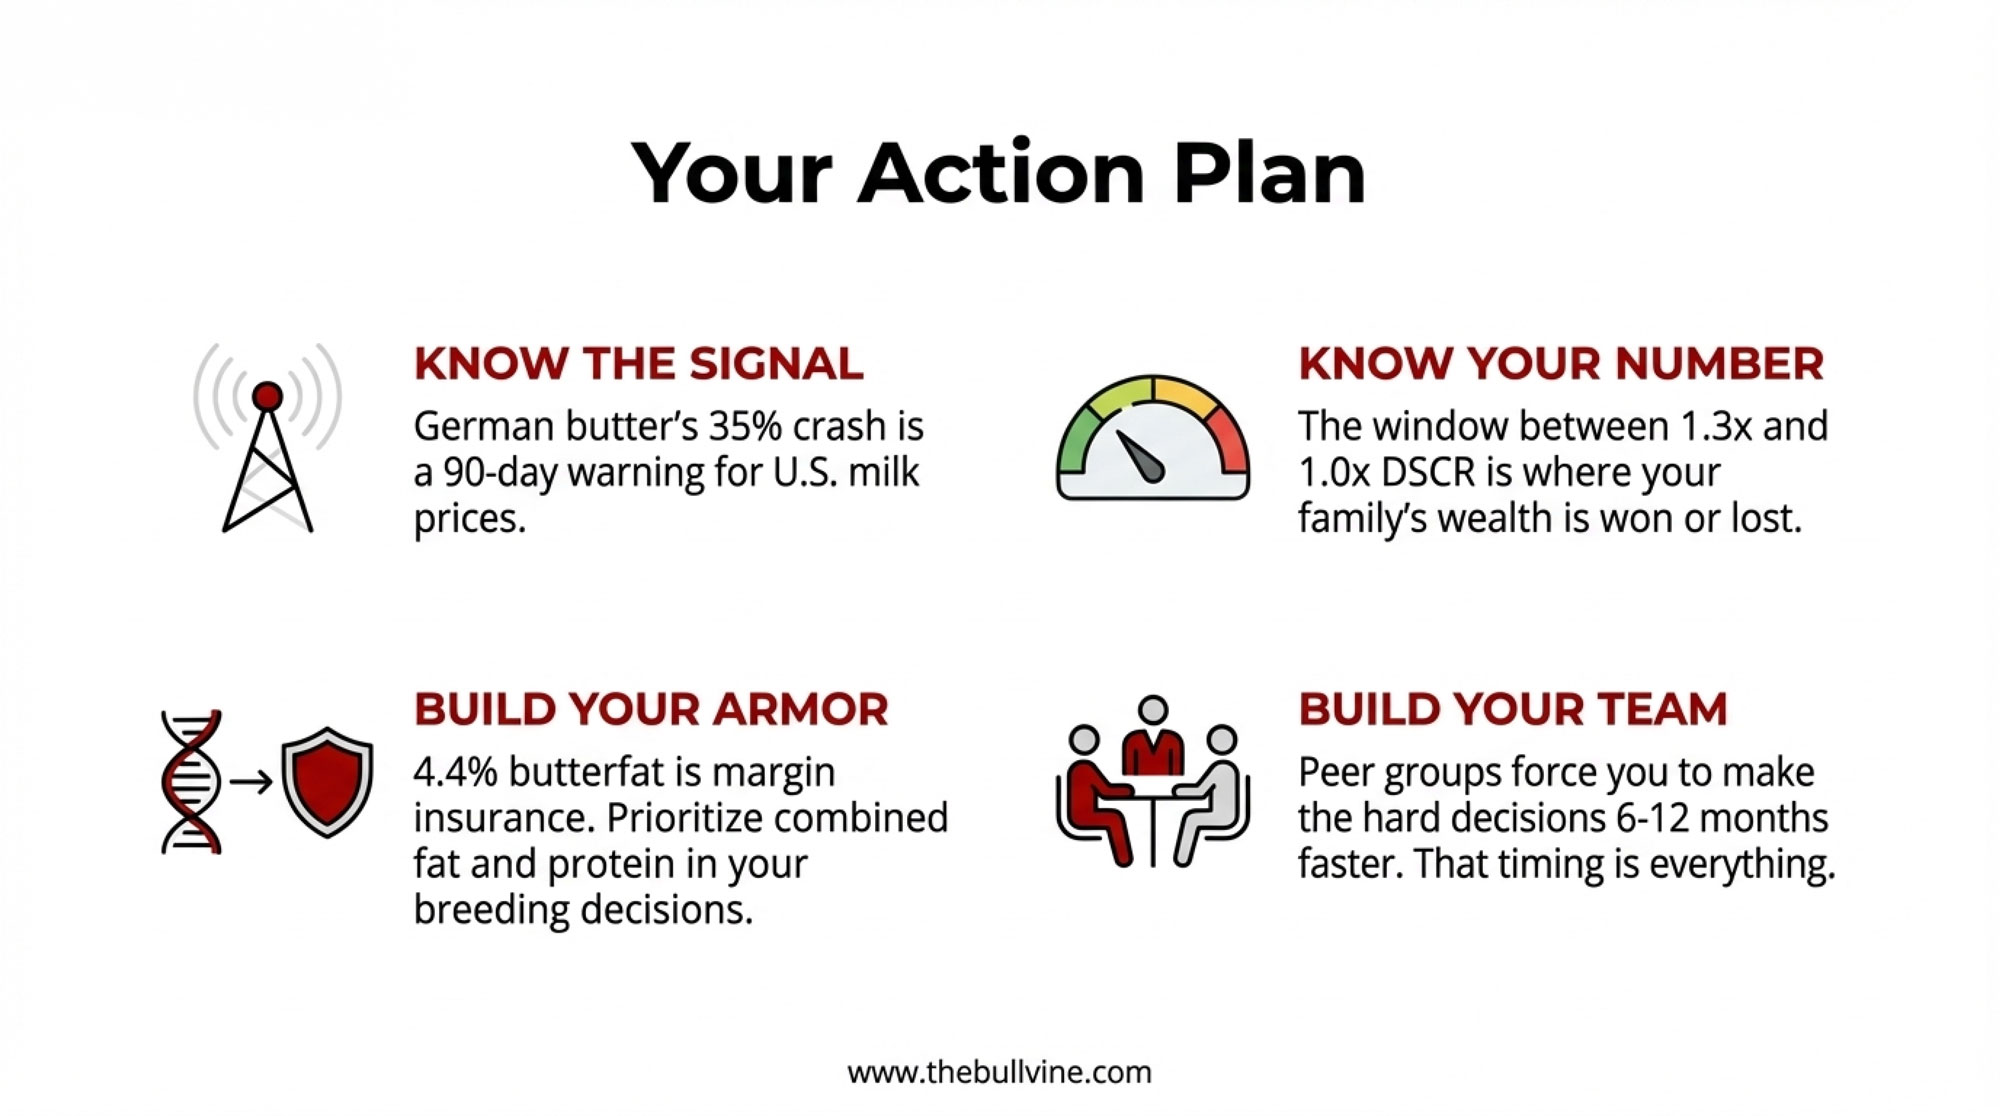
KEY TAKEAWAYS
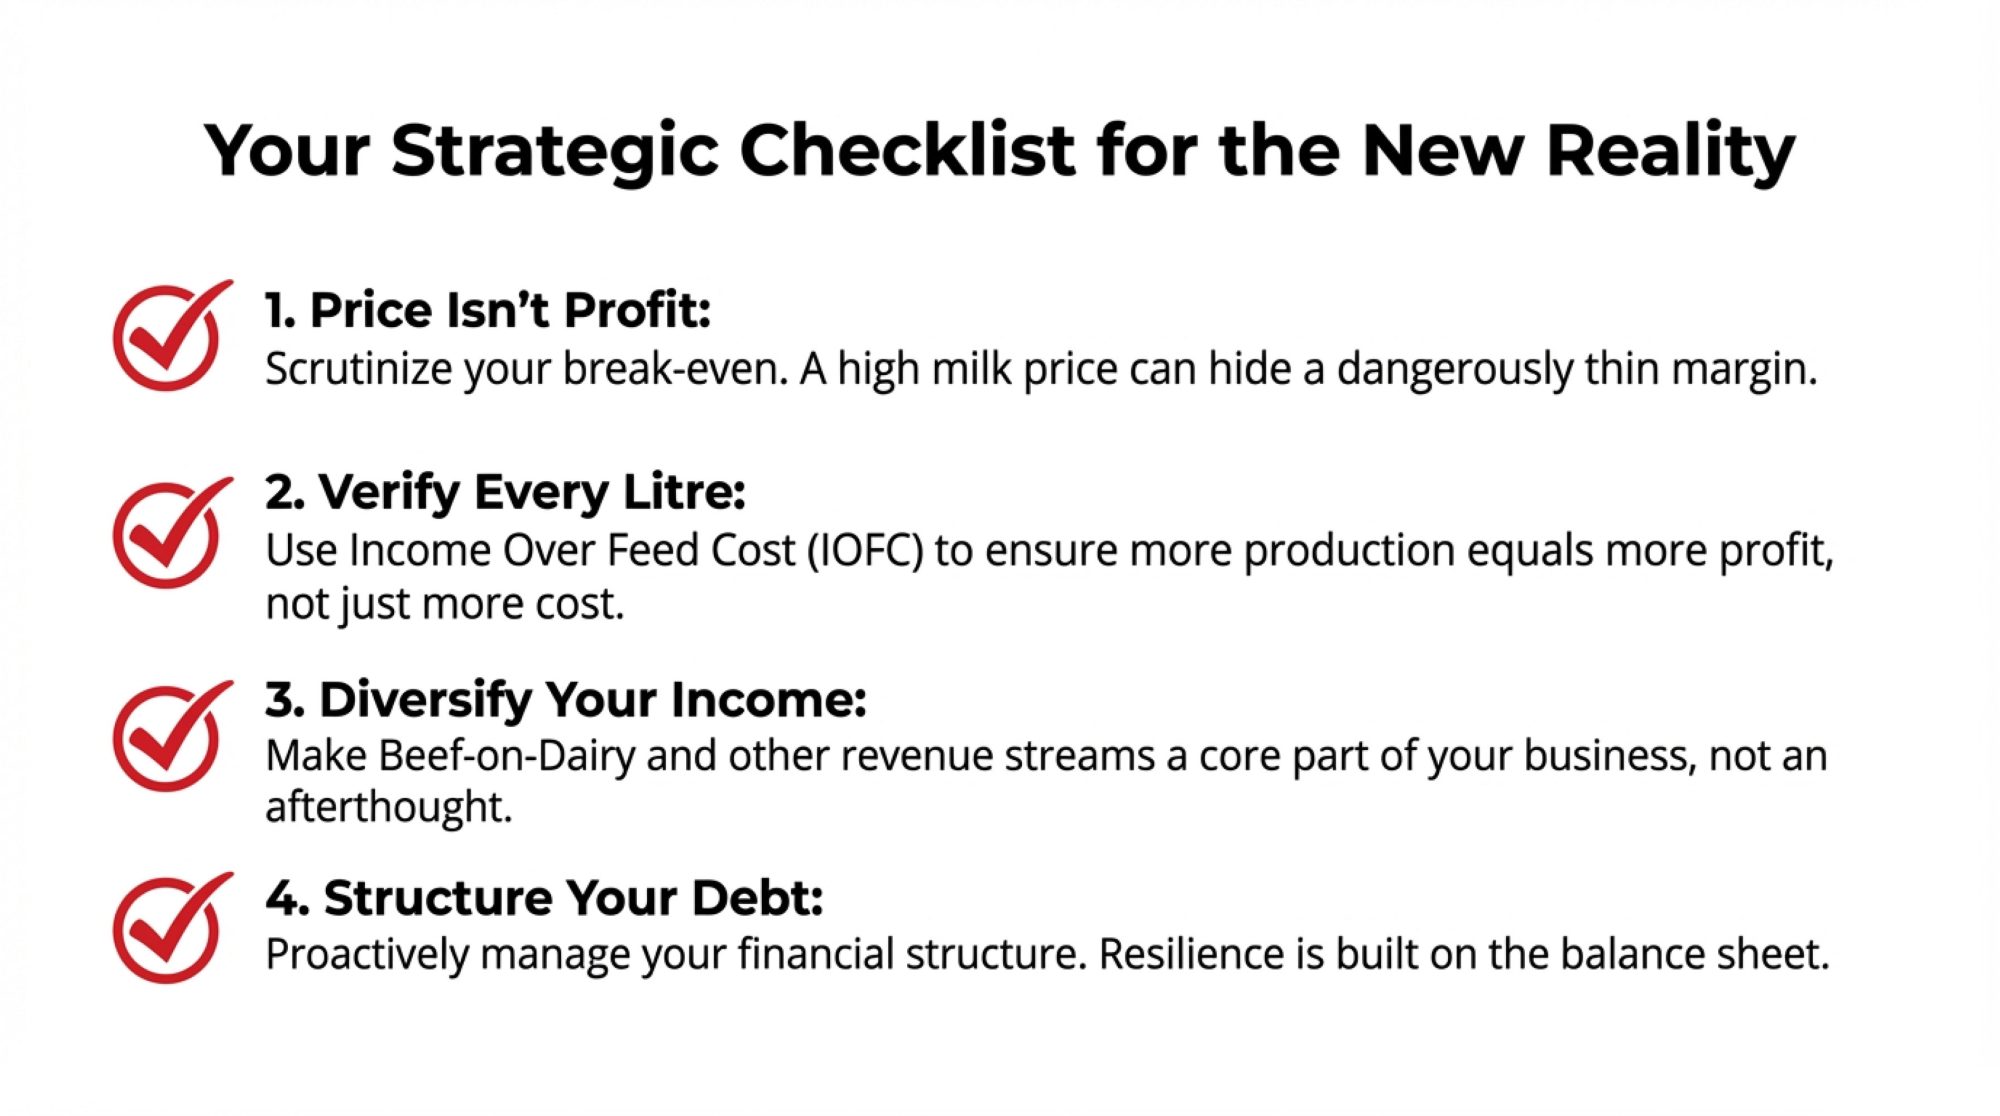
- Calf-health proofs hit US genetics in 2026. USDA data on 680,000+ calves confirms scours and respiratory resistance are heritable—and selectable.
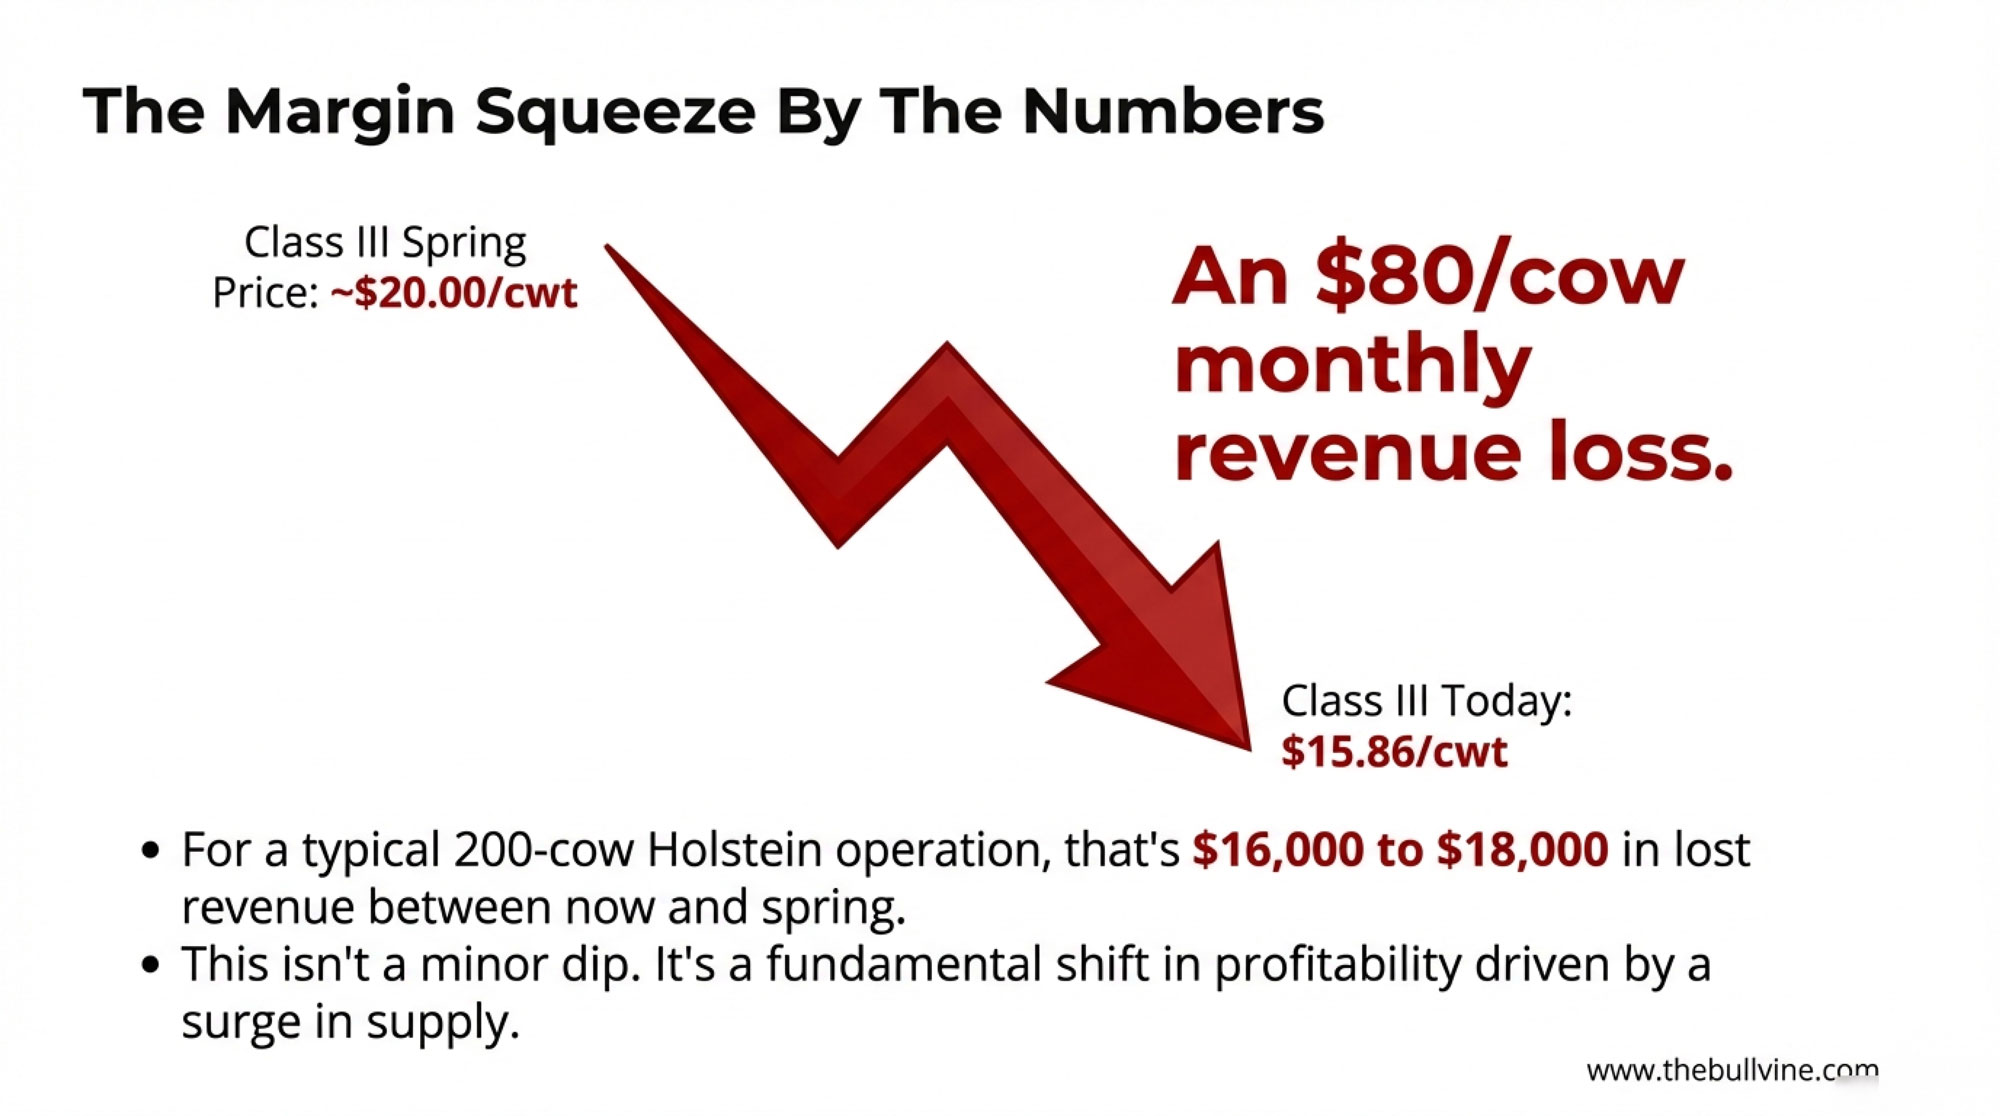
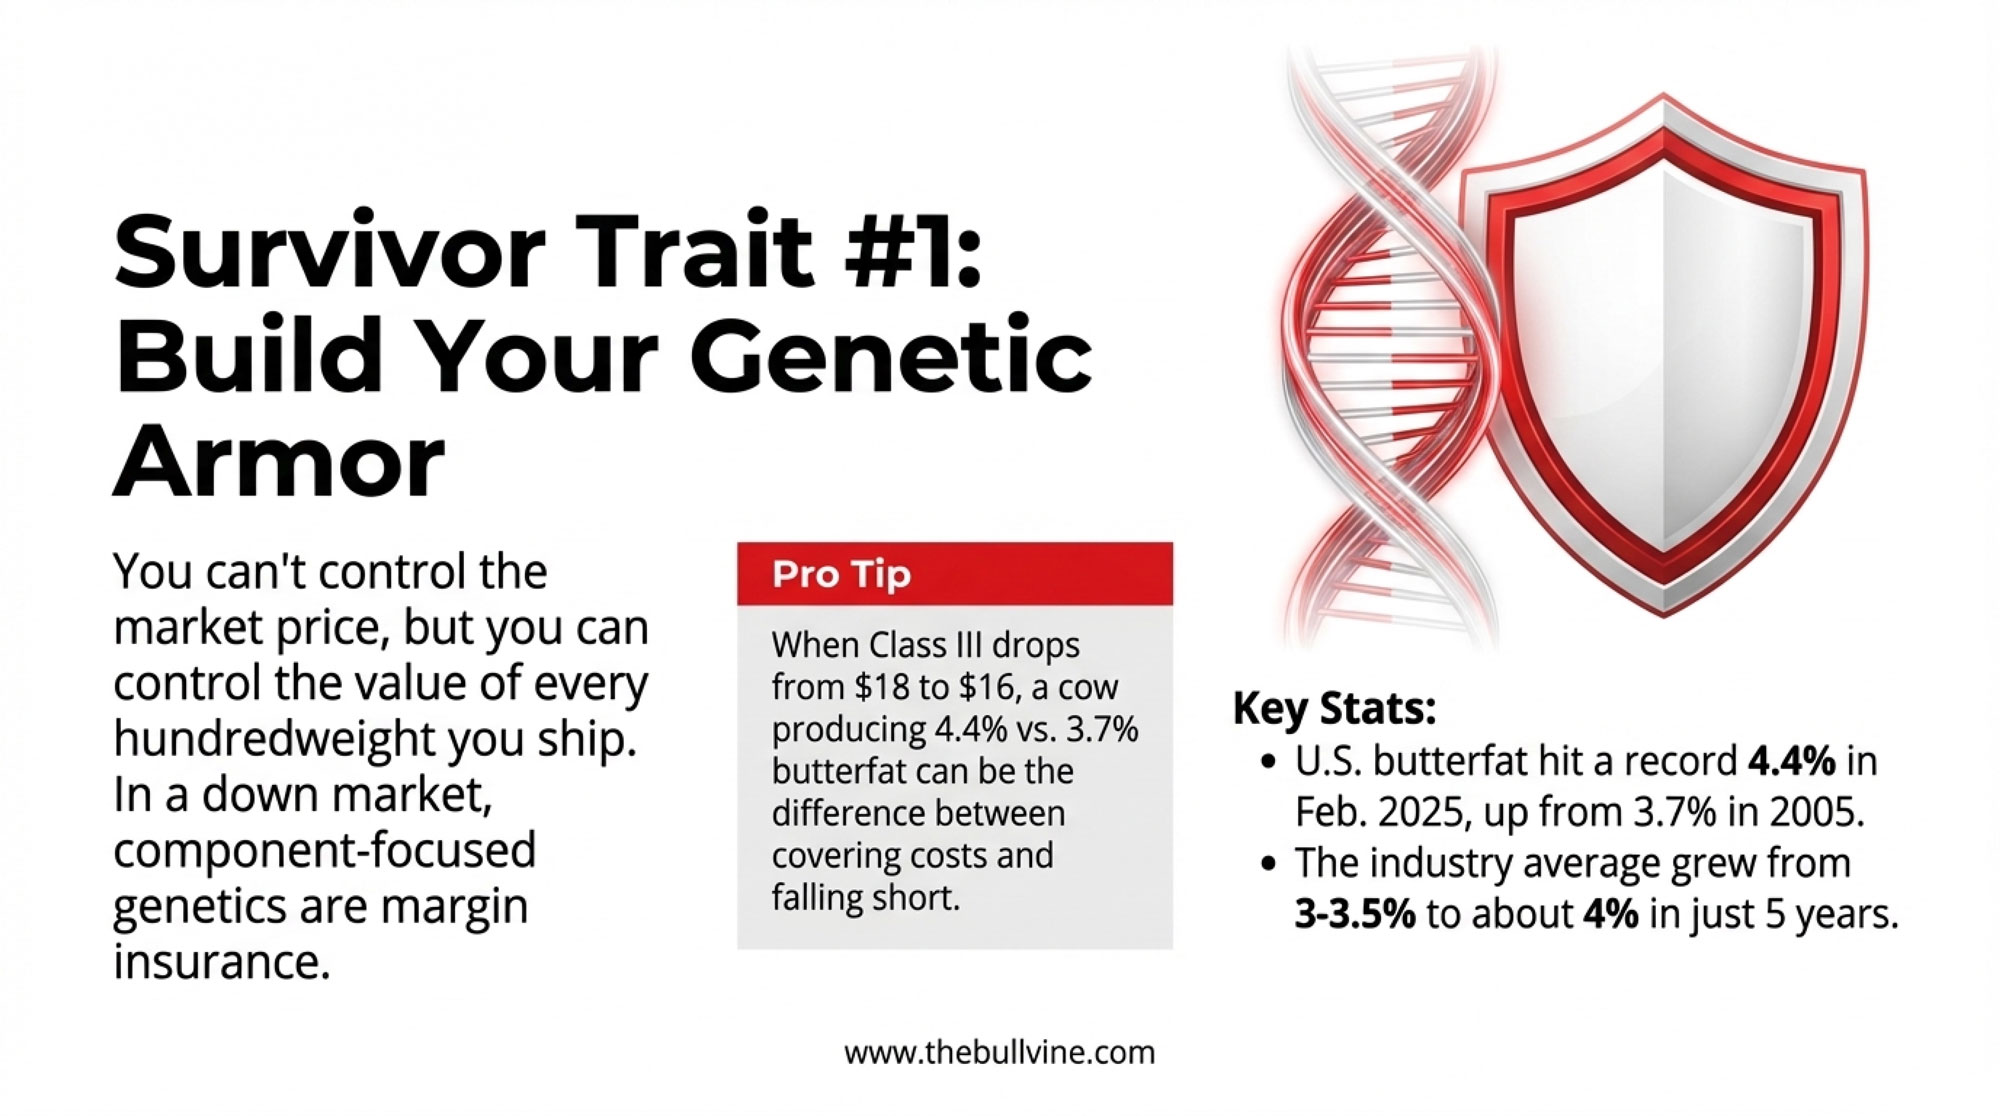
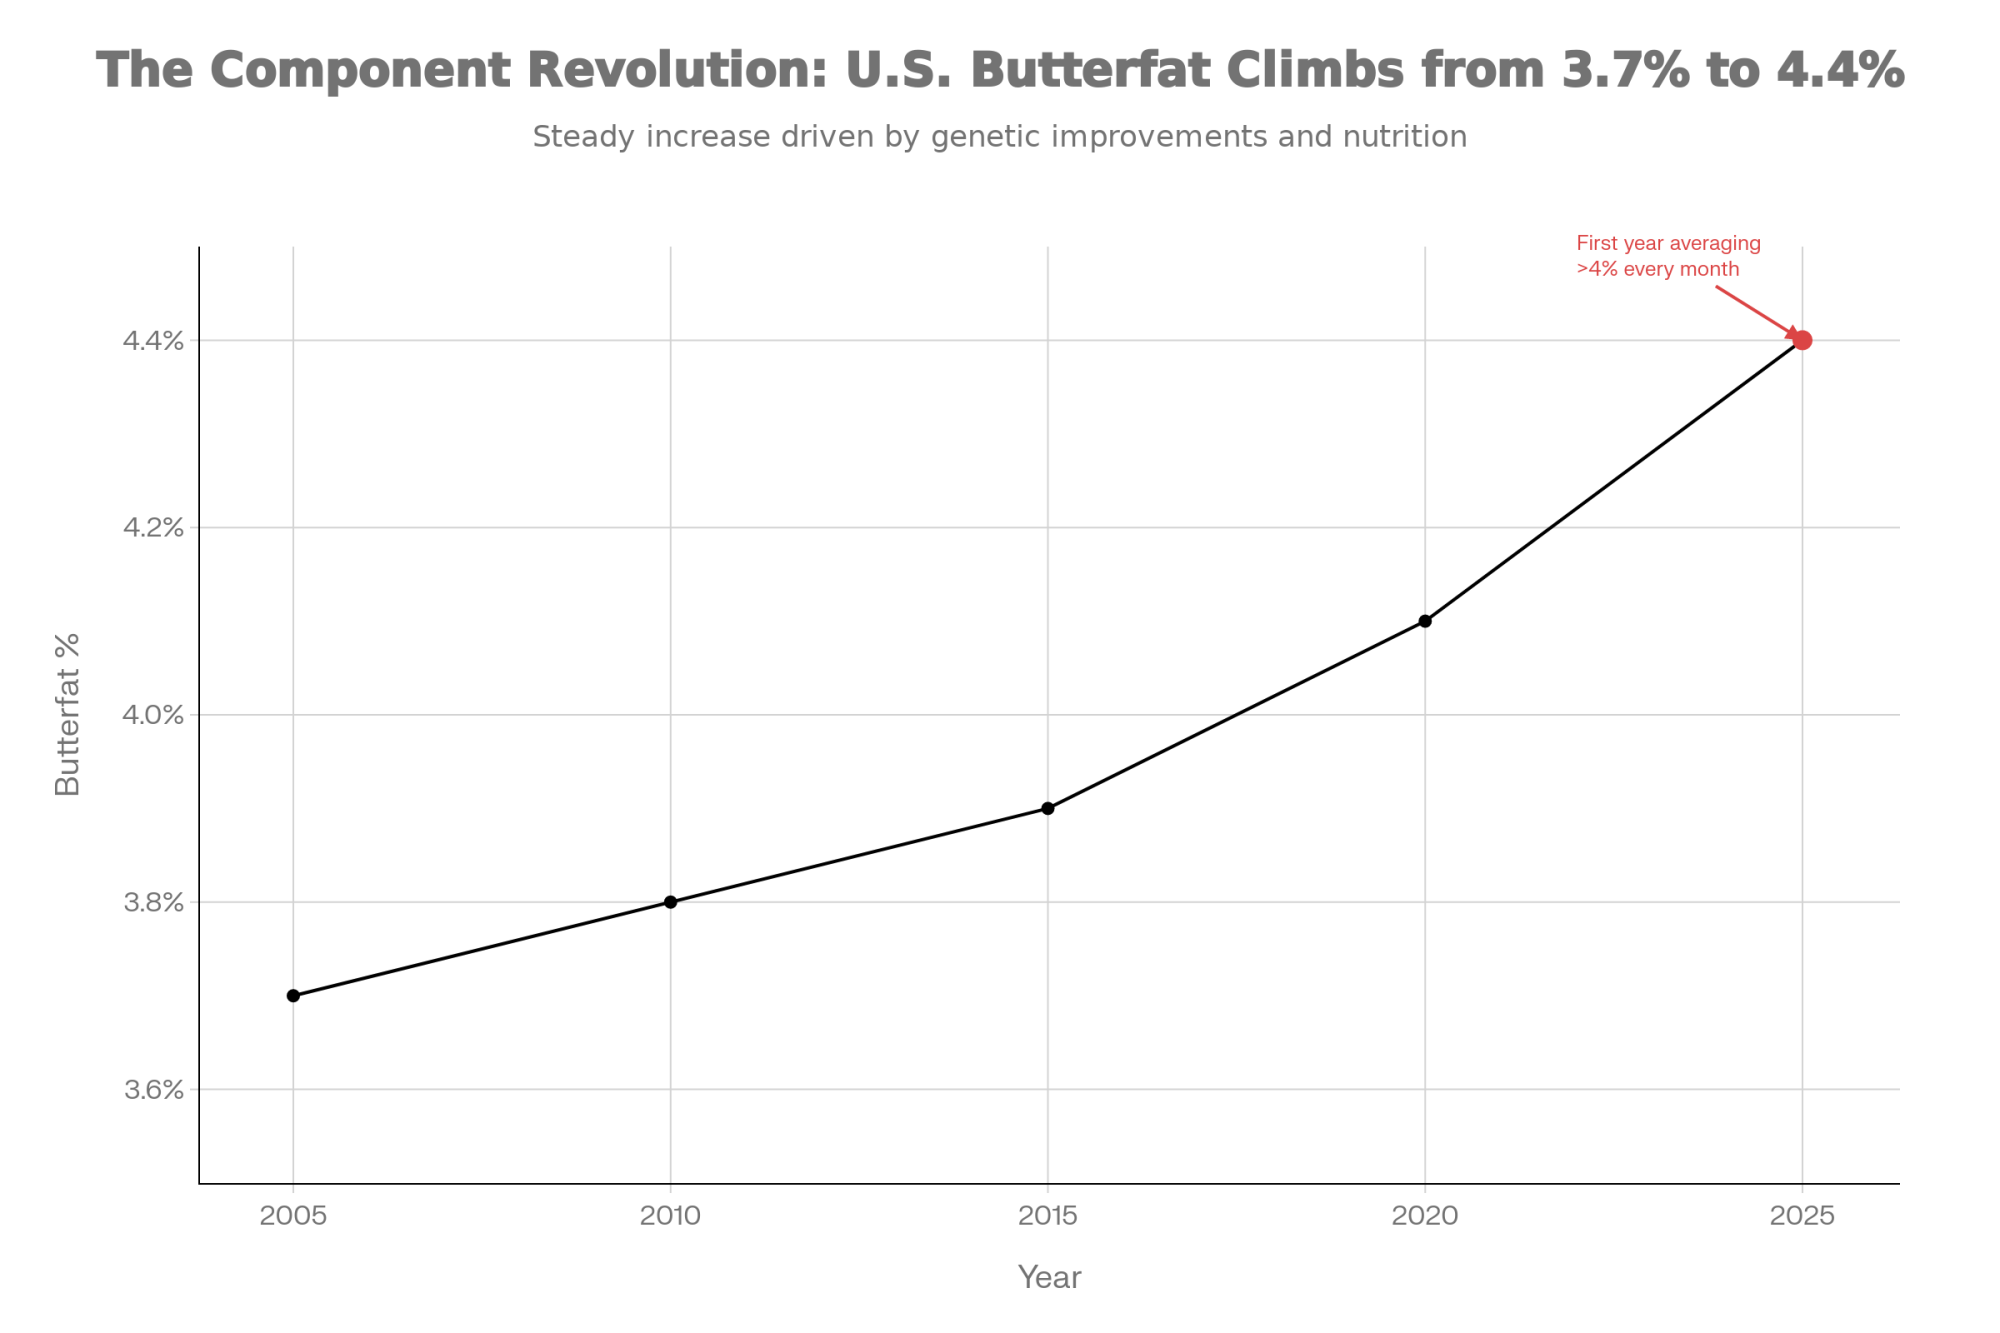
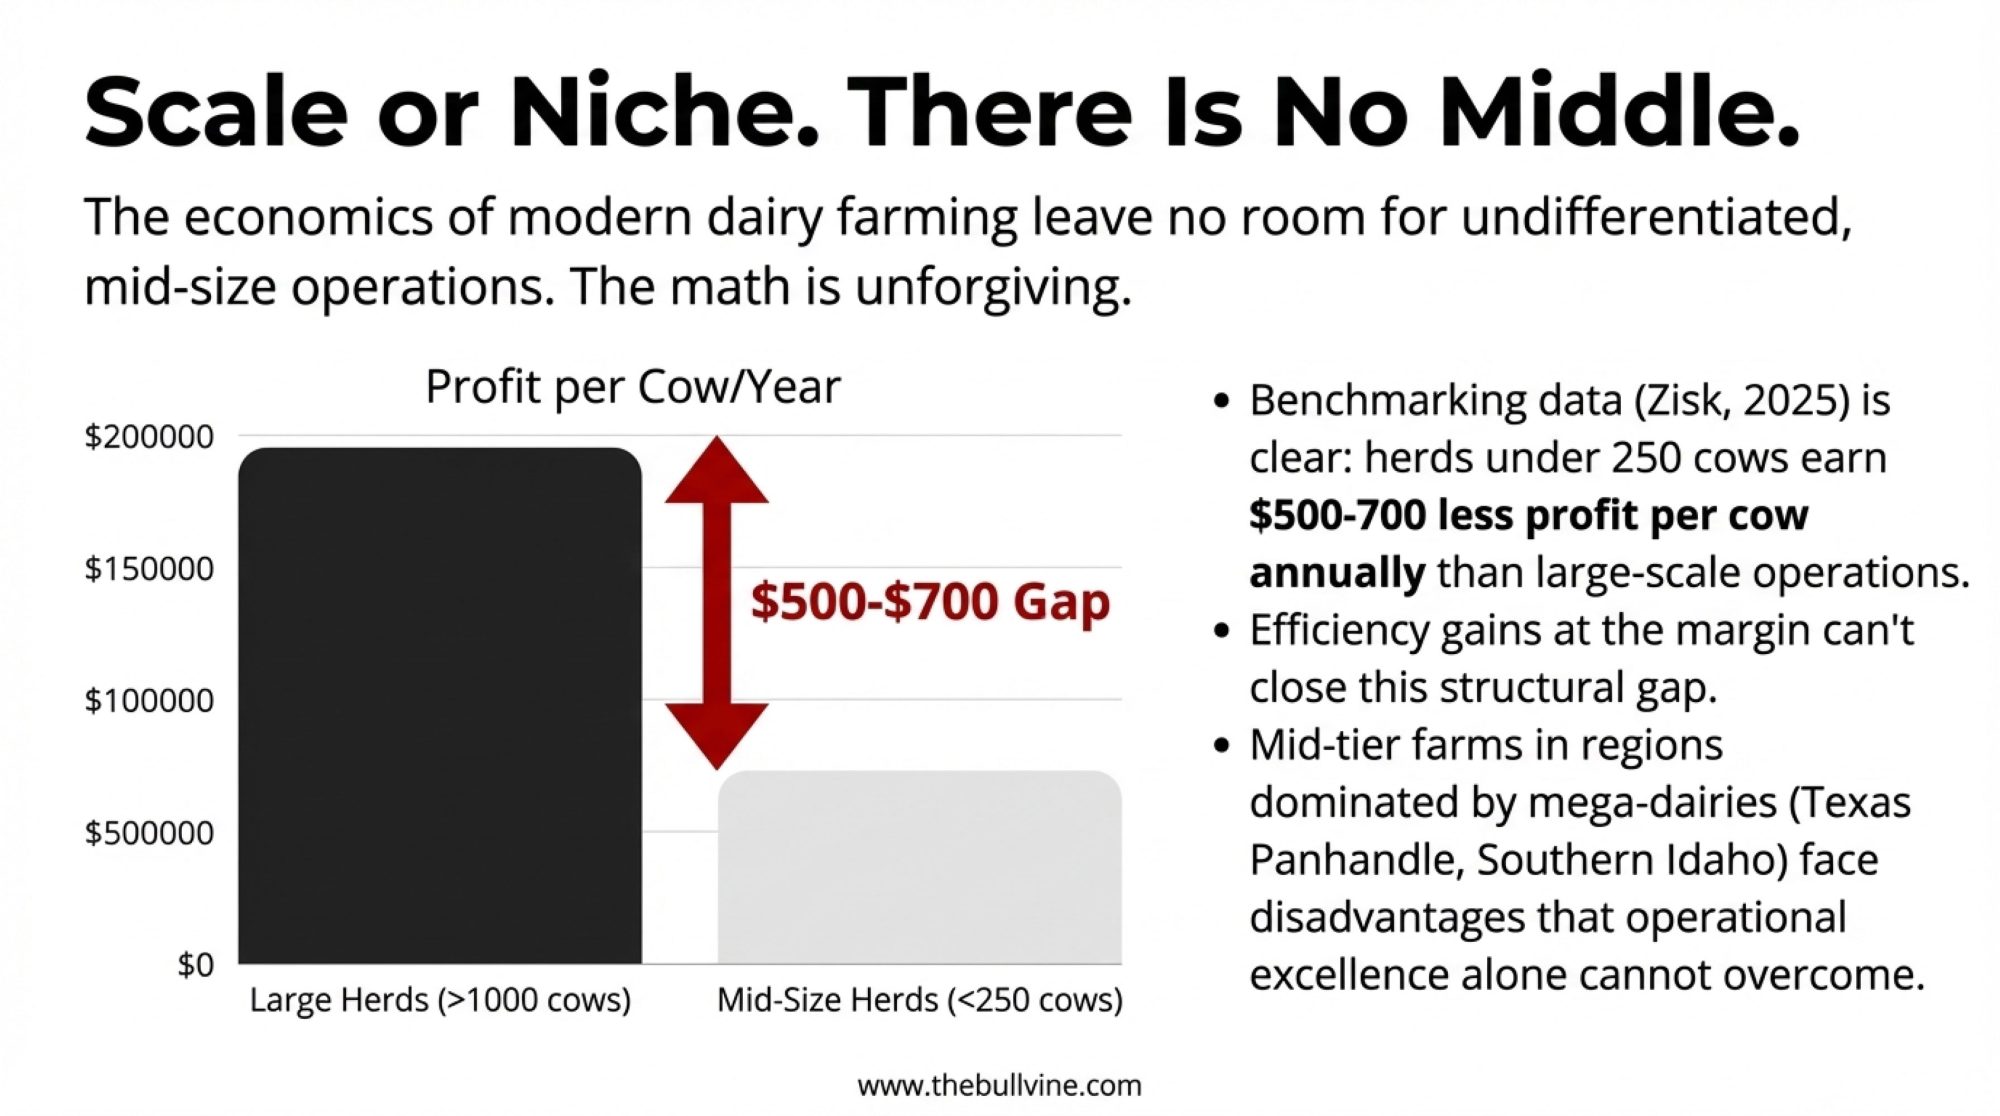
- Sick calves drain $27,000/year from a 1,000-cow herd. That’s treatment, slower growth, and daughters that never reach their genetic potential.
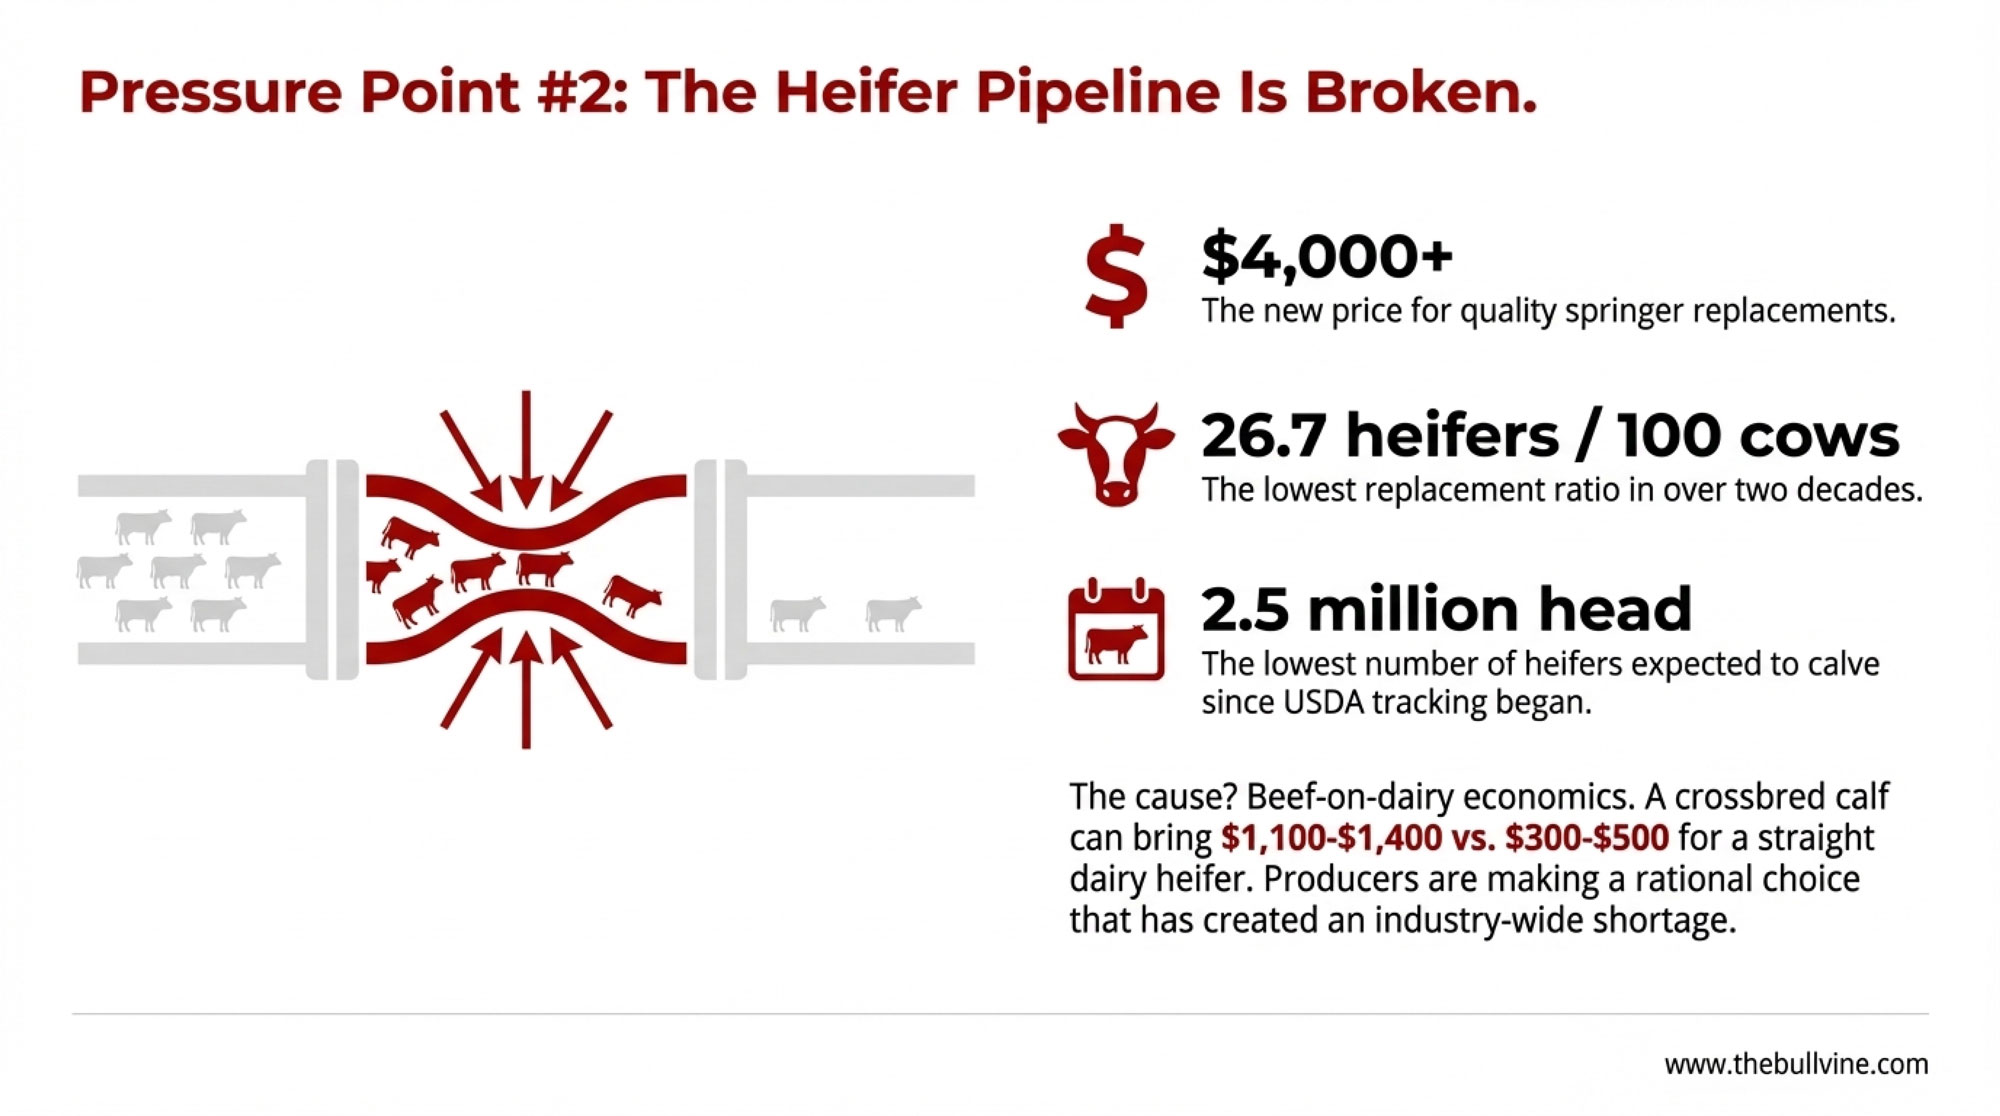
- The breeding math has changed. Beef-cross calves are topping $1,000. Heifers cost $2,500+ to raise. Replacements just hit a 20-year low. Every straw matters.
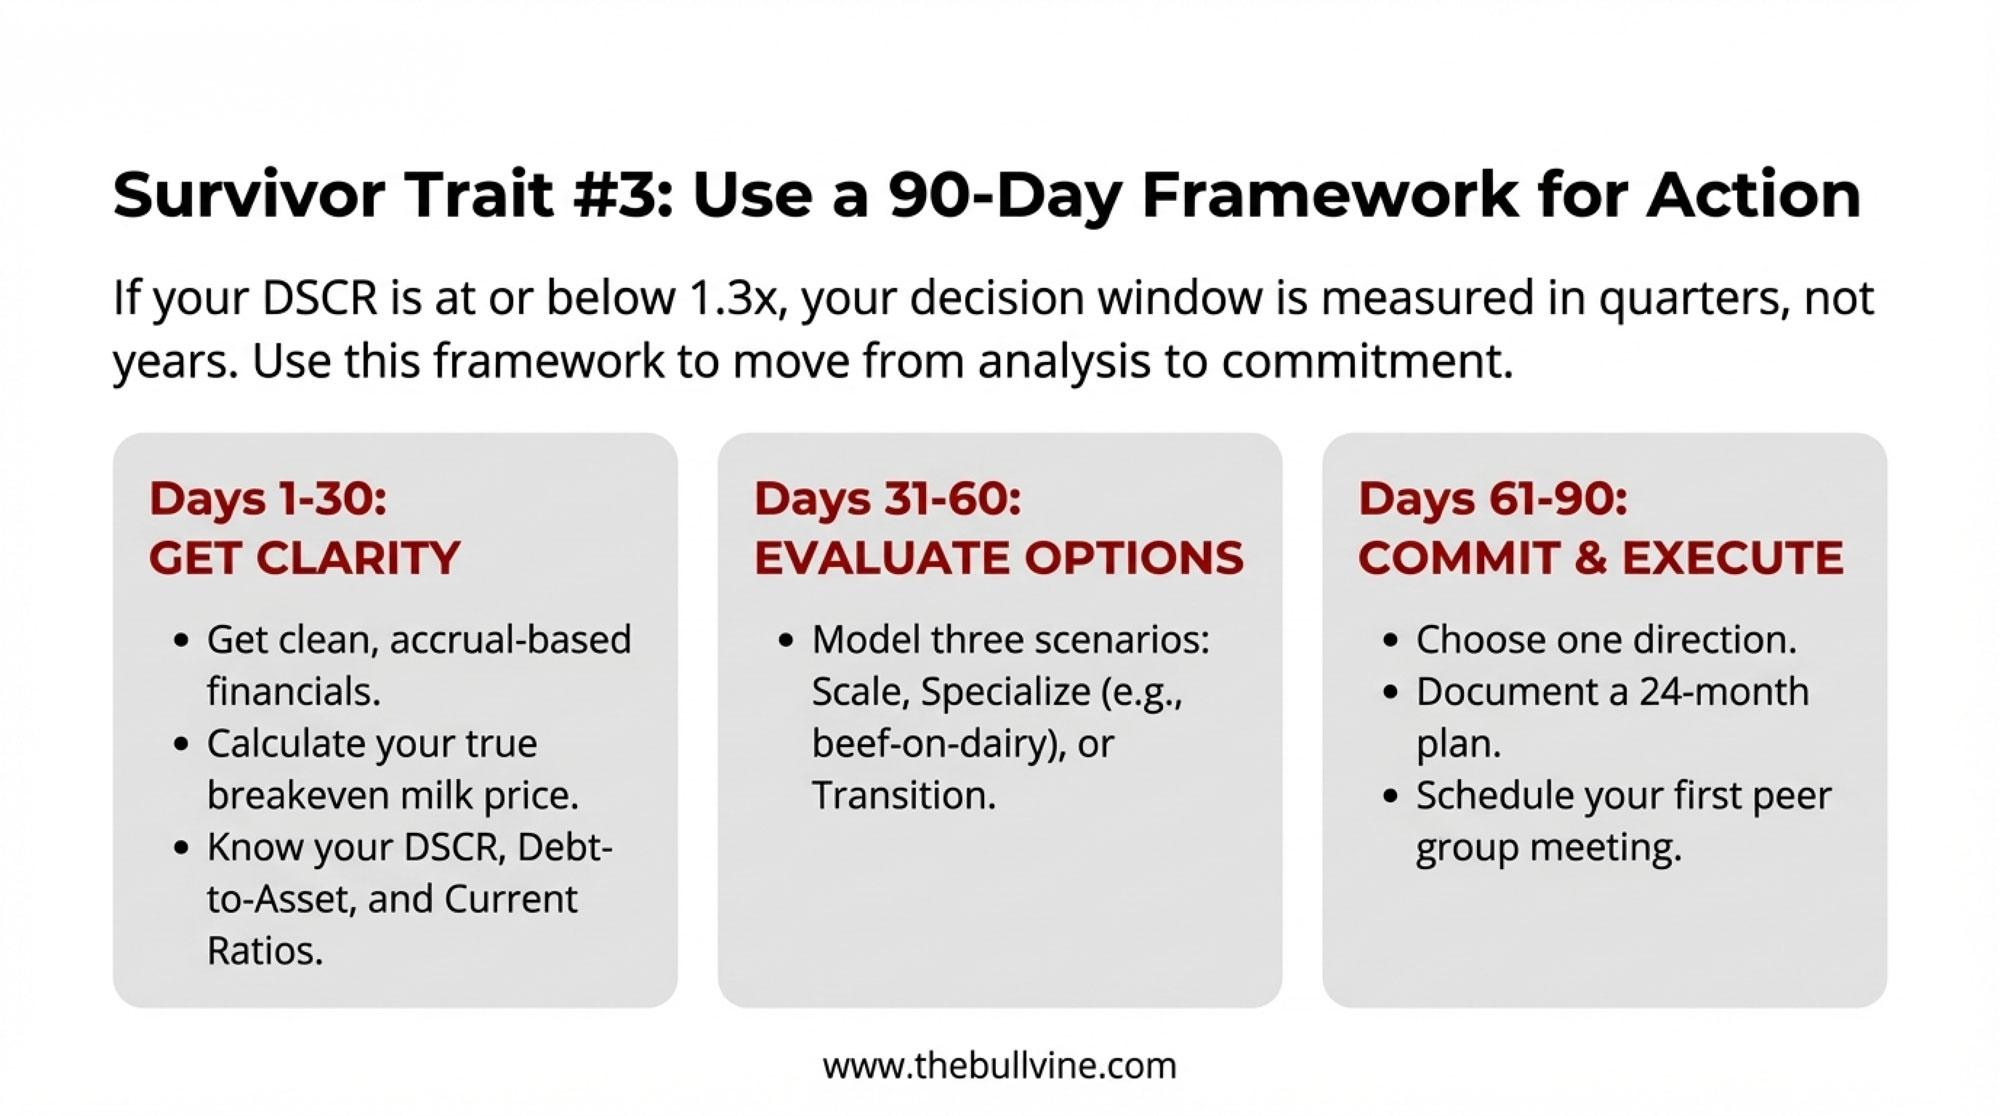
- Five steps shift the money your way. Genomic-test heifers. Set a hard beef-versus-dairy rule. Screen bulls for calf health. Manage calving pressure. Re-check the economics quarterly.
- Act now, bank returns in 18-24 months. Herds implementing this playbook today can realistically add $50,000+ to their bottom line.
Complete references and supporting documentation are available upon request by contacting the editorial team at editor@thebullvine.com.
Learn More
- Beef-on-Dairy’s $500,000 Swing: What 72% of Farms Know That’s Costing You $1,000/Cow Every Year – Reveals how to stop the $1,000-per-cow hemorrhage by aligning genetics with real-world beef premiums, arming you with the specific tactical shifts needed to capture the massive cash-flow opportunity most herds are leaving on the table.
- 438,000 Missing Heifers. $4,100 Price Tags. Beef-on-Dairy’s Reckoning Has Arrived. – Exposes the structural heifer shortage reshaping the industry, delivering the market intelligence you need to navigate record-high replacement costs and position your herd’s inventory for a high-stakes 2027 market rebound.
- The Missing Piece in Genomic Selection: Why the Best Herds Still Walk the Pens – Breaks down why data alone isn’t enough to drive ROI, revealing how elite operations bridge the gap between genomic predictions and on-farm performance to ensure your $5,000 heifer investments actually reach their third lactation.
 Join the Revolution!
 Join the Revolution!
Join over 30,000 successful dairy professionals who rely on Bullvine Weekly for their competitive edge. Delivered directly to your inbox each week, our exclusive industry insights help you make smarter decisions while saving precious hours every week. Never miss critical updates on milk production trends, breakthrough technologies, and profit-boosting strategies that top producers are already implementing. Subscribe now to transform your dairy operation’s efficiency and profitability—your future success is just one click away.