Archive for herd health monitoring

Your Cow’s Breath Knows When SARA Starts. A $3,500 Rumen pH Bolus Trial Proves It.

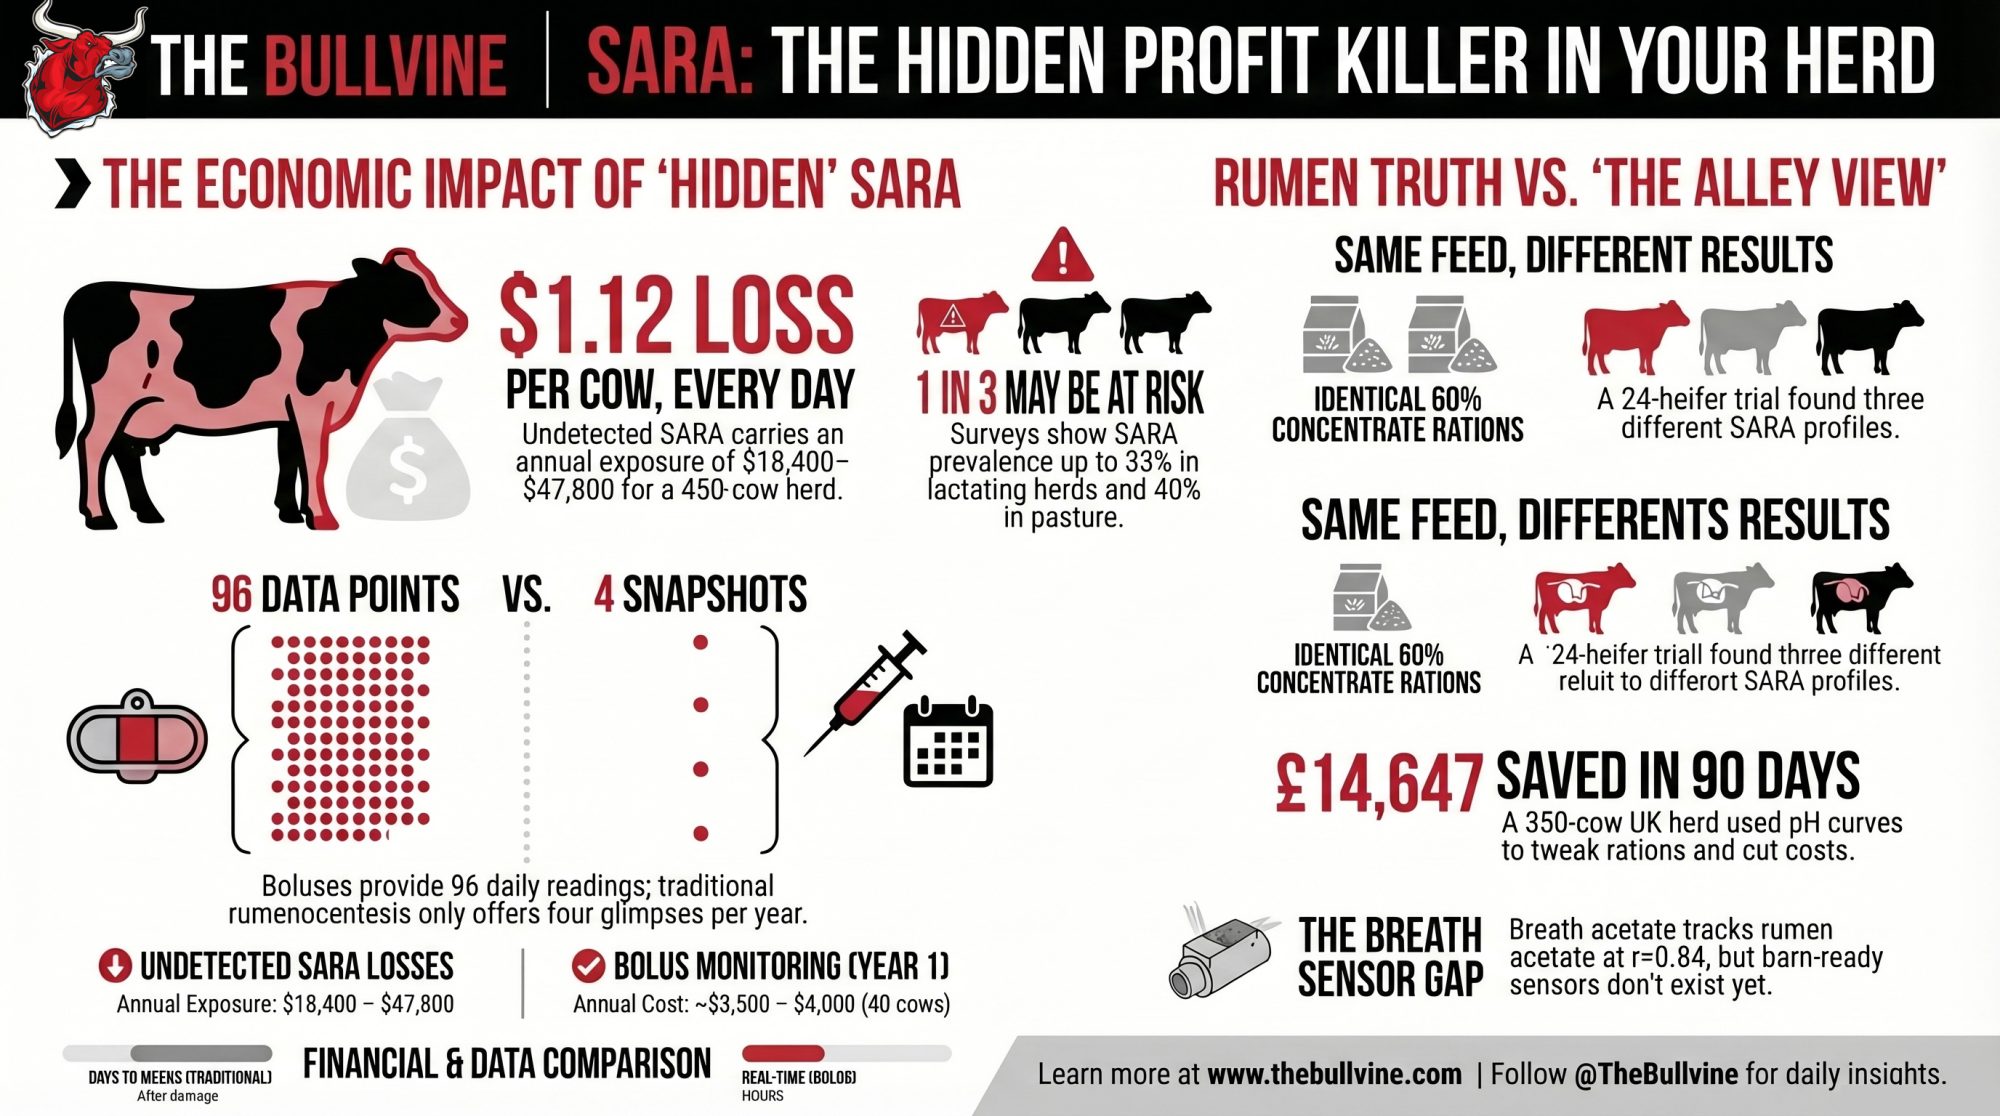
24 heifers, same 60% concentrate ration, same barn—three totally different SARA profiles. The only way anyone saw it was by watching a rumen pH bolus every 15 minutes.

Executive Summary: Continuous pH boluses are already catching SARA patterns that exhalomics can only explain in the lab, and the gap between the two is costing real money. Islam’s JDS work showed breath acetate tracks rumen acetate at r = 0.84, but there’s no affordable barn sensor that can reliably separate a burp from a breath. Meanwhile, Hartinger’s 2024 study bolused 24 first‑lactation cows on the same 60% concentrate ration and found three very different SARA severity clusters, with one extra week on close‑up feed cutting severe SARA odds by 34.5%. Using Stone’s $1.12/cow/day estimate and published prevalence, a 450‑cow herd quietly carries $18,400–$47,800 a year in SARA exposure while relying on four rumen taps and component trends. In contrast, a real 350‑cow UK herd saved £14,647 in 90 days by tweaking the ration twice based on continuous pH curves, with no drop in milk or components. Bolus hardware and data for a 40‑cow trial run about $3,500–$4,000 in year one, and pH sensors last 12–18 months, so the real decision is whether that subscription buys more than another DA surgery and a few lame cows. If you’re serious about collars, feeding tweaks, or future breath sensors, this piece walks through how pH curves can calibrate the tech you already own and show you what four needles a year are missing.

Rumen pH boluses

Picture a 450-cow freestall on a Tuesday afternoon. High-starch TMR. Collars on most cows. Ration hasn’t changed on paper. Cows chewing, tank on target, manure acceptable. Everything looks fine from the alley.

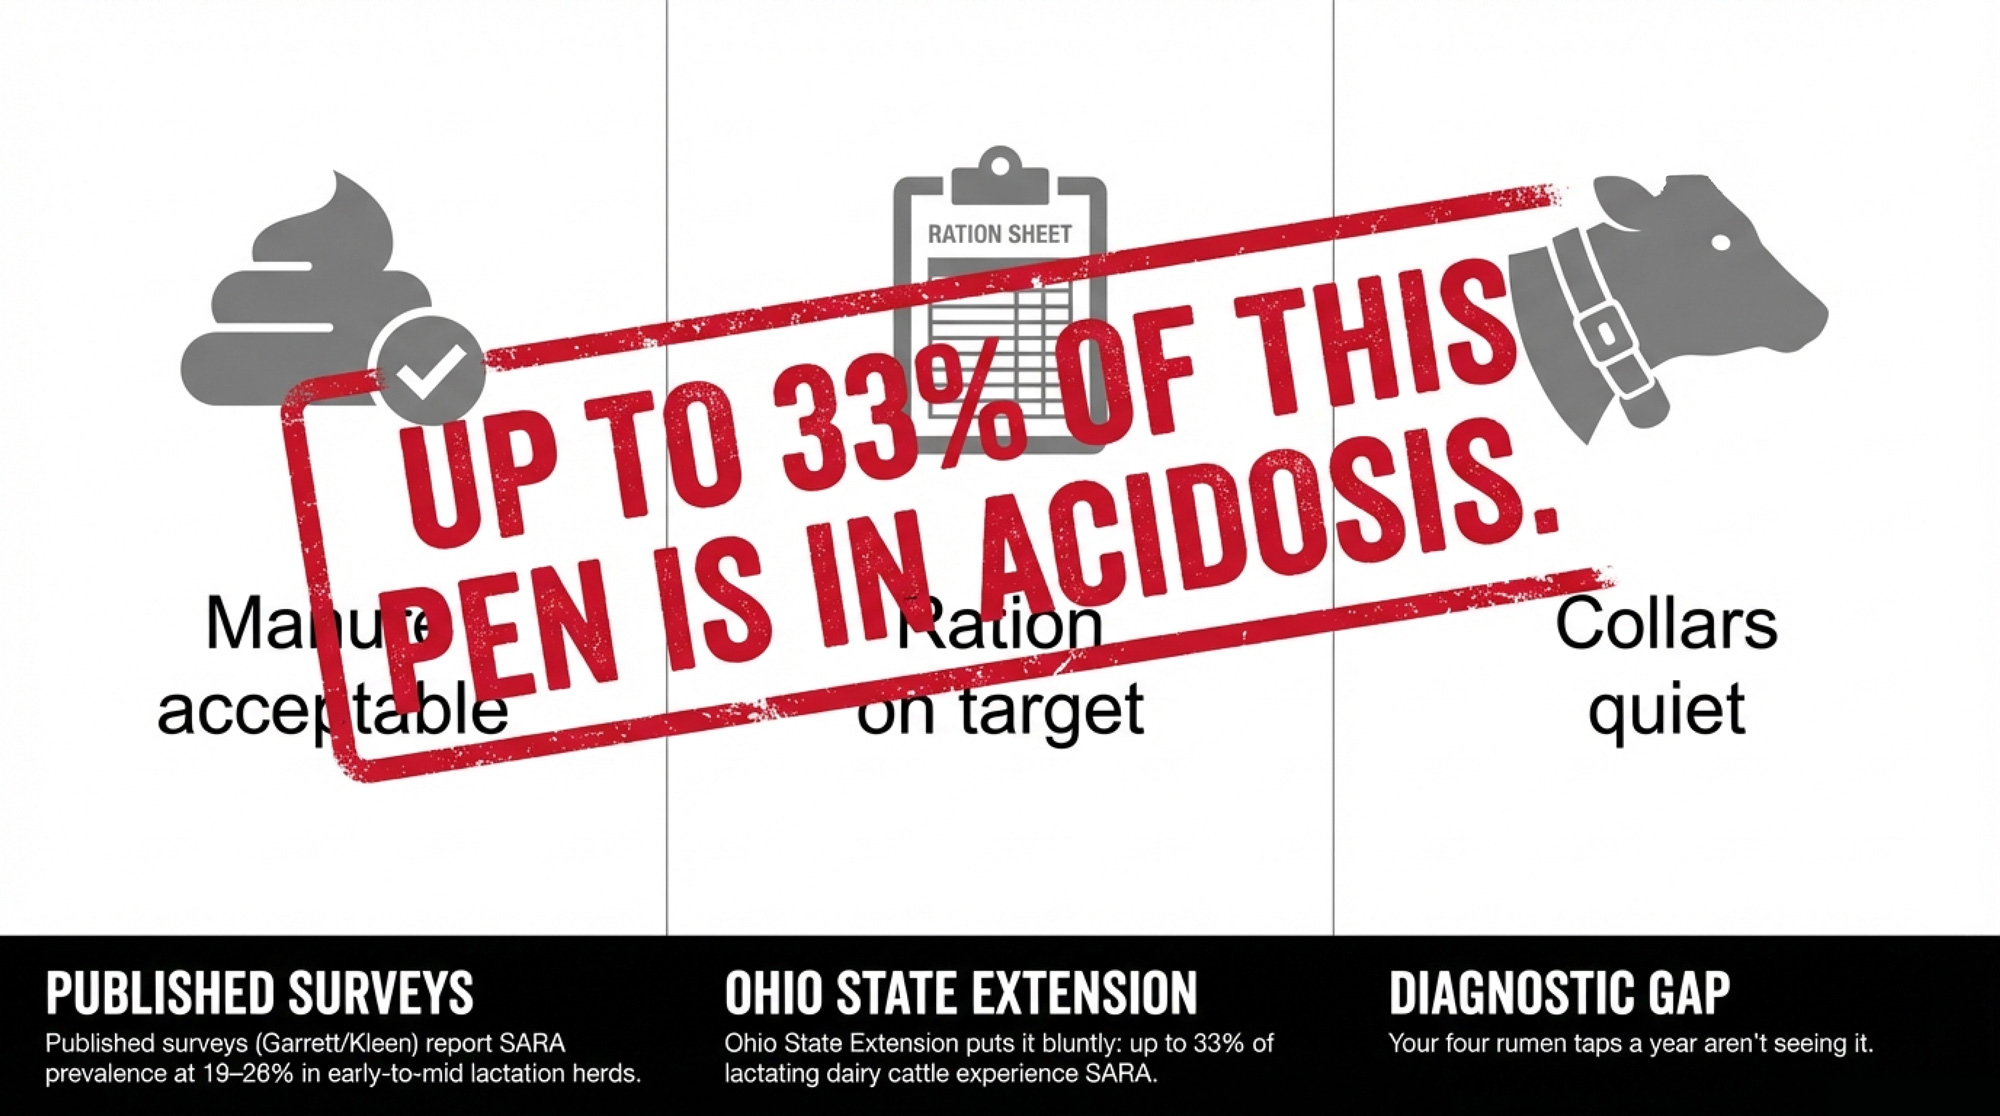
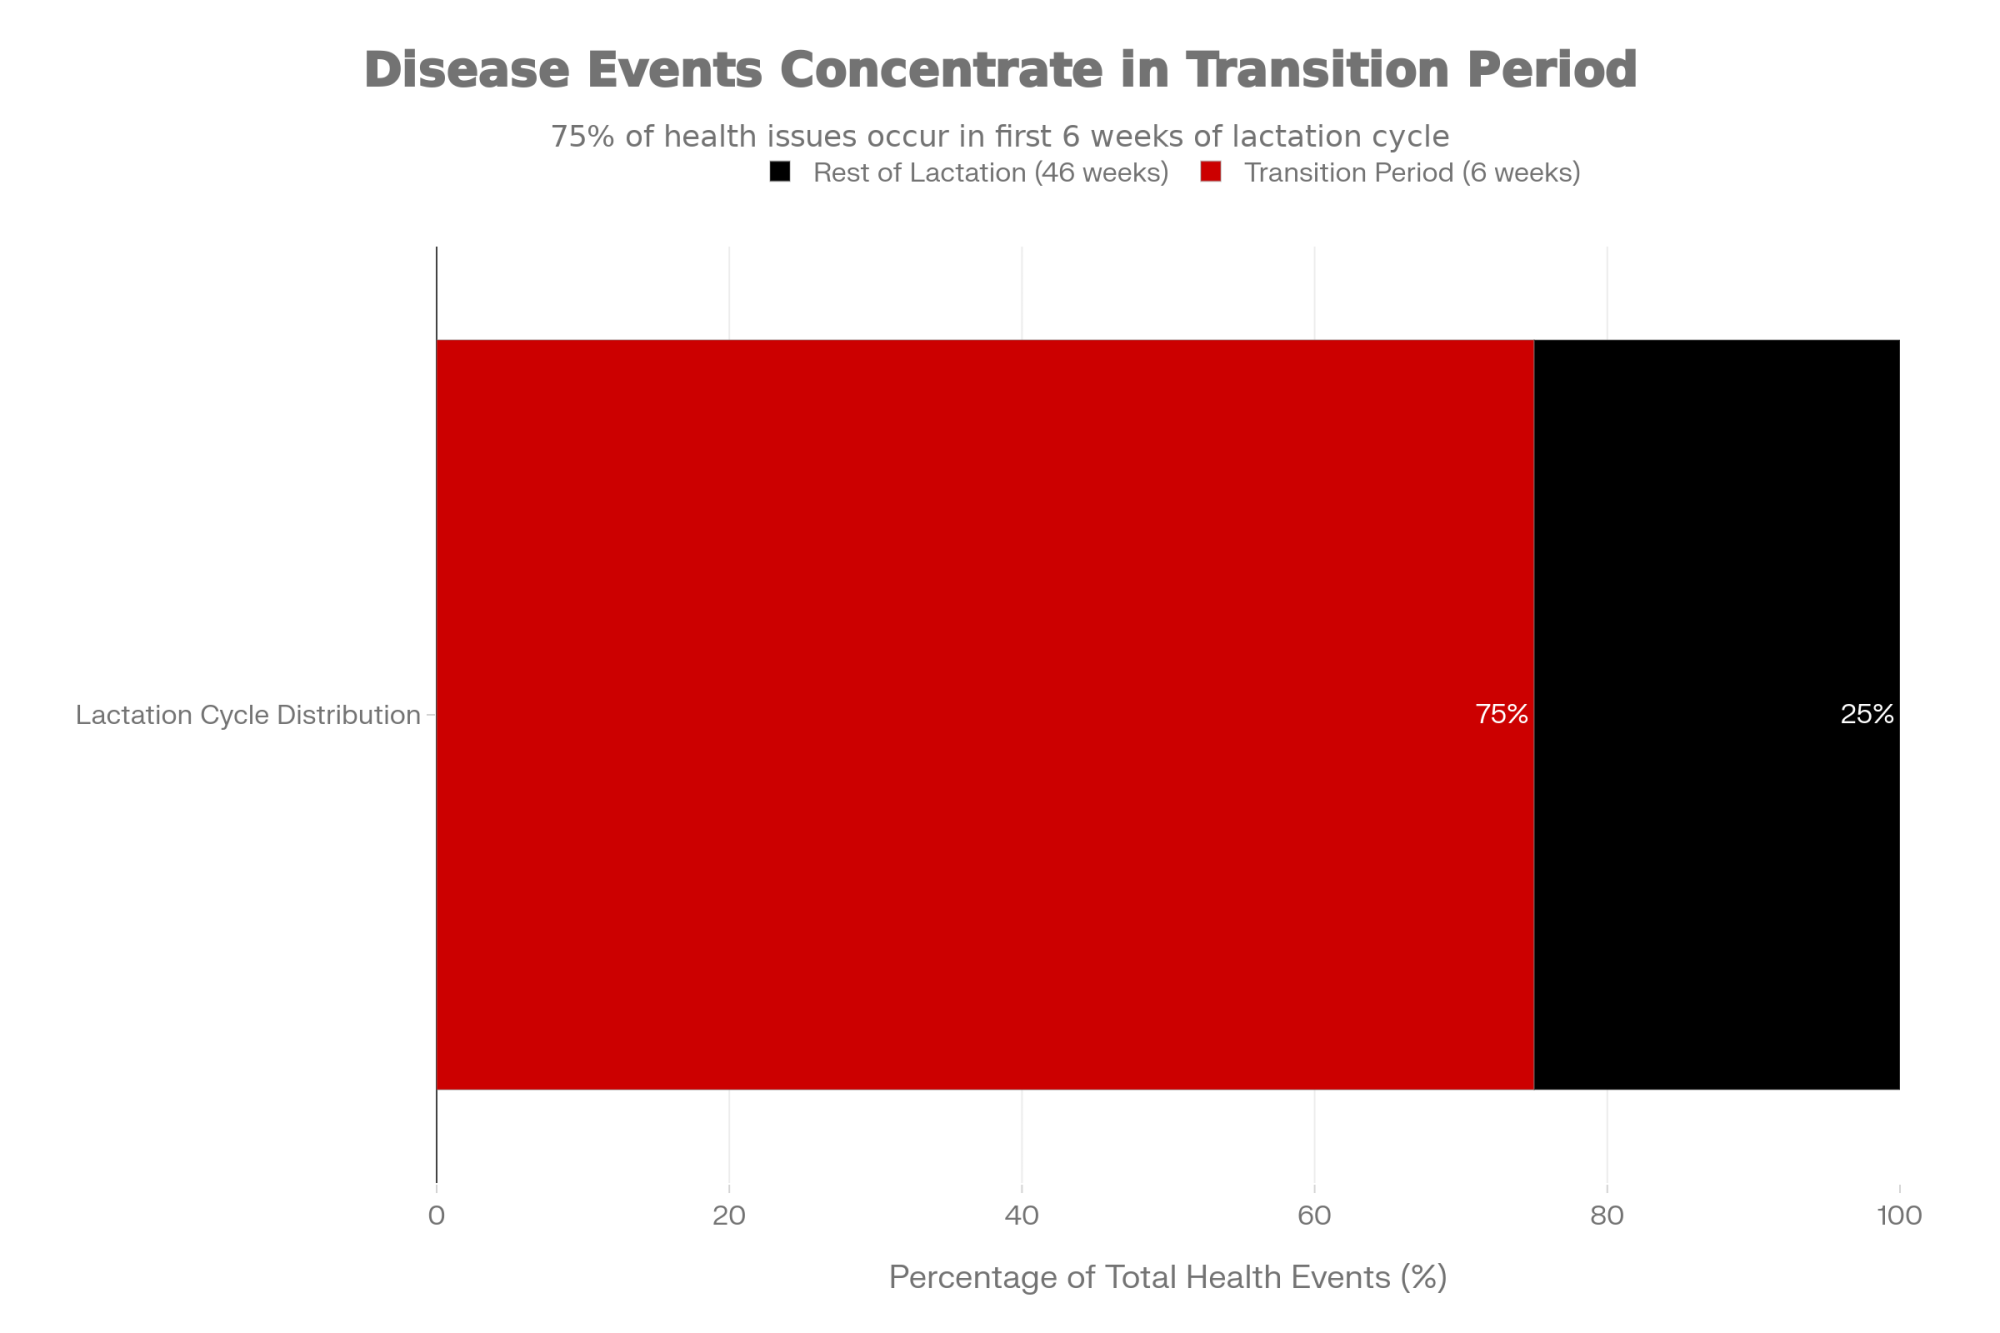
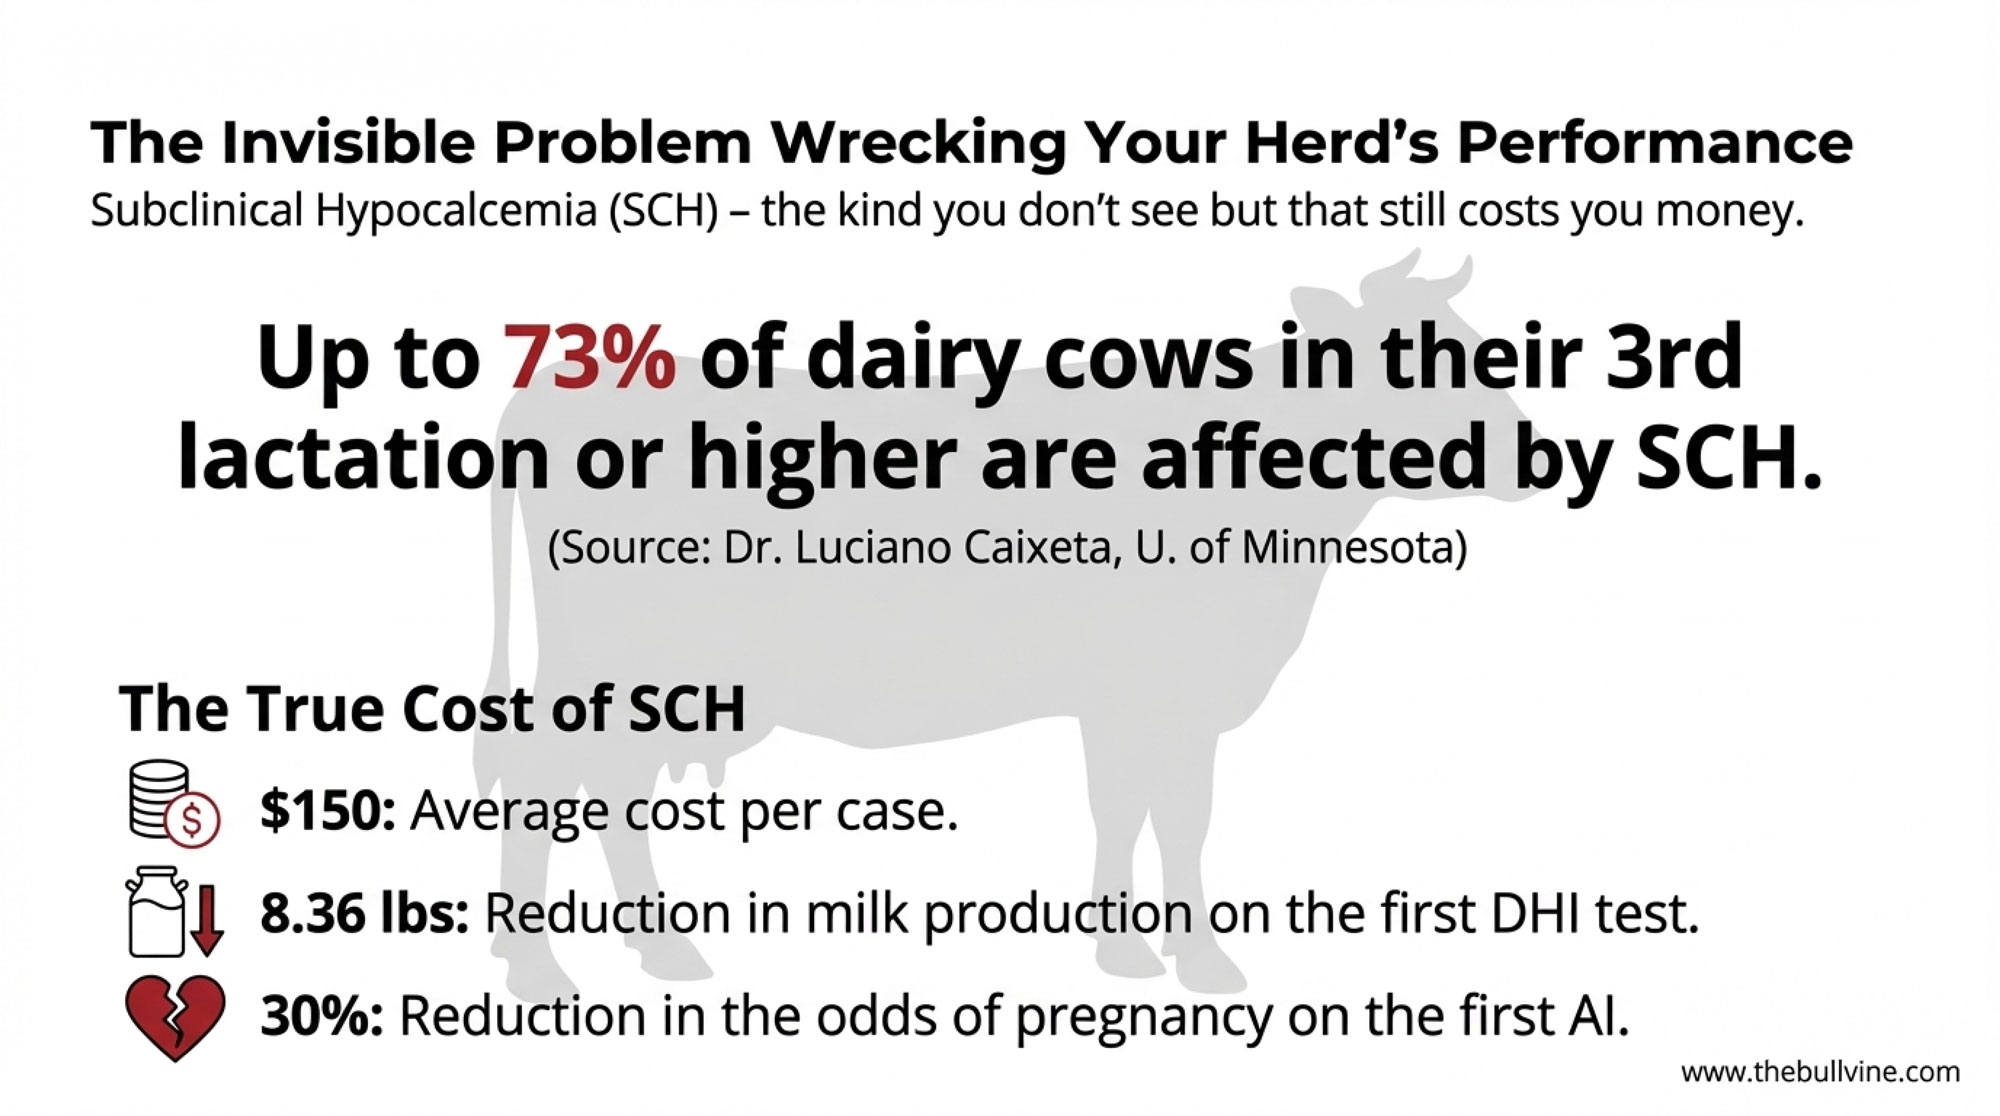
Now picture this: a set of rumen pH boluses in the fresh pen indicates that a quarter of those cows spent more than four hours below pH 5.8 yesterday. Nobody walking through the barn caught it. Published surveys report SARA prevalence at 19–26% in early-to-mid lactation U.S. Holstein herds (Garrett et al. 1997), with European data from Kleen et al. (2013) confirming similar rates across German dairies. Ohio State Extension puts it bluntly: up to 33% of dairy cattle experience SARA during lactation, and up to 40% of pasture cattle have a pH below 5.8. Ontario’s Ministry of Agriculture says if more than 30% of sampled cows sit at or below pH 5.5, consider the whole feeding group at risk. Your four rumenocentesis visits a year aren’t seeing this — and a lab in Zurich has proven it can read those fermentation signals from a field called exhalomics: the metabolic fingerprint in a cow’s exhaled breath.

The science works. The barn sensor doesn’t exist yet. And every progressive operation faces the same question: wait for the perfect tool, or start building your data infrastructure now with what you can actually buy?

What the Breath Data Actually Shows

Islam et al. published a Journal of Dairy Science paper in 2024 measuring volatile organic compounds in cow breath using high-resolution mass spectrometry. They fed cows two distinct starch levels — 16.2% versus 6.3% dry matter — and compared what showed up in exhaled air against what was happening in rumen fluid. The correlations landed hard:

  • Breath acetate tracked rumen acetate at r = 0.84–0.85
  • Breath propionate tracked at r = 0.74
  • The acetate-to-propionate ratio in breath tracked rumen A:P at r = 0.80

The analytical platforms driving this — SESI-MS and PTR-MS — detect compounds at parts-per-trillion levels. Think of an electronic nose that could pick out a single molecule of vinegar in an Olympic pool. These instruments identified over 1,298 unique chemical features in the bovine exhalome, capturing volatile fatty acids, ketone bodies, and metabolites that reflect both rumen fermentation and whole-animal metabolism simultaneously.

The Ketosis Signal Worth Watching

Work by Dobbelaar et al. (1996, Veterinary Quarterly) demonstrated that breath acetone correlates with blood BHB with r = 0.81 in dairy cows. More recent temporal evidence points to a 24-to-48-hour head start on intervention compared to conventional testing — breath acetone levels rise faster than changes detectable in milk ketone composition. If this holds up across herds and seasons, your fresh cow protocol could shift from catching clinical ketosis to intercepting it before signs ever appear.

The data on cross-herd reproducibility is thin. But the biological logic is solid: acetone is the most volatile ketone body and crosses the alveolar membrane freely. The question isn’t whether the signal exists. It’s about whether anyone can reliably capture it in a barn.

Why You Can’t Buy This Yet

Here’s where the exhalomics story gets honest.

SESI-MS and PTR-MS setups run into six figures once you add the mass spectrometer, ionization source, installation, and ongoing support. GreenFeed units, used in many exhalomics trials to capture eructation events and methane, cost tens of thousands per unit. Even if you wrote those cheques, VOC stability tests on collection bags show that some compounds degrade or climb as they interact with bag material. The ETH Zurich team calls out sample degradation as a key limitation — proximity to the lab is critical.

Walking samples down the hall in Zurich is one thing. Shipping them across Ontario, Wisconsin, or Alberta is another.

But the commercial gap isn’t just about price and logistics. There’s a harder technical problem that the correlation coefficients don’t warn you about.

What Happens When a Burp Corrupts Your Breath Data?

Not all cow “breath” is created equal. This is the detail that separates the lab results from what a barn sensor would actually face.

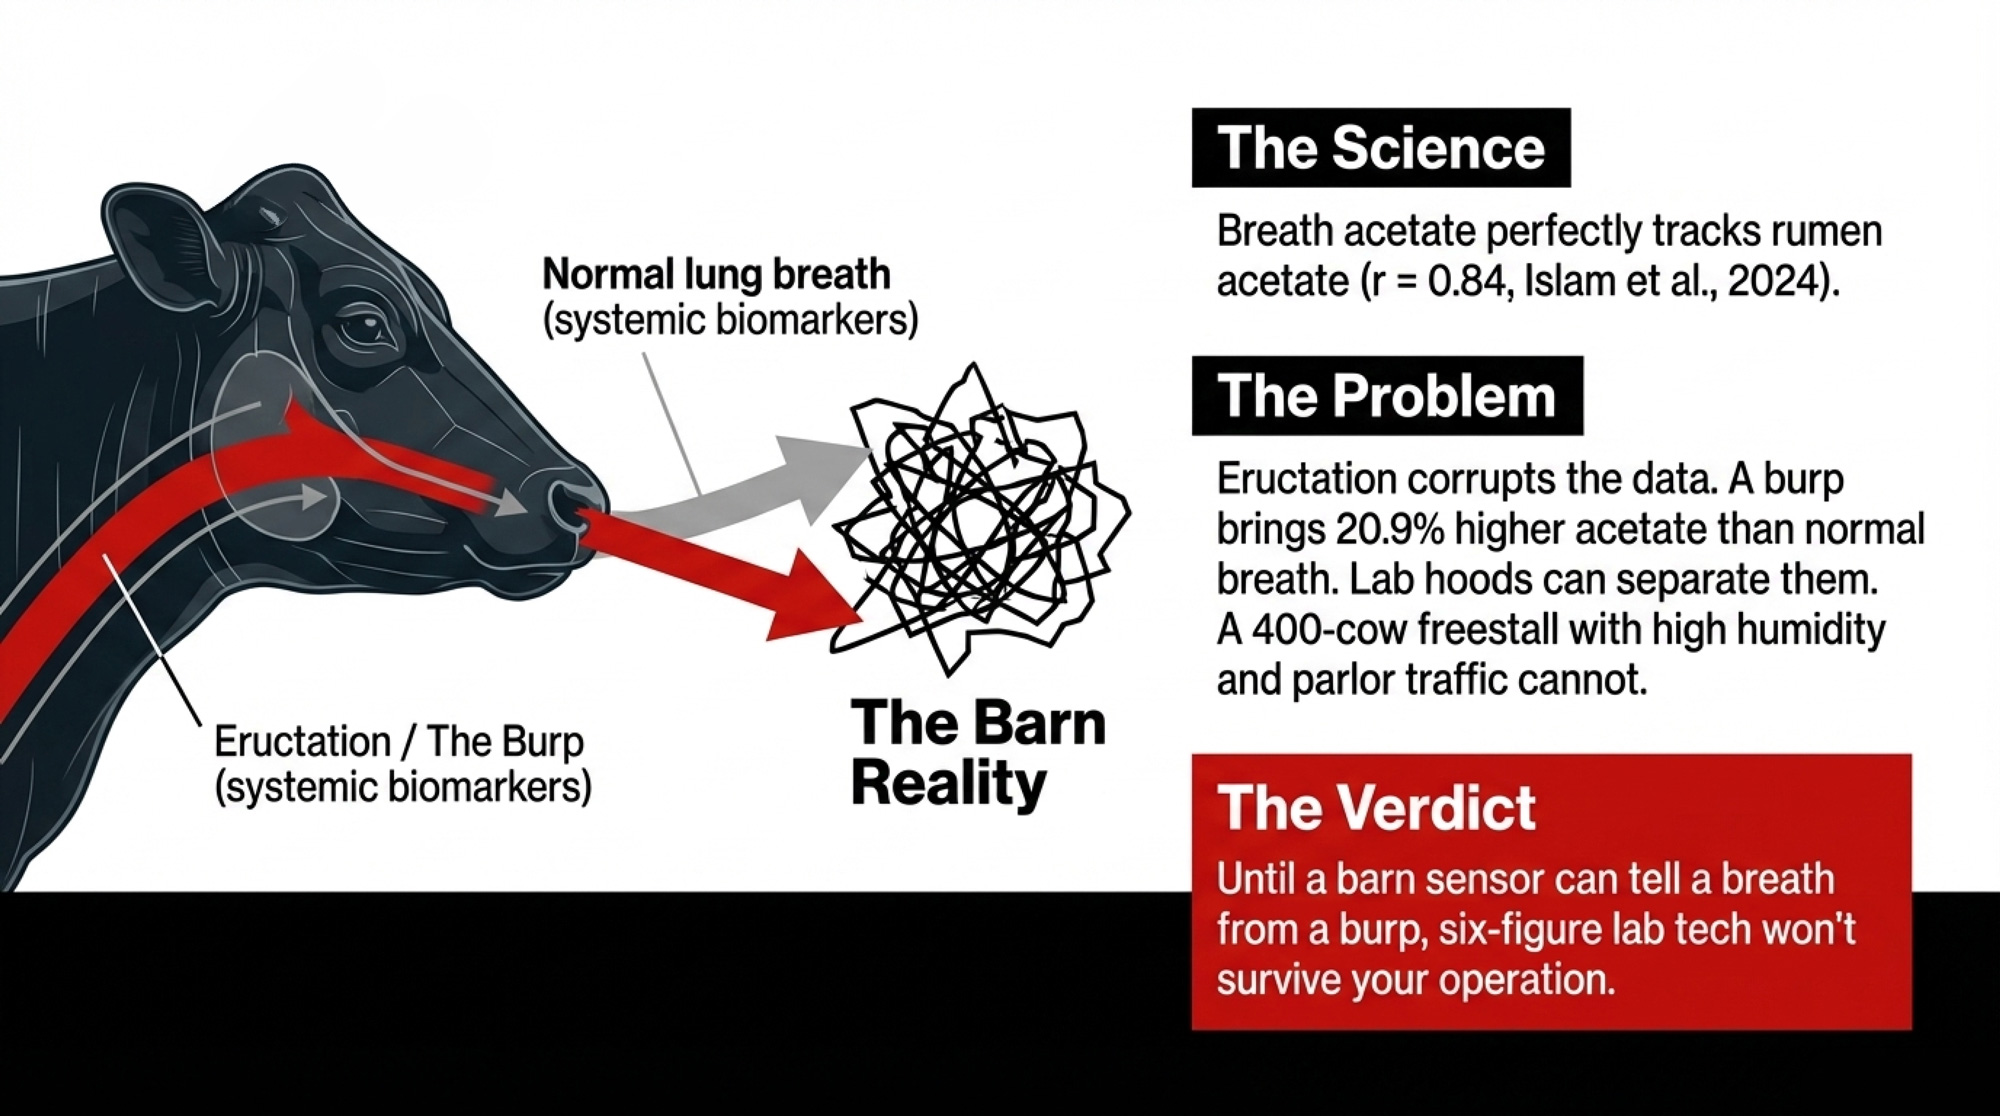
Eructation brings rumen headspace gas — VFA-rich, methane-heavy, straight from the fermentation vat. Normal nasal breathing carries lung air with systemic biomarkers but a much lighter rumen fingerprint. Barrientos Blanco et al. (2025) measured the difference: eructation-dominated samples had 20.9% higher acetate, 27.4% higher propionate, and 32.7% higher butyrate concentrations than respiratory breath samples.

On a real cow, those two streams mix at the muzzle. The lab solution is elegant: use GreenFeed or custom hoods to capture eructation events, then monitor methane in real time as a gate signal. When methane spikes, you’re in an eructation window. When it drops, you’re sampling respiratory breath. That works in a controlled setting with a dedicated unit and an analyst watching the screen. In a 400-cow freestall with high humidity, parlor traffic, and nobody spare? Different story.

Until a commercial system can tell the difference between a burp and a breath under barn conditions, the correlations from Zurich don’t transfer cleanly to your operation. That’s not a reason to ignore the science. It’s a reason to build your baseline with a tool that goes straight to the source.

The $3,500 Bridge You Can Deploy This Month

If the rumen is the organ you’re trying to monitor, a bolus sitting in the reticulum is about as direct as it gets. And unlike a breath sensor, boluses are commercially available now — smaXtec launched its latest dedicated pH bolus in September 2025, and the company is actively pushing into North American herds from its U.S. base in Madison, Wisconsin.

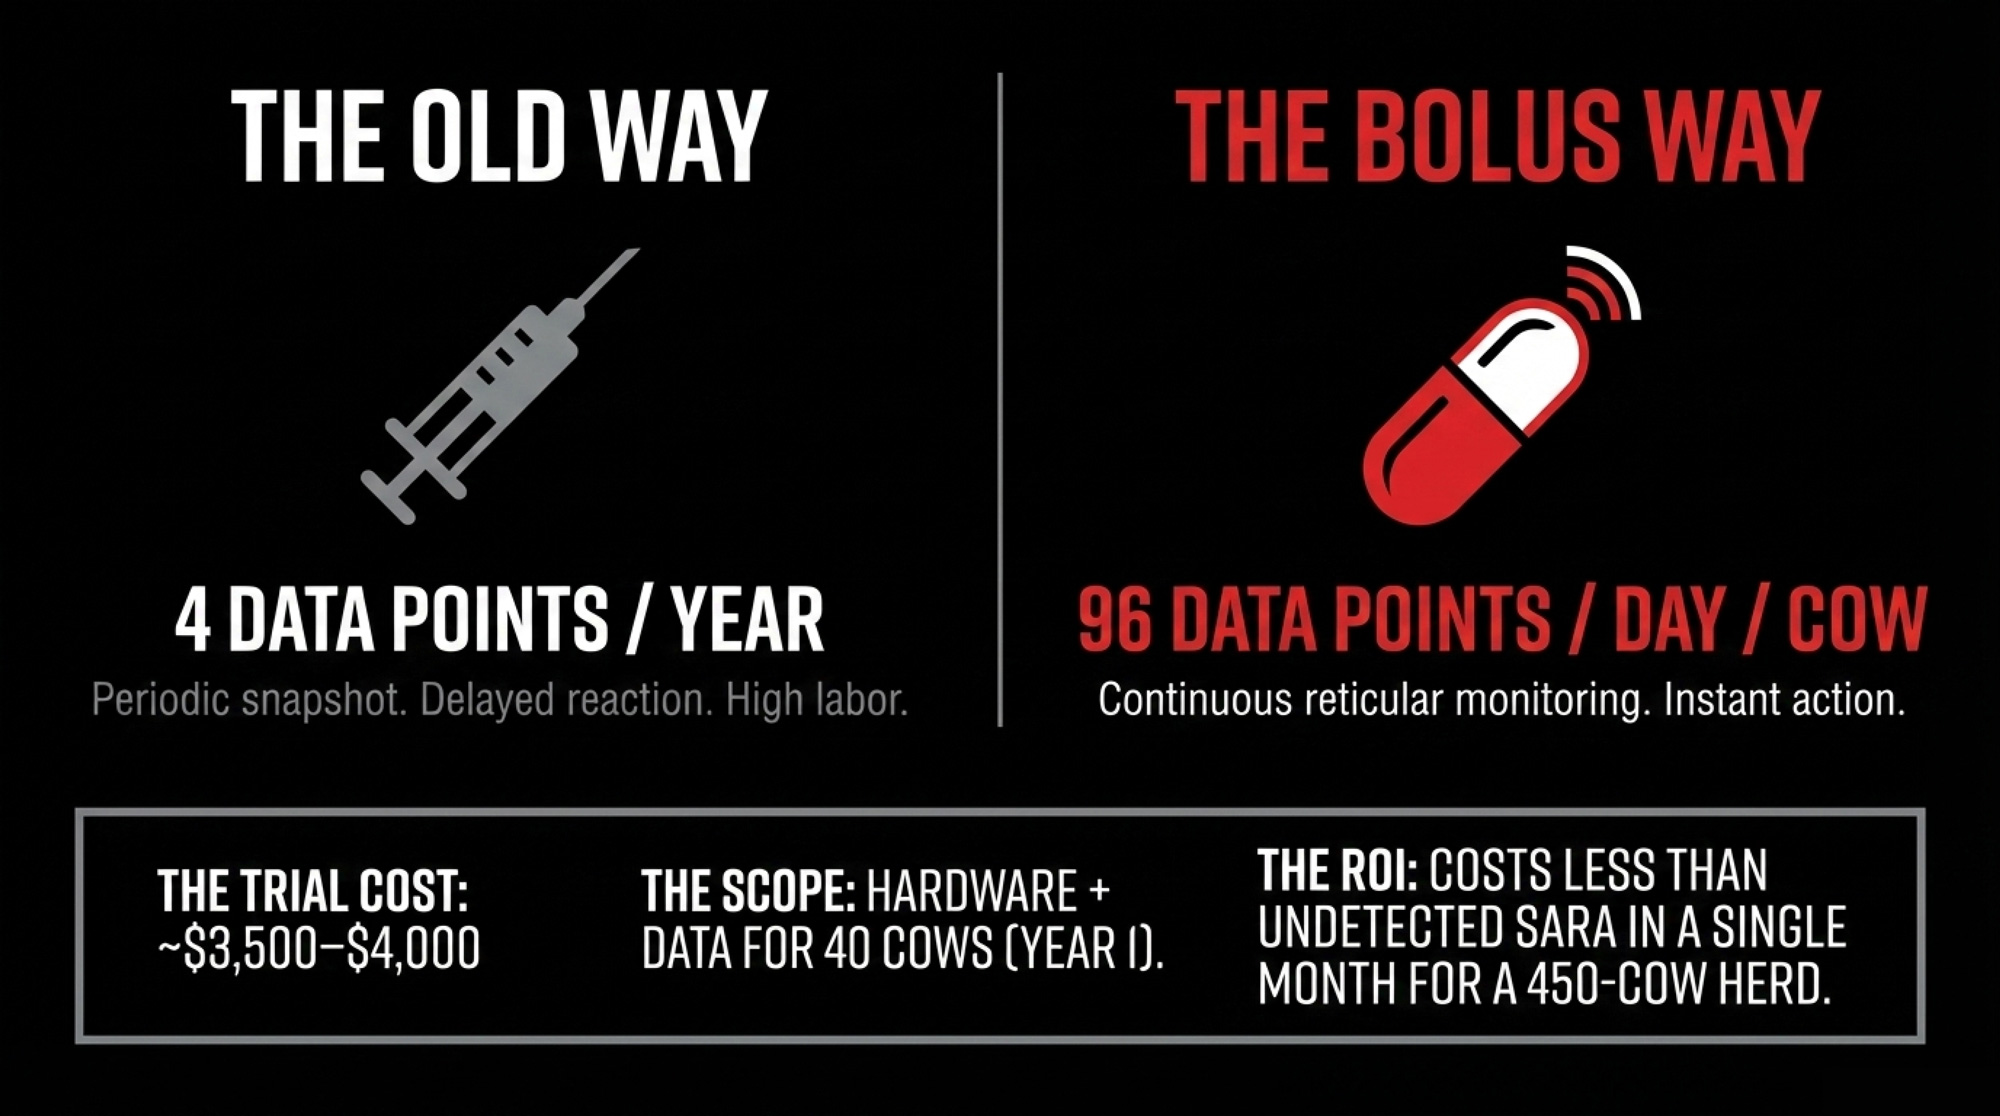
Rumen pH boluses record pH every 10–15 minutes, giving you up to 96 data points per day per cow. Over a 60-day trial on one pen, that’s roughly 5,760 readings per cow. Compare that to four rumenocentesis visits a year.

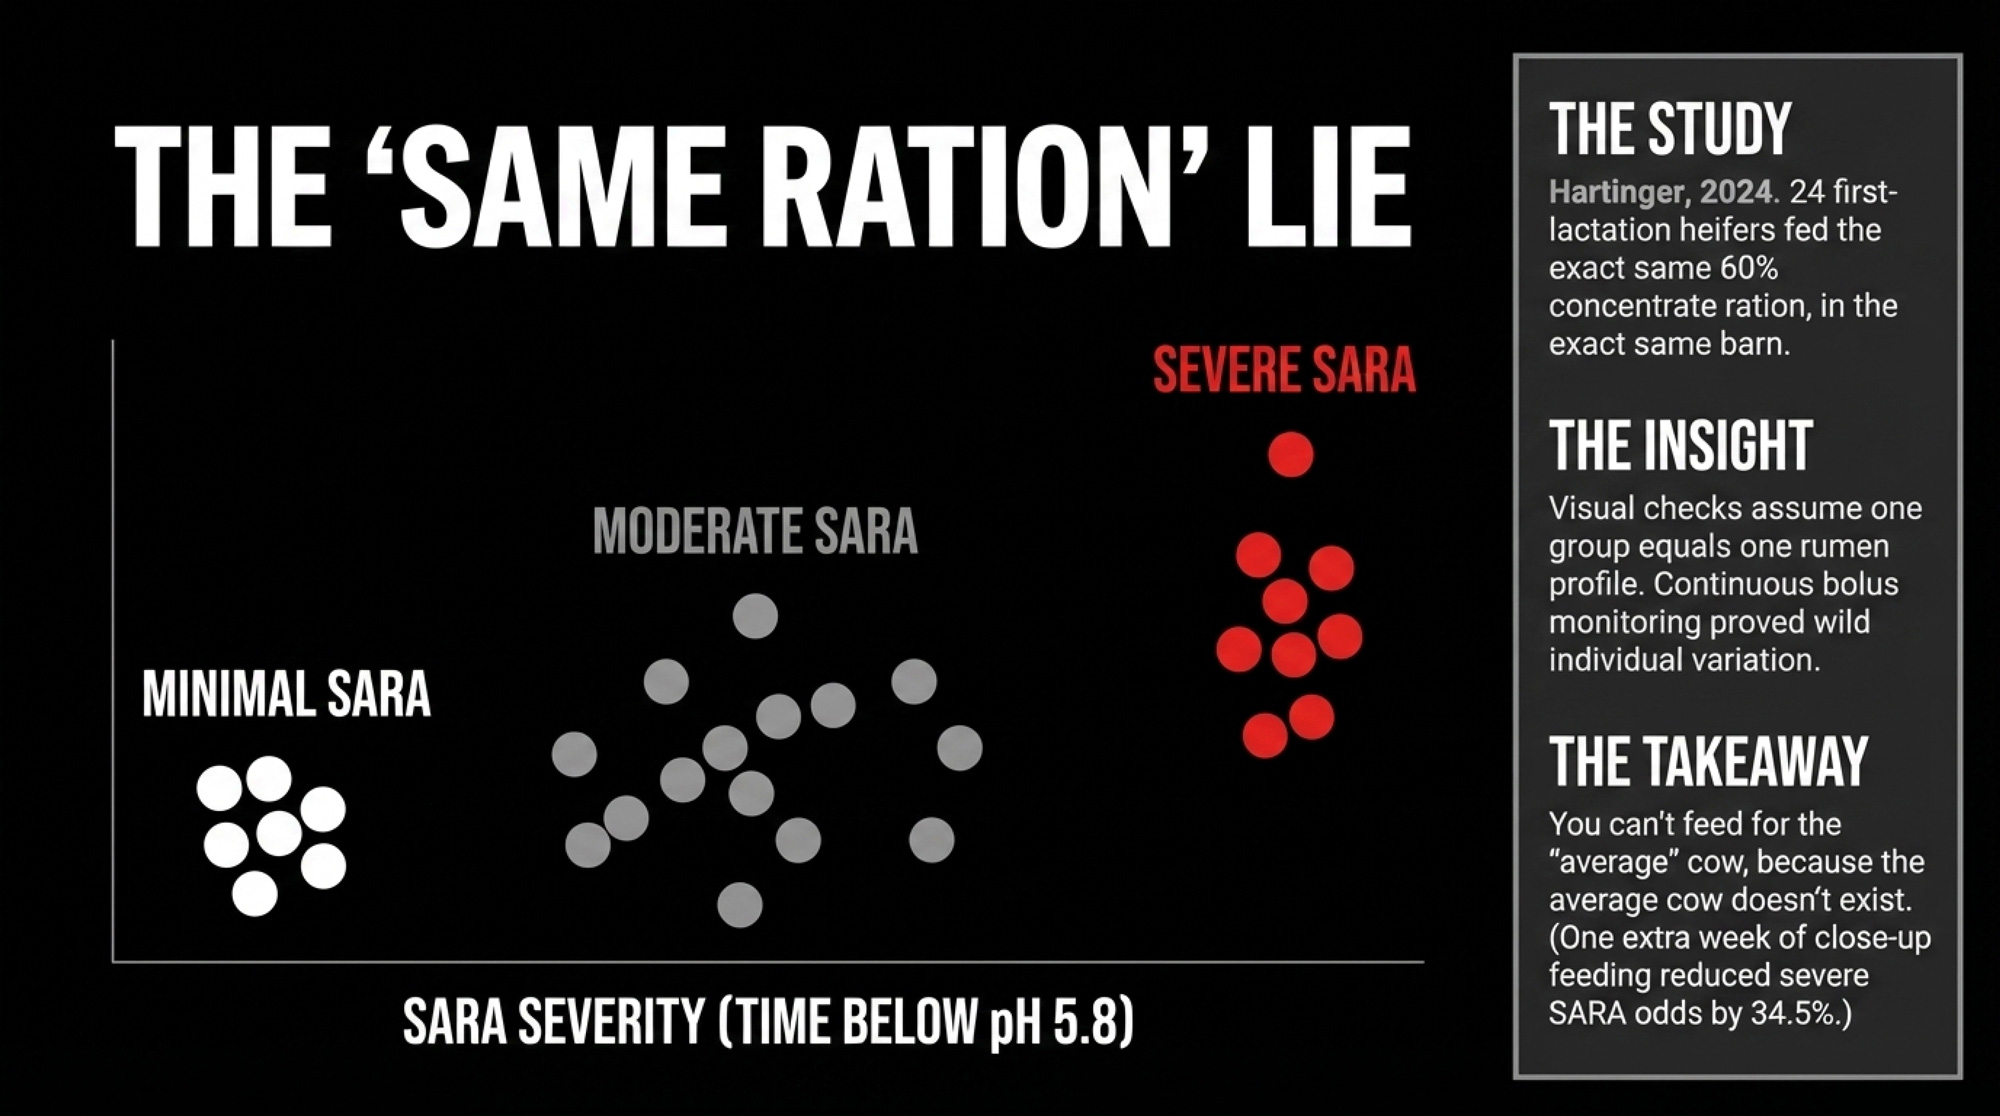
Here’s what makes this uncomfortable. Hartinger et al. (2024) bolused 24 first-lactation Holsteins at the VetFarm research station in Pottenstein, Austria — every heifer on the same 60% concentrate lactation ration. When they clustered the pH data, they didn’t find two groups. They found three. Six cows experienced minimal SARA, exceeding the pH 5.8 threshold for more than 330 minutes on just 7% of experimental days. Nine cows hit that threshold on 20–87% of days. Same feed. Same barn. Wildly different rumens. And one extra week of close-up feeding reduced the odds of severe SARA by 34.5%.

Snapshot rumenocentesis couldn’t have caught that. Neither your collars nor manure scoring alone. Only continuous monitoring revealed the individual variation hiding inside a group that, from the alley, looked like one herd on one ration.

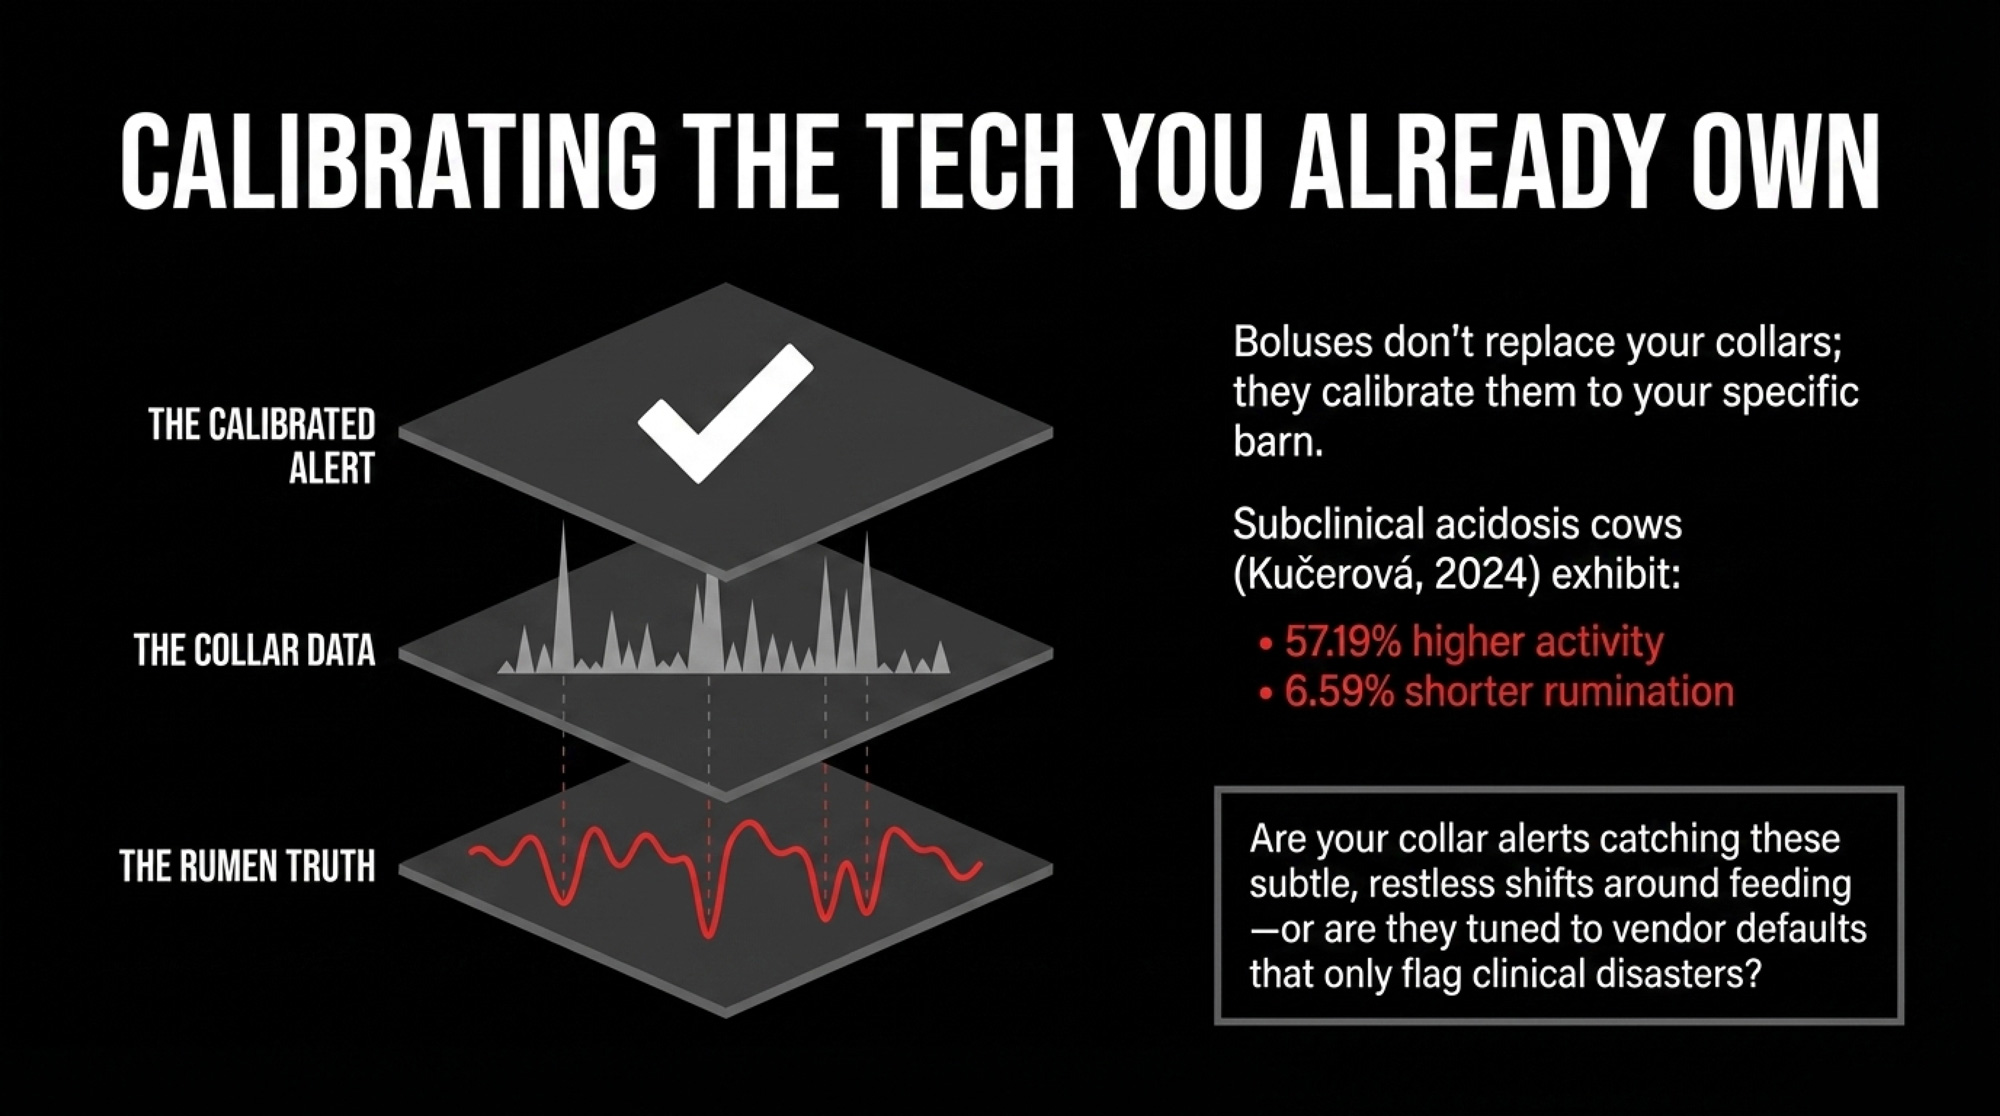
Kučerová et al. (2024) added another layer, finding that subclinical acidosis cows showed an 18.8% lower reticulorumen pH, an 11.88% lower fat-to-protein ratio, a 6.59% shorter rumination time, and a 57.19% higher activity compared to healthy herd mates. Your collars might already be flagging some of these cows. But without rumen truth underneath, you’re reading signals without a reference point.

The Trade-Offs Nobody Puts on the Brochure

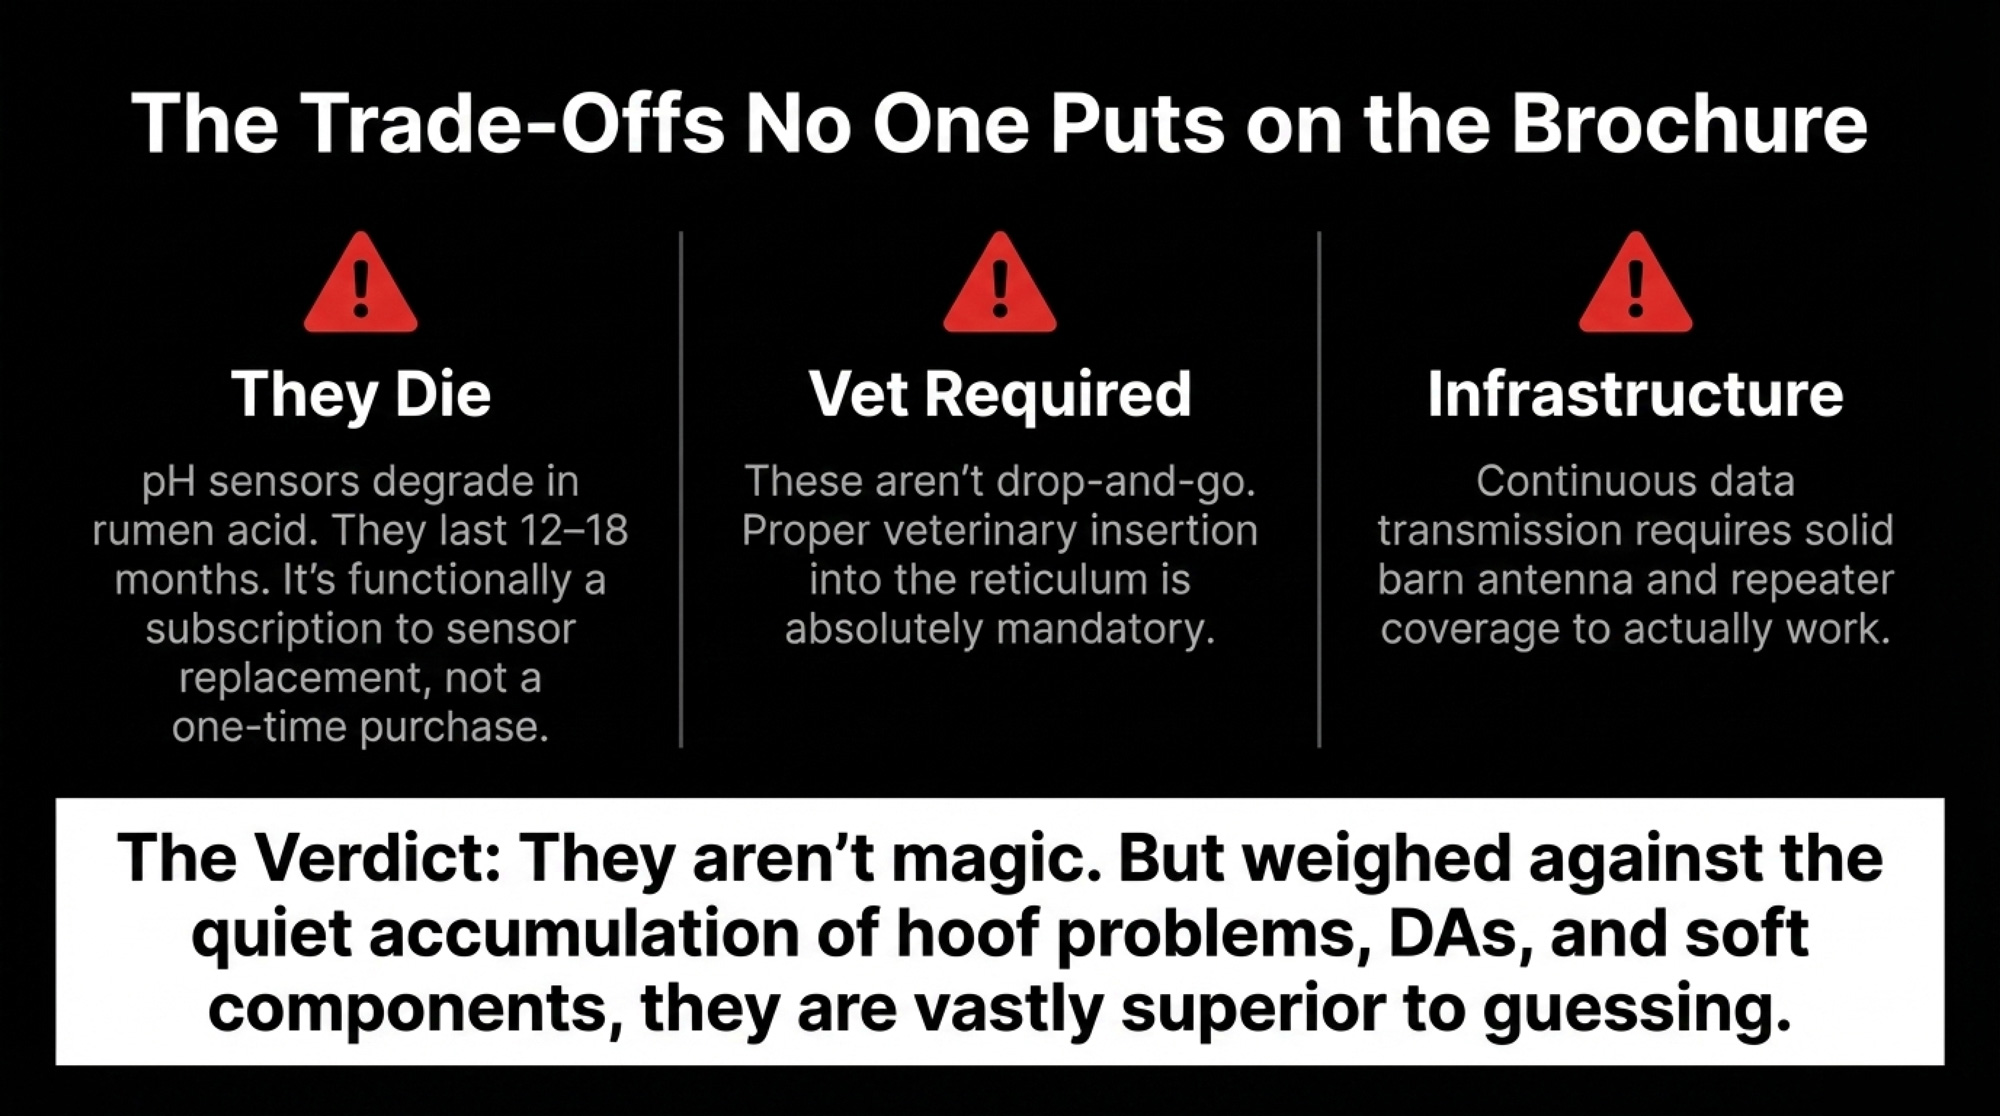
Boluses aren’t magic either. Aidan Connolly, president of AgriTech Capital in Wilmington, N.C., told Farm Progressthat pH sensors in the rumen typically burn out after 12 to 18 months as acid exposure degrades the sensor — compared to 6–7 years for movement-only boluses that track activity and temperature. That means pH monitoring is functionally a subscription to sensor replacement, not a one-time install.

They also need vet insertion. Your barn needs adequate repeater or antenna coverage for continuous data transmission. And pH alone is only one dimension of a complex disorder — it doesn’t directly capture shifts in VFA profiles or microbial population changes. It’s a strong early signal. Not the whole picture.

But weighed against the quiet accumulation of undetected SARA — hoof problems, DAs, sluggish repro, chronically soft components — the question isn’t whether boluses are perfect. It’s whether four rumen taps a year are enough to catch a problem that never stops moving.

How Much Is Undetected SARA Costing Your Herd?

The math isn’t complicated, and it isn’t kind.

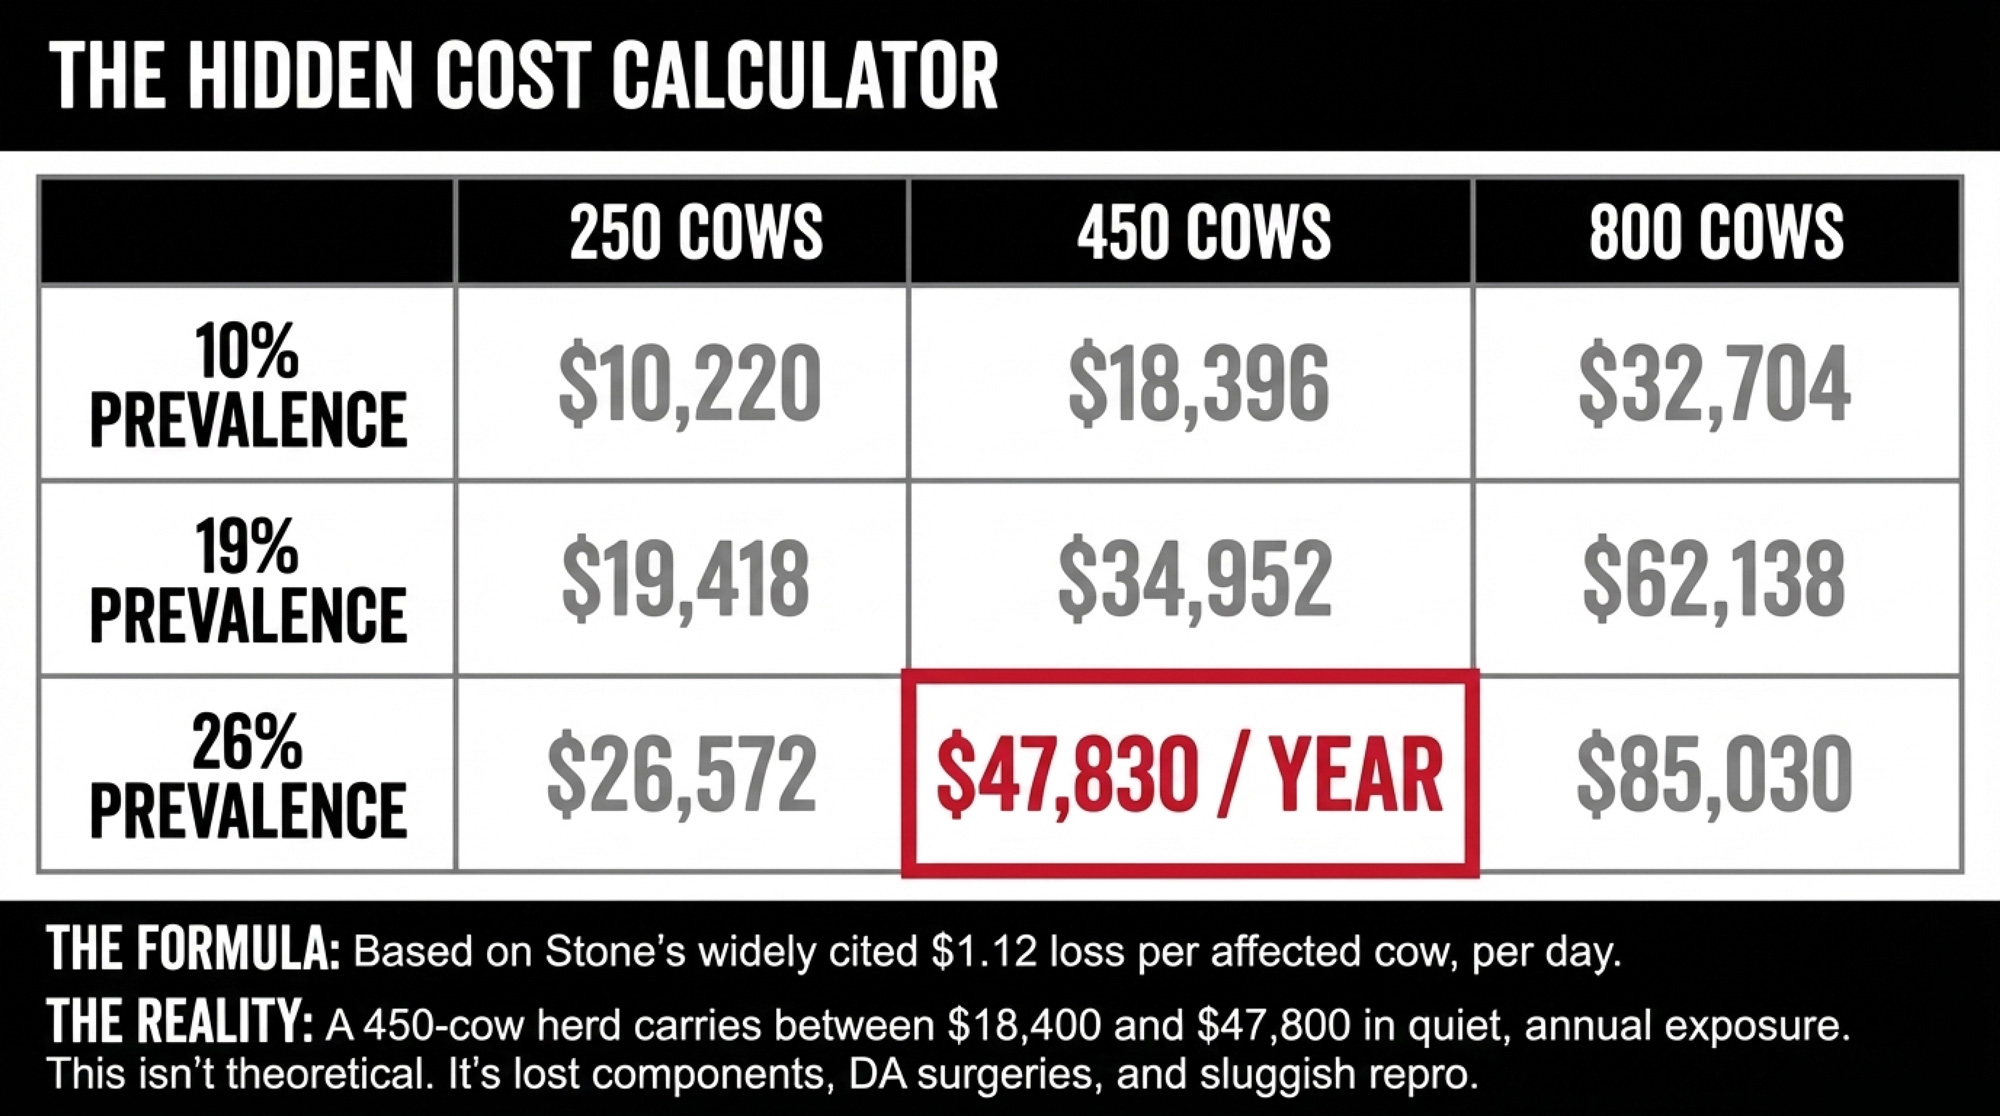
Stone (1999) estimated SARA losses at $1.12 USD per affected cow per day — a figure still cited in Ontario’s current SARA factsheet and widely referenced across the literature. It has never been formally updated. On a 450-cow herd, using the published prevalence range:

MetricUndetected SARA LossesBolus Monitoring (Year 1)
Annual exposure$18,400 – $47,800~$3,500–$4,000 (40 cows)
Per cow/month (herd avg.)~$3.41 – $8.85 in hidden loss~$4.00 investment
Data quality4 snapshots / year96 readings / day per cow
Detection speedDays to weeks after damageHours

Low end: 450 × 10% × $1.12 × 365 = $18,396. High end: 450 × 26% × $1.12 × 365 = $47,830. For the boluses: 40 units at approximately $39 each plus $3.90/cow/month in subscriptions (user-reported pricing, AgTalk May 2025). Total year-one hardware and data: roughly $3,500–$4,000. That’s using a 27-year-old cost estimate that almost certainly understates the real impact.

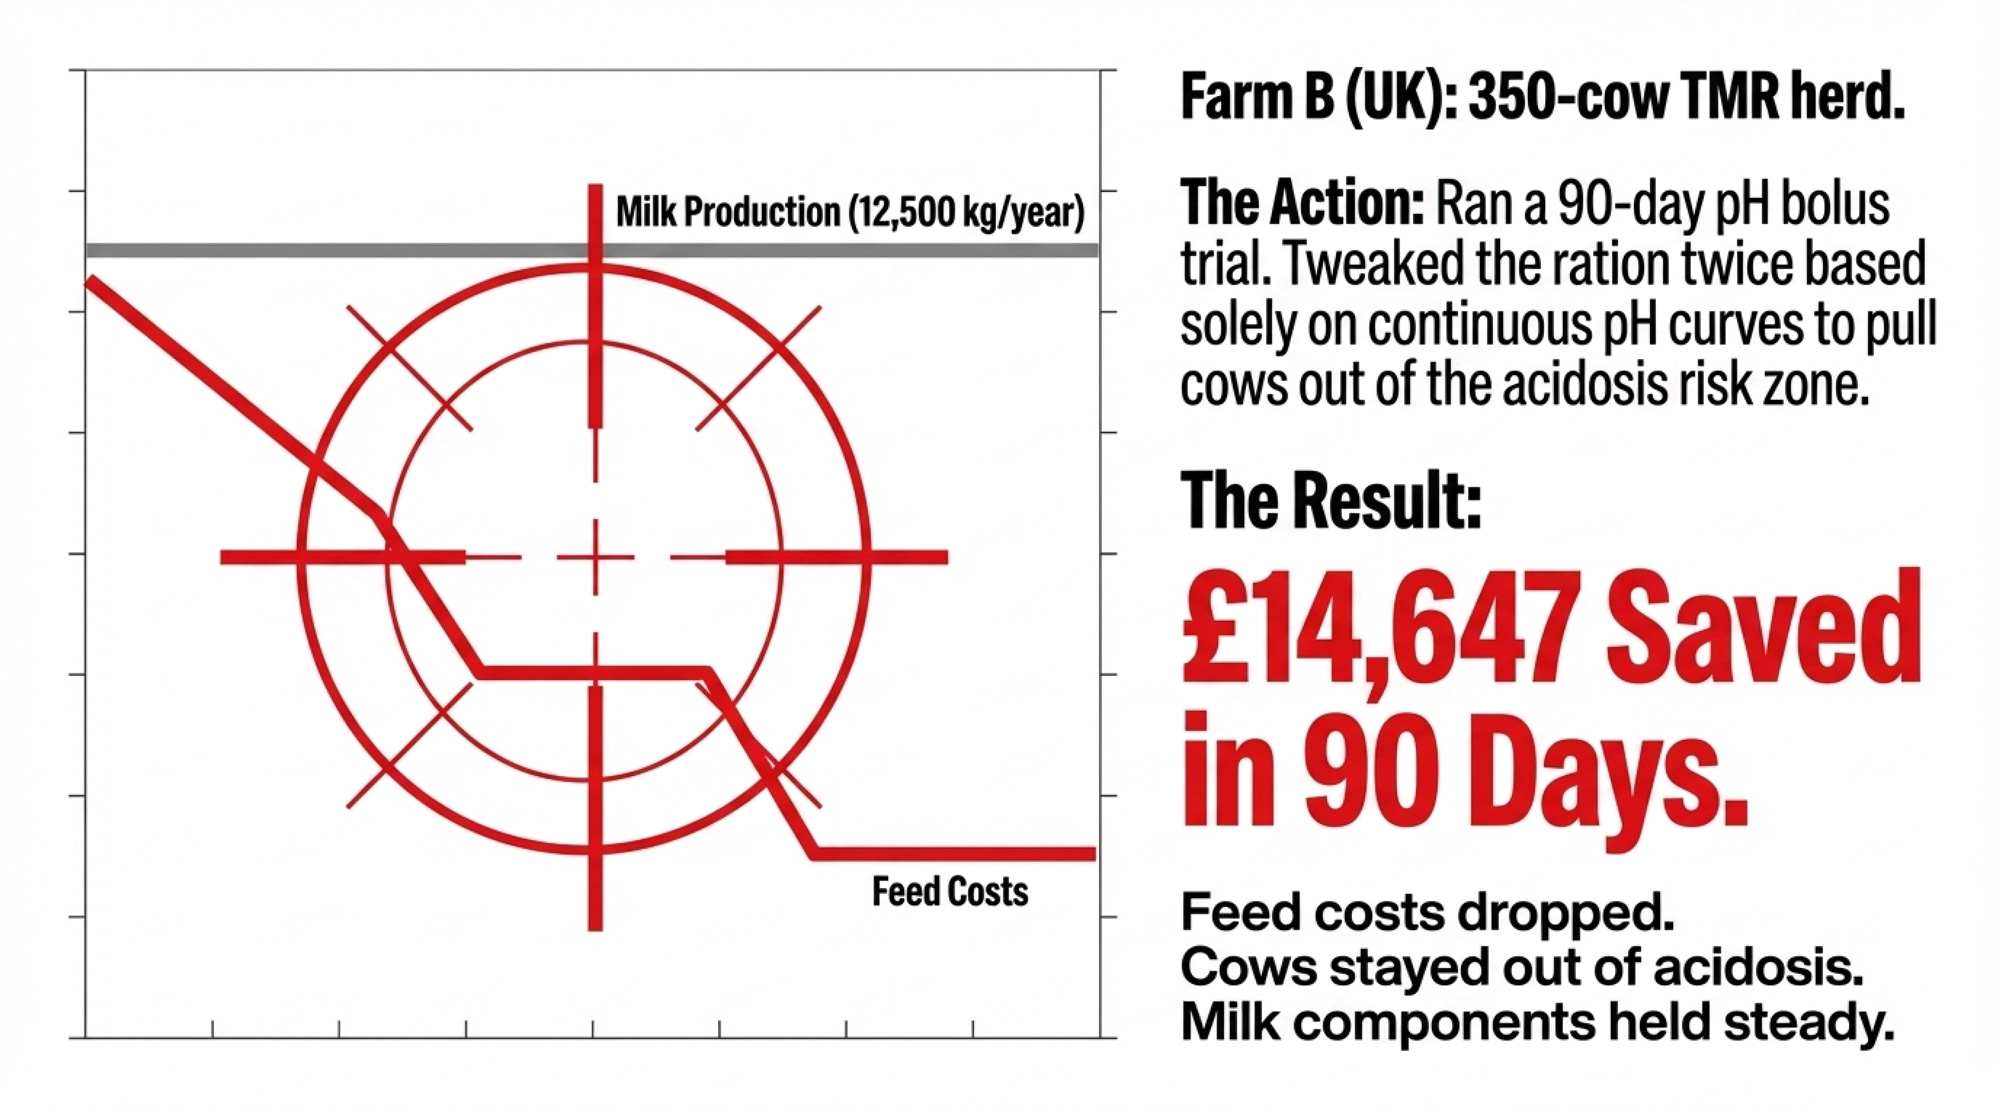
Those aren’t hypothetical numbers. When eCow ran a commercial pH bolus trial across eight dairy farms in South West England, six of the eight farms changed feeding management based on what the bolus data showed. Farm B — a 350-cow, 12,500 kg/year TMR herd — adjusted its ration twice in three months using pH curves as the guide. Each change cut feed cost while keeping cows out of the acidosis risk zone. Total savings: £14,647.50 in 90 days, with no decline in milk production or components. J. Hamilton of Three Counties Feeds, who advised on the trial, called the data “really useful to build up a picture of normal daily pH fluctuations on commercial farms” and noted it “highlighted the nutritional impact of management changes which force cows into unnatural daily routines”.

That UK trial was from 2013. The technology has improved since. At the 2025 Canadian Dairy XPO in Stratford, Ontario, both smaXtec and Guelph-based Cattlescan were promoting bolus-based monitoring to Canadian operators — Cattlescan backed by validation work at the University of Guelph and the University of Wisconsin. The infrastructure is here. The question is whether your herd is collecting data before your neighbor’s is.

How This Calibrates the Tech You Already Own

One of the most valuable things continuous pH data does isn’t replace your collars and parlor system — it calibrates them.

Herds layering bolus pH curves over collar activity, rumination data, and milk components are building what amounts to a green/yellow/red rumen map for their specific conditions. Not a textbook threshold. Not a vendor’s default alert. A picture of what subclinical acidosis actually looks like on their ration, in their barn, with their cows.

If subclinical acidosis cows show 57% higher activity and nearly 7% shorter rumination, do your collar thresholds reflect that? Are your rumination alerts catching the cows that are restless around feeding and short on cud time — or tuned for clinical-level problems that show up weeks later?

When precision tech vendors pitch “real-time metabolic monitoring,” the herd with six months of pH curves and correlated collar data isn’t taking the marketing at face value. They’re evaluating it against data they already own. That’s a fundamentally different buying position than hoping the next sensor works as advertised.

What This Means for Your Operation

Do the SARA math first. Plug your herd size into the prevalence range and the $1.12/day figure. As stale as that estimate is, the number will be uncomfortable. If you’ve never run this calculation, that’s the first problem to solve — before you buy anything.

Start with one pen, not the whole herd. Pick 30–50 cows in your highest-risk group — fresh pen or your hottest starch group. At roughly $39 per bolus and ~$4/cow/month, an 8–12-week trial might run $2,000–$3,000, depending on volume. Compare that to one DA surgery.

Benchmark your collars against rumen truth. Pull your lameness, DA, and chronic low-fat cows from the last six months. If subclinical acidosis cows show 57% higher activity and 7% shorter rumination in published data, are your alerts catching those patterns — or tuned for something else entirely?

Budget for sensor replacement, not just purchase. pH sensors degrade in the rumen after 12–18 months. That’s fundamentally different from an activity collar you buy once. Factor in per-cow annual sensor costs when you run your ROI analysis, not just the upfront hardware.

Get trial-ready before the sensors ship. If a university or sensor company came looking for a test herd tomorrow, could you hand over clean pH data, stable feeding records, and a team comfortable with continuous monitoring? The herds with that infrastructure will shape what “validated” means for breath-based tools. The ones without it will buy whatever ships first and hope.

In the next 30 days: Pick one pen. Talk to your vet about bolus logistics. Get a quote from your smaXtec dealer or regional bolus supplier. Plan one ration adjustment you’ll track with pH curves and collar data together — not just milk and manure.

In the next 90 days: Evaluate whether the bolus data reveals patterns your current monitoring misses. If it does, decide whether to expand bolus coverage or recalibrate your collar alerts based on what the pH curves are teaching you about what subclinical acidosis actually looks like on your farm.

Key Takeaways

  • The VFA correlations are real. The barn sensor isn’t. Islam et al. (2024, JDS) showed breath acetate tracking rumen acetate at r = 0.84. Serious science — but the eructation separation problem, six-figure instruments, and sample degradation mean no commercial barn sensor is imminent.
  • Same ration doesn’t mean same rumen. Hartinger et al. (2024) demonstrated that 24 first-lactation Holsteins on identical diets were divided into three SARA severity clusters. If continuous bolus monitoring can reveal that kind of hidden variation, what’s lurking in your fresh pen right now?
  • Continuous pH turns SARA from a quarterly hunch into a daily decision. Four snapshots a year versus 96 data points per day. One UK herd saved £14,647 in 90 days from two bolus-guided ration adjustments alone.
  • Your collars are already capturing part of this story — they need a reference point. Bolus pH curves don’t replace your existing tech. They tell you whether your existing tech is calibrated against what’s actually happening in the rumen.

The next time your nutritionist schedules rumenocentesis, ask what would change if you already had 60 days of pH and collar data for that group. If the answer is “nothing,” you might be right. But if the answer is “I don’t know,” that’s the gap worth closing before the breath sensor ever ships.

Complete references and supporting documentation are available upon request by contacting the editorial team at editor@thebullvine.com.

Learn More

The Sunday Read Dairy Professionals Don’t Skip.

Every week, thousands of producers, breeders, and industry insiders open Bullvine Weekly for genetics insights, market shifts, and profit strategies they won’t find anywhere else. One email. Five minutes. Smarter decisions all week.

NewsSubscribe
First
Last
Consent

The $42,000 Transition Mistake: Why Blanket Protocols Are Failing Your Best Cows

What if your transition disease rate isn’t 20%—it’s 35%? That measurement gap costs $42K/year. Worse: your best cows pay the genetic price.

EXECUTIVE SUMMARY: Most dairy operations estimate their transition disease rate at 20%—but farms that actually measure often find it’s closer to 35%. That gap represents roughly $42,000 in annual losses on a 400-cow dairy: lost milk, extra treatments, reproductive delays, and elite cows that never reach their genetic potential. The research points to a clear fix. Work from Guelph, Minnesota, Ohio State, and Wisconsin Extension consistently shows that risk-stratified protocols outperform blanket approaches—intensive care for high-risk mature cows, reduced spending on heifers who don’t need it. The numbers back it up: $500 per disease case, $1,000 for multiple diseases, and subclinical hypocalcemia hitting 73% of mature cows at $150 each. For operations investing in superior genetics, every cow that struggles through transition is a cow whose breeding value may never reach the bulk tank—or produce the next generation of your herd’s best females. The research-backed first step? Stop bolusing first-lactation heifers and redirect those resources where they’ll actually make a difference.

transition cow management

Here’s something that catches a lot of producers off guard. Walk into almost any dairy operation—doesn’t matter if it’s a 200-cow tie-stall in Vermont, a 3,000-cow freestall in California’s Central Valley, or a grazing operation in New Zealand—and ask about fresh cow disease rate. You’ll probably hear something like “Oh, we’re running around 20%, maybe 22%.” Reasonable estimate. Feels about right based on what they’re seeing day to day.

But when farms actually start measuring… well, that’s when things get interesting.

I’ve heard from producers who decided to track every single fresh cow event for 90 days—metritis cases, DAs, milk fever, ketosis treatments, all of it—and discovered their numbers were way off. One Wisconsin dairyman figured he was running about 23%. His actual number? North of 34%. And he’s not alone. When farms start systematically tracking every treatment event, every cow that doesn’t quite hit her stride in early lactation, that 20% estimate often turns out to be closer to 30% or higher.

Farm Type & RegionProducer’s EstimateActual Measured RateDisease Rate GapAnnual Cost Gap (400-cow herd)
200-cow tie-stall, Vermont20%34%+14 percentage points$39,200
400-cow freestall, Wisconsin22%35%+13 percentage points$36,400
800-cow freestall, Minnesota18%31%+13 percentage points$72,800
3,000-cow freestall, California21%33%+12 percentage points$252,000
600-cow grazing operation, New Zealand19%29%+10 percentage points$42,000

Dr. Eduardo de Souza Ribeiro, over at the University of Guelph, puts it pretty directly: cows with a poorer transition produce less milk, take longer to get pregnant, and are more likely to lose a pregnancy or be culled from the herd. That adds up to substantial economic losses. And here’s what’s sobering—his review of the research, published in Dairy Global, found that roughly one-third of dairy cows in Western herds experience at least one disease process in the first three weeks after calving. That’s not outliers. That’s typical across the industry.

So what does that cost? Work by Carvalho and colleagues back in 2019 tried to put a price tag on it, estimating about $500 for a single postpartum disease case and around $1,000 when a cow has multiple problems during that critical window. On a 400-cow dairy, it doesn’t take many extra disease cases to add up to tens of thousands of dollars in lost milk, extra treatments, and reproductive delays—even if the exact number varies by herd and region.

What’s interesting—and honestly, a bit frustrating—is that the research showing how to cut those disease rates significantly has been accumulating for over two decades. The barrier isn’t knowledge. It’s how that knowledge moves (or doesn’t) from research journals to actual farm practice.

“You can have the best genetics in the world, but if your cows can’t get through transition healthy, you’ll never see that potential expressed in the bulk tank or the breeding program.”

The Measurement Gap Nobody Talks About

The foundation of any improvement starts with a surprisingly basic question: What’s your actual disease rate?

You know, most dairies have never systematically answered this. They track individual treatments, sure. They know when a cow develops metritis or throws a DA. But calculating an overall incidence rate—the percentage of cows experiencing any metabolic or reproductive disease in the first 21 days—that’s different. And without that number, you’re essentially flying blind.

Why does this matter so much? Multiple sources—University of Maryland Extension, Dairy Global, research published in Frontiers in Veterinary Science—all point to the same finding: about 75% of health problems in dairy cows occur during the transition period. That’s the window from roughly two weeks before calving to four weeks after. Three-quarters of your health challenges, concentrated in about six weeks. That’s a massive concentration of risk in a pretty short timeframe, whether you’re running a confinement operation in the Midwest or a pasture-based system in the Southeast.

When farms start systematically tracking, many discover their disease rates are higher than they’d estimated. A 2019 study in the Journal of Dairy Science looked specifically at barriers to successful transition management and found that variation in both farmer attitude and veterinarian involvement significantly affects outcomes. One of the key barriers they identified? Simply not having a clear picture of what’s actually happening. Hard to fix a problem you haven’t quantified.

Now, break down the disease by parity, and the picture gets even clearer. This is where it gets really practical for protocol decisions. Field data and NAHMS surveys consistently show that disease risk climbs with parity—first-lactation animals typically have substantially lower rates of metabolic and reproductive disease than third- and fourth-lactation cows. Research showed subclinical hypocalcemia affecting around 47% of second-or-greater lactation cows but only about 25% of first-lactation heifers. Clinical milk fever follows the same pattern—it’s far more common in older cows than in first-lactation animals.

Disease TypeFirst-Lactation HeifersSecond-Lactation CowsThird+ Lactation CowsRisk Multiplier (3rd+ vs. 1st)
Subclinical Hypocalcemia25%54%73%2.9×
Clinical Milk Fever2%6%12%6.0×
Hyperketonemia (elevated BHB)8%15%22%2.8×
Displaced Abomasum3%5%9%3.0×
Metritis12%18%25%2.1×
Average Treatment Cost/Cow$82$156$2473.0×

Here’s what that tells us: many operations treat all fresh cows identically—same calcium bolus protocol, same propylene glycol regimen, same monitoring intensity. But different animals have dramatically different risk profiles. And the research is pretty clear that they respond differently to interventions too. So why are we treating a first-calf heifer the same as a fourth-lactation cow? That’s the question worth asking.

What the Research Actually Shows

The scientific literature on transition cow management has reached a level of maturity that’s frankly unusual in agricultural research. We’re not talking about preliminary findings or single studies here. We’re talking about meta-analyses combining decades of data from operations across North America, Europe, and beyond.

On calcium supplementation: Research consistently shows multiparous cows benefit significantly from calcium support, while first-lactation heifers show minimal response. A 2024 review in the journal Animals noted that dairy cows are at considerable risk for hypocalcemia at the onset of lactation, when daily calcium excretion suddenly increases from about 10 grams to 30 grams per day. Think about that—tripling calcium output almost overnight. But—and this is important—that risk concentrates heavily in mature cows, not heifers.

Dr. Luciano Caixeta at the University of Minnesota has noted that subclinical hypocalcemia (the kind you don’t see clinically but still causes problems) has been reported to affect as many as 73% of dairy cows in third or higher lactations, costing an average of about $150 per case. Researchers at the University of Guelph found that herds with a higher incidence of subclinical hypocalcemia experienced an 8.36-pound reduction in milk production on the first test day and a 30% reduction in the odds of pregnancy on the first AI. That’s real money—and real reproductive performance—left on the table.

Dr. Mark van der List, a veterinarian with Boehringer Ingelheim who’s spoken at numerous industry events on this topic, explains the supplementation approach this way: administering an oral calcium supplement to cows at calving, and again 12 hours later, provides much-needed calcium when blood levels are at their lowest. He also cautions about reading product labels carefully—watch out for products containing calcium carbonate, which is limestone. It’s the cheapest form of calcium, but it’s too slowly absorbed to really make a difference when you need rapid uptake.

On negative DCAD diets: This is one where the research is really solid. University of Wisconsin Extension confirms that feeding a negative DCAD diet during the pre-fresh dry period—that last 21 days before calving—successfully increases blood calcium levels before and immediately after calving. The result is a lower incidence of both clinical and subclinical milk fever.

Meta-analyses and field trials show that properly formulated negative DCAD diets can cut the risk of clinical milk fever by well over half. Some studies report relative risks in the 0.2-0.4 range compared with neutral DCAD diets. That’s substantial protection for your high-risk animals.

But here’s the nuance that matters for your operation—and this is where a lot of folks are spending money they don’t need to spend. The same Wisconsin Extension research notes that while negative DCAD diets can benefit heifers in some ways, studies have shown their impact on productive performance has been either neutral or negative. Heifers have a much lower risk of developing milk fever than multiparous cows, so feeding them a negative DCAD diet is likely unnecessary. That’s a cost you can redirect elsewhere.

On propylene glycol: A 2025 study published in Frontiers in Veterinary Science demonstrated that a targeted propylene glycol protocol effectively decreased ketosis incidence from 33.3% in control cows to 6.7% in treated cows at 14 days postpartum. The research confirms propylene glycol’s efficacy—but notice that word “targeted.” When used appropriately and aimed at cows that actually need it, rather than blanket-treating everyone, the results are strong.

What’s emerging from all this research is a consistent pattern: targeted, risk-stratified protocols generally outperform blanket treatment approaches, both economically and in terms of animal outcomes. Treat the cows that need treatment. Don’t treat the ones that don’t. Seems obvious, but it requires knowing who falls into which category.

Body Condition: The Early Warning System Many Farms Miss

This is where things get really practical—and where, honestly, a lot of farms are leaving money on the table.

Kirby Krogstad at Ohio State has been doing some fascinating work on the connections between body condition score, hyperketonemia, and downstream health outcomes. His research, published in the Journal of Dairy Science, tracked approximately 900 cows and found some pretty compelling relationships that should inform how we manage transition cows.

Here’s what stood out: cows who lost more than 0.375 BCS in early lactation were nearly five times more likely to lose their pregnancy. Five times. That’s not a subtle effect—that’s a flashing warning sign. And mature cows—third lactation and beyond—testing above 1.2 mmol/L of BHB produced about 11.8 pounds less milk per day than their non-hyperketonemic counterparts. On a 400-cow dairy with even modest prevalence of hyperketonemia in older cows, that adds up fast.

BCS Loss (units)Milk Production (lbs/day)Pregnancy Rate (%)
0.08645
0.258242
0.3757838
0.57432
0.756826
1.06222

Key Benchmarks (Krogstad, Ohio State): Target ≤10% of 2nd-lactation cows and ≤20% of 3rd+ lactation cows with elevated BHB in week one. Exceeding these thresholds signals protocol problems.

What’s particularly useful is Krogstad’s benchmark recommendations for the first week in milk. He suggests that 10% or less of second-lactation cows should show elevated BHB, and 20% or less of third-plus lactation cows. If your herd exceeds these thresholds, that’s a signal worth paying attention to. It’s a simple metric you can track that tells you whether your transition protocols are working.

Dr. Ribeiro at Guelph recommends that body condition scoring at dry-off should be moderate—3.0 to 3.25 on a 1-to-5 scale—and maintained through calving. The intervention point, importantly, is 100-plus days before calving, not at calving itself. By the time a cow reaches the close-up pen, overconditioned, you’re already playing catch-up. The time to manage body condition is back in late lactation, not when she’s three weeks from freshening.

I’ve heard from California producers who started scoring every cow at 200 DIM and adjusting rations for the overconditioned ones. Several report noticeable drops in fresh cow disease within a couple of lactation cycles. Not because they were doing anything fancy at calving—they were just preventing the problem from developing in the first place. That kind of proactive approach works whether you’re in a dry lot system in the Southwest or a freestall barn in the upper Midwest.

Why This Matters for Your Elite Genetics

Here’s something that doesn’t get talked about enough in the transition cow conversation: the genetic implications.

If you’re investing in elite genetics—whether that’s genomic-tested heifers, embryo transfer calves from proven cow families, or semen from high-ranking sires—transition disease can undermine that entire investment. A cow from an exceptional dam line who struggles through her first lactation due to ketosis or metritis may never express her true genetic potential. Worse, she might get culled before she ever gets a chance to prove herself or contribute daughters to the herd.

Think about it this way: that heifer calf from your best cow family represents years of breeding decisions. She carries genetics for high components, longevity, fertility—whatever traits you’ve been selecting for. But if she hits the fresh pen and immediately battles subclinical hypocalcemia followed by a DA, her first lactation becomes a salvage operation rather than a showcase of her genetic merit.

The research from Guelph on subclinical hypocalcemia showed a 30% reduction in the odds of pregnancy at first AI. For a cow you’re counting on to produce the next generation of your herd’s genetics, that reproductive hit is devastating. You need her pregnant early to get that next heifer calf. You need her healthy to produce enough milk to justify keeping her. Transition disease compromises both.

Dr. Ribeiro’s point about cows with poor transitions being “more likely to get culled from the herd” hits especially hard when you’re talking about animals carrying superior genetics. Every elite cow that leaves the herd early due to transition-related complications represents not just lost milk revenue but lost genetic progress. Her potential replacement heifers never get born. Her genomic contribution to your herd’s improvement disappears.

This is why getting transition management right matters beyond just the immediate economics. It’s about protecting your genetic investment and ensuring your best animals live long enough, and stay healthy enough to reach their potential and pass those genetics forward.

Building Momentum: The First Move That Actually Works

For operations looking to bridge the gap between current practice and what research supports, the question becomes practical: where do you actually start?

The answer, based on both research and what we’re seeing on progressive farms from the Northeast to the Pacific Northwest, might surprise you. Rather than overhauling everything at once (which rarely sticks anyway), the highest-confidence first move is often the simplest: stop bolusing first-lactation heifers while maintaining supplementation for multiparous cows.

The economics here are modest but illustrative. A 400-cow dairy with 33% heifer rotation spends roughly $1,300 to $1,500 annually on heifer calcium boluses. Research suggests this spending produces minimal benefit because heifers face naturally low hypocalcemia risk—remember that Wisconsin Extension finding about neutral or negative performance impacts? You’re spending money for essentially no return.

But more valuable than the direct savings is what this change accomplishes organizationally:

  • It’s reversible. If heifer disease somehow increases—unlikely based on research, but possible—you restart the protocol immediately. No permanent commitment required.
  • It’s measurable. Track the heifer disease rate before and after. You’ll have concrete evidence of whether it works for your specific operation, your genetics, and your facilities.
  • It builds collaborative relationships. Approaching your vet with “Can we try this as a 60-day test?” creates a partnership rather than conflict. You’re not challenging their expertise; you’re inviting them into an experiment.
  • It establishes a template. Successfully implementing one evidence-based change creates permission—and confidence—for the next.

Dr. van der List emphasizes this collaborative approach: ask your veterinarian about blood calcium testing, he suggests. They can help you evaluate the results and develop the right supplementation strategies for your herd. That kind of data-driven partnership is exactly what makes protocol changes stick long-term.

The farms achieving the best transition outcomes didn’t get there through revolutionary overnight changes. They built systematic improvement through sequential small wins. One protocol adjustment at a time, measuring as they went.

The Three-Tier Framework: How It Works in Practice

Operations that have successfully reduced fresh cow disease often employ some version of risk stratification. The basic principle is straightforward: different animals get different protocols based on their probability of developing disease. Here’s how one common framework breaks down.

Tier 1 (Low Risk): First-lactation heifers and multiparous cows with body condition under 3.5 and no disease history

  • Standard dry cow nutrition without DCAD manipulation
  • No calcium supplementation at calving
  • Propylene glycol only if clinical signs emerge
  • Standard monitoring protocols

These are your low-maintenance animals. They don’t need aggressive intervention, and providing it anyway just costs money without improving outcomes.

Tier 2 (Moderate Risk): Multiparous cows with normal body condition (3.0-3.5) or single-episode disease history

  • Negative DCAD diet for the final 21 days prepartum
  • Single calcium bolus at calving
  • Propylene glycol is based on ketone testing, not blanket treatment
  • Enhanced daily observation during the fresh period

This is probably your largest group numerically. They need targeted support, based on what we know works.

Tier 3 (High Risk): Overconditioned cows (BCS above 3.5), fourth-plus lactation cows, or those with multiple disease episodes

  • Controlled-energy ration beginning at 150 days in milk (because you’re managing body condition early)
  • Aggressive DCAD protocol for 21-plus days prepartum
  • Multiple calcium boluses (at calving and 12 hours post-calving)
  • Propylene glycol protocol from day -7 to +21
  • Blood ketone testing days 5-9 postpartum
  • Intensive daily monitoring
Protocol CategoryTier 1: Low Risk (1st-lactation heifers, BCS <3.5)Tier 2: Moderate Risk (Multiparous, normal BCS)Tier 3: High Risk (BCS >3.5, 4th+ lactation, disease history)
DCAD Diet (Prepartum)Standard dry cow rationNegative DCAD for final 21 daysAggressive negative DCAD for 21+ days
Calcium SupplementationNone at calvingSingle bolus at calvingMultiple boluses (calving + 12 hrs post)
Propylene GlycolOnly if clinical signs emergeBased on ketone testing, not blanketProtocol from day -7 to +21
Body Condition ManagementStandard monitoringMonitor at dry-off and calvingControlled-energy ration starting 150 DIM
Monitoring IntensityStandard fresh cow checksEnhanced daily observationBlood ketone testing days 5–9; intensive daily monitoring
Estimated Annual Cost/Cow$18$62$147
Target Disease Rate<8%<15%<25% (vs. 45%+ without intervention)

These are your problem children—the cows you know are going to struggle if you don’t get ahead of it. They deserve the intensive protocols because, for them, it actually pays off. And if these happen to be your highest-genetic-merit animals in their fourth or fifth lactation, protecting them through transition protects your breeding program.

The ROI Snapshot: Tier 3 cows receive significantly more intervention, but overall spending frequently decreases because low-risk animals no longer receive unnecessary treatment. You’re reallocating resources, not adding them.

A note on infrastructure: Implementing this kind of stratification does require some basic capabilities. Lactanet’s housing guidelines for dry and transition cows note that well-designed facilities are built with a transition and calving management strategy in mind, addressing factors such as management group sizing, cattle movement, and health needs for different groups.

At minimum, you’ll want the ability to separate close-up cows into at least two groups—or clearly identify high-risk individuals within a mixed group—plus access to DCAD ration formulation through your nutritionist and either cow-side ketone testing or a protocol with your vet for blood work.

Now, I know what some of you are thinking: “We don’t have separate pens for that.” Fair enough. Operations without separate close-up pen capacity can still implement modified stratification by identifying and flagging high-risk individuals for enhanced monitoring and intervention. Some farms use colored leg bands. Others use separate feeding times or headlock sorting. Robotic milking operations sometimes leverage their existing cow identification systems to trigger different supplement protocols. It’s not as clean as separate pens, but it works. The principle matters more than the specific implementation.

A note on seasonality: If you’re running a seasonal calving operation—spring calving in the Upper Midwest, fall calving in parts of the South—you’ll want to think about how heat stress or cold stress might compound transition challenges. The tier assignments don’t change, but your monitoring intensity during environmental stress periods probably should. Summer calvings, in particular, tend to have elevated disease rates even in otherwise healthy cows.

An example scenario for a 400-cow herd might look something like this:

ApproachAnnual Intervention CostDisease EventsDisease CostTotal Cost
Blanket Protocol~$12,000~140~$70,000~$82,000
Stratified Protocol~$10,000~60~$30,000~$40,000
Potential Annual Savings   ~$42,000

Your actual numbers will depend on your baseline disease rate, local costs, milk price, and specific herd conditions. But the general principle holds: targeting resources toward high-risk cows while reducing unnecessary interventions in low-risk animals tends to improve both outcomes and economics. It’s not magic—it’s just matching the intervention to the animal that needs it.

Quick Reference: Key Benchmarks

BHB targets (Krogstad, Ohio State, Journal of Dairy Science):

  • ≤10% of 2nd-lactation cows with elevated BHB in week 1
  • ≤20% of 3rd+ lactation cows with elevated BHB in week 1

Body condition targets (Ribeiro, University of Guelph):

  • 3.0-3.25 BCS at dry-off (1-5 scale)
  • Maintain through calving; intervene at 200 DIM if needed

Disease cost estimates (Carvalho et al., 2019):

  • ~$500 per single disease case
  • ~$1,000 for multiple diseases in the same cow

Subclinical hypocalcemia cost (Caixeta, University of Minnesota):

  • ~$150 per case
  • Affects up to 73% of 3rd+ lactation cows

DCAD timing (University of Wisconsin Extension):

  • Final 21 days prepartum for multiparous cows
  • Generally unnecessary for first-lactation heifers

When Good Enough Is Good Enough: Knowing Your Optimization Limit

One finding worth noting: operations that substantially reduce their disease rates often shift their optimization focus. Rather than continuing to push on disease reduction, many move toward production and reproduction metrics.

This makes economic sense when you think about it. Some level of transition disease is simply unavoidable—due to genetics, environment, and factors unrelated to nutrition. Retained placenta and certain cases of metritis aren’t fully preventable with nutritional protocols alone. More than 35% of all dairy cows have at least one clinical disease event during the first 90 days in milk, as Dr. Caixeta at Minnesota has noted. Some of that is just the biology we’re working with. You can optimize, but you can’t eliminate.

The research frontier is increasingly focused on inflammation management and precision monitoring technologies. There’s growing evidence that we’ll have more refined best management practices in the coming years—approaches that address dry matter drop, metabolic stress, and inflammation together, because all three are interconnected. Penn State and other extension programs are actively working in this space. It’s worth watching.

The return on investment for moving from high disease rates down to more moderate levels is typically substantial—that’s the $40,000 or more we’ve been discussing. But at some point, the economics of further disease optimization start to diminish relative to improvements in production and reproduction. You’ve reached a point of diminishing returns in disease prevention, and your attention is better directed elsewhere.

What progressive operations tend to optimize once they’ve addressed the big disease issues:

  • Early lactation production—targeting 80-plus pounds per day at first DHI test
  • Days to conception—pushing below 80 days versus the industry standard of around 100
  • Heifer development—getting fresh heifers producing at 90-plus percent of mature cow potential within the first few months

These become your next frontiers once transition health is reasonably controlled.

Why Knowledge Transfer Takes So Long

Perhaps the most thought-provoking aspect of transition cow research is how long it takes proven practices to reach widespread adoption. Negative DCAD feeding was demonstrated to be effective in the late 1980s. More than three decades later, many dairies still don’t use it consistently. Why is that?

That 2019 Journal of Dairy Science study on barriers to successful transition management found something interesting: the lack of a single definition of the transition period emerged as one barrier to improvement. Everyone’s talking about “transition cows,” but not everyone means the same timeframe or the same priorities. And barriers varied significantly across farms, suggesting that a tailored approach is required to achieve meaningful change. There’s no one-size-fits-all solution here—which makes extension work and consulting more challenging.

A 2025 study of Ontario dairy veterinarians published in the Journal of Dairy Science found that trust and communication emerged as critical components of veterinarian-client relationships—and it was acknowledged that these relationships take time to build. The researchers noted that veterinarians observed that proactive producers who implemented preventive strategies achieved better outcomes, whereas others exhibited greater resistance to change, often shaped by multigenerational traditions and economic constraints.

And you know what? None of these dynamics reflect bad intentions. They reflect the practical reality that changing established practices requires more than just evidence—it requires aligned incentives, collaborative relationships, and operational systems that support implementation. A protocol that works great in theory but doesn’t fit your labor situation or facility layout won’t actually be implemented.

What seems to accelerate adoption, based on what we’re seeing across the industry:

  • Producers who measure baseline disease rates and calculate their own economics (hard to argue with your own numbers)
  • Veterinarians who engage with current literature on transition research
  • Nutritionist partnerships focused on outcomes rather than product volume
  • Peer networks where successful protocol changes get shared and validated (sometimes the neighbor’s experience is more convincing than any research paper)

The operations achieving the best transition outcomes typically share a common characteristic: they’ve developed collaborative relationships with their advisory team where data-driven protocol adjustments are welcomed rather than resisted. It’s not adversarial—it’s problem-solving together.

Practical Takeaways

Start with measurement. Before changing any protocol, establish your actual disease rate by parity. The exercise takes about 60 days and requires only consistent tracking. Many operations discover rates higher than they’d estimated—and that discovery itself often motivates change.

Consider the parity difference. First-lactation heifers face fundamentally different metabolic challenges than fourth-lactation cows. The research is clear that treating them identically often leaves money on the table. Match your protocols to your animals.

Begin with low-risk changes. Discontinuing calcium supplementation for first-lactation heifers represents one of the lowest-risk, highest-confidence first moves. Frame it as a 60-day test with your veterinarian. Collect data. See what happens.

Collaborate rather than confront. Successful protocol changes typically emerge from partnerships between producers and their advisors. Come with data and questions rather than demands. As the Ontario veterinarian research found, trust and communication are the foundation.

Assess your infrastructure honestly. Stratified protocols work best with separate close-up pen capability, but modified approaches can work with careful individual-cow identification even in mixed groups. Don’t let perfect be the enemy of good.

Protect your genetic investment. Your best cows—the ones carrying the genetics you’ve spent years developing—deserve protocols that keep them healthy through transition. A cow that can’t get through the fresh period without complications may never show you what she’s capable of producing or passing on.

Calculate your specific economics. The general principle—that targeted protocols tend to outperform blanket approaches—is well-supported by the research. Your specific numbers will vary, but they’re worth calculating. It’s hard to prioritize what you haven’t quantified.

There’s a real gap between what the research shows and what’s actually happening on many farms—and that gap represents opportunity. The knowledge is there. The economics generally work out. What remains is finding the right starting point for your operation and building from there.

For operations willing to invest the time in systematic measurement and collaborative protocol development, the research suggests meaningful improvement is available—not through revolutionary change, but through thoughtful, evidence-based adjustments applied consistently over time. Small wins, stacked up, become significant results.

The Bullvine brings dairy producers research-backed insights for informed decision-making. For detailed guidance on transition cow protocols, consult with your herd veterinarian and review resources from university extension programs, including University of Wisconsin, Penn State, University of Minnesota, and University of Guelph.

Learn More:

The Sunday Read Dairy Professionals Don’t Skip.

Every week, thousands of producers, breeders, and industry insiders open Bullvine Weekly for genetics insights, market shifts, and profit strategies they won’t find anywhere else. One email. Five minutes. Smarter decisions all week.

NewsSubscribe
First
Last
Consent

First Case of HPAI Confirmed in Nebraska Dairy Herd: Why It Matters for Midwest and West Coast Dairy Producers

HPAI just hit a Nebraska dairy. Movement rules, milk pickup, and crew safety just moved to the top of the list for herds across the Midwest and West Coast.

EXECUTIVE SUMMARY: A Nebraska dairy herd just confirmed HPAI infection, creating a critical new risk for dairy producers across the Midwest and West Coast. The location of this outbreak, at the heart of major transportation corridors, exposes every operation to silent transmission through shared equipment, feed trucks, and milk haulers. We’ve mapped the highest-risk routes, and the data is clear: prevention is the only viable strategy. Farms must immediately implement stringent biosecurity protocols, including meticulous vehicle and personnel logs, and have frank conversations with milk haulers and feed suppliers about their travel routes. A single positive test can halt all milk sales, making proactive measures essential to protecting your revenue.

KEY TAKEAWAYS

  • Cut losses by 60% through smart monitoring — Rumination collars and activity sensors detect infections 5-7 days earlier than traditional methods, giving you the critical window needed for containment
  • Protect nearly $950 per cow — Cornell’s economic analysis shows this represents the average loss per infected animal in midwestern markets, making early detection systems pay for themselves quickly
  • Recognize the silent threat — With 80% of infected cows shedding virus without symptoms, visual health checks alone won’t cut it anymore; you need data-driven detection systems
  • Invest now or pay later — Technology costs of $150-250K for comprehensive monitoring seem steep until you consider that a single outbreak can cost over $1 million in a thousand-cow operation
  • Join the regional defense networks — Producer coalitions in the Midwest and California are already pooling biosecurity resources and sharing diagnostic data — cooperation that’s proving essential for 2025’s volatile dairy landscape
H5N1 dairy biosecurity, dairy farm profitability, herd health monitoring, H5N1 economic impact, dairy farm management

Nebraska’s confirmation of H5N1 infection in 2024 is more than a regional alert—it’s a threat to the entire U.S. dairy supply chain, linking powerful genetic hubs in California, prolific herds in Wisconsin, and the hardworking dairies scattered through the Midwest’s dry lots. This virus has found a critical foothold in the arteries of our industry.

Peer-reviewed research from Cornell University paints a sobering picture: affected cows lost an average of 945 kilograms of milk over roughly 67 days, including losses accrued before symptoms appeared. This translates to an economic hit of nearly $950 per animal in midwestern markets, considering butterfat content and typical seasonal price shifts. For a dairy with 1,000 fresh cows, that’s nearly a million-dollar loss in milk volume alone.

Technology That’s Actually Making a Difference

One development that catches my attention: farms using advanced monitoring tools—automatic rumination collars, temperature sensors, and AI-driven activity monitors—detect infections 5-7 days earlier than traditional observation methods, enabling an estimated 60% reduction in losses.

Technology costs are not trivial. Implementing comprehensive monitoring systems for a thousand-cow operation ranges from $150,000 to $250,000, depending heavily on infrastructure and existing hardware. Still, this upfront investment can prevent far greater loss during outbreaks.

The Genomic Evidence That Changes Everything

USDA APHIS genomic sequencing confirms Nebraska’s virus belongs to the aggressive California 2.3.4.4b clade that has plagued herds for over a year. USDA’s National Milk Testing Program has detected viral RNA in roughly 20% of milk samples nationwide, demonstrating widespread presence. Since launching, the program has completed over 210,000 PCR tests—the most extensive dairy surveillance effort in U.S. history.

The Silent Spreaders Nobody Expected

Significantly, field data from Cornell’s Diego Diel and colleagues show that about 80% of infected cows shed virus without symptoms, seriously complicating detection and containment efforts.

These asymptomatic carriers can devastate operations before anyone realizes there’s trouble brewing. Traditional “wait and see” management becomes a liability when four out of five infected animals look perfectly healthy while spreading disease.

Market Forces Reshaping Operations

The insurance sector is adjusting to these disease risks. Although specific premium data is limited, leading veterinary associations confirm tighter scrutiny and potential coverage restrictions for farms lacking biosecurity measures.

Labor markets reflect these biosecurity demands. Skilled milkers increasingly gravitate toward farms with stringent health protocols, often seeing wage adjustments to compensate for perceived risks. Meanwhile, lenders reinforce these expectations, requiring formal disease management proof for financing approval.

The Silver Lining in Regional Cooperation

Still, cooperation offers hope. Producer coalitions in the Midwest and California are pooling diagnostic and biosecurity resources, an emergent strategy to bolster sector resilience.

The federal response has been substantial. USDA’s National Milk Testing Strategy represents unprecedented surveillance across dairy operations nationwide, while support programs help producers implement enhanced biosecurity measures.

The Hard Truth About What’s Next

Ignoring these developments jeopardizes more than herd health—it threatens the foundation of U.S. dairy. We’re not going back to 2019 management styles. This virus has established a permanent presence in our transportation networks, and hoping it goes away won’t change that reality.

Operations that embrace monitoring technology, implement strict biosecurity protocols, and work with regional cooperative networks will survive—and potentially thrive. Those waiting for things to return to normal are gambling their operation’s future on increasingly impossible odds.

The adoption of monitoring technology, strict biosecurity measures, and regional collaboration are no longer optional but vital to survival.

Complete references and supporting documentation are available upon request by contacting the editorial team at editor@thebullvine.com.

Learn More:

The Sunday Read Dairy Professionals Don’t Skip.

Every week, thousands of producers, breeders, and industry insiders open Bullvine Weekly for genetics insights, market shifts, and profit strategies they won’t find anywhere else. One email. Five minutes. Smarter decisions all week.

NewsSubscribe
First
Last
Consent

The $400-Per-Cow Advantage: How AI Is Redefining Dairy Profitability

Farms using AI are banking an extra $400 per cow annually. That’s real money, not hype.

EXECUTIVE SUMMARY: Look, I’ve been watching this AI thing roll through dairy country for a while now, and here’s what’s actually happening out there. Farms leveraging AI are pulling in around $400 extra per cow each year — that’s not some pie-in-the-sky number, that’s documented profit. Now, where you farm matters big time: Wisconsin guys are seeing $380-420 per cow, but head west to California, where labor’s expensive and heat stress is brutal? Some dairies are hitting $500 per cow. Meanwhile, Europe’s way ahead of us — the Dutch have 67% adoption, Australia’s at 40%, and we’re… well, we’re playing catch-up because half our rural areas can’t even get decent internet. Here’s the thing, though — you don’t need to drop a fortune or revolutionize everything overnight. Start with health monitoring, get your feet wet, and build from there. The farms making moves now? They’re the ones who’ll be writing checks while others are still debating.

KEY TAKEAWAYS

  • Add $400 per cow to your bottom line by starting with health monitoring systems — fastest ROI you’ll see, especially if you’re dealing with winter stress in the Midwest or heat challenges down south
  • Get your internet sorted first — you need at least 25 Mbps to make AI worth a damn, and too many US dairy regions are still stuck in the stone age connectivity-wise
  • Invest $8-12K in training your key people — all that fancy data’s worthless if your team can’t read it or act on it when a cow’s in trouble at 3 AM
  • Lock down your data ownership rights — negotiate clear contracts so your farm’s valuable information doesn’t end up helping commodity traders make money off your back
  • Pick partners who’ll stick around — go with vendors tied to university research or proven track records, because that shiny startup might disappear right when you need support most
dairy profitability, AI in dairy farming, herd health monitoring, dairy farm technology ROI, precision dairy

Look, I’ve been watching this AI wave roll through dairy farms for a couple of years now, and the truth? Those 3 AM alerts — yeah, the ones you dread — they’re saving lives.

Take Amber Horn up in Wisconsin. She’s got 2,100 cows, and one night, her phone buzzed — not some random call, but a sensor picking up a fever in cow #287 before you could see any signs.

That alert, thanks to the smaXtec system, helped Amber’s dairy dodge nearly half a million in losses and deliver a jaw-dropping 7.8x ROI last year.

And Amber isn’t alone.

Decoding the ROI

Dairies using AI tech bump their bottom line by about $400 extra per cow annually, but geography matters:

  • $380–420 in Wisconsin confinement barns — think harsh winters and steady, demanding labor
  • $290–350 in Texas heat-stressed herds — battling scorching days
  • $450–500 in California dairies — where labor’s pricey and heat stress bites deeper

The numbers? Sound, backed by multiple solid sources.

Joe, just nearby Amber, put it bluntly:

“That sensor paid for itself the first time it flagged a cow before I even saw she was sick. Saved me $2,000 in vet bills and kept her in the string.”

Beyond the Hype

The University of Wisconsin’s Dairy Brain project? Not some lab toy. They’re managing data for over 4,000 cows — spotting health issues faster than even the best vet — but the barn is no lab: frozen pipes and spotty internet threaten even the best tech.

Fortunately, Brazil’s innovators have developed AI that works offline, syncing when the internet is restored—a vital feature for far-flung farms.

Global Snapshot

Europe leads, with 67% of Dutch dairies digitally monitoring, but only 25% deeply utilizing AI.

Australia’s dancing to a different tune — 40% adoption focused on pasture and breeding.

America? Split in two:

  • 37% adoption among big dairies (500+ cows)
  • Less than 20% among smaller operations

Much of this is held back by lagging broadband — only 39% of dairy regions can hit the 25 Mbps needed for AI.

An Aussie consultant said it best:

“We’ve cut feed costs by over 30% with AI. That’s the difference between winning and falling behind.”

Crunching the Numbers

Expect costs of about $75,000 upfront and $12,000 yearly maintenance for an AI system.

Payback is about 15 months on average, with a 30% risk buffer accounting for tech glitches, staffing changes, and market shifts.

Smaller farms often see quicker returns by dumping manual checks altogether.

Guard Your Data

Current laws don’t protect your data rights well — your farm’s info can be sold or shared without your say-so.

States like Vermont and California try to help, but most of us are still in the wild west.

Your Playbook to Win

  • Start simple: Begin with health monitoring — lowest hanging fruit, fastest payback
  • Build your base: Secure reliable internet — no speed, no smart tech
  • Train your team: Data’s useless if no one understands it
  • Protect your data: Don’t sign away your farm’s story
  • Choose partners for the long haul: Pick vendors tied to universities or proven track records — those who will still be around in five years. AI isn’t coming to dairy farming—it’s here, it’s profitable, and it’s creating competitive gaps that widen every month. Operations implementing comprehensive AI systems achieve documented 10-20% production increases while reducing costs 15-25%, with payback periods as short as 15 months.

Your competitive position depends on action, not analysis. The producers winning this transition aren’t waiting for perfect solutions—they’re implementing effective ones and improving as they learn.

The choice is stark: embrace the technology and its challenges now, or risk falling behind operations that started today.

Bottom line? The 2025 dairy landscape is separating into winners and everyone else. Time to choose which side you’re on.

Complete references and supporting documentation are available upon request by contacting the editorial team at editor@thebullvine.com.

Learn More:

The Sunday Read Dairy Professionals Don’t Skip.

Every week, thousands of producers, breeders, and industry insiders open Bullvine Weekly for genetics insights, market shifts, and profit strategies they won’t find anywhere else. One email. Five minutes. Smarter decisions all week.

NewsSubscribe
First
Last
Consent

Cents and Sensors: How Top Dairies Are Cashing In

Farms boosting profits by $400 per cow? It’s happening, and here’s how.

Executive Summary: Here’s the deal—precision tech isn’t a future dream anymore; it’s putting real money in farm checks. Farms adopting these tools report an extra $200–$400 net profit per cow annually. Feed costs can drop by up to 25%, and automated health checks catch lameness with 85% accuracy—double what a quick barn walk finds. From Europe, trimming carbon footprints by 6–9%, to bold moves in Denmark and the Midwest, this trend marries profit with sustainability. Cornell and UC Davis experts warn that the gap between adopters and laggards is widening. With milk selling for around $19/cwt, squeezing margins, this is a no-brainer ROI play—you should consider this now.

Key Takeaways

  • Cut feed costs by up to 25% with AI-optimized rations—talk to your nutritionist about precision feeding to lock in savings this season.
  • Save $300–$500 per cow annually by catching lameness early—install automated health monitors as per Journal of Dairy Science findings.
  • Expect a 2–5 year payback on robotic milking investments, which is critical when $19/cwt milk prices erode margins.
  • Confirm your infrastructure: 480 V three-phase power and at least 25 Mbps upload—tech only pays if it runs smoothly.
  • Watch regional trends: the Midwest races toward robotics, the West maximizes feed efficiency in drought, and Europe drives carbon cuts—tailor your strategy accordingly.
dairy technology, robotic milking ROI, farm efficiency, herd health monitoring, dairy farm profitability

Let’s be clear about AI in dairy: it’s not theory anymore—it’s cash in your pocket. Farms using these tools are seeing an extra $200–$400 in annual cash flow per cow. This isn’t just one miracle gadget; it’s a savvy mix of feed savings, sharper health monitoring, and production boosts.

Slashing Feed Costs, Boosting Herd Health

Feeding has long been the farm’s biggest cost drain. Precision feeding systems can pay for themselves in as little as two years, typically by year four. According to a 2024 University of Illinois Extension bulletin, AI-optimized rations trim about $0.30 per cow per day in feed costs without denting yields.

Health monitoring is quietly emerging as a key player. A 2023 Journal of Dairy Science study found that automated systems spot lameness with 85% accuracy—double the accuracy of what we detect by eye—saving around $300–$500 per cow annually and boosting fertility, as confirmed by Cornell research.

At milk near $19 per hundredweight and feed gobbling over half the check, automation is no longer a luxury. European farms under strict sustainability mandates reduce their carbon footprints by up to 9% while maintaining—or even increasing—production.

From Robots to Lameness Detection: Tech in Action

Today’s tech watches over 50 cow behaviors—from chewing time to standing duration—flagging trouble days before visible symptoms. Here are a few standout examples:

  • SCR’s Heatime system hits 95% accuracy in detecting heats. With its acquisition of CattleEye, GEA now monitors over 100,000 cows worldwide for lameness and changes in condition.
  • The Vray Holsteins farm in France, a roughly 200-cow operation, recorded a 10% production increase after installing Lely A4 robots, with fresh cows regularly producing over 40 kg/day.

Calculating the Real Cost of Automation

The initial investment for robotic systems ranges from $75,000 for small setups to over $ 600,000 at scale. Brazilian studies suggest a typical payback near five years. Additionally, budget for annual maintenance (15–20% of capital costs), software subscriptions, and increased electricity bills.

Avoiding the Implementation Pitfalls

Implementation hurdles often boil down to wiring and team training. Purdue’s Dr. John Bernard recommends phased rollouts—start small, build confidence, then scale.

  • Infrastructure: Rock-solid 480 V three-phase power and ≥ 25 Mbps upload.
  • Integration: Systems must “talk” or data silos stall progress.
  • Cybersecurity: Swiss dairies faced ransomware freezes—plan defenses now.

Smart Start: Actionable Tech Tips for Dairy Operators

  • Review 30-day feed costs; target a 20% cut with AI rations (UIUC Extension).
  • Audit robotic milking weekly; aim for ≥ 2.8 visits/cow/day (Midwest benchmark).
  • Flag 3–5 high-risk cows weekly via lameness alerts; treat within 48 hrs.
  • Verify electrical/internet readiness before upgrades: 480 V three-phase, 25 Mbps upload.
  • Phase rollouts over 3–6 months, prioritizing staff training and data integration.

The Verdict: Adapt or Be Left Behind

Halter’s $100M raise vaulted its valuation past $1B; McKinsey forecasts up to $90B in ag-AI value by 2030. Regional flavors matter: Midwest automation for labor, West precision feeding amid drought, Europe’s sustainability tech, and Denmark’s near-universal robotics.

Dr. Sarah Johnson of UC Davis warns that the gulf between adopters and laggards is widening. Cornell’s Dr. Michael Gould of the Dyson School offers a stark conclusion:

“At Cornell, we say waiting could cost you your competitive edge—the time to act is now.”

This isn’t tinkering at the edges; it’s a farm-management revolution. The pack is already sprinting. The only question is whether you’ll lead it or watch it disappear over the horizon.

Complete references and supporting documentation are available upon request by contacting the editorial team at editor@thebullvine.com.

Learn More:

The Sunday Read Dairy Professionals Don’t Skip.

Every week, thousands of producers, breeders, and industry insiders open Bullvine Weekly for genetics insights, market shifts, and profit strategies they won’t find anywhere else. One email. Five minutes. Smarter decisions all week.

NewsSubscribe
First
Last
Consent
Send this to a friend