What the 28-point sugar swing in molasses means for your calf program—and the five questions your supplier should be able to answer.
You know how it is when you’re standing at the feed store or reviewing a quote from your supplier, trying to make sense of what you’re actually buying? Most of us zero in on the guaranteed analysis—crude protein, minimum fat, maximum fiber. Those numbers feel solid. They seem like they’re telling the whole story.
But here’s what I’ve been thinking about lately. A growing body of research, combined with what calf managers are observing from Wisconsin to California to the Northeast, suggests that one of the most common ingredients on that tag may be affecting heifer development in ways the guaranteed analysis simply doesn’t capture.
That ingredient is molasses.
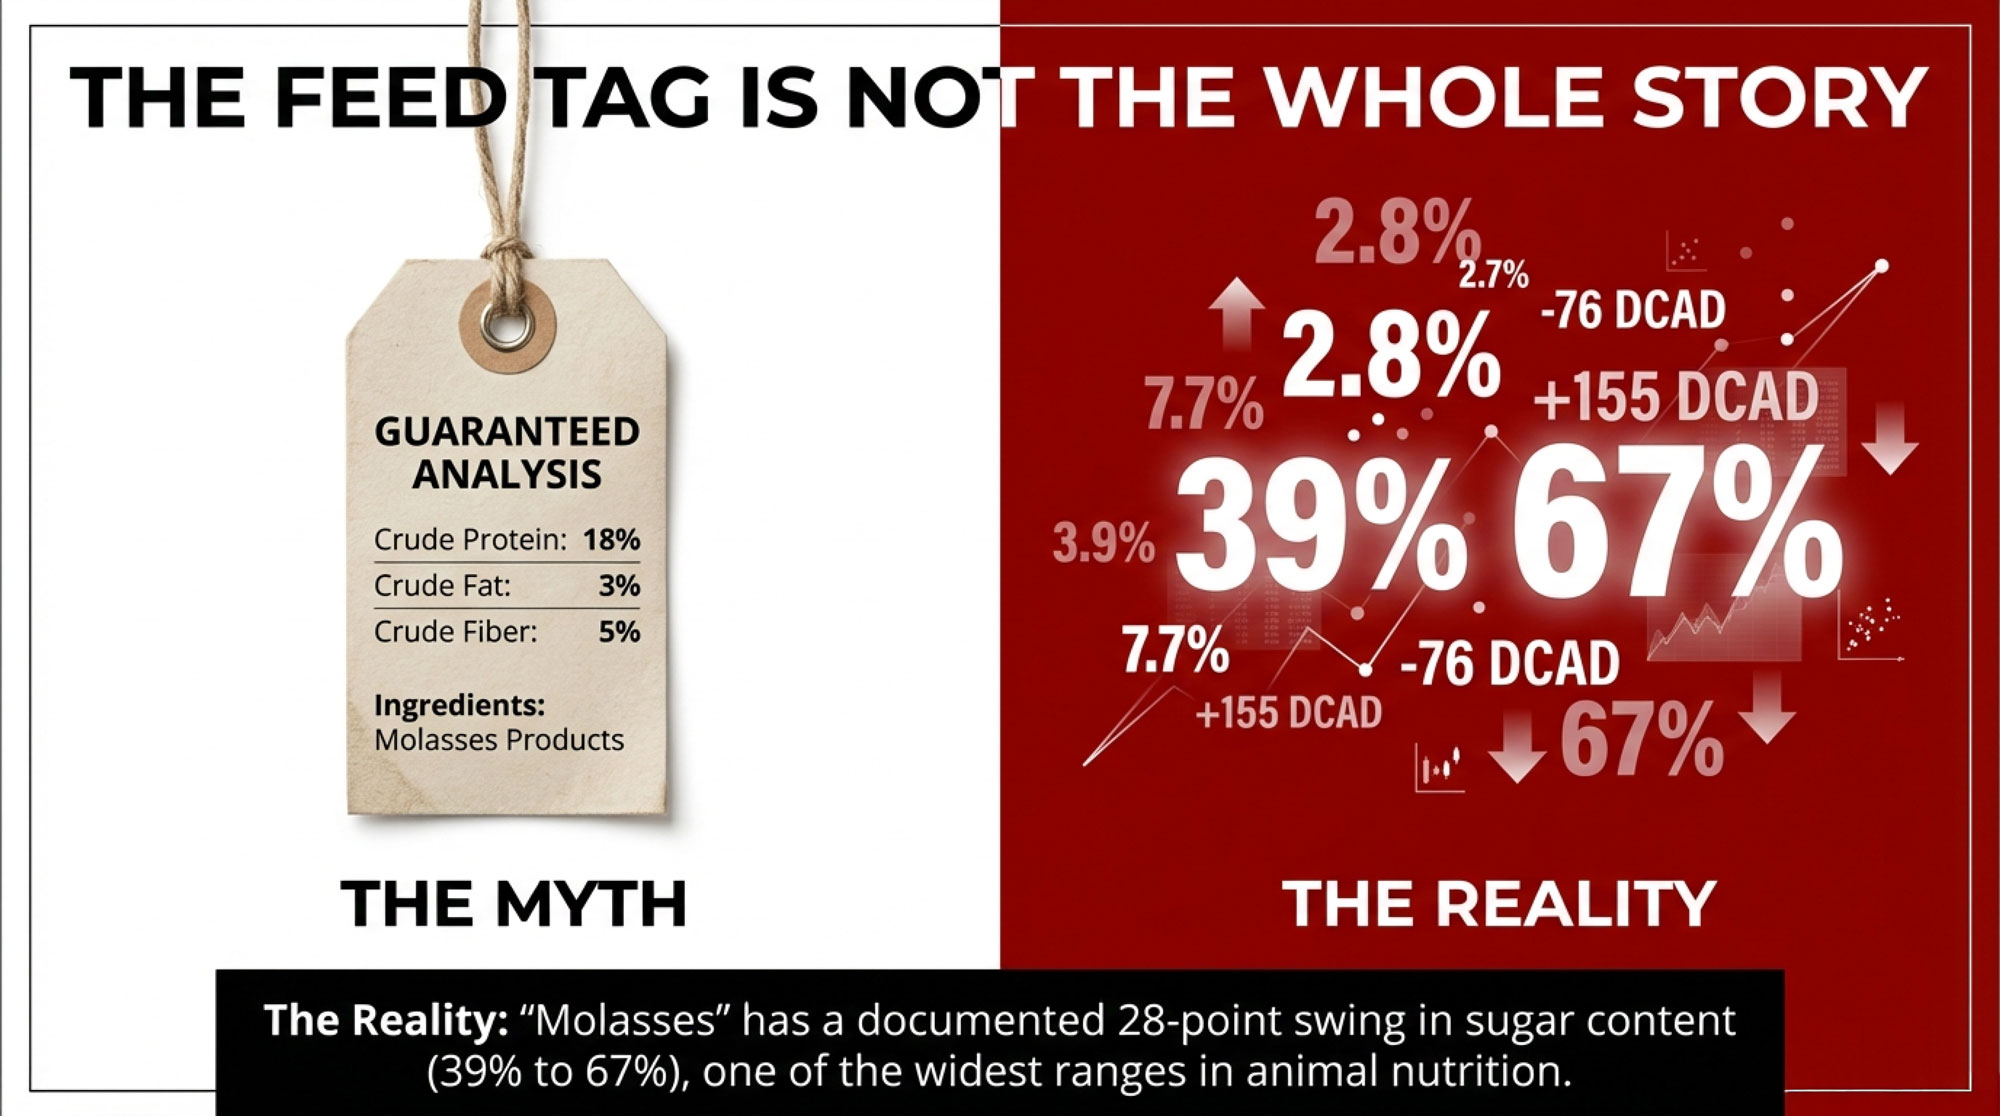
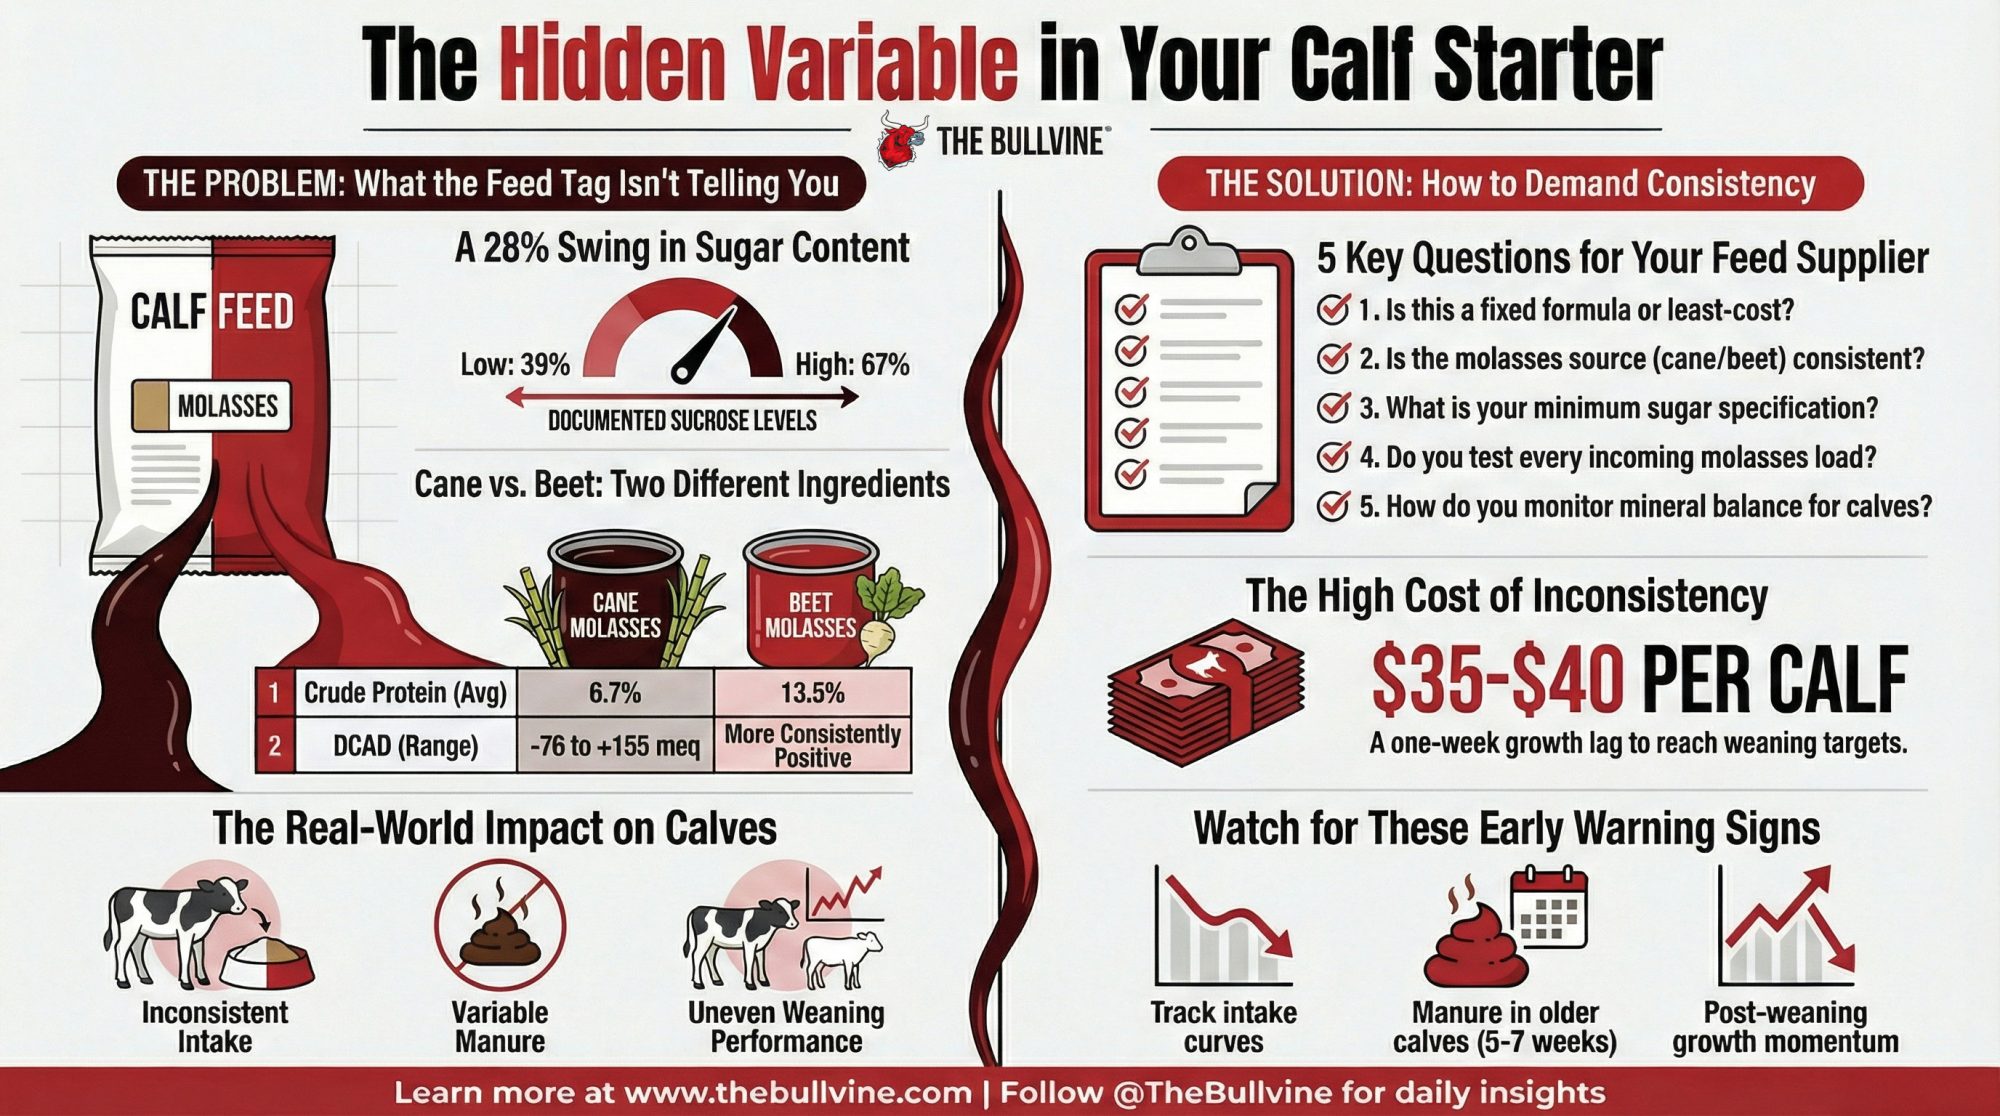
What appears as a single, standardized commodity actually represents one of the most variable ingredients in animal nutrition. A 2020 study published in the Journal of Dairy Science by Palmonari and colleagues documented sucrose content in cane molasses ranging from 39% to 67% on a dry-matter basis. That’s not a minor fluctuation—we’re talking about a swing that can meaningfully alter energy delivery, fermentation patterns, and rumen development in young calves.
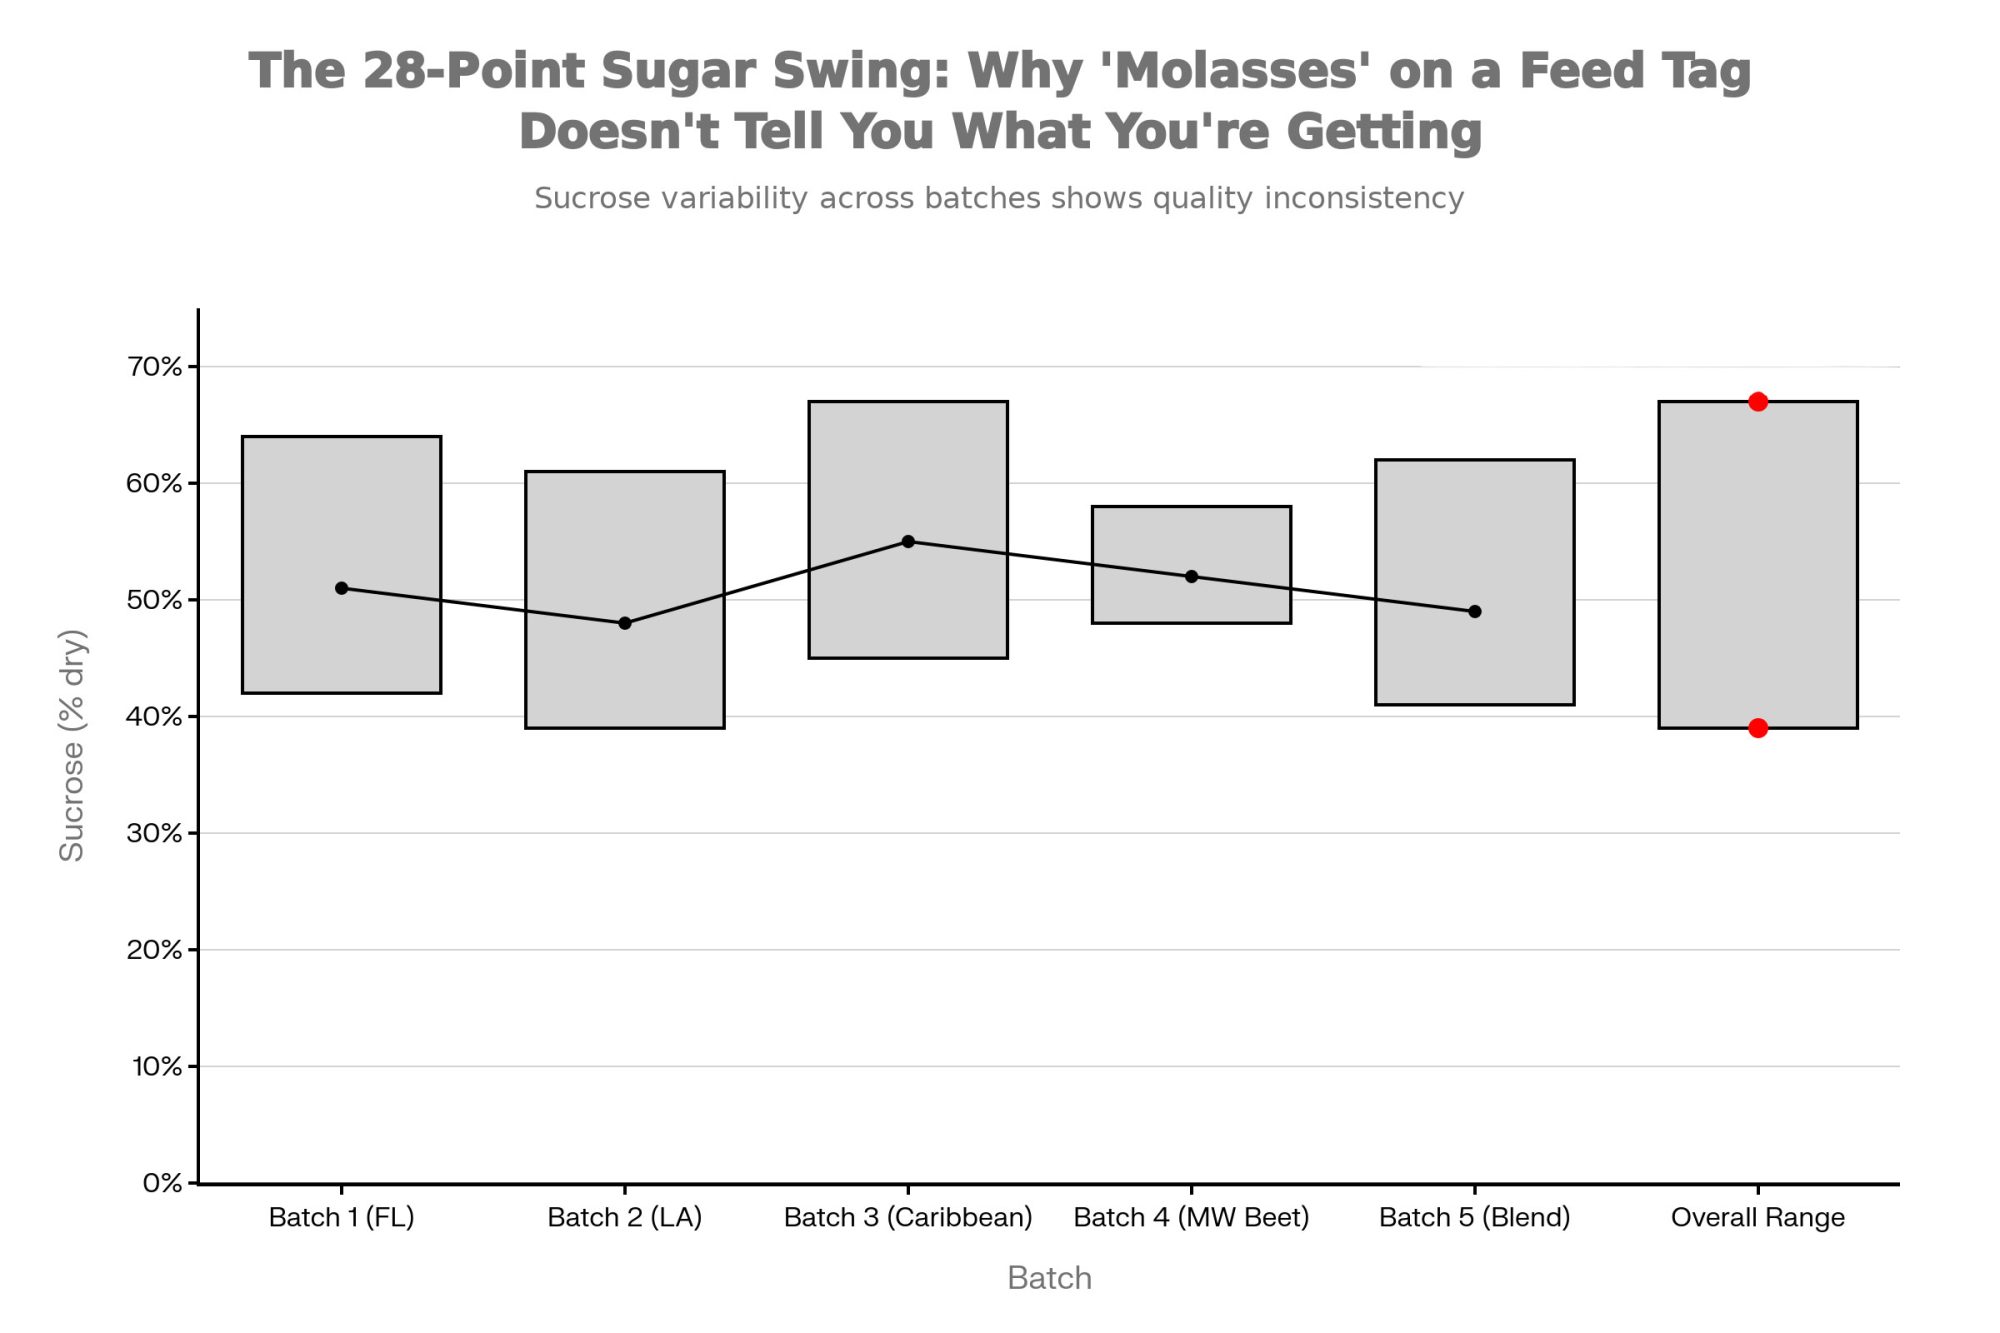
Researchers studying early-life nutrition have noted that, while this variability is well documented in the scientific literature, its practical implications for calf programs are often overlooked at the farm level. When you’re looking at a 28-percentage-point swing in sugar content, you’re essentially dealing with different ingredients showing up under the same name on that feed tag.
For operations investing significant resources in replacement heifer programs—and that’s most of us these days, given heifer values—understanding this variable is becoming increasingly important for achieving consistent results.
What the Research Actually Shows
The assumption that “molasses is molasses” doesn’t hold up once you start digging into laboratory data. The Palmonari study systematically characterized molasses samples from suppliers around the world, and honestly, the compositional differences they documented were more dramatic than I expected when I first came across this work.
Here’s what stood out:
- Sucrose content in cane molasses averaged about 49% but ranged from 39% to 67% on a dry matter basis
- Crude protein differed dramatically between sources—beet molasses averaged 13.5% while cane molasses averaged just 6.7%
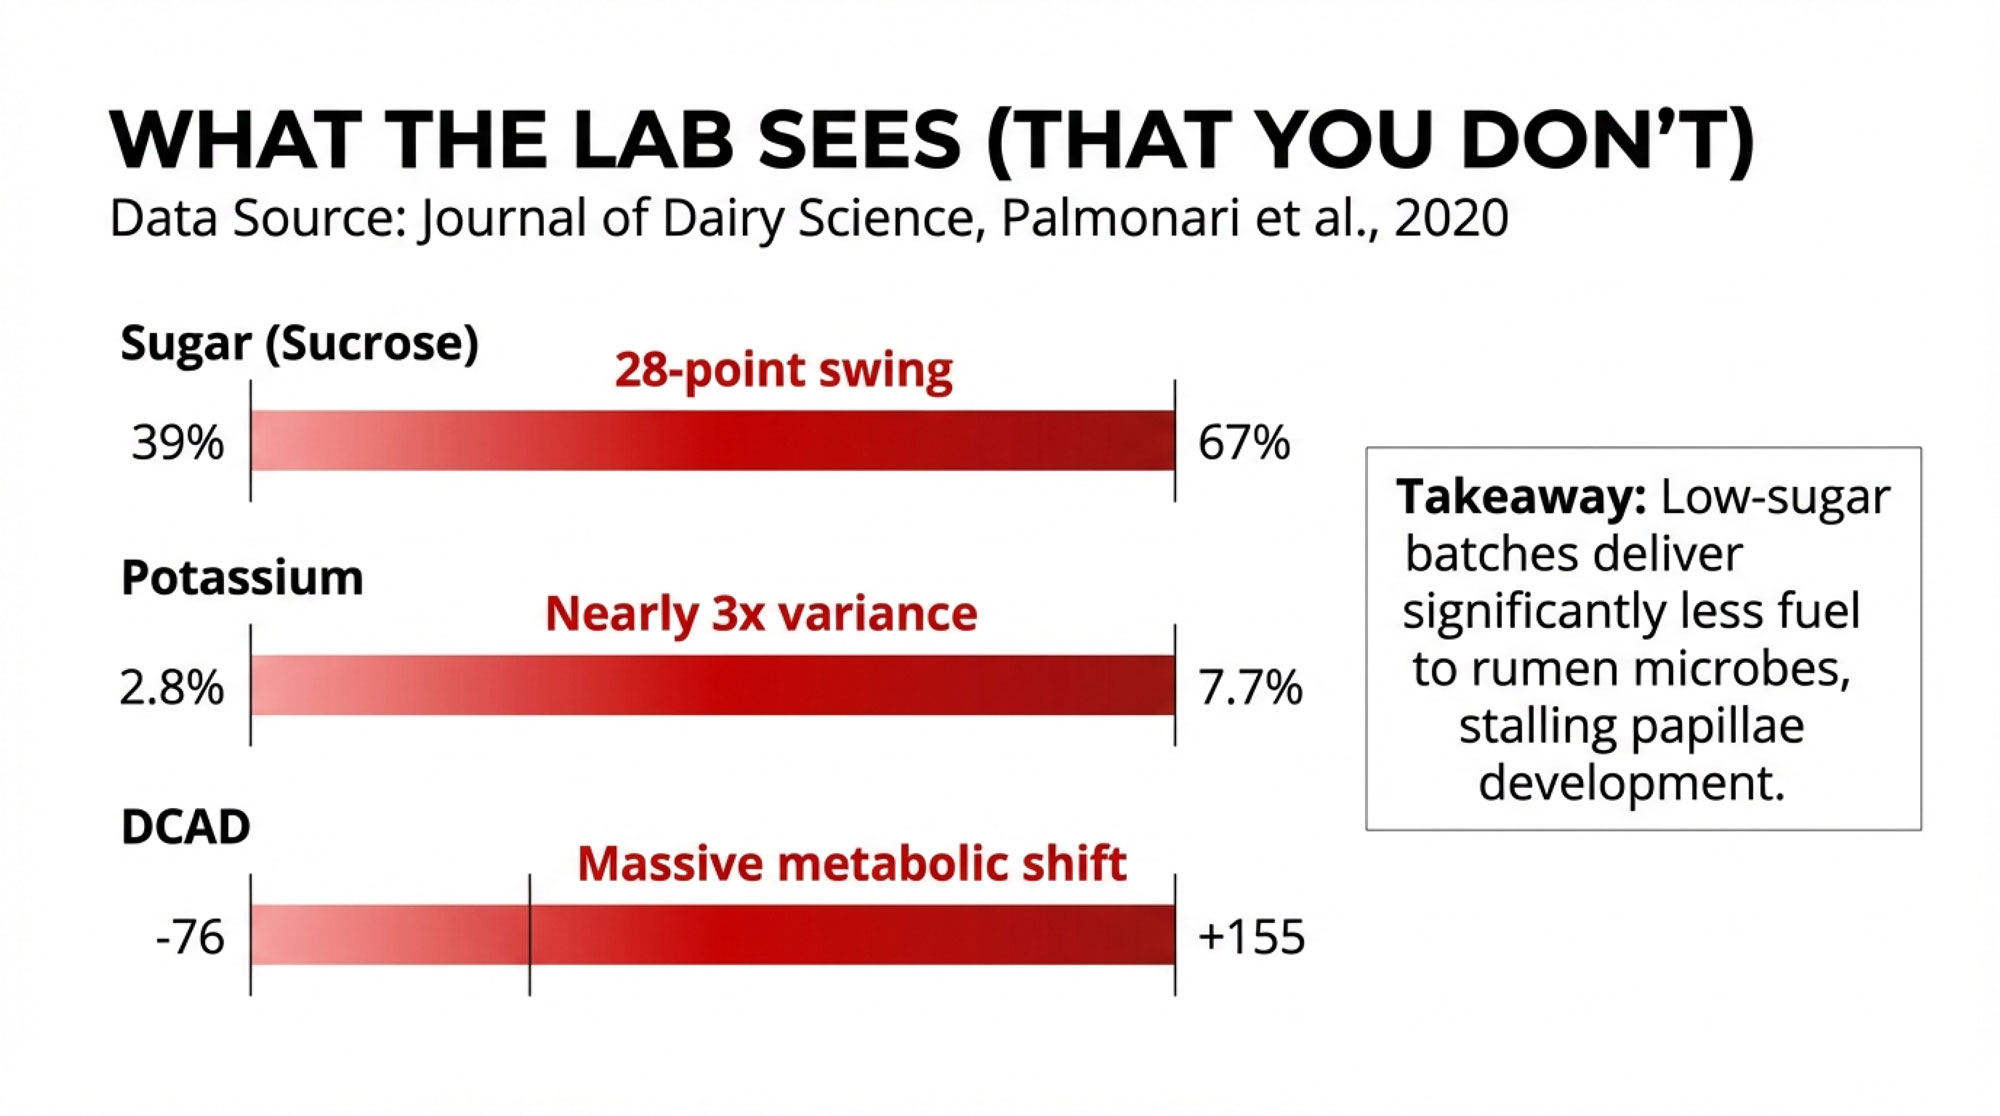
- Potassium levels in cane molasses ranged from roughly 2.8% to 7.7%, nearly a threefold variance
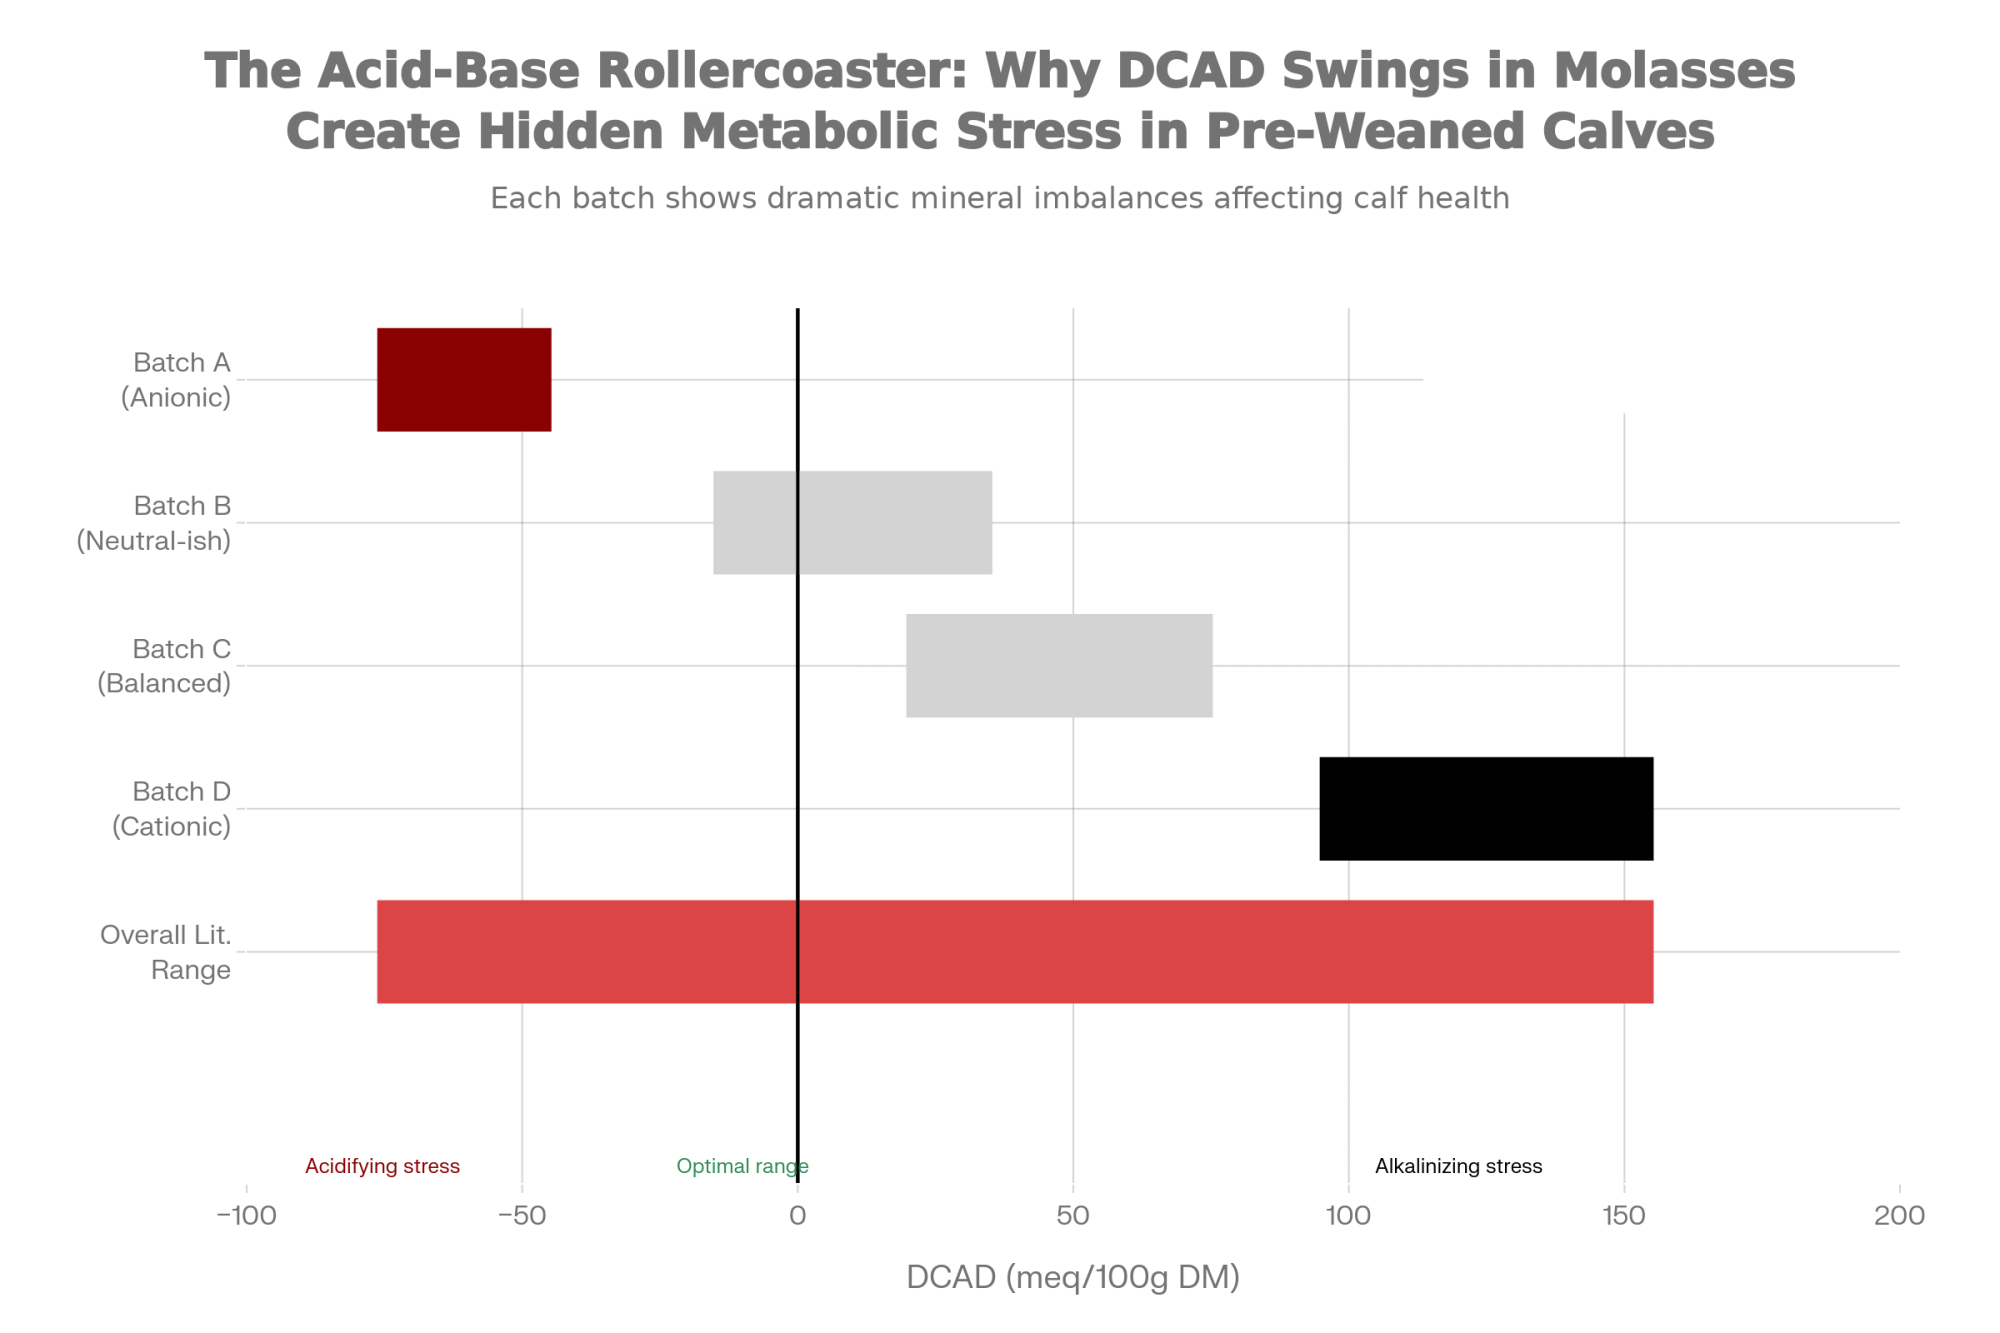
- Dietary Cation-Anion Difference (DCAD) in cane molasses showed a range from -76 to +155 meq/100g DM
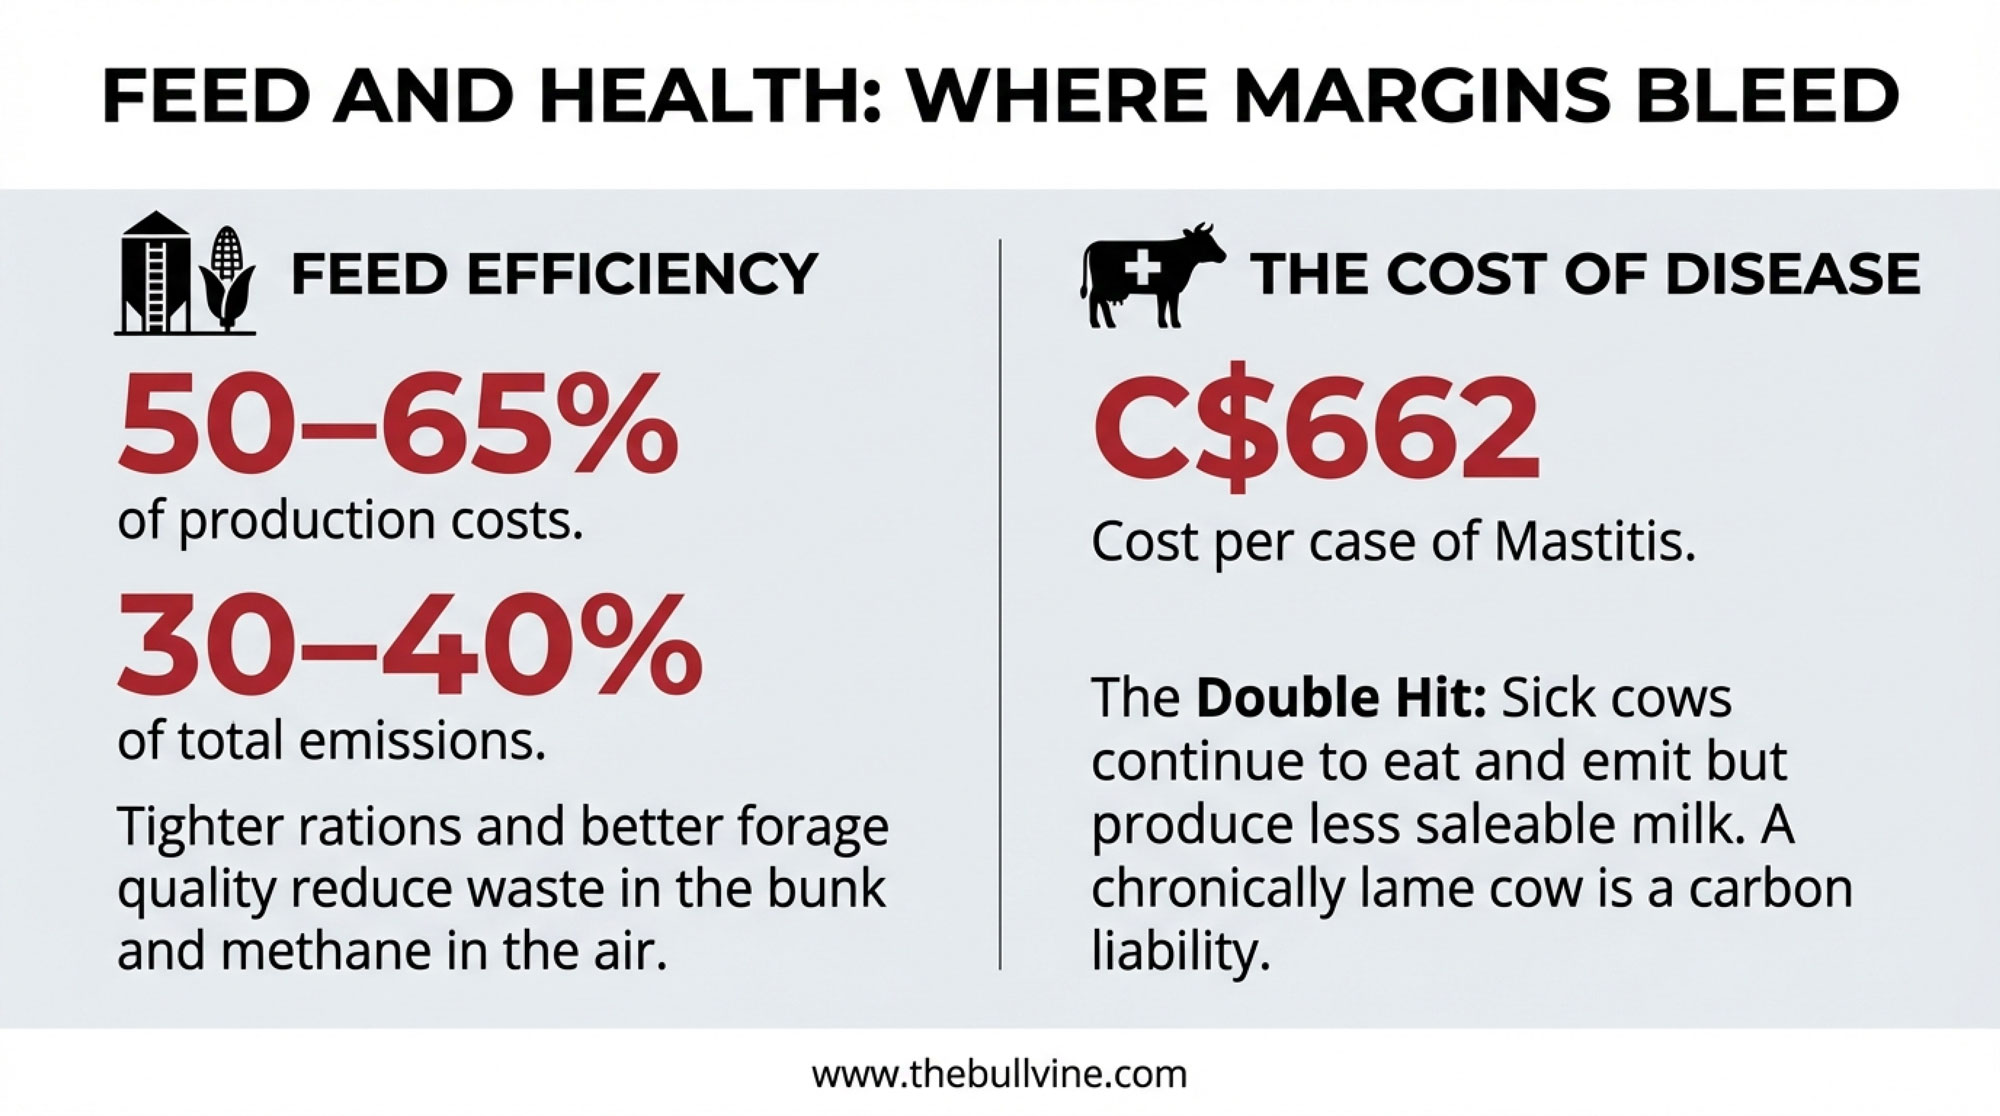
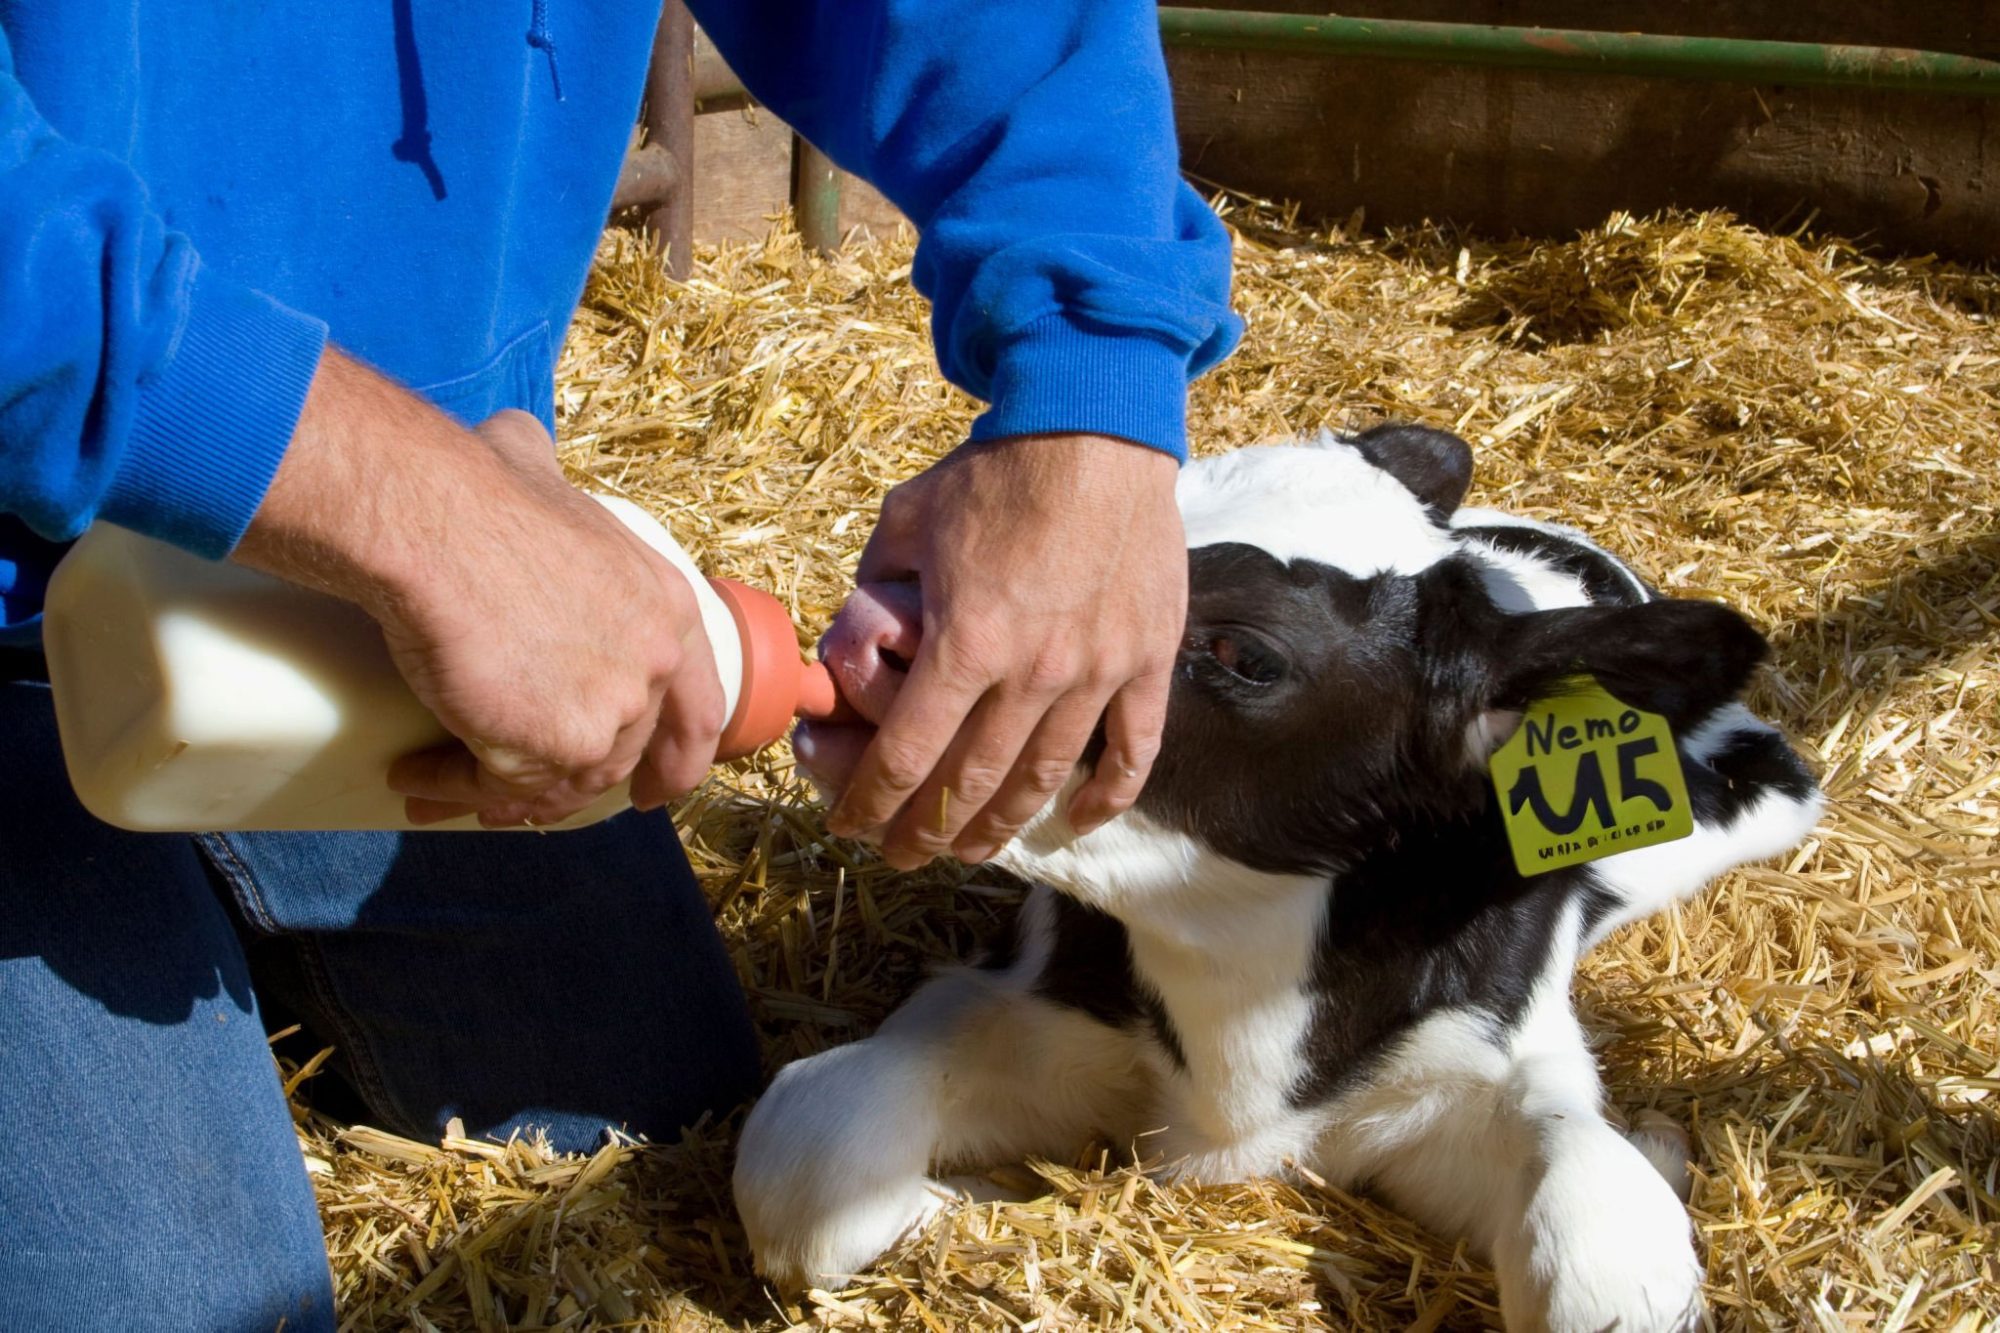
Why does this matter for your calf barn? Molasses serves a dual biological function in calf starters. Beyond driving palatability and encouraging early dry matter intake (which we all know is critical for rumen development), molasses provides the rapidly fermentable sugars that fuel rumen microbial populations. These microbes produce volatile fatty acids—particularly butyrate—which directly stimulates the growth of rumen papillae. Those finger-like projections are what allow the calf to absorb nutrients efficiently throughout her productive life.
When molasses quality fluctuates, so does this entire digestive process. A batch of starter containing low-sugar molasses delivers less fermentable substrate to rumen microbes, potentially slowing butyrate production during the critical pre-weaning window.
Industry reviews and technical reports indicate that many feed manufacturers source molasses from multiple suppliers throughout the year. That’s just the nature of commodity markets—and it’s not necessarily a criticism. But it does mean batch-to-batch variability can creep into your calf program without anyone specifically tracking it.
Cane Versus Beet: Two Different Ingredients
The differences between cane and beet molasses go well beyond their plant origins. These are functionally different ingredients that affect calf metabolism differently—yet feed tags rarely specify which type is being used.
| Parameter | Cane Molasses | Beet Molasses | Clinical Significance |
| Crude Protein | 6.7% avg (range: 2.2–9.3%) | 13.5% avg (range: 10.7–15.6%) | Beet provides 2× more protein; impacts amino acid balance in starter |
| Sugar Profile | Sucrose + glucose + fructose (mixed) | Almost exclusively sucrose | Cane ferments faster; beet requires enzymatic breakdown first |
| Potassium (K) | Highly variable: 2.8–7.7% | Consistently high (~4.5–5.5%) | Wide cane variability can stress DCAD balance; beet more predictable |
| DCAD Range | –76 to +155 meq/100g DM | More consistent: +66 avg meq | Cane swings create acid-base stress; beet better for budding system maturity |
| Regional Availability | South (FL, LA, TX), Caribbean, S. America | Midwest (MN, ND, MI, ID) | Geography determines typical molasses type by region |
| Consistency (Year-Round) | Batch-to-batch variability common | More consistent sourcing | Beet easier to specify; cane requires active supplier vetting |
Data Source: Palmonari et al., Journal of Dairy Science, 2020
I’ve looked at dozens of calf starter tags over the years, and almost universally, they just say “molasses” or “molasses products.” That’s perfectly legal, but it doesn’t tell you much about what you’re actually getting.

| Parameter | Cane Molasses | Beet Molasses |
| Crude Protein | 6.7% average (range: 2.2–9.3%) | 13.5% average (range: 10.7–15.6%) |
| Sugar Profile | Sucrose + glucose + fructose | Almost exclusively sucrose |
| Potassium | Variable (2.8–7.7%) | Consistently high |
| DCAD | Highly variable (-76 to +155 meq) | More consistently positive (+66 avg) |
Data from Palmonari et al., Journal of Dairy Science, 2020
The sugar profile difference is worth understanding, though in practice, molasses typically accounts for only 5–7% of the starter’s dry matter. Cane molasses contains appreciable free glucose and fructose—monosaccharides that rumen microbes can ferment immediately. Beet molasses is almost exclusively sucrose, which must be enzymatically broken down before fermentation proceeds.
Since both sugar sources are ultimately fermented and molasses inclusion is relatively modest, dramatic shifts in calf performance from source switching alone would be unusual in well-formulated starters. However, the cumulative effect of multiple ingredient variables—including molasses quality—can influence consistency, particularly in operations monitoring intake and growth patterns closely.
What matters more, from a practical standpoint, is consistency within a given source type. Whether a mill uses cane or beet molasses is less important than whether it uses the same type with a similar composition batch after batch.
A note on regional sourcing: Geography plays a meaningful role here. Cane molasses is produced primarily in the South—Florida, Louisiana, Texas—or imported from the Caribbean and South America. Beet molasses comes from processing plants in Minnesota, North Dakota, Michigan, Idaho, and other northern regions. If you’re a producer in Wisconsin or Minnesota, the locally available molasses is almost certainly beet. Operations in the Southeast have easier access to cane. This doesn’t mean one is inherently better, but “standard molasses” means different things in different regions—and switching suppliers can inadvertently switch your source type.
The Mineral Balance Question: When Consistency Matters
One of the more significant findings from the research involves DCAD and mineral variability. The 200+ milliequivalent swing in DCAD between molasses batches represents meaningful compositional variation, though the practical impact depends heavily on overall diet formulation and molasses inclusion rate.
In typical calf starter formulations where molasses represents 5–7% of dry matter, mineral imbalances severe enough to cause clinical problems are relatively uncommon. However, what producers may observe is more subtle: slight variations in intake consistency, minor changes in manure character, or small differences in how calves transition through weaning.
Here’s what’s worth watching for:
“The calves look fine, but performance isn’t quite as consistent as it was last quarter.”
This pattern—where nothing is dramatically wrong but consistency has declined—is where ingredient variability often shows up first. It’s not necessarily pathogenic scours or clinical acidosis. It’s the kind of variability that makes it harder to predict which calves will hit weaning targets on schedule.
Here’s a reference I’ve found useful for distinguishing between different types of digestive upset:
| Clinical Sign | Nutritional Variability | Pathogenic Scours |
| Calf demeanor | Generally normal, eating | Dull, depressed, off-feed |
| Outbreak pattern | Subtle, affects consistency metrics | Progressive, spreads calf-to-calf |
| Temperature | Normal (<103°F) | Often elevated (>103°F) |
| Manure character | Variable consistency, not severe | Often contains mucus or blood |
| Response to management | Improves with consistent feed | Requires treatment protocol |
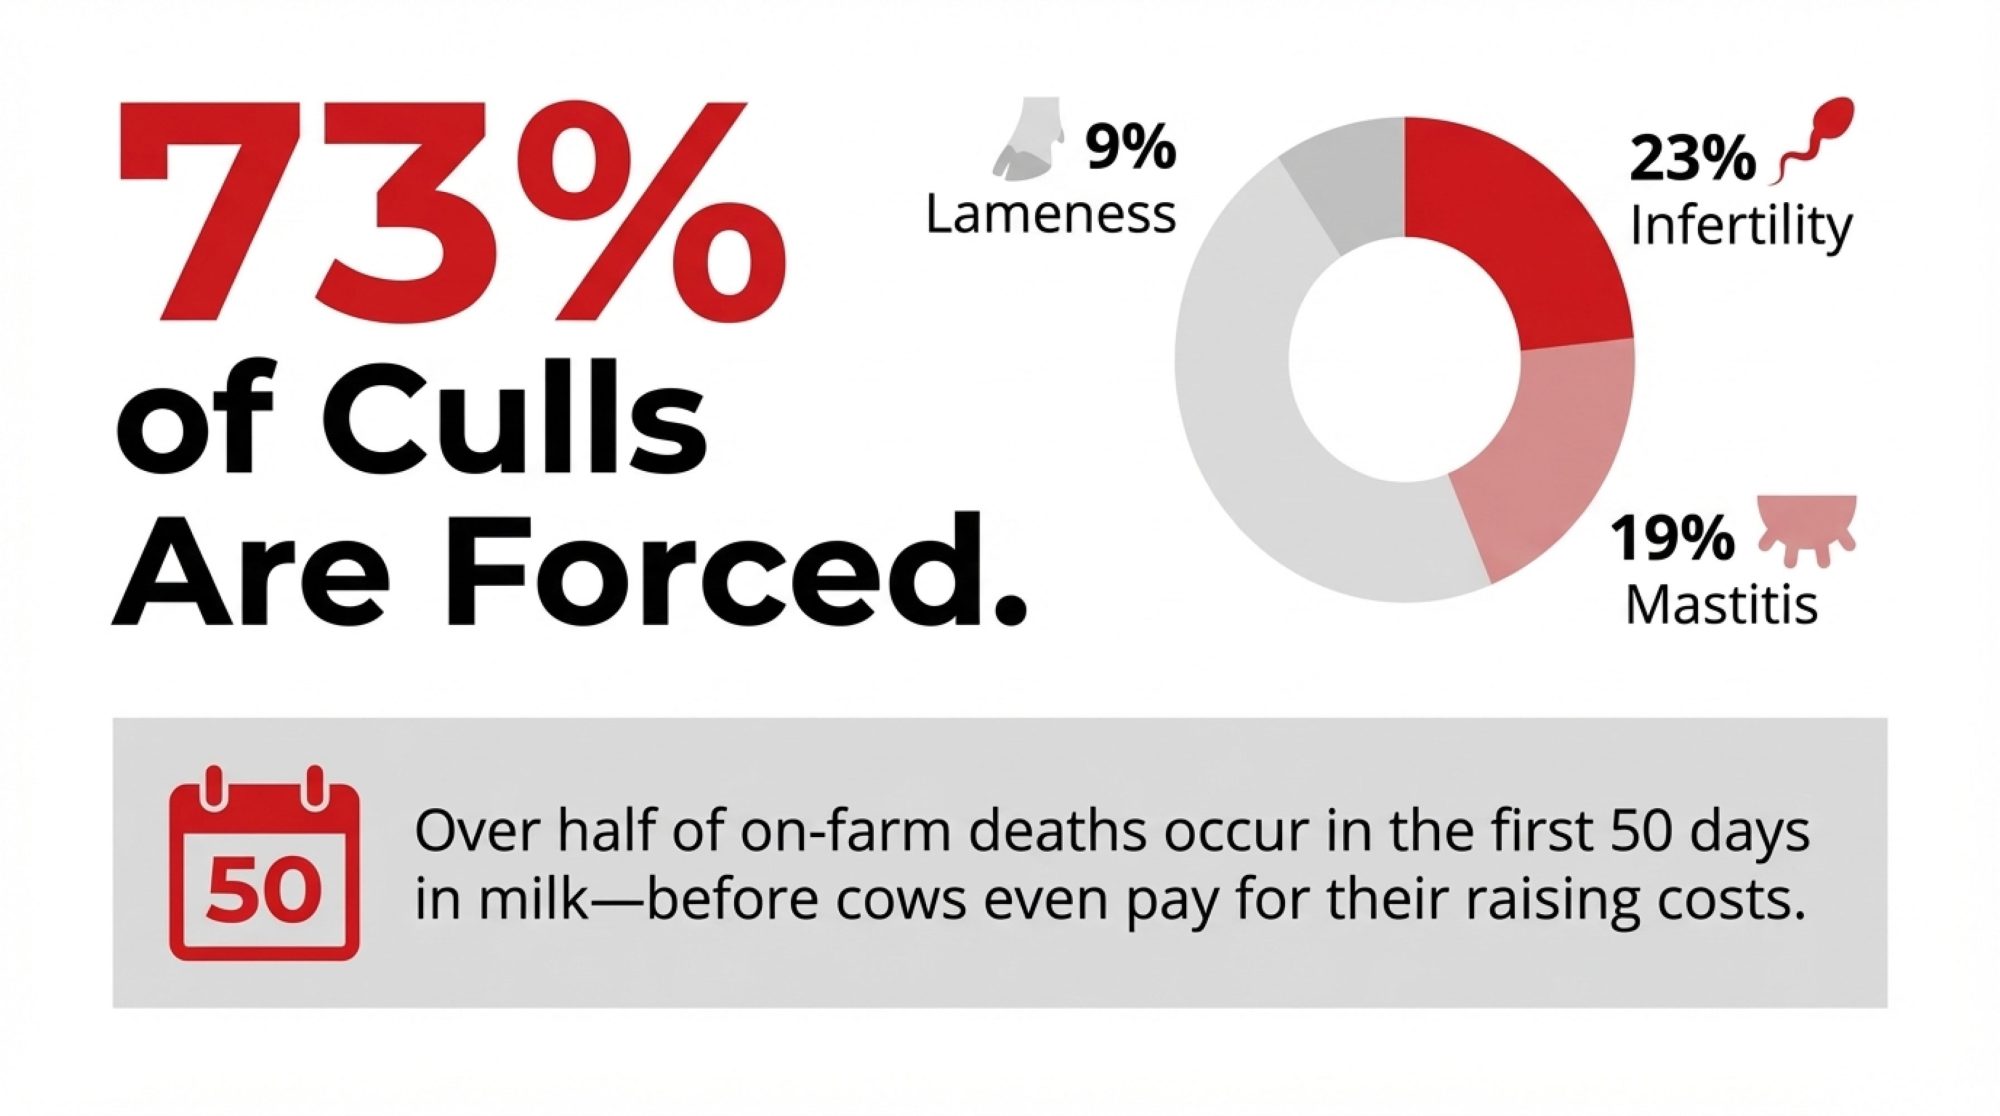
What’s encouraging is that the industry has made real progress on calf survival over the years. USDA NAHMS data from the Dairy 2014 study found preweaning heifer mortality at about 5.0%, with digestive disorders accounting for roughly 32% of known causes of death. Earlier NAHMS studies from the 1990s and 2007 reported somewhat higher mortality rates—around 7.8–8.4%—with scours historically accounting for a larger share of the total.
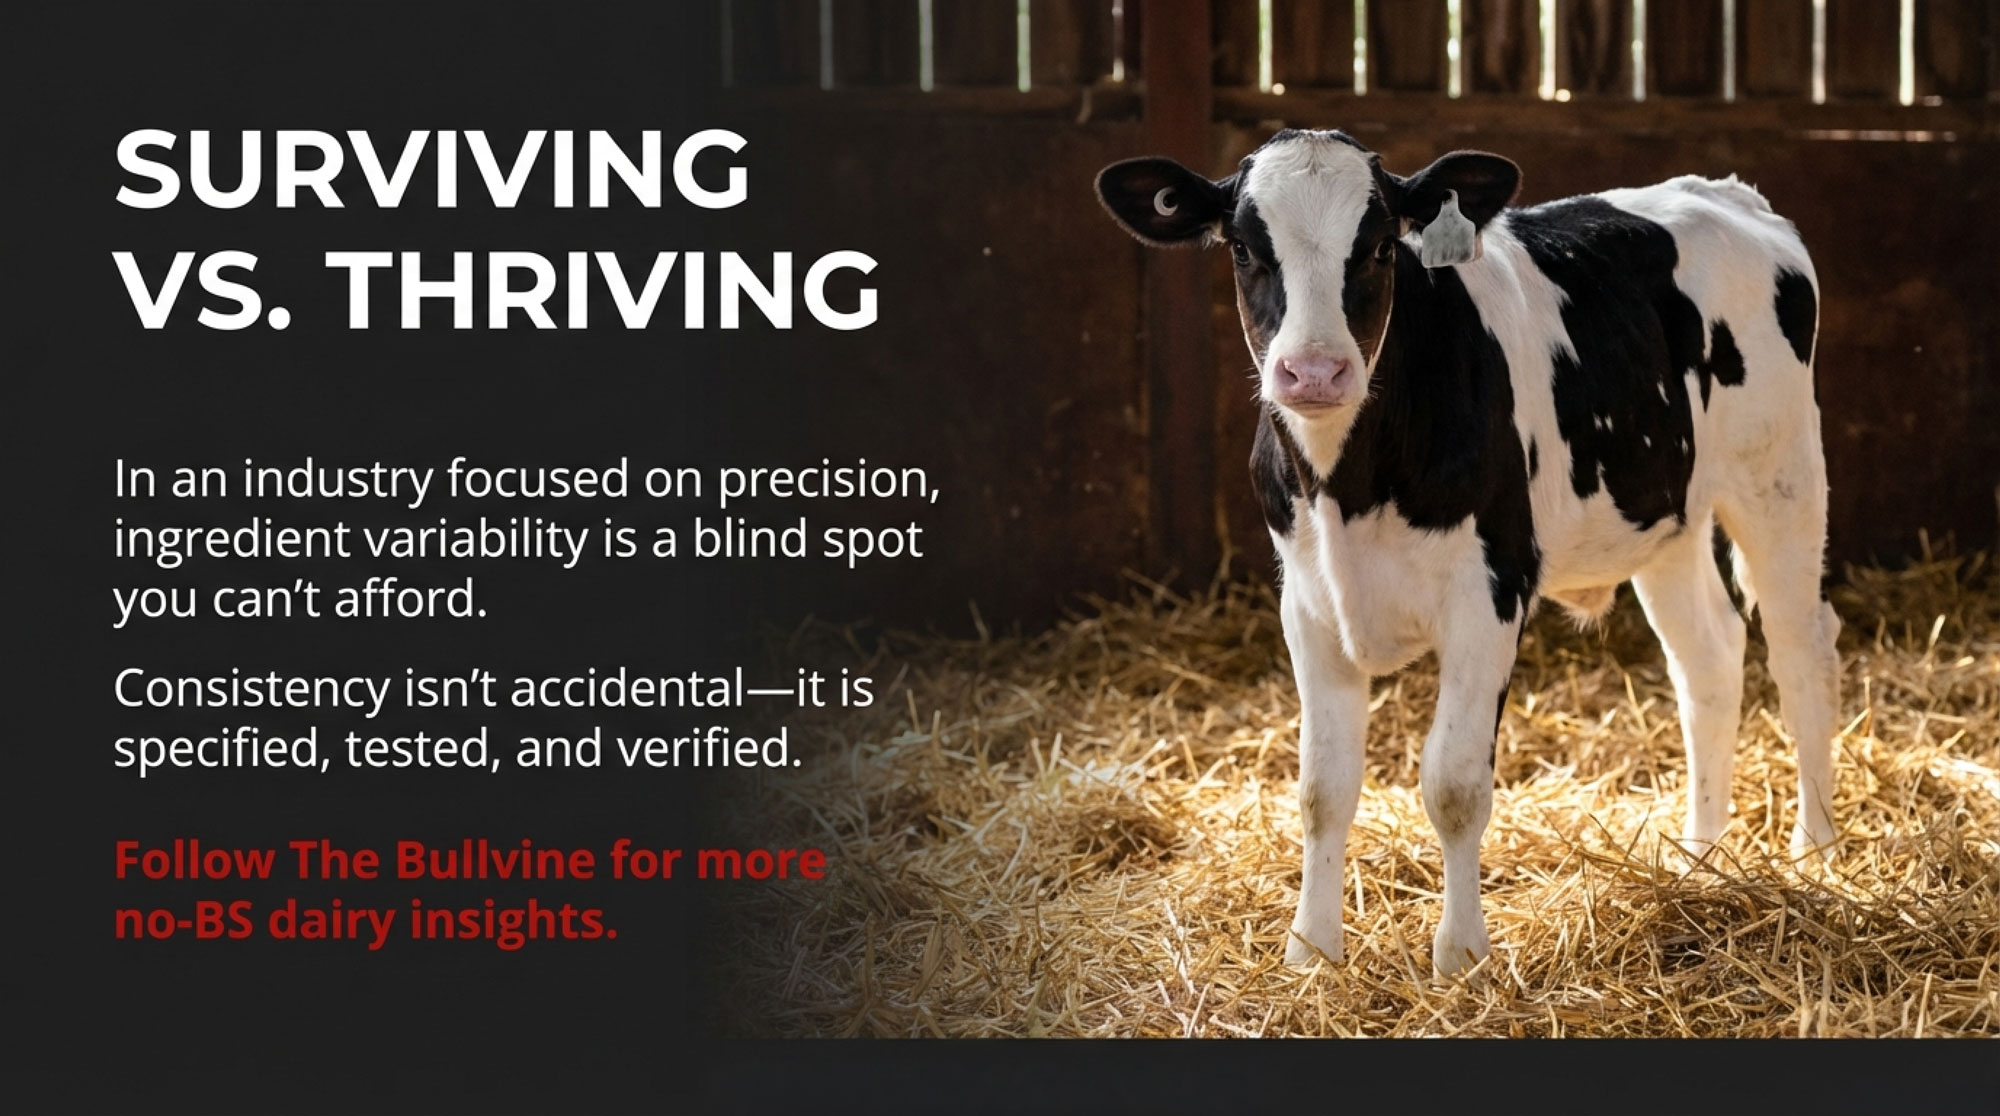
So we’re moving in the right direction as an industry. But as mortality rates have improved, attention is increasingly shifting to consistency and performance optimization—the difference between calves that simply survive and calves that thrive.
Making Sense of DCAD
Dietary Cation-Anion Difference represents the balance of key minerals and influences acid-base status. If you’ve worked with close-up dry cows (and most of us have spent plenty of time thinking about transition period management), you know DCAD for milk fever prevention. But its impact on calves receives far less attention.
Think of DCAD like pH balance in a swimming pool. There’s an ideal range where everything works. Push too far in either direction and problems emerge.
For calves, those problems manifest as metabolic stress that diverts energy away from growth.
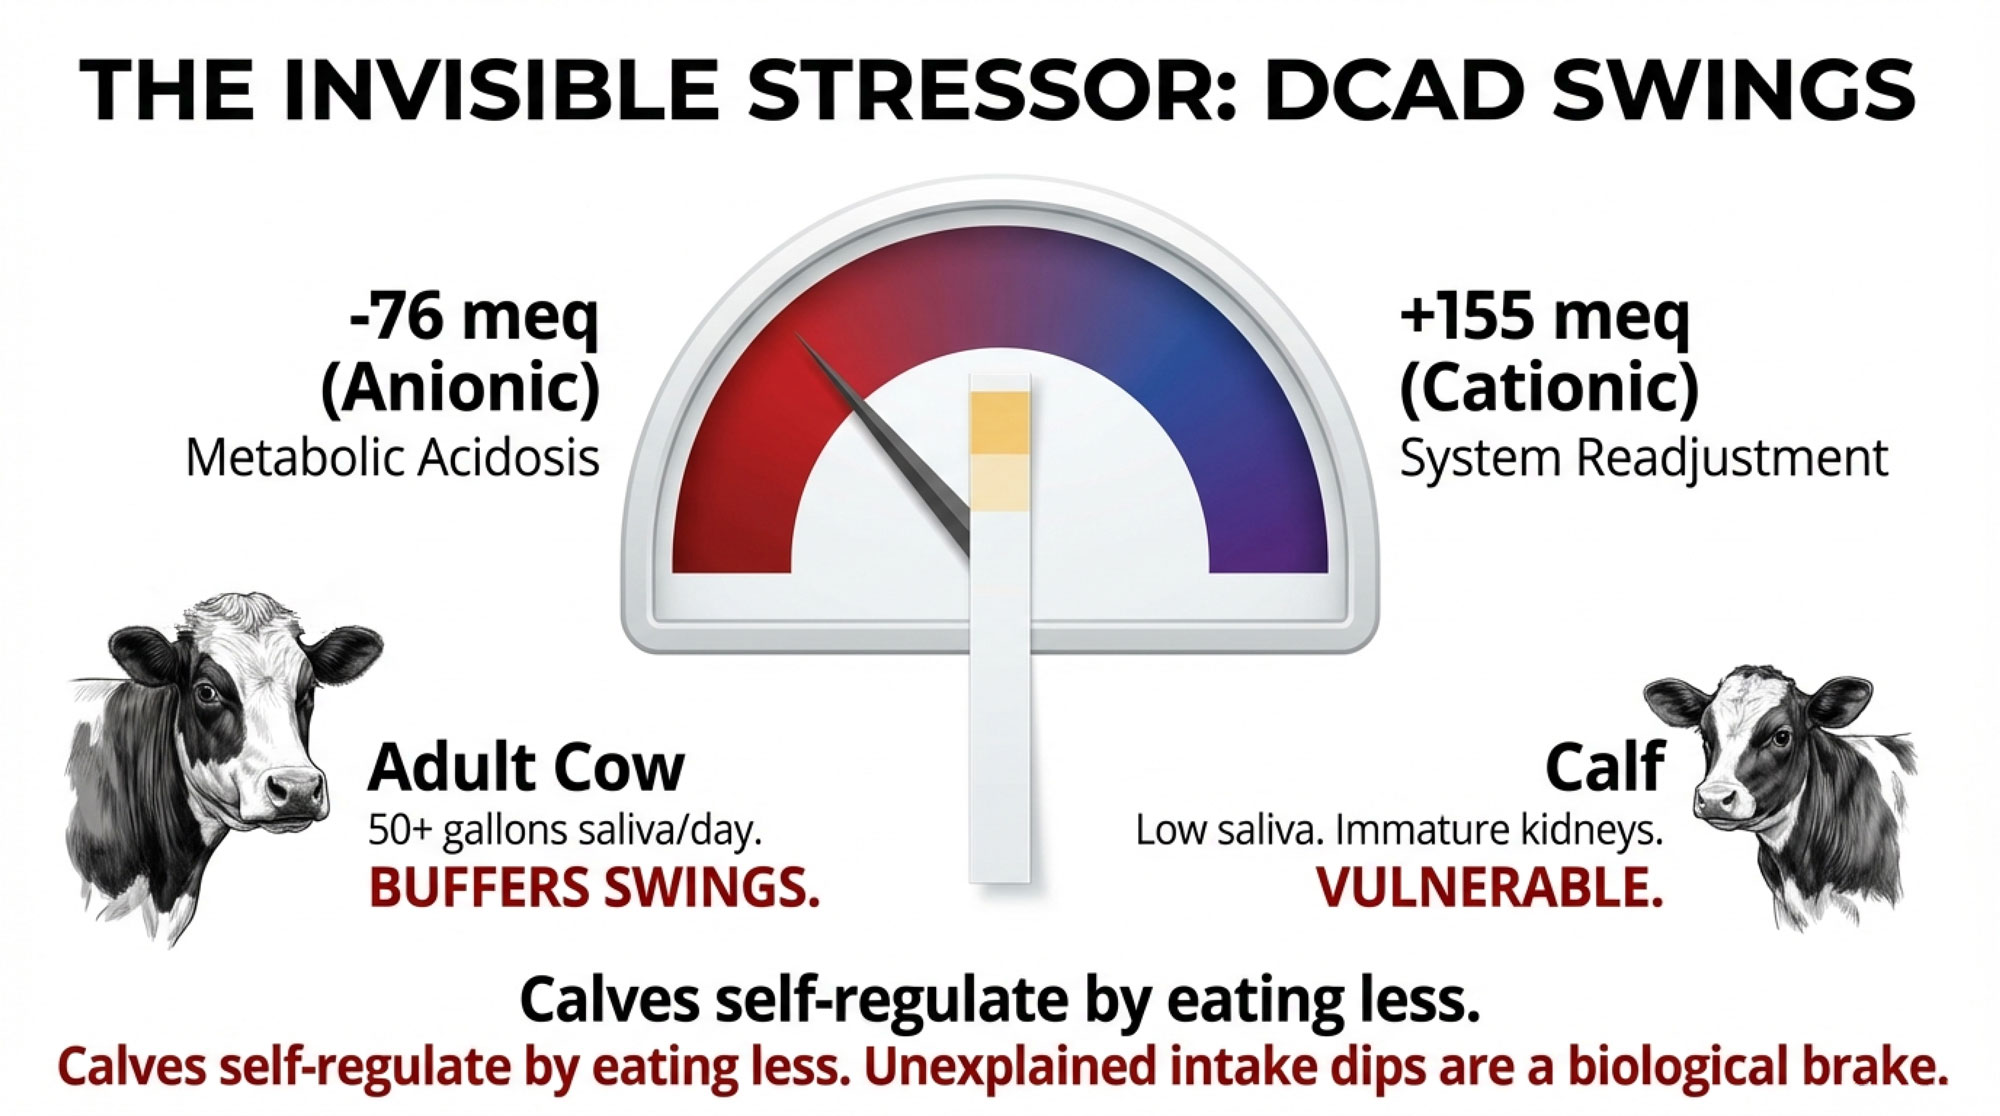
The challenge is that cane molasses DCAD can swing by more than 200 milliequivalents between batches. When a strongly anionic load arrives, it nudges the calf toward metabolic acidosis. When a highly cationic batch follows, the system has to readjust in the opposite direction.
Why does this matter more in calves than in mature cows? Adult cattle produce 50-plus gallons of saliva daily—essentially a massive buffer tank of bicarbonate that helps neutralize pH swings. Pre-weaned calves produce very little saliva and lack this buffering capacity. Their kidneys are also still maturing, which limits their ability to excrete excess minerals efficiently.
The observable result is often erratic feed intake. Calves experiencing metabolic stress from DCAD fluctuations frequently self-regulate by reducing consumption—a biological brake that protects against further imbalance but at the expense of growth.
If you’re seeing unexplained intake variability that doesn’t match weather patterns or management changes, ingredient consistency might be worth examining.
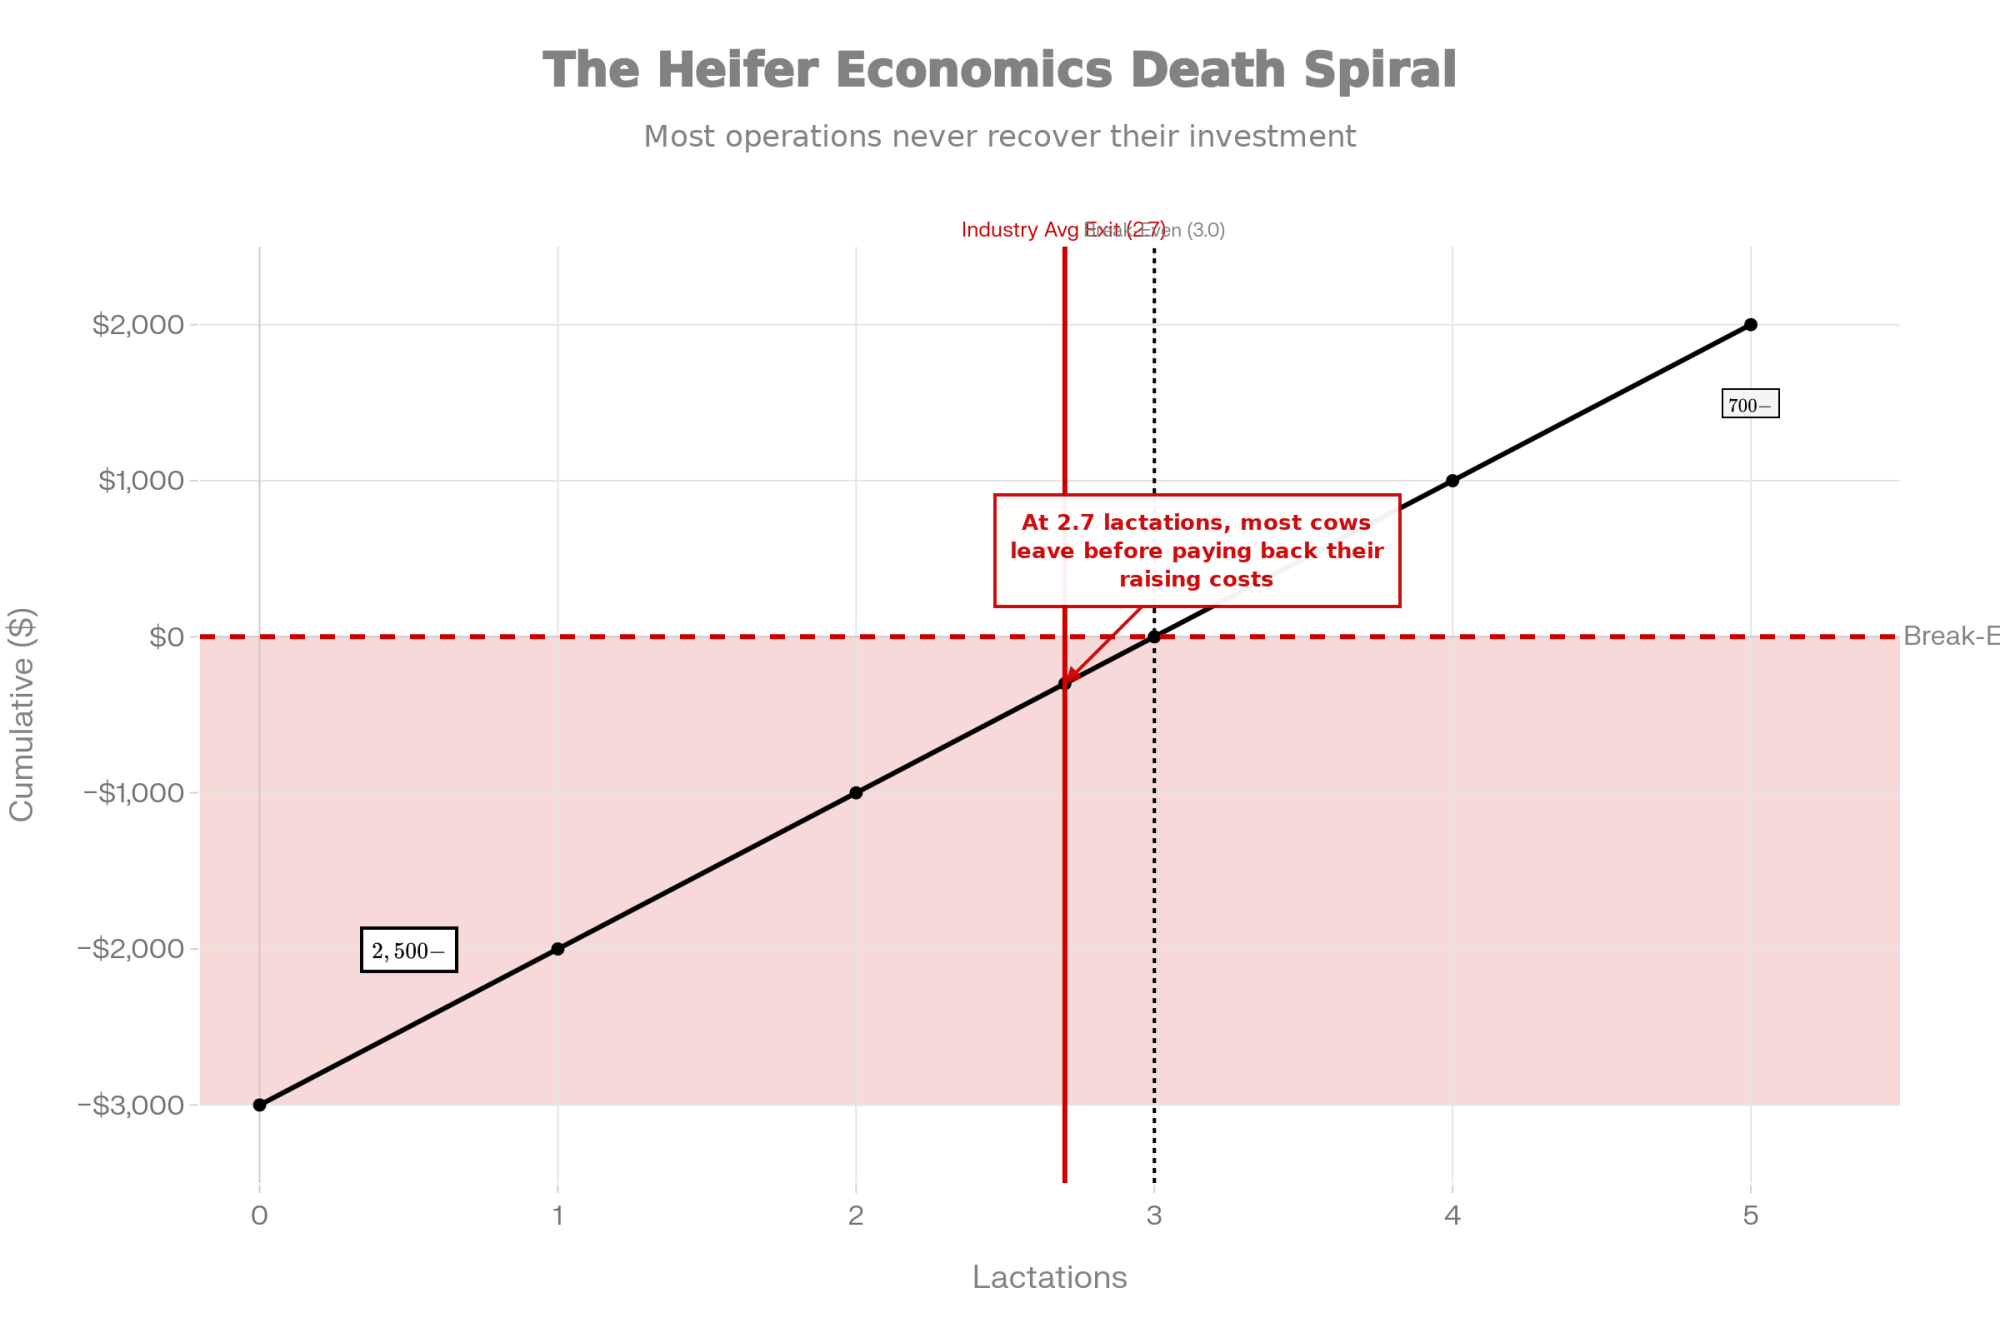
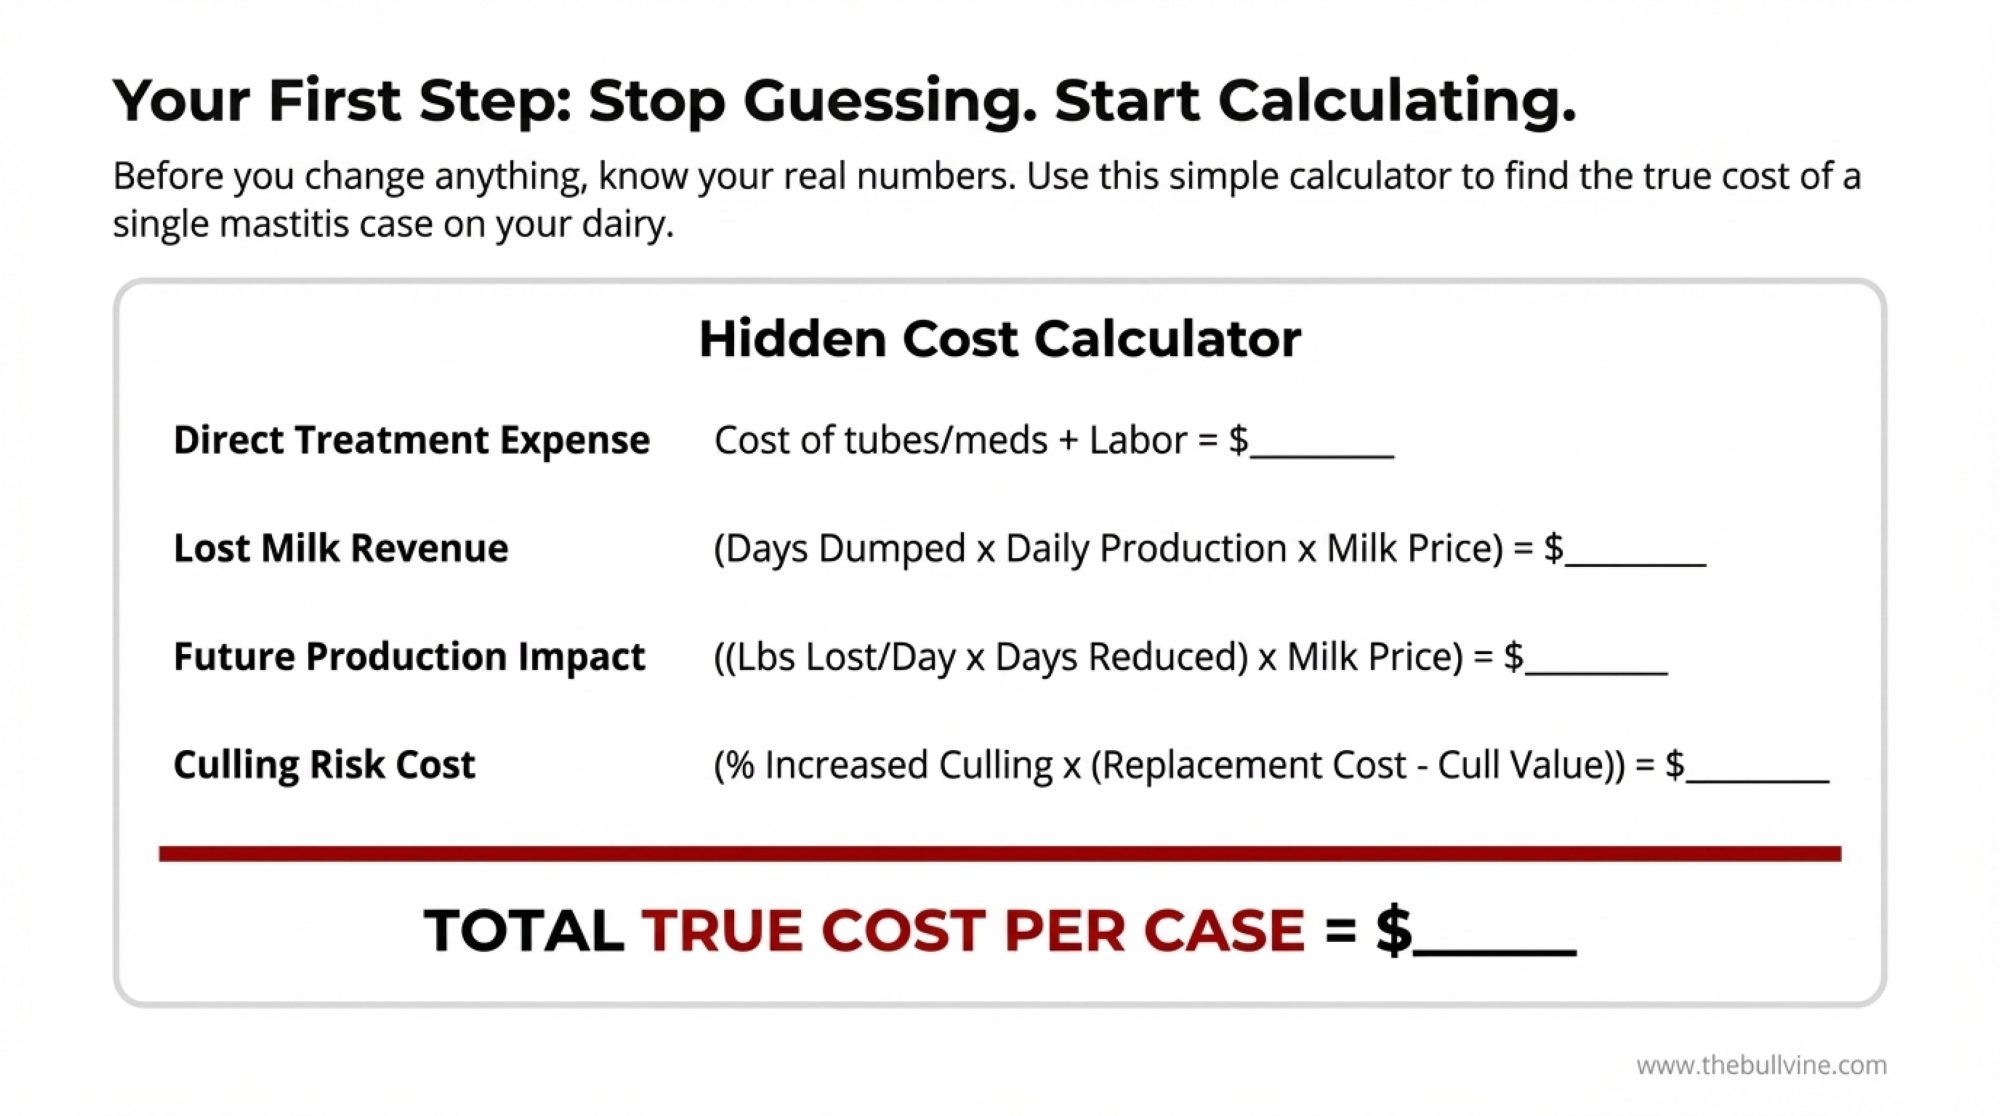
Thinking Through the Economics
For operations raising replacement heifers, the economic impact of ingredient variability can compound across multiple factors. I want to be upfront here—these aren’t hard universal numbers. They’re illustrative scenarios based on reasonable assumptions and published biological relationships. Your specific situation will depend on your herd, management, and many other variables.

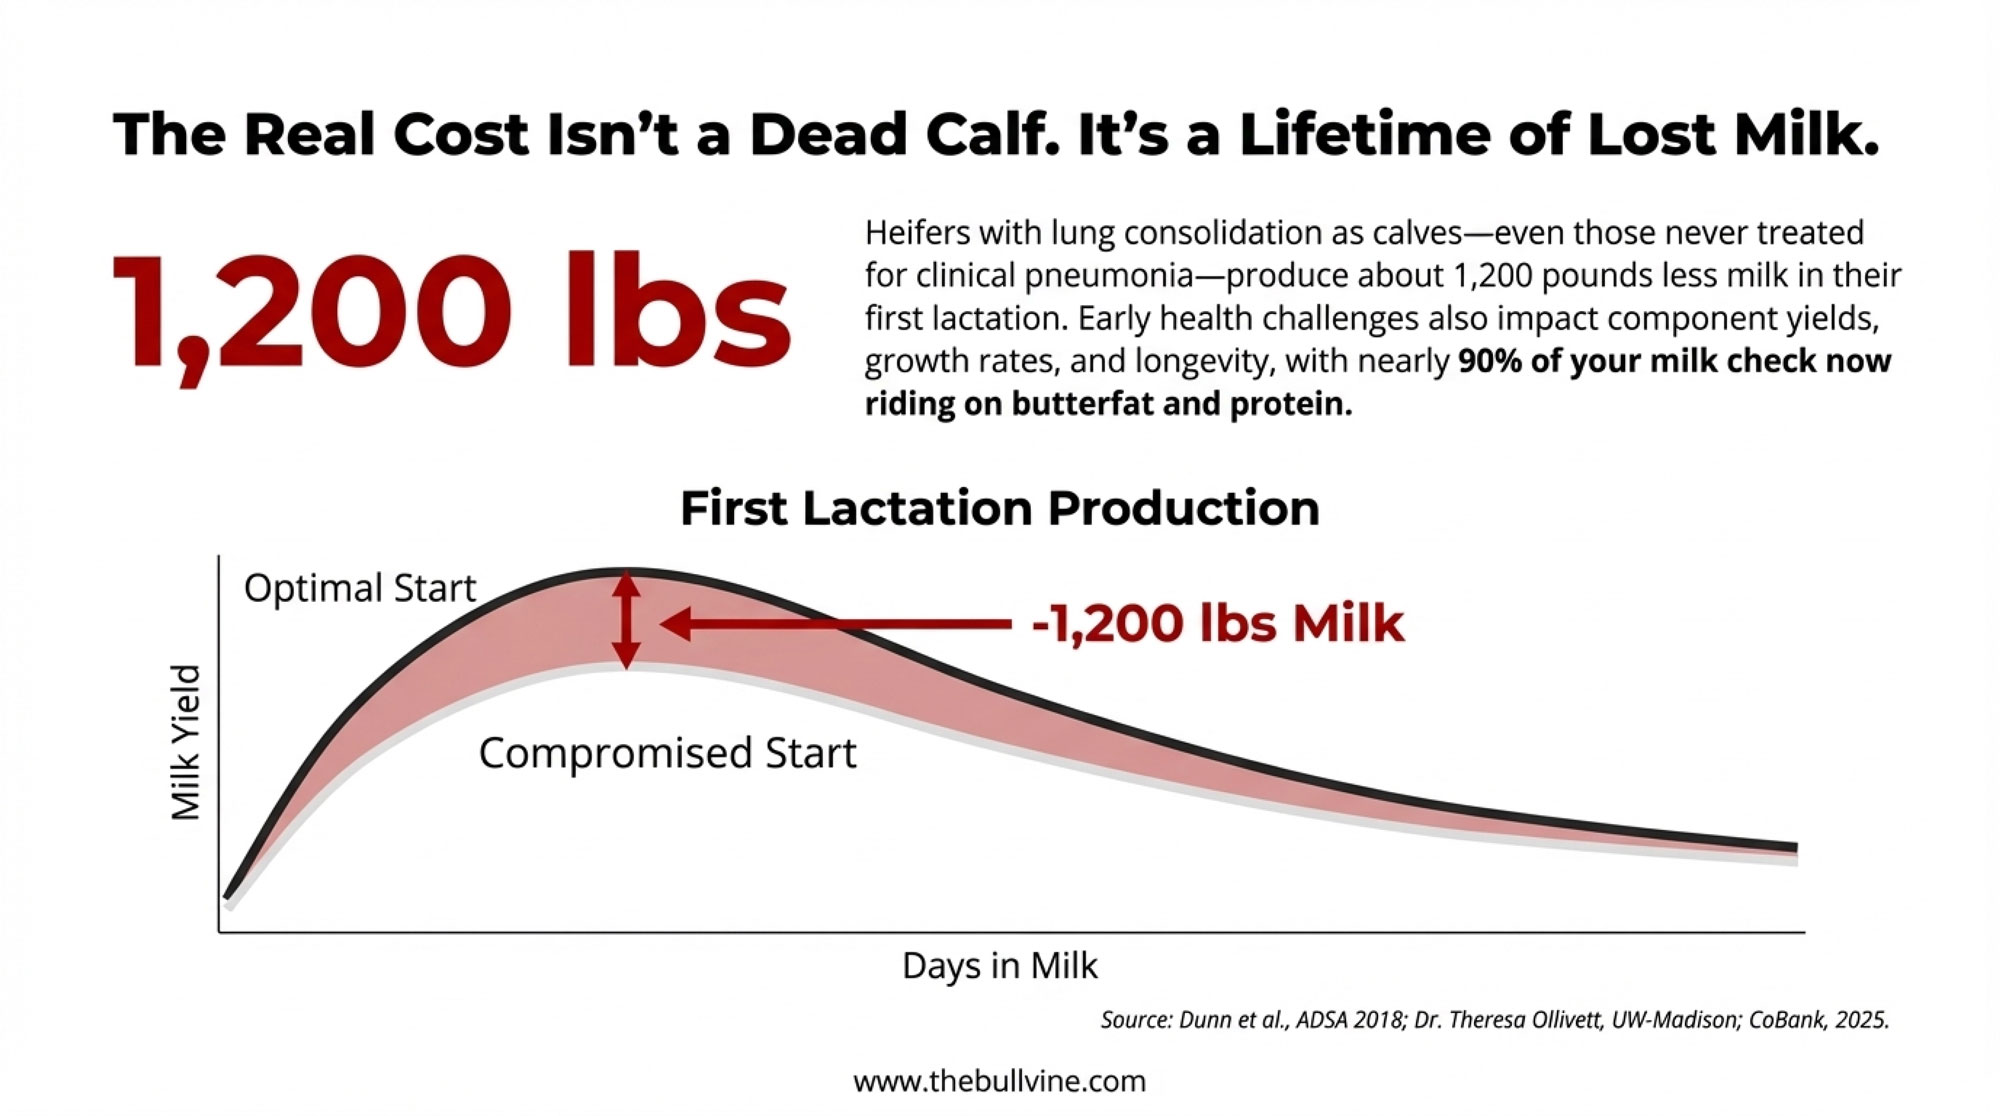
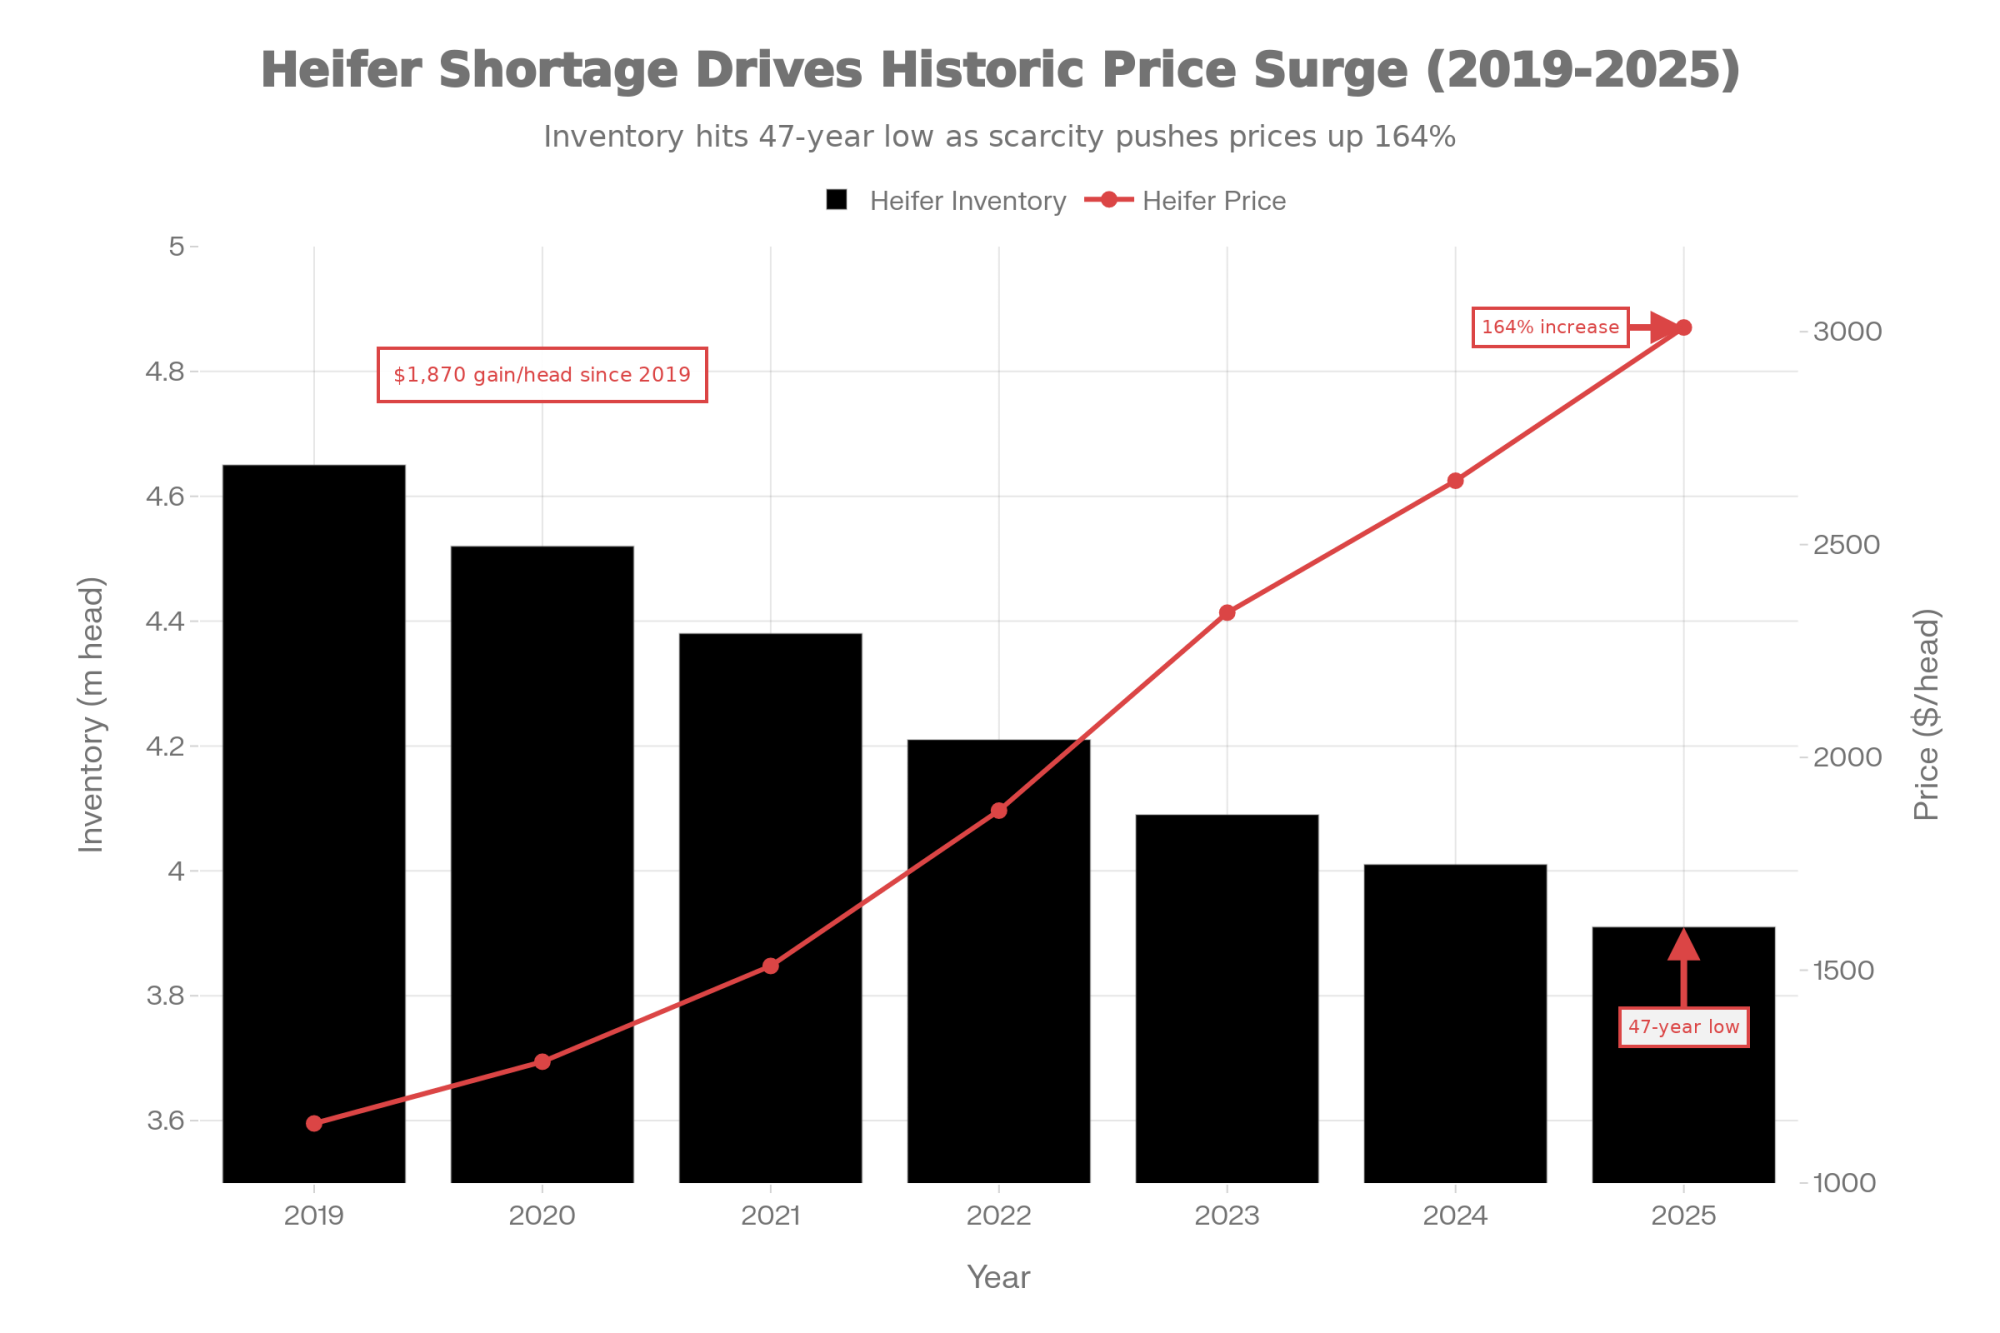
For every 1 kilogram of additional preweaning ADG, first-lactation milk yield increased by roughly 850–1,100 kilograms—about 1,870 to 2,425 pounds of milk.
— Soberon and Van Amburgh, Cornell University, 2012–2013
| Cost Component | Low Impact ($) | Typical ($) | High Impact ($) |
|---|---|---|---|
| Growth lag (1 week delay at $5.50/day) | 35 | 38.50 | 42 |
| Additional monitoring & treatment | 10 | 18 | 25 |
| Subtotal: Direct variability costs | 45 | 56.50 | 67 |
| First-lactation milk (per lactation per calf) | — | — | — |
| Assumed growth lag recovery gap in FL milk | 200 lbs milk × $18/cwt | 360 lbs milk × $18/cwt | 500 lbs milk × $18/cwt |
| Value recovery potential | $36 | $65 | $90 |
| Net cost after recovery (or risk exposure) | $9 | –$8.50 | –$23 |
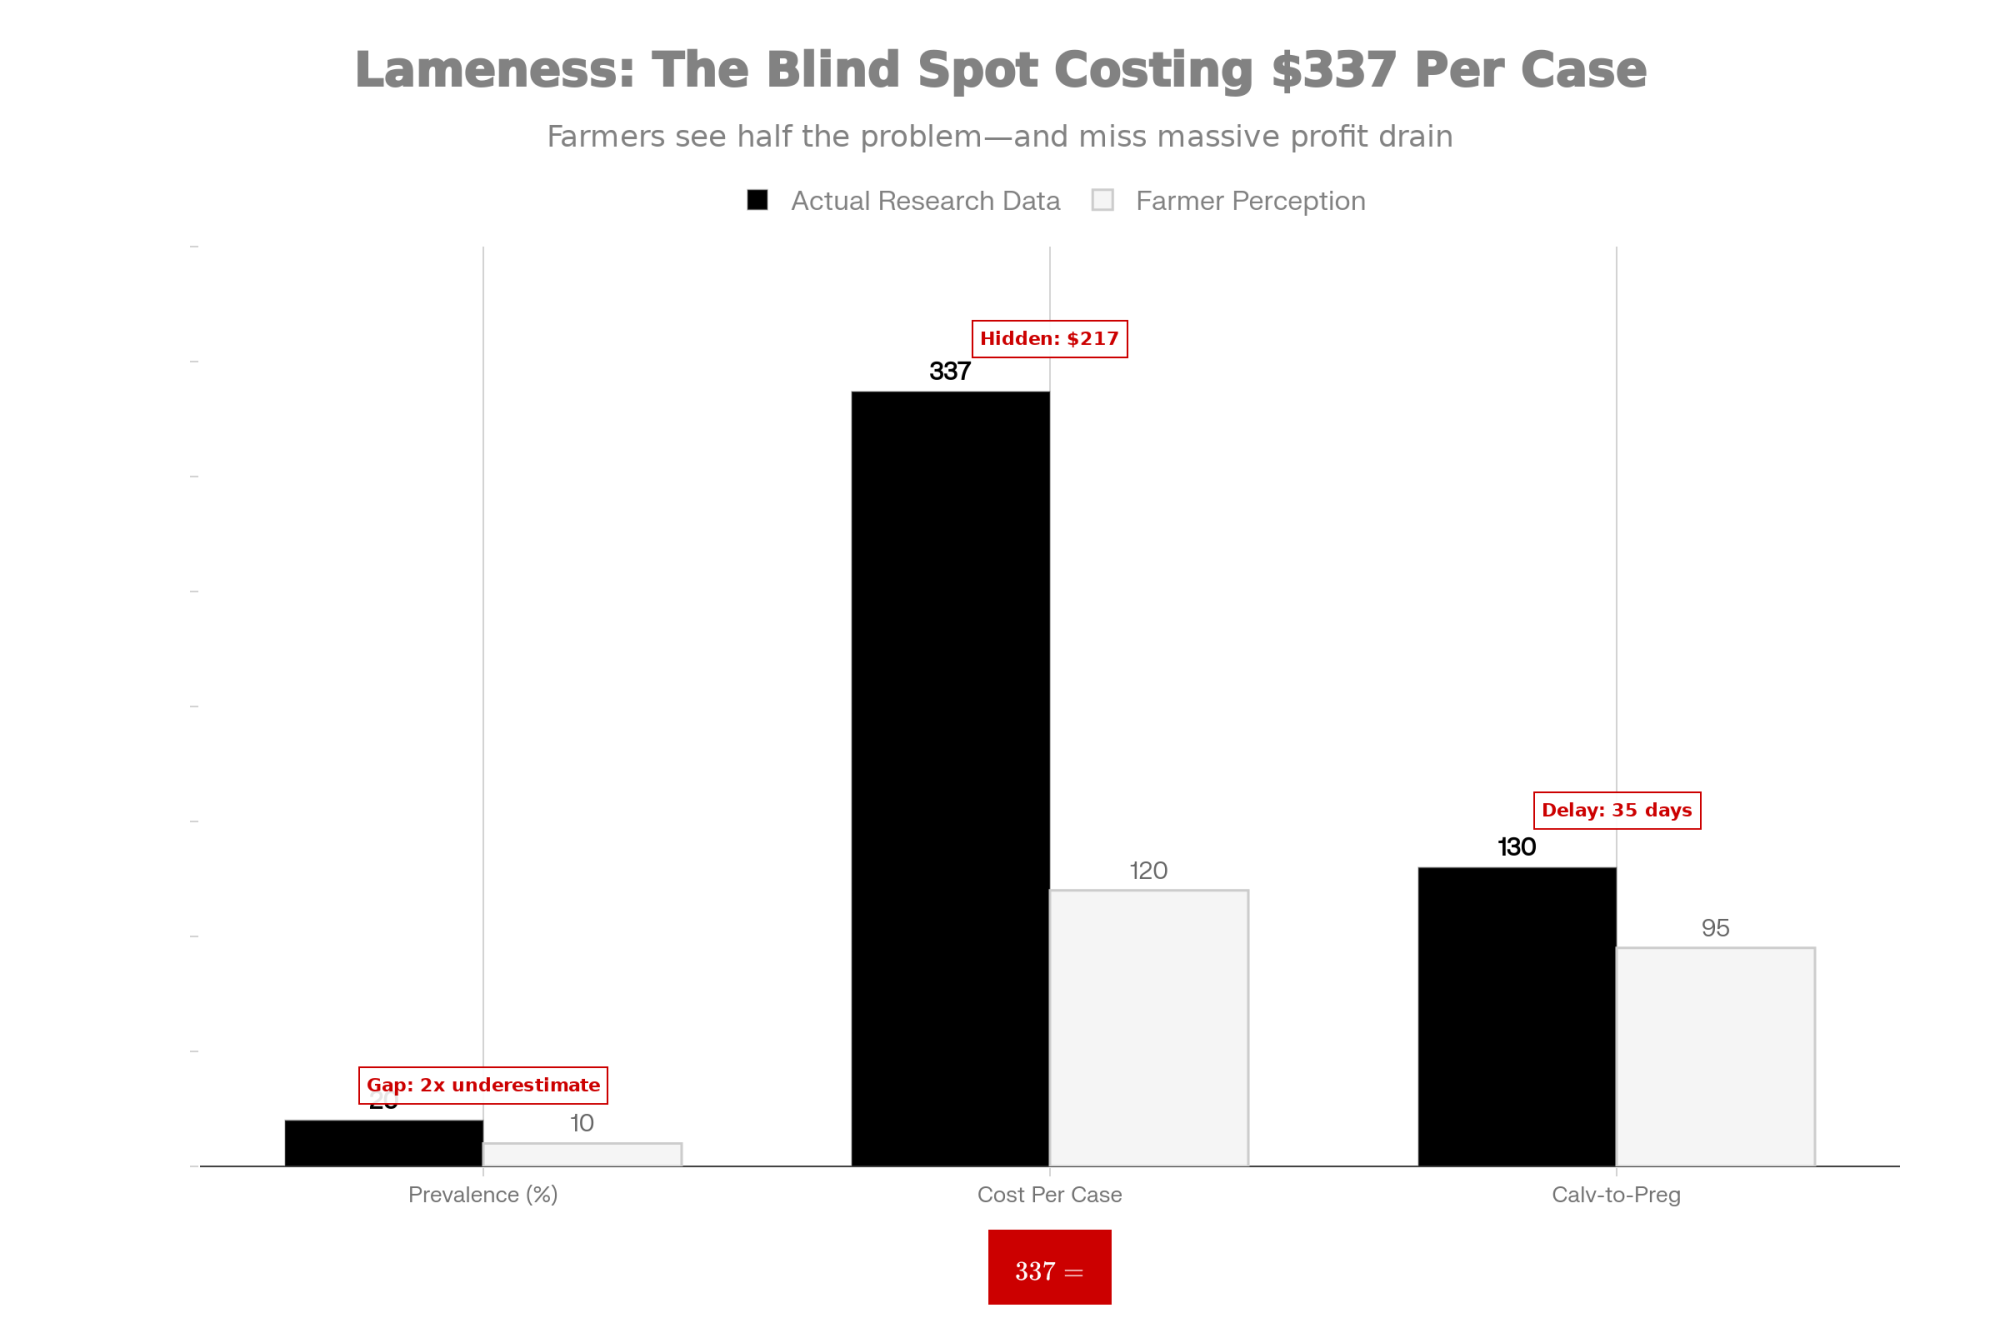
Potential hidden costs of variability per calf:
- Growth lag: If inconsistent nutrition adds even a week to reaching weaning targets, at typical pre-weaning costs of $5–6/day, that’s $35–40 per calf
- Treatment costs: Additional monitoring, electrolytes, and labor when performance becomes unpredictable—perhaps $15–25 per affected calf
- Future milk: When inconsistent nutrition suppresses early growth, that milk production difference follows those heifers into first lactation and beyond
The investment side:
Nutritionists working with multiple mills often note that starters made with tightly specified, tested ingredients tend to command a noticeable per-ton premium compared with least-cost commodity formulations. The exact spread depends heavily on region, ingredient markets, and additive packages—somewhere between $30 and $70 per ton, based on conversations I’ve had.
When you consider extra days on feed, management complexity, and potential milk yield differences, it becomes easier to see how relatively small per-calf investments in ingredient consistency might deliver meaningful returns.
What some producers are observing:
On several dairies in the Upper Midwest, calf managers working closely with their nutritionists have noticed a pattern worth sharing. Every six to eight weeks, starter intake would become slightly less predictable, and a small percentage of older hutch calves—the 5–7 week olds who should be past the high-risk window for most pathogens—would show softer manure than usual.
When these herds began tracking feed deliveries against calf performance, the timing often correlated with new starter batches. In some cases, further investigation revealed that ingredient sourcing was changing based on market prices—sometimes cane, sometimes beet, sometimes blends—without the farm being specifically informed.
After switching to starters with fixed formulations and specified ingredient sourcing, those same operations commonly reported smoother intake curves and more predictable weaning outcomes.
Are these controlled trials? No—and I want to be clear about that distinction. But the observations align logically with the compositional variability documented in the research.
Early Indicators: What to Watch in the First 90 Days
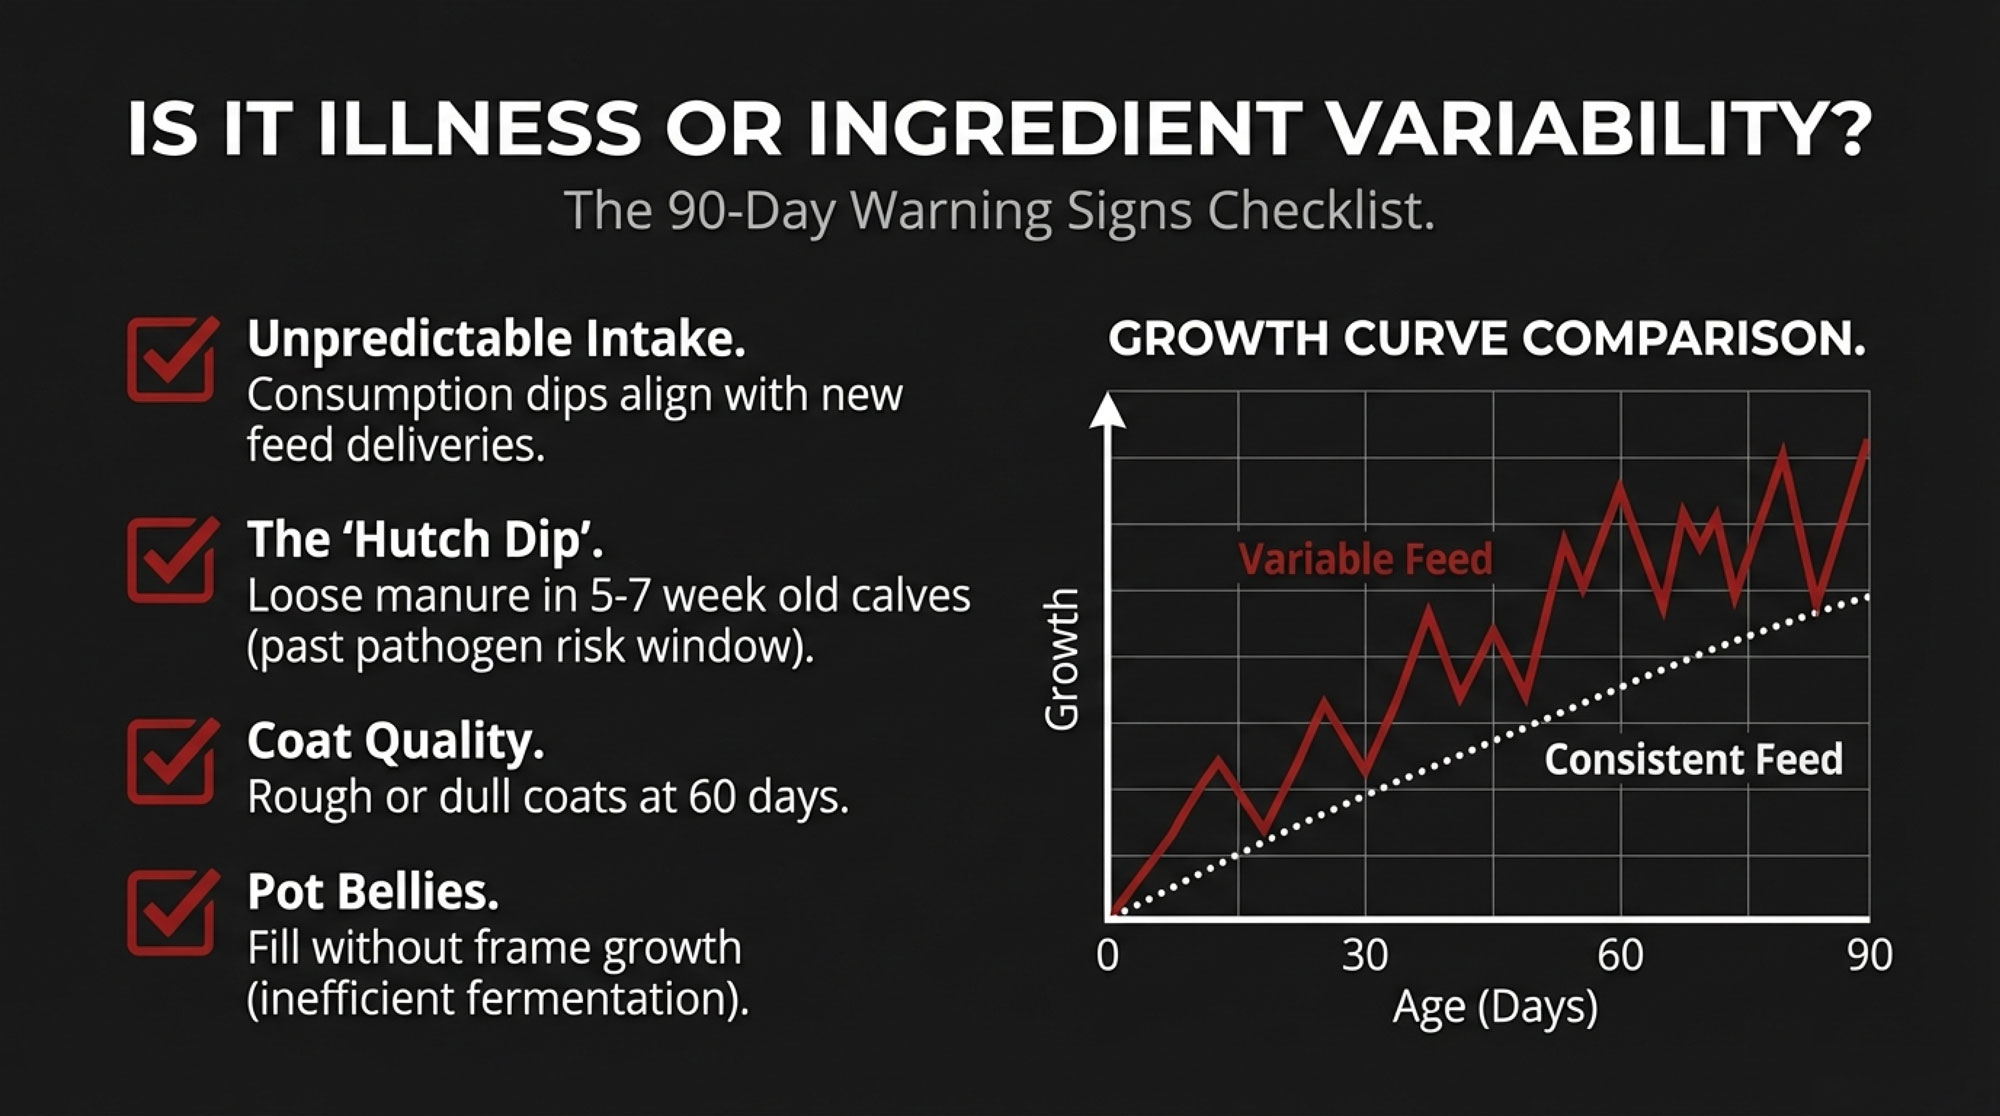
You don’t have to wait two years for first-lactation data to assess whether your starter program is delivering consistent results. Several indicators become visible within the first 90 days—if you know what to look for.
| Monitoring Focus | Days 1–14 | Days 15–35 | Days 36–60 | Days 61–90 |
|---|---|---|---|---|
| Intake Patterns | Establish baseline | Watch for daily consistency; compare delivery dates | Identify correlation between new feed batches and intake dips | Confirm steady upward curve or flag variability |
| Manure (older calves) | Monitor for pathogenic scours | 5+ week olds should be past acute phase | Watch for unexplained soft manure (suggests metabolic drift) | Should be firm; loose manure = performance concern |
| Coat Quality | Rough coats normal (early) | Gradual improvement expected | Should be noticeably slick and shiny | Dull or rough coat = potential absorption issue |
| Body Condition vs. Frame | Assess baseline body/frame ratio | Monitor for pot belly without frame growth | Pot belly pattern = slow fermentation signal | Strong frame growth, minimal fill = good metabolic health |
| Post-Weaning Momentum | N/A | N/A | Prepare for transition | Calves should maintain growth through weaning, not plateau |
A 90-Day Monitoring Approach:
- Intake patterns: Is daily starter consumption following a steady upward curve, or does it fluctuate after new feed deliveries? Tracking this for a few weeks can reveal patterns that correlate with delivery dates.
- Manure in older calves: Are 5–7 week old calves experiencing loose manure episodes that don’t respond to typical treatment? These older calves should be past the high-risk window for most pathogens.
- Coat quality at 60 days: Calves should display a slick, shiny hair coat approaching weaning. Rough, dull coats can suggest metabolic stress or absorption issues.
- Body condition vs. fill: Are calves developing “pot bellies” without corresponding frame growth? This pattern can indicate slow fermentation and inefficient nutrient conversion.
- Post-weaning momentum: Do calves maintain growth through weaning, or do they plateau for 7–10 days when milk is removed? A well-developed rumen should carry them through this transition more smoothly.
Patterns of inconsistent intake, unexplained digestive changes in older calves, and post-weaning growth stalls might suggest the starter program is delivering variable nutrition even while meeting tag guarantees.
Why the Supply Chain Makes Consistency Challenging
Why does ingredient variability persist? The supply chain itself creates structural barriers that even well-intentioned manufacturers face.
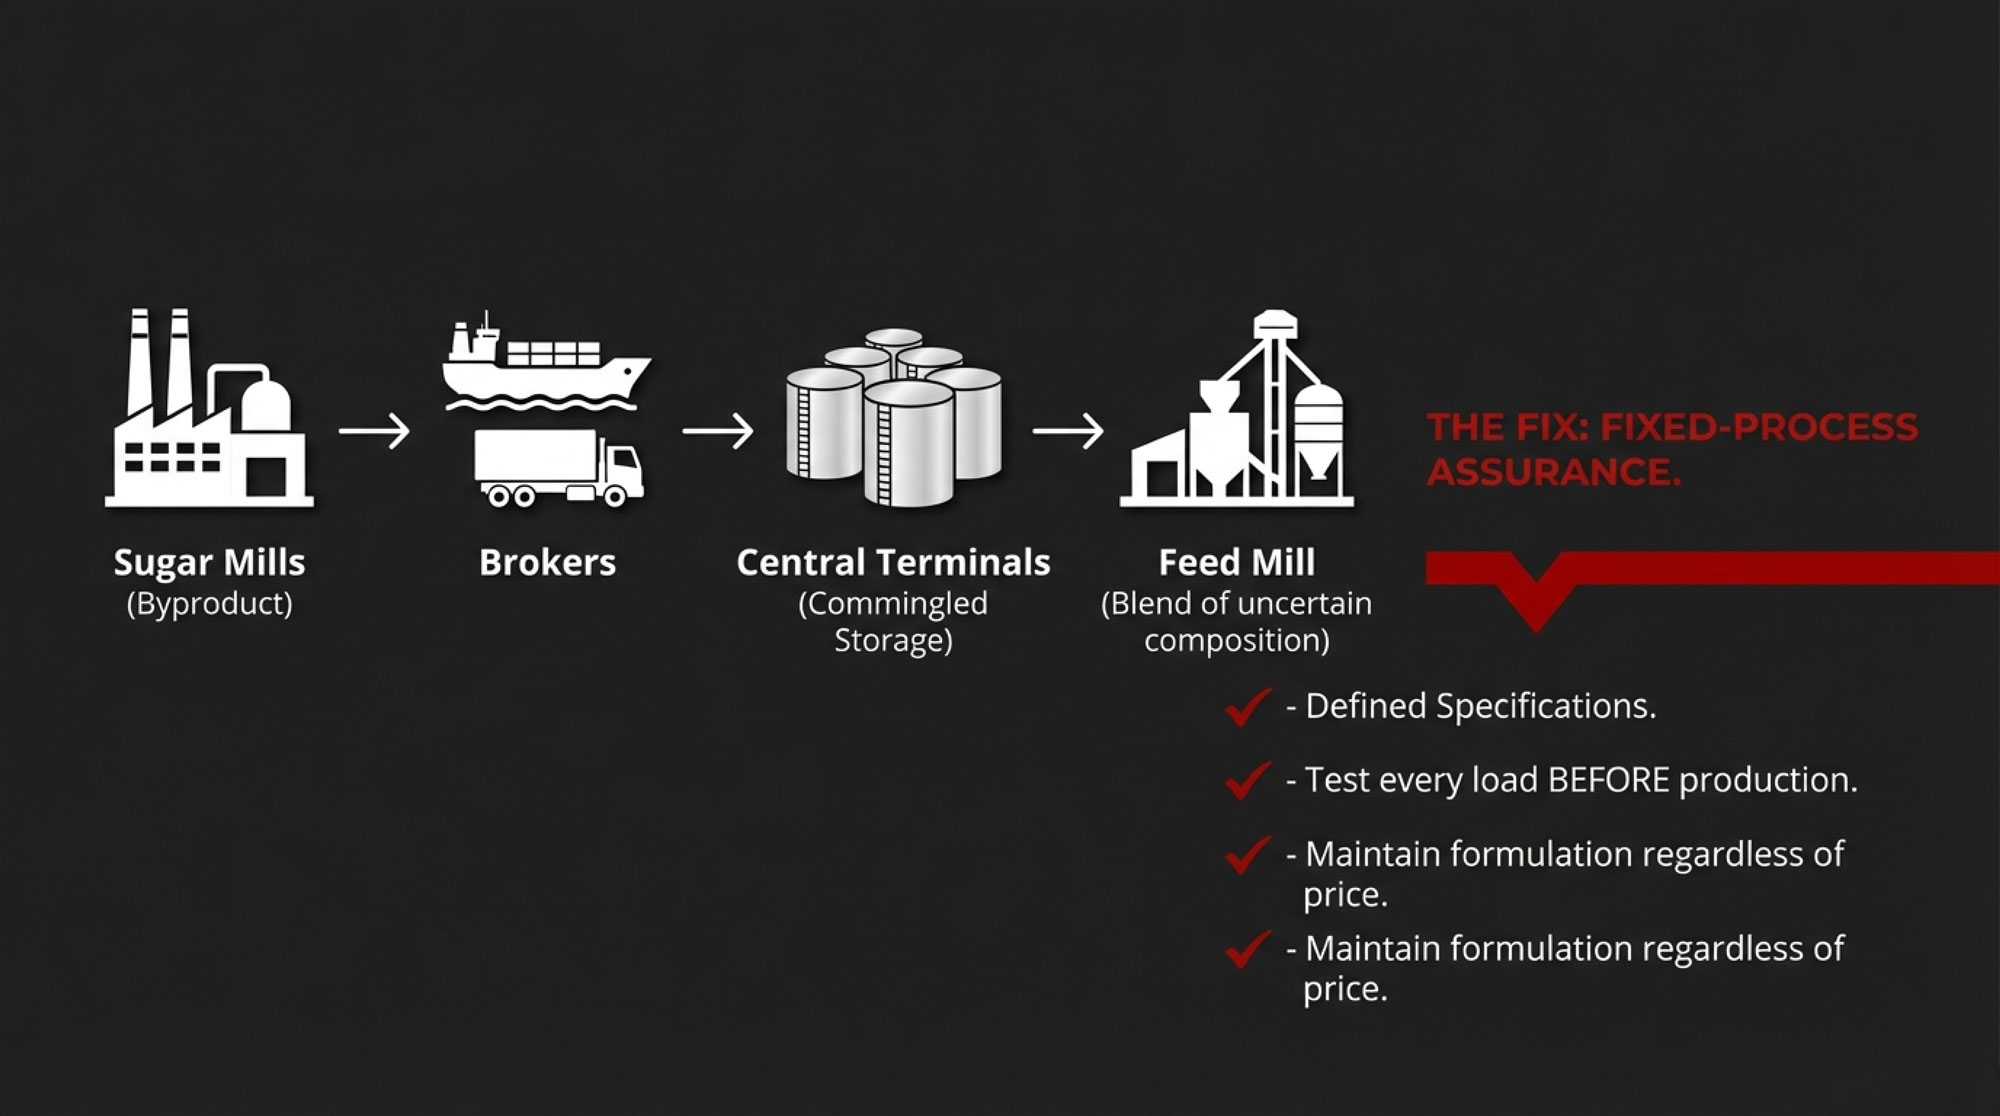
Most molasses travels through multiple stages: sugar mills produce it as a byproduct of varying quality, brokers purchase from multiple sources across regions and seasons, and central terminals often commingle batches in shared storage. By the time a tanker reaches a feed mill, the contents may be a blend of uncertain composition.
For manufacturers seeking consistency, maintaining separate storage for specified sources requires significant capital investment. Shipping cane molasses from Florida to Upper Midwest mills costs considerably more than sourcing local beet molasses. Most mills also lack dedicated quarantine capacity to test incoming loads before production.
This explains why some manufacturers invest in “Fixed-Process Assurance”—defined specifications, testing every load, and maintaining formulations regardless of commodity prices—while others follow standard procurement practices. Both approaches have their logic; they just produce different outcomes for ingredient consistency.
It’s worth noting that commodity suppliers aren’t cutting corners maliciously. The system evolved for volume and efficiency, which serves many applications well. It just wasn’t designed for the tight specifications that performance-focused calf nutrition may require.
Questions for Your Supplier
Producers evaluating calf starter programs can learn a lot by asking specific questions about ingredient sourcing and quality control. The goal isn’t confrontation—it’s building an informed partnership. Most feed representatives genuinely want to help, but they may not volunteer technical details unless you ask directly.
Five questions that reveal quality commitment:
| Question to Ask | Strong Answer | Worth Following Up |
| “Does this starter use a fixed formula, or does it adjust based on commodity prices?” | Fixed formula—ingredients don’t change batch to batch | “We use the least-cost formulation,” or “It adjusts based on markets.” |
| “Is the molasses cane, beet, or a blend? Does that stay consistent year-round?” | Specific source named, consistent throughout the year | “Standard blend” or “Whatever’s available.” |
| “What’s your minimum specification for sugar content in incoming molasses?” | Specific number cited (e.g., “43% TSI minimum”) | “Industry standard” or “We trust our suppliers.” |
| “Do you test every incoming molasses load, or rely on supplier certificates?” | In-house testing on each delivery before production | “We rely on supplier documentation.” |
| “How do you monitor mineral balance for calf feeds specifically?” | Active monitoring with defined limits for calf products | Focus only on meeting guaranteed analysis minimums |
Suppliers committed to quality typically welcome these questions and provide specific, confident answers. The conversation itself often reveals how much thought has gone into ingredient consistency. If you’re getting vague responses or a lot of “industry standard” language, that tells you something, too.
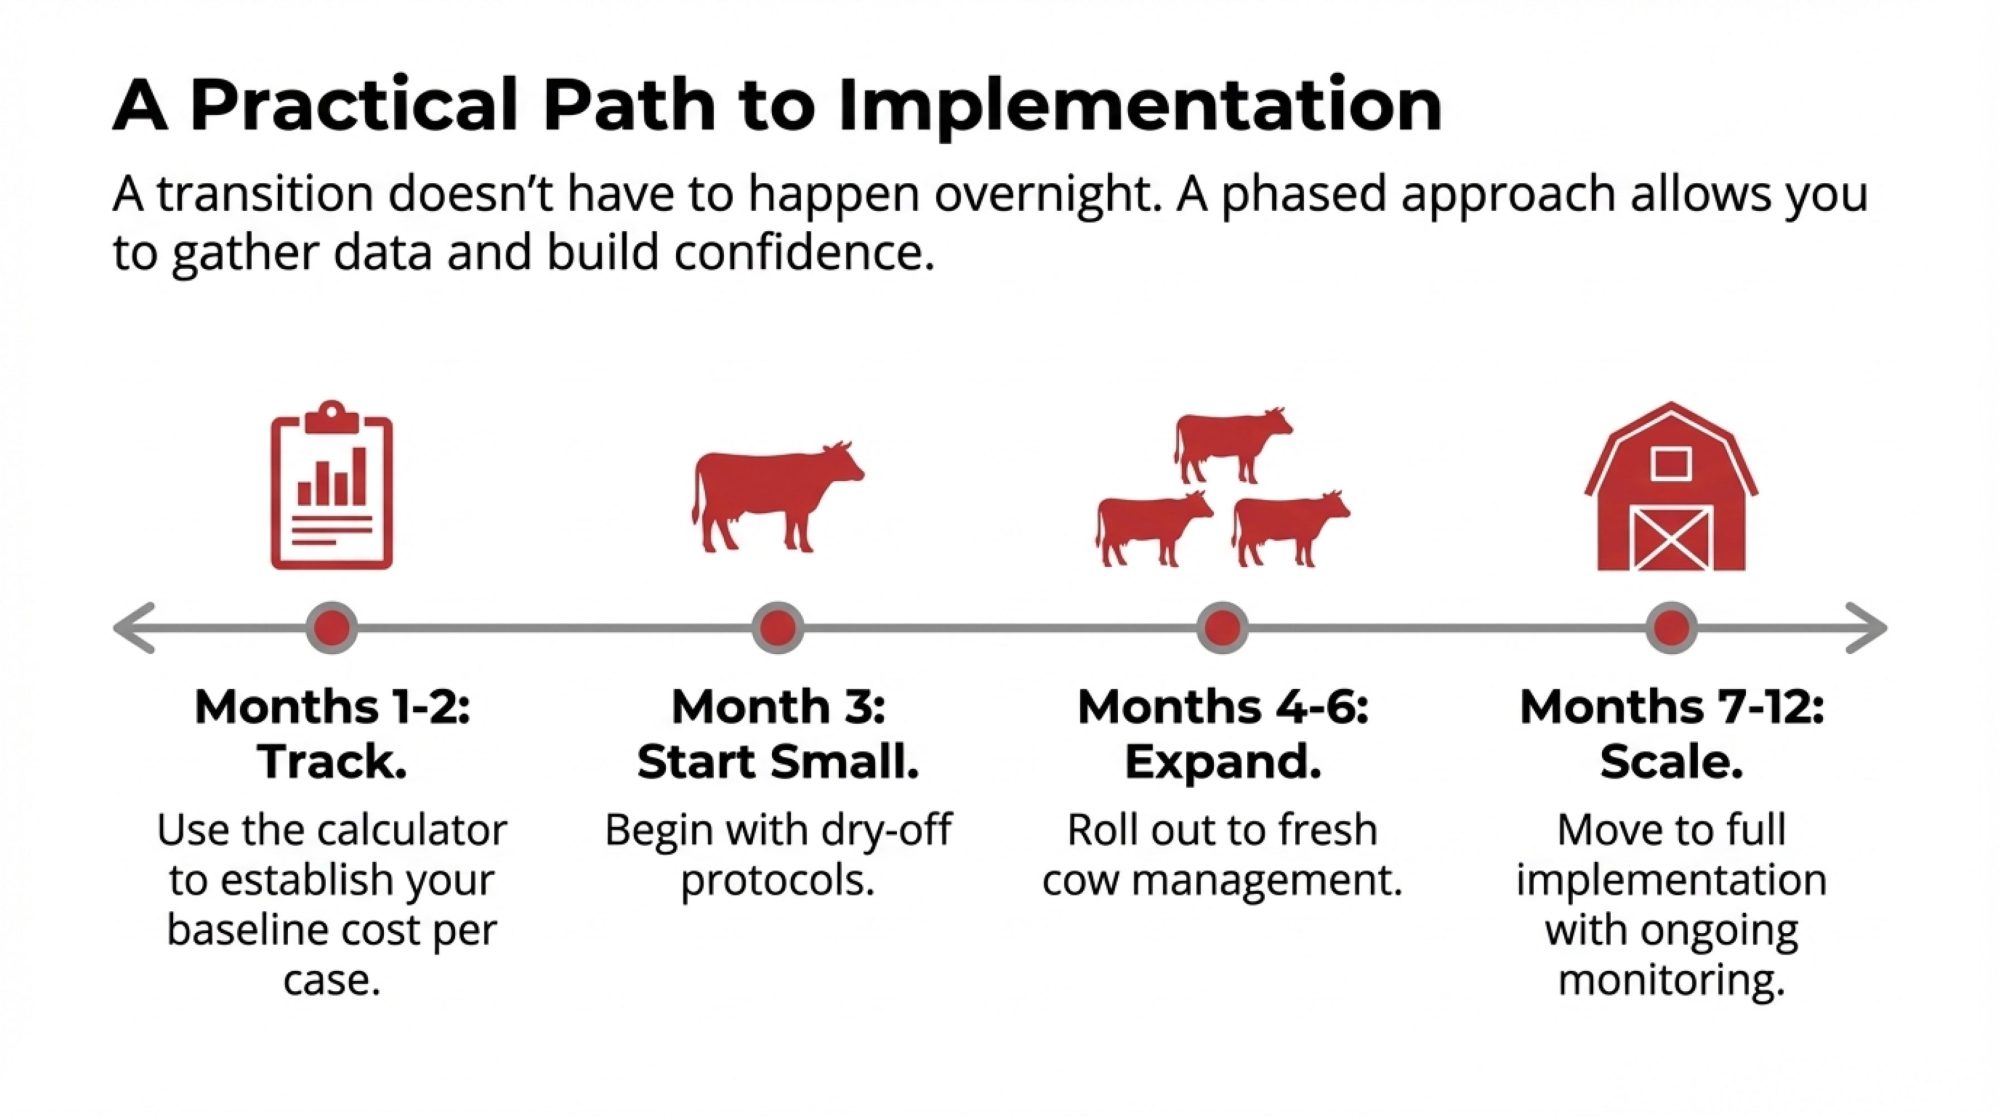
A Practical Approach
For producers who want to explore whether ingredient variability might be affecting results, here’s a measured approach that minimizes risk while gathering useful information.
Step 1: Document current performance. Track starter intake patterns, digestive consistency, and weaning weights for your current calf group. Even a simple notebook log gives you concrete information for conversations with your nutritionist.
Step 2: Start a conversation. Approach your nutritionist or feed representative with curiosity: “I’m seeing some variability in my calf performance that I can’t fully explain with management factors. Can we look at the ingredient specifications in my starter?”
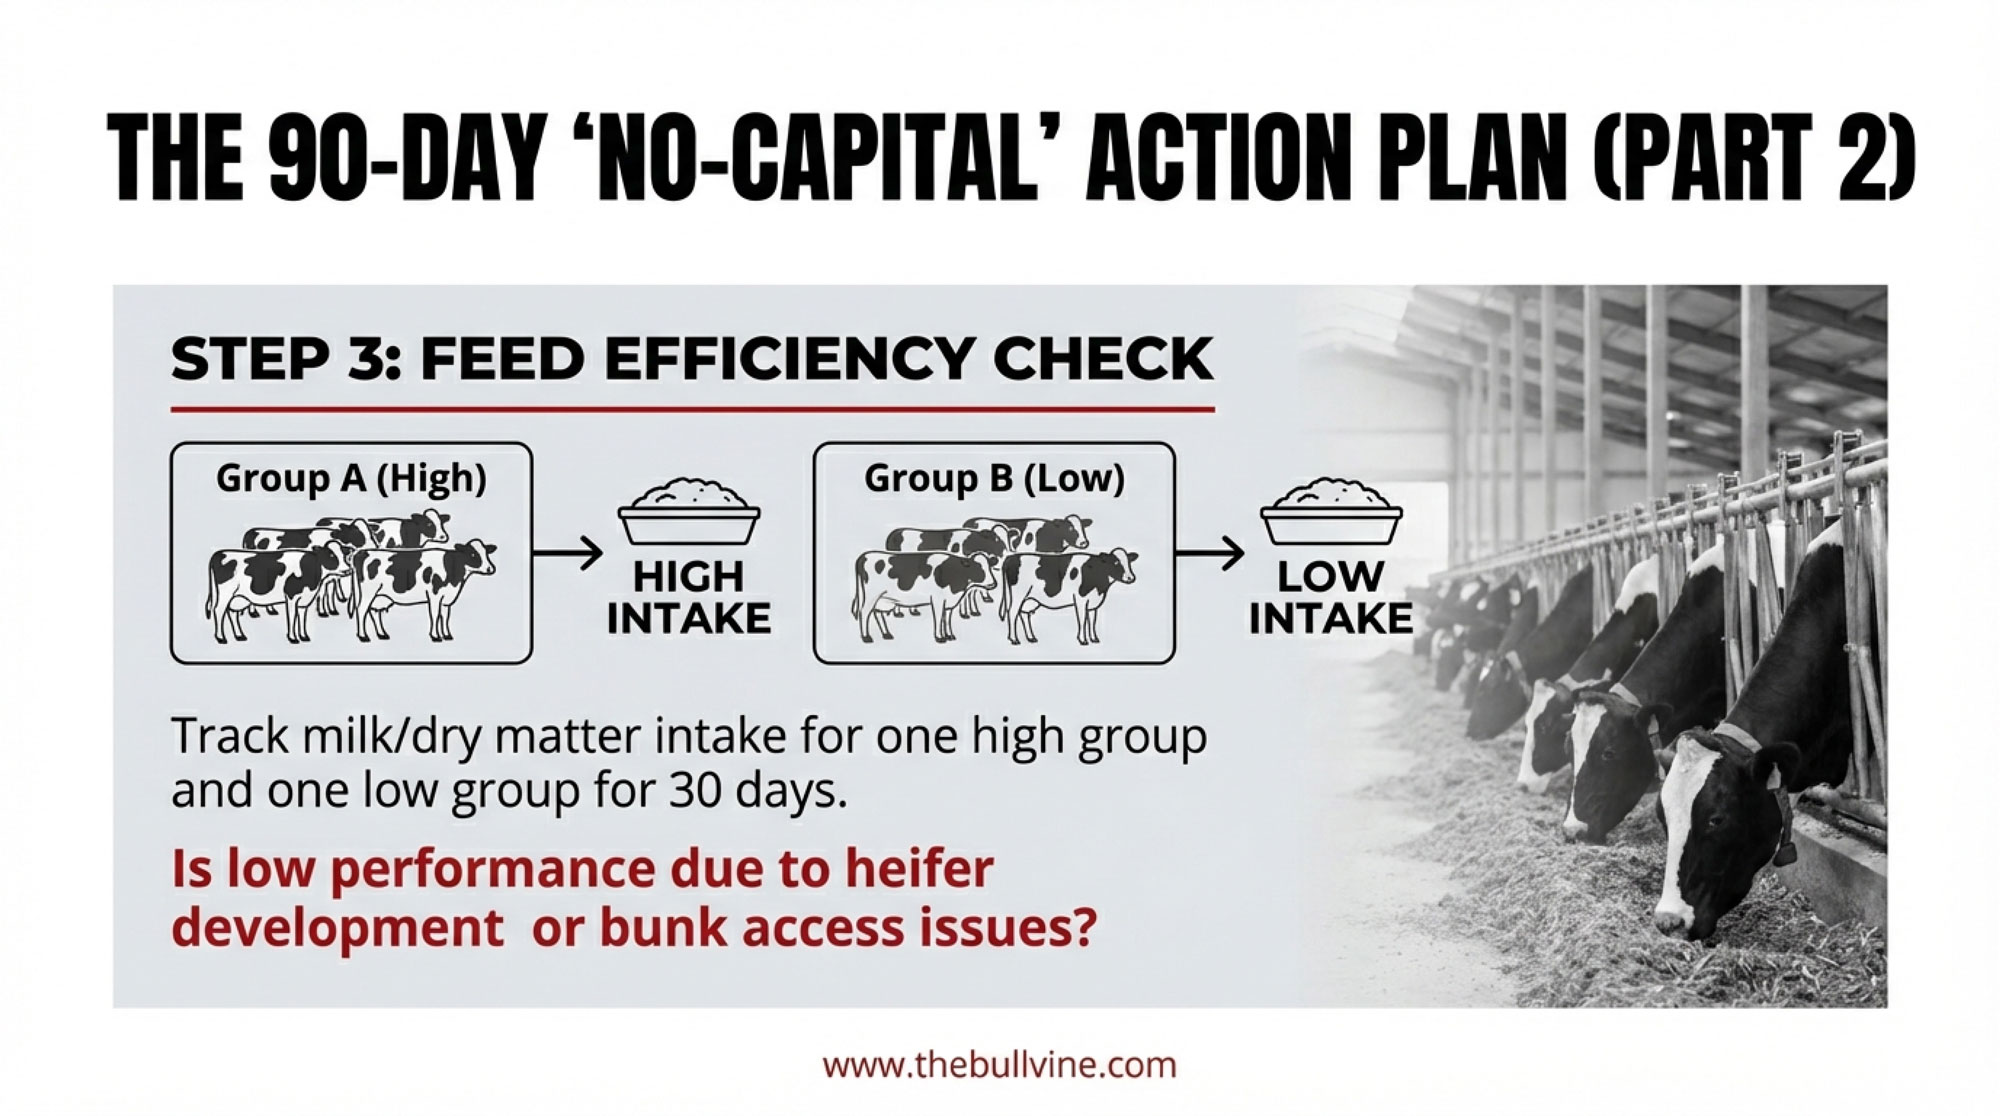
Step 3: Consider a comparison. Rather than switching everything at once, test a fixed-process starter on one group of calves while maintaining the current program for another. Compare intake consistency, health events, and weaning outcomes over 60–90 days.
Step 4: Evaluate total cost. When assessing results, account for management time, predictability, and growth outcomes—not just the per-ton price. The lowest-cost bag isn’t always the lowest-cost option when you factor in the complete picture.
Sponsored Post
Key Takeaways
What the research indicates:
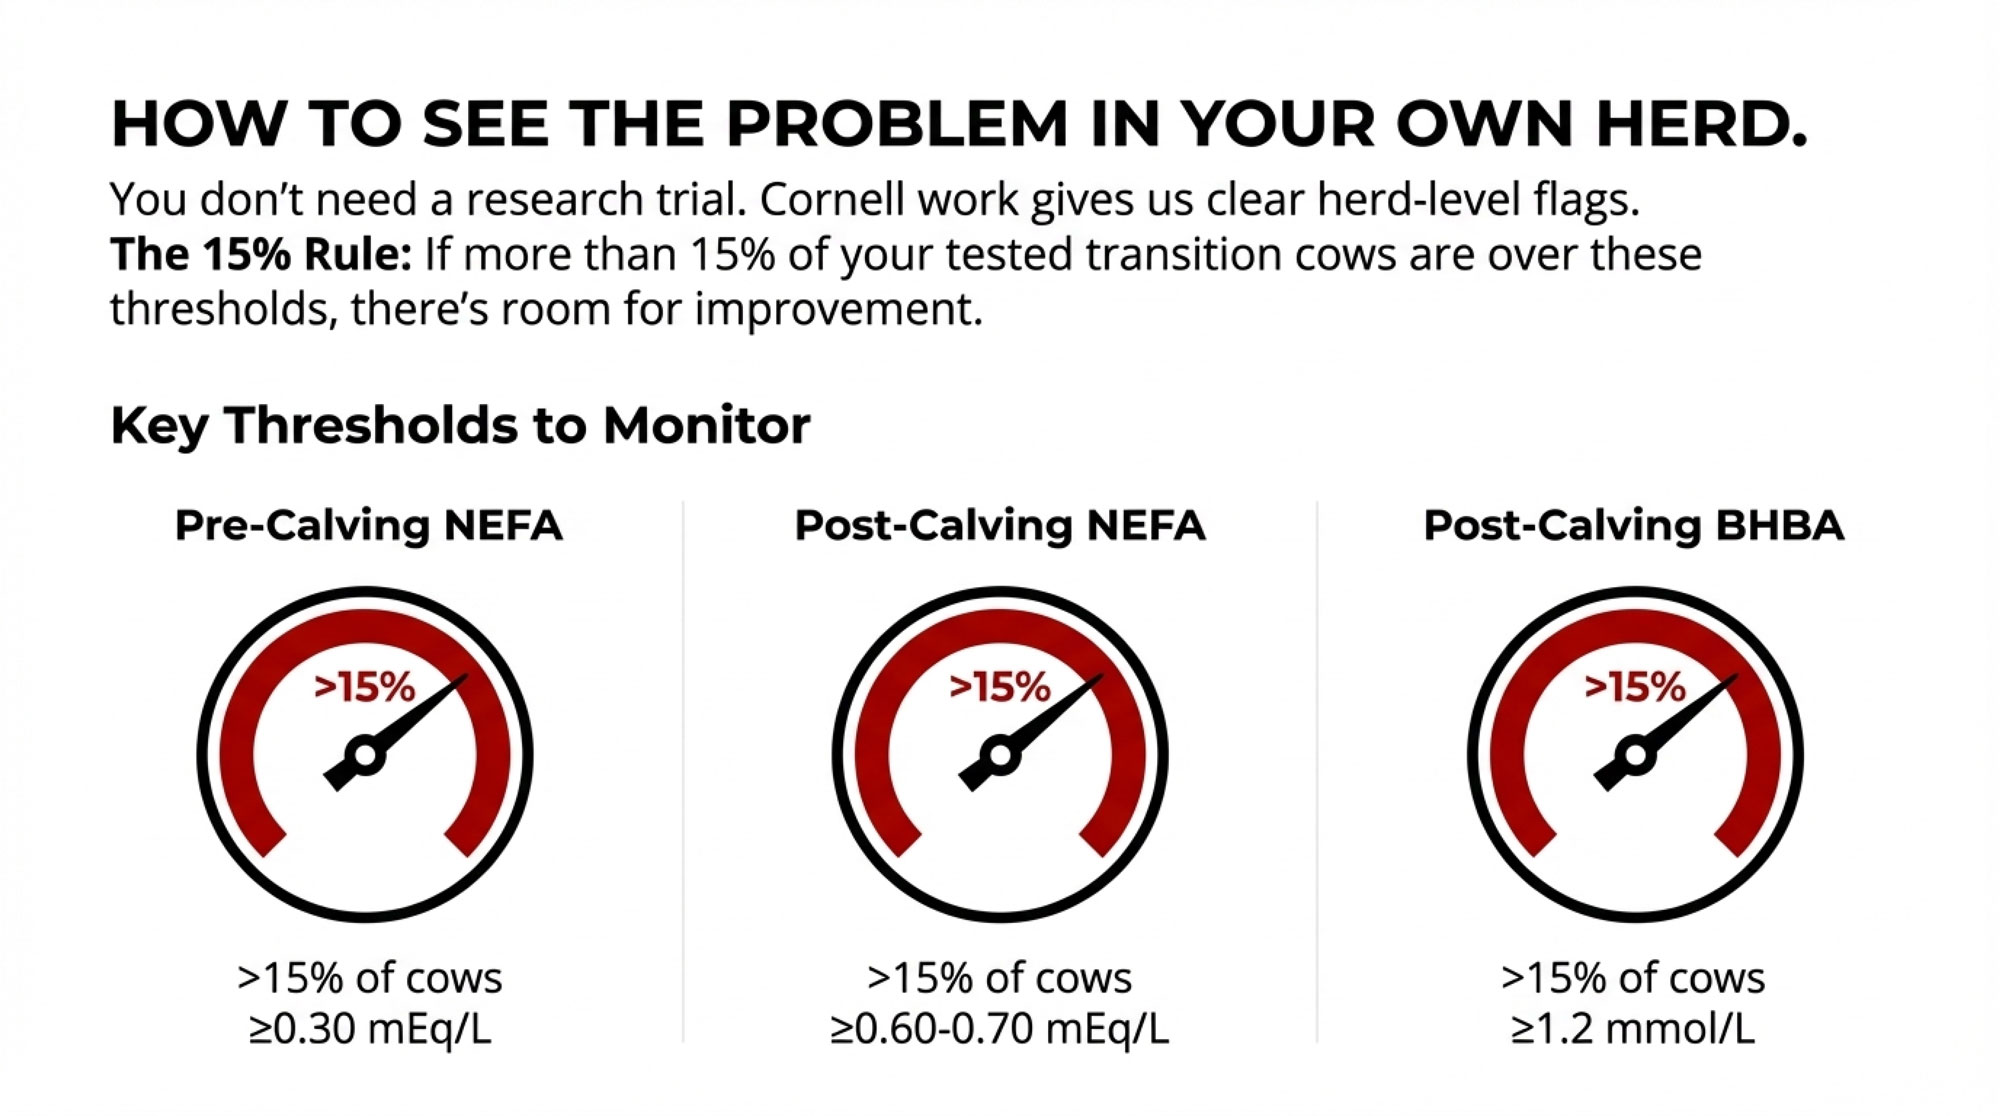
- Molasses composition varies more than feed tags reveal, with sugar content ranging from 39% to 67% and DCAD differing by over 200 milliequivalents between batches
- Cane and beet molasses have different compositional profiles, though practical impacts depend on inclusion rates and overall formulation
- Ingredient variability can manifest as subtle inconsistencies in intake patterns and growth performance
What producers are finding:
- The guaranteed analysis represents a legal minimum, not a guarantee of batch-to-batch consistency
- Performance indicators are often visible within 90 days—well before first-lactation data arrives
- The economics can favor investing in consistency, though specific returns vary by operation
Practical next steps:
- Ask specific questions about ingredient sourcing, testing protocols, and specifications
- Document calf performance patterns to identify potential variability effects
- Evaluate feed programs based on total cost and predictability, not just initial price
The broader lesson here is that consistency may be among the most underappreciated attributes in calf nutrition. A calf’s developing rumen needs steady, predictable substrate to build the biological foundation for a productive cow. What progressive producers are recognizing is that this consistency doesn’t necessarily arrive automatically with every delivery—it often needs to be specified, tested, and verified through intentional quality management.
The feed tag tells you what should be in the bag. The question worth exploring is whether anyone has verified that’s what you’re consistently getting.
Executive Summary:
The feed tag says “molasses.” It doesn’t tell you whether this batch has 39% sugar or 67%—a swing documented in the Journal of Dairy Science that represents one of the widest compositional ranges in animal nutrition. At typical inclusion rates of 5-7% of starter dry matter, this variability won’t cause dramatic clinical problems. But it does contribute to the subtle inconsistencies producers notice: unpredictable intake curves, variable manure in older hutch calves, uneven weaning performance. Dairies that track feed deliveries against calf metrics often discover that performance dips align with new starter batches—sometimes because molasses sources changed without anyone mentioning it. The takeaway isn’t about cane versus beet or switching suppliers. It’s about asking specific questions: fixed formula or least-cost? In-house testing or supplier certificates? For operations spending $5-6 per calf per day on replacement heifers, ingredient consistency may be the difference between calves that survive and calves that thrive.
Complete references and supporting documentation are available upon request by contacting the editorial team at editor@thebullvine.com.
Learn More
- Matching the Feed to the Calf: Birth to 120 Days – Practical Science for Dairy-Beef Calves – Lock in steady gains with this protocol-driven guide that reveals how a 14°F temperature shift slashes scours by 60%. It delivers the precise consistency benchmarks required to bridge the gap between variable ingredients and predictable weaning.
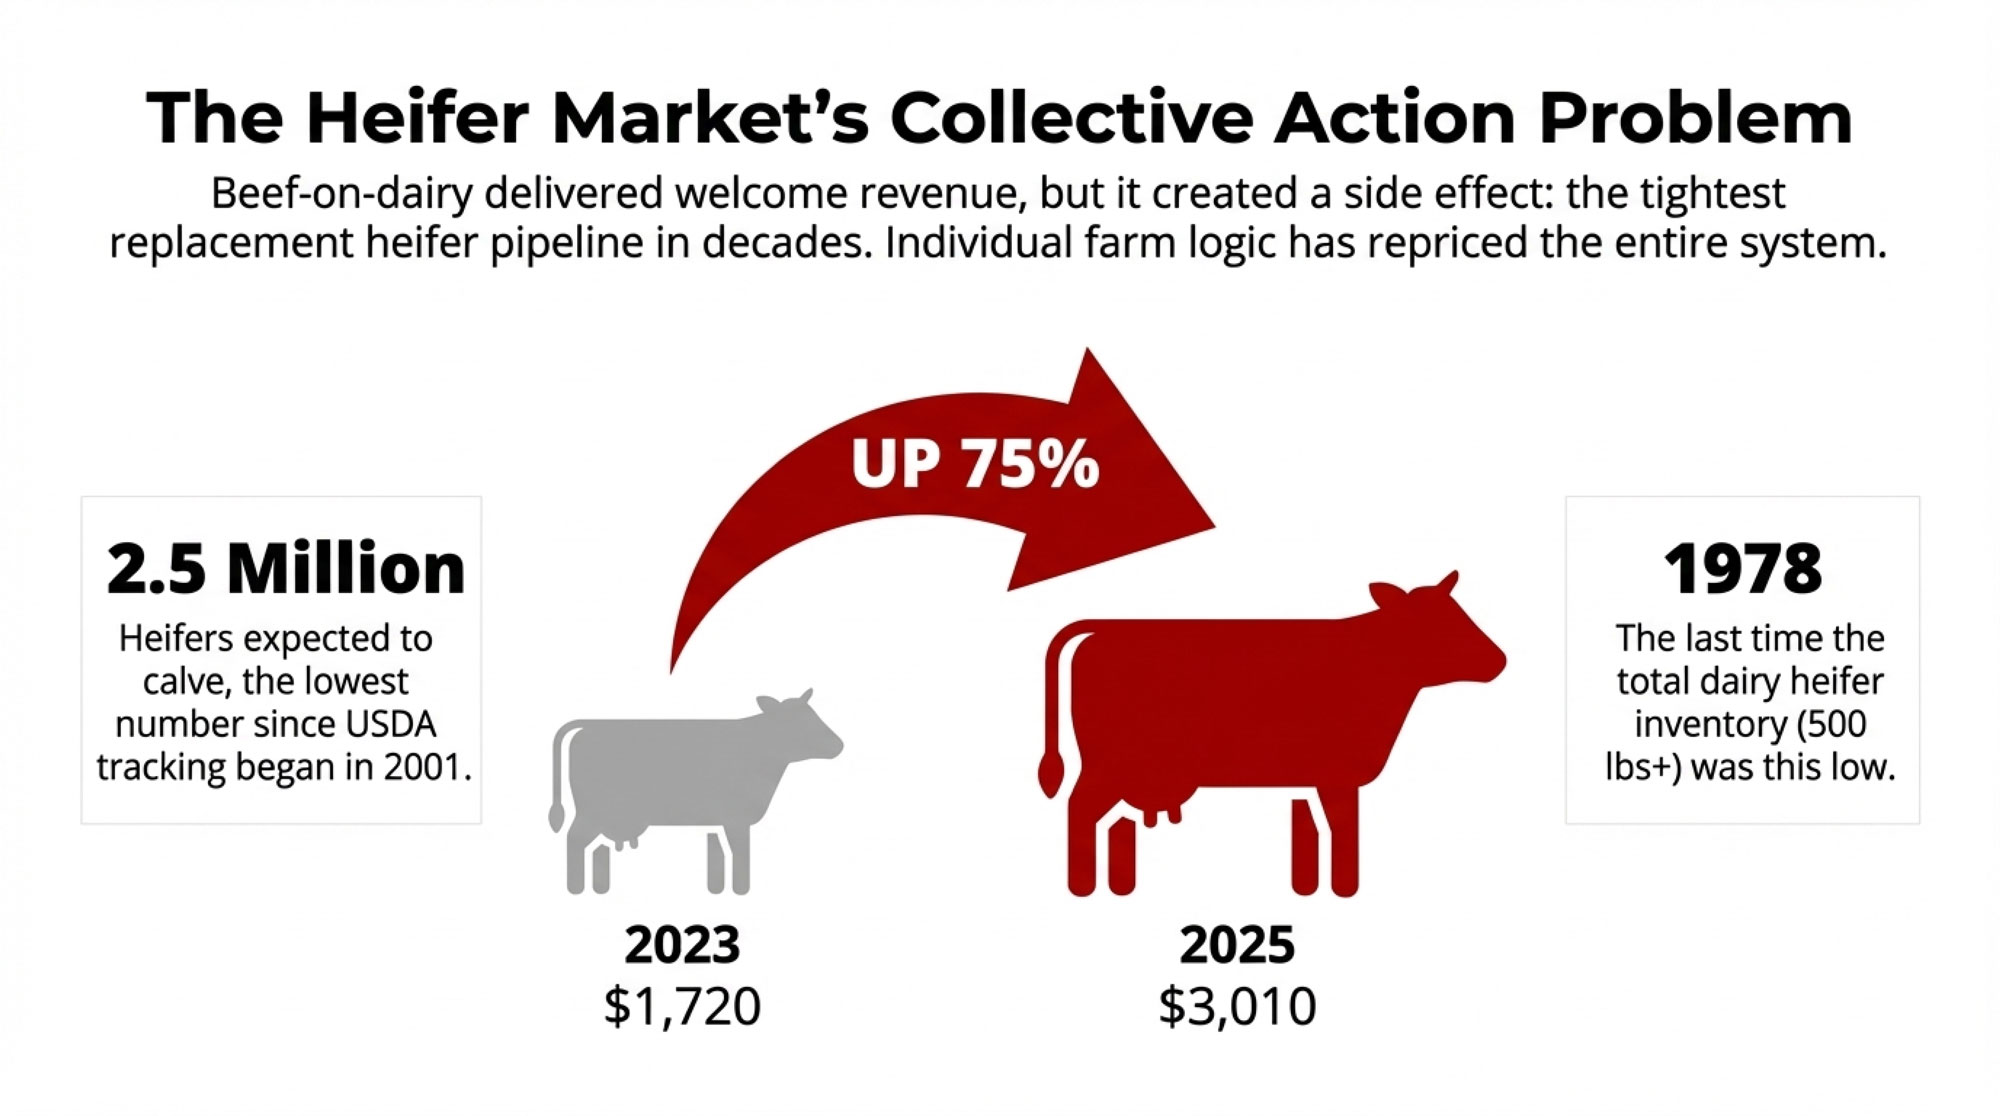
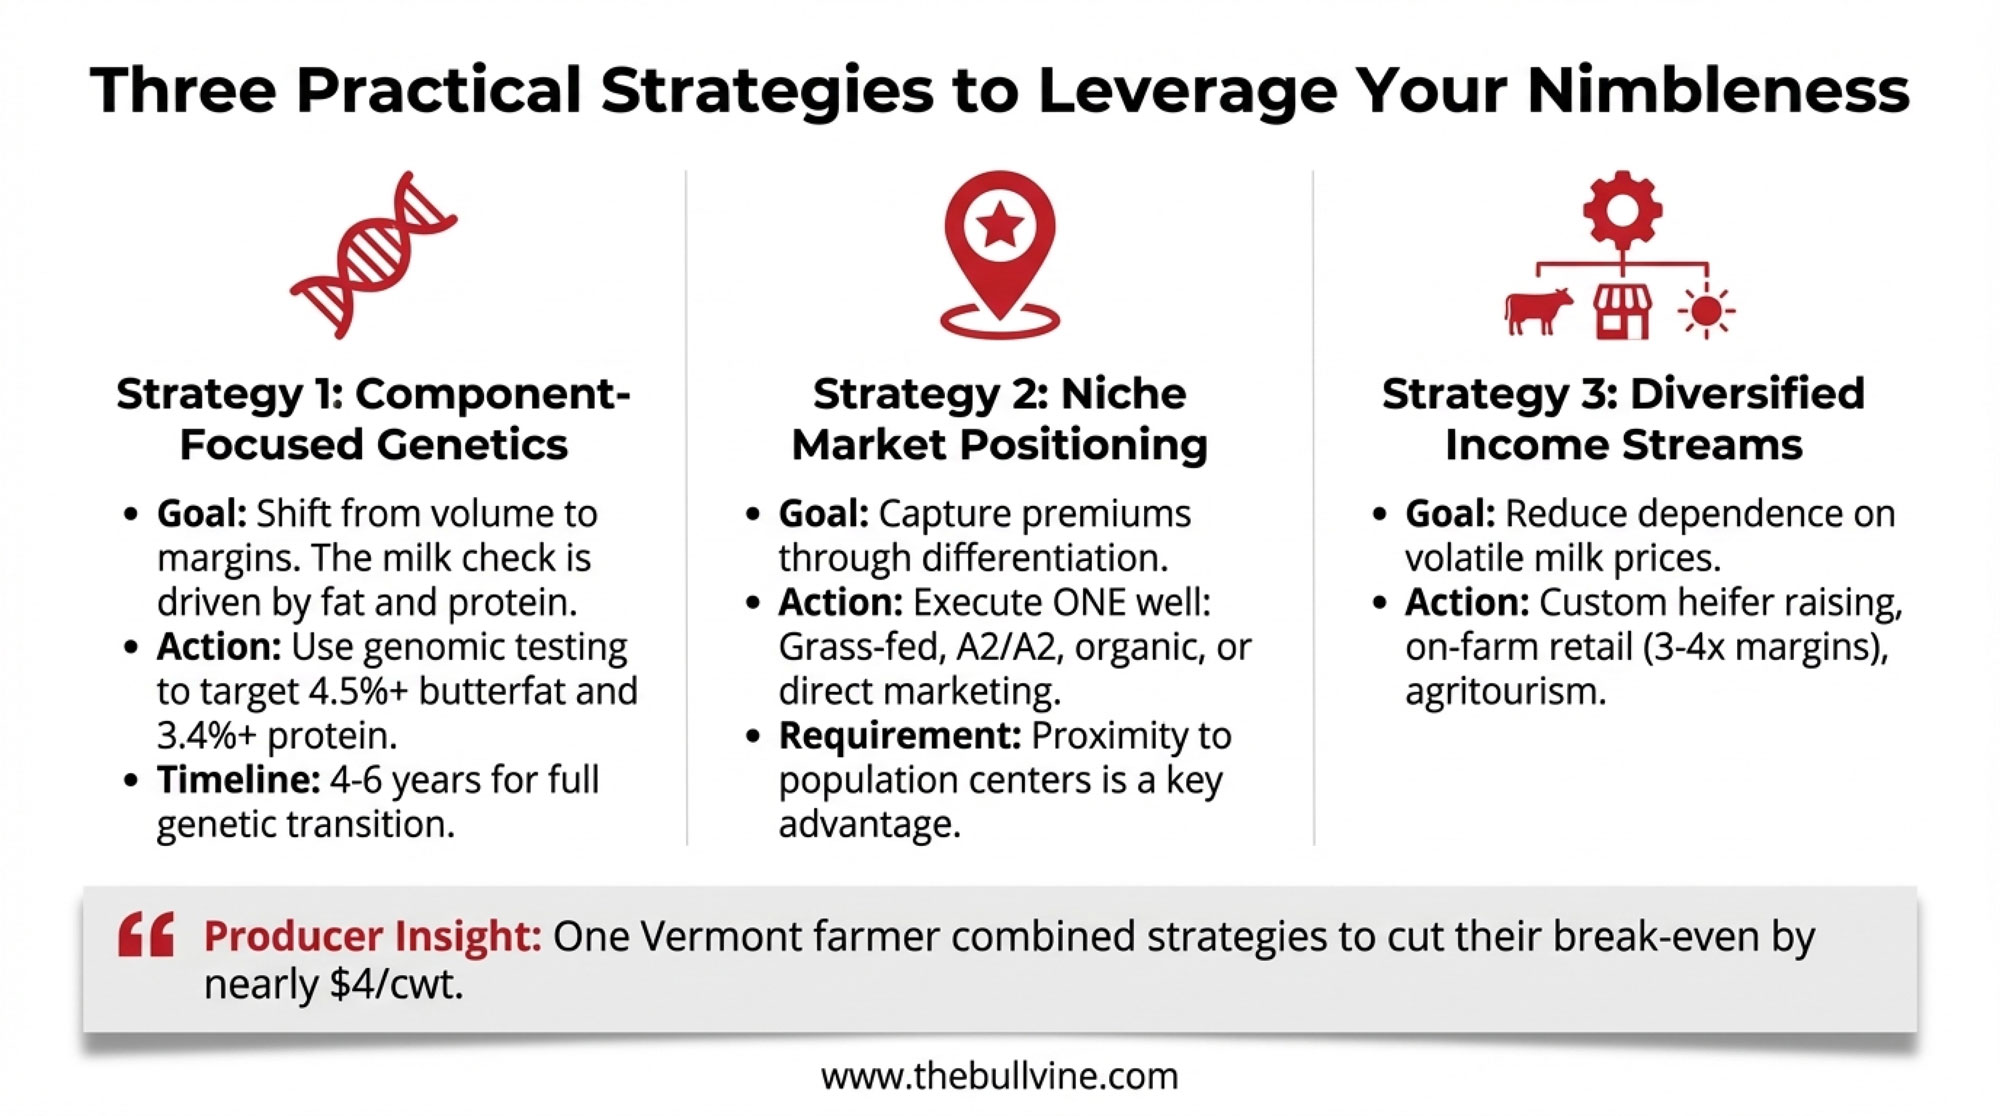
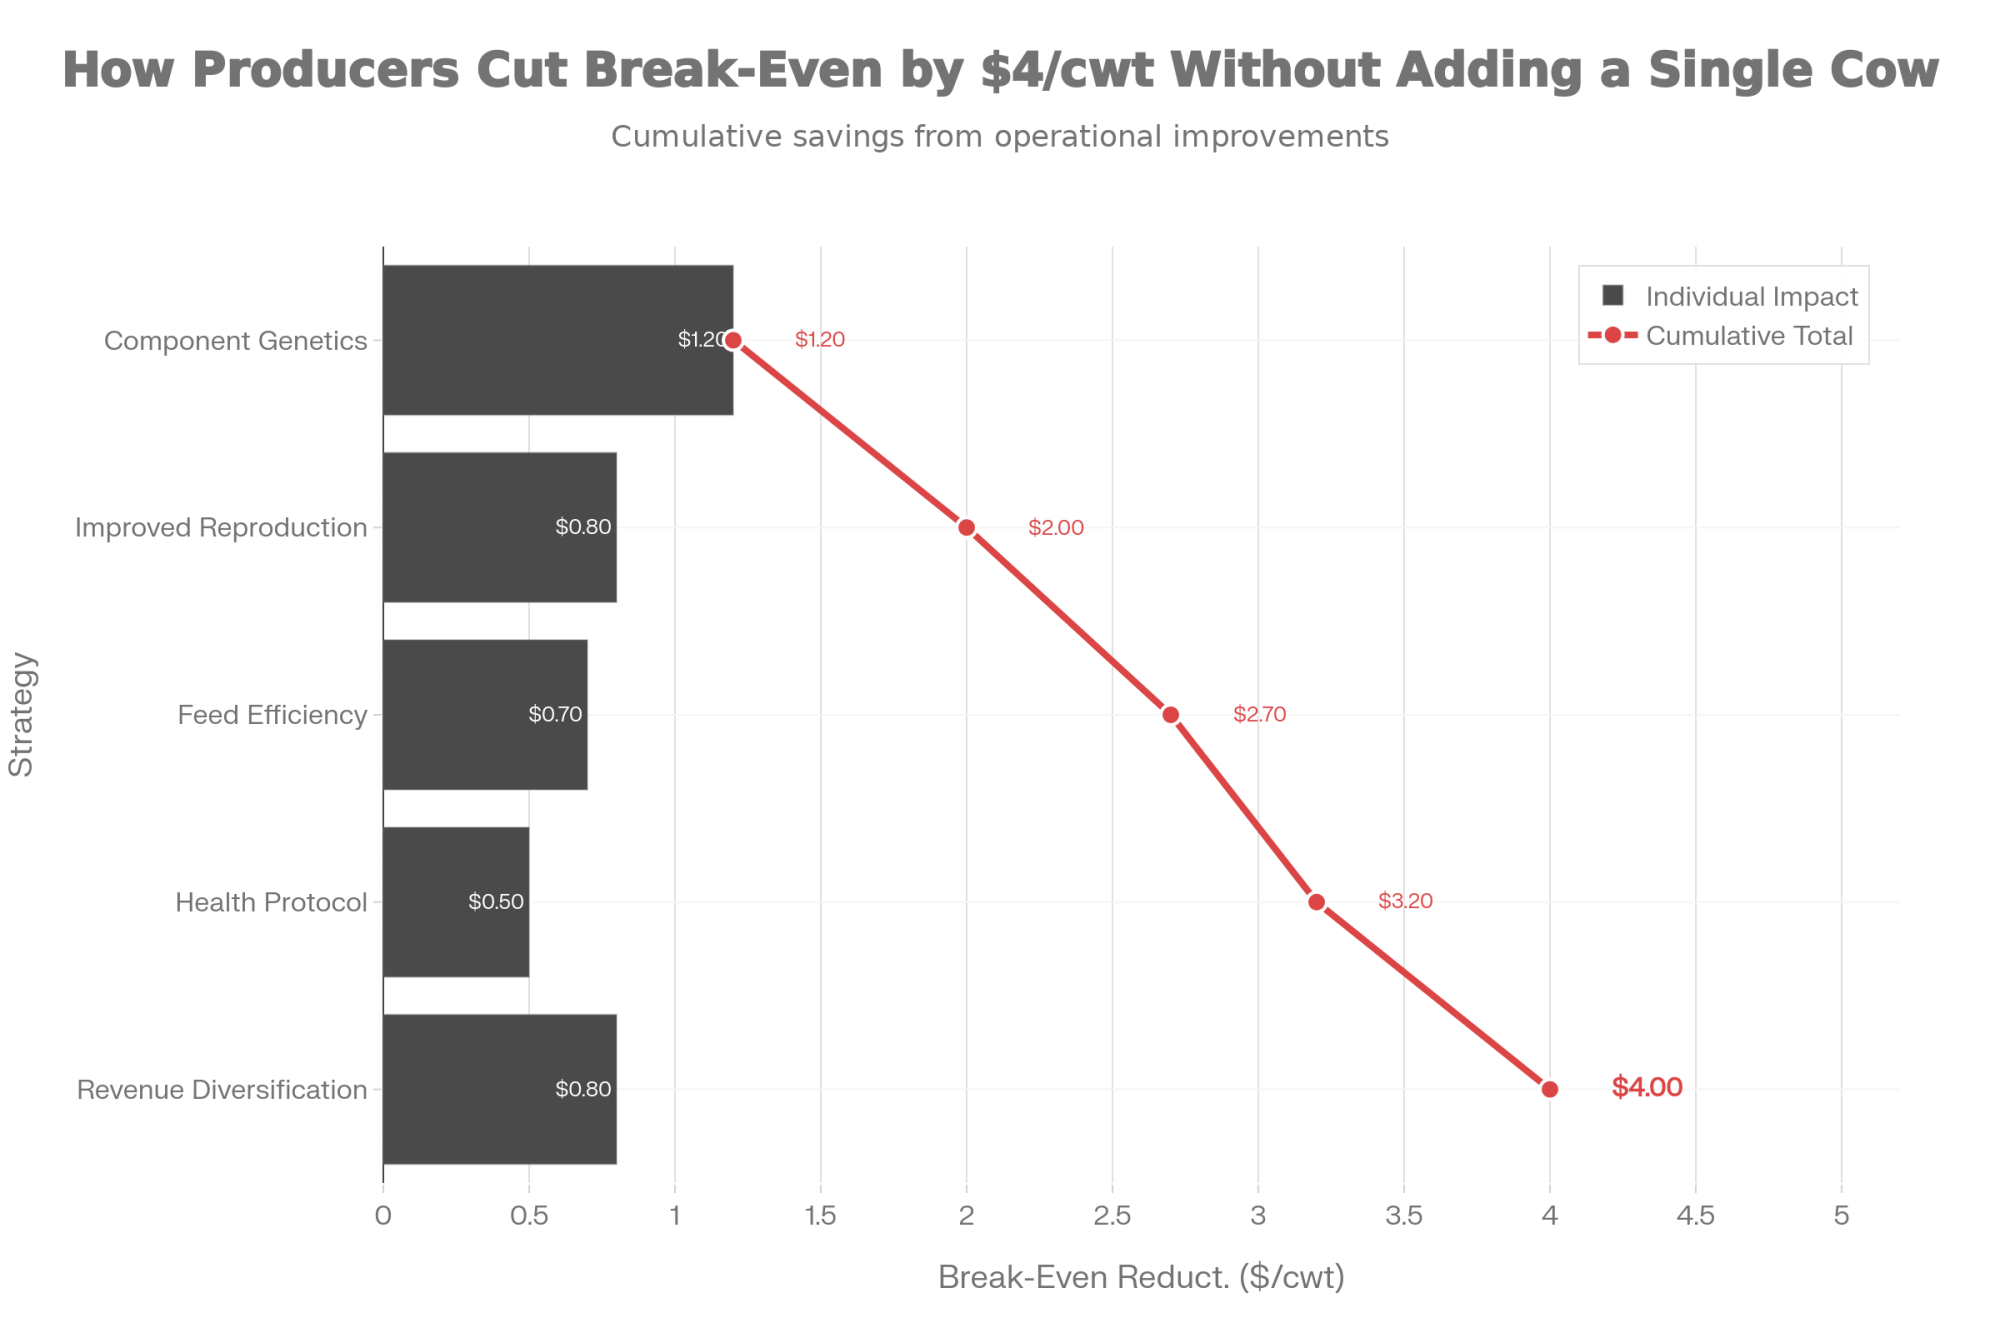
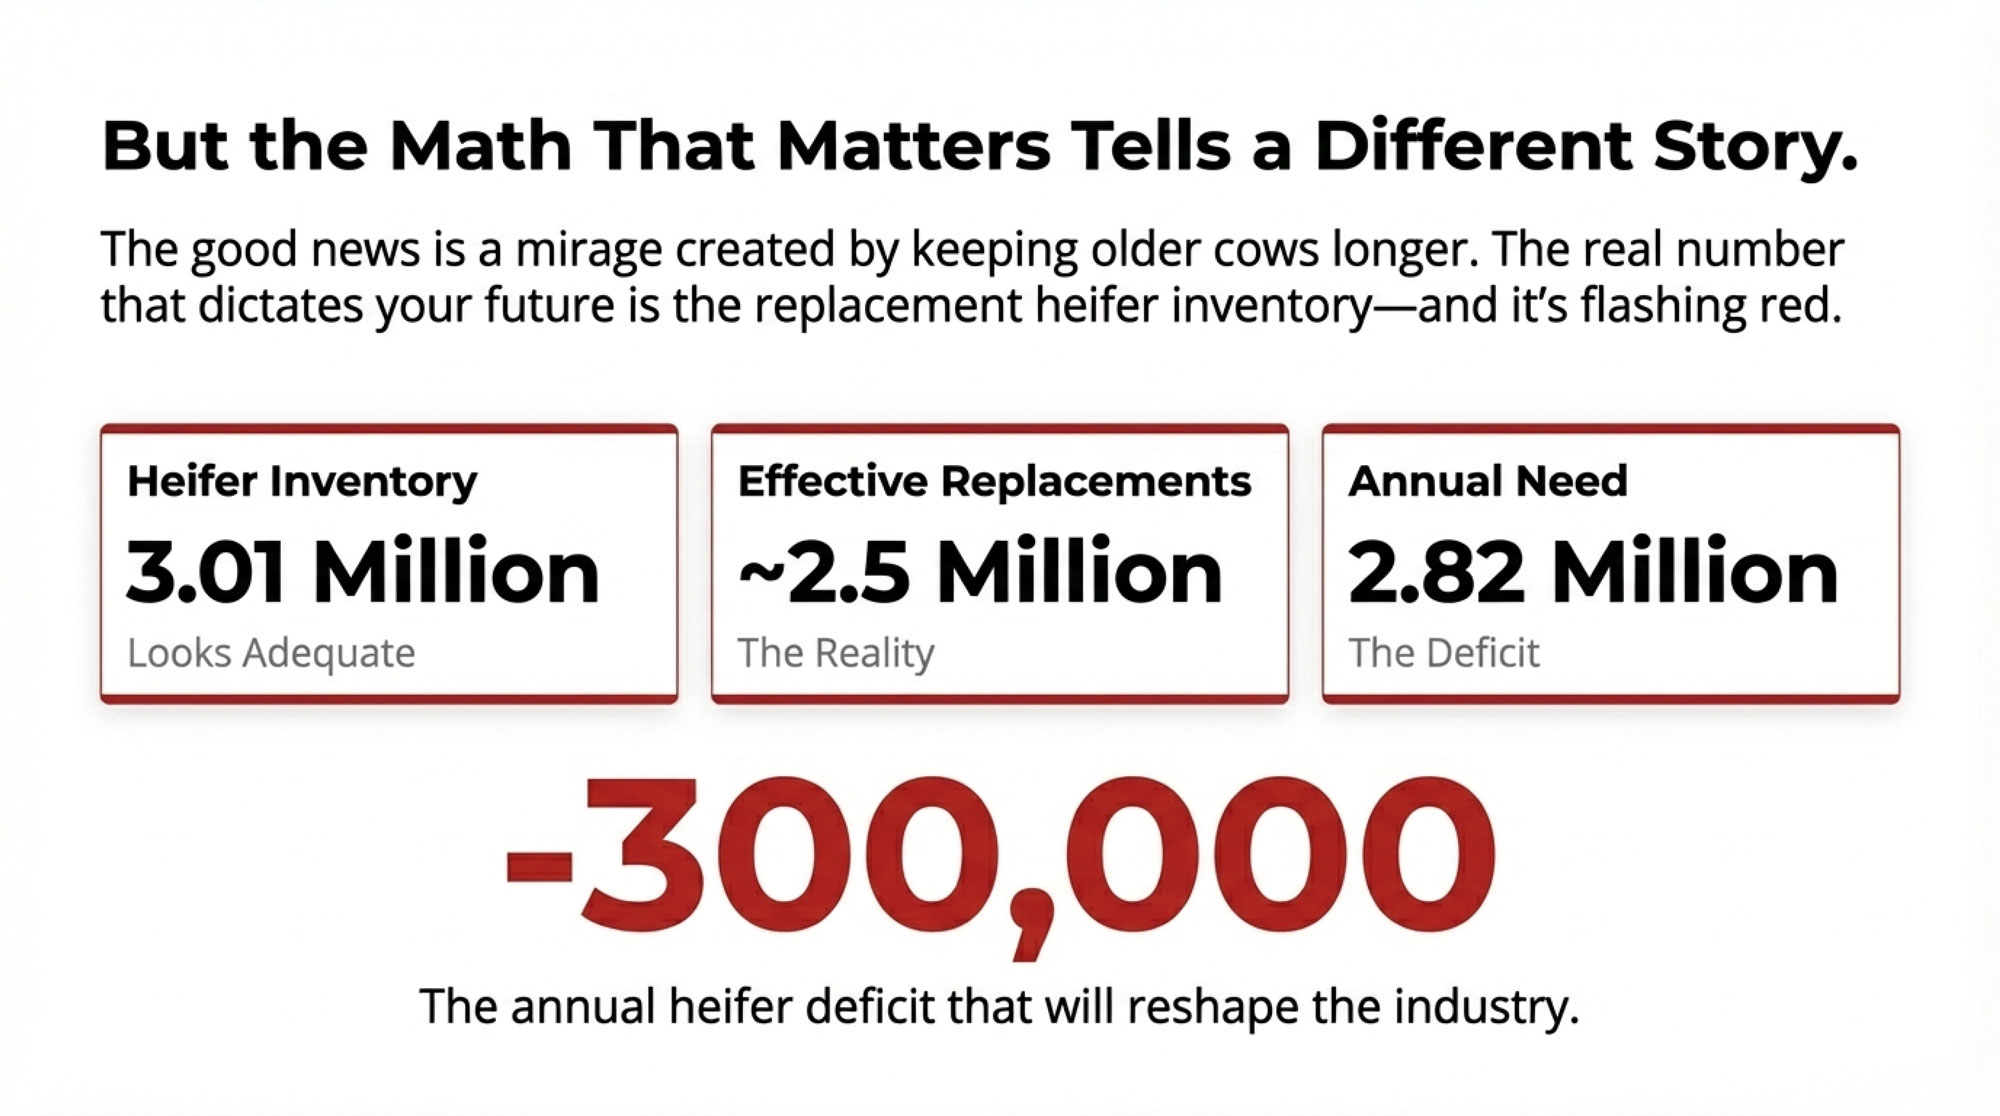
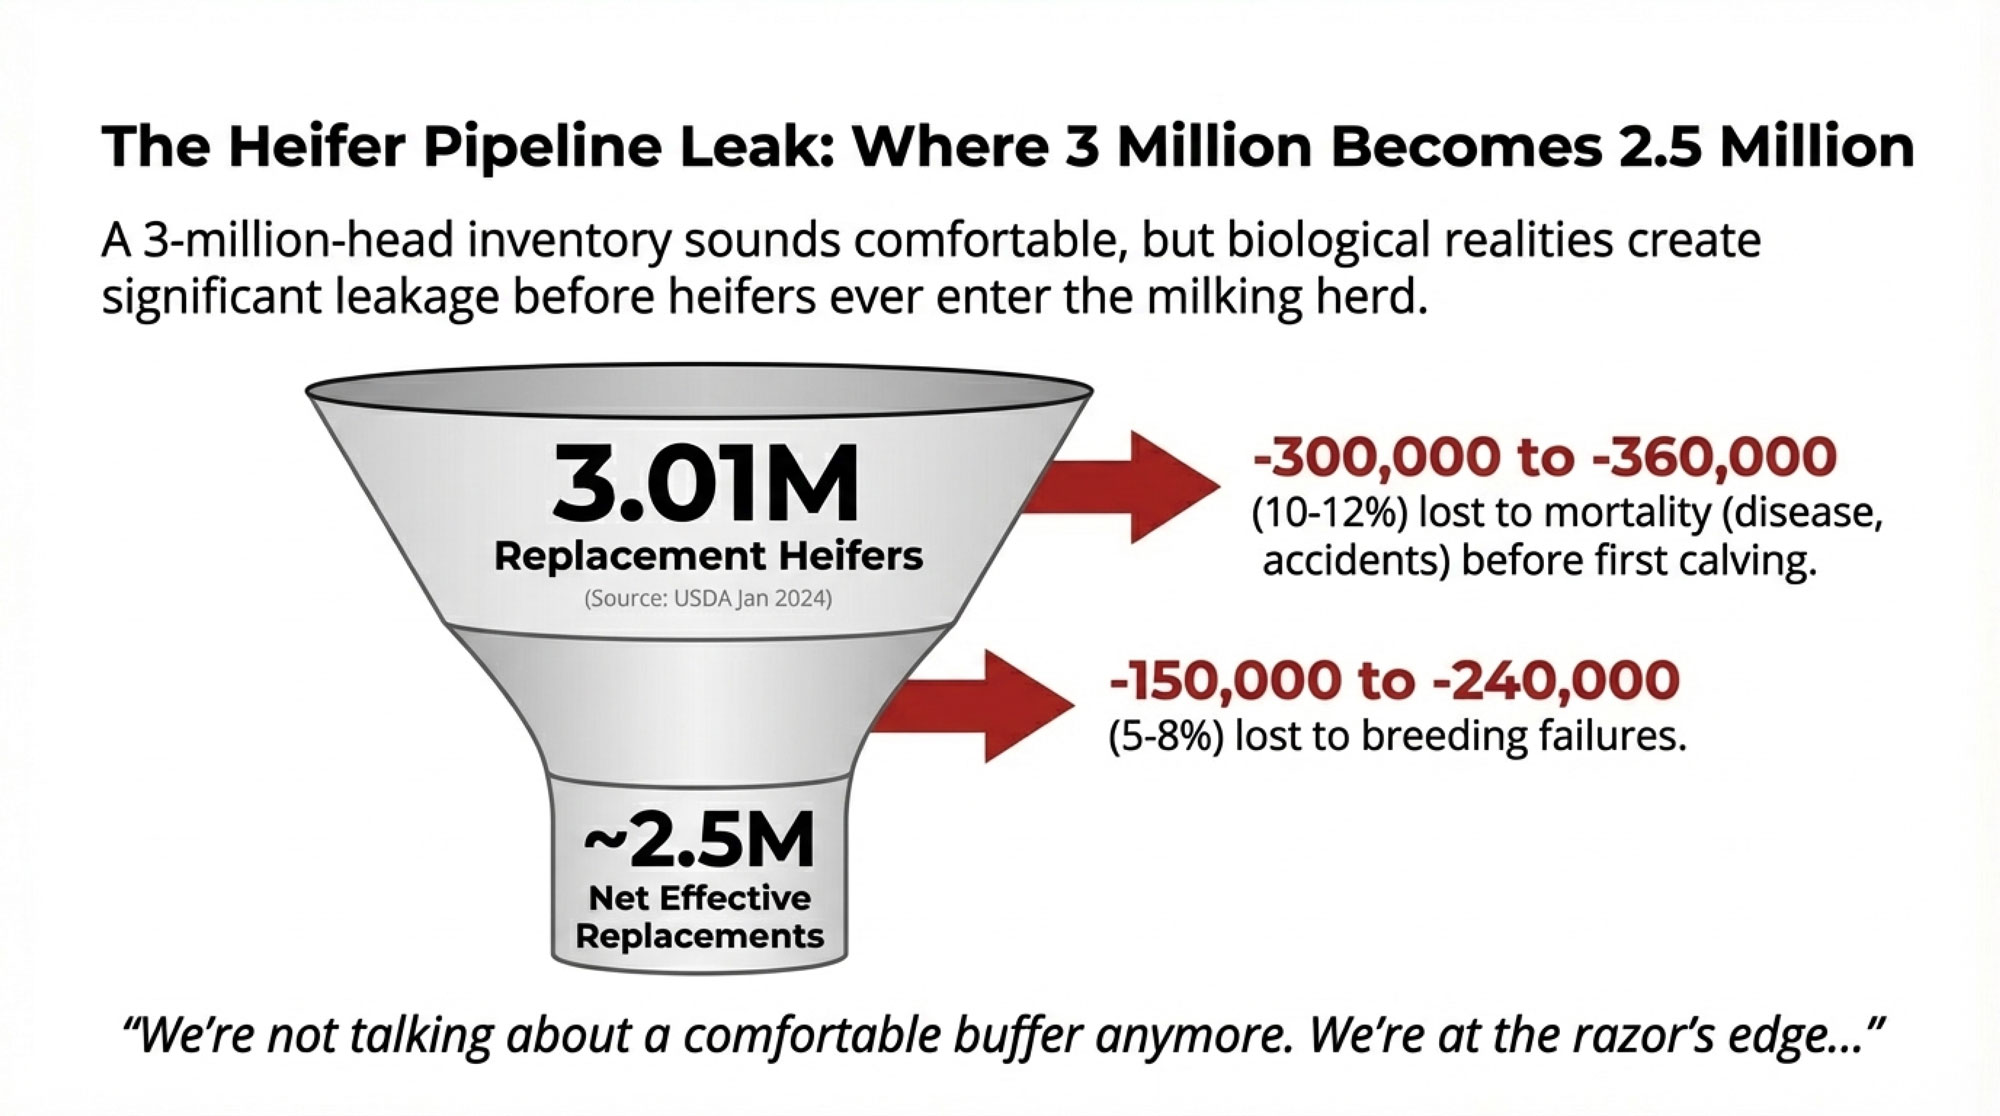
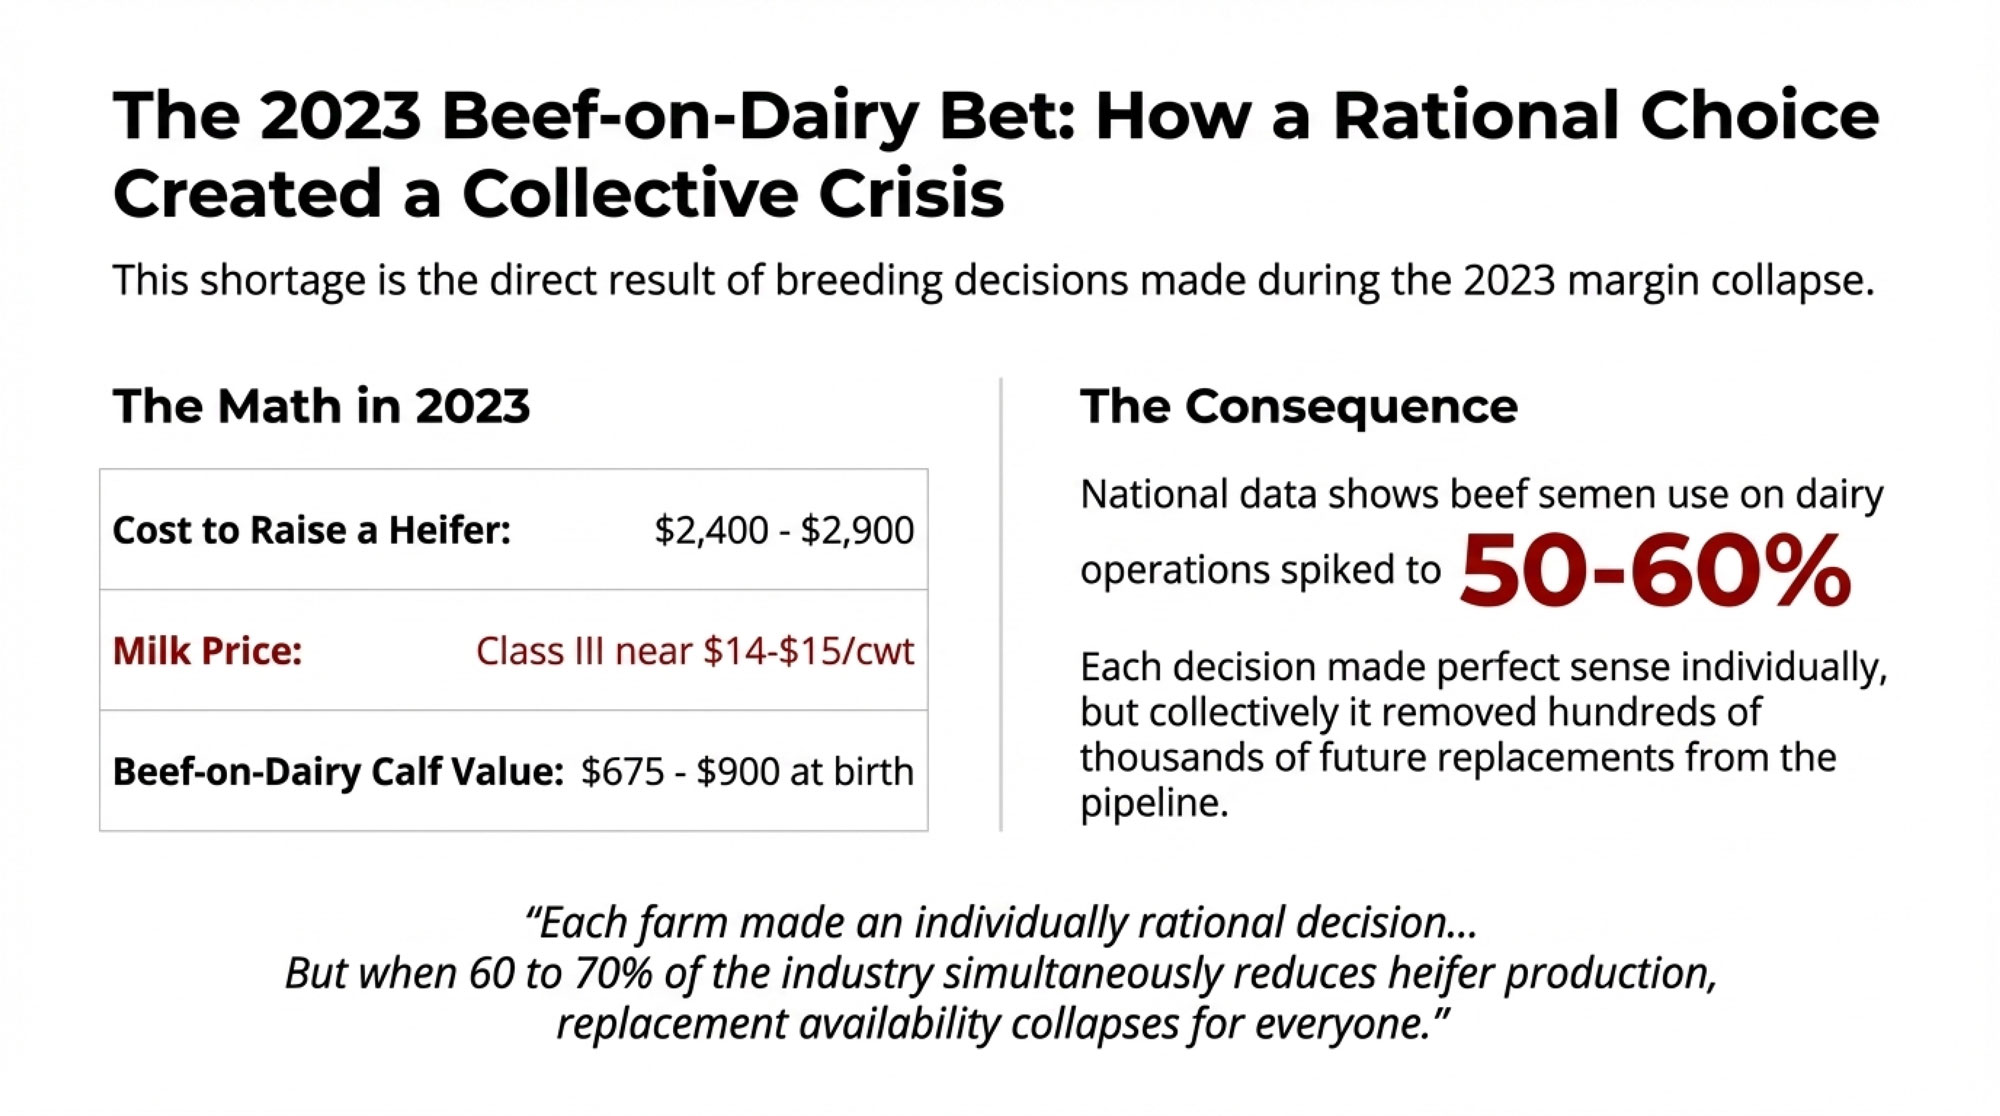
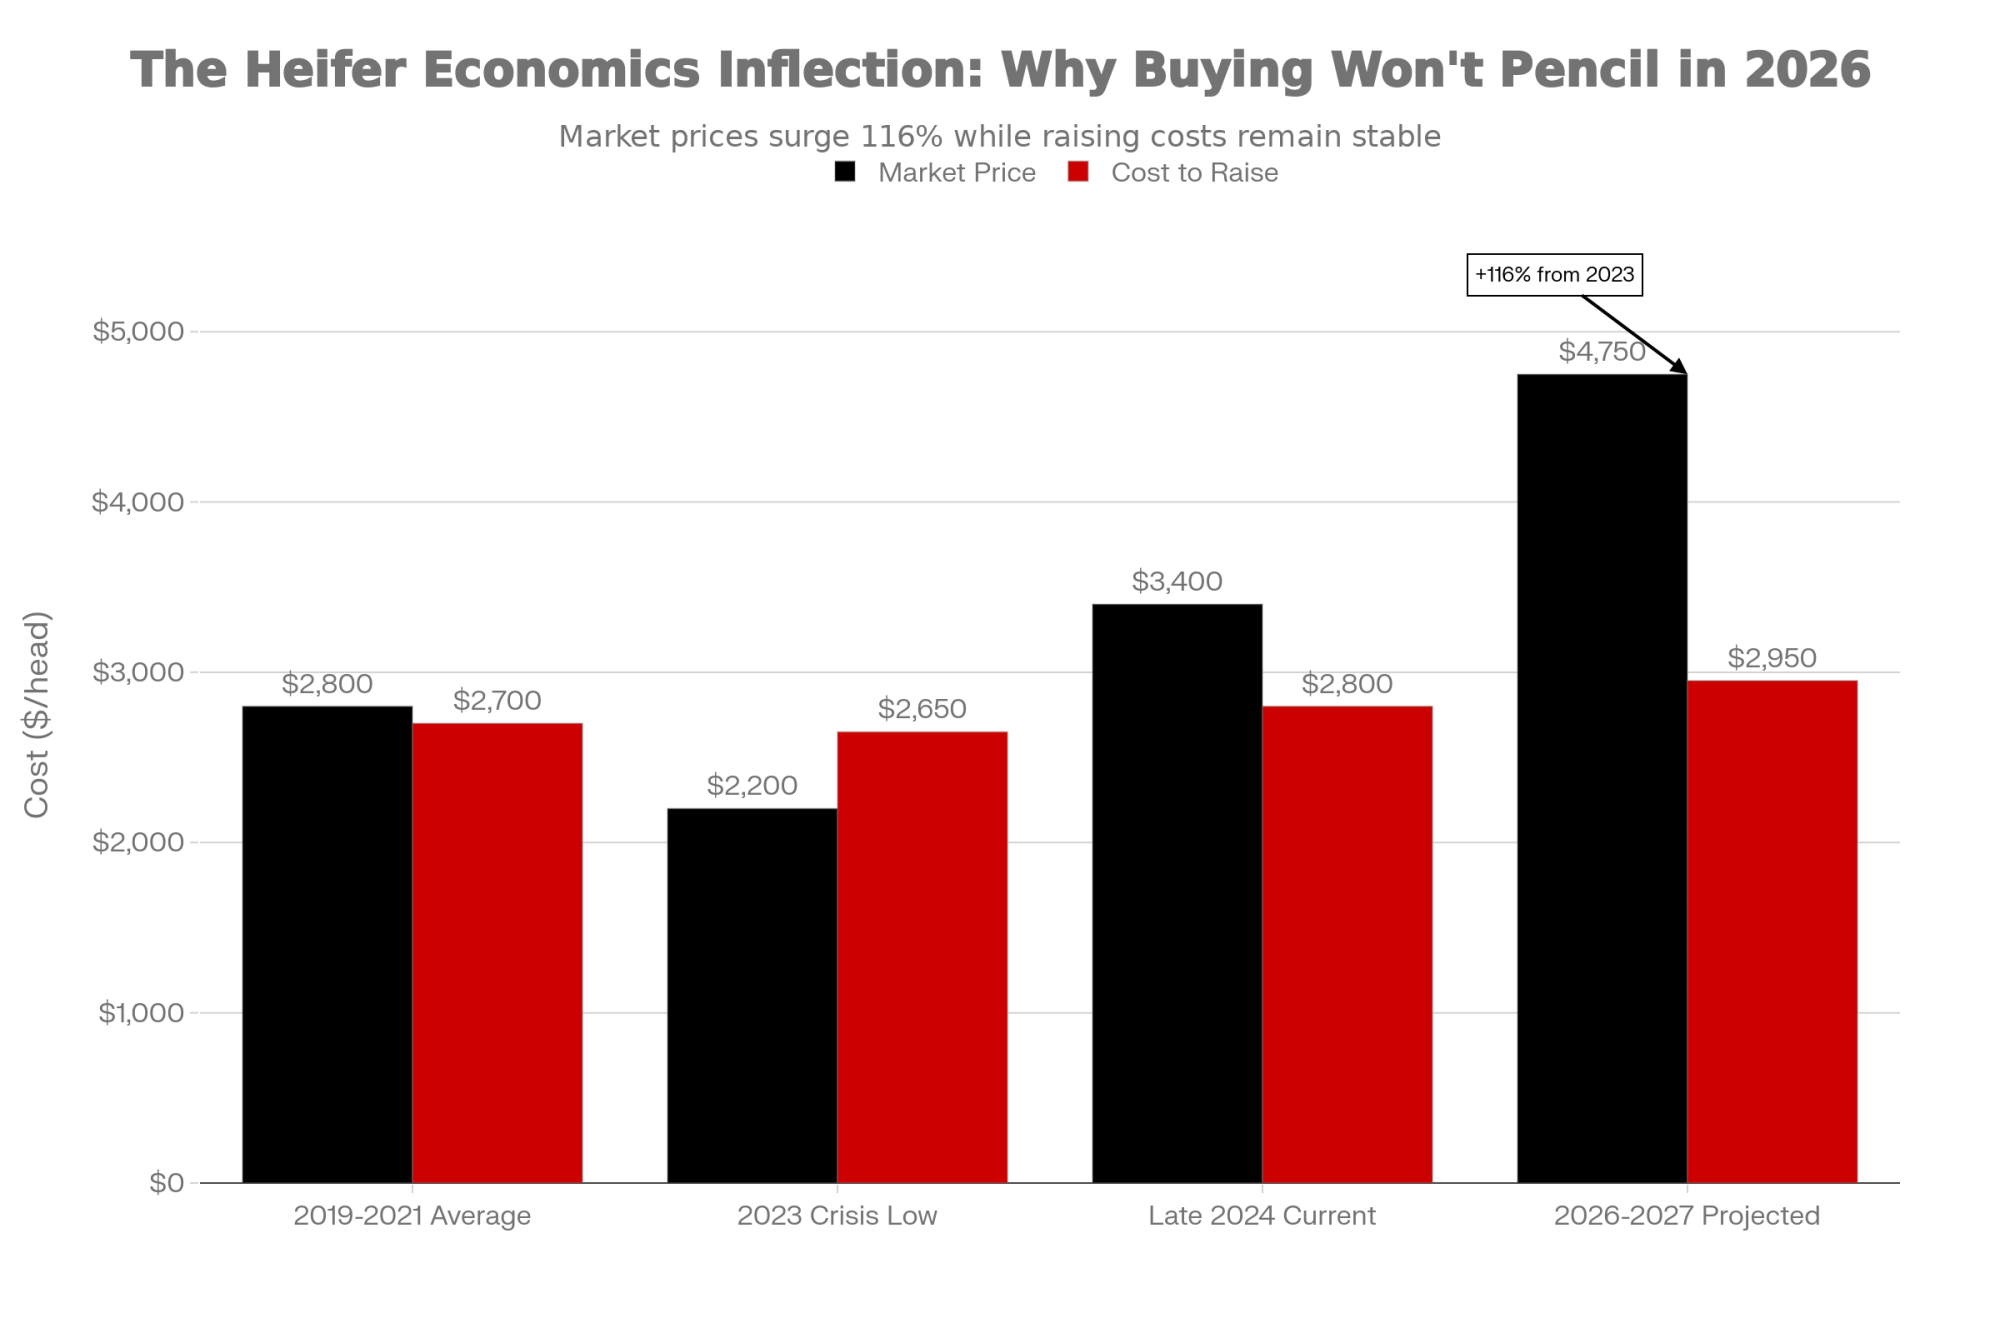
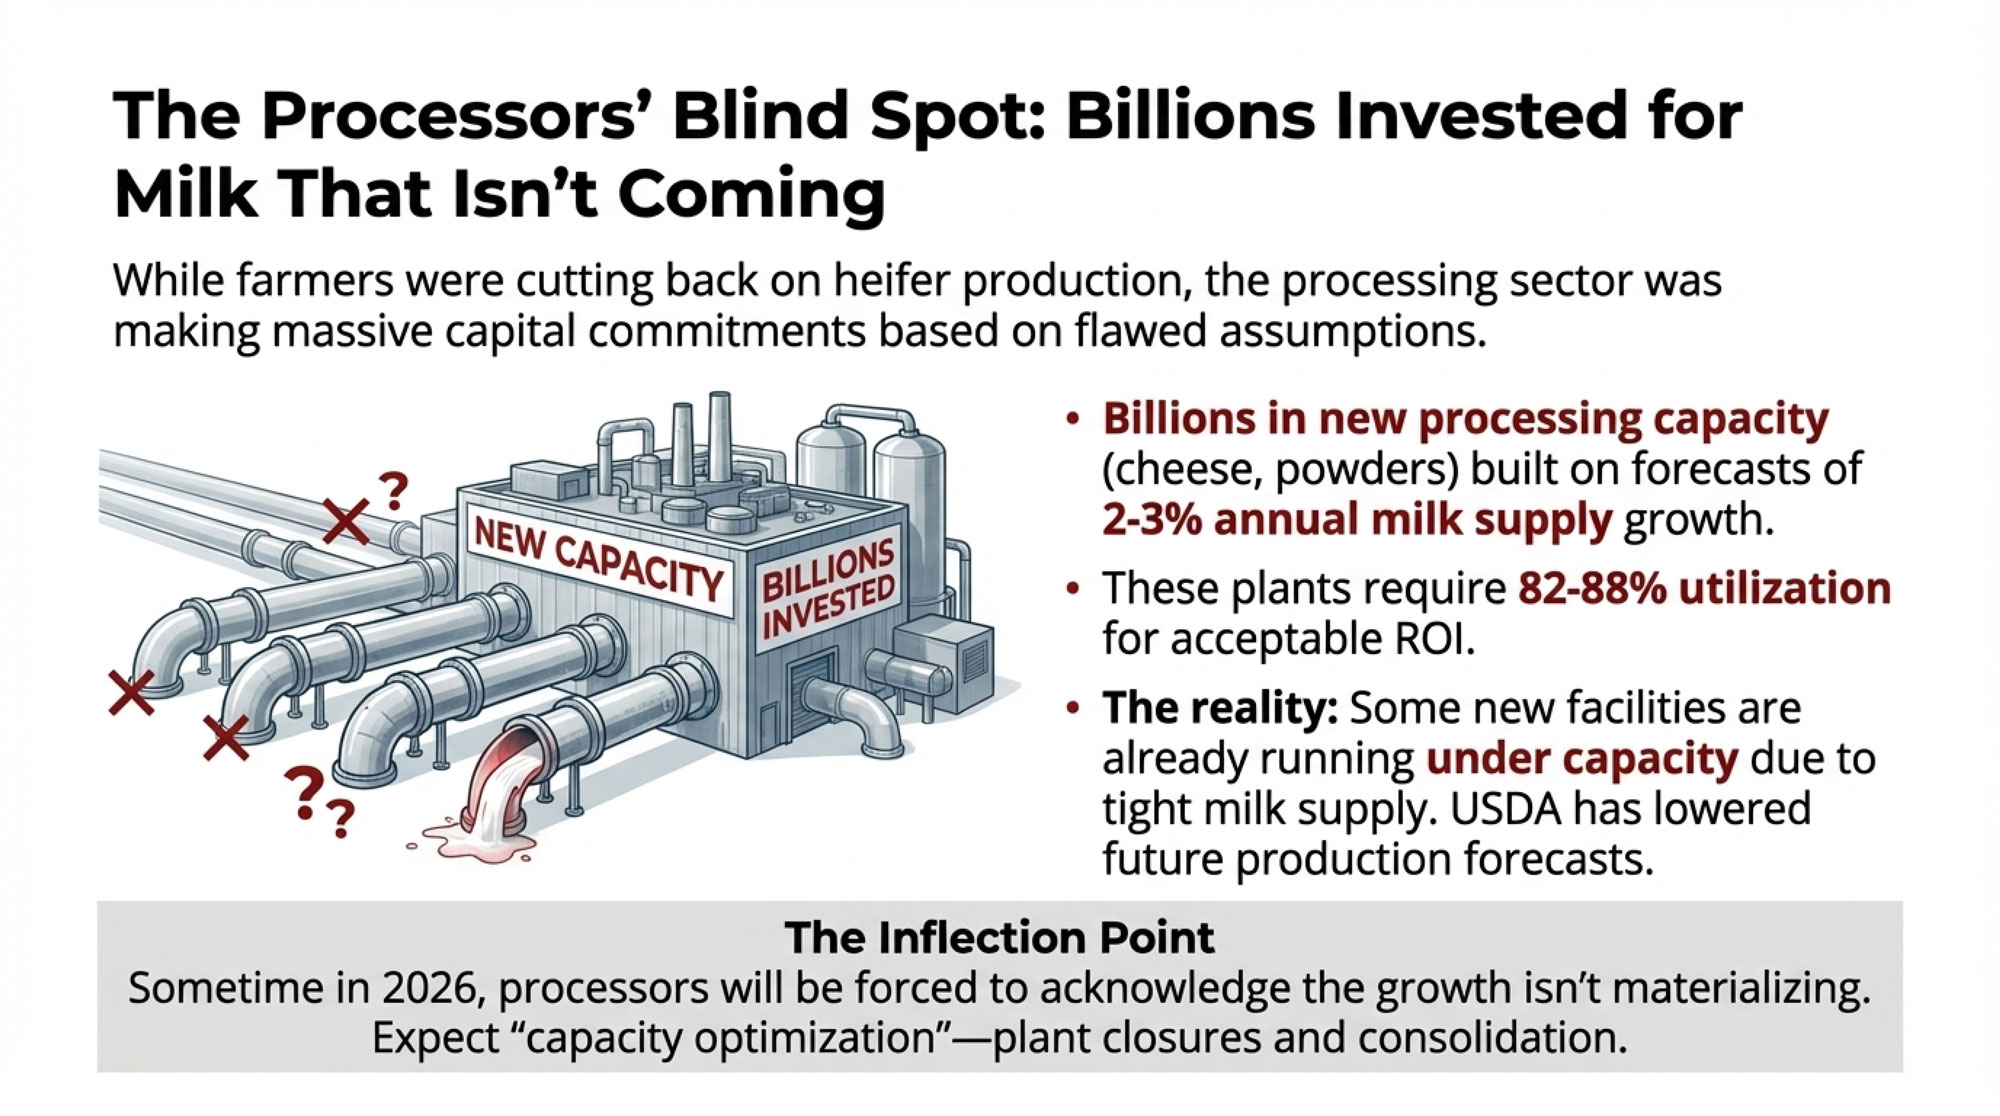
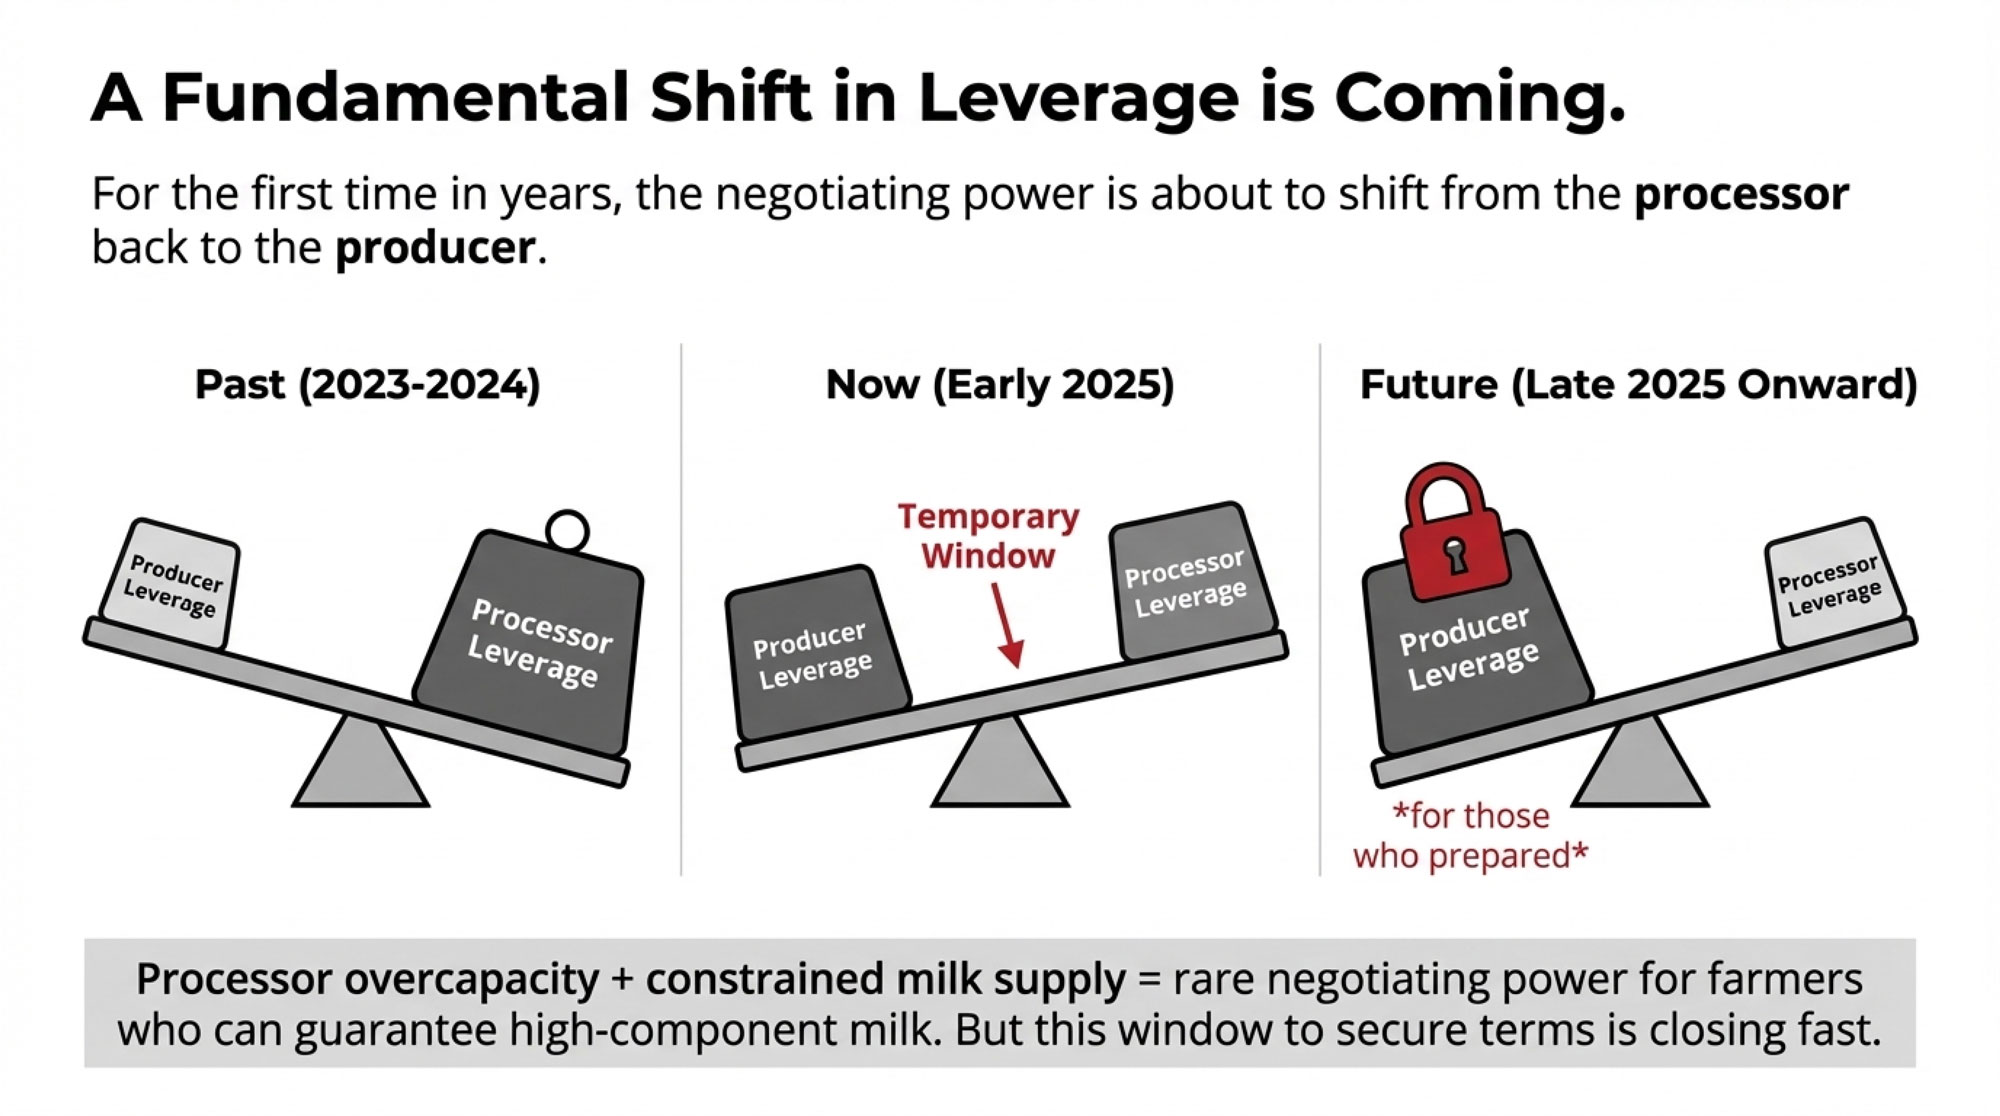
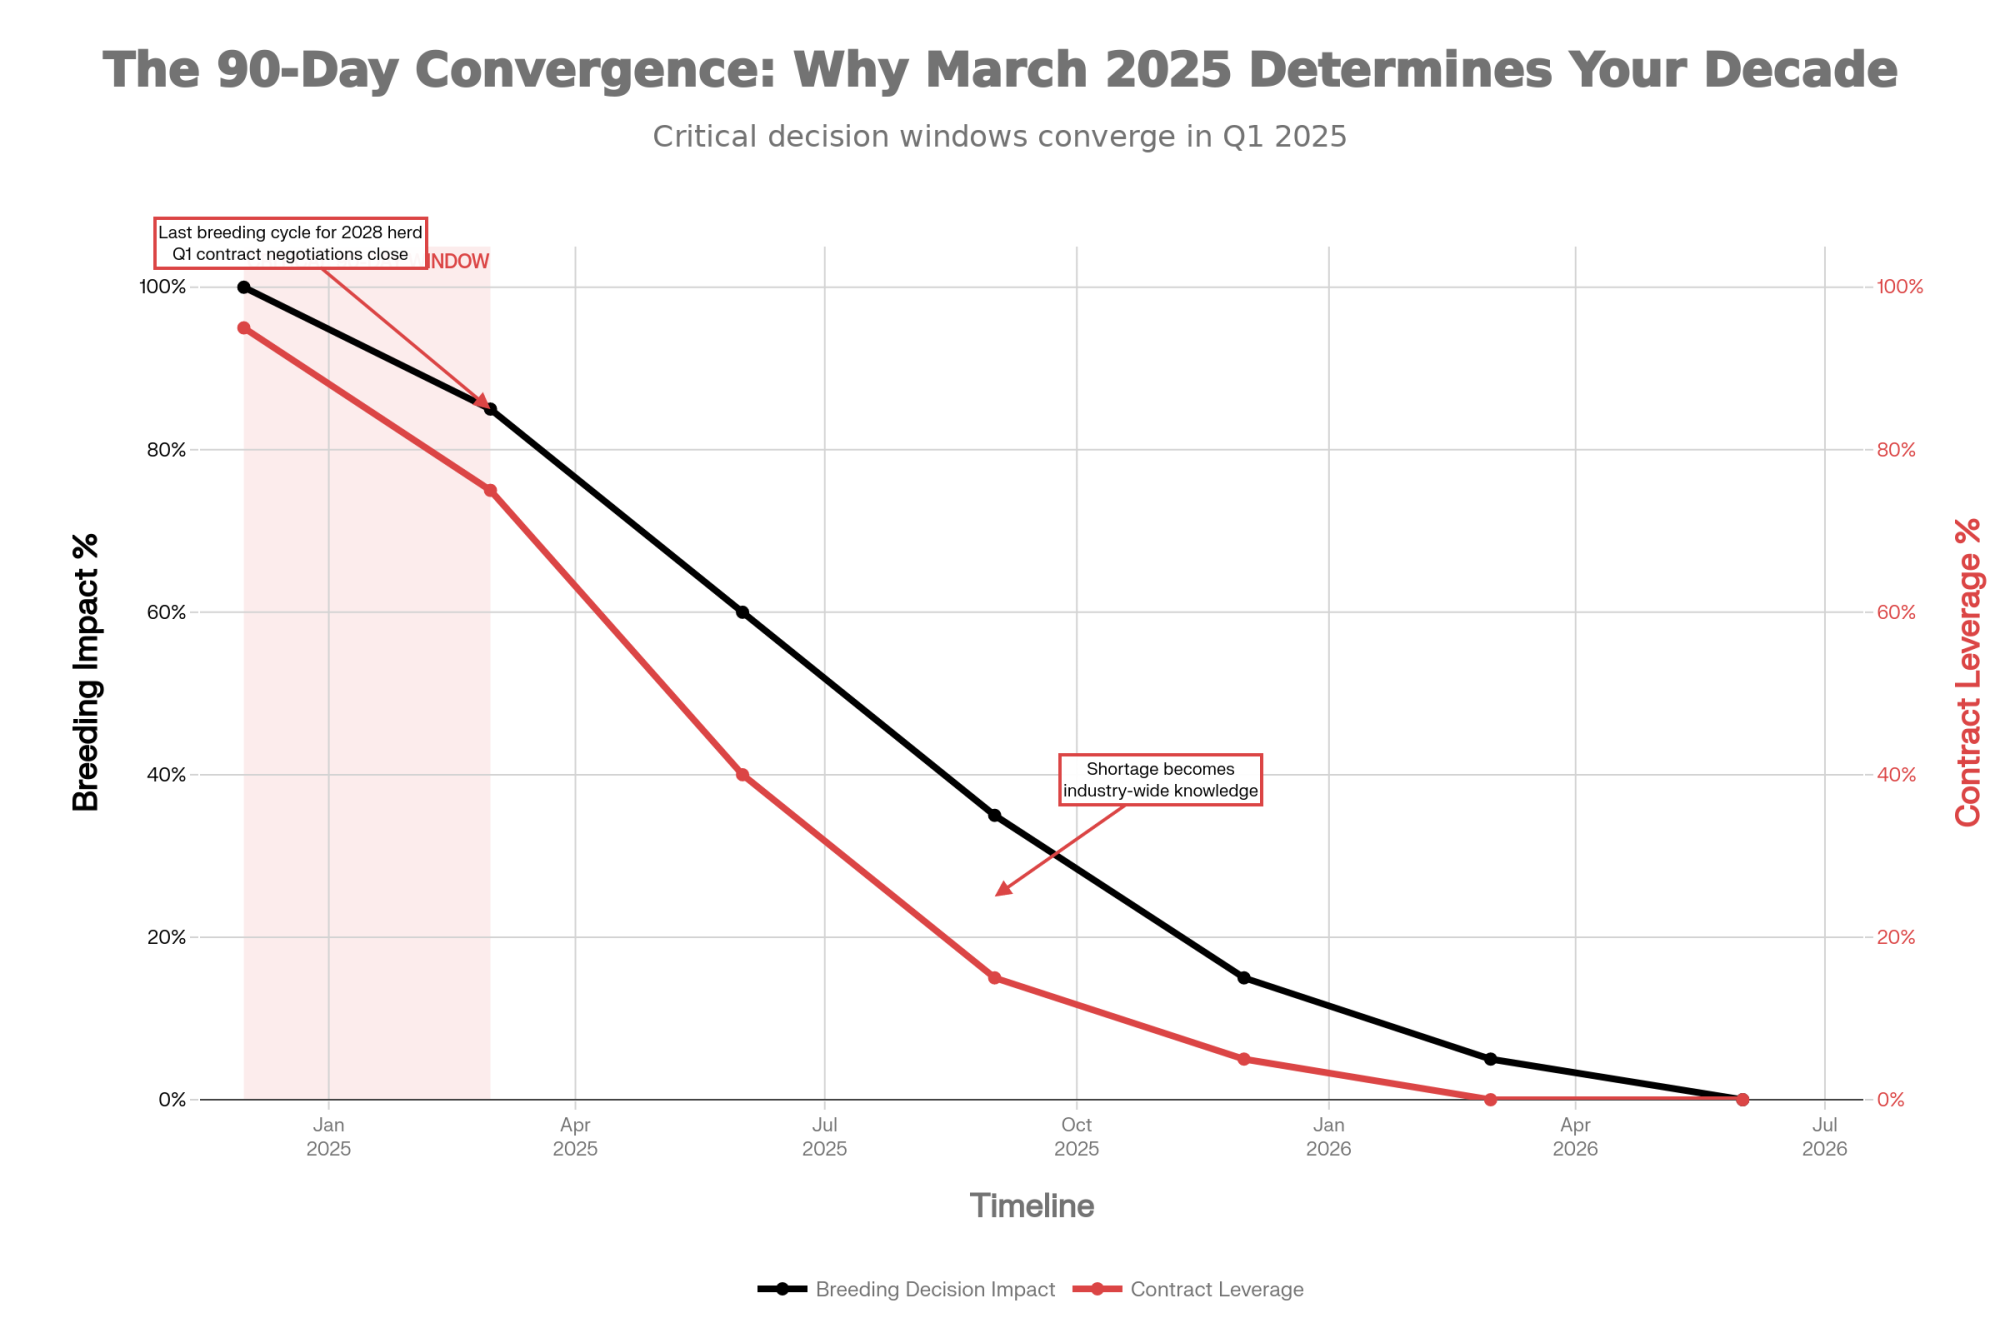
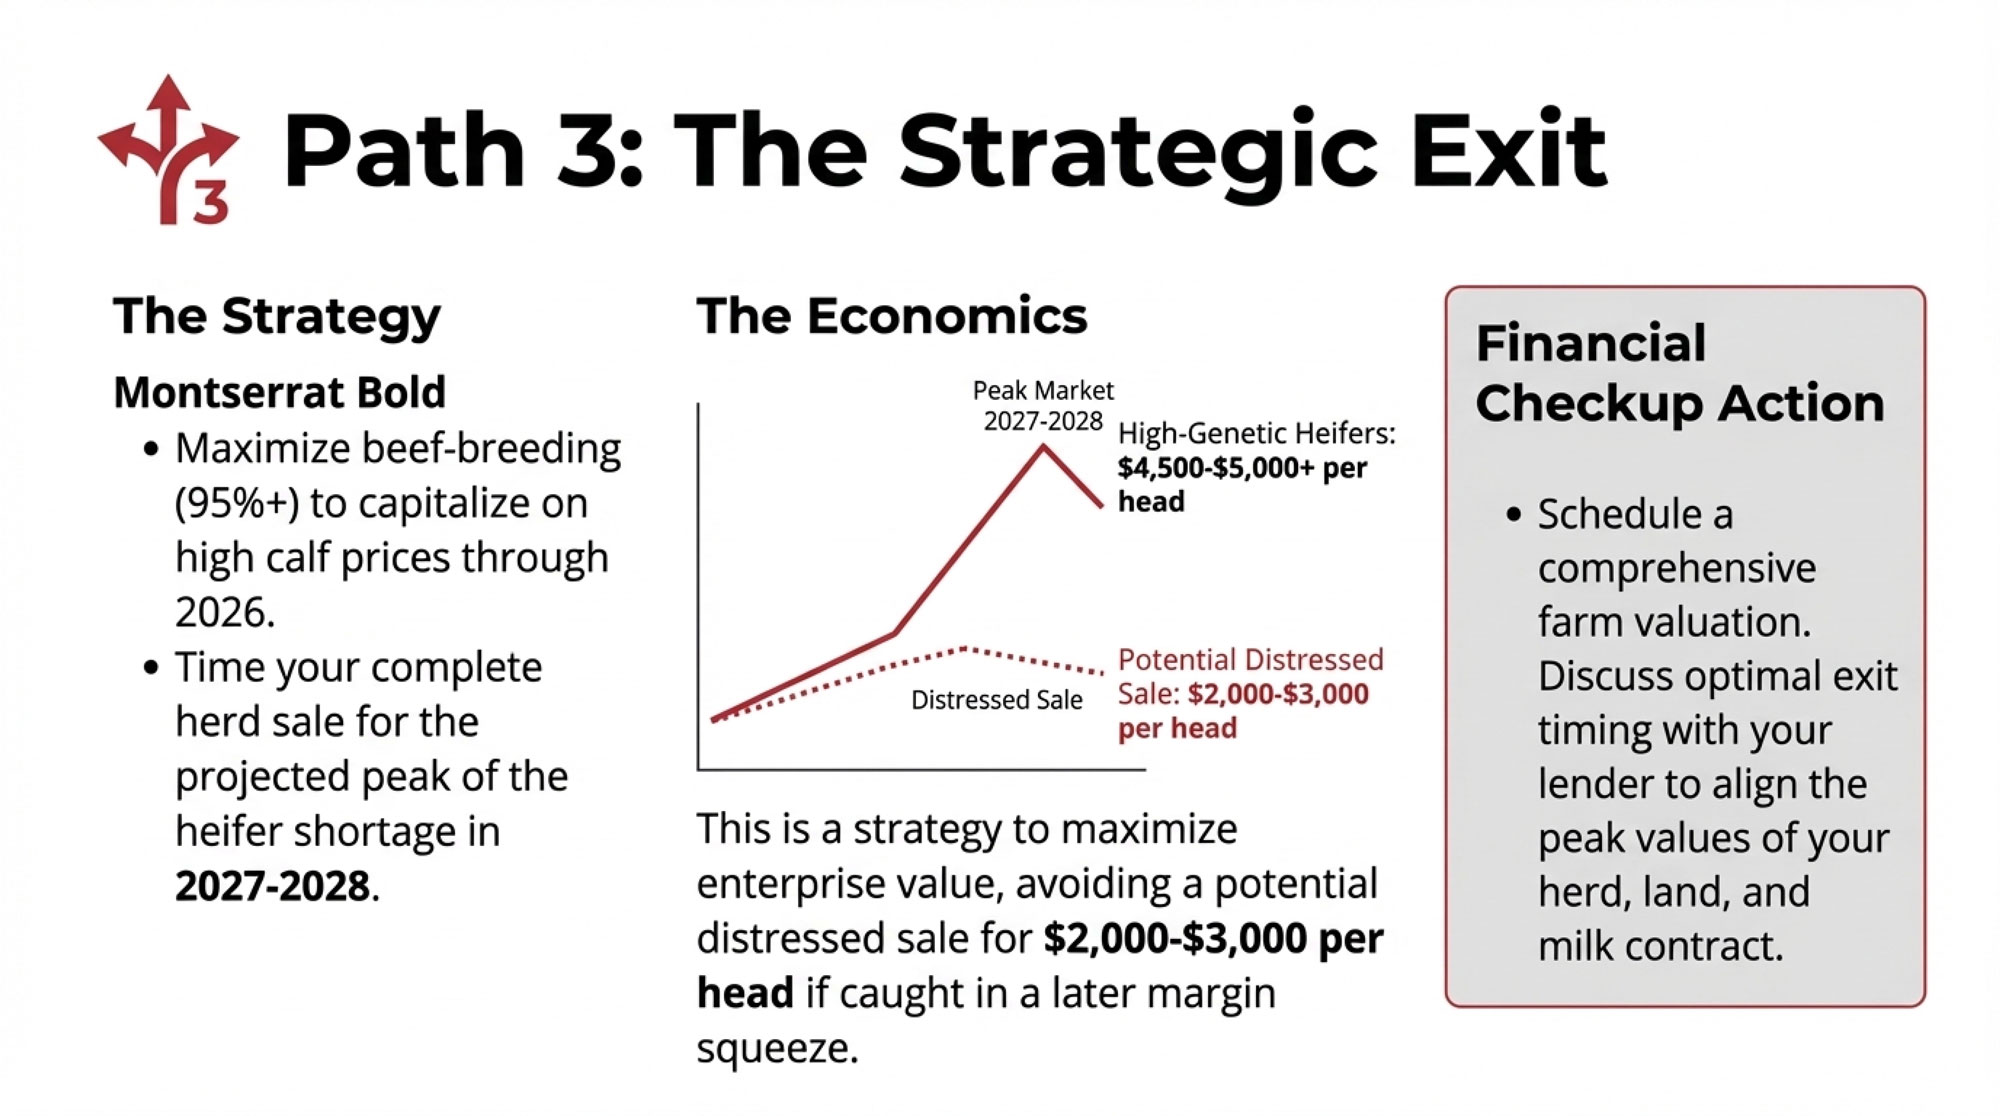
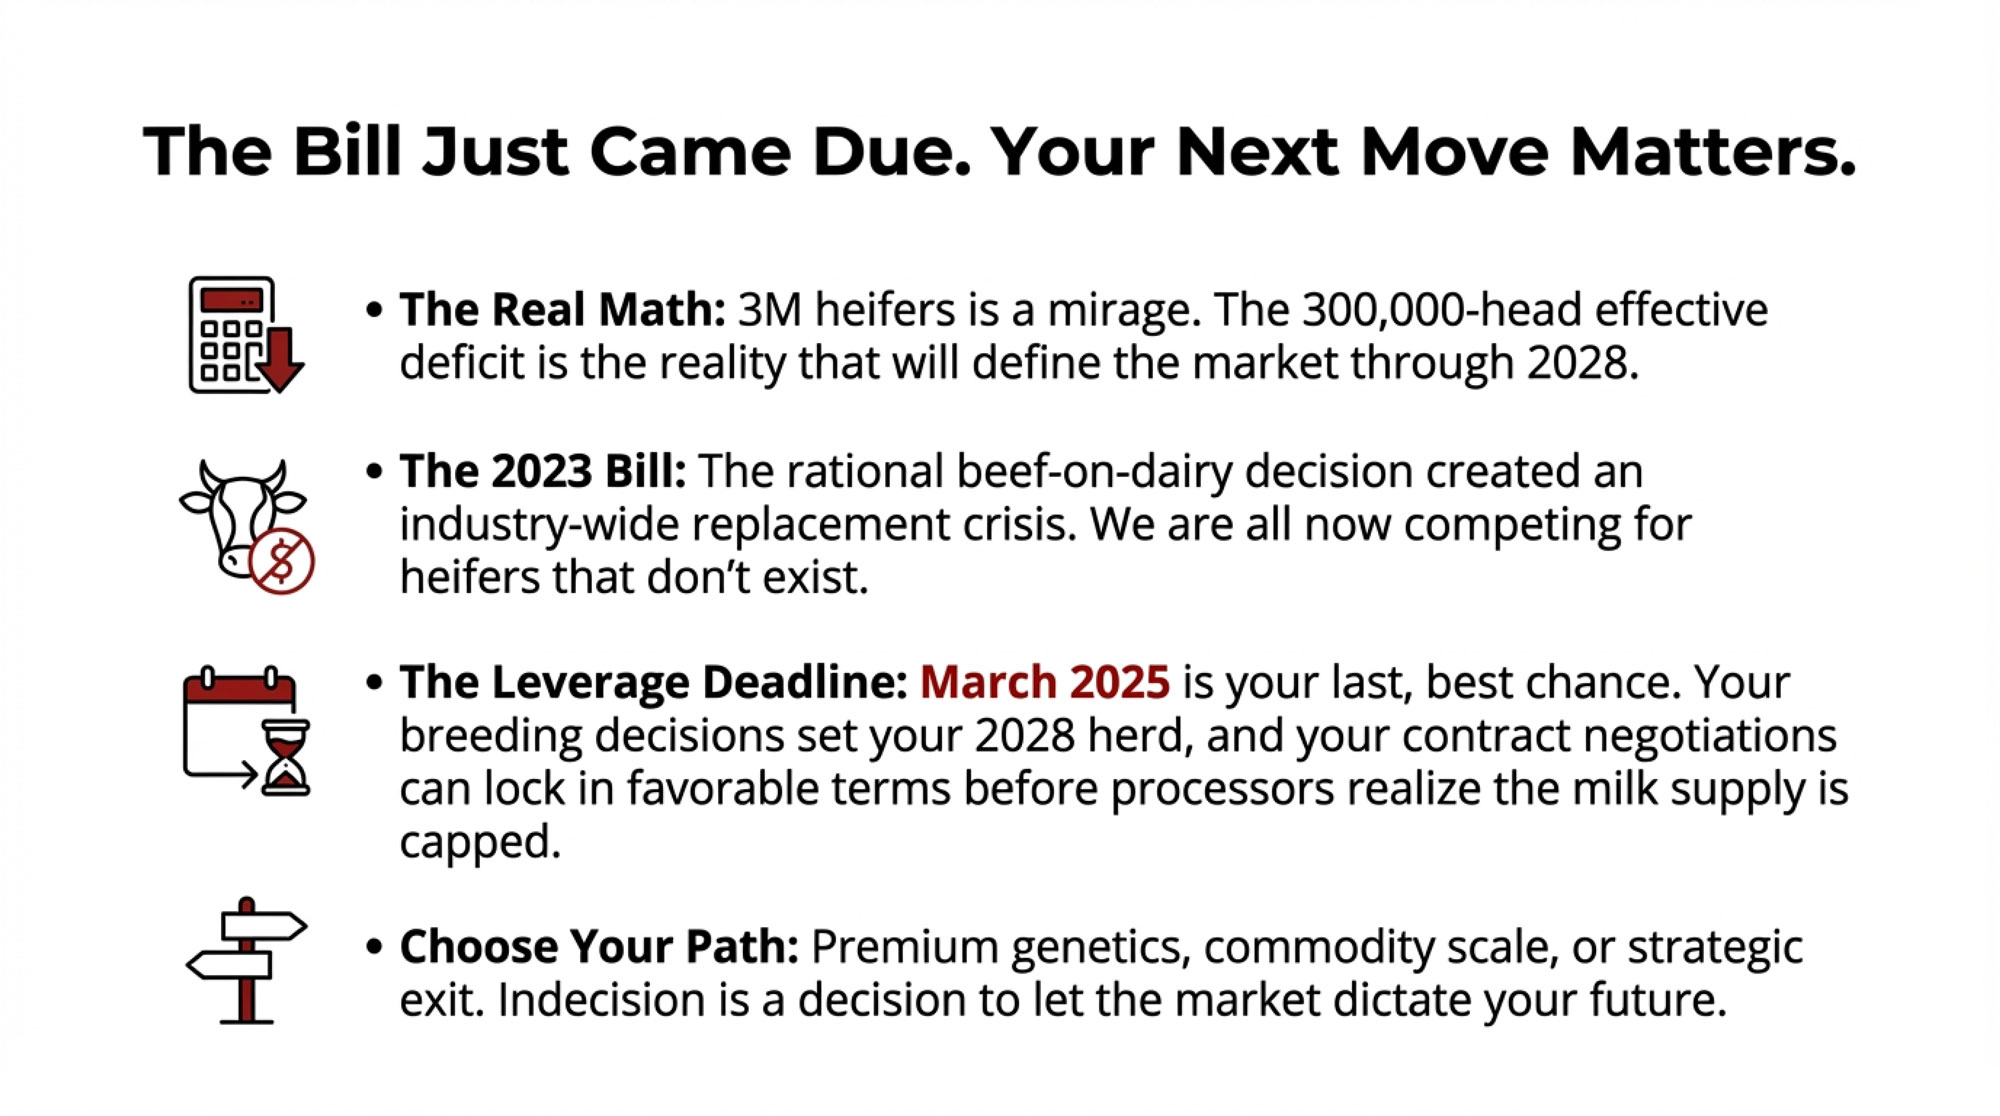
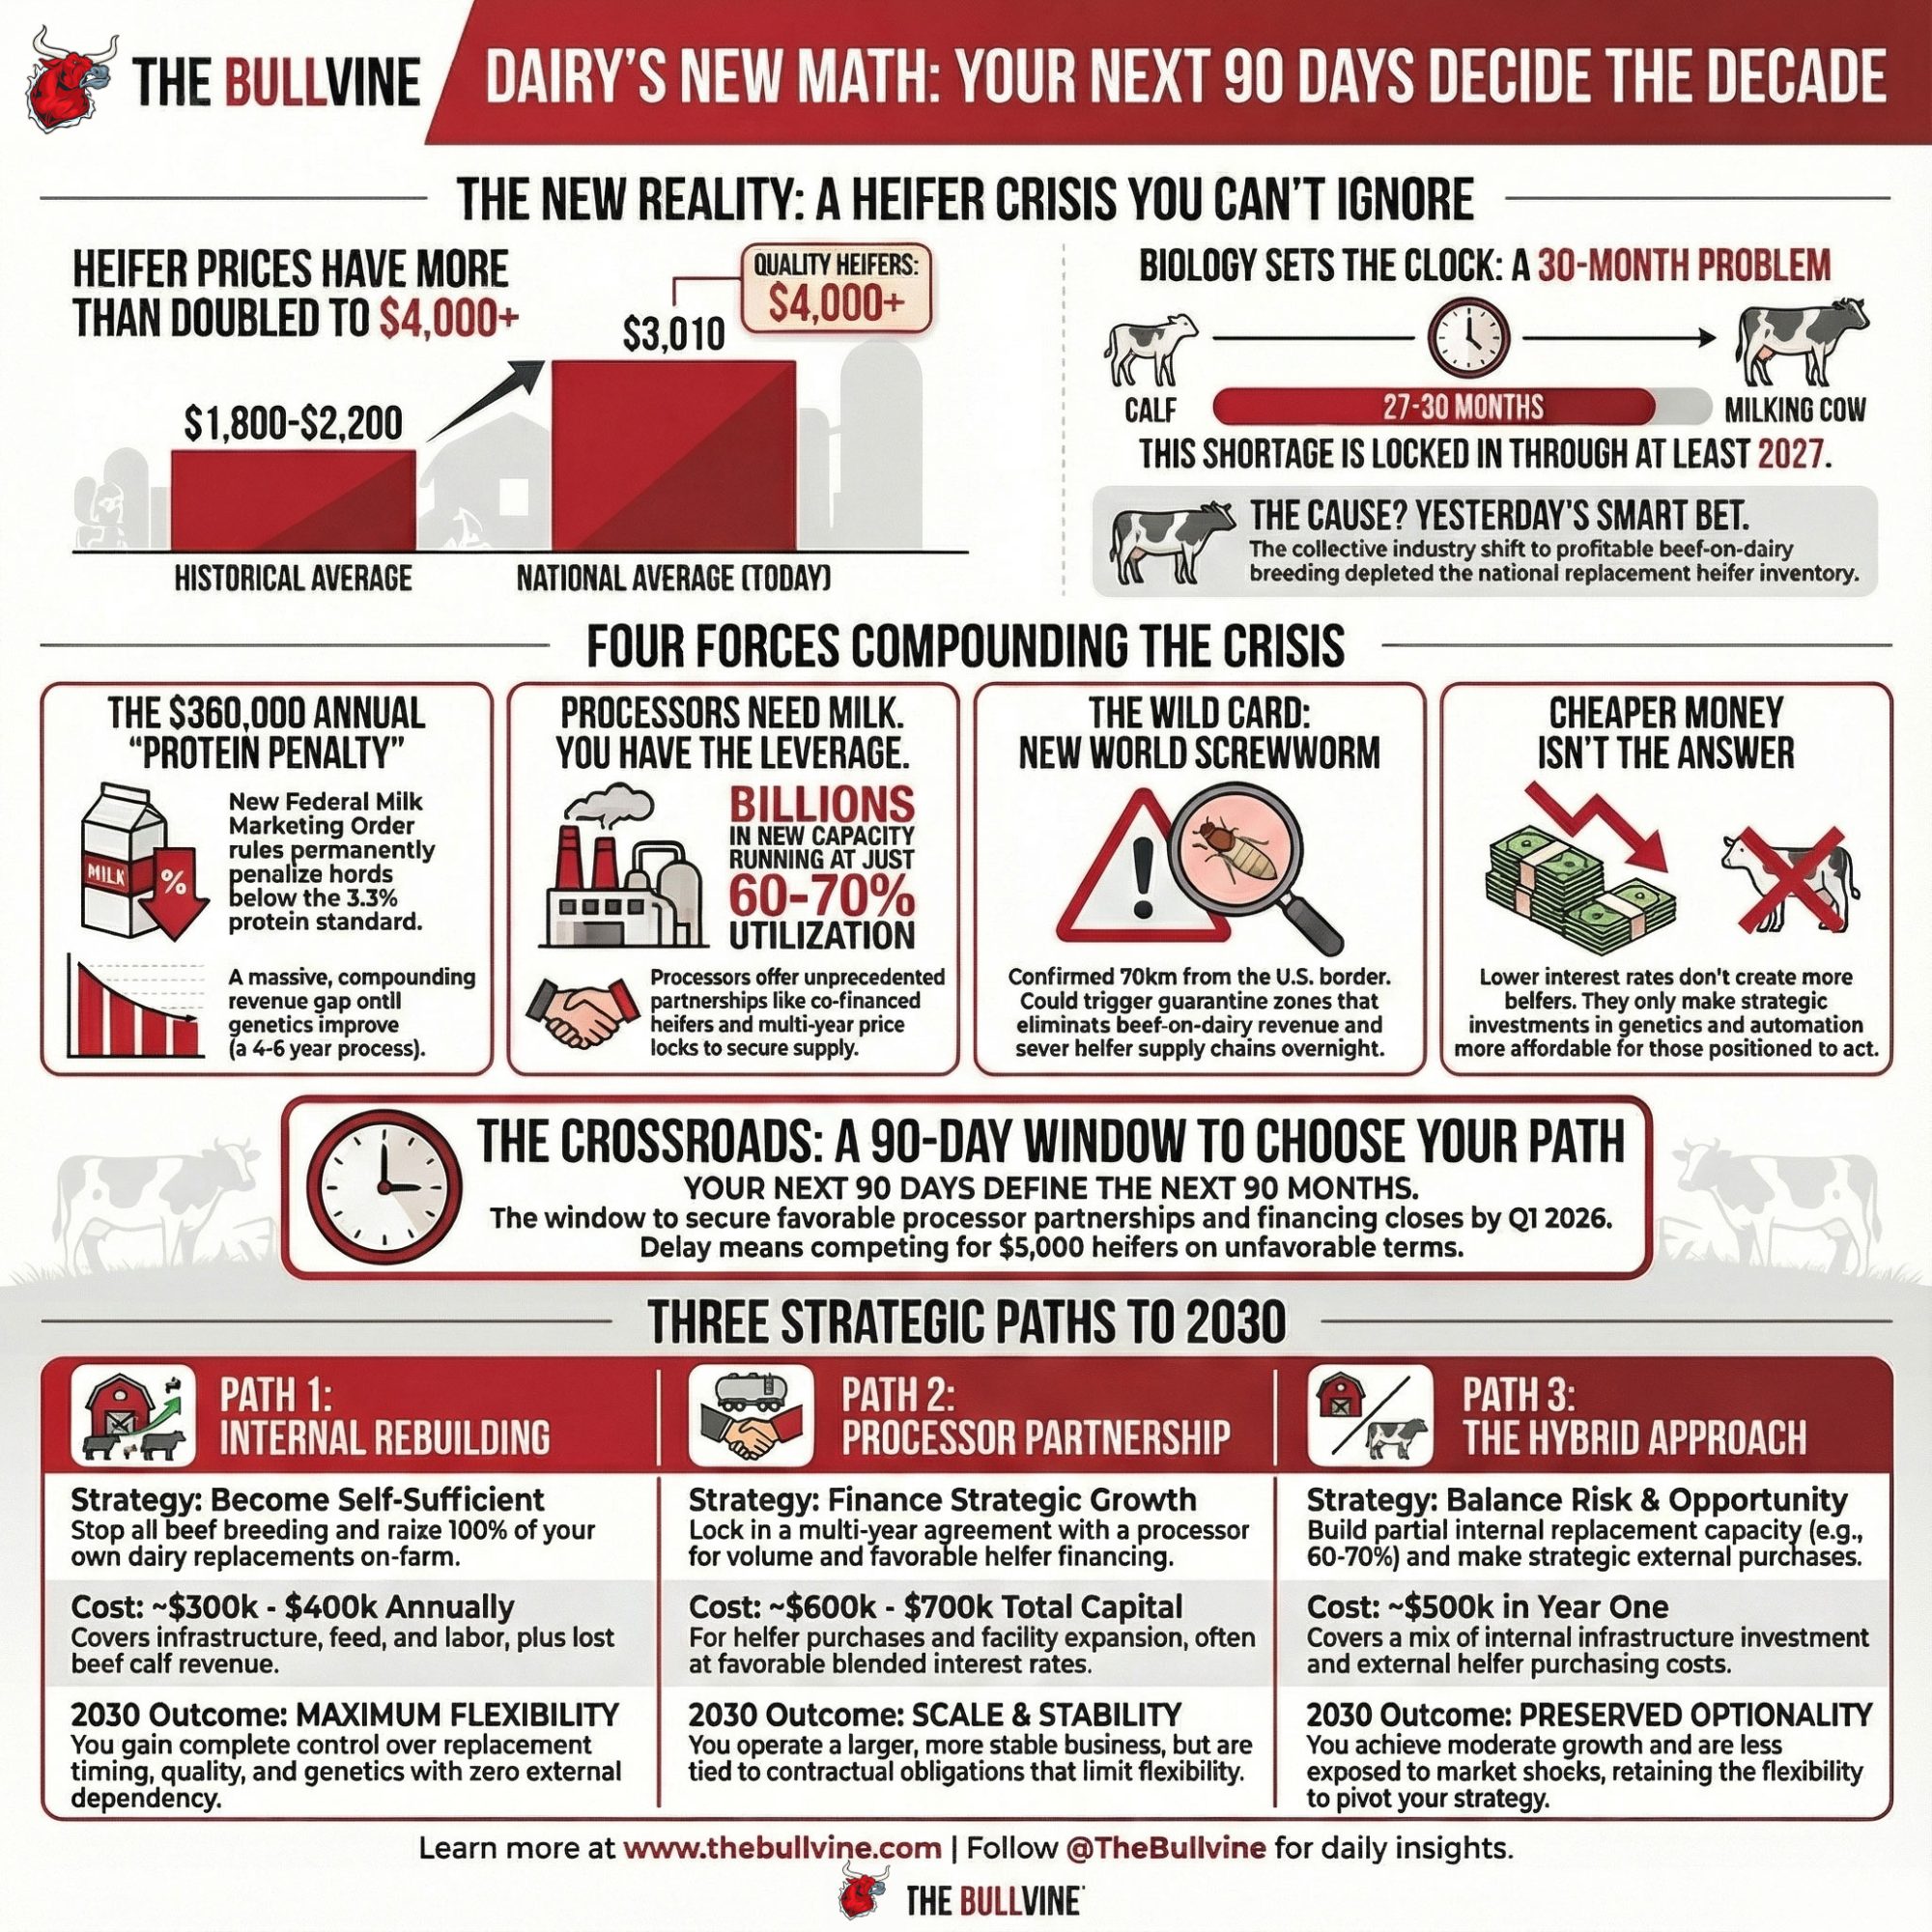
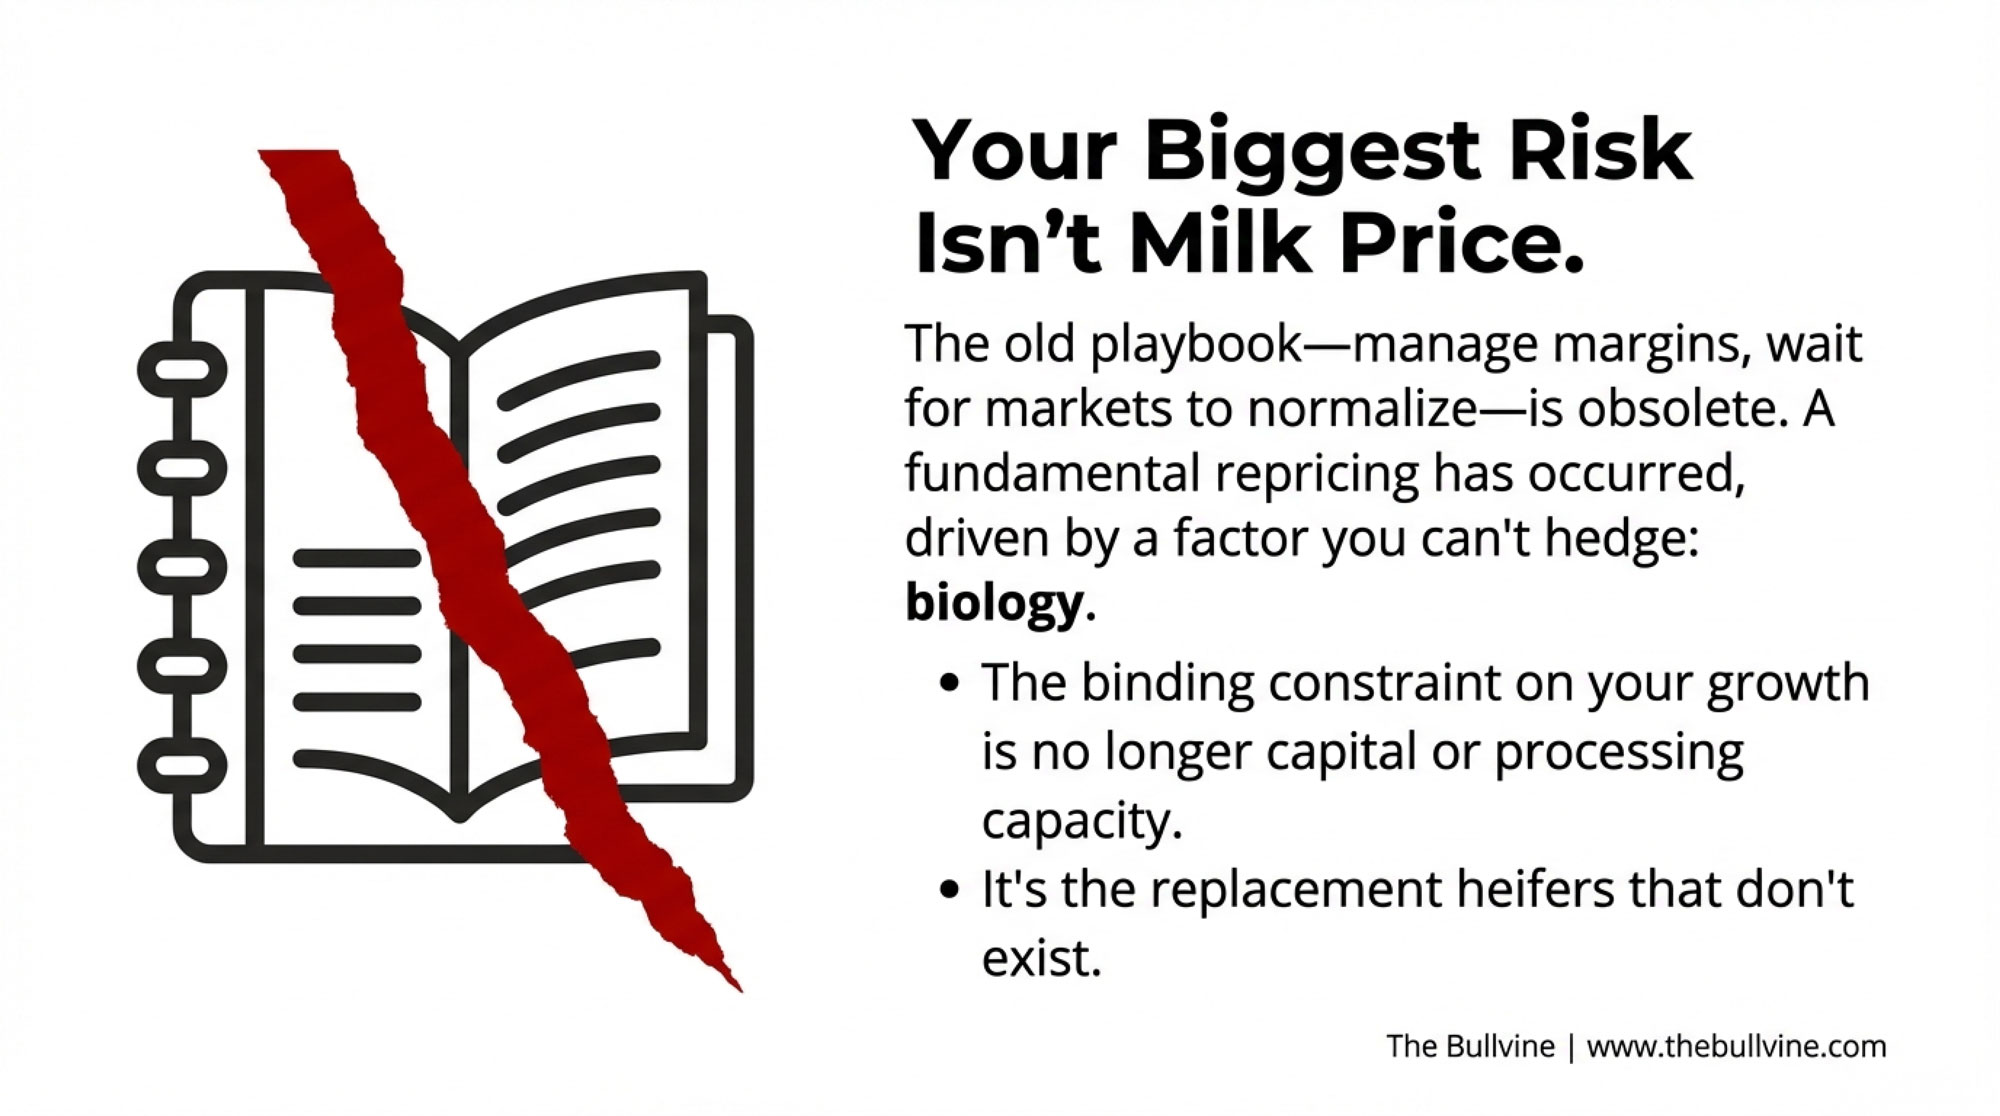
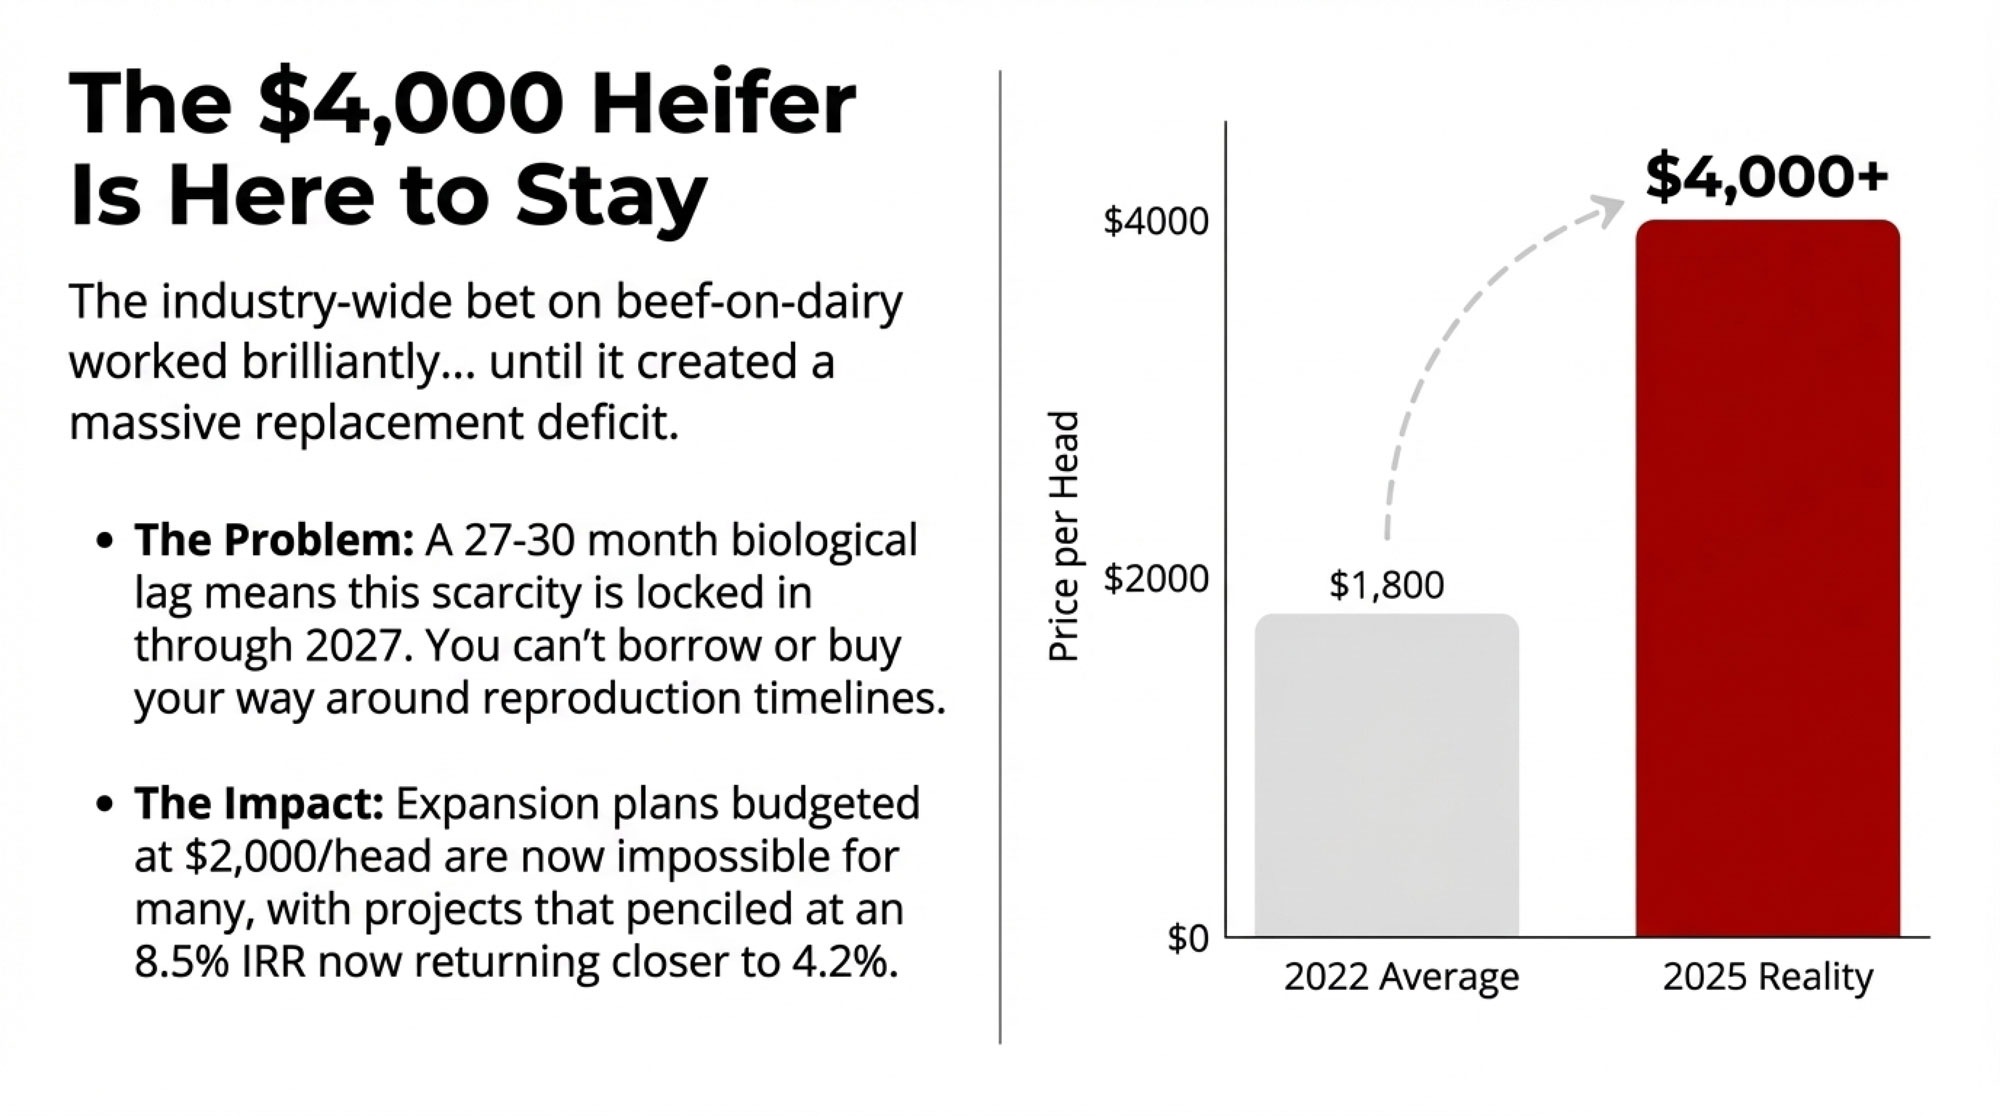
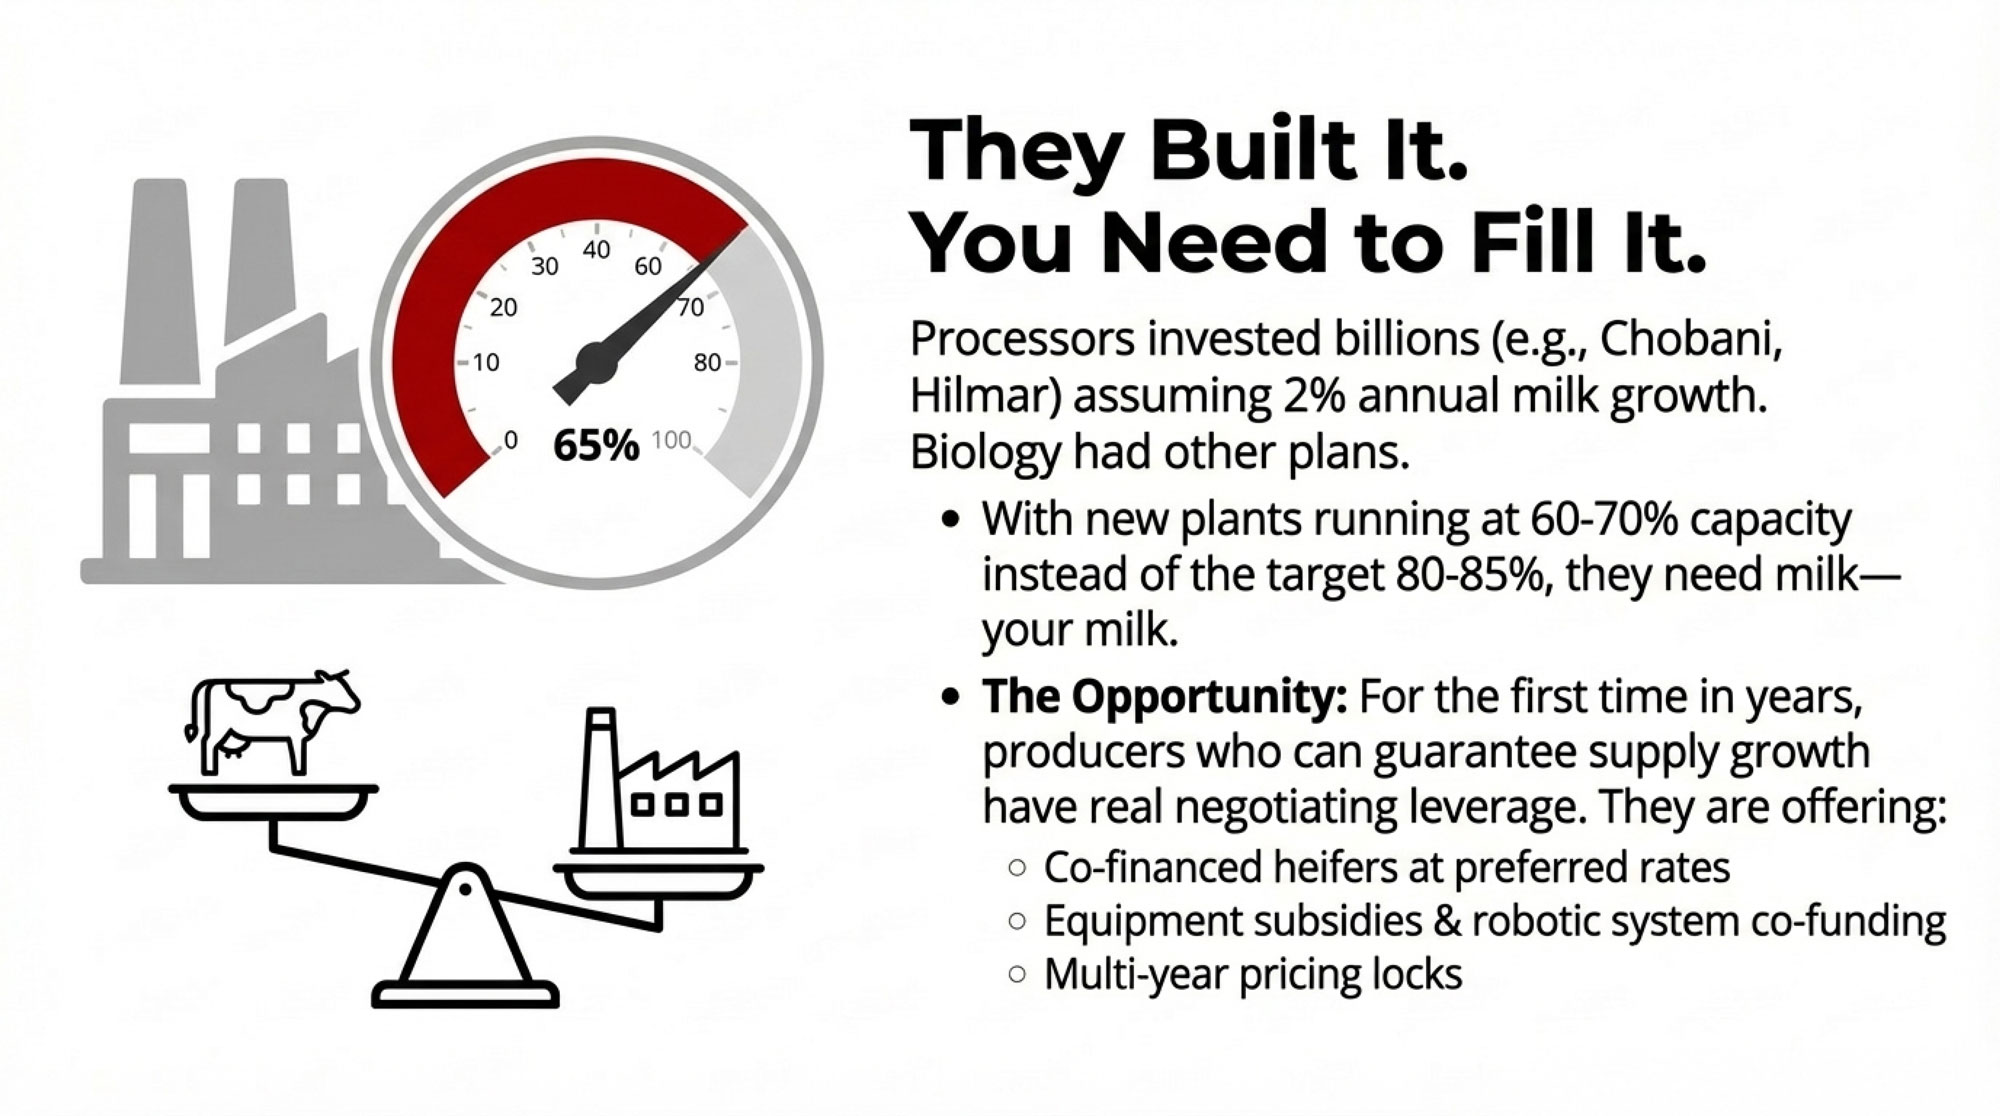
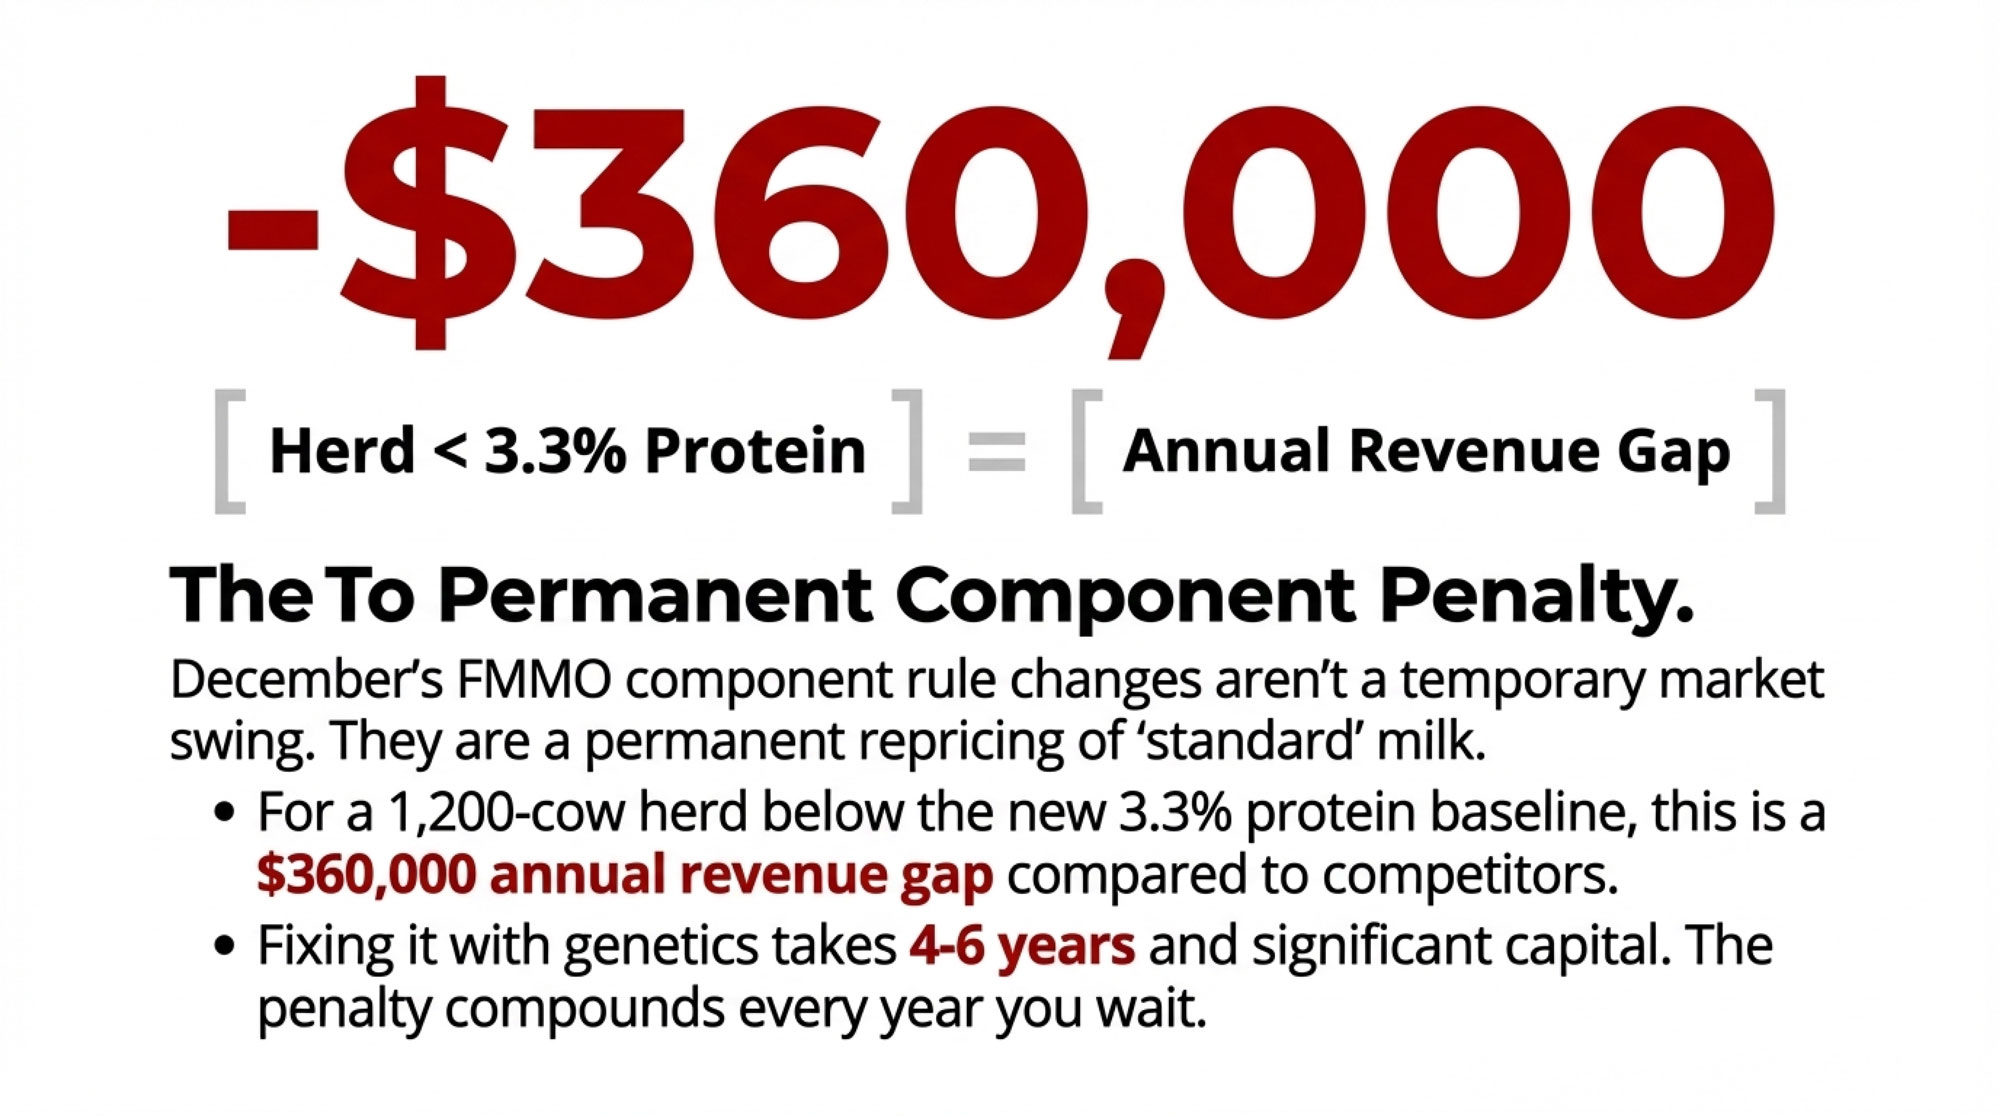
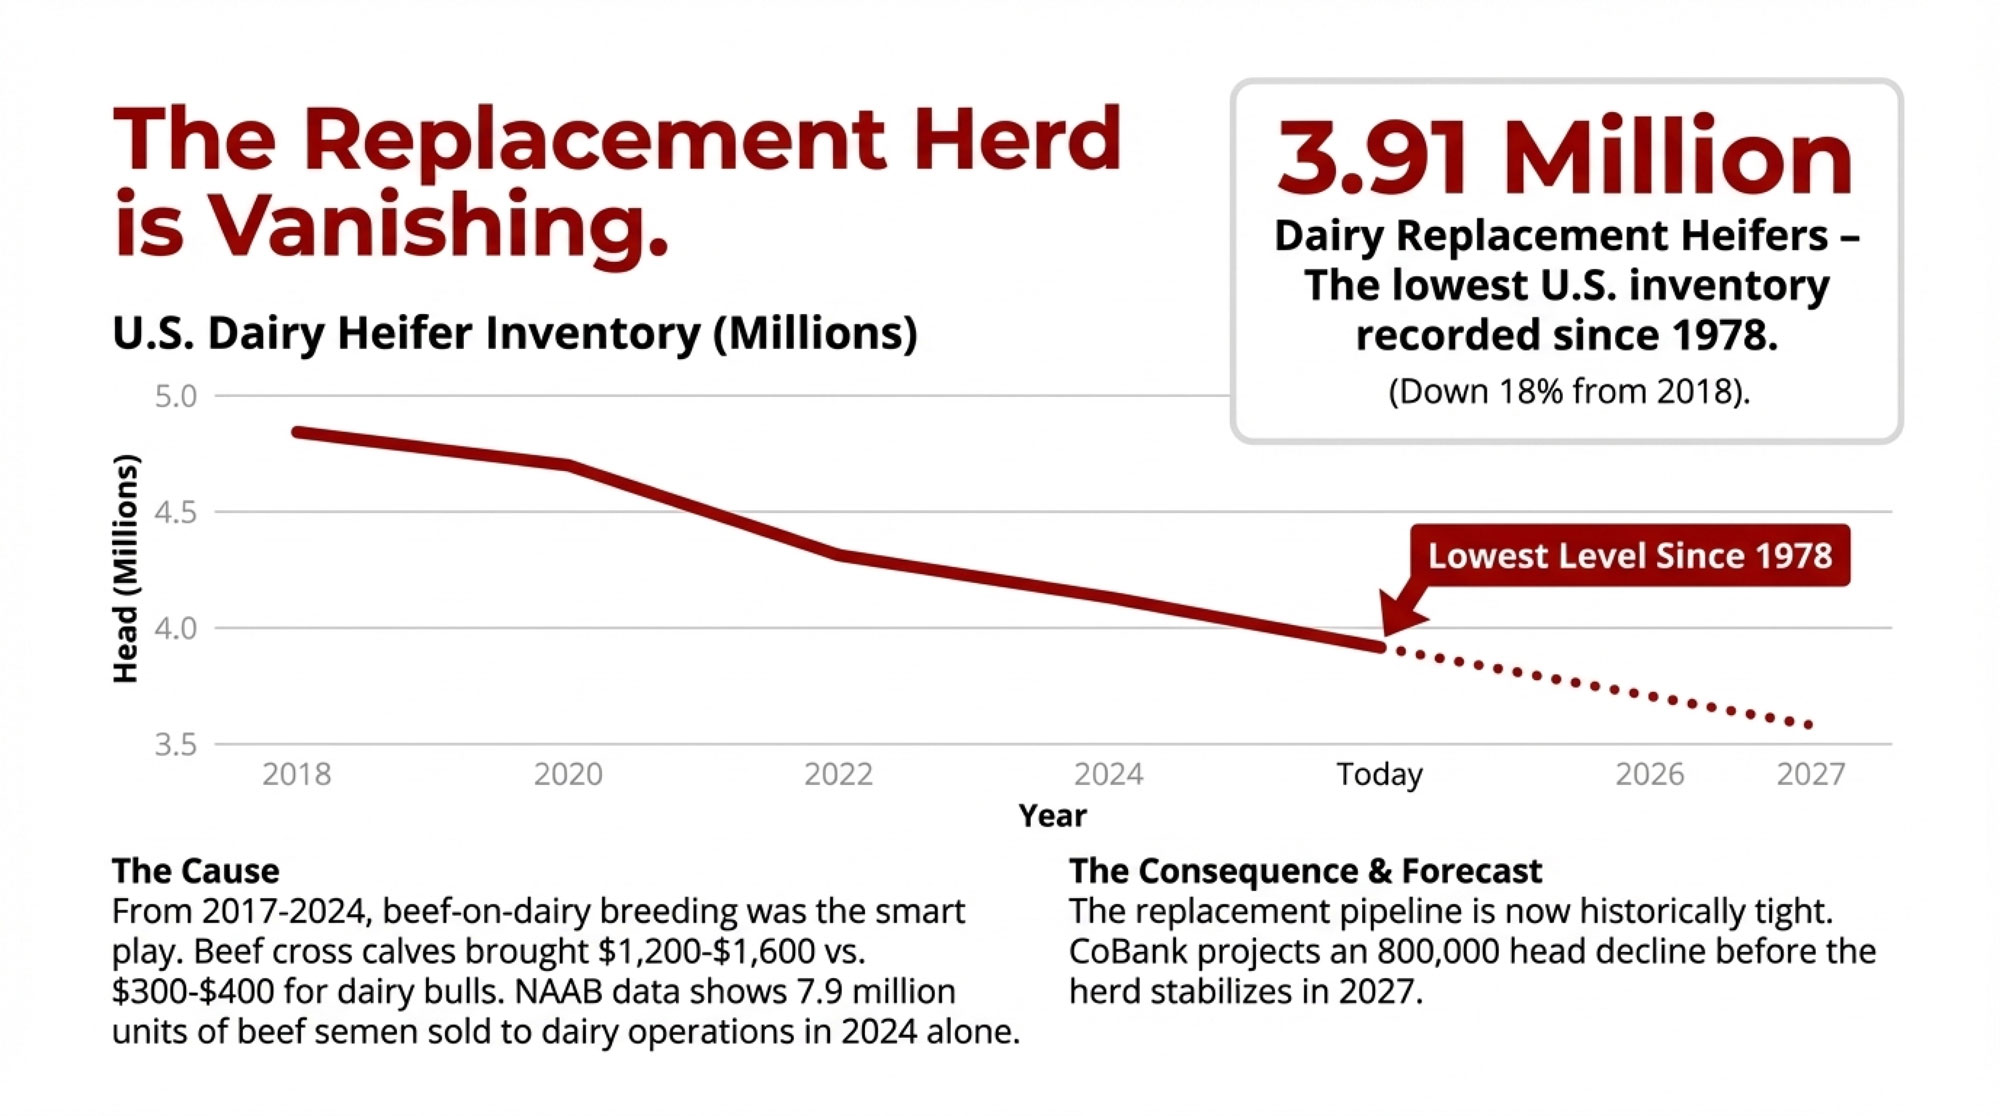
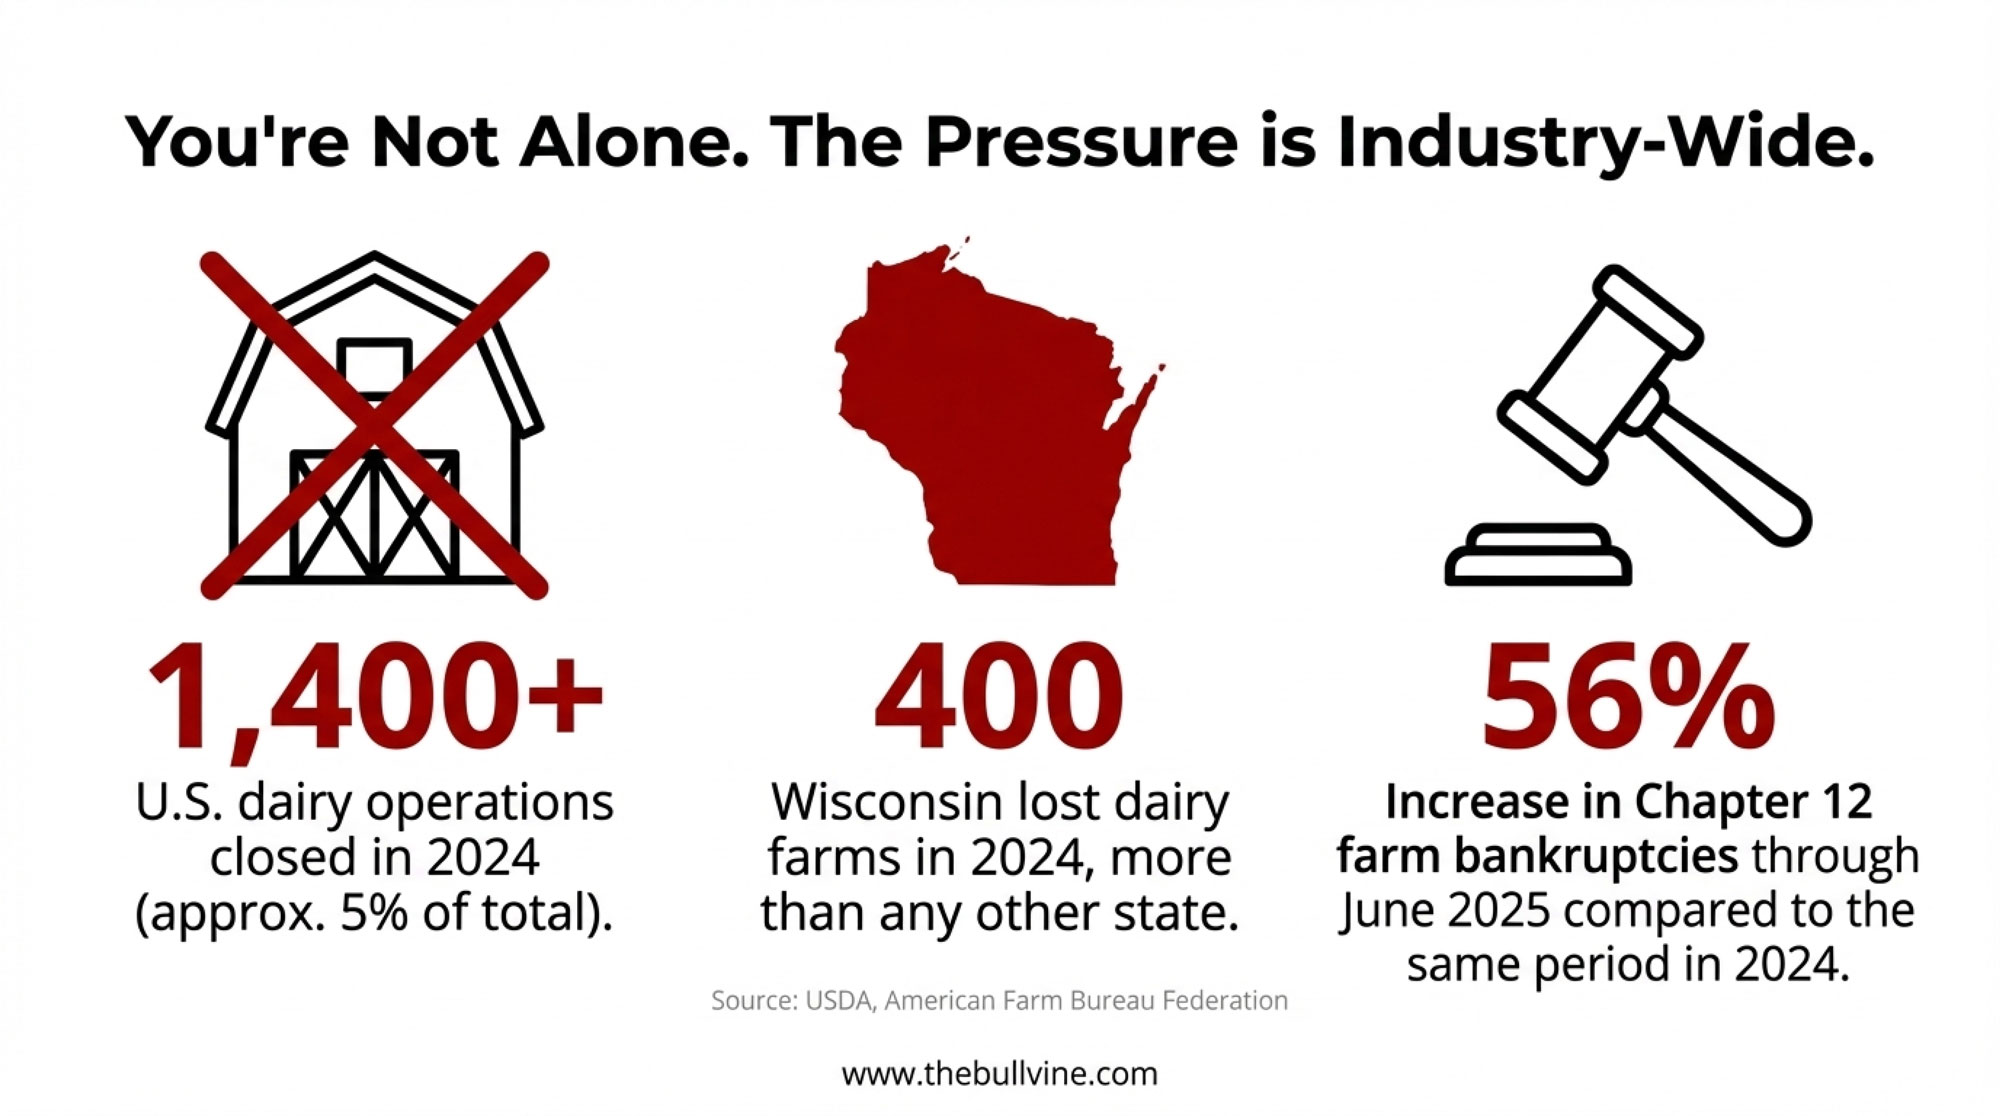
- Biology Repriced Dairy: $4,000 Heifers Created a 90-Day Window When You Have Leverage, Not Processors– Master the $3,000 heifer crisis with this strategic breakdown of the $360,000 revenue gap facing operations that ignore component genetics. It arms you with a long-term roadmap to turn your replacement program into a high-leverage asset.
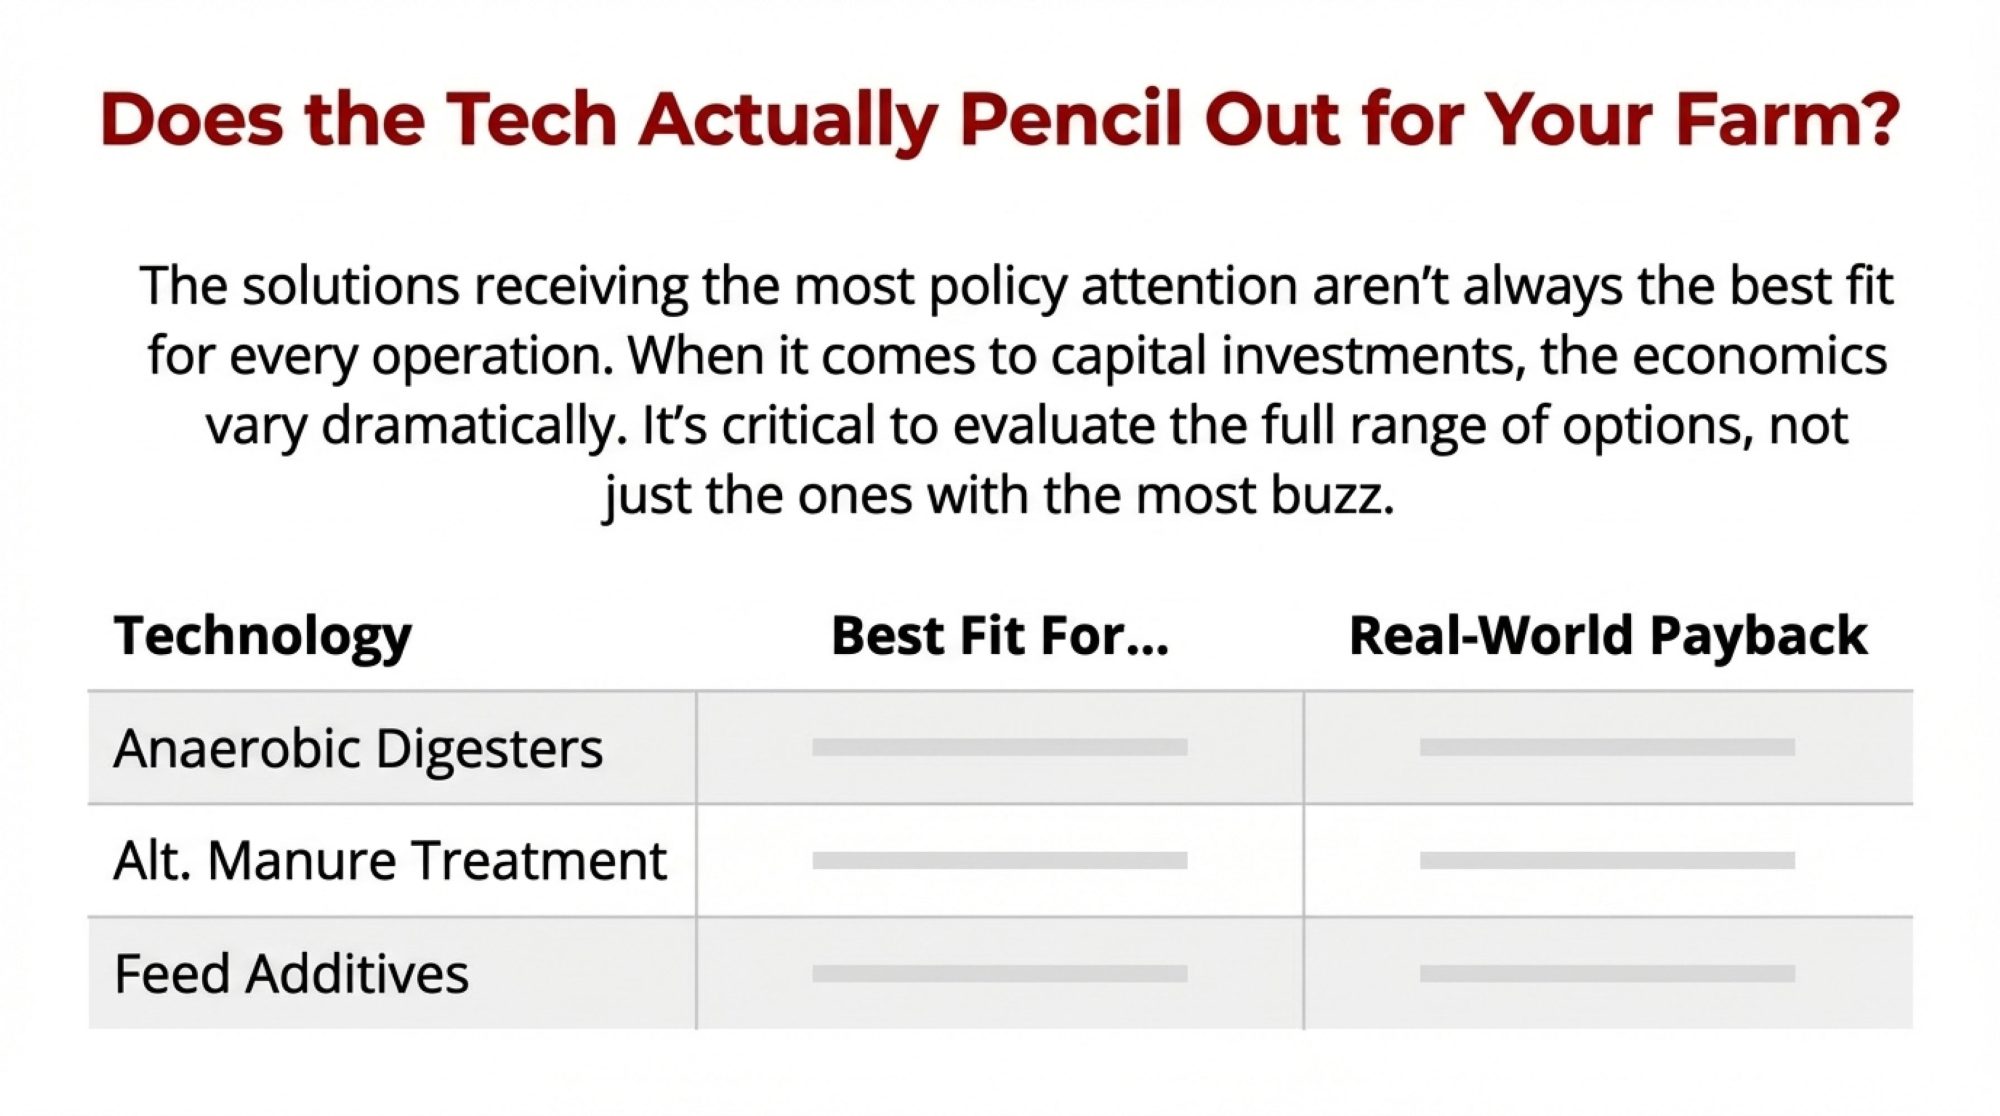
- Dairy Tech ROI: The Questions That Separate $50K Wins from $200K Mistakes – Stop gambling on automation and use this ROI-focused analysis to identify the 15% return threshold for your next investment. It shows how precision sensors detect illness 48 hours early, effectively bulletproofing your calf barn against nutritional volatility.
 Join the Revolution!
Join over 30,000 successful dairy professionals who rely on Bullvine Weekly for their competitive edge. Delivered directly to your inbox each week, our exclusive industry insights help you make smarter decisions while saving precious hours every week. Never miss critical updates on milk production trends, breakthrough technologies, and profit-boosting strategies that top producers are already implementing. Subscribe now to transform your dairy operation’s efficiency and profitability—your future success is just one click away.