Half of U.S. dairy farms will vanish by 2030. The survivors? They’re making one decision differently.
EXECUTIVE SUMMARY: The math stopped working when milk prices crept up 16% but diesel doubled and feed jumped 40%—that’s why 2,800 dairy farms close annually and milk checks now arrive with crisis hotline cards. Most producers don’t realize they have just 18 months from first losses to forced decisions, and waiting those extra six months costs families $380,000 in preserved equity. Strategic exits at month 8-10 save $400,000-$680,000; forced liquidations leave $100,000-$200,000. With half of America’s 26,000 dairy farms vanishing by 2030 and kids as young as 14 running milking shifts, this isn’t about failure—it’s about timing. This article provides the exact month-by-month timeline, real alternatives that work (partnerships, robotics, organic), and the framework to make informed decisions while you still have choices. Because sometimes the bravest thing you can do is preserve what three generations built before it’s too late.

So I was talking with a producer last week—you know how these conversations go, catching up at the feed store or after a meeting—and he mentioned something that really stuck with me. His milk check came with a little card tucked in. Mental health resources, crisis hotline numbers.
After thirty years in this business, that’s…well, that’s something new.
And it got me thinking about what we’re all seeing out there. The combination of labor challenges, these heat waves that seem to hit harder every year, and margins that just don’t pencil out anymore—especially for those 200 to 400 cow operations that used to be the heart of rural communities. You know the ones I’m talking about. Maybe it’s your operation.
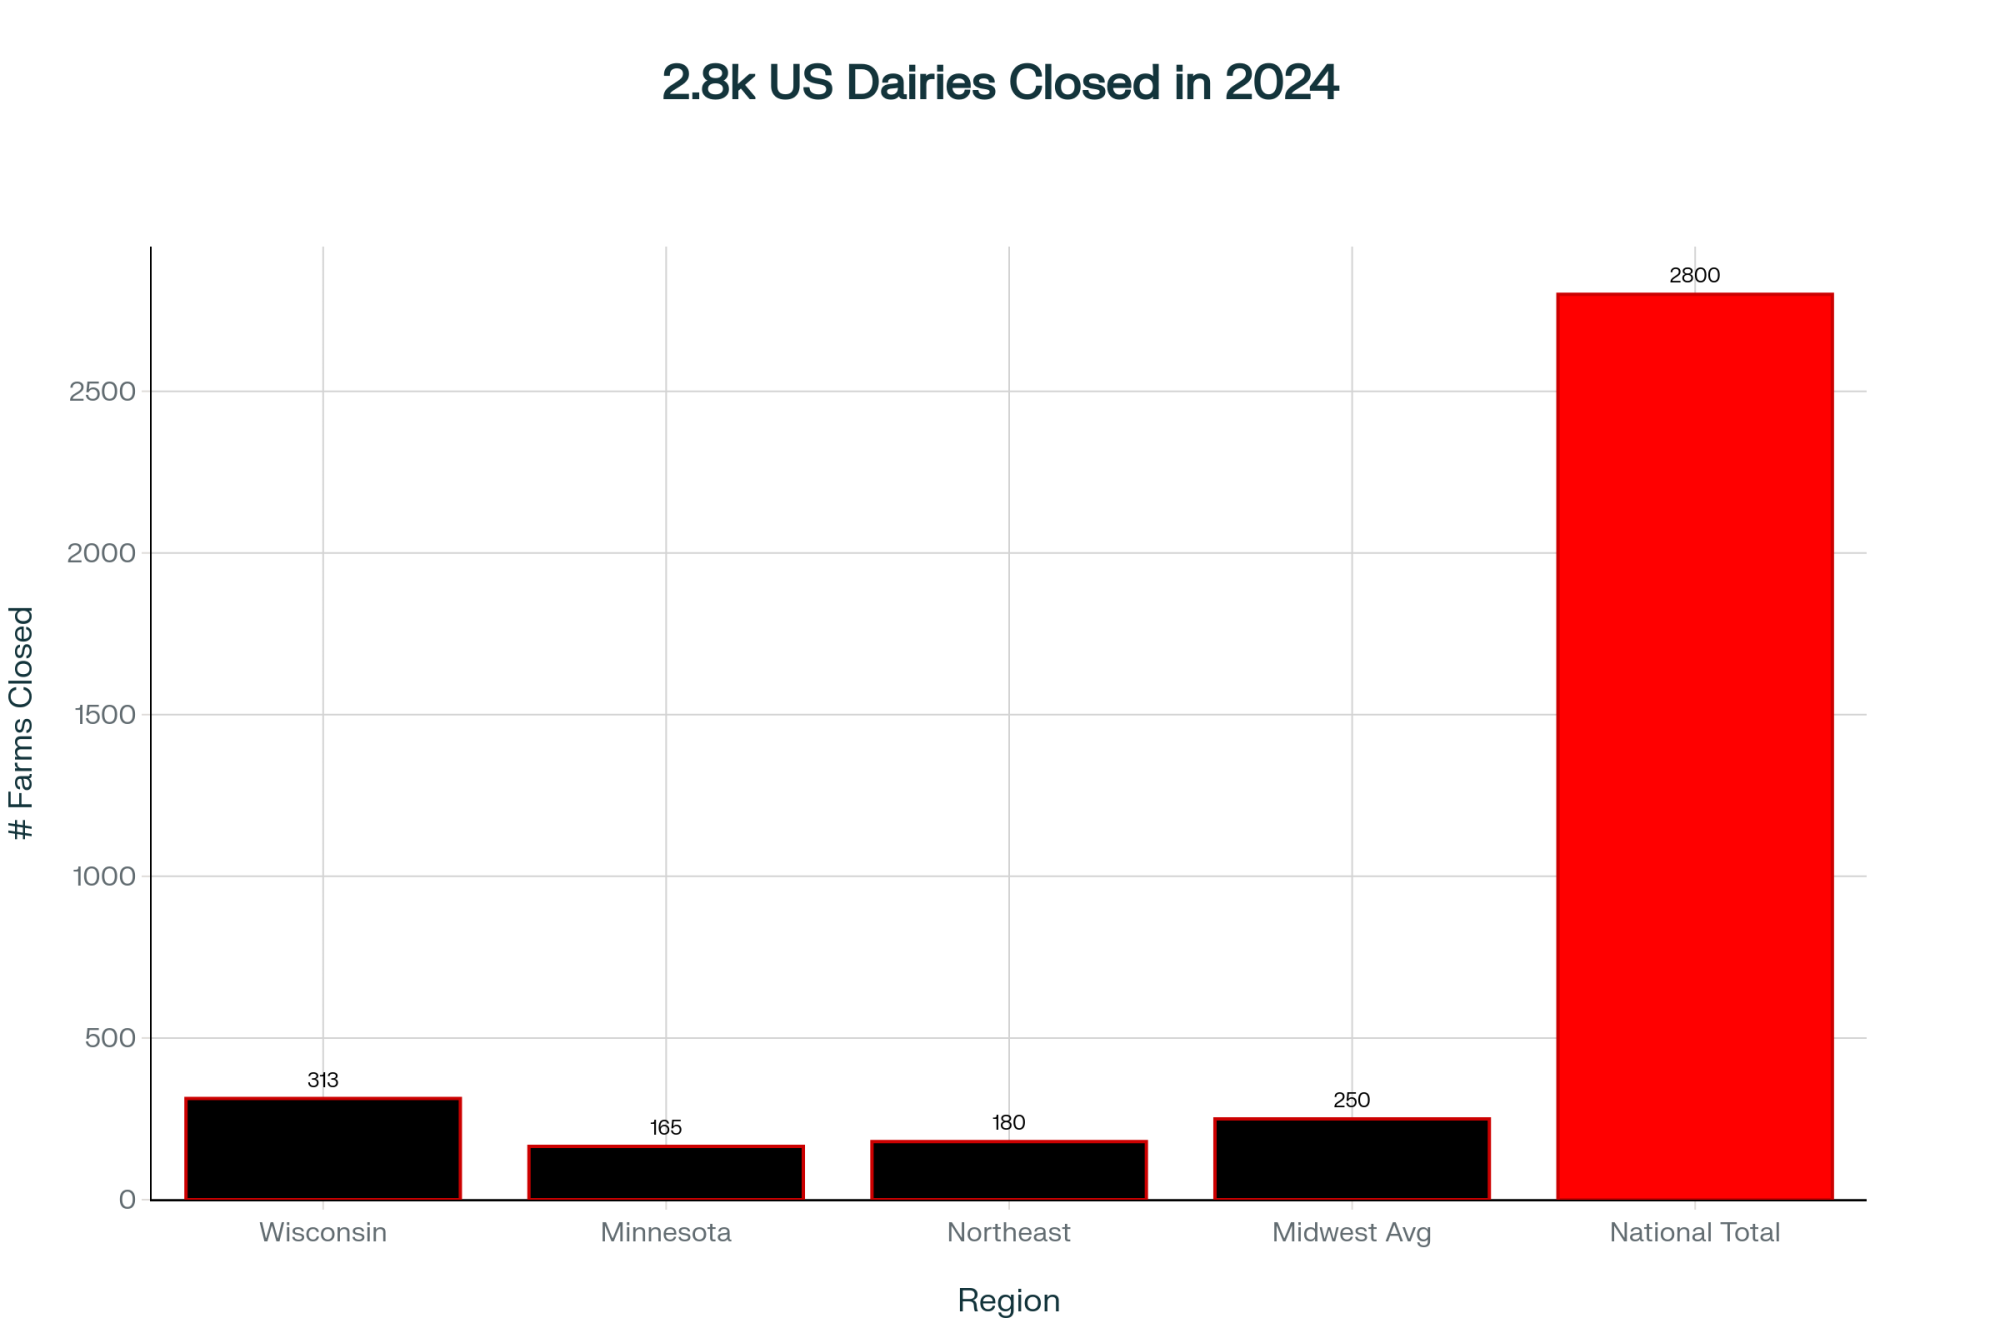
Here’s what’s keeping me up at night: Industry projections from Rabobank show we’re losing about 2,800 farms every year now—that’s 7 to 9% of all U.S. dairy operations annually. The economists I trust—folks at Cornell PRO-DAIRY, Wisconsin’s Center for Dairy Profitability, the people who really understand our business—they keep talking about this 12 to 18 month window. That’s what you’ve got when things start going sideways. And what do you do in those months? The difference can be hundreds of thousands of dollars. I’m not exaggerating. We’re talking about preserving what your family built versus watching it disappear.
What’s Really Different in the Barn These Days
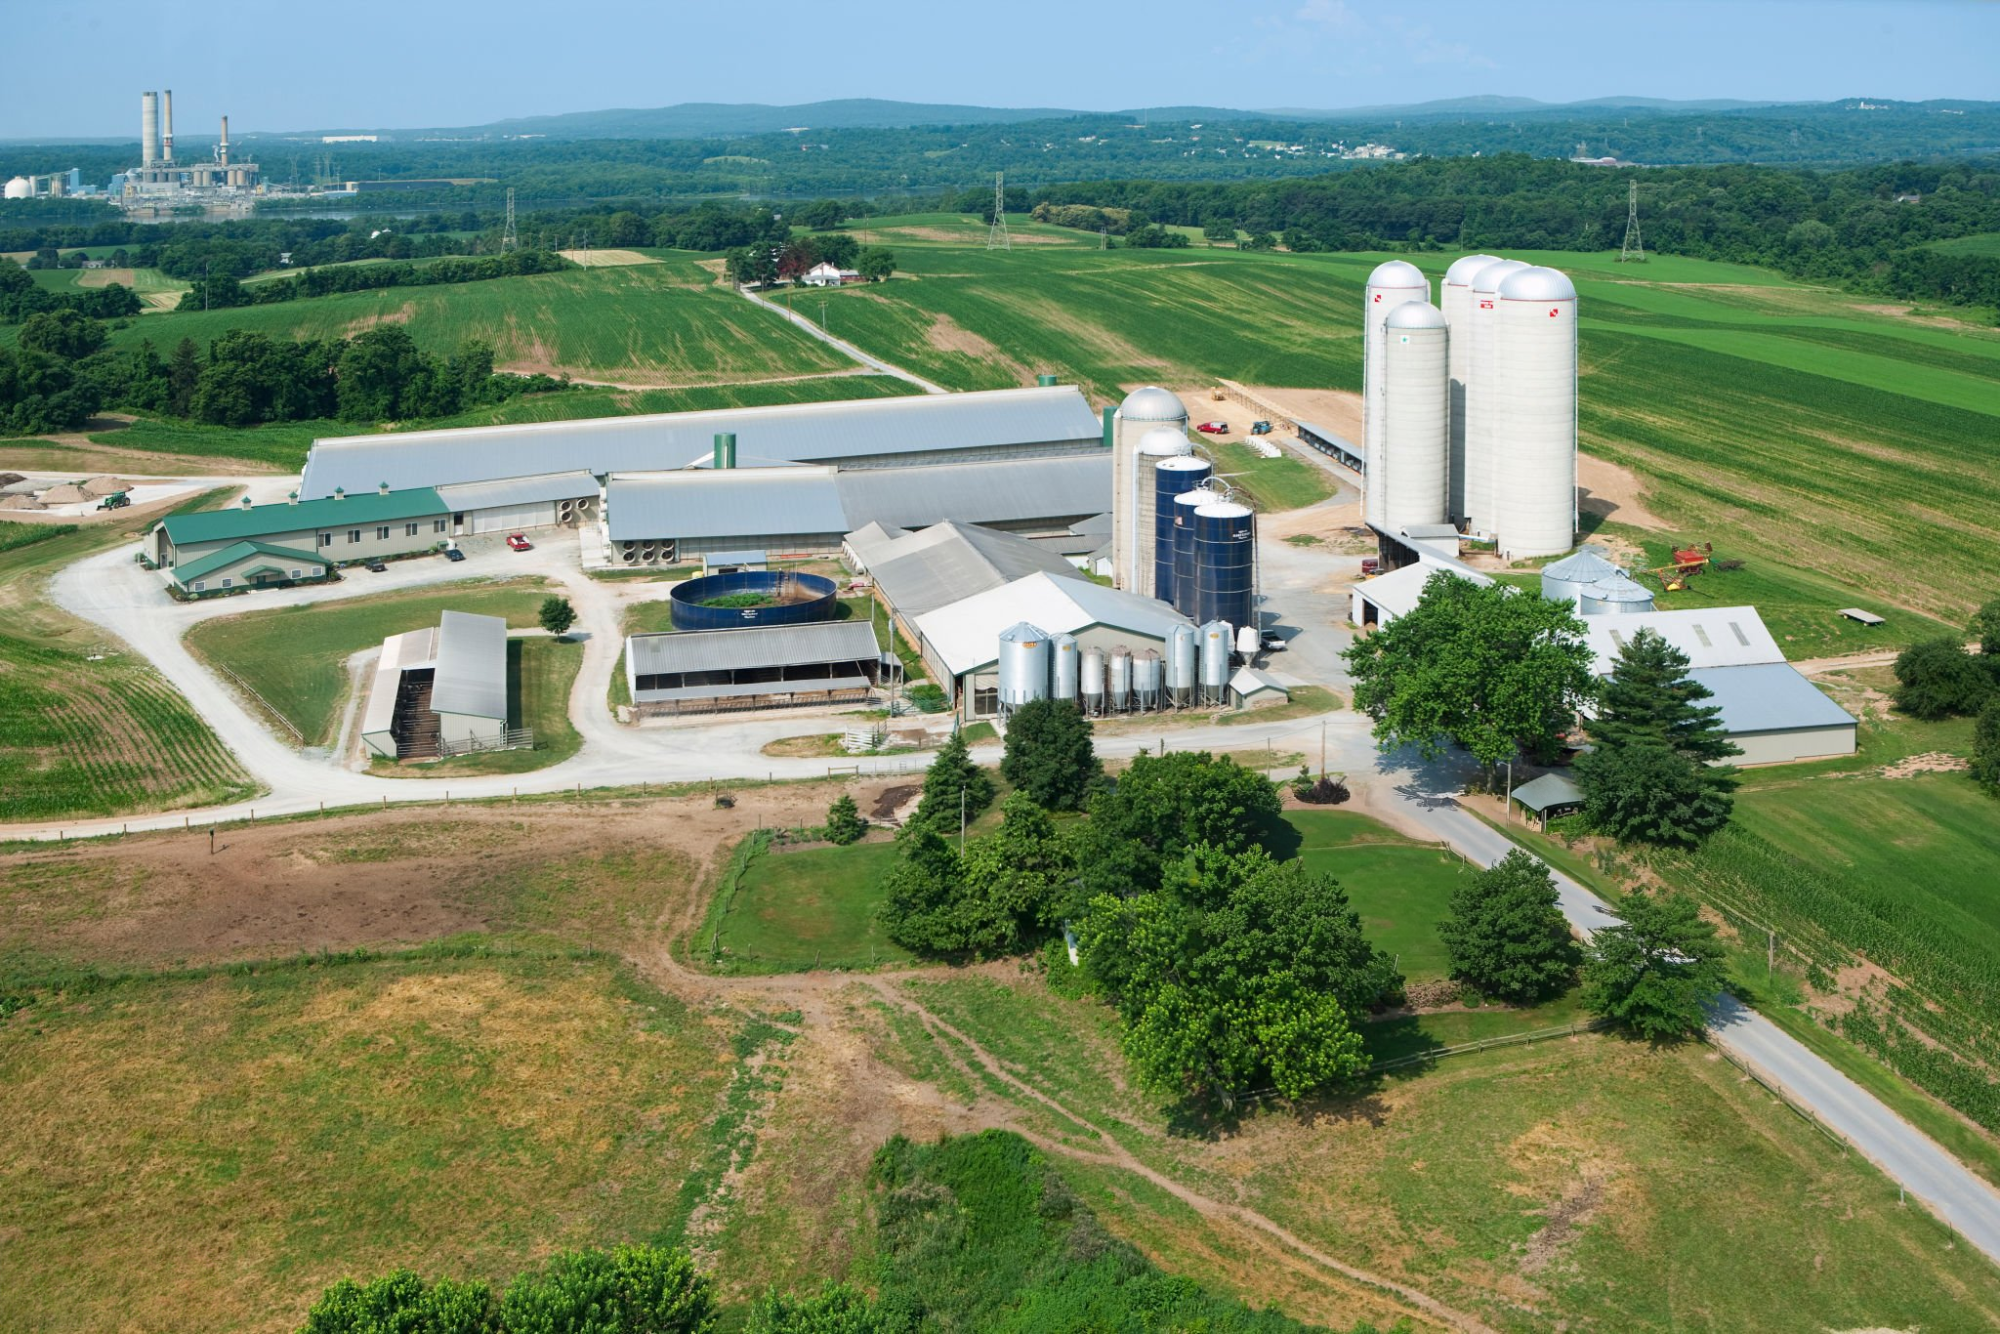
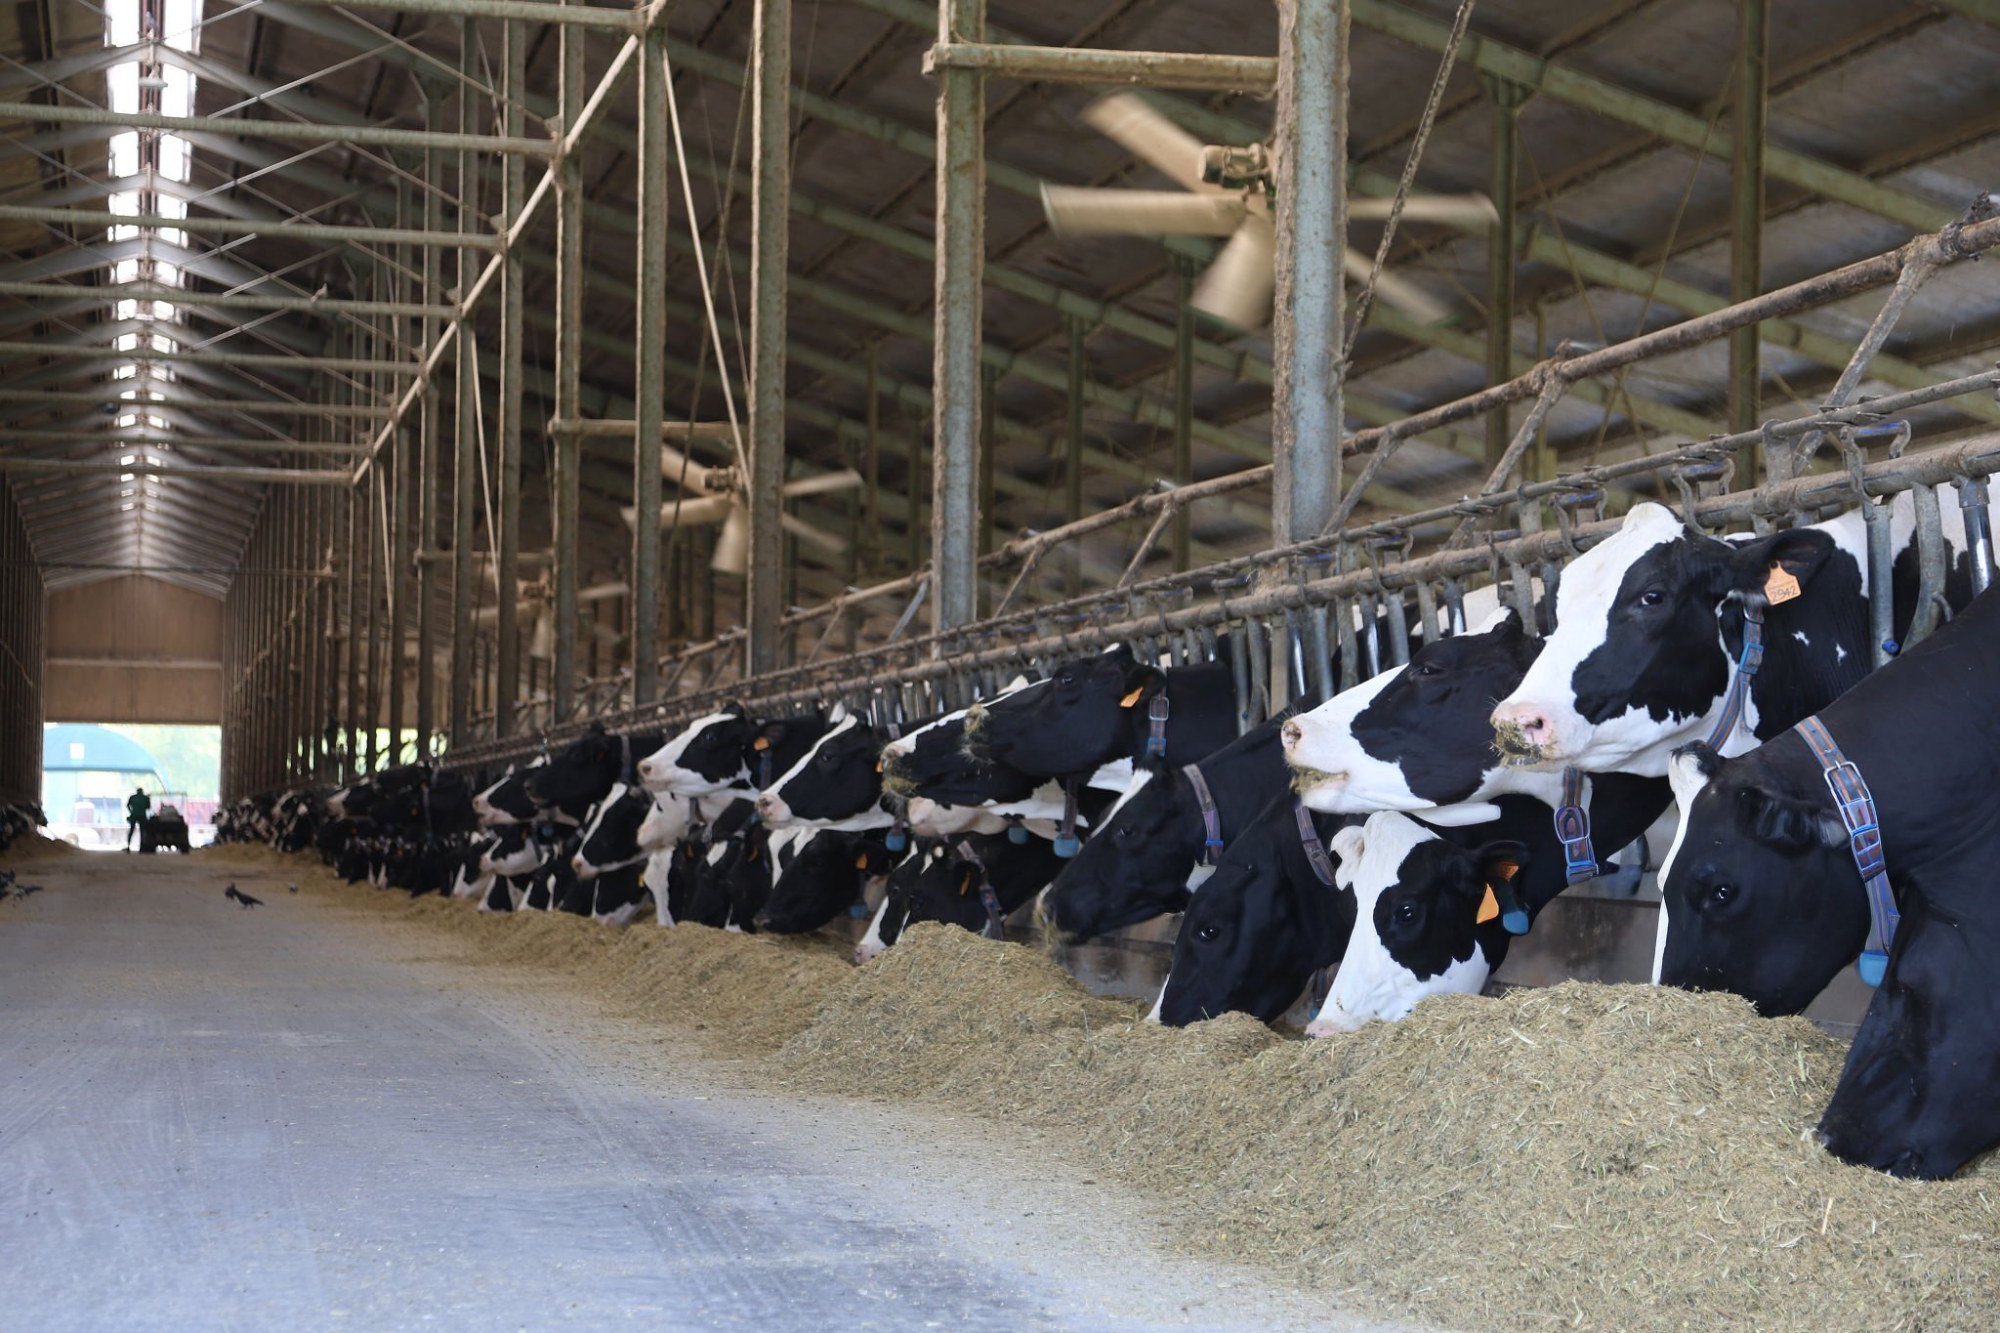
You probably know this already, but walk into any mid-sized dairy operation today, and it feels different than it did five years ago. Can’t quite put your finger on it at first, but then you realize—it’s quieter. Not the good kind of quiet either.
Five years back, you’d hear workers talking during morning milking —maybe some Spanish conversation —and teenagers grumbling about the early start (though secretly learning the trade). Now? Often, it’s just the owners — usually in their fifties, maybe early sixties — doing the work of four or five people. And they look exhausted.
What’s interesting is how the numbers back up what we’re feeling. The National Milk Producers Federation’s 2025 workforce data shows that immigrant workers make up about 51% of our workforce, but here’s the kicker—they produce 79% of the milk. Think about that for a second. And these folks, they’re operating under a kind of stress that wasn’t there before. I see it myself. Unfamiliar truck pulls up? Conversations stop. Workers keep phone numbers in their pockets now—family contacts, immigration attorneys. That’s become normal, and it shouldn’t be.
The age thing is really something else. Was talking to a Wisconsin producer recently who’s got two helpers, both in their seventies. “There’s just no pipeline of younger workers,” he told me. And he’s right—USDA’s Economic Research Service documented that agricultural employment dropped by 155,000 workers between March and July this year. That’s 7% of our workforce, gone in four months.
But here’s what really gets me—and I hate even saying this—we’ve got fourteen-, fifteen-year-old kids running full milking shifts. Not helping out, not learning from Dad or Grandpa. Running the shift. Because there’s literally nobody else. That’s not how it’s supposed to work.
When Everything Comes at You at Once
The Labor Situation Can Change Overnight
Let me tell you about what happened in Lovington, New Mexico, this past June. Shows you how fast things can go south.
Isaak Bos was running his operation like any other day when Homeland Security showed up. Full enforcement action, armed agents, the whole thing. By the time they left? Sixty-four percent of his workforce was gone. Eleven were arrested on the spot, and another twenty-four were let go when their papers didn’t check out. The Albuquerque Journal covered it extensively—this isn’t hearsay, it’s a documented fact.
“Milk production had effectively ceased,” Bos told reporters. “We’re barely able to keep going.”
Here’s what really opened my eyes—UC Davis agricultural economists have been tracking this, and their 2025 research found that when raids happen, farms that haven’t even been touched lose 25 to 45% of their workers. They just stop showing up. Can’t blame them, really. Word travels fast in these communities. One raid in Vermont affects operations in Wisconsin, Idaho, and California. Everyone’s on edge.
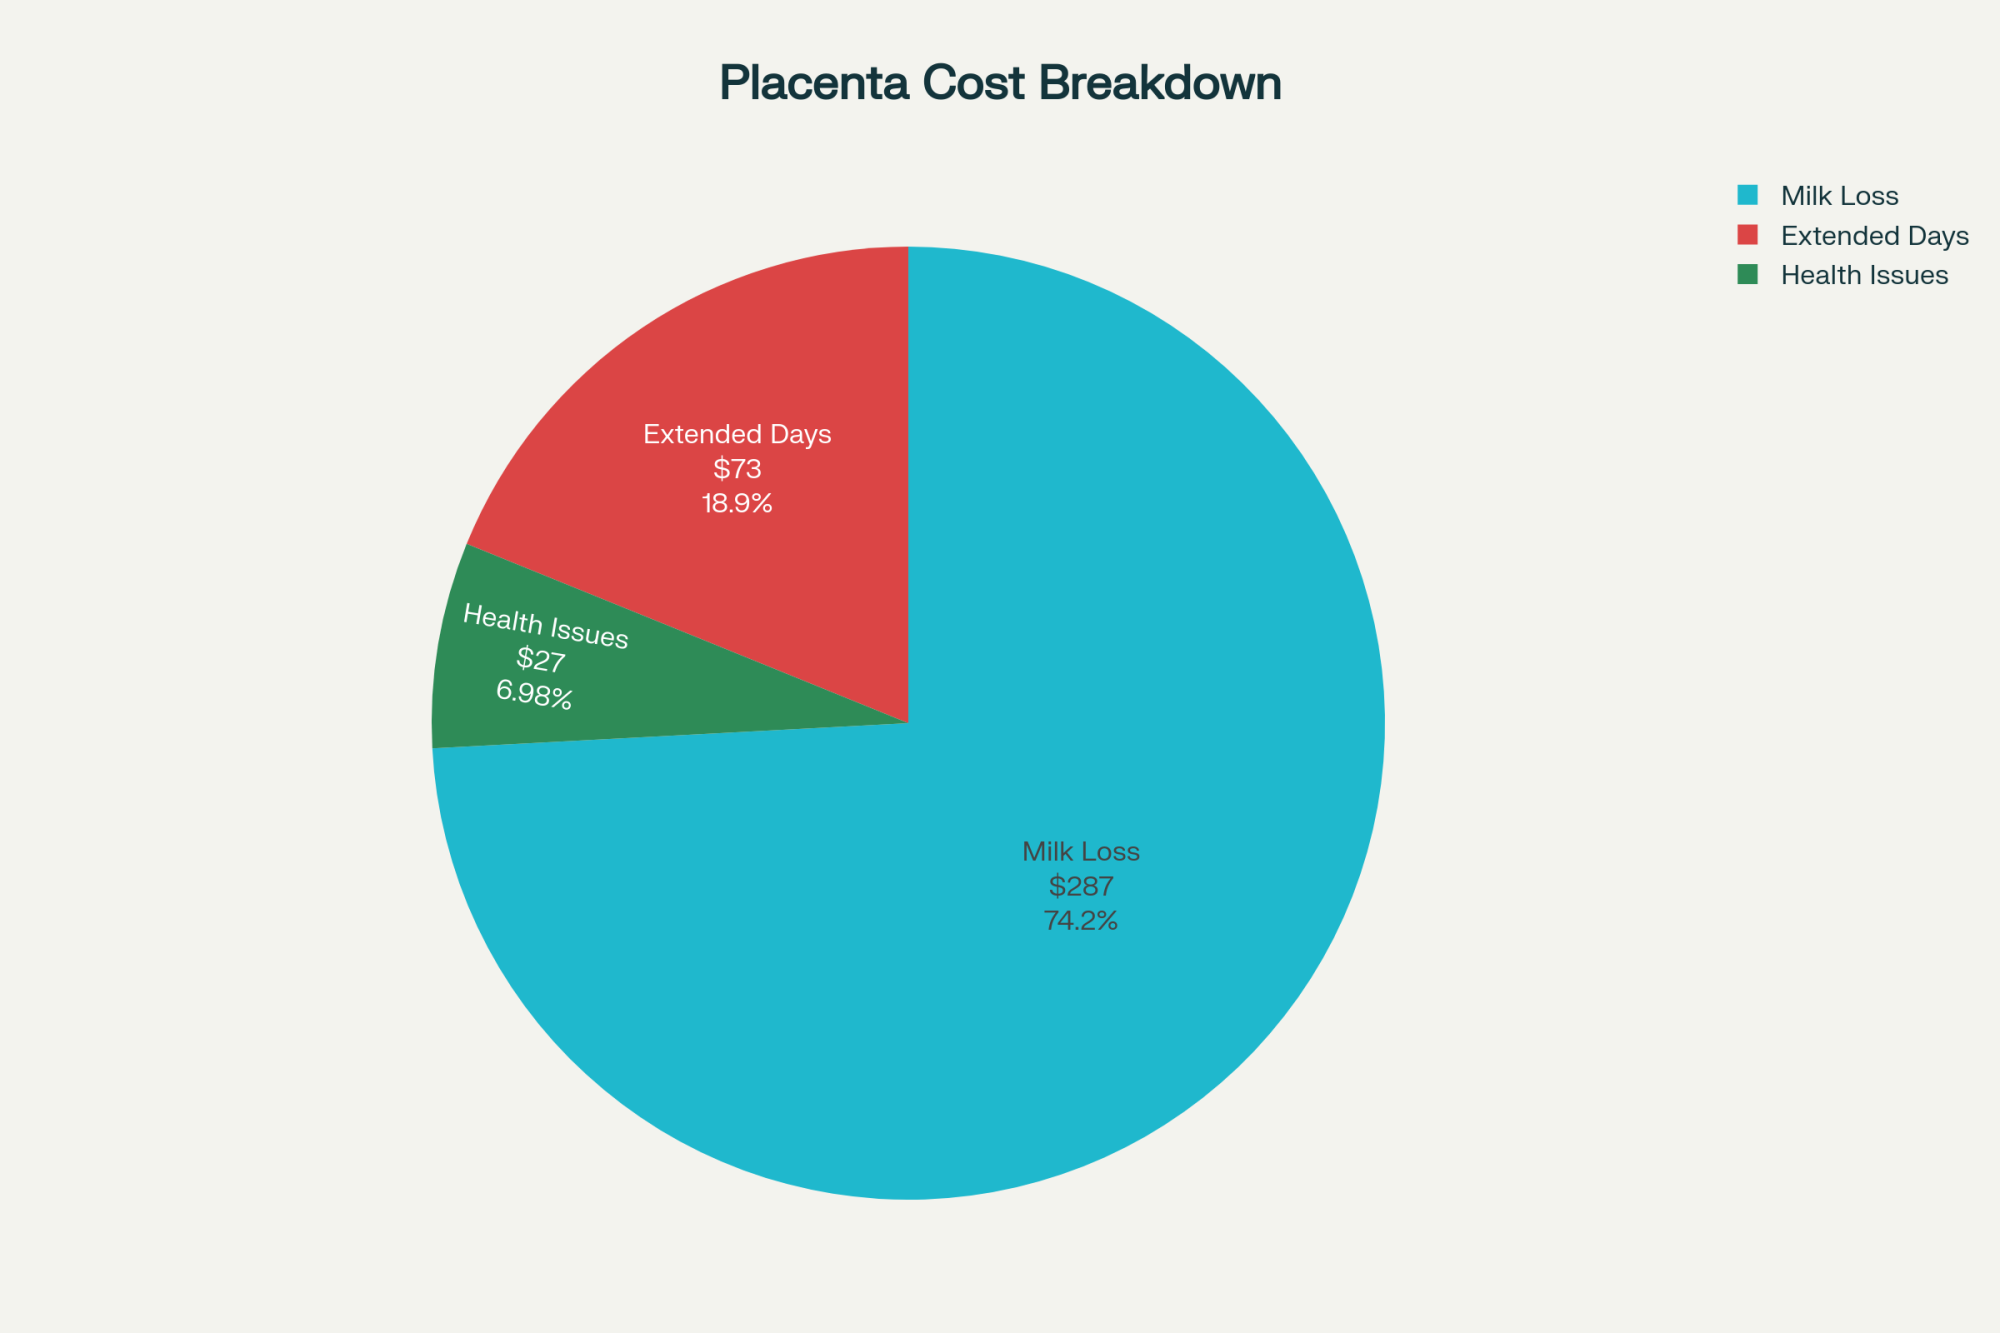
Heat Stress Is Getting More Expensive Every Year
While we’re scrambling for workers, the heat’s becoming a bigger problem than most people realize. And I mean, we all feel it, right? But the numbers are sobering.
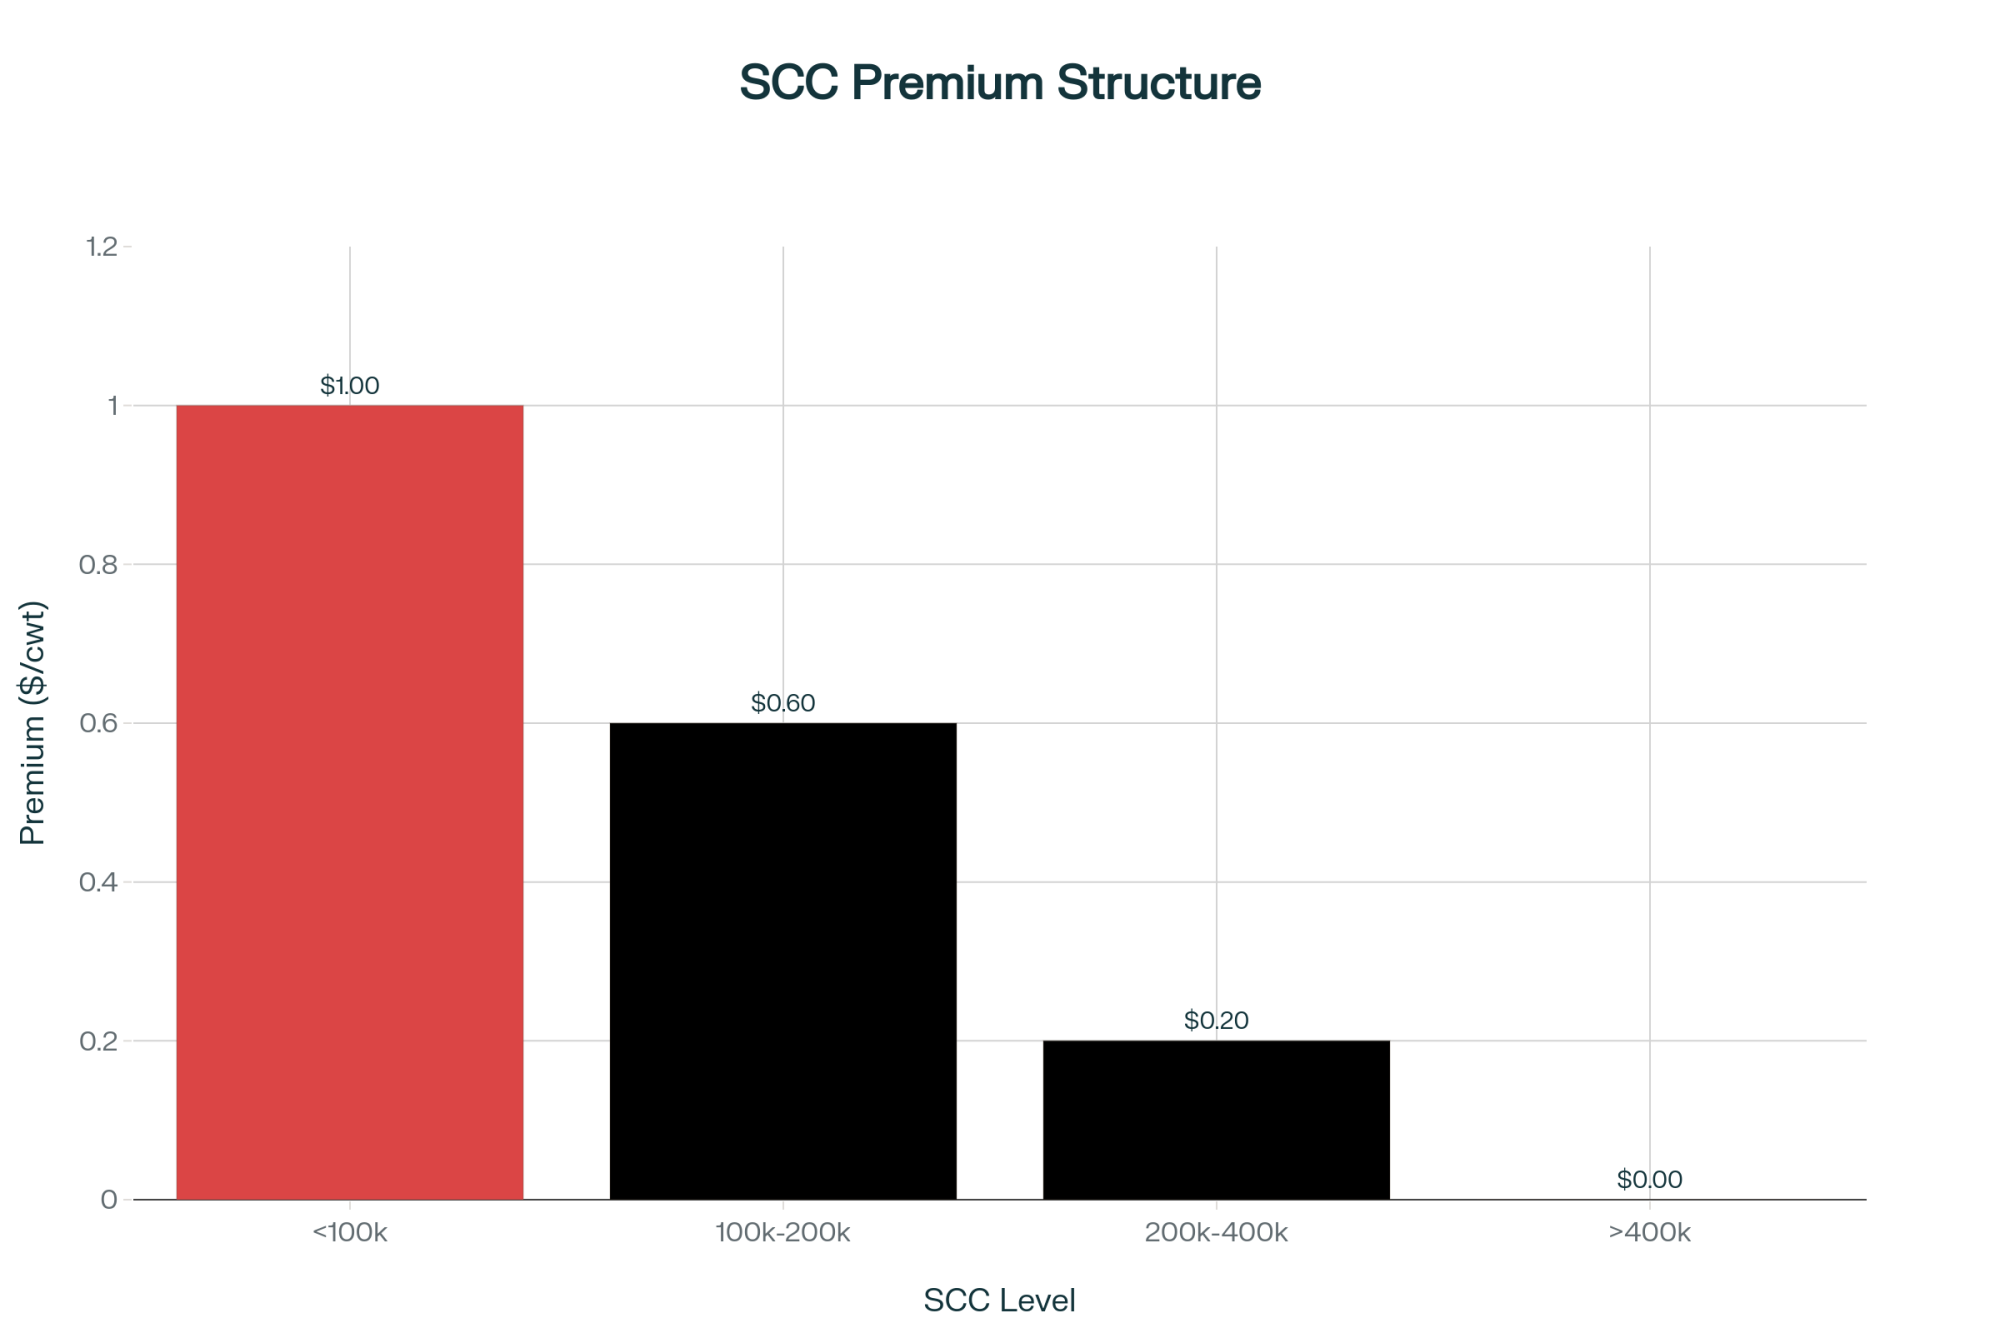
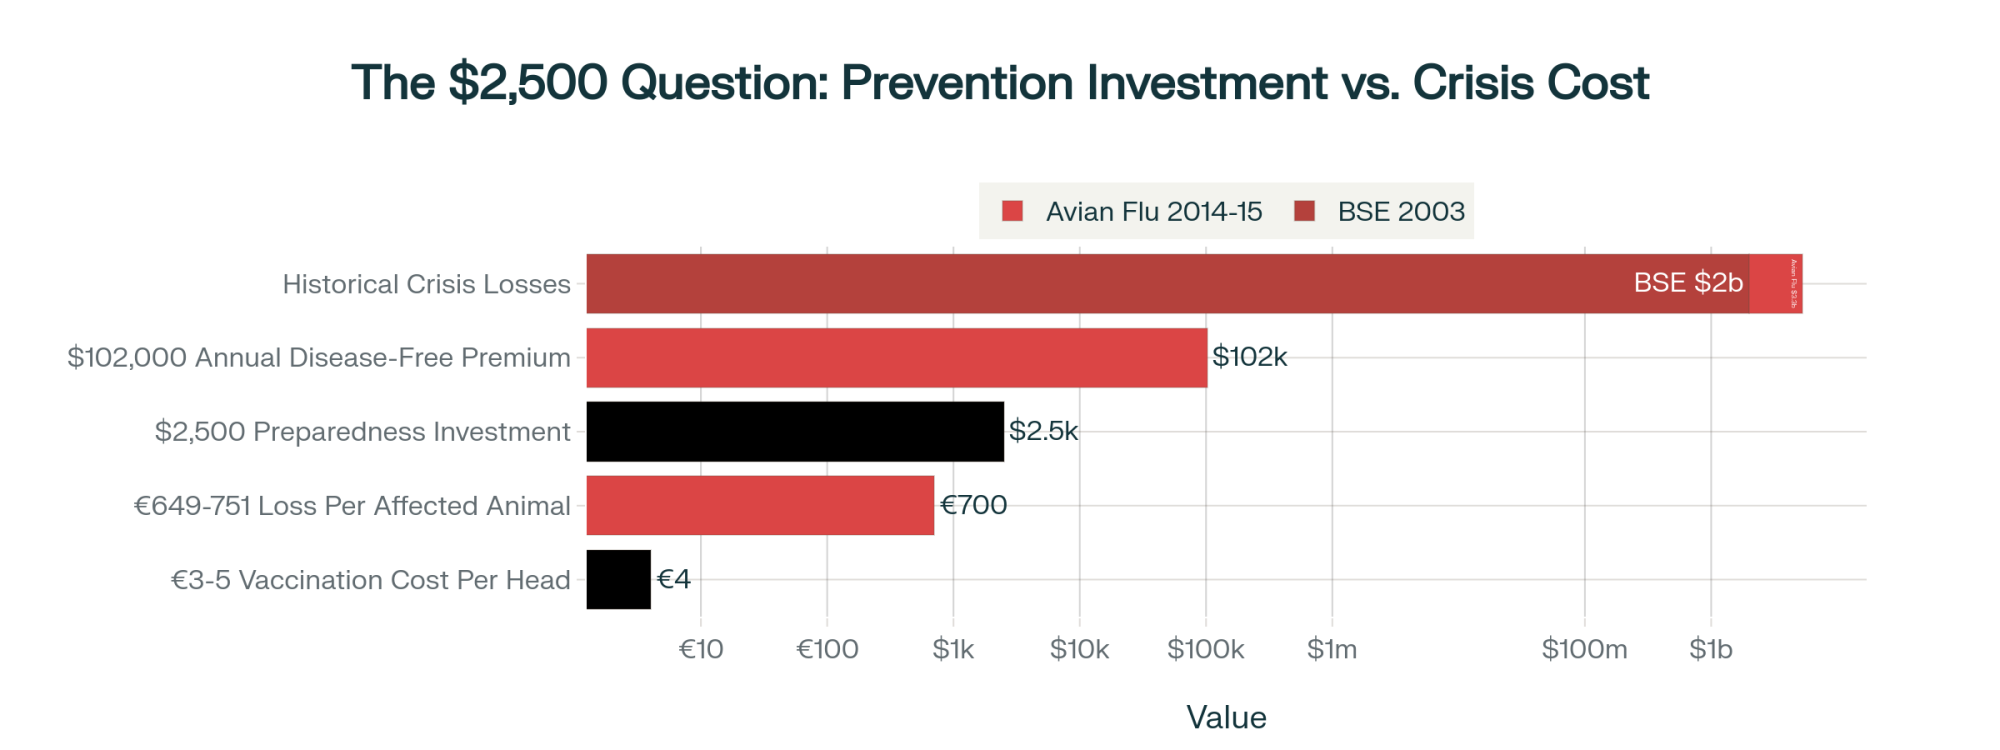
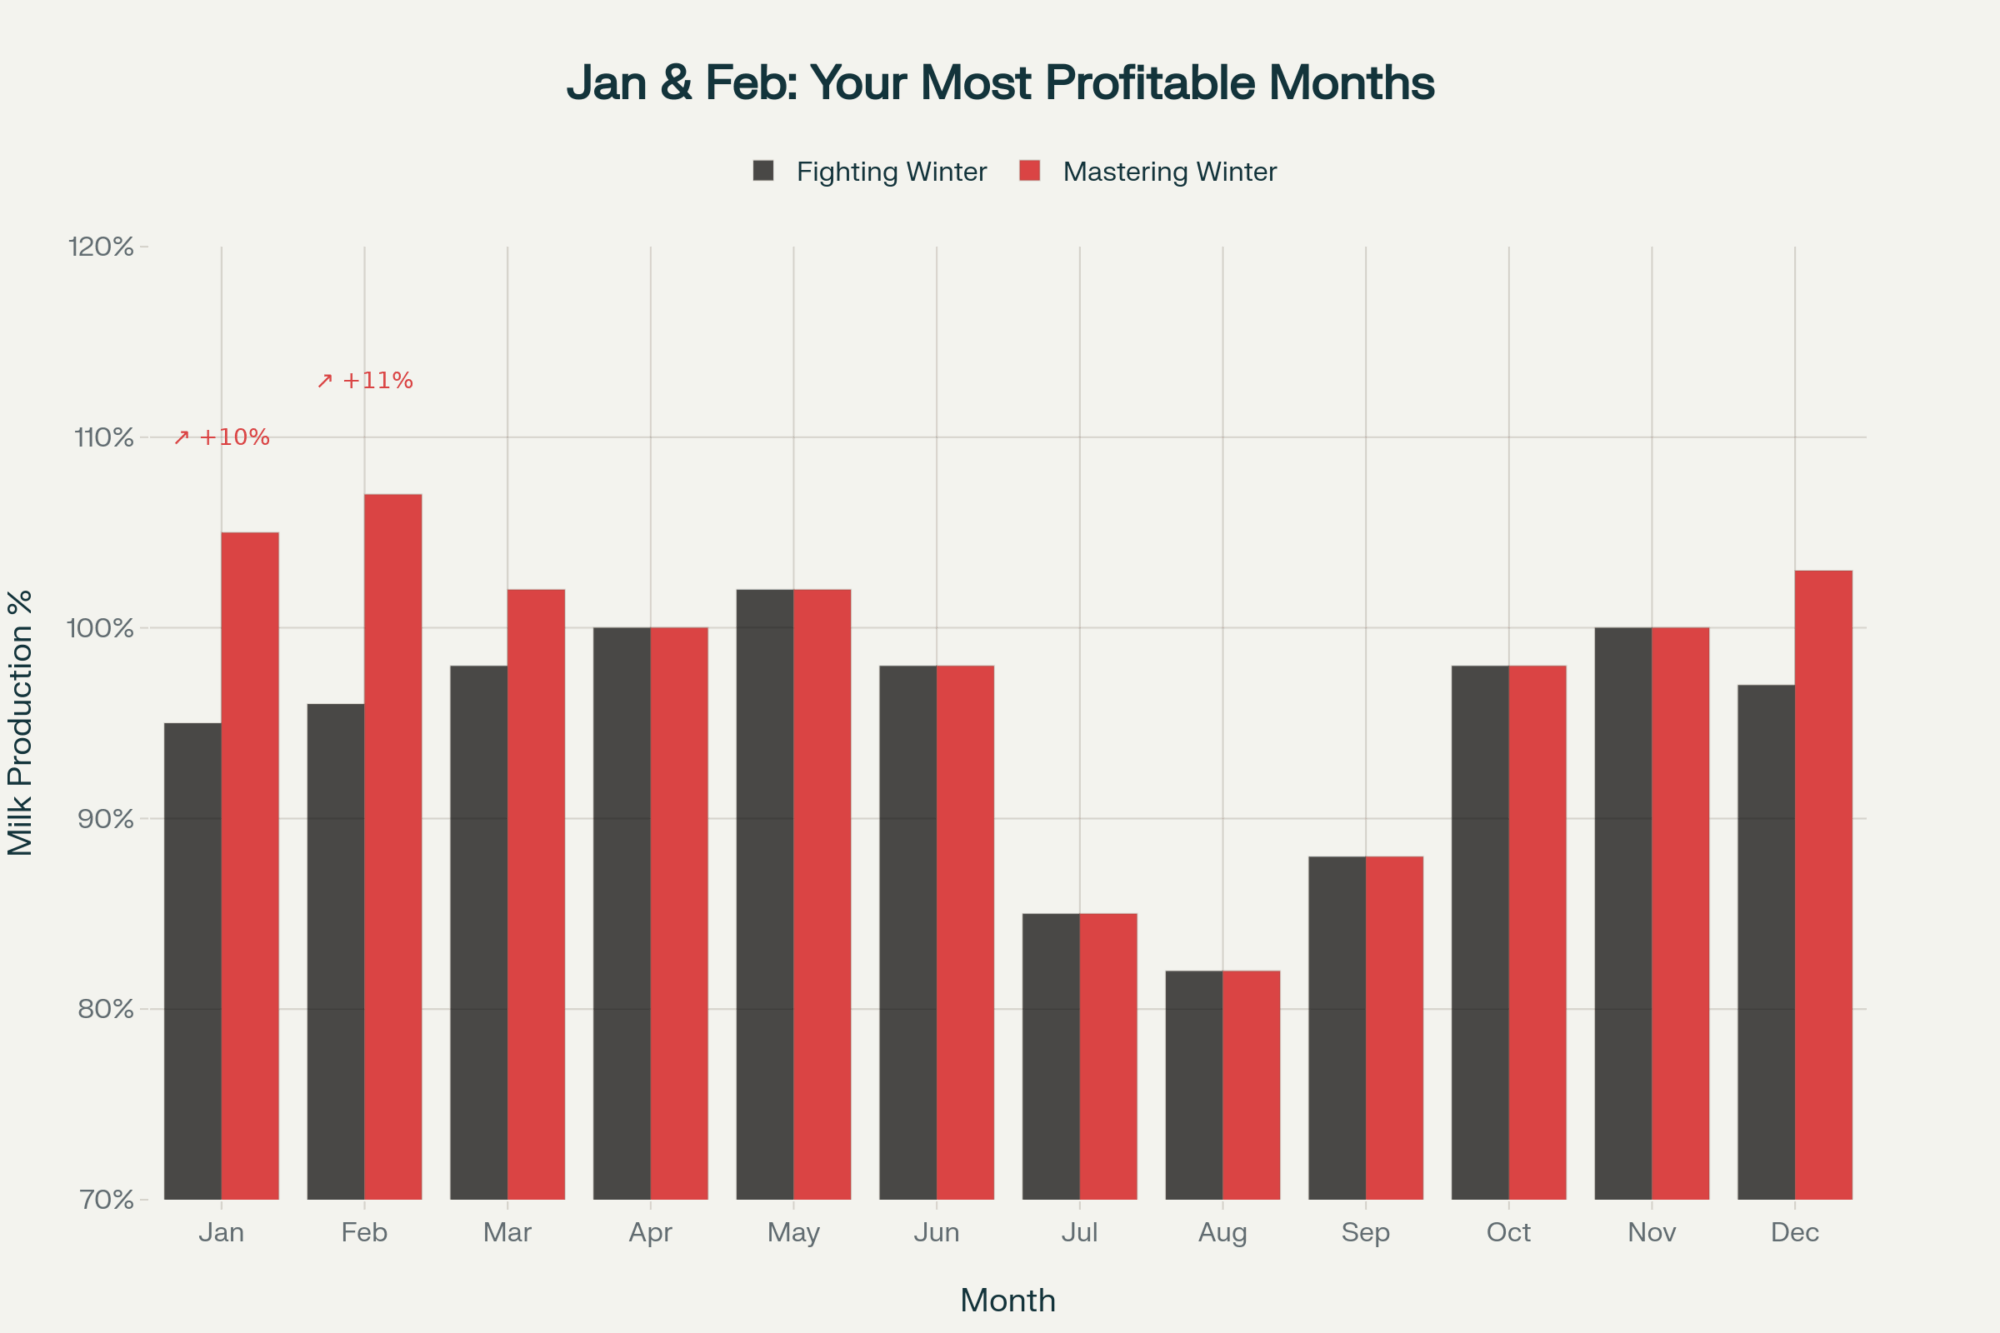
This study from Science Advances—Dr. Nathaniel Mueller and his team published it this year—found that one day of extreme heat cuts milk production by up to 10%. And here’s the kicker: those effects stick around for more than ten days. Small farms, the ones under 100 cows? According to the University of Illinois farmdoc daily analysis from March, they’re losing 1.6% of production annually just to heat stress. That’s nearly 60% worse than bigger operations that can afford better cooling.
Let me put this in real terms. If you’re running a small operation, maybe clearing $60 to $175 per cow annually (and that’s being optimistic these days), Texas A&M and Florida extension economists calculate you’re looking at heat stress losses of $400 to $700 per cow. Even up here in the Midwest, we’re seeing impact. Pennsylvania operations are reporting similar challenges. California producers? They’re dealing with both heat and water restrictions—double whammy.
Now, the extension folks—and they mean well—they recommend cooling systems. Tunnel ventilation, evaporative cooling, all that. Penn State, Wisconsin, and Cornell all cite $70,000 to $85,000 for a 200-cow operation. But here’s the thing nobody wants to say out loud: if you’re already losing sixty, seventy thousand a year, where’s that money coming from? Banks aren’t lending for improvements when you can’t show positive cash flow.
The Math Just Doesn’t Work Anymore
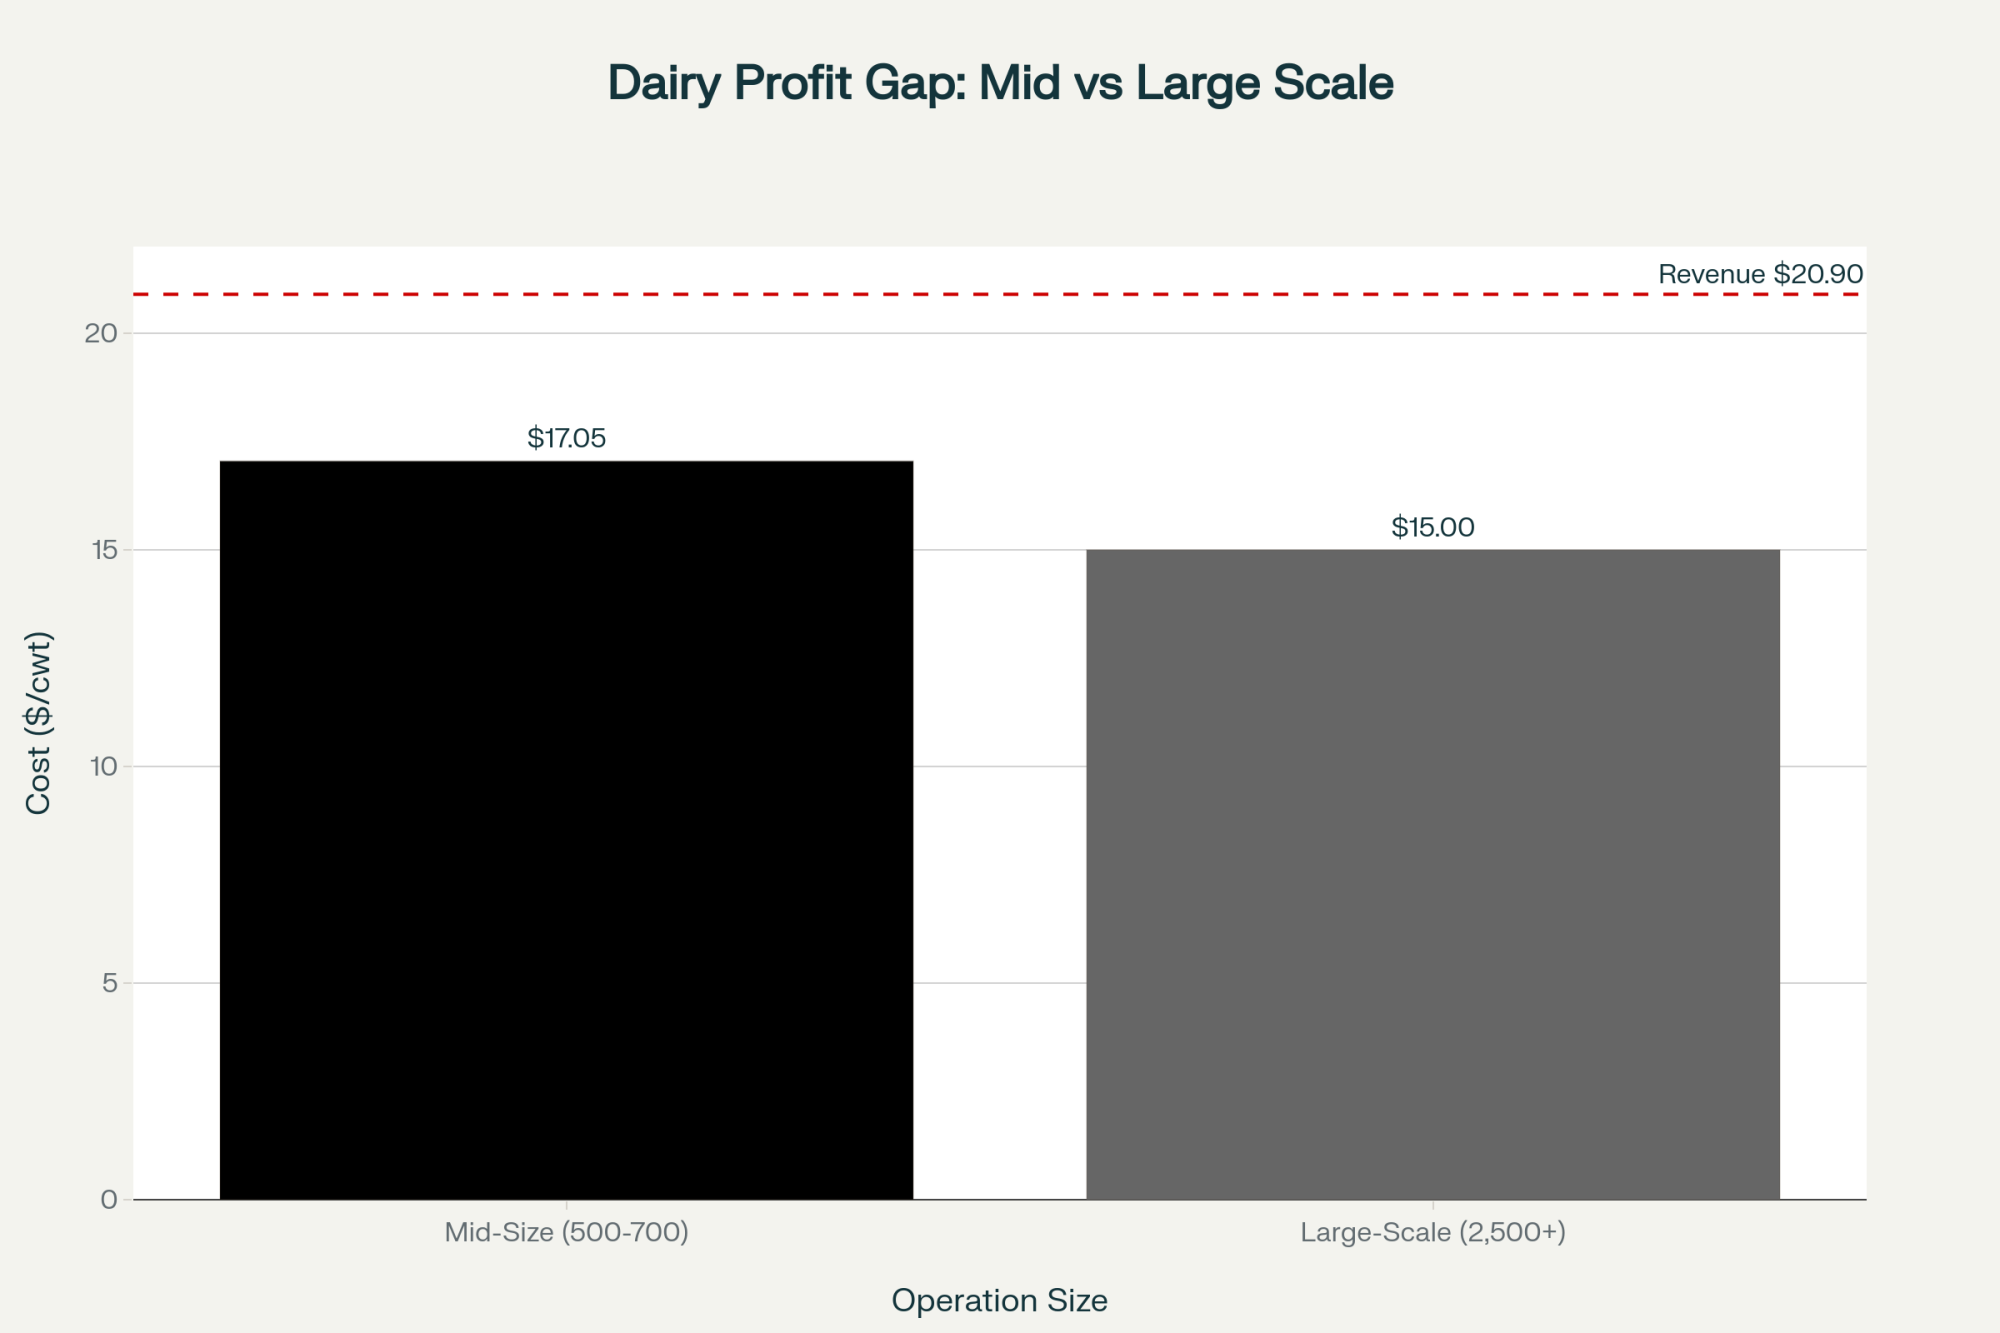
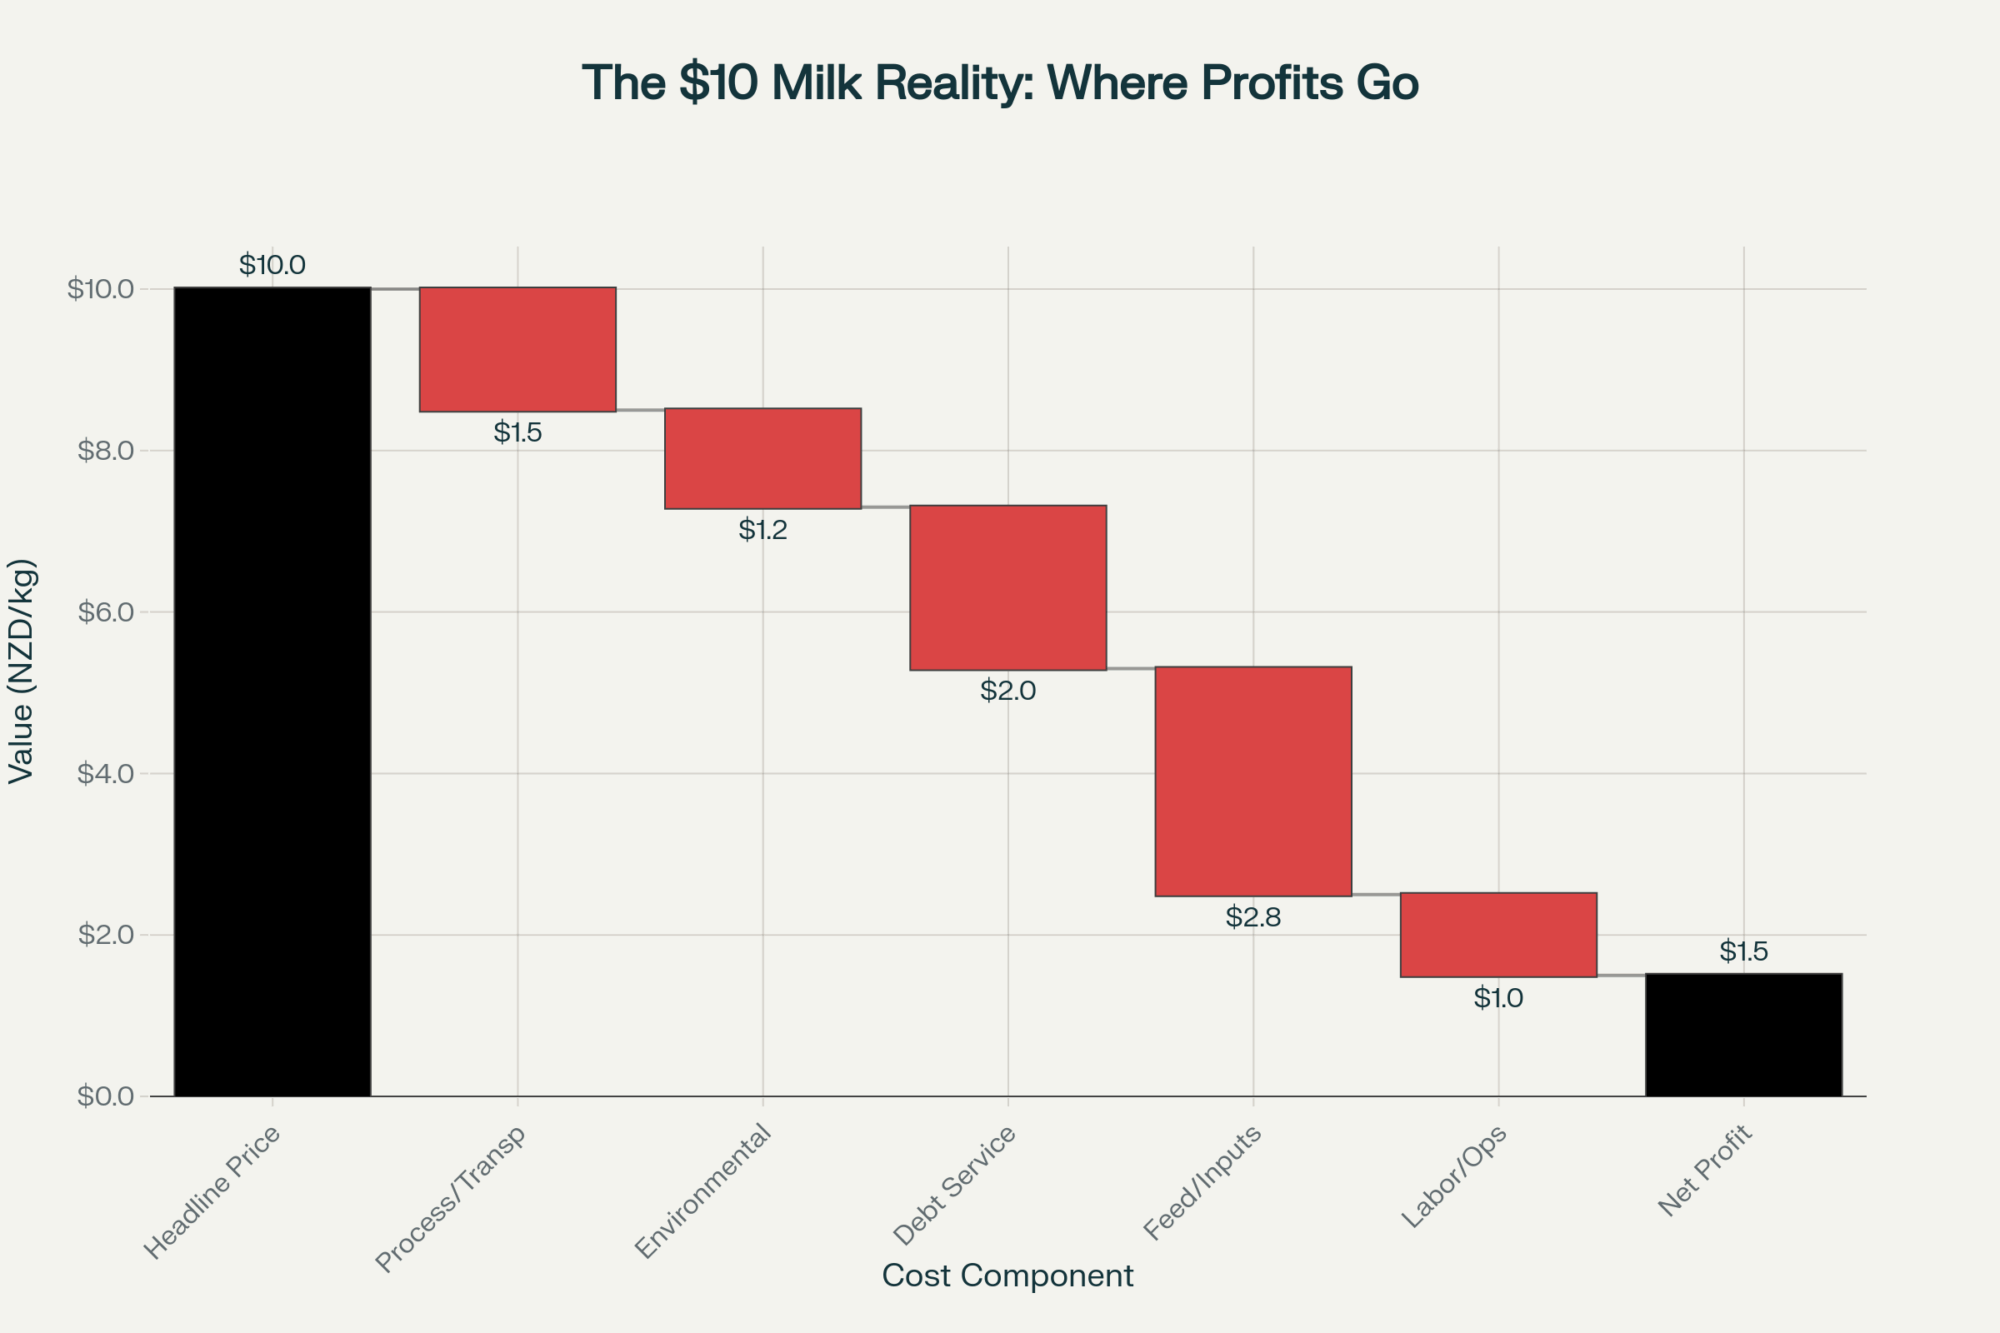
November’s milk price came in at $21.55 per hundredweight. But you know how it is—after co-op deductions, quality adjustments, hauling…you’re seeing less. Sometimes a lot less.
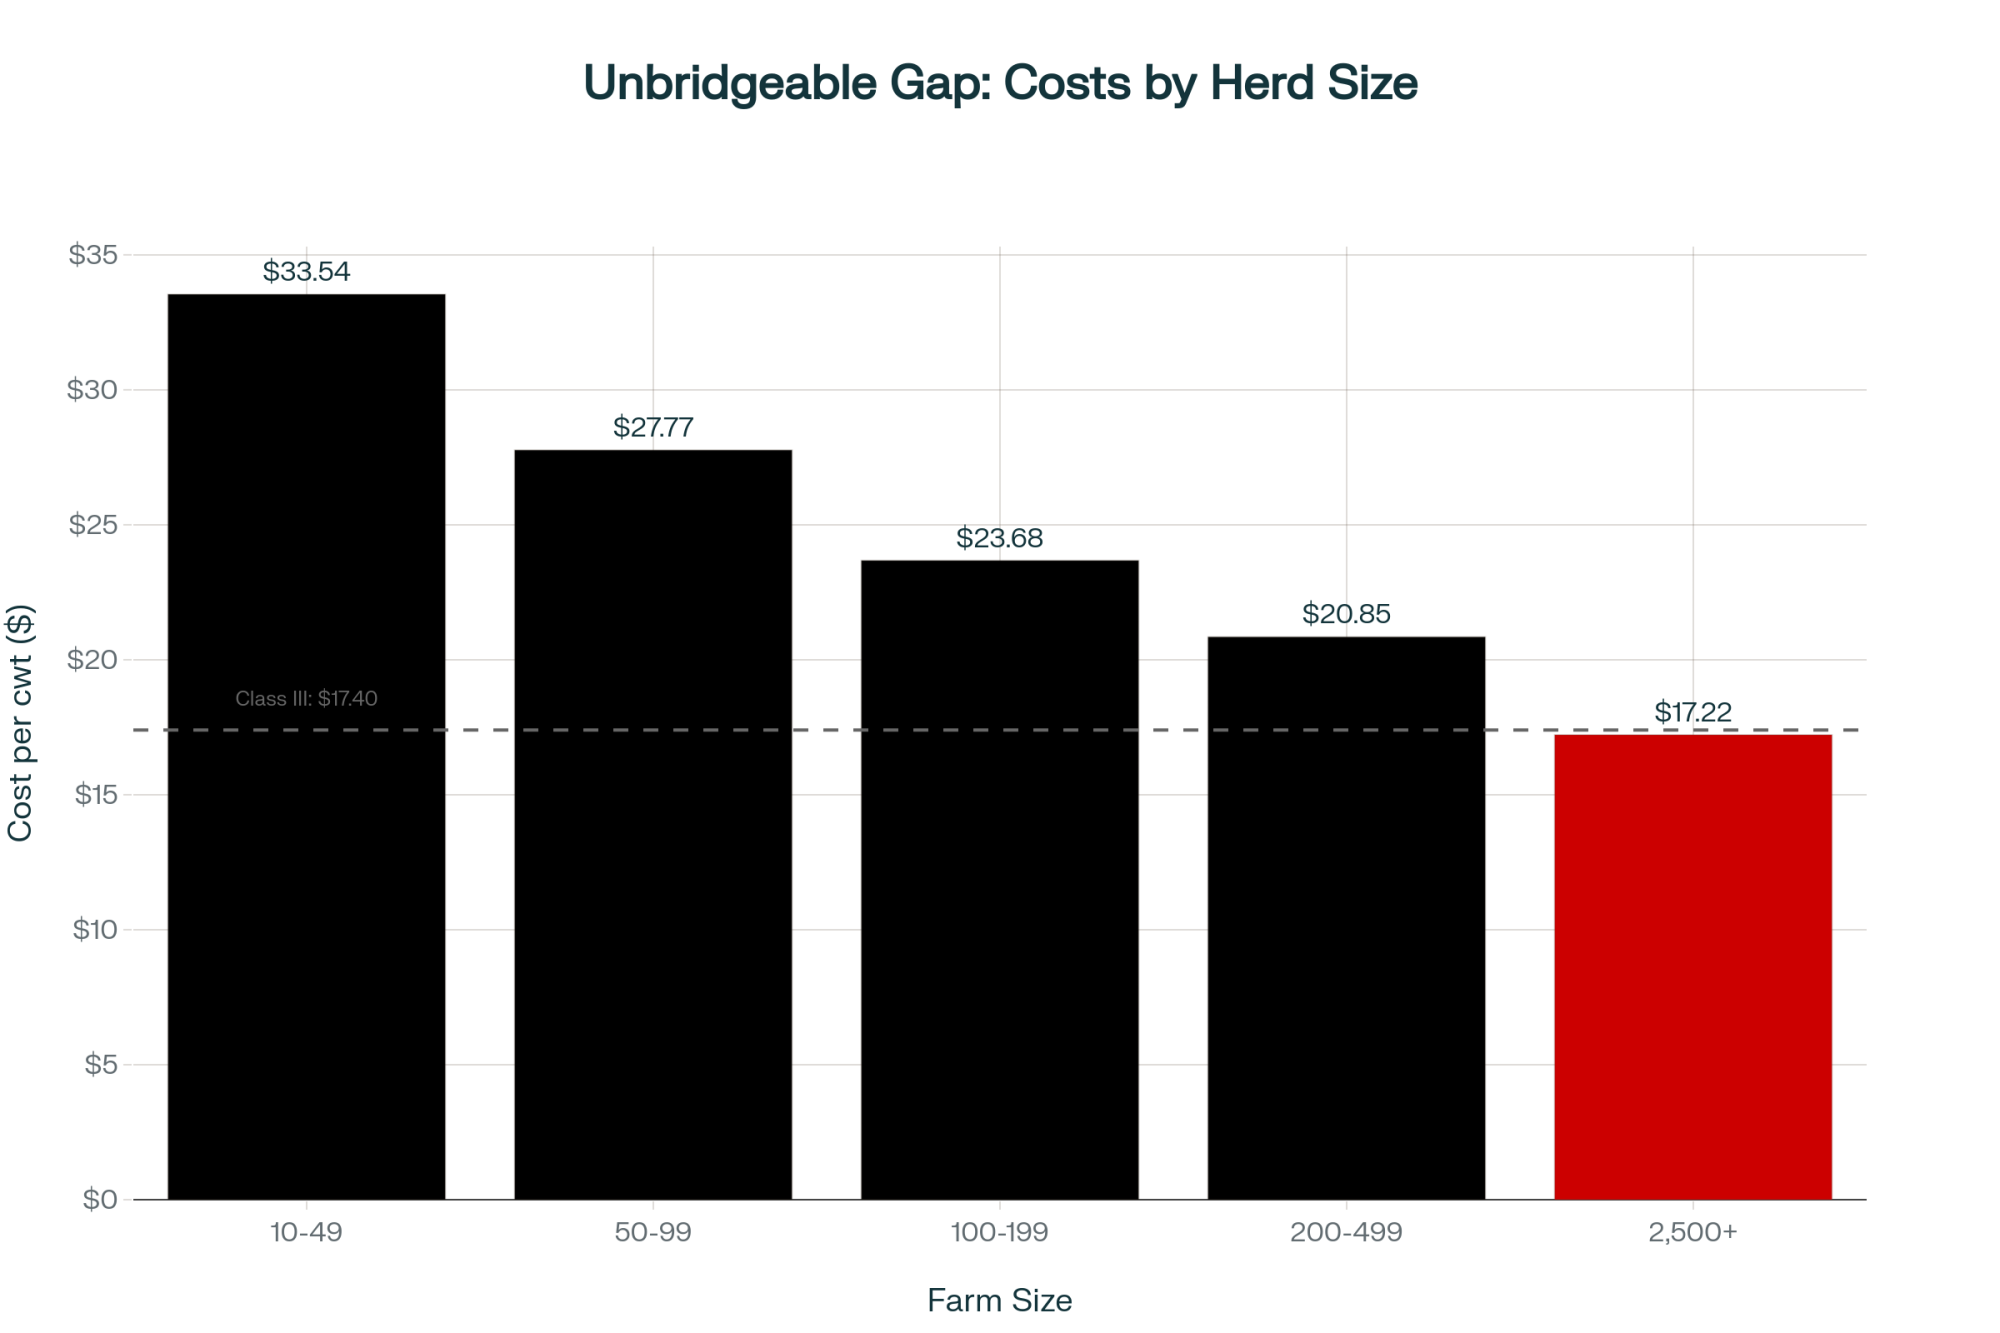
Here’s what’s interesting—and I really wish I could draw you a picture here because it’s striking when you see it laid out. I was looking at the cost changes since 2020, and the spread is just brutal. Let me walk you through what I mean:
Back in 2020, we had milk at about $18.50 per hundredweight. Your basic feed costs, let’s index them at 100 to make it simple. Labor was running around $16 an hour if you could find it. Diesel? About $2.20 a gallon.
Fast forward to now, 2025. Milk’s up to $21.55—hey, that’s 16% better, right? But look at everything else. Feed costs have jumped 40% from that baseline. Labor—if you can even find workers—is running $20 to $21 an hour, up 30%. And diesel? Don’t get me started. We’re looking at $4.40 a gallon in many areas. That’s doubled.
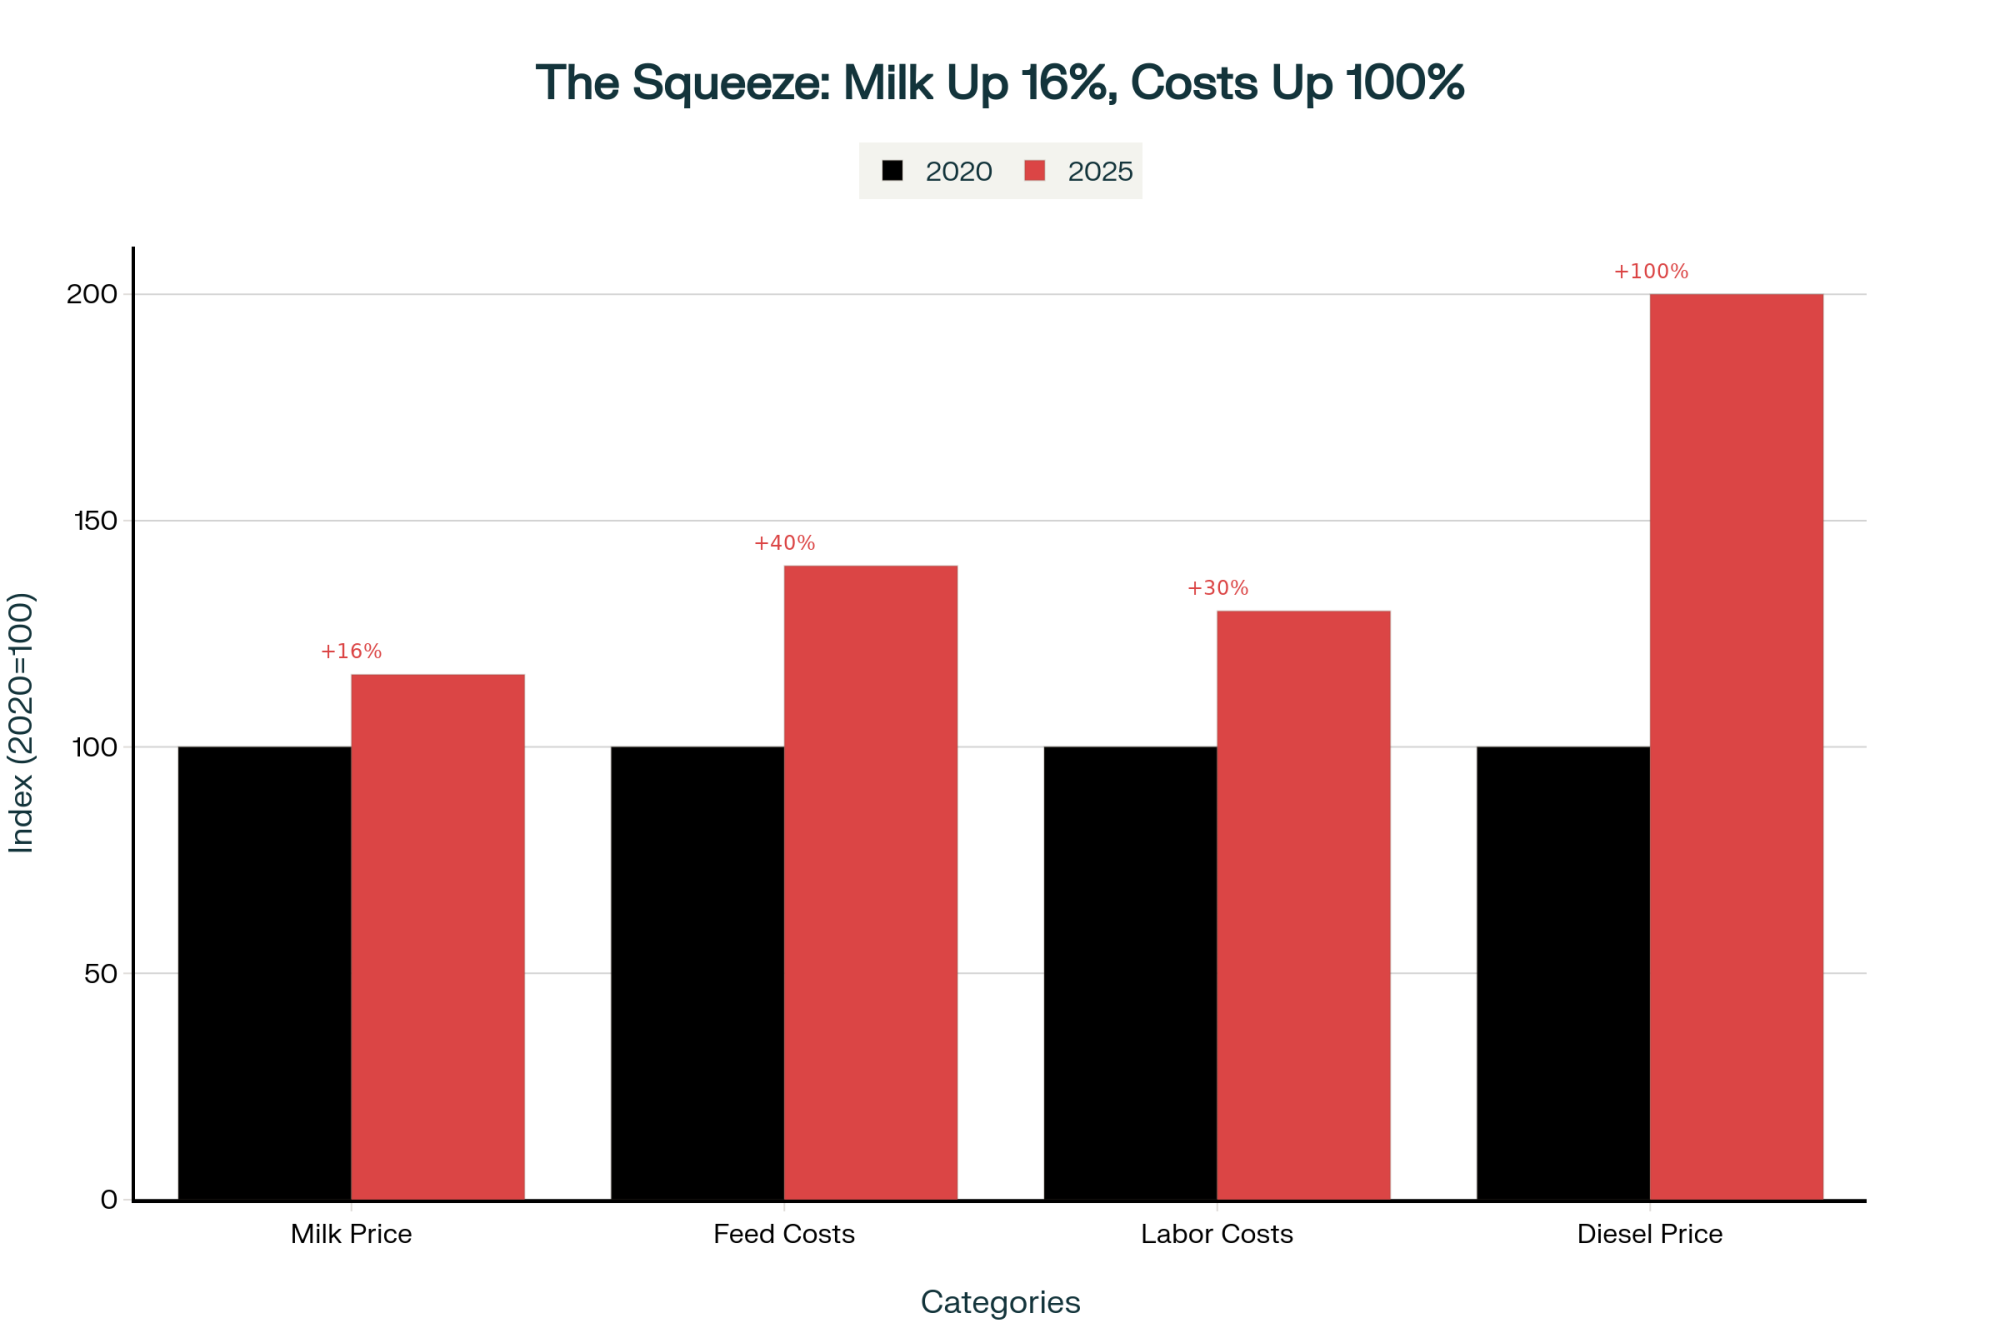
So you’ve got milk prices creeping up by 16% while your inputs shoot up by 30%, 40%, or even 100%. That gap between what you’re getting paid and what you’re paying out? That’s where your equity bleeds away, month after month. When the milk check doesn’t cover the feed bill, you’re basically robbing Peter to pay Paul.
The bankruptcy numbers tell the same story—259 dairy farms filed Chapter 12 between April 2024 and March 2025. That’s a 55% jump from the year before. But here’s what that doesn’t capture—for every farm that files, there’s probably another one or two quietly selling off equipment, maybe some land, trying to restructure without the paperwork. The stigma’s real, you know?

Understanding That 12 to 18 Month Timeline
When the economists at Cornell and Wisconsin talk about this 12- to 18-month window, they’re not being dramatic. Let me walk you through what this looks like, based on what I’m seeing across multiple operations. Think of it as a composite—no single farm, but patterns I see repeatedly.
Months 1 Through 6: The Slow Bleed
You start drawing more heavily on your operating line. Maybe go from $140,000 to $165,000 over a quarter. It feels manageable because you’ve still got credit available.
You start making small compromises. Put off that gutter cleaner repair—sure, it means 90 minutes of manual scraping every day, but you save $3,200. You match a wage offer you can’t really afford because if that last good employee leaves, you’re done.
The bank might restructure some debt and convert short-term debt to long-term debt. Feels like breathing room, right? But you’re just locking in obligations you probably can’t meet long-term.
Months 7 Through 12: Options Starting to Close
Your credit line’s getting close to maxed out. The lender—and these are good people who want to help—they start asking for monthly financials instead of quarterly. That’s never a good sign, as you probably know.
You can’t defer maintenance anymore, but you can’t afford it either. You’re one major breakdown away from crisis. One bad bout of mastitis in the fresh cow group. One compressor failure.
This is when those hard conversations happen. I know a couple in Vermont who have been farming for 40 years. She found him in the barn at 2 AM, just standing there. “We need to talk about what we’re doing,” she said. But they convinced themselves spring prices would turn things around. In my experience…they rarely do.
Months 13 Through 18: Decision Time
Banks lose confidence. You’ve violated debt covenants—maybe debt-to-asset ratio, maybe working capital requirements. Your options are bankruptcy or a forced sale. Any equity you’ve got left needs immediate action if you want to preserve it.
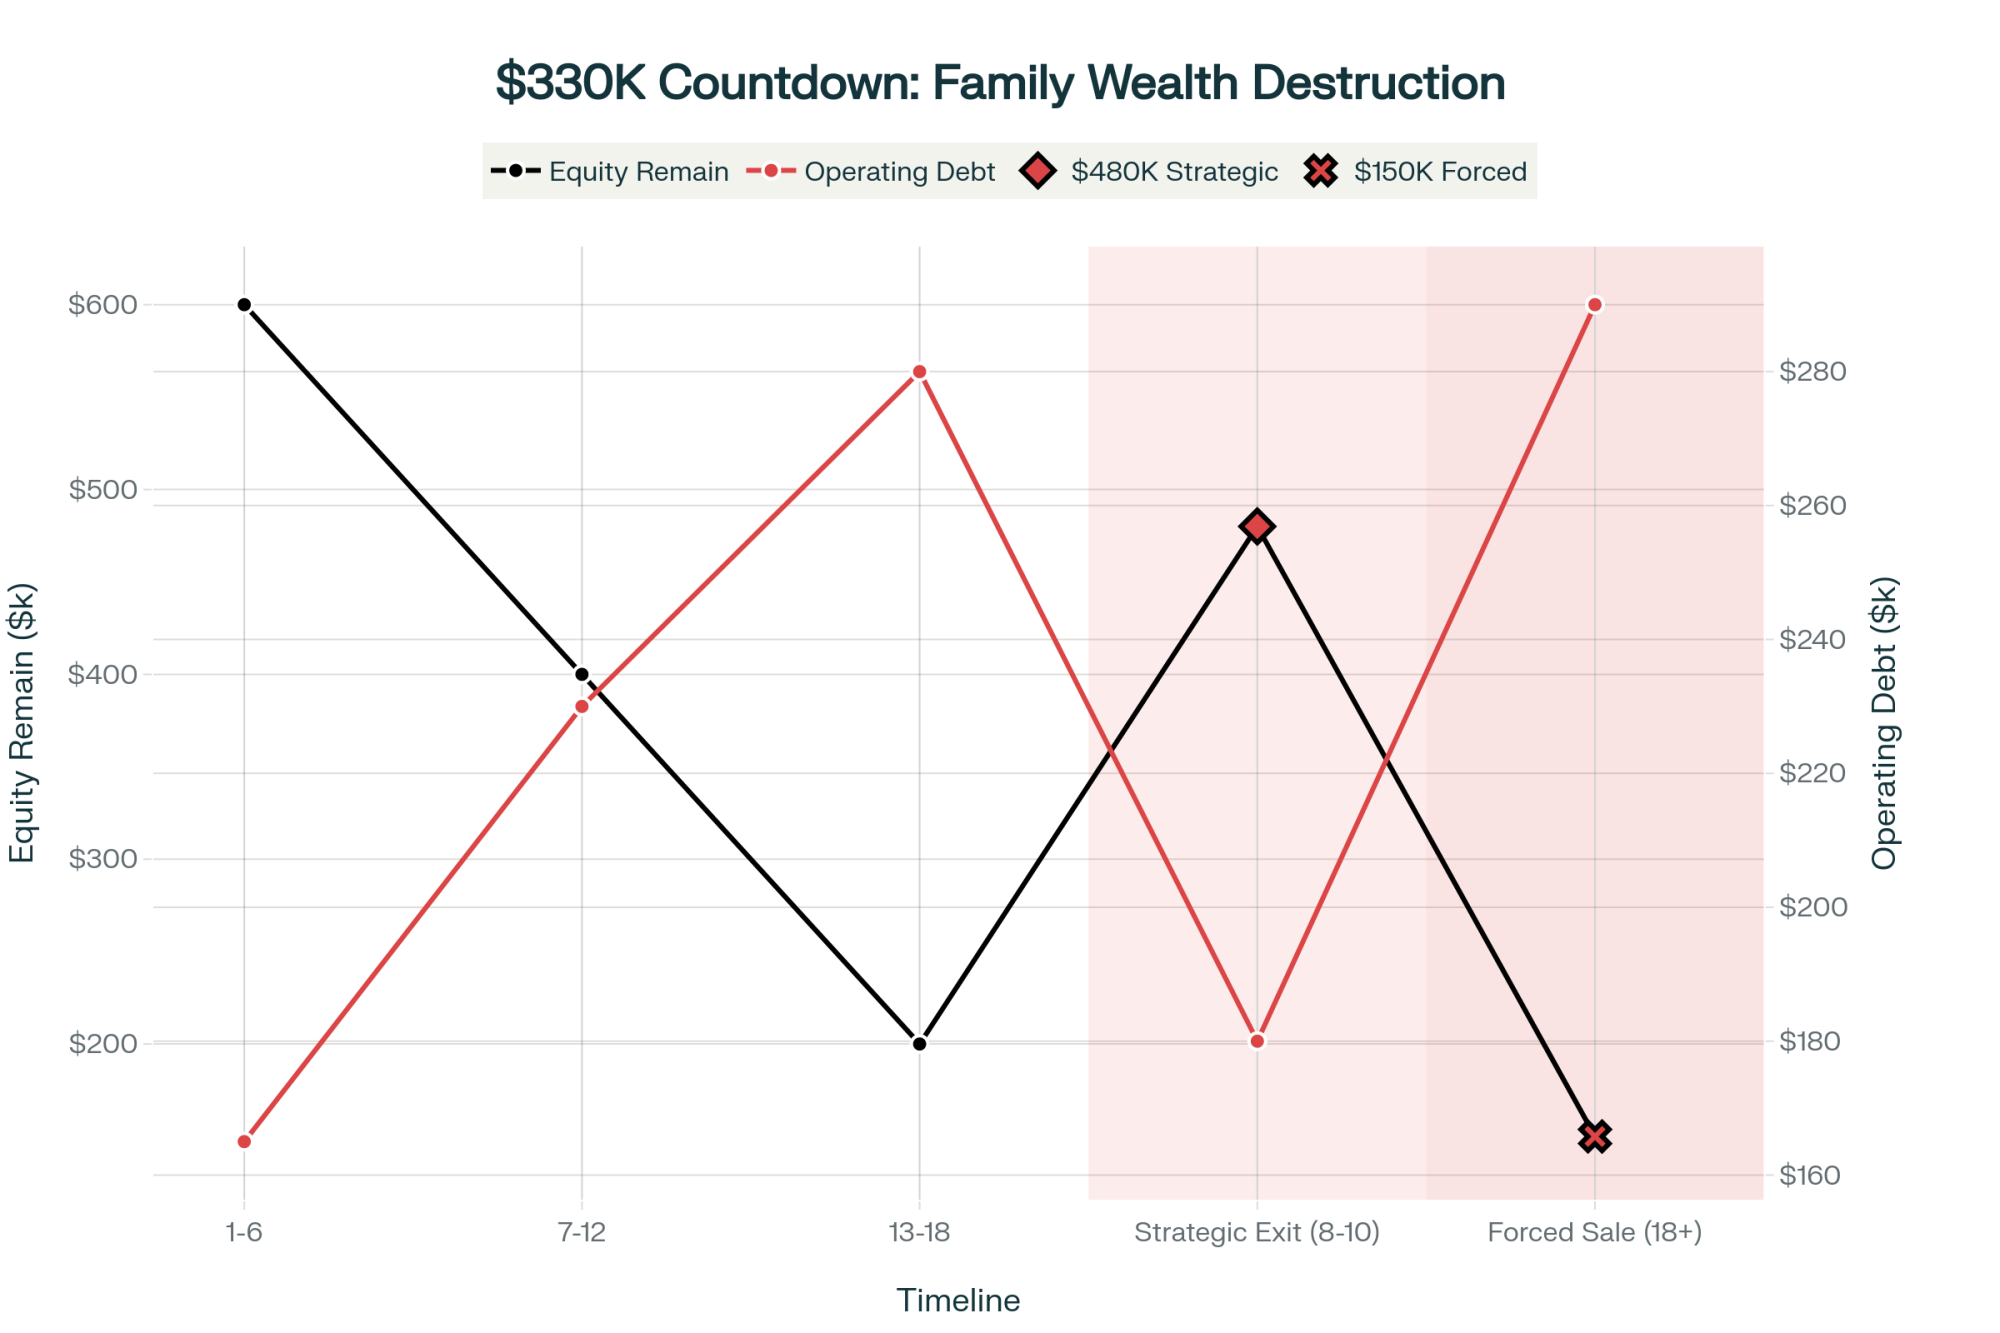
By now, that window for a strategic exit? It’s mostly closed. Operations that could’ve preserved $400,000 to $600,000 in family wealth six months earlier are looking at scenarios where keeping $100,000 to $200,000 feels like a win.
The Conversation Nobody Wants to Have
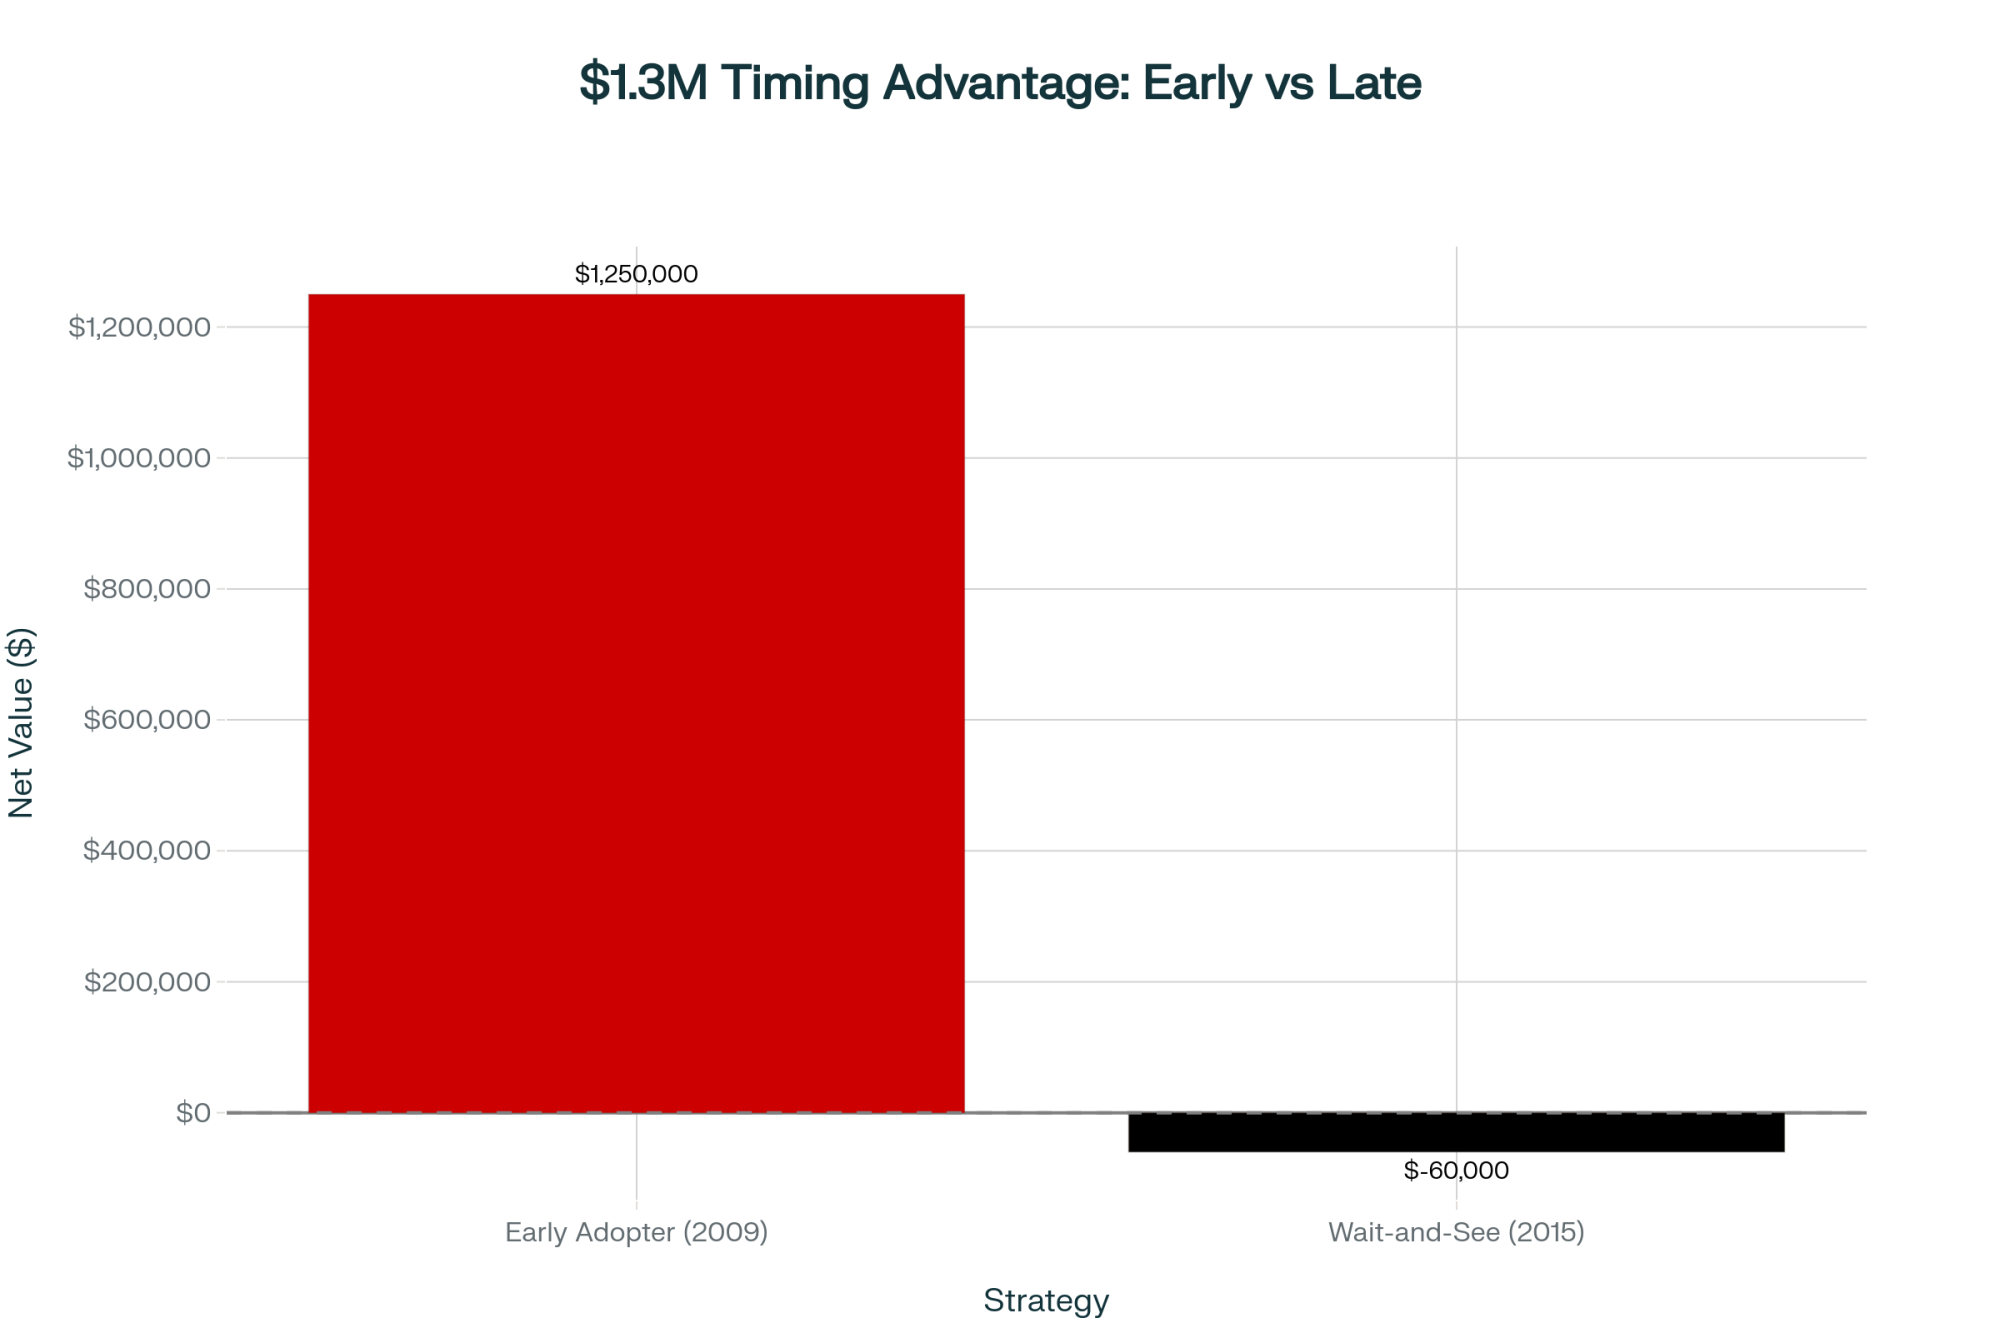
Here’s something we need to be honest about, even though it’s uncomfortable: strategic exits made early preserve dramatically more wealth than waiting for the bank to force your hand.
Let me break down what I’ve seen happen, based on actual auction results and sale data from 2025:
Strategic Exit (while you’ve still got 7-9 months of runway):
- Sell your herd voluntarily, maybe get $1,850 per good cow
- Equipment goes through a proper auction with time to market it right
- Real estate gets listed properly, not fire-sold
- Families walk away with $400,000 to $680,000
Forced Liquidation (month 18 and beyond):
- Distressed sale, maybe $1,400 per cow if you’re lucky
- Equipment auction under pressure, buyers know you’re desperate
- Real estate sells fast and cheap
- Families keep $100,000 to $200,000
That three to five hundred thousand dollar difference? That’s college funds. That’s retirement. That’s the chance to start over without crushing debt. And the only variable is timing.
As a Pennsylvania dairyman who went through this last year told me: “The hardest part was admitting we needed to exit. Once we did, we realized we should’ve made the decision six months earlier. Would’ve kept another $200,000.”
What Producers Are Actually Doing
Making Do with What They’ve Got
Was talking to a reproductive specialist in Florida last week—smart guy, been around—and he told me about a client who couldn’t afford a proper cooling system. Five thousand for misters was out of reach. So this producer rigged up a garden sprinkler on a fence post in the holding pen.
“It kept cows from dropping 10 to 20 pounds of production per day,” he said. “Bought him a month to generate some cash flow for proper cooling.”
That’s the reality for a lot of us, isn’t it? Hardware store solutions. Making do. It’s not ideal, but it keeps you going another day.
Partnerships—Sometimes They Work
Three neighbors in Idaho pooled their operations last year. Formed an LLC, consolidated everything. Individually, they were all questionable. Together? They’re actually competitive now.
But finding the right partners is tough. You need compatible management styles, similar work ethics, and—here’s the kicker—about $75,000 to $150,000 just for legal setup and restructuring. Folks who track these things estimate that maybe one in four or five partnership attempts actually succeeds long-term. The rest fall apart, usually over management disputes, within eighteen months. The Milk Producers Council has been documenting these partnerships, and the success stories all have one thing in common: clear, written agreements about everything from work schedules to exit strategies.
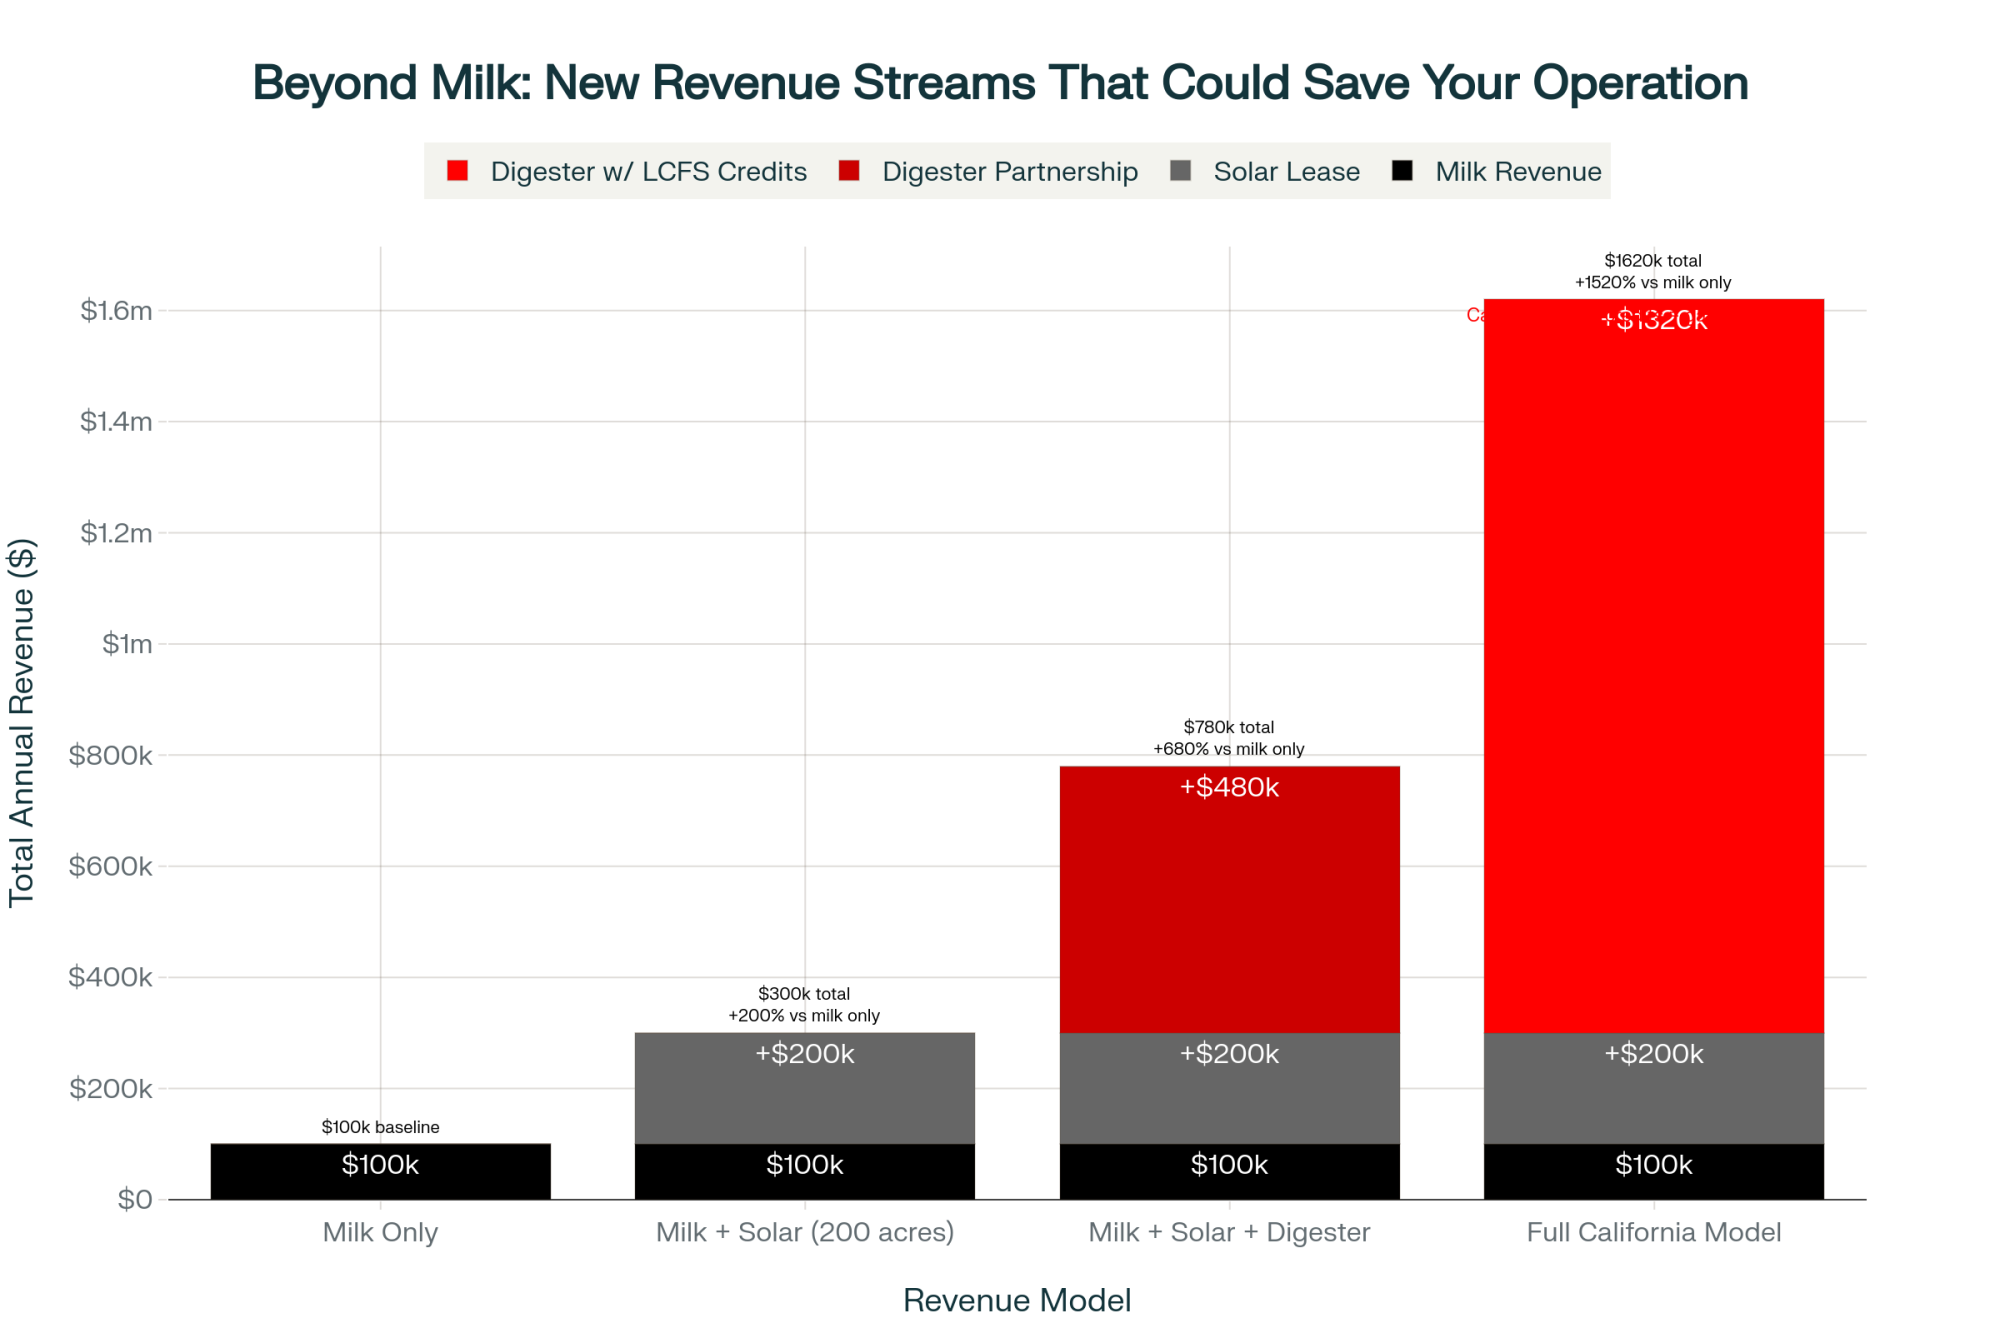
Some Folks Are Finding New Paths
It’s not all doom and gloom, and I want to be clear about that. Some operations are finding ways forward that work.
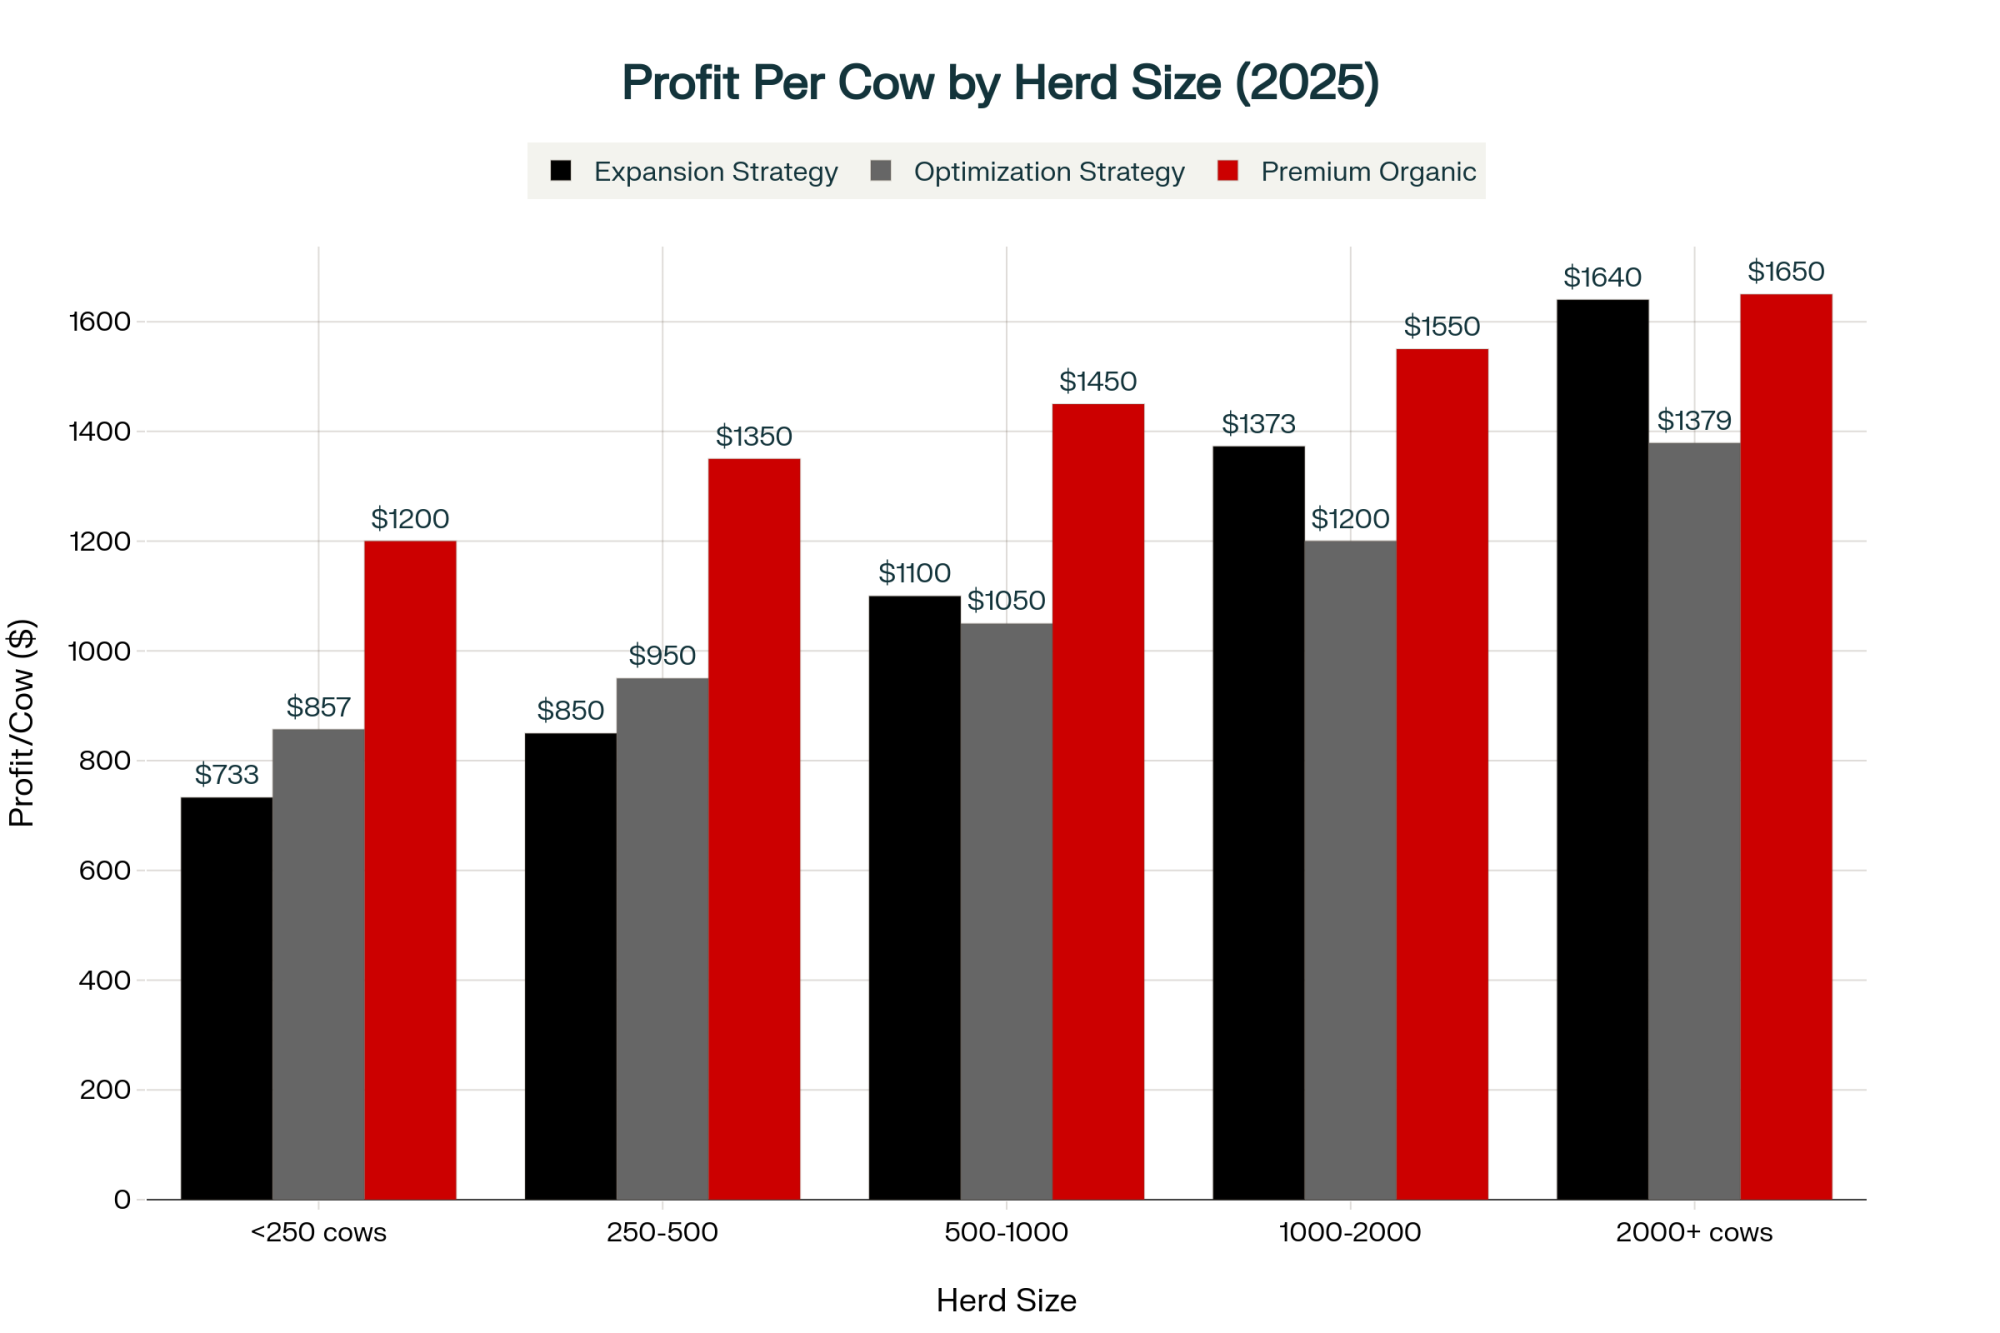
Several Vermont farms I know of are transitioning to organic. USDA’s organic price reports show a $38 per hundredweight price, compared with the $21.55 conventional price. But it’s brutal—the Northeast Organic Dairy Producers Alliance documents that it takes years and costs hundreds of thousands, while your revenues drop during the transition. You need deep pockets to weather that storm.
There are operations near Philadelphia, Boston, places like that, doing on-farm processing. Selling direct at $12 per gallon to customers who want the “farm experience.” One New York operation I visited invested $380,000 in processing facilities and visitor infrastructure. It’s working for them, but you need the right location and wealthy suburban customers nearby.
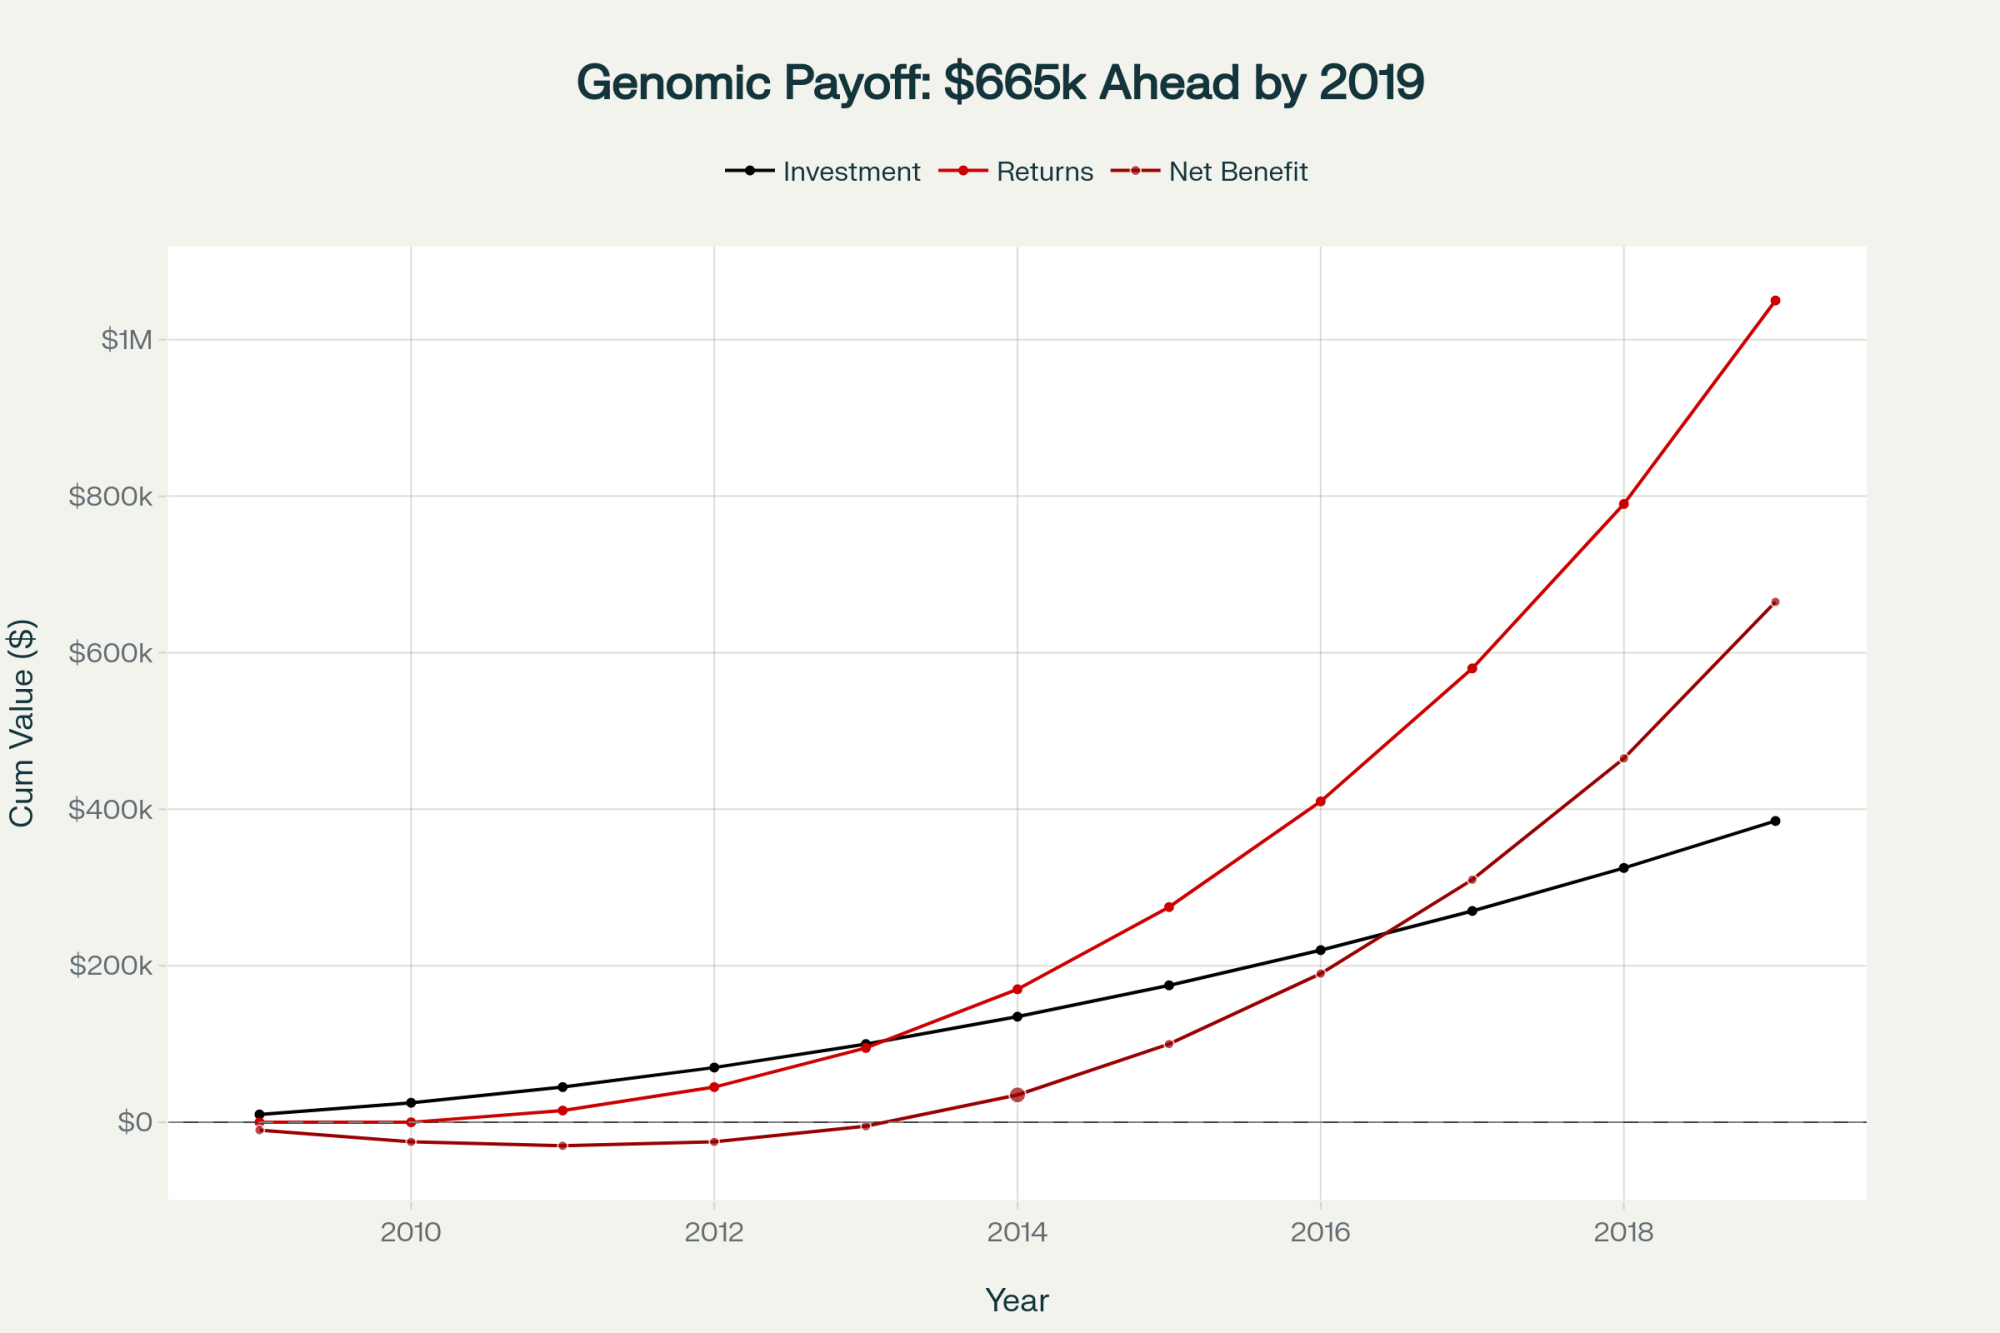
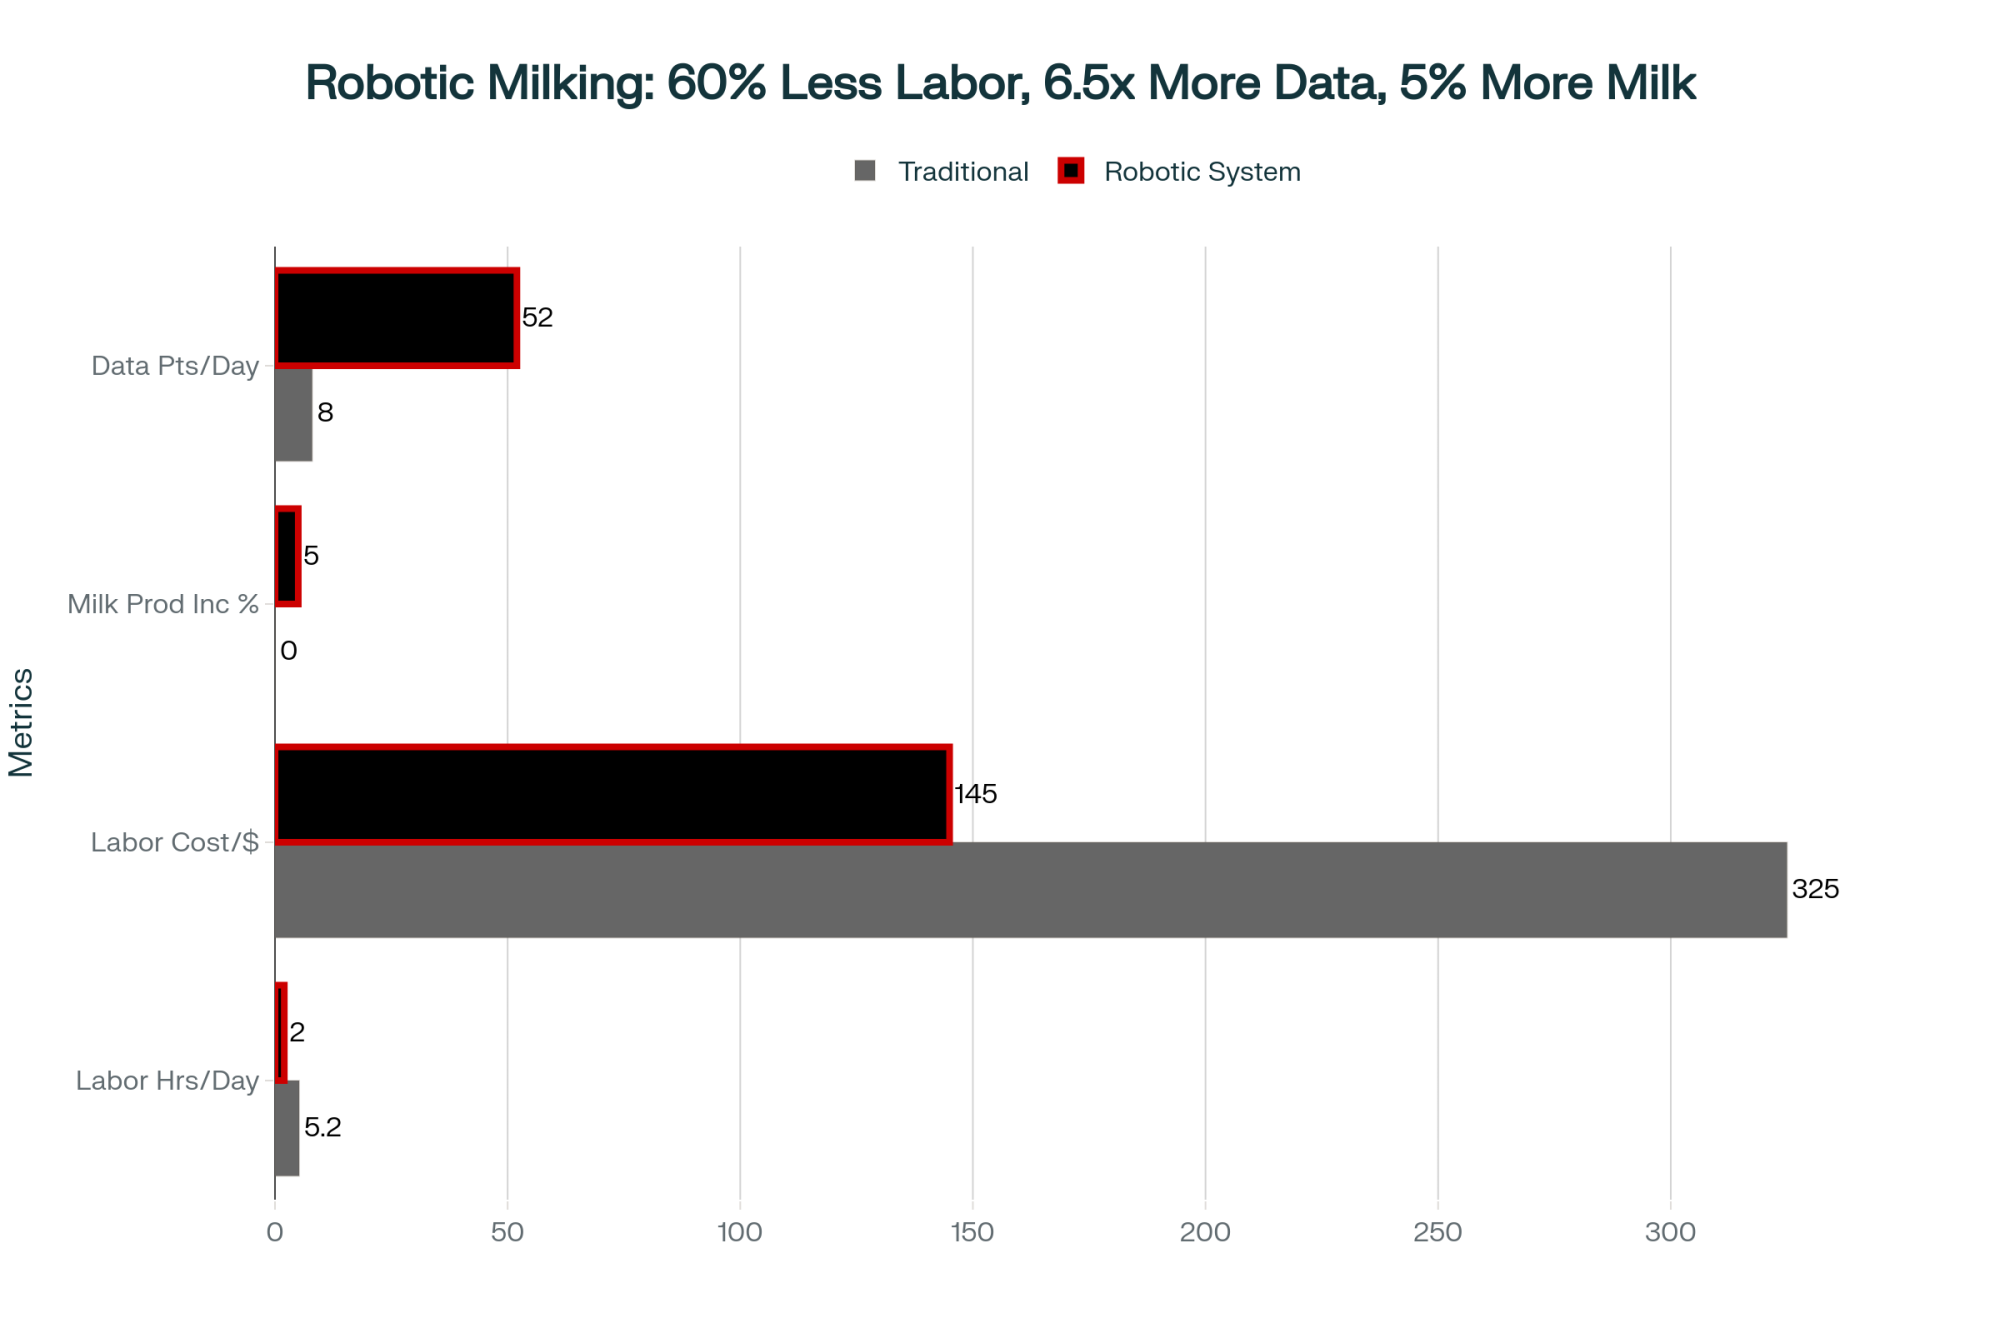
In Ohio, the Johnsons invested $800,000 in robotic milkers—but only after selling 60 acres to raise capital. Three years later, they’re viable with 300 cows and two full-time people. Not everyone has 60 acres to sell, but for those who do, technology might be an option. Just remember, the payback period is typically 7-10 years if everything goes right.
And here’s something interesting—completely legal, but not widely known—strategic bankruptcy under Section 1232 of the tax code can actually preserve more wealth than conventional sales in certain circumstances. The provision treats specific capital gains as dischargeable debt. You need a good attorney who understands agriculture, but it’s an option worth knowing about.
The Human Cost Nobody Talks About
We focus so much on the financial side, but the human toll…that’s what really matters, isn’t it?
The CDC found that farmers are 3.5 times more likely to die by suicide than the general population. Dr. Andria Jones-Bitton’s research at the University of Guelph documented that 68% of farmers experience chronic stress. Nearly half meet clinical definitions for anxiety. About 35% for depression.
Think about what this means for families. Farm wives who’ve managed the books and fed calves for twenty-five years suddenly need to find outside employment at fifty with no traditional work history. Kids who worked adult hours on the farm, watching it fail, wondering if it was somehow their fault. The weight of being the generation that “lost the farm”—that stays with people.
A dairy wife from Minnesota shared something that really stuck with me: “Being married to a farmer means putting everything else on hold from April to October, just trying to keep your husband from breaking.” Another described herself as essentially a single parent because her husband’s always in the barn, always stressed, never really present even when he’s physically there.
Where This Is All Heading

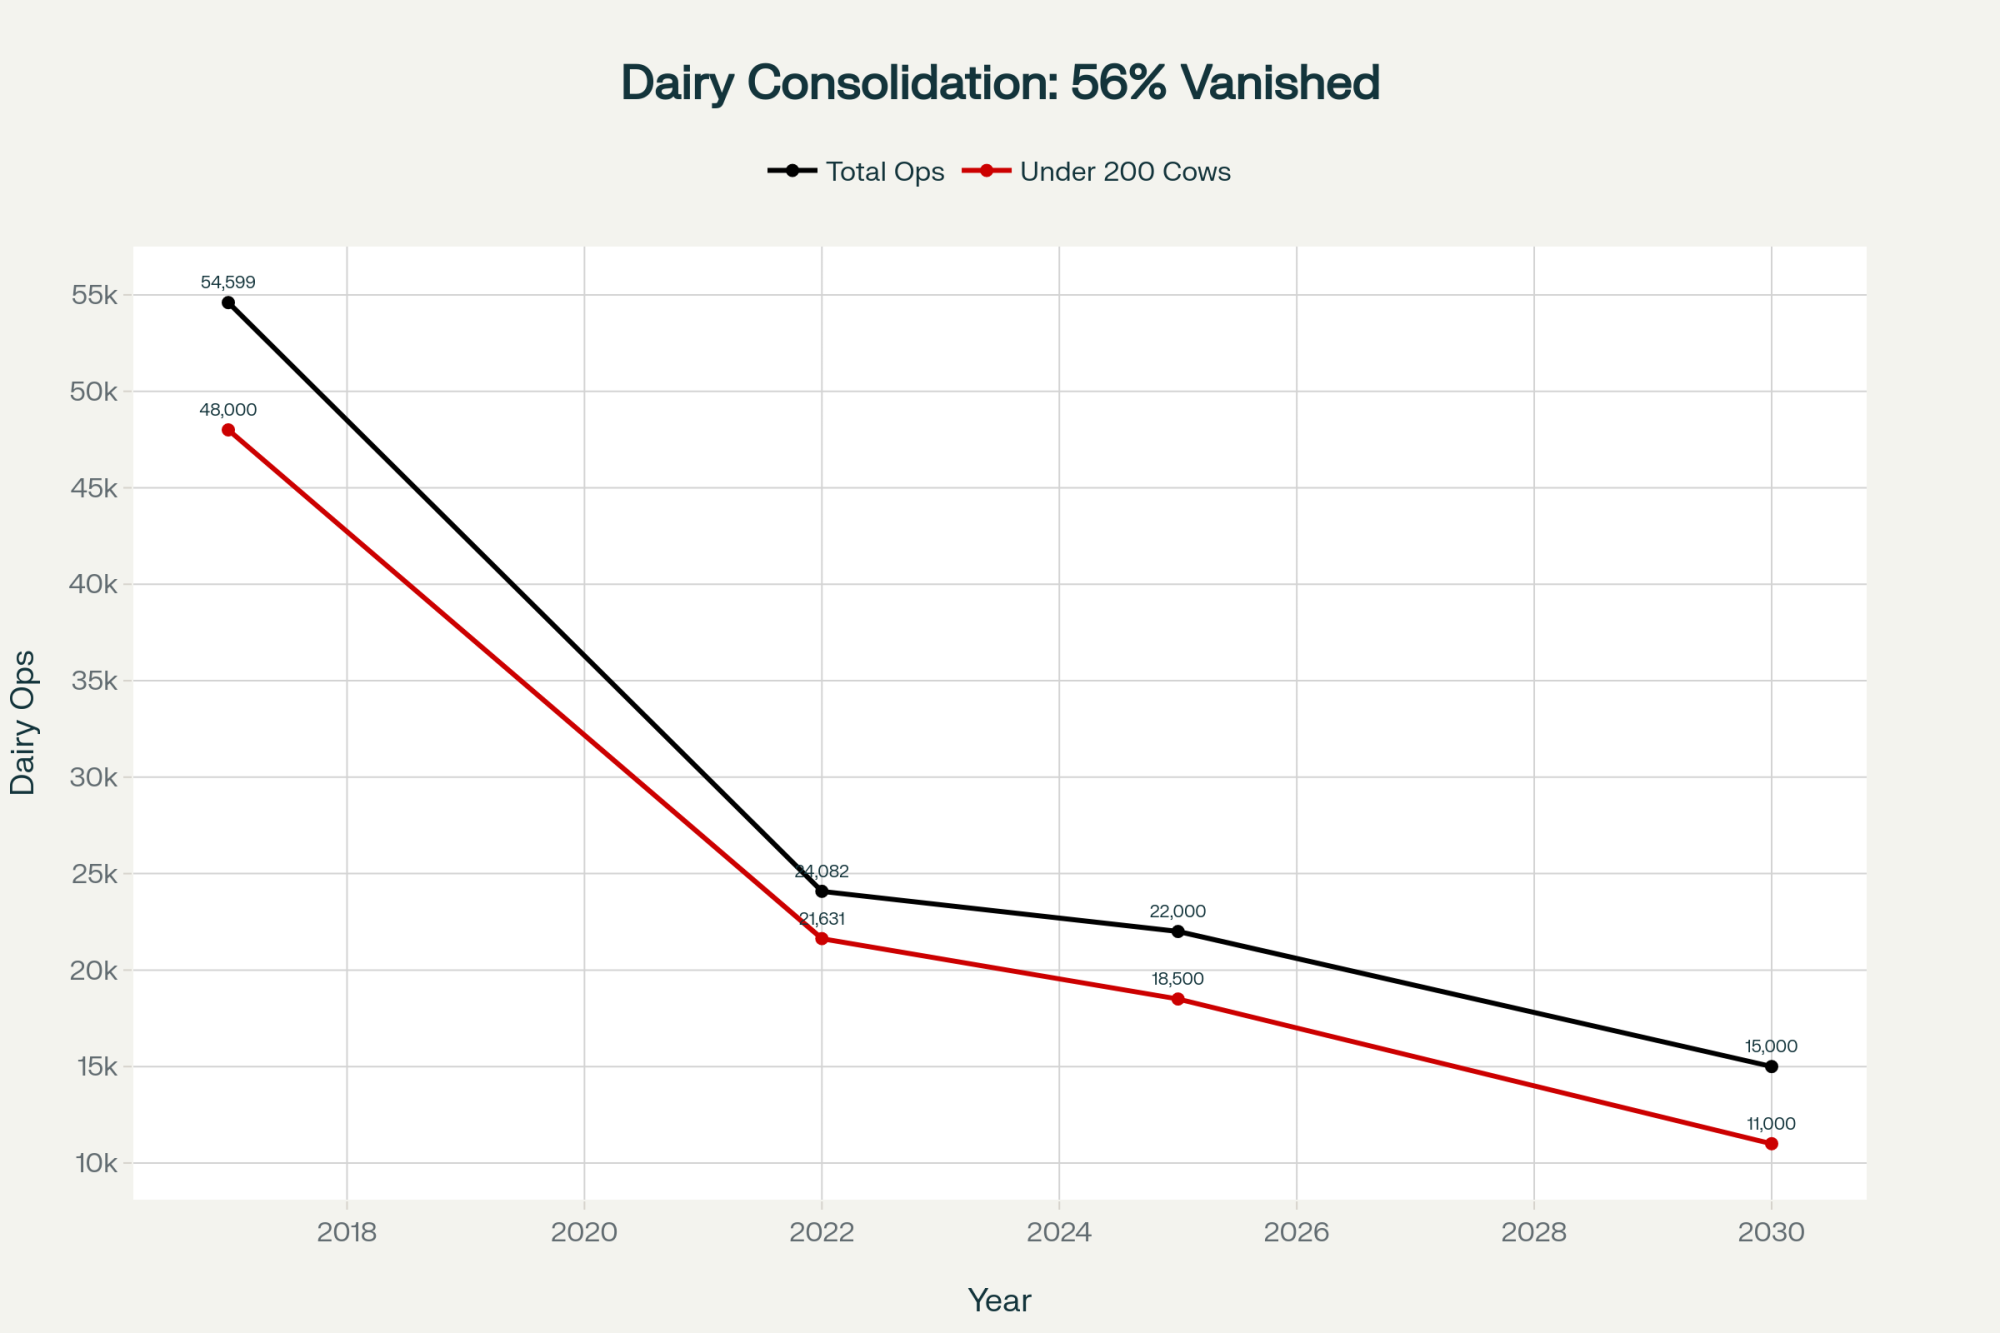
Industry projections are sobering—we’ll lose 7 to 9% of operations annually through 2027. Let me put that in real numbers so you can picture what’s happening:
The Decline We’re Looking At:
- 2020: We had 31,657 dairy operations according to the Census of Agriculture
- 2022: Down to 28,900
- 2024: About 26,400 (estimated)
- Right now, 2025: Around 26,000 operations
Now, if we keep losing 7% a year like the projections suggest:
- 2026: We’re looking at 24,180 operations
- 2027: Down to 22,487
- 2028: About 20,893
- 2029: Roughly 19,430
- 2030: Somewhere between 13,000 and 18,000 operations

Some folks think consolidation could accelerate in those final years—once you hit certain thresholds with processing capacity and infrastructure, things can snowball. That’s why some projections go as low as 12,000 to 14,000 farms by 2030.
Picture that trend line…it’s not a gentle slope. We’re talking about losing half—maybe more—of all U.S. dairy farms in just five years. Each of those data points? That’s hundreds of families making the decision we’ve been talking about.
If this keeps up—and honestly, I don’t see what would change it—by 2030, we’re looking at:
- Going from today’s 26,000 farms down to maybe 13,000 to 18,000 (could be even lower if things accelerate)
- Operations with over 1,000 cows controlling 65 to 72% of all production
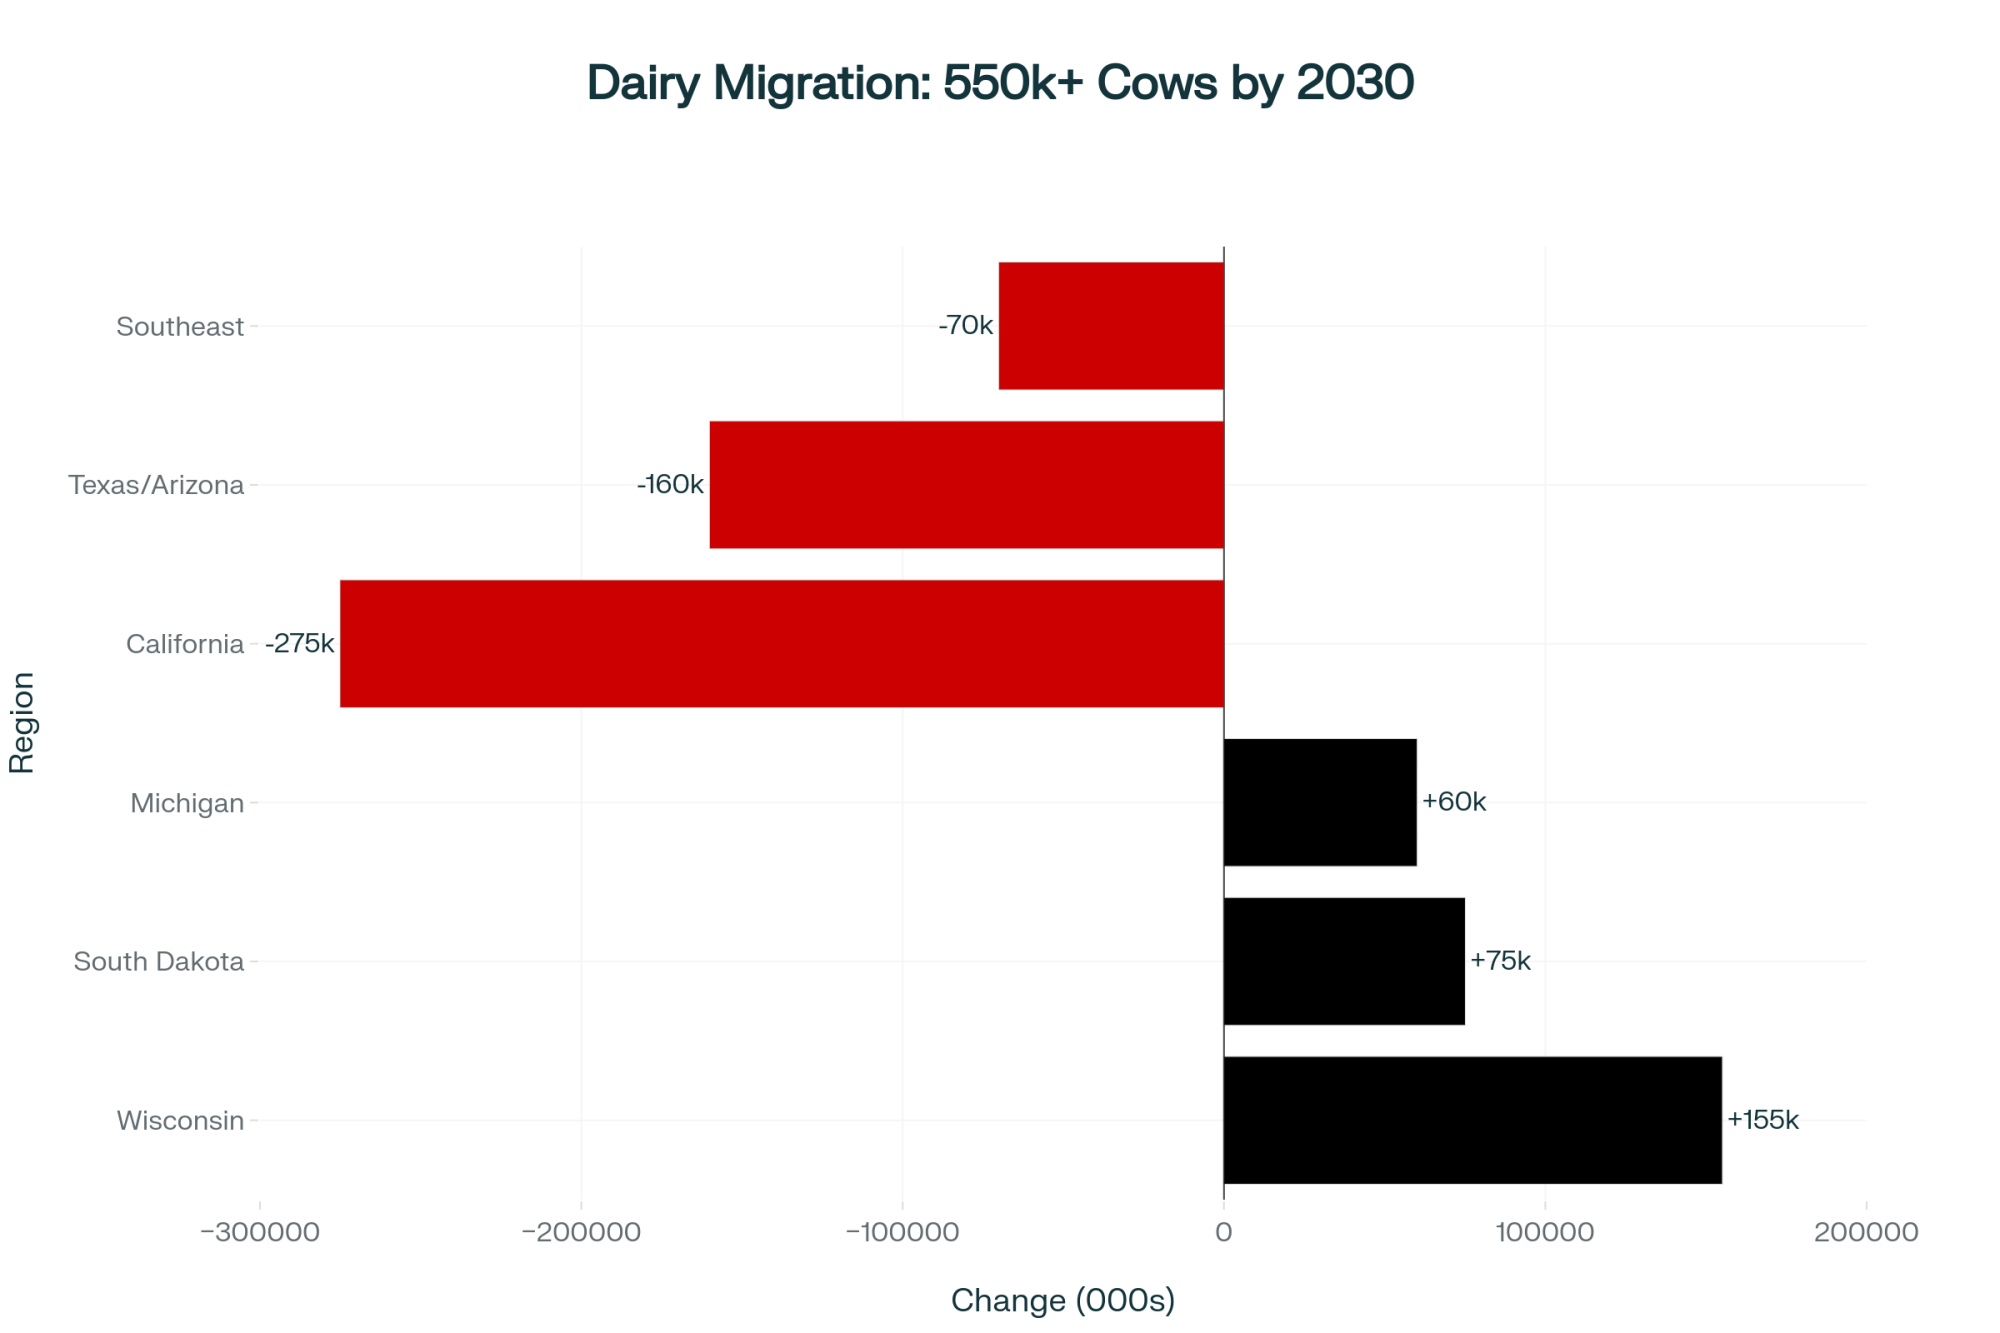
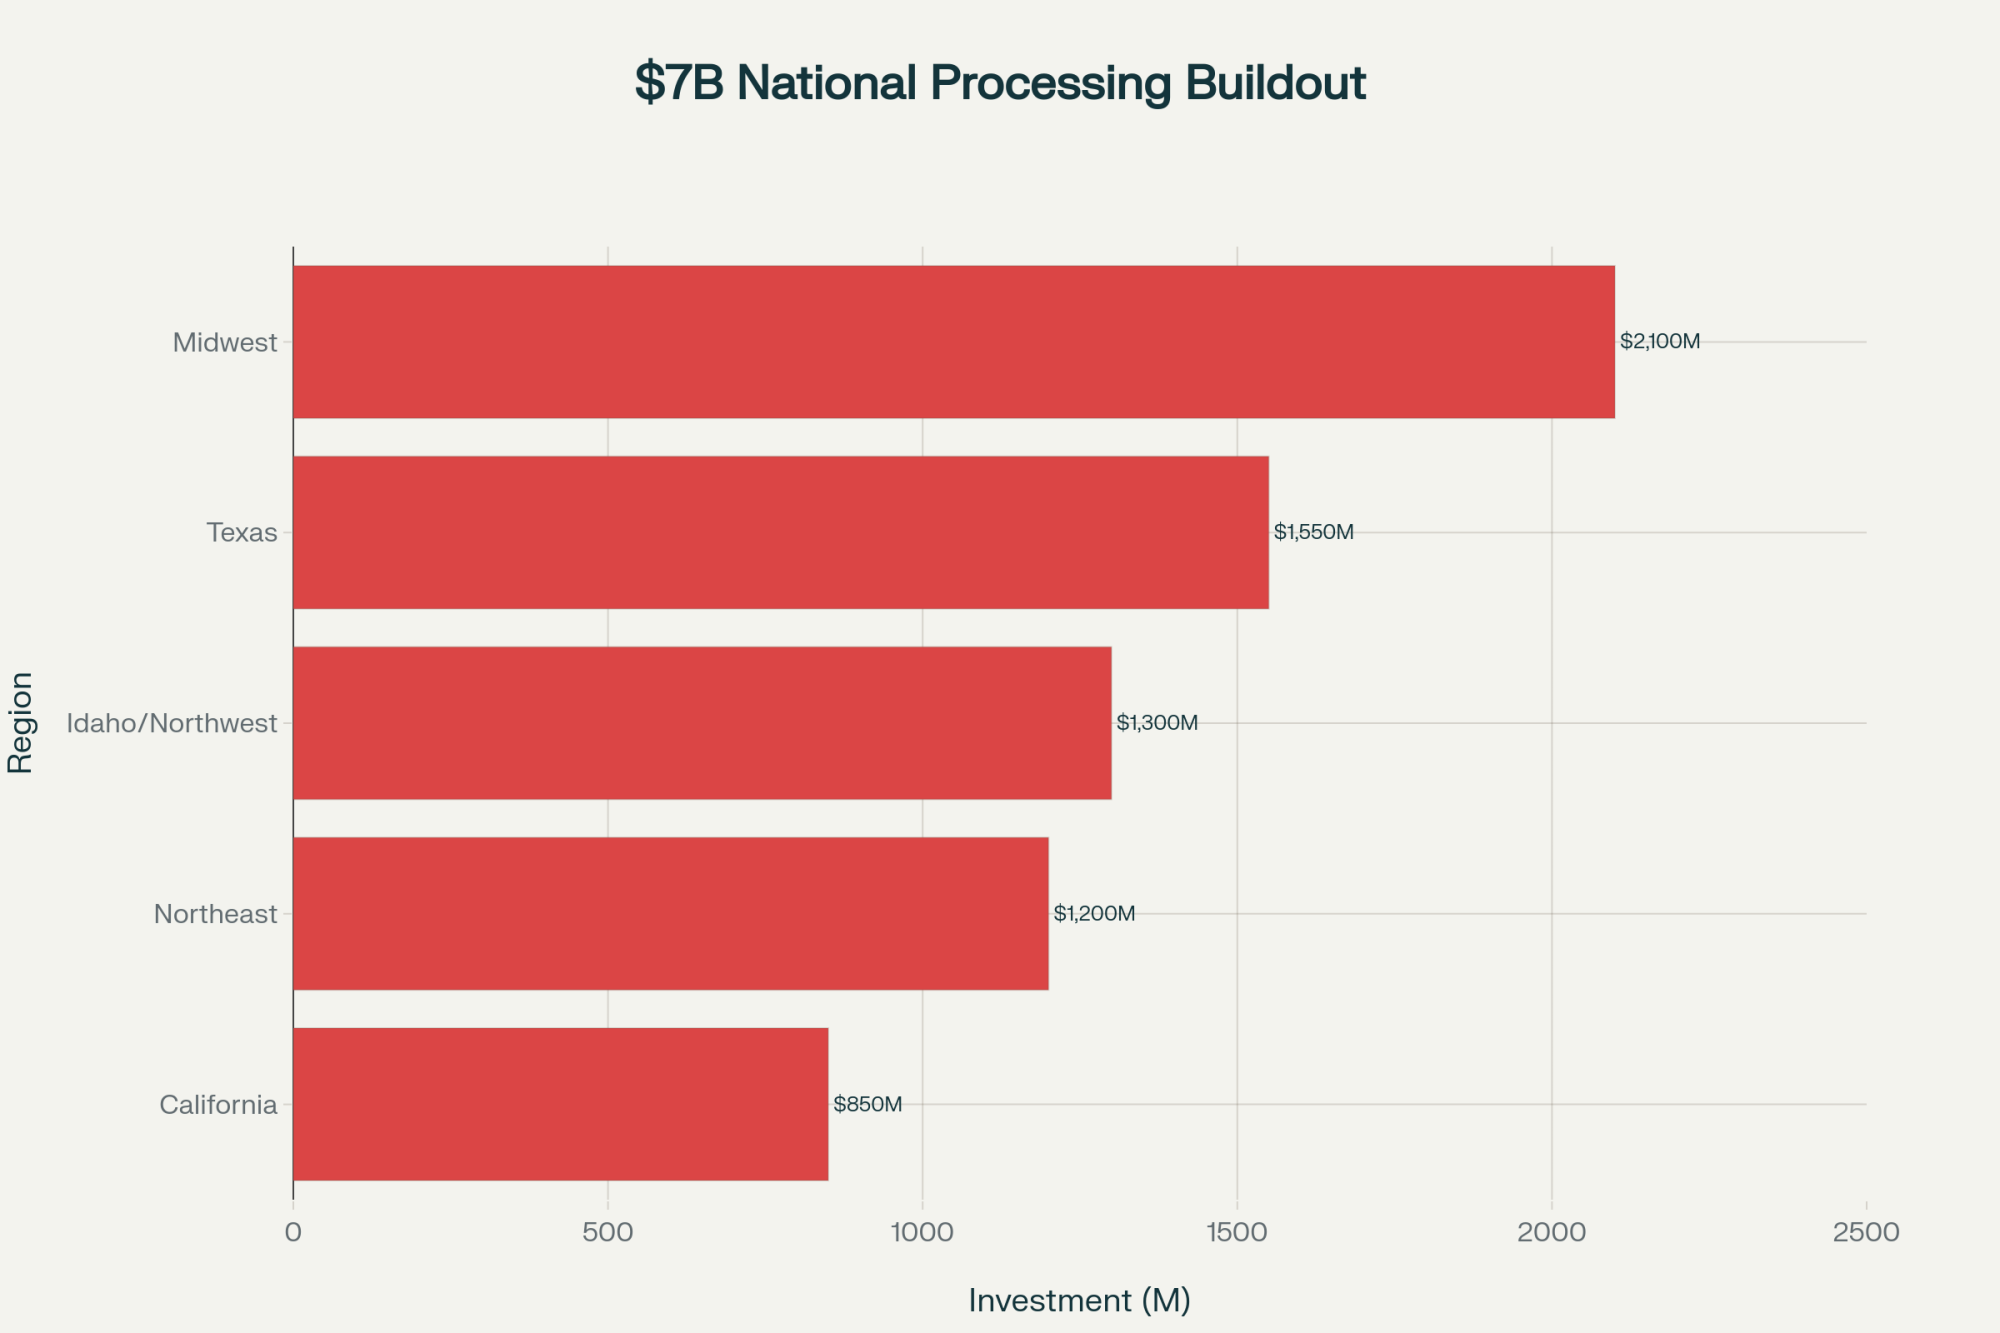
- Production moving to Idaho, New Mexico, Texas—where those economies of scale work better
- Traditional dairy states—Wisconsin, Vermont, upstate New York, and Pennsylvania Dutch Country—are losing half to two-thirds of their farms
You know, this consolidation might create certain efficiencies. Sure. But it reduces resilience. When 65% of your milk comes from fewer, larger operations, any disruption—such as a disease outbreak, a weather event, or another immigration raid—has massive impacts. We got a taste of this during COVID. Next time? It’ll be worse.
What You Need to Know Right Now
If Your Operation’s Losing Money
First thing—and I mean this week—sit down and calculate your actual runway. How many months can you really keep going at current burn rates? Be honest with yourself. This isn’t the time for optimism.
Get a confidential consultation with someone who understands agricultural transitions. Your state extension service can usually connect you. Do it now while you still have options. Every month you operate at a loss, you’re converting twenty to thirty thousand dollars in family wealth into expenses you’ll never recover. That’s real money that could be in your pocket.
Look at all your options. Strategic exit while you’ve got equity to preserve. Partnerships, if you’ve got the right neighbors and the relationship to make it work. Maybe pivoting to specialty markets if you’re positioned for it—A2 milk premiums, grass-fed certification, direct marketing if you’re near population centers. Scaling up if—and this is rare—you somehow have capital access.
But here’s what matters most: your family’s wellbeing trumps everything else. Your mental health, your marriage, your relationship with your kids—all of that matters infinitely more than what the neighbors think.
For the Lenders and Consultants
I know you’re reading this too. If you’re working with struggling operations, please—have honest conversations about strategic exits before all the equity’s gone. Stop promoting solutions that require capital these farms don’t have. That robotic milking system might be amazing technology, but not if the farm goes bankrupt before the ROI shows up.
Communities need to start planning for transitions. I know it’s hard to accept, but pretending family dairy’s going to reverse these trends somehow…that’s not helping anyone.
Making the Tough Call
I keep thinking about this Wisconsin family I know—real people, not a composite. They made their exit decision with about 8 to 10 months left in their viability window. Walked away with $482,000 in preserved equity. If they’d waited until the bank forced their hand? They’d have kept less than $200,000.
That $280,000 difference came down to one thing: having the courage to make a strategic decision while they still had choices.
For all of us looking at that 12 to 18 month countdown—and you know who you are—the question isn’t whether the farm continues. We can read the economics. The question is whether you preserve the wealth you’ve built through strategic action or lose it through delay.
Getting Help
If you’re struggling—financially, mentally, or both—please reach out. There’s no shame in it.
Mental Health Support:
- National Suicide Prevention Lifeline: 988
- Farm Aid Hotline: 1-800-FARM-AID
- AgriStress Helpline: 1-833-897-2474
Financial Planning:
- Your state extension service has transition specialists
- Wisconsin Farm Center: 1-800-942-2474
- Pennsylvania Center for Dairy Excellence: 1-888-373-7232
- Cornell PRO-DAIRY programs
- Michigan State Extension: 1-888-678-3464
Look, the clock’s ticking on thousands of operations. Understanding the timeline, recognizing your options, and—this is the hard part—acting while you still have choices…that’s what determines whether you preserve what three generations built or watch it disappear.
The decision’s incredibly difficult. I get that. But the math? The math is becoming clearer every day.
And if you’re reading this thinking, “he’s describing my farm”… maybe it’s time for that conversation you’ve been avoiding. Better to have it now, on your terms, than later on someone else’s.
We’re all in this together, even when it feels like we’re alone. And sometimes the bravest thing you can do is know when it’s time to preserve what you can and move forward.
KEY TAKEAWAYS
- Your 18-month countdown starts the day you can’t pay all bills on time—most farmers don’t realize until month 12, when half their equity is already gone
- The $380,000 decision: Exit strategically at month 8-10, keeping $480K, or wait for forced liquidation at month 18, keeping $100K (real Wisconsin example)
- Red flags demanding immediate action: Bank requests monthly financials, your 14-year-old runs milking shifts, you’re choosing between feed bills and diesel
- Three viable options remain: Strategic exit (preserves family wealth), partnerships with neighbors (1 in 4 succeed with $75-150K legal costs), or technology pivot (requires $800K+ capital)
- This week’s action: Call your state extension service for confidential consultation—it’s free, and waiting another month costs you $20-30K in family wealth that’s gone forever
Complete references and supporting documentation are available upon request by contacting the editorial team at editor@thebullvine.com.
Learn More:
- Why 2025 Could Be the Most Profitable Year for Dairy Farmers Yet! – This piece provides a counter-strategy to the exit-focused mindset, demonstrating how to leverage lower input costs, nutritional science, and smart herd management to build a stronger, more profitable bottom line in the current climate.
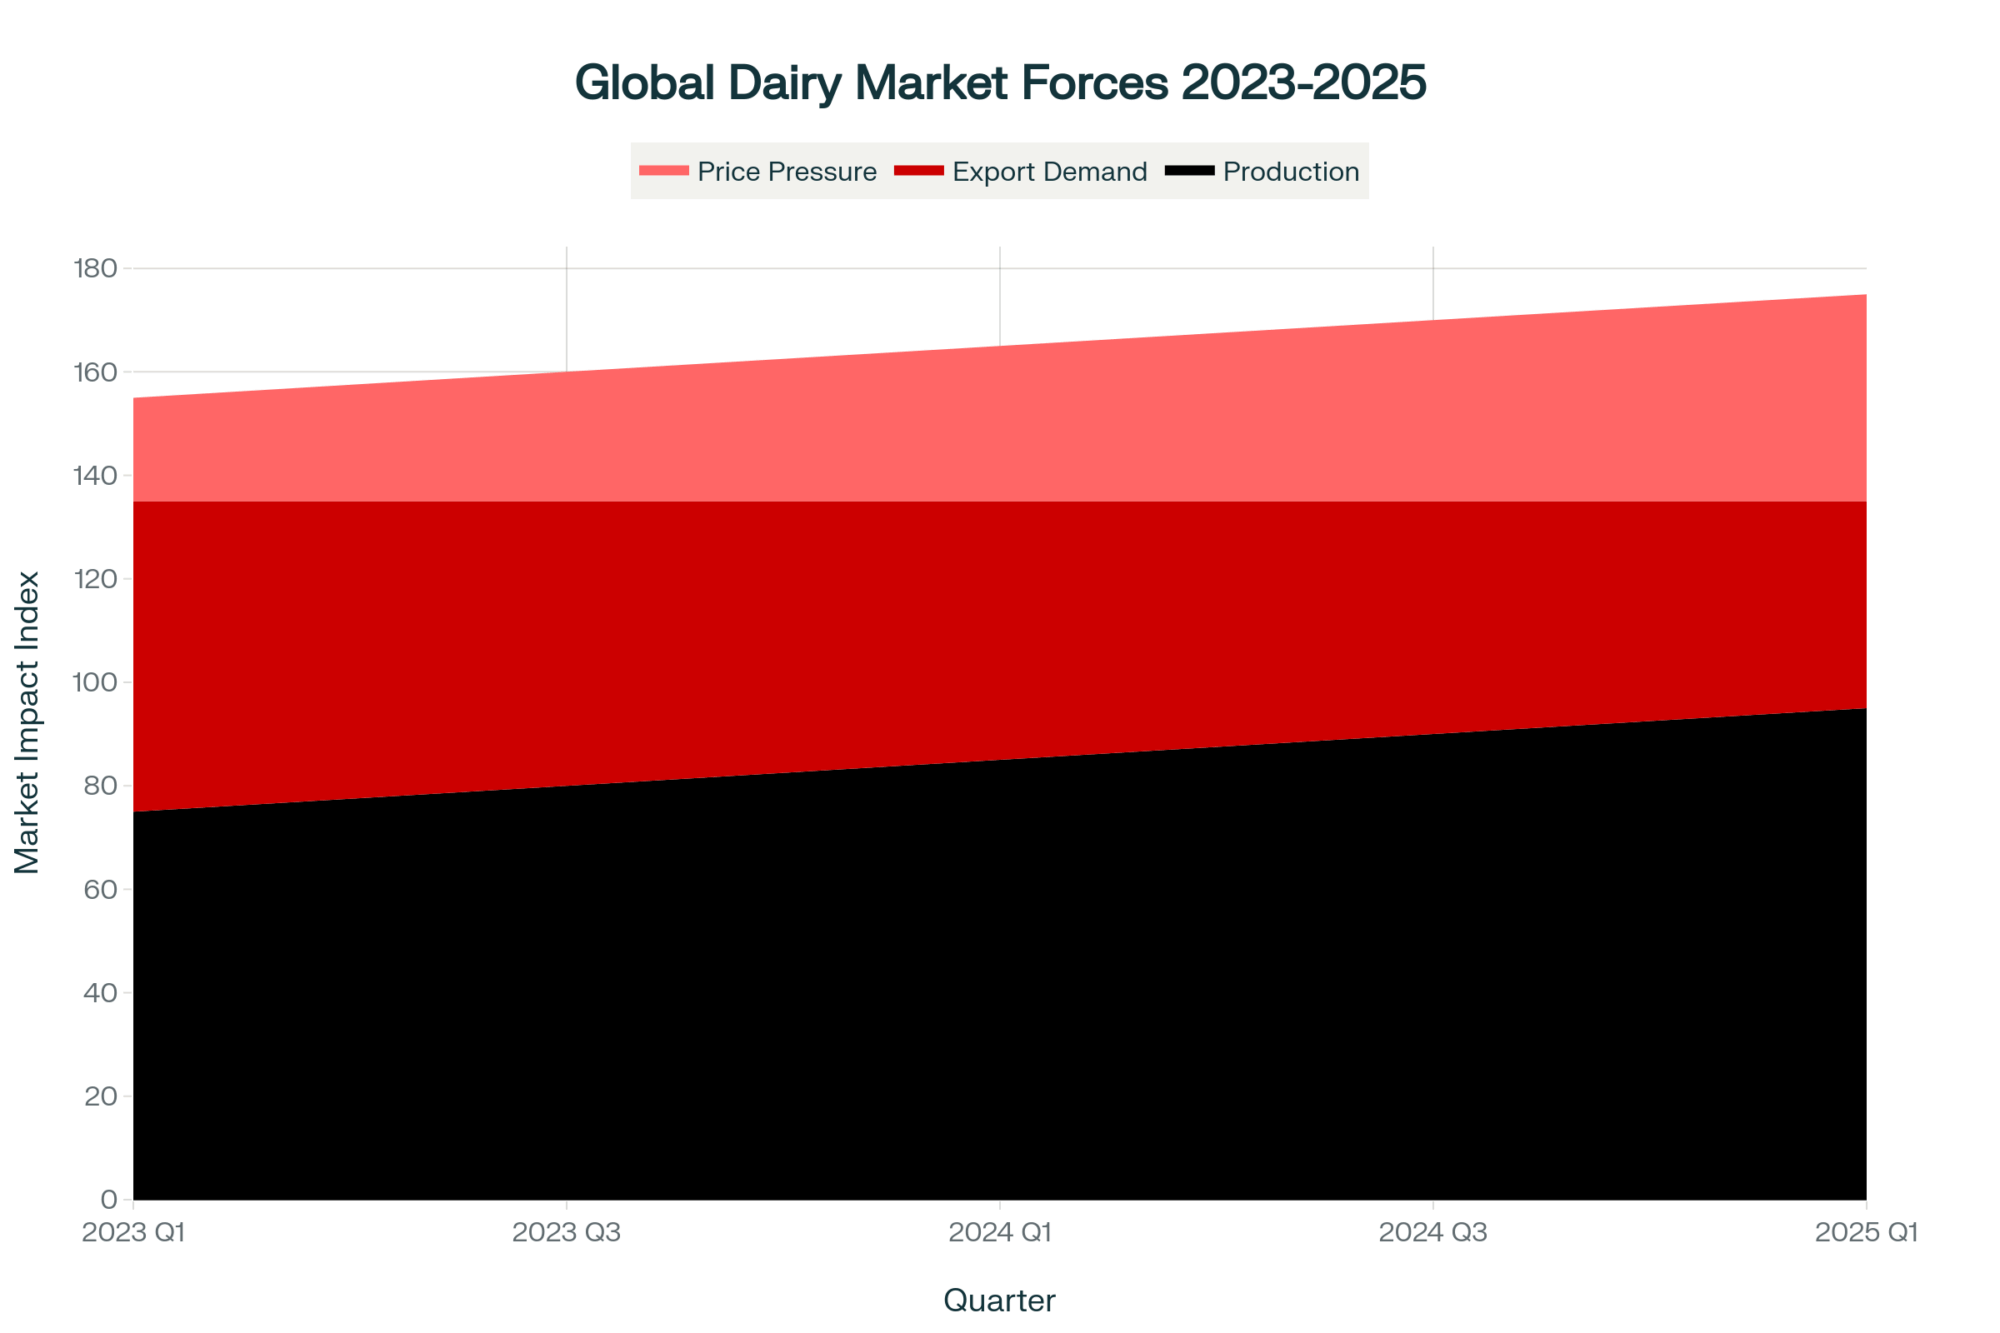
- Global Dairy Market Recap: Mixed Signals and Opportunities – January 20, 2025 – Understand the “why” behind your milk check. This article decodes the complex global signals, from European price drops to SGX futures, helping you make smarter strategic decisions by seeing the macro-trends before they hit your farm.
- Robotic Milking Revolution: Why Modern Dairy Farms Are Choosing Automation in 2025 – The main article cites the high cost of robotics; this piece details the high reward. It breaks down the ROI, labor-saving data, and health-monitoring advantages that make automation a viable long-term survival strategy.
 Join the Revolution!
 Join the Revolution!
Join over 30,000 successful dairy professionals who rely on Bullvine Weekly for their competitive edge. Delivered directly to your inbox each week, our exclusive industry insights help you make smarter decisions while saving precious hours every week. Never miss critical updates on milk production trends, breakthrough technologies, and profit-boosting strategies that top producers are already implementing. Subscribe now to transform your dairy operation’s efficiency and profitability—your future success is just one click away.