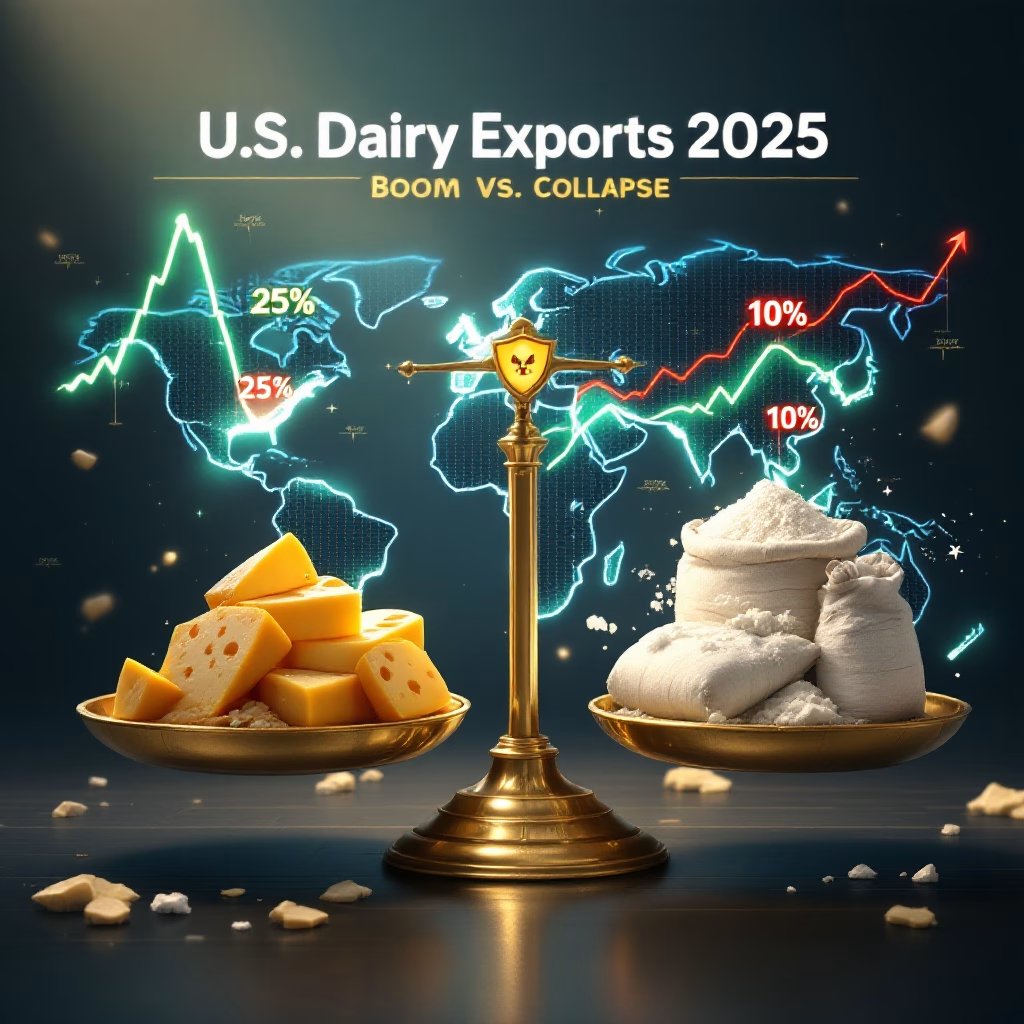
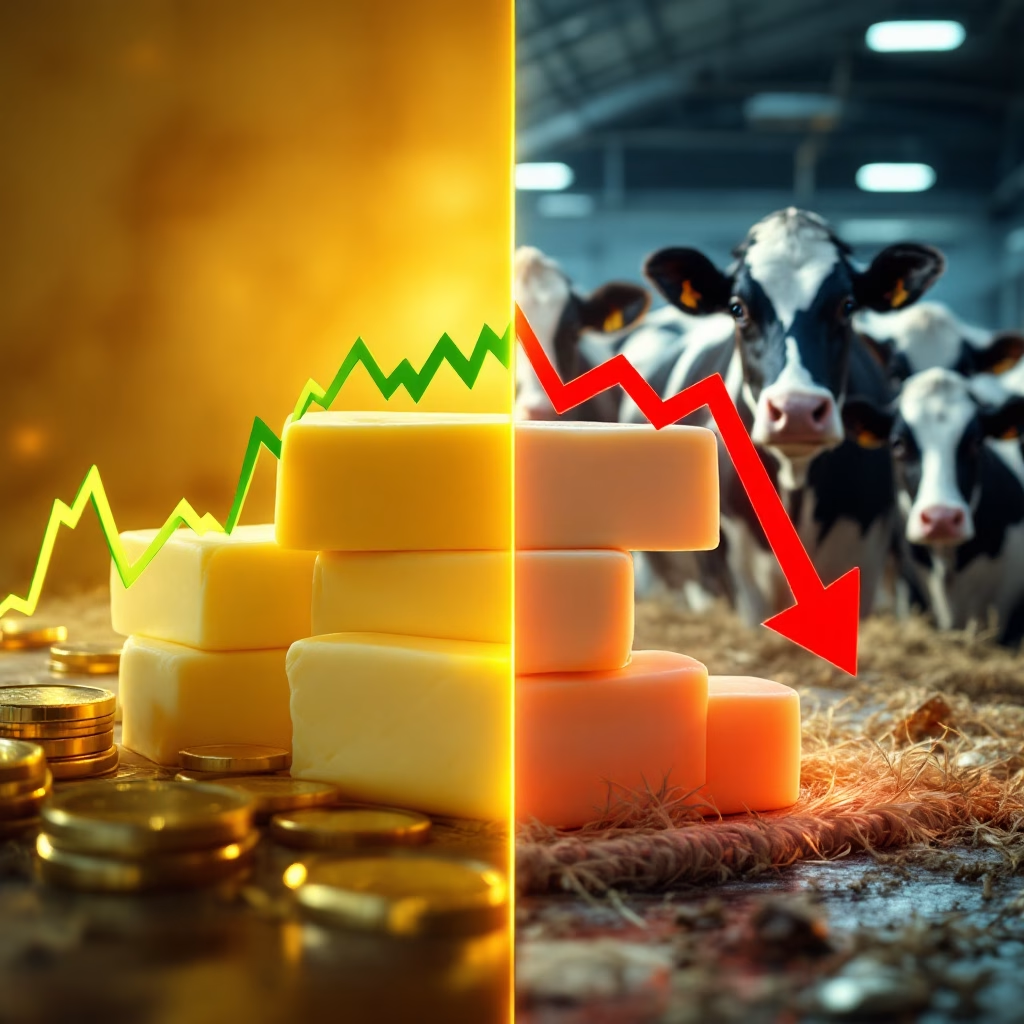
Fat outpacing protein: Global dairy markets fracture as European SMP plunges while Asian futures soar – component ratios reshaping the industry.
EXECUTIVE SUMMARY: The global dairy market for the week ending April 22, 2025, revealed critical divergences with fat-based products strengthening while protein markets splintered along regional lines. European and Asian dairy futures told dramatically different stories, with European SMP futures sliding 1.4% while Asian-focused contracts surged 3.4%, creating unprecedented regional price gaps. This market split occurs as European milk undergoes a fundamental transformation – fluid volume decreased 0.9% year-on-year, but milk solids increased 0.6%, driven entirely by higher fat content while protein remained flat. German processors have decisively responded by boosting butter production 10.9% at the expense of cheese output, exemplifying a strategic pivot toward capitalizing on the fat premium. Despite various regional pressures, most dairy commodities maintain substantial premiums over last year’s levels (butter +25.2%, whey +33.6%, WMP +21.8%), supporting generally positive margin outlooks for producers.
KEY TAKEAWAYS:
Component value trumps volume production: The EU data shows milk solids, particularly fat, driving returns despite lower fluid volume. Feeding strategies that optimize components rather than simply maximizing production volume will deliver superior margins in today’s market.
Regional market access increasingly critical: The stark divergence between European and Asian market sentiment for SMP and WMP highlights the importance of processor relationships. Producers selling into export-oriented plants may see completely different signals than those focused on domestic markets.
German manufacturing shift creating local pressure: The dramatic 10.9% increase in German butter production is creating temporary European spot price weakness despite strong global signals. This demonstrates how regional processing decisions can temporarily override broader market fundamentals.
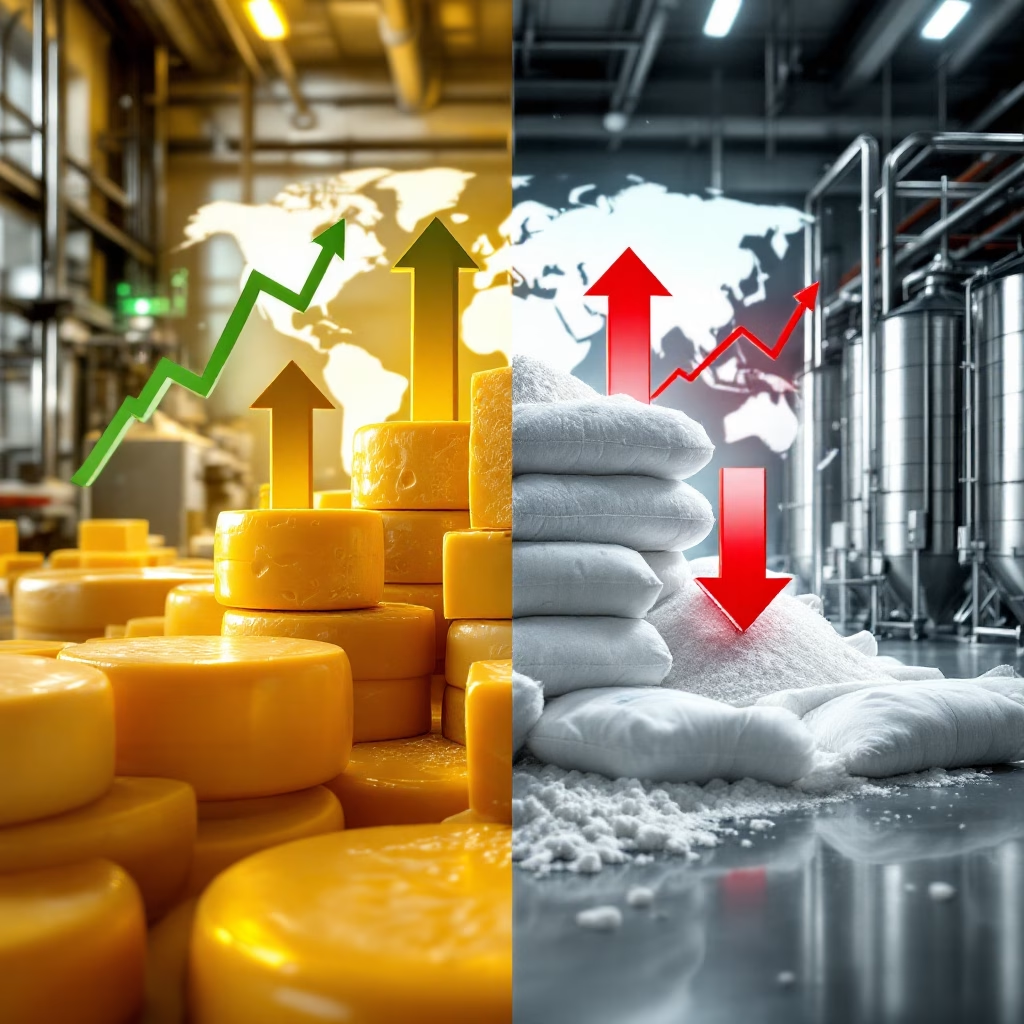
Mozzarella reveals global-European disconnect: While European mozzarella prices fell 0.9%, GDT auction prices surged 5.4% – signaling booming international demand not reflected in European internal pricing. This creates premium opportunities for export-oriented producers.
Long-term butterfat premium persists: Despite some weekly softness, butter maintains a substantial 25.2% premium over last year, suggesting the fat-focused production strategy remains economically advantageous through at least mid-2025.
European butterfat values soared to record highs while protein markets struggled in this week’s dairy trading. German processors have dramatically shifted production toward butter (+10.9%) and away from cheese as higher milkfat components reshape the manufacturing landscape.
Fat is king in today’s global dairy markets. That’s the unmistakable message from this week’s trading activity, which saw butter futures climb while SMP markets diverged sharply between regions. European milk production is undergoing a fundamental transformation – while total volume dropped 0.9%, farmers produce milk with significantly more fat content.
EEX dairy futures saw moderate activity, with 3,440 tonnes traded last week. Butter futures showed notable strength, gaining 1.4% to reach €7,292/tonne alongside expanding open interest – signaling traders are betting on continued butter strength.
Meanwhile, European SMP futures dropped 1.4% to €2,454/tonne despite increased open interest. When prices fall while bets increase, traders are positioning for further declines.
SGX trading volumes were substantially higher at 10,975 tonnes. The contradiction in SGX SMP sentiment was most striking, which gained 3.4% to $2,905/tonne, directly opposing the European outlook.
“We’re essentially seeing two completely different dairy worlds developing,” market analyst Thomas Weber explains. “European traders are bearish on protein while Asian buyers remain aggressively bullish.”
PROCESSORS FOLLOW THE MONEY
German dairy processors have responded decisively to these market signals. February butter production jumped 10.9% year-on-year (adjusted for leap year), while cheese output declined 0.8%.
European spot markets showed mostly declining prices as of April 16. The EU butter index dipped slightly (-0.2%) to €7,452/tonne, though French butter bucked the trend by rising 1.2% to €7,740/tonne.
SMP showed more pronounced weakness, with the EU index falling 1.9% to €2,385/tonne – consistent with the negative sentiment in EEX futures.
GLOBAL AUCTION SHOWS STRENGTH OUTSIDE EUROPE
The Global Dairy Trade auction painted a more optimistic picture, with the overall price index increasing 1.6% to $4,385/tonne. A substantial volume of 16,718 tonnes changed hands with strong participation from 181 bidders.
WMP made gains among major commodities, climbing 2.8% to $4,171/tonne. European-origin products commanded substantial premiums, with Solarec’s Belgian WMP selling at $4,800 compared to Fonterra’s $4,105 for the same contract period.
The most dramatic price movement came from lactose, which skyrocketed 22.0% to $1,376/tonne, signaling significant supply disruption or sudden demand surge likely related to infant formula production.
One of the most striking market divergences appeared in mozzarella. While European EEX Mozzarella dropped 0.9% to €4,225/tonne, the GDT Mozzarella index surged 5.4% to $4,763/tonne.
This dramatic contradiction points to booming international demand for pizza cheese that isn’t reflected in European internal pricing. Asian food service growth drives this export demand while domestic European consumption lags.
Most European cheese indices continued declining, with Cheddar Curd and Mild Cheddar down 0.9% and 0.8%, respectively. Only Young Gouda showed resilience with minimal gain.
MILK COMPOSITION DRIVING MARKET DYNAMICS
The February 2025 milk production data reveal a transformative shift affecting the dairy complex. While overall EU-27+UK fluid milk decreased by 0.9%, the composition improved significantly, with average fat content reaching 4.26% and protein 3.48%.
This compositional change increased total milk solids by 0.6% year-on-year despite lower fluid volume. Breaking down the components shows the increase was driven entirely by fat (+1.0%), while protein remained completely flat.
Denmark exemplifies this trend even more dramatically. Despite fluid milk falling 1.4%, Danish milk solids jumped 1.7% due to significantly higher fat content (4.65% vs. 4.46% last February).
This fundamental shift towards higher fat content provides a biological explanation for the relative price strength of butter versus SMP. There’s more fat and no additional protein entering the market than last year.
WHAT THIS MEANS FOR YOUR FARM
For dairy producers, these market signals suggest several key strategies:
Focus on fat production for maximum returns. With European butterfat values remaining 25.2% above last year despite recent softness, the economic signals favor optimizing for fat over volume.
Watch your market exposure. Processors with strong export connections to Asia are seeing dramatically different demand signals than those focused solely on European markets, particularly for products like SMP and mozzarella.
Understand your milk price formula. The growing divergence between fat and protein values means your pay formula’s component weighting will dramatically impact your bottom line this year.
Consider feed strategies that boost butterfat. With EU butter spot prices 25.2% higher than last year, feed additives and ration adjustments that enhance fat production will likely deliver strong ROI.
THE BOTTOM LINE
The global dairy market is experiencing a fundamental restructuring of relative values between fat and protein. This isn’t just a temporary price fluctuation – it reflects changing consumer preferences and biological shifts in milk composition.
Smart producers are already adapting their breeding and feeding programs to capitalize on this new reality. With fat components driving returns despite lower fluid volume, the old model of chasing maximum milk production looks increasingly outdated.
“We’re seeing a once-in-a-generation shift in how milk value is created,” notes dairy economist Maria Gonzalez. “Farmers who understand this component revolution will thrive, while those stuck in a volume mindset may struggle despite producing more milk.”
Join over 30,000 successful dairy professionals who rely on Bullvine Daily for their competitive edge. Delivered directly to your inbox each week, our exclusive industry insights help you make smarter decisions while saving precious hours every week. Never miss critical updates on milk production trends, breakthrough technologies, and profit-boosting strategies that top producers are already implementing. Subscribe now to transform your dairy operation’s efficiency and profitability—your future success is just one click away.
Chinese buyers stockpiling dairy as tariffs hit! Whey imports explode 41.7% while New Zealand celebrates and US suppliers face extinction from 125% tariffs.
EXECUTIVE SUMMARY: China’s dairy import landscape has dramatically shifted in early 2025, with March data showing explosive growth in whey (41.7%), cheese (8.6%), and whole milk powder (30.7%) as buyers race to beat crushing new tariffs. This surge comes amid a perfect storm: Chinese domestic milk production has plummeted below cost at .40/cwt, the recovering hog industry is driving unprecedented whey demand, and trade wars have created clear winners (New Zealand with duty-free access) and losers (US facing prohibitive 125% tariffs). The timing couldn’t be more critical – China implemented initial 10% tariffs on US dairy products on March 10th before escalating to levels that effectively slam the door on American suppliers, reshaping global dairy supply chains virtually overnight. While most categories show strength, infant formula remains the exception with imports plummeting 35% due to China’s birth rate collapse, creating a market where overall volume shrinks yet premium segments thrive.
KEY TAKEAWAYS
Chinese buyers are stockpiling whey at record levels – March imports reached 67,812 metric tons, the highest monthly volume in nearly four years, driven by both tariff fears and surging demand from China’s recovering pig industry following African Swine Fever
New Zealand dominates as US faces extinction in China – With duty-free access as of January 2024, New Zealand has captured nearly 46% of China’s dairy imports and dominates growing butter/cheese segments, while American suppliers face devastating 125% tariffs that effectively eliminate export opportunities
Domestic production crisis creates import opportunities – Chinese milk prices have fallen to $19.40/cwt (15% below last year), well below production costs, forcing smaller operations out of business and creating a supply gap that imports must fill
Trade policy now outweighs market fundamentals – Geopolitical tensions have replaced traditional economic signals as the primary driver shaping dairy trade flows, requiring exporters to develop new strategic approaches focused on policy risk rather than just price competitiveness
Category-specific approach critical for success – While overall dairy imports grow, the infant formula market has collapsed by 35% due to demographic challenges, highlighting how success requires targeted strategies for specific segments rather than broad-brush approaches
Chinese buyers are scrambling to secure dairy supplies amid escalating trade tensions, with March import volumes surging across most categories. Whey imports exploded to 67,812 metric tons – a stunning 41.7% jump from last year – while cheese imports climbed 8.6% and whole milk powder jumped 30.7%. Behind these dramatic numbers lies a perfect storm of factors: buyers racing to beat crippling tariffs, domestic milk production faltering below cost, and shifting supplier dynamics that have New Zealand dairy farmers celebrating while American exporters face disaster. The new trade landscape creates clear winners and losers that will reshape dairy markets for years.
Supplier
Market Position
Key Trends (Jan-Feb 2025)
Key Challenges (as of April 2025)
New Zealand
Dominant (46% share)
Strong growth in butter, cream, cheese
None – enjoys full duty-free access
European Union
Major Supplier
Overall volume down 16.5%; strength in specific categories
Anti-subsidy investigation by China
United States
#3 Supplier
Significant decline expected
Facing prohibitive 125% tariffs
Australia
Key Supplier
Strong performance in cheese
There are fewer trade barriers than the US/EU
Chinese Buyers Stockpile Whey as Tariff Deadline Looms
Talk about planning! Chinese importers dramatically accelerated their whey purchases in March, pushing low-protein whey imports to their highest monthly volume in nearly four years.
Why the sudden buying frenzy? It’s simple – they’re racing against the tariff clock. The United States has dominated China’s whey market, supplying nearly 46% of its imports in early 2025. However, with US-China relations deteriorating and new Trump administration tariffs looming, Chinese buyers knew the party wouldn’t last forever.
“This isn’t random stockpiling – it’s calculated risk management,” says dairy market analyst Zhang Wei. “Chinese feed mills and food processors can see the writing on the wall with these trade tensions.”
The timing couldn’t be more critical. It was just the beginning when China slapped that initial 10% tariff on US dairy products on March 10th. By early April, we’d seen those rates skyrocket to a prohibitive 125%, slamming the door on American suppliers. For perspective, China represents about $584 million in annual US dairy exports – making it America’s third-largest market.
Isn’t it interesting how seemingly unrelated factors create market opportunities? The surge in whey imports directly connects to China’s ongoing recovery from African Swine Fever (ASF), which devastated their hog industry starting in 2018.
This highly contagious virus forced the mass culling of infected herds, slashing China’s swine inventory by 40-60%. But here’s what matters now – their pig industry is recovering, driving serious whey demand for piglet feed.
Remember how US whey shipments to China plummeted 41% in August 2023 compared to the previous year? That trend has completely reversed as China’s pig farms rebuild. But there’s another critical factor at work – industry restructuring. After ASF decimated small farms, larger commercial operations gained market share. These bigger farms wean piglets earlier, which means they use more whey per pig throughout its lifecycle.
Before ASF hit, China’s whey consumption averaged about 0.45 kg per piglet. That figure’s climbing as consolidation continues, potentially driving even greater demand as herds fully recover. But here’s the billion-dollar question: where will all that whey come from now that US suppliers face prohibitive tariffs?
Cheese and Milk Powders Also Show Strength
It’s not just whey we are seeing dramatic increases. Chinese cheese imports reached 16,726 metric tons in March, climbing 8.6% above year-ago levels. Unlike whey, where American suppliers dominated, New Zealand has captured the lion’s share of China’s cheese market.
Let’s face it – New Zealand dairy exporters are now drinking champagne. Their free trade agreement gives them duty-free access to China while American suppliers face crushing tariffs. The numbers tell the story – New Zealand and Australia supplied about 80% of China’s cheese imports in early 2025.
New Zealand’s strong milk production season has allowed them to pivot manufacturing toward products that are seeing increased Chinese demand. Their timing couldn’t be better as trade barriers knock out their biggest competitor.
Milk powder imports also rebounded in March, with whole milk powder surging 30.7% to 43,232 metric tons, while skim milk powder eked out a slight 0.7% gain. This marks a reversal from earlier trends, as China reduced powder imports during January and February.
Domestic Production Challenges Create Import Opportunities
Have you noticed China’s domestic dairy sector is caught in a painful price-cost squeeze? Chinese milk prices have been spiraling downward since late 2021, hitting $19.40/cwt in January 2025 – well below the cost of production for many farmers.
Rabobank forecasts a 2.6% decline in China’s milk output in 2025, marking the second consecutive year of contraction. With farmgate milk prices 15% lower year-over-year in February, Chinese farmers have little incentive to expand production.
Many smaller operations are exiting the business entirely, while even larger farms are scaling back production plans. This domestic supply contraction creates a fundamental gap that imports must fill, especially as Chinese consumers show signs of increasing dairy consumption in specific categories.
Early 2025 economic data indicated stronger-than-expected results, potentially boosting consumer purchasing power for dairy products. But here’s the kicker – the escalating trade war threatens to undermine this economic momentum. China exported nearly $440 billion worth of goods to the United States last year, and economists warn the trade war will significantly impact China’s growth prospects.
Infant Formula: The One Category Bucking the Trend
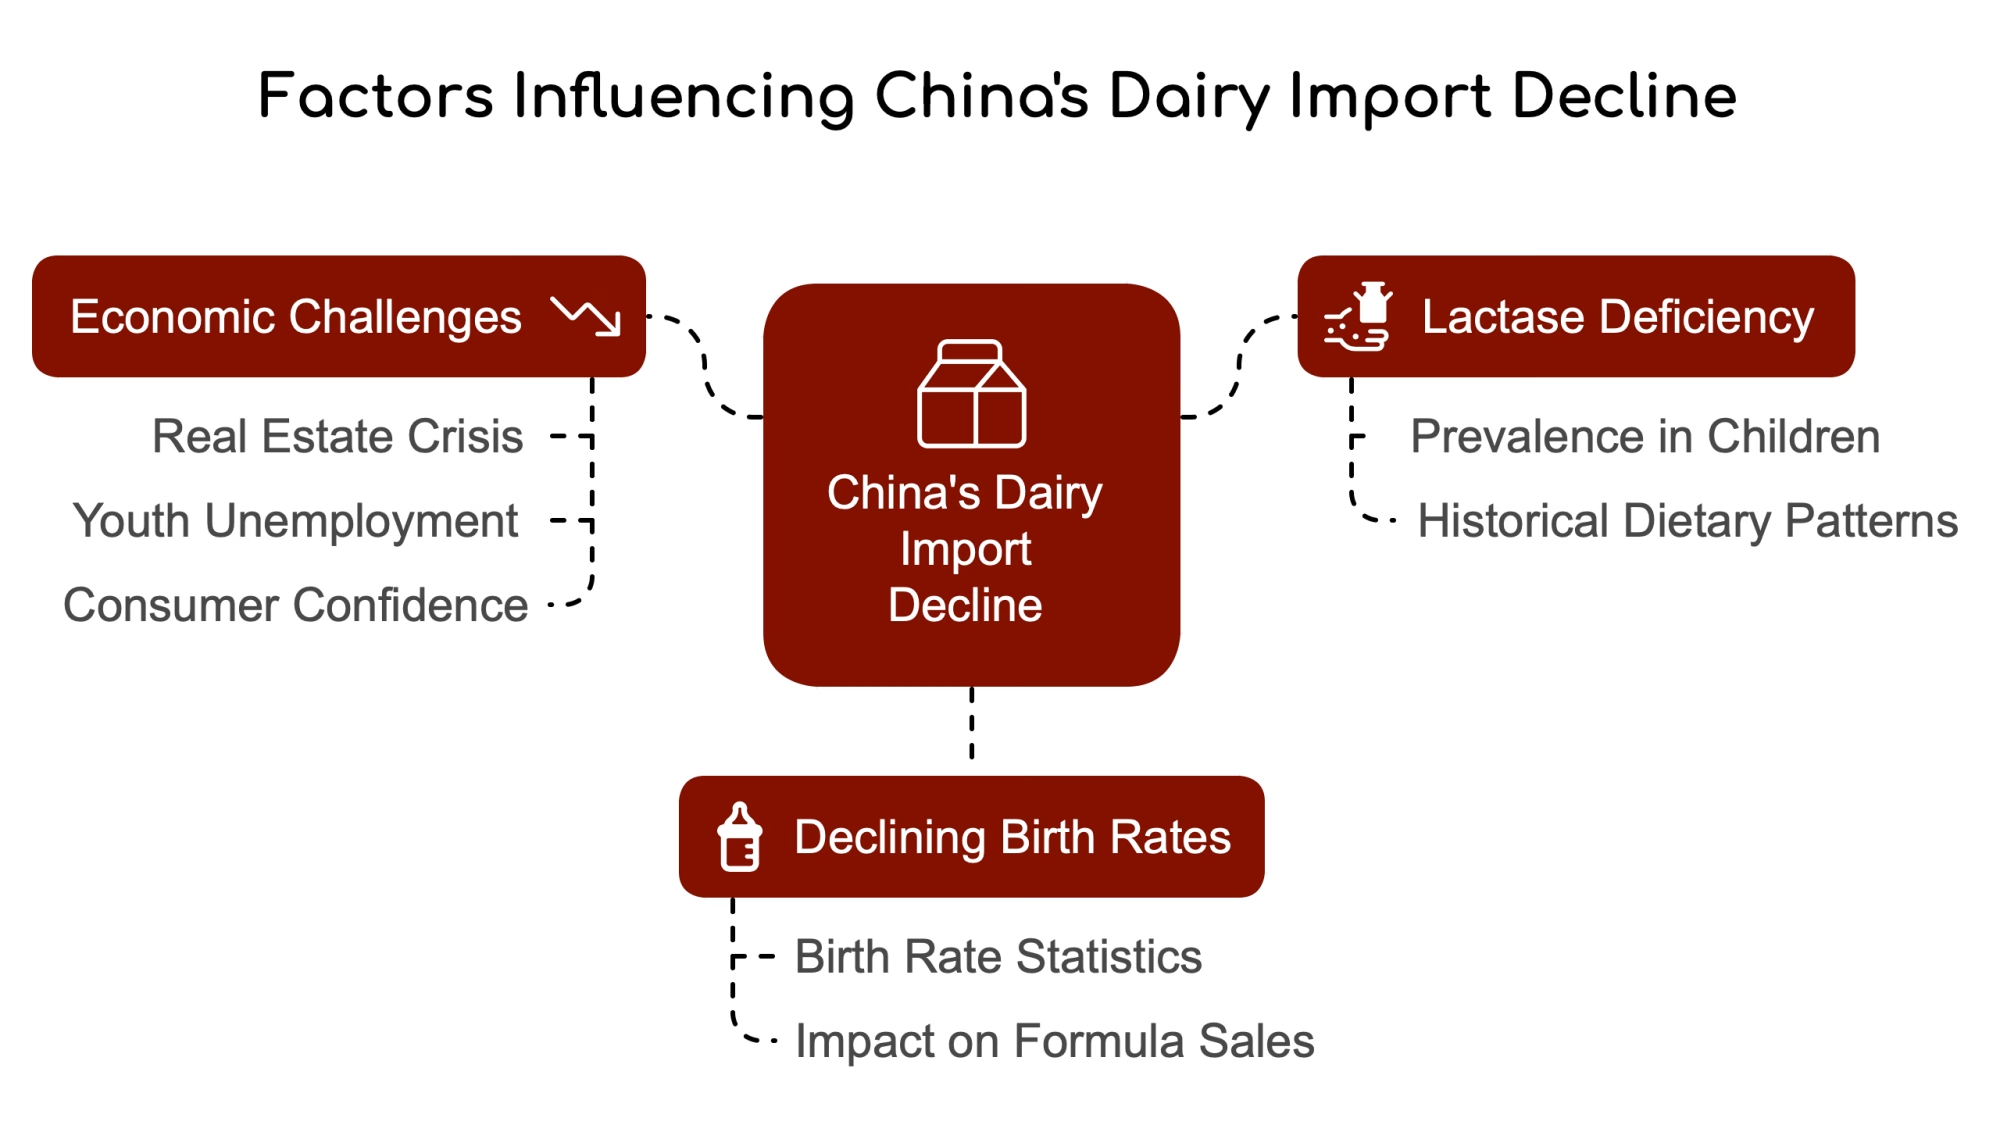
While most dairy categories are growing, infant formula tells a different story. China’s imports fell by a shocking 14.8% in 2024, and the downward trend has only accelerated in 2025, with imports down 35% in the first half of the year compared to 2024.
The reason? It’s simple demographics. China’s birth rate has collapsed, with annual births plummeting by half between 2016 and 2023 – from 18.7 million to just 9 million babies. One food industry analyst bluntly called it a “crisis” for the infant formula industry.
But even within this shrinking market, there are fascinating bright spots. Several foreign infant formula brands achieved double-digit growth in 2024 by focusing on the premium segment, which expanded to 37% of the market from 32.8% in 2023.
Isn’t that typical of China’s evolving consumer landscape? Even as the overall market contracts, premium and specialized segments grow. Health-conscious Chinese parents with means are increasingly seeking specialized formulas like hypoallergenic options and organic products. The lesson here? Companies with the right premium positioning can still win even in challenging markets.
New Supplier Landscape: Winners and Losers
The escalating US-China trade war has completely reshuffled the competitive landscape for dairy exporters to China, creating clear winners and losers overnight.
New Zealand: Popping Champagne
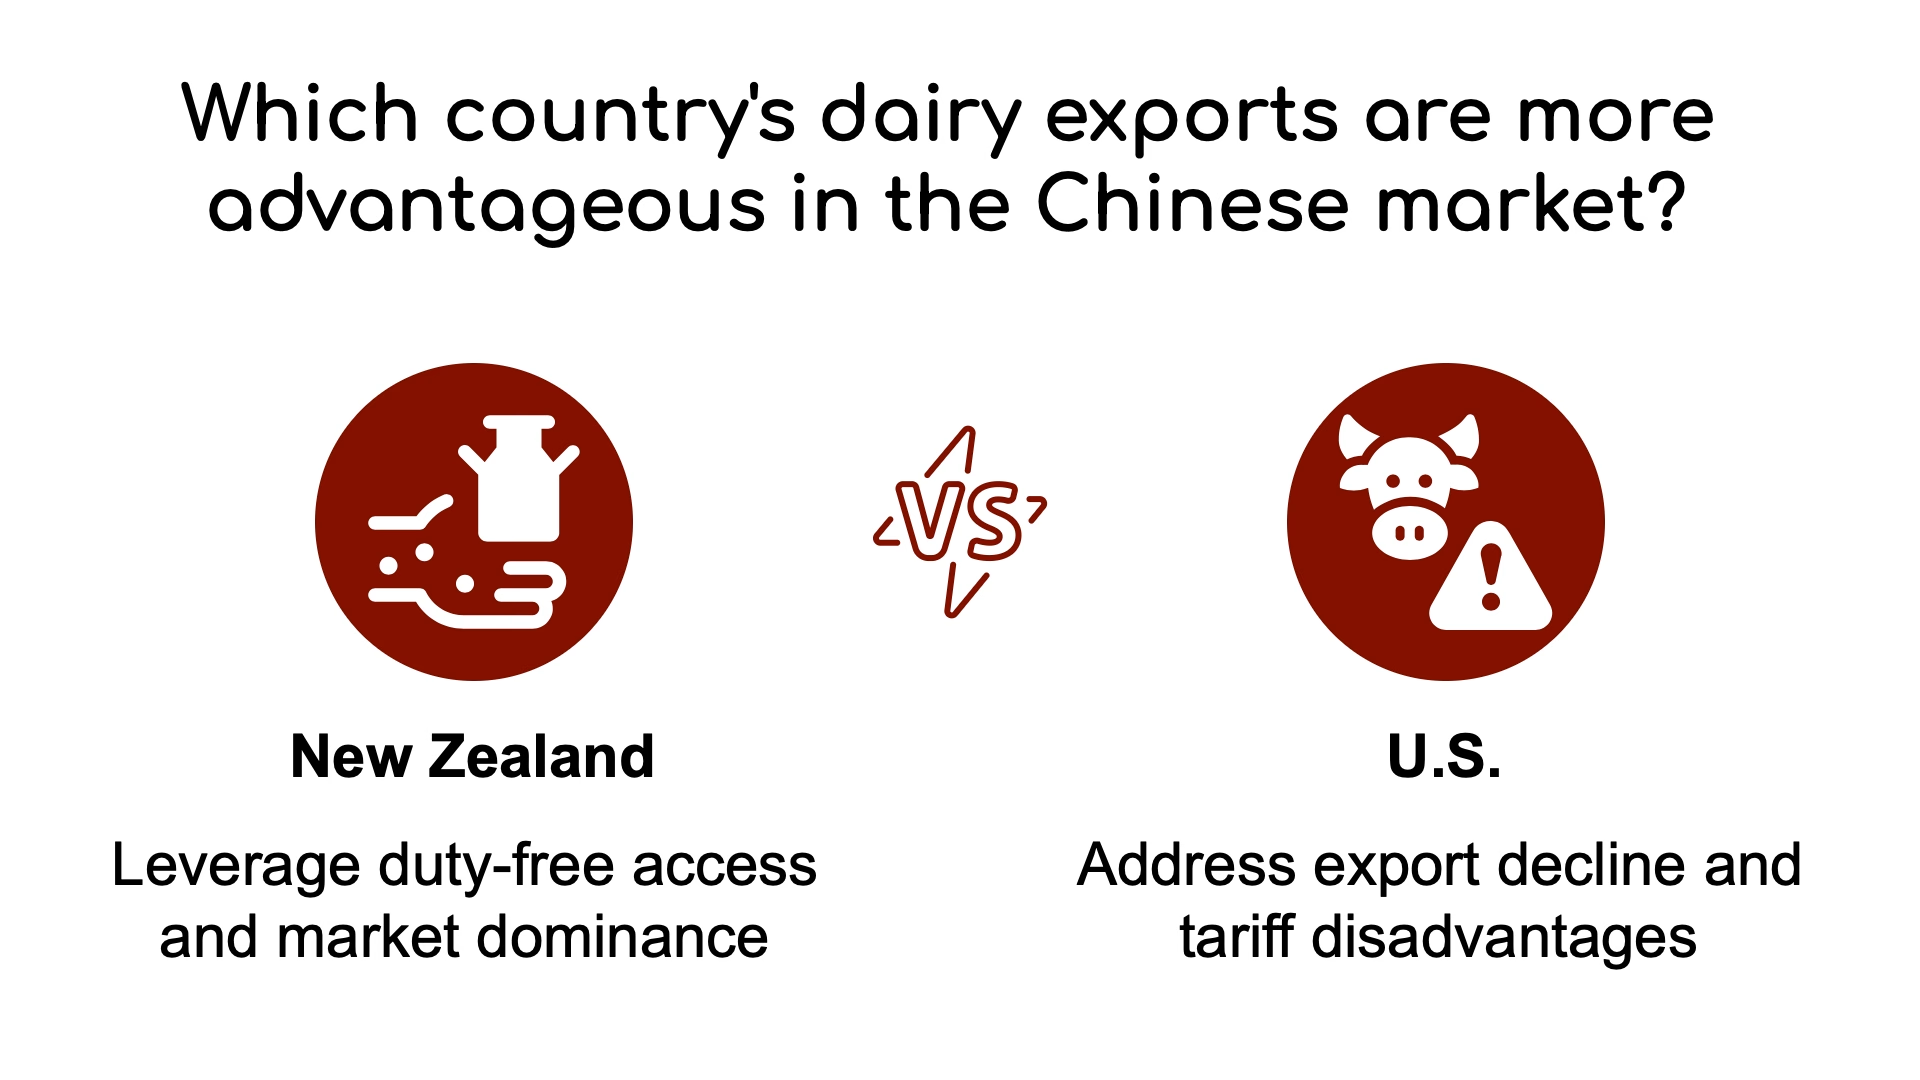
New Zealand couldn’t have scripted a better scenario if they tried. Already China’s largest dairy supplier with a 46% share of total dairy import volume in 2024, New Zealand’s position is further strengthened by its comprehensive free trade agreement. While US products face punishing tariffs of up to 125%, New Zealand’s dairy enters China completely duty-free as of January 2024.
The impact is already visible in trade data. New Zealand dominated China’s growing imports of butter (up 72.6%), cream (up 12.7%), and cheese (up 14.5%) during January-February. Fonterra, New Zealand’s dairy giant, reported January shipments significantly higher in volume and value, driven partly by Chinese demand.
United States: From Leader to Loser Overnight
For US dairy exporters, the situation has turned dire. The initial 10% tariff slapped on US dairy products on March 10th quickly escalated to a prohibitive 125% by mid-April, effectively pricing American dairy out of the Chinese market.
This goes far beyond just lost sales. The damage spreads throughout the supply chain as American processors scramble to find alternative markets for massive product volumes, potentially at lower prices.
The whey category faces the most immediate impact. With nearly half of US whey exports headed to China, processors now face the daunting challenge of redirecting these volumes to other markets. Can they pivot fast enough, or will we see a price collapse in other markets as diverted products flood in?
European Union: Caught in the Middle
The European Union occupies a middle ground in this trade reshuffling. EU dairy exports to China decreased by 16.5% in early 2025, but specific countries and products showed strength. France emerged as a key supplier of butter and cream, while Italy saw its fresh cheese exports to China soar by 38.7%.
A significant win for European suppliers came in March when China lifted restrictions on heat-treated German dairy products that had been imposed due to a foot-and-mouth disease case. This reopened a vital market for Germany, which sent nearly 25% of its non-EU dairy exports to China in 2023.
But can European suppliers capitalize on America’s misfortune? They face challenges with China’s ongoing anti-subsidy investigation into certain EU dairy imports, particularly cream and cheese varieties. This probe creates uncertainty for future EU access to the Chinese market. Are we seeing a pattern of China systematically targeting Western dairy suppliers while favoring New Zealand and Australia?
What This Means for Global Dairy Markets
The shifts in China’s import patterns have significant consequences for the Chinese domestic market and the broader global dairy landscape.
For US dairy farmers, the situation is harrowing. Not only are exports to China effectively blocked, but the redirection of products to other markets will likely pressure domestic prices. The USDA has slashed milk price forecasts for 2025, with analysts projecting Class III milk prices could drop by 35¢/cwt due to trade disruptions.
New Zealand and Australian producers stand to benefit as they fill the gap left by American suppliers. European exporters may find opportunities in specific categories like whey and lactose, which the US previously dominated, though they must navigate their trade tensions with China.
For Chinese consumers, the long-term impact will likely be higher prices for certain dairy products as tariffs force a shift to potentially more expensive suppliers. The country’s efforts to increase domestic production self-sufficiency may accelerate in response to these trade disruptions.
The Bottom Line: Navigating the New Dairy Order
Let’s face it – the surge in China’s March dairy imports reflects both opportunistic buying ahead of tariffs and genuine need driven by domestic production shortfalls. This short-term boost masks more profound structural changes in the global dairy trade that will persist long after the headlines fade.
Understanding these shifting trade patterns for dairy farmers worldwide is crucial for navigating the reality of the new market. Those in tariff-affected regions must explore alternative markets and possibly adjust production plans. At the same time, those with favorable access to China should capitalize on the opportunity while remaining vigilant about potential policy changes.
The dairy industry has always been cyclical, but today’s challenges extend beyond normal market fluctuations. The current trade war has fundamentally altered competitive dynamics in ways that will reshape dairy supply chains for years, requiring unprecedented adaptability from all market participants.
Are you positioned to thrive in this new landscape, or will you be caught flat-footed as markets shift? The winners will recognize these structural changes early and adapt their strategies accordingly. The losers? Those who expect things to go back to “normal” once this trade dispute resolves. The harsh reality is that we’re looking at a permanently altered dairy trade landscape – and the time to adjust is now.
Chinese Dairy Demand Drops: What It Means for Global Dairy Markets – Provides context on China’s contrasting import trends from late 2024, when whole milk powder imports plummeted 45% while cheese imports grew 6%, illustrating the category-specific nature of Chinese demand.
Join the Revolution!
Join over 30,000 successful dairy professionals who rely on Bullvine Daily for their competitive edge. Delivered directly to your inbox each week, our exclusive industry insights help you make smarter decisions while saving precious hours every week. Never miss critical updates on milk production trends, breakthrough technologies, and profit-boosting strategies that top producers are already implementing. Subscribe now to transform your dairy operation’s efficiency and profitability—your future success is just one click away.
U.S. Dairy Under Siege: 125% China Tariffs, Bird Flu & Labor Crunch Threaten $76B Industry’s Survival.
EXECUTIVE SUMMARY: The U.S. dairy industry faces a perfect storm of 125% Chinese tariffs, avian flu outbreaks in 18 states, and labor shortages, jeopardizing its $76B domestic market and 17% export dependency. While record consumer demand (661 lbs/person) and competitive cheese/butter pricing offer temporary relief, China’s trade blockade has crushed whey exports, risking a $0.90/cwt milk price collapse. With Mexico and Canada absorbing 50% of exports and $8.5B in processing upgrades underway, survival hinges on market diversification, biosecurity overhauls, and aggressive risk management.
KEY TAKEAWAYS
China’s 125% tariffs shut down the #1 global dairy importer, crushing $584M in annual whey exports overnight.
Domestic demand hits 66-year highs (661 lbs/person) but can’t absorb 17% of milk production if exports stall.
HPAI outbreaks in 1,021 herds add production risks and could trigger non-tariff trade barriers.
U.S. cheese/butter prices undercut global rivals by 21-33%, but extreme tariffs negate this advantage.
Strategic lifelines: Diversify to Southeast Asia/MENA, lock in $18/cwt futures, and convert lactose to ethanol.
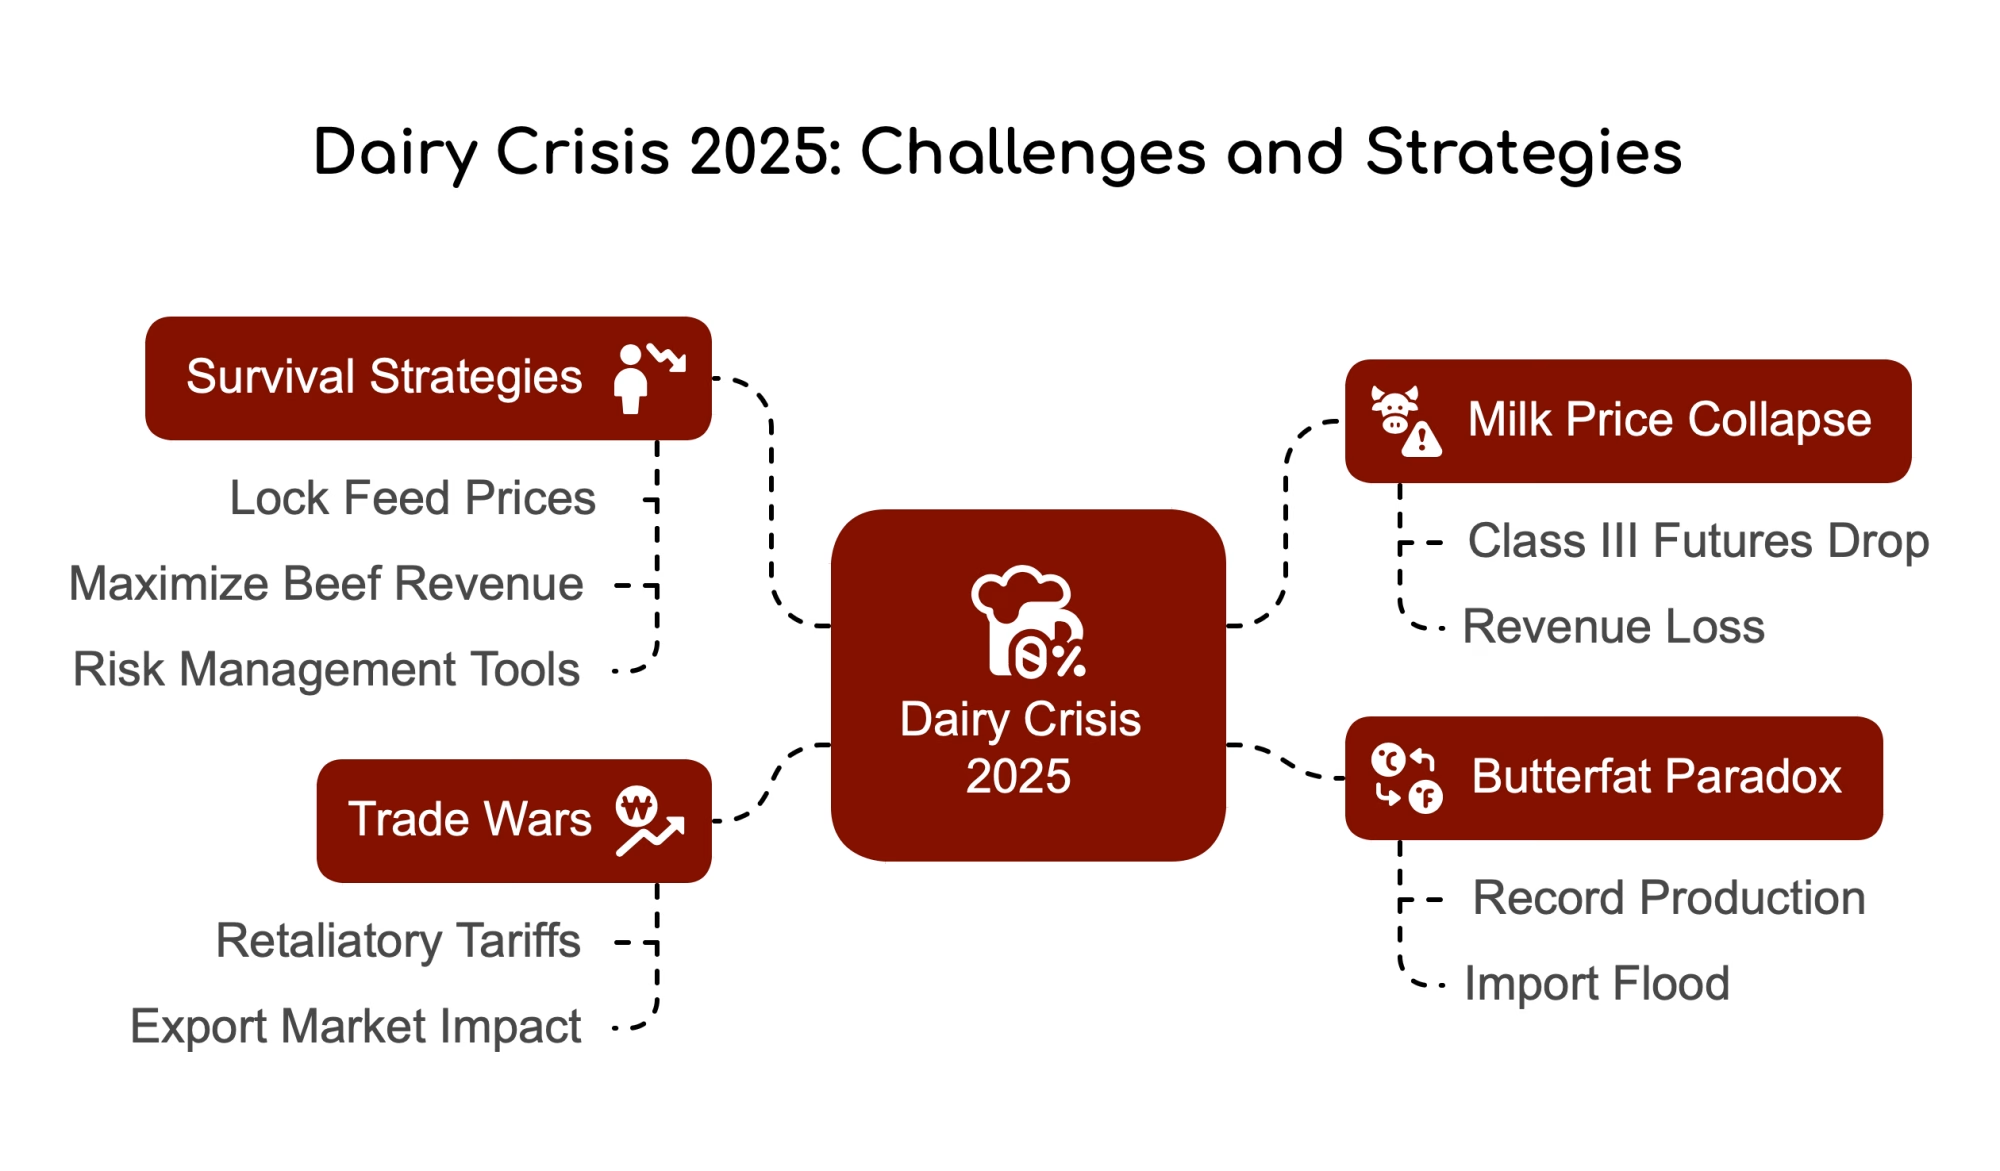
China slapped a whopping 125% tariff on all American dairy products, slamming the door on the world’s largest import market. This trade crisis couldn’t come at a worse time as the industry battles widespread avian influenza across 18 states and persistent labor shortages, creating dairy’s difficult trifecta.
The tariff war exploded in early April 2025, with the U.S. imposing 145% duties on Chinese goods while China hit back with 125% tariffs on everything American. Despite strong domestic consumption and $8.5 billion in processing investments, our industry’s 16-17% export dependency leaves us dangerously exposed when markets suddenly close.
If dairy trade stalls, U.S. consumers simply can’t absorb all the milk component production and resulting dairy products, highlighting the potential price collapse if export channels remain blocked.
CHINA TARIFFS CRUSH WHEY EXPORTS
Let’s face it – the China market closure delivers a particularly devastating blow to U.S. whey exports. About 40% of American whey production previously went to China for hog feed, a market now effectively padlocked by prohibitive tariffs.
Processors are already dumping surplus whey into domestic feed channels, driving prices down to $0.38/lb – a steep drop from $0.46/lb in mid-April. Industry analysts project dry whey prices could crash into the high $0.30s by year-end if Chinese access remains blocked.
This collapse threatens to slash Class III milk prices by $0.60-$0.90 per hundredweight, directly hitting your bottom line regardless of whether your milk goes into cheese or other products. How long can producers absorb these price shocks before making tough herd decisions?
PRICE ADVANTAGE PROVIDES PARTIAL BUFFER
Despite the tariff nightmare, U.S. dairy maintains significant price advantages in key export categories that might help cushion some impacts in markets outside China.
As of April 21, 2025, U.S. cheddar sells for approximately $1.77/lb compared to global benchmark prices of $2.23/lb – a 21% advantage. The gap is even wider for butter, with American products at $2.34/lb versus $3.48/lb internationally – a 33% discount that makes U.S. butter highly competitive despite moderate tariffs.
Given the lower price points, the U.S. dairy trade should continue despite the tariffs. Should that happen, domestic inventories should remain in balance, supporting dairy product prices.
But here’s the million-dollar question: Can price advantages overcome geopolitical tensions that worsen daily?
MEXICO AND CANADA RELATIONSHIPS CRITICAL
Maintaining strong trade relationships with Mexico and Canada becomes crucial, as China is effectively closed. Together with China, these markets account for over 50% of all U.S. dairy exports.
Mexico remains America’s largest dairy customer, purchasing over 25% of total exports worth approximately $2.47 billion in 2024. Recent data shows cheese exports to Mexico hit record levels in early 2025, with 18% month-over-month growth in February as buyers stockpiled ahead of potential tariffs.
Trade with Canada continues under USMCA tariff-rate quotas, though disputes persist over Canada’s allocation methods. The U.S. argues Canada unfairly reserves 85% of cheese quotas for domestic processors, violating trade agreements.
INDUSTRY FACES MULTIPLE HEADWINDS
Beyond tariffs, the industry continues battling a severe HPAI outbreak affecting over 1,021 herds across 18 states. The virus spreads through contaminated equipment and raw milk, though pasteurization effectively neutralizes it in commercial products.
The USDA covers 75% of biosecurity upgrade costs through the Emergency Assistance for Livestock program, but implementation remains inconsistent across affected regions.
Labor shortages continue plaguing operations, though technology offers partial solutions. We’re seeing 42% of large U.S. dairies now using automated milking systems, reducing labor needs by 30% while increasing yield per cow.
Isn’t it time we seriously addressed these structural labor issues instead of applying band-aid solutions every few years?
STRATEGIC RESPONSES EMERGING
Forward-thinking producers are implementing several strategies to weather the trade storm:
Lactose Diversification: Converting surplus lactose to ethanol, leveraging USDA’s Bioenergy Program subsidies (up to $0.45/gallon)
Butterfat Arbitrage: Exploiting the $1.14/lb price gap versus EU butter through targeted exports to Middle East and North African markets
Risk Management: Locking in Class III futures above $18/cwt through Q3 2025, using CME options to hedge against feed cost spikes
The following 90 days will test our agility, but history shows dairy adapts faster than any sector in agriculture.
DOMESTIC CONSUMPTION PROVIDES FOUNDATION
Despite export challenges, the U.S. dairy industry stands on solid domestic ground. We achieved record retail sales exceeding $76 billion last year, with per capita consumption reaching 661 pounds – the highest level since 1959.
This strong domestic foundation provides critical stability as we navigate international turbulence. Consumer price increases remain moderate across major dairy categories – fluid milk (+3.2%), cheese (+4.7%), butter (+5.8%), ice cream (+3.5%), and yogurt (+2.8%) – suggesting demand remains firm.
The U.S. dairy sector stands at a critical inflection point. We’re walking a “tariff tightrope” while trying to leverage inherent strengths like price competitiveness and processing investments.
Success will depend on diversifying export destinations beyond China, optimizing component production, and accelerating automation to offset labor challenges. Those implementing strategic risk management and remaining nimble in product allocation will weather this storm better than those clinging to pre-crisis business models.
As one industry veteran said, “We’ve survived price crashes, pandemics, and policy upheavals. This tariff war is another challenge that will ultimately make American dairy more resilient, innovative, and competitive on the global stage.”
What’s your operation doing to prepare for these turbulent times? The producers who act now rather than react later will still stand when the dust settles.
Join over 30,000 successful dairy professionals who rely on Bullvine Daily for their competitive edge. Delivered directly to your inbox each week, our exclusive industry insights help you make smarter decisions while saving precious hours every week. Never miss critical updates on milk production trends, breakthrough technologies, and profit-boosting strategies that top producers are already implementing. Subscribe now to transform your dairy operation’s efficiency and profitability—your future success is just one click away.
Fonterra’s FMP hits $9.60 as 500+ farmers lock in 2026 prices amid global volatility. Why this risk move matters.
EXECUTIVE SUMMARY: Fonterra’s April Fixed Milk Price (FMP) event saw record demand, with 547 farmers securing $9.60/kgMS for 2026 production—oversubscribed by 9.6%. This reflects heightened risk aversion as dairy markets face trade tensions, supply constraints, and China’s fluctuating demand. The FMP program not only stabilizes farmer income but fuels Fonterra’s B2B strategy by enabling fixed-price contracts for customers. New farmers and veterans alike leveraged the tool, signaling a shift toward proactive risk management. With global volatility persisting, Fonterra’s enhancements to FMP (like multi-year locks) aim to future-proof dairy businesses.
KEY TAKEAWAYS:
$9.60/kgMS is a historic high, beating recent payouts and signaling farmer caution about future market drops.
10% oversubscription rule allowed full uptake of 27.4M kgMS, showing Fonterra’s adaptive risk strategy.
FMP supports new farmers (high debt) and Fonterra’s B2B pivot by securing customer pricing deals.
Global trade wars and supply crunches make price locks a survival tool, not just a perk.
Fonterra plans FMP upgrades (floor prices, multi-year options) to stay ahead of third-party rivals.
More than 500 Fonterra farmers have grabbed a guaranteed $9.60/kg milk solids for portions of their 2026 season production in April’s Fixed Milk Price event, showing how hungry dairy producers are for income certainty in today’s rollercoaster market.
Fonterra’s April 7-8 Fixed Milk Price (FMP) offering attracted 547 farmers who collectively applied for 27.4 million kilograms of milk solids, blowing past the cooperative’s initial 25 million kg offering. Thanks to recently introduced flexibility rules allowing up to 10% oversubscription, Fonterra accepted all applications, marking a dramatic jump from March’s event, where about 300 farmers secured 15 million kg at $9.53.
“We’ve offered FMP contracts since 2019 because we know some of our farmers want the option of having greater certainty for a portion of their revenue,” said Lisa Payne, Fonterra’s milk supply director. “This includes farmers who are just starting, and in March and April, we’ve seen new farmers who will start supplying from June and utilizing the service.”
Why Farmers Are Flocking to Fixed Pricing
Let’s face it – the $9.60 price isn’t just good, it’s downright impressive. It comfortably beats Fonterra’s final Farmgate Milk Prices for recent seasons: $8.22/kg for 2022/23 and $7.83/kg for 2023/24. It even tops the record final price of $9.30/kg achieved in 2021/22.
Why wouldn’t farmers jump at this opportunity? After all, who doesn’t want to lock in a price already higher than most have seen in years?
This strong uptake suggests farmers view $9.60 as an attractive price point worth securing now, despite being nearly 14 months away from the start of the 2026 season (June 2025-May 2026).
The dramatic jump in participation between March and April—despite only a 7-cent price difference—shows this level may have crossed a psychological threshold for many producers, representing a value they consider highly attractive for future production.
How Fonterra’s FMP Program Works
Launched in 2019, Fonterra’s Fixed Milk Price program lets farmers lock in a predetermined price for up to 50% of their seasonal milk production. This creates a partial hedge against market volatility that’s become increasingly valuable in today’s rollercoaster economic climate.
The mechanics are straightforward: Fonterra announces monthly offering events with specific volumes and prices available. These prices reference the SGX-NZX milk price futures market, providing transparent market-based pricing following Global Dairy Trade auctions.
Farmers have a defined application window, typically 48 hours, to submit bids for the volume they wish to fix at the offered price. A service fee—typically 10 cents per kilogram of milk solids—comes off the offered price.
Benefits Beyond Price Certainty
For new entrants to the dairy industry, this certainty can be transformative. Early-career farmers typically operate with higher debt levels and tighter margins, challenging price volatility. The ability to lock in a portion of revenue provides crucial breathing room as they establish their operations.
“It’s great to be able to support the next generation of farmers who may require a greater level of certainty in their farm income,” Payne noted.
The program’s voluntary nature lets farmers customize their risk management approach based on individual circumstances. Some may choose to fix prices for the maximum allowable 50% of production, creating a significant income safety net, while others might participate more selectively.
Have you ever wondered how this might help your operation specifically? Think about those major purchases or investments you’ve been putting off due to market uncertainty. Couldn’t a guaranteed price for half your production make those decisions much easier?
Strategic Value for Fonterra
While the FMP program benefits participating farmers, it’s equally valuable to Fonterra’s broader business strategy. This dual benefit represents the cooperative model at its best—creating tools that serve individual members while strengthening the collective enterprise.
“It enables us to offer price risk management solutions to key customers that value price certainty for the products they source from us,” Payne explained. “The premiums we earn from those contracts flow through as improved earnings, which can then be returned to farmer shareholders as dividends.”
This capability directly supports Fonterra’s strategic pivot toward business-to-business operations, particularly in the Ingredients and Foodservice segments. The FMP program strengthens Fonterra’s competitive position in these core B2B markets by enabling differentiated price risk management offerings that many competitors can’t match.
Market Context Driving Demand for Certainty
The surging interest in Fonterra’s FMP program happens against a backdrop of heightened global economic uncertainty, making price certainty increasingly valuable to farmers and dairy customers.
Recent months have seen escalating trade tensions that threaten to disrupt global dairy markets. Tariff announcements from major economies have created significant market volatility, with the potential for tit-for-tat measures affecting established dairy trade flows.
Beyond trade tensions, dairy markets face persistent volatility driven by supply-demand imbalances and structural changes. Global milk production remains constrained in key exporting regions like the EU, New Zealand, and Australia due to environmental regulations, climate challenges, and declining dairy herds.
You’ve got to wonder – with all this uncertainty swirling around, isn’t locking in a solid price just smart business rather than gambling on what might happen?
Evolution of Risk Management Tools
Fonterra continues to evolve its approach to price risk management. Since launching in 2019, the program has seen steady refinement based on farmer feedback and changing market conditions.
Recent announcements indicate that Fonterra is developing expanded options, including multi-season price fixing, minimum price guarantees, and price collar mechanisms that would establish floor and ceiling prices. These enhancements would bring Fonterra’s offerings closer to the sophisticated risk management tools in other agricultural commodity markets.
The evolution toward more flexible offerings reflects growing farmer sophistication in financial risk management. Just as farmers utilize diversified approaches to weather risk, herd management, and input purchasing, they increasingly seek customizable approaches to milk price risk.
What This Means for Dairy’s Future
The overwhelming response to Fonterra’s April Fixed Milk Price offering at $9.60 per kilogram of milk solids reflects a dairy industry increasingly focused on managing risk in an uncertain world. The event demonstrates the growing importance of income certainty in farmers ‘ strategic planning, with 547 farmers scrambling to secure this price for portions of their future production.
For Fonterra, the program’s continued success validates its strategy of developing sophisticated risk management tools that benefit individual farmers and the cooperative. By allowing producers to lock in favorable prices while enabling Fonterra to offer similar certainty to key customers, the FMP program strengthens the entire value chain from farm to market.
As global market volatility persists amid trade tensions, supply constraints, and demand fluctuations, tools that provide stability will likely become increasingly valuable. Fonterra’s ongoing enhancements to the FMP program position it to meet this growing demand for certainty in uncertain times, supporting current farmers and the next generation of dairy producers navigating a complex global industry.
Isn’t it time we recognized that sophisticated risk management has become as fundamental to successful farming as pasture management or animal husbandry? In embracing these tools, New Zealand’s dairy farmers are adapting to the realities of a volatile global marketplace while maintaining their competitive edge in world dairy markets.
Join over 30,000 successful dairy professionals who rely on Bullvine Daily for their competitive edge. Delivered directly to your inbox each week, our exclusive industry insights help you make smarter decisions while saving precious hours every week. Never miss critical updates on milk production trends, breakthrough technologies, and profit-boosting strategies that top producers are already implementing. Subscribe now to transform your dairy operation’s efficiency and profitability—your future success is just one click away.
Milk prices CRASHED in all 11 FMMO regions March 2025—butterfat hits 3-year low. Survival strategies for dairy farmers inside. Are you prepared?
EXECUTIVE SUMMARY: March 2025 saw uniform milk prices drop universally across all 11 Federal Milk Marketing Orders, driven by plummeting butterfat values (lowest since 2021) and component price collapses. Class III (cheese) and Class IV (butter/powder) milk took the hardest hits, falling $1.56/cwt and $1.69/cwt respectively, while total pooled milk volume surged despite prices—a self-defeating trend worsening oversupply. The temporary Class I pricing formula provided minor relief but expires June 1, threatening fluid milk stability. With April futures signaling deeper declines and Rabobank forecasting global dairy turbulence, producers face urgent decisions: cull low-efficiency cows, hedge prices, and rethink genetic strategies to survive the structural reset.
KEY TAKEAWAYS
Universal Price Collapse: All 11 FMMO regions saw declines ($0.76–$1.49/cwt), with Upper Midwest hardest hit at $18.82/cwt.
Component Bloodbath: Butterfat crashed 20¢/lb (3-year low), dragging Class IV down $1.69/cwt. Protein held slightly stronger at $2.46/lb.
Pooling Paradox: Total pooled milk surged 2.16B lbs despite prices—Class III cheese milk hit 6.56B lbs, incentivizing oversupply.
June Formula Flip: Class I’s “average-of +74¢” safety net ends June 1, risking $0.33–$0.62/cwt losses if spreads widen.
April Forecast: Futures predict $17.22/cwt Class III and $17.91/cwt Class IV—prepare for inverted spreads and depooling incentives.
The Federal Milk Marketing Order (FMMO) system just delivered a gut punch to U.S. dairy farmers—March milk prices plummeted in all 11 regions, with some zones seeing the steepest drops since 2021. This isn’t a market correction. It’s a warning shot across your barn roof. While industry analysts mumble about “cyclical trends,” The Bullvine’s cutting through the noise to tell you why this crash matters, who’s getting hit hardest, and how to bulletproof your operation before the next shockwave hits.
THE GREAT MILK PRICE PLUNGE: WHAT JUST HAPPENED?
Let’s get raw: Every FMMO region saw prices drop in March 2025, with losses ranging from $0.76 to a brutal $1.49 per hundredweight. The Upper Midwest took the hardest hit—again—with prices cratering to $18.82/cwt. Even Florida’s “haven” fluid milk market didn’t escape, sliding 76 cents to $24.66/cwt. This is like watching your best Holstein drop from 120 to 90 pounds daily—you feel it in your bulk tank and wallet.
Why This Isn’t Just “Business as Usual”
Butterfat values crashed to a 3-year low ($2.62/lb), dragging Class IV (butter/powder) prices down $1.69/cwt. That’s like watching your TMR mixer break down right before feeding time catastrophic.
Cheese markets (Class III) dropped $1.56/cwt despite still up $2.28 from last year. Translation: The floor’s falling faster than a fresh heifer on a frozen freestall alley.
Component values were slaughtered: Protein (-7¢), nonfat solids (-12¢), and other solids (-11¢). This isn’t a dip—it’s a bloodbath worse than a botched dehorning job.
Are you betting on butterfat when it’s worth less than in 2021? The industry pushed high-component genetics for a decade, and now we’re watching that strategy implode in real-time.
CLASS WARFARE: WHICH MILK CATEGORIES GOT HIT WORST?
Fluid Milk’s False Security (Class I)
“Stable” Class I prices? Don’t buy the hype. While the base price only dipped 25¢ to $21.02/cwt, thanks to a soon-to-expire pricing formula. Come June 1, when regulators ditch the “average-of plus 74¢” safety net for the old “higher-of” method, fluid milk could get rocked harder than a fresh-cut haylage pile fermenting in July heat.
Reality Check: Florida’s $26.42/cwt Class I price looks sweet until you realize it’s propped up by zone differentials—artificial life support that’ll vanish faster than silage inoculant in summer heat if processing plants relocate or consumer habits shift.
Manufacturing Milk’s Meltdown (Classes III & IV)
Cheese and butter/powder markets are where the real carnage happened:
Class IV (butter/powder): Down $1.69/cwt month-over-month and $1.88/cwt year-over-year. That’s like watching your SCC spike from 150,000 to 400,000 overnight.
Class III (cheese): Despite being up $2.28 from 2024, March’s $1.56/cwt drop exposed its vulnerability faster than a high-producing cow with subclinical ketosis.
The Killer Detail: The Class III-IV spread shrank to just 41¢, removing incentives to depool (removing milk from FMMO revenue sharing). Translation? More milk is stuck in low-value pools, dragging everyone down like mastitis in your best string.
THE DIRTY SECRET NO ONE’S TALKING ABOUT: POOLING PARADOX
Here’s where it gets wild: Milk pooled through FMMOs surged by 2.16 billion pounds in March.
More milk, lower prices—this isn’t supply and demand, it’s a suicide pact-like breeding your entire herd to non-genomic tested young bulls.
Why Farmers Keep Digging the Hole Deeper
Class III pooling hit 6.56 billion pounds—the highest since August 2024, like watching your neighbors expand their herds during a milk price crash.
Class IV jumped 685 million pounds despite prices tanking faster than a cow’s calcium levels at freshening.
The Bullvine Take: This isn’t resilience—it’s desperation. Farmers are flooding the system with milk to meet loan payments; unaware they’re collectively suppressing prices. It’s the dairy equivalent of running toward a burning commodity shed because everyone else is. We’ve seen this movie before—2009, 2015, 2020—and the ending always stinks worse than a neglected manure lagoon in August.
Are you part of the problem? If you’re pushing production while prices plummet, you’re helping dig the industry grave. When will we learn that sometimes less milk means more money?
BUTTERFAT’S BLOODBATH: THE SILENT KILLER
March’s butterfat price ($2.62/lb) hasn’t been this low since December 2021. For herds averaging 4% butterfat:
Loss per cow: ~$0.52/cwt monthly, like watching your feed efficiency drop 0.1 points across the herd
Annualized hit: Over $6/cwt if trends continue—that’s a full-blown displaced abomasum requiring surgery, not just a mild case of milk fever
Genetic Wake-Up Call: The industry’s decade-long push for higher butterfat is backfiring like a poorly timed CIDR protocol. With component values crashing, that 5% BF superstar might be costing you more feed than she’s earning at the market. Your +1000 GTPI heifer with +0.50% fat PTA isn’t impressive when the market won’t pay for her expensive output.
Has your genetic strategy adapted to the reality of the new market? Or are you still selecting bulls like it’s 2020?
JUNE’S LOOMING DISASTER: THE FORMULA CHANGE NO ONE’S READY FOR
Mark June 1, 2025, in red on your calendar like a problem cow’s hoof wrap. That’s when the Class I pricing formula reverts to the “higher-of” method. Here’s why it matters:
March Example: The current formula gave farmers an extra 62¢/cwt vs. the old method—the difference between profitable and breakeven for many operations.
April Forecast: 33¢/cwt cushion—disappearing in June faster than quality hay in a drought year.
Doomsday Scenario: If Class III and IV diverge sharply (like April’s projected 79¢ spread), fluid milk prices could nosedive overnight. Your 2023-24 risk management plans? It is obsolete, like a tie-stall barn in the age of rotary parlors.
How many farmers even know this formula change is coming? The industry’s asleep at the wheel while regulators prepare to pull the rug out from under us. Wake up!
BULLVINE’S SURVIVAL BLUEPRINT
1. Ditch the “More Milk” Mentality
The data’s clear: Producing more milk into a falling market is financial suicide, like feeding a high-cost ration to your lowest-producing string. Cull low-component cows now. If your herd’s butterfat is under 3.8%, ask if she’s worth keeping like you would a chronic mastitis case. Remember: Sometimes, your best cull decision is your most profitable one.
2. Renegotiate Feed Contracts—Yesterday
With corn and soy futures fluctuating, lock in prices now. Every 10¢ saved per bushel puts $0.15/cwt back in your pocket—that’s like finding free bypass protein. Talk to your nutritionist about substituting ingredients without sacrificing rumen health or component production. Consider alternative fiber sources like soyhulls or beet pulp if your forage quality took a hit last season.
3. Hedge Like Your Farm Depends on It (Because It Does)
April’s Class III futures at $17.22/cwt signal more pain ahead. Sell 25% of Q3 production forward, even at these prices. It’s like treating for metritis early painful but necessary to prevent bigger problems. Work with your co-op or milk handler to understand your basis adjustments and ensure you’re not leaving mailbox price premiums on the table.
4. Prep for the June Formula Flip
Shift milk to Class I buyers before June 1 if your location and quality parameters allow it.
Diversify: Explore direct fluid sales to bypass pooling—think of it crossbreeding your marketing strategy like you might use beef genetics on your bottom-end heifers.
5. Genetic Pivot
Start selecting for protein, not just butterfat. March’s protein value ($2.46/lb) held stronger than fat, and cheese demand isn’t disappearing like last year’s silage. Review your genetic plan with your AI rep and consider bulls with positive milk and protein that might have been overlooked in the fat-focused era. Remember: Today’s genetic decision impacts your component checks for the next decade—choose wisely.
Is your operation prepared to survive on $17/cwt milk? If not, you need to start making changes today, not tomorrow.
THE ELEPHANT IN THE MILK PARLOR: WHEN WILL IT END?
Rabobank’s global optimism doesn’t match U.S. realities. Here’s our forecast:
2025 Q2: Prices keep sliding, hitting $17/cwt by June—like watching your reproduction rate drop 5 points in one month.
2026: Margin protection claims surge as feed costs rise faster than a somatic cell counts in a poorly maintained parlor.
Long Game: 10% of U.S. dairies fold or consolidate by 2026—that’s not a prediction; it’s a mathematical certainty like pregnancy rates after skipping heat detection.
Final Warning: This isn’t 2020’s “COVID crash” or 2009’s recession. It’s a structural reset, like transitioning from conventional to robotic milking. Adapt or become another statistic in the USDA’s declining dairy farm count.
WHEN EXPANSION MIGHT MAKE SENSE
While most operations should be battening down the hatches, there are specific scenarios where strategic growth deserves consideration. For farms with exceptional component efficiency (producing 3.8%+ butterfat at lower-than-average feed costs) or those with direct marketing channels that bypass FMMO pricing entirely, the current environment could present acquisition opportunities as struggling operations exit.
If you’re in a strong equity position with locked-in feed costs and processing contracts, expanding while land and cattle prices soften might position you for the eventual market recovery. However, this strategy requires ironclad risk management and substantial financial reserves—not for the faint of heart or highly leveraged.
Remember, even during downturns, the most efficient producers can remain profitable. The question isn’t just whether to expand but whether your operation has the efficiency metrics to justify growth when others are retreating.
THE BOTTOM LINE
The milk price crash of March 2025 isn’t just another dip in the cycle—it’s exposing fundamental weaknesses in how we produce and market milk in America. The industry’s addiction to volume over value has created a self-destructive pattern crushing margins across all regions.
Your Move: Stop following the herd mentality driving us off a cliff. Reassess your component strategy, cull aggressively, lock in feed costs, and prepare for the June formula change like your farm depends on it—because it does.
Will you be the one who saw it coming or left wondering what hit you? The Bullvine’s betting on the former. Let’s prove us right.
Risk Management Dive deep into practical risk management tools—like Dairy Margin Coverage and Dairy Revenue Protection—to safeguard your operation from milk price volatility and market shocks.
Join the Revolution!
Join over 30,000 successful dairy professionals who rely on Bullvine Daily for their competitive edge. Delivered directly to your inbox each week, our exclusive industry insights help you make smarter decisions while saving precious hours every week. Never miss critical updates on milk production trends, breakthrough technologies, and profit-boosting strategies that top producers are already implementing. Subscribe now to transform your dairy operation’s efficiency and profitability—your future success is just one click away.
Dairy margins set to crash in 2025: China tariffs, feed costs & spring flush threaten profits. Act now to survive – or lose your herd.
EXECUTIVE SUMMARY: U.S. dairy margins face a perfect storm in 2025 as China’s 84-125% tariffs slam exports, feed costs surge, and spring flush floods markets. Income-over-feed costs will drop below $12/cwt, eroding profits after an 8-month boom. Pacific Northwest producers face steeper discounts, while record cull cow prices ($145+/cwt) offer exit strategies. Cheese markets defy trends temporarily, but powder/whey collapses demand urgent pivots. Consolidation will accelerate—small farms must cut costs, leverage risk tools, or sell before margins implode.
KEY TAKEAWAYS:
China’s tariffs nuke 43% of U.S. dairy exports – whey prices crashed 23%, powder inventories ballooned 57%
Feed costs up 30¢/bushel – corn futures rally as DMC’s $9.50 safety net leaves producers exposed
Spring flush + weak demand = 6-7% milk surplus – prices drop as fresh cows peak
PNW milk checks trail national avg by $1.50/cwt – but culling 20% of herd nets $348K at current beef prices
Survival demands: ruthless cost control, DMC max coverage, pivot to cheese/Class III markets
The party’s over, folks. After riding high on $12+ margins since mid-2024, U.S. dairy producers are staring down the barrel of a significant profit contraction. The spring flush, plummeting commodity prices, rising feed costs, and a devastating trade war with China create the perfect storm. But while many will struggle, the savvy operators who act now will not only survive—they’ll position themselves to thrive when the market rebounds.
It’s like watching your best milker suddenly drop 20 pounds of production without warning. The warning signs are flashing red across the dairy landscape. Income-over-feed costs, which soared above $15/cwt in late 2024, are projected to drop below $12/cwt from March through August 2025. The USDA has slashed its All-Milk price forecast by a staggering $1.95/cwt since January—the steepest price erosion since the 2018 trade war meltdown. Meanwhile, December 2025 corn futures have rallied 30 cents per bushel since March 31, and China’s retaliatory tariffs have effectively slammed the door on U.S. whey and powder exports.
But here’s what the economists aren’t telling you: this margin squeeze isn’t just another cyclical downturn—a structural reckoning that will accelerate the transformation of America’s dairy industry. The question isn’t whether you’ll feel the pinch but whether you’ll emerge stronger when the dust settles.
The Margin Mirage: How We Got Here and Where We’re Headed
Let’s cut through the noise and face facts: the historic profitability dairy producers enjoyed since mid-2024 was always living on borrowed time—like expecting your bulk tank to stay full after you’ve dried off half your herd.
From July 2024 through February 2025, income-over-feed costs calculated under the DMC program consistently exceeded $12/cwt for eight consecutive months, peaking at an eye-watering $15.57/cwt in September 2024. This extended run provided a crucial financial reprieve after the challenges of 2023, allowing many operations to strengthen balance sheets and make delayed investments.
Month
All-Milk Price ($/cwt)
Feed Cost ($/cwt)
IOFC Margin ($/cwt)
July 2024
22.80
10.47
12.33
Sept 2024
25.50
9.93
15.57
Jan 2025
23.00
9.15
13.85
Feb 2025
22.60
9.48
13.12
Apr 2025
21.10 (est)
9.80 (est)
11.30 (est)
But the February 2025 margin figure of $13.12/cwt already signaled the beginning of the end. By April, the USDA had slashed its 2025 All-Milk price forecast to $21.10/cwt—a cumulative decline of $1.95/cwt from January’s initial estimates of $23.05/cwt.
Why the dramatic reversal? Four converging forces are crushing your margins:
Commodity Price Collapse: Since their early 2025 peaks, block cheddar has fallen 8%, butter has dropped 3-4%, NFDM has plunged 14%, and dry whey has crashed a staggering 23%. This translates directly to lower milk checks starting with March production paid in April—like watching your PPD evaporate faster than spilled milk on a hot parlor floor.
Feed Cost Rally: While the talking heads promised lower feed costs for 2025, reality tells a different story. December 2025 corn futures have surged from $4.36/bushel on March 31 to $4.64/bushel by mid-April, while soybean meal futures show volatility, with December 2025 contracts hovering around $308/ton. It’s like watching your TMR cost climb while your component premiums disappear.
Spring Flush Pressure: The seasonal surge in milk production (typically 6-7% higher than fall levels) is flooding markets struggling with weak demand, creating a classic supply-demand imbalance that further depresses prices. Just as your fresh cows hit peak production, the market doesn’t want the extra milk.
Trade War Catastrophe: The most underreported factor in this equation is the devastating impact of China’s retaliatory tariffs. Between February and mid-April 2025, tariffs on U.S. dairy exports to China escalated from baseline levels to a prohibitive 84-125%, closing America’s third-largest dairy export market overnight.
Are you still clinging to the fantasy that this is just another temporary dip? Wake up! Dairy Markets and Policy forecasts predict income-over-feed costs will fall below $12/cwt from March through August 2025. While these values remain relatively strong historically, the rapid contraction from recent highs will catch many producers flat-footed—like a cow suddenly going off feed with no warning signs.
The China Syndrome: How Trade Politics Are Crushing Your Milk Check
While economists focus on domestic supply-demand fundamentals, they’re missing the elephant in the room: the trade war with China has created a powder keg for U.S. dairy exports.
The escalation happened with breathtaking speed:
February 4, 2025: U.S. reinstates 10% tariff on Chinese imports
March 4, 2025: U.S. increases tariff to 20% on Chinese imports
March 10, 2025: China imposes 10% retaliatory tariff on U.S. dairy
April 3, 2025: U.S. imposes an additional 34% tariff on Chinese imports
April 4, 2025: China matches with 34% retaliatory tariff on U.S. goods
April 9, 2025: U.S. increases tariffs to 104-125% on Chinese goods
April 10, 2025: China retaliates with 84% tariff on U.S. goods
Commodity
Pre-Tariff Price (Feb 2025)
Current Price (Apr 2025)
% Change
China’s Market Share
Dry Whey
$0.60/lb
$0.465/lb
-23%
42% of U.S. exports
NFDM
$1.36/lb
$1.17/lb
-14%
18% of U.S. exports
Lactose
$0.52/lb
$0.41/lb
-21%
43% of U.S. exports
This isn’t just another trade spat—it’s a structural disruption already sending shockwaves through dairy markets. February 2025 export data showed NFDM exports down 26% (lowest volume since 2019), total whey exports down 5%, and whey protein concentrate plunging 26%. The 53% decrease in Chinese demand for whey products is just the beginning—like watching your best export customer suddenly decide they don’t need your milk anymore.
Your co-op representatives aren’t telling you that China accounts for roughly 43% of U.S. lactose exports and is a critical market for whey products, absorbing 42% of all U.S. whey exports in 2024. With tariffs exceeding 100%, New Zealand (which enjoys duty-free access through its FTA) and EU exporters will capture any Chinese import demand, leaving U.S. suppliers effectively shut out.
The result? A massive oversupply of whey and powder in domestic markets creates downward pressure on prices that will persist until the trade dispute is resolved or U.S. exporters develop alternative markets—neither of which will happen overnight. It’s like suddenly having to find a new milk hauler after yours quits with no notice—except this hauler took 43% of your production.
When will industry leaders stop pretending we can wait this out? The hard truth is that we must completely reimagine our export strategy—and fast. The Chinese government has bluntly stated that at the 125% tariff level, U.S. goods are “no longer marketable” in their country.
Regional Pain Points: Why Pacific Northwest Producers Are Feeling the Squeeze First
Suppose you’re producing milk in the Pacific Northwest. In that case, you’re already feeling the margin compression more acutely than your counterparts in other regions—like being the first cow in the herd to show signs of ketosis.
Federal Milk Marketing Order data confirms that PNW producers (Order 124) receive significantly lower blend prices than national averages. From January to March 2025, the PNW Uniform Price ranged from $20.32/cwt to $20.63/cwt—consistently trailing the All Market Average Uniform Price of $21.01/cwt to $21.23/cwt.
Region
Avg Uniform Price (Mar 2025)
PPD ($/cwt)
Class I Utilization
Pacific NW
$20.47
$0.21
15%
Northeast
$21.73
$1.47
35%
National Avg
$21.12
$0.63
25%
The Producer Price Differential (PPD) tells an even more sobering story. The PNW PPD ranged from just $0.14/cwt to $0.29/cwt during the first quarter of 2025, compared to the All Market Average PPD of $0.60-$0.66/cwt and Northeast PPDs of $1.46-$1.47/cwt.
Why such a stark regional disadvantage? The PNW’s relatively low utilization of milk in Class I (fluid milk) and higher transportation costs create a structural disadvantage that becomes particularly painful during market downturns.
But there’s a silver lining for PNW producers—and it’s wearing a hide. Cull cow prices are exceptionally strong, with Dairy Boner cows (80-85% lean) trading in the $140.00-$145.00/cwt range and Dairy Lean cows (85-90% lean) fetching $141.00-$148.50/cwt at Toppenish, Washington auctions in April 2025.
For a 1,200-cow operation, strategically culling 20% of the herd could generate $348,000 in immediate revenue—potentially offsetting months of negative milk margins. This creates a powerful economic incentive to aggressively cull less productive animals or consider a profitable exit strategy. It’s like having your low-producing three-quarters suddenly worth more as hamburger than they are in the milking string.
Isn’t it time to question whether the FMMO system serves all producers equally? The regional disparities have become too glaring to ignore.
The Cheese Anomaly: Understanding the Market Disconnect
Here’s where things get interesting—and potentially profitable for strategic producers. Despite the bearish overall dairy outlook, the cheese market displays remarkable resilience and strength.
What explains this paradox? Several factors are at play:
Lower starting inventories at the beginning of 2025 (American-style cheese stocks were down 8% year-over-year)
Positive export forecasts due to competitive pricing
Processors securing supplies ahead of anticipated seasonal demand
The immediate physical market needs temporarily outweigh longer-term bearish forecasts
This divergence creates a strategic opportunity. While powder-heavy markets suffer from the impact of the China tariff, cheese-focused operations may weather the storm more effectively. Producers with the flexibility to shift milk toward Class III markets could potentially mitigate some margin pressure—like having a Jersey herd when butterfat premiums are high.
Are you still stubbornly clinging to a one-size-fits-all production strategy? The data shows that adaptability—specifically, the ability to pivot toward cheese production—could be your financial lifeline in 2025.
The Consolidation Acceleration: Why This Downturn Will Transform the Industry
The coming margin squeeze will accelerate the long-term structural transformation of U.S. dairy. Between 2017 and 2022, the number of U.S. farms reporting milk sales dropped by a staggering 39%—the largest percentage decline recorded between adjacent census periods dating back to at least 1982.
During this same period, the number of farms with 2,500 or more cows increased, rising from 714 to 834. By 2022, operations with 1,000 or more cows accounted for 66% of all U.S. milk sales, up from 57% in 2017.
The hard truth: This margin compression will disproportionately impact smaller and mid-sized operations lacking economies of scale. Larger dairy operations consistently demonstrate lower average production costs, particularly in non-feed costs like labor, capital recovery, and overhead. It’s like watching the industry’s herd get culled, with only the most efficient producers remaining in the milking string.
As the industry navigates this challenging period, we’ll likely see:
Accelerated exit of smaller operations unable to withstand prolonged negative returns—like watching a group of heifers fail to cut at classification time
Increased consolidation as larger producers acquire struggling operations
Strategic culling across all farm sizes, potentially leading to tighter milk supplies later in 2025 or into 2026
Regional shifts in production as areas with structural disadvantages (like the PNW) see faster contraction
Let’s be brutally honest: Are we better off with fewer, larger farms? The industry’s blind push toward consolidation deserves more scrutiny than it’s getting. While economies of scale are real, we’re rapidly losing the diversity and resilience that comes with having operations of various sizes and production models.
The Safety Net Illusion: Why DMC Won’t Save You This Time
Don’t count on government programs to bail you out of this margin squeeze. While the Dairy Margin Coverage (DMC) program provides a crucial buffer against catastrophic margin collapses, its structure presents significant limitations in the current environment—like relying on a single-strand electric fence to contain your heifers.
The program’s maximum coverage level of $9.50/cwt means that producers, even those enrolled at the highest level, remain fully exposed to margin declines from the recent highs (above $12-$13/cwt) down to the $9.50 trigger point. This structure effectively protects against severe downturns but offers no protection during moderately declining margins from previously high levels—precisely the scenario we’re facing.
The DMC’s feed cost calculation also uses a fixed formula based on national average prices for corn, soybean meal, and alfalfa hay. This formulaic approach means the calculated DMC margin may not accurately reflect the actual feed costs experienced by individual farms, which can vary significantly based on region, specific ration ingredients, and purchasing timing.
The bottom line is that DMC provides catastrophic coverage, not profit protection. Producers relying solely on DMC will be exposed to significant margin erosion before any payments trigger—like having mastitis treatment on hand but no prevention program.
When will we demand a safety net that works for modern dairy operations? The current system was designed for a different era and different market realities.
Strategic Survival: Five Actions to Take Now
So, what should forward-thinking dairy producers do in the face of this looming margin squeeze? Here are five strategic actions to implement immediately:
1. Implement Aggressive Cost Control
Now is the time for ruthless efficiency. Focus on feed optimization through precision nutrition, potentially adjusting for component values that show divergent price trends. Scrutinize all non-feed costs, seeking economies where possible. Consider:
Reevaluating ration formulations to optimize for current component values—like adjusting your TMR when your butterfat tests drop
Implementing energy efficiency measures to reduce utility costs
Reviewing labor allocation and potentially restructuring workflows—like reorganizing your milking routine for maximum parlor efficiency
Deferring non-essential capital expenditures
Stop treating all expenses as sacred cows. Every line item in your budget deserves scrutiny when margins tighten.
2. Develop a Strategic Culling Plan
The current high cull cow prices create a unique opportunity to reshape your herd while generating significant cash flow. Develop a comprehensive culling strategy that:
Identifies bottom-performing animals based on production, reproduction, and health metrics—like sorting your DairyComp list by income over feed cost
Establishes clear culling thresholds tied to projected margins
Balances immediate cash flow needs against long-term herd productivity
Considers the replacement cost and availability of heifers
Are you still hanging onto underperforming cows out of habit or sentiment? With beef prices this high, that’s a luxury you can’t afford.
3. Enhance Risk Management
With margins under pressure, robust risk management becomes critical. Consider:
Maximizing DMC coverage at $9.50/cwt for Tier 1 production
Evaluating supplemental risk management tools like Livestock Gross Margin for Dairy (LGM-Dairy) insurance
Implementing a disciplined approach to forward contracting both milk and feed inputs—like locking in your corn silage acreage needs before prices spike
Developing trigger-based decision rules for futures and options strategies
The days of flying by the seat of your pants are over. If you’re not actively managing price risk in this environment, you’re gambling with your operation’s future.
4. Diversify Revenue Streams
Forward-thinking producers are finding creative ways to generate additional income:
Exploring premium markets for specialty milk (A2, grass-fed, organic)
Developing direct-to-consumer products or partnerships
Monetizing manure through composting or energy production—like turning your lagoon into a revenue source
Leveraging high beef prices through strategic breeding decisions (beef-on-dairy)
Why are you still putting all your eggs in one commodity milk basket? The most resilient operations are those with multiple revenue streams.
5. Position for Post-Squeeze Opportunities
Every market downturn creates opportunities for those with the financial strength and strategic vision to capitalize on them:
Maintain capital reserves to acquire assets from distressed operations—like having cash ready when your neighbor’s heifer herd comes up for sale
Identify potential expansion opportunities in regions with stronger milk prices
Prepare for potential land acquisition as financial pressure forces sales
Invest selectively in efficiency-enhancing technologies that will provide competitive advantages when margins recover
Are you thinking like a victim or an opportunist? The producers who emerge strongest from this downturn will see it as a chance to strengthen their position, not just survive.
The Bottom Line: Survival of the Strategically Fittest
The coming dairy margin squeeze isn’t just another cyclical downturn—it’s a structural reckoning that will accelerate the transformation of America’s dairy industry. The convergence of falling commodity prices, rising feed costs, seasonal supply pressure, and severe trade disruptions creates a challenging environment that will test even well-managed operations.
Regional disparities will intensify these challenges, with PNW producers facing particularly acute pressure from lower milk prices. However, the strong cull cow market provides a significant financial lever for strategic herd management or even profitable exit for some producers.
The industry’s response will align with long-term structural trends, likely accelerating consolidation and favoring larger operations with economies of scale. While official forecasts suggest stability in overall cow numbers for 2025, the economic pressures may lead to actual herd reductions as the year unfolds, potentially setting the stage for stronger markets in late 2025 or 2026.
Survival—and ultimately success—will depend on diligent risk management, stringent cost control, strategic adaptation to shifting market signals, and potentially tricky decisions regarding herd management and business structure. Those who act decisively now won’t just weather this storm—they’ll emerge stronger when margins inevitably recover.
The question isn’t whether this margin squeeze will transform the industry—it’s whether you’ll be a victim of that transformation or one of its beneficiaries. The following choices and actions are yours, just like deciding whether to treat that three-quarters cow or send her to the sale barn. Your decisions in the coming months will determine your dairy’s future for years.
It’s time to stop waiting for someone else to fix this problem. Not your co-op, not the USDA, not Congress. Take control of your destiny. Reassess every aspect of your operation. Challenge conventional wisdom. Most importantly, act now before the full force of this margin squeeze hits your bottom line.
What changes will YOU make today to ensure you’re still in business when the next upturn arrives?
April 2025 Dairy Risk Management Calendar Discover actionable risk management strategies to navigate the spring flush, falling milk prices, and shrinking export opportunities before summer hits.
Join the Revolution!
Join over 30,000 successful dairy professionals who rely on Bullvine Daily for their competitive edge. Delivered directly to your inbox each week, our exclusive industry insights help you make smarter decisions while saving precious hours every week. Never miss critical updates on milk production trends, breakthrough technologies, and profit-boosting strategies that top producers are already implementing. Subscribe now to transform your dairy operation’s efficiency and profitability—your future success is just one click away.
Lactose soars 22% as GDT index climbs 1.6% – Asia’s hungry buyers drive prices while Oceania’s spring flush looms. Mixed signals demand smart strategies.
EXECUTIVE SUMMARY: The April 15 GDT auction saw dairy markets rally with a 1.6% price index gain – the second consecutive increase since mid-March. While lactose skyrocketed 22% and mozzarella jumped 5.4%, skim milk powder and cheddar faltered, exposing market fragmentation. Intense bidding from 181 participants absorbed 16,718MT of product, signaling strong Asian/Middle Eastern demand despite geopolitical tensions. Analysts warn Oceania’s seasonal milk surge could reverse gains, urging producers to balance optimism with caution. The results highlight a critical juncture: specialty ingredients thrive while commodity powders struggle. Strategic alignment with high-value components like lactose becomes essential as trade wars and supply shifts reshape profitability landscapes.
KEY TAKEAWAYS:
Lactose dominates: 22% price surge reflects pharma/infant formula demand shifts
Tuesday’s Global Dairy Trade (GDT) auction delivered much-needed adrenaline for dairy farmers worldwide, with the Price Index climbing 1.6% to reach €3,854 per metric ton. This marks the second consecutive increase since mid-March, accumulating a 2.7% gain that suggests demand fundamentals are strengthening despite the looming shadow of Oceania’s spring flush. But don’t pop the champagne just yet – today’s results revealed dramatic price variations across product categories that expose the fragmented reality of our global markets.
While lactose prices exploded by an eye-popping 22%, skim milk powder and cheddar posted disappointing declines, creating a market landscape as uneven as a poorly graded freestall barn. This mixed performance across dairy commodities paints a complex picture that demands strategic thinking from producers who want to position themselves ahead of the curve.
AUCTION BREAKDOWN: THE WINNERS AND LOSERS YOU NEED TO KNOW
Tuesday’s GDT Trading Event #378 results revealed a dairy market moving in multiple directions simultaneously – much like a fresh heifer with a calcium deficiency. Five categories posted gains while two experienced declines, underscoring the complex supply and demand dynamics influencing different segments of the global dairy market.
Lactose emerged as the undisputed champion, posting an extraordinary 22% price surge to reach €1,210 per metric ton. This dramatic increase starkly contrasts the single-digit movements seen across other product categories and suggests specific market factors are driving exceptional demand for this dairy component. Just as a high-producing Holstein separates herself from the herd during peak lactation, lactose has broken away from the pack with a performance that demands attention. The pharmaceutical industry’s growing lactose requirements for drug delivery systems and increased demand from infant formula manufacturers likely contributed to this remarkable price jump.
Mozzarella demonstrated impressive strength as the second-best performer, climbing 5.4% to €4,187 per metric ton. This substantial increase reflects the global food service sector’s continued recovery and pizza’s unrelenting popularity across expanding international markets. Whole Milk Powder (WMP), a critical benchmark product for the auction, posted a solid 2.8% gain to reach €3,666 per metric ton. As a key ingredient for recombined milk products in regions with limited fresh milk infrastructure, WMP’s positive performance signals improving sentiment among buyers in developing markets – similar to how a rising somatic cell count signals potential mastitis issues before clinical symptoms appear.
Dairy fats continued their positive trajectory, though with more modest gains. Anhydrous Milk Fat (AMF) increased by 2.1% to €6,011 per metric ton, while butter rose 1.5% to €6,750 per ton. These results suggest the rehabilitation of dairy fat’s reputation among consumers continues to support demand despite the premium prices these products command – much like how premium genetics command higher prices despite the additional investment required.
On the downside, Skim Milk Powder (SMP) recorded a 2.3% decrease, settling at €2,457 per metric ton. This decline stands in stark contrast to previous auctions where SMP showed strength. For instance, the February 4, 2025 auction saw SMP prices rise 4.7%. The current downturn may reflect shifting production patterns or competitive pressure from alternative protein sources. Similarly, cheddar prices retreated by 1.8% to €4,327 per metric ton, breaking from the positive momentum observed in earlier 2025 auctions, where it had gained 3.7% in February.
Price Performance by Product (April 15, 2025)
Product
Price Change
Current Price
Lactose
+22.0%
€1,210/t
Mozzarella
+5.4%
€4,187/t
Whole Milk Powder
+2.8%
€3,666/t
Anhydrous Milk Fat
+2.1%
€6,011/t
Butter
+1.5%
€6,750/t
Skim Milk Powder
-2.3%
€2,457/t
Cheddar
-1.8%
€4,327/t
The absence of Butter Milk Powder data for this auction creates a small gap in market intelligence. However, this product typically represents a smaller proportion of overall dairy trade volumes – much like a single cow’s production data might be missing from the monthly DHIA report. Still, it doesn’t invalidate the herd’s overall performance.
MARKET DYNAMICS: BUYERS SCRAMBLE FOR LIMITED SUPPLY
Let’s cut through the noise and get to what matters: buyers are hungry, and supply is tight. The operational metrics from Tuesday’s auction show robust market engagement and intense competition for available products. The auction attracted 181 participating bidders, with 115 securing winning bids – reflecting a 63.5% success rate. This high level of participation suggests broad-based interest across the global dairy supply chain, similar to how a well-attended bull sale indicates a strong interest in superior genetics.
The auction process was lengthy and competitive, lasting 2 hours and 33 minutes and requiring 18 bidding rounds to conclude. These extended negotiations point to determined buyer interest and active price discovery, hallmarks of a market with genuine underlying demand – not unlike the persistent activity in a rotary parlor during peak milking hours.
Perhaps most telling was the relationship between supply and sales. The total quantity sold reached 16,718 metric tons, remarkably close to the minimum supply volume of 16,066 metric tons offered for the event. This near-perfect alignment between minimum offering and actual sales suggests sellers presented relatively little volume above their base commitments, and buyers absorbed almost this constrained supply. Such dynamics typically create conditions for price strength, as evidenced by the overall index increase – similar to how limited heifer availability drives replacement costs higher during herd expansion phases.
The average winning price in USD terms reached $4,385 per metric ton, highlighting the international nature of the auction and the need for participants to navigate currency considerations alongside pure commodity valuations. This dual reporting in Euros (€3,854) and US Dollars provides essential context for global stakeholders assessing the financial implications across different currency environments – much like how dairy producers must track both component and fluid milk prices to understand their milk check fully.
These operational metrics collectively suggest a market characterized by tight supply meeting determined demand – conditions conducive to price support and potential future gains if supply constraints persist, similar to how a balanced feed ration optimizes production and component levels.
HISTORICAL CONTEXT: IS THIS THE START OF A REAL RALLY?
Tuesday’s auction results gain significance when viewed within the context of recent GDT events. The 1.6% increase marks the second consecutive rise since mid-March, generating a cumulative gain of 2.7%. This developing pattern of sequential increases carries more weight than a single isolated event might suggest, potentially indicating a strengthening market undercurrent – much like how consecutive months of improving pregnancy rates signal improving reproductive management rather than random variation.
Looking back further, we can observe the volatile nature of GDT results throughout early 2025 and late 2024. The February 4, 2025 auction delivered a substantial 3.7% increase, characterized as the “second GDT trading event in a row with a rising index.” That event saw particularly strong gains in lactose (+17.7%), skim milk powder (+4.7%), and whole milk powder (+4.1%). January’s auction posted a more modest result. Going back to August 2024, the market showed exceptional strength, with the GDT Price Index jumping 5.5%, described as “the largest percentage rise since March 2021.” That surge was led by whole milk powder, which increased by 7.2%.
This historical perspective reveals that while Tuesday’s 1.6% gain is modest compared to some recent peaks, it contributes to a generally positive trend line punctuated by occasional volatility – not unlike a lactation curve with its peaks, persistence, and occasional dips.
The persistence of lactose as a consistent outperformer deserves special attention. The February auction saw lactose prices increase by 17.7%, while Tuesday’s auction recorded an even more dramatic 22% surge. This sustained strength suggests structural factors supporting lactose values rather than mere speculative activity or short-term supply disruptions – similar to how consistent genetic selection for components gradually improves a herd’s butterfat and protein levels over generations.
GLOBAL FACTORS: THE STORM CLOUDS ON THE HORIZON
Tuesday’s GDT auction results emerge against a complex backdrop of international forces shaping dairy markets. The intense competition among buyers suggests resilient underlying demand even as international tensions create potential headwinds. The escalating trade war between the US and China underscores how broader economic conflicts can influence dairy trade flows and buying patterns – much like how a single case of Johne’s disease can disrupt an entire herd’s management plan.
Looking forward, analysts caution about potential “downward pressure” emerging in coming weeks, linked directly to expected “seasonal production increases from Oceania.” This projected supply expansion from key exporting regions like New Zealand and Australia represents a perennial pattern that can temporarily dampen price momentum during peak production periods – similar to how the spring flush in the Northern Hemisphere typically pressures farmgate prices despite processors running at full capacity.
These competing factors – strengthening demand versus expanding supply – create a balanced market outlook. The current positive signals are encouraging but remain susceptible to disruption from both predictable seasonal patterns and unpredictable geopolitical events – not unlike how a well-managed dairy operation can still be vulnerable to both anticipated seasonal challenges and unexpected disease outbreaks.
Meanwhile, parallel developments in related dairy markets add context to the GDT results. The CME dairy markets on April 14, 2025 (the day before the GDT auction) showed an intriguing split, with cheese prices climbing significantly while butter and powder markets remained static. This division mirrors some of the product-specific divergence seen in the GDT results. It highlights how different segments of the dairy complex can follow distinct trajectories based on their unique supply-demand dynamics – similar to how different cow groups within the same herd can show varying production responses to the same management changes.
Let’s be blunt: the Trump administration’s aggressive trade stance with China looms large over dairy markets. With the escalating trade war between these economic superpowers, dairy exports could become either a bargaining chip or collateral damage. Smart producers are watching these developments closely, as they could dramatically reshape global trade flows virtually overnight.
STRATEGIC IMPLICATIONS: WHAT SMART PRODUCERS SHOULD DO NOW
Tuesday’s GDT results offer encouragement and strategic considerations for dairy producers worldwide. The overall price increase and strong buyer participation suggest improving fundamental demand for dairy commodities. This provides a potential foundation for farm-level milk price support – much like how a solid forage base provides the foundation for efficient milk production.
The dramatic divergence in product performance – from lactose’s 22% surge to SMP’s 2.3% decline – underscores the importance of understanding which dairy components drive farmgate pricing in different regions. Producers whose milk checks are heavily influenced by protein values may face different outcomes than those in markets where butterfat or specialty components carry greater weight – similar to how different feeding strategies might optimize either volume or components depending on payment structures.
For forward-thinking farmers, several strategic considerations emerge:
Price Risk Management
With the GDT events showing continued volatility alongside a generally improving trend, producers should evaluate opportunities to lock in favorable prices through forward contracts, futures markets, or other risk management tools. The mixed signals from different product categories suggest selectively protecting components showing the greatest strength while maintaining flexibility on those facing pressure – not unlike how selective dry cow therapy targets specific animals rather than blanket treatment.
Let’s face it – too many dairy producers still approach price risk management as an optional luxury rather than a business essential. In today’s volatile markets, failing to lock in favorable prices when they appear is like leaving your barn doors open during a tornado. The smart money is moving now to protect margins while maintaining flexibility to capitalize on potential upside.
Production Optimization
The exceptional premium currently commanded by lactose (+22%) and the solid performance of whole milk powder (+2.8%) suggest value in optimizing milk composition where possible. While genetic selection works over longer timeframes, nutritional strategies can influence component levels within the current lactation – similar to how adjusting the forage-to-concentrate ratio can shift milk component levels within days.
Market Positioning
Farms selling into processing streams focused on export markets should carefully monitor shifting international demand. The noted strength from Asian and Middle Eastern buyers suggests producers aligned with processors serving these regions may benefit from improved demand transmission through the supply chain – much like how farms supplying specialty markets like A2 or grass-fed milk can capture premium prices when consumer demand strengthens.
Cost Control Vigilance
Despite improving prices, the cautionary notes about potential seasonal pressure and ongoing geopolitical tensions highlight the importance of maintaining disciplined cost structures. Farms with lower breakeven points will be better positioned to weather potential volatility if downward pressure materializes in the coming weeks – similar to how maintaining proper body condition scores helps cows weather transition periods with fewer metabolic disorders.
WHAT’S DRIVING LACTOSE’S REMARKABLE SURGE?
The 22% price explosion for lactose deserves special attention from dairy industry stakeholders. This dramatic increase follows a 17.7% gain in February, establishing a pattern of exceptional performance that far outpaces other dairy commodities. Several factors likely contribute to this remarkable strength:
Pharmaceutical Demand: The pharmaceutical industry relies heavily on lactose as an excipient (inactive ingredient) in tablet formulations. Recent supply chain disruptions and increased medication production may drive heightened demand – similar to how specialized feed additives become scarce during supply chain disruptions.
Infant Formula Production: China’s relaxation of its one-child policy and growing middle class across Asia has fueled infant formula demand, where lactose serves as a critical ingredient – not unlike how specialized calf milk replacers rely on specific dairy components for optimal performance.
Functional Food Applications: The growing market for protein-fortified foods and beverages often incorporates lactose and lactose derivatives for their functional properties – similar to how precision feeding of amino acids optimizes milk protein synthesis.
Supply Constraints: Production limitations or logistical challenges may restrict lactose availability, creating a supply-demand imbalance that drives prices higher – much like how limited heifer availability during expansion phases drives replacement costs upward.
For dairy producers, this trend raises intriguing questions about potential premiums for milk with higher lactose content and whether processing technology investments focusing on lactose extraction and refinement might offer new revenue opportunities. While most payment systems don’t directly reward lactose content, the component’s surging value may eventually influence processor strategies and potentially create new premium opportunities for forward-thinking producers – similar to how component pricing gradually evolved to reward butterfat and protein.
The uncomfortable truth most industry analysts won’t tell you is that our payment systems are woefully behind market realities. While processors reap windfall profits from lactose’s remarkable price surge, dairy farmers producing the raw material see virtually none of this upside. This disconnect between market value and farm-level compensation represents another example of how the industry’s outdated pricing structures fail to align incentives throughout the supply chain properly.
LOOKING AHEAD: KEY MARKET INDICATORS TO WATCH
As dairy farmers digest Tuesday’s GDT results and plan their strategies for the coming months, several critical indicators will help gauge whether the current positive momentum can be sustained:
Oceanian Production Data: Milk production figures from New Zealand and Australia in the coming weeks will reveal whether the anticipated seasonal increase materializes at projected levels or faces constraints – similar to how monitoring dry matter intake helps predict potential milk production shifts.
Chinese Buying Patterns: China’s purchasing behavior at upcoming GDT events will provide crucial insights into whether the world’s largest dairy importer is rebuilding inventories or remaining cautious amid economic challenges – not unlike how monitoring rumination minutes helps predict potential health issues before clinical symptoms appear.
US-China Trade Relations: Any developments in the ongoing trade tensions could significantly impact global dairy trade flows and price dynamics – similar to how a single case of a reportable disease can disrupt export certifications.
European Milk Production: As the Northern Hemisphere spring flush progresses, European production volumes will influence global supply balances and potentially pressure certain product categories – much like how a neighboring farm’s expansion can affect local milk hauling routes and processing capacity.
Oil Prices and Logistics Costs: Transportation and energy costs significantly impact dairy trade economics; monitoring these factors provides context for price movements – similar to how feed costs directly affect milk production profitability.
By keeping a close eye on these indicators while maintaining flexible operational and risk management strategies, dairy producers can position themselves to capitalize on market opportunities while protecting against potential downside risks in this dynamic global marketplace – just as successful herd managers balance aggressive production goals with sound preventative health protocols.
THE BOTTOM LINE
Tuesday’s GDT auction results suggest the global dairy market is gradually finding its footing after a period of uncertainty. The 1.6% overall price increase, combined with exceptional strength in lactose and solid performance in whole milk powder, indicates improving demand fundamentals that could eventually translate to stronger farmgate prices. However, just as a cow’s transition period requires careful management despite the promise of peak milk ahead, dairy producers should maintain disciplined cost structures and risk management strategies as seasonal supply increases loom.
The divergent performance across product categories highlights the importance of understanding your milk market’s specific component valuation – because, in today’s complex dairy economy, what you’re paid for matters as much as how much you produce. Smart producers will use this market intelligence to position themselves ahead of the curve, locking in favorable prices where appropriate while maintaining the operational flexibility to capitalize on emerging opportunities.
Let’s be crystal clear: this market isn’t delivering uniform good news across all dairy categories. The winners and losers in today’s dairy economy will be determined by production efficiency and strategic alignment with the right market segments and components. Those who continue to produce commodity milk without understanding these nuanced market signals risk being left behind as the industry continues its relentless evolution toward greater specialization and value-added production.
Join over 30,000 successful dairy professionals who rely on Bullvine Daily for their competitive edge. Delivered directly to your inbox each week, our exclusive industry insights help you make smarter decisions while saving precious hours every week. Never miss critical updates on milk production trends, breakthrough technologies, and profit-boosting strategies that top producers are already implementing. Subscribe now to transform your dairy operation’s efficiency and profitability—your future success is just one click away.
$4k heifers & $1k calves: How long can dairy’s gold rush last? Experts say 2026+ — but there’s a catch.
Dairy farmers, it’s time to pinch yourselves. You’re not dreaming. Those newborn beef-cross calves are fetching north of $1,000 a pop, and top-quality springing heifers are commanding eye-watering prices exceeding $4,000 per head. Spring sales are shattering records left and right, leaving many of us wondering: How long can this milk check on hooves possibly last?
Buckle up, buttercup. The answer might surprise you – and it’s high time to rethink your entire breeding strategy.
The Perfect Storm: Why Cattle Prices Have Gone Nuclear
Let’s cut the bull: We’re witnessing a once-in-a-generation market realignment, not some temporary blip on the radar. The U.S. beef cow herd has crashed harder than a fresh heifer on a slick parlor floor, plummeting to its lowest level since 1961. We’re talking about a staggering 11% reduction since 2019 – equivalent to wiping out every beef cow in Texas twice over.
Meanwhile, dairy heifer inventories have shriveled faster than udders hit with oxytocin, reaching lows not seen since 1978. This isn’t just a cyclical dip – it’s a structural transformation of the entire cattle industry that’s making even the most stoic old-timers raise their eyebrows at auction barns.
The numbers tell the brutal truth: The total U.S. cattle inventory sits at a measly 86.7 million head, the lowest since 1951. We’ve endured six consecutive years of herd contraction, creating a supply vacuum that’s sucking prices skyward faster than a TMR mixer empties a silage bunker.
Location
Date
Category
Price Range/Head
Source
Pipestone, MN
1/16/2025
Supreme Springing Heifers
$3,700-$4,150
Lomira, WI
1/31/2025
Beef x Dairy Calves (60-100lbs)
$680-$1,100
New Holland, PA
1/27/2025
Beef x Dairy Bull Calves
$800-$1,160
Turlock, CA
1/24/2025
Approved Springing Heifers
$2,400-$2,800
Source: USDA-verified auction reports
Even more telling: dairy-beef slaughter cattle are now averaging $2,485 per head, outperforming native beef cattle by $100 per head at finishing. The market has fundamentally rewired faster than a parlor after a lightning strike.
Why This Isn’t Your Grandpappy’s Cattle Cycle
Veterans of the industry might be thinking, “We’ve seen high prices before – they always come back down like butterfat in a separator.” But here’s why this time truly is different:
The Beef Herd’s Biological Bottleneck
The beef sector isn’t just choosing not to expand – it physically can’t expand quickly. Despite record-high calf prices screaming for more production louder than a hungry calf at weaning time, beef replacement heifer numbers continue dropping, down another 1% in 2025.
Why? The math is brutally simple: a 750-pound heifer selling at $274/cwt puts $2,055 in a producer’s pocket today versus waiting two years for a breeding return. With 7% interest rates and soaring labor costs, the financial incentive to sell rather than breed is more overwhelming than the urge to check milk prices first thing every morning.
Metric
2025
2024
Change
Total U.S. Cattle Inventory
86.7M head
87.2M head
-0.6%
Beef Cows
27.9M head
28.0M head
-0.5%
Dairy Replacement Heifers
3.91M head
3.95M head
-0.9%
Beef Replacement Heifers
4.67M head
4.72M head
-1.0%
Source: USDA NASS January 2025 Cattle Report
Dairy’s Genetic Revolution
Meanwhile, the dairy industry has fundamentally altered its breeding playbook. With beef-cross calves pulling $1,000+ at birth, farms are going all-in on beef genetics faster than they adopted genomic testing. The days of breeding everything to Holstein are disappearing quicker than free donuts at a DHIA meeting.
The numbers back this up: The National Association of Animal Breeders reports that 7.9 million units of beef semen were sold to dairy farmers in 2024, nearly matching the 9.9 million units of sexed dairy semen. That’s a staggering shift in breeding strategy reshaping the entire industry.
Dairy replacement heifers expected to calve in 2025 hit their lowest level since USDA began tracking this metric in 2001. The pipeline is emptier than a bulk tank on milk pickup day, and refilling it would require dairy farmers to sacrifice the immediate cash bonanza of beef-cross calves.
The Demand Side: Consumers Keep Paying Up (For Now)
You might think sky-high prices would crush consumer demand faster than a foot in a fresh cow pie. Surprisingly, that hasn’t happened – yet.
Retail beef prices hit a record $8.42 per pound in March 2025. That’s enough to make anyone flinch at the meat counter like they’ve touched an electric fence. Yet consumers keep reaching for their wallets. Why?
Quality is trumping price sensitivity. The proportion of U.S. beef grading USDA Prime has more than doubled since 2014, now representing 9.6% of production. Choice-grade beef has grown 20%, capturing over three-quarters of the market share. Americans eat less beef (down to 55.4 lbs per person annually), but they demand better beef when they indulge – much like the shift from fluid milk to higher-value dairy products.
“The strength of demand has been incredible—beef demand is at 30-year highs,” notes Lance Zimmerman, a senior beef analyst at RaboBank. “In 2014-15, the average consumer had to work 14 and a half minutes to afford a pound of beef. In 2024, they only have to work 13 minutes”.
On the dairy side, cheese consumption continues its relentless climb, with Americans now devouring 40 pounds per person annually. This cheese-fueled engine soaks up 35% of U.S. milk production, creating stable demand despite fluid milk’s ongoing decline faster than a sick cow’s body condition score.
Input Costs: The Pressure Cooker
The current economic environment for cattle producers presents many opportunities and challenges. Let’s look at what’s happening with the costs that make or break your operation:
Input Cost
2025 Price
2022 Peak
Change
Corn (bu)
$4.35
$6.54
-33.5%
Diesel (gal)
$3.85
$5.20
-26.0%
Labor (hourly)
$24.50
$19.75
+24.1%
7-Year Loan Rate
7.1%
4.5%
+57.8%
Sources: USDA WASDE, EIA, Federal Reserve
Feed costs have moderated significantly from their 2022-2023 peaks, giving producers some breathing room. Corn prices have settled around $4.35/bushel, down from $6.54 in 2022/23. Soybean meal has dropped to the $300-$310 per ton range.
Hay stocks are up 6% from last year, pushing prices lower and making winter feeding less painful than a displaced abomasum. As of December 1, 2024, on-farm hay stocks were estimated at 81.5 million tons, up 6% from the previous year and well above the 2022 low.
But don’t get too comfortable. While feed costs have eased, other expenses are biting hard:
Labor now consumes 40¢ of every dollar on many dairy farms – more than twice what your grandfather budgeted
Interest rates hovering around 7% make expansion loans more painful than stepping on a hoof pick
Energy and fertilizer costs remain stubbornly high, like mastitis in a problem cow
The Crystal Ball: How Long Will This Party Last?
Now for the million-dollar question: When will this milk check bounce?
After crunching the numbers and analyzing forecasts from every ag economist worth their salt, here’s the verdict: These historically high prices will persist throughout 2025 and likely extend well into 2026.
The USDA and CattleFax projections align: expect fed cattle to average $199-$201/cwt through 2025. For a 1,400-lb steer, that’s $2,786-$2,814/head—numbers that’ll keep feedlots hungry for calves.
Why so long? Biology dictates the timeline. Even if heifer retention started today (which it isn’t), those calves wouldn’t calve until 2027. The supply pipeline simply can’t refill faster than nature allows – unlike switching from 2X to 3X milking.
The Long Game: 2027 and Beyond
Eventually, all good things must end – like the useful life of a TMR mixer. Most analysts expect a gradual price moderation in late 2026 or 2027, assuming favorable conditions finally allow herd rebuilding to gain traction.
But here’s the kicker: a return to pre-2023 price levels appears highly unlikely within the next 3-4 years. The cattle deficit is simply too deep, and the rebuilding process too slow – more like breeding a herd from scratch than making minor genetic improvements.
For dairy heifers specifically, prices may moderate even more slowly. The structural shift toward beef-on-dairy breeding has permanently altered replacement dynamics. Dairy farms can’t switch back to purebreds overnight, especially when crossbred calves continue commanding premiums that make Holstein bulls look like cull cows at auction.
Black Swan Risks That Could Derail the Boom
While the fundamentals point to sustained high prices, several wild cards could shuffle the deck faster than a nervous heifer in a headlock:
HPAI: The Looming Threat
Highly Pathogenic Avian Influenza has already jumped to 42 dairy herds nationwide. While mortality remains low, infected cows typically see a 10-15% milk production drop – similar to a moderate case of ketosis. A third distinct spillover event was confirmed in Arizona in February 2025, suggesting the virus is becoming more adept at infecting cattle.
The entire protein complex could shudder if HPAI spreads more widely or consumer confidence wavers. Vaccine development is underway but faces significant hurdles – making biosecurity more important than ever, even for operations that have been lax about footbaths.
Drought’s Comeback Tour
NOAA’s outlook paints the Southwest and Plains as tinderboxes heading into summer 2025. Another 2012-level drought could force massive sell-offs, ironically extending the supply crunch by forcing breeders to liquidate even more cows – similar to how culling during low milk prices eventually leads to higher prices.
Consumer Resistance
At some point, consumers may finally balk at $8+ per pound beef prices. While quality has kept demand resilient so far, there’s a breaking point for every budget – just as there’s a production ceiling for every cow, no matter how much bypass protein you feed her. A significant economic downturn could accelerate this demand destruction.
The Bottom Line: Are You Ready to Capitalize or Get Left Behind?
This isn’t a bubble – it’s the new reality for the foreseeable future. The biological constraints of cattle production and the structural shifts in breeding strategies have created a supply deficit that will take years to resolve – like rebuilding a herd after a catastrophic disease outbreak.
Smart dairy operators are embracing this paradigm shift, adjusting their breeding programs to capitalize on beef-cross premiums while carefully managing their replacement pipeline. They’re locking in feed costs while they remain favorable and budgeting for the long-term reality of expensive replacements.
The clock is ticking. With heifer retention still MIA and beef demand bulletproof, these prices aren’t just staying – they’re setting the stage for the next agricultural revolution. Those who adapt fastest will reap the greatest rewards.
Are you positioned to capitalize on this historic opportunity? Or are you still breeding like it’s 2015 when a day-old Holstein bull calf was worth less than the colostrum it consumed?
It’s time to challenge the sacred cows of your breeding program:
Are you still breeding your bottom 30% of cows to dairy bulls “just in case”? Stop leaving money on the table.
Have you explored multiple beef breeds to find the ideal cross for your herd? One size doesn’t fit all.
Are you developing relationships with specific feedlots or backgrounders who recognize the value of your calves? Don’t settle for commodity prices on premium stock.
The Bullvine’s Call to Action: Look hard at your breeding program this week. Run the numbers on what an aggressive shift to beef-on-dairy could mean for your bottom line. Challenge the conventional wisdom that says you need to raise every replacement. Buying high-quality replacements might be more profitable in this market than growing your mediocre heifers.
The gravy train is running full steam ahead but won’t last forever. Will you be on board when it reaches the station, or will you be left watching from the platform, wondering what could have been?
Key Takeaways
Supply crunch rules: Beef herds haven’t been this small since JFK’s presidency; dairy replacements are scarce as farms prioritize beef-cross calves.
Demand defies gravity: Consumers pay $8.42/lb for beef despite inflation, while cheese addiction props up dairy margins.
No relief until 2027: Prices stay sky-high for 18–24 months—biology prevents faster herd recovery.
Black swans loom: HPAI in cattle, drought, or recession could crash the party overnight.
Adapt or bleed: Tiered breeding programs and beef genetics are now survival tools, not luxuries.
Executive Summary
Record-breaking prices for dairy heifers ($4,000+/head) and beef-cross calves ($1,000+/head) are rooted in a historic U.S. cattle shortage, with beef herds at 1961 lows and dairy replacements at 1978 levels. Tight supplies, resilient consumer demand, and a seismic shift toward beef-on-dairy breeding strategies will sustain prices through 2025–2026. Risks like HPAI outbreaks, drought, or economic downturns could disrupt the boom, but biology guarantees no quick fixes: herd rebuilding takes years. Dairy farmers must adapt breeding programs, lock in feed costs, and budget for $3,500+ replacements to survive the new normal.
Editor’s Note: This analysis synthesizes data from USDA NASS, auction reports from major markets nationwide, and forecasts from leading agricultural economic institutions. All figures current as of April 14, 2025.
Replacement Heifer Prices Reach Record Territory Uncover the economic impact of $4,000 heifers and the beef-on-dairy revolution. Gain insights into adapting your breeding and herd management strategies to thrive in this new reality.
Join the Revolution!
Join over 30,000 successful dairy professionals who rely on Bullvine Daily for their competitive edge. Delivered directly to your inbox each week, our exclusive industry insights help you make smarter decisions while saving precious hours every week. Never miss critical updates on milk production trends, breakthrough technologies, and profit-boosting strategies that top producers are already implementing. Subscribe now to transform your dairy operation’s efficiency and profitability—your future success is just one click away.
USDA shocks markets with bullish milk forecast as FMD outbreaks threaten European trade. Futures slump signals global dairy crossroads.
EXECUTIVE SUMMARY: The global dairy market faces pivotal shifts as SGX futures decline (-1.5% butter, -0.7% SMP) despite resilient EU physical prices (+29.9% butter YoY). USDA’s surprise 0.3% milk production hike for 2025 contrasts with Dutch output declines (-2.5% Feb), while Poland surges (+0.4%). FMD outbreaks in Slovakia/Hungary trigger border checks, risking $2B+ in EU trade disruptions. Upcoming GDT auction and China’s whey tariffs add volatility, with traders betting against fats as protein markets show unexpected resilience.
KEY TAKEAWAYS:
US Herd Surprise: USDA revises 2025 milk forecast up 0.3% despite March cuts, signaling potential oversupply.
Disease Dollar Risk: Sixth Slovakian FMD case threatens EU exports – 10 outbreaks since March disrupt $7B+ trade corridors.
West vs East EU Split: Dutch milk solids drop -0.8% YTD as Poland climbs +1.6%, reshaping continental supply chains.
Auction Alert: April 15 GDT event tests global appetite after Pulse auction shows SMP resilience ($2,800) amid butter fatigue.
The global dairy market stands at a critical junction as futures contracts show concern for weakness while physical markets tell a more complex story. European Energy Exchange (EEX) and Singapore Exchange (SGX) futures trading revealed cautionary sentiment last week, with SGX registering broad-based declines that erased previous gains. Meanwhile, the USDA’s surprising April forecast revision signals potential supply pressure that could reshape Q2 margins. With Foot and Mouth Disease outbreaks in Central Europe adding another layer of complexity, producers face a market landscape that demands both vigilance and strategic positioning.
Futures Frenzy: Why Traders Are Betting Against Butter
The futures markets painted a revealing picture of trader psychology last week, with a stark divergence between fat and protein contracts that innovative producers should watch closely.
EEX Trading Signals
The European Energy Exchange trading reached 2,940 tonnes (588 lots), with Thursday emerging as the most active session at 965 tonnes. While butter futures slipped just 0.2% to €7,188 per tonne, the real story appeared in the options pit – 174 contracts abandoned like churned cream, signaling growing skepticism about Europe’s fat rally sustaining its 29.9% year-over-year premium.
In stark contrast, EEX Skim Milk Powder futures dipped 0.3% to €2,487 per tonne, yet open interest surged by 222 lots to 5,734 lots. This rush of new positioning despite price weakness suggests traders are placing strategic bets on protein’s future direction – possibly influenced by the strong GDT SMP result (+5.9%) from the previous week.
EEX Whey futures bucked the trend entirely, climbing 1.5% to €918 per tonne, partially recovering the previous week’s 1.2% decline. This resilience in the face of broader market caution suggests whey’s fundamentals may be diverging from the broader dairy complex.
Contract
EEX Weekly Change
SGX Weekly Change
Key Price Driver
Butter
-0.2%
-1.5%
EU over-supply fears
SMP
-0.3%
-0.7%
GDT auction volatility
Whey
+1.5%
N/A
China tariff uncertainty
This table exposes where traders are placing billion-euro bets as markets pivot.
SGX’s Global Warning Signs
The SGX platform witnessed substantially higher trading volumes at 18,421 lots/tonnes, with WMP dominating at 9,784 lots. The globally focused SGX contracts flashed warning signs across the board:
WMP futures averaged $3,744 per tonne for April-November, dropping 1.4% and reversing the previous week’s 0.6% gain
SMP futures declined 0.7% to $2,816 per tonne
AMF eased 0.5% to $6,635 per tonne
Butter futures took the hardest hit, falling 1.5% to $6,771 per tonne
The Milk Map Redrawn: Poland’s Surprising Ascent Challenges Dutch Dominance
Polish farms outproduce Dutch rivals by 1.9% year-over-year – a margin wider than the EEX butter/SMP price gap. This eastward production shift could redefine EU dairy geopolitics in the coming quarters.
Metric
Netherlands
Poland
Feb Collections
-2.5%
+0.4%
Milk Solids Yield
4.69% Fat
4.17% Fat
Regulatory Pressure
High
Low
Poland’s 1.9% production lead over the Netherlands could reshape EU dairy power dynamics.
Dutch milk collections totaled 1.06 million tonnes in February, down 2.5% compared to February 2024, with year-to-date collections down 2.2% when adjusted for the leap day. Despite impressive component levels (4.69% fat, 3.64% protein), total milk solids for January-February reached just 184,000 tonnes, down 0.8% year-over-year.
Meanwhile, Polish milk production hit 1.06 million tonnes in February, up 0.4% year-over-year, with cumulative output for January-February up 1.1% on a leap-year adjusted basis. Component levels (4.17% fat, 3.47% protein) delivered 80,800 tonnes of milk solids in February, up 1.5% year-over-year.
These diverging national trends highlight the danger of viewing EU production through a single lens. Environmental regulations are reshaping the Dutch dairy landscape while Poland’s growth trajectory continues – a critical dynamic for anyone tracking European supply fundamentals.
CME Dairy Cash Markets: Cheese Surges While Whey Falters Under Chinese Pressure
The Chicago Mercantile Exchange spot markets showed surprising strength last week, with cheese prices defying the bearish sentiment in futures markets. Cheddar barrels gained 11¢ during the week, closing at $1.8050/lb on April 11, while blocks rose by 10.5¢, finishing at $1.7450/lb. Butter prices also showed resilience, closing at $2.3475/lb, up 5.25¢ for the week.
Nonfat dry milk increased slightly to $1.1675/lb, while dry whey declined by 2¢ to $0.4650/lb – a direct casualty of China’s retaliatory tariffs on U.S. whey products. This divergence between domestic cheese strength and international whey weakness highlights the complex crosscurrents facing U.S. dairy producers.
Border Checks & Billion Euro Bets: FMD’s Ripple Effect Threatens European Trade
The FMD situation in Central Europe took a concerning turn, with Slovakia confirming its sixth outbreak on April 8 (sample taken April 4). Combined with Hungary’s four confirmed cases, this brings the total FMD-affected locations in Europe since early March to ten.
Date
Location
Herd Type
Containment Status
April 4
Slovakia
Beef Cattle
Active
March 21
Slovakia
Dairy
Contained
March 7
Hungary
Mixed
Expanding
Six outbreaks in 30 days – the numbers behind Europe’s border checks.
The Slovakian government’s declaration of a state of emergency and reintroduction of temporary border checks with Hungary and Austria signals the seriousness of the situation. While containment efforts remain focused on specific zones, the highly contagious nature of FMD creates significant risk beyond the immediate outbreak areas.
Will Slovakia’s 6th FMD case trigger EU-wide export bans? The economic stakes couldn’t be higher. Even localized outbreaks trigger complex control measures that impede logistics and raise costs. Third countries often implement broad import bans, creating trade friction that ripples the entire European dairy supply chain.
5 Auction Outcomes That Could Reshape Q2 Dairy Margins
The upcoming Global Dairy Trade auction (Trading Event 378) on April 15 will be a critical barometer for international demand signals. Fonterra has maintained its 12-month GDT event forecast quantities, with 7,369 tonnes of WMP, 2,235 tonnes of SMP, 2,180 tonnes of AMF, 1,005 tonnes of butter, and 310 tonnes of Cheddar on offer.
The interim GDT Pulse auction held on April 8 (PA076) provided mixed signals, with Fonterra Regular C2 WMP selling at $3,980 per tonne (below the TE377 Contract 2 price of $4,030) and SMP Medium Heat – NZ at $2,800 per tonne—a total of 45 participating bidders.
Forward-looking producers should watch for these potential auction outcomes:
Further, WMP price erosion below $3,900 would signal a weakened Asian demand
SMP maintaining its premium over $2,800 despite futures weakness would indicate protein resilience
Butter continuing its slide from TE377’s 3.9% decline would confirm fat’s vulnerability
Strong participation from Chinese buyers would challenge the trade tension narrative
Widening spreads between near-term and forward contracts would signal market uncertainty
102.92 million Tonnes: USDA’s Bombshell Production Forecast Shocks Markets
The USDA’s April WASDE report delivered a seismic shift in the U.S. milk production outlook. The agency raised its 2025 forecast to 102.92 million tonnes (226.9 billion pounds), representing a 0.3% increase over 2024. That’s enough milk to fill 14,000 Olympic pools… with whole milk.
Metric
March Forecast
April Forecast
Change
Milk Production
102.6M t
102.92M t
+0.3%
All-Milk Price
$21.50/cwt
$21.10/cwt
-1.9%
Herd Growth
0.1%
0.4%
+300%
USDA’s startling herd growth revision – enough cows to fill 300 Super Bowls.
This upward revision was attributed to higher expected milk production per cow and a slightly larger average cow inventory than the previous forecast. The dramatic reversal from March’s downward revision sent ripples through the market, with the projected all-milk price for 2025 falling from $23.05/cwt in January’s outlook to just $21.10/cwt in April.
That USDA forecast revision isn’t just numbers – it’s a warning flare for global buyers banking on tight supplies.
The Bottom Line: Positioning Your Dairy Operation for Market Volatility
The week ending April 14 solidified a tone of caution across the global dairy landscape. Futures markets, particularly SGX, reflected increased bearishness. In contrast, European physical markets displayed mixed signals – still benefiting from strong year-on-year price support but showing short-term fatigue in fats and whey.
The USDA’s upward revision of its U.S. milk production forecast was the week’s most significant development, suggesting potentially greater supply pressure ahead than anticipated just one month prior. This contrasts with the mixed picture in the EU, where Dutch production is declining while Polish output increases.
Forward-looking producers should watch three metrics: 1) German whey inventories, 2) U.S. heifer retention rates, and 3) Chinese tariff timelines. Master these, and you’ll milk this volatility for profit while others still wonder what hit them.
The question isn’t whether the market will change—it’s whether your operation is positioned to adapt when it does. Are you prepared to understand the headlines and regulatory details determining which dairy businesses thrive in this new environment?
Join over 30,000 successful dairy professionals who rely on Bullvine Daily for their competitive edge. Delivered directly to your inbox each week, our exclusive industry insights help you make smarter decisions while saving precious hours every week. Never miss critical updates on milk production trends, breakthrough technologies, and profit-boosting strategies that top producers are already implementing. Subscribe now to transform your dairy operation’s efficiency and profitability—your future success is just one click away.
Global dairy faces climate & trade upheaval! Discover how North American producers can turn challenges into export gold.
EXECUTIVE SUMMARY: The global dairy sector is navigating unprecedented disruption from climate stress, shifting trade policies, and evolving consumer demands. North American producers exported $8.22B in 2024, led by Mexico and Canada, but face volatility in commodity powders and rising competition. Key strategies include doubling down on record cheese exports, adopting heat-stress tech, and leveraging sustainability as a market differentiator. While climate risks hit small farms hardest, opportunities emerge in Latin America’s snack cheese boom and Asia’s protein craze. Success hinges on diversifying products, securing trade deals, and embracing collaborative export models.
KEY TAKEAWAYS:
Cheese is king: U.S. cheese exports hit 1.1B lbs in 2024—target Latin America’s 8% annual growth.
Beat the heat: Cooling systems can boost milk yields by 12% as heat stress costs $1.2B/year.
Trade wars matter: 250% Canadian tariffs and EU name restrictions demand aggressive FTA enforcement.
Sustainability sells: GHG-neutral goals and recyclable packaging are now market-access essentials.
Size-specific strategies: Big farms invest in direct exports; small farms thrive via cooperatives and niche products.
North American producers face unprecedented challenges and exciting opportunities in today’s rapidly evolving dairy landscape. The global dairy sector is dramatically transforming from climate change to shifting consumer preferences. This comprehensive guide will equip you with the knowledge and strategies to navigate these turbulent waters and position your operation for success in the international marketplace.
The New Global Dairy Trade Landscape: Where Opportunity Knocks
Why Mexico and Canada Are Your Dairy’s Golden Ticket
The United States remains a powerhouse in the global dairy trade, with exports reaching a staggering $8.22 billion in 2024. This figure represents the second-highest export value on record, demonstrating the sector’s resilience and global reach. Here’s the breakdown of our top markets:
Mexico: The undisputed champion, importing $2.47 billion in U.S. dairy products.
Canada: A strong second place, with record imports of $1.14 billion.
China: A complex but crucial market, importing $584 million despite recent challenges.
Pro Tip: Latin America’s cheese appetite is growing 8% annually. Focus on mozzarella and processed varieties for food service to tap into this booming market.
The Cheese Conquest: How U.S. Dairy is Dominating Global Markets
U.S. cheese exports have shattered records, reaching a mind-boggling 1.1 billion pounds in 2024 – enough to circle the globe 1.5 times! This 17% year-over-year increase showcases the strength of American cheese in the international arena.
However, not all dairy categories are enjoying the same success. NFDM/SMP exports have declined for three consecutive years, facing stiff competition from New Zealand and the EU. Whey products show a mixed performance, with high-protein concentrates (WPC80+) in high demand, particularly in China.
Why This Matters: The split in export performance underscores the need for distinct strategies: one to amplify cheese and high-value ingredient success and another to navigate the more competitive powder categories.
Climate Change: The Silent Profit Killer You Can’t Ignore
The Bottom Line: Climate adaptation is no longer optional – it’s essential for survival. Here’s your action plan:
Evaluate your current heat abatement strategies
Consider partnering with other small farms to invest in advanced cooling technologies
Explore government programs that may offset costs for climate adaptation measures
Navigating Regulatory Headwinds & Tailwinds: Your Guide to Global Dairy Politics
The Real Story Behind Canada’s 250% Dairy Tariffs
While recent criticisms of Canada’s high dairy tariffs are technically correct, they oversimplify the complex U.S.-Canada dairy trade relationship. Here’s what you need to know:
Canada uses a Tariff Rate Quota (TRQ) system to protect its domestic industry
Under the TRQ, a certain amount of dairy products enter duty-free
Above that cap, tariffs of 250-270% apply, depending on the product
The U.S. dairy industry’s main complaint is the inability to fully utilize even the duty-free quota despite demand from Canadian buyers.
Sustainability & Animal Welfare: The New Currency of Global Dairy Trade
A clear global trend is emerging toward incorporating sustainability considerations into food production and trade. This encompasses:
Reducing GHG emissions
Optimizing water and land use
Improving manure management
Utilizing sustainable packaging
What This Means For Your Operation: Sustainability metrics are increasingly becoming competitive differentiators rather than merely compliance requirements. Invest in practices that reduce your environmental footprint while improving efficiency to stay ahead of potential regulations and meet evolving consumer demands.
Capitalizing on Shifting Global Demand: Your Roadmap to International Success
The New Consumer Landscape: Health, Convenience, and Sustainability
Understanding evolving consumer preferences is key to capitalizing on global dairy opportunities. Here are the trends shaping demand:
Health & Wellness Focus: Consumers seek products with tangible health benefits beyond basic nutrition.
Protein Power: High-quality protein content gives dairy a significant advantage in this trend.
Sustainability & Ethics: Growing demand for eco-friendly packaging and sustainably sourced dairy.
Plant-Based Interaction: Both a challenge and an opportunity for dairy innovation.
Indulgence & Flavor: Despite health trends, taste remains a primary driver of food choice.
Regional Market Opportunities: Where to Focus Your Export Efforts
Asia: A vast, underdeveloped market with immense growth potential, driven by rising incomes and urbanization.
Latin America: An established and consistently growing market benefiting from geographic proximity to the U.S.
Middle East & North Africa (MENA): Significant growth potential, fueled by economic modernization and increasing tourism.
Technology: Your Secret Weapon for Global Competitiveness
Precision Dairy Management: More Than Just Fancy Gadgets
The integration of digital technologies is transforming dairy operations worldwide. Smart sensors monitoring individual cow health, environmental conditions, and milk quality provide real-time data that drives decision-making. These technologies aren’t just for large operations – even smaller farms can benefit from targeted investments in key areas:
Automated heat detection systems that improve breeding efficiency
Milk component analyzers that help optimize nutrition and identify health issues early
Water recycling systems that reduce consumption and costs
“We installed sensors to monitor rumination patterns last year,” reports Maria Rodriguez, a 120-cow dairy farmer in Wisconsin. “We’ve cut treatment costs by 22% by catching health issues days earlier than before.”
Climate Adaptation Technologies Worth Your Investment
As global temperatures rise, investing in heat abatement becomes increasingly critical. The most effective systems combine multiple approaches:
High-velocity fans strategically placed throughout barns
Sprinkler systems that activate based on temperature thresholds
Barn designs that maximize natural ventilation
Shade structures for pasture-based systems
These investments pay for themselves through maintained production during heat events. Research shows that adequately cooled cows can maintain up to 90% of their normal production during heat waves, compared to just 60-70% in non-cooled environments.
Strategic Positioning: Different Approaches for Different Operations
For Large Operations: Leverage Your Scale
If you’re operating a larger dairy, your scale provides significant advantages in the global marketplace:
Direct export relationships: Establish direct connections with international buyers
Specialized product development: Invest in R&D to create products tailored to specific international markets
Vertical integration: Control more of your supply chain to ensure quality and consistency
Sustainability certification: Implement comprehensive programs that can be marketed as value-added attributes
For Smaller Operations: Collaboration is Key
Smaller dairies can still participate in the global marketplace through strategic collaboration:
Join export-focused cooperatives: Pool resources with other producers to access international markets
Specialize in premium niches: Focus on high-value specialty products rather than competing on volume
Develop regional identity: Leverage your local story and practices as marketing advantages
Shared technology investments: Partner with neighboring farms to afford advanced technologies
The Bottom Line: Act Now to Secure Your Future
The global dairy landscape is changing faster than ever before. New tariffs announced last week will impose a blanket 10% on all products entering the U.S., with some countries facing even higher rates of 20-25%. These developments, combined with the ongoing shifts in production and consumption patterns, create challenges and opportunities.
The most successful dairy operations in the coming years will be those that:
Stay informed about rapidly evolving global market conditions
Invest strategically in technologies that improve efficiency and resilience
Diversify their product mix to capitalize on emerging consumer trends
Build relationships in multiple international markets to spread risk
Embrace sustainability as both an ethical imperative and a business advantage
Ignore Mexico’s demand for butterfat, and you’ll miss 40% of export growth opportunities. Fail to adapt to climate change and watch your production efficiency steadily decline. The choice is clear: adapt, thrive, or maintain the status quo and struggle.
By strategically positioning your operation to address these global market shifts, you can transform challenges into opportunities for growth and profitability in the evolving dairy landscape. The world is hungry for quality dairy products – make sure your operation is ready to feed that demand.
Join over 30,000 successful dairy professionals who rely on Bullvine Daily for their competitive edge. Delivered directly to your inbox each week, our exclusive industry insights help you make smarter decisions while saving precious hours every week. Never miss critical updates on milk production trends, breakthrough technologies, and profit-boosting strategies that top producers are already implementing. Subscribe now to transform your dairy operation’s efficiency and profitability—your future success is just one click away.
Spring flush floods markets! Cheese prices defy logic, China tariffs slam exports. Your survival guide inside.
EXECUTIVE SUMMARY: The North American dairy market faces unprecedented contradictions during the 2025 spring flush: Cheese prices surged 10-11¢/lb despite record milk discounts, while China’s 84% whey tariffs triggered a 2.5¢ price collapse. Butter defied growing inventories with a 5.25¢ rally, and USDA slashed 2025 milk price forecasts to $21.10/cwt (-$1.95 since January). With feed costs squeezing margins and processing plants overwhelmed, producers must navigate surplus milk, shifting trade flows, and volatile futures. Strategic pivots to specialty butter, export diversification, and feed hedging emerge as critical survival tactics.
KEY TAKEAWAYS:
Milk tsunami: Central U.S. spot milk trades $5 under Class III; 9.41M-head herd strains processing capacity
Cheese paradox: Barrels hit $1.805/lb (+11¢) as new plants absorb surplus, but USDA warns of $17.60/cwt Class III prices
Whey wipeout: China’s tariffs erase 38% of U.S. exports—prices plunge to 46.5¢/lb (-35% vs 2019 tariff impact)
Butter’s hidden play: Inventories up 17%, but unsalted shortages create $0.15/lb premiums for agile producers
Margin meltdown: Soybean meal dips to $300/ton, but 2025 all-milk forecast down $1.95/cwt since January
Spring flush is in full swing across North America, bringing abundant milk supplies and regional variations in production timing. Southern regions like California and Arizona appear to be past their peak, while northern areas such as Wisconsin and Minnesota are still ramping up output. USDA data shows February 2025 milk production at 17.7 billion pounds, up 0.9% year-over-year when adjusted for leap year effects, with the national herd reaching 9.41 million head — the largest since August 2021.
Spot milk prices in the Central region traded at steep discounts of $1.00 to $5.00 below Class III prices during the week ending April 11, reflecting oversupply as processors struggle to keep pace with production volumes.
Cheese Prices Defy Milk Glut
Cheddar prices surged despite the abundance of discounted milk supplies. CME cheddar barrels gained 11¢ during the week, closing at $1.8050/lb on April 11 — breaking above the $1.80 threshold for the first time since February. Blocks rose by 10.5¢, finishing at $1.7450/lb.
Analysts attribute this strength to increased demand from new cheese processing plants in Texas and Kansas, expected to add over 360 million pounds of annual cheese production capacity by year-end.
Whey Exports Hit by China Tariffs
China’s retaliatory tariffs on U.S. whey products — now as high as 84% — have sent shockwaves through the market. Dry whey prices at CME fell by 2¢ during the week, closing at $0.4650/lb on April 11.
Table: U.S. Dairy Exports to China (2024)
Product
Export Volume (Metric Tons)
Share of U.S. Exports to China
Value ($ Million)
Whey
152,000
38%
190
Skim Milk Powder
128,000
32%
320
Lactose
72,000
18%
90
Cheese
32,000
8%
160
Source: USDA Trade Data
With China accounting for approximately 40% of U.S. whey exports, manufacturers are scrambling to find alternative markets in Southeast Asia and Latin America.
Butter Market Shows Resilience
Butter prices gained traction despite growing inventories, with CME butter closing at $2.3475/lb on April 11 — up 5.25¢ for the week.
Manufacturers are taking advantage of inexpensive cream supplies to build stocks ahead of summer demand peaks. Interestingly, some producers report tight availability for unsalted butter spot loads as production commitments extend through May.
Farmer Takeaways: Strategies for Navigating the Spring Flush
Lock in feed contracts now: Take advantage of lower soybean meal prices while managing corn price risks.
Diversify export markets: Shift focus from China to Southeast Asia and Latin America for whey and powder sales.
Capitalize on specialty butter demand: Unsalted butter stocks are tight; explore premium pricing opportunities.
Monitor processing capacity: New cheese plants are demanding more milk; leverage spot milk sales strategically.
Evaluate risk management tools: Hedging Class III futures could protect against potential market reversals.
Outlook: Adapting to Market Contradictions
The North American dairy market is presenting a series of contradictions this spring: cheese prices rally while spot milk trades at steep discounts; butter inventories grow yet unsalted formats remain tight; whey markets collapse under tariff pressure despite steady domestic demand.
Producers must stay agile as they navigate abundant milk supplies and volatile commodity markets influenced by geopolitical tensions and shifting consumer preferences.
Final Thought: Will you ride this wave or get caught in its undertow? The producers who thrive will be those who adapt quickly — finding opportunities amidst market chaos while protecting their bottom line through strategic decisions.
Join over 30,000 successful dairy professionals who rely on Bullvine Daily for their competitive edge. Delivered directly to your inbox each week, our exclusive industry insights help you make smarter decisions while saving precious hours every week. Never miss critical updates on milk production trends, breakthrough technologies, and profit-boosting strategies that top producers are already implementing. Subscribe now to transform your dairy operation’s efficiency and profitability—your future success is just one click away.
Butterfat flooding markets while restaurant sales plummet! Learn how smart dairy farmers are protecting profits amid 2025’s market volatility.
EXECUTIVE SUMMARY: The US dairy market in 2025 faces significant crosscurrents as record-high butterfat levels (4.40%) and protein content (3.40%) flood processing plants while domestic demand signals flash warning signs, particularly with restaurant sales sliding from $97.0 billion in December to $95.5 billion by February. This market uncertainty has sent futures contracts tumbling, with April-to-June Class III futures falling by $2.57/cwt since January. Despite these challenges, several positive factors exist: feed costs are trending lower, US dairy products are priced more competitively than EU and New Zealand alternatives and tight replacement heifer inventories will keep milk production in check. For producers, success in 2025 hinges on implementing strategic breeding decisions, locking in favorable feed costs, and utilizing risk management tools to protect price floors amid ongoing market volatility.
KEY TAKEAWAYS
Component Economy Redefines Supply: While milk volume growth is modest (0.5%), butterfat production is surging (+5.3%), creating a “buyers’ market” for cream that processors must strategically manage.
Feed Cost Relief Provides Critical Buffer: With corn ($4.60/bu), soybean meal ($290/ton), and alfalfa hay ($159/ton) all trending lower than 2024, farmers can save $7,430 annually per 100 cows by locking in contracts now.
Strategic Breeding Shifts: Farmers balance record beef semen usage (7.9M units) with increased gender-sorted semen purchases (+18% to 9.9M units) to capitalize on beef markets while rebuilding dairy replacements.
Global Price Advantage Under Threat: US butter prices ($5,140/MT) are 60% lower than EU competitors ($8,250/MT), creating export opportunities that could vanish if trade tensions escalate.
Action Required Now: Successful dairy farmers must immediately audit component premiums in milk contracts, hedge Q3 milk via DRP, and cull low-fat cows to maintain profitability through 2025’s volatile market conditions.
The US dairy sector faces a complex balancing act in 2025, with component-rich milk flooding processing plants while demand signals flash warning signs. Here’s your action plan to navigate these crosscurrents and protect your bottom line.
As we move through the second quarter of 2025, the US dairy market is experiencing significant volatility. Despite entering the year with considerable optimism, emerging headwinds in domestic demand, export uncertainties, and unprecedented growth in milk components have created a challenging landscape for producers. This market recalibration has triggered substantial declines in dairy futures contracts, raising concerns across the industry. However, several positive factors remain, including favorable feed costs, competitive international pricing positions, and constrained replacement heifer inventories.
Butterfat Tsunami: Will Cream Glut Sink Milk Checks?
The US dairy sector began in 2025, building on substantial momentum from a positive 2024. Domestic retail dairy sales continued their upward climb, reaching approximately $78 billion, representing growth of $2 billion over the previous year. This confirmed dairy’s position as the largest category in retail grocery, demonstrating resilience even amid broader economic pressures.
However, the food service sector tells a different story. Restaurant sales have slid from $97.0 billion in December to $95.5 billion by February 2025, reaching a seven-month low. This decline reflects growing consumer caution about dining out.
“Foot traffic at restaurants hasn’t been that great since last spring,” notes Mike North, Principal of Risk Management. “People just haven’t been going out with the same zeal they had in the past. And 51% of the food dollar in America is spent out of the home. So, what happens at restaurants is important to what comes through on dairy demand.”
This weakness in food service is particularly concerning since cheese consumption at home has stagnated. With over half of Americans’ food spending outside the house, sluggish restaurant sales present a real challenge for dairy demand.
“We’re drowning in butterfat but starving for profits,” Wisconsin dairyman Jim Borden says. “Processors need to step up or watch farms fold.”
Trade Wars Loom: Can US Cheese Survive Without Mexico?
The export landscape in early 2025 presents both opportunities and risks. January exports set a record for the month at $714 million (+20% year-over-year), and February followed with $723.5 million in export value, an 8% increase compared to February 2024.
Heightened trade tensions further complicate the export environment. In March 2025, the US administration levied new tariffs on imports from Canada, Mexico, and China, promptly triggering announcements of retaliatory tariffs that specifically include dairy products.
“We are likely to see some inefficient plants close and some plants not run at 100% capacity,” warns North. “But with all of this cheese potentially coming online, we have a real need for exports because we will be creating many additional products.”
The Hidden Threat: Component Surge Outpacing Volume Growth
While US milk production is projected to grow just 0.5% in 2025, this modest figure masks a more significant trend: the dramatic increase in milk components. Butterfat levels have vaulted from 3.70% to 4.40% over the past 20 years, while protein has climbed from 3.06% to 3.40%.
Table 3: Milk Component Evolution (2000–2025)
Year
Avg. Butterfat (%)
Avg. Protein (%)
Milk Volume Growth (%)
Butterfat Production Growth (%)
2000
3.70
3.06
2.1
2.8
2010
3.85
3.12
1.4
3.2
2020
4.05
3.25
0.9
4.1
2025
4.40
3.40
0.5
5.3
Since 2016, the average annual growth rate for milk volume was 0.9%, compared to 1.5% for protein and 2.2% for butterfat. This “component economy” fundamentally changes how supply should be assessed. A modest 0.5% increase in projected milk volume for 2025 likely translates into a considerably larger increase in the pounds of butterfat and protein supplied to the market.
This component surge is driving the “buyers’ market for cream” noted in early 2025, with spot cream multiples falling below 1.00 in early March, starkly contrasting the premiums observed a year prior.
$4.60 Corn = Profit Window Lock in feed contracts by June before drought risks spike prices.
Heifer Shortage Creates Breeding Strategy Pivot
A key factor limiting potential herd growth is the availability of replacement heifers. The January 1, 2025 inventory of milk replacement heifers was estimated at 3.914 million head, a decline of 1% from the previous year. This trend continued downward, with the dairy replacement heifer inventory reaching its lowest since 2004.
Table 4: Breeding Strategy Shift (2023 vs. 2024)
Metric
2023
2024
Change (%)
Beef Semen Sales
7.9M units
7.9M units
0%
Gender-Sorted Semen
8.4M units
9.9M units
+18%
Dairy Replacements
4.06M head
3.914M head
-3.6%
Sarina Sharp notes with the Daily Dairy Report: “This heifer shortage will be with us for a while. It means that the cows in the barn are older and less efficient on average than we would have been able to expect if we could cull at a normal rate and replace older dairy cows with a new heifer.”
Breeding strategies employed by dairy producers further illuminate the dynamics influencing future herd size:
Beef semen usage on dairy cows remained at a record 7.9 million units in 2024
Gender-sorted dairy semen sales surged by 1.5 million units (18% increase) in 2024, reaching 9.9 million units
This reflects a strategic move by producers to generate required replacements while capitalizing on the beef market precisely
The sentiment shift in the dairy market during Q1 2025 is reflected in CME dairy futures prices. From early January to early April 2025:
April-to-June Class III futures fell by $2.57/cwt to average $16.86
Class IV futures dropped even more dramatically, losing $2.73 to reach $17.77
July-to-December Class III settled around $17.86/cwt, down $1.07/cwt
July-to-December Class IV settled near $18.51/cwt, down $1.99/cwt
This sharp erosion in futures prices reflects the market’s absorption of negative signals: softening domestic demand, heightened export risks, and the weight of ample milk component supplies.
The USDA projects the 2025 Class III milk price at $19.10 per cwt, up from the 2024 estimate of $18.89 per cwt, benefiting from strong whey prices and slightly improved cheese prices. However, futures markets are trading well below these official forecasts, suggesting significant market pessimism.
Feed Cost Relief: Your Profit Lifeline in 2025
A significant positive factor mitigating the impact of lower milk prices is the trend in feed costs. Major feed components have generally trended lower compared to the previous year:
Table 2: Feed Cost Forecasts & Savings
Feed
2024 Avg Price
2025 Avg Price
USDA 2025/26 Projection
Annual Savings per 100 Cows
Corn
$4.80/bu
$4.60/bu
$4.20/bu
$1,080
Soybean Meal
$330/ton
$290/ton
$287/ton
$2,150
Alfalfa Hay
$201/ton
$159/ton
$150/ton
$4,200
This reduction in feed expenses provides a critical counterbalance to the pressure from lower milk prices, helping to support producer margins that would otherwise be squeezed more severely.
Dairy Farmer Survival Checklist for 2025
☑ Audit component premiums in your milk contract
☑ Hedge 50% of Q3 milk via DRP
☑ Cull low-fat cows now
3 Critical Strategies to Protect Your Dairy Farm in 2025
1. Lock in Feed Costs Now
Take advantage of lower feed prices by securing long-term contracts
Consider forward contracting corn below $4.60/bushel and soybean meal under $300/ton
Evaluate on-farm forage production to reduce purchased feed dependency
2. Implement Strategic Breeding Decisions
Continue selective use of beef semen on lower genetic merit animals
Increase the use of gender-sorted semen on top genetic merit animals
Focus on breeding for components (fat and protein) rather than volume
3. Protect Your Price Floor
Enroll in Dairy Revenue Protection (DRP) to establish price floors
Consider options strategies that protect the downside while allowing upside potential
Evaluate forward contracting a portion of production through your processor
Questions to Ask Your Processor:
How does your payment system reward components vs. volume?
What premium opportunities exist for higher-component milk?
Are there volume incentives or quality bonuses available?
Table 5: Global Butter Price Gap (April 2025)
Region
Price per Metric Ton
vs. US Price
United States
$5,140
Baseline
European Union
$8,250
+60%
New Zealand
$7,800
+52%
The Bottom Line: Adapt or Exit
2025 demands a war-room strategy: Trim heifer costs, weaponize butterfat, and shield your milk price TODAY. The dairy boom is over—adapt or exit.
The outlook for the remainder of 2025 is cautious optimism for market stabilization, heavily caveated by substantial downside risks. Continued pressure on farm-level milk prices is anticipated in the near term (Q2 and potentially Q3) as the market works through ample component supplies against uncertain demand.
Never underestimate the American dairy farmer’s resilience. As Michael Dykes, president and CEO of the International Dairy Foods Association, puts it: “If there’s a market demand for the milk, they’ll find a way to start producing more heifers with sexed semen. They’ll find a way to make the terms they will work with rations; they’ll increase the milk production per cow. I firmly believe that dairy farmers respond to the market signals.”
For producers, success in 2025 will hinge on diligent cost management, maximizing revenue from milk components, and implementing robust risk management strategies. Those who can successfully navigate these crosscurrents – balancing the headwinds in demand with the opportunities presented by lower input costs and competitive international pricing – will be best positioned to emerge stronger when market conditions stabilize.
Join over 30,000 successful dairy professionals who rely on Bullvine Daily for their competitive edge. Delivered directly to your inbox each week, our exclusive industry insights help you make smarter decisions while saving precious hours every week. Never miss critical updates on milk production trends, breakthrough technologies, and profit-boosting strategies that top producers are already implementing. Subscribe now to transform your dairy operation’s efficiency and profitability—your future success is just one click away.
U.S. dairy drowning in cream: Can exports save the day? Discover why selling abroad isn’t a quick fix and what smart farmers should do now.
EXECUTIVE SUMMARY: The U.S. dairy industry faces a massive cream surplus, driven by record-high butterfat content, rebounding milk production, and weak food service demand. While exports have surged due to a significant price advantage (U.S. butter at $2.30/lb vs. Europe’s $8,600/MT), structural hurdles prevent a quick fix. These include mismatched butter standards (80% U.S. vs. 82% global), high market entry costs, and volatile tariffs (e.g., Canada’s 25% retaliation). Exports alone won’t drain the glut short-term, but long-term strategies like targeting Latin America, adapting products, and building export infrastructure offer hope. Success requires a shift from opportunistic selling to sustained international market development, potentially transforming U.S. dairy’s global role.
KEY TAKEAWAYS:
Cream glut stems from multiple factors: 4.43% butterfat content, 1.7% milk production surge, cheese production shifts, and weak food service demand.
Export growth is impressive (butter +126%, AMF +525% in early 2025) but faces hurdles like 80% vs. 82% butter standards and complex tariffs (e.g., China’s 125% on U.S. dairy).
Short-term export relief is unlikely due to the scale of surplus (270M lbs butter stocks) and structural barriers.
Long-term success requires strategic shifts: sustained market development, product adaptation (e.g., 82% unsalted butter), and targeting regions like Mexico/Central America.
Industry collaboration is crucial: processors must invest in export capabilities, while organizations like USDEC need to address trade barriers and provide market intelligence.
The dairy industry’s swimming in cream right now, with butter prices hitting rock-bottom while international markets are paying nearly double. Everyone’s asking the same question at the co-op meetings: can we export our way out of this mess? The short answer isn’t simple – while our exports are taking off, real-world hurdles mean exports alone won’t bail us out overnight. But with some smart moves, we could turn international sales from an occasional relief valve into a consistent market for our butterfat.
The Perfect Storm: How America’s Cream Glut Formed
Let’s break down how we got here:
Milk Floodgates Open: Big Herds, Bigger Output
Our cows are pumping out richer milk than ever before. Butterfat hit a whopping 4.43% earlier this year – numbers we’ve never seen before. Years of selecting components and feeding for fat have paid off too well.
“We’re making butter Americans don’t want to buy,” says Wisconsin churn operator Mark Tolbert. “Our cows keep pumping out more butterfat while processors scramble to find homes for it all.”
Production jumped 1.7% late last year, dumping another 160 million pounds of milk fat onto an already flooded market. That’s a lot of butter churns running over.
Cheese Shift Dumps More Cream on Markets
The cheese side isn’t helping either. While cheese production hit a record 14.25 billion pounds last year, the high-fat varieties like Cheddar dropped by 5.8%. That trend’s continuing this year, with American-type cheese production down another 1.3% in February.
Meanwhile, those fancy new cheese plants in Wisconsin and Texas are diverting 15% of our milkfat away from butter – 50% more than last year. More cheese overall, but less fat being used up.
Food Service Weakness Compounds the Problem
Restaurants and bakeries aren’t buying like they used to. The food service sector’s been soft, hitting cream prices hard.
Cream values have tanked to decade lows—farmers now earn just $1.10 for every dollar of butterfat. That’s about as bad as the COVID crash in 2020. Butter churns are running at 92% capacity, just trying to handle all the excess cream.
Export Explosion: U.S. Butterfat’s Global Price Advantage
Here’s where things get interesting – our cheap butter looks mighty attractive overseas.
Fire Sale Prices: U.S. Butter’s Dramatic Discount
Our butter’s selling for $2.30/lb while European butter’s fetching nearly $8,600/MT – a 30% discount even after adjusting for fat differences. We’re practically giving it away compared to world prices.
Region
Jan 2025 Avg
Feb 2025 Avg
Mar 2025 Avg
Early Apr 2025 Spot/Range
U.S. CME Grade AA
~$5,470/MT
~$5,246/MT
~$5,129/MT
~$5,110-$5,180/MT
Europe (W. Europe 82% FOB)
~$7,400/MT
~$7,700/MT
~$8,687/MT
$7,975-$8,600/MT
Oceania (82% FOB / GDT)
~$6,800/MT
~$7,280/MT
~$7,550/MT
$7,400-$7,600/MT
Record-Breaking Export Growth
Buyers overseas aren’t stupid – they’re loading up on our cheap butterfat. Butter exports jumped 41% in January and then exploded by 126% in February, hitting 11.5 million pounds. For the first two months of this year, we’ve shipped 84% more butter than the same time last year.
Anhydrous milkfat (AMF) exports have gone wild – up 525% in January alone. Canada’s buying 239% more, and Mexico’s purchases jumped nearly 1,600%.
Product
Jan 2025 (MT)
Jan 2024 (MT)
% Change
Feb 2025 (MT)
Feb 2024 (MT)
% Change
Key Destinations
Butter
3,188
2,261
+41%
5,216
2,308
+126%
Canada, C. America, MENA
AMF
3,897
623
+525%
N/A
N/A
N/A
Canada, Mexico, MENA
Total Butterfat
7,085
2,884
+146%
N/A
N/A
N/A
–
For the first time in over two years, we exported more butter than we imported in February. That’s a big shift.
Why Selling Overseas Isn’t a Quick Fix
So why can’t exports solve everything? There are some real roadblocks:
The 80% vs. 82% Butter Battle
Our standard butter is 80% fat and usually salted. The rest of the world wants 82% unsalted. That’s not just a small detail – it means retooling production lines and changing processes. You can’t just take butter meant for Kroger and ship it to Saudi Arabia.
AMF: America’s Secret Export Weapon
AMF (that’s almost pure butterfat at 99%) doesn’t have the same standards problem as butter, which explains why it’s selling like hotcakes overseas. For processors looking to move butterfat fast, AMF is the easier path than reformulating butter production.
The Tariff Minefield
The trade situation is a mess right now. The White House slapped 25% tariffs on Canada and Mexico in March, and they hit back hard. Canada put 25% tariffs on our dairy, and China went nuclear with 125% tariffs on U.S. dairy products.
Breaking into export markets isn’t like selling to the following country. Companies need international sales teams, specialized paperwork experts, and relationships with buyers overseas. All that takes time and money.
The U.S. has traditionally imported butter rather than exported it, so we don’t have the connections and systems we do for powder or cheese. You can’t flip that switch overnight.
Exporting the Surplus: Short-Term Pain, Long-Term Gain
Why Exports Won’t Immediately Eliminate the Cream Glut
Let’s be realistic – exports alone can’t fix this overnight:
The sheer scale of the problem is massive. Butter stocks jumped 26% in January alone to over 270 million pounds.
The hurdles we discussed – different butter standards, export costs, and crazy tariff situations – all slow down the export machine.
Building international relationships takes time. You can’t just call up a buyer in Saudi Arabia and ship tomorrow.
So while exports will help, we’ll likely need other fixes too – maybe producing less milk fat or finding new uses here at home.
Strategic Path Forward: Building Long-Term Export Capacity
But there’s good news for the long haul. If we play this right, exports could become a reliable outlet for our butterfat:
Sustained Export Investment: Processors must stop treating exports as a dumping ground for surplus and start building a real, long-term international business.
Strategic Market Targeting: Mexico and Central America make natural targets – they’re close by and have favorable trade deals like CAFTA-DR with zero dairy tariffs.
Product Adaptation: Plants should consider dedicated lines for 82% unsalted butter or focus more on AMF production since it’s already selling well overseas.
Enhanced Industry Collaboration: The U.S. Dairy Export Council needs everyone’s support to open doors and fight trade barriers.
Cream Rising: The Future of U.S. Butterfat Exports
This cream glut is both a crisis and an opportunity. While exports won’t immediately drain the lake, they’re becoming crucial to the solution. The export boom we’re seeing proves that when the price is right, buyers will come.
Going forward, we need a multi-pronged approach. On the export side, we must build lasting relationships, adapt our products, and navigate the trade minefield. We might need to rethink milk composition, production volumes, or processing capacity at home.
Can we export our way out of the cream glut? Not overnight. But with smart investments and a long-term view, exports can become a consistent market for our butterfat rather than just an emergency outlet when prices crash.
3 Steps to Survive the Cream Glut
Audit your herd’s butterfat trends with your nutritionist. Are you still selecting and feeding for maximum components when the market’s drowning in fat?
Demand export-ready pricing from your co-op. If they’re selling cream at rock-bottom prices domestically, ask what they’re doing to capture higher international values.
Attend USDEC’s June webinar on navigating tariff complexities. Understanding the rapidly changing trade landscape is essential for long-term planning.
Exports might seem distant for those of us with our boots in the barn every day, but they’re becoming crucial to our bottom line. Those who see the global market as a real opportunity – not just a place to dump surplus – will still be milking cows when this shakes out. The U.S. can become a consistent global supplier of high-quality butterfat, but it’ll take patience, investment, and a long-term vision.
Join over 30,000 successful dairy professionals who rely on Bullvine Daily for their competitive edge. Delivered directly to your inbox each week, our exclusive industry insights help you make smarter decisions while saving precious hours every week. Never miss critical updates on milk production trends, breakthrough technologies, and profit-boosting strategies that top producers are already implementing. Subscribe now to transform your dairy operation’s efficiency and profitability—your future success is just one click away.
84% Chinese tariffs slam US dairy exports. Prices plunge, markets scramble. Can producers pivot fast enough to survive?
EXECUTIVE SUMMARY: Escalating US-China trade tensions have triggered an 84% retaliatory tariff on critical dairy exports like whey and lactose, threatening over $500M in annual US sales. With China absorbing 42% of US whey and 72% of US lactose exports, domestic prices face collapse as surplus product floods markets. Historical parallels to 2019’s 55% export drop suggest even steeper declines now, compounded by expanded US production capacity. New Zealand and the EU stand to gain market share via trade agreements, while US producers must urgently diversify to Mexico/SE Asia and shift to value-added products like cheese. This crisis underscores the peril of over-reliance on a single export partner in volatile trade climates.
KEY TAKEAWAYS:
Tariff Tsunami: 84% Chinese tariffs make US whey/lactose uncompetitive overnight, risking $584M in annual exports
History Repeating: 2019’s 25% tariff caused 55% export drop – 2025’s higher rates could be catastrophic
Global Reshuffle: NZ’s duty-free access and EU’s food-grade products position them to exploit US losses
Survival Playbook: Producers must target Mexico/SE Asia markets, pivot to cheese/butter, and lock in forward contracts
Domino Effect: US milk prices could follow whey’s downward spiral, squeezing margins for farmers and processors
The escalating trade war between the United States and China has thrown a massive wrench into the dairy export machine. With retaliatory tariffs reaching 84% on critical dairy ingredients like whey and lactose, over $500 million in US dairy exports to China hang in the balance. This trade disruption comes at the worst possible time – just as US processors have expanded production capacity and China’s domestic milk output is forecast to decline by 2.6% in 2025.
The Tariff Time Bomb: A 90-Day Fuse
The US-China trade relationship deteriorated quickly in early 2025, with tariffs skyrocketing through tit-for-tat retaliations.
What began as manageable trade friction has morphed into a full-blown trade war:
February 4: The US imposed an initial 10% tariff on Chinese goods
March 3-4: US tariffs jumped to 20%
March 10: China retaliated with 10% tariffs on US dairy products
April 2: The US announced “Reciprocal Tariffs” with a baseline 10% global tariff and an additional 34% on China
April 4-8: China announced a matching 34% retaliatory tariff
April 9: The US paused new tariffs for most countries but dramatically increased the China-specific rate to 125%
April 10: China matched with an 84% retaliatory tariff on US goods
This lightning-fast escalation has created a perfect storm for US dairy exporters. Unlike previous trade disputes, China has explicitly denied exemptions for agricultural tariffs, removing potential avenues for relief.
“China’s 84% tariff on US goods came into force Thursday, April 10,” confirms the National Milk Producers Federation. “The tariffs will certainly hit our exports to China.”
Why This Matters: The China Dependency
The Chinese market represents an outsized portion of US dairy ingredient exports, making it virtually impossible to pivot quickly to alternative destinations without significant price concessions.
China is the third biggest export market for US dairy, with 385,485 metric tons worth $584 million exported in 2024. While this represents growth of 29% over the past decade, recent trends were already concerning – US dairy exports to China fell by 9% in 2024 compared to 2023.
For whey products specifically, the dependency is even more pronounced:
China purchased 42% of all US whey exports in 2024
For lactose, China absorbed 110,000 metric tons, representing 72% of China’s total lactose imports
Phil Plourd of Ever.ag captures the industry sentiment: “China takes a lot of US whey products – dry whey, whey protein concentrates, permeate, lactose. US manufacturers and marketers had to be very concerned about the initial 34% levy announced by China. Today, we’re up to 84%, making things more challenging.”
The Fallout: Price Collapse and Supply Chain Disruption
The ramifications extend beyond just lost sales volumes. The entire market dynamics for whey and lactose face significant disruption.
Lessons from 2019
We’ve seen this movie before, but the 2025 version looks considerably worse. During a similar trade dispute in 2019, when China imposed a 25% tariff on US whey products:
US exports of dry whey and permeate to China plummeted by 55%
Domestic dry whey prices collapsed by over 35%
Lactose exports fell 33%
With tariffs now more than triple those 2019 levels and US production capacity expanded, the market impact could be devastating. RaboResearch expects the US dry whey and milk markets to respond similarly to 2019 but with potentially more severe consequences.
The New Zealand Advantage
New Zealand enjoys a massive competitive edge thanks to its Free Trade Agreement with China, which grants duty-free access. This creates a price gap that’s nearly impossible for US exporters to overcome.
The 84% tariff makes US dairy exports to China effectively 104% more expensive than New Zealand’s duty-free shipments. New Zealand is already China’s largest dairy supplier, accounting for 51% of imports in the first half of 2024.
Global Winners and Losers
The disruption of established US-China trade channels creates opportunities and challenges across the global dairy landscape.
Who Stands to Gain?
The clear winners include dairy exporters from regions with better market access to China:
New Zealand: With its Free Trade Agreement granting duty-free access, New Zealand is perfectly positioned to capitalize on US exclusion.
European Union: Already supplying 35% of China’s whey imports, the EU stands to capture additional market share, particularly in higher-value segments. EU milk production is forecast to increase by 0.5% year-on-year in 2025.
South America: Argentina has the potential to increase milk production (forecast +4% in 2025) and strengthen its position as a dairy exporter.
Can Anyone Fully Replace US Supply?
Despite opportunities for competitors, the ability of alternative suppliers to fully replace US volumes appears limited:
Production Constraints: Milk production growth in the EU is projected to be modest (around 0.5% in 2025)
Different Product Profiles: Much of EU lactose exports to China are higher-quality, higher-priced materials, making them imperfect substitutes for US feed-grade lactose
China’s Shrinking Demand: China’s milk production is forecast to decline by 2.6% in 2025, marking the second consecutive year of contraction
Your Survival Playbook: Strategic Moves for Dairy Producers
With the Chinese market effectively closed by prohibitive tariffs, US dairy stakeholders must rapidly pivot to minimize damage:
1. Diversify Export Markets
Mexico and Southeast Asia represent the most promising alternatives. US dairy exports to Mexico rose 8% in value in February 2025, while February exports to China increased 4% before the tariff spike.
Focus on cheese and high-value products – cheese exports to China jumped 649% in February 2025 compared to the previous year, showing strong demand for specialty products even amid trade tensions.
2. Shift Product Mix
The market signals are clear – commodity ingredients face the biggest hit while value-added products show resilience:
Cheese exports boomed 14% in February 2025
Butter shipments surged 126%
Meanwhile, nonfat dry milk collapsed by 28%
This divergence suggests producers should prioritize milk components (fat and protein) that support higher-value product streams rather than focusing on volume.
3. Lock in Contracts and Hedge
With milk futures having already dropped 12% on tariff threats alone, forward contracting and price hedging are essential risk management tools. The 90-day tariff pause for most countries provides a brief window to secure alternative arrangements.
The Bottom Line
The 84% tariff wall between America’s massive whey and lactose production and China’s substantial ingredient demand represents a seismic disruption in the global dairy trade. While diplomatic solutions remain possible, the immediate outlook indicates significant pain for US producers and international supply chain adjustments.
The crisis underscores the inherent risks of concentrated export dependence for US dairy stakeholders. Smart producers will use this wake-up call to accelerate market diversification, shift toward value-added products, and implement robust risk management strategies.
Rabobank’s Q1 Global Dairy Quarterly report notes that global dairy prices are expected to remain elevated despite modest global supply growth of 0.8% in 2025. This suggests that producers who can navigate the trade turbulence and access alternative markets may still find profitable opportunities amid the chaos.
Your Move: Is your operation ready to pivot from China’s dependency to new markets and product streams? The dairy operations that survive and thrive will adapt fastest to this new trade reality.
Learn more:
Why Milk Prices Already Dropped 12% Before Tariffs Hit Explore how tariff threats alone caused a 12% plunge in milk prices, with $8.2 billion in exports at risk. Learn survival strategies for farmers navigating market volatility.
How Trump’s Tariffs Threaten Your Herd’s Bottom Line Dive into the broader implications of Trump’s sweeping tariffs, with $16.6 billion in dairy exports at stake. Discover actionable strategies for farmers to mitigate losses and adapt to shifting trade dynamics.
Join the Revolution!
Join over 30,000 successful dairy professionals who rely on Bullvine Daily for their competitive edge. Delivered directly to your inbox each week, our exclusive industry insights help you make smarter decisions while saving precious hours every week. Never miss critical updates on milk production trends, breakthrough technologies, and profit-boosting strategies that top producers are already implementing. Subscribe now to transform your dairy operation’s efficiency and profitability—your future success is just one click away.
Dairy crisis 2025: Plummeting prices, trade wars & butterfat glut crush farmers—survival strategies to weather the storm inside.
EXECUTIVE SUMMARY: U.S. dairy farmers face a triple threat in 2025: milk prices nosedived (Class III at $16.86/cwt, -15% since January), retaliatory tariffs slashed exports to key markets, and a butterfat glut from record-high components and surging imports. Feed cost relief offers limited respite, while beef-on-dairy breeding risks long-term herd shortages. Survival hinges on locking feed prices, maximizing beef revenue, and deploying risk management tools like DMC. Farmers must balance short-term cash flow with strategic herd planning to endure the downturn.
KEY TAKEAWAYS:
Milk price collapse: Futures dropped $2.50/cwt since January, erasing $25K/month for 1M-lb herds.
At the start of 2025, dairy farmers had every reason to feel optimistic. Domestic retail sales climbed $2 billion over the previous year to $78 billion, while restaurant sales surged from $93.7 billion in March 2024 to $97.6 billion by November 2024. Export markets were equally promising, with international cheese shipments growing by 17% to hit a record 1.13 billion pounds and overall dairy exports reaching .2 billion—second only to the .5 billion all-time high in 2022.
But that optimism didn’t last long. By February 2025, restaurant sales had dipped to $95.5 billion—a seven-month low—and escalating tariffs on U.S. dairy exports made international buyers hesitant. Meanwhile, U.S. dairy farmers continued producing record levels of components like butterfat and protein, further saturating the market and sending futures contracts into a tailspin.
“The current market downturn, following a period of relative optimism, may accelerate underlying industry trends,” notes Dr. Mark Stephenson, dairy economist at the University of Wisconsin-Madison. “Operations with weaker financial positions or higher production costs could face heightened pressure, potentially leading to further consolidation within the sector as more resilient farms find opportunities to expand.”
The Price Plunge: $2.50/cwt Vanishes Overnight
Milk prices have taken a nosedive in early 2025, erasing significant revenue for dairy farmers across the country and dropping by $2.57 per hundredweight (cwt), settling at an average between January and April of $16.86/cwt for April-to-June contracts. Class IV futures fell even further, losing $2.73/cwt during the same period.
Month/Contract
Class III ($/cwt)
Class IV ($/cwt)
Key Event
Jan 2025 (Peak)
$20.34
$20.73
Tariff talks begin
Feb 2025
$20.18
$19.90
Restaurant sales dip
Mar 2025
$18.62
$18.21
Retaliatory tariffs imposed
Apr-Jun 2025 Futures
$16.86
$17.77
Record butter imports reported
Source: CME Group, USDA AMS
For farmers producing one million pounds of milk monthly, this price drop translates to roughly $25,000-$27,500 less revenue every month—a devastating hit to cash flow and profitability.
“A drop like this isn’t just numbers on paper—it’s a real gut punch when you’re trying to pay feed bills or make loan payments,” says John Newton, Chief Economist at the American Farm Bureau Federation.
Demand-Side Worries: Restaurants and Exports Falter
The food service sector—responsible for half of all dairy consumption—has shown troubling signs of weakening demand in recent months. Restaurant sales fell from $97 billion in December 2024 to $95.5 billion by February 2025, marking a noticeable decline as consumers tighten discretionary spending on dining out.
Export markets aren’t faring much better due to escalating trade tensions with key partners like Canada, Mexico, and China—countries that collectively account for half of U.S. dairy exports by volume and over 40% by value. Retaliatory tariffs imposed by these nations have made U.S.-produced dairy less competitive globally.
“This reliance on exports makes the U.S. dairy sector increasingly susceptible to geopolitical tensions and trade policy decisions,” explains Tom Vilsack, president and CEO of the U.S. Dairy Export Council.
The Butterfat Paradox: Record Production Meets Import Flood
Despite record butterfat production domestically, processors are overwhelmed with cream supplies. At the same time, butter imports continue flooding into the U.S.—up 46% year-over-year from countries like Ireland and New Zealand.
“We’re drowning in cream while still importing butter—it makes zero sense,” says Mary Ledman, Global Dairy Strategist at Rabobank.
Beef-on-Dairy Strategy: Short-Term Gain vs Long-Term Risk
Many farmers have turned to beef-on-dairy breeding strategies to capitalize on strong beef markets while reducing reliance on low-value bull calves from traditional Holstein breeding programs.
Beef semen sales hit a record 7.9 million units in 2024—a clear sign that producers prioritize short-term cash flow over herd expansion.
“Beef prices are saving us right now—but replacement heifers are scarce as hen’s teeth,” warns Dr. Albert De Vries from the University of Florida.
While this strategy provides immediate financial relief through premium crossbred calves fetching up to $300 per head, it risks creating long-term shortages in replacement heifers for herd growth and sustainability.
The Bottom Line: Survival Strategies for Dairy Farmers
1. Lock In Feed Costs While Prices Are Low
Corn prices are down significantly at $4.20/bushel (-14% year-over-year), while alfalfa hay is averaging $210/ton (-9%). Securing feed contracts now can protect margins against future price volatility during summer droughts or other disruptions.
2. Milk Every Penny from Beef Markets
Strong beef prices provide a lifeline for cash flow through crossbred calves and cull cows—but balancing short-term gains with long-term herd needs is critical, given replacement heifer shortages.
3. Use Risk Management Tools
With milk prices tumbling—Class III futures averaging .86/cwt—programs like Dairy Margin Coverage (DMC) and Dairy Revenue Protection (Dairy-RP) are essential tools for stabilizing farm finances during volatile times.
“Risk management isn’t optional anymore—it’s survival,” says John Newton.
Join over 30,000 successful dairy professionals who rely on Bullvine Daily for their competitive edge. Delivered directly to your inbox each week, our exclusive industry insights help you make smarter decisions while saving precious hours every week. Never miss critical updates on milk production trends, breakthrough technologies, and profit-boosting strategies that top producers are already implementing. Subscribe now to transform your dairy operation’s efficiency and profitability—your future success is just one click away.
84% tariffs slam U.S. dairy exports to China. Why can’t farmers capitalize on China’s milk shortage despite crashing prices & production?
EXECUTIVE SUMMARY: China’s dairy production is plummeting (-9.2% in 2025), but U.S. farmers face insurmountable barriers: 84% retaliatory tariffs, New Zealand’s duty-free dominance, and China’s lactose-intolerant population. While milk prices crashed by 15% and skim powder production dropped by 30%, structural issues like shrinking birth rates and economic stagnation limit demand. With FTAs favoring competitors and trade tensions escalating, experts urge dairy producers to pivot to Mexico, Southeast Asia, and value-added niches instead of chasing China’s shrinking market.
KEY TAKEAWAYS:
84% tariffs make U.S. dairy exports to China 104% more expensive than New Zealand’s duty-free shipments.
New Zealand controls 46% of China’s import market—their FTA advantage is irreversible without policy shifts.
China’s milk consumption growth is capped by lactose intolerance (87% in teens) and declining birth rates.
Diversify or die: USDA grants and co-ops offer lifelines for exploring Latin America, MENA, and specialty markets.
Economic headwinds (real estate crisis, youth unemployment) slash Chinese spending on “non-essential” dairy.
China’s dairy sector is shrinking fast, with milk collections down 9.2% in early 2025 compared to last year. Milk prices have dropped 15%, and skim milk powder production has plummeted by more than 30%. While this might sound like an opportunity for U.S. dairy exports, the reality is much more brutal.
Why China’s Dairy Market is Shrinking
After years of pushing hard to expand its dairy industry, China is now dealing with serious oversupply problems. Between 2018 and 2023, their milk production jumped by 27% (24.7 billion pounds) as part of their national plan to rely less on imports.
“Dairy production has remained stable, and the number of cows has been gradually adjusted,” China’s agriculture ministry stated in December 2024. “While the oversupply of milk will continue in the first half of 2025, it is expected that supply and demand imbalances will ease in the second half of the year.”
The problem? Chinese consumers aren’t drinking enough milk to keep up with all this production. Raw milk prices crashed from 4.38 yuan/kg in 2021 to just 3.14 yuan/kg by September 2024 – a brutal 28% drop forcing many smaller farms out of business.
Why China Isn’t Buying
Trouble Digesting Milk
Let’s face it – many Chinese people simply can’t comfortably digest milk. Studies show that lactase deficiency affects about 38.5% of Chinese children aged 3-5, jumping to a whopping 87% in older kids. This biological reality means milk has never been a staple in Chinese diets.
Declining Birth Rates
China’s birth rate has fallen, dropping from 13.03 births per thousand people in 2013 to just 6.39 in 2023. This hits infant formula sales hard – historically a major driver for dairy imports.
There was a small bump in 2024 during the “Year of the Dragon” (considered lucky in Chinese culture), but that’s a blip in the long-term downward trend.
Economic Challenges
China’s economy struggles with real estate problems, high youth unemployment, and weak consumer confidence. As USDEC notes: “China’s economy continues to be challenged on multiple fronts—a real estate crisis; elevated youth unemployment; underfunded local governments; deflation; and disappointing GDP growth—not to mention potential fallout from trade battles with the U.S.”
When money’s tight, dairy products are often the first thing cut from shopping lists.
The Competitive Landscape: Why New Zealand Wins
New Zealand’s Duty-Free Advantage: As of January 1, 2024, all New Zealand dairy products enter China completely duty-free. This gives Kiwi producers roughly $350 million in annual tariff savings compared to U.S. suppliers.
Dominant Market Position: New Zealand commands a 46% share of China’s dairy import market. Their exports to China jumped significantly in late 2024, especially milk powder, butter, and cheese.
U.S. Export Decline: Meanwhile, U.S. dairy exports to China tanked in 2024, falling to $584 million – the lowest since 2020. Overall volume dropped 9%, according to USDEC.
Bottom Line: New Zealand’s free trade advantage is practically impossible to overcome without significant policy changes. Any import opportunities created by China’s production decline will benefit New Zealand, not U.S. producers.
The Trade War Impact: 84% of Tariffs Close the Door
The trade relationship between U.S. dairy and China has gone from bad to worse. Here’s how quickly things escalated:
Tariff Timeline:
February 1, 2025: U.S. slaps 10% tariff on all Chinese imports
March 3, 2025: U.S. increases tariff to 20%
March 4, 2025: China announces 10% retaliatory tariff on U.S. dairy (effective March 10)
April 2, 2025: U.S. imposes additional 34% “reciprocal” tariff
April 4, 2025: China matches with a 34% retaliatory tariff (effective April 10)
April 9, 2025: U.S. increases reciprocal tariff to 84%
April 9, 2025: China immediately matches with an 84% retaliatory tariff (effective April 10)
“China will impose a 10% tariff on US dairy products starting March 10 as the trade war intensifies,” reported The Bullvine in early March.
As of today (April 9, 2025), the U.S. has just announced an increase of its tariff on China from 34% to 84%, with China immediately matching. Starting tomorrow, virtually all U.S. dairy products entering China will face an additional 84% tariff on top of existing rates – effectively slamming the door shut on exports.
Quick Takeaways for Dairy Farmers
Small Operations: Focus on domestic specialty markets; consider joining cooperatives with diversified export portfolios
Medium Operations: Explore USDA Market Access Program funding for new market development in Southeast Asia and Latin America
Large Operations: Evaluate product mix to target markets less impacted by tariffs; consider joint ventures with partners in FTA countries
Bottom Line for Dairy Producers
The brutal truth? U.S. dairy producers shouldn’t expect any meaningful export opportunities to China shortly. The triple whammy of sky-high tariffs, weak Chinese consumer demand, and competition from duty-free suppliers like New Zealand create a perfect storm that effectively locks us out of the market.
3 Steps for Farmers:
Explore USDA Market Access Program grants for export market development (applications due June 14, 2025)
Contact your co-op or industry association about market diversification strategies
Look beyond China to Mexico, Southeast Asia, and the Middle East/North Africa markets
This trade war highlights why putting all your eggs in one export basket is risky. The most brilliant move now is to diversify your markets and focus on regions where U.S. dairy still has competitive advantages.
Join over 30,000 successful dairy professionals who rely on Bullvine Daily for their competitive edge. Delivered directly to your inbox each week, our exclusive industry insights help you make smarter decisions while saving precious hours every week. Never miss critical updates on milk production trends, breakthrough technologies, and profit-boosting strategies that top producers are already implementing. Subscribe now to transform your dairy operation’s efficiency and profitability—your future success is just one click away.
Global dairy markets split: Europe slumps as Oceania booms. Trade wars ignite. Smart farmers chase fat percentages to survive 2025 chaos.
EXECUTIVE SUMMARY: Global dairy markets face stark regional divides, with European futures declining (-0.8% butter, -1.2% whey) despite physical prices holding 31.9% above 2024 levels, while Oceania milk production grows (+1.2% NZ). Escalating U.S.-China trade tensions threaten exports as cheese emerges as a bright spot (+19% EU prices). Farmers must prioritize component efficiency (4.33% Belgian milkfat), diversify trade routes, and leverage futures markets to navigate volatility. With EU production declining (-5% Belgium) and component-driven profits rising, strategic agility separates survivors from casualties.
This week, the global dairy landscape presents a stark contrast, with European futures markets trending downward while physical markets remain substantially above year-ago levels. Oceania continues showing production growth in stark contrast to European declines, creating regional supply imbalances that smart producers are turning into profit opportunities. Meanwhile, Trump’s sweeping tariffs have triggered retaliatory measures from key dairy-importing nations, threatening established trade flows as U.S. exports already showed weakness.
FUTURES MARKETS REVEAL BATTLE BETWEEN EUROPEAN BEARS AND ASIAN BULLS
European traders hit the panic button last week, with EEX futures declining across all significant categories despite robust year-over-year gains. Butter futures led the slide, dropping 0.8% to €7,201 for the April-November strip, with open interest reduced by 28 lots to 2,831 lots. This reduction suggests traders are cutting their exposure amid increasing uncertainty.
SMP wasn’t spared either, sliding 0.5% to €2,494 despite a substantial increase in open interest by 724 lots to 5,512 lots. Whey futures performed worst, tumbling 1.2% to €904, reflecting challenges in the protein ingredient sector.
Meanwhile, Singapore’s SGX painted a dramatically different picture with mostly positive price movements:
EU PHYSICAL MARKETS: SHORT-TERM BLUES, LONG-TERM GREEN
Don’t let this week’s dips fool you. The EU’s dairy quotation system revealed short-term pressure despite substantial year-over-year strength. The butter index dropped 0.7% to €7,568, with Dutch butter taking the biggest hit at 1.3% (€100) to €7,400. German butter slipped 0.7% to €7,475, while French butter remained steady at €7,830.
The annual comparison is genuinely eye-popping – the butter index stands at a staggering 31.9% (€1,831) above last year’s levels. This massive annual appreciation has been a boon for European dairy producers, who’ve maintained production despite rising costs and regulatory pressures.
SMP followed a similar pattern, with the index losing 0.7% to €2,422 yet remaining 3.7% (€87) above year-ago levels. Whey prices also weakened to €875 but stand an impressive 36.3% (€233) above 12 months ago. Only WMP provided a weekly bright spot, with the index gaining 0.8% to €4,435, driven by a substantial 2.5% rise in French WMP.
CHEESE INDICES: THE REAL MONEY MAKERS
European cheese indices all posted modest weekly declines but maintained impressive annual gains that suggest fundamental strength in the category:
Cheese Type
Weekly Change
New Price
YoY Gain
Cheddar Curd
-0.7%
€4,795
+18.2%
Mild Cheddar
-0.4%
€4,810
+19.1%
Young Gouda
-0.9%
€4,380
+13.1%
Mozzarella
-1.3%
€4,284
+19.2%
Despite short-term fluctuations, these substantial year-over-year gains across all cheese categories point to strong structural support for cheese values. This aligns with the EU dairy forecast for 2025, which projects increased cheese production even as milk production declines – a clear sign that processors prioritize this high-value segment.
GDT AUCTION: POWDER POWER PLAY
The latest Global Dairy Trade auction (TE377) saw the overall index climb 1.1% to $4,250. SMP emerged as the star performer with a robust 5.9% gain to $2,876, while WMP edged down just 0.1% to $4,062.
The divergence between European and Oceanic powder values was highlighted by Solarec’s Belgian Regular WMP selling at $4,665 compared to Fonterra’s $3,980. Butter experienced the most significant decline among major products, falling 3.9% to $7,895, while AMF bucked the fat trend by rising 2.4% to $6,695. With 17,643 tonnes sold to 163 bidders, the auction demonstrated healthy participation despite market uncertainty.
PRODUCTION PATTERNS: OCEANIA SURGES WHILE EUROPE CONTRACTS
The most striking feature of this week’s data is the dramatic regional divergence in milk production. Fonterra reported New Zealand milk collections were up 1.2% year-over-year to 133.7 million kgMS, driven primarily by South Island’s impressive 2.9% growth. Fonterra Australia collections also grew by 1.6% to 8.2 million kgMS.
This Oceanic growth presents a stark contrast to European struggles:
Country
Feb 2025 Production
YoY Change
Spain
579kt
-1.2%
Italy
1.06 million tonnes
-1.0%
Belgium
340kt
-5.0%
Belgian producers face the most dramatic challenges, with February collections plummeting 5.0% and cumulative production down 4.2% for 2025. This aligns with broader projections for EU dairy in 2025, which forecast a 0.2% overall decline in milk production due to shrinking cow herds, environmental regulations, and disease pressures.
COMPONENT EFFICIENCY: THE NEW BATTLEGROUND
Looking beyond raw volumes, component data reveals significant variations in milk quality that impact processor returns. Belgian milk posted the highest component levels with 4.33% milkfat and 3.53% protein, followed by Italian milk at 4.05% and 3.49% protein. Spanish milk recorded relatively lower components at 3.88% milkfat and 3.40% protein.
This variation explains why Spanish milk solids collections grew slightly (+0.2%) despite volume declines, while Italian milk solids remained flat and Belgian milk solids fell less dramatically (-3.3%) than their volume drop. The growing gap between volume and component trends underscores the industry’s increasing focus on nutritional density rather than raw output.
NZ DAIRY COW CULLING: FEWER, BETTER COWS
In a seemingly counterintuitive trend, New Zealand dairy cow slaughters increased 9.1% year-over-year to 76,649 head in February despite the growth in milk production. This suggests Kiwi producers achieve greater efficiency with fewer animals, likely through improved genetics and management practices.
The 12-month rolling dairy cow slaughter total was 771 thousand head, still 4.9% below the same period last year. This indicates a longer-term moderation in culling rates after more aggressive herd reductions in prior years.
TRADE WAR FALLOUT: DAIRY IN THE CROSSHAIRS
This week, the elephant in the room is the dramatic expansion of global trade tensions following Trump’s “Liberation Day” tariff announcements. Speaking from the Rose Garden, Trump implemented sweeping tariffs on more than 180 countries and territories, using the trade deficit in each relationship as the basis for tariff calculations.
While Canada and Mexico were spared, many key markets for U.S. dairy products were hit. China swiftly announced retaliatory 34% tariffs on U.S. products, mirroring the percentage in the administration’s list. This comes on top of existing tariffs from earlier conflicts.
The timing couldn’t be worse for U.S. dairy exports, which already showed weakness. After adjusting for leap day, February exports fell 4.3% year-over-year, with particularly sharp declines in nonfat dry milk shipments, which hit their lowest February volume since 2016. Southeast Asian demand for milk powder has been notably weak.
The news wasn’t bad – U.S. cheese exports rose 7.3% to 99 million pounds, the largest February volume ever recorded. Butter exports also soared 134.2%, while anhydrous milkfat shipments increased nearly tenfold compared to February 2024.
5 SURVIVAL STRATEGIES FOR DAIRY FARMERS
The current global dairy environment presents both significant challenges and strategic opportunities:
Component Over Volume – The growing divergence between volume and milk solids trends underscores the importance of breeding and management decisions that maximize component efficiency rather than raw output.
Regional Strategies Must Differ – European producers face regulatory and cost constraints that necessitate a more significant focus on value-added processing. In contrast, Oceania producers may have more opportunity for volume growth.
Cheese Holds Particular Promise – With cheese indices showing the most substantial year-over-year gains, processors will likely continue shifting milk toward this category, especially in Europe, where cheese production is forecast to increase.
Trade War Demands Contingency Planning – Producers and processors heavily dependent on export markets must develop alternatives for potential disruption of established trade flows. Asian markets beyond China may present growing opportunities as trade patterns shift.
Price Volatility Requires Sophisticated Risk Management – The divergence between European and Asian futures markets highlights the value of a diversified approach to hedging across multiple exchanges.
THE BOTTOM LINE: THINK GLOBAL, ACT LOCAL
The global dairy market continues sending contradictory signals that challenge straightforward interpretation. Short-term European weakness contrasts with robust year-over-year gains. Production trends show dramatic regional divergence, with Oceania growing while Europe contracts. Meanwhile, the escalating trade war adds significant uncertainty to market projections.
Smart dairy producers will look beyond immediate price signals to understand the structural factors driving longer-term trends. Focusing on efficiency improvements, component optimization, and strategic product mix decisions will prove more valuable than reactive responses to weekly market fluctuations.
This market isn’t for the faint-hearted. European producers are walking a tightrope between component premiums and volume cliffs. U.S. exporters are caught in a geopolitical meat grinder. Oceania? They’re just quietly printing money while the Northern Hemisphere fights.
The playbook’s clear: Think global, act local, and never stop chasing components. Because in this market, fat percentage isn’t just a number – it’s your lifeline.
Join over 30,000 successful dairy professionals who rely on Bullvine Daily for their competitive edge. Delivered directly to your inbox each week, our exclusive industry insights help you make smarter decisions while saving precious hours every week. Never miss critical updates on milk production trends, breakthrough technologies, and profit-boosting strategies that top producers are already implementing. Subscribe now to transform your dairy operation’s efficiency and profitability—your future success is just one click away.
Trade war escalates as 44% tariffs threaten $485M in U.S. dairy exports. China retaliates, H5N1 spreads – survival strategies for farmers revealed.
EXECUTIVE SUMMARY: The U.S. dairy sector faces a perfect storm as President Trump’s “Liberation Day” tariffs trigger China’s retaliatory 44% duties, putting $485M in exports at immediate risk. February data reveals collapsing powder sales (-53% in SE Asia) but record cheese exports (+7.3%), while butter shipments surge 134%. Simultaneously, H5N1 outbreaks cost farms up to $1.2M, and EU geographical indications threaten $59B in U.S. cheese revenue. Producers must act now: lock in feed prices, shift milk classes, and leverage USDA support programs to survive this unprecedented crisis.
KEY TAKEAWAYS:
China’s 44% tariff wall could erase 83% of $584M annual U.S. dairy exports within months
Butter exports (+134%) and cheese (+7.3%) shine while powder collapses (-53% in SE Asia)
H5N1 costs hit $372K testing/$1.2M culling for large herds – apply for USDA aid NOW
EU’s cheese name grab threatens $59B over 10 years – fight for “parmesan” labeling rights
5 survival moves: Hedge feed, shift to Class IV, demand USMCA enforcement, chase new markets, use H5N1 funds
The dairy world is caught in the crossfire of an escalating global trade war following President Trump’s sweeping “Liberation Day” tariffs announced this week. These aggressive new measures, affecting more than 180 countries and territories, have triggered immediate retaliation from China and sent financial markets tumbling. For dairy farmers worldwide, this dramatic shift in trade policy creates both immediate challenges and potential opportunities depending on your location and export exposure.
TRADE WAR BOMBSHELL: HOW “LIBERATION DAY” RESHAPES GLOBAL DAIRY MARKETS
The long-anticipated tariffs hit harder than most analysts expected, with a baseline 10% levy on all imports starting April 5, followed by steeper rates kicking in from April 9. While Canada and Mexico escaped unscathed from this latest round, key dairy importers without significant new barriers.
China wasted no time firing back, announcing a matching 34% tariff on all U.S. products starting April 10. This comes on top of existing 10% tariffs from previous trade disputes, creating a crushing 44% total barrier for U.S. dairy exports to America’s third-largest dairy market worth $584 million in 2024. Industry analysts project this could erase 83% of this trade within months – putting $485 million at immediate risk.
Market
Export Value (2024)
Key Products Affected
Mexico
$2.47 Billion
Cheese, NFDM, Whey
Canada
$1.14 Billion
Fluid Milk, Yogurt
China
$584 Million
Infant Formula, Whey
Japan
$394.61 Million
Cheese, Ice Cream
South Korea
$385.66 Million
Cheese, Lactose
Philippines
$364.98 Million
NFDM, Whey
Indonesia
$244.83 Million
NFDM, Butteroil
Australia
$173.87 Million
Cheese, Specialty Products
European Union
$167.14 Million
Whey Proteins
Dominican Republic
$134.7 Million
Cheese, NFDM
The European Union, a significant cheese exporter to the U.S., faces a challenging position. Alexander Anton of the European Dairy Association emphasized: “Our sector is already under enormous pressure from China’s anti-subsidy investigation and ongoing global market challenges. Now, U.S. tariffs risk compounding that crisis.”
FEBRUARY EXPORT DATA REVEALS TROUBLING SIGNS BEFORE THE TARIFF WAR ERUPTED
The latest export data from February showed U.S. dairy exports slipping 4.3% year-over-year (adjusted for leap day), with sharp divergences between products hinting at challenges that predated the current tariff crisis.
Product
Feb 2025 Volume
YOY Change
Key Markets Impacted
Cheese
99M lbs
+7.3%
South Korea (+50%)
Butter
18.7M lbs
+134.2%
Middle East, Canada
NFDM/SMP
177.36M lbs
+0.2%
SE Asia (-53%)
Dry Whey
57.35M lbs
-10.3%
China (-58%)
Whey Protein Isolate
12.1M lbs
+14.2%
Global Sports Nutrition
Nonfat dry milk/skim milk powder (NFDM/SMP) exports plummeted to their lowest February volume since 2016, with Southeast Asian sales collapsing dramatically. This drop pushed U.S. NFDM/SMP exports to troubling lows – a concerning sign for America’s leading dairy export product.
The bright spot? Cheese exports maintained their strong growth trajectory, improving 7.3% year-over-year and setting an all-time February record at 99 million pounds. Growth across diverse markets compensated for a 5.9% drop in cheese exports to Mexico.
Butter exports delivered the most dramatic performance, soaring 134.2% as U.S. butterfat prices sat at a significant discount compared to European and Oceanian competitors. This price advantage could prove pivotal as trade barriers reshape global dairy flows. Anhydrous milkfat shipments also skyrocketed to 7.5 million pounds, nearly ten times the volume shipped in February 2024.
WHY GLOBAL DAIRY PRODUCERS MUST PREPARE FOR MARKET UPHEAVAL
The tariff fallout varies dramatically depending on where your farm sits globally. The outlook appears grim for European producers, particularly Irish dairy farmers exporting Kerrygold butter to the U.S…
The Irish Farmers Association warns: “Kerrygold is now the second best-selling butter brand in the U.S., where we sent almost €500m of product in 2024. The fact that New Zealand only has a 10% tariff for dairy products while the EU will have 20% tariffs will leave us at a competitive disadvantage.”
New Zealand, meanwhile, finds itself in a relatively stronger position despite the turmoil. Agriculture Minister Todd McClay offered an optimistic assessment: “While these tariffs create additional costs that will largely be passed on to consumers, New Zealand is in a stronger position than many other countries, some facing higher tariff barriers.”
Australian dairy exports, primarily cheese and curd, reached record highs last year, with volume lifting 17.5% year-on-year. The country faces only the baseline 10% tariff, potentially giving it a competitive edge against European rivals hit with the 20% rate.
THE HIDDEN COST CRISIS: HOW EQUIPMENT TARIFFS ADD $45.65 PER COW
While Canada escaped new tariffs in this round, existing 25% steel and aluminum duties directly hit equipment costs for dairy operations on both sides of the border. A New York dairy co-op’s analysis shows these tariffs added $21,000 to a 460-cow barn renovation – $45.65 per cow in hidden costs before milk even hits the tank.
AJ Wormuth, who manages 3,600 dairy cows at Half Full Dairy in upstate New York, reports accelerating a barn renovation after being informed that metal stall costs would increase by $21,000 due to these steel tariffs. “We’re facing a double challenge — lower prices coupled with increasing costs,” Wormuth explains.
The concerns are equally pressing for smaller operations like Annie Watson’s 70-cow organic dairy in Maine. She calculates that tariffs could increase her grain expenses from Canada by $1,200 monthly. “It would be more manageable if many of our organic dairy farmers weren’t already financially struggling due to market conditions,” notes Watson.
CME MARKET REACTION: WHICH DAIRY COMMODITIES FACE THE BIGGEST PRESSURE?
This week’s CME spot market movements offered a glimpse into immediate market reactions to the tariff drama, with most dairy commodities facing downward pressure:
Butter took the biggest hit, falling 5.5¢ to settle at $2.295/lb with a heavy trading volume of 28 loads. With U.S. butter production jumping 6.3% year-over-year in February amid rising milk fat tests (now at 4.43%, up 0.13% from last year), the market faces significant oversupply challenges that exports might have helped alleviate before tariff barriers emerged.
Nonfat dry milk slipped a modest half-cent to $1.1575/lb, but concerning fundamentals lurk beneath this relatively stable price. Manufacturers’ NDM inventories have ballooned to 329.14 million pounds, a shocking 57% increase from last year, while domestic and international demand remains sluggish.
Dry whey continued downward, losing a penny to settle at 49¢ per pound. The ongoing preference for higher-protein products (whey protein isolate production jumped 14.2% while dry whey production fell 10.3%) hasn’t provided price support, and the escalating China trade conflict threatens to undermine export prospects further.
The cheese markets showed surprising resilience amid the turmoil. Cheddar blocks inched up half a cent to $1.64/lb on heavy volume (47 loads traded, including 24 on Tuesday alone), while barrels gained 2.5¢ to reach $1.66/lb, inverting the typical block-barrel spread. This strength comes despite February cheese production climbing 1.3% year-over-year to 1.115 billion pounds.
H5N1 CRISIS: THE PERFECT STORM THREATENING DAIRY FARM SURVIVAL
As if trade wars weren’t enough, the dairy industry simultaneously battles an unprecedented H5N1 avian influenza outbreak in cattle. Since the first detection on March 24, 2024, the virus has spread to at least 192 dairy herds across 13 states. This biosecurity crisis adds another layer of complexity, with mandatory testing now required for interstate cattle movement.
Cost Factor
Small Farm (70 cows)
Large Farm (3,000 cows)
Testing
$8,700
$372,000
Milk Loss (14 days)
$11,200
$480,000
Culling
$28,000
$1.2M
The USDA has committed $200 million to combat the spread, offering up to $10,000 per farm for veterinary costs and testing. With the American Association of Bovine Practitioners estimating economic impacts of $100-$200 per cow, this represents yet another financial pressure point for dairy operations already struggling with trade disruptions.
THE $59 BILLION THREAT: WHY EU CHEESE NAME RESTRICTIONS COULD DEVASTATE U.S. PRODUCERS
Beyond immediate tariff concerns lurks another trade dispute with potentially devastating consequences. The EU’s aggressive stance on geographical indications for cheese names threatens to cost U.S. dairy producers $59 billion over the next decade, according to a new report by Informa Economics IEG.
U.S. cheesemakers face restrictions on using terms like “parmesan,” “feta,” and “gorgonzola” – names many American producers consider generic. Wisconsin cheesemaker Sarah Pratt bluntly says, “They want to steal ‘parmesan’ from our vocabulary like they stole our grandfathers’ recipes.”
5 SURVIVAL STRATEGIES EVERY DAIRY PRODUCER NEEDS NOW
The long shadow of a trade war has impacted dairy futures significantly, with Class III contracts dipping below $18/cwt through August. This comes at a particularly challenging time for farm profitability – February’s milk margin over feed cost fell to $13.12/cwt, down 73¢ from January.
Market
New Tariff Rate
Projected Export Loss
At-Risk Jobs
China
44% (cumulative)
$485M (83% of 2024)
8,200
EU
20%
$67M annual
1,400
Southeast Asia
10-15%
$214M annual
3,700
South Korea
10%
$38.5M annual
650
The silver lining? Feed costs appear to be headed lower. May soybean futures plunged to $9.77/bu following China’s retaliatory tariff announcement, while May corn settled at $4.60/bu. This potential operating cost relief may help offset some milk price pressure.
For forward-thinking dairy producers, several strategic priorities emerge:
Lock in feed prices NOW using CME’s discounted DEC25 corn futures at $4.18/bu to protect against future volatility.
Demand USDA enforce USMCA Chapter 32 to break Canada’s tariff-rate quota manipulation that blocks U.S. access to promised markets.
Shift 15% of milk to Class IV before June, hedging windows close to diversify revenue streams.
Apply for H5N1 support programs, including the $10,000 per farm veterinary reimbursement and $2,000 monthly PPE allowance from USDA.
Explore alternative export markets in Southeast Asia and the Middle East, where U.S. butter exports grew 776% year-over-year in recent data.
The coming months will reveal whether this trade war becomes a prolonged reality or another chapter in ongoing negotiations. What’s certain is that global dairy markets face a significant adjustment period as trade flows recalibrate to this new reality – creating both challenges and opportunities for adaptable dairy businesses worldwide.
Leonard Poen of the University of Wisconsin-Madison extension warns that retaliatory tariffs could decrease the income of a medium-sized farm in Wisconsin with about 250 cattle by up to $56,000 per year. “I don’t think any part of the supply chain is going to be insulated from this,” he cautions.
As Agriculture Secretary Brooke Rollins explores methods to “potentially alleviate any economic disasters that might befall some of our farmers,” the industry must prepare for a prolonged period of volatility. Those who implement strategic responses and remain adaptable to changing conditions will be best positioned to weather this storm and potentially emerge stronger when trade relationships stabilize.
Join over 30,000 successful dairy professionals who rely on Bullvine Daily for their competitive edge. Delivered directly to your inbox each week, our exclusive industry insights help you make smarter decisions while saving precious hours every week. Never miss critical updates on milk production trends, breakthrough technologies, and profit-boosting strategies that top producers are already implementing. Subscribe now to transform your dairy operation’s efficiency and profitability—your future success is just one click away.
Cheese exports boom 14% while NFDM crashes 28%: How U.S. dairy walks the tariff tightrope between record profits and market chaos.
EXECUTIVE SUMMARY: February 2025 revealed a divided U.S. dairy export landscape: Cheese and butter shipments surged (14% and 126%, respectively) despite Canadian tariffs, while nonfat dry milk collapsed (-28%) amid global oversupply. Trade tensions with Canada and Mexico threaten $1.43B in exports as H5N1 protocols add logistical hurdles. Rabobank forecasts modest 0.8% global milk growth, intensifying competition. The article exposes how breed selection (Jerseys vs Holsteins), blockchain traceability, and premiumization strategies will determine winners in this high-stakes market reshaped by disease risks and protectionist policies.
KEY TAKEAWAYS
Value Over Volume: Cheese/butter exports now drive 63% of dairy export value growth
Trade War Fallout: Canada’s TRQ System Blocks $210M in Potential Annual U.S. Dairy Sales
Disease = Dollars: H5N1 testing delays cost exporters $18/lb in EU market penalties
Breed Calculus: Jerseys’ 5.86% ROI outpaces Holsteins in component-driven export markets
The numbers tell a conflicting story: While U.S. dairy exports hit $723.5 million in February 2025 (an 8% annual increase), nonfat dry milk shipments cratered by 28%. Cheese and butterfat sales soar even as trade wars loom. What does this paradox mean for dairy farmers and global markets? Let’s dissect the chaos.
The Export Tightrope: Walking Record Values and Market Volatility
The U.S. dairy sector’s export performance in early 2025 resembles a high-stakes balancing act. Total export value surged to $1.43 billion in January-February (+14% year-over-year), yet volume declines in key categories reveal vulnerabilities.
The Mexico Factor: Stability Amidst Storm Clouds
Mexico retained its position as America’s top dairy buyer at $396.2 million (+10%) for January-February, but cracks emerged:
Cheese exports to Mexico fell 5% by volume despite global growth
Reliance on a single market now represents 27.7% of total U.S. dairy exports
“Any disruption in trade flow is troubling,” warns Jaime Castaneda of the National Milk Producers Federation. With 40% of exports flowing to Mexico and Canada, this concentration risk keeps analysts awake at night.
“President Trump isn’t going after the system of supply management as much as looking to dump surplus subsidized U.S. dairy products on the Canadian market,” counters Pierre Lampron, President of Dairy Farmers of Canada, highlighting the Canadian perspective on trade tensions.
Cheese & Butter: The Unlikely Heroes
Cheese Exports Break Barriers
Market
Volume (Million lbs)
Change vs. 2024
South Korea
25.6
+40%
Japan
19.2
+10%
Australia
13.0
+37%
Canada
8.4
+19%
Source: USDA Foreign Agricultural Service, February 2025 Export Data
Cheese exports hit $223.7 million in February (+14% value), proving premium products can defy economic gravity. South Korea’s 40% volume surge reflects strategic market diversification.
“We had a record year in 2024 as a nation. We exported 1.1 billion pounds of cheese to other countries,” notes John Umhoefer, Wisconsin Cheese Makers Association Executive Director. “We like trade issues to get resolved as fast as possible. We like the free and fair trade to flow in both directions.”
Butter’s Shock Surge: 126% Volume Jump
Butter exports defied Canada’s 25% retaliatory tariffs, reaching 11.5 million pounds in February. “This isn’t your grandfather’s commodity market,” notes IDFA’s Becky Rasdall Vargas. “Innovative packaging and targeted marketing are unlocking new demand channels.”
The Powder Crisis: NFDM Exports Crash 28%
While cheese thrives, nonfat dry milk (NFDM) tells a different story:
February 2025 Powder Performance
NFDM: 106.9M lbs (-28%)
Whey Protein Concentrate: 21.3M lbs (-29%)
Lactose: 73.1M lbs (-7%)
Source: USDA FAS Export Data, February 2025
“Powders are the canary in the coal mine,” explains dairy economist Chuck Nicholson. “Trade disputes and global oversupply first hit them.” With China reducing imports (-4% to the Philippines), the U.S. faces a $210M quarterly powder shortfall.
H5N1 Testing Protocols: Impact on Export Compliance
The USDA’s National Milk Testing Strategy (NMTS), implemented in December 2024, has added a layer of complexity to exports. According to a USDA whistleblower report, delayed test results have impacted EU shipments, with some containers held at ports awaiting clearance.
“The D1.1 outbreaks in Nevada and Arizona were identified through silo testing before affected cattle developed clinical signs, providing evidence that the NMTS is working,” reports the American Veterinary Medical Association. This early detection system has prevented three potential outbreaks in February alone but has created logistical challenges for exporters facing tight shipping deadlines.
Trade Wars & Tariffs: The Double-Edged Sword
Canada’s TRQ System: Protectionism or Fair Play?
President Trump’s criticism of 250-390% Canadian dairy tariffs misses nuance. Under USMCA:
85-100% of Canadian TRQs go to domestic processors
U.S. exports face 0% tariffs below quotas
2024 saw $1.1B in duty-free U.S. dairy to Canada (+55% since 2020)
“By 2024, as a result of trade concessions, some 18% of our domestic milk production will be outsourced to dairy farmers in other countries at a time when Canadians are more aware than ever of the importance of ensuring our food security,” states Pierre Lampron of Dairy Farmers of Canada, highlighting concerns about the impact of trade agreements on Canadian producers.
“Our issue isn’t tariffs—it’s accessing the quotas,” clarifies Rasdall Vargas. Canadian processors dominate TRQ allocations, creating “invisible trade barriers.”
The Innovation Imperative: Data-Driven Dairy
DeGroot Dairy Case Study: Blockchain Implementation
Wisconsin’s DeGroot Dairy implemented blockchain traceability in 2024, resulting in a 22% increase in EU export margins. Their system tracks milk from individual cow groups through processing, providing verifiable documentation for export certification.
“Blockchain isn’t just buzzword technology—it’s solving real problems for our export program,” explains Sarah DeGroot, export manager. “When H5N1 testing requirements changed overnight, our digital documentation allowed us to adapt immediately while competitors were stuck with paperwork delays.”
“US supply expansion is expected in 2025, but it’s likely to be modest at sub-1%,” notes Michael Harvey, RaboResearch senior dairy analyst. This limited growth helps explain why export values remain strong despite volume challenges in some categories.
In contrast, Rabobank’s analysis of Northwestern Europe forecasts a potential 20% drop in milk production by 2035 unless the industry adapts. “To counterbalance the rising costs, companies should shift their focus on producing high-value dairy products,” recommends Richard Scheper, Rabobank dairy analyst, aligning with the U.S. shift toward value-added exports.
The Bottom Line: Navigating the New Dairy Geopolitics
Three make-or-break factors for 2025:
Trade Agility: With 18% of U.S. milk production exported, rapid response to tariff changes is critical.
Disease Diplomacy: Transparent H5N1 management could become a market differentiator.
“This isn’t about surviving 2025—it’s about dominating 2030,” declares IDFA CEO Michael Dykes. As global dairy demand grows 2.3% annually, U.S. exporters must master this high-wire act.
Your Move: Will your operation chase volatile commodity markets or build value-added resilience? Share your strategy in the comments—the most innovative response wins a Bullvine analysis of your export potential.
Join over 30,000 successful dairy professionals who rely on Bullvine Daily for their competitive edge. Delivered directly to your inbox each week, our exclusive industry insights help you make smarter decisions while saving precious hours every week. Never miss critical updates on milk production trends, breakthrough technologies, and profit-boosting strategies that top producers are already implementing. Subscribe now to transform your dairy operation’s efficiency and profitability—your future success is just one click away.
Dairy’s profit paradox: GDT prices rise, but are farmers cashing in? Explore how genetics and global trends redefine milk margins in 2025.
EXECUTIVE SUMMARY: The latest Global Dairy Trade auction broke a months-long losing streak with a 1.1% index rise, yet the results reveal deeper industry challenges. While skim milk powder surged 5.9%, butter and other key commodities fell, highlighting uneven recovery across dairy markets. Meanwhile, genetic advancements are reshaping profitability by prioritizing component yields like butterfat and protein over raw volume. Countries like New Zealand and Australia showcase contrasting models of crisis response, from cooperative stability to retail-driven vertical integration. However, escalating feed costs threaten to erase gains for high-genetic herds, exposing the disconnect between commodity price increases and farmgate profitability. Dairy producers must navigate volatile short-term markets while leveraging genetic strategies to secure long-term margins.
KEY TAKEAWAYS:
Auction Insights: GDT index rose 1.1%, but uneven product performance signals fragile market recovery.
Global Models: NZ’s cooperative pricing vs Australia’s retail-driven vertical integration offer contrasting solutions.
Profit Disconnect: Rising feed costs threaten margins even as auction prices climb.
Action Plan: Producers should focus on genetic audits, contract flexibility, and component-focused production strategies.
The dairy sector’s opening months of 2025 have revealed a stark contradiction – while global commodity markets wobble, genetic breakthroughs are quietly rewriting milk’s economic DNA. This collision of short-term volatility and long-term transformation demands urgent analysis from every producer holding a milking claw.
Breaking News: Q1 Auction Sets Stage for Turbulent Year
January’s Global Dairy Trade auction delivered a 1.4% index decline, continuing 2024’s downward trend despite pockets of strength in mozzarella (+3.6%) and butter. With 143 successful bidders moving 17,643 tonnes, the results confirmed three critical realities:
Protein Power: Skim milk powder’s 5.9% drop contrasts sharply with cheese gains, exposing shifting demand patterns
Geopolitical Drag: China’s uneven recovery and Southeast Asia’s import fluctuations continue destabilizing traditional markets
Processor Calculus: Rabobank’s “balanced but brittle” assessment masks looming supply chain reconfigurations
The real story lies beneath these numbers – a fundamental mismatch between commodity pricing mechanisms and on-farm profitability drivers.
Feature Deep Dive: Genetics Rewrite the Profit Equation
While markets falter, U.S. herds are achieving once-unthinkable component averages – 4.23% butterfat and 3.29% protein – through genomic leaps accounting for 70% of recent gains . This revolution demands recalculating every aspect of dairy economics:
The New Milk Math
This updated genetic index prioritizes component value over raw volume, reflecting market realities where 1lb of fat now outearns 2.3kg of protein . Western Megadairies and Midwest family farms converge on three strategies:
Sexed Semen Stratification: 61% of U.S. herds now use elite genetics on the top 30% of cows
Embryo Acceleration: The top 5% of females contribute 40% of genetic progress through IVF programs
While GDT’s mozzarella bounce made headlines, feed costs have erased 63% of those gains for component-focused herds. This equation explains why 41% of high-genetic herds maintained profits despite Q1’s index drop – their component surge offset stagnant prices.
Your Profit Playbook
Genetic Audit
Re-run breeding decisions through NM$ 2025’s feed efficiency lens
Target 4.5% butterfat thresholds through genomic culling
Contract Calculus
Weigh Fonterra-style risk sharing against Coles-like vertical offers
Model 5-year feed cost scenarios against component potential
Market Hedge
Allocate 30% of production to cheese-focused components
Explore specialty fat premiums through AMF partnerships
The Bullvine Bottom Line
Dairy’s 2025 inflection point demands a dual vision: navigate quarterly auctions while building a decade-long genetic advantage. As markets reward component density over raw volume, the herds that thrive will treat every heifer as a futures contract and every AI straw as a strategic asset.
Are Dairy Genetics a Commodity? This article examines whether dairy genetics have become a commodity, balancing cost-efficiency with the pursuit of top-tier breeding goals.
How Beef Semen is Revolutionizing Dairy Farming Discover how beef semen is reshaping dairy herd strategies, boosting profitability, and unlocking new revenue streams through crossbreeding.
2025’s dairy crisis hits hard: Herd math fails as milk prices crash 18%. Can new risk strategies salvage your milk check before summer?
EXECUTIVE SUMMARY: The 2025 dairy market faces unprecedented challenges, with milk prices plummeting $1.95/cwt since January, export opportunities shrinking 12%, and productivity dropping 3.2% despite larger herds. While traditional safety nets like DMC sit .44 above triggers, emerging strategies – from component-focused culling (butterfat up 2.2%) to strategic Chicago puts – offer hope. Producers must rethink risk management timelines and milk quality priorities to survive the margin squeeze with replacement heifer inventories down 37,000 head and feed savings potential ($0.59/bu corn).
KEY TAKEAWAYS:
DMC’s Diminishing Returns: February’s $13.94 margin leaves a $4.44 buffer – pair with futures to avoid coverage gaps
Component Cash Cow: Butterfat/protein growth (2.2%) now outpaces volume – test herds above 4.1% BF
The spring flush has arrived, but this year brings a challenging combination of falling milk prices, softening exports, and risk management strategies that worked in January but may leave your operation vulnerable by summer. If you haven’t updated your approach since the year began, now’s the time.
Export markets cooling – While EU milk production fell 1.8% and New Zealand grew just 0.7%, China’s domestic push and Southeast Asian tariffs have cut U.S. export opportunities by 12% year-over-year [USDA ERS].
Production paradox – February 2025 saw a 62,000-head herd expansion (9.405M cows) despite plunging productivity – milk per cow dropped 3.2% (61 lbs monthly) compared to February 2024 [USDA Milk Production Report].
Risk management recalibration is needed. DMC’s February margin, at $13.94 (the projected peak in 2025), is $4.44 above triggers, requiring producers to reassess coverage strategies [HighGround Dairy].
During a recent visit to the Johansen operation in Wisconsin, third-generation farmer Mark shared his perspective while maintaining equipment: “DMC looked solid in January. Now, I’m looking at feed contracts that don’t align with Class III futures at .10 – down .95 from January’s peak. It’s keeping me up at night.”
DMC: Understanding the Limitations
HighGround Dairy’s analysis shows that DMC has triggered payments in 65% of months since 2015—an impressive figure that deserves careful context.
Current market realities:
January’s $13.85/cwt margin resulted in no payments
February’s forecast of $13.94 remains $4.44 above the trigger level
2025’s projected average margin ($10.20) provides limited protection
Dairy-RP: Timing Matters More Than Ever
The Q3 Coverage Window
April’s Dairy-RP window for July-September coverage requires urgent attention. With Class III futures at $19.10 (down $1.95 from January’s $21.05), producers face critical decisions:
Secure coverage now at current levels
Monitor markets closely for potential improvements
LGM-Dairy: Reading Between the Lines
Understanding the Full Financial Picture
LGM’s 11-month coverage window offers flexibility but requires careful consideration:
Premium payment timing can strain cash flow when margins tighten
May 2025-March 2026 coverage locks in today’s feed/milk ratio
Strategic Herd Management
Production Trends and Hard Choices
USDA’s February data reveals a 37,000-head drop-in replacement heifers – your next springer just got 8% pricier [USDA Cattle Inventory Report]. Meanwhile, fluid milk utilization hit a historic low – Class I now accounts for just 20% of shipments [FMMO].
Dr. Tara Voss, UW Extension dairy geneticist, explained the productivity puzzle: “Producers culling sub-25K lb cows are removing animals that still help cover fixed costs. Focus on components – the 2.2% annual growth in butterfat/protein outpaces volume gains.”
Practical Approaches for Today’s Market
Diversify Risk Tools – Pair Tier II DMC with Chicago puts if milking 250+ head.
Leverage Feed Savings – With corn at $4.07/bu (down $0.59 from 2023), renegotiate rations.
Monitor Export Windows – Europe’s 1.8% milk slump creates cheese opportunities if tariffs permit
Join over 30,000 successful dairy professionals who rely on Bullvine Daily for their competitive edge. Delivered directly to your inbox each week, our exclusive industry insights help you make smarter decisions while saving precious hours every week. Never miss critical updates on milk production trends, breakthrough technologies, and profit-boosting strategies that top producers are already implementing. Subscribe now to transform your dairy operation’s efficiency and profitability—your future success is just one click away.
Butter stocks hit 305M lbs – highest since 2021. CME prices plunge 25¢ as spring flush threatens profits. Can farmers pivot before margins melt?
EXECUTIVE SUMMARY: The USDA reports U.S. butter stocks surged to 305.53 million pounds in February 2025, the highest February level since 2021, driven by recovering milk production and cheap cream. CME spot prices dropped 25¢ to $2.30/lb, pressuring dairy profits as spring flush threatens further oversupply. While cheese inventories remain 5.3% below 2024 levels, farmers face a critical juncture: hedge strategically, diversify into specialty cheeses, or risk margins evaporating like “a Popsicle in a calf pen.” Immediate action is urged to navigate volatile pricing and June’s federal milk formula overhaul.
KEY TAKEAWAYS:
Butter glut alert: 305M lbs in cold storage (+2.6% YoY) forces prices to 3-year lows ($2.30/lb).
Cheese breather: Stocks down 5.3% YoY, but mozzarella/parmesan hit records amid pizza demand.
Spring flush risk: Rising milk volumes could push butter prices below $2.00 without aggressive hedging.
Profit math: 1 lb butter ≈ 2 bushels corn – a margin-crushing trade for minor operations.
Survival playbook: Size-specific strategies from Class III futures to artisanal cheese shifts.
February’s USDA Cold Storage report confirms what dairy farmers already knew: Butter stocks are overflowing, hitting 305.53 million pounds – the highest February level since 2021. While cheese inventories remain 5.3% below last year’s levels, the butter glut has sent CME spot prices tumbling to $2.30/lb, down 25¢ since January. Here’s how this impacts your operation – and why spring flush might worsen things.
BUTTER: THE COLD STORAGE COW IN THE ROOM
Stocks: 305.53 million lbs (Feb 2025) vs. 297.69 million lbs (Feb 2024)
Price Trend: CME spot butter at $2.30/lb, down 25¢ YTD
Cream Costs: Multiples below 1.00 for central region churns
Why Farmers Should Care “That 25¢ price drop? It’s like losing a full diesel tank off your margin – every 1,000 pounds you’re hauling to market just became heavier.”
Churns are humming with cream – milk production is recovering, butterfat tests are up, and cream multiples are trading at fire-sale levels (below 1.00 in the Midwest). However, while domestic demand holds steady, consumers are increasingly reaching for imported butter. The result? U.S.-produced butter piles up faster than a spring calf gains weight.
Price Pressure Points
Factor
Impact
Spring Flush
More cream = more churns = more butter
CME Rule Change
Older butter excluded from trading (post-12/1/24)
Consumer Shifts
Imported butter displaces domestic stocks
“Tracking butter stocks is like watching a stubborn calf learn to nurse – predictable in theory, messy in practice. Here’s why…”
CHEESE: THE SILENT SPOKESPERSON
Total Cheese Stocks: 1.38 billion lbs (-5.3% YoY)
American Cheese: 783 million lbs (-5.7% YoY)
Italian Cheeses: 16 million lbs below forecasts (mozzarella/parmesan hit records)
Regional Reality Check The East North Central region (IL, IN, MI, OH, WI) still holds half the nation’s specialty cheese inventory. While Italian cheeses lagged, mozzarella and parmesan posted February records – a nod to pizza chains and pasta demand.
The Silver Lining Cheese stocks are underwhelming, not overflowing. This tightness could soften the blow of butter’s price collapse – but only if you’re diversified.
ACTION PLAN: TURNING GLUT INTO GAIN
1. Hedge Strategically
Farm Size
Strategy
Large
40-50% hedging at $18.53/cwt Class III
Mid
Forward contract 30-40% through Q2
Small
Explore specialty cheeses (e.g., artisanal gouda)
2. Monitor the Federal Order Changes June 1, 2025, marks a milk pricing formula overhaul. Producers should:
Track USDA’s Q2 forecasts (e.g., cheese at $1.8200 vs. current $1.6200)
Prepare for volatility – stock deviations could trigger price swings
3. Profitability Math “At $2.30/lb butter, you’re essentially trading 1 lb of butter for 2 bushels of corn – a tough math for profit margins. Hedge early or risk getting milked.”
The Bottom Line
Butter stocks aren’t just numbers—your equity is in a freezer, melting faster than a Popsicle in a calf pen. With spring flush looming and prices below $2.40/lb, 2025 demands sharp hedging and diversified risk management. Stay vigilant—the market’s about to churn harder than a fresh bulk tank lid.
Join over 30,000 successful dairy professionals who rely on Bullvine Daily for their competitive edge. Delivered directly to your inbox each week, our exclusive industry insights help you make smarter decisions while saving precious hours every week. Never miss critical updates on milk production trends, breakthrough technologies, and profit-boosting strategies that top producers are already implementing. Subscribe now to transform your dairy operation’s efficiency and profitability—your future success is just one click away.
Dairy’s billion-dollar battle: Farmers vs. processors over cheese yields’ 12.5% surge. Who profits?
EXECUTIVE SUMMARY: The U.S. dairy industry has seen a 12.5% surge in cheese yields since 2010, driven by higher butterfat (4.23%) and protein (3.29%) levels in milk. This shift adds $2.50+ in value per hundredweight, fueling a $8 billion processor expansion. However, farmers argue outdated Federal Milk Marketing Orders (FMMOs) undervalue their contributions, with 58% of milk checks tied to butterfat and 31% to protein. The USDA’s 2025 FMMO reforms aim to modernize pricing but delay risk perpetuating inequities. Higher yields also offer environmental benefits, reducing water and feed use. The industry faces a crossroads: equitable value distribution or prolonged conflict between producers and processors.
KEY TAKEAWAYS
12.5% cheese yield surge since 2010 drives billion-dollar value shift, with 100 lbs milk now yielding 11.41 lbs cheese.
Farmers demand fair pay for higher components as processors expand capacity; 58% of milk checks are tied to butterfat.
2025 FMMO reforms modernize pricing (e.g., 91% butterfat recovery, updated make allowances), but delays spark equity debates.
Sustainability wins: Higher yields cut water, feed, and land use, boosting export competitiveness.
Call to action: Transparent pricing, advocacy for FMMO updates, and direct marketing urged to capture value.
In a dairy industry where margins are measured in tenths of a percent, the 12.5% surge in cheese yields since 2010 has sparked a gold rush—and a fierce debate over who deserves the treasure. As butterfat and protein levels reach unprecedented heights, dairy farmers and processors are locked in a battle for value, with billions at stake.
The Component Revolution: From Plateau to Profit Goldmine
For six decades, the dairy industry operated on a simple truth: 100 pounds of milk reliably yielded 10 pounds of cheese. This consistency was rooted in milk’s composition, which held butterfat steady at 3.65–3.69% and protein at 3% from the 1950s to 2010. But the past 15 years have rewritten the rulebook.
Butterfat levels now average 4.23%, a 16% jump since 2010, while protein has climbed to 3.29%. These gains—driven by genetic advancements, precision nutrition, and regional specialization—have transformed the economics of cheese production. Today, 100 pounds of milk yield 11.41 pounds of cheese, a 12.5% increase from 2010. At current wholesale prices, this shift adds roughly $2.50 in value per hundredweight of milk—a windfall worth billions annually.
Regional Leaders: The Pacific Northwest leads the charge, with butterfat averaging 4.3% and protein at 3.4%. The Upper Midwest, once a laggard, now boasts 4.12% butterfat and 3.22% protein. These disparities highlight growing competitive advantages for producers in high-component regions.
Processing Perfection vs. Real-World Reality
The 11.41-pound figure represents “processing perfection,” but debate rages over its feasibility. At the 2024 International Dairy Foods Association’s Dairy Forum, processors split into three camps:
Skeptics: Argued that capturing all solids is impossible due to whey losses.
Optimists: Claimed yields could exceed 12 pounds with advanced techniques.
Pragmatists: Accepted the metric as a benchmark for efficiency.
Case Study: One processor reduced daily milk intake by two semi-truckloads while maintaining output by optimizing solids capture. Another executive reported achieving 12 pounds of cheese per 100 pounds of milk in 2023, citing superior regional components and refined processes.
The Billion-Dollar Question: Who Profits from Higher Yields?
While farmers engineered this revolution, processors are capitalizing on its spoils. The dairy industry is investing $8 billion in new plants through 2026, aggressively expanding cheese production capacity. Meanwhile, milk prices remain stagnant, raising questions about fair compensation.
The Math of Inequity:
58% of milk check revenue now comes from butterfat alone.
Protein contributes 31%, leaving just 11% tied to volume.
Yet, Federal Milk Marketing Orders (FMMOs) still use outdated component standards set in 2010.
Farmers’ Frustration: “We’re producing milk that’s worth more per pound, but our checks aren’t reflecting that,” says Tom H., a Wisconsin producer who boosted herd butterfat from 3.8% to 4.4% in five years. “Our income per cow is up 15%, but imagine what we could achieve with fair pricing.”
The Future of FMMOs: 2025 Reforms Bring Modernization
The USDA’s final rule amending all 11 FMMOs, effective June 1, 2025, represents the most significant pricing overhaul in decades. Key changes include:
Table 1: 2025 FMMO Amendments – Key Changes
Category
Current Standard
2025 Amendment
Milk Composition Factors
3.25% true protein, 5.75% other solids
3.3% true protein, 6% other solids, 9.3% nonfat solids
Class I Pricing
“Higher-of” Class III/IV
Class III or IV skim milk price
Make Allowances
Varies by product
$0.2519/lb for cheese, $0.2272/lb for butter, $0.2393/lb for NFDM, $0.2668/lb for dry whey
Butterfat Recovery
90% in Class III formulas
91% recovery rate
Implementation Timeline:
June 1, 2025: Most changes take effect, including updated make allowances and Class I pricing.
Dec. 1, 2025: Skim milk composition factors updated to reflect modern component levels.
Referendum Approval:
Producer Majority: Two-thirds of voting producers in each FMMO approved the amendments.
Volume Majority: Two-thirds of the pooled milk volume in each FMMO supported the reforms.
Industry Reactions:
Gregg Doud (NMPF): “This final plan will provide a firmer footing and fairer milk pricing, which will help the dairy industry thrive.”
Michael Dykes (IDFA): Supported reforms to modernize pricing structures.
Sustainability’s Silver Lining
Higher yields aren’t just a profit play but an environmental win. With more cheese from less milk:
Water Use Drops: Less milk needed per pound of cheese reduces processing water consumption.
Feed Efficiency Improves: Cows producing higher-component milk may require less feed per output unit.
Export Competitiveness: Lower unit costs make U.S. cheese more competitive globally.
Market Growth: Cheese, butter, and yogurt sales have surged 15.4% ($10.1B) over three years, driven by innovation and convenience trends. Higher component yields directly fuel this growth, as seen in CoBank’s analysis of dairy market expansion.
The Value Capture Formula: Are You Getting Paid for Your Genetics?
To assess whether you’re capturing the actual value of your components, use this simplified model:
Calculate Component Gains:
Butterfat: (Current test – 3.65%) × 2.5 (pounds of cheese per 0.1% increase)
Protein: (Current test – 3.00%) × 1.2 (pounds of cheese per 0.1% increase)
Multiply by Milk Volume:
Total cheese gain = (Butterfat + Protein gains) × Hundredweights produced
Compare to Component Premiums:
Subtract premiums from projected cheese value to identify gaps.
Example: A 1,000-cow herd producing 4.2% butterfat and 3.3% protein:
Total:$3,170/month in unclaimed value if premiums lag.
The Bottom Line
The dairy industry’s component revolution is irreversible. Farmers have proven they can drive genetic and nutritional excellence. Now, the fight is over who controls the profits.
For Farmers: Prioritize components over volume. Invest in genetics, nutrition, and data tools to maximize butterfat and protein. Calculate your actual value and demand fair compensation.
For Regulators: Update FMMO standards now. Delaying recognition of today’s milk composition exacerbates inequities.
The cheese yield explosion isn’t just about numbers—it’s about justice. One processor quipped, “If you’re not making more cheese per vat, you’re losing money. If farmers aren’t making more money per cow, they’re losing patience.” The industry must continue the status quo or forge a future where value flows equitably from farm to factory.
Join over 30,000 successful dairy professionals who rely on Bullvine Daily for their competitive edge. Delivered directly to your inbox each week, our exclusive industry insights help you make smarter decisions while saving precious hours every week. Never miss critical updates on milk production trends, breakthrough technologies, and profit-boosting strategies that top producers are already implementing. Subscribe now to transform your dairy operation’s efficiency and profitability—your future success is just one click away.
U.S. dairy faces a crisis as SMP exports to China hit ZERO. Can they reclaim the market? The Bullvine dives into the numbers, geopolitical stakes, and strategies to survive.
EXECUTIVE SUMMARY: U.S. skim milk powder (SMP) exports to China collapsed in early 2025, with zero shipments in February—the first complete halt since 2019. This downturn stems from steep price disadvantages ($27/MT premium over EU/NZ) and China’s aggressive domestic production growth, which achieved 85% dairy self-sufficiency by 2023. New Zealand and the EU now dominate China’s SMP/WMP markets, leveraging tariff-free access and strategic product adjustments. Deflation (-0.7% CPI in February) and oversupply risks threaten U.S. dairy, particularly with new cheese capacity straining export-dependent markets. To recover, U.S. exporters must pivot to butter/cheese production, lobby for tariff parity, and innovate SMP blends tailored to Chinese processors. The stakes are clear: adapt or lose global relevance.
KEY TAKEAWAYS:
U.S. SMP Collapse: Zero exports to China in February 2025 reflect pricing gaps ($27/MT premium) and China’s self-sufficiency surge.
NZ/EU Dominance: New Zealand’s tariff-free access and EU’s geopolitical alignment capture China’s shrinking SMP/WMP demand.
Deflation + Oversupply: China’s economic slump and U.S. cheese overproduction risk price crashes and plant closures.
Strategic Imperatives: Shift to butter/cheese, demand tariff relief, and innovate SMP blends to regain market share.
February 2025 delivered a gut punch to U.S. dairy: SMP exports to China plunged to their lowest level since 2013, with zero shipments recorded for the first time since the 2019 trade war. As EU and New Zealand suppliers dominate, The Bullvine investigates why American dairy is losing ground and what farmers must do to survive.
The U.S. SMP Collapse: Price Wars and Domestic Surges
China’s skim milk powder (SMP) imports from the U.S. collapsed in early 2025, with January shipments down 60% year-over-year and zero exports in February—the first complete shutdown since May 2019. This crisis stems from two forces:
Price Disadvantage: U.S. SMP traded at a $27/MT premium over EU and New Zealand competitors in late 2024, driven by tight domestic supplies (-14% SMP production in 2024).
China’s Milk Self-Sufficiency: Rabobank confirms China achieved 85% dairy self-sufficiency by 2023, surpassing its 2018 target through large-scale farm expansions and improved yields. Domestic raw milk production surged 10 million metric tons (MMT) from 2018–2023, slashing import reliance.
Winners and Losers in China’s Shifting Market
Metric
New Zealand
EU
U.S.
SMP Market Share (2024)
68%
Rising
Collapsed
WMP Dominance
90% of China’s imports
Limited
0% (Feb 2025)
Key Leverage
Tariff-free access
Geopolitical alignment
None
China’s Strategic Shifts:
WMP Imports: Projected to stabilize at 460,000 MT in 2024, down from 845,000 MT in 2022, as domestic production fills demand.
Cheese & Butter: Butter imports surged 32% YoY in 2022, but USDA forecasts 2024 declines due to economic headwinds.
Whey: U.S. remains China’s top supplier despite a 38,700t H1 2024 drop in global whey demand.
Economic Headwinds: Deflation and Oversupply
China’s -0.7% February 2025 CPI—the steepest deflation since 2020—has suppressed consumer spending. Key impacts:
Domestic Dairy Demand Stagnation: UHT milk imports stabilized after a 4.7% January 2025 drop, reflecting China’s push for self-reliance.
Global Glut: Rabobank forecasts 0.8% global milk supply growth in 2025, but China’s import recovery hinges on economic stimulus.
U.S. Cheese Overproduction: New processing capacity (+200M lbs/year) risks price crashes without export demand.
Geopolitical Realities and U.S. Strategic Failures
“The U.S. priced itself out of China’s market,” says a U.S. Dairy Export Council source. “Mexico is now our lifeline, but we need radical changes.”
Critical Errors:
Trade Policy: No progress on China’s retaliatory tariffs (e.g., 10% on U.S. pork since March 2025).
Competitive Blind Spots: EU butterfat shortages boosted New Zealand’s SMP/WMP exports, while U.S. prices lagged.
Recommended Shifts:
Redirect SMP to Butter/Cheddar: Match EU/NZ’s product mix adjustments to align with China’s cheese demand.
Lobby for Tariff Parity: Demand urgency in U.S.-China trade talks to offset New Zealand’s tariff-free advantage.
Provocative Takeaways for Dairy Farmers
“China’s SMP Door Is Closed—For Now.”
With 15,000 MT/day domestic milk surplus and WMP self-sufficiency goals, China’s import recovery is a 2026+ prospect.
“Deflation Isn’t the Only Threat—Oversupply Is.”
U.S. cheese plants risk closures if exports stall; hedge with Dairy Revenue Protection (DRP).
“Mexico Can’t Save Us Alone.”
Diversify to Southeast Asia, where SMP demand grew 3.4% in early 2024.
The Bullvine’s Call to Action
Price Transparency: Publish weekly SMP benchmarks to compete with EU/NZ.
Innovate or Die: Develop high-protein SMP blends for China’s bakery sector.
Demand Policy Reform: Pressure Washington to fast-track tariff relief in bilateral talks.
Final Warning: “New Zealand and the EU are rewriting global dairy trade rules. Will U.S. farmers adapt—or become collateral damage?”
Join over 30,000 successful dairy professionals who rely on Bullvine Daily for their competitive edge. Delivered directly to your inbox each week, our exclusive industry insights help you make smarter decisions while saving precious hours every week. Never miss critical updates on milk production trends, breakthrough technologies, and profit-boosting strategies that top producers are already implementing. Subscribe now to transform your dairy operation’s efficiency and profitability—your future success is just one click away.
Fonterra profits soar, EU butter prices rocket, and US markets defy forecasts—what’s next for global dairy?
EXECUTIVE SUMMARY: Fonterra’s FY25 interim results reveal an 8% net profit surge to NZ $729M and a 16% operating profit jump, driven by premium products and efficiency gains. EU butter prices exploded 33.5% YoY to €7,548/MT, while SMP stagnated, reflecting a structural shift toward fat-rich products. US Class III futures rallied to $18.53/cwt, defying USDA’s bearish outlook, as block cheese prices rebounded. Production disparities widened: New Zealand’s milk solids grew 3.7% YTD, while the EU faced declines. Strategic plays include capitalizing on the $1,106 GDT butter-AMF spread, hedging futures, and adopting precision breeding.
KEY TAKEAWAYS
Fonterra’s Profit Powerhouse: NZ $729M net profit and NZ $1.07B operating profit, fueled by digital overhauls and premium protein investments.
EU Butter’s Golden Run: Prices soared 33.5% YoY (€7,548/MT), outpacing SMP (€2,443/MT) and driving cheese gains (Cheddar: +19.4%, Mozzarella: +16.7%).
US Markets Defy USDA: Class III futures hit $18.53/cwt (vs. USDA’s $17.95/cwt) as cream multiples crash below 1.00, signaling summer demand spikes.
Production Divide: Oceania thrives (NZ: +3.7% YTD) while Europe struggles (Netherlands: -2.1% YTD).
Strategic Action: Target butterfat premiums, hedge Class III futures, and adopt sexed semen (+18% GB adoption) for herd optimization.
The global dairy industry is buzzing with high-stakes action. Fonterra’s profits are surging, EU butter prices are breaking records, and US markets are defying USDA forecasts. Whether you’re chasing butterfat premiums or hedging Class III futures, this report cuts through the noise to deliver the intel you need to stay ahead of the herd.
Fonterra Posts Record Profits: NZ $729M Net Profit
“We’re locking in value at every turn” — Miles Hurrell, Fonterra CEO
New Zealand’s dairy powerhouse Fonterra delivered stellar FY25 interim results:
Farmgate milk price midpoint held steady at NZ $10.00/kgMS
Farmers benefit from a narrowed milk price forecast range (NZ $9.70-$10.30/kgMS) and a 3.6% season-to-date production surge, driven by improved pasture conditions.
Fonterra continues to invest heavily in strategic expansions:
NZ $75M high-value protein plant at Studholme
NZ $150M UHT cream line at Edendale
NZ $130M digital overhaul, aiming for a 12% supply chain efficiency boost
Fonterra Financial Firepower
Metric
FY25 Interim Result
YoY Change
Net Profit
NZ $729M
+8%
Operating Profit
NZ $1.07B
+16%
Milk Price Midpoint
NZ $10.00/kgMS
Held
CAPEX Commitments
NZ $130M
New
“This isn’t just profit—it’s war chest building,” says a Wellington analyst tracking Fonterra’s NZ $500M digital overhaul.
EU Butter Prices Explode: Up 31% Year-Over-Year
“SMP prices are stuck in neutral while butter drives the entire complex” — Jan De Vries, Amsterdam Dairy Trader
European butter prices continue their meteoric rise, hitting €7,548/MT (+33.5% YoY) (EC Market Reports). French butter leads the charge at €7,590/MT, while Dutch and German butter trail closely at €7,530-7,525/MT.
Cheese markets are also surging:
Cheddar Curd climbs to €4,858/MT (+19.4%)
Mozzarella rockets €618/MT higher than last year
EU Price Volcano
Product
Current Price
YoY Change
Price Leader
Butter
€7,548/MT
+33.5%
France (+€250)
SMP
€2,443/MT
+3.0%
Germany (€2,460)
Young Gouda
€4,465/MT
+12.0%
Netherlands
Mozzarella
€4,310/MT
+16.7%
Italy
Production Wars: Oceania Gains vs EU Struggles
“Oceania’s efficiency is leaving Europe in the dust” — Rabobank Global Dairy Analyst
New Zealand continues to dominate with robust production growth:
Meanwhile, Europe faces production headwinds: Dutch milk collections fell 2.6% YoY in February (adjusted for leap year), while SMP prices stalled at €2,443/MT as buyers balk at thin inventories (Rabobank 2025 Outlook).
Adopt precision breeding techniques as sexed semen reshapes herd genetics across GB herds (+18%).
Fonterra’s Strategic Investments Signal Long-Term Gains
“Digital overhauls will squeeze 12% more efficiency from our supply chain” — Fonterra Board Statement
Fonterra is doubling down on innovation with major projects aimed at boosting profitability and sustainability:
Fonterra’s Strategic Investments
Project
Location
Investment
Timeline
Expected Impact
High-Value Protein Plant
Studholme
NZ $75M
2026
+15% protein yield
UHT Cream Line
Edendale
NZ $150M
Q3 2025
40M additional liters/year
Digital Overhaul
Nationwide
NZ $130M
2025-2030
12% supply chain efficiency gain
Decarbonization Push
Clandeboye
NZ $45M
2027
9% emissions reduction
Is the EU Butter Bubble About to Burst?
“With butter stocks rising 26% and cream multiples crashing, the EU’s golden run may face headwinds. — Amsterdam Trader
The Bottom Line
This is no time for complacency! With Fonterra printing money, EU churns maxed out, and US markets defying expectations, dairy producers who act now will be first in line when the market turns.
Strap in—the second half of 2025 could make or break operations. Those who read these tea leaves today will be tomorrow’s leaders.
Join over 30,000 successful dairy professionals who rely on Bullvine Daily for their competitive edge. Delivered directly to your inbox each week, our exclusive industry insights help you make smarter decisions while saving precious hours every week. Never miss critical updates on milk production trends, breakthrough technologies, and profit-boosting strategies that top producers are already implementing. Subscribe now to transform your dairy operation’s efficiency and profitability—your future success is just one click away.
Dollar dive vs. tariff wars: Can currency chaos save US dairy exports? The Bullvine breaks down the high-stakes game.
EXECUTIVE SUMMARY: The US dairy industry faces a paradox: a weakening dollar boosts export competitiveness, but retaliatory tariffs threaten profitability. A 5.7% dollar drop since January 2025 has made American dairy cheaper globally, offsetting some tariff impacts. However, tariffs on key markets like Mexico (25%) and China (10-15%) risk eroding gains, with Cornell University projecting a $6 billion loss over four years. While cheese and milk powder exports surged in 2024, domestic demand remains critical, as 84% of US milk stays at home. Farmers must navigate volatility by diversifying markets, focusing on premium products, and hedging against currency swings. The dollar’s decline is no silver bullet – it’s a temporary reprieve demanding strategic action.
KEY TAKEAWAYS:
Currency advantage vs. tariff pain: A weaker dollar offsets tariff hikes, but margins remain fragile.
Diversify or die: Shift focus to Southeast Asia, Africa, and Middle East to reduce reliance on Mexico/China.
Domestic risks linger: A weak dollar could trigger recession, threatening 84% of US milk consumption.
Hedge aggressively: Financial tools are essential to survive currency/tariff volatility.
Uncle Sam’s wallet is getting lighter by the day, and for once, that might not be terrible news for America’s dairy farmers. The almighty dollar has taken a nosedive, shedding a whopping 5.7% of its value since January – the kind of freefall we haven’t seen since the 2008 financial crisis.
But here’s where it gets interesting: while politicians play chicken with tariffs, this currency slide is quietly reshaping the global dairy chessboard. Every cent the dollar drops makes American dairy more appetizing to foreign buyers. It’s like a sale at the global dairy store, and Uncle Sam’s cheese is suddenly the bargain of the century.
Key Data:
Metric
2024 Value
Change
Total US Dairy Exports
$8.2B
+2% YoY
Cheese Exports to Mexico
+30% (Dec 2024)
Record high
Butterfat Exports
+28% (2024)
Driven by Canada
Tariff Wars: The $6 Billion Migraine
Let’s not sugarcoat it – the tariff situation is a Grade A disaster for US dairy. President Trump’s recent temper tantrum slapped a 25% tax on most goods from Mexico and Canada, with China getting hit with a 10% surcharge. These aren’t just any markets – they’re the holy trinity of US dairy exports, gobbling up over half of what we ship overseas.
Cornell University’s Charles Nicholson puts it bluntly: “If you pick a trade fight with our major export destinations, the retaliation will cost dairy farmers $6 billion over four years.”
Farmer Reality Check “The dollar drop saved my cheese exports to Japan, but tariffs erased those gains. We’re stuck in a never-ending cycle of policy whiplash.” – Sarah Miller, Wisconsin Cheese Exporter (USDA Farm Report, 2025)
But here’s the twist: even with these tariffs, certain American dairy products could stay in the game, especially in the premium market where quality trumps price sensitivity.
The Great Currency Offset: Can Math Save the Day?
Here’s where things get interesting – and where The Bullvine’s going to do some math that’ll make your head spin. We’ve got tariffs pushing prices up 10-25%, but a dollar drop giving us a 5-6% discount. Sounds like we’re still underwater, right?
Mike North, president of Ever.Ag, throws a wrench in the works: “Only small changes can have large impacts on price.”
Tariff vs. Currency: The Breakdown
Factor
Impact
Outcome
25% Tariff
+25% Price Increase
Offset by 5-6% Currency Discount
10% Tariff
+10% Price Increase
Partially Offset by Currency
5.7% Dollar Decline
-5.7% Price Drop
Boosts Competitiveness
Take cheese exports, for example. Despite the tariff tempest, they jumped 12% in August compared to last year. Japan, South Korea, and Mexico couldn’t get enough of our cheddar. Milk powder? Up a whopping 15%, with Southeast Asia and Africa suddenly treating American powder like it’s going out of style.
The Risks No One’s Talking About
While the dollar’s decline offers relief, economists warn of volatility. Dr. Ben Brown, University of Missouri, cautions: “Currency fluctuations are unpredictable – farmers shouldn’t rely solely on exchange rates. A sudden dollar rebound could erase export gains overnight.”
Key Vulnerabilities
Dollar Rebound Risk: A Fed rate hike could reverse currency trends.
Trade Policy Uncertainty: Retaliatory tariffs may escalate beyond current levels.
Domestic Demand: A weaker dollar risks recession-driven demand drops at home.
The Mexico Paradox: When Weak Meets Weaker
Now, let’s talk Mexico – our dairy industry’s favorite customer and current political punching bag. Here’s where currency chaos gets really interesting. The peso’s taking a beating too, which means Mexican buyers have less purchasing power for our dollar-priced dairy.
Krysta Harden, CEO of the US Dairy Export Council, cuts through the noise: “Mexico imported .47 billion in US dairy in 2024 – a record high. But with tariffs looming, we need to focus on essentials, not luxury items.”
Farmer Perspective “We’re shifting to bulk milk powder and butter, but tariffs are still eating into margins. The dollar drop helps, but it’s not enough.” – Juan Perez, California Dairy Exporter (USDEC Trade Report, 2025)
The China Syndrome: Trade War Redux
Just when you thought US-China trade relations couldn’t get more complicated, here we go again. Beijing’s slapping 10-15% tariffs on US agricultural products, including dairy, starting March 10, 2025. It’s like watching a bad movie sequel – same plot, higher stakes.
But here’s the twist: that weakening dollar might just be the secret weapon US dairy never knew it needed. Even with the tariff handicap, certain American dairy products could stay in the game, especially in the premium market where quality trumps price sensitivity.
The Home Front: America’s Dairy Dilemma
While we’re busy counting our export pennies, let’s not forget where most of our milk actually goes – right here at home. A staggering 84% of US milk production never leaves American soil. That means domestic market health isn’t just important – it’s everything.
Here’s the rub: that weak dollar that’s helping exports is also making imports more expensive, potentially pushing America towards a recession if consumers tighten their belts. Recent retail data shows Americans are already watching their wallets, with sales barely inching up 0.2% in February after a 1.2% nosedive in January.
But there’s a silver lining for domestic dairy producers. As foreign dairy products become pricier, local options start looking a lot more attractive. It’s like a “Buy American” campaign, courtesy of the currency markets.
The Bullvine’s Bottom Line: Adapt or Get Milked Dry
So, what’s a savvy dairy farmer to do in this economic maelstrom? The Bullvine’s got your back with some hard-hitting strategies:
First, look beyond the usual suspects. While Mexico and China play tariff tug-of-war, markets in Southeast Asia, Africa, and the Middle East are hungry for quality dairy. Time to redraw your export map.
Second, premium is the new normal. In a world where currency advantages can evaporate overnight, quality is your best defense. Invest in products that command loyalty beyond price.
Third, hedge like your farm depends on it – because it does. With volatility the only constant, smart financial instruments are no longer optional. They’re survival tools.
Fourth, keep your ear to the ground and your eyes on Washington. In this climate, today’s policy tweet could be tomorrow’s market earthquake. Stay informed, stay ahead.
Finally, diversify or die. If this currency-tariff rollercoaster has taught us anything, it’s that putting all your milk in one market is a recipe for disaster. Spread those risks like you spread your fertilizer – liberally and strategically.
Join over 30,000 successful dairy professionals who rely on Bullvine Daily for their competitive edge. Delivered directly to your inbox each week, our exclusive industry insights help you make smarter decisions while saving precious hours every week. Never miss critical updates on milk production trends, breakthrough technologies, and profit-boosting strategies that top producers are already implementing. Subscribe now to transform your dairy operation’s efficiency and profitability—your future success is just one click away.
Dairy markets plunge as milk floods markets. Can producers adapt to heifer shortage and avian flu impacts?
EXECUTIVE SUMMARY: U.S. dairy markets face intense pressure as milk production surges (+1% YOY to 17.73M lbs in February) while prices plummet: butter (-4¢), cheese blocks (-9¢), and barrels (-14¢) hit multi-month lows. Despite historic heifer shortages, herds expanded to 9.405M head, driven by lower cull rates. Component production booms—cream output up 12.7M lbs YOY, milk protein +3.1%—but processors struggle with oversupply. Regional disparities sharpen due to avian influenza (California down 3.8%) and growth in Texas/Idaho. Futures indicate painful near-term margins (Class III .95/cwt), but export opportunities and feed cost savings (10.1% YOY) offer lifelines. Producers must prioritize cost control, component optimization, and strategic culling to survive the squeeze.
Component Wars: Butterfat surges (+12.7M lbs cream) dominate, but protein growth (+3.1%) lags behind demand.
Regional Crisis: California production plummets (-3.8% YOY) from avian flu, while Texas/Idaho thrive.
Futures Forecast Pain: Class III futures at $17.95/cwt threaten margins; Q4 rebound potential hinges on exports.
Strategic Solutions: Lock in sub-$4.70 corn, target 3.5% butterfat herds, and consider culling low-performing cows.
The whey market’s 5¢ rally to 50¢/lb this week fooled nobody who’s read a milk check lately. USDA’s Dairy Market News confirms what every producer knows – demand remains “lackluster” with inventories ballooning. This dead-cat bounce comes as:
Butter crashes 4¢ to $2.3025/lb
Cheese blocks nosedive 9¢ to $1.6025
Barrels implode 14¢ to $1.55 – an 11-month low[3]
“Buyers play hardball below 50¢,” says our Chicago floor contact. “With milk flows increasing, this whey rally has expiration date written all over it.”
MILK FLOODGATES OPEN AS HERD EXPANSION DEFIES LOGIC
USDA’s March shocker: 9.405 million head in February – highest since May 2023. How?
HERD GROWTH DESPITE HEIFER ARMAGEDDON
Metric
Feb 2025
Change YOY
Total Dairy Cows
9.405M
+62k
Heifers 500lb+
3.914M
-7% (1978 low)
Cull Rate (Jan-Feb)
89k below historic avg
Producers are playing musical barns – 15k cows added in February alone. The result? 17.73M lbs February output (+1% YOY leap-adjusted) – biggest jump since 2023.
“Processors are fat-hungry,” notes USDA economist Dr. Mark Svennson. “That $2.30 butter price? Still 18% above 5-year average. The fat premium’s alive.”
COAST-TO-COAST CRISIS: BIRD FLU DECIMATES WESTERN HERDS
Avian influenza isn’t just a poultry problem anymore:
STATE-LEVEL MILK PRODUCTION
Region
YOY Change
Key Factor
California
-3.8%
62% herds infected
Texas
+4.1%
New mega-facilities
Pacific NW
-2.9%
Historic basis discounts
Upper Midwest
+1.3%
Component focus
“California’s looking at 5% production drop by June if culling continues,” warns Western United Dairies’ Janelle Hasser.
FUTURES FORECAST: PAIN BEFORE GAIN?
USDA’s revised projections paint a grim near-term picture:
2025 PRICE PROJECTIONS
Metric
March Estimate
Change vs Feb
Profit Threshold
All-Milk Price
$21.60/cwt
-$1.00
$22.00+
Class III
$17.95/cwt
-$1.15
$19.50
Class IV
$18.80/cwt
-$0.90
$20.00
Feed Cost Savings
10.1% YOY
Corn $4.85/bu
Soymeal $395/ton
“Q4 could see $19.75 Class III,” says CME analyst Luke Torrison. “But getting from here to there will bankrupt marginal operators.”
THE BULLVINE BOTTOM LINE: ADAPT OR EXIT
Cost Crunch Calculus: Lock in sub-$4.70 corn now – USDA sees 2025 feed savings offsetting 14% of milk price decline.
Component Premium Play: 3.5% BF herds now capturing $0.47/cwt premium over 3.0% herds.
Exit Strategy Window: Beef prices at $1.92/lb make culling profitable – 12% ROI on heifer-replacement deferral.
As one Wisconsin producer told us: “I’m feeding more haylage, culling 5% low-end cows, and praying Class IV finds its legs by June. If not? The auctioneer’s getting my Rolodex.”
Join over 30,000 successful dairy professionals who rely on Bullvine Daily for their competitive edge. Delivered directly to your inbox each week, our exclusive industry insights help you make smarter decisions while saving precious hours every week. Never miss critical updates on milk production trends, breakthrough technologies, and profit-boosting strategies that top producers are already implementing. Subscribe now to transform your dairy operation’s efficiency and profitability—your future success is just one click away.
China blocks U.S. beef plants—your cull cow checks hang in the balance as $4.13 billion in exports face sudden termination. Is your dairy ready?
EXECUTIVE SUMMARY: China’s refusal to renew registrations for 390 U.S. beef plants creates an urgent threat to dairy producer profitability, potentially eliminating .13 billion in beef exports precisely when declining milk margins make cull income increasingly crucial. This calculated move amid escalating trade tensions and China’s oversupplied domestic beef market could flood U.S. markets with products previously destined for export, depressing cull cow values nationwide. Innovative dairy producers should consider accelerating planned culls, exploring alternative marketing channels, and implementing specific risk management strategies like Livestock Risk Protection insurance with 70-100% coverage levels or CME Live Cattle options to protect against this emerging threat to their bottom line.
KEY TAKEAWAYS
China’s registration block threatens $4.13 billion in beef exports, with ripple effects that could significantly depress domestic cull cow prices at a time when dairy margins are already tightening.
The timing creates a perfect storm for dairy producers: milk margins are down 11% while simultaneously threatening cull income, serving as a critical financial buffer during downturns.
Immediate action steps include rethinking culling timelines, exploring direct marketing arrangements, and implementing specific risk protection through USDA LRP insurance or CME futures options.
This situation exposes a fundamental vulnerability in modern dairy economics: over-reliance on strong cull values to maintain profitability when milk prices weaken.
Beyond direct trade impacts, China’s decision potentially violates Phase 1 trade commitments and represents a strategic move to protect its oversupplied domestic beef market at the expense of U.S. dairy producers.
While you were milking cows this weekend, China quietly pulled the rug from under U.S. dairy producers. In a move that threatens to tank cull cow prices just when dairy margins are already shrinking, Chinese officials have refused to renew registrations for approximately 390 U.S. beef plants—potentially wiping out $4.13 billion in U.S. beef exports and delivering a devastating blow to your bottom line. With dairy margins already under pressure, this diplomatic snub couldn’t come at a worse time for producers counting on strong cull values to offset weakening milk prices.
China’s Power Play Exposes Dairy’s Vulnerability
Export registrations for more than 1,000 U.S. meat plants granted under the 2020 “Phase 1” trade deal officially lapsed on Sunday, March 16. While China has since renewed registrations for pork and poultry facilities through 2030, U.S. beef facility registrations remain conspicuously listed as “expired.”
This isn’t some administrative hiccup—it’s a calculated move amid escalating trade tensions.
The registration status for beef plants across the United States, including operations owned by major producers like Tyson Foods, Smithfield Packaged Meats, and Cargill Meat Solutions, was deliberately changed from “effective” to “expired” on the website of China’s General Administration of Customs.
They’re squeezing American agriculture from both ends—hiking tariffs while shutting down market access through regulatory maneuvers.
Is your operation prepared for a potential cull cow price shock when beef export channels suddenly close?
The Double Whammy Threatening Your Operation
Why should you care about beef plant registrations? Because your dairy operation’s profitability is directly tied to those beef export channels.
When China blocks U.S. beef exports, that meat gets dumped back into domestic markets, driving down cull cow prices precisely when you need that income most.
The timing of this situation is particularly treacherous. This market disruption arrives as dairy margins are compressing, making cull income increasingly crucial to your operation’s financial health.
When milk prices struggle, the check for your culled cows becomes an essential lifeline—one that’s now at serious risk.
China’s Domestic Beef Glut
While the timing aligns perfectly with broader trade tensions, China’s reluctance to renew beef registrations stems from domestic market conditions.
The country has been grappling with a significant oversupply in its domestic beef market, which has led to financial losses for Chinese producers throughout 2024.
Unlike pork and poultry—where registrations were promptly renewed—Chinese officials appear to be using regulatory tools to protect domestic beef producers already struggling with depressed prices.
Under the Phase 1 trade deal, China must update its approved plant list within 20 days of receiving updates from the USDA.
Their refusal to do so isn’t just inconvenient—it potentially violates explicit trade commitments.
This isn’t the first wave of registration expirations, either. In February 2025, registrations for 84 U.S. plants lapsed.
While shipments from those plants continue to clear customs, the industry does not know how long China will continue accepting these imports.
Beyond the paperwork hurdles, exporters face additional challenges.
As Joe Schuele, spokesperson for the U.S. Meat Export Federation, explains: “We are hoping for similar news soon on the beef side, but for now, the 390 US beef facilities that expired on March 16 have not yet been renewed. For now, we have advised exporters that beef produced before March 16 should clear customs, provided that importers had secured import quarantine permits before March 16.”
U.S. meat shipments to China reached $2.5 billion last year, making it the second-largest export market by value.
The USMEF impact assessment doesn’t just consider direct export losses. As Schuele explains, the $4.13 billion figure “not only takes into consideration the loss of direct exports to China, but also the impact of the improved prices U.S. beef cuts command in Japan, Korea, and Taiwan when exporters also have access to China and Chinese buyers are active in the market.”
In other words, losing China creates a domino effect across all export markets.
The loss of the Chinese market would hurt exporters of beef parts in the United States, which has limited domestic demand.
When those products can’t be shipped to China, they flood local markets and drive down prices—including for your cull cows.
How exposed is your dairy to beef market volatility, and what’s your backup plan if cull prices drop 20% overnight?
Strategic Moves to Protect Your Operation
While this diplomatic chess match plays out, you need actionable strategies to protect your operation’s profitability:
1. Rethink Your Culling Timeline
If you were planning routine culls in the coming months, consider accelerating that timeline before market impacts materialize fully.
Alternatively, if you can profitably maintain marginally productive cows, you might benefit from holding them longer until this trade situation stabilizes.
2. Explore Alternative Marketing Channels
This might be the time to investigate direct marketing arrangements with local processors or explore niche markets for dairy beef that might be less affected by export market disruptions.
3. Implement Risk Management Strategies
Don’t leave your operation exposed to these market whims. Explore Livestock Risk Protection (LRP) insurance options specifically for cull cows through your crop insurance agent.
The USDA’s LRP program offers coverage levels between 70-100% of expected ending values, with premiums partially subsidized (ranging from 35-55% depending on coverage level).
Consider strategically using Chicago Mercantile Exchange (CME) Live Cattle futures contracts to hedge against potential price declines. For most dairy operations, buying put options might offer the most practical protection against downside risk while limiting your maximum loss to the premium paid.
With dairy margins already under pressure, this diplomatic dispute threatens to undermine a critical revenue stream many operations take for granted.
The situation remains fluid, with industry stakeholders pressing for resolution. However, a quick resolution seems unlikely, given broader trade tensions and China’s apparent willingness to use agricultural trade as leverage.
Innovative producers will prepare for market volatility rather than hoping for diplomatic miracles.
Your operation’s resilience depends on recognizing and adapting these market signals early. Those who understand how global beef trade impacts local cull values—and take proactive steps to mitigate those risks—will be better positioned to weather whatever comes next in this high-stakes international trade dispute.
Join over 30,000 successful dairy professionals who rely on Bullvine Daily for their competitive edge. Delivered directly to your inbox each week, our exclusive industry insights help you make smarter decisions while saving precious hours every week. Never miss critical updates on milk production trends, breakthrough technologies, and profit-boosting strategies that top producers are already implementing. Subscribe now to transform your dairy operation’s efficiency and profitability—your future success is just one click away.
Mozzarella soars 5.1% while powder plummets! Is your milk heading to the right place? The smart money’s in cheese – are you cashing in?
EXECUTIVE SUMMARY: Tuesday’s Global Dairy Trade auction revealed a dramatic market divide that savvy dairy producers can’t afford to ignore: mozzarella cheese prices surged an impressive 5.1% while skim milk powder dropped 0.4%, creating a 5.5 percentage point spread between winners and losers. This widening gap signals a fundamental shift in the global dairy landscape where value-added products like cheese consistently outperform commodity ingredients. Regional advantages are emerging, with cheese-focused North American and European operations potentially outperforming powder-dependent Southern Hemisphere producers. Forward-thinking dairy farmers should immediately audit where their milk ends up, optimize for components that boost cheese yield, explore direct partnerships with specialty cheese makers, and implement strict quality protocols to capture available premiums. The market is clearly rewarding producers who ensure their milk flows into high-value streams rather than simply focusing on volume.
KEY TAKEAWAYS
MARKET DIVIDE: Mozzarella cheese jumped 5.1% to $4,704/MT while skim milk powder fell 0.4% to $2,729/MT in Tuesday’s GDT auction, continuing a pattern of cheese outperforming powder.
COMPONENT VALUE EXPLOSION: Every 0.1 percentage point increase in milk protein can boost cheese yield by 0.25 pounds per hundredweight, creating substantial financial opportunity when cheese prices surge.
ACTION REQUIRED: Implement the five-step Dairy Producer Action Plan – audit your milk’s destination, optimize components, explore direct partnerships, leverage quality premiums, and hedge strategically.
REGIONAL IMPLICATIONS: North American and European producers with cheese exposure stand to benefit most, while Southern Hemisphere operations heavily dependent on powder exports face continued margin pressure.
SUCCESS MODEL: The Larson family dairy boosted their milk check 22% above neighbors by negotiating direct supply agreements with specialty cheese makers and implementing strict quality and component management.
The latest Global Dairy Trade auction reveals what savvy dairy farmers already knew – the smart money is in cheese! Tuesday’s trading showed mozzarella prices soaring a whopping 5.1% while skim milk powder producers watched their products sink again. This widening gap between winners and losers isn’t just market noise – it’s a clear signal that processors without cheese in their portfolios are leaving serious money on the table.
CHEESE CHAMPIONS DOMINATE AUCTION SCENE
When the dust settled on Tuesday’s trading session, the overall Global Dairy Trade Index remained unchanged, but that headline masks the real story – cheese is king in today’s dairy landscape. Mozzarella led the charge with a stunning 5.1% price surge to $4,704 per metric ton ($2.13 per pound), continuing a pattern of strength in the cheese market.
Cheddar wasn’t far behind, posting a solid 1.0% gain to $4,976 per metric ton ($2.25 per pound). These aren’t just incremental movements – they represent a fundamental shift where value is created in the global dairy supply chain.
The cheese category’s strength has followed an established pattern in recent trading sessions. In the March 6th auction, mozzarella posted an even more impressive 7.9% gain to $4,477 per metric ton, even as the overall GDT index declined by 0.5%. This continued momentum in the cheese sector deserves our attention.
WHO’S CASHING IN?
Dairy farmers supplying milk to cheese-focused processors are the winners in today’s market. With 111 winning bidders battling through 18 rounds of competitive bidding for 19,540 metric tons of product, demand remains fierce despite uneven category performance.
Processors with flexible manufacturing capabilities who’ve invested in cheese production are laughing all the way to the bank. Meanwhile, those locked into powder-heavy portfolios scramble to explain diminishing returns to their farmer suppliers.
POWDER MARKET FALTERS WHILE FAT DIVERGES
The powder sector is weak, with skim milk powder dropping by 0.4% to $2,729 per metric ton ($1.23 per pound). This represents a reversal from the previous auction on March 6th, when skim milk powder had increased by 0.6% to $2,744 per metric ton.
“There are safety relief mechanisms in Federal Orders that are only expected to be employed when the system isn’t working properly. One of those is de-pooling of milk… when processors routinely find that obligations to pay the minimum milk price are more than they can recover from their product prices.” — Dr. Mark Stephenson, dairy economist.
Whole milk powder barely remained above water, with a meager 0.2% increase to $4,052 per metric ton ($1.83 per pound). This modest rise does little to recover from the 2.2% drop in the March 6th auction, when WMP fell to $4,061 per metric ton.
Perhaps most interesting is the divergence in the fat markets. Butter managed a respectable 1.1% increase to $7,667 per metric ton ($3.47 per pound), while anhydrous milk fat (AMF) dropped by 1.8% to $6,561 per metric ton ($2.97 per pound). This widening spread between premium consumer-facing products (butter) and industrial ingredients (AMF) tells us consumers are still willing to pay for branded dairy products while food manufacturers are squeezing suppliers.
UNDERSTANDING THE CHEESE-POWDER DIVIDE
Why are we seeing such dramatic differences between cheese and powder markets? The answer lies in fundamentally different market dynamics:
Cheese markets typically respond more quickly to consumer demand signals, with restaurant and retail sales driving value. These markets also benefit from product differentiation and branding, allowing producers to capture premium pricing with strong demand.
Powder markets, by contrast, function more as commodity ingredients, with prices heavily influenced by global stocks and industrial demand. These products face stronger international competition and typically experience more volatile price swings based on supply fundamentals.
The numbers don’t lie – see below precisely how much cheese outperforms other dairy commodities in today’s market. This performance gap directly translates to processor margins and producer milk checks.
PRODUCT PERFORMANCE SCORECARD – MARCH 18, 2025 GDT AUCTION
PRODUCT CATEGORY
PRICE CHANGE
CURRENT PRICE (USD/MT)
CURRENT PRICE (USD/LB)
CHEESE WINNERS
Mozzarella
+5.1%
$4,704
$2.13
Cheddar
+1.0%
$4,976
$2.25
FAT PRODUCTS
Butter
+1.1%
$7,667
$3.47
Anhydrous Milk Fat
-1.8%
$6,561
$2.97
POWDER PRODUCTS
Whole Milk Powder
+0.2%
$4,052
$1.83
Skim Milk Powder
-0.4%
$2,729
$1.23
Lactose
+0.5%
$1,165
$0.52
Butter Milk Powder
N/A
N/A
N/A
Source: Global Dairy Trade Auction Results, March 18, 2025
Understanding these different market cycles helps explain why innovative processors have invested in flexibility – the ability to shift production emphasis toward higher-value products when market signals support such moves.
THE POWDER PERSPECTIVE: WHY SOME REGIONS STICK WITH WHAT WORKS
While cheese is winning the value battle right now, there are legitimate reasons some regions remain committed to powder production:
Powder production offers several advantages that explain its continued prominence in global dairy:
Shelf-life and storage benefits—Powder can be stored for extended periods without refrigeration, which is critical for distant export markets.
Transportation economics – Removing water reduces shipping costs dramatically, allowing producers to reach far-flung markets cost-effectively.
Processing flexibility – Powder can be reconstituted for various applications, from infant formula to bakery products, providing end-use versatility.
Production scale advantages – Large drying operations achieve economies of scale that specialized cheese plants may not match.
“Every dairy market has different structural advantages. New Zealand’s grass-based seasonal production model aligns perfectly with powder export markets. At the same time, Wisconsin’s cheese focus reflects regional expertise and proximity to major consumer markets.” — Mary Ledman, Global Dairy Strategist, Rabobank.
The imaginative play isn’t necessarily abandoning powder entirely but ensuring your operation aligns with the right product mix for your specific regional advantages and market opportunities.
DAIRY PRODUCER ACTION PLAN: POSITIONING FOR PROFIT
Don’t just read these market signals – act on them! Here’s your five-step action plan to capitalize on the cheese-powder divide:
1. AUDIT YOUR MILK’S DESTINATION
Call your cooperative or processor today and ask these specific questions:
What percentage of my milk goes into cheese production versus powder?
How does your product mix compare to industry averages?
What premium programs exist for cheese-quality milk?
2. OPTIMIZE YOUR COMPONENT STRATEGY
With cheese outperforming powder, protein, and fat components deserve extra attention:
Evaluate your current feeding program with your nutritionist specifically for component optimization
Consider genetic selection focused on cheese yield traits
Implement management practices that boost components, not just volume
“Every 0.1 percentage point increase in milk protein can boost cheese yield by 0.25 pounds per hundredweight. That’s real money when cheese prices surge.” — Dr. Dave Barbano, Professor of Food Science, Cornell University.
3. EXPLORE DIRECT PARTNERSHIPS
Forward-thinking producers are bypassing traditional channels:
Investigate specialty cheese makers in your region seeking dedicated milk supplies
Consider producer coalitions that can collectively negotiate better terms
Evaluate feasibility of on-farm processing focused on high-value products
4. LEVERAGE QUALITY PREMIUMS
Cheesemakers pay up for milk that performs better:
Implement strict protocols for somatic cell count reduction
Monitor bacterial counts obsessively
Document and promote your quality management practices
5. HEDGE STRATEGICALLY
Don’t leave yourself exposed to market swings:
Work with a knowledgeable broker to develop a cheese-focused hedging strategy
Consider options strategies that protect the downside while maintaining the upside potential
Stay informed through weekly market analysis reports
WHAT THIS MEANS FOR YOUR OPERATION
The message couldn’t be more straightforward for progressive dairy producers – your milk’s destination matters more than ever. The 5.1% premium jump in mozzarella versus the 0.4% decline in skim milk powder represents a massive value gap that directly impacts your bottom line depending on which processing stream your milk enters.
Industry analysts suggest this price divergence could create regional advantages, though the full impact remains to be seen:
North American producers with significant cheese exposure may be better positioned than their powder-dependent counterparts.
European processors with investments in specialty cheese production could leverage their market position for premium returns.
Southern Hemisphere producers approaching their autumn production season may need to reconsider their heavy reliance on powder exports.
SUCCESS STORY: PIVOT TO PROSPERITY
The Larson family dairy in Wisconsin’s cheese country saw this market divide coming years ago and made strategic decisions that are paying off handsomely today:
“We were shipping to a commodity plant with no incentive for components beyond the Federal Order minimums,” explains Tom Larson. “After seeing the cheese premium trend emerging, we approached three specialty cheese makers and negotiated a direct supply agreement with component bonuses 15% above base Class III.”
Their strategy included:
Shifting feed rations to boost protein components
Implementing strict quality protocols that earned additional premiums
Developing a three-year contract with gradual volume increases
Retaining flexibility to expand direct marketing relationships
The result? “Our milk check runs 22% higher per hundredweight than neighboring farms still focused on volume alone,” Larson notes. “It required investment in record-keeping and management, but the payoff has been substantial.”
MARKET OUTLOOK: TURBULENCE AHEAD
While Tuesday’s trading session showed remarkable stability in the overall index, the dramatic category differences suggest underlying market turbulence that savvy producers need to navigate. The GDT has shown volatility in recent auctions, with the March 6th session showing a 0.5% overall decline despite strength in cheese.
Several factors will shape dairy markets in the coming months:
Shifting consumer preferences continue to favor cheese and premium butter over commodity ingredients.
As the Southern Hemisphere approaches autumn, regional production shifts will impact global supply dynamics.
Processing capacity decisions by primary cooperatives and manufacturers will respond to these price signals.
“Higher prices will come when domestic and global demand resurges in 2025.” — Ken Bailey, PhD, Dairy Industry Economist.
The next GDT auction will tell us whether cheese’s dominant performance represents the beginning of a sustained rally or just another short-term market swing. But the trend is clear – commodity producers are getting squeezed while value-added manufacturers thrive.
BOTTOM LINE
Don’t get caught on the wrong side of this market divide. If your milk is flowing primarily into powder production, it’s time to have serious conversations with your cooperative or processor about their product mix strategy. Innovative producers are already exploring options to shift their milk toward higher-value cheese streams.
The latest GDT results confirm what leading dairy operations have known for months – the path to profitability isn’t through producing more milk but ensuring it goes into the right products. With mozzarella outperforming skim milk powder by 5.5 percentage points in a single trading session, the financial implications for your operation couldn’t be more precise.
“Dairy farmers are the clear winners when they align their production with high-value markets. With 111 winning bidders battling through 18 rounds of competitive bidding for 19,540 metric tons of product, demand remains fierce for the right products.”
Will you be among the winners riding the cheese wave or the losers stuck in the powder trap? The choice might determine whether your operation thrives or survives in 2025’s increasingly divided dairy marketplace.
Join over 30,000 successful dairy professionals who rely on Bullvine Daily for their competitive edge. Delivered directly to your inbox each week, our exclusive industry insights help you make smarter decisions while saving precious hours every week. Never miss critical updates on milk production trends, breakthrough technologies, and profit-boosting strategies that top producers are already implementing. Subscribe now to transform your dairy operation’s efficiency and profitability—your future success is just one click away.
Butter prices surge 27% while USDA slashes milk forecasts. Will your dairy operation profit or collapse in this contradictory market?
EXECUTIVE SUMMARY: Global dairy markets are sending conflicting signals: European butter prices have skyrocketed 27% year-over-year, while the USDA cut 2025 milk price forecasts by $1.00. Futures trading volumes hit 16,000 tonnes, signaling trader panic over volatility. Fat-rich products like butter and cheese command historic premiums, while protein values (SMP) struggle. The USDA’s surprise production forecast reduction raises concerns about shrinking margins and productivity. Producers must prioritize component optimization, risk management, and cost efficiency to survive these market contradictions.
KEY TAKEAWAYS
Fat vs. Protein Divide: Butter (+27%) and cheese (+18%) dominate gains, while SMP prices lag (+1.7%)—optimize milk components for fat.
USDA Warning: 2025 milk price forecasts slashed to $21.60/cwt (+0.1% production growth), signaling margin compression ahead.
Europe’s Decline: France/Germany milk production drops (-1.7%/-2.2%), tightening EU supply as processors compete for shrinking volumes.
Action Plan: Maximize butterfat, lock in risk strategies, slash input costs, and target high-value product streams.
While European butter trades at a staggering 27% premium over last year, the USDA has just cut its 2025 all-milk price forecast by a whole dollar to $21.60.
As futures contracts trade at dizzying volumes, The Bullvine cuts through the market noise to expose what these contradictory trends mean for your bottom line.
“While European butter trades at a staggering 27% premium over last year, the USDA slashed its milk price forecast by a full dollar. This isn’t a coincidence – it’s a warning.”
DAIRY FUTURES EXPLODE WITH TRADER PANIC
The dairy futures arena exploded with activity last week, with over 16,000 tonnes traded across European and Singaporean exchanges.
This wasn’t casual positioning – it was a feeding frenzy of uncertainty.
EEX reported 5,580 tonnes changing hands, with 1,850 tonnes traded on Tuesday alone. Meanwhile, SGX saw an even more aggressive 10,418 tonnes traded.
THE BULLVINE’S TAKE: When futures traders get this active, they’re not just hedging but panicking. The smart money is desperately trying to lock in positions because they see something brewing that average producers don’t.
This level of activity typically precedes significant market movements. Is your operation protected against the volatility these traders are expecting?
“When futures traders get this active, they’re not just hedging – they’re panicking. The smart money sees something coming that average producers don’t.”
FAT PROFITS VS. PROTEIN PROBLEMS: THE DIVERGENCE NOBODY’S TALKING ABOUT
The market is sending crystal clear signals about where the money is heading. EEX butter futures held firm, with the March-October strip averaging €7,427 (up 0.8%), while SMP plunged 1.8% to €2,501.
This isn’t just a random fluctuation – it’s a fundamental shift in demand patterns that’s being overlooked.
European quotations tell the same story:
Butter: €7,407, a jaw-dropping +27.4% above last year
Cheddar curd: €4,845, standing +18.5% above previous year
Mozzarella: €4,246, representing a +15.7% year-over-year premium
SMP: €2,453, down 1.4% week-over-week but still +1.7% above the previous year
Year-Over-Year European Dairy Price Comparison
Product
Current Price (€)
Change vs Last Year (€)
% Change
Butter
7,407
+1,594
+27.4%
Cheddar Curd
4,845
+755
+18.5%
Mild Cheddar
4,808
+726
+17.8%
Mozzarella
4,246
+576
+15.7%
Young Gouda
4,400
+419
+10.5%
SMP
2,453
+40
+1.7%
Whey
885
+185
+26.4%
WMP
4,372
+697
+19.0%
“The days of being paid for white water are numbered. The market is screaming for fat while protein values struggle.”
THE BULLVINE’S TAKE: The fat market shows remarkable resilience while protein values struggle. If your nutrition program is still focused on volume while the market screams for components, that approach could cost you thousands this year.
Progressive producers should maximize components through advanced nutrition and genetics focused on butterfat, not just volume.
USDA BOMBSHELL: MILK FORECAST SLASHED IN SURPRISE MOVE
The USDA dropped a market bombshell in its March WASDE report, cutting the 2025 milk production forecast to 226.2 billion pounds (102.60 million tonnes) – a substantial reduction from February’s estimate of 102.92 million tonnes.
This creates a puzzling contradiction: Why would milk per cow suddenly decline when producers invest in genetics and management designed to increase efficiency?
USDA March 2025 Forecast Revisions
Metric
February Forecast
March Forecast
Change
2025 Milk Production (mil MT)
102.92
102.60
-0.3%
Growth vs 2024
+0.4%
+0.1%
-0.3 pts
All-Milk Price ($/cwt)
$22.60*
$21.60
-$1.00
Class III Price ($/cwt)
$19.10*
$17.95
-$1.15
Class IV Price ($/cwt)
$19.70*
$18.80
-$0.90
*Previous forecast values derived from reported changes
“Are you basing your expansion decisions on government forecasts that change dramatically monthly? That’s a dangerous game few can afford to play.”
The price forecast news is especially alarming. The average all-milk price is now projected at $21.60 per hundredweight, down from 2024’s average of $22.61.
Class III milk prices have been most severely impacted, with projections cut by $1.15 to $17.95 per hundredweight.
Class IV prices also face downward pressure, expected to average $18.80 per hundredweight, a $0.90 reduction.
France reported that January milk production was down 1.7% year-over-year to 2.02 million tonnes, with milk solid collection dropping even more sharply to 1.9%.
Germany, Europe’s dairy powerhouse, reported January volumes falling 2.2% year-over-year to 2.66 million tonnes, worse than expected.
Only Denmark bucked the trend, with milk production increasing 1.1% year-over-year to 478,000 tonnes. Impressive component levels (4.63% fat, 3.75% protein) drove a 2.0% increase in milk solid collection.
European January 2025 Milk Production Trends
Country
Volume (mil tonnes)
Y/Y Change
Milkfat %
Protein %
MS Change
France
2.02
-1.7%
4.25%
3.34%
-1.9%
Germany
2.66
-2.2%
*
*
*
Denmark
0.478
+1.1%
4.63%
3.75%
+2.0%
*Component data for Germany not yet available
Germany represents approximately 23% of EU milk production, making this decline particularly significant for European dairy markets.
THE BULLVINE’S TAKE: The decline of European production in key countries has created a complex competitive landscape.
European processors will fight aggressively for milk supplies in declining regions, while areas with production growth may face price pressure.
These geographic variations create both opportunities and threats for globally-minded producers.
5 MARKET INDICATORS SMART PRODUCERS ARE WATCHING
Don’t just react to these market shifts – anticipate them by monitoring these critical indicators:
Forward Price Projections: Watch for revisions in the following WASDE report.
EEX and SGX Futures Volume: When weekly volumes exceed 7,500 tonnes, volatility typically follows.
Fat-to-Protein Price Ratio: Component optimization becomes crucial when butter maintains a 27%+ premium over year-ago levels while SMP struggles.
Feed Cost Trajectory: Changes in feed costs could partially offset milk price declines.
Production Per Cow: The puzzling USDA forecast of lower productivity despite higher cow numbers needs close monitoring.
WINNERS AND LOSERS: ARE YOU POSITIONED TO PROFIT?
WINNERS:
Component-focused producers: Those maximizing butterfat will capture premium prices while others struggle
European cheese manufacturers: Tight milk supplies and substantial cheese premiums create favorable margins
Forward-thinking hedgers: Producers who locked in prices ahead of recent volatility will outperform peers
Efficiency-obsessed operations: Those with the lowest cost structures will weather the coming margin compression
LOSERS:
Volume-chasing producers: Operations focusing on milk volume over components face declining returns
Late adopters of risk management: Those without hedging strategies face full exposure to price volatility
Input-heavy operations: Farms with high purchased feed costs will struggle most as margins tighten
Reactive planners: Producers who fail to adjust strategies based on market signals will suffer most
“In this market, there’s no middle ground. You’re either strategically positioning for these contradictions or becoming another casualty of them.”
5 TOUGH QUESTIONS EVERY DAIRY PRODUCER NEEDS TO ANSWER TODAY
Take a hard look at your business and answer these critical questions:
Component Strategy: Given the current 27% year-over-year premium, are you maximizing butterfat production?
Risk Protection: What percentage of your 2025 production is protected against the USDA’s newly lowered price forecasts?
Feed Efficiency: Can you capture margin opportunities if feed costs decline?
Cash Flow Planning: Have you stress-tested your finances against the new $21.60 all-milk price scenario?
Strategic Focus: Does your expansion strategy make sense considering USDA’s reduced production value forecast?
YOUR STRATEGIC ROADMAP FOR NAVIGATING MARKET CONTRADICTIONS
The global dairy landscape is evolving rapidly, requiring producers to make tactical adjustments. The contradictory signals between robust European fat values and weakening U.S. milk price forecasts demand a strategic response.
Successful producers will:
Maximize component yields through precision nutrition and genetics
Implement aggressive risk management strategies to protect against volatility
Scrutinize all input costs with renewed vigor as margins potentially compress
Target your milk quality parameters to the most profitable product stream in your region
THE BULLVINE’S TAKE: This isn’t time for business as usual. The dairy market sends clear warning signals that only the prepared will heed.
The producers who thrive will recognize that these contradictions aren’t random—they’re predictable outcomes of global supply and demand fundamentals that can be leveraged for profit.
What changes will you implement today to ensure you’re among them?
“This isn’t time for business as usual. While others react to yesterday’s news, smart producers are already capitalizing on tomorrow’s market reality.”
Join over 30,000 successful dairy professionals who rely on Bullvine Daily for their competitive edge. Delivered directly to your inbox each week, our exclusive industry insights help you make smarter decisions while saving precious hours every week. Never miss critical updates on milk production trends, breakthrough technologies, and profit-boosting strategies that top producers are already implementing. Subscribe now to transform your dairy operation’s efficiency and profitability—your future success is just one click away.
Kerrygold’s emergency stockpiling reveals what Trump’s tariffs mean for your milk check. Dairy’s perfect storm is brewing—are you prepared?
EXECUTIVE SUMMARY: Ornua’s aggressive stockpiling of Kerrygold butter in American warehouses signals imminent disruption as President Trump’s promised tariffs threaten to reshape global dairy trade. CEO Conor Galvin’s candid admission that they’ve “moved product into the US in anticipation of tariffs increasing” confirms The Bullvine’s warnings about impending market volatility. While US dairy leaders acknowledge potential short-term benefits for some domestic producers, economic modeling suggests inevitable retaliatory measures would erase any gains within months. Current component values show butterfat at .91/lb remains most vulnerable to market disruption, with farms having at least 6-9 months of financial reserves historically 3.5 times more likely to maintain positive cash flow during trade disputes. Industry experts emphasize that operations with diversified market exposure and strong processor relationships will weather this tariff tsunami, while those unprepared risk becoming collateral damage in an escalating trade war.
KEY TAKEAWAYS
VERIFIED THREAT: Ornua CEO confirms active stockpiling of Kerrygold products ahead of tariffs, demonstrating foremost market leaders are treating this as a certainty, not a possibility
FINANCIAL PREPARATION CRITICAL: Operations with 6-9 months of liquid reserves (twice the standard recommendation) survived previous trade disputes at 3.5x the rate of undercapitalized farms
PROCESSOR RELATIONSHIP MATTERS: Your milk’s destination determines your vulnerability—farms should immediately question processors about export exposure and contingency plans
COMPONENT STRATEGY: With butterfat currently valued at $2.91/lb, understand how EU butter tariffs could temporarily boost then ultimately crash component values as retaliatory measures impact exports
TIMING IS EVERYTHING: Forward contracting 40-50% of production now could protect margins, as CME futures currently reflect favorable pricing compared to expected spot markets under tariff conditions
While Washington and Brussels exchange threats in an escalating trade dispute, dairy farmers worldwide are watching their potential profits evaporate. Ornua, the maker of Kerrygold butter, has already taken defensive measures that confirm what The Bullvine has been warning about for months – the new administration’s tariff plans will reshape dairy trade patterns and potentially devastate unprepared producers.
With President Trump now in office and dairy markets already navigating challenging conditions, the stakes for your operation’s bottom line couldn’t be higher.
EMERGENCY STOCKPILING: Ornua’s Desperate Move to Protect Kerrygold
In a revealing move that speaks volumes about the seriousness of this threat, Ornua has been quietly stockpiling Kerrygold products in American warehouses for months. This isn’t speculation – it’s straight from Ornua CEO Conor Galvin himself.
“We’ve moved product into the US in anticipation of tariffs increasing. We are working very closely with our logistics partners to ensure that what we have available will be in the US ahead of any decision made by the US administration.” — Conor Galvin, Ornua CEO.
Galvin’s candid assessment doesn’t stop there. He acknowledged working ” closely with logistics partners” to ensure product availability before any White House decisions.
But here’s the sobering reality check every dairy farmer needs to hear – Galvin admits their stockpiling strategy has severe limitations:
“But the reality is, that won’t help us for the butter we make in 2025, the cows you haven’t milked yet. So there is only so much we can do.” — Conor Galvin, Ornua CEO.
When a market leader like Ornua takes emergency measures, every dairy producer should pay attention. Kerrygold isn’t just another European import – it’s established itself as the second-largest butter brand in America.
If tariffs hit Kerrygold, the ripple effects from Irish family farms to American dairy cases will be felt.
THE HARD NUMBERS: Current Dairy Markets Before the Storm
Before discussing potential tariff impacts, let’s clarify where the market stands. The latest USDA data shows the actual price points that could be affected by any trade disruption:
Commodity
Price ($/lb)
Butter
$2.5748
Nonfat Dry Milk
$1.3952
Cheese (40-lb Blocks)
$1.7583
Cheese (500-lb Barrels)
$1.7326
Dry Whey
$0.6353
These wholesale commodity prices directly influence what you get paid for your milk. Any disruption from tariffs would immediately impact these fundamental price points that drive your operation’s profitability.
TARIFF TECHNICALITIES: Understanding the Import Codes That Could Impact You
European butter imports like Kerrygold currently enter the US under Harmonized Tariff Schedule (HTS) code 0405.10.20, with a general duty rate of 12.3¢/kg. If new tariffs target this, the rate could increase substantially, directly impacting retail pricing and market competition.
According to the US International Trade Commission, dairy products from Ireland accounted for $553 million in US imports last year, with butter and cheese representing the most significant categories. Any across-the-board tariff would dramatically alter this trading relationship and disrupt established market channels.
TRUMP’S TARIFF PLAYBOOK: What We Know for Certain
The speculation about potential tariffs isn’t theoretical anymore. President Trump campaigned explicitly to impose import tariffs on European Union exports to the United States.
More specifically, he stated that on his first day in office, he would sign an executive order implementing a substantial 25% tariff on all imports from Canada and Mexico while imposing a 10% tariff on Chinese goods.
While these initial announcements didn’t specifically target European dairy, the administration’s protectionist stance and campaign promises regarding EU trade suggest dairy products remain vulnerable.
Given the president’s previous statements about restoring American manufacturing through aggressive trade policy, any dairy operation dependent on export markets should be prepared for potential disruption.
WHAT U.S. DAIRY LEADERS ARE SAYING
The National Milk Producers Federation (NMPF) has taken a measured but concerned stance on the developing trade situation.
“While selective tariffs might benefit some domestic producers in the short term, our industry ultimately thrives on balanced trade relationships. Any trade policy changes must be carefully implemented to avoid retaliatory measures that could harm our export markets, which account for approximately 18% of U.S. milk production.” — Jim Mulhern, President & CEO, National Milk Producers Federation.
Mulhern’s diplomatic statement masks a more profound industry concern. According to U.S. Dairy Export Council data, the U.S. exported nearly $9.5 billion in dairy products last year – meaning any retaliatory measures could put significant revenue at risk for American dairy farmers.
THE CRITICAL TIMELINE: Acting Before It’s Too Late
The clock is ticking. President Trump took office in January 2025, and we’re now in mid-March. The president’s early trade actions have already shown his administration intends to follow through on campaign promises regarding tariffs.
For dairy farmers and processors, this compressed timeline means:
The window for preemptive stockpiling (like Ornua’s strategy) has largely closed
Future dairy production decisions need to account for potential market disruptions
New processing and export relationships need to be established quickly if current channels face tariff threats
WHAT THE ECONOMISTS SAY: Learning From History
Agricultural economists who’ve studied previous trade disputes offer a sobering perspective. Dr. Christopher Hurt, Professor Emeritus of Agricultural Economics at Purdue University, notes significant historical parallels:
“Looking back at the 2018-2019 trade tensions, dairy farmers who diversified their market exposure and maintained 6-9 months of financial reserves weathered the volatility better than those operating with minimal cushion. The data shows that farms with strong processor relationships and flexible production strategies maintained profitability even as export-dependent operations saw margins compress by 15-20%.”
Dr. Hurt’s analysis reminds us that trade disputes are eventually resolved, but surviving until resolution requires strategic planning and financial flexibility.
PROTECT YOUR FARM: Actionable Strategies for Smart Operators
The Bullvine isn’t in the business of sugar-coating reality. Here’s what competent dairy operators should be doing right now based on current milk pricing fundamentals:
Federal Milk Order Class Prices (December 2024)
Class
Price ($/cwt)
Monthly Change
Class II
$21.28
-$0.24
Class III
$18.62
-$1.33
Class IV
$20.74
-$0.38
These numbers tell the real story – all major milk classes saw price declines in December, with Class III (cheese milk) taking the biggest hit at -.33/cwt. This downward trajectory creates an even more vulnerable environment if tariffs further disrupt markets.
1. DIVERSIFY YOUR MARKET EXPOSURE
If you’re selling to processors heavily dependent on exports to markets facing potential tariffs, it’s time to have serious conversations about diversification. Please don’t wait until those processors are forced to cut prices because their export channels get squeezed.
Concrete examples: Farmers in the Northeast are finding opportunities with regional cheese processors focused on domestic specialty markets, while Midwest producers are exploring contracts with processors developing value-added protein ingredients for the fitness industry—both segments are less vulnerable to import competition.
2. WATCH PROCESSING CAPACITY CLOSELY
As companies like Ornua adjust their production and export strategies, processing capacity could shift regionally. Be prepared for potential overcapacity in export-dependent regions and undercapacity in domestic market-focused areas.
3. BUILD STRATEGIC RESERVES
Ornua’s stockpiling strategy works for shelf-stable products like butter, but all dairy operations need financial reserves to weather market volatility. Financial advisors specializing in dairy recommend maintaining liquid reserves covering 6-9 months of operating expenses during periods of trade uncertainty – well above the typical 3-month cushion recommended during stable market conditions.
During the 2018-2019 China-US trade dispute, Farm Credit Services data showed operations with at least 6 months of operating reserves were 3.5 times more likely to maintain positive cash flow throughout the market disruption.
4. ALIGN WITH STRONG PROCESSORS
Not all processors will face equal impact. Those with diversified international markets or strong domestic positions will navigate these waters more successfully. Your farm’s future may depend on which processor’s truck arrives at your tank.
Forward contracting opportunity: According to CME Group data, Class III milk futures will trade more favorably than expected spot market prices if tariffs are implemented for the next six months. Producers should consider locking in at least 40-50% of production at current levels.
FOLLOW THE MONEY: Component Values Driving Your Milk Check
Understanding the specific components driving your milk price reveals where tariff impacts might hit hardest:
Component
Price ($/lb)
Butterfat
$2.9104
Protein
$1.9637
Nonfat Solids
$1.2151
Other Solids
$0.4493
Look closely at these numbers. Butterfat at $2.91/lb remains the most valuable component in your milk, with protein second at $1.96/lb. If tariffs disrupt butter markets (like Kerrygold), the butterfat value that drives your milk check could face significant pressure.
Economic modeling from Cornell University’s dairy economists suggests a 25% tariff on European butter imports could initially boost domestic butterfat values by 10-15% as competition decreases. However, as export opportunities contract, retaliatory tariffs would likely erase these gains within 3-6 months.
THE POTENTIAL DOMESTIC UPSIDE
Not every potential tariff’s impact would be harmful to American dairy producers. Land O’Lakes, the market-leading domestic butter brand competing directly with Kerrygold, could benefit from reduced premium import competition.
Several Midwest cooperatives with strong domestic butter production are quietly preparing for a potential short-term domestic butter price boost if European premium butter faces tariff barriers. Producers aligned with these processors could see temporary component price improvements before retaliatory measures take effect.
THE BULLVINE BOTTOM LINE: Survive Now, Thrive Later
This looming trade war isn’t just another news item to scroll past – it represents a fundamental reshaping of global dairy markets that will separate the survivors from the casualties. Ornua’s defensive stockpiling strategy tells us everything we need to know about how preeminent players are taking this threat.
“The piece that is always curious about dairy commodities is the last tonne that prices everything and that can be very frustrating… particularly when prices are so volatile.” — Conor Galvin, Ornua CEO.
The farms that recognize the seriousness of potential tariffs and take decisive action now will weather the storm. Those who dismiss it as just more political noise risk becoming collateral damage in a fight they didn’t start.
Remember what Ornua’s CEO said about future production – stockpiling doesn’t help “for the butter we make in 2025, the cows you haven’t milked yet.” That stark reality applies to every dairy operation worldwide. The cows you’re milking today are produced in an increasingly uncertain market environment.
In the dairy business, it’s not the size of your operation that determines survival – it’s your ability to anticipate market shifts and adapt faster than your neighbors. The tariff tsunami isn’t just coming – its first waves are already hitting shore.
5 QUESTIONS TO ASK YOUR PROCESSOR TODAY
What percentage of your production currently goes to export markets?
Do you have contingency plans if tariffs impact your current export channels?
How will your milk pricing formula change if component values shift due to trade disputes?
Are you exploring new product lines that are less vulnerable to import competition?
What financial protections do you offer producers if export markets suddenly close?
Join over 30,000 successful dairy professionals who rely on Bullvine Daily for their competitive edge. Delivered directly to your inbox each week, our exclusive industry insights help you make smarter decisions while saving precious hours every week. Never miss critical updates on milk production trends, breakthrough technologies, and profit-boosting strategies that top producers are already implementing. Subscribe now to transform your dairy operation’s efficiency and profitability—your future success is just one click away.
USDA just cut your 2025 milk check by $125,000. Find out why Washington’s forecasters are slashing prices while sending contradictory production signals.
EXECUTIVE SUMMARY: The USDA’s March WASDE report has dramatically cut the 2025 all-milk price forecast by a full dollar to $21.60 per hundredweight, potentially reducing annual revenue by $125,000 for a 500-cow dairy operation. This unexpected reduction coincides with puzzling production projections that predict higher cow inventories yet lower milk output per cow, contradicting basic dairy economics. Historical analysis reveals USDA has consistently revised forecasts downward mid-year in four of the past five years, suggesting a pattern of initial optimism followed by sobering corrections. While these projections create planning challenges, successful producers are focusing on controllable factors—implementing feed efficiency programs that can save $0.75-1.25/cwt, optimizing milk components for premium payments, and employing risk management strategies that blend contracted and cash market sales. The most resilient operations are questioning forecast assumptions while maintaining operational excellence to buffer against market volatility.
KEY TAKEAWAYS
USDA has cut the 2025 all-milk price forecast to $21.60/cwt, down $1.00 from February’s projection and $1.01 below the 2024 estimate.
For a 500-cow dairy producing 25,000 pounds per cow annually, this forecast reduction represents approximately $125,000 in lost revenue.
Operations with production below 24,000 pounds per cow annually will struggle to remain profitable if prices settle at or below $21.60/cwt.
Feed efficiency improvements can potentially reduce production costs by $0.75-1.25/cwt, helping offset lower milk prices.
The most successful producers blend price risk management (40% six-month contracts, 30% three-month contracts, 30% cash market) while focusing on operational excellence rather than forecast anxiety.
The USDA’s March World Agricultural Supply and Demand Estimates (WASDE) report has sent shockwaves through the dairy industry, cutting the 2025 all-milk price forecast by a whole dollar to $21.60 per hundredweight (cwt). This dramatic reduction comes alongside lowered projections for cheese, butter, nonfat dry milk (NDM), and whey prices, signaling potential financial strain for producers nationwide.
Adding to the confusion, the report predicts higher cow inventories but lower milk output per cow—a contradiction that has industry experts questioning the reliability of USDA’s forecasting methodology.
“The USDA’s March WASDE report has sent shockwaves through the dairy industry, cutting the 2025 all-milk price forecast by a full dollar to $21.60 per hundredweight.”
“This kind of whiplash in forecasting makes it impossible to plan,” says Wisconsin dairy producer Mike Johnson, who milks 350 cows. “We’re making feed purchasing and breeding decisions months in advance, and now USDA tells us our milk will be worth a dollar less? That’s the difference between profit and loss for many operations.”
For a 500-cow dairy producing 25,000 pounds per cow annually, this forecast reduction represents approximately $125,000 in reduced annual revenue—enough to cancel planned equipment upgrades or halt facility improvements that would have enhanced efficiency.
PRODUCTION PUZZLE: MORE COWS BUT LESS MILK?
The March WASDE report (USDA-OCE-2025-3, released March 8, 2025) revises the 2025 milk production forecast downward to 226.2 billion pounds—a 700-million-pound reduction from February’s estimate. The USDA attributes this adjustment to “lower expected milk output per cow more than offsetting slightly higher cow inventories.”
This puzzling scenario raises questions about why productivity per cow is expected to decline despite ongoing investments in genetics and management strategies aimed at increasing efficiency.
“The USDA attributes this adjustment to ‘lower expected milk output per cow more than offsetting slightly higher cow inventories’ — a puzzling scenario that raises questions.”
For context, the 2024 production estimate remains unchanged at 225.9 billion pounds, which is 400 million pounds less than the actual production total of 226.3 billion pounds in 2023. Despite the slight year-over-year increase projected for 2025, the downward revision creates uncertainty for producers planning herd expansions or capital investments based on earlier forecasts.
Milk Production Trends at a Glance
Year
Annual Production (Billion Pounds)
Notes
2023
226.3
Actual production (USDA-NASS Annual Milk Production Report)
2024
225.9
Current estimate (unchanged from February WASDE)
2025
226.2
March forecast (down 700 million pounds from February)
This reduction represents approximately 0.3% of expected annual production—a seemingly minor adjustment but one with significant ripple effects throughout the supply chain.
“We’ve tracked USDA forecasts for the past five years, and they’ve revised production downward mid-year in four of those five years,” notes California producer Maria Sanchez, who manages a 1,200-cow operation. “We’ve learned to take the early-year optimism with a grain of salt and build in a buffer when setting our production targets.”
YOUR 2025 MILK CHECK: PREPARE FOR SMALLER DEPOSITS
The March WASDE report delivers sobering news for producers counting on strong returns in 2025. The all-milk price is now projected at $21.60 per cwt—down $1.00 from February’s forecast of $22.60 and $1.01 below the current estimate for 2024 ($22.61 per cwt).
This marks a year-over-year decline in expected milk check values, raising concerns about broader market trends.
USDA’s Dramatic Price Forecast Shift
Category
February 2025 Forecast
March 2025 Forecast
Change
All-Milk Price
$22.60/cwt
$21.60/cwt
-$1.00
Class III Price
$19.05/cwt*
$17.95/cwt
-$1.10
Class IV Price
$19.75/cwt*
$18.80/cwt
-$0.95
*February Class III and IV forecasts derived from USDA Dairy Market News (Vol. 92, No. 7)
Cheese, butter, NDM, and whey prices have all been lowered based on recent market trends, directly impacting Class III and Class IV milk values:
Class III price is now forecasted at $17.95 per cwt—down from the 2024 estimate of $18.89.
Class IV price is projected at $18.80 per cwt—significantly lower than the unchanged 2024 estimate of $20.75.
Dr. Peter Vitaliano, Chief Economist at the National Milk Producers Federation, expressed concern about these revisions: “These significant downward adjustments create planning challenges for dairy producers who rely on consistent projections for business decisions.”
BEHIND THE NUMBERS: WHY IS WASHINGTON CHANGING ITS TUNE?
The March WASDE report raises fundamental questions about how USDA forecasts are developed and what factors drive their frequent revisions. While official explanations focus on productivity adjustments, several market analysts suggest other factors may influence these projections.
Looking at historical data, USDA has revised its all-milk price forecast downward by an average of $0.85/cwt between January and March forecasts over the past four years, suggesting a pattern of initial optimism followed by reality adjustments.
“We often see a tendency toward optimism in early forecasts that gets tempered by market realities as the year progresses.” — Tanner Ehmke, lead economist at CoBank’s Knowledge Exchange.
Tanner Ehmke, lead economist at CoBank’s Knowledge Exchange division, notes: “We often see a tendency toward optimism in early forecasts that gets tempered by market realities as the year progresses.”
Sarah Williams, dairy futures analyst at Central States Commodities, adds: “The futures markets have reacted strongly to this forecast revision. We’re seeing significant repositioning in Class III and Class IV contracts.”
The contradiction between expanding herd sizes and reduced output expectations suggests either a shift in herd demographics or flaws in assessing productivity trends.
SURVIVAL STRATEGIES: PROTECTING YOUR DAIRY BUSINESS
With lower price projections and tighter margins ahead, dairy producers must reassess their strategies to effectively navigate this challenging environment.
Smart Moves for Small to Mid-Sized Dairies
Feed Efficiency: Prioritize programs that reduce feed costs while maintaining productivity. University of Wisconsin research shows a potential 10-15% feed cost reduction through precision ration formulation, saving $0.75-1.25/cwt in production costs.
Component Optimization: Focus on butterfat and protein levels to maximize revenue from processors offering premiums. Each 0.1% increase in butterfat can add $0.15-0.20/cwt to your milk check.
Direct Marketing: Explore specialty product arrangements that may offer higher pricing. Local cheese production partnerships can increase farm revenue by 20-30% compared to conventional milk sales.
Winning Tactics for Large Operations
Economies of Scale: Leverage bulk purchasing power to negotiate input pricing. Through forward contracting, volume discounts on feed ingredients can reduce costs by 5-8%.
Advanced Analytics: Use data-driven insights to identify operational efficiencies. Feed management software implementations show an ROI of 3:1 through reduced waste and optimized rations.
Processor Negotiations: Evaluate component premiums across multiple buyers. In the same region, component pricing differences between processors can vary by up to $0.30/cwt.
“Frequent revisions force us to readjust operations constantly.” — Michael Johnson, VP of Supply Chain at Great Lakes Dairy Processing.
CASE STUDY: Weathering the Forecast Storm
The Hilltop Dairy operation in Pennsylvania has implemented a comprehensive risk management strategy that combines milk price contracting, feed-forward purchasing, and production efficiency measures. Owner James Wilson explains their approach:
“We’ve calculated our breakeven all-milk price at different production levels: $19.75/cwt at current feed prices, dropping to $18.90/cwt if we achieve our efficiency targets. Based on USDA’s forecast history, we contract 40% of our production six months ahead, 30% three months ahead, and leave 30% exposed to cash markets. Despite volatile USDA forecasts, this blended approach has kept our milk revenue within 5% of our projected budget for three consecutive years.”
MARK THESE DATES: UPCOMING WASDE REPORTS TO WATCH
The following WASDE report will be released on April 10th at noon ET and will provide critical insights into whether March’s adjustments represent a new baseline or a temporary shift.
Critical WASDE Release Dates for Your Calendar
Month
Release Date
Time
April
April 10
12:00 PM ET
May
May 12
12:00 PM ET
June
June 12
12:00 PM ET
Producers should integrate these release dates into their planning calendars to stay ahead of market developments.
At current breakeven prices, operations producing below 24,000 pounds per cow annually will struggle to remain profitable if the all-milk price settles at or below $21.60/cwt. Those with higher debt loads face even more significant challenges as interest expenses consume an increasing percentage of milk revenue.
BOTTOM LINE: QUESTION WASHINGTON, TRUST YOUR INSTINCTS
The USDA’s March WASDE report underscores the importance of resilience and adaptability in navigating uncertain market conditions. While government forecasts provide valuable perspectives, successful producers complement these projections with diverse information sources and flexible management approaches.
“Your farm’s survival depends on questioning assumptions behind these projections and adapting your strategies accordingly.”
Your farm’s survival depends on questioning the assumptions behind these projections and adapting your strategies accordingly. What changes will you make based on this latest forecast?
“The most successful producers I work with don’t get caught up in forecast anxiety,” observes Iowa State Extension dairy specialist Thomas Reynolds. “They focus instead on what they can control—feed efficiency, reproduction, cow comfort, and cost management. The price will be what it will be, but operational excellence provides the buffer against forecast failures.”
Join over 30,000 successful dairy professionals who rely on Bullvine Daily for their competitive edge. Delivered directly to your inbox each week, our exclusive industry insights help you make smarter decisions while saving precious hours every week. Never miss critical updates on milk production trends, breakthrough technologies, and profit-boosting strategies that top producers are already implementing. Subscribe now to transform your dairy operation’s efficiency and profitability—your future success is just one click away.
Trade wars bite: U.S. dairy exports face new tariffs while spring milk floods processors. Are falling powder prices the canary in the coal mine?
Executive Summary
The dairy industry faces significant market disruption as new tariffs targeting U.S. exports to Canada and China create domestic and international buyer uncertainty. Nonfat dry milk prices have retreated to 10-month lows at $1.155 per pound, while whey markets continue their bearish slide, dropping to 45ȼ per pound—the lowest since early June. In contrast, cheese and butter markets show signs of stabilization, with CME spot Cheddar blocks jumping 7ȼ to .6925 this week. Since February, the 5% decline in the dollar index has created potential export opportunities despite trade tensions, as U.S. dairy products become more price-competitive globally. The market outlook remains uncertain as seasonal production increases coincide with trade disruptions, suggesting continued volatility across dairy commodity sectors.
Key Takeaways
Powder markets under severe pressure: NDM and whey prices have fallen to multi-month lows as buyers adopt conservative purchasing strategies amid trade uncertainty
Market divergence creates strategic opportunities: While powder struggles, cheese and butter markets show resilience, suggesting targeted production and marketing approaches may be necessary.
Currency effects partially offset trade barriers: The weaker dollar creates pricing advantages for U.S. dairy exports, potentially opening windows for international sales despite tariffs.
Spring flush amplifies market challenges: Seasonal production increases are creating supply pressure at the worst possible time, with processing facilities facing longer queues at dryers.
Market flexibility critical for producers: The uneven performance across product categories highlights the importance of adaptable production decisions and marketing strategies in the current volatile environment
The dairy markets are navigating turbulent waters as trade disputes cast long shadows over pricing and demand. New tariffs targeting U.S. dairy exports to Canada and China have significantly disrupted market dynamics, creating a cautious atmosphere among buyers domestically and internationally. This week’s market movements reveal a complex landscape where certain commodities are finding their footing while others continue to slide.
POWDER MARKETS FACE HEADWINDS AMID TRADE TENSIONS
The nonfat dry milk (NDM) market is experiencing notable pressure as buyers adopt increasingly conservative purchasing strategies. Importers are demonstrating marked hesitation to commit to volumes that might face tariffs down the road, while domestic users are similarly limiting purchases to immediate needs, anticipating further price declines in this export-dependent sector.
The CME spot NDM market briefly showed signs of life this week before retreating to $1.155 per pound, matching the 10-month low established last Friday. This represents a significant decline from October 2024, when USDA reported NDM prices averaging $1.3685 per pound. The current scenario starkly contrasts the previous fall’s market conditions, when condensed skim was readily available, but recently produced volumes ranged from balanced to tight.
Spring Flush Adds to Market Pressure
The arrival of spring has brought the familiar seasonal increase in milk production, further complicating the powder market outlook. With milk flows climbing, processing facilities are experiencing longer queues at dryers. This supply growth comes at a particularly challenging time, as export channels face obstacles from trade disputes and domestic buyers remain cautious.
WHEY MARKETS CONTINUE DOWNWARD TRAJECTORY
The whey market continues its bearish trend, with prices falling further this week. CME spot whey powder dropped another 4ȼ to reach 45ȼ, marking the lowest price point since early June. This represents a dramatic decline from October 2024’s reported prices, when dry whey was trading at around 60ȼ per pound.
USDA market analysts offer a candid assessment, noting “growing concerns among market actors as to what international trading activity will look like over the next few months.” Domestic end users have lost interest in dry whey volumes priced above 50ȼ per pound, indicating a significant shift in price expectations.
The agency characterizes the market as bearish “with few indications of the alternative in the near term.” While demand for high-protein whey concentrates and isolates remains robust, the industry continues to generate ample whey for powder production.
CHEESE AND BUTTER MARKETS FIND STABILITY
While powder markets continue their decline, other dairy commodities have shown resilience. After weeks of bearish pressure, the invisible hand of the market has stepped in to restore some balance:
CME spot Cheddar blocks jumped 7ȼ this week to $1.6925
Barrels rallied 6ȼ to reach $1.69
Butter added 3.25ȼ to climb to $2.3425
These figures reflect significant shifts from October 2024, when cheese blocks and barrels traded at $1.90 and $1.87, respectively, and butter commanded nearly $2.70 per pound.
Market Fundamentals Remain Mixed
Despite the modest recovery in cheese and butter prices, several factors that drove February’s market collapse remain in play:
Cream supplies continue to be abundant and affordable
Churns are operating at high capacity
U.S. cheese production continues to expand
Domestic demand for cheese and butter lacks vigor
However, the recent price corrections have created opportunities for international buyers. U.S. cheese and butter present attractive value propositions to foreign purchasers compared to alternatives from other major dairy exporting regions.
CURRENCY EFFECTS CREATE EXPORT OPPORTUNITIES
A 5% decline in the dollar index since early February has enhanced the purchasing power of foreign currencies when buying U.S. dairy products. This currency effect, combined with stable to higher dairy prices in Oceania and Europe, has widened the gap between U.S. and international values.
This pricing disparity creates potential opportunities for buyers willing to navigate the uncertain U.S. trade policy landscape. International purchasers can effectively acquire U.S. dairy products at bargain prices compared to global alternatives, potentially offsetting some of the negative impact of recent trade tensions.
OUTLOOK REMAINS UNCERTAIN AS MARKETS ADJUST
The dairy industry is at a crossroads, with markets adjusting to new trading realities while seasonal production trends follow their typical patterns. The combination of trade tensions, seasonal milk production increases, and uneven demand across product categories suggests that continued volatility may lie ahead.
The divergent performance across product categories for dairy producers underscores the importance of maintaining flexibility in production decisions and marketing strategies. While powder markets face significant headwinds, stabilizing cheese and butter prices guarantees that market mechanisms continue functioning.
The coming weeks will be critical in determining whether the modest recovery in cheese and butter markets can be sustained and whether powder markets will find support or continue their decline under pressure from seasonal and trade-related factors.
Join over 30,000 successful dairy professionals who rely on Bullvine Daily for their competitive edge. Delivered directly to your inbox each week, our exclusive industry insights help you make smarter decisions while saving precious hours every week. Never miss critical updates on milk production trends, breakthrough technologies, and profit-boosting strategies that top producers are already implementing. Subscribe now to transform your dairy operation’s efficiency and profitability—your future success is just one click away.
Florida dairy farmers earn $5.11 more per cwt than Midwest farms for identical milk. Is geography worth $1.28 million per year? June 1 changes everything.
EXECUTIVE SUMMARY: The February 2025 Federal Milk Marketing Order prices reveal a stark $5.11 per hundredweight divide between Florida ($25.42) and Upper Midwest ($20.31) producers, creating a $1.28 million annual advantage for identical 1,000-cow operations based solely on geography. This regional inequality highlights fundamental flaws in a system that undergoes significant transformation on June 1, when the return to the “higher-of” Class I formula, updated make allowances, and other changes take effect. Meanwhile, a dramatic shift in component values—with protein surging and butterfat declining—signals strategic production opportunities for forward-thinking producers. Smart dairy farmers are already preparing by shifting focus to protein production, calculating their June 1 impact, and implementing risk management strategies before market volatility intensifies.
KEY TAKEAWAYS
Regional Price Gap: A $5.11 per hundredweight difference between identical milk in Florida versus the Upper Midwest creates “dairy haves and have-nots” based purely on location, not management quality.
June 1 Formula Change: The return to the “higher-of” Class I pricing formula would have reduced February’s Class I price by 44 cents, suggesting the change may not benefit producers as promised.
Component Value Shift: With protein values rising (up 20¢ to $2.53/lb) and butterfat falling (down 13¢ to $2.82/lb), producers should reassess breeding and nutrition programs to emphasize protein.
Action Required: Dairy producers must prepare for June 1 by calculating their specific exposure to formula changes, adjusting production strategies to emphasize protein, and implementing risk management tools before prices decline.
Depooling Impact: February’s narrow 28-cent spread between Class III and IV prices reduced depooling incentives, but March’s projected 46-cent spread could trigger Class IV depooling, affecting producer payments.
Florida dairy farmers are banking $5.11 more per hundredweight than their Upper Midwest counterparts for identical milk—highway robbery or fair market?
With significant pricing changes coming June 1, here’s who stands to win and get the short end of the stick in Dairy’s great regional lottery.
The Cold, Hard Numbers: February’s Price Reality
February’s Federal Milk Marketing Order (FMMO) uniform prices tell a tale of two dairy industries. Prices increased in just three of the 11 FMMOs—those blessed with high Class I (fluid milk) utilization—while the other eight regions saw declines from January.
This pattern creates winners and losers based purely on geography, not management skill or milk quality.
The Florida order maintained its crown with an impressive $25.42 per hundredweight (cwt), climbing 38 cents from January. Meanwhile, Upper Midwest producers scraped the bottom at a measly $20.31 per cwt.
FMMO Region
February 2025 Uniform Price
Change from January
Florida
$25.42/cwt
+$0.38
Southeast
$24.32/cwt
+$0.22
Appalachian
$23.65/cwt
+$0.15
Northeast
$22.18/cwt
-$0.27
Arizona
$22.02/cwt
-$0.31
Pacific Northwest
$21.14/cwt
-$0.42
California
$20.94/cwt
-$0.35
Central
$20.75/cwt
-$0.29
Southwest
$20.72/cwt
-$0.33
Mideast
$20.67/cwt
-$0.31
Upper Midwest
$20.31/cwt
-$0.38
PRICE GAP
$5.11/cwt
This $5.11 difference in identical products has producers questioning the fairness of a system that seems to play favorites. What does your region cost you each month?
For a 1,000-cow dairy producing 70 pounds per cow daily, this regional difference amounts to over $107,310 monthly—more than $1.28 million annually.
“A Florida dairy farm with 1,000 cows will earn $1.28 MILLION MORE annually than an identical Upper Midwest operation—purely because of geography. That’s not a pricing system; it’s a lottery.”
Bill Davidson, who milks 850 cows near Eau Claire, Wisconsin, feels the regional sting every month: “We’re producing the same quality milk with the same components as farms in Florida, but we’re getting over $5 less per hundredweight. That’s more than $800,000 a year, and our operation loses because of our zip code. How is that fair?”
Are Your Milk Classes Working FOR You or AGAINST You?
Class prices displayed similarly uneven performance in February. The Class I base price jumped to $21.27 per cwt, up 89 cents from January and a substantial $3.28 from February 2024.
But other classes faltered:
Class II fell 50 cents to $21.08 per cwt
Class III dipped 16 cents to $20.18
Class IV took the biggest hit, plunging 83 cents to a 12-month low of $19.90
Milk Class
February 2025 Price
Change from January
Change from Feb 2024
Class I (base)
$21.27/cwt
+$0.89
+$3.28
Class II
$21.08/cwt
-$0.50
+$0.55
Class III
$20.18/cwt
-$0.16
+$4.10
Class IV
$19.90/cwt
-$0.83
+$0.05
Class III-IV Spread
$0.28/cwt
↓
Narrowest since Mar 2023
JUNE 1 ALERT: Your Milk Check Is About to Change
Mark your calendars for June 1, 2025, the day the dairy pricing system will undergo its biggest overhaul in years.
After months of hearings and negotiations, all 11 FMMOs approved amendments to pricing formulas that will fundamentally alter how your milk check is calculated.
The most significant change is the return to the “higher-of” formula for Class I milk pricing. This reverses the controversial “average-of plus 74 cents” formula that’s been in place for years.
Based on February’s numbers, this would have reduced the Class I base price by 44 cents per cwt—proving that what sounds good in a boardroom doesn’t always benefit farmers.
“The irony is stunning: The ‘higher-of’ formula that benefits farmers would have REDUCED February’s Class I price by 44 cents. Are we fixing the system or just reshuffling who gets squeezed?”
Changes Taking Effect June 1
Winners
Losers
Return to “higher-of” formula
High Class I utilization areas
Would have reduced Feb Class I price by $0.44/cwt
Updated make allowances
Processors gain increased margins
All producers face potential payment reductions
June 1 also brings updated manufacturing allowances for processors—essentially increasing what they can deduct from your milk check.
The new make allowances include 25.19 cents for cheese, 22.72 cents for butter, 23.93 cents for nonfat dry milk, and 26.68 cents for dry whey.
The timing of these changes—deliberately set for World Milk Day—seems almost like a cruel joke to producers facing potentially reduced payments.
Maria Hernandez, whose family operates a 400-cow dairy near Orlando, Florida, sees both sides of the regional pricing debate: “Yes, we benefit from Florida’s higher prices, but our production costs are also higher. What matters to all of us is stability. These constant formula changes create uncertainty that makes it impossible to plan long-term.”⁷
FOLLOW THE MONEY: Component Shift Could Make or Break Your Dairy
Innovative dairy producers don’t just look at the bottom line—they follow the components.
February saw a dramatic shift as butterfat values plummeted about 13 cents to $2.82 per pound, their lowest level since July 2023. Meanwhile, protein values surged more than 20 cents to $2.53 per pound, hitting a four-month high.
Component
February 2025 Value
Change from January
Trend
Butterfat
$2.82/lb
-$0.13
Lowest since July 2023
Protein
$2.53/lb
+$0.20
4-month high
Nonfat Solids
$1.55/lb
-$0.045
↓
Other Solids
$0.48/lb
-$0.06
↓
“When protein is worth $2.53 and butterfat only $2.82 per pound, the market sends a clear signal: The era of fat-focused production is ending. The question is whether YOUR breeding program has gotten the message.”
This inverse relationship signals a critical shift in production strategy. Farms focusing on butterfat may need to reconsider their approach, while those with high-protein herds could see their advantage grow.
The gap between these component values tells a more precise market story than any press release—consumers are chasing protein, not fat.
Research from the Journal of Dairy Science has long shown that milk components vary significantly across farms and directly impact profitability under the FMMO pricing system.⁹ Smart producers can manage these components through strategic decisions about breed selection, lactation management, feed rations, and milking frequency.
The $5 QUESTION: Is Geographic Lottery Fair for Dairy Farmers?
The $5.11 gap between Florida and Upper Midwest prices exposes the growing inequity built into the FMMO system.
Originally designed to ensure fair milk prices across regions, today’s system has morphed into one that heavily favors certain areas—creating dairy haves and have-nots.
The System’s Historical Logic
Regional price differentials weren’t created in a vacuum. They were established to reflect actual economic factors: transportation costs to move milk from surplus to deficit regions, local supply and demand conditions, and higher production costs in certain areas. Florida’s high fluid utilization (Class I) and distance from major production regions historically justified higher prices to ensure adequate local supply.
But as milk production has consolidated and transportation systems have evolved, many industry experts from Cornell University and other institutions question whether today’s extreme regional price gaps truly reflect economic reality—or if they’ve become an outdated mechanism that arbitrarily rewards some producers while punishing others.
While the upcoming June changes will adjust Class I differentials, they’re unlikely to close this regional chasm. Divergent pricing guarantees that identical milk produced with identical care receives wildly different payments based on location.
This regional lottery undermines the FMMO system’s very purpose of creating an equitable playing field for all dairy producers.
Regional Price Gap Impact
Monthly Loss per Farm Size
100-cow dairy
$10,710 per month
500-cow dairy
$53,550 per month
1,000-cow dairy
$107,100 per month
5,000-cow dairy
$535,500 per month
Are YOU prepared for June 1? The time to adjust your business strategy is NOW.
POOLING EXPOSED: How Your Check Gets Manipulated
Think of milk pooling like a community fund: producers contribute milk, the fund collects revenue from all classes, and everyone gets a share based on complex rules. But here’s the catch—when prices align a certain way, handlers can withdraw their high-value milk from the pool, leaving less money for everyone else.
That’s deploying in simple terms, and it’s why February’s numbers matter to YOUR bottom line.
February’s tiny 28-cent spread between Class III and IV prices meant less incentive for this manipulation—but for how long?
February’s class price dynamics dramatically altered the pooling game. At just 28 cents per cwt, the spread between Class III and Class IV prices hit its narrowest margin since March 2023.
This tight spread reduced processors’ incentives to deploy milk, a practice that often leaves producers with the short end of the stick.
The result? Despite three fewer marketing days than in January, the total milk pooled in February barely declined, reaching 12.65 billion pounds, according to USDA pooling data.
Class IV pooling surged by 1.26 billion pounds to 2.7 billion pounds—the highest volume since April 2023—while Class III pooling dropped by 895 million pounds.
These shifts directly impact producer payments and expose how vulnerable the system is to manipulation.
MARCH WARNING: Prepare for Price Pressure
Looking ahead, March uniform prices will likely decline.
The March Class I base price has already been announced at $21.02 per cwt, down 25 cents from February.
Based on Chicago Mercantile Exchange futures prices as of March 13, both Class III and IV could drop substantially, with Class III projected at $18.25 and Class IV at $18.71—creating a 46-cent spread that reverses February’s trend and could trigger more Class IV deployment putting your March milk check at risk.
This forecasted decline comes just months before the June 1 pricing changes take effect—giving producers little time to adjust their business models before yet another seismic shift in the payment system.
Those prepared for these changes will survive; those caught unaware may not.
SURVIVAL GUIDE: Three Steps to Beat the System
February’s price data reveals more than just numbers—it exposes a system in transition that rewards those who understand its complexities.
The regional disparities, shifting component values, and upcoming formula changes create threats and opportunities.
1. PROTEIN POWER: Shift Your Production Focus
With protein values outpacing butterfat, review your nutrition program and consider genetic selection that emphasizes protein content.
According to research from the University of Wisconsin’s Dairy Innovation Hub, producers can increase milk protein by 0.1-0.2 percentage points through targeted nutrition strategies, potentially adding thousands in annual revenue.
Consult with nutritionists about amino acid-balanced rations and evaluate your breeding program to select for higher protein traits.
2. CRUNCH THE NUMBERS: Calculate Your June 1 Impact
Run detailed scenarios showing how the return to the “higher-of” formula will impact your specific operation based on your utilization and component levels.
Progressive Dairy’s analysis shows the impact will vary dramatically depending on your regional blend price and utilization rates.
Don’t wait for your co-op or milk handler to tell you what’s coming—do the math yourself.
3. HEDGE YOUR BETS: Risk Management is Essential
Consider futures contracts or options to protect against volatility during the transition period.
Even smaller producers should explore minimum price guarantees and Dairy Revenue Protection options before June 1 hits.
Innovative producers are already preparing for the June 1 changes by reassessing production strategies, considering component optimization, and exploring risk management tools.
As the pricing game changes, so must your approach to playing it. Those who adapt will thrive; those who don’t risk getting culled from an industry that shows little mercy to the unprepared.
“The dairy pricing system isn’t just complex—it’s deliberately opaque. Those who master its intricacies will survive June 1; those who don’t understand their milk check may not be writing checks much longer.”
The dairy pricing system may be complex, but one thing is crystal clear: knowing how to navigate it separates those who will survive from those who won’t.
February’s numbers are just the first sign of what promises to be a high-stakes year for America’s dairy farmers.
Join over 30,000 successful dairy professionals who rely on Bullvine Daily for their competitive edge. Delivered directly to your inbox each week, our exclusive industry insights help you make smarter decisions while saving precious hours every week. Never miss critical updates on milk production trends, breakthrough technologies, and profit-boosting strategies that top producers are already implementing. Subscribe now to transform your dairy operation’s efficiency and profitability—your future success is just one click away.
Australian dairy giant flips loss-making bulk segment to $24.4M profit while competitors struggle. See the strategy others don’t want you to know!
EXECUTIVE SUMMARY: Bega Cheese has delivered a masterclass in dairy processing profitability with its latest half-year results, posting a 44% surge in normalized EBITDA to $110.3 million despite challenging market conditions. The Australian company’s most remarkable achievement is transforming its bulk foods segment from a $5.6 million loss to a $24.4 million profit – a $30 million swing that defies industry conventional wisdom about commodity operations. While its branded business continued steady growth across key categories like yogurt (9%) and milk-based beverages (7%), it’s Bega’s strategic approach to aligning global commodity prices with farmgate milk costs that has created its competitive advantage. These results outpace industry averages and suggest competitors have been using market conditions as excuses rather than addressing execution issues, potentially signaling stronger farmgate milk pricing for producers in coming seasons.
KEY TAKEAWAYS:
Bulk Business Revival: Contrary to industry trends of abandoning commodity operations, Bega’s strategic reorientation toward higher-value proteins and better alignment between global dairy prices and farmgate costs generated a remarkable $30 million turnaround in its bulk segment.
Strategic Asset Optimization: Bega’s willingness to make tough decisions about facility closures, including distribution coolrooms and the Leeton juice processing site, directly contributed to a 17% reduction in net debt while improving gross margins by 1.6 percentage points.
Brand Portfolio Strength: Despite consumer downtrading, Bega’s diverse brand portfolio (including Dairy Farmers, Vegemite, and Bega cheese) achieved category-beating growth rates in yogurt (9%) and milk-based beverages (7%), demonstrating the value of product and brand diversification.
Farmer Implications: Bega’s improved profitability and stronger balance sheet position signal potential increases in farmgate milk prices within 6-9 months as competition for milk supply intensifies among processors.
Performance Gap Exposed: Bega’s results reveal that market challenges used by other processors as excuses for poor performance can be overcome through precise execution, raising questions about management capability across the industry.
While most dairy processors have been whining about commodity volatility and tight margins, Bega Cheese has engineered a financial turnaround that should have every dairy executive frantically taking notes. The Australian powerhouse just released its half-year numbers, showing a solid 3% revenue increase to $1.78 billion and a 14% profit jump despite what it describes as “challenging” shopper spending patterns.
But the real story? Their previously loss-making bulk dairy segment has flipped to profitability faster than milk spoils in the summer heat. If this dramatic reversal doesn’t shake up your boardroom strategy discussions, you should hand your market share to Bega on a silver platter.
SHOCK AND AWE: Financial Results That Leave Competitors Speechless
Bega Cheese’s financial performance isn’t just good – the result makes competitors question their entire business model. According to Bega’s February 2025 Half-Year Results Presentation, the company reported revenue of $1.8 billion for the first half of fiscal year 2025, representing a solid 3% increase over the same period last year.
But revenue growth only tells a fraction of the story. The actual headline is their normalized EBITDA (earnings before interest, taxes, depreciation, and amortization) performance – a jaw-dropping $110.3 million that smashed last year’s figure by 44%. This isn’t just incremental improvement; it’s a $33.8 million year-on-year surge that separates industry leaders from also-rans.
“Chair Barry Irwin told investors its result was achieved during a challenging trading environment with lower discretionary consumer spend and downtrading across sales channels and products.” — Bega Cheese Half-Year Announcement
Financial Metric
1H FY2025 ($M)
1H FY2024 ($M)
Change (%)
Net Revenue
1,782.1
1,728.0
+3%
Normalised EBITDA
110.3
76.5
+44%
Depreciation & Amortisation
46.0
42.9
+7%
Normalised EBIT
64.3
33.6
+91%
Net Finance Costs
16.7
16.5
+1%
Normalised Profit After Tax
35.9
13.3
+170%
Basic EPS (cents)
11.8
4.4
+168%
These results substantially outperform the broader Australian dairy processing sector, where the Australian Dairy Products Federation reports average EBITDA growth across major processors has remained under 10% for the same period. While most dairy companies have struggled with inflationary pressures cutting into margins, Bega has expanded its gross margin by 1.6 percentage points.
The company has demonstrated its confidence in future performance by declaring a dividend of 6.0 cents per share, payable on April 3, 2025. This represents a 50% increase from the 4.0 cents per share paid in the same period last year, distributing $18.3 million to shareholders.
These results are even more impressive because they netted a statutory profit (the bottom-line profit figure reported under accounting standards) of $30.2 million – enough to drive the share price to its highest point since mid-2021, climbing above $6.10 after the February 20 announcement.
In a bizarre twist that showcases the volatility of markets, Bega’s share price suddenly plunged almost a dollar late last week as approximately 1.75 million shares were sold off by traders taking profits. The stock dropped as low as $5.20 before recovering to around $5.45 in early trading the following week.
THE $30 MILLION MIRACLE: How Bega Flipped Its Bulk Business from Loser to Legend
The most stunning aspect of Bega’s results – and the one that should have industry analysts rewriting their playbooks – is the dramatic turnaround in the bulk segment. This division posted a statutory EBITDA of $24.4 million compared to a $5.6 million loss in the same period a year ago.
That’s a $30 million swing in performance within a single business segment—a reversal that most dairy executives consider impossible in today’s volatile markets.
“The Bulk business further orientated its mix to higher value proteins and delivered strong cost savings results. Bulk segment earnings are majority 1H FY25 weighted as roughly two-thirds of milk intake occurs in the seasonally stronger first half.” — From Bega’s Investor Presentation.
The key factor behind this remarkable recovery? According to the company, the bulk business benefited from a better alignment between global dairy commodities and Australian farmgate milk prices. While international benchmark indicators like the Global Dairy Trade (GDT) index have stabilized, Dairy Australia reports that farmgate prices in Australia have moderated from last year’s peaks, creating a more favorable cost-to-revenue ratio for processors.
In simple terms, Bega managed to balance input costs and market returns, creating a sustainable operating model for its commodity business. This strategic shift demonstrates that bulk dairy operations can be highly profitable when managed with precision and market awareness.
This result dispels the conventional wisdom that dairy processors should minimize exposure to commodity markets and focus exclusively on value-added consumer products. While many industry consultants and analysts have preached the gospel of abandoning bulk operations, Bega demonstrated that a well-executed commodity strategy can deliver extraordinary returns.
For industry executives who’ve been justifying poor performance by blaming commodity volatility, Bega’s results just eliminated their favorite excuse.
Segment
External Revenue ($M)
Growth vs 1H FY2024
Normalised EBITDA ($M)
Increase/(Decrease) vs 1H FY2024 ($M)
Branded
1,522.2
+1%
104.2
+7.4
Bulk
259.9
+18%
24.4
+30.0
Unallocated overheads
–
–
(16.5)
(0.4)
Inter-segment elimination
–
–
(1.8)
(3.2)
Group total
1,782.1
+3%
110.3
+33.8
BRAND DOMINANCE: Winning the Consumer Battle While Others Retreat
While the bulk segment turnaround grabbed headlines, Bega’s branded business continued its impressive growth despite challenging consumer conditions. The company’s success reflects its focus on high-value categories, innovation, and cost-saving programs, including closing more distribution coolrooms around Australia and selling its southern NSW juicing plant in October.
Bega Group isn’t just any dairy company – it’s the powerhouse behind some of Australia’s most recognizable consumer brands, including Dairy Farmers, Masters and Farmers Union dairy products, Vegemite, Bega peanut butter and cheese, and Daily Juice. This portfolio of iconic brands has allowed Bega to maintain market strength even as consumers become more price-sensitive.
The category-specific performance tells a compelling story about where Australian consumers are directing their spending:
While white milk category growth remained flat, milk-based beverages grew an impressive 7% to capture nearly 50% of that $1 billion market
Yogurt showed even more substantial growth at 9%, allowing Bega to hold 24% of the $1.9 billion market
Spreads and chilled juice categories showed modest but solid growth at 3% and 4% respectively
These figures demonstrate Bega’s ability to identify and capitalize on growth opportunities even in categories where overall consumer spending has been constrained.
According to Dairy Australia’s market analysis, these growth rates outpace category averages, with the general yogurt market growing at approximately 5% and flavored milk at 4% industry-wide. Bega’s overperformance suggests the company is gaining market share while improving profitability – the holy grail of consumer goods strategy.
CUT, OPTIMIZE, DOMINATE: The Strategic Moves Others Should Copy
Bega’s commitment to innovation, cost-cutting measures, and efficient cash optimization strategies has paid off. The company is now positioned to continue reaping the benefits of a rebounding market and maintaining profitability despite ongoing inflationary pressures.
While other processors use harsh market conditions to excuse mediocre performance, Bega has implemented concrete strategic moves that have delivered measurable results.
“The continued focus on cash optimization and realizing the benefits of innovation and cost-saving initiatives is expected to offset inflationary impacts and further improve profitability and leverage in FY25.” — Bega Cheese Management Statement.
The company made several strategic moves during the period, including the October sale of the Leeton juice processing site, which contributed to its improved financial position. Additionally, Bega has continued closing distribution coolrooms around Australia as part of its ongoing efficiency drive.
These decisions demonstrate Bega’s willingness to make tough choices about asset rationalization to concentrate resources on higher-performing segments. The result: Bega has reduced its net debt by $43.7 million (17%) year-on-year while simultaneously improving its return on funds employed from 4.7% to 7.9%.
The company’s improved performance for dairy farmers supplying Bega potentially signals stronger processor demand for milk, which could translate into more favorable farmgate pricing in coming seasons. According to Dairy Australia’s latest Situation and Outlook report, processor profitability is a leading indicator of farmgate price movements, with a typical 6-9 month lag between improved processor margins and adjustments to milk payments.
“When processors achieve this kind of financial turnaround, it typically creates more competition for milk supply, which can benefit farmers through improved pricing and contract terms,” notes Australian Dairy Farmers’ market analyst David Burton. “The question now is whether other processors will need to respond to maintain their milk supply base.”
WAKE-UP CALL: Why Every Dairy Executive Should Fear What Bega Just Proved
Bega’s exceptional half-year performance is a wake-up call for the entire dairy processing sector. It demonstrates that exceptional results are possible even in challenging market conditions.
The alignment between global dairy commodity prices and Australian farmgate milk prices that benefited Bega’s bulk foods segment suggests a more balanced and sustainable market environment –where processors who execute with precision can capture substantial value.
“The group reaffirms its normalized EBITDA of $190 to $200 million in FY2025. The group expects to be at the upper end of this range.” — Bega Cheese Earnings Guidance.
For processors who have abandoned or minimized their bulk operations in favor of consumer brands, Bega’s results raise provocative questions about whether they’ve surrendered a potentially lucrative market segment. The $30 million swing in the bulk segment’s performance demonstrates the substantial upside potential in commodity operations when market conditions align, and strategic execution is spot-on.
Key Performance Measure
1H FY2025
1H FY2024
Change
Net Revenue Growth
3.1%
3.2%
-0.1 ppts
Gross margin (% of Revenue)
21.8%
20.2%
+1.6 ppts
Net Debt ($M)
207.2
250.9
-17%
Leverage Ratio (times)
1.3
1.9
-0.6
Return on Funds Employed (%)
7.9%
4.7%
+3.2 ppts
Dividends per share (cents)
6.0
4.0
+50%
The dairy industry faces complex challenges – from shifting consumer preferences to sustainability imperatives and market consolidation. Yet Bega’s performance shows that these challenges aren’t insurmountable barriers to profitability.
Mark Williams, dairy sector analyst at MarketInsight Financial, notes: “Bega’s results starkly contrast to the narrative we’ve heard from many processors that market conditions make profitability impossible. This raises serious questions about whether poor performance elsewhere stems from market conditions or management execution.”
Dairy processors can achieve exceptional results even in turbulent markets by balancing operational efficiency with strategic brand development, maintaining disciplined financial management, and investing in growth initiatives.
As Bega’s Executive Chairman Barry Irwin understands, significant opportunities often emerge during the most challenging times. For dairy industry leaders paying attention, Bega’s first-half performance represents impressive financial results and a blueprint for sustainable success in an increasingly competitive global dairy marketplace.
The question now is: who will learn from their example, and who will be left behind?
Join over 30,000 successful dairy professionals who rely on Bullvine Daily for their competitive edge. Delivered directly to your inbox each week, our exclusive industry insights help you make smarter decisions while saving precious hours every week. Never miss critical updates on milk production trends, breakthrough technologies, and profit-boosting strategies that top producers are already implementing. Subscribe now to transform your dairy operation’s efficiency and profitability—your future success is just one click away.
81 days till dairy chaos: Midwest farms face $56k losses as processors gain. Who survives the 2025 pricing overhaul? Time’s ticking.
The most significant dairy pricing overhaul in a generation will fundamentally transform American milk markets starting June 1st. The return to the “higher-of” Class I formula corrects a catastrophic 2018 Farm Bill experiment that cost producers an estimated $725 million during pandemic market disruptions. However, processor-friendly manufacturing allowance increases will extract approximately $56,000 annually from typical 100-cow operations, creating dramatic regional disparities that will permanently reshape America’s dairy landscape. This analysis provides the regional impact breakdown, processor perspectives, and tactical survival guide you need to navigate dairy’s new economic battlefield.
THE FUNDAMENTAL SHIFT: RETURNING WHAT WAS TAKEN
Let’s dispense with the bureaucratic jargon and call Federal Milk Marketing Orders what they are: the rules that determine who gets what slice of the dairy revenue pie. That pie is being reshaped to create clear winners and losers across America’s dairy landscape.
“The return to the ‘higher-of’ formula isn’t some grand gift to dairy farmers—it’s merely returning what was stolen from them through the disastrous 2018 change.”
Restoring the “higher-of” Class I pricing formula reverses one of recent dairy history’s most catastrophic policy experiments. When the 2018 Farm Bill implemented the average-plus-74-cents formula, few anticipated how disastrously it would perform during market upheavals. During the pandemic, this flawed formula transferred an estimated $725 million from farmers’ pockets to processors’ profit margins—a wealth transfer that should outrage every dairy producer in America.
Dana Coale, deputy administrator of the AMS Dairy Program, acknowledged these pandemic-related losses, noting that the 2018 farm bill formula “resulted in steep reductions in producer income as a result of market disruptions during the COVID-19 pandemic.” The new order, according to Coale, “gives you certainty as to what lies ahead. You know what’s coming”.
Pricing Element
Pre-2025 Formula
2025 Formula
Impact
Class I Mover
Average + $0.74
Higher of III/IV
+$0.44/cwt baseline
Cheese Pricing
Blocks & Barrels
Blocks Only
Reduced volatility
ESL Products
No adjustment
24-mo rolling average
Processor stability
Location Differentials
Last updated 2008
Modernized zone adjustments
Regional variations
THE REGIONAL BATTLEFIELD: WHERE YOU FARM DETERMINES IF YOU WIN OR LOSE
The nationwide referendum that approved these changes in December 2024 masked profound regional disparities in how these reforms will impact farm-level profitability. Analysis of USDA data reveals a stark geographic divide that will permanently alter regional competitive advantages, potentially reshaping dairy production patterns for years to come.
Region
Pool Value Impact
Key Factor
Action Required
Northeast
Positive
High Class I utilization
Maximize component yield
Upper Midwest
Negative
Make allowance penalties
Renegotiate premiums
California
Potential $94M reduction
Class III/IV dependence
Cost containment
Central/Mideast
Positive
Proximity to fluid markets
Expand Class I capacity
NORTHEAST PRODUCERS: THE UNEXPECTED WINNERS
The 2025 FMMO reforms create a potentially game-changing competitive advantage for Northeast dairy producers due to higher Class I utilization in the region. According to industry analysis, Northeast producers stand to benefit significantly from the reforms due to high Class I utilization, boosting profitability potential. The Northeast dairy industry is further positioned for growth driven by new processing capacity in New York and Pennsylvania, creating a unique window of opportunity.
The proposed allowance increases will have substantially less impact on Northeast producers due to the region’s higher Class I utilization. This contrasts sharply with areas like California, the Upper Midwest, the Southwest, and the Pacific Northwest, where higher Class III and IV utilization makes producers more vulnerable to the adverse effects of increased make allowances.
UPPER MIDWEST OPERATIONS FACE SERIOUS CHALLENGES
The reforms present a troubling financial picture for dairy farmers in the Upper Midwest. Edge Dairy Farmer Cooperative directly acknowledges that the reforms “would slightly decrease the minimum regulated price private milk buyers have to pay to pooled milk producers in the Upper Midwest order”. This regional disadvantage stems from several technical aspects of the reform package, particularly how components are valued.
The decision to update skim milk composition factors without corresponding increases in butterfat factors creates particular complications for Upper Midwest producers who typically emphasize butterfat production. According to industry analysis, these adjustments could significantly impact the Upper Midwest pool value. This substantial financial hit threatens the region’s competitive position and demands immediate adaptive strategies from affected producers.
WESTERN OPERATIONS: CALIFORNIA, SOUTHWEST, AND PACIFIC NORTHWEST DISADVANTAGED
Detailed analysis shows that the proposed increases in make allowances would significantly reduce the total pool value in several western orders. According to Farm Bureau analysis, California would have experienced a $94 million reduction in pool value, while the Southwest would have seen a $72 million decrease.
These regional disadvantages stem from the higher proportion of milk utilized in Class III and IV manufacturing in these areas. With make allowance increases directly reducing the value of milk used in these classes, western producers face the most dramatic negative impacts from the reforms. This geographic inequality creates concerning implications for an FMMO system supposedly designed to prevent such regional disparities.
CENTRAL AND MIDEAST REGIONS: MODEST GAINS LIKELY
In contrast to the challenges facing Upper Midwest and Western producers, operations in the Central and Mideast orders are positioned to see price improvements under the new system. According to industry analysis, the reforms “would slightly increase the price to producers in the Central and Mideast orders”.
This regional advantage stems from how the updated class price calculations and differentials interact with these regions’ typical milk composition and utilization patterns. The geographic proximity to major population centers and fluid milk markets gives these producers a competitive advantage under the reformed pricing structure.
PROCESSOR PERSPECTIVE: THE MAKE ALLOWANCE VICTORY
While producer organizations have focused on the return to the “higher-of” formula, processors have secured substantial increases in make allowances—the margin built into pricing formulas to cover manufacturing costs. This represents a significant win for the processing sector that deserves careful examination.
Product
2008 Make Allowance
2025 Final Rule
Change
Cheese
$0.2003/lb
$0.2519/lb
+25.8%
Butter
$0.1715/lb
$0.2272/lb
+32.5%
Nonfat Dry Milk
$0.1678/lb
$0.2393/lb
+42.6%
Dry Whey
$0.1991/lb
$0.2668/lb
+34.0%
International Dairy Foods Association President and CEO Michael Dykes acknowledged the reforms include “important updates to elements of the FMMO system, including much-needed changes to ‘make allowances.'” Dykes also noted that “While the USDA process did not address all issues within the supply chain, particularly for Class I and organic milk processors, IDFA is optimistic that this process has laid the groundwork for a unified and forward-looking dairy industry”.
“USDA instead bases make allowances on an unscientific, voluntary survey that allows processors to opt-out, skewing the results in a direction that results in lower milk prices for farmers.”
— Zippy Duvall, President, American Farm Bureau Federation.
Farm Bureau President Zippy Duvall strongly criticized the process, stating, “USDA instead bases make allowances on an unscientific, voluntary survey that allows processors to opt-out, skewing the results in a direction that results in lower milk prices for farmers.” According to Farm Bureau analysis, “changing the make allowance without a mandatory, audited survey could lead to unjust penalties for dairy farmers, which directly defies the intended purpose of the FMMO system”.
The effects of these allowance increases are substantial. If implemented between 2019 and 2023, they would have reduced Class III prices by 90 cents/cwt and Class IV prices by 85 cents/cwt. These reductions directly impact producer payments, particularly in regions with high manufacturing utilization.
SURVIVAL TOOLKIT: YOUR 81-DAY ACTION PLAN
With implementation just 81 days away, forward-thinking producers are already developing comprehensive adaptation strategies. The following approaches represent the emerging consensus among dairy finance specialists and progressive operators:
REGION-SPECIFIC PROFIT MAXIMIZATION STRATEGIES
The stark regional disparities in reform impacts demand location-specific adaptation strategies:
For Northeast producers, the FMMO reforms coincide with new processing investments in New York and Pennsylvania, creating a unique window of opportunity. These producers face what industry analysts describe as “a period of potential competitive advantage after years of challenging margins”. A continued focus on maximizing milk components per cow remains “the greatest opportunity for our producers to maximize their profitability.” Before breaking ground on expansion plans, ensure you’re extracting maximum value from your existing herd through optimized nutrition, genetics, and management practices focused on component production efficiency.
Upper Midwest producers facing decreased regulated minimum prices must immediately pursue enhanced over-order premium negotiations. Concerned about potential pool value losses, these producers need to identify alternate revenue streams.
“To the extent that co-ops are not losing money at these higher make allowances, potentially that wouldn’t be coming off as a deduction. And to the extent that you have more proprietary firms covering their make allowances, they may be able to put some of those over-order premiums back into place.” — Mark Stephenson, dairy policy expert.
Western operations in California, the Southwest, and the Pacific Northwest face the most significant challenges, with analysis projecting substantial pool value losses. These producers must evaluate whether their current scale and efficiency can overcome these regulatory disadvantages or consider more dramatic business model adjustments.
COMPONENT PRODUCTION FOCUS: DECEMBER 1ST IMPLEMENTATION
The reforms include significant changes to milk composition factors, with true protein updated from 3.1 to 3.3 percent and other solids from 5.9 to 6 percent, effective December 1, 2025. These adjustments will slightly increase beverage (Class I) milk sales revenue to pooled producers, creating incentives to optimize component production.
Component
Previous Standard
2025 Standard
Implementation Date
True Protein
3.1%
3.3%
Dec 1, 2025
Other Solids
5.9%
6.0%
Dec 1, 2025
Nonfat Solids
9.0%
9.3%
Dec 1, 2025
Butterfat
No change
No change
N/A
However, USDA decided against updating butterfat solids factors despite the recent growth in milk butterfat content. This imbalanced approach to component valuation creates new strategic considerations for feeding and breeding programs, particularly for operations that have historically emphasized butterfat production.
The six-month delay in implementing these composition factor updates (June 1 vs. December 1) creates a transition period requiring careful planning. According to analysis, composition factor updates would contribute to a significant increase across all orders. Due to the implementation delay, this benefit would be inaccessible for the first six months. This delay could cost dairy farmers more than $100 million during the first six months alone.
HEDGING PROGRAM RECALIBRATION
The structural changes to pricing formulas necessitate an immediate review of risk management strategies. Industry experts have expressly cautioned about complications for dairy producers’ hedging programs. Producers utilizing Class III milk futures or equivalent USDA insurance products may face increased exposure to butterfat price risk under the new system.
Progressive operations are already consulting with risk management specialists to recalibrate their hedging programs, particularly regarding the alignment between component production, forward contracting practices, and futures positions. The transition period between now and full implementation presents a critical window for adjusting these strategies.
Removing 500-pound barrel cheddar cheese from pricing calculations will also impact hedging strategies. According to industry analysis, “Industry advocates of this removal believe relying solely on 40-pound block cheddar cheese to set the monthly announced cheese price will reduce the volatility of cheese prices”. However, this change requires careful reconsideration of existing risk management approaches.
IMPLEMENTATION TIMELINE: CRITICAL DATES TO MONITOR
Milestone
Date
Significance
Final Rule Published
Jan 17, 2025
Official regulation text
Producer Referendum
Dec 31, 2024
2/3 approval threshold met
Implementation Start
June 1, 2025
Majority of changes take effect
Component Updates
Dec 1, 2025
Milk composition factors
THE COMPETITIVE COUNTDOWN: PREPARE NOW OR PERISH LATER
The most significant milk pricing overhaul in a generation will reshape dairy economics starting June 1, 2025—just 81 days from now. The return to the “higher-of” Class I formula corrects a fundamental injustice from the 2018 Farm Bill that cost producers hundreds of millions during market disruptions. However, the increased make allowances, adjusted component factors, and specialized ESL pricing create a complex web of implications that vary dramatically by region, farm size, and production profile.
USDA’s Dana Coale suggests the reforms provide certainty about “what lies ahead,” but that certainty includes opportunities and challenges depending on your operation’s circumstances. The 81-day implementation countdown represents a critical preparation window forward-thinking producers utilize to adapt contracts, recalibrate risk management, and optimize component production strategies.
“This final plan will provide a firmer footing and fairer milk pricing, which will help the dairy industry thrive for years to come.”
— Gregg Doud, President and CEO of the National Milk Producers Federation.
While industry organizations debate the adequacy of these reforms—with some noting more could have been done to enhance the pricing formula—the reality is that June 1st marks the beginning of a new dairy economic paradigm regardless of these philosophical disputes. National Milk Producers Federation President and CEO Gregg Doud believes “This final plan will provide a firmer footing and fairer milk pricing, which will help the dairy industry thrive for years to come”. However, others offer starkly different assessments.
Your competitors aren’t waiting for perfect reforms but adapting to what’s coming. The question is whether your operation is similarly prepared for dairy’s new economic landscape. Industry leaders have noted, “While there is always more to do to keep the orders relevant and purposeful, at this juncture, we are encouraged that the FMMO will continue to provide the market stability needed for producers and processors”. That stability, however, will benefit some regions far more than others—making your adaptation strategy more critical than ever.
Key Takeaways:
Processor Advantage: Make allowances surge 25-42%, costing farmers $56k/year per 100 cows
Regional Warfare: Northeast gains from high Class I utilization; Midwest/California face $94M+ losses
Pandemic Payback: Restored “higher-of” formula recovers $725M stolen from farmers in 2018 policy failure
Survival Countdown: 81 days to renegotiate premiums, adjust hedging, and optimize component production
Executive Summary:
The USDA’s June 1, 2025 Federal Milk Marketing Order reforms will radically reshape dairy economics, reversing a flawed 2018 policy that cost farmers $725 million during the pandemic. While restoring the “higher-of” formula benefits some, controversial processor-friendly make allowances could strip $56,000 annually from 100-cow operations. Regional disparities will create clear winners (Northeast) and losers (Midwest, California), with urgent adaptation required as competitors already pivot strategies. The clock is ticking—81 days remain to restructure contracts, risk management, and production plans.
Join over 30,000 successful dairy professionals who rely on Bullvine Daily for their competitive edge. Delivered directly to your inbox each week, our exclusive industry insights help you make smarter decisions while saving precious hours every week. Never miss critical updates on milk production trends, breakthrough technologies, and profit-boosting strategies that top producers are already implementing. Subscribe now to transform your dairy operation’s efficiency and profitability—your future success is just one click away.
Fonterra’s 25% profit surge keeps $10 milk prices intact—double win for farmers! Global dominance vs struggling competitors revealed
EXECUTIVE SUMMARY: Fonterra shocks the dairy world with upgraded earnings (55-75 NZ cents/share) while holding its NZ$10/kgMS milk price—a rare dual victory for farmers. Their consumer division’s strong performance during divestment talks creates strategic tension: short-term gains vs long-term stability. While global peers like Arla and DFA face price cuts, Fonterra’s innovative balancing act delivers fatter dividends (up to NZk for 200k shares) and positions NZ as the dairy profit leader. With March 20 interim results looming, experts urge farmers to prioritize debt reduction and infrastructure over expansion in this volatile climate.
Consumer division sale could net NZ$3.2B but risks losing reliable revenue stream
NZ dairy profits outpace struggling global competitors by 15-20% margins
Interim dividends (up to 50% payout) hit accounts by early April 2025
Financial advisors strongly recommend using windfalls for debt reduction over expansion
Fonterra just cranked up their earnings forecast to 55-75 New Zealand cents per share, a massive jump from their previous 40-60 cents guidance. We’re talking about a potential 25% increase at the upper end! And get this—they’re keeping that fat $10 milk price intact. Talk about having your cake and eating it, too!
Here’s the deal: Fonterra’s projecting way better earnings while still paying farmers that juicy NZ$10 per kgMS. I’ve spent the last decade covering dairy cooperatives, and this hardly ever happens. Usually, when a processor makes more money, farmers get squeezed. Not this time! Their consumer brands are killing it when shopping them around to potential buyers. For Kiwi dairy farmers, this means fat milk checks PLUS beefier dividends. When did you last catch that kind of break in this business?
CONSUMER BRANDS CRUSHING IT WHEN IT MATTERS MOST
I’ve gotta tell you, Fonterra’s consumer division is on fire right now. Miles Hurrell (who always liked his no-BS style) says the upgrade “reflects the underlying strength of our core ingredients business and the resilience in our consumer channel.”
The timing’s just perfect. It’s like putting your champion Holstein up for auction right after she wins Supreme Champion at the Royal Show. That’s exactly what’s happening as Fonterra parades these high-performing consumer brands in front of buyers with deep pockets.
NEW ZEALAND DAIRY PROFITS CRUSHING GLOBAL COMPETITION
You might be wondering if this is happening everywhere. Nope! What makes this profit surge so darn impressive is how it stacks up against other major dairy cooperatives:
Cooperative
2025 Profit Outlook
Milk Price Trend
Strategic Focus
Fonterra (NZ)
Up to 25% increase
Maintained at NZ$10/kgMS
Consumer division divestment
Arla Foods (EU)
Flat to declining
Reduced €/kg payments
Cost-cutting initiatives
Dairy Farmers of America
Mixed regional results
Class III price pressure
Domestic market focus
FrieslandCampina
Restructuring costs impact
Reduced €/kg payments
Sustainability investments
Fonterra’s standing alone on this one. European and American dairy farmers are getting hammered while Kiwis live the dream—better corporate earnings AND peak milk prices. And you thought the All Blacks were New Zealand’s only world-beaters!
ARE THEY SELLING THE CROWN JEWELS?
So here’s where it gets interesting. If they go the IPO route, they’ll call it “Mainland Group”—a powerhouse operating in over 20 countries. The roadshow’s happening right now as potential buyers circle these assets like sharks.
I sometimes wake up at 3 AM wondering: Are they selling off their golden goose? Think about it—these consumer brands perform consistently even when commodity markets tank. Is Fonterra chasing a quick payday at the expense of long-term stability?
It’s like selling your most reliable cow because she’s worth good money. Sure, the check looks great today, but what about next year? What do you think? Is your cooperative making the right call here?
You should hear the conversations at the local feed store these days! Fonterra keeps the milk price rock-solid at NZ$10 per kilogram of milk solids while projecting more substantial earnings. It’s like getting a raise AND a bonus in the same paycheck!
This completely flips the script in dairy. Usually, when processors pay more for milk, their margins get squeezed like the last bit of toothpaste in the tube. Somehow, Fonterra’s pulling off this magical balancing act.
Grant McCallum (the Northland MP who still milks cows) puts it bluntly: “It’s great news… The dividend is going to add real value to those Fonterra shareholders. It might be another $60,000, which is not insignificant compared to a payout.”
Shareholding Size
Potential Dividend at 60c
New Potential Dividend at 75c
Potential Increase
50,000 shares
NZ$30,000
NZ$37,500
Up to NZ$7,500
100,000 shares
NZ$60,000
NZ$75,000
Up to NZ$15,000
200,000 shares
NZ$120,000
NZ$150,000
Up to NZ$30,000
Look at those numbers! We’re talking serious cash with Fonterra’s dividend policy being 60-80% of full-year earnings (up to half hitting bank accounts next month). For perspective, that’s a new tractor, a milking plant upgrade, or fixing that beat-up farm truck. So what’s it gonna be?
SHAKE IT UP: THE BIGGEST RESTRUCTURING IN YEARS
I’ve gotta hand it to Fonterra—they’ve got guts. This consumer division sale represents the most significant strategic shakeup since… well, forever. Management thinks they’ll create value by focusing on ingredients and cashing in on consumer brands.
I get it—sort of. Fonterra’s bread and butter is the ingredients business. But I’ve seen enough cooperatives chase “focus” right into irrelevance. Remember what happened to those California co-ops that sold off their value-added divisions? It’s not pretty.
The final call rests with Fonterra’s farmer shareholders. Just make sure you’re paying attention when that vote comes around!
MARK YOUR CALENDAR: MARCH 20 IS PAYDAY
Circle March 20th on your calendar with that fat red Sharpie! That’s when all these promises turn into cold, hard cash. Fonterra releases their interim results that day, and we’ll see precisely how much flows directly to farmers’ accounts.
With up to 50% of the yearly dividend hitting the interim payment, we’re looking at some hefty checks by early April. This is perfect timing for autumn feed bills and winter planning.
I’ve already heard whispers that some equipment dealers are offering “Fonterra dividend specials” for April delivery. Savvy marketers know where the money’s flowing!
DAIRY DOLLARS: PUTTING THIS WINDFALL TO WORK
Let’s get real for a minute. This profit surge means actual money in your pocket—combining that NZ$10 milk price with enhanced dividends creates a serious financial opportunity. So what’s your plan?
McCallum doesn’t mince words: “With global uncertainty swirling around potential tariffs, it’s very prudent to pay down some debt and invest in some key infrastructure.”
I couldn’t agree more. This cash injection is perfectly timed, with feed, fuel, and fertilizer prices still through the roof. I’ve watched too many dairy farmers expand aggressively during good times only to get hammered when the inevitable downturn hits. The competent operators I know are using this to strengthen their position—slashing debt, upgrading critical equipment, or building that rainy-day fund.
Bottom line? Fonterra delivers the goods—fat milk checks AND improved dividends. That’s rarer than a perfect score in linear classification! It’s worth celebrating as you drag yourself out of bed for tomorrow’s 4:30 AM milking.
So what’s your play? Are you team “kill some debt,” team “upgrade that mixer wagon,” or team “finally take that fishing trip”? Whatever you decide, it’s nice to have options for a change.
Join over 30,000 successful dairy professionals who rely on Bullvine Daily for their competitive edge. Delivered directly to your inbox each week, our exclusive industry insights help you make smarter decisions while saving precious hours every week. Never miss critical updates on milk production trends, breakthrough technologies, and profit-boosting strategies that top producers are already implementing. Subscribe now to transform your dairy operation’s efficiency and profitability—your future success is just one click away.
American cheese shatters the billion-pound export barrier as global demand surges! With 17% growth pushing exports past 508,000 metric tons and the U.S. crowned the #1 cheese supplier, discover how record-breaking dairy exports reshape farm economics and why the world can’t get enough of what your cows produce.
EXECUTIVE SUMMARY: U.S. dairy exports have reached unprecedented heights, with cheese shipments breaking the billion-pound barrier (508,808 metric tons) and total export values hitting $8.2 billion in 2024 – the second-highest ever. While total export volume dipped slightly (-0.4%), the industry’s strategic shift to higher-value products like cheese has created additional value for producers. With exports representing 18% of U.S. milk production and massive cheese processing expansion underway, American dairy farms producing high-component milk are uniquely positioned to benefit from this global demand surge.
KEY TAKEAWAYS:
U.S. cheese exports smashed records, reaching 508,808 metric tons in 2024 (17% year-over-year growth)
The United States is now the #1 cheese supplier to the world, with exports exceeding the billion-pound mark for the first time
Overall, the value of dairy exports increased by 2% to $8.2 billion despite a slight 0.4% decline in volume.
Mexico remains the top U.S. dairy customer, with exports growing 7% in 2024
More than 450,000 metric tons of new cheese production capacity coming online between 2023-2026
Exports now represent 18% of U.S. milk production, up from previous years
Latin America showed exceptional growth, with record values for Mexico, Central America, and South America
As milk trucks rumble across frost-covered driveways before dawn, the familiar hum of their engines signals not just another local delivery but the beginning of a global journey. The sweet, grassy aroma of fresh milk that filled your bulk tank this morning might soon become cheese savored by families in Mexico City, Tokyo, or Seoul. The first months of 2025 have confirmed what industry insiders call a transformative shift in U.S. dairy’s position on the world stage – with American cheese now dominating international markets at record volumes.
American cheese exports reached 508,808 metric tons in 2024, making the U.S. the world’s leading cheese supplier. Processing plants across the country are working at capacity to meet international demand.
U.S. CHEESE CRUSHES EXPORT RECORDS: FIRST-EVER BILLION-POUND MILESTONE
American cheese has officially conquered global dinner tables in a way that would make our grandfathers’ jaws drop. U.S. cheese exports reached a staggering 508,808 metric tons (1.12 billion pounds) in 2024, a 17% jump from the previous record. The sharp, nutty aroma of aged cheddar and the creamy reliability of American mozzarella are winning international fans at an unprecedented rate.
Think about it this way: if you lined up all the cheese America exported last year, it would stretch from New York to Los Angeles and back – twice. Approximately 45 billion grilled cheese sandwiches worth of dairy protein are feeding families worldwide.
Throughout 2024, the U.S. leveraged competitive pricing, consistent quality, and strong production capacity to position itself as the world’s leading cheese supplier. This global leadership directly translated to more vigorous milk checks for farmers, providing critical revenue streams when input costs for feed, labor, and compliance remained stubbornly high.
“The United States is already the No. 1 cheese supplier to the world, and we know we can strengthen our position in the years ahead,” noted Krysta Harden, president and CEO of the U.S. Dairy Export Council. This statement isn’t just industry optimism – it’s backed by complex numbers showing American cheese consistently winning market share from European and Oceanian competitors.
MASSIVE PROCESSING EXPANSION CREATES NEW MILK MARKETS
The distinctive whine of construction equipment at new cheese plant sites represents music to dairy farmers’ ears. The tang of freshly welded stainless steel and the rhythmic hum of new pasteurizers being tested signal more than industrial development – they represent crucial new markets for your milk.
More than 450,000 metric tons of new U.S. cheese production capacity will come online between 2023 and 2026, creating critical outlets at a time when domestic consumption alone cannot absorb increasing production.
Your dairy operation is increasingly connected to global markets, with exports accounting for 18% of U.S. milk production. Every tanker leaving your farm potentially contributes to America’s export success.
For dairy farms in regions like the Upper Midwest, Southwest, and Idaho, where these plants are growing, the investment signals long-term confidence in American dairy’s future. Manufacturers wouldn’t be pouring millions into stainless steel if they weren’t betting on your ability to supply high-quality milk for decades.
The timing couldn’t be better, as component levels in American milk continue their upward march. Today’s Holstein herds regularly produce milk testing above 4.0% fat and 3.2% protein, which would have seemed impossible twenty years ago. These higher component concentrations translate directly to cheese yield, creating a win-win for processors and the farmers supplying them.
COMPONENT ENHANCEMENT: YOUR STRATEGY FOR EXPORT PROSPERITY
The global cheese boom means your focus on components has never been more valuable. Farms producing milk with above-average butterfat and protein are capturing premium prices as processors compete for milk that yields more cheese per vat.
What practical steps can boost your components and position your operation for export market success?
Nutritionists point to several evidence-based strategies: increasing the forage-to-concentrate ratio (particularly with high-quality corn silage), precisely balancing amino acids, and ensuring adequate, effective fiber to maintain butterfat. Leading herds also make genetic selection decisions heavily weighted toward component traits, recognizing that minor percentage improvements multiply millions of pounds of lifetime production.
John Wilson, a third-generation Wisconsin dairy farmer, implemented these strategies and saw dramatic results. “We increased our components by focusing on cow comfort, forage quality, and genetics. Over three years, our fat test increased from 3.8% to 4.2%, and we’re capturing a premium of almost per hundredweight,” Wilson explains as he walks through his milking parlor where the rhythmic pulse of vacuum pumps provides a steady backbeat to his morning routine. “With exports driving cheese demand, these components are our ticket to staying profitable.”
While cheese export growth dominates headlines, the overall dairy export landscape shows a more complex picture directly impacting your bottom line. Total U.S. dairy exports slipped by 0.4% in milk solids equivalent terms during 2024, primarily due to weakness in nonfat dry milk/skim milk powder (NFDM/SMP) markets.
NFDM/SMP exports faced significant challenges, with December 2024 volumes plunging 23% (14,992 metric tons) to 49,565 metric tons – the first time monthly sales fell below 50,000 since July 2019. This powder performance dip meant milk could have found international homes instead of pressured domestic markets.
U.S. NFDM/SMP exports declined 8% for the entire year, mainly due to reduced U.S. production, limited available supply, and pricing issues that favored competitors. The contrast between thriving cheese exports and struggling powder markets highlights why diversified export strategies matter for industry stability.
Despite the volume dip, the value of U.S. dairy exports reached $8.2 billion in 2024 – a 2% increase ($202 million) and the second-highest total ever, trailing only 2022’s $9.7 billion. This value growth reflects the industry’s strategic shift toward higher-value products like cheese, creating more dollars per hundredweight for producers.
Product Category
Volume (Metric Tons)
Year-over-Year Change
Cheese
508,808
+17%
NFDM/SMP
Year total not specified
-8%
Total Dairy Exports (MSE)
Not specified
-0.4%
Total Export Value
$8.2 billion
+2% ($202M)
Source: U.S. Dairy Export Council, 2025
MEXICO & LATIN AMERICA: THE MARKETS DRIVING YOUR MILK CHECK
When you watch tank trucks pull away from your farm, the diesel exhaust mingling with the sweet scent of fresh milk, you might not realize how many are ultimately bound for Mexican dinner tables. Latin America has emerged as the foundation of American dairy export success, with Mexico alone purchasing $2.47 billion in U.S. dairy products in 2024.
As you sip your morning coffee, farmers across Mexico are incorporating U.S. cheese into breakfast dishes – the sizzle of melting cheese in quesadillas and the stretch of mozzarella in countless dishes, driving a 7% increase in exports to our southern neighbor last year. This growth isn’t just happening in Mexico – U.S. dairy export volume gained across South America (+6%) and Central America, with countries like Costa Rica, Guatemala, and El Salvador all setting new import records.
Mexico’s growing appetite for U.S. dairy drove $2.47 billion in exports in 2024, supporting milk prices for American farmers. The popularity of cheese-based dishes throughout Latin America creates steady demand for U.S. dairy products.
What is the significance of your operation? This regional strength creates crucial outlets for American milk production that would otherwise depress domestic prices. Every semi-truck of cheese crossing the southern border represents milk that doesn’t weigh down your local market.
“I’ve completely changed how I think about our market,” says Maria Hernandez, whose 850-cow operation in California produces high-component milk primarily destined for export markets. Standing in her feed alley as the distinctive sound of mixer wagons and the earthy scent of TMR fill the air, she continues, “We’re essentially feeding families in Mexico City and Lima now, not just our domestic market. That global connection has made me more focused on consistency and quality than ever.”
Market
Export Value (2024)
Mexico
$2.47 Billion
Canada
$1.14 Billion
Total Value to All Markets
$8.2 Billion
Source: International Dairy Foods Association, 2025
NAVIGATING EXPORT HEADWINDS: TRADE TENSIONS AND MARKET VOLATILITY
The road to export growth isn’t without potholes that could jolt your operation’s planning. U.S. dairy exporters faced significant headwinds in 2024, including Chinese demand contraction for the third straight year and intensified competition from New Zealand and European suppliers aggressively targeting traditional U.S. export destinations.
U.S. dairy exports to China reached their lowest annual total since 2020, a troubling trend given China’s critical market for American whey products used in its massive pork industry. Meanwhile, Oceanian suppliers have reworked their product mix to target Latin American and Southeast Asian markets, driving margin compression in regions where U.S. dairy previously enjoyed more substantial positions.
Trade policy uncertainty adds another layer of complexity to your farm planning. In early 2025, President Donald Trump agreed to a 30-day pause on tariff threats against Canada and Mexico. Since these nations represent more than 40% of U.S. dairy exports, any tariff implementation could trigger retaliatory measures that disproportionately target agricultural products – potentially stranding significant milk volumes in domestic markets and pressuring prices.
How should your farm navigate these uncertainties? Financial advisors recommend maintaining higher cash reserves than historical norms, carefully evaluating major capital expenditures, and considering risk management tools like forward contracting and futures markets to lock in profitability during favorable windows.
YOUR FARM’S STAKE IN THE EXPORT BOOM: POSITIONING FOR PROFIT
As morning fog lifts from your pastures and the first rays of sunlight catch the steam rising from cows’ breath in the cool morning air, the international connections of your operation become increasingly apparent. Approximately one day’s milk produced on America’s dairy farms each week is exported – roughly 18% of all production. Your contribution to feeding the world has never been more direct or economically significant.
Expanding processing capacity proves that your future is increasingly tied to global markets. New cheese plants online between 2023 and 2026 represent massive bets on American dairy’s international competitiveness. These facilities wouldn’t exist without confidence in your production capacity and the world’s appetite for what your cows produce.
For forward-thinking producers, this export-driven future demands strategic decisions. Component enhancement provides immediate returns, but other factors increasingly influence your competitiveness in export-focused processing:
Milk with superior microbiological quality enjoys longer shelf-life in international transport
Consistent component levels throughout the year (avoiding seasonal swings) create processing efficiencies
Sustainability credentials increasingly influence purchasing decisions, particularly in premium markets
On-farm practices that minimize heat-sensitive protein damage produce superior yields in high-heat cheese applications typical in export markets.
“We’ve shifted our management to focus on what I call ‘exportable milk quality,'” explains Thomas Johnson, whose 450-cow Michigan dairy consistently earns quality premiums. The crisp smell of sanitizer and the gentle whoosh of automatic detachers provide the backdrop as he monitors the milking process. “Beyond basic components, we’ve reduced our somatic cell count below 100,000, implemented cooling that gets milk below 38°F within 30 minutes of harvest, and documented our carbon footprint reduction. These steps directly translate to premiums from processors serving export markets.”
Metric
Value
Total U.S. Dairy Export Value (2024)
$8.2 Billion
Year-over-Year Value Increase
$202-223 Million
Percentage of U.S. Milk Production Exported
18%
Jobs Supported by U.S. Dairy Industry
3.2 Million
Economic Contribution to U.S. Economy
$800 Billion
Sources: U.S. Dairy Export Council, International Dairy Foods Association, 2025
THE FUTURE IS GLOBAL: WHY EXPORTS MATTER MORE THAN EVER
The billion-pound cheese milestone represents more than just a number – it symbolizes American dairy’s transformation from a domestic industry to a global powerhouse. This global connection provides crucial stability for your operation as domestic consumption patterns evolve and production efficiency continues improving.
As you walk through your barn today, the familiar sounds of cows crunching feed and the rhythmic pulse of milking equipment serve as the backdrop to an increasingly global enterprise. The milk your cows produce increasingly travels to dinner tables your grandparents couldn’t have imagined reaching. From Mexican pizza toppings to Japanese cheese boards, American dairy products have become essential ingredients in global cuisine.
“Our industry is poised to become the world’s leading supplier of dairy products thanks to the resilience and innovation of the American dairy industry,” said Michael Dykes, president and CEO of the International Dairy Foods Association. “Overall, U.S. dairy exports are performing well, but we can do more. With new trade agreements that remove obstacles and increase market access, we wouldn’t just break records – we would redefine the global dairy landscape for decades to come.”
The path forward requires both individual farm adaptation and collective industry action. Your focus on components, quality, and sustainability positions your operation for success while industry organizations work to secure favorable trade terms and develop new markets. This partnership between progressive producers and forward-thinking processors has transformed American dairy from a regional industry into a global powerhouse – with your farm playing a crucial role in feeding a hungry world.
Join over 30,000 successful dairy professionals who rely on Bullvine Daily for their competitive edge. Delivered directly to your inbox each week, our exclusive industry insights help you make smarter decisions while saving precious hours every week. Never miss critical updates on milk production trends, breakthrough technologies, and profit-boosting strategies that top producers are already implementing. Subscribe now to transform your dairy operation’s efficiency and profitability—your future success is just one click away.
China just dealt American dairy farmers a double blow by welcoming German dairy products back while slapping new 10% tariffs on US exports. This calculated move threatens America’s position in key export markets and could reshape your milk check within months.
EXECUTIVE SUMMARY: In a strategic trade maneuver, China has lifted its ban on German dairy products effective March 6, 2025, while simultaneously announcing 10% retaliatory tariffs on American dairy exports on March 4. This creates a significant market advantage for European suppliers over American exporters. The reopening gives German producers renewed access to a market that represented nearly 25% of their non-EU exports in 2023, while the new tariffs on US products apply to shipments leaving after March 10, 2025. The timing and coordination of these two policy decisions reveal the sophisticated use of agricultural trade as diplomatic leverage amid escalating trade tensions.
KEY TAKEAWAYS:
China has lifted restrictions on German dairy imports while simultaneously imposing 10% tariffs on US dairy products
Germany exported $225 million in dairy to China in 2023, representing nearly 25% of its non-EU exports
China’s new 10% tariff on US dairy applies to products not shipped by March 10 or arrived by April 12, 2025
Foot-and-mouth disease in Germany was contained to a single case with no spread beyond the initial January outbreak
German Agriculture Minister Cem Oezdemir called the agreement with China a significant achievement for German dairy exports.
Talk about a gut punch to American dairy. China just pulled off a textbook one-two trade combo that’s got dairy market insiders buzzing. In one swift move, Beijing has welcomed German dairy products back with open arms while slapping new tariffs on American exports.
The timing here? Not coincidental. These decisions came just days apart in early March, turning what might have looked like routine agricultural policy into something much more calculated. German dairy processors are practically popping champagne while American exporters wonder how they’ll compete with a fresh 10% handicap. Let’s break down what’s going on and what it means for your bottom line.
TRADE WAR HITS YOUR MILK CHECK: How China’s Double-Move Threatens US Dairy Profits
You can’t make this stuff up. On March 6, China suddenly decided Germany’s dairy was safe again after a two-month ban following that foot-and-mouth disease case in Brandenburg. German Agriculture Minister Cem Oezdemir couldn’t contain his excitement: “With China, we have one of our largest and most significant markets for dairy products back in operation.”
Why’s this such a big deal? Just look at the numbers:
But here’s where it gets interesting. Two days earlier, on March 4, China announced it would impose a 10% tariff on U.S. dairy products. Coincidence? I don’t think so.
These new tariffs kick in for anything not shipped by March 10 or arrived by April 12. It’s pretty obvious what’s happening – Germany gets a free pass while American products suddenly cost 10% more. You don’t need an economics degree to see who wins there.
This isn’t just bureaucratic maneuvering. It’s going to hit your milk check. When processors face export barriers, those costs eventually return to the farm level. Components that used to fetch premium prices might suddenly be worth less because export markets aren’t paying what they used to.
PROTEIN POWERPLAY: Why Whey Markets Face Immediate Disruption
The whey market’s where you’ll feel this one. High-protein whey concentrates have become dairy’s golden ticket – they’re not just commodity products but sophisticated ingredients commanding serious premiums in global markets.
Look at that – 18% of everything American cows produce is in international markets. When nearly one-fifth of your product suddenly faces new barriers, that’s not just an export problem. That’s a whole-industry problem.
The China market alone represents up to $800 million in U.S. dairy exports. Imagine all that with a 10% price disadvantage compared to the German competition. Not pretty.
Here’s the kicker. When export markets for high-value proteins take a hit, processors can’t pay as much for the milk components that go into those products. That trickles right back to your bulk tank. The changes might start subtly, but sustained market access problems eventually reshape how your milk is priced.
DISEASE CONTROL SHOWCASE: How Germany’s FMD Response Reopened Markets
You’ve got to hand it to the Germans – they handled that FMD outbreak like pros. When they discovered foot-and-mouth in that water buffalo herd near Berlin on January 10, it was their first case in nearly 40 years. That could have been devastating.
Instead, they locked it down immediately. Their veterinary authorities contained it to that single herd – no spread, no additional cases. By February, the European Commission felt confident enough to downgrade the 3-kilometer protection zone around the site to observation status.
Fast forward to early March, and China’s giving them the green light again. That’s one speedy recovery from what could have been a market-crushing diagnosis. It shows two things: Germany has severe disease control systems, and China and Germany want this trade relationship back on track ASAP.
Let’s be honest—dairy is becoming a political football. What we see with China isn’t just milk and cheese; it’s about leverage in a much bigger game.
Agricultural products make perfect retaliatory targets because they hit right in the heartland. When countries want to send a message, they often start with farm goods because the pain is immediate and visible.
Check out this timeline:
Table 3: China’s New Dairy Tariff Implementation Timeline
Key Date
Significance
March 4, 2025
China announces 10% tariff on U.S. dairy products
March 6, 2025
China lifts restrictions on German dairy imports
March 10, 2025
Tariffs effective for new U.S. dairy shipments
April 12, 2025
Grace period ends for in-transit U.S. shipments
The choreography here is no accident. This isn’t just trade policy; it’s trade strategy. China’s using dairy as both a carrot and a stick, rewarding Germany while penalizing the U.S.
German producers have been positioning themselves for this moment ever since Russia slammed the door on their dairy back in 2014. They pivoted hard toward Asian markets, building relationships and developing products specifically for Chinese consumers. Now, that investment’s paying off in a big way.
FARM-LEVEL STRATEGIES: Protecting Your Profitability Amid Trade Chaos
So what’s a dairy farmer to do when global politics messes with your milk check? Several things.
First, thank goodness for market diversity. The processors who’ll weather this storm best are those who aren’t overly dependent on any export destination. China matters, but it’s not everything. The most resilient dairy operations work with processors who have options.
Second, double down on components. When export markets get wonky, the farms that maintain profitability often produce milk with higher protein and fat percentages through superior genetics and management. Processors still reward quality components even when markets shift.
Third, don’t underestimate biosecurity. Germany’s FMD experience shows how even a single disease outbreak can derail trade relationships overnight. Your farm’s health protocols aren’t just about animal welfare and market access. Those documentation binders nobody wants to update? They might be worth more than you think.
MARKET OUTLOOK: Where Dairy Exports Head Next
What happens from here? A few things to watch.
First, let’s see how China implements these tariffs. While they’ve announced a blanket 10% on dairy products, the reality of trade policy often includes product-specific quirks. Some categories might face more significant hurdles than others.
Second, German processors still need to rebuild their relationship with China. Yes, they’ve got the green light, but two months of interruption means supply chains need reconnecting. American suppliers who stayed engaged during Germany’s absence might hold onto some market share despite the tariff disadvantage, especially if they’ve built unique product specifications that aren’t easily replaced.
The International Dairy Foods Association isn’t taking this lying down. They’re pushing the Trump Administration to “quickly resolve the ongoing tariff concerns with Canada, Mexico, and China—America’ top agricultural trading partners.” Their warning is clear: “A prolonged tariff war will deliver significant economic damage to American dairy farmers, processors, and rural communities.”
For farmers making decisions about the future, focusing on efficiency and component-driven production still makes the most sense. Trade politics might be chaotic, but global protein demand keeps growing, especially in nutrition and health applications where U.S. products have traditionally excelled.
CONCLUSION: Weathering The International Trade Storm
The bottom line? China’s dairy trade decisions aren’t random. They’re using agricultural trade as strategic leverage in a bigger diplomatic game. Understanding these political dimensions is becoming as crucial for dairy farmers as monitoring components and feed costs.
Whey protein markets face particular uncertainty, with German suppliers gaining preferential treatment while American exporters navigate new tariff barriers. This reshuffles competitive relationships in one of the dairy’s most valuable product categories, eventually impacting how processors structure their producer payment programs.
Your best move? Focus on what you can control – production excellence and component quality – while supporting industry efforts to develop diverse export markets. Individual farmers can’t solve international trade disputes, but collectively supporting effective trade policy and market development builds the resilience we all need to navigate this increasingly complex global dairy landscape.
Join over 30,000 successful dairy professionals who rely on Bullvine Daily for their competitive edge. Delivered directly to your inbox each week, our exclusive industry insights help you make smarter decisions while saving precious hours every week. Never miss critical updates on milk production trends, breakthrough technologies, and profit-boosting strategies that top producers are already implementing. Subscribe now to transform your dairy operation’s efficiency and profitability—your future success is just one click away.
Butter prices rise, SMP weakens, and shrinking herds tighten supply. Discover how global dairy trends are reshaping strategies for 2025 success.
Executive Summary
The global dairy market is navigating a period of divergence, with butter prices showing resilience while skim milk powder (SMP) faces downward pressure. USDA has revised its 2025 milk production forecast downward for the third consecutive month, signaling tightening supplies as European dairy herds decline. U.S. dairy production is consolidating, with significant operations dominating milk sales, creating opportunities for component optimization over volume growth. Global trade data reveals strong butter demand but weaker protein markets, while health challenges like Highly Pathogenic Avian Influenza (HPAI) add complexity to the outlook. Producers must focus on aligning their production systems with high-demand products and leveraging strategic risk management to thrive amid these shifting dynamics.
Key Takeaways
Butter Strength vs. SMP Weakness: Butter prices rose 0.8% on EEX futures while SMP fell 2.2%, reflecting diverging market trends for milk components.
Shrinking Herds Tighten Supply: USDA forecasts a 1.1 billion-pound reduction in 2025 U.S. milk production; European herds also face steep declines.
Industry Consolidation: Large farms (1,000+ cows) now account for 66% of U.S. milk sales, emphasizing the shift toward concentrated production systems.
Global Trade Trends: Butter demand remains strong globally, with prices up 2.7% at GDT, while WMP and SMP face headwinds from international competition.
Strategic Focus Needed: Producers should prioritize component optimization (e.g., milkfat for butter/cheese) and monitor key metrics like Chinese import demand and herd sizes.
The global dairy landscape reveals crucial divergences that demand producer attention: butter markets show resilience. At the same time, SMP faces weakness, European dairy herds continue their concerning decline, and USDA has revised its 2025 milk production forecast downward for the third consecutive month. These signals point to a tightening supply situation that may support prices, yet component optimization – not just volume – will determine which producers capture the highest returns.
Market Heats: Butter Rises While SMP Declines
The European Energy Exchange (EEX) reported substantial trading volume last week, with 5,090 tonnes changing hands. This activity was nearly evenly split between butter (2,705 tonnes) and skim milk powder (2,385 tonnes), with Tuesday emerging as the most active trading day.
Butter futures demonstrated modest strength on the EEX, with the March to October 2025 strip averaging €7,367, marking a 0.8% increase week-over-week. The total open interest for EEX butter futures increased by 94 lots to 2,981 lots, suggesting growing engagement from market participants despite price uncertainty.
In contrast, skim milk powder futures on the EEX declined 2.2% to €2,547, mirroring the weaker outlook for nonfat dry milk identified in USDA’s latest forecasts. This divergent performance between butter and SMP reflects a fundamental shift in component valuation that producers must navigate strategically in 2025.
The Shrinking Herd: Production Constraints Point to Price Support
The USDA has consistently revised its milk production forecasts downward over recent months, creating a tightening supply situation that may provide price support. The most recent forecast shows 2025 milk production at 226.9 billion pounds, representing a cumulative reduction of 1.1 billion pounds since December 2024.
The structural transformation of U.S. dairy production continues to accelerate, with significant implications for market dynamics. According to the 2022 Census of Agriculture, U.S. farms selling milk declined by 39% between 2017 and 2022 – the most substantial decline between adjacent Census periods dating back to 1982.
Table 1: U.S. Dairy Industry Structure and Consolidation (2017-2022)
Metric
2017
2022
Change
Farms selling milk
40,336
24,470
-39%
Milk cow inventory
9.5 million
9.3 million
-2.4%
Farms with 2,500+ cows
714
834
+16.8%
Share of milk sales from farms with 1,000+ cows
57%
66%
+9 percentage points
Total milk sales value
$36.7 billion
$52.8 billion
+44%
Meanwhile, European dairy cow inventory data for December 2024 revealed consistent declines across major producing countries. Germany’s dairy cow population stood at 3.59 million head, down 123,000 head (-3.3%) compared to the previous year, while France and the Netherlands showed similar troubling trends.
Beyond Volume: Component Optimization Is the New Profit Driver
The latest USDA forecasts reveal a critical divergence across dairy product categories, creating challenges and opportunities for strategically positioned producers. The February forecast raised cheese prices to $1.8800 per pound, citing “tight inventories from 2024 that are expected to carry into 2025,” while estimates for butter, nonfat dry milk, and dry whey faced downward pressure.
What many producers may miss: USDA forecasts suggest “growth in milk components will likely balance out the lower-than-average growth per cow,” indicating a shift toward quality over quantity in production metrics. Farms that align their milk component profiles with cheese manufacturing requirements may capture premium returns despite broader market adjustments.
According to data released on March 6, 2025, the all-milk price forecast has been revised upward to $22.75 per cwt, up $0.25 from the previous month’s estimate. While this price level represents solid returns, it demands efficiency and strategic positioning from producers.
Global Signals: How International Markets Are Reshaping Your Operation
The Singapore Exchange futures offer additional perspectives on global dairy commodity trends. SGX whole milk powder futures traded down 0.7% over the March-October 2025 curve, with the average price settling at ,779. In contrast, SGX butter futures showed significant strength, rising 4.0% to $6,939.
The Global Dairy Trade auction (Event 375) recorded a modest decline of 0.5%, with the average winning price reaching $4,209. While WMP declined 2.2% to $4,061, butter strengthened by 2.7% to $7,577, reinforcing the narrative of stronger milkfat values relative to protein components.
Regional milk production data revealed divergent trends, with Spanish collections declining 0.9% year over year while Irish production surged 9.4%. Chinese farmgate milk prices have stabilized at 3.12 Yuan/Kg after declining 13.8% year over year, creating uncertainty about import demand from this crucial market.
Beyond the Markets: Health Challenges Adding New Complexity
An often-overlooked factor impacting 2025 dairy markets is the continued presence of Highly Pathogenic Avian Influenza (HPAI) in US dairy herds. First confirmed in March 2024, HPAI had spread to 925 cases across 16 states by January 14, 2025, according to APHIS.
The first human case associated with exposure to infected dairy cattle was reported on April 1, 2024, highlighting the public health dimension of this challenge. As this situation continues to evolve, producers must remain informed about biosecurity protocols and market implications.
Strategic Positioning: How Smart Producers Are Responding
The current dairy market landscape presents a complex picture requiring strategic responses from industry stakeholders. The moderately positive performance of butter futures indicates sustained demand for milkfat products despite broader market uncertainties.
The divergent performance between butter and skim milk powder markets suggests ongoing structural imbalances in component valorization. While milkfat continues to command a premium, protein markets face more challenging conditions. This divergence creates strategic opportunities for dairy processors and producers who can optimize their systems accordingly.
For individual dairy producers, success in 2025 will likely come from combining tactical excellence in production management with strategic positioning aligned with emerging market signals. USDA analysis shows feed prices will remain favorable in 2025, potentially supporting margins if milk prices remain current.
Bottom Line: Your Action Plan for Q2 2025
The global dairy market is resilient amid evolving supply and demand dynamics. The USDA’s upward revision of the all-milk price forecast to $22.75 per cwt offers cautious optimism. Still, the persistent decline in European dairy herds and emerging health challenges like HPAI add complexity to the outlook.
The operations that will thrive in this environment will be those that:
Focus on component optimization rather than simply maximizing volume
Maintain financial flexibility to adapt to market shifts
Align their production systems with the products showing the most substantial demand
As we move into 2025, producers should monitor several key metrics: the evolution of European dairy herds, US replacement heifer numbers, Chinese import demand, and the continuing divergence between butter and SMP prices. These indicators will provide early signals about potential market shifts that could create challenges and opportunities in the months ahead.
Insights from USDA’s 10-Year Dairy Forecast Dive into long-term projections for milk production, price trends, and market volatility. Discover strategies to adapt to evolving industry dynamics and capitalize on growth opportunities.
Join over 30,000 successful dairy professionals who rely on Bullvine Daily for their competitive edge. Delivered directly to your inbox each week, our exclusive industry insights help you make smarter decisions while saving precious hours every week. Never miss critical updates on milk production trends, breakthrough technologies, and profit-boosting strategies that top producers are already implementing. Subscribe now to transform your dairy operation’s efficiency and profitability—your future success is just one click away.
To provide the best experiences, we use technologies like cookies to store and/or access device information. Consenting to these technologies will allow us to process data such as browsing behavior or unique IDs on this site. Not consenting or withdrawing consent, may adversely affect certain features and functions.
Functional
Always active
The technical storage or access is strictly necessary for the legitimate purpose of enabling the use of a specific service explicitly requested by the subscriber or user, or for the sole purpose of carrying out the transmission of a communication over an electronic communications network.
Preferences
The technical storage or access is necessary for the legitimate purpose of storing preferences that are not requested by the subscriber or user.
Statistics
The technical storage or access that is used exclusively for statistical purposes.The technical storage or access that is used exclusively for anonymous statistical purposes. Without a subpoena, voluntary compliance on the part of your Internet Service Provider, or additional records from a third party, information stored or retrieved for this purpose alone cannot usually be used to identify you.
Marketing
The technical storage or access is required to create user profiles to send advertising, or to track the user on a website or across several websites for similar marketing purposes.
To provide the best experiences, we and our partners use technologies like cookies to store and/or access device information. Consenting to these technologies will allow us and our partners to process personal data such as browsing behavior or unique IDs on this site and show (non-) personalized ads. Not consenting or withdrawing consent, may adversely affect certain features and functions.
Click below to consent to the above or make granular choices. Your choices will be applied to this site only. You can change your settings at any time, including withdrawing your consent, by using the toggles on the Cookie Policy, or by clicking on the manage consent button at the bottom of the screen.
Functional
Always active
The technical storage or access is strictly necessary for the legitimate purpose of enabling the use of a specific service explicitly requested by the subscriber or user, or for the sole purpose of carrying out the transmission of a communication over an electronic communications network.
Preferences
The technical storage or access is necessary for the legitimate purpose of storing preferences that are not requested by the subscriber or user.
Statistics
The technical storage or access that is used exclusively for statistical purposes.The technical storage or access that is used exclusively for anonymous statistical purposes. Without a subpoena, voluntary compliance on the part of your Internet Service Provider, or additional records from a third party, information stored or retrieved for this purpose alone cannot usually be used to identify you.
Marketing
The technical storage or access is required to create user profiles to send advertising, or to track the user on a website or across several websites for similar marketing purposes.













 Join the Revolution!