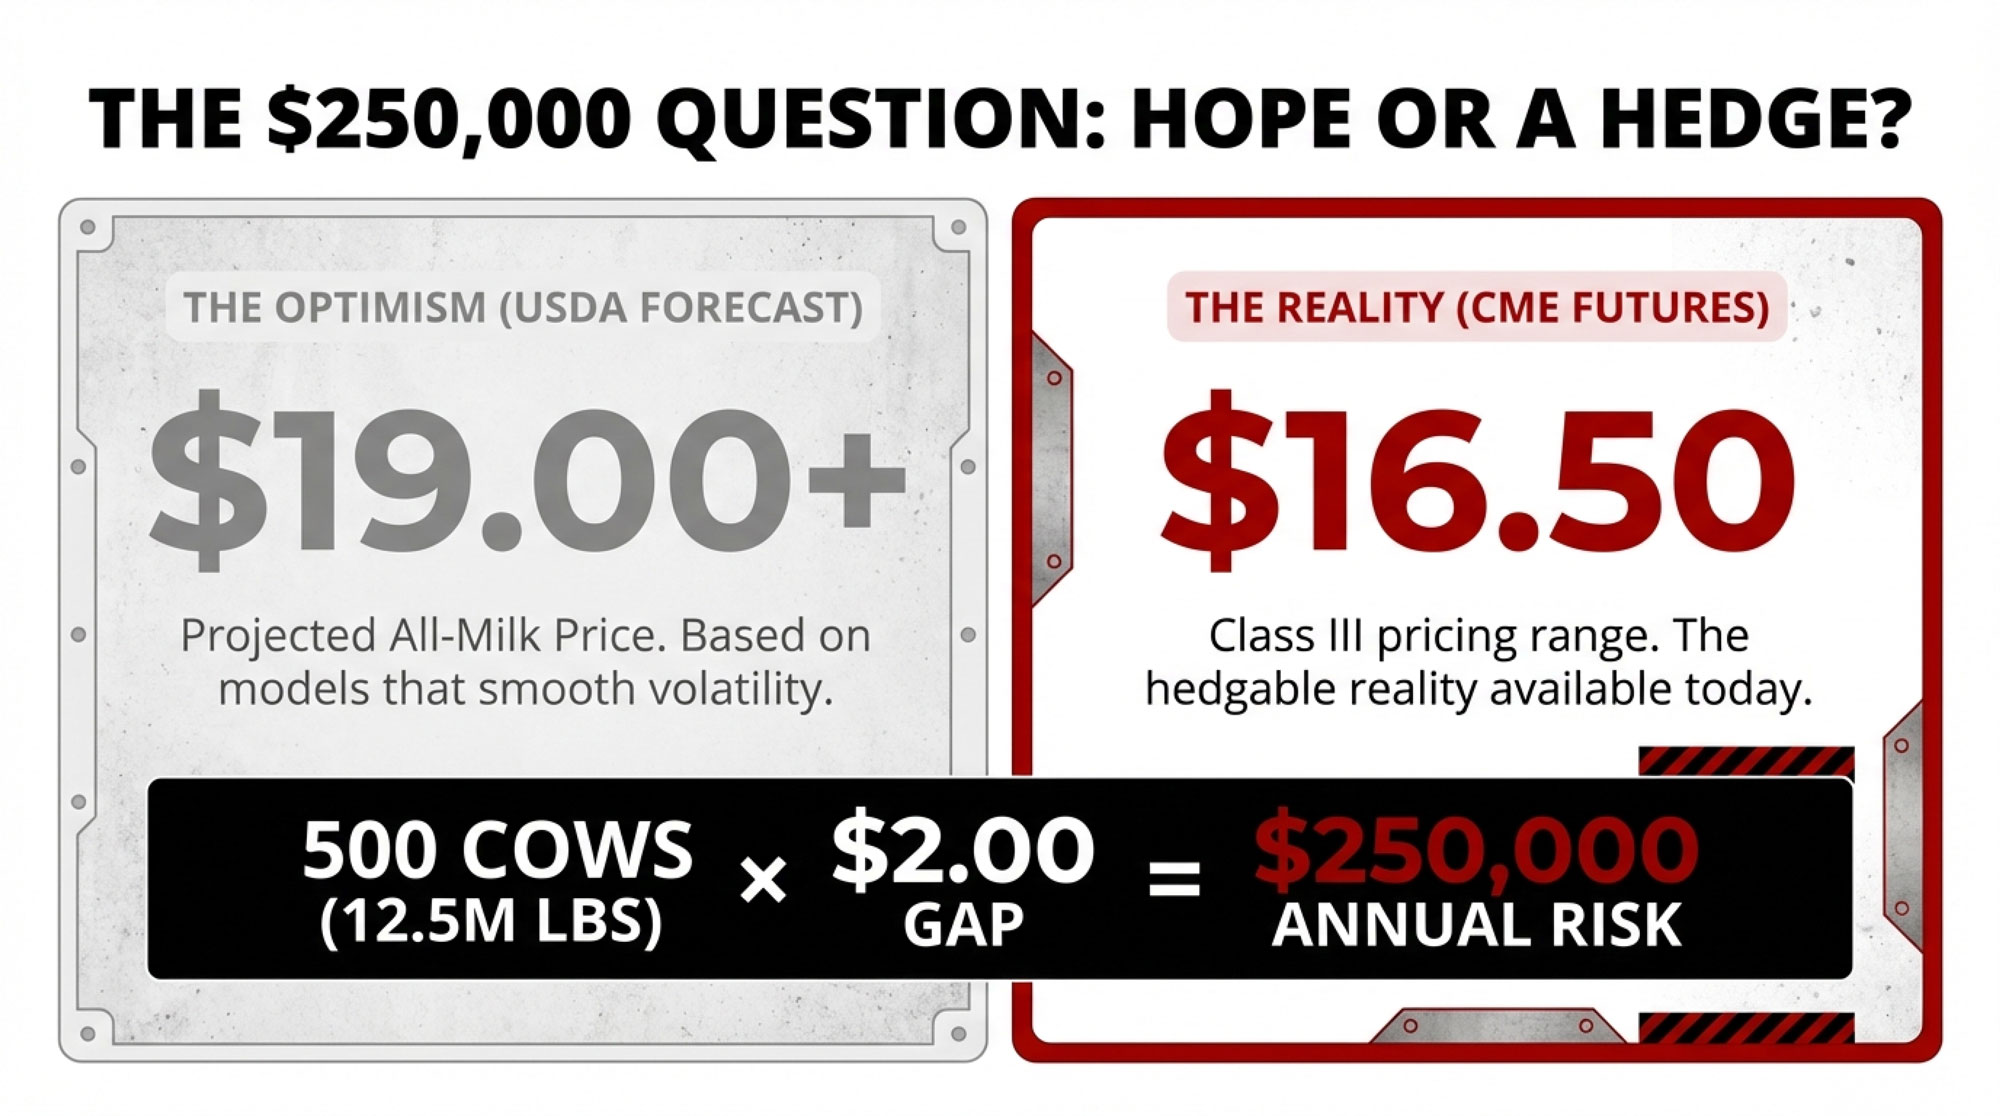
One 500‑cow Wisconsin herd found its ‘cost’ number was off by $1.50/cwt. That was $172,500 they weren’t seeing. How far off is yours?
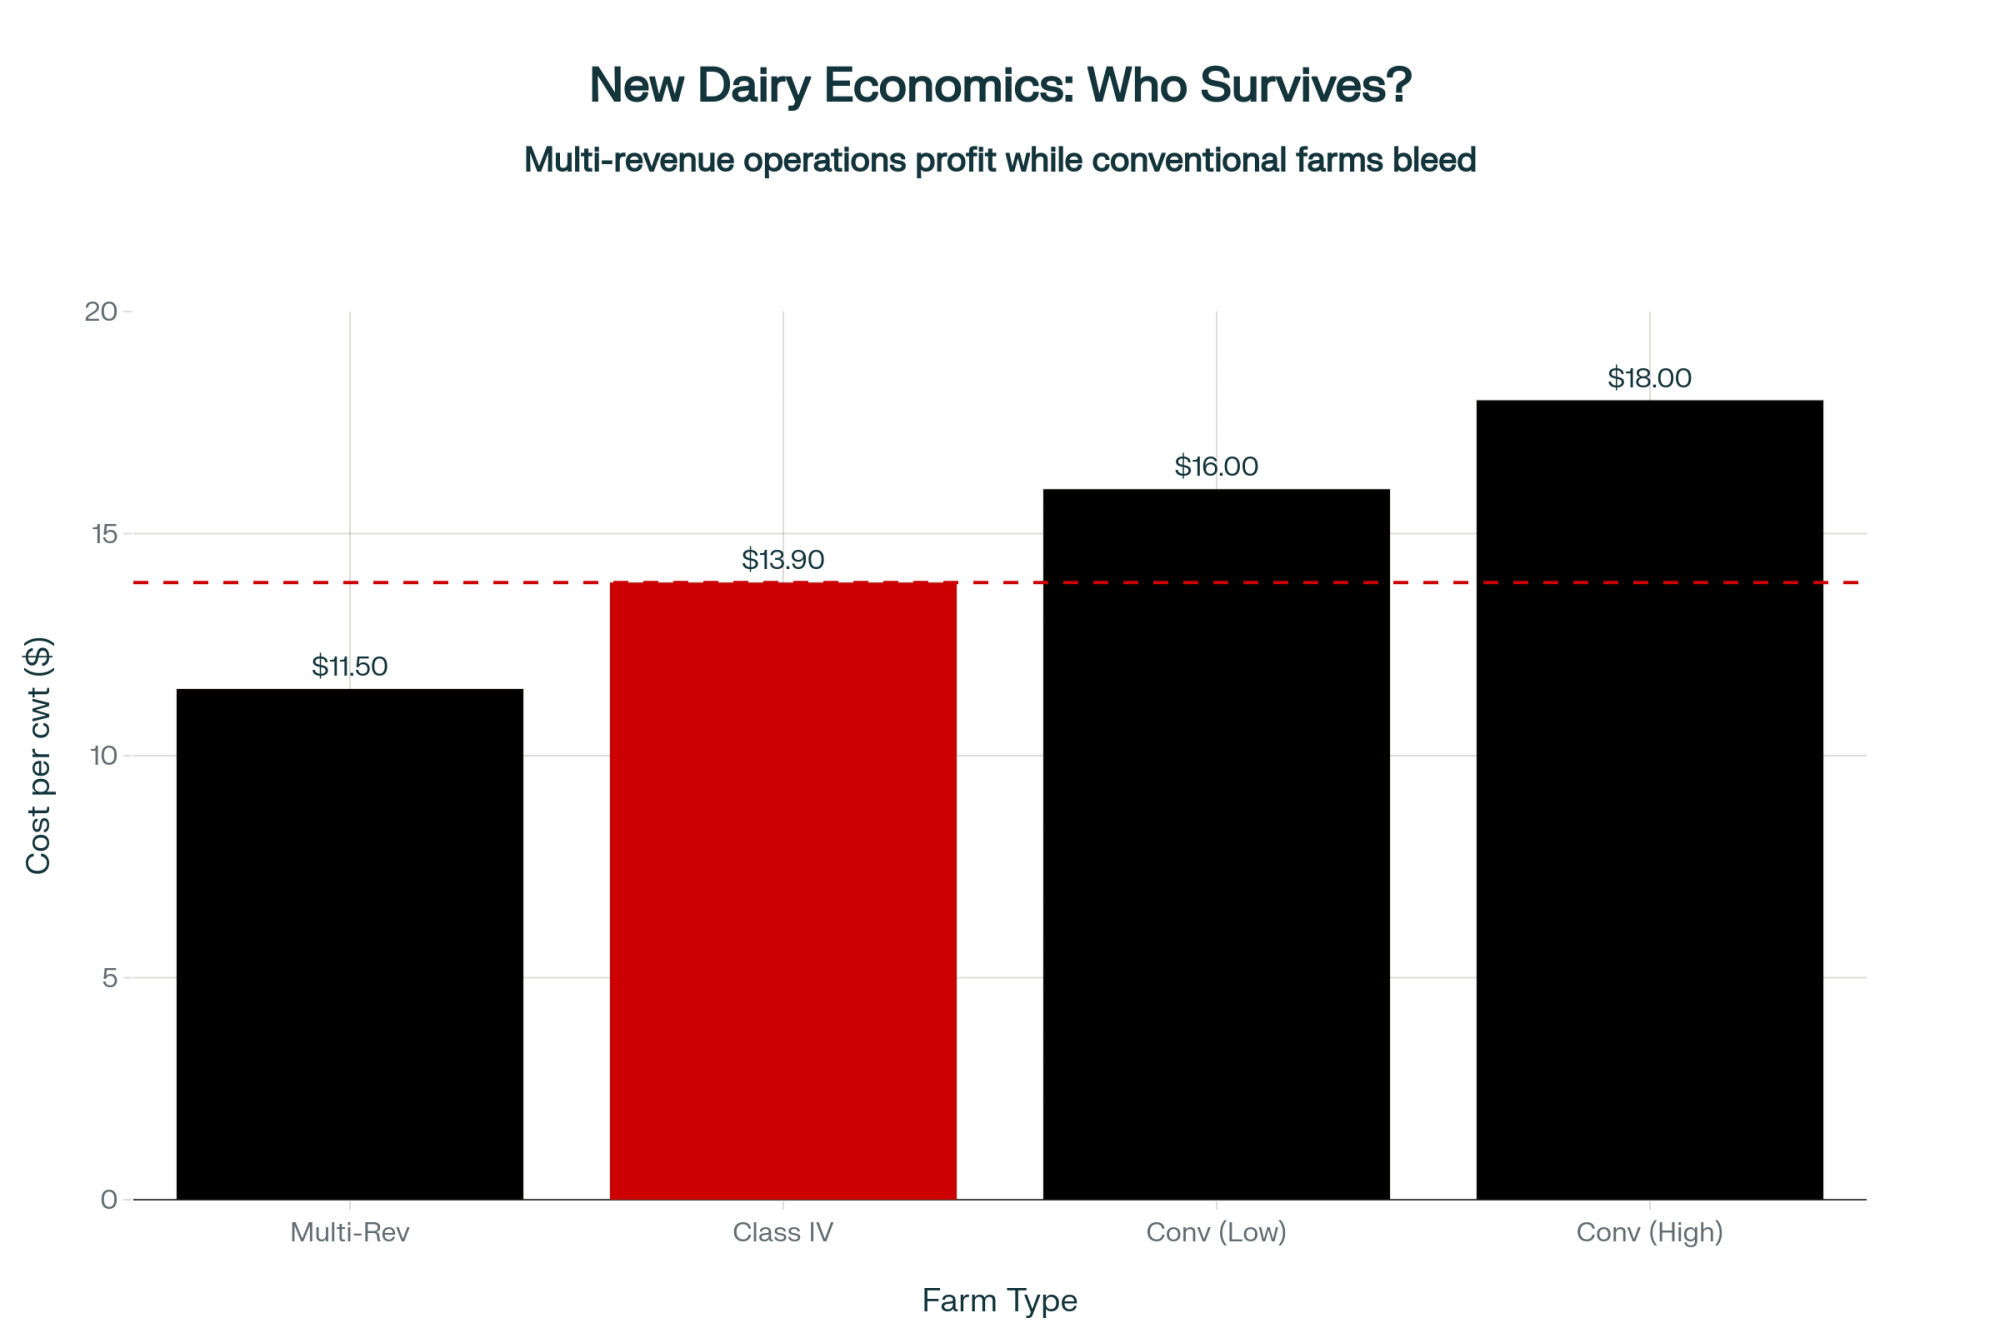
Executive Summary: Mid‑size dairies are staring at barn math they can’t ignore: January Class III at $14.59/cwt against USDA full economic costs of $20.54/cwt for 500–999 cow herds, a $5.95 gap that means roughly $182,850 in red ink for a 500‑cow herd at 23,000 lbs. USDA’s 2026 all‑milk forecast sits at $18.95/cwt. The Class III futures strip has rallied — March through November now trades around $18.00–$18.46 — but January’s $14.59 and February’s ~$15.00 already dragged the strip-weighted annual average to roughly $17.65, still well below ERS full economic cost. ERS and Hoard’s data confirm what you feel in your own books: mid‑size herds carry about $1.40/cwt more cost than 2,000‑cow operations, and cheaper corn hasn’t erased that structural disadvantage. Butter and cheese prices are both down double digits, so income over feed is projected $1.50–$2.30/cwt lower than 2025, even with $4.15 corn, while cull cows look rich at $160/cwt and replacements still sit near $2,860–$3,110. The article walks through a full 500‑cow barn‑math example, then lays out five concrete moves: audit feed shrink, rerun true-cost-of-production, calculate your burn rate, rethink cull vs. replacement timing, and use fall Class III and risk tools only where the numbers actually pencil. You finish with practical thresholds — from months of burn‑rate runway to $18.50 lock‑in triggers — and one uncomfortable but useful question: if you plug in your own herd’s numbers, how long before your working capital runs out?
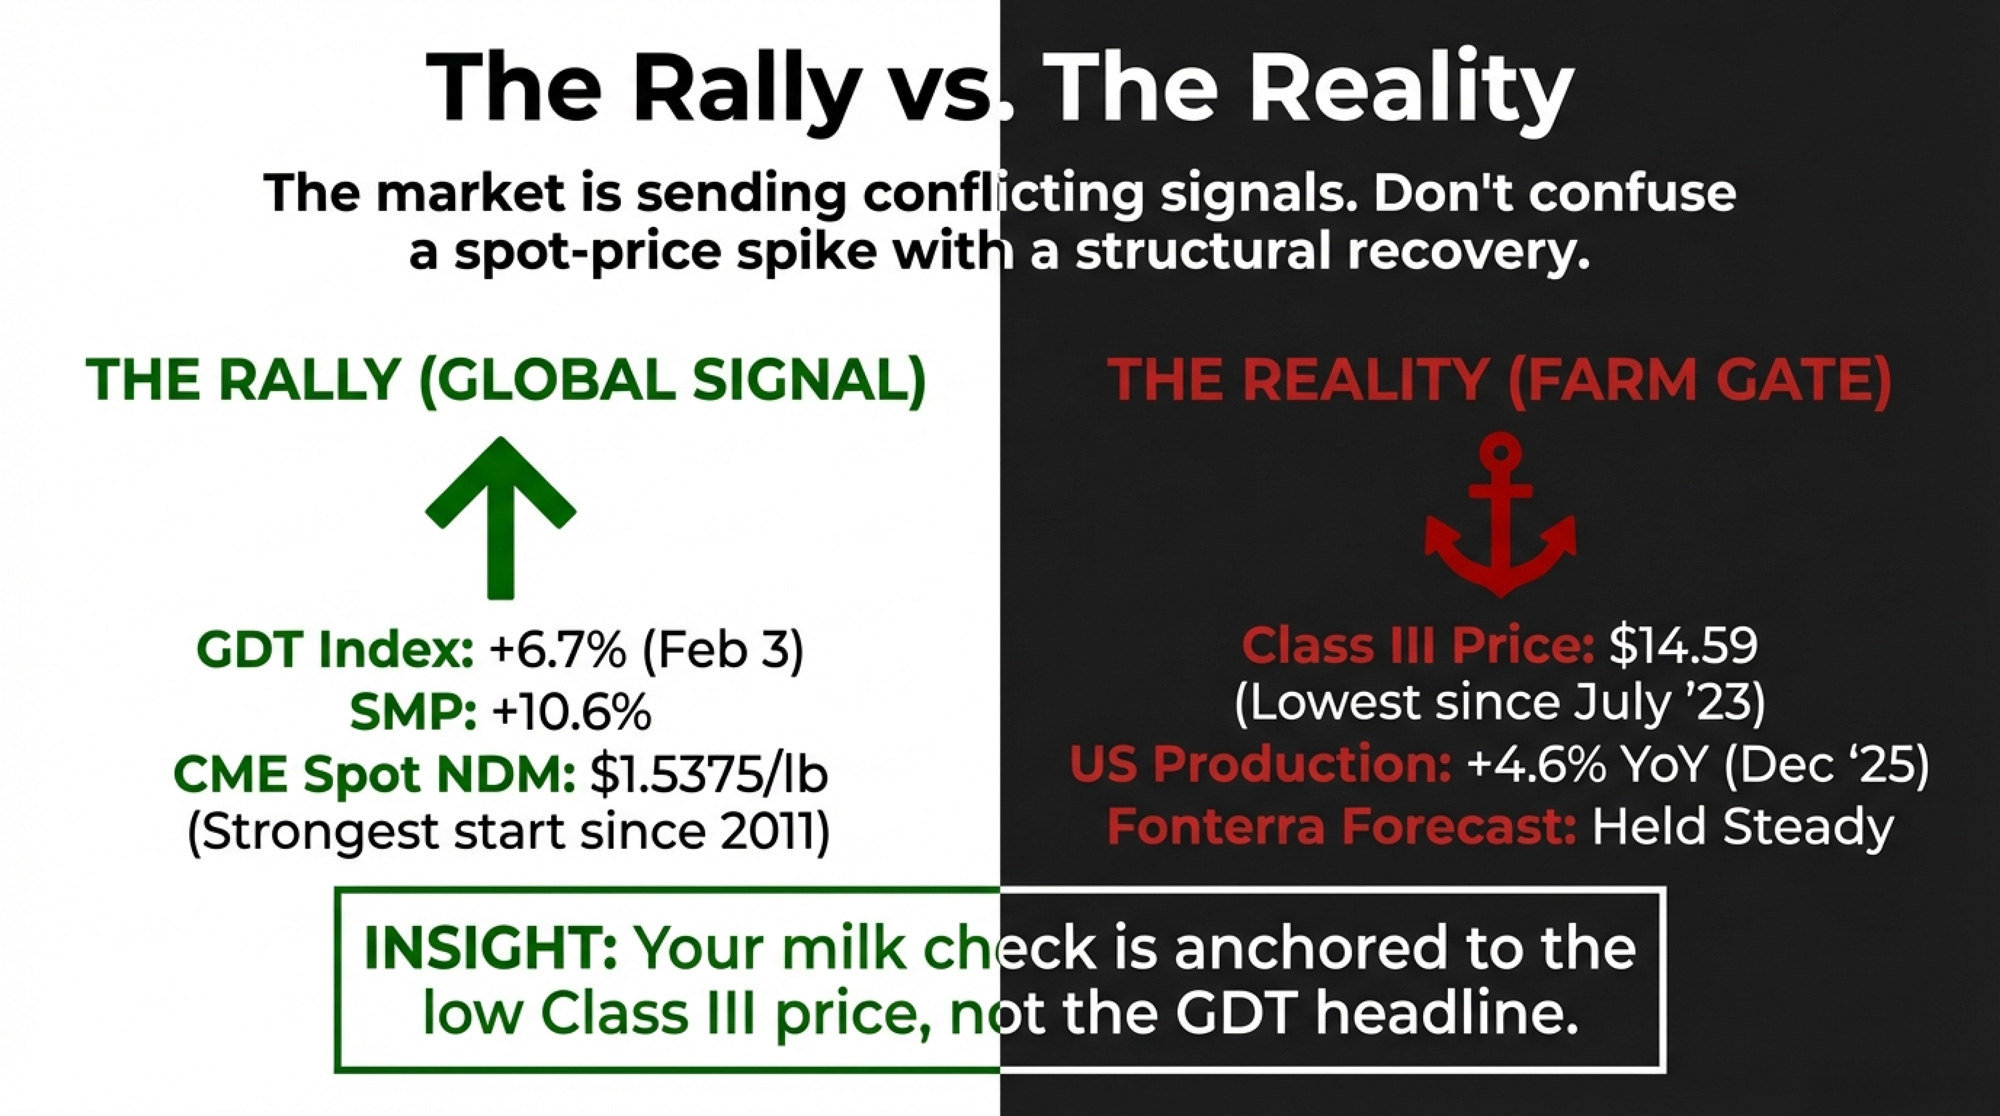
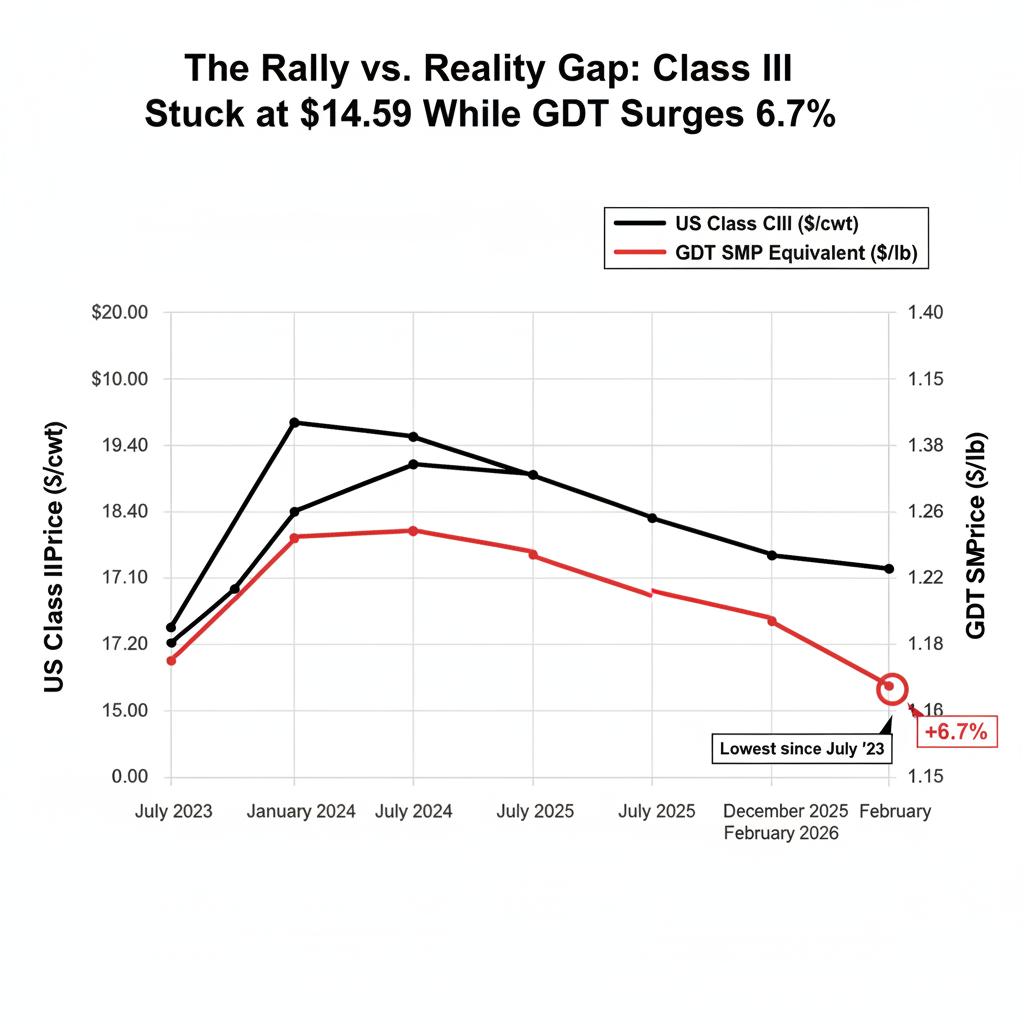
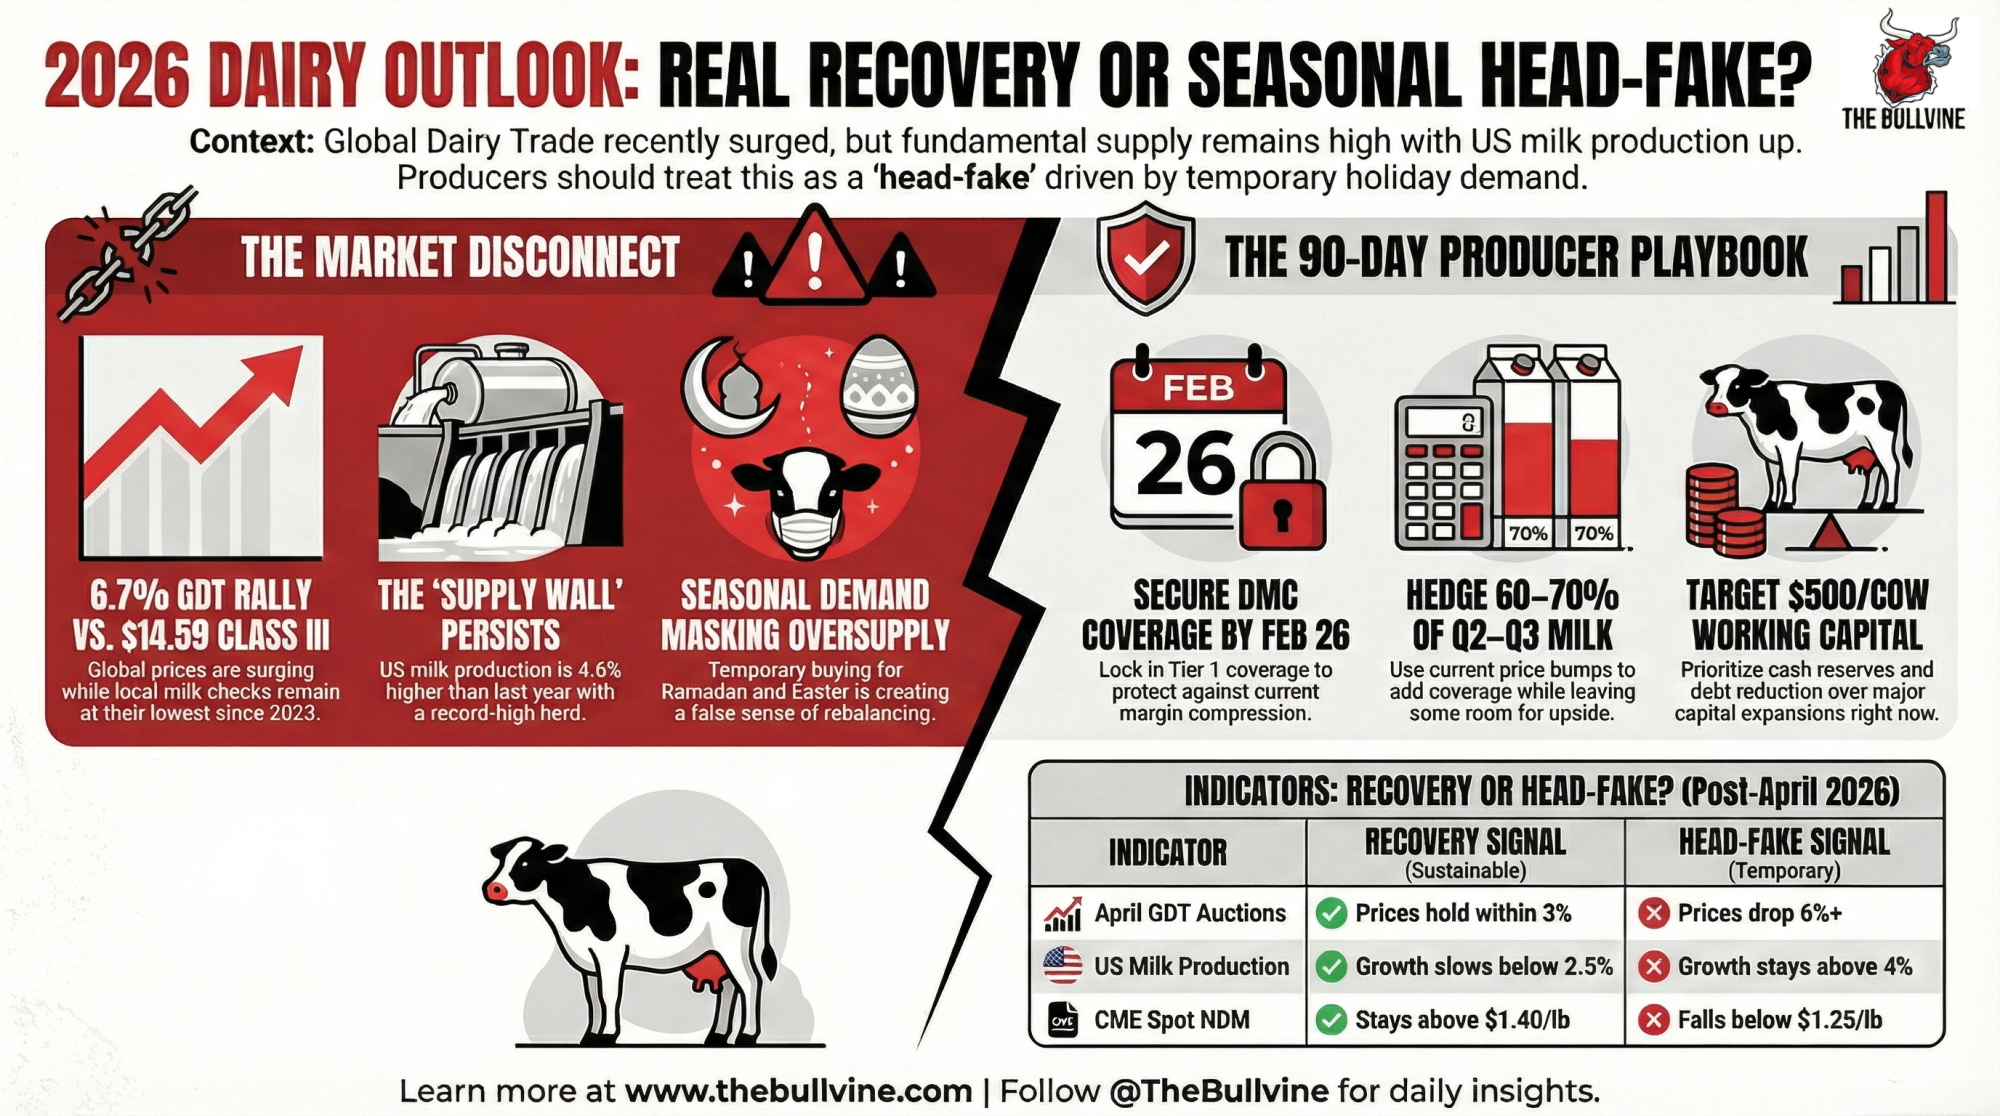
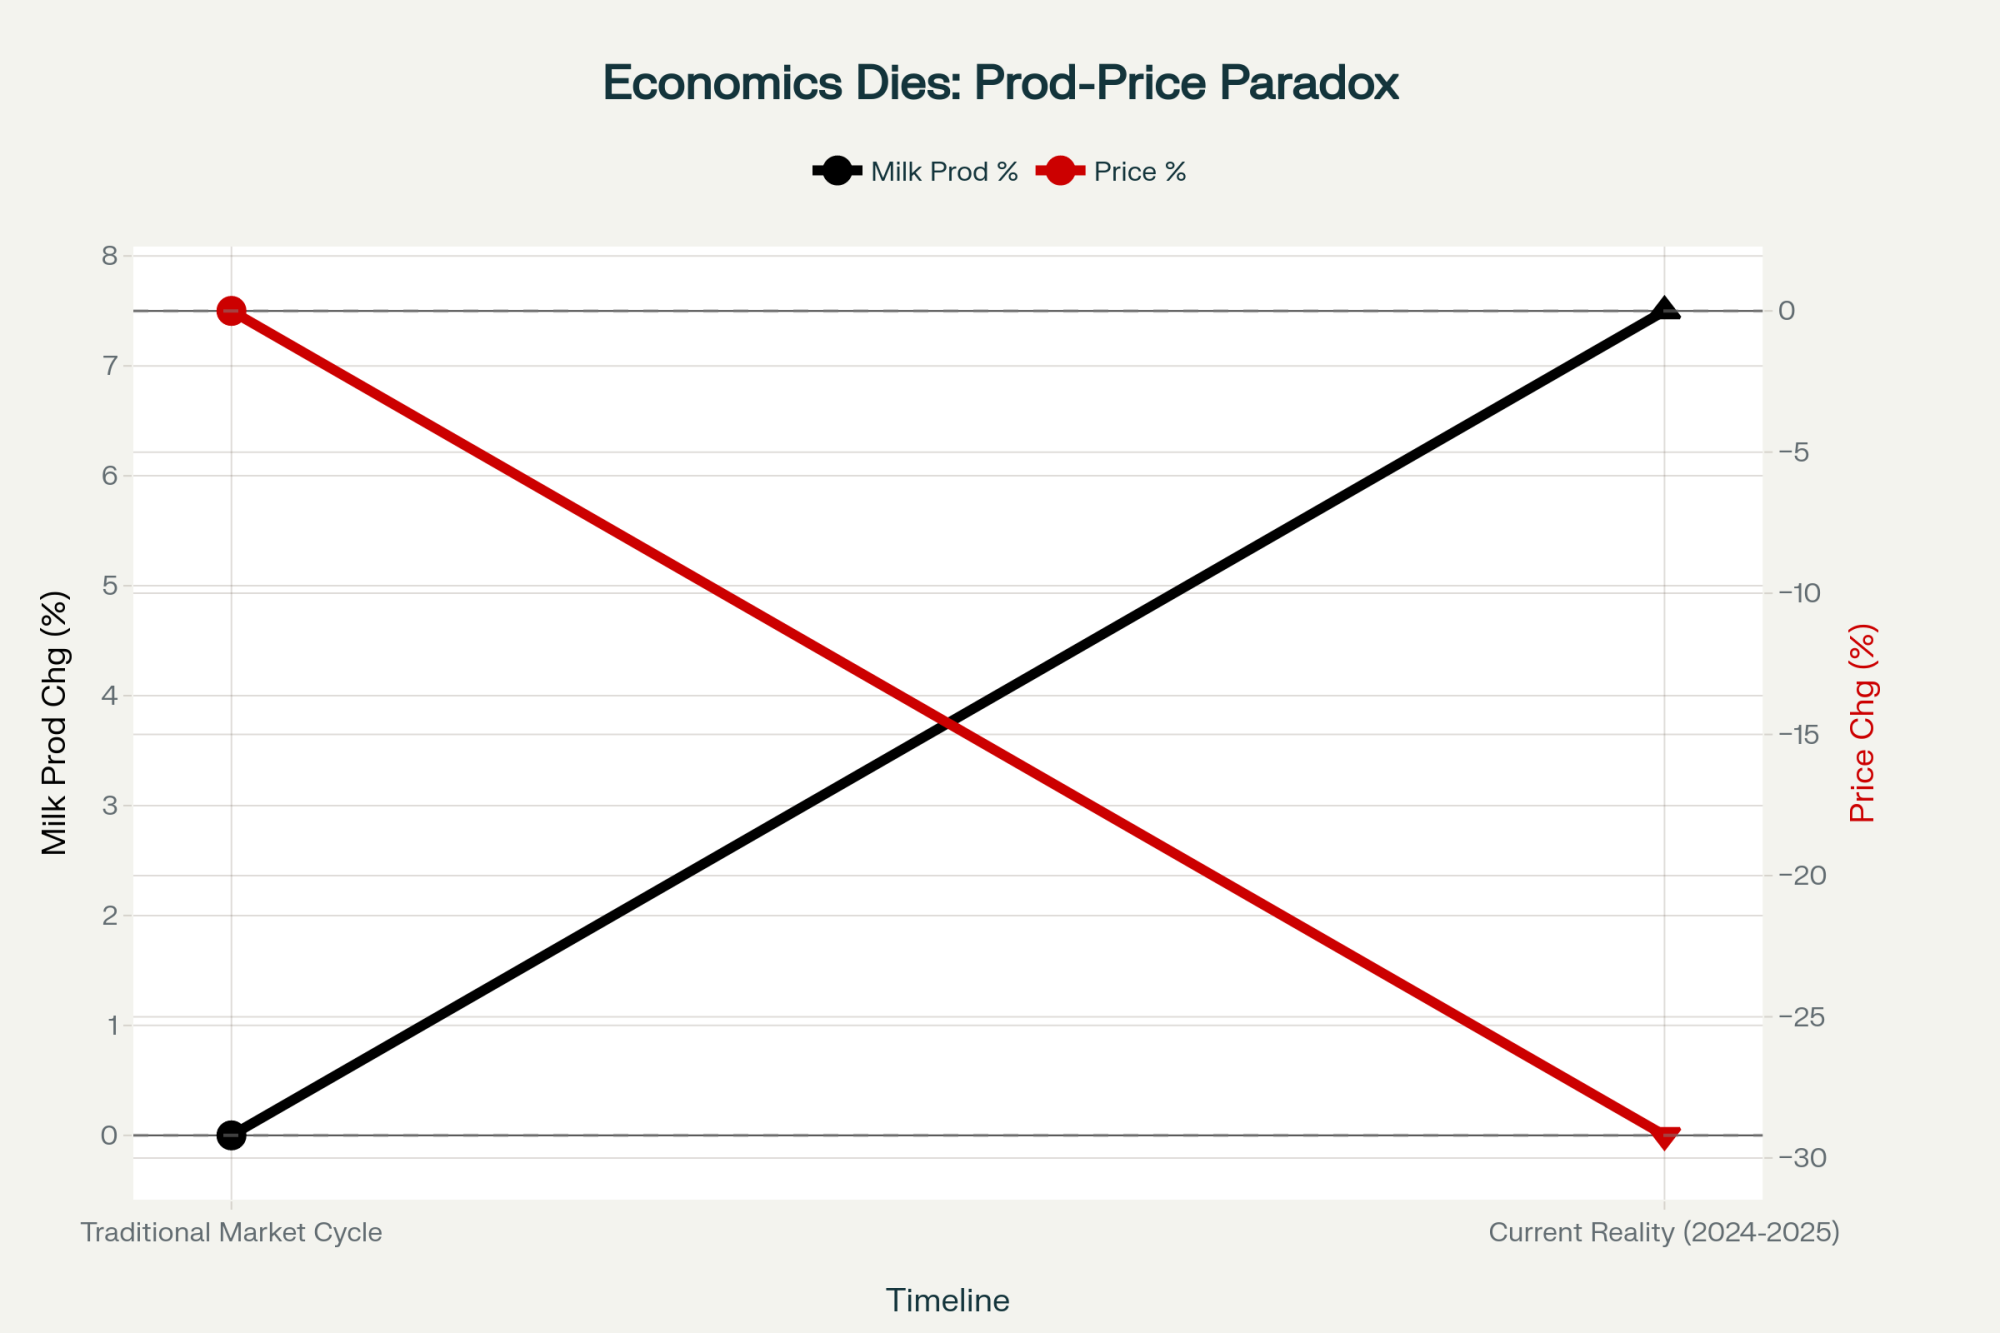
January 2026 Class III hit $14.59/cwt — the lowest since July 2023, per USDA AMS data released February 4. Three weeks later, USDA’s Economic Research Service published a structural report that pegged the full economic costs for herds of 500–999 cows at $20.54/cwt. That’s a $5.95 gap on every hundredweight. And the cheapest corn in five years isn’t going to close it.
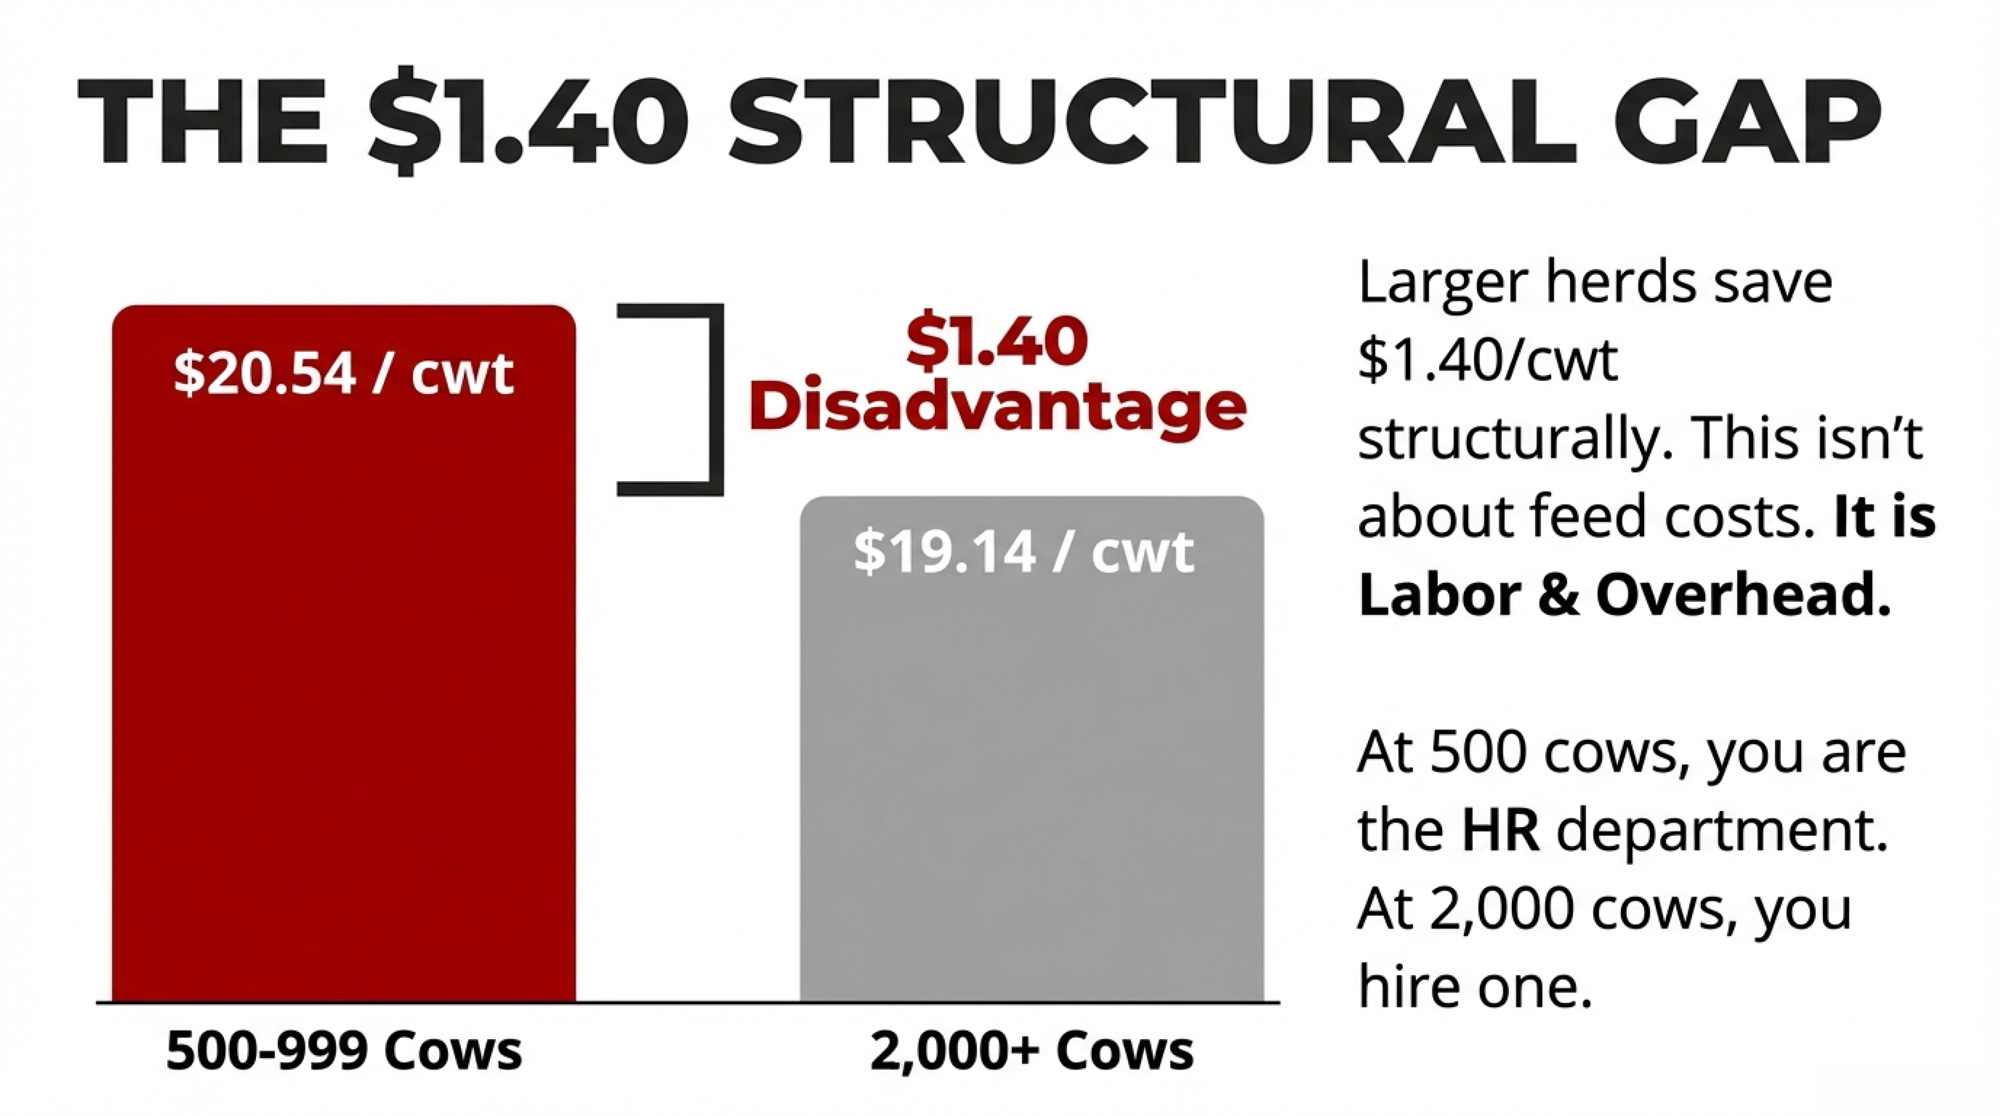
Feed costs are down. Milk is down further. And the structural cost disadvantage that 500-cow herds carry — roughly $1.40/cwt more than operations running 2,000-plus cows, per the same ERS data — doesn’t move with commodity prices.
The $1.50 Nobody Budgets
A mid-size Wisconsin dairy recently ran a full cost-of-production analysis through a UW Extension-affiliated farm financial counseling program. The analysis put their actual all-in cost roughly $1.50/cwt higher than the figure the operation had been using for planning — a gap driven by market-rate family labor, real depreciation on aging equipment, interest repriced at current rates, and health insurance.
That gap is common. UW Extension benchmarks for mid-size Wisconsin herds land at $18–$19/cwt on a full economic cost basis. The ERS national figure is higher — $20.54 for 500–999 cows, drawn from the 2021 Agricultural Resource Management Survey, published February 22, 2026. That’s the most recent herd-size breakdown available; post-2021 inflation in input costs likely pushes current numbers higher.
Bradley Zwilling, vice president of data analysis at the Illinois Farm Business Farm Management Association, framed the tension in a January 2026 interview with Brownfield Ag News: “From an economics standpoint, we’ve got lots of negative numbers, but when we look at the cash side, we’re still able to squeak out a profit margin.” That was Zwilling’s read on Illinois dairy farms specifically, speaking with Brownfield’s Larry Lee. His underlying study — a December 2025 economic review of milk costs published through farmdoc daily — projects that economic costs will remain above total returns through 2026, even as cash margins stay barely positive.
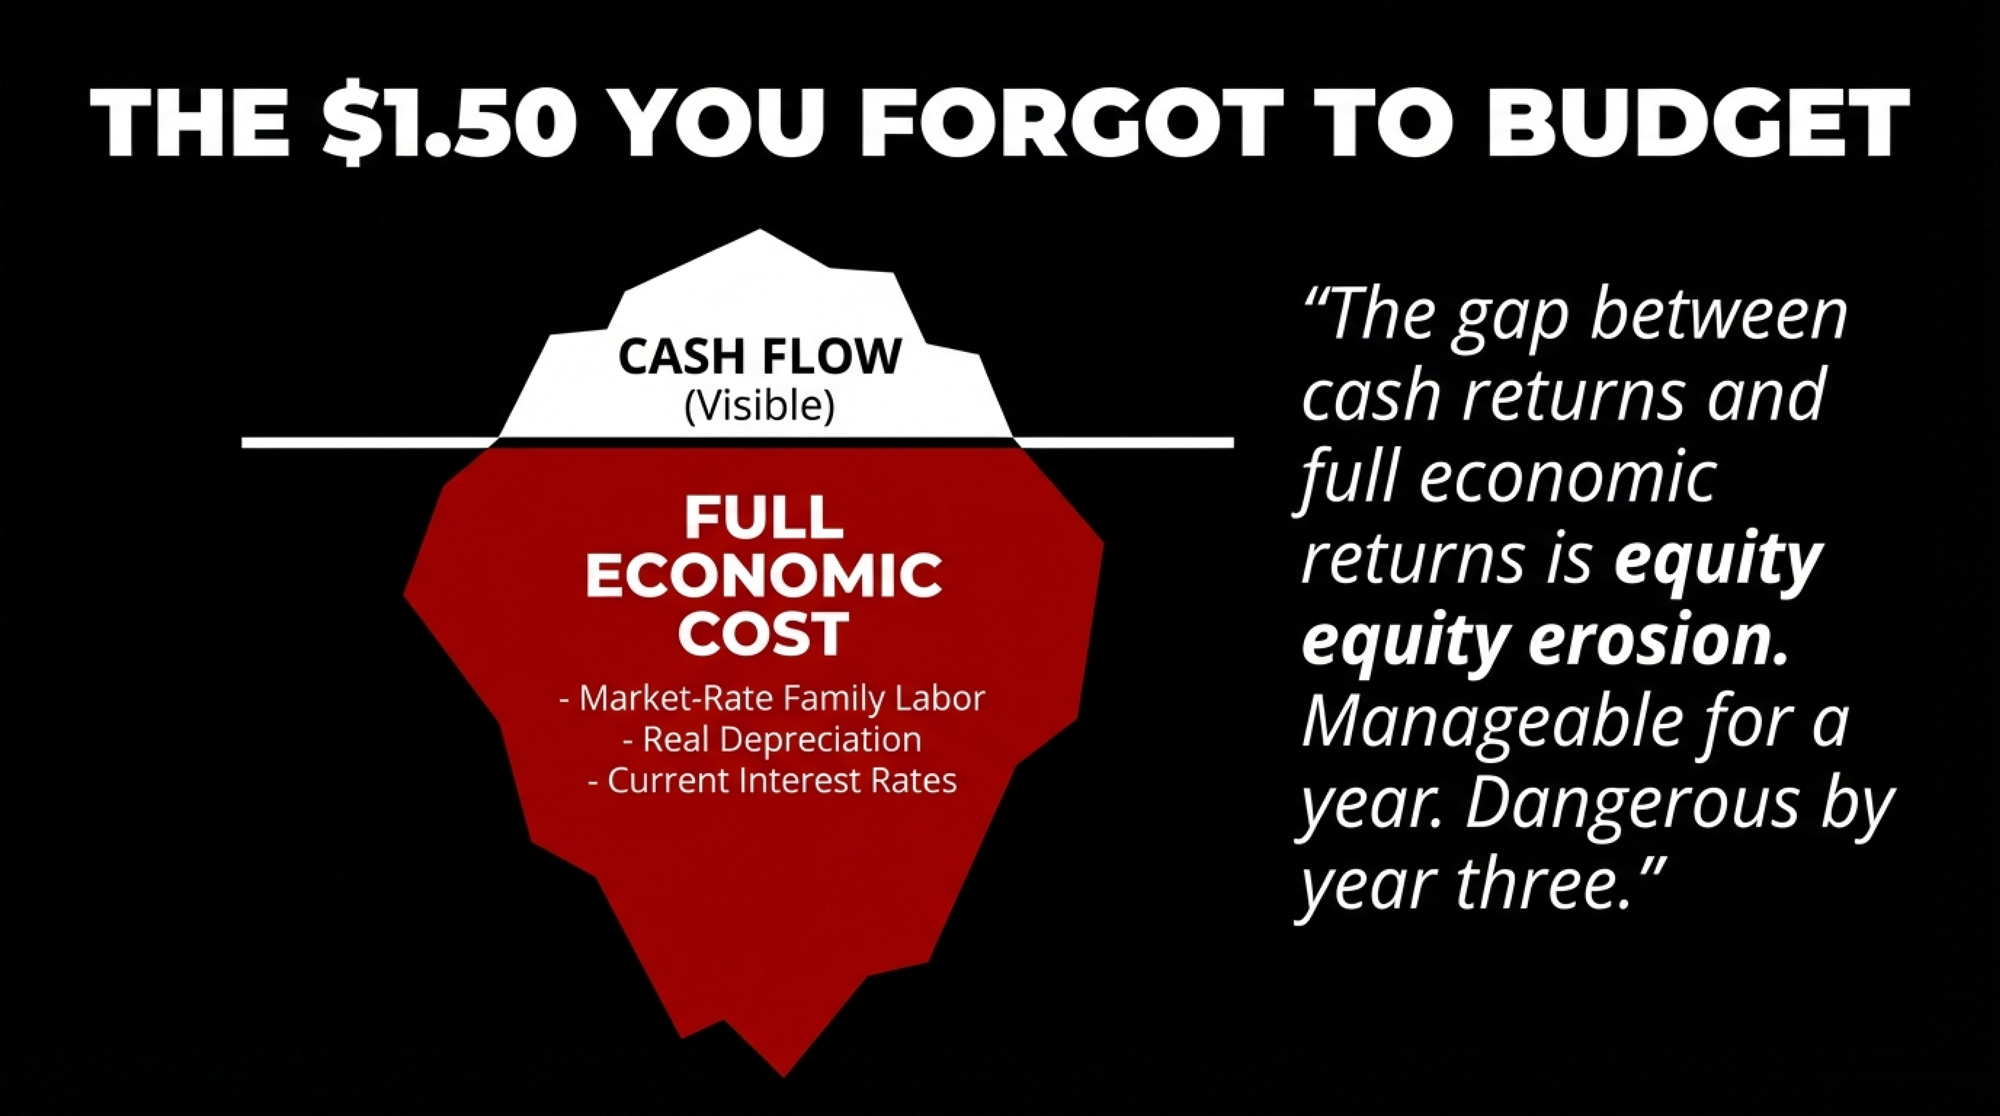
The gap Zwilling describes — between cash returns and full economic returns — is equity erosion. Manageable for a year. Dangerous by year three.
David Kohl, professor emeritus of agricultural economics at Virginia Tech and a regular keynote speaker at PDPW conferences, offers a specific metric for gauging how long you can sustain it: your burn rate — working capital divided by monthly shortfall. “You’d like to have a burn rate of 3½ years or more,” he has told PDPW audiences. Below 2½ years, Kohl calls it the red-light zone.
Related: As we detailed when the February WASDE dropped, even the USDA’s upgraded $18.95 all-milk forecast doesn’t close this gap for the average mid-size operation.
Why Does It Cost $1.40 More Per Cwt to Run 500 Cows Than 2,000?
| Herd Size | Full Economic Cost ($/cwt) |
|---|---|
| <50 cows | $42.71 |
| 50–99 cows | $32.18 |
| 100–199 cows | $26.44 |
| 200–499 cows | $22.89 |
| 500–999 cows | $20.54 |
| 1,000–1,999 cows | $19.67 |
| 2,000+ cows | $19.14 |
The ERS data lay it out starkly. Full economic cost drops from $42.71/cwt for herds under 50 cows to $20.54 for 500–999 and $19.14 for 2,000-plus. That $1.40/cwt gap between mid-size and large is almost entirely structural.
Labor is the biggest driver. USDA’s 2020 consolidation report (ERR-274) documented total labor costs of $8.14/cwt for herds under 50 cows versus $1.85/cwt for herds above 2,500 — a $6.29 spread driven overwhelmingly by unpaid family labor in smaller operations. Hoard’s Dairyman benchmarks place commercial mid-size dairies in the $3–$4+/cwt range for total labor. Average hired dairy wages hit $19.52/hour as of May 2025, up 30% from $15.07 in April 2020.
At 500 cows, you’re the owner, the herd manager, the HR department, and the risk manager. At 3,000, those are four separate positions — and their combined salary is spread across six times the production.
Hoard’s data reinforces the broader point, too: operations with over 2,000 cows carry cash costs roughly $1.50/cwt below the all-size average, with most of that decline coming from non-feed expenses. But management quality still matters. Hoard’s has also reported that the best-managed small herds produce within $0.20/cwt of the best-managed large herds. That’s best-to-best, though. The average mid-size herd carries a measurable disadvantage that doesn’t disappear with cheaper grain.
Related: For more on how replacement costs and labor shifts compound these structural pressures, see why replacement costs are rewriting mid-size dairy economics.
What Does $16.50 Class III Look Like on a 500-Cow Herd?
Here’s the barn math. A 500-cow herd at 23,000 lbs/cow produces 115,000 cwt per year.
| Scenario | Milk Price | Annual Gross | vs. $20.54 ERS Full Cost |
|---|---|---|---|
| Strip-weighted 2026 avg (~$17.65 Class III) | $17.65/cwt | $2,029,750 | –$332,350 |
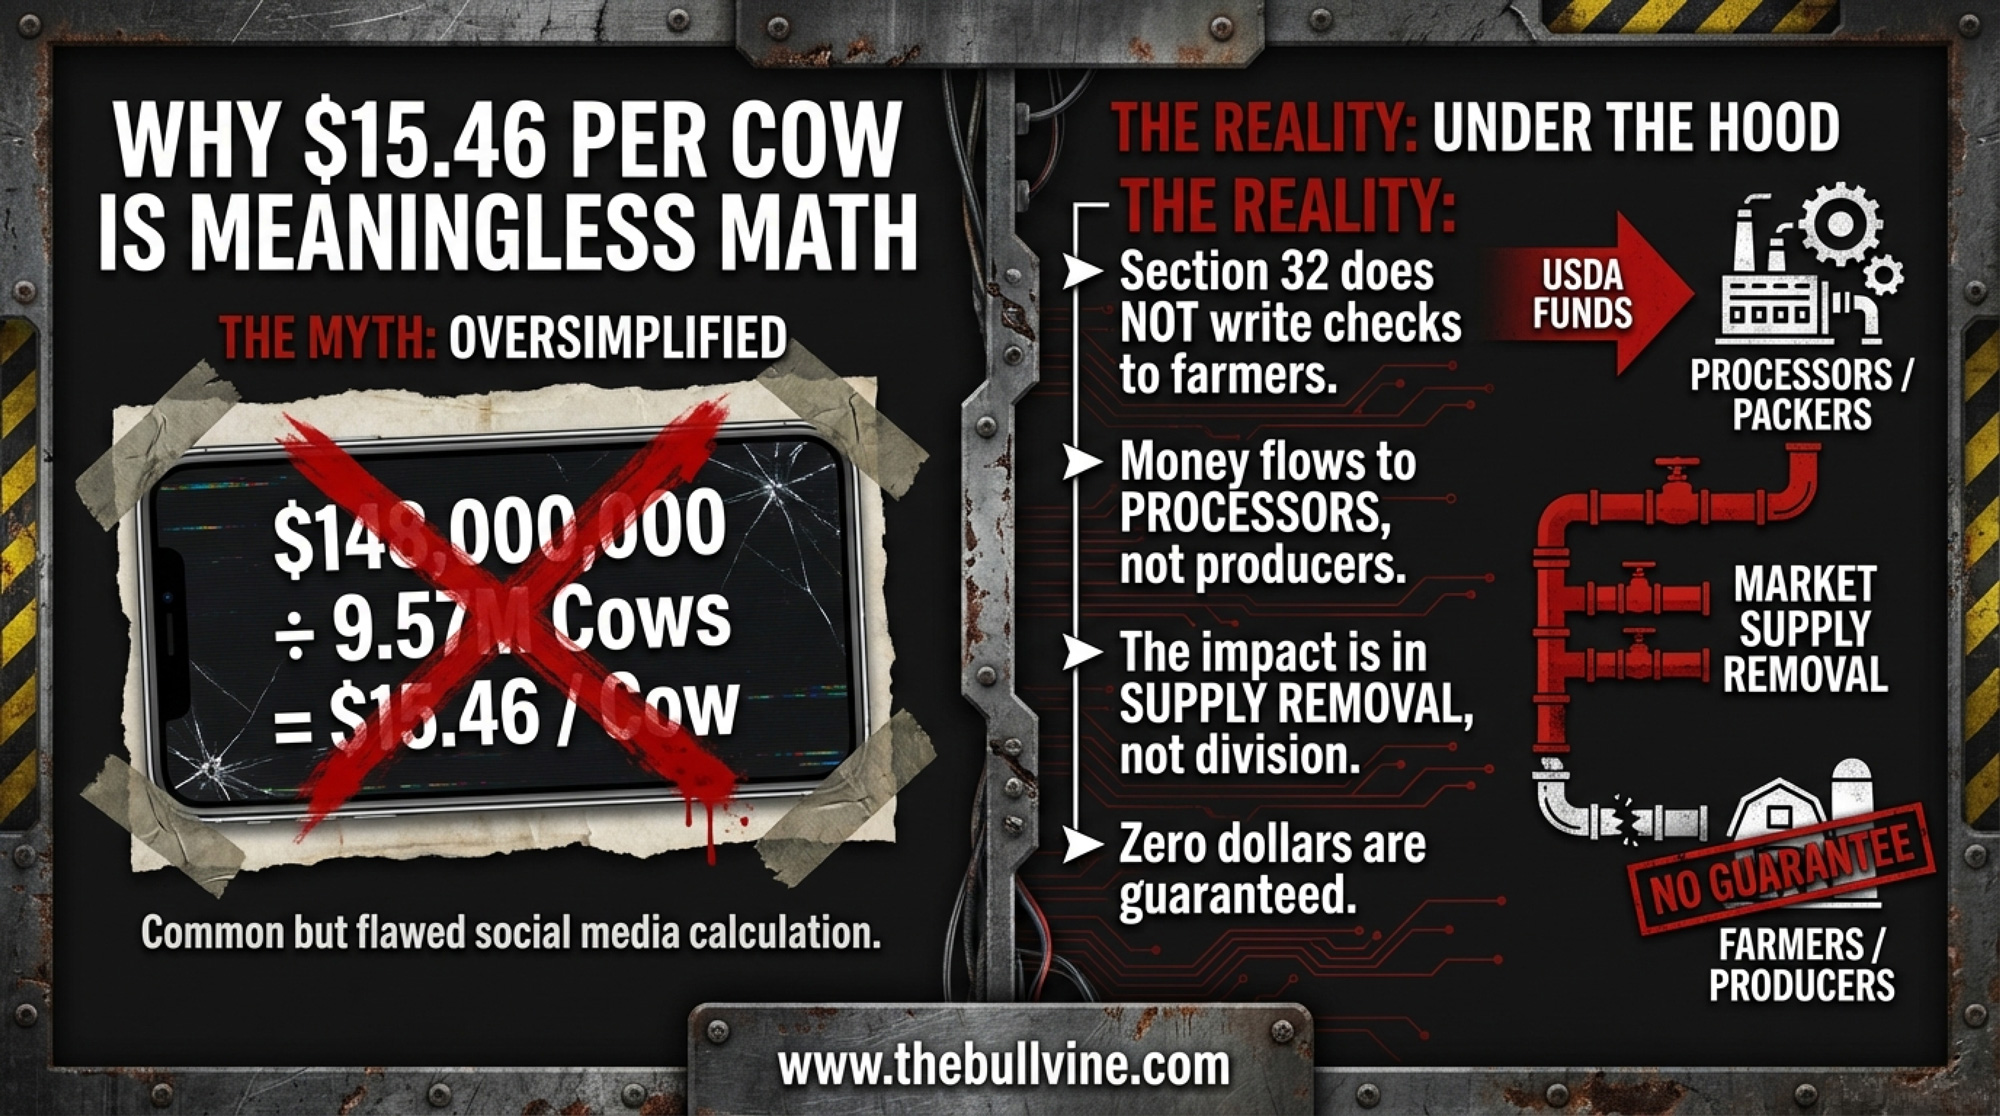
Math: 500 cows × 23,000 lbs ÷ 100 = 115,000 cwt × price = gross. Subtract 115,000 × $20.54 ($2,362,100) for full economic cost. Divide the gap by 500 for the per-cow figure.
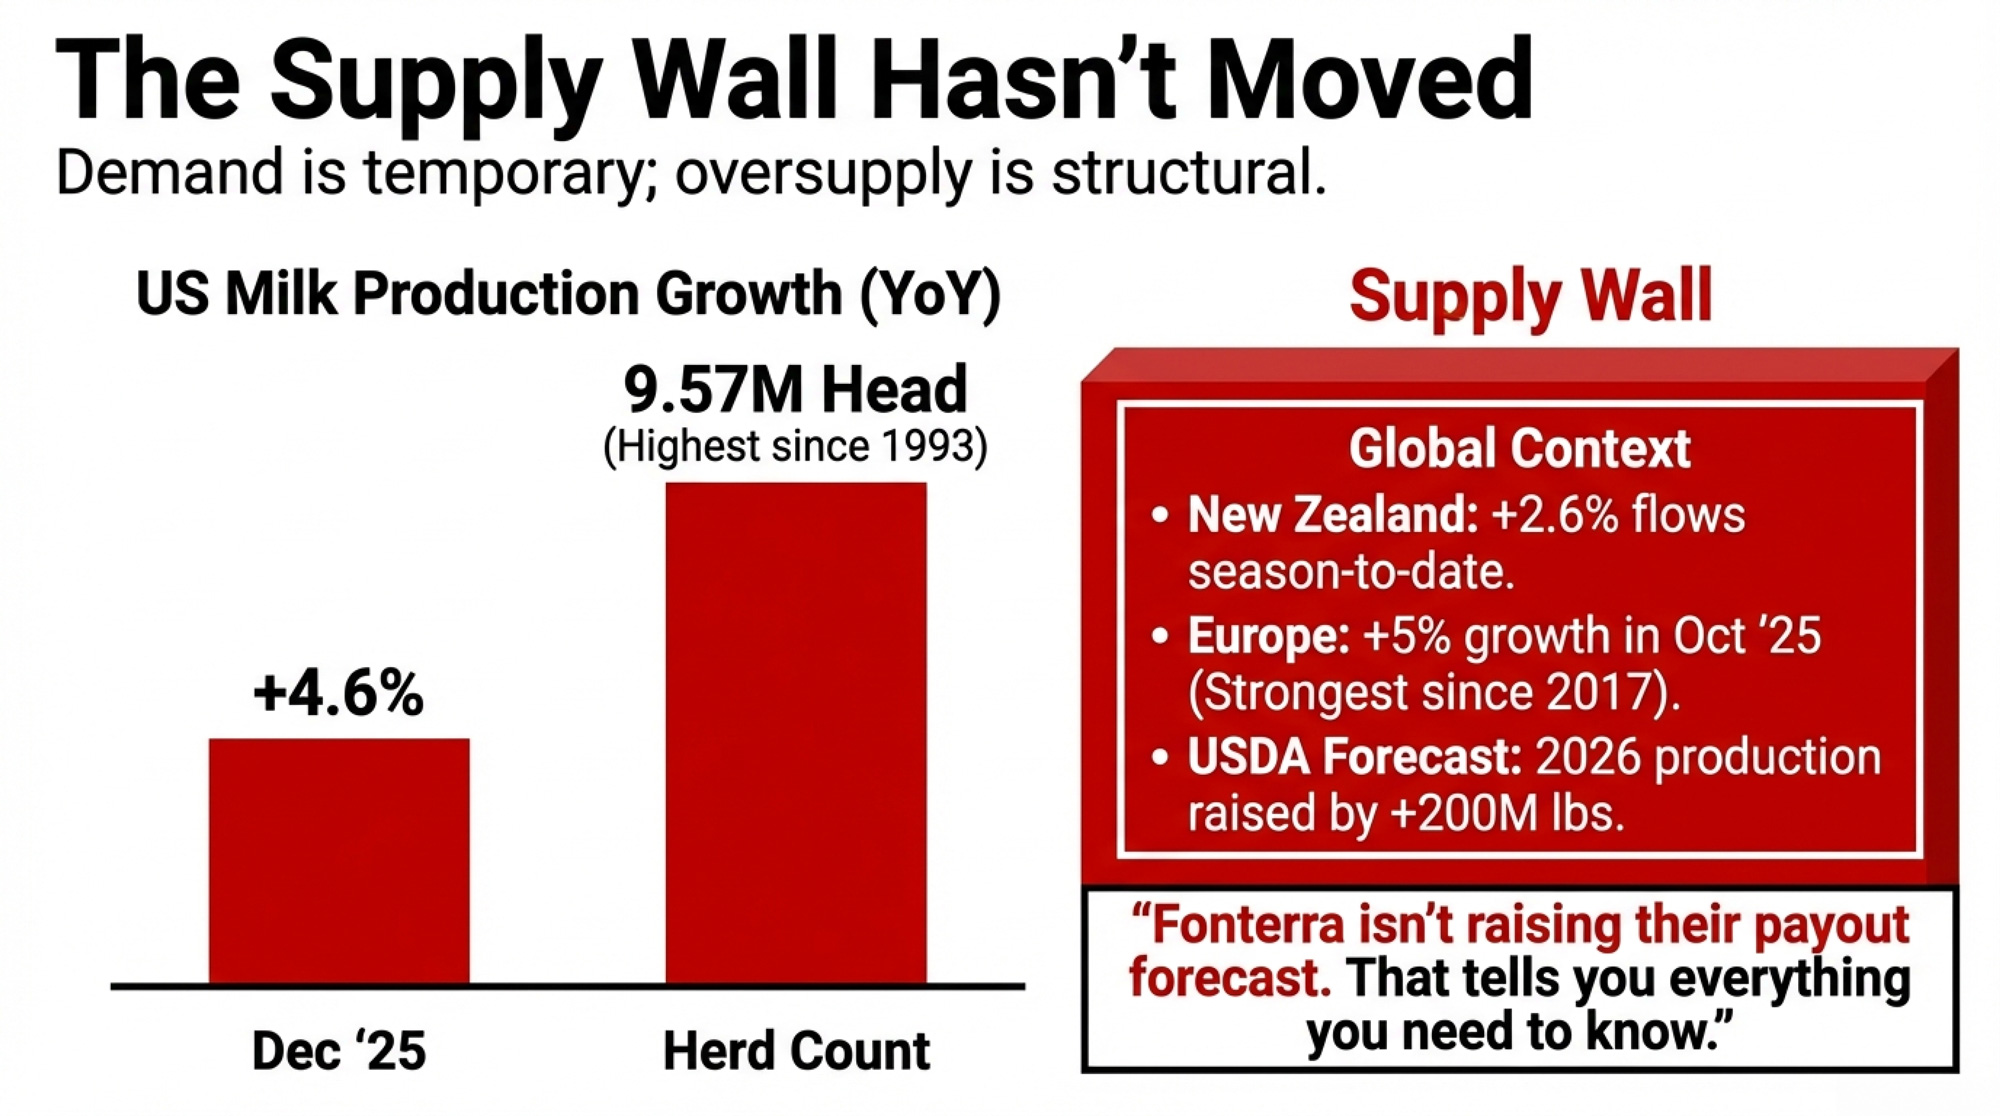
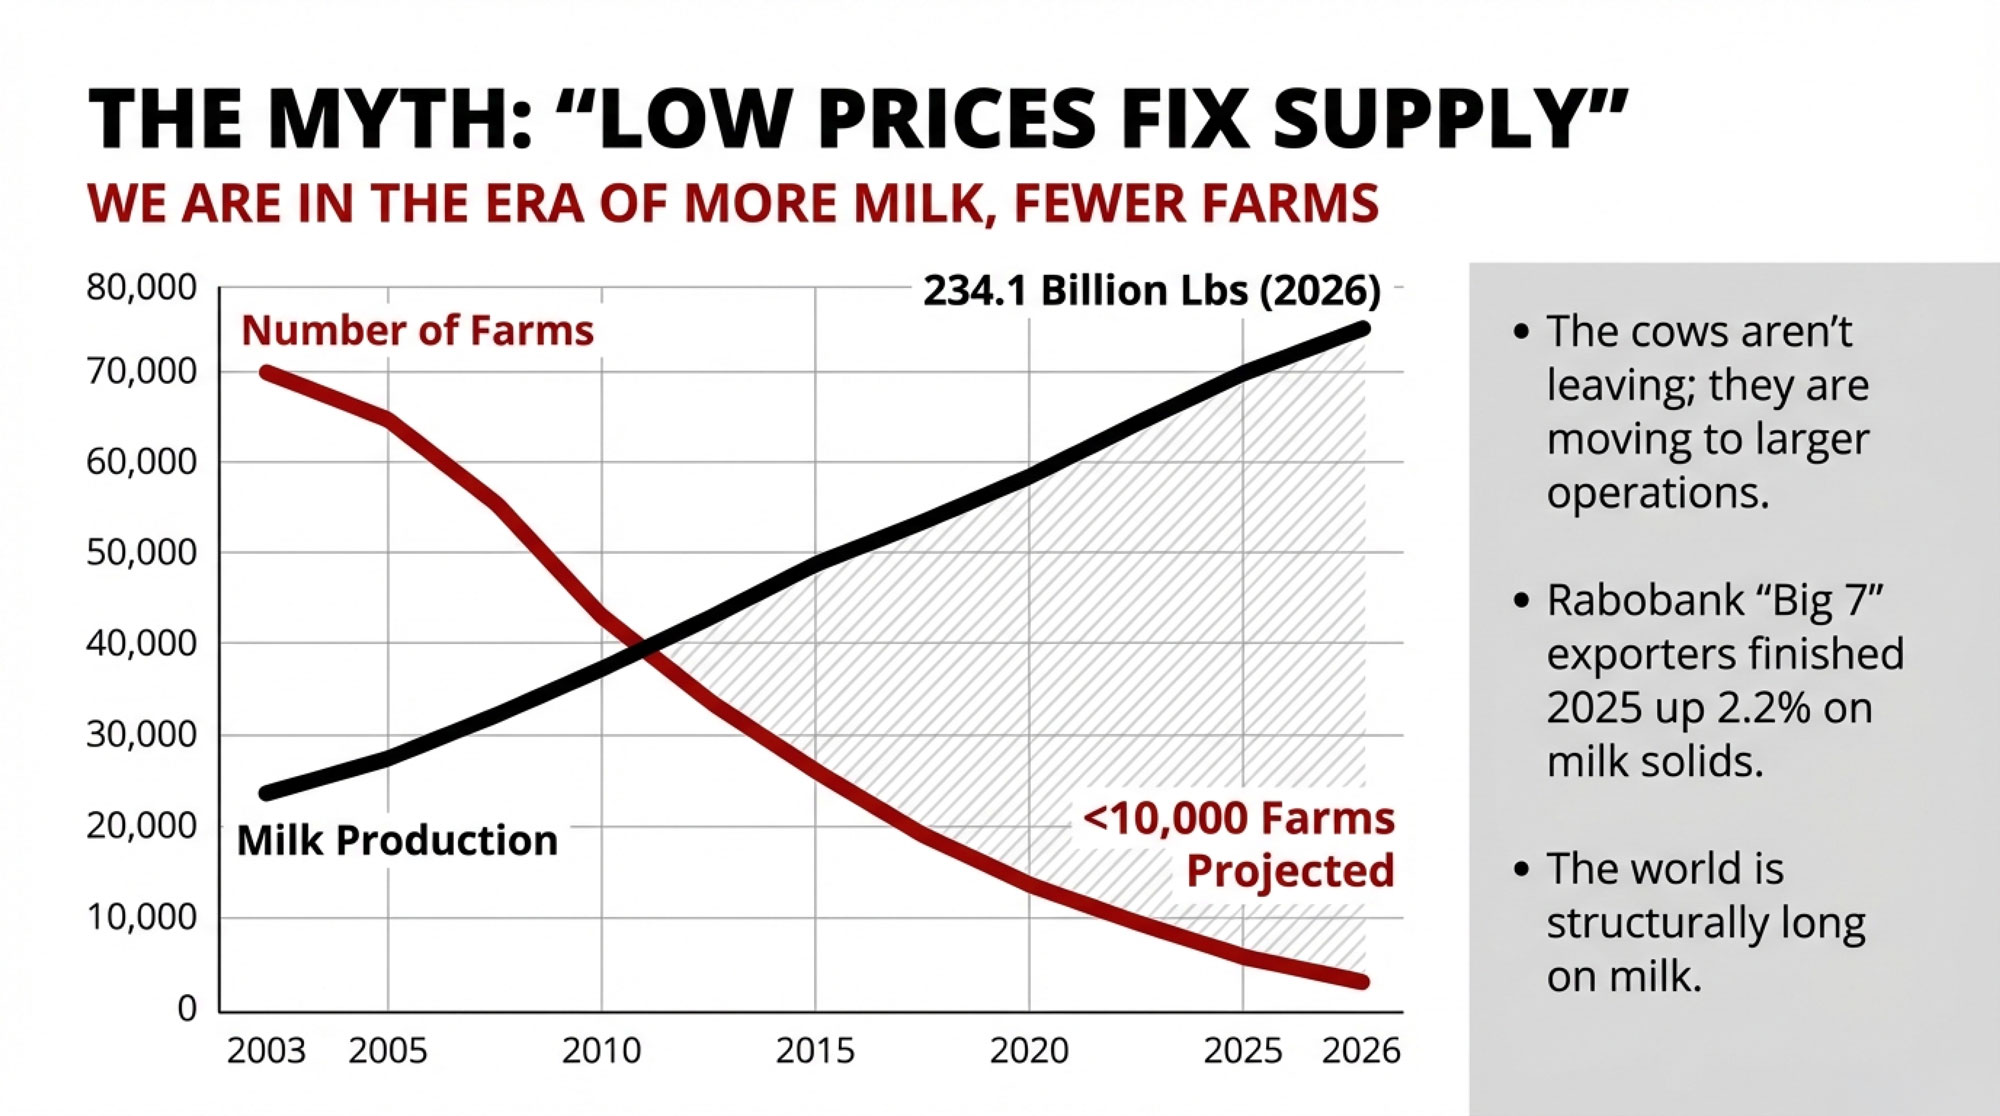
Even at USDA’s more optimistic $18.95 annual average, a 500-cow herd at national ERS cost runs $182,850 in the red for the year. The only scenario with positive returns? Last year’s prices. And USDA projects 1.3% more production in 2026 (234.5 billion lbs) from a January 1 herd of 9.568 million cows, up 188,000.
Plug in your own numbers. Replace 500 with your herd size, 23,000 with your rolling herd average, and $20.54 with your actual full economic cost. If you don’t know your full economic cost — including market-rate family labor, real depreciation, and current interest — that’s the first number to find.
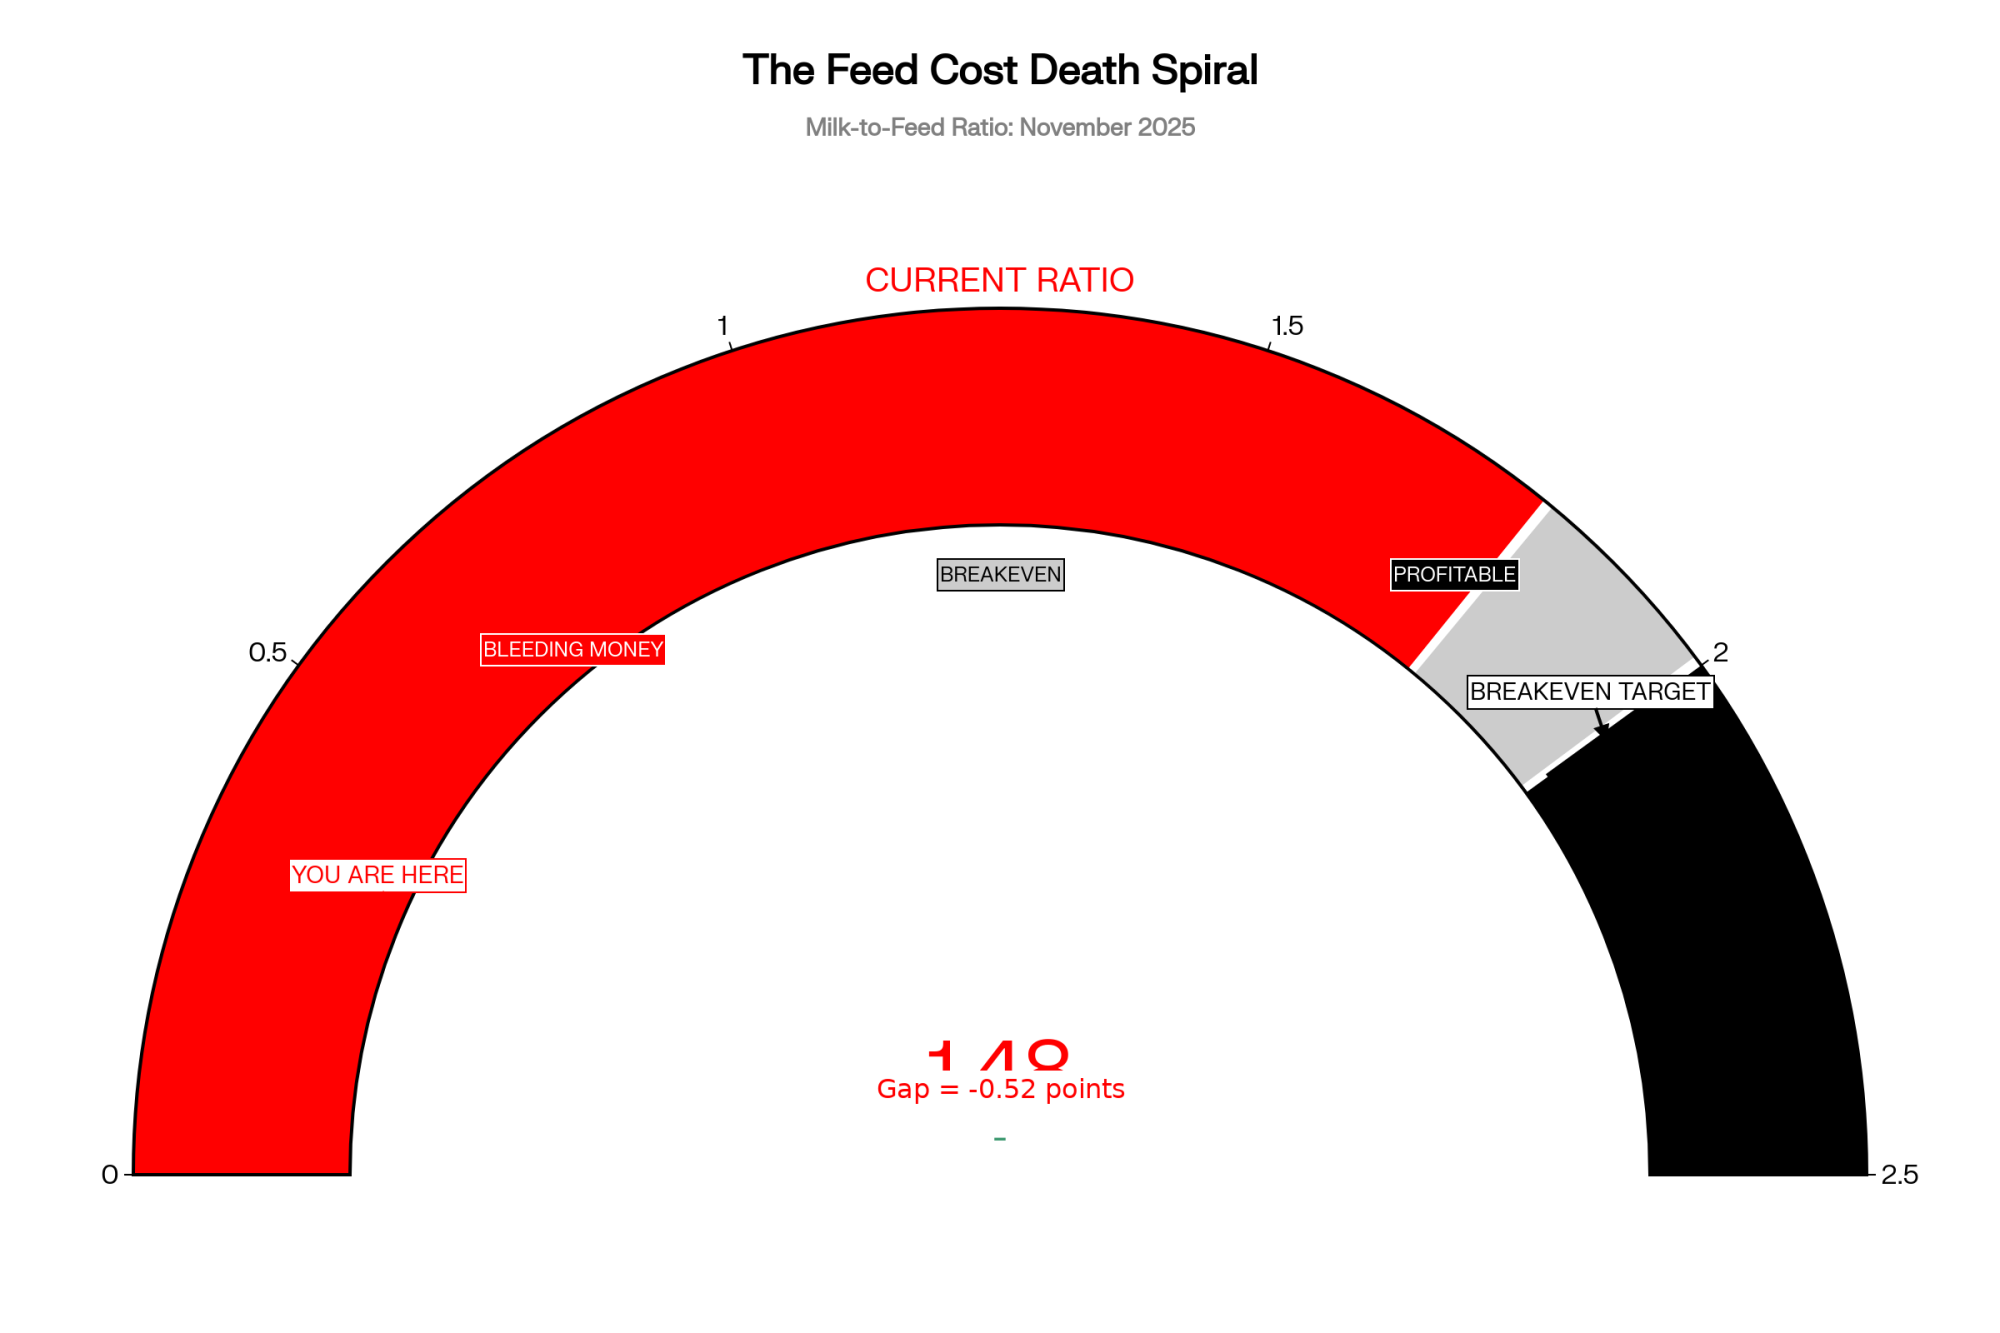
Cheap Feed Won’t Close the $5.95 Gap.
Corn at $4.15/bushel, soybean meal at $319/ton, alfalfa hay at $177/ton — all near five-year lows. But income over feed costs for 2026 projects at roughly $10–$11.40/cwt, down $1.50–$2.30 from 2025. Feed dropped. Milk dropped faster.
The component breakdown shows why:
| Commodity | 2025 Avg | 2026 Projected | Change |
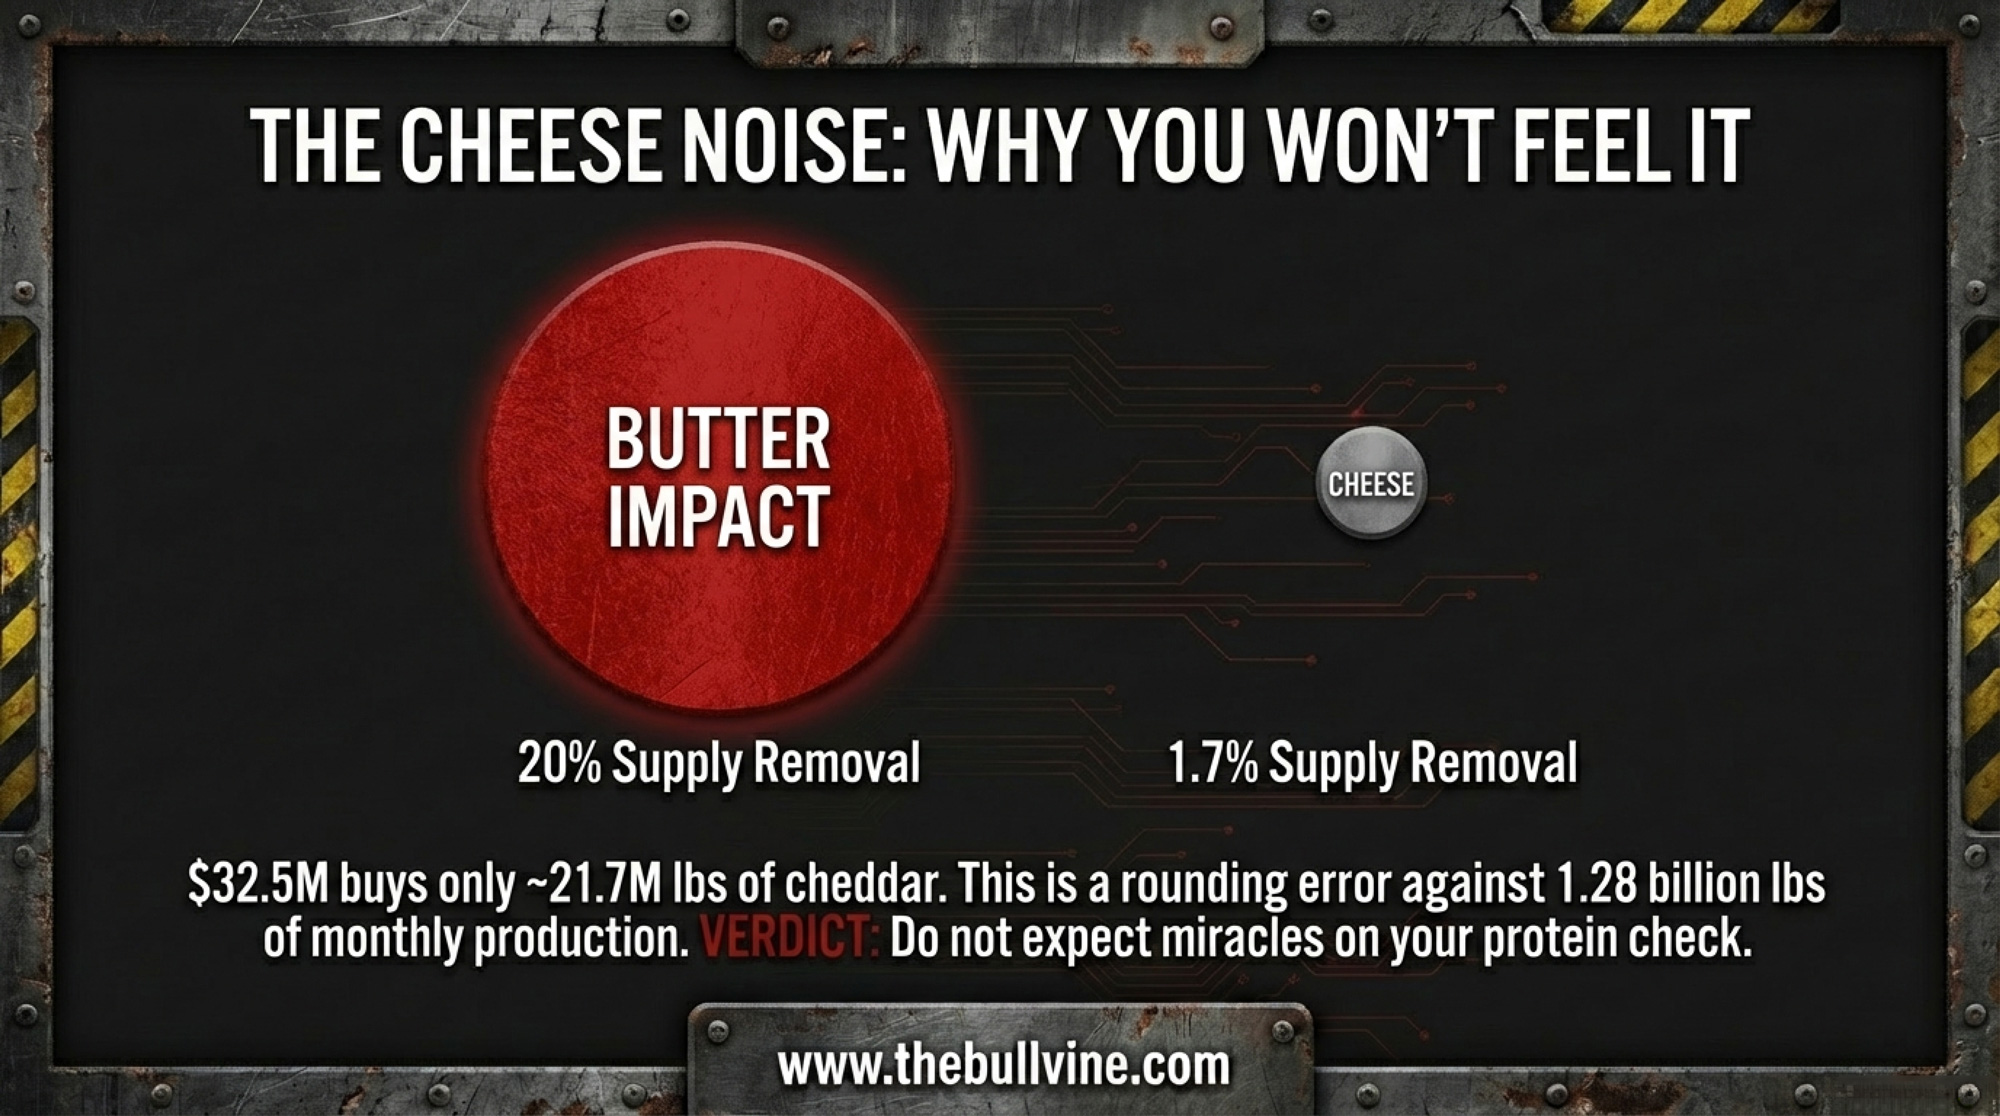
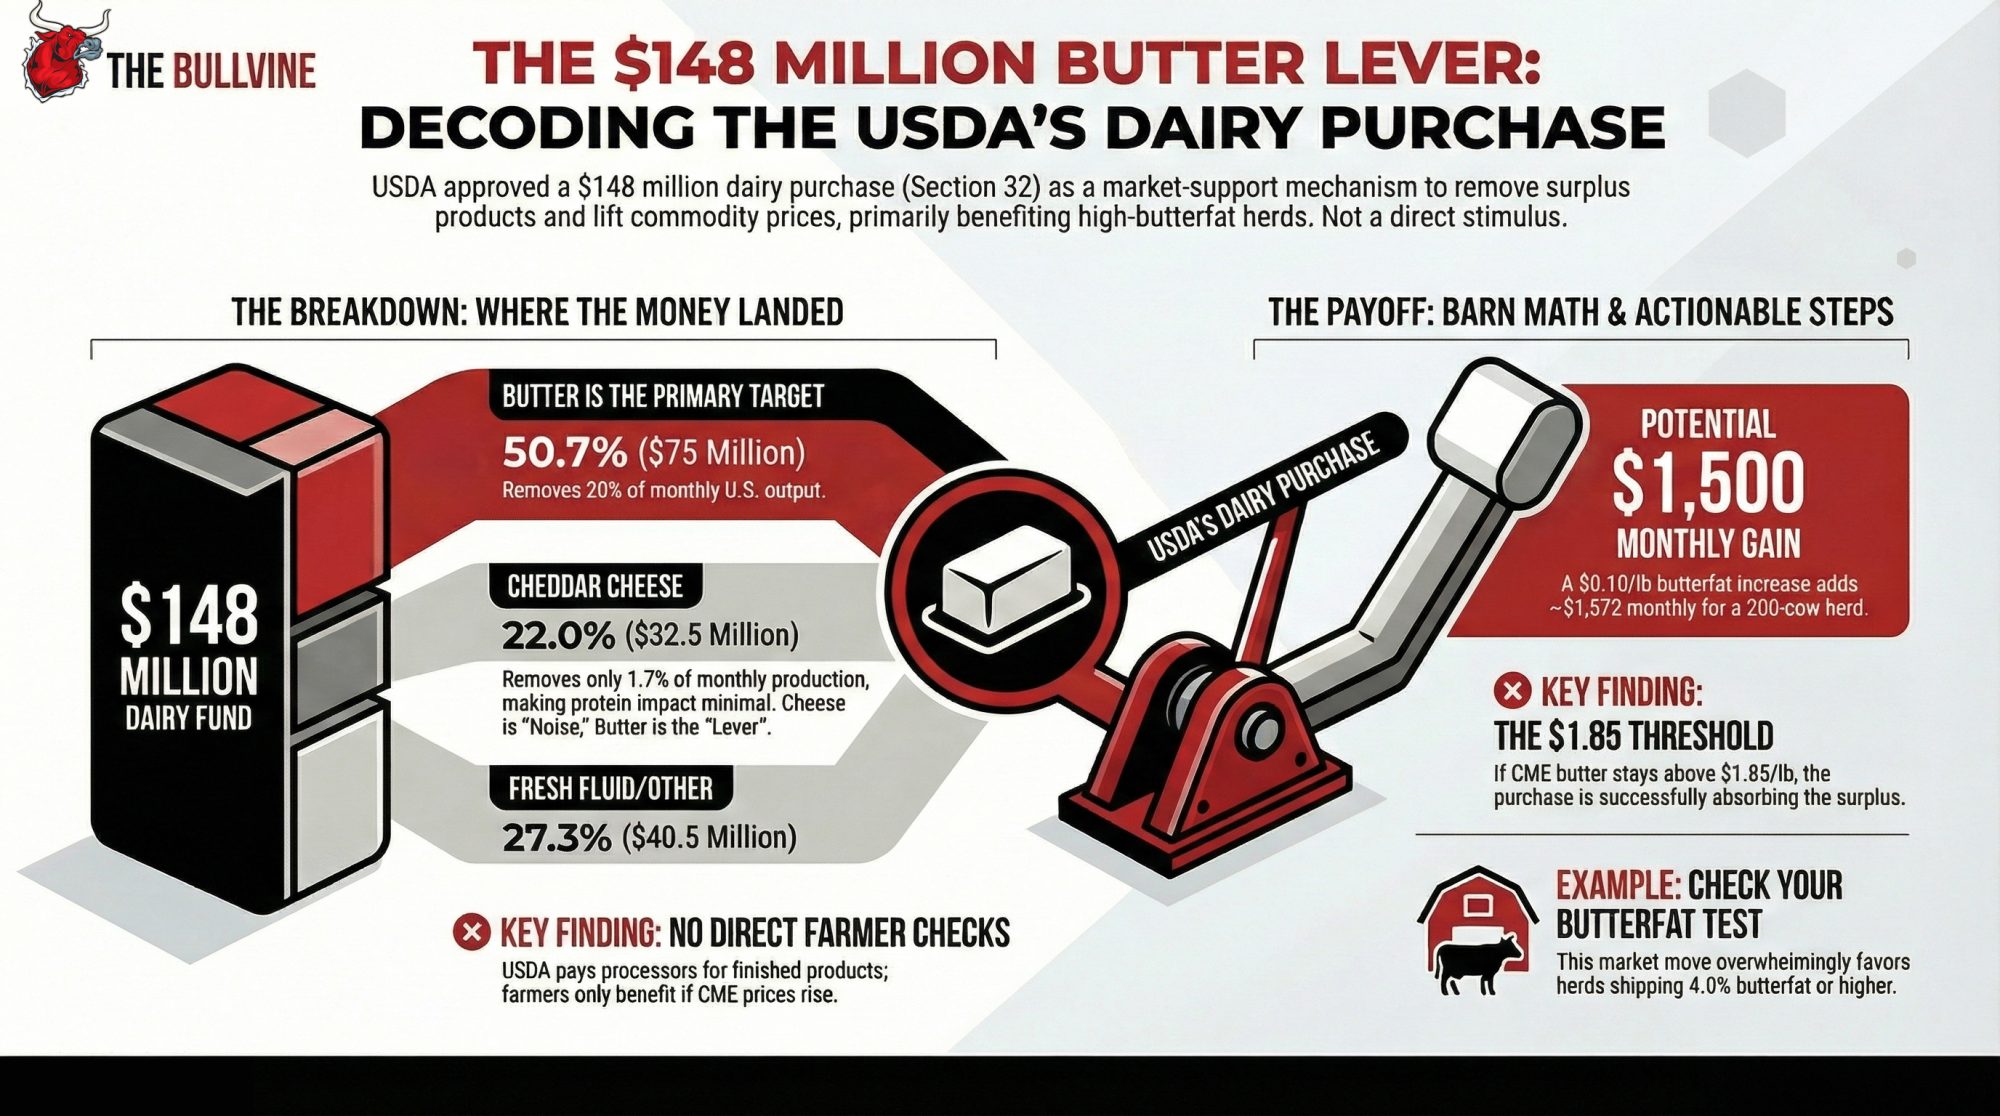
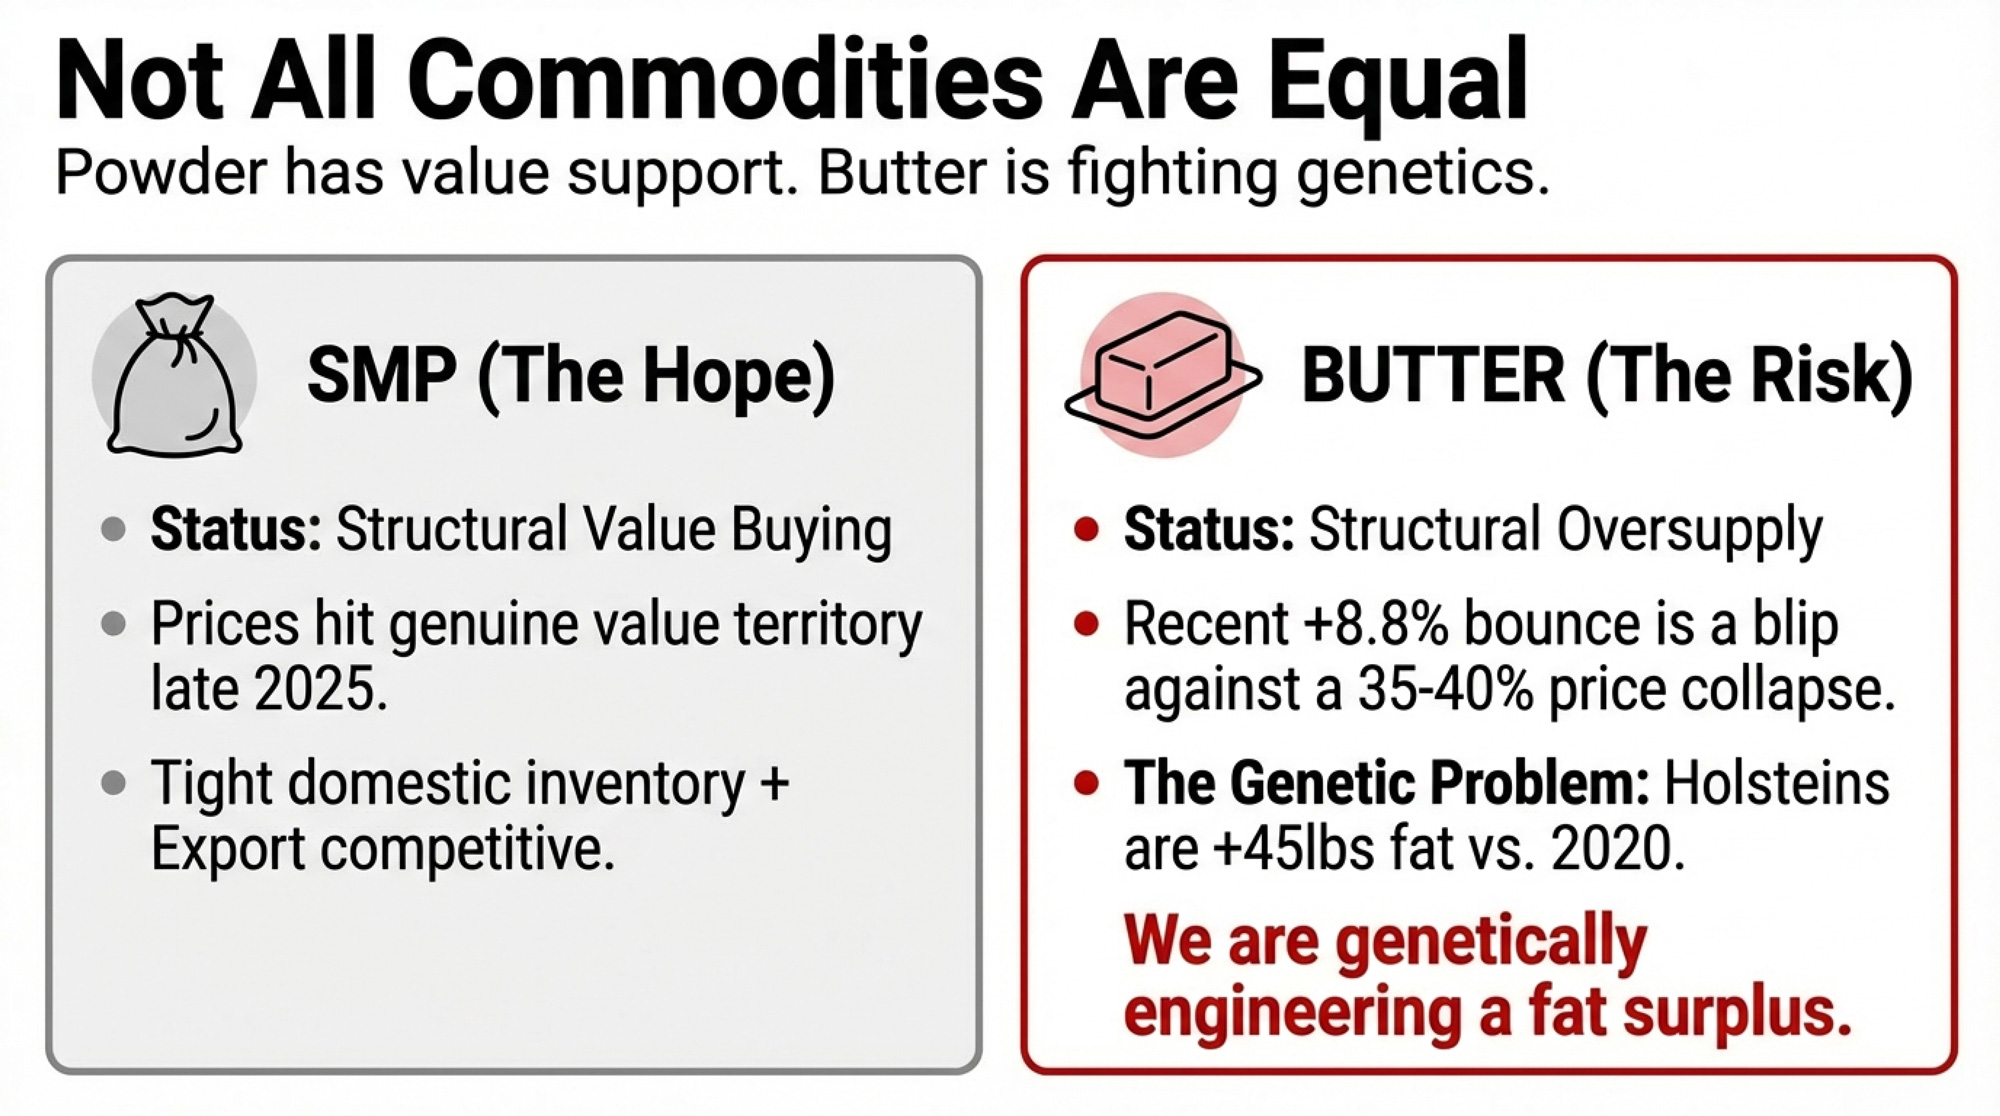
| Butter | $2.22/lb | $1.68/lb | –24% |
| Cheese (blocks) | $1.79/lb | $1.60/lb | –11% |
| Whey | $0.60/lb | $0.69/lb | +15% |
| NDM | $1.24/lb | $1.32/lb | +6.5% |
Source: USDA 2026 Agricultural Outlook Forum, February 19, 2026
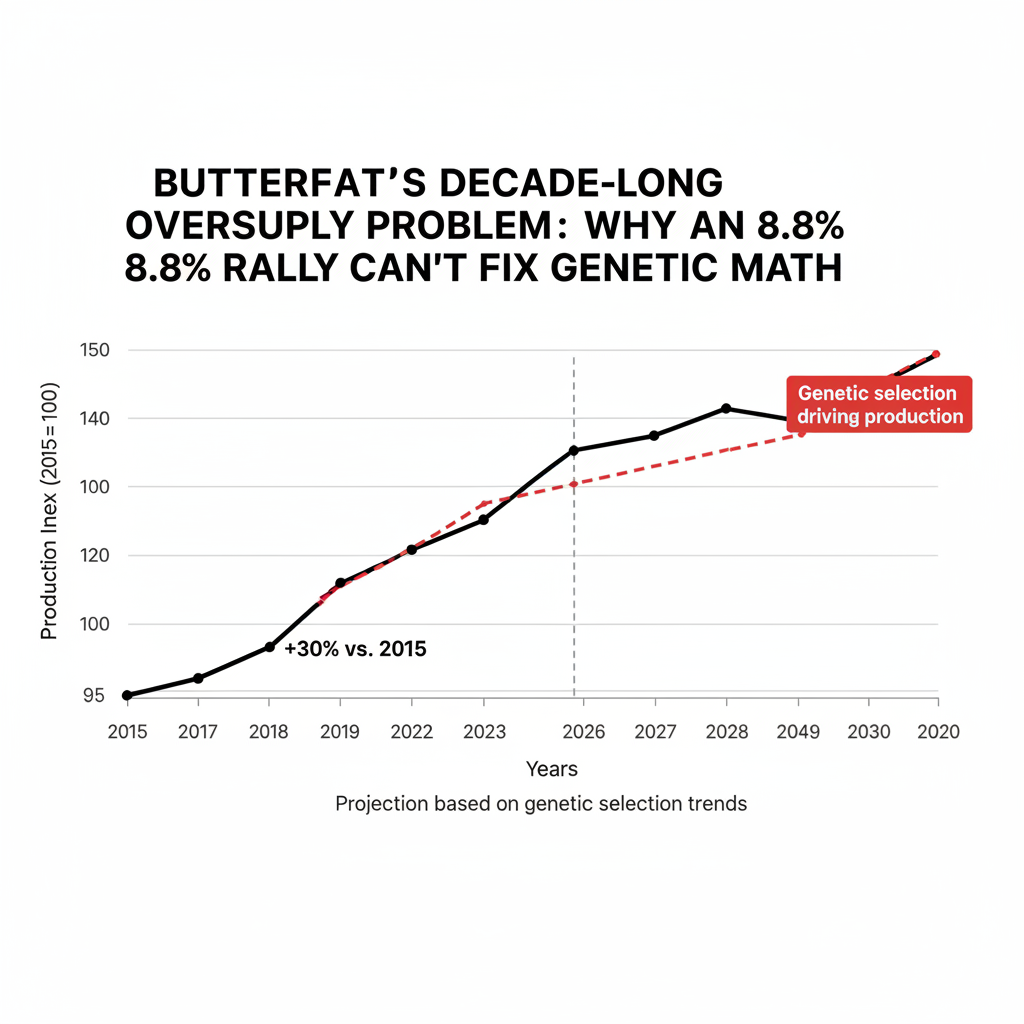
Butter and cheese drive your Class III check, and both are down double digits. National milk-fat tests averaged 4.32%in 2025, up from 4.24% in 2024 — more fat per pound of milk than the market can absorb. Lucas Sjostrom, executive director of Minnesota Milk, told the Red River Farm Network in January 2026: “Although milk is milk, it’s the components that we sell, and we’ve got all sorts of components on the market.”
Fat-heavy herds are losing more ground than protein-heavy herds right now. Pull your last three checks and compare fat revenue per cwt to the same months in 2025. If your herd tests fat-dominant, the 24% butter decline is hitting your check harder than national averages suggest. Protein-heavy herds are partially insulated. Your checks tell you which camp you’re in — USDA averages won’t.
Related: For how the widening Class III–IV spread compounds this pain, see the $3 milk trap and what it means for your 500-cow check.
USDA Says $18.95. The Futures Strip Finally Caught Up — Almost.
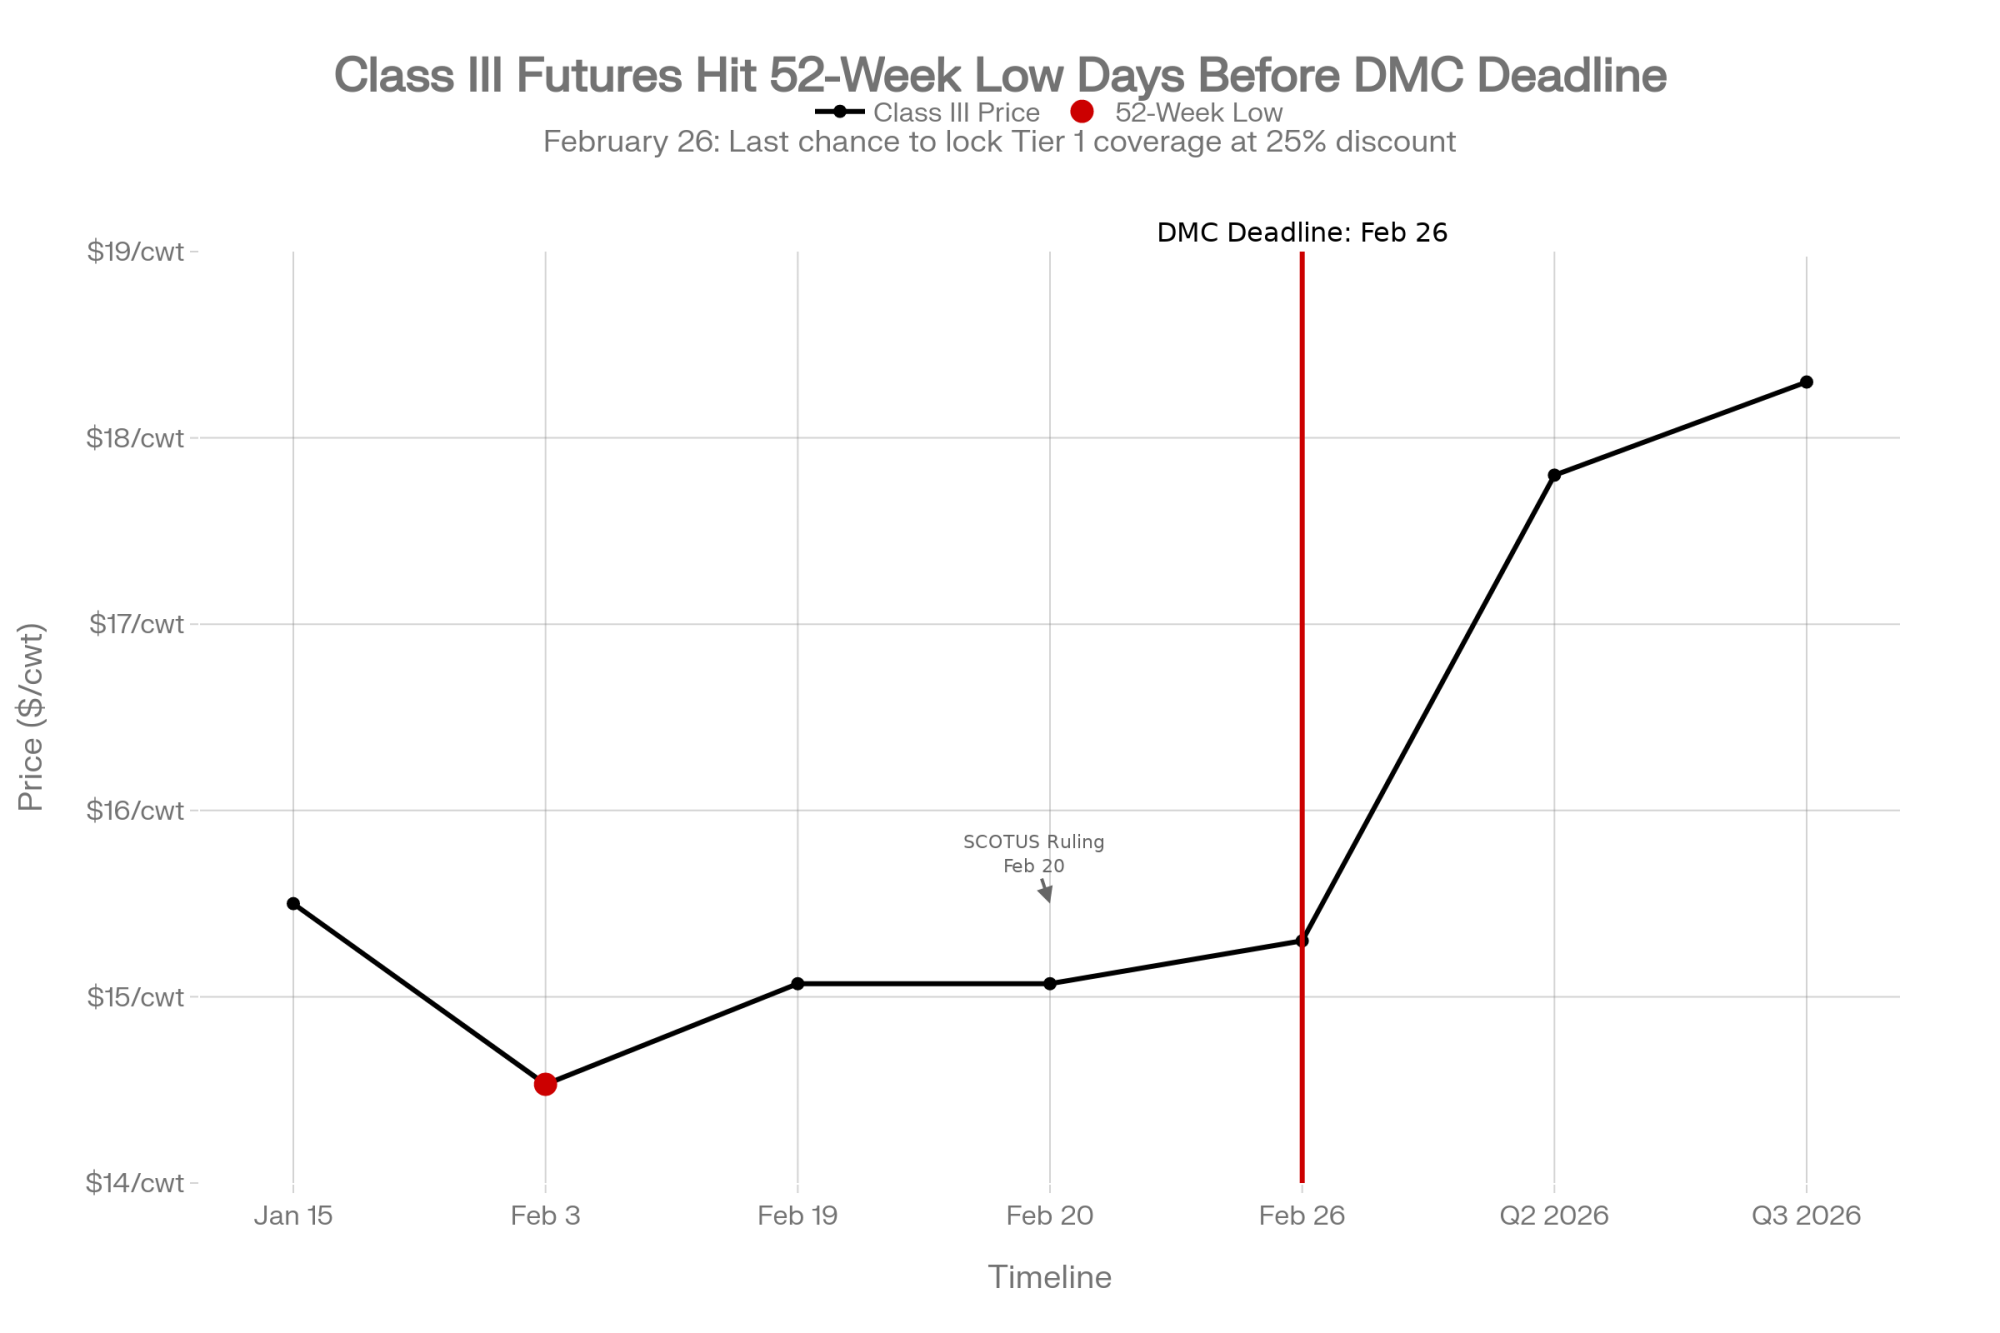
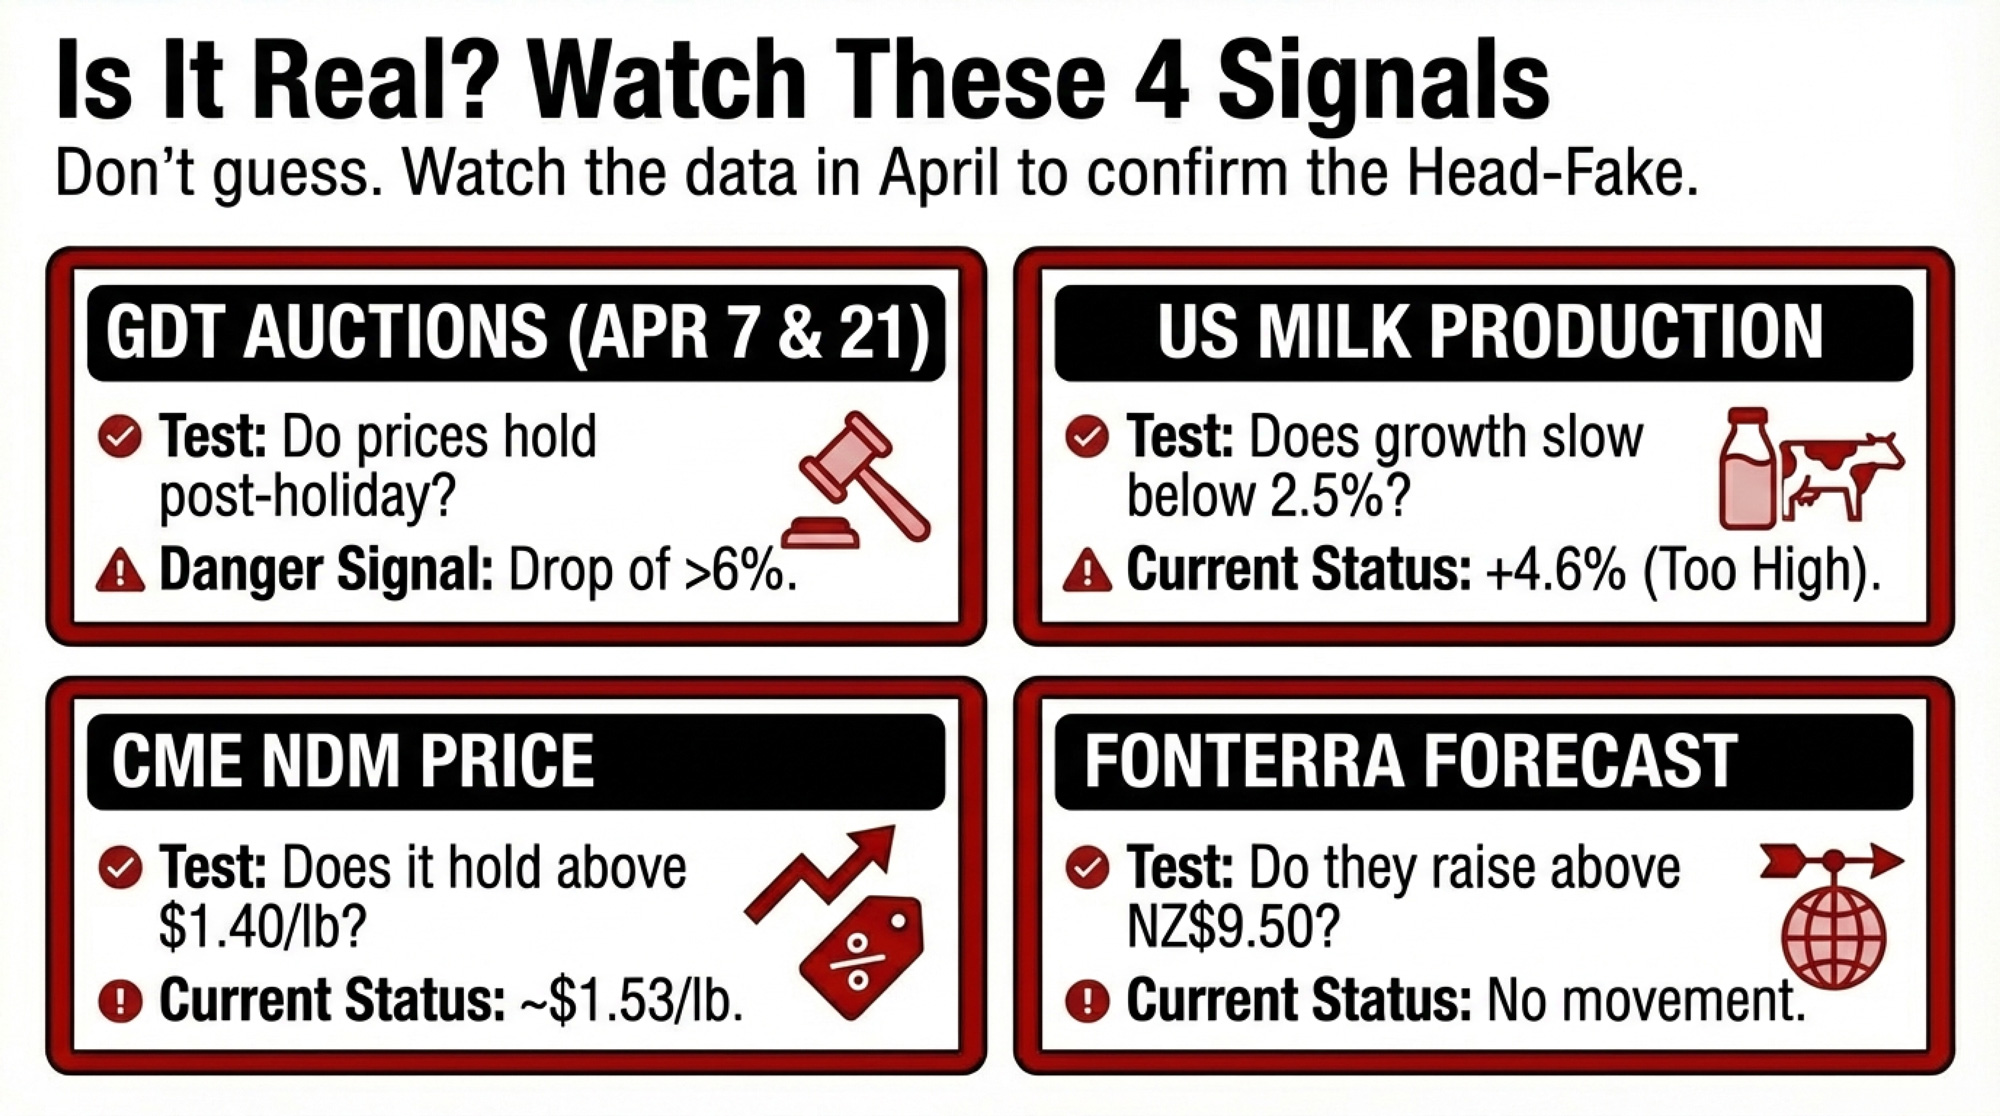
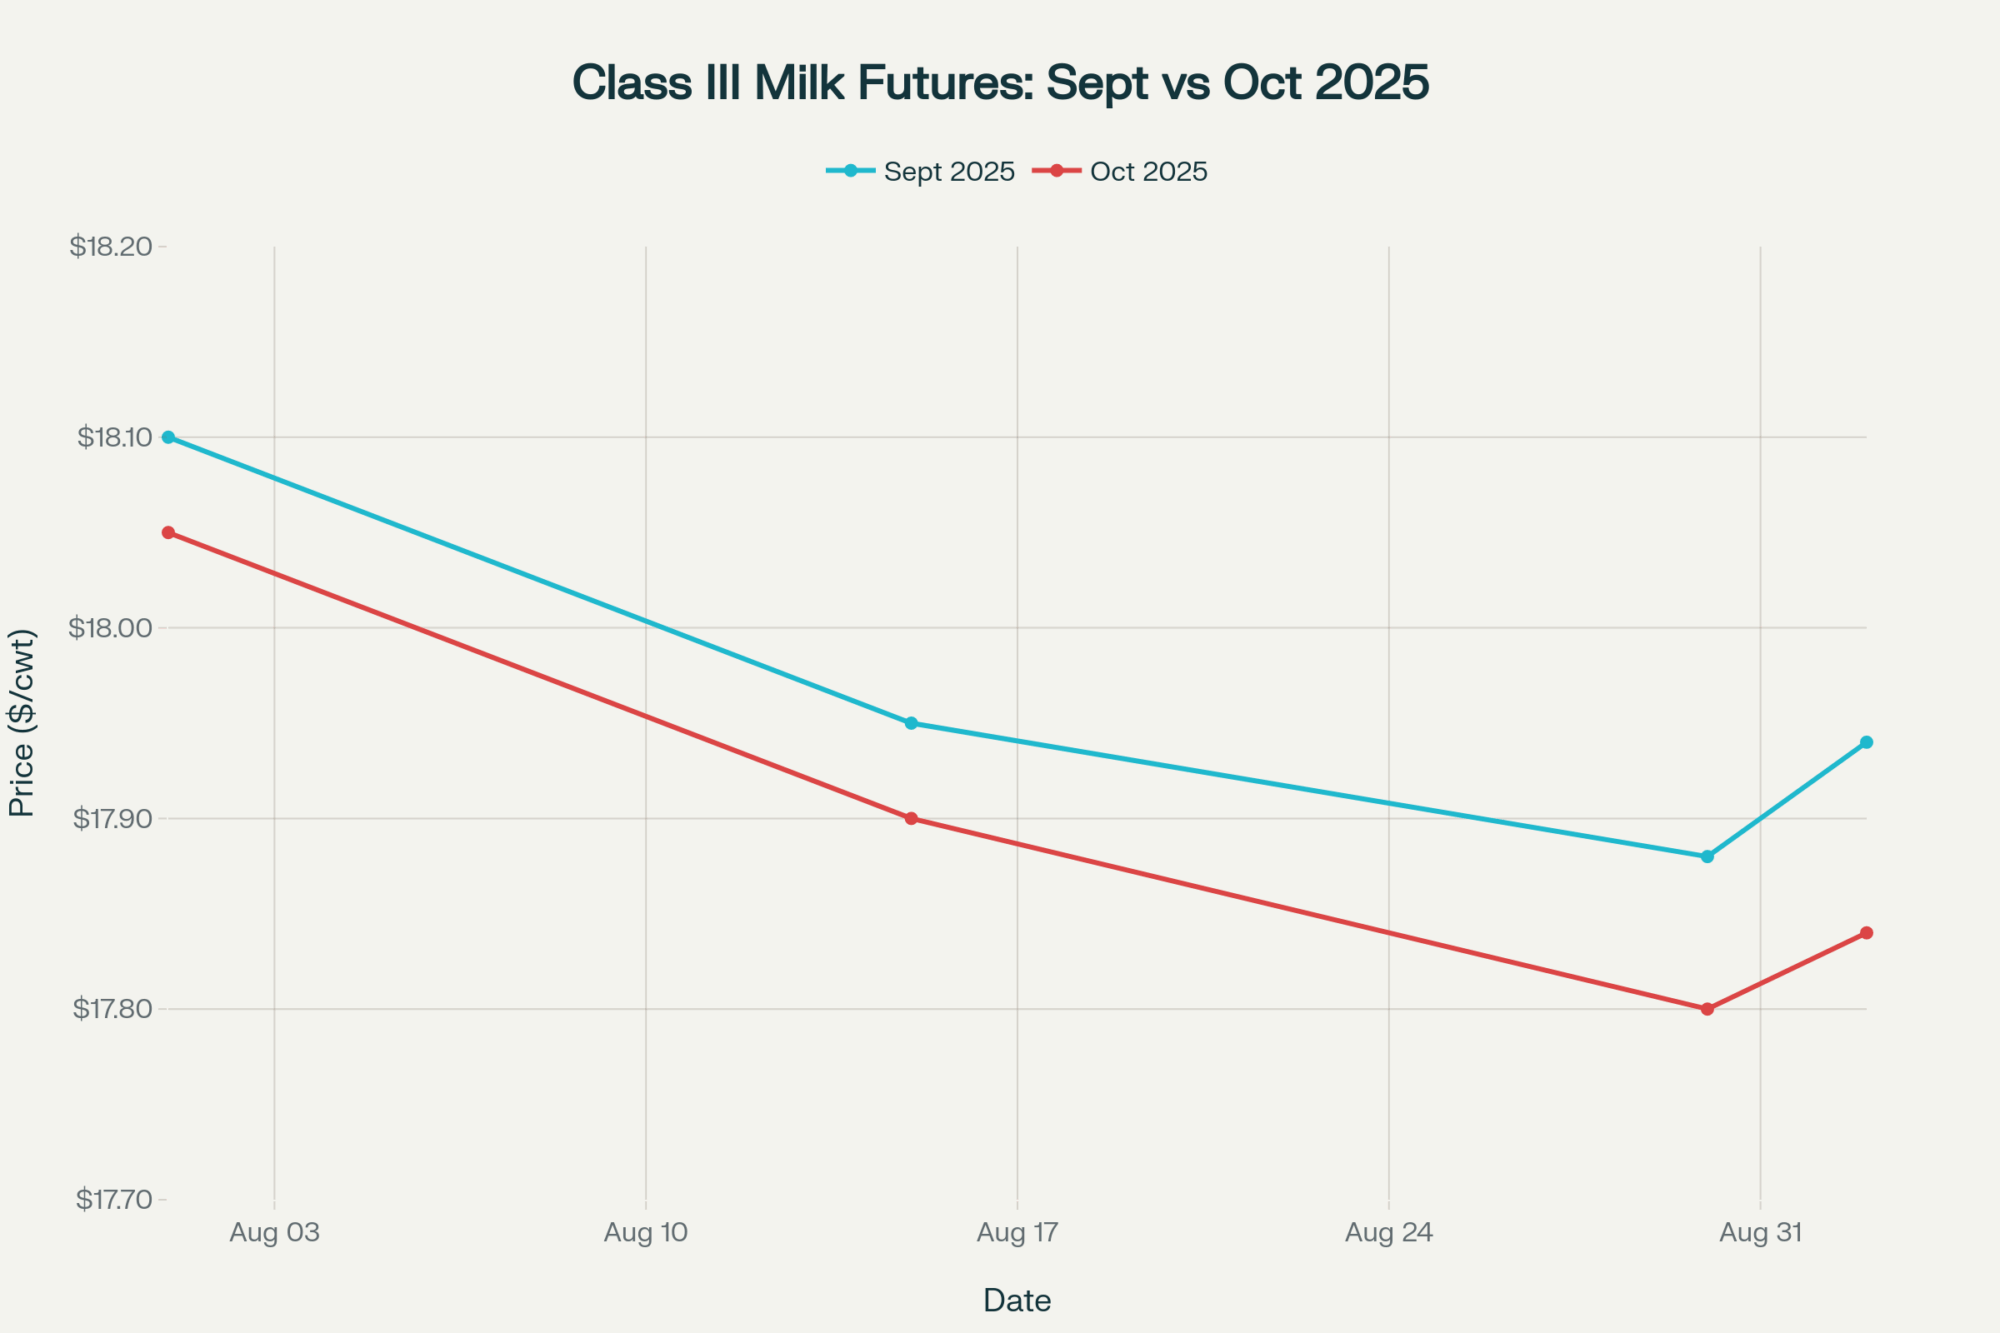
USDA’s February WASDE pegs 2026 all-milk at $18.95/cwt. When the article was first drafted in late February, the Class III strip was pricing $15.38 for February and $17.13 for March. By month-end, a sharp cheese rally — blocks surging past $1.86 — pulled March to $18.00 and lifted June through November above $18.00. USDA’s own quarterly projections from the Outlook Forum (February 19): Q1 at $17.90, climbing to Q4 at $19.90.
That $19.90 fourth quarter still has to do heavy lifting — but the gap between the strip and USDA’s forecast has narrowed sharply. The problem is January ($14.59) and February (~$15.00) are already in the books. Those two months drag the strip-weighted annual average to roughly $17.65, even with $18+ contracts the rest of the year.
For budgeting, the futures strip is where actual contract money trades. The strip now prices $18.00–$18.46 from March through December — much closer to USDA’s $18.95 than it was two weeks ago. But the damage from a $14.59 January and ~$15.00 February is already baked in. Your strip-weighted annual average sits closer to $17.65 than $18.95, and that’s before accounting for basis and actual mailbox discounts.
The Replacement Squeeze Making Culling Decisions Harder
The standard margin playbook says cull the bottom 5–8% and capture cash. Cull values are cooperating: CattleFax analyst Mary Kurzweil confirmed live-market support at $160/cwt in late February, with 90s trim projected into the mid-$440s. At $160 live, a 1,400-lb Holstein brings roughly $2,240 per head. Shipping 25–40 cows from a 500-cow herd generates $56,000–$90,000 in immediate cash.
| Item | National Average (Feb 2026) |
|---|---|
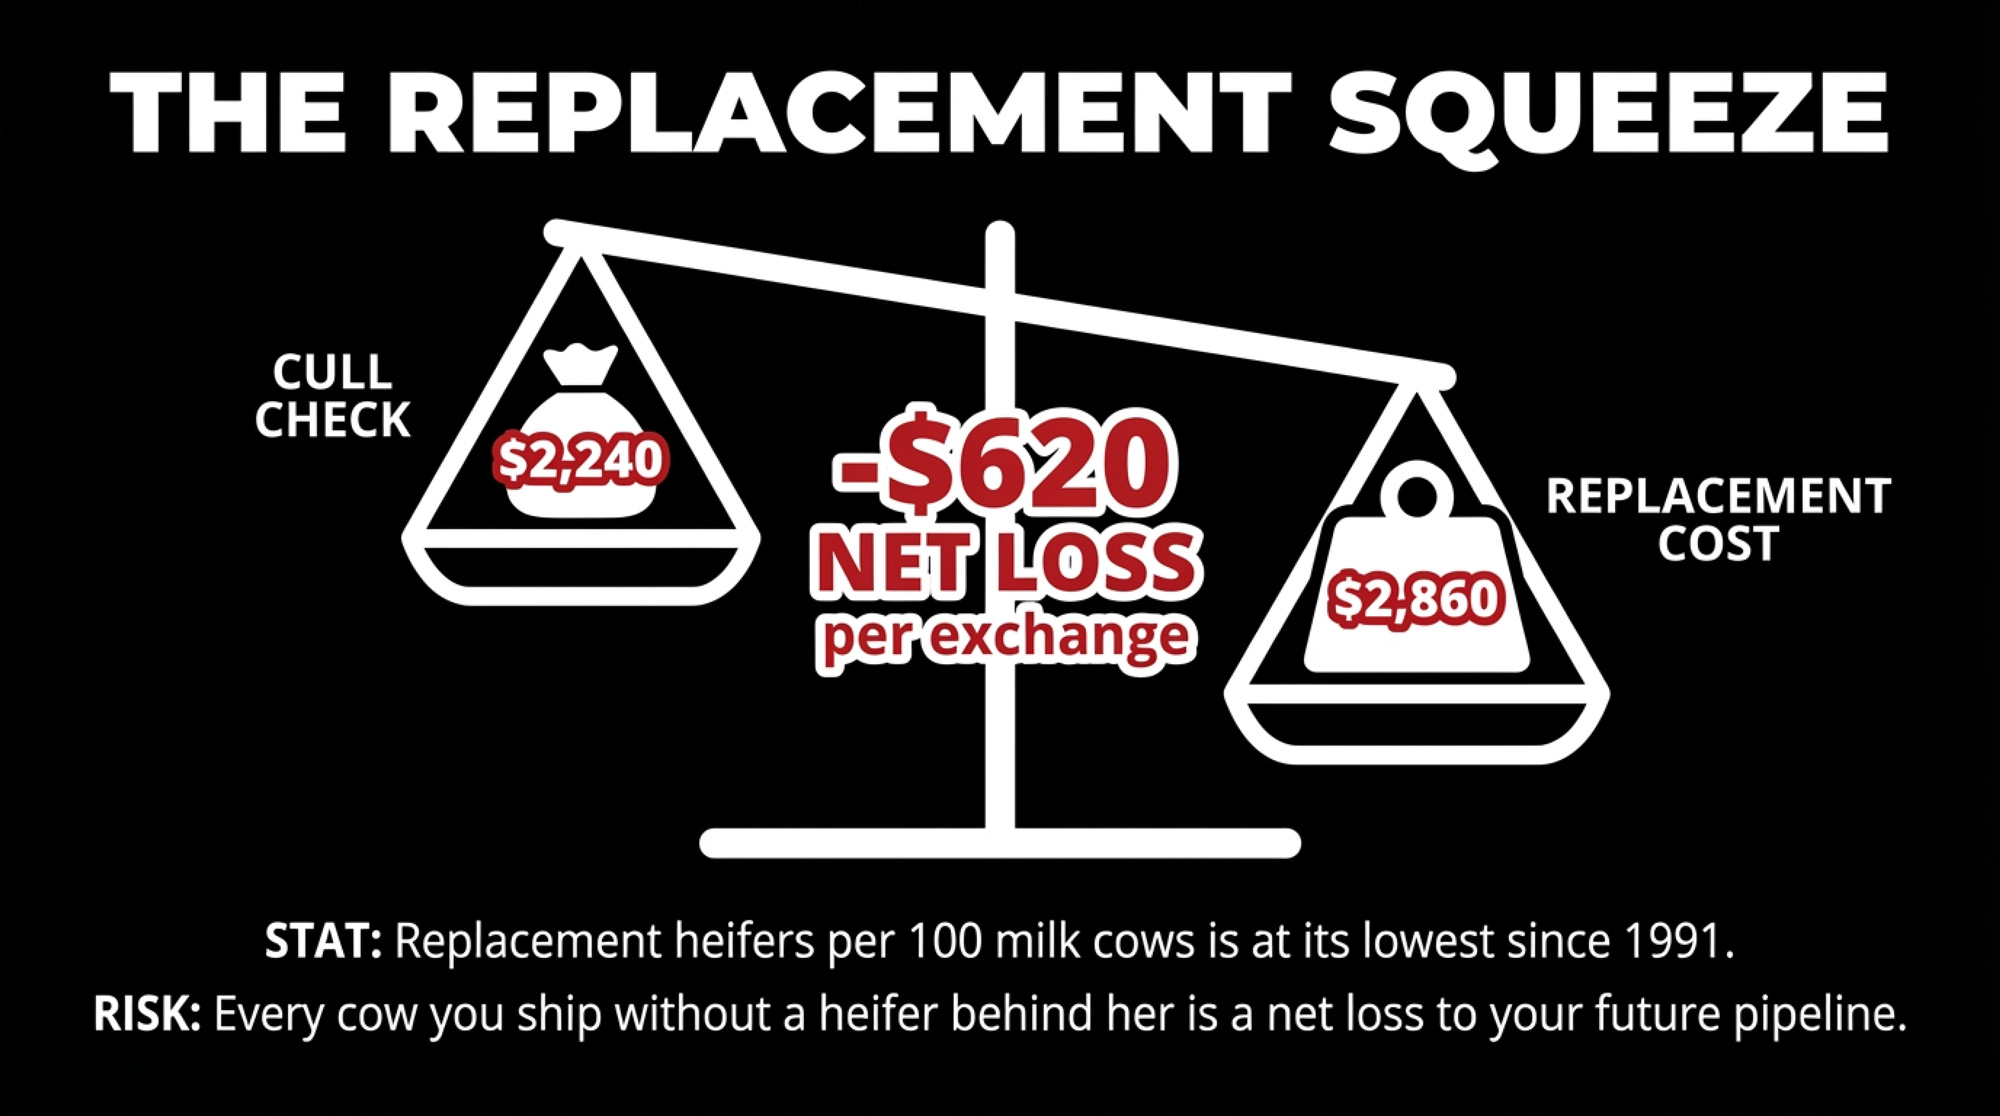
| Cull cow revenue (1,400 lb @ $160/cwt live) | $2,240 |
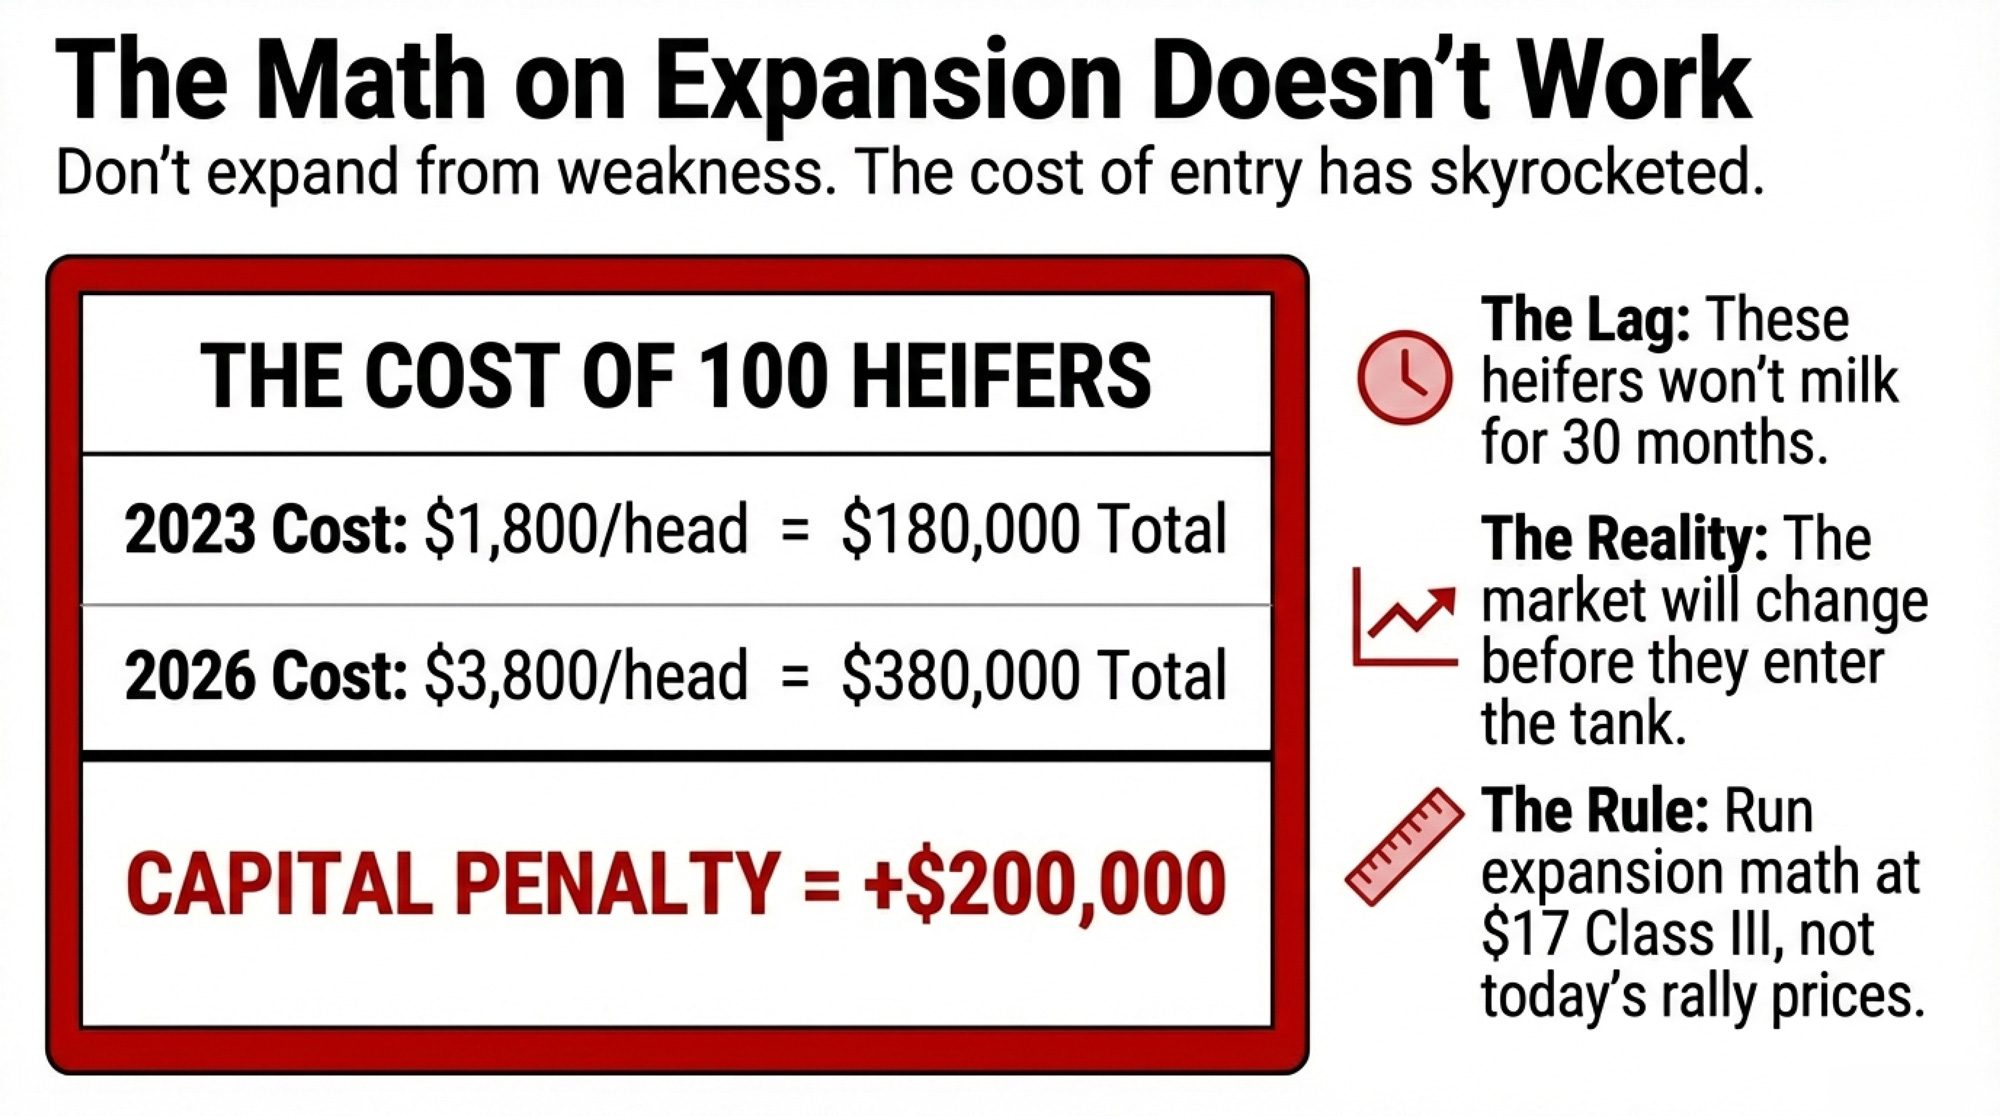
| Replacement cost (springer heifer, national avg) | $2,860 |
| Net cost per cow culled & replaced | –$620 |
But replacements complicate that equation. Heifers hit a record $3,110/head nationally in October 2025. By January 2026, the average eased to $2,860 — but top springers at Pennsylvania’s Premier Livestock & Auctions still cleared $2,850–$4,050 at the February 18 sale. Net cost of culling and replacing at national averages: roughly $620 per cow. And dairy replacement heifers per 100 milk cows hit their lowest percentage since 1991 as of January 1, 2026.
Internal rearing runs roughly $2,034/head in Pennsylvania and $1,709 in the Midwest, per Penn State Extension data updated December 2025. That’s substantially cheaper than buying — but it takes 24–26 months to reach the milking string. If your beef-cross rate exceeds 40%, every cull today has pipeline consequences in 2028.
Five Moves That Pencil Out Right Now
Each has a verified dollar amount and a named source.
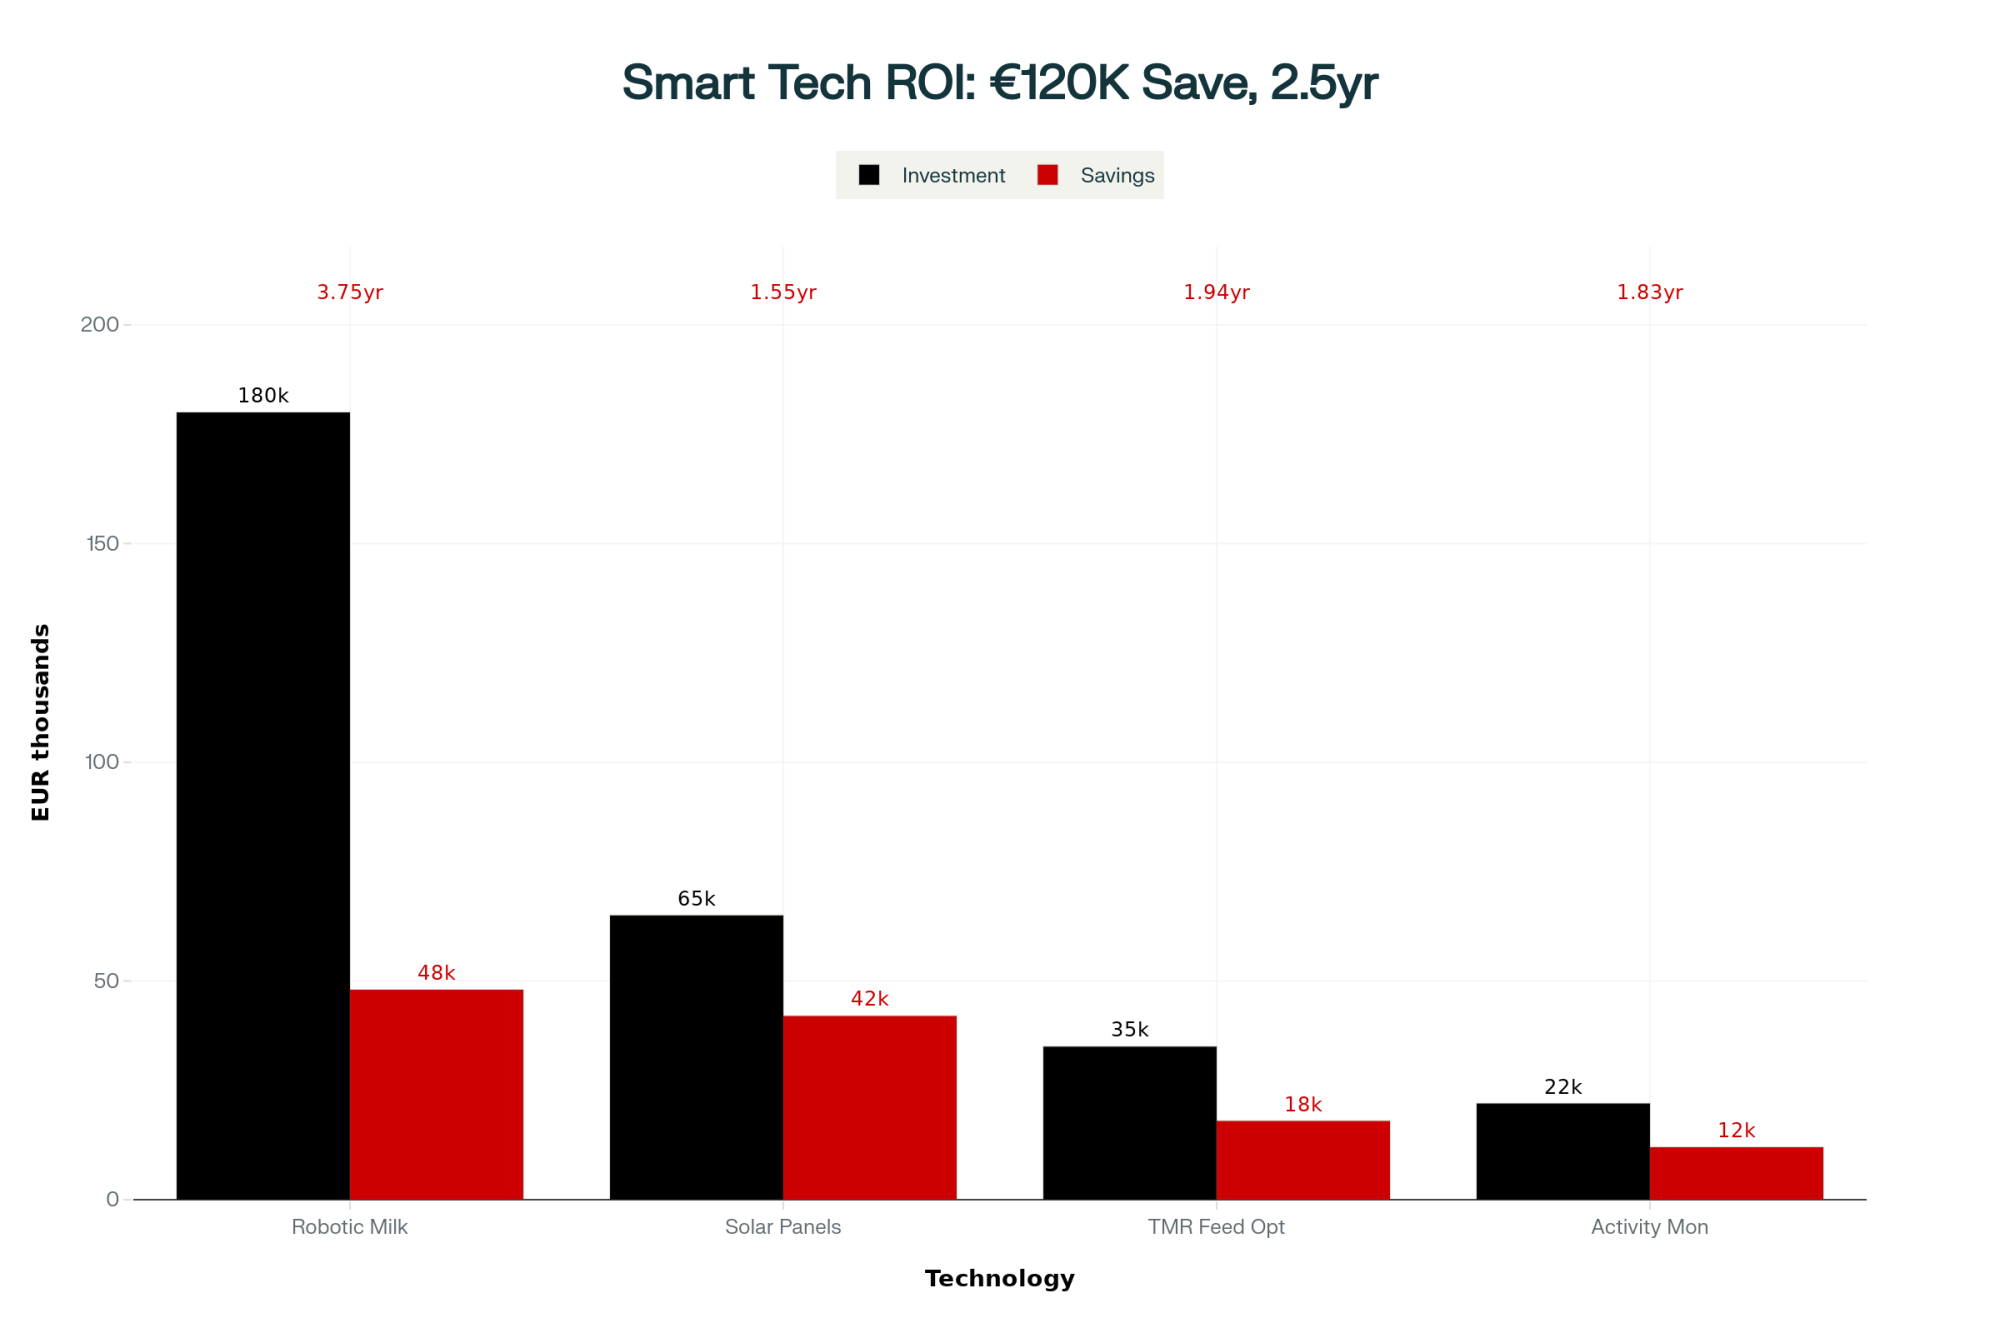
1. Audit feed shrink this month. Dr. Mike Brouk at Kansas State presented the math at the 2019 Vita Plus Dairy Summit, and it still holds: a 500-cow dairy running $7.50/cow/day in feed costs can capture roughly $50,000/year from a 4-point reduction in shrink. “Comparatively speaking, capturing $50,000 from milk price alone for a 500-cow herd would require an additional 32 cents per cwt for the year,” Brouk said. No capital required.
At scale, the payoff compounds. According to a 2018 Dairy Global profile, the Statz Brothers dairy — run by Joe Statz, his two sons, and cousins Troy and Wesley — milks 4,400 cows near Marshall, Wisconsin. They built a dedicated feed center and dropped shrink from around 10% to 2–3%. Todd Follendorf, then a nutritionist at Cornerstone Dairy Nutrition in Waunakee, described the rationale in that profile: “Shrink control has been the main reason why we built the whole facility. Before, we had shrink percentages of around 10% every single day. Now, we have reduced this to 2% to 3%.” At $8/cow/day feed cost and a 5-point reduction across 4,400 cows, the documented savings exceed $500,000 per year.
2. Cull strategically — but count your pipeline first. At $2,240/head cull revenue and $2,860 per replacement, every cow you ship without a heifer behind her costs more than the check you deposit. Run the math both ways before loading the trailer.
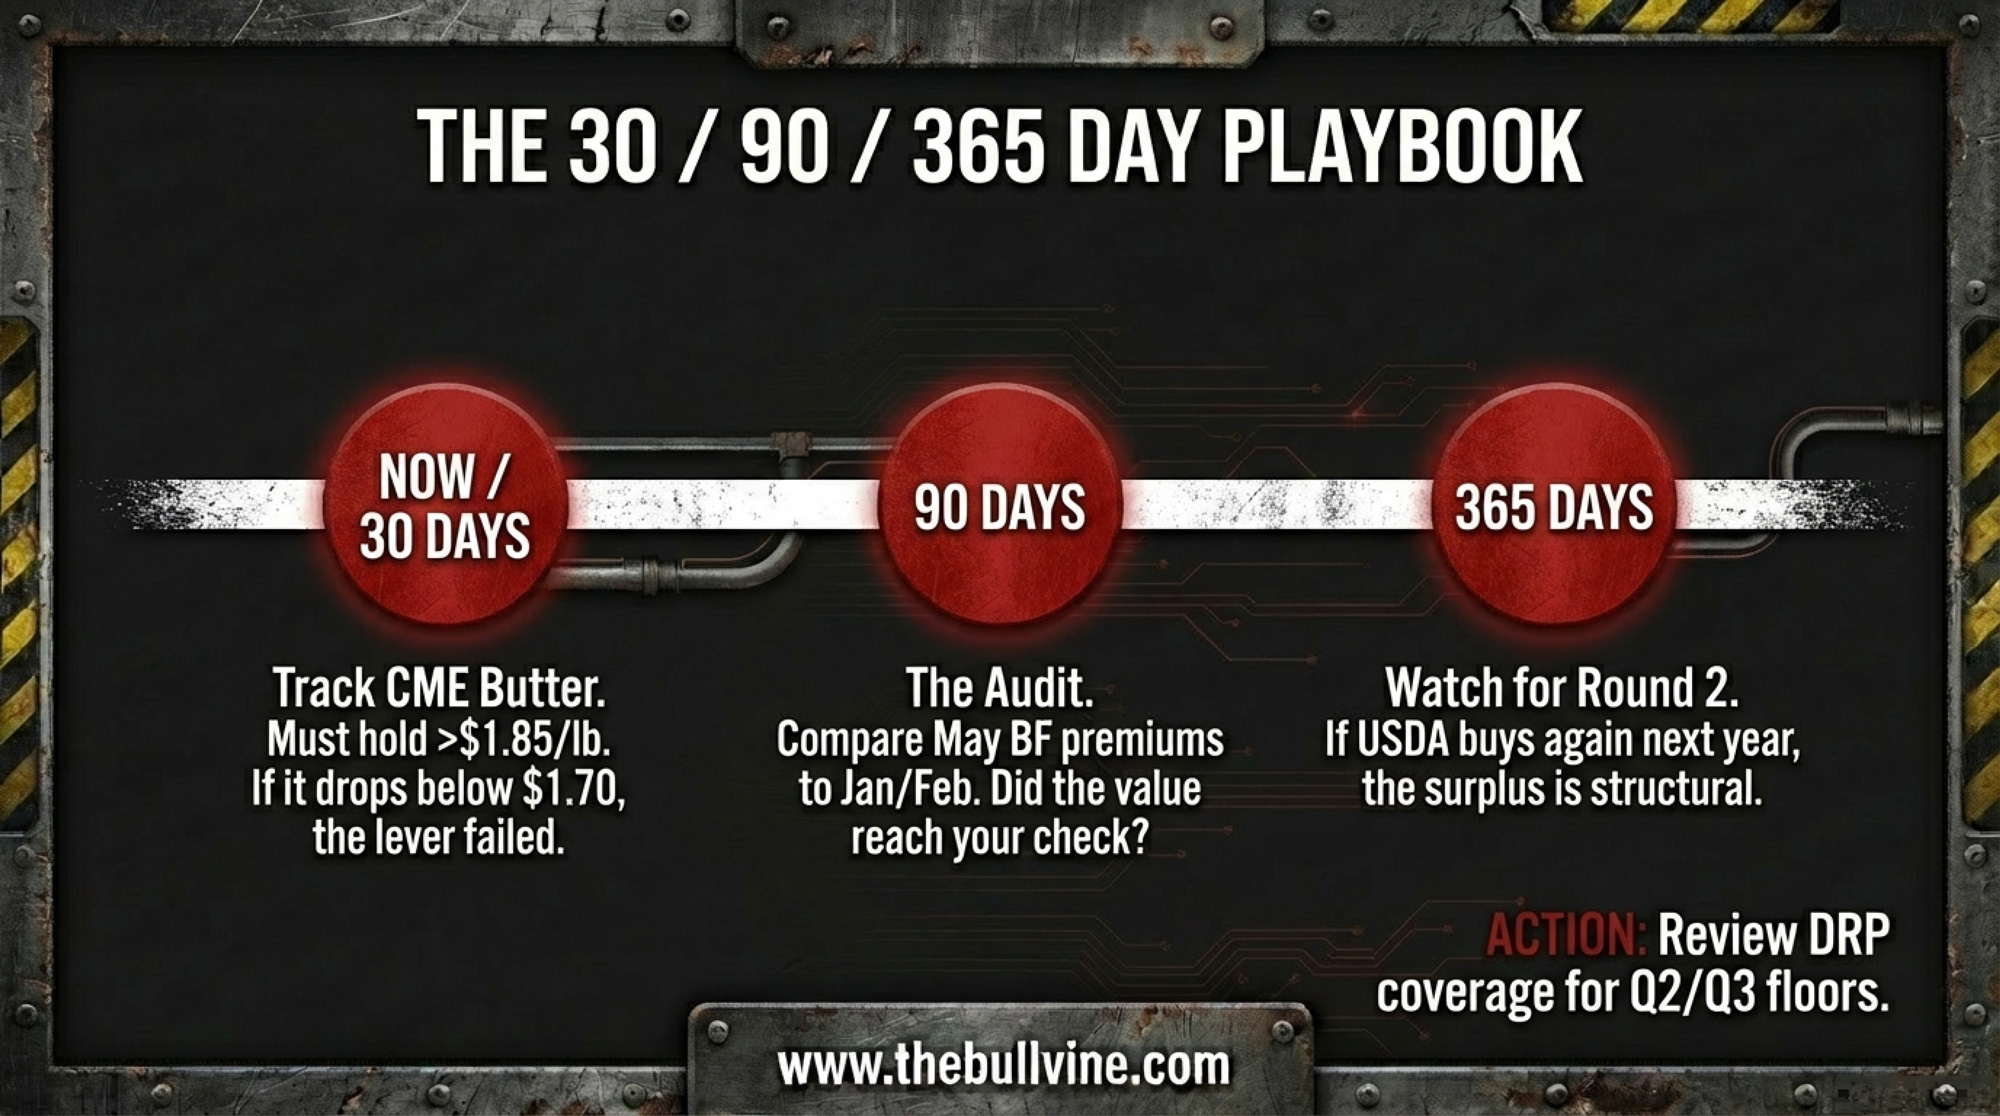
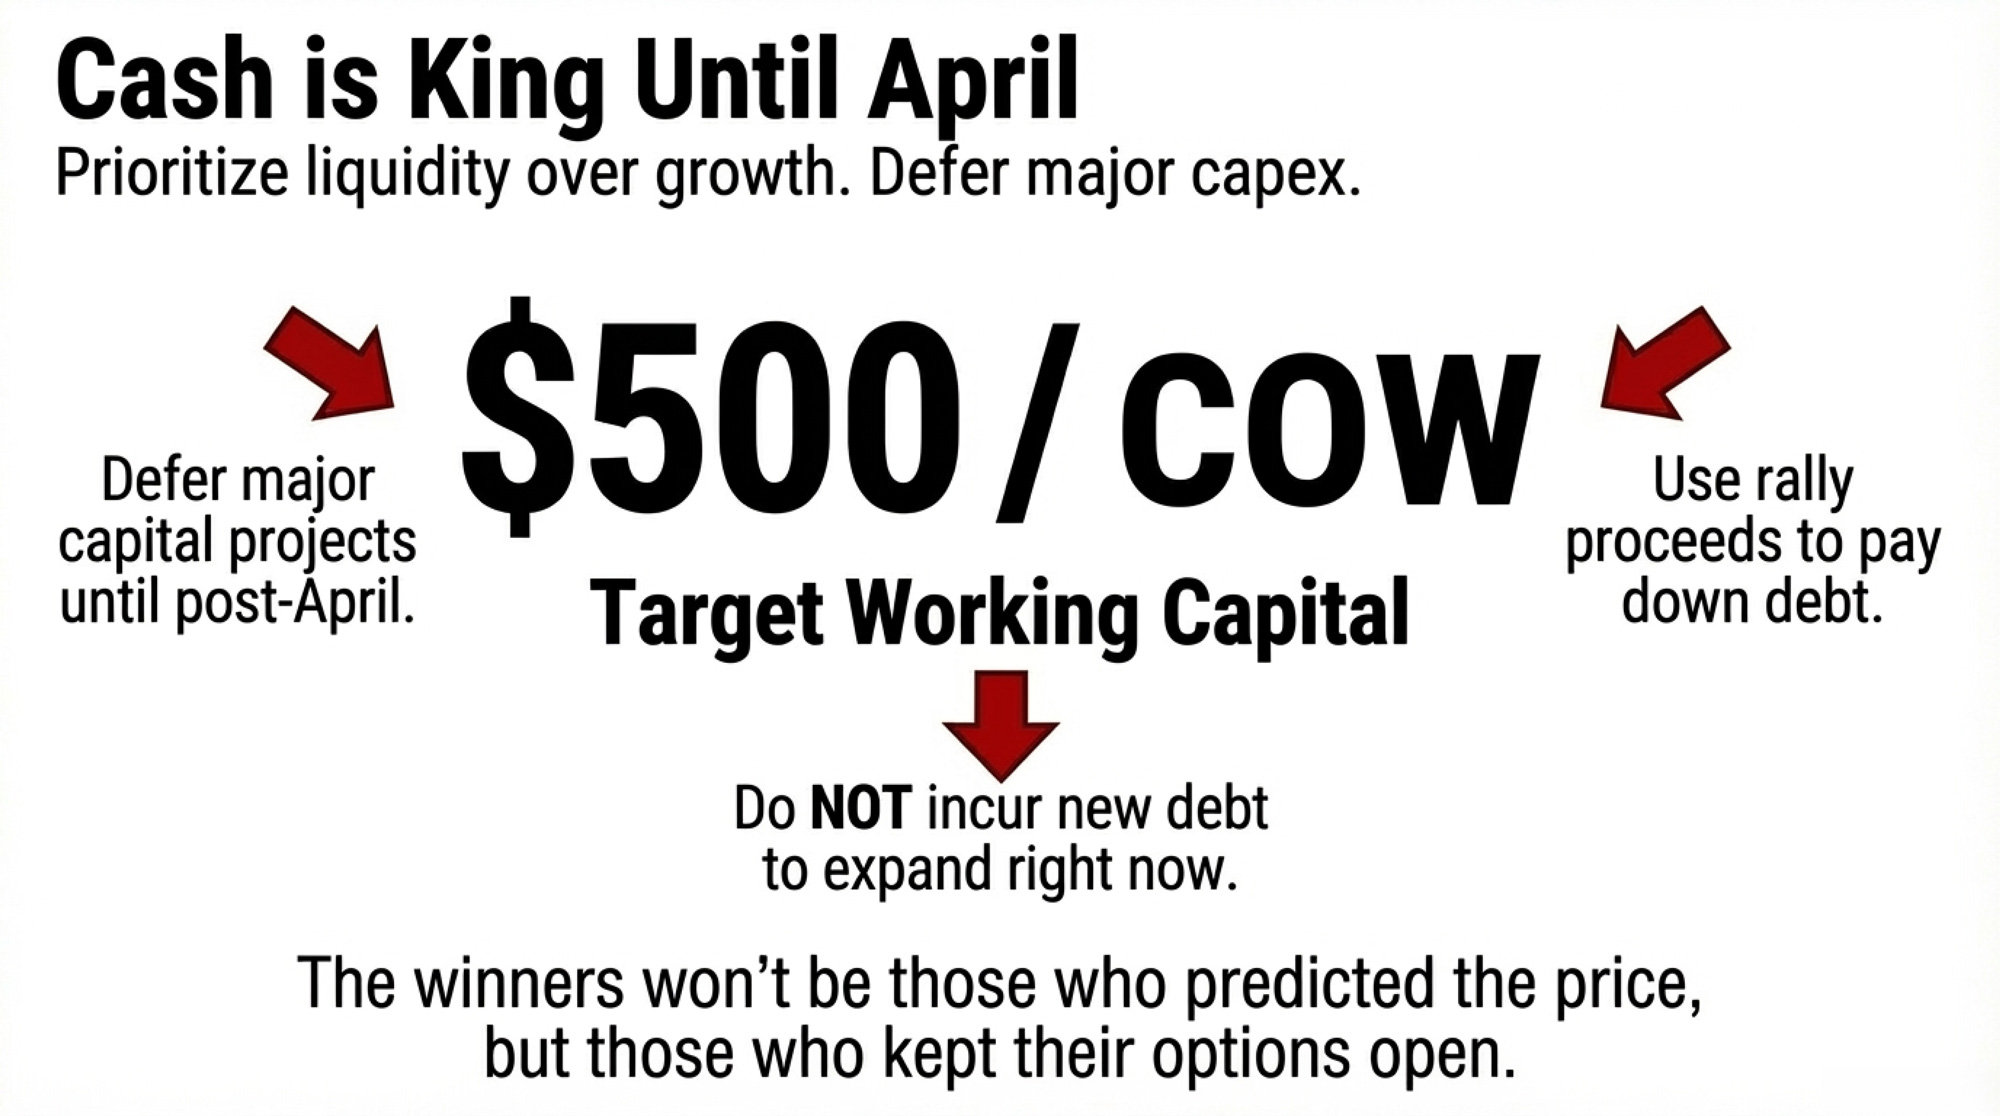
3. Lock fall production if Class III contracts clear $18.50. September–December contracts sat at $18.35–$18.46 in late February. That’s close to lockable. You give up upside if the market rallies past $19, but if you’re carrying significant debt service, certainty may matter more than optionality.
4. Review your component profile against current prices. Butter down 24%, cheese down 11%, whey up 15%. If your herd tests fat-dominant, your check is being hit harder than national averages suggest. Pull actual checks, not projections.
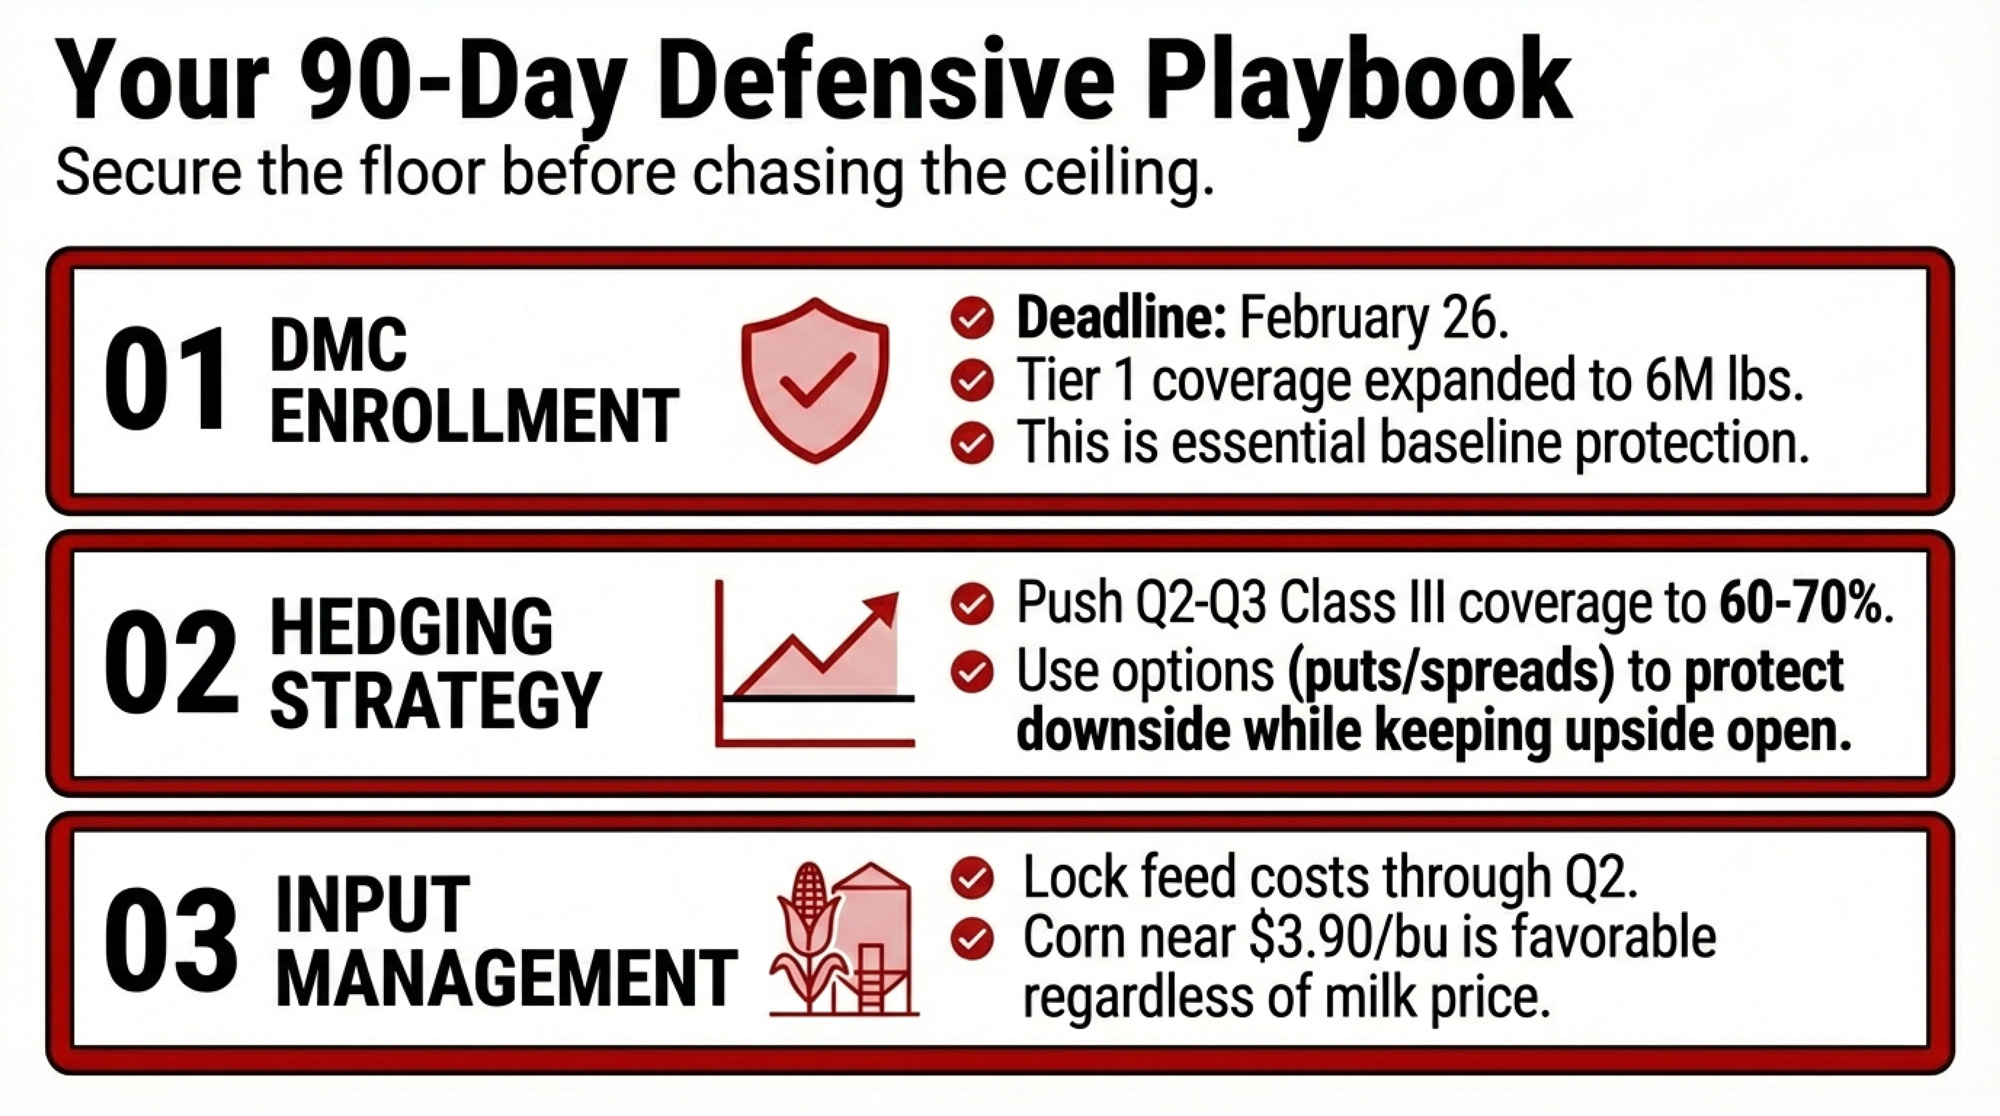
5. Talk to your lender before April — on your terms. If the operating note assumed $19+ milk, those assumptions broke in January. Build a revised projection off the futures strip (~$18.00–$18.46 March through fall) — but weight your annual average for the $14.59 January and ~$15.00 February already in the books. That pulls your working number closer to $17.65 than $18.95. Kohl’s burn-rate formula gives you the framing: working capital ÷ monthly shortfall = months of runway.
The Safety Net Covers Half — Maybe
DMC payouts above $1/cwt are projected for January through April 2026, with smaller payments through July. The Tier 1 coverage expansion to 6 million pounds helps mid-size herds. But a 500-cow dairy producing 11.5 million lbs annually gets coverage on about 52% of its milk. The other 48% rides exposed.
William Loux, senior vice president of global economic affairs at the National Milk Producers Federation, framed it in a January 2026 interview with Dairy Herd: “It’s good that DMC is paying out, but it’s almost always better for prices, and better for dairy farmers, if they don’t.”
Related: For a deeper comparison of DMC vs. DRP in the current price environment, see how DRP compares to DMC for spring 2026 risk management.
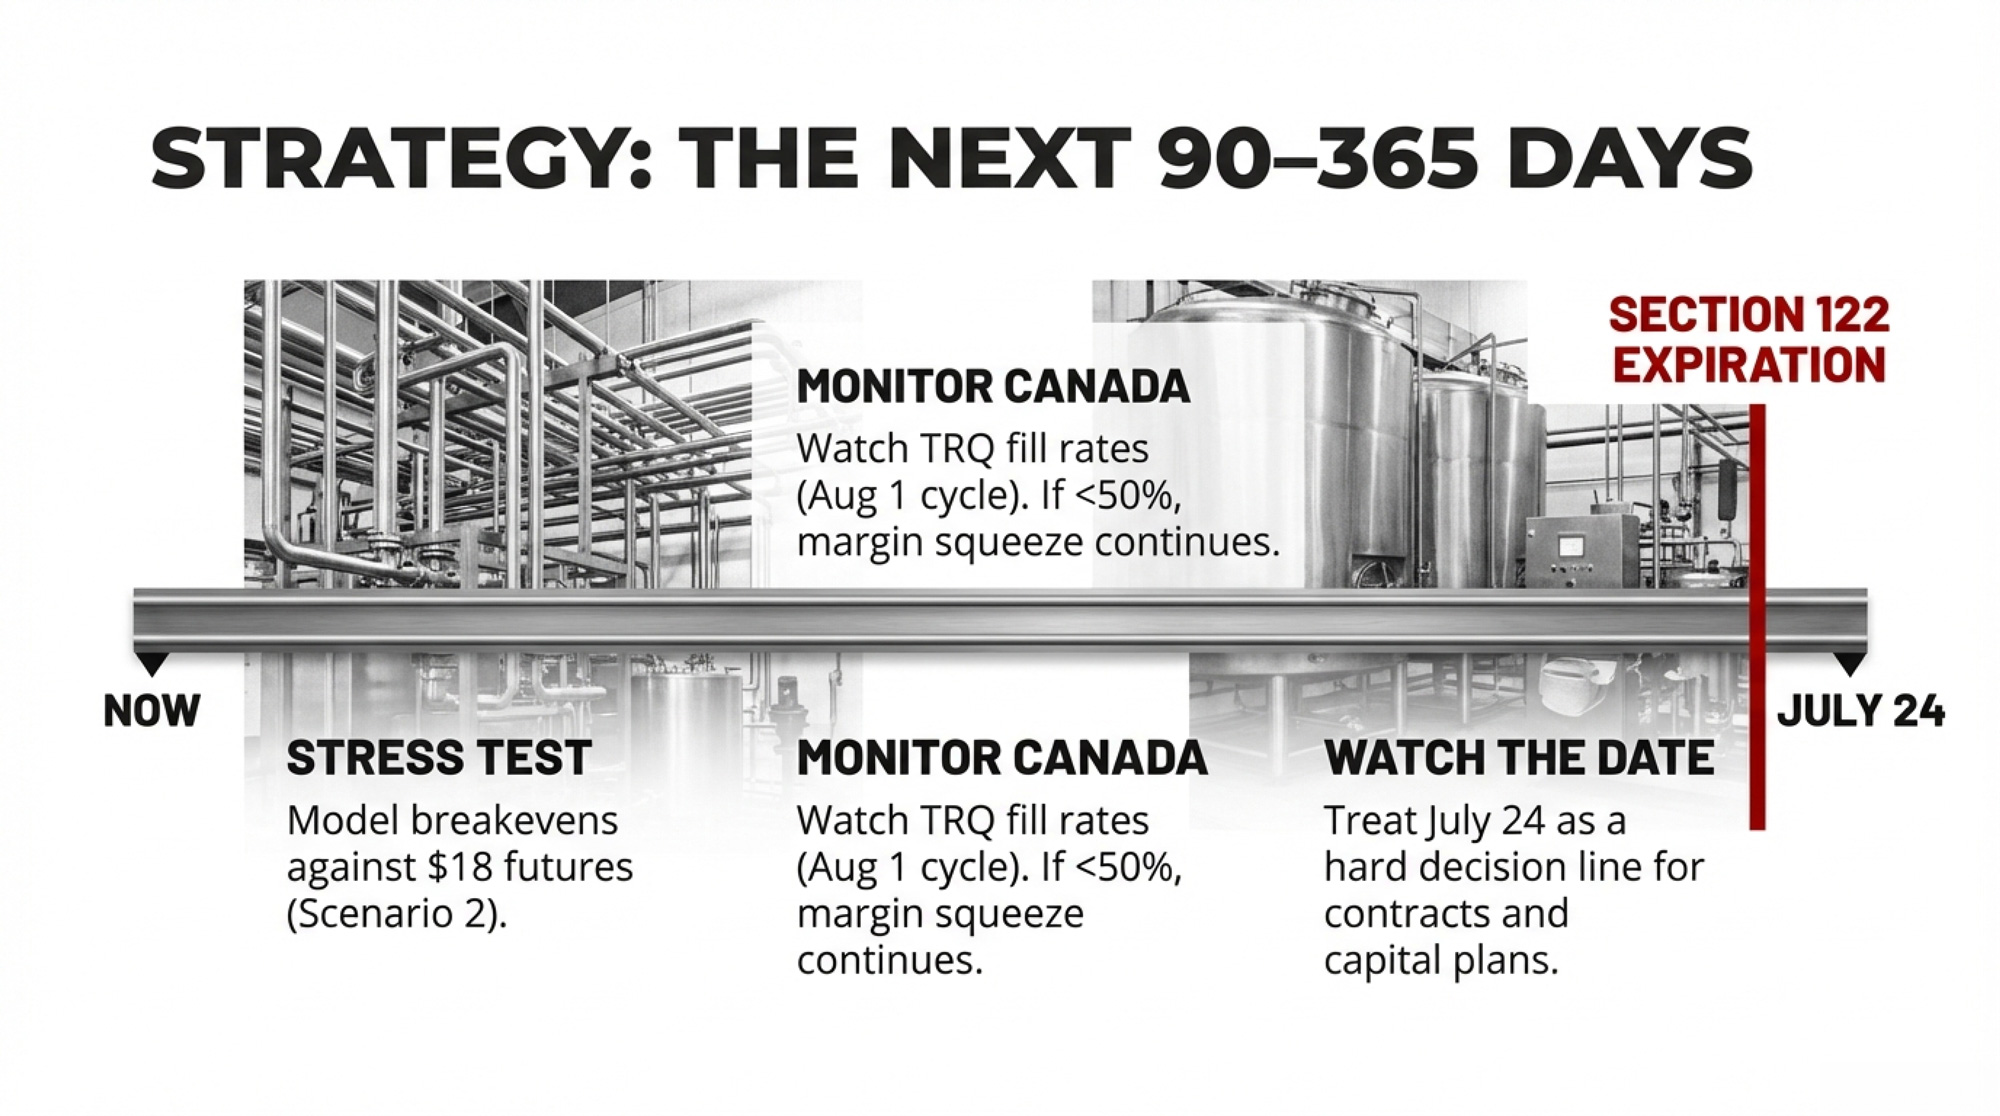
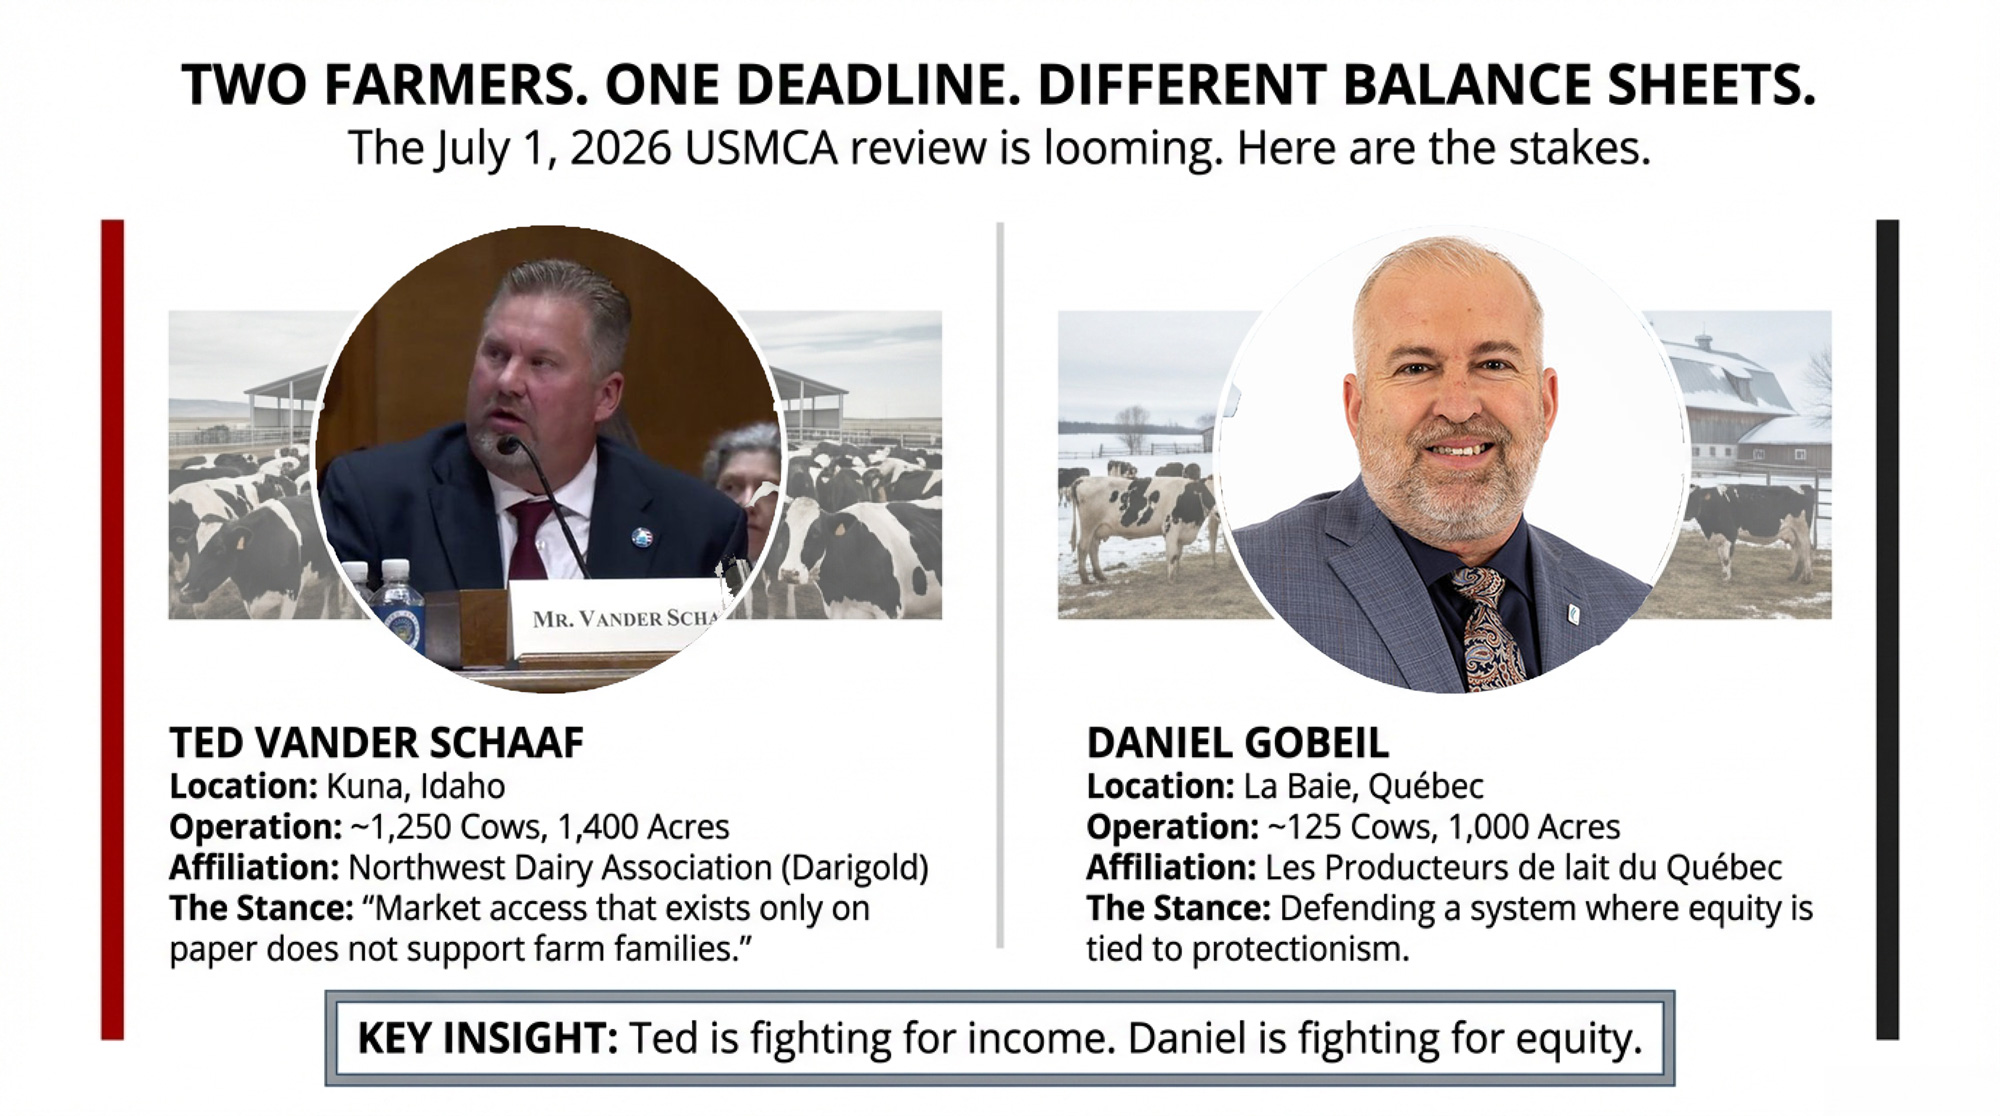
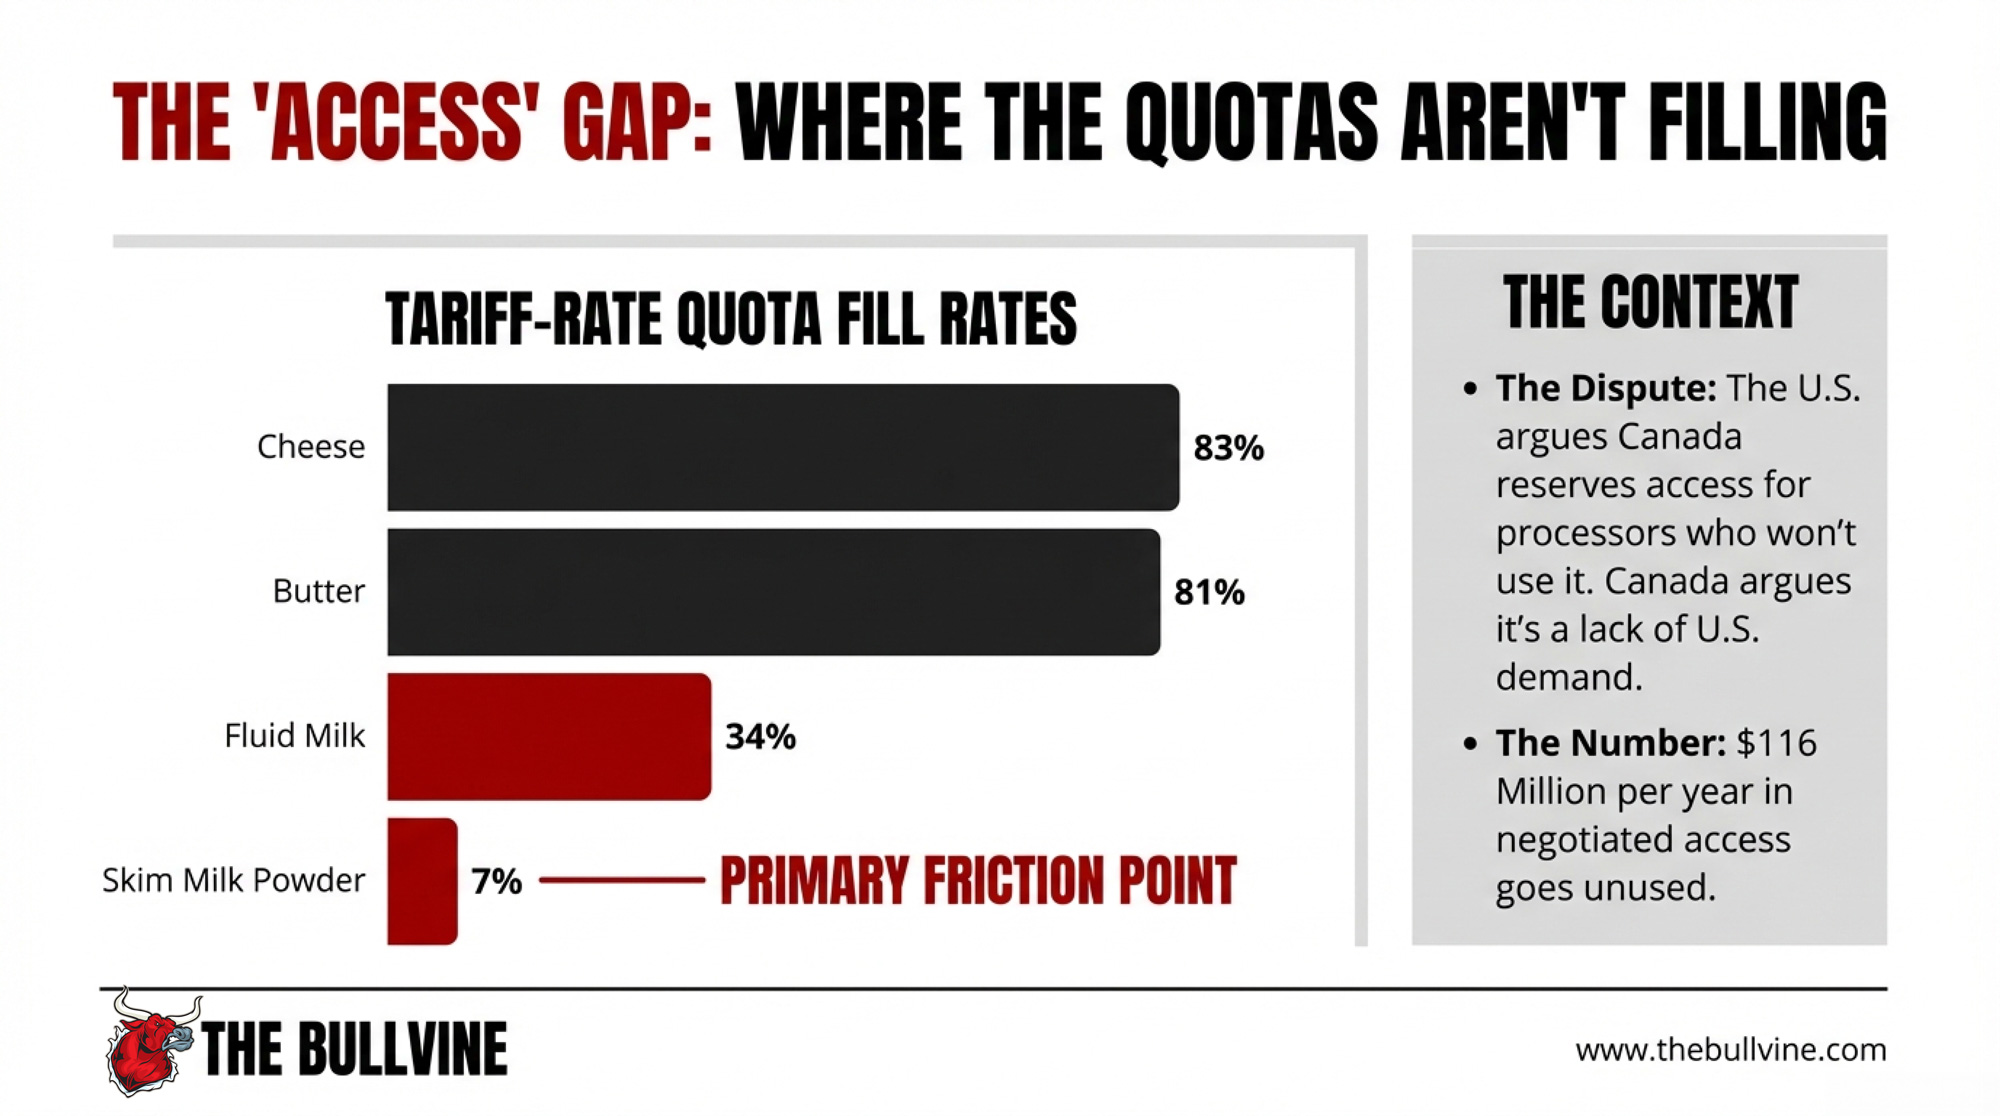
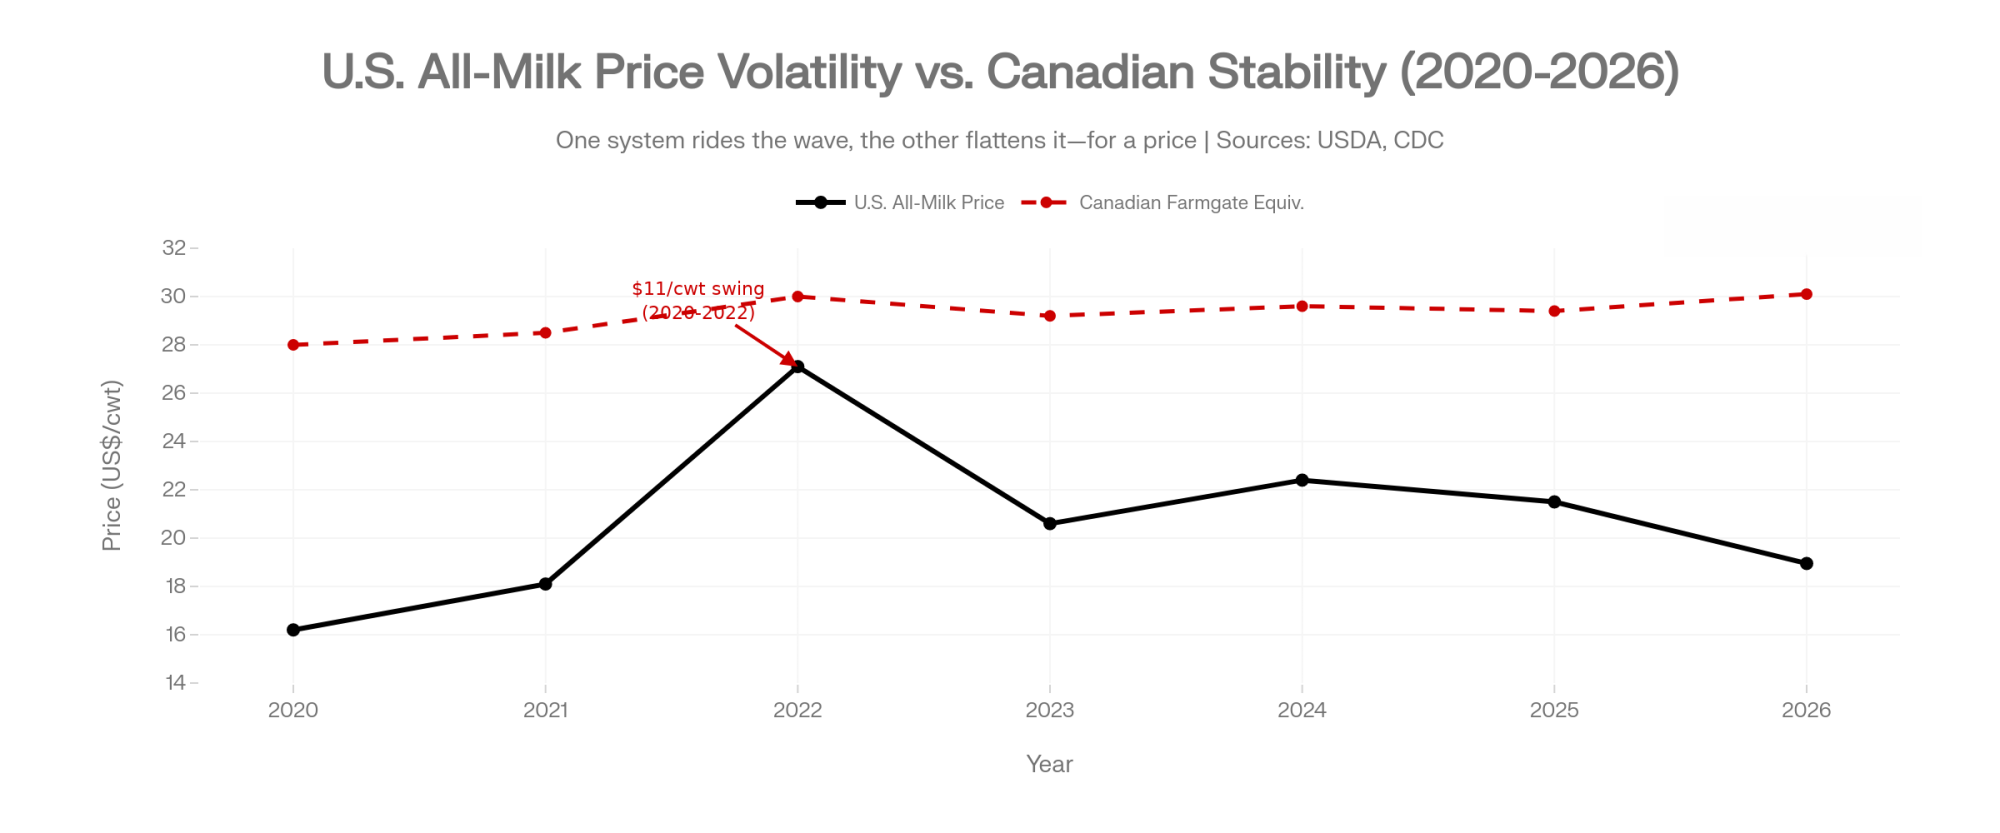
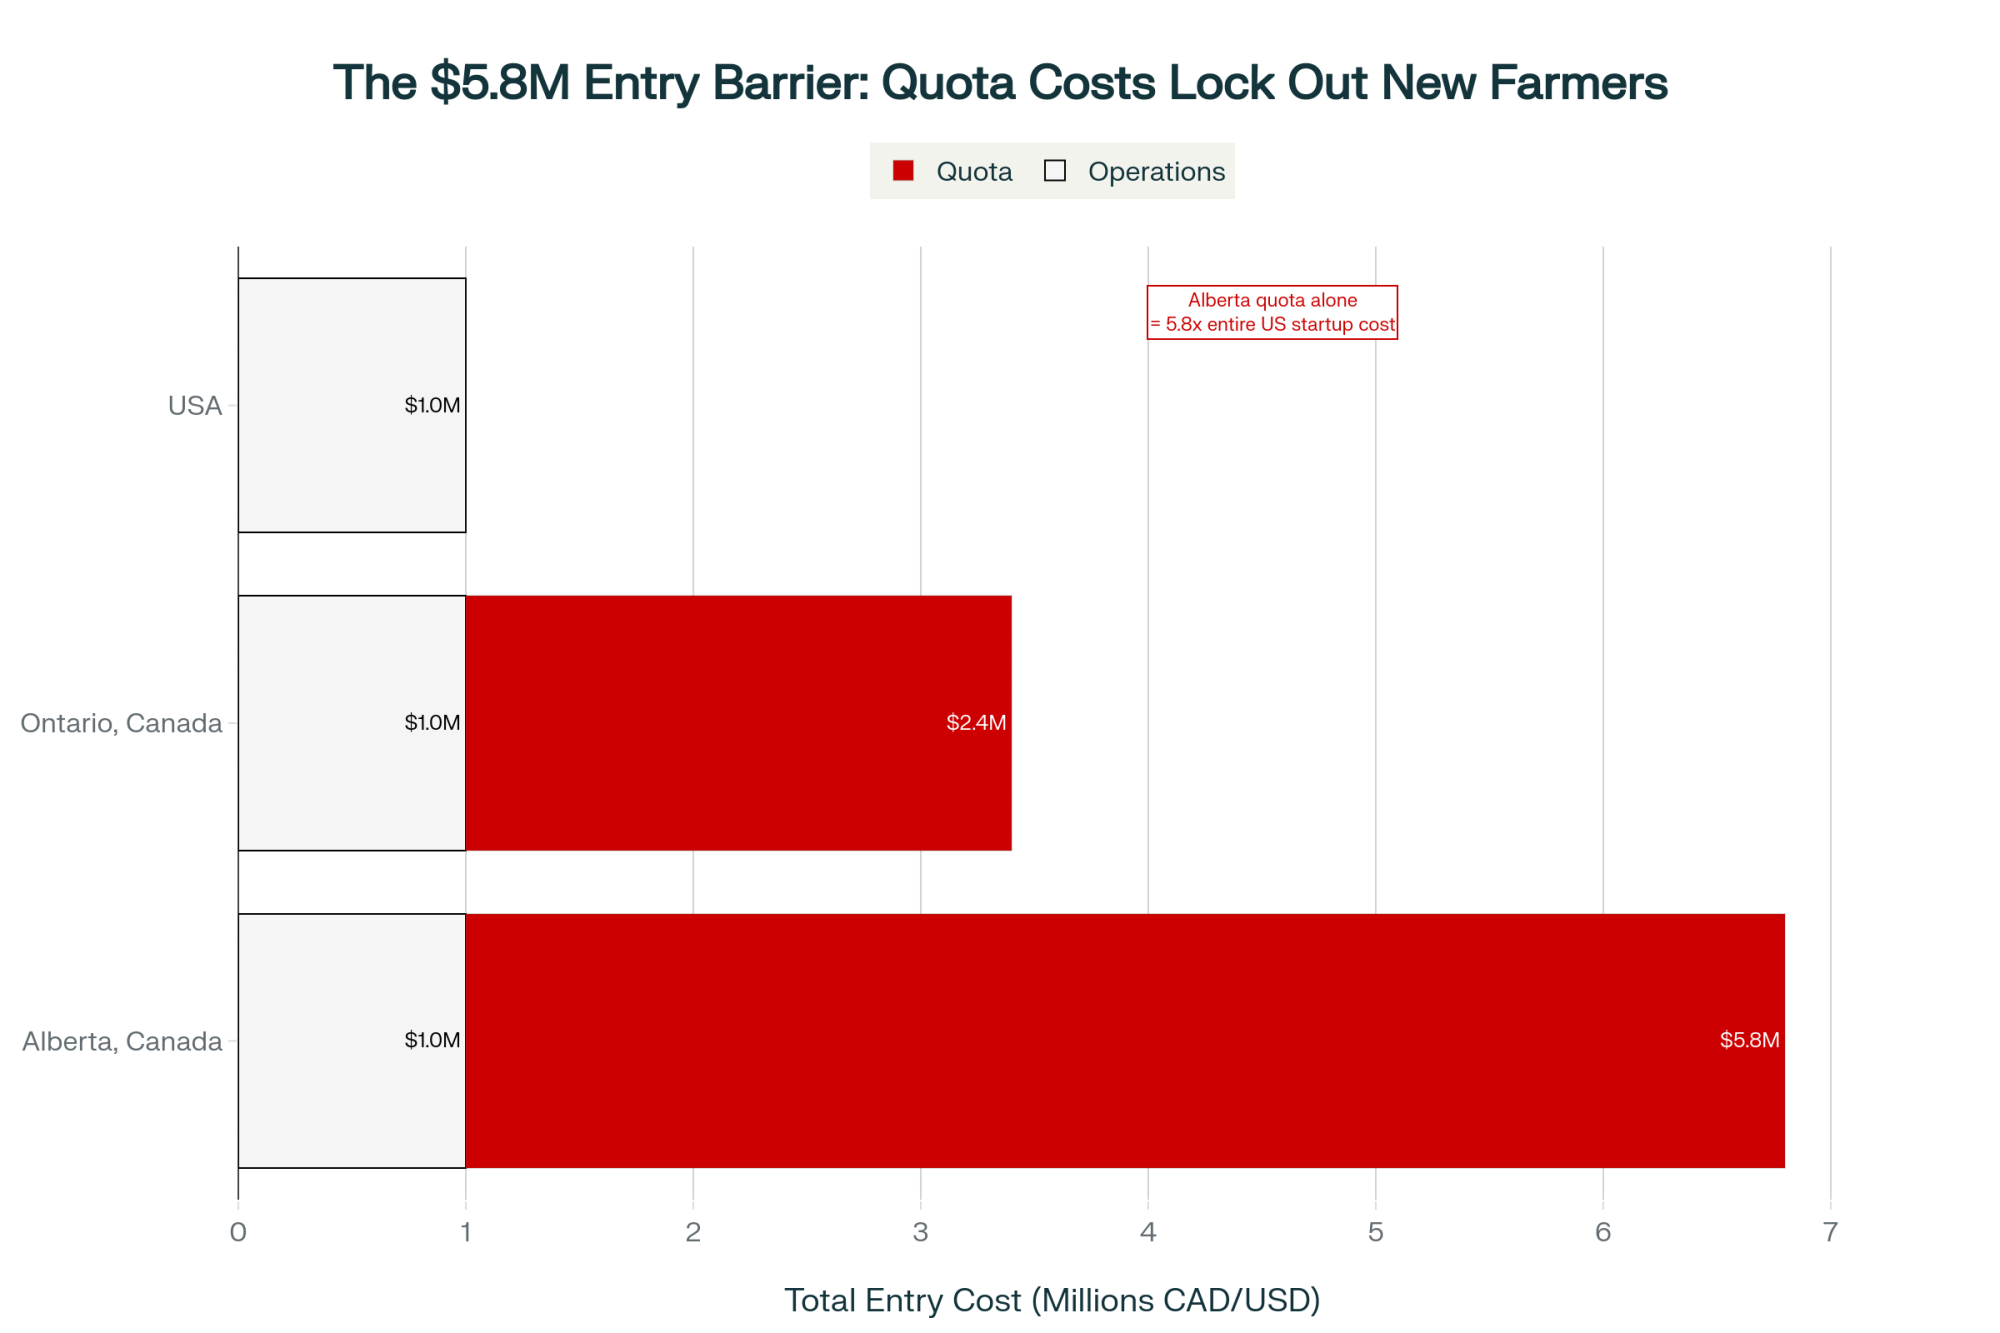
A Note for Canadian Readers
This analysis uses U.S. Federal Milk Marketing Order pricing, USDA cost data, and the DMC safety net — none of which apply directly under Canadian supply management. COP-based pricing, quota value, and a fundamentally different risk structure change the math. But the underlying question — do you know your actual full cost of production to within a dollar? — crosses the border. If your quota-adjusted breakeven hasn’t been stress-tested against current feed, labor, and interest costs, the same $1.50/cwt gap could be showing up in your numbers, too.
What This Means for Your Operation
- Find your real breakeven this month — not the one in your head. The mid-size Wisconsin dairy that ran a full COP analysis found a $1.50/cwt gap between their working estimate and reality. At 115,000 cwt on a 500-cow herd, a gap that size means $172,500/year in costs you’re not tracking. Contact your Extension office, farm financial counselor, or lender’s ag team.
- Calculate your burn rate this week. Working capital ÷ monthly cash shortfall = months of runway. Below 30 months is Kohl’s red-light zone — and at that point, you should be making active decisions, not waiting for the market.
- Compare your actual component revenue to the same months in 2025. This tells you whether national averages apply to your check or whether the 24% butter decline is disproportionately eating your margin.
- Run the cull-vs.-Replace math before shipping. Net cost of culling without pipeline: roughly $620/cow at current national averages. If your heifer inventory is already thin, aggressive culling generates cash today and creates a $2,860+/head problem in 2028.
- Audit feed shrink before the end of March. Brouk’s math: roughly $50,000/year on 500 cows from a 4-point reduction. That’s the cheapest margin improvement available — no capital, no contract, no market recovery required.
- Watch the September–December Class III strip. Above $18.50 = lockable protection on fall production. Below $17.50 = restructuring timeline accelerates.
Key Takeaways
- If your full economic cost exceeds $18/cwt and your strip-weighted annual Class III averages ~$17.65, you’re eroding equity at roughly $2.89/cwt × your annual production. For a 500-cow herd: roughly $332,000/year. The strip has rallied from where it sat in mid-February — but $18+ contracts for the rest of the year can’t fully erase a $14.59 January.
- The structural scale gap — $1.40/cwt between 500- and 2,000+-cow herds, per ERS — doesn’t change with corn prices. Cheap feed narrows the feed-cost piece slightly, but can’t close a gap built on labor, management overhead, and purchasing power.
- Income over feed is down $1.50–$2.30/cwt from 2025 despite lower input costs. The market priced in more milk and softer demand for fat before it priced in cheaper corn.
- The first 30-day move is free. A feed shrink audit and a full cost-of-production analysis cost time, not money — and they’re the only two things on this list that work regardless of what the market does next.
The Bottom Line
What’s your actual full economic cost per cwt — not the number you’ve been carrying in your head, but the one that survives a spreadsheet with market-rate family labor, real depreciation, and today’s interest rate? If you don’t know that number to within a dollar, it’s the most important thing you can find out before the next milk check arrives.
Complete references and supporting documentation are available upon request by contacting the editorial team at editor@thebullvine.com.
Learn More
- Feed Cost Revolution: Why 2025–26 Could Be Your Most Profitable Year Yet—Or Your Biggest Missed Opportunity – Master the grain procurement game with a methodical approach to storage and contracting. This breakdown arms you with a 90-day execution roadmap to capitalize on record corn supplies while dodging the $300-per-ton soybean meal trap.
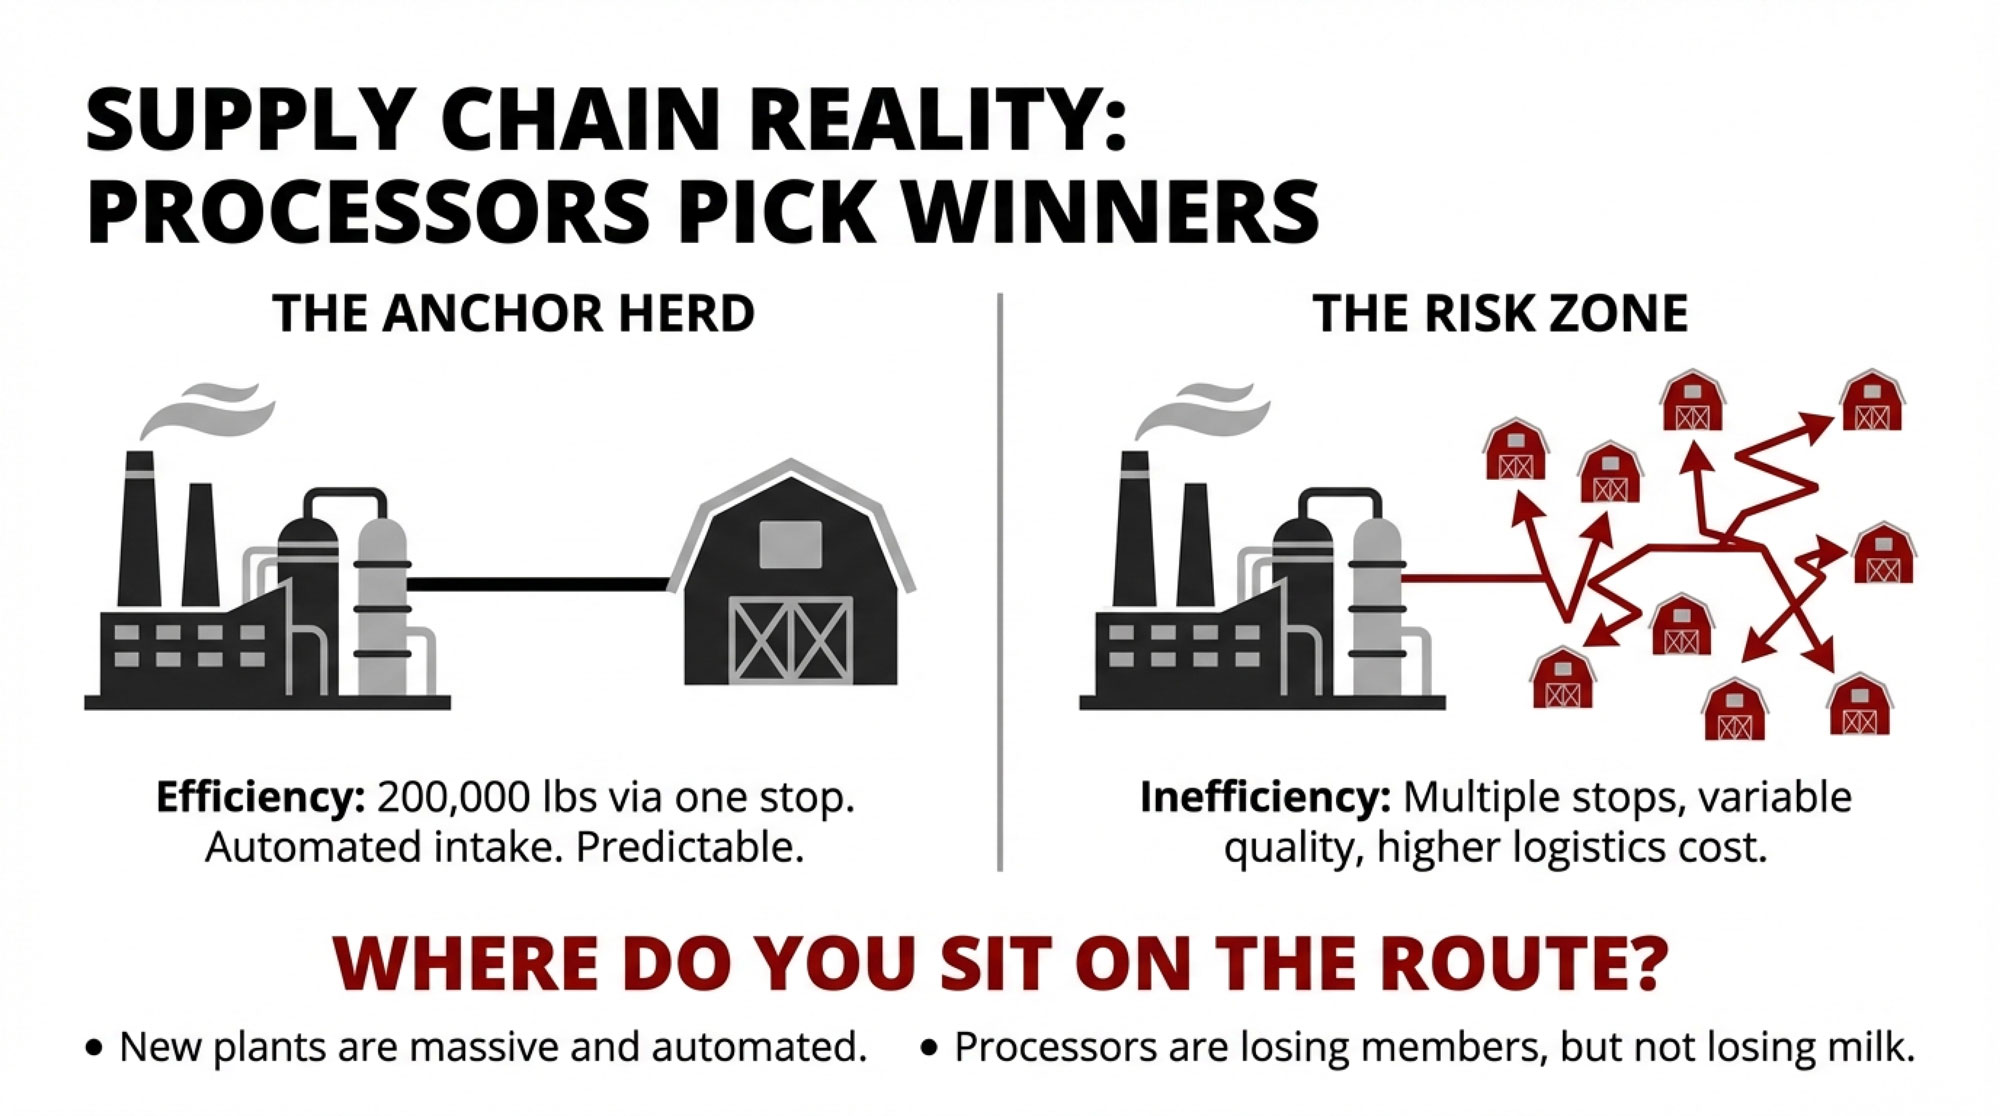
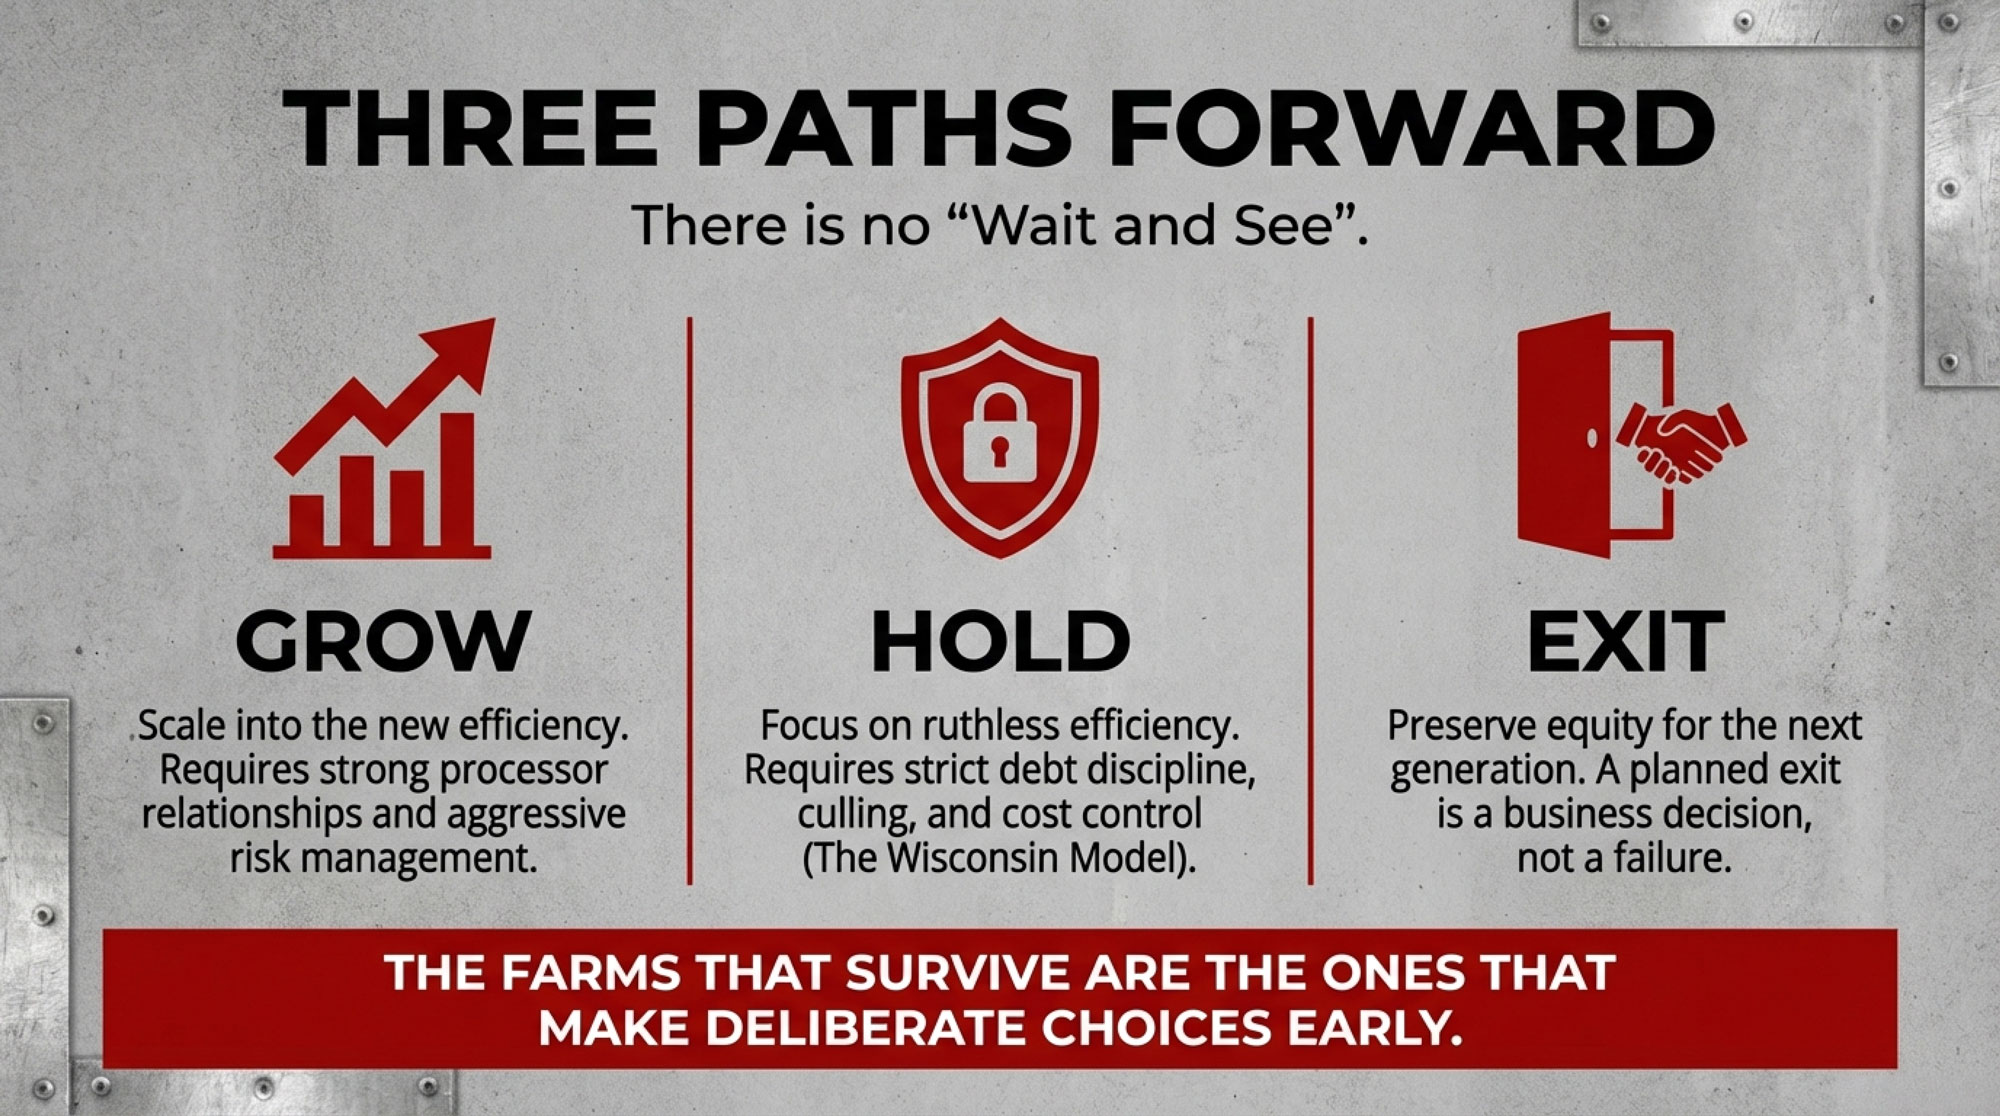
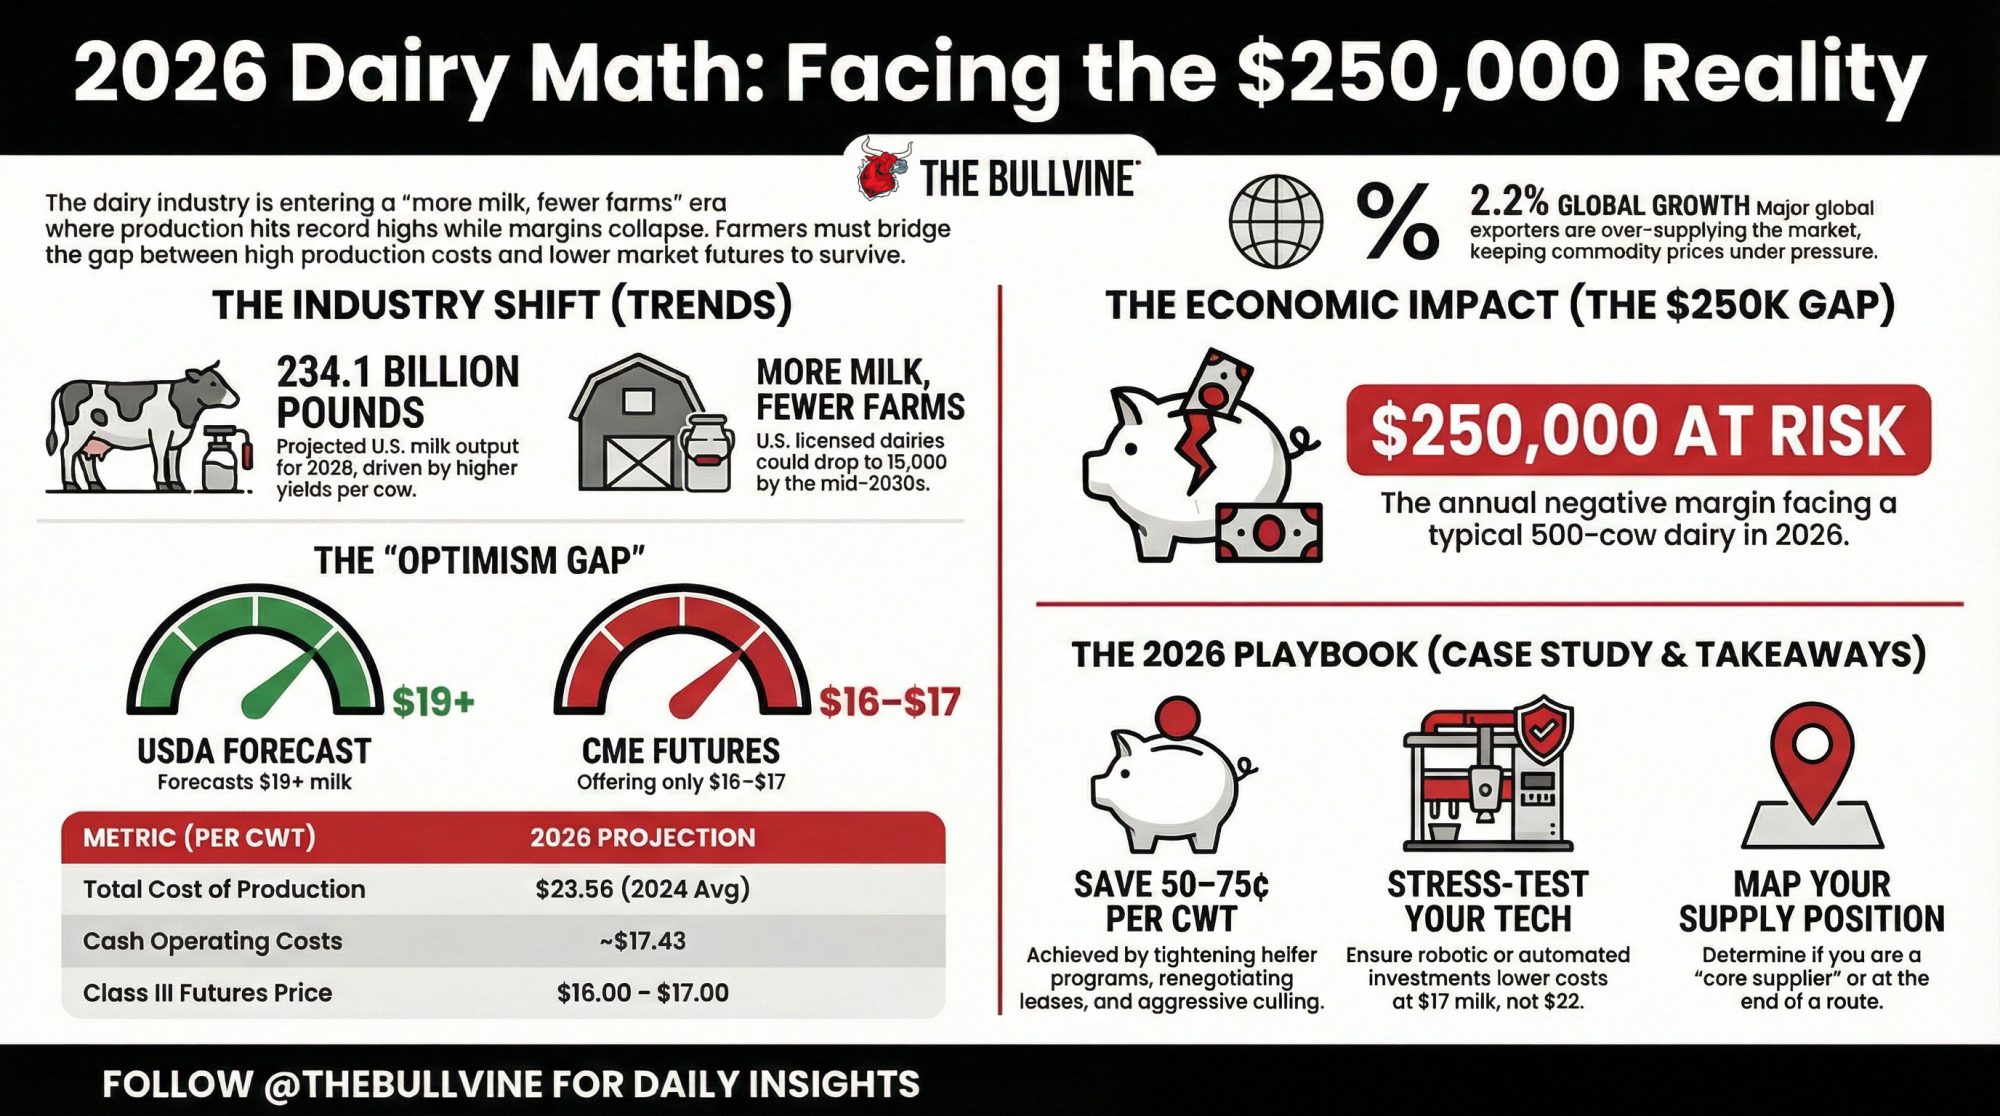
- More Milk, Fewer Farms, $250K at Risk: The 2026 Numbers Every Dairy Needs to Run – Identify the critical $250,000 margin gap hiding in your 2026 projections before the market decides your future. This strategic guide reveals how to stress-test your operation at $17 milk and choose your path—grow, hold, or exit.
- Genetic Correlations Upended: Why Sticking with Old Breeding Indices Could Cost Your Dairy $486 Per Cow – And What the Data Really Proves – Stop wasting money on outdated breeding benchmarks and unlock a $486-per-cow profit advantage. This analysis exposes the flaw in conformation-heavy indices and delivers the data-backed reality of how the 2025 Net Merit shift rewards your bottom line.
 The Sunday Read Dairy Professionals Don’t Skip.
 The Sunday Read Dairy Professionals Don’t Skip.
Every week, thousands of producers, breeders, and industry insiders open Bullvine Weekly for genetics insights, market shifts, and profit strategies they won’t find anywhere else. One email. Five minutes. Smarter decisions all week.