Eight dairy farms close every single day in America. Understanding what’s driving this consolidation—and your options for navigating it—has never been more important.
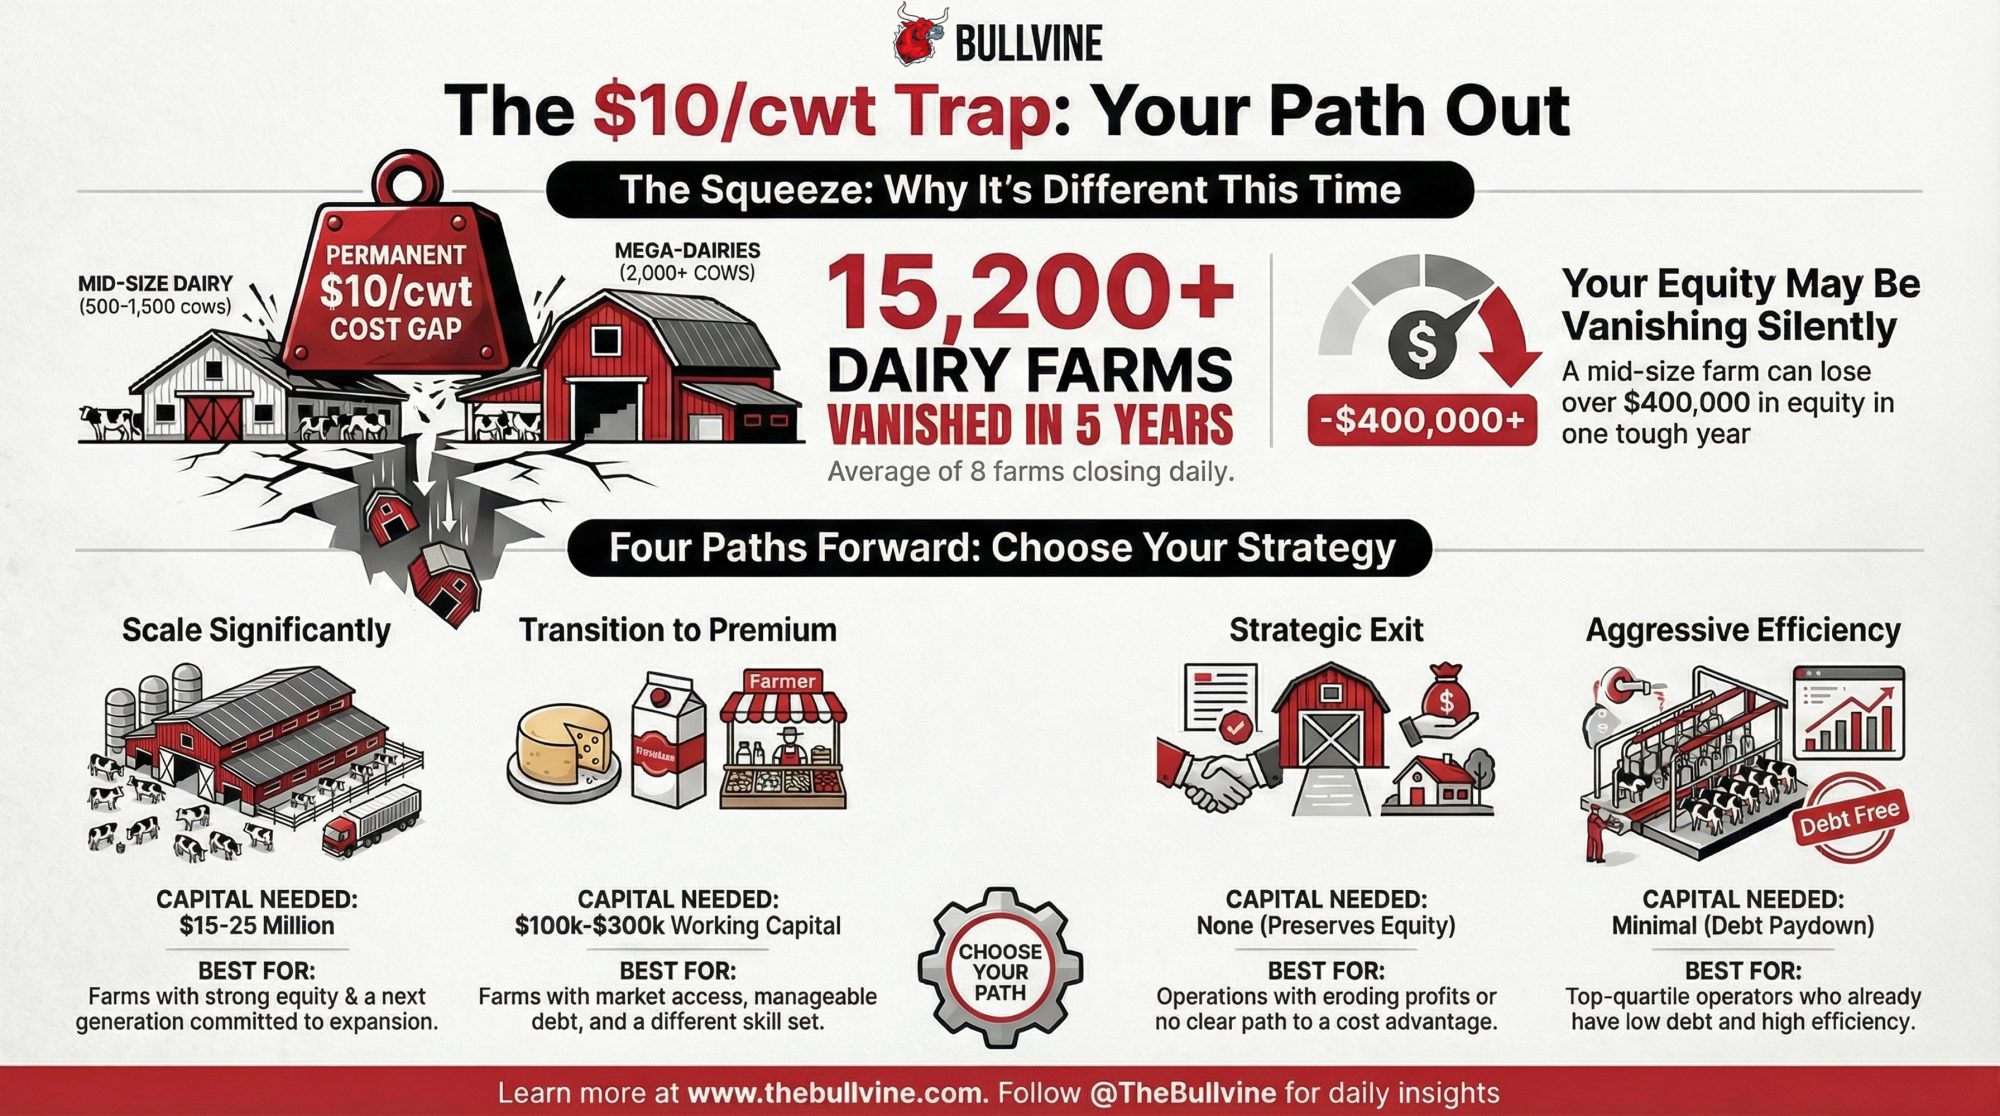
Executive Summary: Eight dairy farms close every single day in America—and mid-size operations (500-1,500 cows) are taking the hardest hit. USDA Census data shows over 15,200 farms vanished between 2017 and 2022, driven by a $10/cwt cost gap that gives 2,000+ cow operations a decisive structural advantage. This isn’t a price cycle to wait out; it’s a permanent industry transformation, and silence is a losing strategy. This analysis breaks down four realistic paths forward—scale significantly, transition to premium, exit strategically, or pursue aggressive efficiency—with specific capital requirements, timelines, and success factors for each. The essential first move: calculate your “equity velocity” to determine if you’re silently bleeding $400,000+ annually while your balance sheet looks stable. Take the 30-Day Financial Audit Challenge and choose your path before the market chooses it for you.
That number stopped me cold when I first calculated it. Eight farms. Every day. For five years straight.
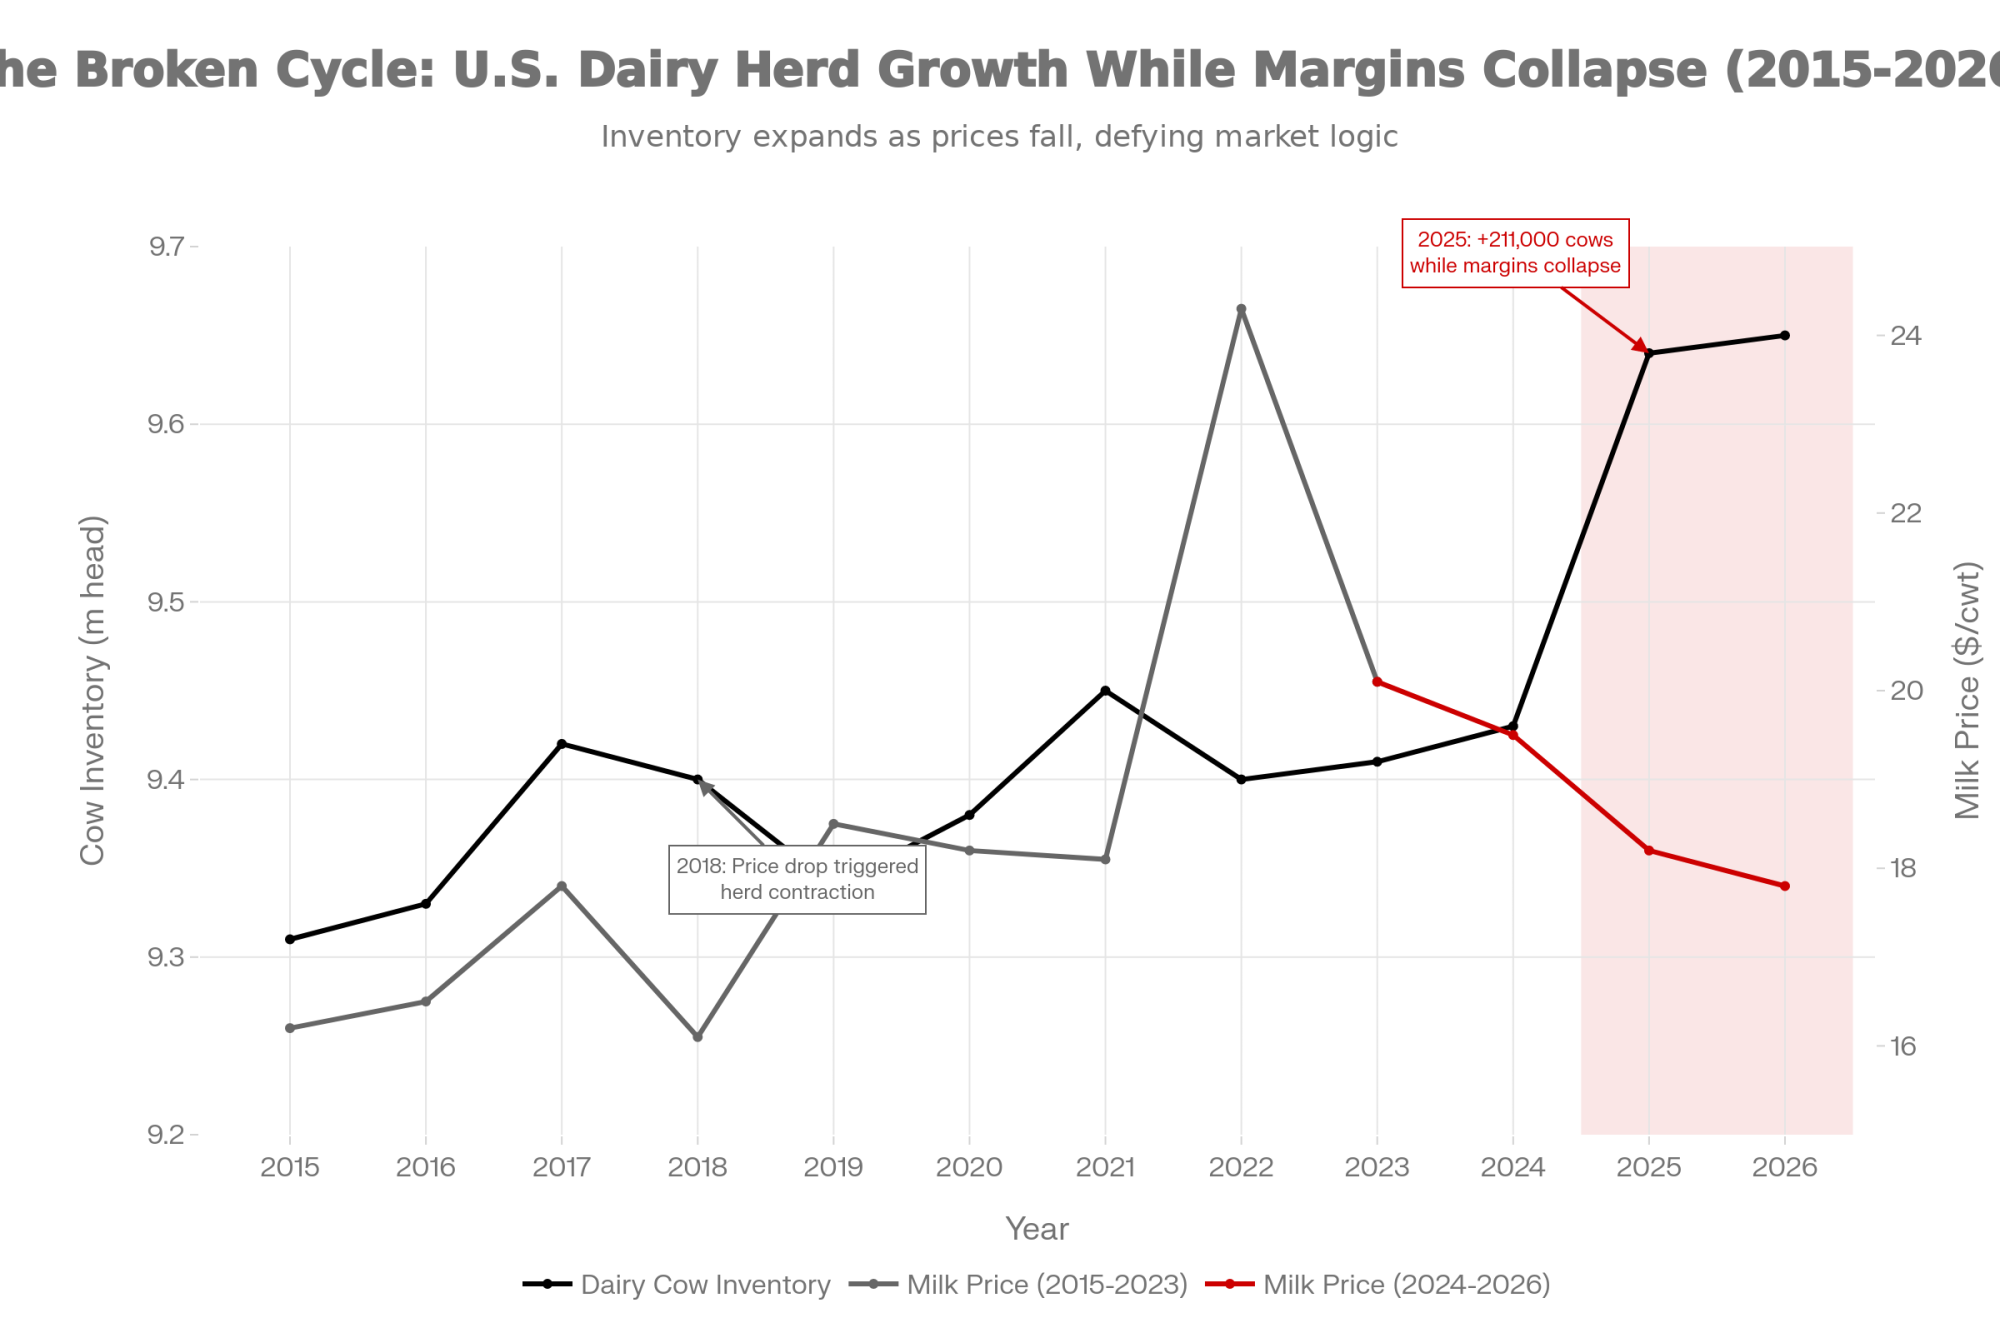
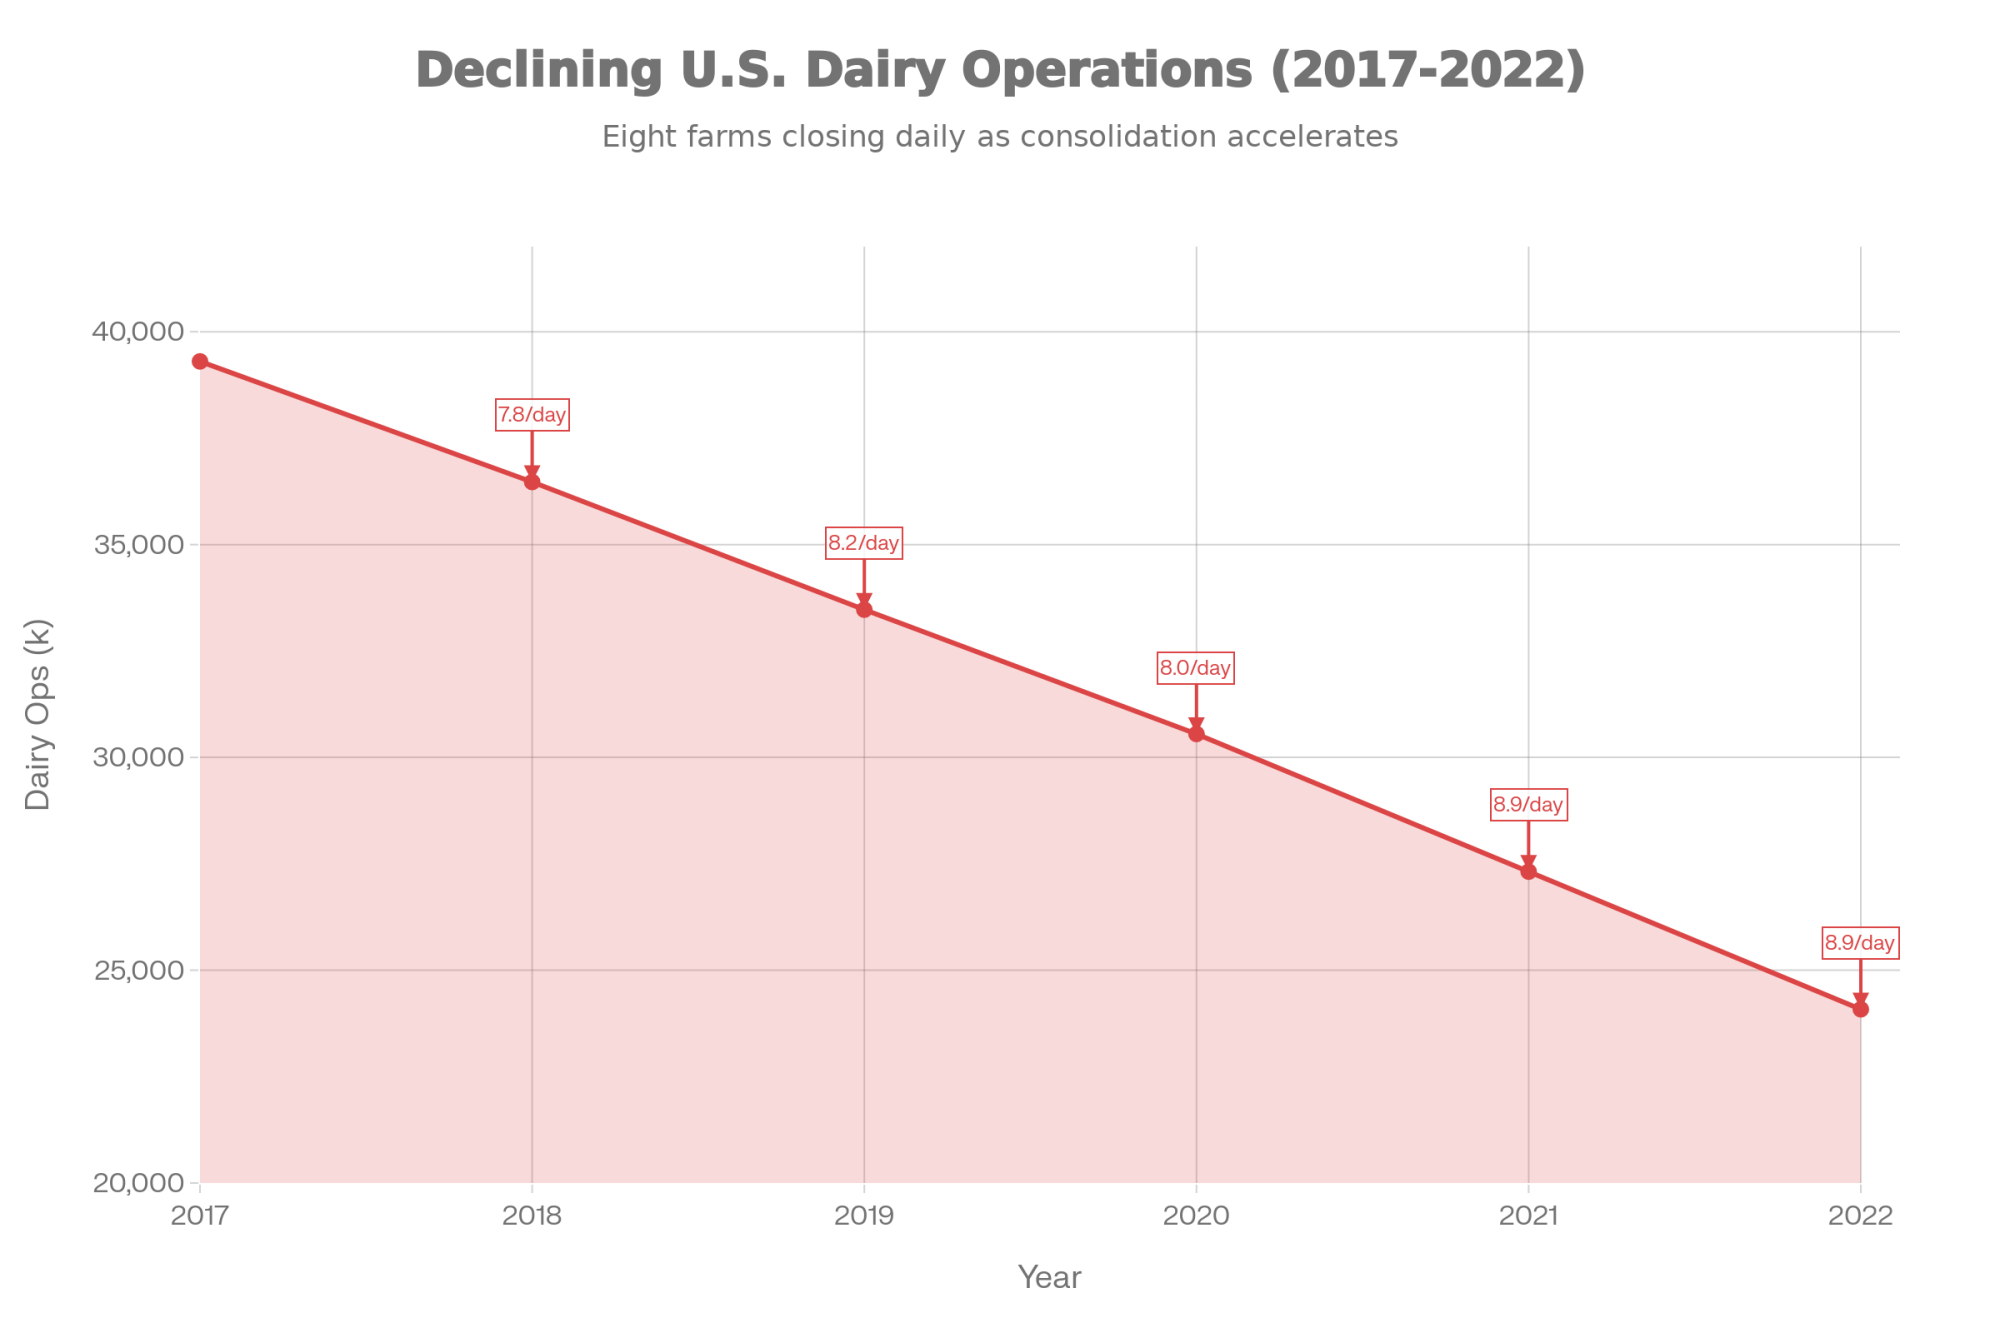
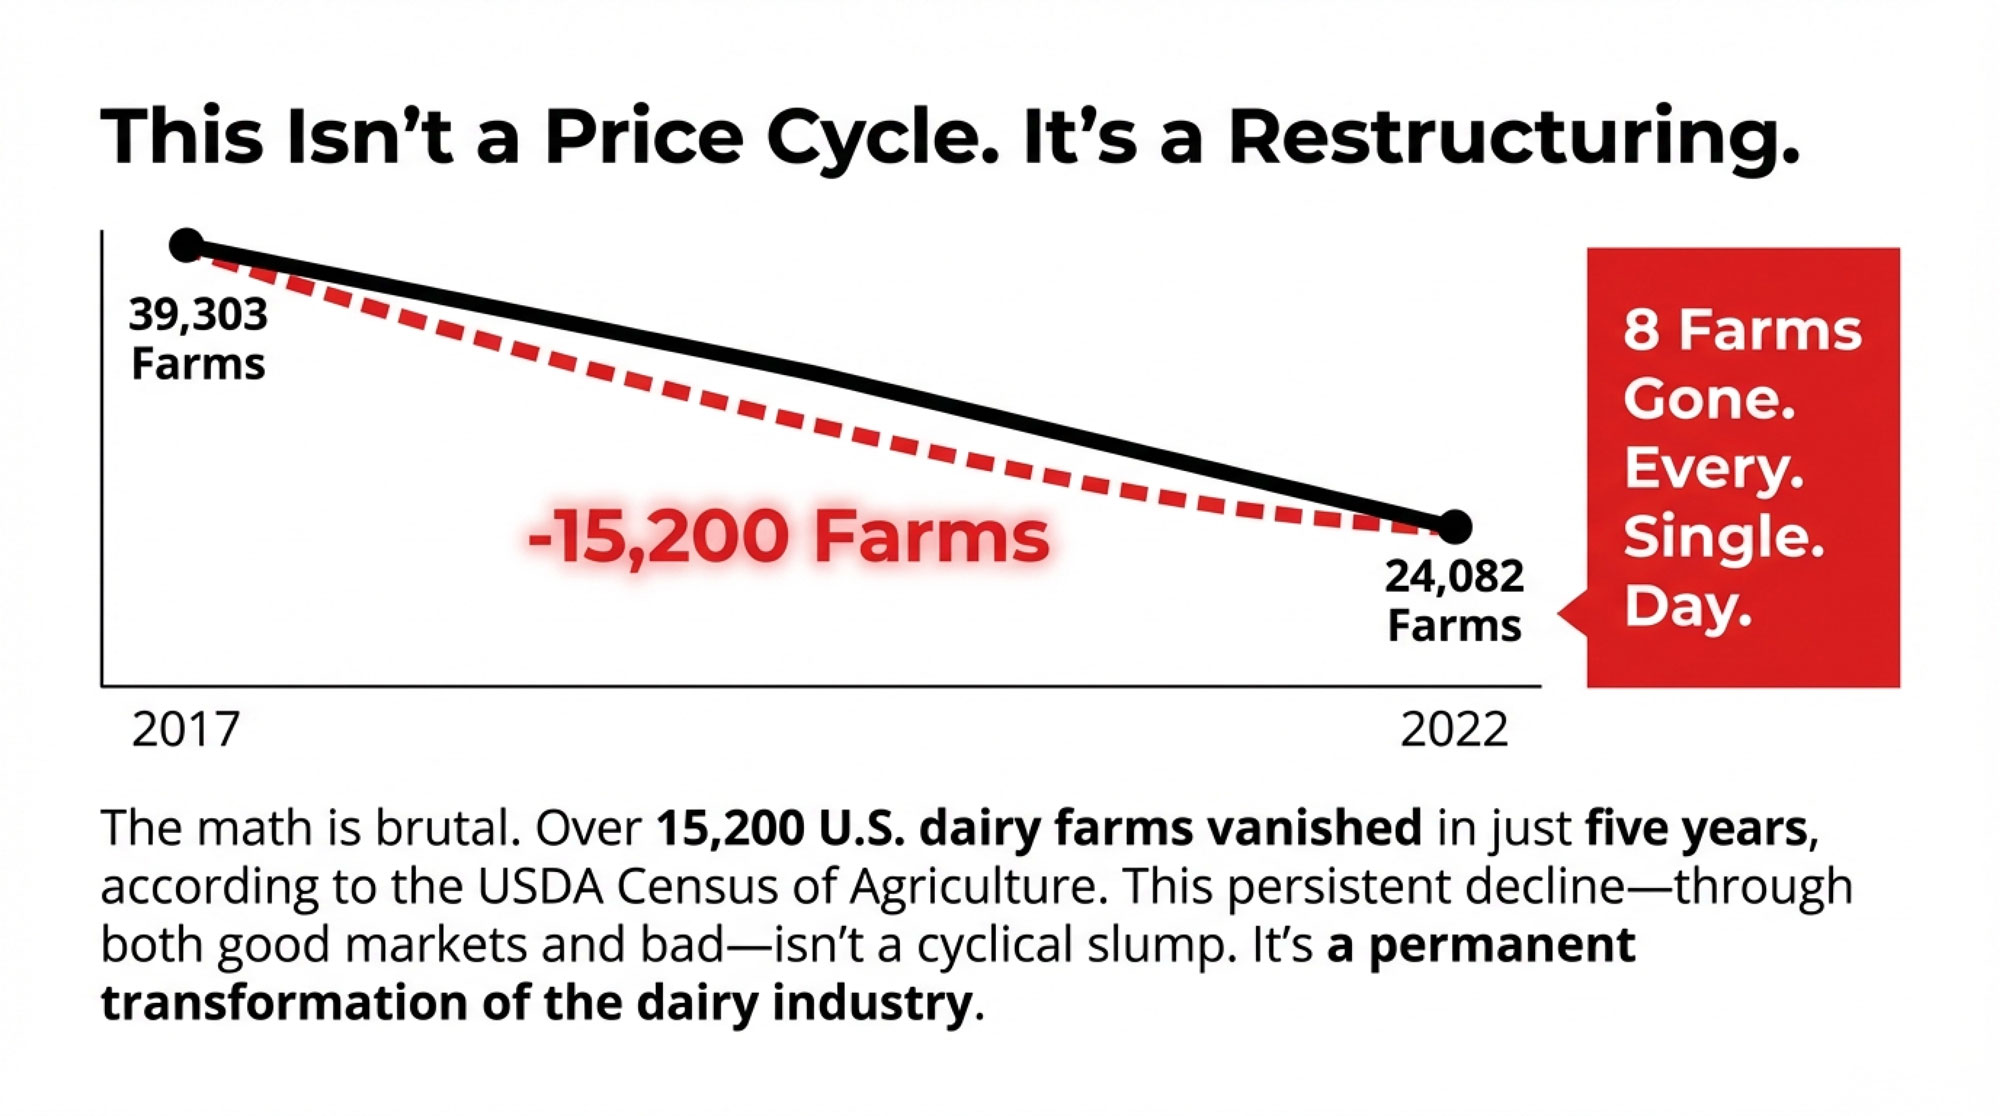
USDA’s 2022 Census of Agriculture documents the math clearly: U.S. dairy operations dropped from 39,303 in 2017 to 24,082 in 2022—more than 15,200 farms gone in half a decade. The closures slow down during high-price periods, but they never actually stop. And that persistence through both good markets and bad tells us something important: we’re not watching a normal price cycle play out. This is a structural change.
What’s driving it? Part of the answer showed up in some Canadian grocery pricing data I was reviewing recently. During the period when farm input costs were climbing sharply, food retailer margins expanded rather than compressed. Much of the additional money consumers were paying didn’t flow back to producers. It accumulated in other parts of the supply chain.
Now, I want to be fair here—retailers face their own cost pressures and competitive dynamics. But the pattern illustrates something Dr. Michael Boehlje has written about extensively. He’s a Distinguished Professor Emeritus in Agricultural Economics at Purdue who’s studied farm and agribusiness management for decades, and his analysis suggests that commodity supply chains tend to extract value from the farm level when one segment has more pricing power than another. That’s not an accusation. It’s just how these systems often work.
The question for dairy producers isn’t whether this structural shift is happening—the data makes that clear. The question is what to do about it.
The Barbell Effect: Where the Industry Is Headed
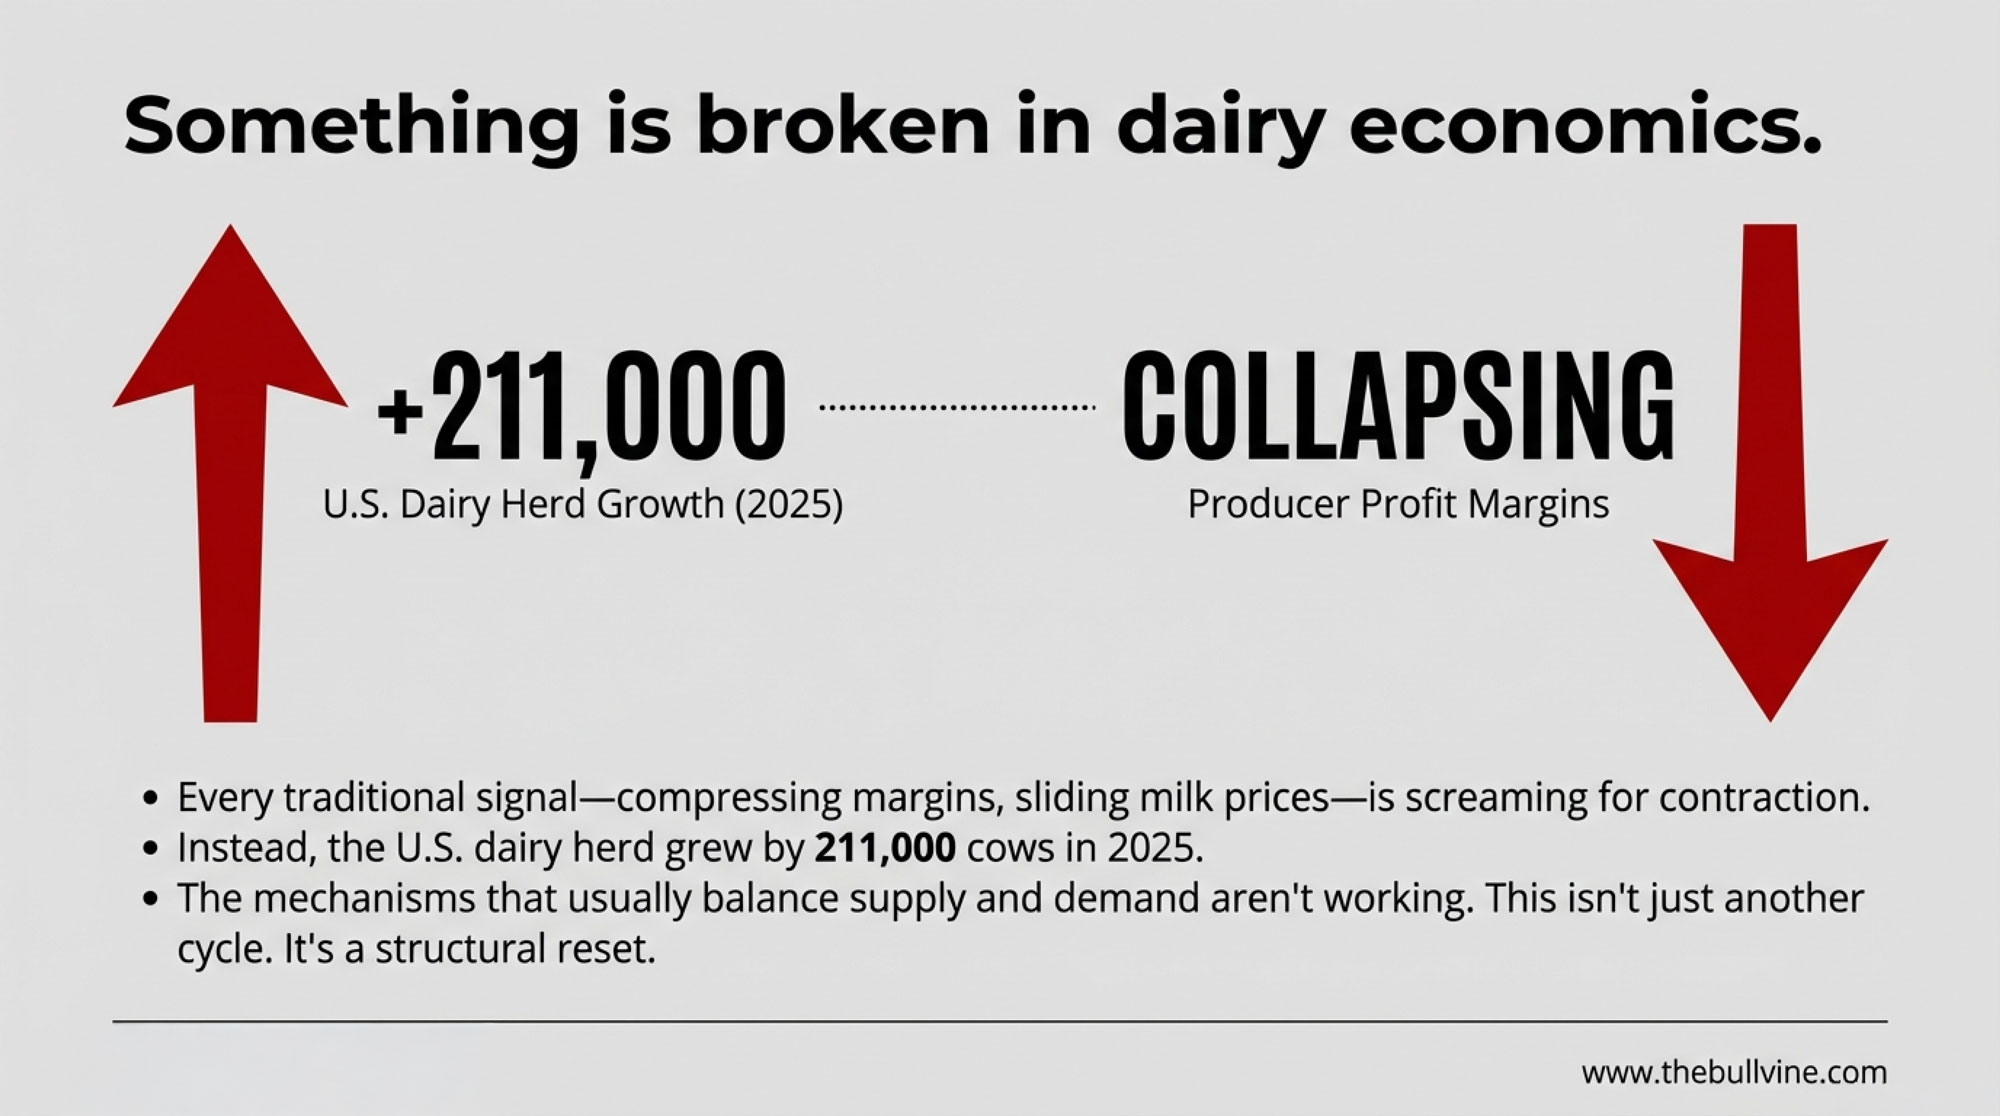
What we’re witnessing isn’t random attrition. It’s a fundamental reshaping of the industry into what economists call a “barbell” structure—growth at both extremes while the middle gets squeezed out.
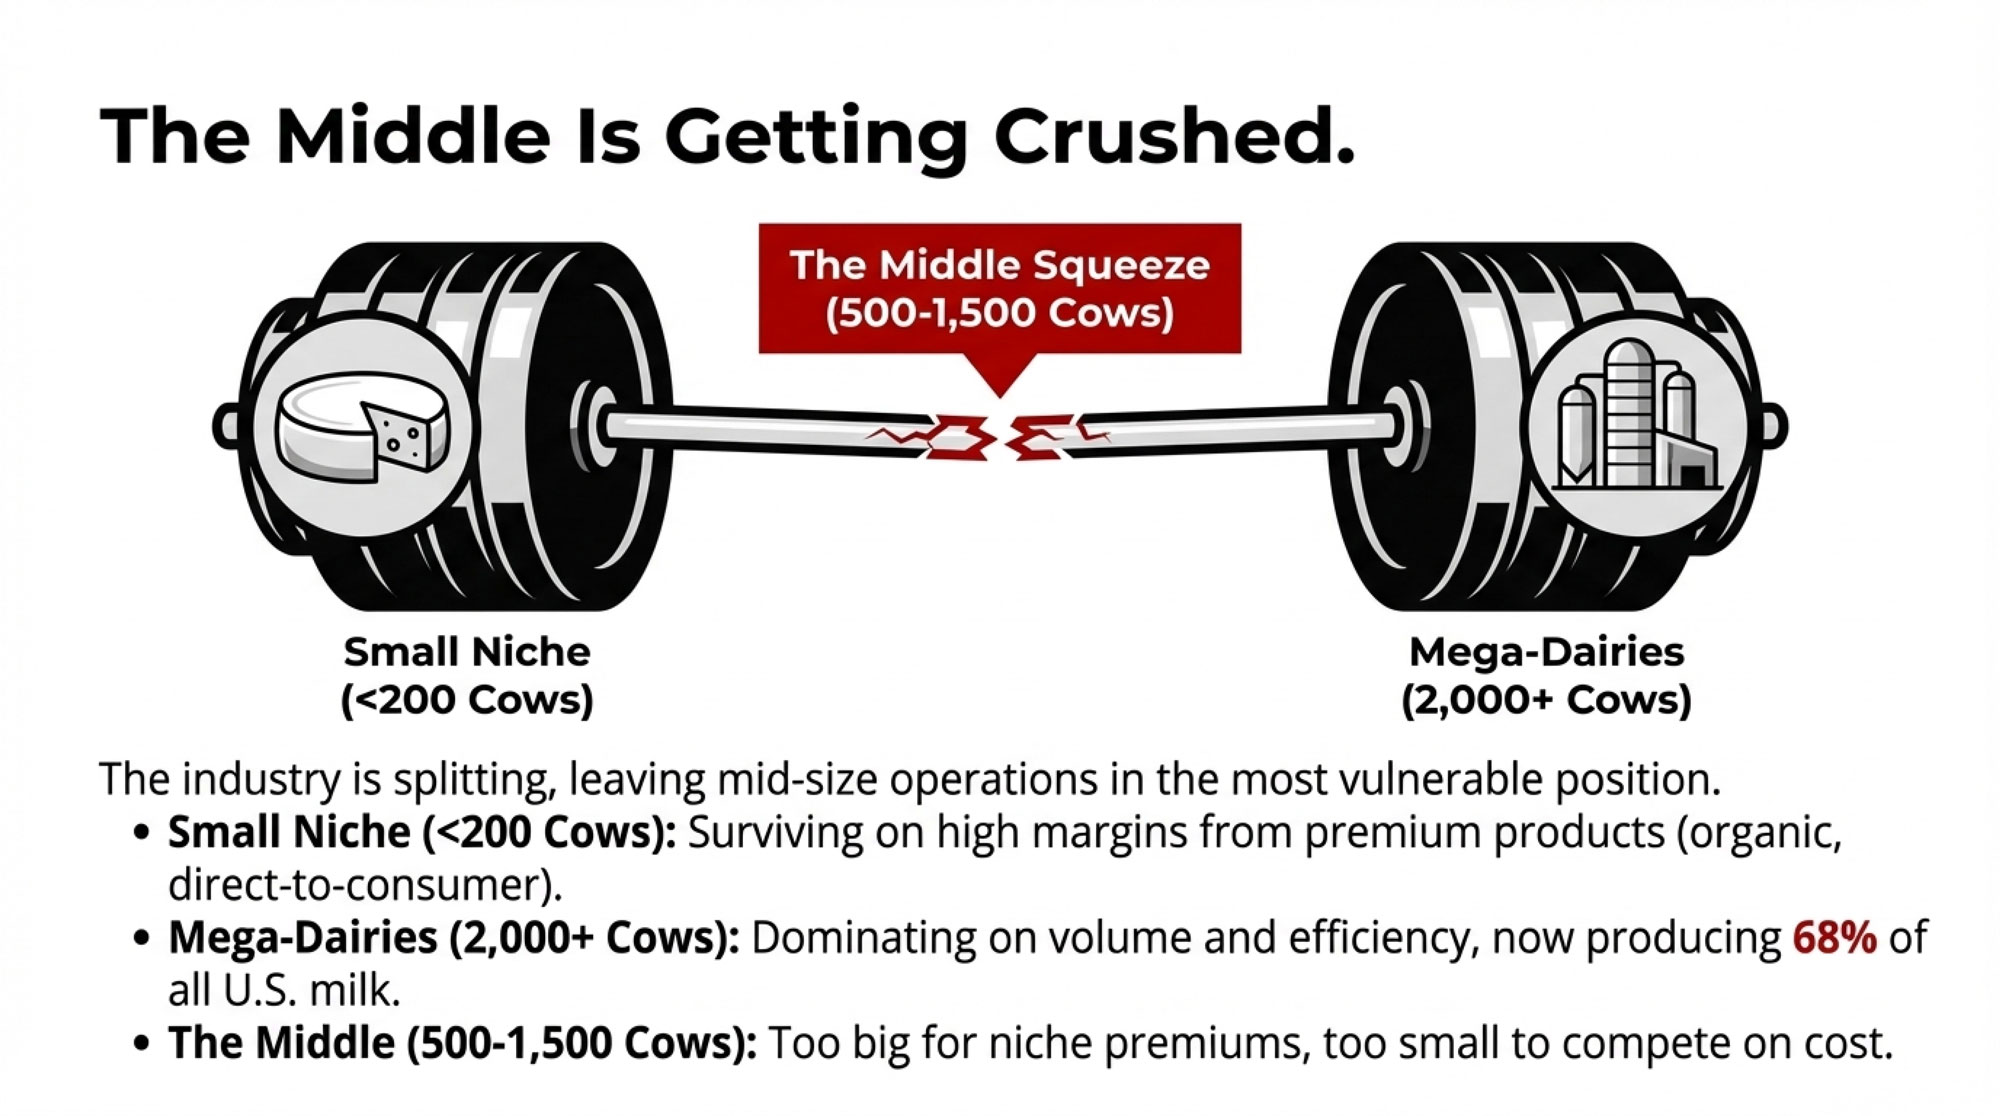
On one end: Small operations under 200 cows that have carved out premium niches—organic, grass-fed, farmstead cheese, direct-to-consumer sales. They survive on margins, not volume.
On the other end: Large operations running 2,000+ cows with aggressive automation, professional management teams, and cost structures that commodity markets actually support. Rabobank data shows these large operations now account for roughly 68% of U.S. milk production.
In the middle: Operations running 500-1,500 cows that are too big to capture premium pricing but too small to achieve the cost efficiencies of mega-dairies. This is where the structural pressure is most intense—and where farm losses are concentrated.
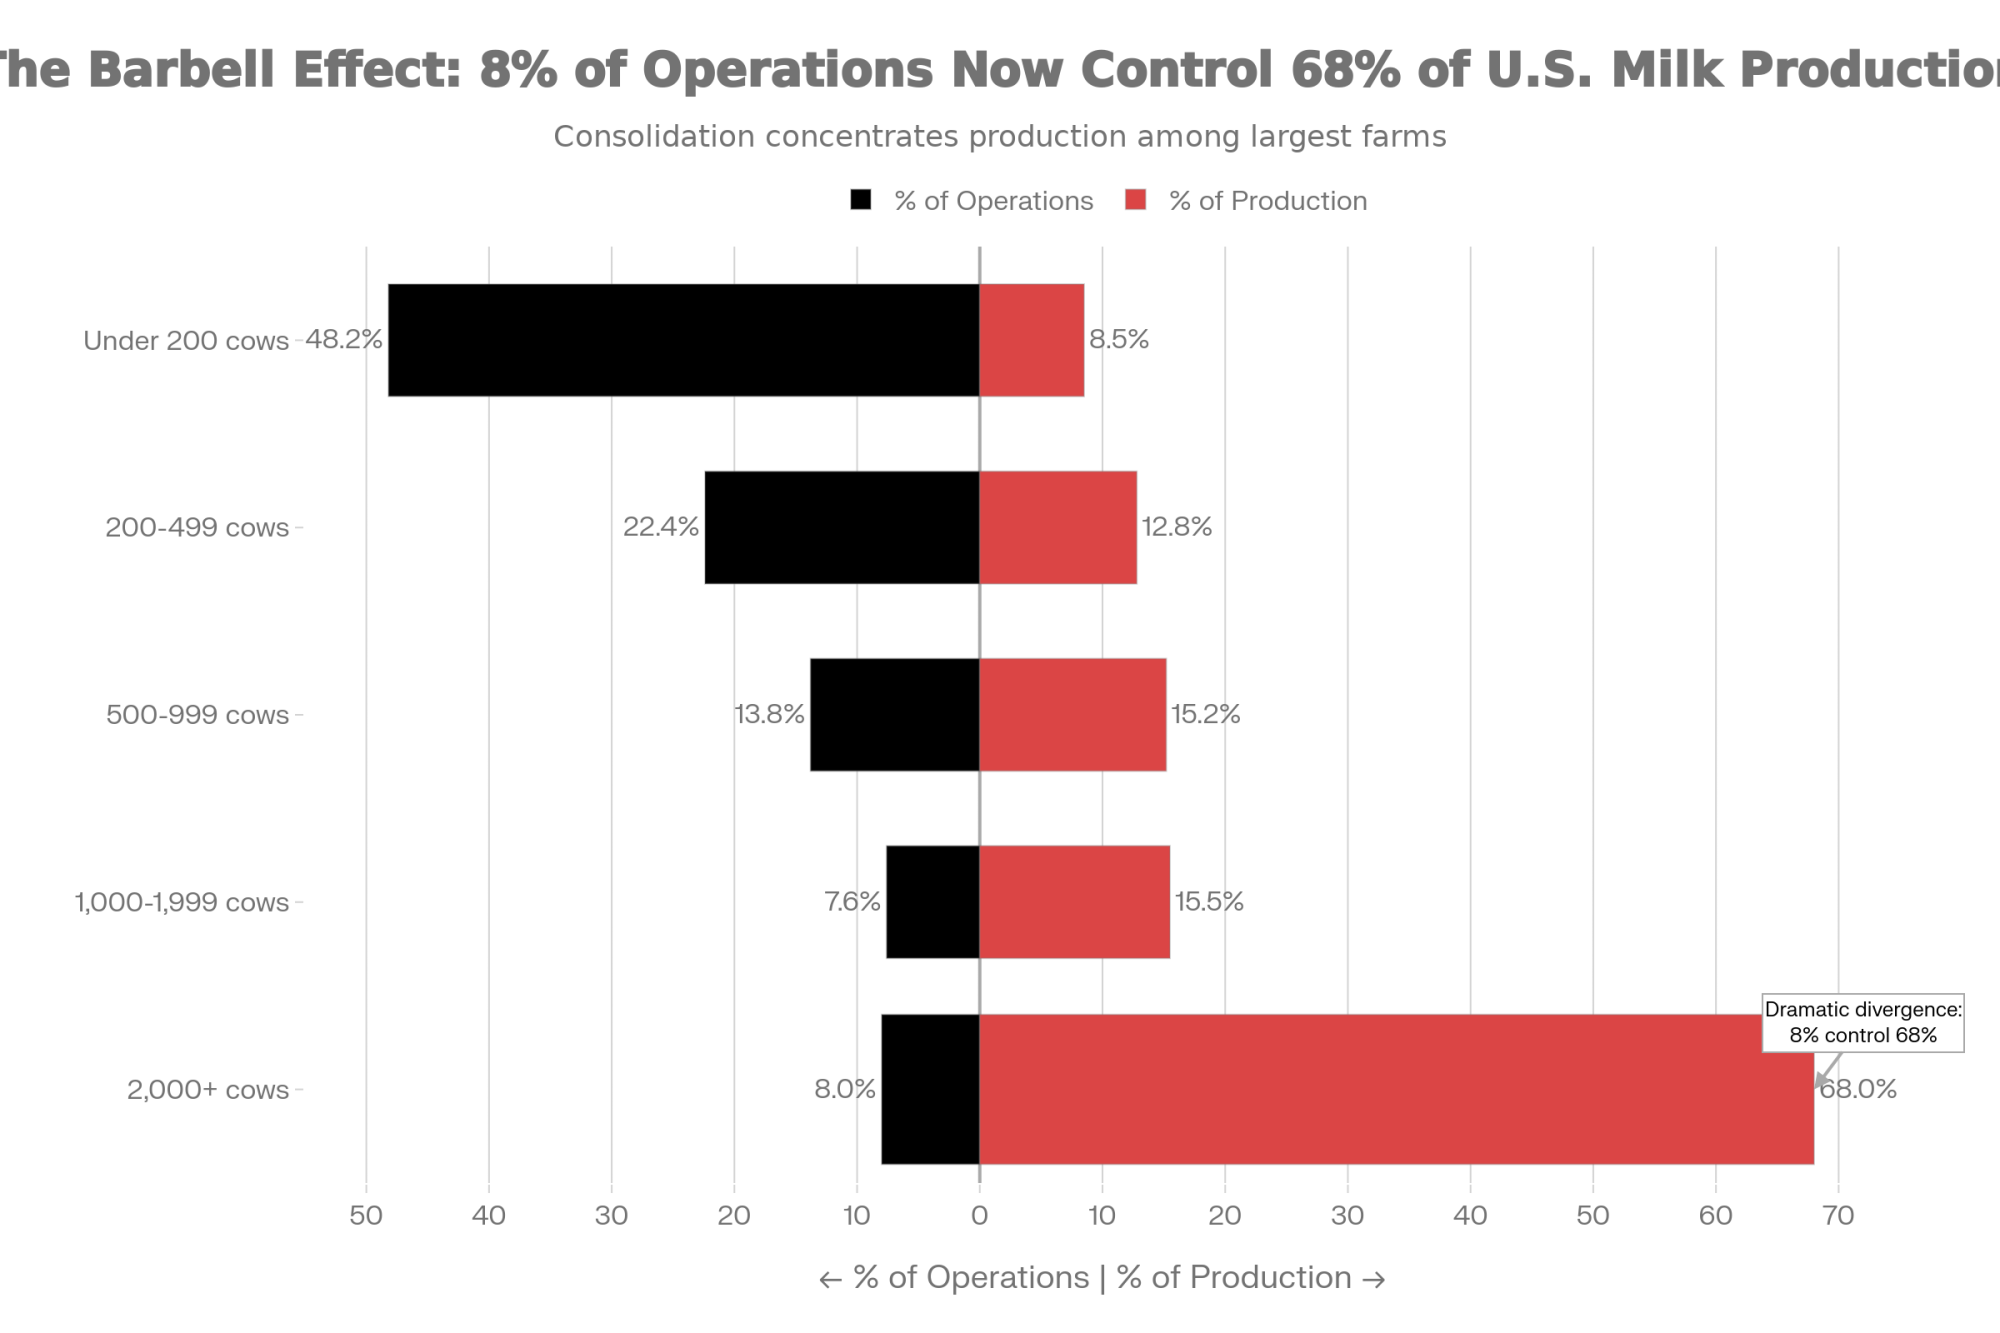
| Operation Size | % of Operations | % of Milk Production |
| Under 200 cows | 48.2% | 8.5% |
| 200-499 cows | 22.4% | 12.8% |
| 500-999 cows | 13.8% | 15.2% |
| 1,000-1,999 cows | 7.6% | 15.5% |
| 2,000+ cows | 8.0% | 68.0% |
The Consolidation Numbers Tell a Consistent Story
The trajectory has been remarkably steady across regions and time periods, which is what makes it feel structural rather than cyclical.
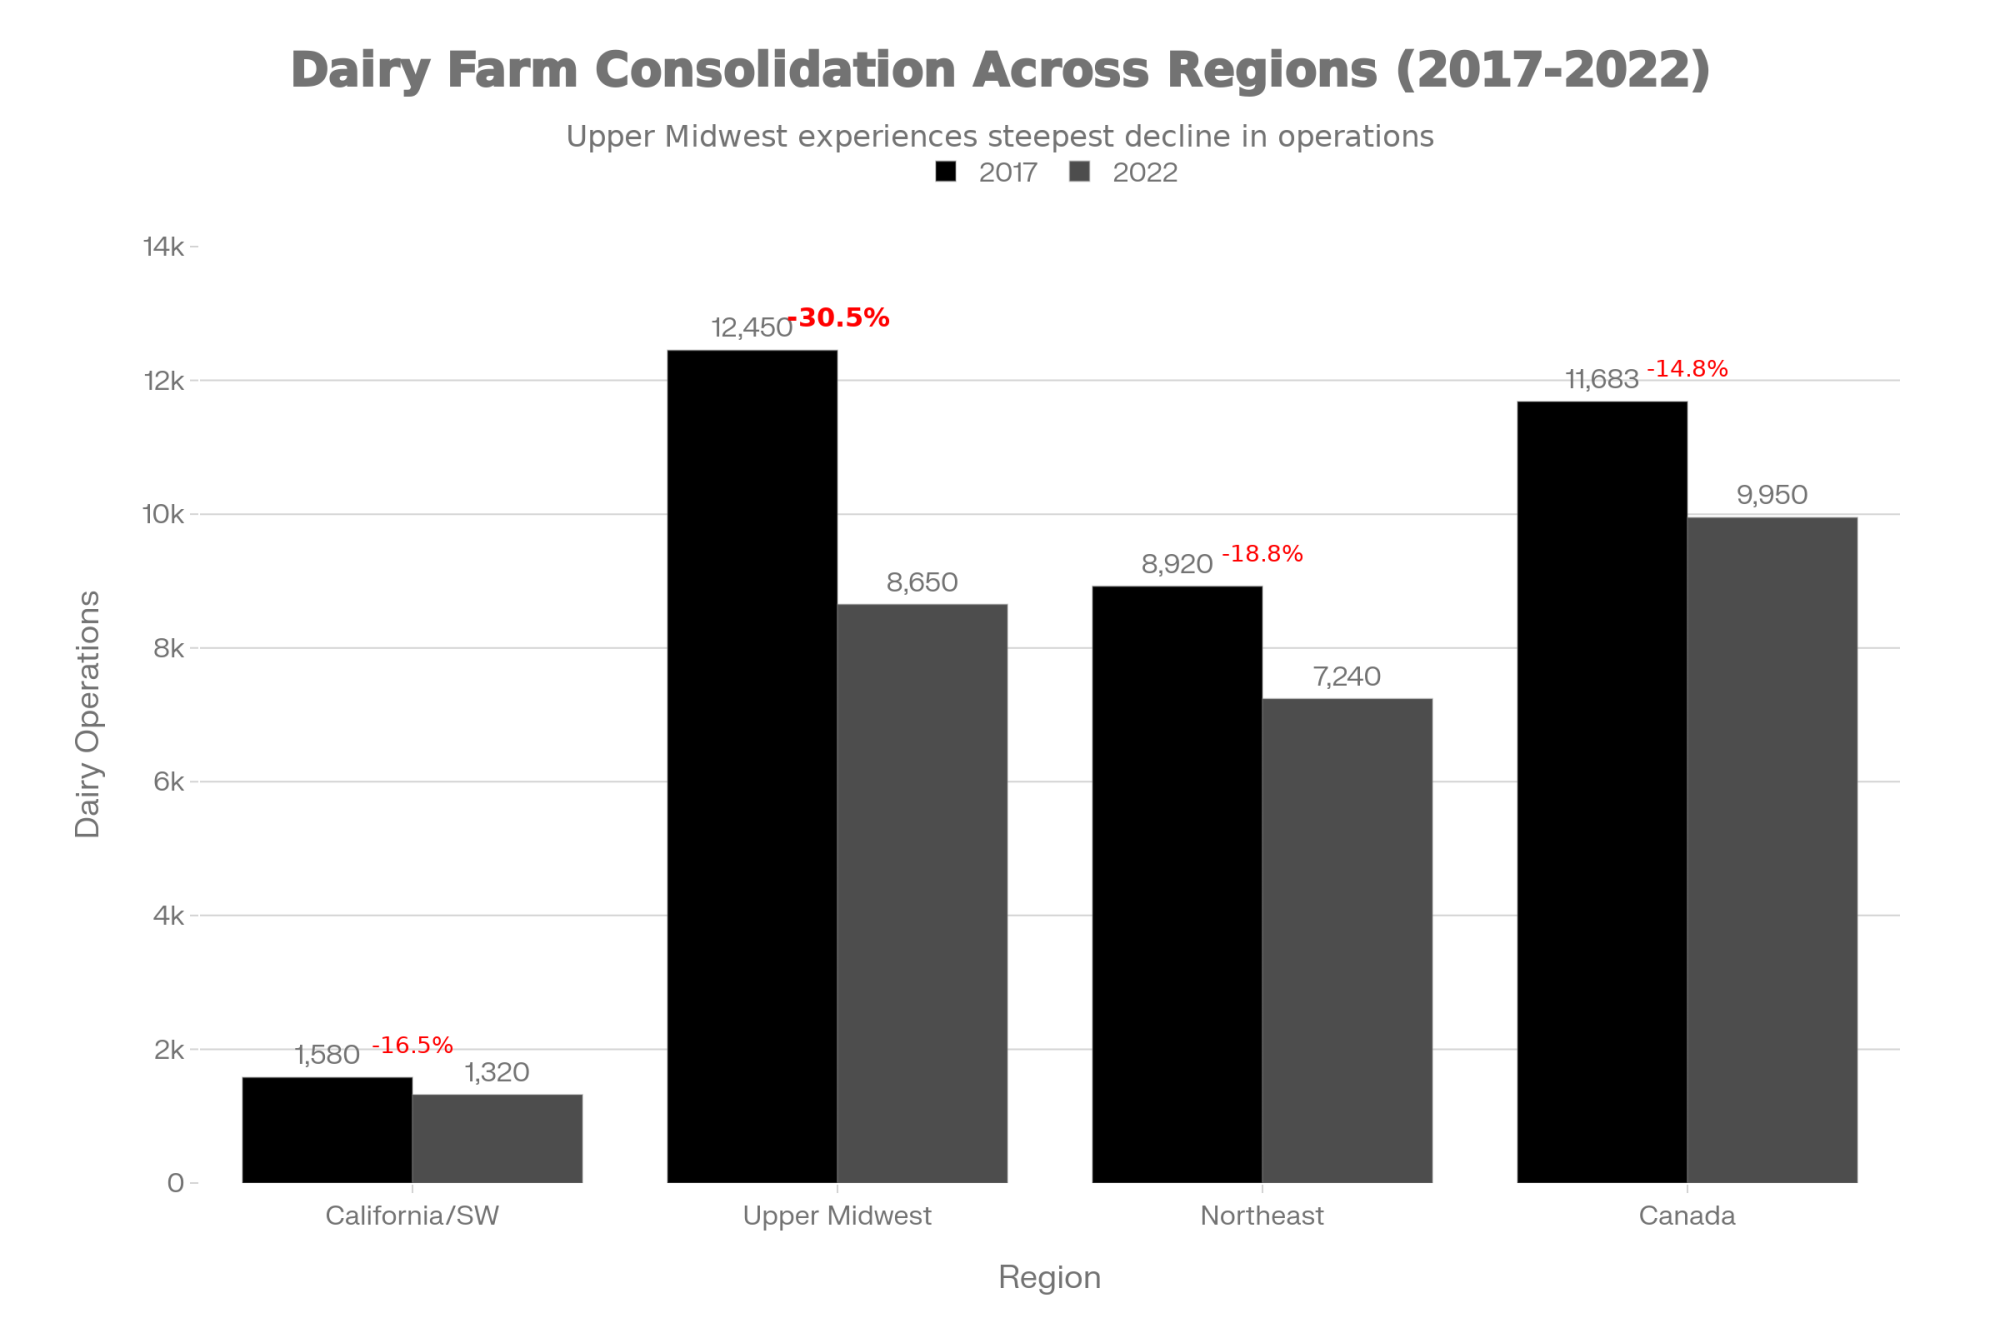
Wisconsin DATCP licensing data shows the state lost 818 dairy farms in 2019, another 455 in 2023, and roughly 400 more in 2024. Add up the losses since 2019, and you’re past 1,500 operations—gone from a state that still thinks of itself as America’s Dairyland. Minnesota shows similar patterns. So does New York.
What surprised me when I dug into the regional data is how differently this plays out depending on where you’re farming.
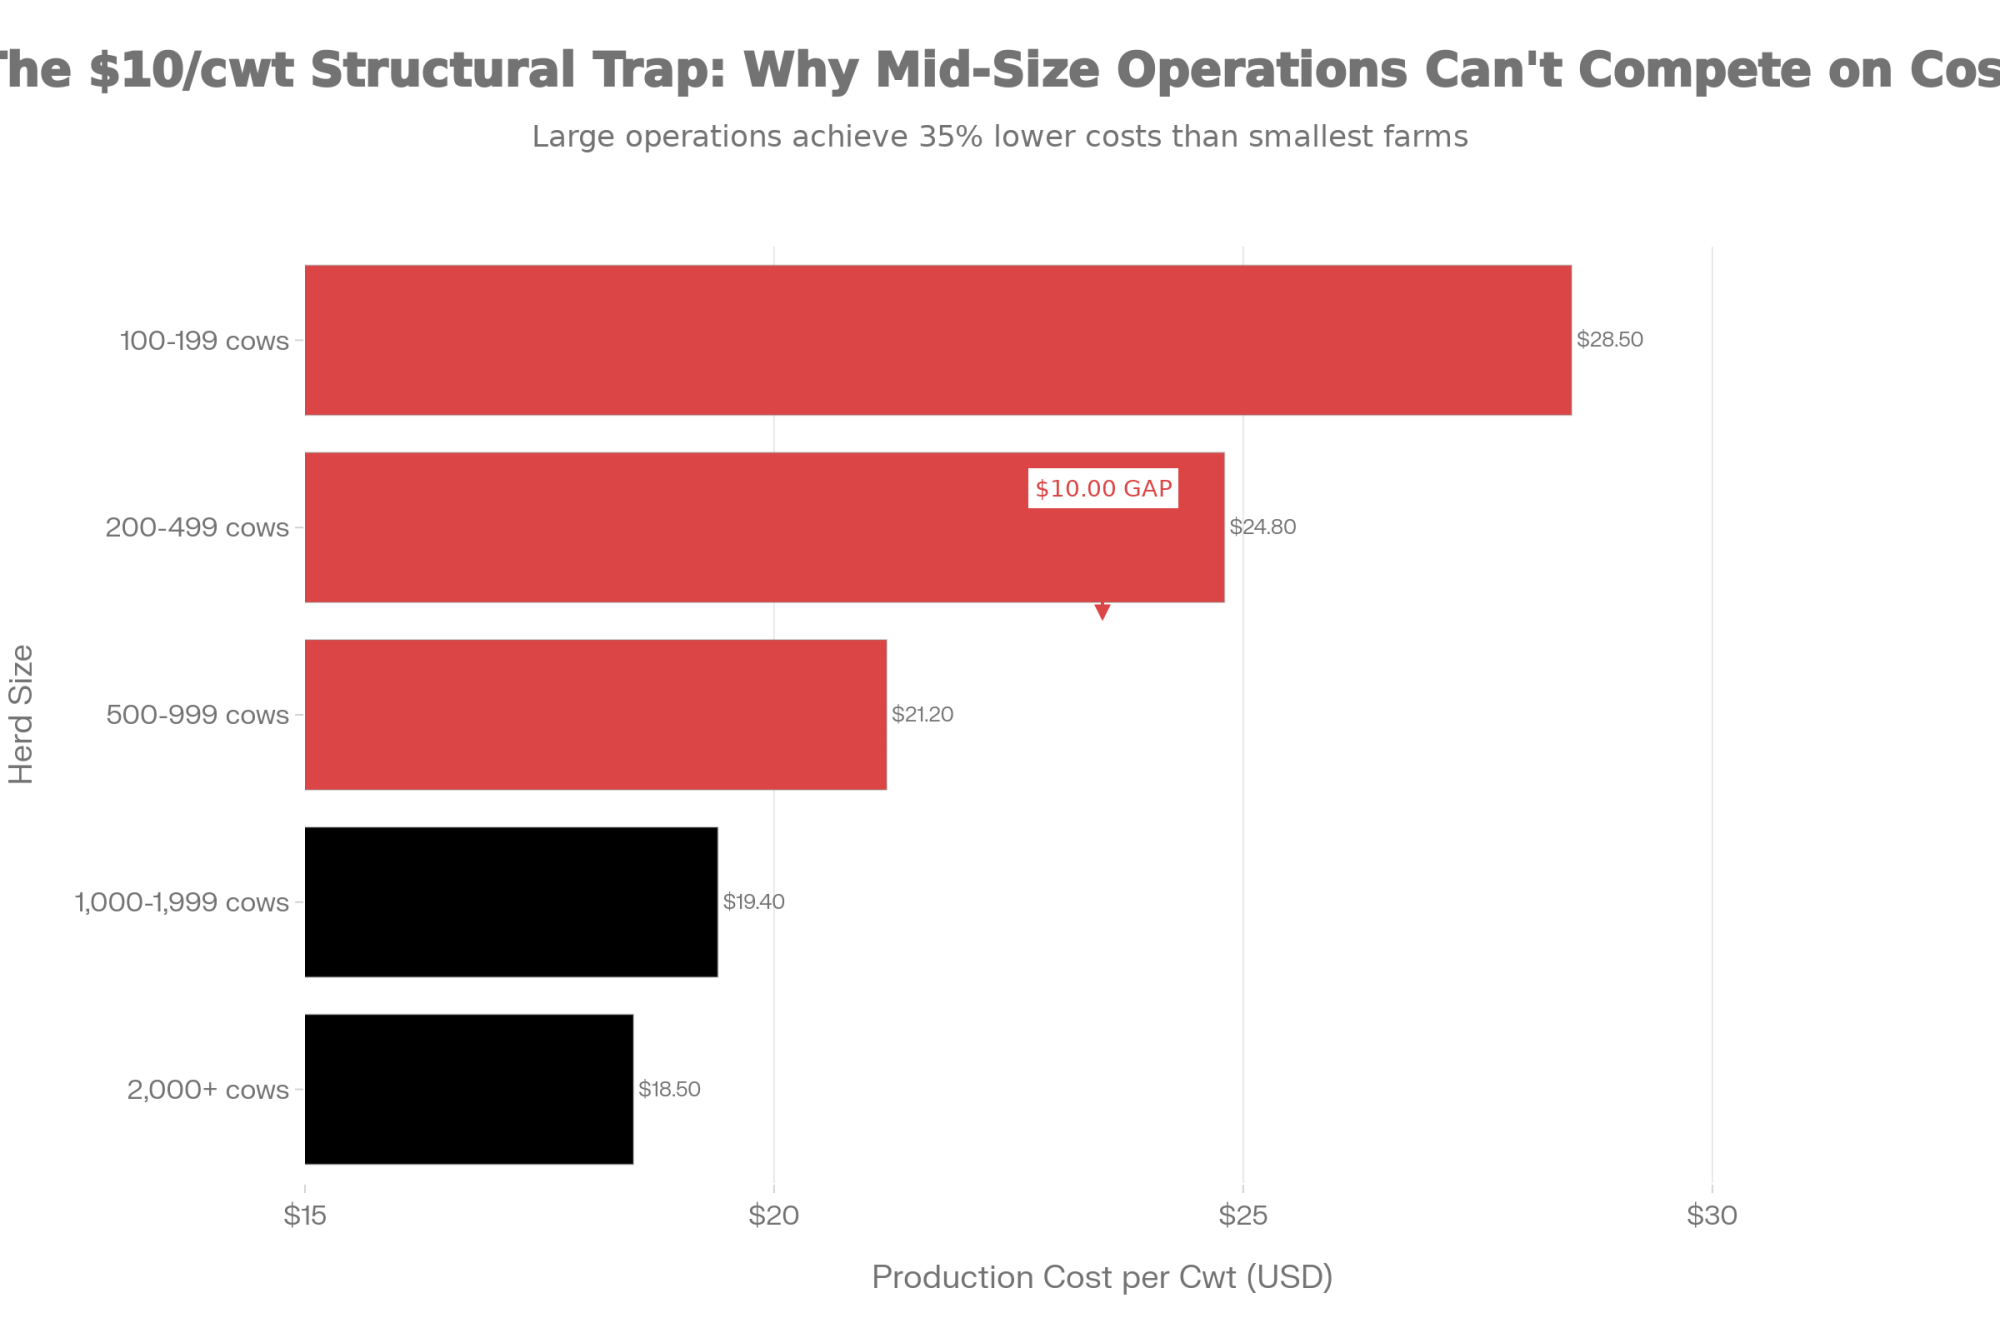
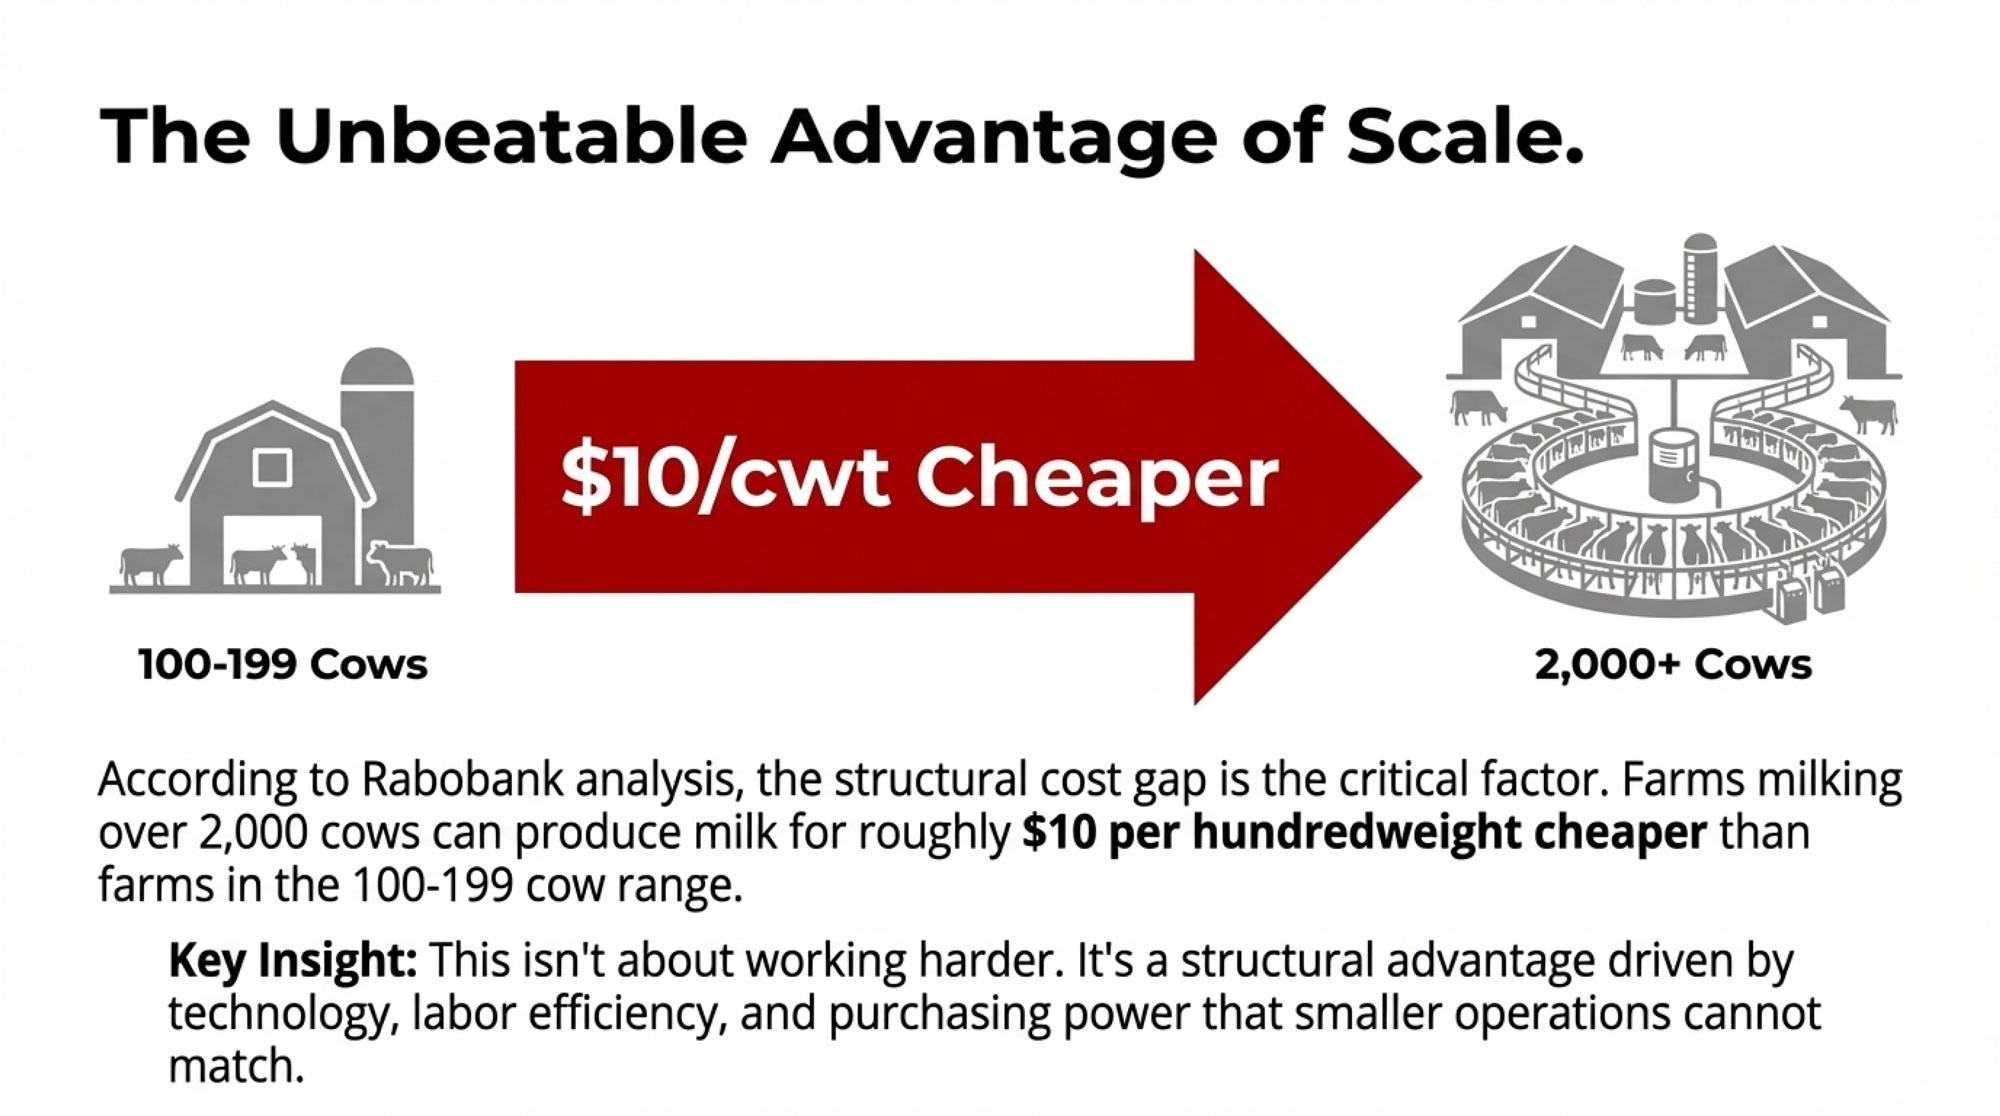
In California’s Central Valley and the Southwest—Texas, New Mexico, Arizona—consolidation has largely run its course. These regions now operate predominantly with very large dairies, many running drylot systems suited to arid climates, that have achieved cost structures that smaller operations struggle to match. Lucas Fuess, a senior dairy analyst at Rabobank, has noted that farms milking more than 2,000 cows can produce milk about $10 per hundredweight cheaper than farms running 100-199 cows. That’s not a small advantage. Over a year of production, that gap becomes the difference between building equity and burning through it.
The Upper Midwest presents a more complicated picture. You still find significant numbers of 200-800 cow operations in Wisconsin and Minnesota, but the economics are getting harder. The survivors tend to fall into two camps: those scaling toward 1,500+ cows to capture efficiency gains, and those capturing specialty premiums through organic certification, grass-fed programs, or artisan cheese partnerships. The middle ground between those strategies has gotten thin.
The Northeast faces high land costs and increasingly complex environmental regulations—such as nutrient management plans, CAFO permitting requirements, and setback rules that vary from county to county. But proximity to premium urban markets creates opportunities that don’t exist in rural South Dakota. I’ve talked with Vermont and New York producers who’ve built genuinely sustainable businesses through direct sales and value-added products. It requires different skills than commodity production, but the path exists.
Canadian producers operate under supply management, which provides price stability that U.S. farmers can only dream about. But even that hasn’t stopped consolidation entirely. A peer-reviewed study in the Canadian Veterinary Journal documented that Canadian dairy farms decreased by nearly 62% between 1991 and 2011—from over 39,000 operations down to fewer than 15,000. Current government data shows the decline continuing, with farm numbers dropping from about 12,000 in 2014 to roughly 9,250 in 2024.
Several industry analysts—including teams at Rabo AgriFinance and various land-grant universities—have projected that if current attrition rates continue, total U.S. dairy operations could fall into the 8,000 to 12,000 range by the mid-2030s. That’s not a formal USDA forecast, just an extrapolation. But the math isn’t complicated.
Technology and Labor: The Accelerating Factors
Two forces are speeding up the consolidation timeline in ways worth understanding.
Precision dairy technology—robotic milking systems, automated feeding, sensor-based health monitoring—requires significant capital investment but dramatically reduces labor needs per cow. A 2,000-cow operation with modern automation might run with 12-15 employees. Try running 500 cows with proportionally fewer workers, and you’ll find the per-cow labor costs much harder to manage. The technology favors scale in ways that weren’t true twenty years ago.
And then there’s the labor market itself. Finding reliable dairy workers has become genuinely difficult across most regions. The work is demanding, the hours are long, and competition from other industries has intensified. Larger operations can offer better wages, benefits, and more predictable schedules. Smaller operations often rely heavily on family labor—which works until the next generation makes different choices. Larger farms don’t just have more employees; they have HR systems. A 500-cow dairy often lacks the scale to hire an HR manager but is too big for the owner to handle all personnel issues personally. This adds to the “middle squeeze.
That generational piece matters more than we sometimes acknowledge. USDA data consistently shows the average age of farm operators climbing—it’s now 58.1 years for primary operators nationally, according to the 2022 Census. The same Census found that producers aged 65 and older now outnumber those under 35 by more than 4 to 1. And when the current generation steps back, many of those farms won’t continue as dairies, regardless of market conditions.
The Equity Question: What’s Really Happening to Your Balance Sheet
This is the piece I think deserves more attention, because it changes how you think about timing.
Many operations show strong balance sheets on paper. Land values appreciated significantly from 2010-2022. Multi-generational farms often carry substantial equity. But when you calculate what I’ve started calling “equity velocity”—the rate at which that equity is actually changing when you account for everything—the picture sometimes shifts dramatically.
Here’s a concrete example. Say you’re running a 500-cow operation with $5 million in starting equity. Not unusual for an established family dairy in Wisconsin or Minnesota.
THE EQUITY EROSION CALCULATION
In a challenging year, here’s what the math might actually look like:
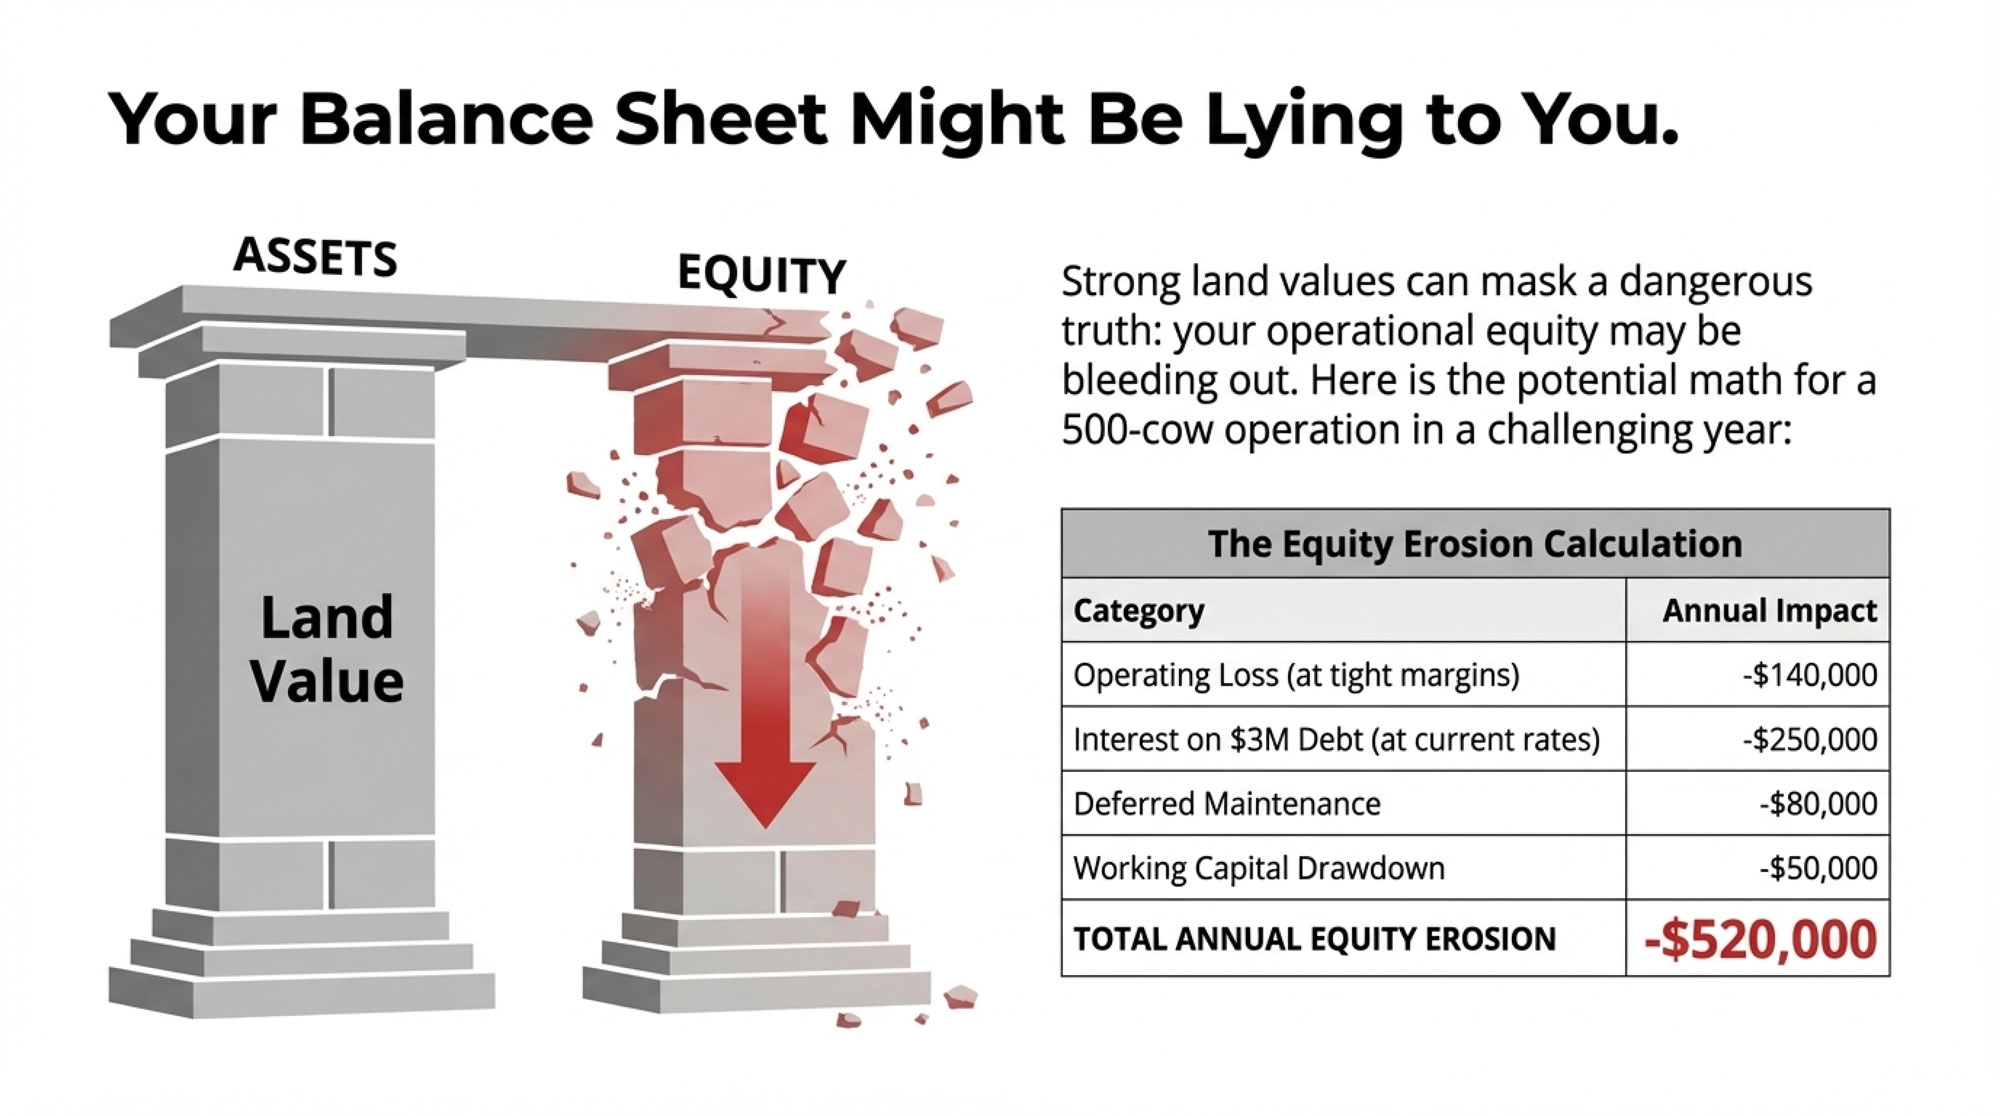
| Category | Annual Impact | Notes |
|---|---|---|
| Operating loss at negative margins | -$140,000 | Assumes $1.50-2.00/cwt below breakeven |
| Interest on $3M debt at current rates | -$200,000 to -$250,000 | 6.5-8.5% rates vs. 3-4% in 2019-2021 |
| Deferred maintenance | -$60,000 to -$80,000 | Mixer wagon, parlor equipment, facility repairs pushed to “next year” |
| Working capital drawdown | -$30,000 to -$50,000 | Feed inventory, supplies, cash reserves declining |
| TOTAL ANNUAL EQUITY EROSION | -$430,000 to -$520,000 | Before major breakdowns, herd health crises, or feed quality issues |
That’s potentially half a million dollars gone in a single difficult year. Before any major breakdowns. Before any herd health crises during the transition period with your fresh cows. Before a mycotoxin problem shows up in your feed.
Strong milk price years can reverse the trend. Some operations manage costs far better than others. But if you haven’t run this calculation for your own operation recently, you’re flying blind.
Mark Stephenson at UW-Madison—he’s the Director of Dairy Policy Analysis and received the Distinguished Service to Wisconsin Agriculture award in 2024—has made an observation that stuck with me. Farmers often think of equity as their safety net, he’s noted, but the erosion can happen gradually enough that it’s not obvious until a lender review reveals how much the picture has changed.
What One Producer Learned
I recently talked with a Wisconsin dairy farmer who exited in 2023 after 28 years running a 650-cow operation. He asked that I not use his name—these decisions still carry emotional weight in our communities—but his perspective is worth hearing.
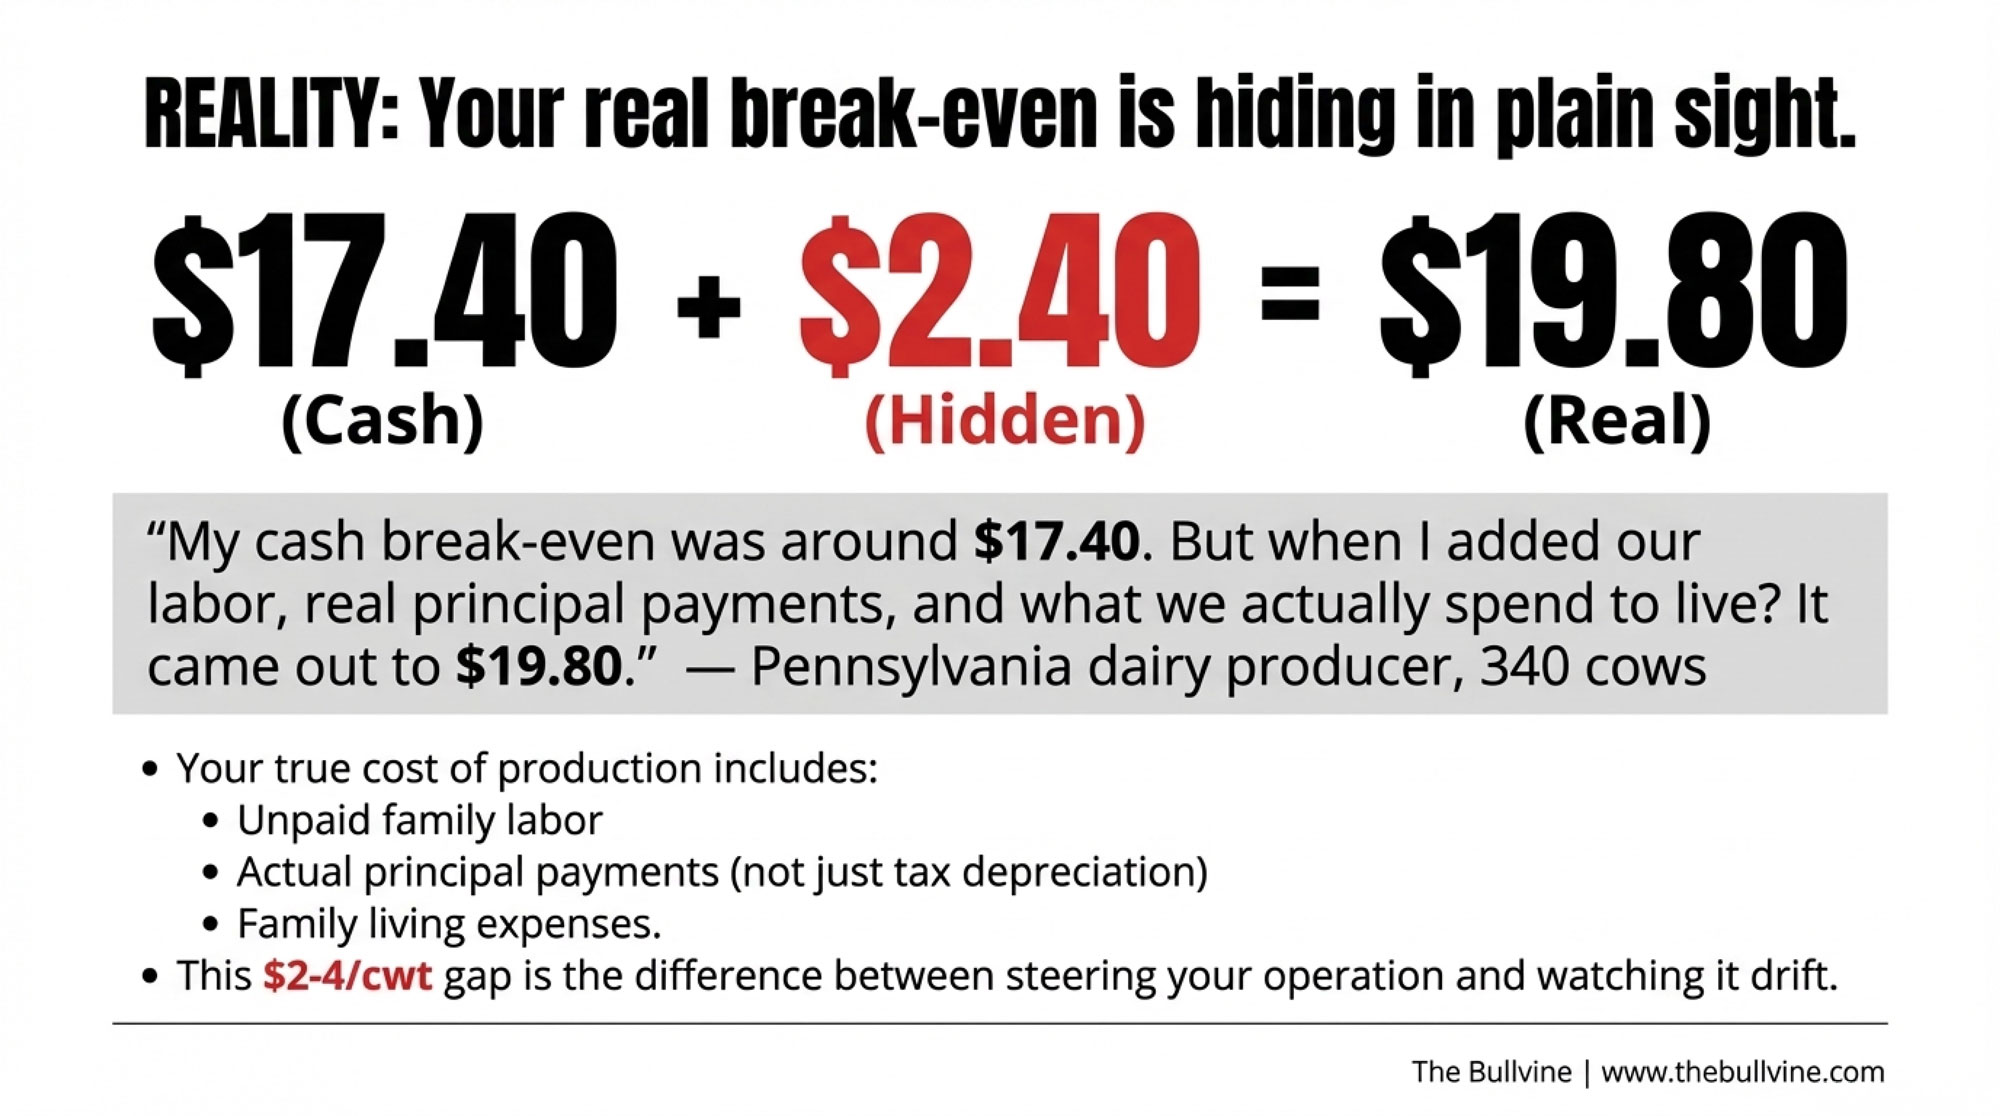
“I had $4.2 million in equity on paper,” he told me. “But when I really calculated the trajectory—the interest costs, the maintenance I kept deferring, my wife’s off-farm income basically subsidizing everything—I could see where things were headed if conditions didn’t improve substantially.”
He sold in early 2023, netting $3.8 million after paying off all debt, and now consults with other operations facing similar decisions.
“The hardest part was telling my dad, who’s 84 and started the place in 1968. But he said something I think about a lot: ‘I built this to take care of the family, not the other way around.'”
That’s not the only path forward, obviously. But it’s one that more operations are considering seriously.
A Different Story: Making the Middle Work
Not every mid-size operation is struggling, though. I spoke with a 400-cow dairy in central Wisconsin—they asked me not to identify them specifically—that’s been consistently profitable through the recent volatility.
Their formula:
- Aggressive cost tracking (feed costs monitored weekly, not monthly)
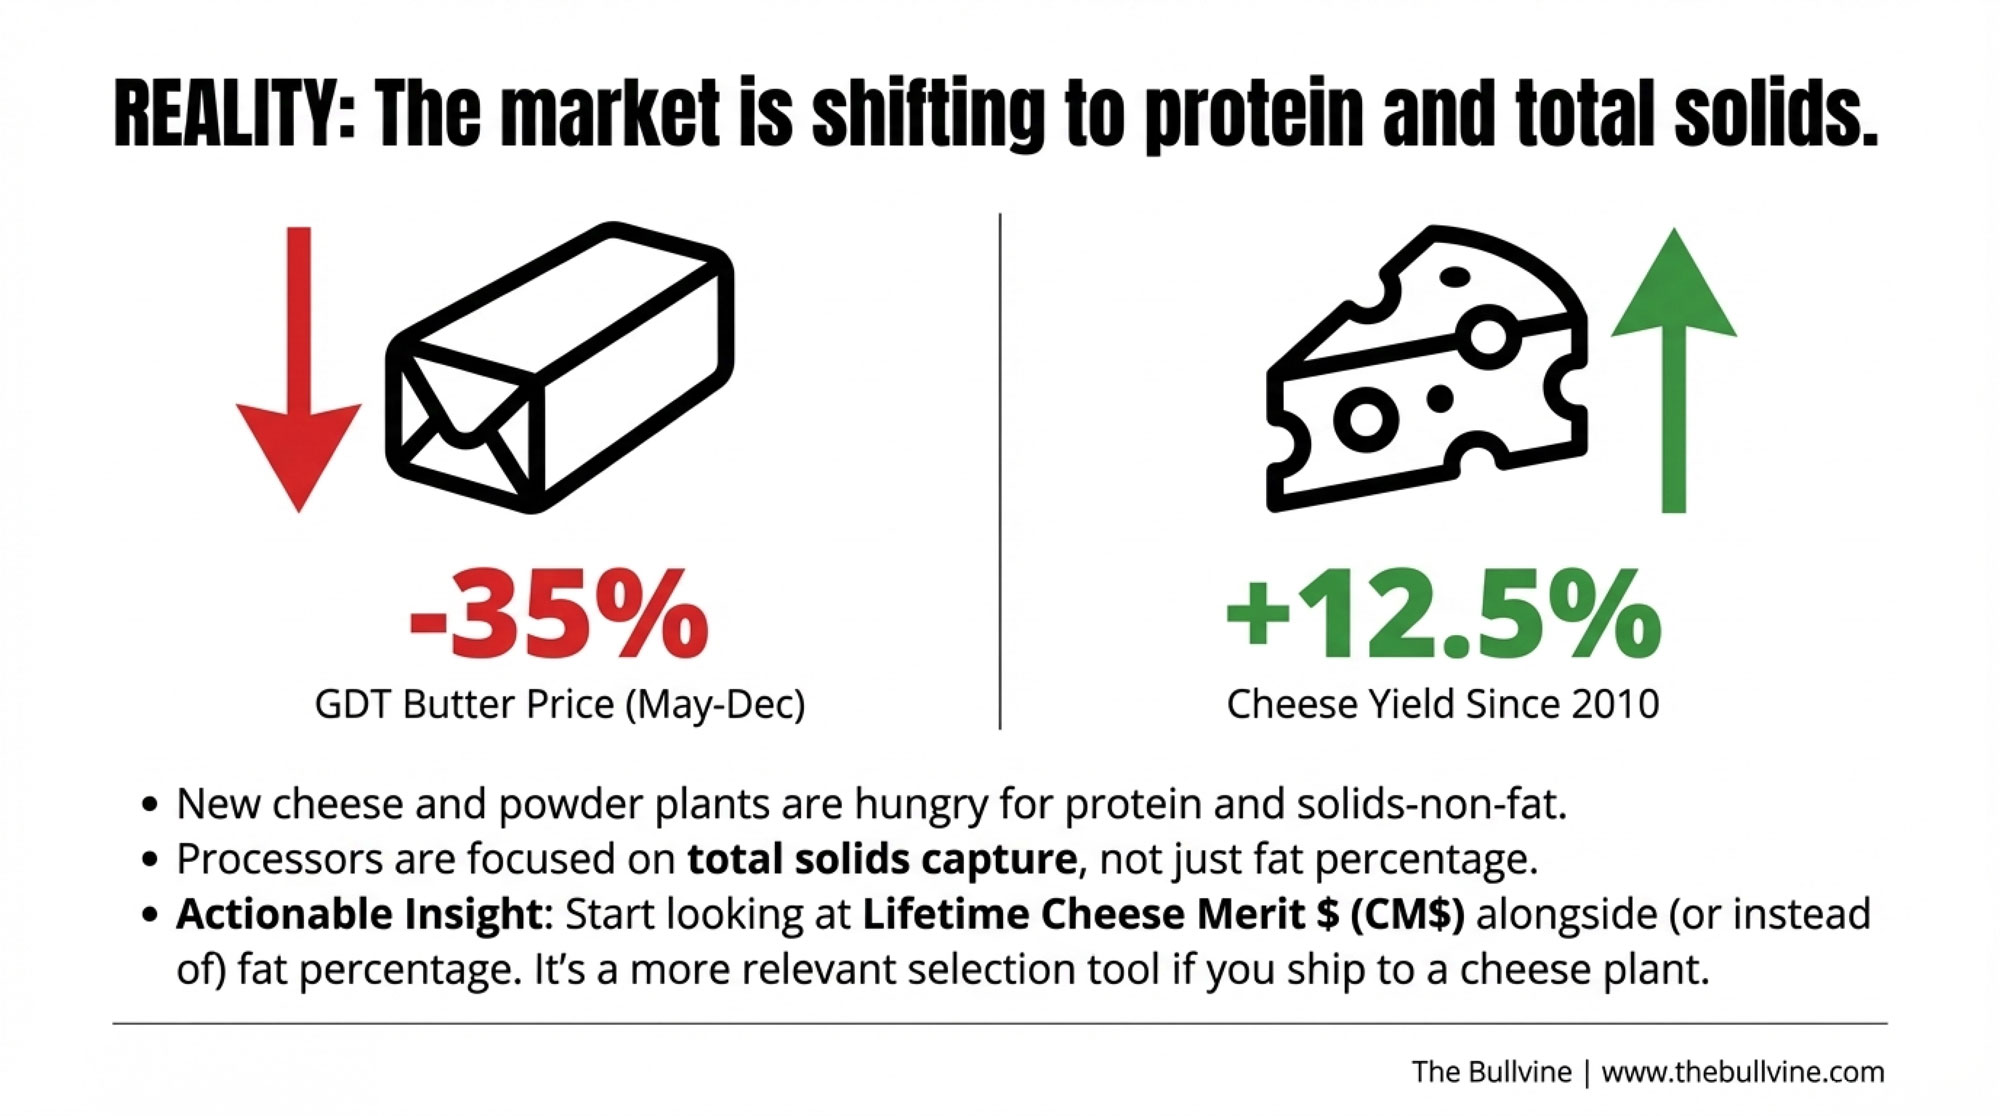
- Premium processor relationship (specialty cheese buyer paying for high-component milk)
- Zero debt (paid off expansion fifteen years ago)
- Professional management (next-gen operator returned with agribusiness career experience)
“We’re not getting rich,” the father told me, “but we’re not burning equity either. The key was getting our debt to zero before the interest rate spike. That changed everything.”
Their butterfat runs consistently above 4.2%, which helps with their processor relationship. They’ve invested in cow comfort—good ventilation, proper stall sizing, well-maintained freestall surfaces—and their herd health metrics show it. Fresh cow management is tight. Their transition protocol catches problems early. Nothing fancy, really. Just solid fundamentals executed consistently.
The lesson: The middle isn’t completely dead—but survival requires hitting a specific combination of factors that not every operation can replicate.
Understanding the Macro Picture: Headwinds and Tailwinds
Here’s where the broader farm economy context matters.
USDA’s Economic Research Service projected net farm income around $180 billion for 2025, second only to 2022 in nominal terms. The September 2025 forecast put it at $179.8 billion.
Sounds encouraging, right? The catch is that roughly $40.5 billion of that comes from government payments rather than market returns. And aggregate farm income numbers don’t tell you much about dairy specifically, or about operations of particular sizes in particular regions.
Current Forces Shaping Dairy Economics
HEADWINDS (Working Against You):
- Interest rates remain elevated compared to the 2010-2021 era—debt service costs have doubled or tripled for many operations
- Labor availability continues tightening with no relief in sight
- Input cost volatility (feed, fuel, fertilizer) shows no signs of stabilizing
- Consolidation momentum means your competitors keep getting more efficient
- Generational transfer challenges—fewer successors, more complexity
TAILWINDS (Working For You):
- Strong domestic demand for dairy products remains stable
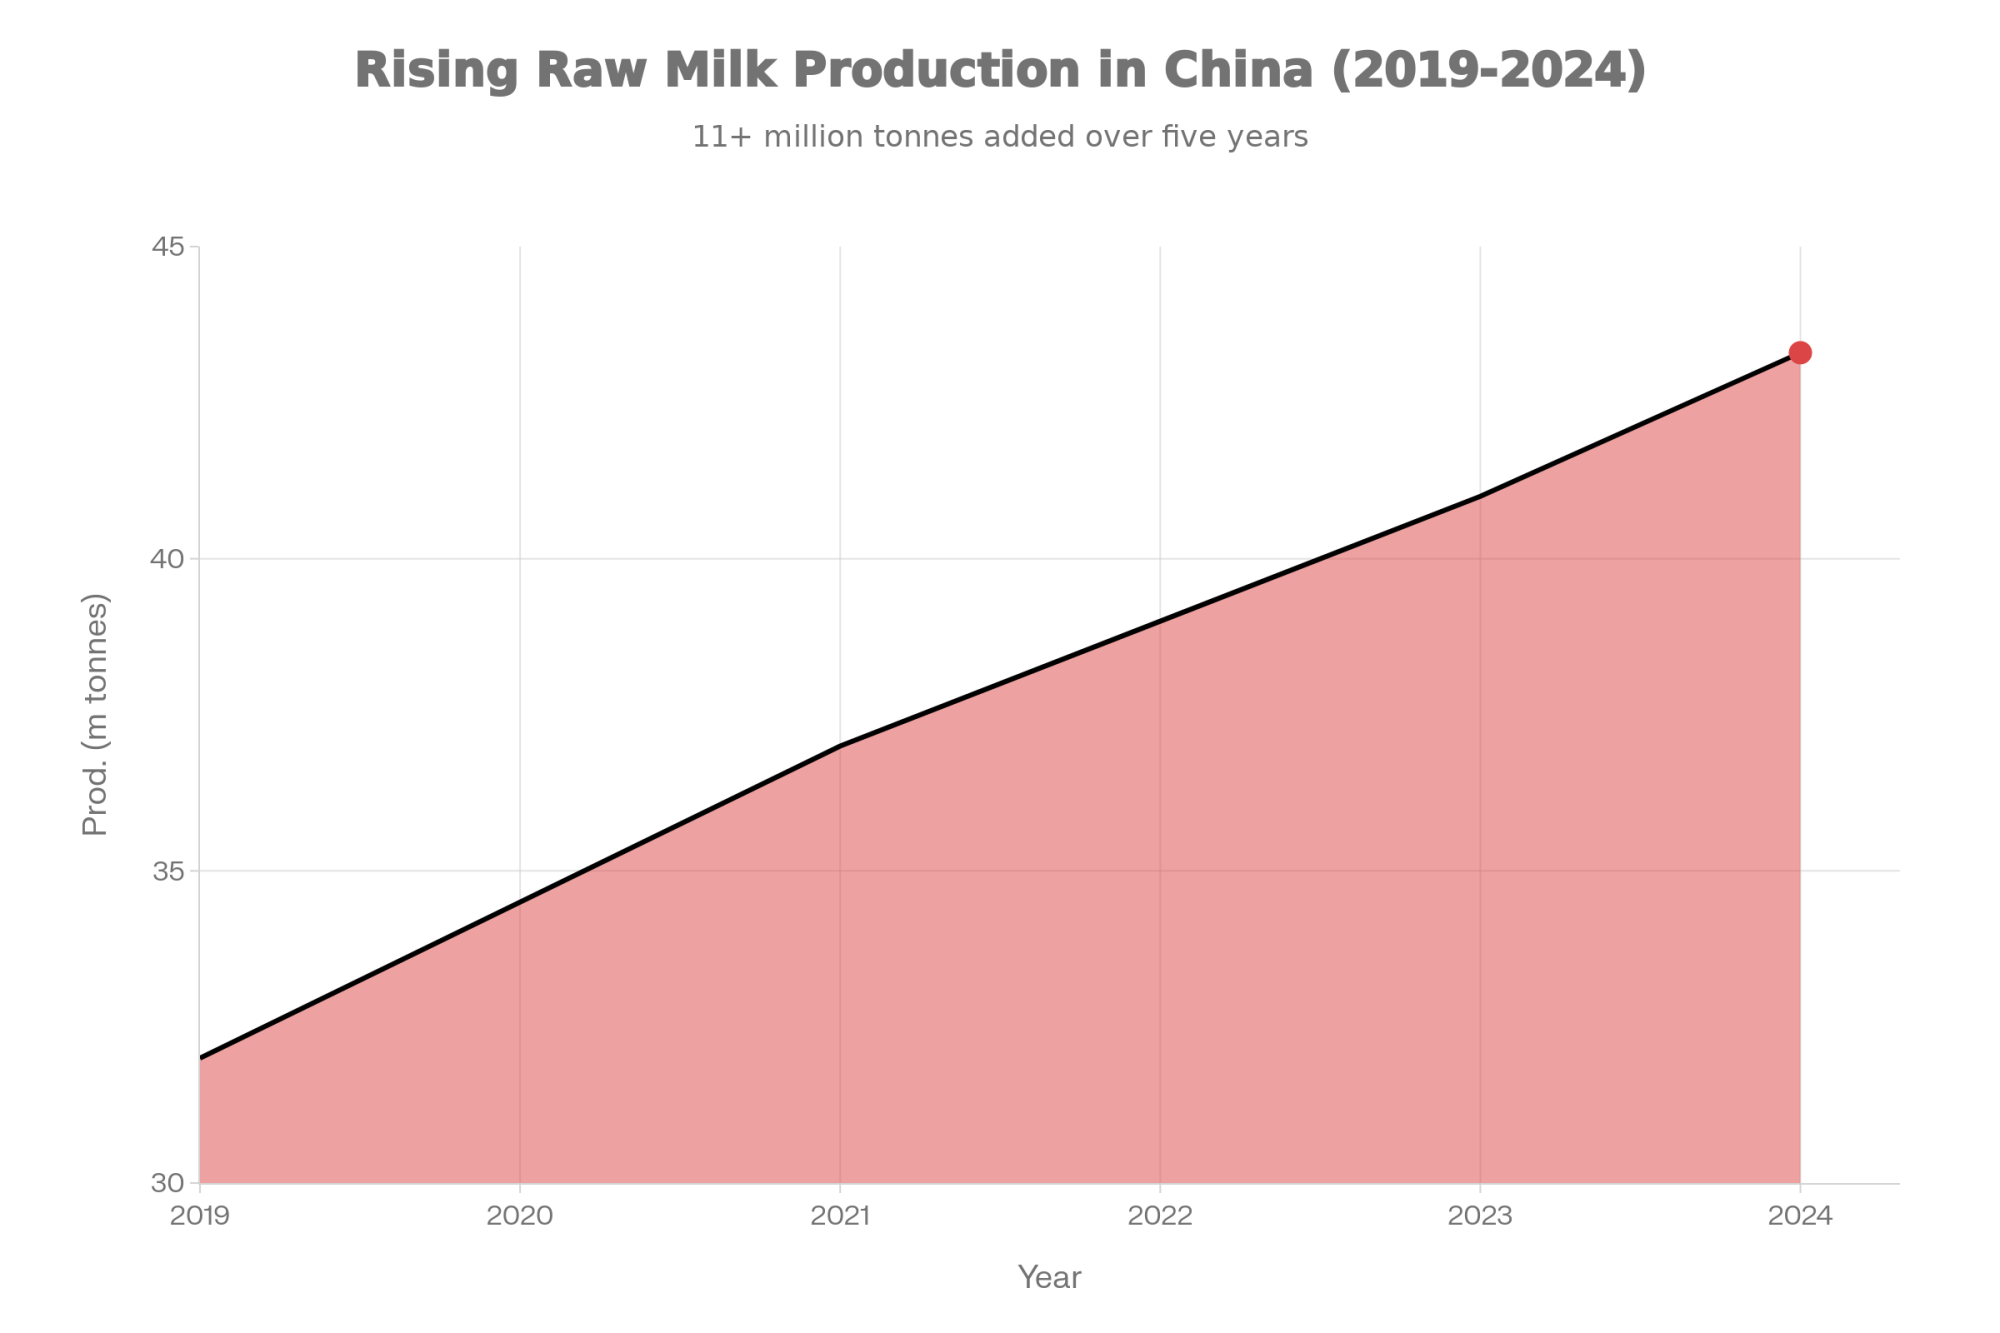
- Export market growth has created new outlets (though with added volatility)
- Premium market expansion—organic, grass-fed, and local continue growing
- Technology improvements can boost efficiency (if you can afford the capital)
- Land values remain strong in most dairy regions (supporting equity—for now)
The net effect: Volatility has increased. The spread between good years and bad years has widened. For operations carrying significant debt, that volatility translates directly into financial stress—strong years barely rebuild what weak years destroy.
A Balanced Look at Cooperatives
The cooperative question comes up constantly, and it deserves careful treatment because the reality is more complicated than either critics or defenders usually acknowledge.
Agricultural cooperatives exist to give farmers collective bargaining power—that’s the core purpose behind the 1922 Capper-Volstead Act’s antitrust exemptions. Many cooperatives serve that function well. Organic Valley maintains transparent pricing, ties board compensation to member outcomes, and operates with governance that gives members a meaningful voice.
At the same time, a 2020 federal antitrust lawsuit raised questions about coordination between Dairy Farmers of America and Dean Foods. The case settled without disclosed terms, so we don’t have a definitive legal finding. But asking questions about how large cooperative structures balance processing business interests against member price maximization seems reasonable.
The honest answer: It depends on the cooperative. Smaller regional organizations where members know board members personally tend to maintain strong accountability. Massive organizations representing thousands of farms across multiple states face different structural dynamics.
Questions to ask about your cooperative:
- How transparent are the pricing formulas in practice?
- What’s the actual balance between member returns and retained earnings?
- How are board members compensated, and for what outcomes?
- When did you last attend a member meeting or vote?
Realistic Strategic Options
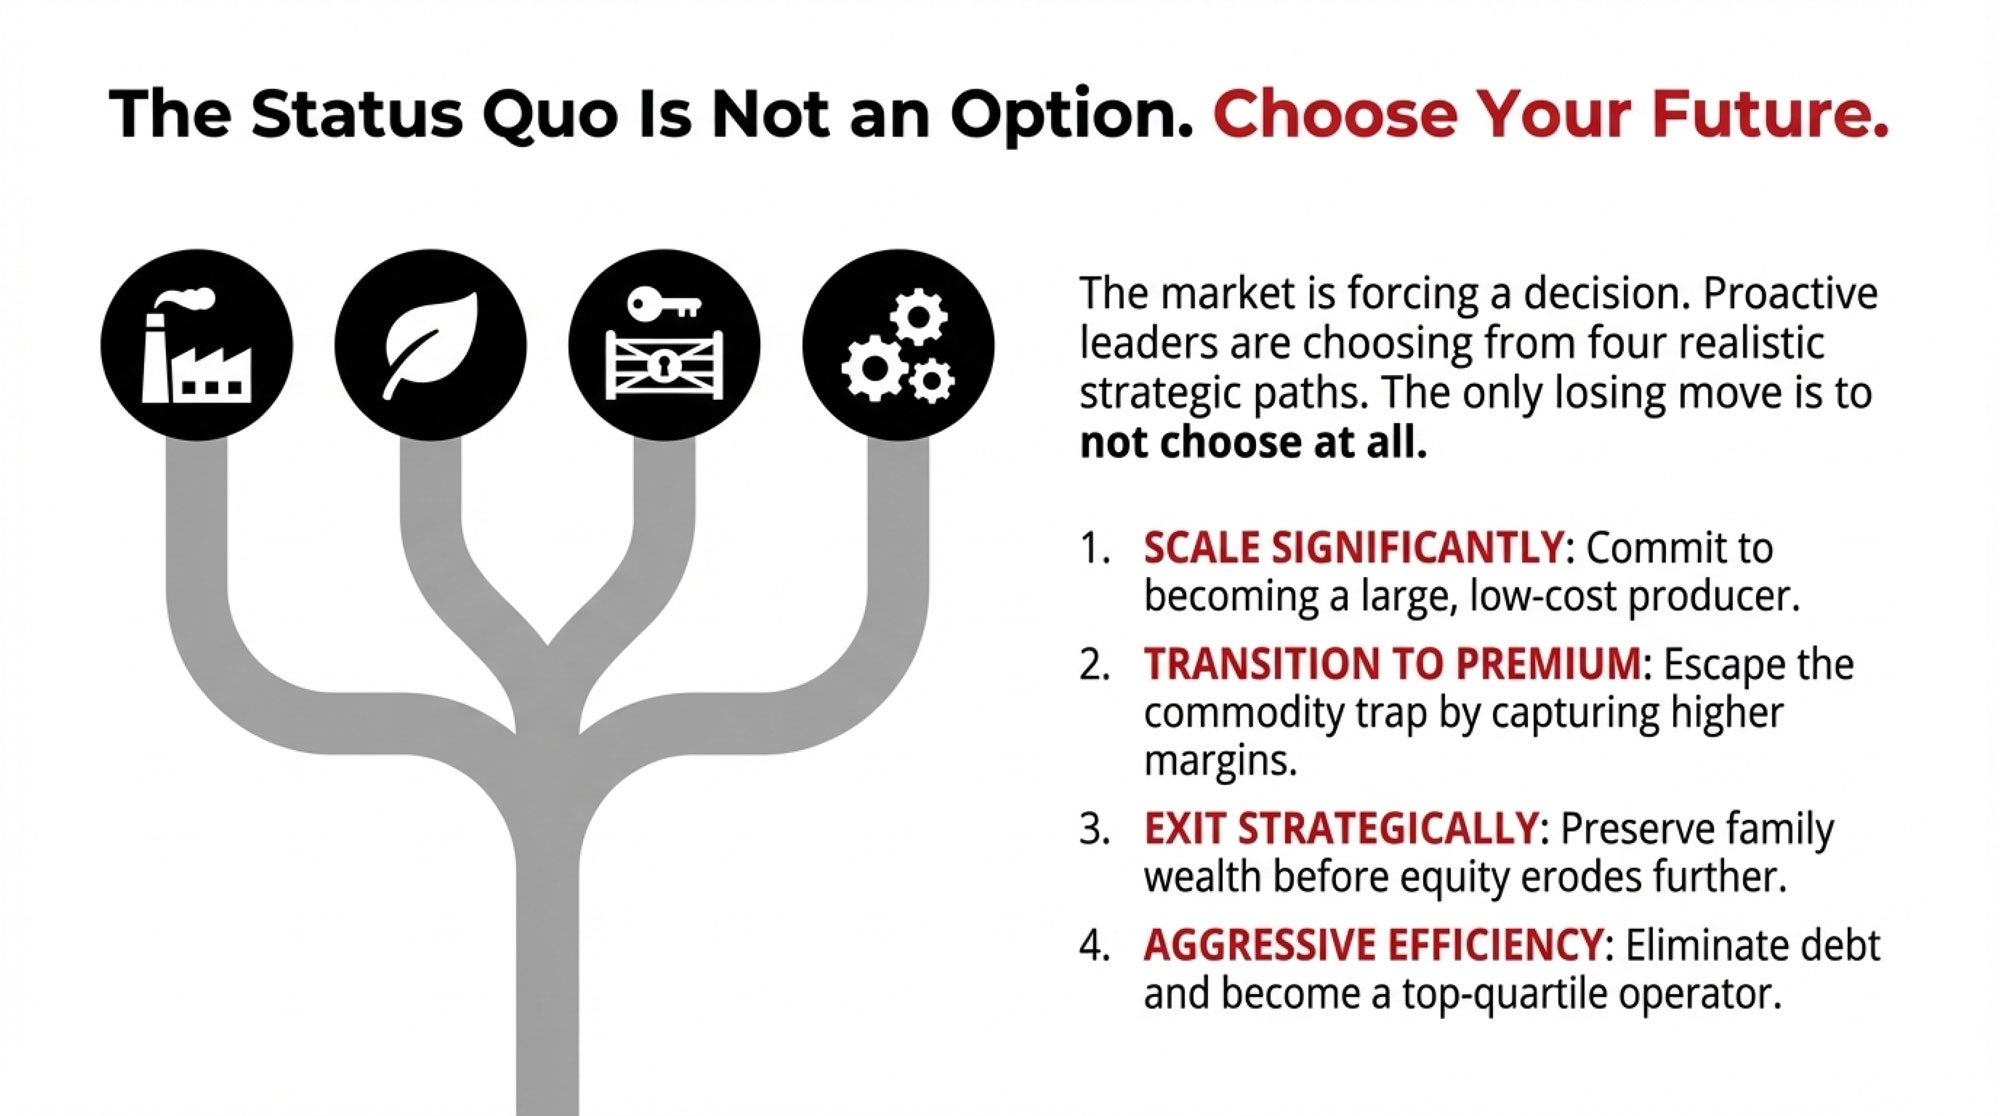
For farms in that 500-2,000 cow range—the segment facing the most significant structural questions—here’s how I’d frame the realistic choices. I want to be honest about both the potential and the requirements.
| Path | Capital Needed | Realistic Assessment | Timeline | Best Fit |
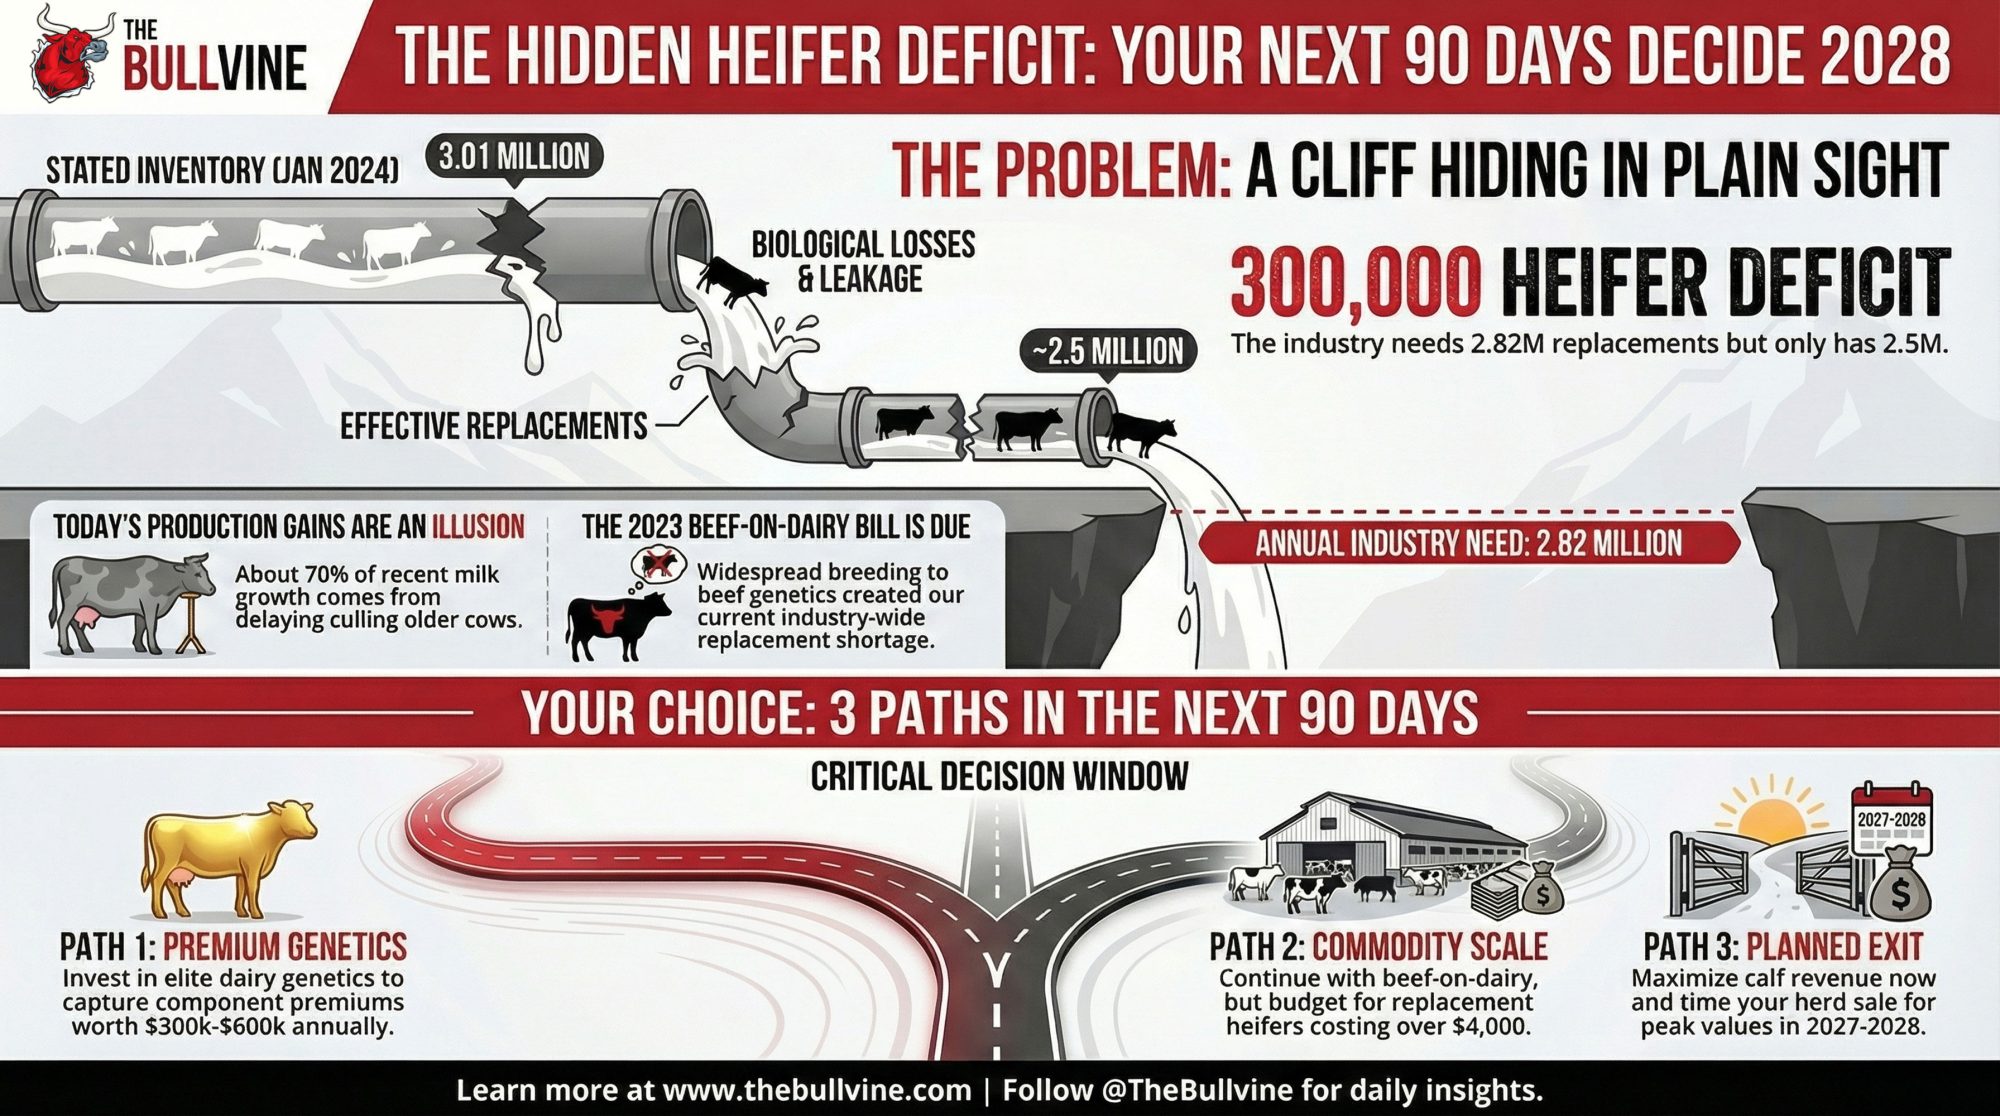
| Scale significantly | $15-25 million (industry estimates) | Achievable for some; requires specific conditions | 7-12 years | Strong equity, favorable location, committed next generation |
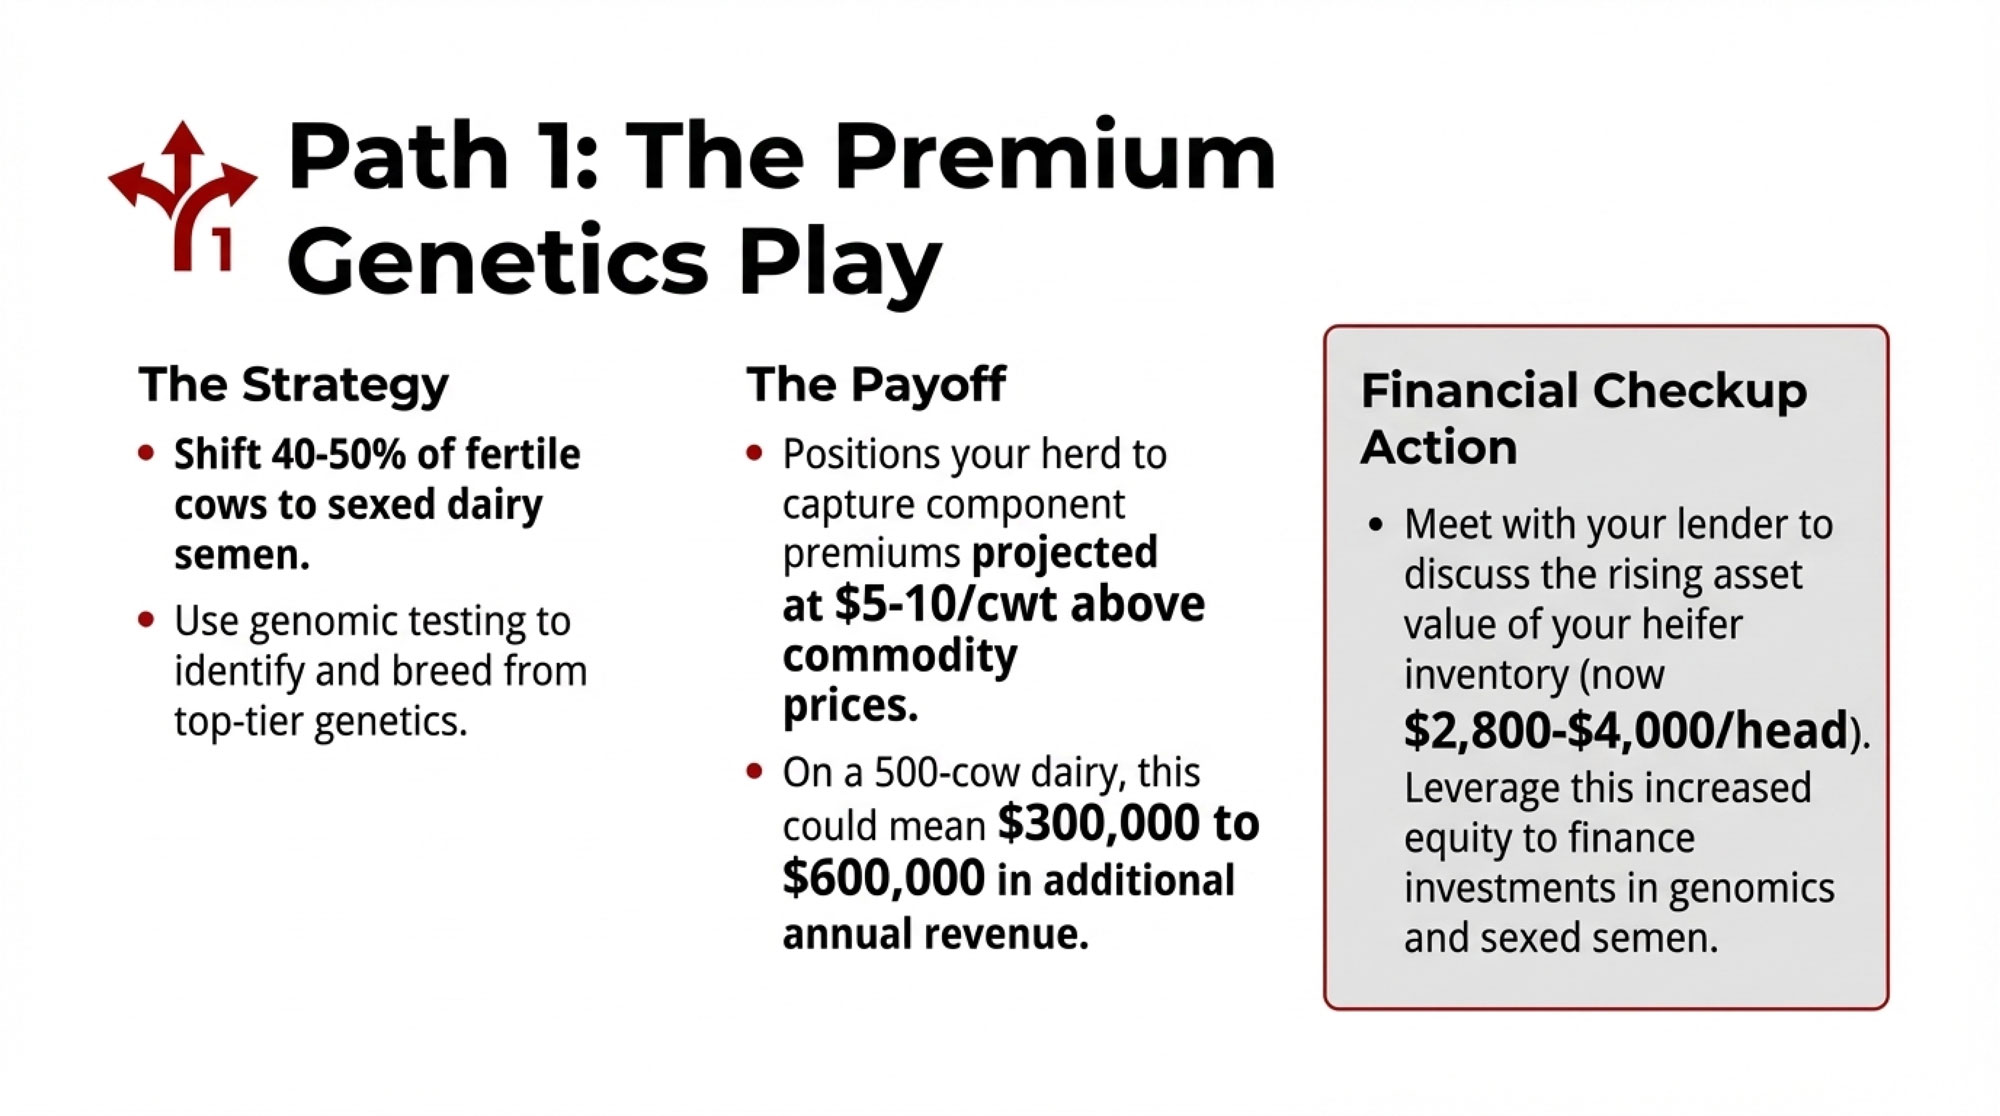
| Transition to premium | $100-300k working capital + transition period | Works in the right circumstances | 4-6 years | Market access, suitable land, manageable debt |
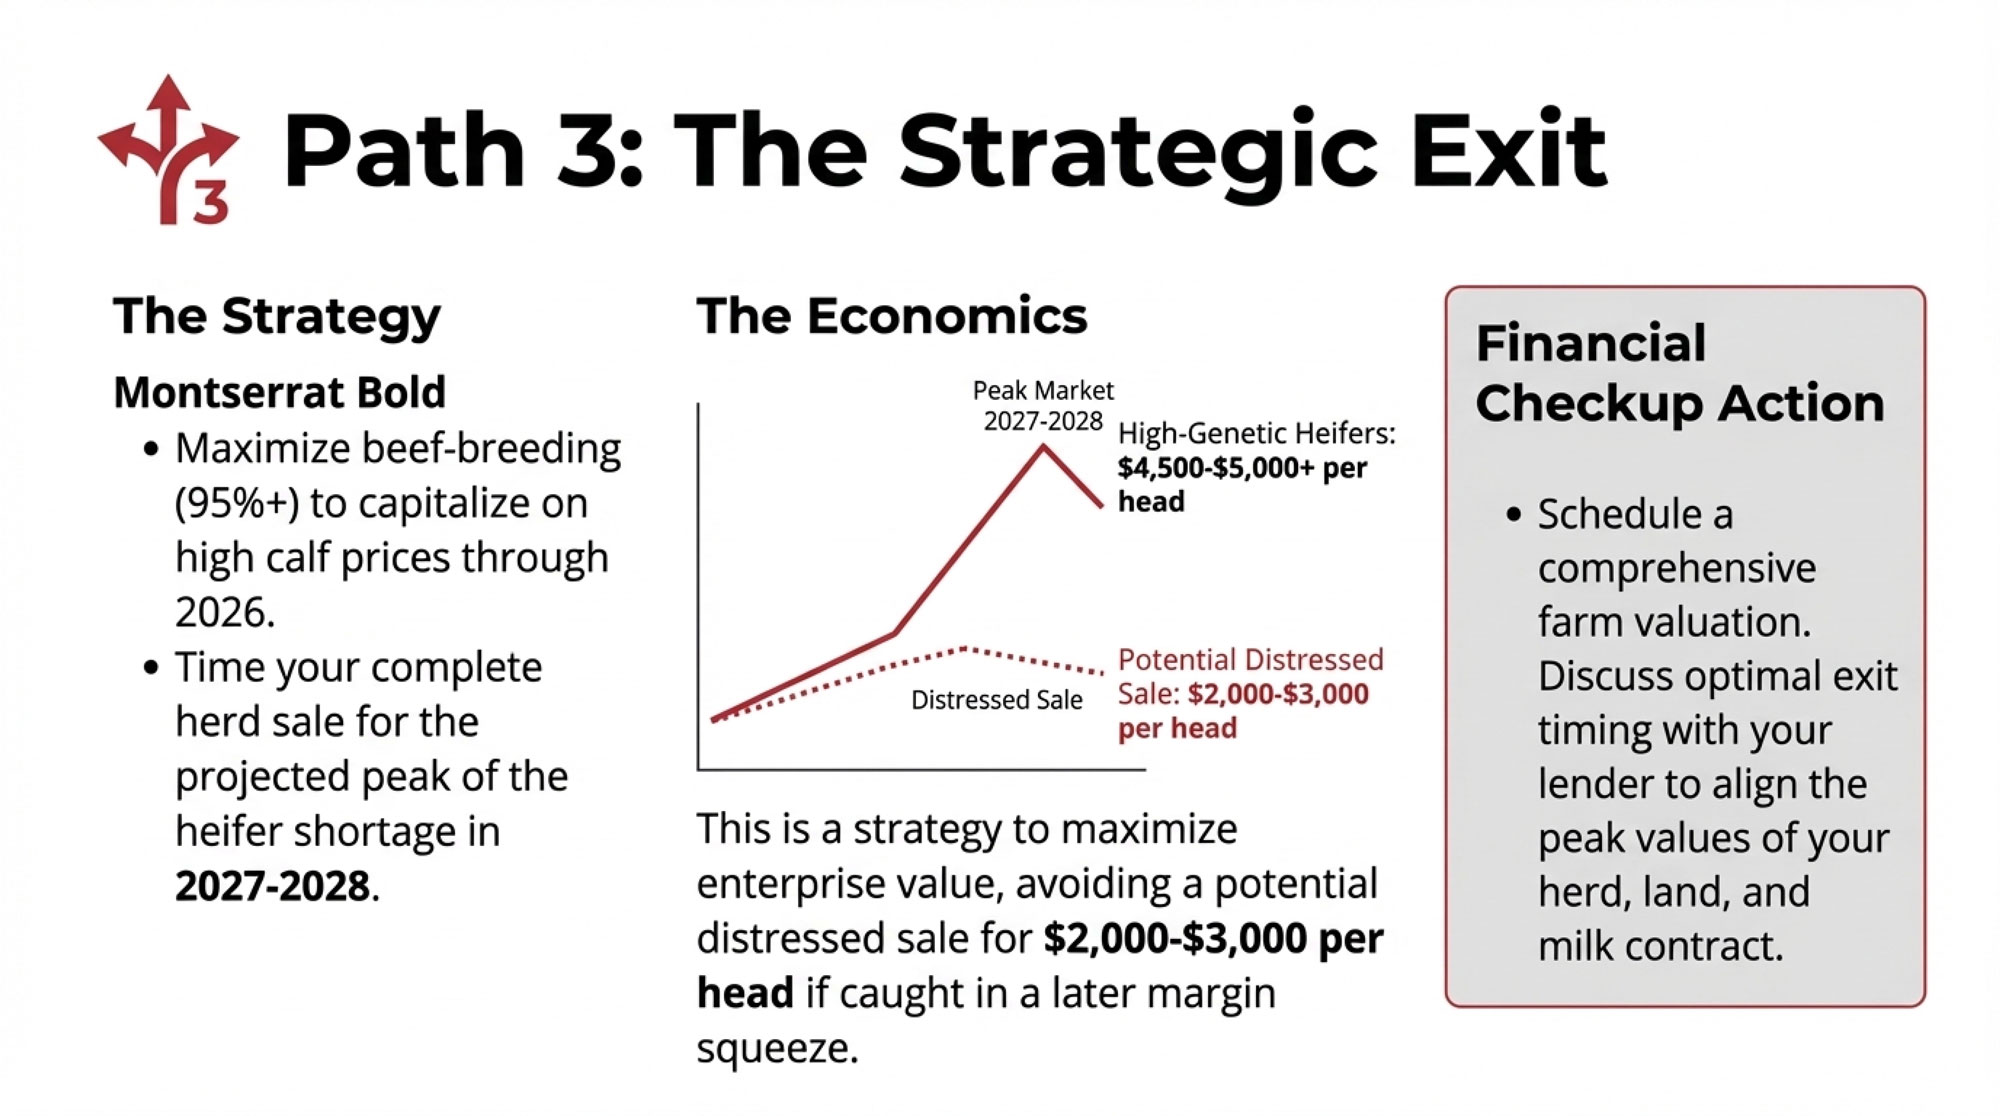
| Strategic exit | None (preserves existing) | Often, the financially optimal choice | 6-18 months | Approaching transition, eroding position, no clear cost advantage |
| Aggressive efficiency | Minimal (debt paydown) | Requires already being in the top quartile | Ongoing | Already efficient, moderate debt, family aligned |
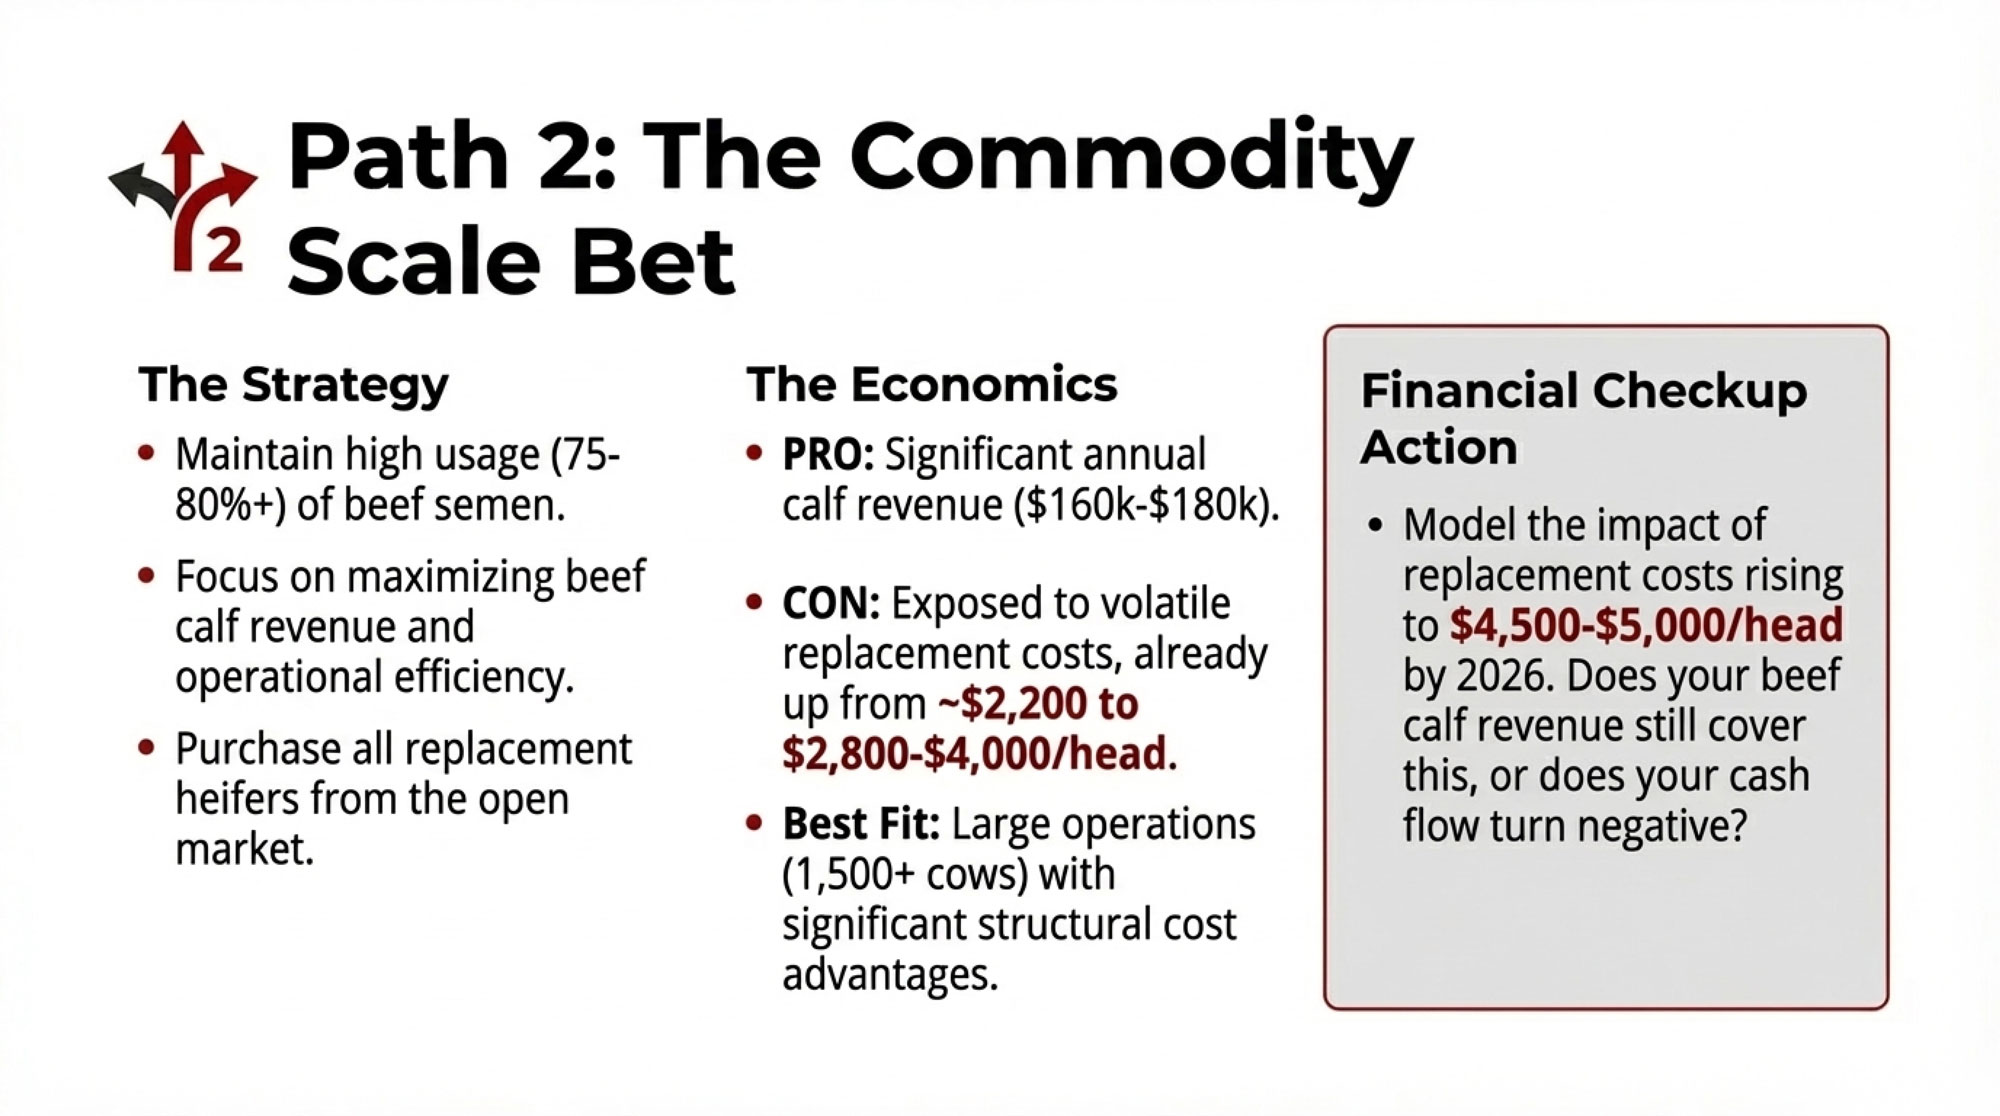
The Scaling Path
Expanding to 3,000-5,000+ cows can achieve competitive cost structures. But the requirements are substantial: major capital, strong existing equity, location with expansion capacity (land, water, permits, labor), willingness to shift from hands-on farming to managing a 20+ person team, and committed next-generation leadership.
The Dykman Dairy situation in British Columbia offers a cautionary lesson. According to CBC reporting on BC Supreme Court filings from November 2024, the Bank of Nova Scotia sought creditor protection for an operation that had accumulated $75 million in debt. Court documents showed monthly interest payments had climbed to $463,000—a level that became impossible to sustain when conditions tightened.
The underlying economics may have been strained for years. Favorable interest rates just masked the problem until they weren’t favorable anymore.
The Premium Market Path
Current organic milk pay prices range from approximately $33/cwt to $50/cwt, depending on certification and buyer, according to NODPA market reports. Grass-fed certified operations often command $36-50/cwt. Compare that to conventional prices in the high-teens to low-twenties, and the appeal is obvious.
The challenge is the three-year transition period: you’re operating under organic protocols—organic feed costs, pasture requirements, different herd health approaches—while still receiving conventional prices. Feed costs run 40-60% higher during transition. University extension budgets suggest you might need $100,000-300,000 in working capital just to bridge that gap.
Geography matters too. Direct marketing works within 50-100 miles of population centers with consumers willing to pay premiums. If you’re in rural central Wisconsin, your customer base for farmstead products may simply not exist.
The Exit Path
For operations where the next generation has other plans, where structural cost disadvantages can’t realistically be overcome, or where operators are approaching retirement anyway, preserving equity through a well-planned exit often represents the best outcome for family wealth.
The timing math matters enormously. If equity erosion runs $200,000-$400,000 annually, each year of delay reduces the amount the family preserves. Exiting with $4 million is substantially different from exiting with $2 million five years later.
The Efficiency Path
Some operations can position themselves for survival through aggressive cost management and debt elimination. The Wisconsin family I mentioned earlier is proof that it can work.
But this path requires already operating at high efficiency. It leaves essentially no margin for error—one bad year, one major equipment failure, one significant herd health challenge can change the math entirely. And it depends on milk prices eventually improving enough to reward your persistence.
If you’re pursuing this approach, establish clear decision triggers in advance: “If we haven’t reduced our debt-to-asset ratio to X by 2028, we execute Plan B.” Having predetermined benchmarks prevents the gradual slide that happens when hope substitutes for honest assessment.
A Note for Canadian Producers
Supply management provides price stability—Canadian prices typically work out to the low- to mid-$20s per cwt in U.S. dollar terms, notably higher than U.S. commodity prices most years. That matters for planning.
But supply management doesn’t eliminate structural pressures. It changes how they manifest. Quota values represent real equity but have become significant entry barriers for anyone without family connections—you’re looking at millions just for the right to ship milk before buying your first cow.
Trade agreements keep nibbling at the system. USMCA created new access for U.S. dairy products. The federal government announced $1.75 billion CAD over eight years to compensate producers for trade concessions under CETA and CPTPP back in August 2019—an acknowledgment of real economic impacts.
The fundamental questions about financial trajectory, generational transition, and long-term positioning apply north of the border, too. The specific numbers just differ.
The Bullvine 30-Day Financial Audit Challenge
I’m not going to end this piece by suggesting you bookmark some websites. I’m going to challenge you to do something harder.
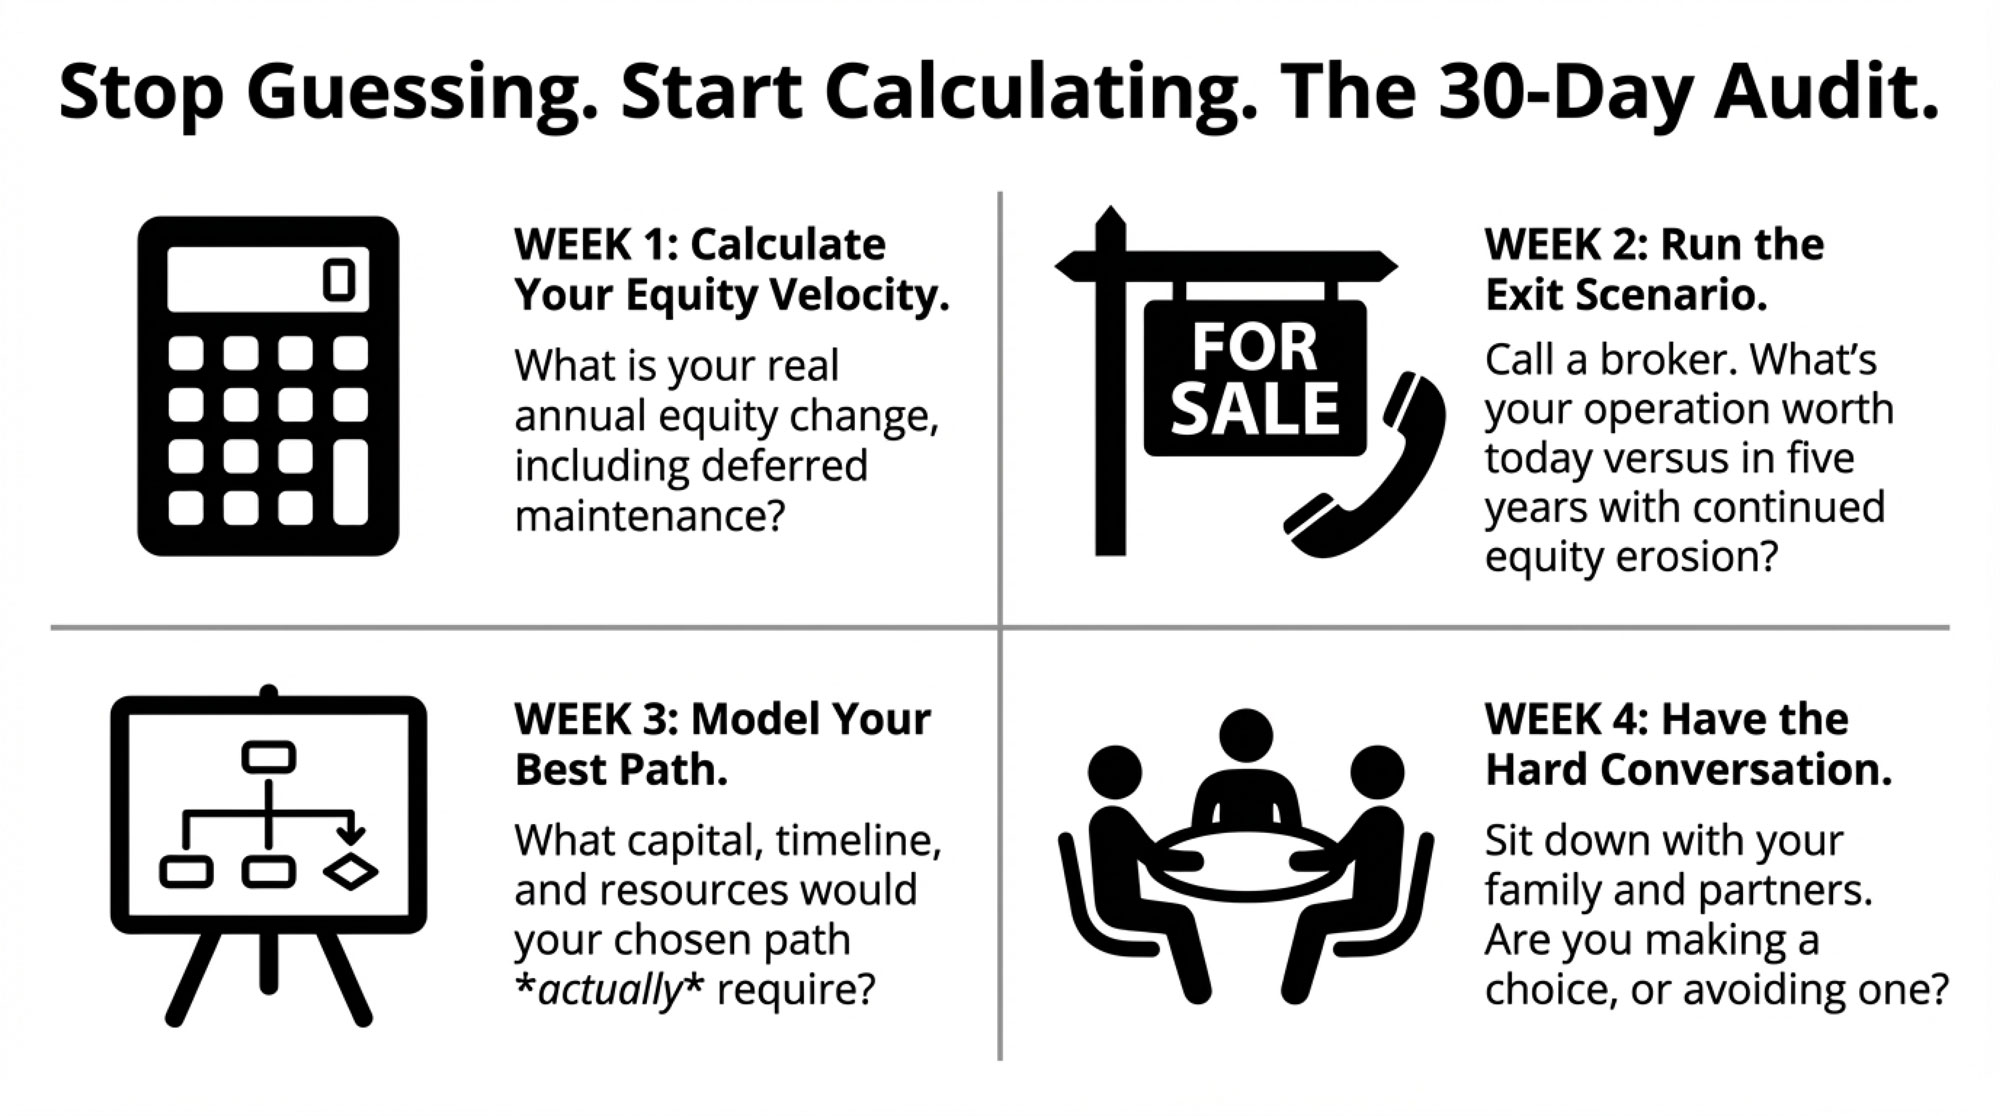
In the next 30 days, complete this financial audit:
Week 1: Calculate Your True Equity Velocity
Pull your last three years of financial records. Calculate your actual equity change—not the balance sheet snapshot, but the trend. Include operating results, interest costs, deferred maintenance (be honest), and working capital movement. Write down the annual number. If it’s negative, how many years until you hit zero?
Week 2: Run the Exit Scenario
Call a farm real estate broker. Get a realistic market value for your operation—land, quota (if Canadian), livestock, equipment. Subtract all debt. That’s your exit number today. Now subtract your annual equity erosion multiplied by five. That’s your exit number if you wait until 2031. Expect this call to be uncomfortable. A real estate broker’s job is to give you a market truth, not a sentimental one.
Week 3: Model Your Best-Case Path
Pick the strategic option from the table above that fits your situation. What would it actually take to execute? Capital required? Timeline? Success probability based on your honest assessment of your advantages and disadvantages? Write it down.
Week 4: Have the Conversation
Sit down with your spouse, your kids if they’re involved, and your business partner. Share what you learned in weeks 1-3. Ask the question directly: “Are we making a strategic choice, or are we just avoiding making one?”
Resources for Your Audit
- USDA ERS Farm Income and Wealth Statistics: ers.usda.gov/topics/farm-economy
- Your state’s land-grant university extension: Search for dairy enterprise budgets specific to your region
- Farm Credit System: farmcreditnetwork.com for confidential financial assessment
- Agricultural mediation programs: Available in most states and provinces for transition planning help
- Canadian Dairy Commission: cdc-ccl.gc.ca for supply management data and producer resources
The Bottom Line
The dairy industry has always demanded resilience. What makes this period different is the structural nature of the transformation underway.
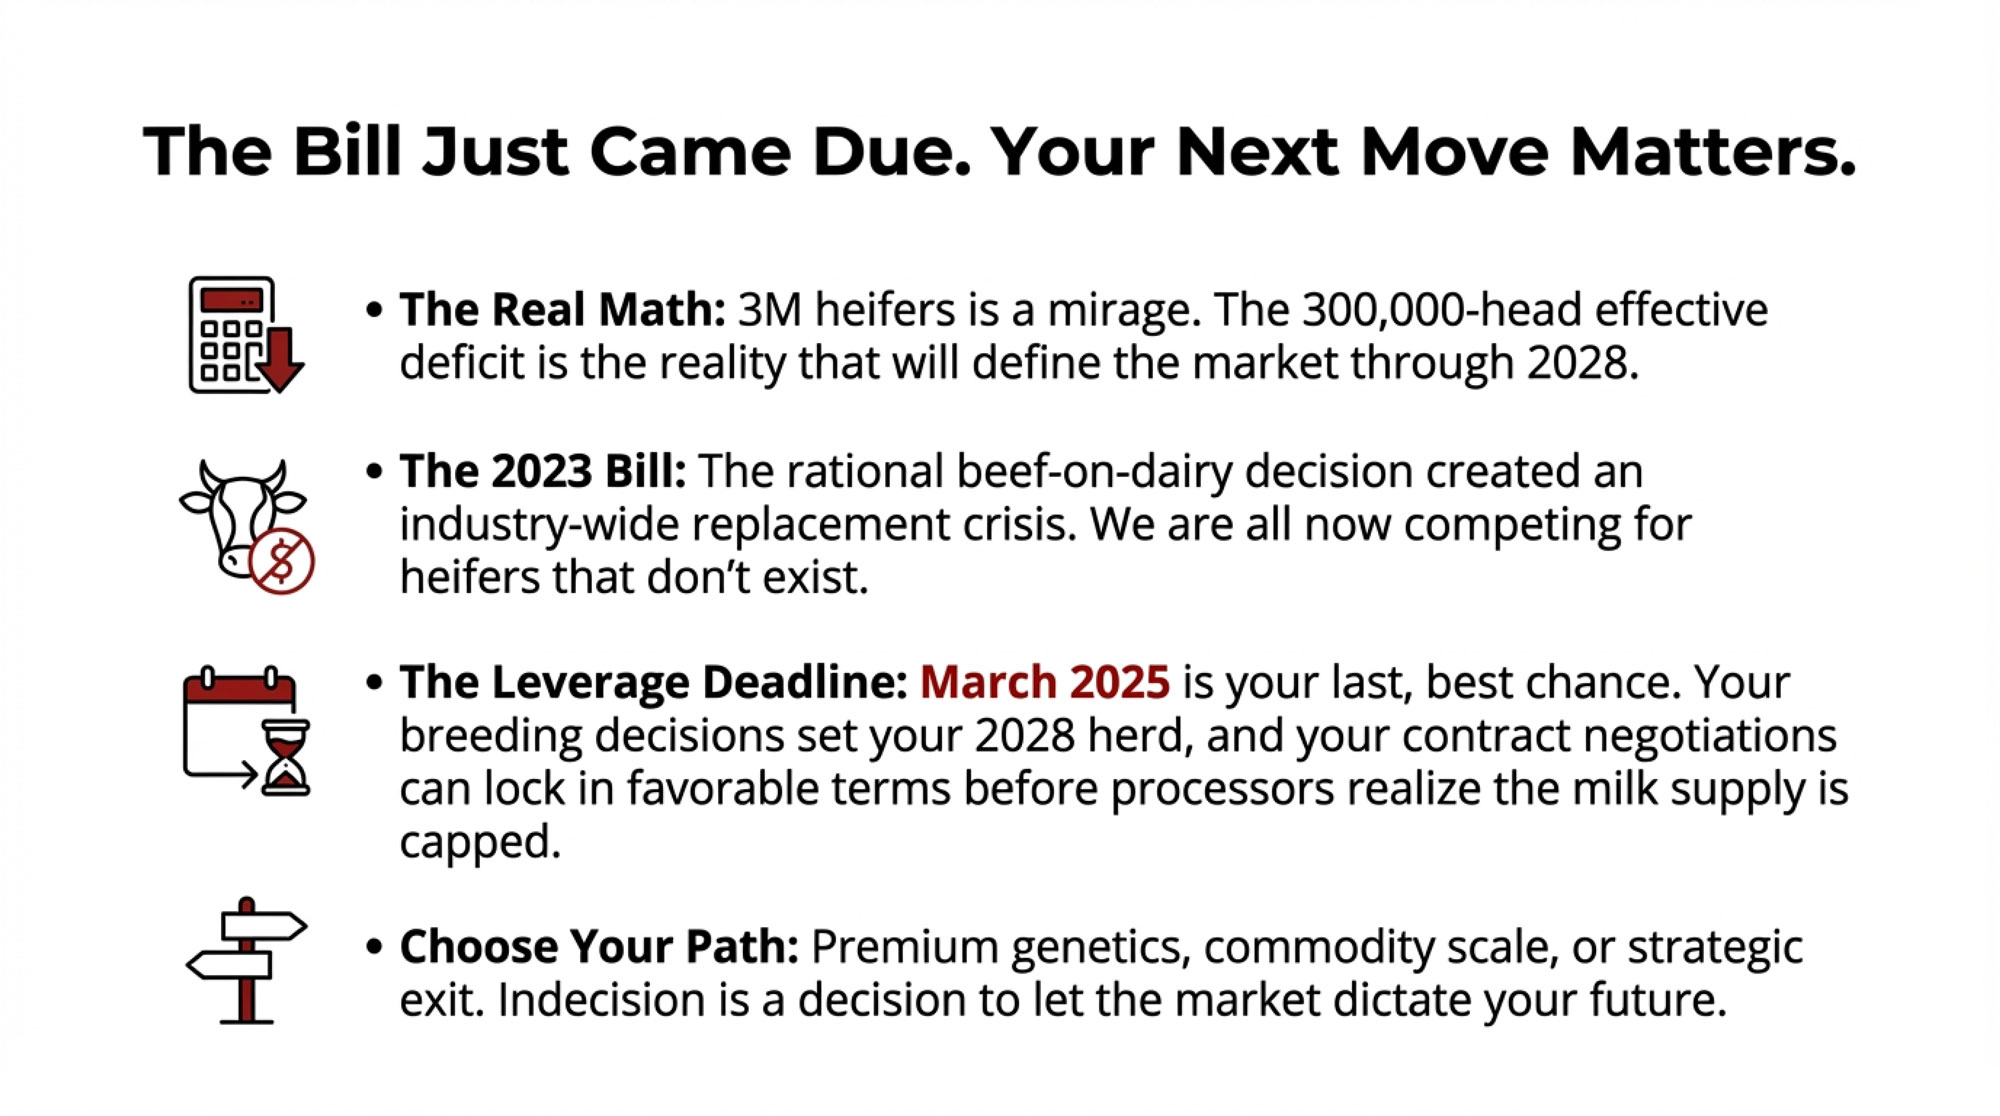
In the 2026 dairy economy, silence is a strategy—usually a losing one.
The farmers I’ve watched navigate these transitions successfully are the ones who did the math, had the hard conversations, and made deliberate choices while they still had good options. The ones who waited until the crisis forced their hand? They walked away with less. Every time.
Choose your path before the market chooses it for you.
KEY TAKEAWAYS
- The math is brutal: 8 dairy farms close every single day—and mid-size operations (500-1,500 cows) are hit hardest, trapped between premium markets they can’t access and scale economics they can’t achieve
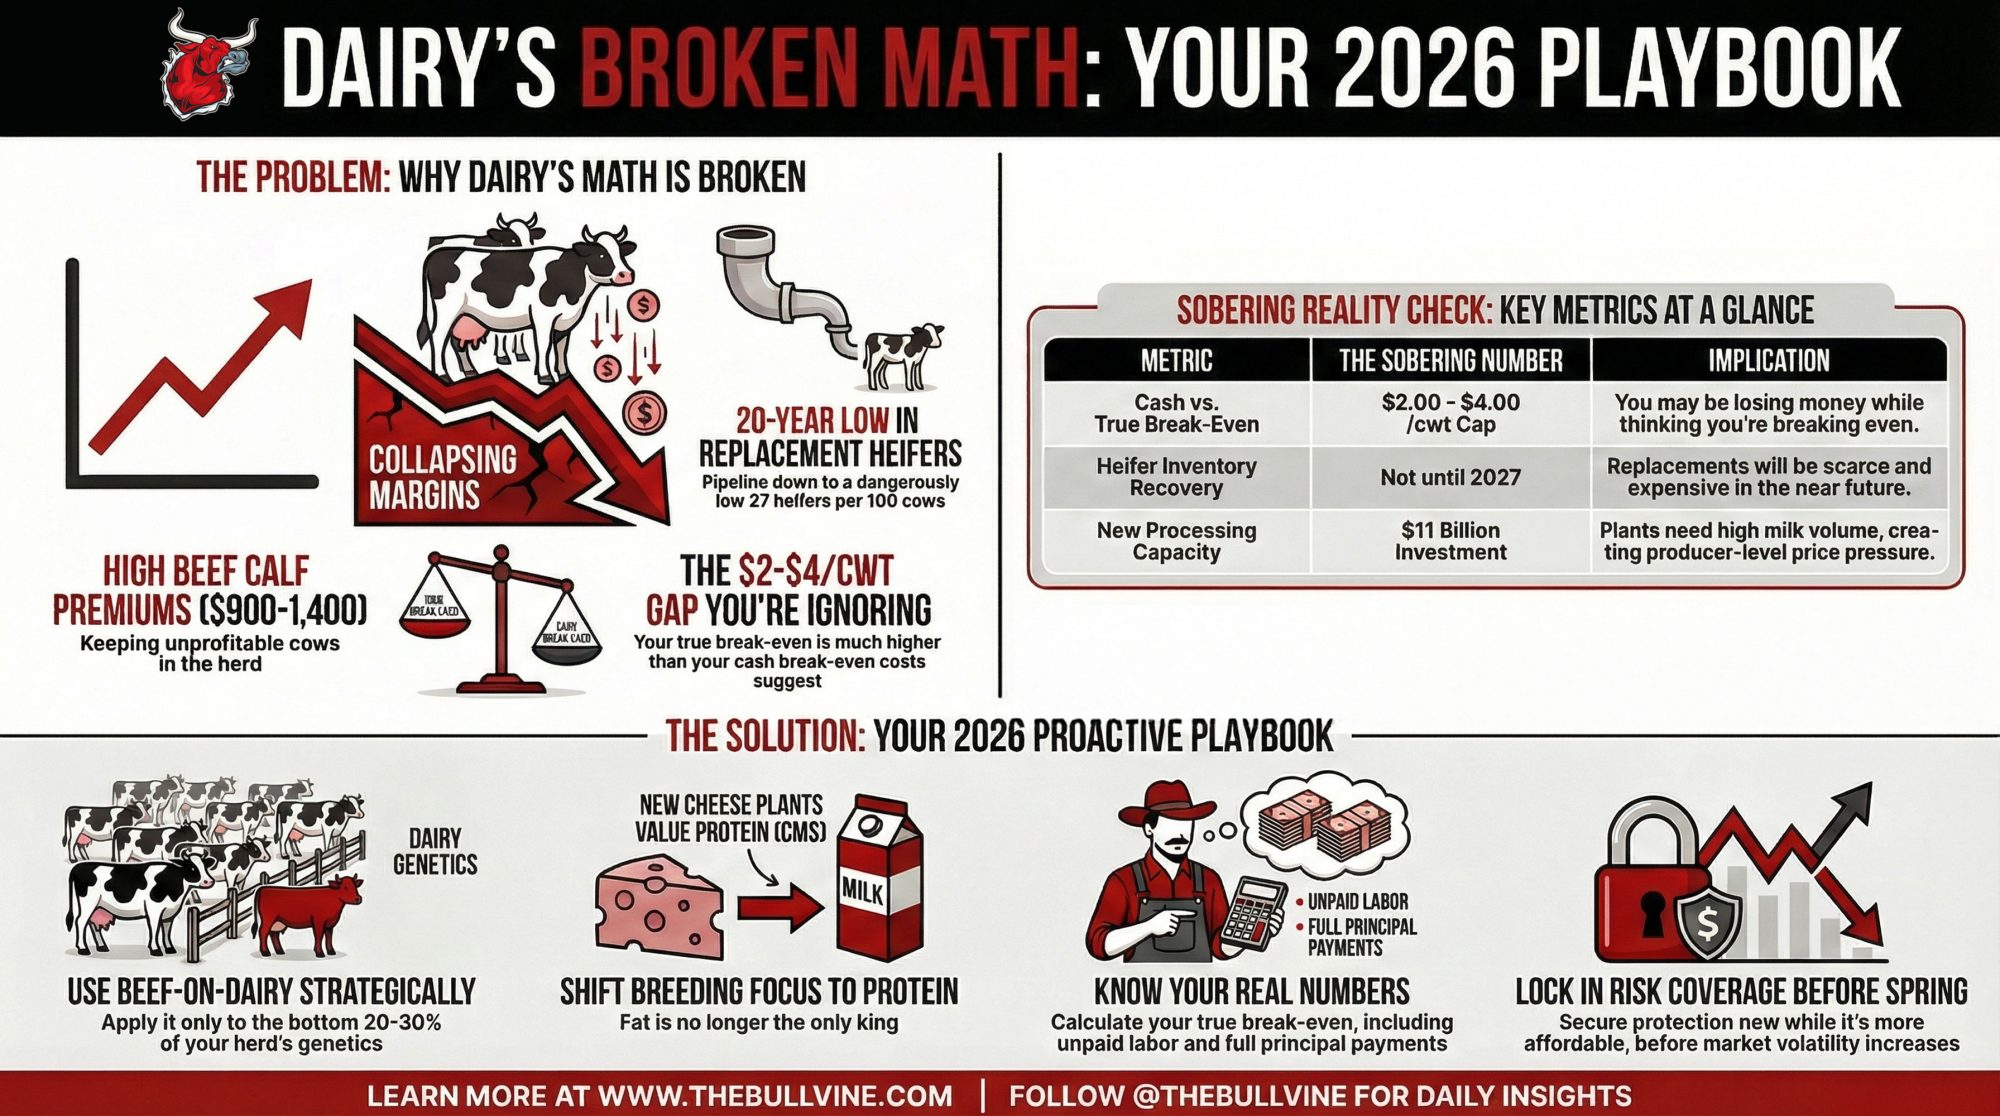
- The $10/cwt gap is permanent: Large operations (2,000+ cows) now produce 68% of U.S. milk at structurally lower costs—this isn’t a cycle to wait out
- Your equity may be vanishing: Factor in $3M debt at current rates, deferred maintenance, and negative margins, and you could be bleeding $400,000-$500,000 annually while your balance sheet looks stable
- Four paths exist—each with a price tag: Scale to 3,000+ cows ($15-25M), transition to premium ($100-300K + 3-year runway), exit strategically while equity holds, or eliminate all debt and operate top-quartile
- Choose now, or the market chooses for you: Producers who preserved wealth decided early; those who waited walked away with less—every time
Complete references and supporting documentation are available upon request by contacting the editorial team at editor@thebullvine.com.
Learn More
- The Four Numbers Every Dairy Producer Needs to Calculate This Week – This tactical framework arms you with four critical metrics—including your actual liquidity runway—needed to stop the financial guesswork. It breaks down exactly how to audit your survival odds before Monday’s first milking.
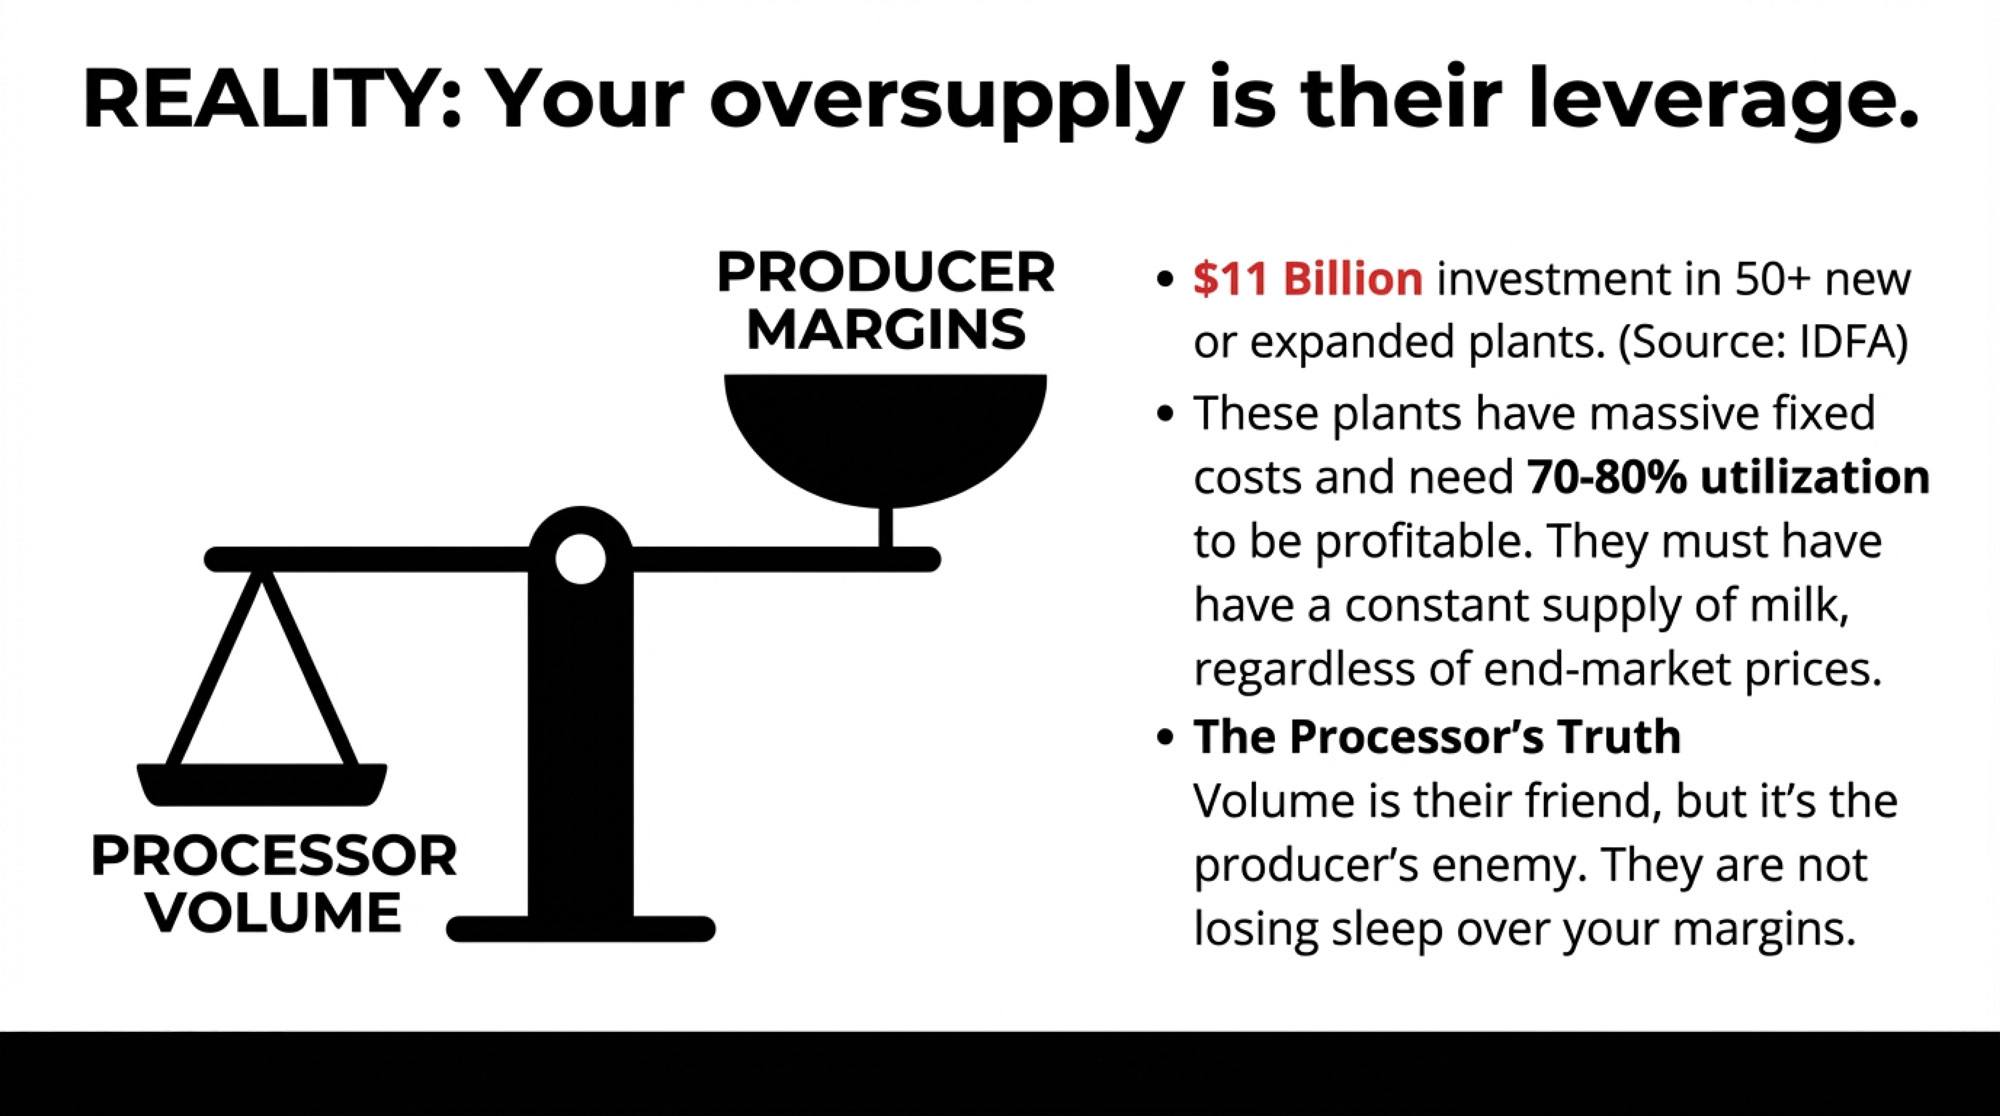
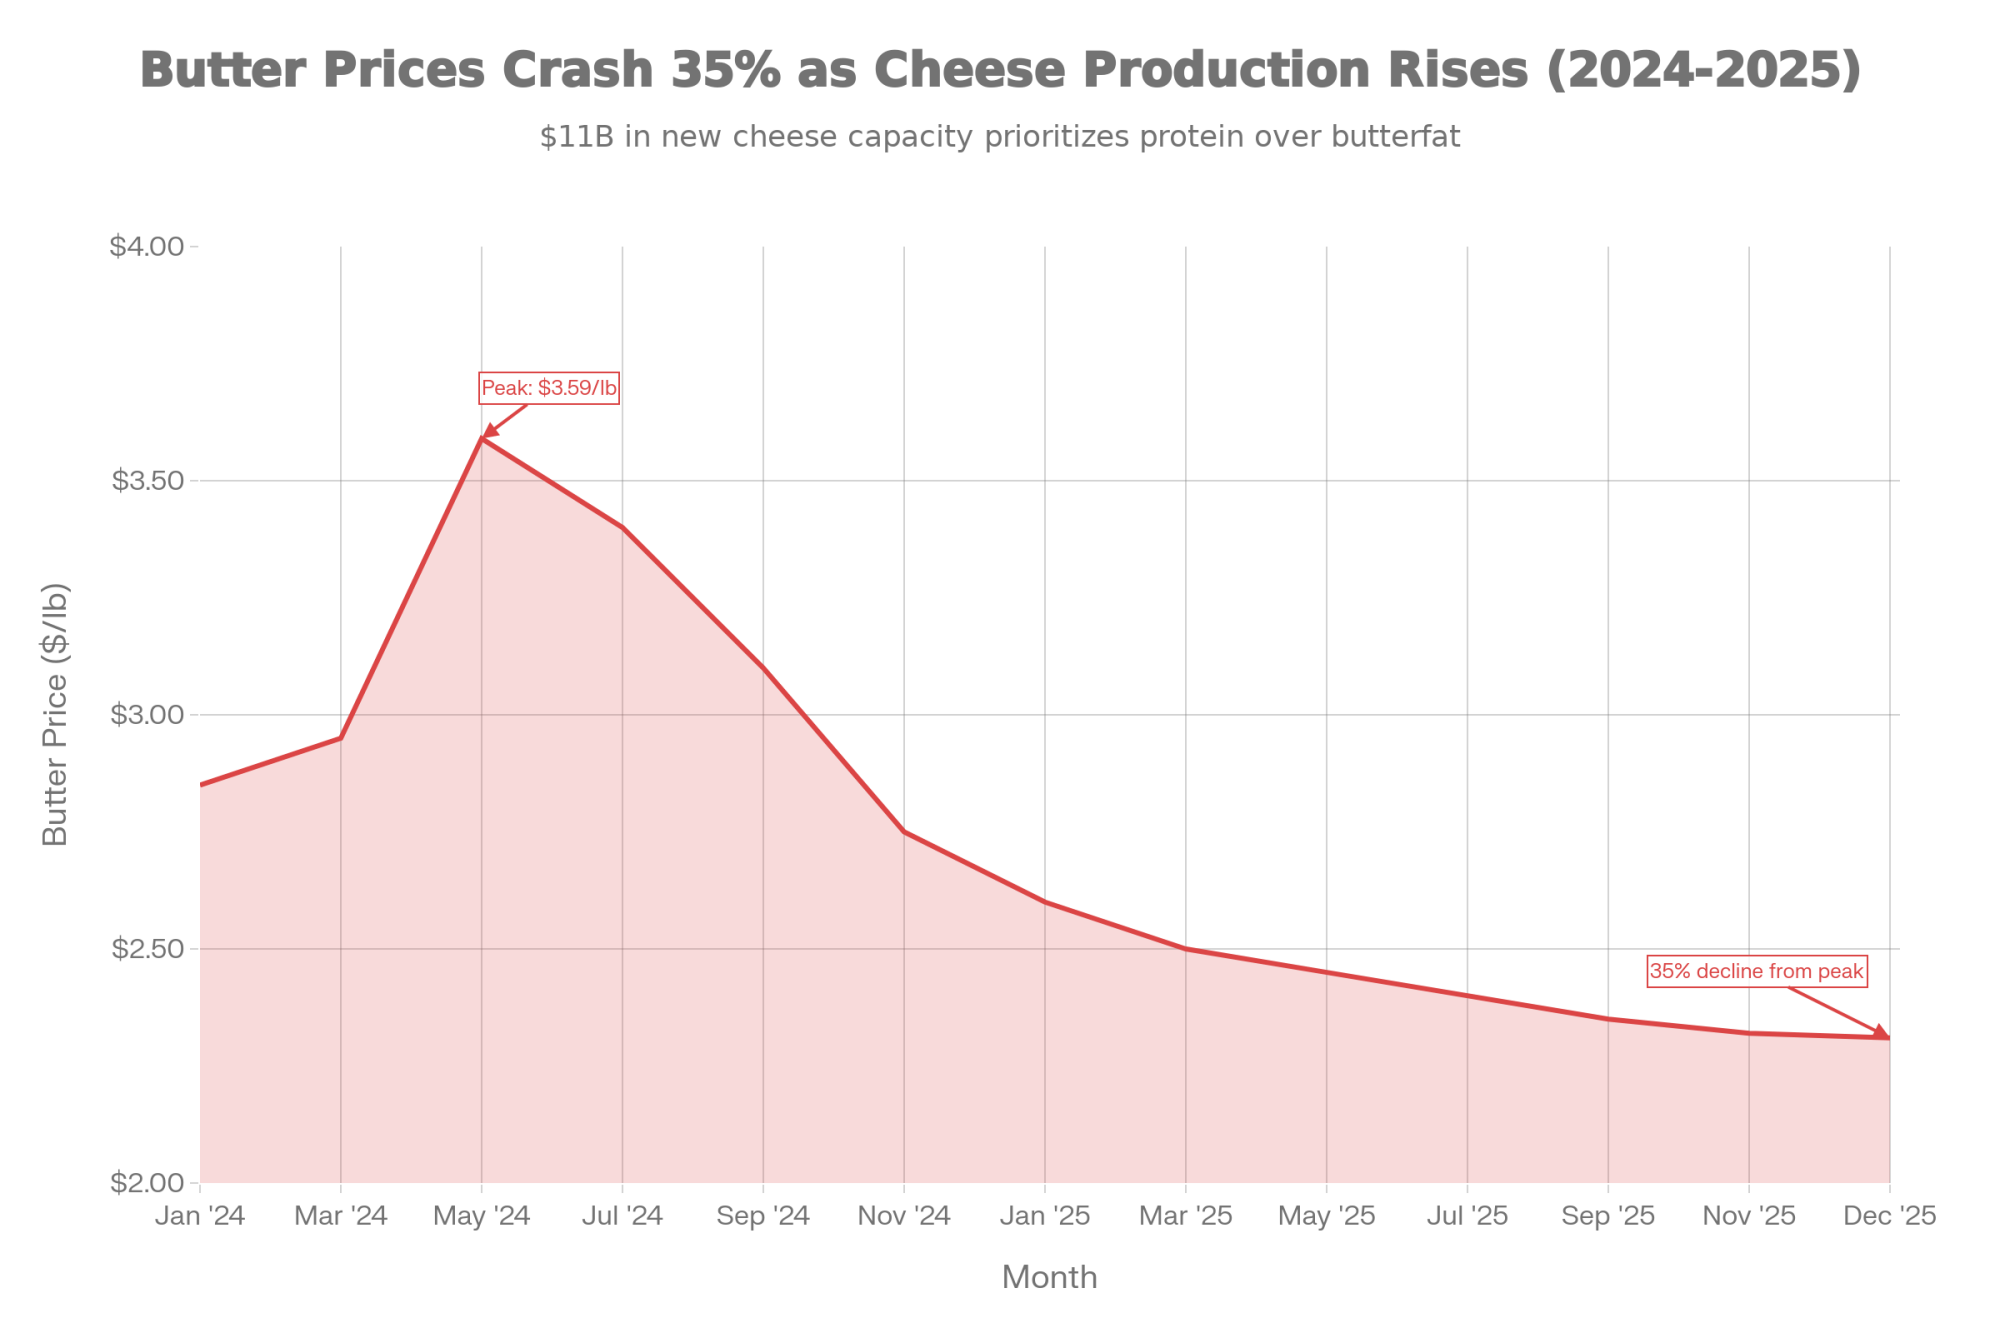
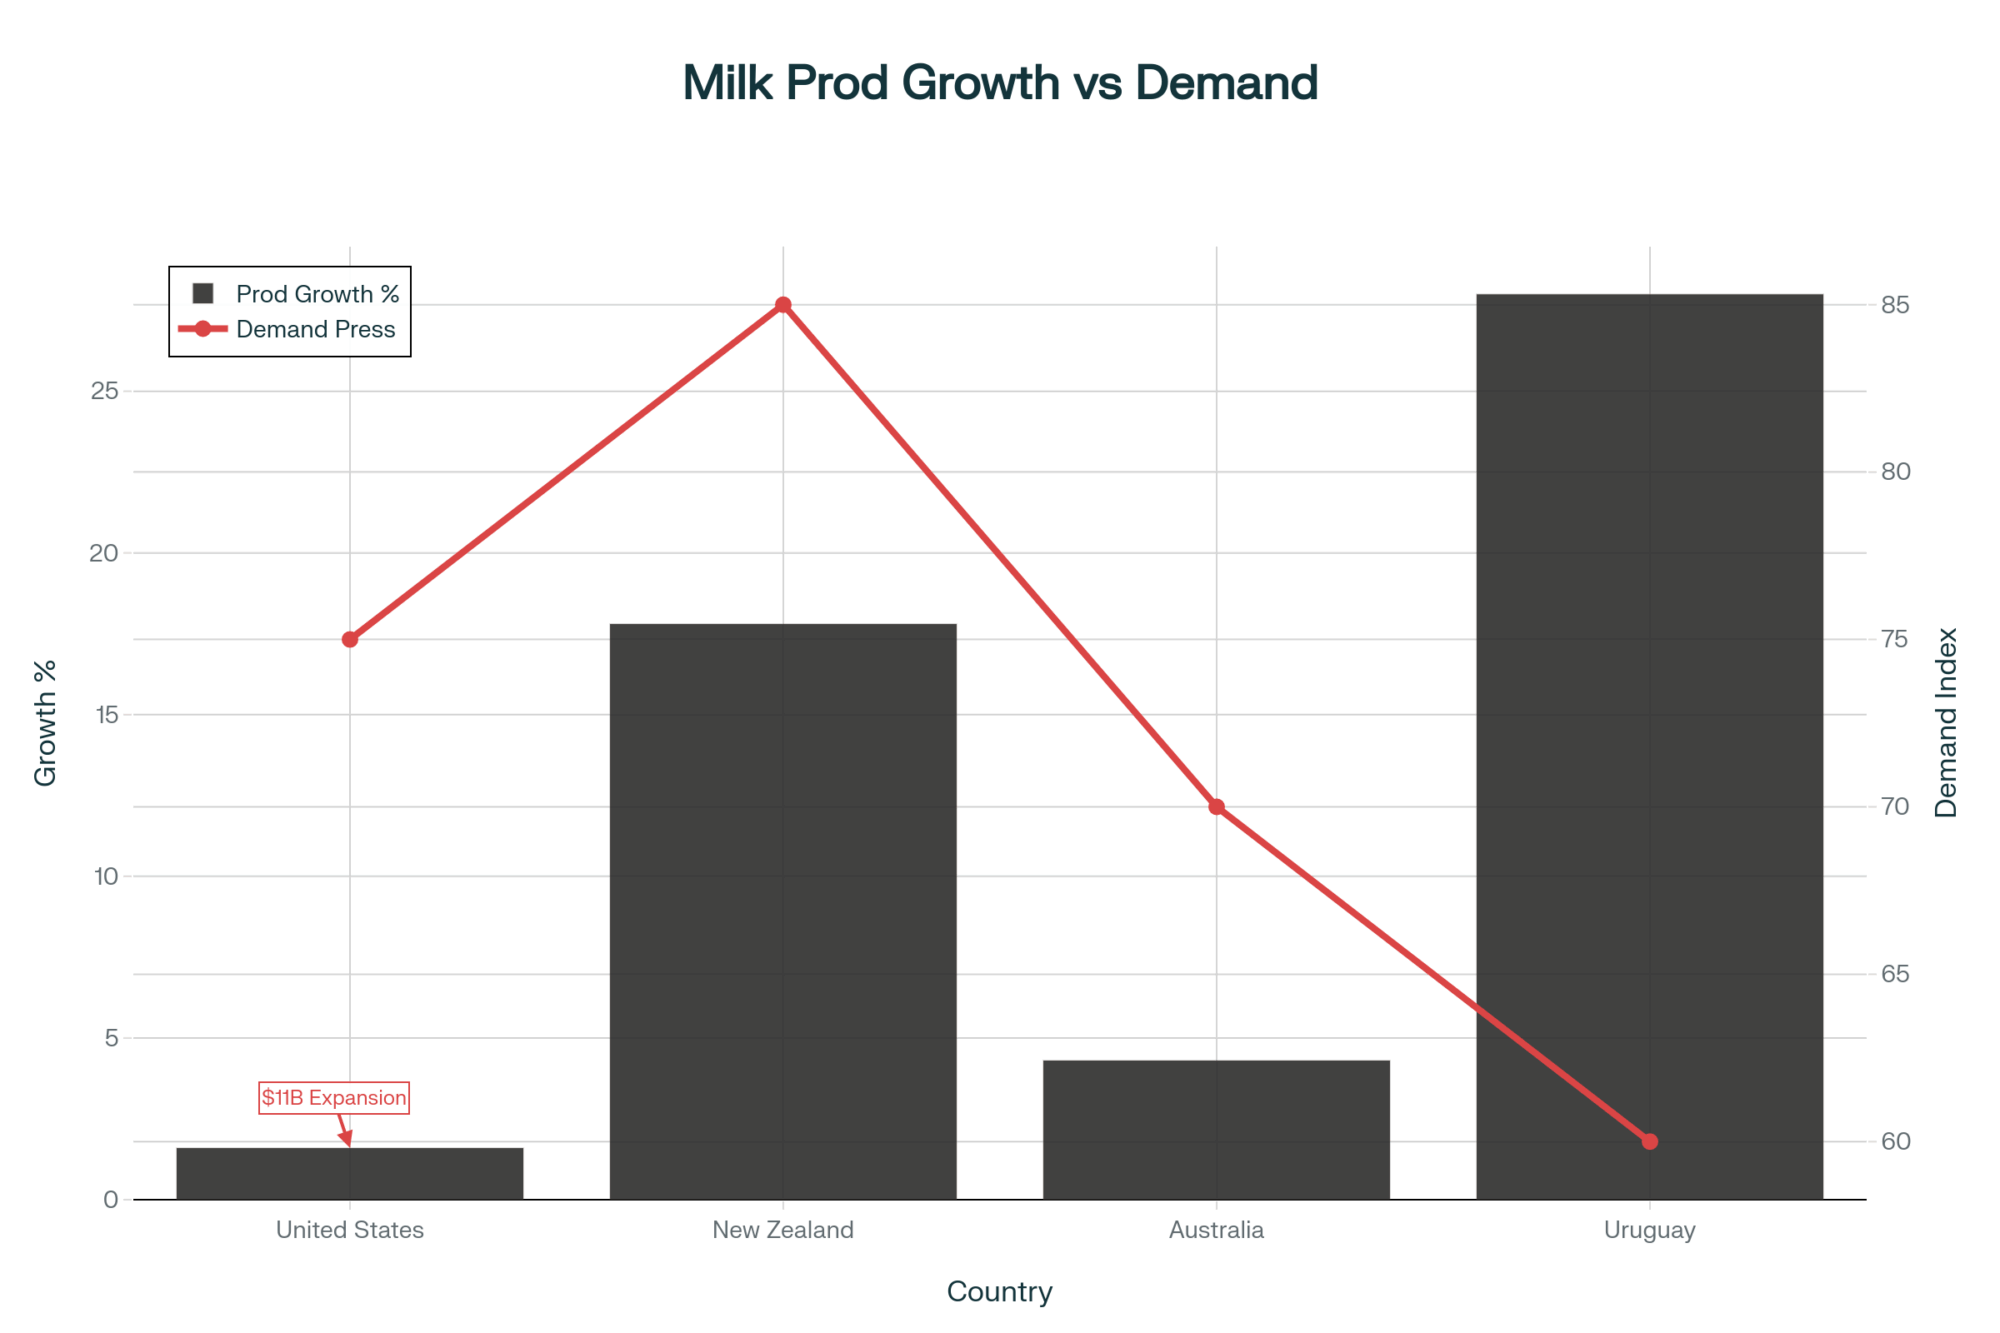
- The $11 Billion Reality Check: Why Dairy Processors Are Banking on Fewer, Bigger Farms – This analysis exposes the massive processor-driven shift toward mega-dairies and reveals how billions in new capital are reshuffling the deck. It delivers the long-term blueprint for positioning your equity against industrial-scale competition.
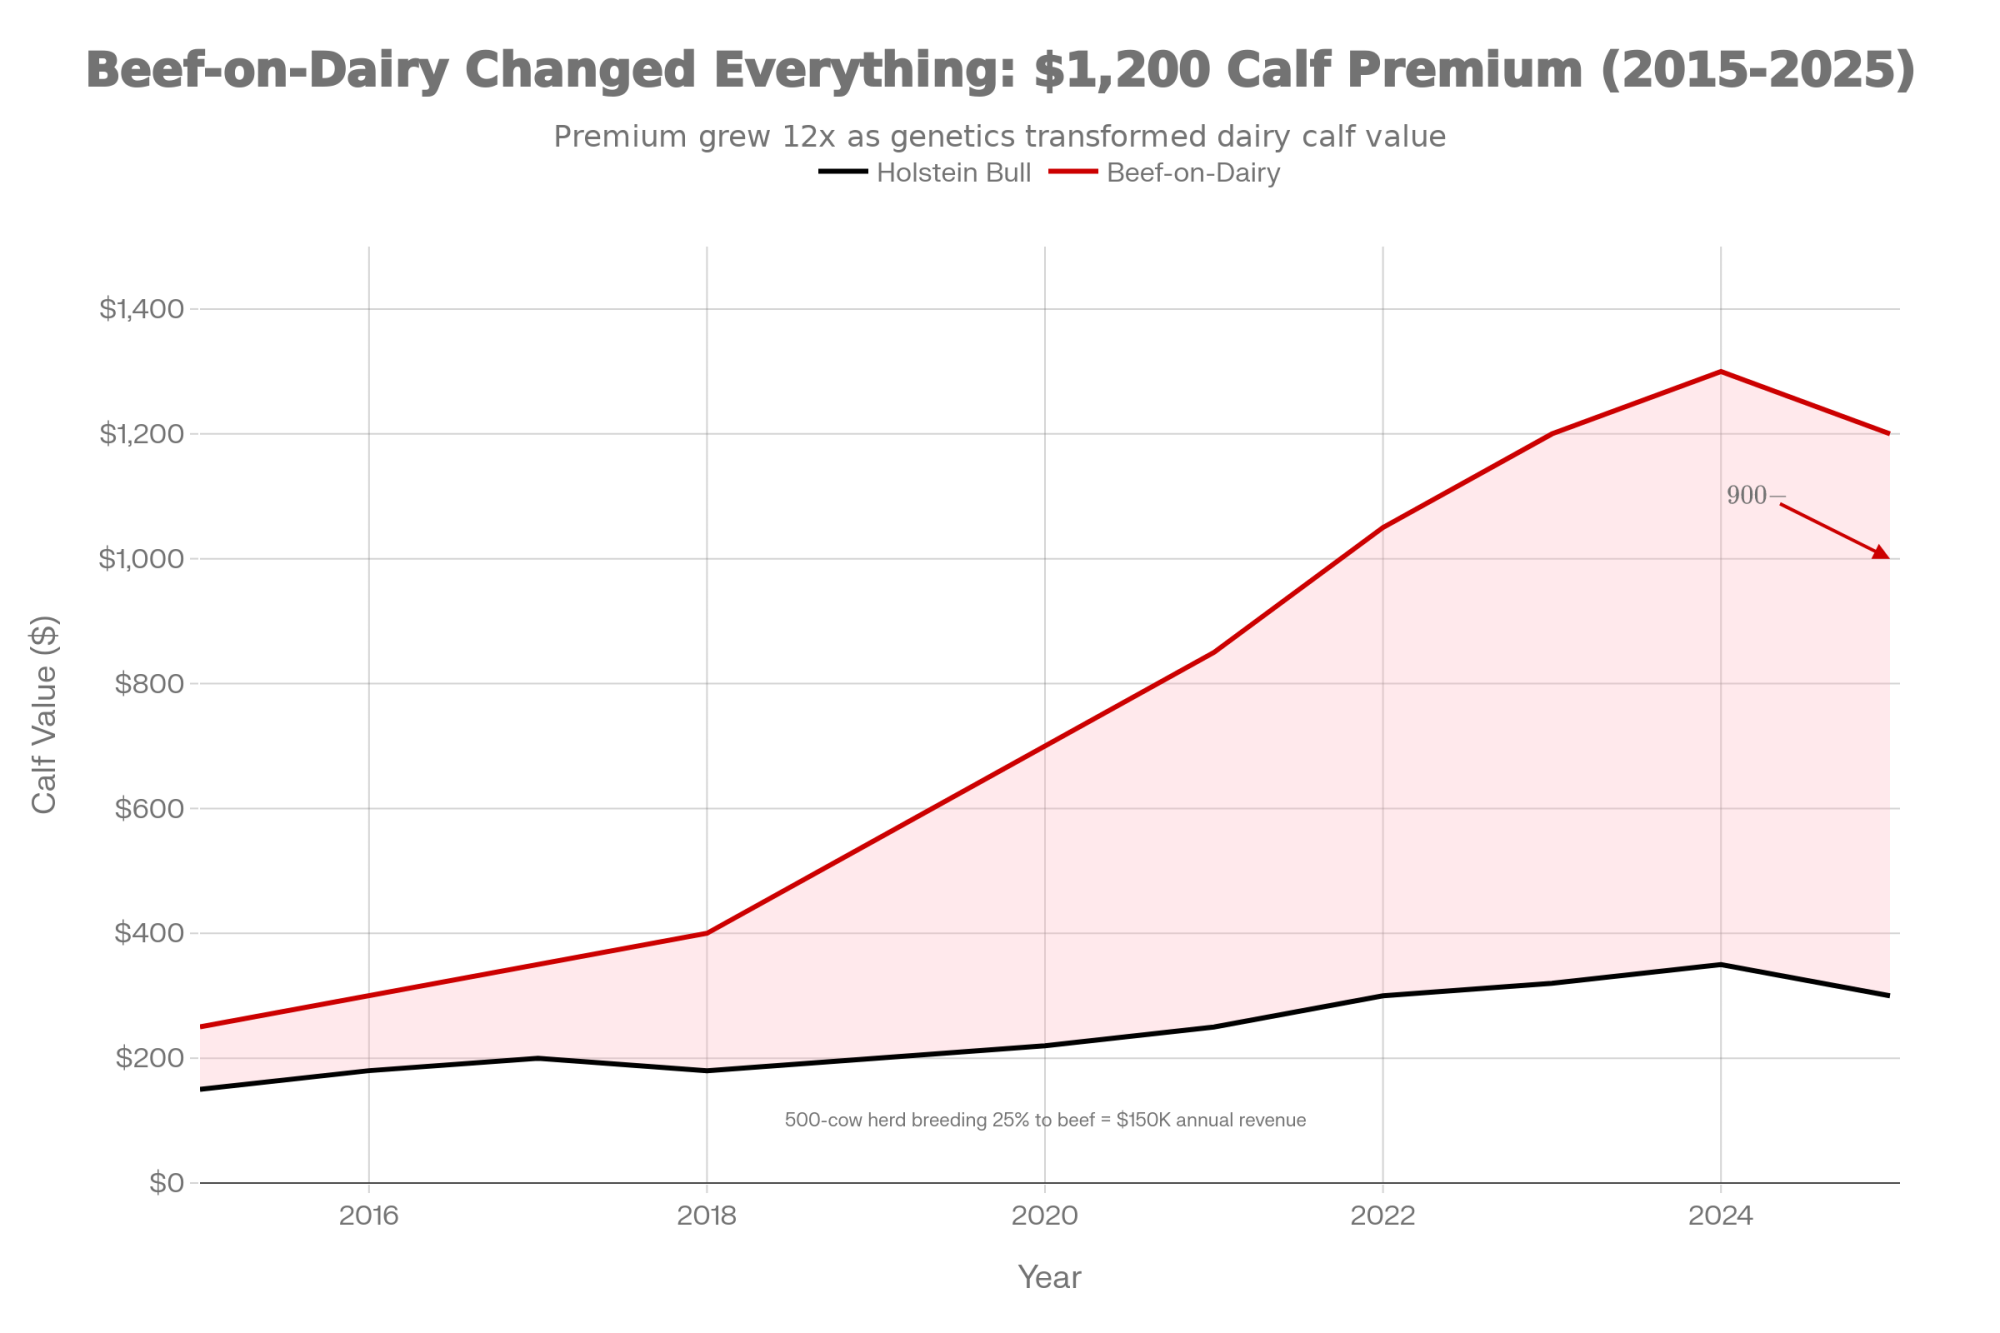
- The Next Frontier: What’s Really Coming for Dairy Cattle Breeding (2025-2030) – Gene editing and AI-powered breeding are no longer science fiction—they are active profit drivers. This guide reveals how emerging CRISPR technology and predictive sensors can generate an additional $5,000 in annual revenue per cow.
 Join the Revolution!
 Join the Revolution!
Join over 30,000 successful dairy professionals who rely on Bullvine Weekly for their competitive edge. Delivered directly to your inbox each week, our exclusive industry insights help you make smarter decisions while saving precious hours every week. Never miss critical updates on milk production trends, breakthrough technologies, and profit-boosting strategies that top producers are already implementing. Subscribe now to transform your dairy operation’s efficiency and profitability—your future success is just one click away.