USDA’s January Dairy Production Report looks bullish. Your milk cheque doesn’t. Where did the extra $3 per cow per day disappear?
Executive Summary: USDA’s January Dairy Production Report shows bigger cheese and butter output and near‑record export value, but it doesn’t explain why your milk cheque may still feel tight. The article lays out how that product mix—more value on fat, cheese, and high‑protein whey, less on basic powder—creates a hidden $1.75–$3.52 per cow per day gap between volume herds and solids‑focused herds in the same market. A simple A‑vs‑B barn‑math example walks through how an 85‑lb, high‑component herd can out‑earn a 90‑lb volume herd by more than $630,000 a year on 500 cows. From there, it gives you concrete levers: cull on solids and margin instead of litres alone, tweak rations to trade 1–3 lb of thin milk for more fat and protein, and tilt sire selection toward NM$/CM$ or a custom solids‑heavy index. It also shows what waiting costs, using a 300‑cow herd that can quietly give up $27,000–$47,000 over 90 days by “seeing where prices go.” The piece ends with a 30‑day kitchen‑table checklist—using your last three cheques and feed sheets—and a breakeven question to test whether your numbers still work if export‑driven component values slip.
Two weeks before today’s USDA Dairy Products report dropped, a 450‑cow family dairy in central Wisconsin sat at the kitchen table, going over their latest milk cheque. Their pens are full of stout‑framed Holsteins that look the part—clean legs, solid udders, no obvious train wrecks—and on paper, the herd is shipping plenty of milk. But the cheque in front of them said something different: margin per cow had slipped again, even though production and components looked fine on the report.
So when the new report came out this morning, they didn’t breathe a sigh of relief. They asked the harder question you’re probably asking too: “If the report looks good and my cheque still feels tight, where’s the money really going?”
That gap between what the USDA data says and what your own milk cheque feels like is exactly where the $3‑per‑cow gap lives—and even if you only claw back half of it, that’s roughly $1.75 per cow per day.
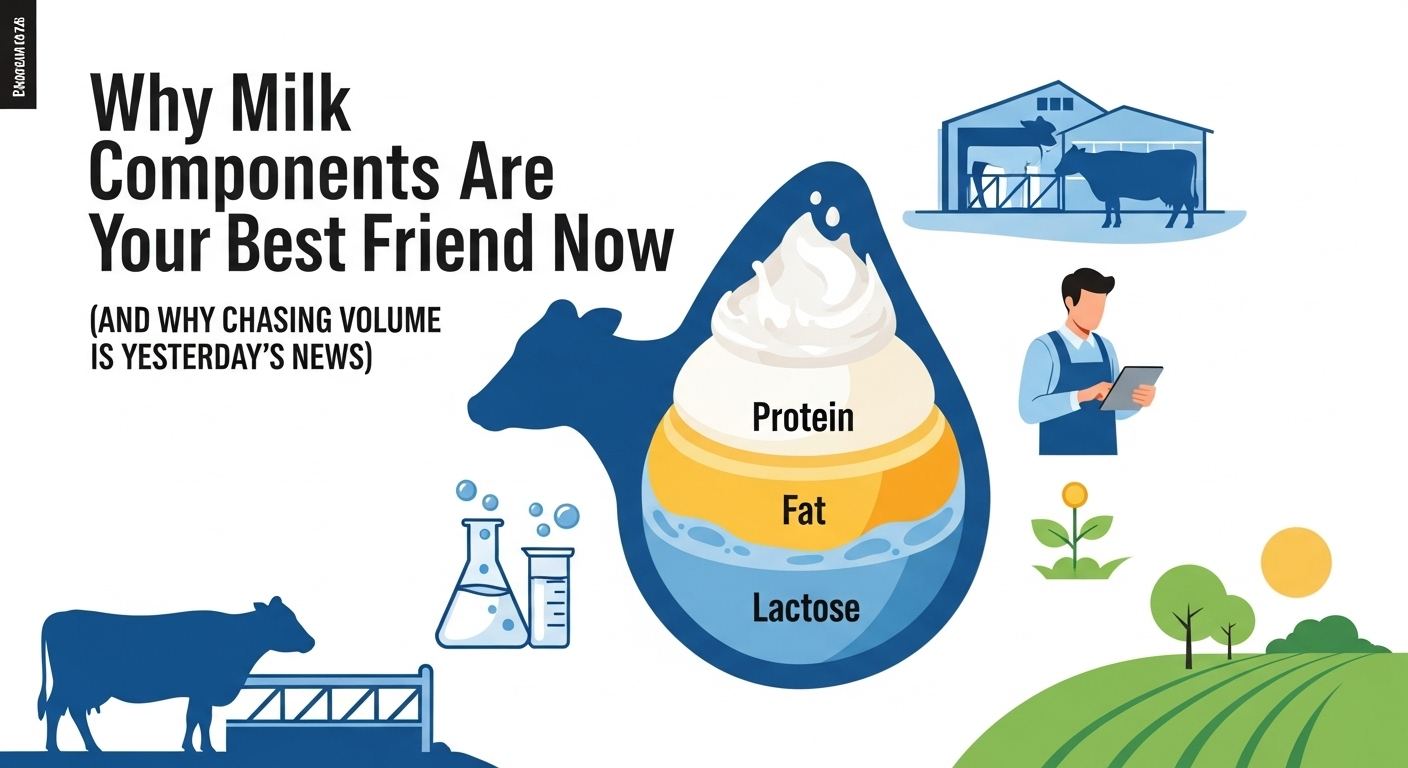
What’s Actually Changing in the Product Mix
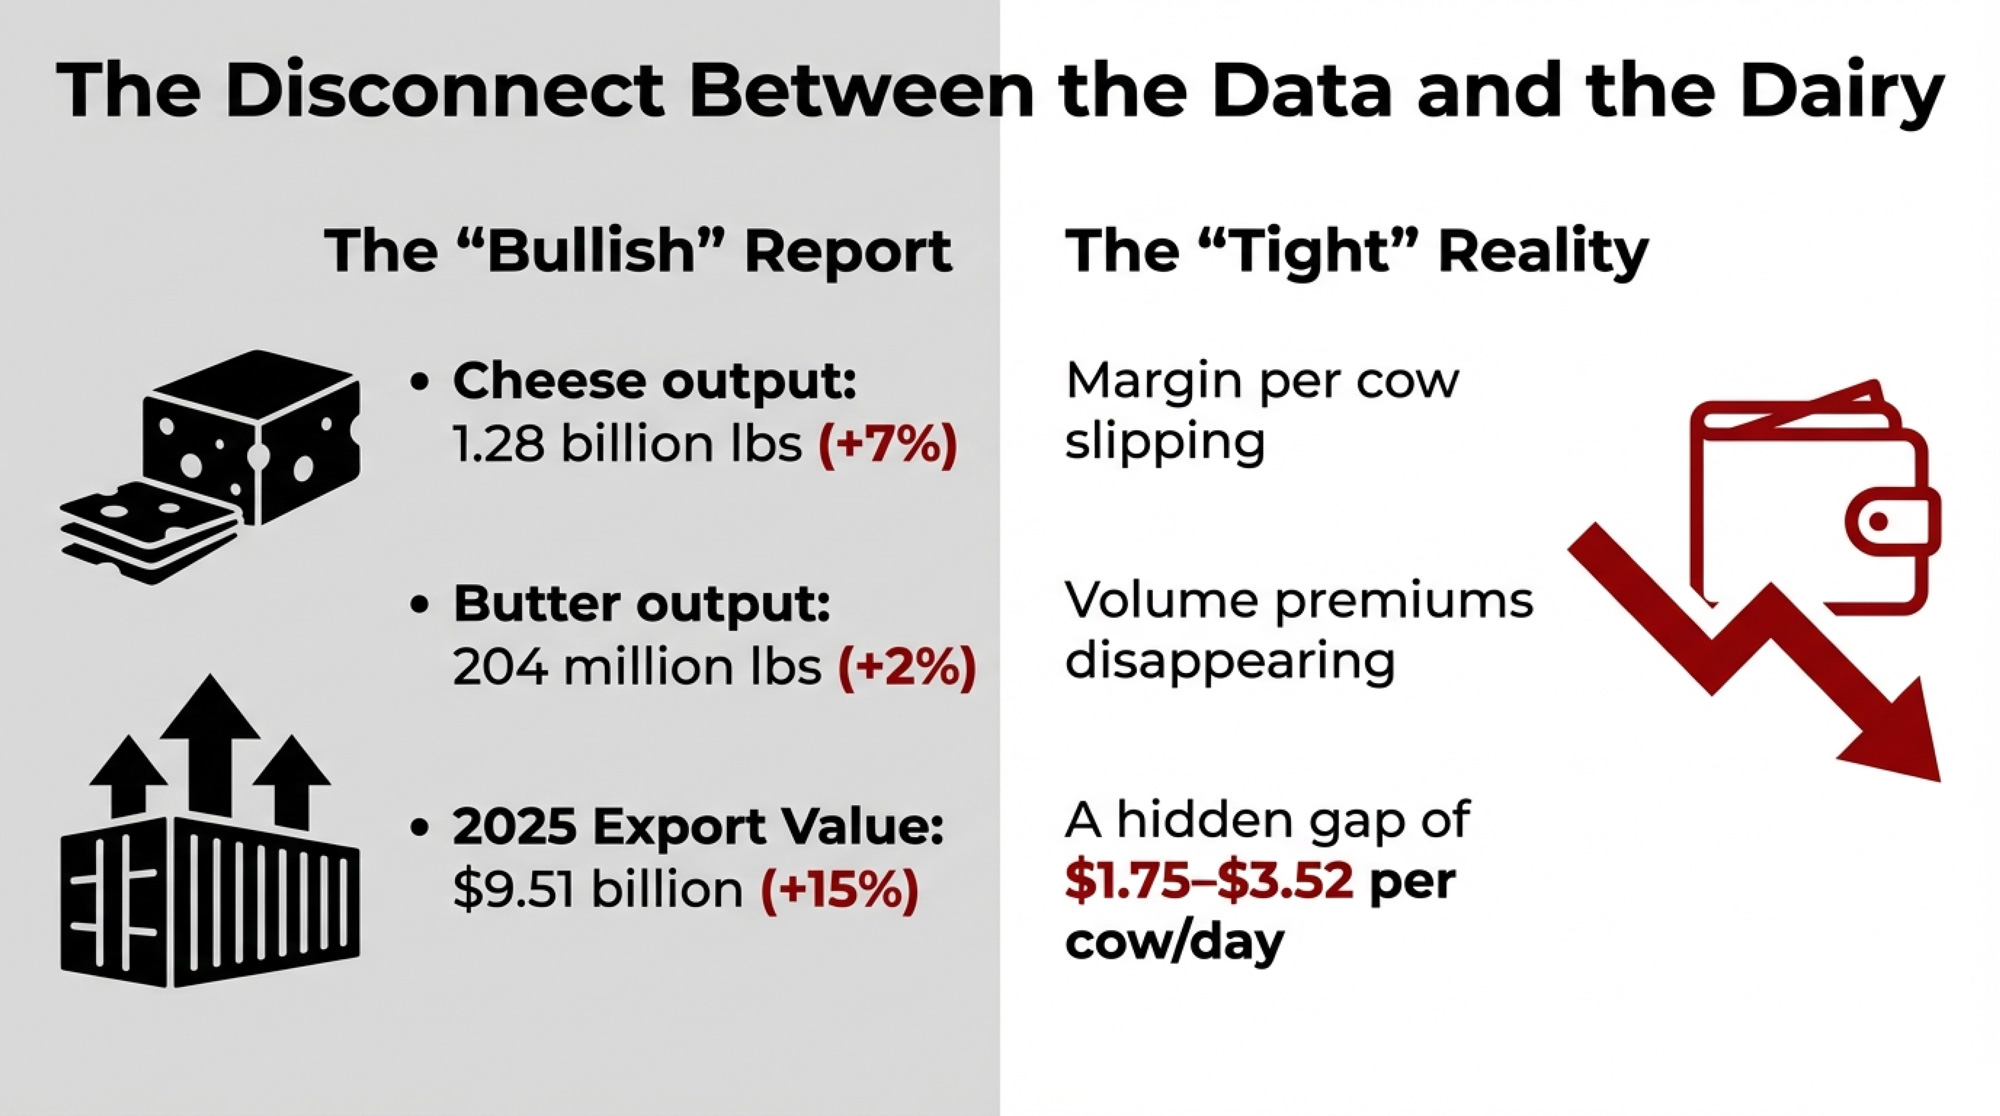
Today’s Dairy Products report reads like a win if you only look at tonnage. Analysis of USDA’s December 2025 Dairy Products report shows total cheese production at about 1.28 billion lb, nearly 7% more than December 2024 and about 4.4% higher than November, as both American‑type and Italian‑type cheeses posted solid gains. Plants didn’t just make more cheese overall—they leaned harder into styles that spin off valuable whey streams and ingredient options.
| Product Category | Dec 2025 Production | Year-over-Year Change | What It Means for Your Check |
| Total Cheese | 1.28 billion lb | +7% | Higher protein premiums if grid reflects whey value |
| Butter | 204 million lb | +2% | Butterfat premiums stay elevated |
| NFDM (human food) | 127 million lb | -3% | Basic skim powder loses ground to higher-value uses |
| Export cheese (2025 total) | 613,045 MT | +20% | Offshore demand tilts toward solids, not volume |
| Export butterfat (2025 total) | 122,085 MT | +167% | Fat tests matter more than ever |
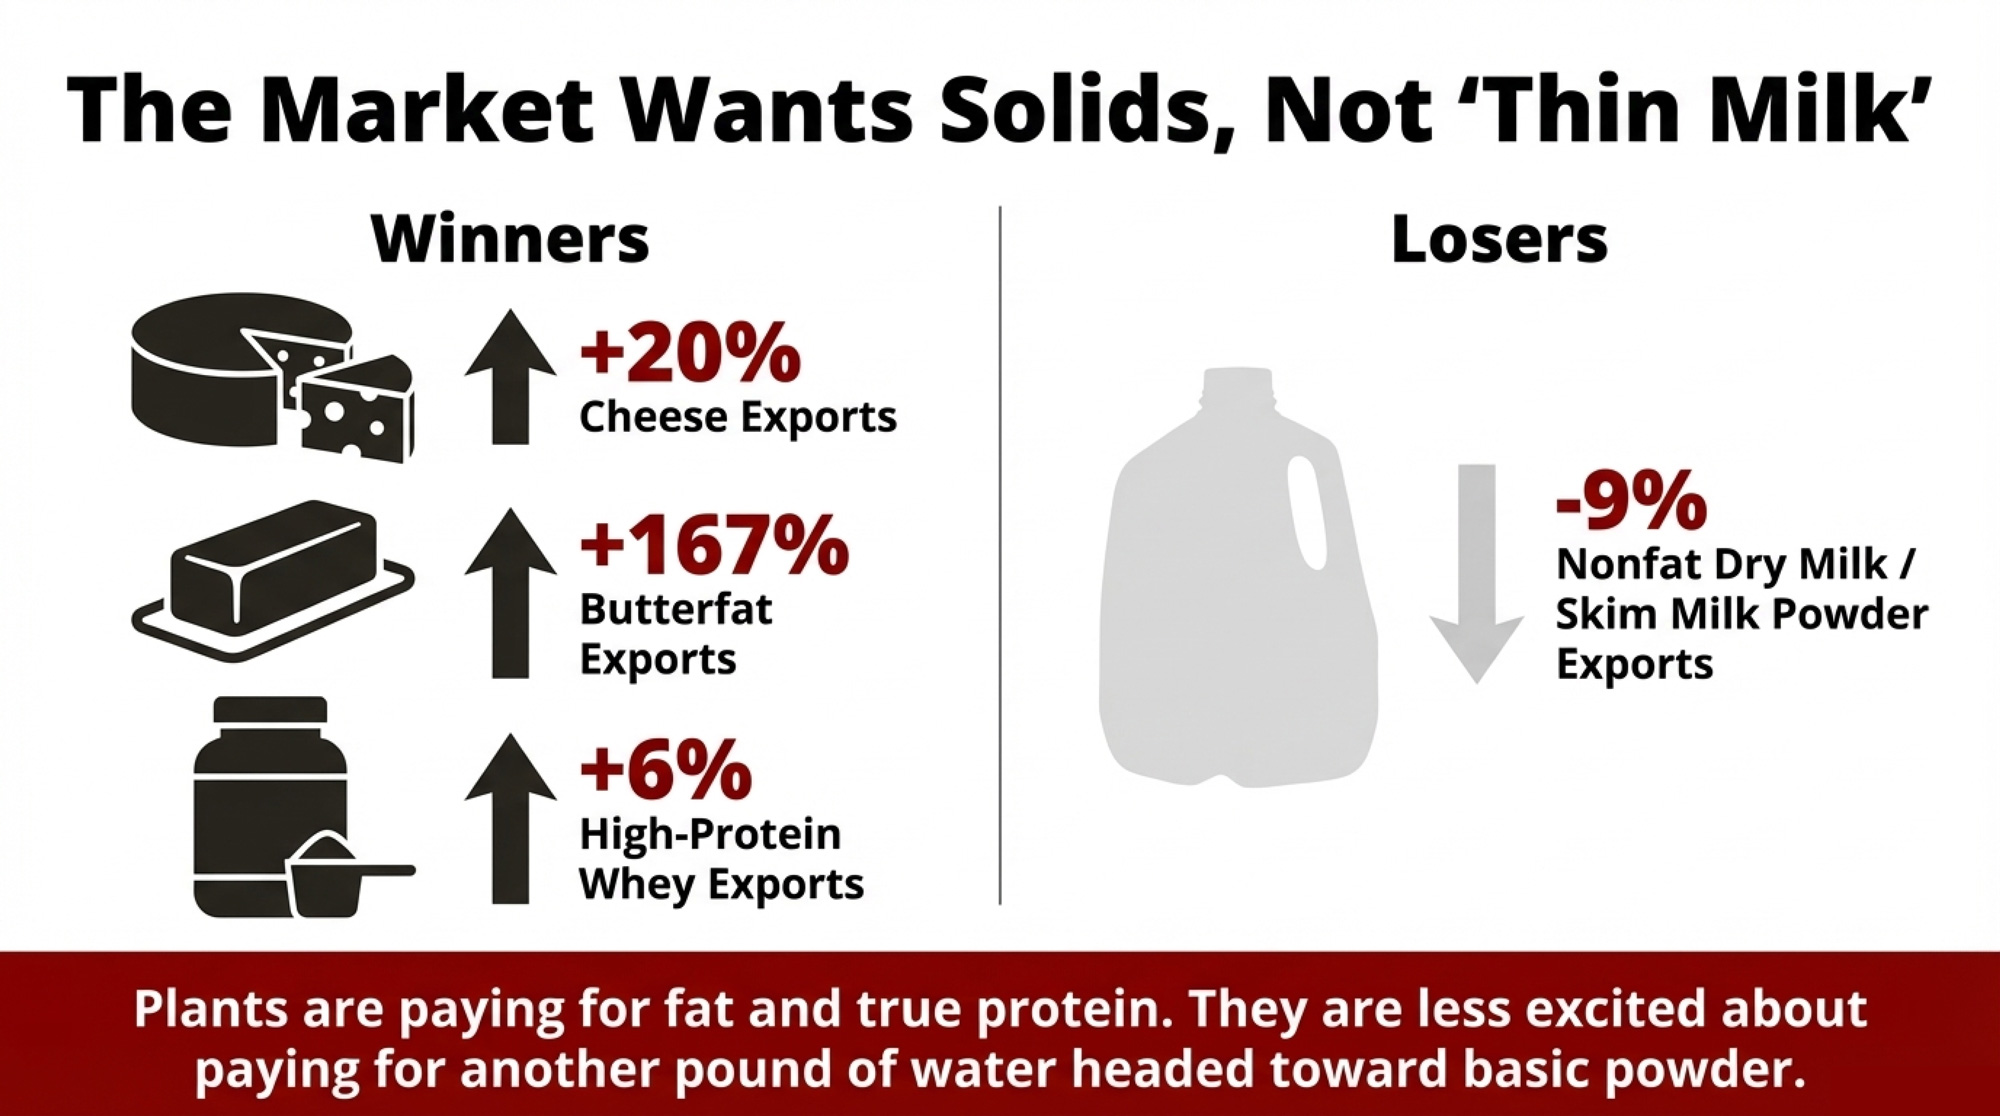
Butter told a similar story. U.S. plants turned out roughly 204 million lb of butter in December, about 2% more than a year earlier and around 15% more than in November as higher fat tests and new stainless kept churns busy. That jump lines up with what you’re seeing yourself—fat tests staying stout and more talk about 82% export‑spec butter, not just domestic 80%.
Powders and protein ingredients are where the picture gets messier. USDA data show nonfat dry milk for human food at about 127 million lb in December, down roughly 2.7–3% from a year earlier but nearly 18% higher than November, which shows how quickly skim can slosh between NFDM, SMP, and Class II when prices move. USDEC and other trade reports say 2025 exports of nonfat dry milk/skim milk powder were down about 9% from 2024, even as higher‑value cheese, butterfat, and high‑protein whey ingredients set new records.
The International Dairy Foods Association says U.S. dairy exports in 2025 reached about $9.51 billion, a 15% increase over 2024 and just shy of the record value set in 2022, on 2.8 million metric tons of product—about 5% more volume than the year before. USDEC reports that U.S. suppliers set new export volume records with cheese shipments up 20%to 613,045 metric tons, butterfat exports up 167% to 122,085 metric tons, and high‑protein whey exports up 6% to 77,811 metric tons, with more than 17% of U.S. milk production heading offshore.
Put together, the system is saying something pretty clear:
- “Give us more fat, cheese, and high‑protein whey.”
- “We’re less excited about paying for another pound of thin milk headed toward basic powder.”
That’s fine if your pay contract, ration, and genetics are pointed at that reality. It’s a real problem if they’re still anchored in a powder‑era world.
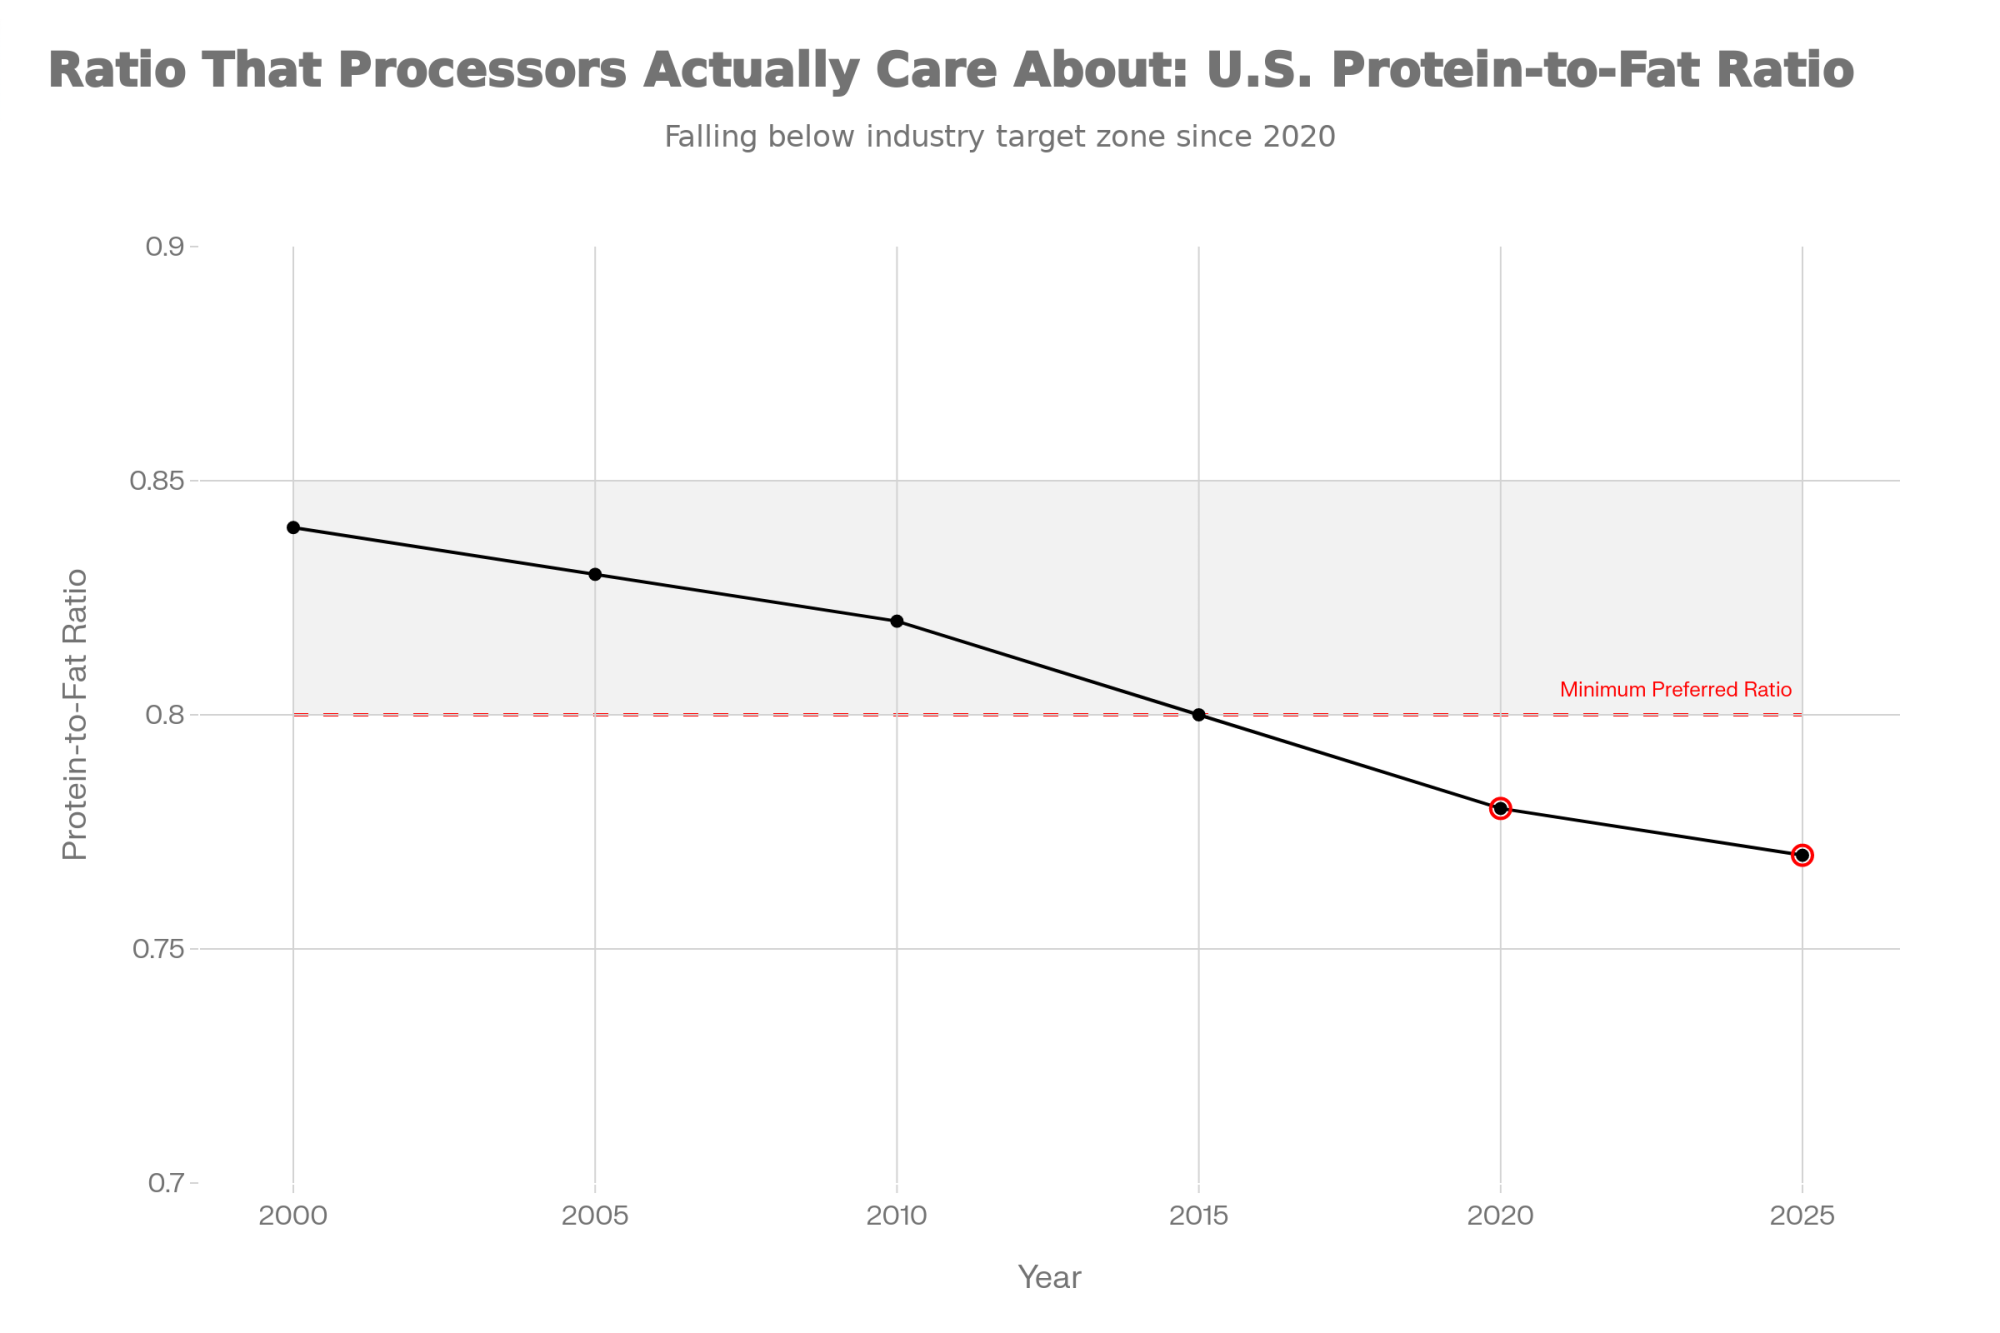
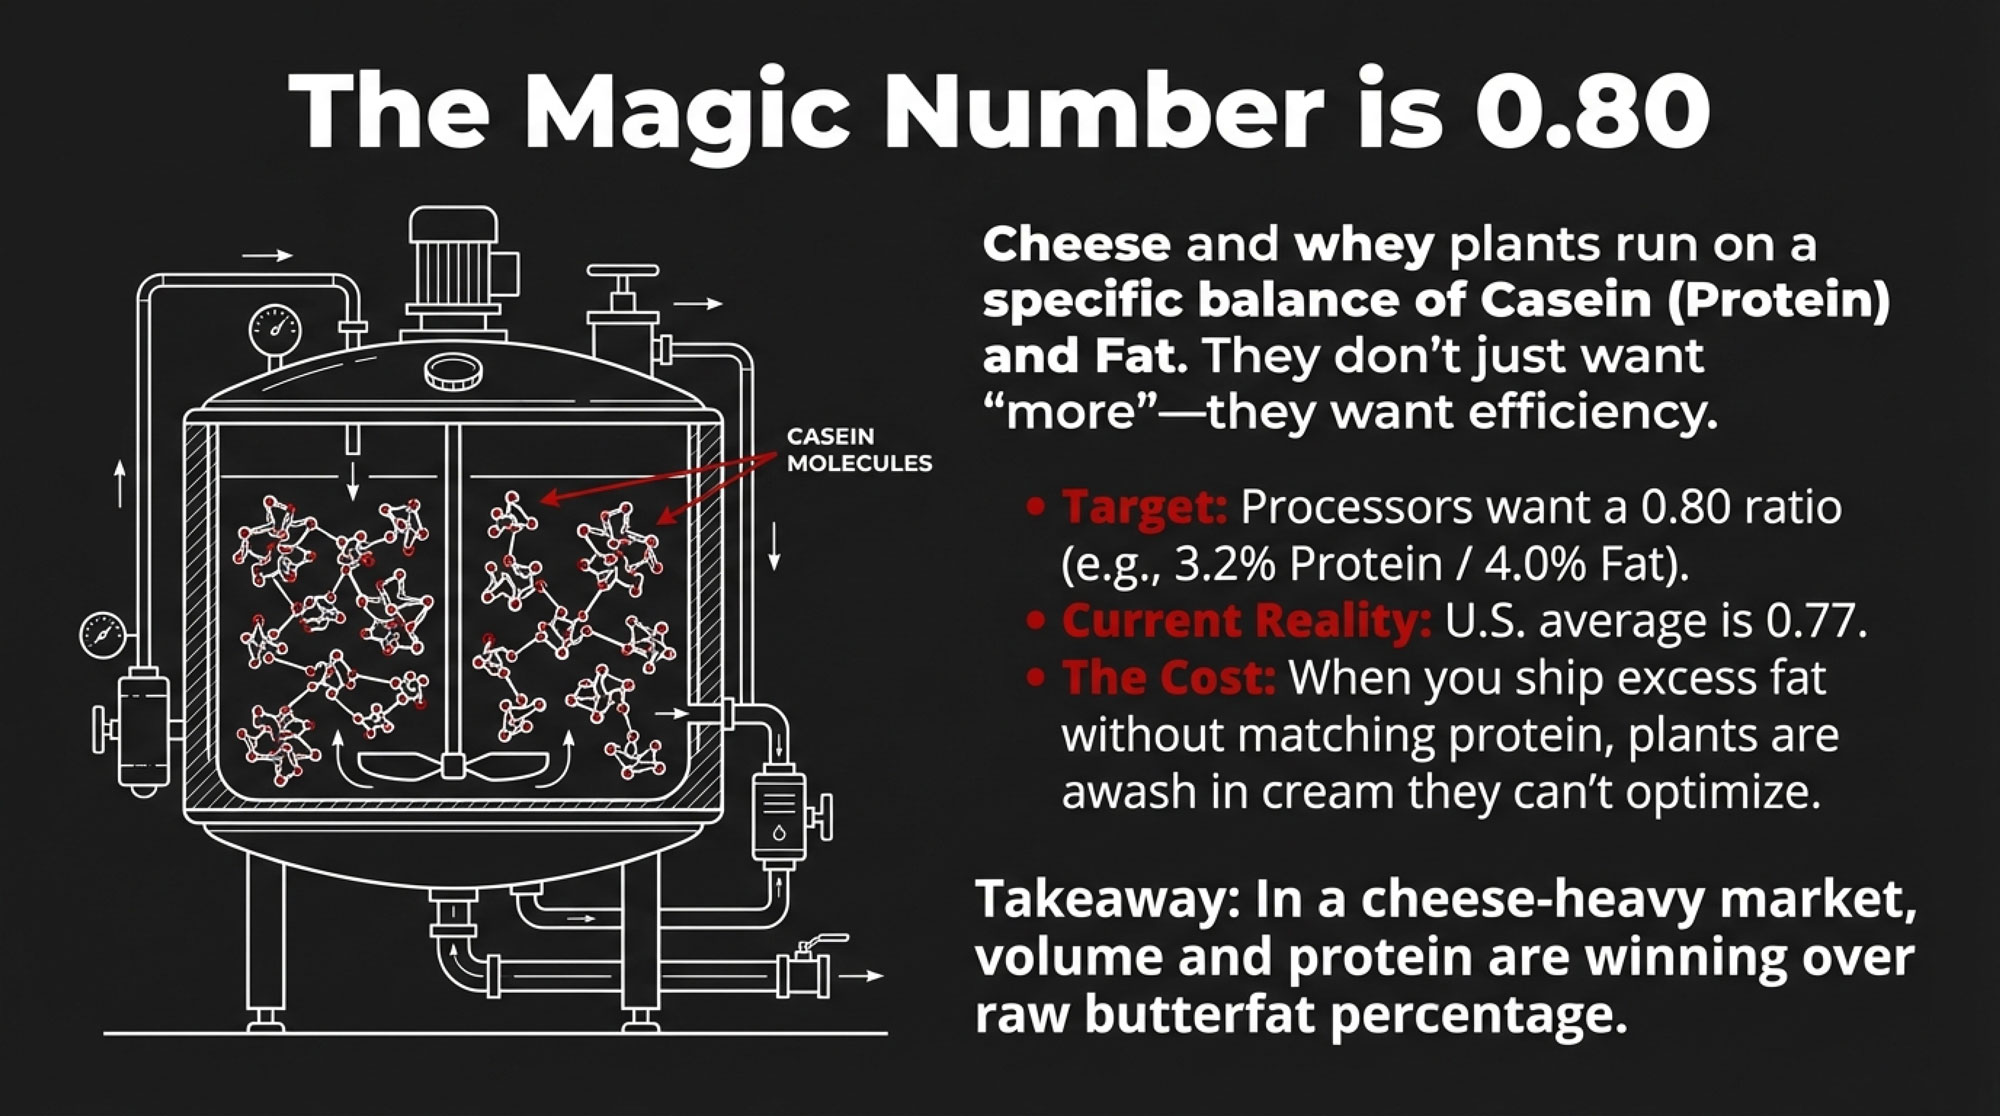
Where the $3‑Per‑Cow Gap Actually Comes From
Here’s where the math stops being theoretical. That central Wisconsin herd’s numbers look a lot like Producer A in this example. Down the road, a solids‑focused robot herd looks more like Producer B.
Producer A vs Producer B: Same Market, Different Cheque
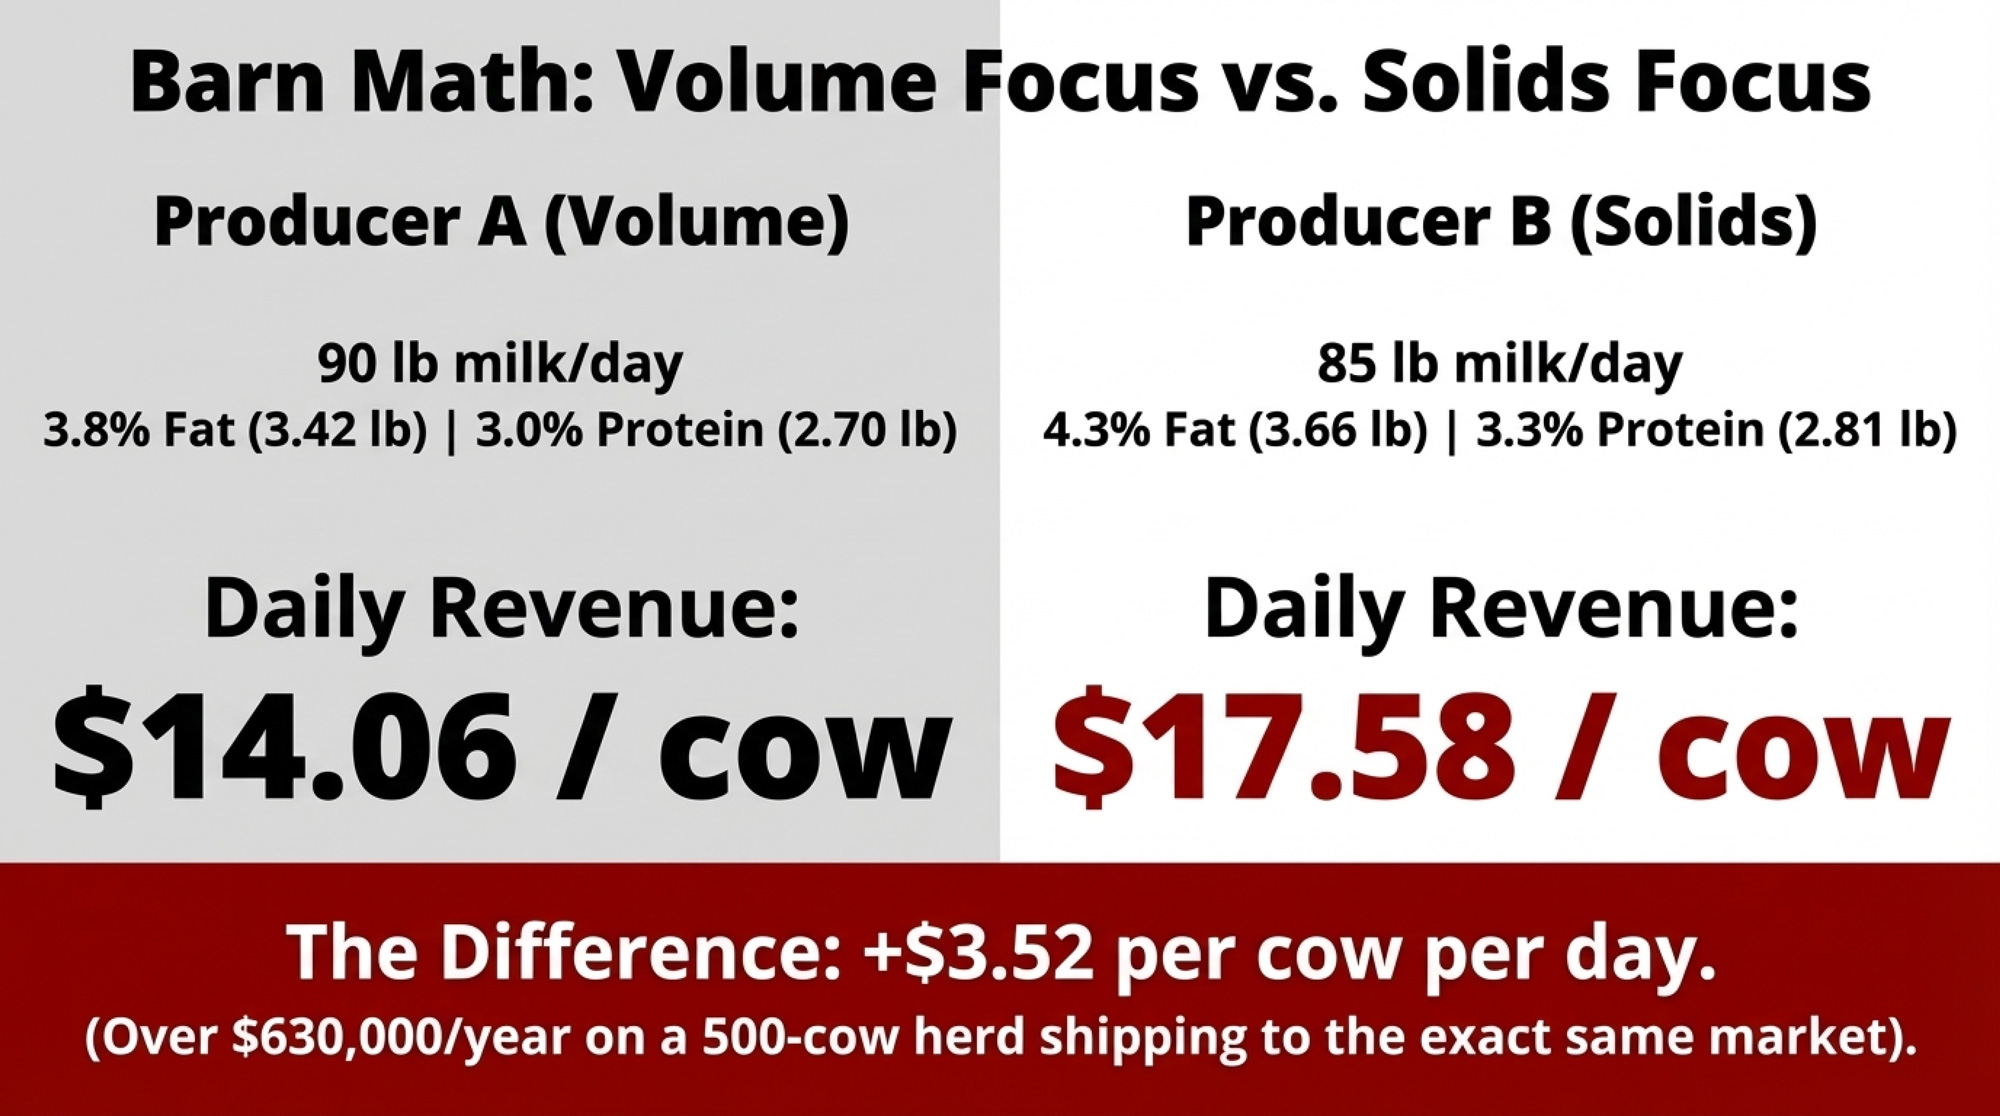
| Metric | Producer A (Volume Focus) | Producer B (Solids Focus) |
| Milk per cow per day | 90 lb | 85 lb |
| Butterfat % (lb) | 3.8% (3.42 lb) | 4.3% (3.66 lb) |
| True protein % (lb) | 3.0% (2.70 lb) | 3.3% (2.81 lb) |
| Fat price (sample grid) | $2.40/lb | $2.50/lb |
| Protein price (sample grid) | $2.00/lb | $3.00/lb |
| Volume premium | $0.50/cwt over 80 lb | None |
| Daily revenue/cow | $14.06 | $17.58 |
| The difference | — | +$3.52/cow/day |
On a sample grid that pays around $2.40/lb for fat, $2.00/lb for protein, and $0.50/cwt in volume premium over 80 lb, Producer A’s 90 lb Holsteins generate:
- Fat: 3.42 × 2.40 = $8.21
- Protein: 2.70 × 2.00 = $5.40
- Volume: 0.90 cwt × 0.50 = $0.45
- Total: $14.06 per cow per day
Under a different sample grid that pays about $2.50/lb for fat and $3.00/lb for protein with no volume premium, Producer B’s 85 lb Holsteins generate:
- Fat: 3.66 × 2.50 = $9.15
- Protein: 2.81 × 3.00 = $8.43
- Total: $17.58 per cow per day
Even though Producer B ships 5 lb less milk, they bring in $3.52 more per cow per day. On 500 cows, that’s about $1,760 per day, roughly $52,800 per month, or more than $630,000 a year.
That’s the math the central Wisconsin family finally put on paper when their “good” report didn’t match the cheque. They didn’t need to be Producer B overnight. They just needed to see where the gap was hiding.
Now, say you don’t get all the way to that kind of grid or solids profile. Basis may move on you, your plant may not pay full whey value, and hauling and quality premiums may look different. Even if you only capture half that gap, you’re still talking about roughly $1.75 per cow per day.
Two herds, shuttling milk into the same kind of product mix, both hearing the same USDA story about strong cheese, butterfat, and whey. One is aligned with how the plant actually makes money in 2026. The other is quietly leaving $1.75–$3.52 per cow per day on the table.
Why the Money Flowed This Way
You don’t need a PhD in dairy economics to see the pattern. You’ve been watching it show up in barn builds, plant expansions, and sire proofs.
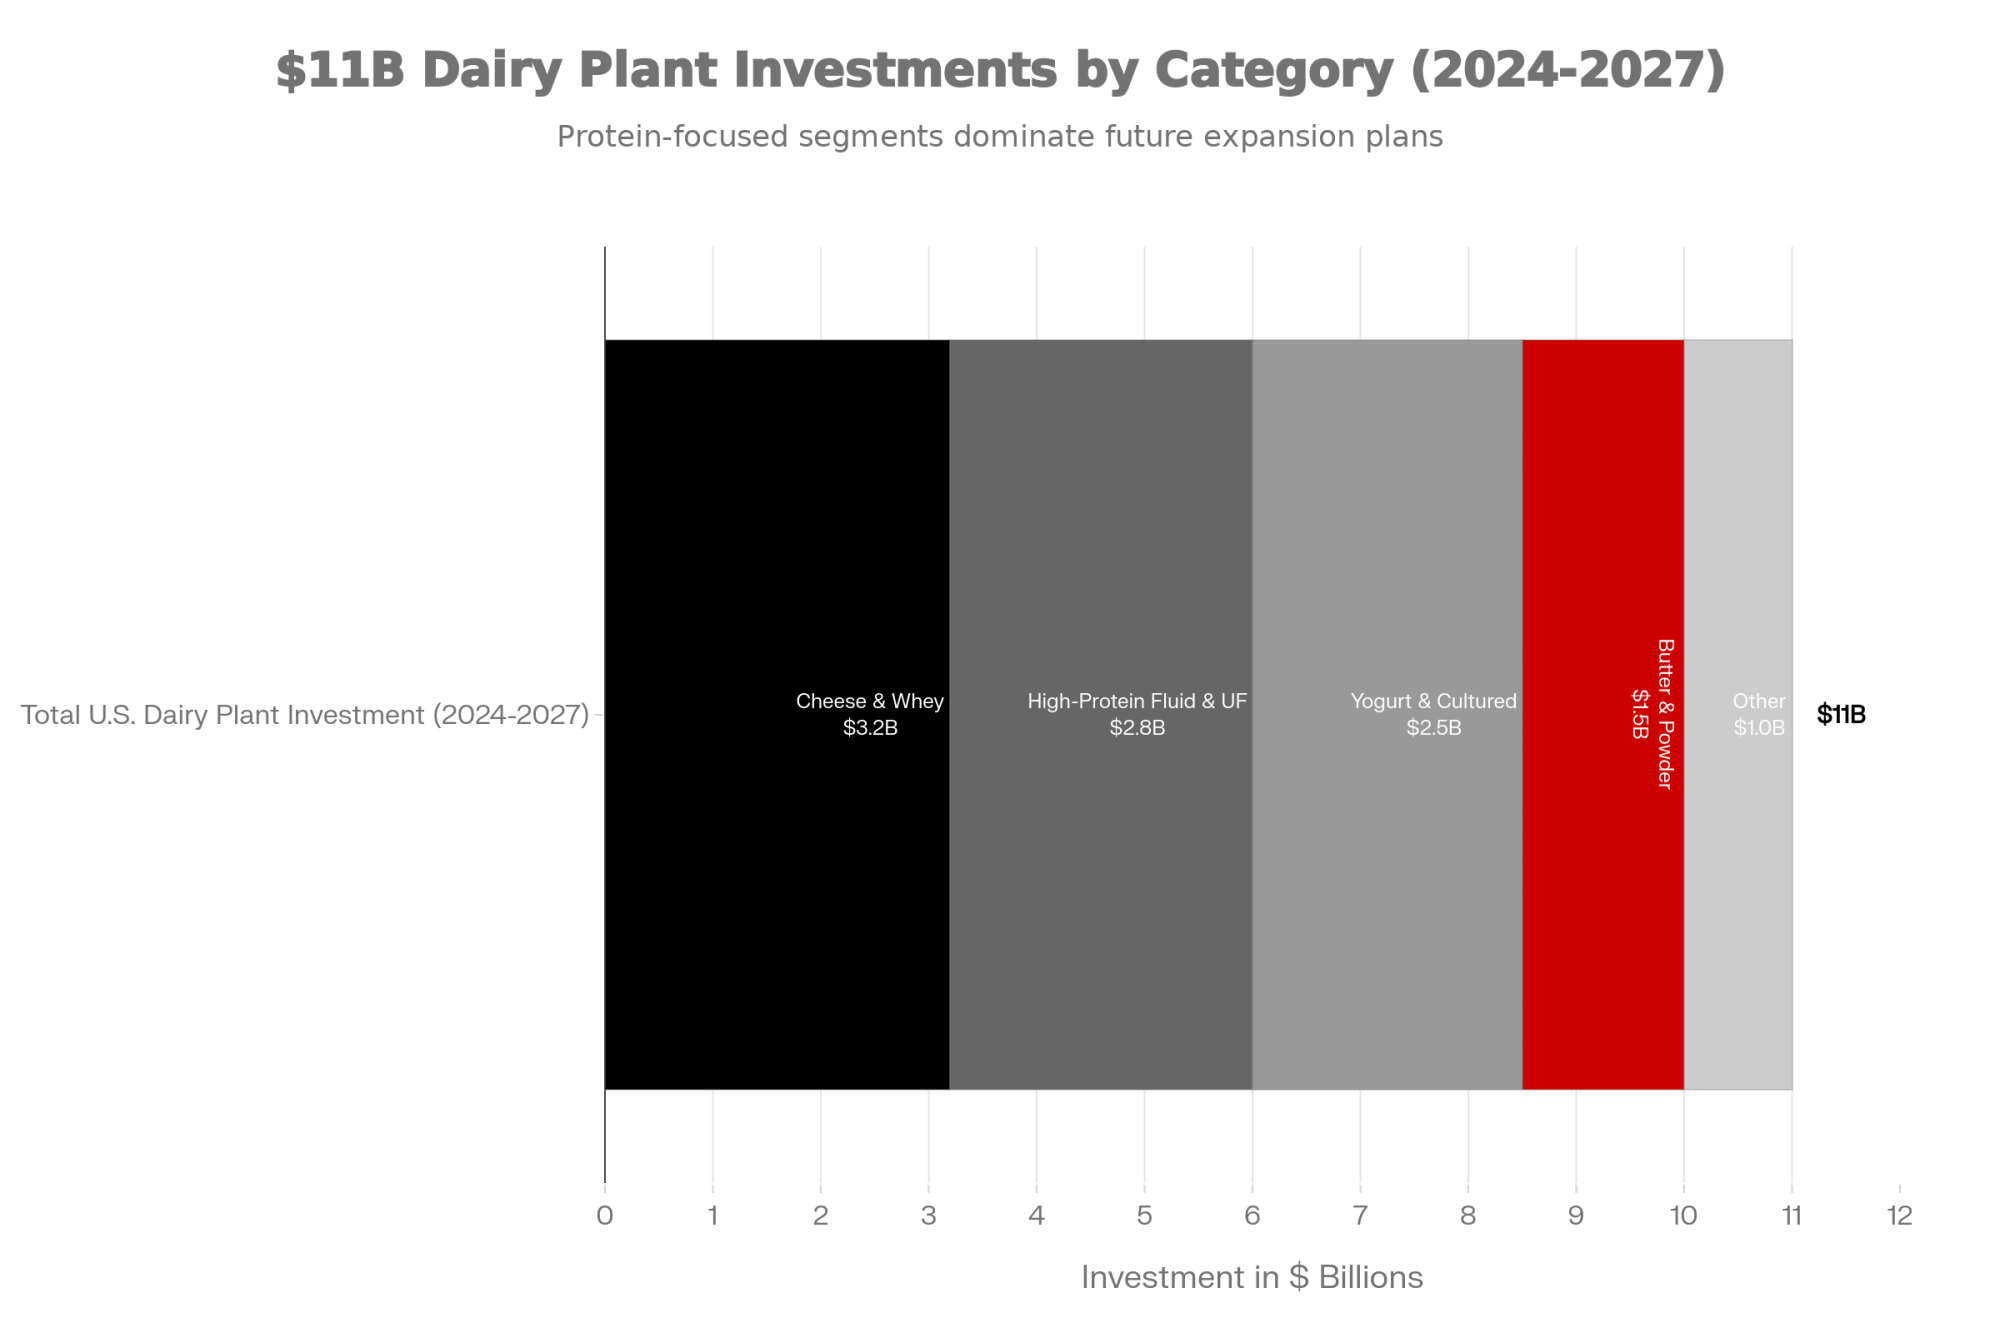
First, capacity and demand aren’t on the same clock. New cheese and butter plants have been ramping up for a while. USDA reports show U.S. cheese production in late 2025 in roughly the 1.22–1.28 billion lb range, with year‑over‑year gains in the low‑ to mid‑single digits as new steel came online and fat tests stayed high. Demand—especially export demand—can blink in a month.
Second, utilization has changed more than most pay grids have. More milkfat is heading into butter and high‑spec export fat, while skim and protein streams flow increasingly into cheese, high‑protein whey, and Class II products instead of a pure NFDM world. December’s production report (NFDM down year‑over‑year while SMP and dry whey bounce) and USDEC’s breakdown of record cheese, butterfat, and high‑protein whey exports confirm the shift.
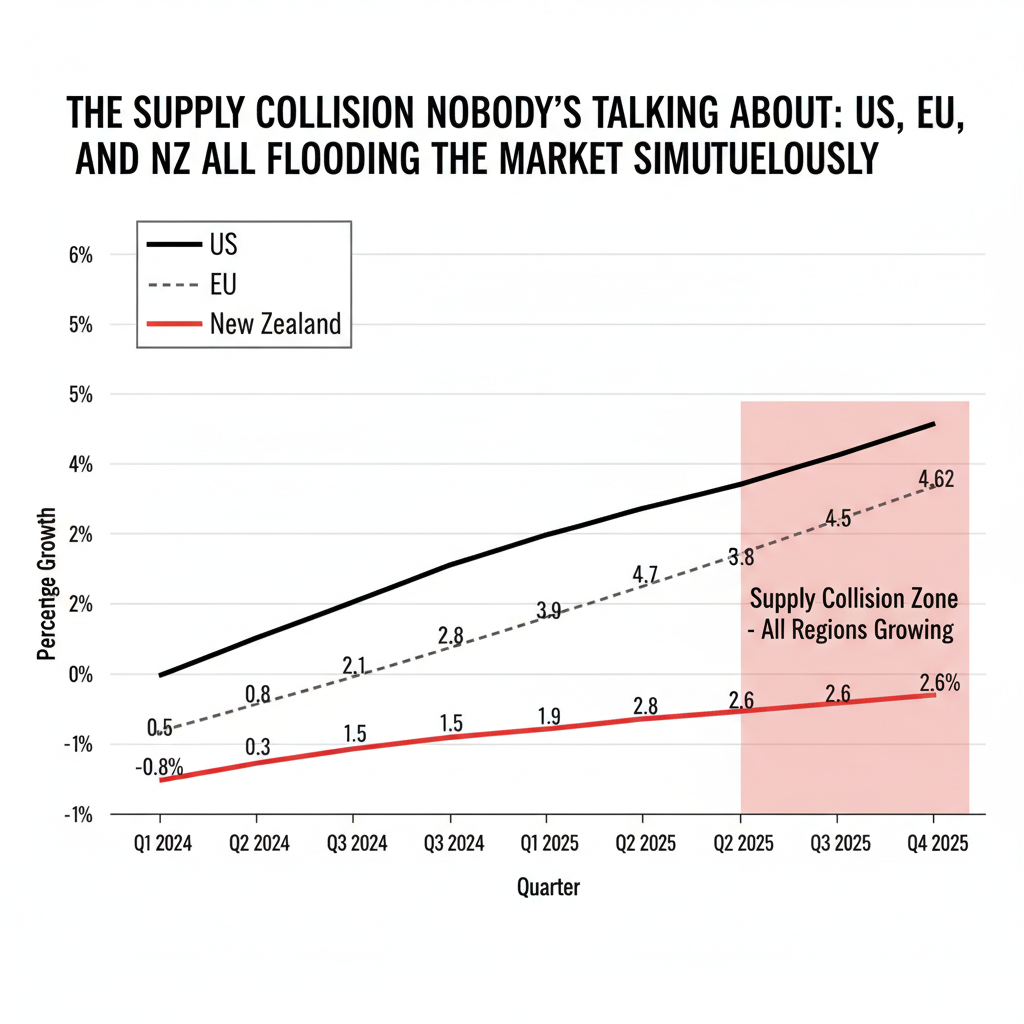
Third, export exposure is bigger than it used to be. IDFA says 2025 U.S. dairy exports reached $9.51 billion in value, a 15% jump from 2024, and USDEC reports that more than 17% of U.S. milk production was exported, with record volumes in cheese, butterfat, and high‑protein whey. That’s great, while overseas buyers are hungry and the global milk supply isn’t overwhelming. It cuts the other way if Europe, New Zealand, or South America floods the market or if key customers pull back.
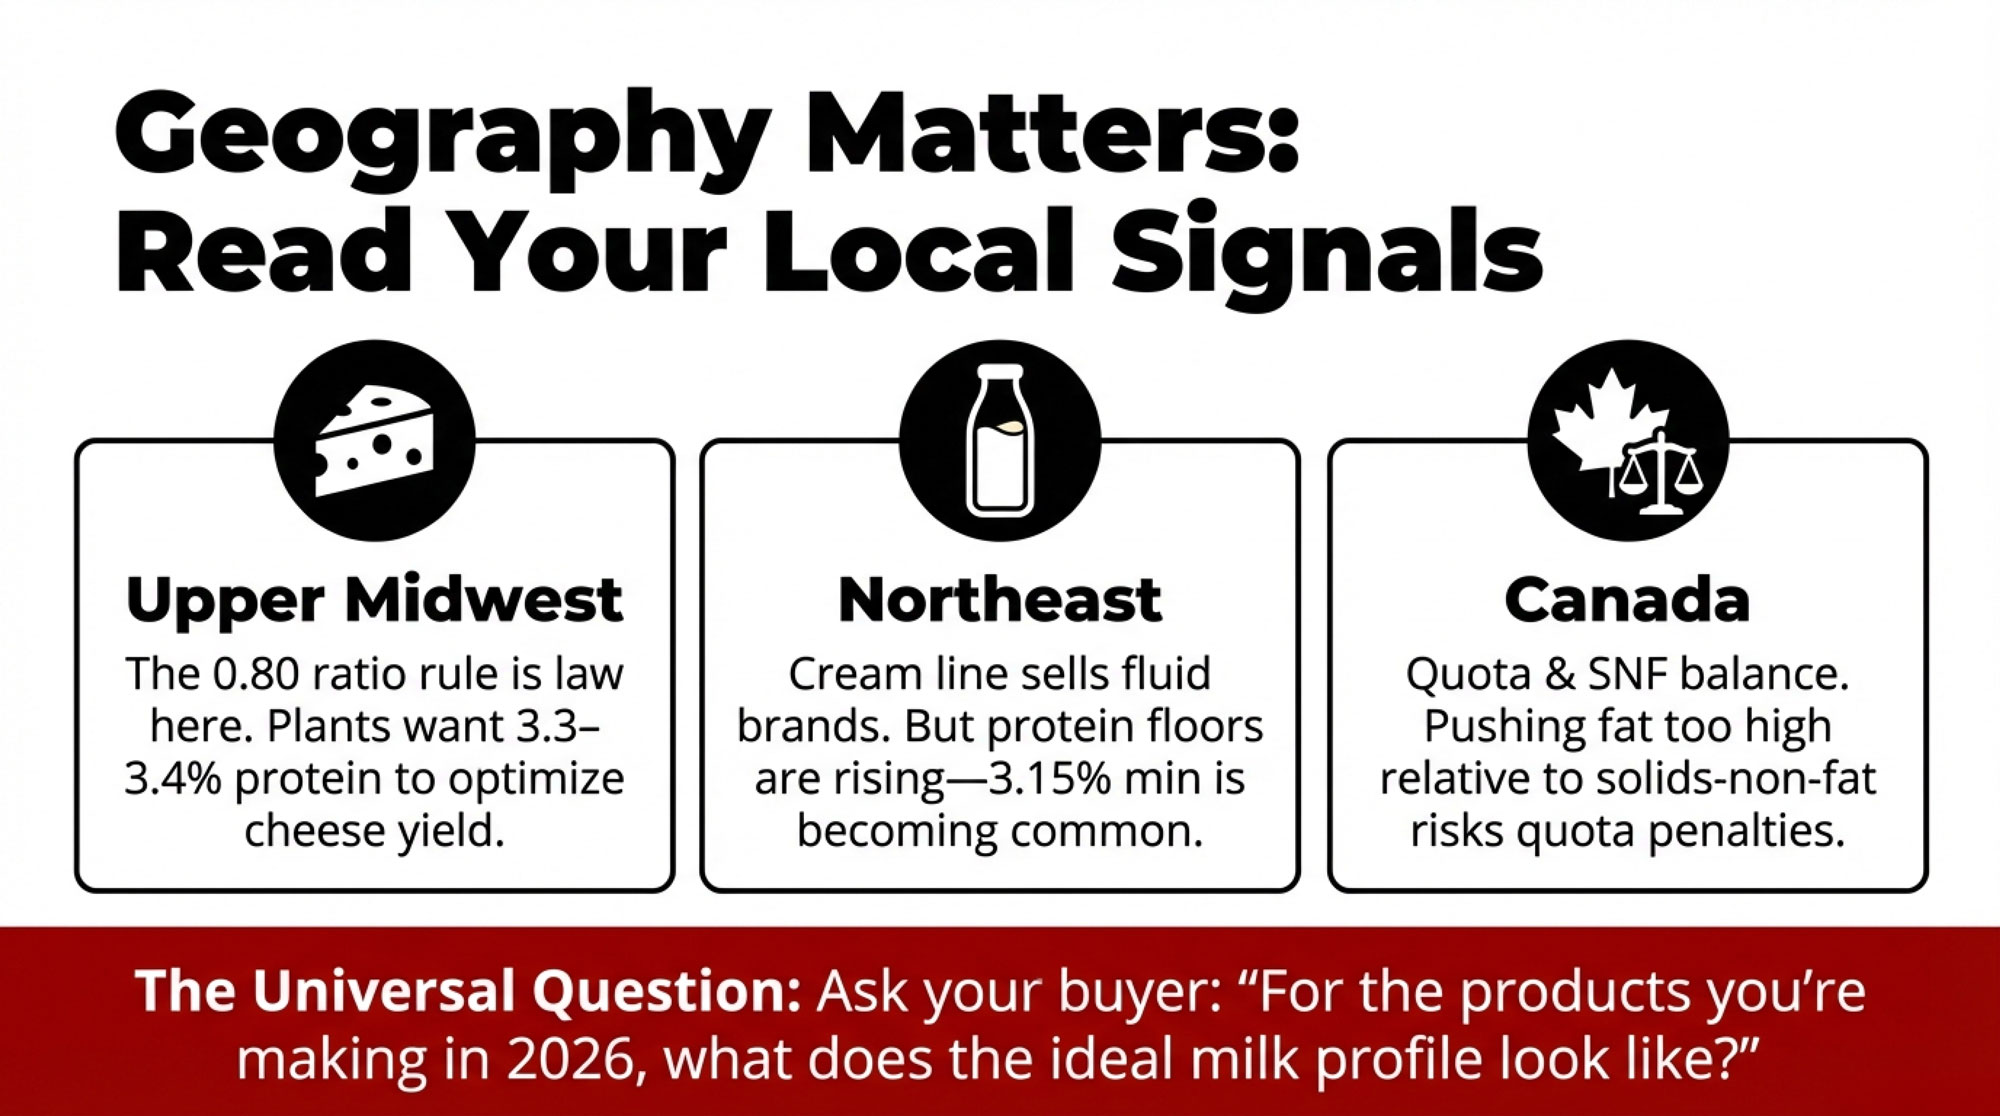
And co‑op pools and contract formulas move slowly. Plenty of grids still price protein like its only job is cheese and treat skim like a powder world—even when the same co‑op is busy touting investments in high‑protein ingredients and differentiated fat products.
So you end up with a national report that looks bullish on product output and exports, while your own milk cheque quietly reflects the gap between that product mix and your particular cows, ration, and contract.
How Much Does Waiting 30 Days Actually Cost?
Here’s where it gets real for your own yard.
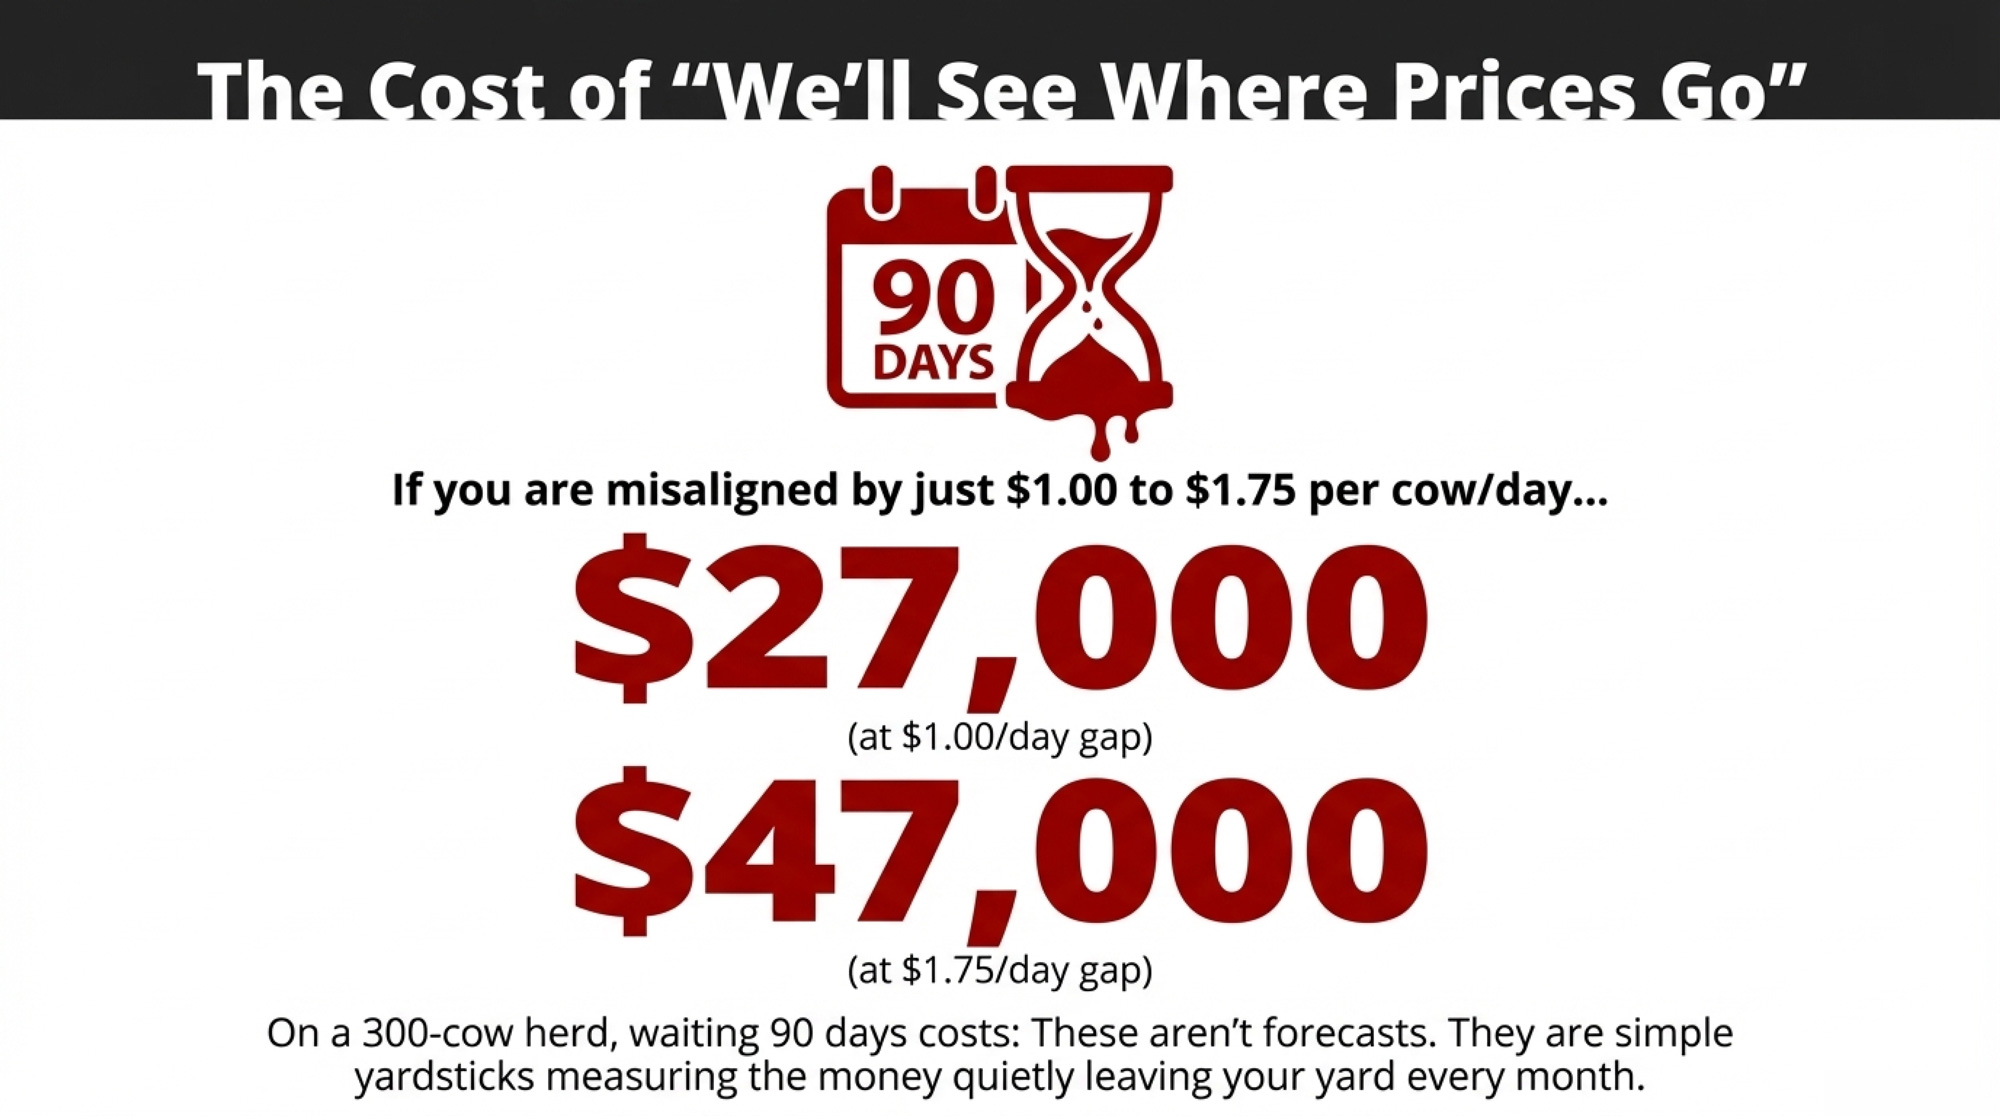
Say there’s a realistic $1.00 per cow per day of improvement on the table between culling and ration changes—either by getting rid of truly unprofitable cows, or by trading a couple of pounds of thin milk for more fat and protein.
On a 300‑cow herd, that’s:
- 300 cows × $1.00 = $300 per day
- About $9,000 a month
- Roughly $27,000 across 90 days
If the gap between an aligned and misaligned solids strategy looks closer to $1.75 per cow per day, the rough “wait 90 days” bill on 300 cows jumps to about $47,000.
Those aren’t forecasts. They’re simple yardsticks. They answer a basic question: “What does ‘we’ll give it another month’ actually cost me if there’s money on the table?”
Are Your Weekly Numbers Telling You the Truth?
You can’t control whether exports stay hot or cool off. You can control how honestly you read your own numbers after you make a change.
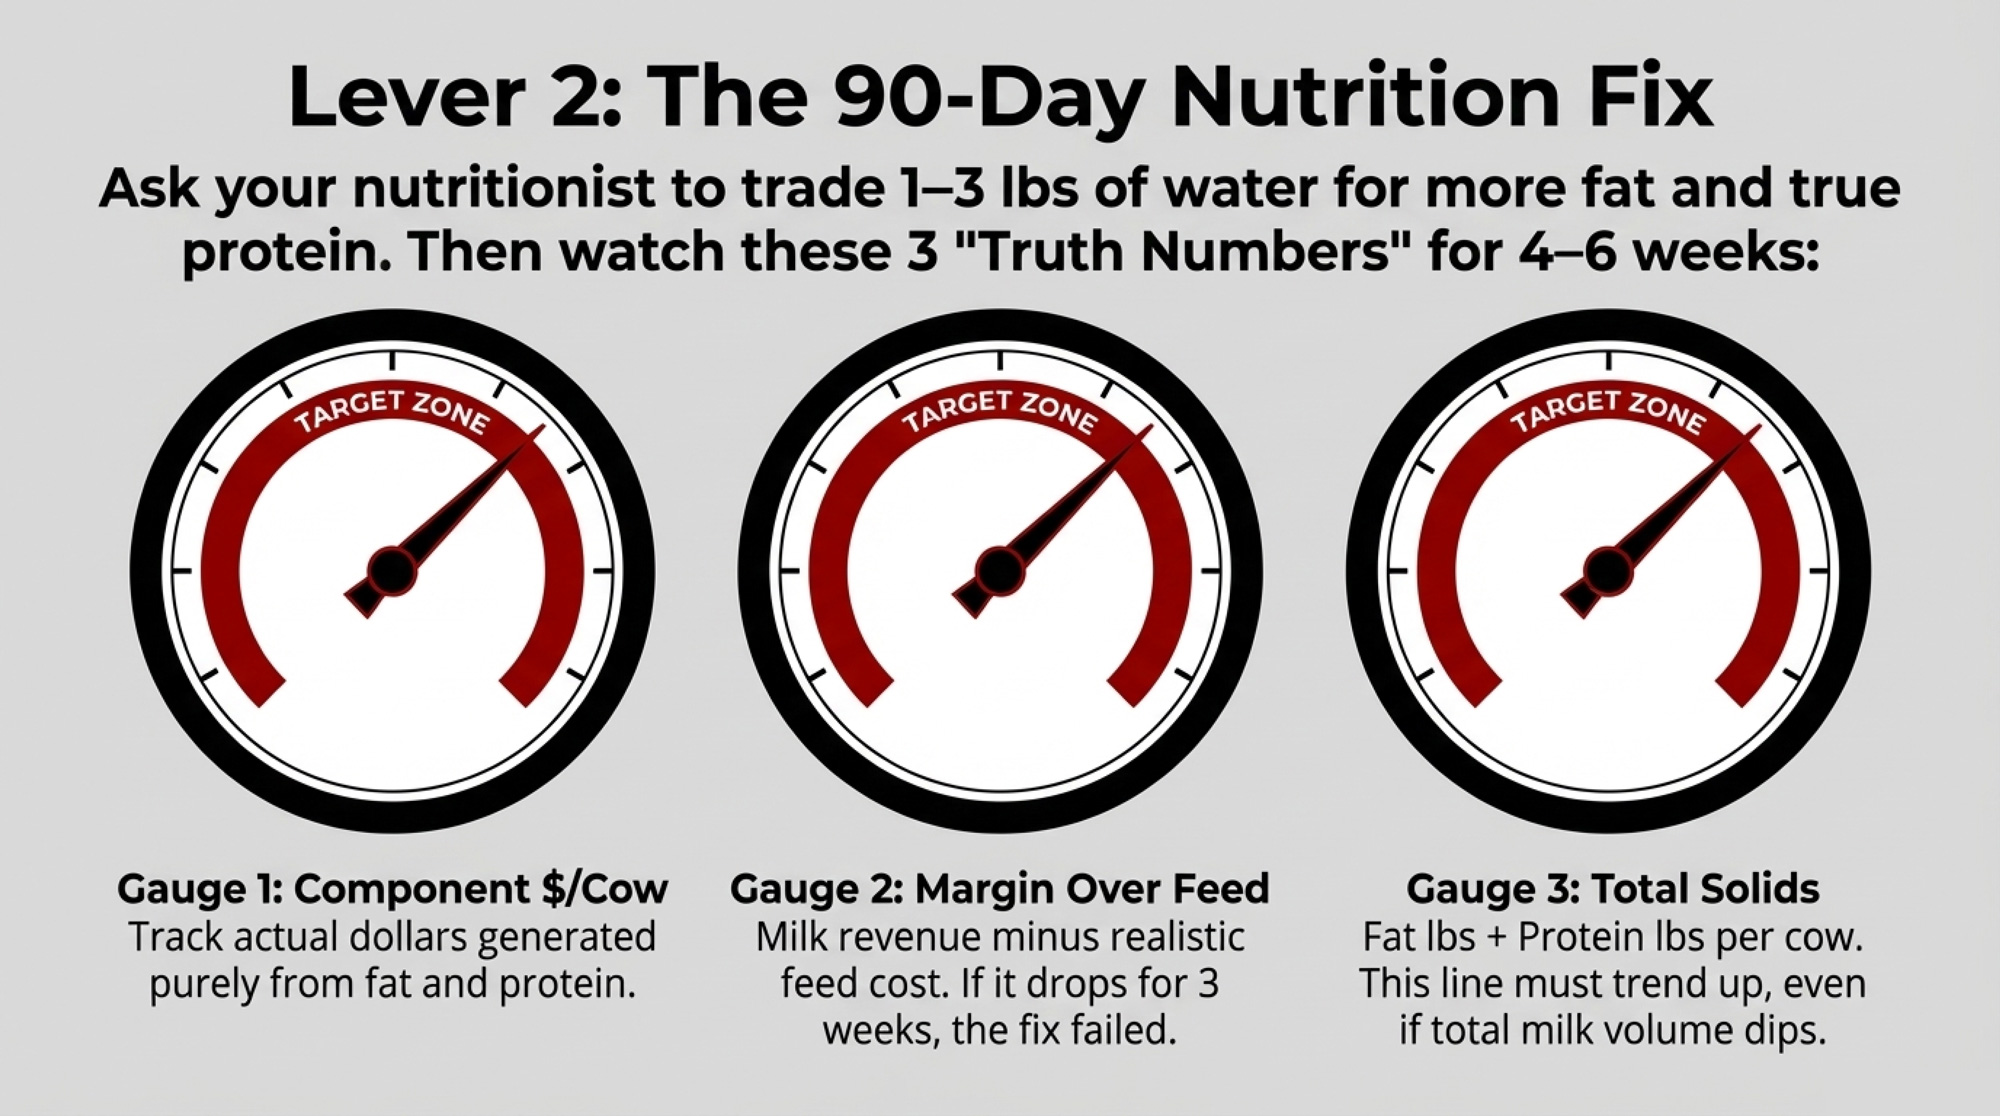
If you tighten up the ration or sharpen the cull list in the next few weeks, three weekly numbers will keep you honest:
- Component dollars per cow per day. Take fat and true protein pounds per cow from your plant or DHI reports and multiply each by the actual prices on your milk cheque. Track that $ per cow per day from components for at least a month after a change.
- Margin over feed per cow per day. Add up all milk revenue per cow (components, over‑order premiums, quality bonuses) and subtract a realistic feed cost per cow. A ration cost times DMI estimate is good enough. If the margin per cow drops for two or three weeks in a row after your “fix,” it’s not a fix.
- Total solids per cow per day. Add fat lb + protein lb per cow. In a world where cheese, butter, and whey output keep climbing, and powder plays a smaller role, that line should trend up even if milk pounds per cow are flat or a little lower.
If butterfat % looks prettier on the report but component dollars per cow, solids per cow, and margin over feed haven’t improved after 4–6 weeks, that ration change is mostly a feel‑good exercise. It isn’t helping your milk cheque.
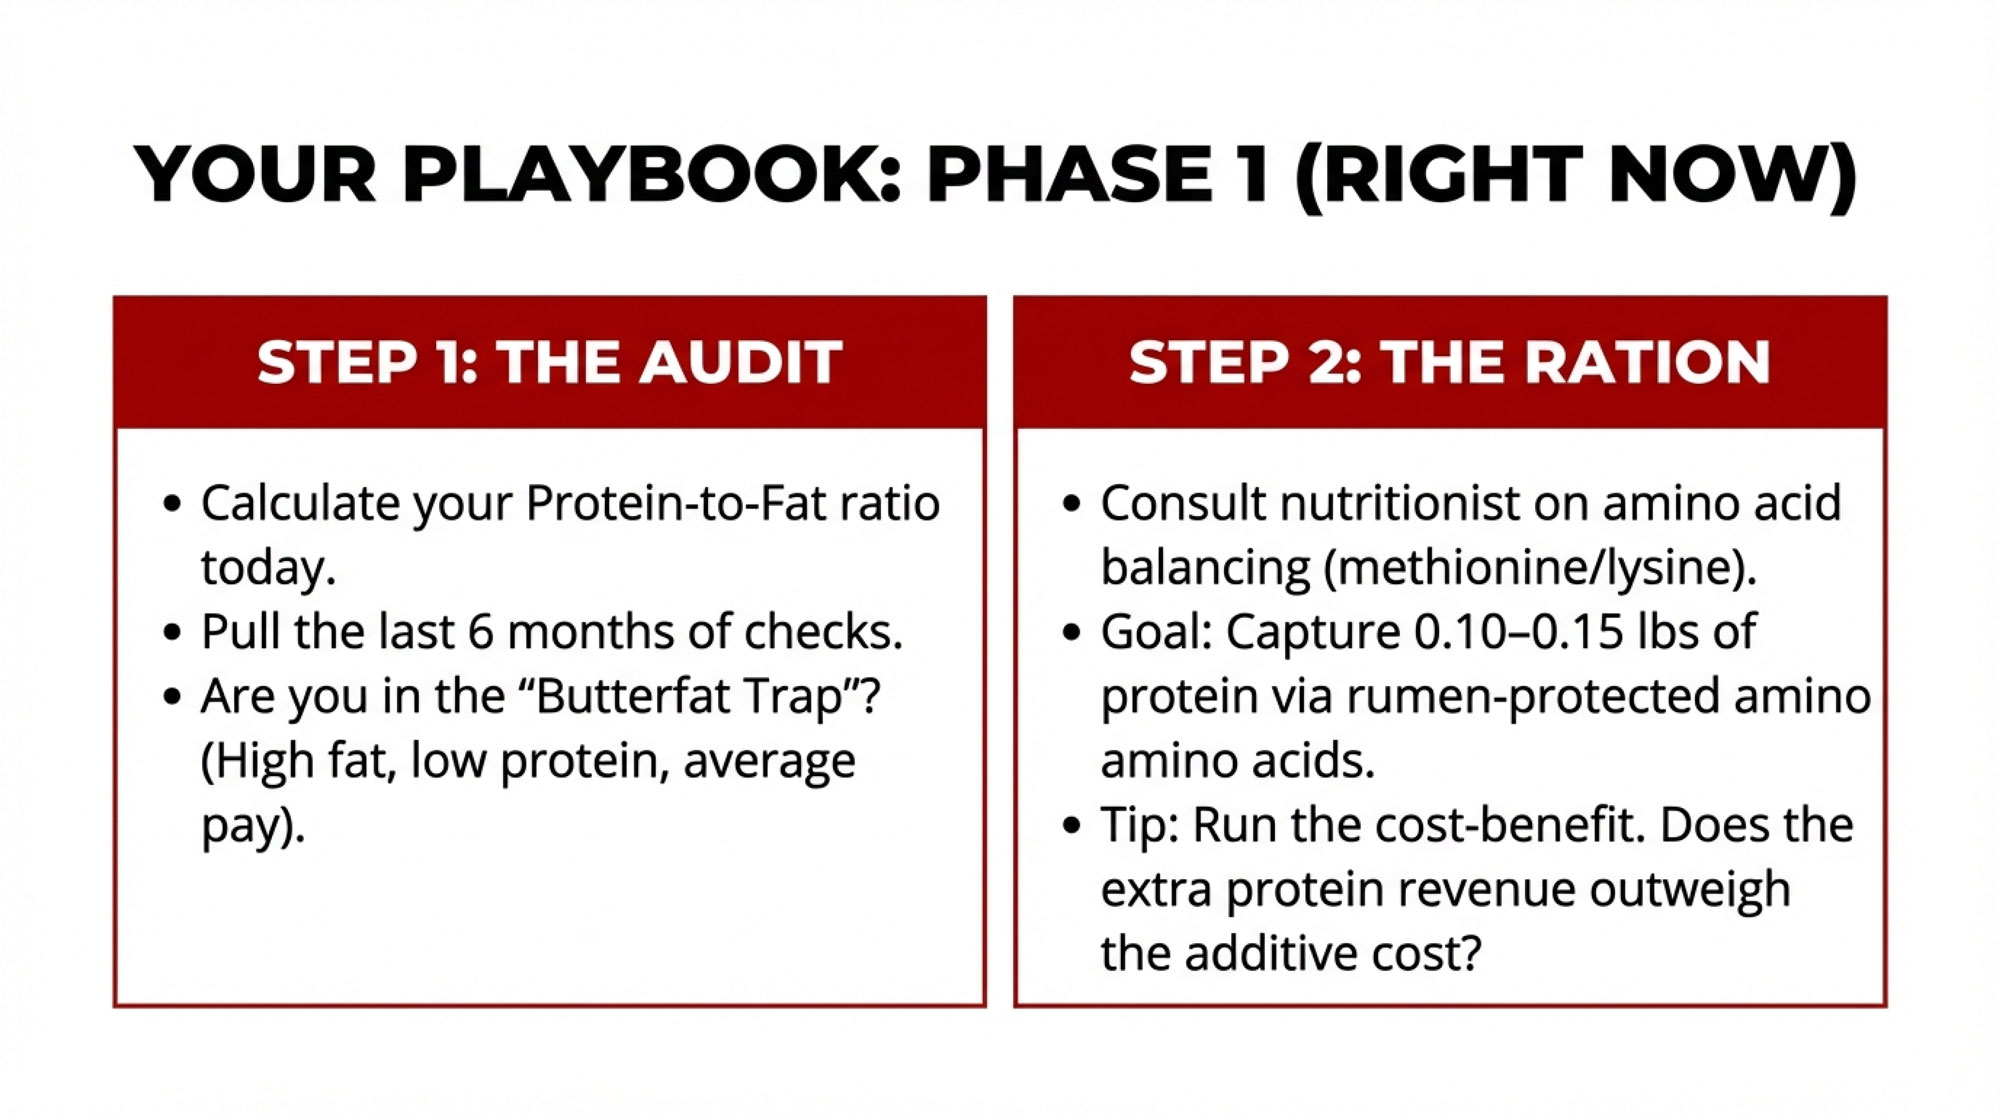
What Should You Actually Do in the Next 30 Days?
If today’s USDA data made you exhale instead of sharpening your pencil, here’s a simple 30‑day gut check.
In the next month, you could:
- Pull your last three milk cheques and an average feed sheet, and calculate component dollars per cow per dayand margin over feed per cow. Don’t get fancy—the point is to put real numbers to your hunches.
- Sit down with your nutritionist and ask where you can reasonably trade 1–3 lb of milk for more fat and protein without wrecking health or repro.
- Flag the bottom 5–10 cows in each pen on solids and health, and ask, “If exports blink and basis cracks, do I really want to be feeding her?”
That central Wisconsin family we started with? They ran these same numbers before this latest report ever hit the newswire. Found seven cows in the bottom pen that hadn’t cleared feed cost in months—and a ration that was still chasing volume instead of components. Small moves. But when you’re leaving $1.75–$3.00 a cow on the table, small moves are the ones that stop the bleeding first.
Options and Trade-Offs for Farmers
You don’t have to overhaul your whole business by summer to close this $3‑per‑cow gap. You need to pull a few levers harder and sooner than feels comfortable.
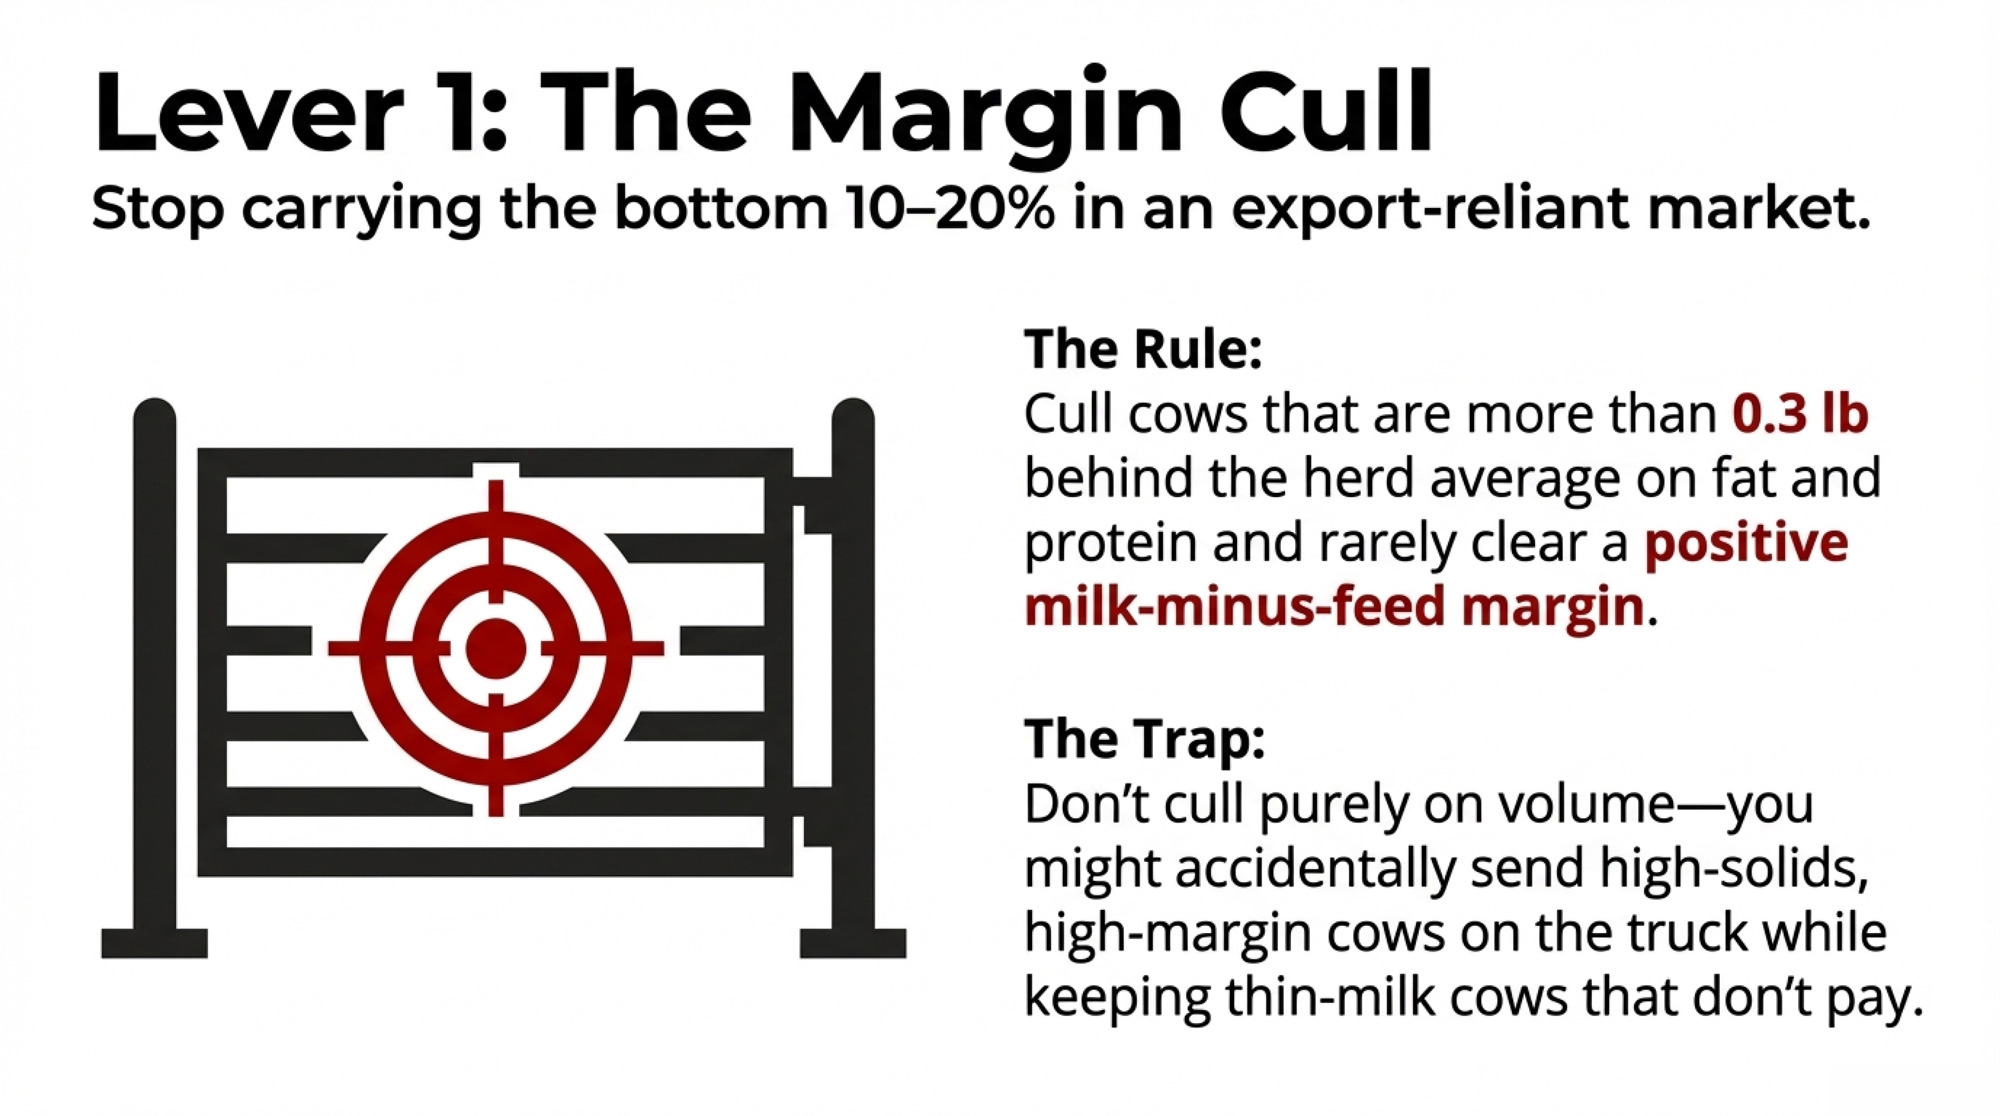
1. Cull on solids and margin, not just volume
When national production is climbing, and exports are doing the heavy lifting, the bottom 10–20% of cows in your herd get more expensive to carry.
- When it makes sense: You’re feeding cows that are always at the bottom of the sort sheet on components, health, and repro. On even a rough milk‑minus‑feed look, a few cows have been underwater for months.
- What it requires: A simple cow‑by‑cow margin check: milk revenue per cow (including components and premiums) minus estimated feed and obvious extra costs. If your lowest 10% of cows are more than about 0.3 lbbehind herd average on fat and protein and rarely clear a positive margin, they’re often strong cull candidates in this kind of market.
- Risks/limits: Cull too aggressively without replacements ready, and you underfill a barn you’ve already paid for. Cull based only on production, and you can accidentally send higher‑solids, high‑margin cows on the truck while you keep bigger‑volume, thin‑milk cows that don’t really pay.
2. Use nutrition as your 90‑day lever
Within 60–90 days, ration changes are typically your fastest way to show something different on the milk cheque.
The sweet spot isn’t starving cows. It’s trading 1–3 lb of mostly water for more fat and true protein, while protecting cow health.
- When it makes sense: You’re already shipping solid volume, but fat and protein tests lag what you’d expect from your genetics and facilities. You suspect the current ration is chasing volume at the expense of components.
- What it requires: Sit down with your nutritionist and ask a very specific question: “What changes would give up a couple of pounds of milk but bump fat and true protein over the next 60 days?” Then watch the three weekly numbers we just walked through—component dollars per cow, margin over feed per cow, and solids per cow.
- Risks/limits: Push the ration too hard and you can cause butterfat depression, SARA, lameness, or repro problems. Rule of thumb: if component dollars per cow and solids per cow aren’t higher after 4–6 weeks, that ration tweak isn’t paying, no matter how nice the test looks.
3. Start documenting how your plant really uses your milk
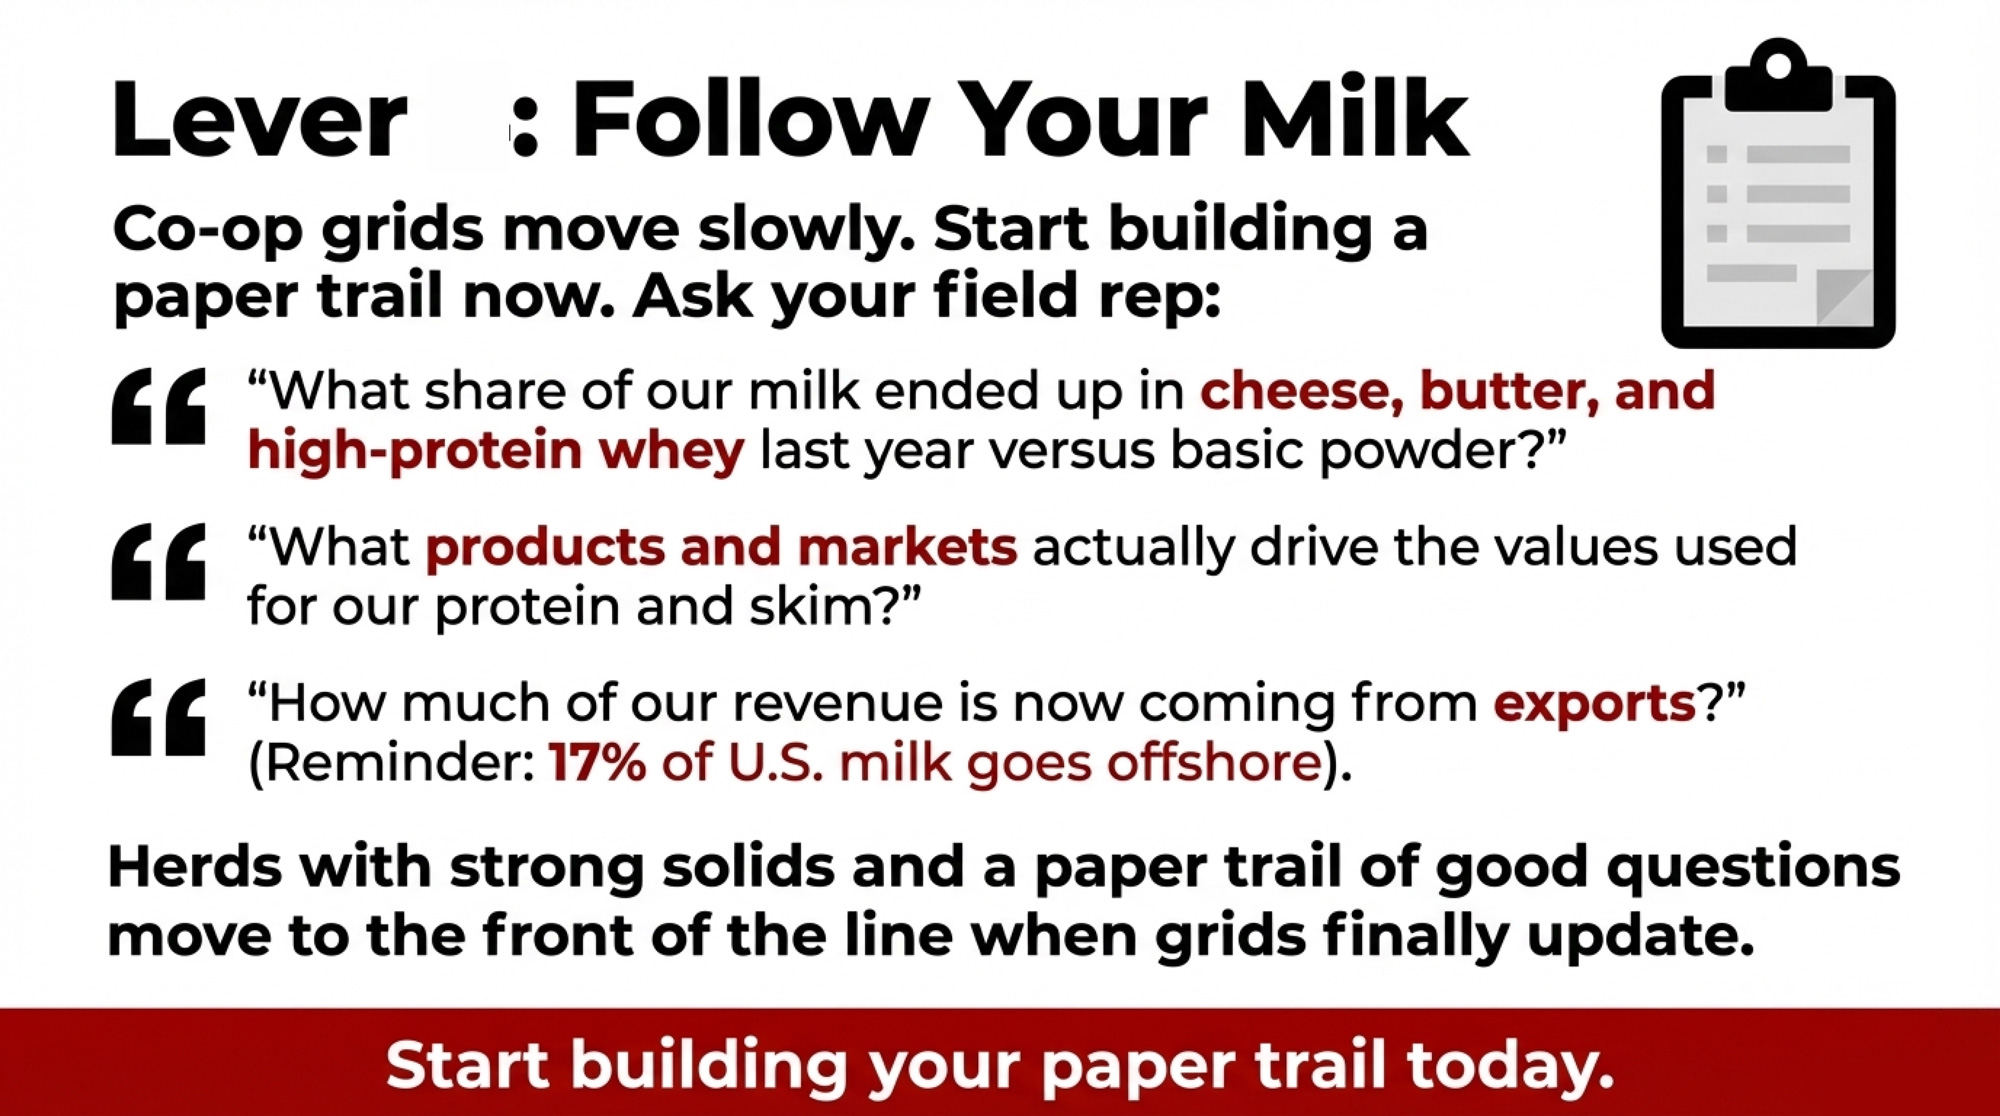
You may be in a long contract or a slow‑moving co‑op. That doesn’t mean you have to be blind.
- When it makes sense: Your gut says your component pay hasn’t caught up with how your plant talks about new cheese vats, butter churns, or whey towers.
- What it requires: Over the next 90–180 days, ask your field rep or board a few basic questions and write the answers down. What share of your milk ended up in cheese + whey, butter, NFDM, SMP, and Class II products last year? What products and markets actually drive the values used for your protein and skim? How much of the co‑op’s revenue now comes from exports versus domestic sales? You’re not trying to win a fight at the next annual meeting. You’re quietly building a record for the next time contracts and grids move.
- Risks/limits: Boards change slowly. You may not get the perfect grid next year. But when utilization and export mix finally show up in pay formulas, herds with strong solids and a paper trail of good questions tend to be at the front of the line.
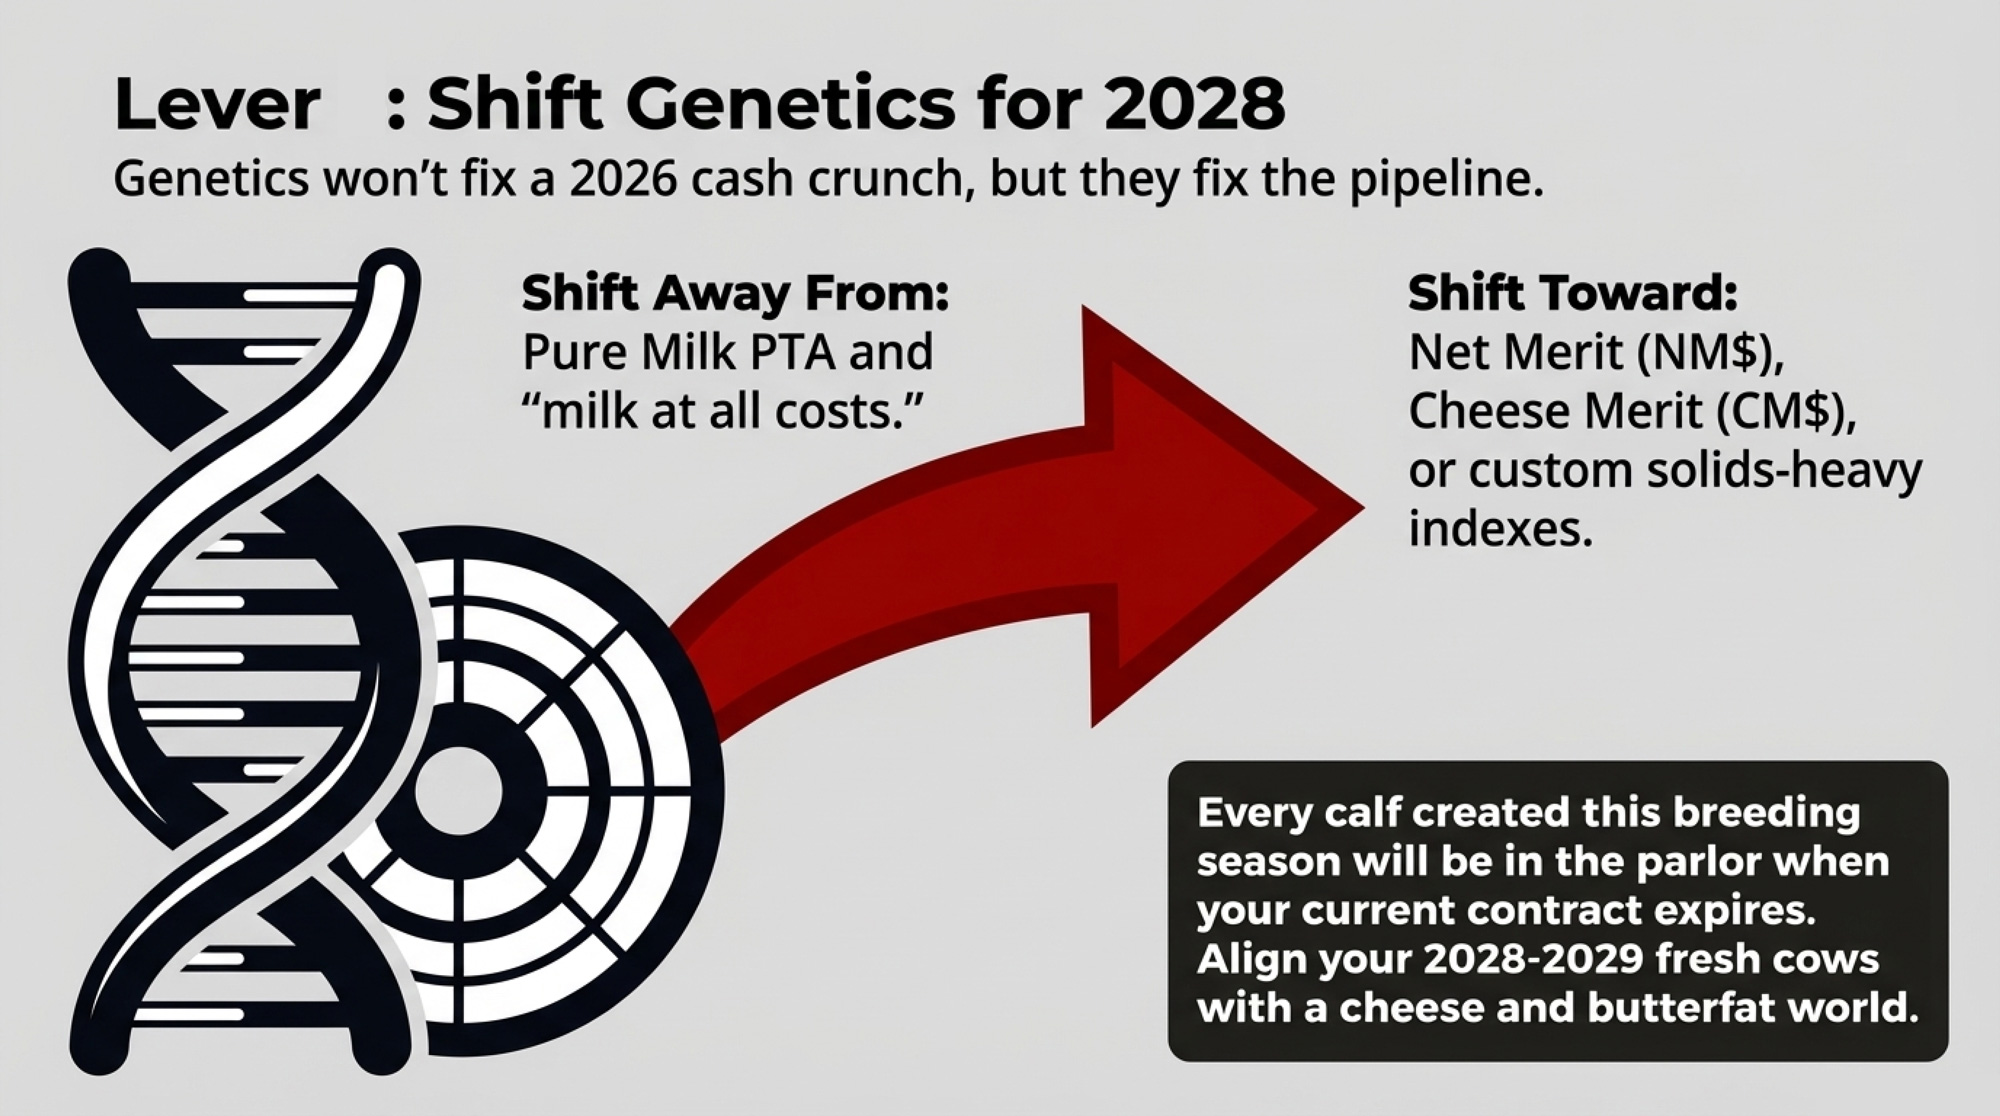
4. Nudge genetics toward more fat and protein—starting this breeding season
Genetics won’t fix a 2026 cash crunch by the time corn silage harvest rolls around. But every calf you create this year will still be in the parlor when today’s contract expires.
- When it makes sense: You plan to milk in this barn for at least another decade, you’re already culling and turning over a portion of the herd each year, and you’re picking sires anyway.
- What it requires: Shift selection pressure one notch toward PTA fat and true protein and one notch away from “milk at all costs.” For most U.S. herds, that means leaning a little harder on indexes that pay for components— Net Merit (NM$), Cheese Merit (CM$) or a custom solids‑heavy index from your AI stud—rather than chasing pure Milk PTA. Over time, that gives you more cows like Producer B: animals whose solids lines match a product mix built on cheese, butter, and high‑protein whey.
- Risks/limits: You won’t see the payback for a couple of years, and genetics alone won’t fix a bad ration or a lopsided contract. Treat this as the background move that makes every future negotiation and ration tweak work a little better.
Key Takeaways
- If your plant’s cheese, butter, and whey output has climbed in the mid‑single digits over the last year but your protein and skim pay haven’t changed, assume there’s a gap and start asking for basic utilization and value breakdowns—not a miracle new grid.
- If your lowest 10% of cows are more than about 0.3 lb behind herd average on fat and protein and rarely clear a positive milk‑minus‑feed margin, treat them as prime cull candidates in a capacity‑heavy, export‑reliant market.
- If you tweak the ration, judge it by component dollars per cow, solids per cow, and margin over feed after 4–6 weeks—if those aren’t better, don’t call the change a success just because the test looks nicer.
- If you’re choosing sires this spring, tilt a little harder toward NM, or a custom solids‑heavy index, and away from sheer Milk PTA, so your 2028–2029 fresh cows don’t drag you back into the same gap.
- If you catch yourself saying “we’ll see where prices go” for another 30 days, write down what that delay costs at $1.00–$3.00 per cow per day on your herd size—then decide if waiting really feels worth that number.
The Bottom Line
You don’t control today’s USDA report. You do control whether it lulls you into a sense of comfort or pushes you to pull a few levers while you still have time.
The real question isn’t what the next headline will say about cheese or butter. It’s how your own numbers will look if export buyers step back, component values soften by 50–75¢/cwt, and you’re still feeding the same cows on the same ration under the same contract. Where does your breakeven sit right now—and does it hold if the world that generated $9.51 billion in exports last year gets a little less hungry?
Complete references and supporting documentation are available upon request by contacting the editorial team at editor@thebullvine.com.
Learn More
- More Milk, Fewer Farms, $250K at Risk: The 2026 Numbers Every Dairy Needs to Run – This breakdown arms you with the exact math needed to survive a $17 Class III market. It reveals the brutal margin gaps facing 500-cow dairies and delivers a tactical checklist to protect your equity before 2026.
- 2025’s Dairy Dilemma: Record Exports, Falling Checks, and What Every Producer Must Decide Next – This analysis exposes why record-breaking export volumes often bleed value from your mailbox. It breaks down the “Asian processing pivot” and structural market shifts, positioning you to navigate the long-term volatility of being a global bargain supplier.
- Net Merit’s $57 “Weight Tax”: How to Pick Holstein Bulls That Still Pay – This article reveals how the 2025 NM$ revision punishes cow size to favor feed efficiency. It delivers a roadmap for selecting sires that maximize component revenue while slashing the maintenance costs that quietly erode your daily profit.
 The Sunday Read Dairy Professionals Don’t Skip.
 The Sunday Read Dairy Professionals Don’t Skip.
Every week, thousands of producers, breeders, and industry insiders open Bullvine Weekly for genetics insights, market shifts, and profit strategies they won’t find anywhere else. One email. Five minutes. Smarter decisions all week.