



Archive for beef-cross calf prices

USDA’s $400–$1,375 Glasgow Calf Range Is a Price Reference, Not a Payment Plan

One Oct. 27, 2026 sale in Glasgow, Kentucky: beef-cross bull calves from $400 to $1,375. Before that cheque funds a payment, know how much of it your loan already needs. All figures are in US dollars.

beef-on-dairy calf income

Before a farm commits the next beef-on-dairy calf cheque, the first number to find is the share its existing debt payments already need. At the Glasgow dairy auction in Smiths Grove, Kentucky, USDA’s Agricultural Marketing Service reported 72 beef-cross baby bull calves averaging US$997.22 a head on October 27, 2026, with individual sales from US$400 to US$1,375. That’s a dated market reference. It doesn’t say what any one farm’s calves will bring next month.

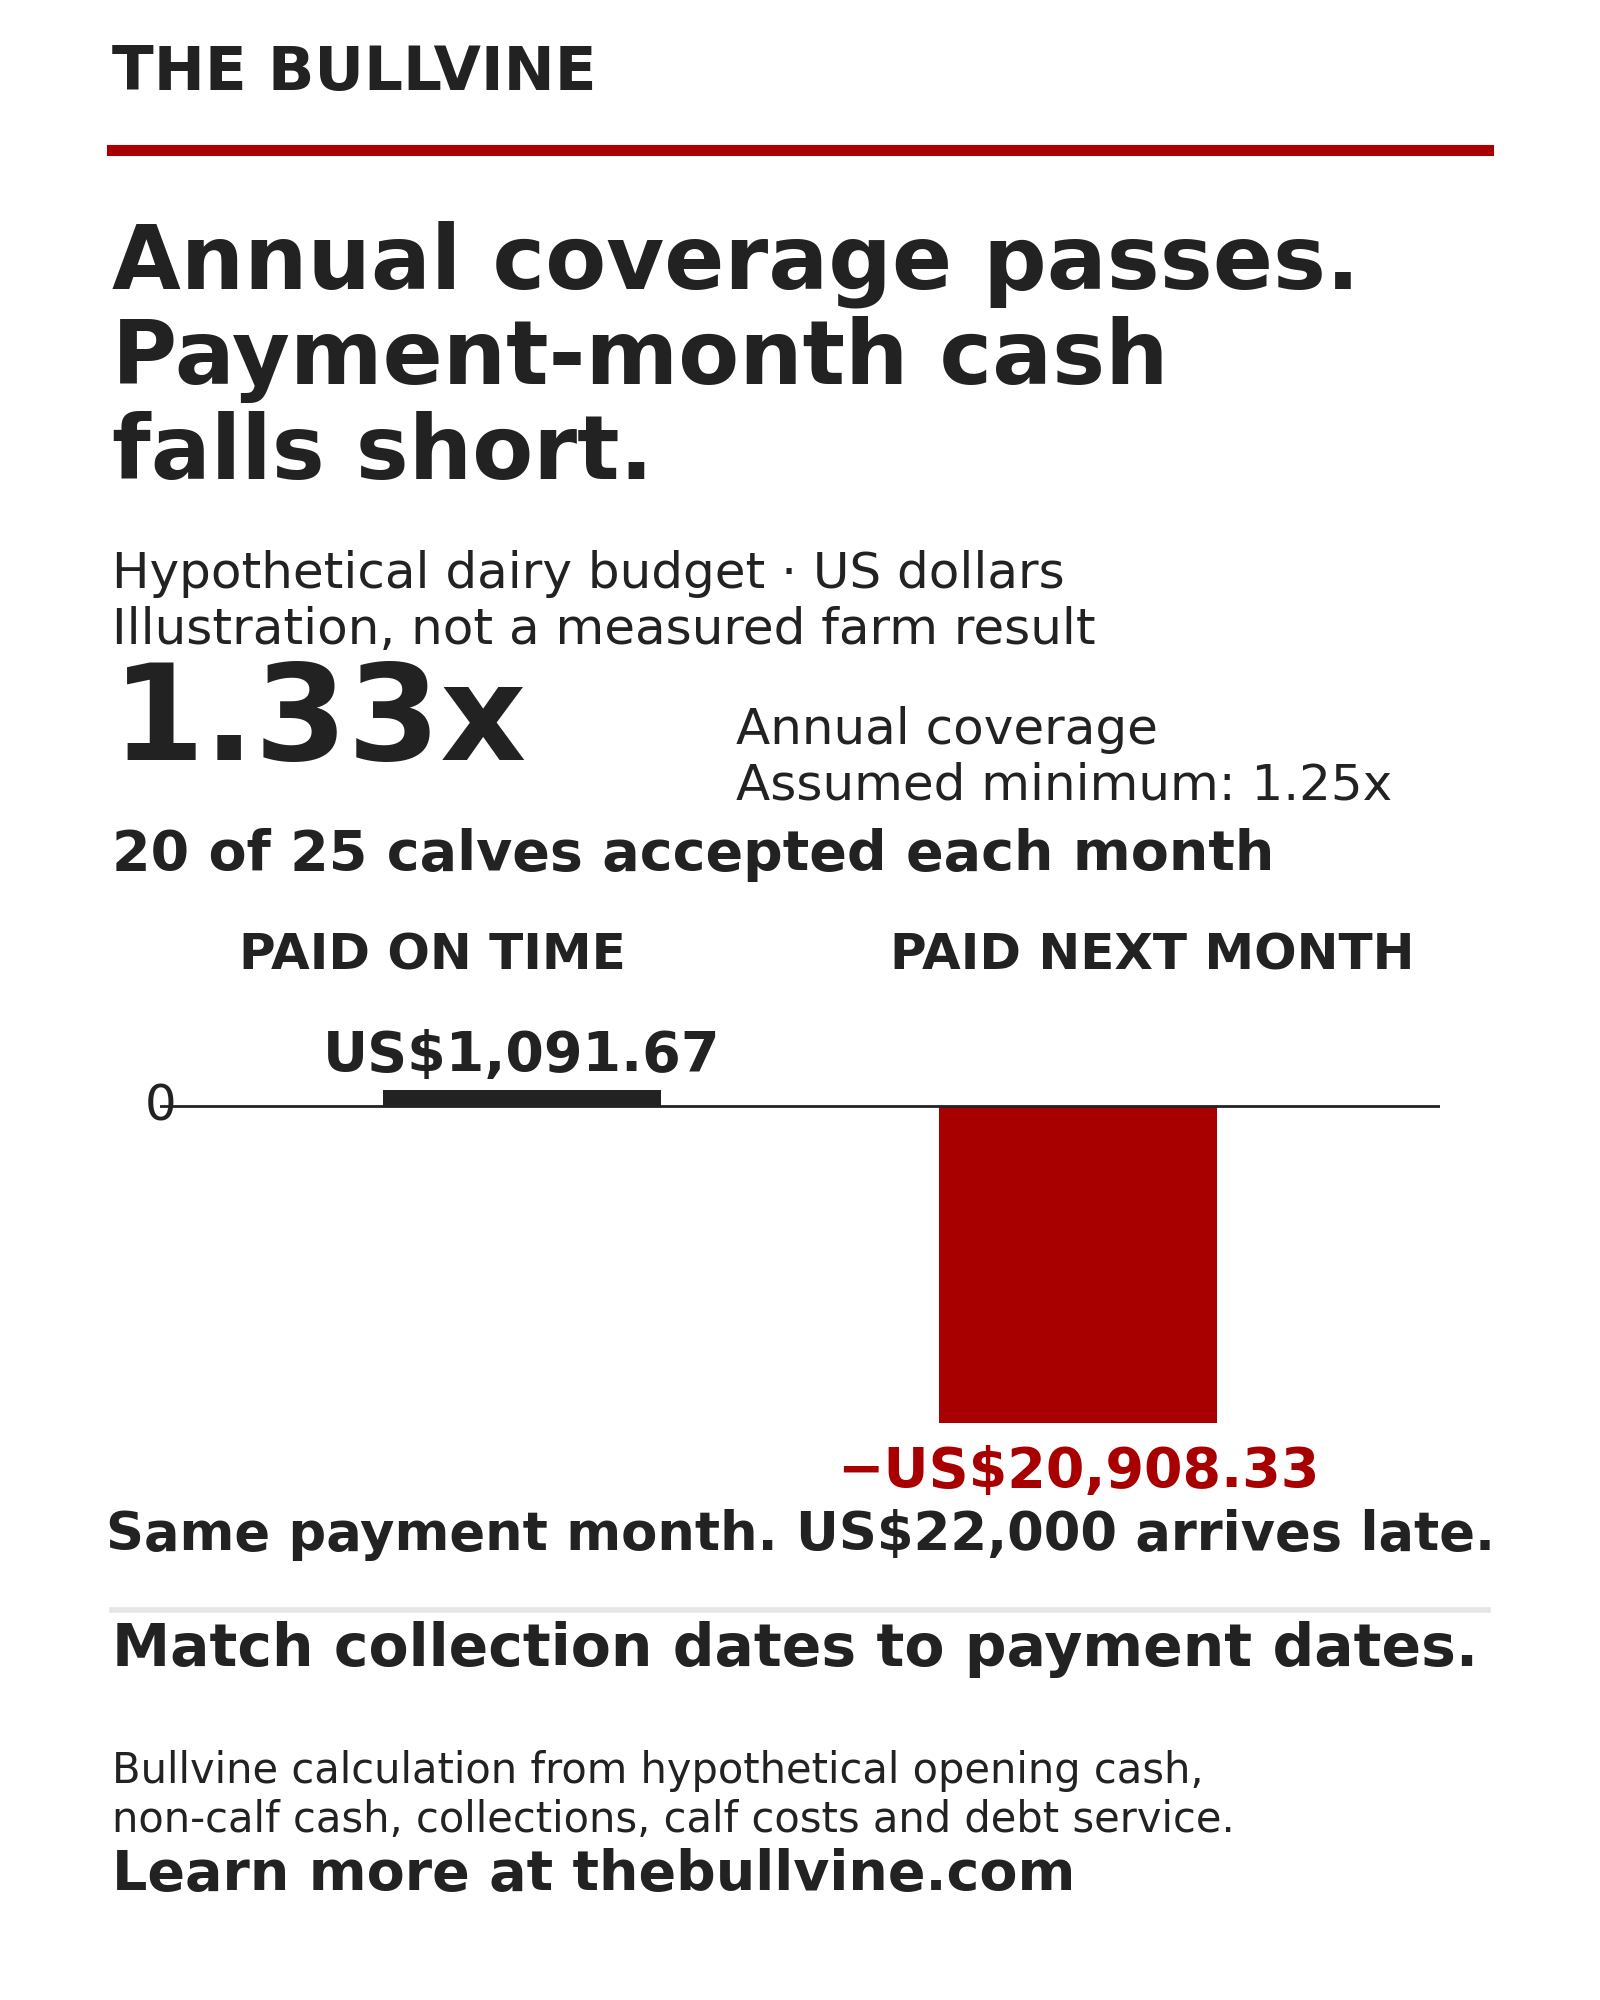
The harder question is how much of a farm budget already depends on calf income. In a hypothetical budget isolated from USDA averages, US$50,000 of annual calf contribution is needed just to cover existing debt payments. A 35% cut in net calf contribution leaves only a US$6,915 annual cash-flow cushion above an assumed 1.25x coverage requirement. In the same model, the farm passes annual coverage at 1.33x and still finishes a payment month US$20,908 short.

What did USDA’s Glasgow report show?

Report 2199 lists baby calves per head (“Per Unit / No Wt”). AMS says prices are FOB unless otherwise noted.

Glasgow dairy auction, Oct 27, 2026 (Final)HeadRange, US$/headAverage, US$/head
Baby bull calves, beef cross72400–1,375997.22
Baby bull calves, breed not labelled52400–1,050846.15
Baby heifer calves, beef cross19575–1,250940.79

Source: USDA AMS / Kentucky Department of Agriculture Market News, Report 2199, sale of October 27, 2026. The table includes baby calves only; specific ages and weights are not reported. These aren’t weaned calves, feeders, fed cattle, or retail beef.

The AMS baby-calf rows omit age, health, sire data, and buyer terms, so nothing in them explains the US$975 spread or predicts where the next calf crop lands.

When does calf income become essential to debt payments?

CoBank’s June 18, 2026 release put beef sales at 12% of revenue for many dairy farms, the lower end of its reported range. The agricultural lender’s figures include cull cows as well as calves, so they can’t be treated as calf income alone. For the cull side of that figure, see our coverage of ERS’s fourth-quarter cull cow price outlook.

Calf income becomes essential the moment there’s a payment the farm couldn’t meet without it, and the place to start is scheduled principal and interest. Iowa State University Extension’s cash-flow guide (File C3-14) notes that principal payments are “not an expense but merely a cash transfer between you and your lender.” It also notes that “a cash flow statement shows liquidity while an income statement shows profitability.” A profitable year can still run short of cash on the wrong date.

Running the Numbers

This hypothetical budget carries US$550,000 of annual debt service, and every result in it is a Bullvine calculation. It applies when calf receipts help fund scheduled debt payments, with the farm’s own figures in place of these inputs. A farm without scheduled debt payments needs a cash-timing check instead of a debt-coverage ratio.

  • Gross receipts: an assumed US$1,100 per calf, less US$103 in assigned calf costs and selling charges, leaves US$997 net cash contribution. These hypothetical inputs are independent of USDA’s Glasgow gross average.
  • Herd and calf sales: the herd is in the 400–500-cow range and sells 300 calves a year (25 a month), for US$299,100 of annual net calf contribution.
  • Non-calf cash: US$500,000 a year is available for debt service, after other operating costs, taxes, and withdrawals but before the principal and interest in annual debt service. Calf receipts and the US$103-per-calf costs sit outside this figure and are counted separately.
  • Debt service: US$550,000 a year in principal and interest.
  • Milk revenue: unchanged in every scenario.
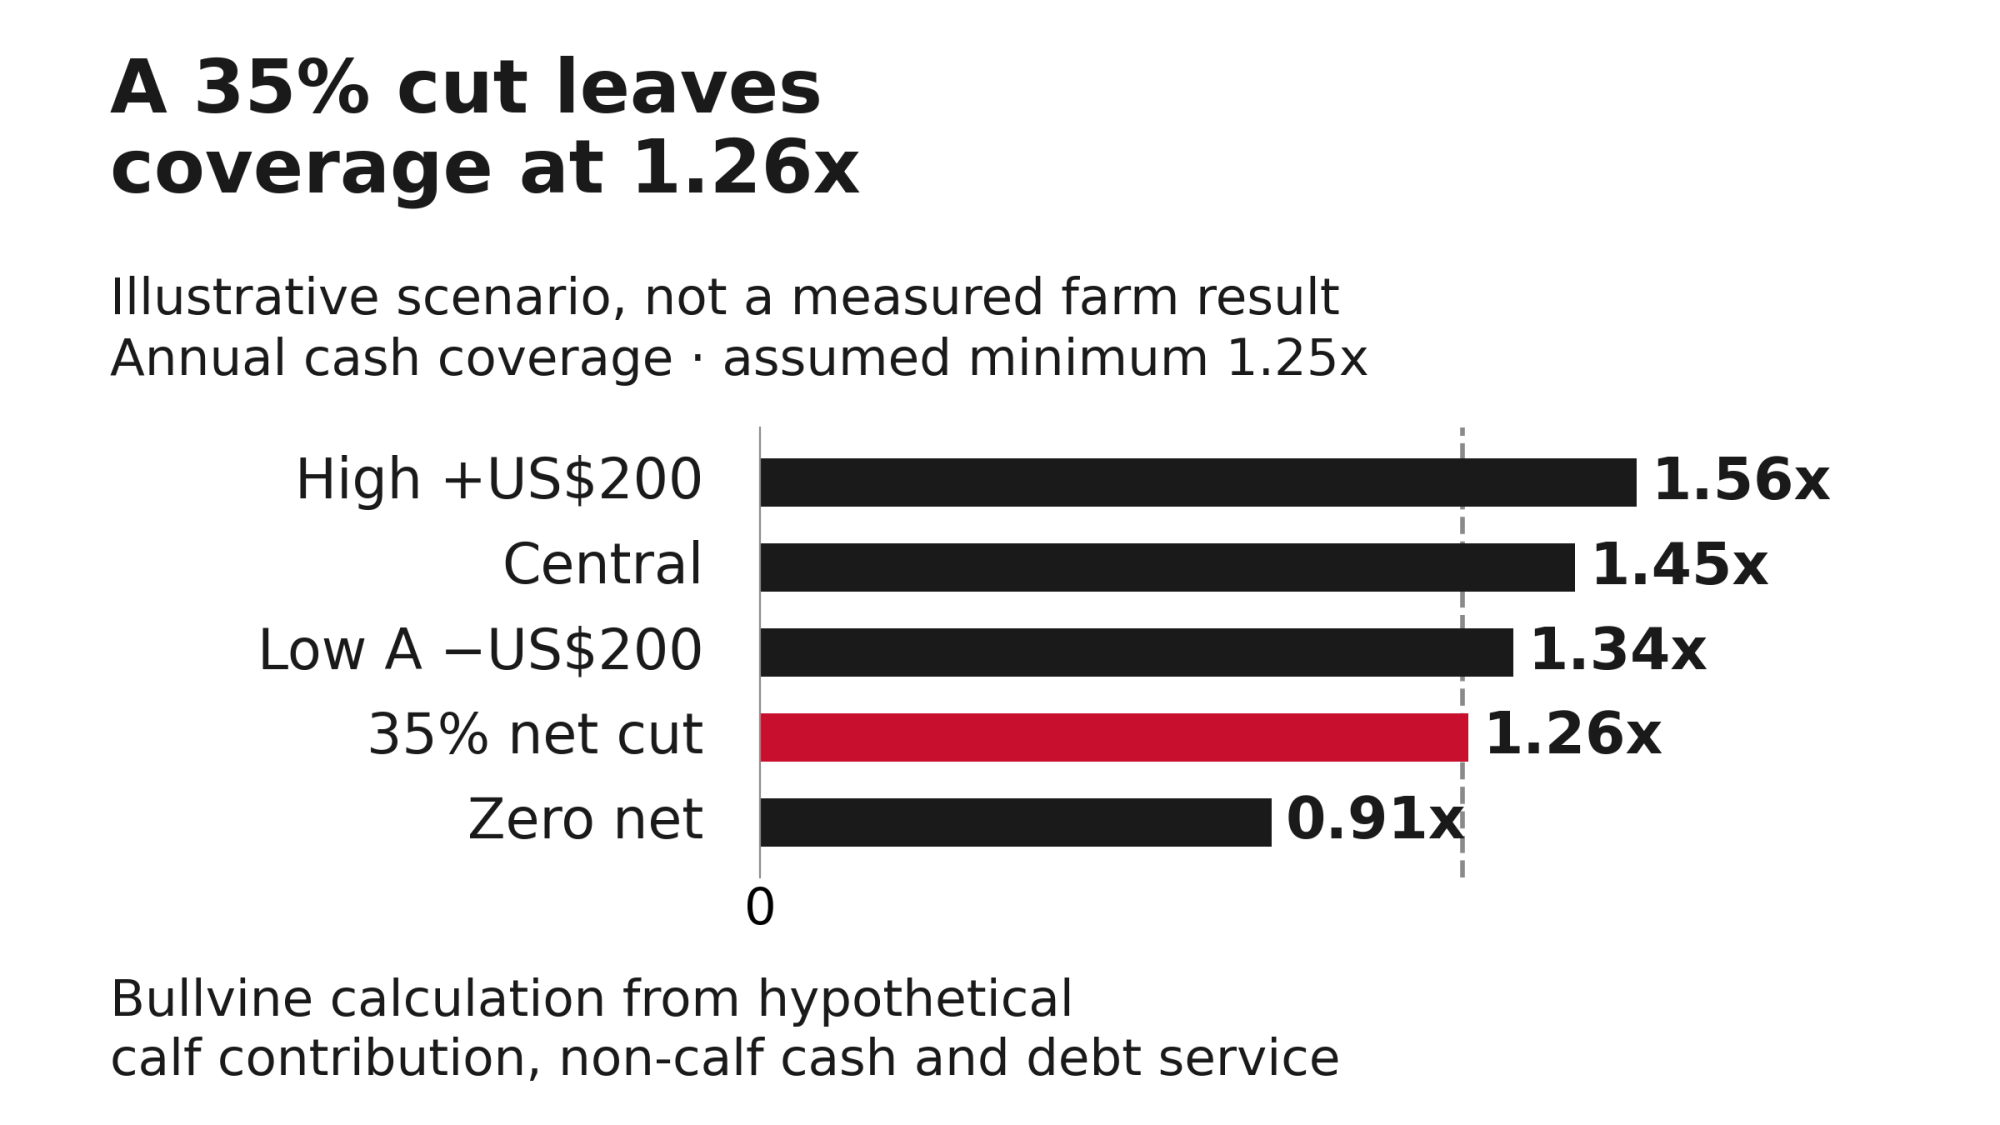
Illustrative annual coverage falls from 1.45x to 1.26x after a 35% net calf contribution cut; minimum 1.25x.
Scenario (Bullvine)Net US$/calfAnnual calf contributionCash coverage
High: +US$2001,197.00359,1001.56x
Central997.00299,1001.45x
Low A: −US$200797.00239,1001.34x
Low B: 35% cut in net contribution648.05194,4151.26x
Zero net calf contribution000.91x

Coverage = (non-calf cash + calf contribution) ÷ debt service. This is a simplified ratio, and the lender’s covenant definition is the one that counts.

The 35% test cuts net calf contribution, not gross sale price. Because calf costs stay fixed, a percentage drop in sale price causes a steeper percentage drop in net contribution.

The three figures below answer three different questions. The 1.25x minimum is illustrative, not a lender standard.
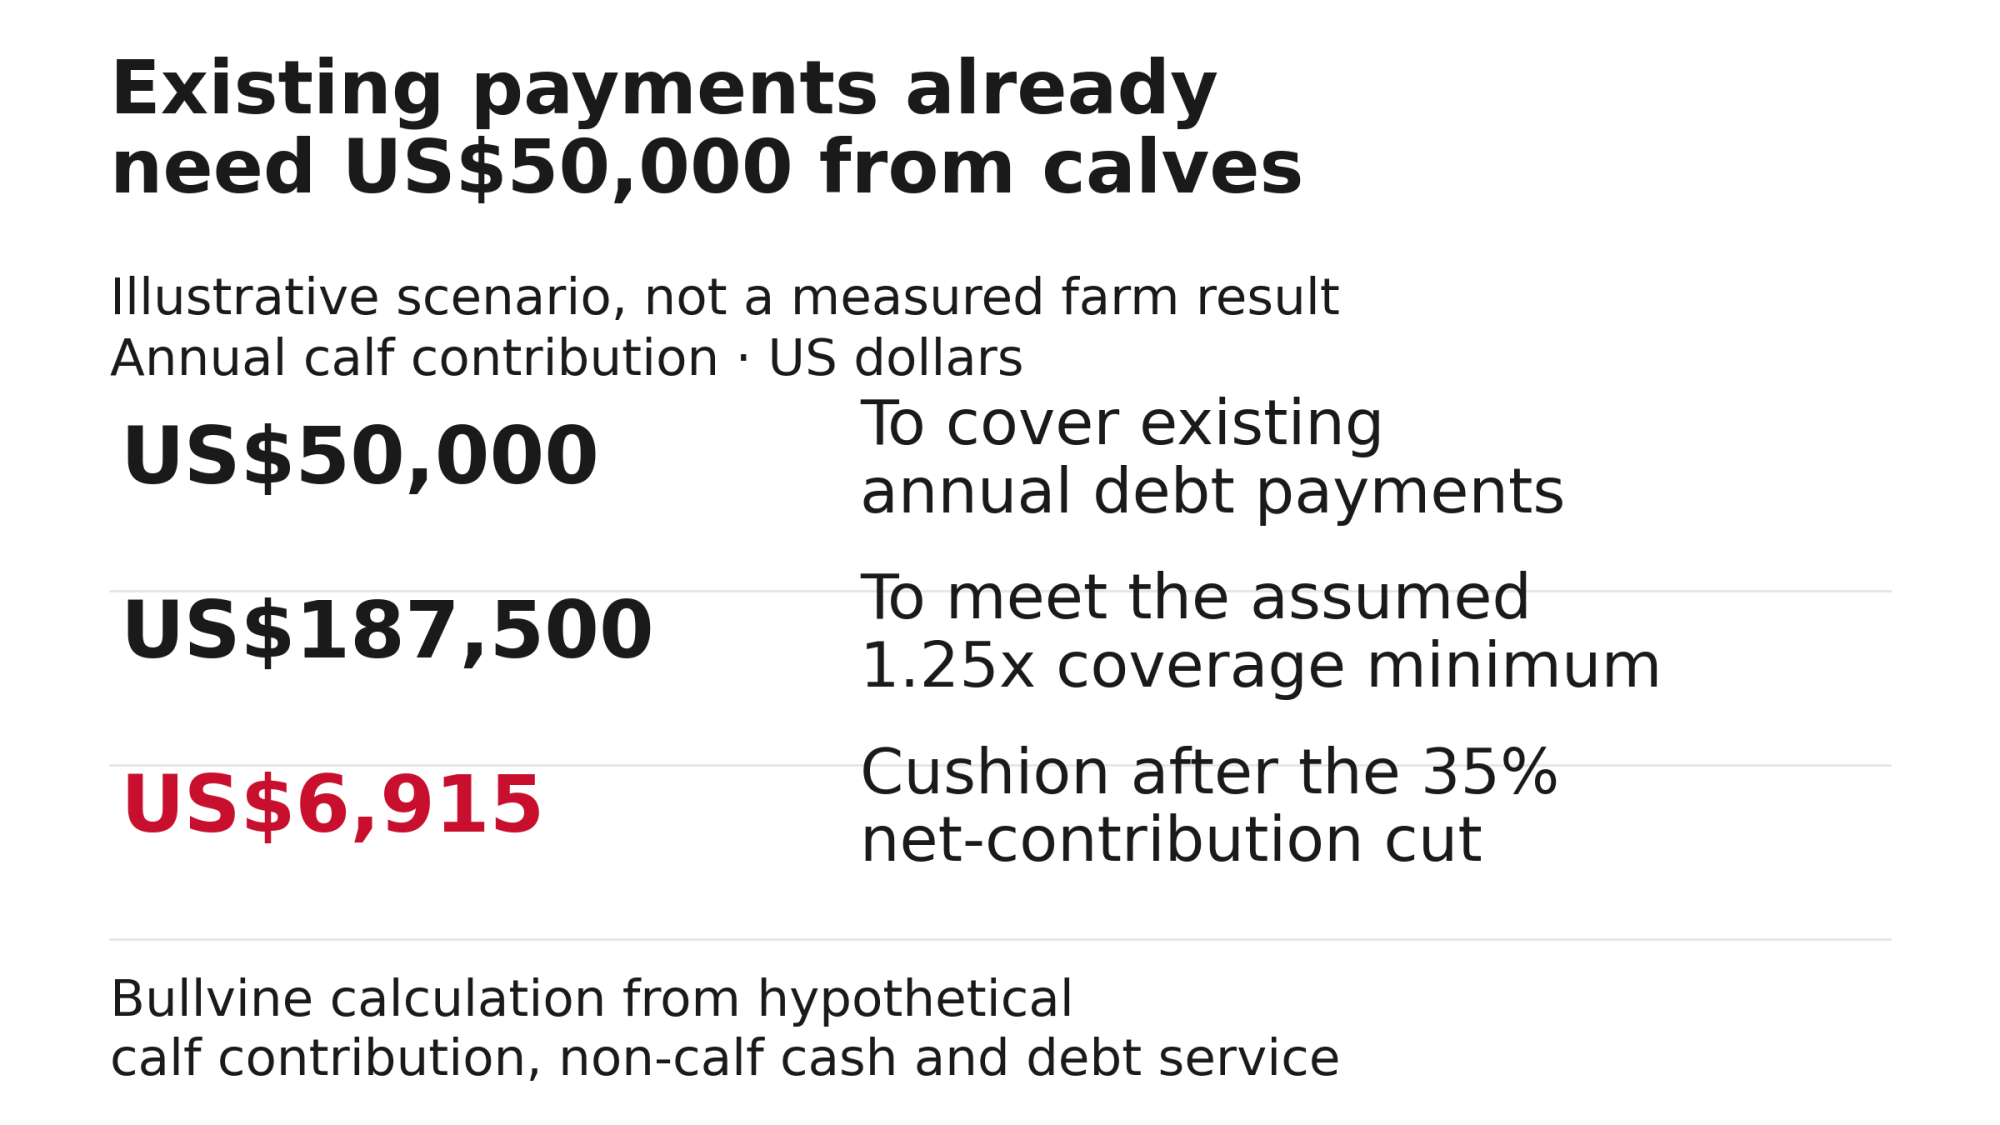
Calf contribution needed: US$50,000 for payments, US$187,500 at 1.25x; stressed cushion US$6,915.
Measure (Bullvine)CalculationWhat it answers
US$50,000 existing dependenceUS$550,000 − US$500,000How much calf contribution is needed just to cover existing annual debt payments?
US$187,500 required at 1.25x1.25 × US$550,000 − US$500,000How much is needed to meet the assumed coverage minimum?
US$6,915 stressed cushionUS$194,415 − US$187,500How much more could annual cash flow fall in the stressed case before hitting that minimum?

The 35% case removes US$104,685 at the illustrative 1.25x minimum, that leaves US$6,915 of annual cash-flow cushion above the coverage requirement, which is not a bank balance or an amount available to borrow. At 1.30x, the same case falls short by US$20,585.

On this simplified basis, the cushion supports about US$5,532 of additional annual debt service at 1.25x (US$6,915 ÷ 1.25), assuming cash generation doesn’t change. It sets a ceiling for the lender conversation and is not a loan amount.

What happens when fewer calves qualify, and payment runs late?

At 1.33x, annual coverage can pass while a single payment month fails. This monthly illustration uses the same assumptions:

  • Opening cash: US$10,000
  • Non-calf cash for the month: US$41,666.67
  • Calves presented: 25
  • Calf costs paid this month: all 25 calves presented carry US$103 in assigned costs, and the model assumes the full 25 × US$103 = US$2,575 is paid during this month.
  • Calves that don’t qualify generate no alternative-sale proceeds in this illustration. The annual reduced-acceptance calculation carries that assumption through all 12 months.
  • Debt payment this month: US$70,000, which is part of the US$550,000 annual total
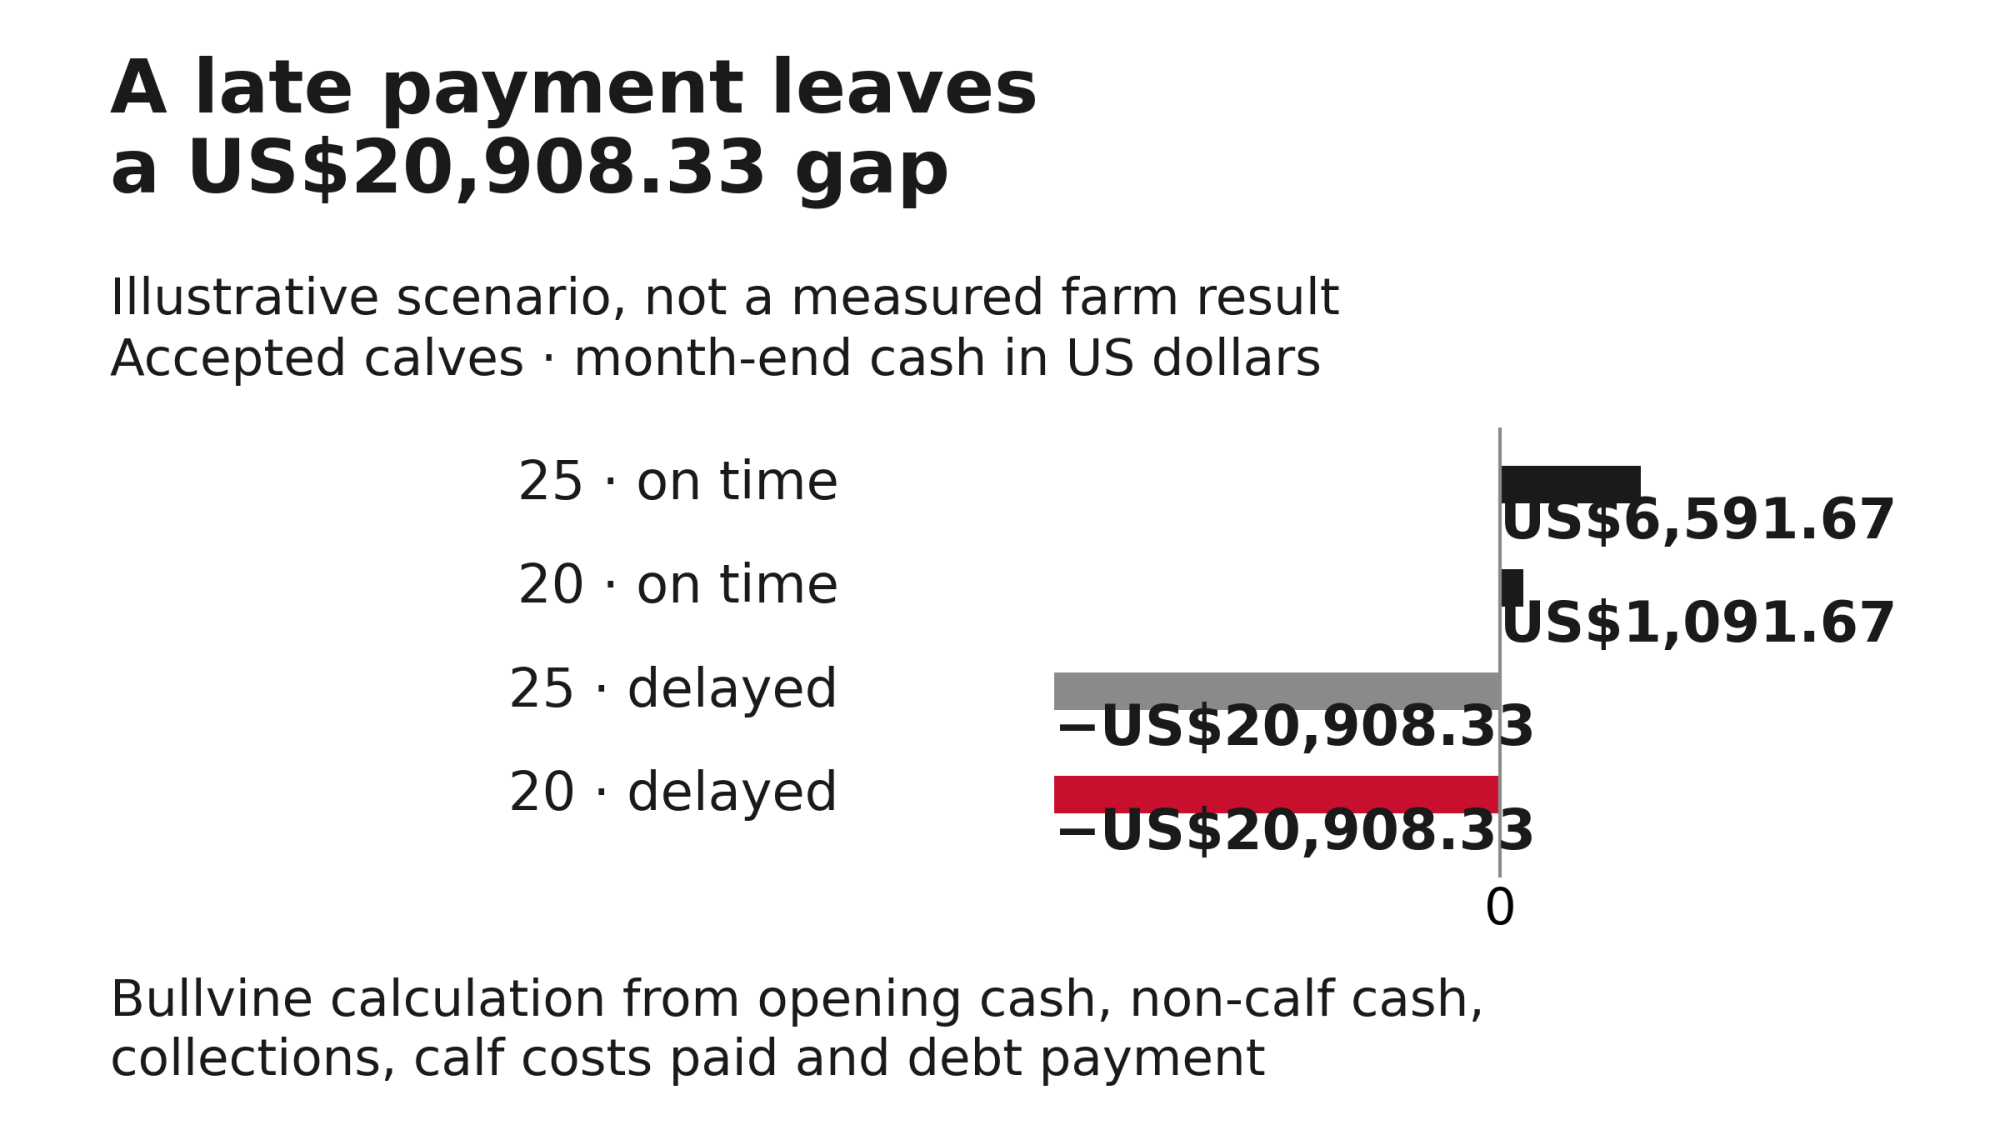
Illustrative closing cash is US$6,591.67 or US$1,091.67 on time, versus −US$20,908.33 with delayed collections.
Payment month (Bullvine)Calves acceptedCalf cash collectedCalf costs paidClosing cash before financing
Baseline, paid on time25US$27,500US$2,575US$6,591.67
Price holds, 5 don’t qualify20US$22,000US$2,575US$1,091.67
All payment delayed a month25US$0US$2,575−US$20,908.33
Both together20US$0US$2,575−US$20,908.33

Figure: Annual cash coverage by scenario (left) and closing cash in the payment month, by scenario (right). Hypothetical Bullvine farm budget; Bullvine calculations, not auction prices.

When calf collections are zero, both delayed-payment scenarios carry the same current-month cash gap. The difference appears in the delayed receipts collected next month: US$27,500 with all 25 calves accepted against US$22,000 with 20 accepted. Those receipts aren’t next month’s closing cash balance.

If 20 calves qualify every month for the whole year and the other five never produce proceeds, annual net calf contribution is 12 × [(20 × US$1,100) − US$2,575] = US$233,100. Annual coverage is (US$500,000 + US$233,100) ÷ US$550,000 = 1.33x. Delay that payment month’s calf receipts, though, and the farm still faces a US$20,908 month-end cash gap before financing. Establishing the timing and size of the peak funding gap takes daily payment dates.

Does the heifer calendar support the beef matings?
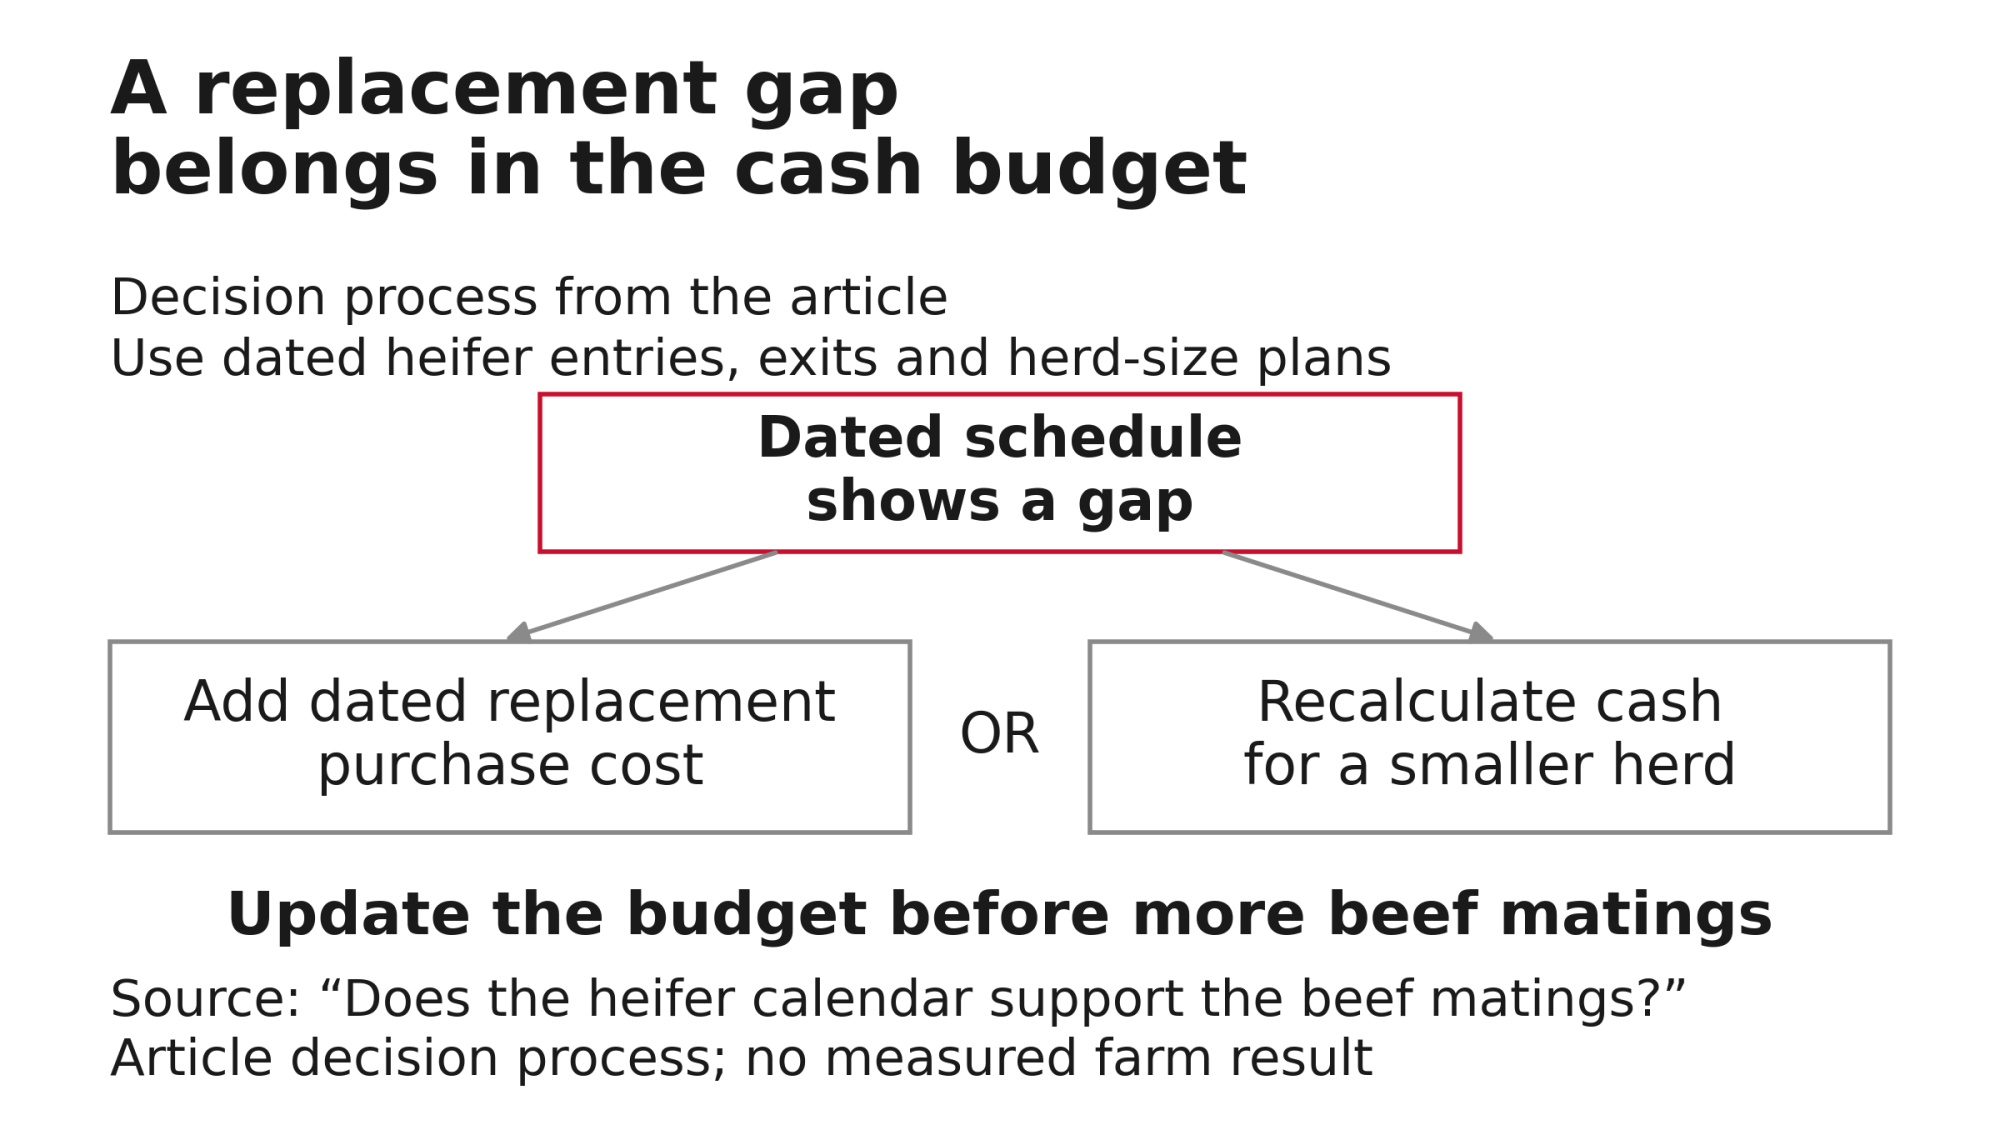
A dated replacement gap leads to purchase costs or revised smaller-herd cash before further beef matings.

CoBank frames the trade-off as a two-year investment in a replacement against a beef-on-dairy calf that is “essentially an instant one-time revenue source.” In June, CoBank projected 796,000 fewer replacements entering herds across 2025 and 2026, followed by roughly 360,000 additional entries across 2027–28. Those are forecasts built on national-average reproductive assumptions that CoBank says vary by region.

The farm-level answer comes from a dated schedule, which needs:

  • Expected first-calving dates for every heifer and dairy pregnancy
  • Allowances for losses and delayed entries
  • Planned exits and herd-size changes
  • Dated purchase costs for any gap the home-raised supply doesn’t cover

A negative balance in any period is a gap. Proving that beef matings caused it takes cohort records, because poor fertility or heifer sales can leave the same hole.

If the gap is real, enter the dated replacement-purchase cost or recalculate operating cash for a smaller herd, including the change in milk receipts and variable costs. Holding US$500,000 of non-calf cash constant while assuming fewer cows produce it overstates coverage.

The Bullvine Pipeline Index calculator scores a herd’s replacement pipeline.

What this means for the operation

Before the next discretionary financial commitment

  1. Reconcile calf sales, costs and bank receipts.
    1. Match each calf to its sale lot, settlement and deposit for the past 12 months.
    1. Compare actual net per calf with the gross-to-net bridge above.
    1. If head shipped, head paid, and cash received don’t match, fix that before setting next year’s budget.
  2. Calculate coverage using the actual loan definition.
    1. From the signed agreement and debt schedule, work out three figures: existing dependence, the calf contribution the covenant requires, and the cushion under a 35% cut in net calf contribution.
    1. Hold any discretionary new commitment until those numbers exist. Essential animal care isn’t discretionary.

Before the next financing or calf-sale agreement

  • Map collections against dated payments.
    • Get in writing who pays, how the final price is set, when acceptance is final, who carries death loss in transit, and when payment is due.
    • Put expected collection dates beside debt payment dates.
    • Set the trigger: agree on a warning point with the lender that leaves time to act before the coverage minimum is reached, allowing for reporting delays and payment dates.
    • If the reconciliation shows headroom, use the verified cash forecast to support the financing discussion. It doesn’t establish what terms a lender will offer.
Before each breeding-plan commitment

  • Check replacement entries before committing more matings to beef. If the heifer calendar shows an uncovered gap, add the purchase cost or the smaller-herd cash effect to the budget first.

The check to run tonight

First confirm that the lender’s definitions of cash available for debt service, the debt-service total, and the measurement period match the figures used below. Where they differ from this simplified model, the lender’s calculation governs.

  1. Multiply the covenant minimum by annual debt service.
  2. Subtract non-calf cash. The result is the calf contribution required.
  3. Cut verified net calf contribution by 35%. If the stressed figure is smaller than the required contribution, the stress puts the farm below its minimum.
Welcome back. Showing your saved numbers.

Is Your Calf Cheque Already Spent?

Find out exactly how much of your debt service requires beef-on-dairy calf income, and see if your farm passes covenant checks when calf nets drop 35%.

Principal & interest (Source: farm debt schedule)
$
Cash left after operating costs/taxes, before debt
$
Total head expected to clear this year
head
Article default: $1,100 (hypothetical)
$
Selling charges & holding costs (Default: $103)
$
Lender requirement (Article assumes 1.25x)
x
Stressed Cash Cushion (35% Cut)
$0
Required: $0Stressed: $0
Current Net per Calf$0
Baseline Coverage Ratio0.00x
Stressed Coverage Ratio0.00x
Get The Bullvine Weekly
How we calculate this

Calculations strictly follow the article’s cash-flow principles (Source: Iowa State C3-14) and stress scenarios:

  • Net per Calf: Gross Receipts – Assigned Costs.
  • Baseline Coverage: (Non-Calf Cash + [Net per Calf × Annual Calves]) ÷ Annual Debt Service.
  • Required Calf Cash: (Minimum Covenant Ratio × Annual Debt Service) – Non-Calf Cash.
  • 35% Cut Stress: Reduces Net per Calf by 35% (simulating market drops while calf costs remain fixed).
  • Stressed Cushion: Stressed Calf Contribution – Required Calf Cash. If negative, it represents a cash shortfall triggering covenant breach.

Illustrative estimate based on your inputs and article methodology [Nov 2026]. Not financial advice. Bullvine calculation.

Methodology

  • Published inputs:
    • USDA AMS Report 2199 (baby calves, per head, no weight, FOB) is used as a dated market reference only.
    • CoBank's June 18, 2026 report and release supply the revenue-share context and replacement forecasts.
    • Iowa State C3-14 supplies the cash-flow principles.
  • Hypothetical budget:
    • US$1,100 gross minus US$103 in assigned calf costs and selling charges gives US$997 net per calf, on 300 calves a year. These inputs are independent of the Glasgow average.
    • US$500,000 of non-calf cash is net of other operating costs, taxes, and withdrawals. It's counted before the principal and interest in the US$550,000 debt service and excludes calf receipts and costs.
    • The 1.25x and 1.30x minimums are illustrative.
  • Sensitivity check: USDA's US$997.22 gross average minus the hypothetical US$103 cost gives US$894.22 net per calf. Bullvine's stressed coverage is then [US$500,000 + (300 × US$894.22 × 0.65)] ÷ US$550,000 = 1.226x, below the illustrative 1.25x minimum. A farm's own settlement statements carry more weight than any auction average.
  • Formulas:
    • Coverage = (non-calf cash + calf contribution) ÷ debt service
    • Required calf contribution = minimum × debt service − non-calf cash
    • Cushion = stressed contribution − required contribution
    • Supportable added debt service = cushion ÷ minimum
    • Closing cash = opening + non-calf cash + collections − calf costs paid − debt payment
  • Limitations:
    • Calf costs and selling charges are a flat US$103-per-calf assumption, not an itemized enterprise budget.
    • The model leaves out changes in those costs, extra holding costs, bridge-financing interest, and savings from new investment.
    • The monthly test shows month-end positions, not timing within the month.
    • The 35% is a chosen stress, not a forecast or a validated safety margin.

Learn More

The Sunday Read Dairy Professionals Don't Skip.

Every week, thousands of producers, breeders, and industry insiders open Bullvine Weekly for genetics insights, market shifts, and profit strategies they won't find anywhere else. One email. Five minutes. Smarter decisions all week.

NewsSubscribe
First
Last
Consent

Genus’s Pig Arm Runs a 29% Margin, Cattle 7.5%. What a Per-Calf Deal Must Prove

Genus’s pig arm posted a 29.3% adjusted operating margin; its cattle arm, 7.5%. One mostly bills after weaning, the other at the straw. What should a per-calf deal prove?

Key Takeaways

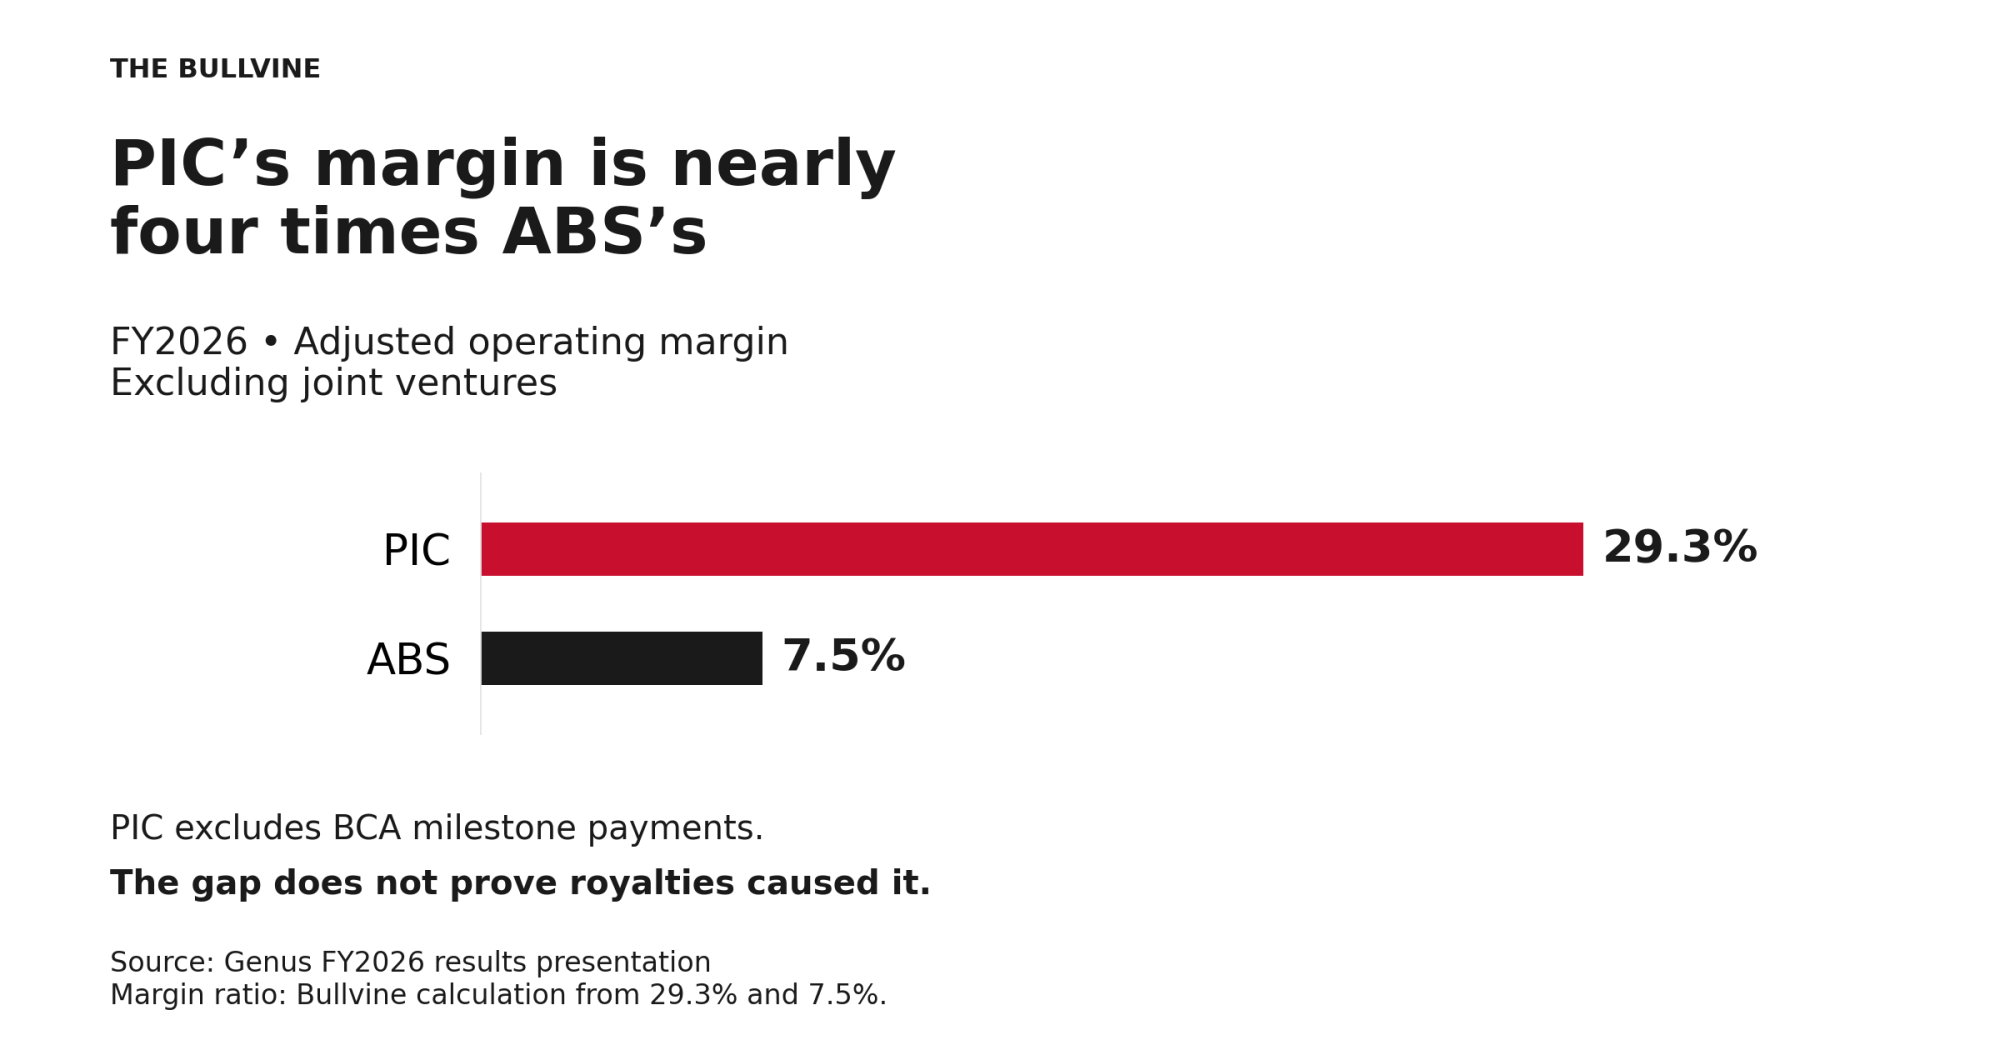
  • Genus’s pig arm posted a 29.3% adjusted operating margin excluding BCA milestones; its cattle arm posted 7.5%. That’s nearly four times ABS’s margin, by Bullvine’s math, but it’s not proof royalties caused the gap.
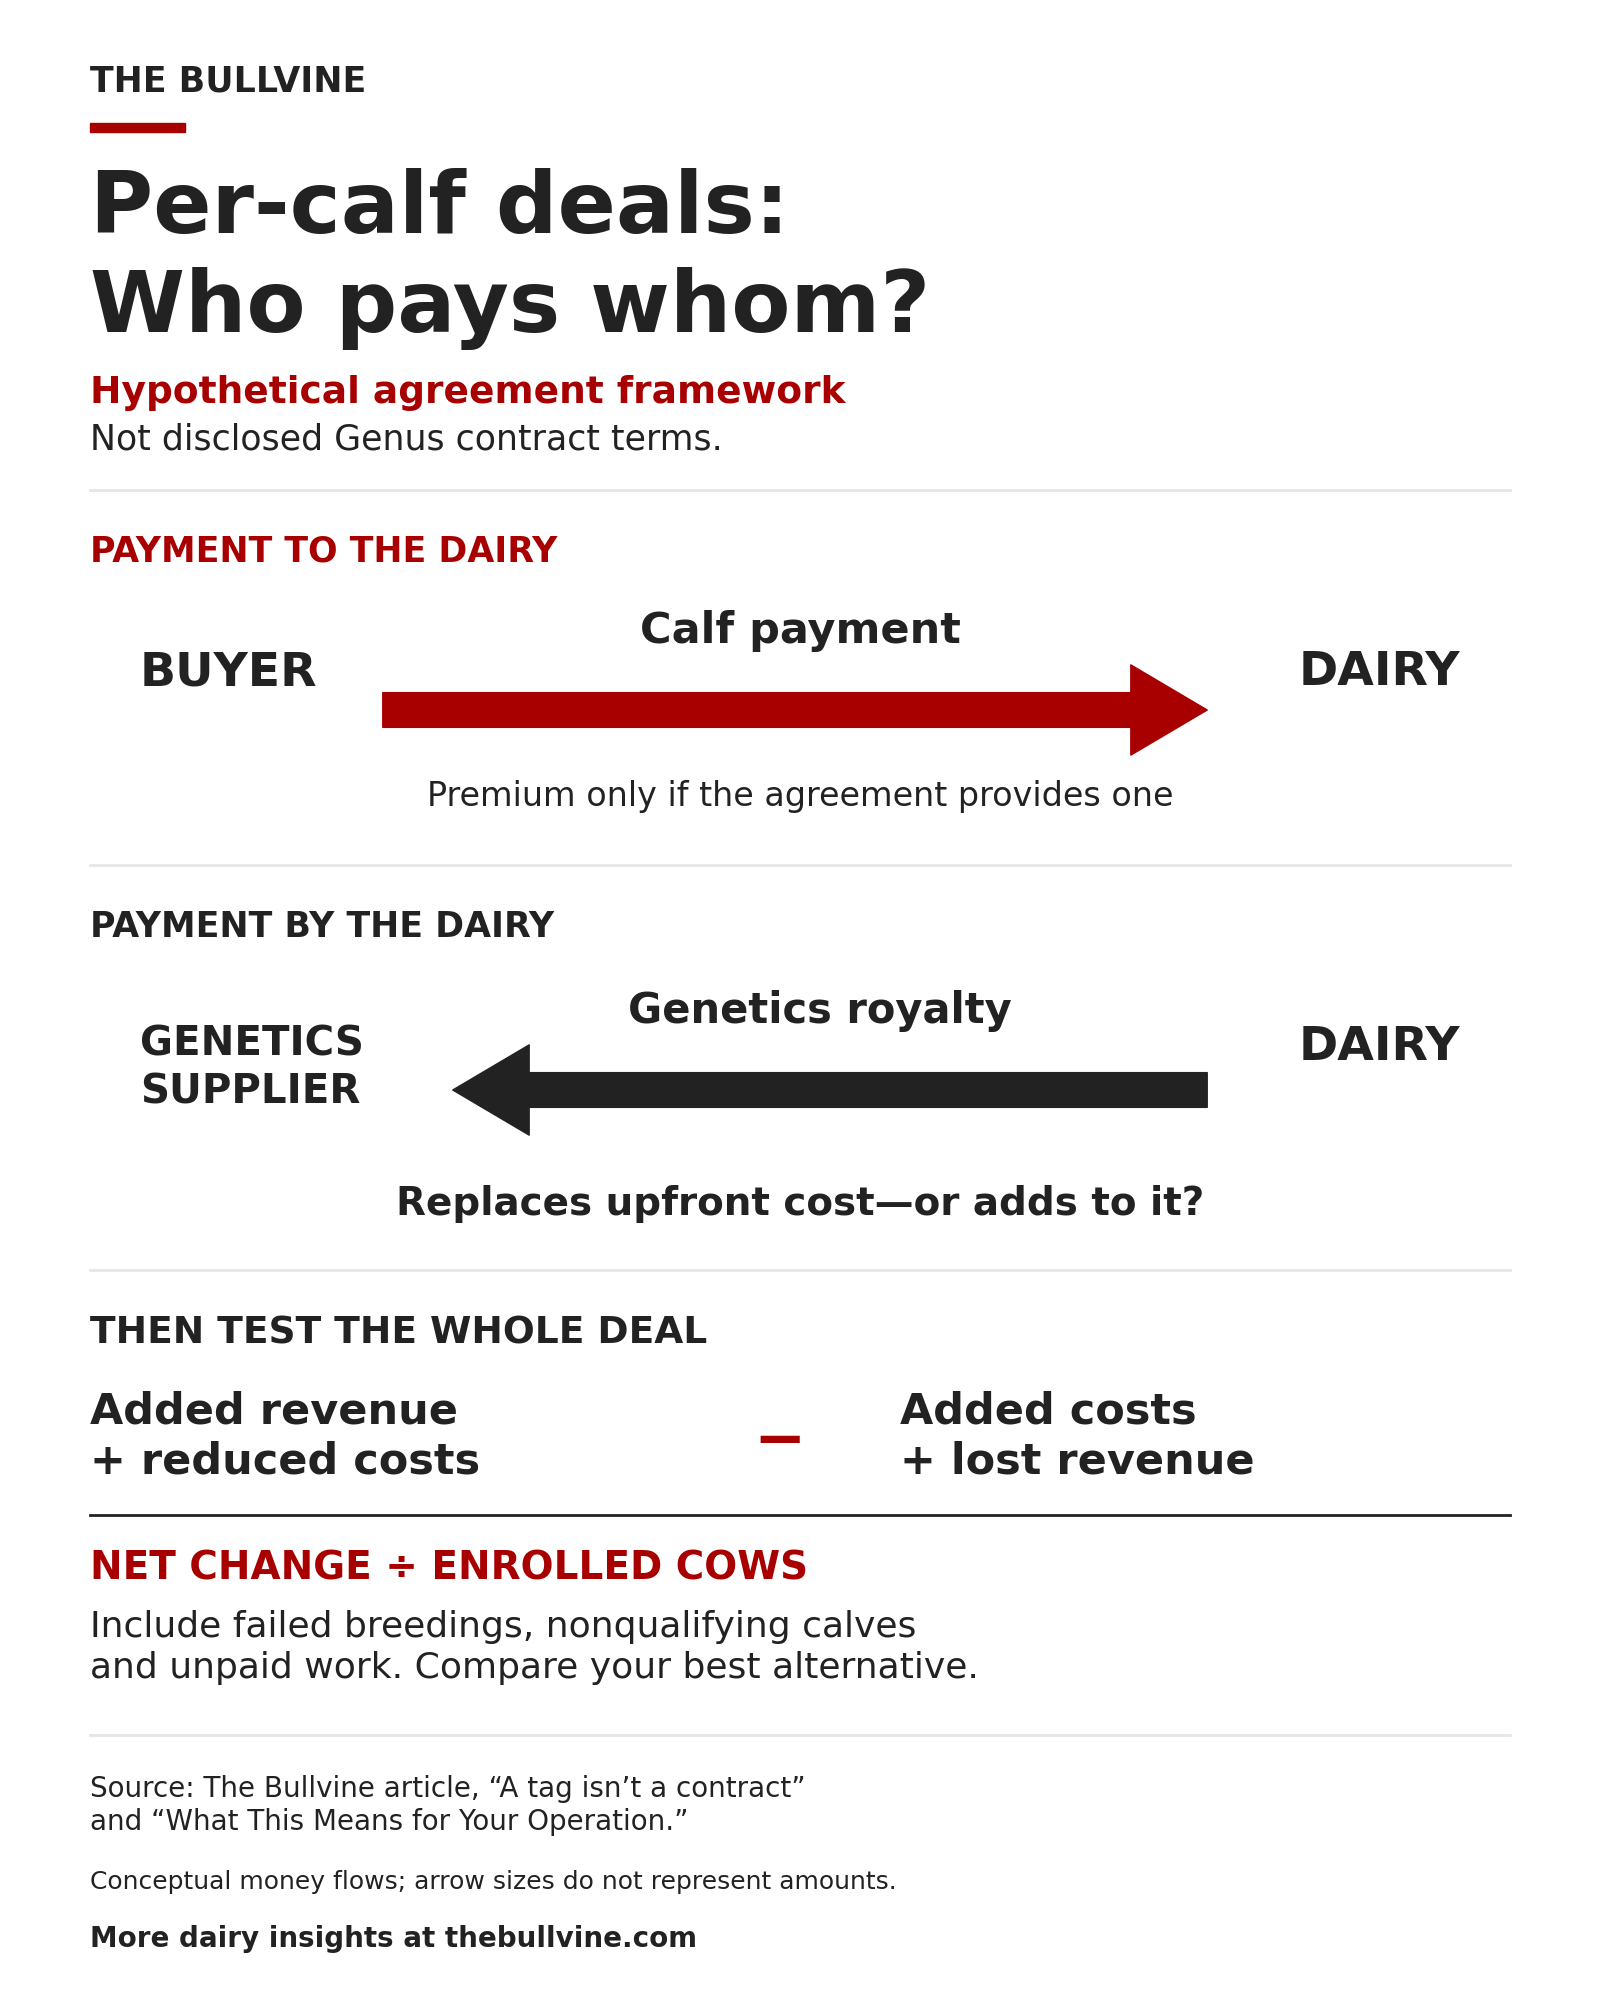
  • A per-calf payment to the dairy and a royalty to the supplier can run in opposite directions. Find out who pays whom, and whether any charge replaces part of the semen price or comes on top of it.
  • Judge any offer with a partial budget across every enrolled cow, against your best realistic alternative, with unsuccessful breedings and unpaid hours counted.

Genus’s pig genetics business, PIC, ran a 29.3% adjusted operating margin in the year to June 30, 2026, excluding milestone payments, according to Genus’s FY2026 results presentation. Its cattle genetics business, ABS, ran at 7.5%. By Bullvine’s math (29.3 ÷ 7.5), that’s nearly four times ABS’s margin.

PIC’s adjusted margin is 29.3% excluding BCA milestones, versus ABS’s 7.5%; both exclude joint ventures.

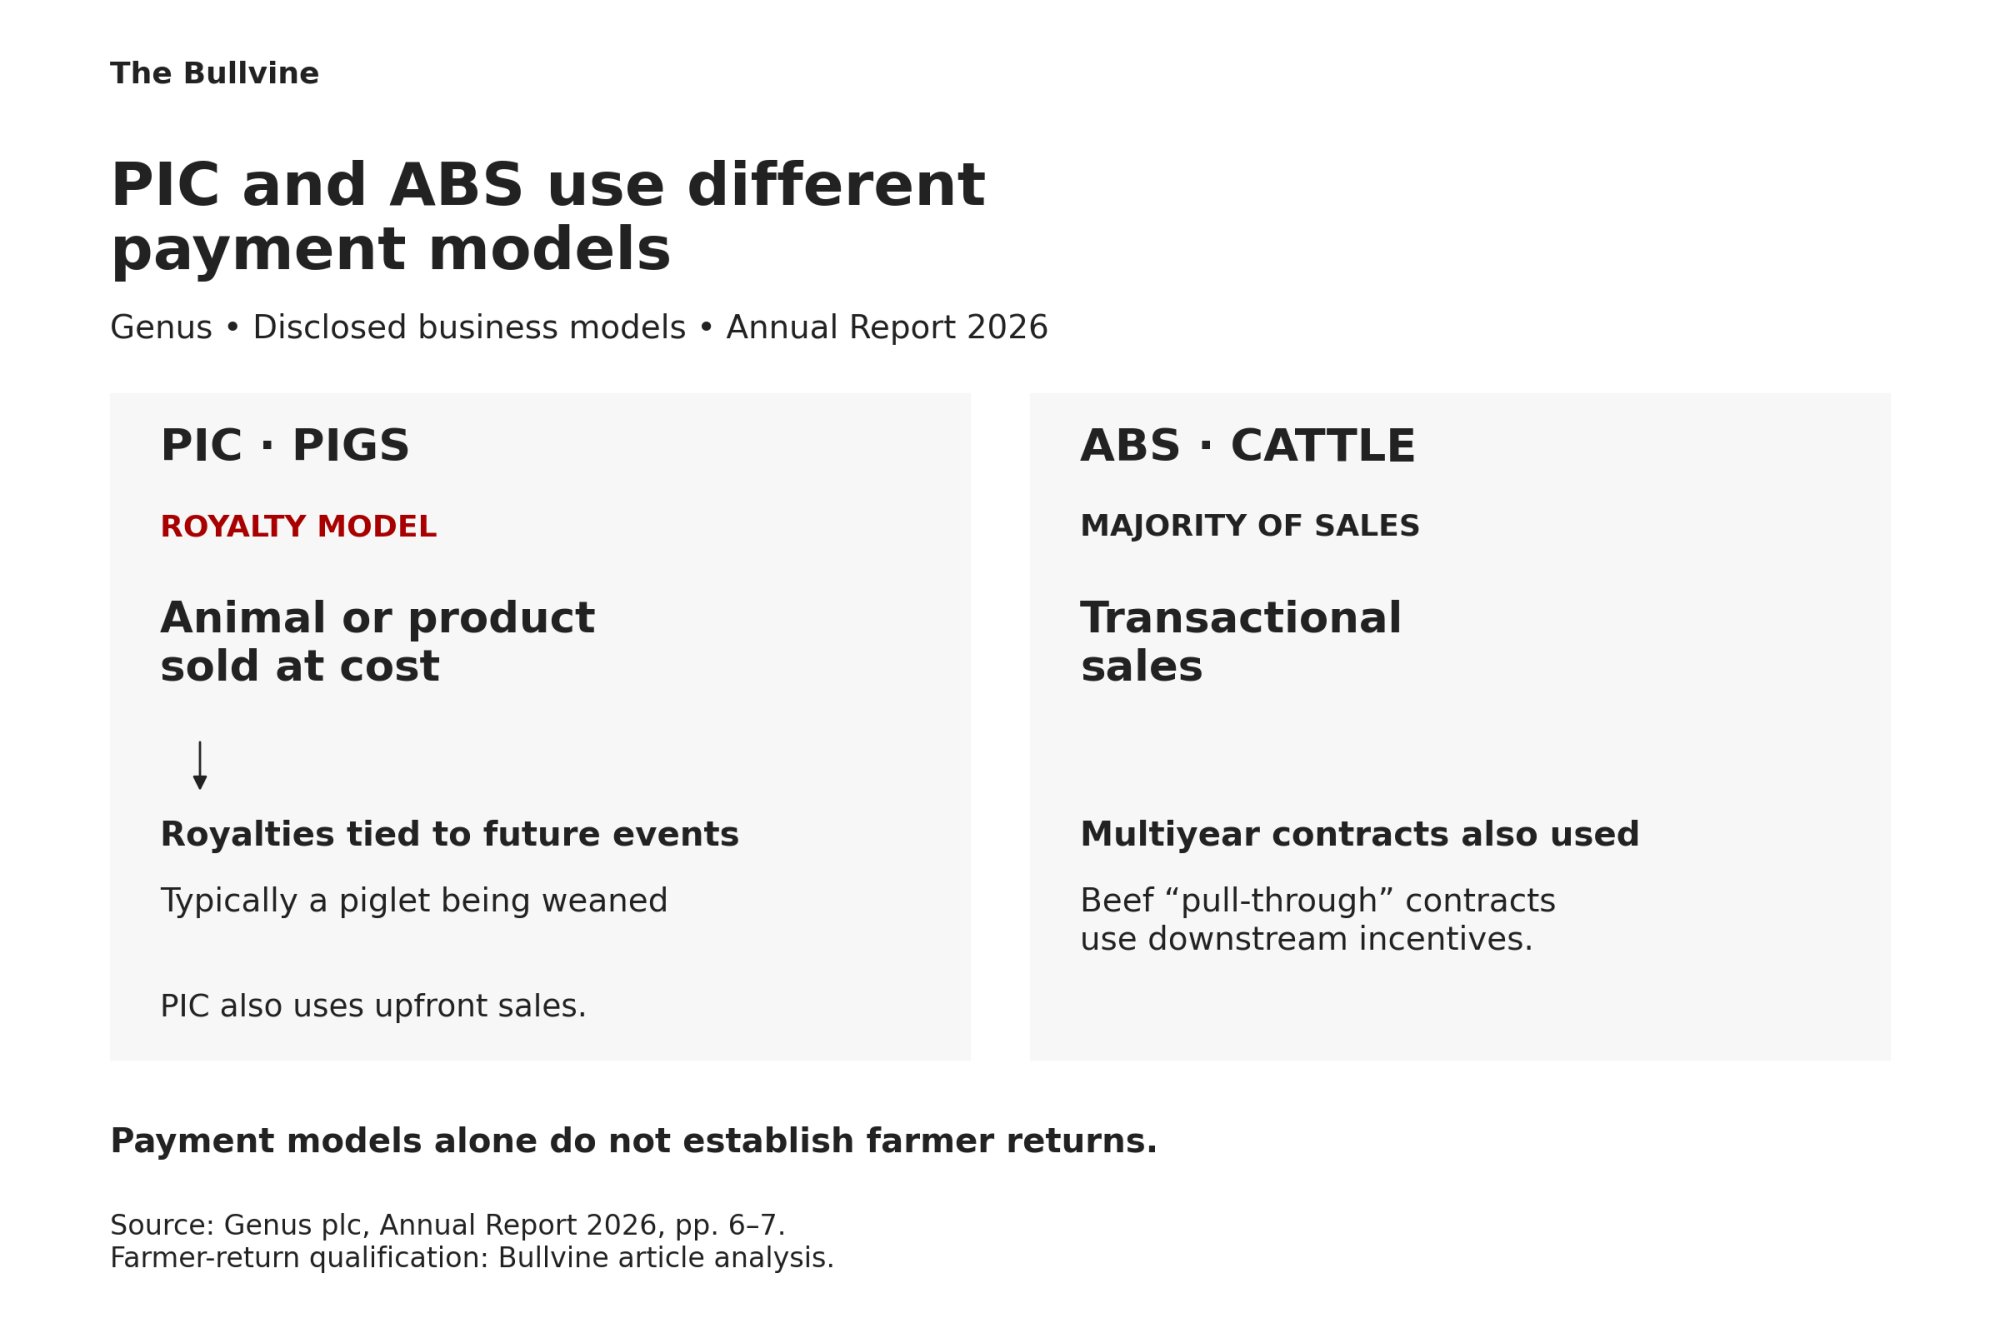
The two businesses also get paid at opposite ends. PIC mostly collects on the back end, after the genetics are working in a customer’s barn. ABS mostly collects up front, when the straw is sold. Genus also says it wants to “Develop more ‘pull-through’ partnerships” in beef, though that describes deals with downstream buyers, not a royalty on dairy calves.

Genus FY2026 adjusted operating margins, excluding joint ventures. PIC reported 30.9%, or 29.3% excluding the £5.6 million in milestone payments from Chinese partner BCA (£3.7 million the year before); ABS 7.5%. Sources: Genus 2026 annual report; FY2026 results presentation.

Here’s how each one works. PIC can sell breeding animals at cost and collect royalties later, “typically a piglet being weaned from the original genetics.” ABS mostly sells straws of semen. Genus says “the majority of our bovine sales are transactional,” with a growing share on multiyear contracts.

That difference matters to any dairy weighing a per-calf genetics offer, and dairies are already changing how they use beef genetics. ABS’s beef volume rose 9% last year, and its conventional dairy volume fell 5%. Genus says dairy farmers in some markets swapped sexed genetics for beef-on-dairy to prioritize near-term beef production. So here’s the question: when genetics builds a better animal, what lets the company behind it get paid past the original sale, and would the dairy come out ahead if it did?

Three things the margins don’t prove

  1. That royalties caused the gap. Genus says, “As their market structures are different, PIC and ABS employ different business models and have different financial profiles.” ABS’s adjusted operating profit, including joint ventures, rose 17% in actual currency to £22.9 million. Genus names its Value Acceleration Program, a restructuring of ABS, as the major driver and credits it with £9.0 million of benefit.
  2. That the pig model can be lifted into cattle, the margin gap describes two different markets, not a template.
  3. That anyone is offering dairies a per-calf royalty. Nothing in Genus’s disclosures describes the kind of offer this article evaluates. What follows is a way to judge one if it lands on your desk.

How the royalty actually works

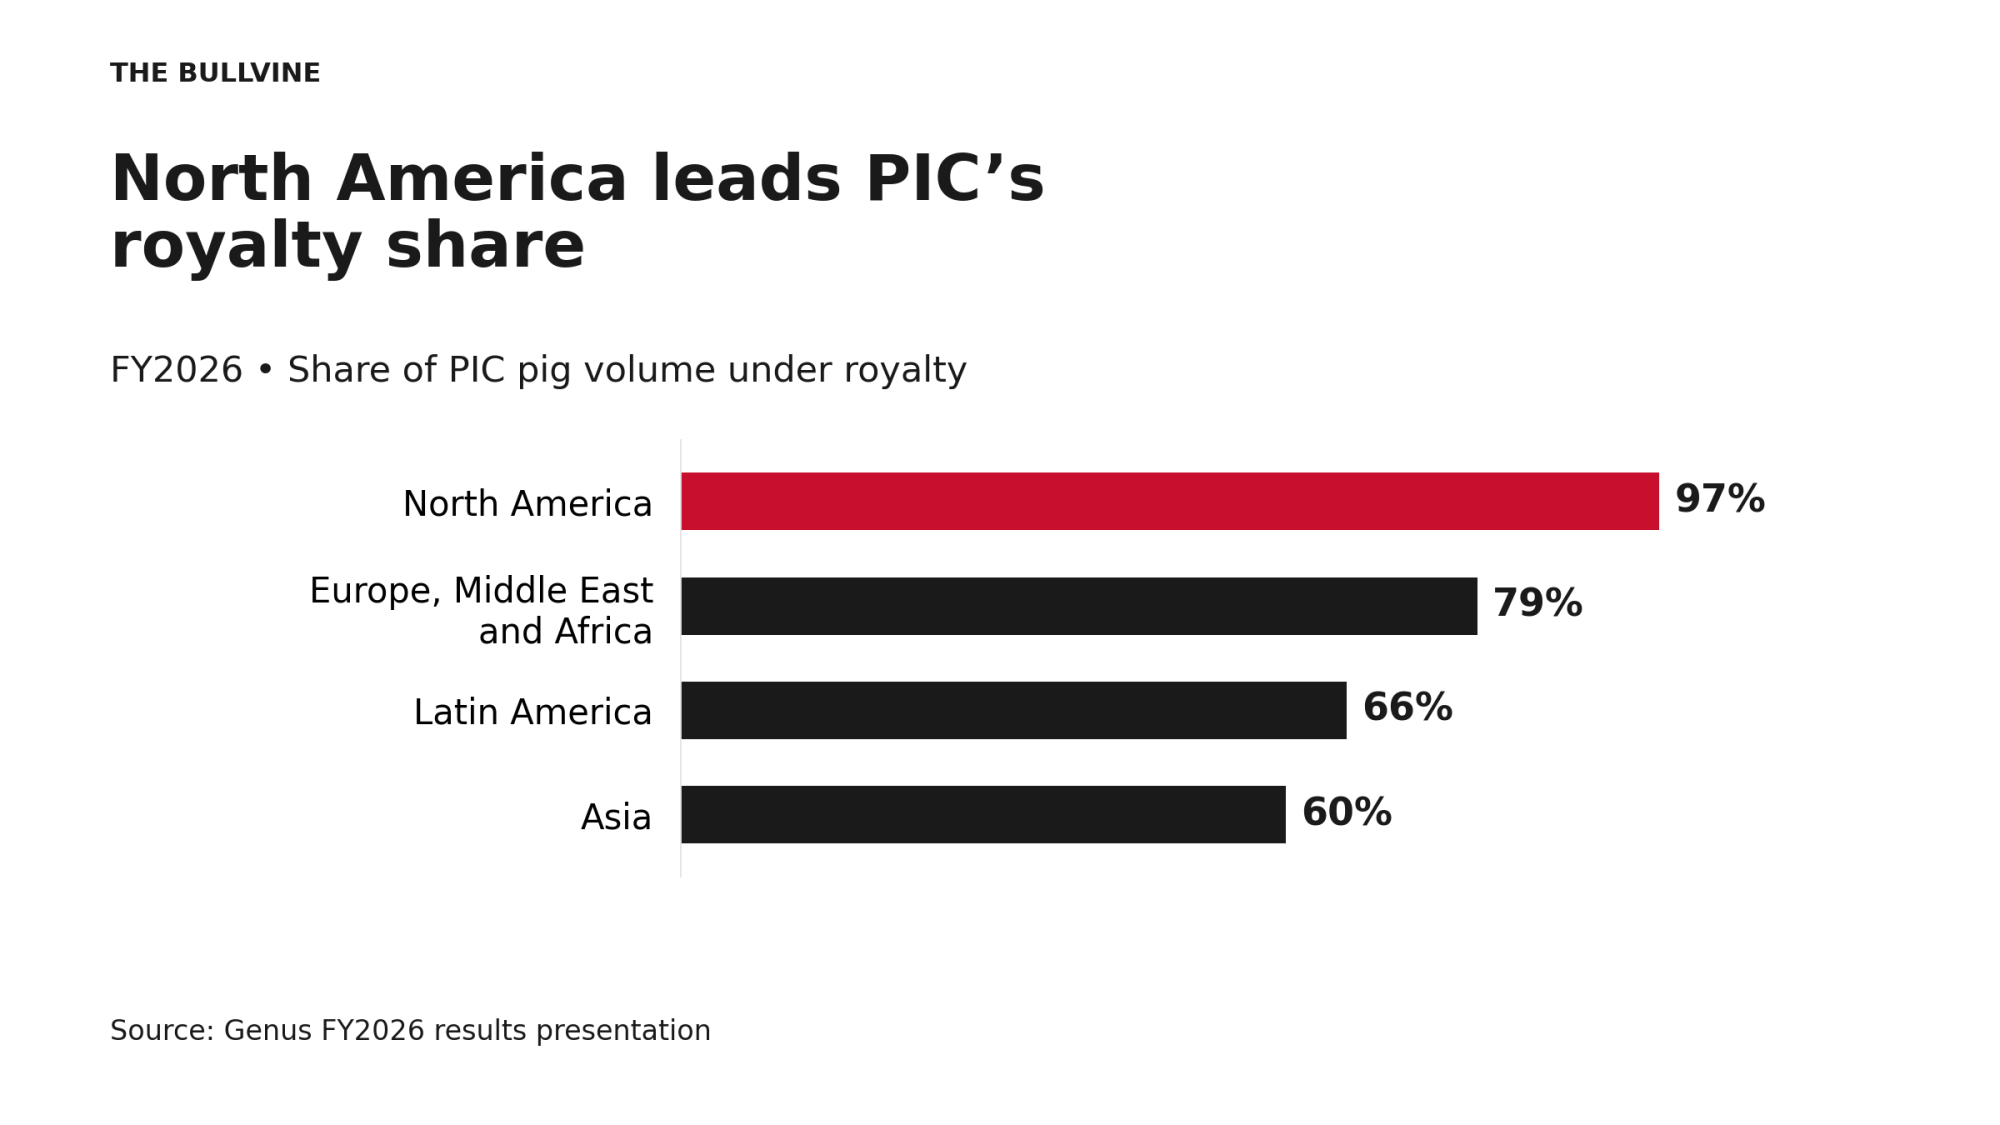
PIC royalty shares: North America 97%, EMEA 79%, Latin America 66%, Asia 60%, FY2026.

In North America, 97% of PIC’s pig volume ran under royalty in fiscal 2026, Genus reports. The share was 79% in Europe, the Middle East and Africa, 66% in Latin America and 60% in Asia. Those shares moved: Latin America’s has eased from 84% in FY2022, and Asia’s has ranged between 57% and 71% over the same period. Genus’s slide shows the figures without explaining the changes.

PIC (pigs)ABS (cattle)
Adjusted operating margin, excl. joint ventures29.3% (30.9% including £5.6M BCA milestones)7.5%
Main payment pointBack end: royalty after the genetics work in the customer’s barn, typically per weaned pigletFront end: straw sold, “the majority of our bovine sales are transactional”
Share of volume on royalty97% in North America (FY2026)NOT IN FILES
Multiyear contractsNot applicableGrowing share, including GENEadvance (1,000+ herds)
Per-calf charge to dairies disclosed?Not applicableNo

Source: Genus FY2026 results presentation and 2026 annual report. The margin ratio (29.3 ÷ 7.5) is Bullvine’s math.

On its investor slides, Genus calls the model “Independent of commodity prices.” That means the royalty isn’t indexed to the pork price. It doesn’t mean royalty revenue can’t move: Genus says North American royalty revenue grew just 1% last year because of customer disease challenges.

The royalty settles an argument before it starts. Nobody has to fight over what share of the pork price belongs to genetics every time a pig changes hands. The contract names an event, usually a weaned piglet, and the bill follows the count. A weaned piglet doesn’t prove genetics earned every dollar it’s worth. It’s an event both sides agreed to count, and that’s the commercially useful part.

The reach is large, too: PIC genetics showed up in 249.6 million market-pig equivalents last year. That’s Genus’s standardized count of slaughter pigs carrying its genetics, with each parent’s genes counting for half.

ABS starts somewhere else. Genus’s website says its bovine genetics are priced on indices of genetic merit, so a better bull can command a higher semen price. ABS also runs two contract models:

  • GENEadvance. ABS is the sole genetics partner for large producers. The program now covers more than 1,000 herds, and Genus says it generated a 9.5% increase in revenue.
  • Pull-through contracts in beef. Genus says ABS uses “‘pull-through’ contracts”: prove the value to processors, packers and retailers, so they give their own suppliers an incentive to use ABS genetics.

The 2026 report’s business-model section doesn’t give the terms of either, and nothing in these disclosures shows either is a per-calf charge to a dairy. Pricing the expectation before breeding is a different business from billing against what happens after it. Which model serves the farmer better depends on the price, the result, and who carries the risk.

Why a $430 beef-on-dairy calf premium isn’t a royalty pool

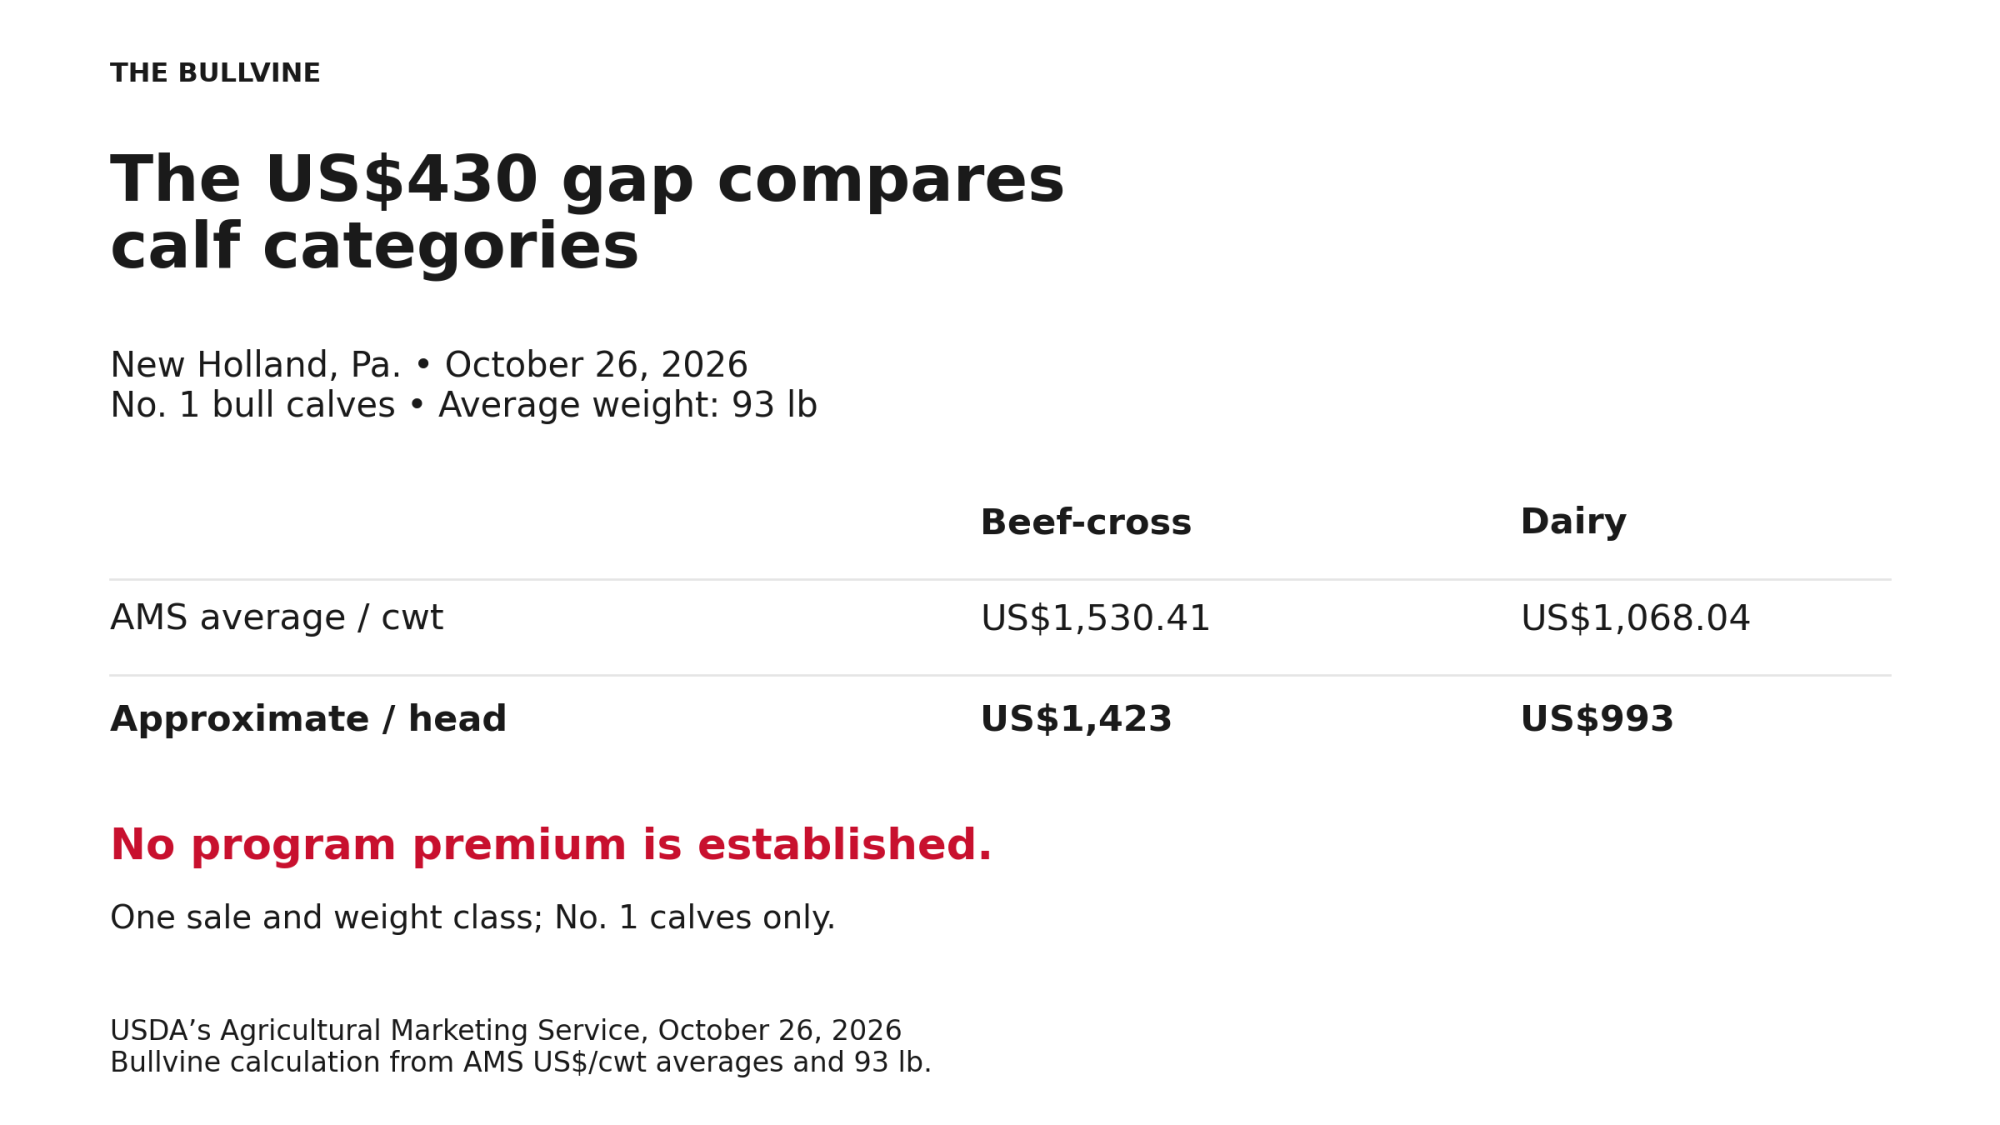
No. 1 calves averaging 93 lb: beef-cross approximately US$1,423, dairy US$993; gap approximately US$430.

At New Holland, Pa., on October 26, 2026, USDA’s Agricultural Marketing Service (New Holland Monday report, Oct. 26, 2026 edition) reported these averages for No. 1 bull calves in the 90–95 lb class (averaging 93 lb):

New Holland, Pa., No. 1 bull calves, 90–95 lb class (avg. 93 lb), Oct. 26, 2026

Calf typeHeadAverage (US$/cwt)Range (US$/cwt)Approx. US$/head
Beef-cross331,530.411,150–1,7501,423
Dairy421,068.04850–1,175993
Gap462.37about 430

Source: USDA AMS New Holland Monday report, Oct. 26, 2026. Per-head figures and the gap row are Bullvine’s conversion of the AMS averages. One sale, one weight class, one week.

  • Beef-cross: US$1,530.41/cwt (approx. US$1,423/head)
  • Dairy: US$1,068.04/cwt (approx. US$993/head)

That leaves a gap of roughly US$430 per head. The per-head figures are Bullvine’s conversion of the AMS averages.

Prices ranged from US$1,150 to US$1,750/cwt for the 33 beef-cross calves and US$850 to US$1,175/cwt for the 42 dairy calves. Compared with the previous week’s sale, AMS reported beef-cross bull calves US$40–$60 lower and dairy bull calves US$60–$80 higher. The report doesn’t label the unit on that line, but every price in it is quoted per hundredweight. So treat it as a snapshot of one sale, one weight class, and one week, not a trend. It only counts calves that reached the ring as No. 1s, and it can’t see the cows that didn’t settle.

The comparison has a second limit. It sets beef-cross calves against dairy calves, not program calves against comparable beef-cross calves sold outside a program. So it can’t establish a premium for joining any particular program. Nor can it tell the dairy how much of the gap belongs to one sire, rather than the crossbreeding decision, calf quality, the buyer’s specs, or that week’s market. The premium isn’t a royalty pool waiting to be split. And the dairy’s whole beef-semen bill isn’t the cost of earning it, because the Holstein alternative needed a breeding too.

For the producer, that boils down to one question: what does the proposed breeding option leave after its costs and conditions, compared with what the dairy does now? The supplier’s question is harder: what result can it prove well enough that someone will pay for it?

A tag isn’t a contract.

Genus’s 2026 report says it wants profit “resulting from the performance of our products in customers’ systems.” In beef-on-dairy, that breaks into four separate jobs: give the calf an identity, record its parentage, measure its performance, and give somebody a reason to pay.

An ear tag provides an identity. A parentage test provides a sire. A performance record shows what the calf did. None of them gets anyone paid for the genetics. Only a contract does.

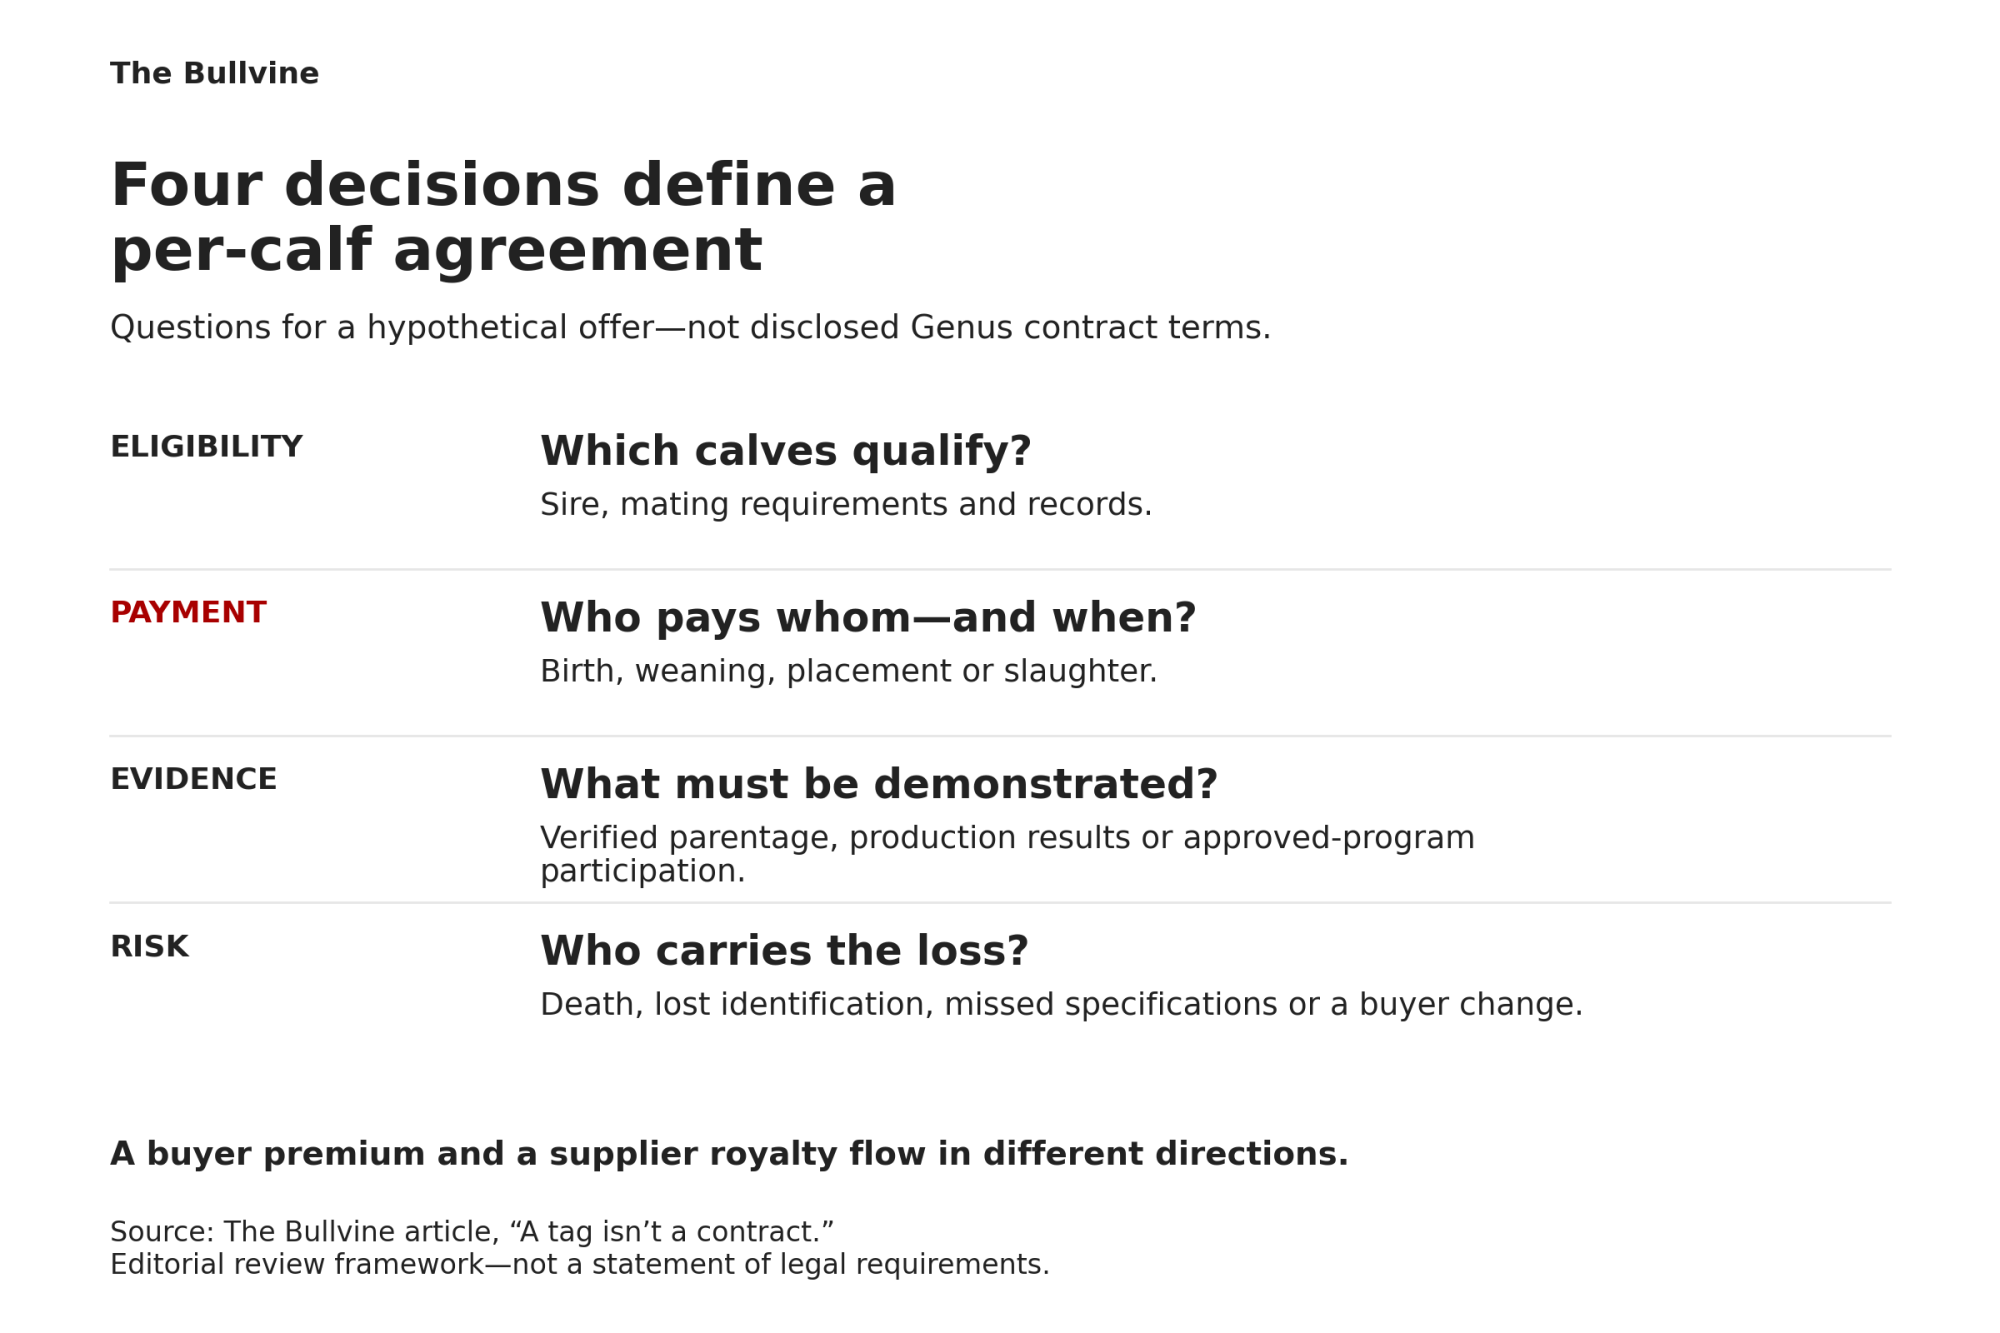
Four decisions make or break a per-calf genetics agreement:

DecisionWhat to defineQuestion to put on the table
Eligible calfSire, mating requirements, records needed to qualifyWhich calves count, and what proof qualifies them?
Payment eventWho pays whom, then the milestone: birth, weaning, placement or slaughterIs a buyer paying the dairy, or is a supplier billing the dairy? At which event?
EvidenceVerified parentage, production results, or participation in an approved programWhat has to be shown before money moves?
RiskCalf death, lost ID, missed spec, change of buyerWho pays when something goes wrong?
  • Define the eligible calf. Specify the sire, mating requirements, and records needed to qualify.
  • Define the payment event. Start with who pays whom: a buyer paying the dairy for the calf, or a supplier billing the dairy for the genetics. Then set the milestone, because birth, weaning, placement, and slaughter are different commercial events.
  • Define the evidence. State whether payment depends on verified parentage, production results, or simply participation in an approved breeding program.
  • Define the risk. Decide who pays when a calf dies, loses its identification, misses a spec, or changes buyers.

A supplier could bill on a qualifying calf without guaranteeing its carcass. A buyer could pay a premium for approved genetics without sending a cent to the breeding company. Both designs work on paper, and the dairy should know which one is on the table before anyone calls it value capture.

Owning cattle isn’t required.

PIC also shows a genetics supplier can stay tied to production without owning the commercial animals. Genus says PIC “only owns proprietary assets at the top of the pyramid,” which Genus says reduces its exposure to “feed costs, disease and pork price volatility.”

So cattle genetics doesn’t have to get into cattle feeding to move past the straw. A genetics company could bill against an agreed event. A downstream buyer could reward qualifying sires, as ABS’s pull-through partnerships aim to. And a dairy could join because its numbers work. Who owns the calf matters less than who holds the information, the purchase commitment, and the contract.

What This Means for Your Operation

Genus’s 2026 report is blunt about what royalties do for PIC: the model “decreases our exposure to cyclical producer profitability and increases our revenue visibility and customer retention.” Those are supplier benefits. What any arrangement does for the dairy is a separate calculation.

Start with the price structure. Does a per-calf charge replace part of the upfront genetics price, or come on top of an unchanged semen price? Compare the total price and the total obligations under each option, not the per-calf figure alone.

If the agreement promises a market outlet, ask whether a named buyer is obligated to buy calves that meet the written specs, or whether the dairy has only qualified to offer them. Ask how the price is set, who pays for testing and recordkeeping, and what happens when pickup runs late, or a calf misses a spec. An agreement that covers only genetics may not involve a buyer at all, but it still needs a defined payment event, evidence standard, and risk split.

The breeding plan still has to work for the cow. A downstream carcass target is no excuse to override the dairy’s fertility, calving-ease and replacement targets. Ownership doesn’t settle the question either. Genus’s report notes bovine genetics has “large genetic co-ops having significant market share.” A co-op can return value through members’ calf checks, just as a private company can earn more by proving a better result.

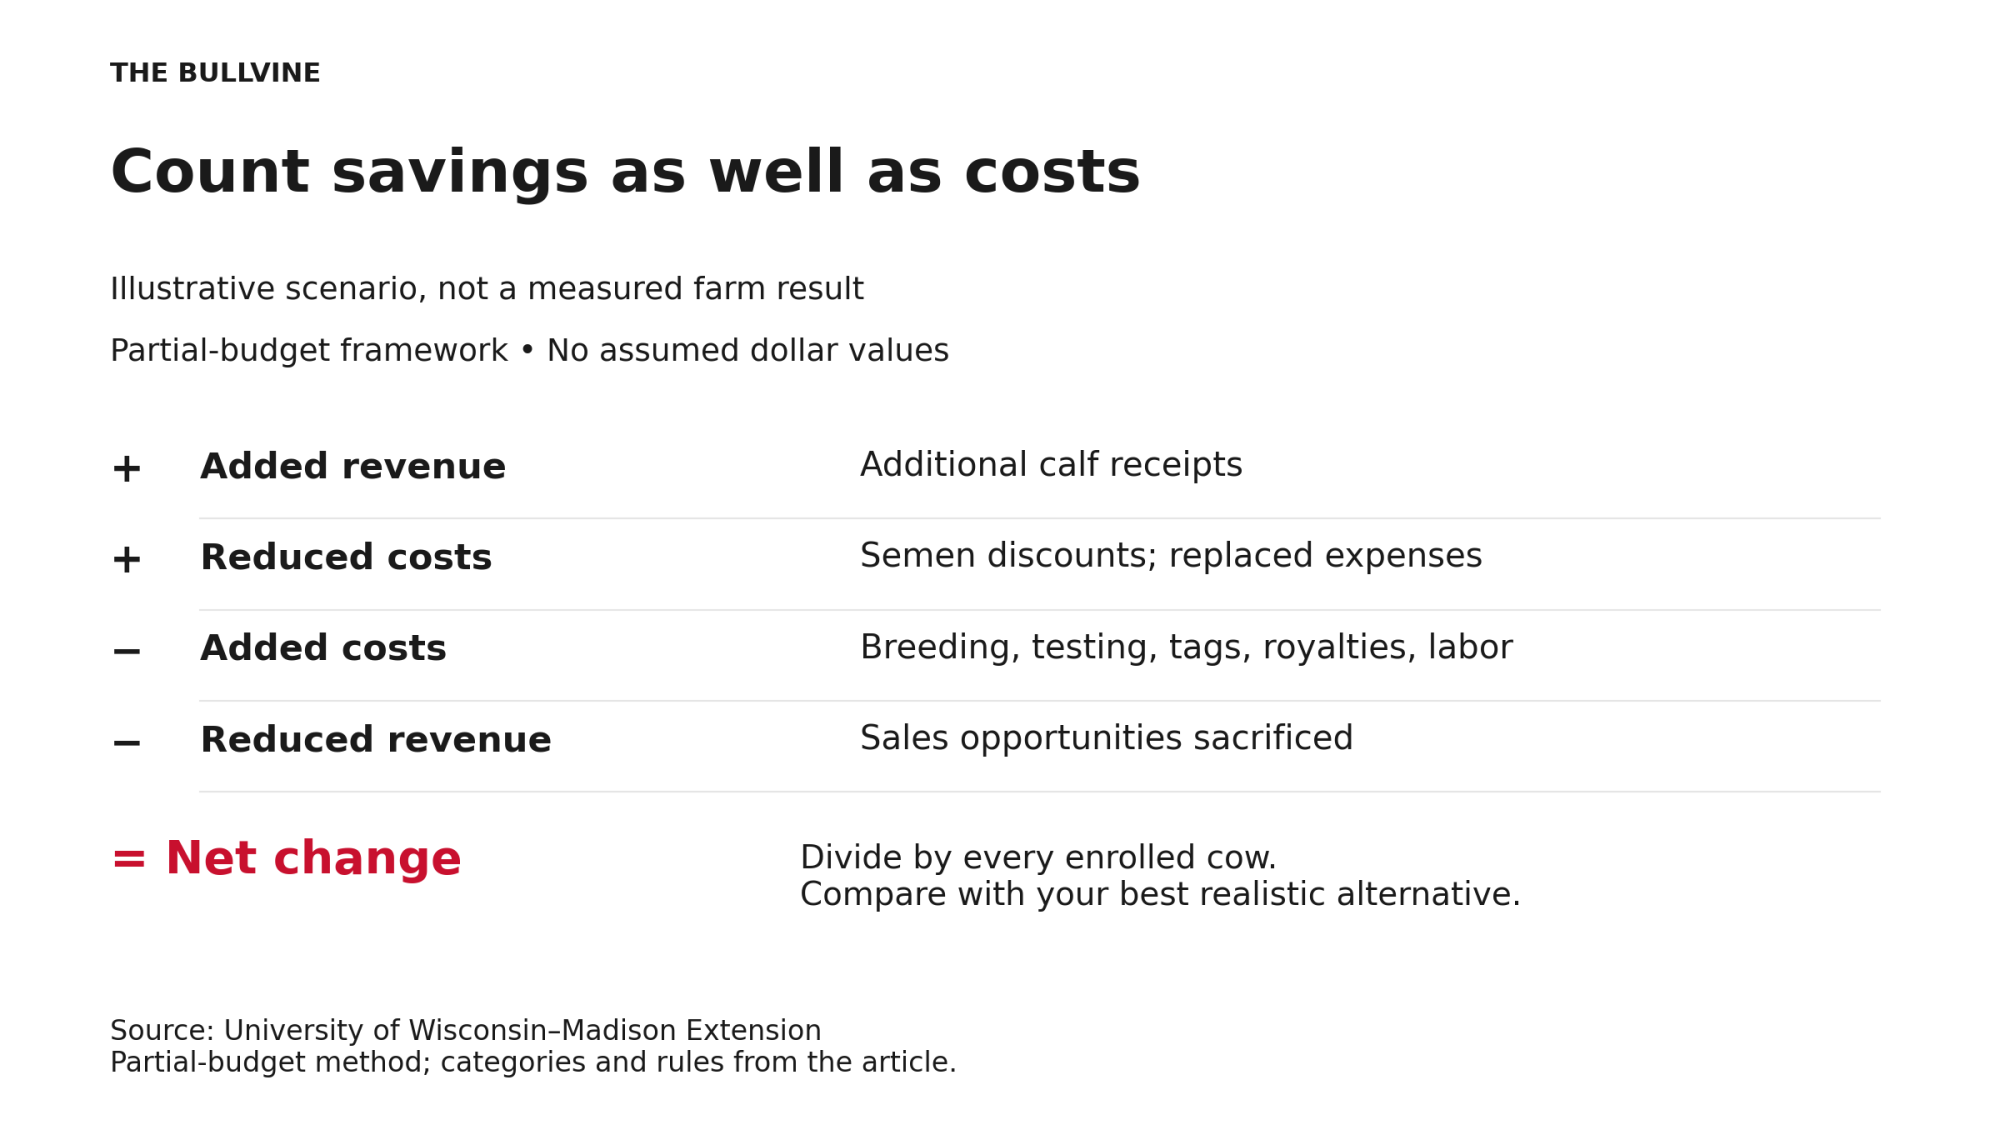
Then run a partial budget. This follows the University of Wisconsin–Madison Extension’s partial-budget method, which also counts unpaid labor and management time.

Net change equals added revenue plus reduced costs minus added costs and reduced revenue; divide by enrolled cows.
Budget lineWhat changes under the proposed agreement?
Added revenueAdditional calf receipts and other supported revenue gains
Reduced costsSemen discounts or expenses the program replaces
Added costsAdditional breeding, testing, tags, royalties, labor and holding costs
Reduced revenueLost sales opportunities or other revenue sacrificed
Net changeAdded revenue + reduced costs − added costs − reduced revenue

Five rules keep the budget honest:

  • Compare the same enrolled group over a period long enough to capture the relevant costs and receipts.
  • Include unsuccessful breedings and nonqualifying calves.
  • Count each change once.
  • Compare against the dairy’s best realistic alternative, not a weaker option that flatters the deal.
  • Divide the net change by the number of enrolled cows.

What to watch

Genus has told investors it wants ABS at a double-digit margin in the medium term. Its next results, or any separate partnership announcement, would show whether pull-through partnerships come with disclosed terms. Until a dairy can read an actual agreement in full, the useful test isn’t whether a supplier deserves a bigger share. It’s whether the whole package (price, obligations and market access together) beats the dairy’s next-best breeding and marketing plan.

Per-Calf Deal Evaluator

Run the partial budget before you sign. Compare the whole package against your best alternative.

Count every cow in the program, including those that won’t settle.


Total calf premiums/receipts.

Semen discounts or saved expenses.

Tags, testing, royalties, and holding.

Sacrificed sales or opportunity costs.

Net Impact Per Enrolled Cow

$0.00

Total Herd Impact: $0.00

Complete references and supporting documentation are available upon request by contacting the editorial team at editor@thebullvine.com.

Learn More

The Sunday Read Dairy Professionals Don’t Skip.

Every week, thousands of producers, breeders, and industry insiders open Bullvine Weekly for genetics insights, market shifts, and profit strategies they won’t find anywhere else. One email. Five minutes. Smarter decisions all week.

NewsSubscribe
First
Last
Consent

Beef-on-Dairy Premiums Rose in Dollars and Fell to 29%–38%, Michigan State Found

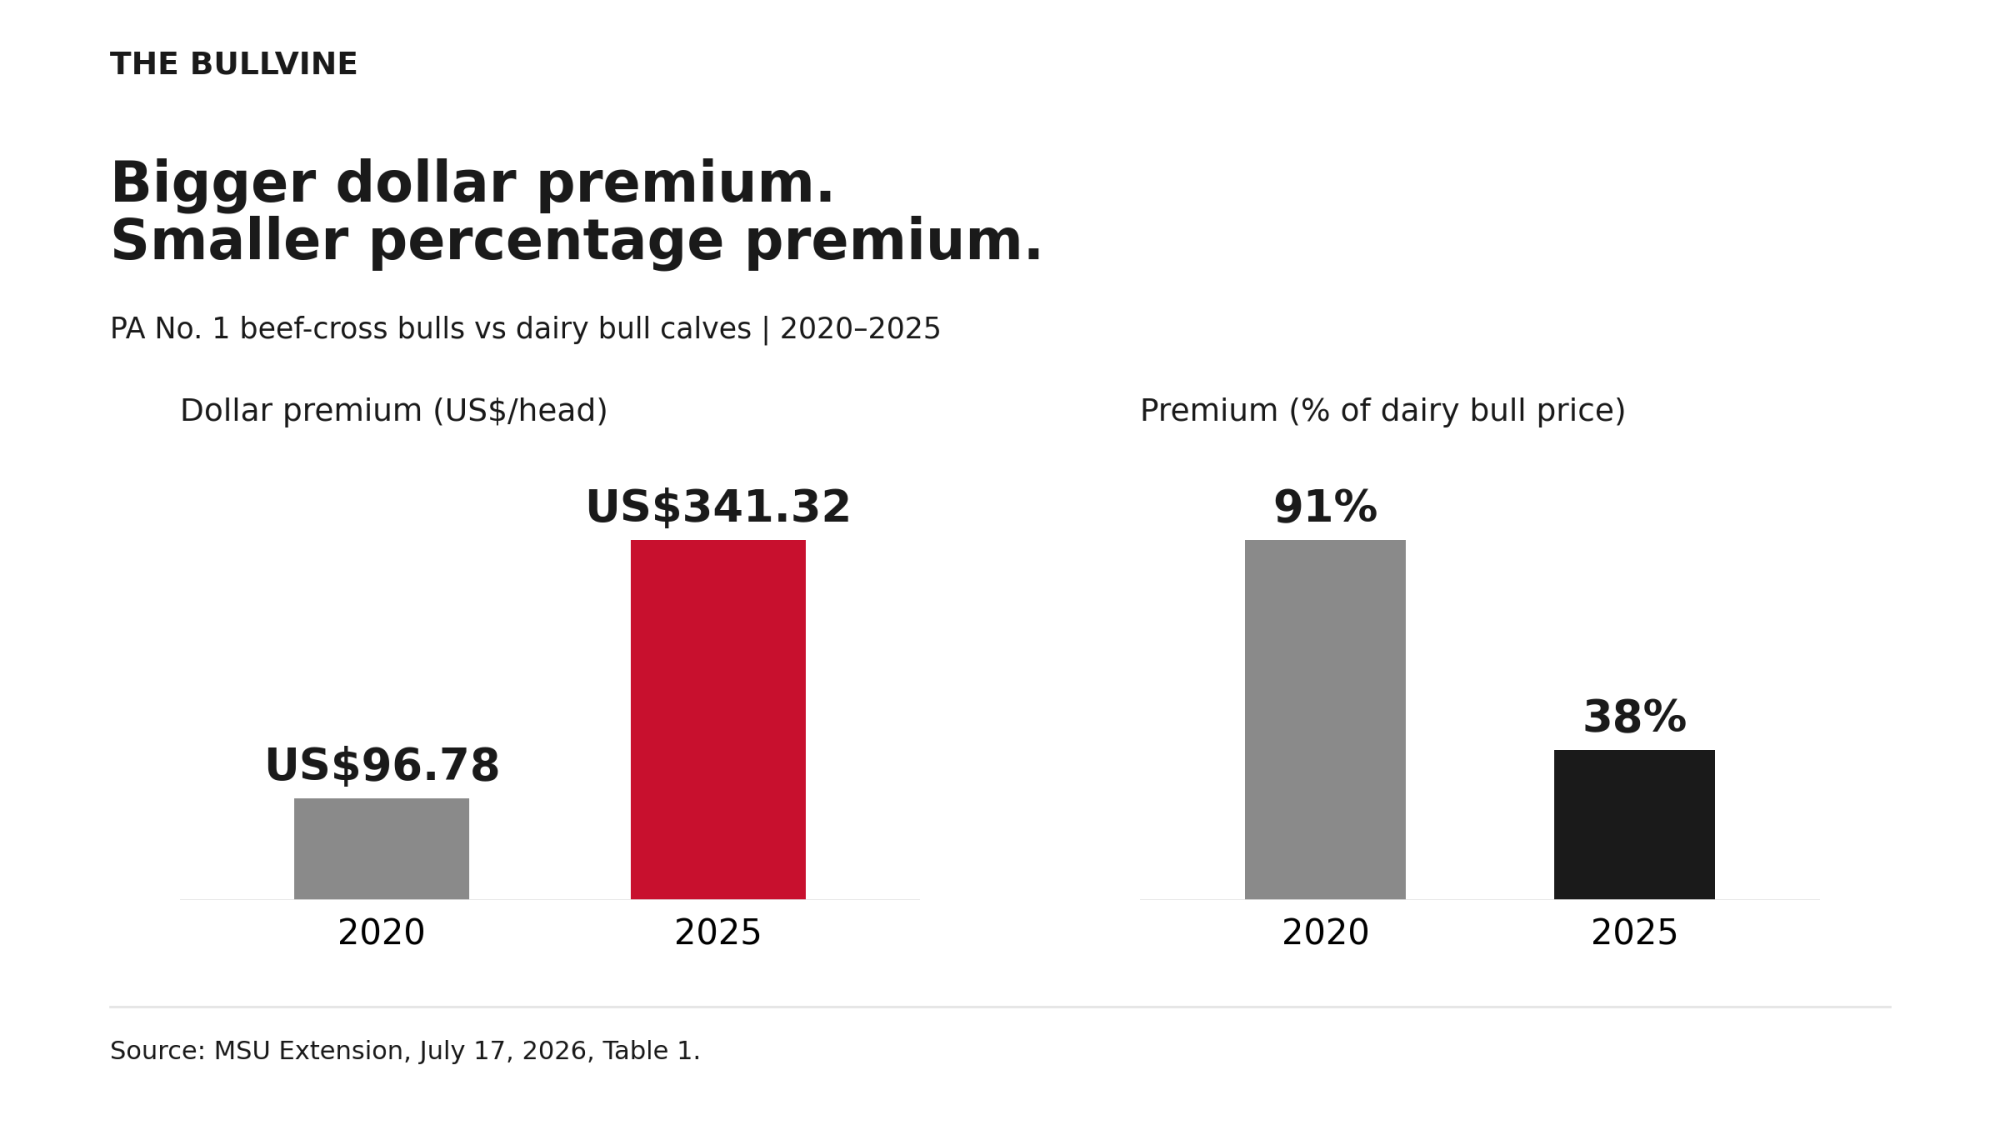
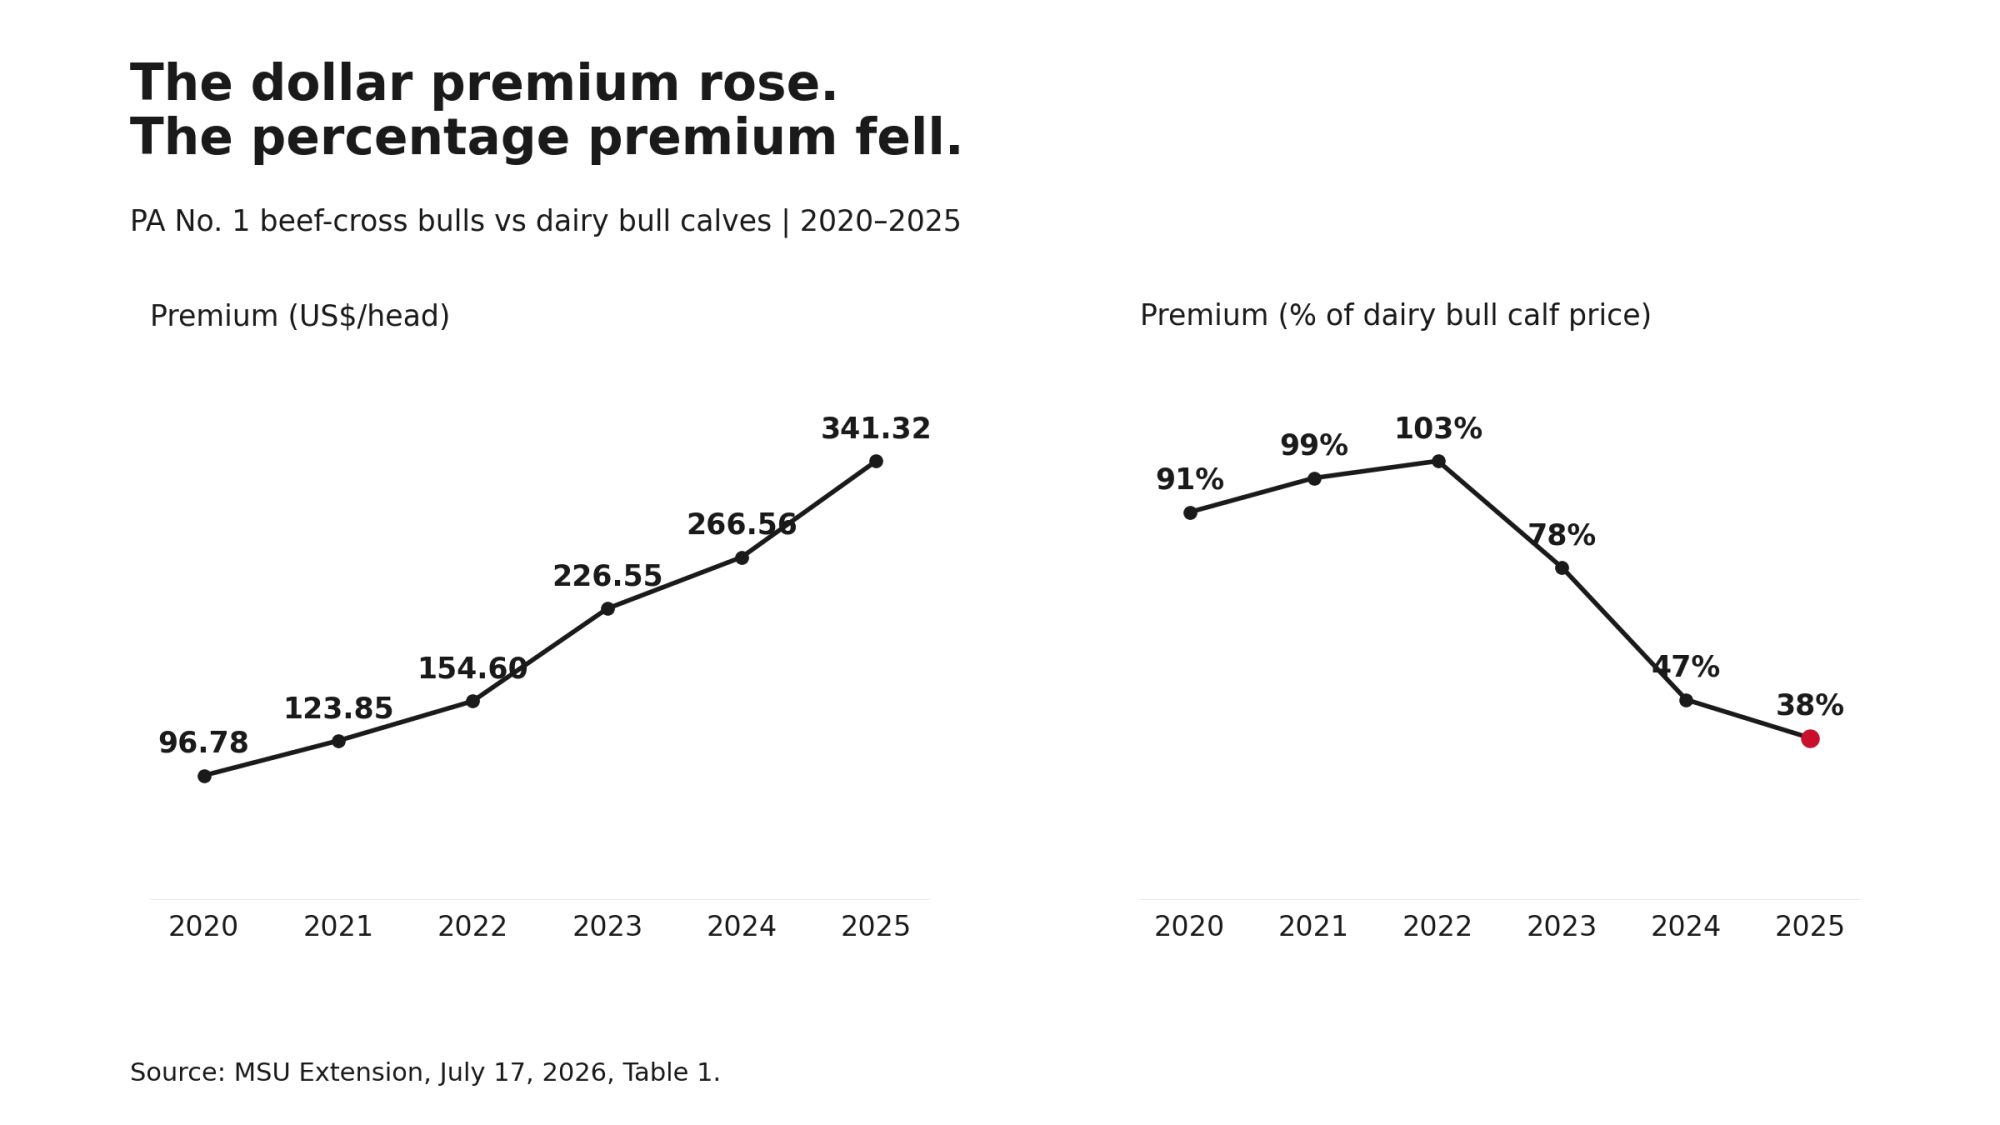
Pennsylvania No. 1 beef-cross bull calves brought US$341.32 over dairy bull calves in 2025, up from US$96.78. The percentage fell from 91% to 38%. Bigger check, smaller ratio. Now run your costs.

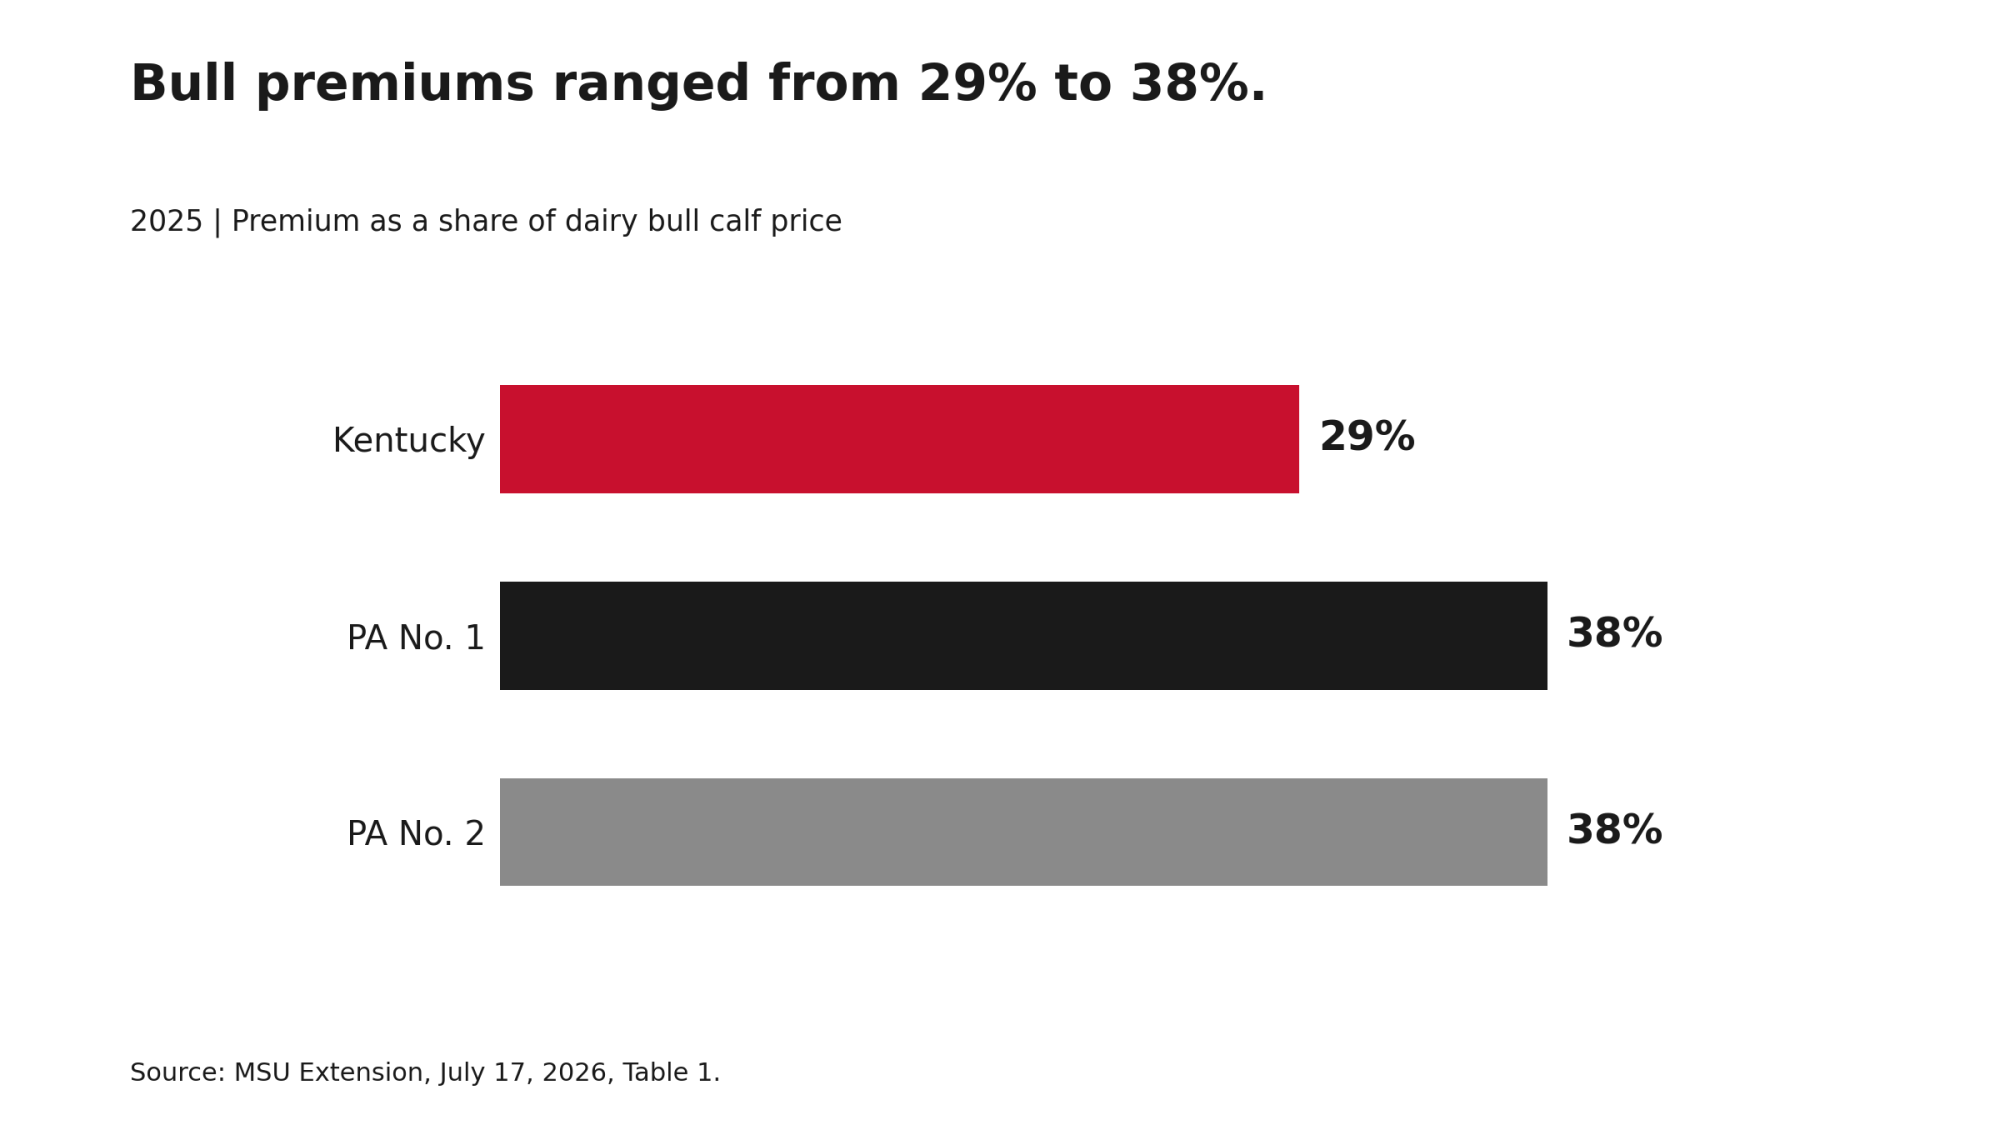
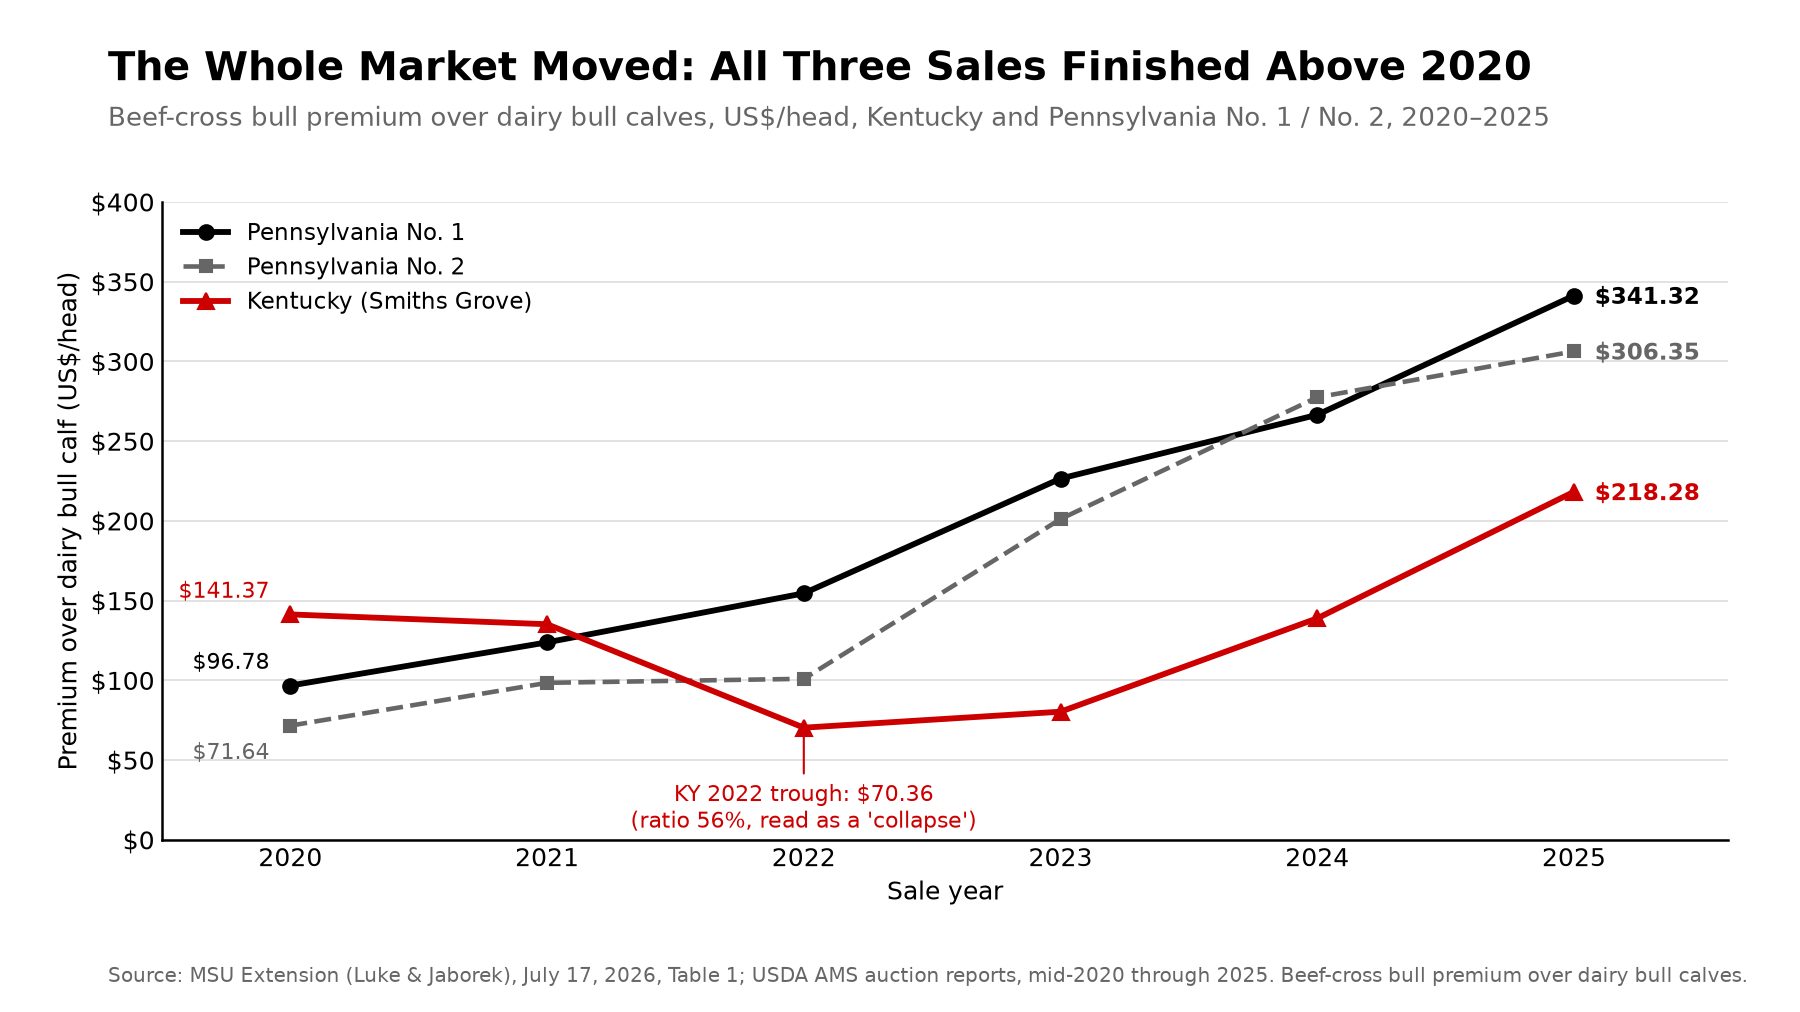
Michigan State University Extension’s Jerad Jaborek and MSU agricultural economist Jaime Luke worked through 67 months of USDA auction prices from Smiths Grove, Kentucky, and New Holland, Pennsylvania, mid-2020 through 2025. From the first year to the last, every sale series showed the same split. Beef-cross bull calves earned bigger dollar premiums over dairy bull calves and smaller percentage premiums. By 2025, the percentage ranged from 29% to 38% across the three sales.

A smaller percentage premium doesn’t necessarily mean beef semen became less profitable. The dollar premium increased. Whether the breeding decision paid better depends on the added costs and the value of the alternative calf.

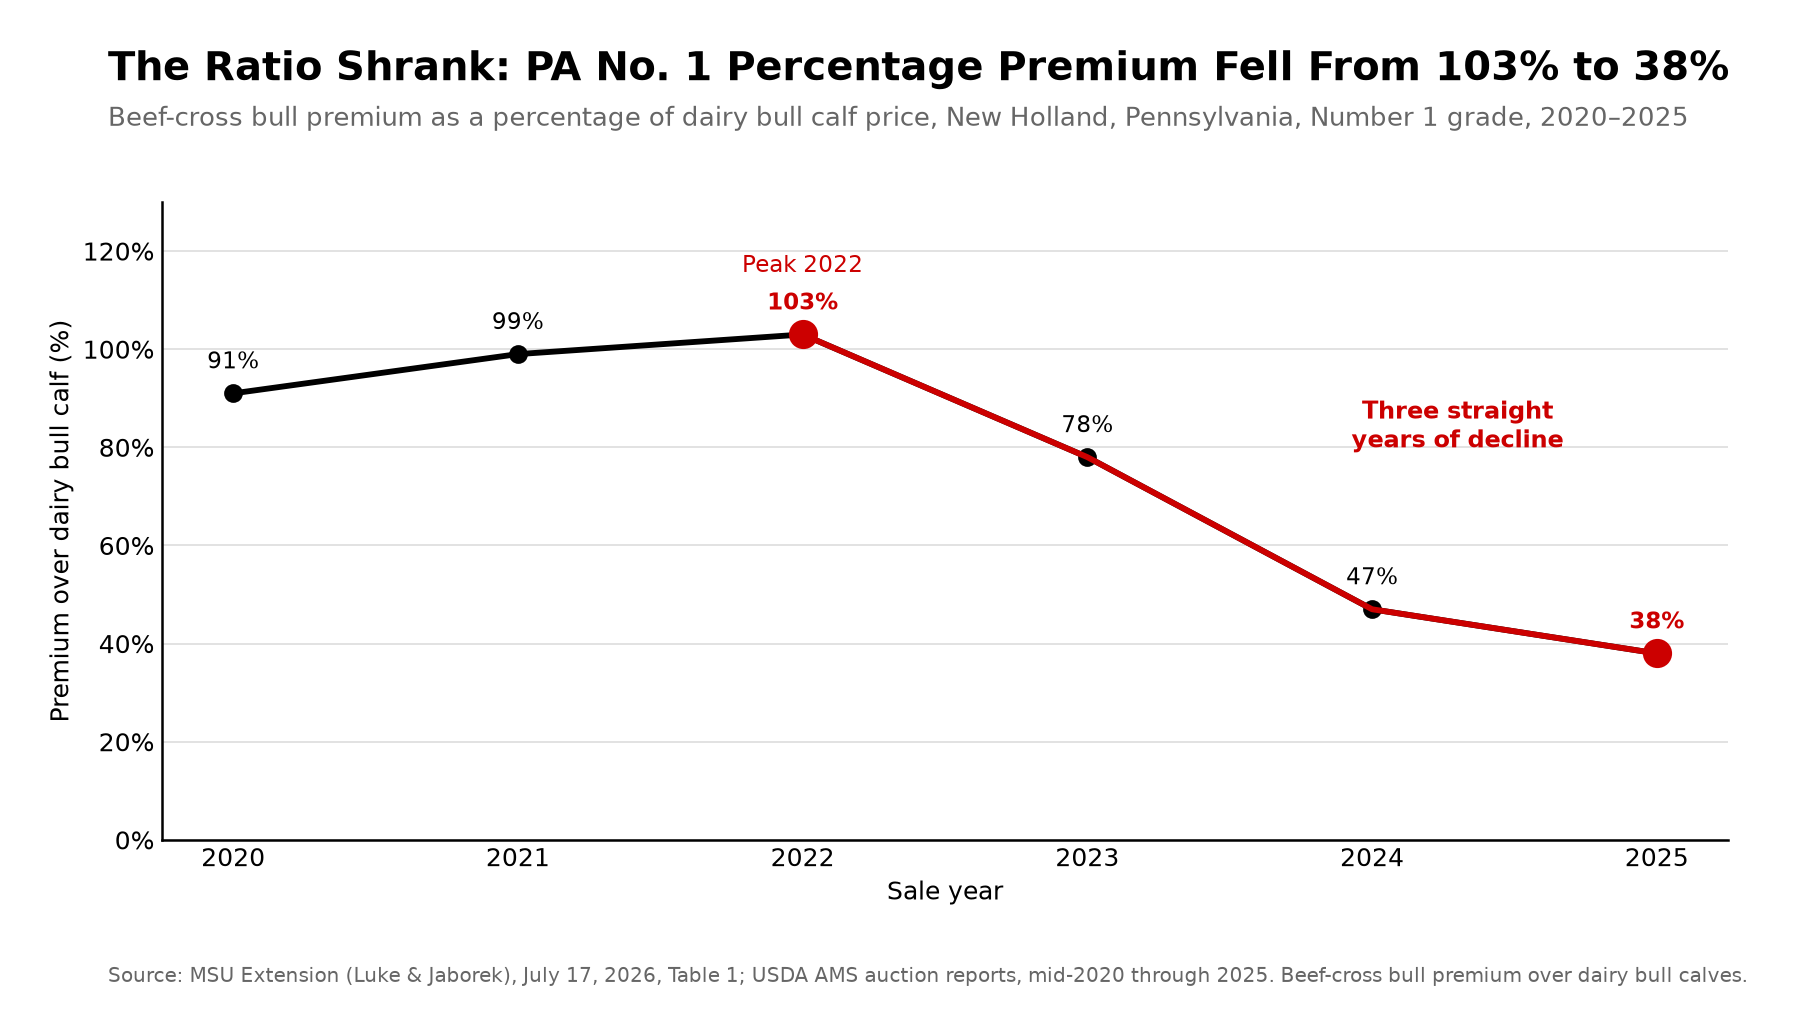
A budget built on the 2020–2021 percentage premiums, 91% and 99% at Pennsylvania No. 1, overstates the relative edge. A budget built on 2025 dollar premiums is a bet on 2025 calf prices. Luke and Jaborek published the full study, including year-by-year price details, in the August 2026 issue of Applied Animal Science (read the study).

What the Auction Data Shows

MSU built quantity-weighted average prices from three recurring USDA Agricultural Marketing Service (AMS) reports: the Farmers Regional Livestock Glasgow Dairy Auction in Smiths Grove, Kentucky, and the Monday and Thursday New Holland Livestock cattle auctions in New Holland, Pennsylvania. MSU’s Pennsylvania figures cover the Number 1 and Number 2 grades AMS assigns under the U.S. Grade Standards for Feeder Cattle. (MSU Extension article).

2025 beef-cross bull premiums over dairy bulls: Kentucky 29%, Pennsylvania No. 1 38%, Pennsylvania No. 2 38%.
Bull premiums were 29% in Kentucky and 38% for both Pennsylvania grades in 2025. Source: MSU Extension, July 17, 2026, Table 1.
YearKentucky (US$/head)Kentucky (%)PA No. 1 (US$/head)PA No. 1 (%)PA No. 2 (US$/head)PA No. 2 (%)
2020141.3728296.789171.6492
2021135.22250123.859998.48102
202270.3656154.60103101.0080
202380.3843226.5578201.1883
2024138.9332266.5647277.5157
2025218.2829341.3238306.3538

Beef-dairy cross bull calf premium over dairy bull calves. Source: MSU Extension, July 17, 2026, Table 1: “Mean differences between quantity-weighted average beef-dairy cross bull and dairy bull calf price by sale, grade and year.”

Pennsylvania No. 1’s percentage premium peaked at 103% in 2022, then fell three straight years to 38%. Kentucky’s percentage fell every year, from 282% to 29%. Its dollar premium dropped to US$70.36 in 2022, then finished at US$218.28, above the US$141.37 it started at. Anyone budgeting on the percentage would have read Kentucky as a collapse. By 2025, the check said otherwise.

PA No. 1 premiums rose from US$96.78 to US$341.32 while percentage premiums fell from 91% to 38%, 2020–2025.
PA No. 1’s dollar premium rose while its percentage premium fell between 2020 and 2025. Source: MSU Extension, July 17, 2026, Table 1.

Heifer premiums moved the same way. At Pennsylvania No. 1, the beef-cross heifer premium over dairy bull calves rose from US$88.92 to US$291.89 while the percentage fell from 82% to 32%. In 2025, it was 17% in Kentucky and 24% for Pennsylvania No. 2.

MSU’s explanation is that the whole market moved: “the prices garnered for all animals entering the beef supply chain are greater today than they were at the beginning of the decade.” MSU ties the climb partly to a U.S. beef cow inventory at “its lowest level since the early 1960s,” with strong beef demand on top, which made calves entering the beef supply chain “a hot commodity.” Bullvine’s New Holland beef-cross calf report tracks what the same barn paid on Oct. 5.

What the Study Can’t Measure

MSU says the extra value of beef-cross calves “could be captured by greater average daily gain and fewer days on feed” before feedlot entry, and that the calves “may achieve better carcass grades.” Those are expectations, not findings.

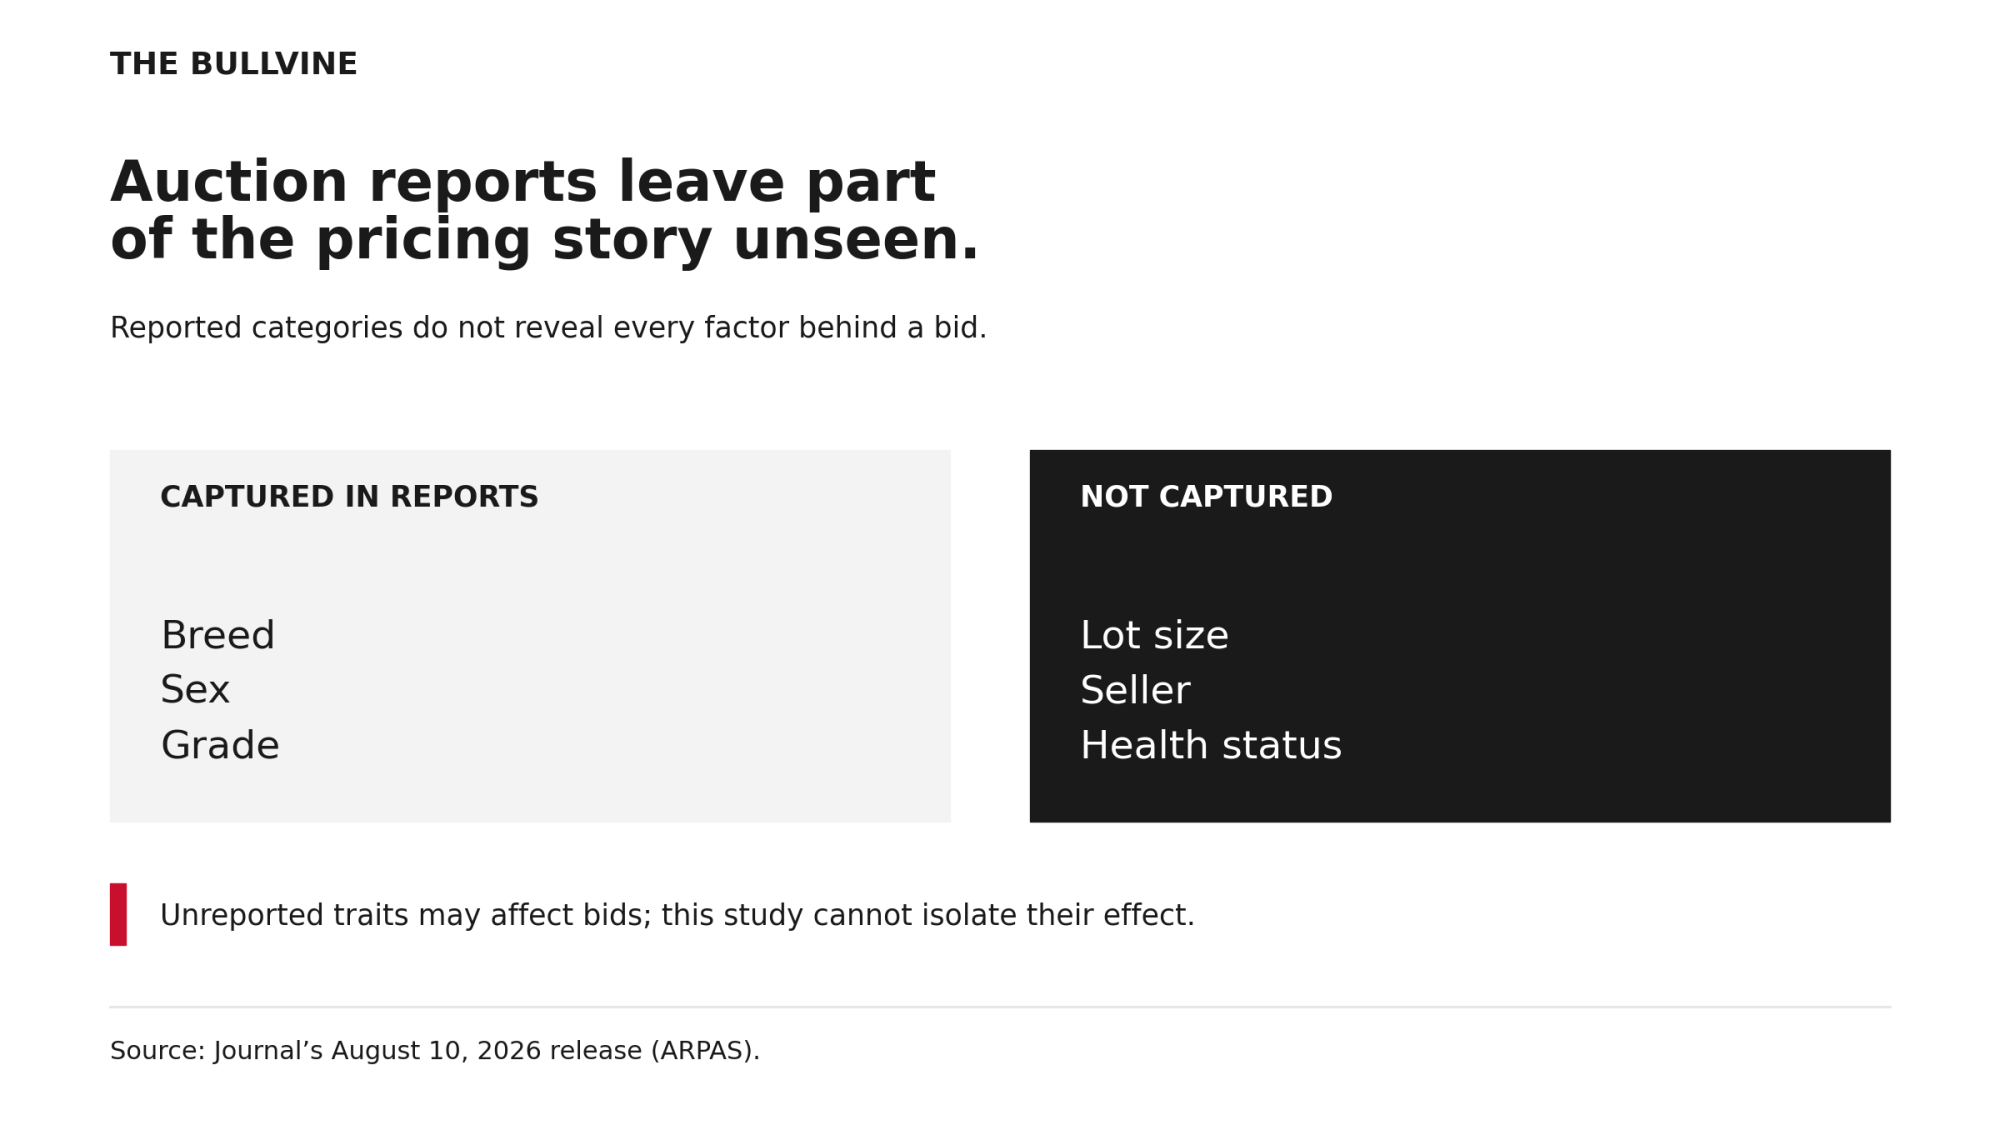
The authors say in the journal’s August 10 release that the reports capture breed, sex, and grade “but nothing about lot size, seller, or health status, all of which shape pricing,” and that some weeks are missing entirely. So the published data cannot isolate what buyers paid for. Unreported traits may well earn money, but this study can’t measure their effect.

MSU also warns that when beef cow inventory numbers increase, beef-dairy cross calves “could be positioned to take a larger relative drop in prices as compared to beef calves because buyers will have the ability to be more selective in the animals they purchase.” That warning measures beef-cross calves against beef calves. The tables measure them against dairy bull calves. It isn’t a forecast for the premium over dairy bull calves. The relative premium shrank from 2020 to 2025, and future markets could move calf prices and the premium in either direction.

Running the Numbers: 70 Beef-Cross Bull Calves

The 70 bull calves here are an illustration. The premiums are MSU’s Pennsylvania No. 1 figures; the totals are Bullvine’s.

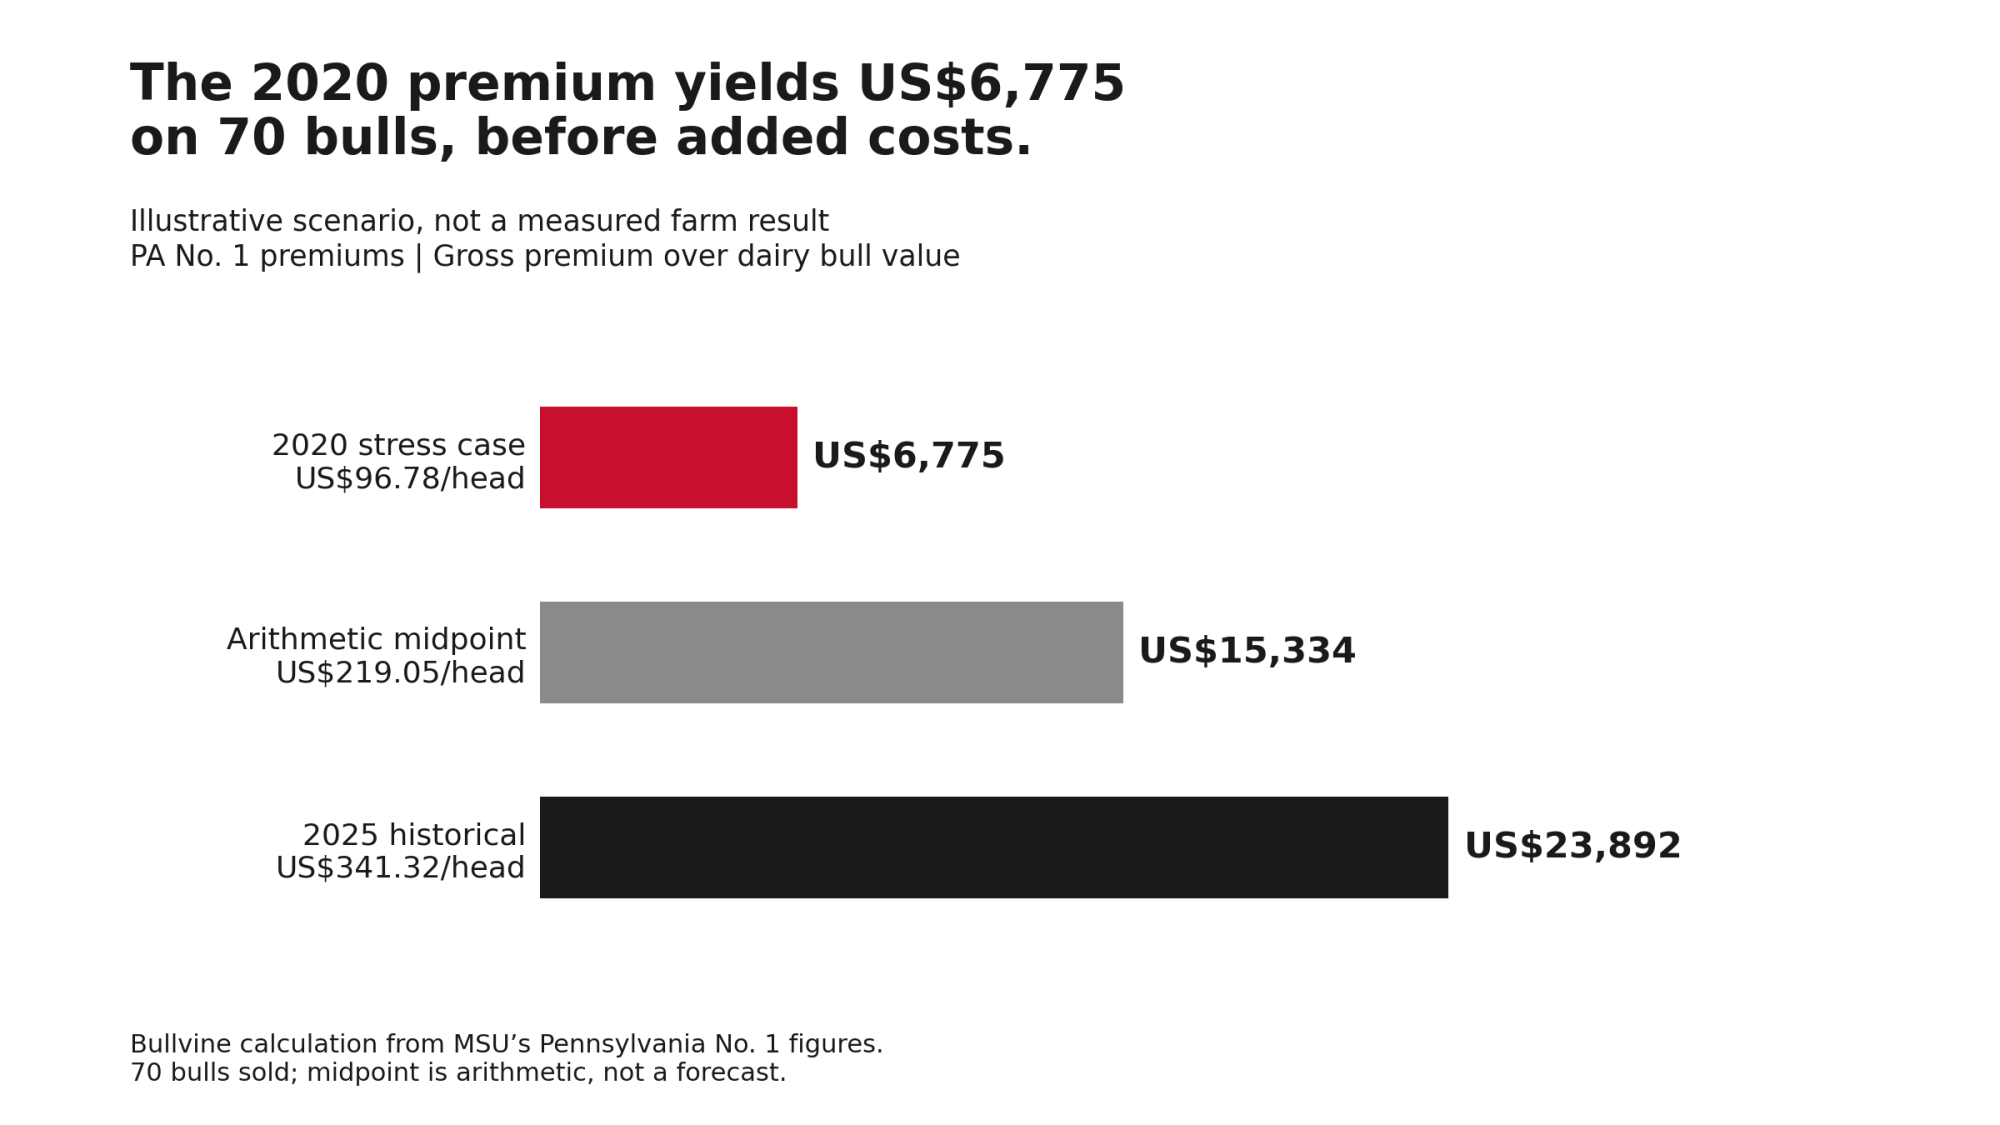
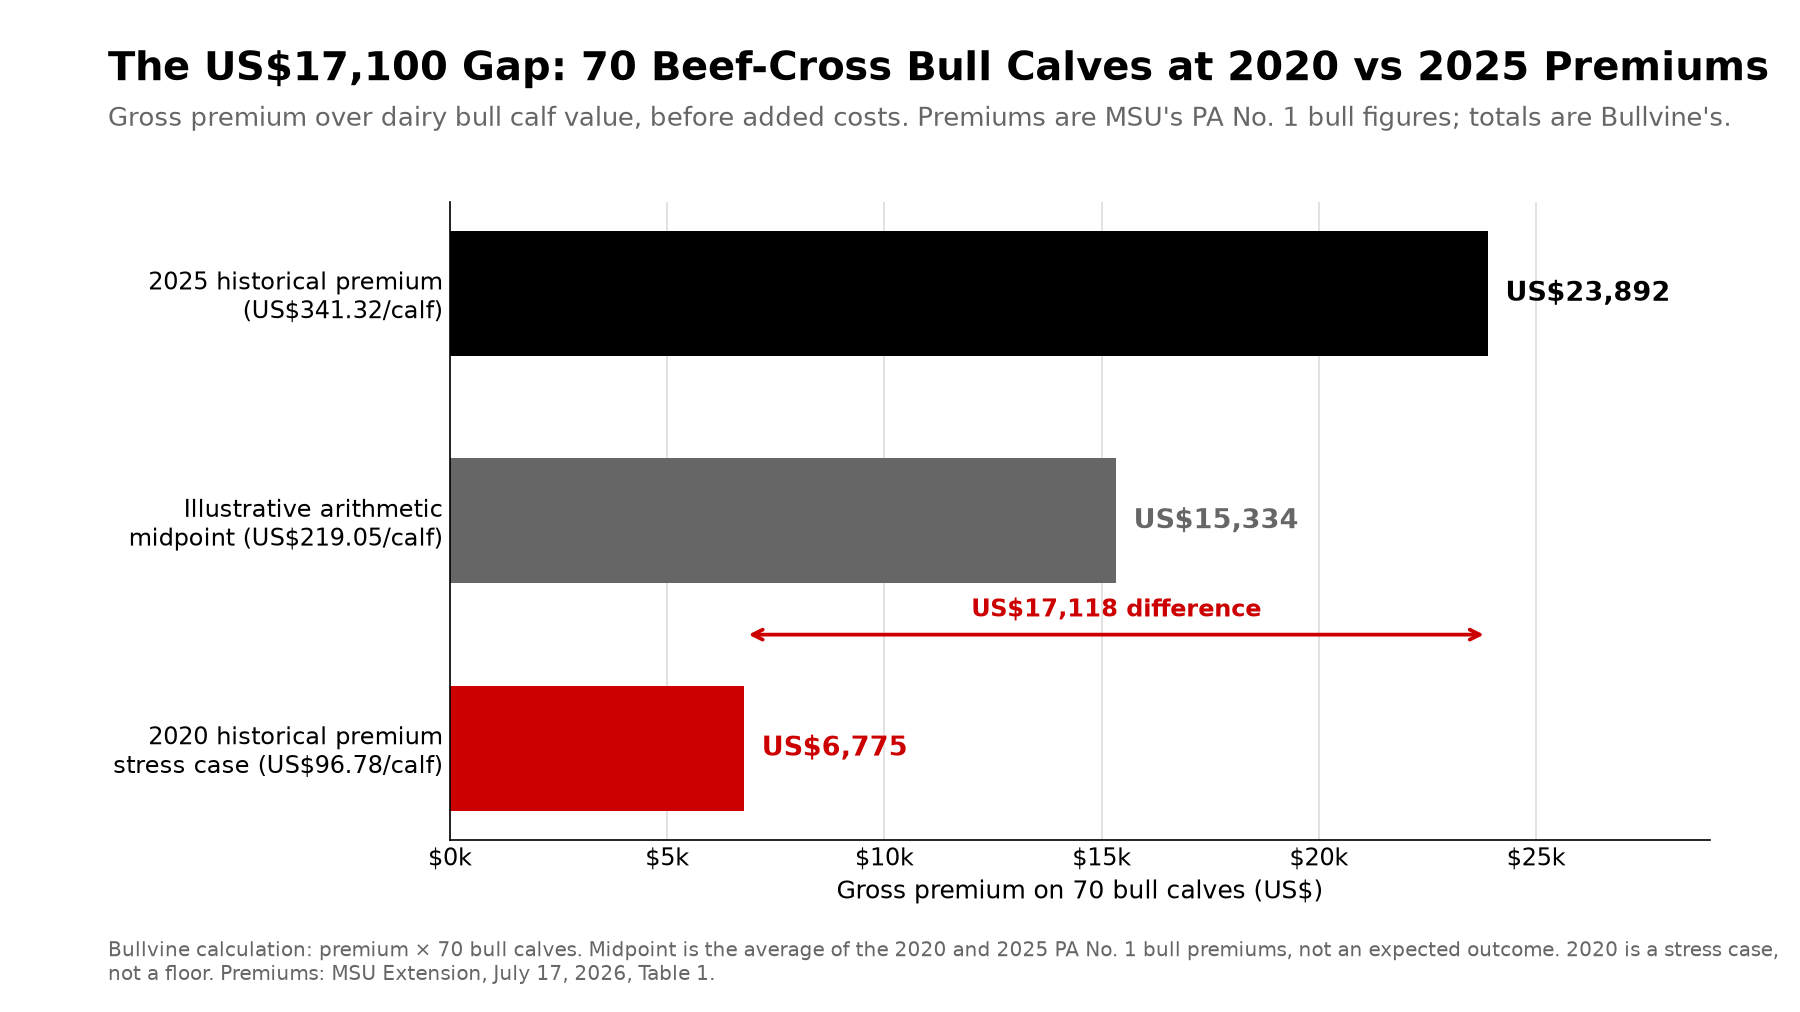
On 70 bulls, gross premiums total US$6,775 at 2020 levels, US$15,334 at the midpoint and US$23,892 at 2025 levels.
The 2020 premium yields US$6,775 on 70 bulls before added costs. Bullvine calculation from MSU’s Pennsylvania No. 1 figures.
ScenarioPremium per bull calfGross premium on 70 bull calves
2025 historical premiumUS$341.32US$23,892
Illustrative arithmetic midpointUS$219.05US$15,334
2020 historical premium stress caseUS$96.78US$6,775

Bullvine calculation. Gross premium over dairy bull calf value, before added costs. The midpoint is arithmetic, not an expected outcome. 2020 is a historical stress case, not a floor.
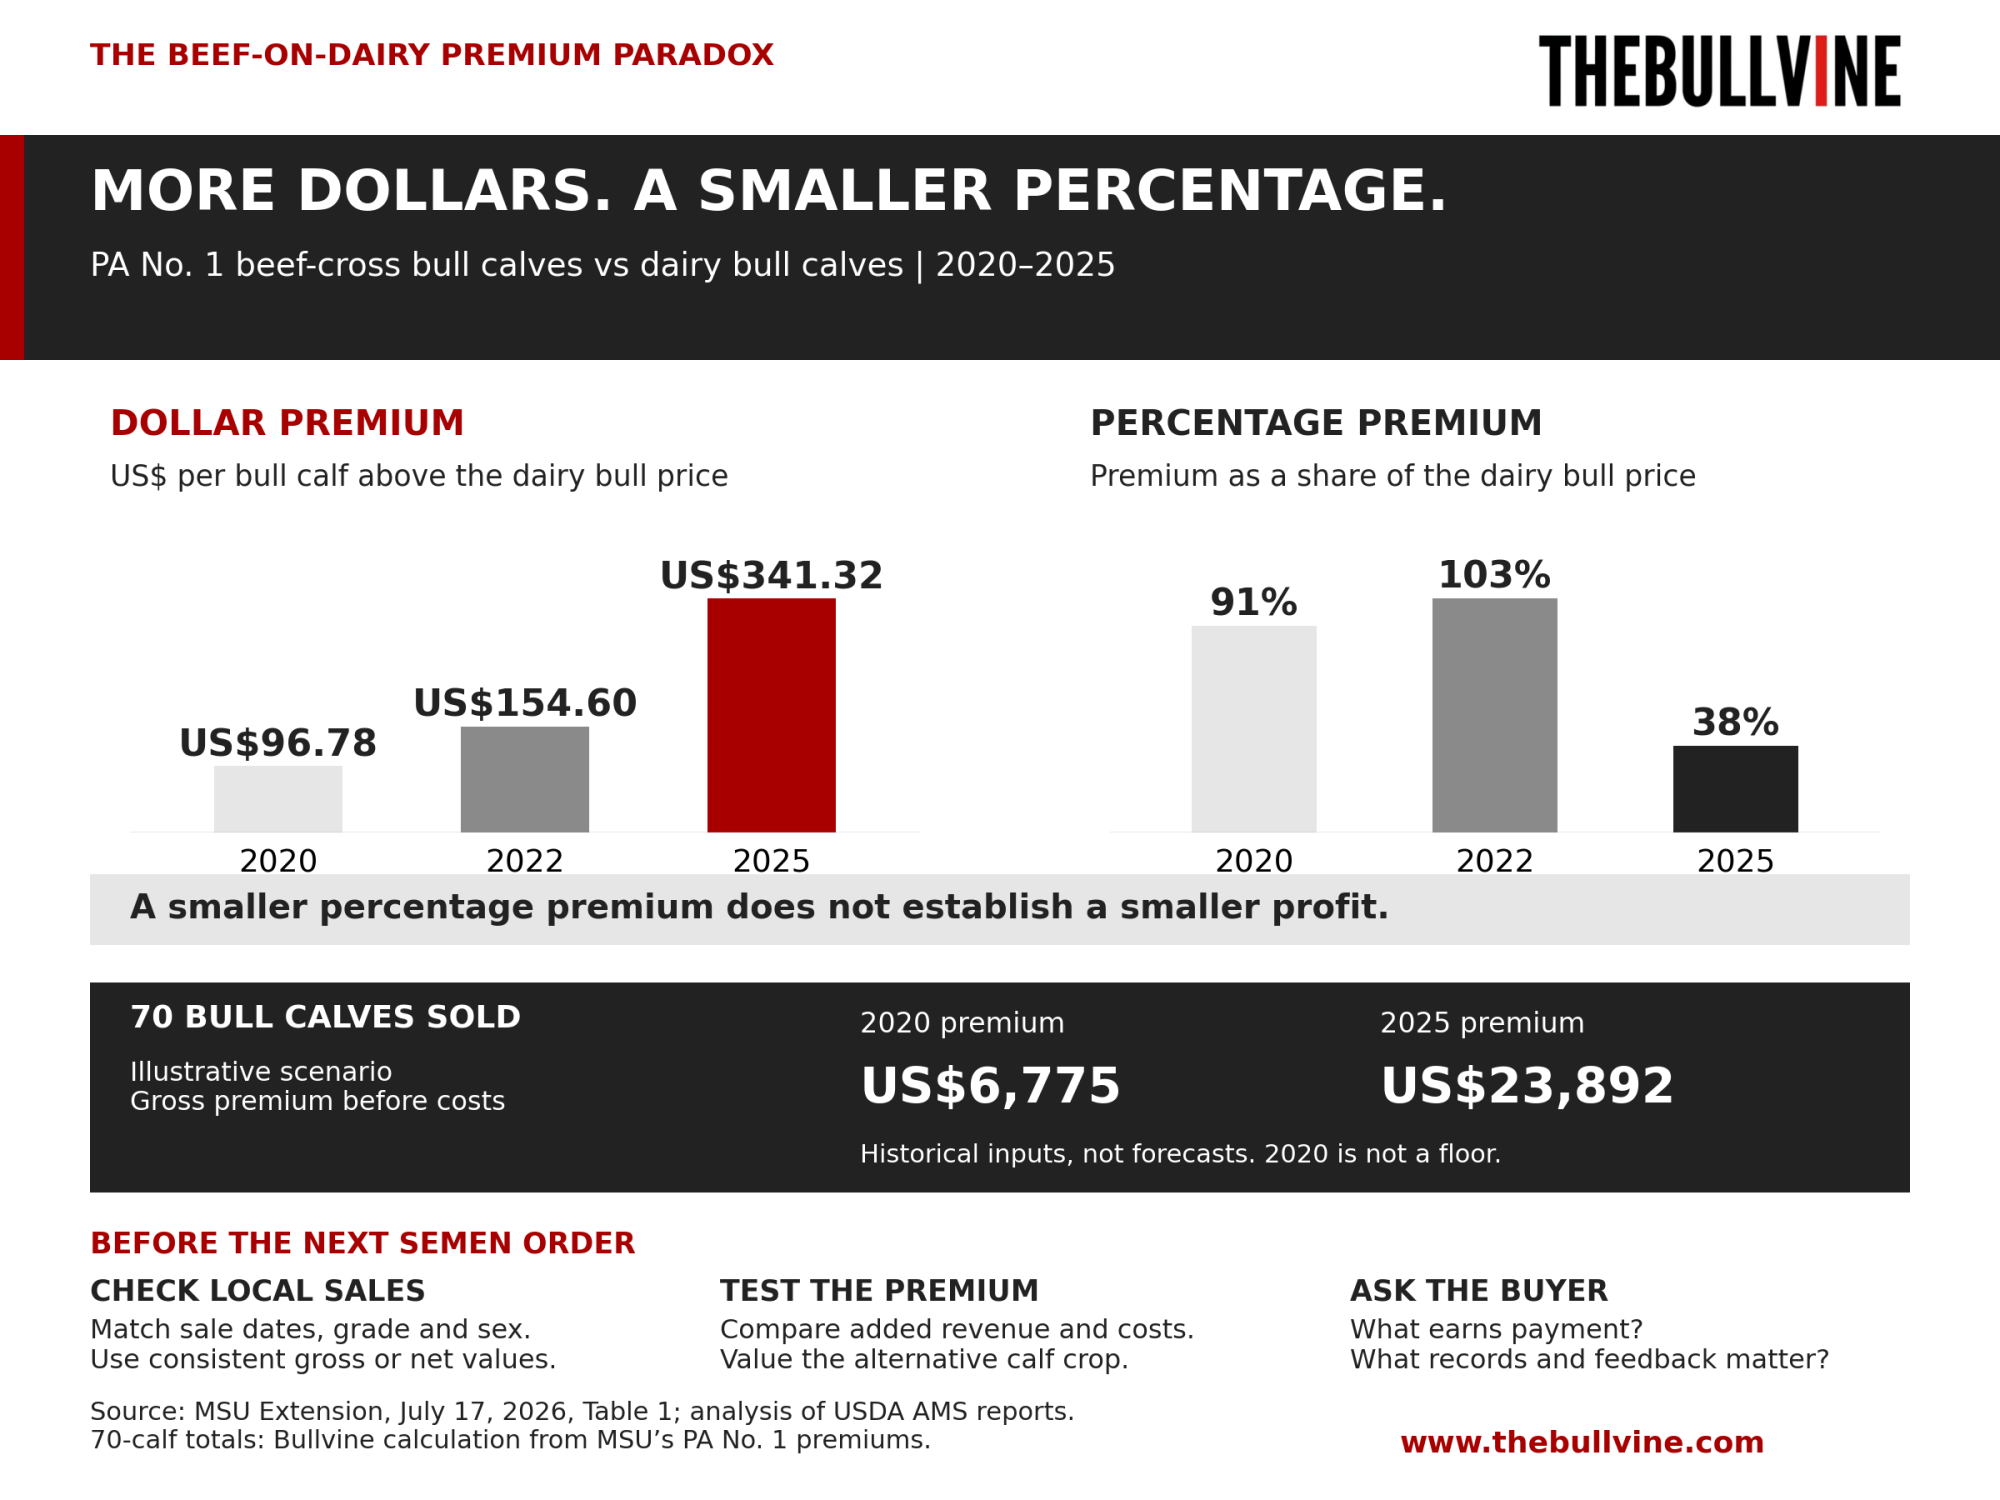
The 2020 stress case generates about US$6,800 in gross premium before added costs. The 2025 case generates about US$17,100 more (US$17,118, calculated before rounding). A beef program that only covers its costs at the 2025 number is carrying 2025 calf prices on its back.

A breeding-program decision also needs revenue from both sexes, the calves the alternative semen strategy would produce, semen use and conception differences, survival and saleability, replacement requirements, and incremental costs.

At Pennsylvania No. 1, a 50:50 mix of beef-cross bulls and heifers works out to about US$92.85 of gross premium per beef-sired calf sold at 2020 levels and about US$316.61 at 2025 levels (Bullvine calculation from MSU Tables 1–2). Set that against your added cost per beef-sired calf sold, extra straws included if conception differs. MSU measures the heifer premium against dairy bull calves too. If the alternative to a beef-sired heifer is a dairy replacement you need, value that calf instead.

Added cost per beef-sired calf sold (illustrative)Net at 2020 premium (US$92.85 gross)Net at 2025 premium (US$316.61 gross)Spread between cases
US$50US$42.85US$266.61US$223.76
US$100−US$7.15US$216.61US$223.76
US$150−US$57.15US$166.61US$223.76
US$200−US$107.15US$116.61US$223.76

What to Ask Your Calf Buyer

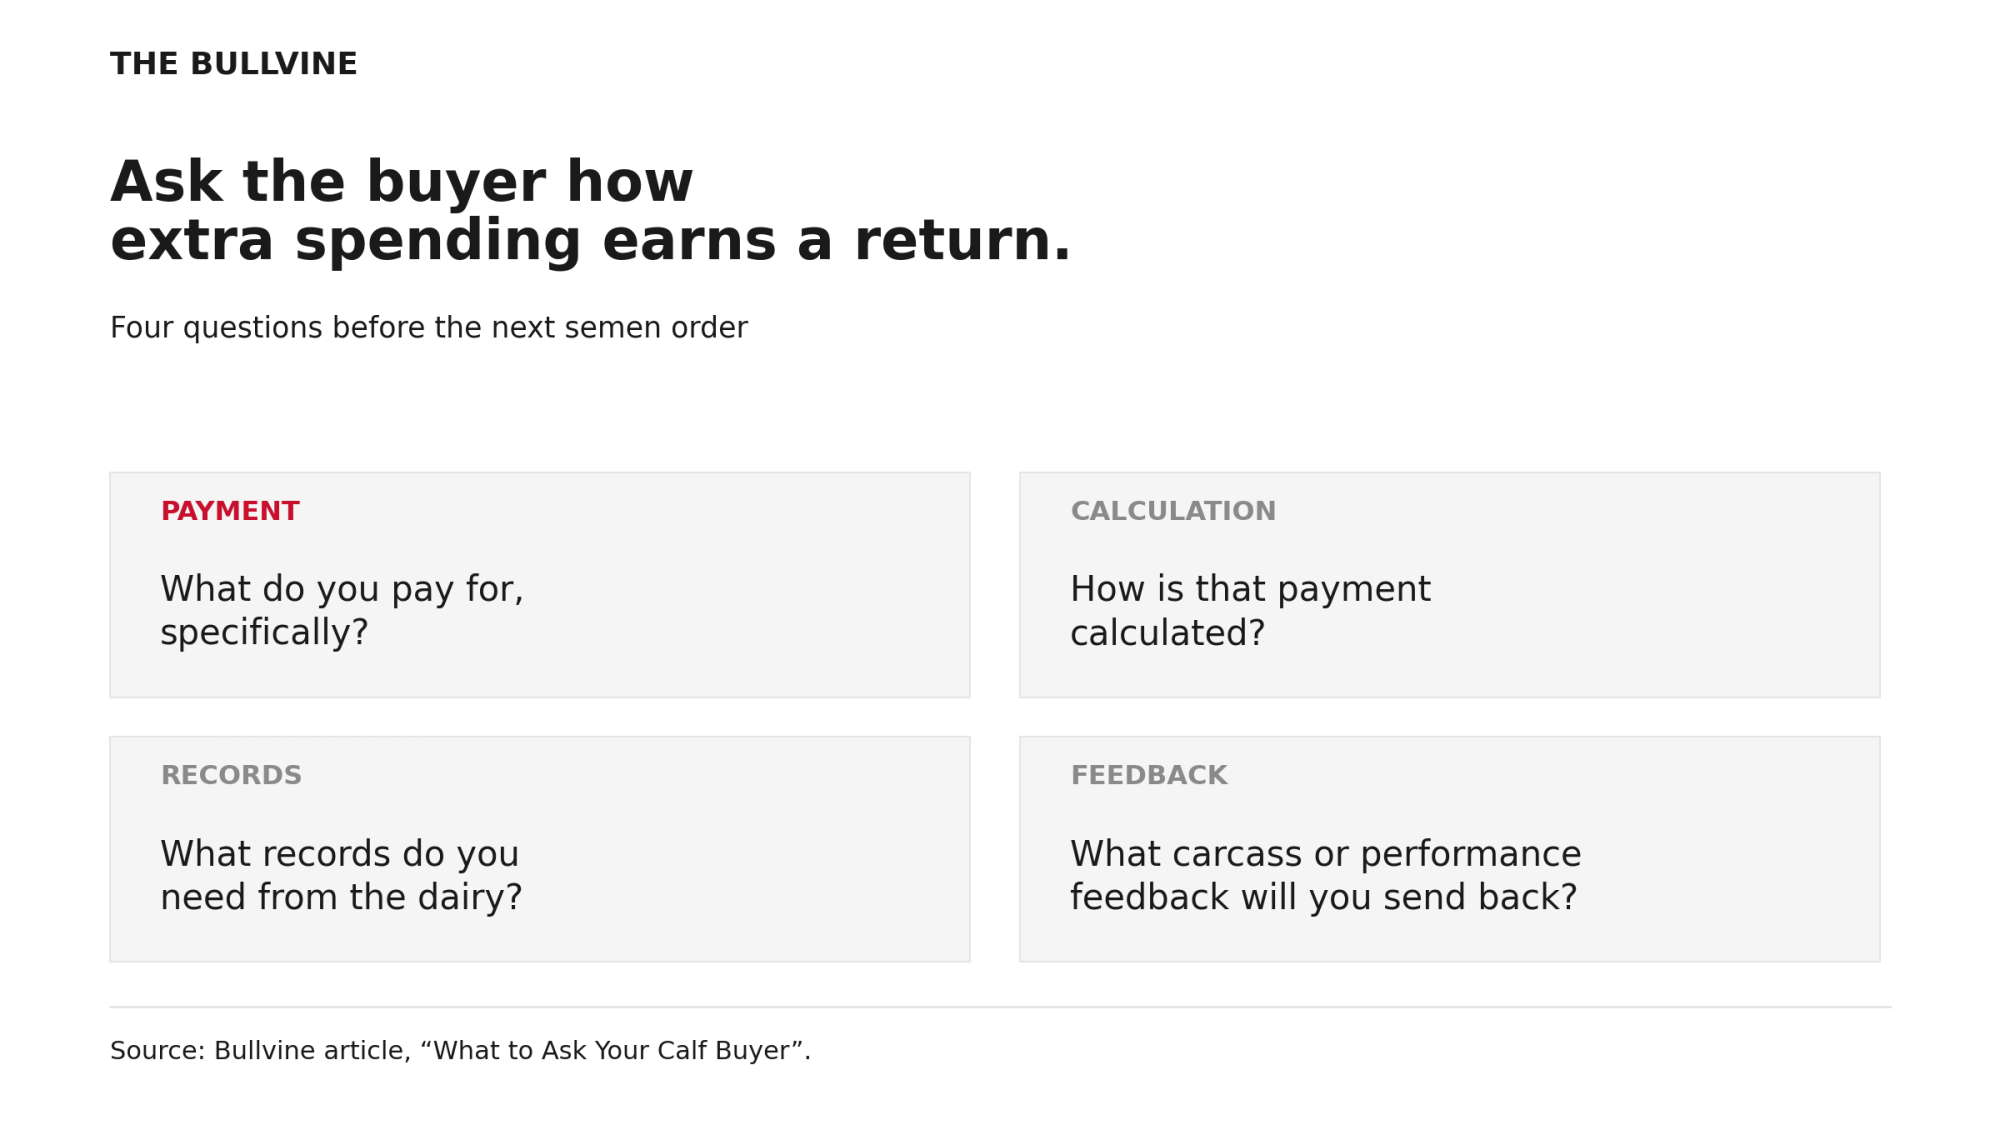
Auction sales and specification-based arrangements aren’t either-or; a herd can use both. Either way, put four questions to the buyer:

  • What do you pay for, specifically?
  • How is that payment calculated?
  • What records do you need from the dairy?
  • What carcass or performance feedback will you send back?

A written price mechanism shows a buyer pays for something. It isn’t the only proof that spending has value, and it isn’t enough by itself, because the payment still has to cover the cost and the rejection risk. For any extra expense, ask what evidence shows it improves your return through this buyer.

Keep essential care out of that test. Colostrum and calving management pay through calf health, survival and growth whether or not a buyer itemizes them. The test is for optional, buyer-specific items like certification, testing, documentation or a premium terminal-trait straw. Judge each on its total benefit, avoided losses included, and weigh it against what a beef straw costs you in replacement value.

Playbook

This week: gather settlements and pick a fair comparison.

  • Pull 12 months of calf settlements and calculate your beef-cross premium over dairy bull calves in dollars and percent, split by sex.
  • Compare like with like: similar sale dates and locations; comparable sex, weight, age and grade; settlement values that are consistently gross or consistently net; and your own history in the same channel.
  • If you sell few dairy bull calves, use a matched local benchmark, such as the same week’s market report for your sale. Setting annual beef-cross receipts against an unmatched annual dairy calf average mixes up market timing with the breeding premium.
  • Small samples and wide price swings limit how much any comparison can tell you.

Before the next semen order: run the scenarios.

  • Review incremental costs per beef-sired calf sold, conception differences and replacement needs.
  • Run both sexes at the 2020 and 2025 premium levels above.
  • Weigh calving ease. Difficult calvings can raise costs and losses.

Over the next calf-sales cycle: track what pays.

  • Record which sires and which buyer arrangements produced which settlements.
  • Check whether the extra spending improved realized returns through that buyer.

More from Bullvine’s beef-on-dairy coverage.

Beef-on-Dairy Margin Stress Test

Plug in your local auction prices and herd data to calculate your actual premium over dairy bull calves.

Load MSU Scenarios:

Premium per Head

$341.00
171% of dairy calf value

Gross Herd Premium

$23,870.00
Before added costs

Net Program Advantage

$20,370.00
Total profit over dairy bulls

Methodology Note

Published inputs: MSU Extension, “Premiums for beef-dairy cross calves shrinking in percentage terms” (Luke and Jaborek), July 17, 2026, Tables 1–2. These are mean differences between quantity-weighted average prices from three USDA AMS reports, mid-2020 through 2025. The full study is Applied Animal Science 42(4), August 2026, DOI 10.15232/aas.2026-02804. Data limitations are from the journal’s August 10, 2026 release.

Bullvine calculations: Scenario totals are premium × 70 bull calves. The midpoint is the average of the 2020 and 2025 PA No. 1 bull premiums. The two-sex figure is the mean of the PA No. 1 bull and heifer premiums for the same year.

Limits: three sale series in two states. Your region, grade, buyer or channel may differ.

Complete references and supporting documentation are available upon request by contacting the editorial team at editor@thebullvine.com.

Learn More

The Sunday Read Dairy Professionals Don’t Skip.

Every week, thousands of producers, breeders, and industry insiders open Bullvine Weekly for genetics insights, market shifts, and profit strategies they won’t find anywhere else. One email. Five minutes. Smarter decisions all week.

NewsSubscribe
First
Last
Consent

Dairy Heifer Shortage Deepens as Beef-Cross Calves Gain Market Share

Record-low dairy heifer numbers and soaring beef-cross calf prices are reshaping the U.S. dairy landscape. As farmers embrace profitable beef-on-dairy breeding, with crossbred calves fetching nearly $300 more than Holsteins, the industry faces tough choices between immediate profits and future milk production.

Summary:

The U.S. dairy industry faces a critical turning point as heifer inventories hit a 47-year low of 3.914 million head, down 0.9% from last year. This shortage, driven by farmers increasingly breeding dairy cows with beef bulls for premium calf prices, threatens to constrain future milk production growth. While beef-cross calves command nearly $300 more per head than purebred Holsteins at auction, this profitable trend creates a challenging balance between immediate returns and long-term sustainability. Adding to these concerns, potential 25% tariffs on trade with Mexico and Canada could disrupt crucial export markets, forcing dairy producers to carefully weigh their breeding strategies and market approaches in an increasingly complex industry landscape.

Key Takeaways:

  • The U.S. dairy sector faces a 47-year low in dairy heifer inventories, complicating future milk production growth.
  • Beef-cross calves are gaining traction, selling for higher prices than traditional Holsteins, affecting the availability of pure dairy replacements.
  • Retaliatory tariffs from Canada and Mexico in response to U.S. policy changes could disrupt dairy export markets.
  • The ongoing shortage urges farmers to innovate and find solutions that balance immediate gains with sustainable growth.
  • Dairy farmers are encouraged to focus on enhancing herd productivity, considering careful breeding, and exploring new export markets.
dairy heifer inventory, beef-cross calf prices, U.S. dairy industry, milk production sustainability, export market challenges

The U.S. dairy landscape faces an unprecedented transformation. Heifer inventories hit a 47-year low of 3.914 million head, down 0.9% from last year. With crossbred calves commanding nearly $300 more than purebred Holsteins, producers must balance lucrative beef-cross opportunities against future milk production capacity. 

Current Inventory Crisis 

YearDairy Heifers (Million Head)% Change from Previous Year
20204.34–
20214.25-2.07%
20224.15-2.35%
20234.07-1.93%
20244.06-0.25%

“Farmers are now trying to decide how long to keep a cow. These cows are paid to produce milk, yet they’re worth as much as beef. You cannot afford to have any die on the farm.”— Gary Sipiorski, Independent Dairy Financial Advisor

Market Economics 

Calf TypeAverage Price (USD)Premium Over Dairy
Holstein Bull$703.75–
Beef-Cross Bull$986.43+40%

The beef-on-dairy strategy offers immediate financial rewards but creates long-term challenges. While crossbred calves command significant premiums, the USDA projects only 2.5 million replacement heifers will enter milking herds in 2025—insufficient to maintain current production levels. 

“Beef-on-dairy calves showcase an opportunity to tell a sustainable story of productivity and efficiency. Their feed efficiency significantly reduces greenhouse gas emissions.”— Dr. Dale Woerner, Meat Scientist, Texas Tech University

Export Market Challenges 

Current Export Data (Jan-Nov 2024) 

  • Mexico: $2.25b (30% of U.S. dairy exports)
  • Canada: $1.1b (14% of exports)

President Trump’s proposed 25% tariffs on Canadian/Mexican imports threaten to disrupt crucial export markets. Industry analysts project: 

  • 15-20% reduction in cheese export volumes
  • 1.2b pounds increase in domestic dairy surplus
  • $0.50/cwt decrease in farmgate milk prices

“If these tariffs take effect, Mexican buyers could pivot to EU suppliers. Our logistical advantage erodes when facing 25% price hikes.”— Dr. Emily Chen, Agricultural Economist

Strategic Adaptation 

StrategyKey BenefitImplementation Timeline
Precision Herd Management+12% Milk Yield per Cow6-18 Months
Strategic Beef-Cross Breeding+$280/Calf RevenueImmediate
Export Market DiversificationReduce Mexico/Canada Reliance2-3 Years

Market Outlook 2025-2026 

IndicatorCurrent12-Month Forecast
Heifer Inventory3.914m3.85m (-1.6%)
Milk Production227.5b lbs225.8b lbs
Beef-Cross Premium$282/head$290-310/head

Action Items for Producers 

  • Inventory Management
    • Calculate replacement needs through 2026
    • Review breeding programs
    • Evaluate herd demographics
  • Market Positioning
    • Secure export contracts before tariff implementation
    • Explore alternative markets
    • Consider value-added processing
  • Genetic Strategy
    • Balance beef-cross with dairy genetics
    • Implement targeted use of sexed semen
    • Select for longevity traits

“Most farms have fallen so in love with producing beef-on-dairy that they don’t have the replacement heifers needed.”— Dr. Geoff Smith, Dairy Technical Services Veterinarian, Zoetis

The Bottom Line

The dairy industry stands at a pivotal crossroads, balancing lucrative beef-cross opportunities against sustainable milk production capacity. With heifer inventories projected to decline another 1.6% by 2025 and export markets facing potential disruption, producers must carefully weigh short-term profits against long-term sustainability. Success will depend on implementing data-driven breeding decisions, maintaining flexible marketing strategies, and building strong replacement heifer programs. Share your operation’s strategy for navigating these challenges in the comments below.

Learn more:

Join the Revolution!

Bullvine Daily is your essential e-zine for staying ahead in the dairy industry. With over 30,000 subscribers, we bring you the week’s top news, helping you manage tasks efficiently. Stay informed about milk production, tech adoption, and more, so you can concentrate on your dairy operations. 

NewsSubscribe
First
Last
Consent

Why Dairy Farmers Are Seeing Double: Unpacking the Surge in Summer Heifer Prices

Why are dairy heifer and calf prices soaring this summer? Find out how heat, avian flu, and scarce replacements are affecting your bottom line.

Summary: The dairy industry is experiencing a significant price hike for dairy heifers and calves this summer, with Holstein springers approaching $3,000 per head, nearly double from last year. Beef-cross calf prices are also rising, with newborn calves commanding $700 or more per head. Key reasons for the price increase include hot weather, the ongoing war against avian influenza, and a scarcity of replacement heifers. Hot weather causes cow heat stress, reducing milk output. Avian influenza restricts the movement of livestock, such as heifers, and stringent quarantine measures can indirectly affect various livestock industries, reducing the availability of replacement heifers and straining market supply systems. The scarcity of replacement heifers is a major cause of rising pricing, as they are critical for ensuring ongoing milk supply. This is a critical time for dairy producers to examine their operations, how these costs will affect their bottom line, and how their farms can respond to these market changes.

  • Holstein springer prices have doubled from last year, nearing $3,000 per head.
  • Beef-cross calf prices are also on the rise, with newborns fetching $700 or more per head.
  • Hot weather is causing heat stress in cows, leading to decreased milk production.
  • Avian influenza impacts livestock movement and quarantine measures, indirectly affecting heifer availability.
  • Scarcity of replacement heifers is a significant factor driving up prices.
  • Dairy producers need to assess the impact of rising costs on their operations and explore strategies to adapt.
dairy industry, price hike, dairy heifers, calves, Holstein springers, beef-cross calf prices, hot weather, avian influenza, scarcity of replacement heifers, cow heat stress, milk output, farm biosecurity measures, USDA, quarantine, containment measures, livestock industries, market supply systems, ongoing milk supply, USDairy, decrease in replacement heifer availability, demand, extreme weather conditions, pricing dynamics, dairy producers, operations, bottom line, market changes.

Have you observed the soaring costs of heifers and calves this summer? This isn’t a coincidental observation; dairy heifers and calves are fetching historic prices, with Holstein springers approaching $3,000 per head—nearly double from last year. Simultaneously, beef-cross calf prices are skyrocketing, with newborn calves commanding $700 per head and higher. What does this imply for you and your dairy business?

The Who, What, When, Where, Why, and How of Soaring Heifer and Calf Prices 

Who: The latest market developments have significantly impacted dairy producers throughout the country.

What: The main event is a significant price hike for dairy heifers and calves. Holstein springers, for example, are witnessing price increases of up to $3,000 per head.

When: These skyrocketing costs will be documented throughout the summer of 2024.

Where: Turlock, Calif., Lomira, Wis., Pipestone, Minn., and New Holland, Pa. have all seen this pattern. 

Why: The key reasons for the price increase include hot weather, the effect of avian influenza, and a lack of replacement heifers.

How: These factors contribute to limited milk supply, which raises demand and prices for heifers and calves. Increased demand indicates strong market conditions for dairy producers eager to sell.

The T.C. Jacoby Dairy Market Report Sheds Light on Compelling Trends 

The T.C. Jacoby Dairy Market Report reveals intriguing patterns, suggesting that Holstein springers have skyrocketed to unprecedented price levels, reaching $3,000 per head this month. This amount is about twice the levels reported a year ago, indicating a robust upward market change. Beef-cross calf prices are also rising nationwide, with newborn calves selling for $700 or more per head.

Hot weather, the continuing war against avian influenza, and a scarcity of replacement heifers have all contributed to a constrained milk supply, which has fueled these healthy pricing trends. Pipestone Livestock Market mirrored similar comments, stating “robust markets and lots of demand for open heifers,” as seen in early August.

Location (sale date)Springing Heifers Supreme/TopSpringing Heifers Approved/MediumHeifer Calves 90-120 poundsHeifer Calves 60-100 poundsBeef Cross Calves
Turlock, Calif. (8-2-24)$2,500-3,250$1,800-2,400–––
Lomira, Wis. (8-2-24)$1,500-2,200$1,200-1,400$380-500–$720-1,010
Pipestone, Minn. (7-18-24)$3,100-3,300$3,000-3,100No test–$750-925
New Holland, Pa. (7-22-24)No reportNo reportNo test–$800-1,100

Prices for springing heifers are much higher in Pipestone, Minnesota, compared to Lomira, Wisconsin, and Turlock, California. Lomira, Wisconsin, is the sole place that offers precise pricing for heifer calves. New Holland, Pa., has the most fantastic range of beef-cross calves, showing strong market demand.

What’s Driving the Soaring Heifer and Calf Prices? The Triple Threat You Need to Know About

The recent spike in dairy heifer and calf prices can be attributed to three critical factors: 

Hot Weather 

Hot weather has an evident influence on dairy output. High temperatures cause cow heat stress, which drastically reduces milk output. Numerous studies support this occurrence; for example, a University of Minnesota research indicated that heat stress may reduce milk supply by up to 10-30% [University of Minnesota Extension]. Reduced milk yields reduce supply, raising prices.

Avian Influenza 

Although avian influenza predominantly affects poultry, the effects extend across the cattle industry. The viral epidemic has led to increased farm biosecurity measures, restricting the movement of livestock such as heifers. The USDA states that “stringent quarantine and containment measures can indirectly affect various livestock industries.” This reduces the availability of replacement heifers and strains market supply systems.

Scarcity of Replacement Heifers 

The lack of replacement heifers is a major cause of rising pricing. Replacement heifers are critical for ensuring ongoing milk supply; without them, existing herds would age without new animals to take their place. According to USDairy’s current statistics, replacement heifer availability has decreased by around 15% from the previous year. Scarcity and increased demand have increased market prices for available heifers and calves.

The Bottom Line

As we’ve seen, the sky-high prices for dairy heifers and calves reflect a persistent tendency in the dairy business. The market has produced possibilities and problems for farmers throughout the country owing to extreme weather conditions, an avian influenza epidemic, and a lack of replacement heifers. The pricing dynamics are altering, with Holstein springers commanding upwards of $3,000 per head and beef-cross calves selling at high prices.

The T.C. Jacoby Dairy Market Report emphasizes the importance of these issues, predicting that tighter supply and strong demand will continue to define future estimates. This is a critical time for dairy producers to examine their operations. How will these skyrocketing costs affect their bottom line? Can their farm respond to these market changes? Navigating these concerns will be critical for dairy producers’ planning for the next months.

Learn more: 

Send this to a friend