





One Oct. 27, 2026 sale in Glasgow, Kentucky: beef-cross bull calves from $400 to $1,375. Before that cheque funds a payment, know how much of it your loan already needs. All figures are in US dollars.
Before a farm commits the next beef-on-dairy calf cheque, the first number to find is the share its existing debt payments already need. At the Glasgow dairy auction in Smiths Grove, Kentucky, USDA’s Agricultural Marketing Service reported 72 beef-cross baby bull calves averaging US$997.22 a head on October 27, 2026, with individual sales from US$400 to US$1,375. That’s a dated market reference. It doesn’t say what any one farm’s calves will bring next month.
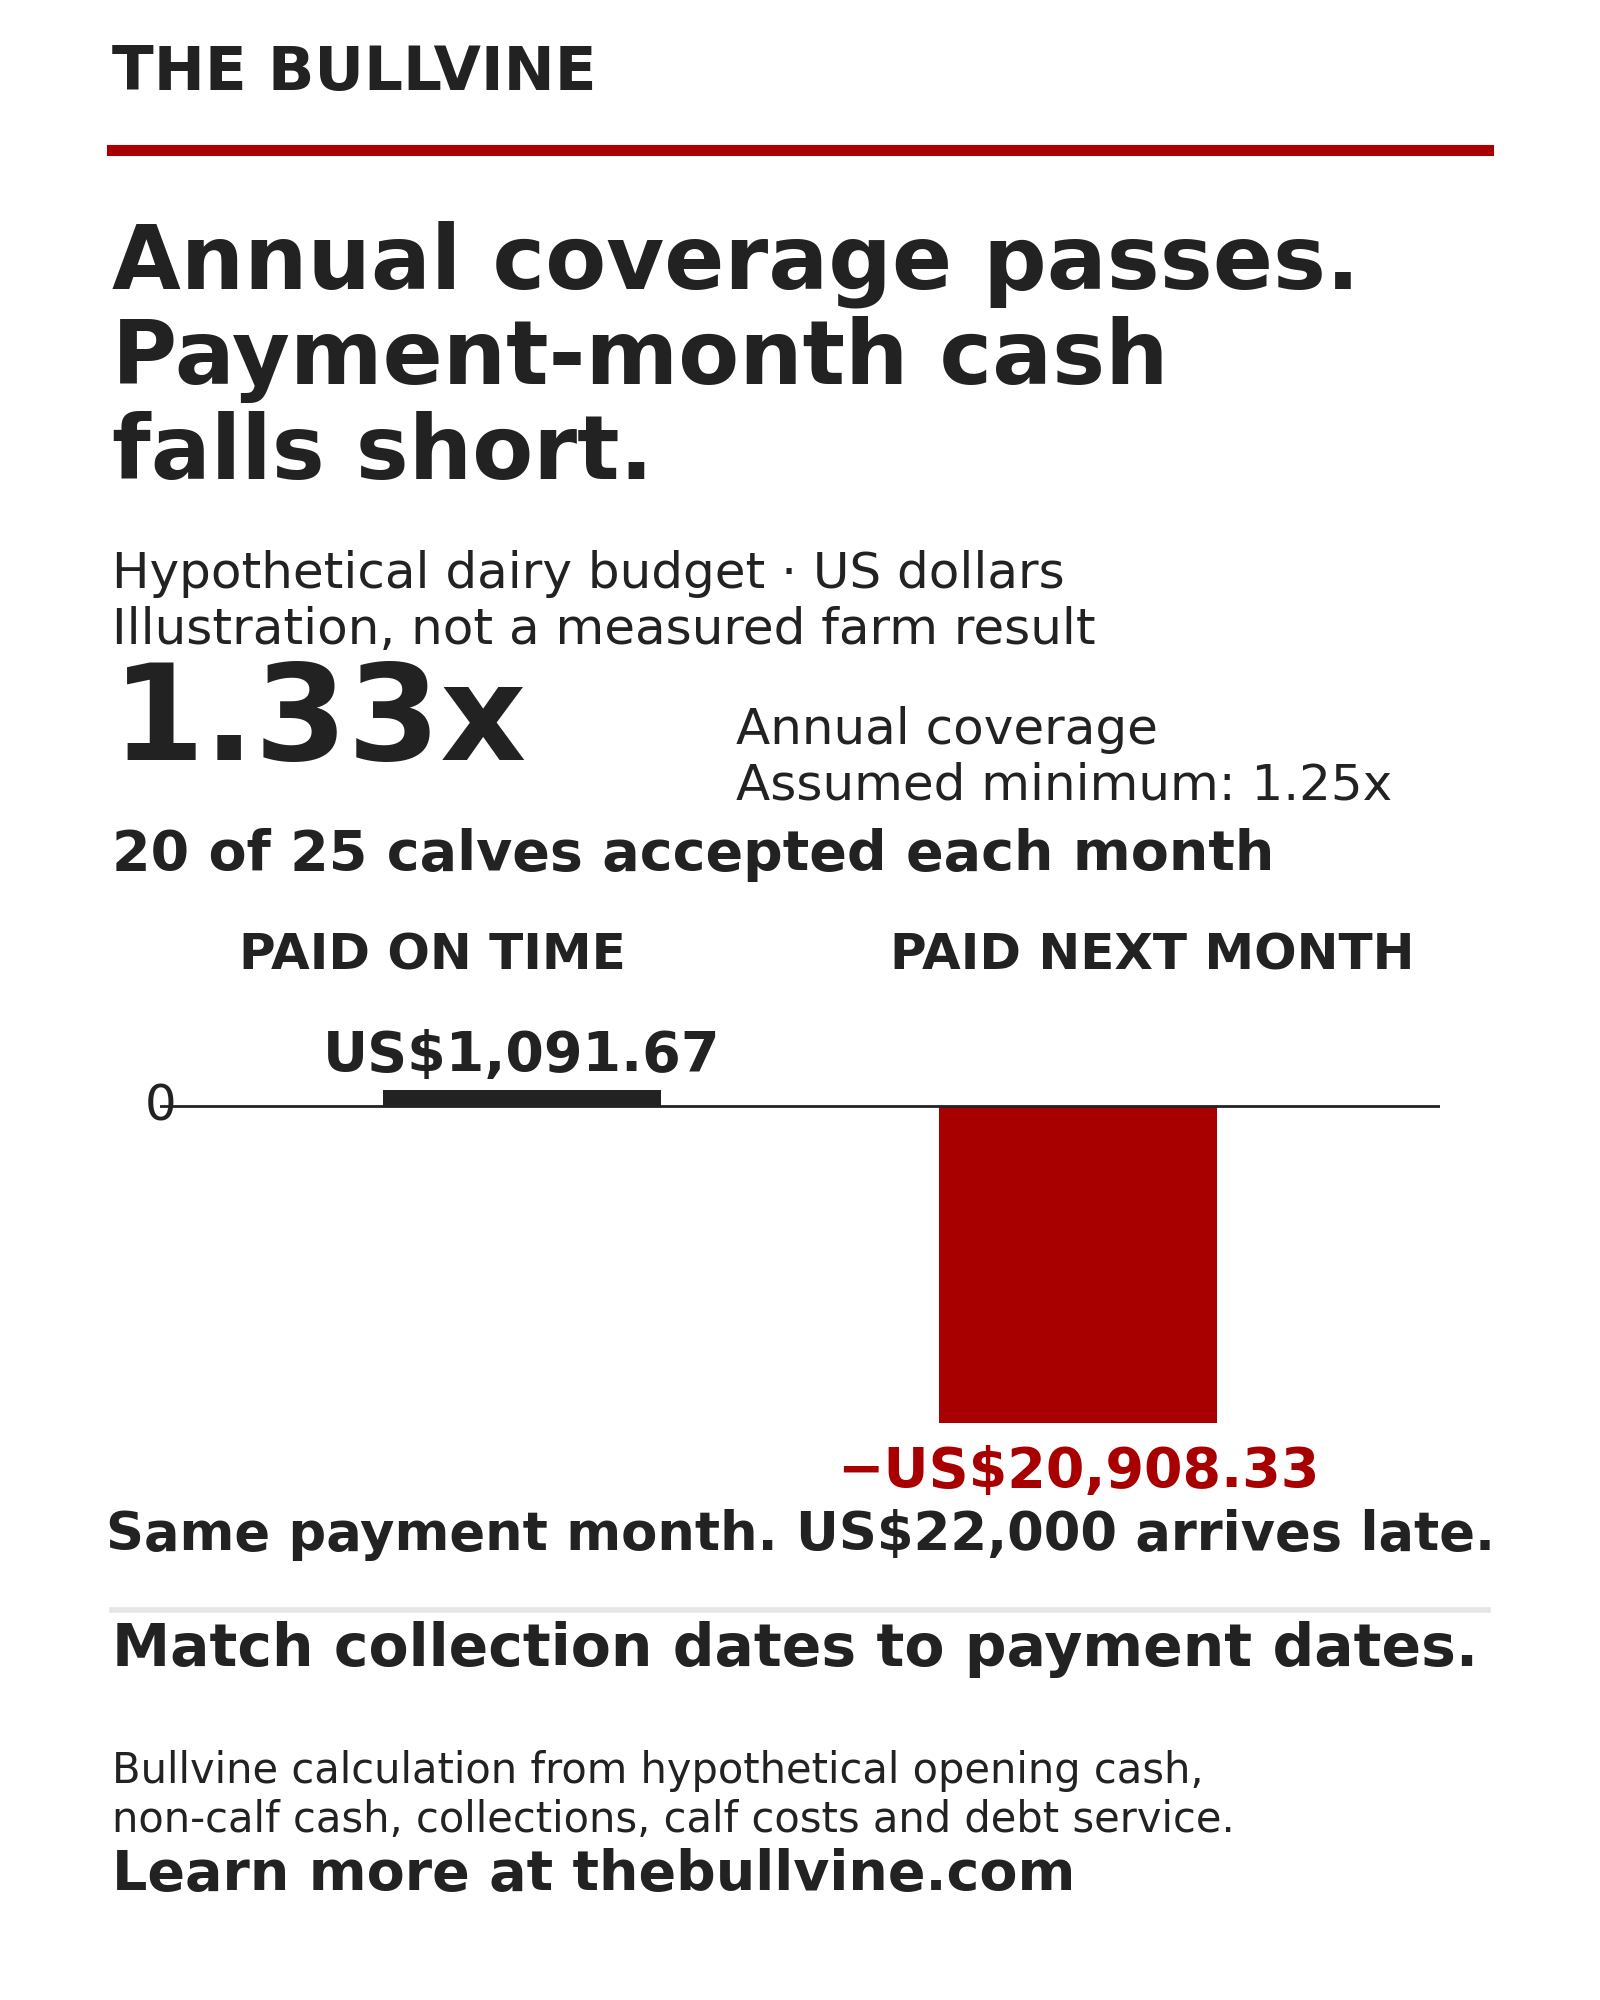
The harder question is how much of a farm budget already depends on calf income. In a hypothetical budget isolated from USDA averages, US$50,000 of annual calf contribution is needed just to cover existing debt payments. A 35% cut in net calf contribution leaves only a US$6,915 annual cash-flow cushion above an assumed 1.25x coverage requirement. In the same model, the farm passes annual coverage at 1.33x and still finishes a payment month US$20,908 short.
What did USDA’s Glasgow report show?
Report 2199 lists baby calves per head (“Per Unit / No Wt”). AMS says prices are FOB unless otherwise noted.
| Glasgow dairy auction, Oct 27, 2026 (Final) | Head | Range, US$/head | Average, US$/head |
| Baby bull calves, beef cross | 72 | 400–1,375 | 997.22 |
| Baby bull calves, breed not labelled | 52 | 400–1,050 | 846.15 |
| Baby heifer calves, beef cross | 19 | 575–1,250 | 940.79 |
Source: USDA AMS / Kentucky Department of Agriculture Market News, Report 2199, sale of October 27, 2026. The table includes baby calves only; specific ages and weights are not reported. These aren’t weaned calves, feeders, fed cattle, or retail beef.
The AMS baby-calf rows omit age, health, sire data, and buyer terms, so nothing in them explains the US$975 spread or predicts where the next calf crop lands.
When does calf income become essential to debt payments?
CoBank’s June 18, 2026 release put beef sales at 12% of revenue for many dairy farms, the lower end of its reported range. The agricultural lender’s figures include cull cows as well as calves, so they can’t be treated as calf income alone. For the cull side of that figure, see our coverage of ERS’s fourth-quarter cull cow price outlook.
Calf income becomes essential the moment there’s a payment the farm couldn’t meet without it, and the place to start is scheduled principal and interest. Iowa State University Extension’s cash-flow guide (File C3-14) notes that principal payments are “not an expense but merely a cash transfer between you and your lender.” It also notes that “a cash flow statement shows liquidity while an income statement shows profitability.” A profitable year can still run short of cash on the wrong date.
Running the Numbers
This hypothetical budget carries US$550,000 of annual debt service, and every result in it is a Bullvine calculation. It applies when calf receipts help fund scheduled debt payments, with the farm’s own figures in place of these inputs. A farm without scheduled debt payments needs a cash-timing check instead of a debt-coverage ratio.
- Gross receipts: an assumed US$1,100 per calf, less US$103 in assigned calf costs and selling charges, leaves US$997 net cash contribution. These hypothetical inputs are independent of USDA’s Glasgow gross average.
- Herd and calf sales: the herd is in the 400–500-cow range and sells 300 calves a year (25 a month), for US$299,100 of annual net calf contribution.
- Non-calf cash: US$500,000 a year is available for debt service, after other operating costs, taxes, and withdrawals but before the principal and interest in annual debt service. Calf receipts and the US$103-per-calf costs sit outside this figure and are counted separately.
- Debt service: US$550,000 a year in principal and interest.
- Milk revenue: unchanged in every scenario.
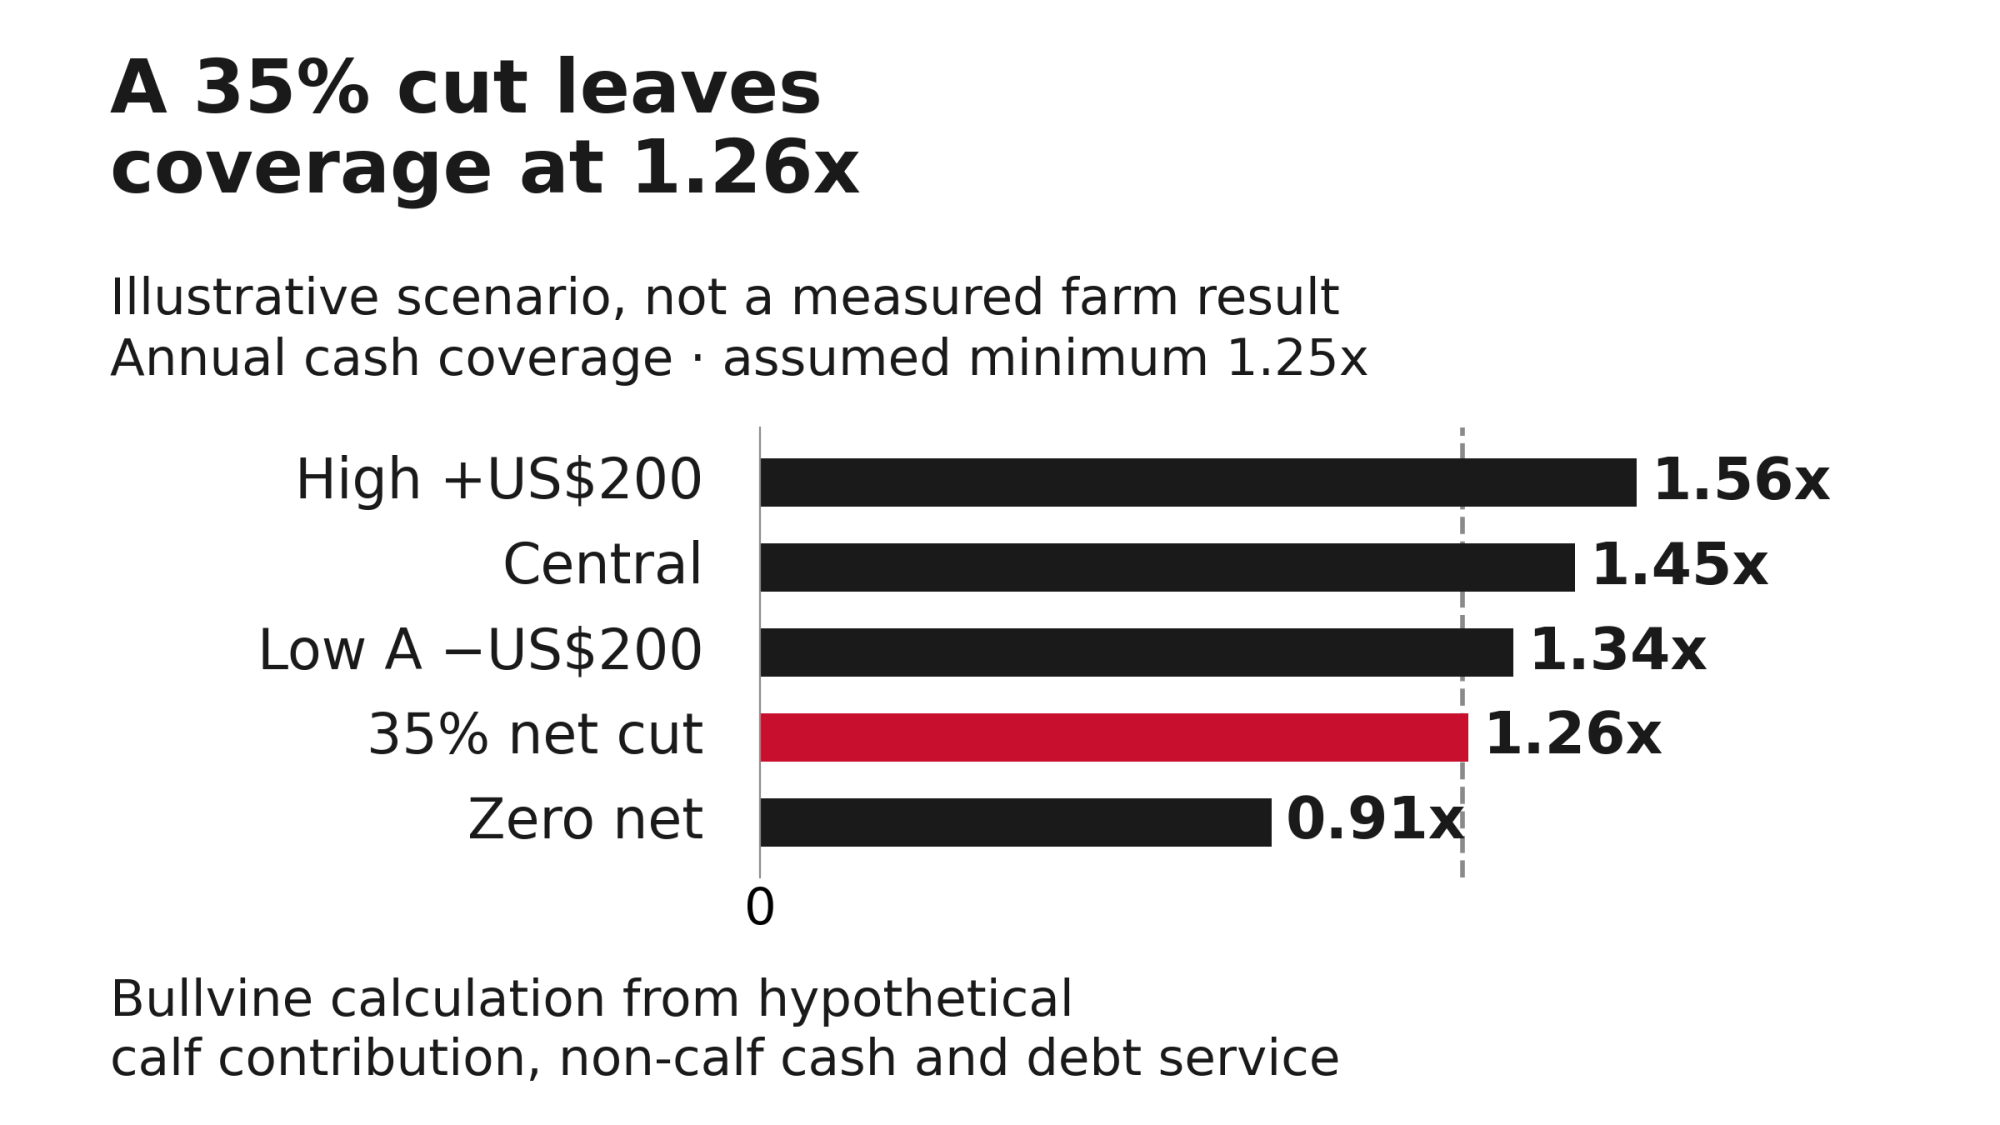
| Scenario (Bullvine) | Net US$/calf | Annual calf contribution | Cash coverage |
| High: +US$200 | 1,197.00 | 359,100 | 1.56x |
| Central | 997.00 | 299,100 | 1.45x |
| Low A: −US$200 | 797.00 | 239,100 | 1.34x |
| Low B: 35% cut in net contribution | 648.05 | 194,415 | 1.26x |
| Zero net calf contribution | 0 | 0 | 0.91x |
Coverage = (non-calf cash + calf contribution) ÷ debt service. This is a simplified ratio, and the lender’s covenant definition is the one that counts.
The 35% test cuts net calf contribution, not gross sale price. Because calf costs stay fixed, a percentage drop in sale price causes a steeper percentage drop in net contribution.
The three figures below answer three different questions. The 1.25x minimum is illustrative, not a lender standard.
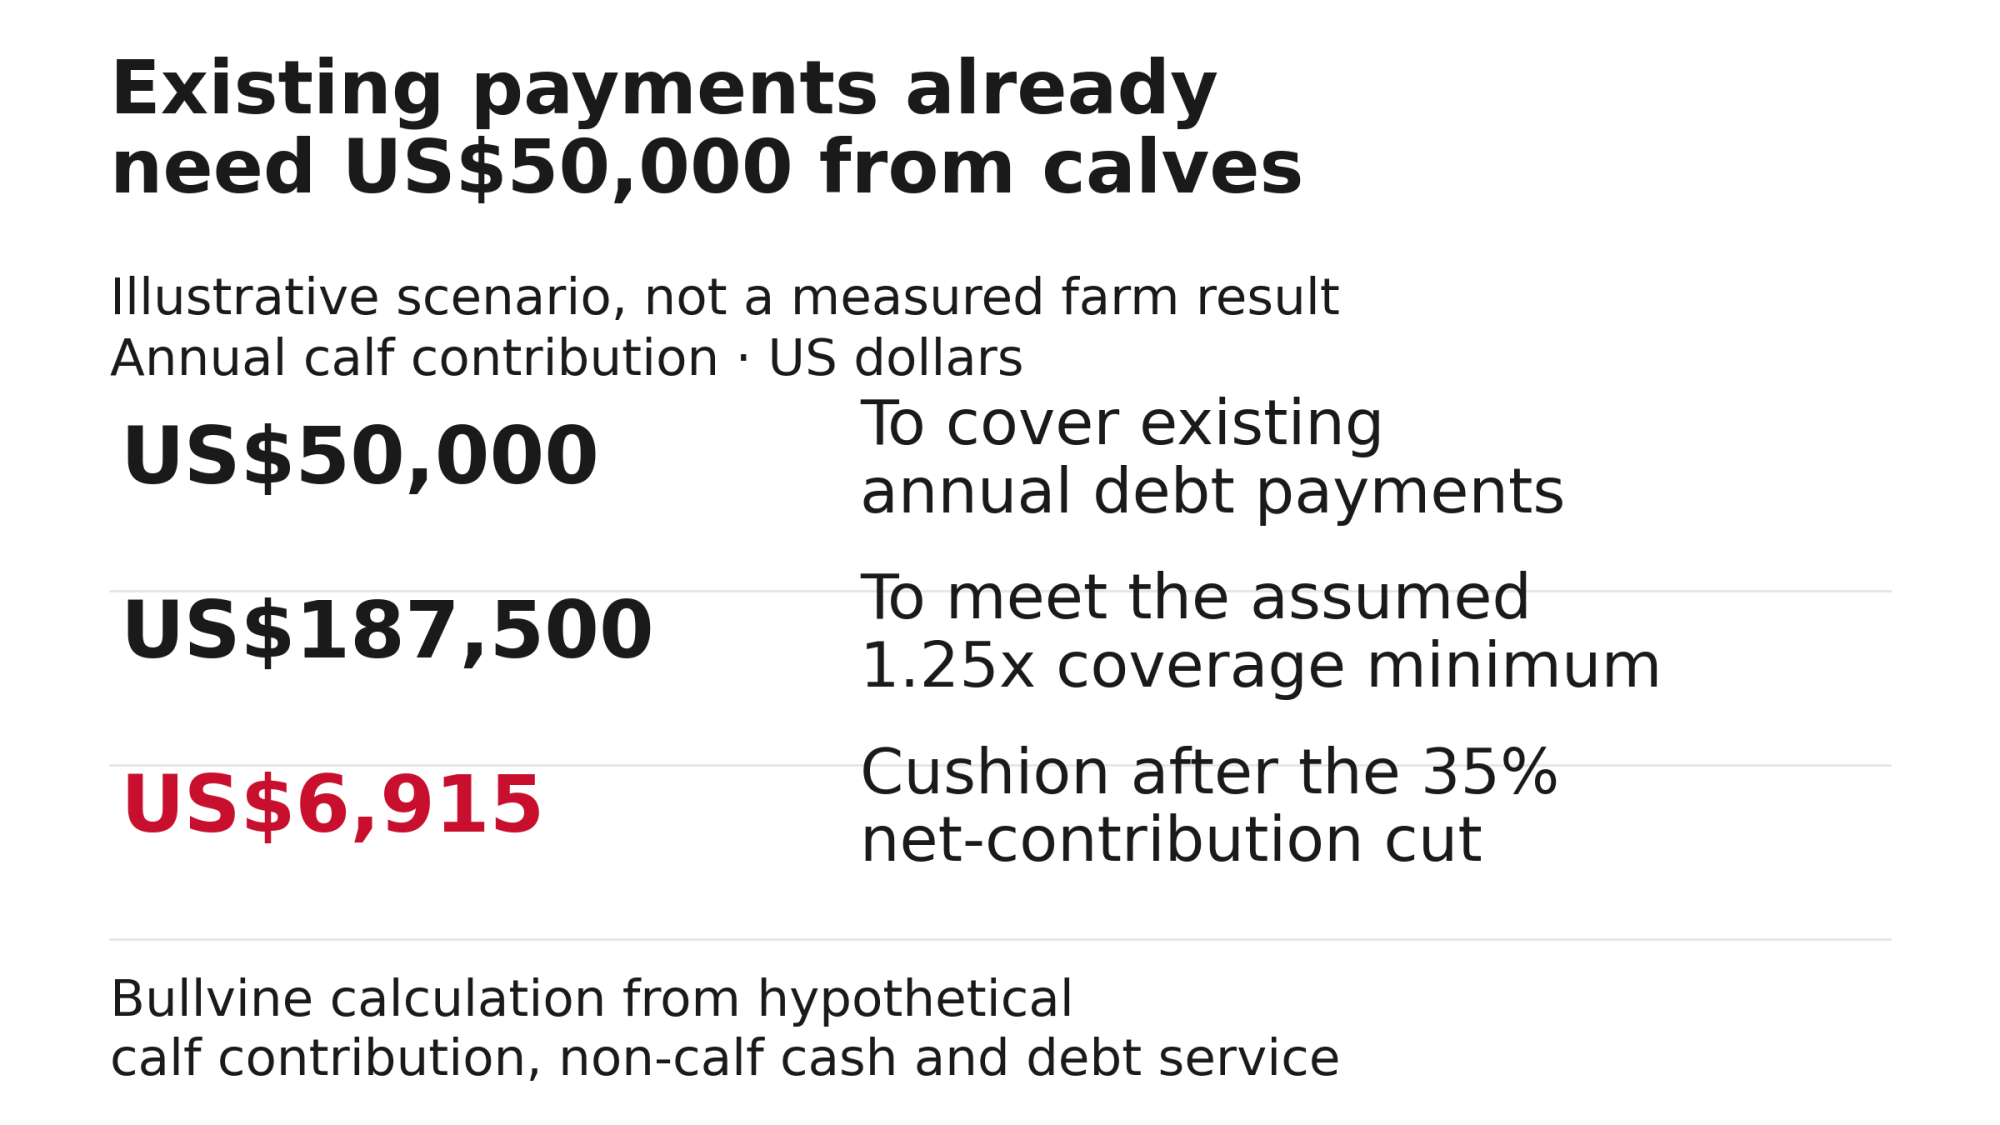
| Measure (Bullvine) | Calculation | What it answers |
| US$50,000 existing dependence | US$550,000 − US$500,000 | How much calf contribution is needed just to cover existing annual debt payments? |
| US$187,500 required at 1.25x | 1.25 × US$550,000 − US$500,000 | How much is needed to meet the assumed coverage minimum? |
| US$6,915 stressed cushion | US$194,415 − US$187,500 | How much more could annual cash flow fall in the stressed case before hitting that minimum? |
The 35% case removes US$104,685 at the illustrative 1.25x minimum, that leaves US$6,915 of annual cash-flow cushion above the coverage requirement, which is not a bank balance or an amount available to borrow. At 1.30x, the same case falls short by US$20,585.
On this simplified basis, the cushion supports about US$5,532 of additional annual debt service at 1.25x (US$6,915 ÷ 1.25), assuming cash generation doesn’t change. It sets a ceiling for the lender conversation and is not a loan amount.
What happens when fewer calves qualify, and payment runs late?
At 1.33x, annual coverage can pass while a single payment month fails. This monthly illustration uses the same assumptions:
- Opening cash: US$10,000
- Non-calf cash for the month: US$41,666.67
- Calves presented: 25
- Calf costs paid this month: all 25 calves presented carry US$103 in assigned costs, and the model assumes the full 25 × US$103 = US$2,575 is paid during this month.
- Calves that don’t qualify generate no alternative-sale proceeds in this illustration. The annual reduced-acceptance calculation carries that assumption through all 12 months.
- Debt payment this month: US$70,000, which is part of the US$550,000 annual total
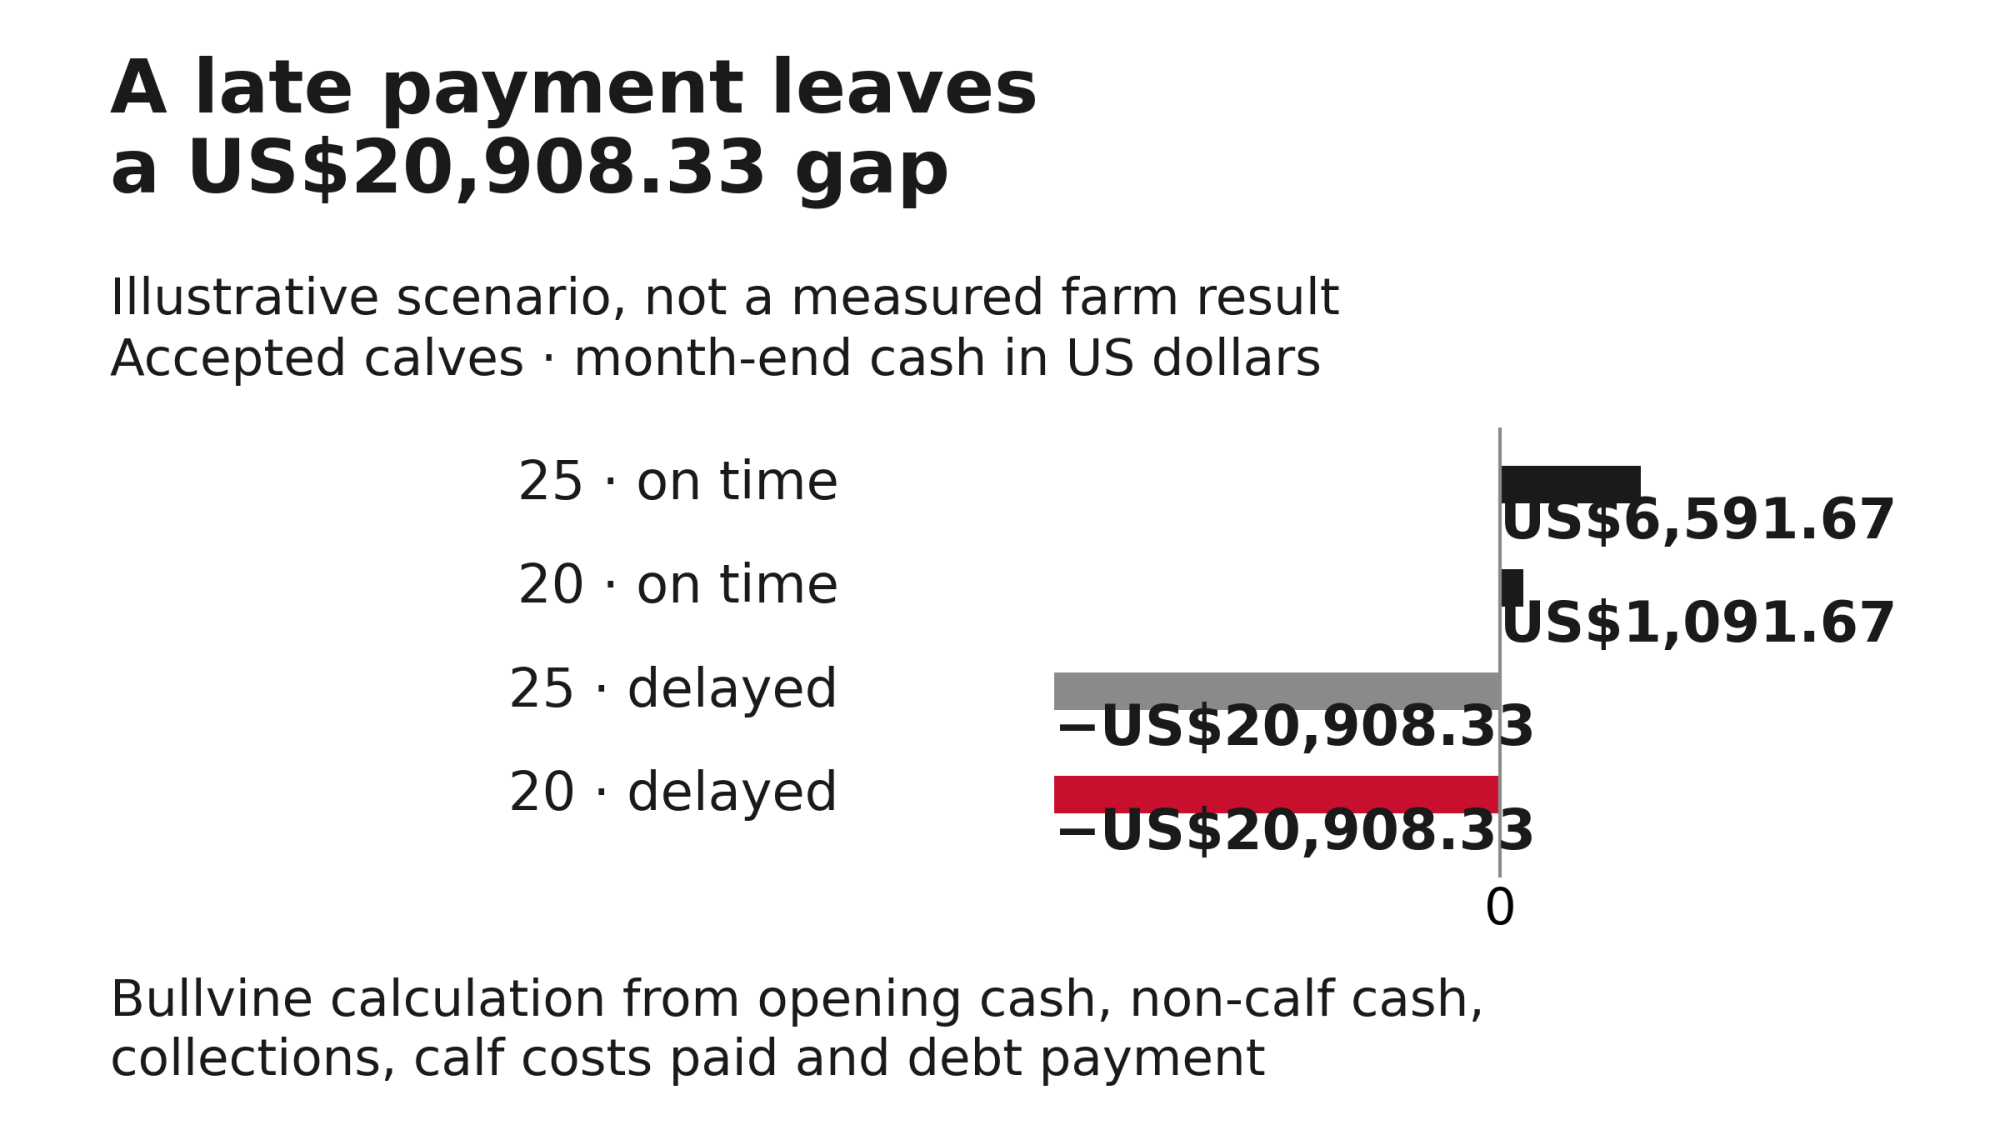
| Payment month (Bullvine) | Calves accepted | Calf cash collected | Calf costs paid | Closing cash before financing |
| Baseline, paid on time | 25 | US$27,500 | US$2,575 | US$6,591.67 |
| Price holds, 5 don’t qualify | 20 | US$22,000 | US$2,575 | US$1,091.67 |
| All payment delayed a month | 25 | US$0 | US$2,575 | −US$20,908.33 |
| Both together | 20 | US$0 | US$2,575 | −US$20,908.33 |
Figure: Annual cash coverage by scenario (left) and closing cash in the payment month, by scenario (right). Hypothetical Bullvine farm budget; Bullvine calculations, not auction prices.
When calf collections are zero, both delayed-payment scenarios carry the same current-month cash gap. The difference appears in the delayed receipts collected next month: US$27,500 with all 25 calves accepted against US$22,000 with 20 accepted. Those receipts aren’t next month’s closing cash balance.
If 20 calves qualify every month for the whole year and the other five never produce proceeds, annual net calf contribution is 12 × [(20 × US$1,100) − US$2,575] = US$233,100. Annual coverage is (US$500,000 + US$233,100) ÷ US$550,000 = 1.33x. Delay that payment month’s calf receipts, though, and the farm still faces a US$20,908 month-end cash gap before financing. Establishing the timing and size of the peak funding gap takes daily payment dates.
Does the heifer calendar support the beef matings?
CoBank frames the trade-off as a two-year investment in a replacement against a beef-on-dairy calf that is “essentially an instant one-time revenue source.” In June, CoBank projected 796,000 fewer replacements entering herds across 2025 and 2026, followed by roughly 360,000 additional entries across 2027–28. Those are forecasts built on national-average reproductive assumptions that CoBank says vary by region.
The farm-level answer comes from a dated schedule, which needs:
- Expected first-calving dates for every heifer and dairy pregnancy
- Allowances for losses and delayed entries
- Planned exits and herd-size changes
- Dated purchase costs for any gap the home-raised supply doesn’t cover
A negative balance in any period is a gap. Proving that beef matings caused it takes cohort records, because poor fertility or heifer sales can leave the same hole.
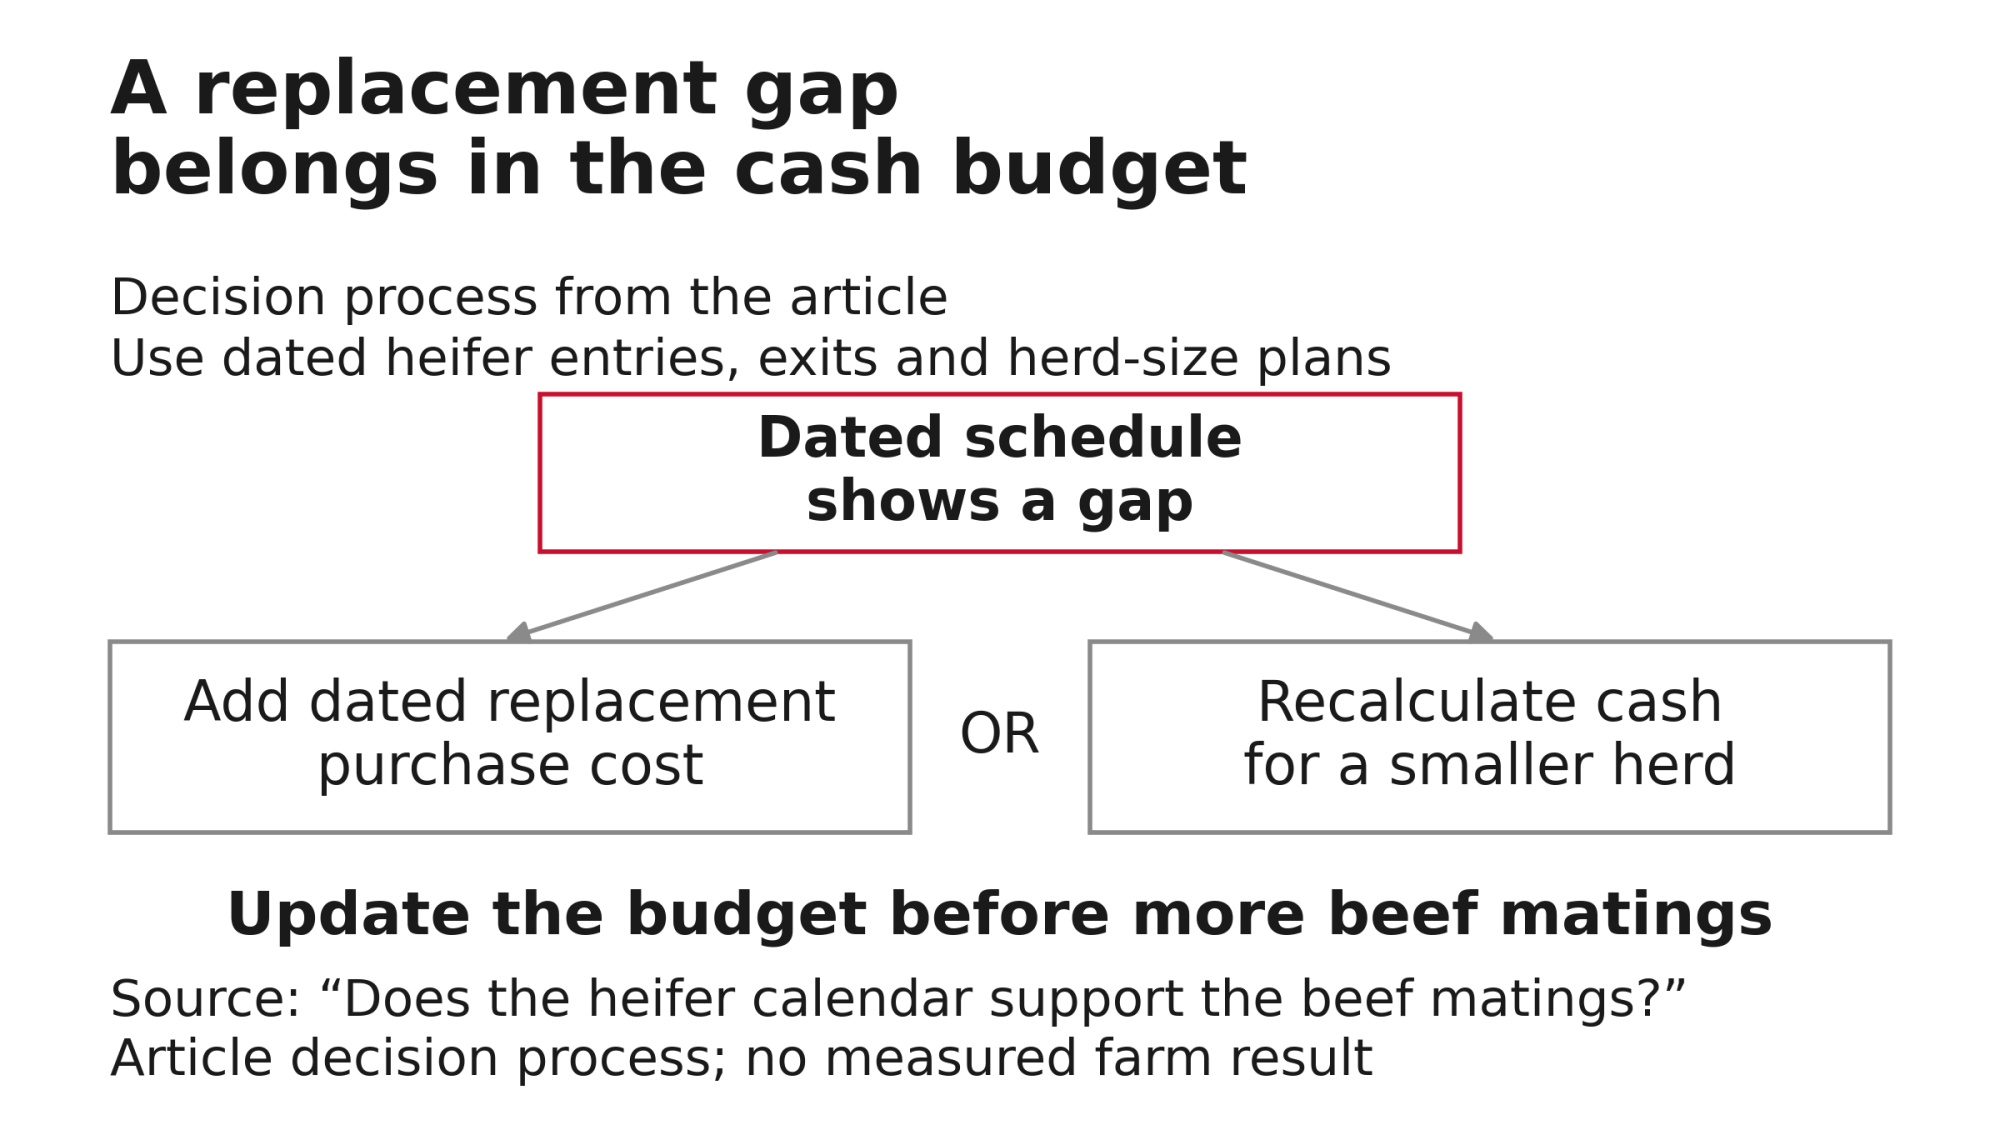
If the gap is real, enter the dated replacement-purchase cost or recalculate operating cash for a smaller herd, including the change in milk receipts and variable costs. Holding US$500,000 of non-calf cash constant while assuming fewer cows produce it overstates coverage.
The Bullvine Pipeline Index calculator scores a herd’s replacement pipeline.
What this means for the operation
Before the next discretionary financial commitment
- Reconcile calf sales, costs and bank receipts.
- Match each calf to its sale lot, settlement and deposit for the past 12 months.
- Compare actual net per calf with the gross-to-net bridge above.
- If head shipped, head paid, and cash received don’t match, fix that before setting next year’s budget.
- Calculate coverage using the actual loan definition.
- From the signed agreement and debt schedule, work out three figures: existing dependence, the calf contribution the covenant requires, and the cushion under a 35% cut in net calf contribution.
- Hold any discretionary new commitment until those numbers exist. Essential animal care isn’t discretionary.
Before the next financing or calf-sale agreement
- Map collections against dated payments.
- Get in writing who pays, how the final price is set, when acceptance is final, who carries death loss in transit, and when payment is due.
- Put expected collection dates beside debt payment dates.
- Set the trigger: agree on a warning point with the lender that leaves time to act before the coverage minimum is reached, allowing for reporting delays and payment dates.
- If the reconciliation shows headroom, use the verified cash forecast to support the financing discussion. It doesn’t establish what terms a lender will offer.
Before each breeding-plan commitment
- Check replacement entries before committing more matings to beef. If the heifer calendar shows an uncovered gap, add the purchase cost or the smaller-herd cash effect to the budget first.
The check to run tonight
First confirm that the lender’s definitions of cash available for debt service, the debt-service total, and the measurement period match the figures used below. Where they differ from this simplified model, the lender’s calculation governs.
- Multiply the covenant minimum by annual debt service.
- Subtract non-calf cash. The result is the calf contribution required.
- Cut verified net calf contribution by 35%. If the stressed figure is smaller than the required contribution, the stress puts the farm below its minimum.
Is Your Calf Cheque Already Spent?
Find out exactly how much of your debt service requires beef-on-dairy calf income, and see if your farm passes covenant checks when calf nets drop 35%.
How we calculate this
Calculations strictly follow the article’s cash-flow principles (Source: Iowa State C3-14) and stress scenarios:
- Net per Calf: Gross Receipts – Assigned Costs.
- Baseline Coverage: (Non-Calf Cash + [Net per Calf × Annual Calves]) ÷ Annual Debt Service.
- Required Calf Cash: (Minimum Covenant Ratio × Annual Debt Service) – Non-Calf Cash.
- 35% Cut Stress: Reduces Net per Calf by 35% (simulating market drops while calf costs remain fixed).
- Stressed Cushion: Stressed Calf Contribution – Required Calf Cash. If negative, it represents a cash shortfall triggering covenant breach.
Illustrative estimate based on your inputs and article methodology [Nov 2026]. Not financial advice. Bullvine calculation.