




Archive for dairy cash flow

USDA’s $400–$1,375 Glasgow Calf Range Is a Price Reference, Not a Payment Plan

One Oct. 27, 2026 sale in Glasgow, Kentucky: beef-cross bull calves from $400 to $1,375. Before that cheque funds a payment, know how much of it your loan already needs. All figures are in US dollars.

beef-on-dairy calf income

Before a farm commits the next beef-on-dairy calf cheque, the first number to find is the share its existing debt payments already need. At the Glasgow dairy auction in Smiths Grove, Kentucky, USDA’s Agricultural Marketing Service reported 72 beef-cross baby bull calves averaging US$997.22 a head on October 27, 2026, with individual sales from US$400 to US$1,375. That’s a dated market reference. It doesn’t say what any one farm’s calves will bring next month.

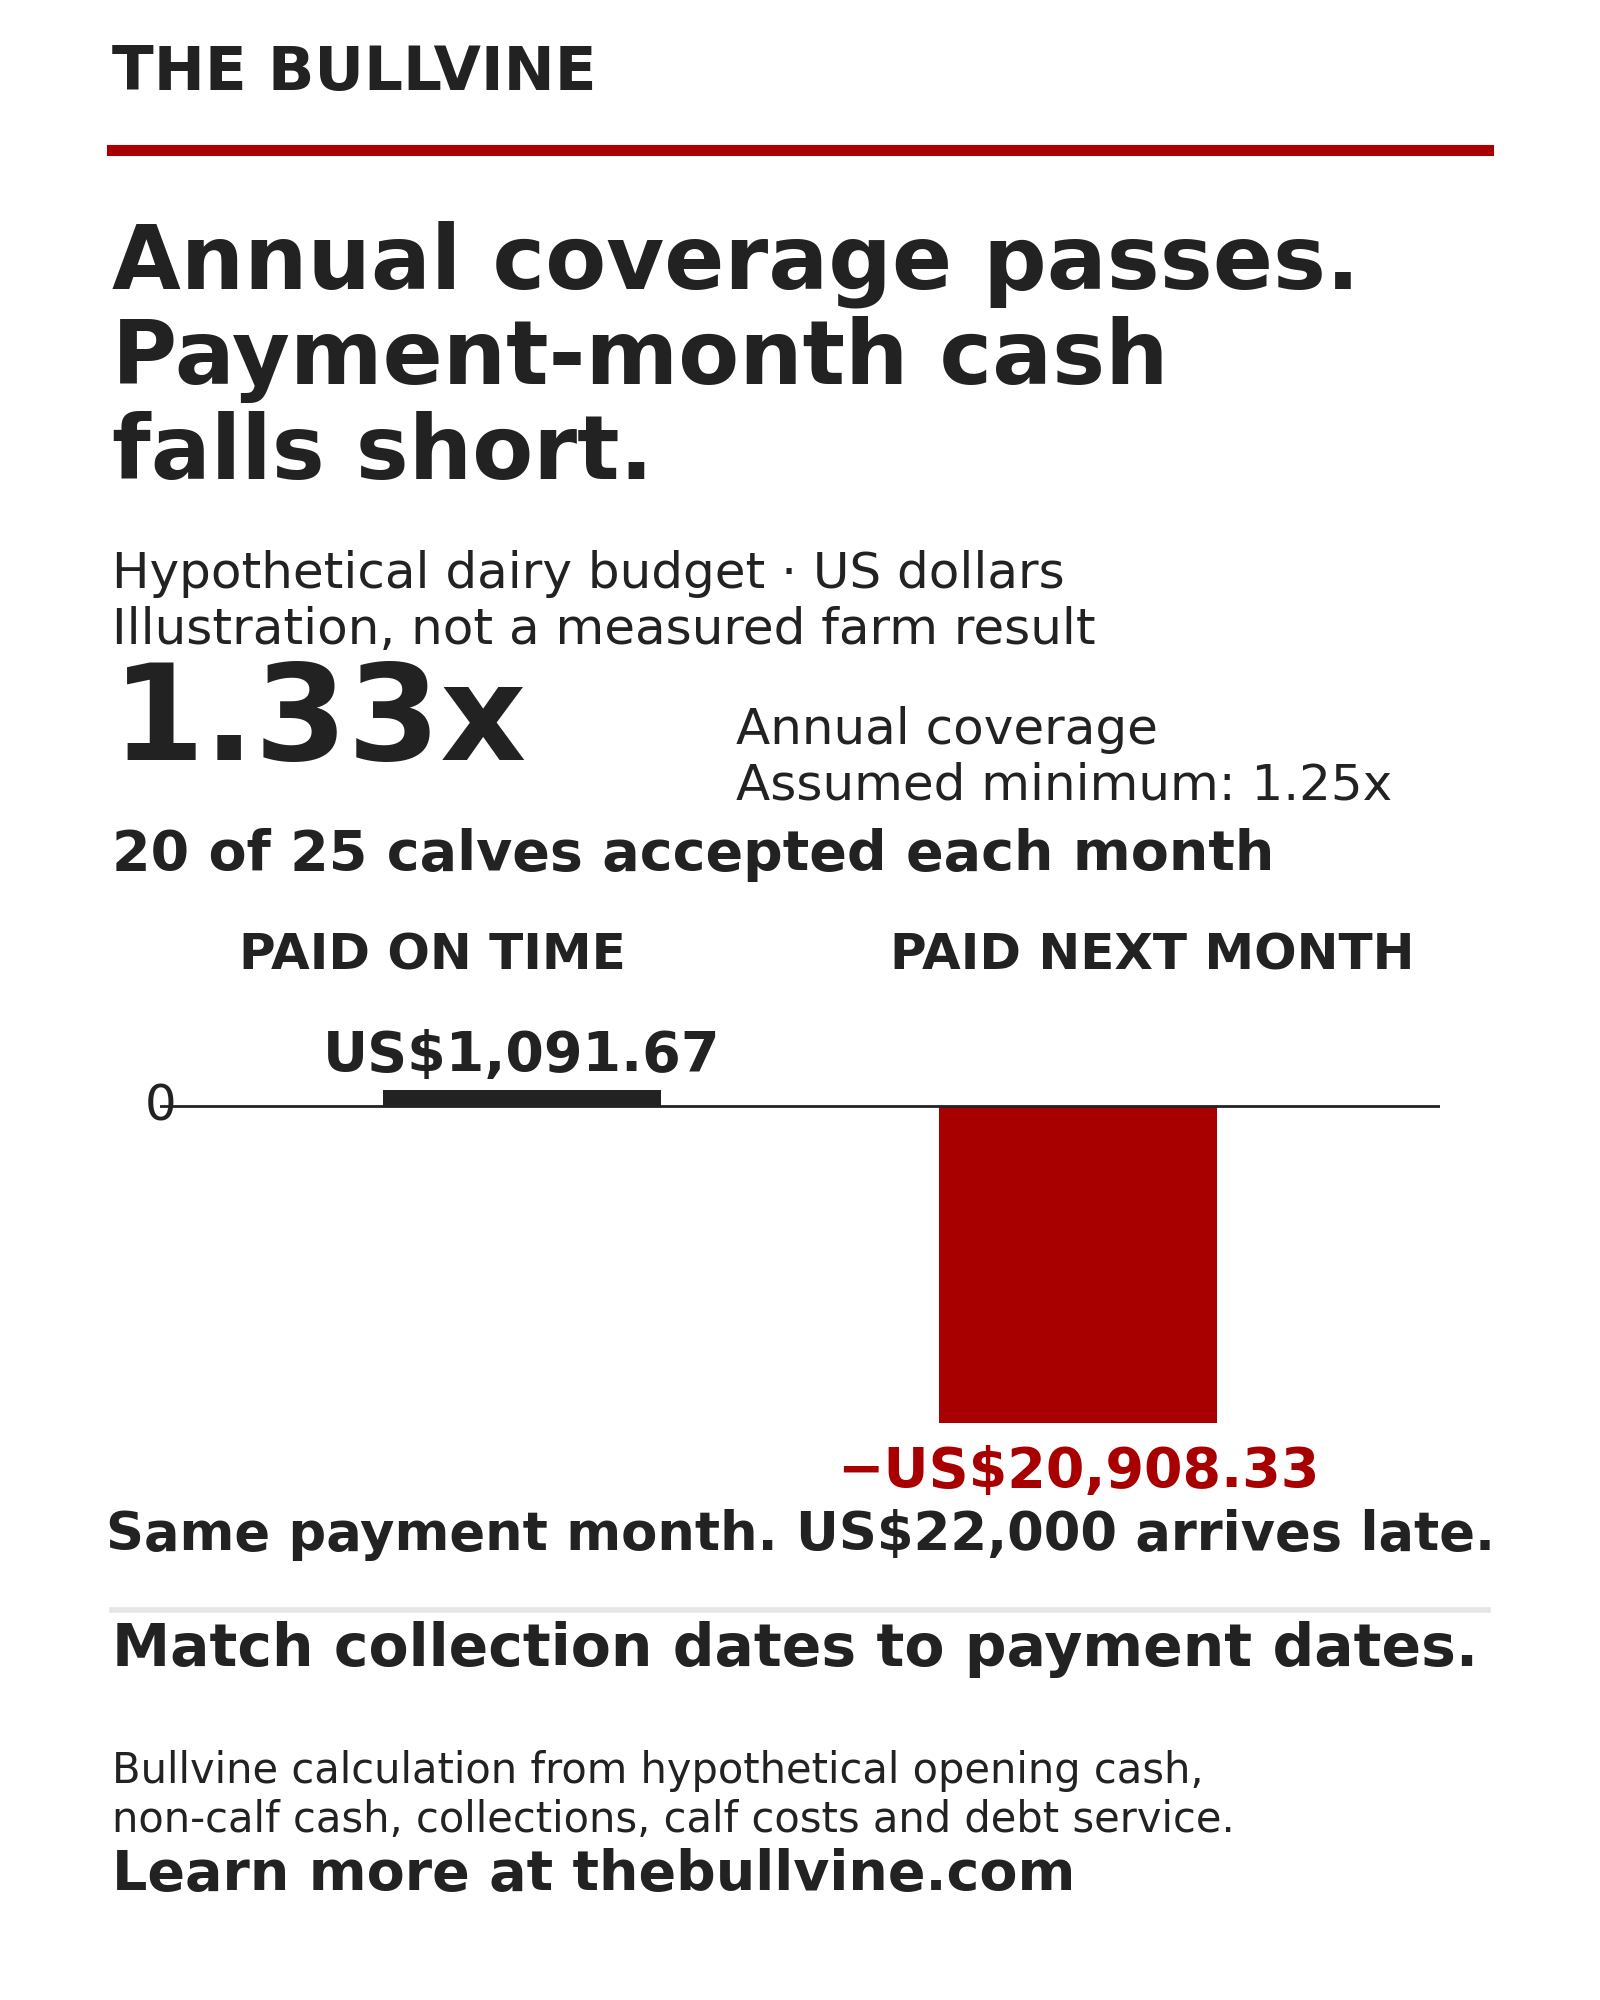
The harder question is how much of a farm budget already depends on calf income. In a hypothetical budget isolated from USDA averages, US$50,000 of annual calf contribution is needed just to cover existing debt payments. A 35% cut in net calf contribution leaves only a US$6,915 annual cash-flow cushion above an assumed 1.25x coverage requirement. In the same model, the farm passes annual coverage at 1.33x and still finishes a payment month US$20,908 short.

What did USDA’s Glasgow report show?

Report 2199 lists baby calves per head (“Per Unit / No Wt”). AMS says prices are FOB unless otherwise noted.

Glasgow dairy auction, Oct 27, 2026 (Final)HeadRange, US$/headAverage, US$/head
Baby bull calves, beef cross72400–1,375997.22
Baby bull calves, breed not labelled52400–1,050846.15
Baby heifer calves, beef cross19575–1,250940.79

Source: USDA AMS / Kentucky Department of Agriculture Market News, Report 2199, sale of October 27, 2026. The table includes baby calves only; specific ages and weights are not reported. These aren’t weaned calves, feeders, fed cattle, or retail beef.

The AMS baby-calf rows omit age, health, sire data, and buyer terms, so nothing in them explains the US$975 spread or predicts where the next calf crop lands.

When does calf income become essential to debt payments?

CoBank’s June 18, 2026 release put beef sales at 12% of revenue for many dairy farms, the lower end of its reported range. The agricultural lender’s figures include cull cows as well as calves, so they can’t be treated as calf income alone. For the cull side of that figure, see our coverage of ERS’s fourth-quarter cull cow price outlook.

Calf income becomes essential the moment there’s a payment the farm couldn’t meet without it, and the place to start is scheduled principal and interest. Iowa State University Extension’s cash-flow guide (File C3-14) notes that principal payments are “not an expense but merely a cash transfer between you and your lender.” It also notes that “a cash flow statement shows liquidity while an income statement shows profitability.” A profitable year can still run short of cash on the wrong date.

Running the Numbers

This hypothetical budget carries US$550,000 of annual debt service, and every result in it is a Bullvine calculation. It applies when calf receipts help fund scheduled debt payments, with the farm’s own figures in place of these inputs. A farm without scheduled debt payments needs a cash-timing check instead of a debt-coverage ratio.

  • Gross receipts: an assumed US$1,100 per calf, less US$103 in assigned calf costs and selling charges, leaves US$997 net cash contribution. These hypothetical inputs are independent of USDA’s Glasgow gross average.
  • Herd and calf sales: the herd is in the 400–500-cow range and sells 300 calves a year (25 a month), for US$299,100 of annual net calf contribution.
  • Non-calf cash: US$500,000 a year is available for debt service, after other operating costs, taxes, and withdrawals but before the principal and interest in annual debt service. Calf receipts and the US$103-per-calf costs sit outside this figure and are counted separately.
  • Debt service: US$550,000 a year in principal and interest.
  • Milk revenue: unchanged in every scenario.
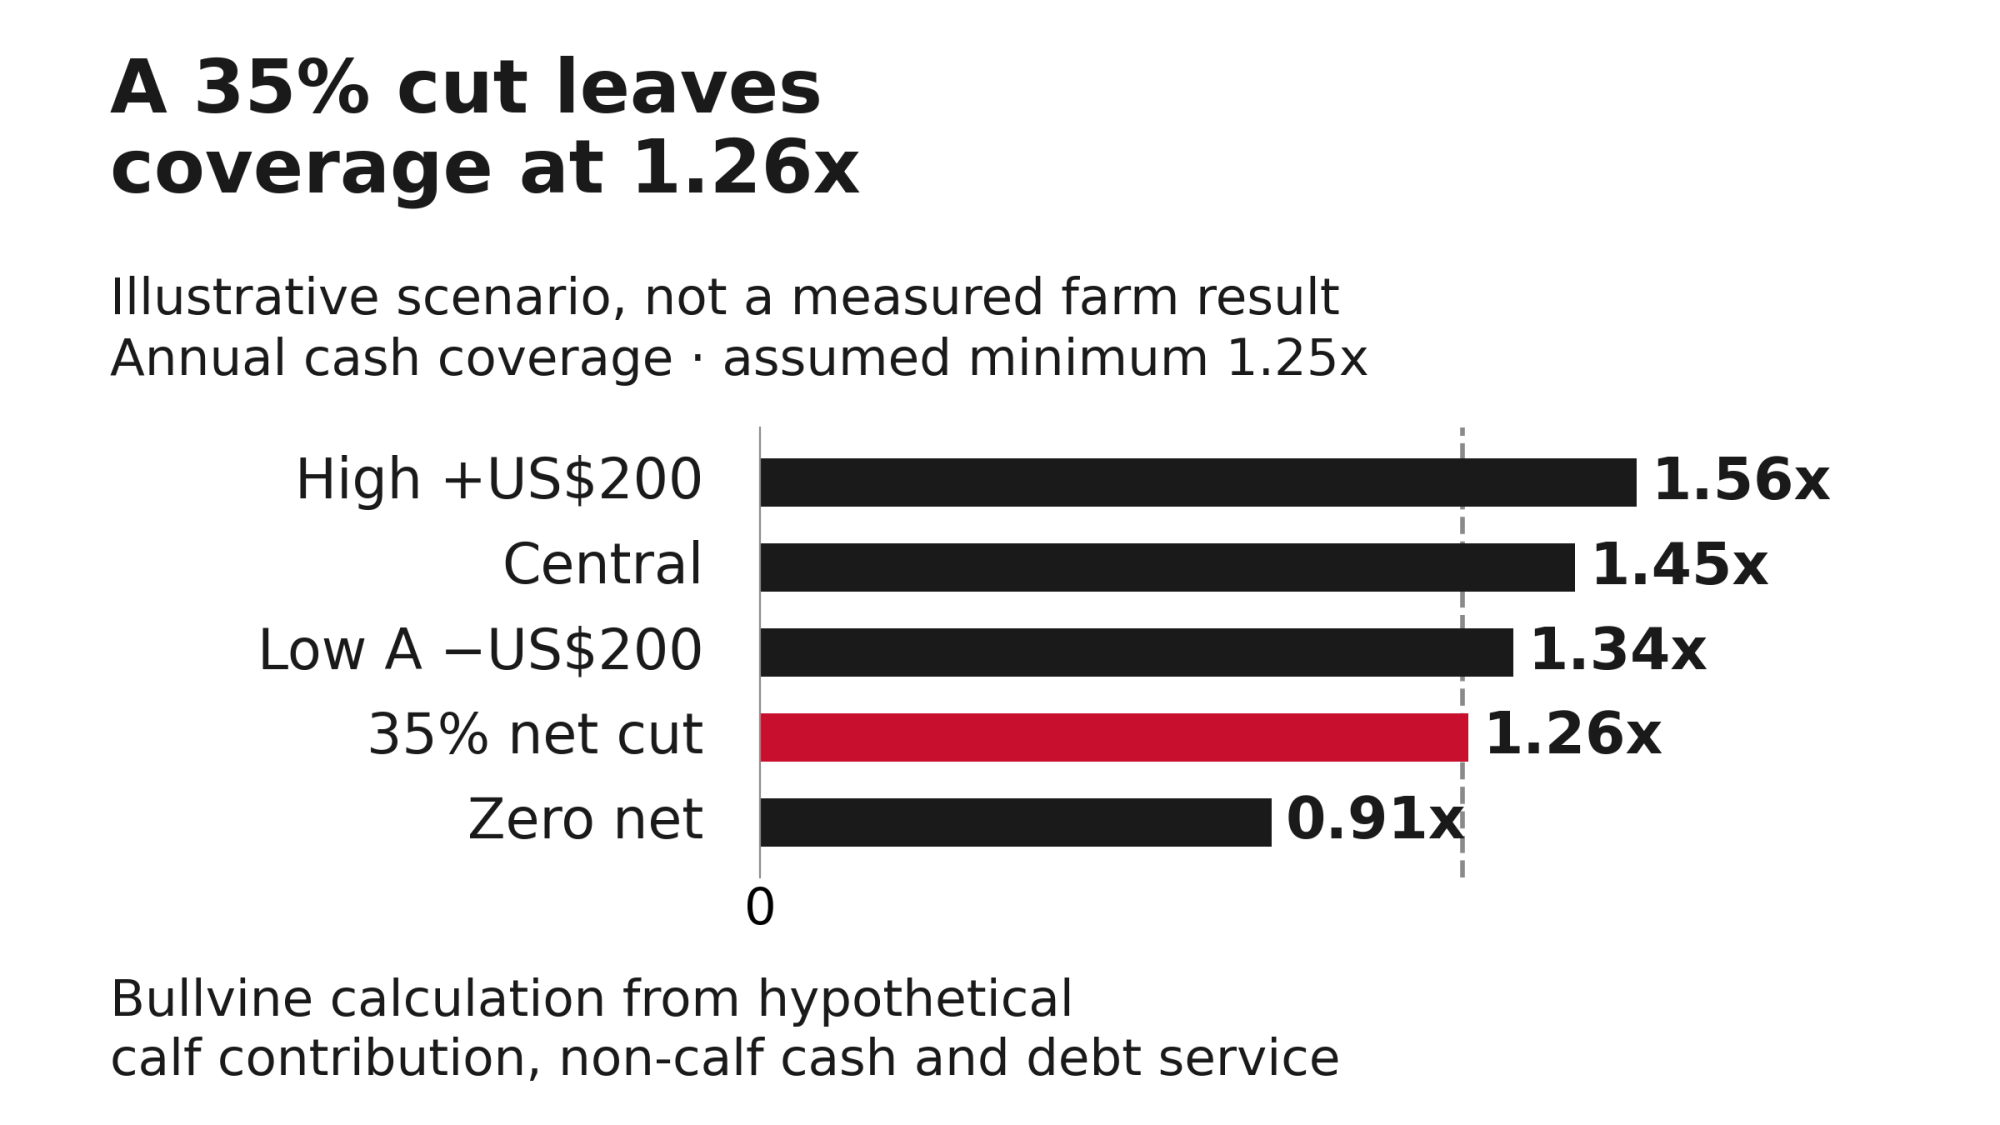
Illustrative annual coverage falls from 1.45x to 1.26x after a 35% net calf contribution cut; minimum 1.25x.
Scenario (Bullvine)Net US$/calfAnnual calf contributionCash coverage
High: +US$2001,197.00359,1001.56x
Central997.00299,1001.45x
Low A: −US$200797.00239,1001.34x
Low B: 35% cut in net contribution648.05194,4151.26x
Zero net calf contribution000.91x

Coverage = (non-calf cash + calf contribution) ÷ debt service. This is a simplified ratio, and the lender’s covenant definition is the one that counts.

The 35% test cuts net calf contribution, not gross sale price. Because calf costs stay fixed, a percentage drop in sale price causes a steeper percentage drop in net contribution.

The three figures below answer three different questions. The 1.25x minimum is illustrative, not a lender standard.
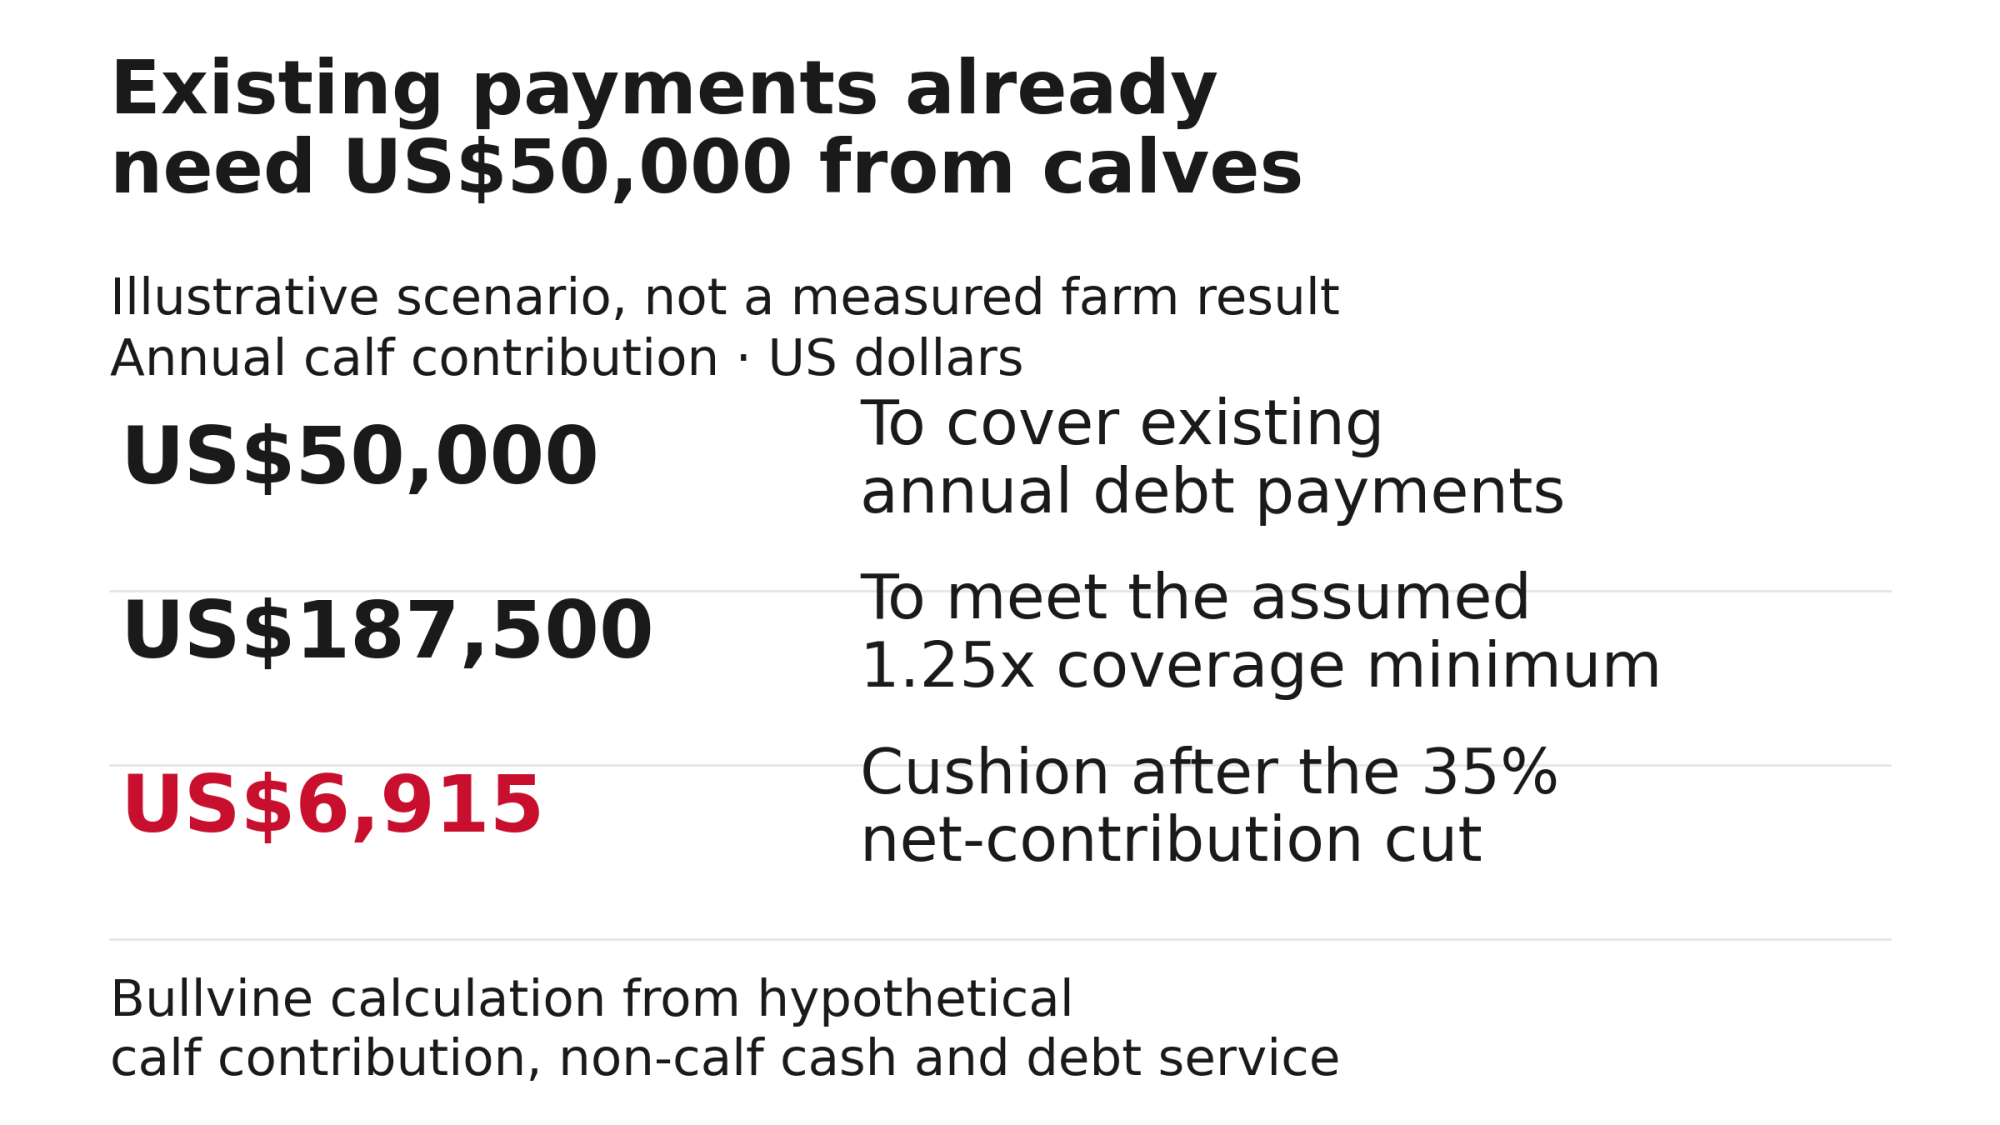
Calf contribution needed: US$50,000 for payments, US$187,500 at 1.25x; stressed cushion US$6,915.
Measure (Bullvine)CalculationWhat it answers
US$50,000 existing dependenceUS$550,000 − US$500,000How much calf contribution is needed just to cover existing annual debt payments?
US$187,500 required at 1.25x1.25 × US$550,000 − US$500,000How much is needed to meet the assumed coverage minimum?
US$6,915 stressed cushionUS$194,415 − US$187,500How much more could annual cash flow fall in the stressed case before hitting that minimum?

The 35% case removes US$104,685 at the illustrative 1.25x minimum, that leaves US$6,915 of annual cash-flow cushion above the coverage requirement, which is not a bank balance or an amount available to borrow. At 1.30x, the same case falls short by US$20,585.

On this simplified basis, the cushion supports about US$5,532 of additional annual debt service at 1.25x (US$6,915 ÷ 1.25), assuming cash generation doesn’t change. It sets a ceiling for the lender conversation and is not a loan amount.

What happens when fewer calves qualify, and payment runs late?

At 1.33x, annual coverage can pass while a single payment month fails. This monthly illustration uses the same assumptions:

  • Opening cash: US$10,000
  • Non-calf cash for the month: US$41,666.67
  • Calves presented: 25
  • Calf costs paid this month: all 25 calves presented carry US$103 in assigned costs, and the model assumes the full 25 × US$103 = US$2,575 is paid during this month.
  • Calves that don’t qualify generate no alternative-sale proceeds in this illustration. The annual reduced-acceptance calculation carries that assumption through all 12 months.
  • Debt payment this month: US$70,000, which is part of the US$550,000 annual total
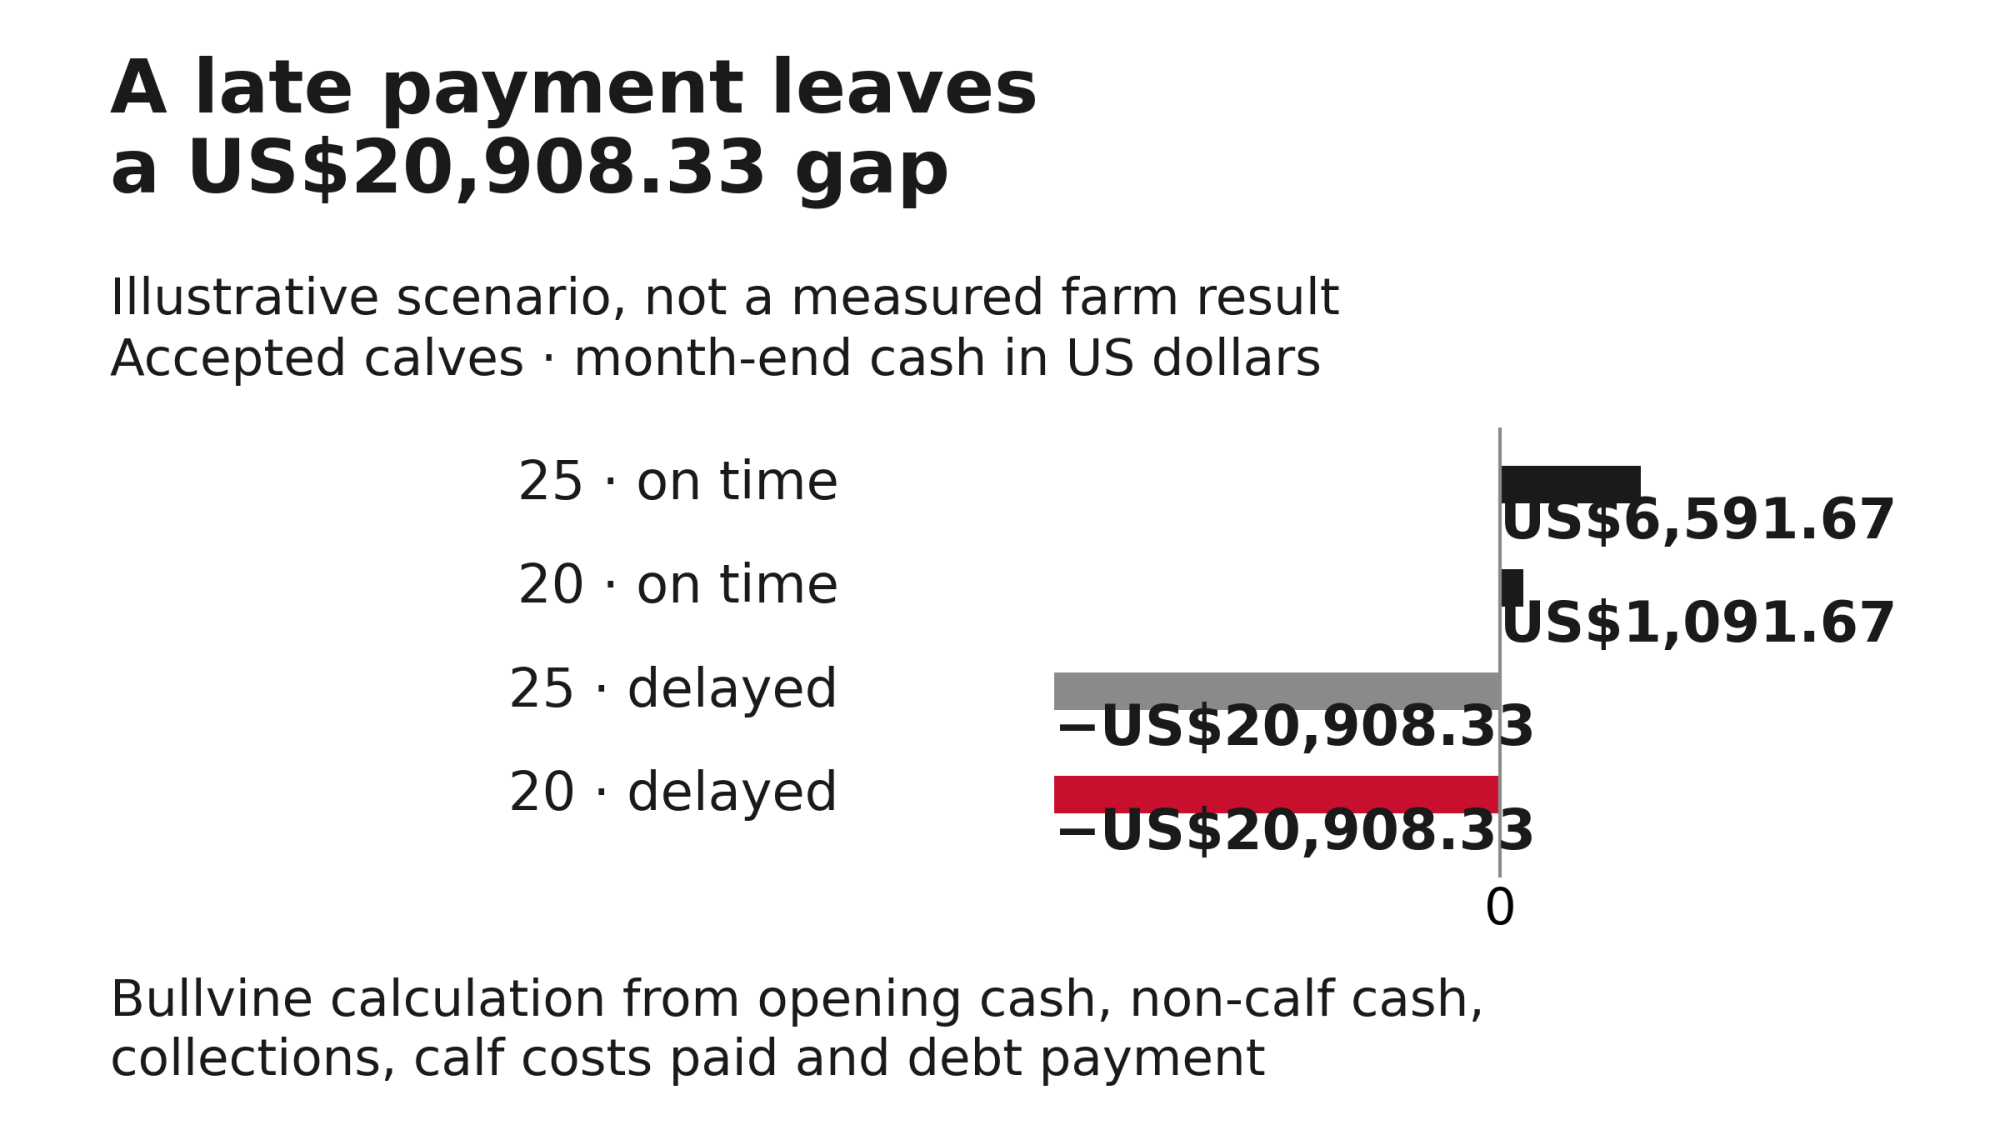
Illustrative closing cash is US$6,591.67 or US$1,091.67 on time, versus −US$20,908.33 with delayed collections.
Payment month (Bullvine)Calves acceptedCalf cash collectedCalf costs paidClosing cash before financing
Baseline, paid on time25US$27,500US$2,575US$6,591.67
Price holds, 5 don’t qualify20US$22,000US$2,575US$1,091.67
All payment delayed a month25US$0US$2,575−US$20,908.33
Both together20US$0US$2,575−US$20,908.33

Figure: Annual cash coverage by scenario (left) and closing cash in the payment month, by scenario (right). Hypothetical Bullvine farm budget; Bullvine calculations, not auction prices.

When calf collections are zero, both delayed-payment scenarios carry the same current-month cash gap. The difference appears in the delayed receipts collected next month: US$27,500 with all 25 calves accepted against US$22,000 with 20 accepted. Those receipts aren’t next month’s closing cash balance.

If 20 calves qualify every month for the whole year and the other five never produce proceeds, annual net calf contribution is 12 × [(20 × US$1,100) − US$2,575] = US$233,100. Annual coverage is (US$500,000 + US$233,100) ÷ US$550,000 = 1.33x. Delay that payment month’s calf receipts, though, and the farm still faces a US$20,908 month-end cash gap before financing. Establishing the timing and size of the peak funding gap takes daily payment dates.

Does the heifer calendar support the beef matings?
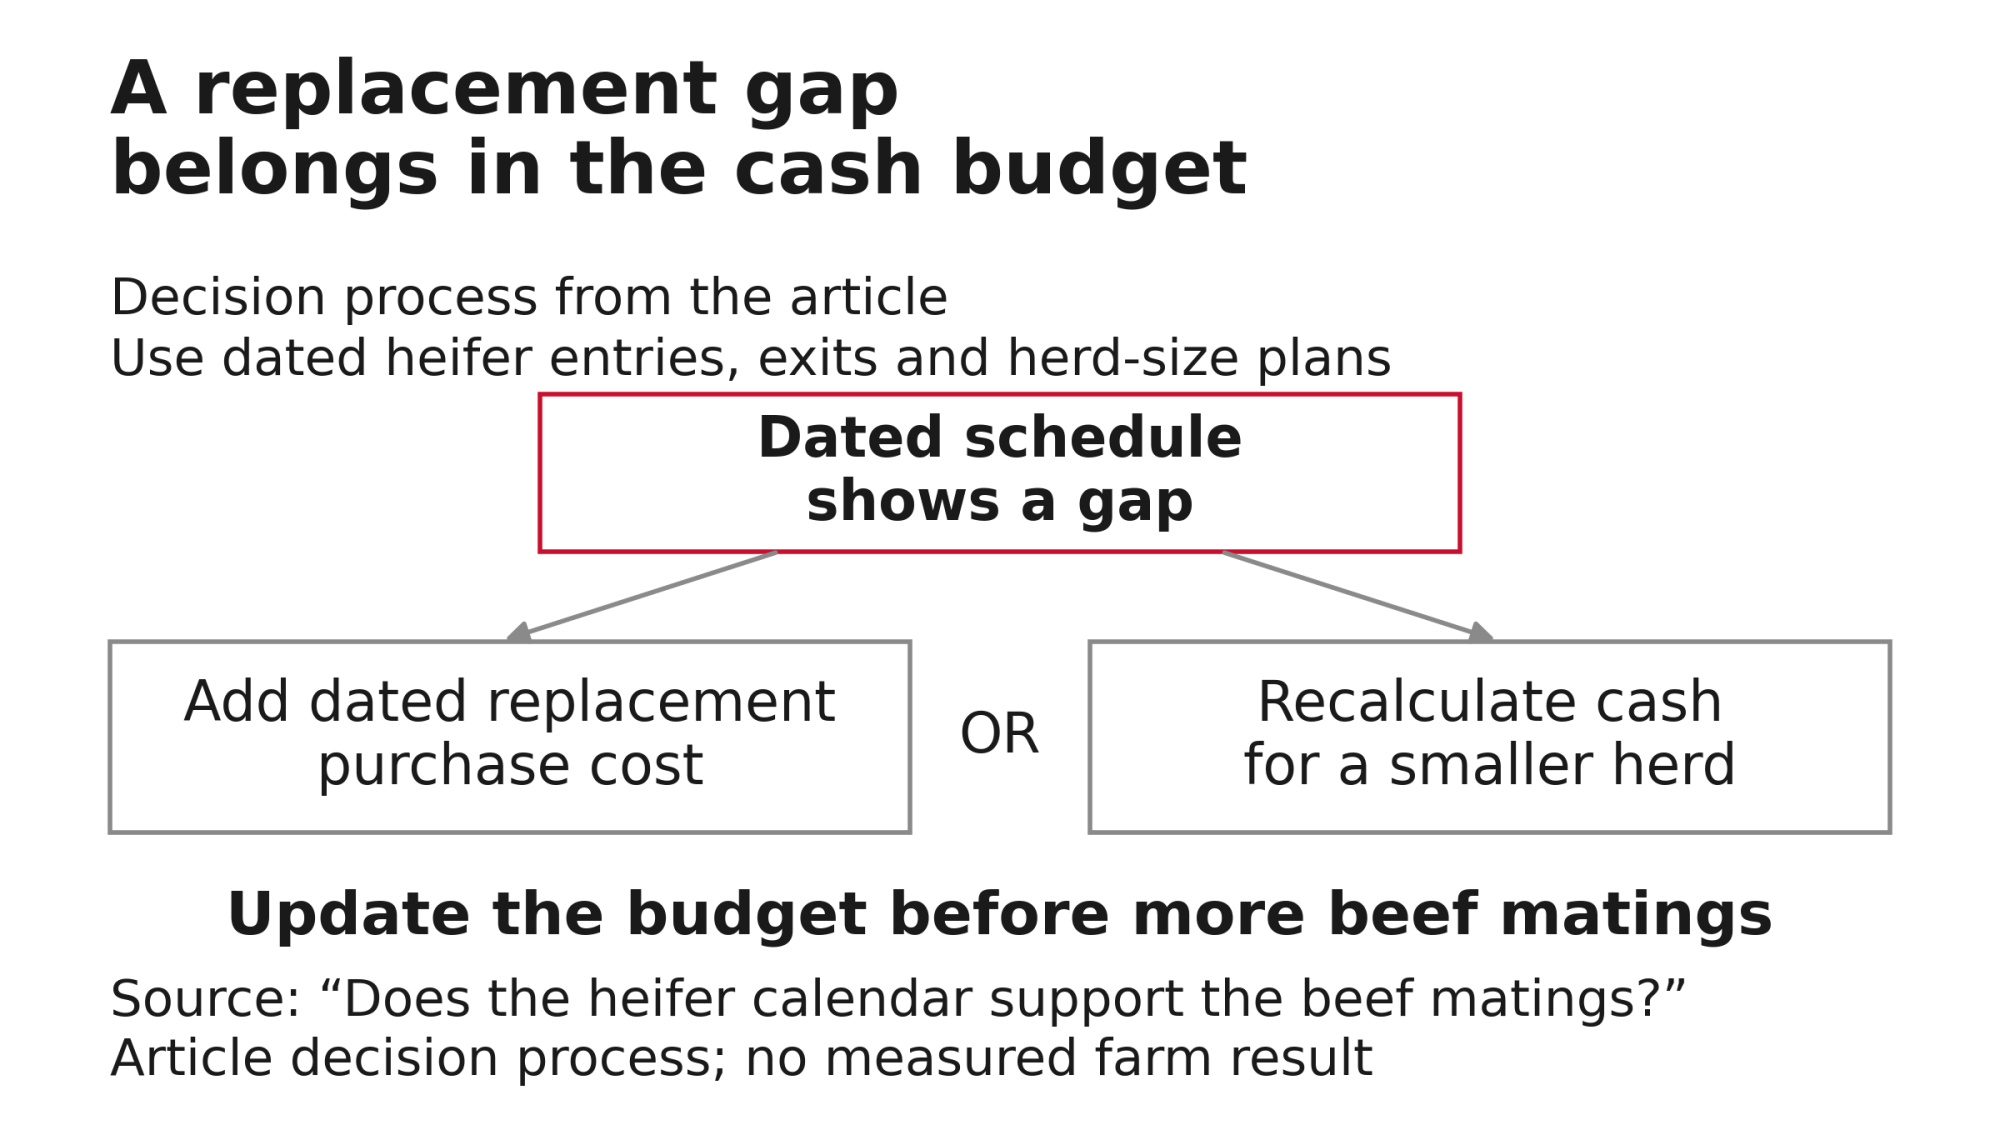
A dated replacement gap leads to purchase costs or revised smaller-herd cash before further beef matings.

CoBank frames the trade-off as a two-year investment in a replacement against a beef-on-dairy calf that is “essentially an instant one-time revenue source.” In June, CoBank projected 796,000 fewer replacements entering herds across 2025 and 2026, followed by roughly 360,000 additional entries across 2027–28. Those are forecasts built on national-average reproductive assumptions that CoBank says vary by region.

The farm-level answer comes from a dated schedule, which needs:

  • Expected first-calving dates for every heifer and dairy pregnancy
  • Allowances for losses and delayed entries
  • Planned exits and herd-size changes
  • Dated purchase costs for any gap the home-raised supply doesn’t cover

A negative balance in any period is a gap. Proving that beef matings caused it takes cohort records, because poor fertility or heifer sales can leave the same hole.

If the gap is real, enter the dated replacement-purchase cost or recalculate operating cash for a smaller herd, including the change in milk receipts and variable costs. Holding US$500,000 of non-calf cash constant while assuming fewer cows produce it overstates coverage.

The Bullvine Pipeline Index calculator scores a herd’s replacement pipeline.

What this means for the operation

Before the next discretionary financial commitment

  1. Reconcile calf sales, costs and bank receipts.
    1. Match each calf to its sale lot, settlement and deposit for the past 12 months.
    1. Compare actual net per calf with the gross-to-net bridge above.
    1. If head shipped, head paid, and cash received don’t match, fix that before setting next year’s budget.
  2. Calculate coverage using the actual loan definition.
    1. From the signed agreement and debt schedule, work out three figures: existing dependence, the calf contribution the covenant requires, and the cushion under a 35% cut in net calf contribution.
    1. Hold any discretionary new commitment until those numbers exist. Essential animal care isn’t discretionary.

Before the next financing or calf-sale agreement

  • Map collections against dated payments.
    • Get in writing who pays, how the final price is set, when acceptance is final, who carries death loss in transit, and when payment is due.
    • Put expected collection dates beside debt payment dates.
    • Set the trigger: agree on a warning point with the lender that leaves time to act before the coverage minimum is reached, allowing for reporting delays and payment dates.
    • If the reconciliation shows headroom, use the verified cash forecast to support the financing discussion. It doesn’t establish what terms a lender will offer.
Before each breeding-plan commitment

  • Check replacement entries before committing more matings to beef. If the heifer calendar shows an uncovered gap, add the purchase cost or the smaller-herd cash effect to the budget first.

The check to run tonight

First confirm that the lender’s definitions of cash available for debt service, the debt-service total, and the measurement period match the figures used below. Where they differ from this simplified model, the lender’s calculation governs.

  1. Multiply the covenant minimum by annual debt service.
  2. Subtract non-calf cash. The result is the calf contribution required.
  3. Cut verified net calf contribution by 35%. If the stressed figure is smaller than the required contribution, the stress puts the farm below its minimum.
Welcome back. Showing your saved numbers.

Is Your Calf Cheque Already Spent?

Find out exactly how much of your debt service requires beef-on-dairy calf income, and see if your farm passes covenant checks when calf nets drop 35%.

Principal & interest (Source: farm debt schedule)
$
Cash left after operating costs/taxes, before debt
$
Total head expected to clear this year
head
Article default: $1,100 (hypothetical)
$
Selling charges & holding costs (Default: $103)
$
Lender requirement (Article assumes 1.25x)
x
Stressed Cash Cushion (35% Cut)
$0
Required: $0Stressed: $0
Current Net per Calf$0
Baseline Coverage Ratio0.00x
Stressed Coverage Ratio0.00x
Get The Bullvine Weekly
How we calculate this

Calculations strictly follow the article’s cash-flow principles (Source: Iowa State C3-14) and stress scenarios:

  • Net per Calf: Gross Receipts – Assigned Costs.
  • Baseline Coverage: (Non-Calf Cash + [Net per Calf × Annual Calves]) ÷ Annual Debt Service.
  • Required Calf Cash: (Minimum Covenant Ratio × Annual Debt Service) – Non-Calf Cash.
  • 35% Cut Stress: Reduces Net per Calf by 35% (simulating market drops while calf costs remain fixed).
  • Stressed Cushion: Stressed Calf Contribution – Required Calf Cash. If negative, it represents a cash shortfall triggering covenant breach.

Illustrative estimate based on your inputs and article methodology [Nov 2026]. Not financial advice. Bullvine calculation.

Methodology

  • Published inputs:
    • USDA AMS Report 2199 (baby calves, per head, no weight, FOB) is used as a dated market reference only.
    • CoBank's June 18, 2026 report and release supply the revenue-share context and replacement forecasts.
    • Iowa State C3-14 supplies the cash-flow principles.
  • Hypothetical budget:
    • US$1,100 gross minus US$103 in assigned calf costs and selling charges gives US$997 net per calf, on 300 calves a year. These inputs are independent of the Glasgow average.
    • US$500,000 of non-calf cash is net of other operating costs, taxes, and withdrawals. It's counted before the principal and interest in the US$550,000 debt service and excludes calf receipts and costs.
    • The 1.25x and 1.30x minimums are illustrative.
  • Sensitivity check: USDA's US$997.22 gross average minus the hypothetical US$103 cost gives US$894.22 net per calf. Bullvine's stressed coverage is then [US$500,000 + (300 × US$894.22 × 0.65)] ÷ US$550,000 = 1.226x, below the illustrative 1.25x minimum. A farm's own settlement statements carry more weight than any auction average.
  • Formulas:
    • Coverage = (non-calf cash + calf contribution) ÷ debt service
    • Required calf contribution = minimum × debt service − non-calf cash
    • Cushion = stressed contribution − required contribution
    • Supportable added debt service = cushion ÷ minimum
    • Closing cash = opening + non-calf cash + collections − calf costs paid − debt payment
  • Limitations:
    • Calf costs and selling charges are a flat US$103-per-calf assumption, not an itemized enterprise budget.
    • The model leaves out changes in those costs, extra holding costs, bridge-financing interest, and savings from new investment.
    • The monthly test shows month-end positions, not timing within the month.
    • The 35% is a chosen stress, not a forecast or a validated safety margin.

Learn More

The Sunday Read Dairy Professionals Don't Skip.

Every week, thousands of producers, breeders, and industry insiders open Bullvine Weekly for genetics insights, market shifts, and profit strategies they won't find anywhere else. One email. Five minutes. Smarter decisions all week.

NewsSubscribe
First
Last
Consent

Robotic Milking Pays 13% More – After 7 Years of Red Ink

Here’s the cash flow math the dealer didn’t show you — and the one number that predicts whether your robots will pay

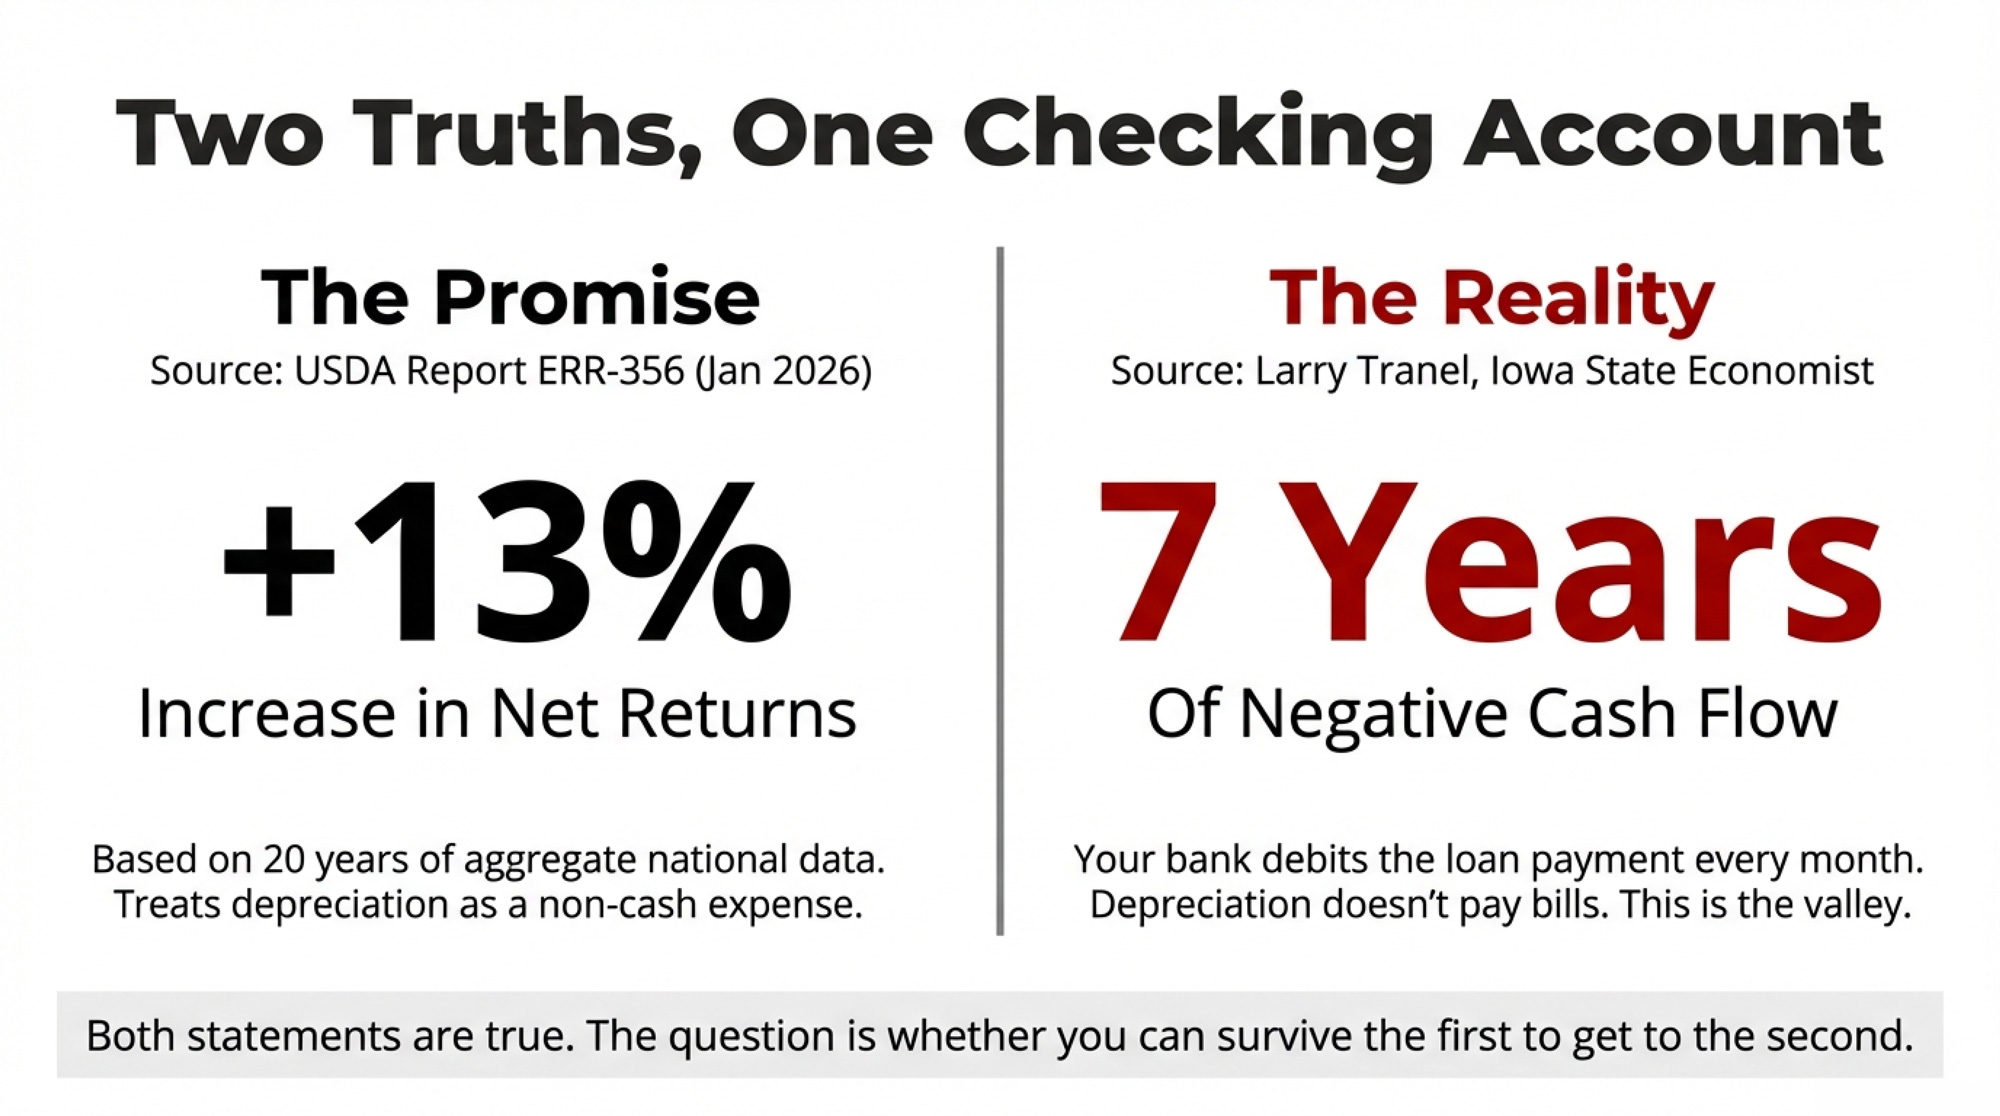
A brand-new USDA Economic Research Service report — Precision Dairy Farming, Robotic Milking, and Profitability in the United States (ERR-356, January 22, 2026) — finds that robotic milking increases U.S. dairy net returns by 13 percent on average. The researchers drew on five waves of USDA Agricultural Resource Management Survey data spanning 2000 through 2021, and they controlled for the fact that stronger managers tend to adopt first. That 13% is an adjusted treatment effect. It’s the strongest national evidence yet that AMS profitability is real.

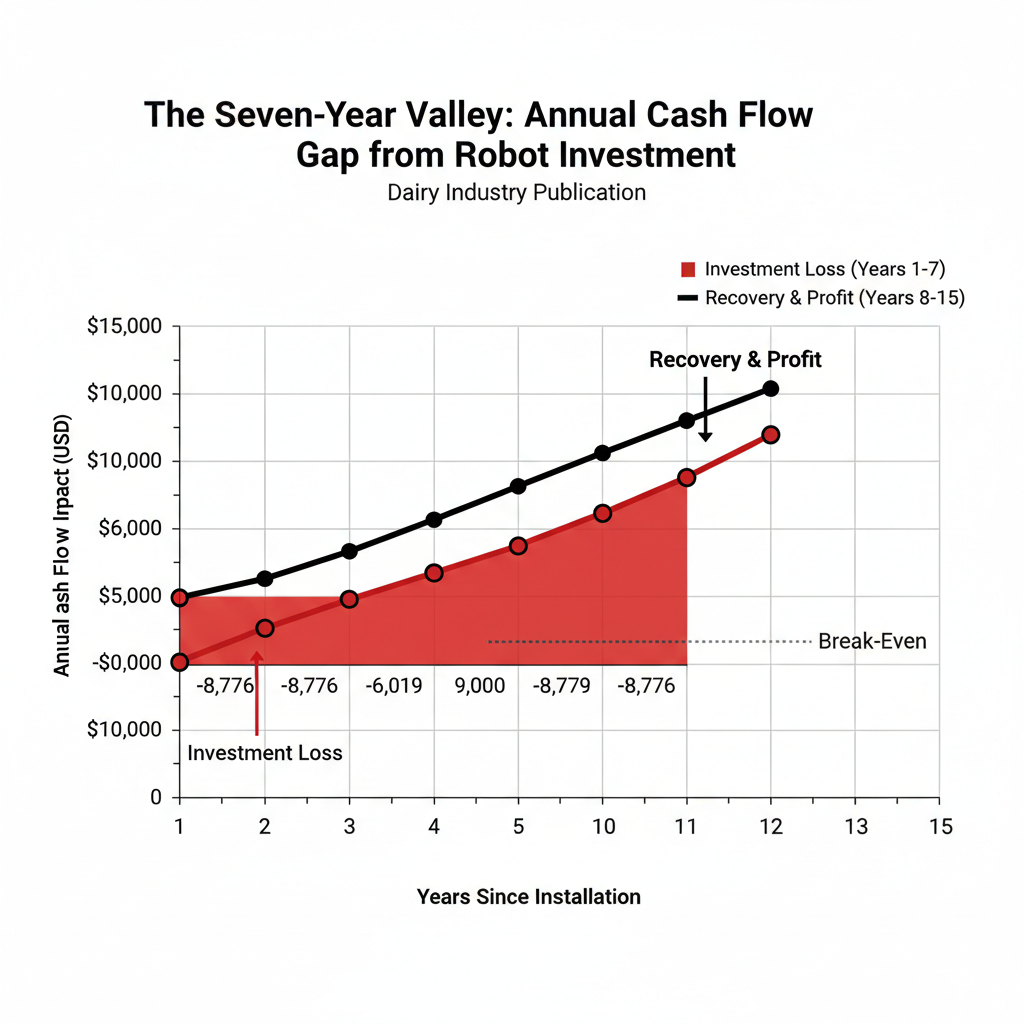
And yet. Iowa State dairy economist Larry Tranel — the guy who’s been running AMS economics since before most dealers had a demo unit — puts it this way: “Cash flow of a robot tends to be very negative in the first seven years, then pretty positive for rest of the life of the AMS, but that is dependent on many variables, especially repair costs across the whole life of the robot.”

Both things are true. The question is whether your operation can survive seven years on the wrong side of the ledger to reach the right one.

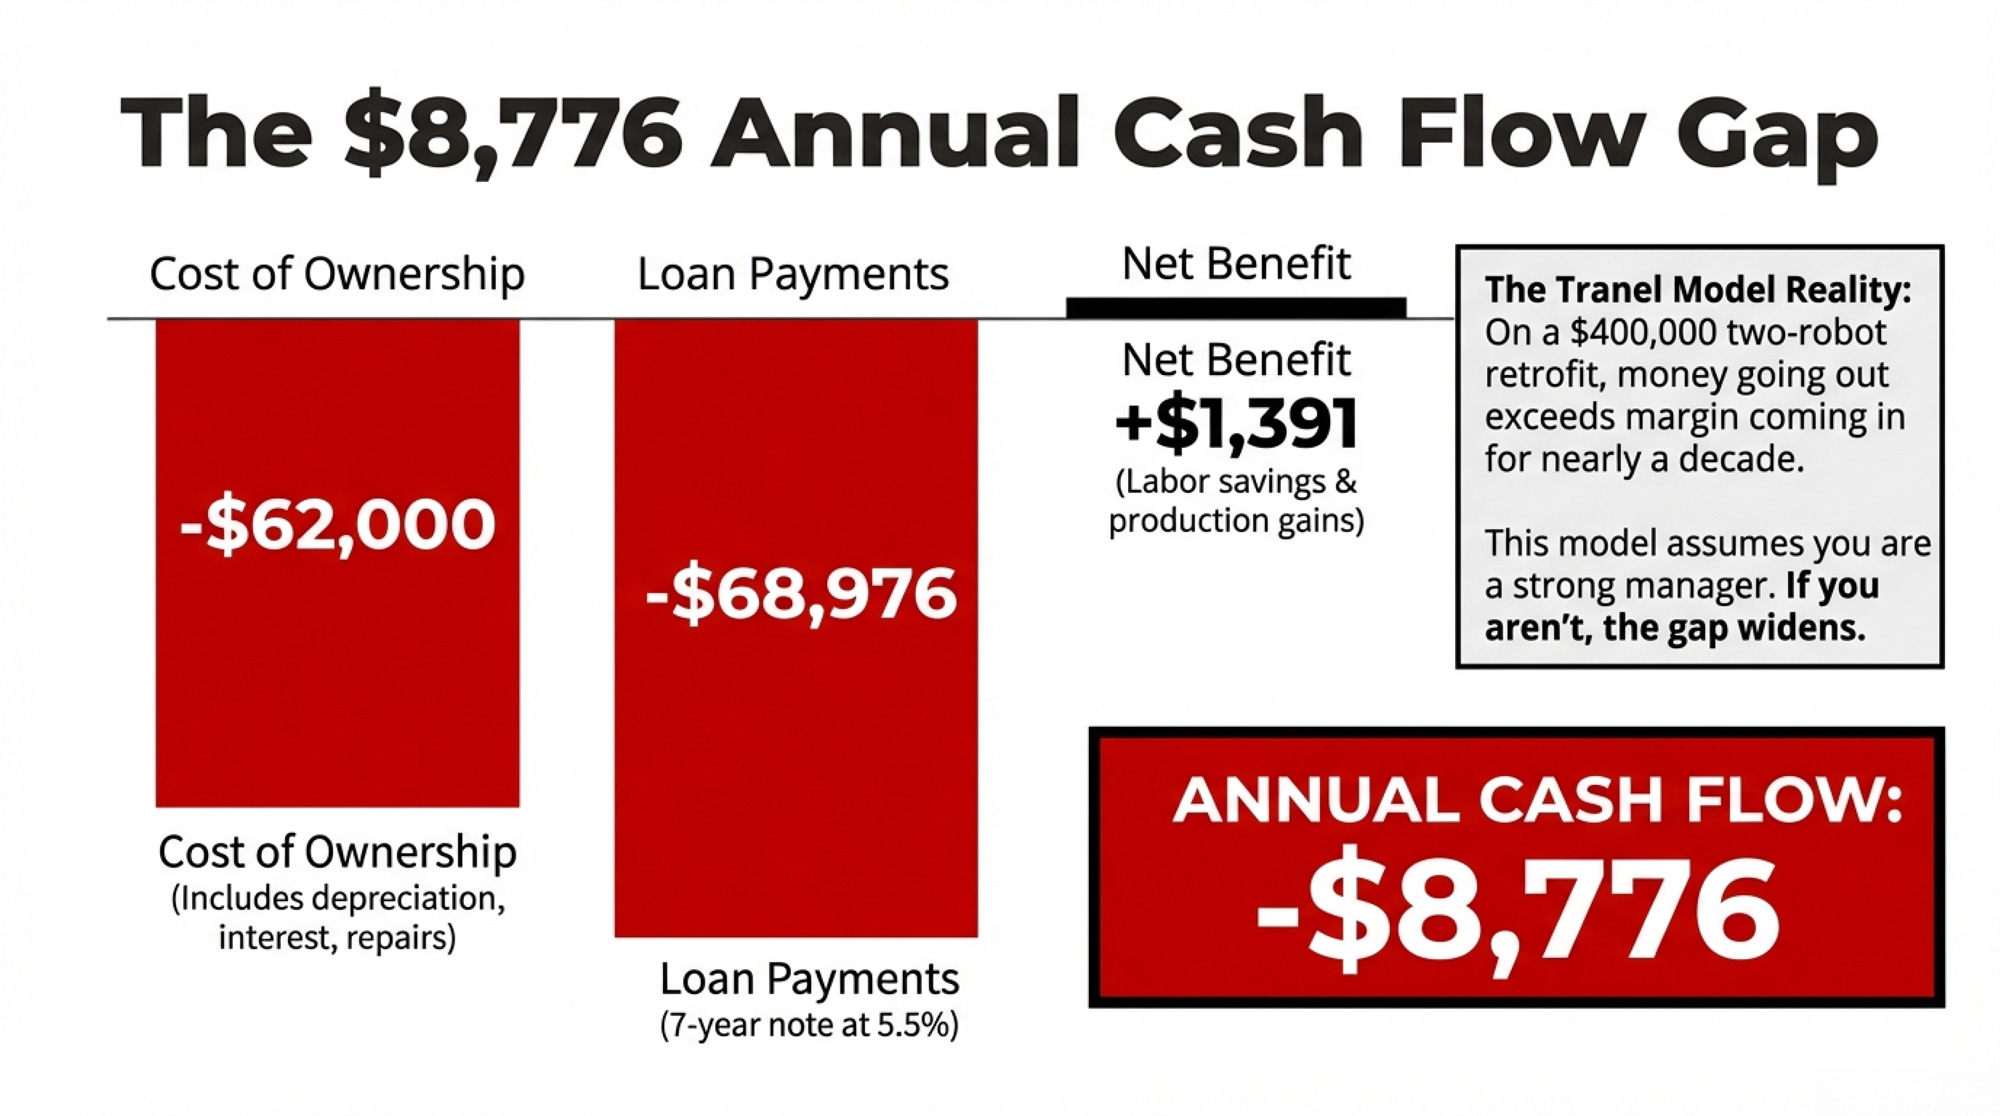
The $8,776 Gap Your Checking Account Feels Every Year

Here’s how the math works in Tranel’s partial budget model for a two-robot retrofit with a total investment of $400,000. Annual ownership costs — depreciation, interest, repairs, insurance — run roughly $62,000. Against that, the net financial benefit from labor savings, production gains, and reduced hired help comes to just $1,391 per year before you assign a single dollar to quality of life.

Now layer on the loan. A 7-year note at 5.5% means an annual payment of $68,976. The capital recovery cost for a 10-year useful life is $60,200. The gap: negative $8,776 per year in cash flow — and that’s before you account for any labor you didn’t actually eliminate.

Why does the USDA aggregate picture look so much rosier? Depreciation. In the national profitability calculation, it’s a non-cash expense spread over the equipment’s useful life. In your checking account, the loan payment is debited every month. For seven years, money going out exceeds the margin improvement coming in. That’s the valley.

Worth noting: the USDA report says only 6% of U.S. milk came from cows milked via box robots as of 2021. AMS remains the minority, meaning the profitability data reflects a population skewed toward early adopters who tend to be stronger managers to begin with.

The Production Gain That Isn’t What You Think

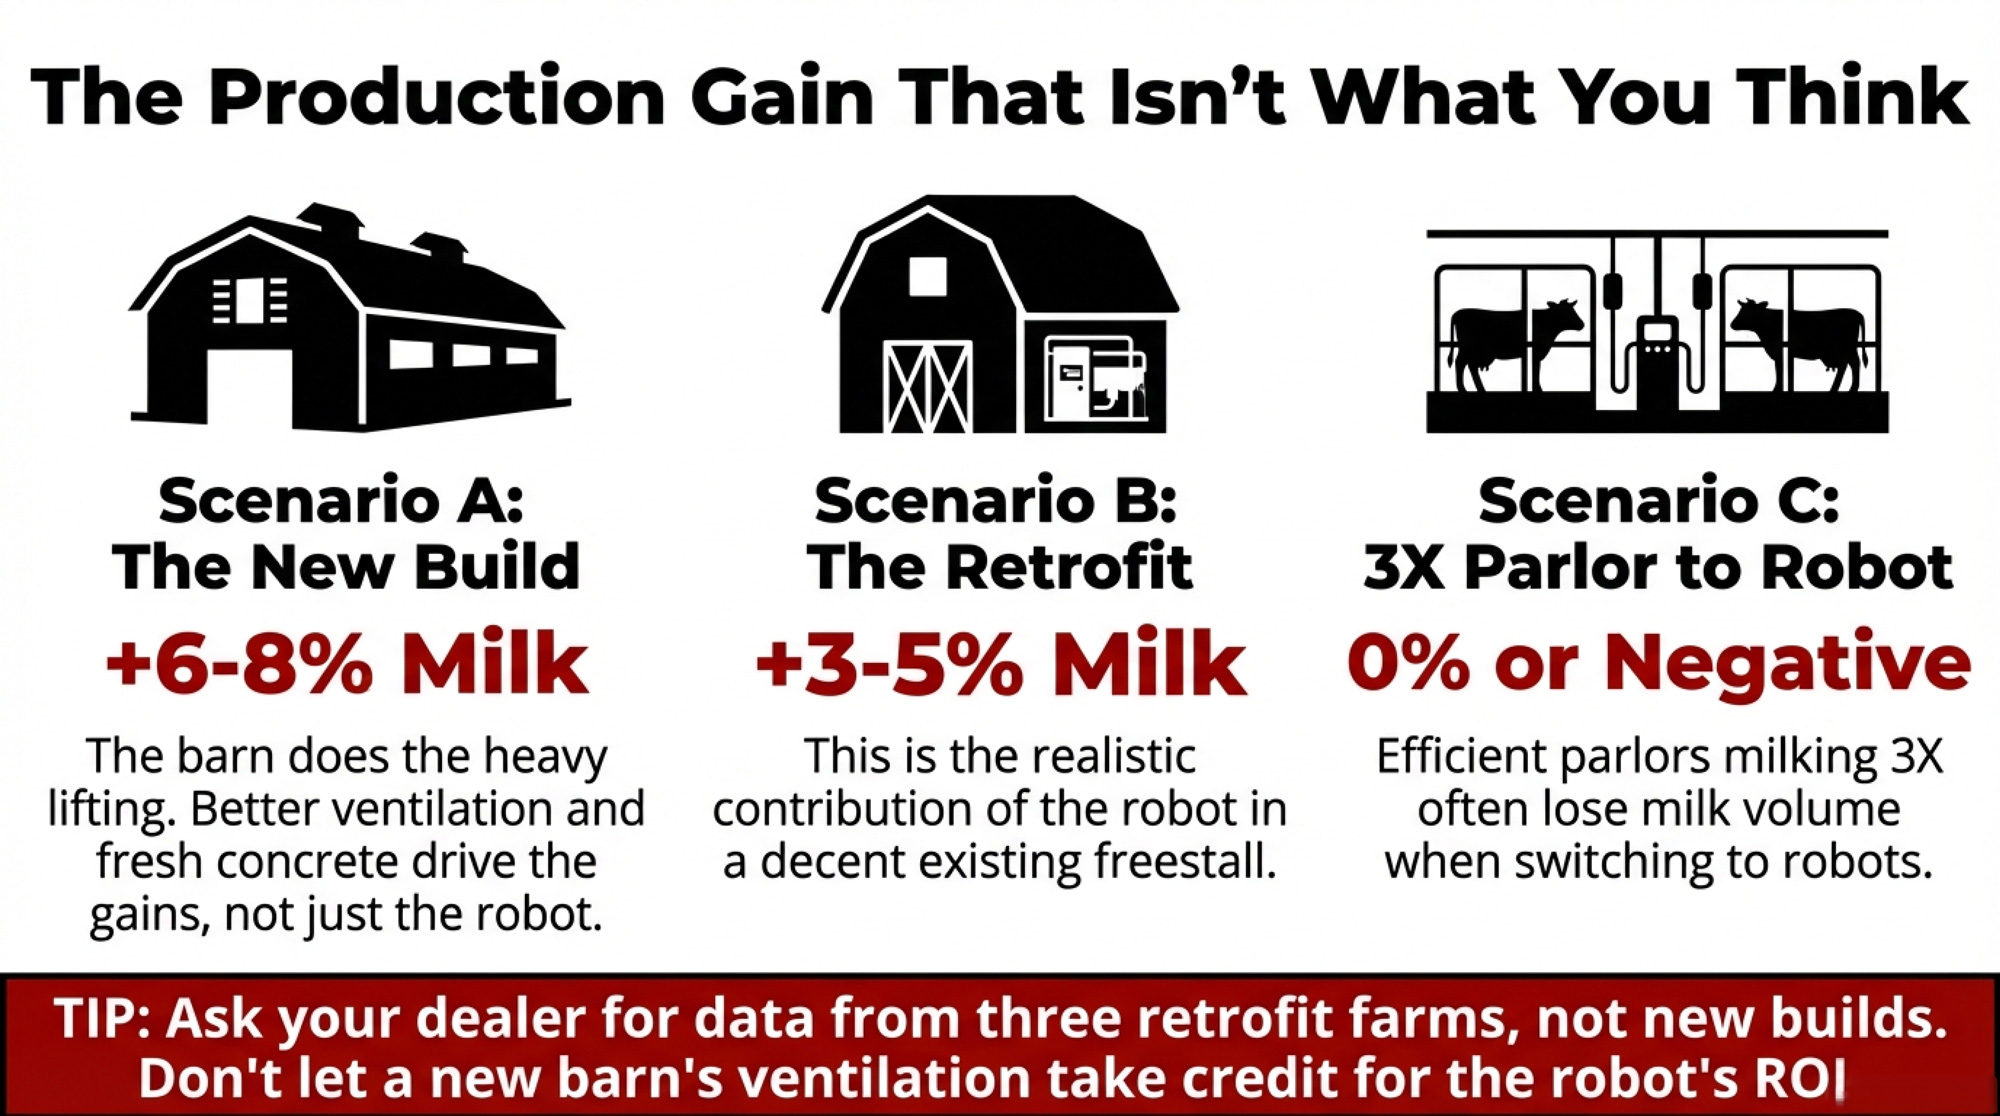
Tranel puts the typical production bump at 3 to 5 percent for herds switching from twice-daily milking. Some farms hit 10% or more. But here’s what gets glossed over at the open house: “Often, much of the increase reported on AMS is due to the new cow housing facility, not just the AMS, as new facilities often increase production 6 to 8 percent over old, worn-out facilities. This is an important point often overlooked.”

That 10% jump your neighbor reported? Maybe 3–5 points came from the robot. The rest came from the new barn. Better ventilation. Fresh concrete.

Already milking 3X in an efficient parlor? Tranel doesn’t sugarcoat it: “Producers currently milking 3X may experience a decrease in milk production.”

Where You’re StartingRealistic Gain
2X in older tie-stall or worn-out freestall6–8% (new barn + robot combined)
2X in decent existing freestall (retrofit)3–5% (robot contribution)
3X in an efficient parlor0% or potentially negative

Source: Tranel, Iowa State Extension (2018)

💡 The Bullvine Tip: Before you sign an AMS contract, ask the dealer for production data from three retrofit farms — not new-builds. If the big gains only show up where somebody also poured a new barn, the robot isn’t the hero. The ventilation and stall comfort are doing the heavy lifting. Purina Canada’s 2025 analysis of Canadian retrofit herds found a trending average of +3 liters/cow/day — about C$2.70/cow/day at a Canadian milk price of roughly 90 cents/liter. A useful reference point, but Canadian pricing doesn’t translate directly to U.S. operations.

At Tranel’s benchmark of 4,500 lb of milk per robot per day, AMS milking costs run about $2.13/cwt (range: $1.77–$3.00). A well-run swing-12 parlor? Roughly $1.08/cwt. That’s a dollar-plus gap you have to close with production gains, labor savings, and management value. Every month.

Cost ComponentAMS ($/cwt)Swing-12 Parlor ($/cwt)
Ownership (depreciation, interest, insurance)$1.05$0.38
Maintenance & Repairs$0.54$0.22
Labor (net after savings)$0.34$0.38
Throughput & Efficiency$0.20$0.10
Total Milking Cost$2.13$1.08
Gap You Must Close+$1.05/cwt—

Where the Maintenance Money Goes

The 2019 joint survey by Extension educators at UW-Madison, the University of Minnesota, and Penn State — with more than 50 complete responses — tracked how costs change as robots age.

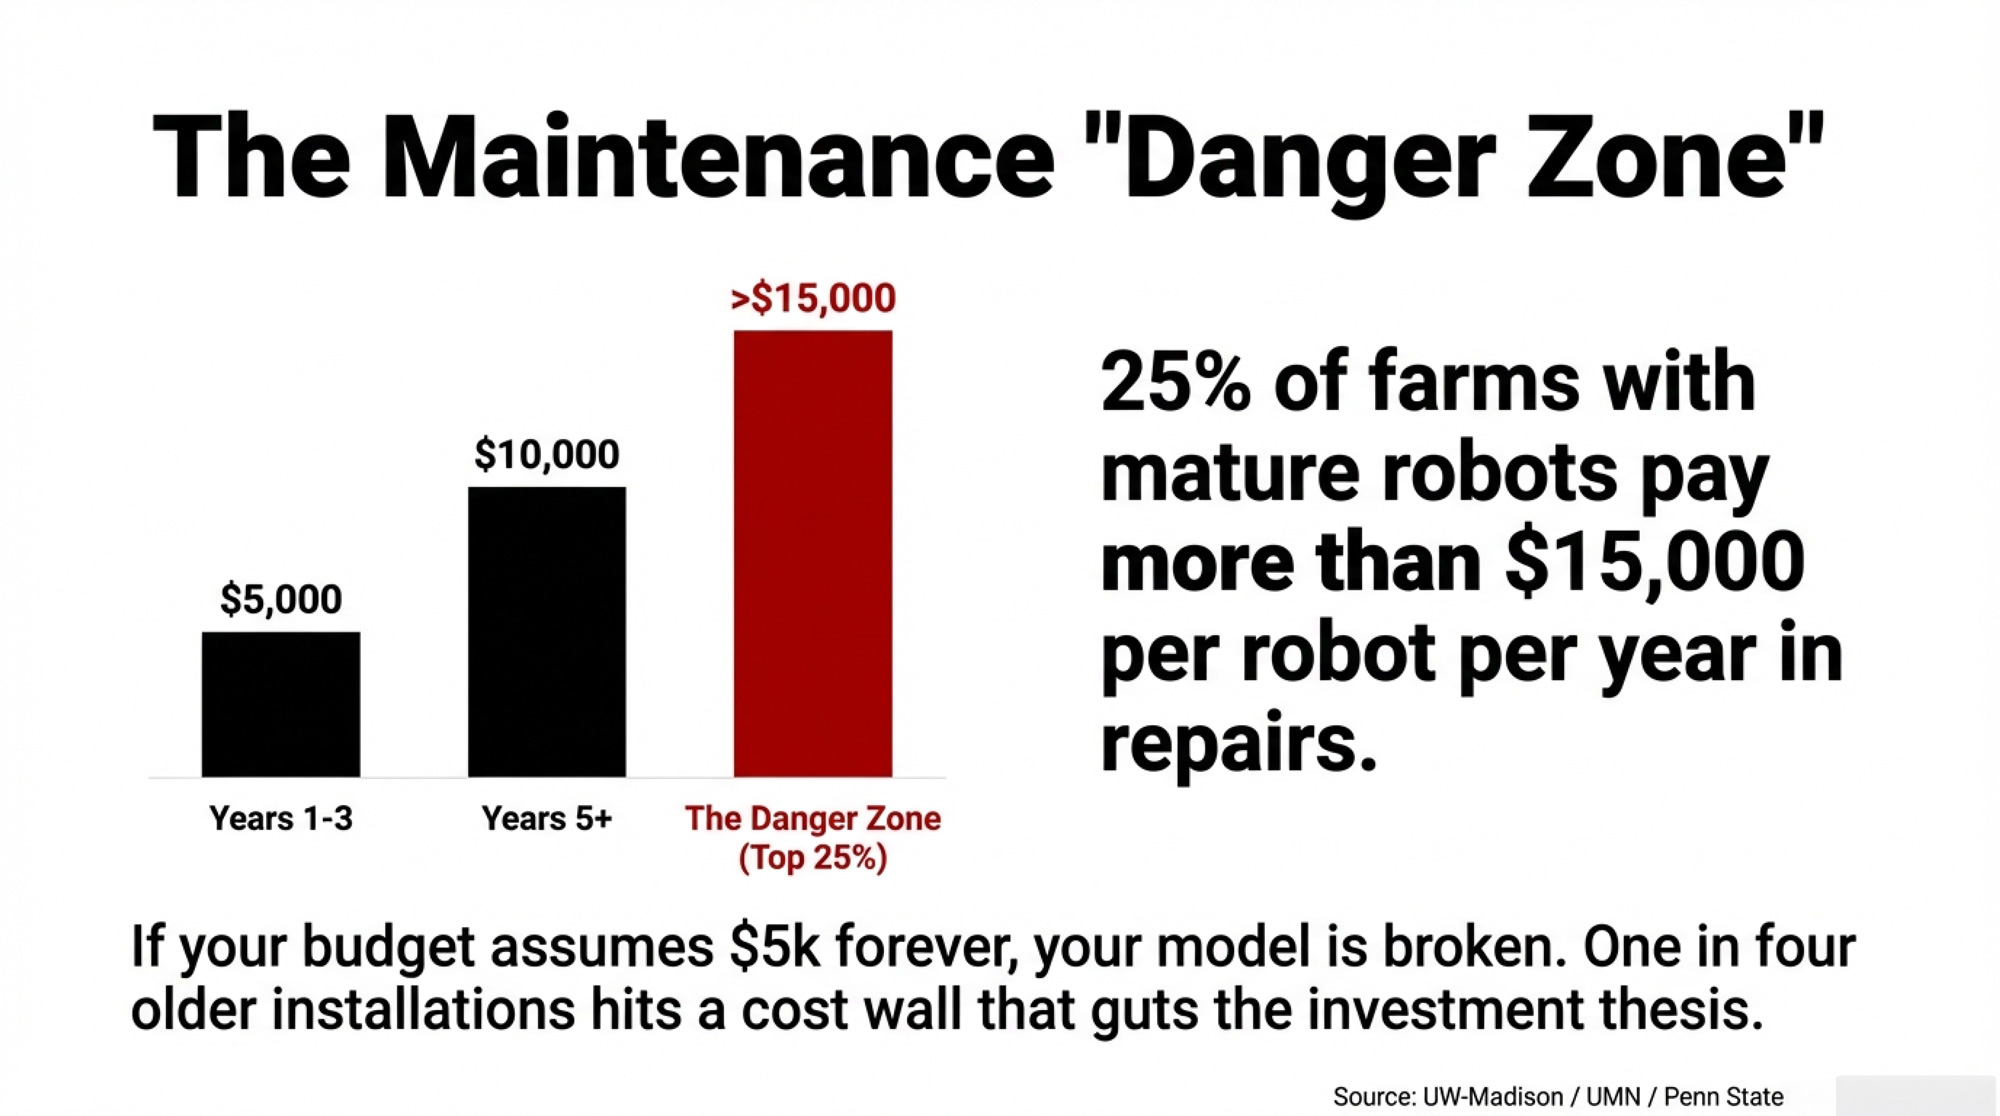
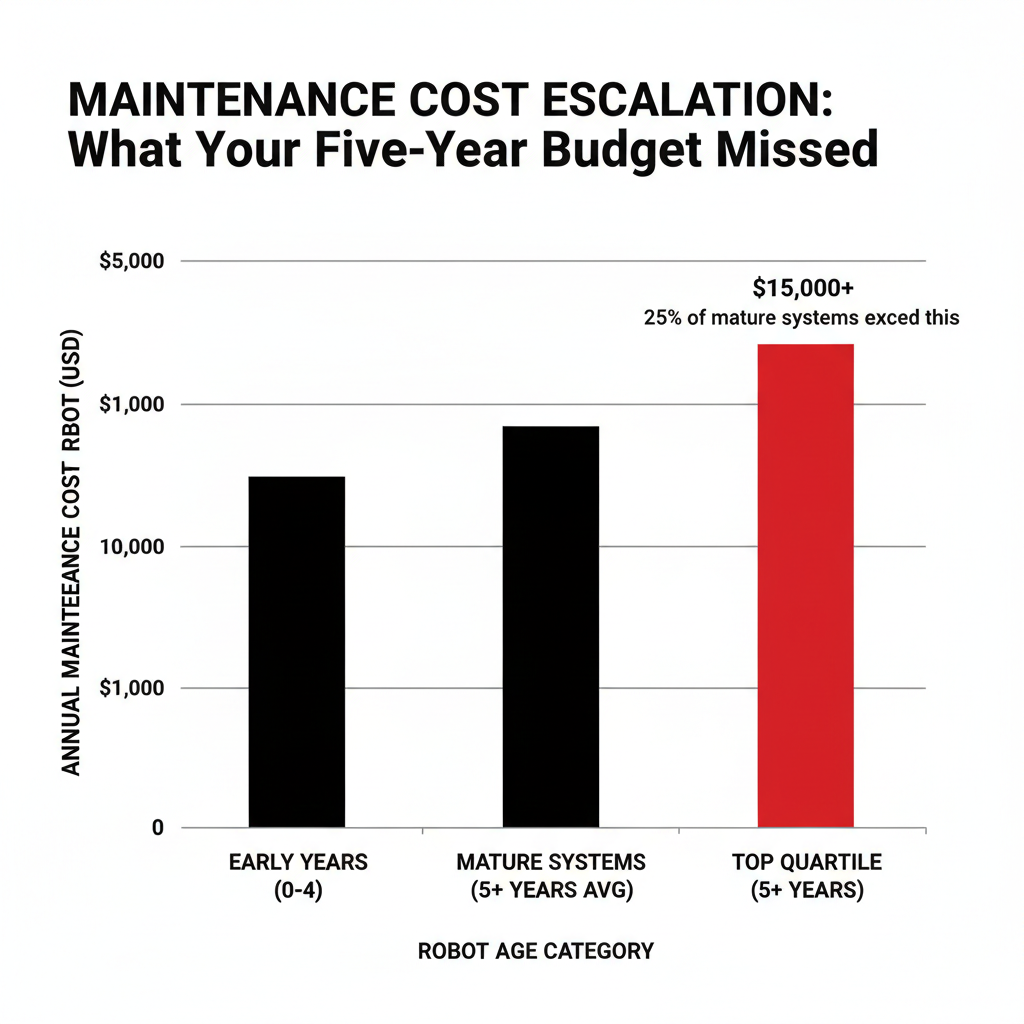
Early years: repairs and maintenance average around $5,000 per robot per year. As units get older, those costs climb to roughly $10,000, driven mainly by bigger repair bills while routine maintenance stays fairly steady.

But averages mask the danger zone. Among farms running robots for 5 years or more, 25% reported maintenance costs exceeding $15,000 per robot per year. A few blew past $25,000. Those producers, in their written comments, “made it clear that adaptation to AMS didn’t go well for them and that they were transitioning back to conventional milking systems or exiting the dairy sector.”

One in four older installations is hitting a cost wall that guts the investment thesis. That’s not a tail risk. That’s a quartile.

One bright spot from the same survey: 45% said dealer service had improved since they first adopted. When your robot goes down, how fast the technician arrives is the difference between a hiccup and days of lost production.

The Labor Savings Are Real. The Mental Load Is the Surprise.

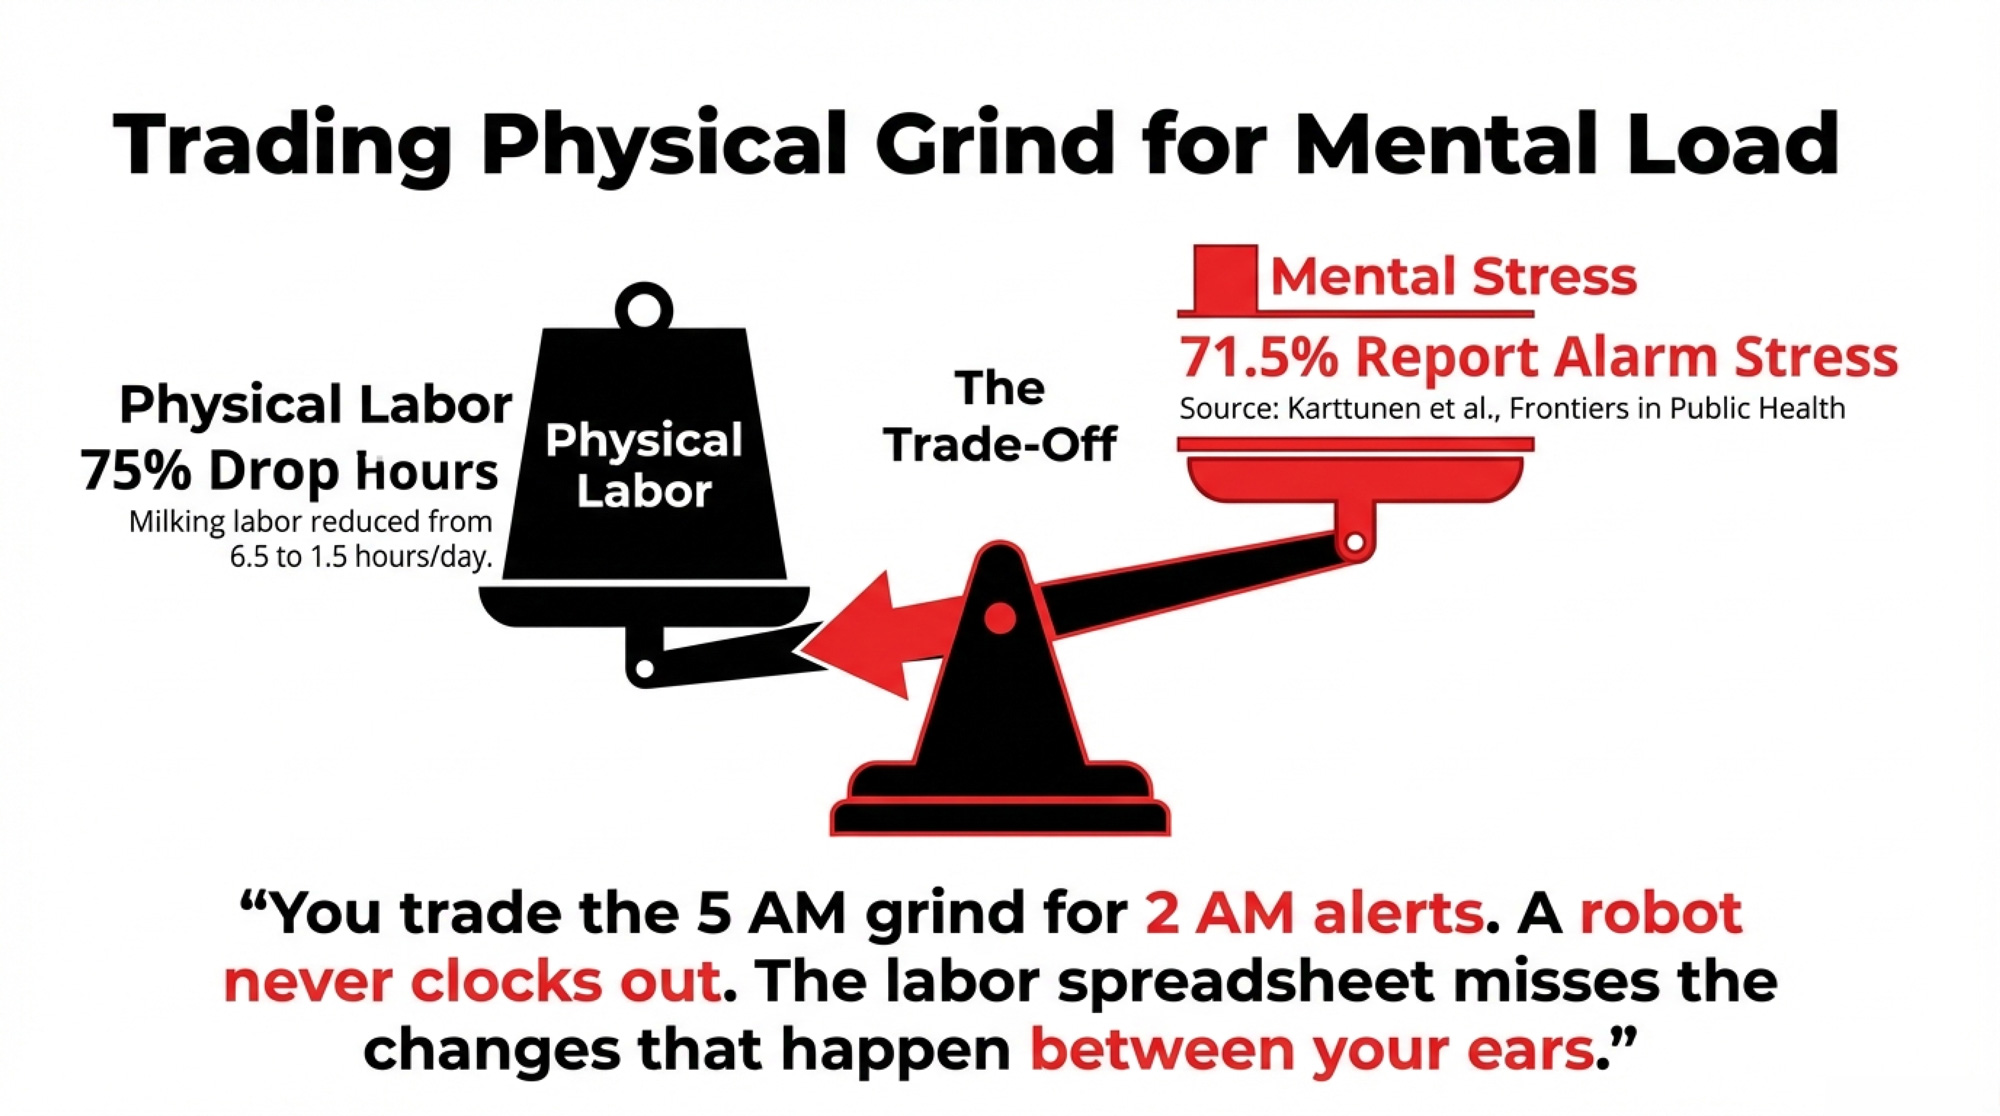
Tranel’s data show a 75% decrease in milking labor hours — from 6.5 hours/day to 1.5 on a typical two-robot farm. The UW–UMN–Penn State survey confirmed average savings of 38% per cow and 43% per hundredweight. At $15/hour, that works out to about $1.50/cwt in labor savings. Top-quartile farms saved $2.40/cwt or more.

But 8% of respondents reported no labor savings at all — mostly because maintenance demands ate the hours right back.

And the labor spreadsheet misses the changes that happen between your ears. A 2014 survey of 228 Finnish AMS farmers — published in 2016 by Karttunen, Rautiainen, and Lunner-Kolstrup in Frontiers in Public Health — found 71.5% reported mental stress from nightly AMS alarms and 51.7% experienced stress from the 24/7 standby. Overall, 93.4% mentioned at least one AMS-related issue causing mental strain.

That survey is now a dozen years old, and alarm management tech has improved. But the underlying reality hasn’t changed — a robot never clocks out. Christina Lunner Kolstrup of the Swedish University of Agricultural Sciences, a co-author on the Finnish study, put it plainly in a summary of her qualitative research reported by Dairy Global in 2021: “Previously, with conventional milking, the working day had a clear and natural ‘start’ and ‘end’, but with the AMS, there are no specific working hours. The informants claimed that they are working longer hours now than before. They are never really done after a working day, as there is always something more to be done in the dairy barn.”

One Wisconsin producer in the Extension survey nailed it: “AMS is not stress free. Physically, it is easier. Mentally stressful.” Another said: “Anyone considering robotics should understand that there is still plenty of daily work involved in milking, robots just give you more flexibility with your time.”

You trade the 5 AM and 5 PM grind for 2 AM alerts. If you run a family operation, that trade-off deserves a kitchen-table conversation before it deserves a dealer quote.

FactorThe Financial Gain (Quantified)The Mental Load Reality (Survey Data)
Milking Labor Hours75% reduction (6.5 hrs/day → 1.5 hrs/day)51.7% report stress from 24/7 standby requirement
Labor Cost Savings38–43% per cow; $1.50–$2.40/cwt71.5% report stress from nightly AMS alarms
Top-Quartile Labor Savings$2.40/cwt or higherWorkdays no longer have clear “start” or “end”
Zero Labor Savings8% of adopters (maintenance ate the hours back)93.4% report at least one AMS-related mental strain
Physical DemandSignificantly easier (no 5 AM/5 PM milking)“Mentally stressful… never really done after a working day”
Schedule FlexibilityMore control over daily timingTrade 5 AM/5 PM grind for 2 AM alerts; alarms wake you at night

The 15.8% Who Stopped

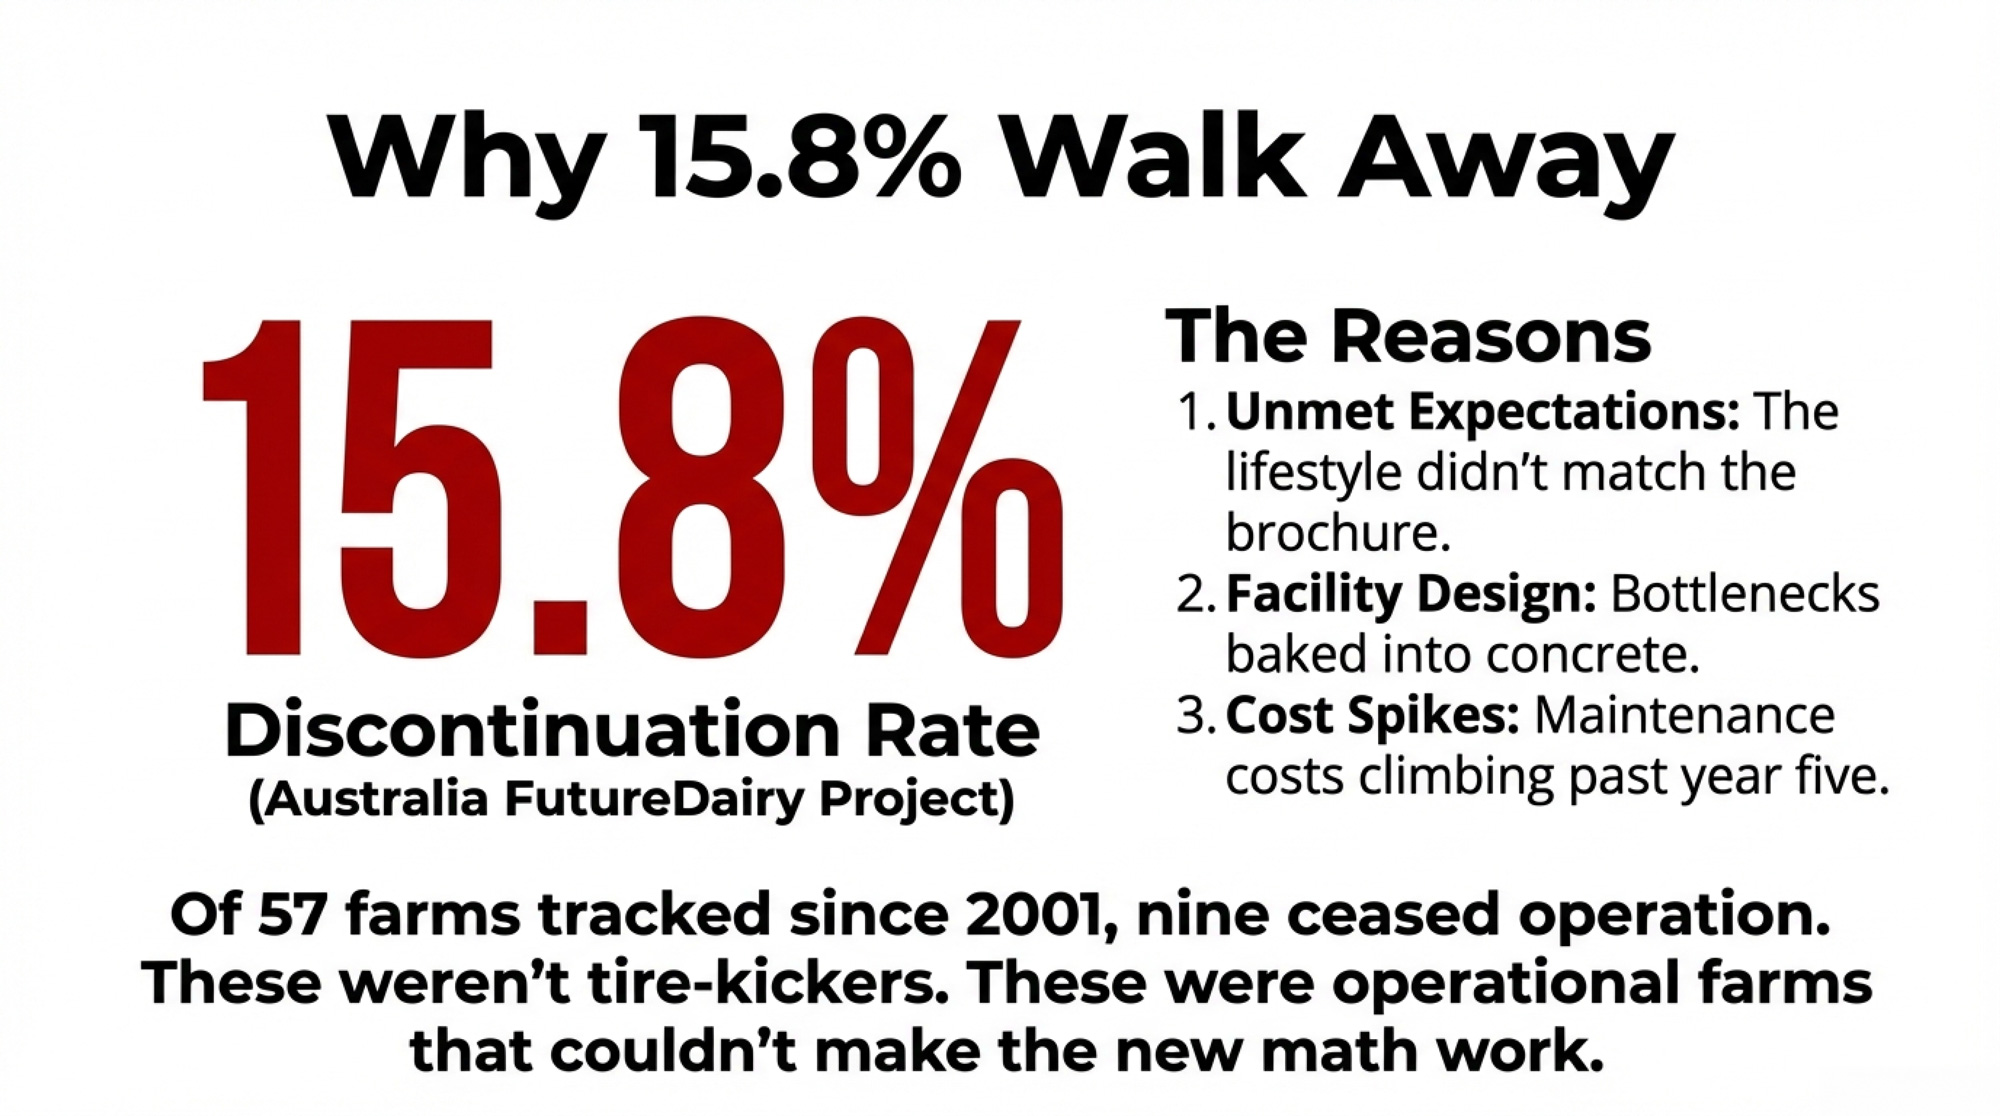
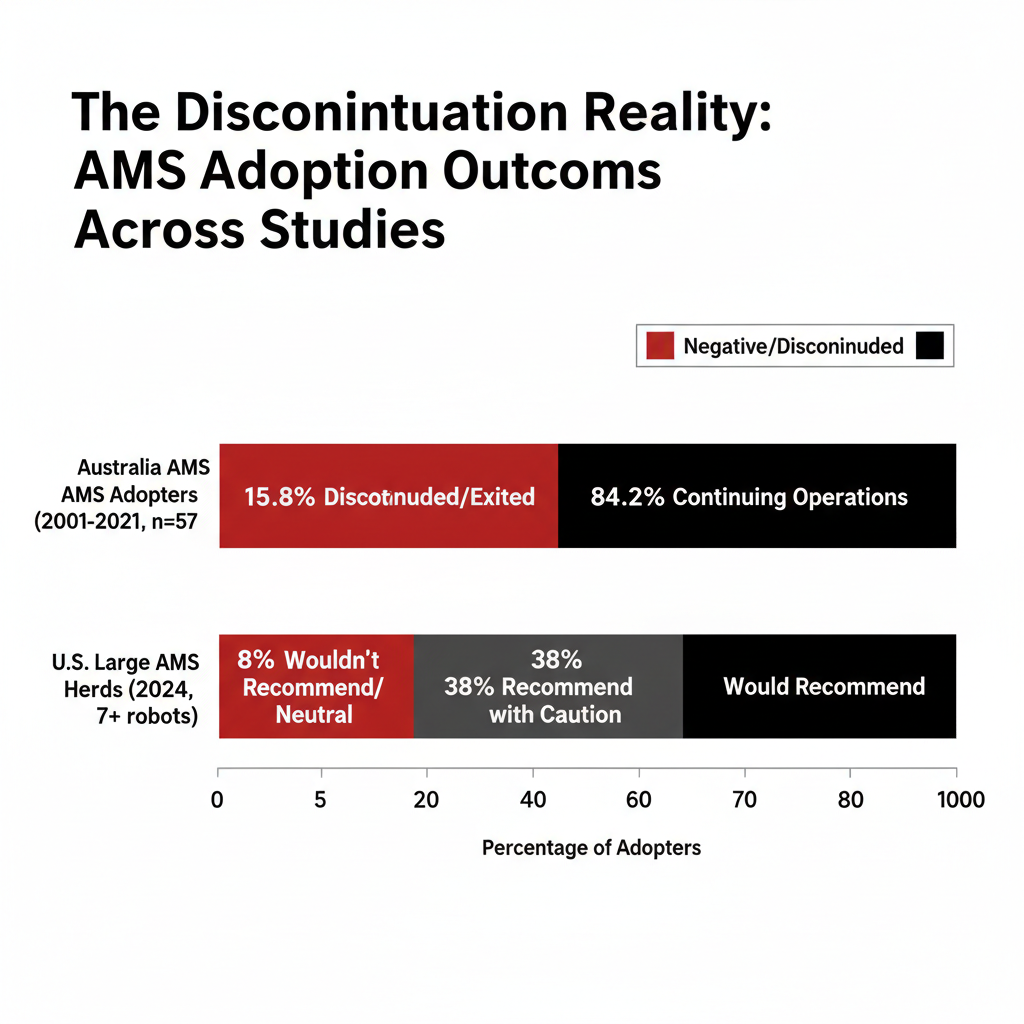
Dr. Nicolas Lyons, dairy technology leader at NSW Department of Primary Industries and a key researcher on Australia’s FutureDairy project, tracked the country’s entire AMS adoption history: “Of the 57 farms that commissioned robots since 2001, now there were only 48 operating. We had nine cease — some went back to a conventional dairy, and some left the industry entirely.”

Nine of 57. A 15.8% discontinuation rate — not among tire-kickers, but among farms that installed robots, ran them, and walked away.

Lyons didn’t dodge the reasons: “It basically comes down to things like expectations weren’t met; some couldn’t make it work; some didn’t have a good relationship with the equipment provider; and some didn’t achieve what they had hoped.”

The pattern usually starts with facility design — cow traffic bottlenecks baked into concrete you can’t move. It compounds when maintenance costs climb past year five. And it breaks open when the promised lifestyle improvement collides with the grind of 24/7 systems management.

What the Satisfied Farms Actually Said

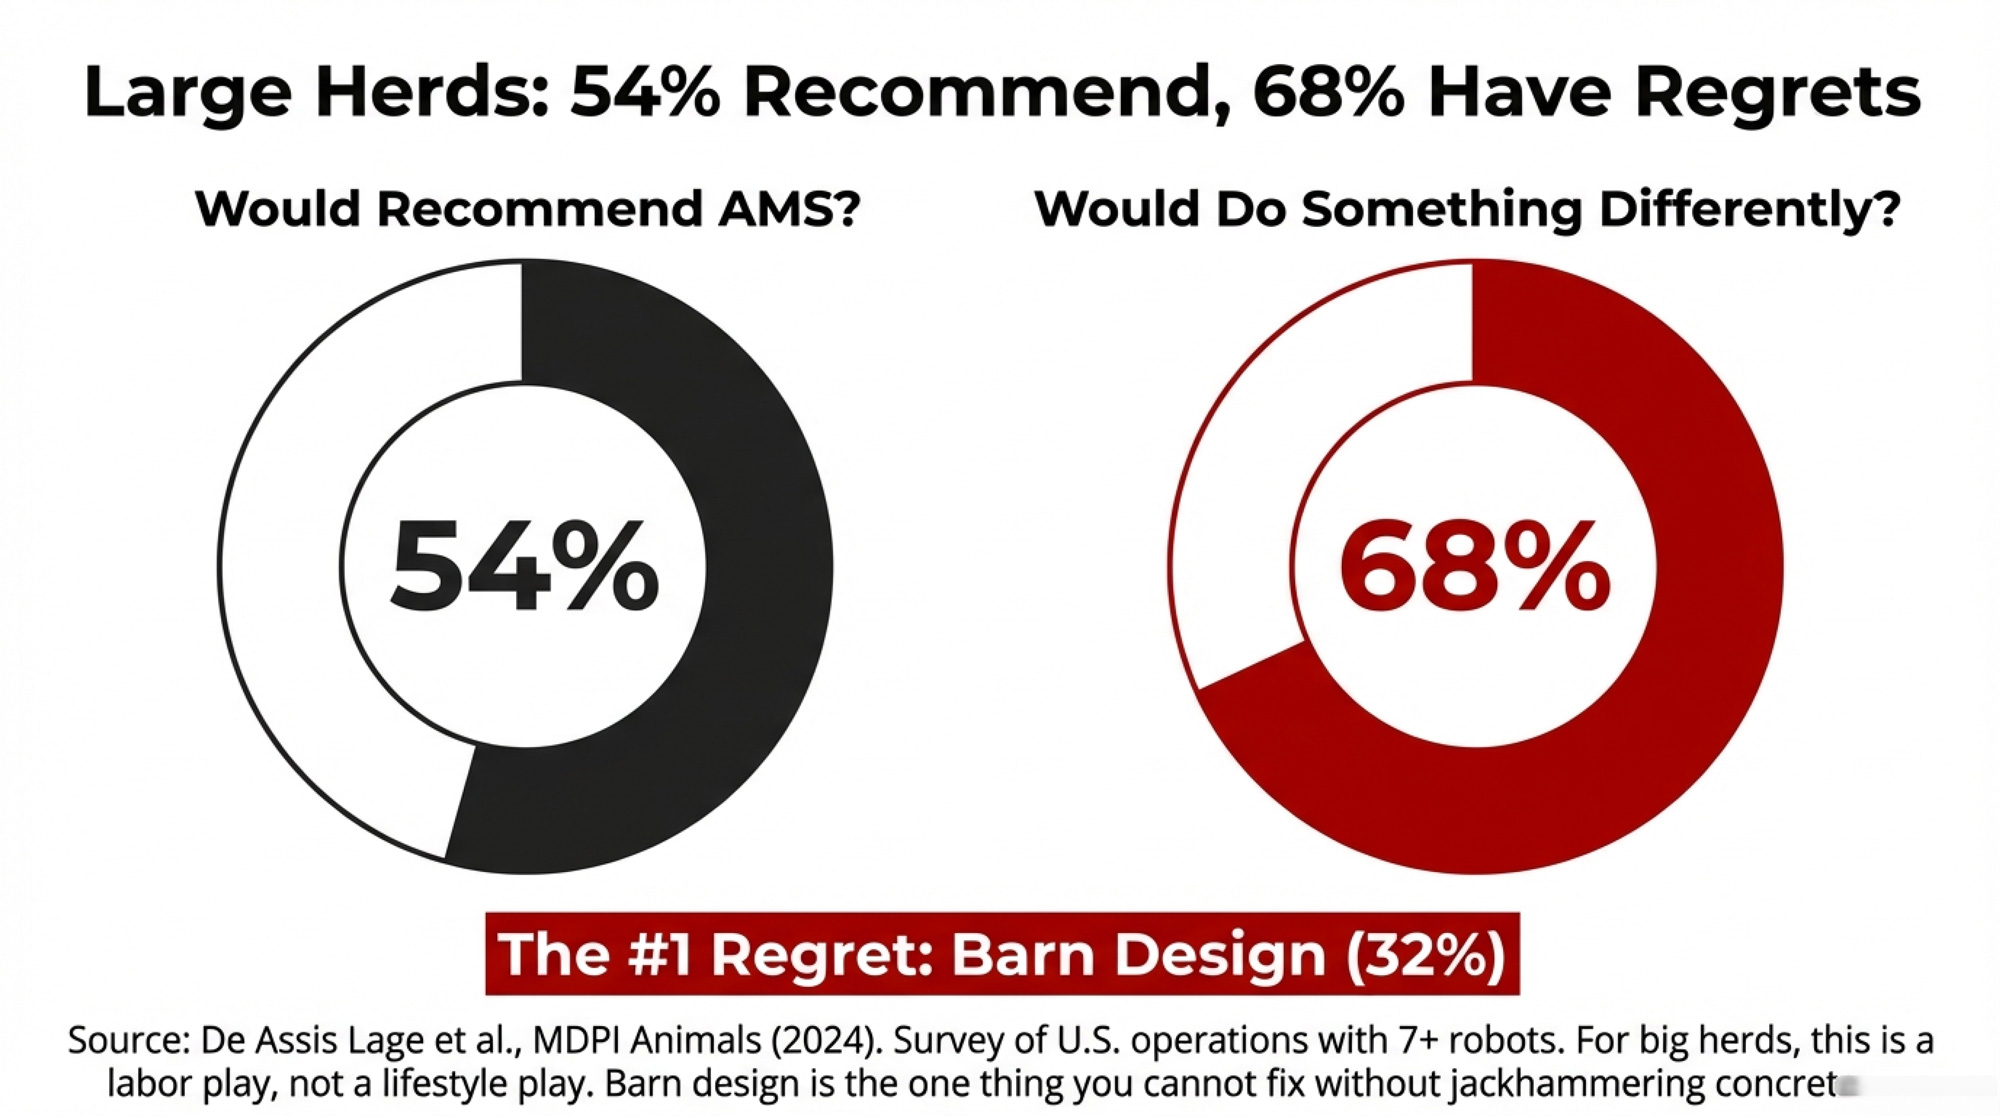
De Assis Lage and colleagues surveyed large U.S. AMS operations — farms running 7 or more milking boxes, median herd around 940 lactating cows — in a 2024 study published in MDPI Animals. The results: 54% would recommend AMS. Another 38% advised careful consideration before adopting. Just 8% were neutral or wouldn’t recommend.

That 38% isn’t a rejection. It’s producers who know it works—and exactly what it costs to get there.

Production results: 58% reported increases, and 32% saw higher fat and protein content. Top adoption motivations for these large herds: labor costs (81%), cow welfare (78%), herd performance (74%). Quality of life came in fourth at 44%. For big U.S. operations, AMS is a labor and performance investment first. The lifestyle argument carries more weight on smaller Canadian and European farms, where it consistently ranks as the top driver.

The regret data matters most: 68% would do something differently. Barn design modifications topped the list (32%), followed by improvements to cow flow (16%). Two-thirds wished they’d planned their facility better — the one thing you absolutely cannot fix without jackhammering concrete.

What Your Lender Sees

Brad Guse, Senior Vice President of Agriculture at BMO Harris Bank, frames the question the way your banker will: “Given the significant capital outlay for robotic dairy equipment, how are you going to repay the debt?”

Tranel’s model answers that bluntly. On a $400,000 investment at 7 years and 5.5%, the payment is $68,976/year. Capital recovery is $60,200/year. The cash squeeze starts on day one.

Guse warns specifically against balloon payments — you’re deferring principal at exactly the point maintenance costs start climbing.

And Tranel raises a timeline question that rarely comes up at the dealer’s table: “If you will be farming for at least another 13 to 17 years, that increases the propensity to put in robotics, but if you are only planning on farming about seven years, then it might not make sense.” Looking at 20 more years? “You need to consider needing to make a second investment of money in 15 years when the equipment wears out.”

The One Number That Predicts Your Return

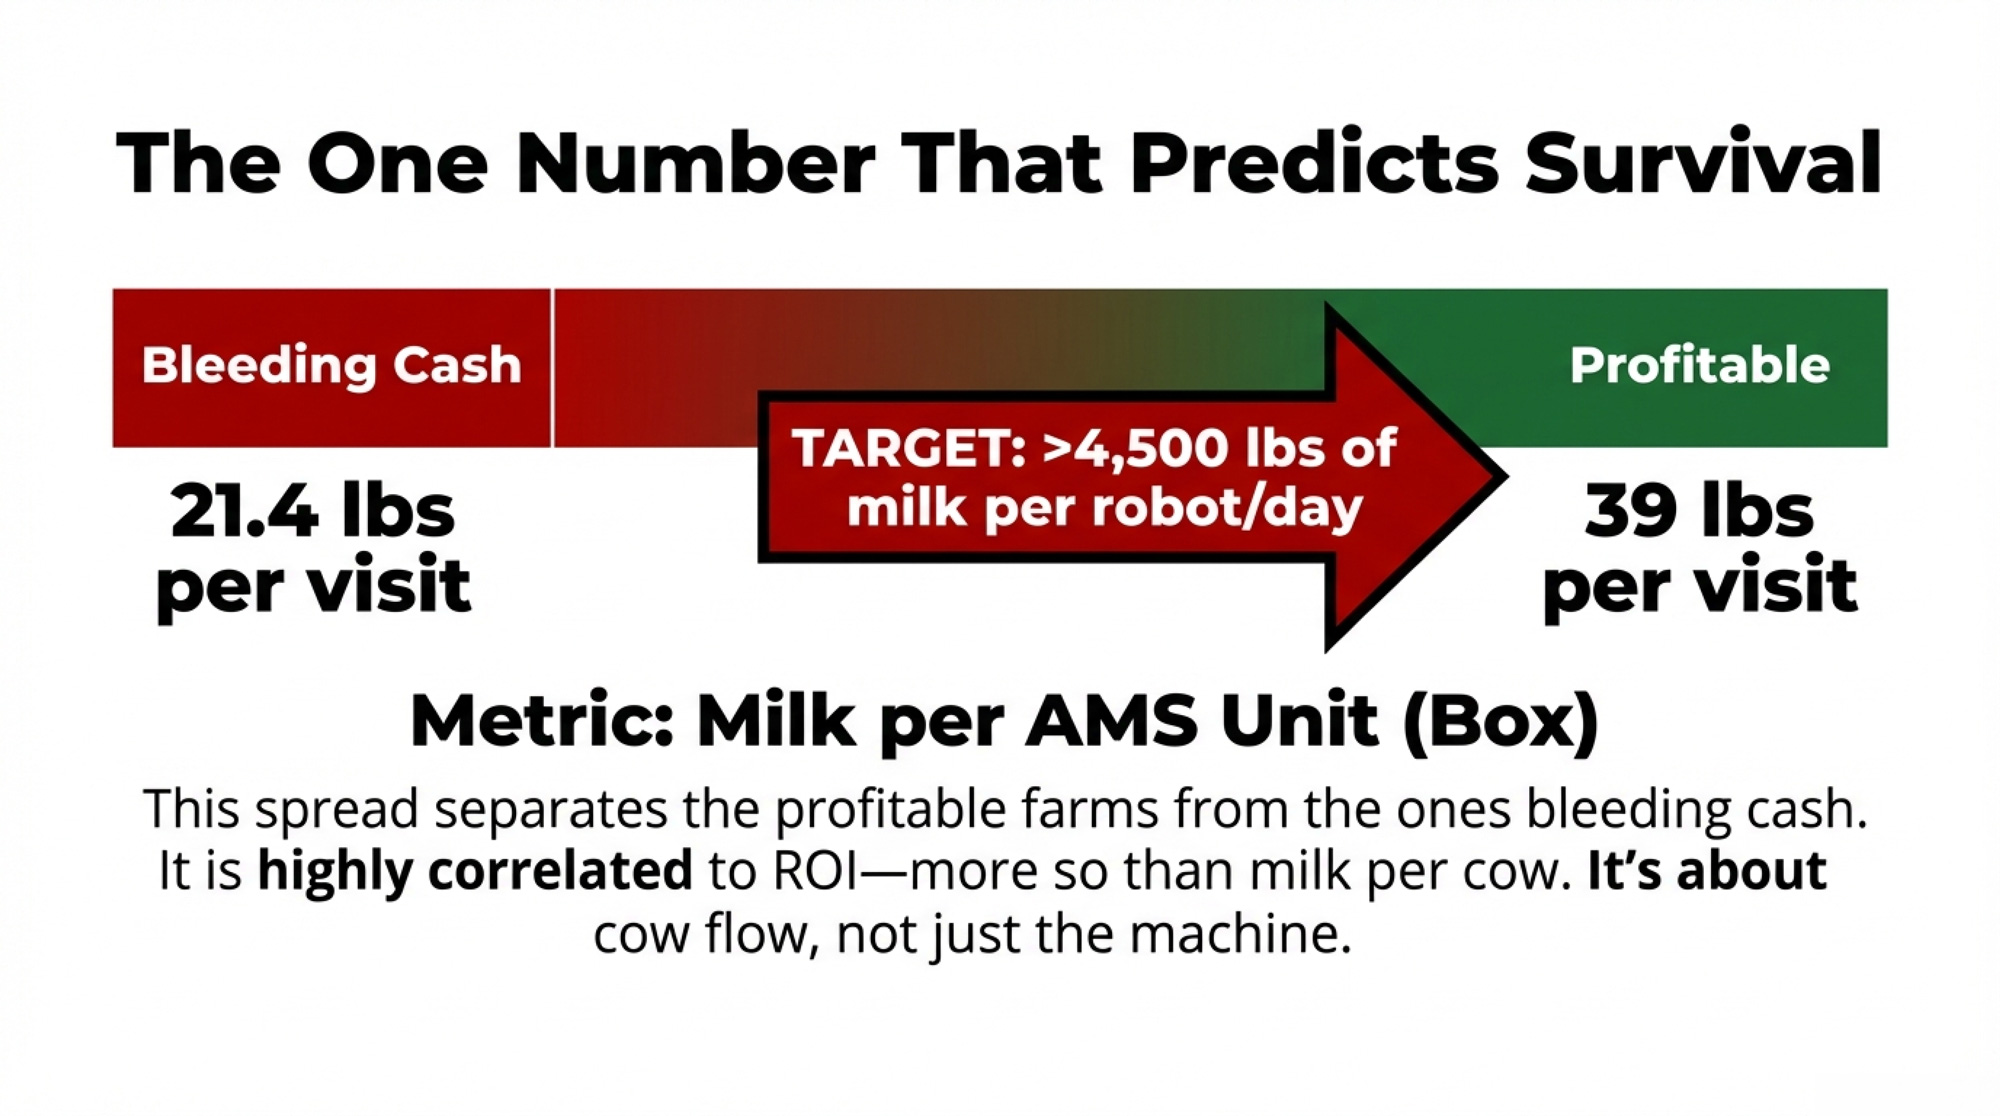
Tranel is clear: milk per AMS unit is “very highly correlated” to AMS profitability — more so than milk per cow. The 2019 survey data showed robot visits ranging from 2.4 to 3.1 per cow per day, and milk per visit ranging from 21.4 to 39 lb.

That spread — 21.4 to 39 lb per visit — separates the robots that pay from the ones that bleed you dry. And the gap isn’t about the machine. It’s cow flow, feed management, lameness protocols, stall comfort, and whether you run the data like a systems manager or treat the robot as a very expensive hired hand.

What This Means for Your Operation

  • Budget AMS milking at $2.00–$2.50/cwt against roughly $1.08/cwt for a good parlor. Your labor savings, production bump, and management-software value have to clear that gap. Monthly.
  • Plan for maintenance to roughly double by year five — and for the real possibility you land in the top quartile at $15,000+ per robot. If your cash flow model assumes $5,000/year in perpetuity, it’s wrong.
  • If you’re milking 3X in an efficient parlor, don’t model production gains from AMS. Tranel’s data says you may lose ground. Be honest about your starting point before you model the finish.
  • Run Tranel’s spreadsheet — search “Iowa State Extension dairy team milking systems” for the free download. [Verify URL is current before publication.] Stress-test your numbers at $17 milk, not just $22. If the math only works at high prices, you’re making a bet, not an investment.
  • Facility design is the regret you can’t undo. Visit retrofits, not just new-builds. Walk through at peak milking time. Ask every operator the same thing: “What would you do differently?”
  • Know your timeline. Less than 10 years to exit? The valley may outlast your career. Twenty years out? Budget for a full equipment replacement at year 15.
  • Have the family conversation about mental load before you have the dealer conversation about price. The Finnish data is clear: 71.5% of AMS farmers reported stress from nightly alarms. Alarm tech has improved since that 2014 survey, but the 24/7 nature of robot management hasn’t changed.

Key Takeaways

  • The January 2026 USDA report (ERR-356) confirms that AMS boosts net returns 13% on average. But Tranel’s cash flow model shows seven years of red ink before you reach the payoff. Both are true. The difference is what you measure.
  • Production gains of 3–5% are realistic for 2X herds. Much of any larger gain comes from new facilities—not from the robot itself. Ask for retrofit data before you sign.
  • AMS milking costs roughly double a good parlor — $2.13/cwt vs. $1.08/cwt in Tranel’s model.
  • 54% of large U.S. AMS farms recommend the technology, but 38% say do your homework first. And 68% wish they’d planned their barn differently.
  • Maintenance costs nearly double as robots age. One in four older installations tops $15,000/robot/year.
  • Of Australia’s 57 AMS adopters since 2001, nine stopped entirely — a 15.8% discontinuation rate driven by unmet expectations and poor dealer relationships.

The Bottom Line

The producers who recommend AMS without hesitation didn’t just buy different equipment. They became different managers — relentless about the gap between 21.4 and 39 lb per visit, obsessed with cow flow, and brutally honest about what the investment demands.

Where does your operation actually sit in that picture? Answer with a spreadsheet — not a brochure — before you pour the concrete.

Executive Summary: 

USDA’s 2026 ERR-356 report says robotic milking and precision tech boost U.S. dairy net returns by about 13% on average, but Iowa State economist Larry Tranel’s cash flow work shows that a typical two-robot install often spends roughly seven years in the red before that upside appears. In his model, a $400,000 system carries about $62,000 in annual ownership costs and nearly $69,000 in loan payments, with only around $1,400 in net financial benefit — leaving an estimated $8,776/year cash flow gap in the early years. Extension surveys echo that pressure, finding that maintenance and repair costs commonly rise from about $5,000 to $10,000 per robot as units age, and that roughly one-quarter of mature AMS herds pay more than $15,000 per robot per year. On the positive side, those same data sets show 3–5% milk increases in most 2X herds that adopt robots, 38–43% labor savings, and better components in many large U.S. dairies, especially when upgrades include new barns. Mental health research from Finland and Sweden then adds a human price tag, with more than 70% of AMS farmers reporting stress from nightly alarms and describing workdays that no longer have a clear start or finish. The full article combines these numbers into a clear playbook — from cost per cwt and milk per robot box to maintenance risk and farming timeline — so you can decide, with eyes open, whether robotic milking fits your herd and your life.

Complete references and supporting documentation are available upon request by contacting the editorial team at editor@thebullvine.com.

Learn More

The Sunday Read Dairy Professionals Don’t Skip.

Every week, thousands of producers, breeders, and industry insiders open Bullvine Weekly for genetics insights, market shifts, and profit strategies they won’t find anywhere else. One email. Five minutes. Smarter decisions all week.

NewsSubscribe
First
Last
Consent
Send this to a friend