Warning: Today’s cheese collapse confirms what smart money already knows – milk’s heading for $16. Action plan inside.
Executive Summary: Today’s 8-cent cheese collapse to $1.5525 sent an unmistakable message: the U.S. dairy industry has entered a margin crisis that smart money says could stretch into 2027. With Europe undercutting our prices by 10 cents, Mexico pulling back orders, and domestic production inexplicably up 4.2%, we’re producing into a black hole. The numbers are sobering – Class III milk heading for $16.50 means your January check drops $3/cwt, translating to $7,500 less monthly revenue for a typical 300-cow operation. At these prices, even well-run dairies lose $1,500 daily. But here’s what 30 years in this industry has taught me: the operations that act decisively in the first 90 days of a crisis are the ones that survive. Those waiting for markets to ‘come back’ typically don’t make it. Your December milk check isn’t just a number anymore—it’s a referendum on whether your operation has what it takes to weather the storm ahead.

Today’s Market Summary Table
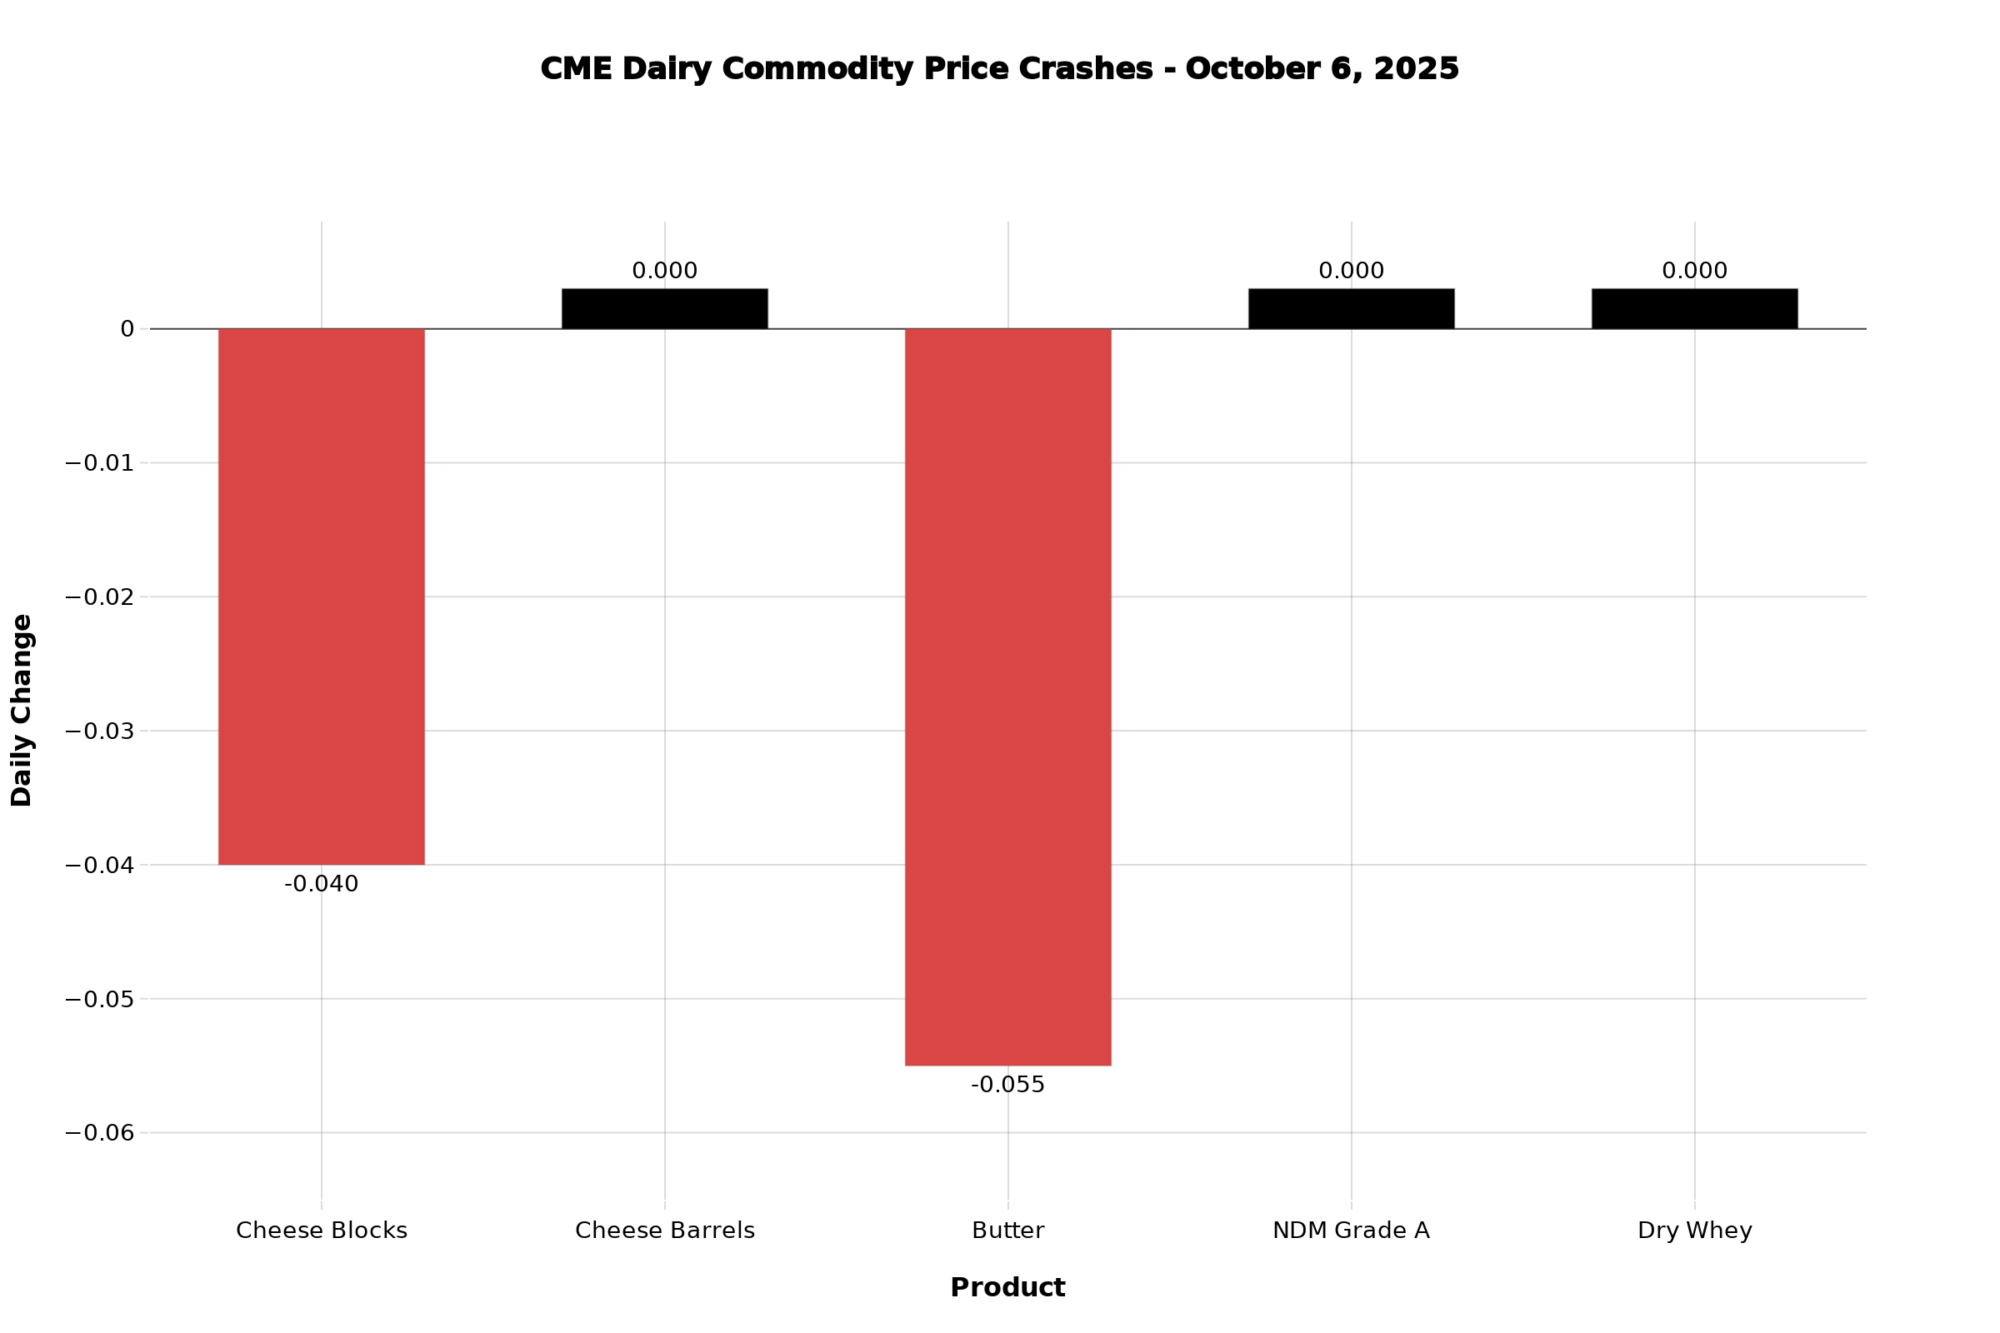
| Product | Close | Change | Trading Activity |
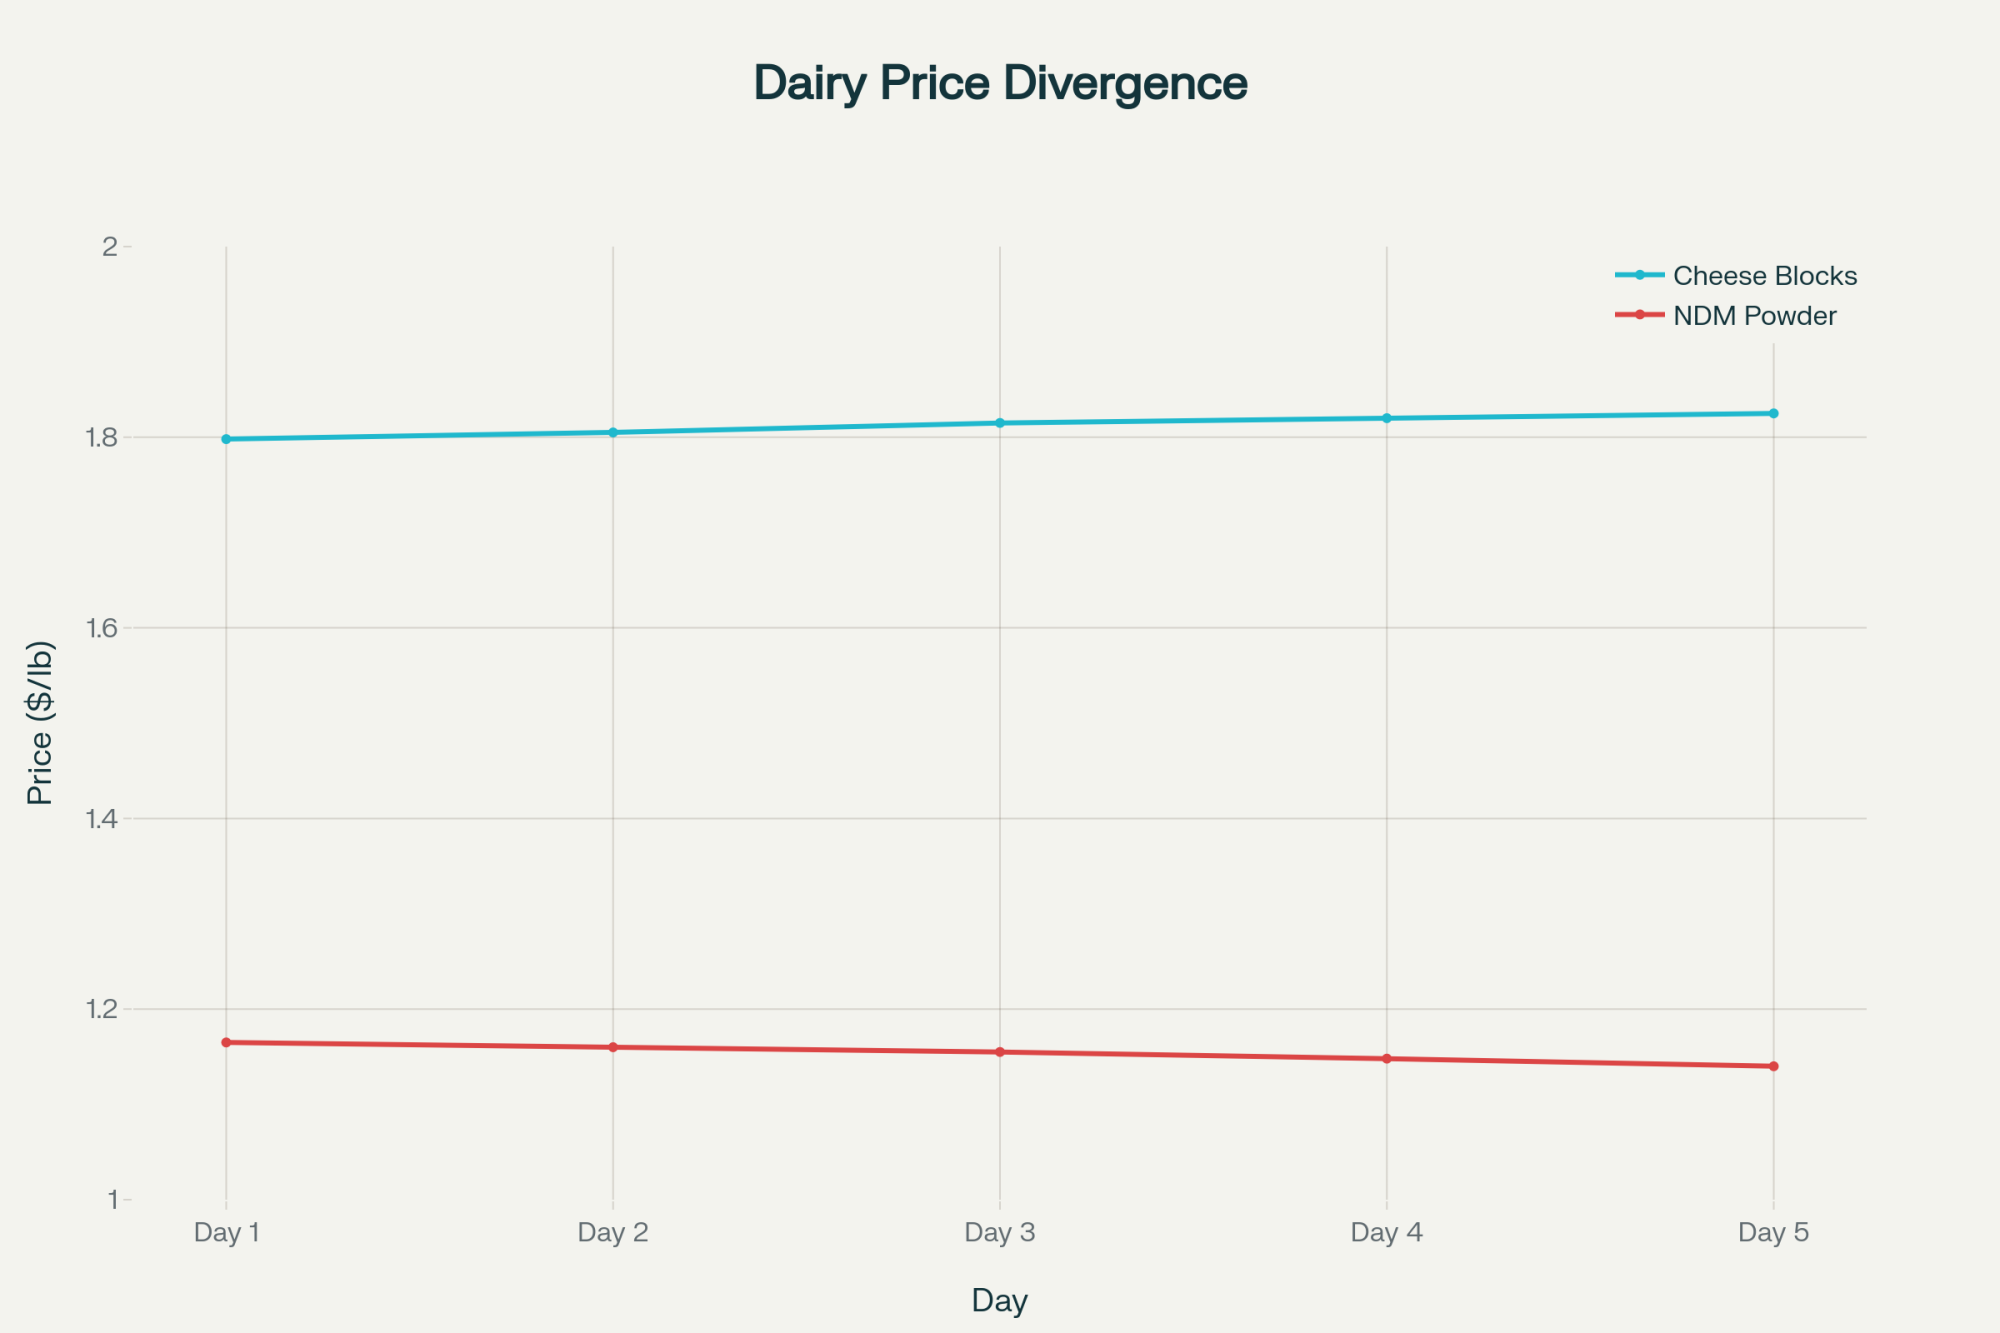
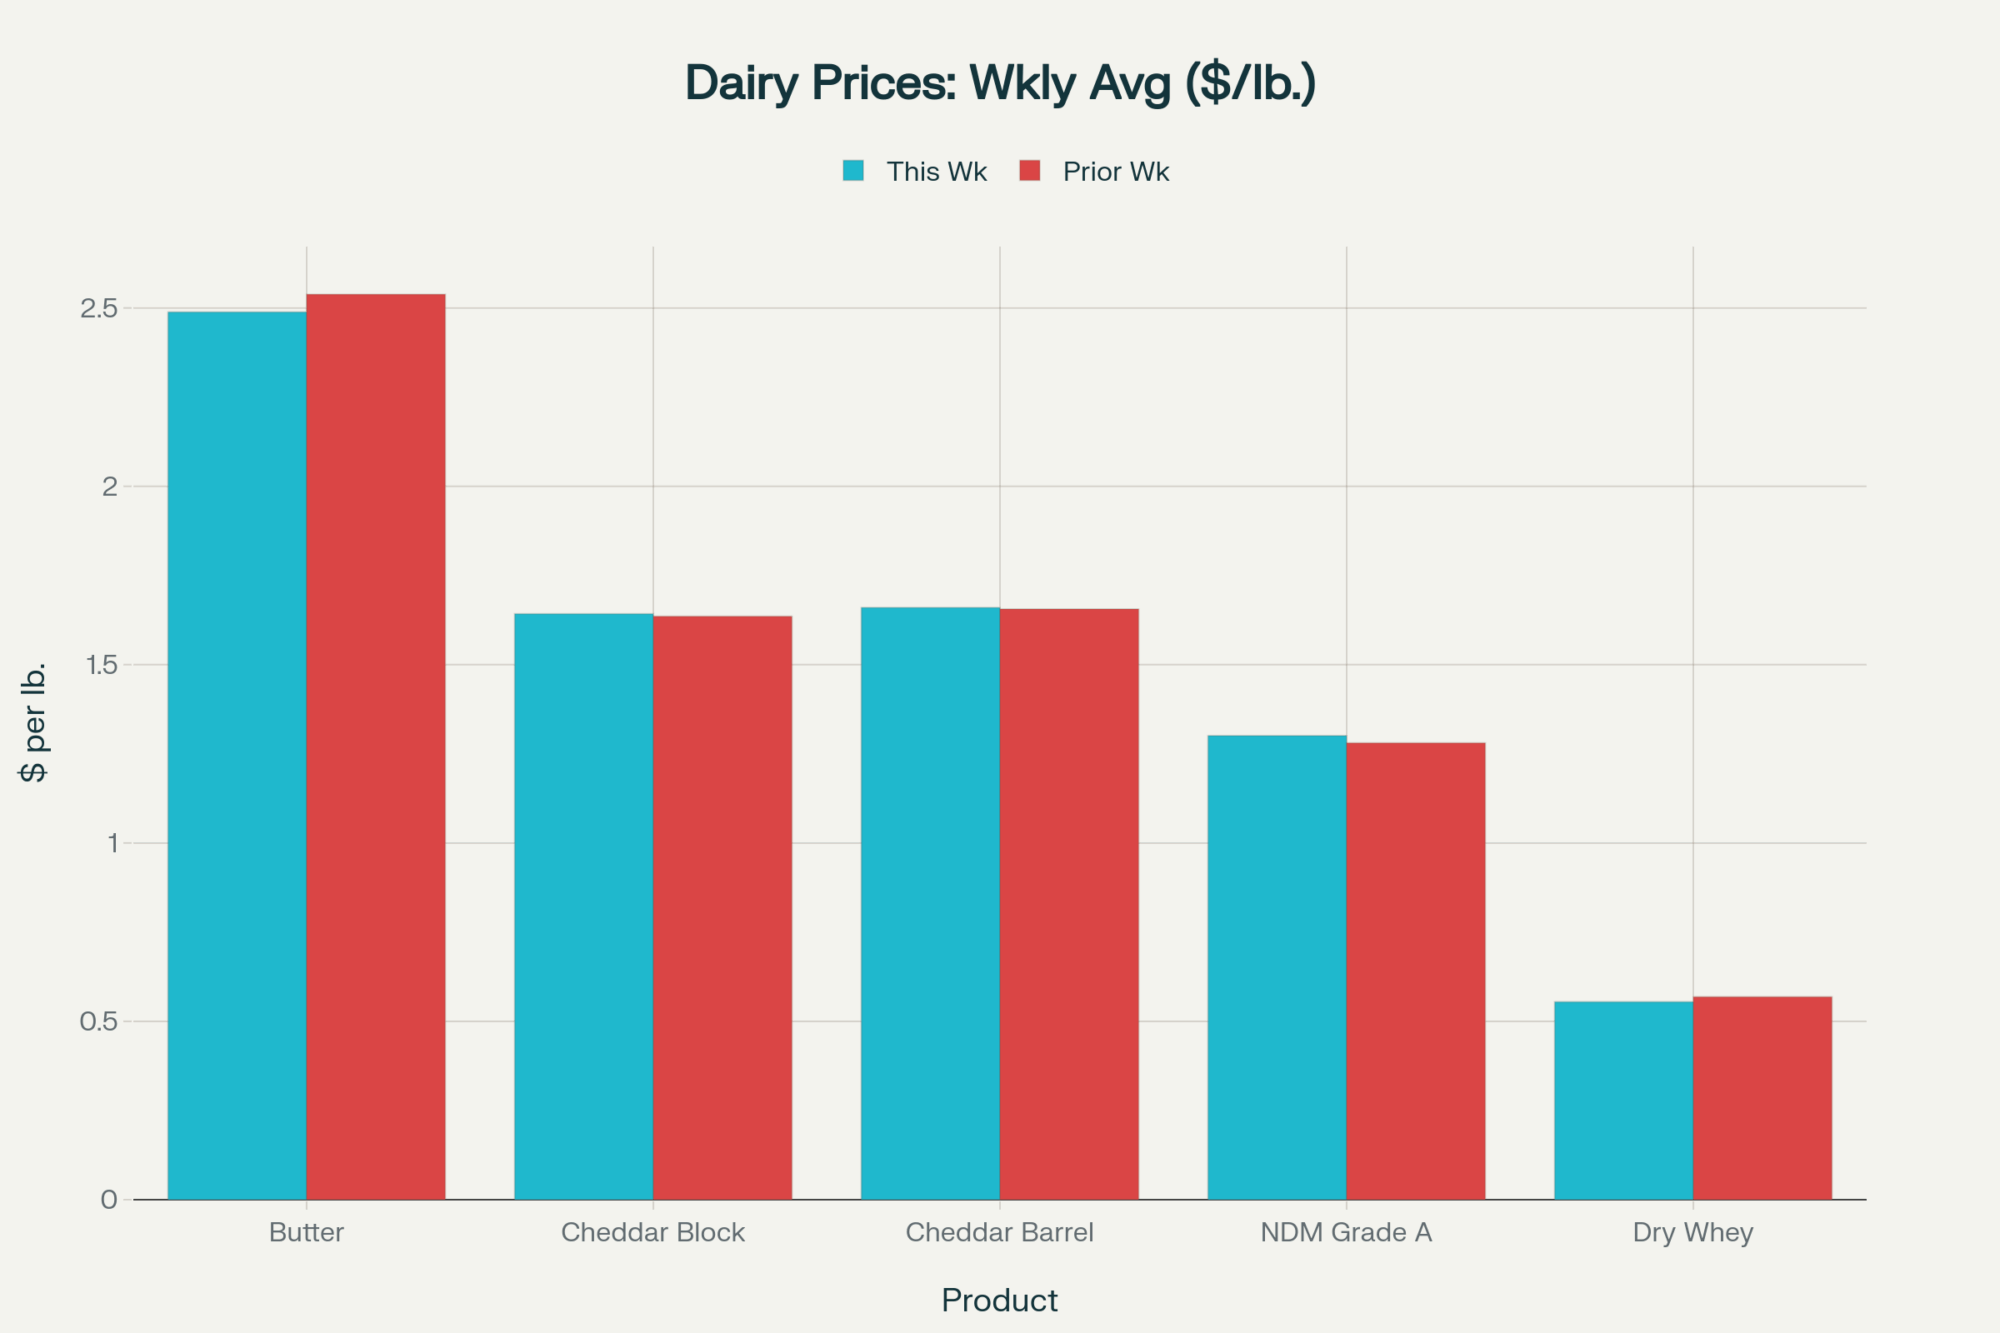
| Cheese Blocks | $1.5525/lb | ↓ $0.08 | 4 trades ($1.5775-$1.6275) |
| Cheese Barrels | $1.6450/lb | ↓ $0.03 | No trades |
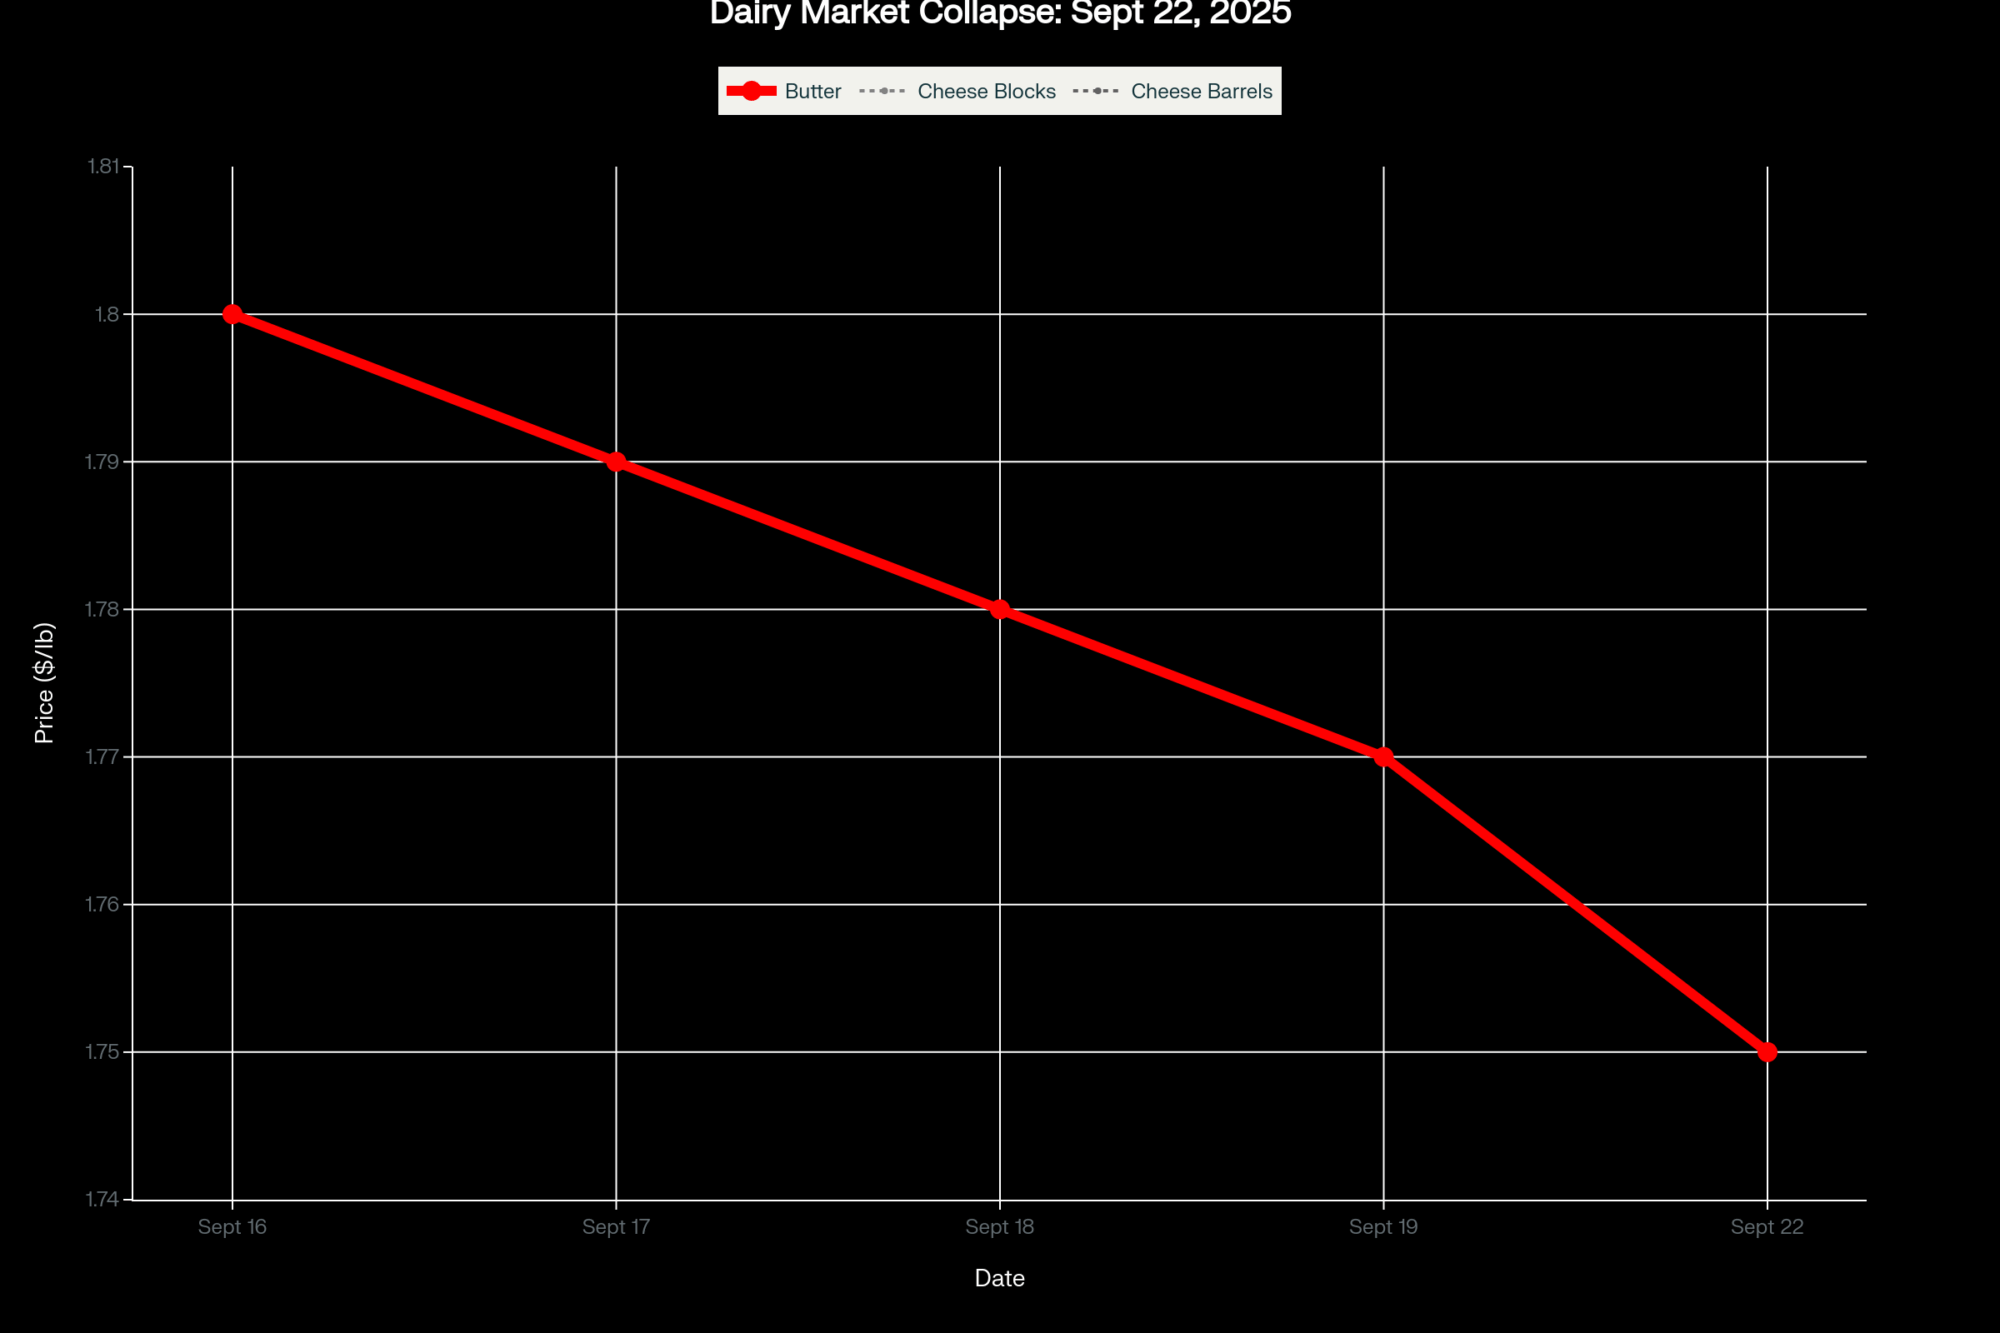
| Butter | $1.5000/lb | Unchanged | 3 trades ($1.49-$1.50) |
| NDM | $1.1575/lb | ↑ $0.0025 | No trades |
| Dry Whey | $0.7500/lb | Unchanged | No trades |
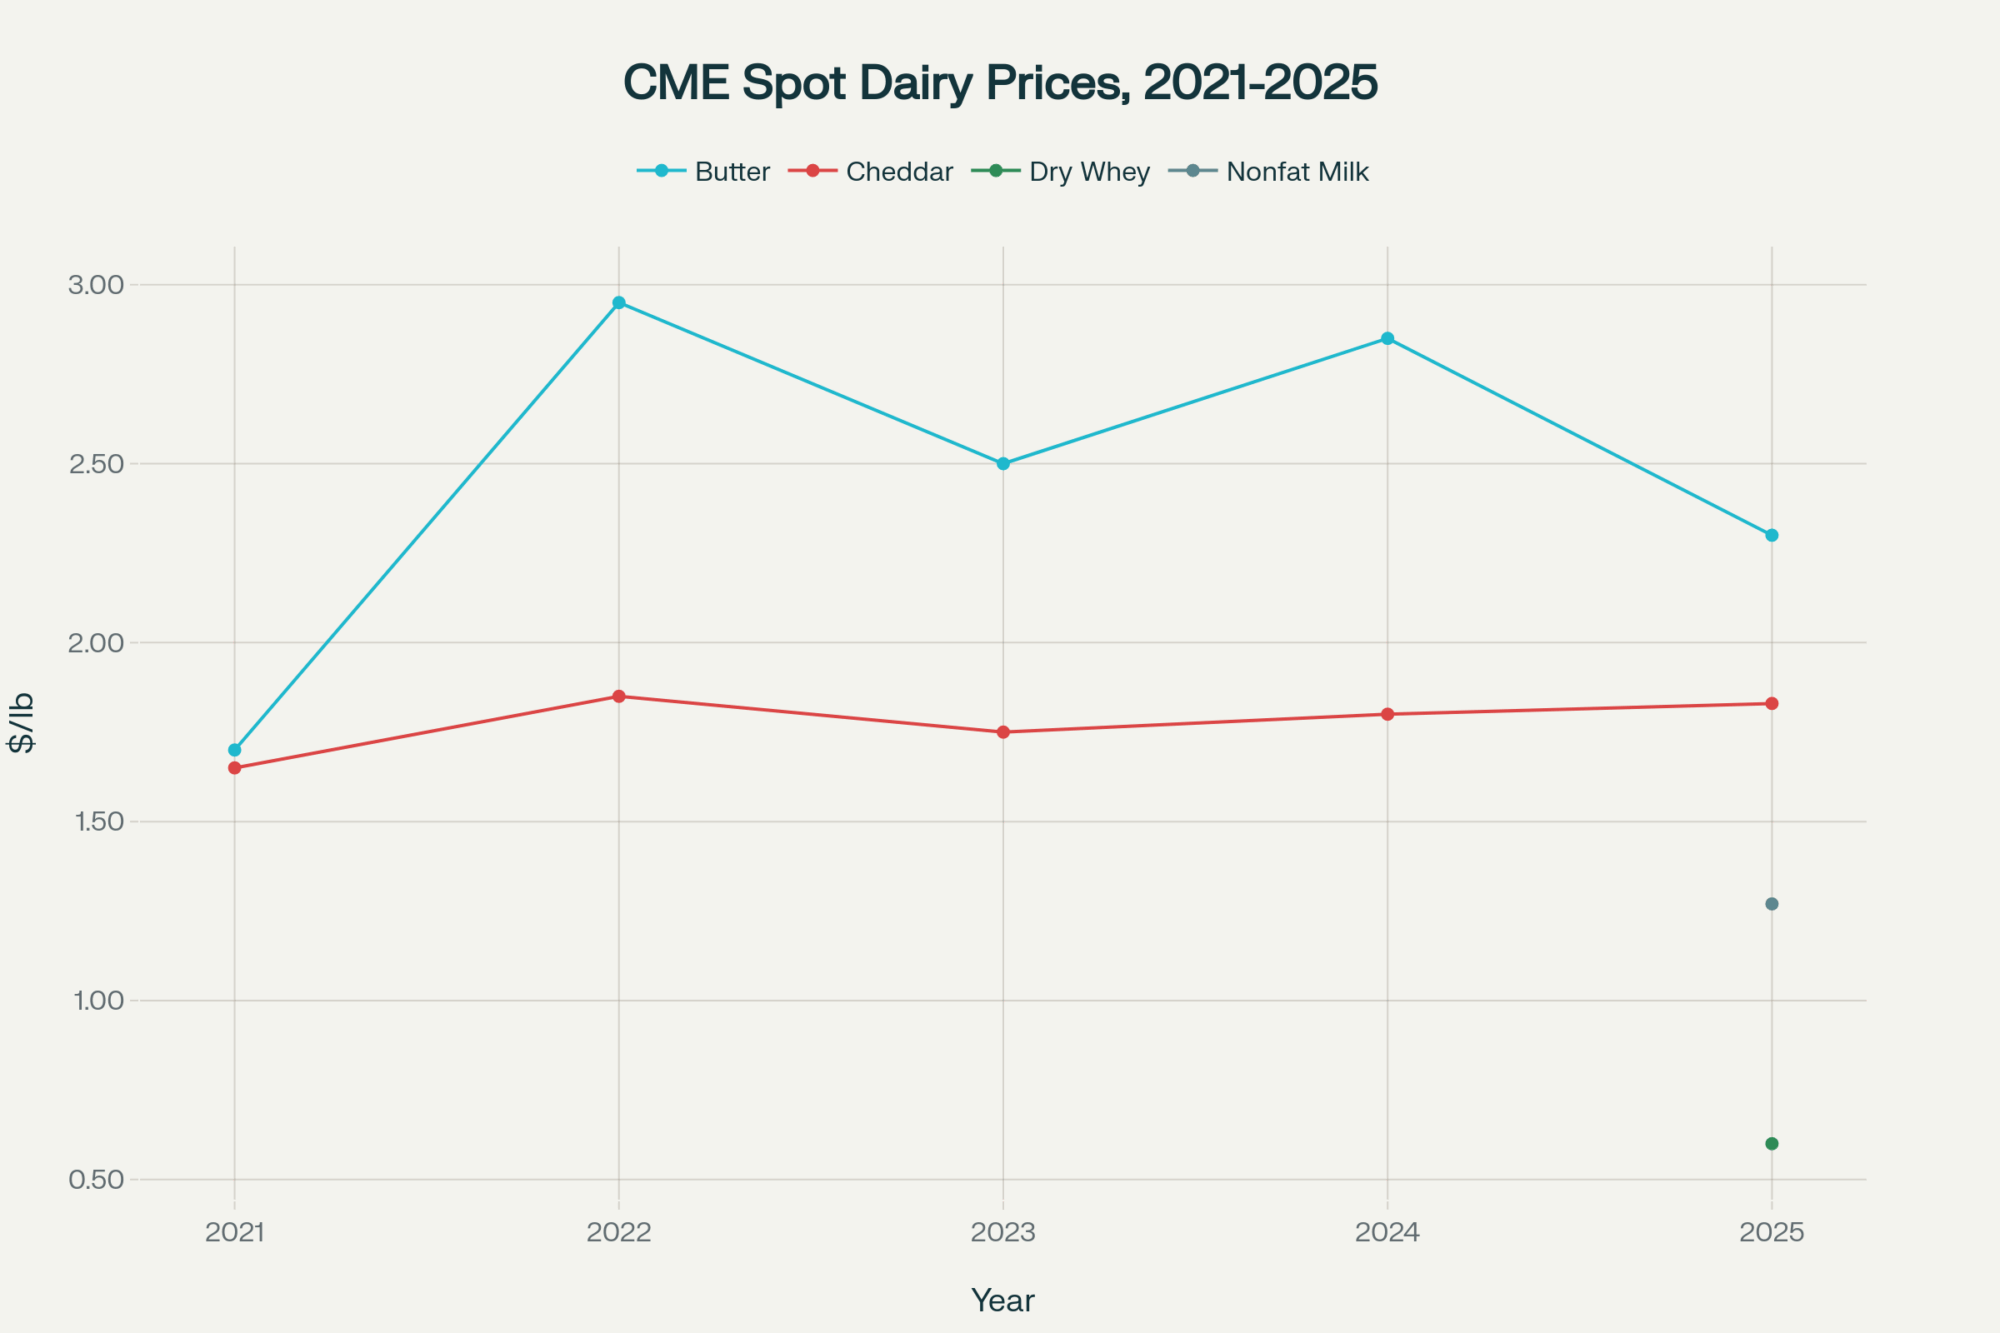
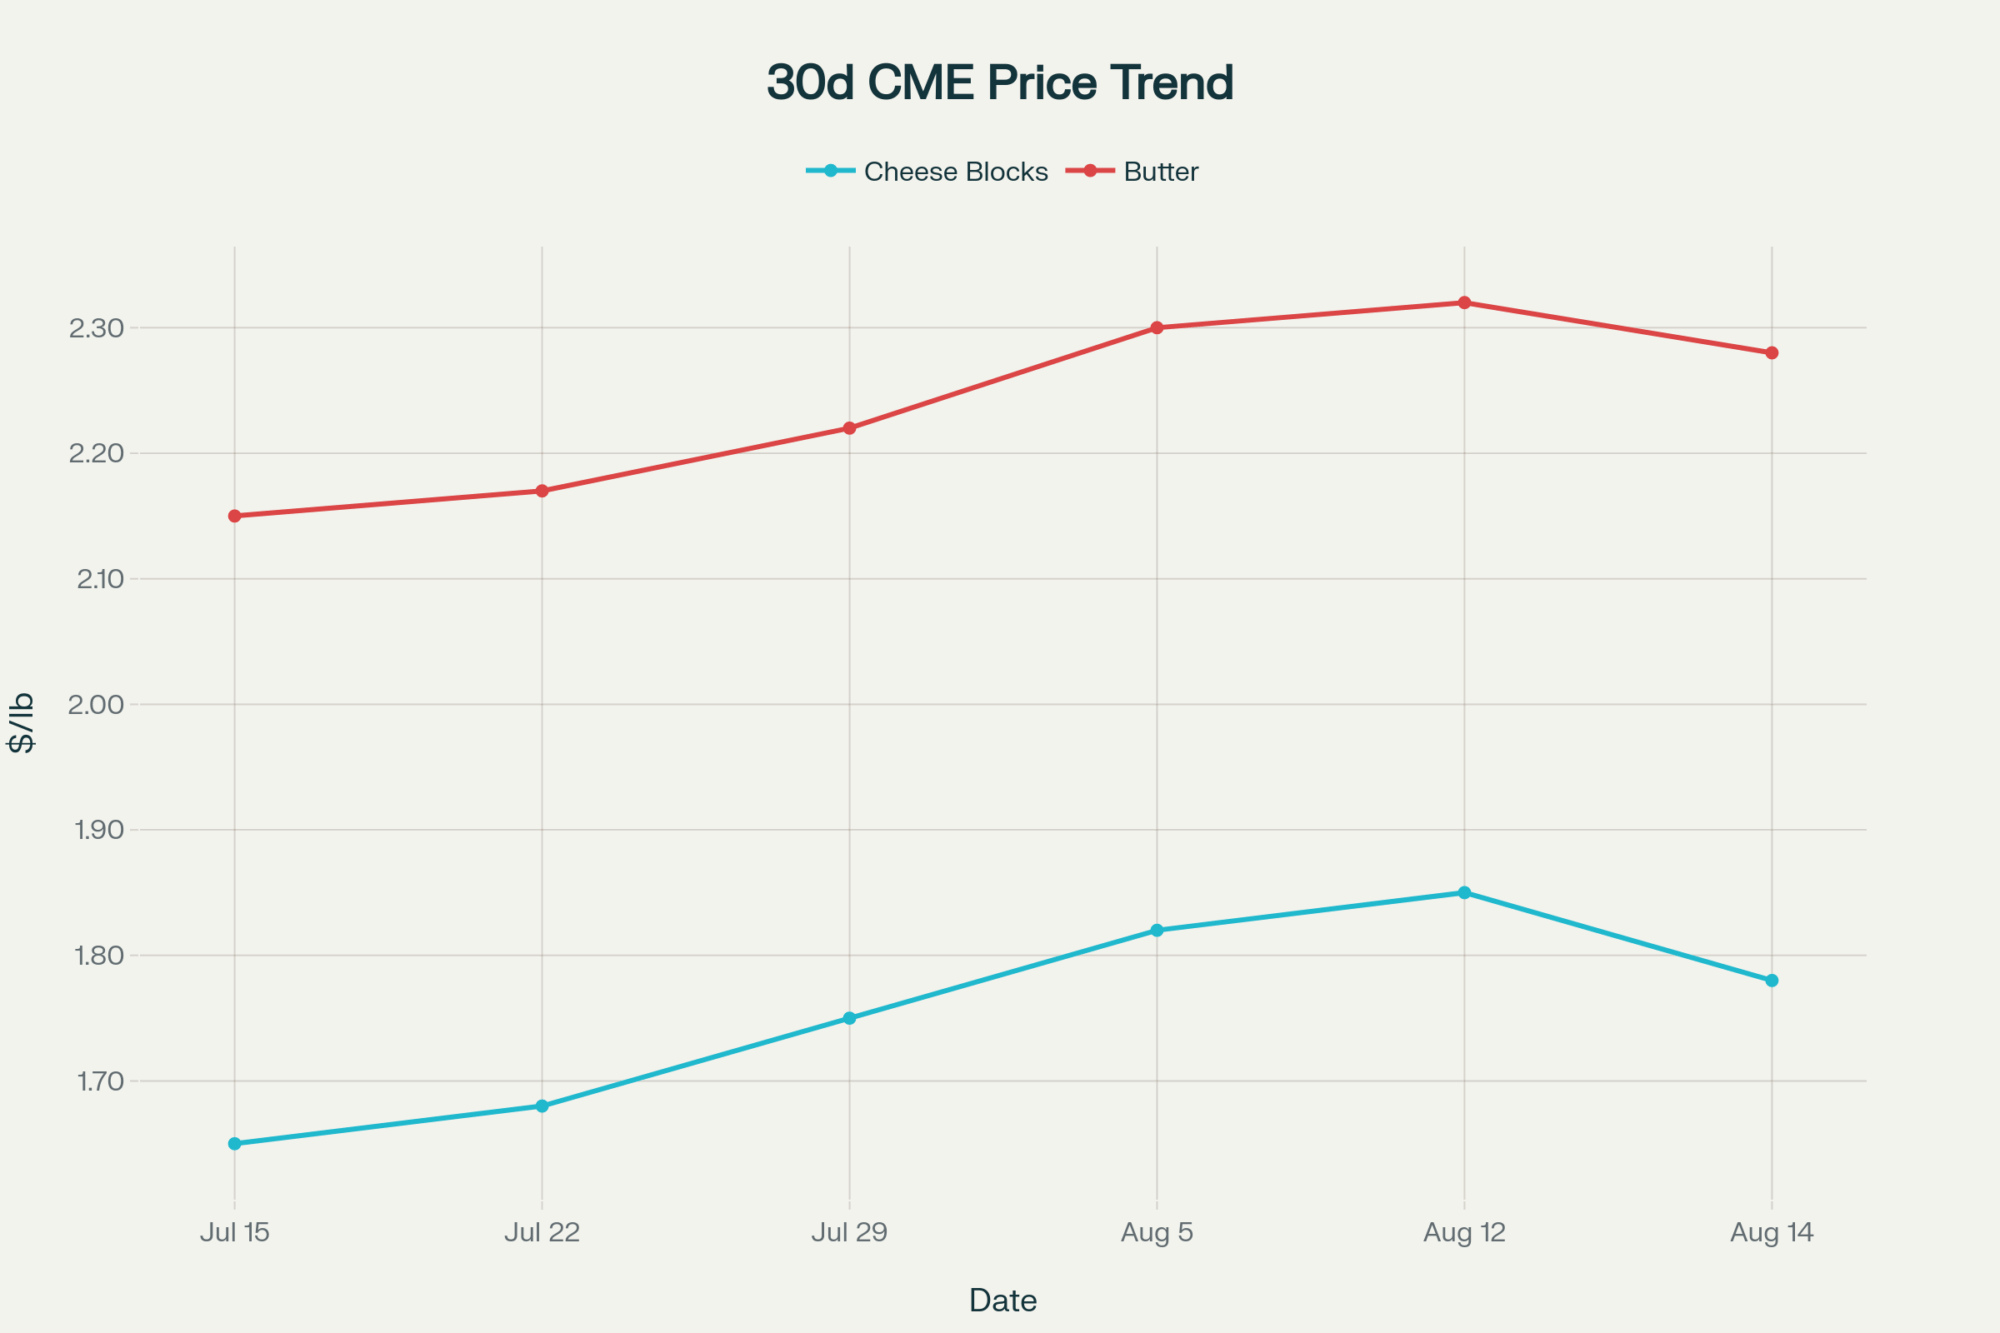
You know that sinking feeling when you check the CME report and see red numbers everywhere? That’s exactly what happened today. Block cheese crashed 8 cents to close at $1.5525 per pound—and here’s what’s interesting, it happened on relatively heavy trading with four separate transactions recorded by the Chicago Mercantile Exchange spanning from $1.5775 to $1.6275, according to today’s CME cash market report. Barrels weren’t far behind, falling 3 cents to $1.6450, though notably without any recorded trades.
What I’ve found particularly telling is how butter stayed frozen at $1.50 with three trades in a tight range, while nonfat dry milk barely budged, climbing just a quarter-cent to $1.1575 with zero trading activity. Days like this tell us something important about where we’re headed. And honestly? It’s time we had a serious conversation about what this means for your December milk check.
Reading the Tea Leaves in Today’s Trading Patterns
Here’s something many of us miss when we just glance at the closing prices—the bid-ask spreads are telling a much bigger story. You probably know this already, but when the gap between what buyers are willing to pay and what sellers are asking widens dramatically, it usually means traders can’t agree on where prices should settle.
Today’s cheese block market saw those four trades bouncing between $1.5775 and $1.6275, but—and this is crucial—CME floor sources report that we had only one bid against one offer at the close. That’s not healthy price discovery; that’s a market running on uncertainty. In my experience working with Chicago traders, when you see heavy block volume with falling prices but no barrel activity, it often means processors are dumping inventory before year-end accounting.

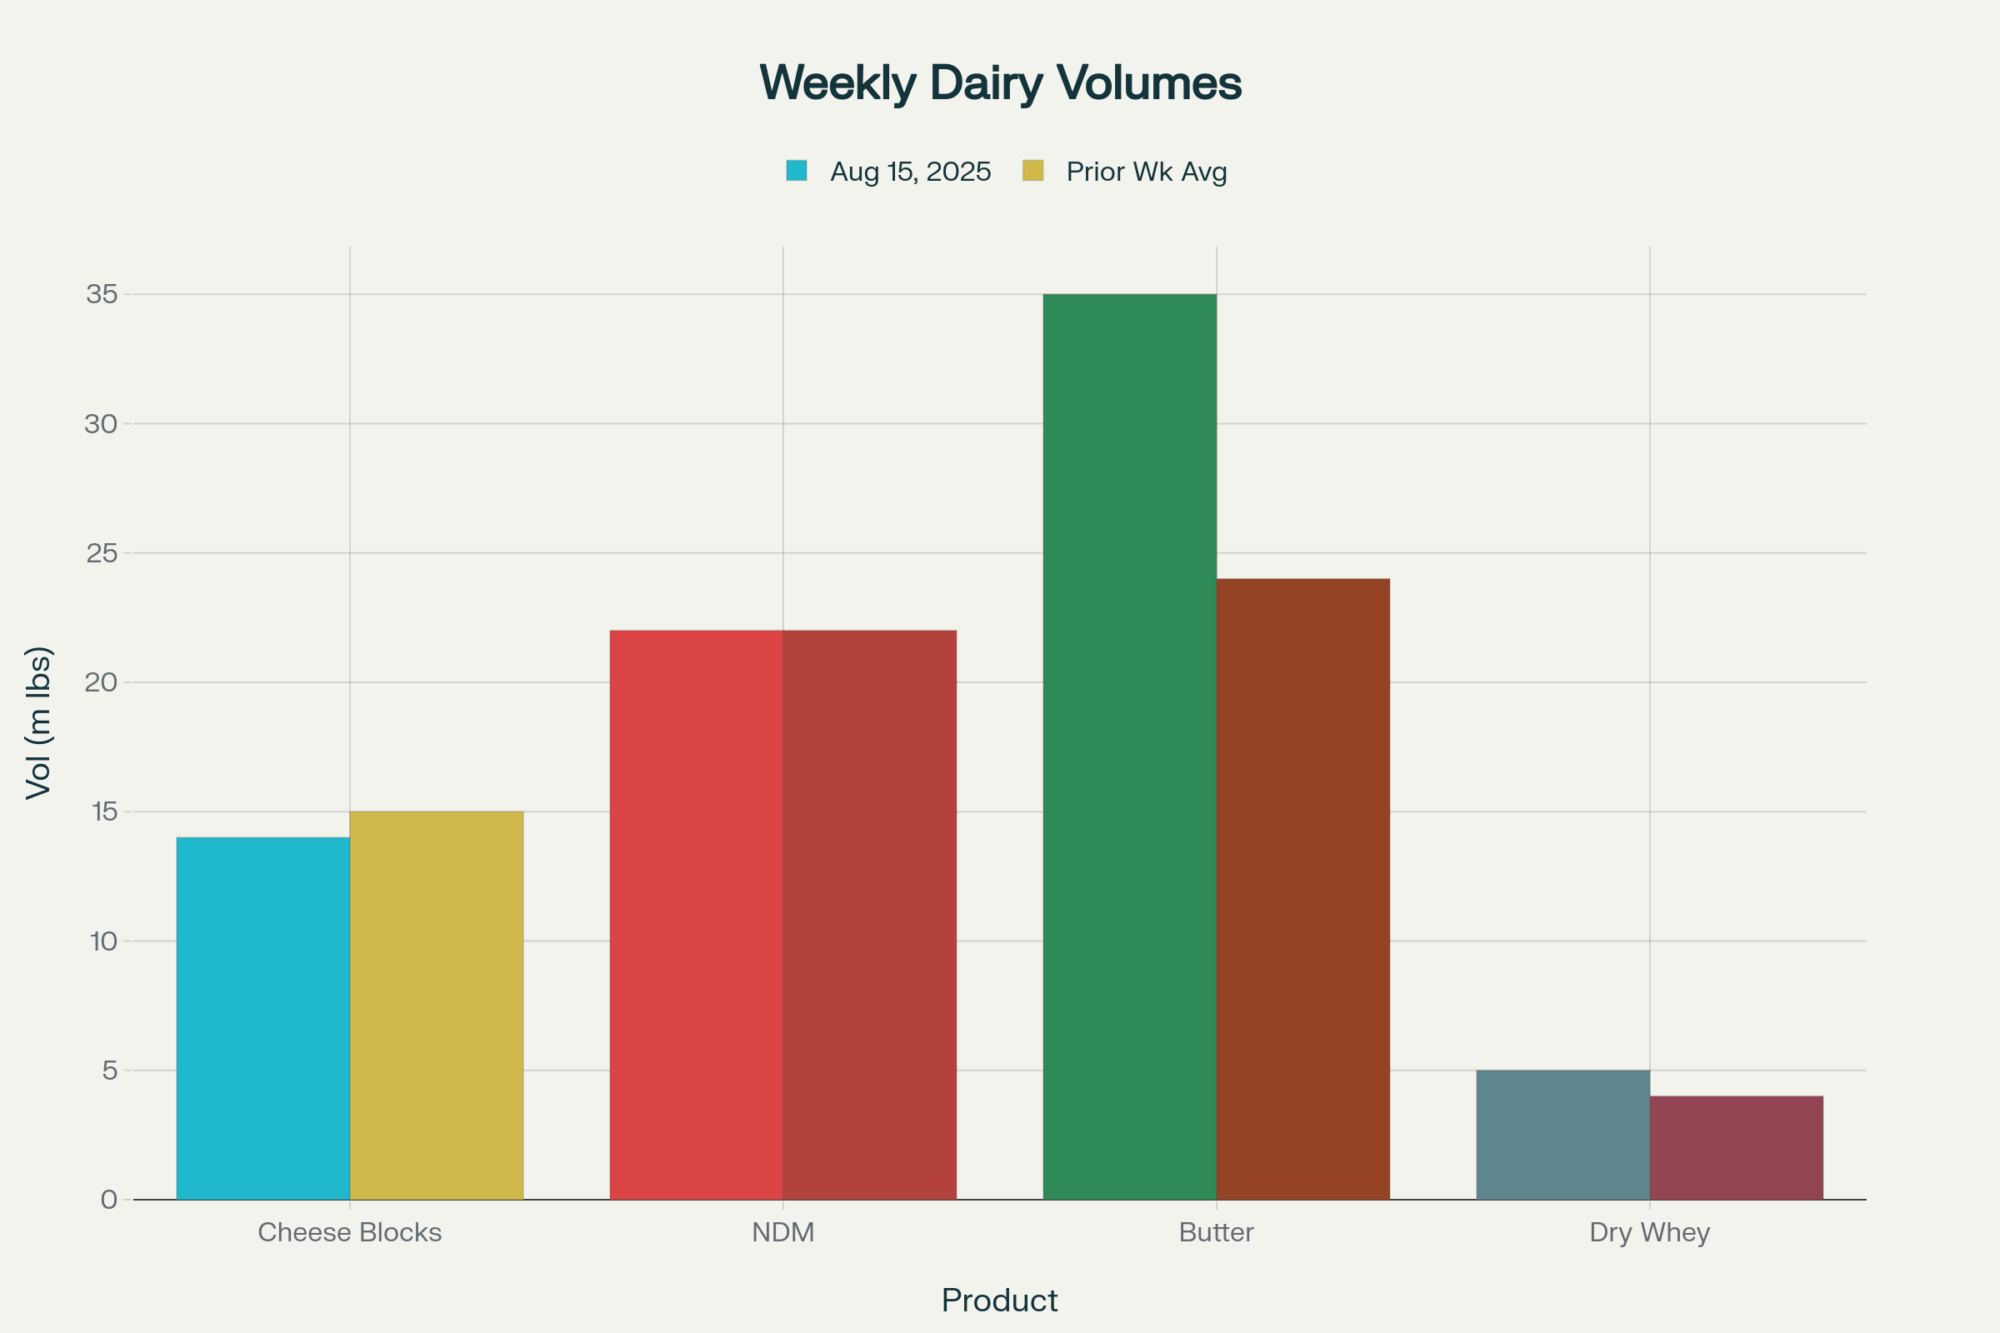
The weekly totals back this up dramatically: 14 block trades this week versus zero for barrels, according to CME weekly volume data. You know what really concerns me? The order book shows just one bid each for blocks and barrels, creating virtually no floor under this market. Compare that to butter, where we’re seeing four offers—sellers everywhere, but buyers have vanished. It’s worth noting that this setup typically precedes another leg lower, especially when remaining buyers finally capitulate.
How Global Markets Are Boxing Us In
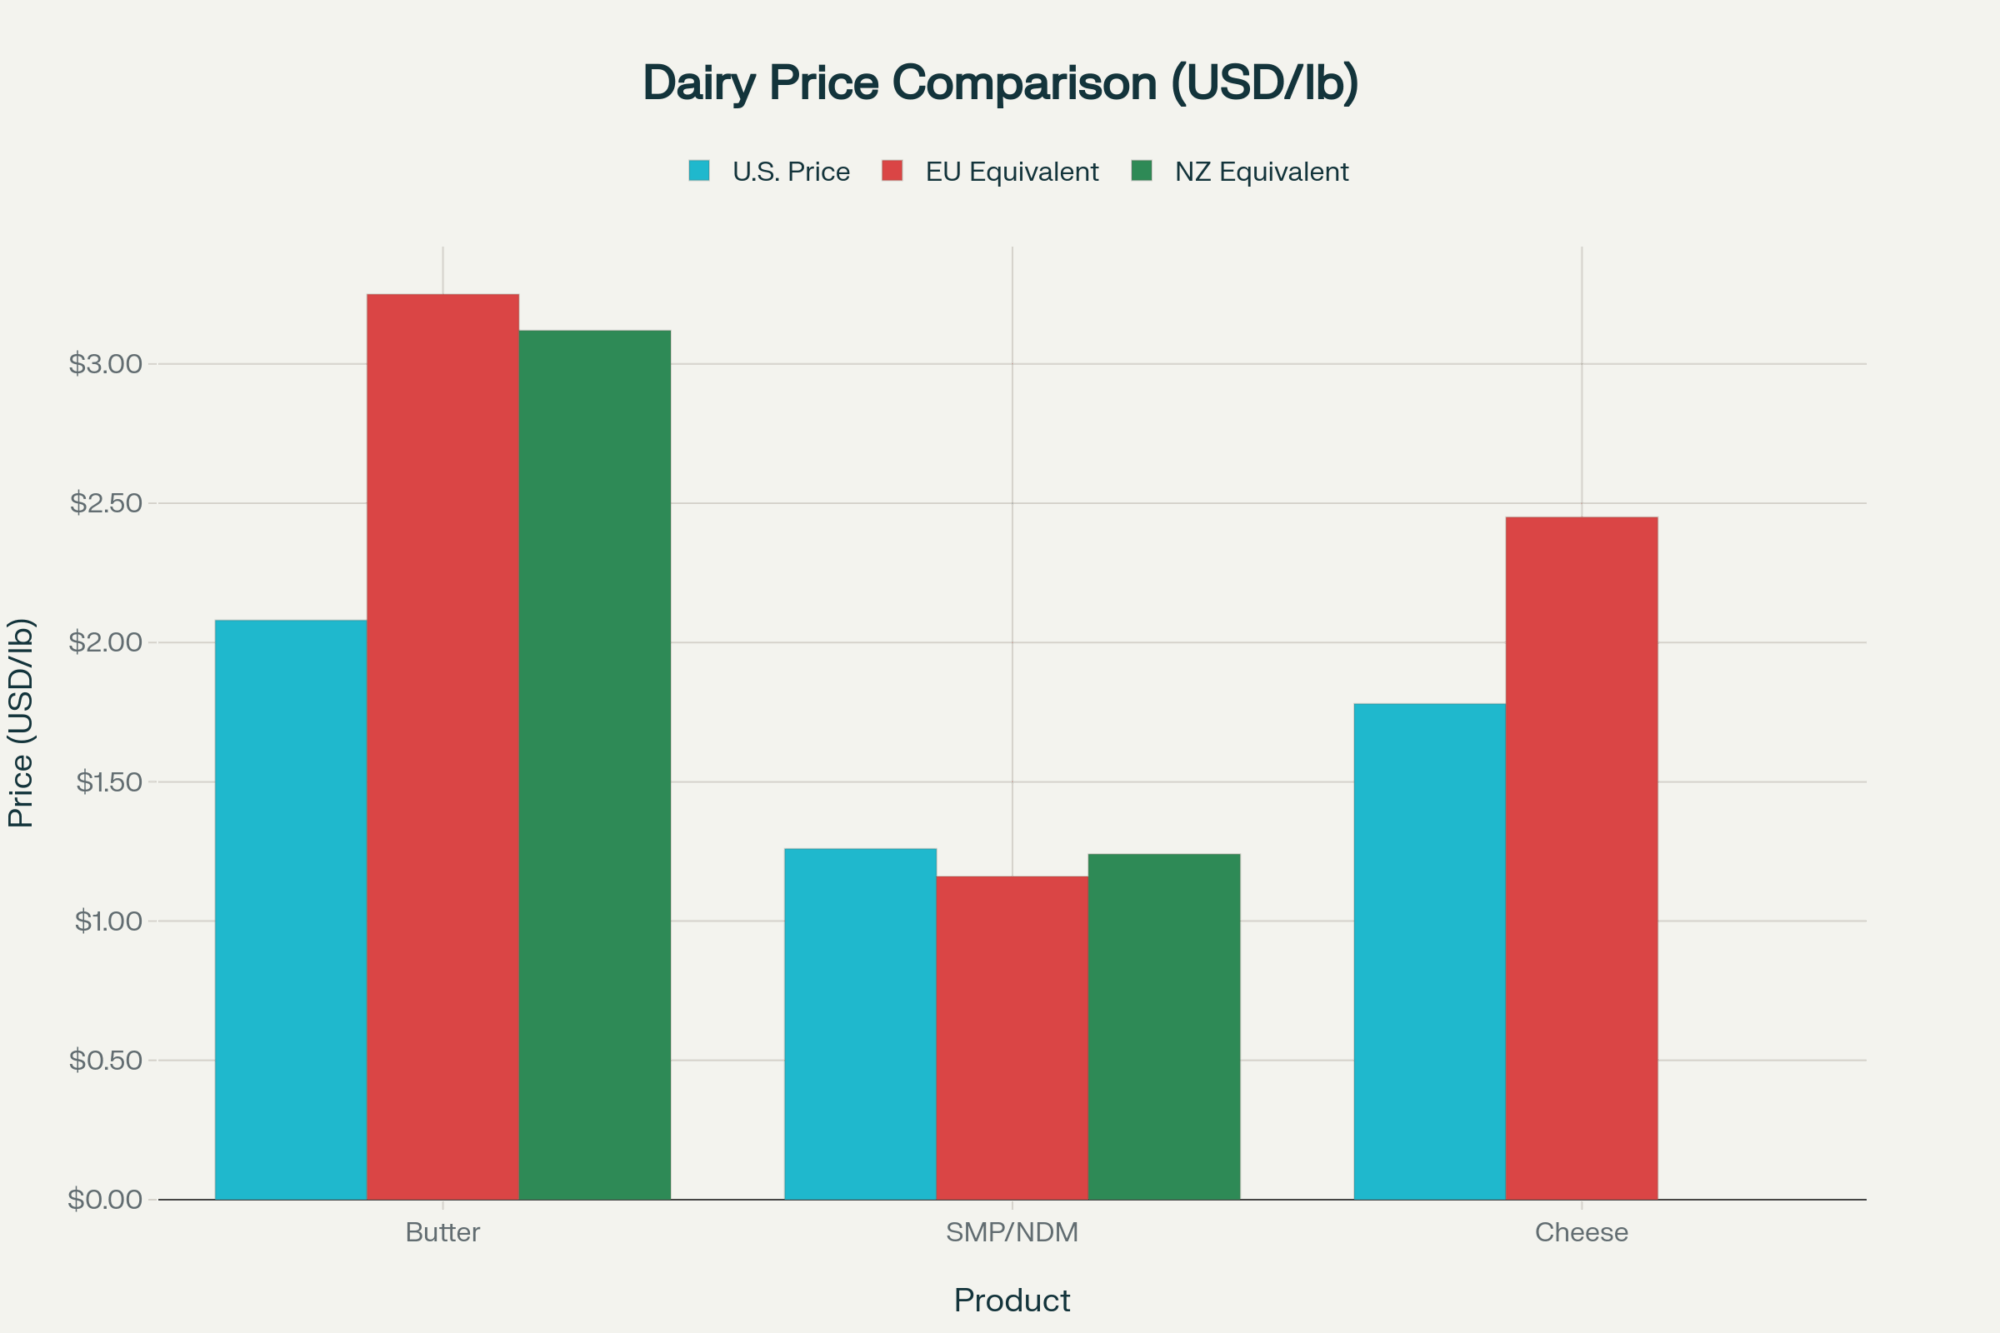
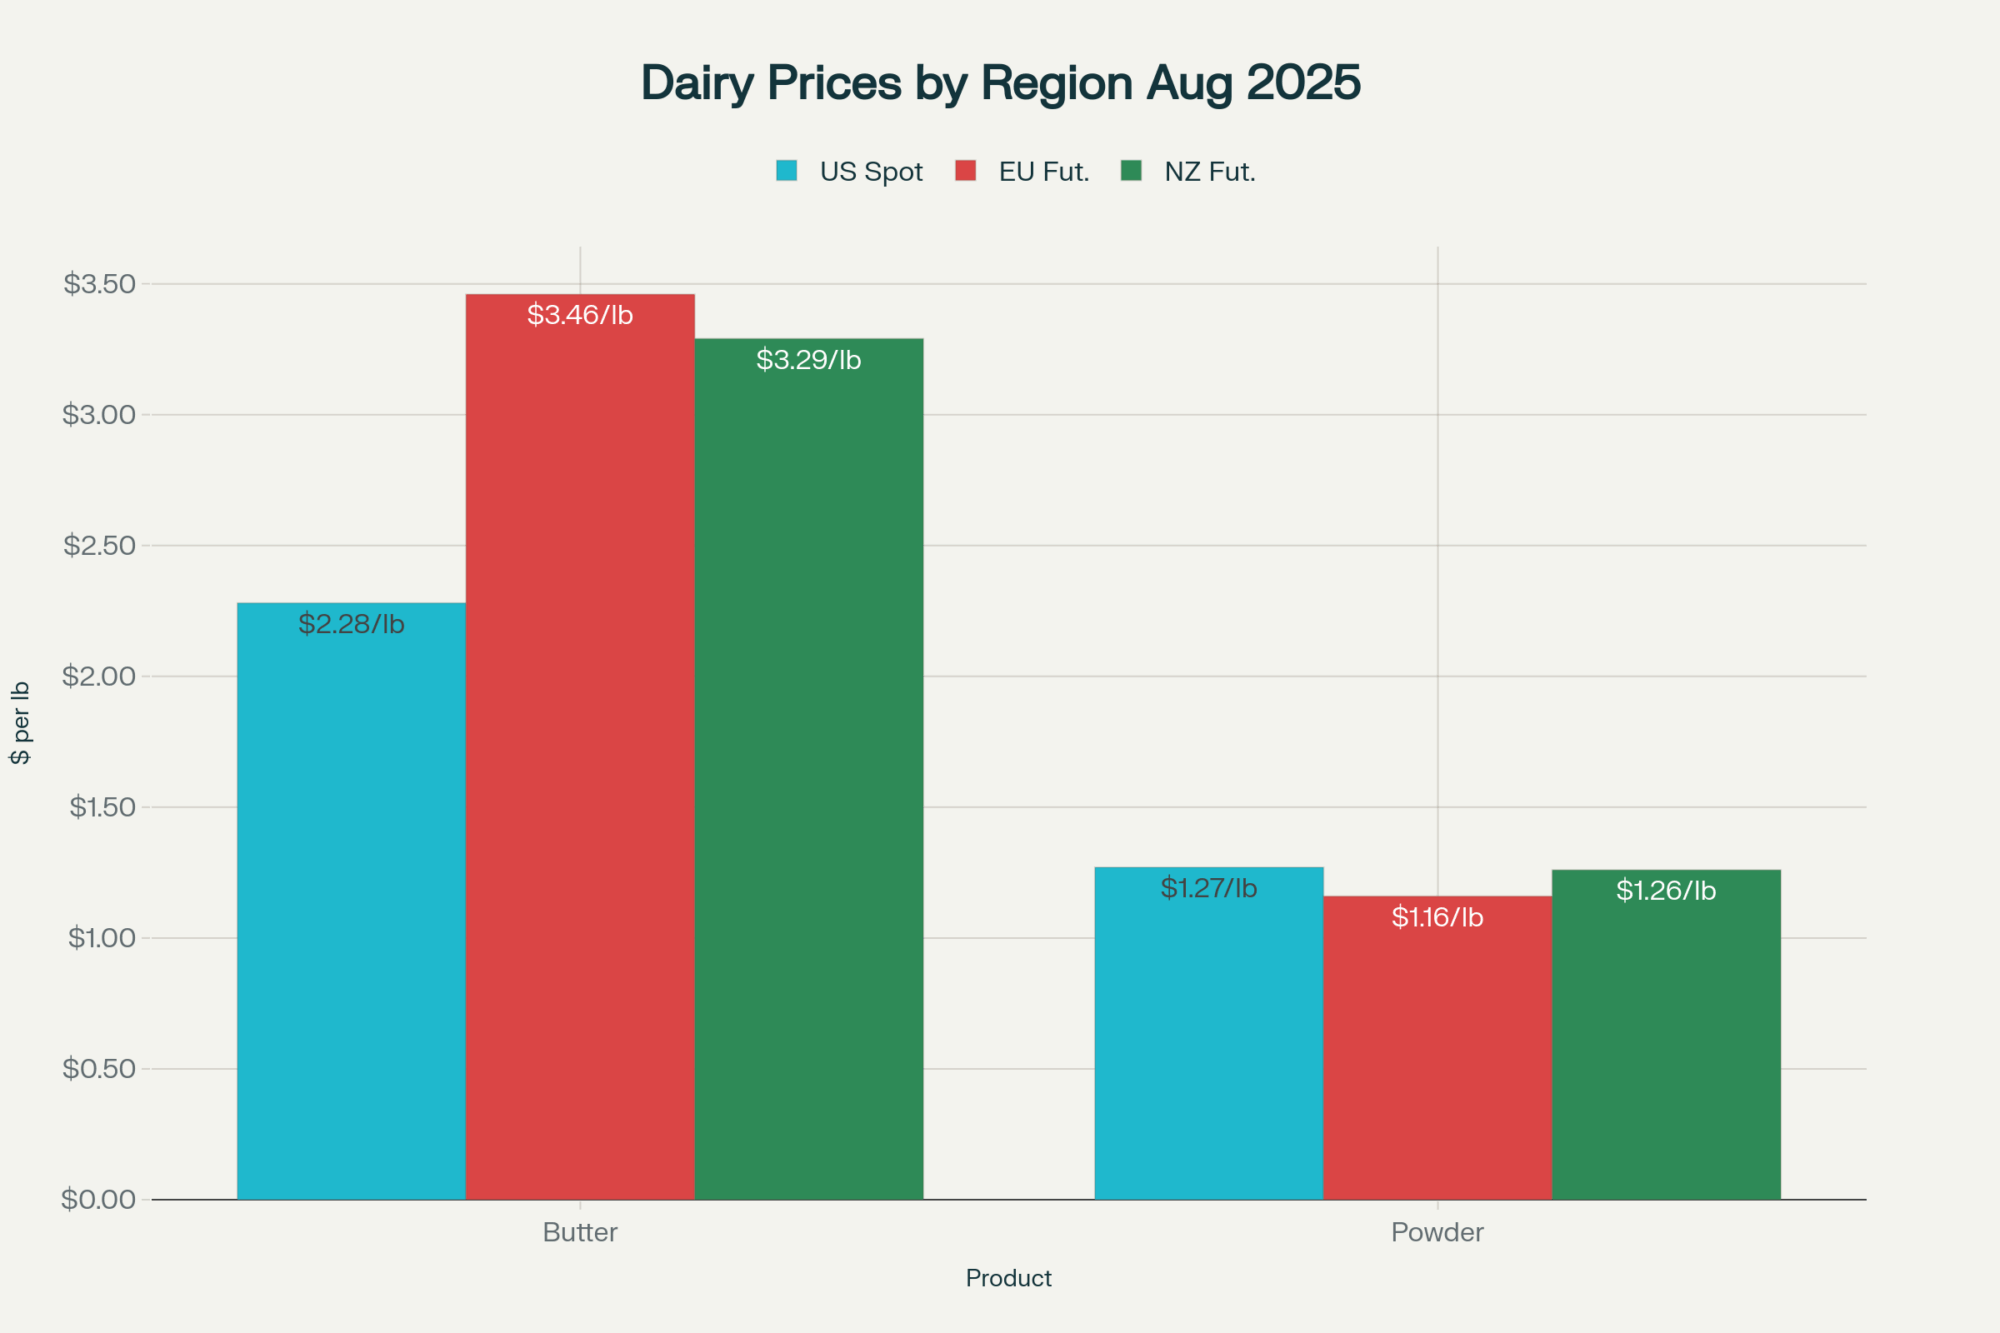
So here’s where things get complicated—and you’ve probably noticed this in your own export conversations if you’re dealing with cooperatives. European butter futures trading at €5,070 per metric ton on the European Energy Exchange work out to about $2.29 per pound at current exchange rates. That’s now competitive with our prices, and according to USDA Foreign Agricultural Service data, they’re capturing business we desperately need.
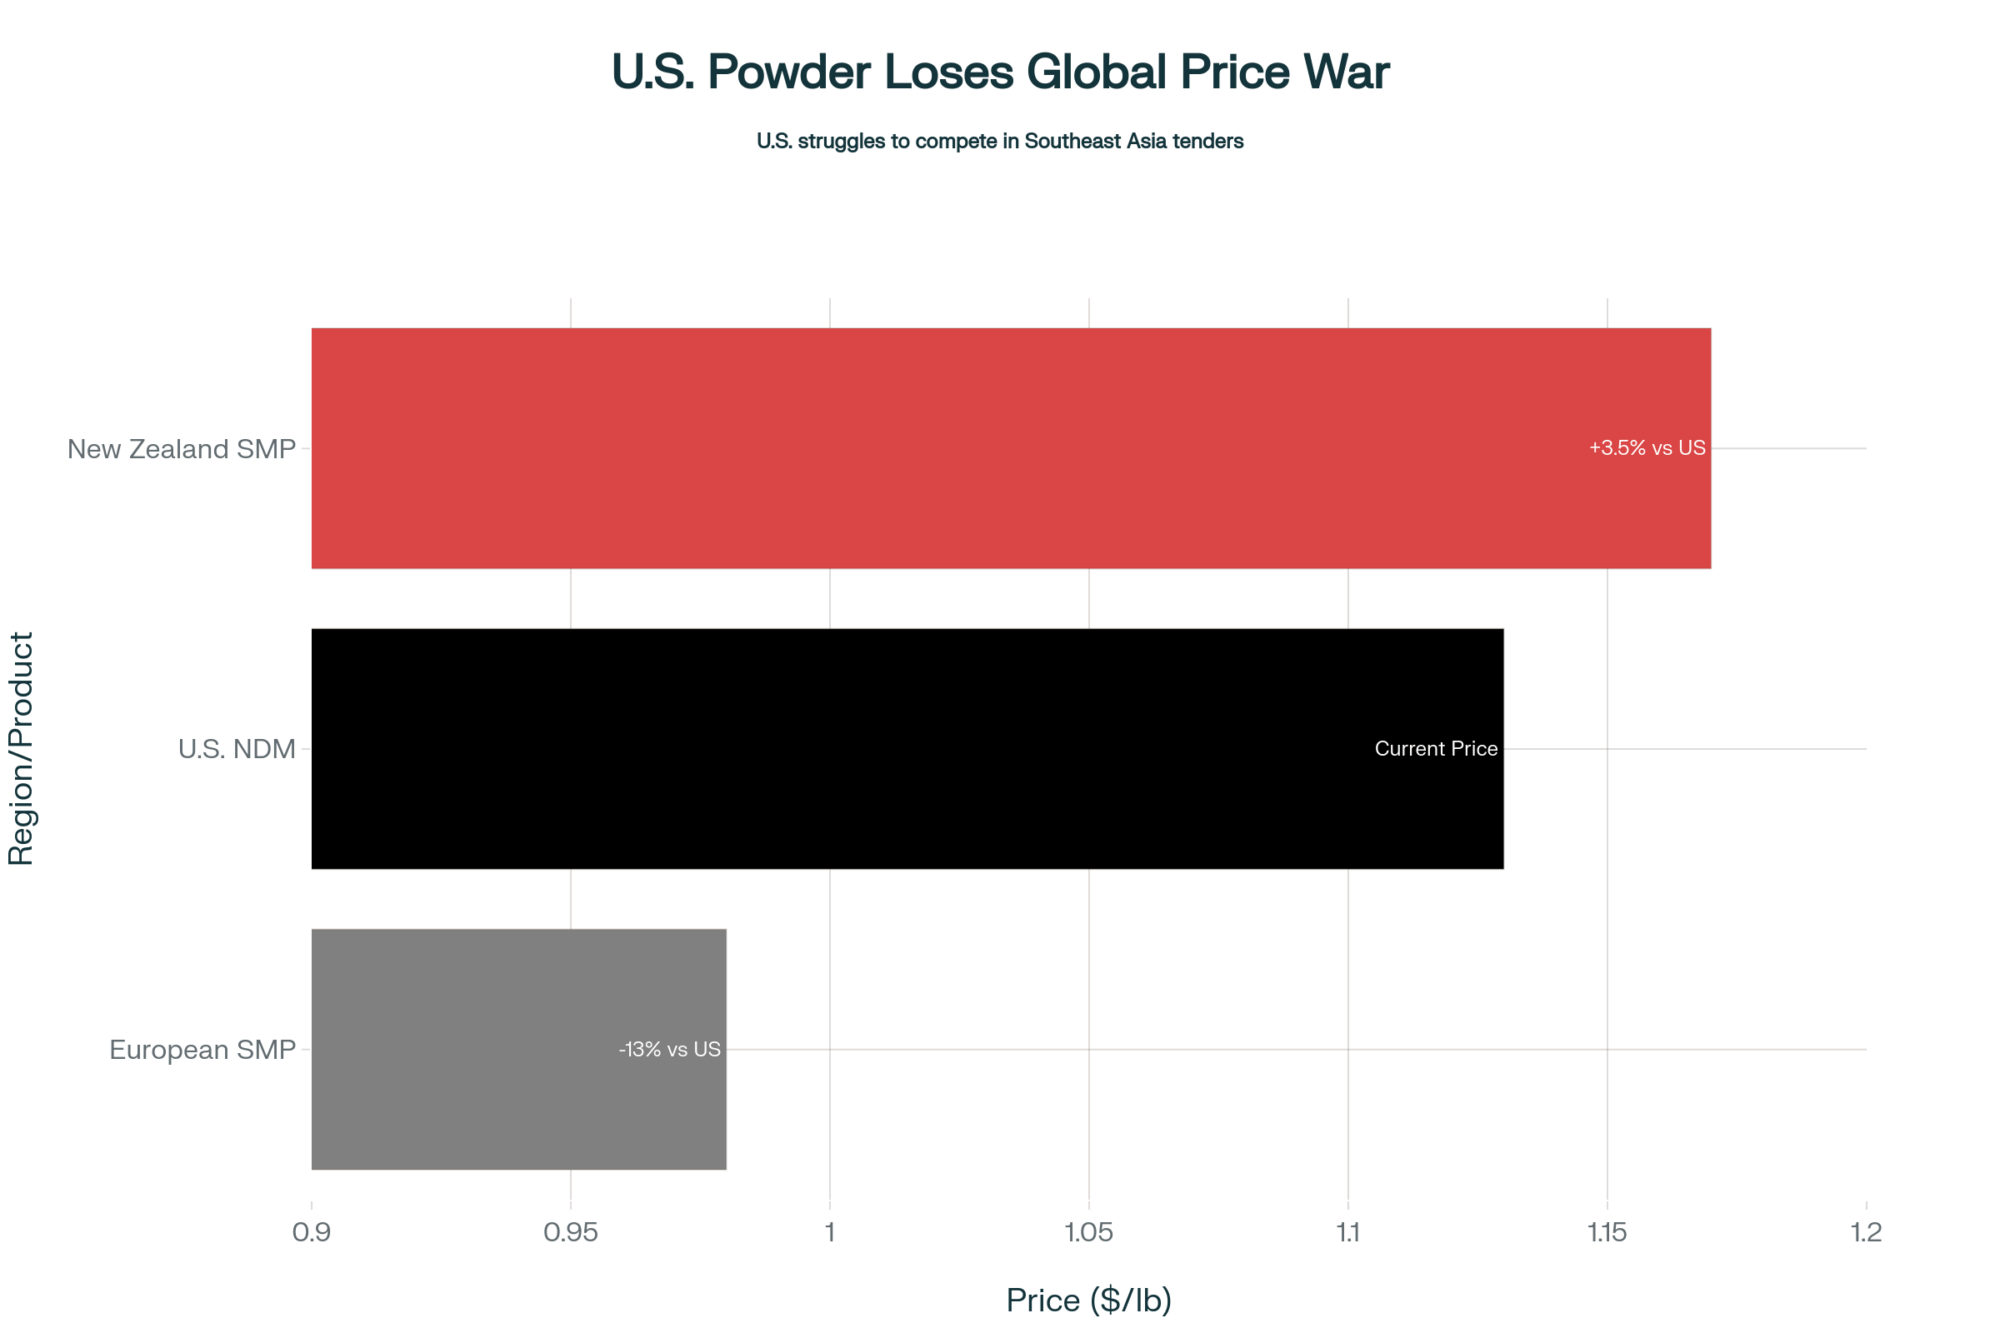
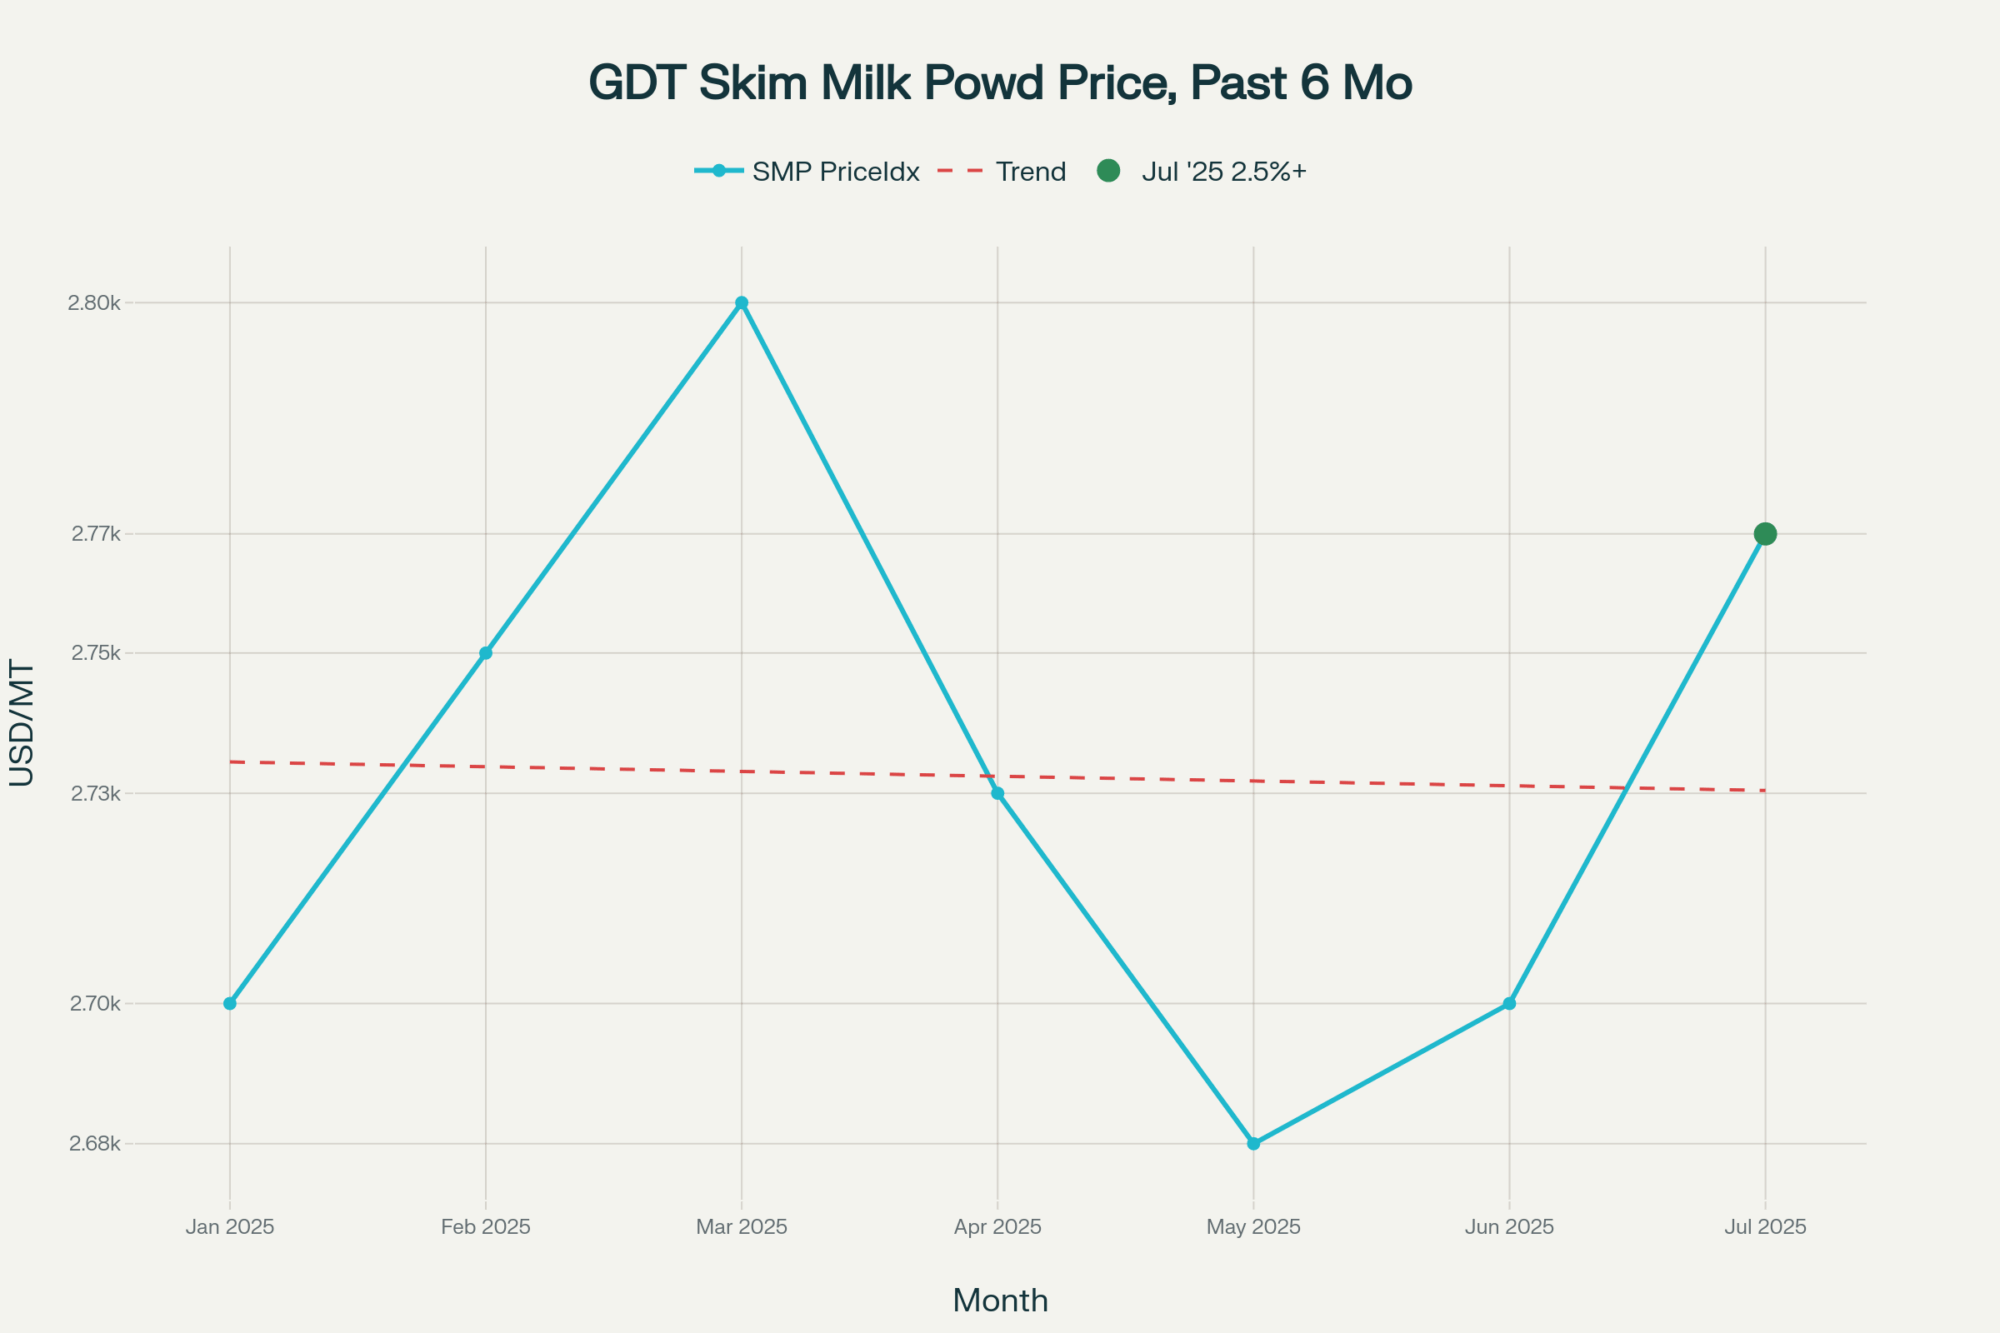
What I find particularly troubling is New Zealand’s positioning on the NZX futures exchange. Their whole milk powder at $3,440 per metric ton signals aggressive pricing to capture Asian market share, based on Global Dairy Trade auction results. And with EU skim milk powder at €2,075 per metric ton—that’s about $1.04 per pound—they’re undercutting our NDM by over 10 cents. In many cases, that’s enough to make a U.S. product completely uncompetitive globally.
Now, Mexico has traditionally been our safety net. USDA trade data shows they account for about 25% of U.S. dairy exports. But here’s what’s changed: the peso weakened by 8% against the dollar this quarter, and according to Conasupo (Mexico’s national food agency), domestic production is ramping up. Several processors I’ve talked with in Wisconsin report Mexican buyers are pulling back on November purchases.
Southeast Asia was supposed to pick up that slack, but USDA attaché reports from Vietnam and Indonesia indicate those markets are currently oversupplied with cheaper product from New Zealand and Europe. And the dollar… well, that’s another story entirely. Federal Reserve data shows it’s near 52-week highs, and research from the International Dairy Federation shows that every 1% rise in the dollar index typically drops our dairy exports by 2-3%.
Feed Markets: The Silver Lining Gets Thinner
Here’s one bright spot, though it’s getting dimmer by the day. According to CME futures settlements, December corn closed at $4.3550 per bushel, with March futures at $4.49. That’s manageable. Soybean meal’s recovery to $322 per ton from Monday’s $316.80 keeps feed costs somewhat reasonable, based on CBOT trading data.
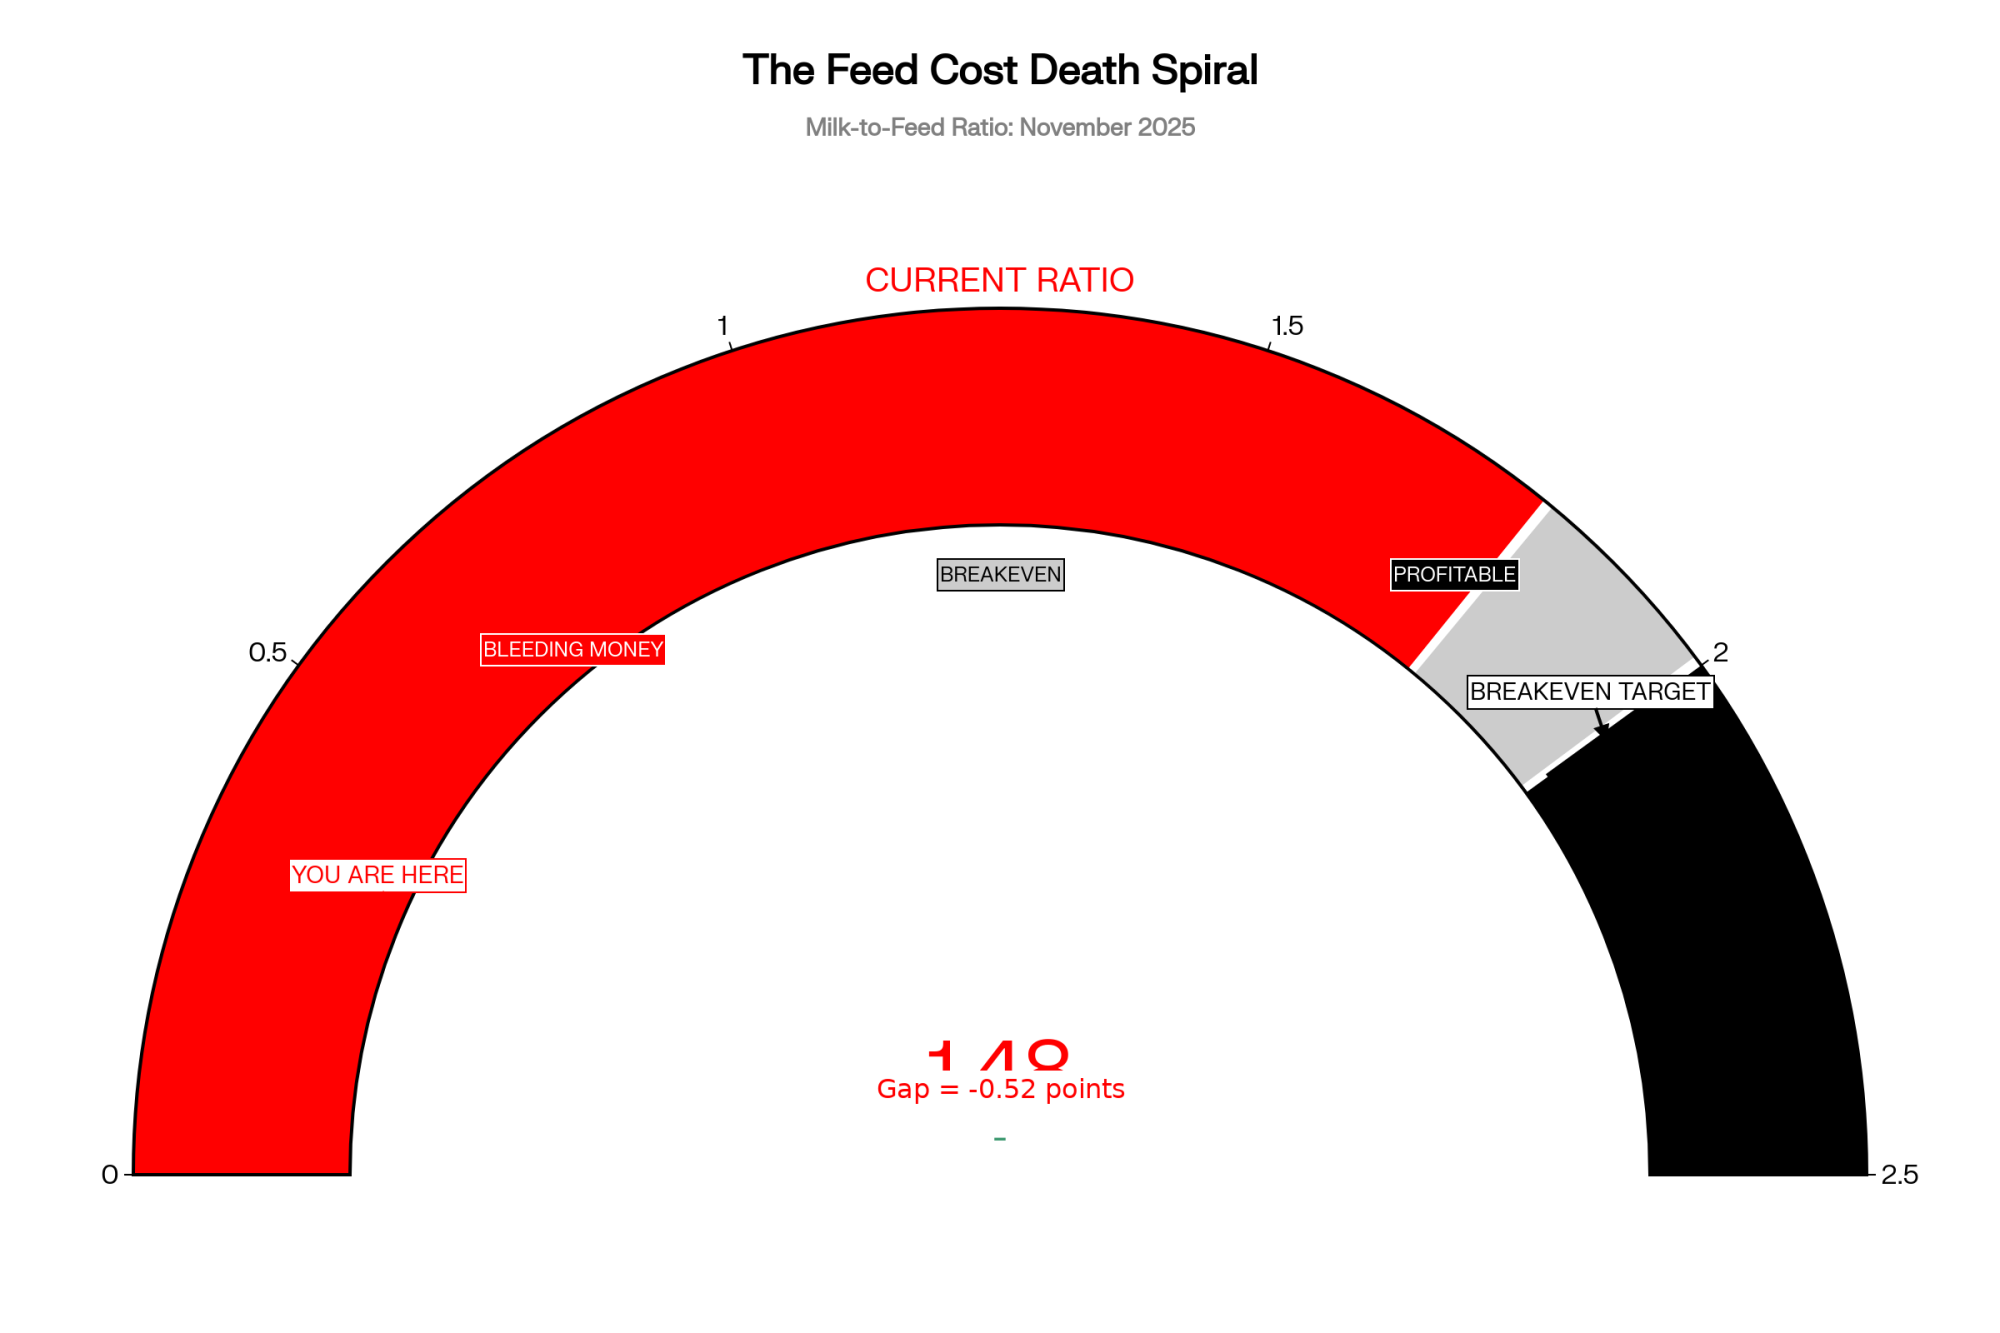
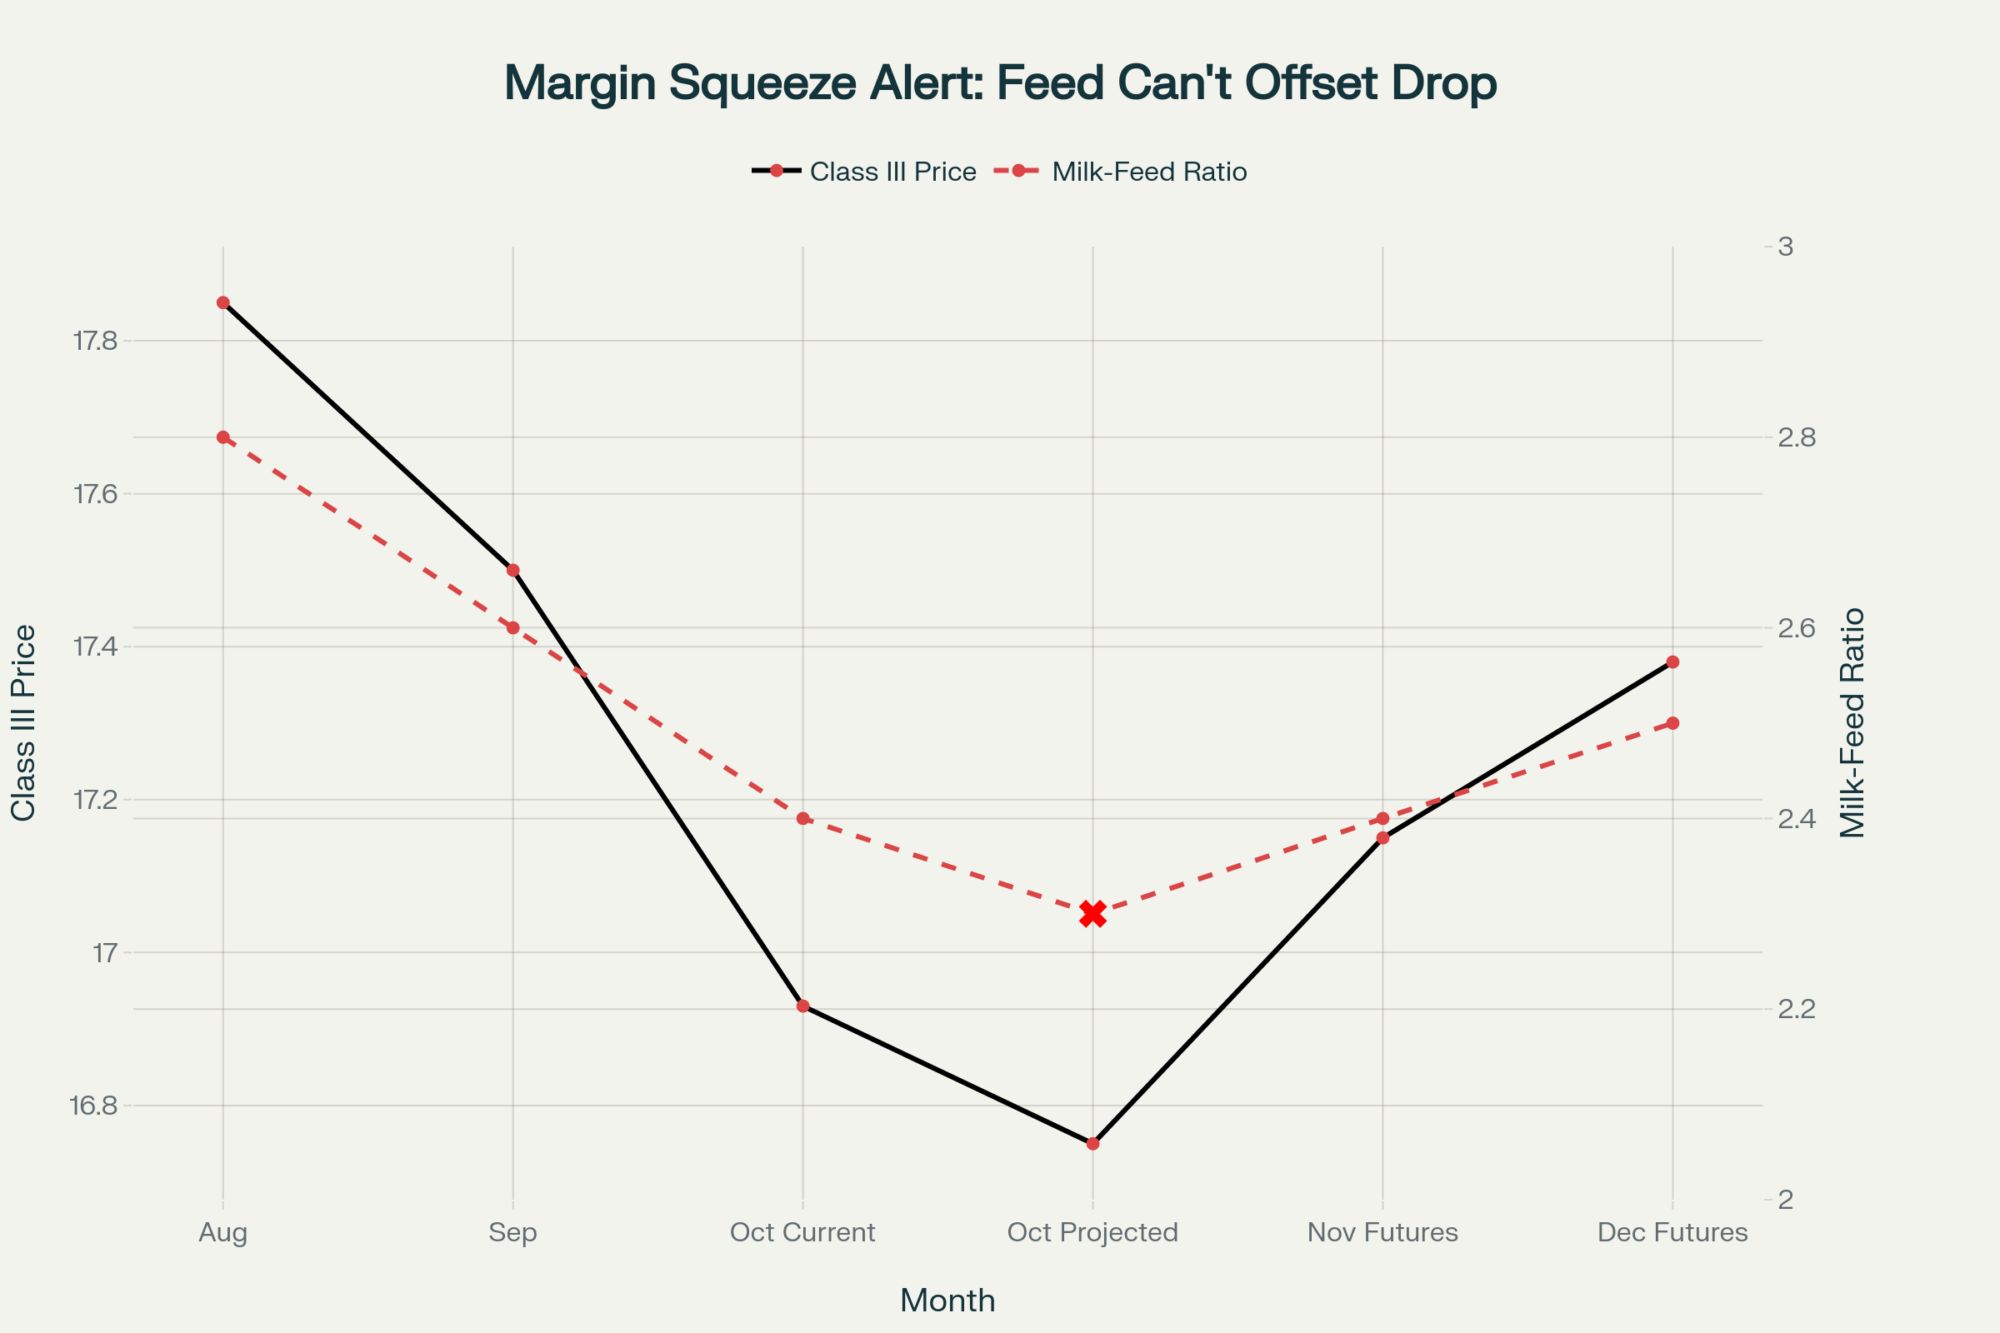
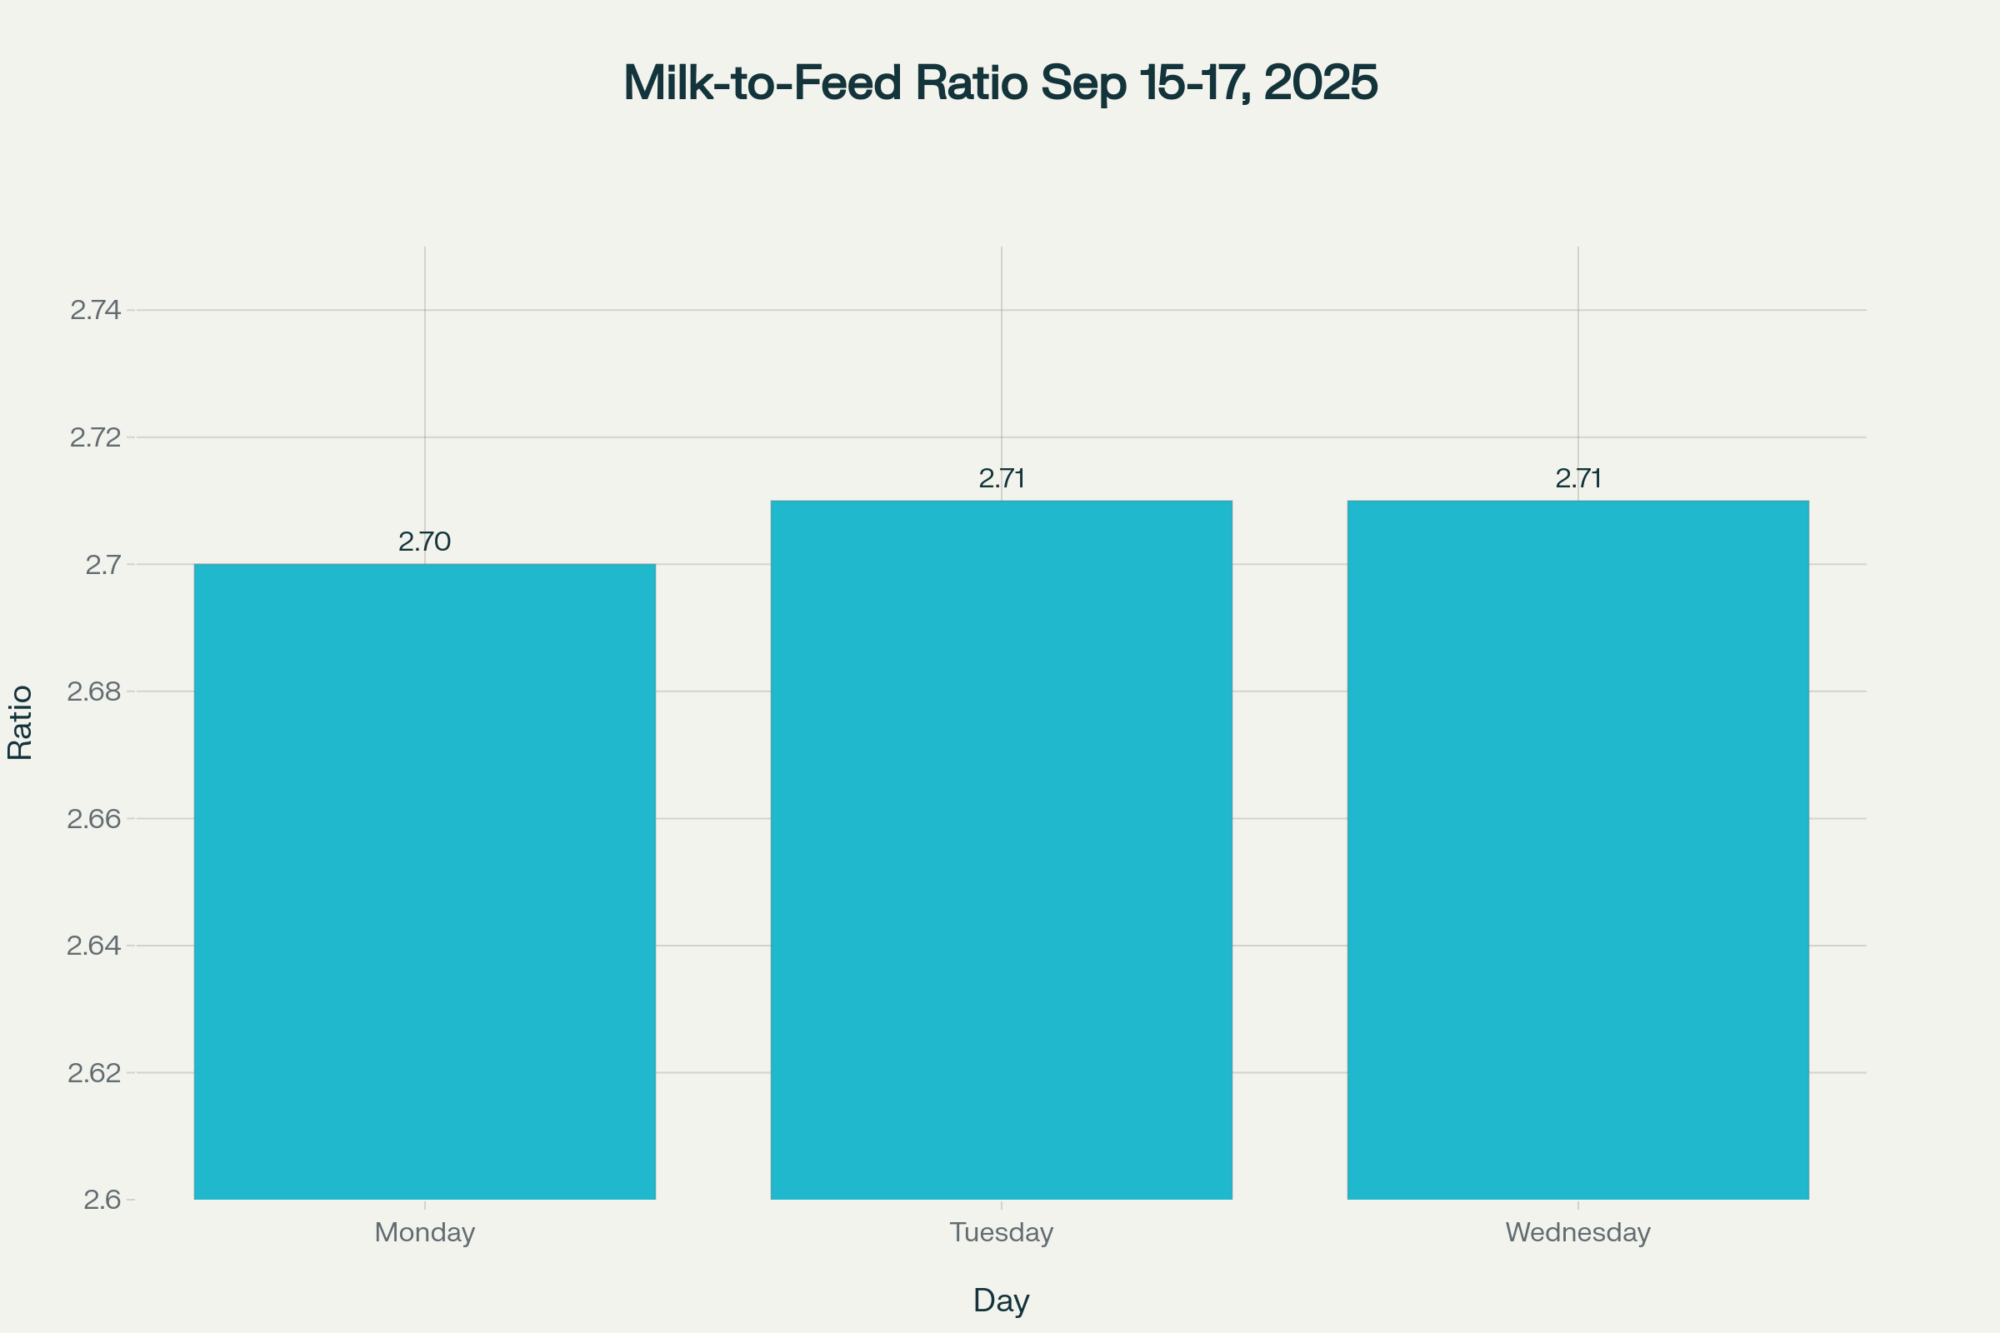
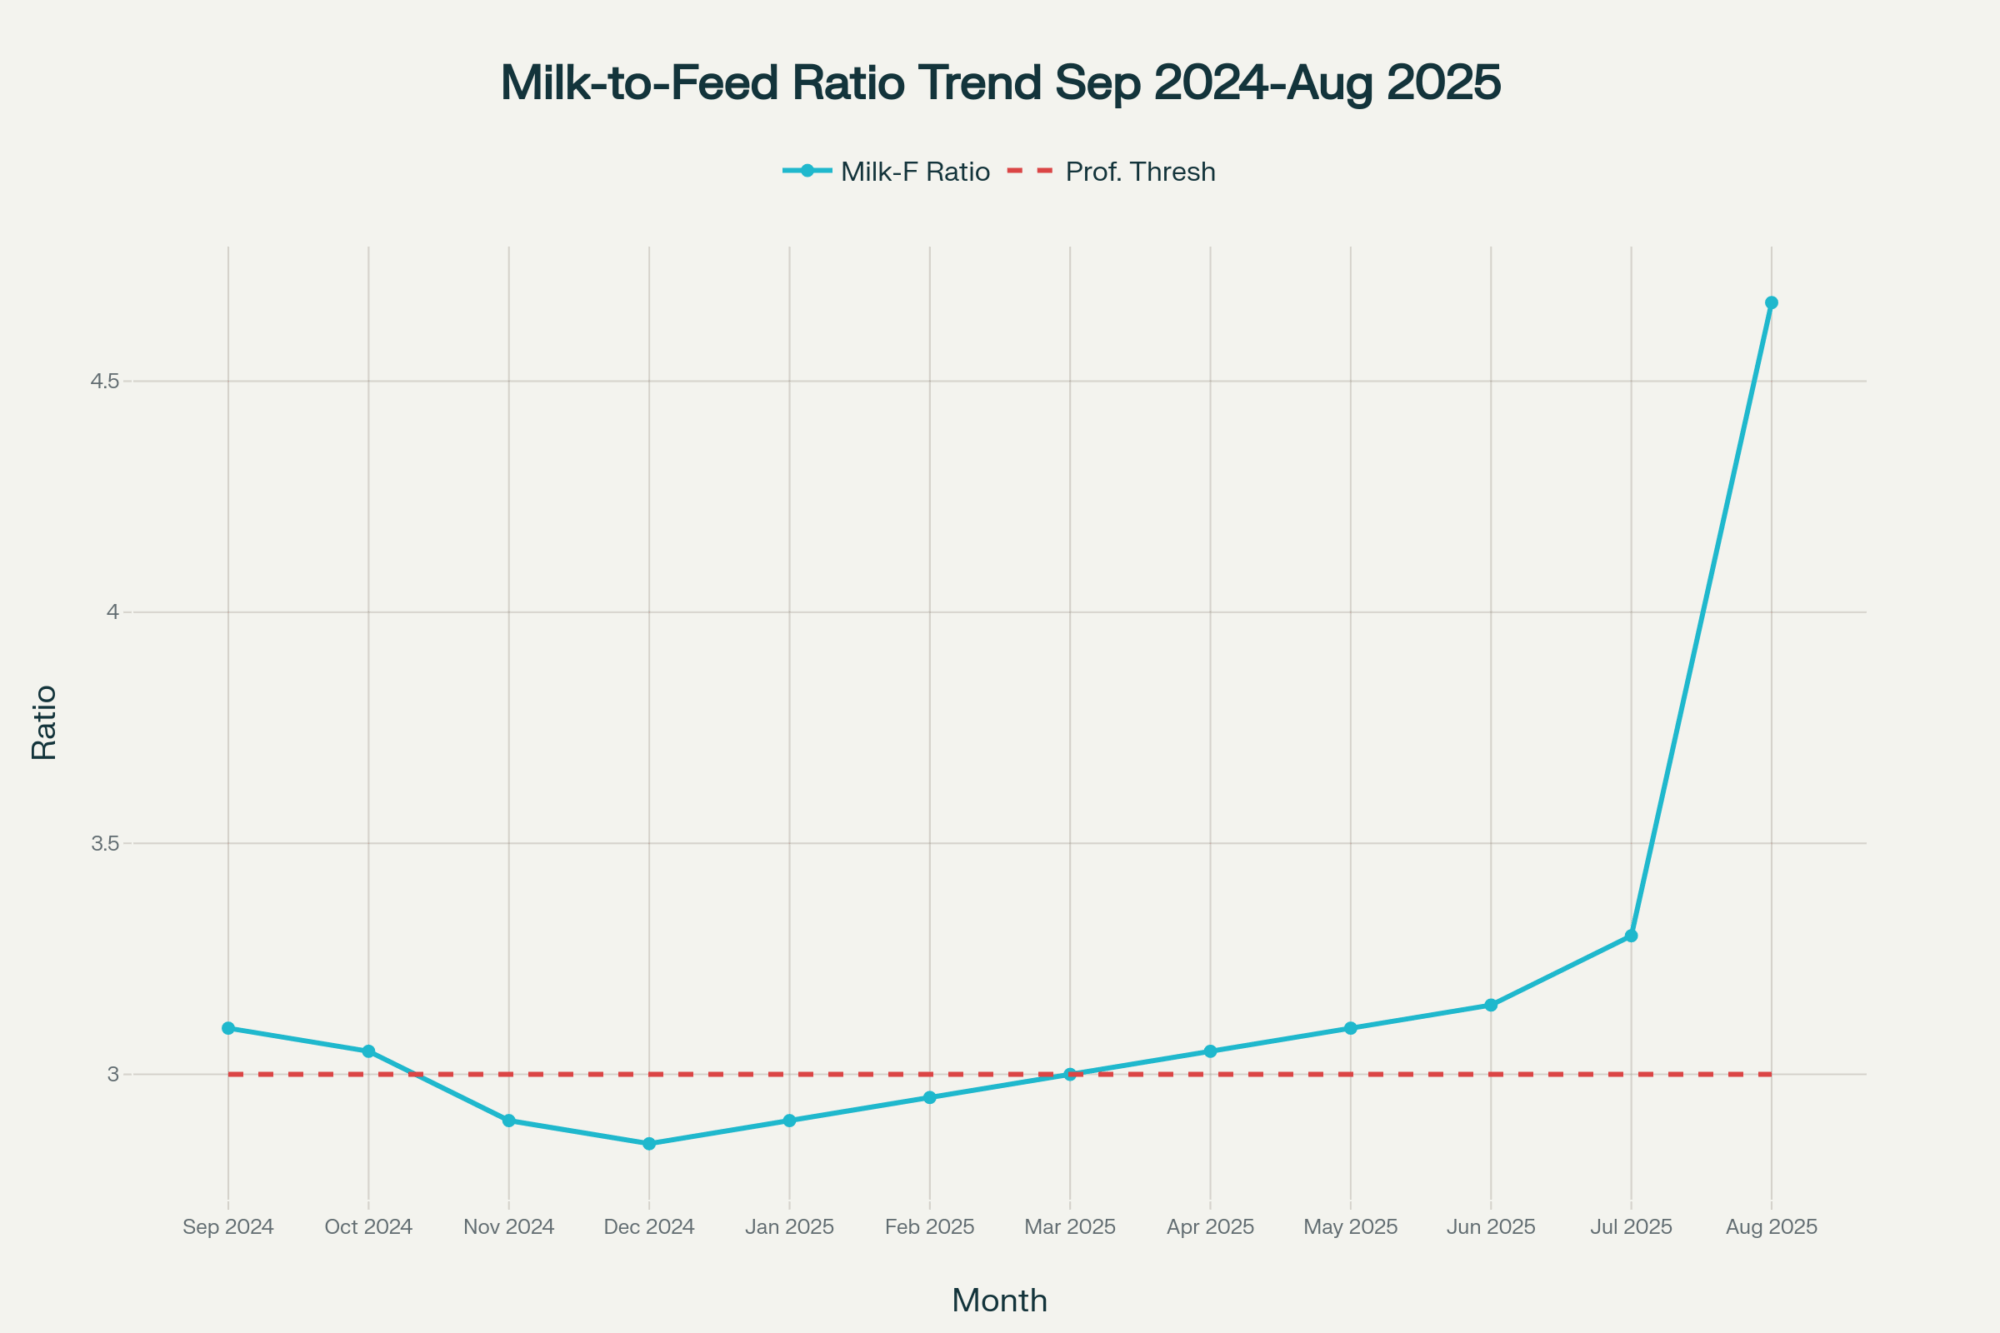
But—and this is a big but—the milk-to-feed ratio is deteriorating fast. Cornell’s Dairy Markets and Policy program calculates that at current prices, income over feed costs could drop below $8 per hundredweight by January. University of Wisconsin Extension analysis confirms that for most operations, that’s below breakeven.
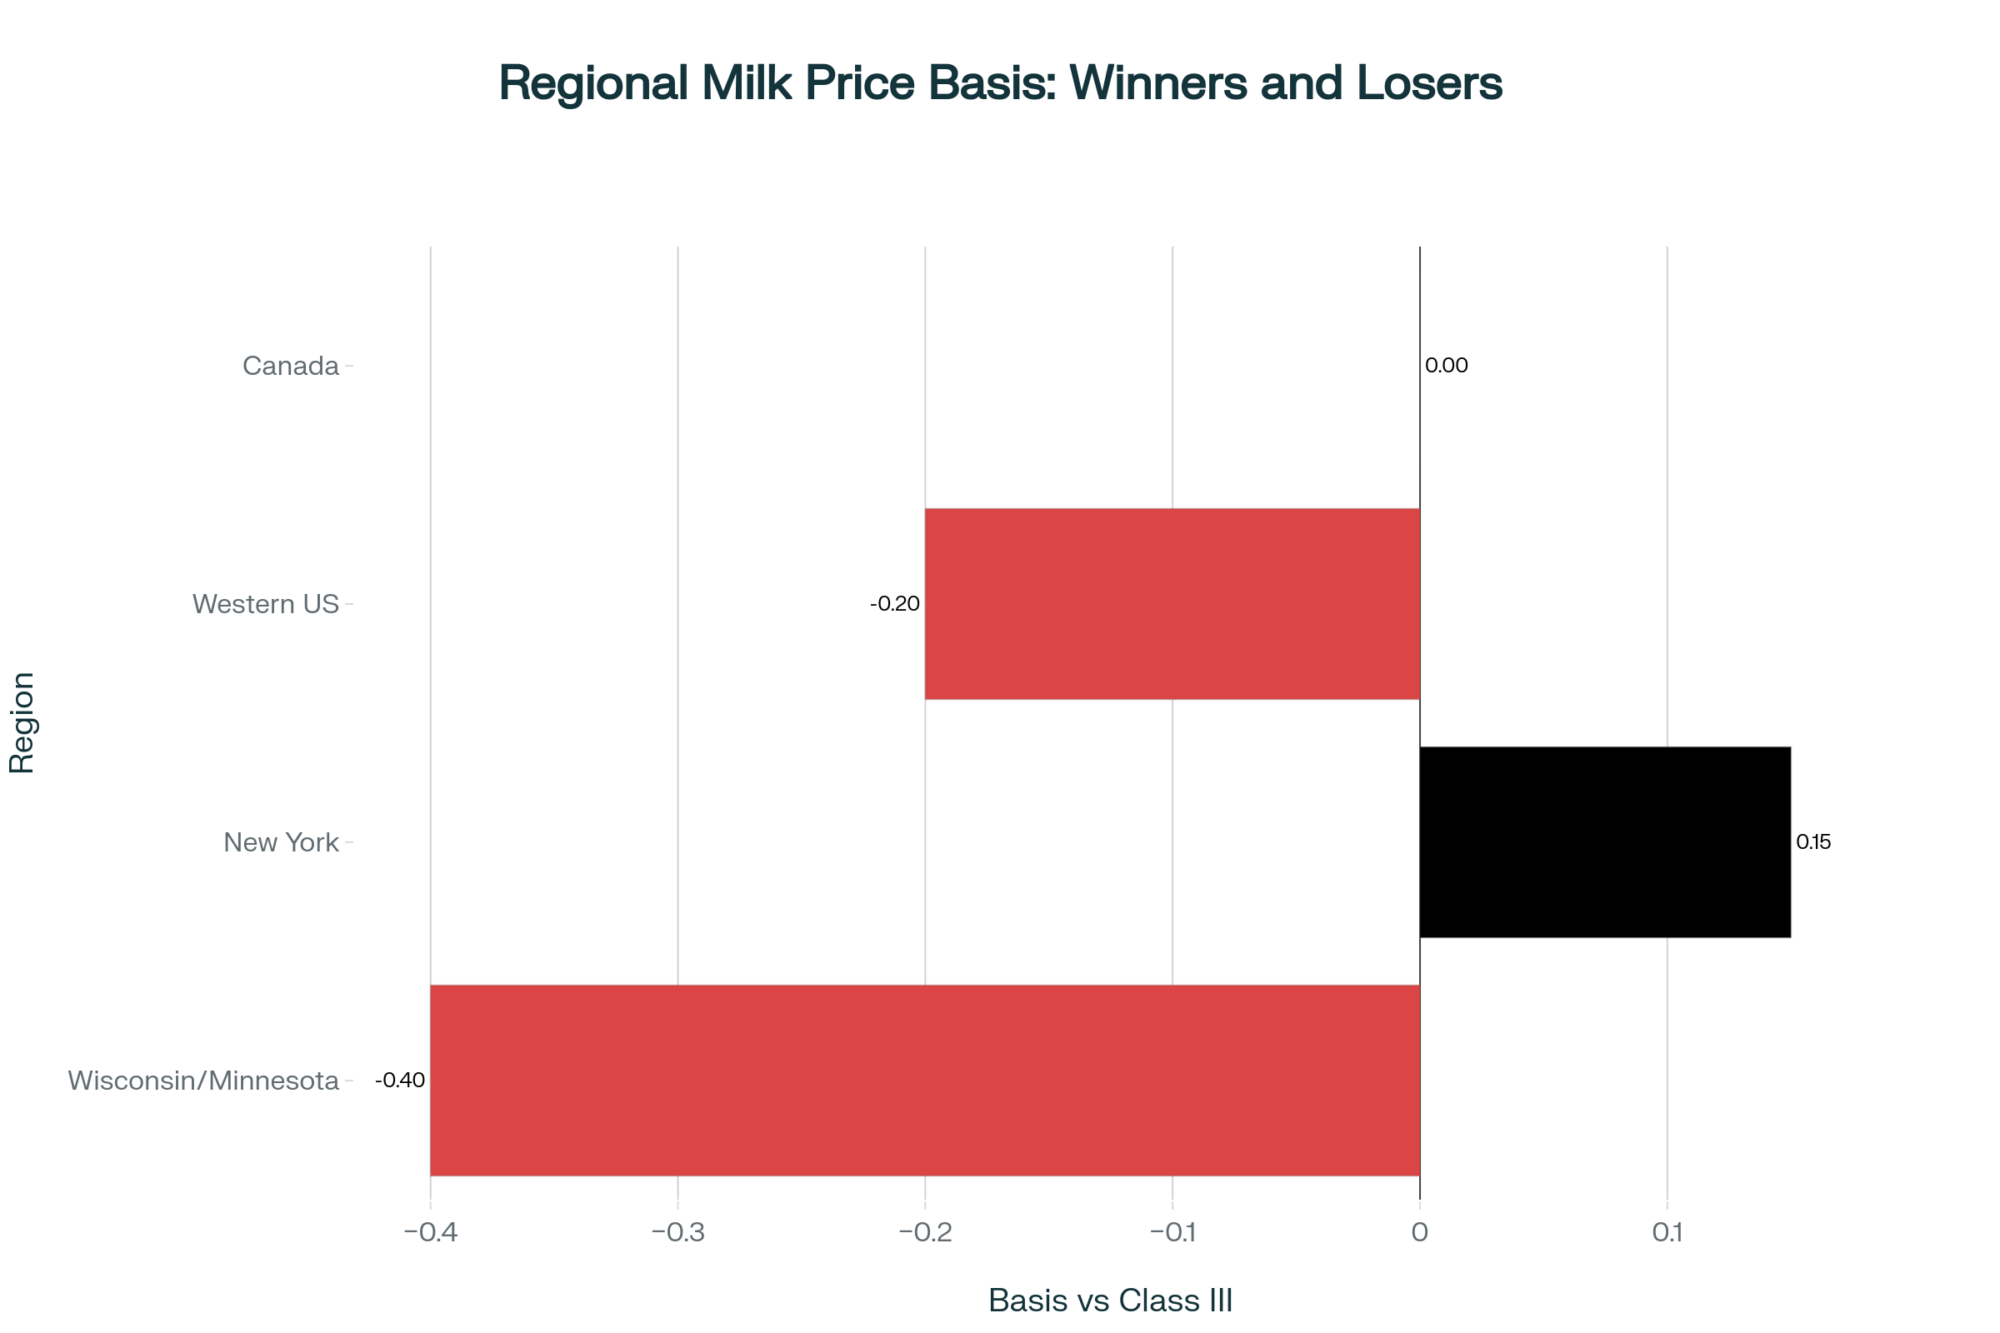
The regional differences are striking, too. USDA Agricultural Marketing Service basis reports show Midwest producers near corn country seeing sub-$4 local cash prices. Meanwhile, California Department of Food and Agriculture data indicates that West Coast producers are facing $5-plus delivered corn. For hay, USDA’s Agricultural Prices report puts the national average at $222 per ton, but Western Premium Alfalfa runs $280 and up according to the latest USDA hay market news.
Production Growth: The Numbers We Can’t Ignore
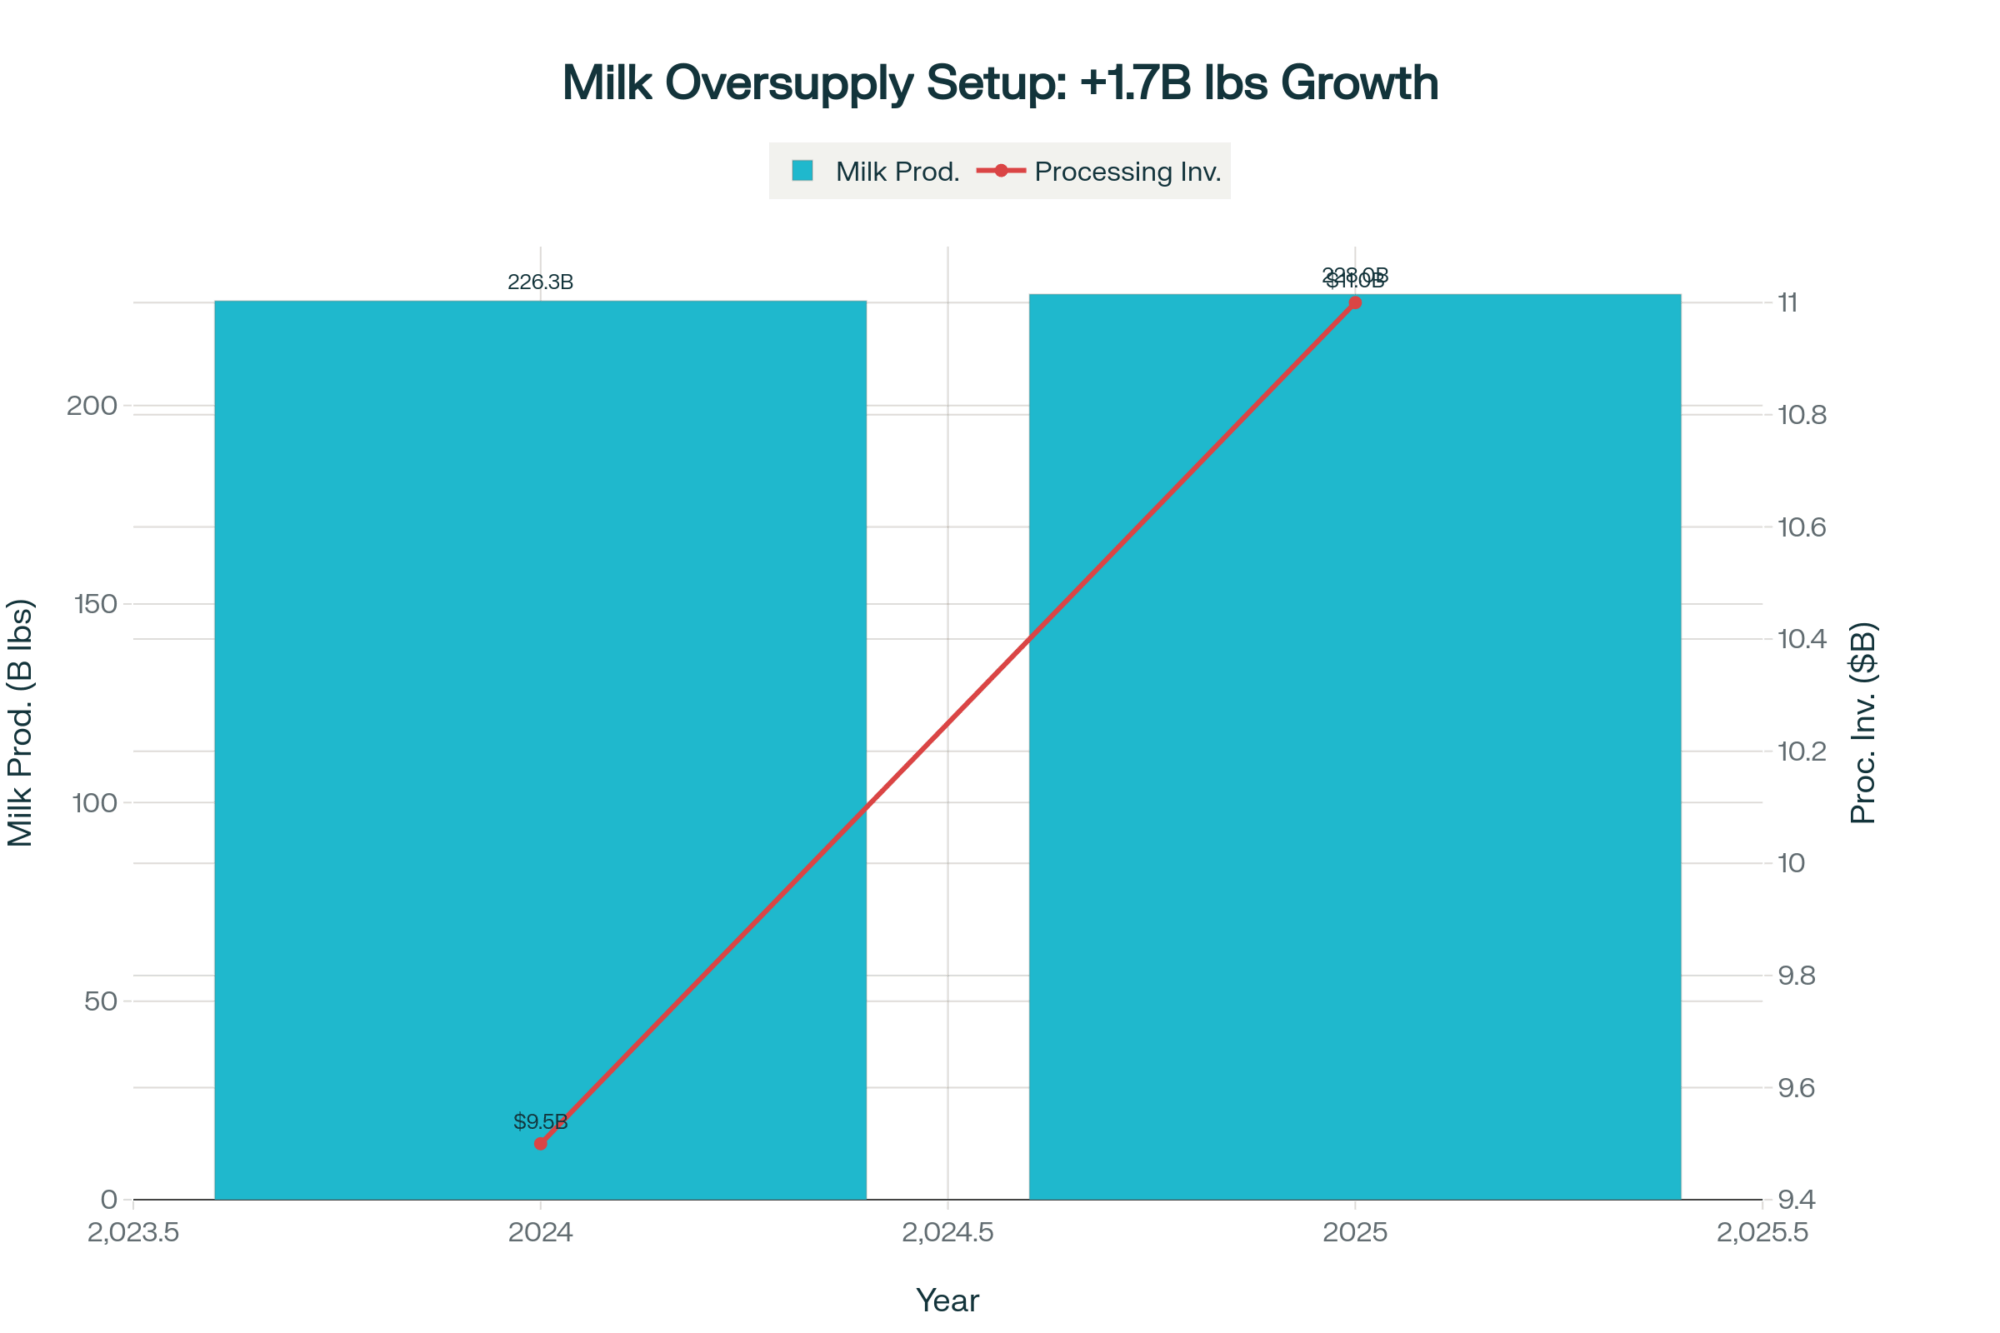
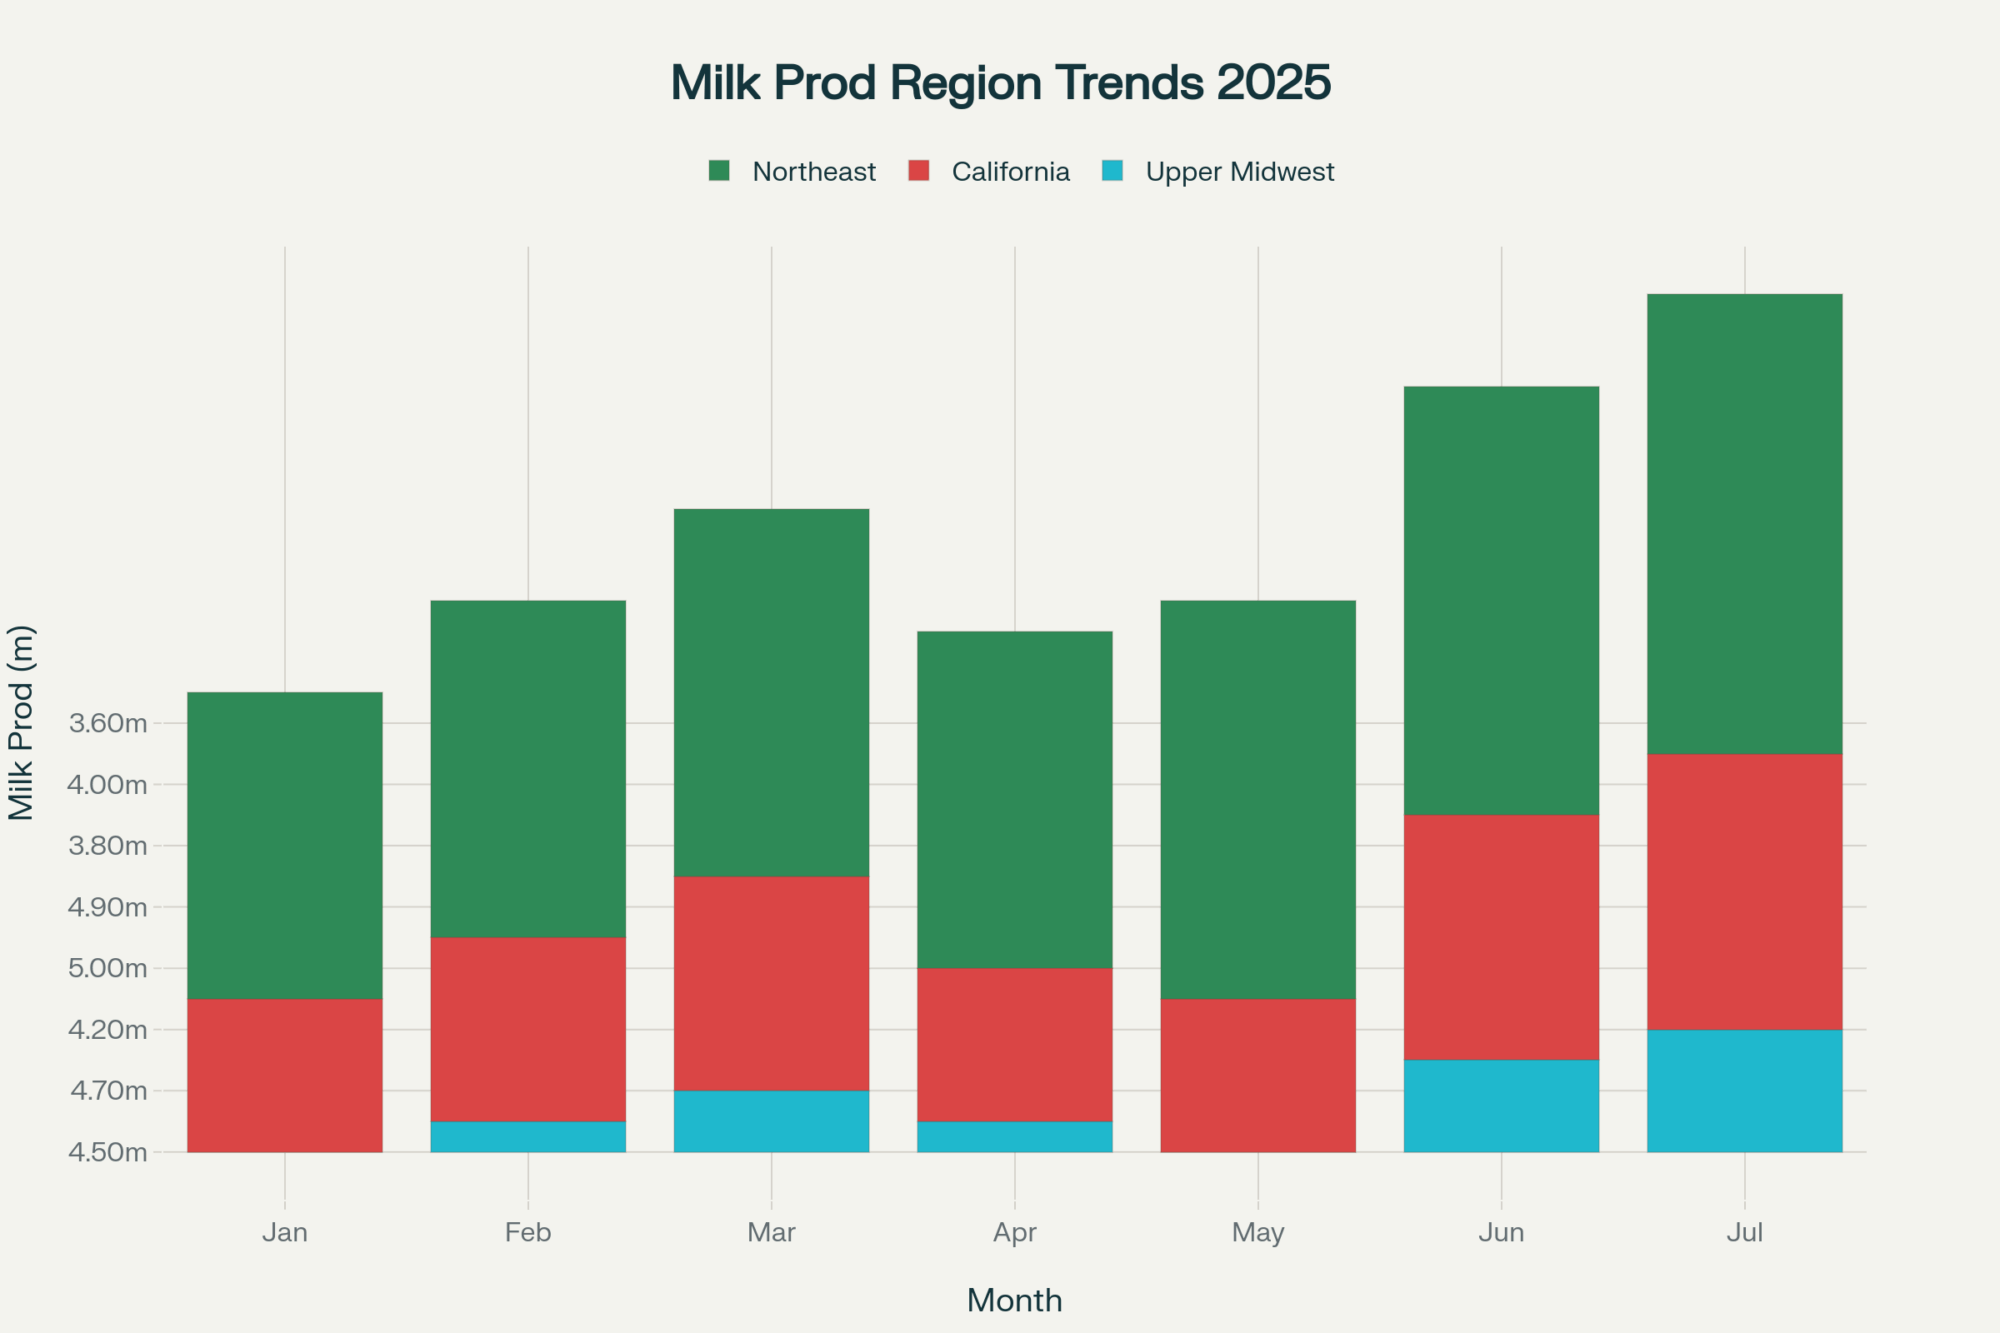
USDA’s National Agricultural Statistics Service finally released that delayed September milk production report on November 10th, and the numbers are… well, they’re sobering. Twenty-four state production hit 18.3 billion pounds, up 4.2% year-over-year. The national herd added 235,000 cows over the past year, while production per cow jumped 30 pounds to 1,999 pounds per month.
What’s really eye-opening is where this growth is concentrated. Kansas leads with 21.1% growth, South Dakota’s up 9.4%—those new processing plants that Dairy Foods magazine has been covering are pulling massive expansion. Looking at efficiency gains, Michigan State University Extension reports their state’s cows are averaging 2,260 pounds per month. That’s 260 pounds above the national average.

The combination of improved genetics—documented in Journal of Dairy Science studies—optimized nutrition protocols from land-grant university research, and modernized facilities, as tracked by Progressive Dairy, has pushed biological limits higher than we thought possible. Here’s the reality check from talking with nutritionists: when your neighbors are achieving these yields, you either match them or risk getting priced out.
Remember all those cheese plants that broke ground in 2023? Kansas Department of Agriculture confirms three major facilities, Texas Department of Agriculture lists two, and South Dakota’s Governor’s Office announced another two. We’ve added 10 billion pounds of annual processing capacity since 2023, according to estimates from the International Dairy Foods Association. These plants have 20-year USDA Rural Development financing that requires running near capacity—this structural oversupply won’t resolve quickly.

What This Means for Your December Check
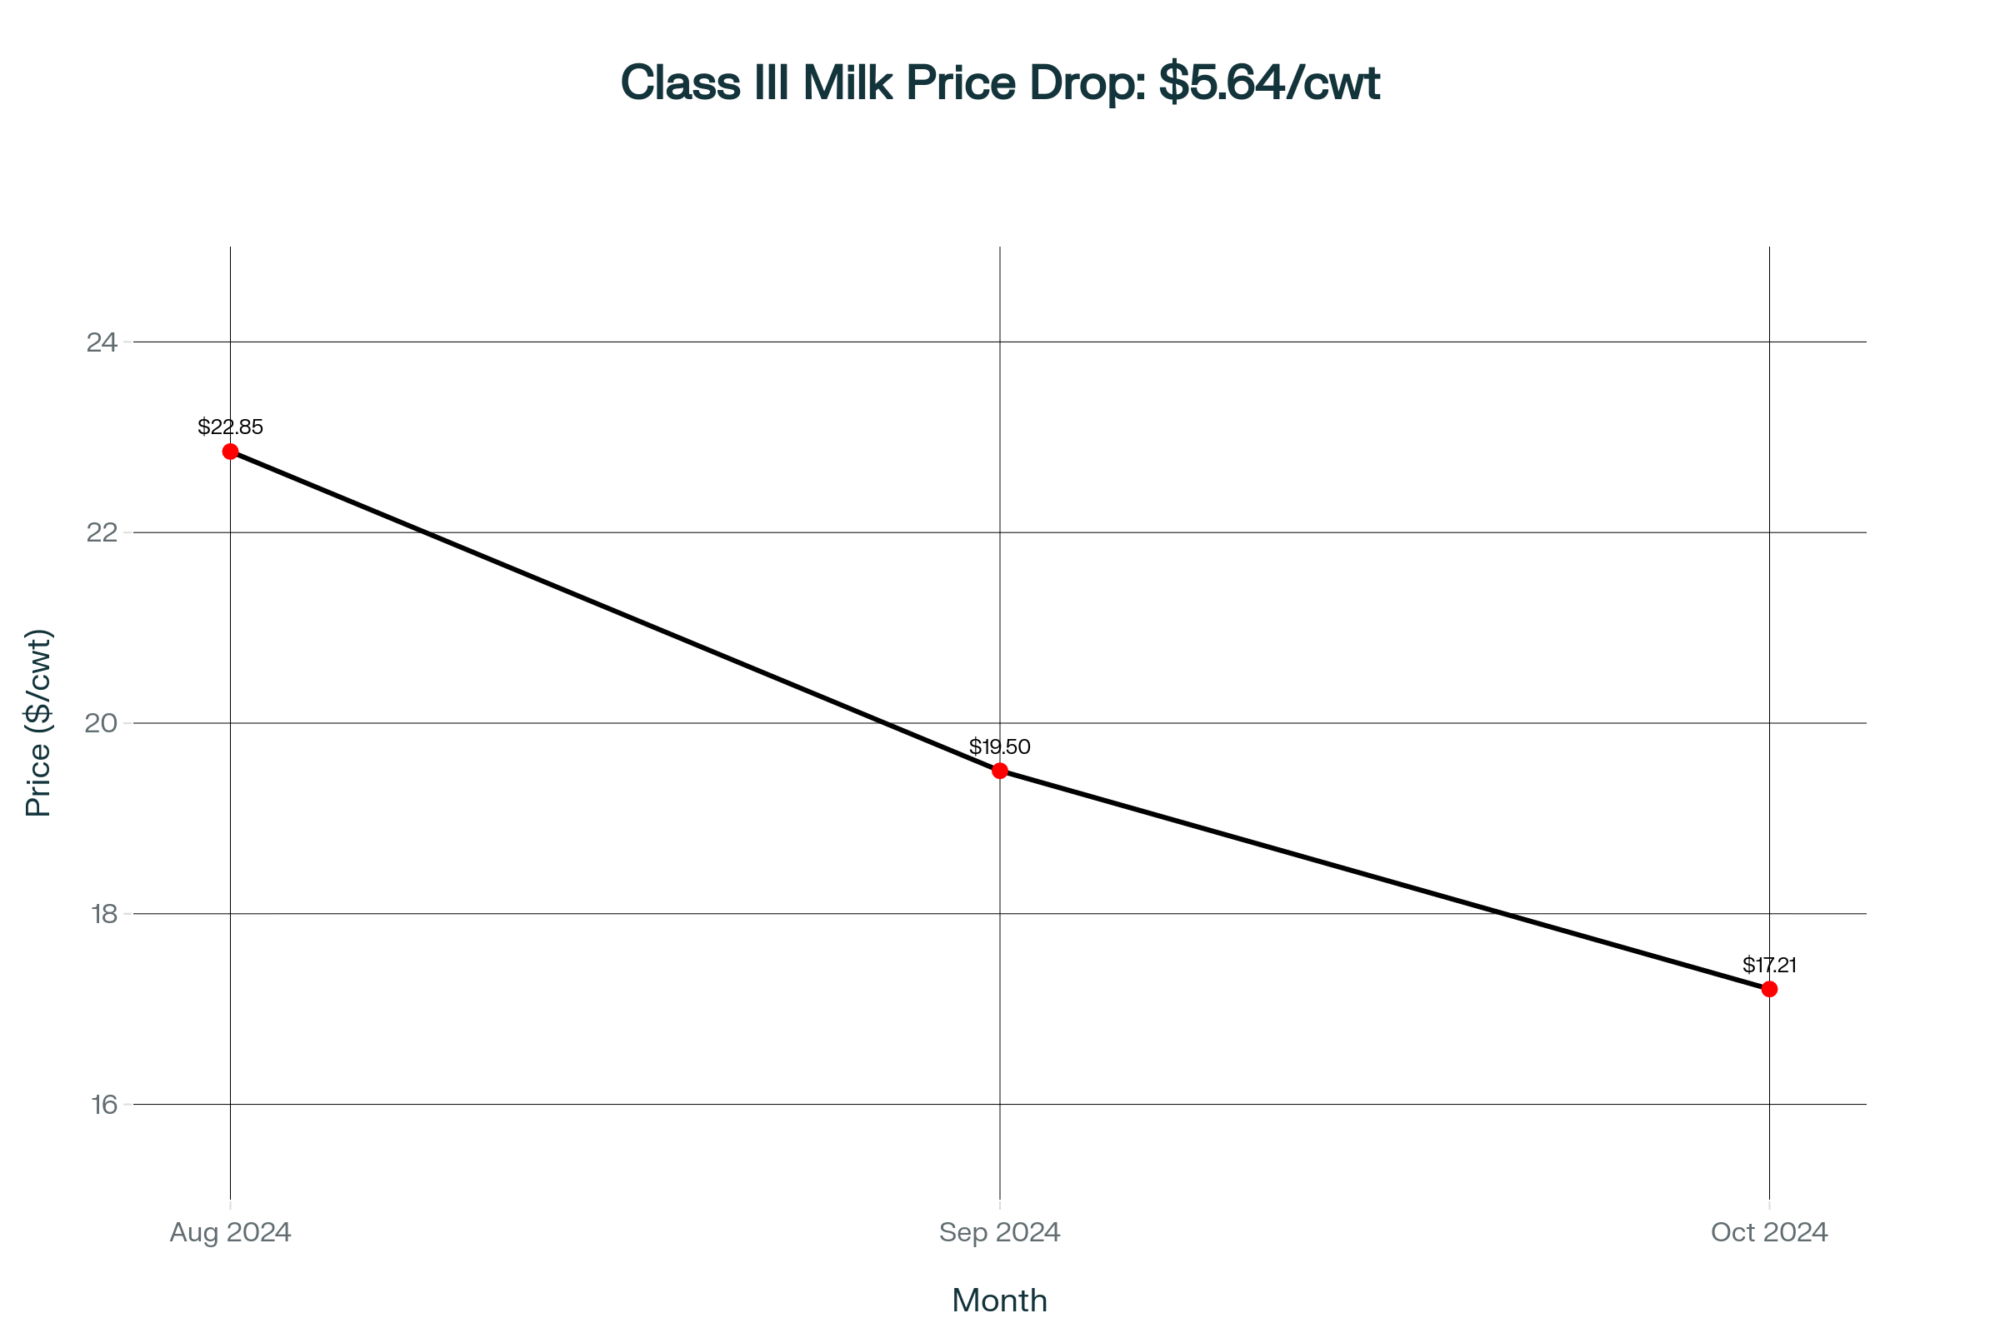
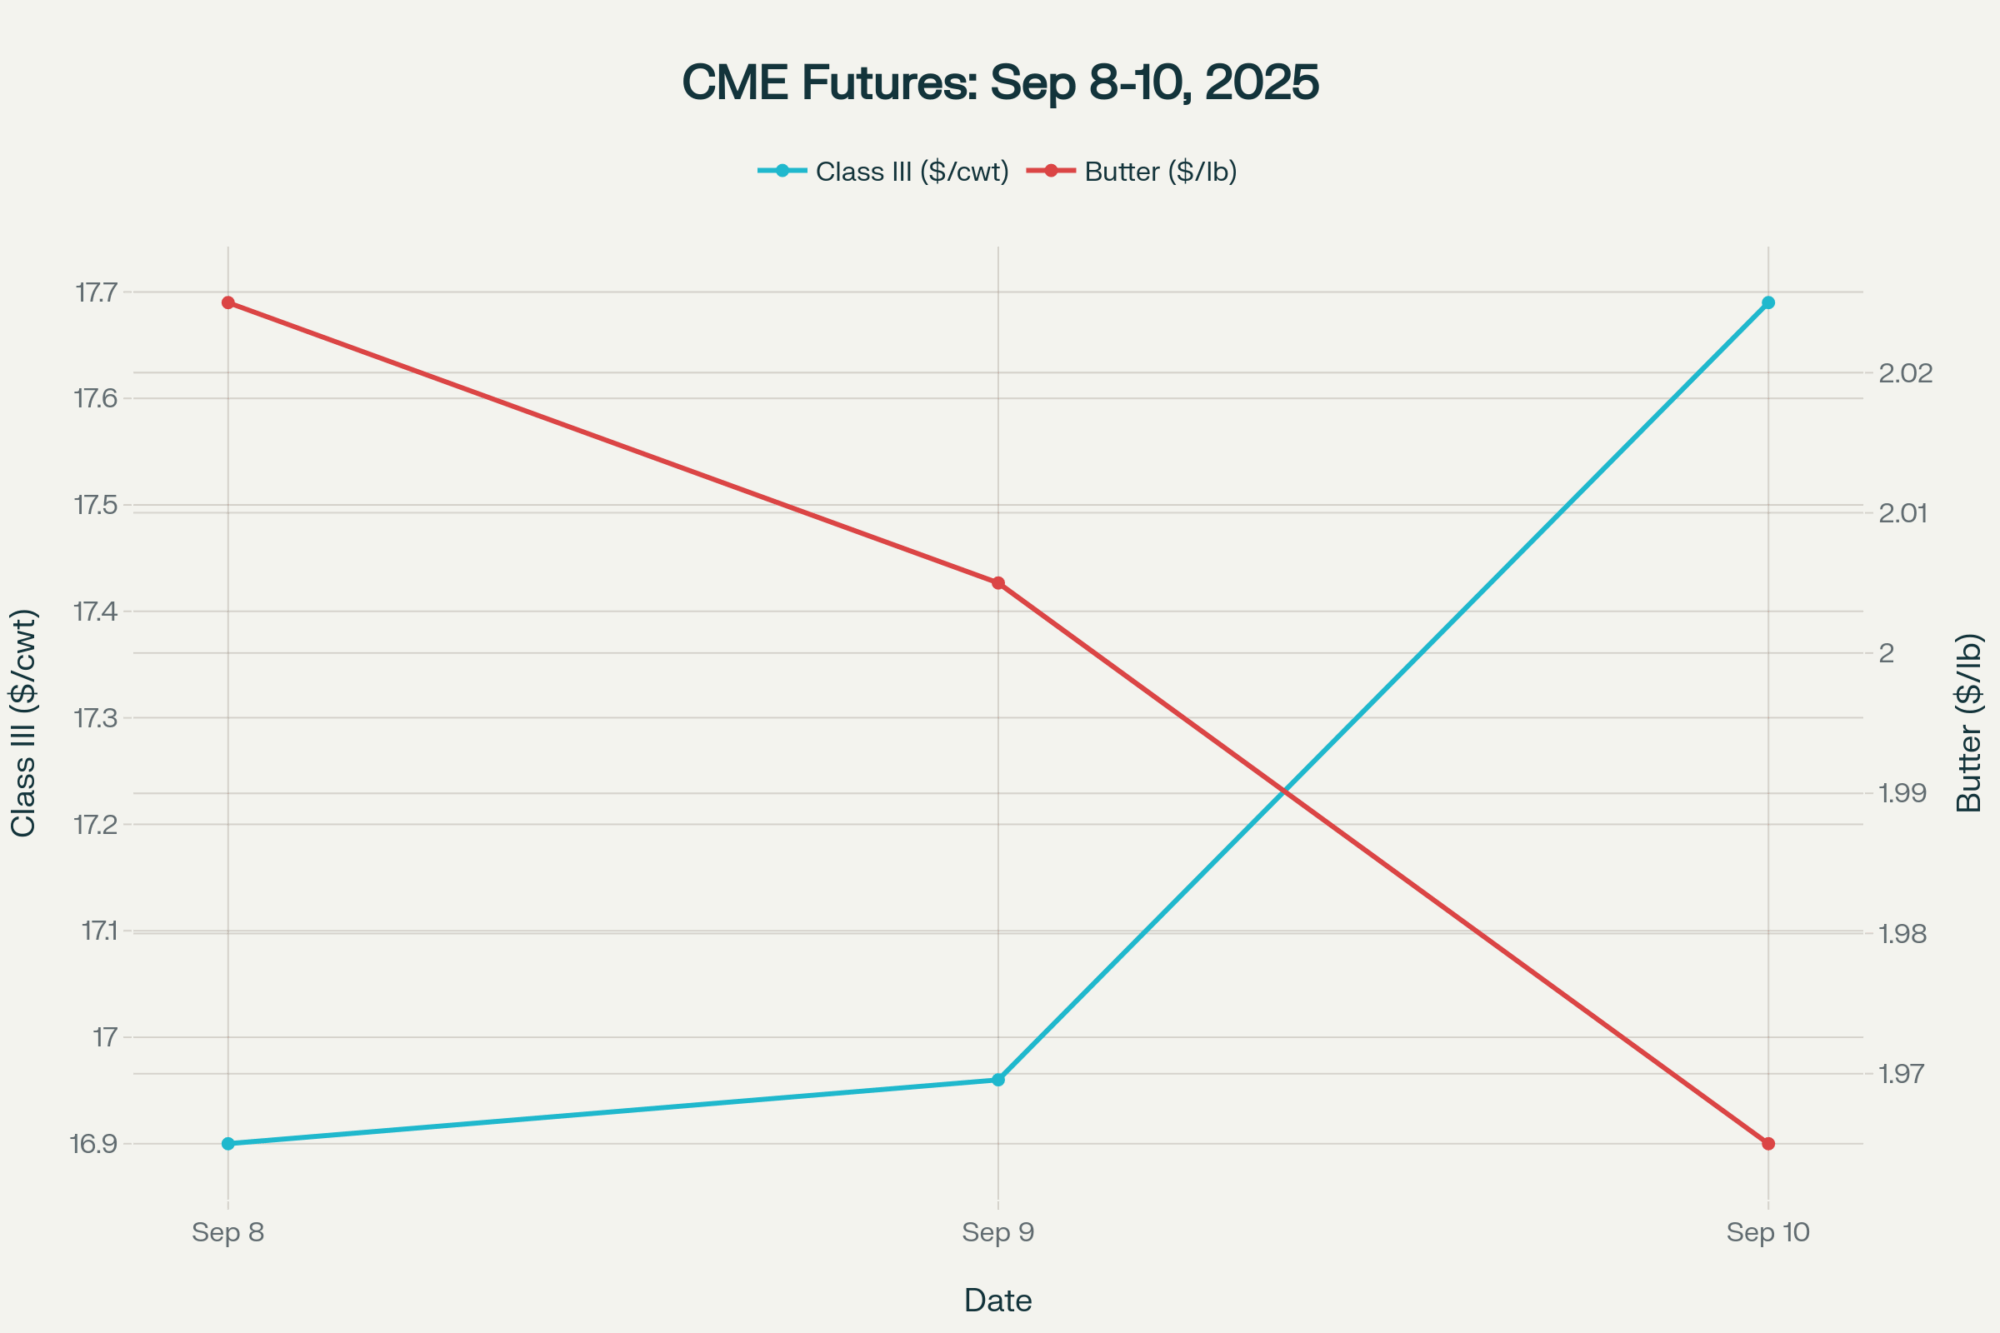
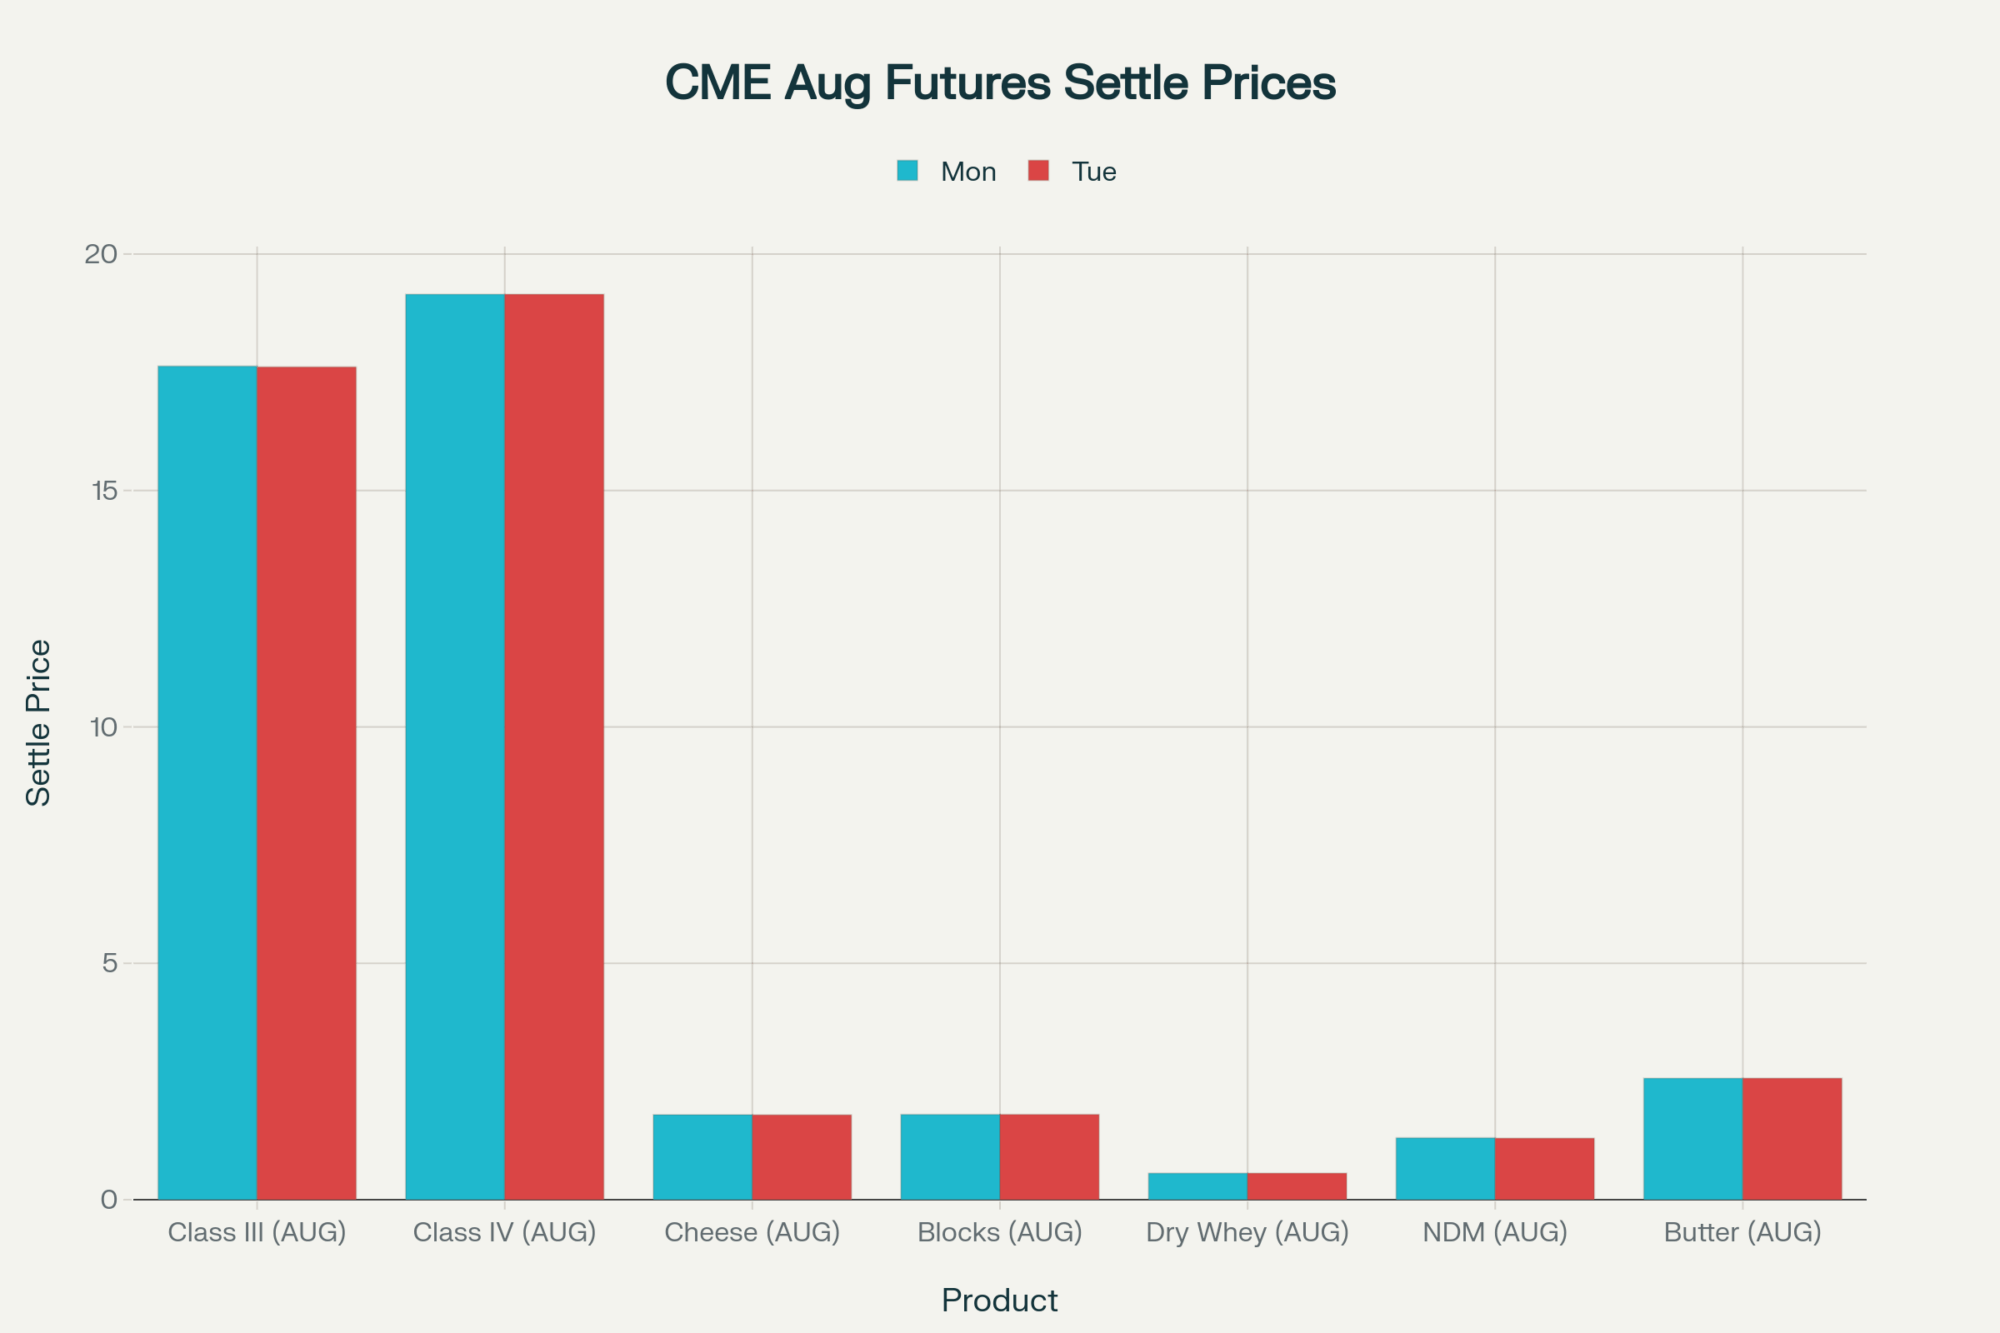
Let’s talk straight about where Class III milk is headed. With November futures already at $17.16 on the CME and December futures implying further weakness according to today’s settlements, several dairy economists I respect are projecting $16.50 or lower by January.
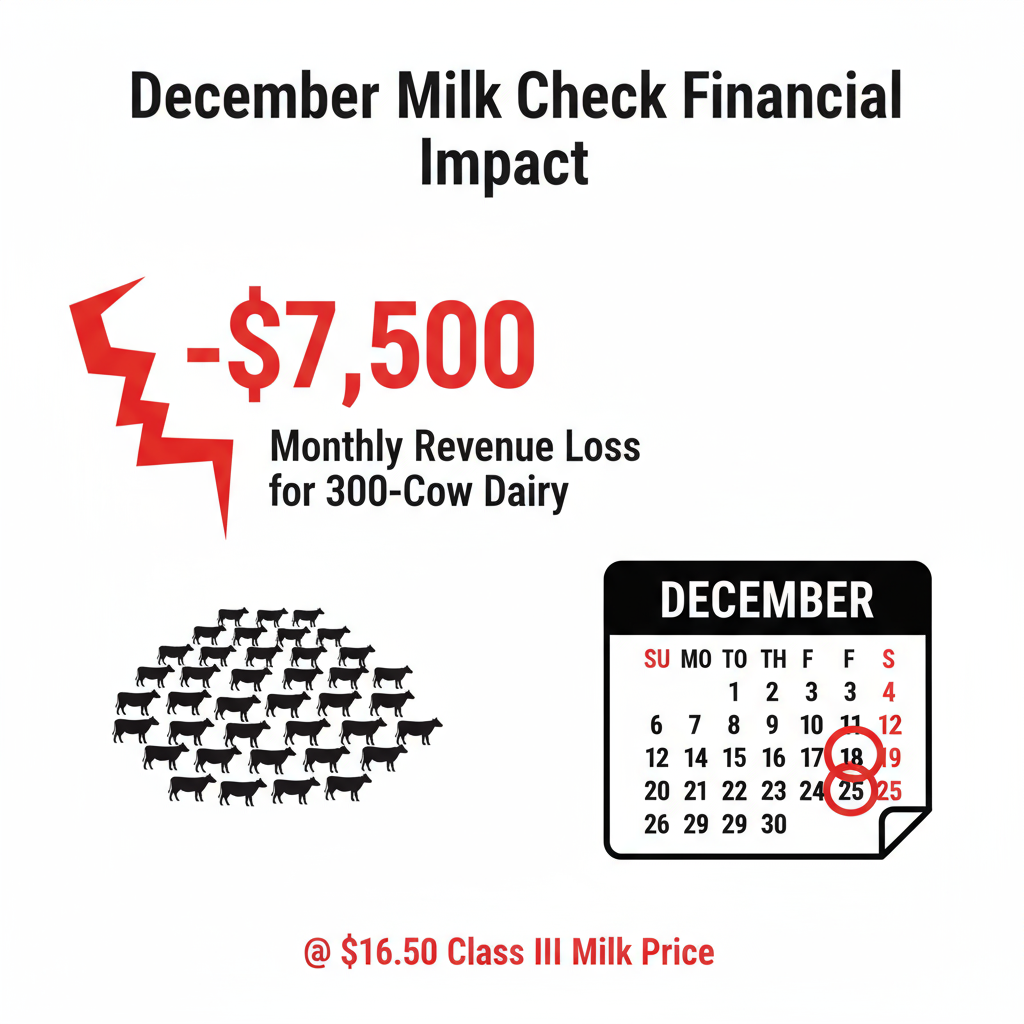
At $16.50 Class III with current feed costs, the University of Minnesota’s dairy profitability calculator shows the average 100-cow dairy loses about $1,500 per day. If we hit spring flush with these prices… well, that’s going to force some tough culling decisions. Today’s spot prices, when run through USDA’s Federal Milk Marketing Order formulas, translate to January milk checks down $2.50 to $3.00 per hundredweight from October.
For a 300-cow dairy shipping 65,000 pounds daily, that’s $7,500 less monthly revenue. Farm Credit Services reports from the Midwest indicate banks are already tightening credit as dairy loan portfolios deteriorate. The Federal Reserve’s October Agricultural Credit Survey shows agricultural loan demand rising while repayment rates fall—if you haven’t locked in operating lines for 2026, today’s price action just made that conversation much harder.
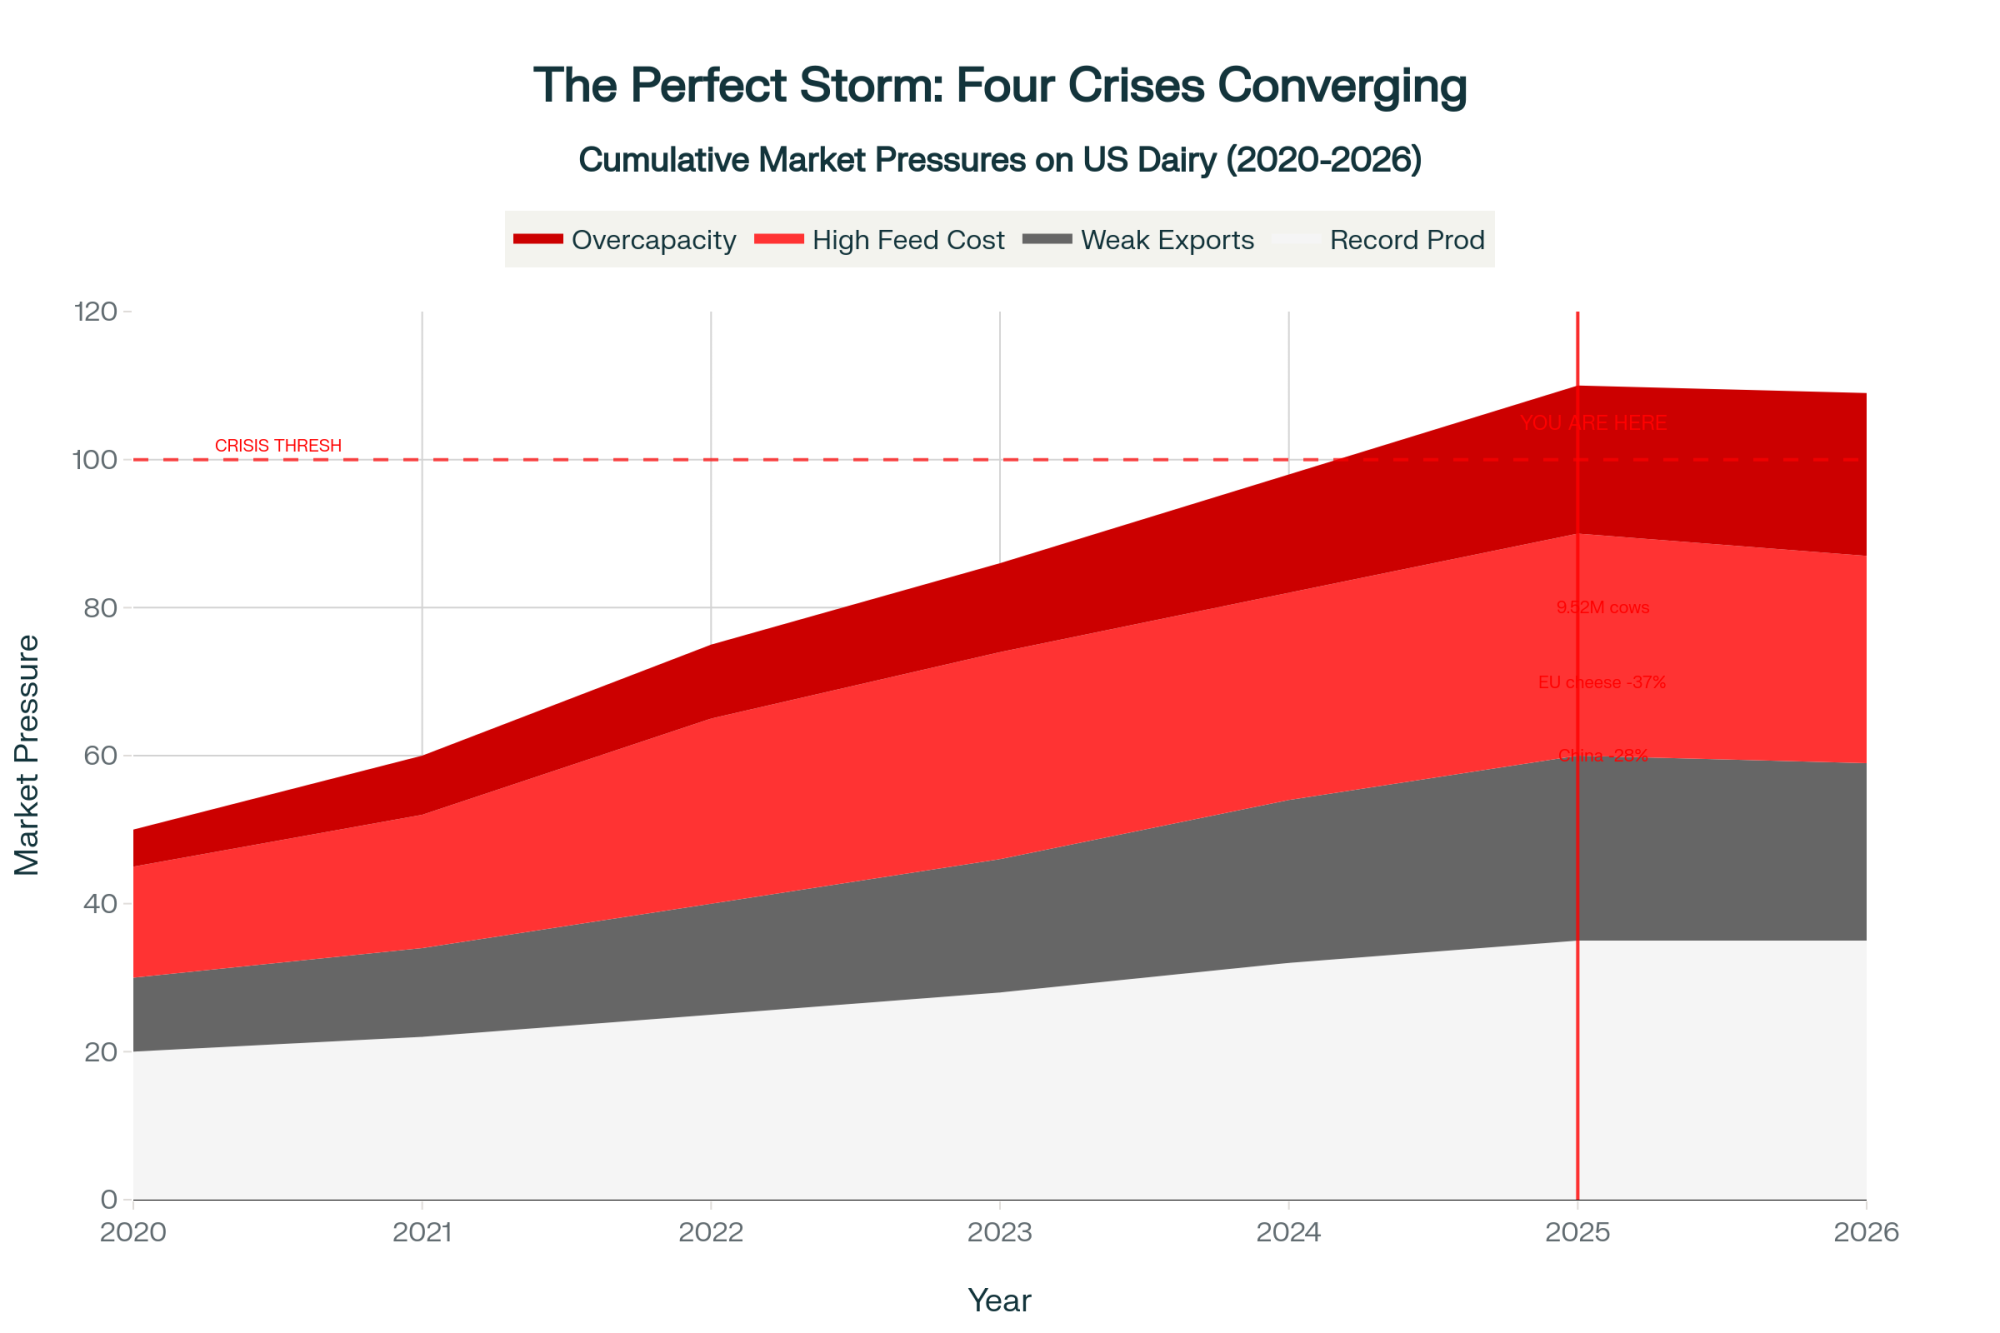
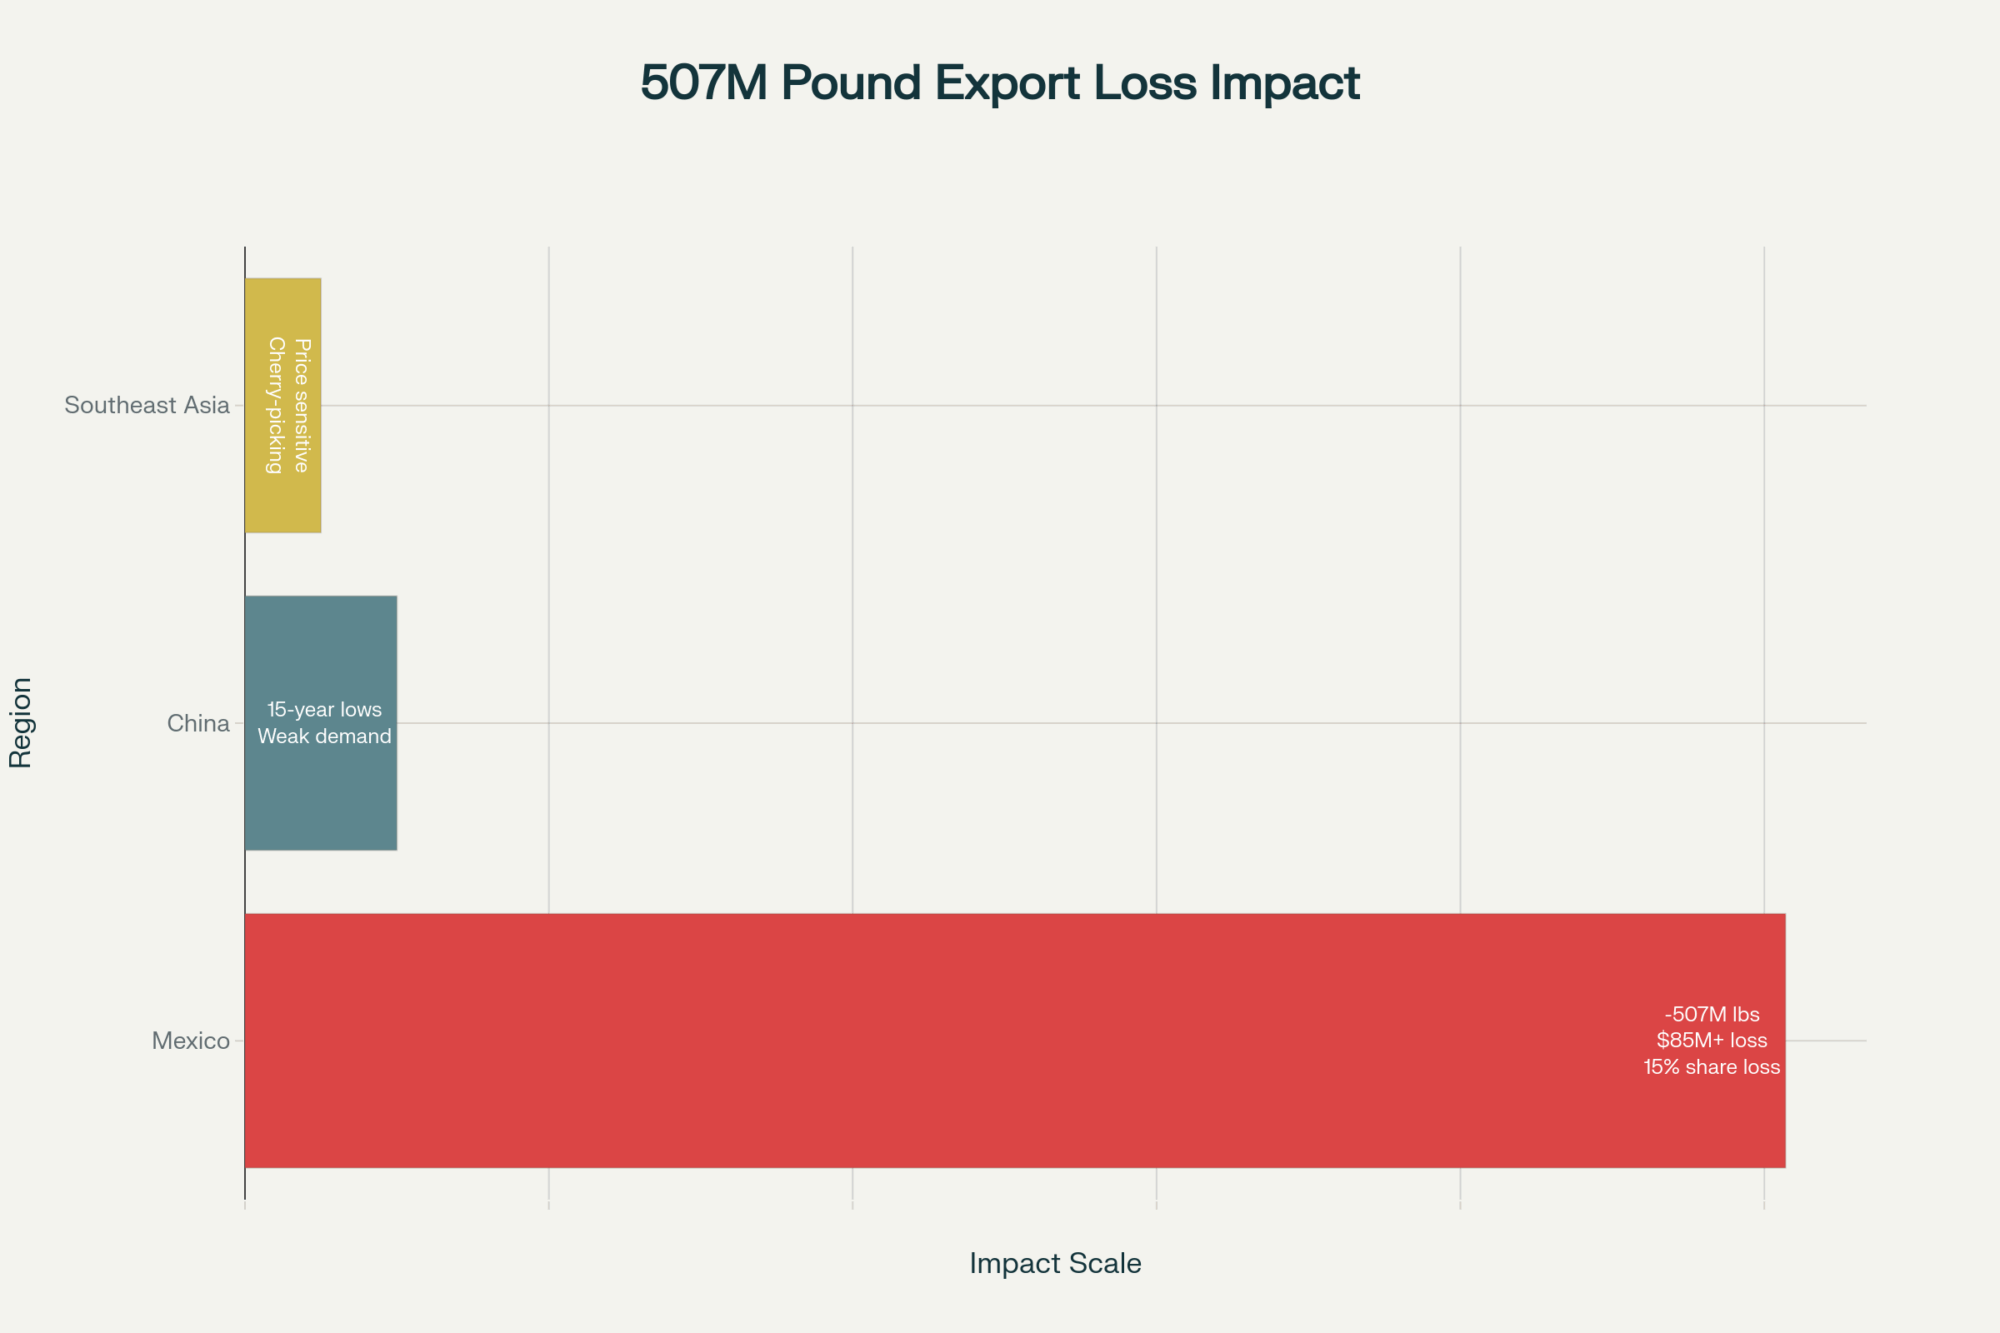
What’s particularly concerning is that our traditional escape route isn’t available. USDA Foreign Agricultural Service data shows China’s imports down 18% year-over-year, Mexico’s pulling back, as I mentioned, and Southeast Asian markets are oversupplied. Without export demand absorbing 15-20% of production—which has been the historical average according to U.S. Dairy Export Council analysis—domestic markets face crushing oversupply through 2026.
Tomorrow Morning’s Practical Action Plan
So what do we do about all this? Here’s my thinking on practical steps based on conversations with risk management specialists and successful producers who’ve weathered previous downturns.
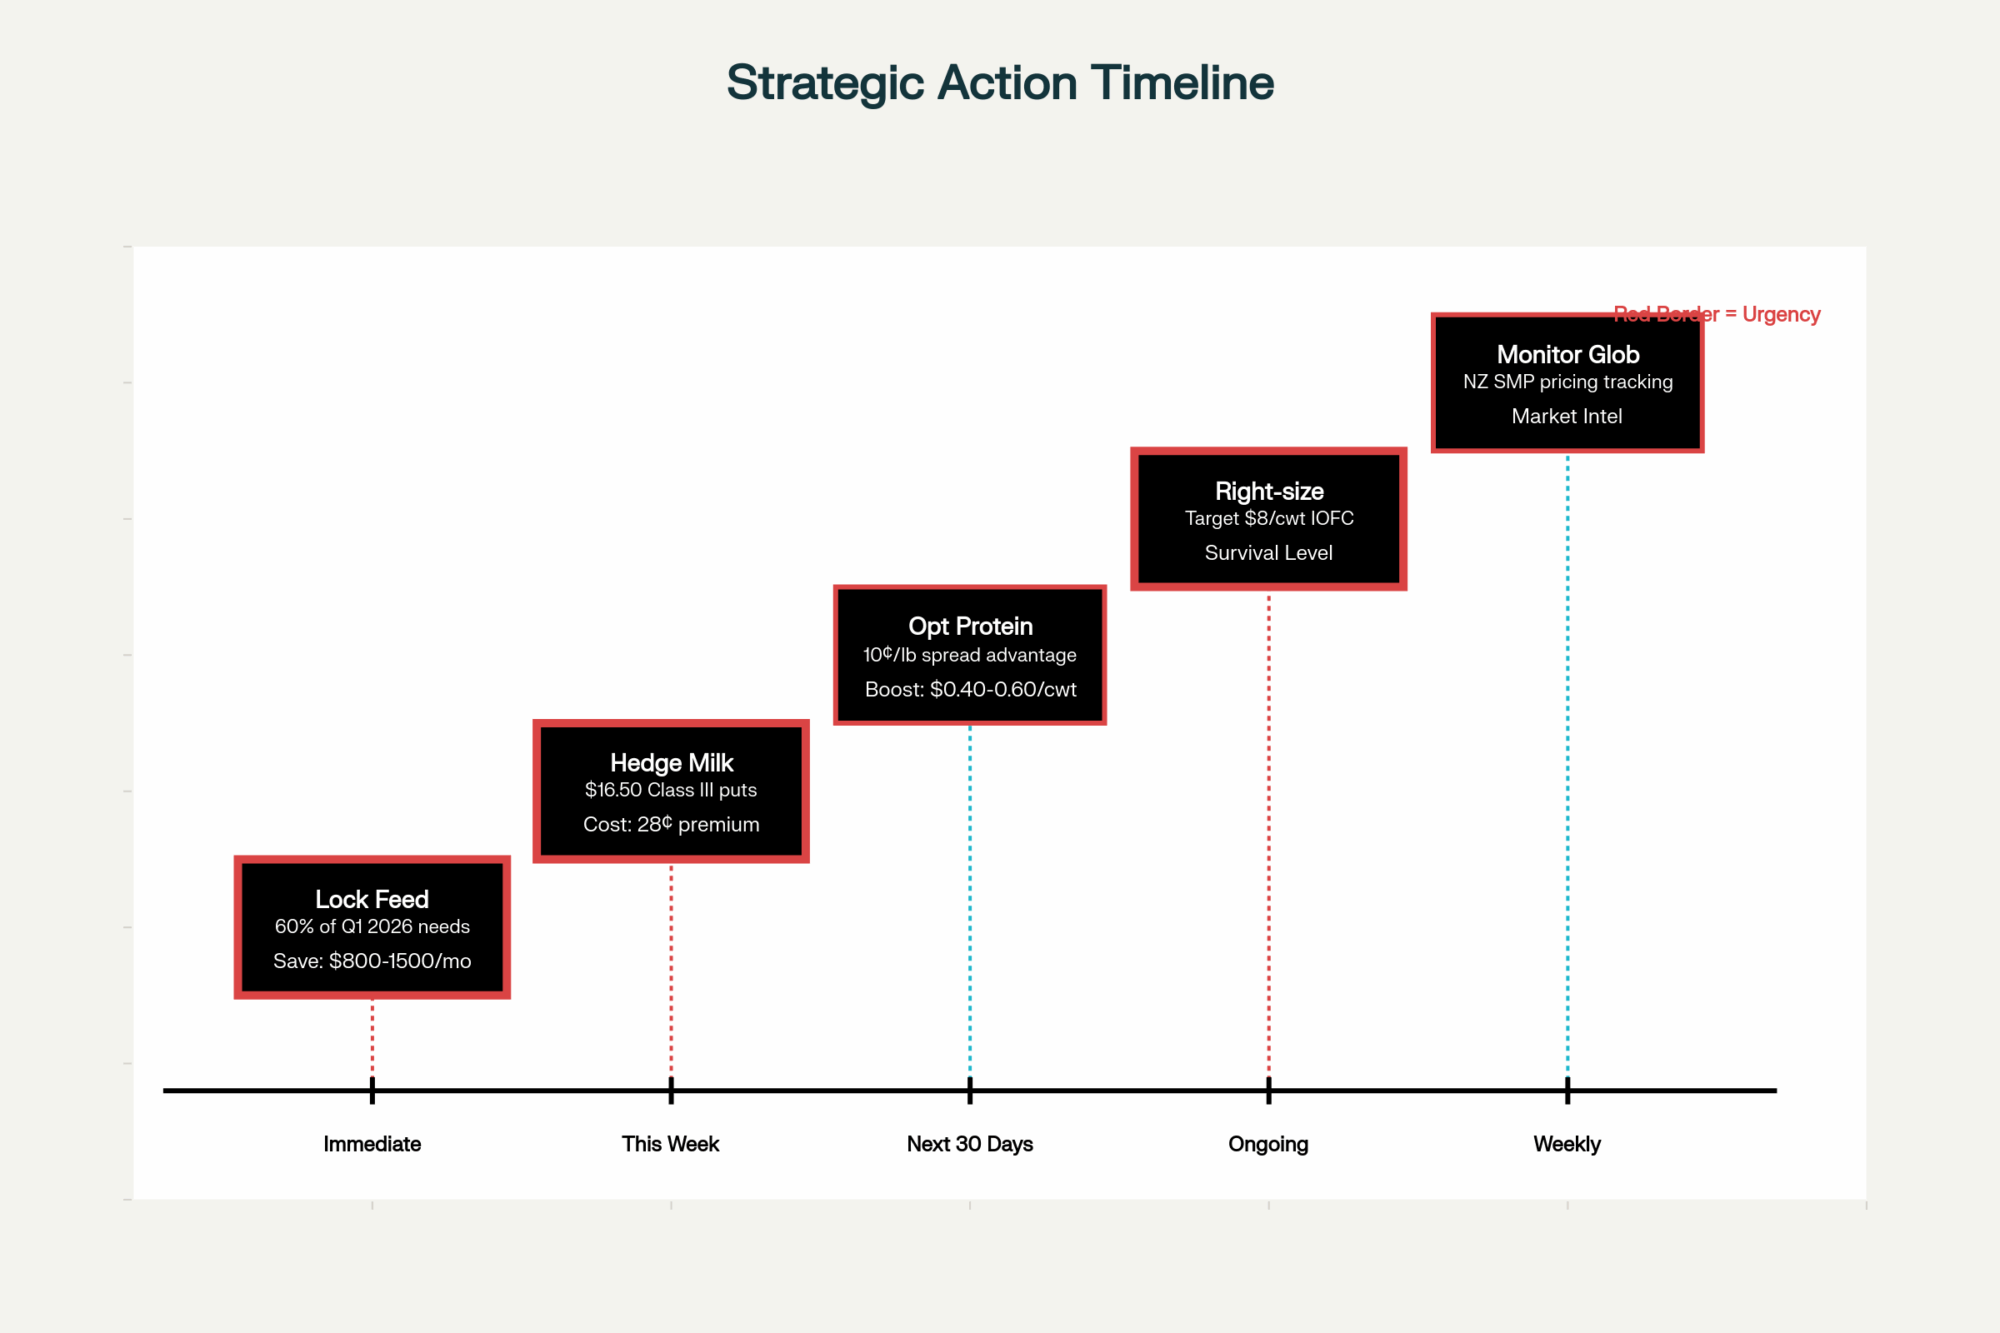
On the hedging front, if we get any bounce above $17.00 for Q1 2026 Class III, I’d seriously consider locking it in. Several commodity brokers I trust are recommending ratio spreads—selling two February $16 puts to buy one February $18 call, which limits your downside while maintaining upside potential. For feed, the consensus among grain merchandisers is to buy March corn under $4.40 and meal under $320 while you can.
Operationally, extension dairy specialists are unanimous: it’s time for aggressive culling. Penn State’s dairy management tools show that every marginal cow below 60 pounds per day is costing you money at these prices. Push breeding decisions to maximize beef-on-dairy premiums while they last—Superior Livestock Auction data shows those crossbred calves bringing $200 to $300 premiums.
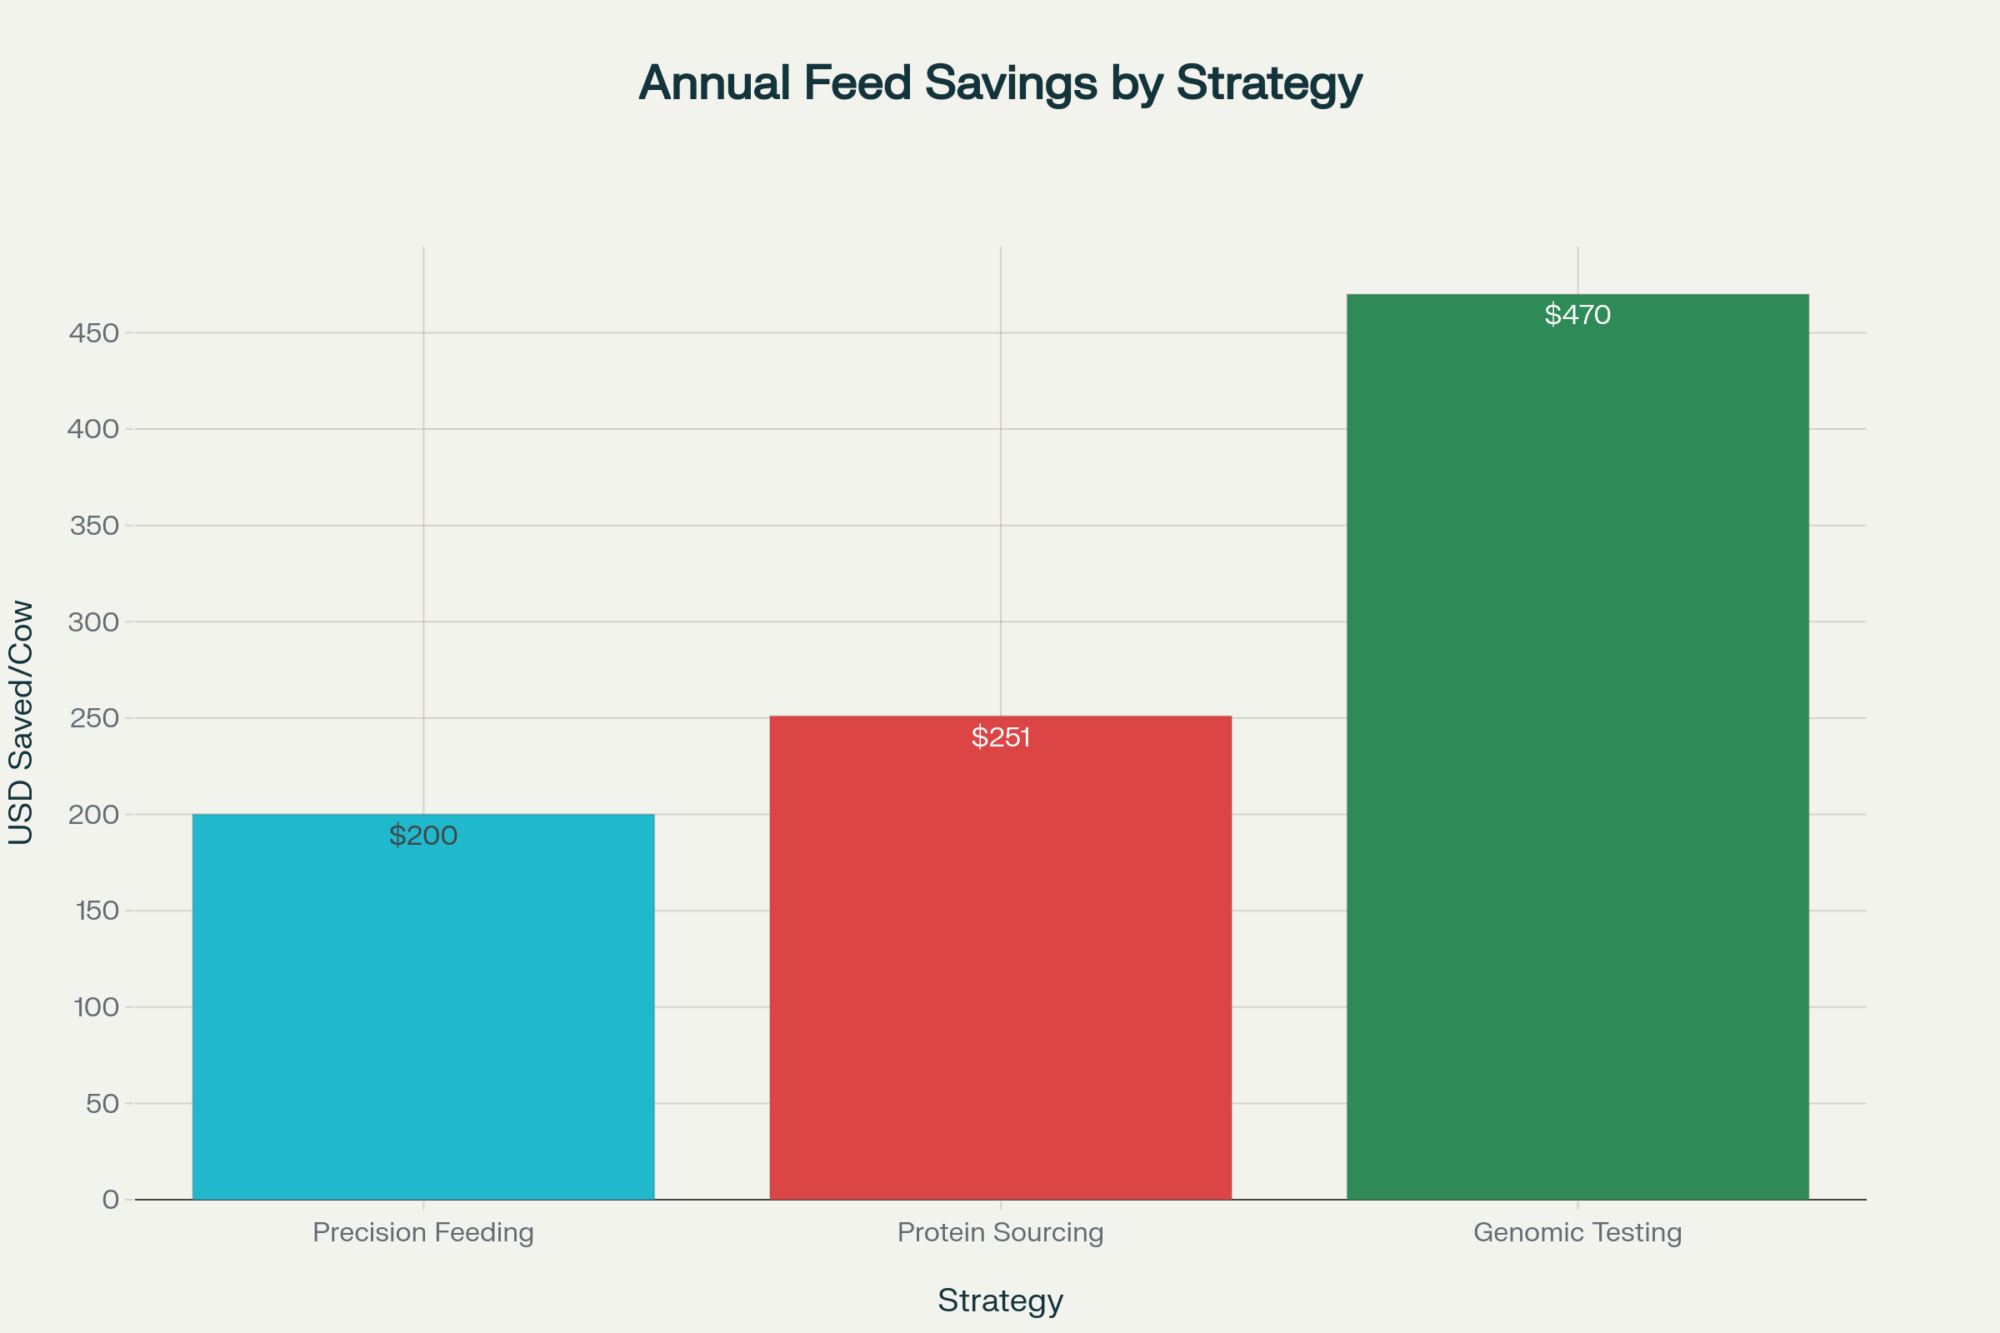
Review every feed ingredient for substitution opportunities. University of Wisconsin research demonstrates that optimizing your grain mix can save $5 per ton without sacrificing production—that equals $50,000 annually for a 500-cow dairy. And here’s something many producers hesitate to do but really should: schedule that lender meeting now, before year-end financials force their hand.
Prepare cash flow projections showing survival through $16 milk—Farm Financial Standards Council guidelines suggest they need to see that you’ve faced reality. Several ag finance specialists recommend considering sale-leaseback arrangements on equipment to generate working capital before values drop further.

The Bottom Line
You know, I’ve been through the 2009 crisis, the 2015-2016 downturn, and 2020’s volatility. What we’re seeing today isn’t just another cycle. Today’s 8-cent cheese collapse, combined with global oversupply data and production growth trends, confirms the U.S. dairy industry faces what could be a two-year margin squeeze.
Looking at the fundamentals—global markets oversupplied according to Rabobank’s latest dairy quarterly, domestic demand softening per USDA disappearance data, and production still growing at 3-4% annually—prices have further to fall before this corrects. The harsh reality, according to agricultural economists at several land-grant universities, is that we could see 5-10% of operations exit by the end of 2026.
Your December milk check has become more than a financial report—it’s a survival test. But here’s what’s encouraging from studying previous downturns: operations that adapt quickly, that make hard decisions now rather than hoping for recovery, those are the ones that emerge stronger. The question facing every producer tonight is simple but profound: will your operation be among the survivors?
What I’ve learned from 30 years of watching these cycles is that the difference between those who make it and those who don’t often comes down to acting decisively in moments like this. Tomorrow morning, when you’re doing chores, think about which camp you want to be in. Then act accordingly.
Key Takeaways
- This isn’t a blip—it’s a reckoning: Today’s 8-cent cheese crash to $1.5525 with only one bid standing confirms we’re entering a 2-year margin squeeze. Class III hits $16.50 by January.
- The world has turned against U.S. dairy: Europe’s 10 cents cheaper, Mexico’s pulling back, and our 4.2% production growth is flooding a shrinking market. Exports can’t save us this time.
- Efficiency gaps will force consolidation: When Michigan averages 2,260 lbs/cow and you’re at 1,900, the math is fatal—every marginal cow costs you $15 daily at these prices.
- Your banker already knows: Today’s CME report just flagged every dairy loan in America. Schedule that meeting now with realistic projections, not wishful thinking.
- History’s lesson is clear: In 2009 and 2015, farms that acted decisively in the first 90 days survived. Those that waited for “normal” to return didn’t make it. Which will you be?
Learn More:
- This Isn’t Your Normal Dairy Downturn – Here’s Your 60-Day Action Plan – This tactical guide provides the immediate 60-day survival plan for the crisis outlined in our report, detailing proven strategies for culling, financial tracking, and component optimization that are working for producers right now.
- Global Dairy Market Dynamics: Navigating Volatility and Strategic Opportunities in 2025 – For a deeper dive into the “why” behind the global price pressure, this strategic analysis explains the GDT dynamics and European overproduction that are boxing in U.S. producers, revealing where future strategic opportunities may lie.
- Robotic Milking Revolution: Why Modern Dairy Farms Are Choosing Automation in 2025 – When margins are crushed by labor and feed costs, this article explores the hard ROI of automation. It details how robotics are delivering 60% labor reductions and providing crucial data to survive long-term margin squeezes.
 The Sunday Read Dairy Professionals Don’t Skip.
 The Sunday Read Dairy Professionals Don’t Skip.
Every week, thousands of producers, breeders, and industry insiders open Bullvine Weekly for genetics insights, market shifts, and profit strategies they won’t find anywhere else. One email. Five minutes. Smarter decisions all week.