Whole milk is back in schools. Will it add real Class I dollars to your milk check—or just a few pennies and a nice photo op?
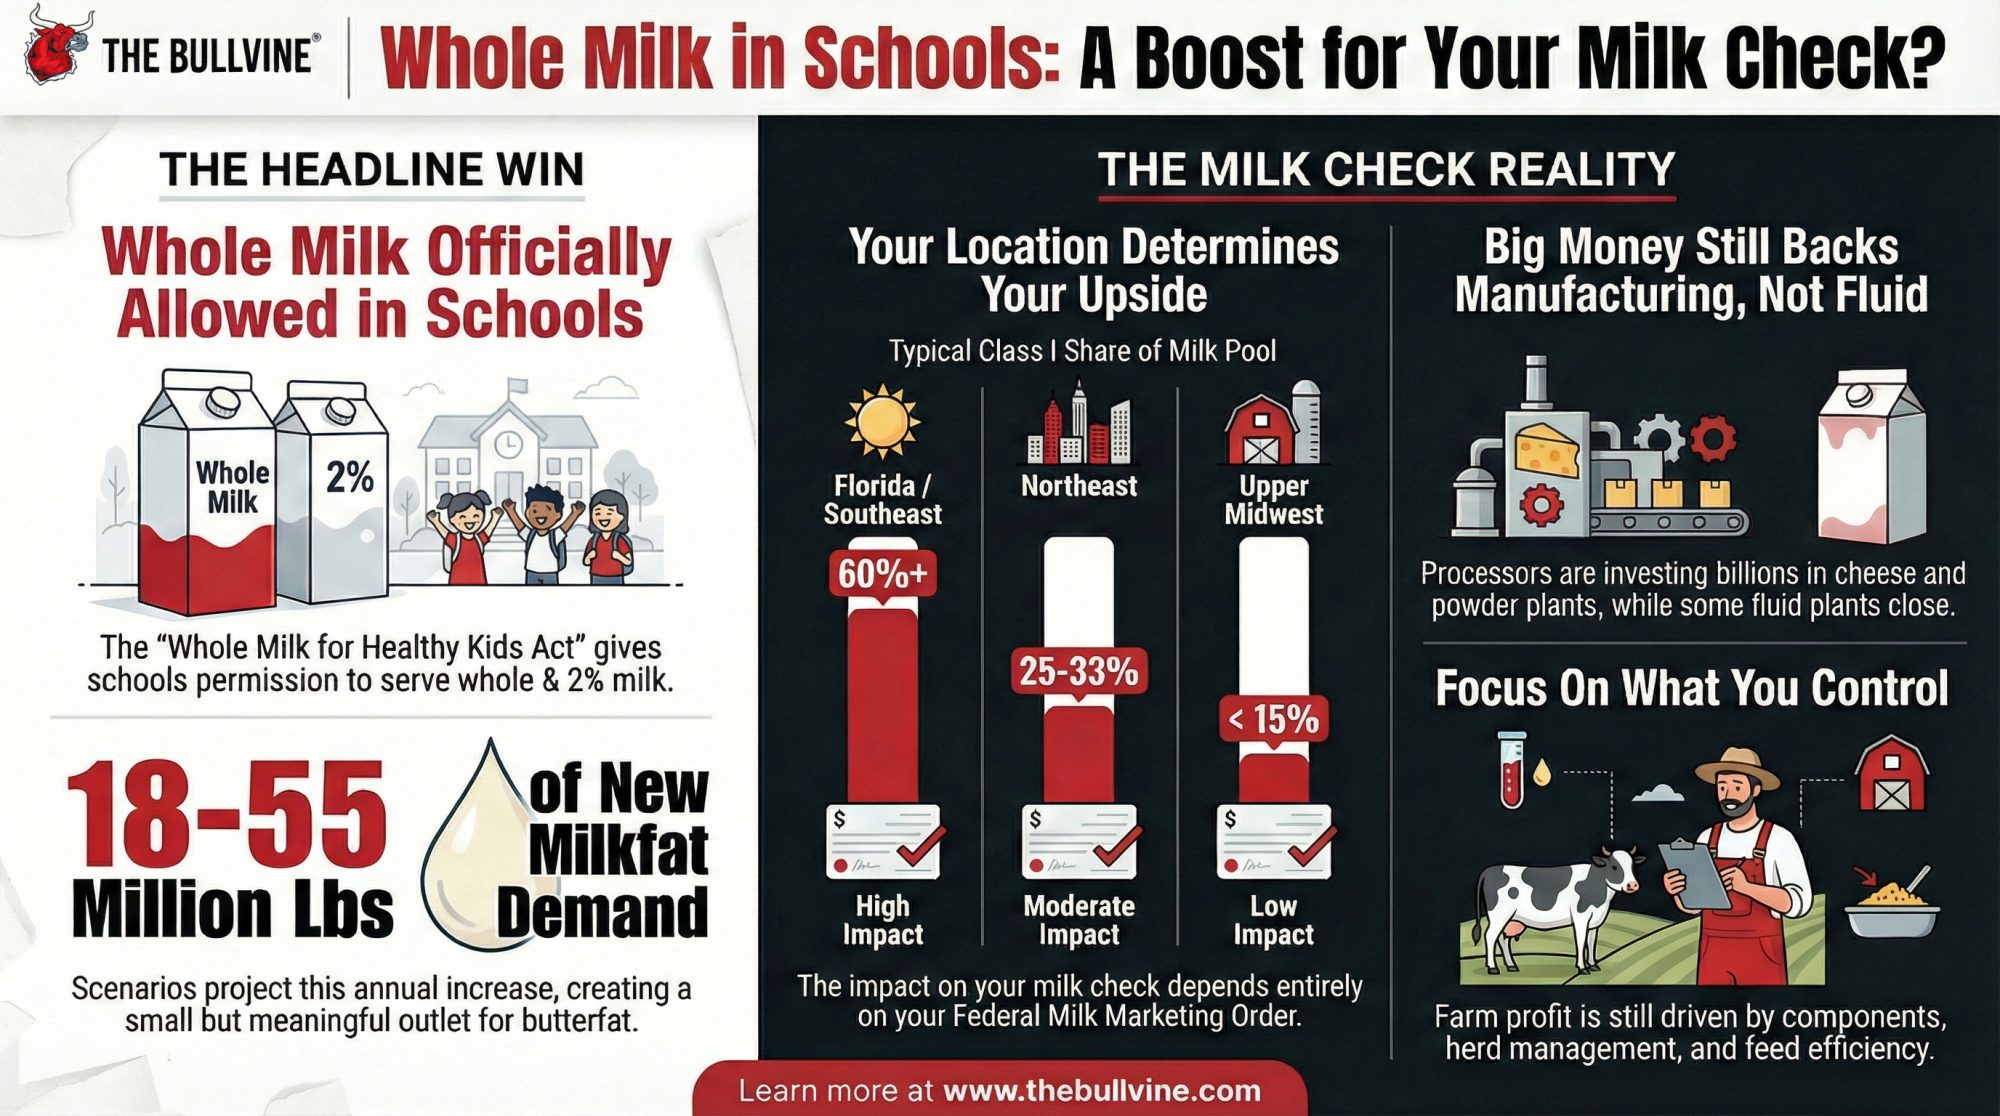
Executive Summary: Whole milk is back in U.S. schools under the Whole Milk for Healthy Kids Act, but for most farms the real question isn’t politics—it’s whether this will add more than pennies to the milk check. AFBF’s scenarios show that if 25–75% of schools adopt whole milk, milkfat use could rise by roughly 18–55 million pounds a year, creating a “small but meaningful” bump in butterfat demand on top of already strong cheese and butter markets. Whether that translates into real money for you depends on your Federal Order: high‑Class‑I regions like Florida, the Southeast, and parts of the Northeast are positioned to feel more of the benefit than manufacturing‑heavy orders such as the Upper Midwest, where Class I often sits in single digits. Recent FMMO changes—bringing back the higher‑of mover, raising Class I differentials, and increasing make allowances—reinforce that split, giving fluid‑heavy orders more upside while cheese‑oriented regions absorb more of the manufacturing cost increases. At the same time, processor investments are still flowing mainly into manufacturing plants like Darigold’s new 8‑million‑pound‑per‑day Pasco butter and powder facility, while fluid plants such as Upstate Niagara’s Rochester operation are closing as fluid sales hit multi‑decade lows, underscoring that cheese and ingredients, not school cartons, still drive most of the business. For producers, the takeaway is to treat whole milk in schools as a modest Class I tailwind rather than a rescue plan, press co‑ops and processors on their school‑milk strategy, watch local bid specs, and keep squeezing profit from the levers you control every day—components, fresh cow management in the transition period, feed efficiency, and disciplined costs.
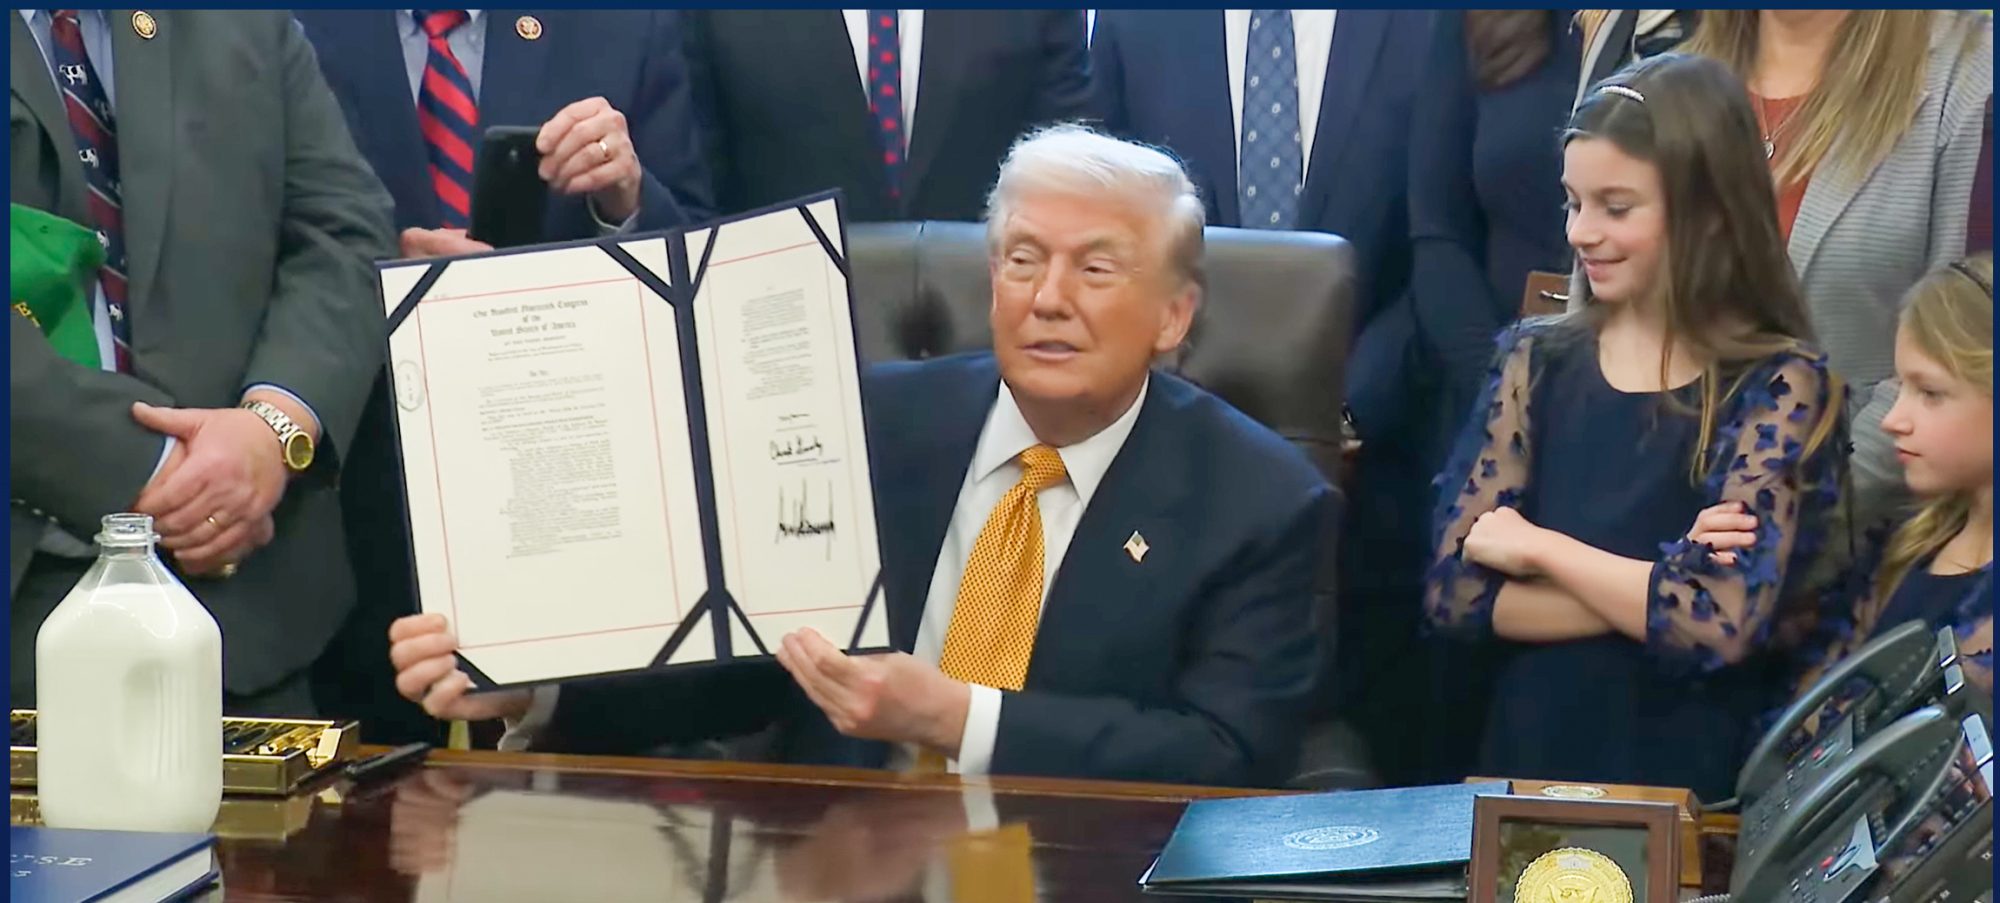
You know it already: everyone’s celebrating the return of whole milk to schools. And that’s understandable. The Whole Milk for Healthy Kids Act, S.222, changes the National School Lunch Act so schools in the National School Lunch Program and School Breakfast Program can once again put whole and 2% milk on the menu alongside low‑fat and fat‑free options, flavored or unflavored, including lactose‑free versions, as long as they still meet the usual nutrition standards set by USDA. That’s right there in the bill language and in how ag media and policy groups have been talking about it over the past year, as the bill moved through Congress and into law.

Dairy outlets and farm organizations have been quick to call it a big win. The Jersey organizations, for example, passed a resolution supporting the bill because they see whole milk as a better fit with how families actually drink milk and how Jersey genetics deliver butterfat. National dairy news has run plenty of “whole milk is back in US schools” headlines, pointing out that this reverses more than a decade of federal rules that pushed schools toward low‑fat and fat‑free milk only. Industry folks and even some nutrition experts have been lining up to say, “It’s about time.”
But before you go out and buy a new tractor on the news, we need to look at your milk check. Because for many of you, this “victory” is going to feel a lot more like a rounding error than a rescue plan.
Over coffee, I keep hearing the same thing from a lot of you: “So is this actually going to move my Class I milk check… or is it mostly political theater?” And honestly, that’s the right way to frame it.
Just so we’re clear from the start: everything here is about the U.S. system—Federal Milk Marketing Orders, U.S. school meal rules, and U.S. fluid markets. If you’re milking cows under Canadian quota, or you’re in New Zealand trying to hit emissions and export targets, the mechanics are very different, even if some of the bigger forces—like long‑term changes in fluid demand—feel familiar.
How We Got to “No Whole Milk” in the First Place
Looking at this trend, it helps to rewind a bit.
Back when the Healthy, Hunger‑Free Kids Act went through in 2010, USDA rewrote the standards for what schools could serve in reimbursable breakfasts and lunches. When the new rules kicked in, schools in the National School Lunch Program and School Breakfast Program were generally limited to unflavored low‑fat (1%) milk, unflavored fat‑free milk, and only fat‑free options if they wanted to serve flavored milk at all. That’s how the regulations and guidance were written, and the “1% or less” campaign around school nutrition really drove that message home in cafeterias.
In practice, what many of us saw on the ground was pretty simple: whole and 2% milk basically vanished from reimbursable school menus. Plants that used to run whole and 2% in half‑pints for school accounts either switched formats or shifted more volume into other products and channels. Over time, school coolers became the place where kids saw only low‑fat or fat‑free labels, even if they were drinking whole milk at home.
Since then, the nutrition conversation around dairy has shifted. A 2021 review in a public‑health journal that looked at “food systems transformation for child health and well‑being” made the case that dairy foods are nutrient‑dense contributors of protein, calcium, and other key nutrients in kids’ diets, and argued pretty strongly for looking at overall diet patterns instead of judging foods on one nutrient like fat. A more recent 2024 paper on U.S. food policy and diet‑related chronic disease doubled down on that broader view, basically saying that if you want to improve diet quality and reduce chronic disease, policy needs to focus on overall eating patterns and the bigger structural drivers of diet, not just single‑nutrient rules.
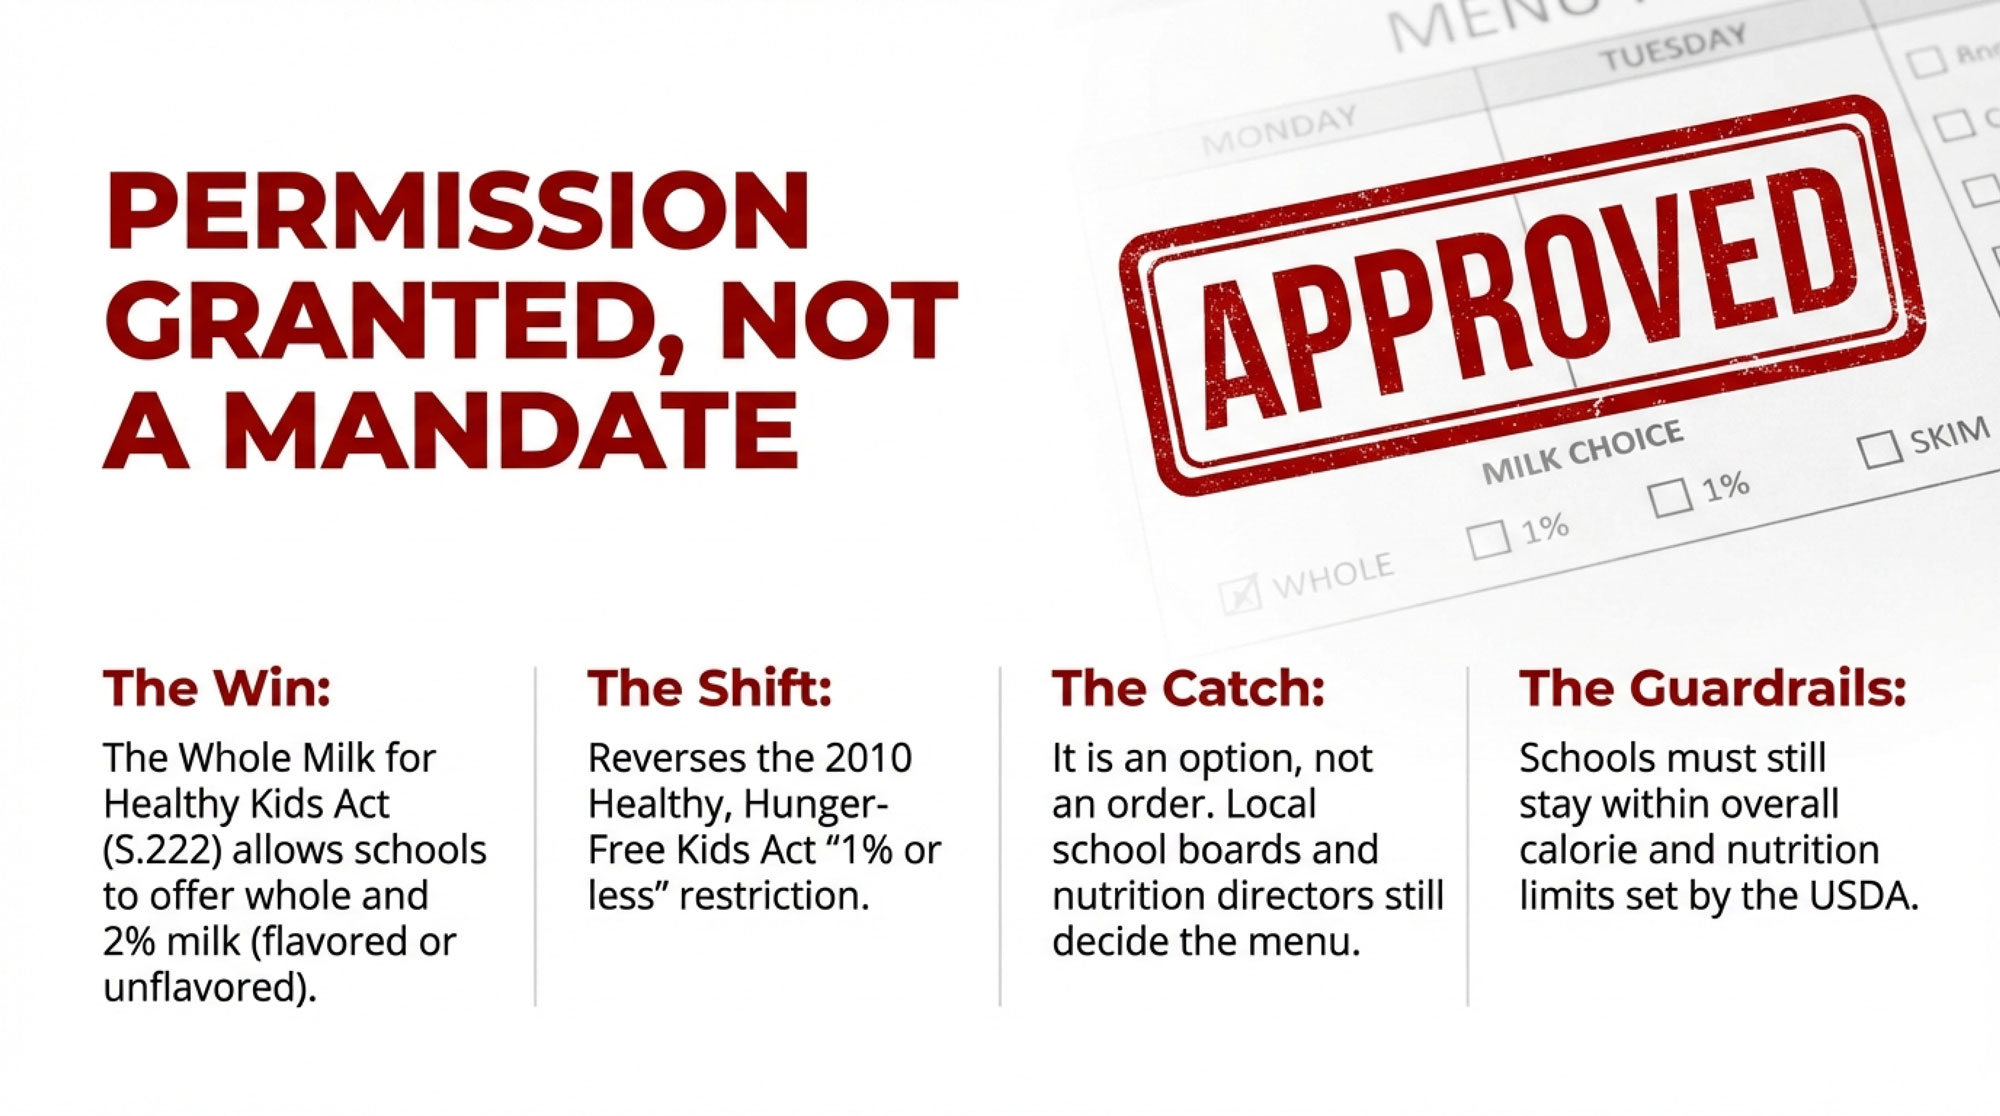
So, this new law is Washington catching up to that more nuanced way of thinking. It doesn’t order every school to serve whole milk. What it does is give schools permission again: they may offer flavored and unflavored whole, 2%, low‑fat, and fat‑free milk as part of reimbursable meals, as long as they stay inside the calorie and nutrition guardrails. Local boards, superintendents, and nutrition directors still decide what actually ends up in the cooler. And the practical “how” will ride on USDA school‑meal guidance and state and local decisions.
In other words, the federal “no” that pushed whole milk out of schools has turned into a “you can, if you choose.” That’s a meaningful shift—but it’s not the same thing as a guaranteed rush of whole milk through every school line in the country.
The Three Adoption Scenarios Everyone Will Talk About
Here’s what’s interesting once you put the emotion to the side and look at the math.

Economists at the American Farm Bureau Federation put together a Market Intel piece called “Back to Whole? How School Milk Could Shift Dairy Demand”. They started from a conservative baseline that treated current school milk as basically skim, then asked a simple question: what happens to butterfat demand if some share of schools switch those cartons to whole milk instead?
They used current National School Lunch and School Breakfast volumes and standard USDA nutrition numbers—about 8 grams of fat in an 8‑ounce serving of whole milk versus roughly 2.5 grams in 1% and almost none in skim. Then they modeled three “what if” adoption levels:
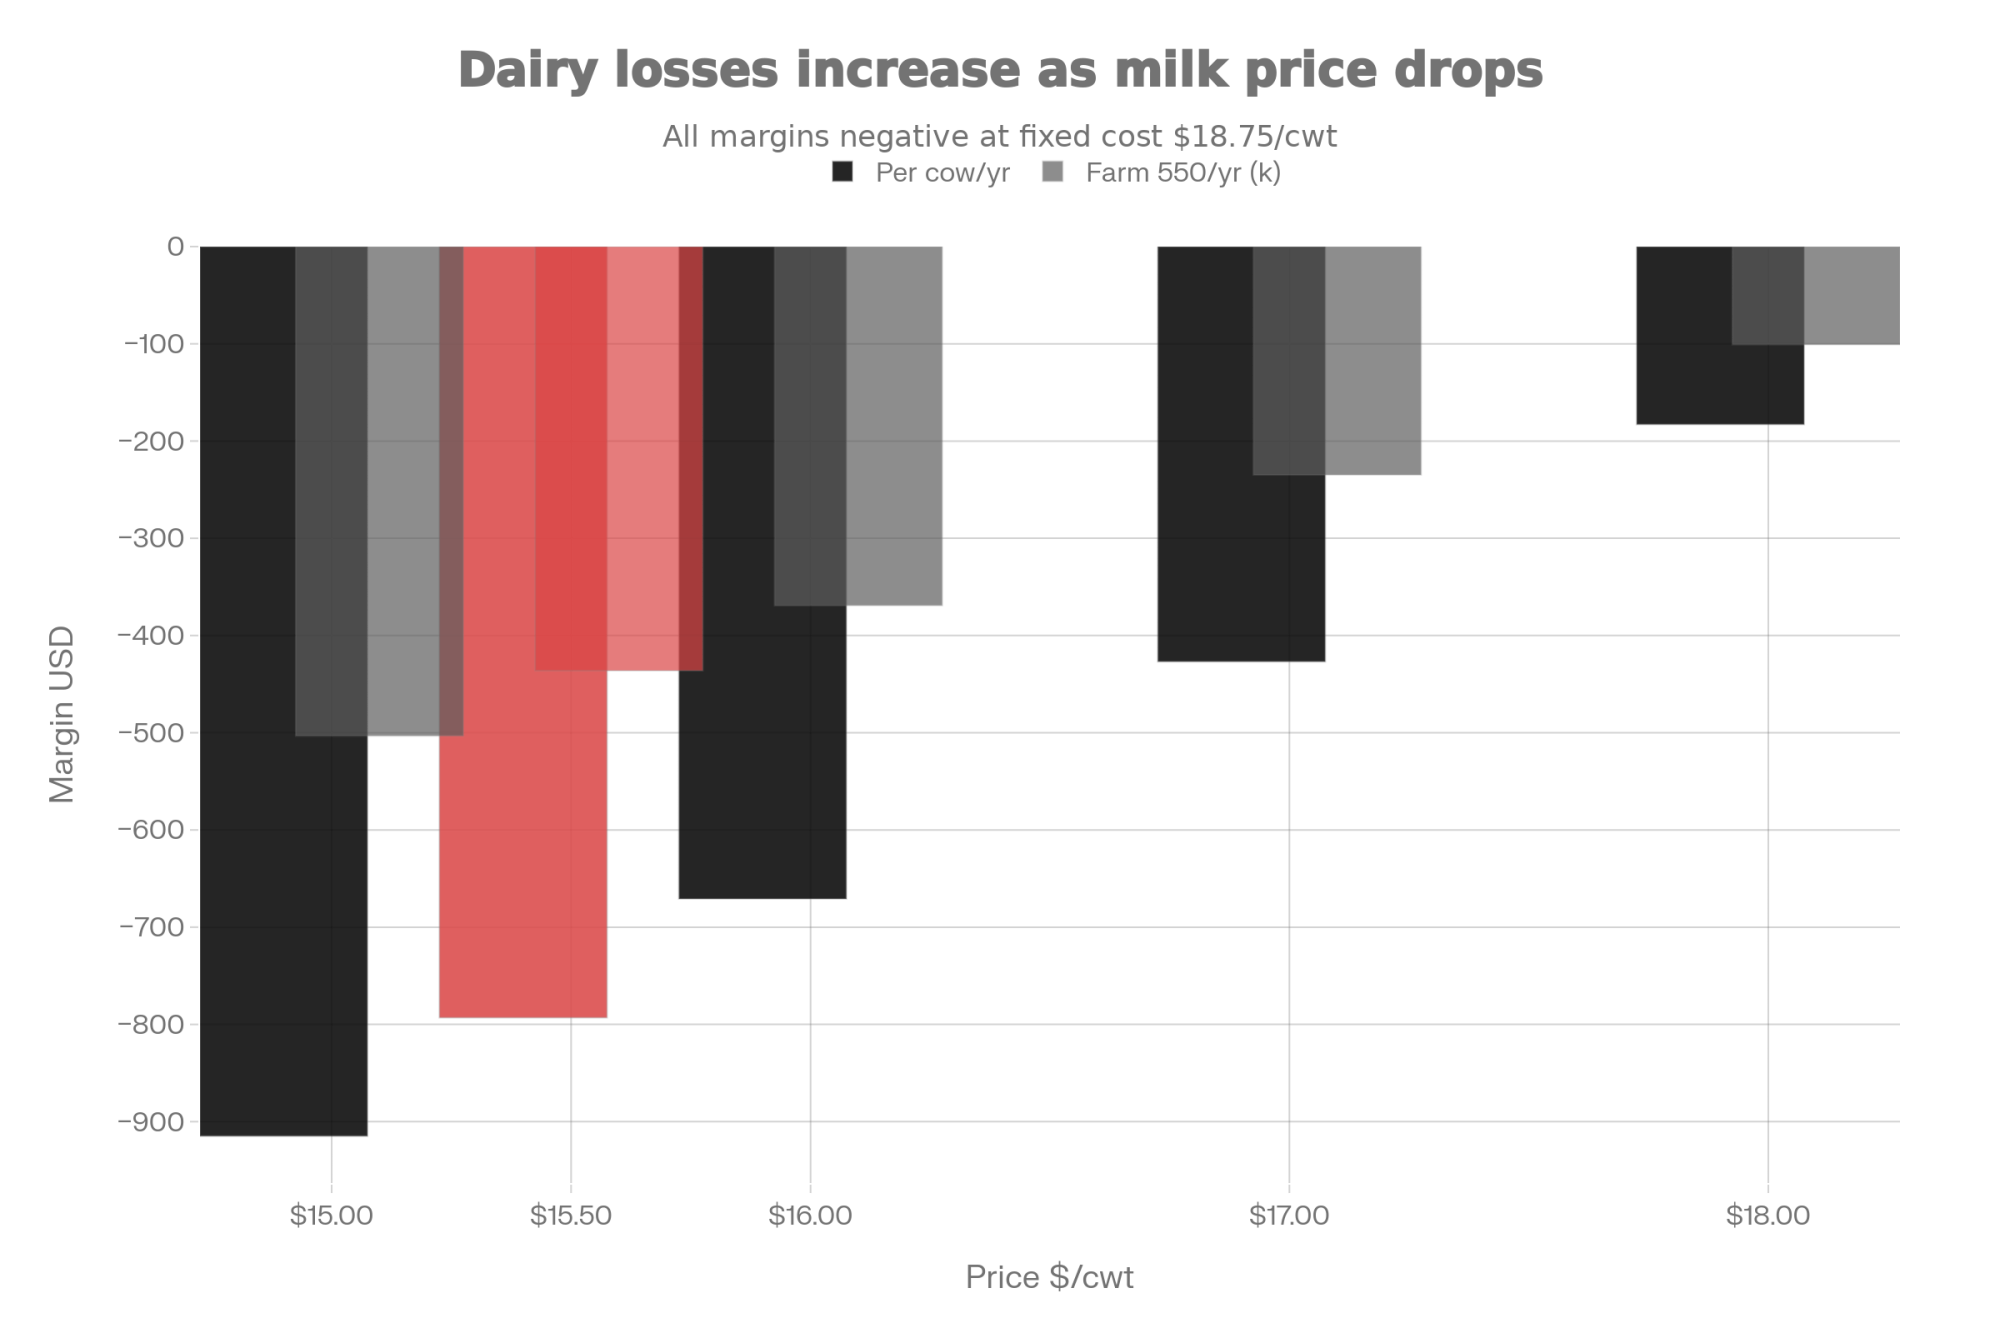
- If about a quarter of schools adopt whole milk, total milkfat use goes up by roughly 18 million pounds per year
- At half of schools, that increase is around 36 million pounds
- At about three‑quarters of schools, the rise is roughly 55 million pounds of additional milkfat annually
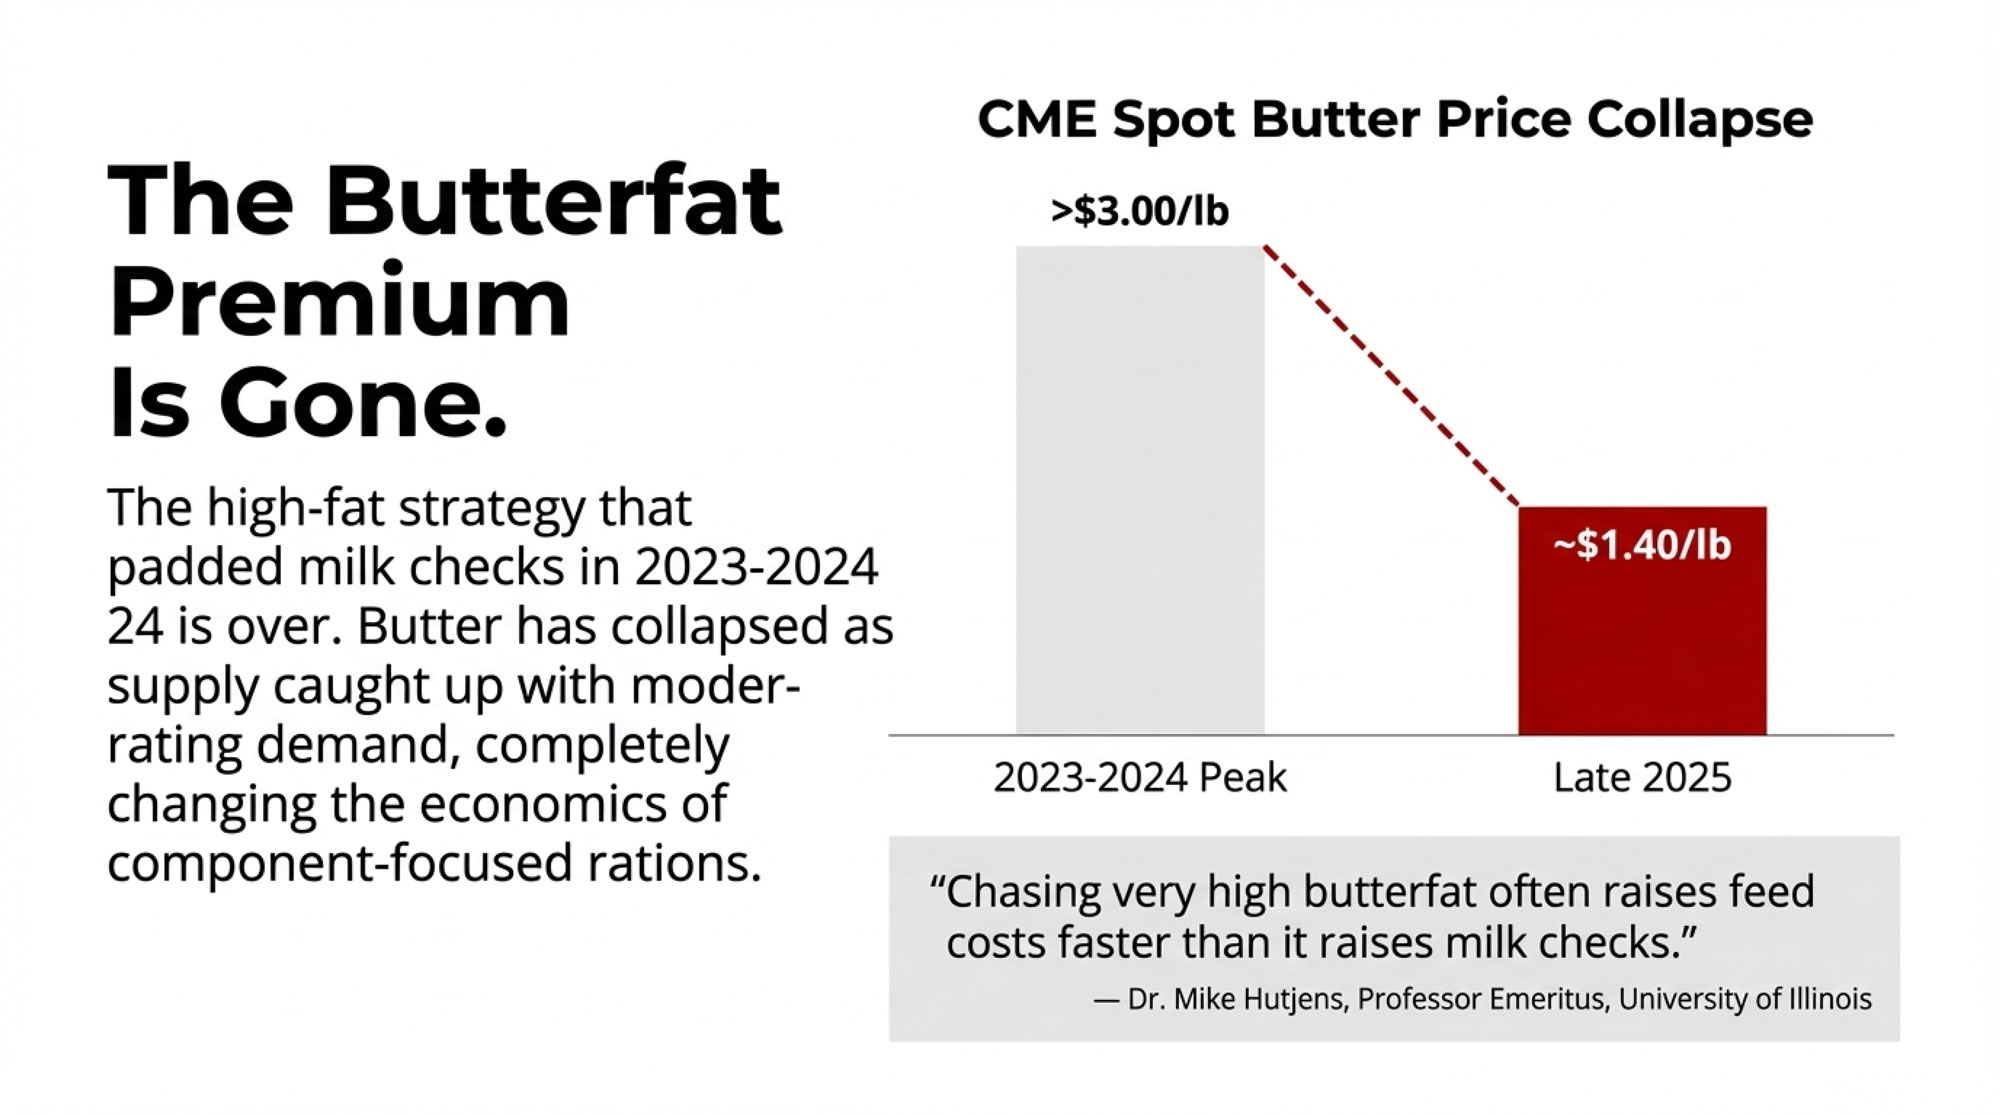
Those figures are scenario numbers, not promises. They rely on baseline assumptions like “what if we start from skim” that may not match every real‑world district. But Farm Bureau describes that range as a “small but meaningful outlet” for butterfat, and it’s not hard to see why: tens of millions of pounds of additional milkfat is big enough to matter when you layer it on top of already strong butter and cheese demand.
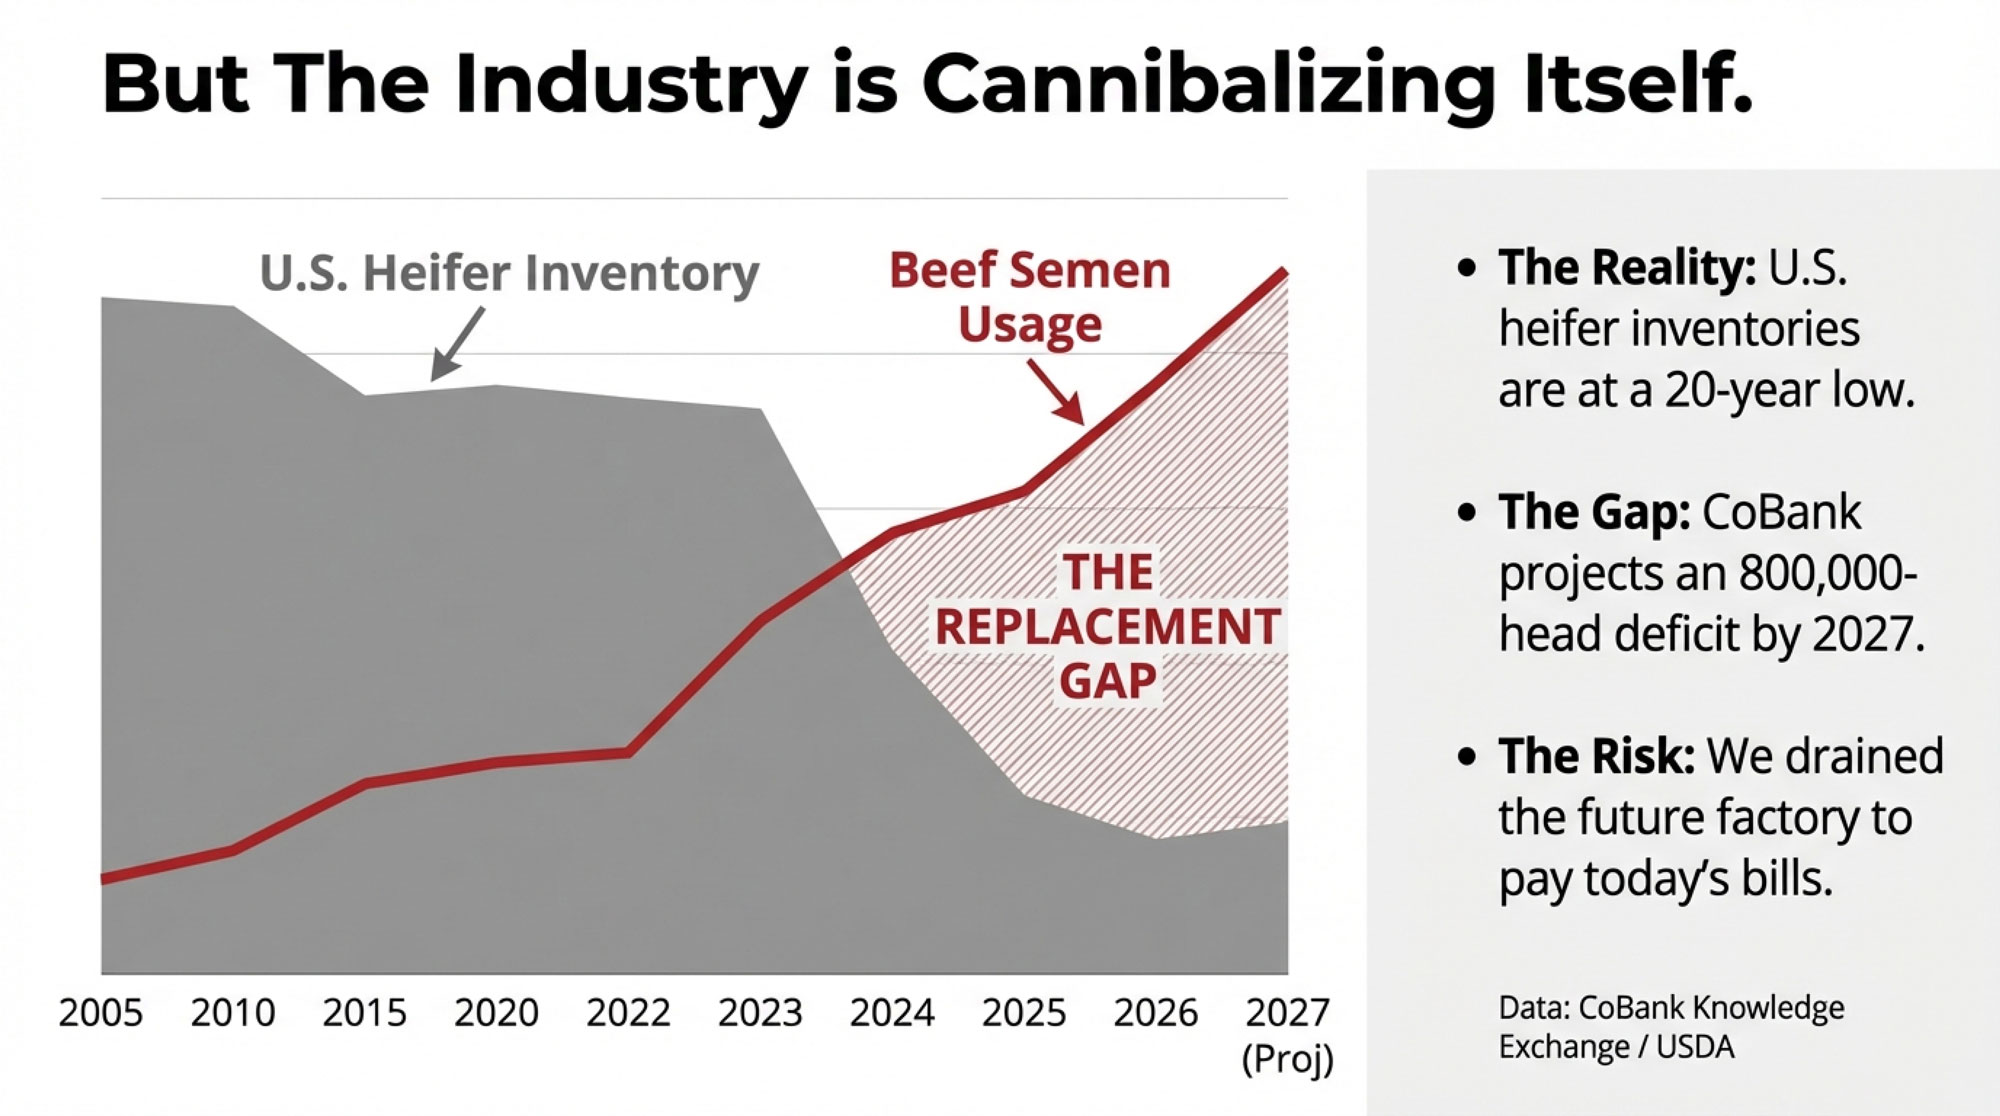
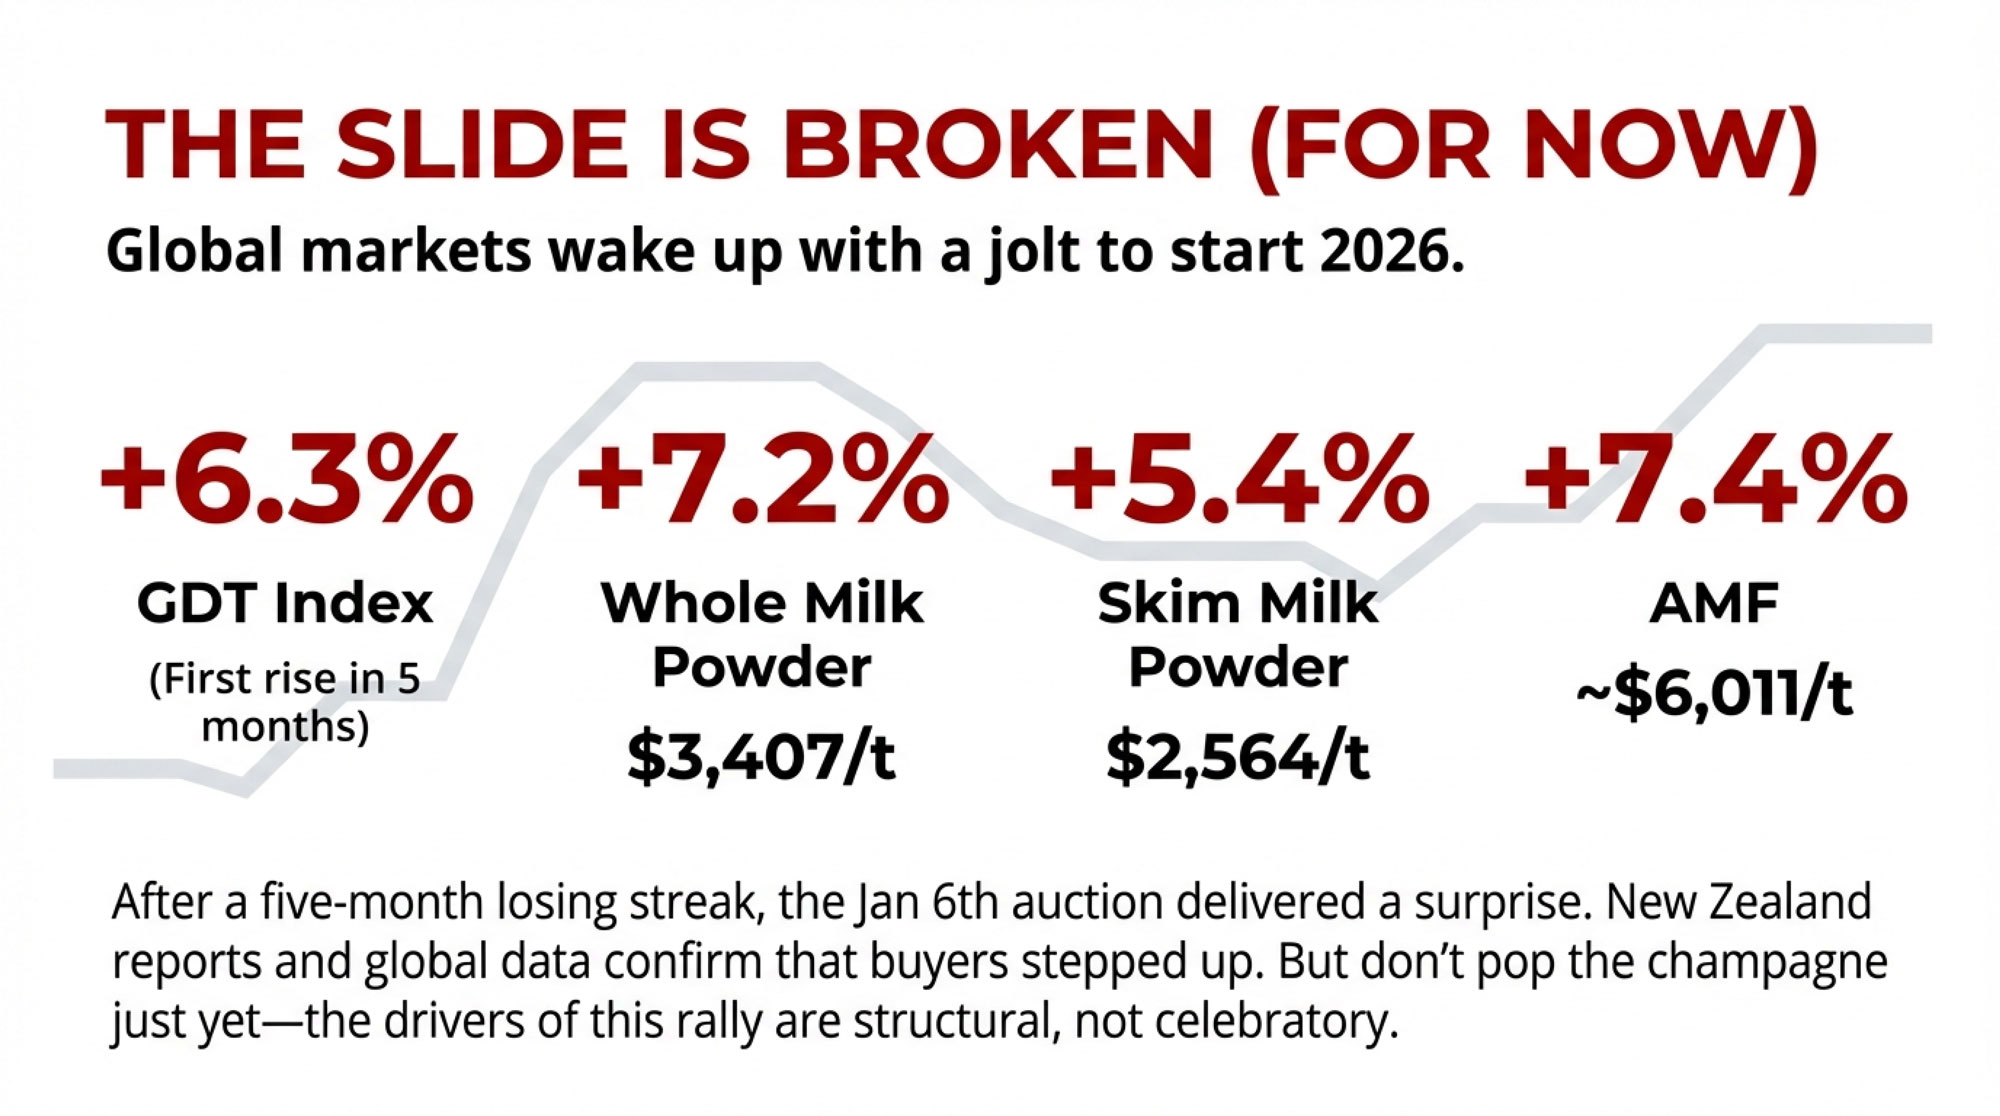
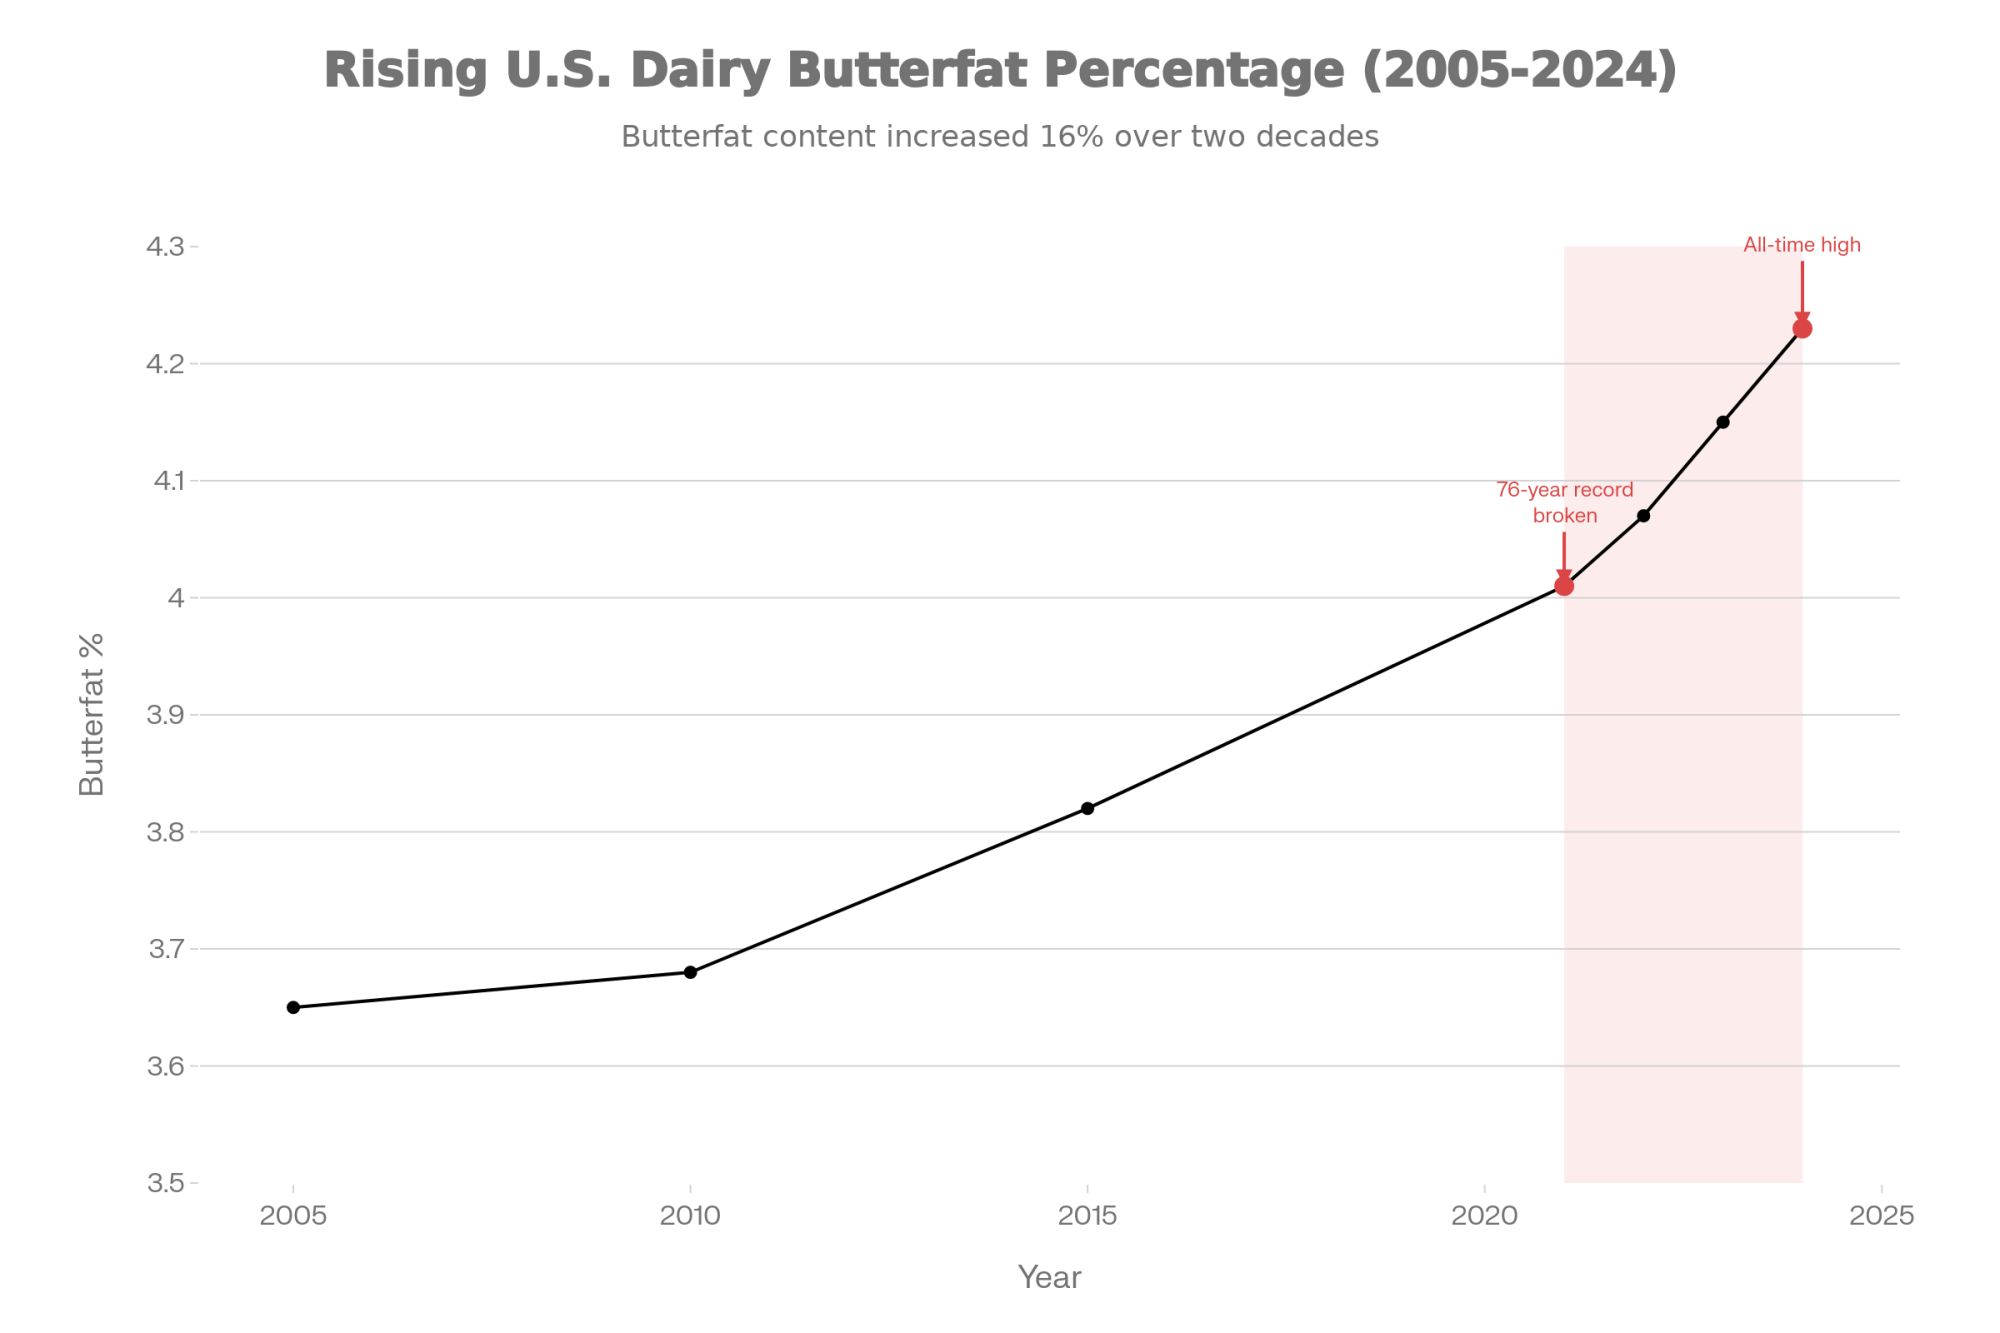
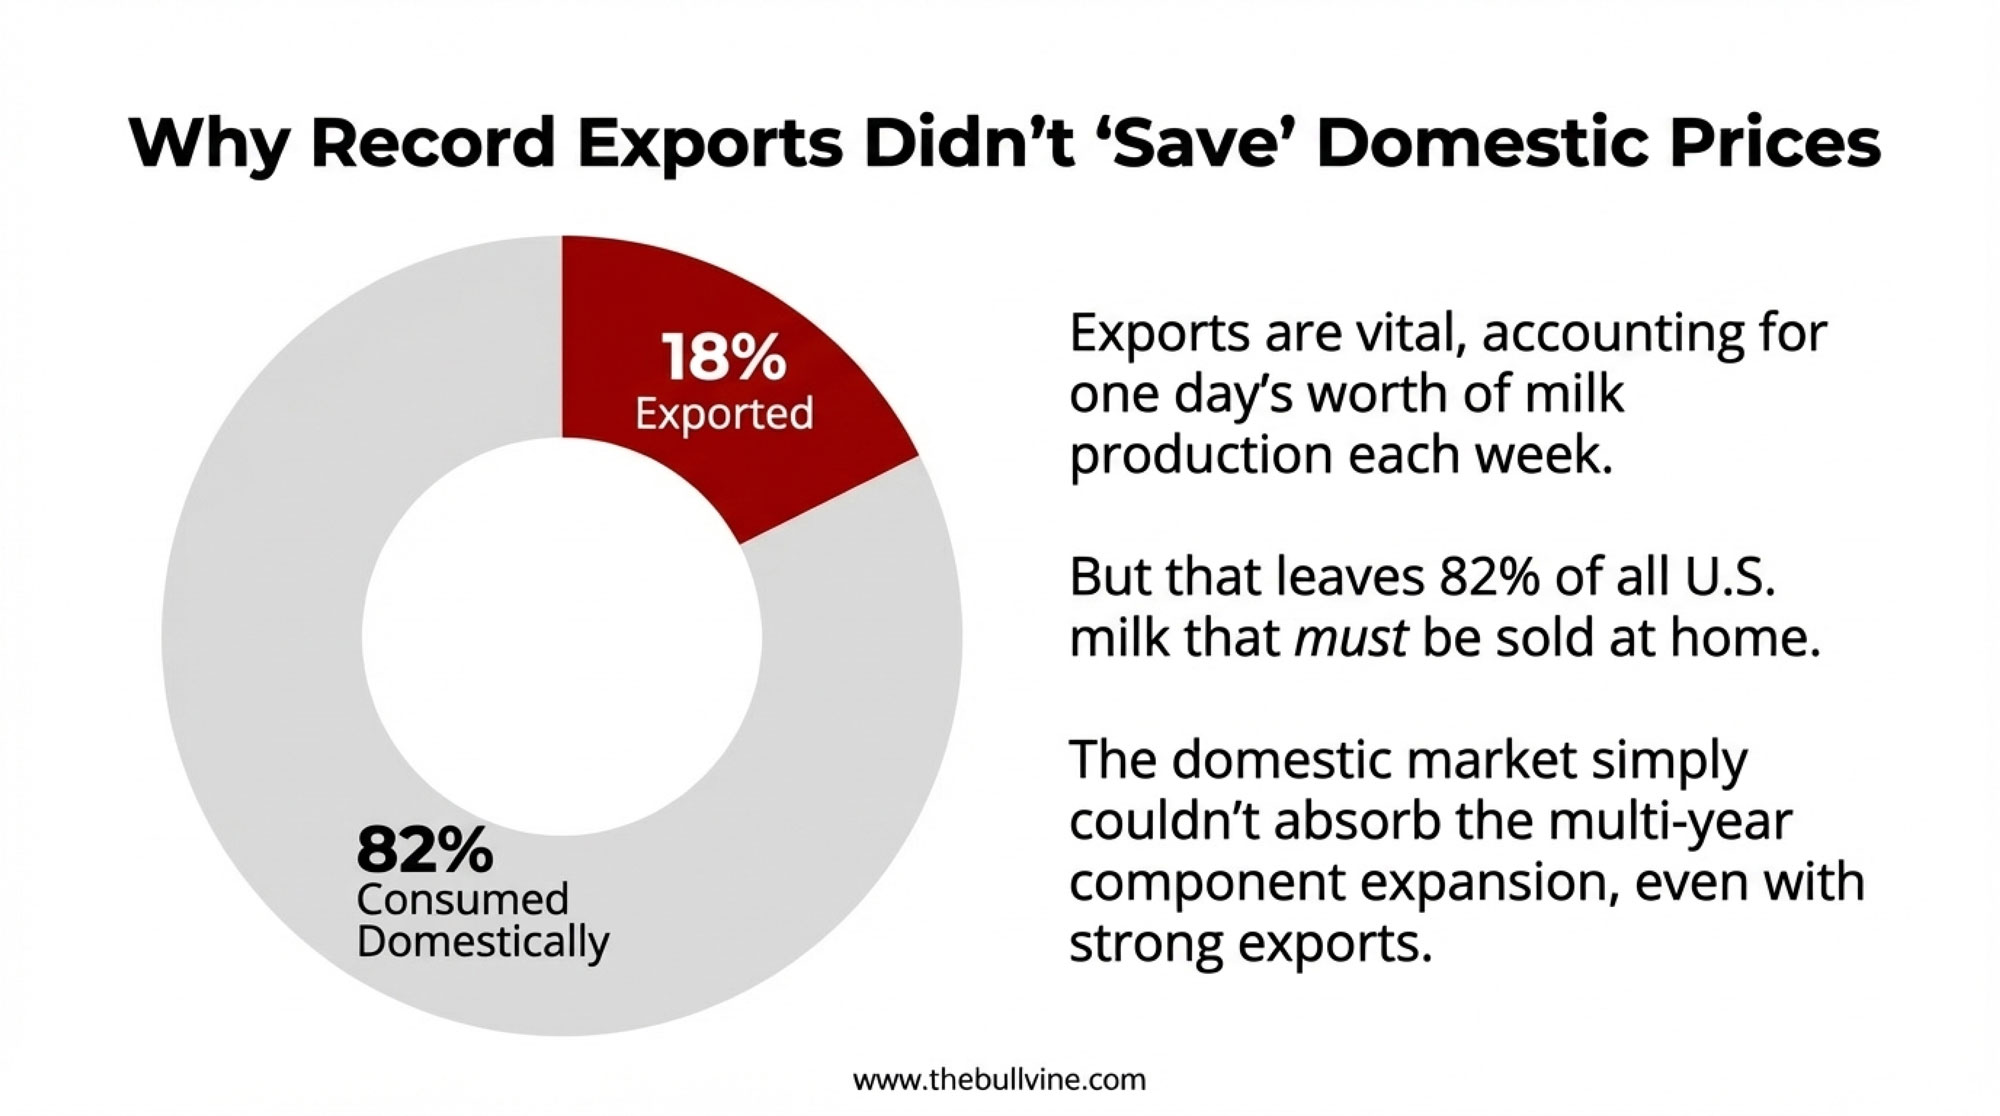
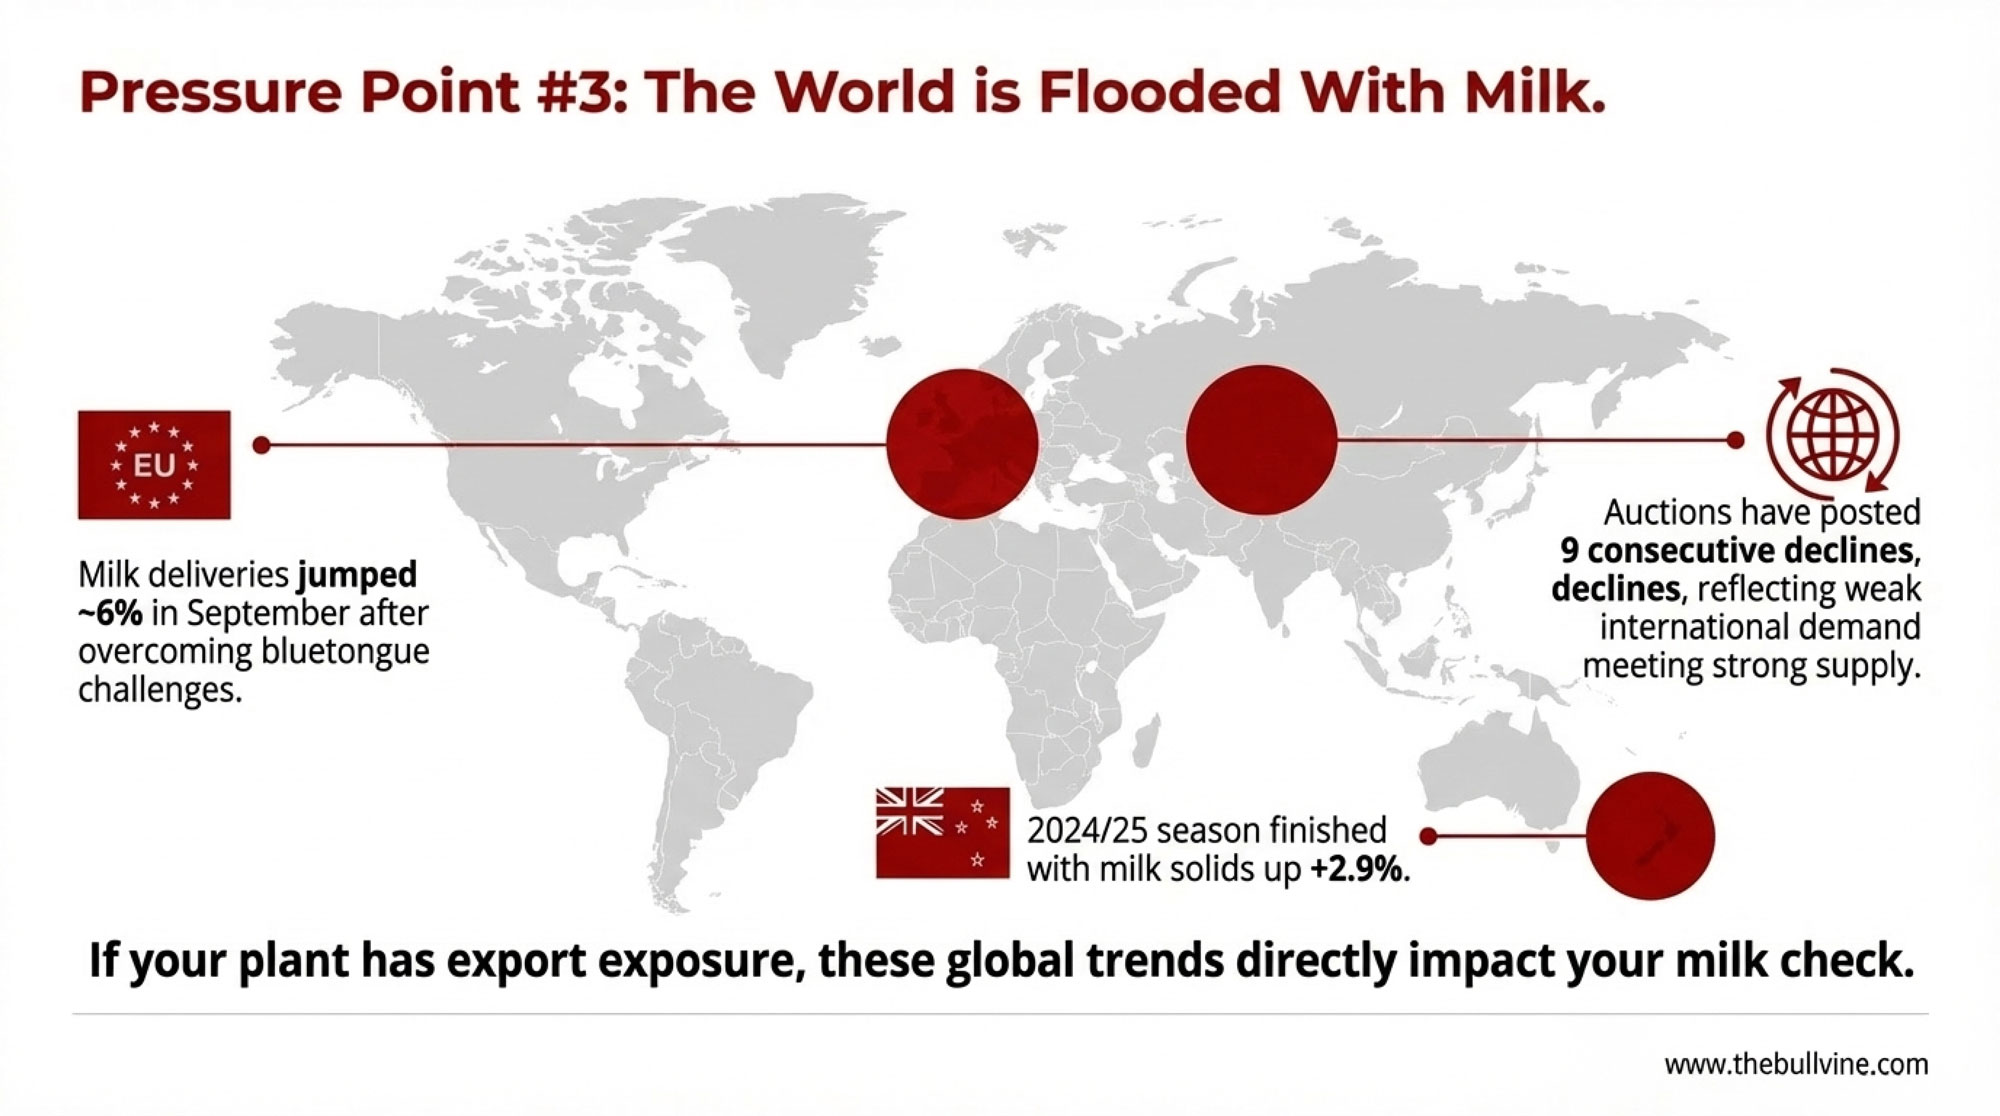
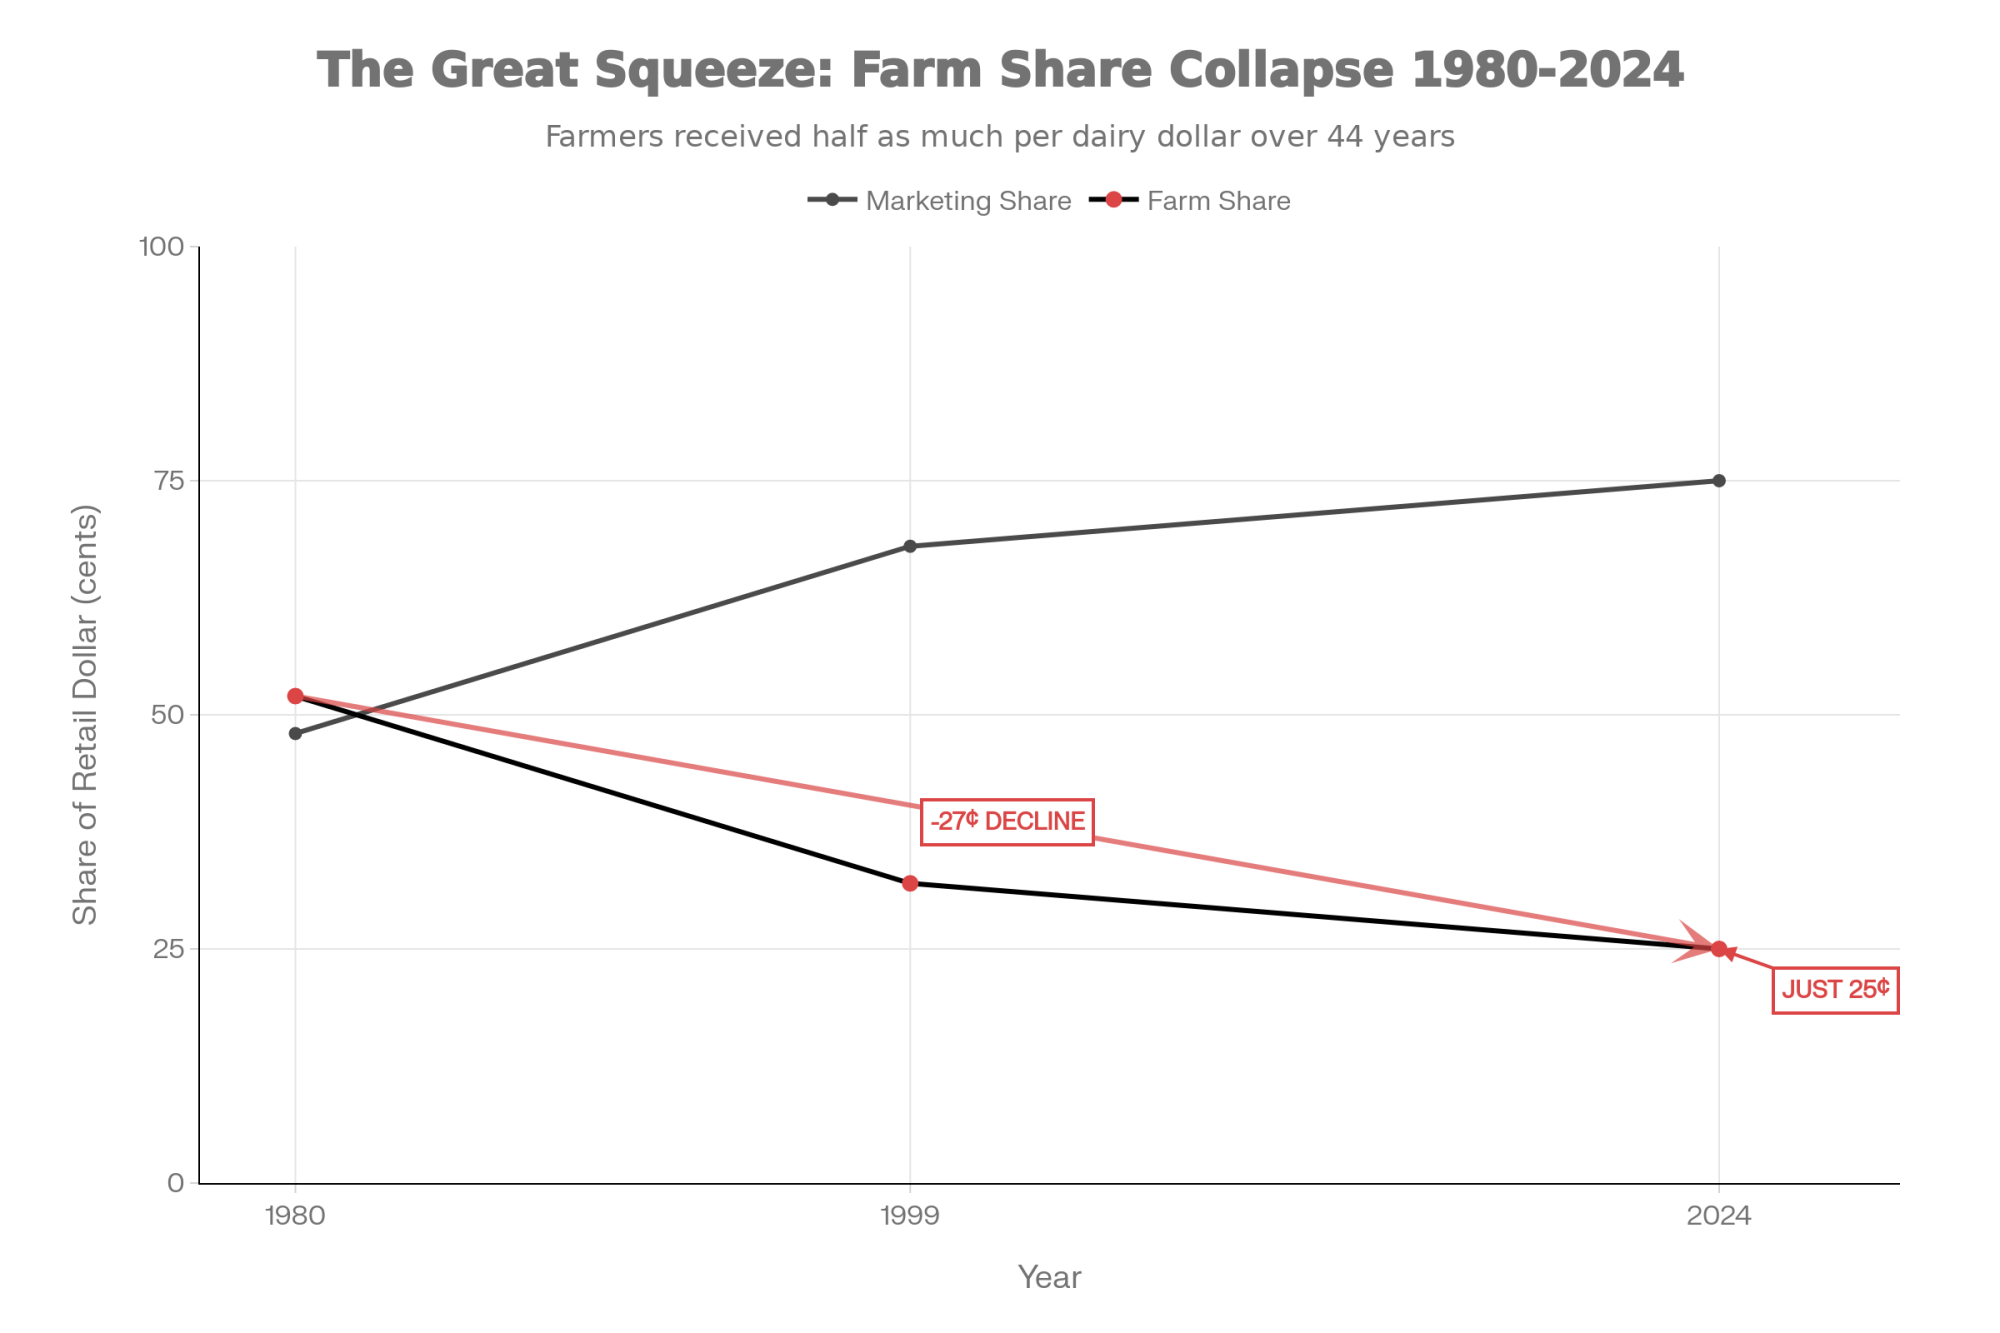
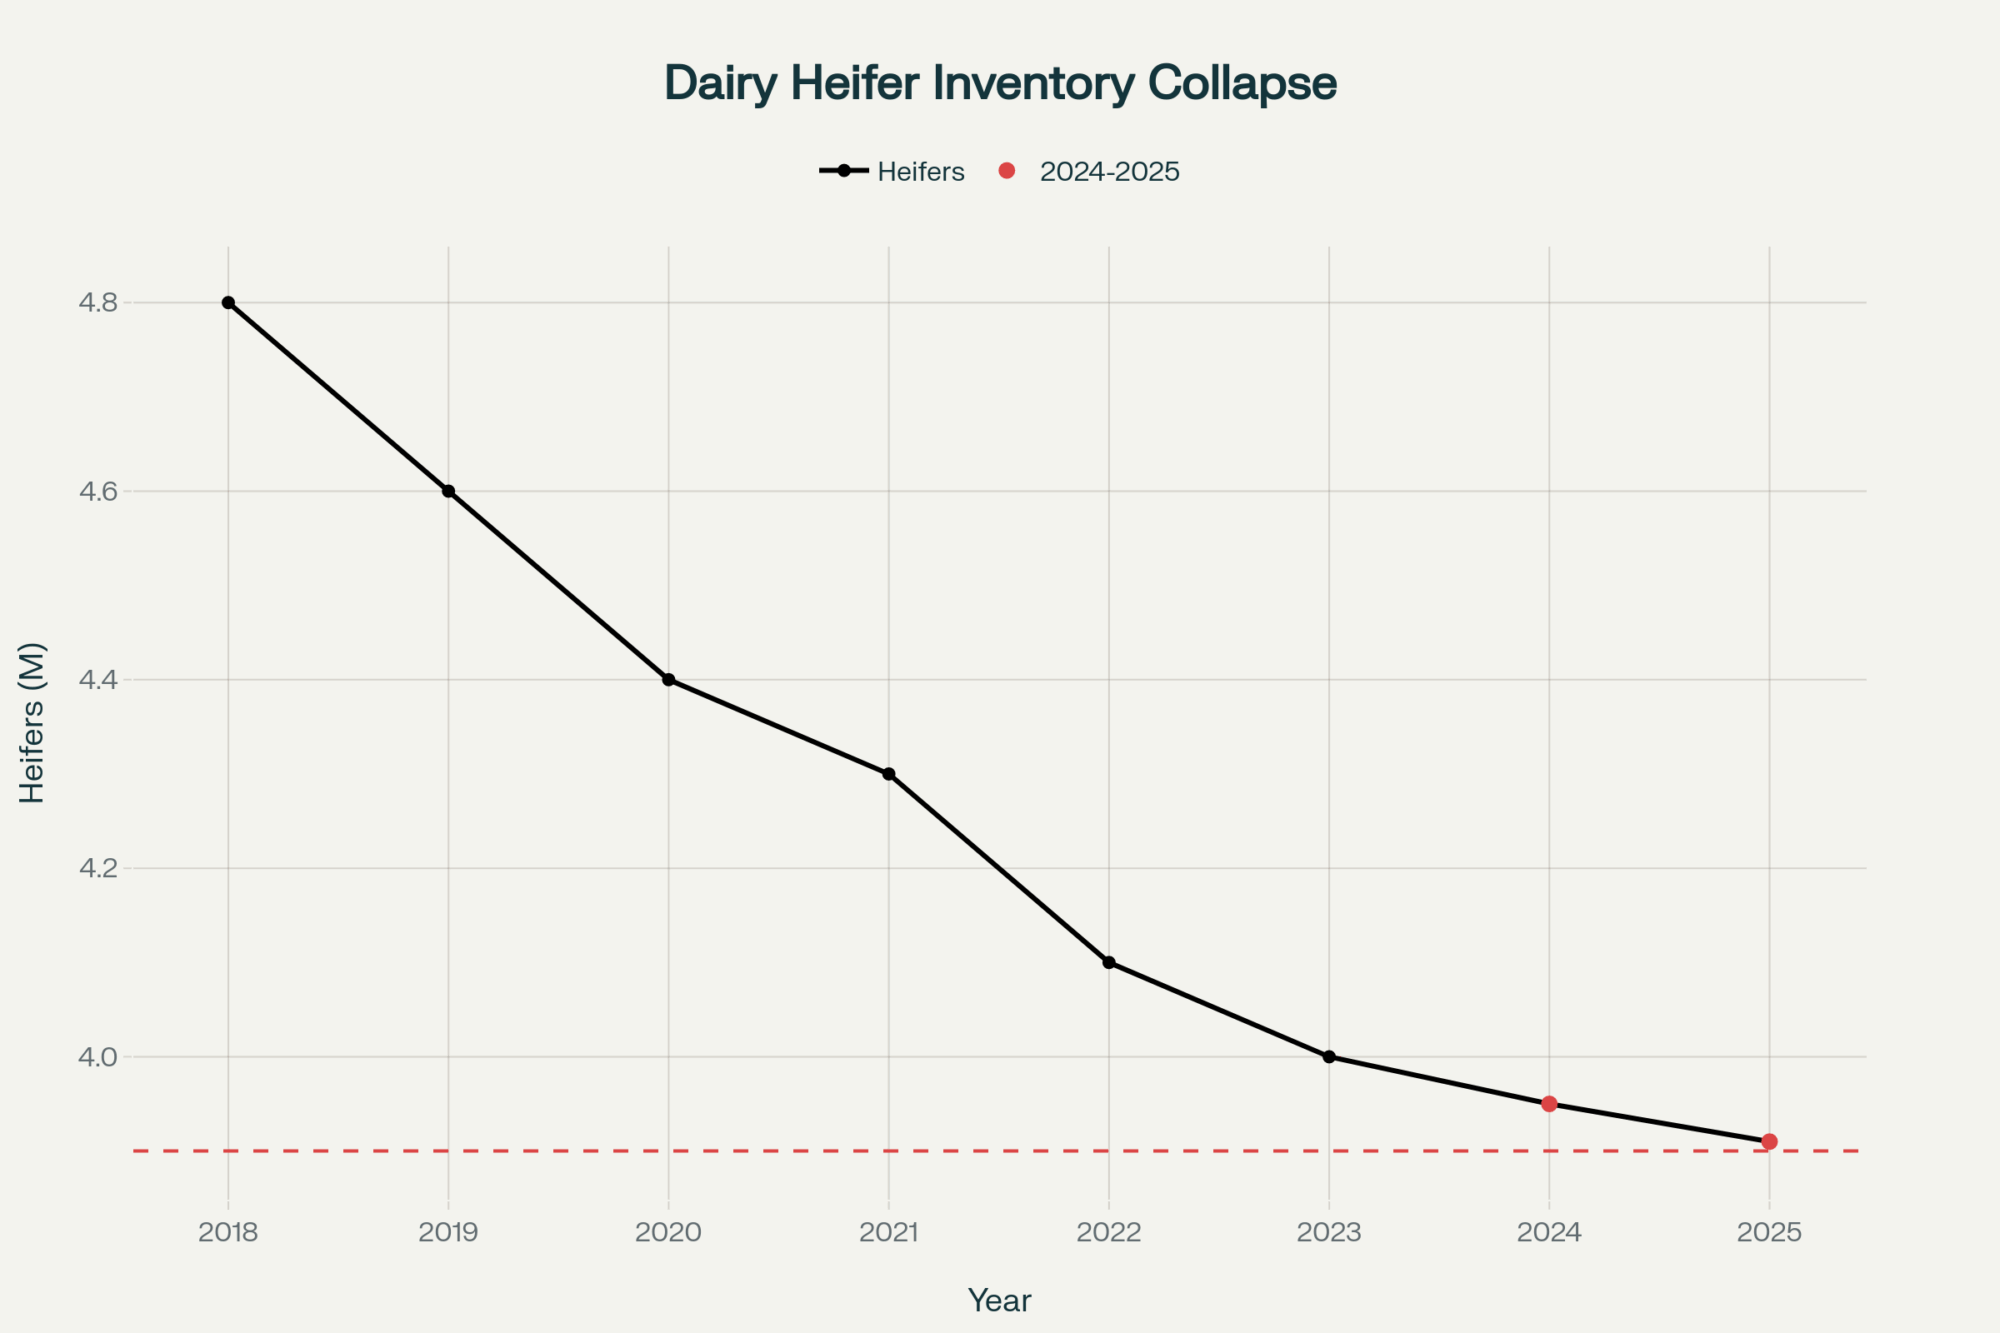
You can feel that in the markets too. The long‑term trend has been clear: per‑capita fluid milk drinking has been sliding for more than 70 years, and USDA’s own analysts have pointed out that the decline was actually steeper in the 2010s than in any of the previous six decades. At the same time, total dairy consumption has hit records on the back of cheese and other products. Industry reporting in 2021, for example, highlighted that fluid milk sales were down to about 44.5 billion pounds, the lowest in 66 years, while cheese and other dairy kept growing.
So those extra 18–55 million pounds of milkfat don’t suddenly turn fluid into the main story again. But they’re not nothing either. The key is that they don’t land on everyone’s milk check equally—and that’s where Class I utilization and Federal Orders come back into the picture.
| Adoption Level | Additional Milkfat (Annual) | High-Fluid Order Impact* | Manufacturing-Heavy Order Impact | Realistic Class I Lift? |
|---|---|---|---|---|
| 25% of schools | ~18 million lbs | +2–4¢/cwt | +0–1¢/cwt | Modest tailwind |
| 50% of schools | ~36 million lbs | +4–7¢/cwt | +1–2¢/cwt | Small but meaningful |
| 75% of schools | ~55 million lbs | +6–11¢/cwt | +2–3¢/cwt | Incremental benefit |
How This Law Affects Your Class I Milk Price
What a lot of farmers are finding as they dig into this is that the exact same policy lands very differently depending on which Federal Order you’re in.
You know the basic structure: Class I is fluid, Class II is soft products like cream and yogurt, Class III is cheese, and Class IV is butter and powder. Your blend price is basically the weighted average of those markets, run through the order’s formulas.
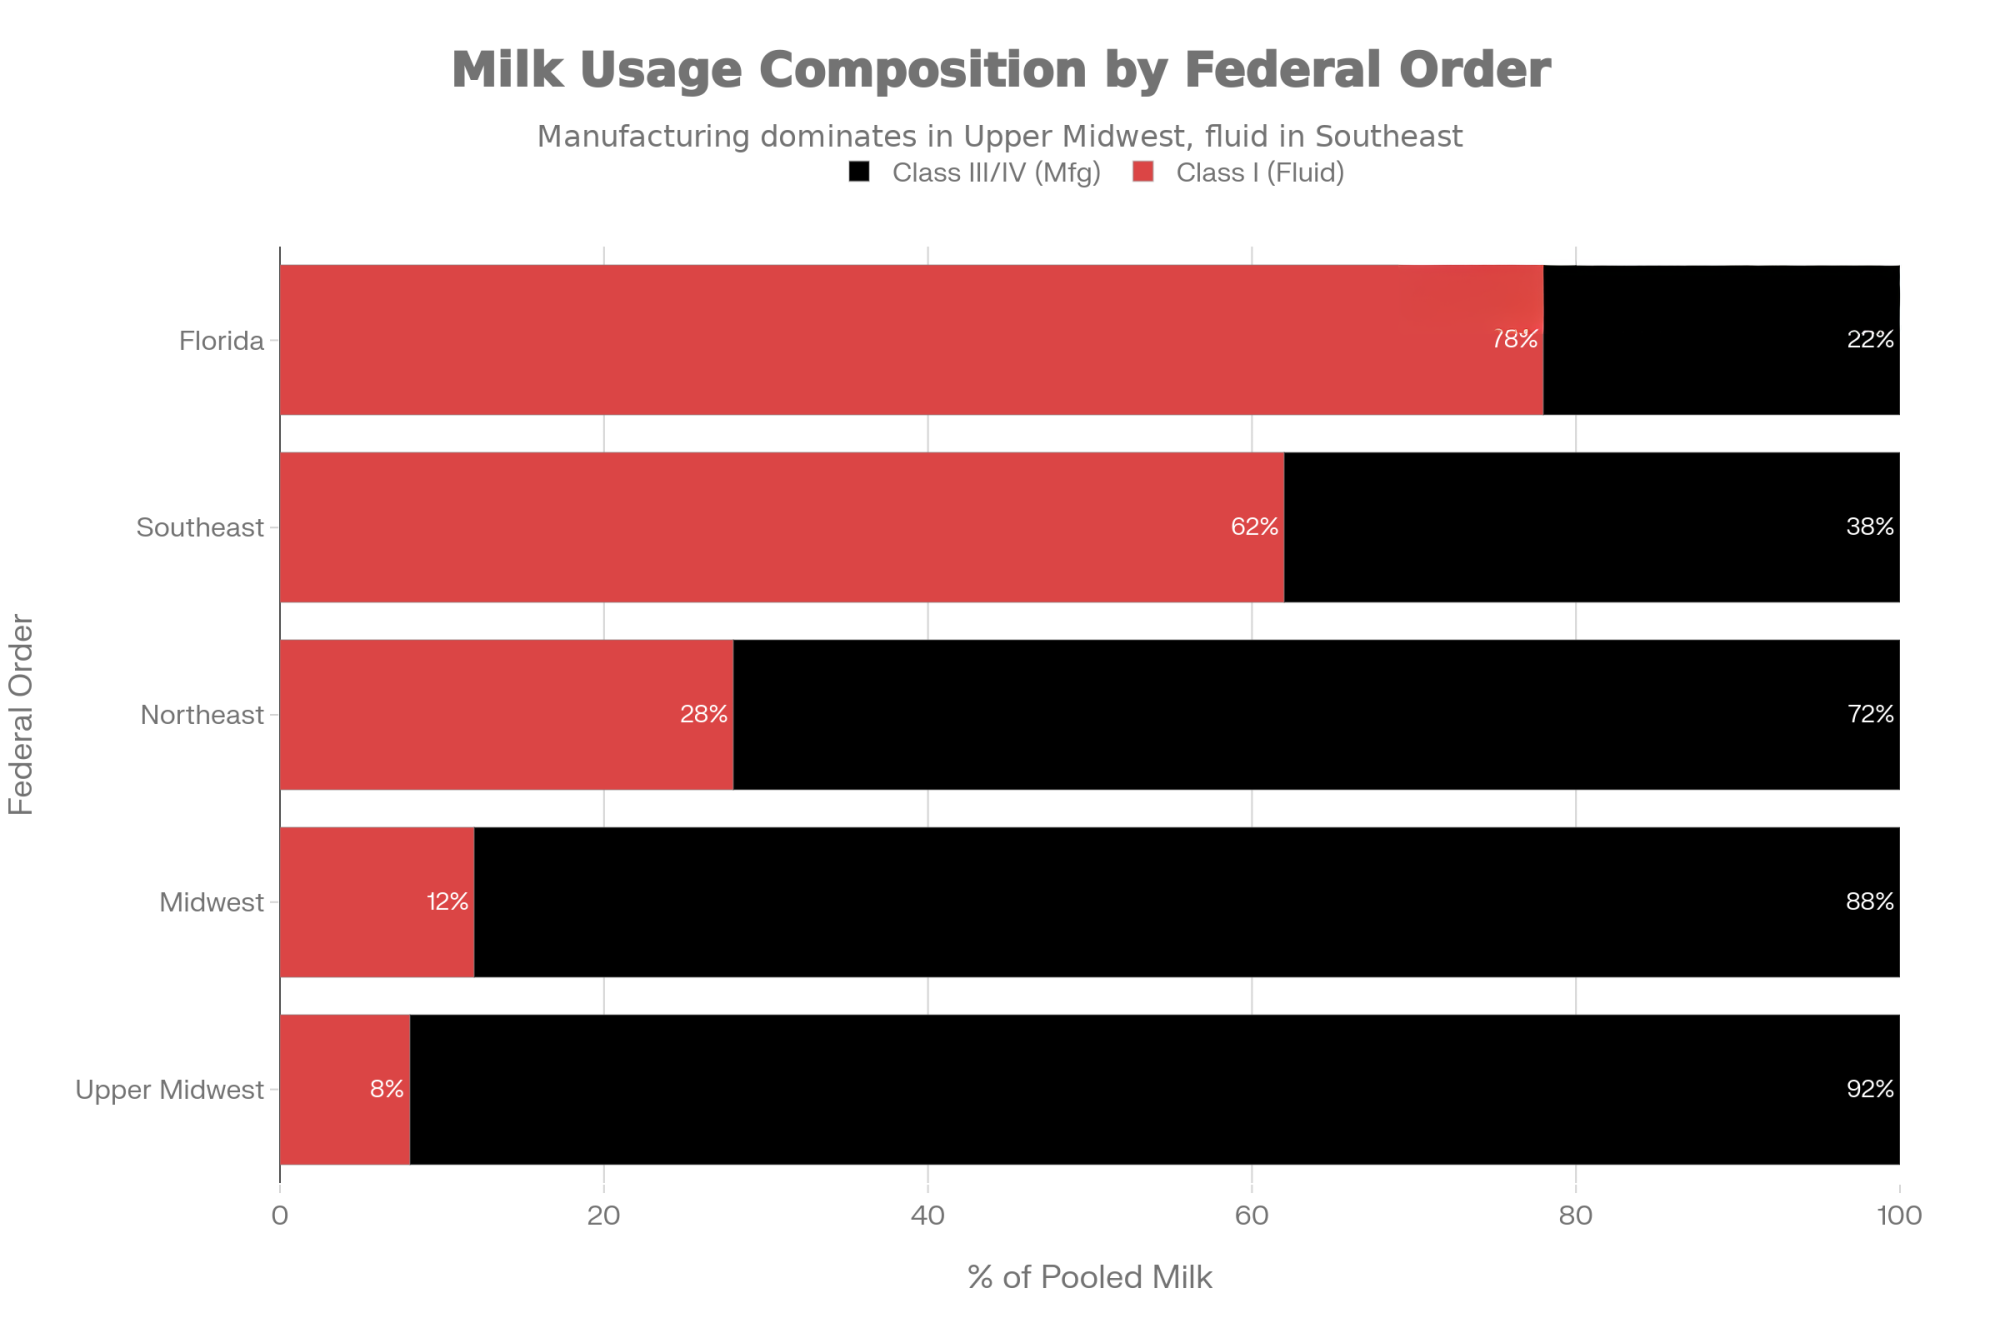
In that AFBF Market Intel piece, they used Federal Order data from the first seven months of the year they studied and pointed out that, nationally, Class I accounted for about 23 billion pounds out of roughly 92 billion pounds of pooled milk. That’s around 25 percent on average.
But once you zoom in, the story changes a lot:
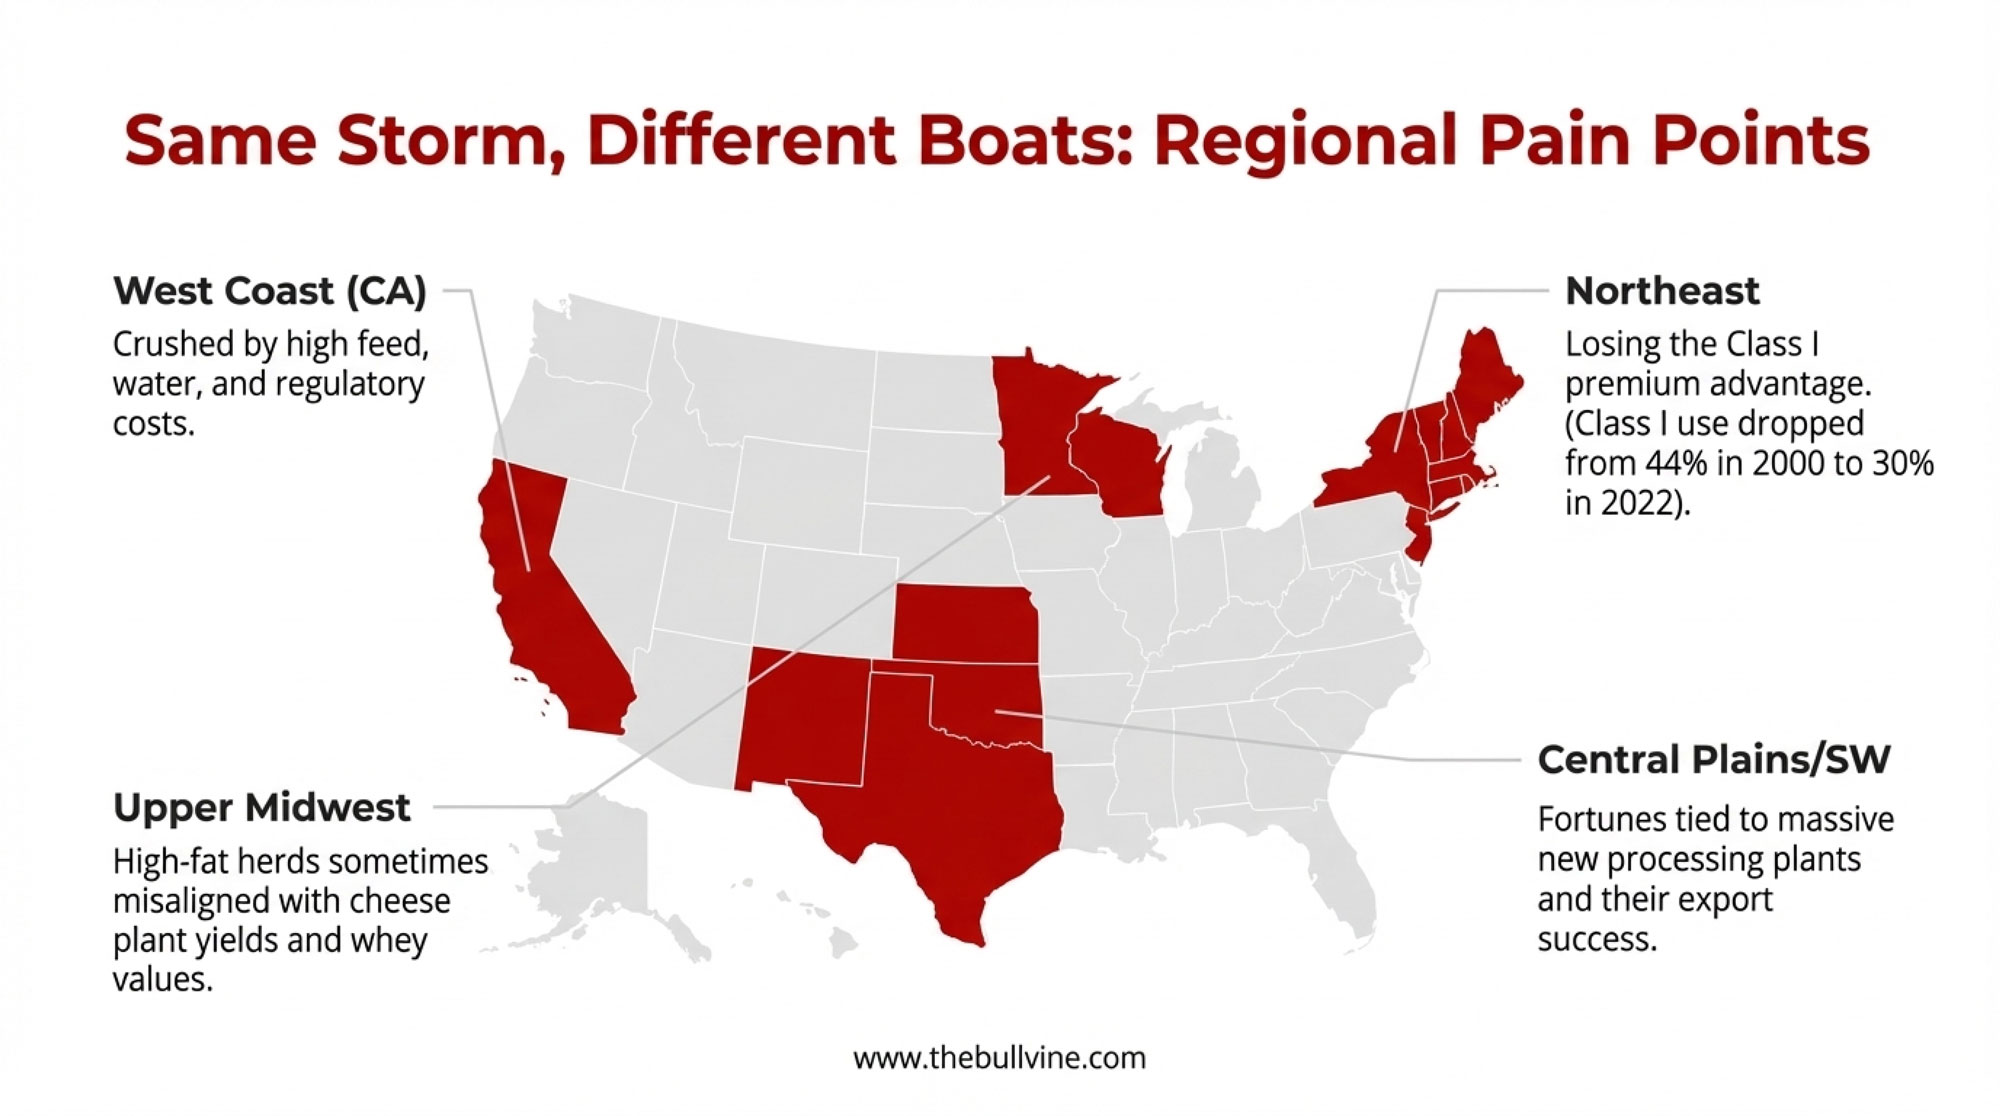
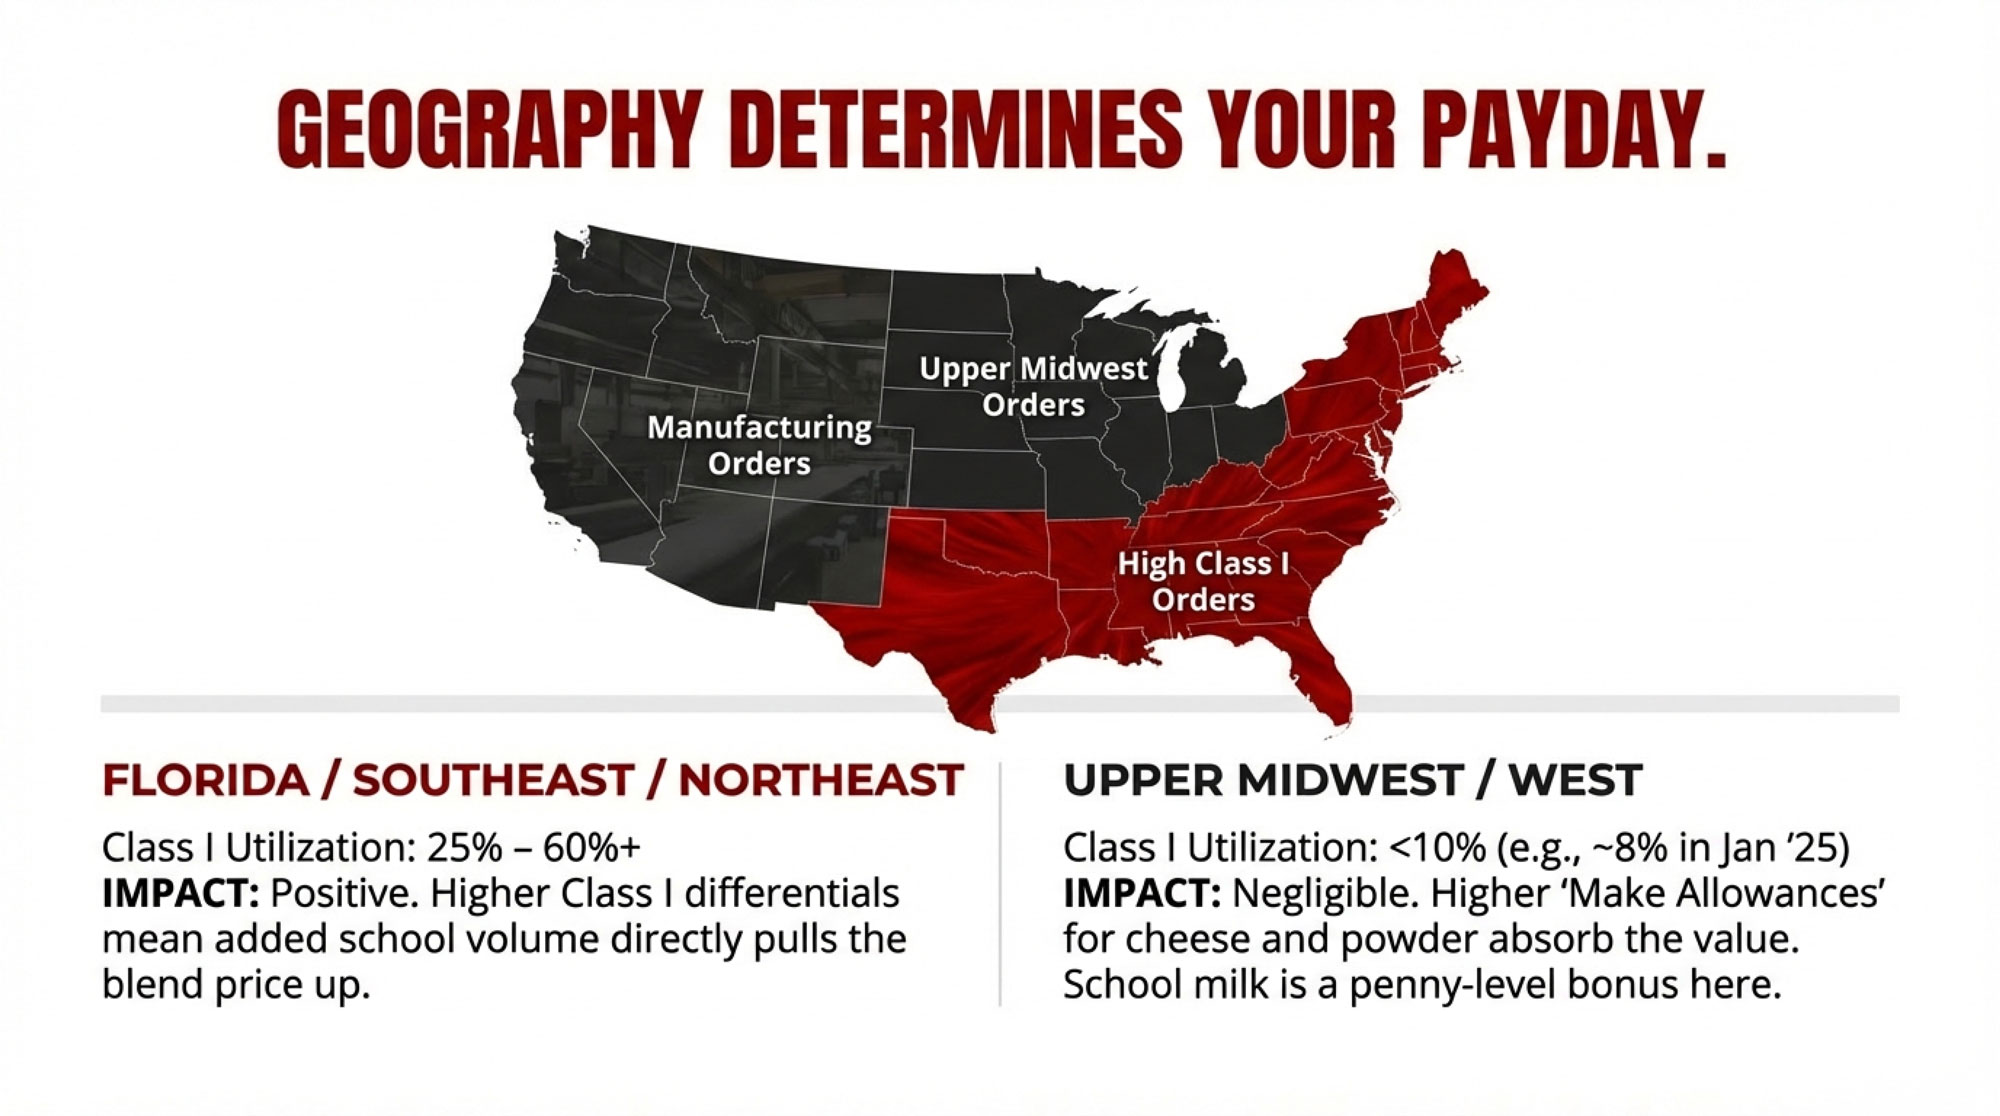
- In high‑fluid markets like Florida and the Southeast, order bulletins regularly show Class I utilization way higher than that—often around 60 percent or more in the Southeast, and in the upper ranges for Florida in some months.
- In the Northeast and surrounding regions, you’ll typically see Class I shares living somewhere between one‑quarter and one‑third of the pool, depending on season and local dynamics.
- In manufacturing‑heavy orders like the Upper Midwest, Class I has dropped into single digits at times. One FMMO report pegged Upper Midwest Class I utilization at just under 8 percent in a January 2025 snapshot.
So an extra pound of Class I demand has a lot more leverage on your blend if you’re in a high‑fluid order than if your pool is mostly cheese and powder.
Then layer the recent Federal Order changes on top. USDA’s 2024 FMMO decision brought back the “higher‑of” Class I mover—instead of an average of Class III and IV advanced prices, Class I is once again set off whichever is higher. The rule also raised Class I differentials, especially in coastal and densely populated areas where fluid milk plays a big role, and it increased make allowances for cheese, butter, nonfat dry milk, and whey to better reflect current processing costs.
Analysts ran the numbers on those changes. Their estimates varied in the fine print but landed in the same ballpark: higher make allowances pulled something on the order of hundreds of millions of dollars out of the pooled value of milk, while the stronger Class I differentials added back a significant, but smaller, slice. The upshot they pointed to is pretty simple: high‑Class‑I orders, especially in the Northeast, come out ahead relative to where they’d be without the differential increase, while manufacturing‑heavy orders feel more of the hit from bigger make allowances.
Tie that back to the school milk story and you get this: if you’re in a region where Class I already makes up a third or more of your pool, and your differentials just improved, then additional Class I demand from schools has a decent shot at nudging your blend in the right direction—if your order actually captures that volume. If your order’s Class I share is usually below 15 percent, any signal from whole milk in schools is going to be competing with Class III and IV markets and the realities of make‑allowance changes.
In other words, if your monthly order report shows Class I living in the single digits, it’s smart to treat this law as a nice bump for dairy’s public image and maybe a small Class I opportunity at the edges, not a core part of your survival strategy.
What This Looks Like on Real Farms
Let’s pull this out of the spreadsheets and onto the farm a bit.
Think about a mid‑size Pennsylvania herd shipping roughly five million pounds of milk a year into a high‑Class‑I order. That order already has a fair chunk of its milk going into fluid and benefitted from higher Class I differentials under the recent FMMO changes. Now imagine a decent share of local school districts decide to put whole milk back in their coolers over the next couple of bid cycles, and your co‑op or processor wins some of that business because they’ve got the packaging and route structure to handle it.
Under the AFBF modeling we talked about, some portion of those 18–36 million pounds of extra milkfat is going to show up in Class I instead of butter or powder. In that kind of environment, you’d expect the effect on your blend to be modest—likely measured in pennies per hundredweight, not dollars. But on several million pounds of milk, even a few pennies per cwt can add up to a couple thousand dollars over a year. That’s not tractor money, but it’s not nothing either. It’s the kind of quiet positive you see when you compare one year’s milk checks to the last and realize the background has shifted a bit.
Shift the picture to Wisconsin. A similar‑sized herd there is shipping into the Upper Midwest order, where most of the pool is effectively priced as Class III or IV, and make‑allowance increases have been a bigger factor than Class I differentials. Class I might be 10 percent of the pool or less in many months.
There, even if local districts bring back whole milk and your buyer serves those accounts, the extra fluid volume has far less leverage on the overall pool. In the kind of “what if” scenarios people have run for heavily manufacturing‑focused orders, that 18–36 million pound national bump in school milkfat tends to wash out to pennies per hundredweight—or sometimes less—when you blend it into pools dominated by cheese and powder.
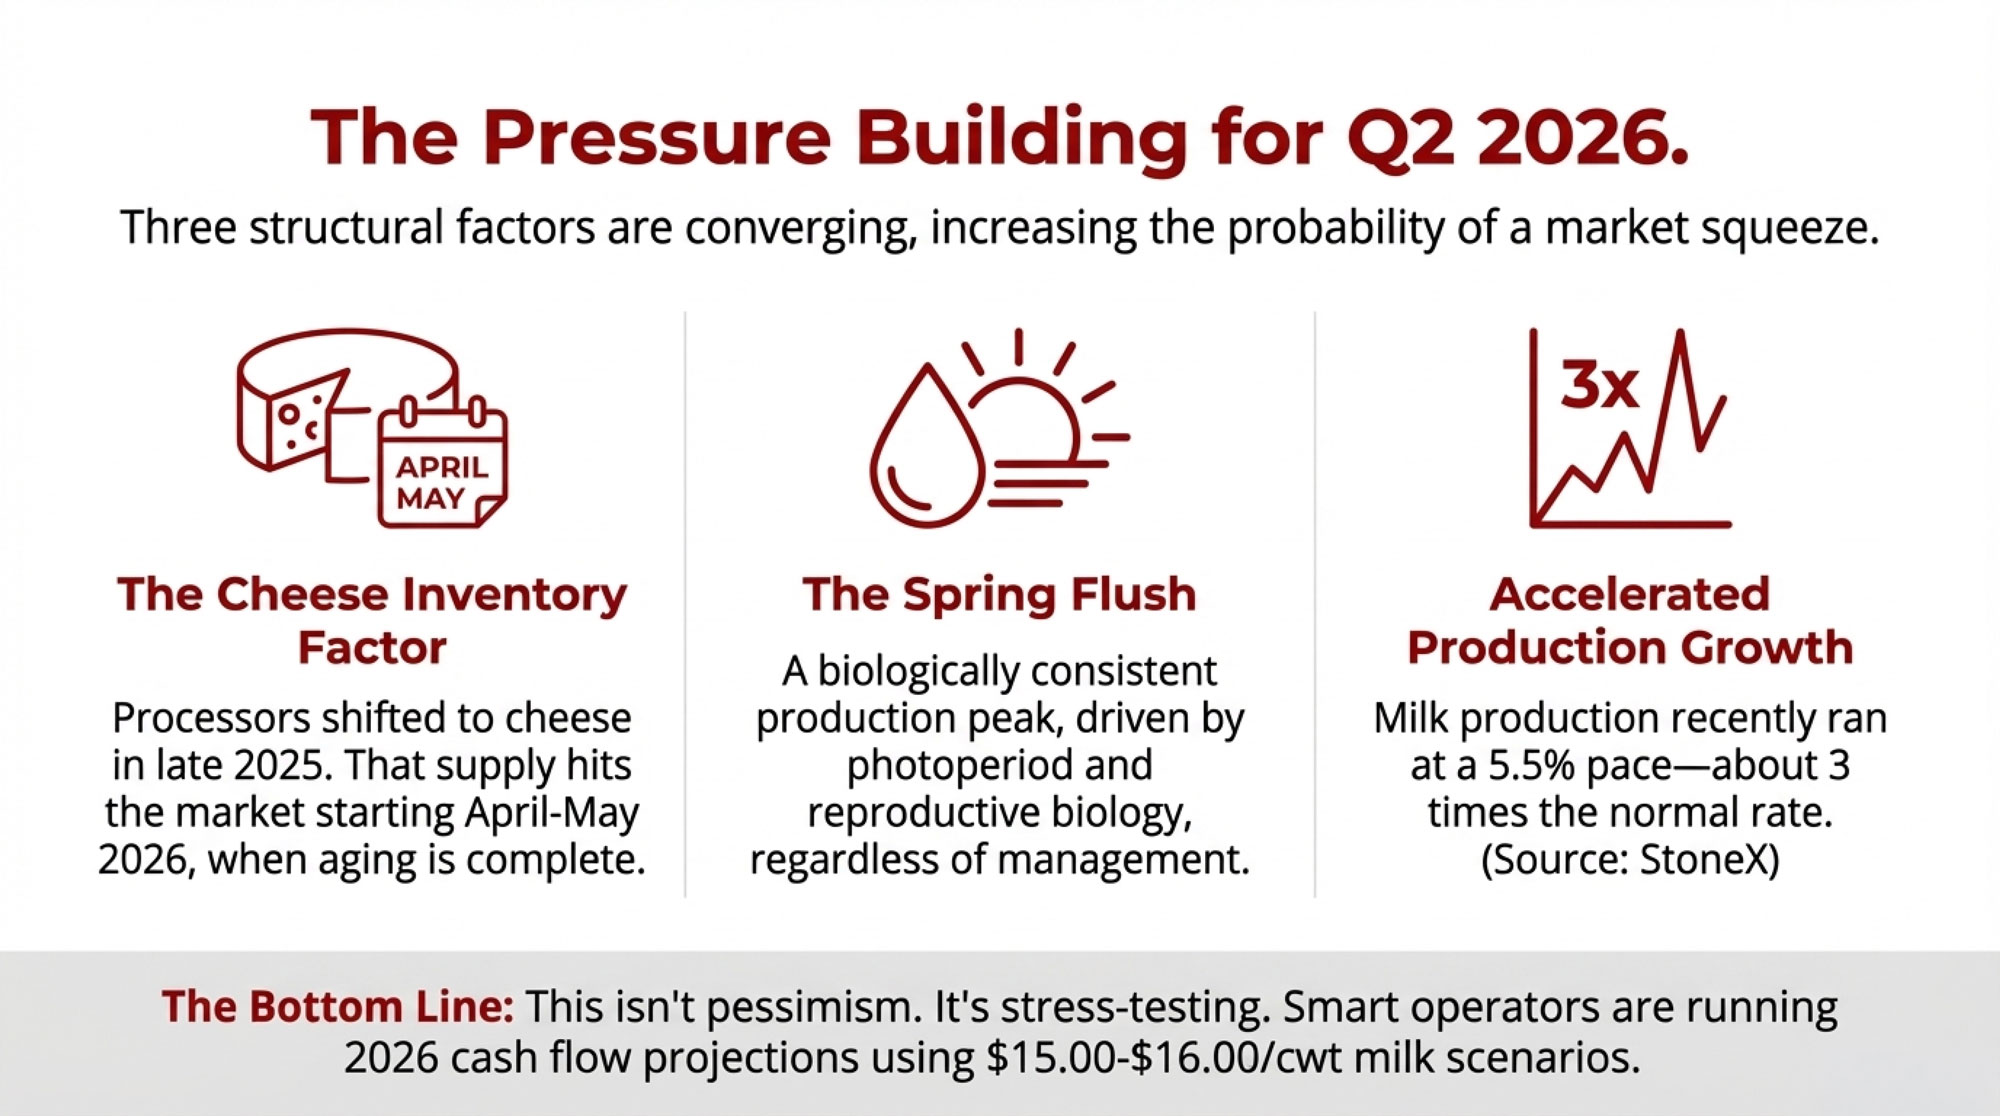
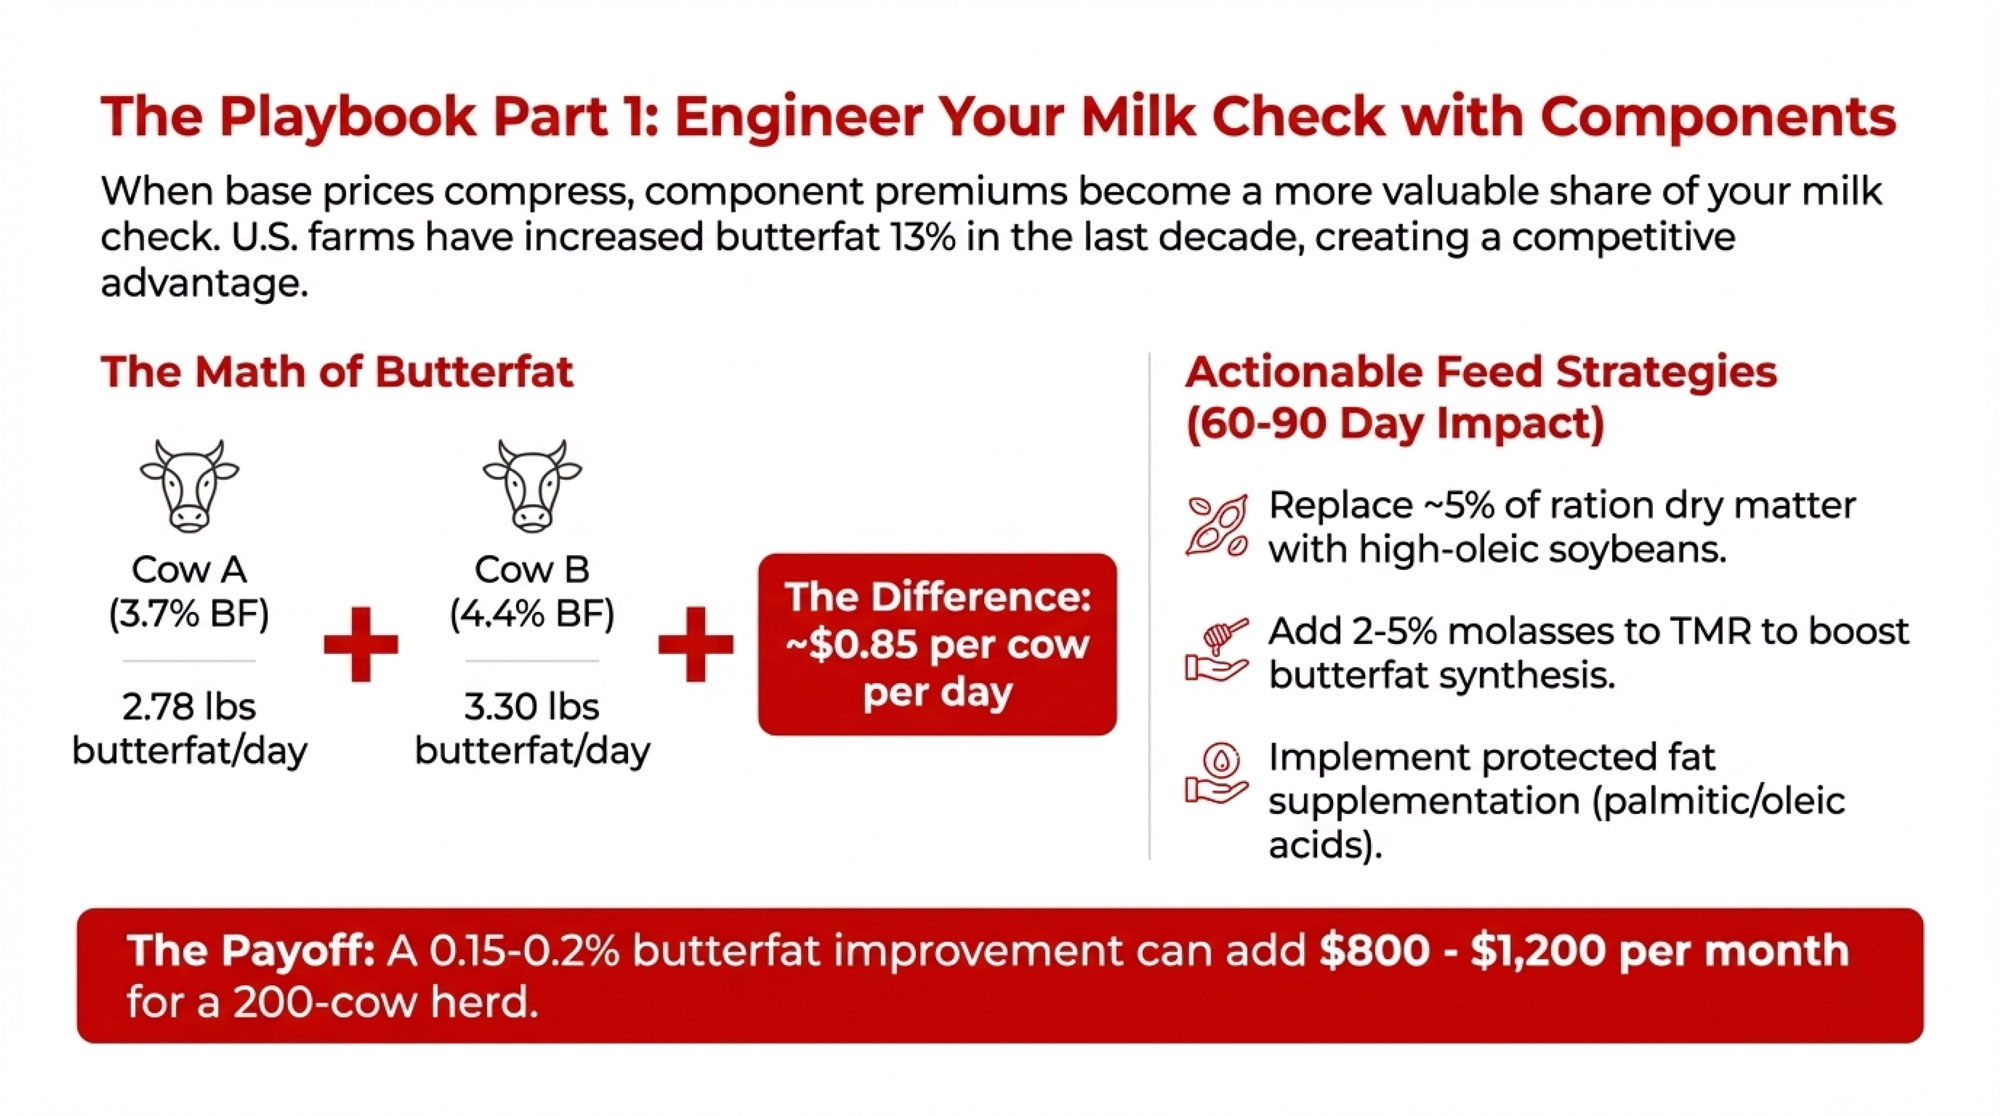
So in those manufacturing regions, your economics are still driven far more by butterfat levels, protein yield, fresh cow management through the transition period, and feed efficiency than by what color caps kids see at lunch. The whole milk law is a bonus at the edges if it sticks, not the main driver of your milk check.
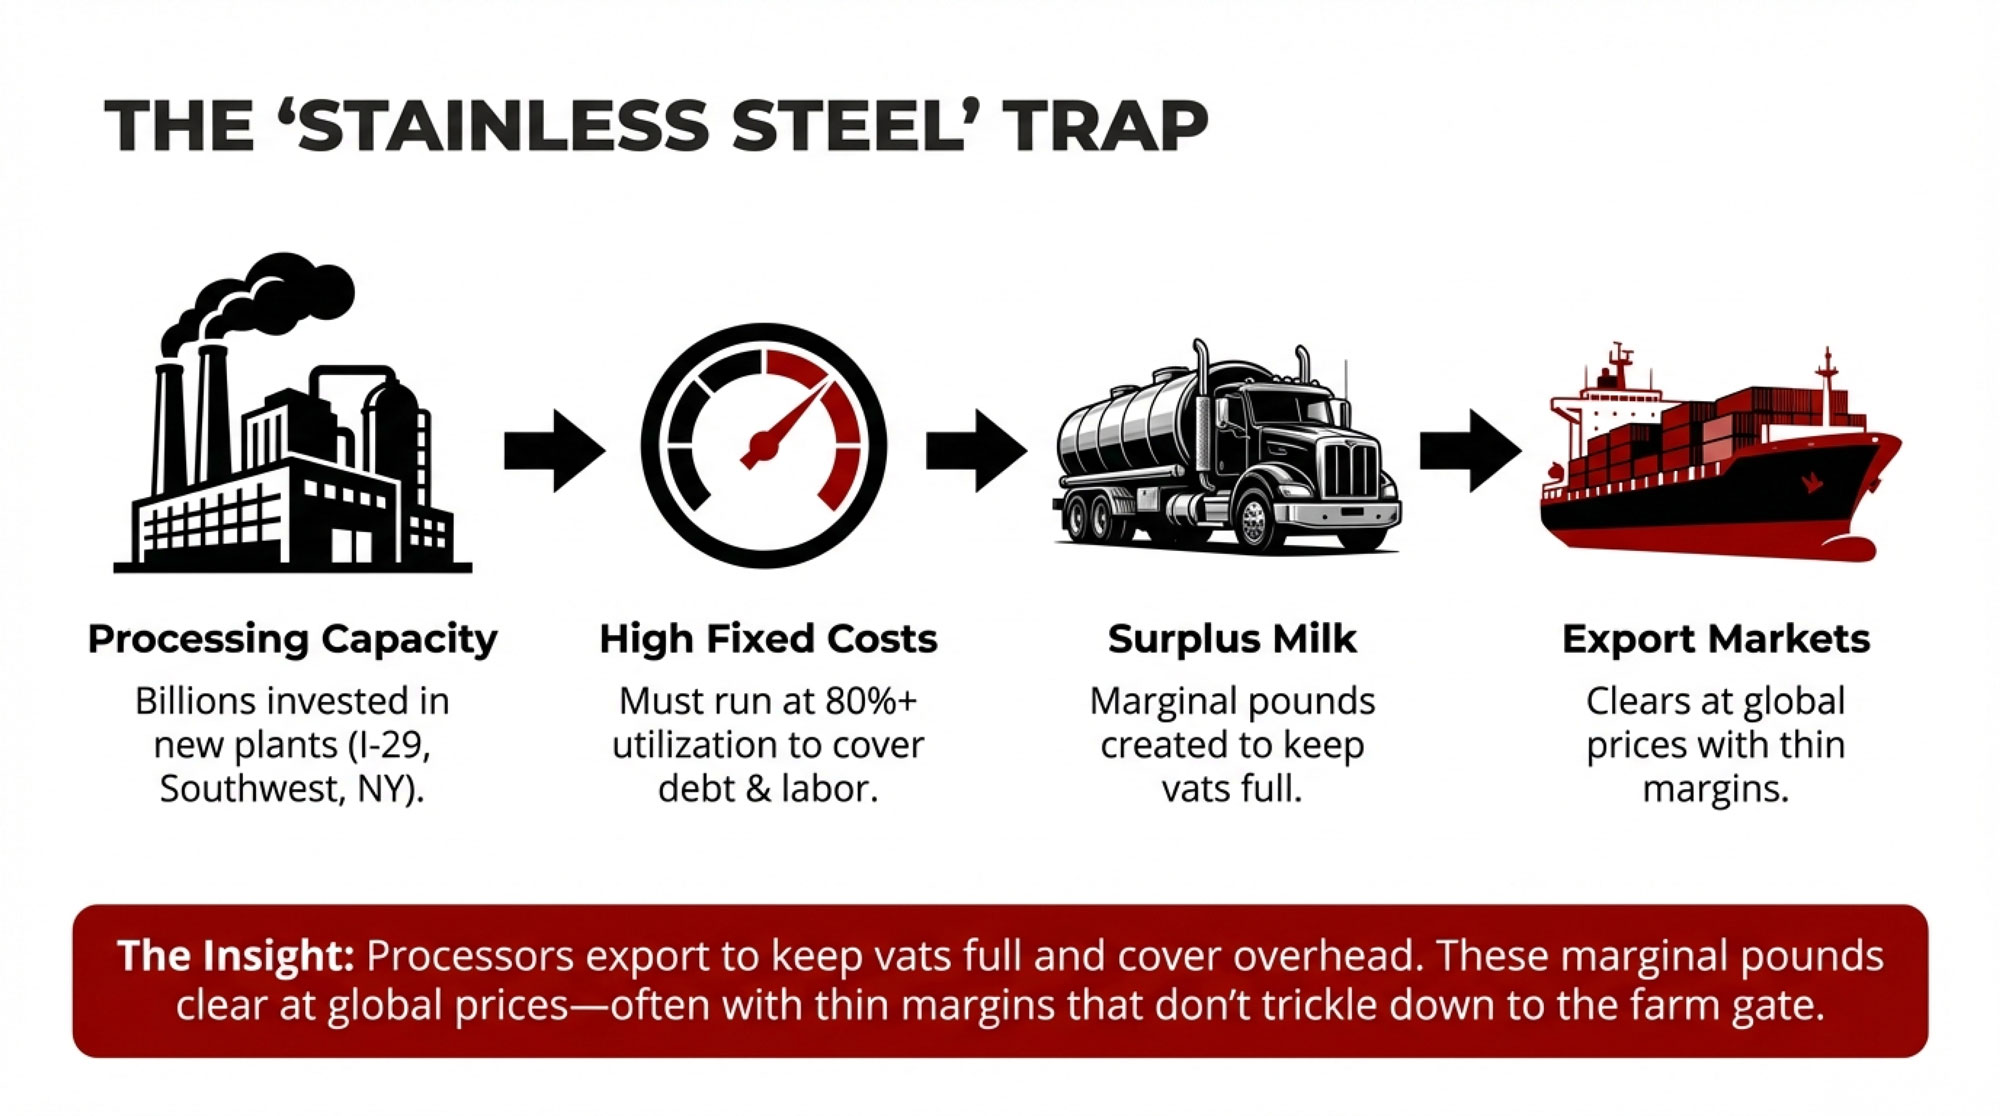
What Processor Investments Are Actually Telling Us
Now, here’s something that’s easy to miss if you just watch the politics and not the capital spending.
If processors truly believed school milk was about to become the main profit engine in the system, you’d expect to see a wave of investment in half‑pint lines, school‑oriented packaging, dedicated distribution hubs, and fleets built around early‑morning school routes.
What we’ve actually seen over the last few years is a little different.
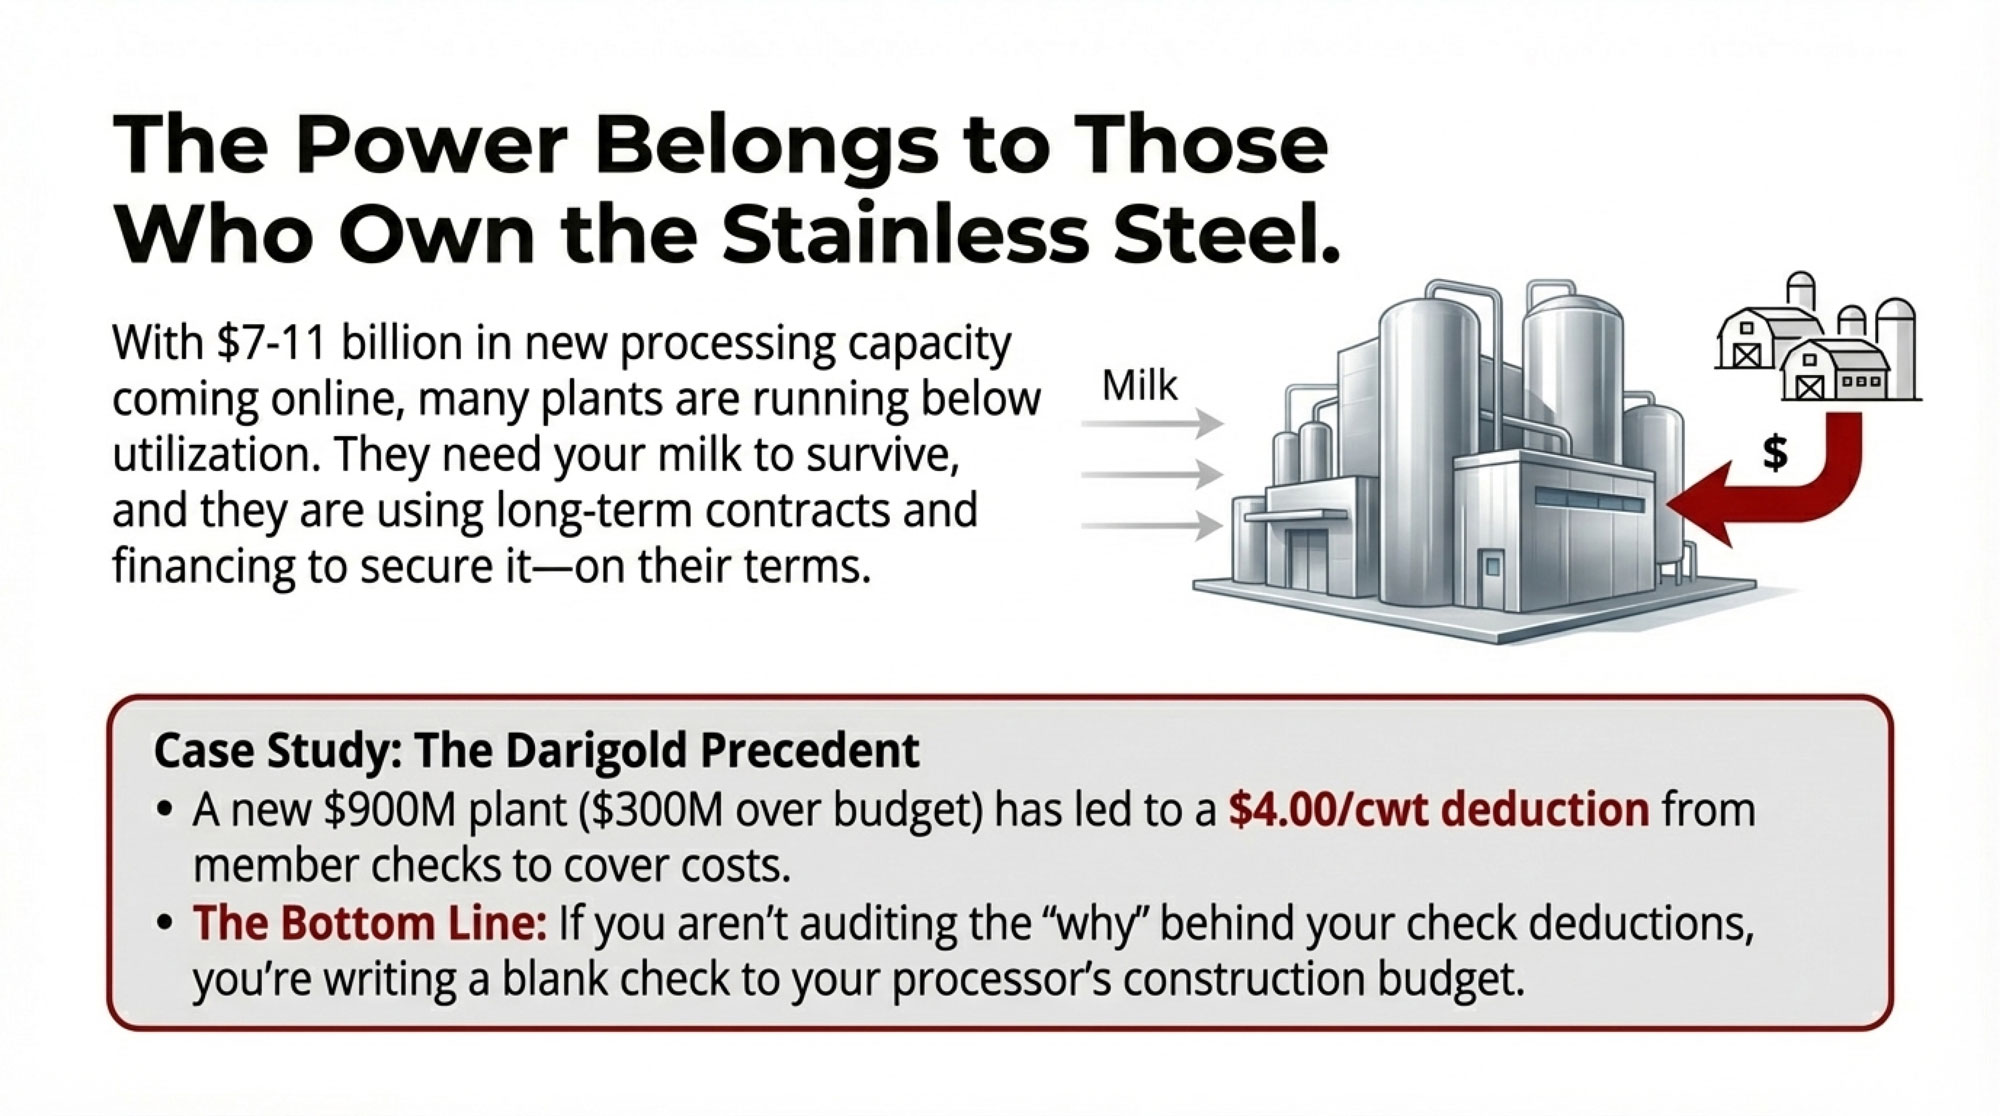
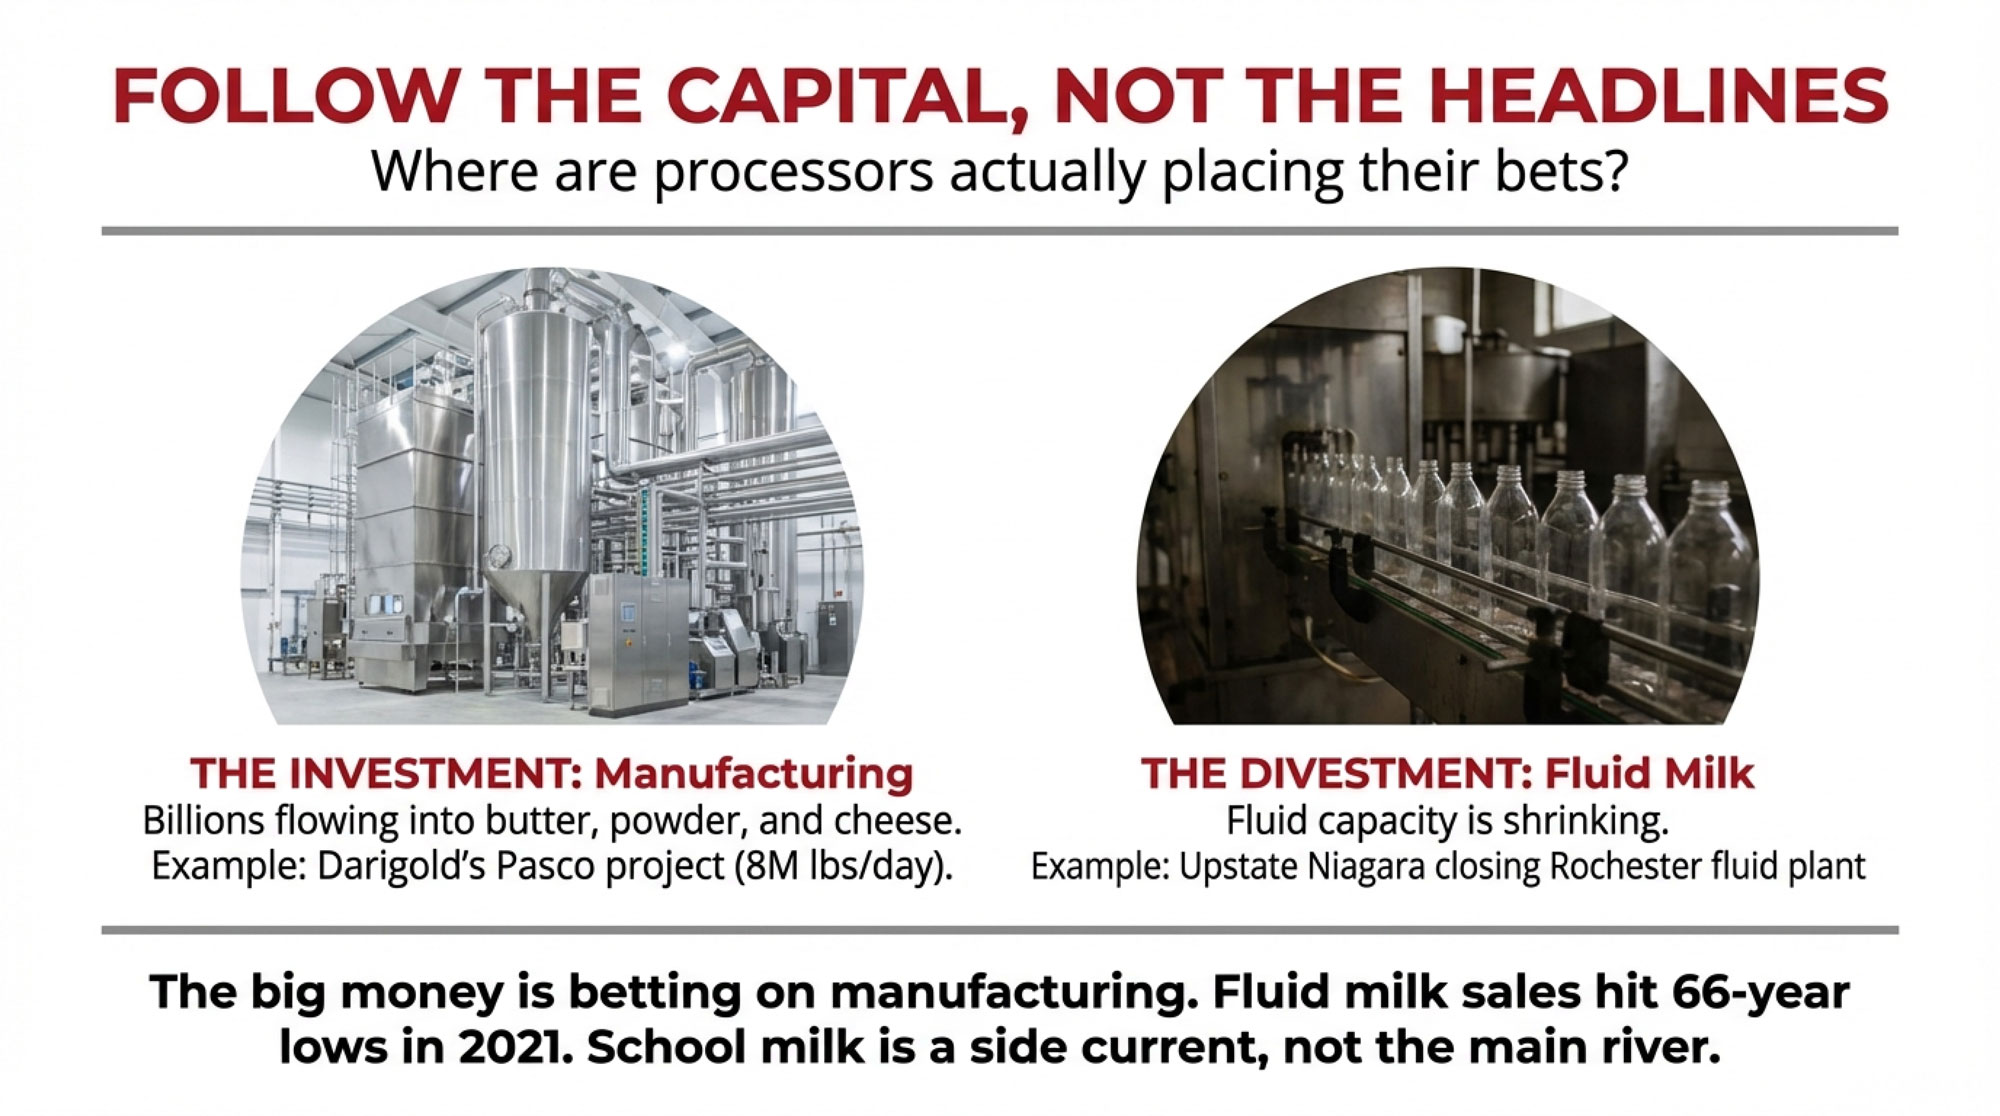
Darigold, for example, has made a lot of noise about its new plant in Pasco, Washington. That project is in the ballpark of a billion‑dollar investment and is designed to process around eight million pounds of milk per day, mostly into butter and milk powders aimed at domestic and export markets. That’s manufacturing‑heavy business, not half‑pint school milk.
Agropur has poured significant capital into cheese and whey capacity in Wisconsin, reinforcing that region’s long‑standing role as a manufacturing powerhouse. And the Michigan Milk Producers Association has made substantial investments modernizing and expanding their cheese and ingredient plants in Michigan. Those choices all line up with a world where cheese, butter, and powders carry the growth story.
On the other side of the ledger, you’ve got moves like Upstate Niagara Cooperative announcing the planned closure of its Rochester, New York, fluid plant by the end of 2025, citing changing markets and declining demand for fresh fluid milk. A lot of Northeast producers will recognize that mix of high‑Class‑I heritage and plant closures—it’s been part of the landscape for years now. That’s a pretty blunt signal that, in at least some regions, fluid doesn’t justify the plant overhead it used to.
All of that fits with the long‑term ERS data on fluid decline and record‑high total dairy consumption. It’s not that school milk doesn’t matter—many cooperatives and processors already serve dozens or hundreds of districts. It’s that the really big capital is still being pointed at manufacturing, not fluid.
So, from a strategy perspective, whole milk in schools looks more like a valuable side current in a manufacturing‑dominated river than a new main channel.
| Processor / Co-op | Project / Action | Type | Scale / Investment | What It Tells You |
|---|---|---|---|---|
| Darigold | Pasco, WA butter & powder plant | New construction | 8M lbs/day capacity (~$1B) | Betting on manufacturing exports, not school fluid |
| Agropur | Wisconsin cheese & whey expansion | Capacity expansion | Multi-state, $100M+ | Doubling down on cheese—the growth story |
| Michigan Milk Producers Assoc. | Cheese & ingredient plant modernization | Upgrade/expansion | $50M+ | Reinforcing manufacturing dominance in region |
| Upstate Niagara Cooperative | Rochester, NY fluid plant closure | Closure | ~2024–2025 timeline | Fluid plants don’t pencil anymore—even in high-Class-I Northeast |
| Most regional processors | School milk capacity | Limited investment | Incremental / “if it fits” | Not a strategic priority—school milk is opportunistic |
The Quiet Retail Signal You Don’t See in the Order Reports
There’s another angle that doesn’t show up directly in your Federal Order bulletins but matters for how people think about milk.
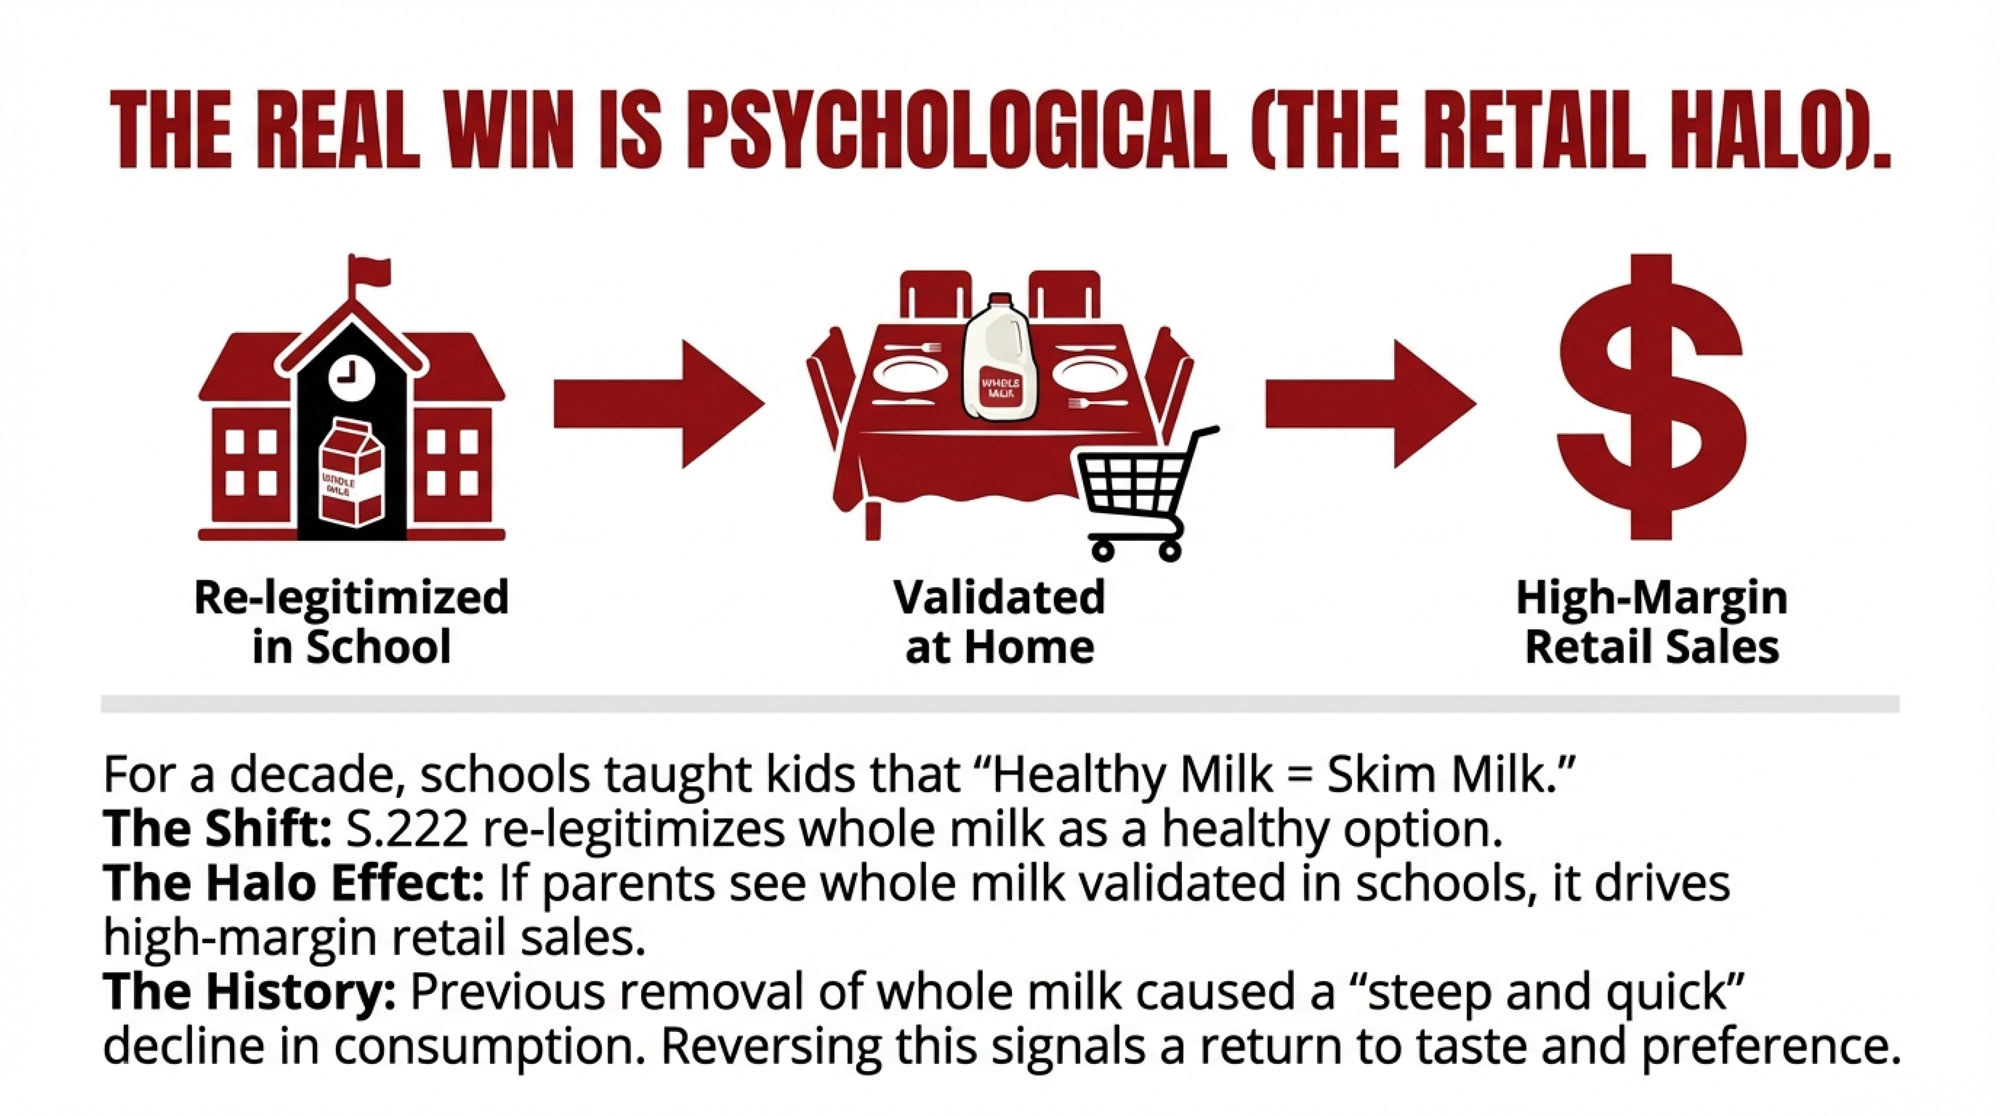
For more than a decade, school cafeterias sent a subtle message: “Whole milk doesn’t belong in a healthy meal.” Kids didn’t see it in the line. The cartons they grabbed were low‑fat or fat‑free, often with flavor added. That wasn’t just a menu choice; it shaped expectations for what “healthy milk” looked like.
Tim Hawk, who works on school marketing for Dairy Farmers of America, summed up what many of us suspected. He talked about how quickly school milk intake dropped when fat was taken out and pointed out that data showed kids generally weren’t drinking skim at home. The “steep and quick” decline in school milk volume after whole milk was removed tells you something about what students actually wanted versus what they were offered.
Now, with the law allowing whole milk back on the menu and nutrition research giving schools cover to look at dairy in the context of overall diet quality instead of just fat percentages, that message changes. When a nutrition director can say, “Yes, whole milk fits here and still keeps us inside the calorie and nutrient rules,” it gives districts more room to line up what they serve with what families and kids are used to.
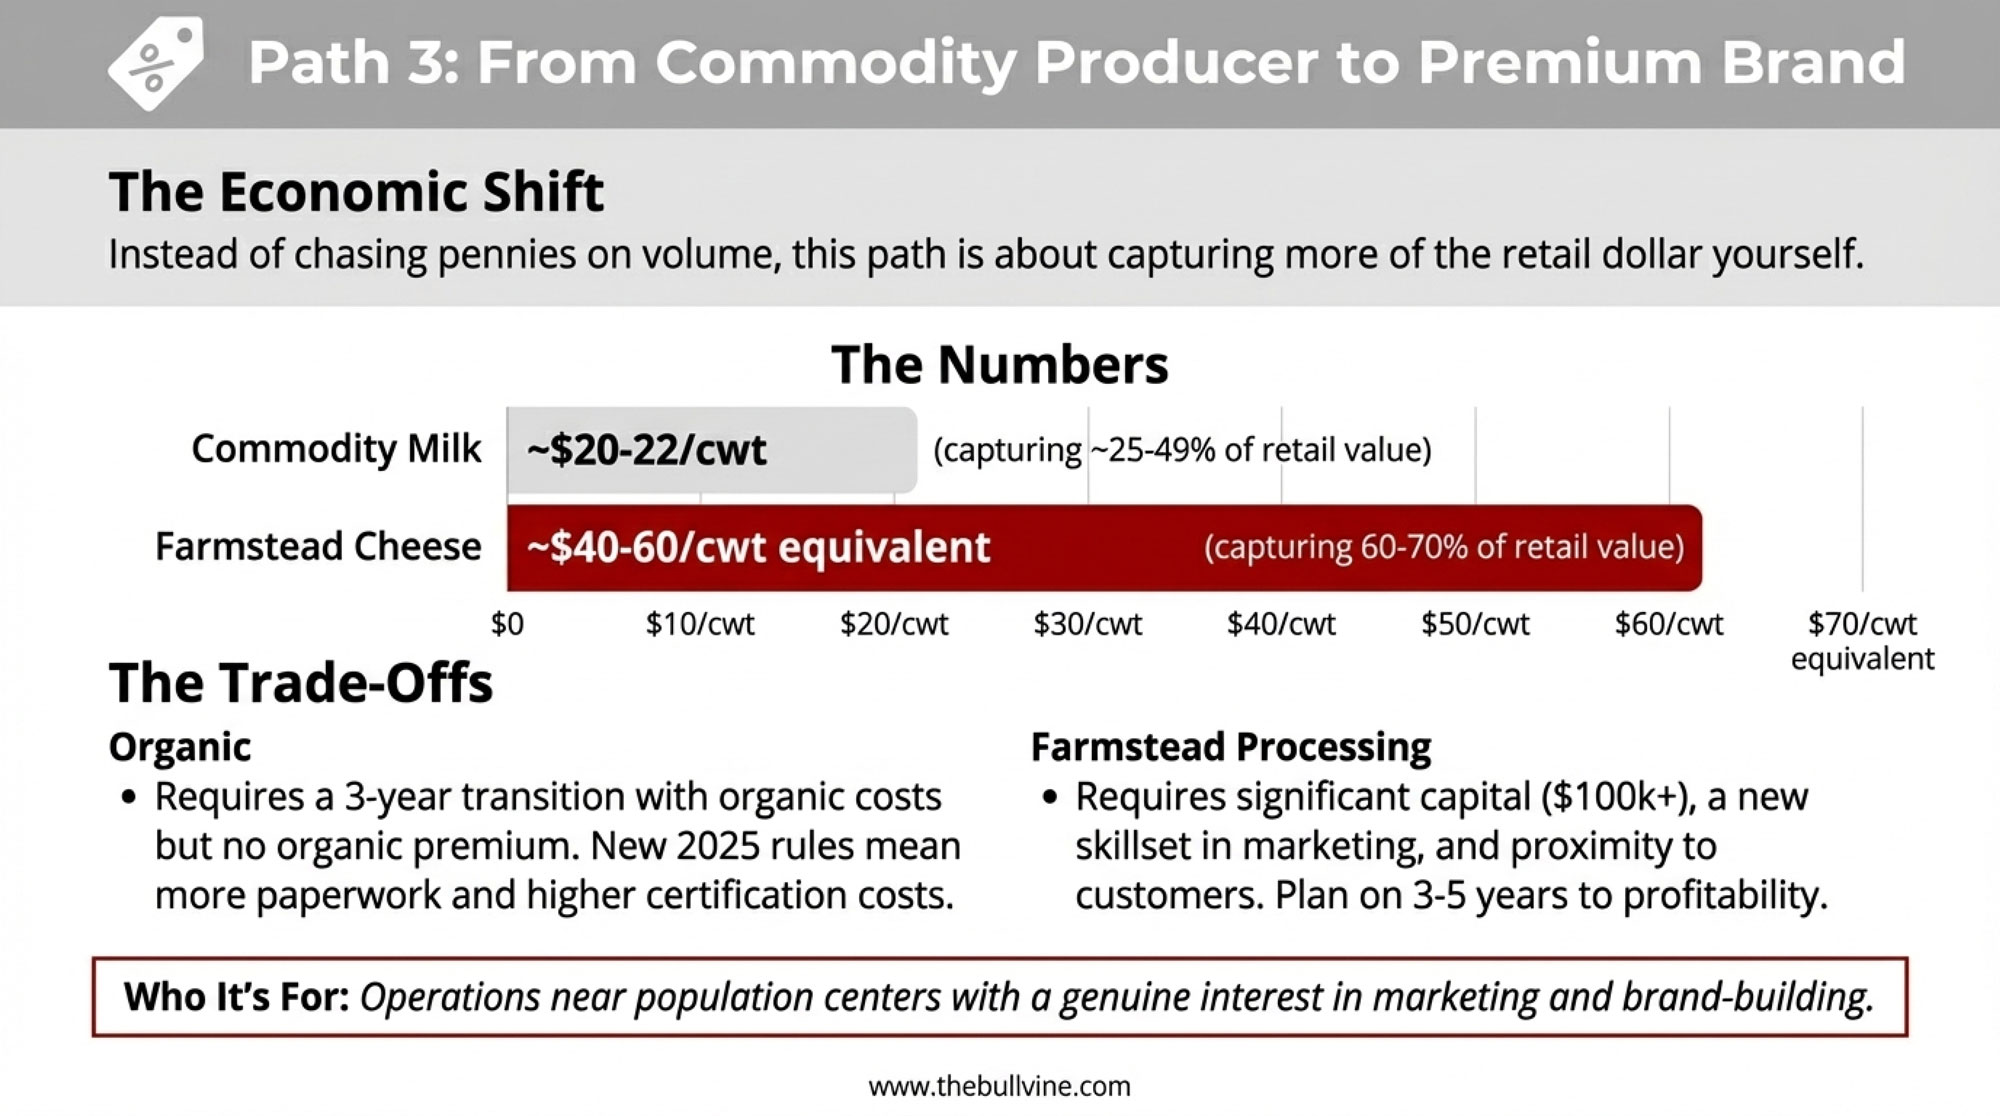
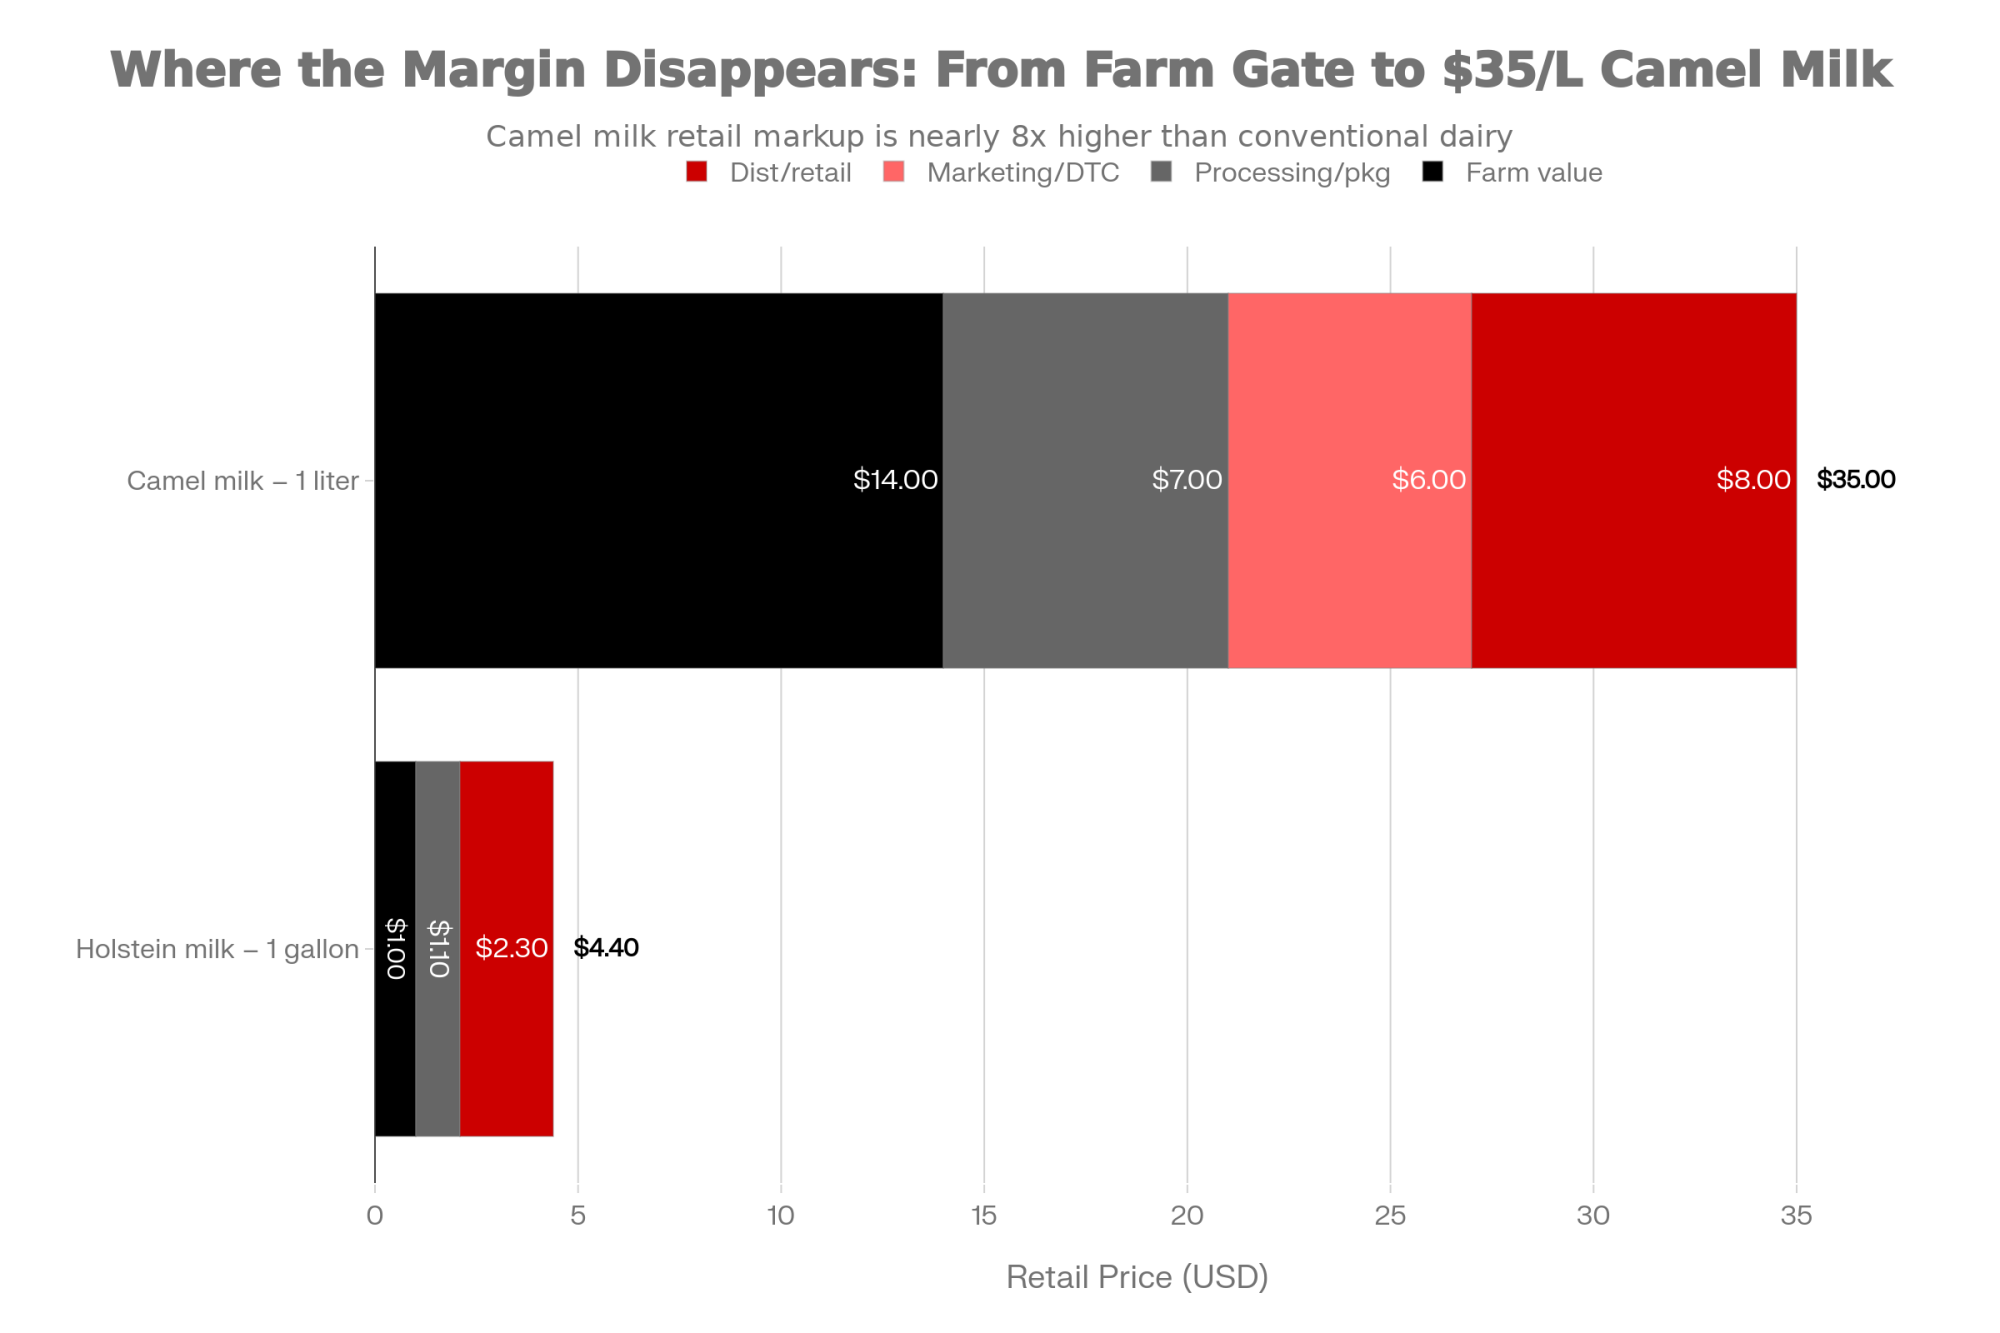
The interesting thing is that the long‑term upside from that shift may show up more in retail over time than in school volumes themselves. School contracts tend to be highly bid, fairly low‑margin, and tightly controlled. Retail whole milk, especially from strong regional brands that lean into quality and local sourcing, can carry more margin and more marketing flexibility. If parents start feeling more comfortable putting whole milk back in the cart because they see it re‑legitimized in school, that can be a quiet but important Class I tailwind.
We don’t have hard scanner data yet on how retail whole milk sales behave after this law is fully in place—that’ll take a couple of years to sort out. But based on past experience with school nutrition changes, and on how broader diet messaging can shift home buying habits, it’s reasonable to expect some spillover from school coolers to home fridges.

Why You Won’t See Whole Milk in Every Cooler Right Away
So if this law is such a “big win,” why aren’t you seeing whole milk in every cafeteria today?
What a lot of producers are hearing as they talk to people in their local systems is that contracts and logistics are doing most of the pacing right now.
A few things are getting in the way of a quick, universal rollout:
- In many districts, milk is bought through multi‑year competitive bids. Those bids spell out everything—fat level, flavors, carton size, pricing formulas, delivery schedule. When the law changed, those contracts didn’t just vanish. The first real window to add whole or 2% milk often comes when the next bid goes out, or when the district negotiates an amendment with its supplier.
- Larger districts often outsource their food service to management companies. Those companies write the menus, make sure they meet USDA rules, and then buy milk and food through their own vendor networks. So even if a school board or superintendent says, “We want whole milk back,” that preference still has to work its way through the food‑service contract and down into co‑op and processor agreements.
- On the processing side, not every plant has spare capacity on half‑pint lines or the flexibility to add more school routes without reshuffling other business. Serving schools is about hitting lots of stops in tight windows every morning with the right mix of products. After a few years of supply‑chain stress—everything from carton availability to driver shortages—most processors are cautious about promising more school volume unless they’re confident they can deliver it day in and day out.
So instead of a light switch, you should probably expect a patchwork. In some areas where bids are up soon and processors already have the right packaging and logistics, you’ll start seeing whole milk in coolers relatively quickly. In others, it’s likely to be a slower grind over several contract cycles.
From a Class I standpoint, that means whatever impact this has on your milk check is going to show up over the course of years, not weeks.
How to “Kick the Tires” on This in Your Own Area
The nice thing about this situation is that you don’t have to just take anybody’s word for it—not your co‑op’s, not your processor’s, and not the politicians’. You can actually test how much this matters where your milk is pooled.
Here are a few ways producers are doing that.
1. Ask Sharper Questions of Your Co‑op or Processor
Instead of stopping at “Is this good for dairy?” you might sit down with your field rep or director and ask:
- How many school districts in our marketing area have milk contracts expiring in the next one to three years, and are whole and 2% milk explicitly allowed in those new bid specs?
- Are we making specific investments in packaging, plant scheduling, or routing to go after whole‑milk school business, or do we have other priorities for that capacity?
- Based on our order’s current Class I utilization, what’s your internal view of how much school milk volume we could realistically capture, and what kind of impact range could that have on the blend over time ?
- How are you going to report progress back to members—will we see anything about school volume or Class I shifts in your annual or quarterly updates?
Those kinds of questions don’t demand miracle answers. They just force your handler to connect the policy story to a practical plan.
2. Keep an Eye on Local School Bids
You don’t need to sit on a school board to see what your local districts are doing.
In a lot of states, bid requests and awards are public documents. Producers are starting to:
- Check state procurement websites and district business‑office pages for milk and beverage RFPs.
- See whether whole and 2% are listed as acceptable options in the new bid specs.
- Note which processors are bidding and winning those contracts.
- Have informal conversations with school board members, business managers, or nutrition directors they already know.
Some farm press and advocacy groups have been encouraging exactly this kind of local engagement to help turn the law into actual cartons on trays. From your perspective, it’s just good intel—it tells you whether “whole milk is back in schools” is actually happening in the markets that matter to your milk check.
3. Build a Simple Federal Order Baseline
The other piece of homework that pays off is setting a baseline for your own order before all this shakes out.
USDA and the order administrators publish Class I utilization data regularly. If you pull the last two or three years of Class I shares for your order and line them up with your average mailbox prices, you’ve got a decent starting point.
Say you see that your Class I share has been bouncing between 18 and 22 percent. A few years from now, when you look back after districts have had time to transition to the new rules, you’ll be able to see whether that range really moved—or whether school milk turned out to be more of a perception win than a volume game in your area.
It’s the same idea you use in the barn. You wouldn’t judge the impact of a new transition‑period protocol or a change to your ration without knowing what your fresh cow performance looked like before you made the switch.
So What Do You Actually Do With This?
If we’re being straight with each other, here’s how this all nets out when you sit down with your own numbers.
1. Know Where Your Order Stands on Class I
If your Federal Order’s Class I share:
- Generally lives around one‑third or higher, then whole milk in schools—combined with the recent Class I differential changes—has the potential to be a modest but real tailwind for your blend over the next few years, assuming your order captures some of that extra volume.
- Spends most of its time under 15 percent, then it’s smarter to treat whole milk in schools as a positive story and a small Class I opportunity at the margins, not as a primary survival lever.
It’s not that one situation is better or worse morally. They’re just different realities based on how your milk is used.
2. Push for a Clear School Milk Strategy
It’s reasonable to expect your co‑op or processor to have an honest view on whether school milk is a strategic growth area or more of a “nice if it comes along” business.
Some good conversation starters are:
- Is school milk a strategic focus for us in the next three to five years, or are we prioritizing other markets with our capital and capacity?
- Do we have the plant and route flexibility to handle more whole‑milk school volume without squeezing higher‑margin channels?
- How will you measure and communicate the impact of school milk on our Class I utilization and our milk checks, if there is one?
The answers will tell you a lot about whether this law is likely to show up in your mailbox or stay mostly in the press releases.
3. Keep Your Own Tracking Simple
A basic spreadsheet that tracks:
- Year
- Your order’s Class I share
- Your average mailbox price
- Notes on major school milk contract changes or plant shifts you’re aware of
will give you something solid to look back on. Three or four years down the road, you’ll be able to see whether there’s a visible relationship between the school milk changes and your order’s Class I share or whether your milk check remained dominated by the same old cheese and butter markets.
4. Don’t Forget Where Your Real Control Lives
At the end of the day, the basics of running a profitable dairy haven’t changed.
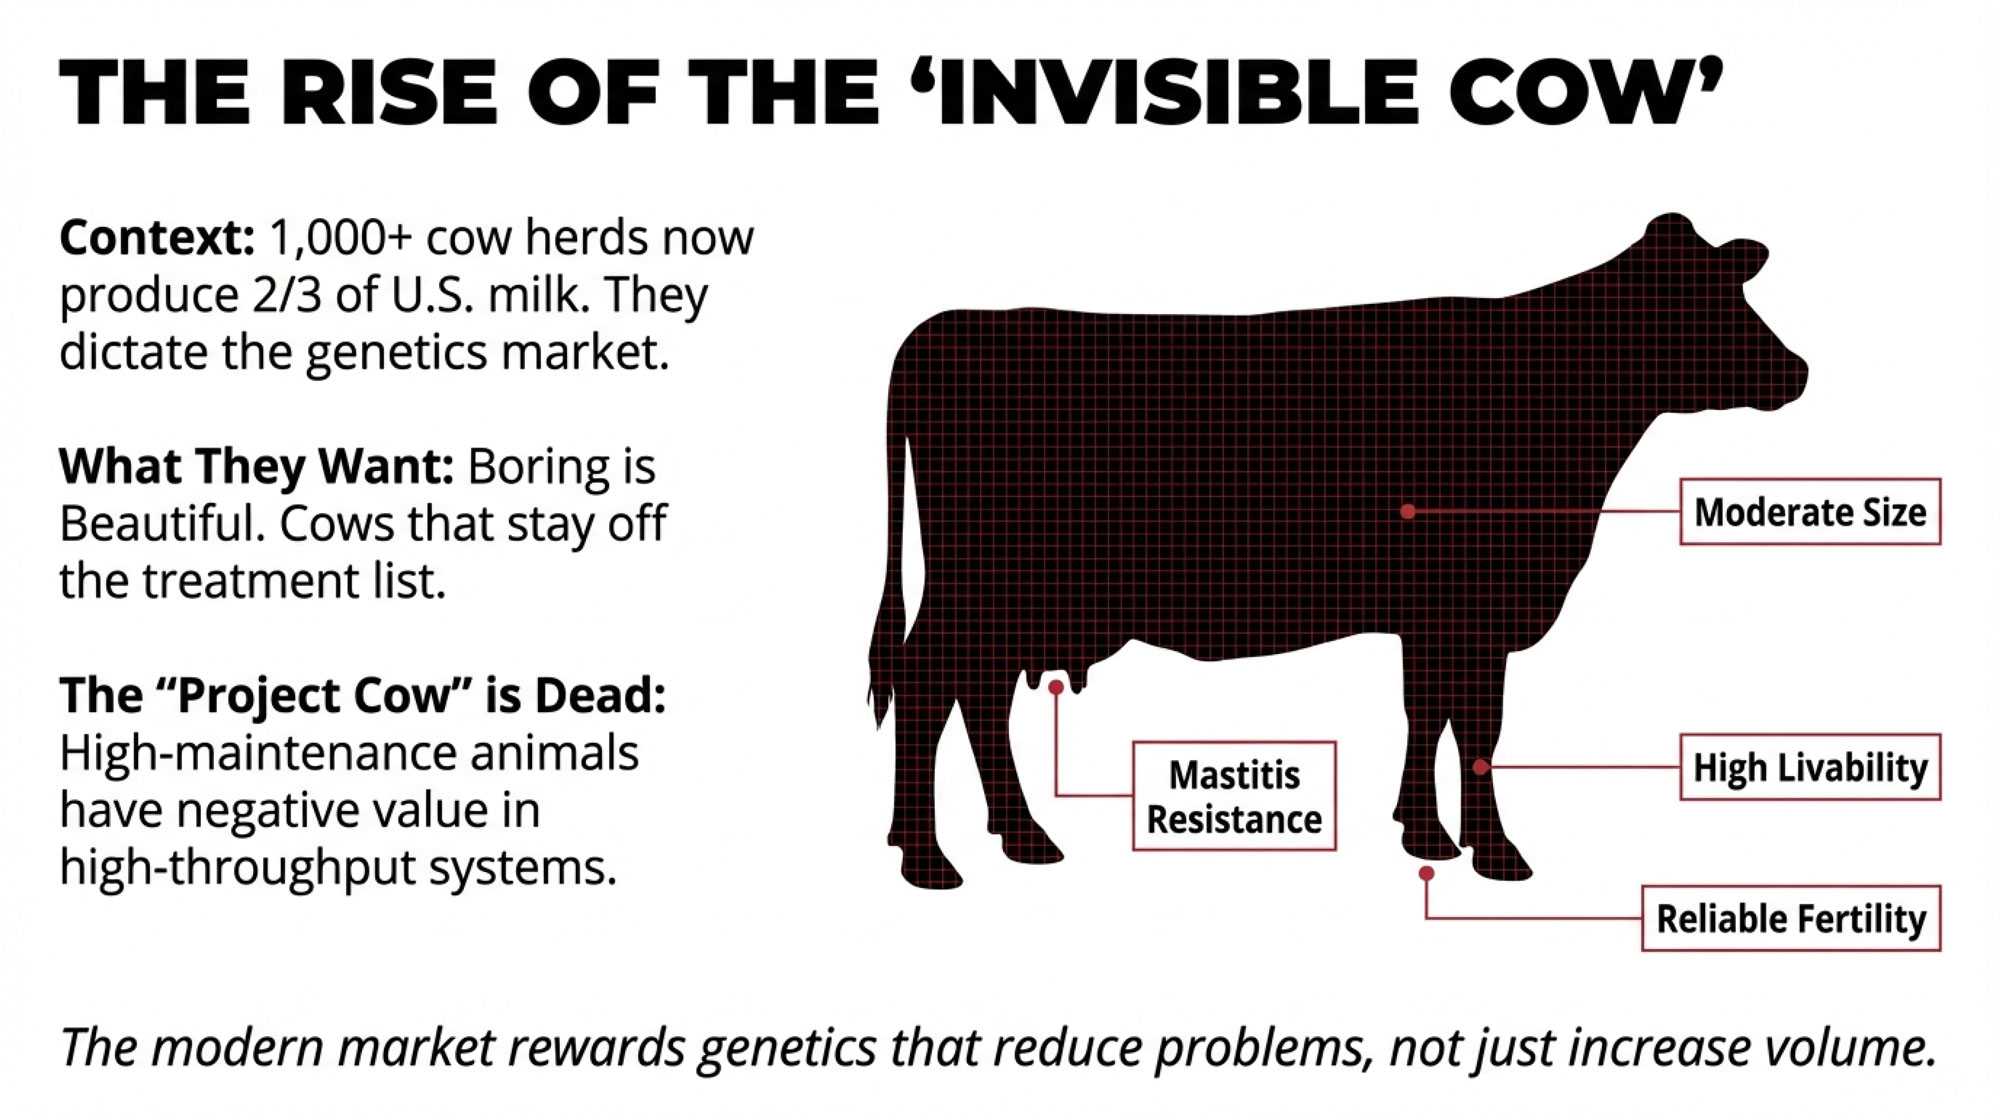
If you’re in a high‑fluid order, it still pays to produce consistent quality and components so your milk is welcome in premium Class I and branded retail channels. In manufacturing‑heavy regions—the Upper Midwest, much of the West, a lot of dry‑lot and larger operations—your economics are still driven mainly by butterfat and protein yield, fresh cow performance through the transition period, feed efficiency, and disciplined cost control.
What I’ve found, looking across a lot of herds and a lot of years, is that genetics plus management is where most of your long‑term profit and resilience really comes from. Breeding for components and health, managing transition cows carefully, keeping feed and cow comfort dialed in—that’s the foundation. Policy wins like this Whole Milk Act can add some lift on top of that, especially in certain orders, but they don’t replace the hard work inside your own barns.
Whole milk in schools can be part of a better Class I story. It’s just not going to rewrite the cheese‑ and powder‑driven math your farm has been living with for decades.
The Bottom Line Over Coffee
If we boil it all down, this is one of those moments where the photos and the speeches are a lot simpler than the economics underneath.
On one hand, the Whole Milk for Healthy Kids Act really does fix a long‑standing disconnect. It brings school rules more in line with nutrition research that treats dairy as a nutrient‑dense food and looks at overall diet quality instead of just grams of fat per serving. It gives schools the option to put whole milk back on the tray and makes it easier for kids and parents to see whole milk as part of a healthy pattern again. That’s a genuine win.
On the other hand, it lands in a dairy economy that has been shaped by more than 70 years of declining fluid consumption, record cheese and ingredient demand, and billions of dollars poured into manufacturing‑oriented plants. Federal Order changes have nudged more value toward high‑Class‑I regions and tightened things in cheese‑heavy orders. None of that disappears because of one piece of legislation.
So the honest way to look at it is something like this:
- If you’re in a high‑Class‑I region, treat this law as a win that’s worth tracking. It might only add pennies per hundredweight to your blend in realistic scenarios, but on a few million pounds of milk—and paired with strong butterfat levels and good fresh cow management—those pennies still matter.
- If you’re in a manufacturing‑dominated order, see it as a boost for dairy’s public story and a potential small plus at the edges of your Class I world. But don’t expect it to fix cheese prices, make allowances, or the core structure of your cost of production.
- Wherever you are, keep doing the things you can truly control: ask sharper questions of your buyers, watch the school bids in your own area, track your order’s Class I share, and keep focusing on genetics and management that make your herd efficient and resilient.
What’s encouraging is that, over the next few years, you’ll be able to tell pretty clearly whether this “big win” is just a picture on the office wall—or one more lever, even if a small one, nudging your milk check in the right direction. We’ll revisit this topic once a couple of bid cycles have run to see how much of the modeled butterfat demand actually shows up in real Class I numbers.
Key Takeaways
- Permission granted, not a mandate: The Whole Milk for Healthy Kids Act allows schools to serve whole and 2% milk—but local boards decide, so expect gradual, patchy adoption over several bid cycles.
- Butterfat bump: helpful, not transformational: AFBF projects 18–55 million pounds of additional milkfat demand annually depending on adoption—meaningful volume, but a fraction of total U.S. butterfat use.
- Your order determines your upside: High‑Class‑I regions (Florida 80%+, Southeast ~60%, Northeast 25–33%) could see modest pennies‑per‑cwt gains; manufacturing‑heavy orders under 15% Class I will barely notice.
- Follow the capital, not the headlines: Processors are betting billions on butter, powder, and cheese (Darigold Pasco, Agropur Wisconsin) while closing fluid plants (Upstate Niagara Rochester)—school milk isn’t where the money is flowing.
- Control what you can: Components, fresh cow management, feed efficiency, and cost discipline still drive your profit—treat school milk as a small Class I tailwind, not a survival strategy.
Complete references and supporting documentation are available upon request by contacting the editorial team at editor@thebullvine.com.
Learn More
- Whole Milk is Back in Schools. Here’s Why Only 834 Dairy Farms Will Really Win. – Stop cheering the policy win and start auditing your bid capacity. This field guide breaks down the critical 2026 RFP timeline and exposes why only a fraction of operations are currently scaled to capture institutional volume.
- FMMO Reality Check: Why 2025’s $2.3 Billion Dairy Pricing Revolution Exposes the Fatal Flaw in American Milk Marketing – Uncover how the 2025 pricing overhaul reshapes your regional advantage. This investigation reveals the massive transfer of value from farms to processors, arming you with the critical math needed to defend your order’s blend price.
- From -43% to +0.8%: The Genetic Shift Powering Dairy’s First Fluid Milk Growth Since 2009 – Genetic selection is the engine behind fairlife’s $7.4 billion success. This deep dive reveals the specific traits driving the first fluid milk growth in 15 years and delivers a blueprint for positioning your herd’s future.
 Join the Revolution!
 Join the Revolution!
Join over 30,000 successful dairy professionals who rely on Bullvine Weekly for their competitive edge. Delivered directly to your inbox each week, our exclusive industry insights help you make smarter decisions while saving precious hours every week. Never miss critical updates on milk production trends, breakthrough technologies, and profit-boosting strategies that top producers are already implementing. Subscribe now to transform your dairy operation’s efficiency and profitability—your future success is just one click away.