


On a Wisconsin 800‑cow dairy, the gap between a forgotten hay test PDF and filing SDRP by August 12 isn’t theory — it’s roughly $80,000 and the difference between a $90K stack and $200K.
Executive Summary: A Wisconsin 800‑cow dairy’s 2026 government payment stack ranges from about $90,000 to $200,000, and the difference isn’t herd work — it’s paperwork. SDRP Stage 2 is the one live lever: filing by August 12 with actual hay test RFV records can turn roughly $385,000 of alfalfa value into $76,000–$130,000 of drought‑quality payments, while relying on the county fallback leaves you stuck near $51,500. The same farm’s FBA check is about $35,278 and DMC January–February at the 6M lb Tier 1 cap adds $13,650, but those programs are already baked in; SDRP is where a forgotten PDF from your nutritionist still moves the needle by about $80,000 mid‑case. That’s the gap between a $90,077 “Loser” stack and a $200,928 “Winner” stack built on the same cows, acres, and milk shipped. If your operating line is over 80% drawn, your DSCR is under 1.1, or your non‑feed costs are above the AFBF $13.34/cwt benchmark, this isn’t “nice to know” — it’s whether your lender sees a receivable on the table or just another wish list.
USDA’s February 2026 WASDE forecast pegs the 2026 all‑milk price at $18.95/cwt, subject to monthly revision. AFBF’s March 1, 2026 Market Intel paper, drawing on USDA ERS cost‑of‑production data, puts total cost of production for large herds at .14/cwt and fixes 2024 farm‑level net return at negative .05/cwt. For a Wisconsin 800‑cow dairy — call it the Dane County profile, an explicitly composite operation modeled on University of Wisconsin Center for Farm Financial Management benchmarks — the margin over feed dairy 2026 math is underwater on a full‑cost basis before the first truck leaves the yard.
Cameron Castillo, the AFBF economist credited as author of the April 22, 2026 Farmer Bridge Assistance tracker, logged $9.6 billion disbursed on about 500,000 approved applications. The dairy share on a comparable Wisconsin land base calculates to roughly $35,278. A grain‑focused neighbor on the same acres receives materially more than the dairy’s share under the same program. The headline gap isn’t the story. The gap hiding inside the dairy’s own 2026 payment stack — FBA, DMC, SDRP Stage 2, ARC/PLC — is. It closes with two phone calls and one FSA office visit before a deadline most 2026 dairy coverage has treated as row‑crop news: August 12, 2026.
Sandy Chalmers, the 11‑Day Window, and the Two‑Letter Code
Per Brownfield Ag News coverage from February through April 2026, Sandy Chalmers, Wisconsin’s FSA State Executive Director, has focused her public comments on application processing, approvals, and disbursement timing. Her role is operational. The structural question — how FBA was designed, and for which commodities — sits at the policy level, not the state FSA level.
The FBA rule published December 8, 2025. Acreage certification on FSA‑578 closed December 19, 2025. Eleven days.
Every fall, Wisconsin dairy operators assign a use code to corn acreage: GR for grain or SL for silage. Based on FSA’s published FBA per‑acre rate schedule and consistent with AFBF tracker totals, corn reported as GR paid approximately $44.36/acre. Corn reported as SL paid zero. Producers filing in 2026 should confirm current per‑acre rates with their county FSA office for the latest schedule.
Same corn. Same field. Same cow it ultimately fed.
A dairy that filed 350 corn acres as SL in September 2025 — the accurate declaration for an operation feeding that corn as silage — made an honest call that calculates to roughly $15,526 in forgone FBA. Not negligence. Not error. Accuracy.
Related: The 2024 Drought Season That Reshaped One Wisconsin Dairy Family
What Does the August 12, 2026 SDRP Deadline Actually Pay an 800‑Cow Dairy?
The biggest dairy‑relevant program in 2026 isn’t FBA. It’s a drought‑relief track with dairy paperwork hiding inside it.
USDA announced April 24, 2026 that the Supplemental Disaster Relief Program Stage 2 deadline moved from April 30 to August 12, 2026, with the payment factor doubled from 35% to 70%. Stage 2 covers forage quality losses — alfalfa and corn silage with documented RFV or TDN reduction during qualifying 2023 or 2024 weather events. Most 2026 dairy coverage of the April 24 extension has treated it as row‑crop news. Dairy‑specific follow‑through has been light.
The FSA Forage Quality Fact Sheet publishes the national calculation framework. For alfalfa, the county high RFV benchmark is 151 and the county low is 75. Quality loss percentage equals (151 − your tested RFV) ÷ 76. Multiply by production value. Multiply by the 70% payment factor. That’s the form.
Without lab records, FSA calculates on county‑average RFV with a penalty applied to the loss percentage, per the Stage 2 guidance. Bring the exact fallback calculation your county office applies into any cash‑flow projection; the penalty factor can vary by program year and county conditions.
Accepting the County Average Is a $40,000+ Donation Back to the Treasury
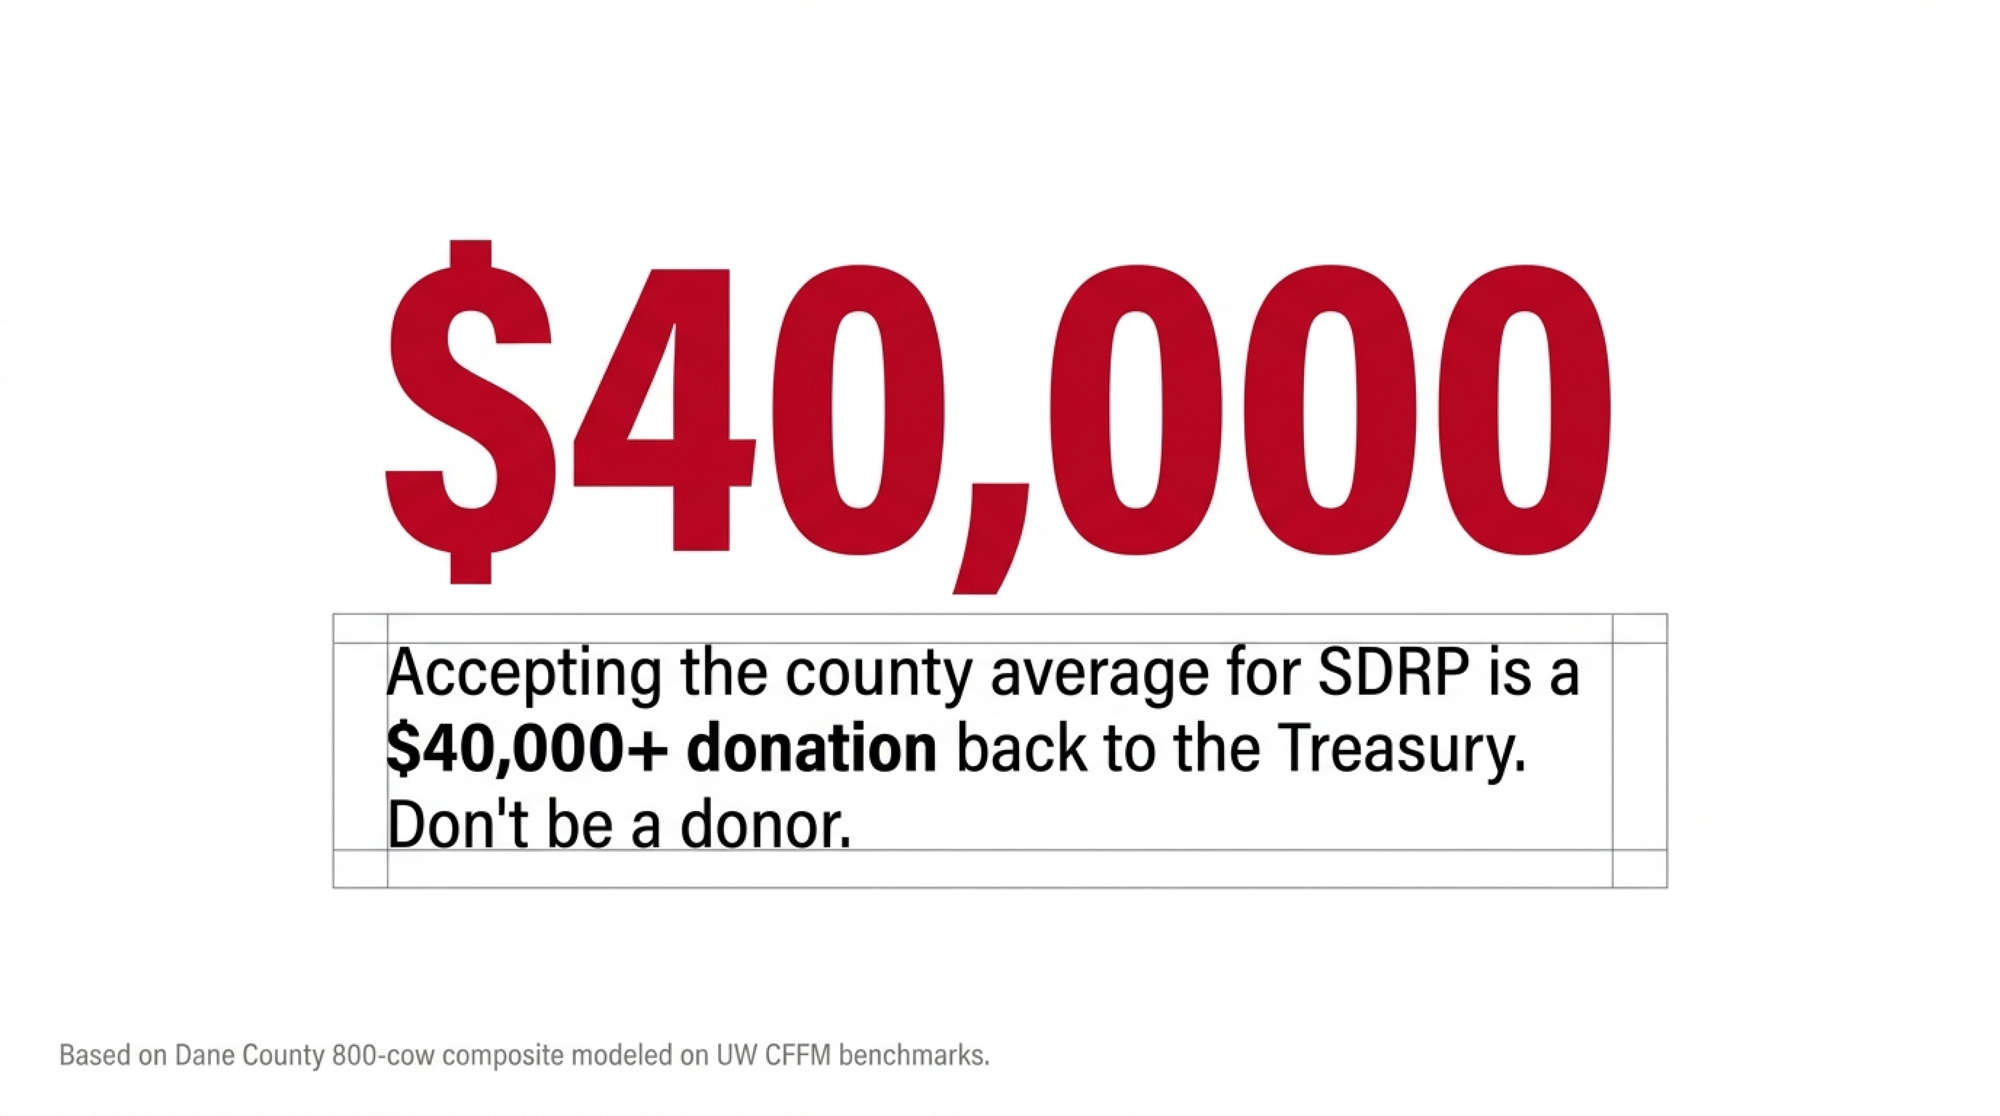
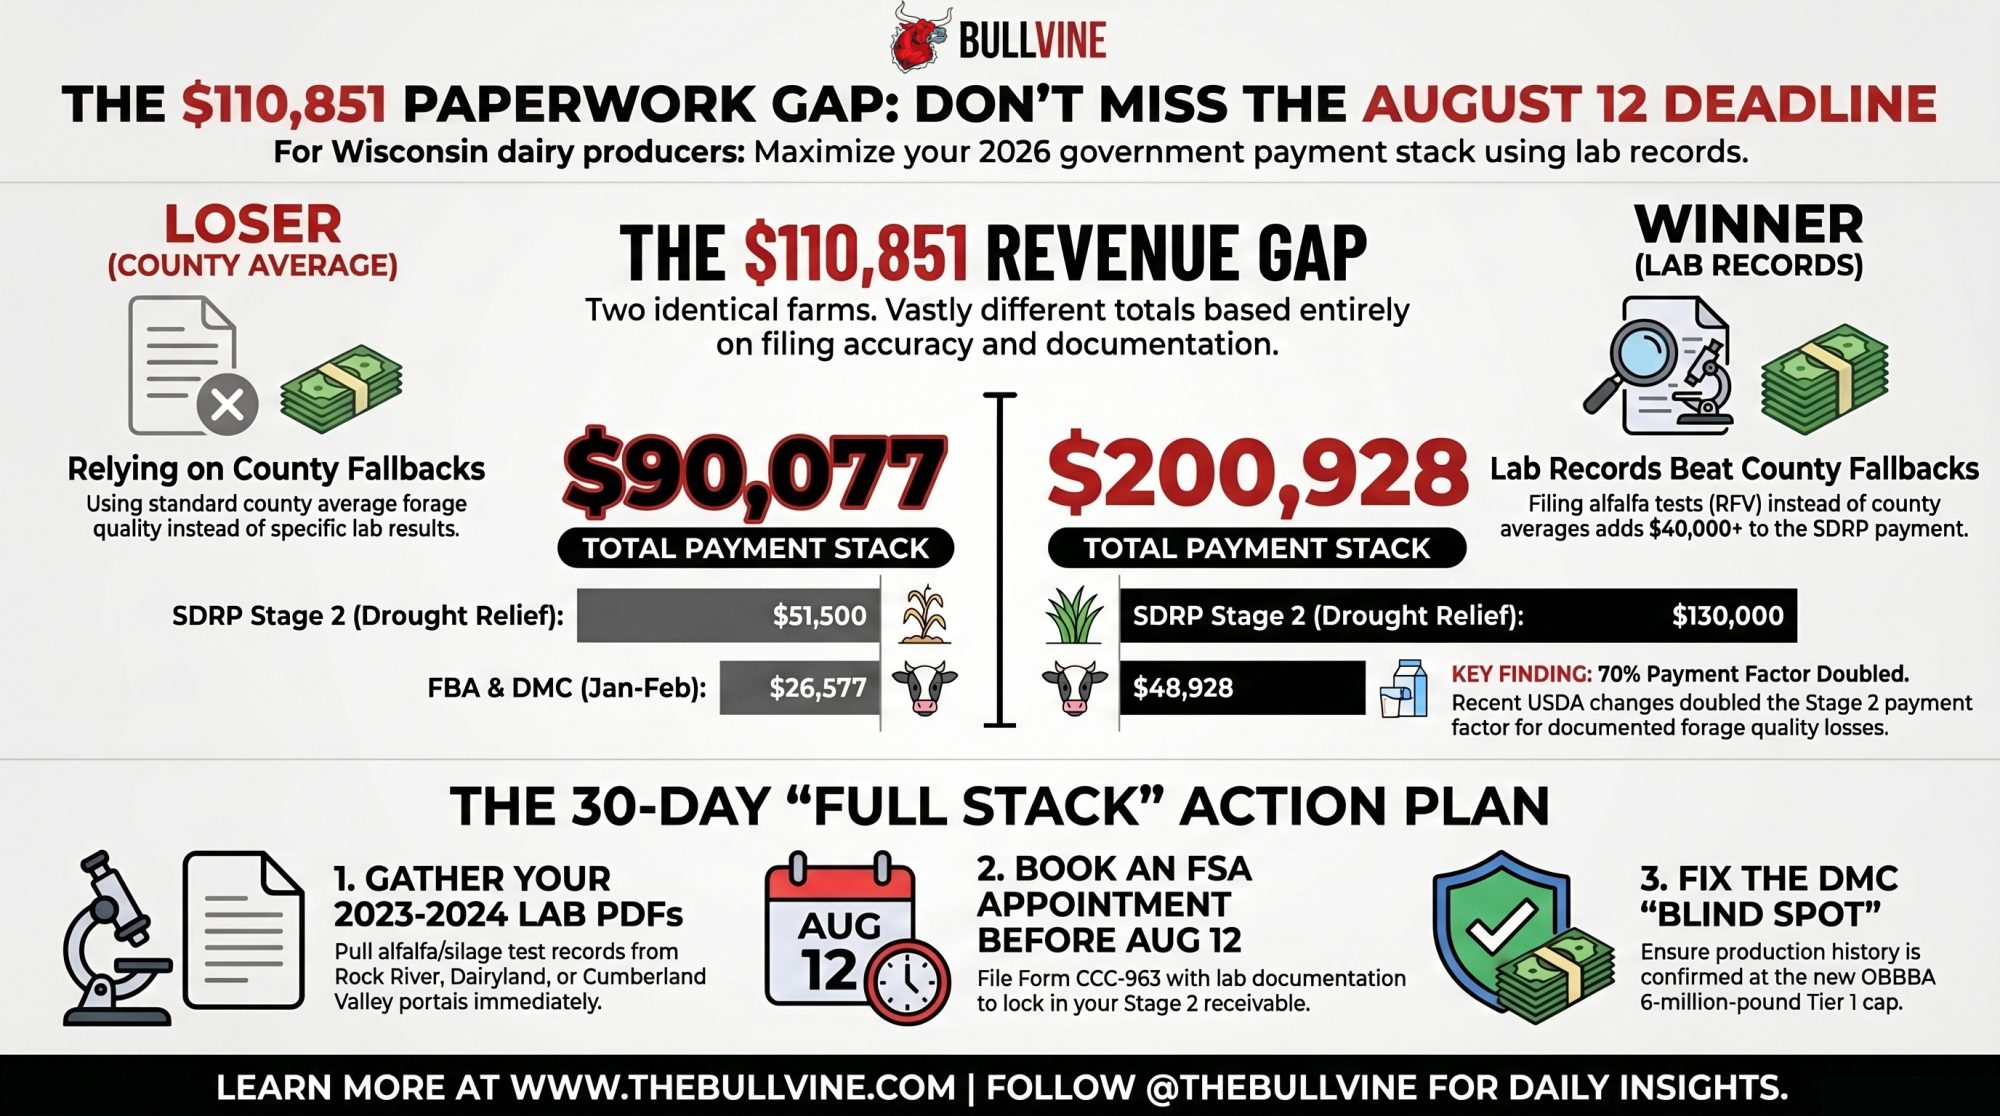
Here’s the assumption that costs Wisconsin dairies the most money before August 12, 2026: that the county fallback is “good enough.” It isn’t. On the Dane County composite’s 550 alfalfa acres, records‑backed filing computes to a post‑cap range of $76,000–$130,000. The fallback computes near $51,500. Mid‑case gap: north of $40,000.
| Window | Action | Trigger / Document | Stake |
| 30 days (before Aug 12) | Pull 2023–2024 alfalfa & corn silage RFV PDFs from Rock River, Dairyland, or Cumberland Valley portals | Lab PDF with harvest date, cutting #, RFV line | $76K–$130K SDRP post-cap |
| 30 days | Book FSA appointment; file CCC-963 Stage 2 application | Operating line drawn >80% for 3+ months → top of list | Same farm, same drought, +$51K vs fallback |
| 30 days | Verify 2025 FSA-578 corn use codes (GR vs SL); confirm DMC at OBBBA 6M lb Tier 1 cap | Same FSA visit, two extra check-boxes | Up to $15,526 FBA recovery + $16,900/10K cwt at January DMC rate |
| 90 days (before Q3 lender renewal) | Build three-scenario DSCR model (best/mid/worst SDRP) with FSA case # attached | Q3 operating line meeting | Receivable vs projection — different lender conversation |
| 90 days | Reconcile DMC production history against 6M lb ceiling; request written confirmation of any OBBBA adjustment | DMC enrollment record | $16,900/month per 10K cwt at January 2026 indemnity rate |
| 365 days (2027 Farm Bill) | Document non-feed cost/cwt vs AFBF $13.34 benchmark | Track Farmdoc & NFU multiplier proposals | Positions farm for any mid-herd reform that lands |
Accepting the county average is a $40,000+ donation back to the Treasury. Don’t be a donor.
Every commercial dairy nutritionist working Wisconsin for the past decade has pushed quality testing. Which means the records exist. They’re in a Rock River Labs portal, a Dairyland Labs PDF, an email folder somebody’s nutritionist sent in 2024 that nobody has opened since. Nobody connected them to a government payment form because nobody called it a dairy program.
What This Means for Your Operation
You’re sitting on a payment stack with a high‑five‑figure variance between best and worst administrative capture, and the variance has nothing to do with herd management. It’s about which FSA forms you’ve filed, whether your corn use codes match your feed plan, and whether your hay test PDFs can be attached to a CCC‑963 before August 12, 2026. The operators who capture the full stack aren’t better farmers. They’re better paperwork clients of their county FSA office.
All payment figures below are estimates based on public program rates as of April 28, 2026. Individual producer payments depend on FSA‑established yields, production history, payment caps, and county‑level data. Verify with your county FSA office before relying on any figure here.
Dane County 800‑Cow Composite — Winner vs. Loser
Two operations. Same herd size. Same acres. Same milk output. One checked the boxes. One didn’t.
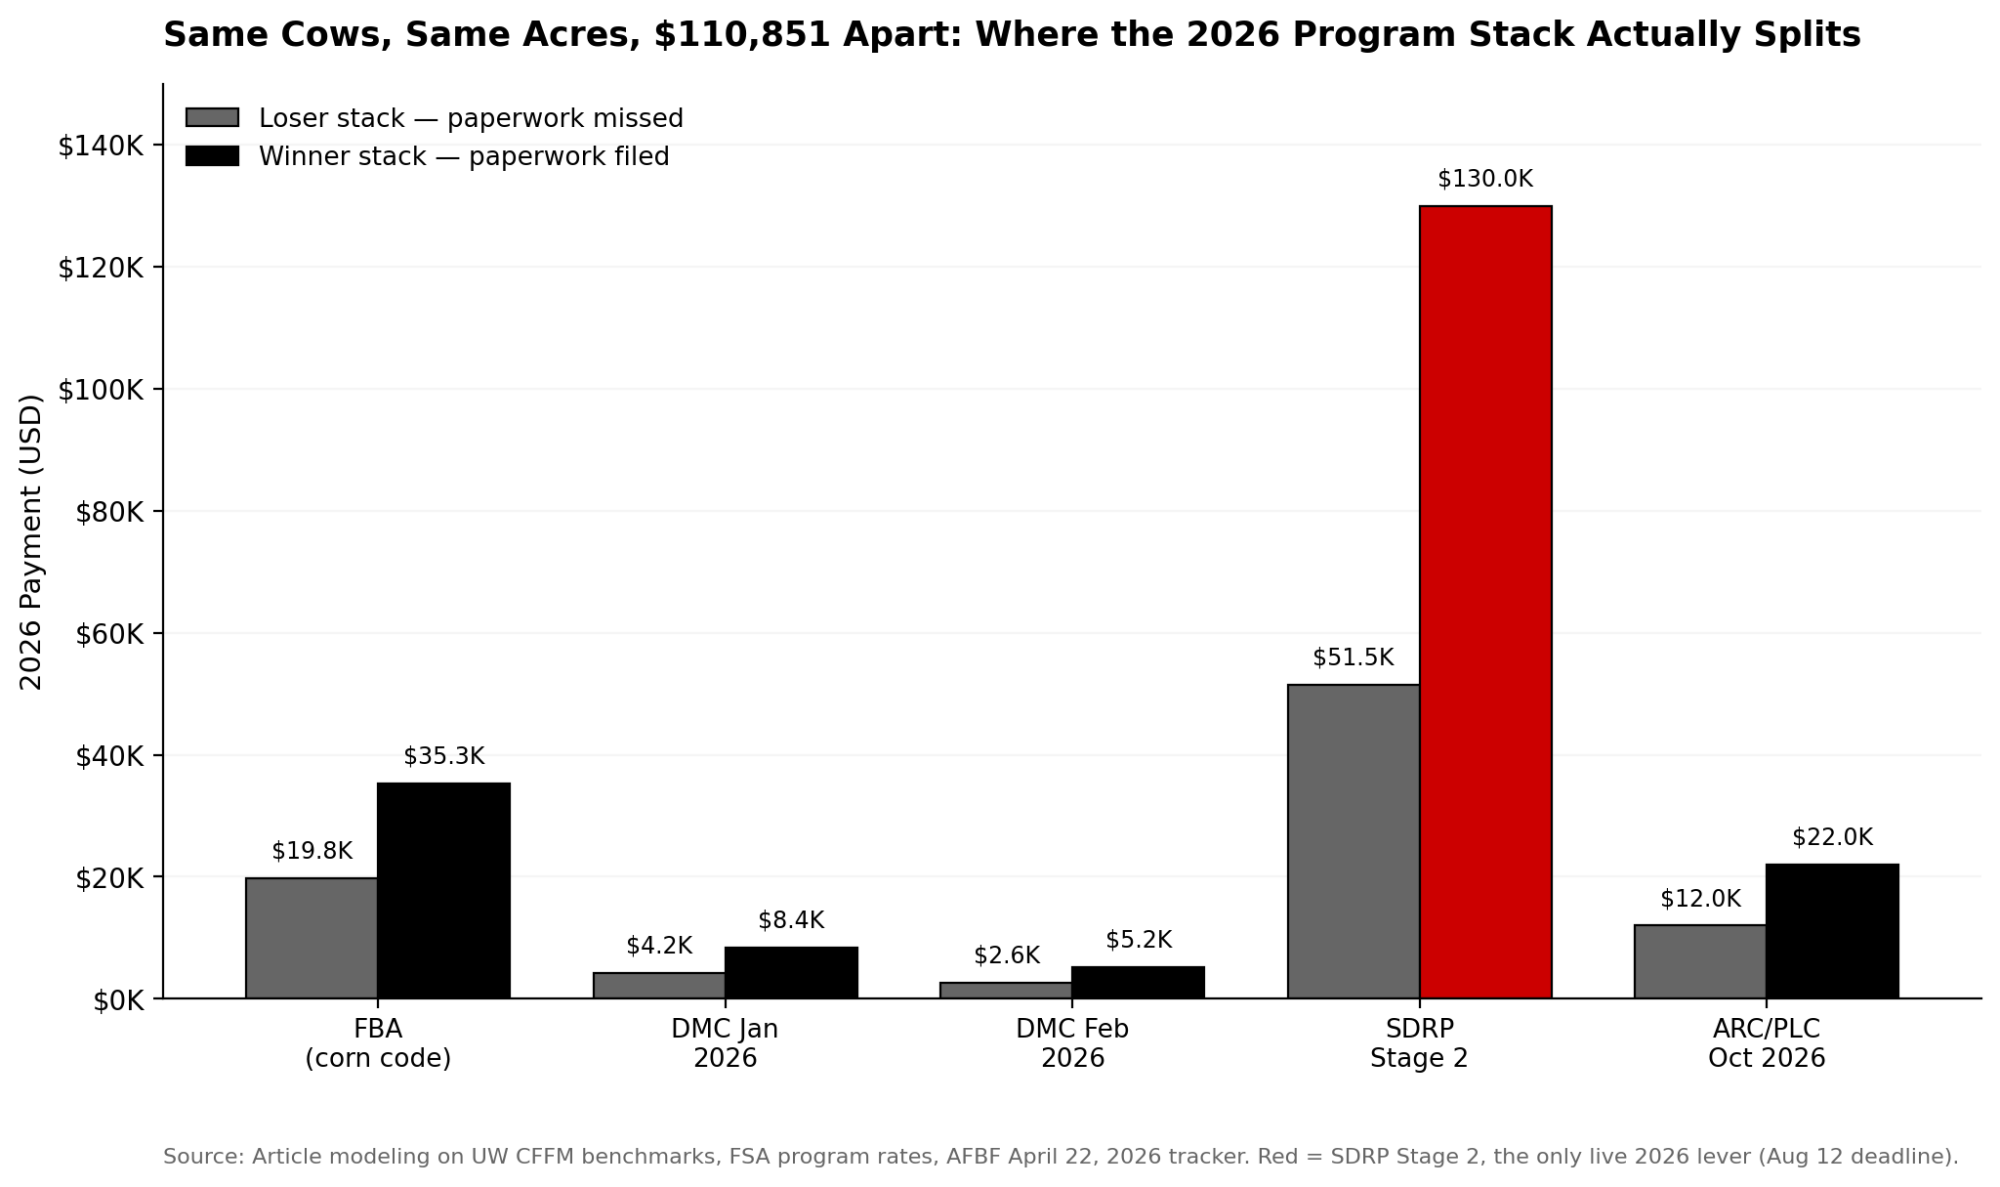
| Line Item | Loser (worst case) | Winner (best case) |
| FBA payment on corn (SL vs GR filing)* | $19,752 | $35,278 |
| DMC Jan 2026 (history under 6M cap vs at cap) | $4,225 | $8,450 |
| DMC Feb 2026 (history under 6M cap vs at cap) | $2,600 | $5,200 |
| SDRP Stage 2 (county fallback vs lab records) | $51,500 | $130,000 |
| ARC/PLC Oct 2026 | $12,000 | $22,000 |
| Stack total | $90,077 | $200,928 |
| Gap vs Loser | — | +$110,851 |
*Loser assumes eligible grain acres coded as SL; Winner assumes those acres coded as GR.
The move from Loser to Winner isn’t herd management. It’s four FSA documents:
- an amended FSA‑578 corn use code,
- a verified DMC production history at OBBBA’s 6M lb Tier 1 cap,
- a CCC‑963 filed with lab‑documented RFV,
- an ARC/PLC election confirmed in October.
Mid‑case capture (lab records on SDRP, DMC at cap, ARC/PLC mid) lands at $168,928 — a $78,851 gap vs the Loser. That’s the $80,000 in the headline.
Running the Numbers: The Dane County 800‑Cow Stack
Composite modeled on University of Wisconsin Center for Farm Financial Management dairy benchmark reports and USDA NASS Wisconsin production norms. Individual farms vary. Replace every input below with your operation’s FSA‑established yields, production history, and lab documentation.
- 800 cows, 24M lbs annual production (30,000 lbs/cow) — a realistic high‑output Wisconsin benchmark. Monthly production ≈ 20,000 cwt.
- 1,900 total acres: 550 alfalfa, 480 corn silage, 350 corn grain, 220 soybeans, 120 oats, 80 wheat, 100 pasture/misc.
- Enrolled at DMC Tier 1, $9.50 coverage, at OBBBA’s 6M lb ceiling.
FBA (received Feb/March 2026):
- 350 corn grain × $44.36 = $15,526
- 220 soybeans × $30.88 = $6,794
- 120 oats × $81.75 = $9,810
- 80 wheat × $39.35 = $3,148
- Subtotal: $35,278
- 550 alfalfa + 480 corn silage + 100 pasture/misc. = 59.5% of the land base, paid $0.
DMC January 2026 indemnity (confirm against the USDA DMC Decision Tool for your operation’s actual production history):
- Reported January 2026 margin $7.81/cwt ($9.50 − $7.81 = $1.69/cwt)
- DMC Tier 1 ceiling 6M lbs annual = 60,000 cwt/year = 5,000 cwt/month
- 5,000 cwt × $1.69 = $8,450/month at the 6M cap
DMC February 2026 indemnity:
- Reported February 2026 margin $8.46/cwt ($9.50 − $8.46 = $1.04/cwt)
- 5,000 cwt × $1.04 = $5,200
Jan + Feb DMC at Tier 1 cap: $13,650. Every 10,000 cwt of additional production history brought under cover equals $16,900 at January’s indemnity rate before tier‑factor adjustments.
SDRP Stage 2 (open, August 12, 2026 deadline):
- 550 alfalfa acres × tons/acre × price/ton = production value basis. Illustrative inputs of 4.0 tons/acre and $175/ton give $385,000. Substitute your FSA‑established county yield and the USDA NASS Wisconsin 2023–2024 price your county office will actually run.
- Tested RFV 100 records: (151 − 100) ÷ 76 = 0.6711 = 67.11% quality loss
- $385,000 × 0.6711 × 0.70 = $180,832 pre‑cap computed ceiling
- County fallback (no lab records, penalty applied to county‑average RFV): about $51,500 computed
Caveat: $180,832 is the pre‑cap computed ceiling. FSA cross‑checks every Stage 2 application against established county yields, county prices, and payment limits. Realistic post‑cap payment for a 550‑acre alfalfa base with documented drought‑year quality losses lands in the $76,000–$130,000 band. The records‑vs‑no‑records gap holds under either figure.
ARC/PLC October 2026 signup:
- 770 row‑crop base acres. Estimated range from recent PLC history: $12,000–$22,000.
Scale it: a 400‑cow operation with 275 alfalfa acres halves the SDRP ceiling. A 1,500‑cow operation with 1,000 alfalfa acres roughly doubles it before payment‑limitation review.
The AFBF Framing: What the April 24 Extension Actually Opened
AFBF’s published framing of FBA — reflected in the April 22 tracker co‑authored by Faith Parum, Ph.D. — roots the program in CCC emergency authority targeting a documented grain‑commodity dislocation, not dairy’s chronic cost‑price inversion. That framing defines what the April 24 SDRP extension is — and isn’t.
It isn’t a dairy program. It’s the one window in 2026 where dairy‑eligible paperwork fits inside a dairy‑sized deadline at a dairy‑relevant payment rate. Stage 2 forage quality applies directly to alfalfa and corn silage. The 70% factor — doubled April 24 — applies in full to new applications and adds a 35% top‑up for producers who filed under Stage 1.
The assumption has been that “general farming wins” from FBA trickle through to dairy. The April 22 tracker and the April 24 extension say the opposite. Dairy’s 2026 program path runs through drought relief, not commodity support. That’s architecture, not rollout timing. For your dairy, that means the only 2026 program still moving meaningful new cash is SDRP, not FBA.
The June Lender Meeting: $90,000 Stack vs $200,000 Stack
Walk in with a receivable, not a wish list. Lenders in 2026 are looking for operators who manage their FSA files as tightly as their somatic cell counts.
Chicago Fed AgLetter reporting through late 2025 pointed to rising non‑real‑estate farm loan demand across the Seventh District. A lender reading a $200,000 government payment projection in June 2026 knows the difference between deposits and optimism.
Here’s the framing that works.
FBA and DMC January are deposits — bring the FSA confirmation. DMC February is in processing, near‑certain, treat as received. SDRP Stage 2 is a filed receivable if you have the case number, filing date, and lab documentation attached. Some ag lenders with FSA program experience may advance against documented filings; the specific rate should come from your lender’s ag desk, not a published assumption.
ARC/PLC is Q4 paydown, not Q2 liquidity. Leading with October ARC/PLC in a June operating‑line conversation signals you’re conflating timing with availability. That closes doors. Separating it explicitly — “this is our Q4 line paydown mechanism” — earns the benefit of the doubt.
On the Dane County composite, annual debt service at current interest rates on roughly $2.8M–$3.5M total debt runs $280,000–$350,000 as a general Midwest benchmark; your amortization schedule will vary. FBA plus DMC received‑to‑date covers 15–20% of that. Add documented SDRP Stage 2 at the mid‑range and program‑income coverage reaches 50–60%. Two scenarios. Both documented. That’s the DSCR conversation.
Why Does a 500‑Cow Dairy Get Hit Hardest by DMC’s Blind Spot in 2026?
If you feel like the program is rigged against the mid‑sized Midwest herd, you aren’t being paranoid — you’re reading the data correctly.
DMC measures one thing. A national all‑milk price minus a standardized feed‑cost stack — corn, soybean meal, premium alfalfa hay. When that formula margin falls below your coverage level, the program pays. Feed cost. That’s the whole program.
Farmdoc’s February 2024 analysis of USDA ERS cost‑of‑production data by herd size makes the structural point: non‑feed costs exceed feed costs for herds under 1,000 cows. Above 2,000 cows, feed dominates. The crossover sits right at the 1,000‑cow line.
That crossover is the blind spot.
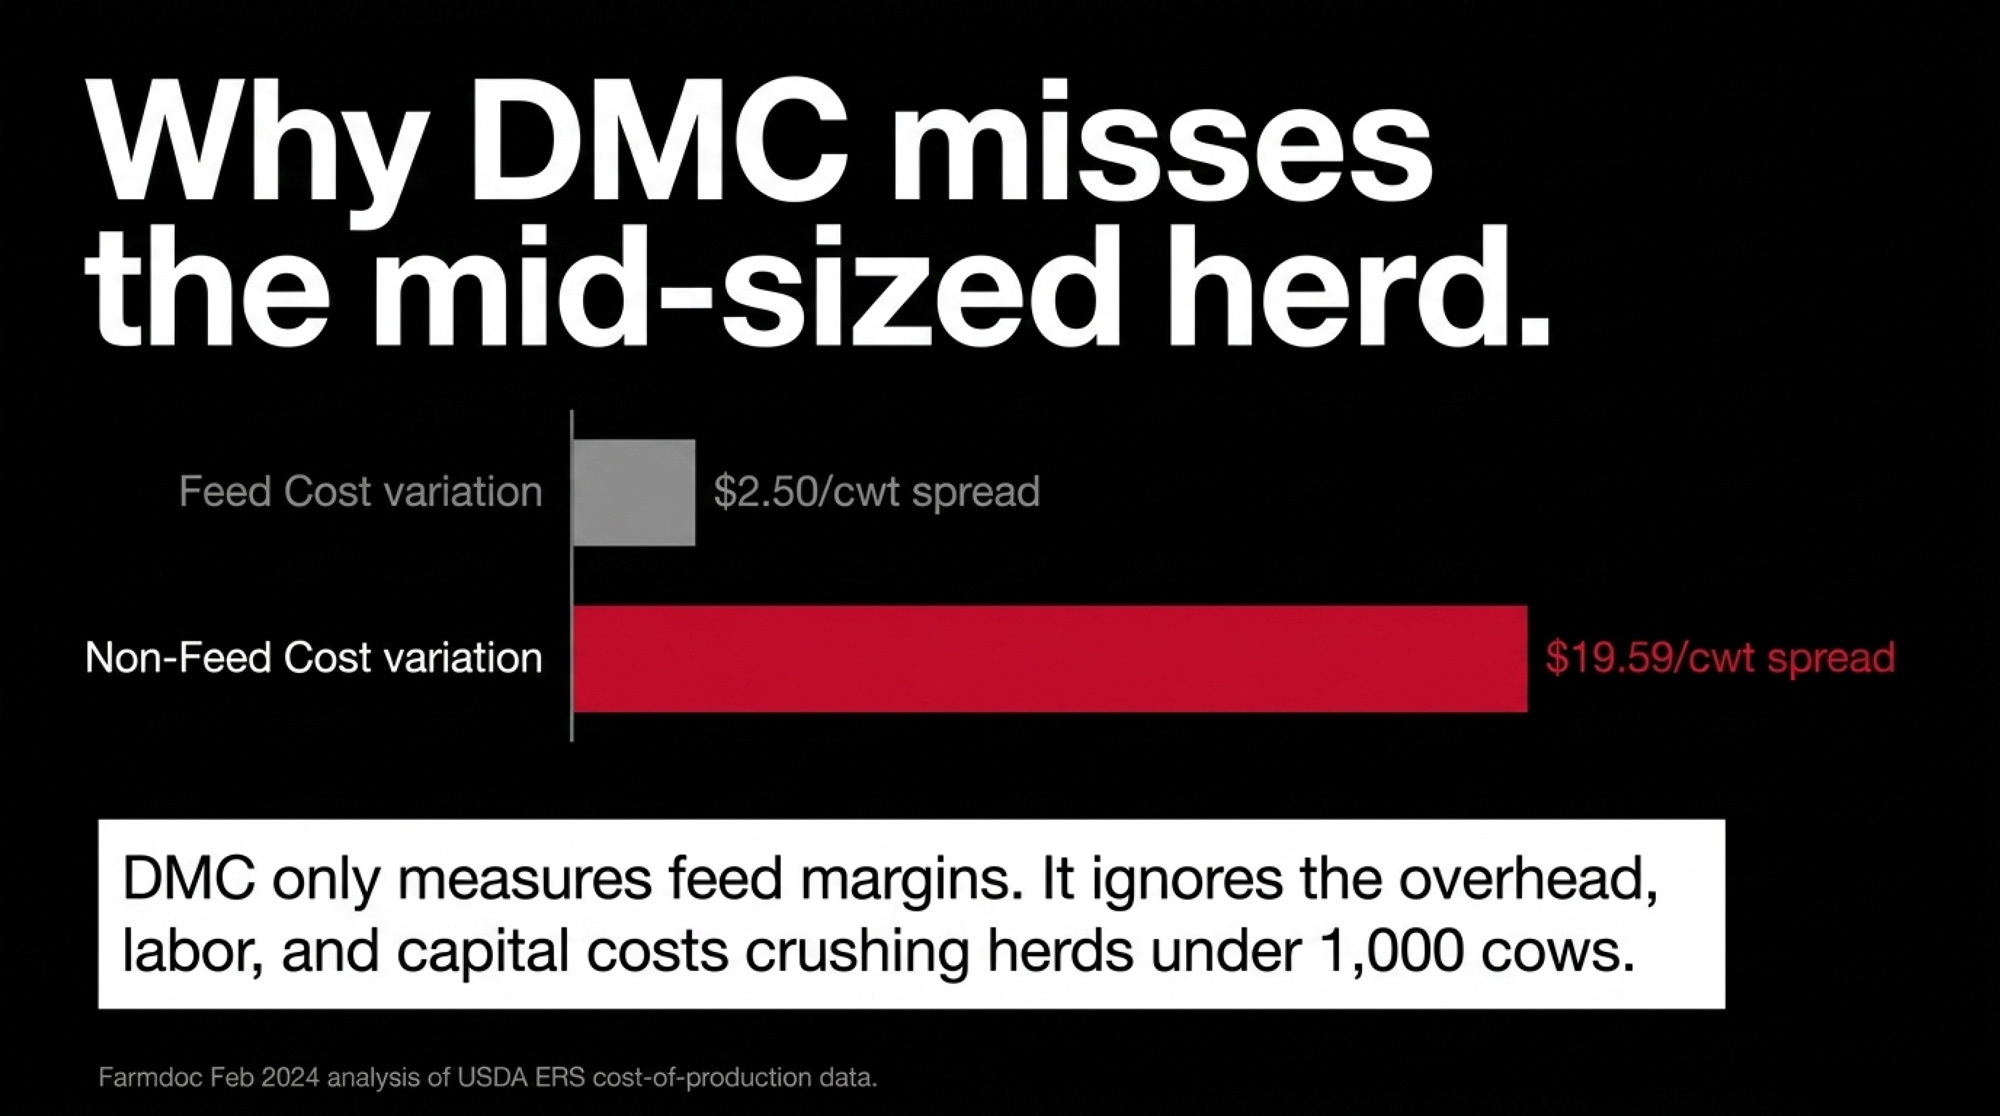
Farmdoc’s ERS‑derived ranges show non‑feed costs spanning from roughly $27.96/cwt at the smallest operations to $8.37/cwt at 2,000+ cow operations — a $19.59/cwt spread driven by overhead, labor, and capital recovery. Feed cost varies across the same herd‑size spectrum by about $2.50/cwt. DMC captures the $2.50. It doesn’t see the $19.59.
AFBF’s March 1, 2026 paper laid the 2024 numbers out cleanly: DMC formula margin $11.98/cwt, non‑feed costs $13.34/cwt, TCOP $23.65/cwt, actual net return negative $1.05/cwt. The formula said the sector was fine. Every milk check in the 300–900 cow band said it wasn’t.
DMC captures the $2.50. It doesn’t see the $19.59.
Regional spread sharpens the picture. The same AFBF paper reports 2024 non‑feed costs at $8.97/cwt in California and $20.21/cwt in the Northeast (Pennsylvania and New York). AFBF’s 2024 regional breakout covers West and Northeast explicitly; Wisconsin and the broader Midwest aren’t separately published in that dataset, so Northeast figures shouldn’t be generalized to Wisconsin operators.
On this analysis, DMC isn’t the dairy safety net. It’s the feed‑margin safety net — and for mid‑size operations where non‑feed cost is the dominant driver, that’s a different program wearing a dairy label. If your non‑feed cost is north of roughly $13/cwt, DMC’s formula is never going to “see” the pressure your lender is staring at.
Related: OBBBA’s Tier 1 Reset: What the 6M lb Ceiling Actually Changes for Your DMC Enrollment
Why Hasn’t the Formula Reform Conversation Happened?
NMPF’s published farm bill priorities emphasize maintaining DMC, expanding production history coverage, and adjusting payment limits — all access improvements. OBBBA (the Overcoming Barriers to Better Business Act) delivered on access: it raised the DMC Tier 1 production‑history ceiling from 5M lbs to 6M lbs — meaning an operation can now cover an extra 1M lbs of annual production at the highest indemnity rate — and extended DMC authorization through 2031. The margin formula itself wasn’t touched.
| Region | Non-Feed Cost ($/cwt, 2024) | TCOP vs DMC Formula Margin | What DMC “Sees” |
| West (California) | $8.97 | Below national TCOP — feed-dominated cost structure | Most of the picture |
| National benchmark (large herds) | $13.34 | TCOP $19.14 vs DMC margin $11.98 — net return –$1.05 | ~50% of pressure |
| Midwest / Wisconsin | Not separately published in AFBF 2024 | Inferred mid-range; verify against UW CFFM benchmarks | Unknown — caution applying NE figures |
| Northeast (PA, NY) | $20.21 | $6.87/cwt above national non-feed average | Roughly 1/3 of pressure |
The coalition math is straightforward. Formula reform creates winners and losers within dairy. Operations with higher non‑feed cost structures — the 300–900 cow band, the Northeast, older facilities — benefit more. Efficient 2,000+ cow Western operations benefit less. Expanding the pie builds coalitions. Redistributing slices fractures them. NMPF’s published rationale: access‑first avoids fracturing the coalition that keeps DMC authorized at all.
The National Farmers Union’s March 2026 Special Order of Business broke that pattern, calling for dairy‑program reforms structured to cover producers’ actual costs of production. Farmdoc’s 2024 policy paper proposed three mechanisms: scaling DMC payments by the ratio of non‑feed to feed costs at a given herd size, creating a parallel non‑feed cost index program, or a flat per‑cow payment targeting the 300–900 cow band. None of the three has moved in the current Congress. Coalition choice, not analytical gap. Until something like that makes it into statute, your non‑feed cost problem is a local management conversation, not a DMC fix.
Related: $16,600 DMC Farm Bill Win vs a 0.9x DSCR: The Gap Policy Won’t Close
The 30/90/365‑Day Playbook for Herds Like the Dane County Composite
Related: Alfalfa RFV Testing Protocol for Dairy Nutritionists and Herd Managers
30‑Day Actions (Before August 12, 2026)
- Pull your 2023 and 2024 alfalfa and corn silage test records today. Rock River Laboratory, Dairyland Laboratories, Cumberland Valley Analytical. Ask for PDFs with harvest date, cutting number, and RFV line.
- Compare your tested RFV to FSA’s national alfalfa high of 151. Below RFV 120 is a strong claim. RFV 100 calculates to 67.1% quality loss before the 70% factor. RFV above 135 makes the records chase marginal — county‑average fallback may be close to equivalent on small acreage.
- Call your FSA county office. Find yours at farmers.gov/contact/fsa‑service‑centers. Ask for a SDRP Stage 2 appointment before August 12, 2026. The form is CCC‑963. Say: “I want to file a Stage 2 application for forage quality losses on alfalfa acres in 2023–2024. I have lab documentation.”
- Red‑flag trigger: If your operating line has been drawn above 80% of approved limit for three consecutive months heading into June, SDRP Stage 2 moves to the top of this list. On the Dane County composite, mid‑range SDRP payment equals roughly 30% of annual debt service.
- Same appointment, two additional checks: confirm your 2025 corn use codes on FSA‑578 and ask whether any amendment path applies if eligible grain acres were filed as SL. Verify 2026 DMC enrollment reflects Tier 1 under OBBBA’s 6M lb ceiling and that production history is at that ceiling.
- Where it backfires: Some FSA offices are still processing OBBBA production‑history updates. Ask for written confirmation of adjustments — don’t rely on verbal.
90‑Day Actions (Before Q3 Lender Renewal)
- Build a three‑scenario DSCR model for the June lender meeting. Best (SDRP filed with records, high post‑cap). Mid (records filed, mid‑range). Worst (county fallback). Show debt service coverage under each. Bring actual FSA deposit records for FBA and DMC. Separate ARC/PLC explicitly as Q4 paydown.
- What it requires: Two hours at the FSA office, three years of milk marketing records from your CPA, your lender’s DSCR worksheet, your SDRP filing confirmation with case number.
- Reconcile DMC production history against OBBBA’s 6M lb Tier 1 ceiling. If your history was set under the 5M lb ceiling and current output runs above 6M lbs, confirm whether your history was recalculated to the new cap. Every 10,000 cwt captured at $1.69/cwt is $16,900 in January alone.
- Where it backfires: Rushing a lender meeting without the SDRP case number converts a documented receivable back into a projection. Different conversation.
365‑Day Moves (2027 Farm Bill Positioning)
- Document your operation’s non‑feed cost per cwt against the AFBF 2024 national benchmark of $13.34/cwt, with regional variance from $8.97/cwt West to $20.21/cwt Northeast. If you’re above the national number, you’re in the DMC blind spot.
- Opportunity signal: If your non‑feed cost lands between $12 and $16/cwt and your DSCR holds above 1.1 without government payments, you’re positioned to benefit from any Farmdoc‑ or NFU‑style DMC multiplier aimed at mid‑size herds. Track 2027 Farm Bill markup for non‑feed cost‑floor language.
- Where it backfires: If non‑feed cost exceeds $16/cwt at 800‑cow scale, no formula reform under discussion closes that gap. That’s a structural cost conversation with a dairy financial consultant, not a legislative fix.
The Trade‑Off at the Center of This
The trade‑off isn’t whether to file. It’s whether to spend 90 minutes retrieving lab records for roughly $80,000 in mid‑case SDRP post‑cap payment vs accepting the county fallback at about 40% of the records‑backed figure and calling it even. On 550 alfalfa acres with documented drought‑year quality losses, that 90 minutes outranks any other paperwork you’ll do this week.
The 2026 DMC paid the Dane County composite $8,450 in January and $5,200 in February at the 6M lb Tier 1 cap. FBA paid $35,278 for the year. SDRP Stage 2, filed before August 12, 2026 with lab records, computes between $76,000 and $130,000 in realistic post‑cap payment. The full stack, captured cleanly, lands in the $170K–$200K band. Captured badly, near $90K. Mid‑case gap: $78,851. Best‑vs‑worst: $110,851.
It’s not strategy. It’s administration nobody sent you an email reminder about — because FBA was a row‑crop program, SDRP was filed under a drought‑relief banner, and DMC’s production history and Tier 1 ceiling reset under OBBBA inside a window most operators didn’t treat as a dairy deadline.
Pull your milk check. Pull your last hay test PDF. Pull your fall 2025 FSA‑578. If corn reads SL and you’ve never asked your county office whether any amendment path applies, if the hay test is in a portal you haven’t opened since second cut 2024, if DMC production history still shows the old 5M lb ceiling — what does your fall 2025 FSA‑578 actually say, and what is your county FSA office’s position on SDRP Stage 2 appointments and corn‑code amendments before August 12, 2026?
CALL TO ACTION: Make These Three Calls This Week
| Step | Contact | What to Ask For |
| 1. Pull your hay records | Rock River Laboratory (Watertown, WI — see rockriverlab.com for current contact) | 2023–2024 alfalfa and corn silage test PDFs with harvest date, cutting, and RFV line |
| 2. Pull your hay records | Dairyland Laboratories (Arcadia, WI — see dairylandlabs.com for current contact) | Same as above |
| 3. Pull your hay records | Cumberland Valley Analytical Services(Waynesboro, PA — see foragelab.com for current contact) | Same as above |
| 4. Book your FSA appointment | Your county FSA office — farmers.gov/contact/fsa‑service‑centers | SDRP Stage 2 appointment before August 12, 2026; corn‑code amendment check on FSA‑578; DMC history confirmed at OBBBA 6M cap |
Key Takeaways
- SDRP Stage 2 is where 2026 money still moves for dairy. Filing before August 12 with actual hay test RFV records turns a $51,500 county‑fallback payment into a $76,000–$130,000 post‑cap range on 550 alfalfa acres — same drought, same farm, different paperwork.
- Your 2023–2024 RFV PDFs are probably already in a Rock River, Dairyland, or Cumberland Valley portal. Pull them, book an FSA appointment, file on CCC‑963. That’s the $80,000 mid‑case decision — 90 minutes of work, not a strategy project.
- Check two other boxes in the same visit: confirm 2025 FSA‑578 corn codes (GR vs SL on grain acres) and that your DMC production history is sitting at OBBBA’s 6M lb Tier 1 cap. Every 10,000 cwt left uncovered cost $16,900 in January alone.
- Walk into the June lender meeting with a filed SDRP case number as a documented receivable, not a projection — especially if your line’s been drawn above 80% for three straight months or non‑feed costs are running above the AFBF $13.34/cwt benchmark.
Complete references and supporting documentation are available upon request by contacting the editorial team at editor@thebullvine.com.
Learn More
- The $15,800 DMC Wake-Up Call: Tier 1 Just Jumped to 6 Million Pounds. Don’t Sign ‘Same as Last Year. — Arms you with the math to claw back $15,800 in premiums by exploiting the new 6 million pound Tier 1 cap. Breaks down why autopilot renewals are a six-figure mistake for mid-sized operations.
- The Triple Cushion Trap: Why 2025’s Strong Margins Won’t Save You in 2026 — Reveals why record-high cull prices and cheap feed are masking a structural insolvency risk for herds above a $20/cwt cost of production. Delivers a survival zone checklist to protect equity before cushions deflate.
- Robots Won’t Save Your Dairy If You’re Alone: 5 Hard Truths About Labor and Robotic Milking ROI Under 500 Cows — Dismantles the trade-show hype around automation by exposing the $27/hour labor threshold required to make robotic milking break even. Follows the money on facility renovation costs that sink 62% of technology investments.
 The Sunday Read Dairy Professionals Don’t Skip.
 The Sunday Read Dairy Professionals Don’t Skip.
Every week, thousands of producers, breeders, and industry insiders open Bullvine Weekly for genetics insights, market shifts, and profit strategies they won’t find anywhere else. One email. Five minutes. Smarter decisions all week.
