Travis Tranel killed a $20M zero‑interest dairy loan. Our barn math shows a 300-cow farm could have saved $193,750 in interest. How far behind does that put you?
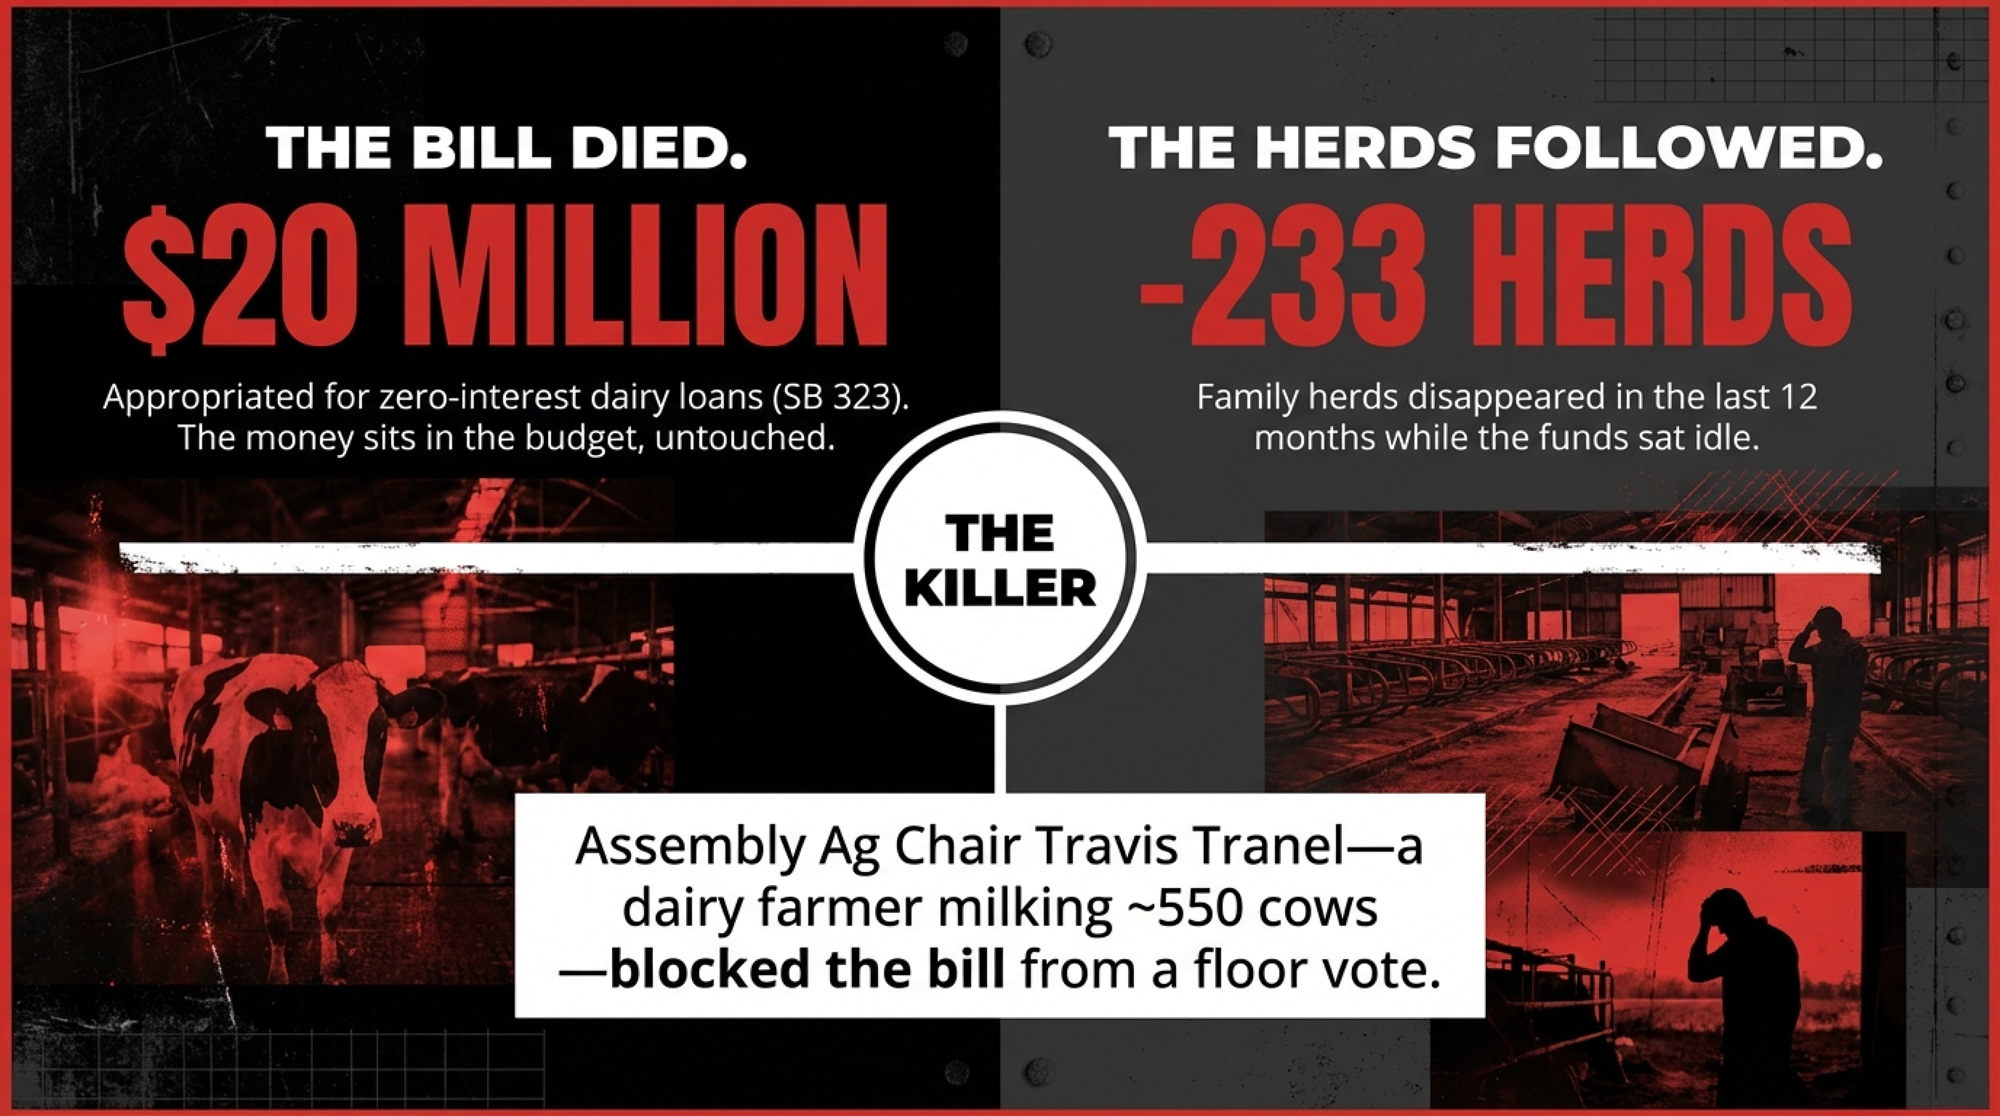
Executive Summary: Wisconsin set aside $20 million for zero‑interest dairy loans to help 50–714 cow herds upgrade equipment, but the program never launched because SB 323 died in the Assembly. The kill shot came from Assembly Ag Chair Travis Tranel — a dairy farmer milking around 550 cows who would have qualified for the loans himself. While that money sits idle, the state starts 2026 with 5,115 licensed herds, 233 fewer than a year ago, even as 1.28 million cows keep turning out record milk through consolidation. Our barn math shows a 300‑cow farm financing a $250,000 upgrade at today’s commercial rates pays about $19,375 a year in interest, or $193,750 over 10 years, instead of zero under SB 323. Meanwhile, states like South Dakota and Idaho are writing $5–55 million checks in bonds, grants, and tax credits to recruit the very cows Wisconsin is losing. This piece unpacks how that policy gap hits your balance sheet and lays out a 30/90/365‑day playbook for pressing lawmakers, rethinking capital plans, or asking if Wisconsin is still the right place for your herd to grow.
Wisconsin’s $20 million Dairy Cattle Innovation Program is dead. SB 323 passed the state Senate 18-15 on January 21, 2026. It never got a floor vote in the Assembly before the session ended on February 21. That same month, the state’s licensed dairy herd count sat at 5,115 — down from 5,348 just a year earlier, according to USDA NASS and Wisconsin DATCP.
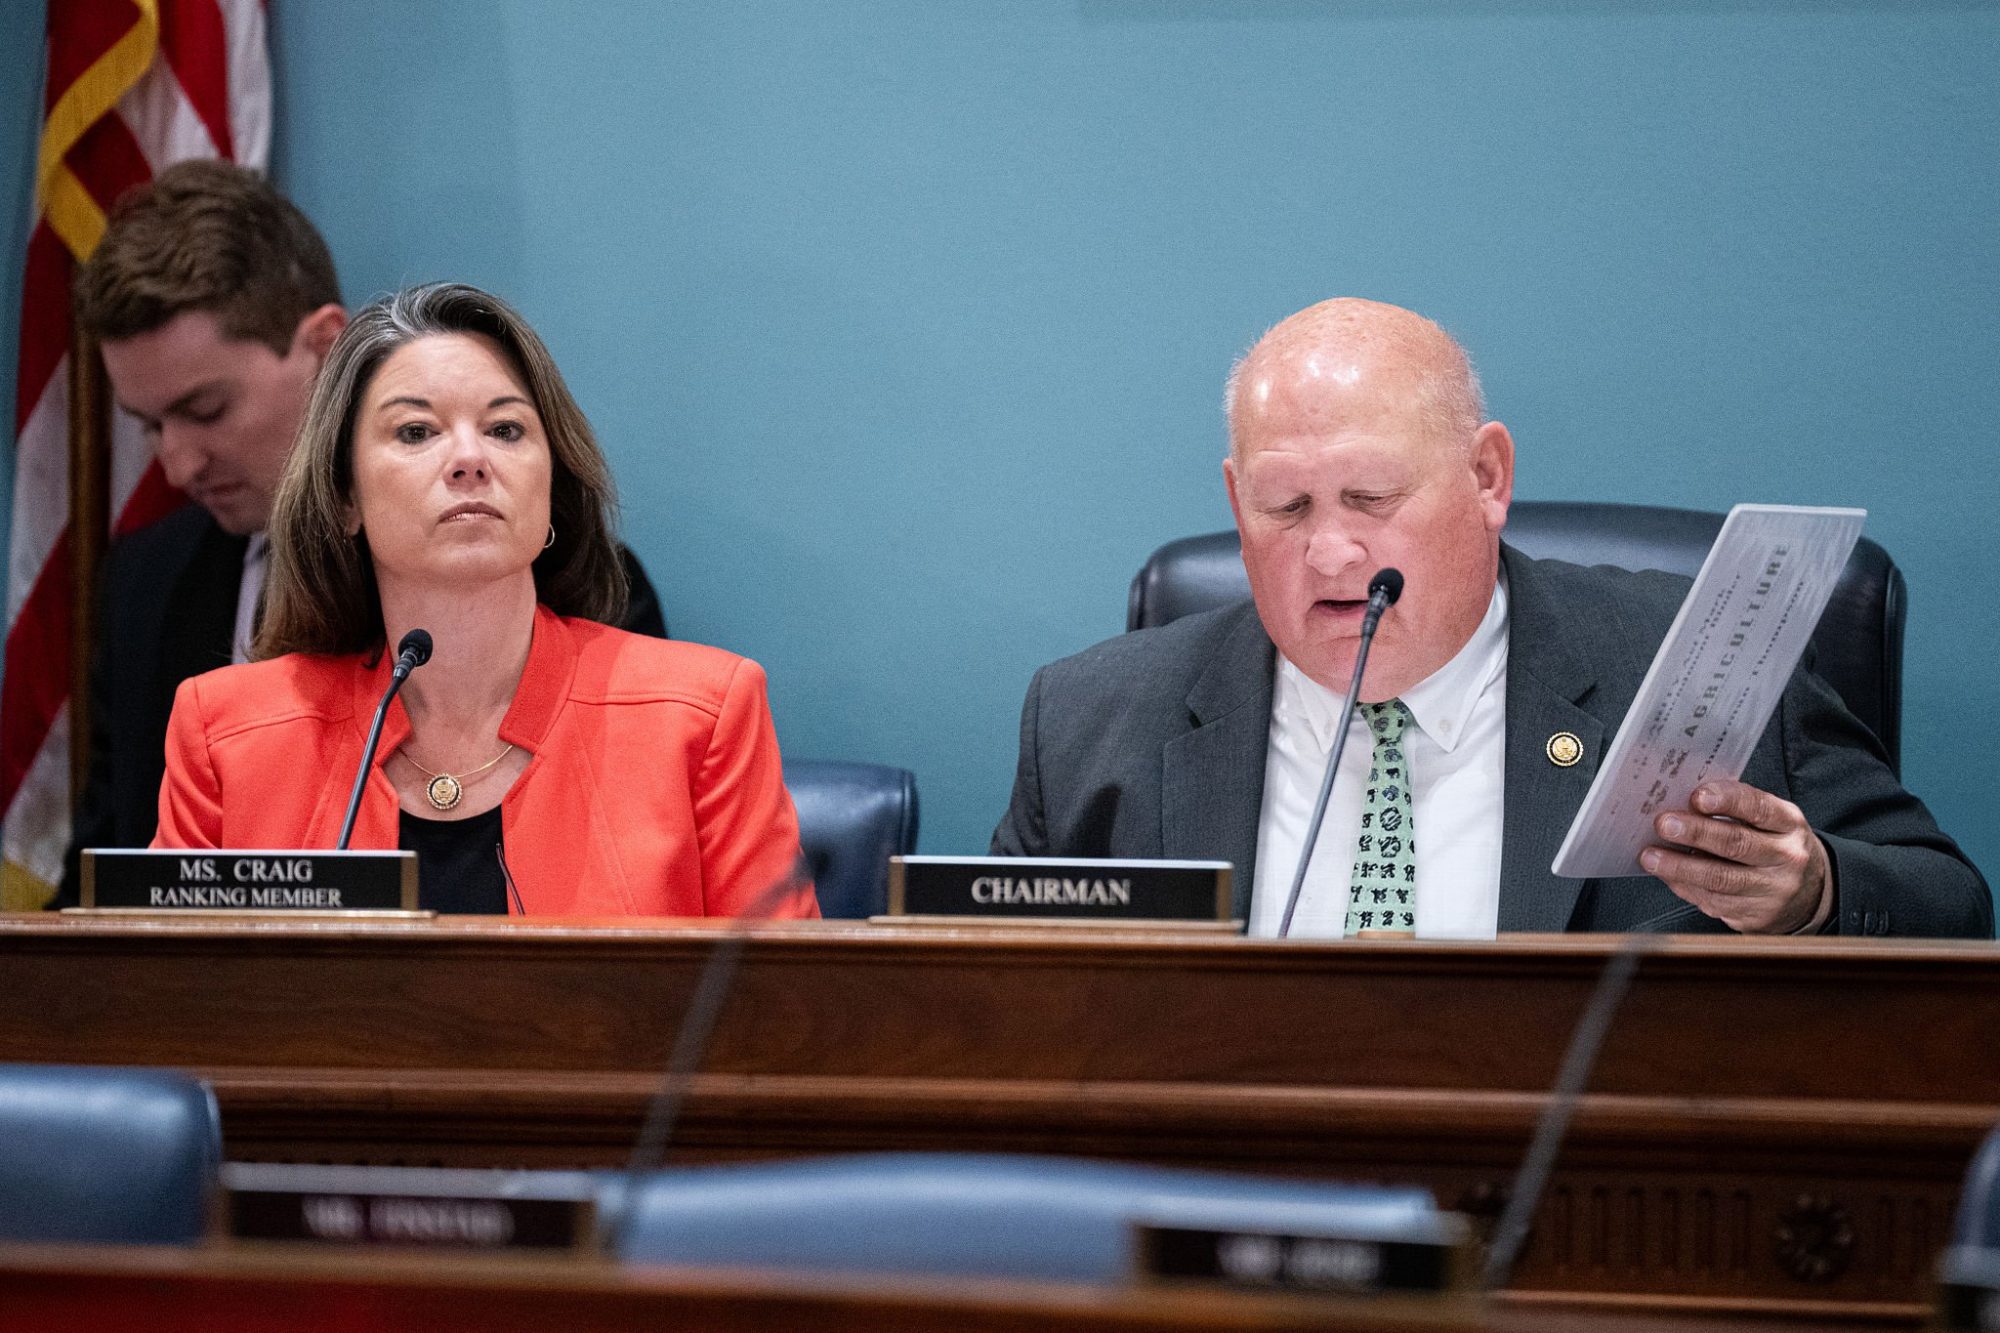
The man who didn’t bring the bill forward? Assembly Agriculture Committee Chair Travis Tranel, a sixth-generation dairy farmer who milks around 550 cows near Cuba City in Grant County, is currently serving his eighth term. A dairy farmer killed a bill to modernize dairy farms. That’s the part nobody’s talking about.
What Did Wisconsin’s $20 Million Dairy Loan Program Fund?
Be specific about what died, because there’s been some confusion. This wasn’t a research bill. Wisconsin already spends $7.8 million a year on dairy research through the Dairy Innovation Hub across UW-Madison, UW-Platteville, and UW-River Falls. That money is still flowing.
SB 323 was a zero-interest revolving loan program — up to $500,000 per farm — for dairy operations with 50 to 714 milking cows. The money was earmarked for on-farm equipment upgrades, technologies that improve milk production efficiency, animal health improvements, manure management systems, and labor-efficiency tools. The robots, the precision feeders, the methane digesters, and the parlor upgrades that farms with fewer than 700 cows can’t finance at competitive rates.
Sen. Rob Stafsholt, the New Richmond Republican who authored the bill, put it bluntly: “Some of the technology that can make farmers as efficient as possible and would help the smaller guys to compete with the bigger guys is often financially out of reach for our small and medium farms”.
The $20 million was already in the state budget. It was appropriated in the July 2025 biennial budget, passed by both chambers, and signed by Governor Evers. The money existed. It just needed a deployment program.
Read more: what happens when the milk truck stops coming to one more Wisconsin yard.
How the Bill Got Killed by Its Own Committee Chair
SB 323 cleared the Senate Agriculture and Revenue Committee 8-0. It passed the full Senate 18-15. In a legislature where dairy bills rarely see that level of bipartisan support, this one had momentum.
Then it reached the Assembly.
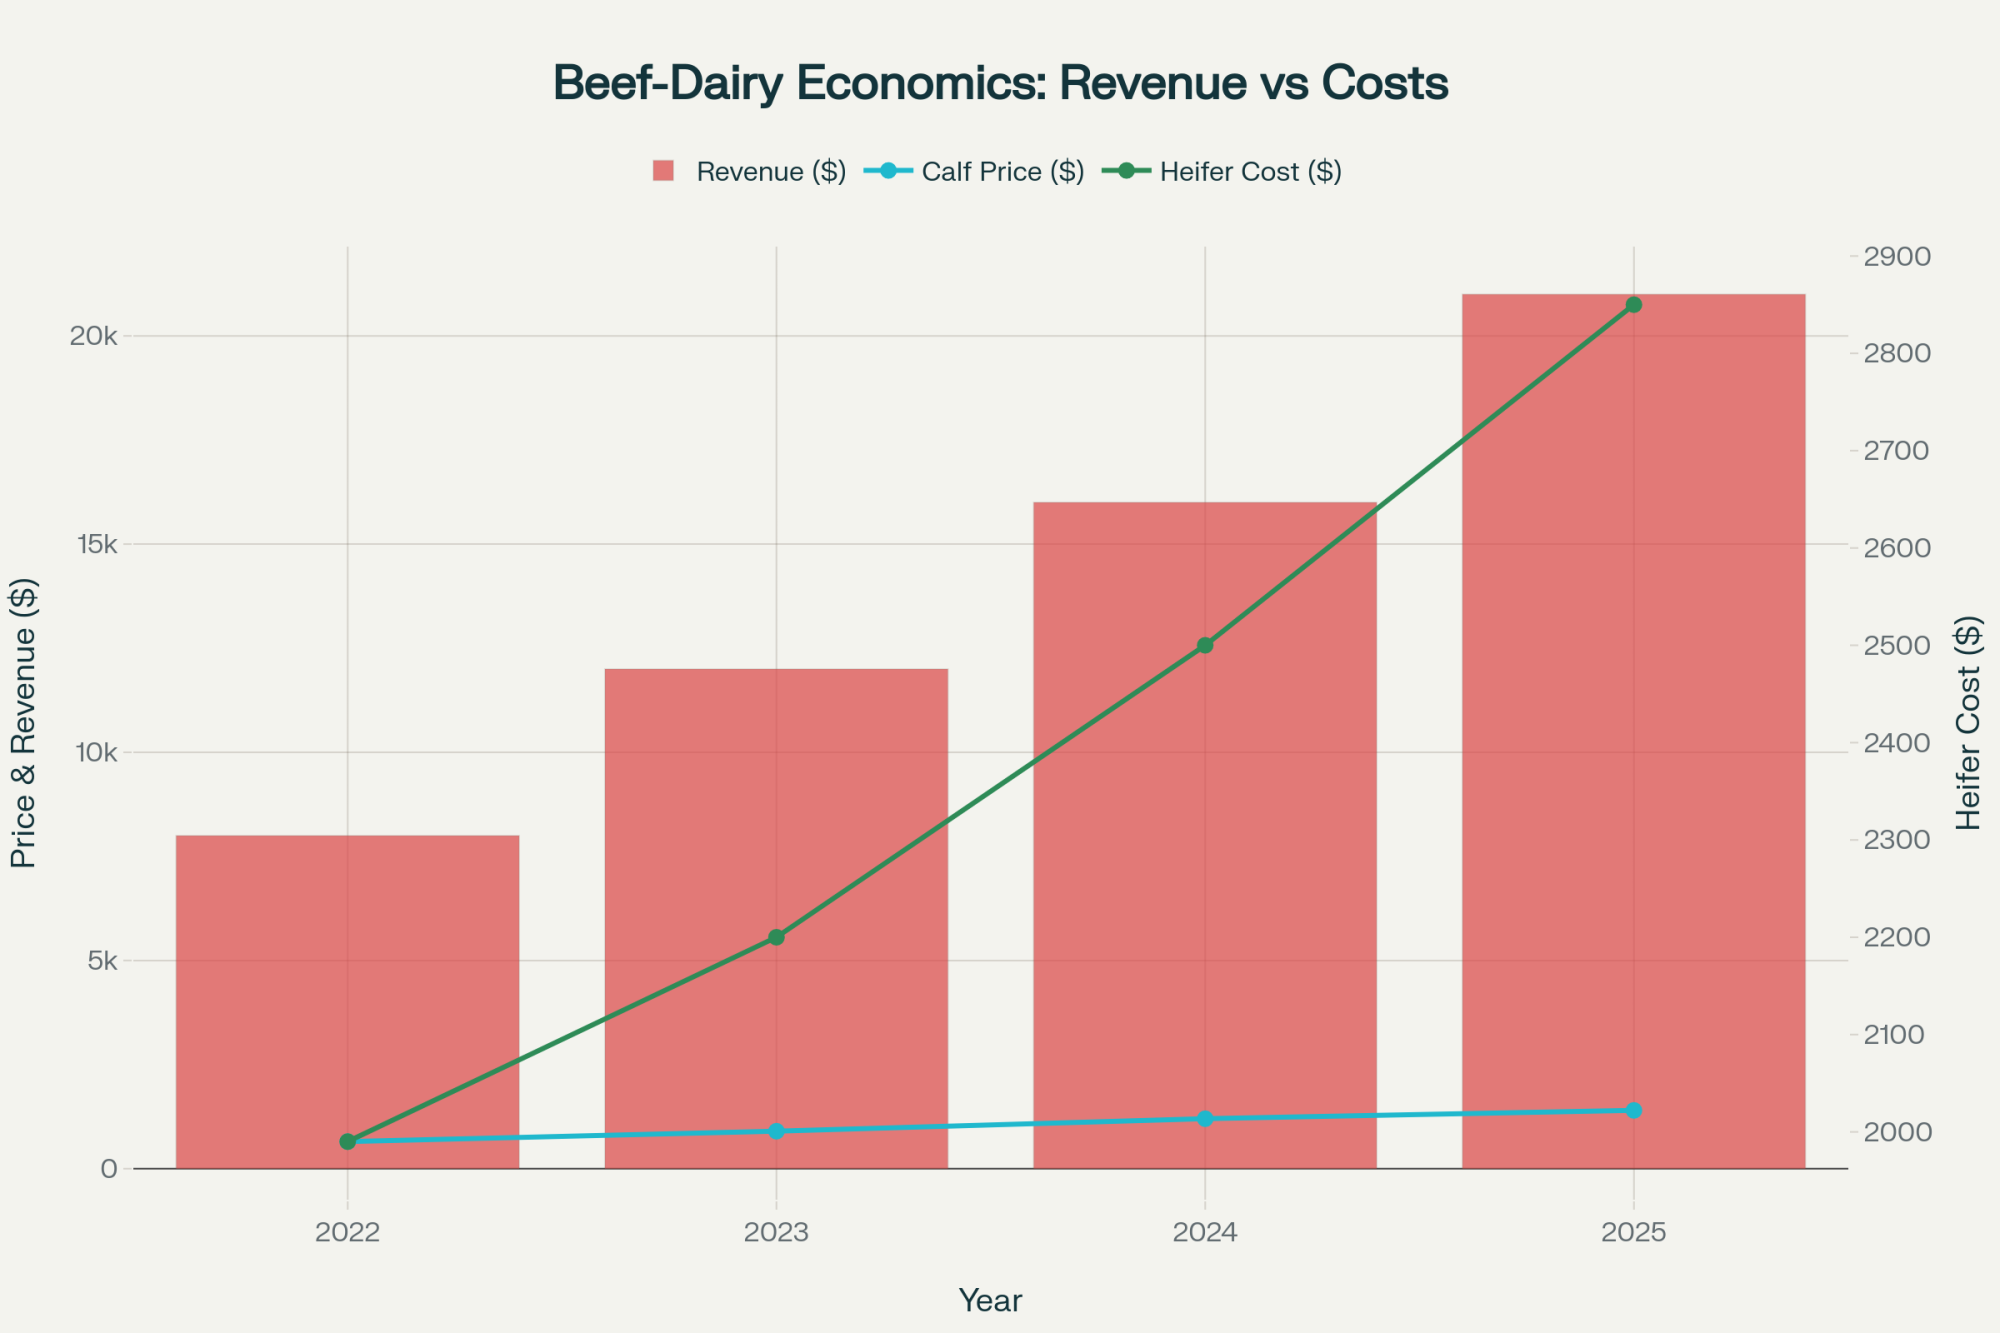
Tranel amended the bill to split the funding — $10 million for dairy cattle loans and $10 million for beef cattle. His reasoning: beef prices are high, supply is low, and Wisconsin should invest in both sectors. “We should have recognized, and we had a substitute amendment that acknowledged beef prices are high and beef supply is low,” Tranel told Brownfield Ag News.
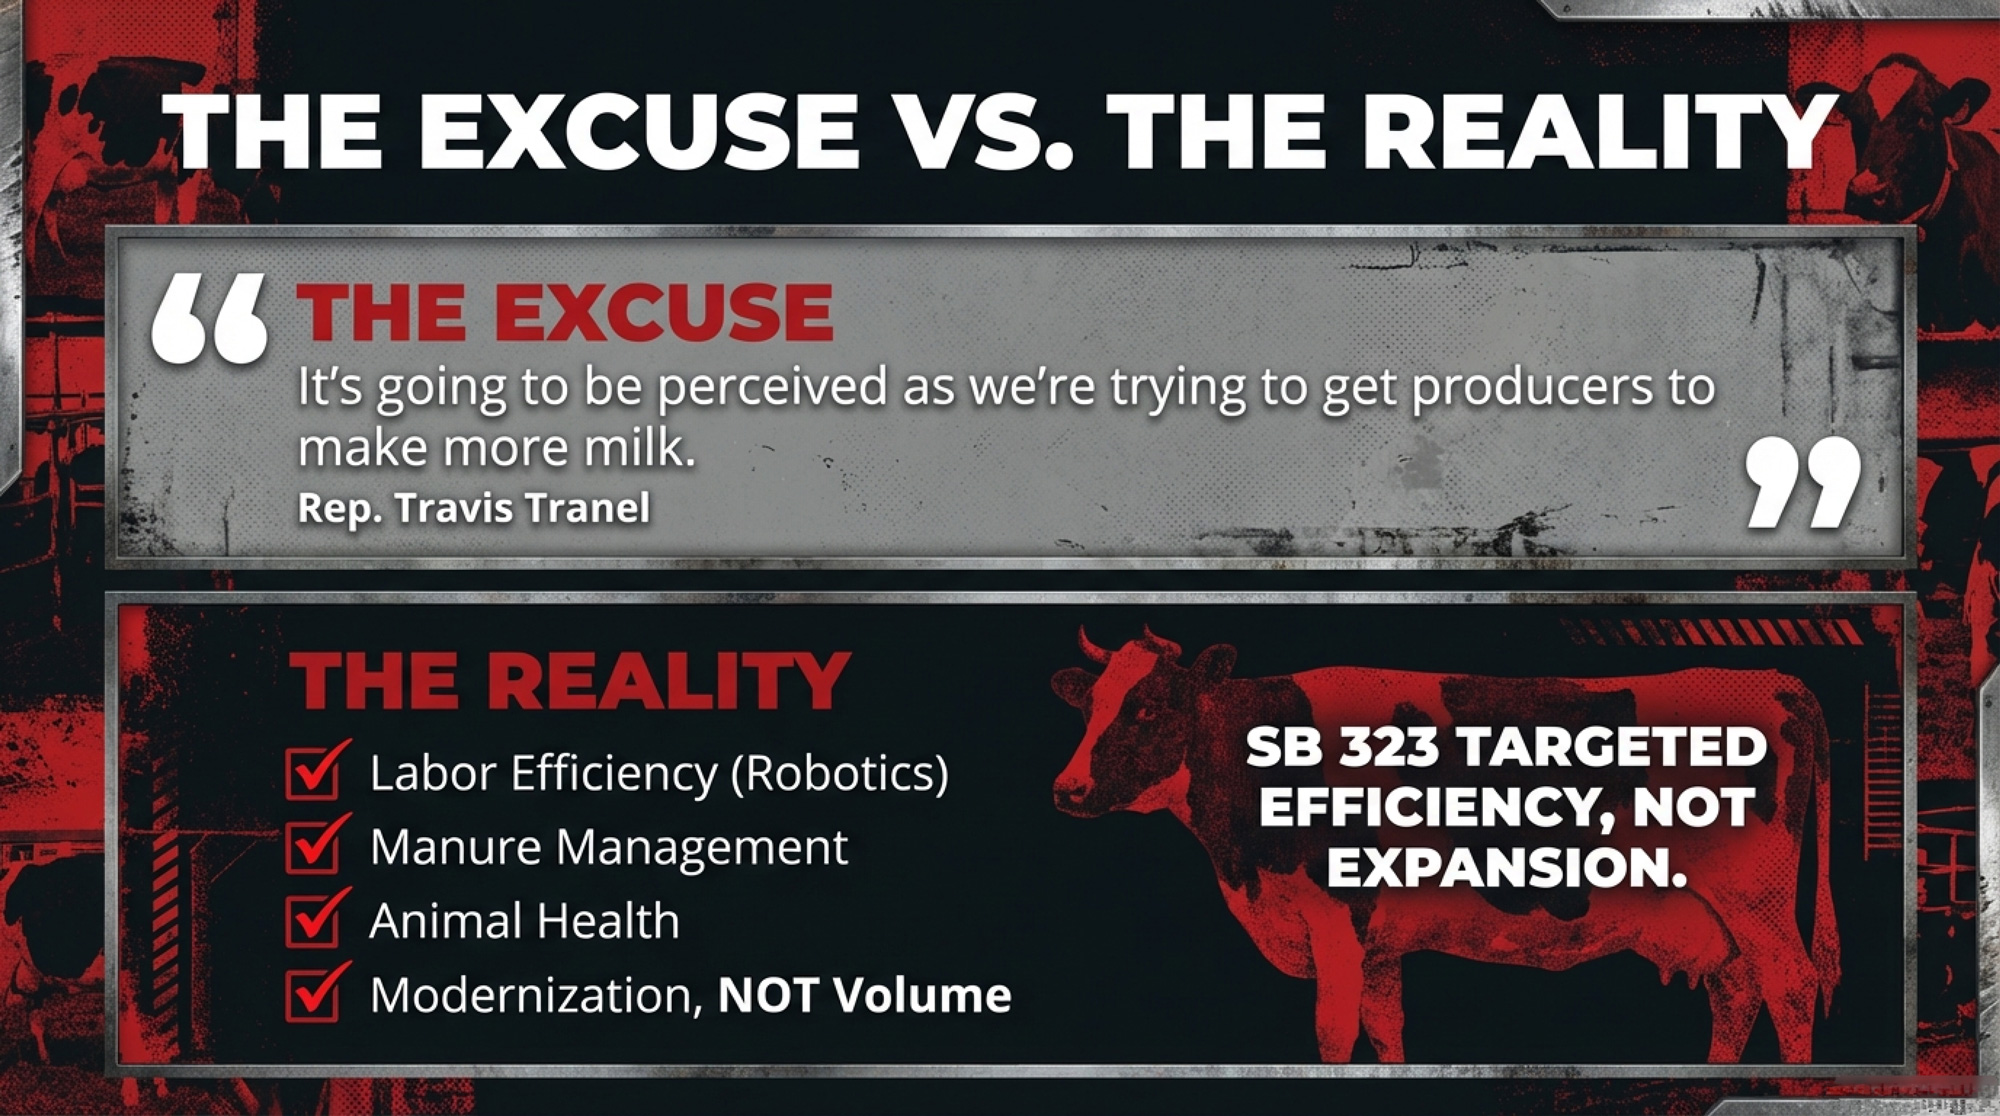
But there was a deeper philosophical objection.. “It doesn’t necessarily look good on the government when we’re pumping more money into the system, and it’s going to be perceived as we’re trying to get producers to make more milk,” he said.
Read that again. The chair of the Assembly Agriculture Committee — a man who milks around 550 cows and holds degrees in economics and finance from Loras College — argued against helping dairy farmers modernize because it might look like the state is encouraging milk production.
The amended bill never reached a floor vote. The session ended. The $20 million will likely return to the general fund, according to Tranel himself.
The Fight That Fractured the Coalition
The bill didn’t just die from Tranel’s hesitation. It was caught in a genuine policy tug-of-war over who deserves the money.
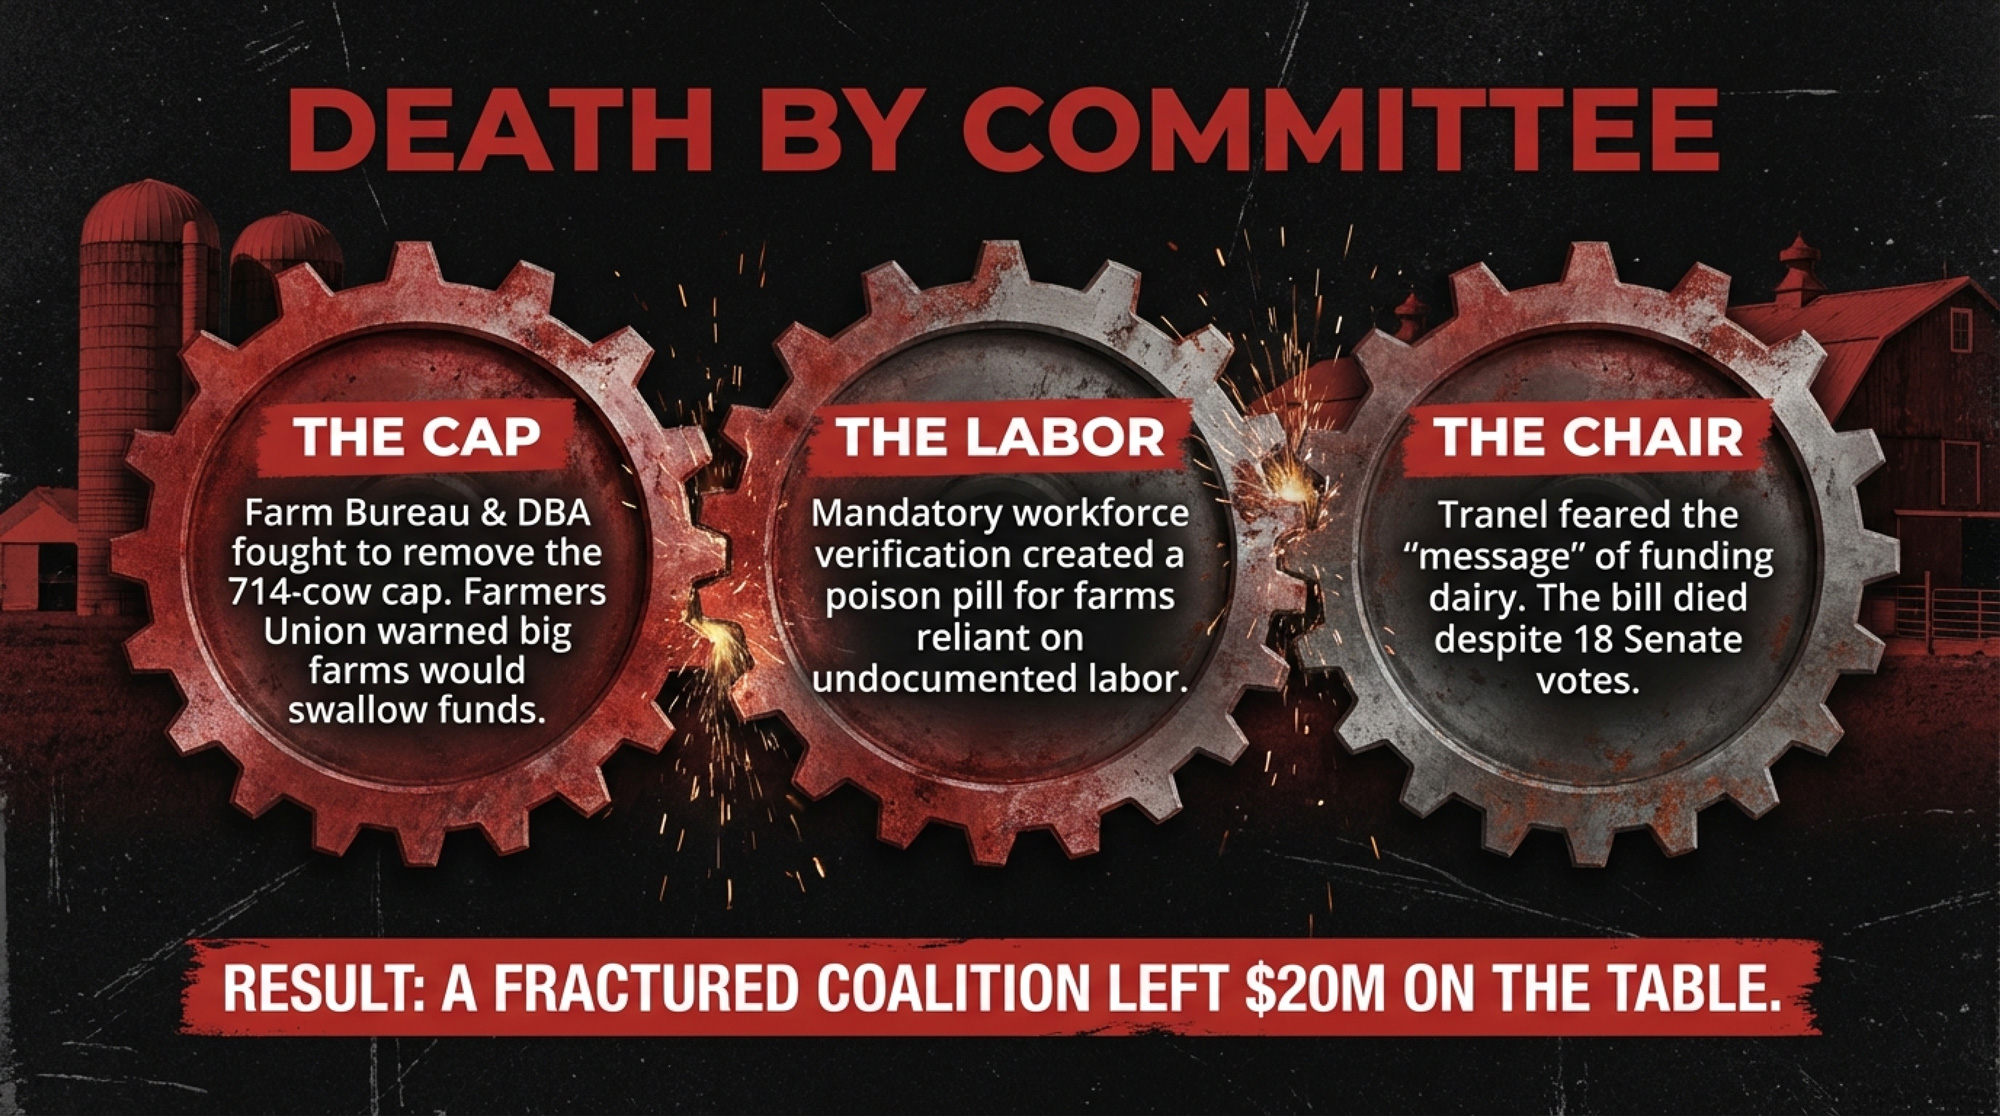
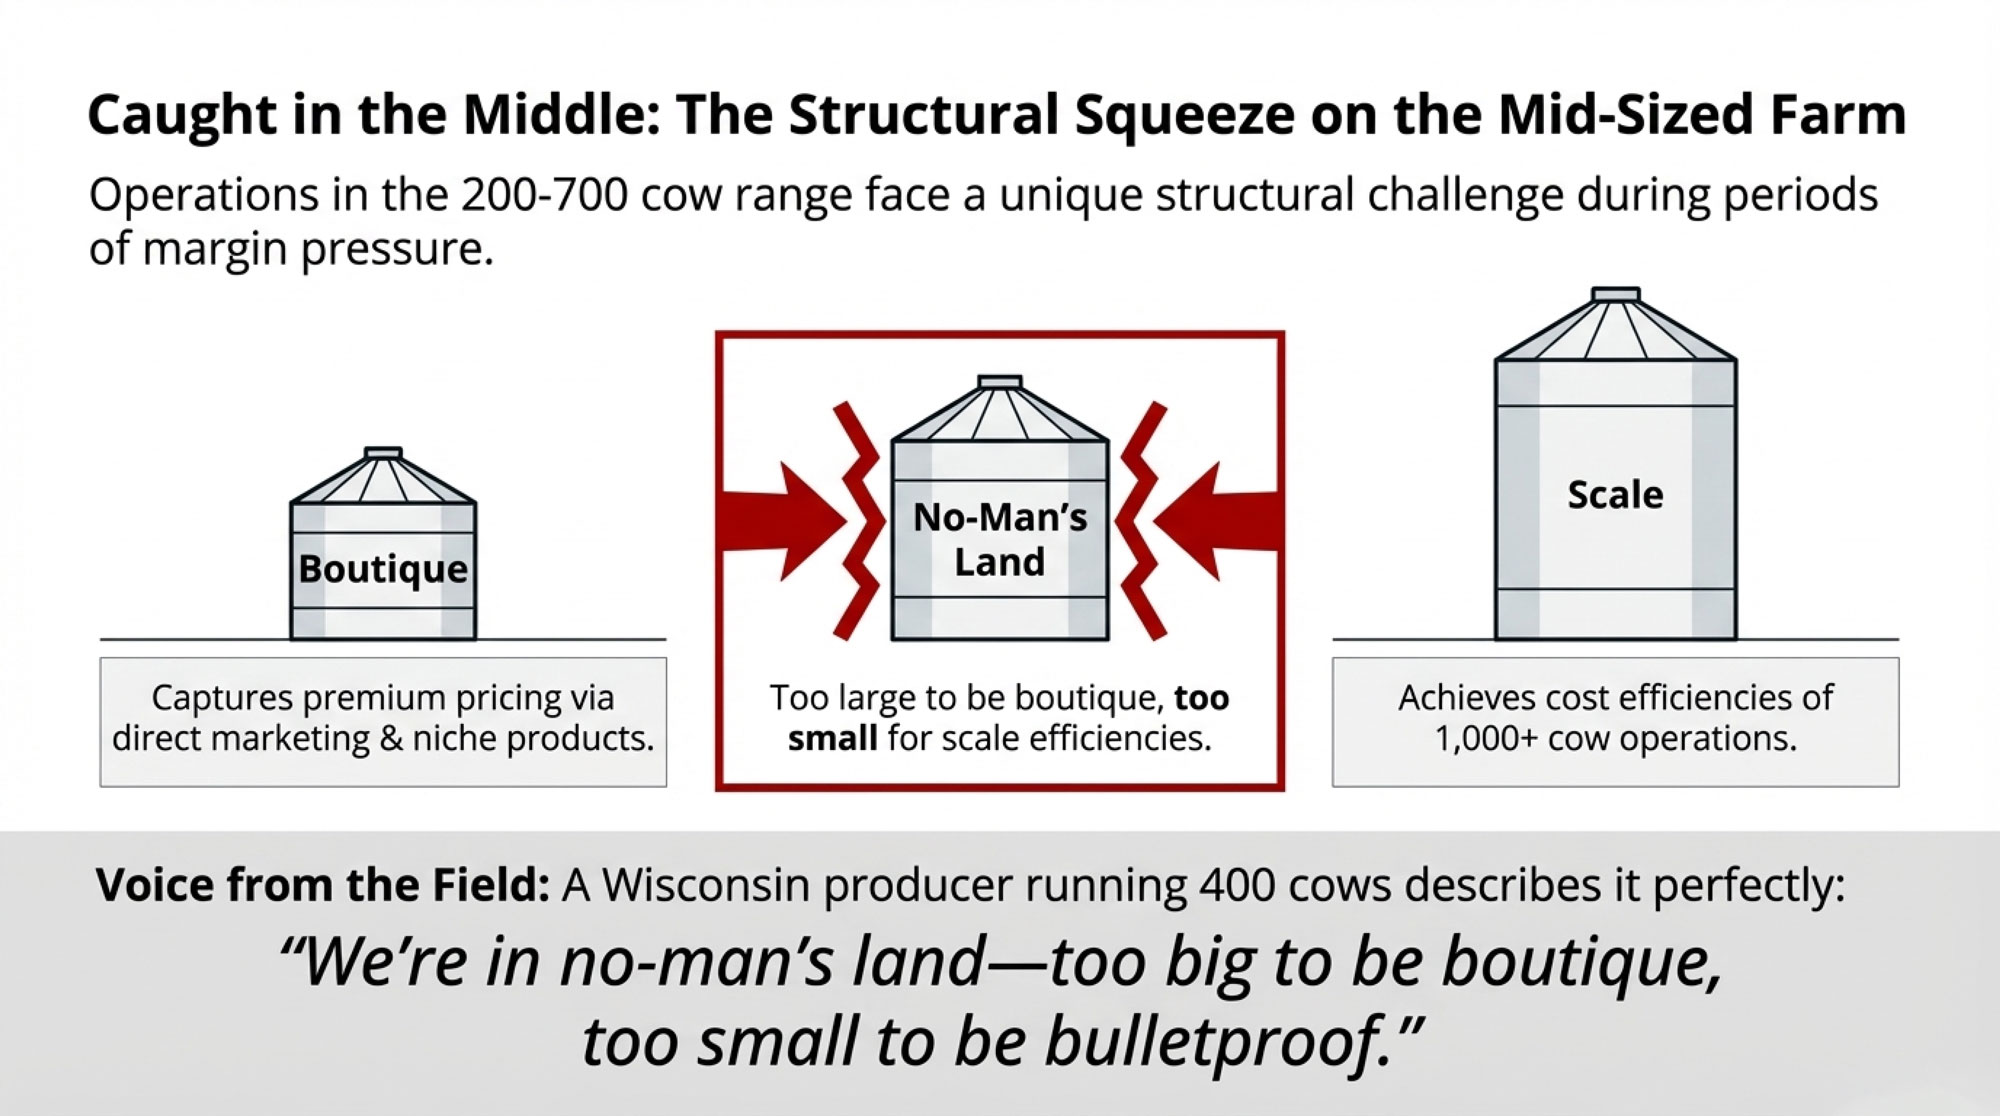
The original bill capped eligibility at 999 animal units — roughly 714 dairy cattle. That was by design. Stafsholt intended the program for small and mid-size operations, the farms disappearing fastest.
The Wisconsin Farm Bureau and the Dairy Business Association both pushed to remove the cap. DBA lobbyists met with bill authors in June 2025, shortly after the bill text circulated. Rep. Clint Moses’ office even shared an early draft amendment with DBA lobbyists in August — before the public saw it.
On the other side, Darin Von Ruden, president of the Wisconsin Farmers Union, defended the cap: “The dollars that are available there could be easily swallowed up by two or three of the biggest farms in the state, and then nobody else will be able to be a part of that process”.
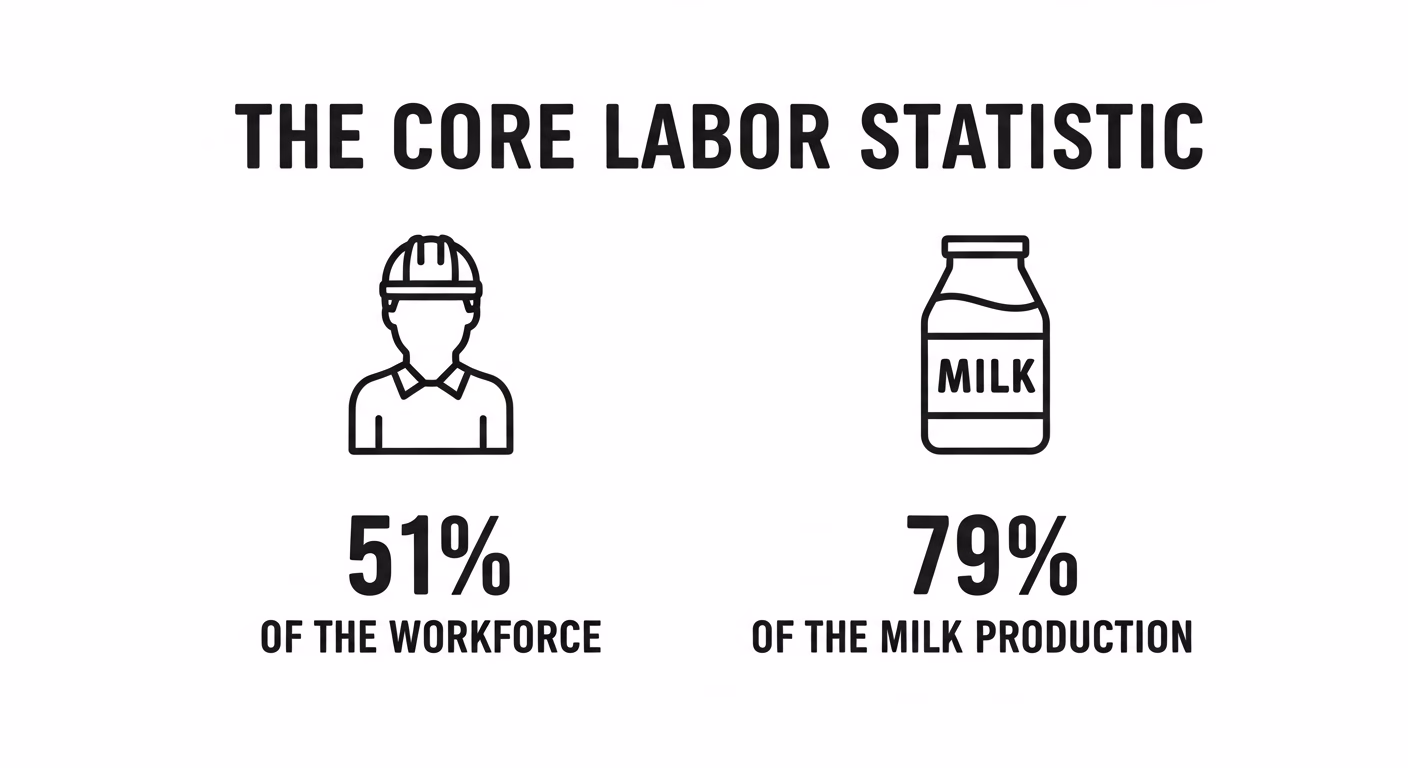
Then there’s the labor provision. SB 323 required participating farms to employ only workers legally authorized to work in Wisconsin. With an estimated 70% of the state’s dairy workforce undocumented, that provision alone could have disqualified a substantial share of otherwise eligible farms. Wisconsin Farm Bureau and DBA initially objected, but Farm Bureau lobbyist Jason Mugnaini told Investigate Midwest the organizations ultimately stopped pushing on it.
Big-farm groups wanted the cap removed. Labor-dependent operations worried about the verification provision. The Assembly Ag chair thought the whole thing sent the wrong message. And a bill with 18 Senate votes died in committee.
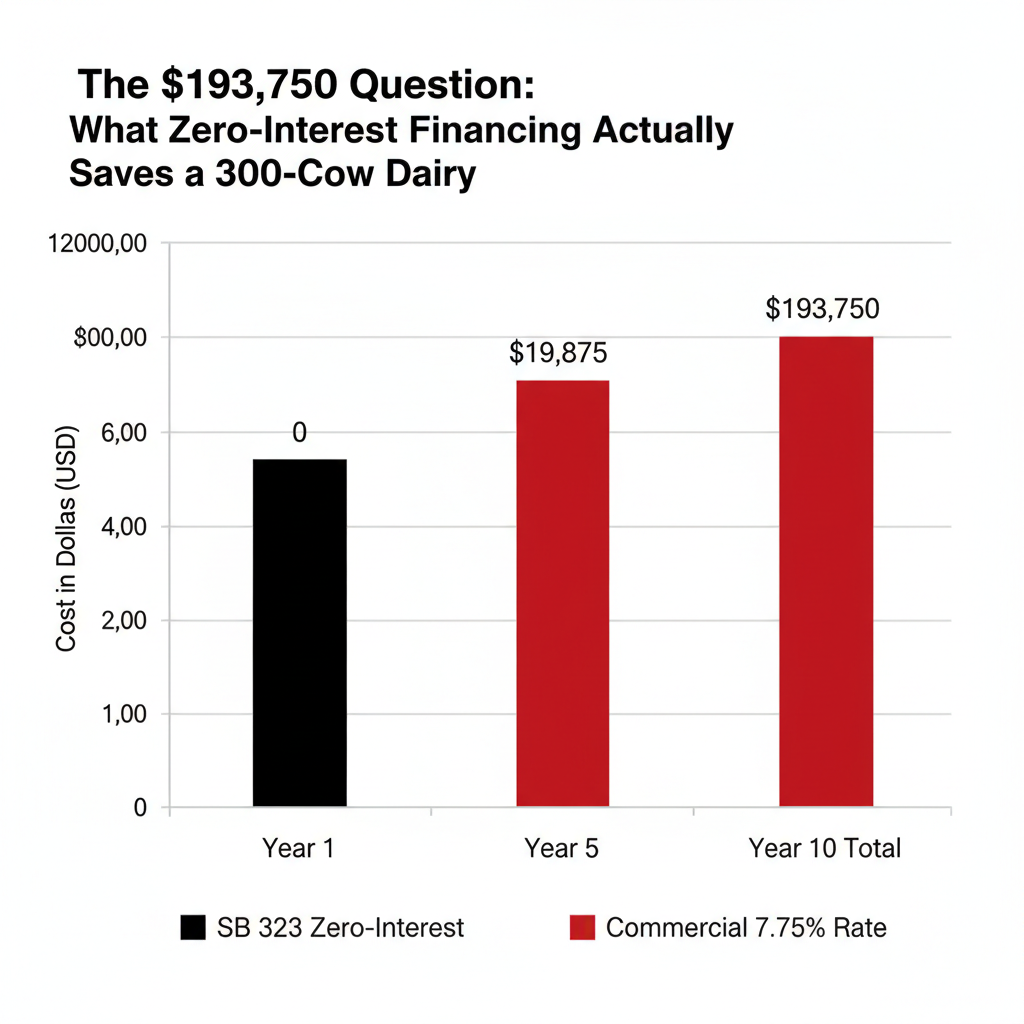
How Much Does Zero-Interest Financing Save a 300-Cow Wisconsin Dairy?
The legislature’s math doesn’t hold up.
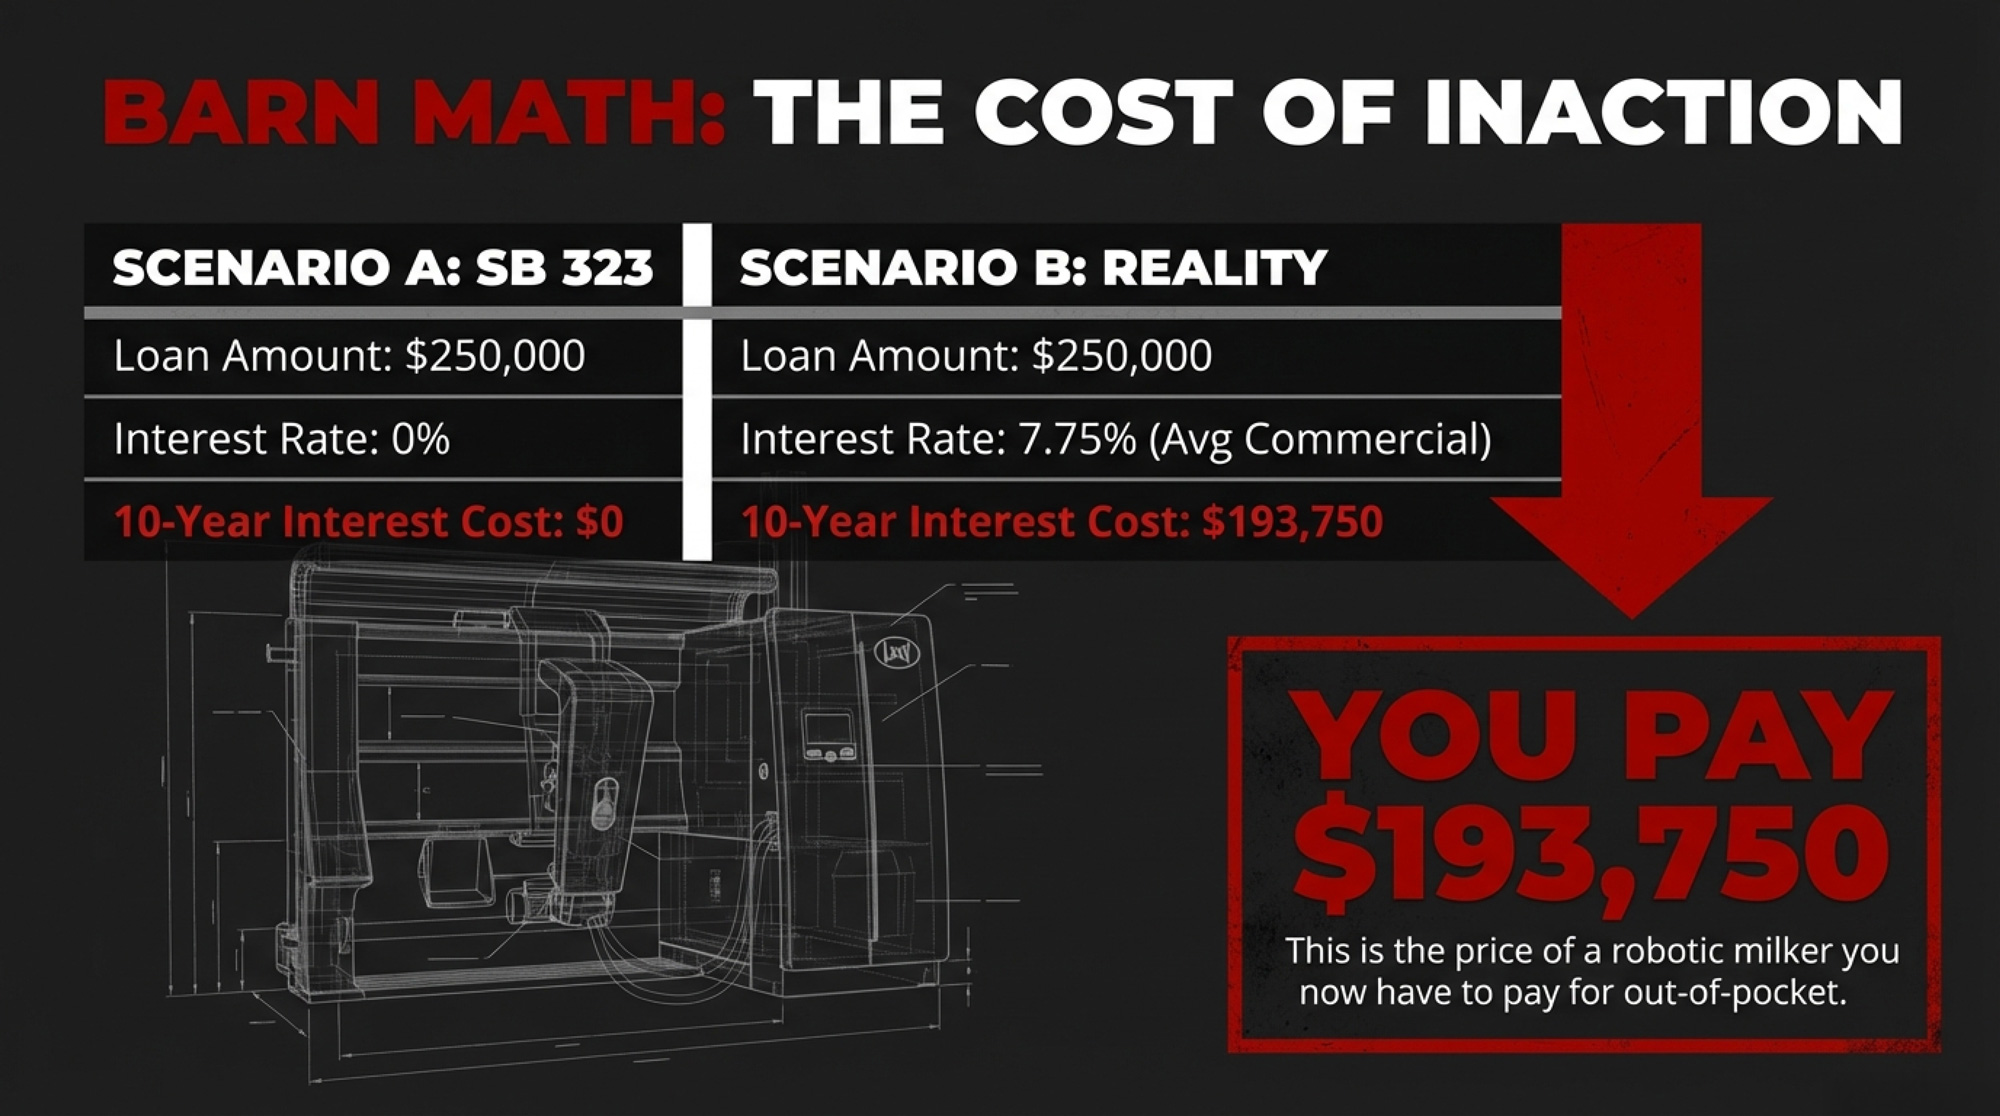
Take a 300-cow Wisconsin dairy considering a $250,000 equipment upgrade — a used robotic milking system, a precision feeding setup, or a manure management overhaul. Under SB 323, that’s a zero-interest loan repaid over up to 10 years.
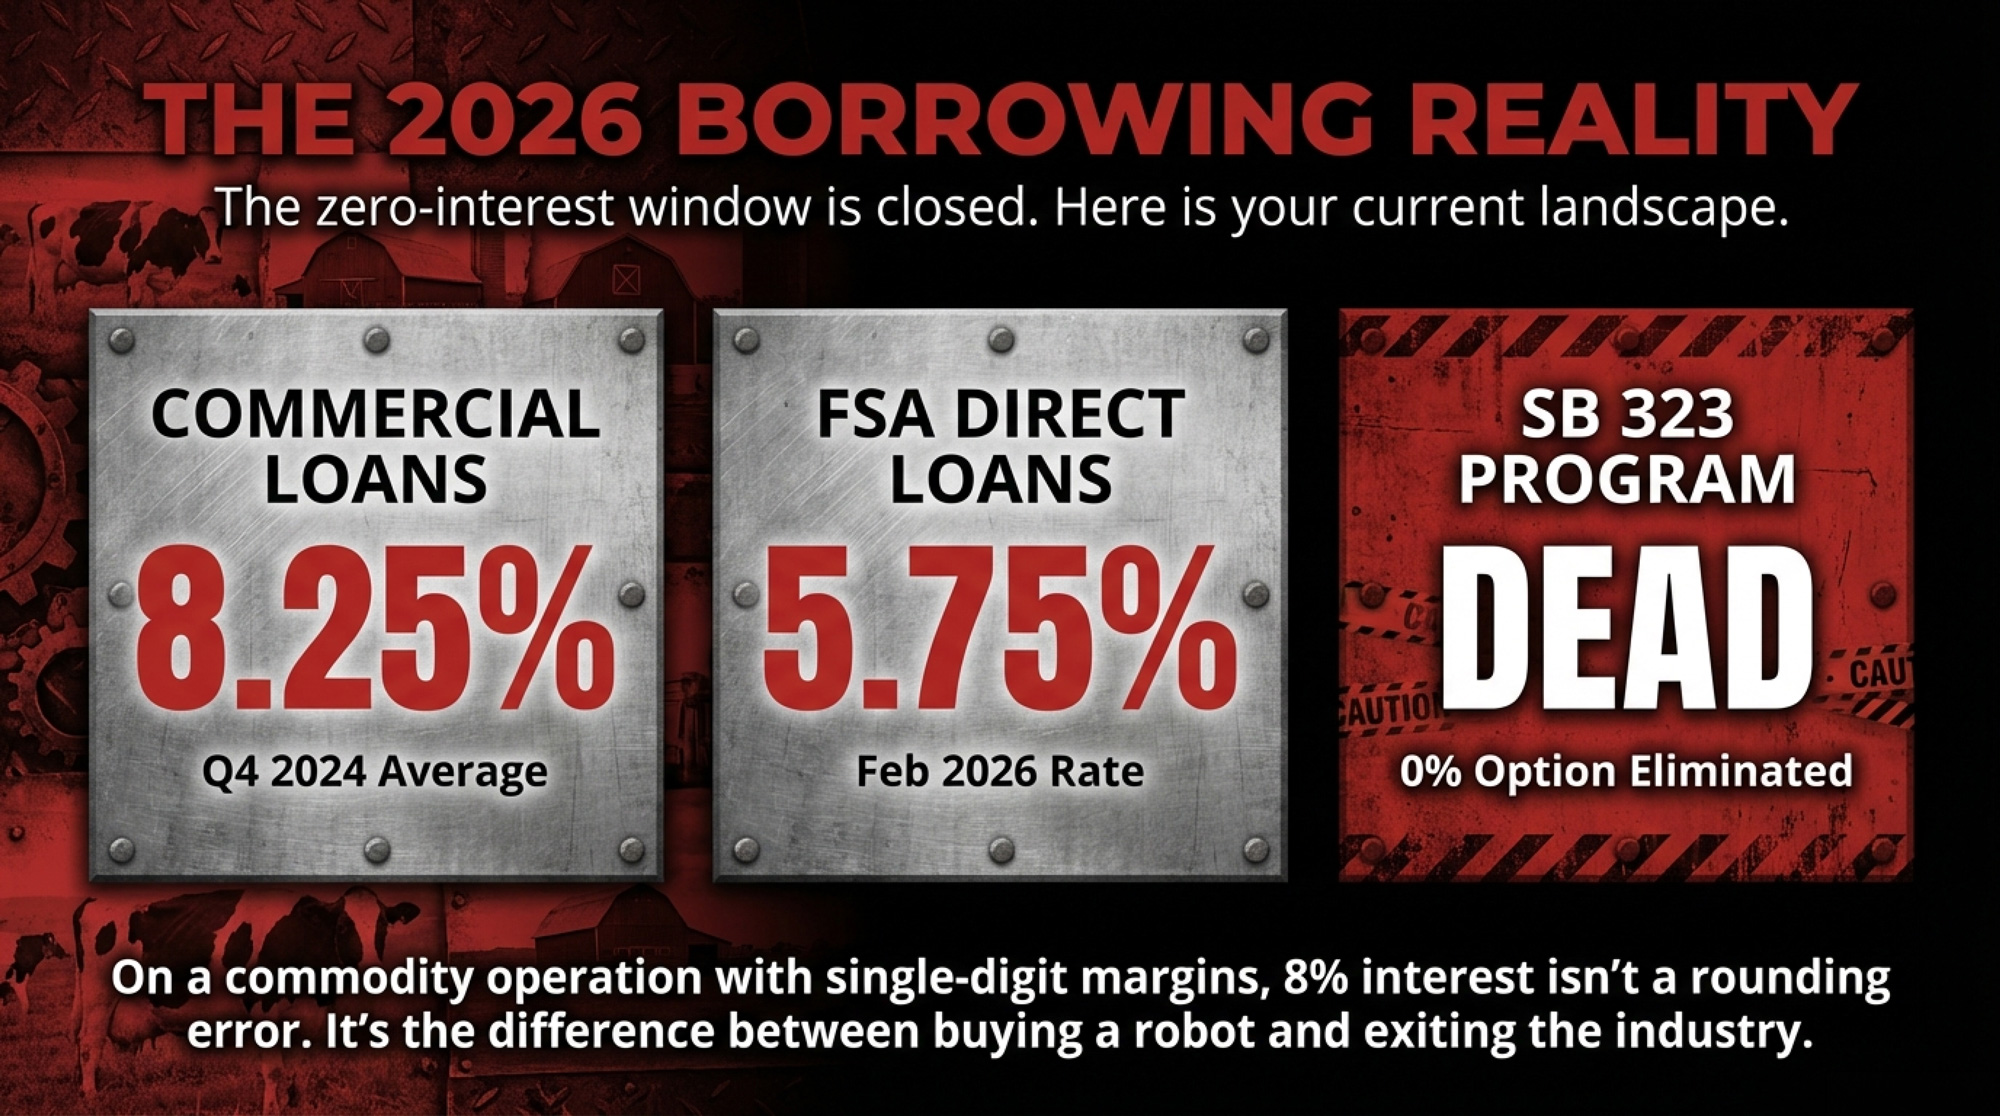
Commercial ag equipment loans currently range from 7.25% to 8.25%, depending on the borrower’s profile and lender. Q4 2024 averages across Federal Reserve agricultural districts were 7.99% variable and 8.12% fixed (Progressive Dairy, March 2025). Even FSA direct farm ownership loans — the cheapest government option available — carry a 5.75% rate as of February 2026.
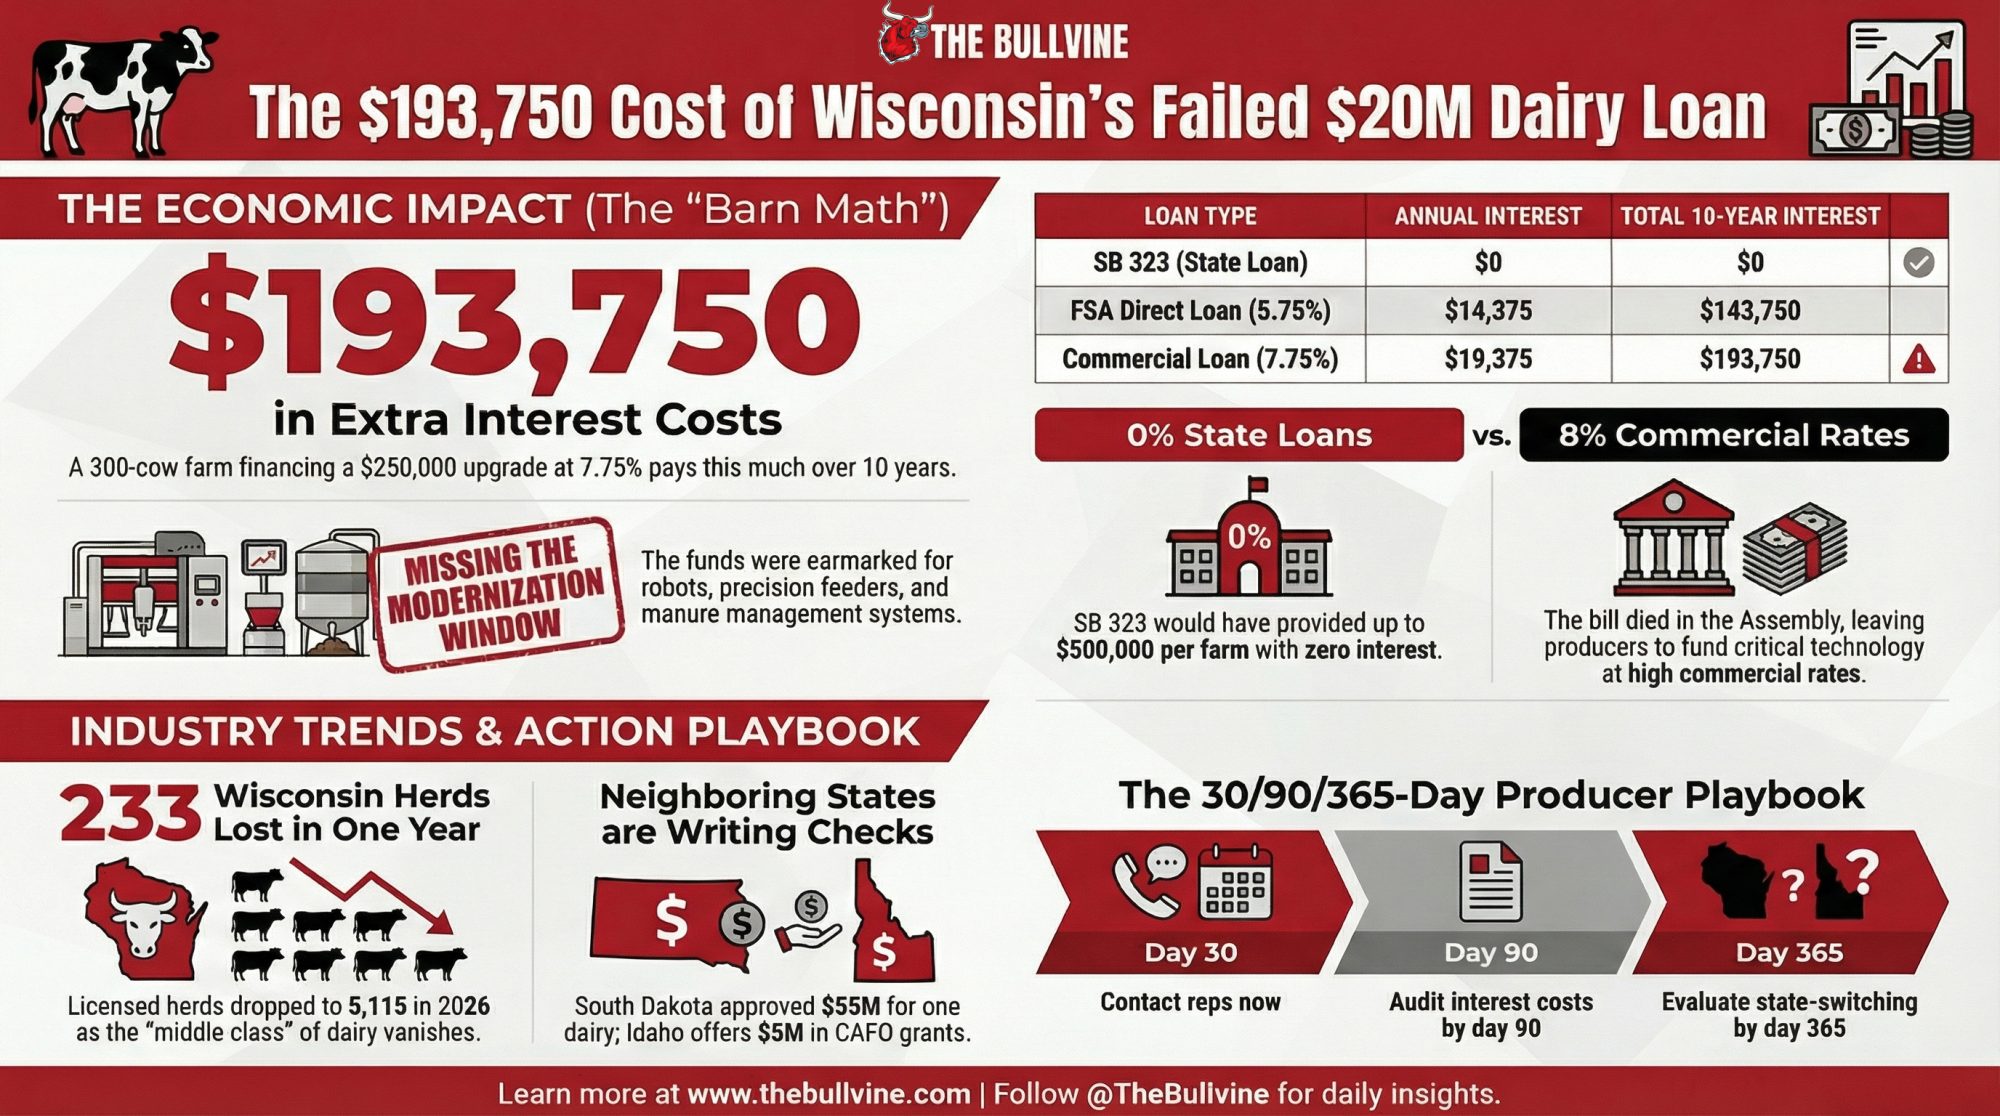
At 7.75% (midpoint of the current commercial range), that $250,000 loan costs roughly $19,375 per year in interest alone — or $193,750 in total interest over a decade. At the $500,000 maximum, you’re looking at $38,750 per year, for a total of $387,500 over 10 years.
On a 300-cow operation, an extra $19,375 in annual interest is the difference between reinvesting in the herd and falling further behind. On a commodity operation where margins routinely sit in single digits, that’s not a rounding error. That’s the next piece of equipment you don’t buy.
The $20 million revolving fund could have financed 40 to 80 farms in the first cycle, depending on loan size. And because it revolves — as farms repay, the money re-lends — the program would have compounded over time, potentially reaching hundreds of operations across multiple cycles.
All of it for 0.038% of Wisconsin’s $52.8 billion dairy economy (DATCP). The rounding error on a rounding error.
Tim Fiocchi at the Wisconsin Farm Bureau nailed it: “You have farmers and business people out there making investment decisions in real time, and even if it’s just a delay, delays have consequences”.
Read more: the real math of on-farm equipment ROI
5,115 Herds Left — And the Bleeding Is Accelerating
Steven Deller, agricultural economist at UW-Madison, described the dynamic bluntly to WPR: “If you’re in your mid-60s, it just doesn’t make sense to be operating a dairy farm with 150 cows. That’s demanding work, that’s really hard labor, and you just say, ‘I can’t do this anymore'”.
The question SB 323 tried to answer: what if you could make that 150-cow farm efficient enough to hand to your kid? Zero-interest financing for a robotic milker or a precision feeder was one way to get there. That option is gone for at least another year.
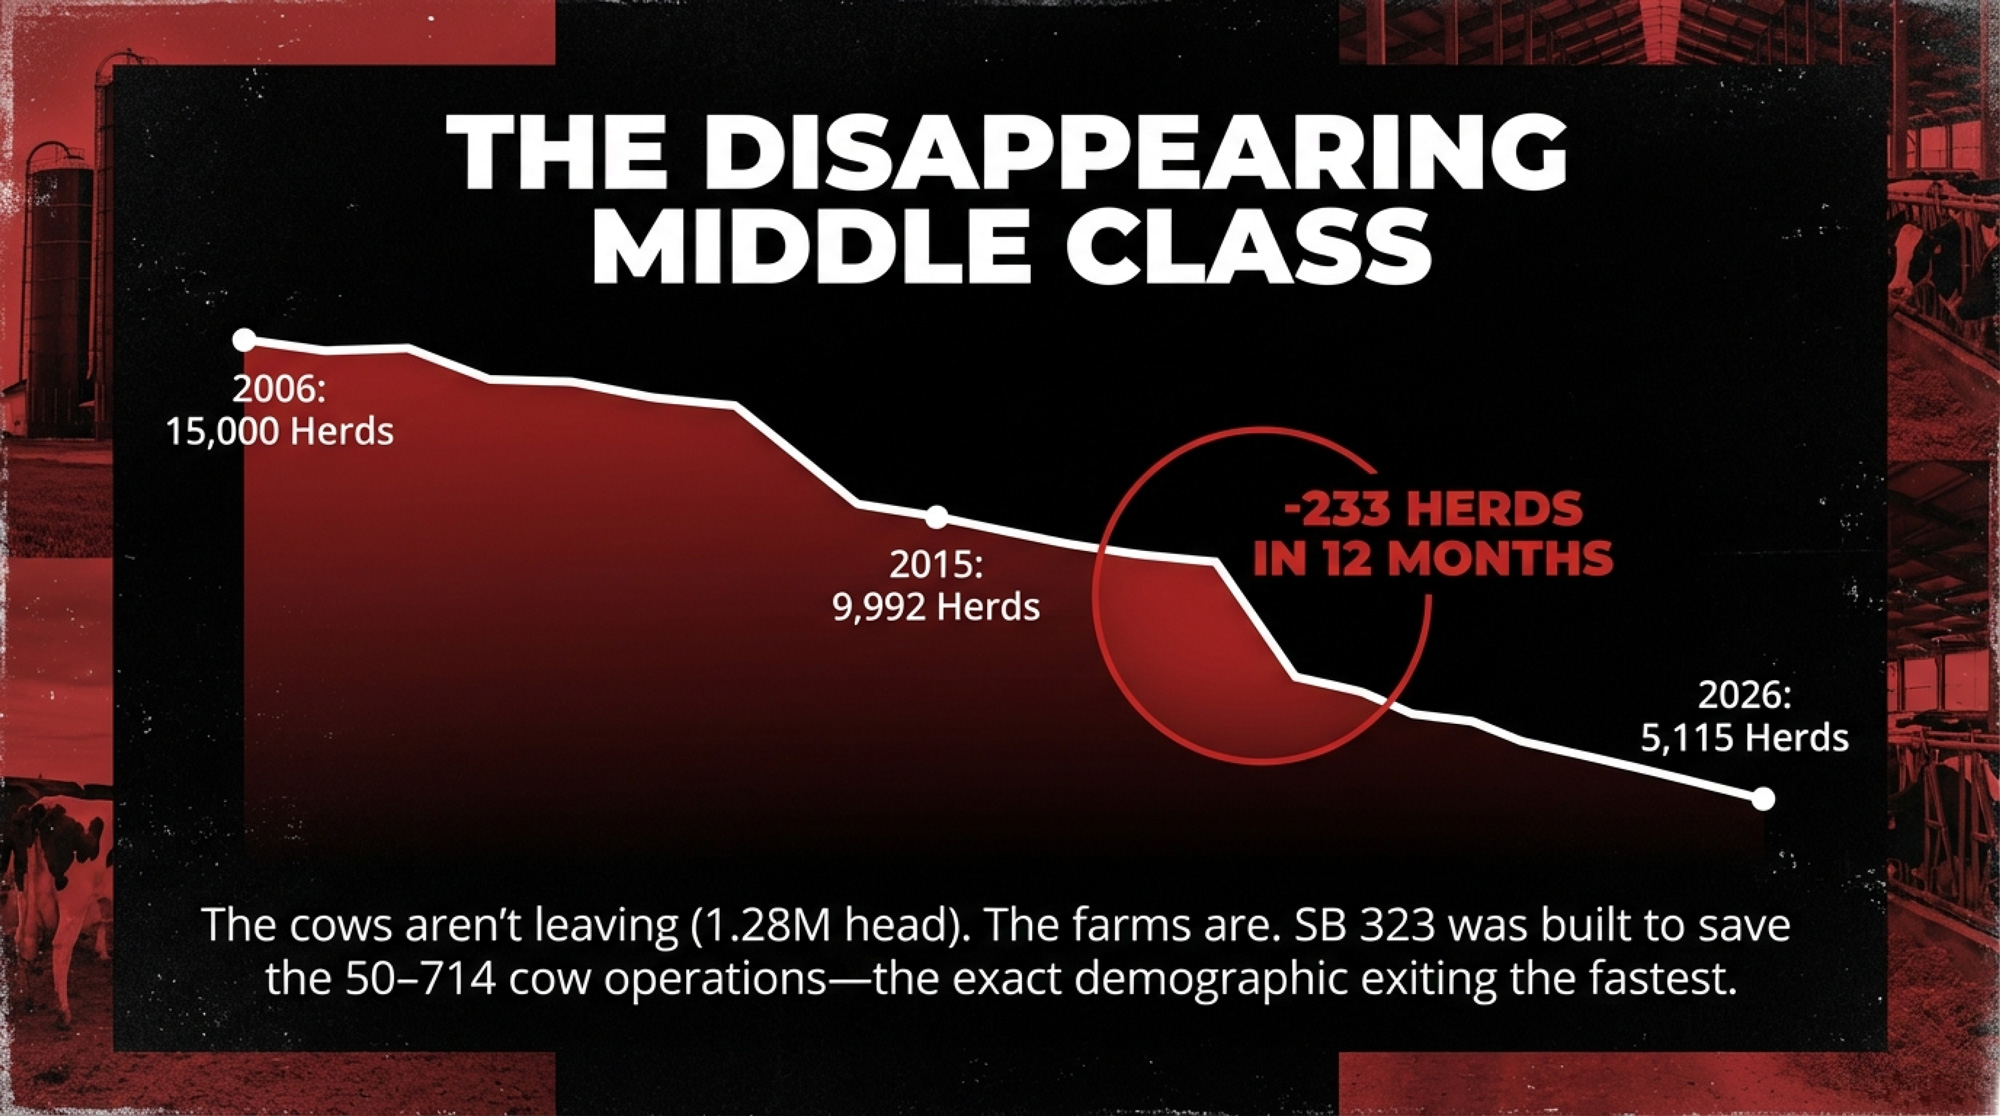
Wisconsin’s dairy farm count tells the story the legislature apparently doesn’t want to read:
| Year | Licensed Dairy Herds | Change |
| ~2006 | ~15,000 | — |
| 2015 | ~9,992 | –5,000 in ~9 years |
| 2022 | ~6,350 | –3,642 in 7 years |
| Jan 2024 | 5,661 | –689 in 2 years |
| Jan 2025 | 5,348 | –313 in 1 year |
| Jan 2026 | 5,115 | –233 in 1 year |
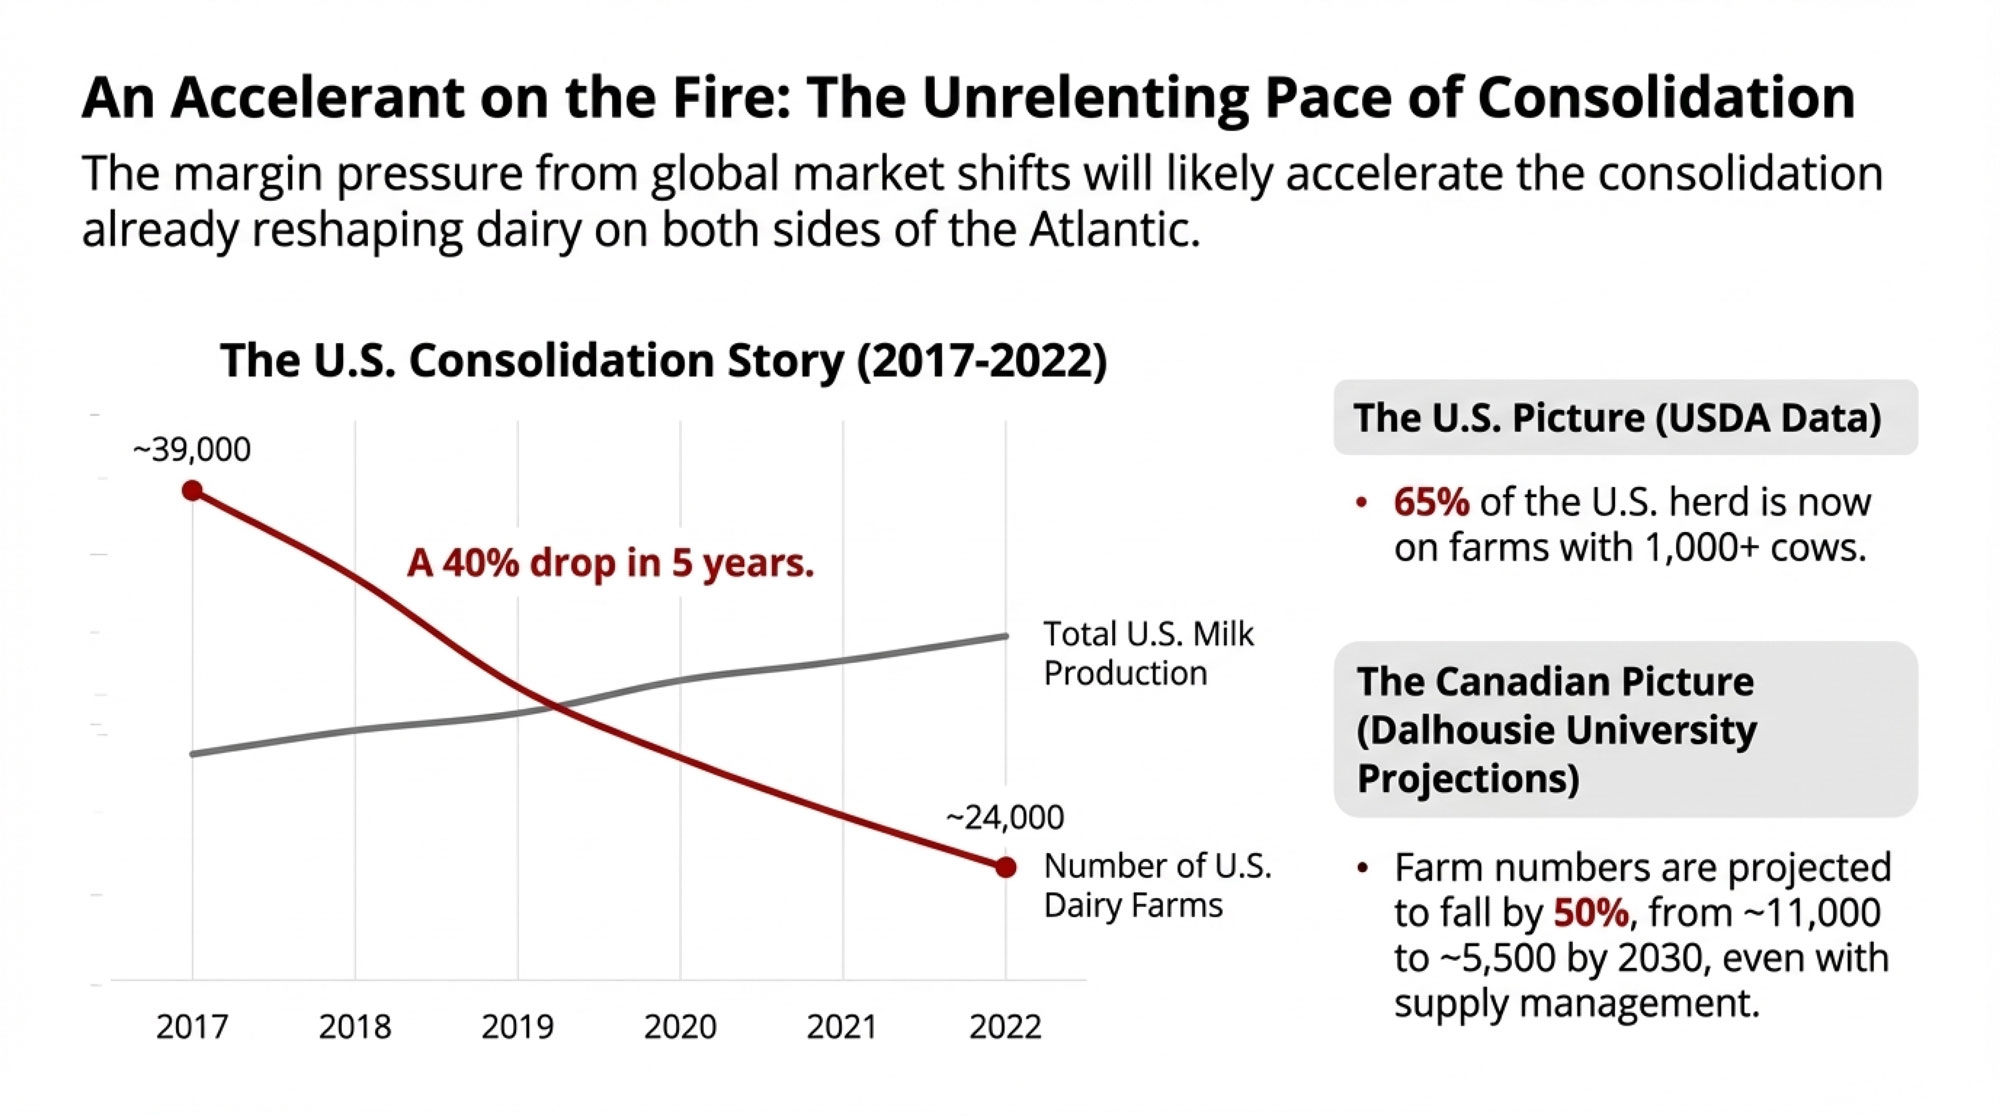
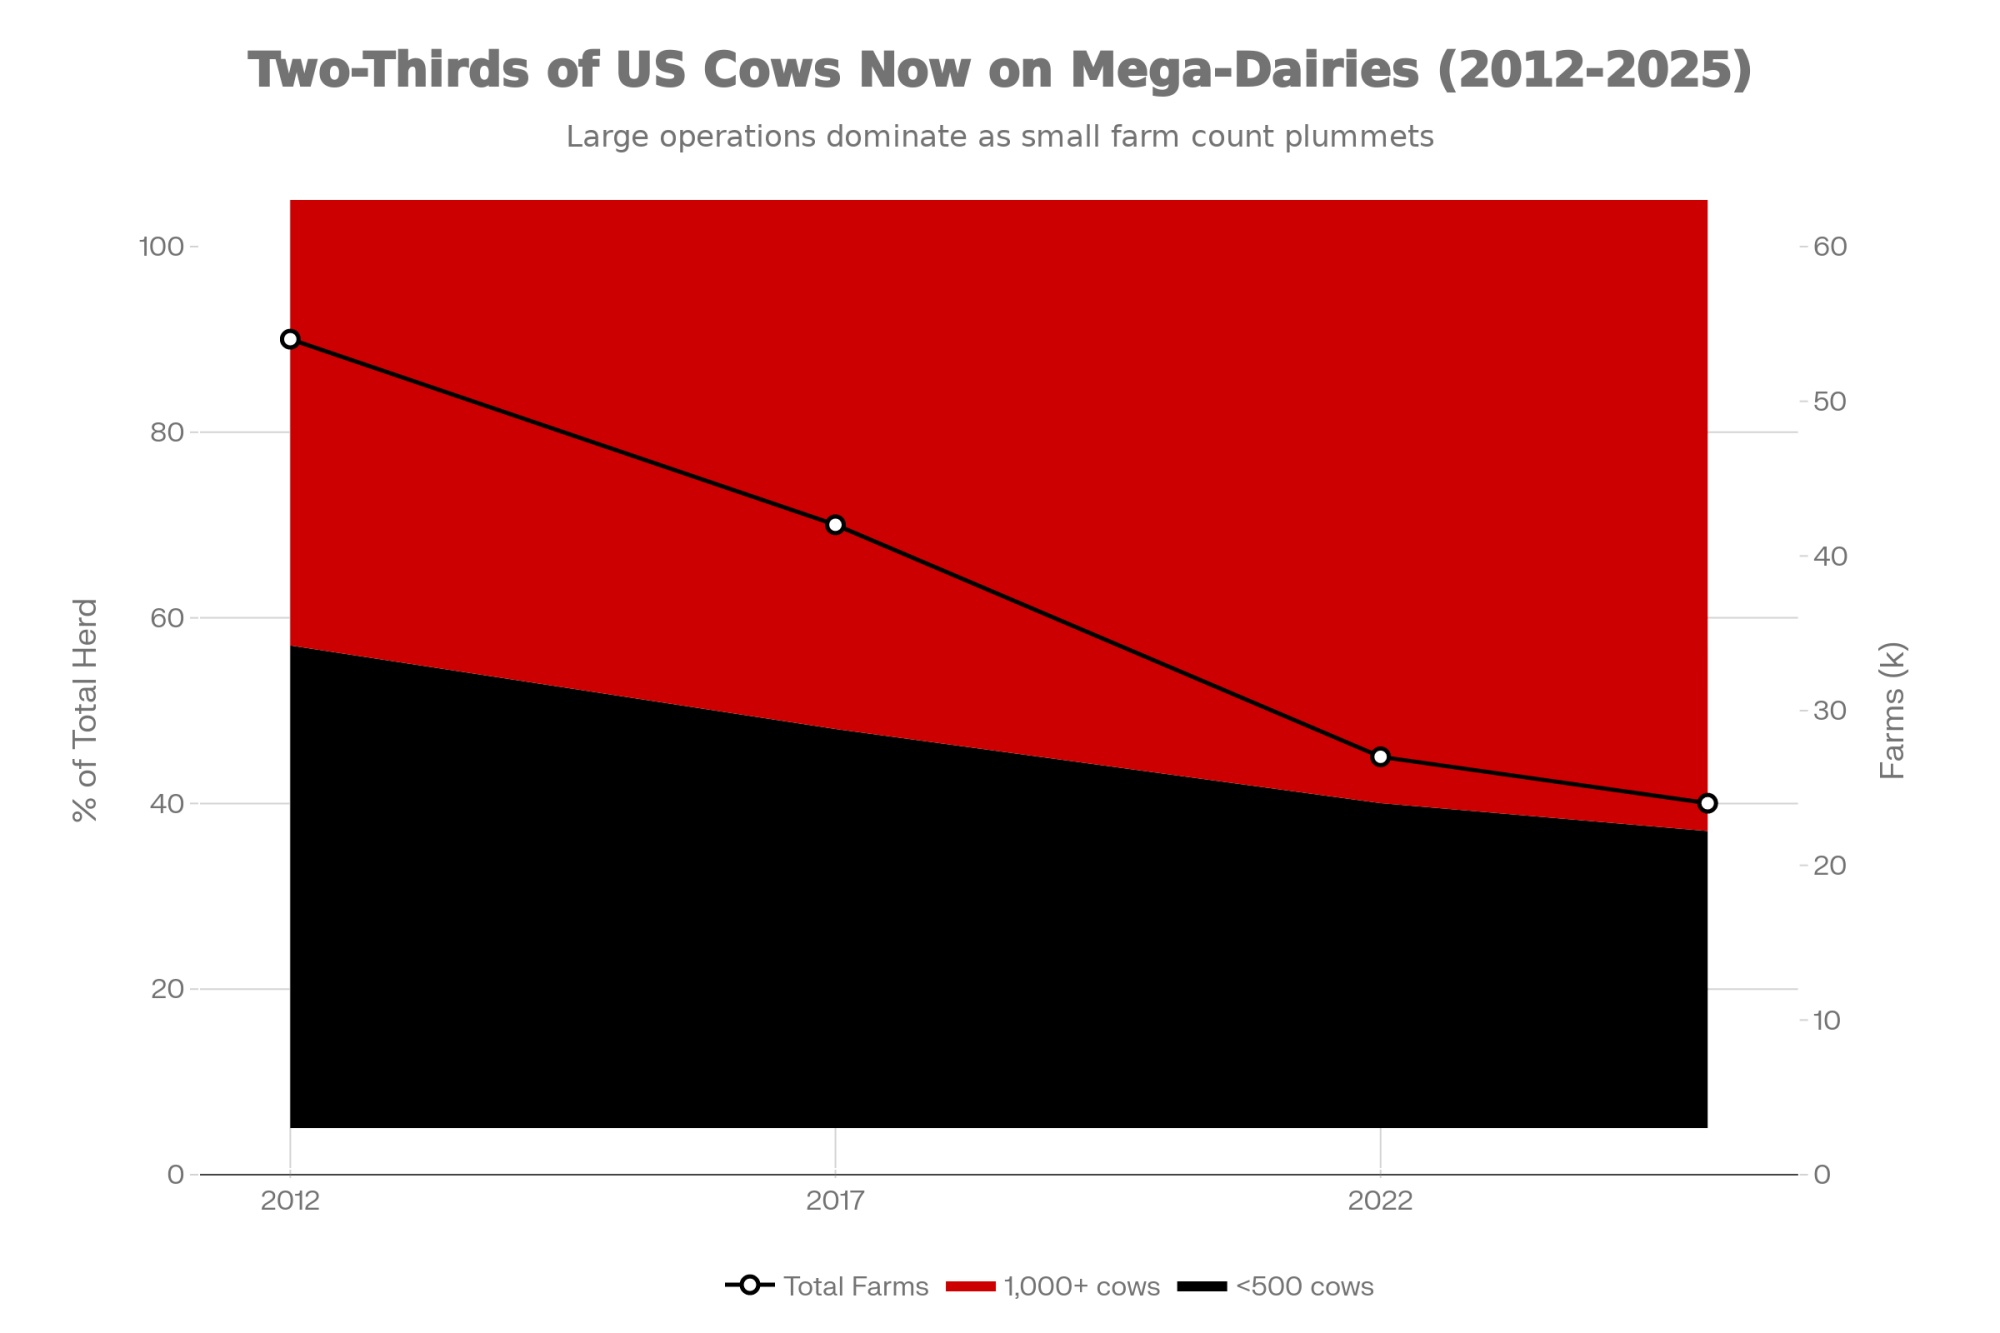
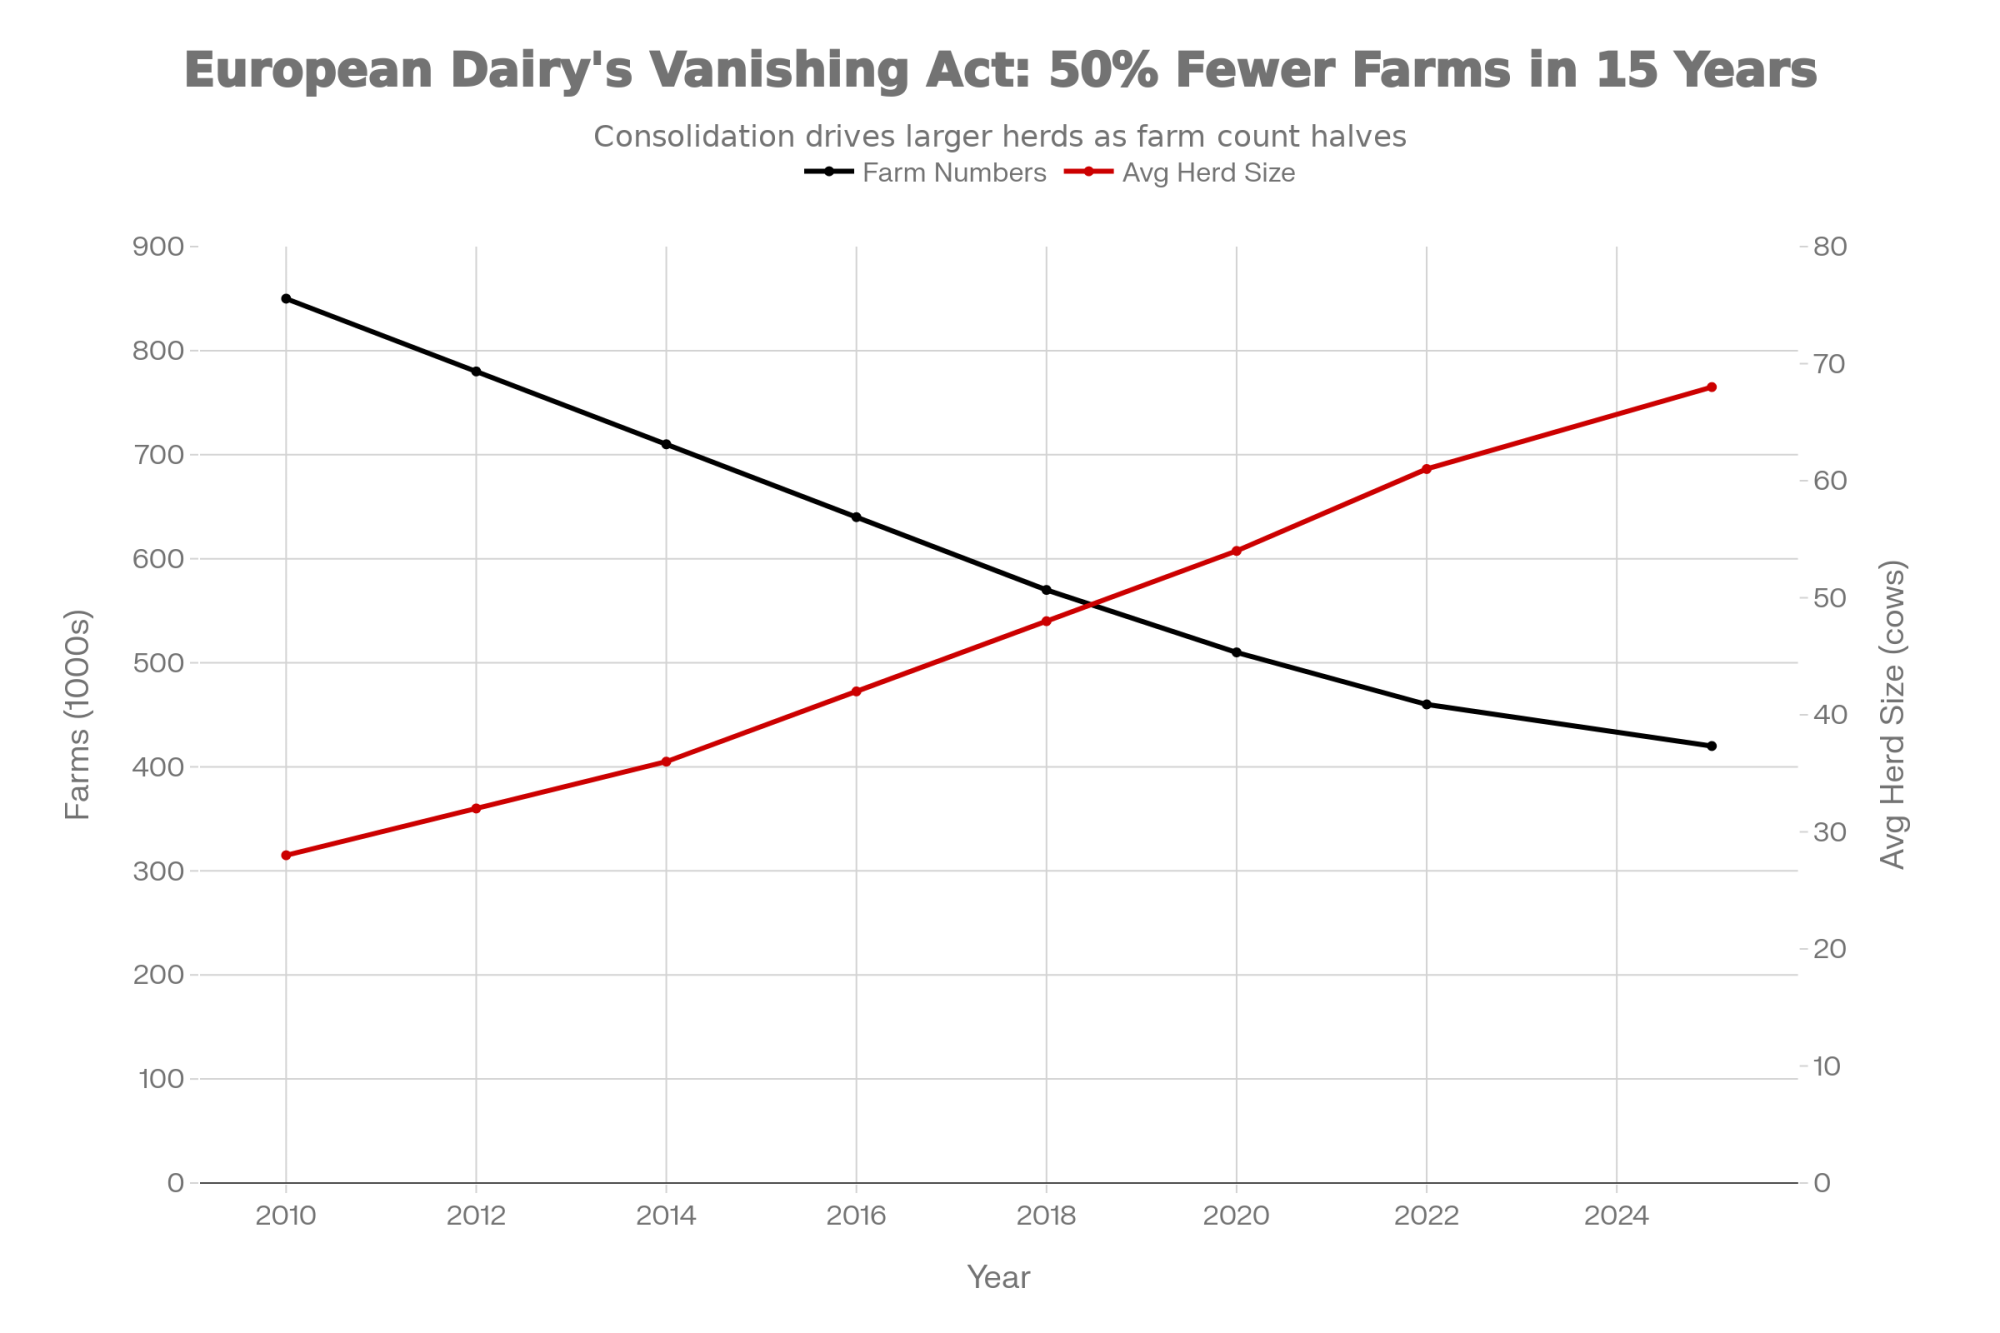
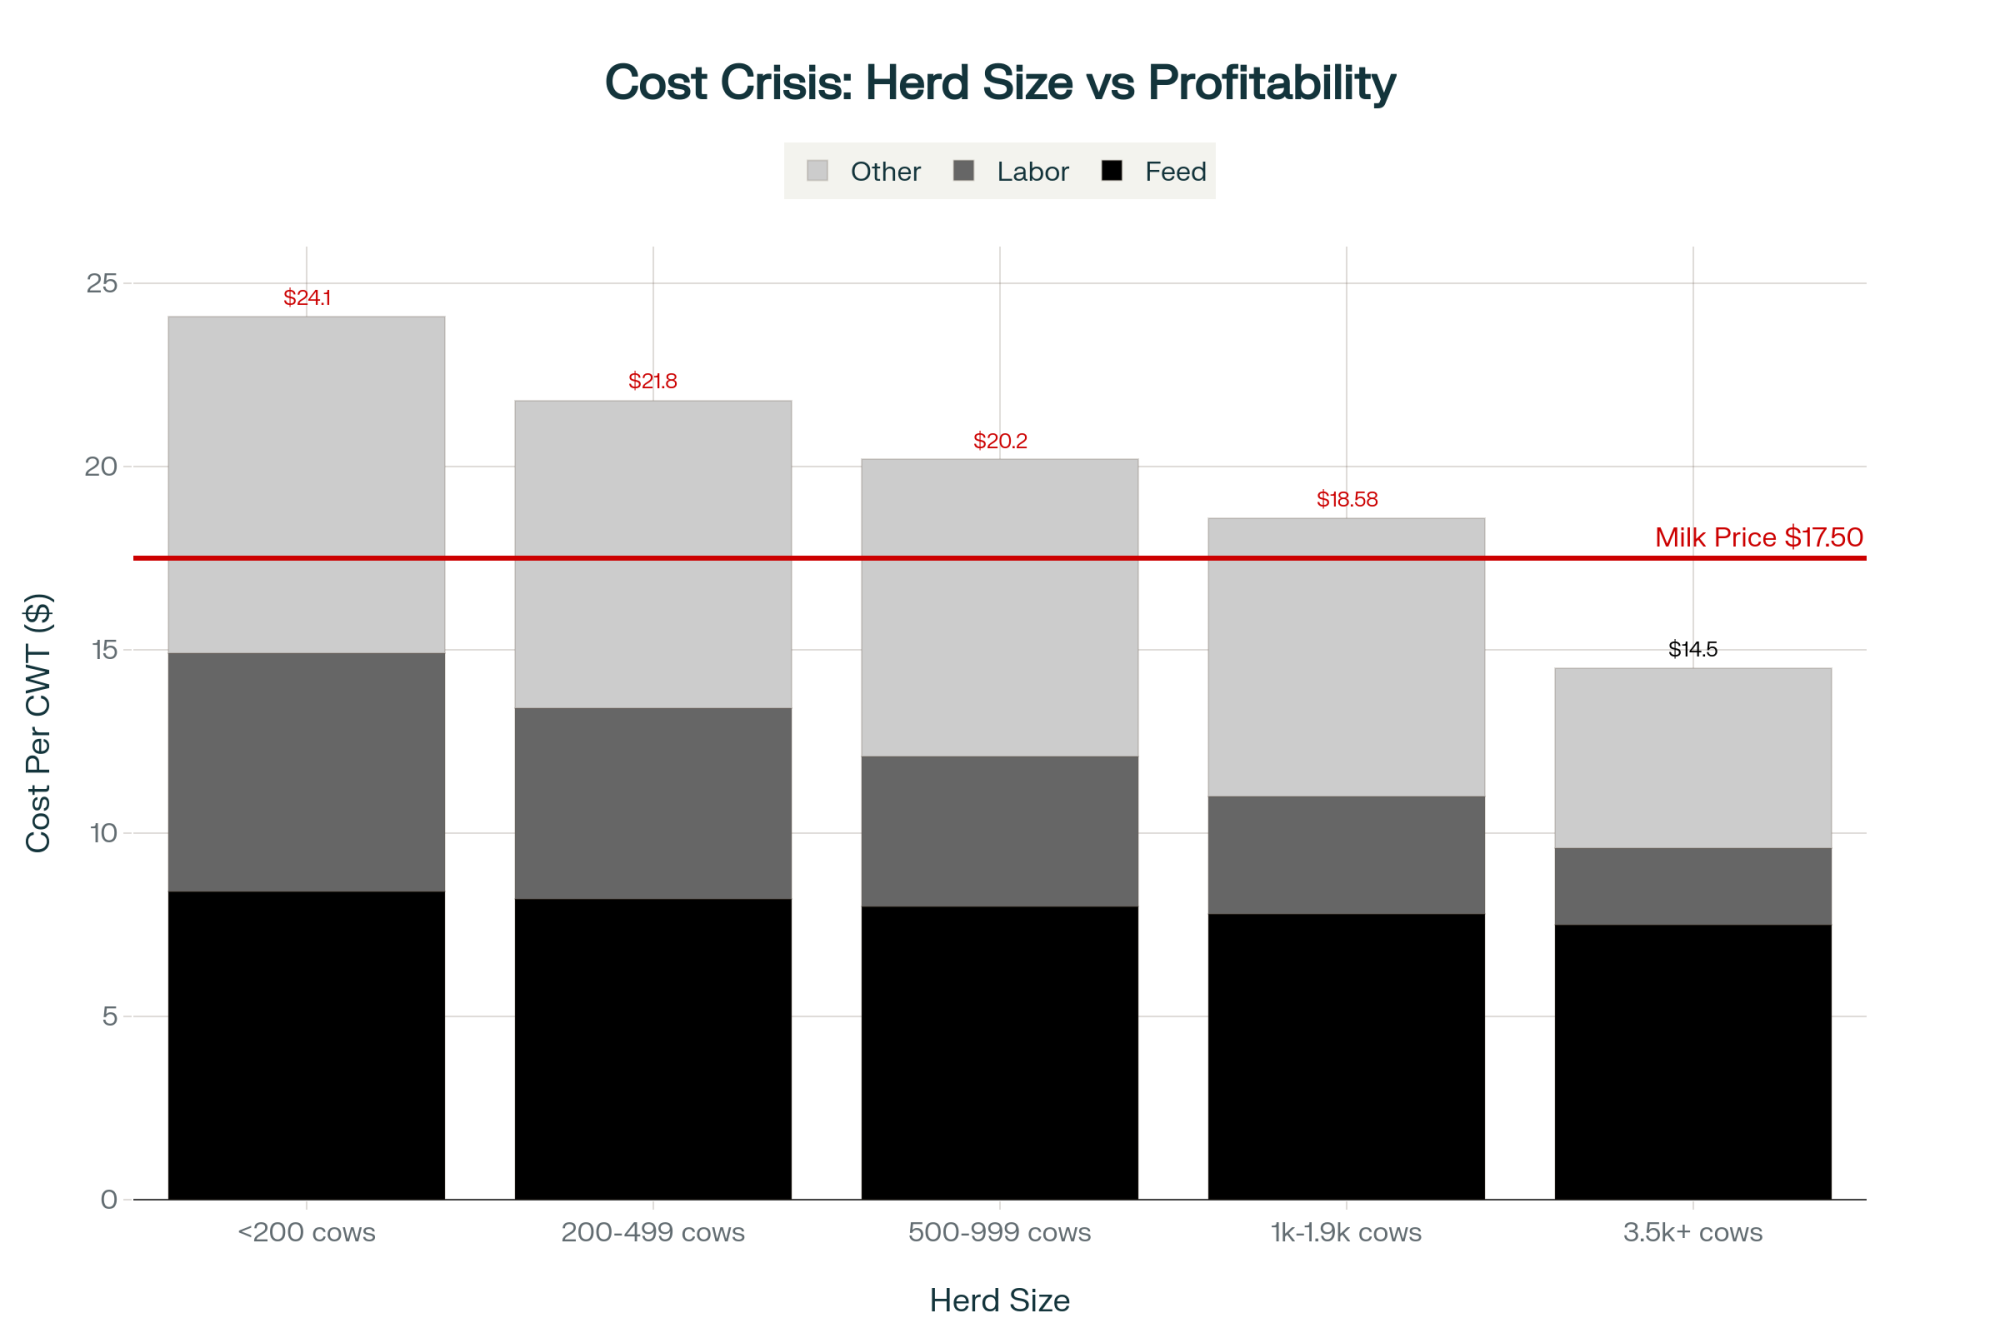
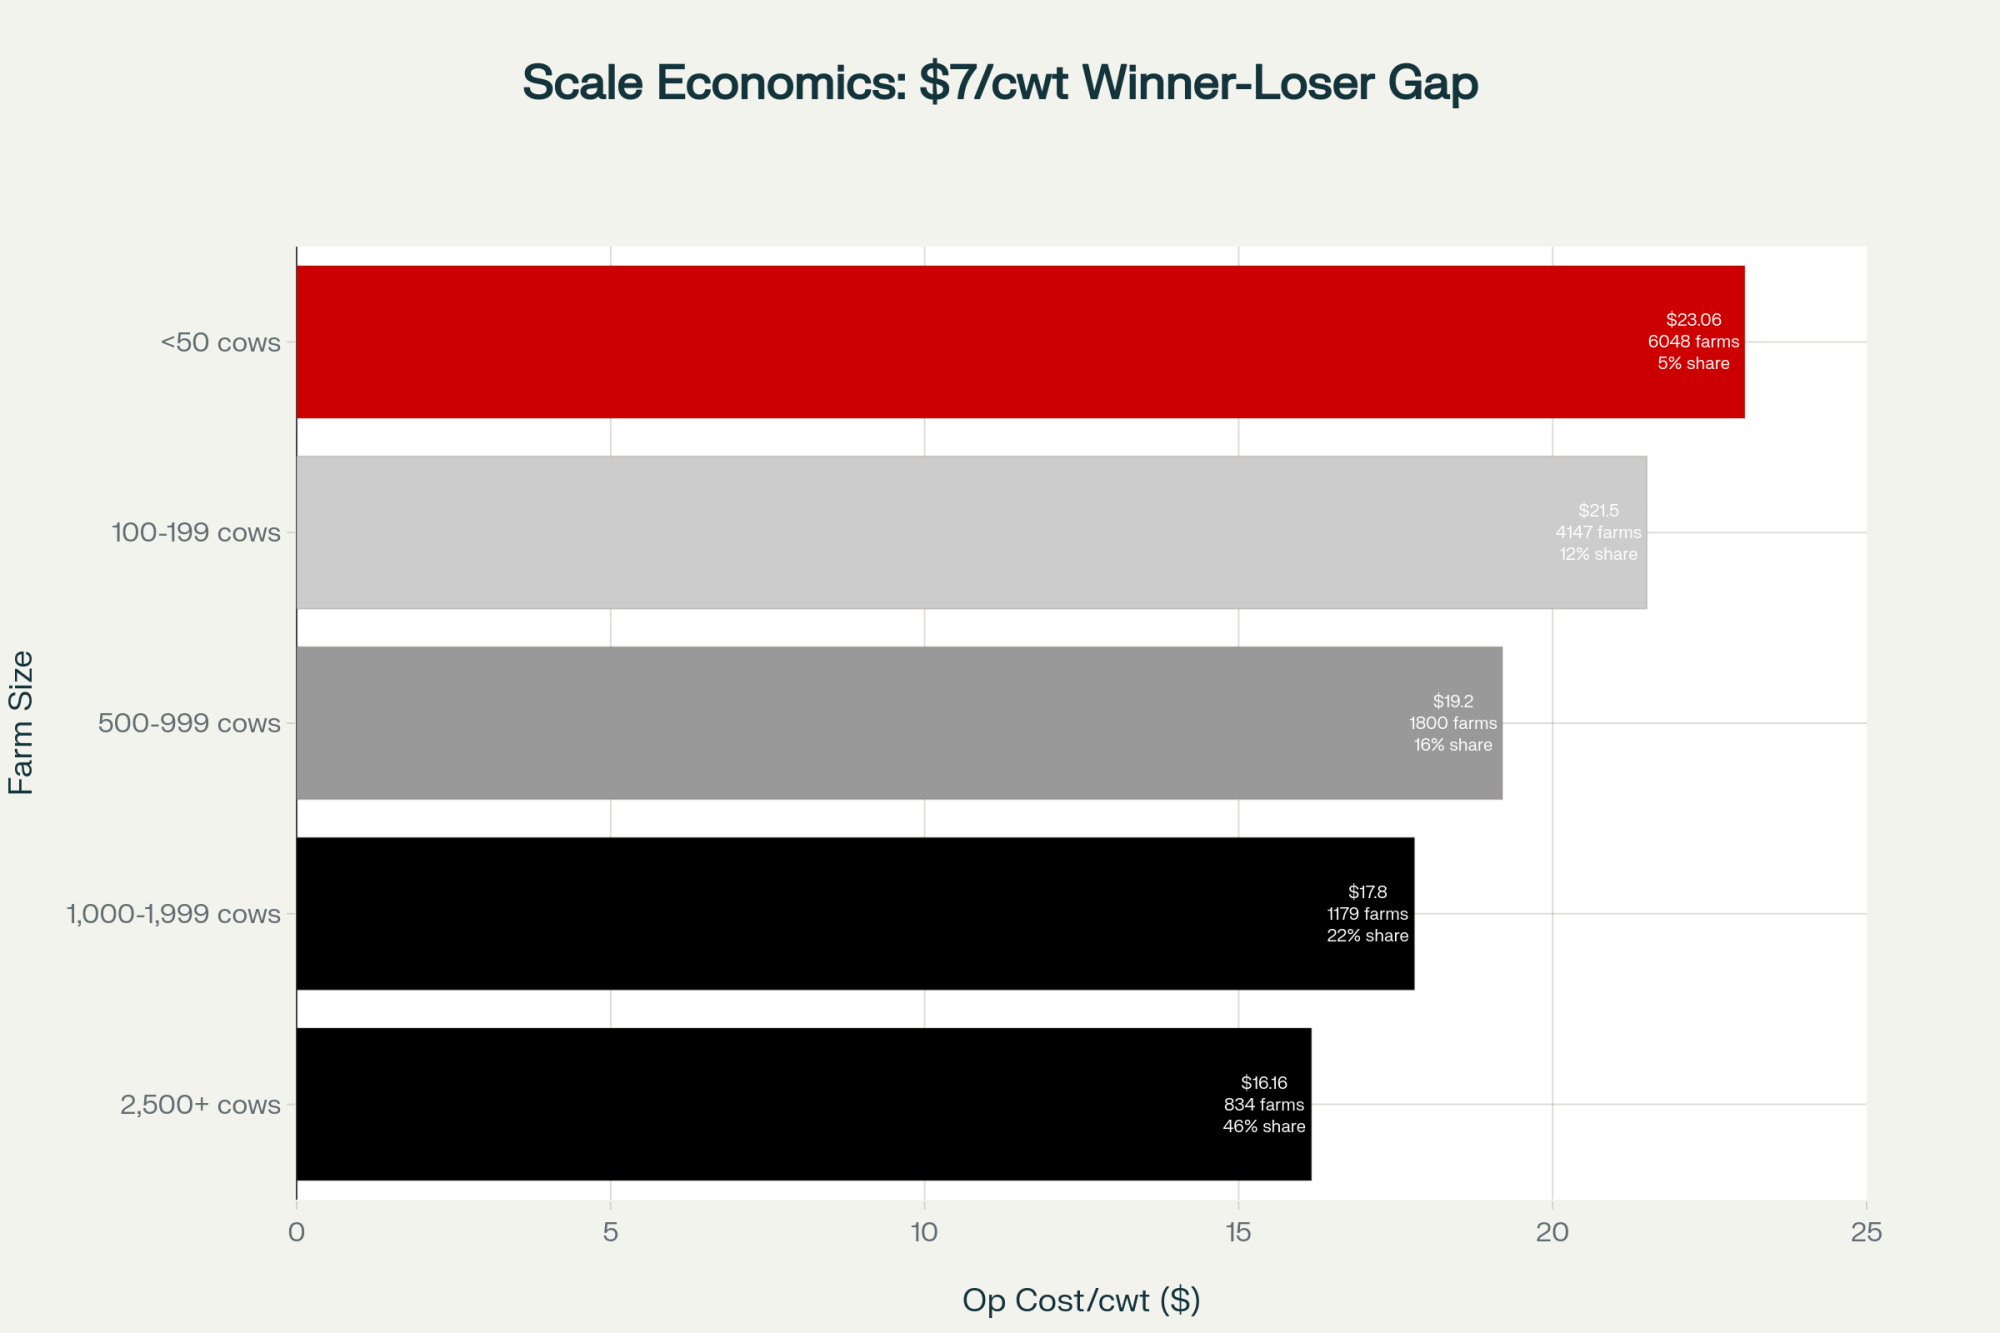
Farms with fewer than 500 cattle — the exact operations SB 323 was designed to help — have decreased 67% since 2002. Operating costs have nearly doubled in the last decade while milk prices have fallen 15% over the same period, according to USDA data.
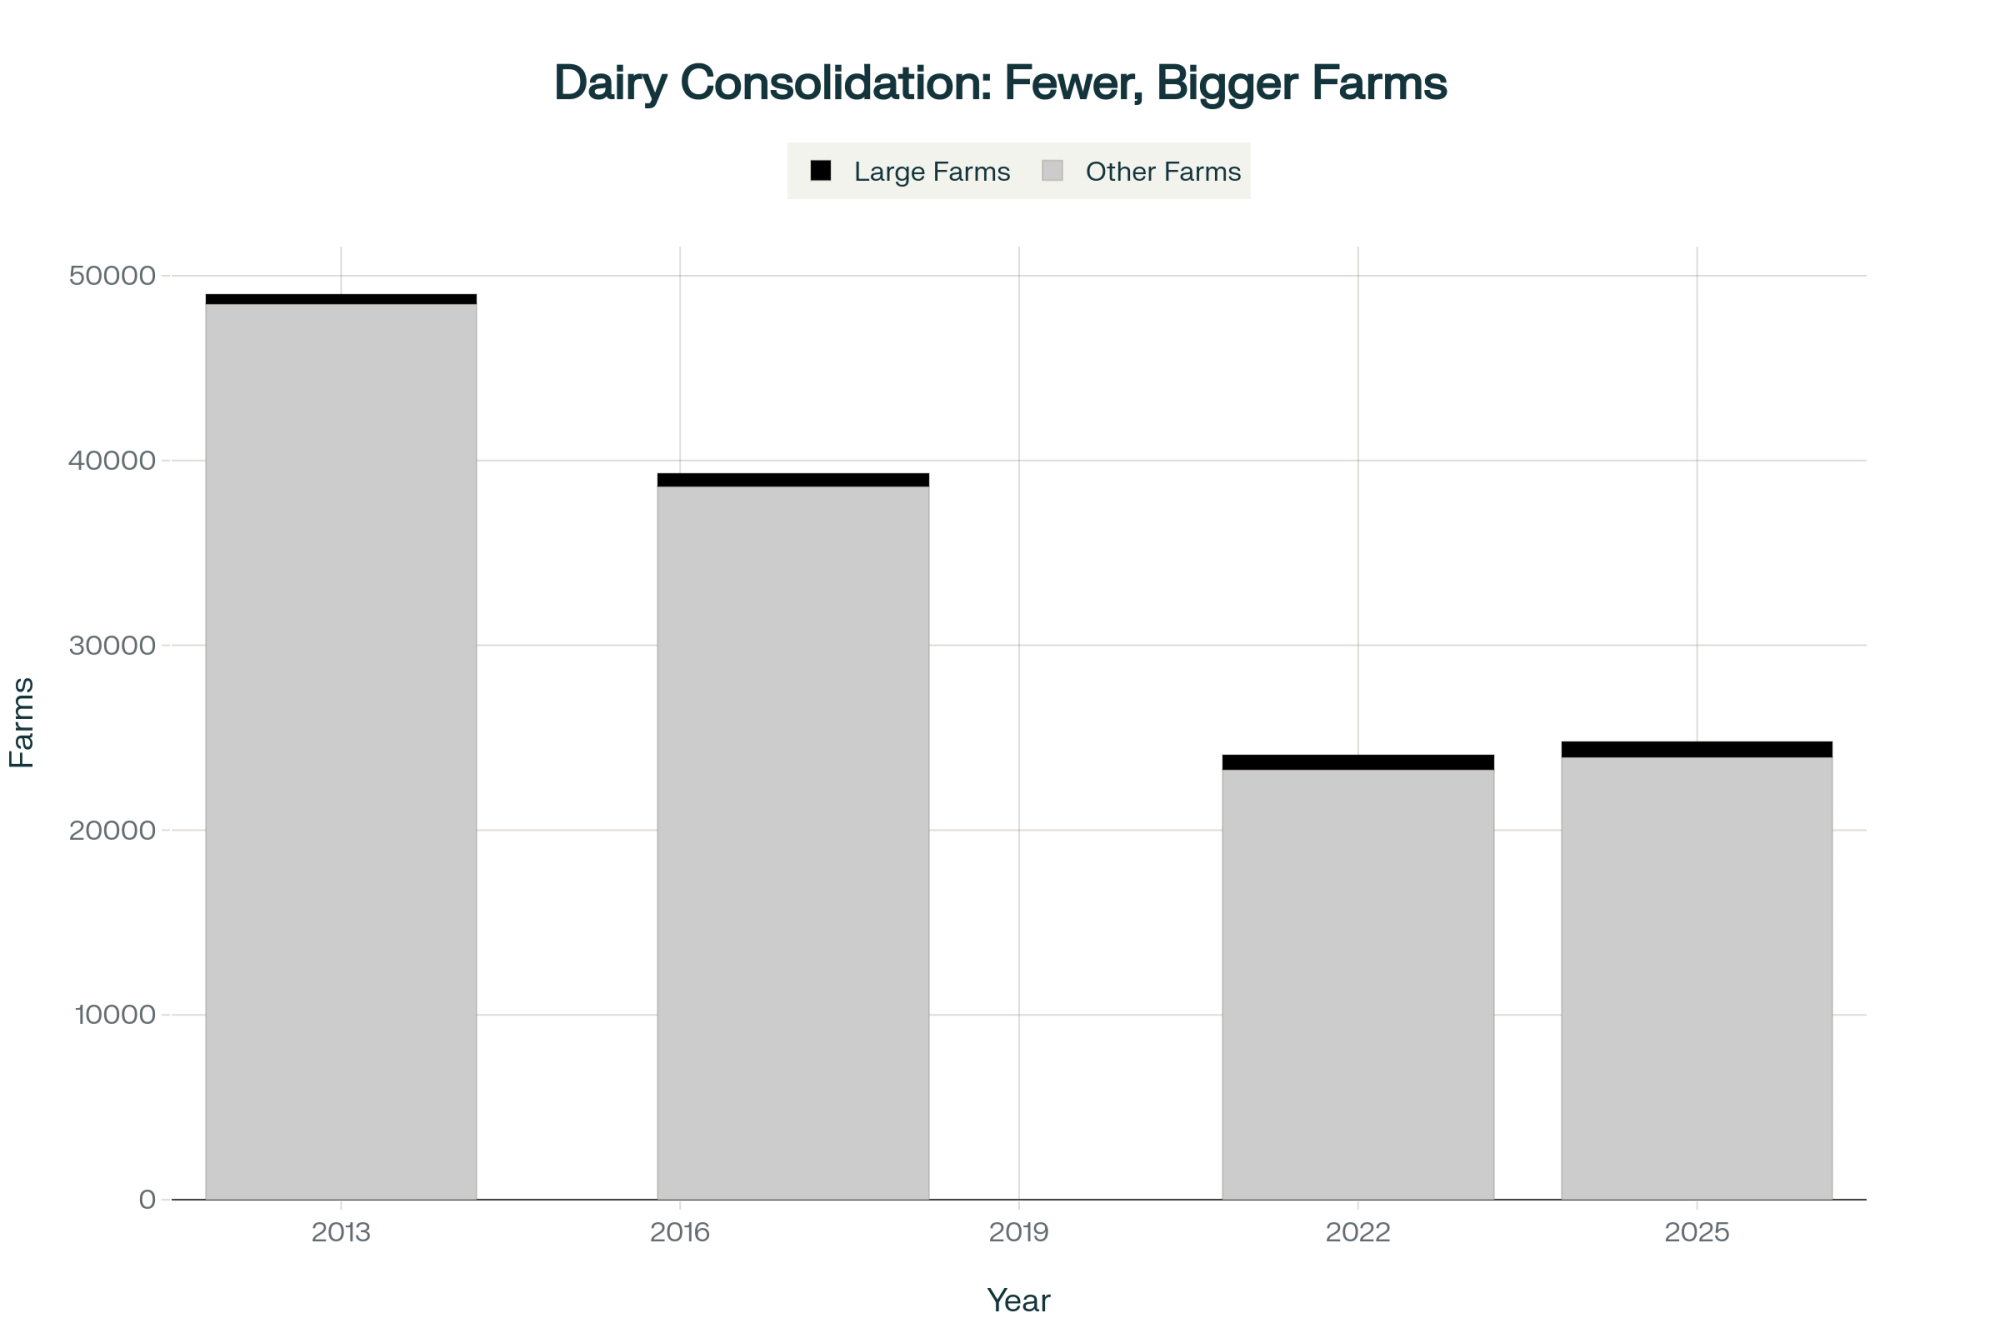
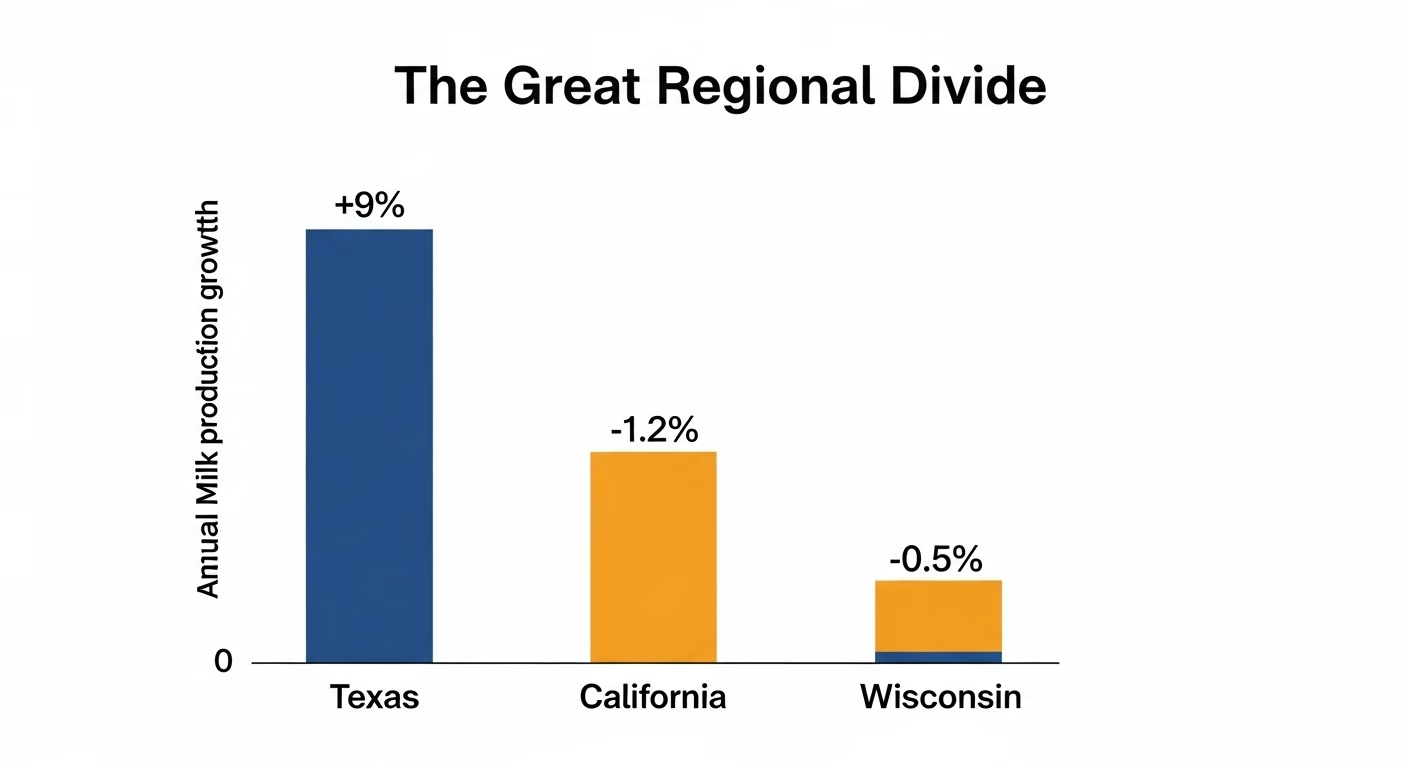
The cows haven’t left. Wisconsin still milks 1.28 million head (DATCP, 2026). Production hit record highs. What’s left is fewer, bigger operations, and a disappearing middle class of dairy farms that SB 323 was specifically built to serve.
Read more: who’s still milking by 2035
What Other States Are Spending to Recruit Your Cows
While Wisconsin’s $20 million sat in limbo, other states were writing checks.
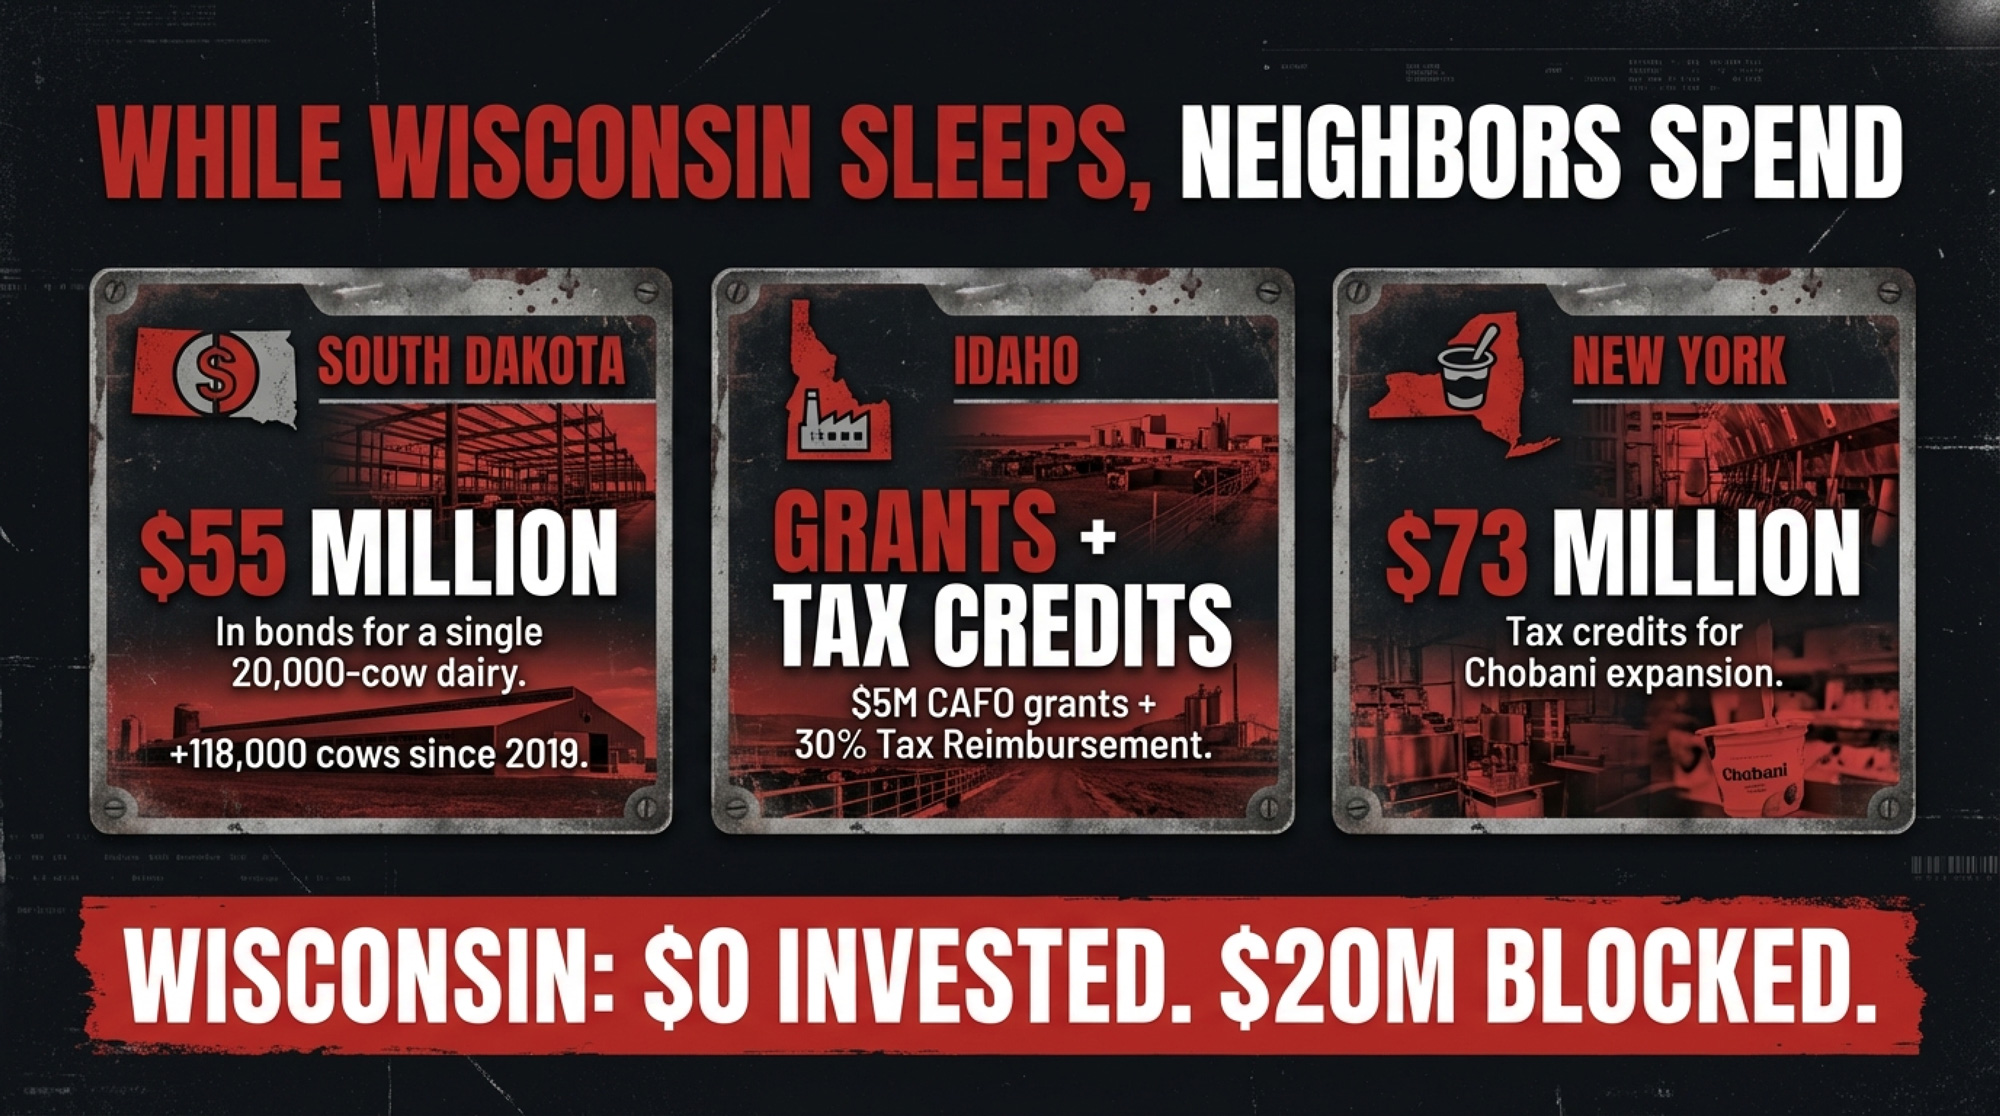
South Dakota grew its dairy herd 70.5% from 2019 to January 2024, adding 118,000 cows to reach 208,000. That wasn’t luck. In a single month — March 2024 — the Governor’s Office of Economic Development approved $17 million in incentives, most of it for dairy. In April, the state’s Economic Development Finance Authority approved a $55 million tax-exempt bond for Riverview LLP to build a 15,000-to-20,000-cow dairy in Kingsbury County. GOED Commissioner Chris Schilken said those 118,000 new cows represent “nearly $4 billion annually” in economic impact.
Idaho passed House Bill 559, creating a $5 million CAFO Improvement Fund — grants, not loans — for environmental and manure-management improvements. The state also offers a Tax Reimbursement Incentive of up to 30% on new state tax revenues for up to 15 years for expanding businesses. When Glanbia Foods expanded $82 million in southern Idaho, the company received a 23% tax credit for 10 years, plus a local property tax exemption.
New York handed Chobani $73 million in state tax credits over 10 years, plus a $22 million Fast NY grant toward a $1.2 billion plant expansion.
Wisconsin offered $20 million in zero-interest loans to farms under 700 cows — and couldn’t get it through its own Ag Committee. South Dakota approved $55 million in bonds for a single 20,000-cow mega-dairy. That’s the competitive math right now.
| State | Investment Type | Total Investment Deployed (2024–2026) | Dairy Herd Growth / Impact |
| South Dakota | $55M tax-exempt bond (single 20K-cow dairy) + $17M incentives (March 2024) | $72 million | +118,000 cows (+70.5%) from 2019–2024; ~$4B annual economic impact |
| Idaho | $5M CAFO Improvement Fund (grants) + 30% Tax Reimbursement Incentive (15-year) | $5M+ grants; 23–30% tax credits for expansions | Glanbia: $82M expansion, 23% tax credit + property tax exemption |
| New York | $73M state tax credits (10-year) + $22M Fast NY grant for Chobani | $95 million | $1.2B Chobani plant expansion secured |
| Wisconsin | $20M zero-interest loan fund (appropriated, never deployed) | $0 | –233 herds (Jan 2025–Jan 2026); program killed in Assembly committee |
The Tranel Contradiction
Travis Tranel is not a Madison politician who’s never touched a bulk tank. His family has farmed in Grant County since before Wisconsin was a state. He took over the family operation in 2002 when his father became ill, while Tranel was still in high school. He custom-bales hay for 40 farms in southwest Wisconsin and northwest Illinois. He holds degrees in economics and finance. He’s been in the legislature since 2010 and has chaired the Ag Committee since 2023.
His own operation — at around 550 cows — would have been eligible for SB 323 funding. He’s well below the 714-cow cap.
And his stated objection — that financing equipment modernization “is going to be perceived as we’re trying to get producers to make more milk” — doesn’t survive contact with the bill text. SB 323’s priority criteria emphasized labor efficiency, manure management, reduced environmental impact, and animal health. Production volume wasn’t a stated goal. Efficiency was.
Tranel has championed other dairy-related legislation. He authored food labeling bills, pushed the heavier dairy tanker weight bill that became law, and secured dairy processor grant funding in the 2025 state budget. He’s not anti-dairy.
But when it came to directly financing equipment upgrades for the small and mid-size farms in his district — farms smaller than his — he decided it sent the wrong message. The man whose official biography says he “takes great pride in being able to keep small family dairies alive and viable” let the small family dairy bill die.
| Category | SB 323 Program Requirement | Travis Tranel’s Operation |
|---|---|---|
| Herd Size Eligibility | 50–714 milking cows | ~550 cows (eligible ✓) |
| Loan Terms | Up to $500,000 at 0% interest, 10-year repayment | Would qualify for $250K–$500K at 0% |
| Program Purpose | Equipment upgrades, labor efficiency, manure management, animal health—not production volume | Operates equipment-dependent 550-cow dairy with custom hay operation |
| Personal Interest Savings (10-year, $250K loan) | Zero interest = $0 cost | <span style=”color: #CC0000;”>$193,750 in commercial interest avoided</span> |
| Stated Objection | N/A | “It doesn’t necessarily look good on the government when we’re pumping more money into the system, and it’s going to be perceived as we’re trying to get producers to make more milk.” |
| Outcome | Bill died in Assembly Ag Committee (no floor vote) | Tranel chose not to move bill forward despite chairing the committee |
Nine months earlier, Tranel told Brownfield something that reads differently now: “Sometimes I think, as farmers, we maybe rely too heavily on farm organizations and just assume that they are doing our bidding for us, and that’s not necessarily always the case”.
Turns out that applies to farmer-legislators too.
What This Means for Your Operation
If you run 50–714 cows in Wisconsin, the zero-interest financing isn’t coming in 2026. Any equipment decisions you’re making this year need to pencil out at commercial rates — 7.25% to 8.25% as of this month. On a $250,000 upgrade, you’re paying roughly $19,375 a year in interest that SB 323 would have eliminated.
| Loan Amount | Financing Type | Annual Interest Cost | Total Interest Cost (10 Years) |
| $100,000 | SB 323 Zero-Interest | $0 | $0 |
| $100,000 | Commercial 7.75% | $7,750 | $77,500 |
| $250,000 | SB 323 Zero-Interest | $0 | $0 |
| $250,000 | Commercial 7.75% | $19,375 | $193,750 |
| $500,000 | SB 323 Zero-Interest | $0 | $0 |
| $500,000 | Commercial 7.75% | $38,750 | $387,500 |
If you’re planning capital improvements: Don’t wait for SB 323’s return. FSA direct farm ownership loans are at 5.75% as of February 2026 — not zero, but better than commercial. USDA REAP grants cover energy efficiency improvements. NRCS EQIP can fund manure management. The federal programs won’t match zero-interest terms, but they exist now.
If you’re a Wisconsin Farm Bureau member: Ask your county organization why the state-level lobby pushed to remove the CAFO cap instead of pushing harder for a floor vote. The cap debate distracted from the bigger fight.
If your operation is above 714 cows, SB 323 was never for you. But the industry benefits from having viable 200–500 cow operations in your milk shed. When your neighbors exit, your hauling costs go up, your processor’s supply volatility increases, and the political will to defend dairy in Madison erodes further.
Run the 30/90/365 check:
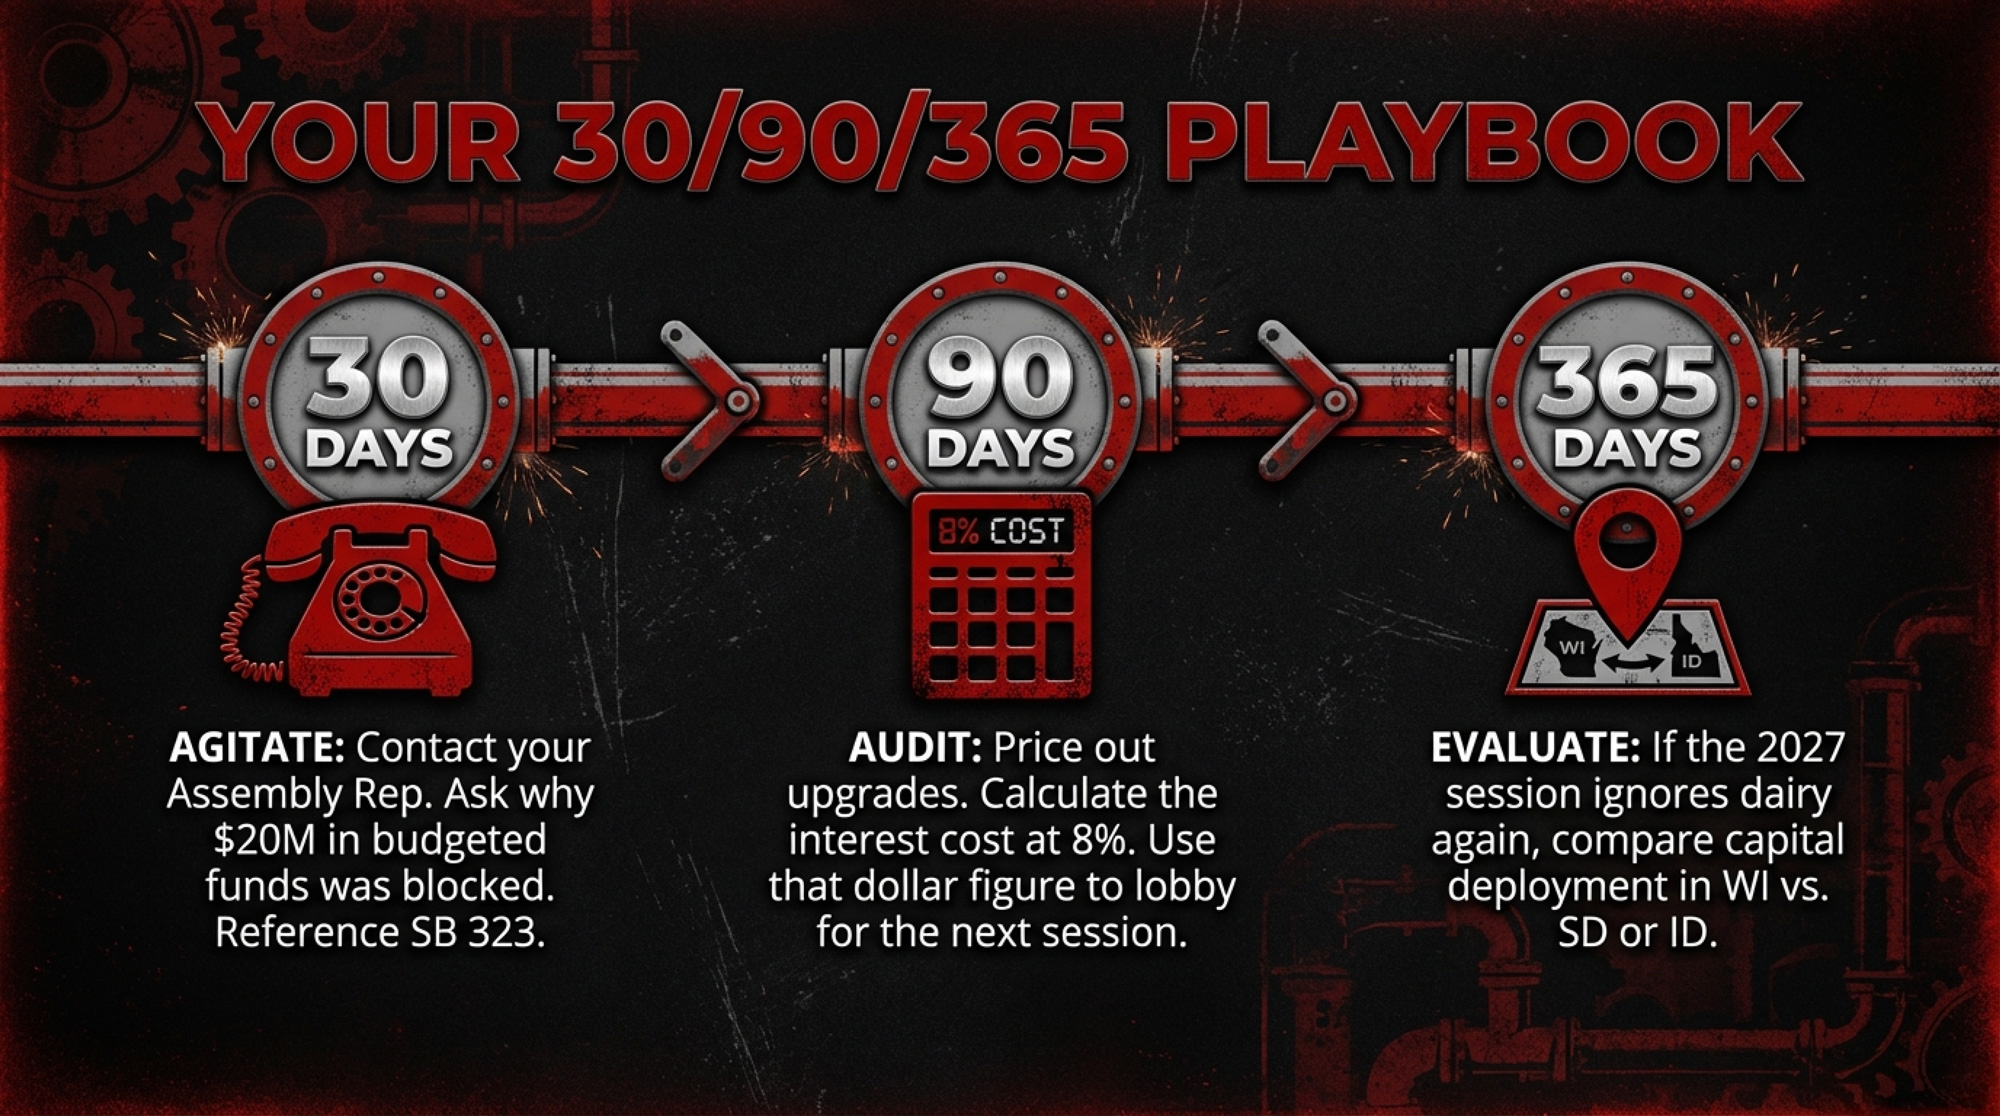
- 30 days: Contact your state Assembly member. Reference SB 323 / AB 363. Ask specifically: why didn’t this bill get a floor vote? The $20 million was already budgeted.
- 90 days: Audit your own equipment needs. Price out the upgrades you’d have financed at zero interest. Calculate the annual interest cost at your current rate. That number is your argument for the next session.
- 365 days: If the bill doesn’t return when the legislature reconvenes in January 2027, seriously evaluate whether Wisconsin’s policy environment still supports your operation in the long term. South Dakota approved $55 million in bonds for a single dairy last year. Idaho is handing out CAFO improvement grants. Other states are making investment decisions in real time — and some of them are investing in your competitors.
Read more: transform your dairy before consolidation decides for you
Key Takeaways:
- Wisconsin already parked $20 million in the budget for zero‑interest dairy loans to 50–714 cow herds — SB 323’s failure means that money doesn’t hit your balance sheet in 2026.
- Assembly Ag Chair Travis Tranel, a dairy farmer milking around 550 cows who would have qualified for the program, chose not to move the bill, saying it sent the wrong signal about “making more milk.”
- At current commercial rates, a 300‑cow farm financing a $250,000 upgrade is writing roughly $19,375 a year in interest checks — $193,750 over 10 years that zero‑interest state money could have erased.
- Wisconsin sits at 5,115 herds, down 233 in a year, while states like South Dakota and Idaho are stacking $5–55 million in bonds, grants, and tax credits to attract the very cows Wisconsin is losing.
- If you’re under 714 cows in Wisconsin, you now need to decide whether to delay upgrades, pay commercial rates, chase federal programs, or start asking if your next major investment should even be in this state.
The Bottom Line
Pull up your last equipment loan statement. Calculate what zero percent over 10 years would save you versus what you’re paying now. That number — the one sitting right there on your desk — is what the Wisconsin Assembly left on the table when the session clock ran out. Travis Tranel knows those numbers. He runs them on his own 550 cows.
Complete references and supporting documentation are available upon request by contacting the editorial team at editor@thebullvine.com.
Learn More
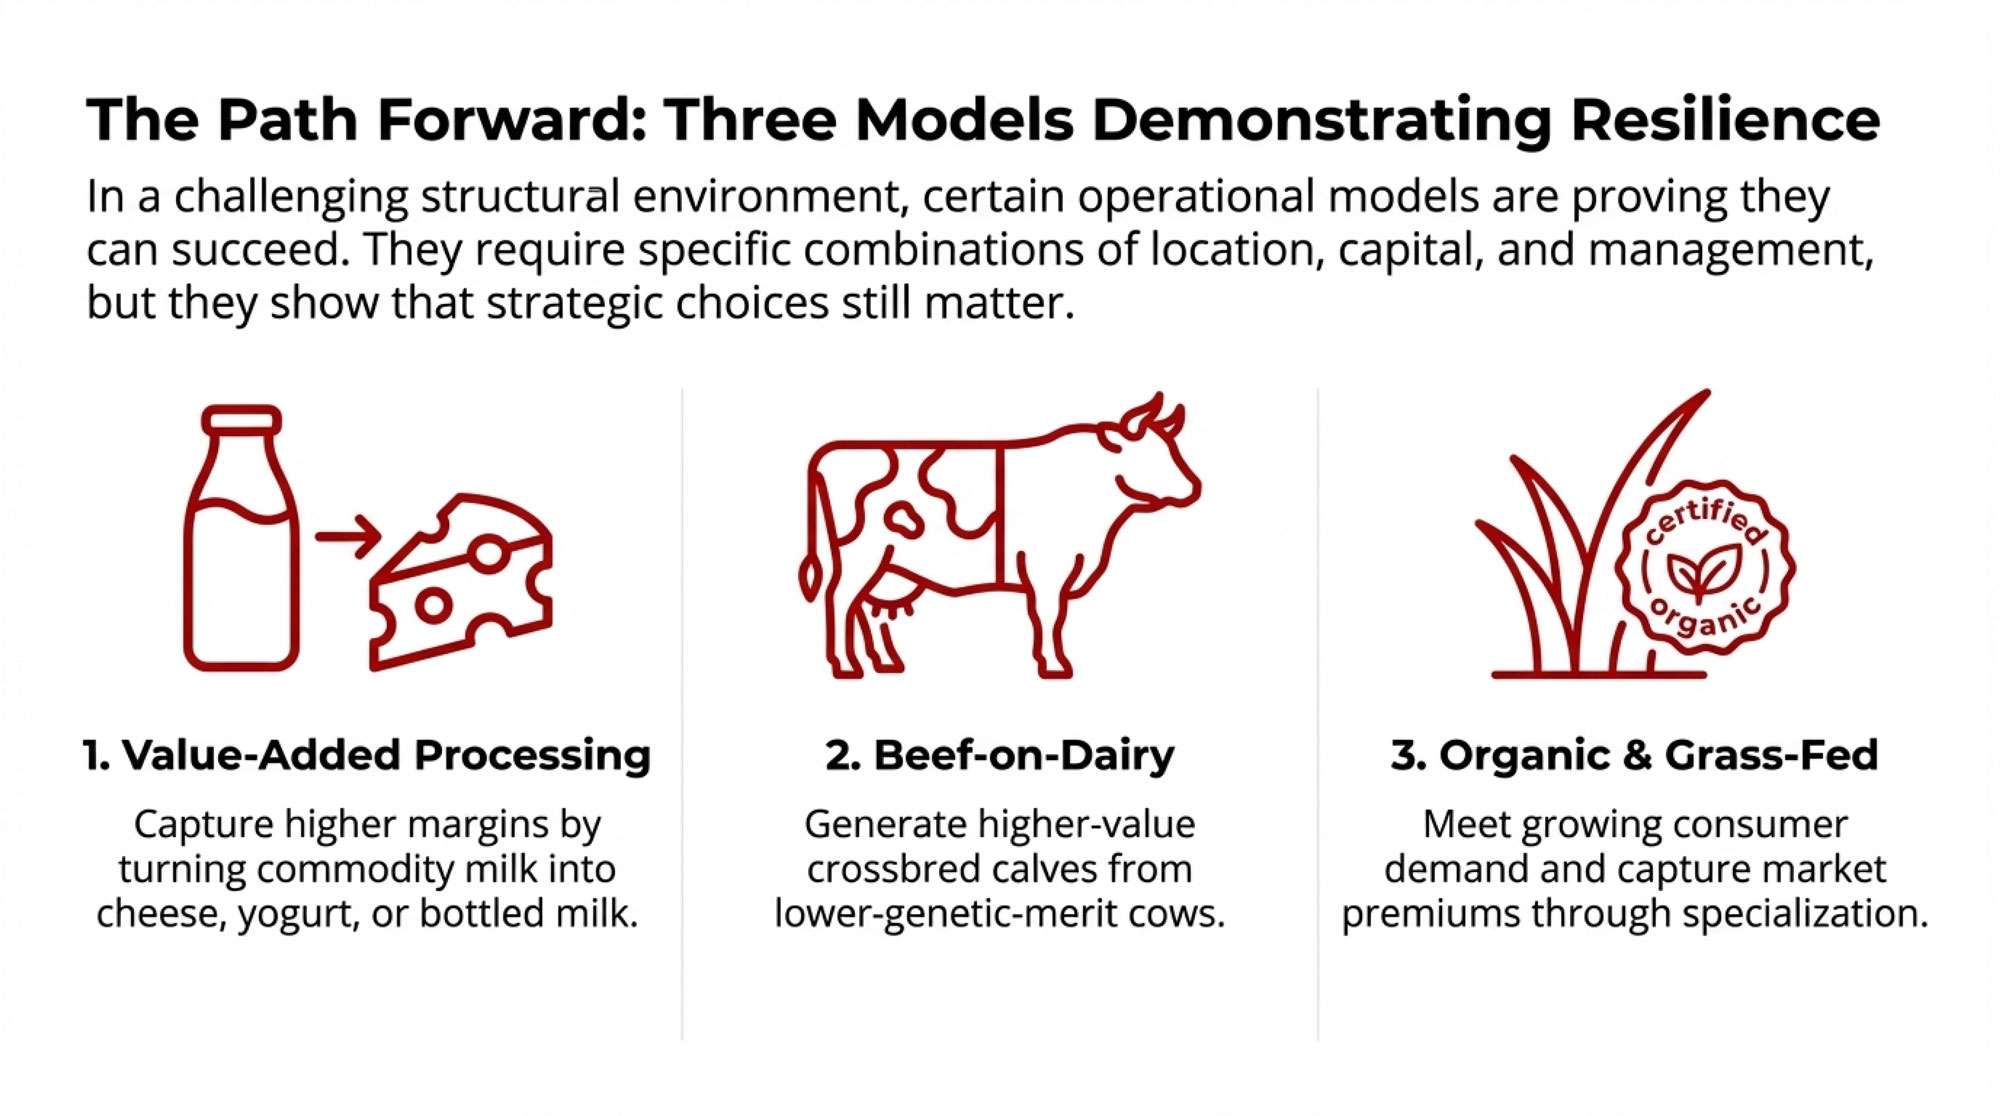
- Dairy Labor on a Knife Edge: 70% Undocumented, $52.8B at Risk, and the 500‑Cow Choice Between Wages, Robots, or Exit – Gain a zero-fluff decision matrix for solving the labor crisis. This breakdown reveals exactly how to compare the long-term ROI of robotic milking against rising wages before a single policy shift erases your operational margins.
- The Rules Changed and Nobody Told You: Three Paths Left for the 300-Cow Dairy – Secure your operation’s future with a brutal, 18-month roadmap for survival. This analysis exposes the unbridgeable competitive gap created by 400 mega-farms and delivers the specific financial benchmarks required to pivot your herd successfully.
- The $10 Billion Yogurt Revolution: How Smart Dairy Farmers Are Banking Record Premiums While Others Miss the Biggest Opportunity in Decades – Capture $2/cwt premiums by weaponizing component density and bypassing the fluid milk race to the bottom. This analysis reveals how unconventional producers are aligning genetics with the surging yogurt-led processing shift to dominate.
 The Sunday Read Dairy Professionals Don’t Skip.
 The Sunday Read Dairy Professionals Don’t Skip.
Every week, thousands of producers, breeders, and industry insiders open Bullvine Weekly for genetics insights, market shifts, and profit strategies they won’t find anywhere else. One email. Five minutes. Smarter decisions all week.