The first 2026 GDT rally is real—but the farms that win from it will be the ones already managing margin, not chasing price.
Executive Summary: Global dairy got a welcome jolt to start 2026 when the first GDT auction pushed the index up 6.3%, led by stronger whole and skim milk powder prices, after a long stretch of weaker events. Behind that headline, the shift is being driven less by a demand boom and more by tighter powder supply: New Zealand offered less product, and US plants have cut powder output by roughly 10% year‑on‑year as milk moves into cheese and high‑protein ingredients instead. At the same time, EU butter prices around €4,400 per tonne, sizeable EU butter stocks, US butter stuck in the mid‑$1.30s, and heavy cheese and whey production all remind us that the world is still working through a “wall of milk,” even if it looks different in Europe, North America, Oceania, and China. Futures markets in Europe and Singapore are quietly confirming this firmer tone, but most official outlooks still point to only modest milk price gains against relatively high input and finance costs. For farmers, this combination means the rally is useful but not a rescue: the biggest wins will come from tightening margin‑management plans, rechecking butterfat versus protein strategy against current pay programs, and using tools like dairy‑beef where local buyers can genuinely support it. In short, this is a moment to use better prices to strengthen your position, not a signal that the hard part of this cycle is behind us.
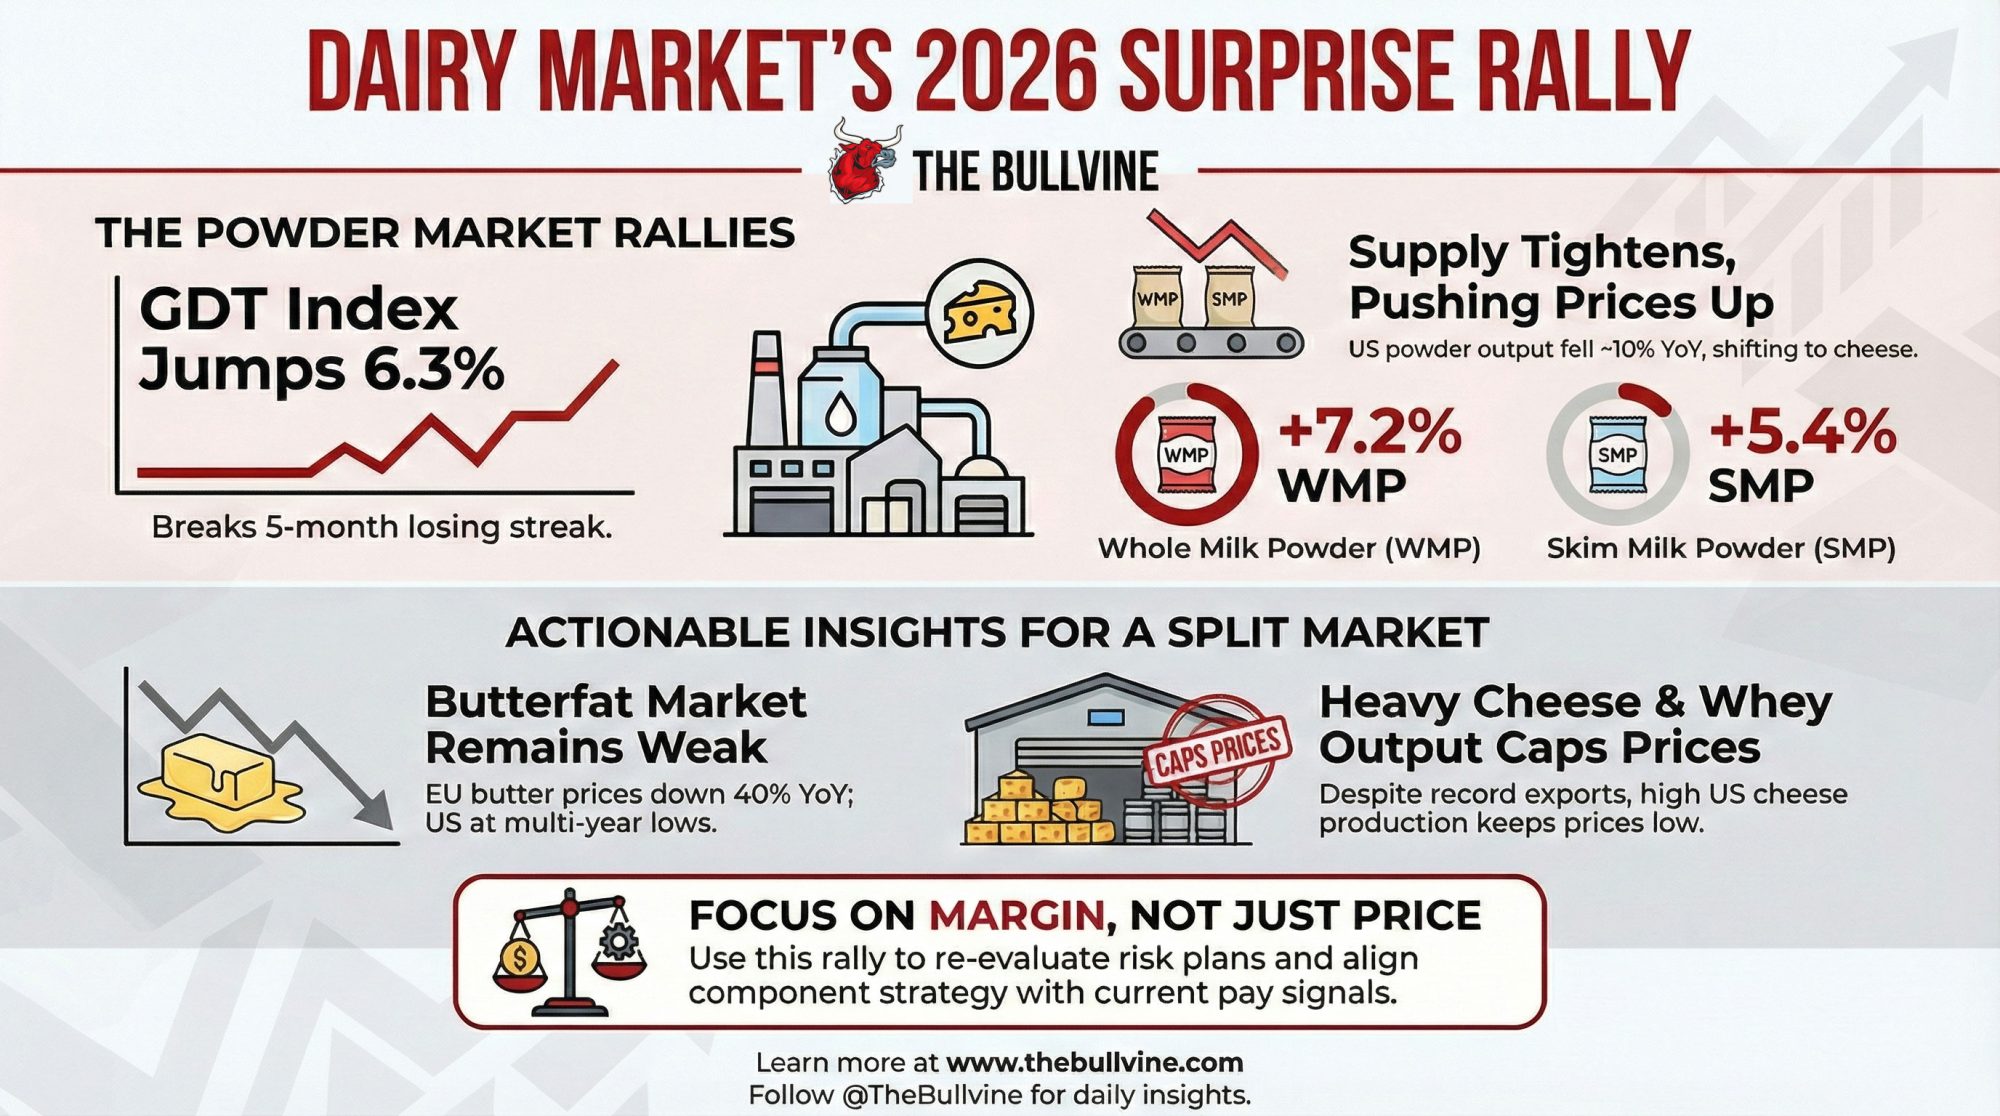
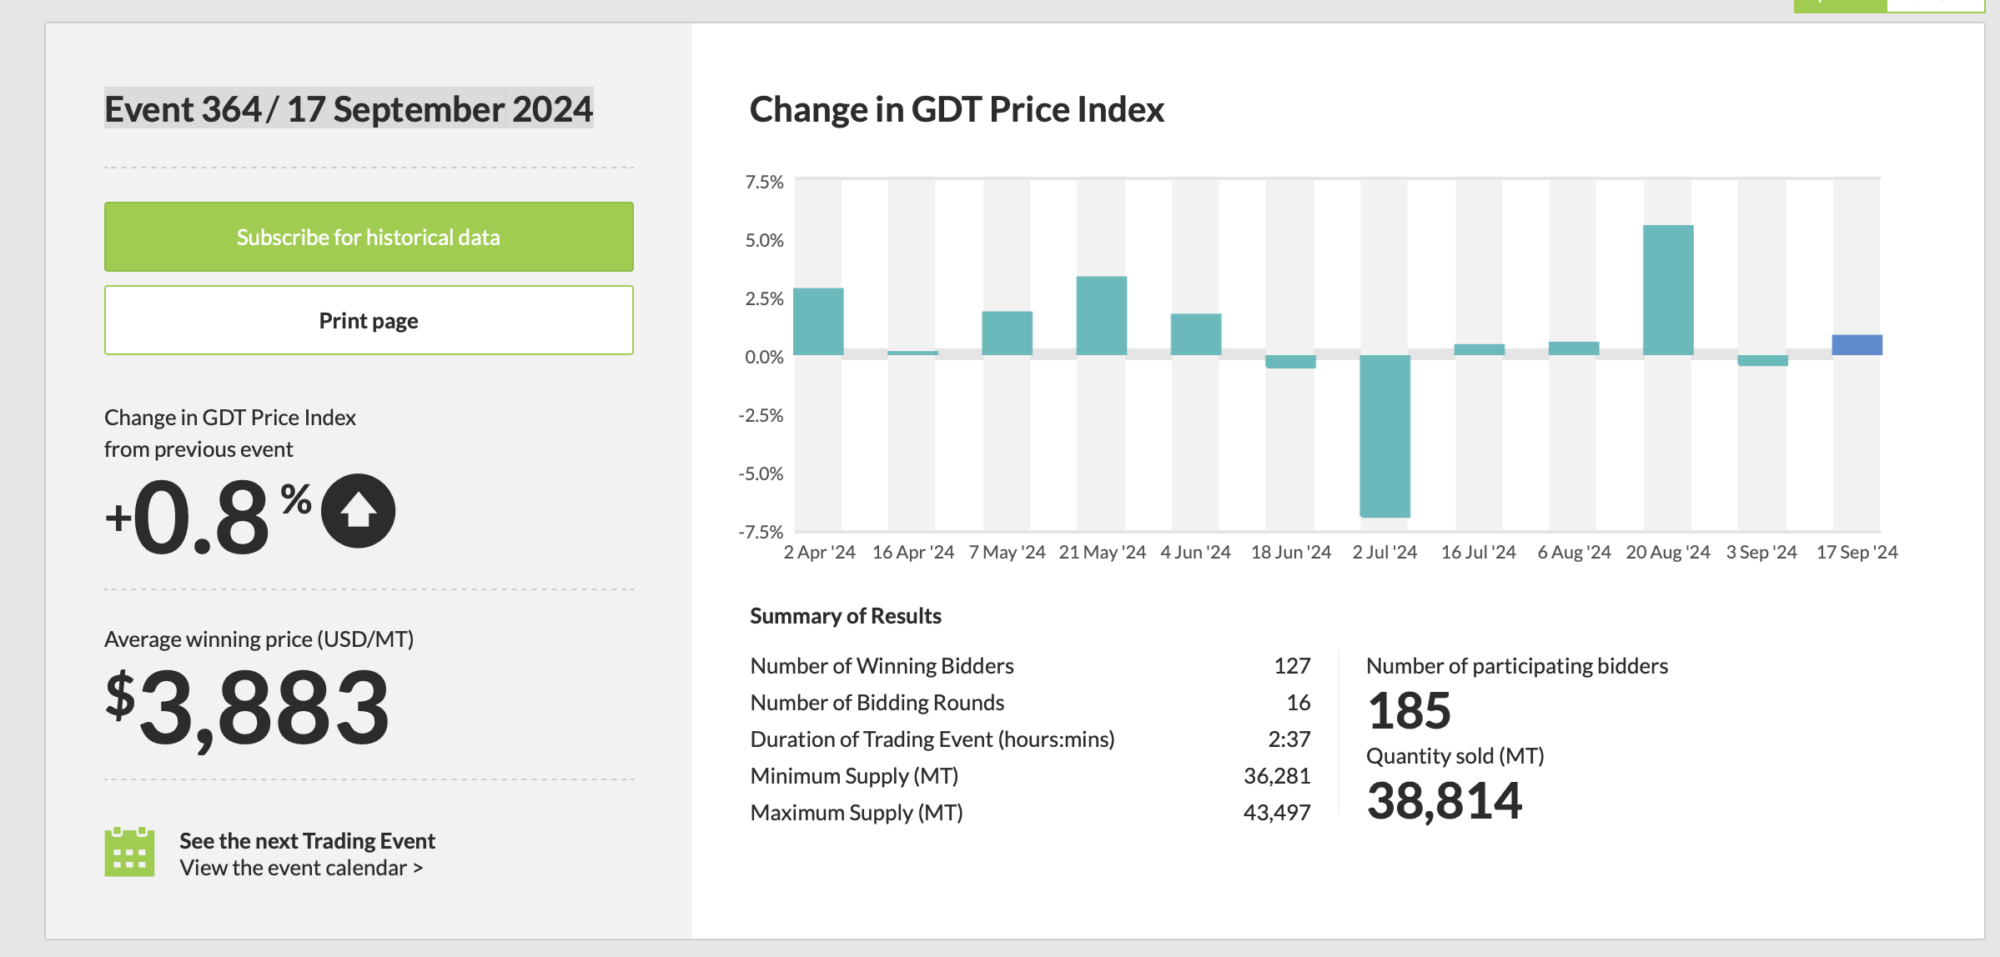
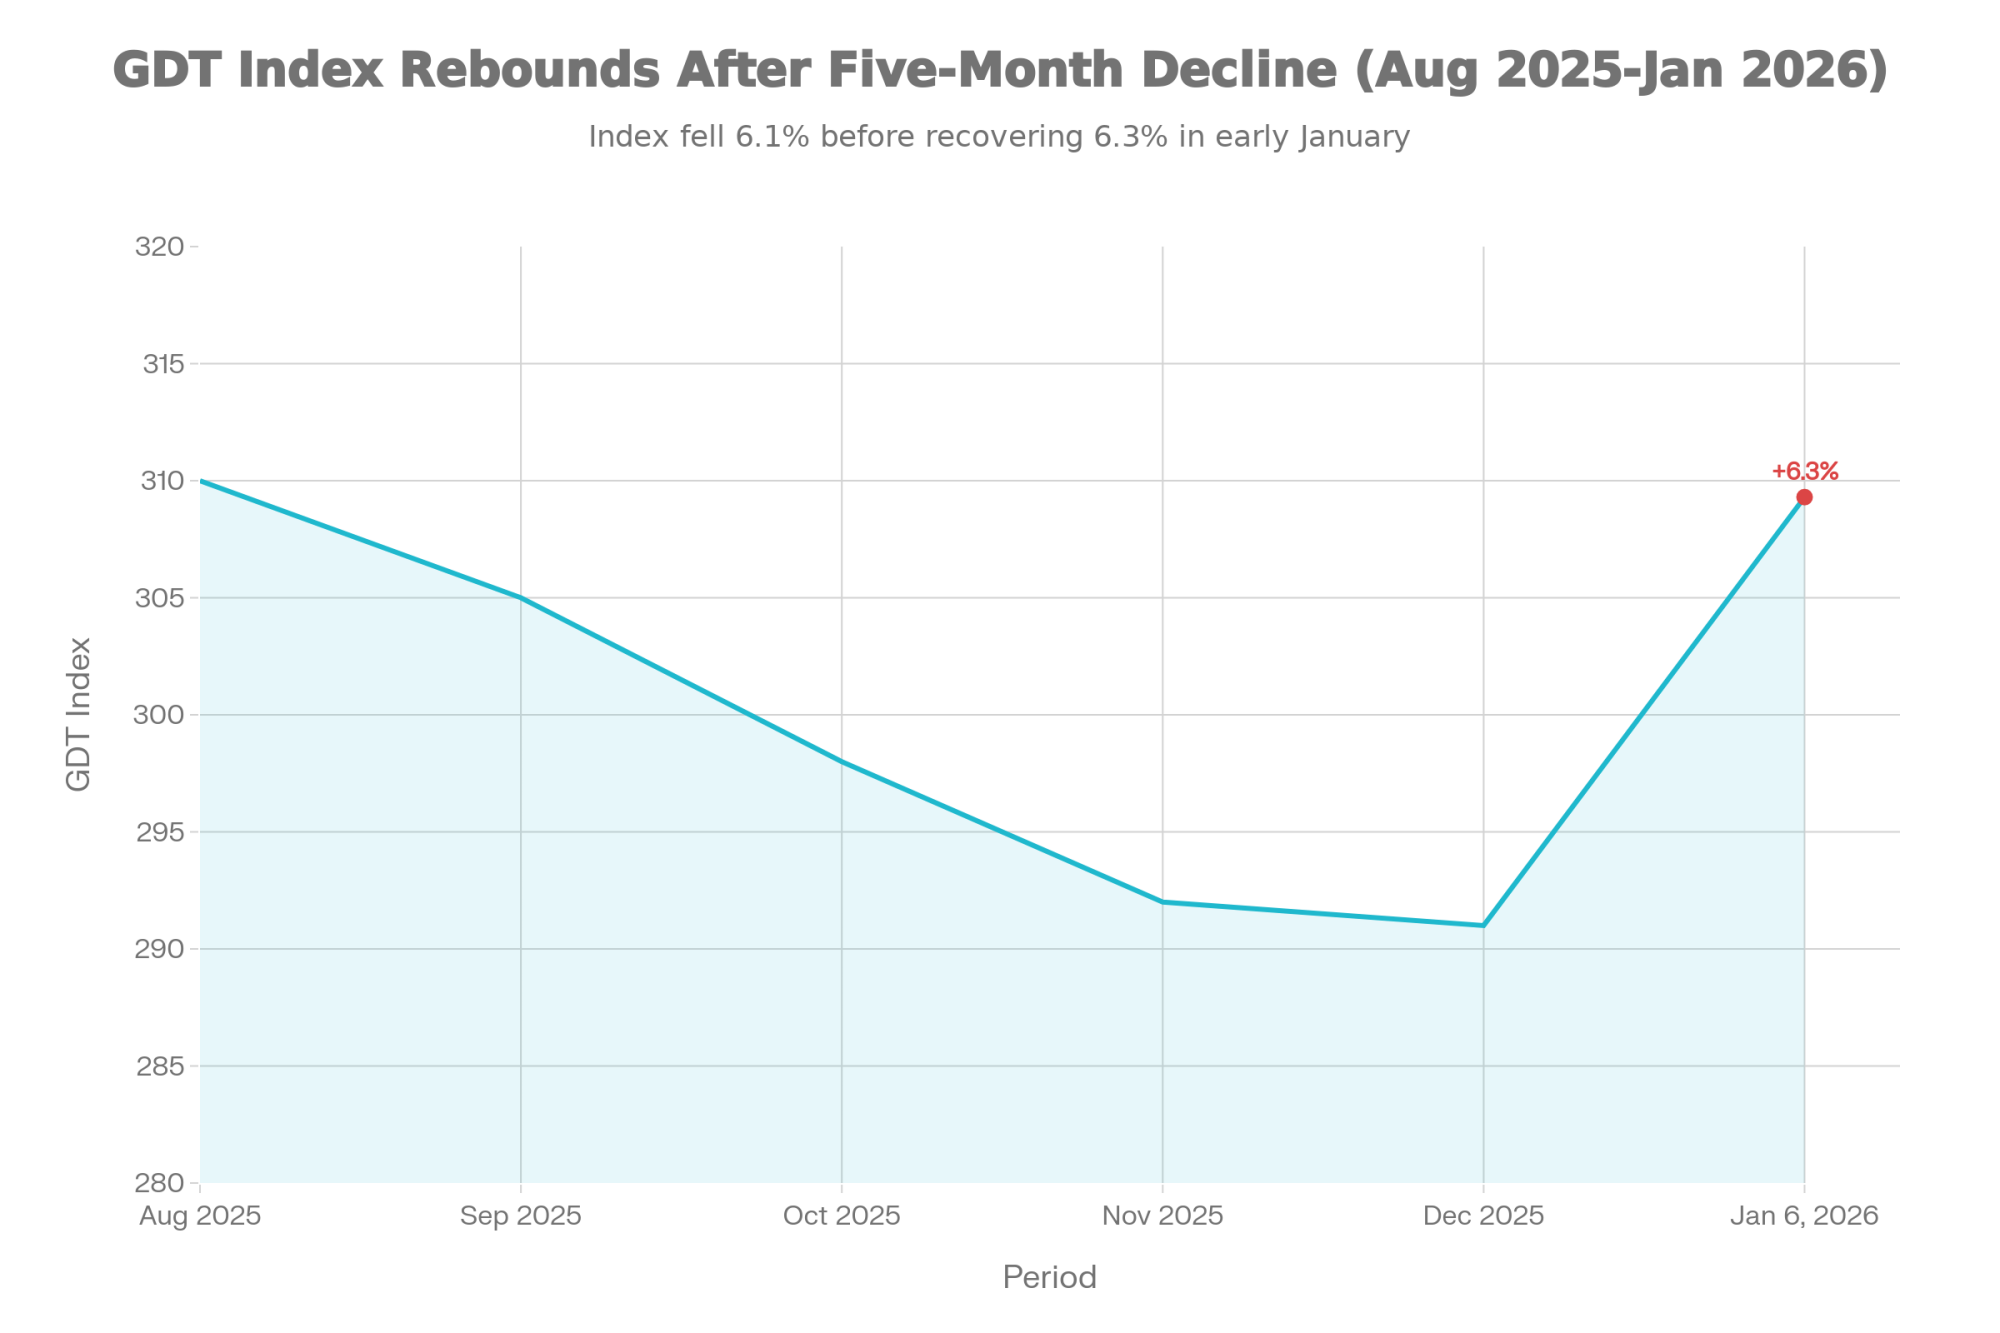
You know those weeks when the market finally gives you something other than bad news? The first Global Dairy Trade auction of 2026 was one of those weeks. The January 6 event pushed the GDT Index up 6.3 percent, according to official GDT results and confirmed by NZX Dairy Insights. That broke a five-month slide that had been wearing on everyone’s nerves.
Before we dig into what’s driving all this, here are the numbers that matter most right now:
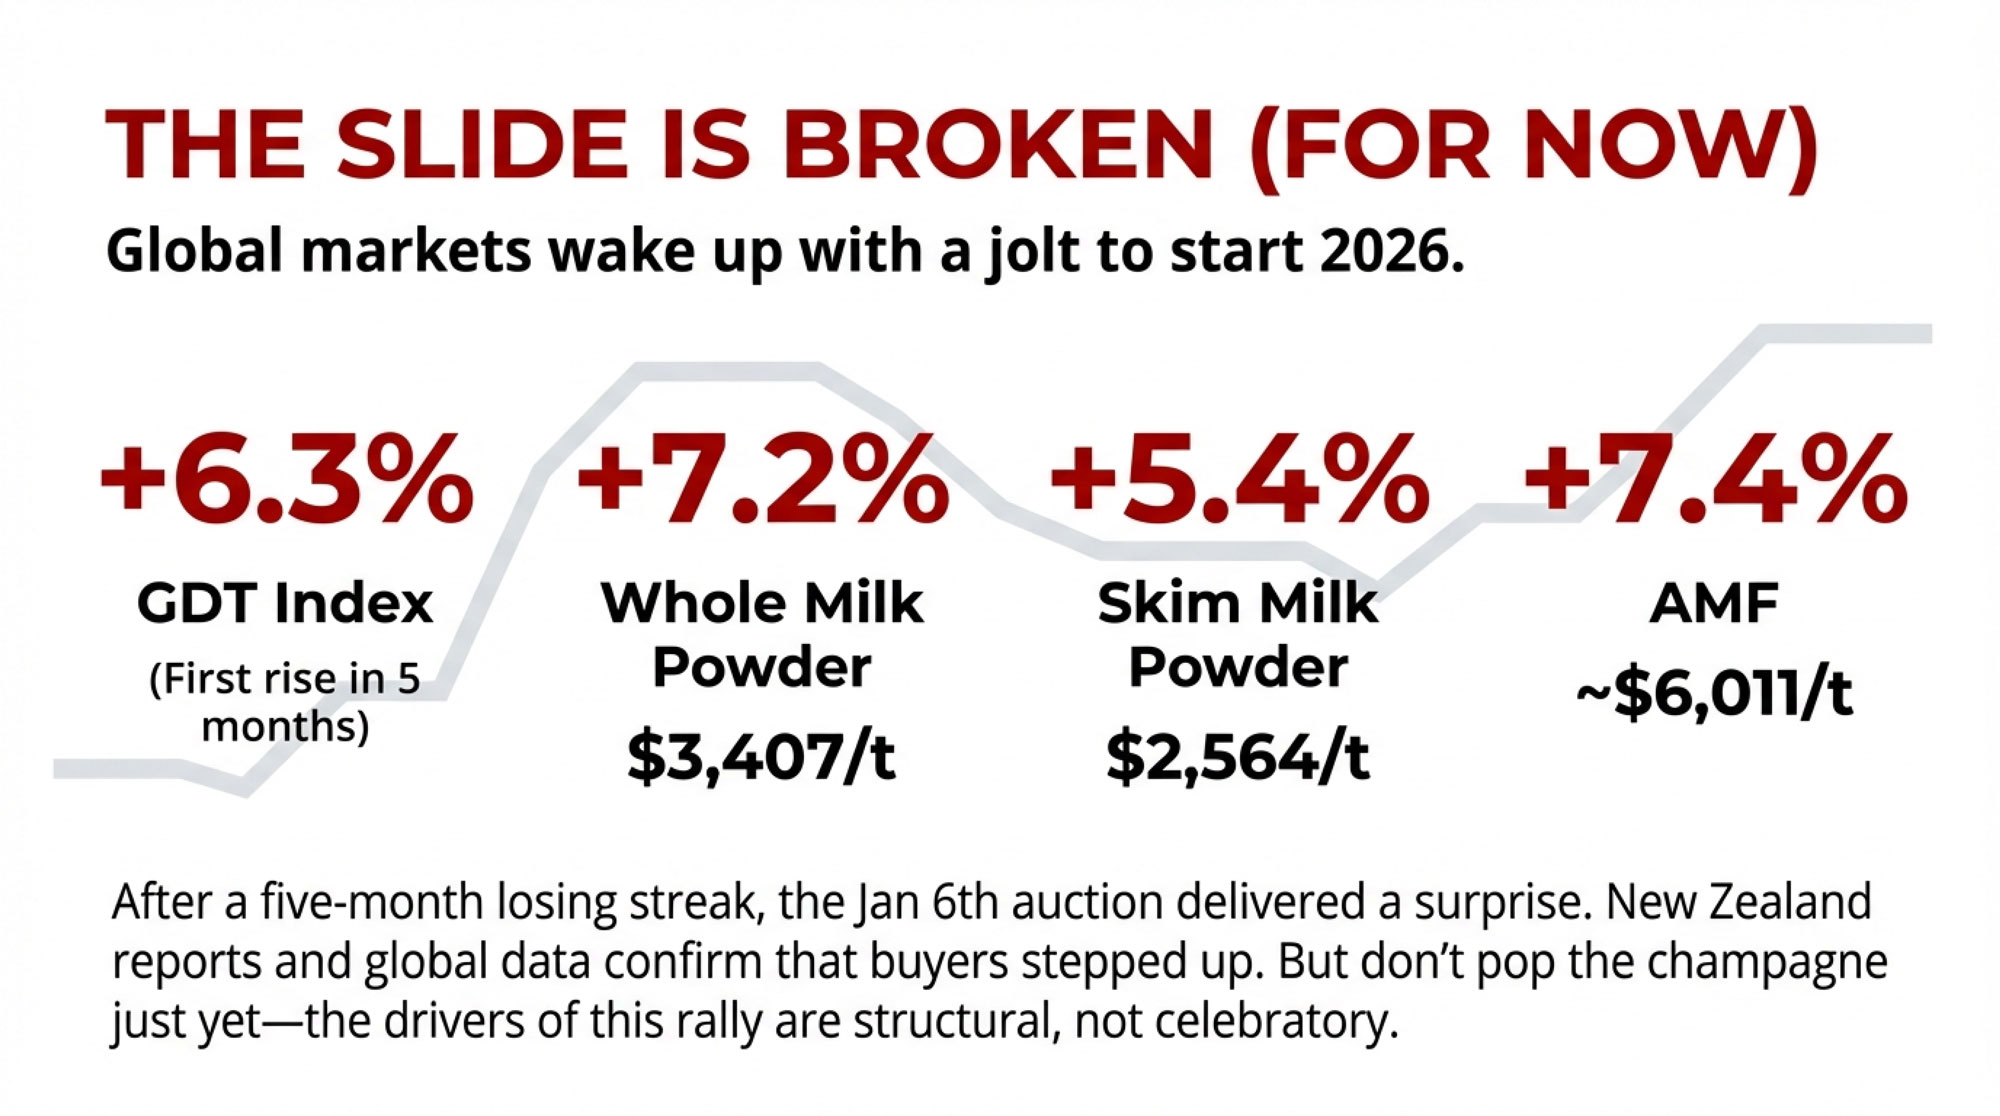
- GDT Price Index: Up 6.3% at Event 395, the first increase since August 2025
- Whole Milk Powder: Up 7.2% to roughly $3,407 per tonne
- Skim Milk Powder: Up 5.4% to about $2,564 per tonne
- Anhydrous Milkfat: Up 7.4% to around $6,011 per tonne
- US Spot NDM: Reached $1.265 per pound for the week ending January 9
- EU Butter Reference: Around €4,408 per tonne, down roughly 40% year-on-year
- CME Spot Butter: Trading in the mid-$1.30s per pound, near multi-year lows
- CME Dry Whey: Slipped into the low-70-cent range per pound
New Zealand and global dairy reports told the same story: less product on offer from Oceania and stronger demand from Asia and the Middle East combined to move the needle. Average winning prices at GDT moved into the mid-$3,500-per-tonne range, which was a welcome change from the drift we’d been seeing.
What’s encouraging is that this is the first time in a while we’ve seen both fat and powder move up together in a meaningful way. It doesn’t mean the year is saved. But it does tell us the market still responds when supply tightens, and buyers step forward.
Powder’s Quiet Turn: Less Balancing, More Bite
Looking at the powder side of this rally, you start to see some interesting structural changes at work. In early January, US spot nonfat dry milk climbed into the mid-$1.20s per pound. The T.C. Jacoby Weekly Market Report, which draws heavily on CME and USDA data, pegged the weekly average at $1.265 per pound for the week ending January 9. That’s a real improvement from where we sat late last year.
At the same time, USDA’s Livestock, Dairy, and Poultry Outlook still points to modest US milk growth for 2026. The October projections have national production rising from around 231 billion pounds in 2025 to 234 billion pounds in 2026, driven by a slightly larger herd averaging just under 9.5 million cows and higher yield per cow. On the surface, you’d expect “more milk” to mean softer powder prices, not firmer.
So what changed? On the production side, you see, we’re simply not making as much powder as we used to. That same Jacoby report highlighted October US nonfat/skim production at just under 150 million pounds, about 10 percent below the same month a year earlier. The analysts described it as one of the lighter October figures they’ve seen in recent years based on USDA’s monthly time series.
| Metric | October 2025 | October 2024 | Change | YoY % |
|---|---|---|---|---|
| Total US Milk Production | 19.25B lbs | 18.98B lbs | +270M | +1.4% |
| Nonfat Dry Milk (NDM) Output | 148.5M lbs | 165.0M lbs | -16.5M | -10.0% |
| US Cheese Production | 286M lbs | 271M lbs | +15M | +5.5% |
| Whey Protein Streams | 42M lbs | 38M lbs | +4M | +10.5% |
On the ground, plants are using their dryers less as a balancing tool. With all the new cheese vats and high-protein lines that have come online across the Midwest and West over the past few years, extra milk that would have gone to powder a decade ago is now more often going into cheese or specialty proteins. A plant manager in the Central Plains told me recently, “If I can put a load into cheese or a protein stream, I’ll do it before I even think about the dryer.” That attitude is becoming pretty common.
Now put that together with the GDT story. Ahead of the first 2026 auction, New Zealand sellers cut back their offered volumes of whole and skim milk powder compared with earlier events, according to NZX Dairy Insights. Milk collections there aren’t running away, and co-ops are managing volume more tightly. Buyers still came to the table, and between that and tighter US production, the whole powder market suddenly looked a lot less heavy than it did in the fall.
So the data suggests this powder rally isn’t just a random bounce. It’s built on less supply meeting stable-to-better demand. The open question is how long that balance holds.
What The Futures Are Whispering
If you sit down with anyone who lives in the risk-management world, they’ll tell you the futures curves matter. And right now, they’re quietly backing up what we’re seeing in spot markets.

On the European Energy Exchange, skim milk powder futures for the early-to-mid-2026 months moved into the low € 2,200-per-tonne range right after the GDT lift. That’s a few percent higher than where they sat in late December. Whey futures edged higher, too, though not by as much.
Over in Singapore, which has become a key hub for hedging Oceania-linked product, whole milk powder futures for the January–August window climbed into the upper-$3,300s per tonne, with skim in the high-$2,600s to low-$2,700s. Anhydrous milkfat and butter futures there saw even stronger percentage gains after the auction.
Why does any of this matter at the farm level? Because these are the curves your co-op or processor looks at when they’re deciding whether to lock in export deals. On Wisconsin farms that ship into export-focused co-ops, and in California plants that rely heavily on overseas powder sales, marketers are much more willing to write business when EEX and SGX curves are firm and active. Those deals, in turn, show up in premiums, base prices, and risk-sharing programs.
You might never place a futures order yourself, but it’s worth knowing that the people pricing your milk are watching those screens every day.
Butterfat: Valuable In Theory, Awkward In Practice
Now, let’s talk butterfat, because this is where many of us feel a disconnect between the “fat is back” headlines and the actual pay stub.
In Europe, the composite butter price, based on Dutch, German, and French quotations, has been around €4,408 per tonne in early January. That’s a bit better than December, but still about 40 percent below where it was a year ago. Vesper’s late-2025 analysis estimated EU butter surpluses at roughly 93,700 tonnes across the first three quarters of 2025, with production up more than 86,000 tonnes year-on-year. That’s a lot of butter to work through, and Vesper expects prices to slip below €4,000 per tonne in the first quarter of 2026.
| Product / Region | Price (Current) | Price (Year Ago) | YoY Change | Status |
|---|---|---|---|---|
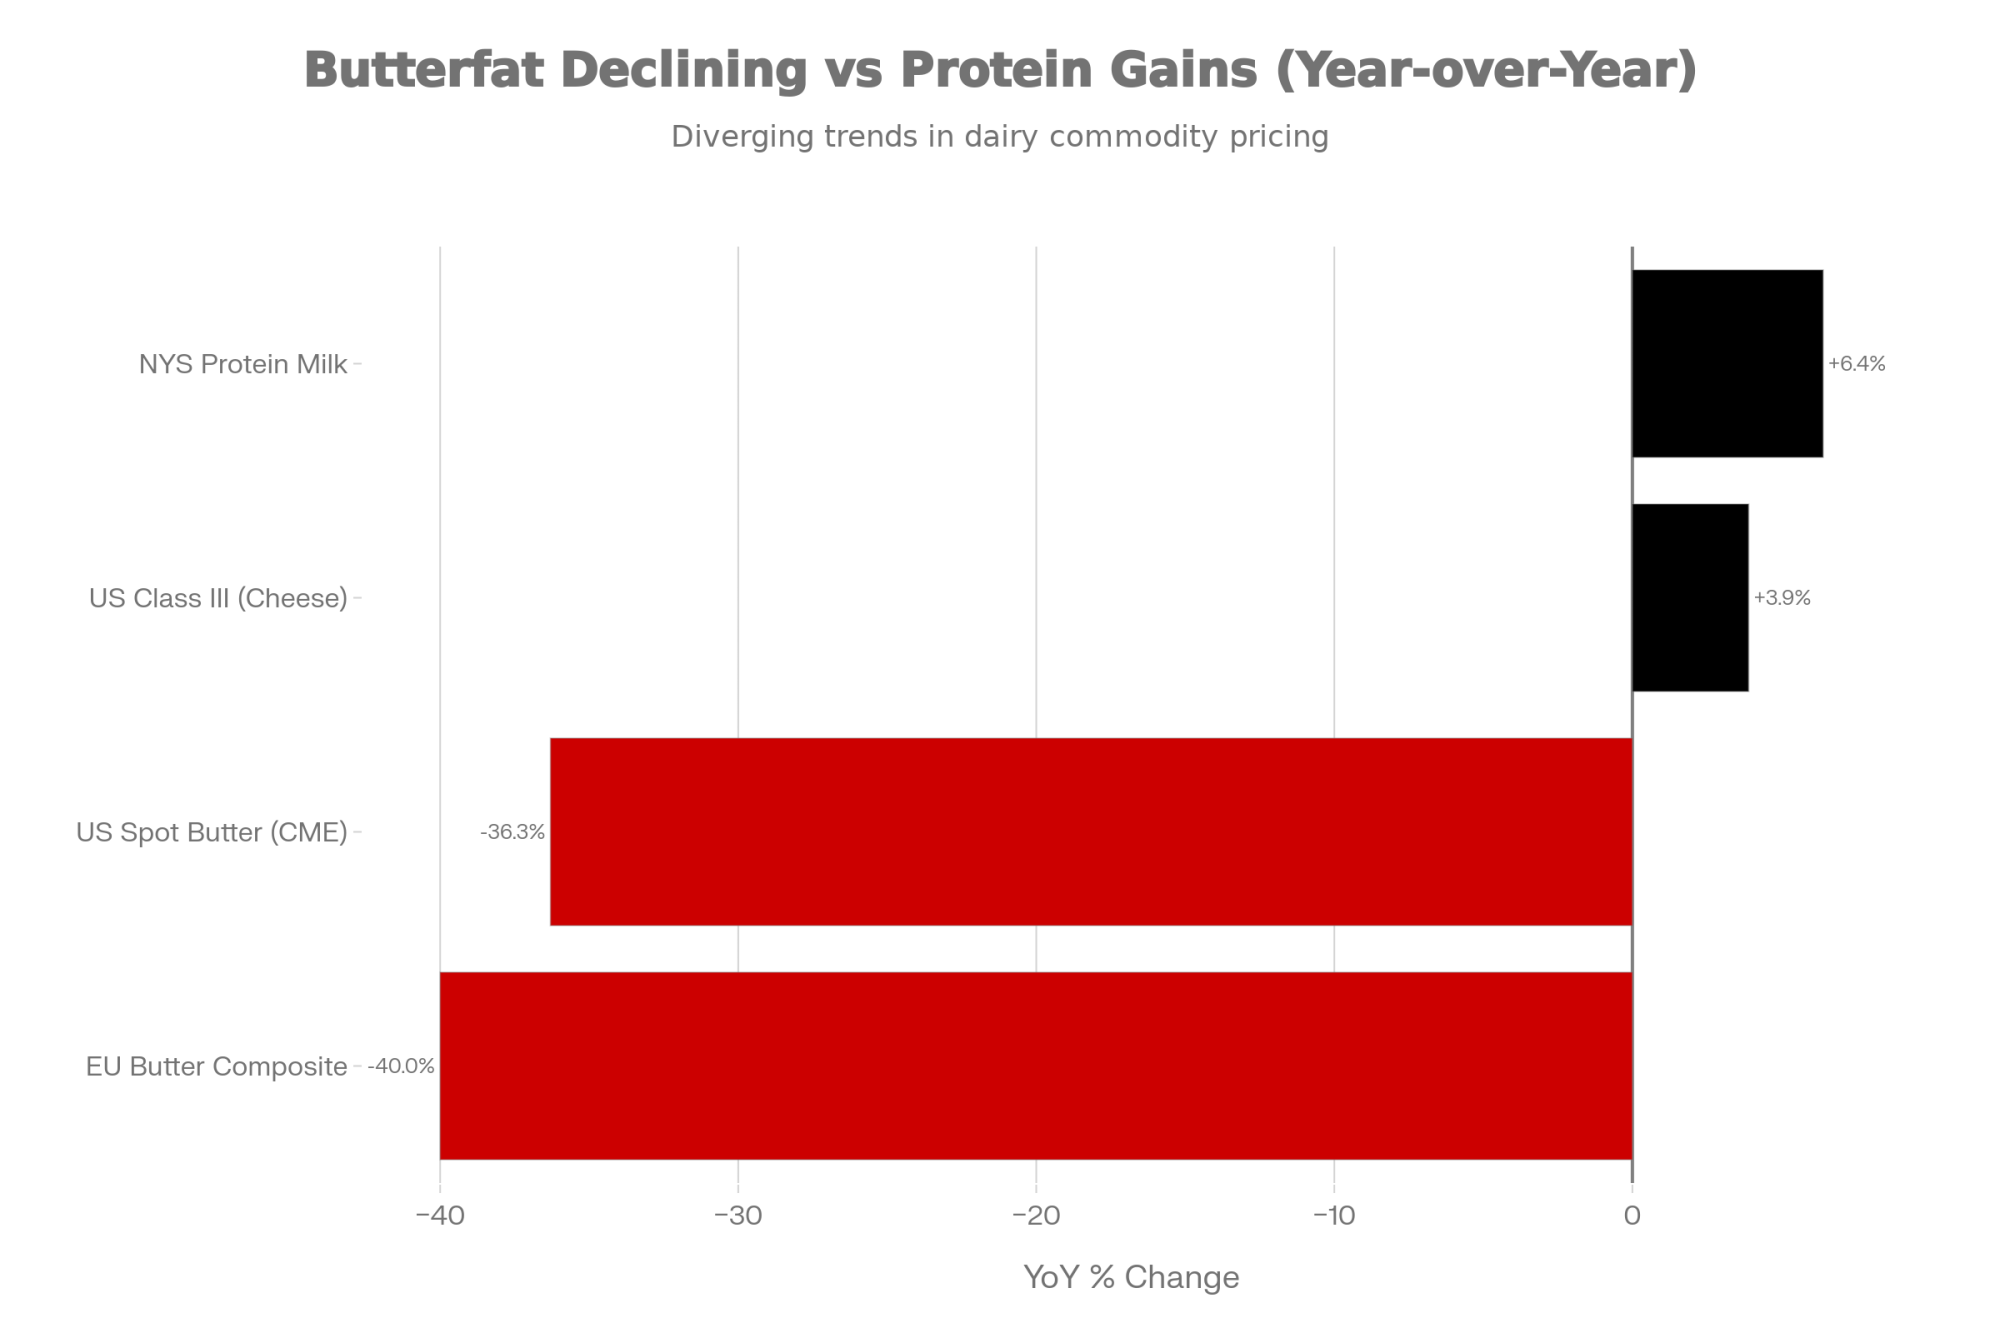
| EU Butter Composite | €4,408/tonne | €7,347/tonne | -€2,939 | ⚠️ -40.0% |
| US Spot Butter (CME) | $1.37/lb | $2.15/lb | -$0.78 | ⚠️ -36.3% |
| US Class III (Cheese) | ~$18.50/cwt | ~$17.80/cwt | +$0.70 | ↑ +3.9% |
| NYS Protein Milk Price | ~$19.25/cwt | ~$18.10/cwt | +$1.15 | ↑ +6.4% |
In the US, it’s a different flavour of the same challenge. Spot butter at the Chicago Mercantile Exchange has started 2026 in the mid-$1.30s per pound. Butter at $1.3750 on January 1, and Ever.Ag’s early-January “Margin Matters” commentary described it as testing multi-year lows. USDA data show butter production in late 2025 still running ahead of year-ago levels, even after accounting for strong cream usage elsewhere in the system.
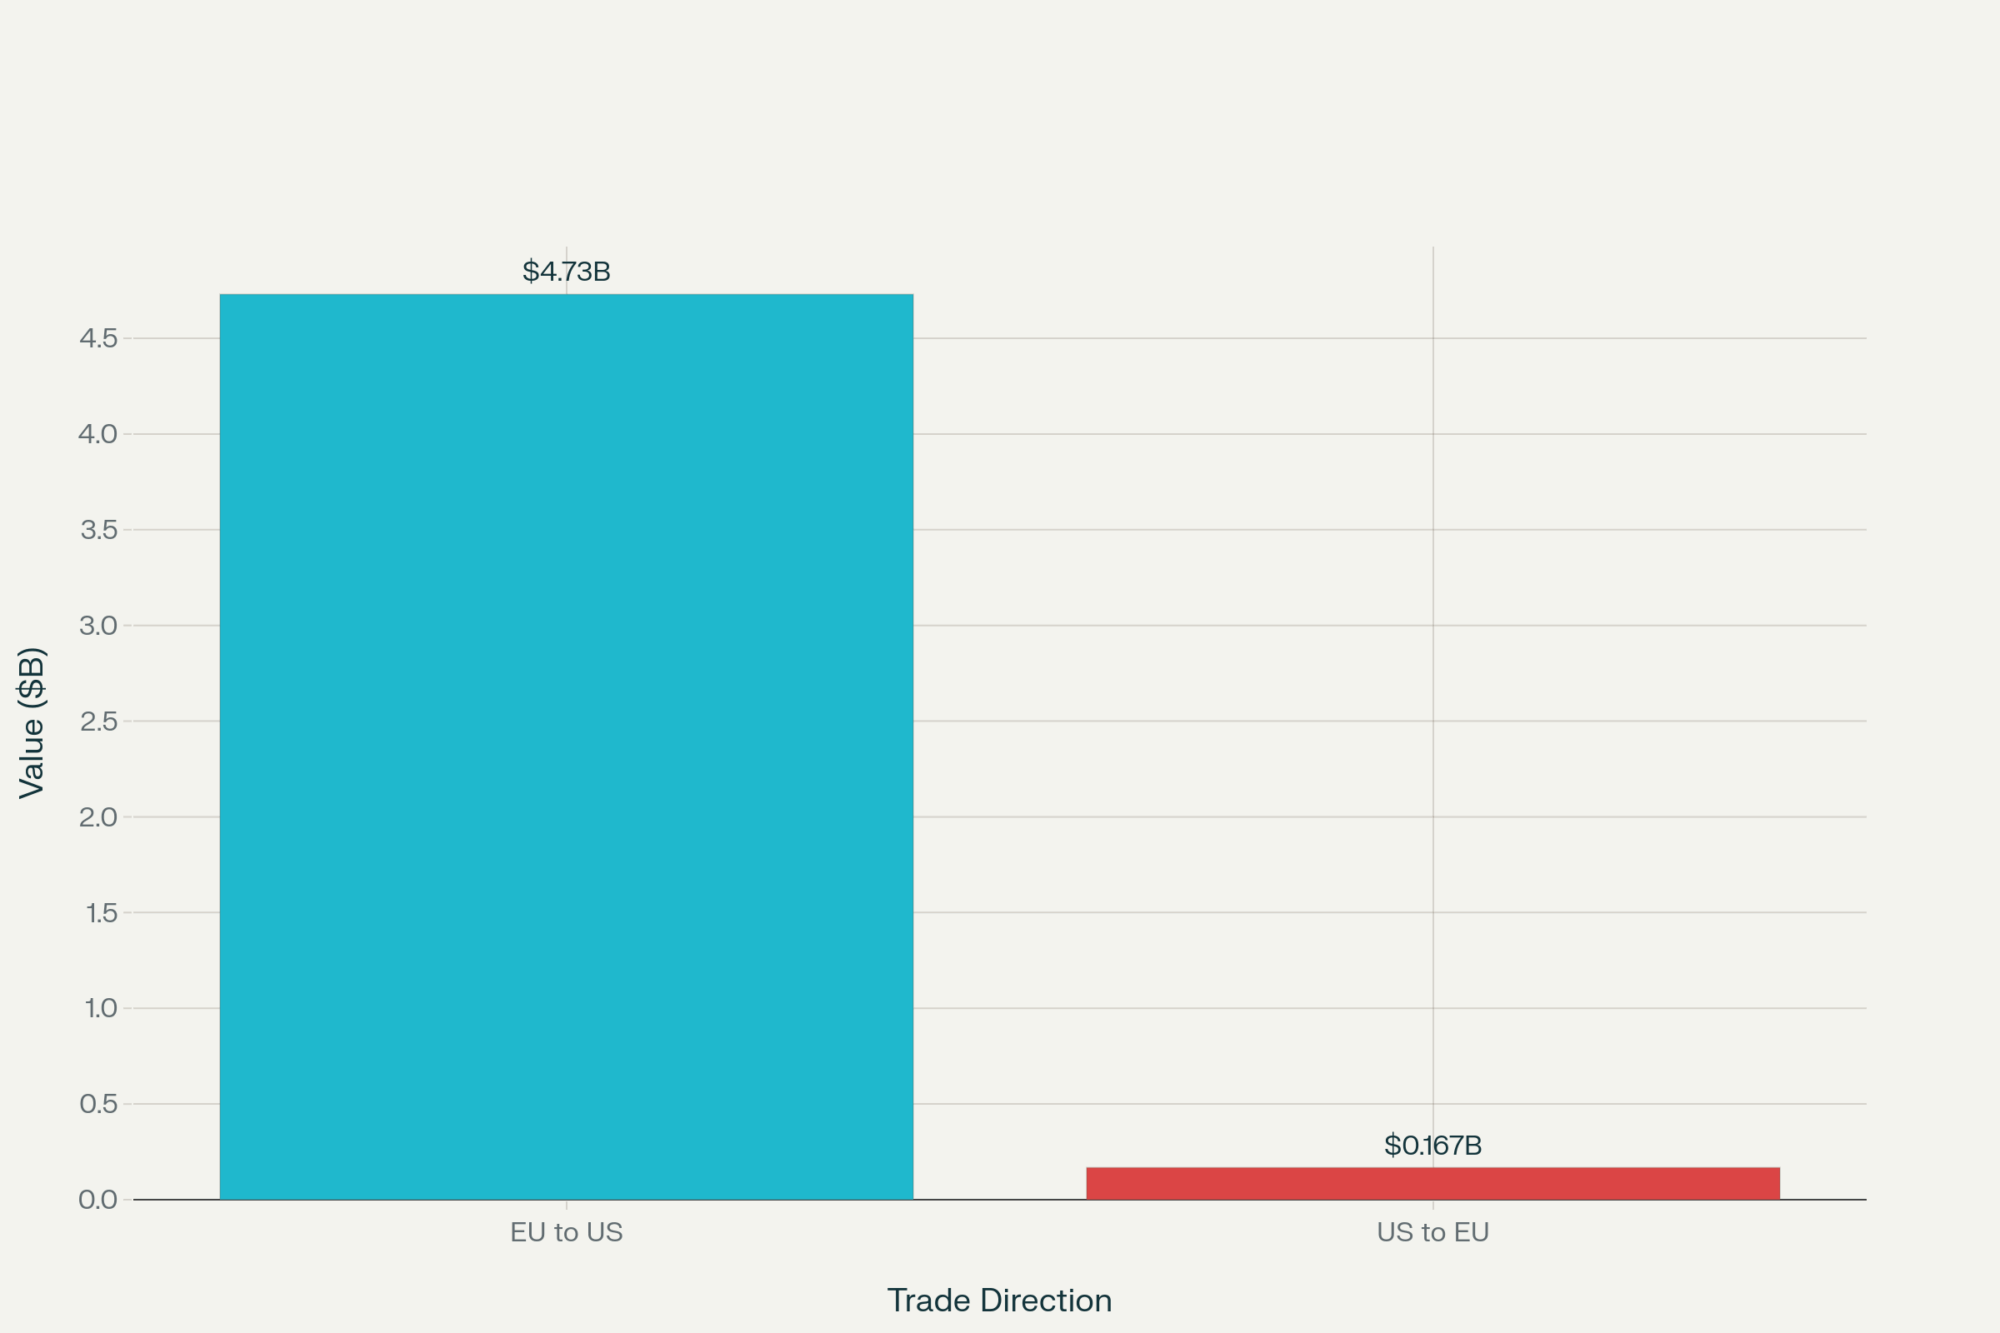
Exports, interestingly, have improved. Late-2025 export summaries from USDA and dairy trade coverage show US butter shipments several times larger than the year before and strong growth in anhydrous milkfat exports as well. International buyers are clearly taking advantage of the discount on US fat relative to European and New Zealand product.
Domestically, the picture is nuanced. Consumers haven’t gone back to low-fat diets. USDA production reports show yogurt and cottage cheese output growing in recent years, while ice cream and sour cream have been flat to slightly down. So people are still comfortable with fat, but they seem to prefer it when it’s paired with protein or cultures.
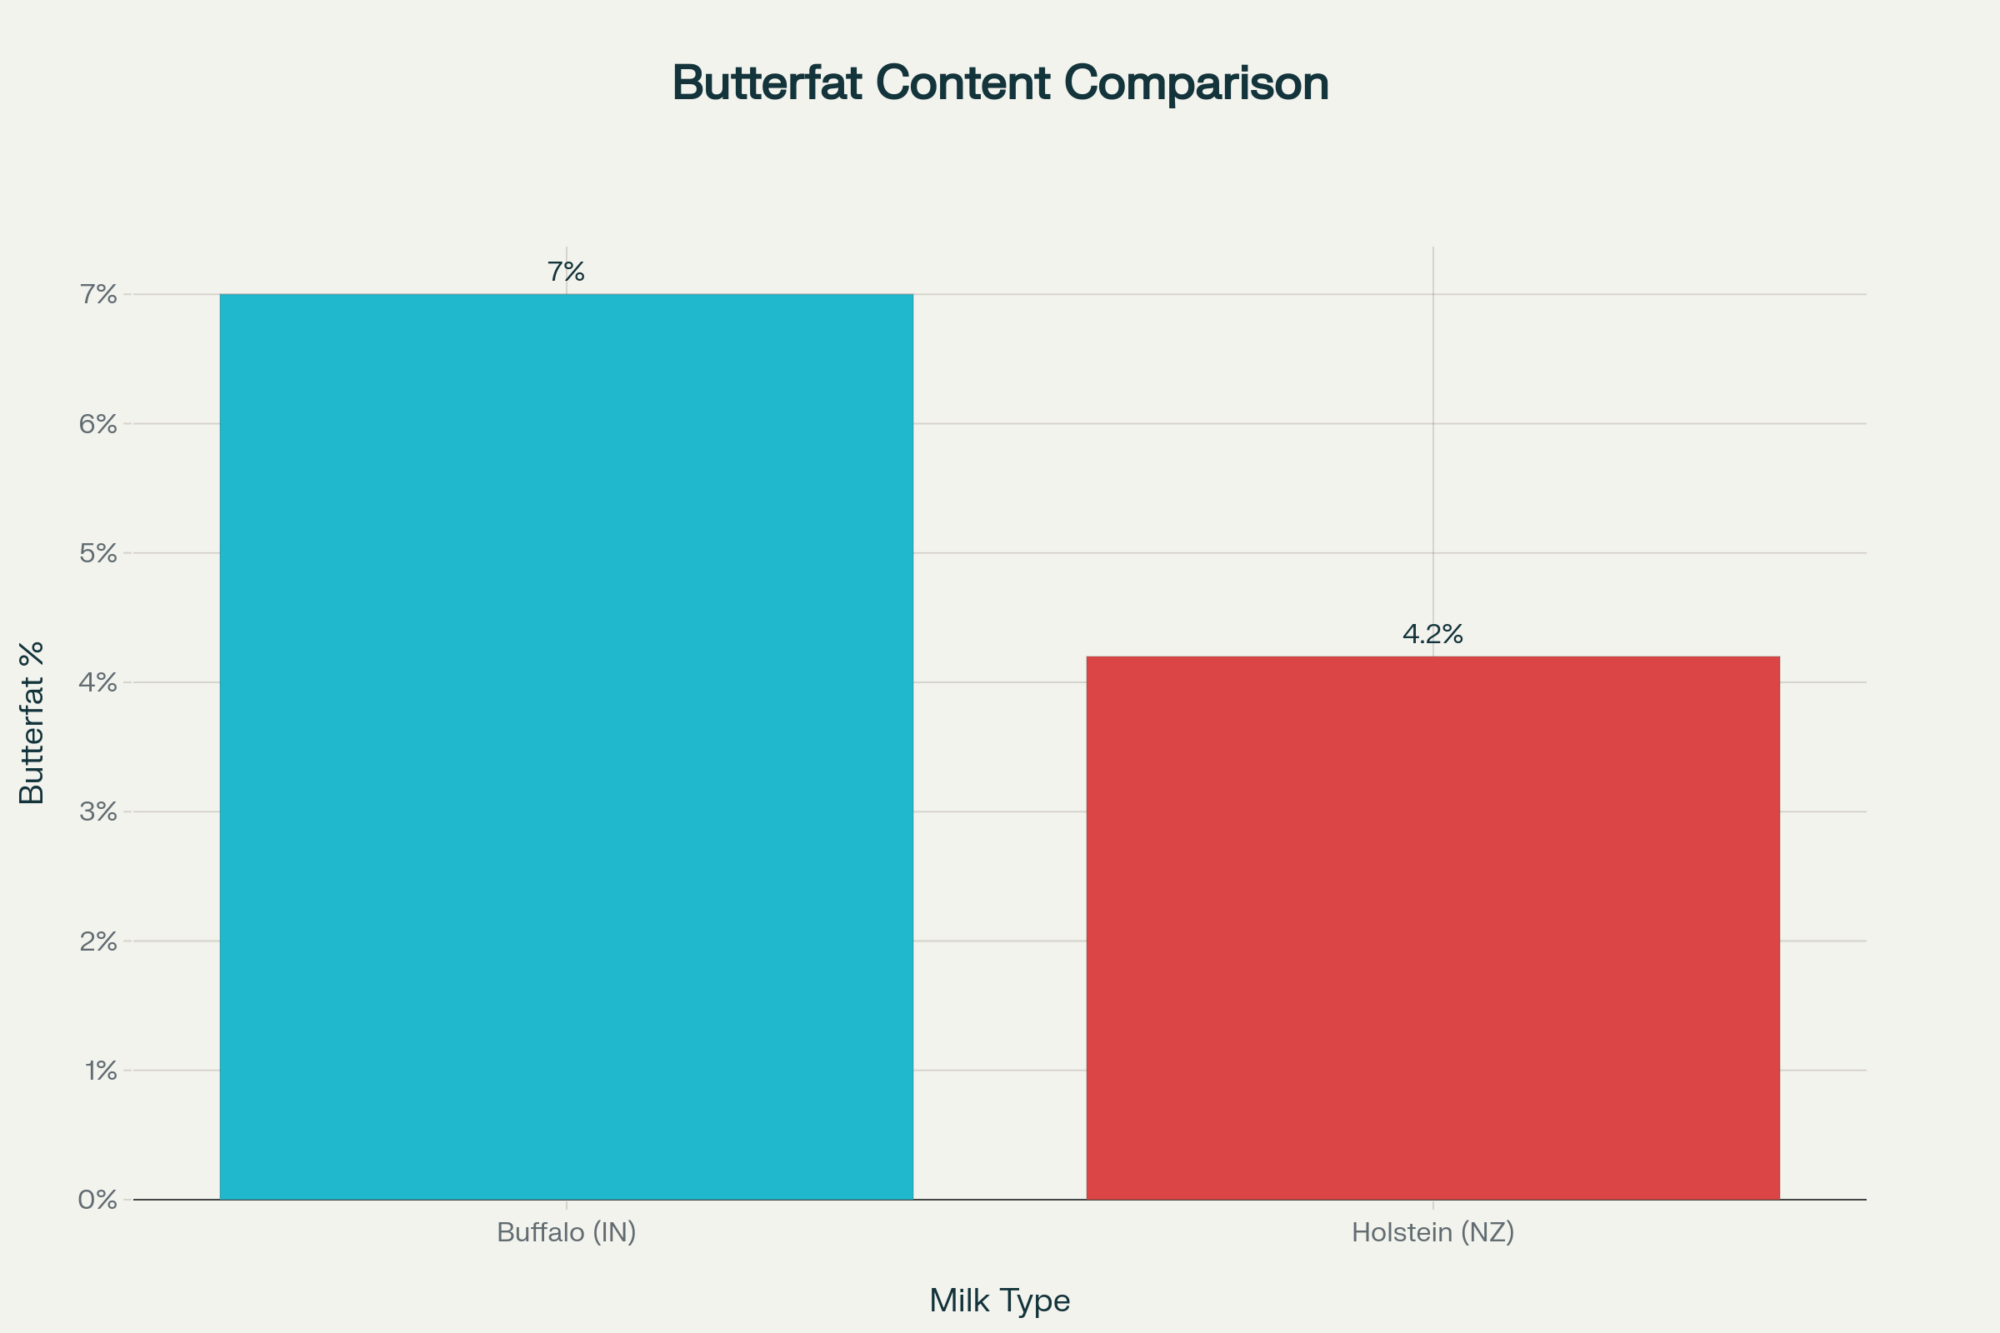
What does that mean for butterfat levels on your farm? Over the last decade, many herds have pushed fat up through better fresh cow management, strong transition programs, and careful ration work. On Northeast and Upper Midwest farms, it’s not unusual now to see rolling herd averages north of 4.0 percent fat. But with butter this cheap, the extra dollars you spend chasing an extra few points of fat may not pay back like they did when butter was at $2.50 or more.
That doesn’t mean you stop caring about fat. It does mean it’s worth sitting down with your nutritionist and milk statement to see whether your current component strategy still lines up with how your buyer is paying today. On some Ontario and New York farms, for instance, processors are quietly putting more emphasis on protein because of where their products – yogurt, cheese, high-protein drinks – are headed. That shifts the economics.
Cheese And Whey: Strong Demand, Full Vats
Cheese has been the main growth engine for the US dairy industry in recent years, as many of us have seen. USDA’s 2025 production data shows total cheese output running several percentage points ahead of the previous year, with some months close to 6% growth. New plants in places like Michigan, Texas, and Idaho are very visible examples of that expansion.
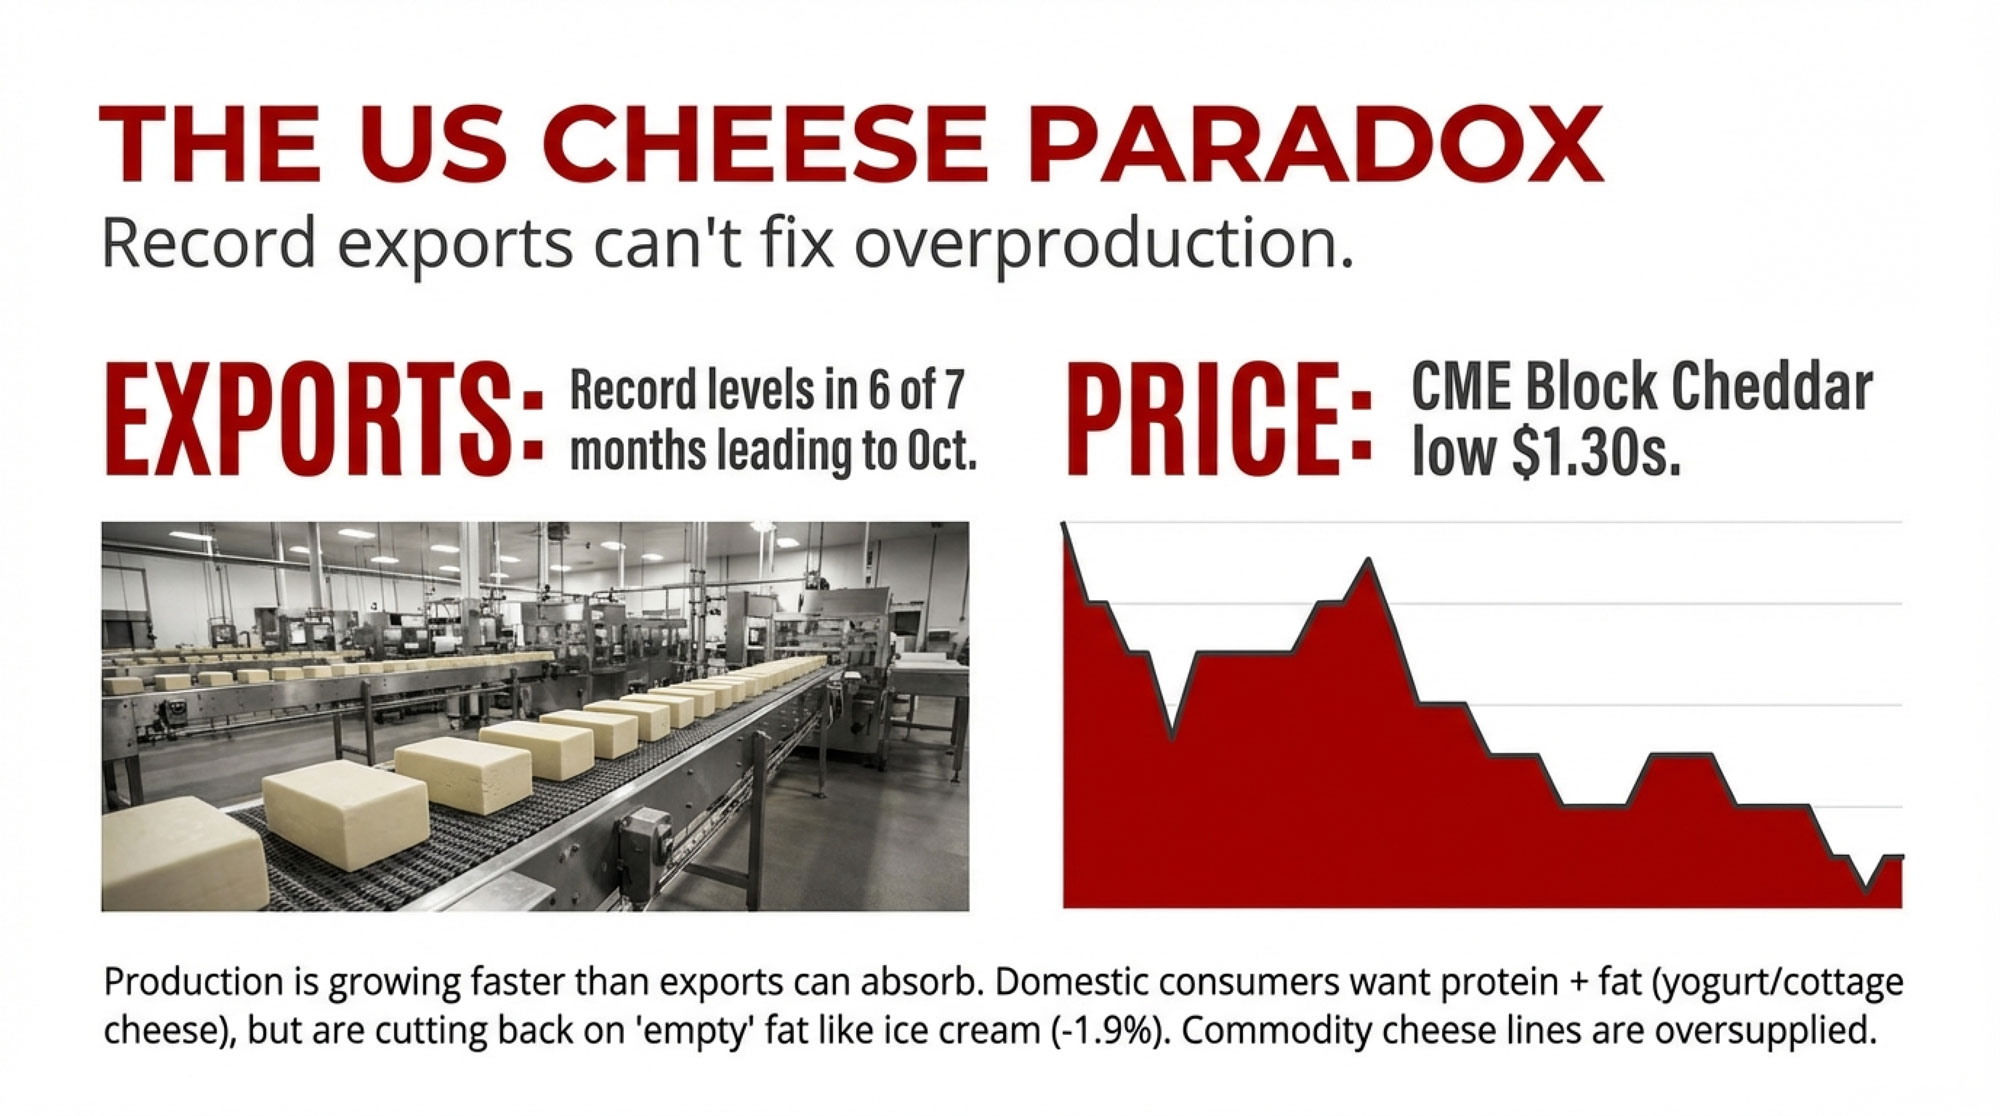
On the price side, CME block Cheddar has been trading in the low-$1.30s per pound to start 2026, down from the $1.60–$1.80 range that held for much of last spring and summer. During that higher-price period, US cheese exports set record or near-record volumes in several months, especially into Mexico and parts of Asia, according to USDA export statistics.
| Metric | Current Status | Year Ago | Change | Implication |
|---|---|---|---|---|
| US Total Cheese Production | +6.0% YoY | Baseline | Higher volume | Supply exceeds domestic + export growth |
| US Cheese Exports | Record+ to Mexico & Asia | Year-ago baseline | Record volumes | Demand is real, but can’t absorb all new production |
| Domestic Cheese Consumption | Relatively flat | Flat | No growth | More product chasing same home market |
| Dry Whey (CME Spot) | $0.70–$0.73/lb | $0.88–$0.92/lb | -20% to -22% | Substantial pressure; excess supply; downside drag |
| Whey Protein Concentrates (WPC) | Firm (specialty) | Strong | Stable to slightly higher | Value-added fractions holding; commodity pressure below |
So why are prices back down? It comes back to volume. Even when exports are “record,” they still only take a slice of total output. The rest has to be eaten domestically or stored. When production grows faster than both domestic use and exports, prices simply don’t have much room to move higher.
Whey is part of this story. Protein demand hasn’t gone away. In fact, consumer research and nutrition studies from the last few years show continued growth in demand for high-protein foods and supplements. Dairy proteins remain a central ingredient in many sports and wellness products.
But every pound of cheese brings whey with it. Processors tend to strip out the higher-value fractions – whey protein concentrates, and isolates – and those markets remain fairly tight. The commodity dry whey that’s left, though, has been under pressure. To start 2026, CME dry whey has slipped into the low-70-cent range per pound, lower than it was in early autumn. Industry analyses point to several months where dry whey output has run ahead of the previous year, adding to stocks.
So, as with butterfat, the headline (“protein is hot”) doesn’t always tell you what’s happening at the commodity end. The details of how your milk is used – commodity cheese, specialty cheese, high-value protein ingredients – matter a lot when it comes back to your mailbox.
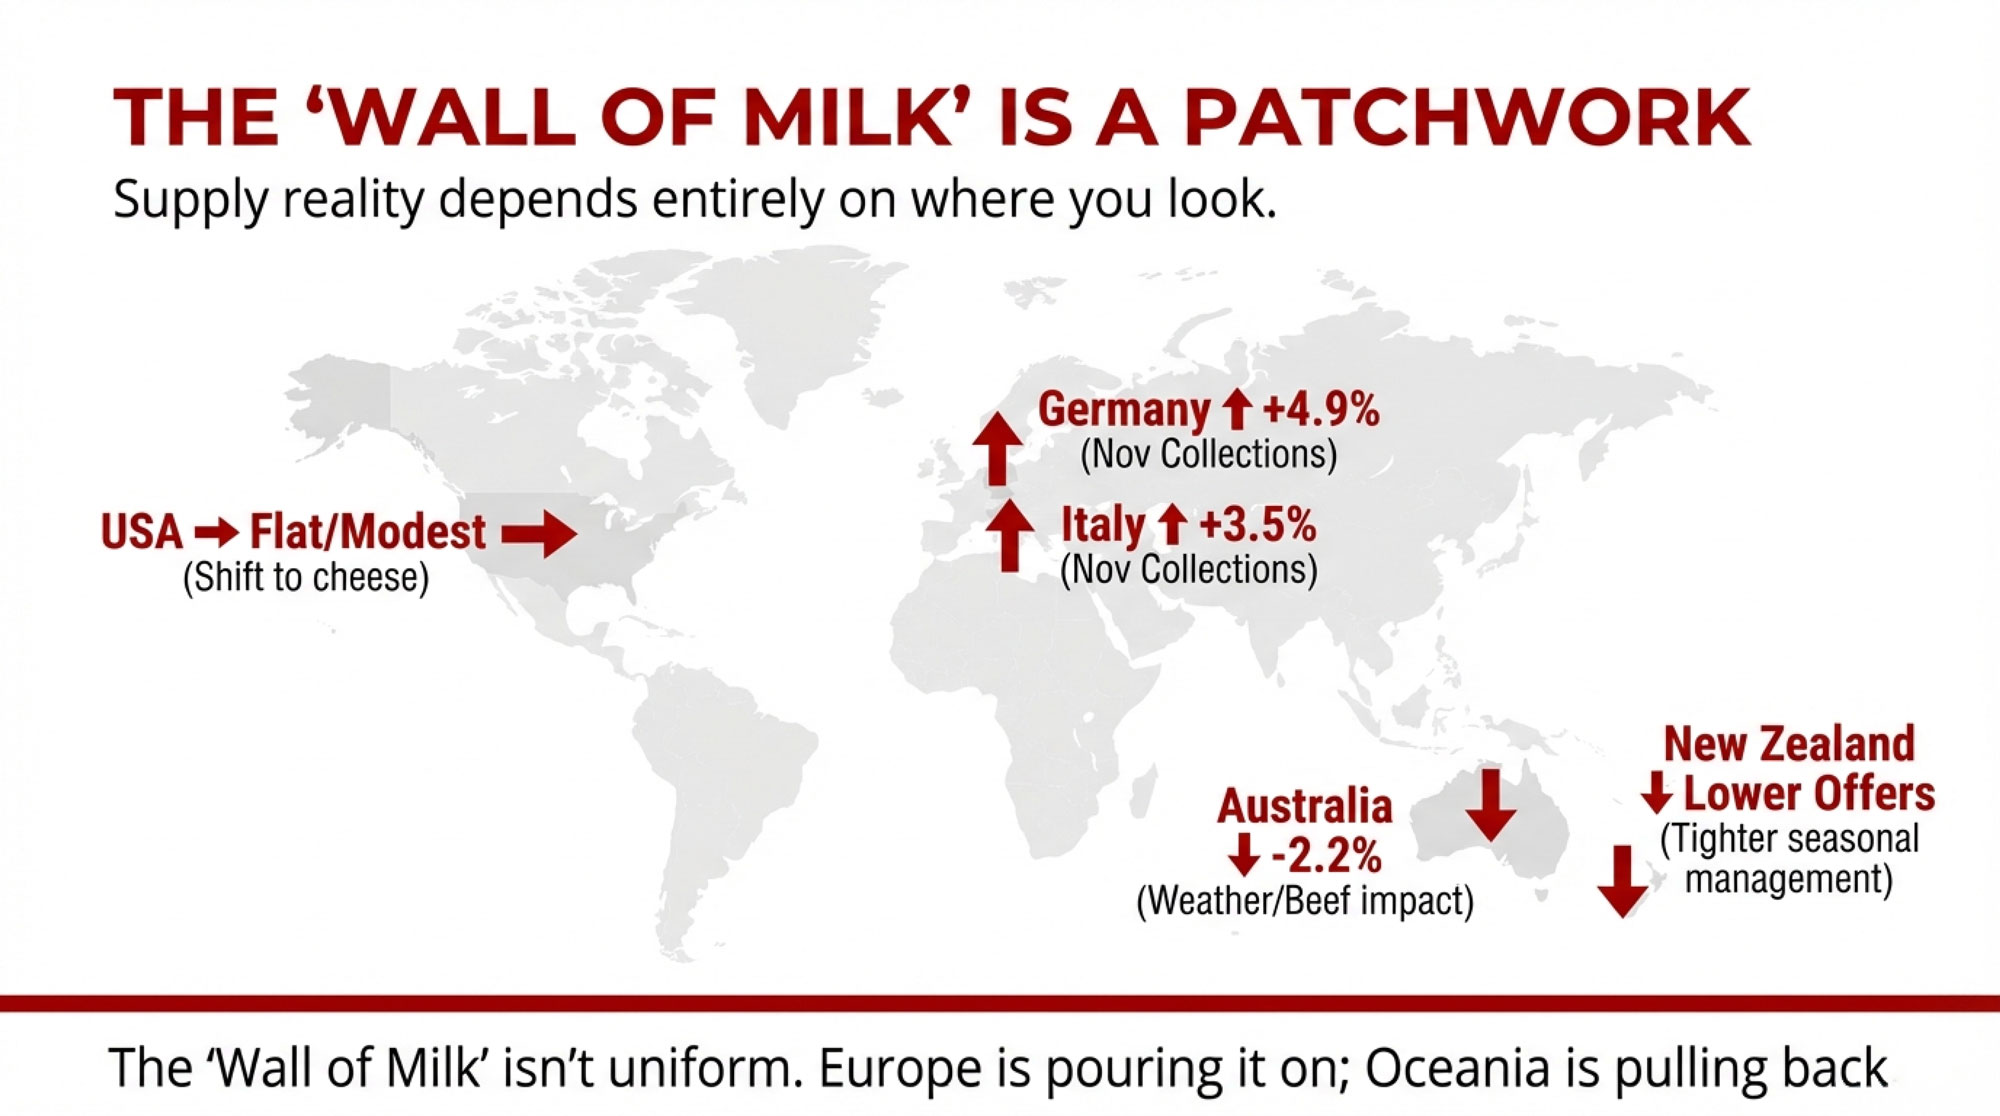
The Wall Of Milk: It Doesn’t Look The Same Everywhere
| Region | Nov Collection (Local Unit) | YoY % Change | YTD Trend | Key Driver |
|---|---|---|---|---|
| Germany | +5.0% | ↑ | Slightly behind 2024 YTD | Higher milksolids (4.1% fat, 3.5% protein) |
| Italy | +3.5% | ↑ | Positive YTD | Solid seasonal strength |
| Spain | -2.0% | ↓ | Positive YTD | Lower volume, but higher solids |
| Ireland | -2.1% | ↓ | Strong YTD lead | Spring flush strength carrying year |
| Australia | -2.2% | ↓ | Behind 2024 YTD | Beef prices, weather, cow numbers under pressure |
| New Zealand | ~Flat | → | N/A (seasonal producers) | Tight GDT offerings, managed supply |
| China | +3.2% | ↑ | Above 2024 (cautious) | Farmgate prices linked to global powder; selective demand |
We all hear about the “wall of milk,” but when you look region by region, it doesn’t look uniform at all. Here’s what the latest data show:
- Germany: November milk collections came in close to 5 percent higher than a year earlier, with milksolids up even more, thanks to butterfat around 4.1 percent and protein near 3.5 percent. But year-to-date, Germany is still slightly behind 2024 because the early months were weaker.
- Italy: November collections were roughly 3.5 percent higher year-on-year, with milksolids up about 4 percent.
- Spain: November volumes were down a couple of percent, yet cumulative milk solids ticked higher as fat and protein percentages improved.
- Ireland: November milk was down just over 2 percent while still holding a solid lead in year-to-date milk and solids thanks to a strong spring flush.
- Australia: November production was around 875,000 tonnes, more than 2 percent lower than a year earlier, and season-to-date volumes are also behind. Dairy Australia and analysts like Bendigo Bank have been open about the drivers: strong beef prices, weather challenges, and structural issues are all making it harder to rebuild cow numbers.
- New Zealand: Ahead of the January auction, local analysts talked about lower milk collection forecasts and reduced whole and skim milk powder offerings compared with previous events, per NZX Dairy Insights. When those smaller catalogs arrived at GDT, and buyers still wanted volume, prices responded quickly.
- China: Official data put December farmgate milk prices in major producing provinces around 3.03 Yuan per kilogram, slightly higher than in November and a few percent above the year before. Academic studies have shown that Chinese raw milk prices have become more tightly linked to international powder prices as imports have grown. When global powder is weak, Chinese farmers feel it quickly; when international prices firm, Chinese buyers become more active, but step by step.
So the global “wall of milk” is really a patchwork. Some bricks are growing, some are shrinking, some are fairly static.
A Practical Playbook For The Year Ahead
Let’s bring this back to the farm office and the kitchen table. What do we do with all this?
1. Use The Powder And Fat Lift To Recheck Your Risk Plan
With powder and fat both stronger than they were in the fall, this is a reasonable time to revisit your risk-management approach. You don’t need to swing for the fences.
You might:
- Talk with your co-op or buyer about locking in a portion of your spring or early-summer milk if Class IV or powder-linked prices offer margins that work for your cost structure.
- In the US, review Dairy Revenue Protection and Dairy Margin Coverage again. University of Wisconsin dairy economists have repeatedly noted that these tools can provide a useful safety net when both milk and feed are volatile.
Mark Stephenson, director of dairy policy analysis at the University of Wisconsin, has been emphasizing for years that producers shouldn’t wait for the “perfect” price. “If you can lock in a margin that covers your costs and leaves something reasonable, that’s worth serious consideration,” he’s noted in recent extension presentations. That kind of thinking – focusing on acceptable margins instead of a perfect price – often serves farms better over the whole cycle.
2. Make Sure Components Match Today’s Pay Signals
Over the past decade, a lot of energy has gone into improving butterfat levels through fresh cow management, solid transition programs, and refined rations. Many herds have made impressive gains. But with butter pricing where it is right now, it’s worth asking whether every extra pound of butterfat is paying back the way it did a few years ago.
Take a recent milk cheque and ask yourself:
- How is each unit of butterfat valued compared to protein?
- Has your processor or co-op changed those relative values in light of current market conditions?
On some Wisconsin and Northeast farms, nutritionists are still prioritizing high-fat content but also placing greater emphasis on protein yield and overall cow health, especially as processors lean into higher-protein products like yogurt, cottage cheese, and protein-enriched milks. The point isn’t to back off on fat, but to ensure your component strategy aligns with today’s economics, not yesterday’s.
3. Lean Into Dairy-Beef Only Where The Market Can Absorb It
Beef-on-dairy has grown very quickly. Farm Bureau Market Intel analyses and USDA data show that many herds are using beef semen strategically on lower-genetic dairy cows. That’s generating a lot more crossbred calves than we had ten years ago.
When everything is lined up – sire choice, health programs, and marketing channels – those calves often bring a clear premium over straight Holstein bull calves. Feedlot operators in the US and Canada have said publicly that well-bred dairy-beef crosses can perform better on growth and carcass traits than traditional Holstein steers. University research from institutions like Penn State and Kansas State supports that.
But not every region is set up the same way. On parts of the Northeast and some more remote Western areas, producers still report challenges finding reliable buyers willing to pay a premium for crosses. So it’s important to match your breeding strategies to your local marketing reality.
Before expanding beef-on-dairy, it’s worth a very practical conversation with your calf buyer or local feedlot:
- What specific genetics are they looking for?
- What health standards and documentation do they require?
- What kind of premium can they realistically sustain over time?
Those answers will tell you whether dairy-beef is a valuable outlet or a potential headache in your area.
4. Think In Margins, Not Just In Class Prices
We all look at the headline Class III and IV prices. They’re a quick barometer. But as recent years have reminded us, margin per hundredweight is what keeps the lights on.
Recent USDA projections suggest that while milk prices may stay under pressure, feed costs are off the extreme highs we saw not long ago. Corn and soybean meal are still volatile, but not at the peaks that squeezed margins so brutally in 2022. That changes the math.
| Period | Class III Milk Price ($/cwt) | Corn Price ($/bu) | SBM Price ($/ton) | Estimated Margin ($/cwt) |
|---|---|---|---|---|
| Q3 2024 | $17.50 | $3.45 | $315 | +$2.10 |
| Q4 2024 | $17.20 | $3.65 | $325 | +$1.85 |
| Jan 2026 (Est. post-GDT) | $18.25 | $3.55 | $318 | +$2.45 |
| 2-Year Historical Average | $18.80 | $3.20 | $290 | +$3.10 |
| Peak (2022) | $23.50 | $6.85 | $480 | -$0.50 |
This season, it’s useful to:
- Update your cost of production with your adviser, including interest, labor, and repairs.
- Talk with your lender about how much downside you can realistically handle before major changes would be needed.
- Decide ahead of time what actions you’ll take if milk or feed prices cross certain thresholds, rather than waiting until stress is high.
Farms that understand their true margin – not just the milk price – tend to make steadier decisions when things get choppy.
5. Keep An Eye On Global Signals, Without Letting Them Drive Every Move
Global benchmarks like GDT, EU wholesale prices, and futures on EEX and SGX have become regular reference points for processors. That doesn’t mean you need to live in the data, but it does help to have a basic feel for where those numbers are.
A practical approach might be:
- Glancing at a simple GDT summary after each event to see if WMP, SMP, butter, and AMF are rising or falling.
- Following one or two reliable sources for EU butter and SMP price trends.
- Asking your co-op rep once or twice a year how closely your local prices track these global indicators.
That way, when you hear “GDT was up six percent this week,” you already have some sense of what that might mean for export-linked values and, eventually, for your own milk cheque.
The Bottom Line
Stepping back, this early-January rally has given the industry something it’s been lacking: a little bit of positive momentum. Powder and fat have come off their lows. Futures markets in Europe and Asia have acknowledged that shift. And we’ve seen that when supply tightens, and buyers stay active, prices can still move.
At the same time, we’re not out of the woods. Milk production across key exporting regions is still ample. Cheese and whey output remains heavy. Butter stocks in Europe are comfortable. Chinese demand looks better than it did, but it’s still cautious rather than aggressive. And on many farms – from smaller family dairies in the Northeast to large dry lot systems in the Southwest – the milk cheque still feels tight for the amount of capital and effort involved.
While the rest of 2026 is far from written, early indications suggest this may be a year where small, smart moves matter: a slightly better hedge, a ration that protects components without overspending, a breeding plan that matches local markets, a stronger relationship with your buyer. None of these alone will transform a balance sheet, but together they can make a meaningful difference.
What’s particularly noteworthy is that we’re starting this year from a place of pressure, but not panic. The supply side will adjust over time. Some regions will scale back faster than others. As that plays out, the operations that keep a clear eye on margins, stay flexible, and base decisions on solid information will be the ones best positioned to benefit when the market finally swings more decisively back in favour of producers.
And that’s why conversations like this – whether at the kitchen table, in the barn office, or over coffee at a conference – still matter. We’re all trying to read the same signals and make the best decisions we can for our herds, our families, and our businesses in a very interconnected dairy world.
Key Takeaways :
- The slide is broken—for now. GDT kicked off 2026 with a 6.3% rally, whole milk powder up 7.2%, skim up 5.4%. First increase in five months.
- Supply, not demand, is driving it. US powder output fell ~10% year-over-year in October as milk shifts to cheese and protein streams. New Zealand also trimmed GDT offerings.
- Fat markets aren’t following. EU butter stocks near 94,000 tonnes, US butter in the mid-$1.30s—don’t expect butterfat to carry your cheque like it did in 2022.
- Futures confirm the turn. EEX and SGX dairy curves have firmed, giving processors more confidence to lock in export deals that eventually flow back to farm prices.
- Act now, not later. Use this window to tighten margin plans, recheck your component strategy against current pay signals, and push dairy-beef only where local buyers genuinely support it.
Complete references and supporting documentation are available upon request by contacting the editorial team at editor@thebullvine.com.
Learn More
- The Four Numbers Every Dairy Producer Needs to Calculate This Week – Deliver immediate financial clarity with a hard-hitting framework to calculate your true breakeven and liquidity runway. This operational audit arms you with the exact numbers needed to decide between aggressive expansion or a strategic pivot.
- Squeezed Out? A 12-Month Decision Guide for 300-1,000 Cow Dairies – Exposes the structural shifts crushing the traditional “middle” of the industry and delivers a strategic roadmap for the next 12 months. Master the heifer inventory crisis and align your herd with the coming protein-heavy pay programs.
- Dairy Tech ROI: The Questions That Separate $50K Wins from $200K Mistakes – Reveals the unvarnished math behind automation to stop you from making a $200,000 mistake. This breakdown of “robot sweet spots” and connectivity requirements identifies the high-ROI tools that actually drive efficiency in today’s labor-tight environment.
 Join the Revolution!
 Join the Revolution!
Join over 30,000 successful dairy professionals who rely on Bullvine Weekly for their competitive edge. Delivered directly to your inbox each week, our exclusive industry insights help you make smarter decisions while saving precious hours every week. Never miss critical updates on milk production trends, breakthrough technologies, and profit-boosting strategies that top producers are already implementing. Subscribe now to transform your dairy operation’s efficiency and profitability—your future success is just one click away.


![Generate SEO elements for this The Bullvine article targeting dairy industry professionals:
ANALYSIS REQUIREMENTS:
Identify the article's primary topic and target audience (dairy farmers, industry professionals, agricultural specialists)
Focus on practical, implementation-oriented keywords that dairy professionals would search for
Consider both technical dairy terminology and business/profitability terms
DELIVERABLES:
1. SEO Keywords (5 keywords):
Create a comma-separated list of relevant keywords mixing:
Primary dairy industry terms (dairy farming, milk production, herd management, etc.)
Technology/innovation terms if applicable (precision agriculture, automated milking, genomic testing, etc.)
Business/economic terms (dairy profitability, farm efficiency, ROI, cost reduction, etc.)
Geographic terms if relevant (dairy industry trends, global dairy, etc.)
2. Focus Keyphrase:
Develop a 2-4 word primary keyphrase that captures the article's core topic and would be commonly searched by dairy professionals seeking this information.
3. Meta Description (under 160 characters):
Write a compelling meta description that:
Summarizes the article's main value proposition
Naturally incorporates the focus keyphrase and 1-2 keywords
Appeals to dairy industry professionals
Includes a benefit or outcome (cost savings, efficiency gains, profit increases, etc.)
Uses action-oriented language that encourages clicks
4. Category Recommendation:
Suggest the most fitting category from The Bullvine website (e.g., Dairy Industry, Genetics, Management, Technology, A.I. Industry, Dairy Markets, Nutrition, Robotic Milking, etc.) where this article should be published for maximum relevance and engagement.
FORMAT REQUIREMENTS: Present results in this exact format:
SEO Keywords: [keyword1, keyword2, keyword3, keyword4, keyword5]
Focus Keyphrase: [primary keyphrase]
Meta Description: [compelling description under 160 characters with natural keyword integration]
Category Recommendation: [Best-fit category from The Bullvine’s options]
DAIRY INDUSTRY CONTEXT: Ensure all elements appeal to dairy farmers, agricultural specialists, and industry professionals seeking practical, profitable solutions for their operations.](https://www.thebullvine.com/wp-content/uploads/2025/09/Google_AI_Studio_2025-09-08T17_37_41.620Z.png)