





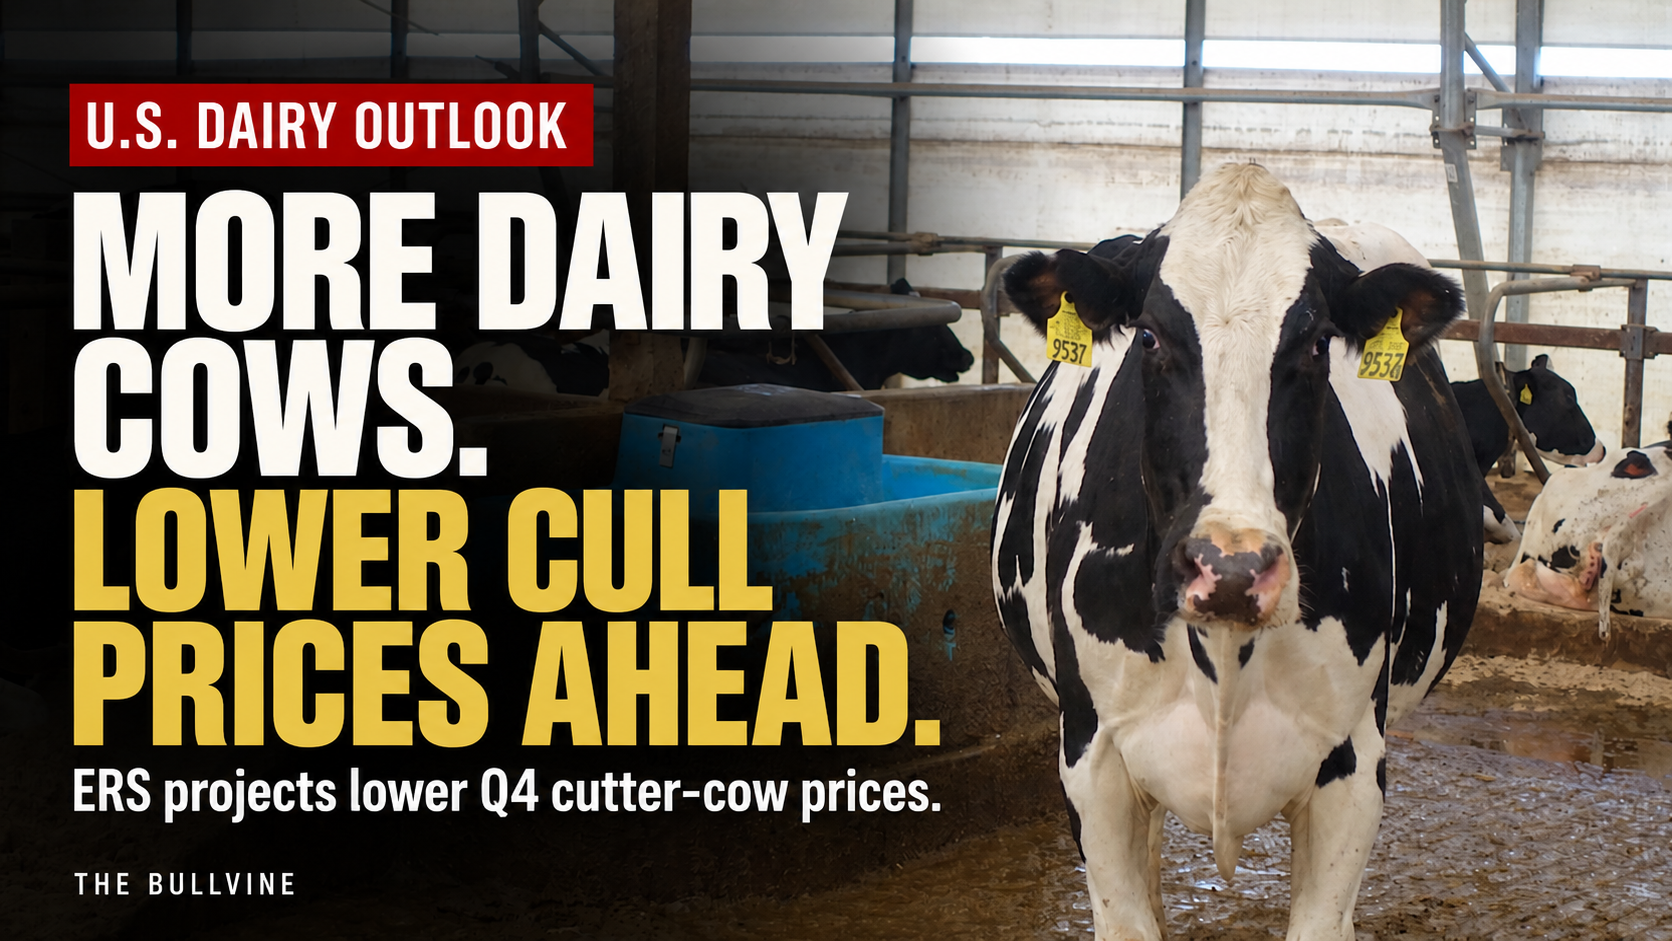
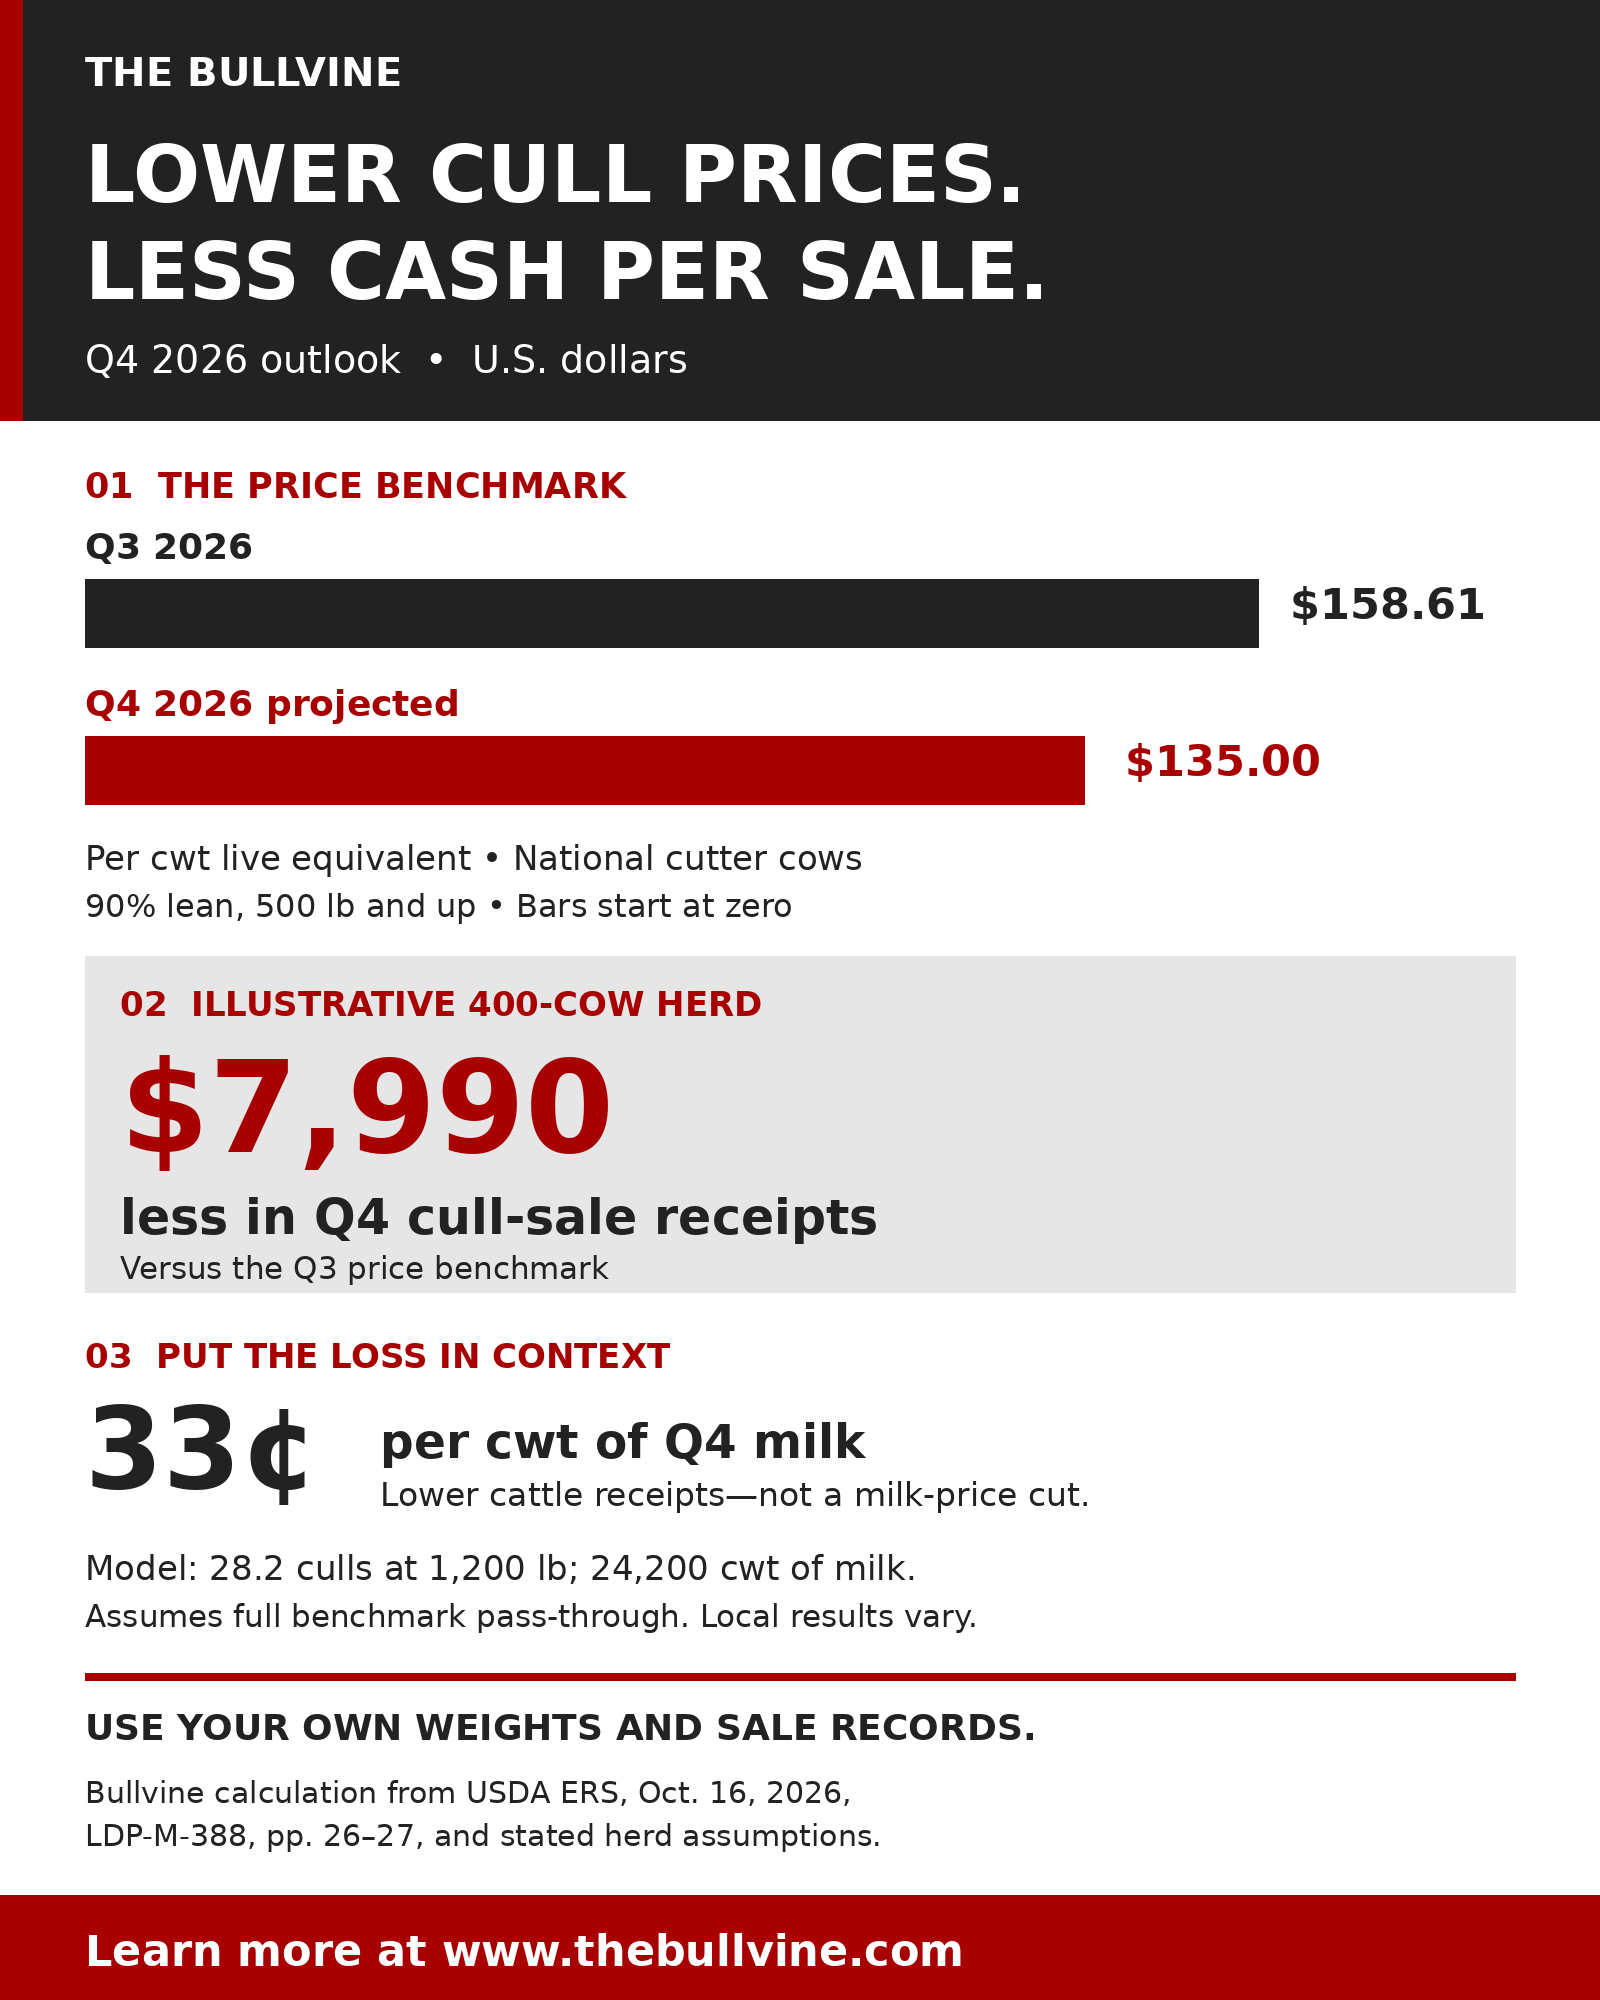
169,000 more cows, and more cows went to slaughter. Now ERS projects cutter cows at $135 in Q4, down from $158.61. Bullvine’s math: about 33¢/cwt of milk on a 400-cow herd.
Figures current as of October 30, 2026. AMS posts October class prices November 4. All dollar amounts are U.S. dollars.
Key Takeaways
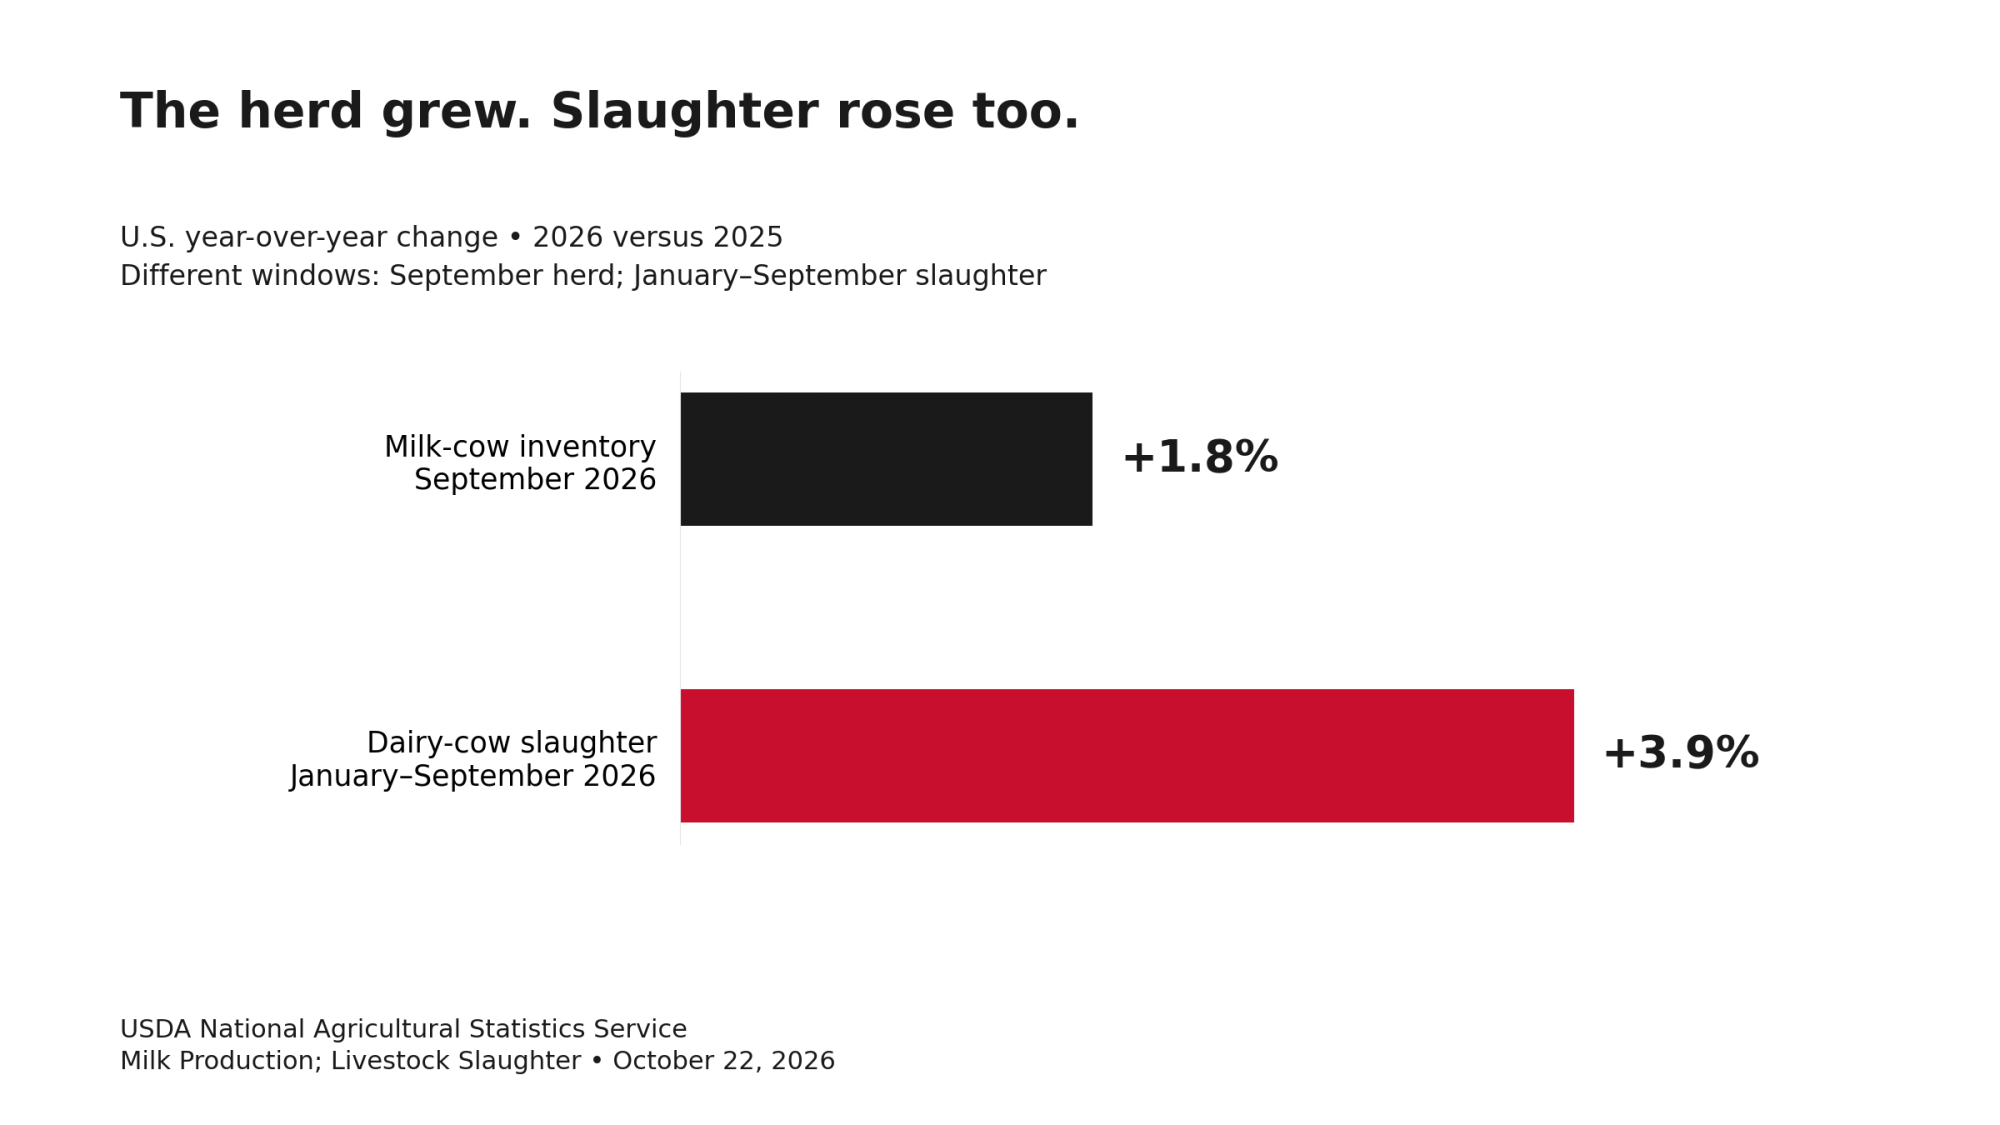
- USDA counts 169,000 more milk cows than a year ago, while January–September dairy-cow slaughter rose 3.9%. Both can be true because additions outpaced exits.
- ERS projects cutter cows falling from $158.61 to $135.00/cwt in Q4. Bullvine’s math puts that at 33–44¢/cwt of milk for a 400-cow herd.
- On the milk check, Class IV has run above Class III for eight straight months, by $2.90/cwt in September. Size your own exposure under your payment terms.
The U.S. dairy herd is bigger than a year ago, even with Class III lower and more dairy cows going to slaughter.In its October 22 report, the USDA National Agricultural Statistics Service counted 169,000 more milk cows this September than a year earlier.
Start with the numbers.
- Herd: 9.743 million cows in September, up 1.8%.
- Price: USDA’s Agricultural Marketing Service put September Class III at $16.04/cwt in its September 2026 announcement (CLS-0926). That’s down $1.55, or 8.8%, from September 2025. By Bullvine’s math, January–September Class III averaged $15.96, down $2.51, or 13.6%, from the same months of 2025.
- Slaughter: NASS reports 2.0217 million dairy cows slaughtered under federal inspection from January through September 2026. That’s up 75,700 head, or 3.9%, from the same months of 2025.
That increase still leaves culling below the 2023–25 average. USDA’s Economic Research Service works from weekly federally inspected data for the first 39 weeks. On that basis, it says slaughter “remained relatively low compared to the average for the past 3 years (2023−25).”
Cull value is moving, too. ERS puts national cutter cows (live equivalent, 90% lean) at $158.61/cwt in the third quarter and projects $135.00 for the fourth. Bullvine’s model applies an annualized national slaughter ratio to a 400-cow herd and puts that projected drop at 33 to 44 cents per cwt of milk.
Is weak Class III shrinking the dairy herd?
Not yet. NASS puts September production at 19.443 billion pounds, up 501 million pounds, or 2.6%, from September 2025. Bullvine’s October 29 breakdown shows which states supplied it.
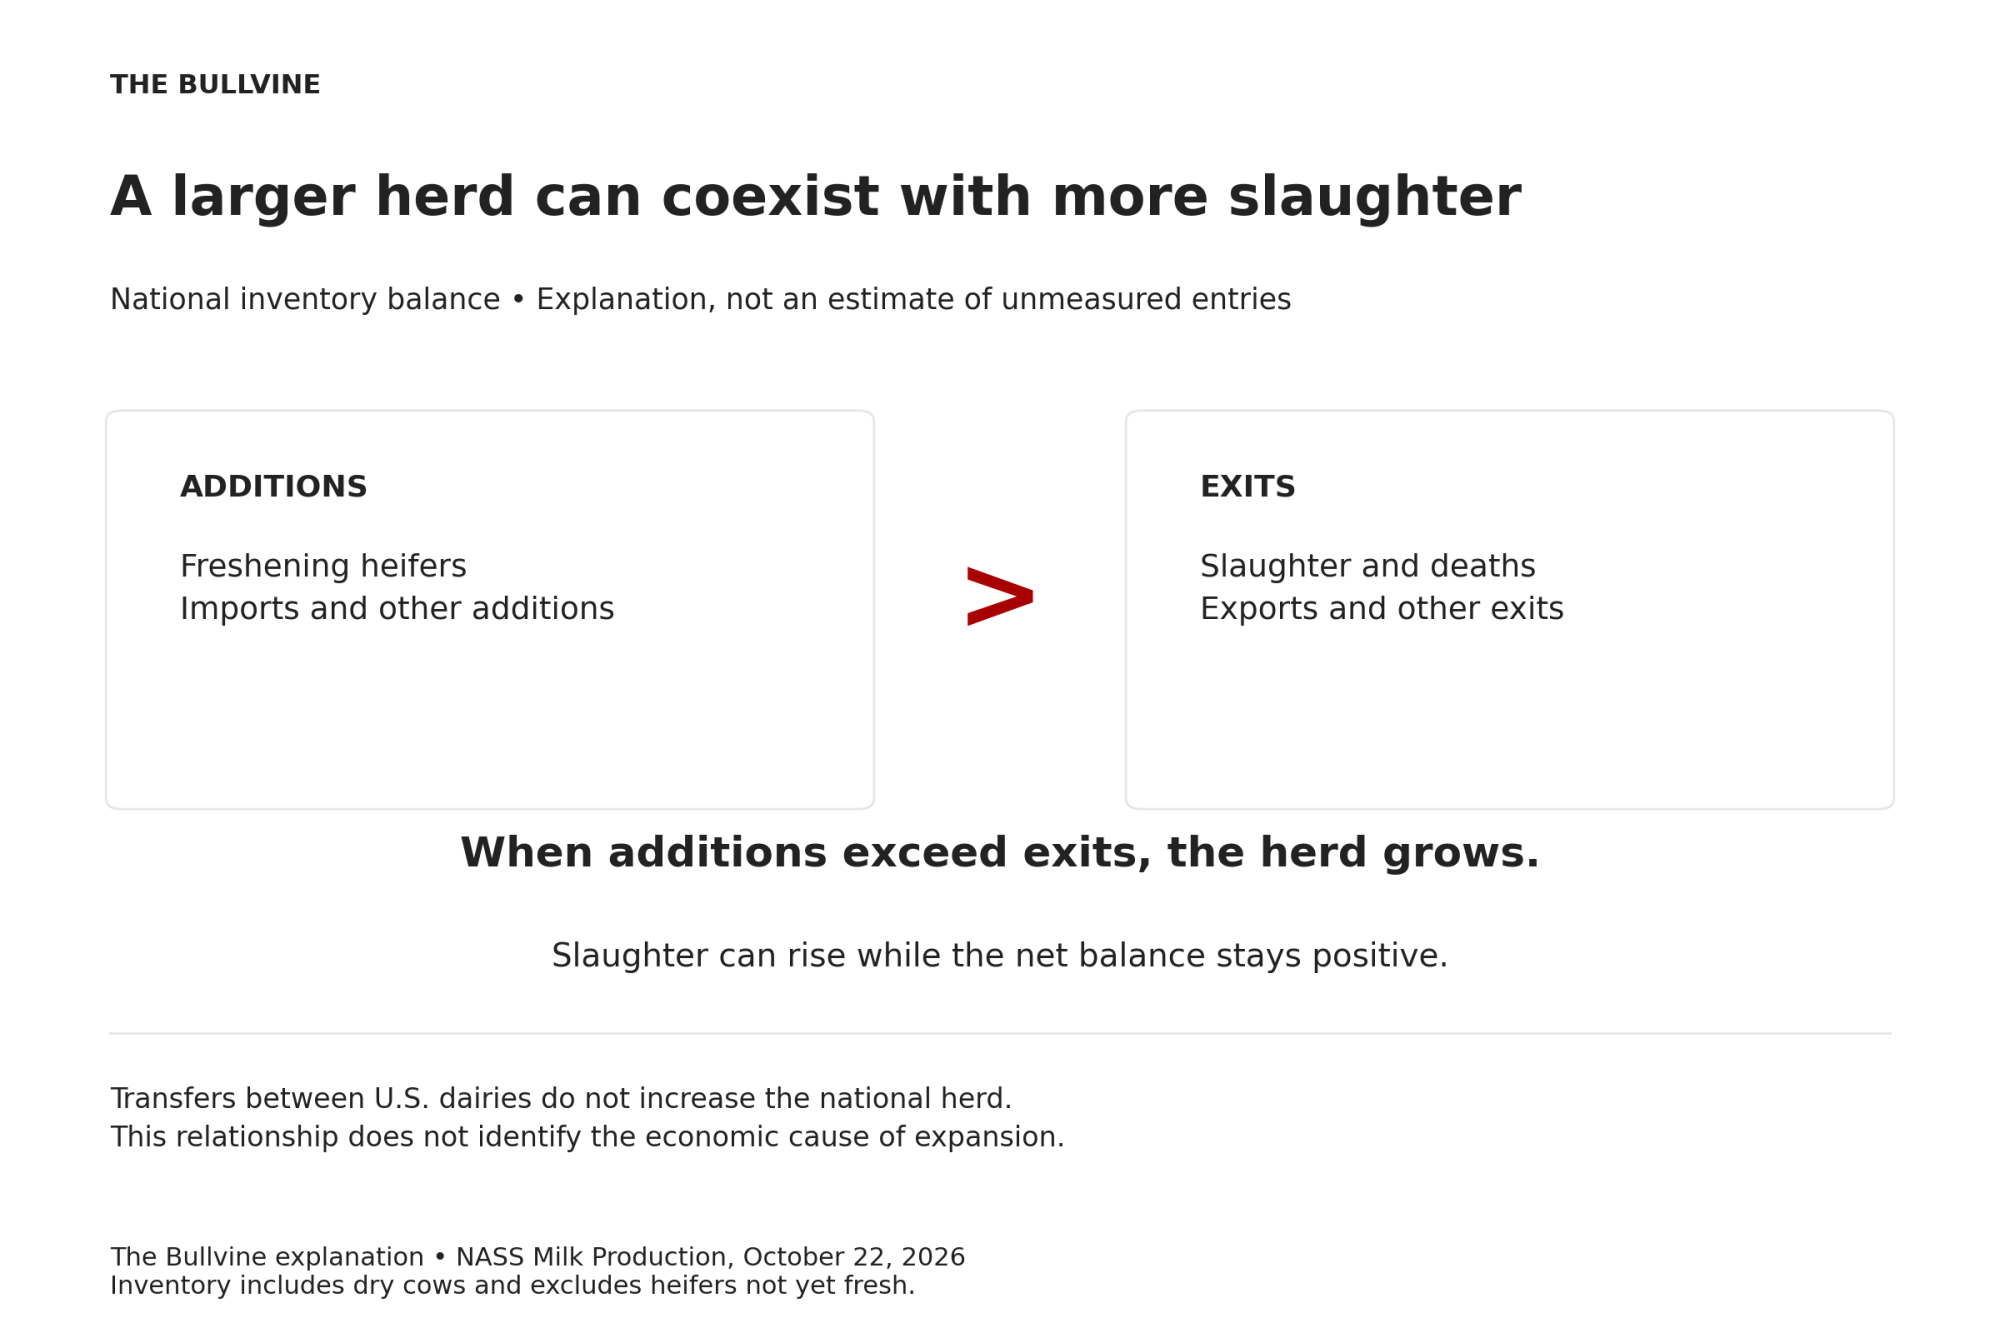
How can the herd grow while slaughter rises? Inventory is a running balance.
- In: cows enter as heifers freshen and through other additions, including imports.
- Out: they leave through slaughter, deaths and other exits.
When additions outpace exits, the herd grows even in a year when slaughter climbs. That accounting explains how the two figures coexist. It doesn’t measure which economic reason drove the growth.
Adjusted for each year’s larger starting herd, slaughter pressure still rose from 2025 (see the Methodology Note). That ratio isn’t complete herd turnover. USDA’s current figures don’t support calling 2026 herd growth a year-over-year collapse in culling.
Why would a marginal cow stay?
CoBank’s June 18 analysis and its October 7 report put forward three drivers:
- Scarce replacements. NASS counted 3.9046 million milk-replacement heifers of at least 500 pounds on January 1, 2026, down 10,700 head from a year earlier. CoBank ties that tight pipeline to farms keeping cows they might otherwise have culled.
- Beef-on-dairy calf revenue. Calf income can improve the return from keeping a cow another lactation.
- Processing plant investment. CoBank’s October report names new plant capacity as another driver of herd expansion.
CoBank doesn’t measure how much of today’s herd growth each one accounts for.
The June report also says culling “has since picked up slightly.” It says cull cow slaughter rose in 35 of 38 weeks from mid-September through mid-June 2026, a net increase of 83,100 dairy cows that “remains far off the 2022 to 2024 pace.” So rising slaughter and a longer-run retention story sit in the same report.
Here’s the economics. A higher slaughter value, on its own, raises the reward for selling a cow. A lower cull price cuts receipts from each sale, but that alone doesn’t show that selling more cows is the best response. Replacement cost and future calf income bear on the keep-or-sell decision separately.
The often-repeated 20% revenue figure needs the same care.
- June report: beef sales contribute 12%–15% on many farms, with some operations approaching 20% on a per-hundredweight basis.
- October report: it cites Farm Credit East’s $5.39/cwt for the Northeast, plus roughly $4.50 for Michigan and $4 for the West Coast. It then says cull cow and calf sales “now account for nearly 20% of dairy farm revenue.”
Neither report gives a nationally representative sample or a national calculation anyone can reproduce.
How long can the beef cushion hold?
CoBank’s October report says milk sales leave producers “barely breaking even.” It adds that “an additional $3 to $5 per cwt. from beef sales allows dairy farmers to continue posting positive margins.” ERS says cull cow prices “have fallen sharply from mid-year highs” and that the drop “appears tied to increased availability of lower priced imported lean trimmings.”
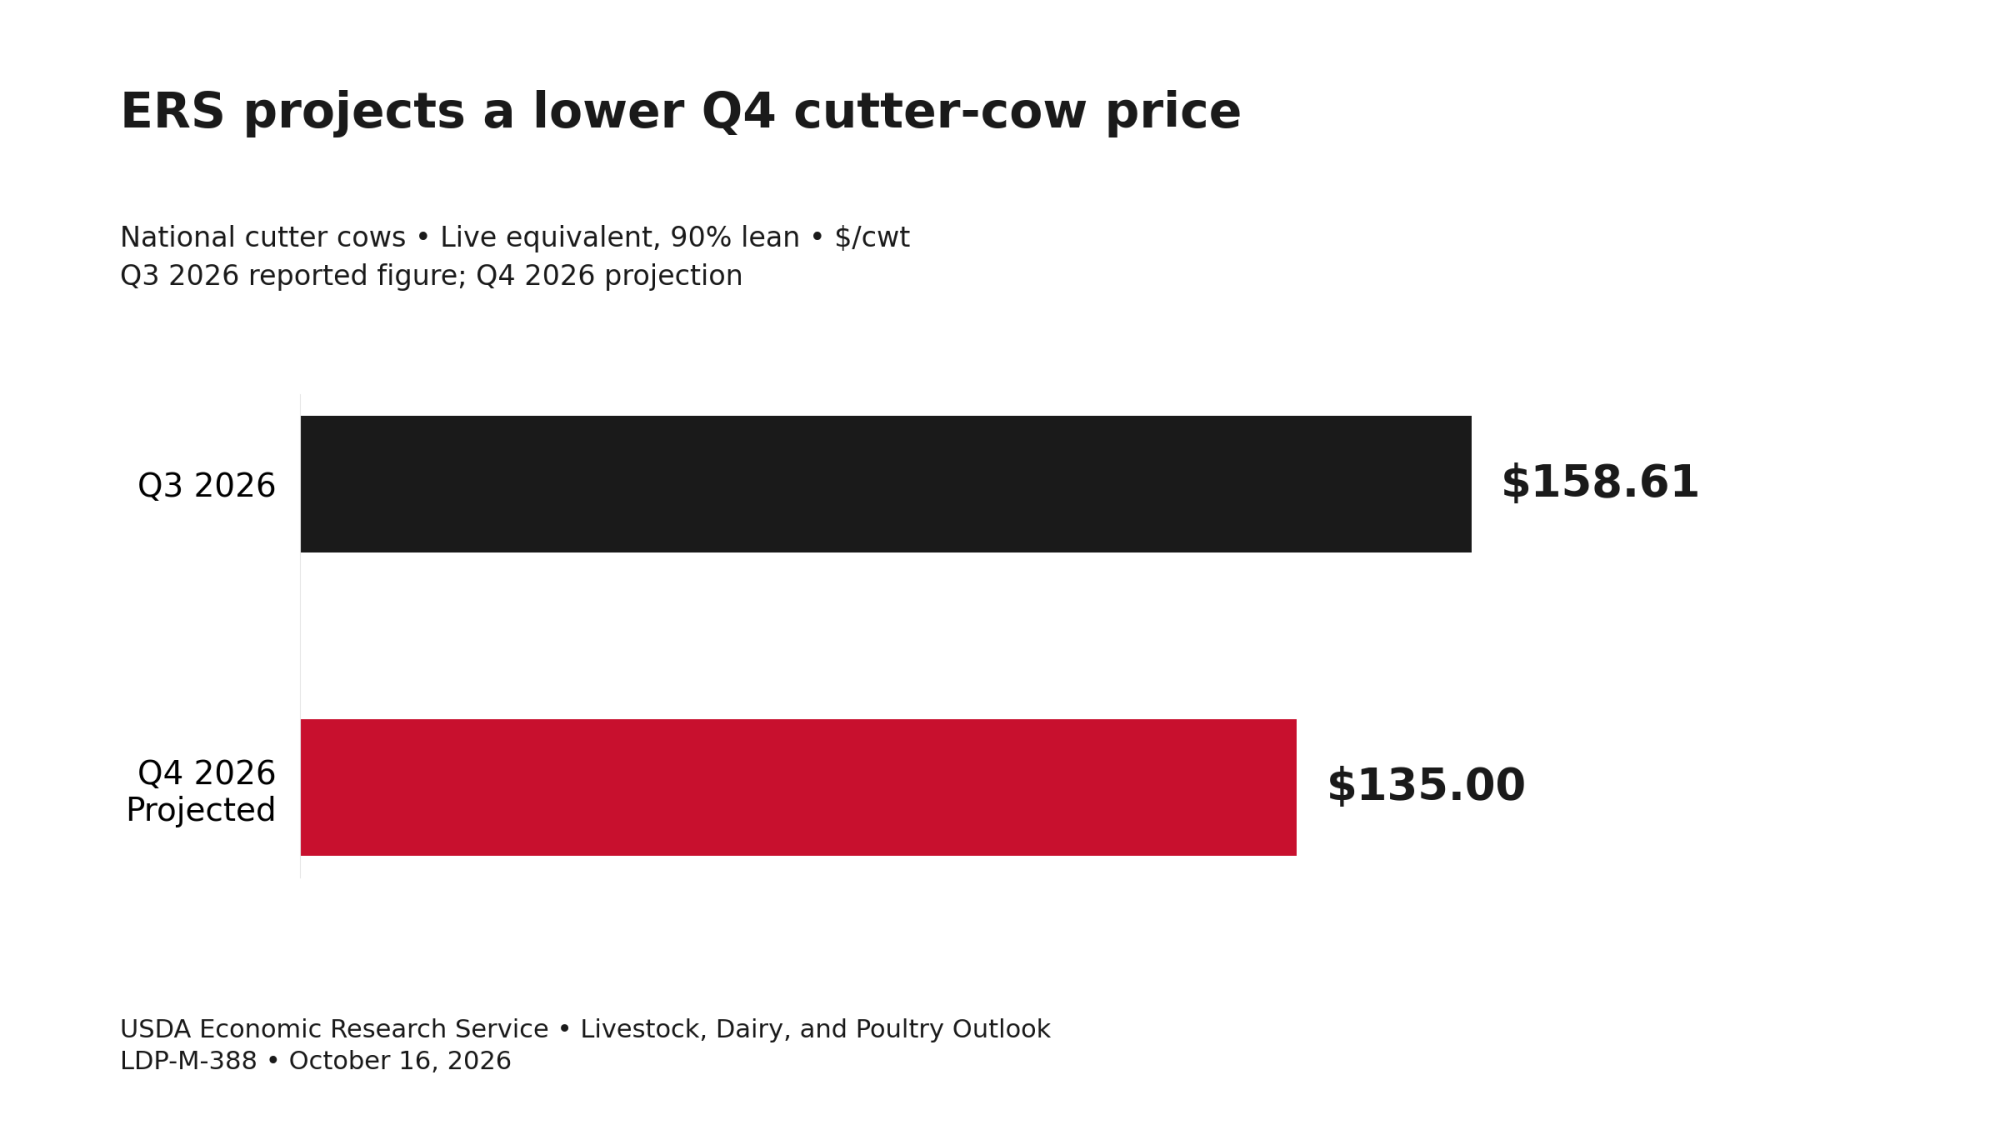
ERS’s annual forecast doesn’t extend the Q4 price level across all of 2027. It projects cutter cows averaging $151.25/cwt in 2027, against $151.97 for 2026, a $0.72 gap by Bullvine’s subtraction. That’s an annual average. It doesn’t mean every quarter recovers or every farm’s receipts stabilize.
Calf prices are the other half of the cushion; Bullvine’s beef-on-dairy premium analysis covers them.
Who carries the Class III exposure?
Calf and cull sales are one side of the budget. The milk check is the other, and in September the federal-order benchmarks put Class IV $2.90/cwt above Class III. That isn’t a one-month gap. AMS’s announced prices put Class IV above Class III every month from February through September 2026, with a peak of $5.40/cwt in May. Those are announced federal-order class prices, not CME spot closes, futures settlements or an individual farm’s mailbox price.
Why the gap matters for your check: if your milk is pooled on a federal order, you’re paid on the order’s uniform, or blend, price. That price is weighted by how the order’s milk is used across classes. Two things can move it:
- Depooling. UW–Madison Extension says pooling is a handler-level decision, and that depooling becomes attractive when a manufacturing class price “exceeds the uniform price.” Depooled milk is then priced through arrangements between the handler and the producer.
- Blend-price effects. Iowa State Extension says depooling “often reduces the blend price” for farmers who remain in the pool.
Your final check also reflects premiums, quality adjustments, hauling, check-off assessments and co-op adjustments, UW notes. For a worked example of how the spread and pooling move a 500-cow milk check, see Same Cows, $15,000 Apart.
“Dairy demand” is also too broad a label. ERS’s October 16 outlook shows January–August domestic use of American-type cheese slipped 0.1%. Dry skim milk products rose 38.5%, and whey protein concentrate rose 4.0%. Dry skim exports fell 7.9%, though, and whey protein concentrate exports fell 11.0%.
Where the herd grew tracks plant investment. NASS shows September herd additions of 29,000 cows in Kansas, 26,000 in Wisconsin, 24,000 in Texas, and 17,000 each in Idaho and South Dakota. CoBank ties Texas and Kansas growth to new plants expected to process upwards of 10 million pounds a day in each state, and South Dakota’s to new I-29 corridor capacity. It also lists $1.1 billion in planned Wisconsin plant investment. A state label still isn’t your class exposure, so check your processor’s payment terms.
Running the Numbers
Published evidence
- NASS: September production of 1,996 pounds per cow.
- AMS: a $2.90/cwt September Class IV premium over Class III.
- ERS: national cutter cows at $158.61/cwt in Q3, projected at $135.00 for Q4. Q4 milk per cow forecast at 6,050 pounds.
Stated assumptions (illustrative, not measured order utilization or any herd’s milk check)
- Herd: 400 cows, dry cows included.
- Class exposure: 25%, 50% or 100% of milk revenue exposed to the full benchmark gap.
- Cull rate: 28.2% a year, or 28.2 modeled culls a quarter.
- Cull weight: 1,200, 1,400 or 1,600 pounds live.
These inputs are a standardized baseline for the arithmetic. Cull weights and cull rates vary with breed mix and management, so substitute your own.
Table 1. Illustrative Bullvine calculation: class-price sensitivity (monthly volume 7,984 cwt)
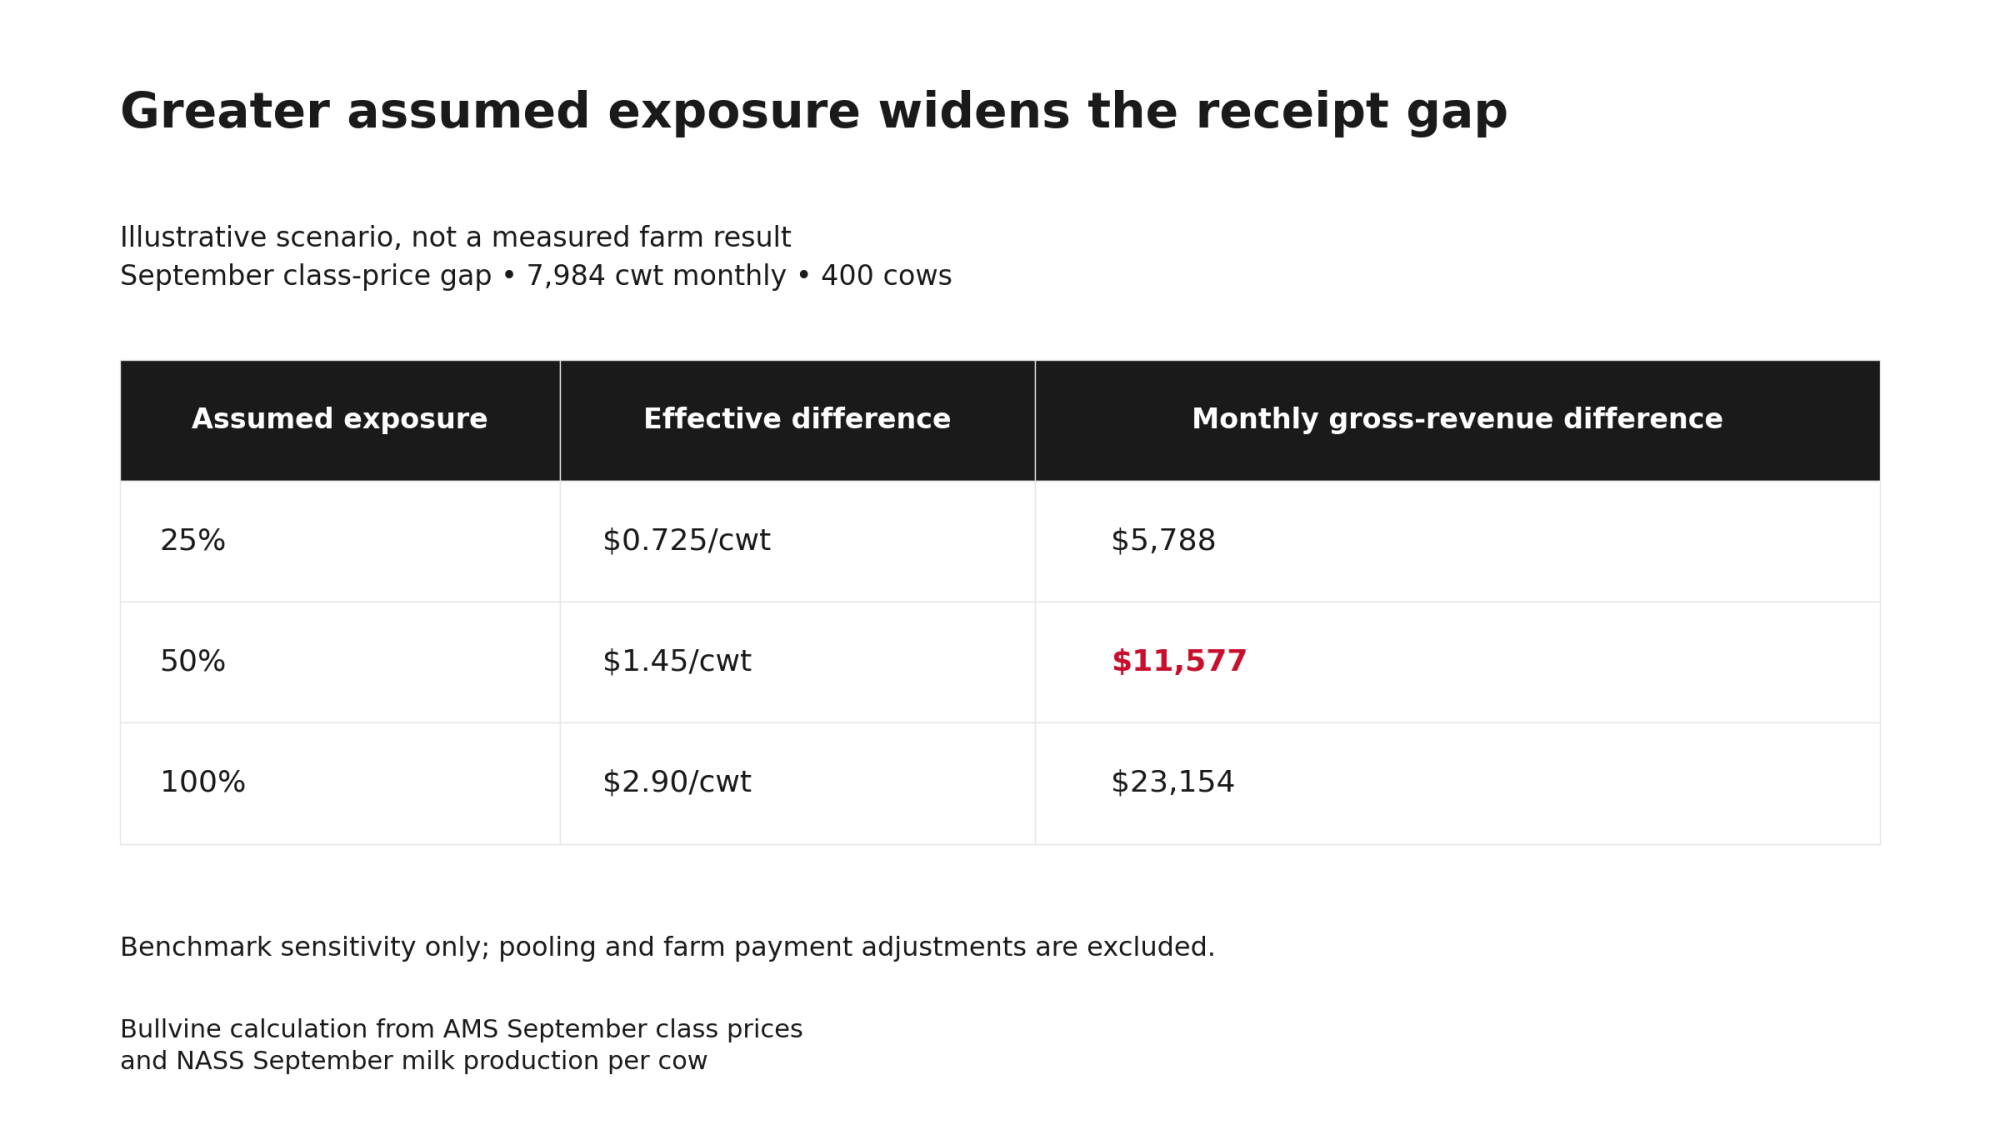
| Case | Assumed exposure | Effective difference | Monthly gross-revenue difference |
| Low | 25% | $0.725/cwt | $5,788 |
| Central | 50% | $1.45/cwt | $11,577 |
| High | 100% | $2.90/cwt | $23,154 |
Table 2. Illustrative Bullvine calculation: lower gross cull receipts vs. the Q3 benchmark (Bullvine’s subtraction of ERS’s Q4 projection from its Q3 figure: $23.61/cwt live; 28.2 culls; Q4 milk 24,200 cwt)
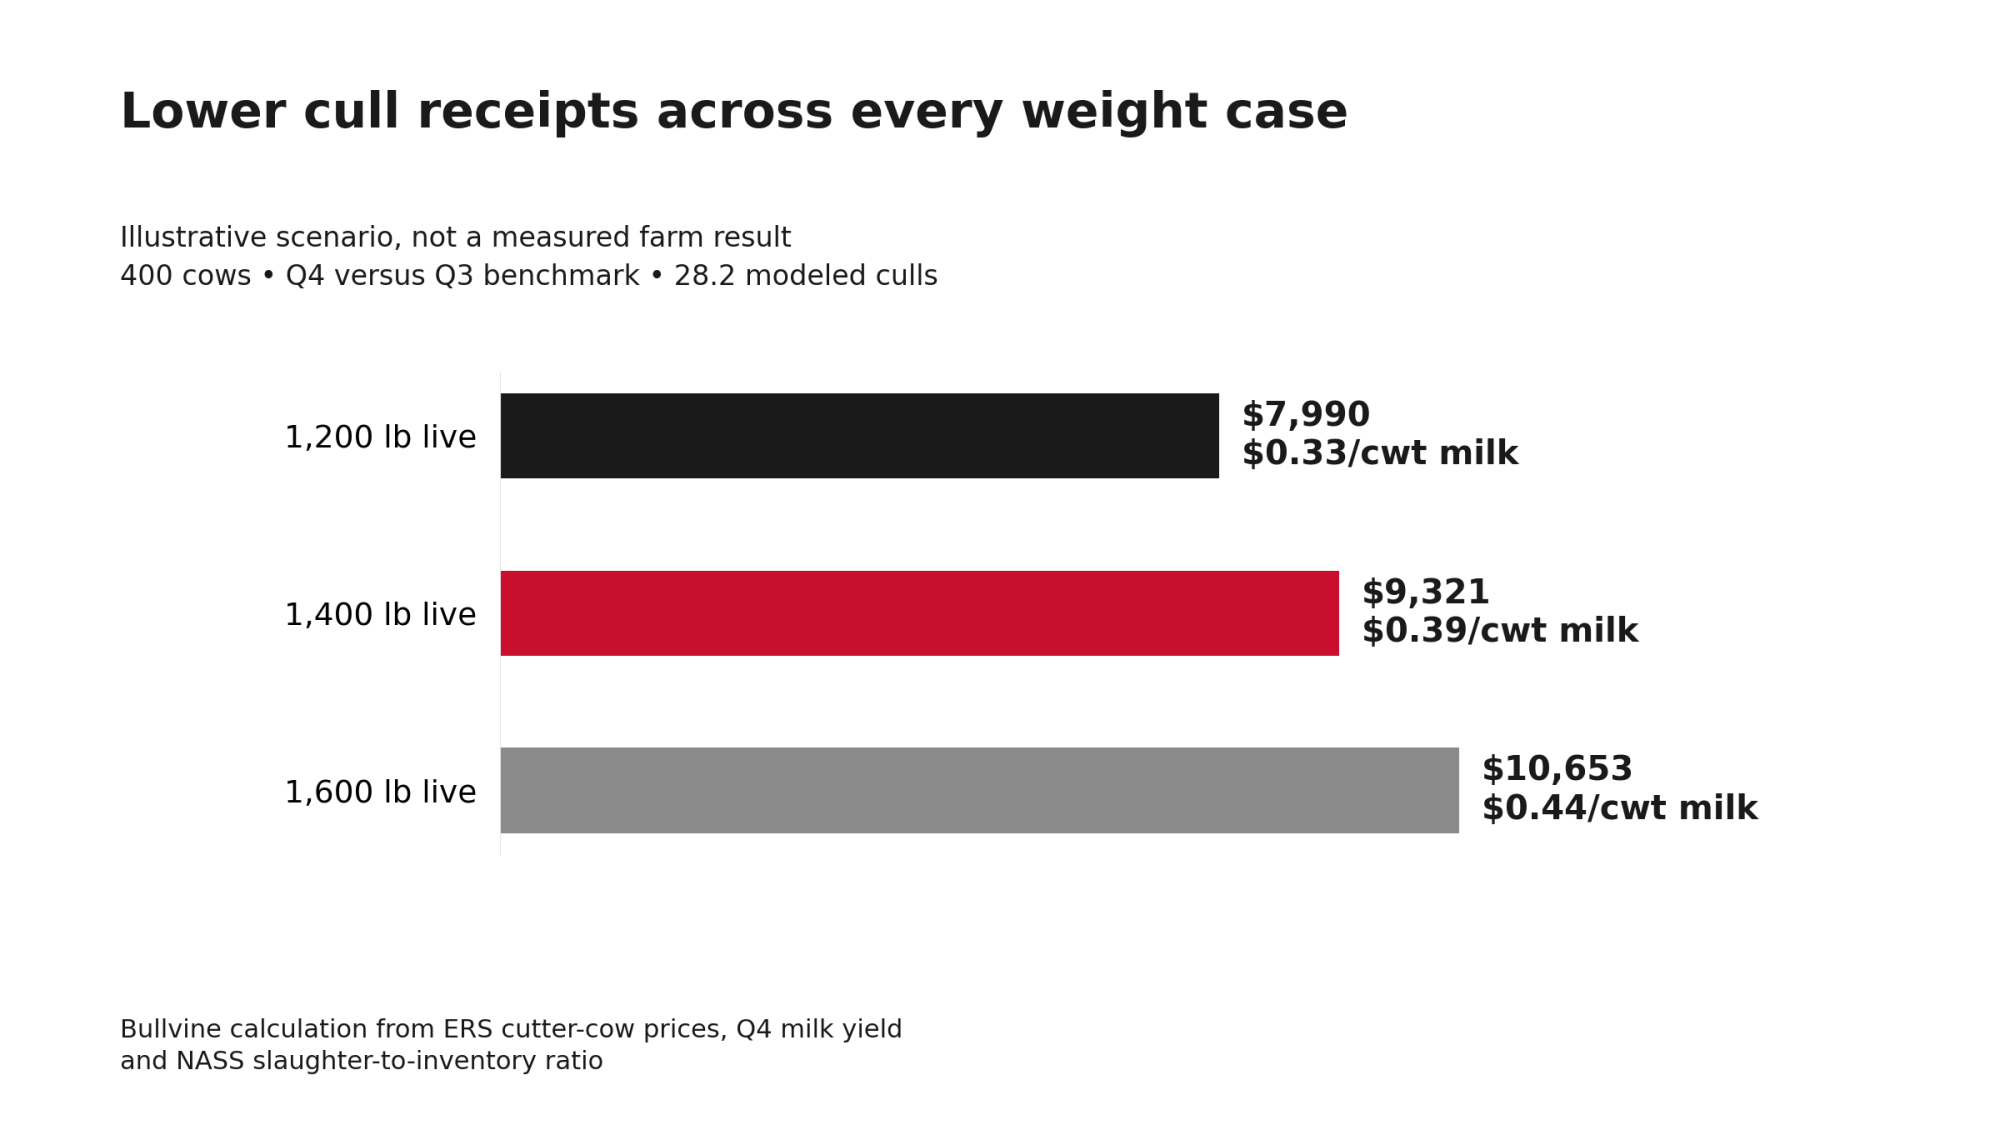
| Cull weight (live) | Lower value per cull | Q4 herd total | Per cwt of Q4 milk | Share of CoBank’s $3–5/cwt |
| 1,200 lb | $283 | $7,990 | $0.33 | 6.6%–11.0% |
| 1,400 lb | $331 | $9,321 | $0.39 | 7.7%–12.8% |
| 1,600 lb | $378 | $10,653 | $0.44 | 8.8%–14.7% |
Table 1 leaves out pooling, components, premiums, deductions, feed costs and calf revenue. It doesn’t claim that switching buyers would capture the gap. Table 2 covers cull cows only and isn’t a forecast that the Q4 price holds into 2027.
What should you check now?
Within 30 days
Split milk receipts, calf sales and cull sales in your cash-flow review. Use your last three milk statements and dated cattle-sale records.
- It’s urgent if recurring milk receipts no longer cover recurring cash obligations.
- It backfires if you count extra cow sales as repeatable operating income without recording the lost productive inventory.
Within 90 days
Work through two numbers with your co-op or processor and your lender, then combine them:
- Milk receipts: the change under your payment terms, using your contract, component tests and deductions.
- Risk positions: separately, the offset or added cash requirement from any existing risk-management positions.
- It’s urgent if the combined downside case breaches your agreed liquidity floor.
- It backfires if you treat the $2.90 benchmark spread as your farm’s exact basis.
Within 365 days
Match expected freshenings against planned removals and expansion commitments. Start with what’s already committed in your replacement pipeline.
- It’s urgent if there’s a projected cow shortfall you can’t fill within available cash and credit.
- It backfires if you keep cows whose health or expected contribution no longer justifies it.
CoBank’s June model points to replacement numbers improving in 2027 and continuing in 2028. That’s a conditional pipeline forecast, and it carries no herd-contraction date. Weigh each keep-or-sell call on three separate considerations:
- The return from another lactation.
- The cost of replacing the cow.
- The cattle income available while she stays.
Compare changes with changes over the same period: the change in milk receipts under a downside case, the change in calf and cull receipts against your existing budget, and the cash balance left after costs and any hedge settlements. Cattle income already in the budget isn’t spare protection.
Before your next lender review, check one number against your contract: how much does a $1/cwt fall in Class III actually change your monthly milk receipts?
Run Your Numbers
R/C Snapshot — Turn the keep-or-sell decision into a hard number before Q4 cull prices fall. This calculator benchmarks your 12-month replacement-to-cull ratio, flagging exactly whether your incoming freshenings can cover your planned exits without forcing you to buy expensive springers.
Methodology Note
Slaughter-to-inventory ratio
- Inputs: January–September federally inspected dairy-cow slaughter, divided by each year’s January 1 milk-cow inventory from NASS Cattle, January 30, 2026 (9.3808 million for 2025; 9.5683 million for 2026).
- Results: 1.9460 million ÷ 9.3808 million = 20.74% for 2025. 2.0217 million ÷ 9.5683 million = 21.13% for 2026, up about 0.4 percentage points.
- Annualized: 21.13% × 12/9 = 28.17%, rounded to 28.2% as a model input only.
- Limits: the ratio excludes deaths, exports and non-federally inspected slaughter, so it isn’t complete herd turnover.
Class III and Class IV comparisons
- Year-to-date Class III: simple average of AMS monthly Class III prices. January–August come from CLS-0826; September ($16.04) from CLS-0926. The 2026 average is $15.96; the 2025 average for the same months is $18.46.
- Spreads: Class IV minus Class III by month. May 2026: $22.32 − $16.92 = $5.40. September: $18.94 − $16.04 = $2.90.
Table 2 exact values
- Culls: 400 × 28.2% ÷ 4 = 28.2 modeled culls.
- Q4 milk: 400 × 6,050 lb = 24,200 cwt.
- Price change: $158.61 − $135.00 = $23.61/cwt, Bullvine’s subtraction.
- Unrounded results: herd totals of $7,989.62, $9,321.23 and $10,652.83; $0.3301, $0.3852 and $0.4402 per cwt.
$0.72: ERS’s 2026 annual cutter-cow figure minus its 2027 forecast.
This analysis does not estimate how many cows would otherwise have been culled.
Complete references and supporting documentation are available upon request by contacting the editorial team at editor@thebullvine.com.
Learn More
- Beef-on-dairy math: the $575 premium that cancels out — Run the $585-per-straw replacement penalty through your own barn math before finalizing next month’s breeding sheet. The following numbers dismantle the hidden cost of chasing crossbred calf premiums on cows that must generate dairy replacements.
- The USDA Formula Change No Milk Check Explains — A recent FMMO make-allowance restructure quietly stripped $0.90/cwt from regulated Class III and IV milk prices. Prepare your balance sheet for the permanent margin impact these regulatory shifts impose on your operation.
- $3,010 Per Heifer. 800,000 Short. Your Beef-on-Dairy Bill Is Due. — With replacement inventories down 800,000 head, this contrarian analysis reveals the unexpected leverage processors wield over farm expansions. A sustainable heifer pipeline suddenly dictates exactly which producers lock in favorable plant contracts.
The Sunday Read Dairy Professionals Don’t Skip.

Every week, thousands of producers, breeders, and industry insiders open Bullvine Weekly for genetics insights, market shifts, and profit strategies they won’t find anywhere else. One email. Five minutes. Smarter decisions all week.