


Whole milk finally won. Your check didn’t move. The $140/cow answer is in your protein-to-fat ratio.
Executive Summary: This feature digs into why, even after full‑fat dairy won big in the 2025–2030 Dietary Guidelines and whole milk returned to U.S. schools, many producers aren’t seeing bigger milk checks. It shows how years of chasing butterfat performance left U.S. herds slightly out of step with cheese and whey plants that now pay more attention to protein and protein‑to‑fat ratio than to record fat tests. Using current data from CoBank, Federal Orders, and major plant investments, the article walks through real numbers—including a two‑herd example with a $70,000‑per‑year difference in component revenue—to prove how protein is quietly becoming the main driver of milk value in cheese‑heavy markets. Regional sections help producers in the Upper Midwest, California, the Northeast, and Canada see how these shifts look under their own pricing and quota systems. The core takeaway is simple: if you want to stay ahead, you need to manage for protein at least as actively as you manage for butterfat. A three‑stage playbook then outlines what to do next—short‑term component audits and ration tweaks, one‑year genetics and genomics choices, and three‑year positioning around new cheese, whey, and sustainability‑linked programs—delivered in a practical, farmer‑to‑farmer tone that respects both the win for whole milk and the new math on the milk check.

If you just skimmed the headlines this year, you’d swear dairy finally got everything it’s been asking for.
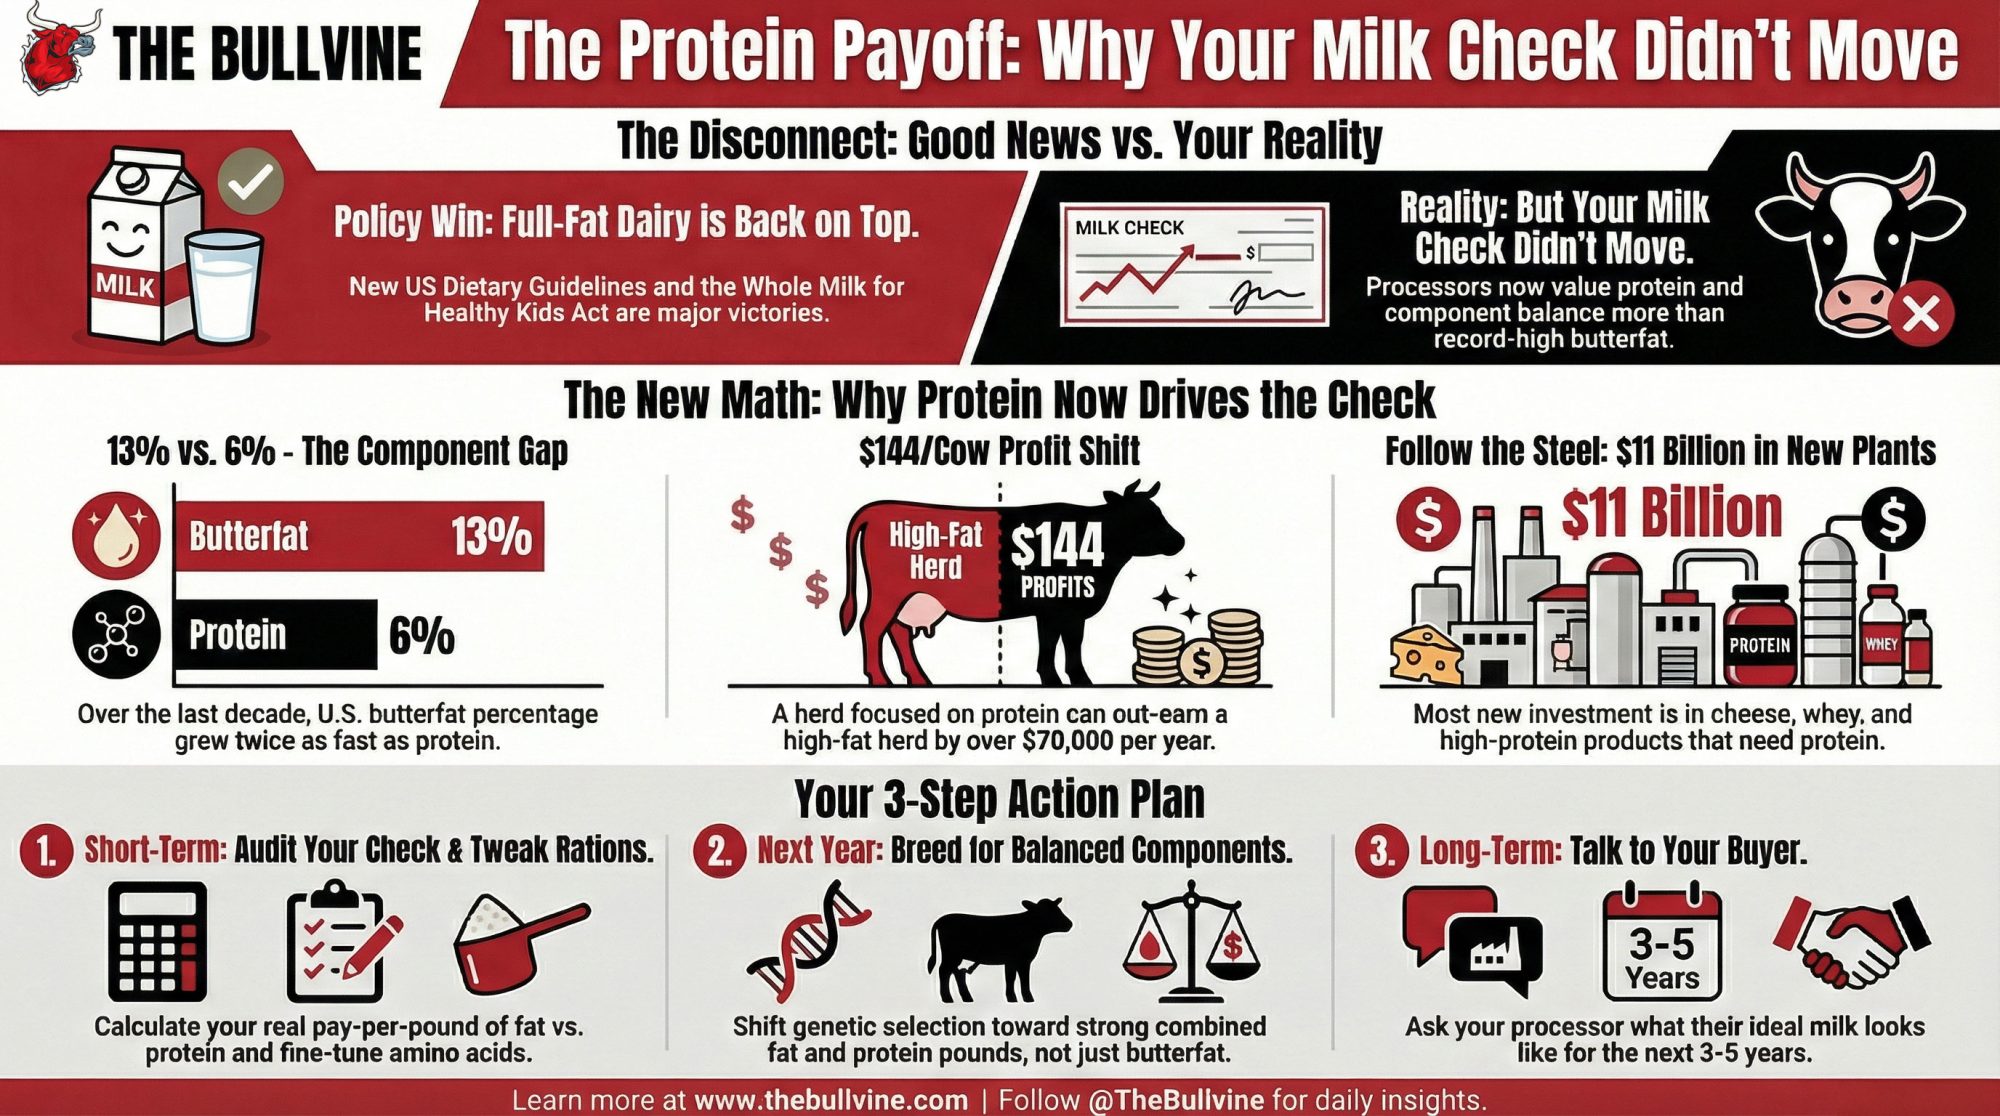
In early January, the U.S. Department of Agriculture and the Department of Health and Human Services rolled out the new 2025–2030 Dietary Guidelines for Americans under the “Eat Real Food” banner at realfood.gov, and dairy is right in the middle of that plate. The guidelines lay out a 2,000‑calorie pattern that includes three daily servings of dairy and spell out that when people consume dairy, they can choose full‑fat dairy with no added sugars as part of a healthy eating pattern, describing dairy as an excellent source of protein, healthy fats, vitamins, and minerals. USDA and HHS press materials even call this a historic reset of nutrition policy that puts real, minimally processed foods—meat, eggs, full‑fat milk, fruits, vegetables—front and center while urging people to prioritize protein and cut back on added sugars and highly processed foods.
On the industry side, the International Dairy Foods Association jumped in with both boots. In a January 6, 2026 statement, Michael Dykes, D.V.M., president and CEO of IDFA, said these guidelines “send a clear and powerful message to Americans: dairy foods belong at the center of a healthy diet,” and he highlighted that the document recommends dairy products “at all fat levels,” including whole and full‑fat milk, yogurt, and cheese. That’s a long way from the older “choose low‑fat or fat‑free dairy most often” messaging many of you have been pushing back against for years.
At the same time, Congress finally moved on to something dairy has chased for more than a decade: getting whole milk back into schools. The Whole Milk for Healthy Kids Act of 2025—H.R. 649—updates National School Lunch and School Breakfast rules so schools can serve whole, 2%, 1%, and fat‑free milk, flavored and unflavored, and it excludes milk’s saturated fat from the weekly saturated‑fat limits used to score school menus. Coverage from Dairy Reporter and farm policy outlets notes that the law also tightens rules for what counts as a nutritionally equivalent non‑dairy beverage, and both dairy and plant‑based groups weighed in heavily as the bill advanced. USJersey organizations formally backed the legislation, arguing that it restores whole- and reduced‑fat milk options in cafeterias and better reflects what families actually drink at home.

On paper, that’s full vindication for how a lot of you have been feeding your own kids for decades.
Then the milk check lands on the table… and the numbers don’t exactly say, “You’re finally getting paid for this,” do they?
So let’s walk through why that is, and what it really means for your butterfat performance, your protein, and your next moves.
Looking at This Trend: What Really Changed in the Guidelines
Looking at this trend, here’s what’s interesting: it’s not just that dairy survived another guideline cycle. It’s that full‑fat dairy stepped out of the penalty box.
The new guidelines on realfood.gov lay out a 2,000‑calorie pattern with three servings of dairy and clearly state that when people consume dairy, they can choose full‑fat dairy with no added sugars as part of a healthy eating pattern. The text calls dairy an excellent source of protein, healthy fats, vitamins, and minerals, and it emphasizes that Americans should prioritize protein-rich foods at every meal, including dairy. USDA and HHS fact sheets describe the package as ending the “war on healthy fats,” encouraging more dairy and other whole‑food fat sources, while still stating that saturated fat should remain below 10% of total calories.
Harvard’s T.H. Chan School of Public Health weighed in with a JAMA Viewpoint in January 2025 that’s worth noting. The authors point out that the numeric saturated‑fat cap stayed at 10% of calories, but the visuals and examples in the new guidelines now prominently feature steak, butter, and full‑fat milk, which could easily make people think the cap has quietly loosened. They argue that the “eat real food” emphasis reflects justified worry about ultra‑processed diets, yet also raises fair questions about whether the 10% cap will be applied consistently in practice.
On the research side, more nutrition scientists have been questioning the old blanket advice always to pick low‑fat dairy. A 2021 review in Nutrients concluded that the evidence supporting a strict saturated‑fat cap is more nuanced than many past guidelines suggested and that saturated fat in whole foods such as full‑fat dairy may not carry the same risk profile as saturated fat in ultra‑processed snacks. A 2024 analysis of U.S. diets found that a large share of saturated fat and added sugar comes from processed meats, desserts, and snack foods, rather than just milk and cheese, which supports a more targeted approach to “bad actors” in the diet.
Now fold in the Whole Milk for Healthy Kids Act. The Congress.gov summary of H.R. 649 spells out that schools in the National School Lunch and School Breakfast Programs can once again offer whole and reduced‑fat milks, both flavored and unflavored, and that fluid milk’s saturated fat is excluded from the weekly saturated‑fat calculation used to judge school menus. Dairy Reporter’s coverage shows dairy groups praising the bill for restoring taste and choice, while public‑health advocates worry it could raise saturated‑fat intake among kids who already overshoot recommended levels.
So nutritionally and politically, the wind is finally at dairy’s back. Full‑fat milk, cheese, and yogurt are back in government advice and school cafeterias.
But as many of you have already noticed, that doesn’t automatically change what your processor pays the most for in each hundredweight of milk.
What Farmers Are Seeing: Butterfat Performance and the Protein Gap
What I’ve seen, looking at the data and listening to producers, is that U.S. herds have done an outstanding job at one thing: butterfat.
University of Minnesota’s Isaac Salfer, assistant professor of dairy nutrition, has tracked bulk tank fat tests in the Upper Midwest in work shared through Dairy Herd Management and extension channels. He showed that from roughly 2000 through 2012, average bulk tank butterfat in that region floated around 3.7 to 3.8 percent. By 2021, the regional average climbed above 4.0 percent, and in January 2022, the average fat test for Upper Midwest herds came in around 4.25 percent. Salfer has even commented that a 3.75% fat test—once considered high for Holsteins—now looks more like the low end of what he expects from well‑managed herds with modern genetics and feeding.
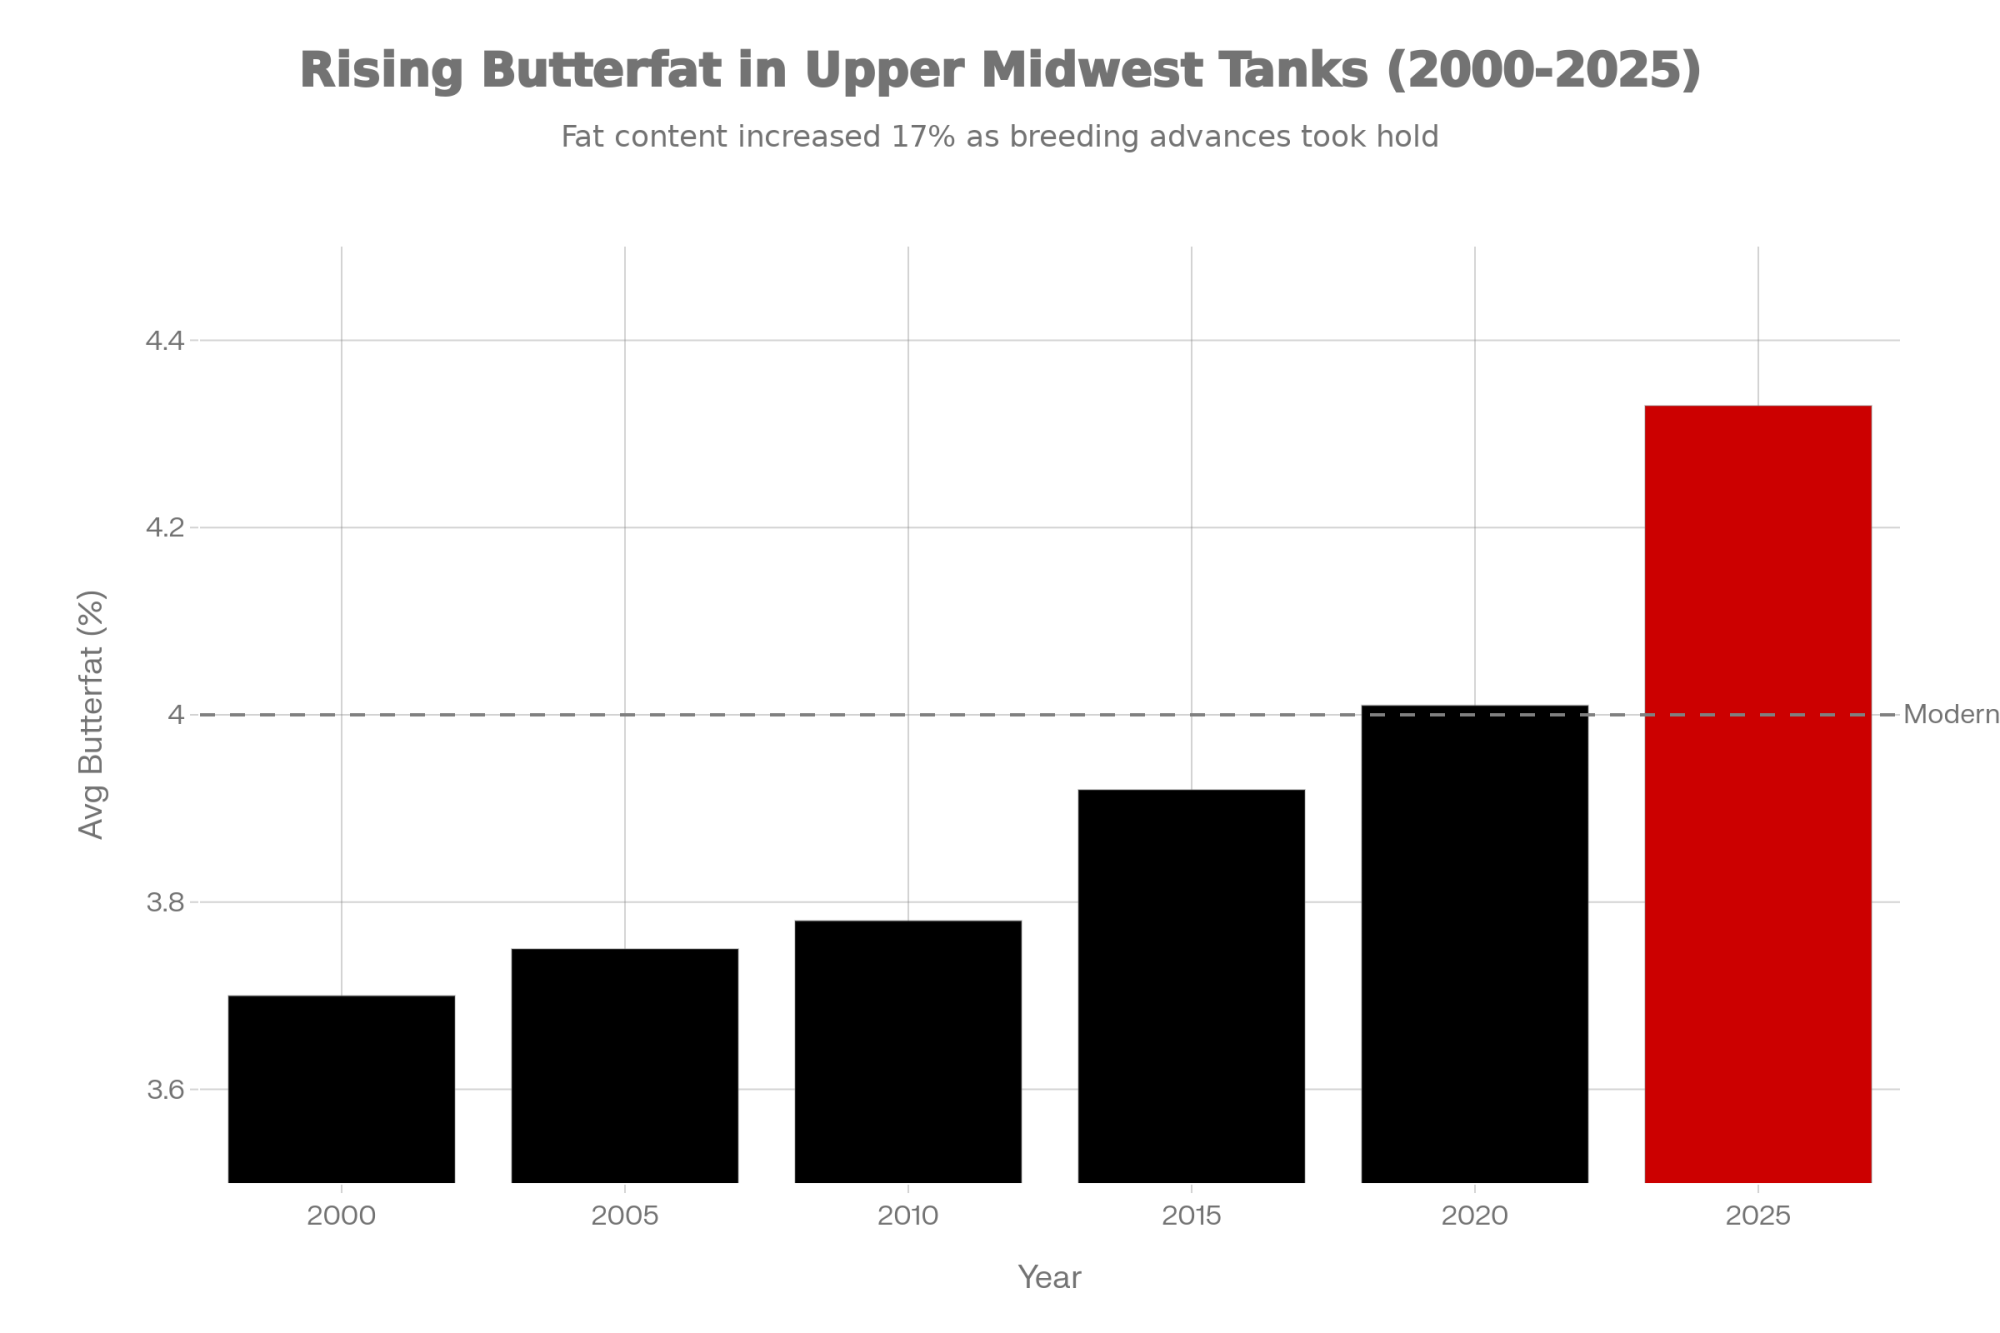
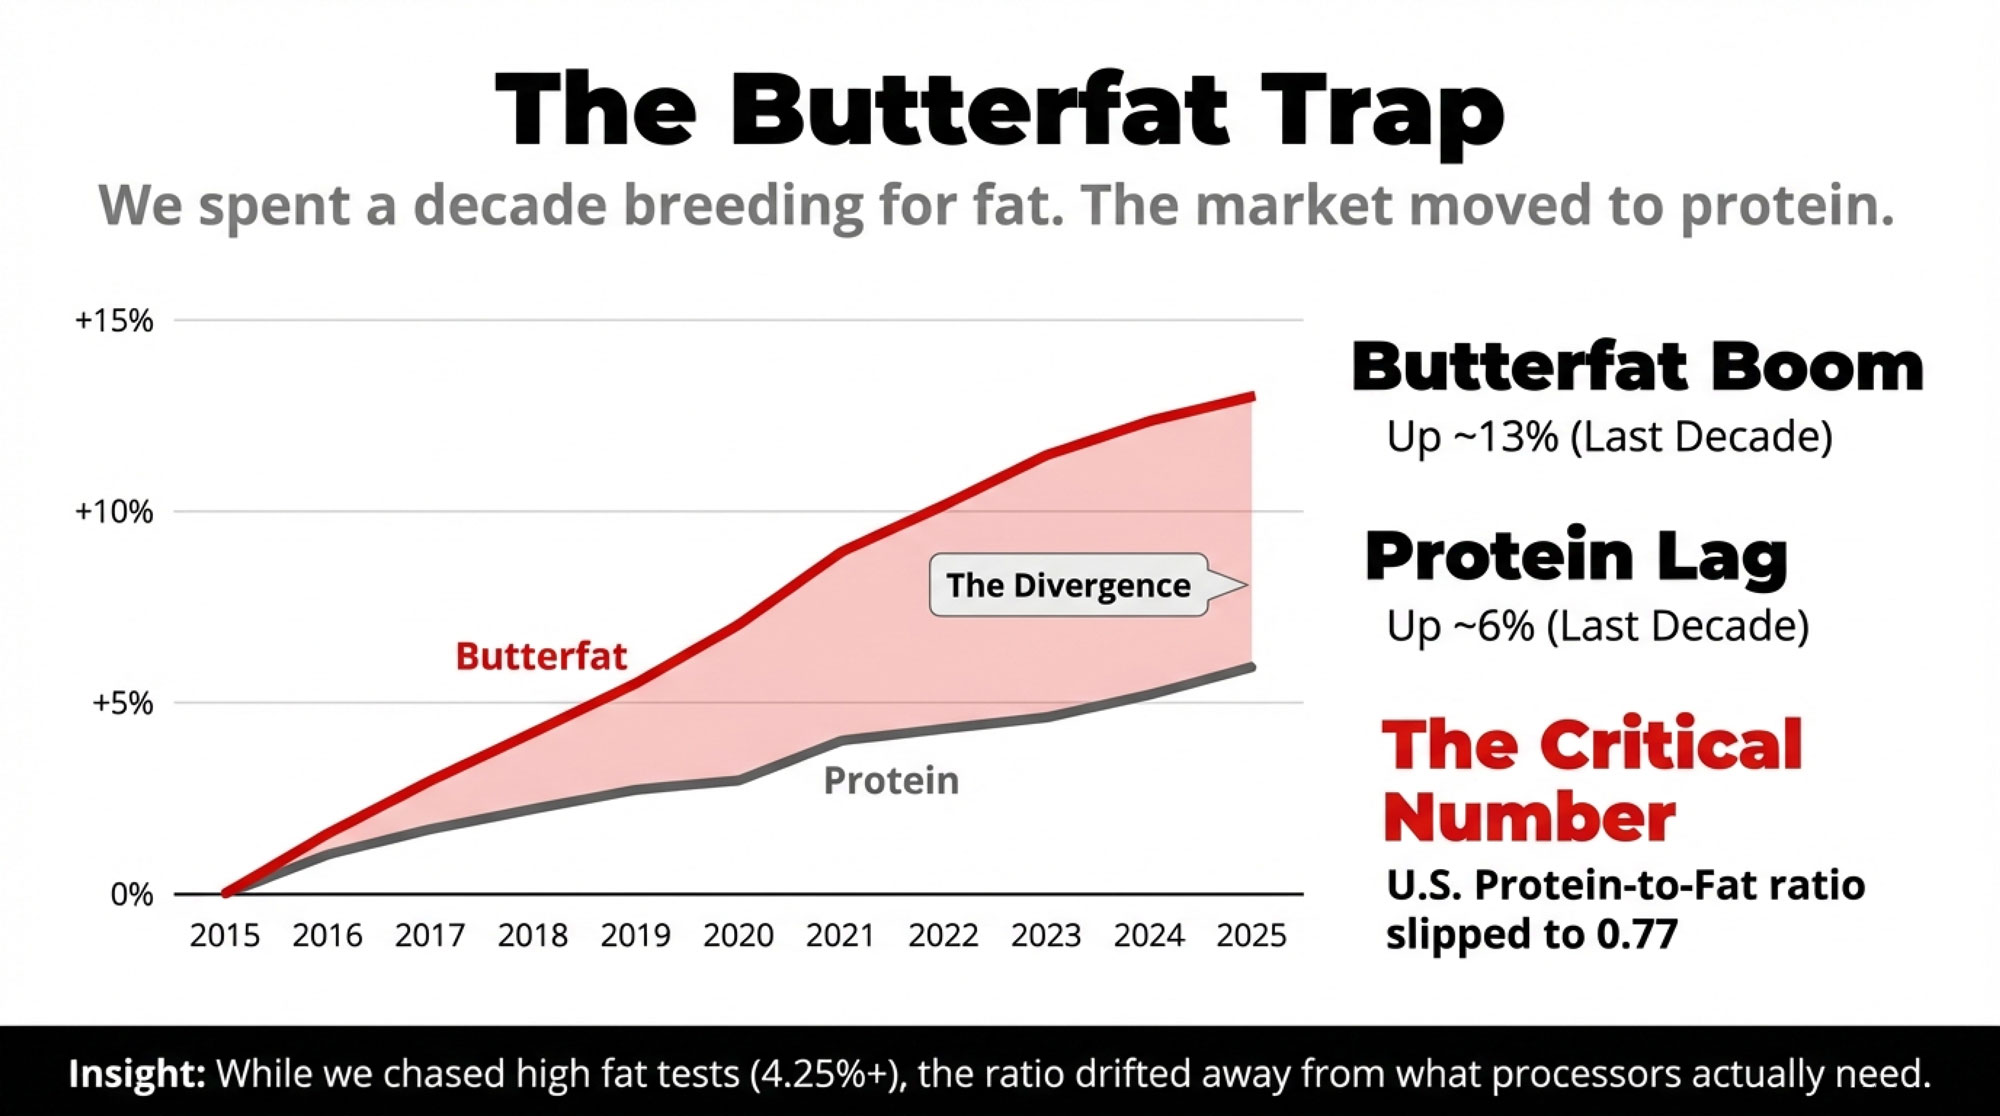
National numbers line up with that story. The average U.S. butterfat climbed from about 3.8% in 2015 to 3.94% in 2020, then 4.01% in 2021, and hit 4.33% by March 2025, based on Federal Milk Marketing Order data. CoBank’s 2025 analysis on components goes a step further and notes that butterfat percentage in U.S. milk has risen about 13% over the last decade, compared to only 2–3% growth in places like the European Union and New Zealand.
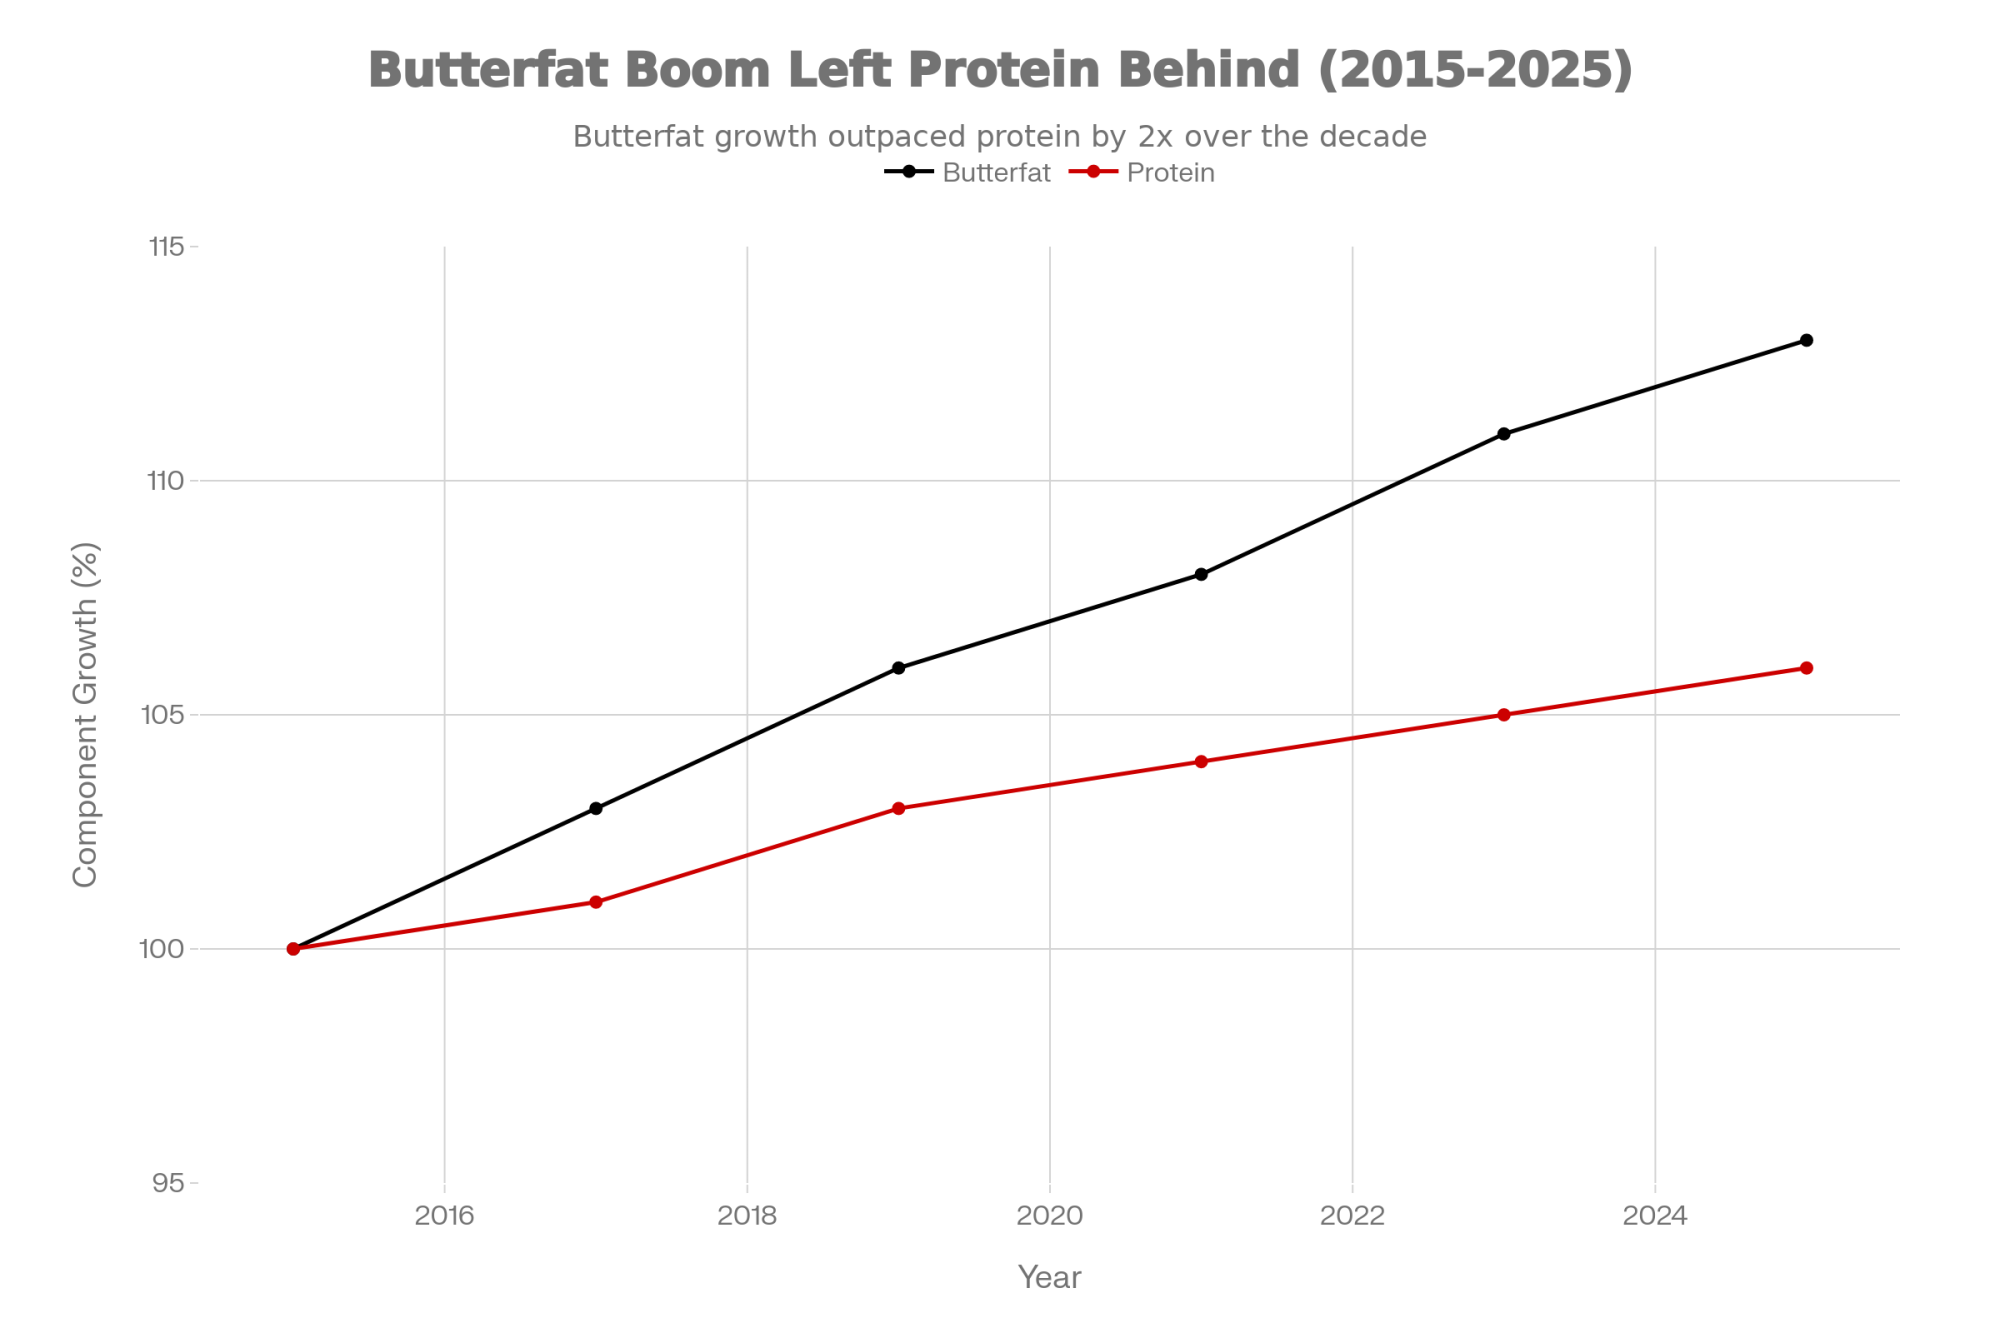
Protein has been moving too, but not nearly as fast. That same CoBank work points out that the average true protein in U.S. milk has increased roughly 6% over the decade, from about 3.1% to around 3.3%. Solid progress, but the gap between fat gains and protein gains is exactly where the trouble starts for processors.
None of this happened by accident. A lot of you have deliberately pushed butterfat performance:
- Picking sires with strong butterfat PTAs, including some Jersey influence in Holstein herds to boost fat and total component yields, as reflected in both CoBank’s commentary.
- Improving forage quality—more digestible fiber, better harvest timing—and ration balance so cows can produce more milk fat without getting knocked off balance energy‑wise.
- Tightening up fresh cow management through the transition period—watching negative energy balance, ketosis risk, rumen function—so higher butterfat doesn’t come with more displaced abomasums or down cows.
For several years, that was exactly what the market seemed to want. CoBank notes that butterfat pay prices led protein in eight of the ten years heading into the mid‑2020s, fueling what its analysts call a butterfat boom. Butter prices ran strong, cream multiples were attractive, and churns running hard while cream supplies periodically looked for a home.
The hitch is that protein hasn’t kept up, and processors—especially the cheese and whey plants—are showing more and more concern about that imbalance.
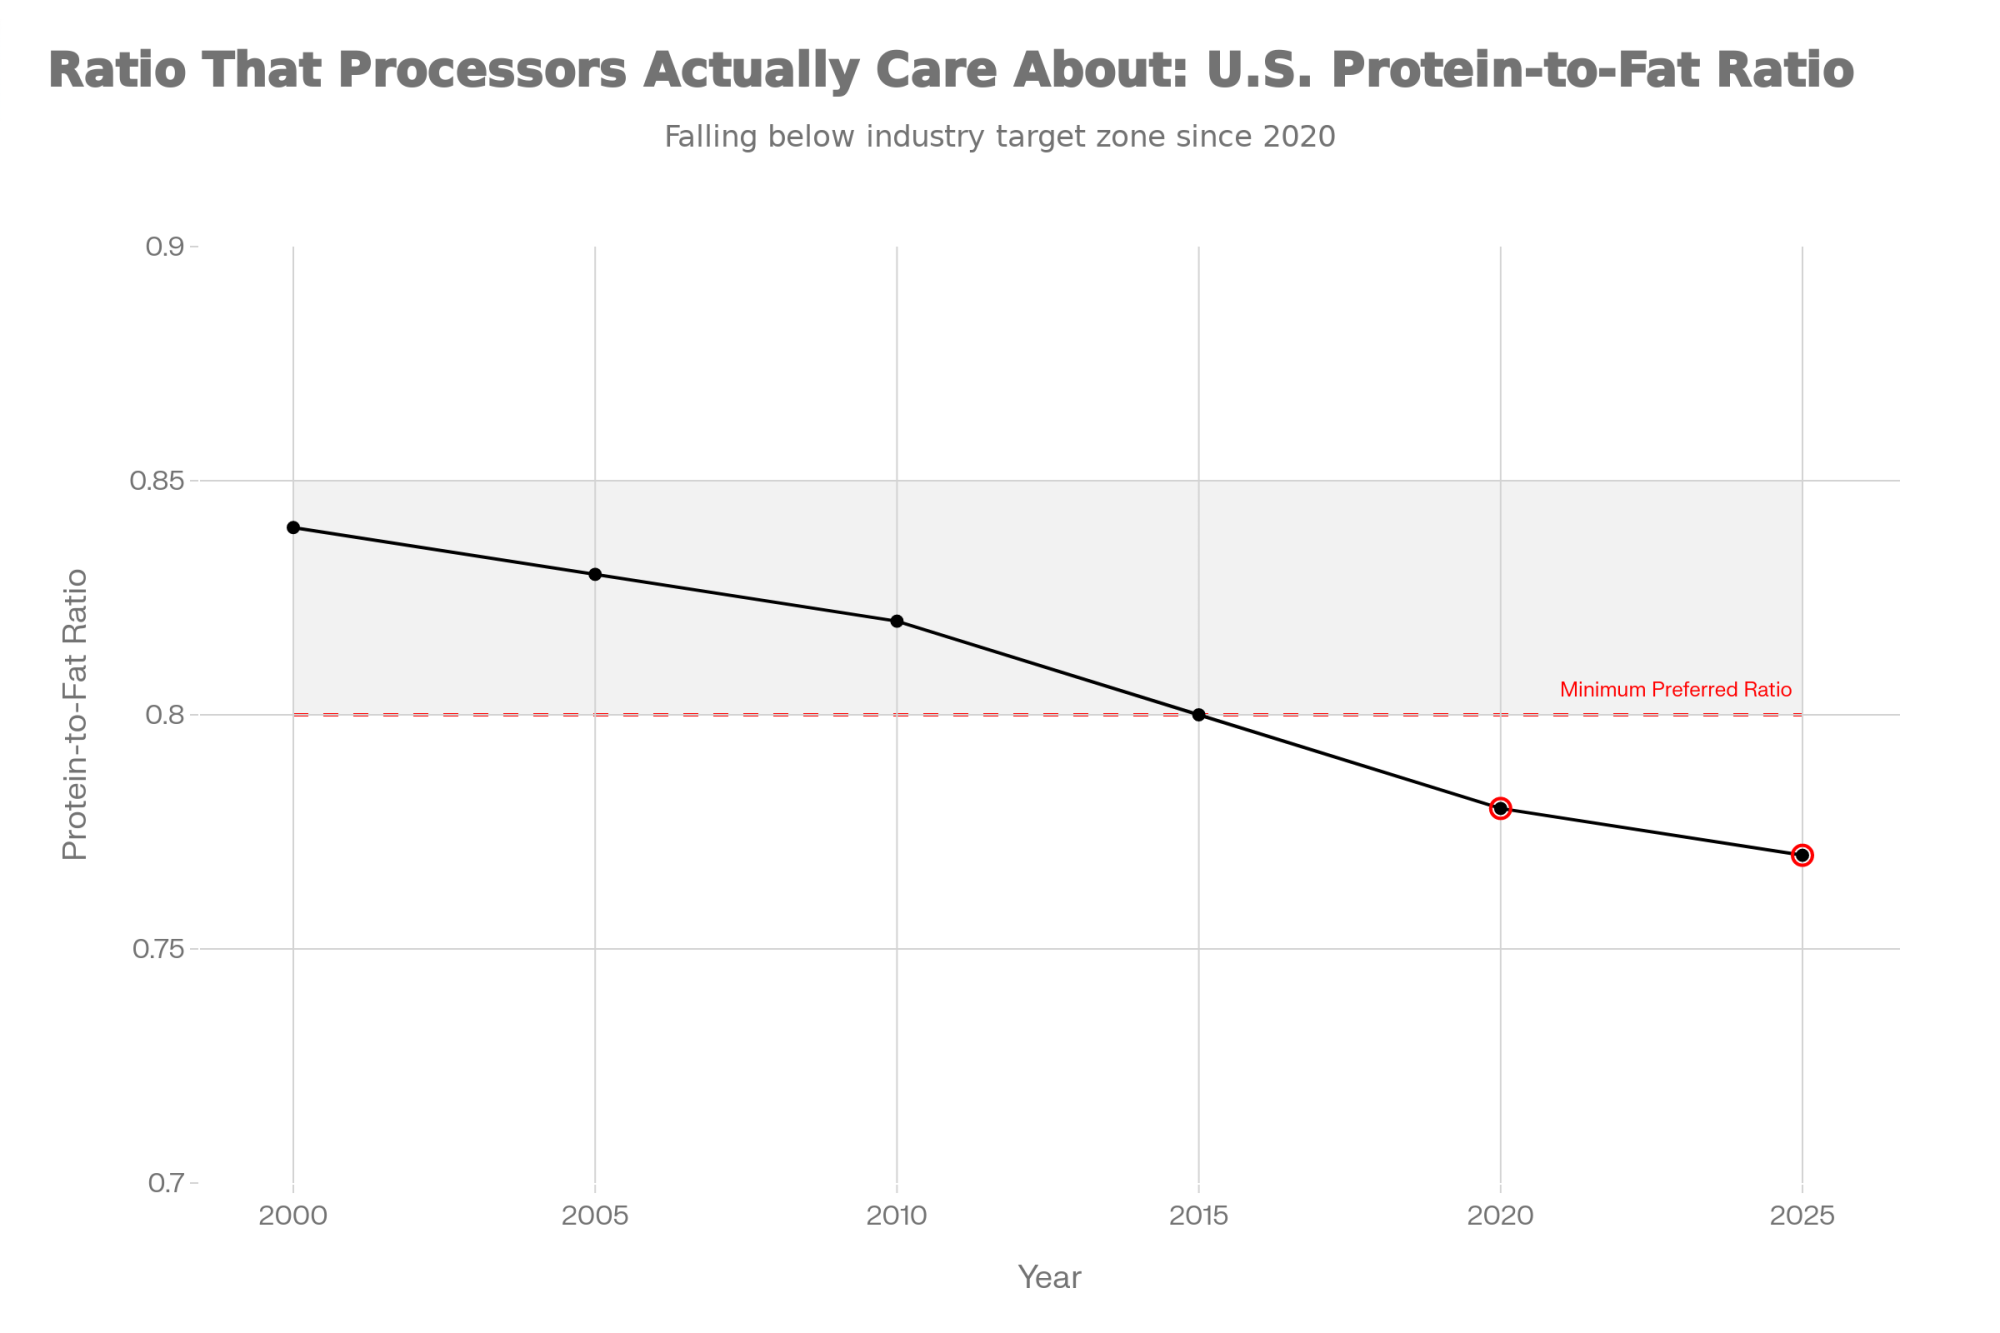
CoBank’s component work shows that from 2000 to 2014, protein prices exceeded butterfat every year, which encouraged a pretty balanced growth in both components and kept the national protein‑to‑fat ratio in the 0.82–0.84 range. As butterfat advanced in both genetics and pricing, the ratio slipped to roughly 0.77. For plants that need a tight balance of casein and fat to fill cheese vats and whey dryers efficiently, that shift matters a lot.
Why Processors Care So Much About the Protein‑to‑Fat Ratio
Looking at this trend from the plant’s side of the road, you start to see why they keep talking about protein‑to‑fat ratios instead of just “more components is better.”
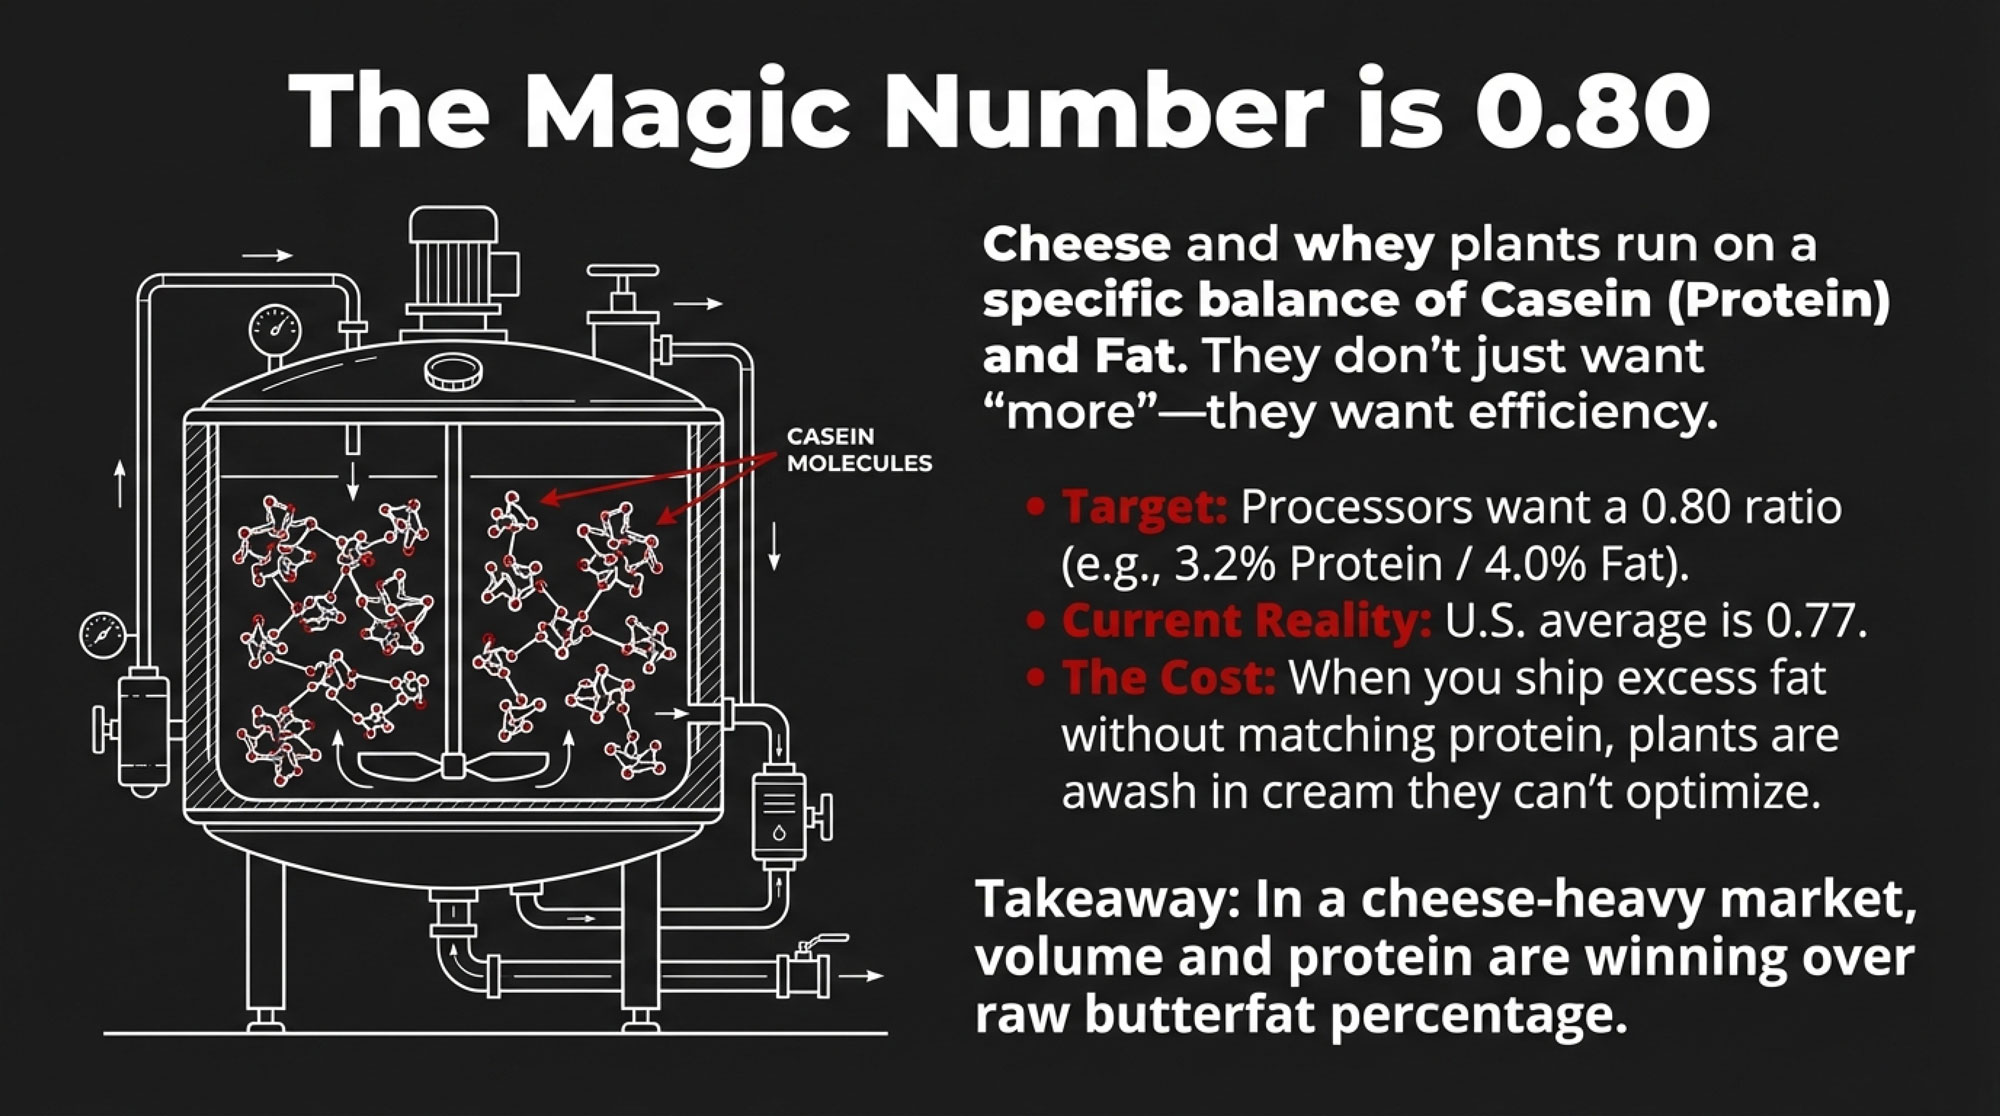
Cheese makers design their yields around a specific relationship between casein and fat. Many plants like their incoming milk somewhere around 3.2% protein and 4.0% fat, giving a protein‑to‑fat ratio near 0.80—not because they’re fussy, but because that ratio makes their cheese vats and whey systems run efficiently. When milk rolls in at, say, 4.2% fat and 3.1% protein, a few things happen:
- There’s more cream than they can easily use in the products they’re making today.
- There are fewer pounds of protein per hundredweight to turn into cheese and high‑value whey proteins.
- They have to spend extra time and money standardizing milk just to hit the specs their equipment and contracts are built around.
CoBank lays that trajectory out clearly. For years, fat and protein grew in step, and protein generally sat ahead of butterfat on the price sheet, so plants got a nicely balanced stream of components. Then, as butterfat stayed “the money maker” in many markets, genetics and feeding strategies pushed fat faster than protein, leaving cheese‑oriented plants awash in cream but relatively short on protein.
At the same time, USDA Class and component price announcements show that butterfat and protein often trade closer together than many folks expect. For example, March 2025 Federal Order component prices reported butterfat near the mid‑$2.60s per pound and protein in the mid‑$2.40s, with month‑to‑month swings moving those numbers back and forth. In some 2025 months and orders, protein has led fat; in others, fat has led protein. Either way, the gap isn’t always as wide as “butterfat always wins” would suggest.
Corey Geiger, CoBank’s lead dairy economist, has been pretty frank about it. In an October 2025 interview, he pointed out that U.S. butterfat percent is up about 13% over the past decade, while New Zealand and the EU sit closer to 2%, and that U.S. true protein is up around 6%. His takeaway was that U.S. producers in many markets should start shifting some focus from butterfat toward producing more protein, especially as cheese and whey plants expand and protein “takes over the pole position on milk checks” in those regions.
So if it feels like you spent ten years building the butterfat levels the market seemed to want, just in time for the same market to start telling you it’s short on protein, you’re not imagining it.
What Producers See in Their Checks: A Simple Milk Check Example
You know how sometimes the only way to really feel a change is to run the math on two herds that look a lot like what you see in your area? Let’s do that.
Picture two 500‑cow herds shipping to the same cheese‑and‑whey plant in a Midwestern Federal Order:
- Herd A (Holstein‑Jersey cross): 75 lb of milk per cow per day, 4.2% butterfat, 3.1% protein.
- Herd B (Holstein): 78 lb of milk per cow per day, 3.8% butterfat, 3.35% protein.
Now layer on representative 2025 component values from Federal Order announcements where both butterfat and protein are in play—think butterfat somewhere in the mid‑$2.60s per pound and protein in the mid‑$2.40s to low‑$2.50s, depending on the month. In some recent orders, protein has nudged above fat; in others, fat has had the edge. But they’re in roughly the same ballpark.
Under those kinds of prices:
- Herd A clearly “wins” on butterfat performance and ships more pounds of fat per cow.
- Herd B gives up some fat, but pushes more protein pounds and a bit more milk.
When you crank those numbers through an actual component pay sheet—with each herd’s fat and protein production multiplied by their respective prices, plus a bit of milk yield difference—it’s easy to reach a scenario where Herd B’s milk brings in tens of thousands of dollars more per year in component revenue than Herd A, despite Herd A’s better fat test. CoBank’s modeling and case examples bear this out in a variety of cheese‑heavy markets: modestly lower fat with noticeably higher protein and milk volume often wins the total component dollar race when protein prices are competitive.
| Metric | Herd A (Fat Focus) | Herd B (Protein Balance) | Difference | Winner |
|---|---|---|---|---|
| Herd Size | 500 cows | 500 cows | — | — |
| Milk Yield (lb/cow/day) | 75 | 78 | +3 lb | Herd B |
| Butterfat % | 4.20% | 3.80% | -0.40% | Herd A |
| Protein % | 3.10% | 3.35% | +0.25% | Herd B |
| Protein:Fat Ratio | 0.74 | 0.88 | +0.14 | Herd B |
| Total Daily Milk (lb) | 37,500 | 39,000 | +1,500 lb | Herd B |
| Est. Annual Revenue Advantage | Baseline | +$72,400 | +$144/cow/year | Herd B |
Your exact math will depend on your local component values, premiums, solids‑non‑fat rules, quality bonuses, and hauling costs. But that basic story—that very high butterfat can be outgunned financially by strong protein plus solid fat in a cheese‑oriented market—is showing up again and again when producers, nutritionists, and farm business advisors sit down and run 6–12 months of milk checks through real pay grids.
Regional Reality Check: It Doesn’t Look the Same Everywhere
It’s worth saying out loud here that the “right” butterfat‑to‑protein balance isn’t identical in every region or every plant.
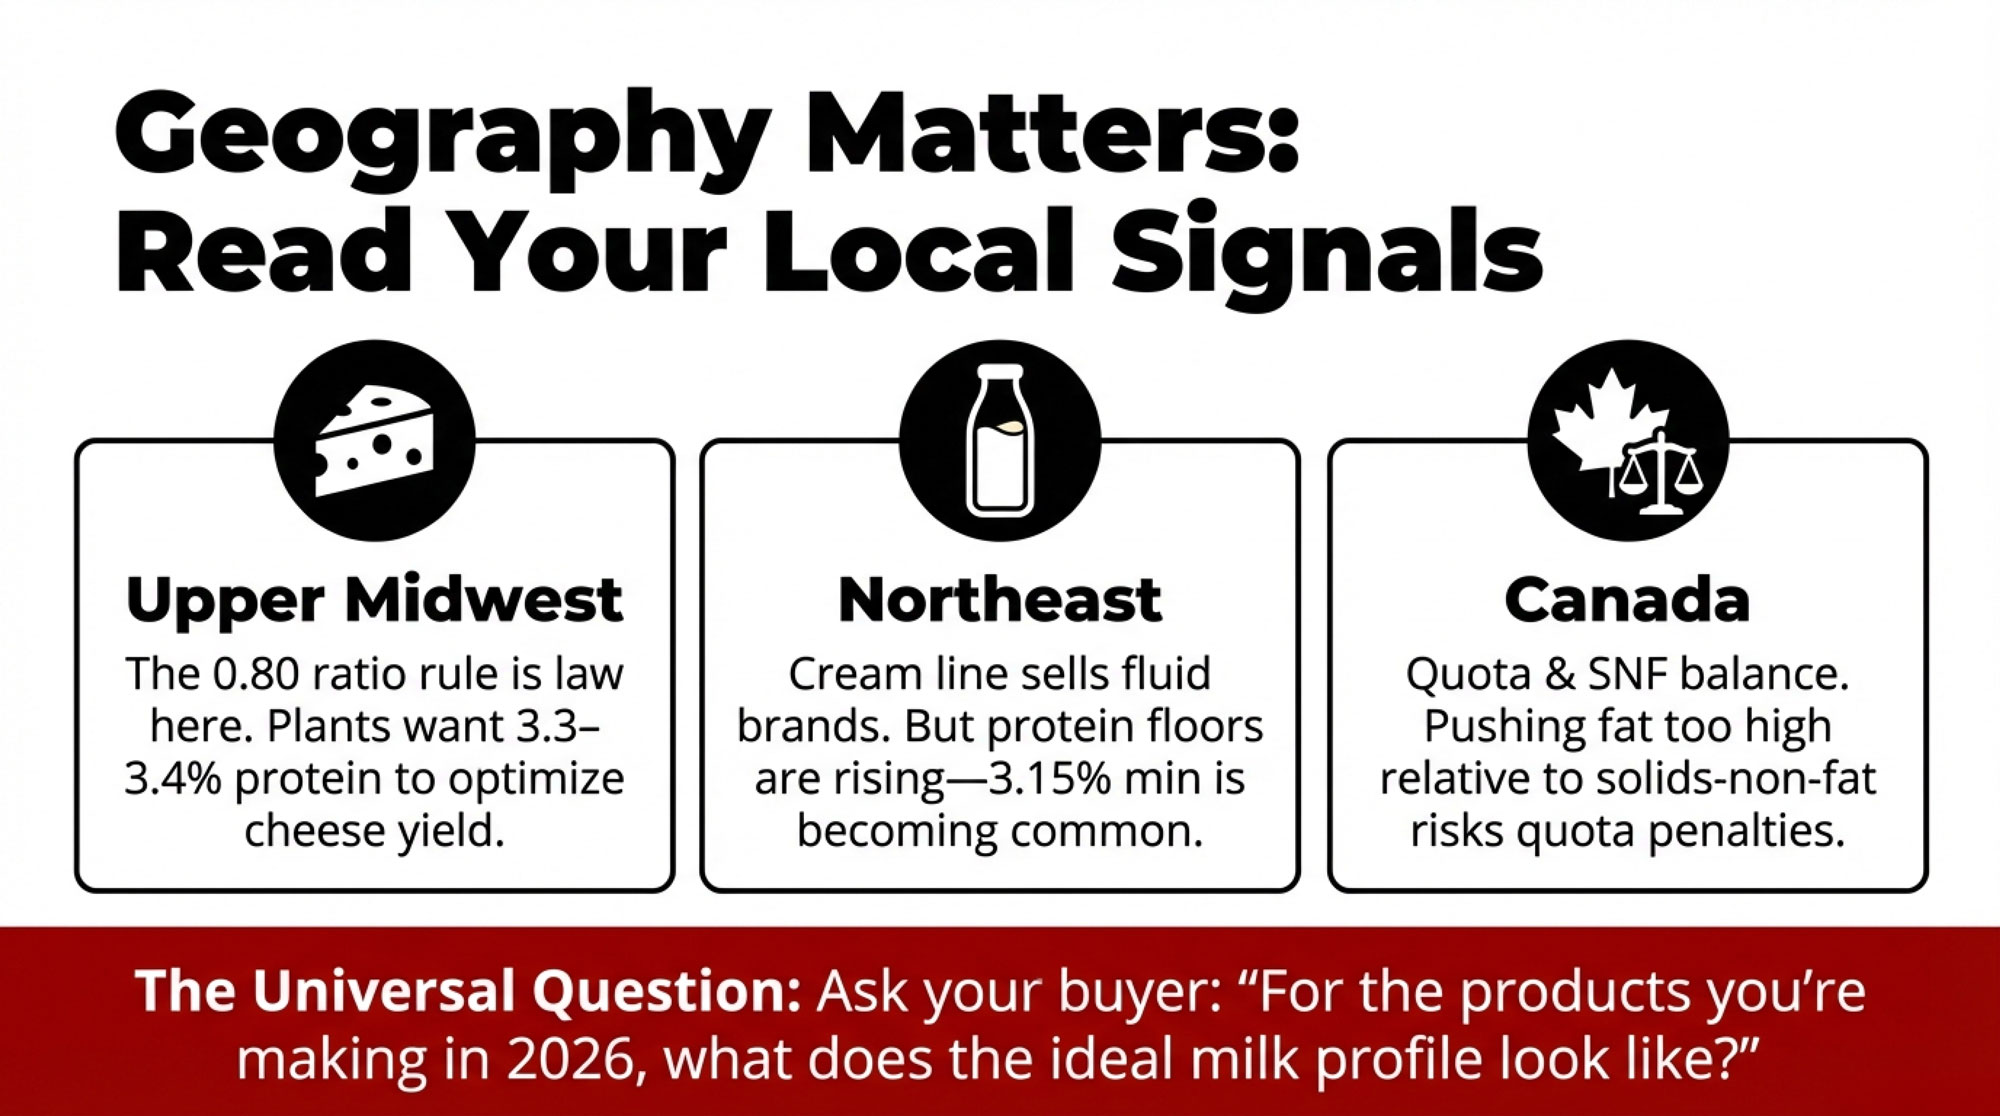
In Wisconsin and the broader Upper Midwest, Federal Order 30 and neighboring areas send a large share of milk into cheddar, mozzarella, and other cheeses, with modern whey protein recovery. CoBank has noted that these plants tend to be especially sensitive to the protein-to-fat ratio and overall component balance because both cheese and whey yields depend heavily on those ratios. It’s not unusual to hear co‑op reps there say they’re comfortable around 4.0% fat, but they get more excited when they see protein closer to 3.3–3.4%.
In California, the picture is more mixed. Since joining the Federal Order system in late 2018, California milk has flowed into a blend of Class I fluid products, Class III cheese, and Class IV butter and powder. State and federal data make clear that nonfat dry milk and skim powder still matter a lot for that market, which means solids‑non‑fat, class utilization, and balancing costs share the stage with component pricing. A large dry lot herd near Tulare shipping to a plant making both cheddar and powder is playing a slightly different game than a freestall herd in central Wisconsin shipping primarily to a mozzarella‑plus‑whey facility.
In the Northeast, Orders 1 and 33 still lean more heavily on Class I fluid, with strong branded players in whole milk, flavored milk, and ice cream. Those brands often pay healthy butterfat premiums because they’re selling the “cream line” and indulgence story, even while yogurt, cheese, and ultra‑filtered milk plants in the region are watching protein very closely. That’s why you’ll see some Northeast‑targeted analysis—including Bullvine pieces—warning that a 3.15% protein test doesn’t cut it anymore if you want to land in the top tier of certain processor grids.
Then there’s Canada, where the entire structure is different. Under supply management and the Canadian Dairy Commission’s component pricing, producers are paid based on a national grid that’s designed to match butterfat and solids‑non‑fat production with domestic demand for different milk classes. A Holstein herd in Quebec or Ontario that pushes fat too high relative to SNF can quickly bump into quota over‑production penalties or create an SNF surplus, even if the component test looks impressive on paper. That’s a very different optimization problem than a U.S. herd chasing Federal Order component prices and cheese‑plant premiums.
So while the national numbers say butterfat is up double digits, and protein is up single digits, your local reality might be:
- “Our mozzarella plant really wants more protein and doesn’t pay much once we’re above 4.0% fat.”
- Or, “Our regional fluid brand still rewards butterfat heavily because most of our milk ends up in bottles and ice cream.”
- Or, “Our quota system is about staying in tight butterfat and SNF bands, not maxing out a single component.”
In that context, one of the most useful questions you can ask your buyer is very simple: “For the products you’re actually making, what does ideal milk look like for you over the next five years?” It sounds basic, but many of us don’t ask it directly enough.
| Region / Market | Primary Products | Preferred Butterfat % | Preferred Protein % | Target Ratio | Key Notes |
|---|---|---|---|---|---|
| Upper Midwest (WI, MN) | Cheddar, mozzarella, whey | 3.9–4.1% | 3.3–3.4% | 0.80–0.85 | Cheese-focused; protein drives value; above 4.2% fat adds cost |
| California | Cheese, powder, fluid mix | 3.8–4.0% | 3.2–3.3% | 0.80–0.83 | SNF matters for powder; Class IV still significant; balancing act |
| Northeast (NY, PA, VT) | Fluid milk, yogurt, ice cream | 4.0–4.3% | 3.2–3.4% | 0.75–0.85 | Fluid brands reward fat; UF/Greek yogurt wants protein; mixed signals |
| Canada (Supply Mgmt.) | Quota-based mix | 3.9–4.1% | 3.3–3.4% | 0.80–0.85 | Exceeding quota in any component triggers penalties; balance is mandatory |
Where School Milk Fits: Stabilizer, Not Silver Bullet
Looking at this trend, you know, it’s tempting to think, “Great—whole milk is back in schools, so butterfat is king again, and we’re saved.”
From a nutrition and category‑health standpoint, the Whole Milk for Healthy Kids Act really is a big win for dairy. The law lets cafeterias put whole and reduced‑fat milk back on the line by exempting milk’s saturated‑fat content from the weekly limit used in menu scoring, and it clarifies what counts as a nutritionally equivalent non‑dairy alternative. Dairy groups have highlighted better taste, greater acceptance, and improved nutrition for kids, while public‑health advocates worry this adds saturated fat back into diets that already exceed recommended levels.
From a volume and pricing standpoint, though, the impact is more modest. Federal Order utilization data and CoBank’s broader market analysis both show that beverage milk is now a minority of total U.S. milk disappearance, and school milk is just one piece of that Class I segment. CoBank economists describe school milk policy changes as important stabilizers: they support butterfat demand, likely raise the floor under fat pricing a bit, and help defend dairy’s relevance with younger consumers. But they’re not big enough to re‑balance a national milk supply that’s become very efficient at producing cream in a system where new stainless steel is increasingly pointed at protein.
So yes, whole milk in schools is a long‑overdue positive. It’s just not a magic lever that can rescue butterfat pricing in markets where everything else is screaming for more protein.
What Producers Are Learning: Reading the Signals That Matter
What I’ve noticed, listening to producers from larger freestall setups in Wisconsin to big dry lot systems in Idaho to smaller tie‑stall herds in the Northeast, is that the folks who seem a little calmer right now aren’t necessarily the ones who guessed every move right. They’re the ones who have been quietly watching a few key signals and adjusting as they go.
First, they’ve watched where the stainless steel is going. CoBank’s late‑2025 work on “Protein will drive milk checks for the foreseeable future” highlights roughly $11 billion in new and expanded dairy plant investments across the U.S., with cheese projects leading the way at about $3.2 billion and significant additional investment in high‑protein fluid and yogurt/cultured dairies. That’s a huge bet on turning milk into cheese, whey, protein‑forward beverages, and cultured products—categories where protein drives a lot of the value.
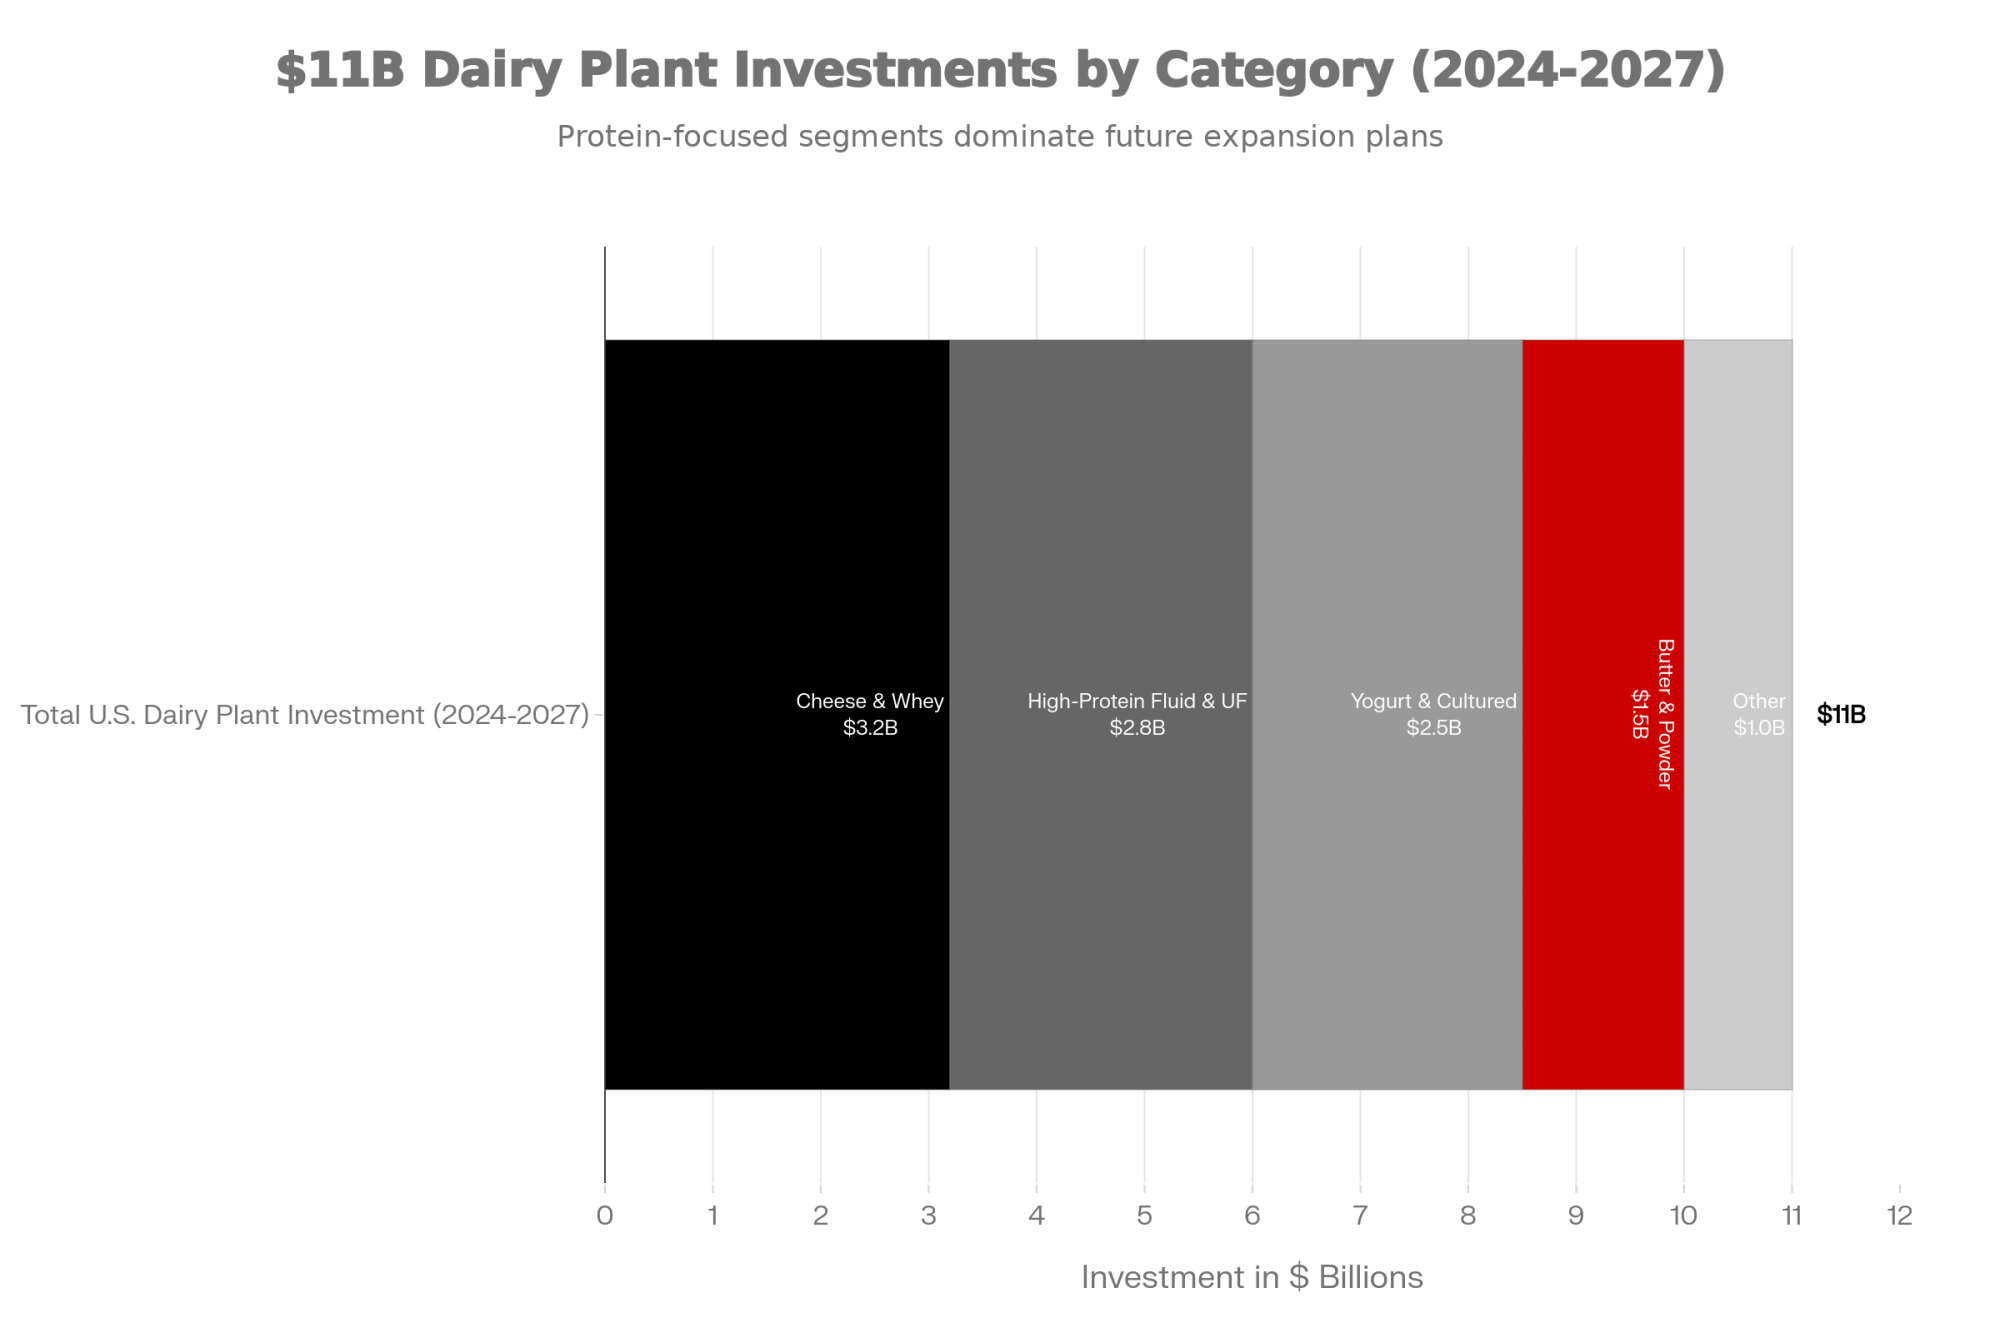
Hilmar Cheese’s Dodge City, Kansas, facility is a good real‑world example. Company announcements and state economic‑development releases describe an investment north of $600 million, roughly 250 new jobs, and a new cheese and whey production plant designed to handle a substantial stream of milk in southwest Kansas. The message around that project is all about cheese and whey—no one is building a plant like that just to chase cream.
On the cultured side, expansions at places like Chobani’s Twin Falls, Idaho complex have turned it into one of the world’s largest yogurt operations, with multiple rounds of investment in Greek‑style yogurt and other high‑protein cultured products. Those lines rely heavily on ultrafiltration and protein concentration. Butterfat still matters for flavor and mouthfeel, but protein is very much in the lead role in the business model.
Second, some herds have quietly fine‑tuned how they look at genetics. Land‑grant extension specialists and geneticists have been pointing out that composite indexes like Net Merit are built around assumptions about component prices and milk usage that get updated in stages. When butterfat enjoyed a long run of leading the milk check, those indexes reflected that. As protein becomes more valuable in cheese‑heavy markets, there can be a lag before the standard indexes fully adjust. That’s why you see some progressive herds—especially larger ones with more replacements and genomic budgets—using custom indexes that put extra weight on protein PTA, total pounds of fat plus protein, and cheese‑specific traits alongside fertility, health, and feed efficiency.
Third, these operations talk with their processors in pretty practical terms. In some cheese‑heavy areas, field reps have told producers, “We’re fine around 4.0% fat, but what we really want is 3.3–3.4% protein.” That kind of specific feedback has a way of influencing ration design, bull selection, and even which cows get sexed semen versus beef semen when replacement numbers aren’t the bottleneck.
None of this guarantees big margins. But it does show how paying attention to where plants are investing, where component prices actually sit on your milk check, and what your buyer says they need can help you tune your herd toward where the market is going, not just where it’s been.
So What Can You Do? A Time‑Framed, Practical Look
So, given all that, the real question is: given your herd, your market, and your resources, what can you realistically do from here?
I’ve found it helps to think in three timeframes: the next few months, the next year, and the next three years.
In the Next Few Months: Low‑Cost Levers and Better Information
In the short term, you’re not going to rewrite your genetics. But you can sharpen your picture of where the money’s really coming from and see if your ration is leaving easy protein dollars on the table.
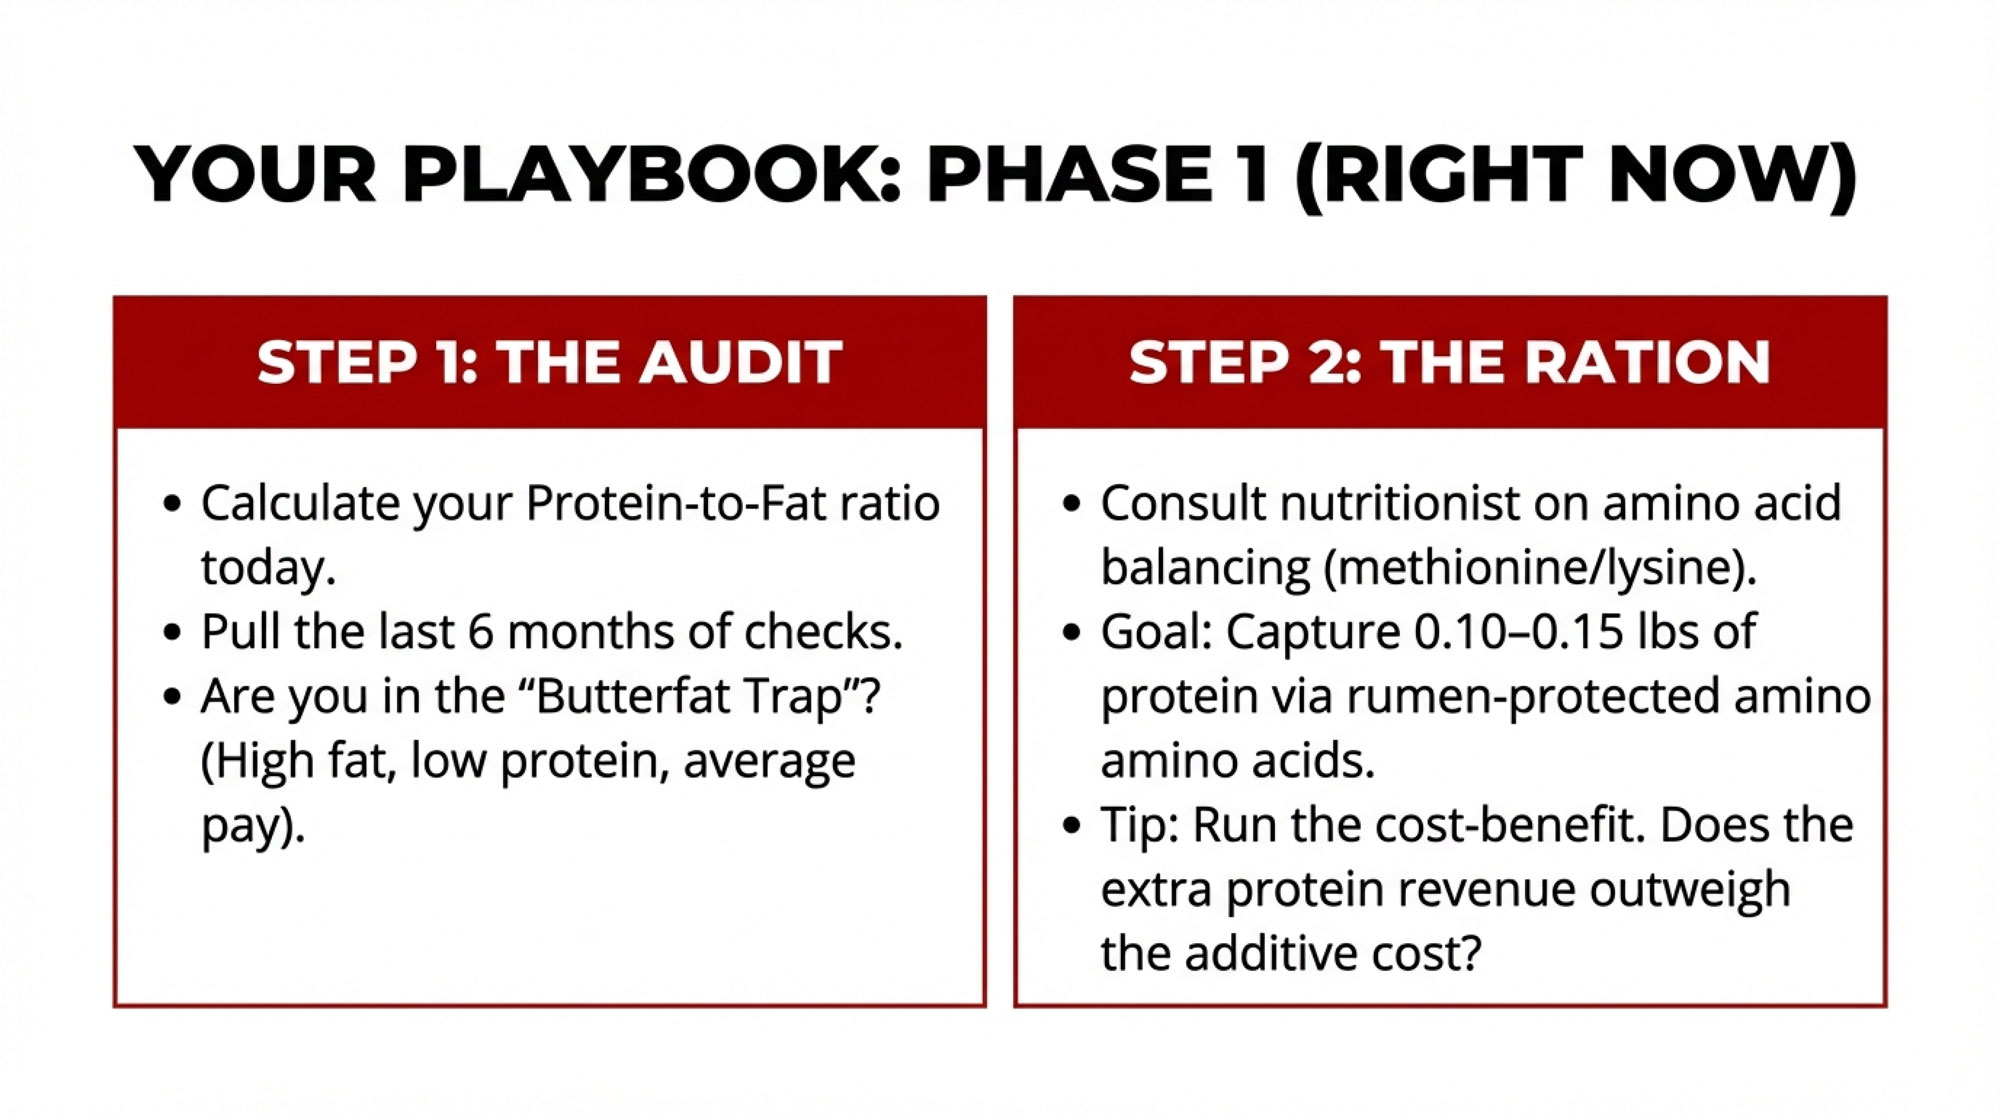
A good first step is a simple component value audit. Sit down with your nutritionist, accountant, or farm business advisor and pull out the last 6–12 months of milk checks. Using the USDA’s component price announcements alongside your plant’s pay sheet, calculate what you effectively received per pound of butterfat and per pound of protein once you factor in quality bonuses, premiums, and any penalties. In conversations with extension folks from Minnesota, Wisconsin, and New York, many producers say that once they see those numbers in black and white, they’re surprised at how much work protein is doing in their own pricing grid.
Once you know your real numbers, ask your nutritionist whether small ration changes could nudge protein up while keeping butterfat performance and cow health solid. That might mean:
- Fine‑tuning amino acid balance—through rumen‑protected methionine and lysine, for example—so the cows have what they need to add 0.10–0.15 point of protein and potentially a bit more milk, which recent nutrition research suggests is feasible when correctly balanced.
- Re‑evaluating bypass fat or specialty fat products to make sure you’re truly getting paid enough for those extra butterfat pounds to justify the cost and any impact on intakes or rumen function.
- Double‑checking fiber digestibility and effective fiber so any push toward higher protein doesn’t trigger butterfat drops or more fresh cow problems during the transition period.
These tweaks might add a few cents per cow per day to your feed cost, depending on products and inclusion rates. Before you spend the money, it’s worth running the full cost‑benefit: if you add X cents per cow per day in amino acid products and get Y more pounds of protein and milk, how does that compare to your actual protein prices and margins?
To keep things manageable, there are three numbers worth tracking closely this month:
- Your average butterfat percent.
- Your average protein percent.
- Your herd’s protein‑to‑fat ratio.
Those three alone will tell you if you’re in the ballpark for your market or if you’ve drifted into very high‑fat, modest‑protein territory that might not fit where your milk is going.

Over the Next Year: Genetics and Relationships
Over the next year, the biggest levers you’ll pull are about genetics and relationships.
On the genetics side, it’s a good time to ask whether your bull selection has leaned too hard toward fat at the expense of protein. CoBank’s work on protein‑driven milk checks, combined with the component gains we’re already seeing, suggests that in many cheese‑oriented markets, protein is poised to do more of the heavy lifting in the milk check, even as butterfat stays important. That doesn’t mean abandoning butterfat—it means looking for bulls that deliver strong combined fat and protein, with a bit more emphasis on protein PTA and total component pounds than you might have used five or ten years ago, especially if your milk is headed primarily into cheese and whey plants.
Many studs now offer custom or cheese‑oriented indexes, and university geneticists and extension specialists have shown how to build your own in‑house index that weights fat, protein, fertility, health traits, and feed efficiency according to your actual pay program and costs. For large freestall or dry‑lot herds shipping primarily into cheese and whey plants, those tools can make a noticeable difference in total component yield and income over a few calf crops.
Genomics fits into this picture differently depending on herd size and replacement pressure. For a 2,000‑cow herd, targeted genomic testing can help identify families that reliably deliver higher components and feed efficiency, and that information can shape both culling and mating plans; extension work in states like Wisconsin and California suggests that this kind of targeted approach tends to pencil out better than testing every heifer. For a 120‑cow tie‑stall herd, it often makes more sense to limit genomics to a handful of top heifers each year, lean on proven sires with strong component proofs, and focus more attention on fresh cow management, forage quality, and reproduction.
On the relationship side, this is a very good year to have a plain‑language component conversation with your co‑op or plant. Some questions worth asking directly:
- “Given what you’re making now, what butterfat and protein levels would you most like to see from us?”
- “Are there specific protein thresholds where you start paying more, or fat levels where it doesn’t really pay for us to push higher?”
- “As new plants or product lines come online, do you expect your component pricing or premiums to shift in the next few years?”
You won’t get a perfect forecast, but even a rough answer can tell you whether chasing another 0.05 point of butterfat is really the smartest use of your dollars, or whether leaning into protein, overall component balance, or even sustainability metrics might be a better focus for your market.
Over the Next Three Years: Positioning Around Protein and New Trends
Once you stretch the horizon out to three years, you’re really deciding what sort of milk you want to produce and where you want it to end up.

On the traditional processing side, CoBank’s December 2025 analysis and related industry reporting highlight that processors have made about an $11 billion bet on protein‑oriented capacity—cheese and whey plants at the front, followed by high‑protein fluid and yogurt/cultured investments. Cheese projects alone account for roughly $3.2 billion of that investment, with the rest spread across fluid and cultured plants that are often geared toward ultra‑filtered and high‑protein products. The message for many U.S. regions is pretty clear: protein is becoming the main driver of value at the plant level, even as butterfat remains vital.
On the emerging technology side, precision‑fermented dairy proteins have moved from PowerPoints into actual steel tanks. Perfect Day’s acquisition of Sterling Biotech in India and the build‑out of a whey‑protein facility in Gujarat—with commercial production targeted for 2026 and scale‑up into 2027—is one example of how non‑farm protein production is stepping into markets like sports nutrition powders, ready‑to‑drink protein beverages, and specialized foods. At the same time, companies like Bel Group are working on precision‑fermented casein and on turning acid whey from cheese and yogurt plants into higher‑value ingredients instead of a disposal headache.
What’s encouraging, even if it’s complicated, is that analysts are still divided on how big a bite precision‑fermented proteins will take out of traditional dairy. Some see them as a growing but niche ingredient stream; others think they’ll capture a meaningful share of specific protein ingredient markets over the next decade. Either way, they’re unlikely to replace the bulk of conventional cheese and milk anytime soon, but they will complicate pricing and positioning for certain whey and casein markets.
Layered on top of that, global buyers like Nestlé and Arla are steadily tightening their climate and sustainability expectations. Nestlé has piloted net‑zero and low‑carbon dairy farms, including projects highlighted in Dairy Global, and Arla’s Climate Check program has been paying its farmers a sustainability incentive tied to farm‑level climate performance while building a massive dataset on emissions per kilo of milk. Those programs aren’t identical to U.S. efforts, but they give a good sense of where large buyers and brands are aiming.
For small and mid‑sized farms in regions like the Northeast, Upper Midwest, and certain Western milksheds, that means the long‑term strategy conversation now includes questions like:
- “Do we want to position ourselves for a low‑carbon or regenerative milk program if our buyer offers one?”
- “Are there animal‑welfare or environmental certifications that could stack on top of our component premiums?”
- “Does it make more sense for us to stay a pure commodity shipper, or to direct a portion of our milk into a program that pays for attributes beyond components?”
Those are big questions, and they won’t have the same answers in every region. But they’re increasingly part of the same conversation as butterfat, protein, and where your milk actually ends up.
The Part We Don’t Put in Charts: Being “Right” at the Wrong Time
There’s one more piece here that doesn’t show up in the spreadsheets, and that’s how this all feels.
A lot of farm families have spent decades defending whole milk—at school board meetings, in conversations with dietitians, even in the grocery aisle—while official advice kept pushing low‑fat and fat‑free dairy. Over those same years, many of you re‑tooled your herds and feeding programs to take butterfat performance from “good enough” to “best in the neighborhood,” while steadily improving forage quality, TMR consistency, and transition‑cow programs so those high components didn’t wreck your fresh pens.
Now the federal government finally turns around and says, “Full‑fat dairy belongs in a healthy diet, and we’re putting whole milk back in schools,” at almost the exact moment your processor is telling you, “We really need more protein in your tank.”
I’ve heard more than one producer say some version of, “My dad argued for whole milk in schools his whole life. He’d love to see this—but it’s crazy it took this long, and it’s not what’s moving our check now.” That kind of bittersweet feeling is real. It deserves to sit right alongside any butterfat or protein chart in this discussion.
What’s interesting is that the farms that tend to ride these swings better over time usually aren’t the ones that predicted every move. They’re the ones that treat each new policy change, plant announcement, and component price sheet as more information—not as a verdict on past decisions. They ask, “Given what we know now, what’s the next smart adjustment for our herd, our market, and our family?” and they keep doing that year after year.
That doesn’t make the frustration go away—especially when you feel like you were “right” about whole milk nutritionally for decades and still aren’t getting rewarded the way you’d hoped. But it does give you a way to respond with intention instead of just reacting.
The Bottom Line
So, you’re sitting at the kitchen table with your milk checks, ration sheets, and breeding list. Where does all this leave you?
A few things feel pretty solid:
- The new Dietary Guidelines and the Whole Milk for Healthy Kids Act are real wins for dairy’s image and full‑fat milk’s place in U.S. nutrition policy. They reflect updated nutrition science and finally line up a bit better with what many of us have believed and practiced on our own farms since the early 2010s.
- At the same time, CoBank’s component work, USDA price announcements, and billions of dollars in cheese, whey, and high‑protein dairy plant investments all point to protein being a major driver of milk value in many U.S. markets over the next several years, especially where most of the milk ends up in manufactured products.
- U.S. herds have done an exceptional job with butterfat performance. The next big opportunity is to balance that fat with stronger protein so your component profile lines up with what your plant can actually use and pay for most profitably—not just with what a genetic index favored during the butterfat boom years.
- You still have practical levers: short‑term ration tweaks that respect cow health and the transition period, medium‑term breeding and genomic choices that nudge your herd toward better component balance, and longer‑term positioning around where your milk goes—cheese, fluid, powders, or value‑added and sustainability‑linked programs.
You don’t have to fix everything this season. You don’t have to stop being proud of the butterfat performance you’ve built. But given where the money and the stainless steel are moving—from Washington’s “Eat Real Food” rollout to Hilmar’s cheese and whey lines in Kansas, from high‑protein yogurt lines in Idaho to new whey‑protein tanks in Gujarat—it’s worth asking yourself a simple question:
What’s one step I can take this season, and one step over the next year, that nudges our herd a little closer to where our milk, our component pricing, and our margins are actually headed?
Because the rules around components and milk pricing have changed before, and they’ll change again. The farms that tend to stay in the game are the ones that keep reading the signals, keep asking good questions, and keep making those small, smart adjustments—without losing who they are in the process.
Key Takeaways
- Policy wins ≠ bigger milk checks. Full-fat dairy in the Dietary Guidelines and whole milk back in schools are image wins—but your processor still pays on components, not nutrition headlines.
- Butterfat boomed; protein lagged. U.S. butterfat jumped ~13% over the past decade while protein rose only ~6%, pushing the national protein-to-fat ratio to 0.77—below the ~0.80 cheese plants need.
- Protein now drives the check in cheese markets. A 500-cow herd shipping 3.35% protein and 3.8% fat can out-earn a 4.2% fat, 3.1% protein herd by $70,000+ per year at the same plant.
- Know your three numbers. Track butterfat %, protein %, and protein-to-fat ratio monthly. These reveal whether your component profile matches what your market actually rewards.
- Act across three timeframes. Now: audit components and adjust rations. This year: shift genetics toward balanced fat + protein. Next three years: align your herd with new cheese, whey, and high-protein plant investments.
Complete references and supporting documentation are available upon request by contacting the editorial team at editor@thebullvine.com.
Learn More
- FMMO Reality Check: Why 2025’s $2.3 Billion Dairy Pricing Revolution Exposes the Fatal Flaw in American Milk Marketing – Arms you with the exact benchmarks—150,000 SCC and 3.3% protein targets—needed to capture the 2025 pricing revolution premiums. Stop chasing volume and start managing for the December 1 composition factors that drive real margin growth.
- $11 Billion Bet on Protein: Is Your Milk Check Positioned to Win? – Exposes the structural $11 billion shift in dairy processing, showing you how to audit your specific pay grid. This strategy helps you stop subsidizing someone else’s cheese yield and captures a potential $70,000 annual protein advantage.
- How Brazil’s Cow-Free Proteins Challenge Everything We Know About Milk – Reveals the 2026 biotechnology timeline that could force your farm into an “efficiency trap.” This analysis prepares you for market disruption by pivoting toward hybrid production models and sustainability-linked premiums before the competition catches on.
 The Sunday Read Dairy Professionals Don’t Skip.
 The Sunday Read Dairy Professionals Don’t Skip.
Every week, thousands of producers, breeders, and industry insiders open Bullvine Weekly for genetics insights, market shifts, and profit strategies they won’t find anywhere else. One email. Five minutes. Smarter decisions all week.


