Your top genomic heifers probably trace to three cow families. In a $3,110 heifer market, that concentration can be a $93,300‑a‑year mistake.
Executive Summary: Replacement heifers averaged $3,110 per head in late 2025, inventories are sitting at a 47‑year low, and that makes your heifer pipeline one of the biggest financial risks on your farm. This article shows how herds like Glenn Kline’s — with every heifer genomic‑tested and beef‑on‑dairy dialed in — can still end up with most of their “best” heifers tracing back to just two or three cow families that don’t consistently last three or more lactations. When those same maternal lines also dominate your AI sires, you’re quietly concentrating inbreeding and fragility, not diversifying. On a 400‑cow herd, that concentration can mean 20–30 extra replacements every year, tying up about $93,300 in replacement capital at current prices. You get a concrete 30/90/365‑day playbook: add a cow‑family column to your data, run survival and culling by family, re‑aim sexed/IVF/beef rules at proven‑durable lines, and double-check your sire list by maternal line. The bottom line: genomics and beef‑on‑dairy still drive progress and cash flow — but adding cow family as a sorting column turns your breeding program into a risk‑management tool instead of a $93,300‑a‑year gamble.
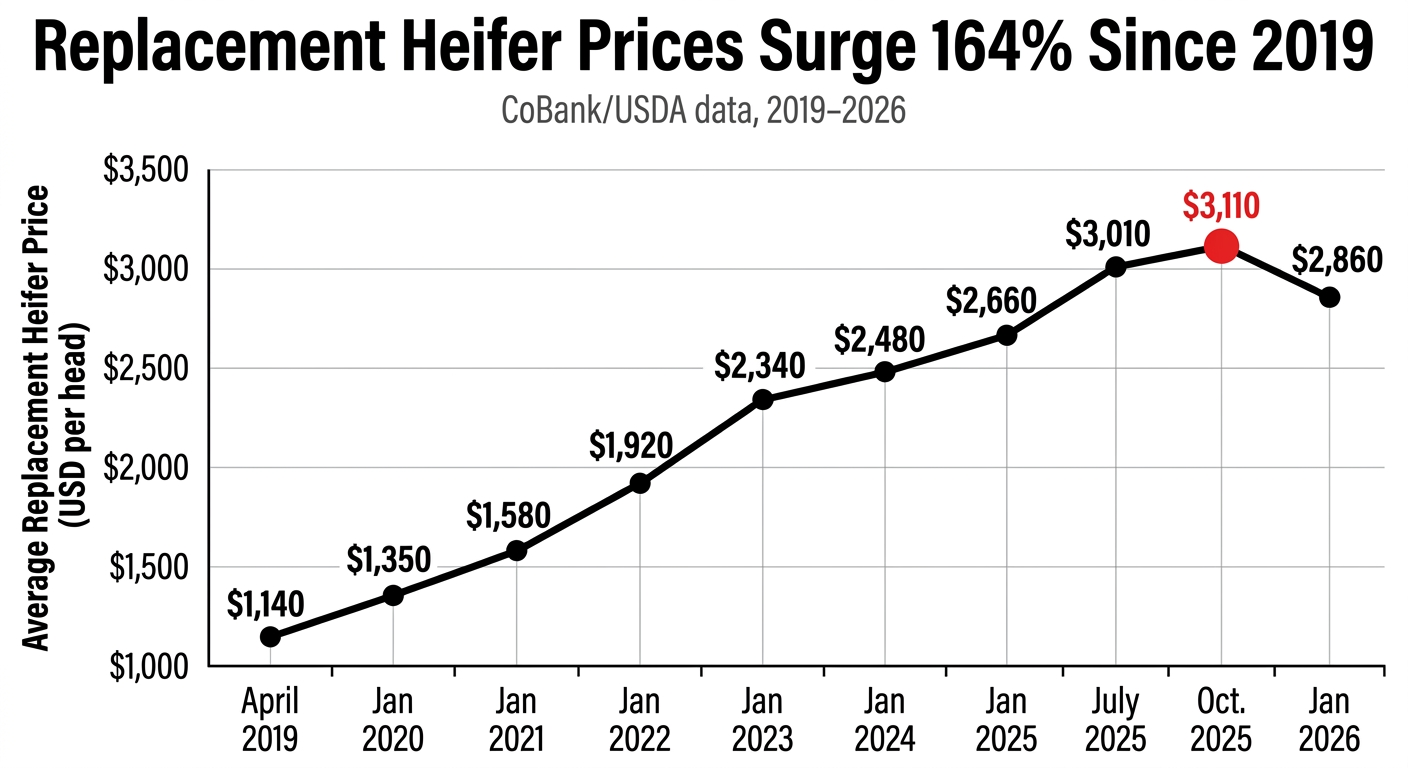
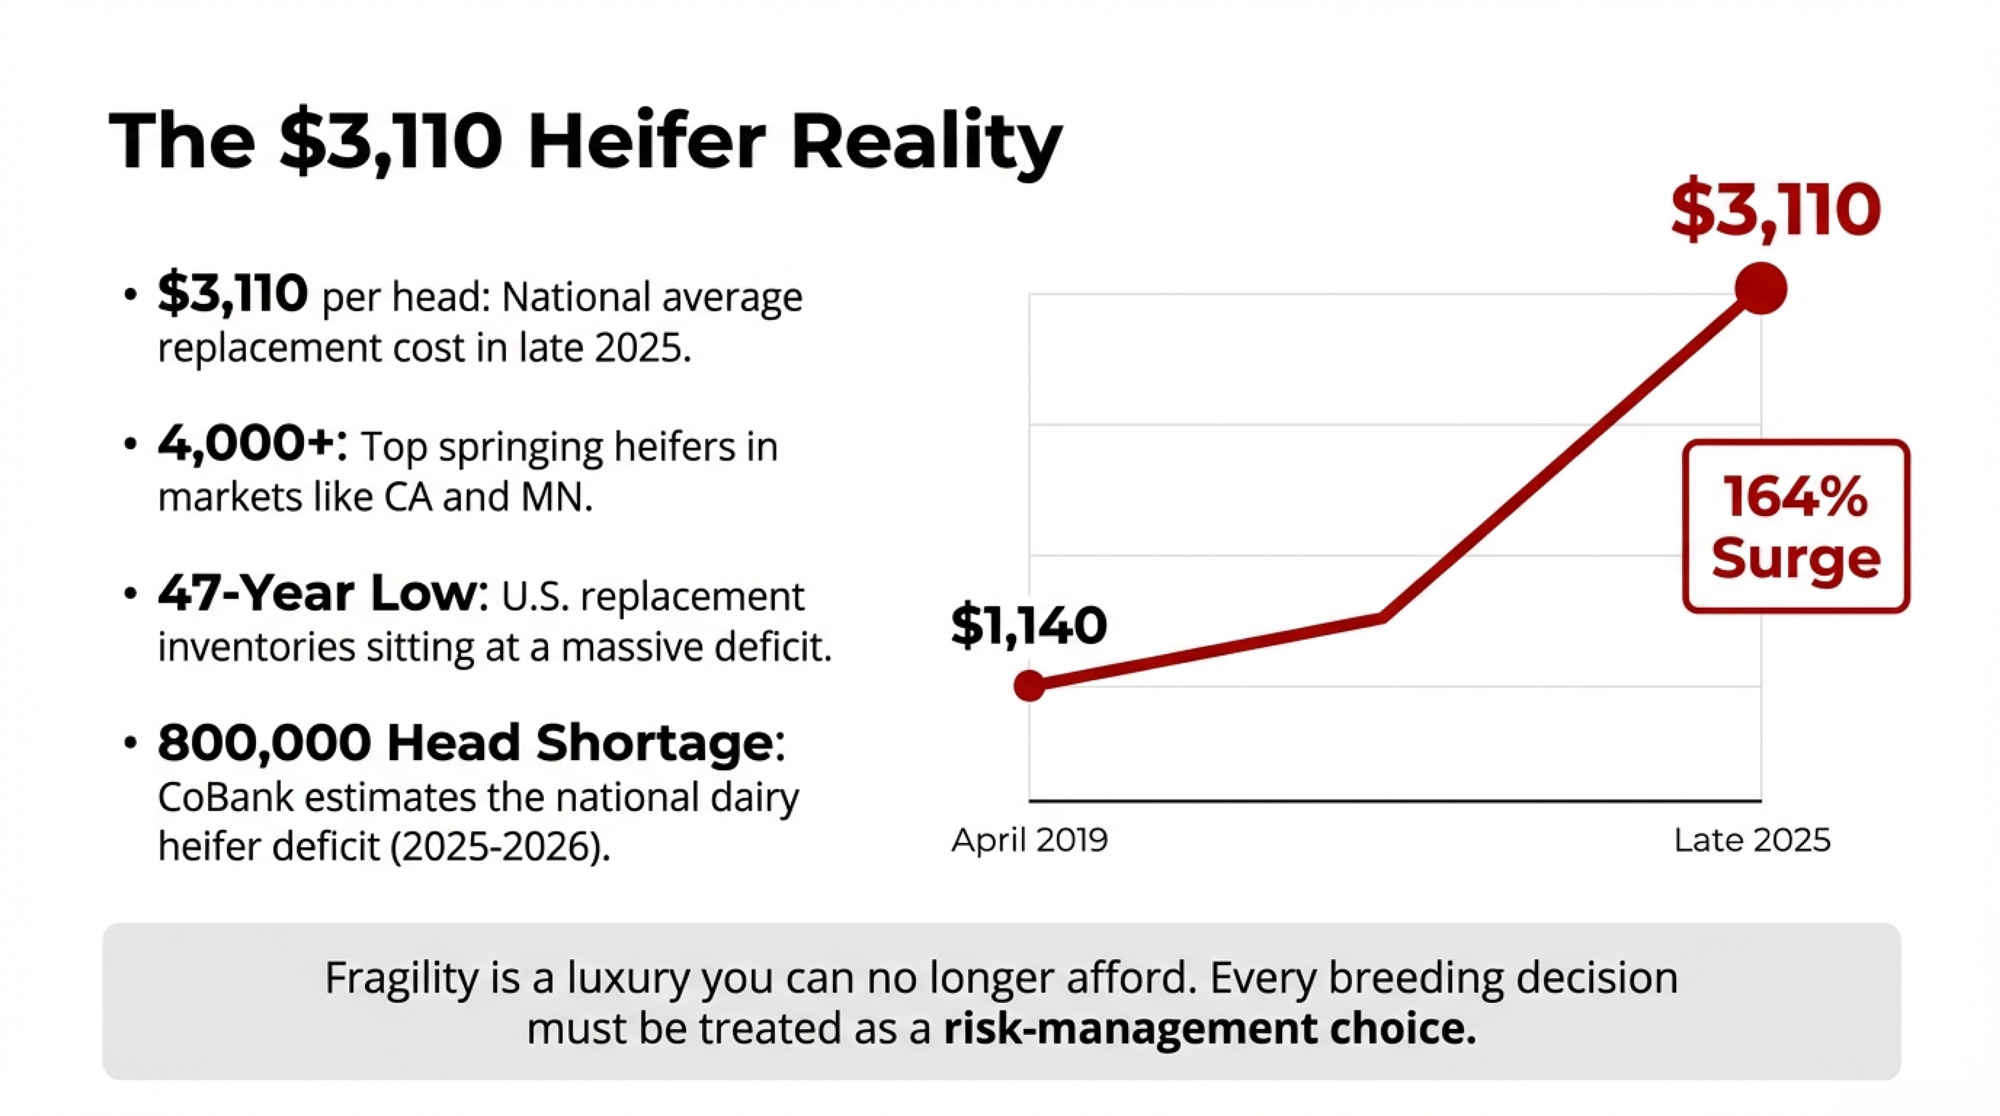
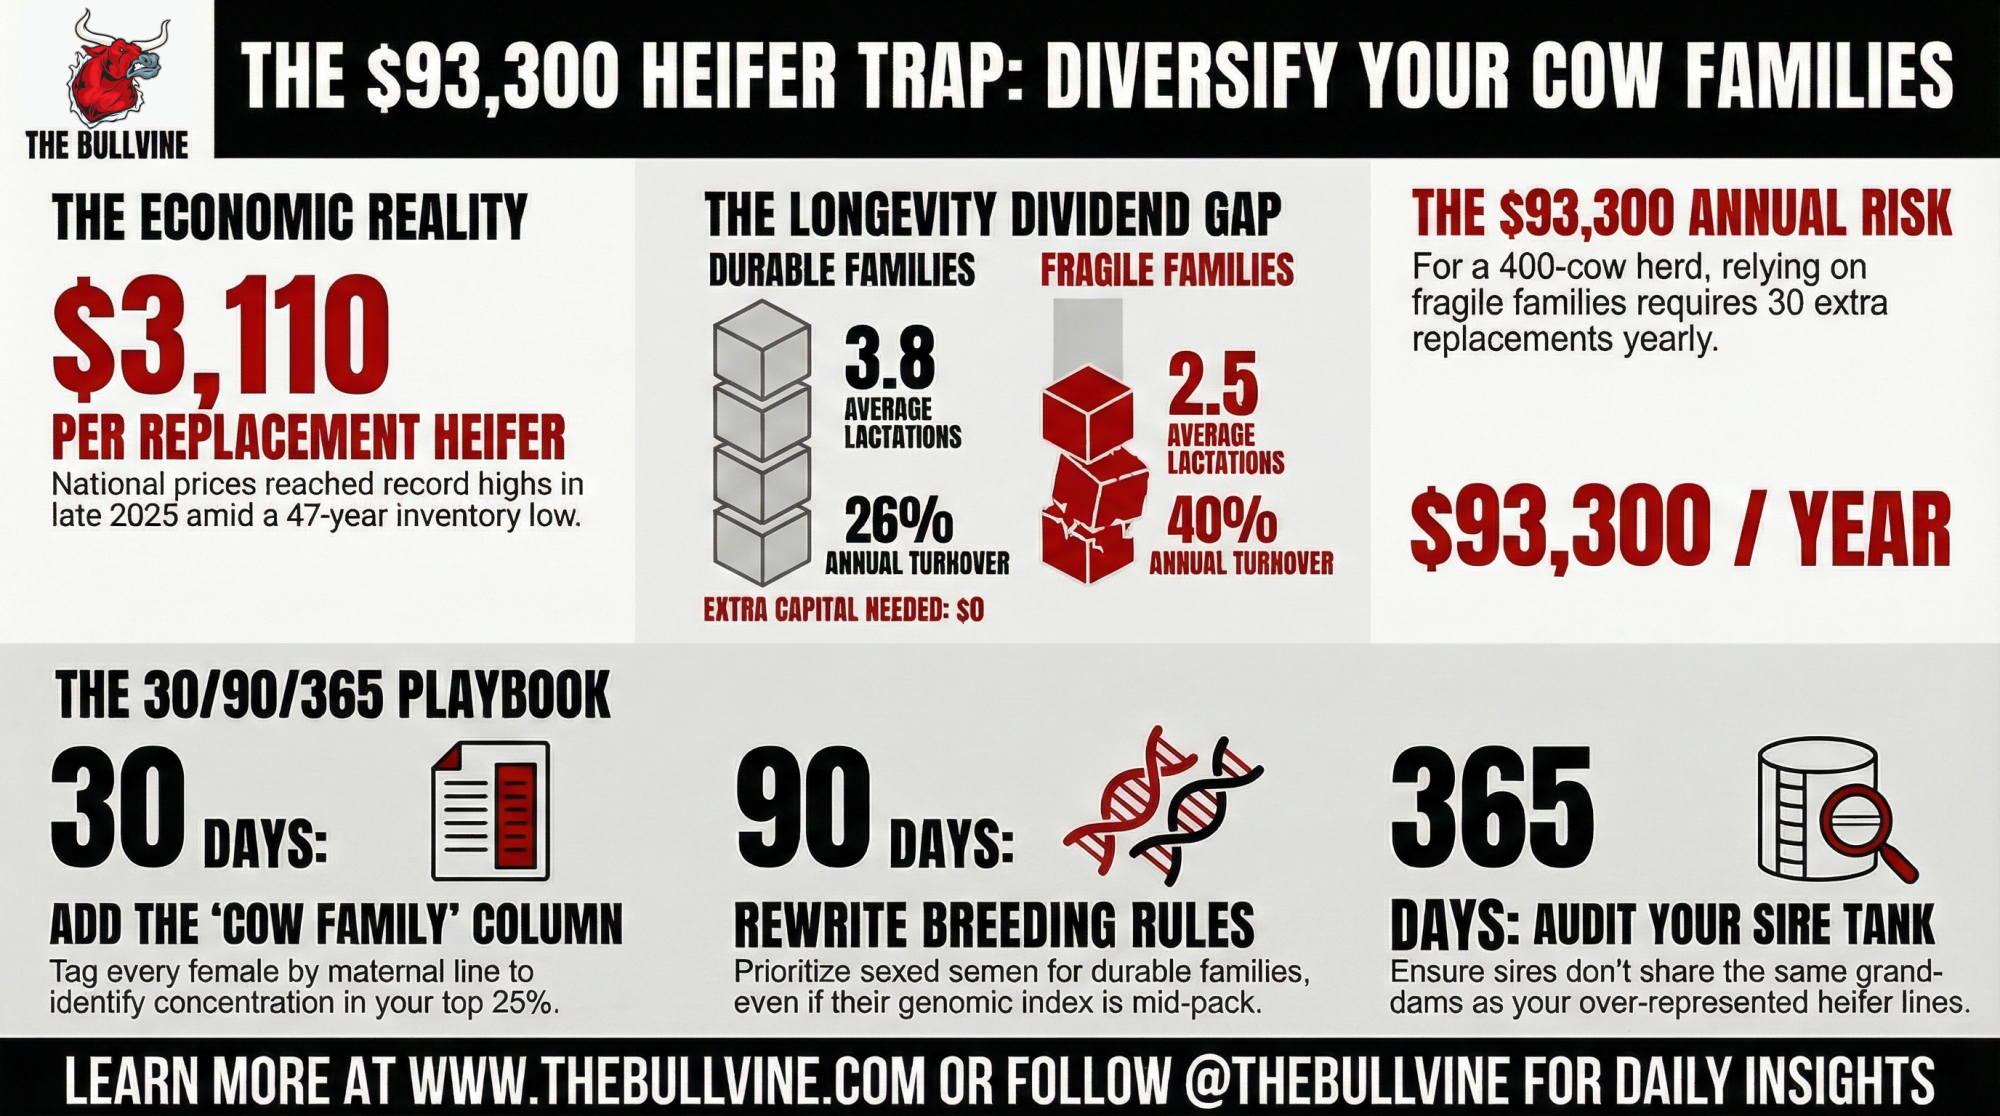
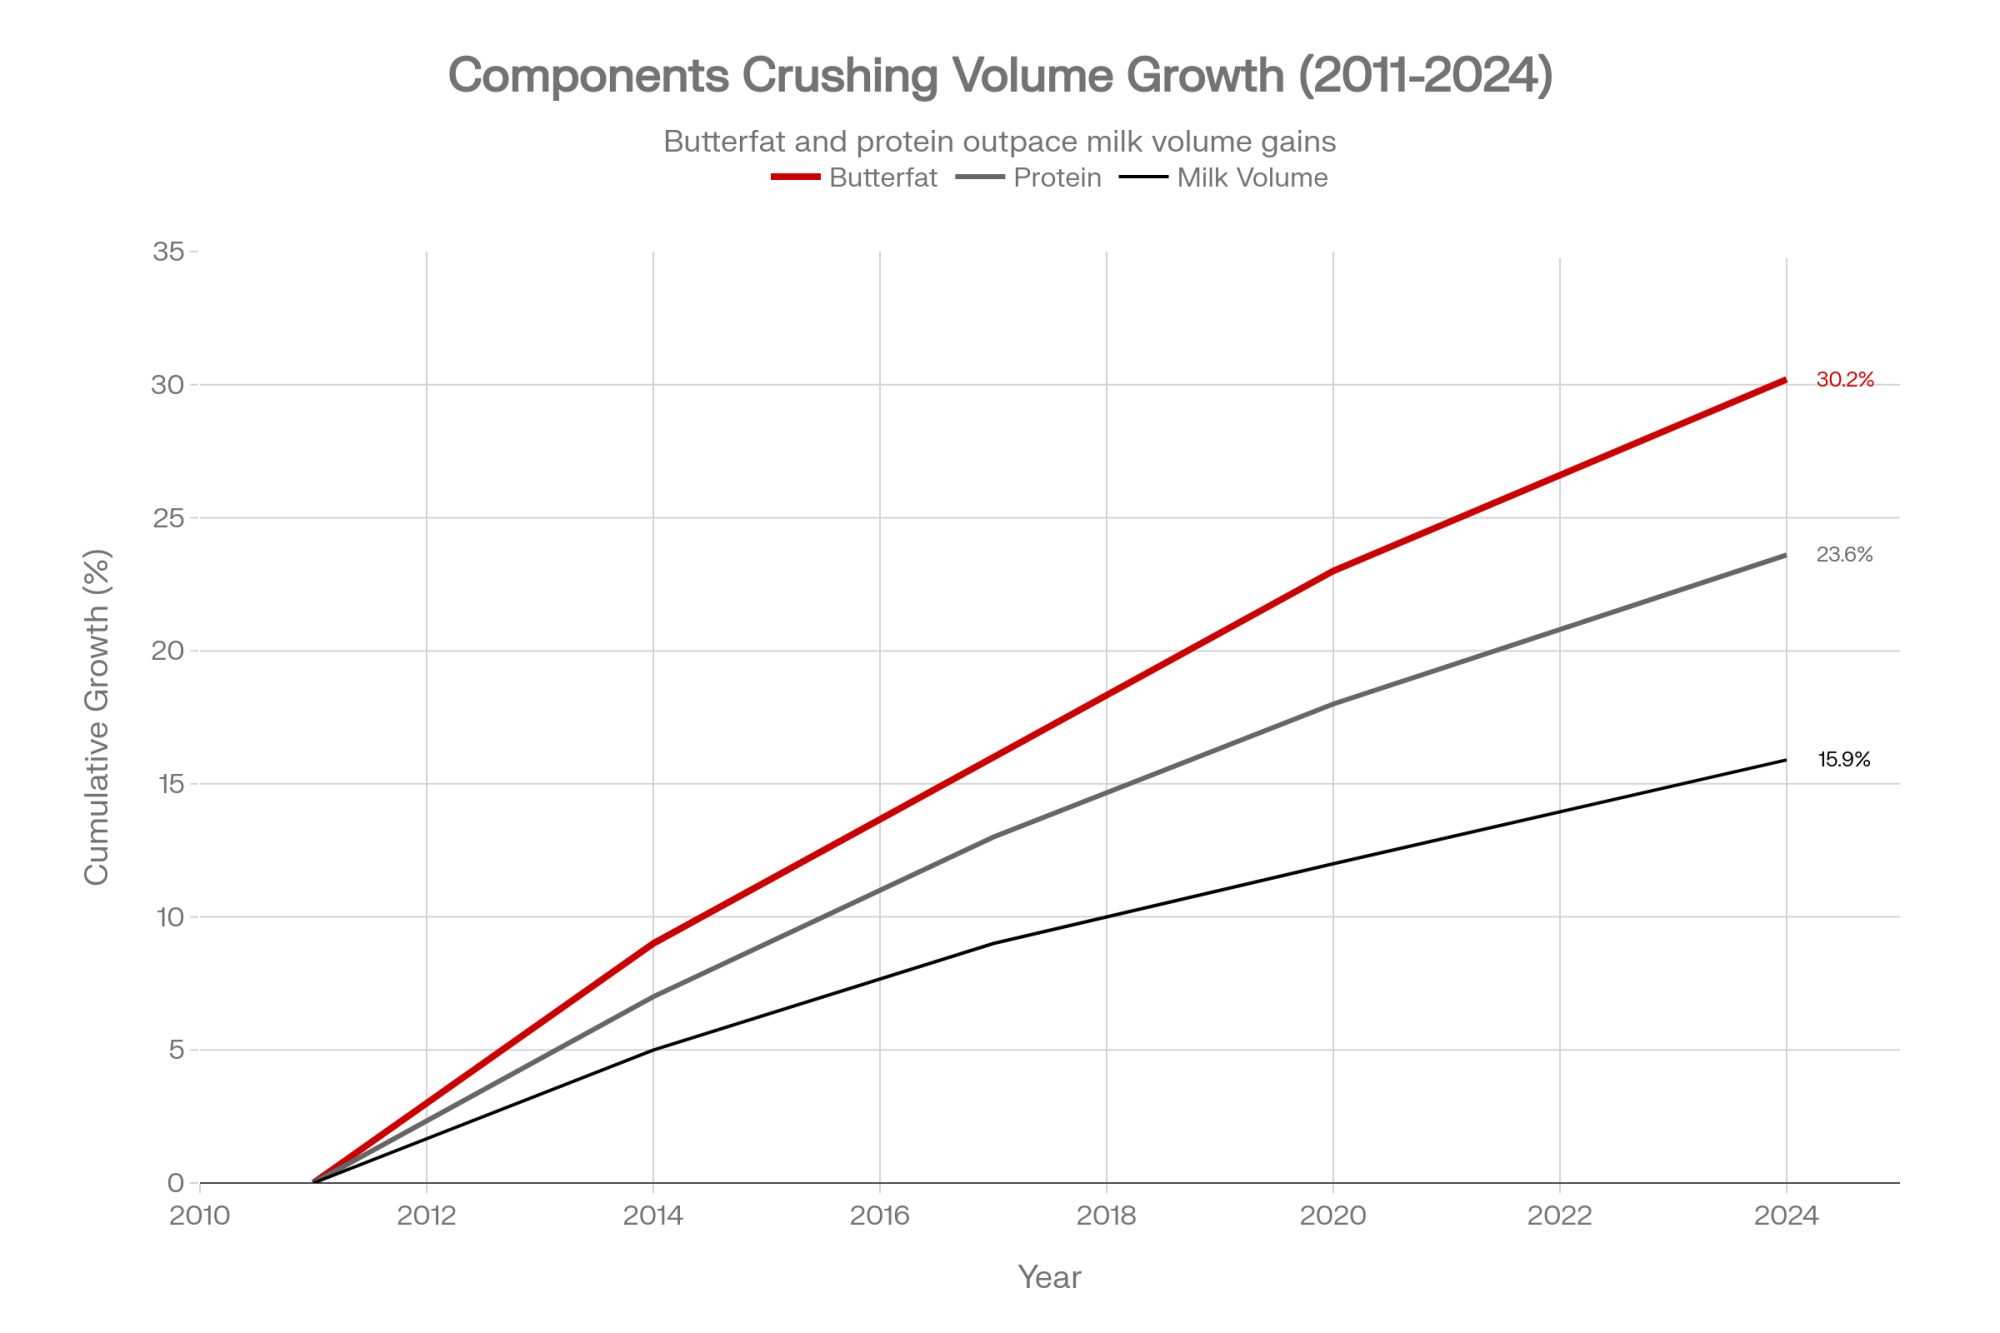
USDA’s October 2025 Agricultural Prices report pegged the average U.S. replacement dairy heifer at $3,110 per head— the highest figure ever recorded in that series. By January 2026, the national average eased to $2,860, but top springing heifers in California and Minnesota were still clearing above $4,000. U.S. replacement inventories? A 47‑year low, with CoBank estimating the country is short roughly 800,000 dairy heifers across 2025–2026.
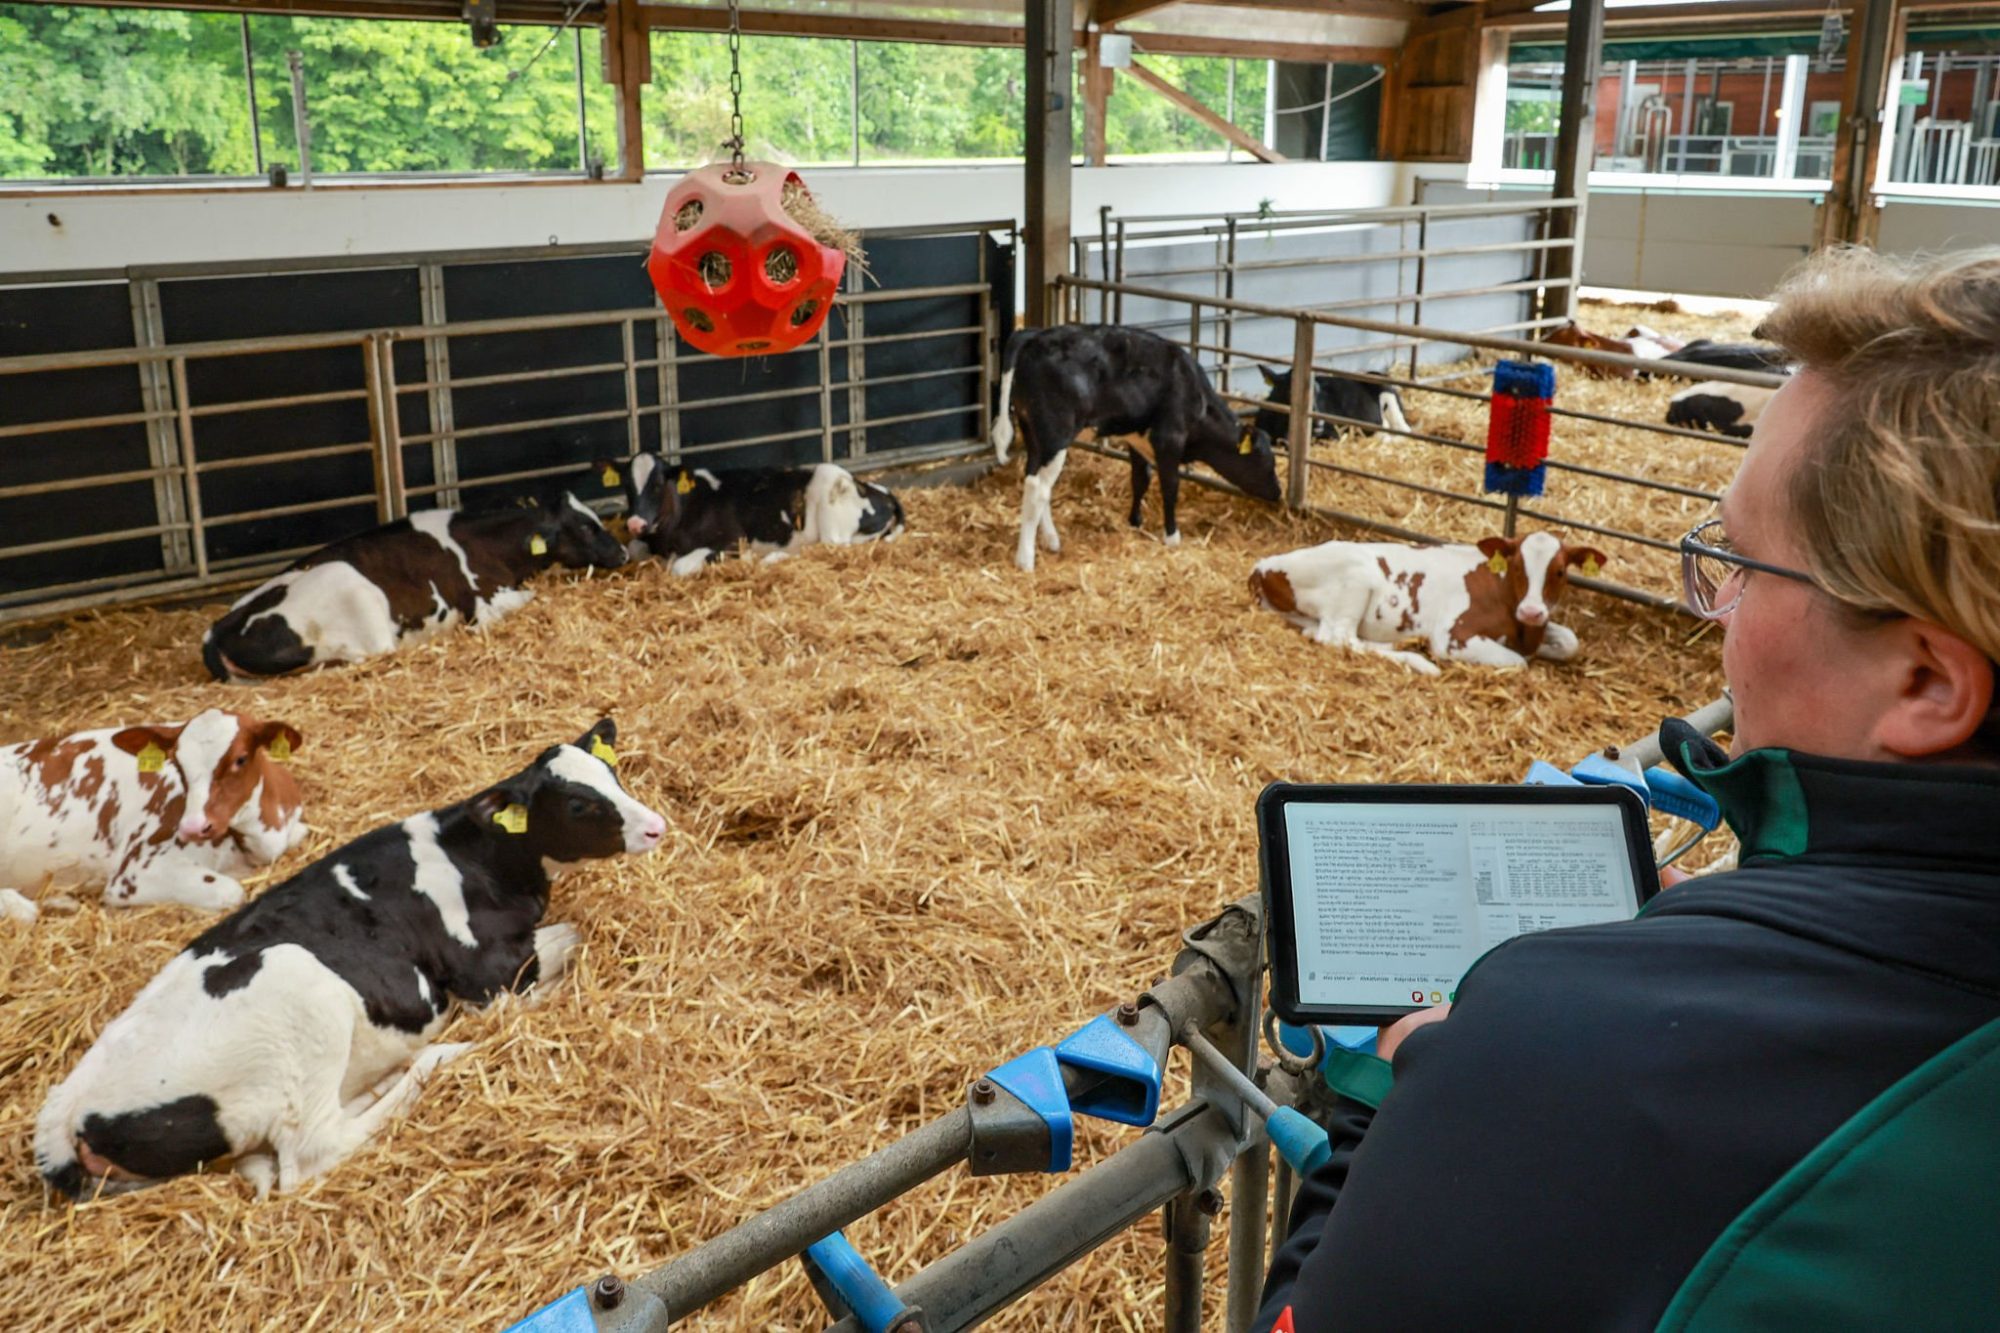
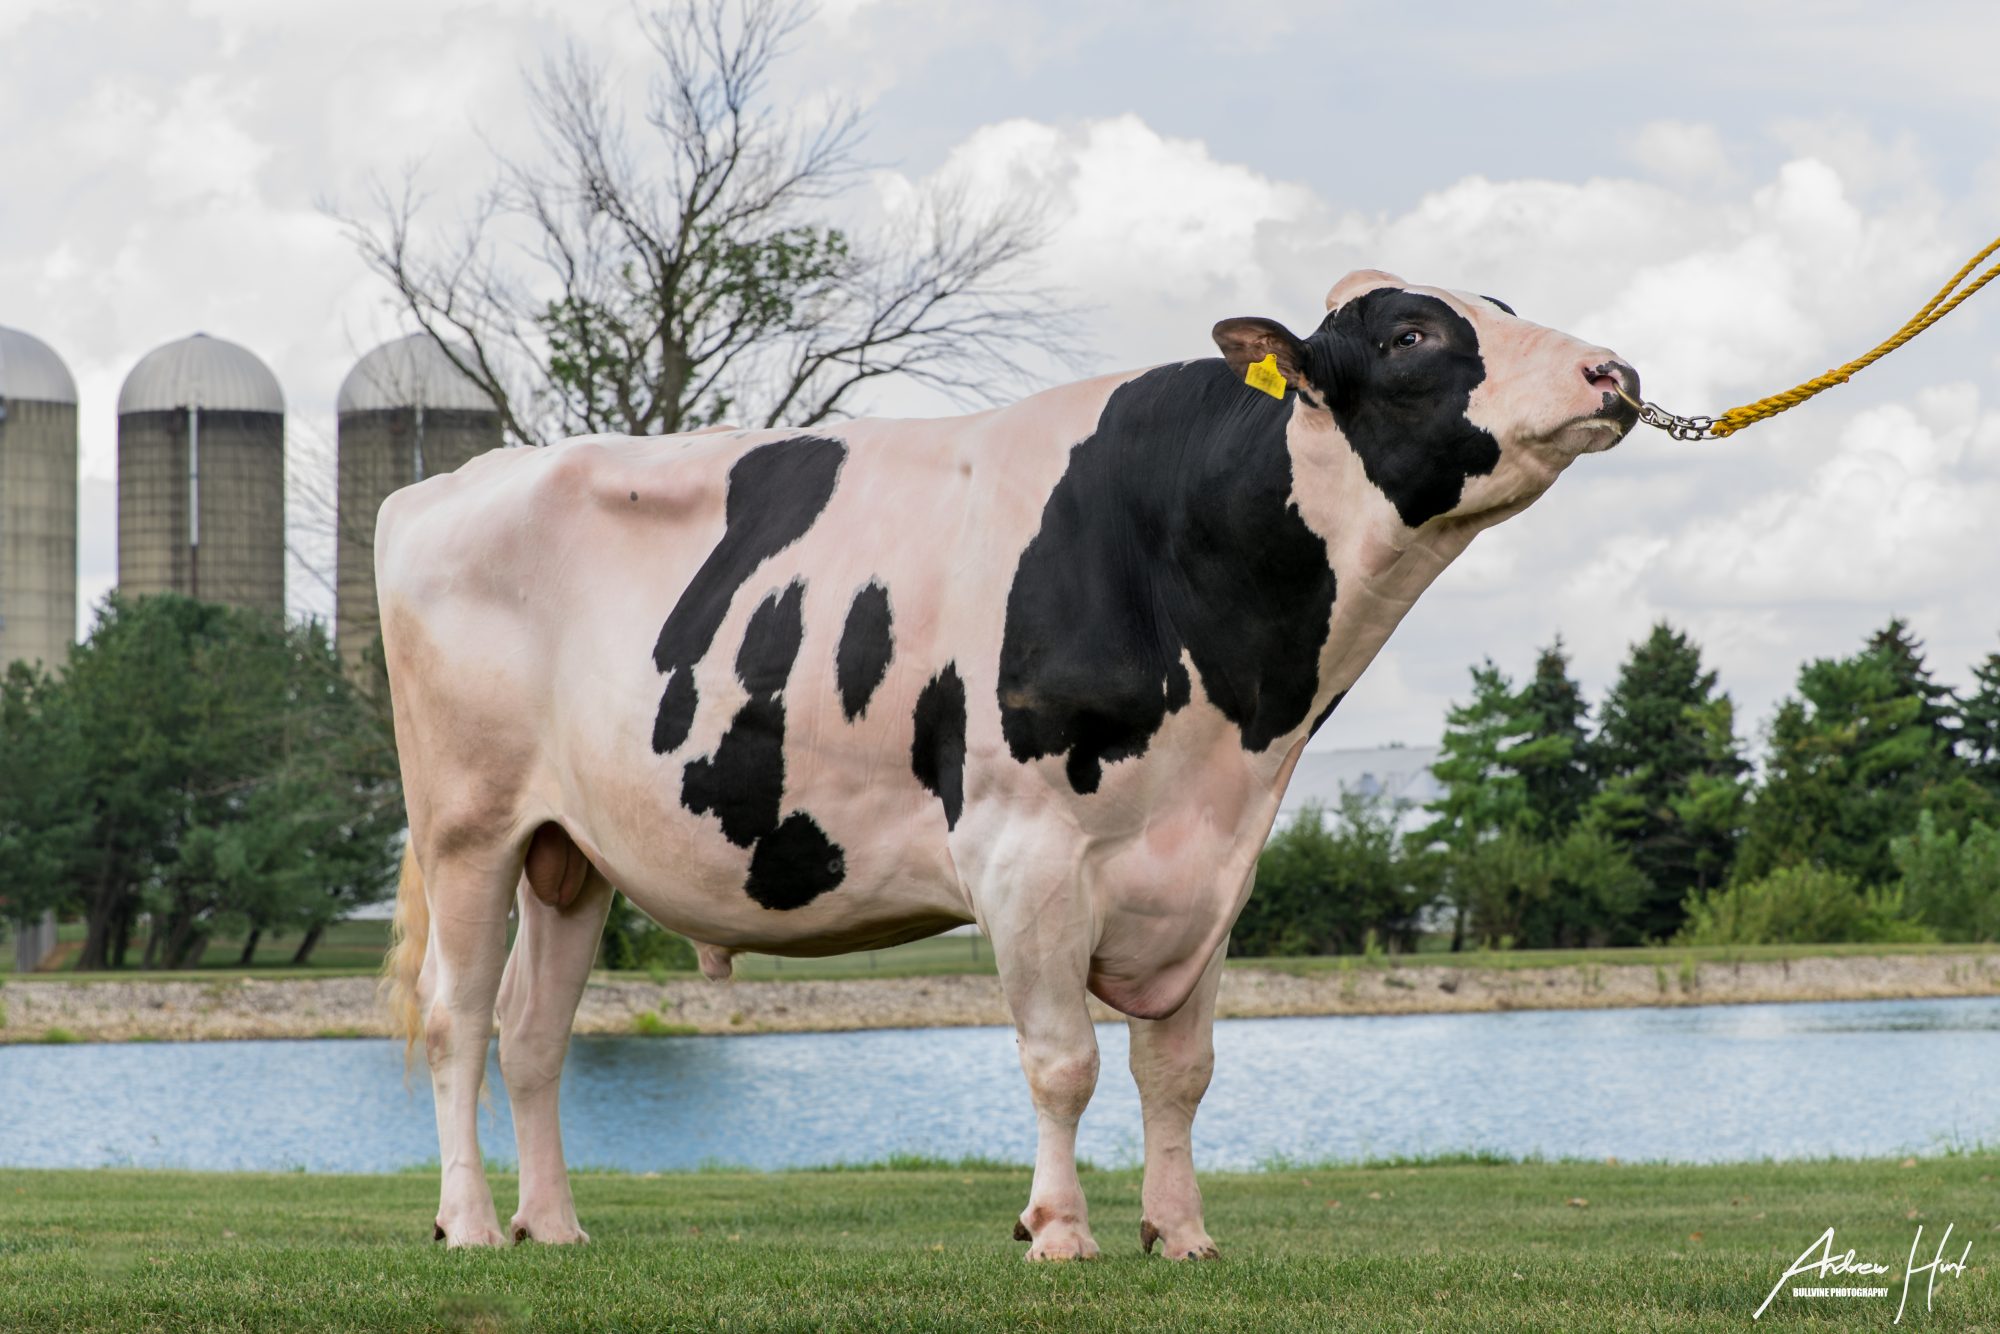
At his Holstein herd in Pennsylvania, Glenn Kline has built exactly the kind of genomic program those prices reward: every heifer is genomic‑tested, lower performers are bred to beef, and IVF is used to multiply the top cows. “Back in 2011, we started on genomic testing, and boy, that’s made a huge difference in our herd,” he told the CDCB industry meeting at World Dairy Expo 2025. When he expanded and had to buy animals in, the gap was obvious. “There was really a significant difference with our original animals lasting longer,” Kline said.
The genomics worked. The bought‑in cows didn’t hold up. But here’s the question Kline’s spreadsheet doesn’t answer — and that most progressive breeders aren’t asking either: which cow families do his best genomic heifers actually belong to? And what does it cost when a handful of famous families quietly dominate your replacement pipeline in the tightest heifer market in five decades?
The Cull Math That Changes Everything
Penn State Extension’s cull‑rate benchmarking using USDA/NAHMS data shows how many cows never reach the point where they’ve truly paid their way. In U.S. dairy herds tracked by NAHMS, the annual combined cull and death rate is around 37–38%, with about 73% of culls involuntary — driven by infertility (23.3%), mastitis (18.6%), lameness, and other biological failures rather than planned marketing decisions.
Penn State and other economic analyses put the full heifer‑rearing cost from birth to calving in the $1,800–$2,400range, depending on system, with roughly $2,000 per head as a solid 24‑month benchmark for many U.S. herds. At that cost level, most operations need three or more lactations before a cow starts delivering a longevity dividend instead of just paying back her childhood.
But NAHMS data still shows average productive life below that three‑lactation mark in many herds, with a large share of cows leaving before they finish a third lactation. Every cow that reaches a fourth lactation saves you at least one replacement you didn’t have to rear or buy and delivers another year of mature‑cow production.
The replacement side of the equation flipped fast. CoBank’s Corey Geiger tracked national averages moving from around $1,140 per head in April 2019 to $2,660 by January 2025, then surging to $3,010 in July 2025 — a 164% jump from that 2019 low. That’s the backdrop for every breeding decision you make right now.
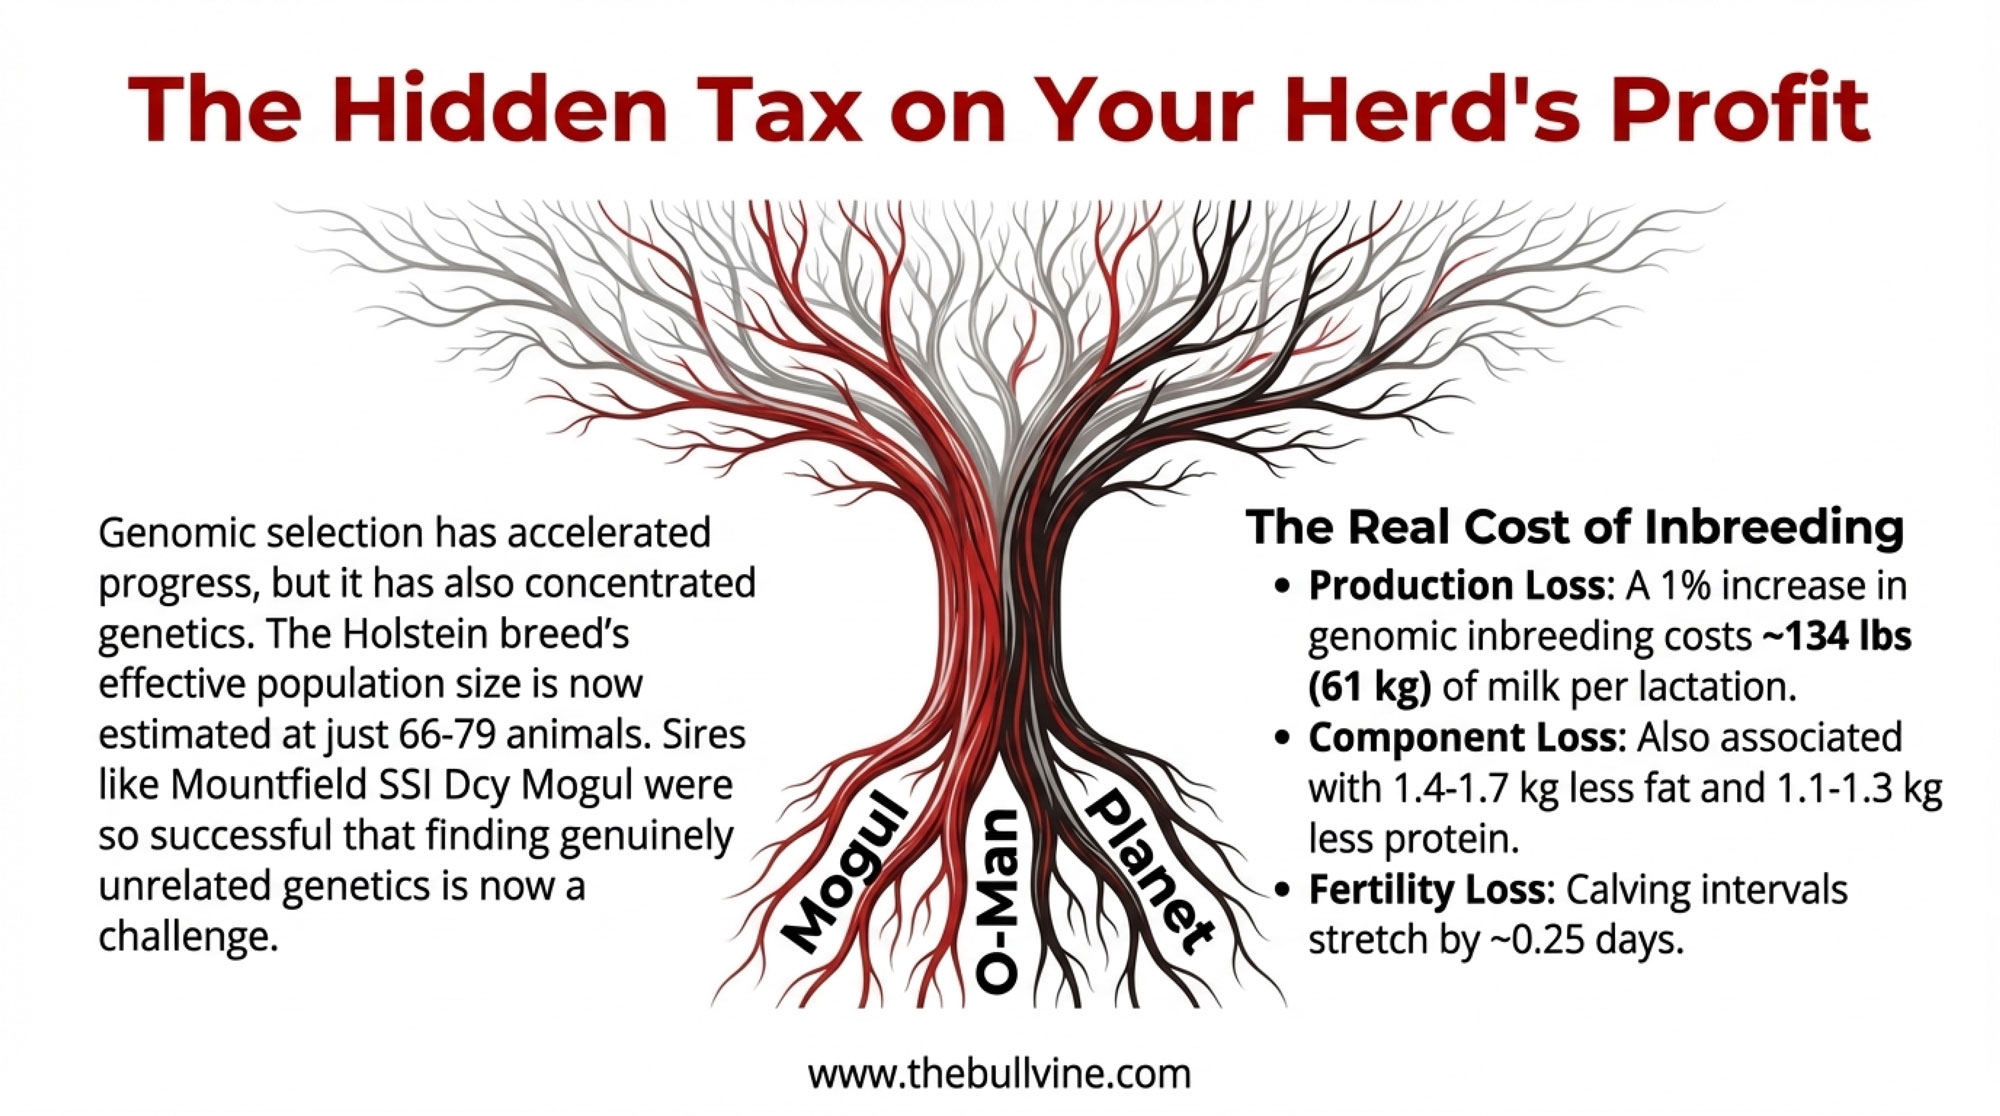
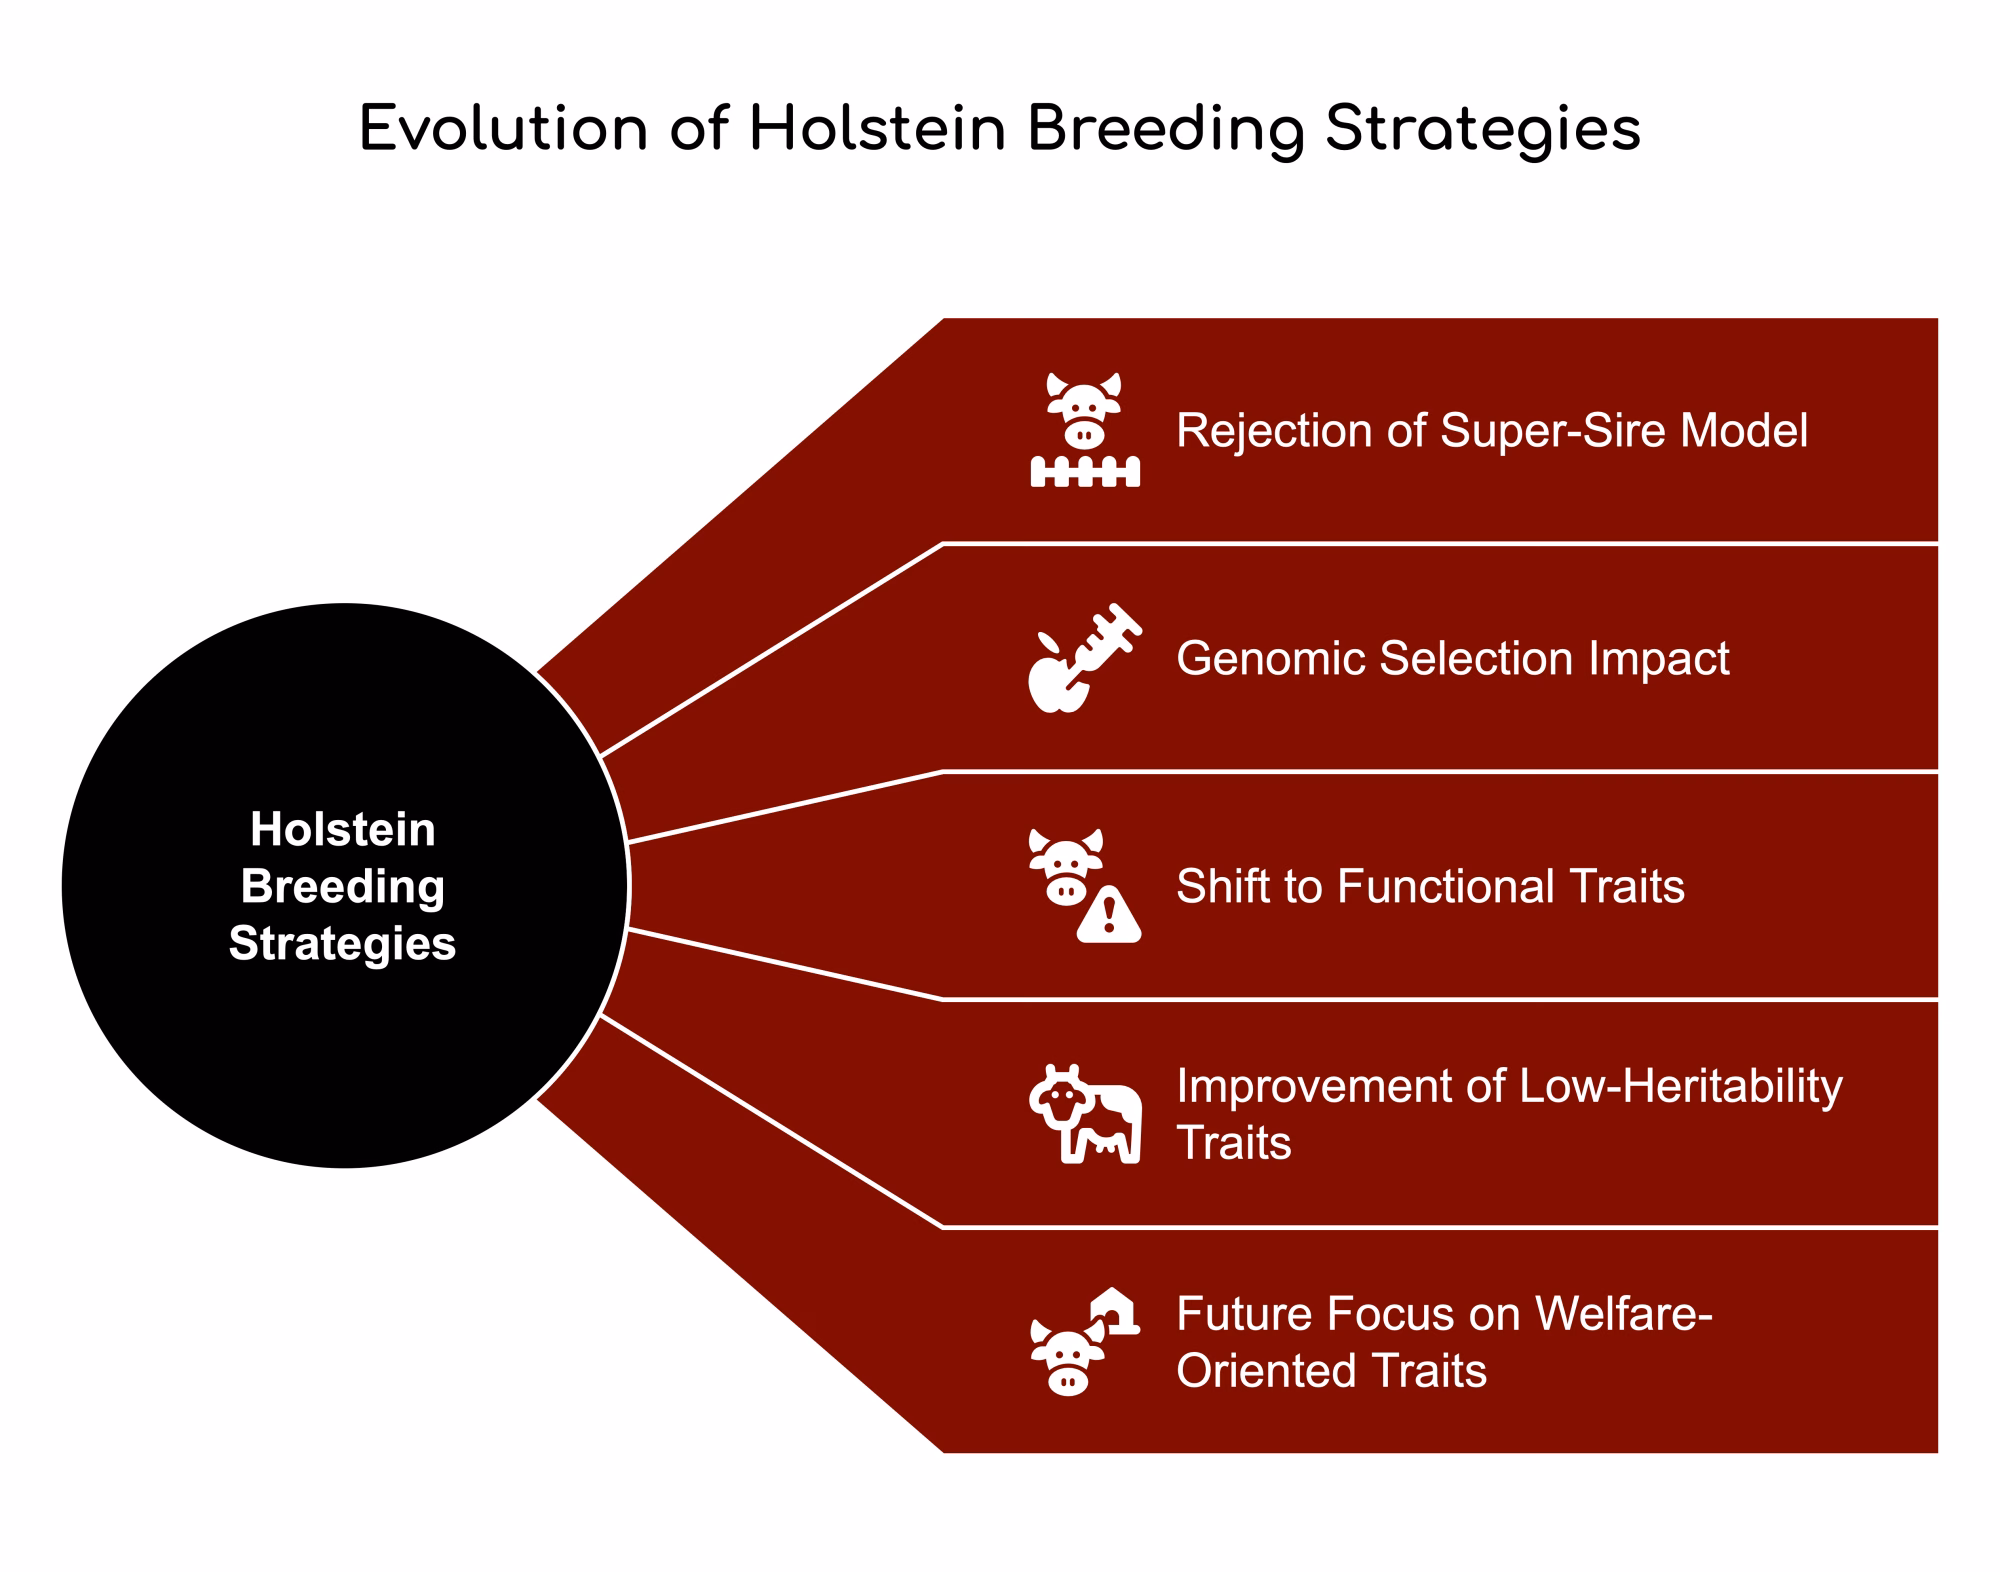
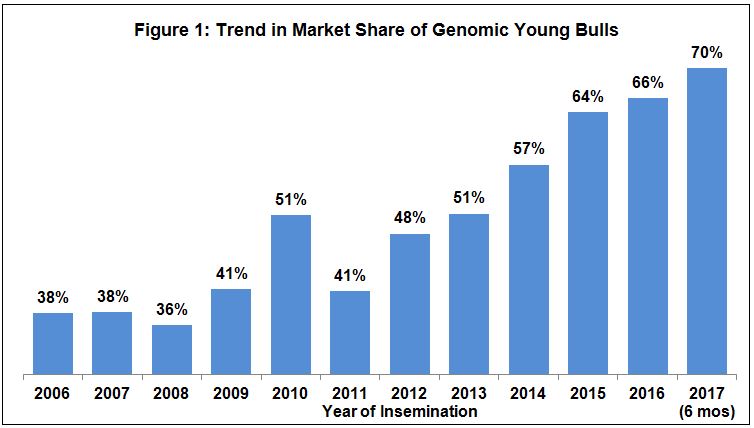
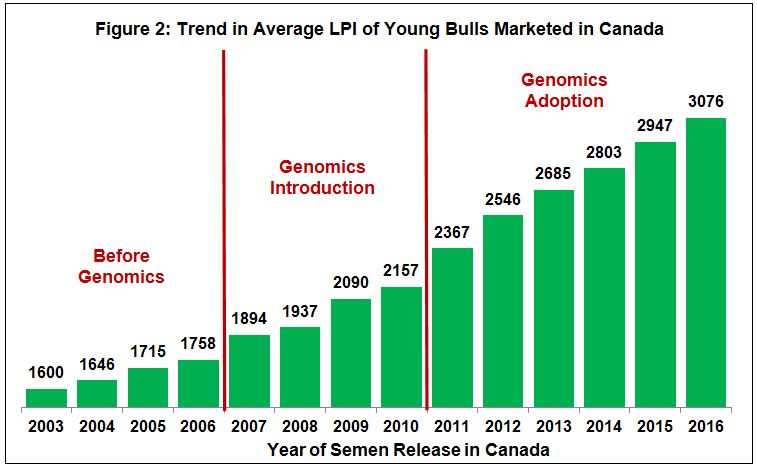
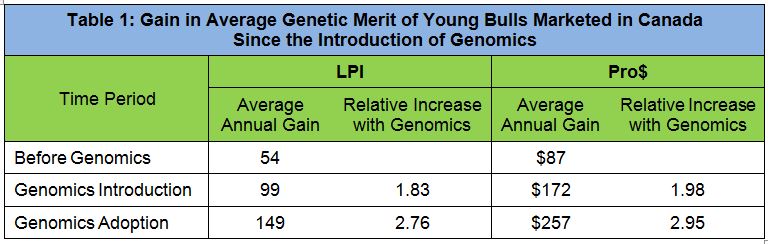
How Genomics Quietly Narrowed the Sire Base
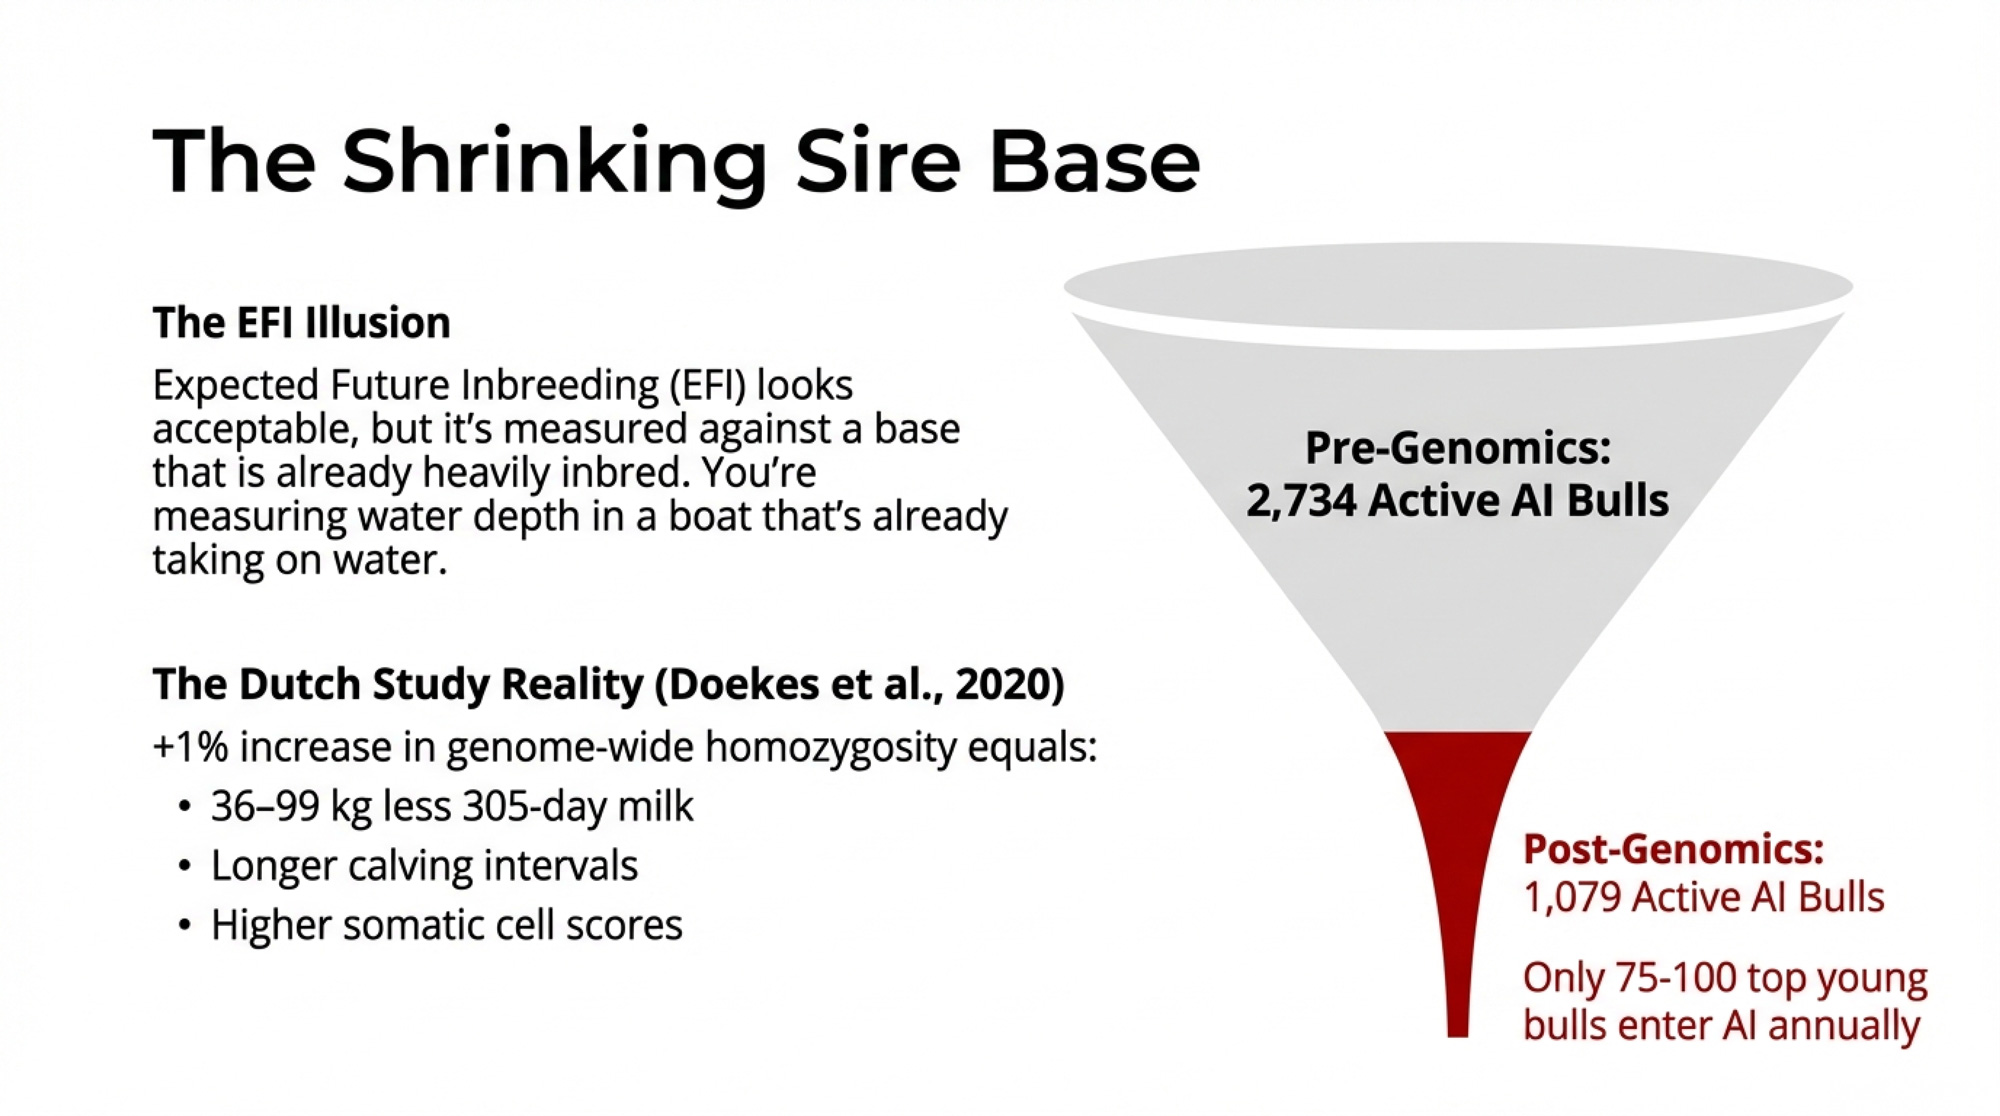
Here’s what the genomic revolution delivered alongside all that genetic gain: a smaller sire base and more concentrated maternal lines. Within the last decade, active Holstein bulls in AI programs dropped from about 2,734 to 1,079, and only 75–100 top genomic young bulls now enter AI each year in the U.S. — down from 1,000+ pedigree‑selected bulls annually before genomics. Big contraction on the male side. And because many of those “new” top bulls come from the same elite cow families, the female side narrows too.
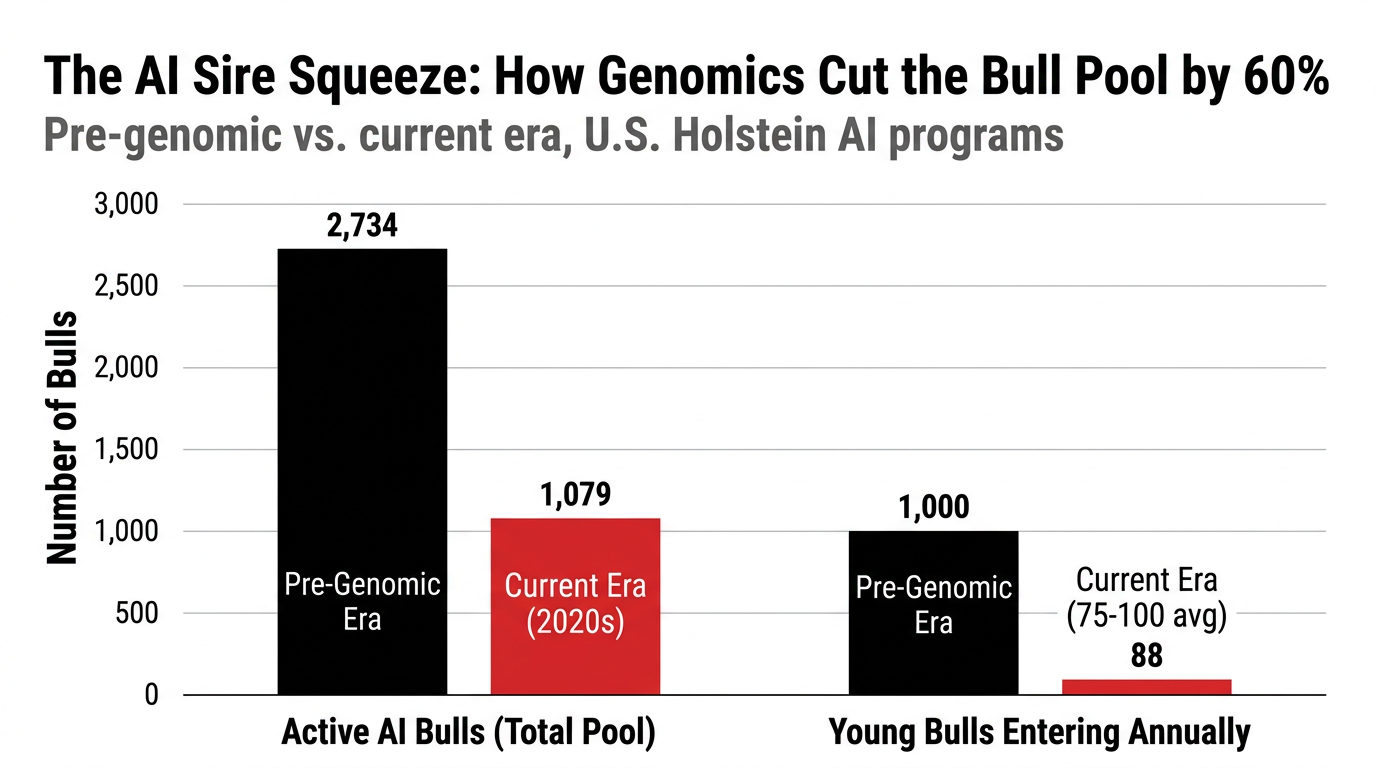
| Metric | Pre-Genomic Era | Current Era (2020s) |
|---|---|---|
| Active AI bulls (total pool) | 2,734 | 1,079 |
| Young bulls entering annually | 1,000+ | 88 (avg 75–100) |
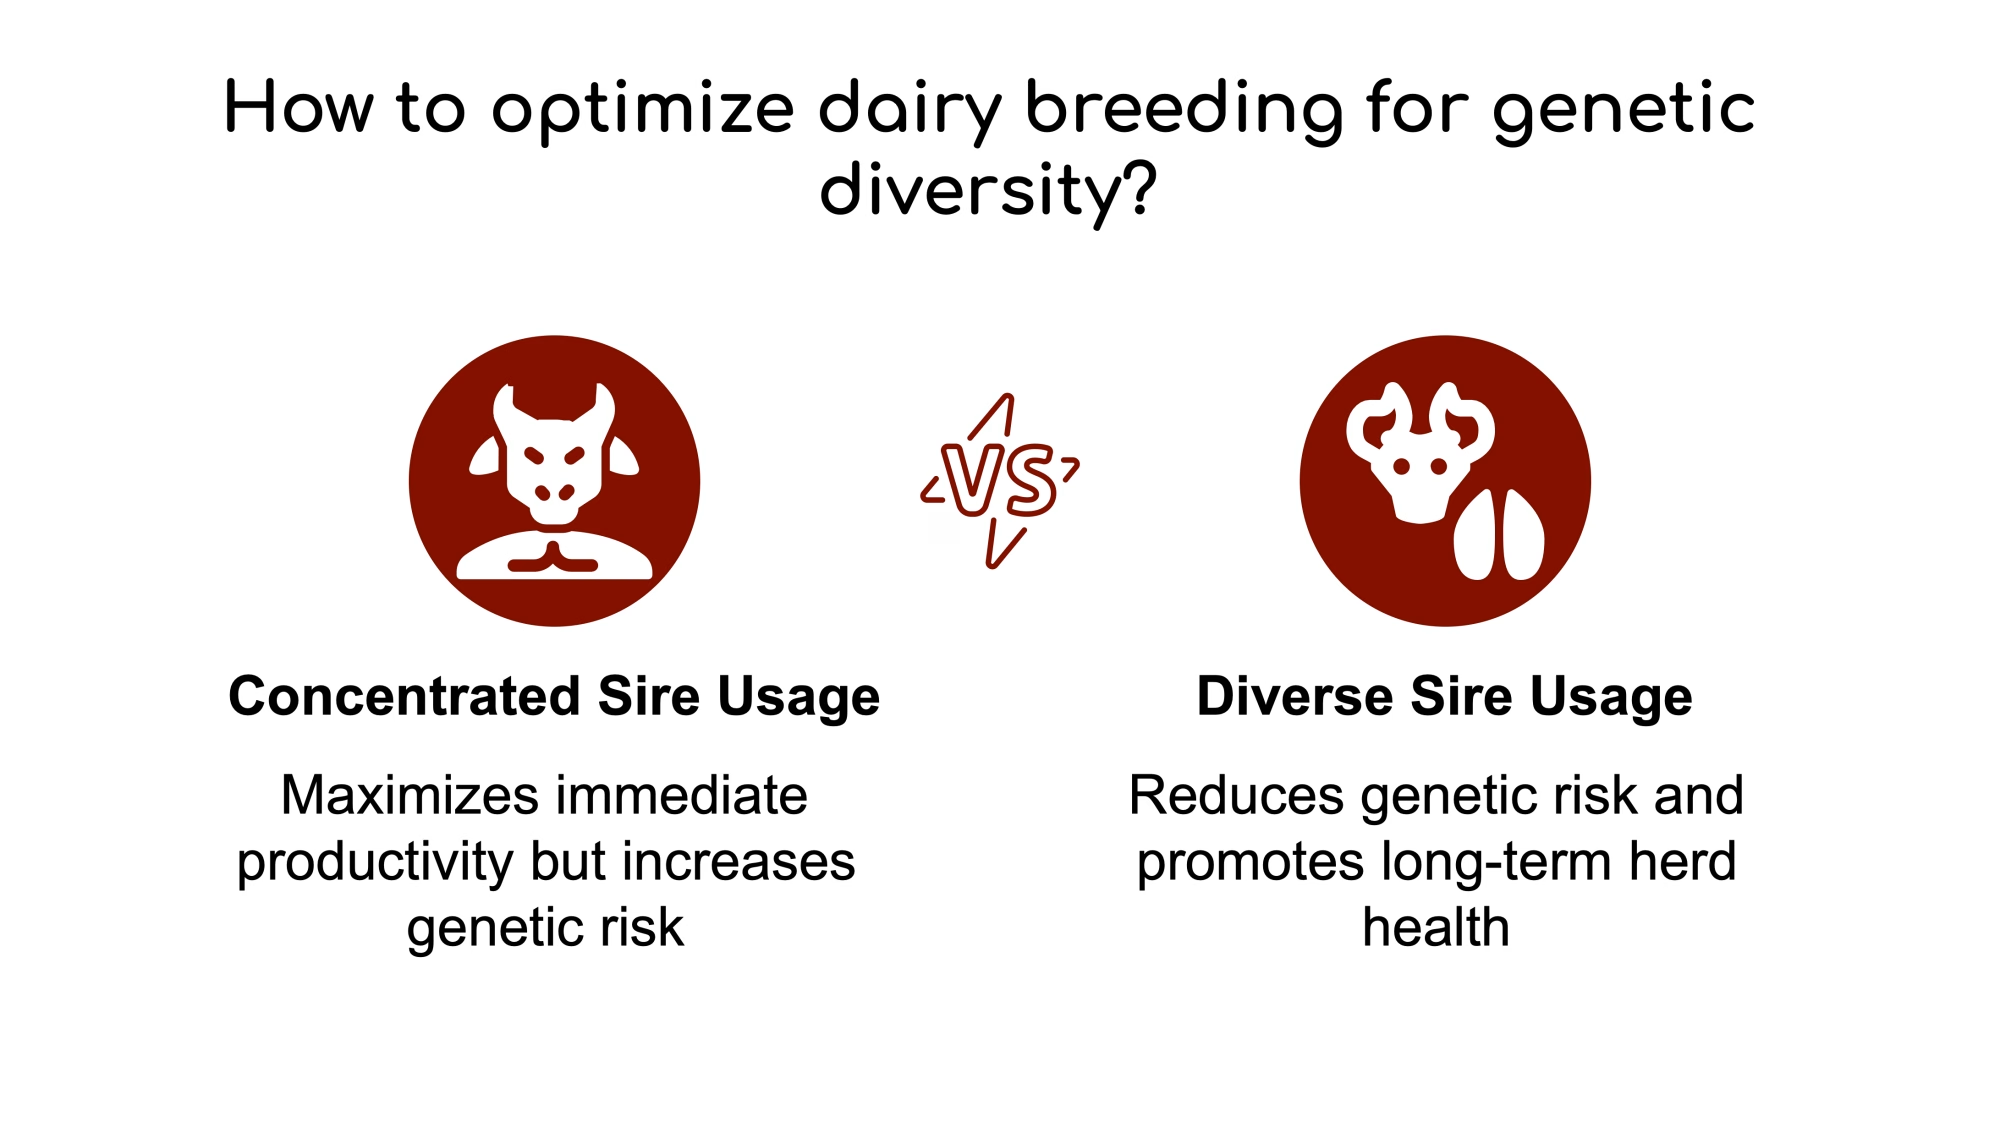
When your genomic‑tested heifer pen is dominated by daughters from three famous cow families, and your AI lineup is stacked with sons and grandsons of those same families, you’re doubling up maternal lines from both sides of the pedigree. The Expected Future Inbreeding (EFI) number on a bull proof might still look acceptable, but EFI is calculated against a base population that’s itself more inbred than it was a decade ago. You’re measuring water depth in a boat that’s already taking on water.
Doekes et al. (2020) analyzed Dutch Holstein Friesians and found roughly 36–99 kg less 305‑day milk per +1% increase in genome‑wide homozygosity, along with longer calving intervals and higher somatic cell scores. That’s the kind of quiet drag you feel when fresh‑pen performance doesn’t match the proofs. Misztal and Lourenco’s 2024 Journal of Animal Science review warned that genomic tools accelerate unfavorable changes in fitness traits alongside production gains, and that management alone can’t fully counteract them if inbreeding continues to rise.
Cow family tracking doesn’t fix inbreeding on its own. It lets you see where you’re stacking weight onto the same thin branches before your fresh‑cow pen and replacement budget start screaming.
What Does a $1,200 Beef‑on‑Dairy Calf Really Cost Your Replacement Program?
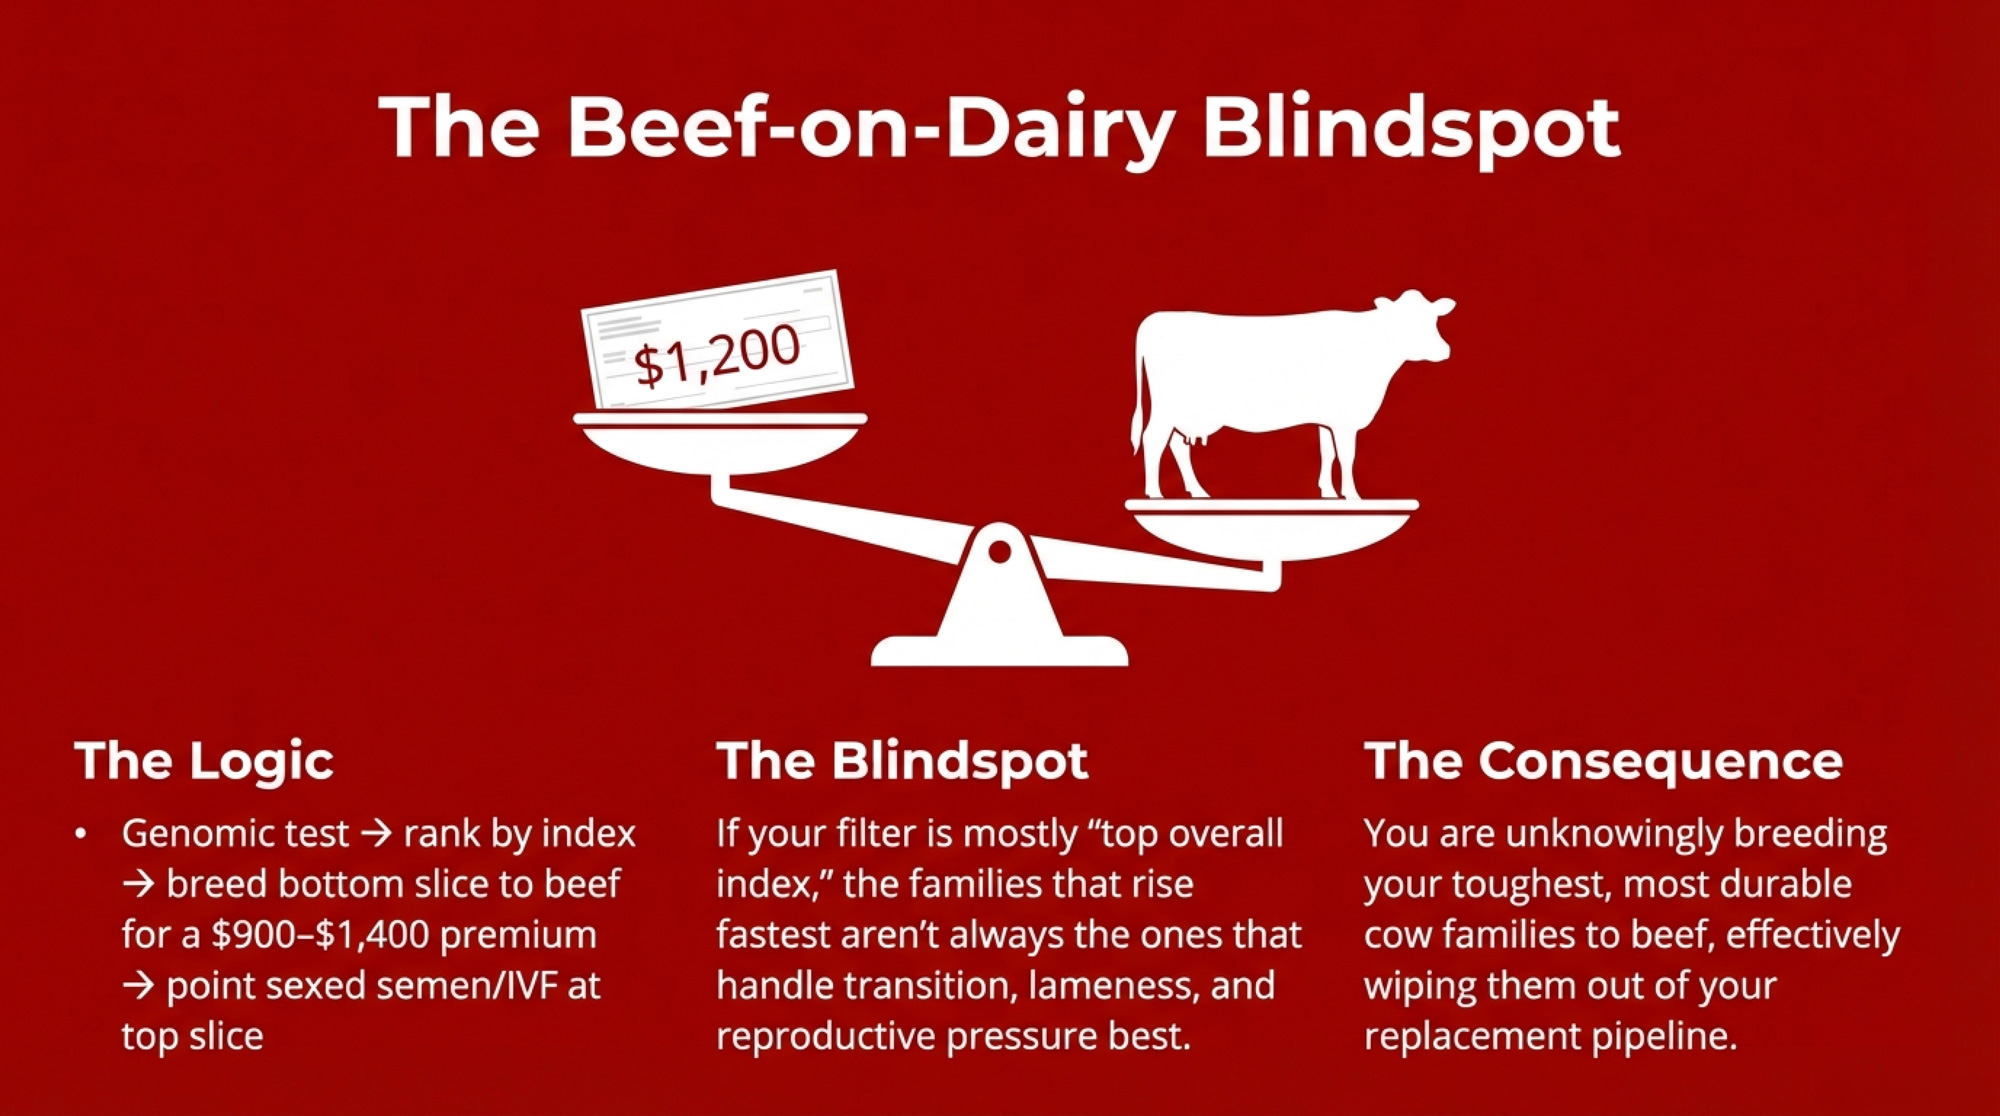
On paper, the beef‑on‑dairy logic is clean. You genomic‑test your heifers, rank them by index, breed the bottom slice to beef — capturing a $900–$1,400 beef‑cross calf premium in many 2024–2025 U.S. markets — and point sexed semen or IVF at the top slice to make replacements. The beef check shows up in 90 days. The genomic ranking tells you you’ve kept the “best” heifers.
Then you put the cow family on top. The picture shifts.
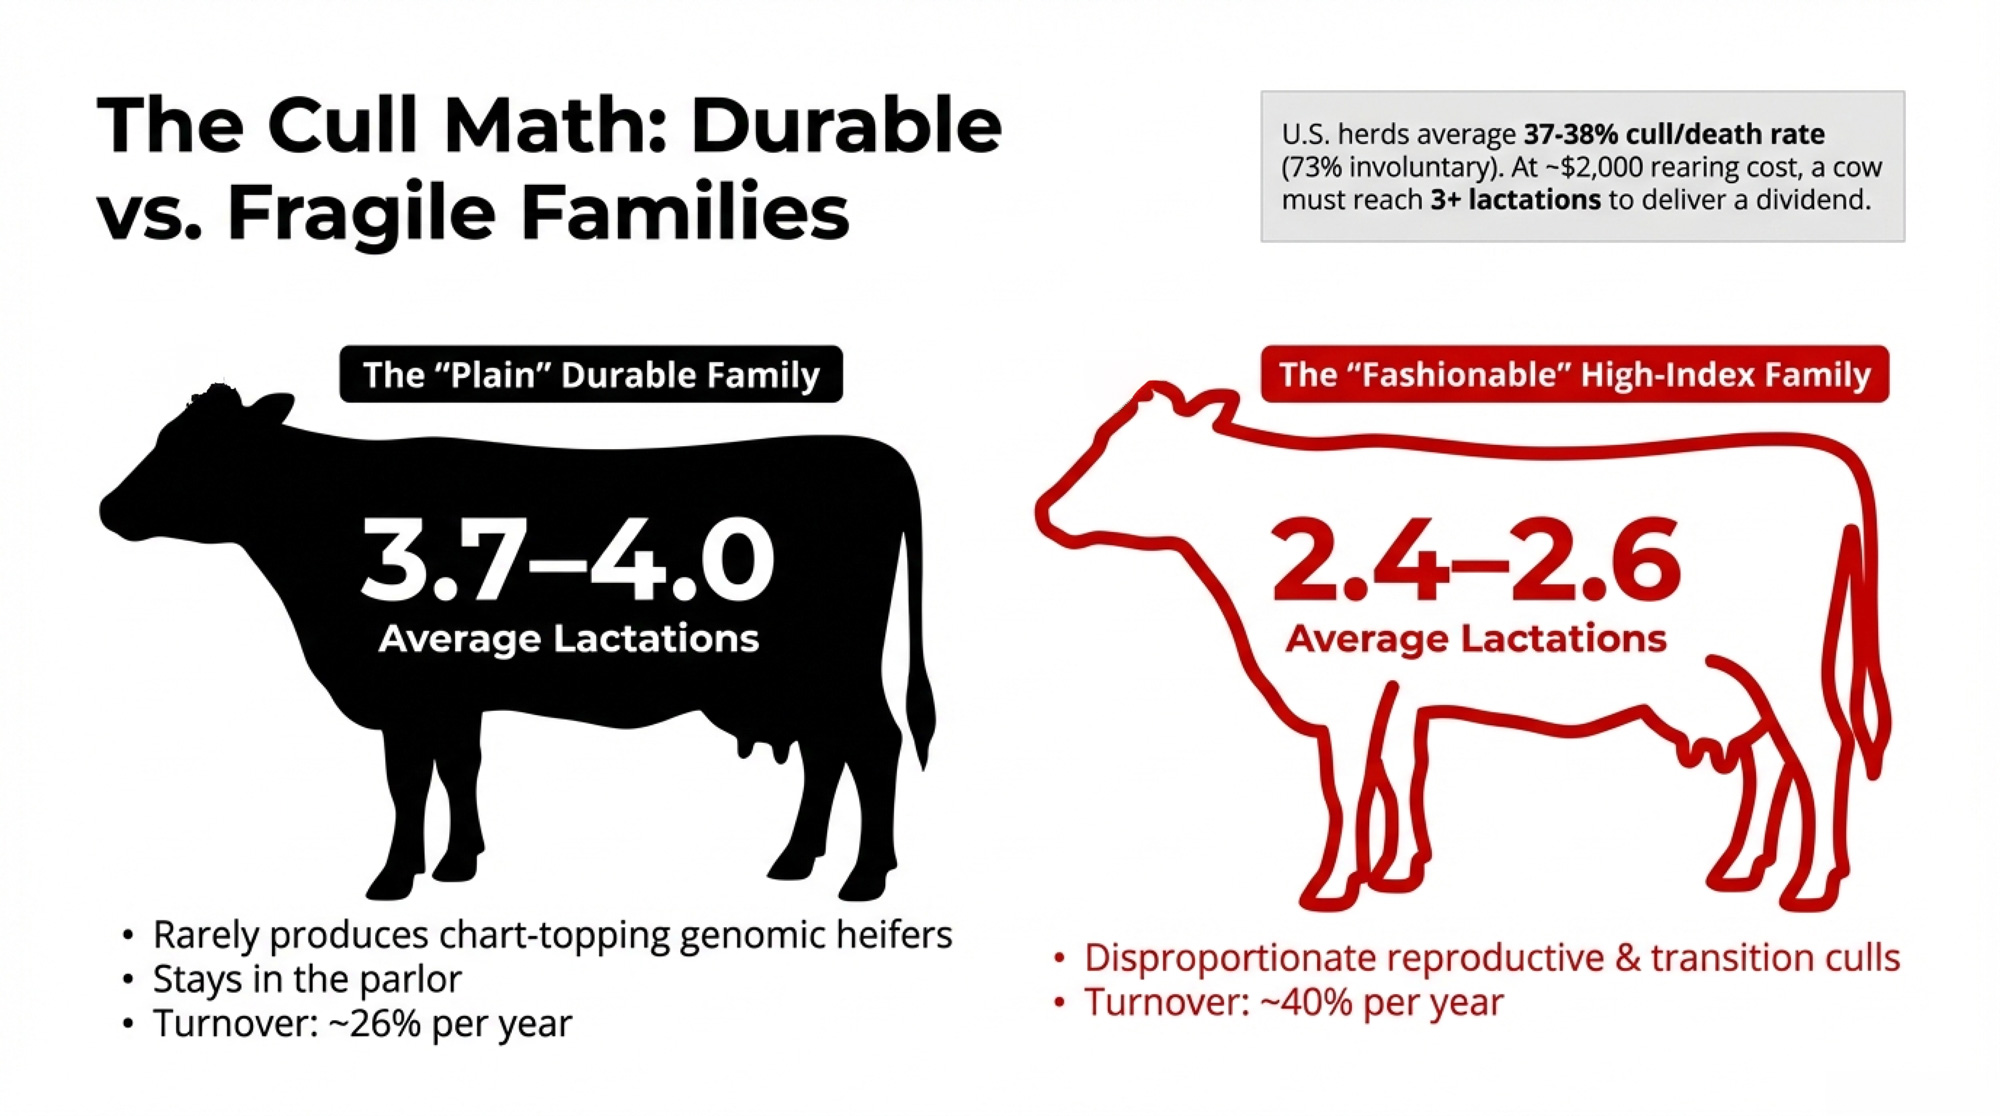
In a composite analysis built from several 300–500‑cow Holstein herds, one “plain” family that rarely produced chart‑topping genomic heifers quietly averaged 3.7–4.0 lactations in the parlor. Two fashionable high‑index families averaged 2.4–2.6 lactations, with disproportionate reproductive and transition‑disease culls. Those are herd‑record numbers, not theory. Your exact figures will differ, but the pattern probably feels familiar: some families stay; some don’t.
Genomics lets you see PL, DPR, and health indexes. But if your filter is still mostly “top overall index,” the families that rise fastest aren’t always the ones that handle your transition, lameness, and reproductive pressure best.
| Metric | Family A (Durable) | Family B (Fragile) | Family C (Fragile) |
|---|---|---|---|
| Average lactations completed | 3.9 | 2.4 | 2.6 |
| Share of genomic-tested heifers | 22% | 31% | 27% |
| Average GTPI rank (percentile) | 68th | 82nd | 79th |
| Involuntary cull rate | 28% | 42% | 39% |
| Top culling reasons | Mastitis, injury | Repro, transition | Lameness, repro |
Running the Numbers: The Trade
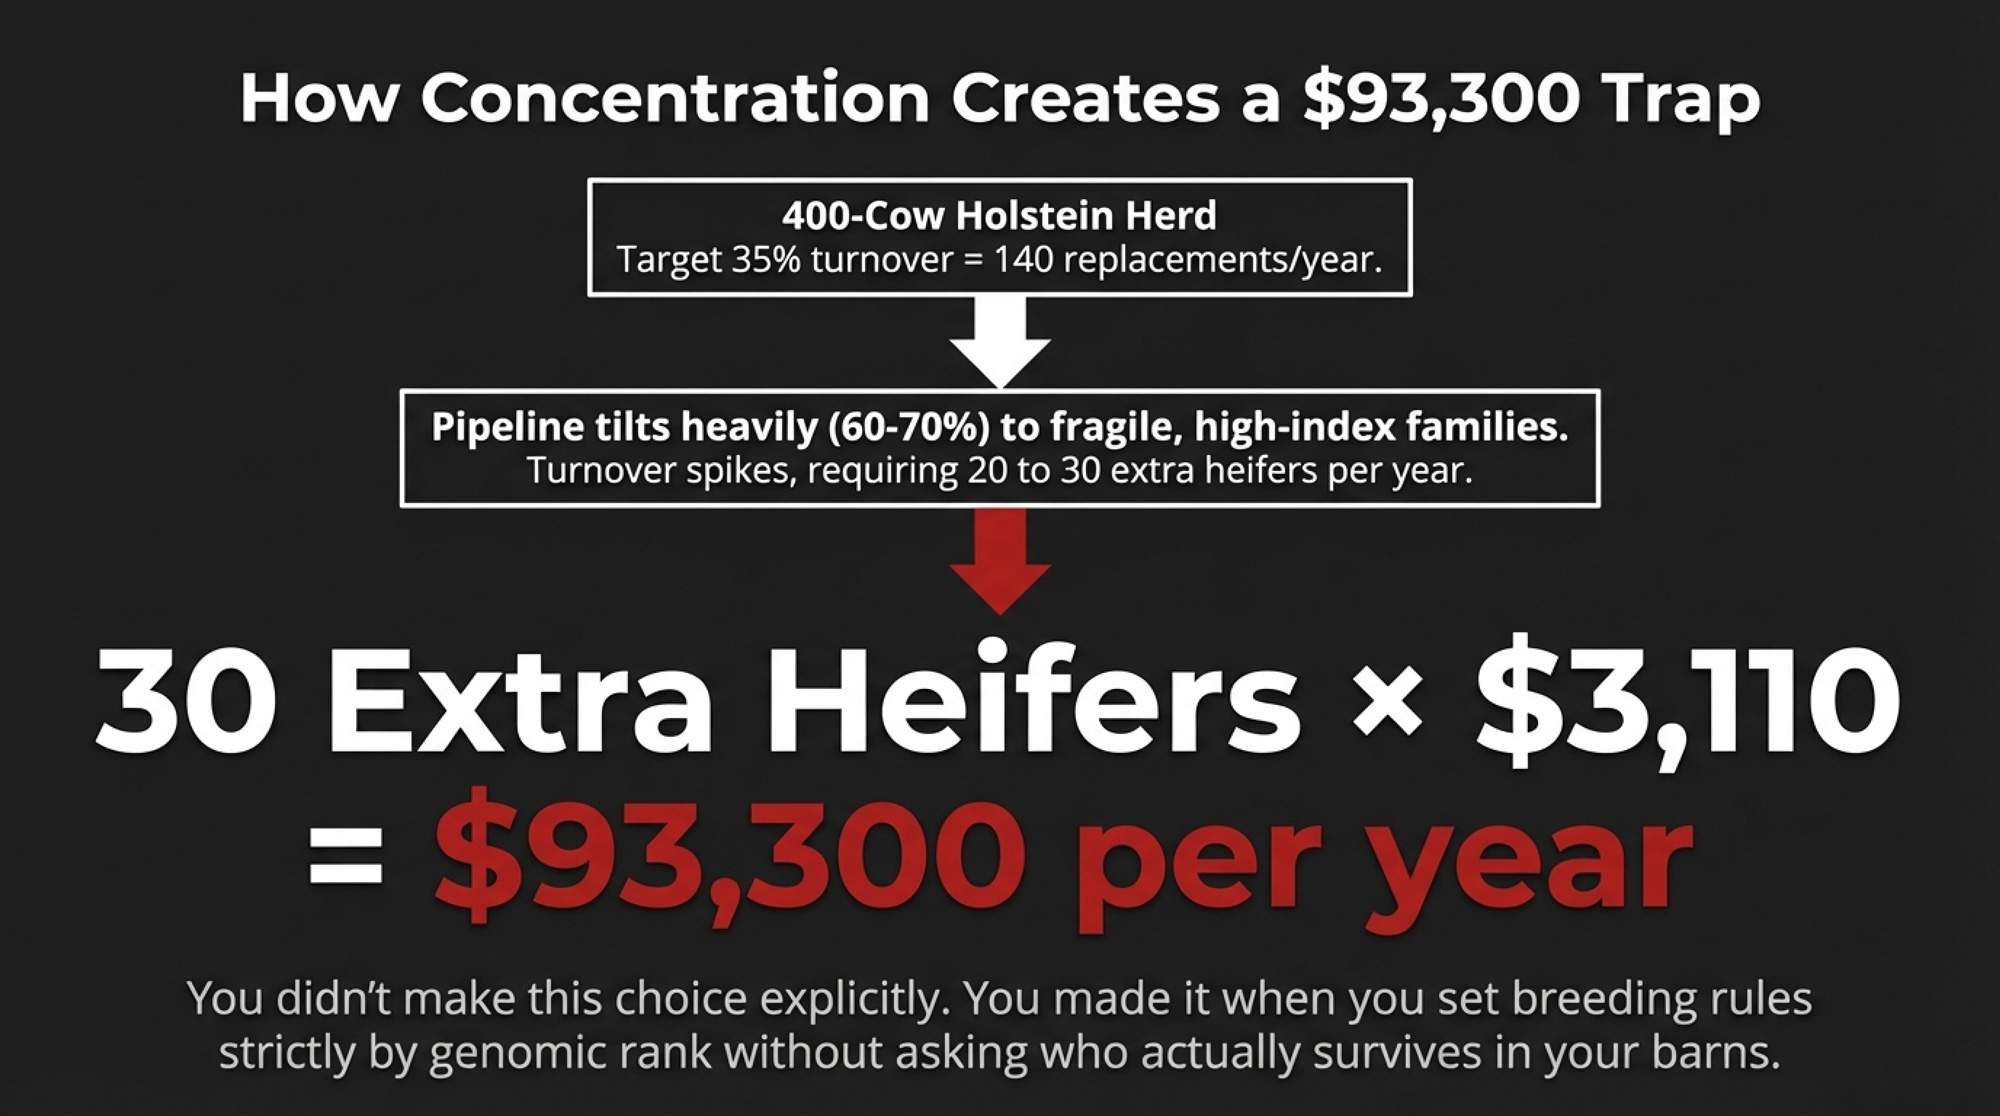
Take a 400‑cow Holstein herd:
- Herd size: 400 milking cows
- Turnover target: 35% → about 140 replacements per year
- Replacement purchase cost (national average): $3,010–$3,110 per head in mid‑ to late‑2025
- Durable families: ~3.8 lactations average (turnover ~26% per year)
- Fragile families: ~2.5 lactations average (turnover ~40% per year)
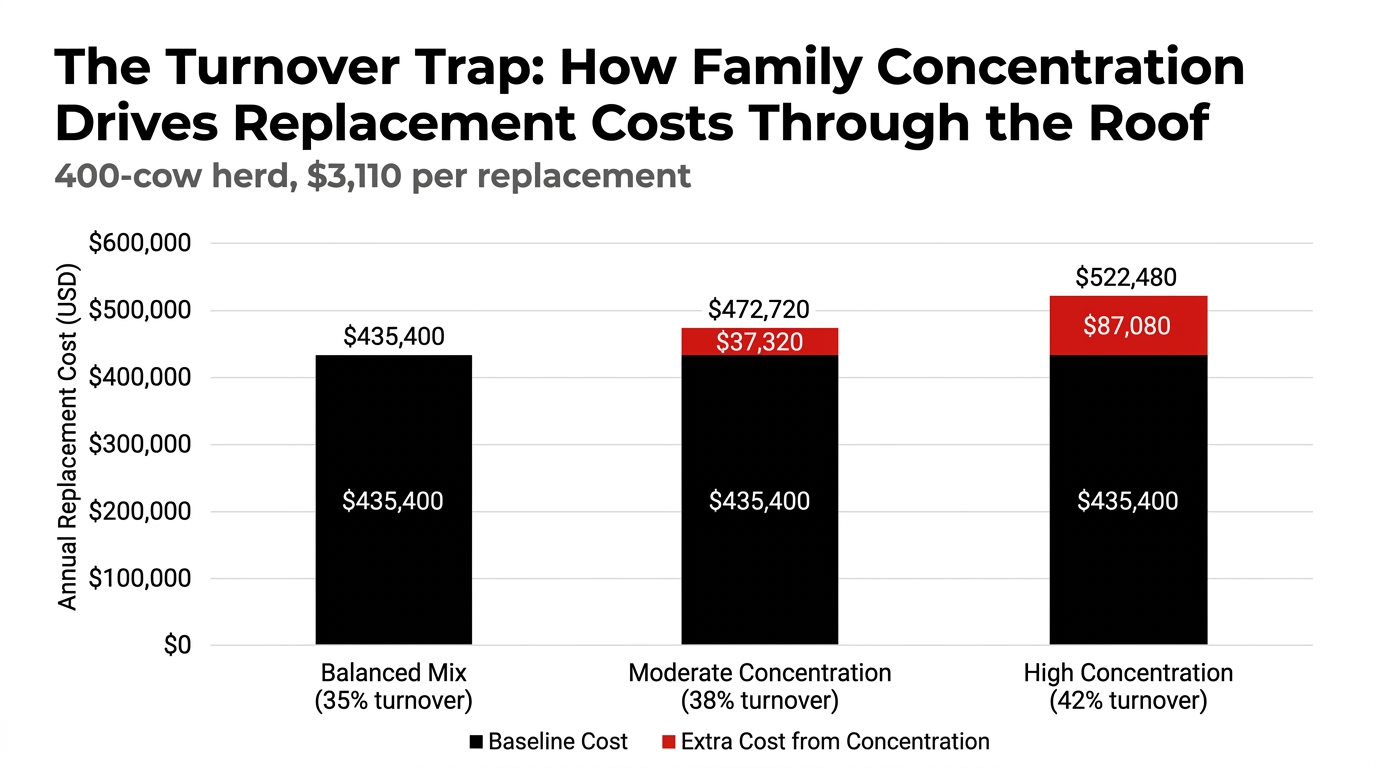
In a balanced scenario, overall turnover sits close to 35%. Replacement needs stay near 140 head. Now imagine your replacement pipeline is heavily tilted — 60–70% of your genomic‑tested replacements come from fragile families, rather than a more even mix. Based on the composite herd data, those herds saw replacement needs rise by 20–30 extra heifers per year.
At $3,110 per purchased replacement:
30 × $3,110 = $93,300 per year in additional capital
as long as that concentration-turnover gap persists.
| Metric | Durable Families | Fragile Families |
|---|---|---|
| Average lactations completed | 3.8 | 2.5 |
| Annual turnover rate | ~26% | ~40% |
| Replacements needed (400-cow herd) | 104 per year | 160 per year |
| Extra replacements vs. baseline | — | +30 per year |
| Annual replacement cost at $3,110/head | $323,440 | $497,600 |
| Additional capital tied up | — | +$93,300/year |
You didn’t make that choice explicitly. You made it when you set beef‑on‑dairy and IVF rules strictly by genomic rank, without asking which families actually survive in your barns.
The 400‑Cow Herd That Added the Cow Family Column
Here’s how those composite herds actually changed their breeding rules — built from several progressive Holstein operations that tracked maternal lines and shared data with their advisors.
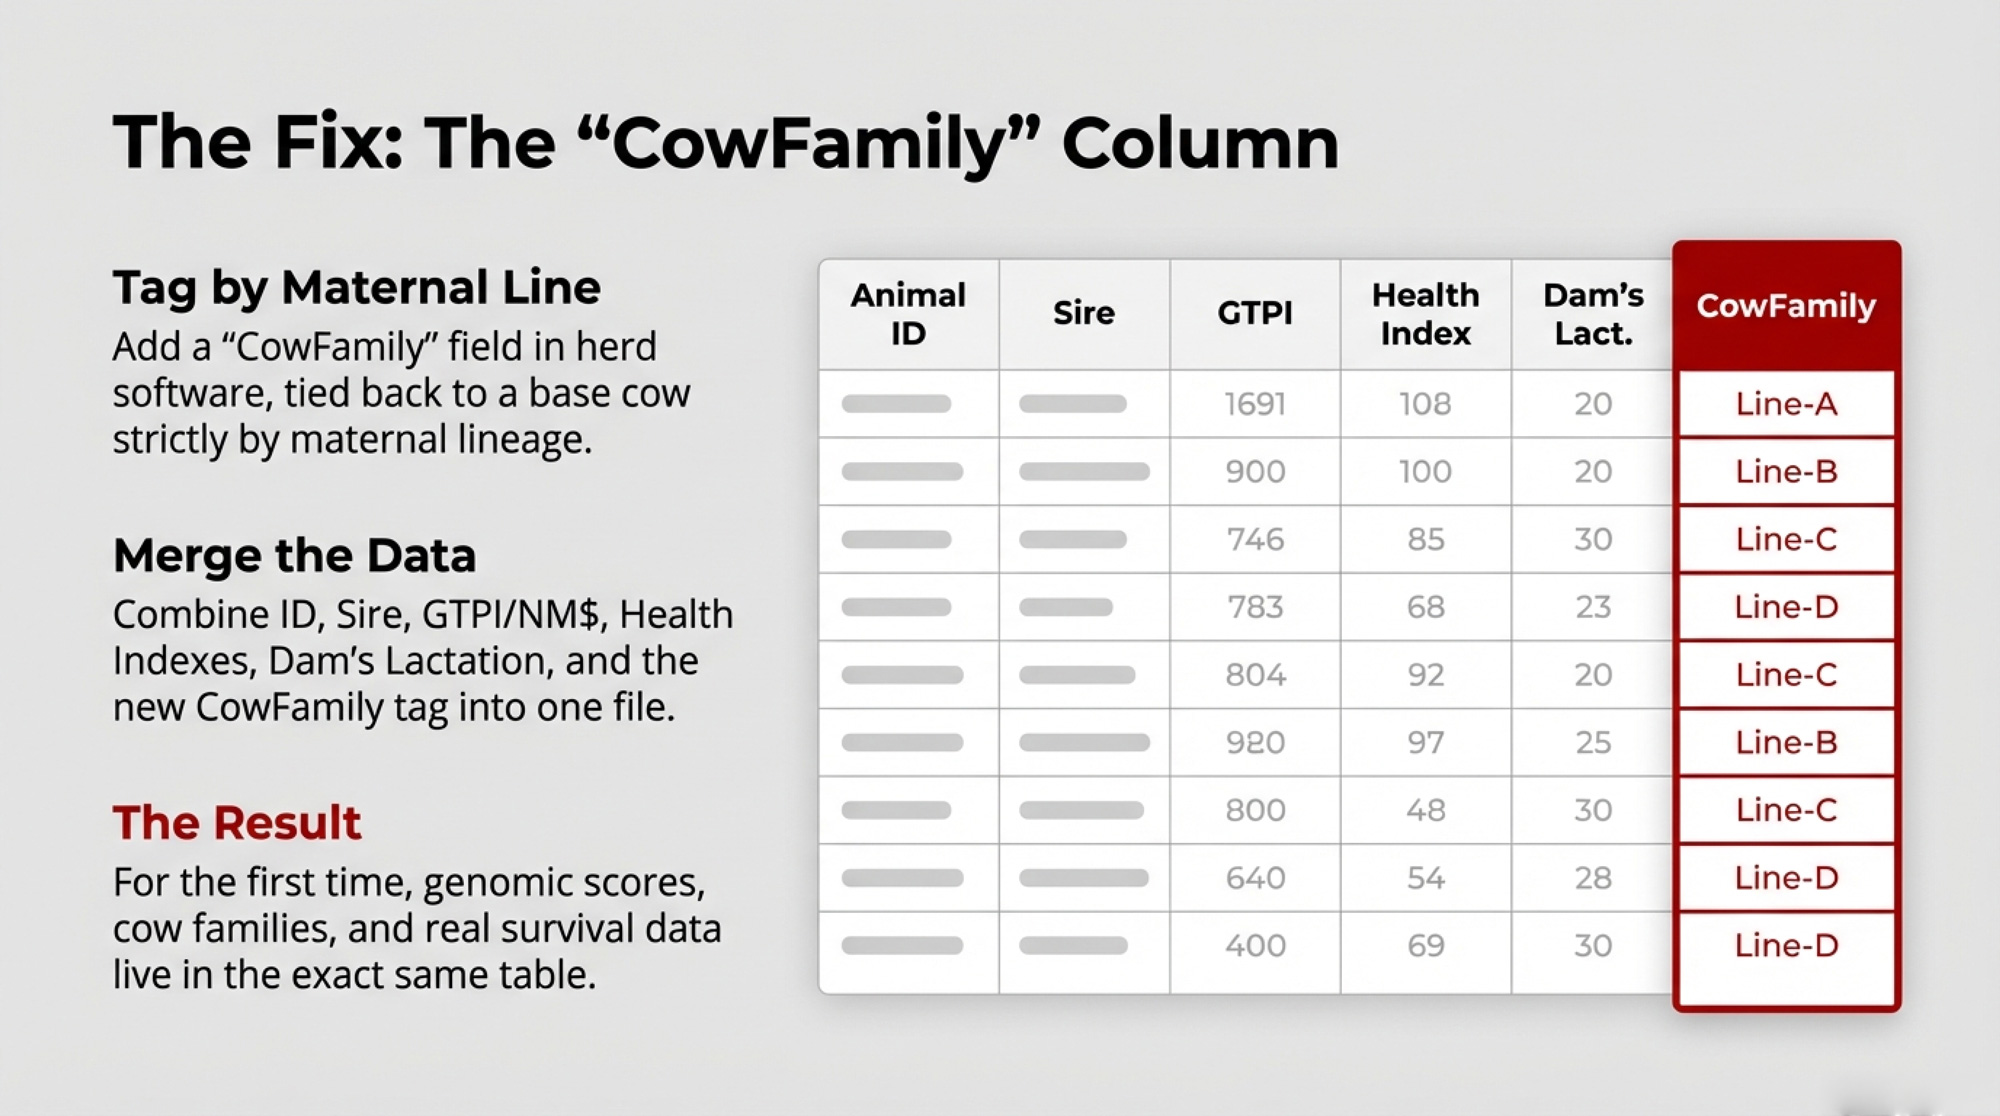
Step 1 — Tag every female by maternal line. They added a “CowFamily” field in herd software. Every female was assigned to a family tied back to a base cow, defined strictly by maternal lineage — not marketing labels.
Step 2 — Build one combined heifer file. For every genomic‑tested heifer: ID, sire, birthdate, CowFamily, GTPI or NM$, PL/DPR/health indexes, and dam’s lactation number and culling status. For the first time, genomic scores, cow families, and real survival data lived in the same table.
Step 3 — Run family‑level stats. Average lactations completed, lifetime milk and components, primary culling reasons by family. The pattern was striking: some high‑index families had excellent longevity — gold. Others underperformed their genomic potential, with many second‑lactation exits. Several mid‑index families quietly averaged nearly 4 lactations, with fewer involuntary culls.
The lesson wasn’t “don’t trust genomics.” It was “don’t let genomics outrun what your cow families are telling you about your own barns.”
Step 4 — Rewrite three breeding rules.
- Sexed semen allocation. Top heifers within each proven‑durable family got priority, even if their GTPI was mid‑pack.
- IVF and donor lists. IVF on high‑index heifers from fragile families was capped; donor status went first to heifers from families that could reach third lactation under current management.
- Beef‑on‑dairy targets. Beef semen was pointed at over‑represented, short‑lived families after enough replacements were secured from the durable families.
Within about two years, those herds consistently reported: no single family supplied more than ~30% of replacements, the annual increase in genomic inbreeding slowed, and a higher share of cows reached third and fourth lactation.
These aren’t randomized trials. But they’re real herd‑record results that line up with the math.
Your Sire Analyst’s Quiet Role in This
Your sire analyst isn’t out to sabotage your herd. They’re working with the same tools and incentives: genomic rankings, strong proofs, and semen that sells. When an AI program finds cow families that reliably produce top‑ranking sons, it’s logical to double down. Those families become donors and bull dams for everyone else. Over time, more bulls in your semen tank share the same grand‑dams and great‑grand‑dams, even if the sires change.
NAAB and industry reports show a concentrated semen market, with a small number of large organizations controlling most of the U.S. AI business. That’s efficient for pushing genetic gain. It also amplifies maternal‑line concentration in the client herds unless you actively steer away.
For breeders like Kline, the practical question isn’t whether AI companies are “wrong.” It’s whether their female programs are quietly overriding their own herd’s economics. If your bull list is heavy with sons of cow families that already account for a big chunk of your heifer pen, you’re not diversifying. You’re doubling down.
The Playbook: What to Do Before Your Next Breeding Cycle
In the Next 30 Days
- Add the cow family column. Export your female inventory, add a “CowFamily” field, and tie each animal back to a base cow.
- Run a concentration check. Pull your genomic‑tested heifer list, sort by GTPI or NM$, and look at the top 25–30%. If three or fewer families supply 60% or more of that group, you’re carrying the concentration risk this article describes.
- Cross‑check your main sires. Note the cow families in their maternal pedigrees. If those match your over‑represented families, flag them as “use thoughtfully” instead of default choices.
In the Next 90 Days
- Calculate family‑level survival from your own data. Average lactations completed, average lifetime milk, voluntary vs involuntary cull ratio, and top culling reasons — by cow family.
- Identify your “insurance” families. Families averaging 3.5+ lactations with lower involuntary cull rates are your built‑in pipeline stabilizers.
- Rewrite three core rules: Sexed semen priority goes to daughters from durable families. IVF donor lists start with high‑health, high‑PL heifers from durable families before fragile ones. Beef semen is allocated first to over‑represented, short‑lived families once replacement needs from durable families are met.
In the Next 365 Days
- Audit your sire lineup by maternal line. For each bull you use heavily, record the cow family of his dam and grand‑dam. Don’t let half your semen volume come from bulls out of the same two or three families.
- Set a practical inbreeding guardrail. Work with your genetic advisor to flag matings in which both the sire and dam come from your most common cow families.
- Track outcomes, not intentions. As the first heifers under new rules freshen, watch average lactations completed by family, voluntary vs involuntary culling by family, and total replacements needed per year vs your target.
| Timeline | Action | Output / Deliverable |
|---|---|---|
| Next 30 Days | Add cow family column to herd software | Every female tagged with maternal line ID |
| Next 30 Days | Run concentration check | % of top genomic heifers from 3 families |
| Next 30 Days | Cross-check main sires by maternal line | List of sires that double-up over-represented families |
| Next 90 Days | Calculate family-level survival stats | Average lactations, cull reasons by family |
| Next 90 Days | Identify “insurance” families (3.5+ lact.) | List of durable families for priority breeding |
| Next 90 Days | Rewrite sexed/IVF/beef rules | Updated protocols prioritizing durable families |
| Next 365 Days | Audit sire lineup by maternal line | Maternal diversity report for bull list |
| Next 365 Days | Set inbreeding guardrails with advisor | Flagged mating pairs from same families |
| Next 365 Days | Track outcomes by family as heifers freshen | Lactation/cull metrics by family, quarterly |
| Ongoing | Monitor replacements needed vs. target | Annual replacement count and cost by family |
What This Means for Your Operation
- Your genomic ranking list is a tool, not a verdict. It doesn’t know which cow families actually survive under your feed, facilities, and disease pressure. Your cull and longevity records do.
- Replacement cost has changed the tolerance for fragility. Going from $1,140 per head in 2019 to $3,010–$3,110 in 2025 means being wrong about cow family durability isn’t a nuisance — it’s a five‑ or six‑figure swing in capital exposure.
- Inbreeding penalties are already in your tank and your parlor. The depression numbers from Dutch Holsteins — up to 99 kg less milk per +1% genomic inbreeding — aren’t abstract; they describe what happens when you stack too many related lines.
- Beef‑on‑dairy decisions need a family filter. Before you write next season’s beef semen rules, pull the last 50 heifers you bred to beef and tag them by cow family and dam’s lactation. If your best longevity families are taking the hit, your protocol is backwards.
- IVF amplifies whatever you point it at. If you aim your IVF budget at cow families that don’t last in your system, you’re multiplying fragility in the tightest replacement window in decades.
Key Takeaways
- If three or fewer cow families supply 60%+ of your top genomic heifers, you’re carrying the concentration risk this article lays out. Put a hard cap on your breeding protocols and deliberately feed replacements from underrepresented, proven‑durable families.
- If your annual replacement rate has drifted above the mid‑35% range without obvious disease crashes, check whether short‑lived families are quietly driving that turnover. Run replacements‑needed per year by cow family and compare that to your longevity and cull data.
- Before your next beef‑on‑dairy semen order, block out an hour to run one report: last 50 heifers bred to beef, tagged by cow family and dam’s lactation number. If durable families are over‑represented in the beef column, fix the rules before the next breeding season.
- On your next call with your sire analyst, ask one extra question: “Which bulls in your lineup come from cow families we don’t already have stacked in this herd?” Make maternal‑line diversity part of the conversation, not an afterthought.
The Bottom Line
Open your genomic heifer list right now. Add a cow family column. Sort by family instead of GTPI. How many maternal lines are you actually betting your next three years of replacements on — and do the families carrying the most weight have the track record in your barns to justify it? If you’re already doing what Kline did — leaning into genomics early, pushing for better cows — this isn’t about blaming you. It’s about upgrading the tools so your cow families, not just your proofs, protect the herd you’ve worked hard to build.
Complete references and supporting documentation are available upon request by contacting the editorial team at editor@thebullvine.com.
Learn More
- Penn State’s $3,110 Heifer Trap: When “One More Lactation” Costs 3× More Than Replacing Her – You’ll gain the exact barn-level math to identify which marginal cows are secretly bleeding your operation dry. This guide arms you with hard culling thresholds and retention pay-off rules to navigate the $3,110 heifer market profitably.
- $3,010 Per Heifer. 800,000 Short. Your Beef-on-Dairy Bill Is Due. – This analysis reveals how to survive the 800,000-heifer deficit by auditing your breeding rebalance and processor contracts. You’ll gain four concrete capital-preservation paths to ensure your operation stays in the group processors treat as long-term partners.
- 9.99% Inbreeding and Rising: How Blondin Sires Turned a Holstein Bottleneck into 75% Growth – Exposes the hidden 9.99% inbreeding ceiling and delivers unconventional outcrossing strategies to reclaim genetic diversity. This disruptor-focused piece breaks down how to use European genetics and niche pedigrees to flip a genetic bottleneck into a competitive growth engine.
 The Sunday Read Dairy Professionals Don’t Skip.
 The Sunday Read Dairy Professionals Don’t Skip.
Every week, thousands of producers, breeders, and industry insiders open Bullvine Weekly for genetics insights, market shifts, and profit strategies they won’t find anywhere else. One email. Five minutes. Smarter decisions all week.


 Dairy products are a key source of valuable proteins and fats for many millions of people worldwide. Dairy cattle are highly susceptible to heat-stress induced decline in milk production, and as the frequency and duration of heat-stress events increases, the long term security of nutrition from dairy products is threatened. Identification of dairy cattle more tolerant of heat stress conditions would be an important progression towards breeding better adapted dairy herds to future climates. Breeding for heat tolerance could be accelerated with genomic selection, using genome wide DNA markers that predict tolerance to heat stress. Here we demonstrate the value of genomic predictions for heat tolerance in cohorts of Holstein cows predicted to be heat tolerant and heat susceptible using controlled-climate chambers simulating a moderate heatwave event. Not only was the heat challenge stimulated decline in milk production less in cows genomically predicted to be heat-tolerant, physiological indicators such as rectal and intra-vaginal temperatures had reduced increases over the 4 day heat challenge. This demonstrates that genomic selection for heat tolerance in dairy cattle is a step towards securing a valuable source of nutrition and improving animal welfare facing a future with predicted increases in heat stress events. (