Your 400‑cow herd can “win” $16,600 on DMC in 2026 and still sit at 0.9x DSCR the minute your banker deletes those dollars from the cash‑flow.
Executive Summary: In 2026, a typical 400‑cow U.S. herd can save about $16,600 in DMC premiums on 6 million pounds — roughly $41.50 per cow — and still sit at 0.9x debt‑service coverage once the banker removes DMC and other program dollars from the cash‑flow. The piece shows the barn math step‑by‑step: $1.66/cwt DMC premium savings, $18.95/cwt all‑milk outlook, and $18–21/cwt true breakeven costs that leave many mid‑size herds below the 1.15–1.25x DSCR comfort band lenders want. It argues that when DSCR clears only 1.0–1.1x with DMC included, DMC has shifted from a safety net to a crutch for a business model that doesn’t pencil. From there, it outlines three realistic branches for 300–500‑cow herds: a turnaround to get “no‑program” DSCR above 1.2x, a reshape into a leaner or premium model, or a staged transition that uses DMC, FSA, and EQIP to protect equity and control timing instead of waiting for the bank to decide. The article also shows which farm‑bill tools actually move your cheque, showing where FSA loan limit increases, EQIP/methane funding, DNIP, and school milk changes genuinely move your milk cheque” or “your margins. It closes with a simple test every operator can run over the next 30 days: calculate DSCR with and without DMC, and ask whether your lender would continue financing the version that stands on its own.
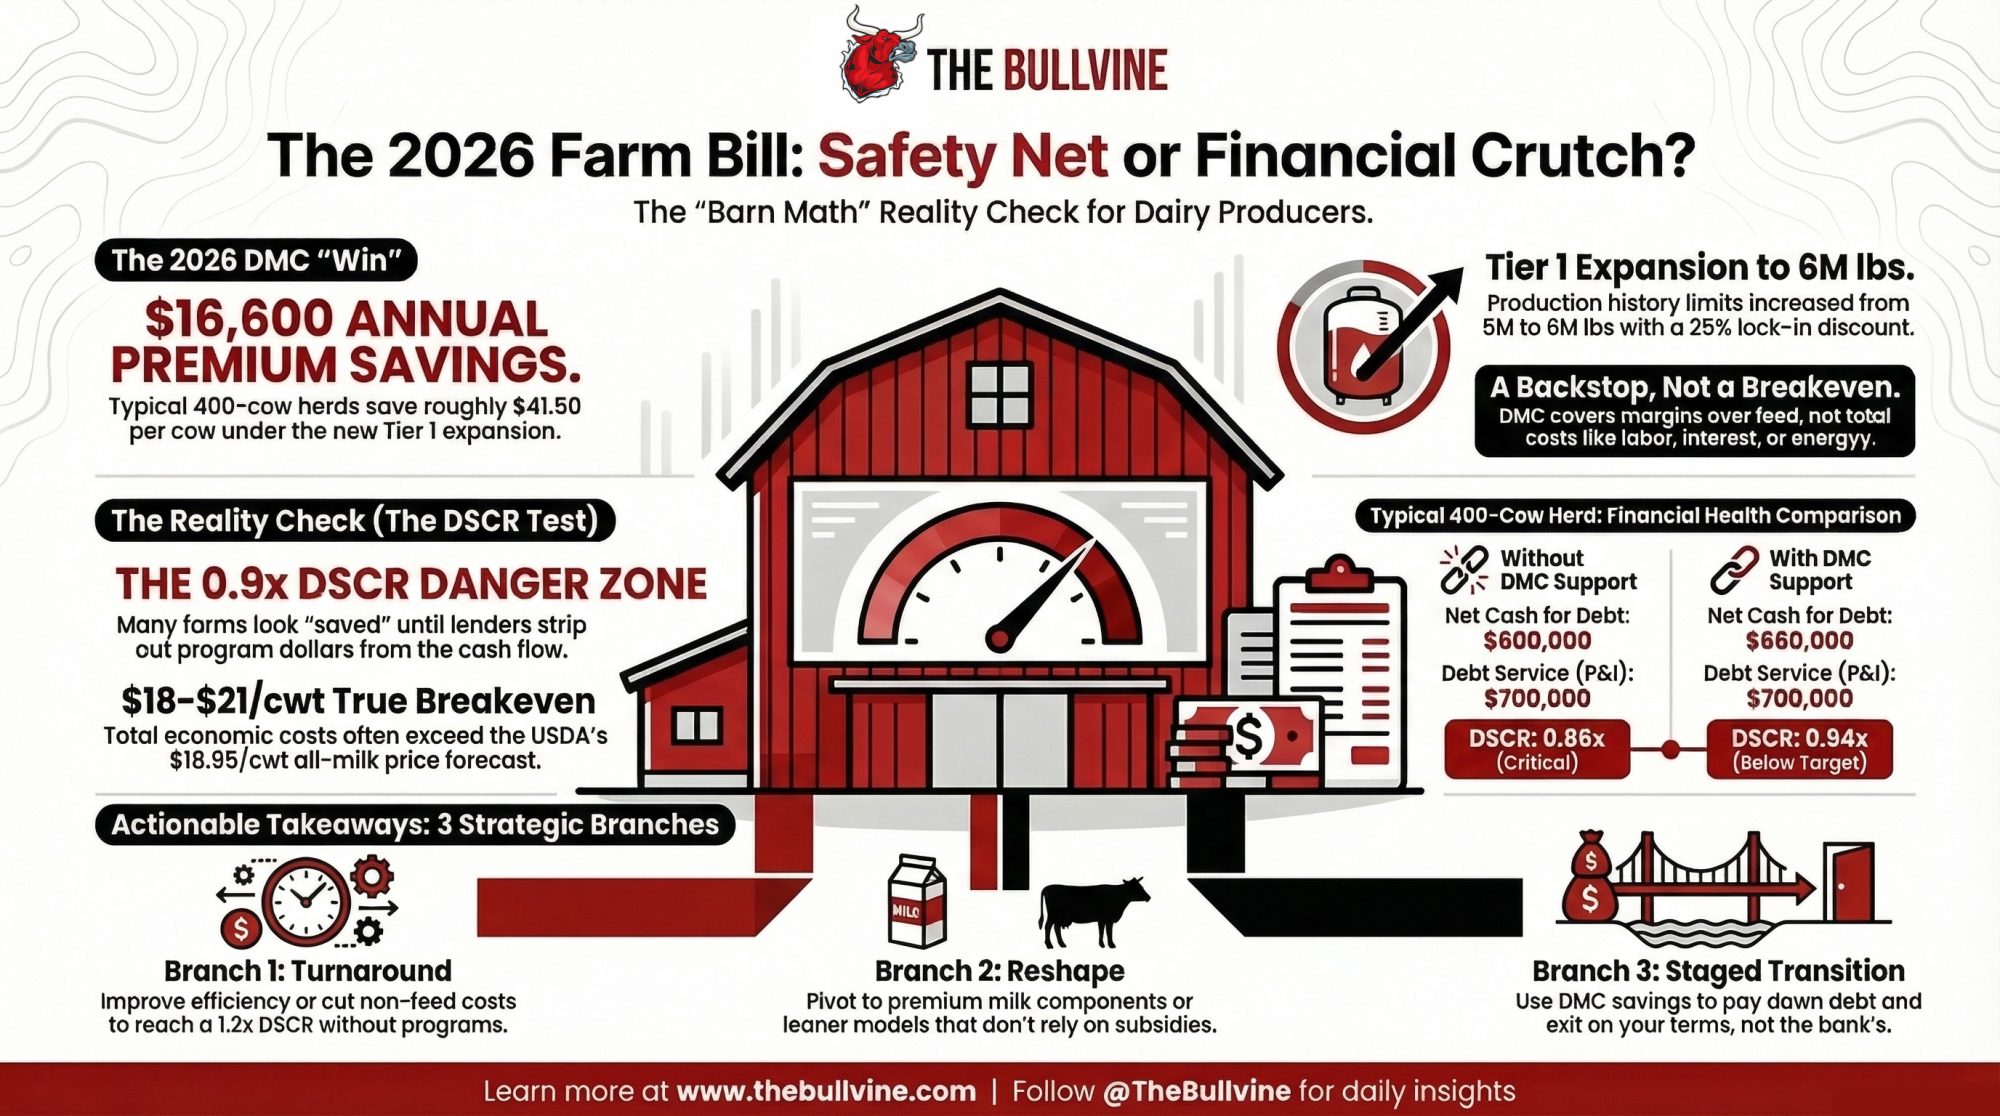
A lot of 400‑cow U.S. dairies look “saved” by the 2026 farm bill on paper. Strip out DMC and other program dollars, and some of those same farms are sitting at about 0.9x debt‑service coverage — not generating enough cash to cover principal and interest on their own.
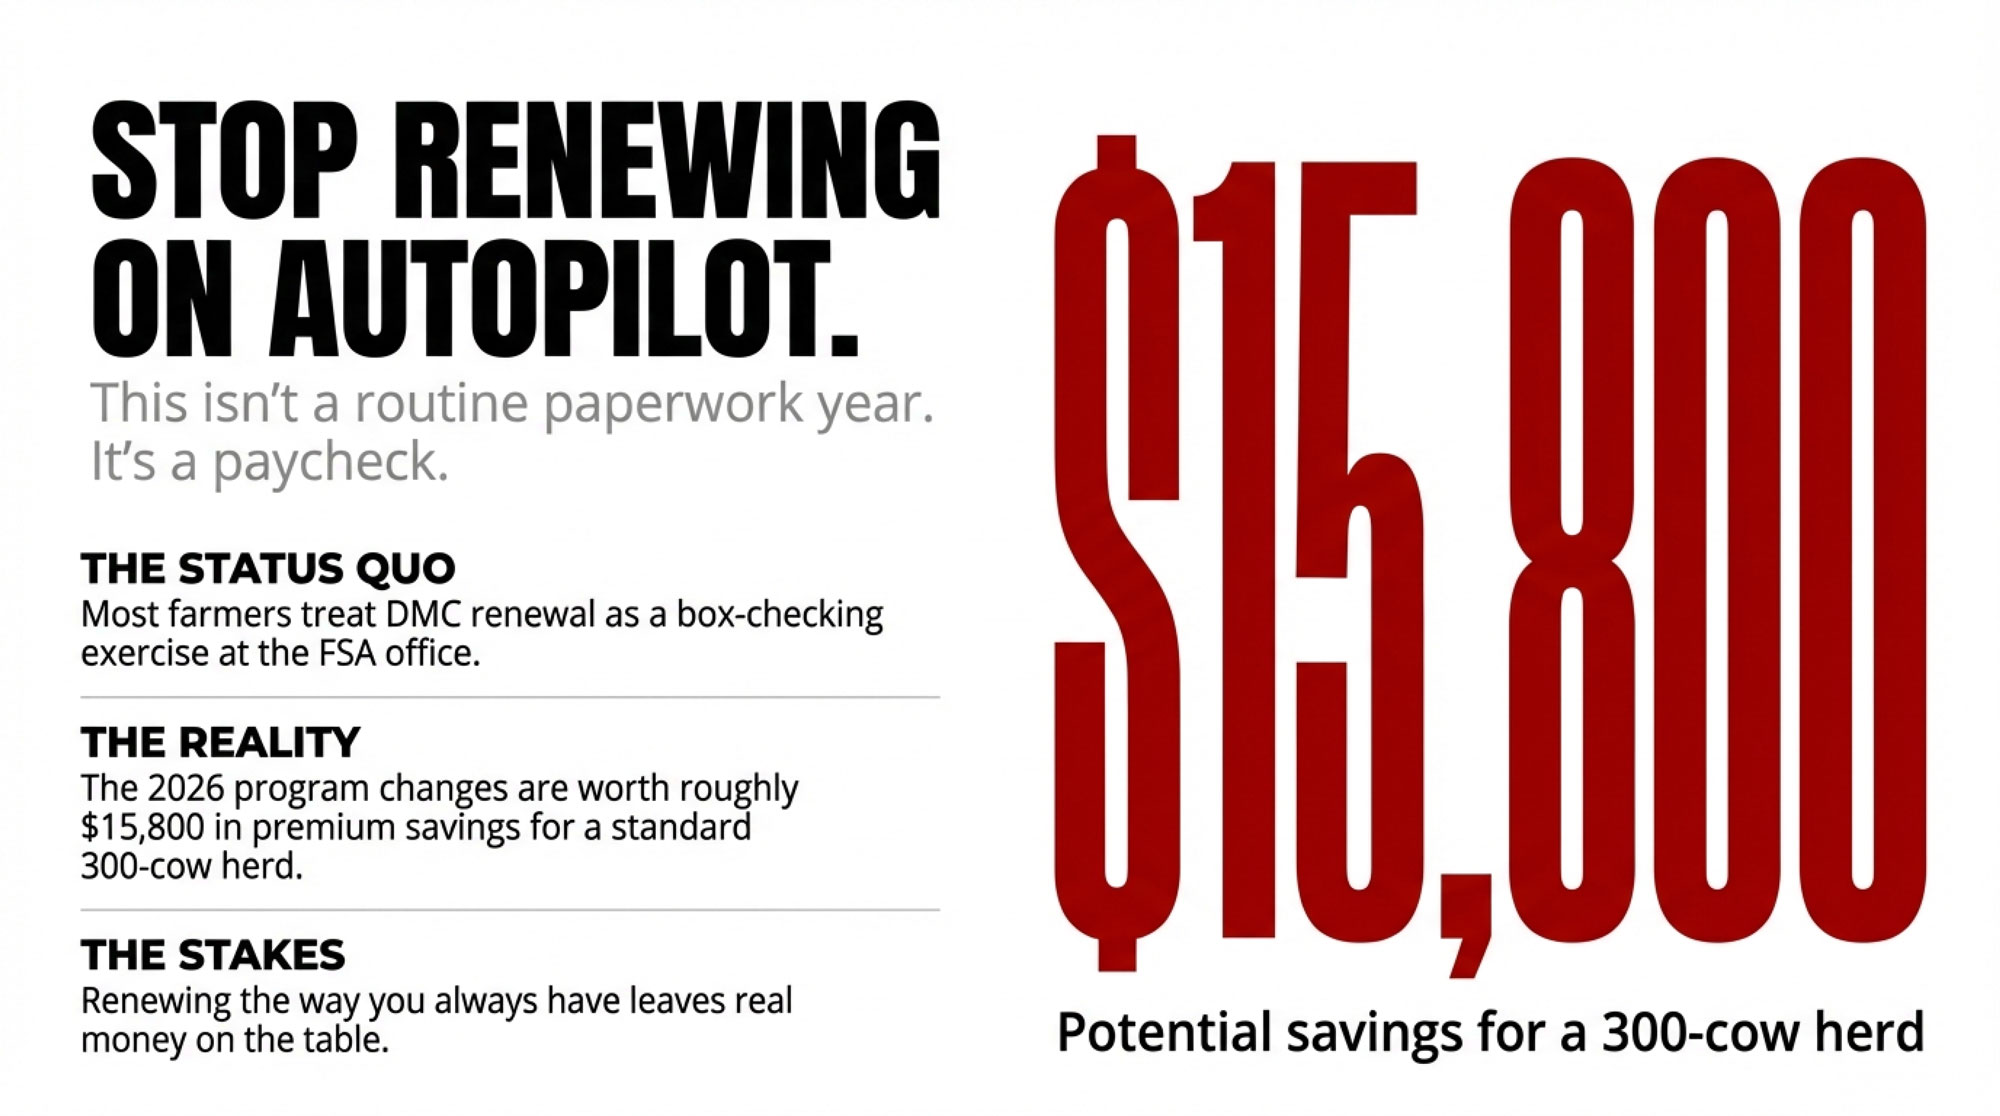
That’s exactly where a composite 400‑cow freestall operator we’ll call ‘Mark’ lands in 2026. His freestall saves roughly $16,600 a year on Dairy Margin Coverage premiums thanks to the new Tier 1 expansion — about $41.50 per cow. Early‑2026 Extension analysis suggests several months of $1‑plus/cwt DMC indemnities on covered milk if margins track the 2019–2023 pattern at the kitchen table, that looks like protection.
Across the lender’s desk, once his banker, Julie, pulls DMC and other program dollars out of the cash flow, the number is simple: around 0.9x DSCR. Without government support, the cash flow doesn’t fully cover annual debt service.
All numbers and policy tools in this piece refer to U.S. non‑quota herds operating under federal programs (DMC, FSA, EQIP, DNIP).
Composite scenario built from producer and lender patterns, Extension data, and ag‑lending benchmarks — not a single real named farm.
“The Farm Bill Saved Us”… Or Did It?
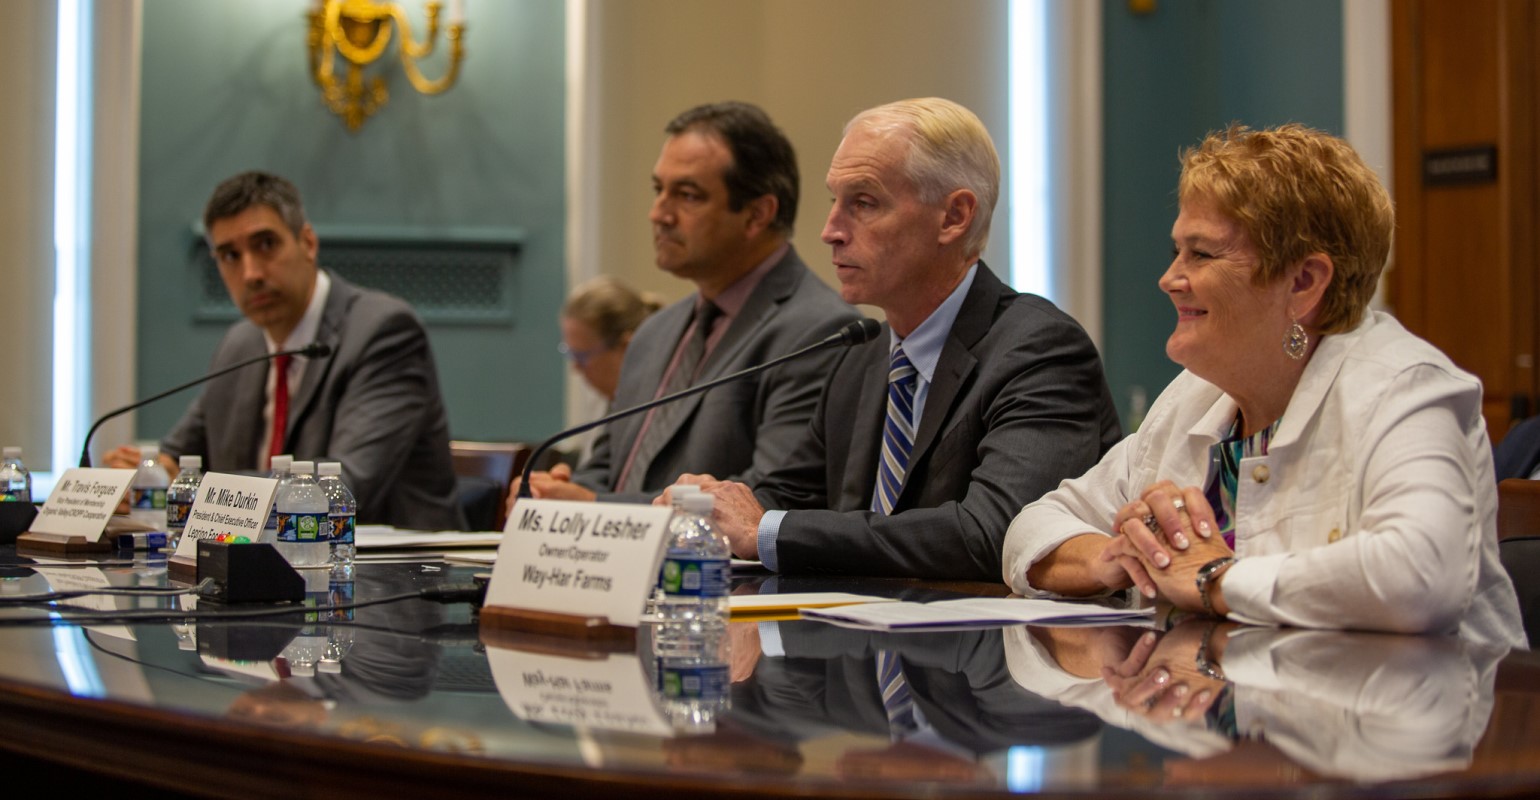
Mark looks a lot like many mid‑size family dairies in 2026. He milks 400 cows, ships about 11 million lbs/year — roughly 110,000 cwt. Two capital projects sit behind him: a parlour upgrade and manure system work, both financed when rates were low and now reset to higher levels. His labour mix mirrors the broader industry — a 2015 Texas A&M/National Milk Producers Federation study estimated immigrant workers account for roughly 51% of U.S. dairy labour and produce close to 79% of the nation’s milk.
On the policy side, he’s done everything right in the new farm‑bill world:
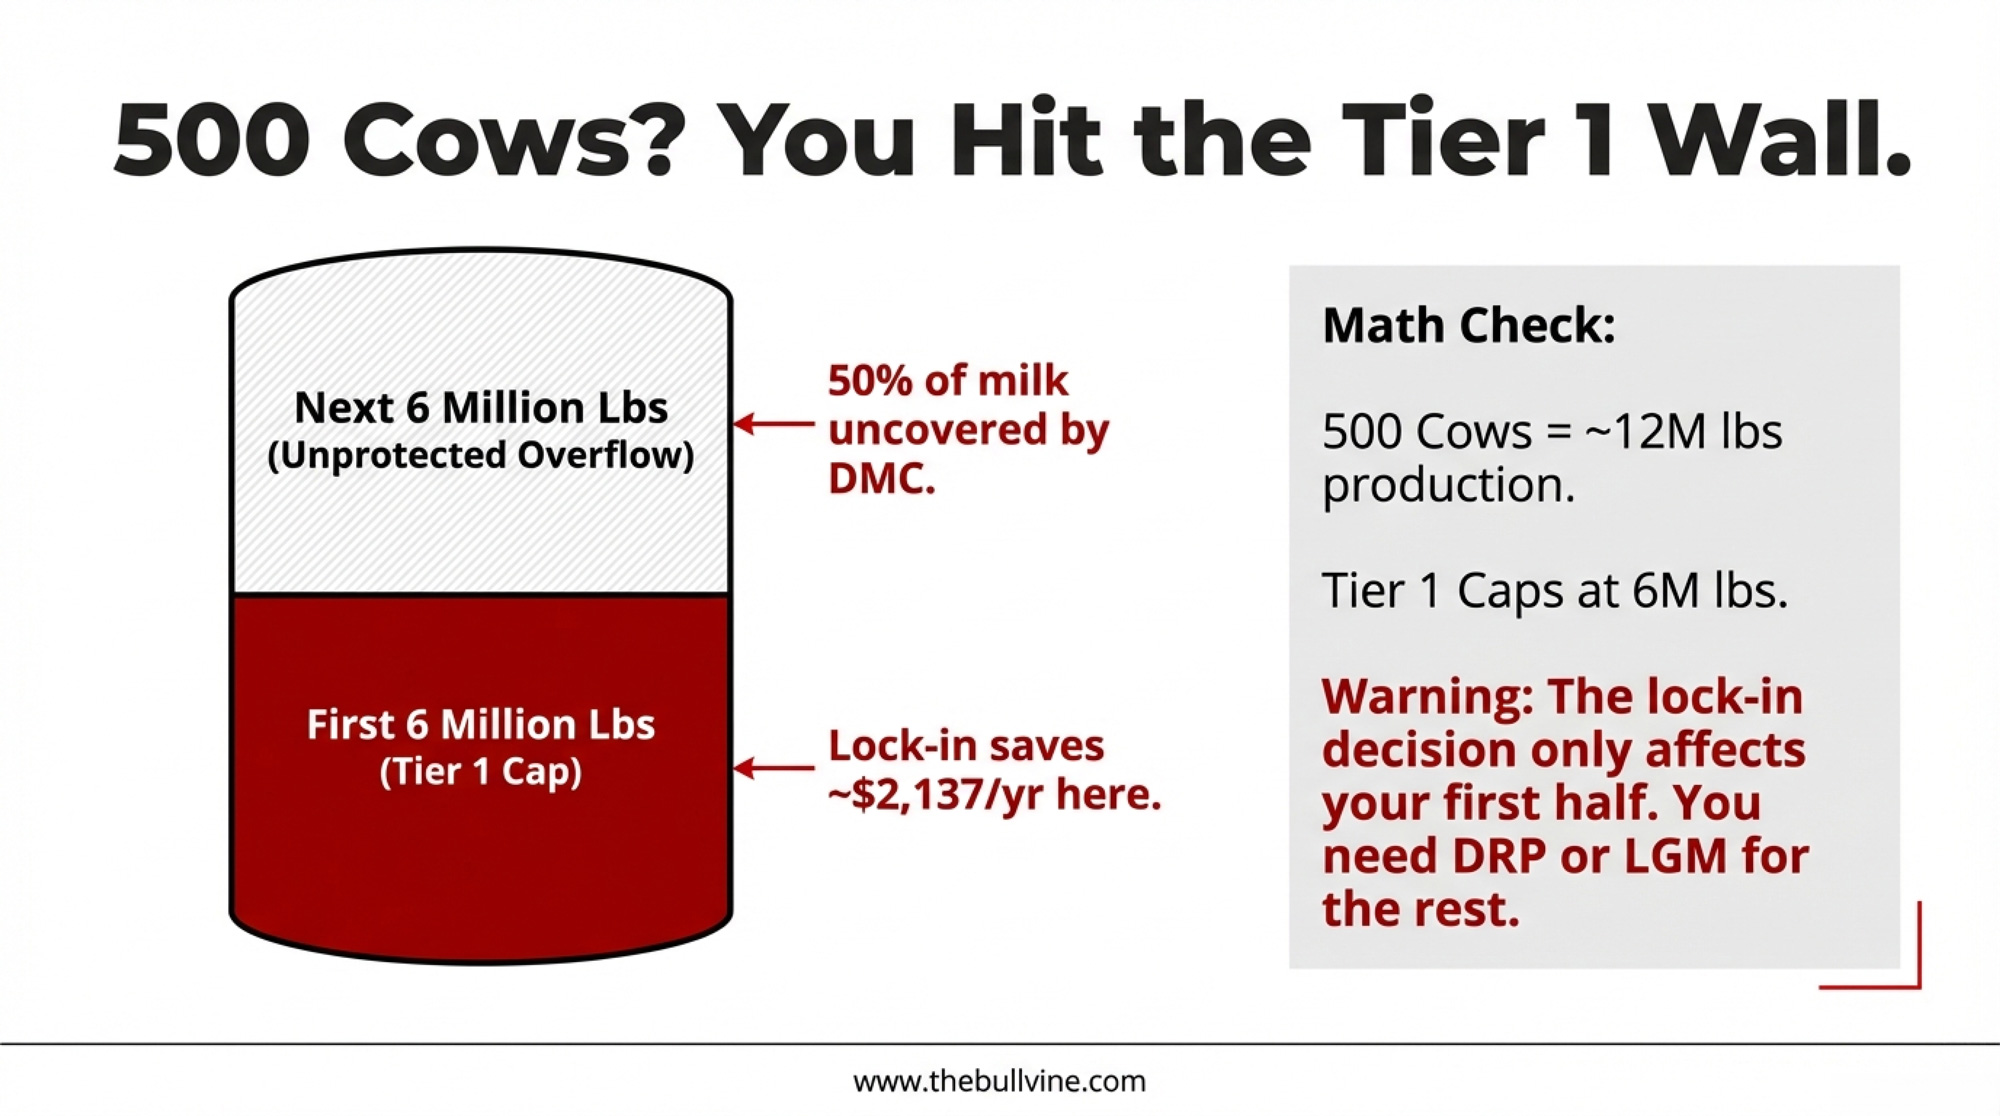
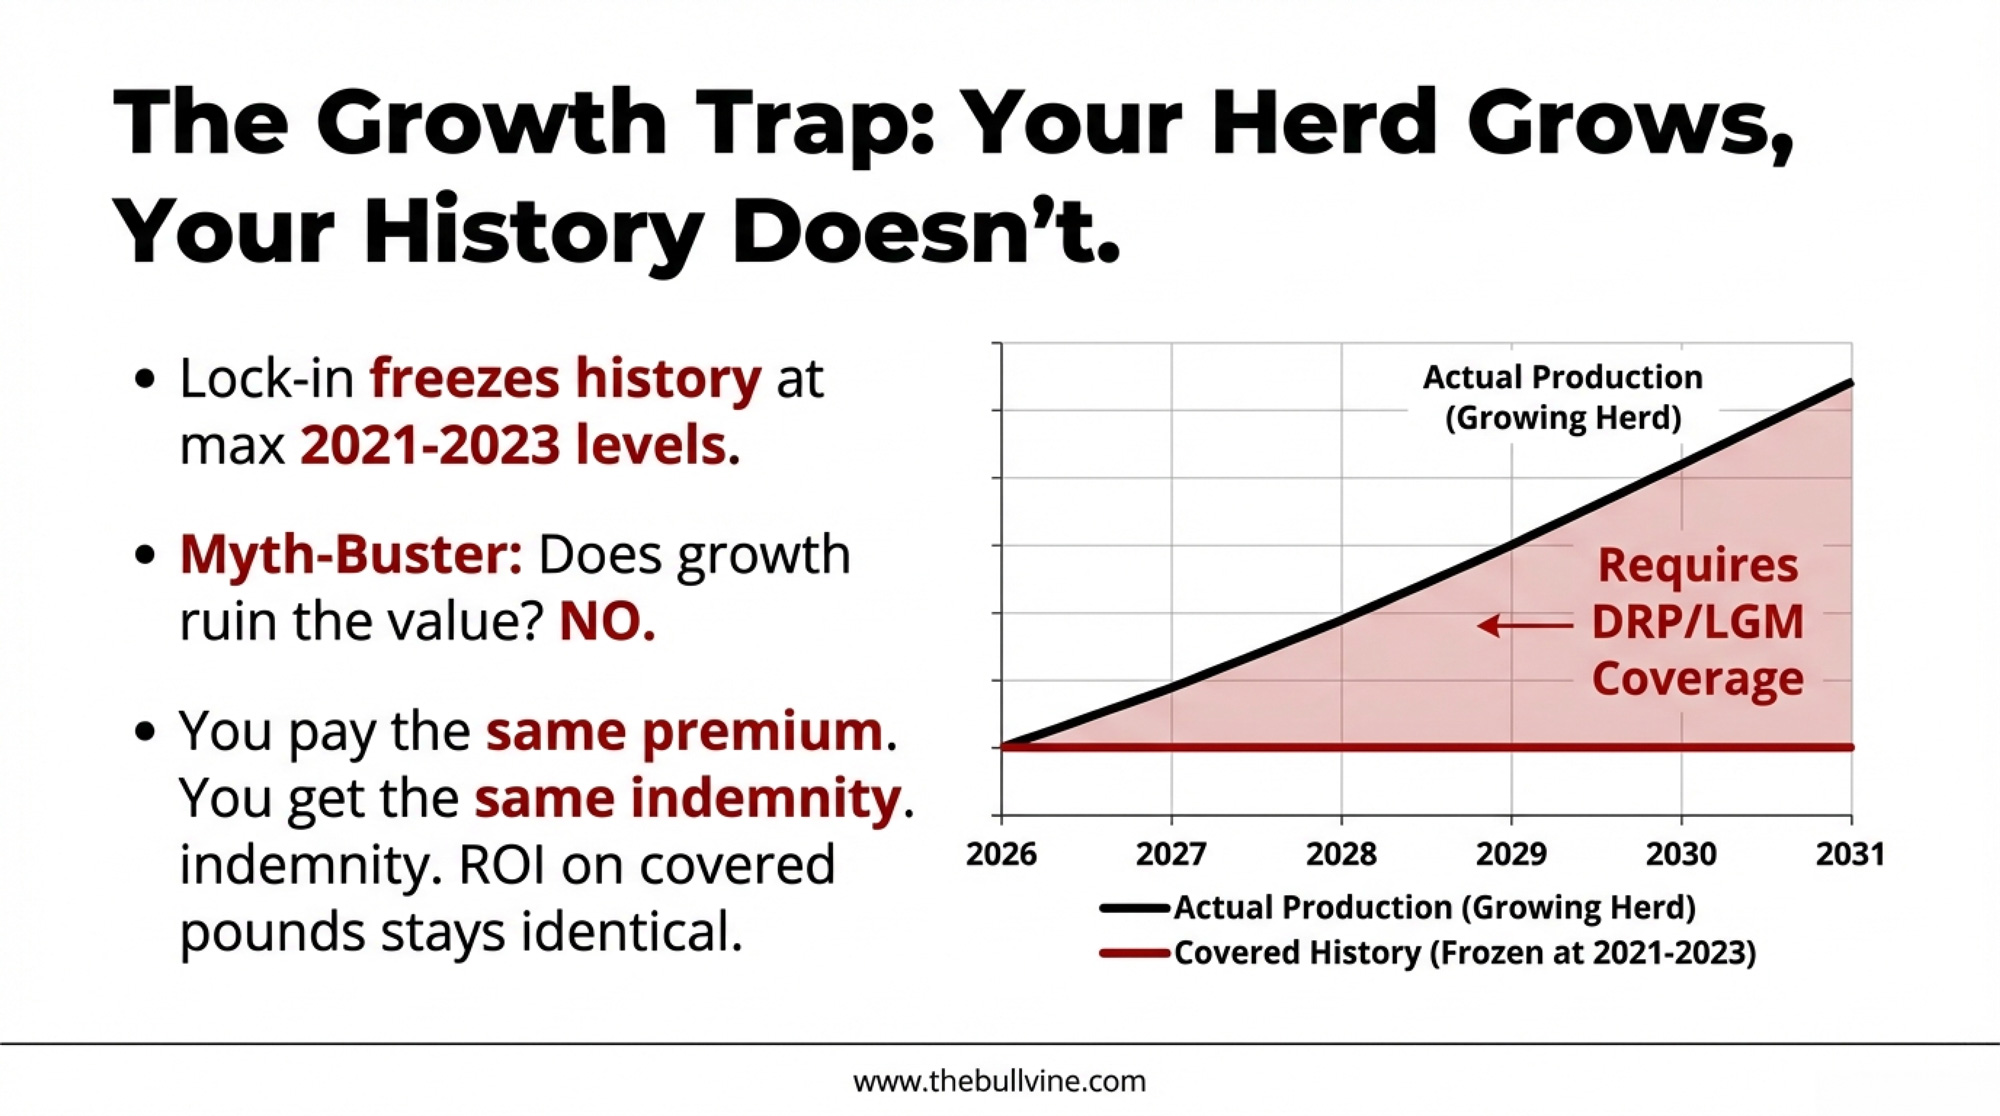
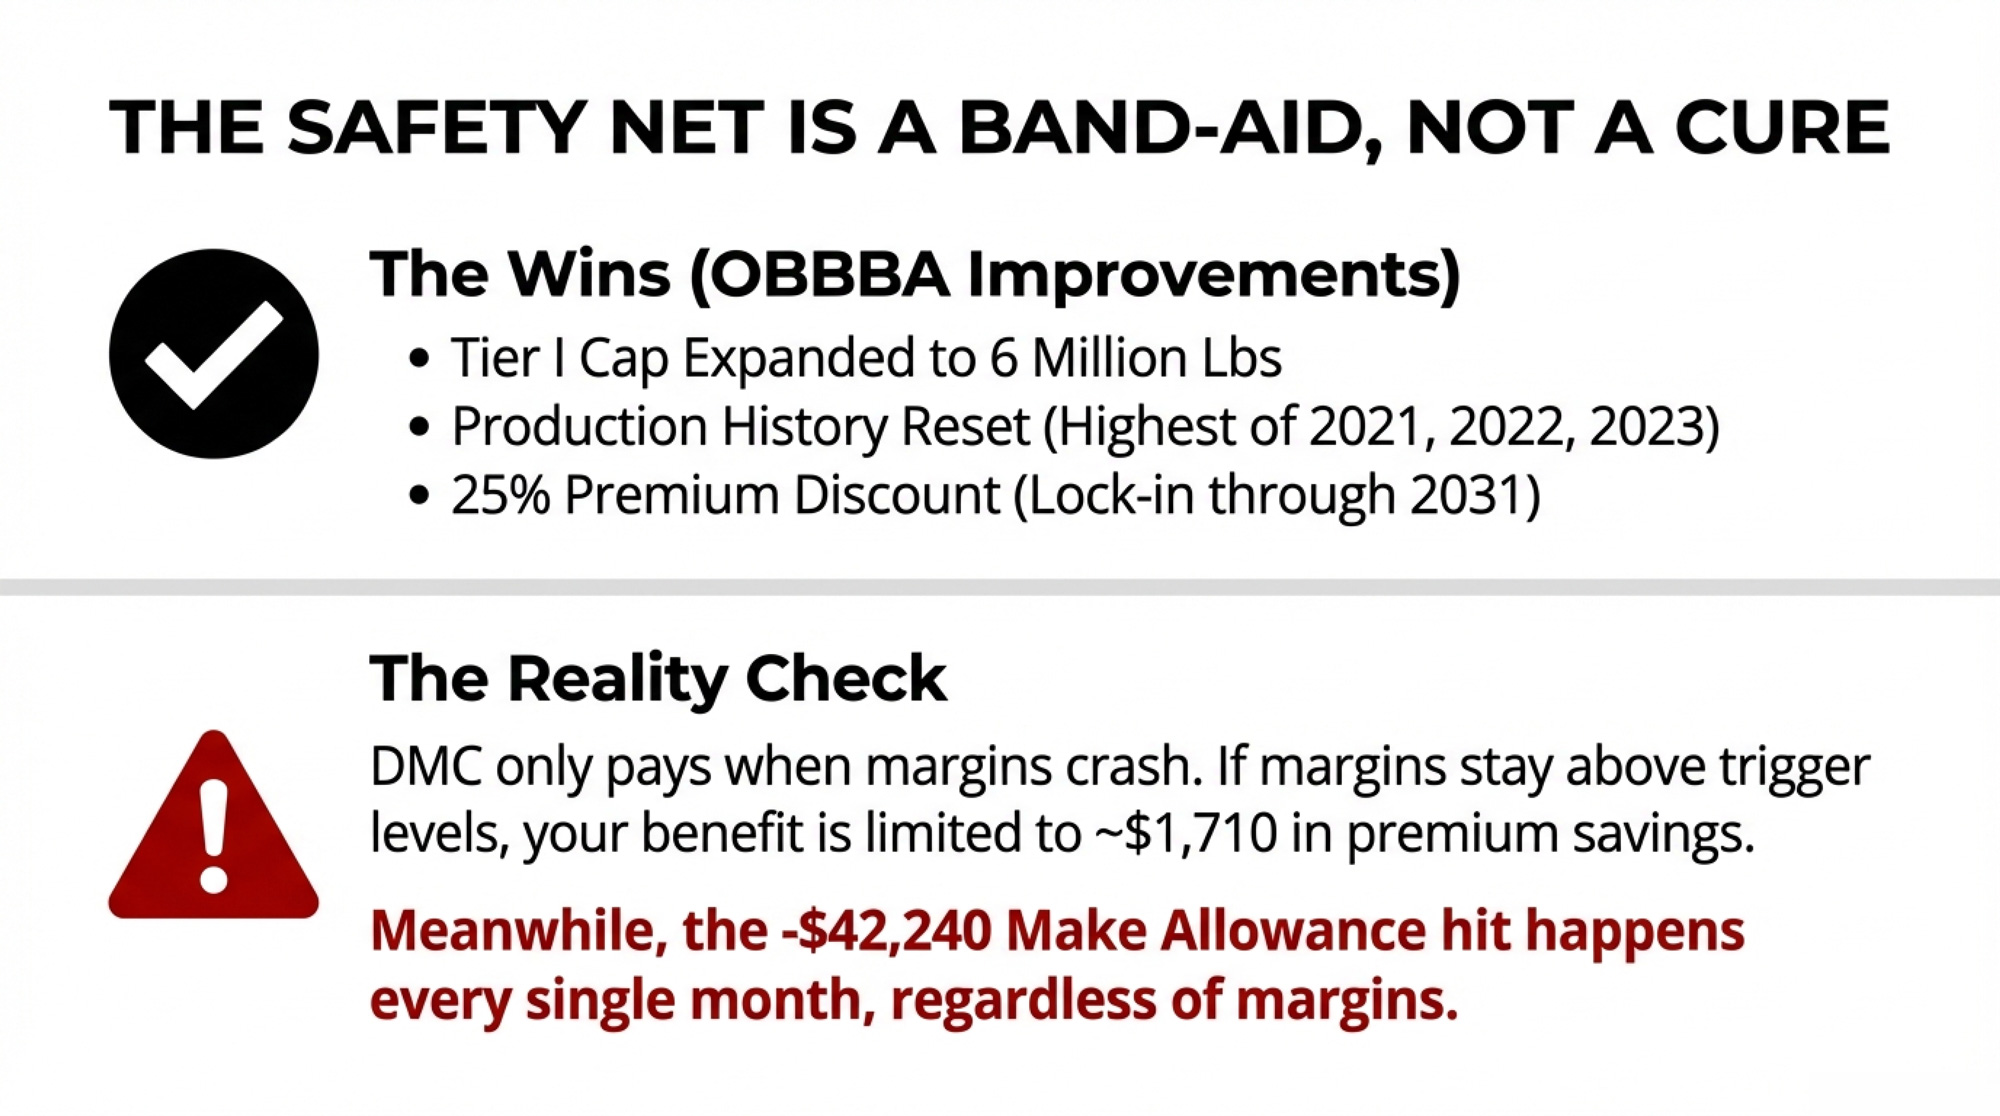
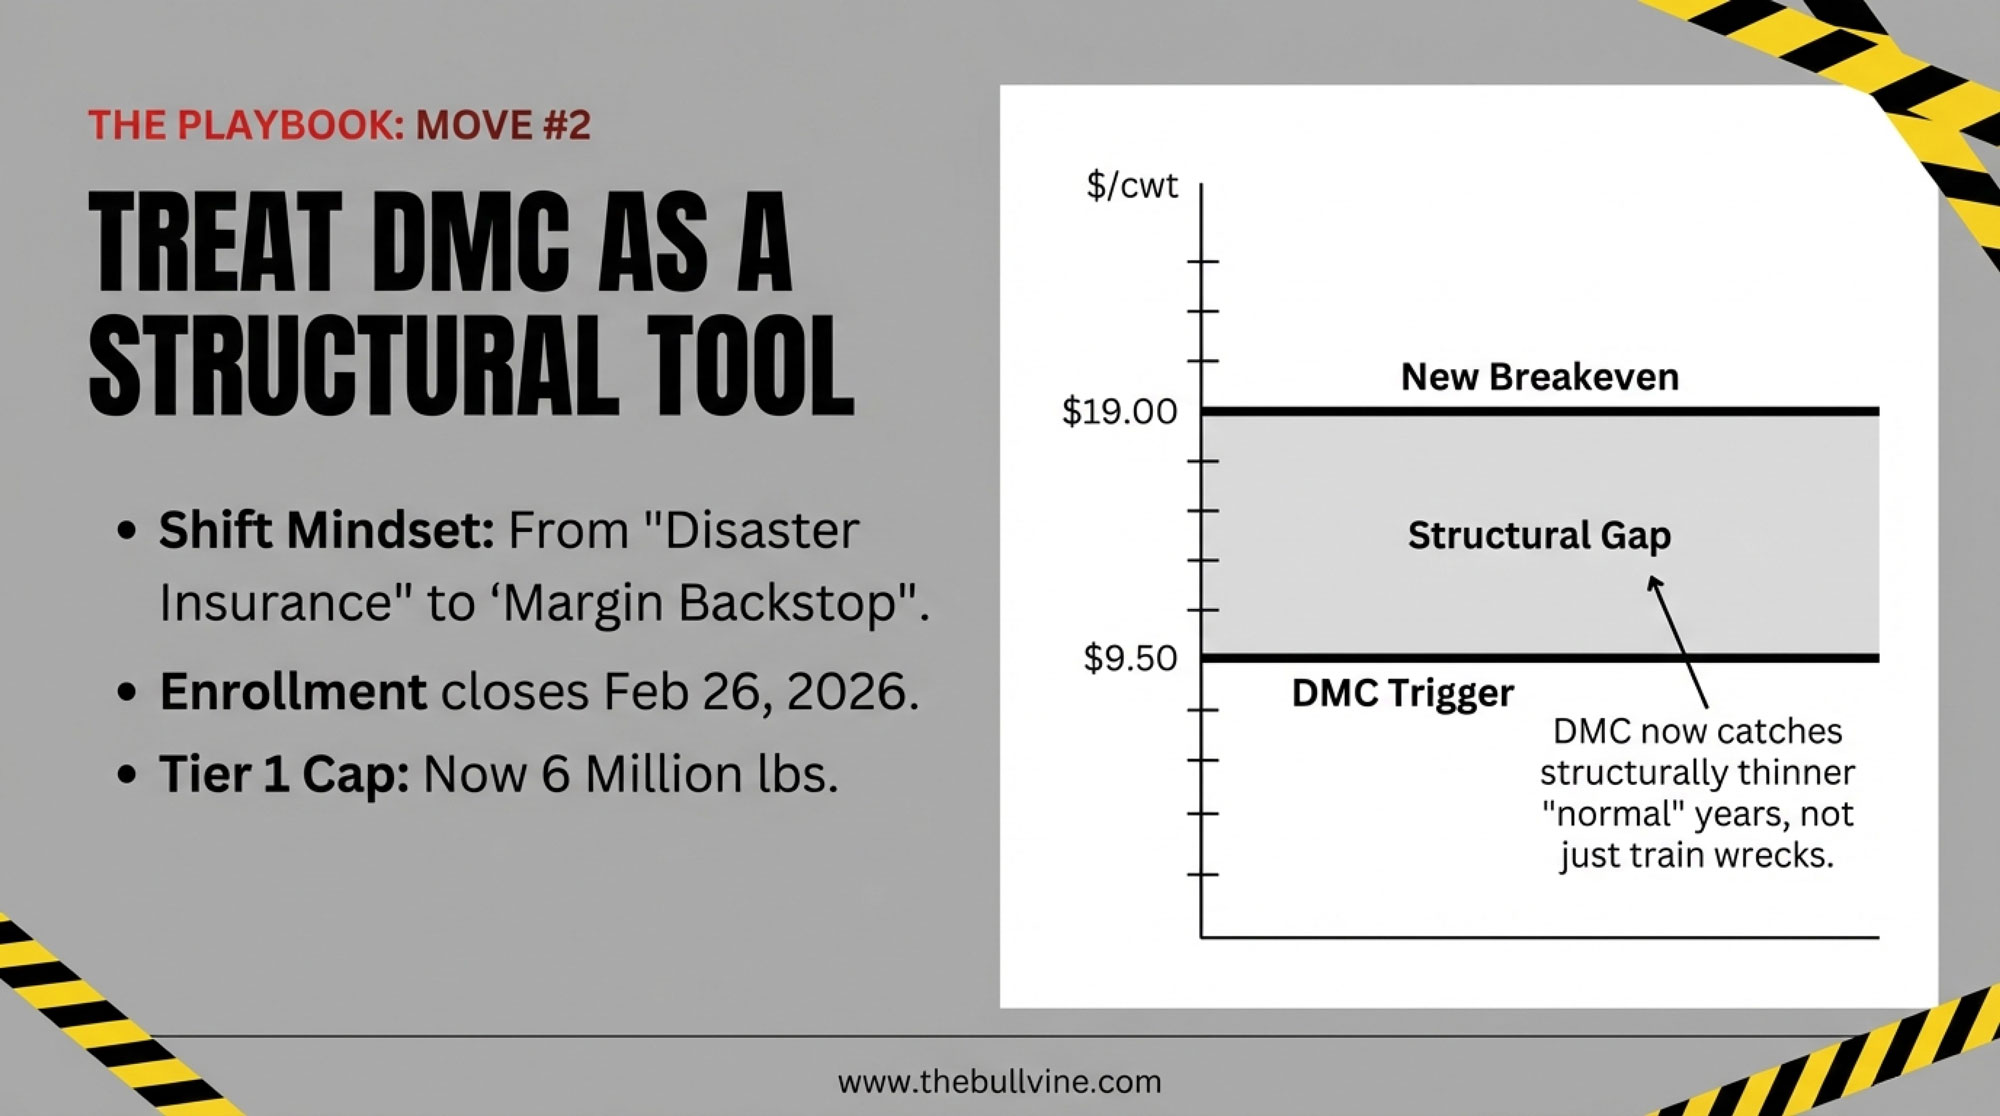
- Maxed Tier 1 DMC at $9.50/cwt on the expanded 6 million lbs production history limit, after USDA raised Tier 1 from 5 to 6 million pounds and allowed history updates to each farm’s highest year from 2021–2023.
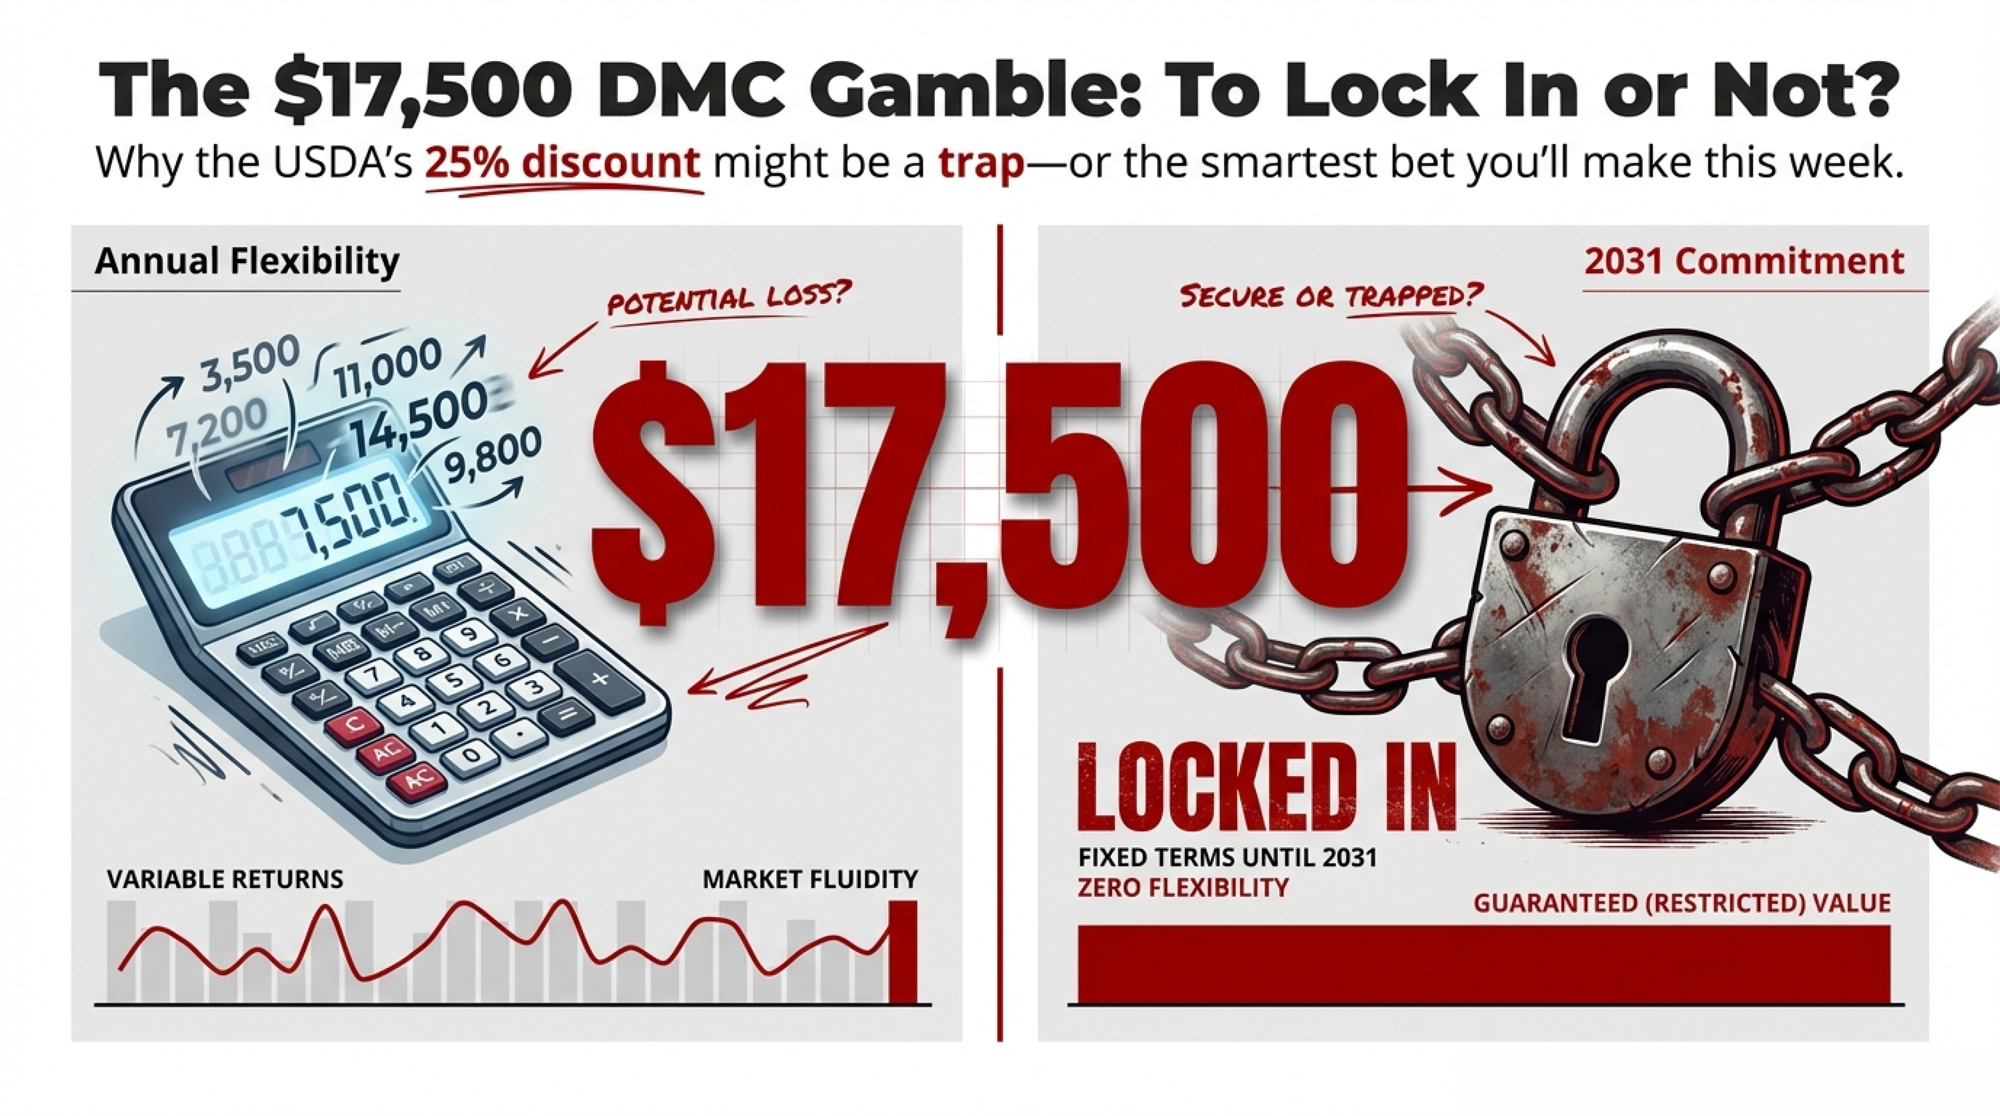
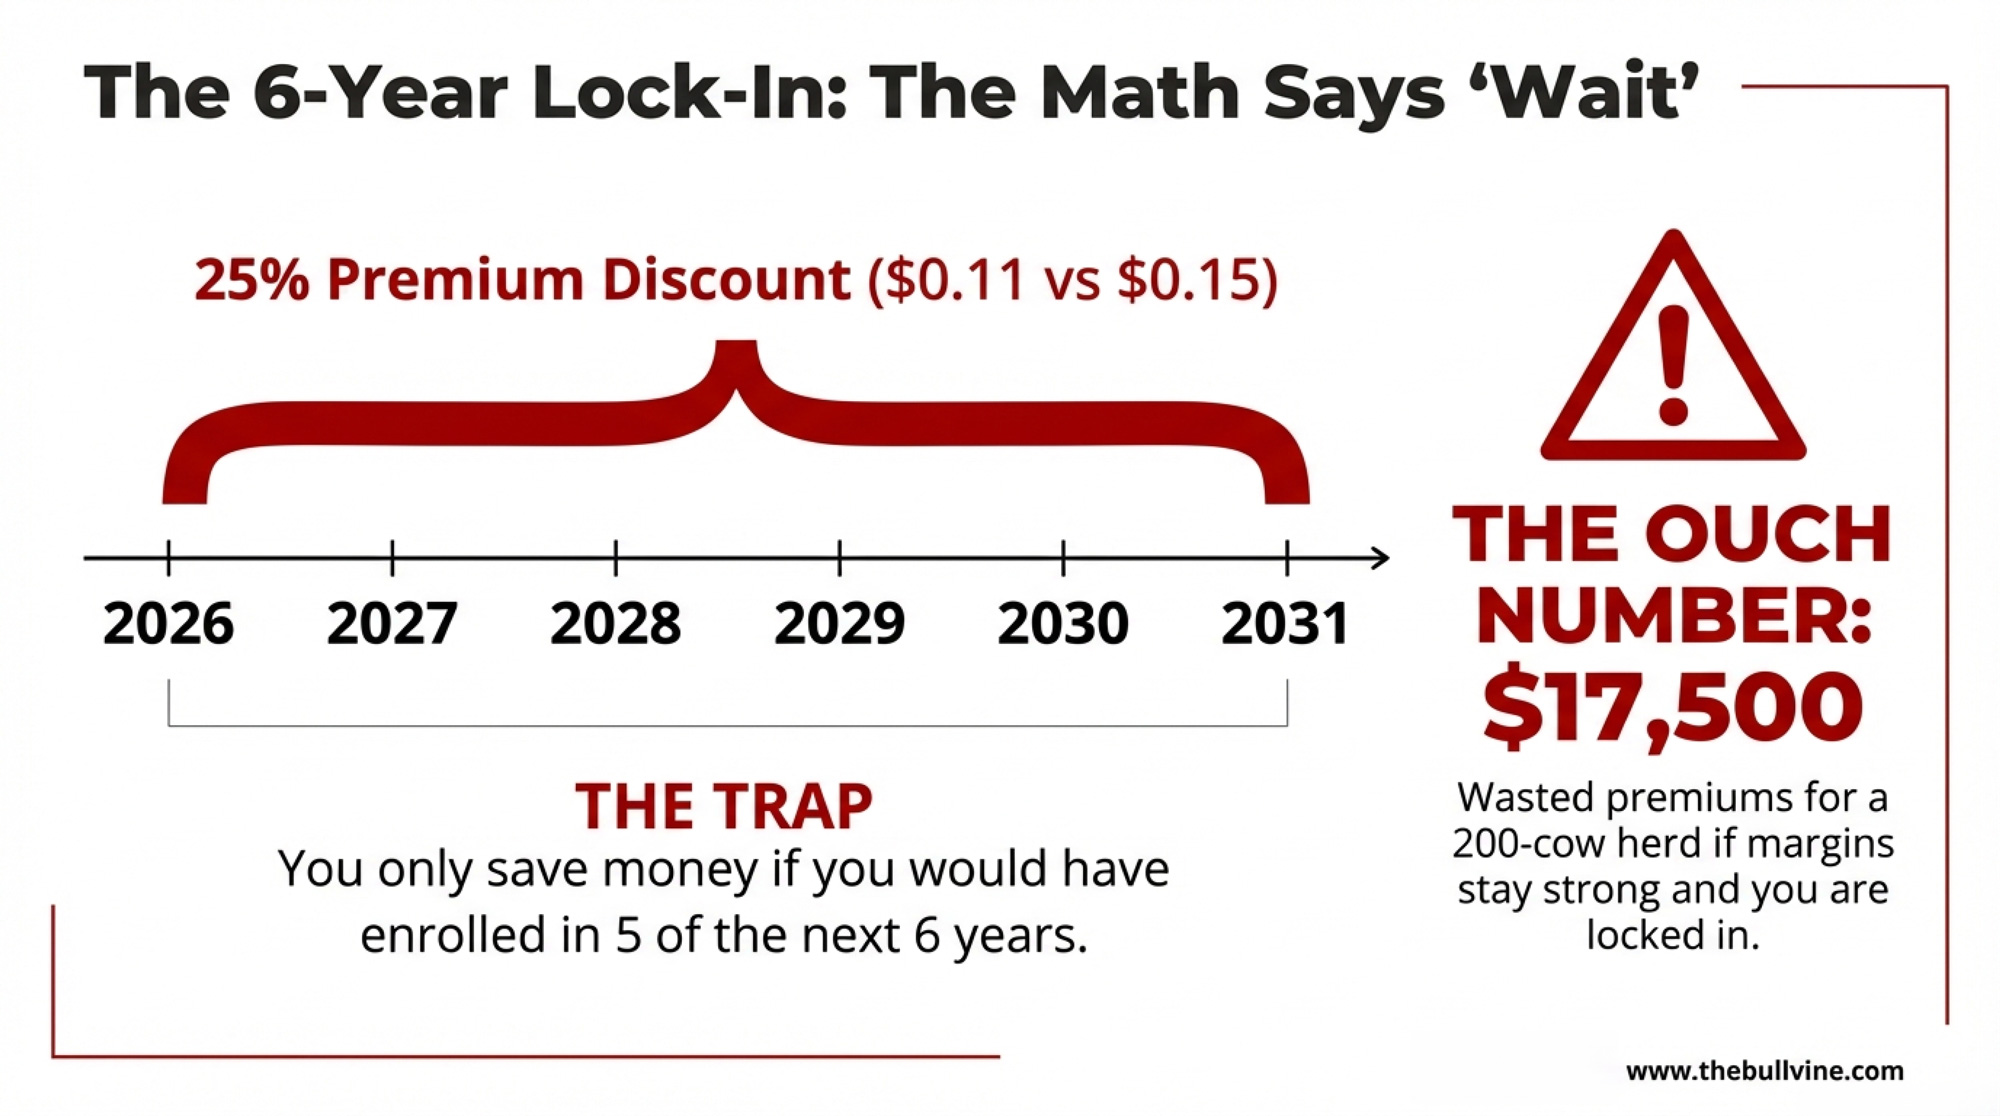
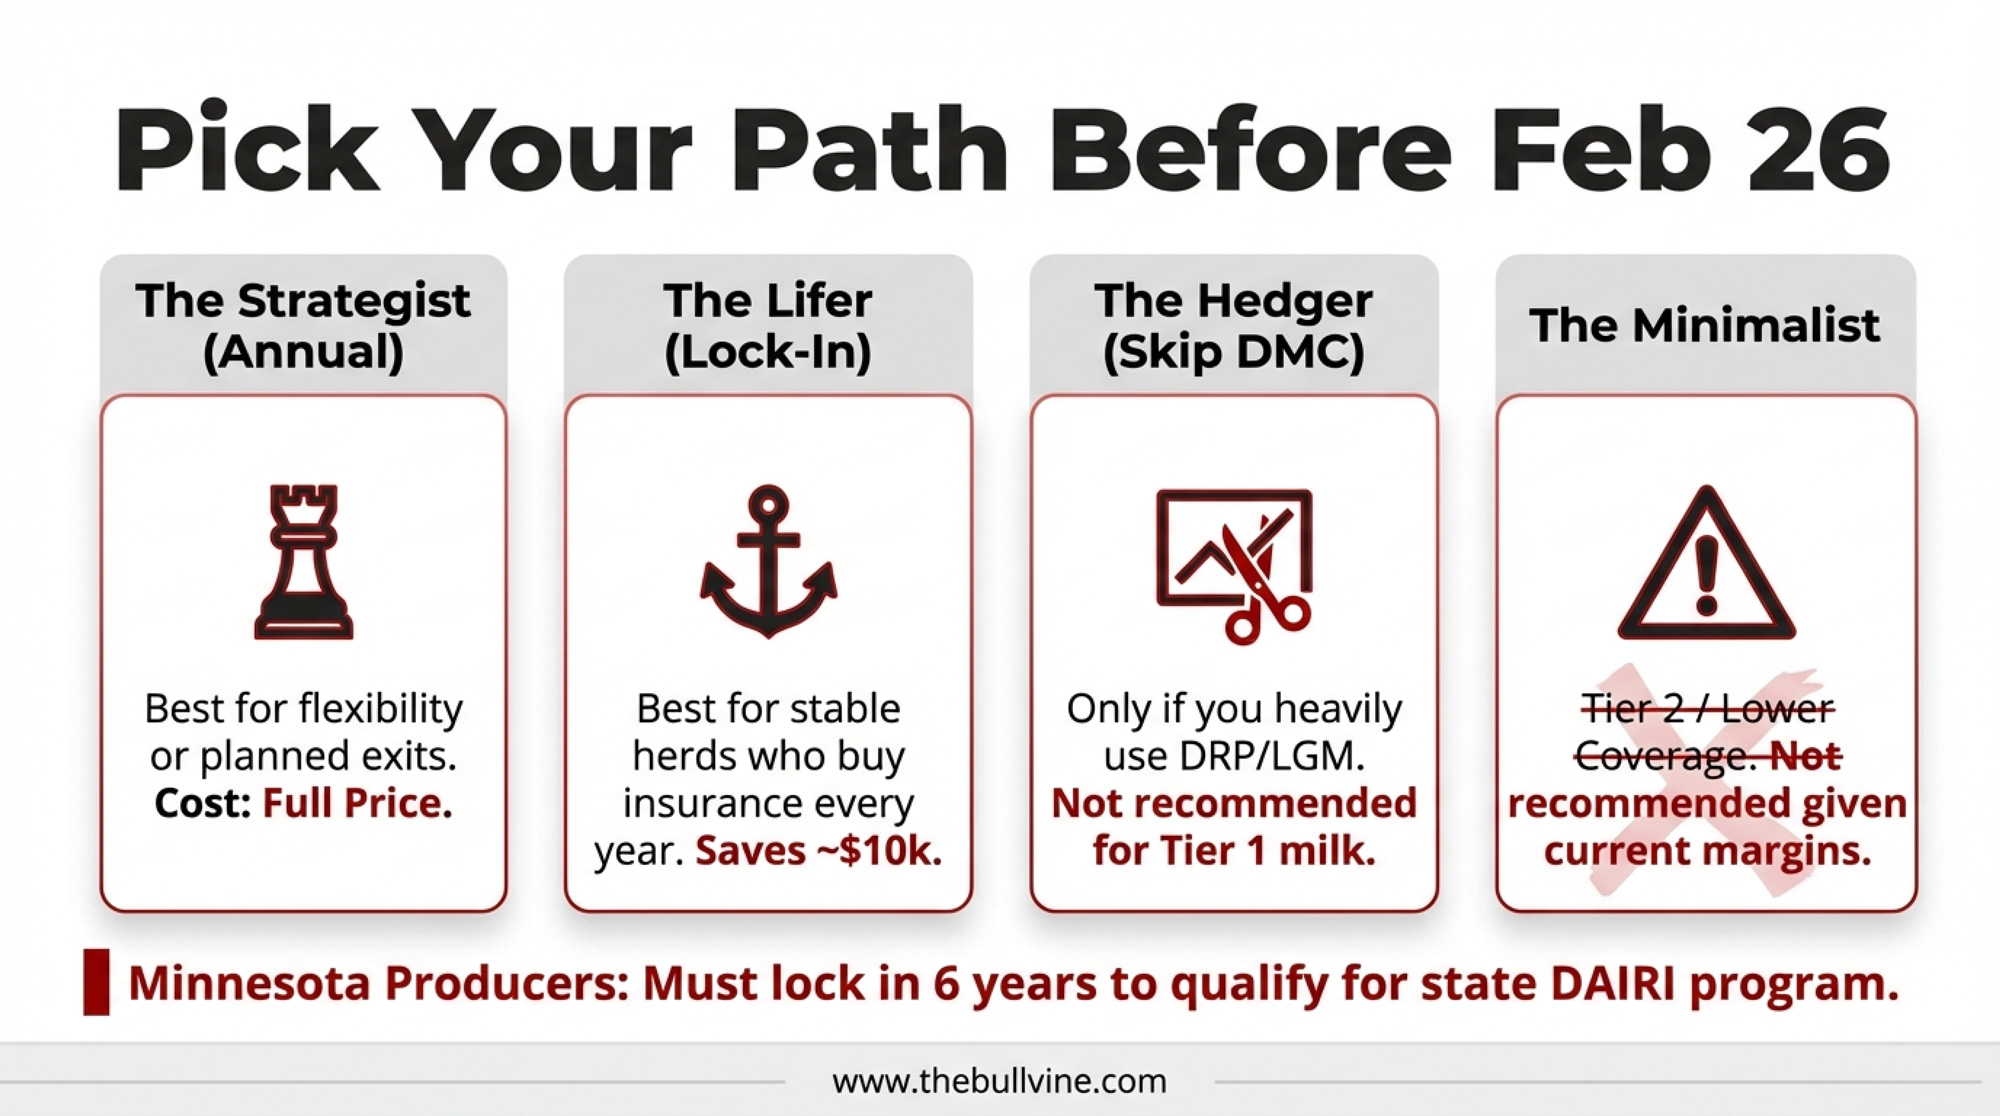
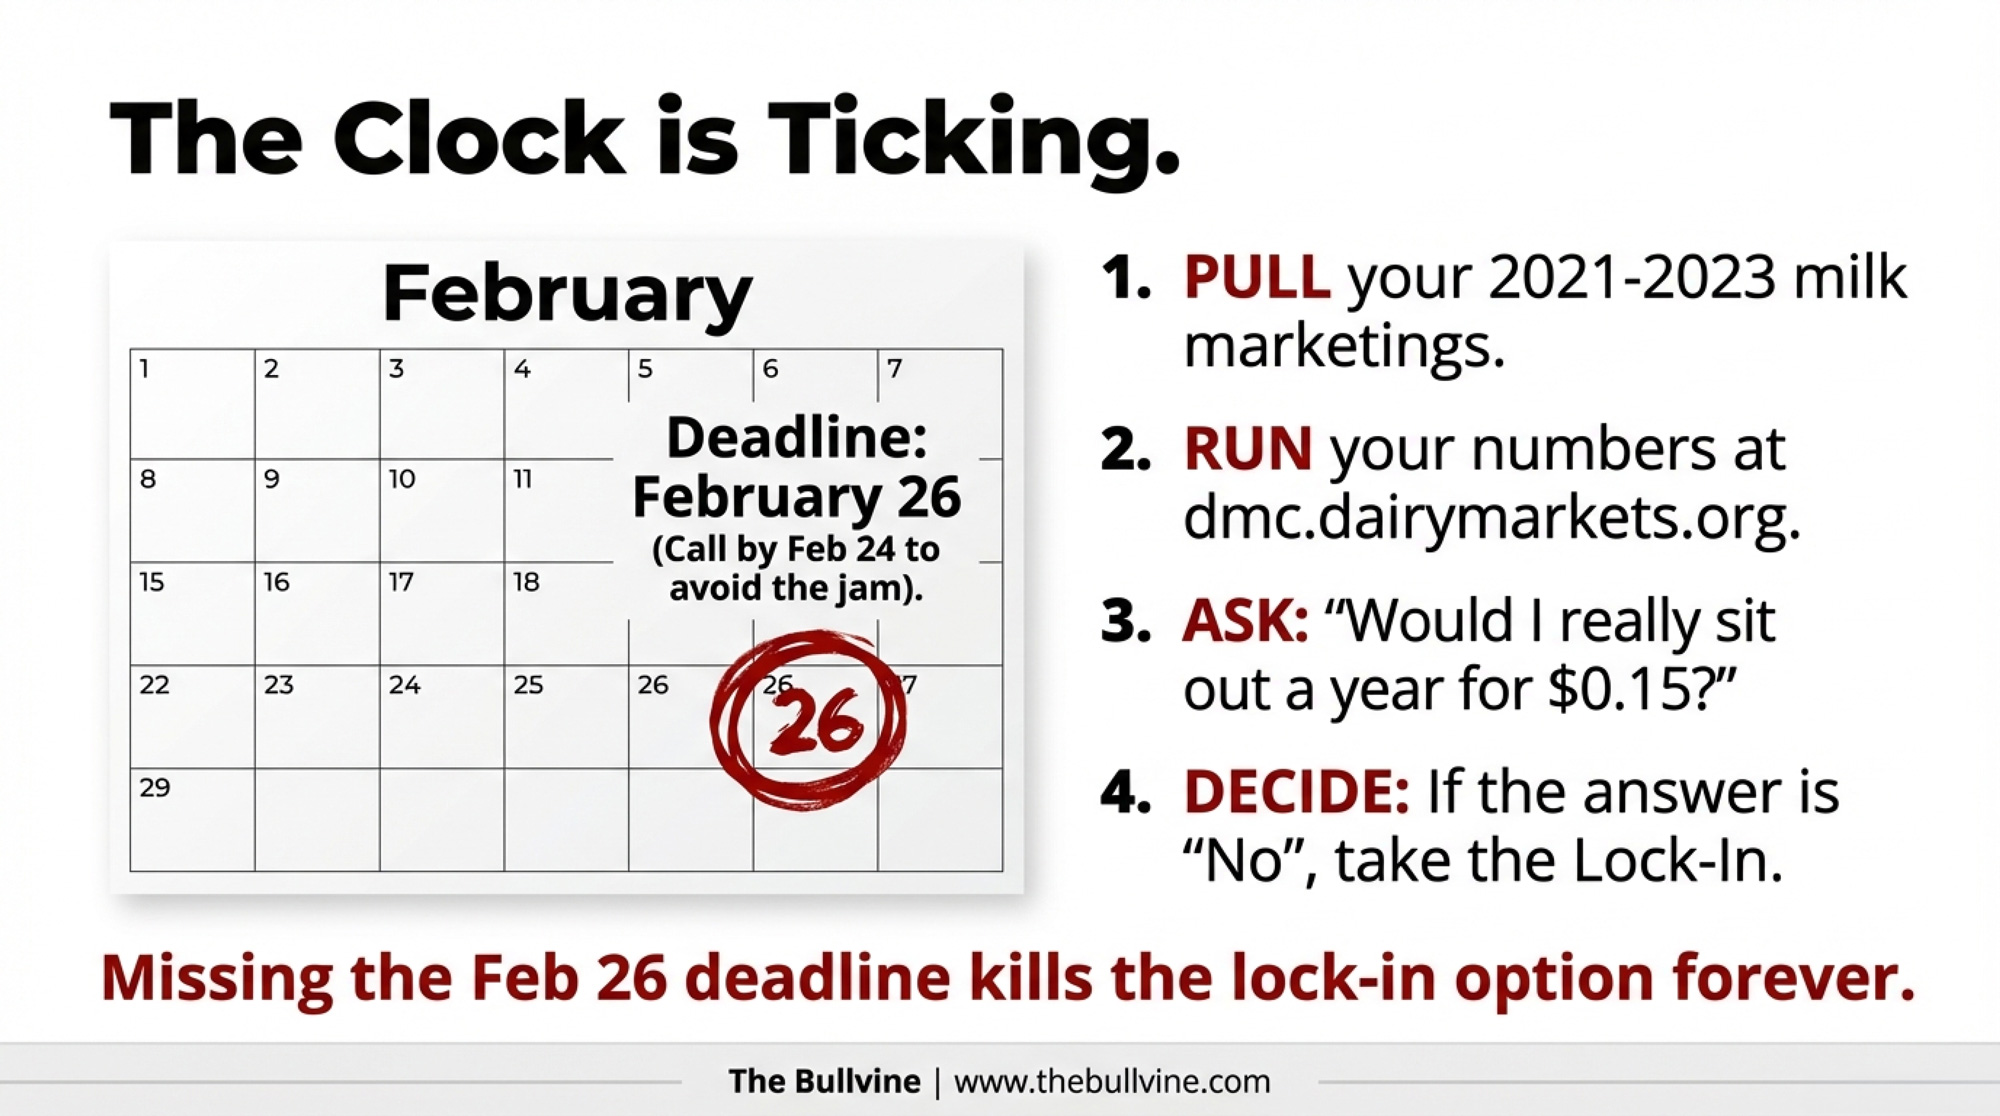
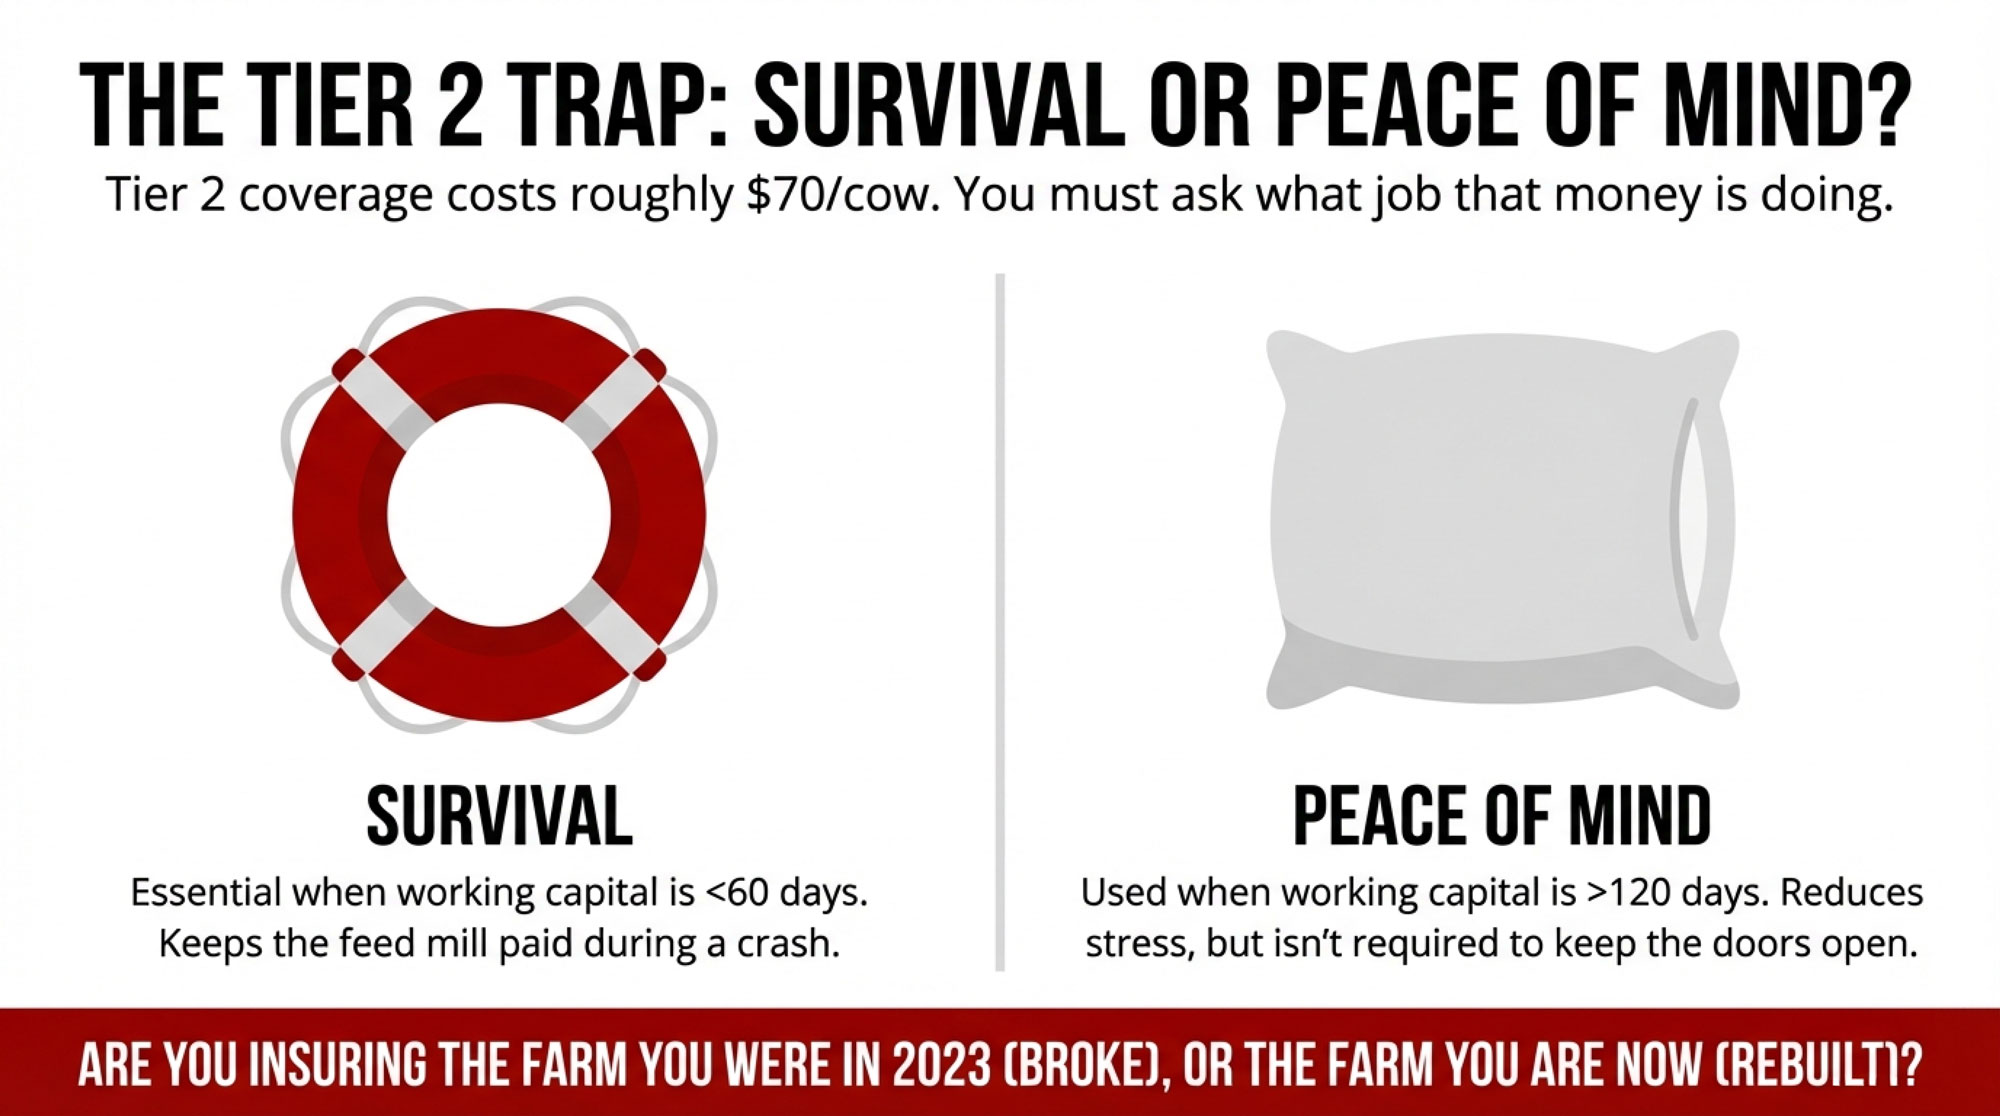
- Locked in the six‑year DMC commitment with a 25% premium discount on Tier 1 premiums from 2026 to 2031.
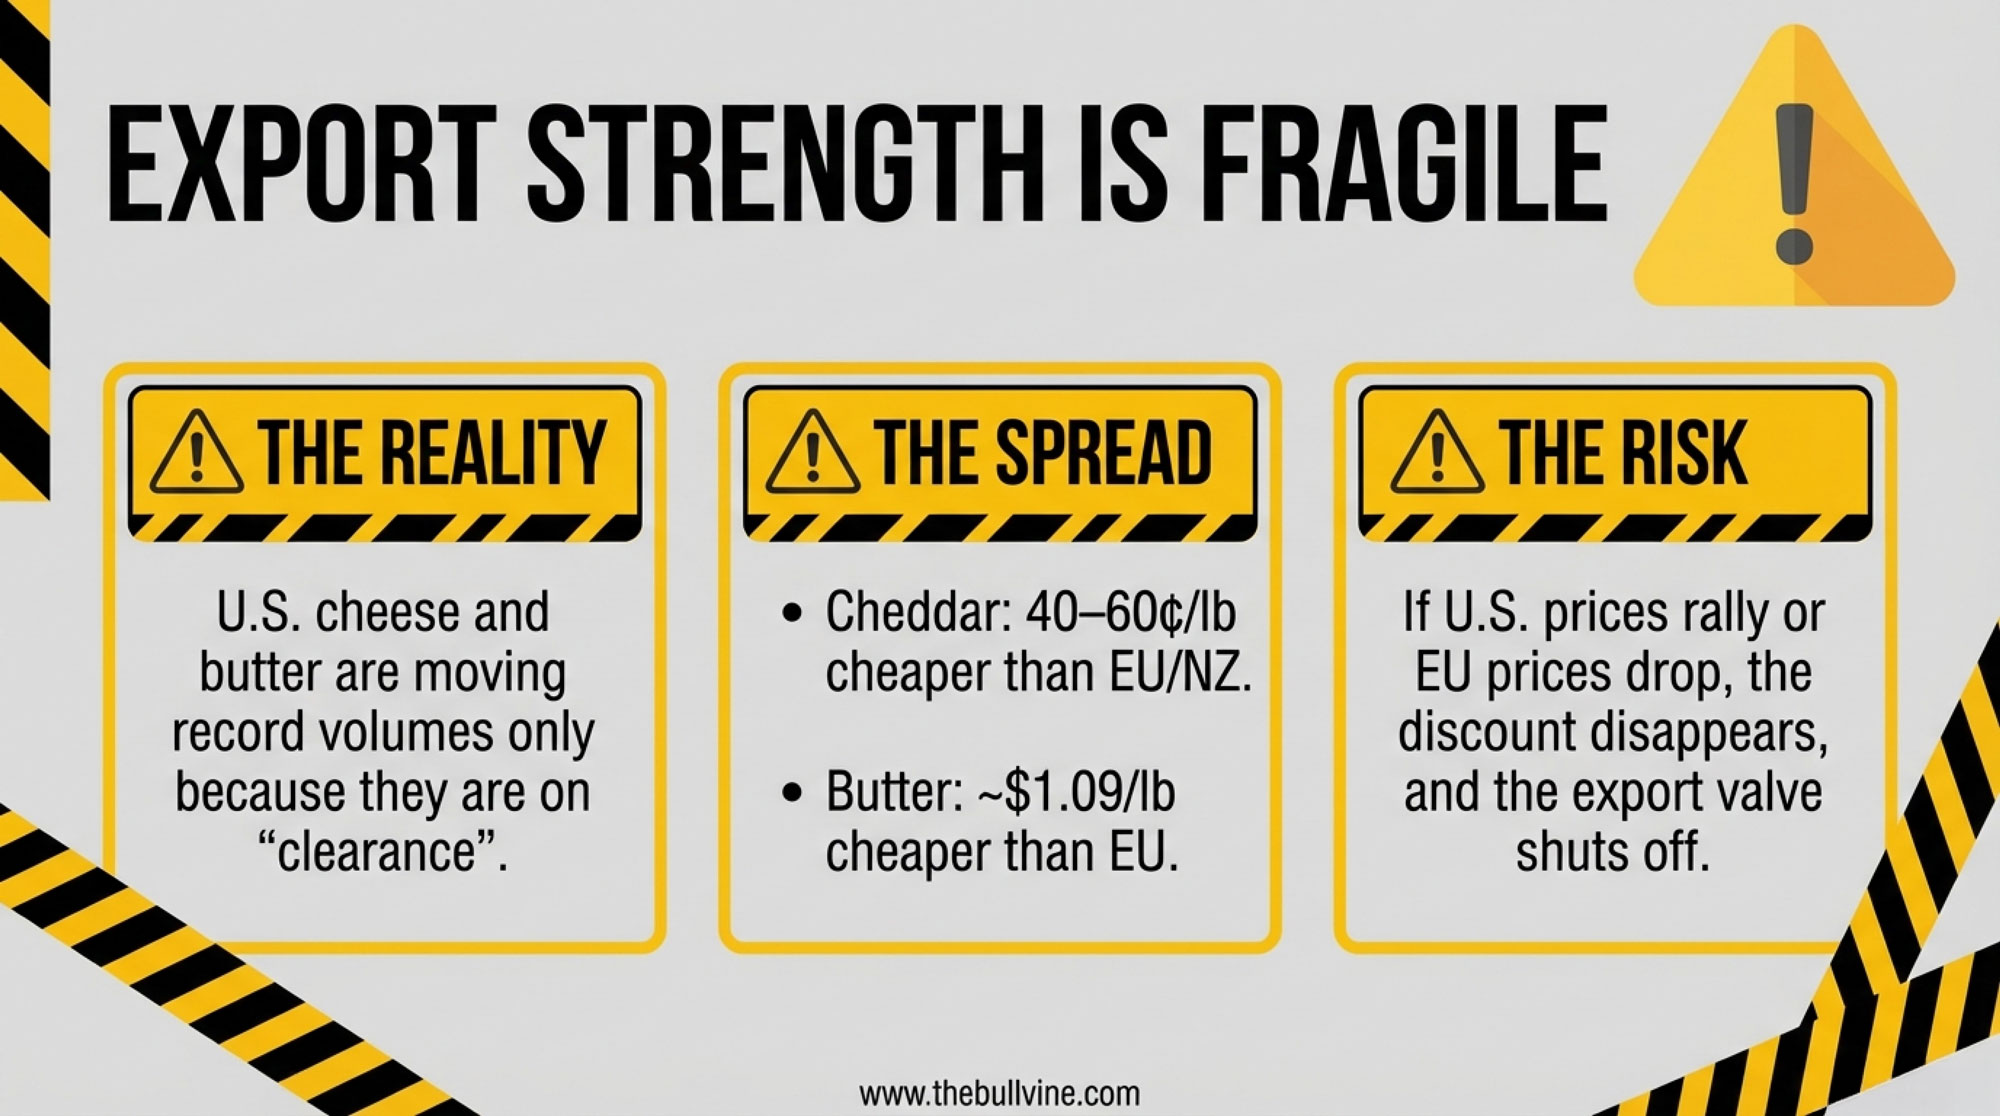
- Layered revenue protection on part of his milk to catch the downside that the DMC formula doesn’t see.
On paper, that’s a safety‑net success story. The deeper math tells a different story.
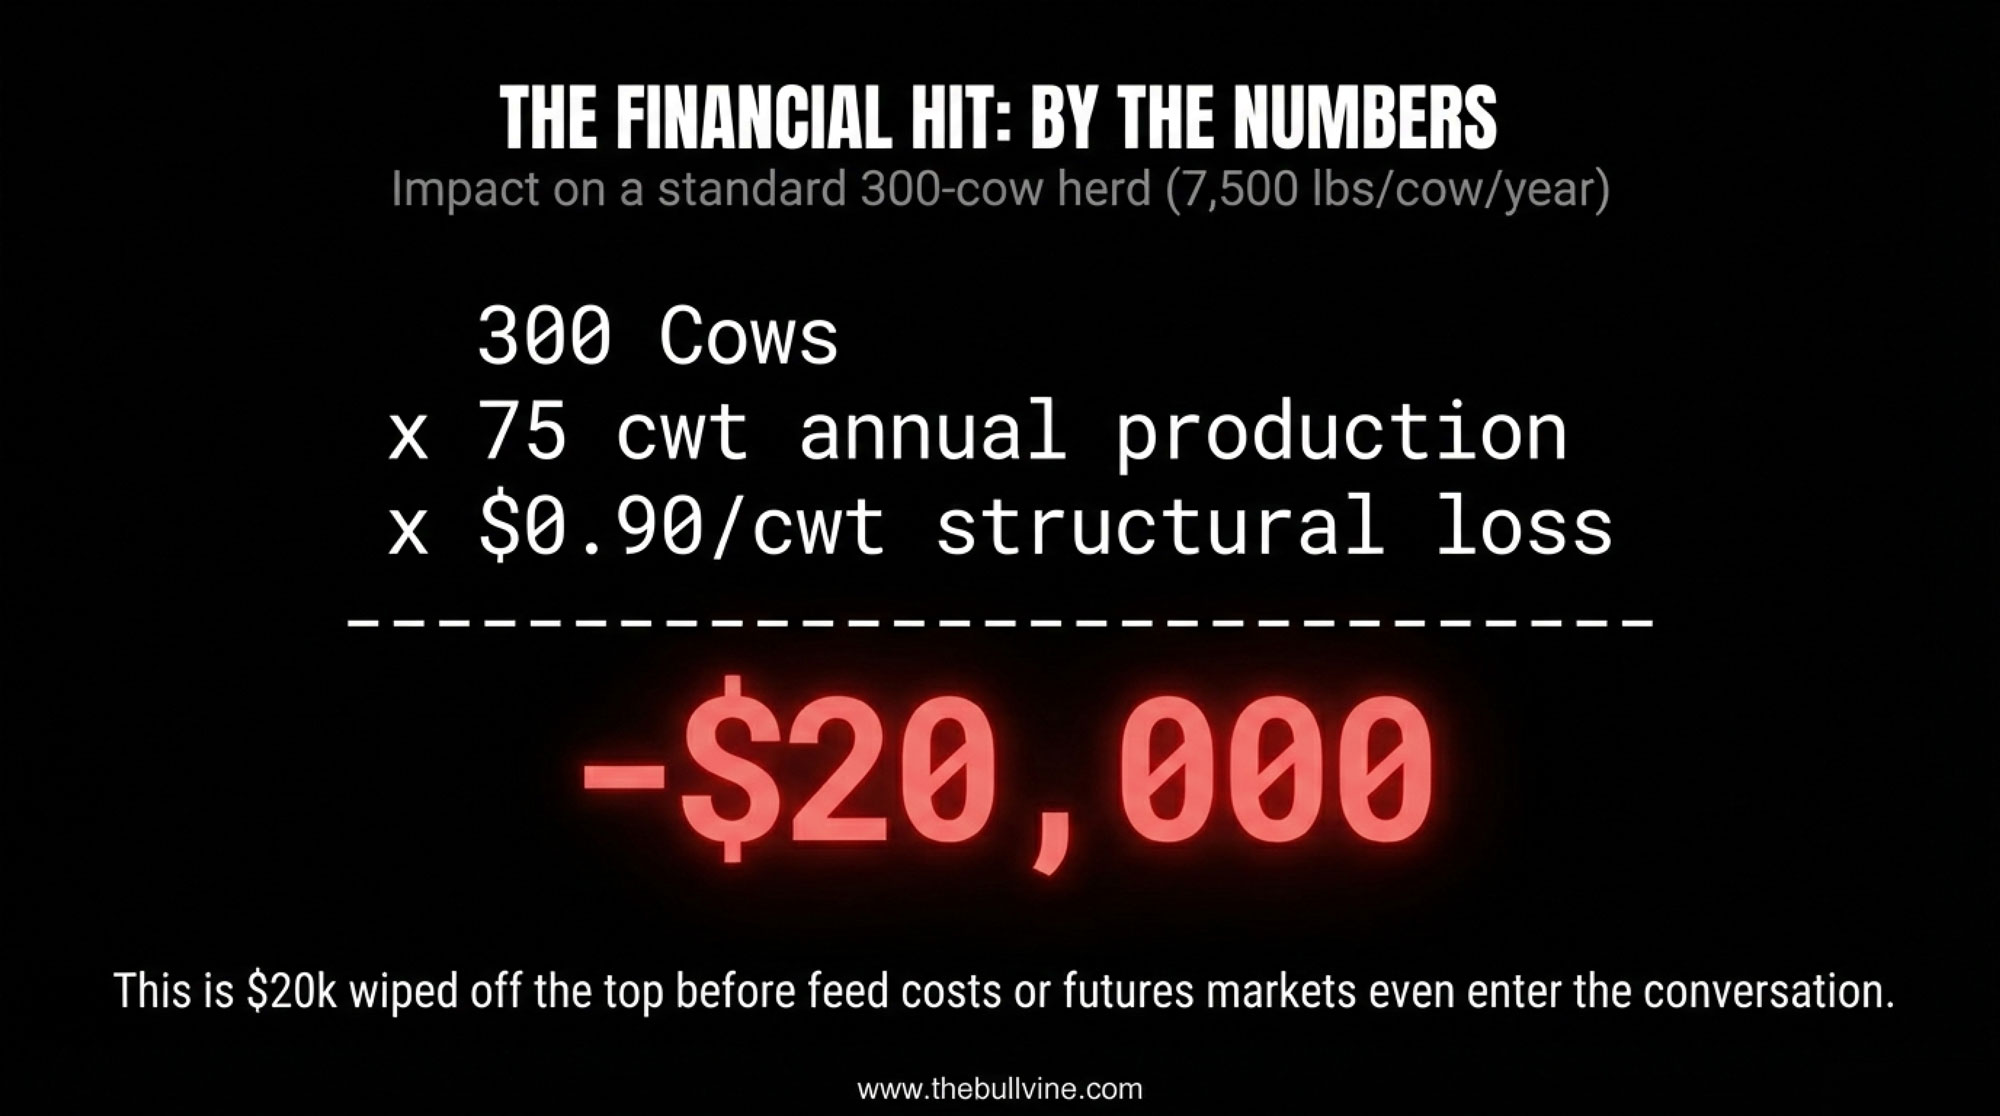
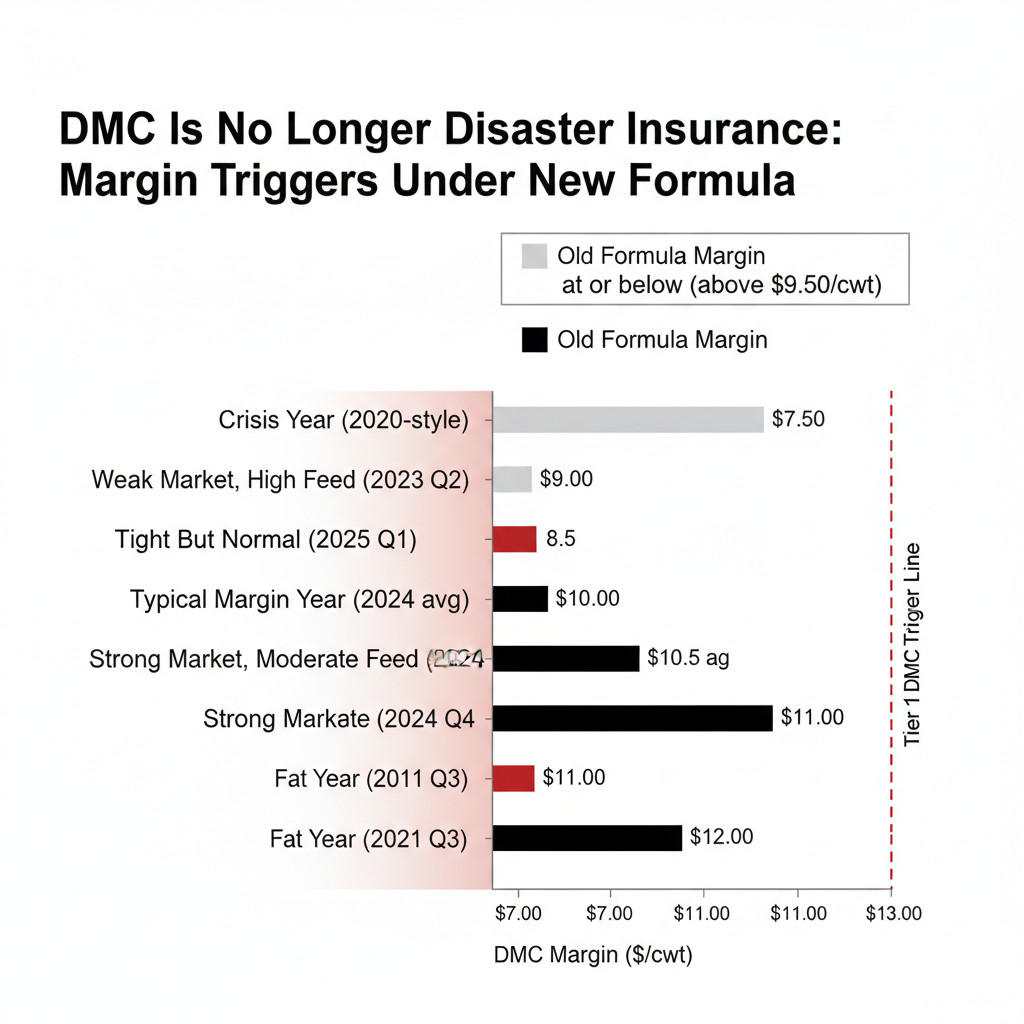
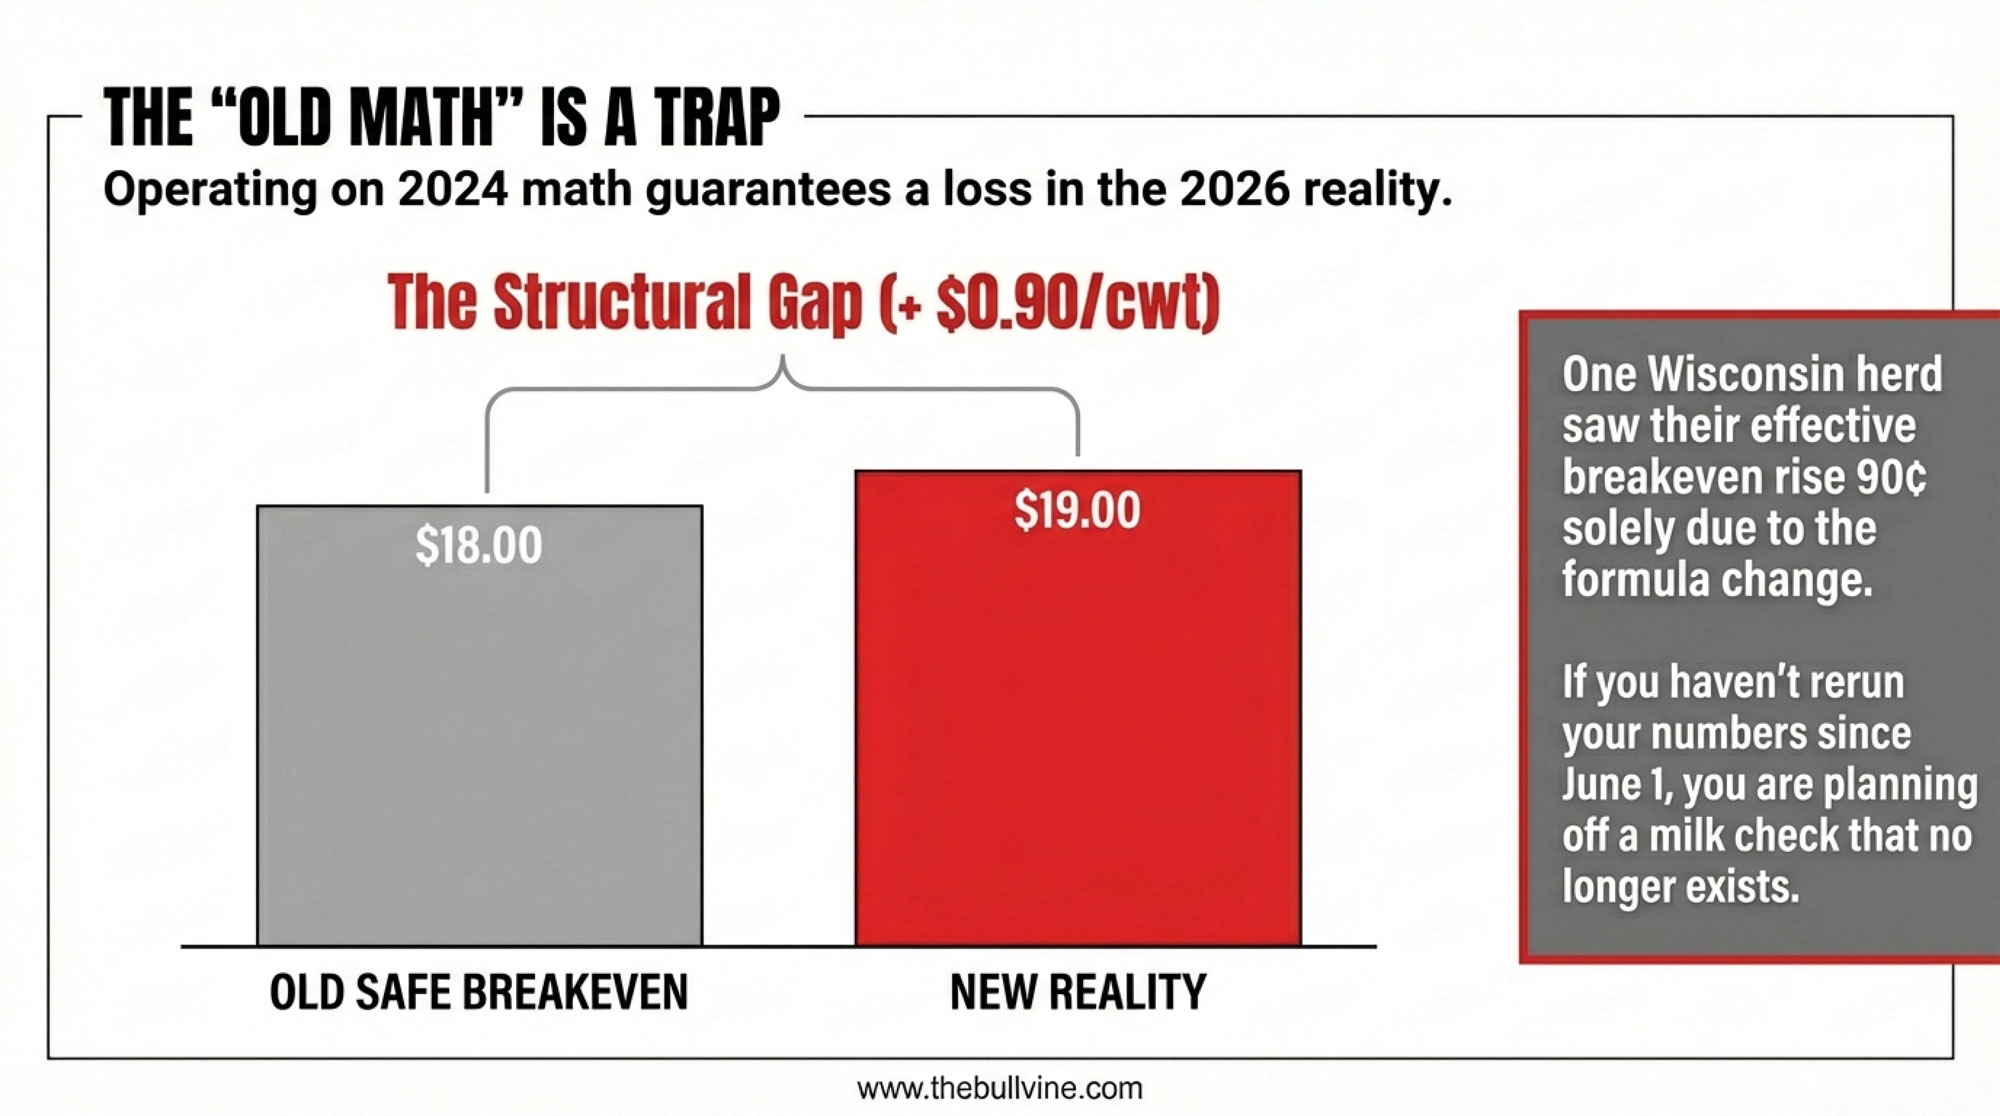
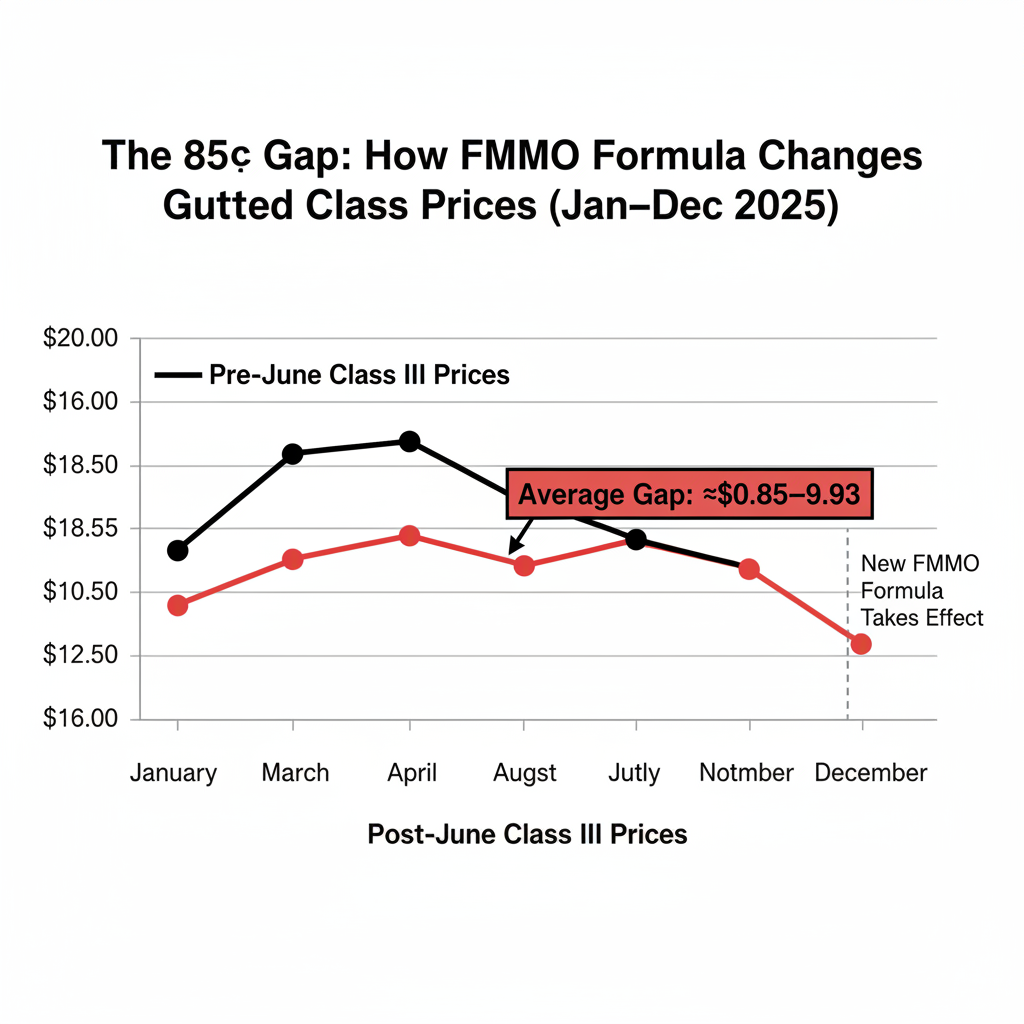
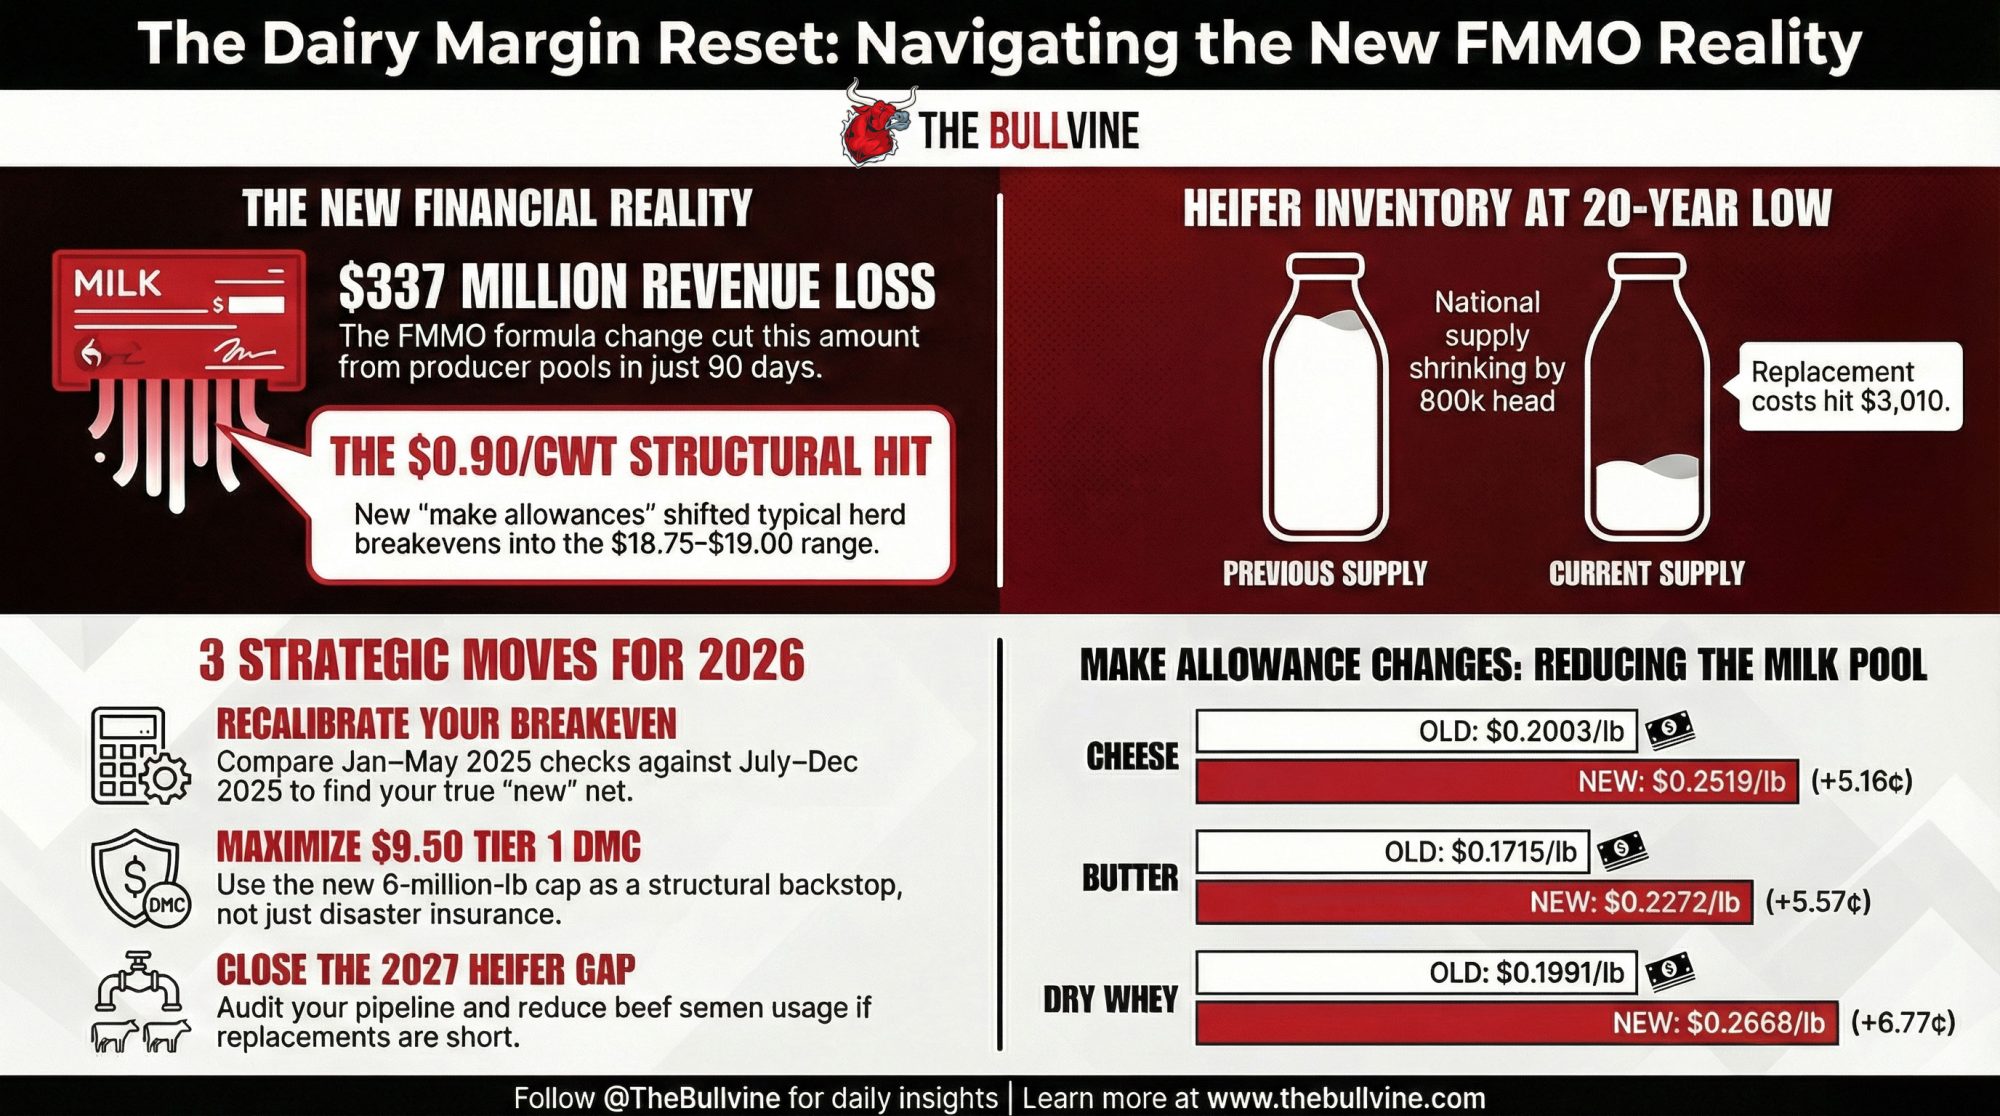
DMC history between 2019 and 2023 shows the margin trigger paying indemnities in roughly half the months at $9.50 Tier 1 coverage, per Farm Bureau and Extension DMC analyses. But in months where the official DMC margin sat near $12/cwt, many farms were still unprofitable once non‑feed costs were layered in. USDA ERS 2021 ARMS data puts the full economic cost of production at roughly $20.54/cwt for 500–999‑cow U.S. herds and $19.14/cwt for herds of 1,000+. Multi‑state Extension work — including UW–Madison benchmarks for mid‑size Wisconsin dairies — lands full costs around $18–19/cwt.
For Mark, the picture snaps into focus:
- A realistic, fully loaded breakeven in the high‑teens to low‑$20s/cwt.
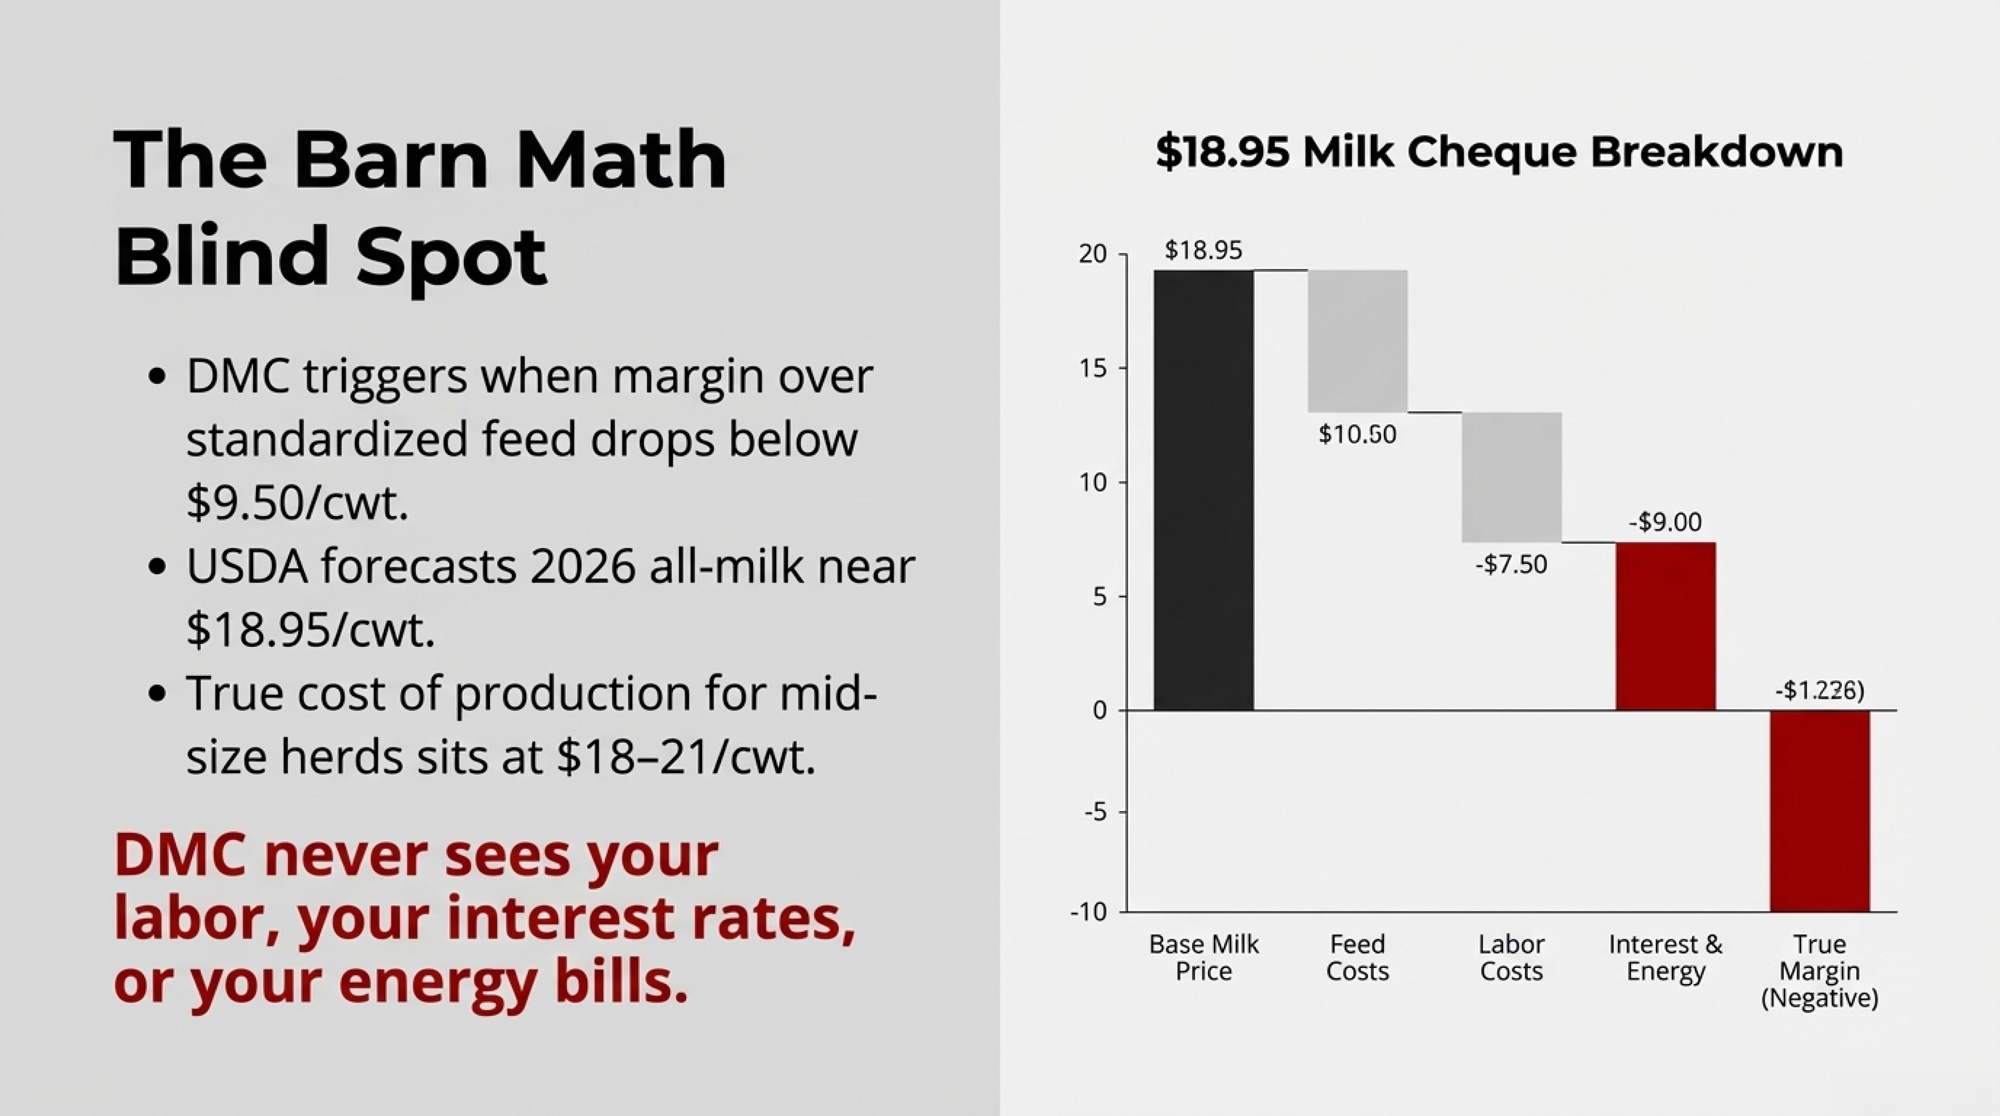
- A DMC margin trigger that calls the farm “covered” as long as income over standardized national feed costsstays above $9.50/cwt — with no view of labour, interest, energy, or family draw.
The comfortable story in a lot of 2026 farm‑bill coverage: “With the new DMC and FSA tools, mid‑size dairies are finally protected.”
The minute Mark’s scenario hits a DSCR calculator, that story flips.
What Does the 2026 DMC Expansion Really Do for a 400‑Cow Herd?
Four changes matter most for a herd like Mark’s:
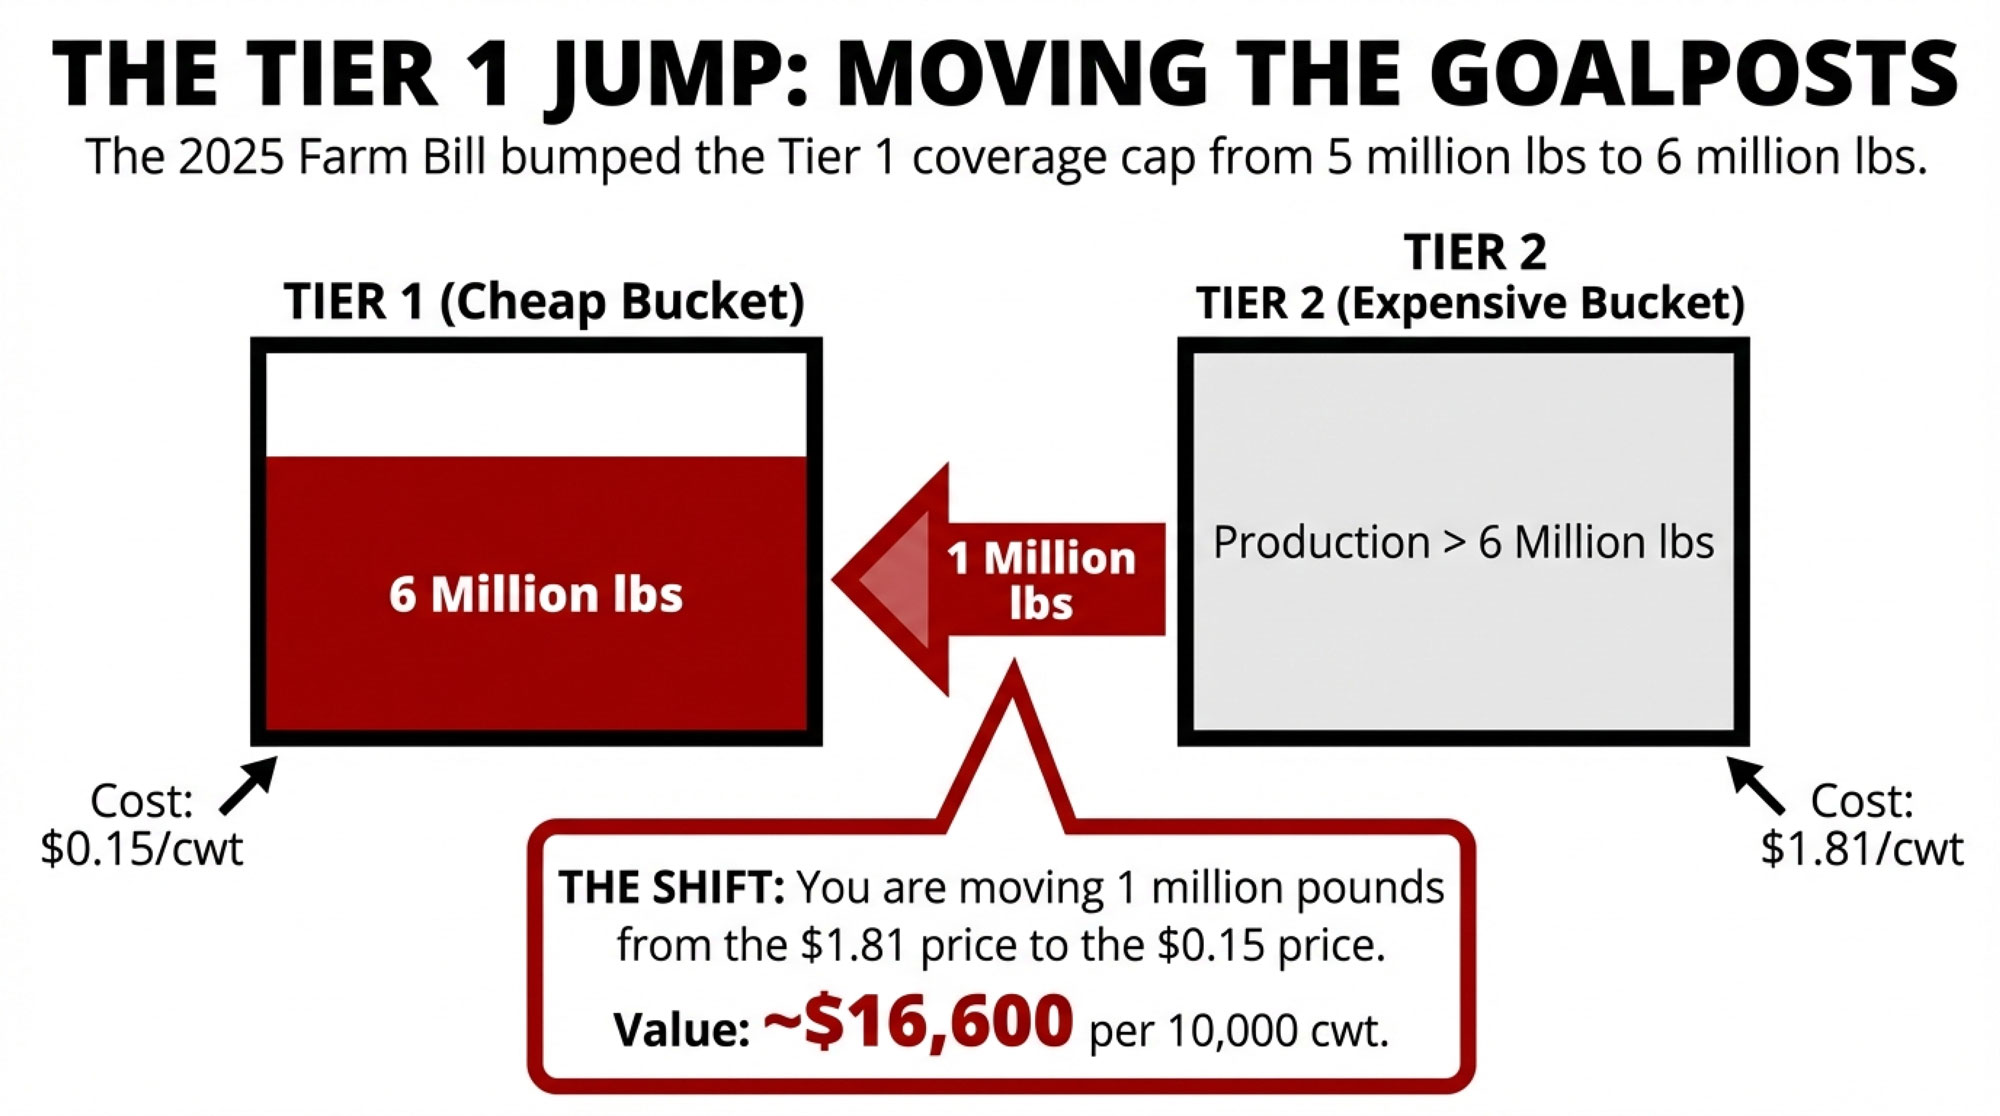
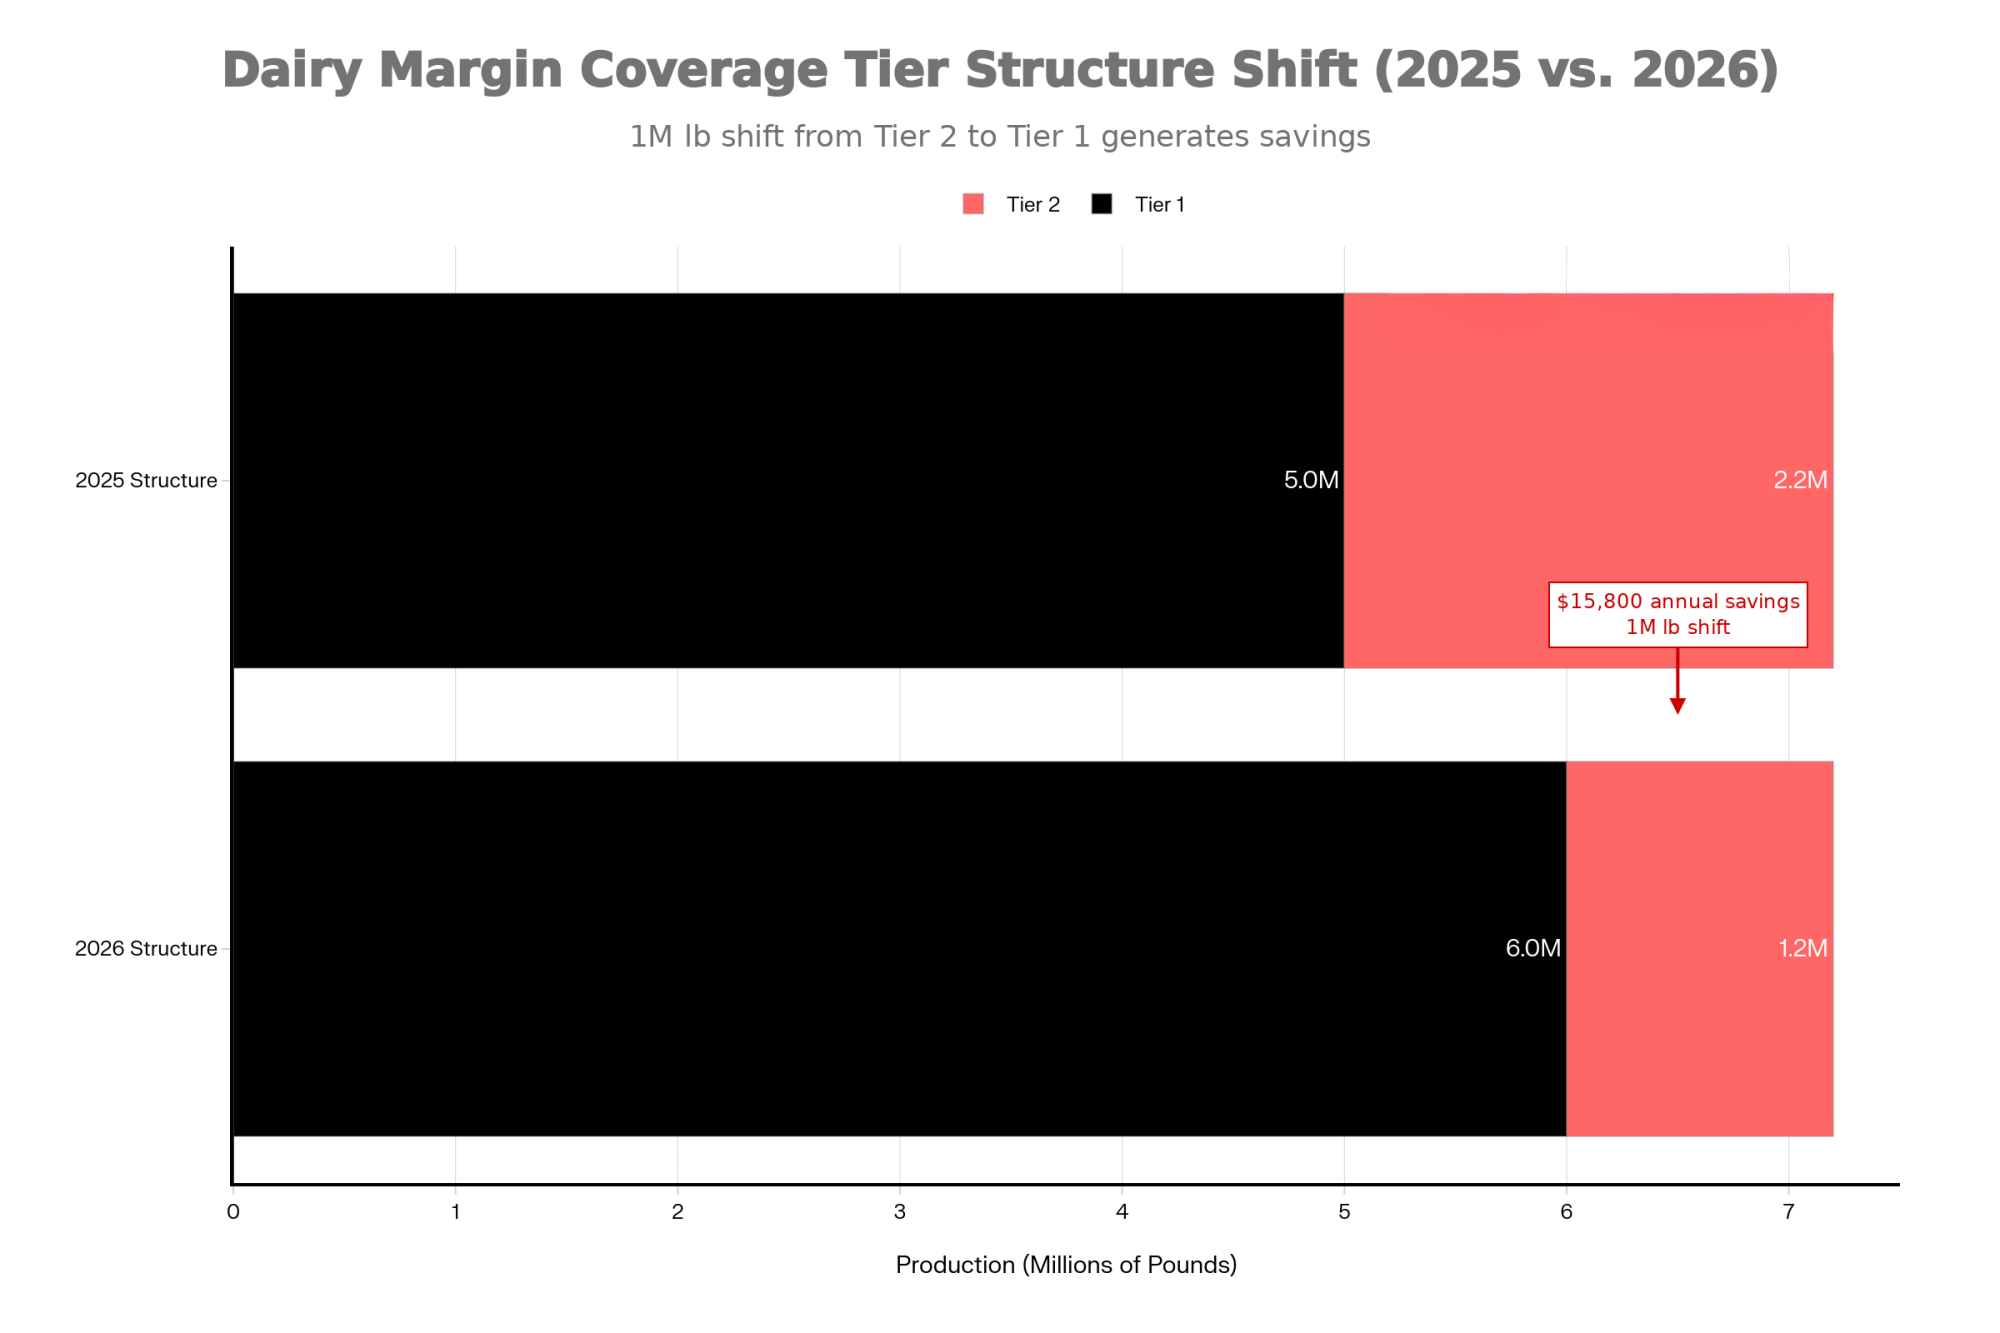
- Tier 1 coverage jumps to 6 million lbs of production history, up from 5 million.
- Production history can be updated to the farm’s highest annual marketings from 2021, 2022, or 2023.
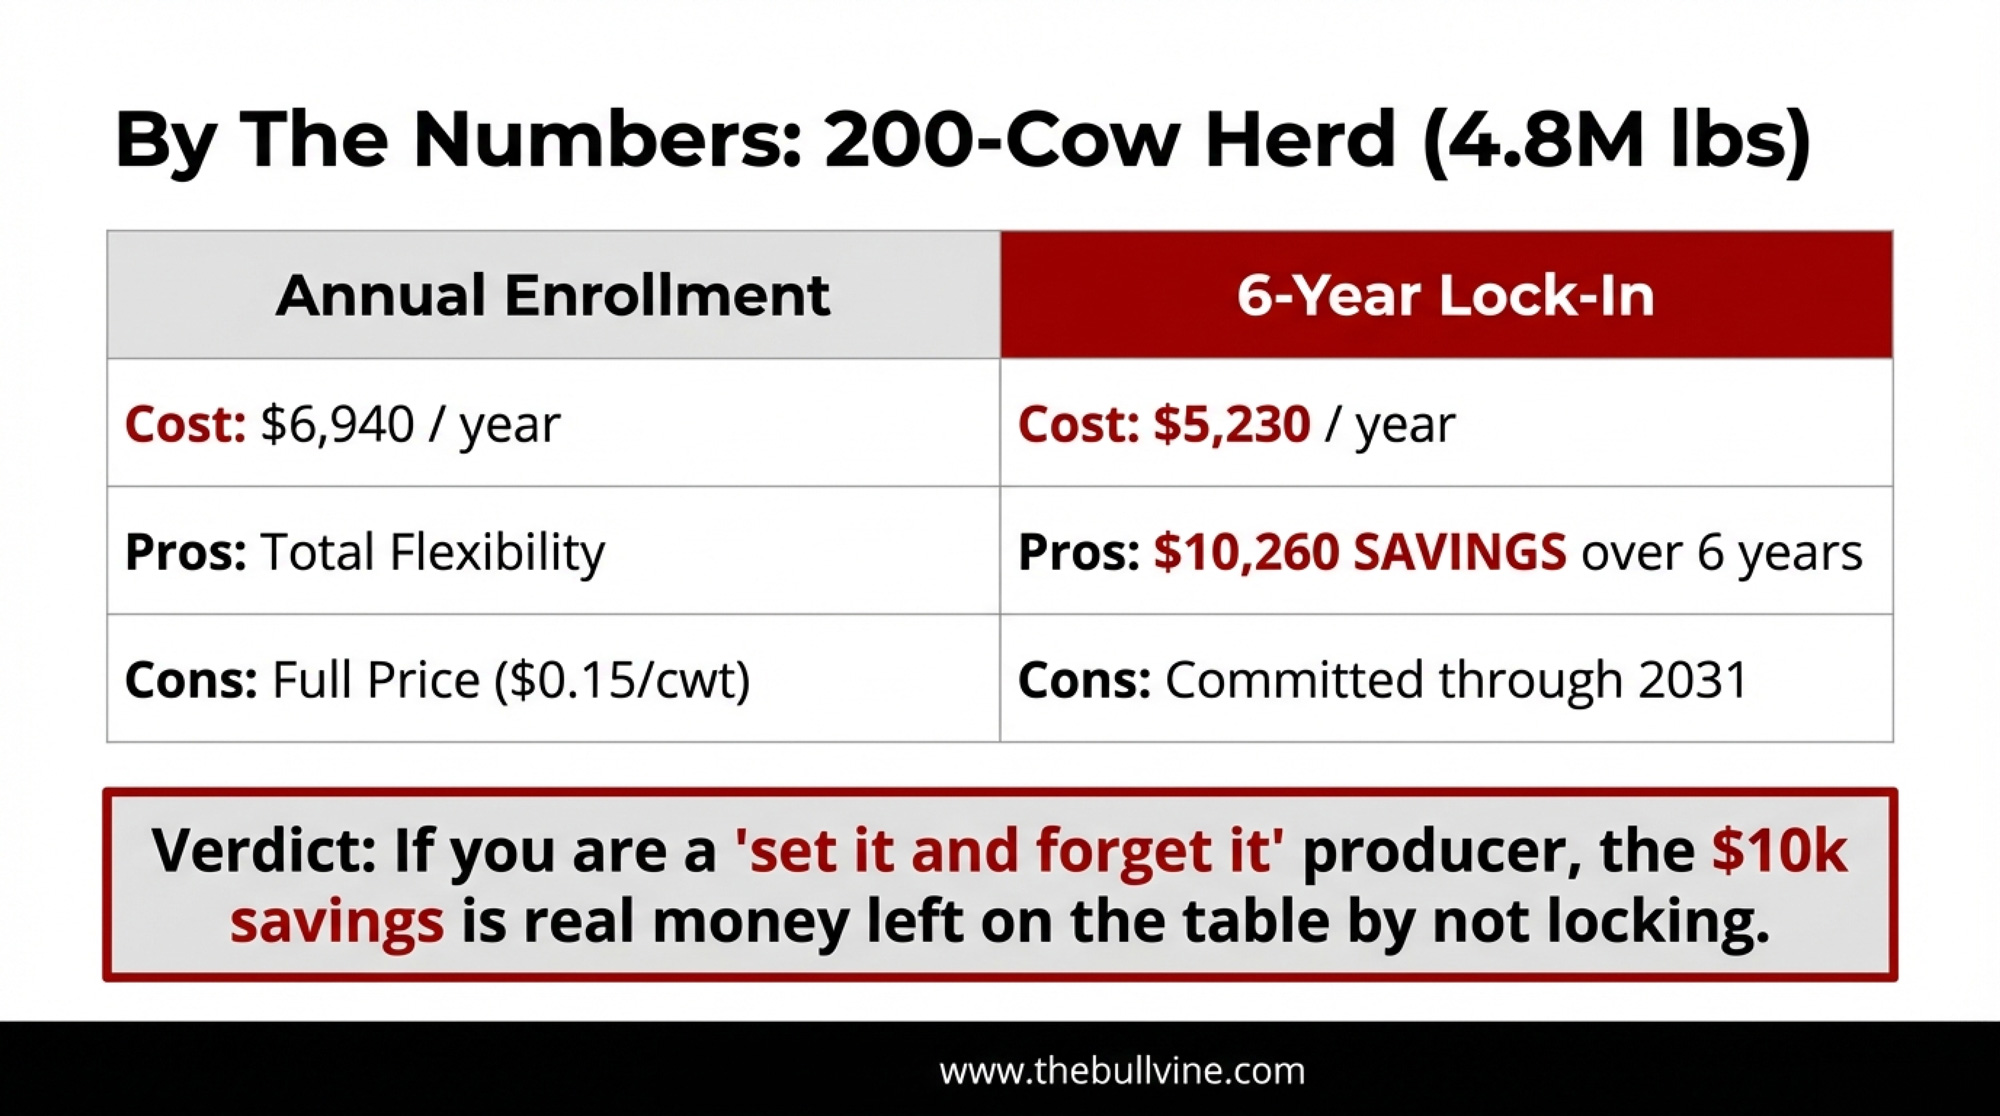
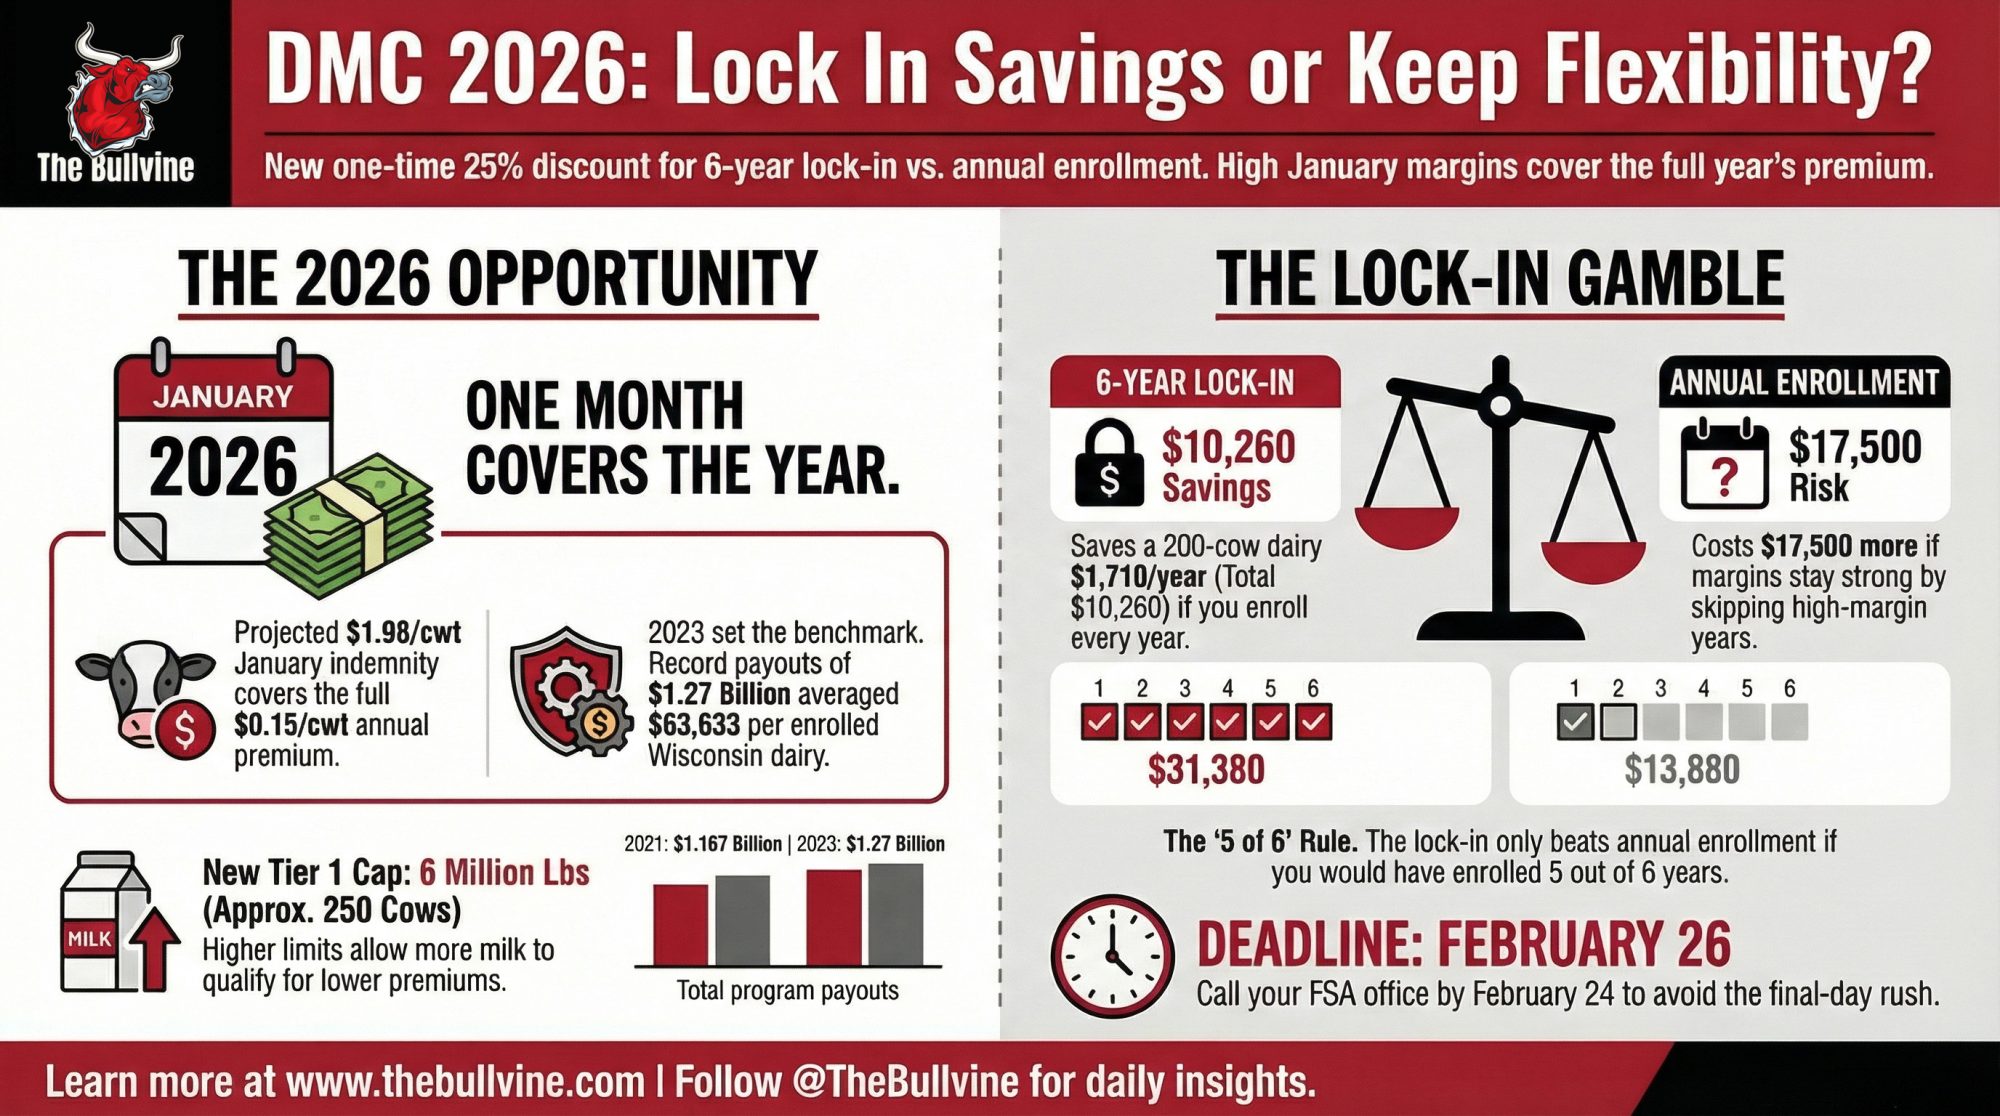
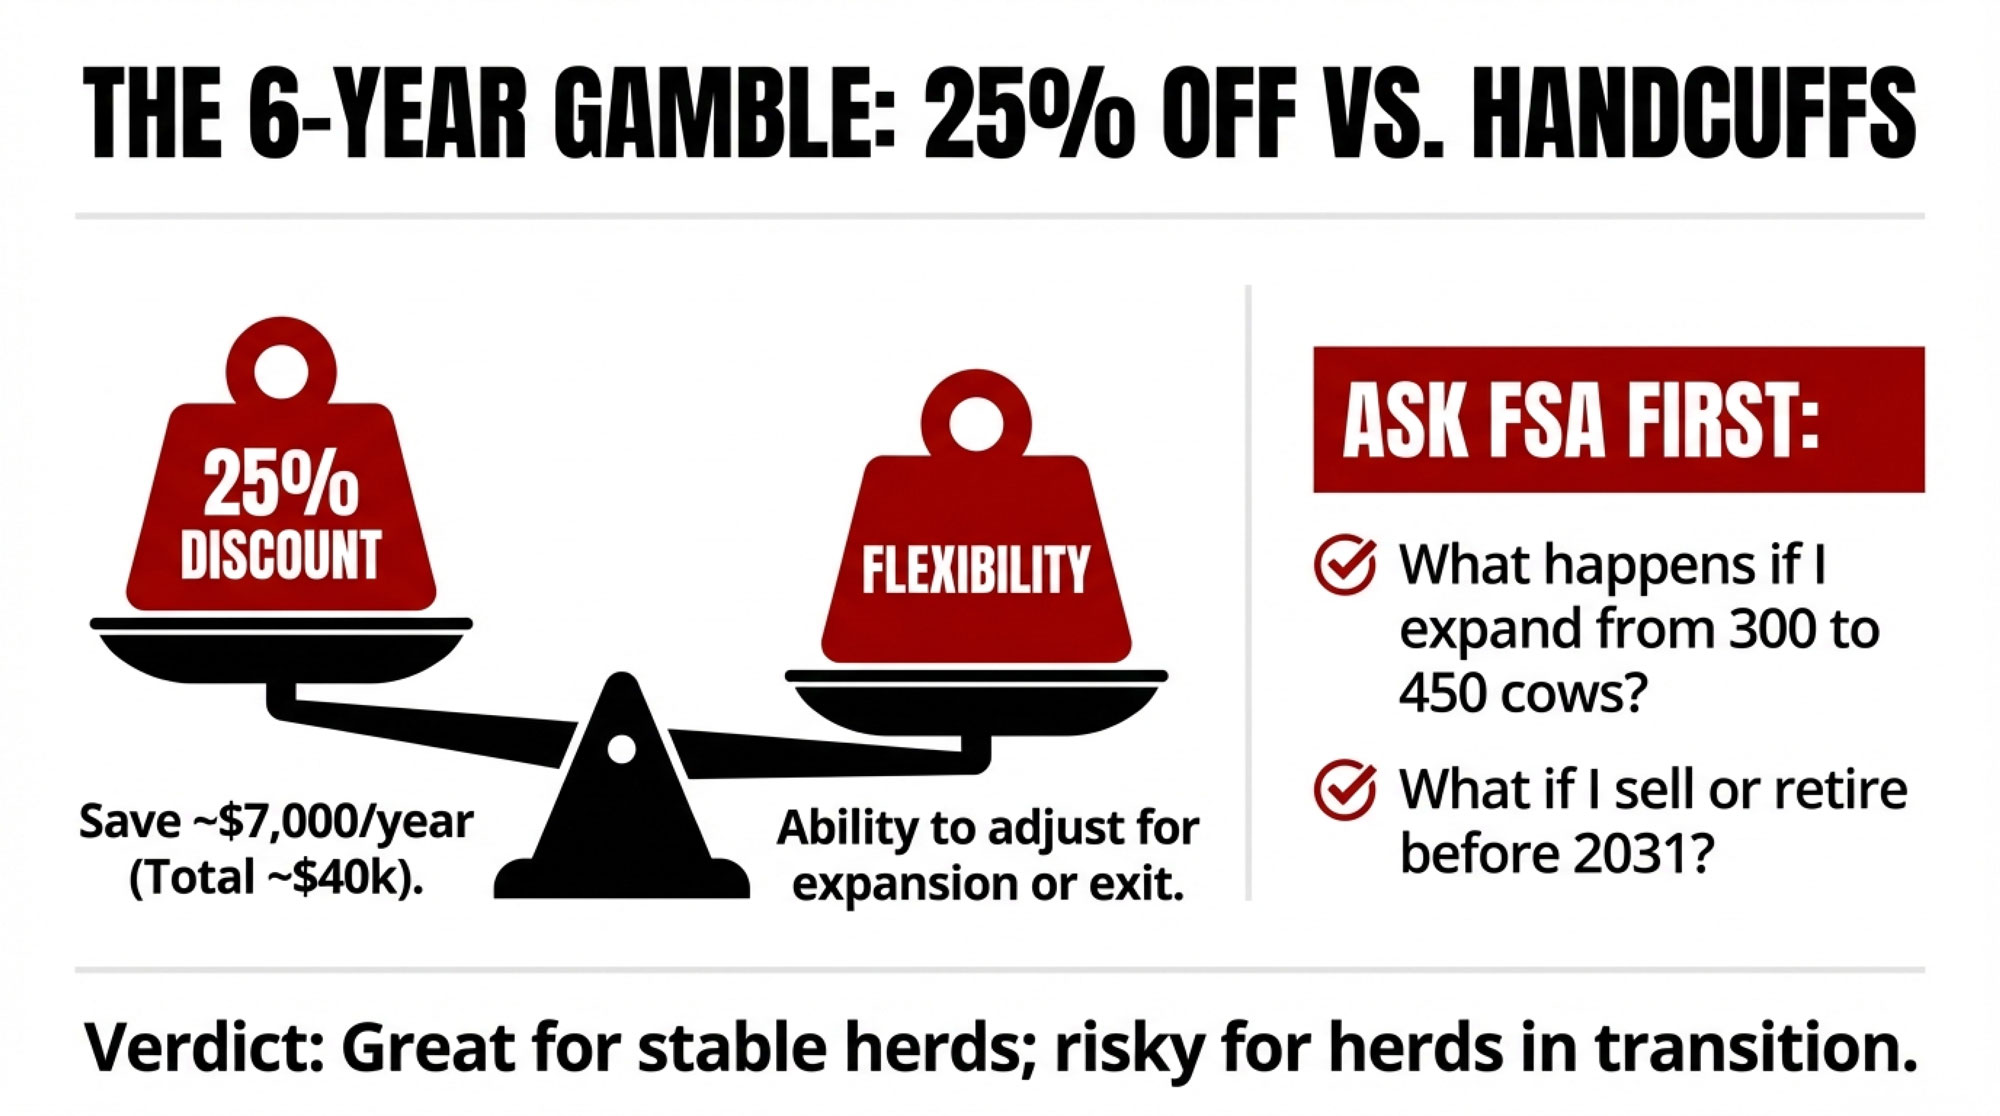
- A six‑year lock‑in offers a 25% discount on Tier 1 premiums if you enroll in the same coverage from 2026 to 2031.
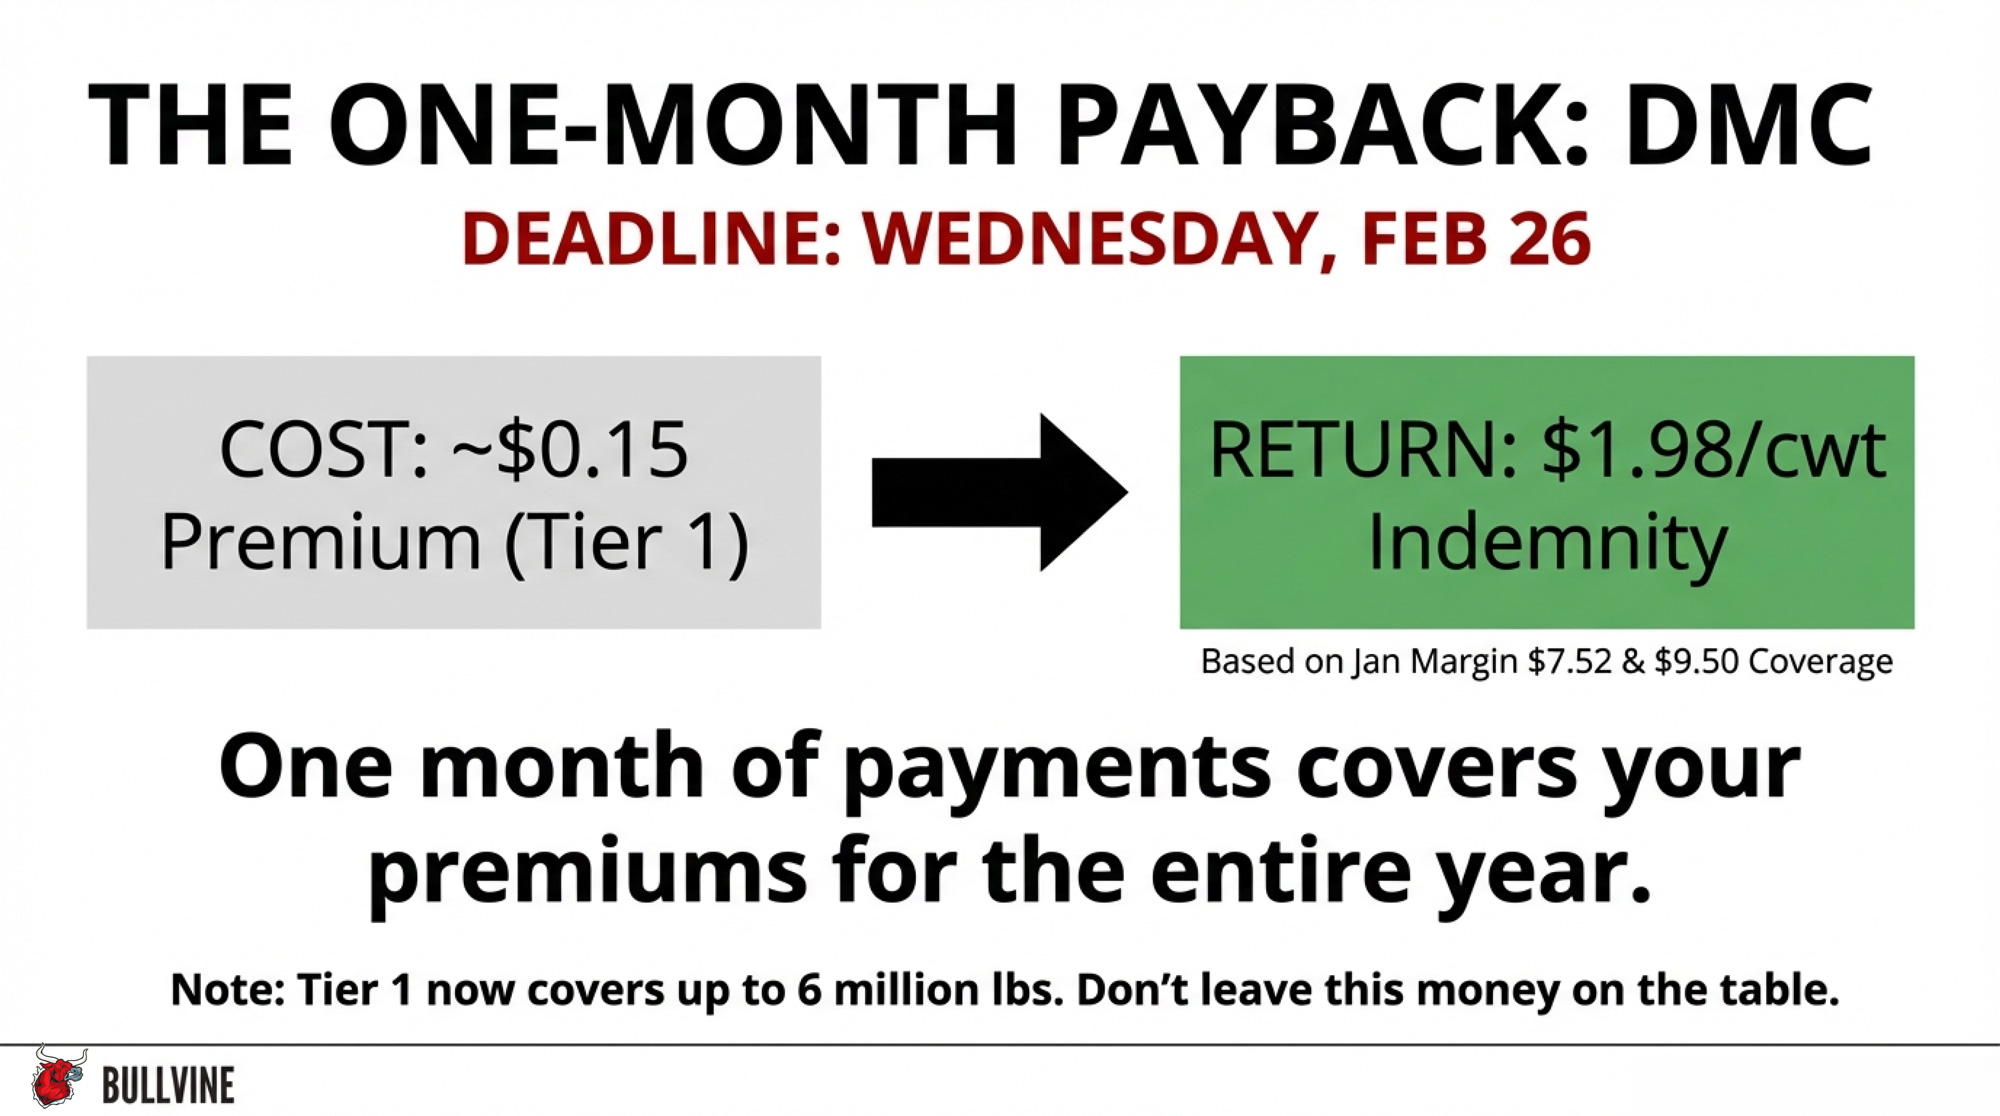
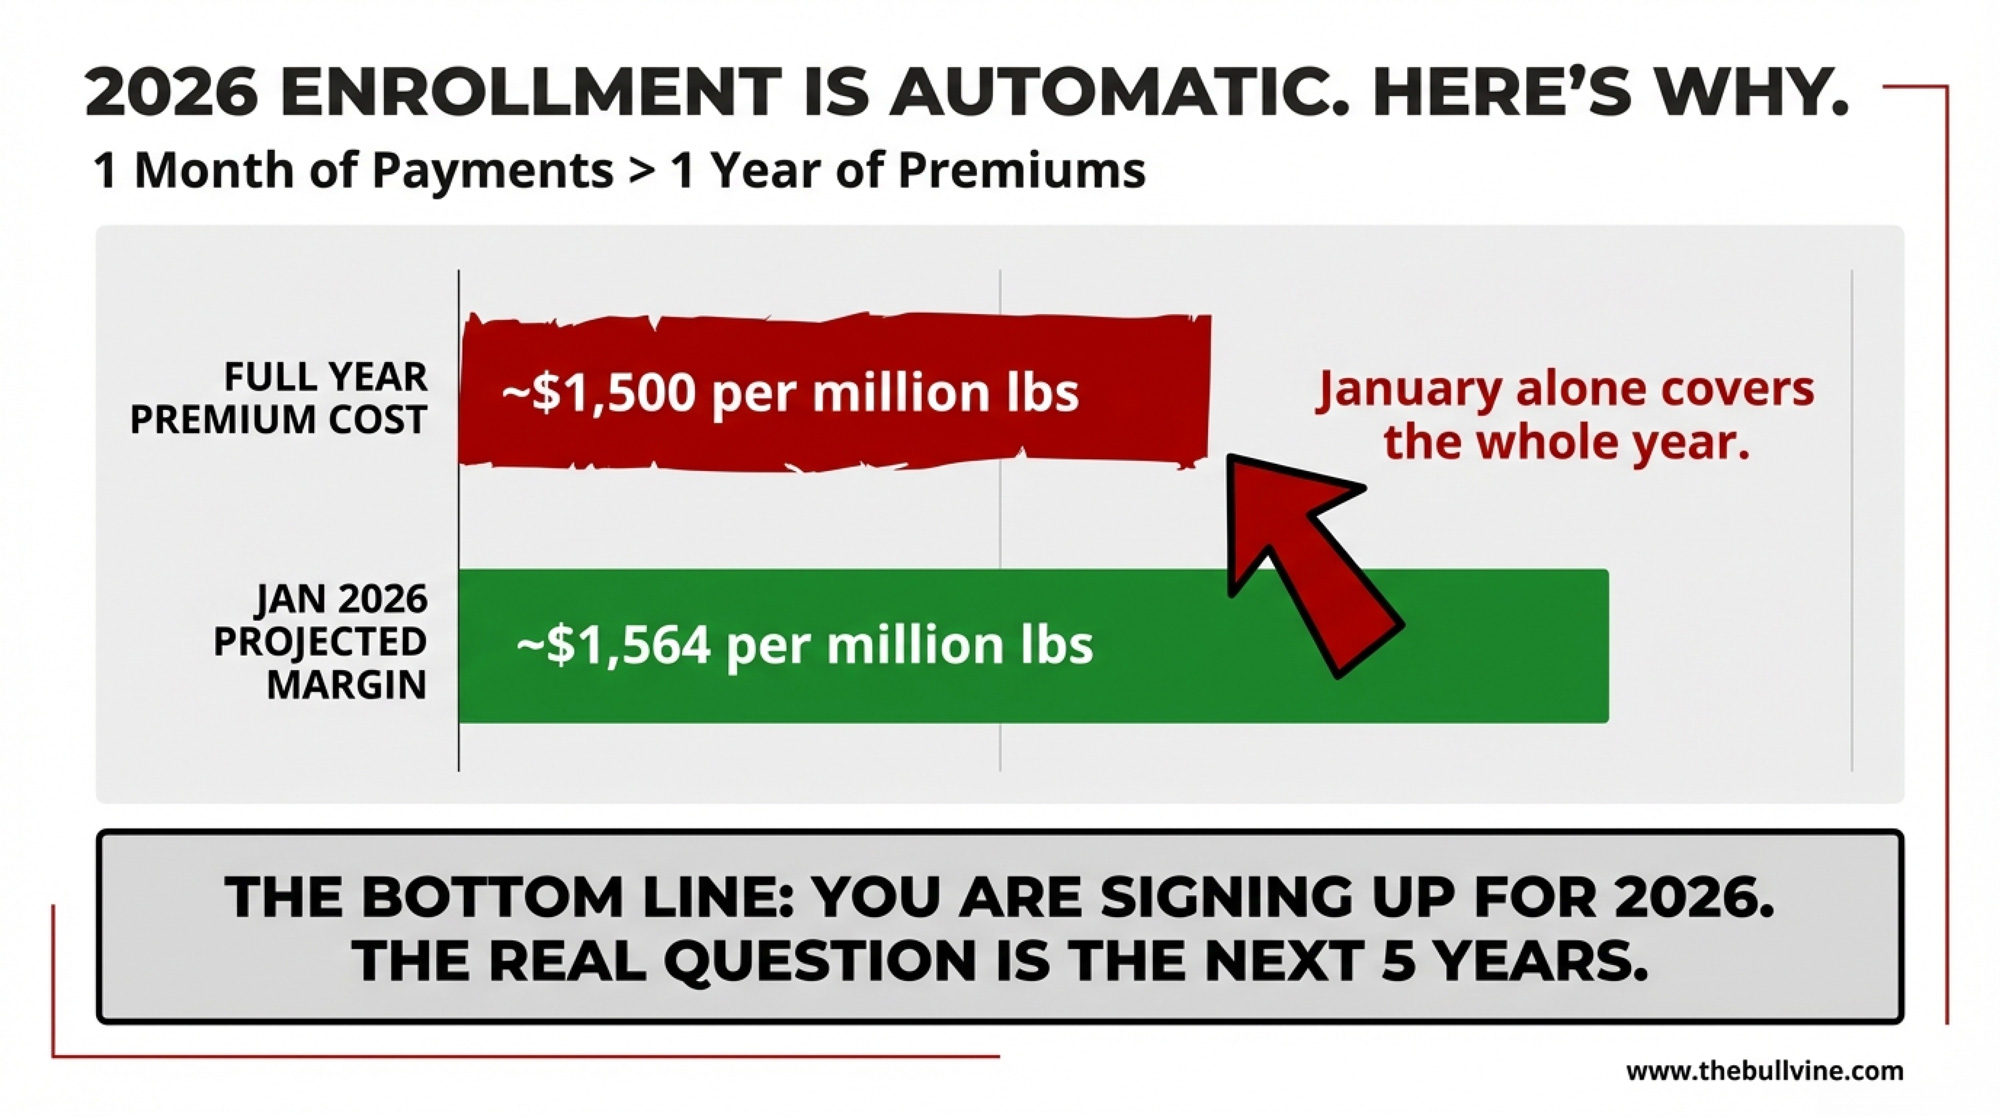
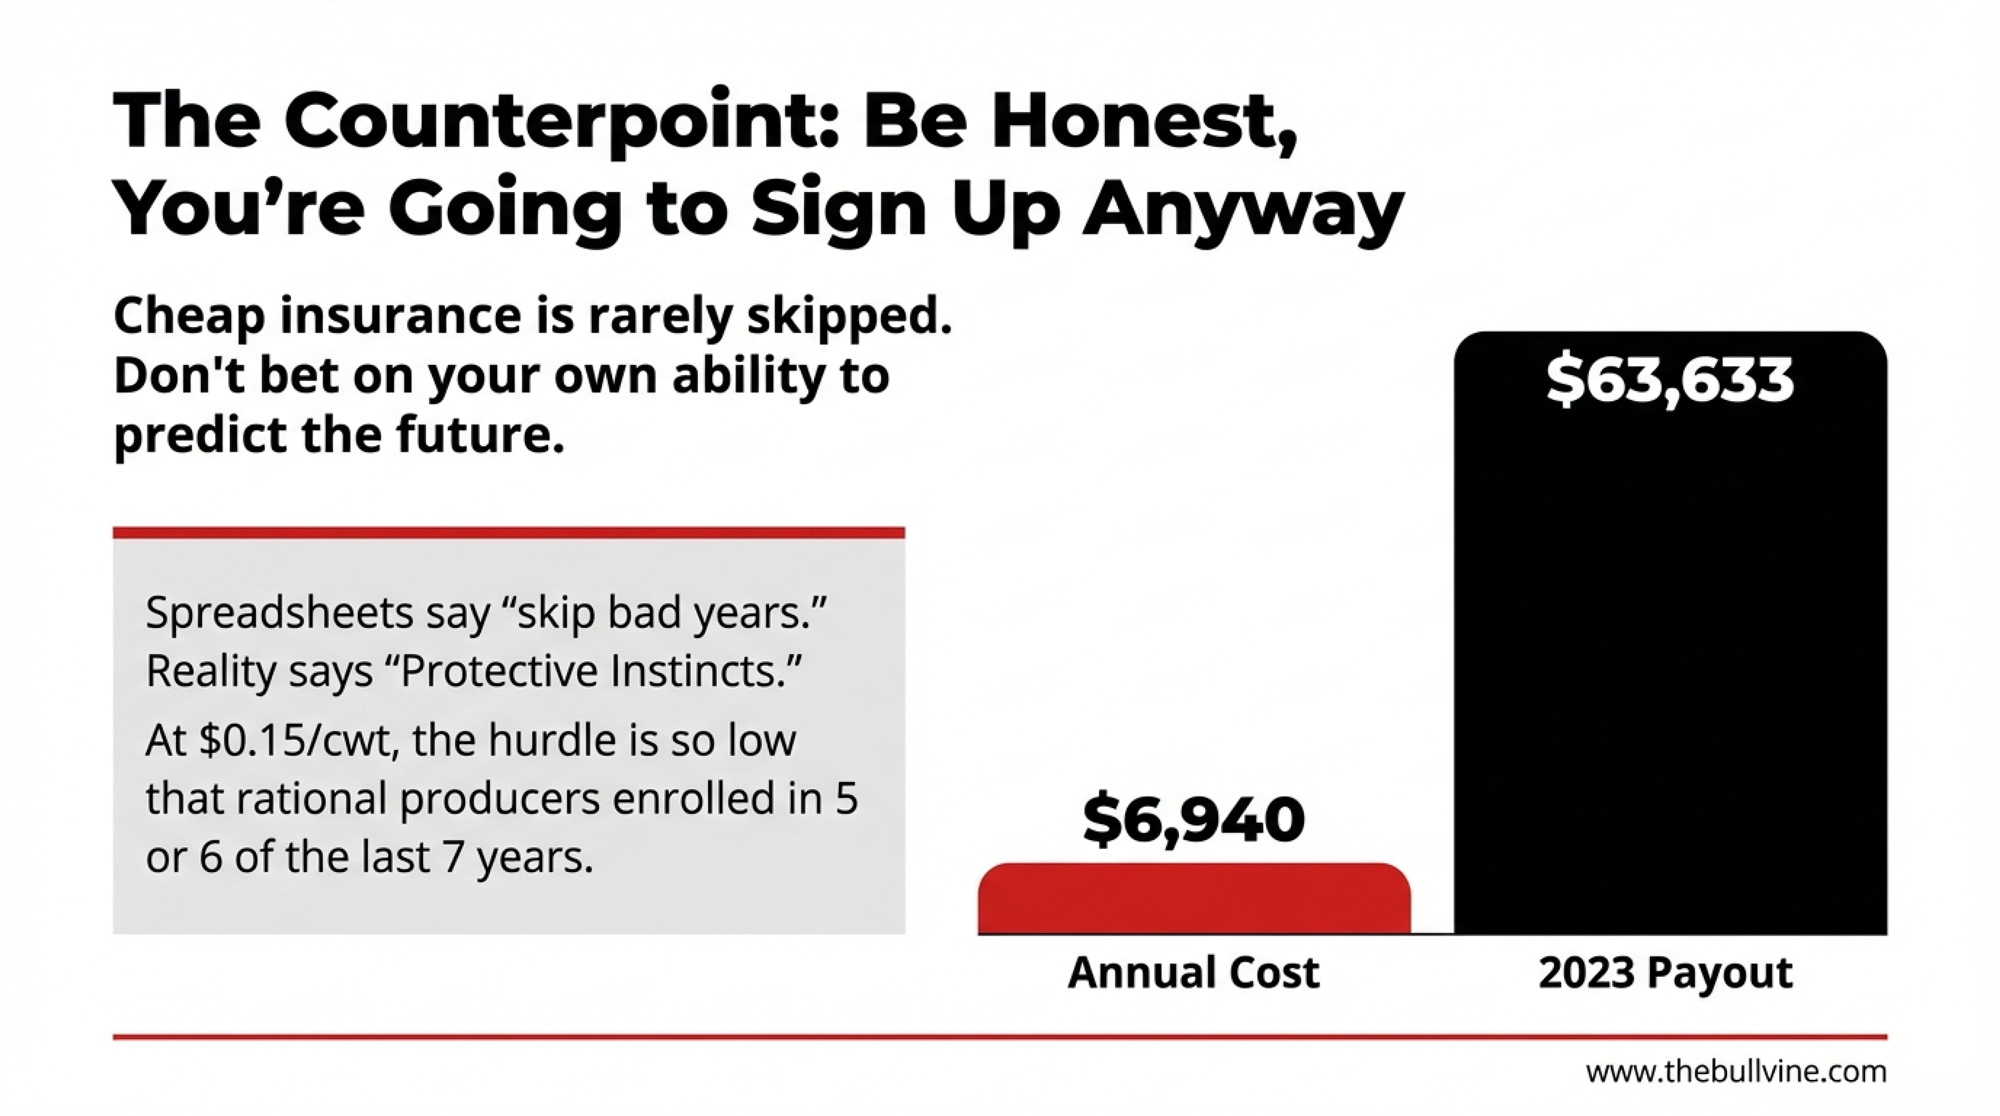
- Tier 1 premiums for $9.50 coverage: $0.15/cwt (before the lock‑in discount).
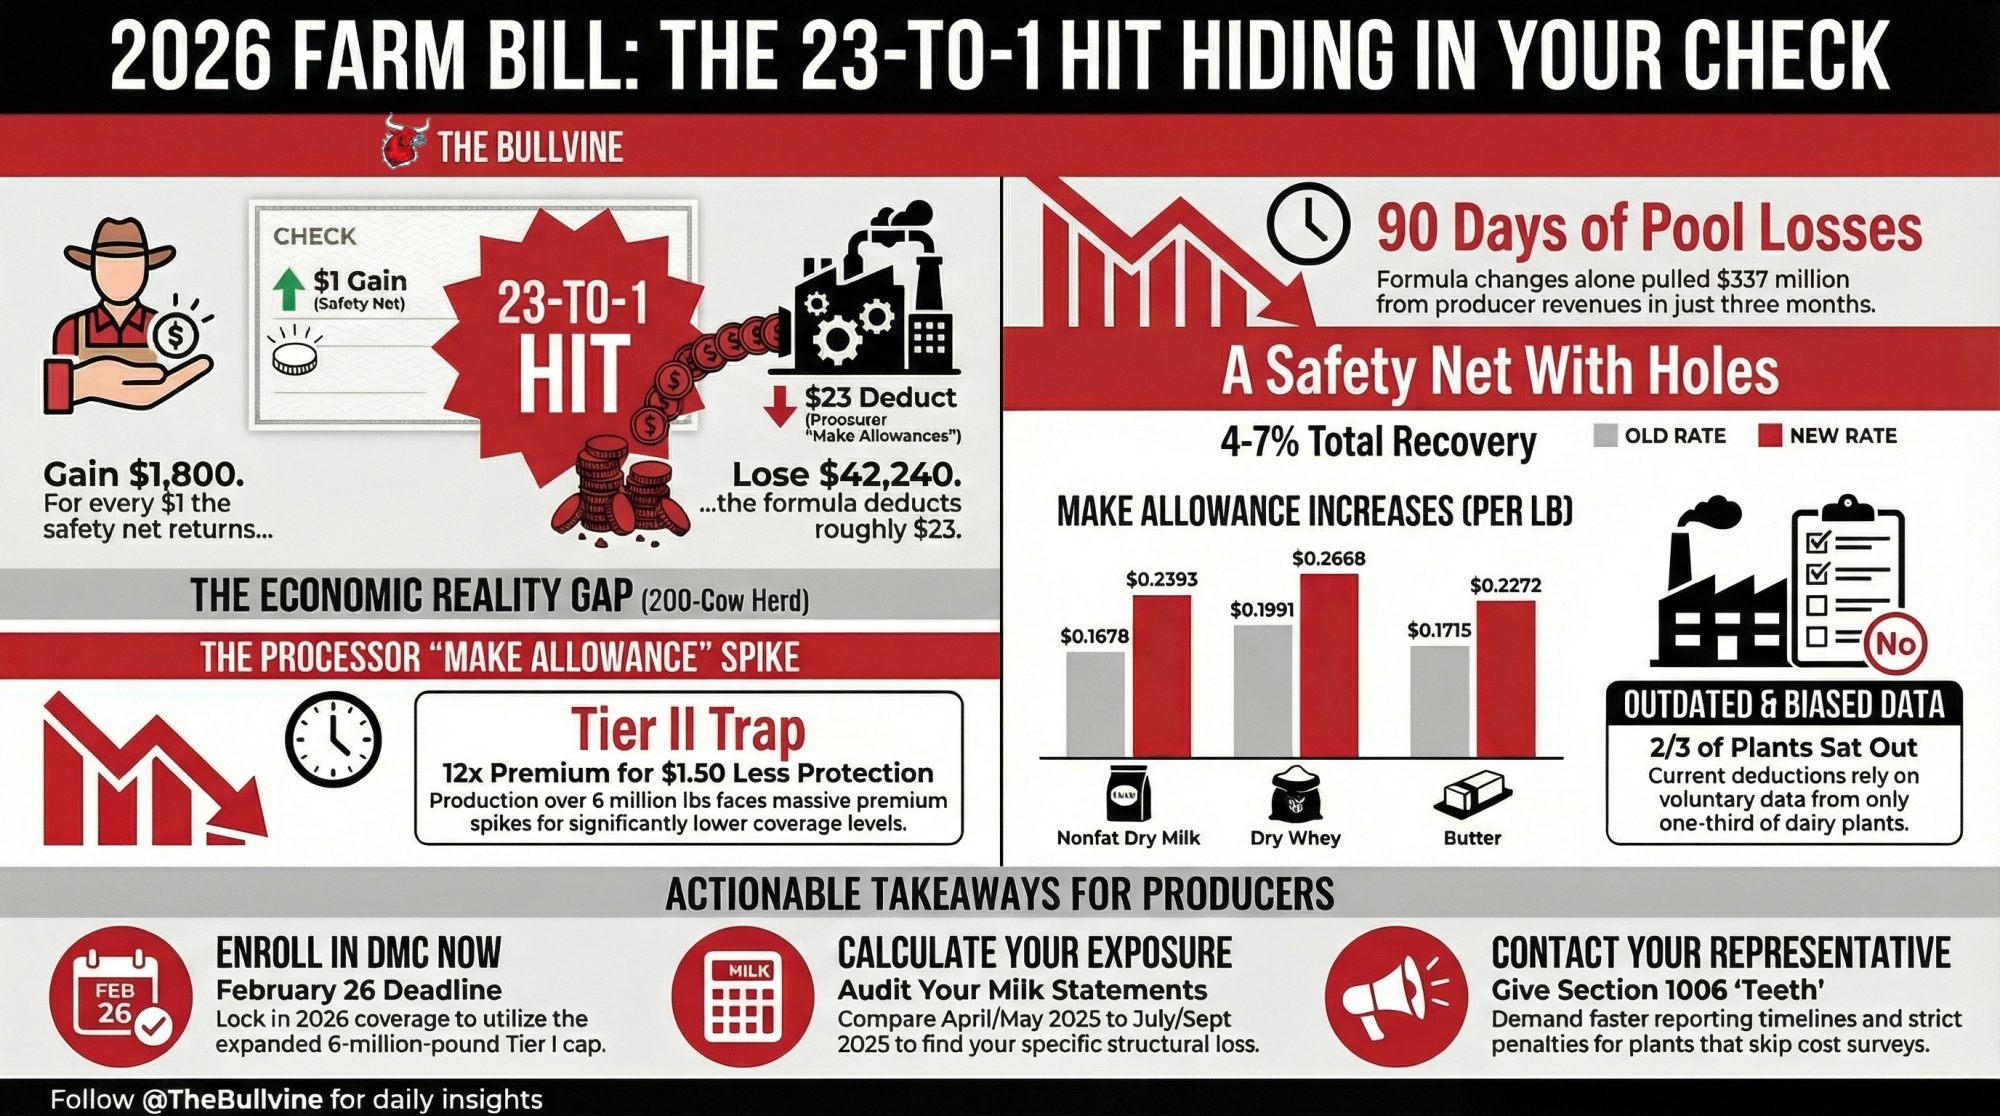
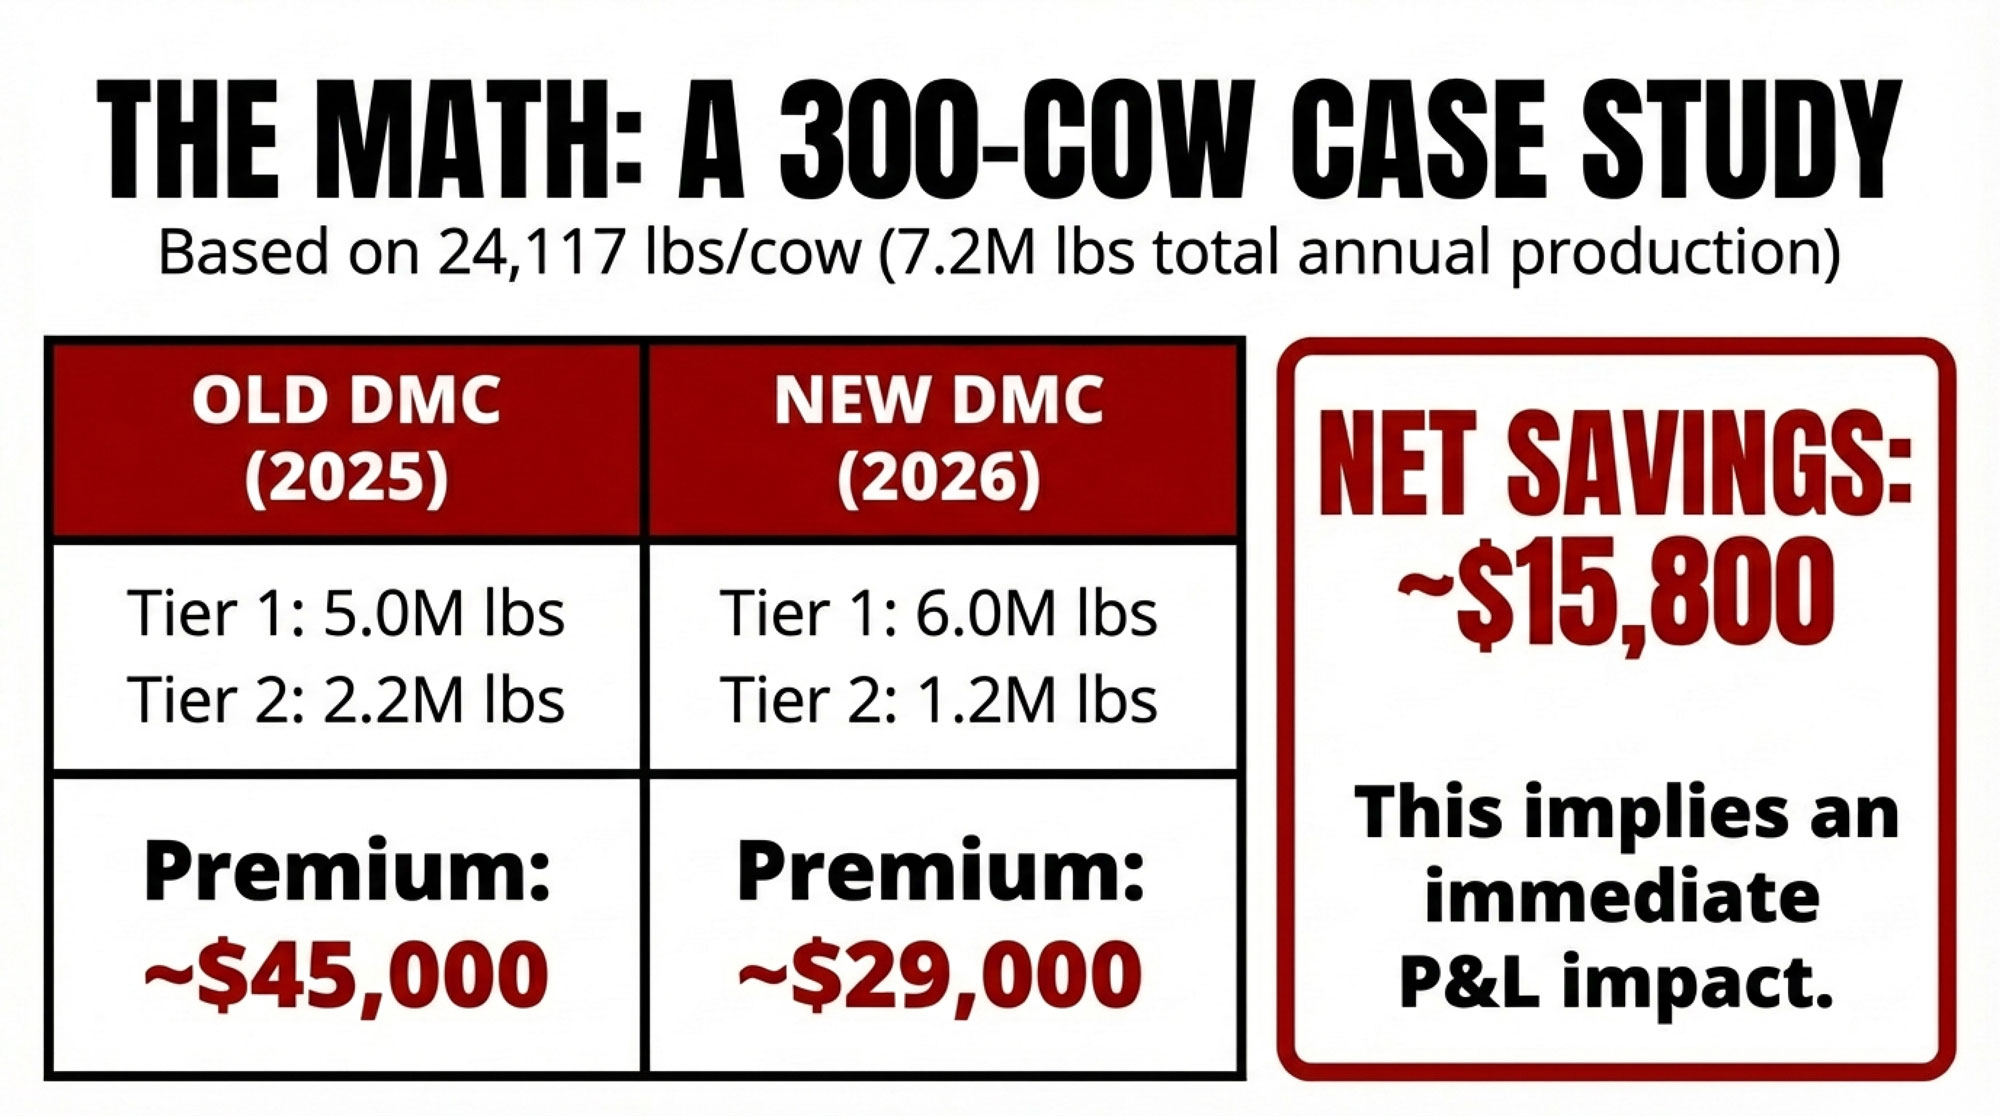
The Premium Math: Where $16,600 Comes From
Swap in your own production numbers:
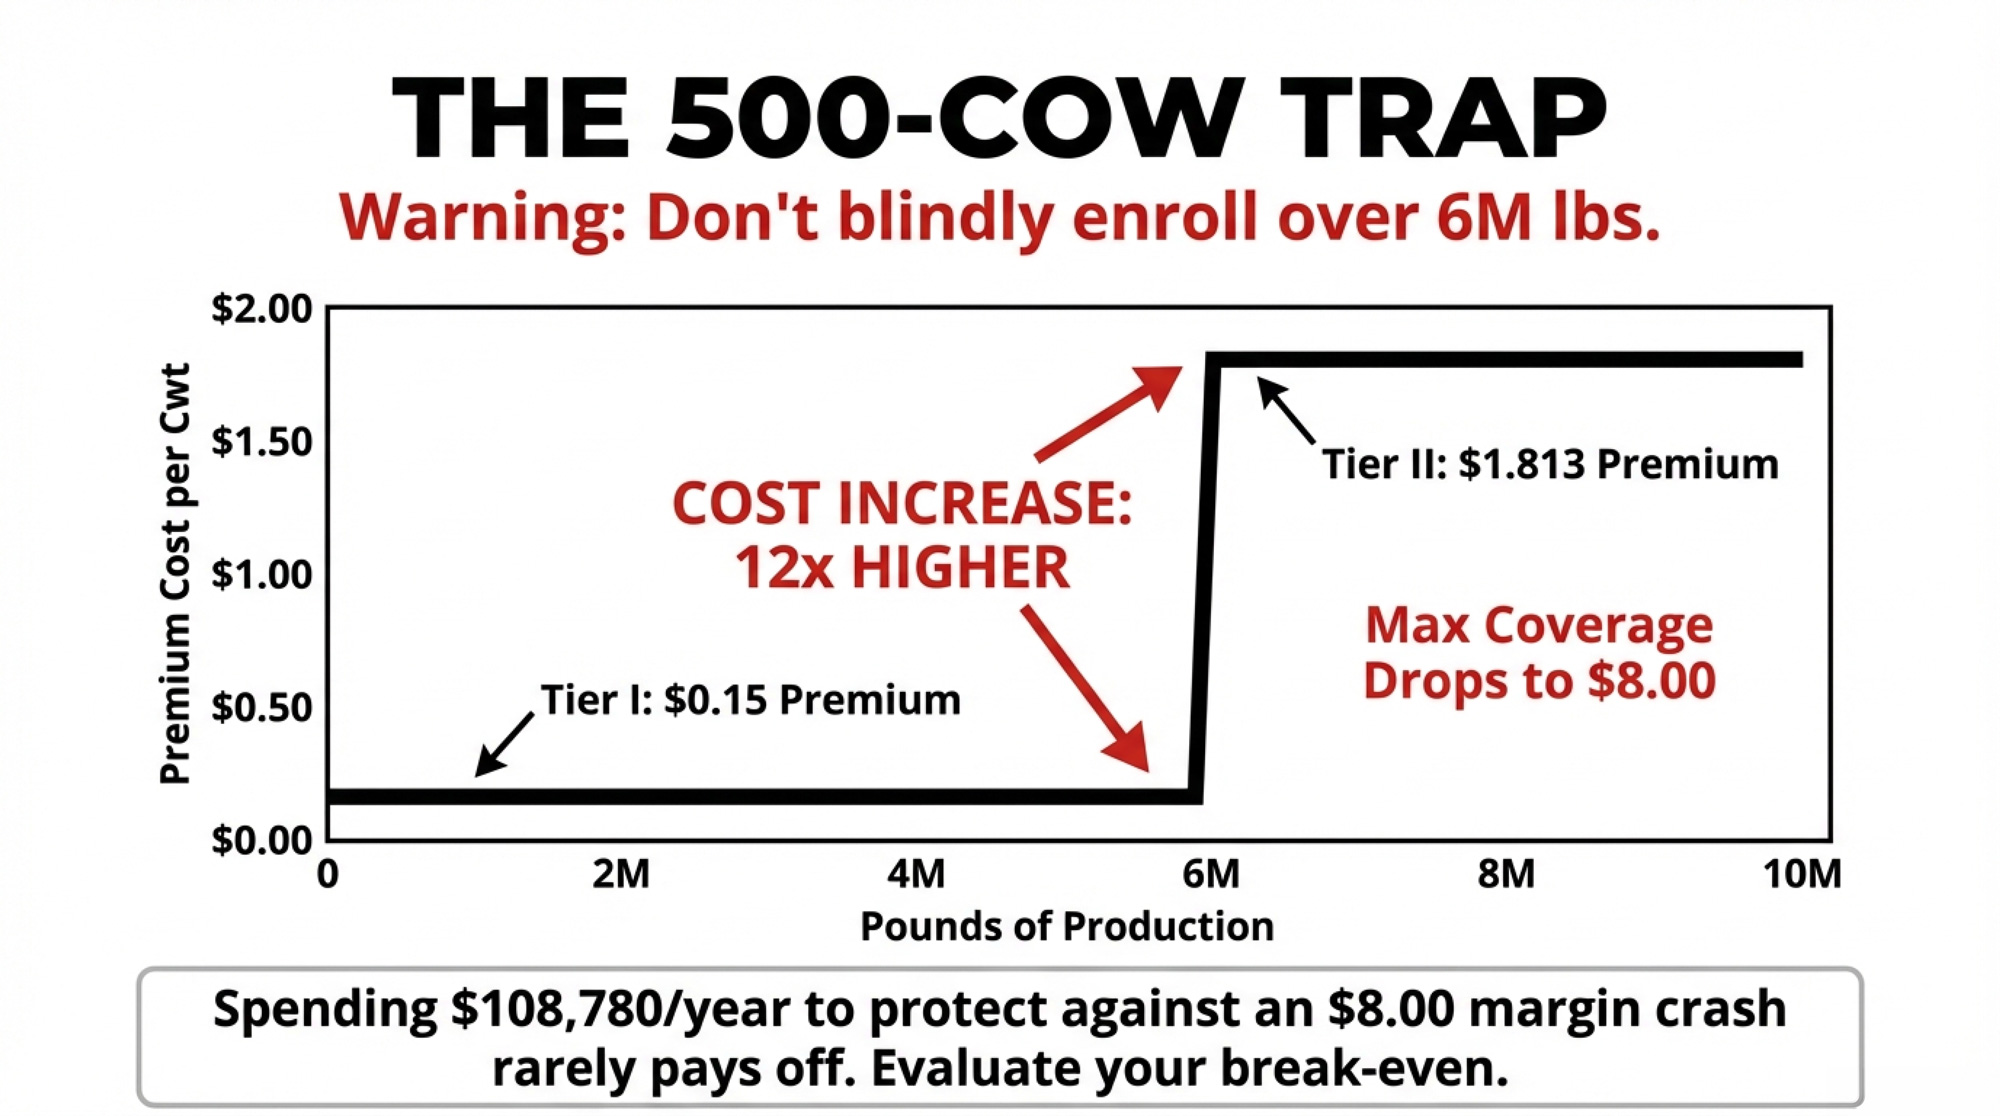
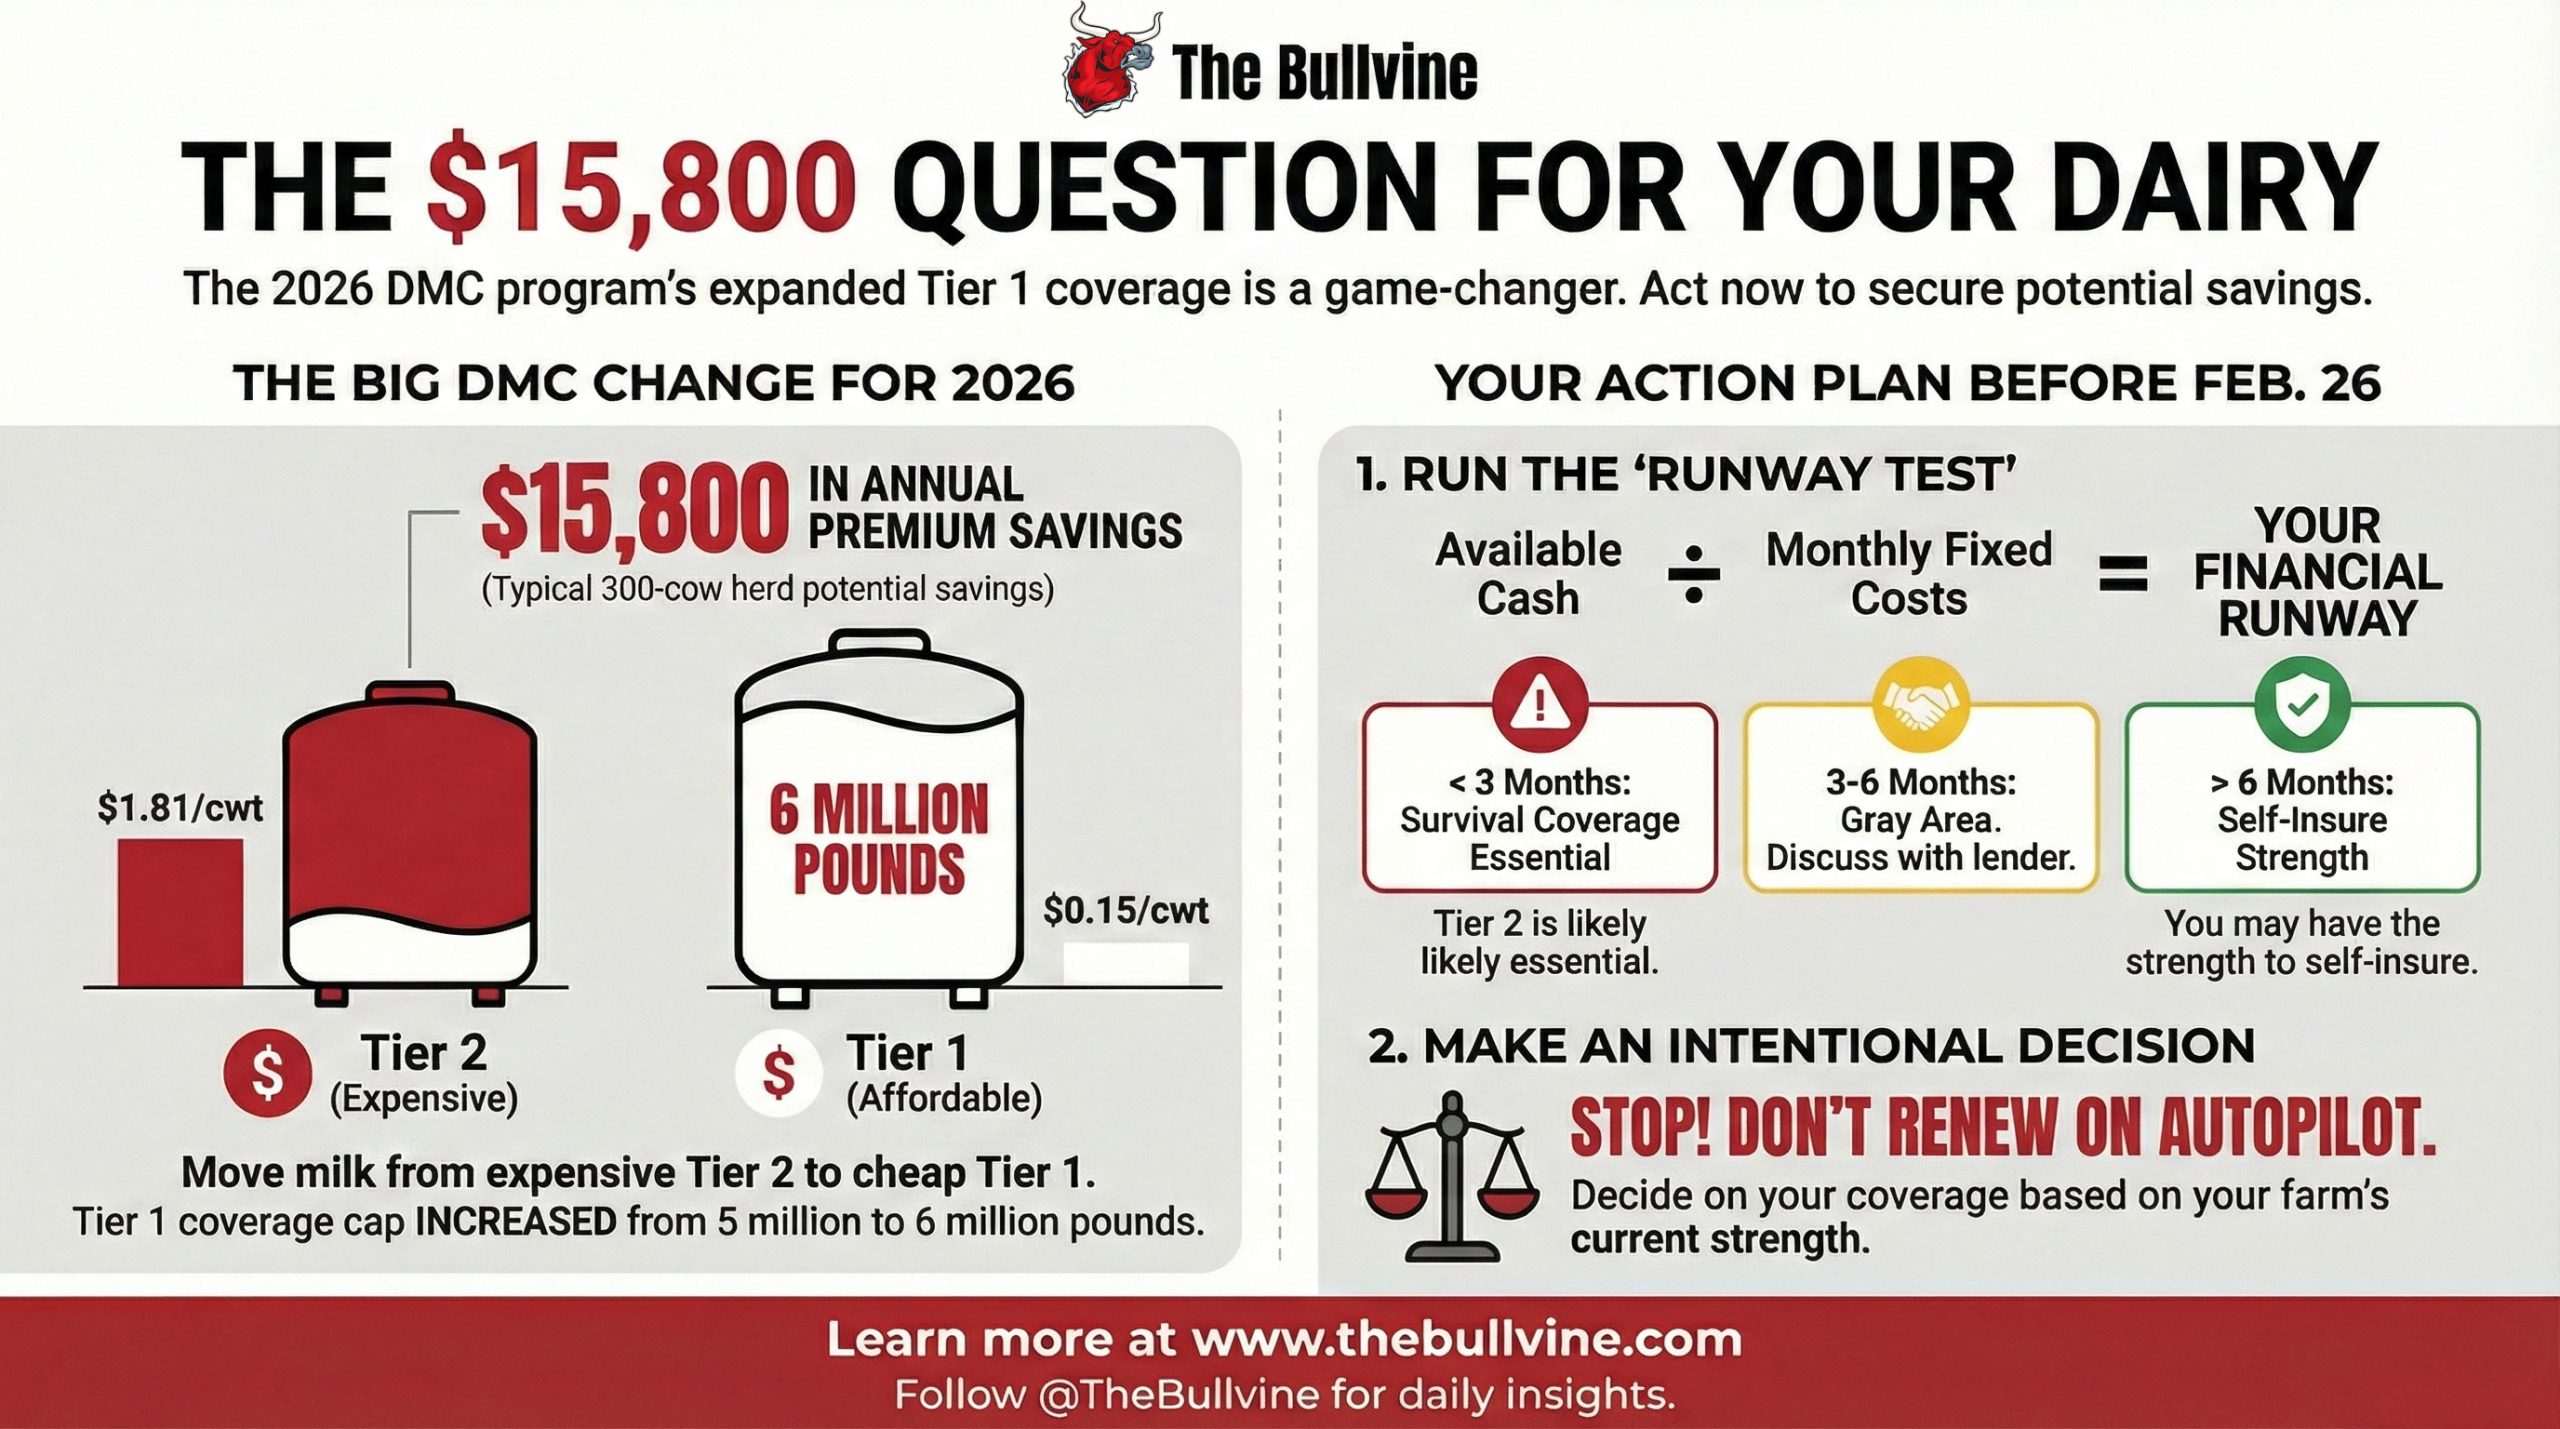
- Extra milk moving from Tier 2 to Tier 1: 1,000,000 lbs (the new 6M minus the old 5M cap).
- Old Tier 2 premium at $8.00 coverage (comparable risk level): $1.81/cwt.
- New Tier 1 premium at $9.50 coverage: $0.15/cwt.
- Per‑cwt savings: $1.81 − $0.15 = $1.66/cwt.
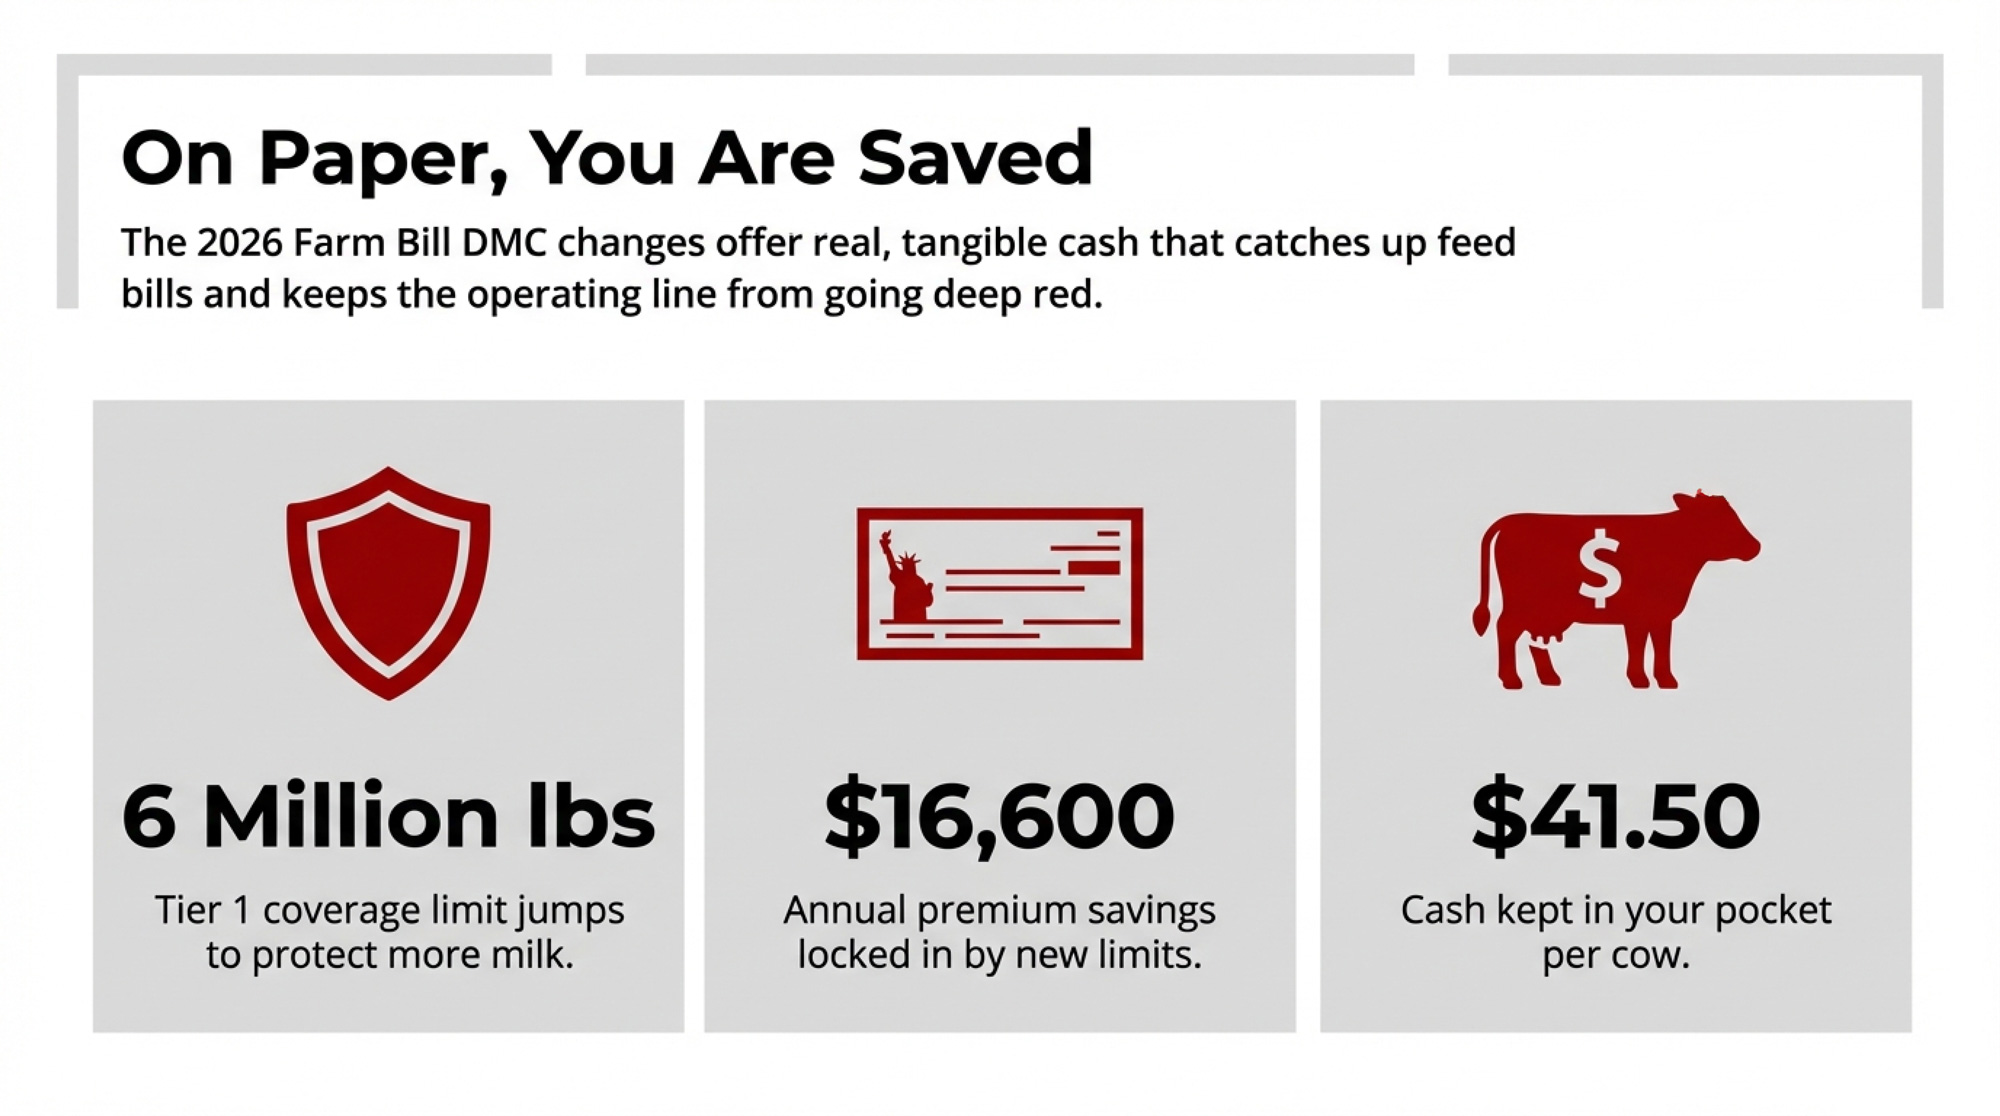
- Annual premium savings: 10,000 cwt × $1.66 = $16,600/year.
- Per cow: $16,600 ÷ 400 = $41.50/cow/year.
That’s money you keep whether DMC pays a dime in indemnities. If 2026 margins track the 2019–2023 pattern, total indemnities could add tens of thousands more, depending on how long margins remain below the $9.50 trigger.
Real cash. The kind that catches up feed bills and keeps the operating line from going deep red.
But the catch is what DMC pays on. It’s the margin over the standardized feed, not the full cost of production. Farm Bureau’s March 2026 analysis calls it a “vital backstop showing its limits” for exactly this reason — it never sees the gap between a $9.50 margin and a $20‑plus all‑in cost on many farms.
So when Julie runs 2026 projections on Mark’s herd, she does it two ways:
- With DMC and other program income in the numerator.
- Without any program income at all.
That’s where the 0.9x shows up.
What Does a 0.9x DSCR Really Mean for a 400‑Cow Herd?
Here’s the barn math a lot of 400‑cow producers and their lenders are walking through right now.
Assumptions (national outlooks + farm‑level benchmarks):
- Herd: 400 milking cows, ~27,500 lbs/cow/year → 11 million lbs, or 110,000 cwt.
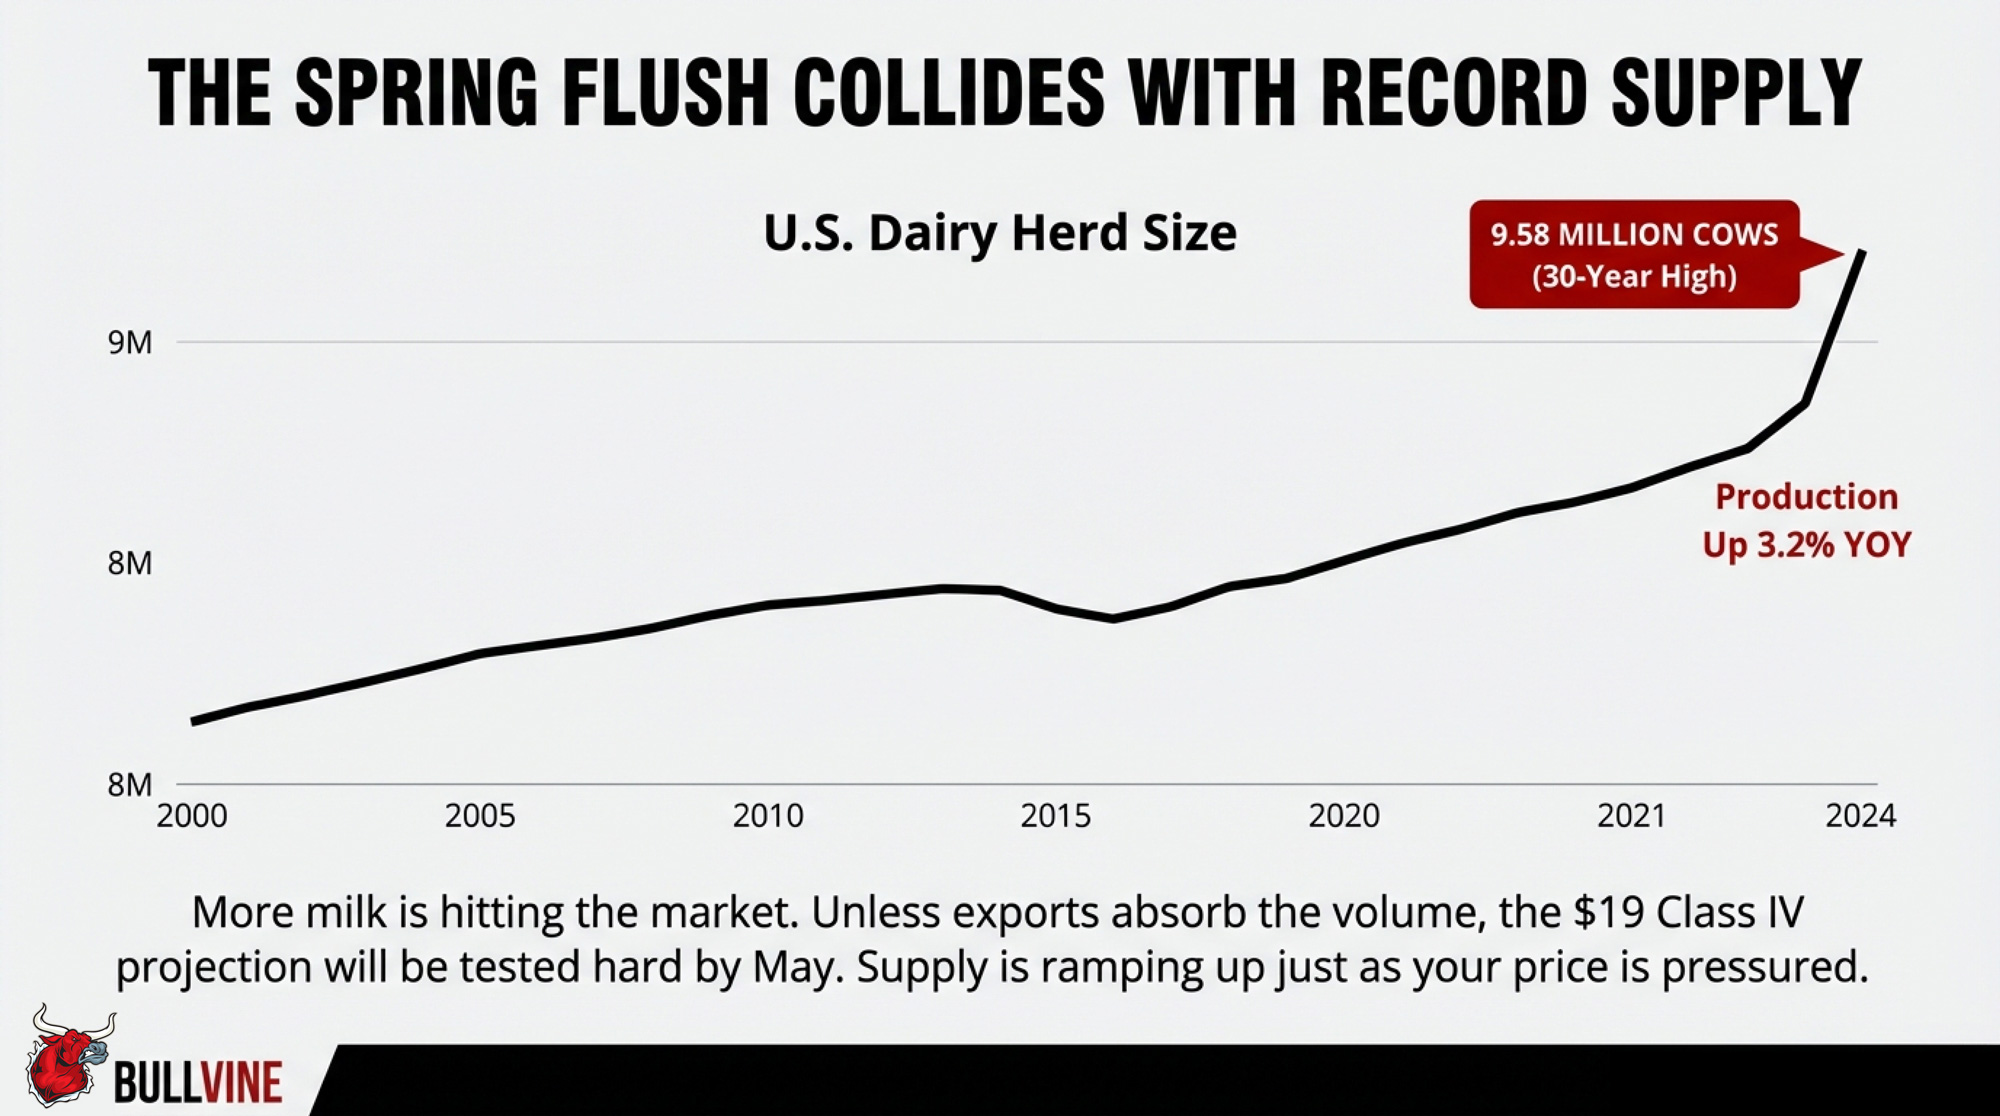
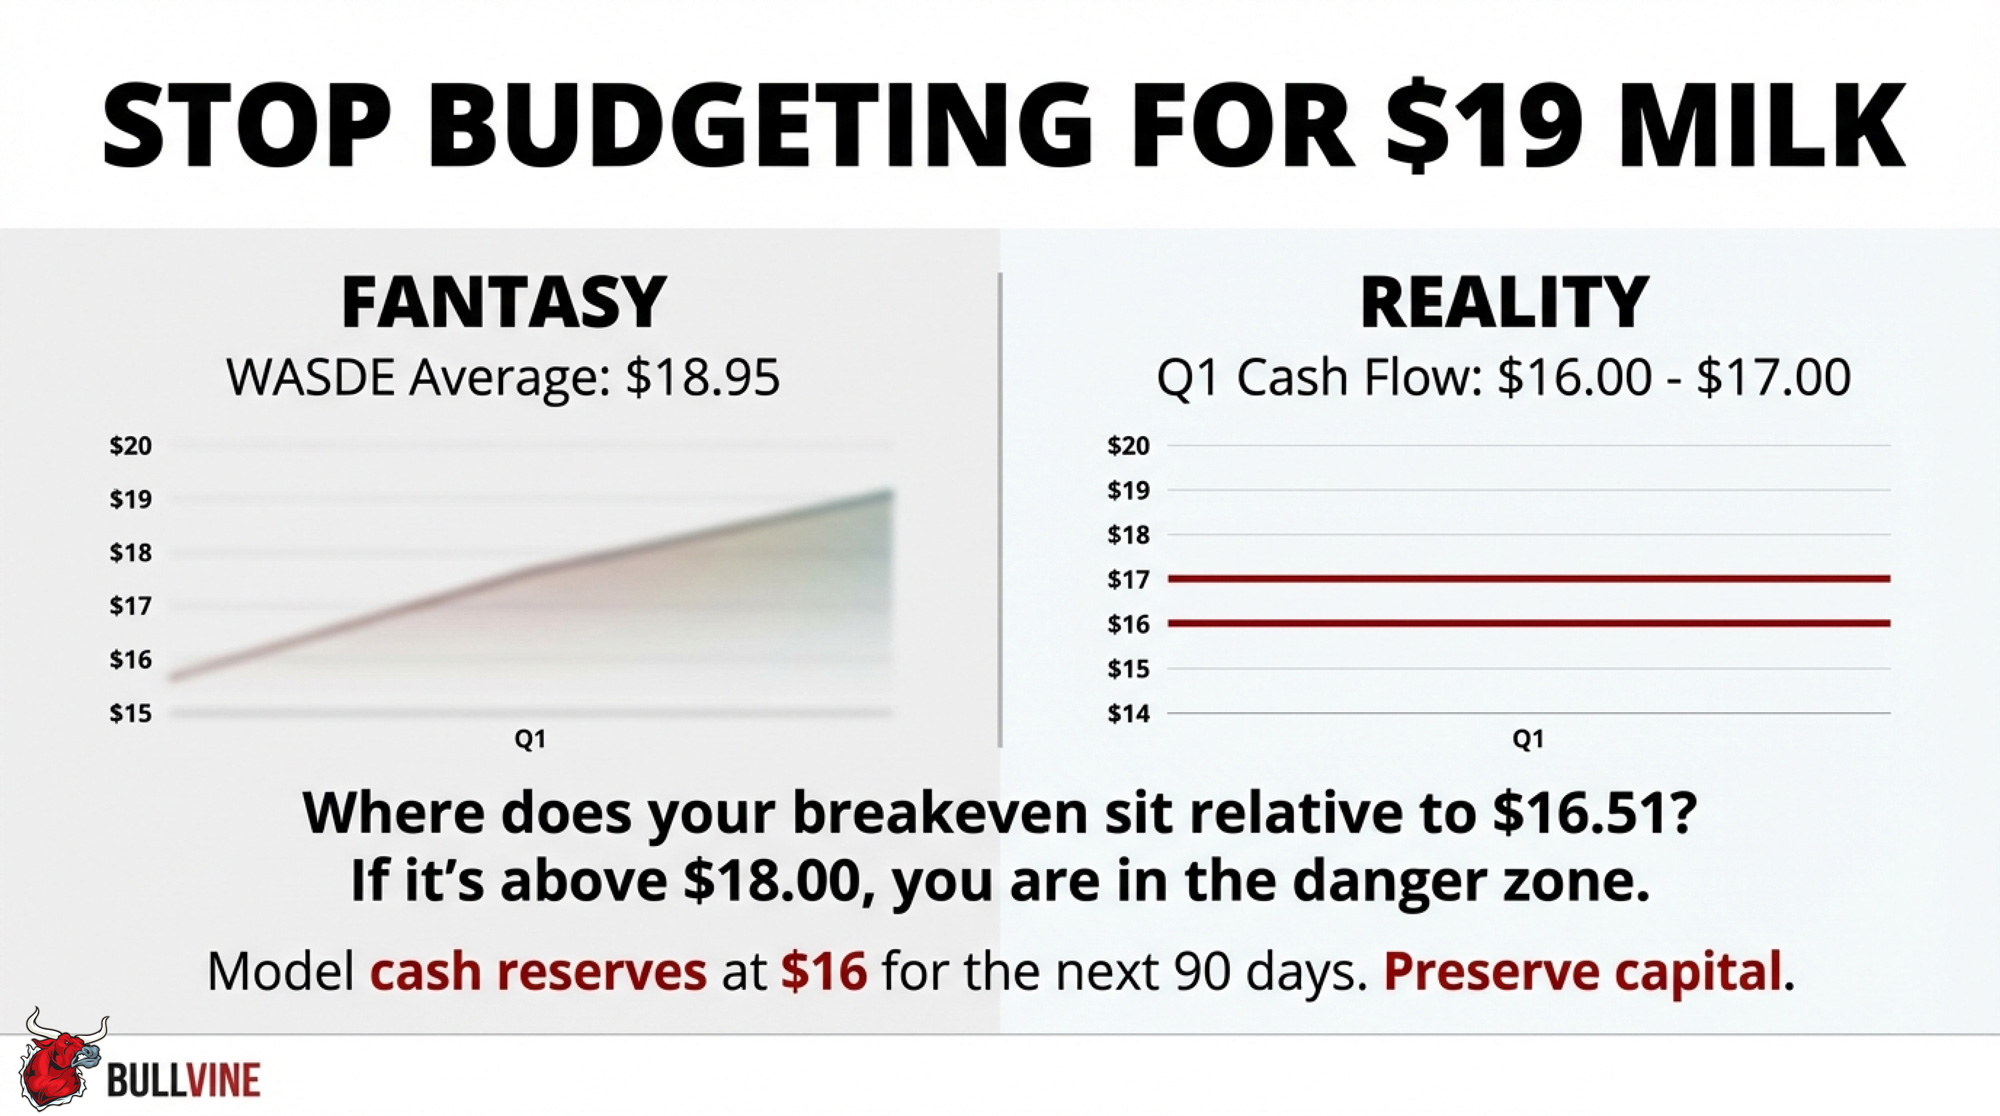
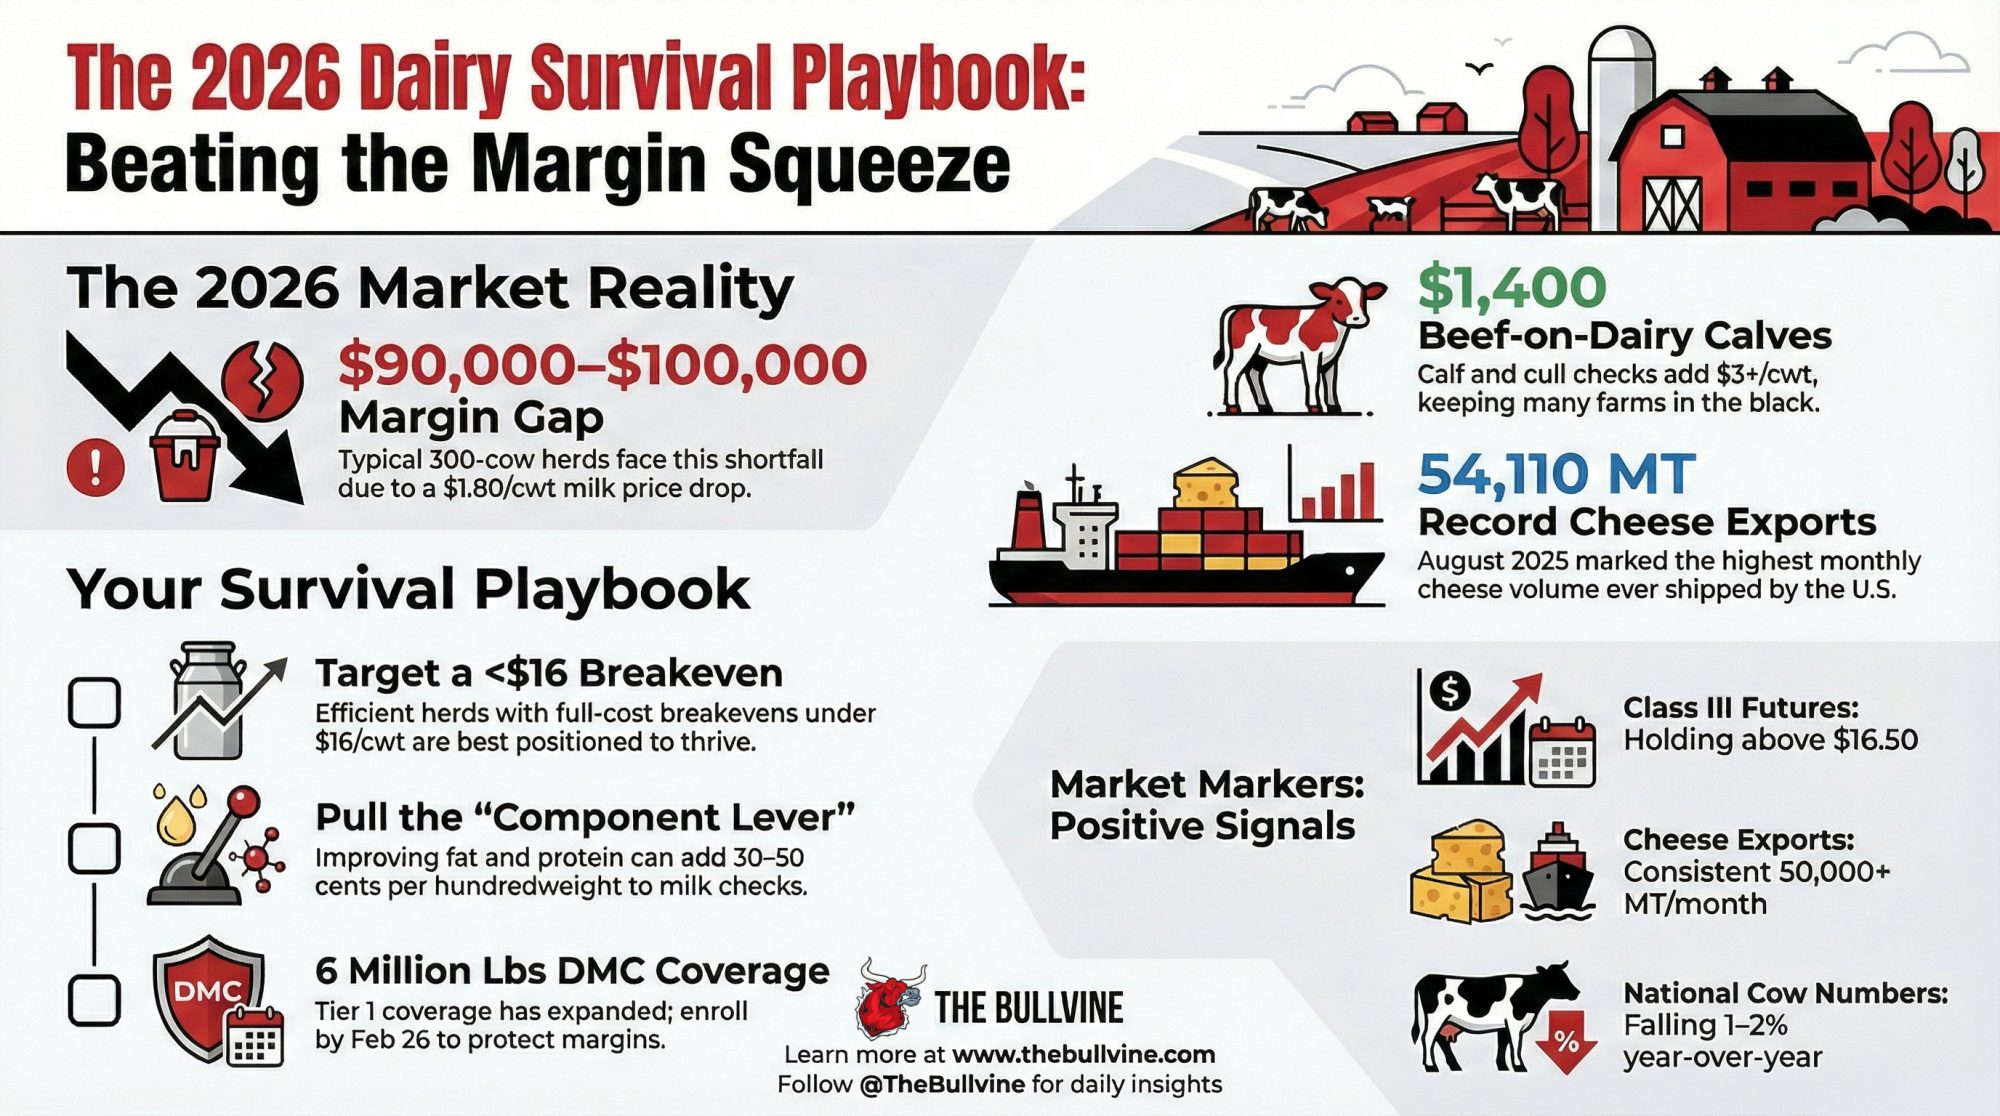
- Milk price scenario: USDA’s February 2026 WASDE puts the annual all‑milk forecast near $18.95/cwt. Once basis and component adjustments hit the cheque, the realized price can land several dollars lower.
- Full cost of production: $18–21/cwt depending on herd size, efficiency, and region (USDA ERS 2021 ARMS; UW Extension mid‑size Wisconsin benchmarks).
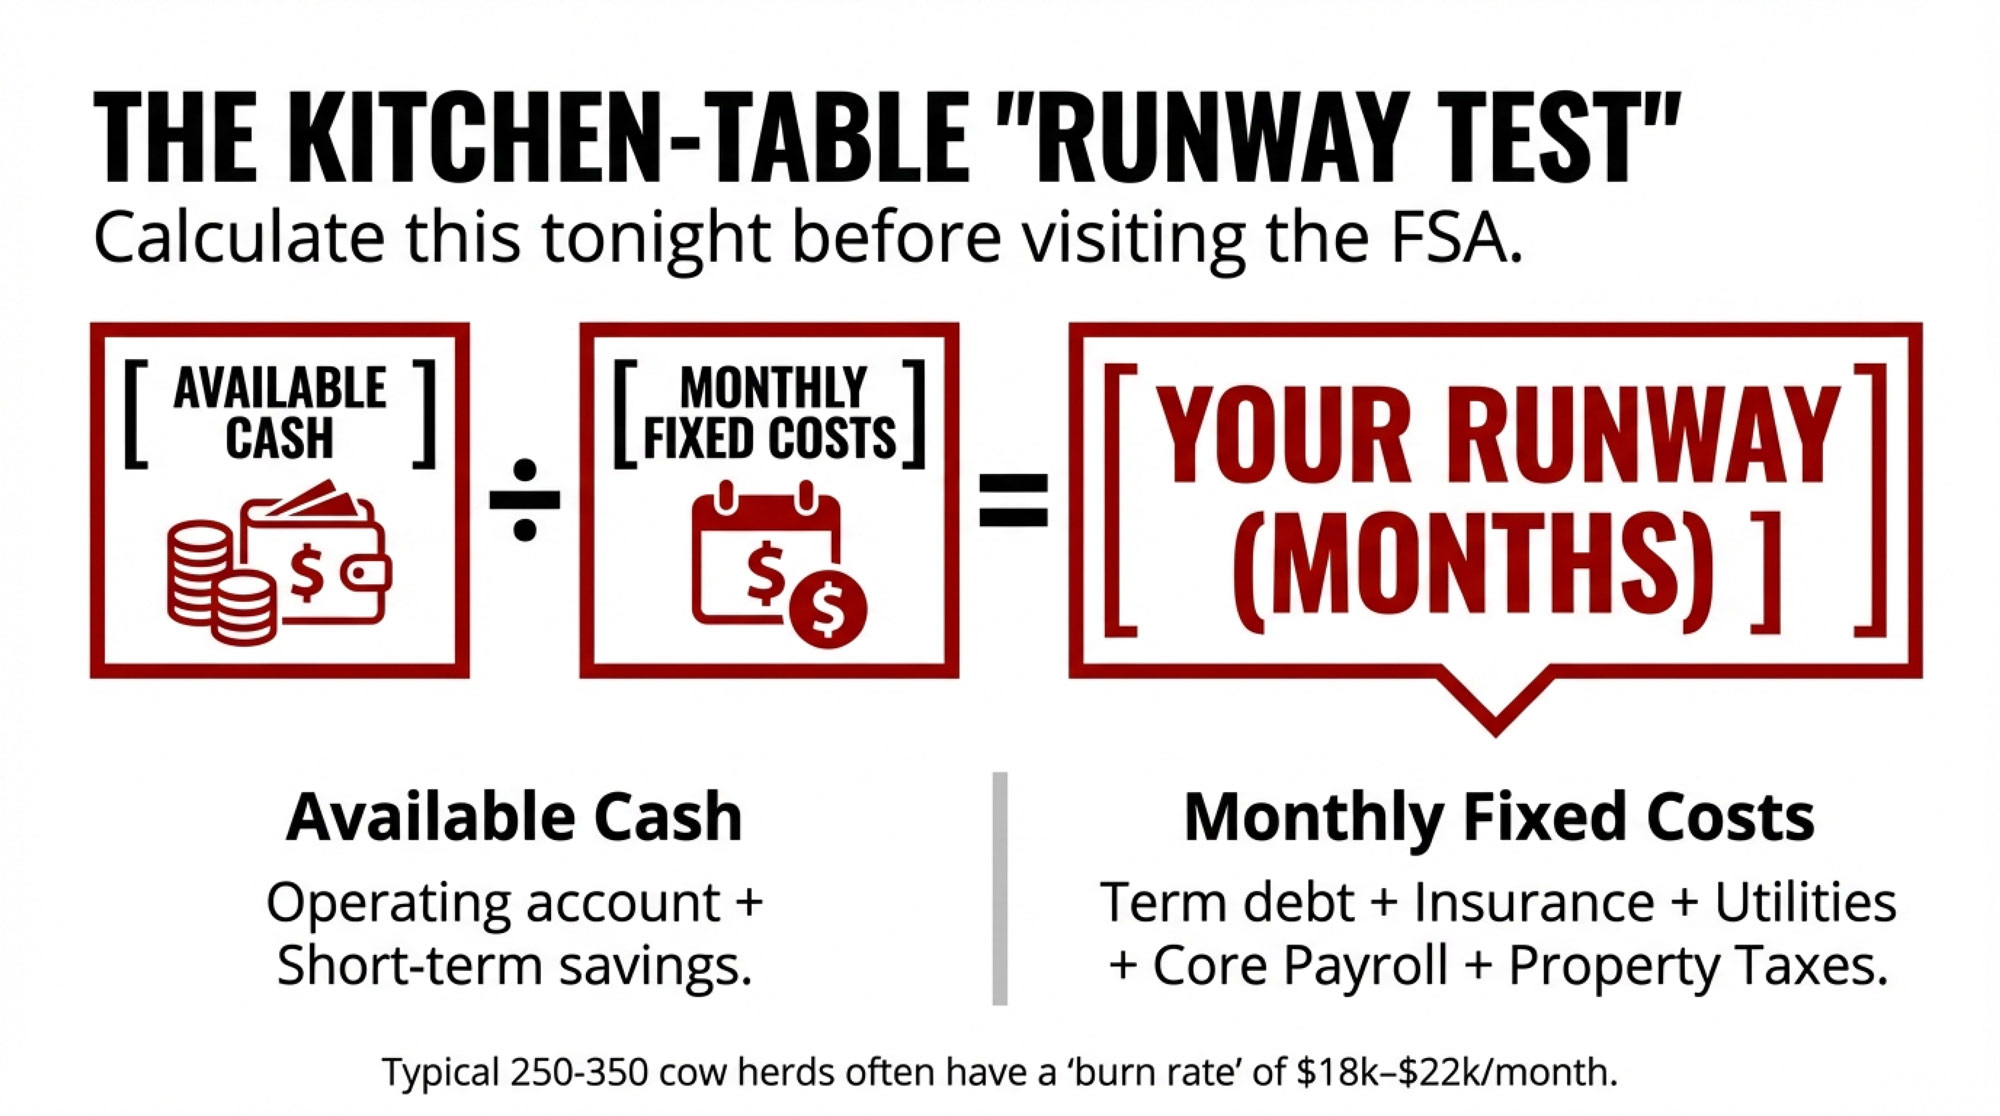
- Annual debt service: In this composite, Mark carries $600,000–900,000 in annual P&I — roughly $1,500–2,250 per cow. That’s not a national average; it’s a realistic range from lender examples and recent mid‑size capital projects.
For DSCR, lenders go back to basics:
(Milk and other income − cash expenses) ÷ annual principal and interest.
The Lender’s Circle
Julie slides the printout across the desk and circles two numbers:
| Metric | Without DMC & Programs | With DMC & Programs |
| Annual Milk Sales (110,000 cwt @ $18.95/cwt) | $2,084,500 | $2,084,500 |
| DMC Premium Savings | $0 | $16,600 |
| Other Cash Expenses | $1,484,500 | $1,484,500 |
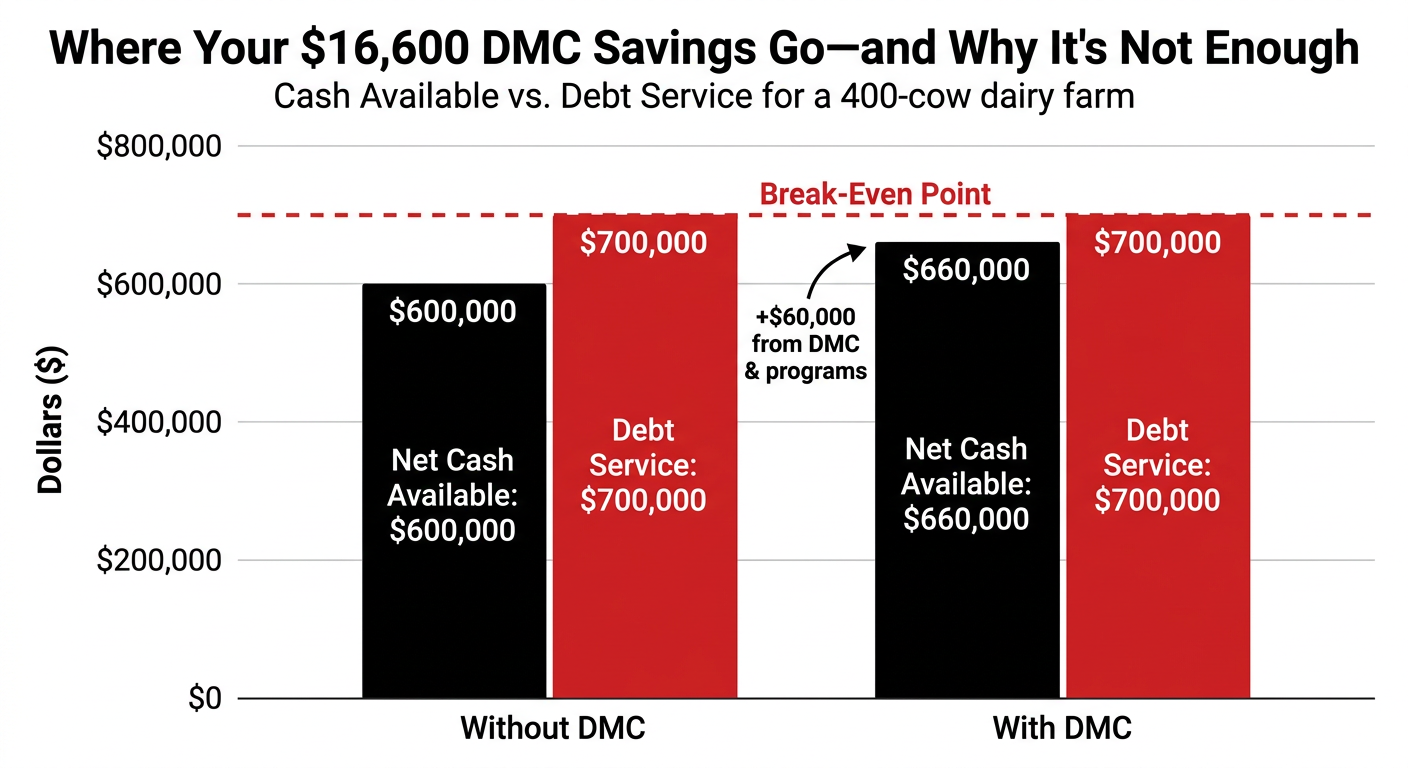
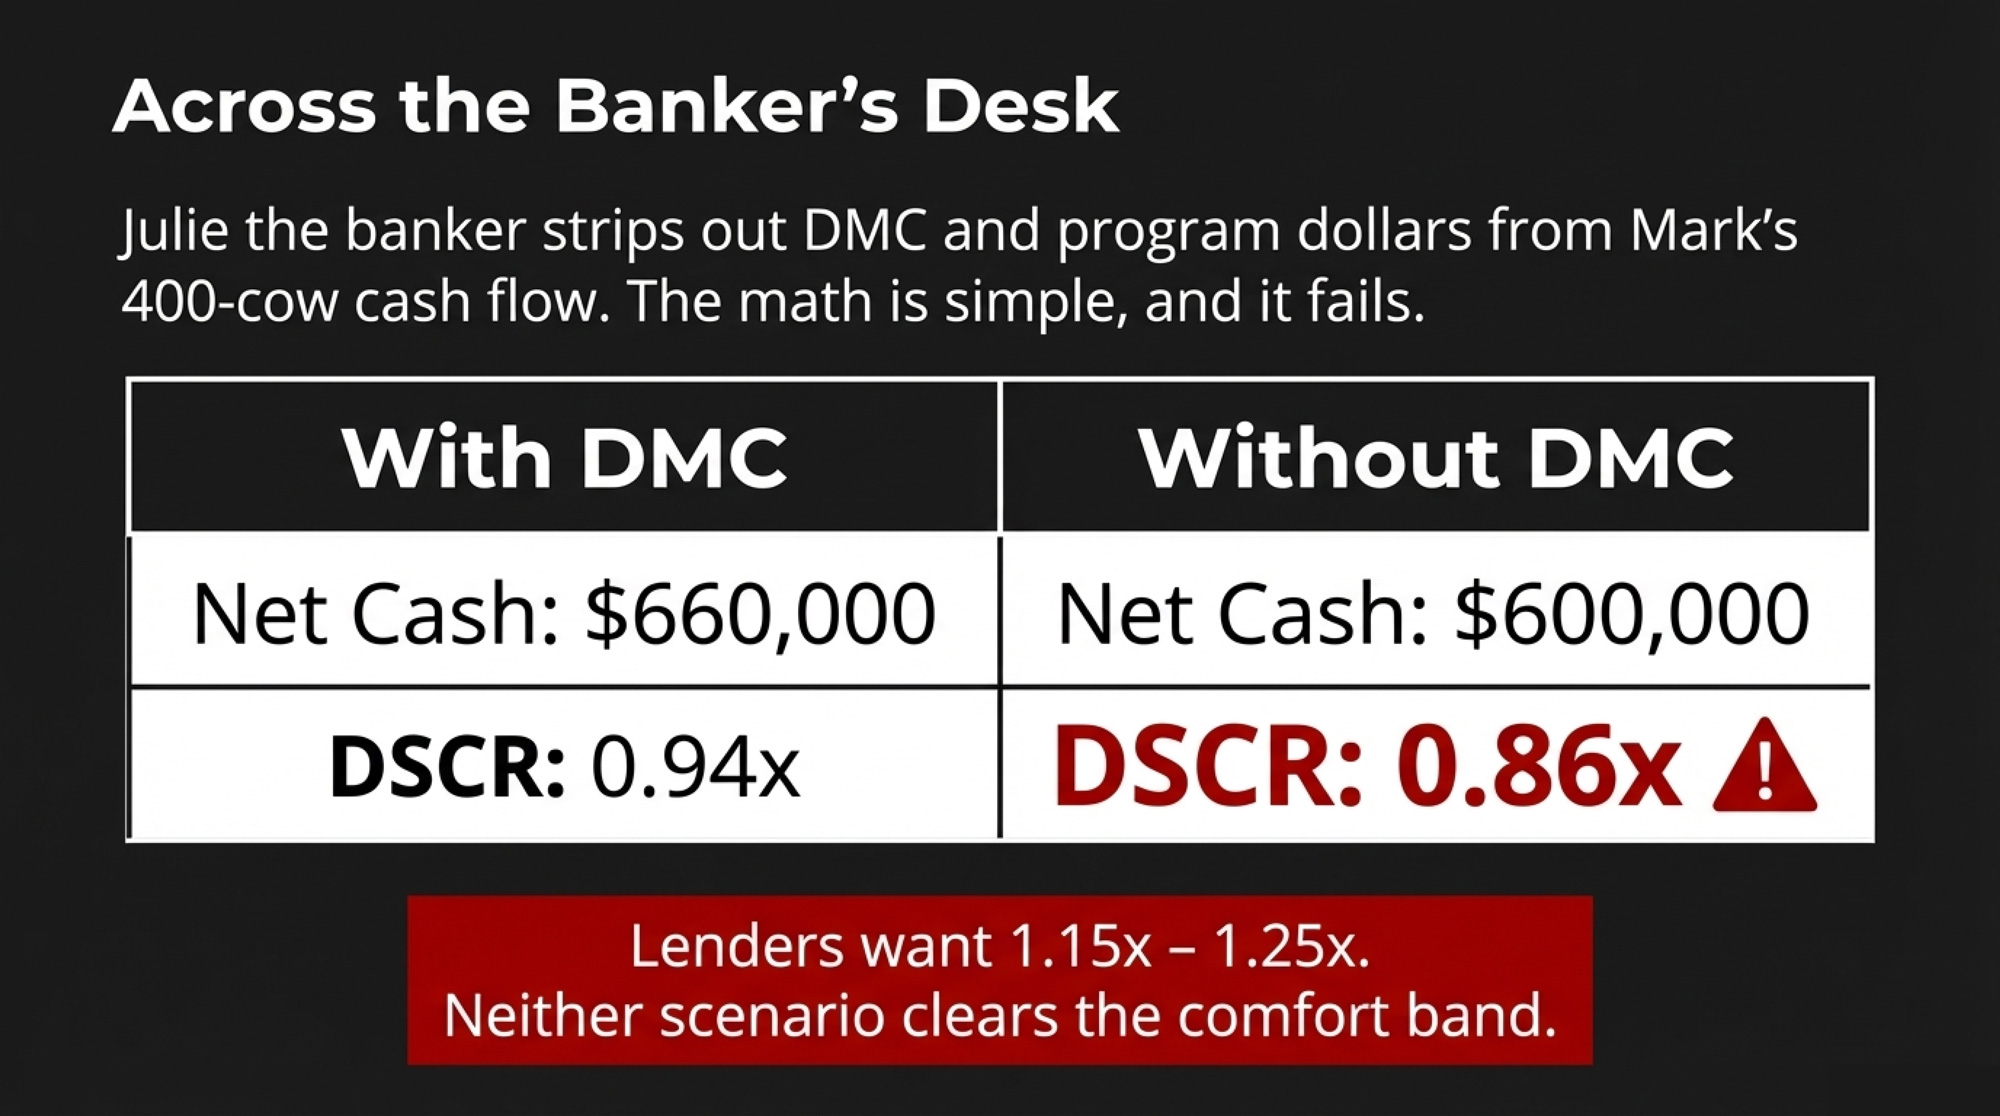
| Net Cash Available for Debt Service | $600,000 | $660,000 |
| Annual Debt Service (P&I) | $700,000 | $700,000 |
| DSCR | 0.86x | 0.94x |
| Lender Comfort Zone | 1.15–1.25x | 1.15–1.25x |
Adjust a few assumptions — slightly higher net cash, slightly lower debt service — and you can push the “with DMC” number just north of 1.1x. Without DMC, it sags back toward 0.9x.
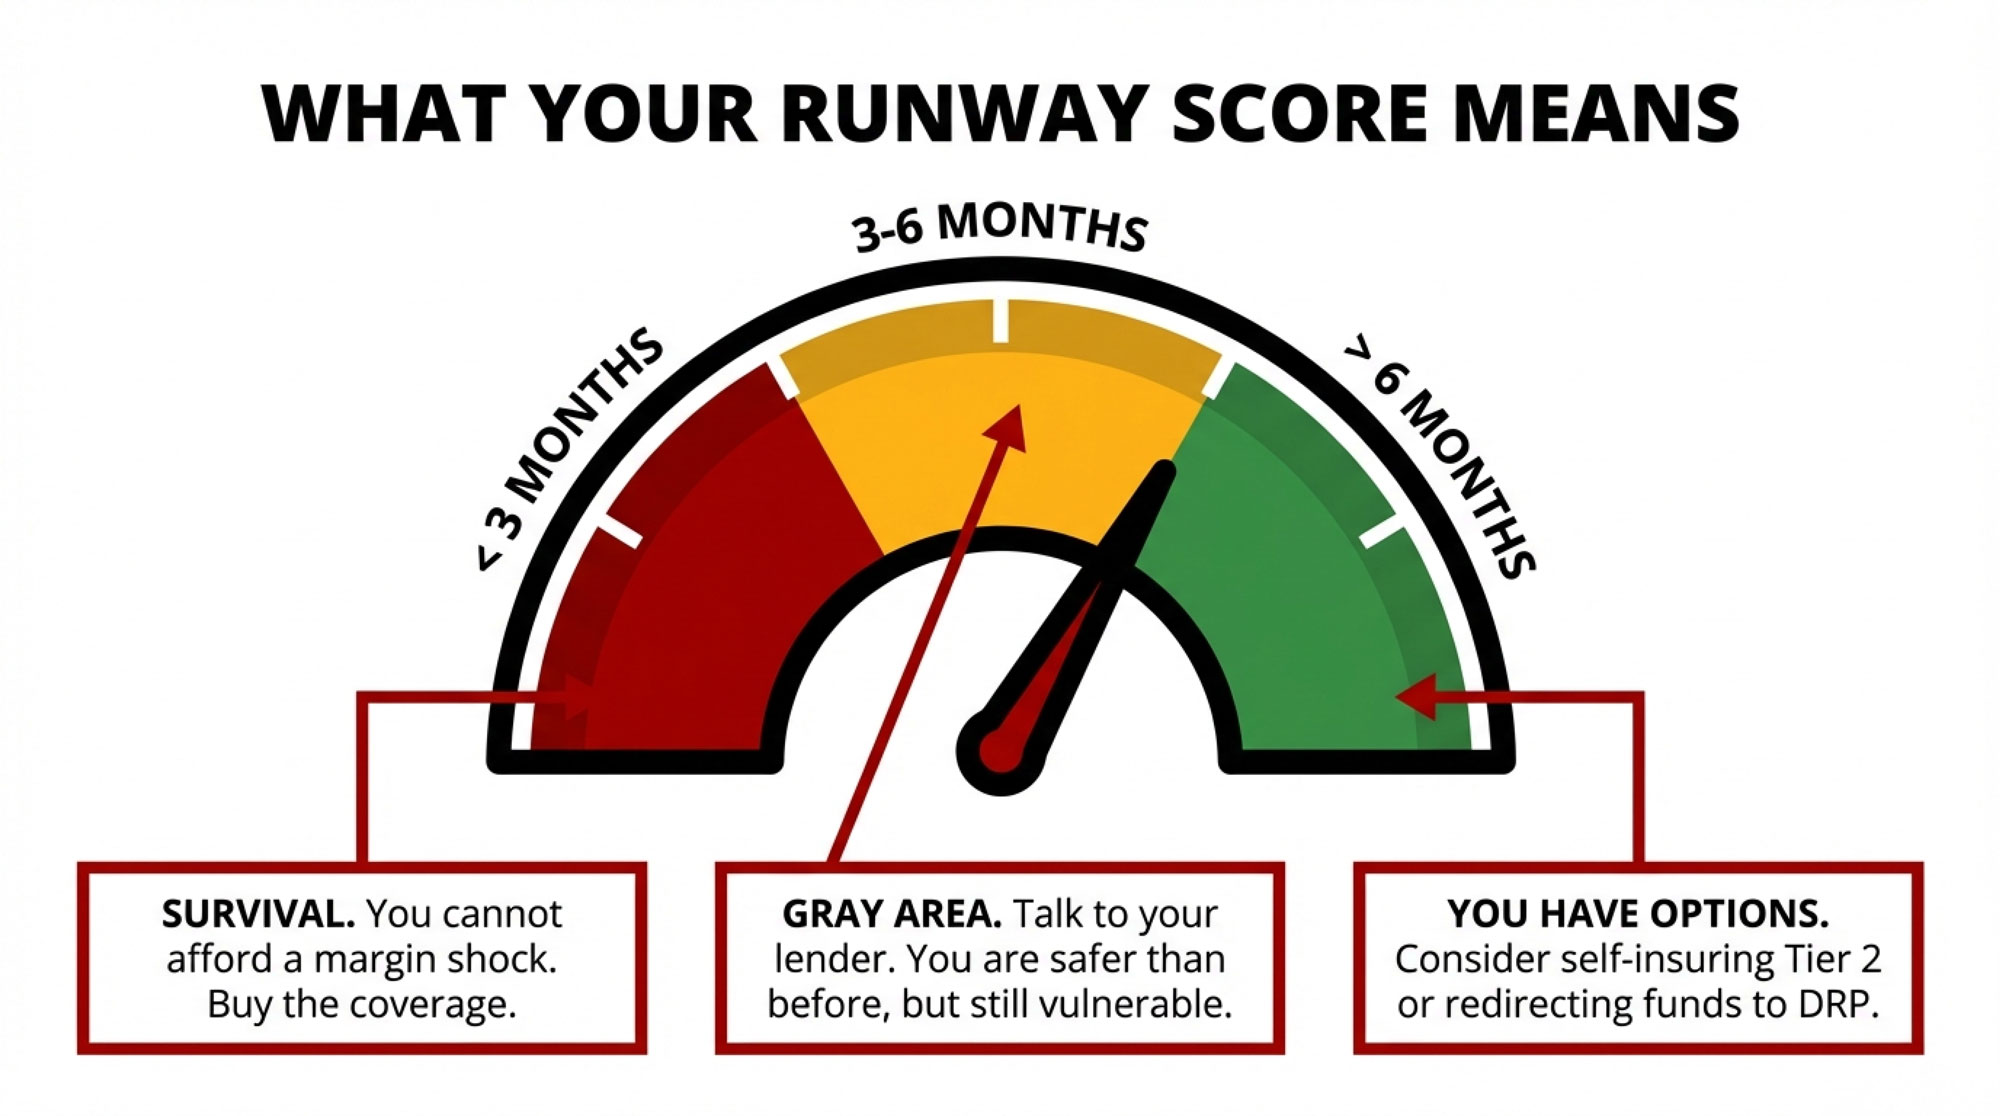
Most ag‑lenders treat a DSCR of roughly 1.15–1.25x as their comfort zone. Anything under 1.0x signals cash‑flow that can’t service its own debt without outside help.
Neither number in that table clears the band. One looks less alarming.
The Turn: Is DMC Your Backstop or Your Business Model?
That question is Mark’s turn, and for a lot of 300–500‑cow operations, reading the same headlines.
The comfortable narrative has sounded like this: DMC is stronger and cheaper. FSA operating and ownership loan limits are higher. Conservation and methane dollars are flowing. Farm Credit and the American Bankers Association have pushed for FSA to raise guaranteed operating loan limits toward $3 million, arguing lenders need those levels to keep financing modern farms.
For a dairy with a solid DSCR, that’s true — higher guaranteed limits unlock better terms and responsible restructures. For a 0.9x herd like Mark’s, the math goes another way:
If your bankable DSCR only works when program dollars are in the numerator, DMC has drifted from being a backstop to a core revenue stream.
Rolling the operating line for another year isn’t risk management at that point. It’s a timing decision on when — and how — the operation changes or exits.
Three Branches — None Start with “Hope DMC Keeps Paying”
Once the math is on paper, most 400‑cow herds in this band end up with three branches.
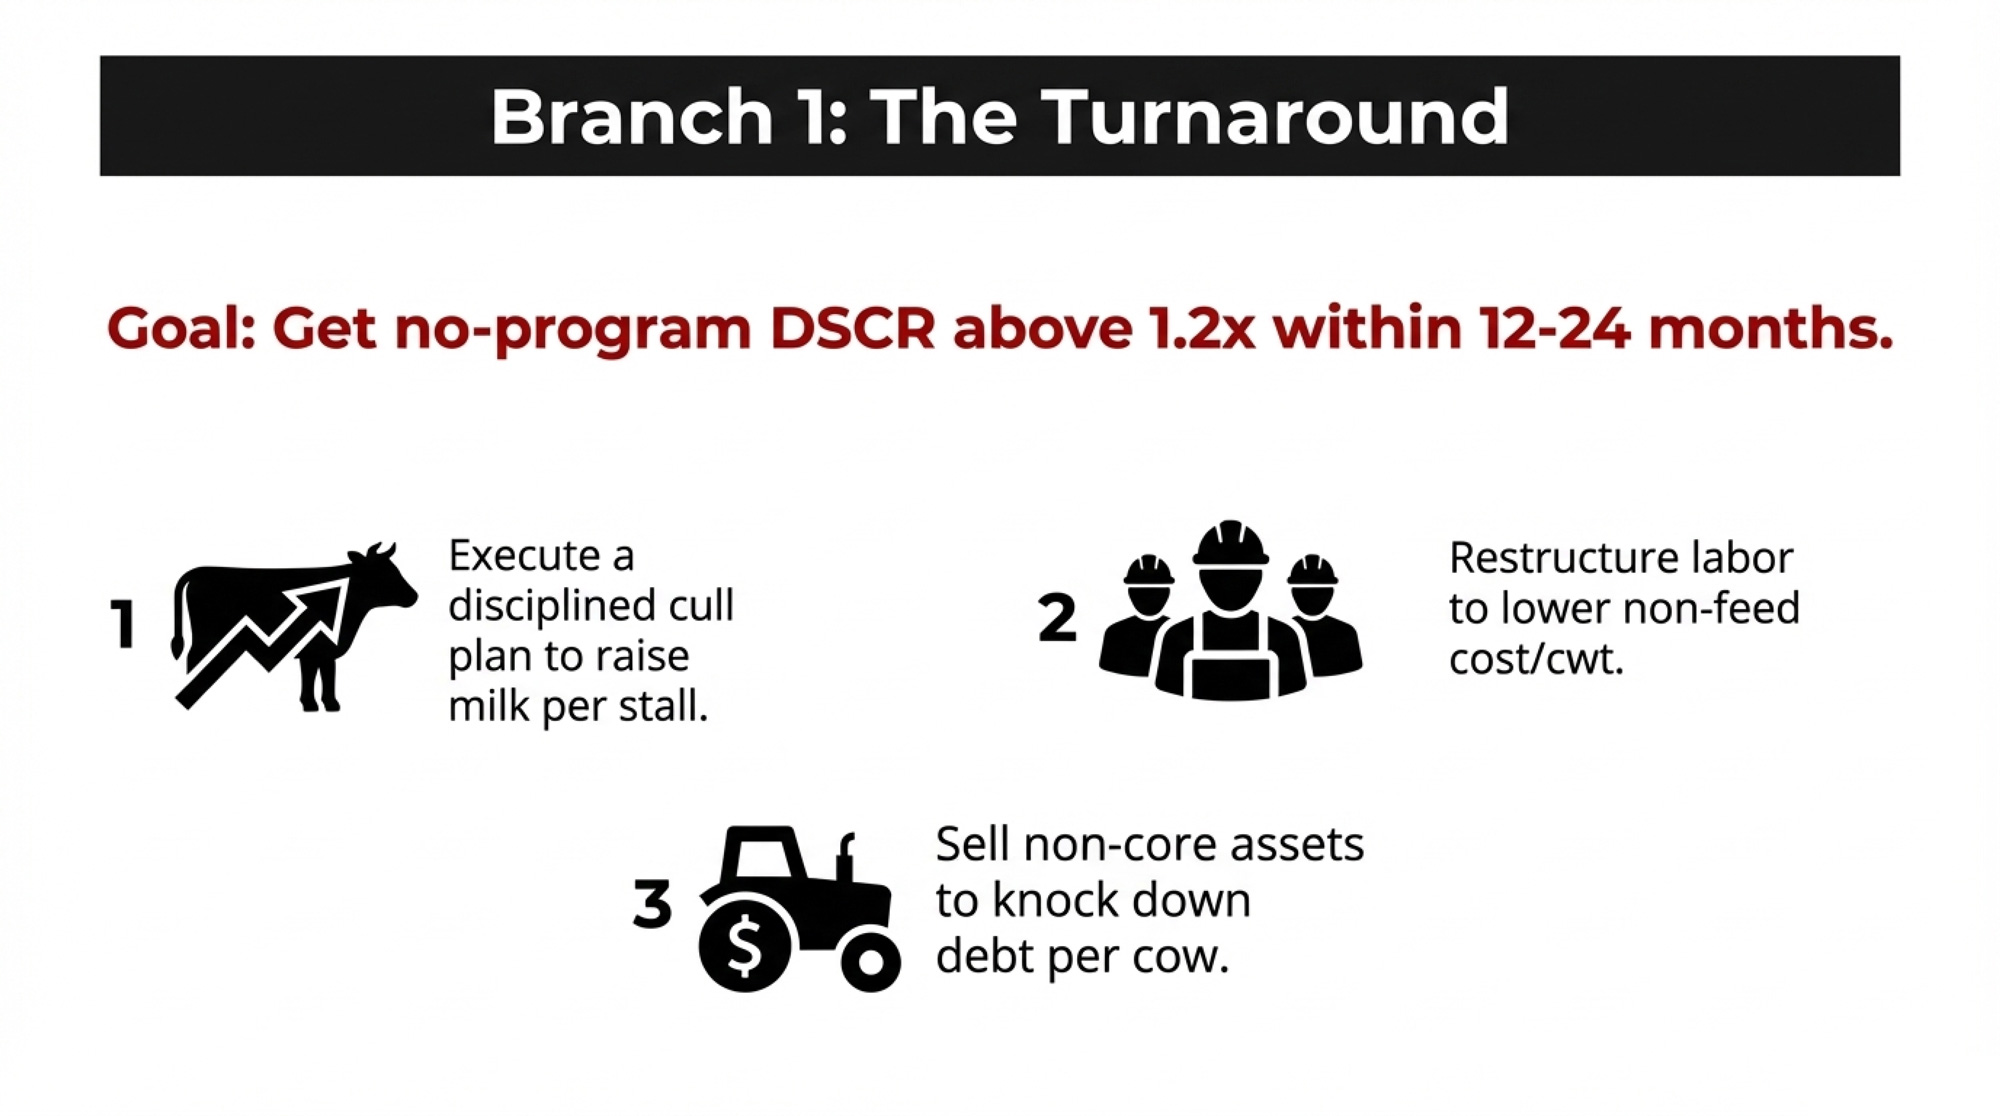
Branch 1: Turnaround — Get DSCR Above 1.2x Without Programs
Mark’s in this lane if “no‑program” DSCR can realistically climb to ≥1.2x within 12–24 months through specific moves: a disciplined cull plan that raises milk per stall; a concrete labour change that lowers non‑feed cost/cwt; selling non‑core assets to knock down debt per cow. In that world, DMC works as designed — a floor under feed‑margin risk, not a permanent revenue line.
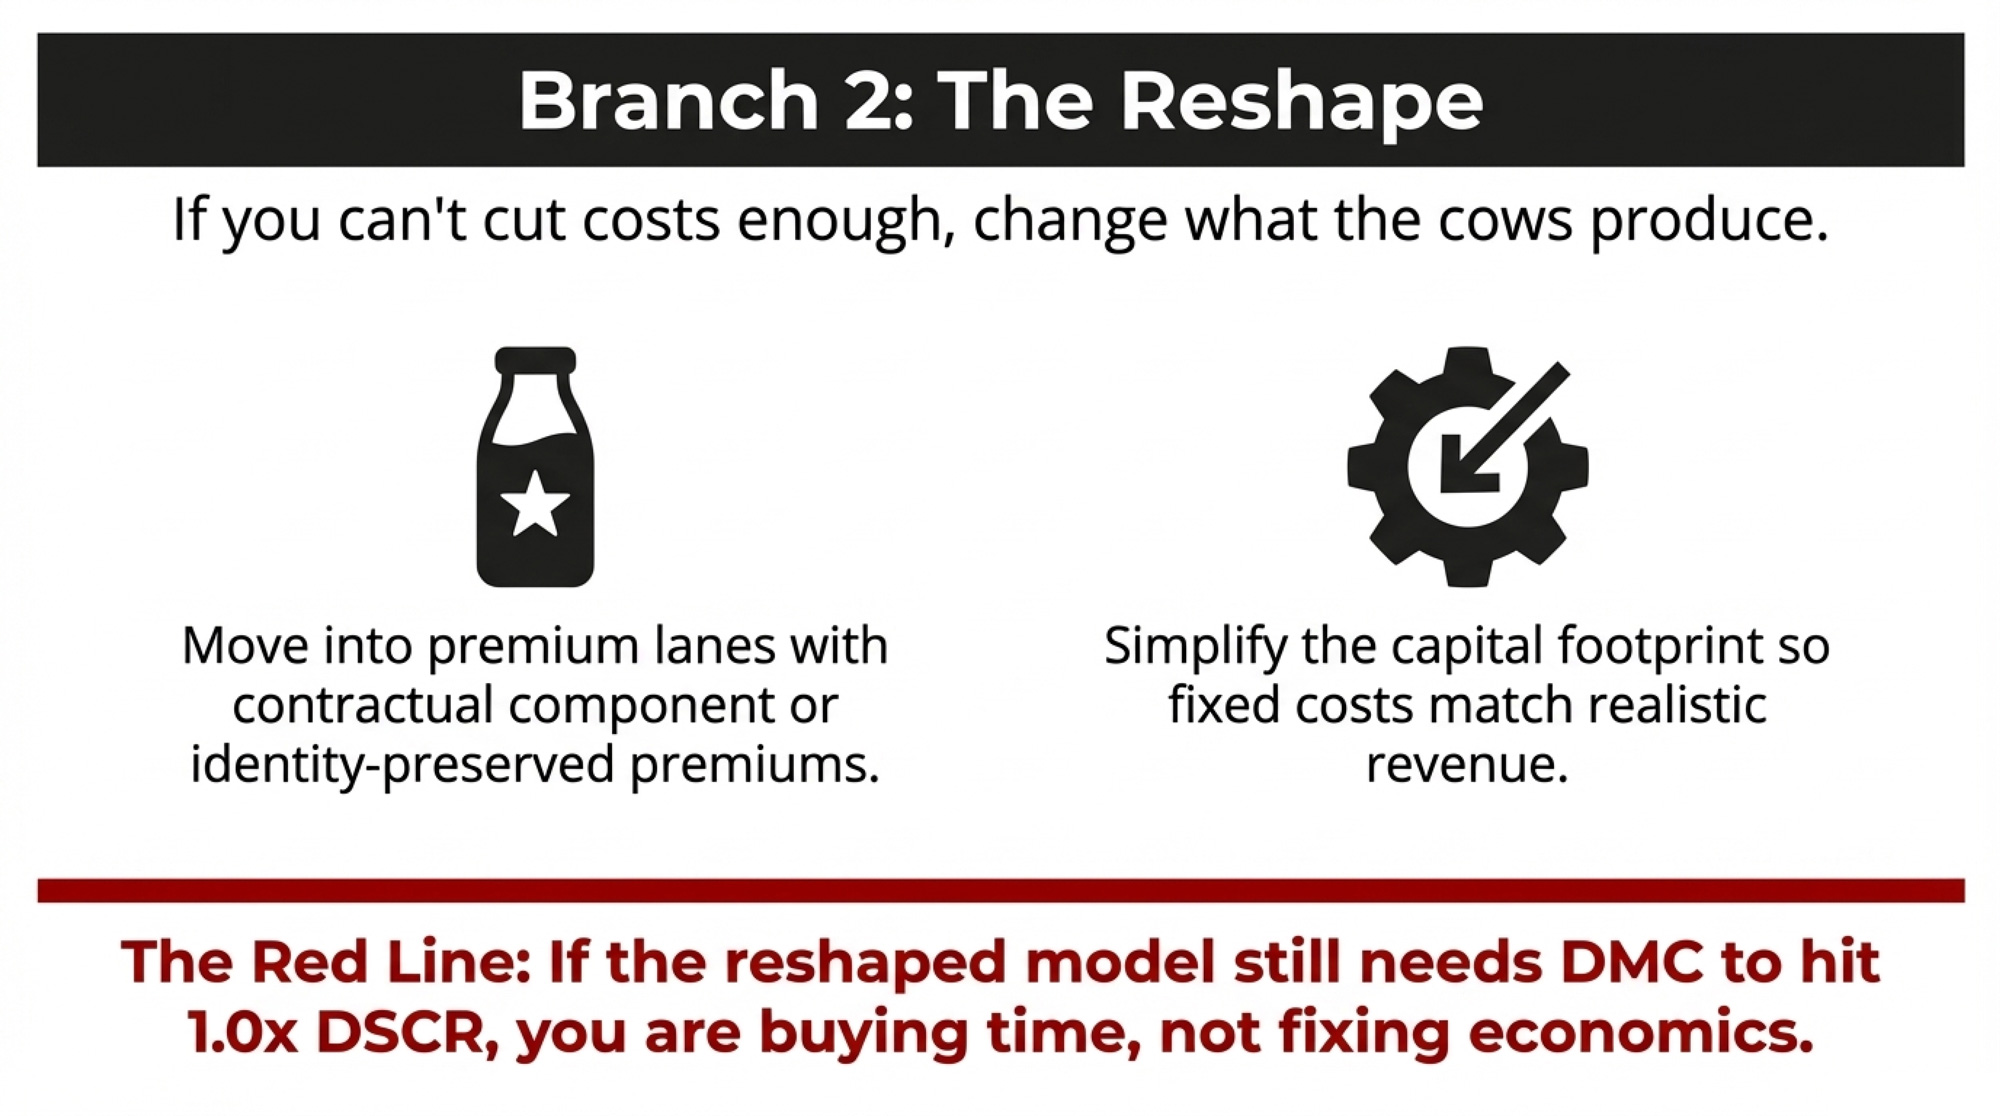
Branch 2: Reshape — Change What the Cows Produce
If Mark can’t get there on cost cuts alone, he may still change the model: move into a premium lane with documented, contractual component or identity‑preserved premiums that actually show up on the cheque; simplify the capital footprint so fixed costs match realistic revenue.
The red line stays put: if the reshaped model still needs DMC to get DSCR to 1.0x, that usually looks more like buying time than fixing core economics.
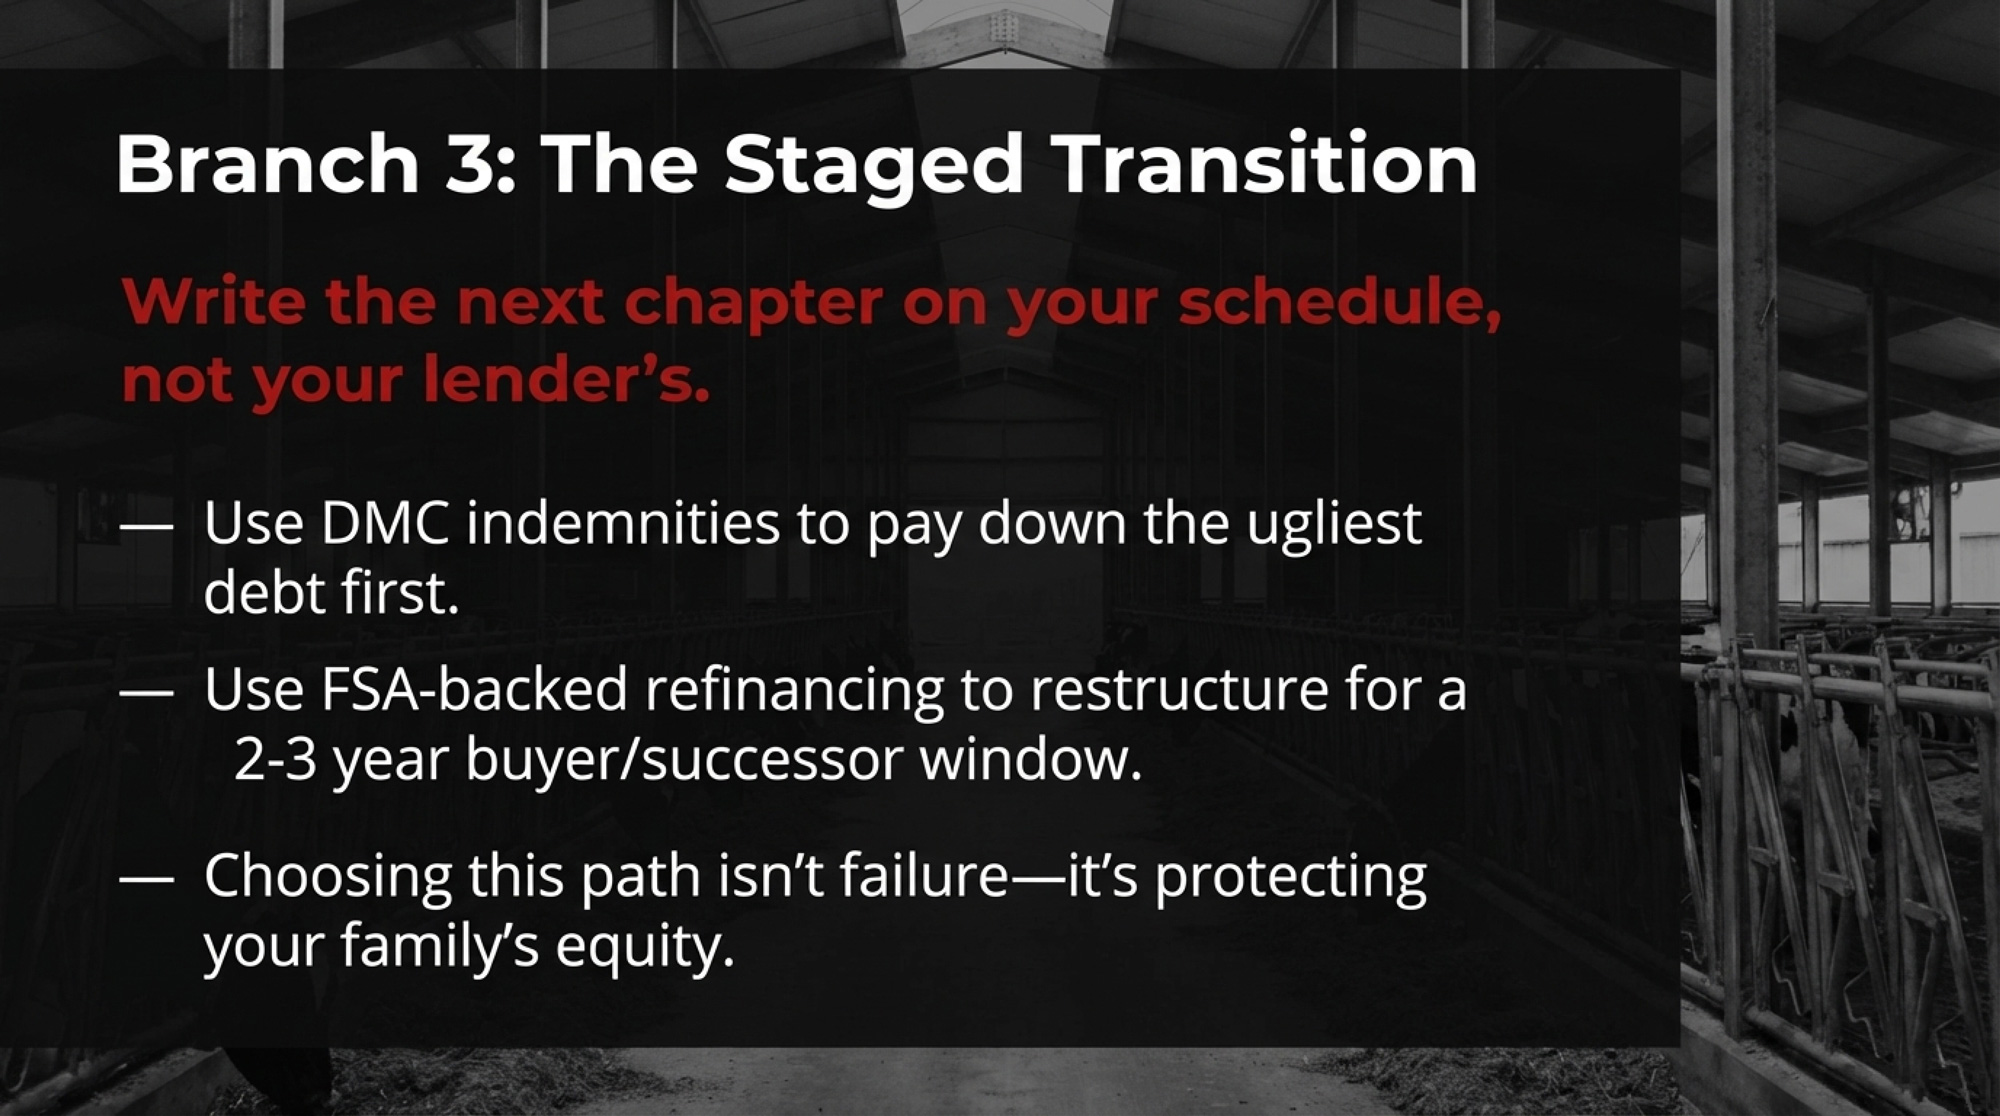
Branch 3: Use the Tools to Stage a Stronger Exit
The hardest conclusion. For many families — Mark’s included — this isn’t spreadsheet math. It’s a barn your grandfather built, and it’s where your kids learned to drive a skid steer.
But the farm‑bill tools aren’t about keeping a struggling model alive indefinitely. They’re about choosing the timing, the terms, and the shape of what comes next on your schedule, not your lender’s:
- Use DMC indemnities and premium savings to pay down the ugliest debt first.
- Use FSA‑backed refinancing to restructure into a form that works for a buyer, successor, or landlord in a 2–3 year window.
- Consider EQIP/energy projects only if they raise resale or lease value without adding obligations the next operator won’t want.
Choosing this path isn’t failure. It means you’re writing the next chapter, not waiting for the bank to write it for you.
What This Means for Your Operation
If you’re in the 300–500‑cow band and this feels uncomfortably close:
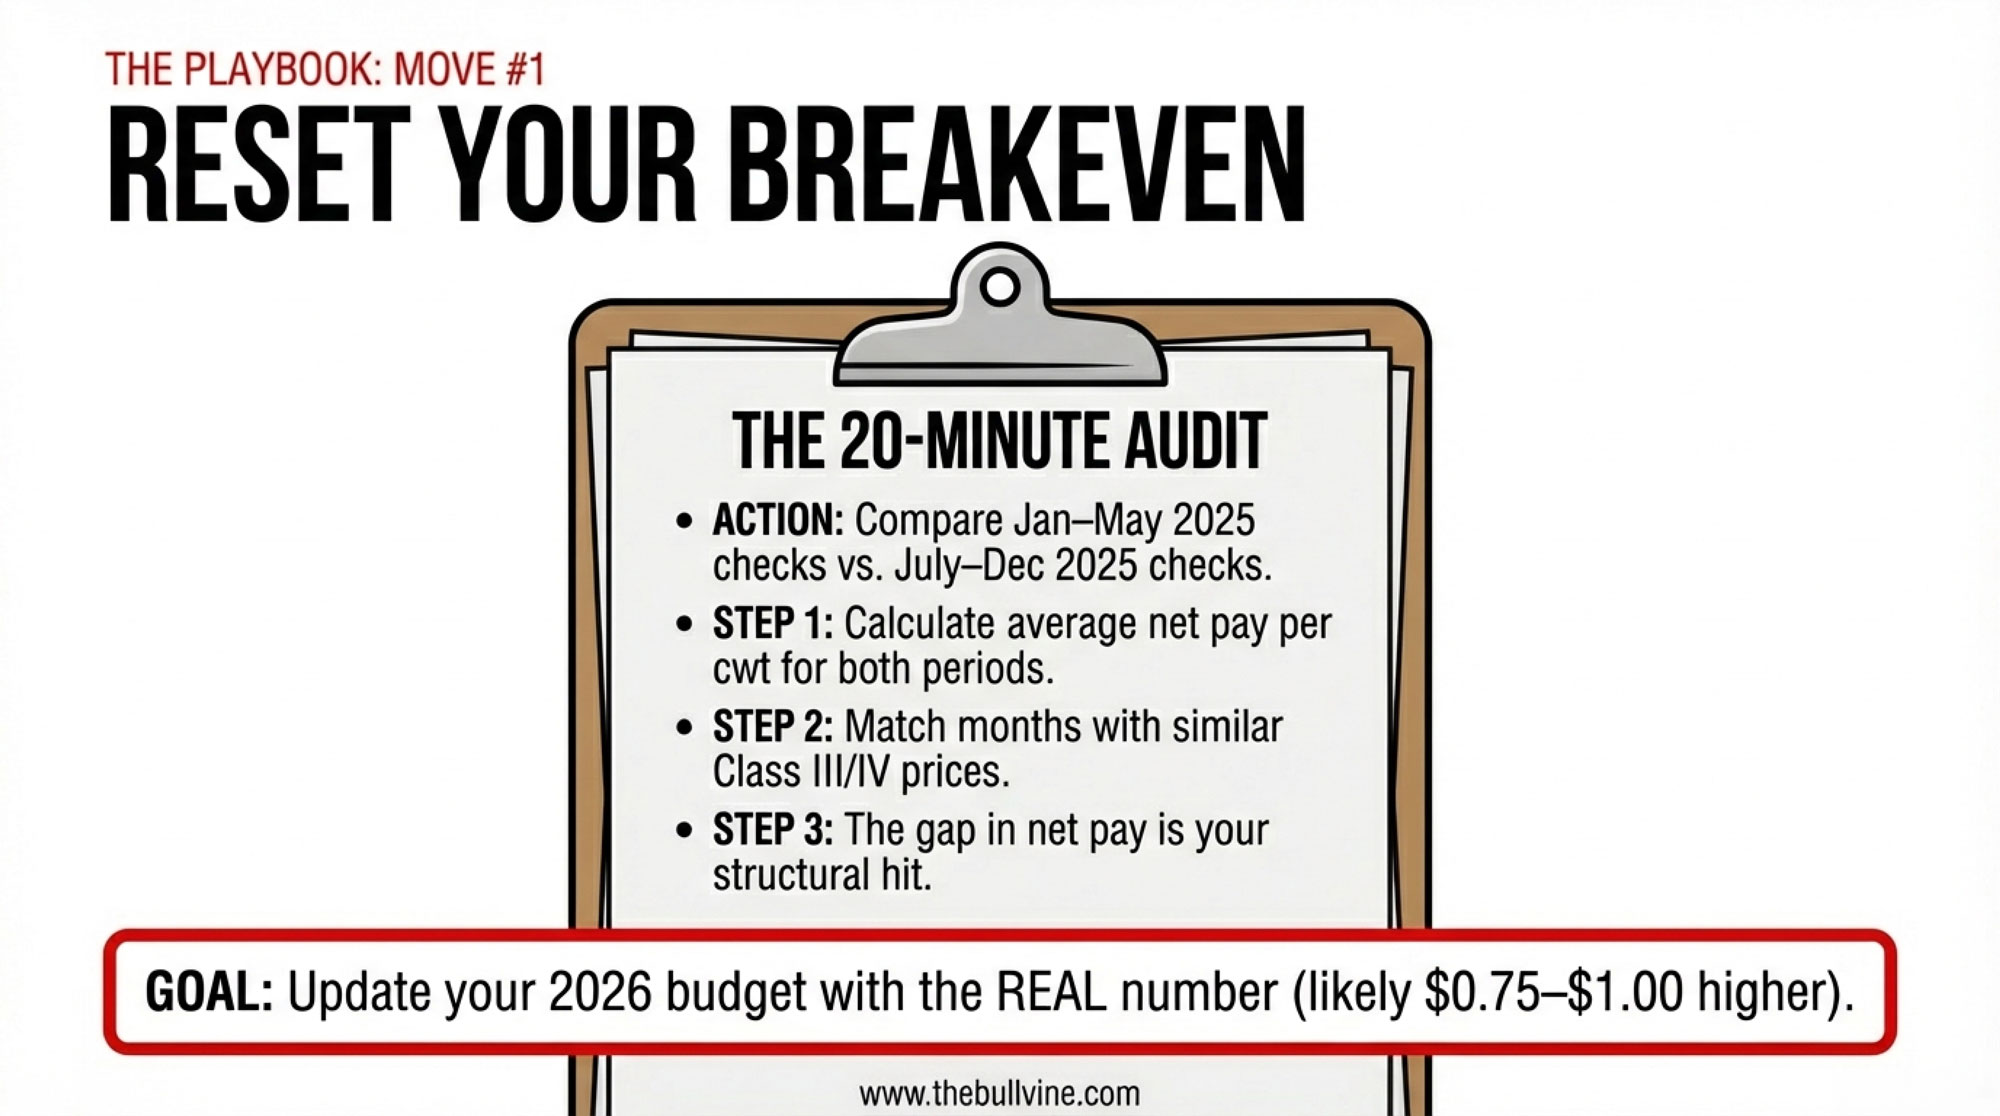
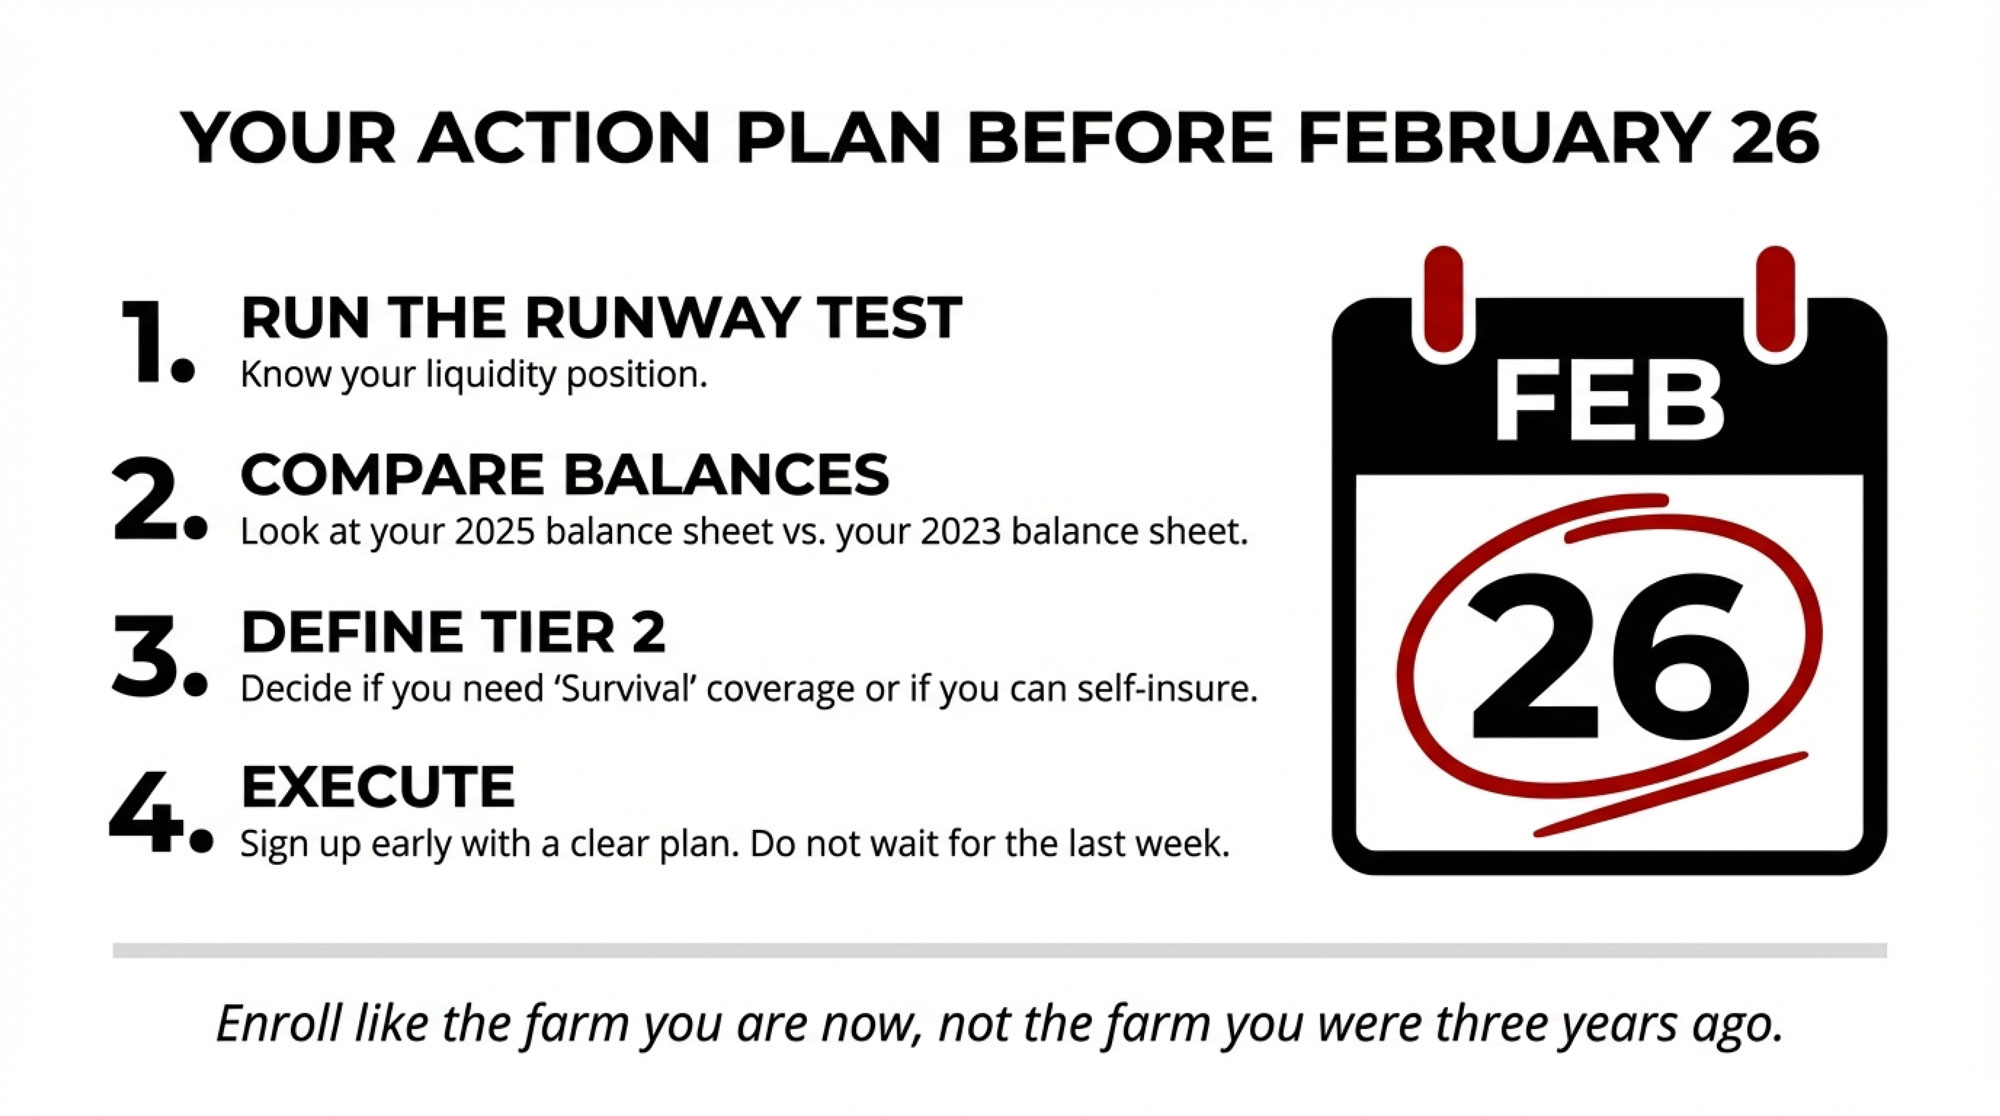
- Within 30 days, run the “no‑program” DSCR test. Bring your last 12 months of milk cheques, a full cost‑of‑production breakdown (including labour at replacement cost), and your P&I schedule. Calculate DSCR with and without DMC. If it’s below 1.0x without programs, you’re looking at a business‑model question, not just a rough year.
- Use the next 90 days to decide which branch you’re really on. If no combination of realistic cost cuts and genuine premiums gets DSCR to ≥1.2x without programs, you’re in “reshape or transition” territory. Better to name that now than let the bank name it in 18 months.
- Treat DMC as protection, not entitlement. Max out Tier 1 and lock in the six‑year discount. Then ask: “Does this business stand on its own if DMC pays nothing for two years?”
- Handle FSA like a scalpel, not a shovel. Model what happens to DSCR if you only restructure existing debtversus if you add new principal. If a new loan doesn’t improve your no‑program DSCR, it’s not expansion money — it’s extra risk.
- Pick EQIP and energy projects that move cost per cwt. Plate coolers, VFDs, targeted manure improvements — cost‑share can cover 50–75% on smaller projects in some states. Full‑scale digesters mostly belong to herds with thousands of cows and corporate advisory teams. If a project doesn’t clearly lower $/cwt or raise asset value within three years, it’s probably not your project.
- Build your risk plan around your own cheque. DNIP and school whole‑milk rules are demand‑side tailwinds. Most of those program dollars flow through retailers and processors first, touching your milk cheque only indirectly.
- Make labour your first policy response. Immigration isn’t fixed in this farm bill, but it’ll decide more 400‑cow futures than any DMC tweak. Hang on to your core crew and keep compliance tight.
| Farm Bill Tool | Direct Impact on Your Cheque | Action for 400-Cow Herds |
|---|---|---|
| DMC Tier 1 expansion | $41.50/cow/year premium savings | ✅ Max out immediately. Lock in 6-year discount. |
| DMC indemnities (when triggered) | $15–30/cow (varies by margin) | ✅ Enroll at $9.50 coverage. Don’t count on it as income. |
| FSA operating loan limit increases | Indirect (better terms if DSCR ≥1.2x) | ⚠️ Use to restructure, not to add debt if sub-1.0x DSCR. |
| EQIP cost-share (plate coolers, VFDs) | $5–15/cow (one-time savings on projects) | ✅ Take it if project lowers $/cwt within 3 years. |
| DNIP & school milk programs | $0 direct (flows through processors) | ❌ Demand-side tailwind. Doesn’t change your cheque in 2026. |
| Full-scale anaerobic digesters | $50–200/cow (only for 1,000+ cow herds) | ❌ Skip. Needs corporate advisory team, not 400-cow scale. |
| Methane funding (small projects) | $8–20/cow (manure improvements) | ⚠️ Consider if resale value increases. Not for survival cash. |
Key Takeaways
- If your DSCR sits below 1.0x without DMC, you’re past a rough‑year problem. You’re looking at a business‑model question the 2026 farm bill can’t fix on its own.
- DMC’s ~$16,600 in premium savings ($41.50/cow) and likely 2026 indemnities are real — but they’re a backstop on margin over feed, not on total cost per cwt. Use them to buy time for decisions, not as a permanent source of income.
- Higher FSA loan limits only win if they lower your no‑program DSCR or make a future sale/transfer cleaner. If they increase total debt on a sub‑1.0x operation, they accelerate an exit.
- Choosing to transition isn’t choosing to fail. If no credible scenario gets your no‑program DSCR above 1.0x, the farm‑bill tools let you control timing, protect your family’s equity, and hand over something cleaner than a foreclosure.
The Bottom Line
At the end of a meeting like this, Julie slides the printout back across the desk and circles the two DSCR numbers. One with DMC, one without.
If DMC went away tomorrow and 2026 milk stayed near the USDA’s $18.95/cwt all‑milk forecast, what would your own DSCR be — and would your bank still lend into that model?
Complete references and supporting documentation are available upon request by contacting the editorial team at editor@thebullvine.com.
Learn More
- The $15,800 DMC Wake-Up Call: Tier 1 Just Jumped to 6 Million Pounds. Don’t Sign ‘Same as Last Year. – Breaks down the exact math to secure over $15,000 in immediate premium savings by optimizing your Tier 1 election. Arms you with a step-by-step checklist to out-calculate the “autopilot” enrollment trap before the 2026 deadline.
- $18.95 Milk & The 0.53x DSCR: Why Your Banker Is Already Moving Without You – Exposes the “Information Gap” between your barn and the credit analyst’s desk during $18.95 milk projections. Delivers a 90-day strategy to protect your equity by leading lender conversations with specific, math-backed turnaround targets.
- AI and Precision Tech: What’s Actually Changing the Game for Dairy Farms in 2025? – Reveals how precision feeding and AI-driven health monitoring are slashing input costs by 25% on mid-size herds. Bridges the gapbetween traditional management and the high-tech efficiency required to push your “no-program” DSCR back into the black.
 The Sunday Read Dairy Professionals Don’t Skip.
 The Sunday Read Dairy Professionals Don’t Skip.
Every week, thousands of producers, breeders, and industry insiders open Bullvine Weekly for genetics insights, market shifts, and profit strategies they won’t find anywhere else. One email. Five minutes. Smarter decisions all week.