


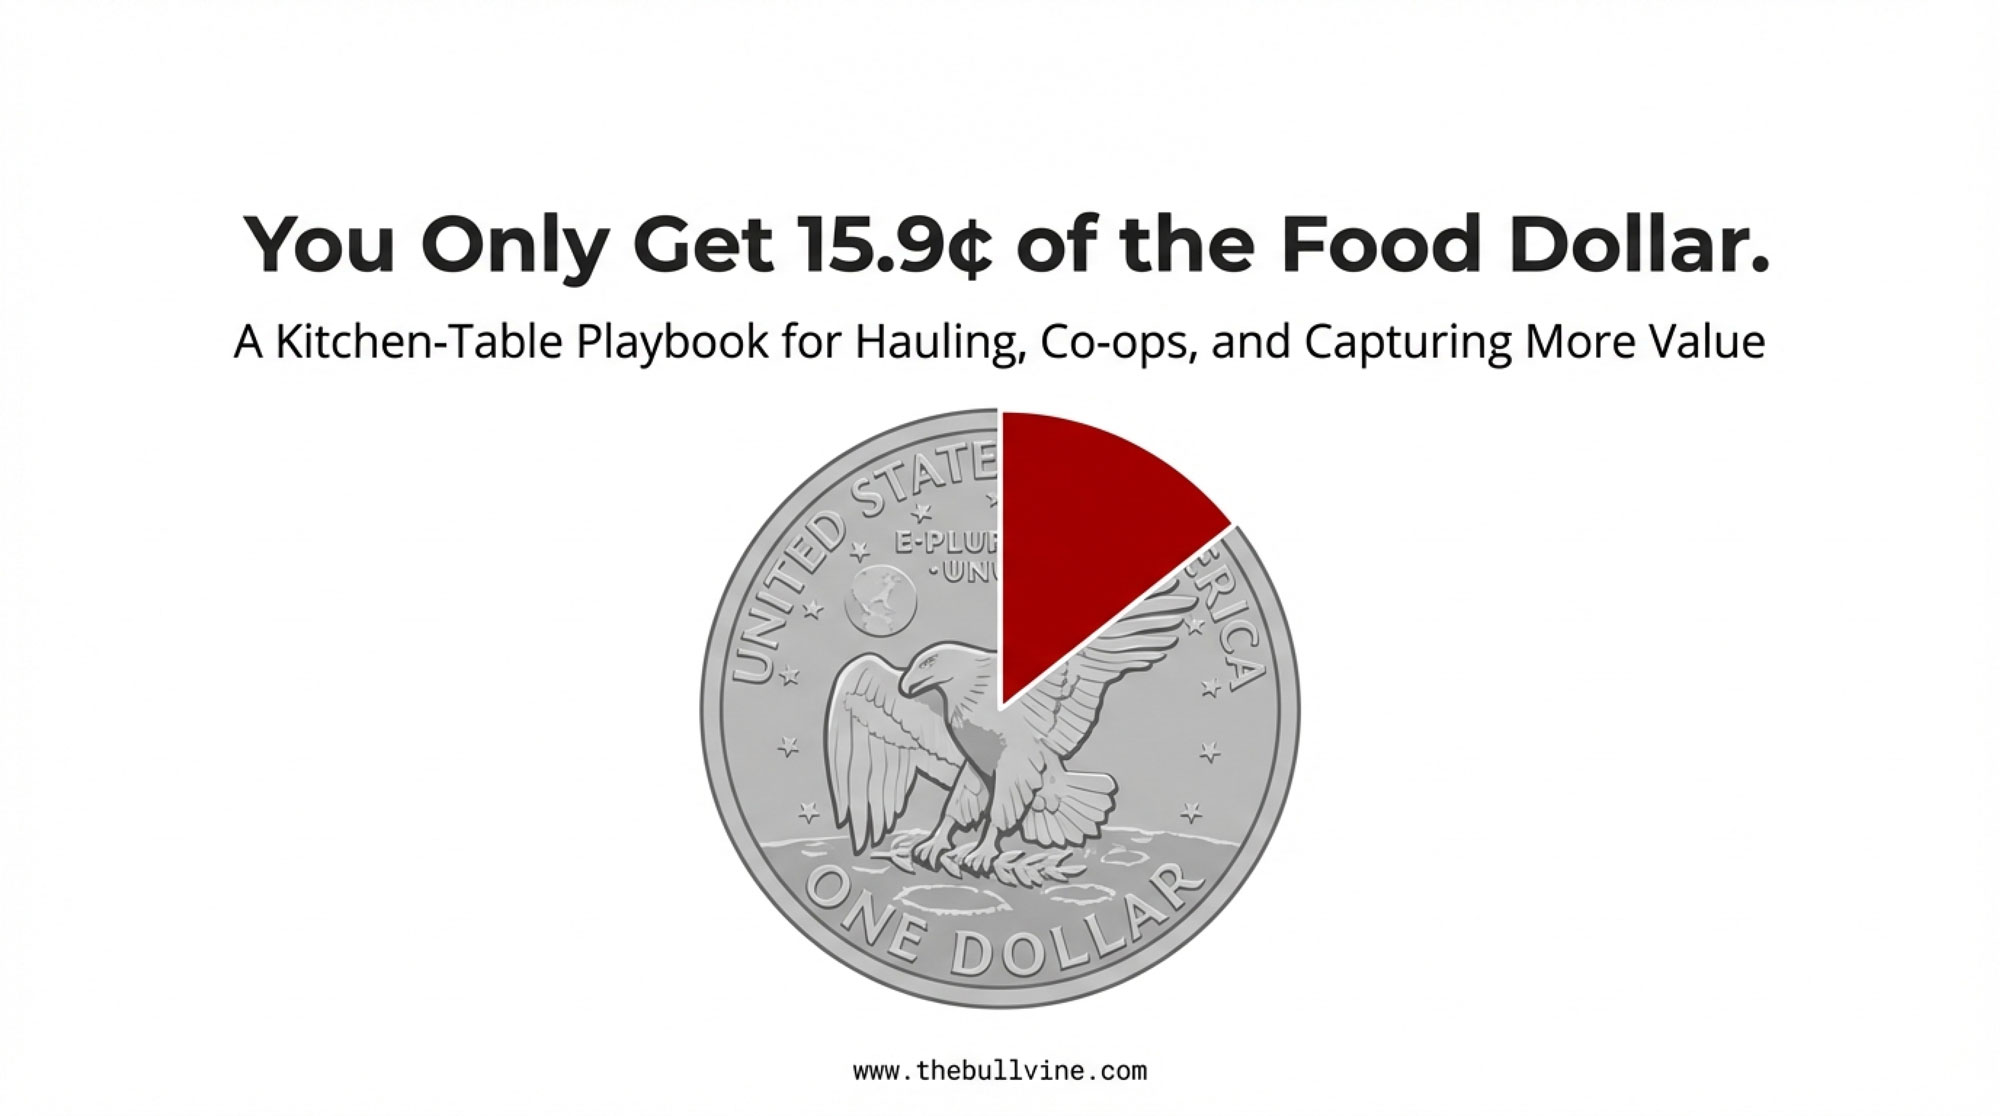
Stuck at 15.9¢ of the food dollar? Here’s how smart hauling, co‑op questions and premium milk can add real cents per cwt to your cheque.
Executive Summary: USDA’s own numbers say farmers now get just 15.9¢ of every U.S. food dollar, and Bullvine modeling shows dairy farmers are likely capturing only about half as much of the retail dairy dollar as they did a few decades ago. At the same time, ERS data show fluid milk has dropped in every decade for more than 70 years while cheese consumption has climbed to record highs, pushing more value toward components and away from jugs. This feature explains why milk demand is more flexible than gasoline demand—which is why an “OPEC for milk” won’t fix your cheque—and then zeroes in on levers still on your side of the laneway. You’ll see how smarter hauling and shared services, local producer groups at the plant gate, and tougher co‑op and board questions can each add real cents per cwt without adding a single stall. The article also walks through when premium or program milk (organic, lactose‑free, A2, cheese‑aligned) actually improves margins—and why you should be looking for at least a 15–20% net premium before you jump. Put together, it reads like a kitchen‑table playbook for nudging more of the dairy dollar back toward your farm over the next five to ten years, one practical decision at a time.
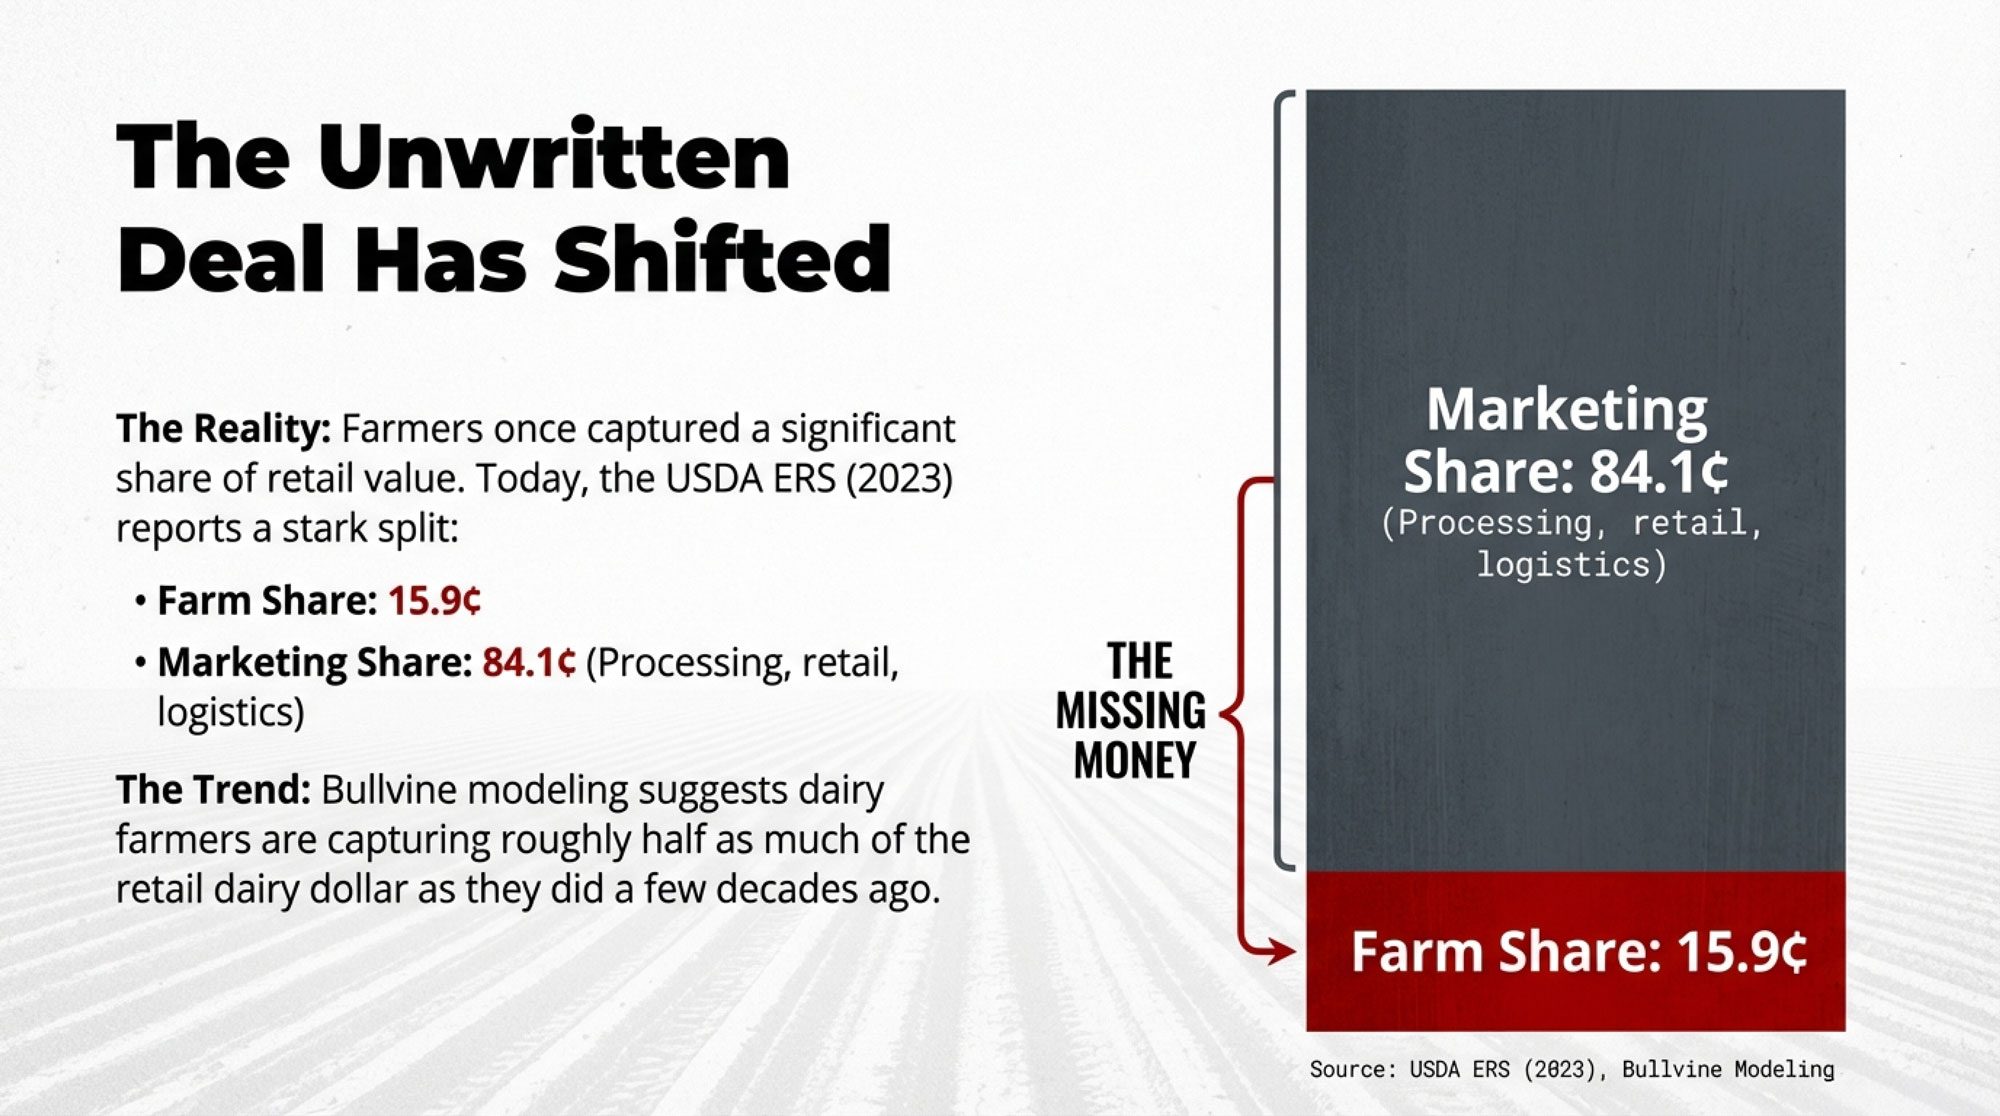
You know, for a long time, the unwritten deal in dairy felt pretty simple. If you stayed on top of fresh cow management, kept butterfat performance respectable, and shipped clean milk on time, you’d get a fair share of what families were paying at the store. A lot of parlors, dry lot systems, and succession plans were built on that basic understanding.
What’s interesting now is that when you really look at today’s numbers, that deal has shifted more than most of us would like. USDA’s Economic Research Service runs the Food Dollar Series, which tracks how every dollar consumers spend on domestically produced food is split between farms and everything that happens after the farm gate. In its latest update, ERS reports that in 2023, farmers received 15.9 cents of each dollar spent on domestically produced food as the farm share, and that the remaining 84.1 cents was the marketing share for processing, transportation, packaging, retailing, and foodservice. ERS also breaks out farm production’s own value-added, which was 9.1 cents in 2023, down from 9.3 cents the year before.
And just to be clear, that’s across all domestically produced food, not just dairy. But it tells you pretty clearly where the leverage sits in today’s food economy.
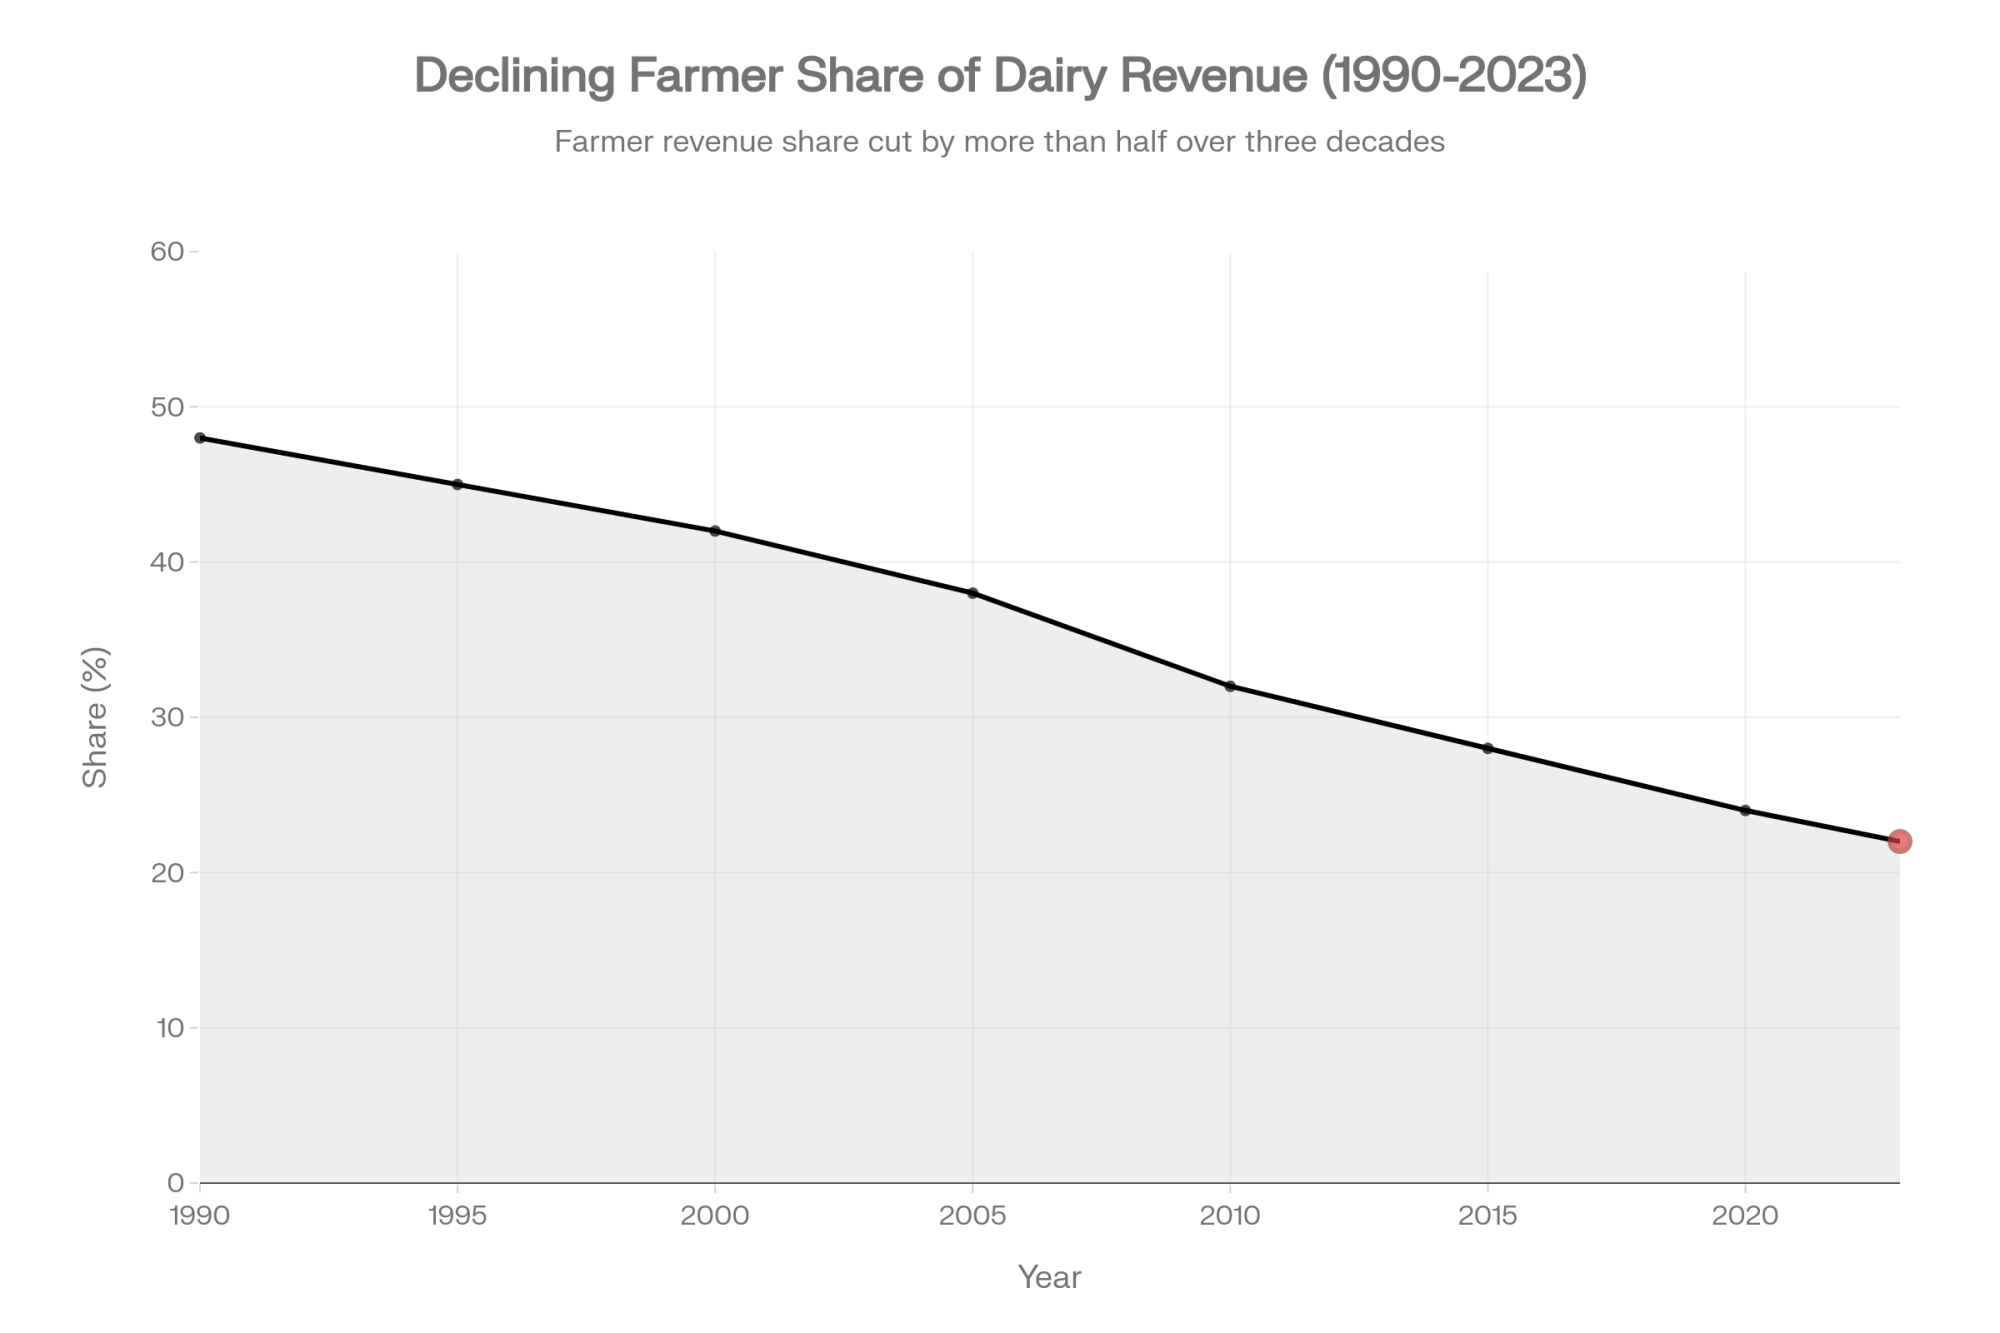
On the dairy side, ERS doesn’t publish a tidy “dairy-only” farm-share series. So at The Bullvine, we rolled up our sleeves. Using ERS’s price-spread approach and USDA farm and retail price data for milk, cheese, butter, and yogurt, we built an internal estimate of how much of the retail dairy dollar is likely making it back to farms over time. The data suggest that, compared with several decades ago, dairy farmers today may capture only around half as much of the retail dairy dollar as they once did. That’s our modeling based on published ERS methods and USDA data—not an official ERS series—, but it matches what a lot of producers say when they look at their milk cheques over a working lifetime.
Either way you slice it, the farmer’s share of the dairy dollar is a lot smaller than it used to be.
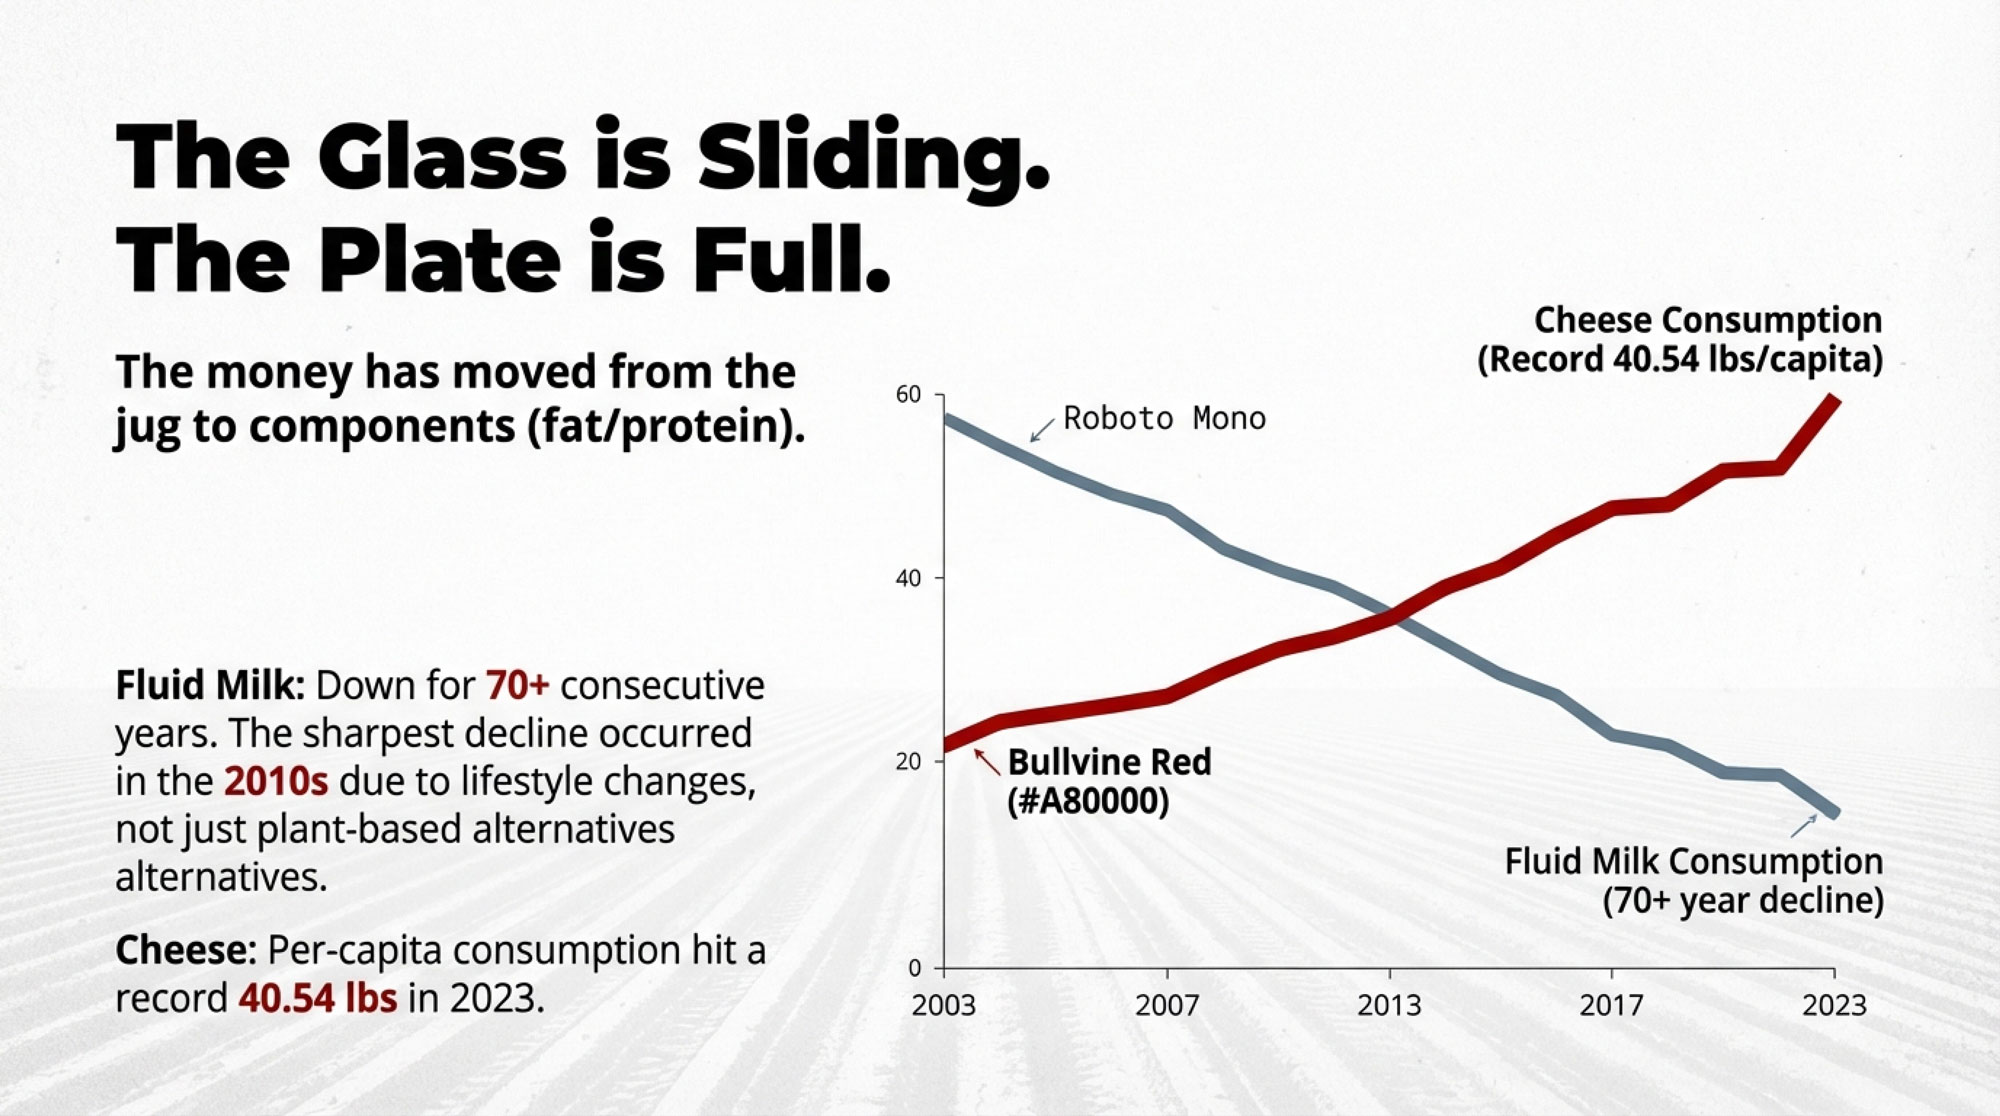
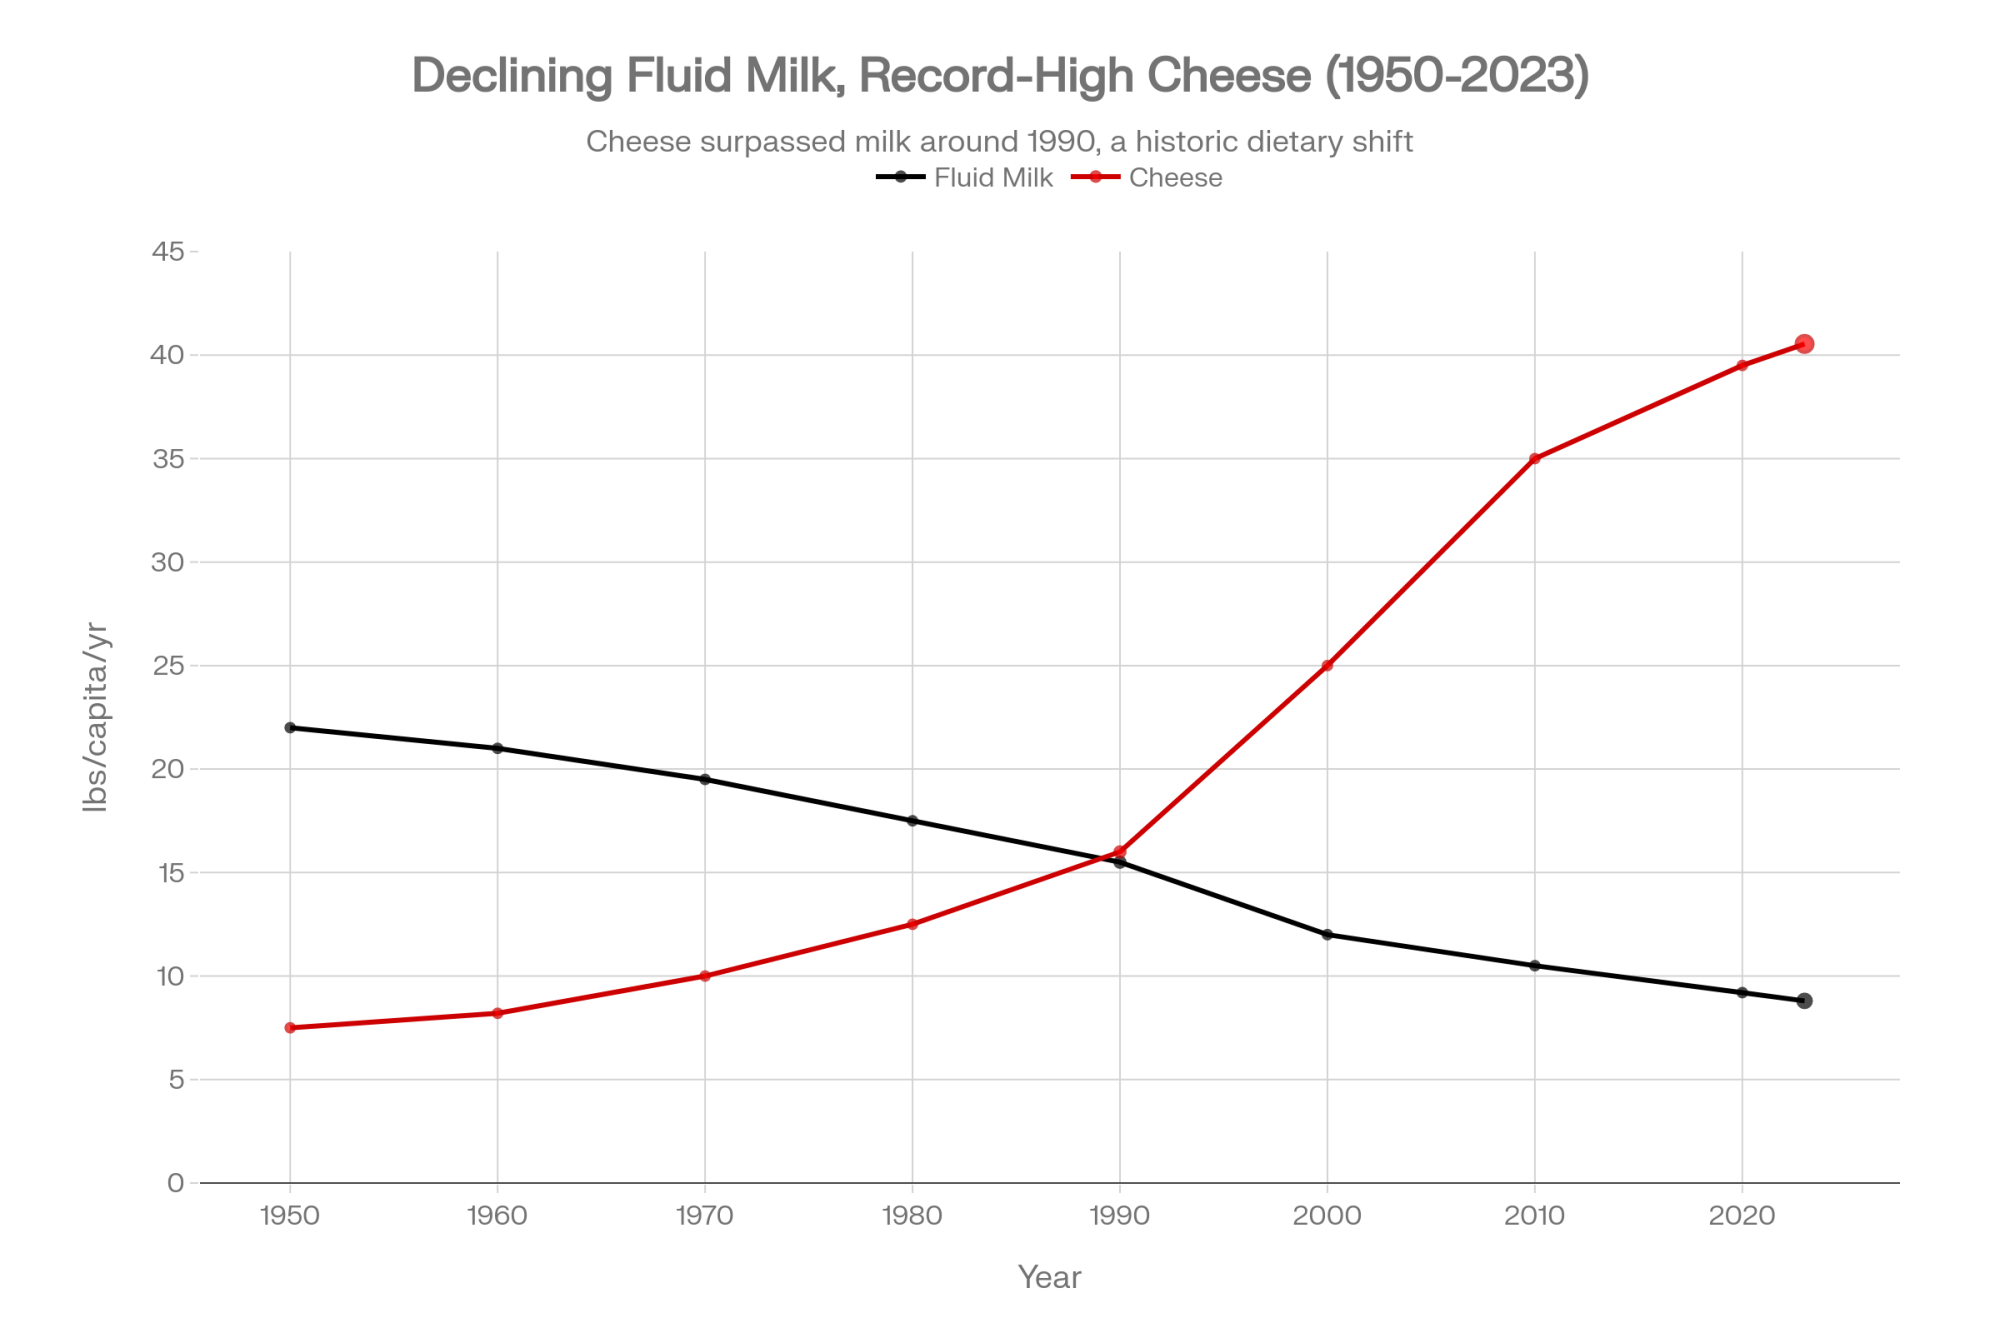
At the same time, ERS economists have been tracking what’s happening at the glass, not just at the checkout. In a 2022 Amber Waves article, ERS economist Hayden Stewart and colleagues used USDA’s Food Availability data and national dietary surveys to show that U.S. per-capita fluid milk consumption has been trending downward for more than 70 years and fell at a faster rate during the 2010s than in each of the previous six decades. They also found that between 2003 and 2018, consumers of all ages drank less fluid milk, and younger generations consistently drank less than older generations did at the same ages. That’s not just a couple of bad years—that’s a structural change in how people drink.
So here we are in 2025: farms are getting a smaller slice of the overall food dollar, our share of the dairy dollar looks to be roughly half of what it once was, people are drinking less fluid milk per head, and the dairy case is crowded with products that didn’t exist when many of us started. The natural question over coffee in the morning is, “How much of that missing money is still realistically in play for my farm—and where can I actually move the needle?”
Looking at This Trend: Where Did Your Share Go?
Looking at this trend from above, ERS basically divides the food dollar into two buckets: the farm share and the marketing share. The farm share is what farms receive for selling raw commodities for food. The marketing share is everything after the farm gate—processing, packaging, transportation, storage, wholesaling, retailing, and foodservice. For 2023, ERS says the farm share was 15.9 cents and the marketing share 84.1 cents, with farm production’s own value-added piece at 9.1 cents.
When we apply ERS’s price-spread methods to a basket of dairy products—fluid milk, cheese, butter, yogurt—and compare farm value to retail value over time, our Bullvine estimate suggests dairy’s farm share has likely dropped to roughly half of what it was a few decades ago. Again, that’s a modeled estimate based on ERS methods and USDA price data, clearly separate from ERS’s official aggregate series. But it aligns closely with what many of you have seen in your own numbers over a working lifetime.
On the demand side, Stewart’s fluid-milk work helps explain why that shrinking share feels so painful. Using the Food Availability series and dietary recall data, his team showed that U.S. daily per-capita fluid milk consumption has decreased in each of the past seven decades, and that the decline was sharpest in the 2010s. From 2003 to 2018, consumers of all ages drank less fluid milk, and younger generations drank less than older generations did at the same ages.
You probably don’t need a chart to see the rest. Walk into a grocery store in Ontario, Wisconsin, or Idaho, and the cooler that used to be mostly white jugs is now sharing space with almond, soy, oat, pea, and coconut drinks, lactose-free milk, ultra-filtered high-protein products, and every flavor of ready-to-drink shake you can imagine. ERS analyses using supermarket scanner data show that plant-based beverages do compete with cow’s milk, but their sales growth is much smaller than the long-run drop in fluid cow’s-milk sales, so they explain only a small portion of the overall decline. The bigger drivers are lifestyle and habit: fewer sit-down breakfasts, more snacking, and a lot more beverage choice.
It’s also worth noting that medical research has long shown that lactose malabsorption is more common among African Americans, American Indians, Asian Americans, and Hispanic/Latino populations than among people of Northern European descent. Once lactose-free dairy products and plant-based alternatives became widely available and affordable, households finally had options they didn’t have a generation or two ago, especially in urban markets with large retail assortments.
While the glass has been sliding, the plate tells a different story. USDA ERS statistics reports that U.S. per-capita cheese consumption reached a record 40.54 pounds in 2023, up one‑third of a pound from 2022’s record and more than 10 pounds above the 30.48‑pound level in 2002. ERS data also show that per-capita cheese consumption has set new records in most years since 2011.
Why Milk Isn’t Oil—and Why That Matters
Every so often, at a milk meeting, someone says, “We just need an OPEC for milk.” That feeling usually comes out of years of price volatility, rising costs, and the sense that someone else is always turning the dial.
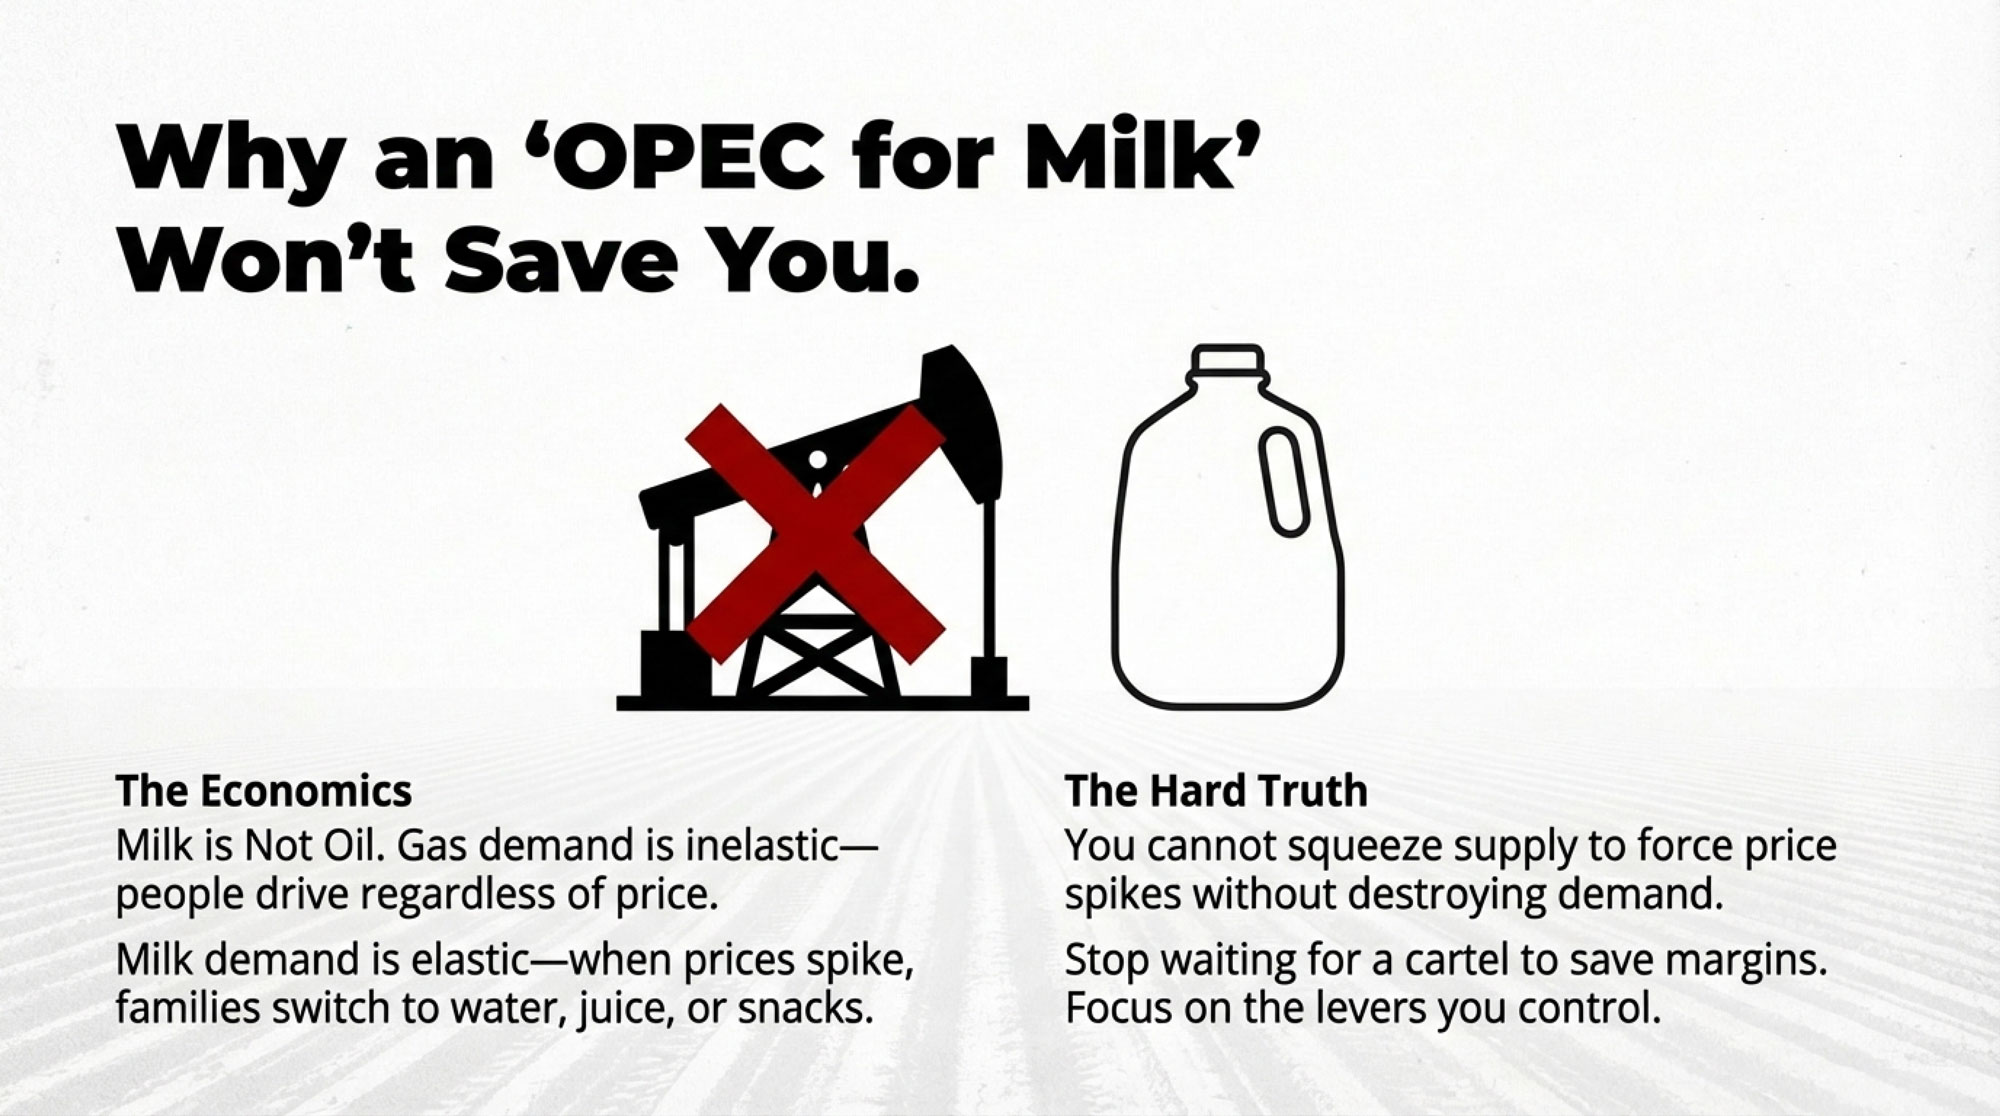
The trouble is, dairy demand simply doesn’t behave like gasoline demand.
Energy agencies and market analysts describe gasoline demand as relatively inelastic in the short term: when prices spike, people complain, but most still need to drive to work and school. They may cut back a bit on discretionary trips or switch to more fuel‑efficient vehicles over time, but in the short run, many trips still have to happen. Even International Energy Agency scenarios that assume strong electric‑vehicle growth and aggressive climate policies project that oil demand declines gradually, not overnight, because transportation, freight, and industry are so tied to liquid fuels.
Milk is different. ERS’s long‑run work on fluid consumption shows that as prices have moved and as more alternatives have appeared, people have steadily adjusted how much milk they drink and when they drink it. When budgets are tight or preferences shift, most households can maintain their calorie and protein intake by switching to other foods, drinks, or dairy products like cheese and yogurt. The Amber Waves analysis makes it clear that per‑capita fluid milk has dropped in every decade for more than 70 years, while per‑capita cheese consumption has climbed to record levels.
So milk demand—especially for fluid—is simply more elastic than gasoline demand. When people have more beverage options, more snacking, and more ways to get their nutrients, they can and do adapt. If milk prices rise too far at retail relative to other foods, or if eating patterns continue to move away from sit‑down breakfasts, fluid milk volumes are going to keep feeling that pressure.
That’s why an “OPEC for milk” isn’t likely to work the way some people hope. Oil exporters deal with a commodity whose short‑term demand is relatively inflexible and whose global supply is influenced by large producers. In dairy, especially fluid dairy, consumers have more substitutes and greater flexibility. That doesn’t mean supply management or quota systems can’t exist—as Canada demonstrates—but it does mean you can’t count on tight supply alone to guarantee a higher or more stable cheque without watching what’s happening on the demand side.
| Attribute | Gasoline | Milk (esp. Fluid) | Key Implication | Notes |
| Short-term elasticity | Low (inelastic) | High (elastic) | 🔴 People can reduce milk consumption; they can’t easily stop driving. | ERS data: fluid consumption down 60% in 70 years; gasoline still central to transport |
| Substitutes available | 1–2 (electric vehicles, public transit—long adoption lag) | 5–7+ (plant-based, other beverages, yogurt, cheese, whole other food categories) | 🔴 Milk competes with dozens of options at breakfast and snack time; oil has no real substitutes short-term. | Grocery store reality: one cooler used to be 90% milk; now it’s 30% milk, 70% alternatives + specials |
| Consumer habit flexibility | Rigid (people need to commute; no easy substitutes) | Flexible (consumers adjust breakfast/snack patterns constantly) | 🔴 Rising milk prices don’t force loyalty; they prompt switching. | Younger generations already drinking less fluid milk at same age than their parents did |
| Global supply concentration | High (OPEC nations, Russia, strategic chokepoints) | Lower (spread across many countries; EU, NZ, US, Canada all major players) | 🔴 Milk supply is already fragmented; no cartel can truly “own” the market. | Canada has supply management; most of world doesn’t. Hard to enforce coordination. |
| Price support mechanisms | Work for oil (cartel can limit supply, force prices up, buyers still buy) | Don’t work as reliably for milk (higher prices → people drink less or switch) | 🔴 OPEC can reduce oil output and raise prices; dairy can’t. Farmers tried; it backfired. | 2008–2011: milk price spikes + high feed costs crushed margins. Volume didn’t hold. |
So rather than waiting for some central “milk OPEC” to rescue margins, it’s more useful to focus on the levers that actually change how much value you capture in your own business.
That’s where the stripper‑well story and the German producer‑group experience come in.
What Tiny Oil Wells Can Teach Small and Mid‑Size Dairy Farms
If you’re running a small or mid‑size dairy, the stripper‑well story is probably more useful than the OPEC analogy.

Back in the early to mid‑1980s, when inflation‑adjusted oil prices dropped sharply, a lot of higher‑cost wells were shut in, and many producers left the industry. Yet one class of wells—marginal “stripper” wells—often kept quietly producing.
The U.S. Energy Information Administration defines stripper oil wells as those producing no more than 15 barrels of oil equivalent per day on a 12‑month average. Using state data and its own estimates, EIA reported that at the end of 2015, the United States had about 380,000 stripper oil wells and roughly 90,000 non‑stripper wells, and that stripper wells still accounted for around 10 percent of total U.S. crude oil production that year.
When you look at U.S. Department of Energy programs and case work focused on small producers, a few patterns show up again and again:
- Multiple owners use joint operating agreements so they can share costs and spread risk while one operator handles day‑to‑day decisions.
- Infrastructure—gathering lines, tank batteries, workover rigs, diagnostic tools—is often shared, so fixed costs are spread across more barrels.
- The focus is on modest, low‑cost improvements rather than big, speculative expansions.
The wells stayed small. But they plugged into shared systems, so they weren’t paying “tiny operator” prices for every truck, every repair, and every service.
If you picture a 70‑cow tie‑stall in Quebec, a 220‑cow freestall in New York, or a 600‑cow dry lot system in Idaho, it’s not a bad analogy. Those herds may not want to become 3,000‑cow outfits—and in many cases they shouldn’t—but they also can’t afford to pay a full “small farm” penalty on every truck, every ton, and every vet or nutritionist call.
Hauling is one obvious place to start.
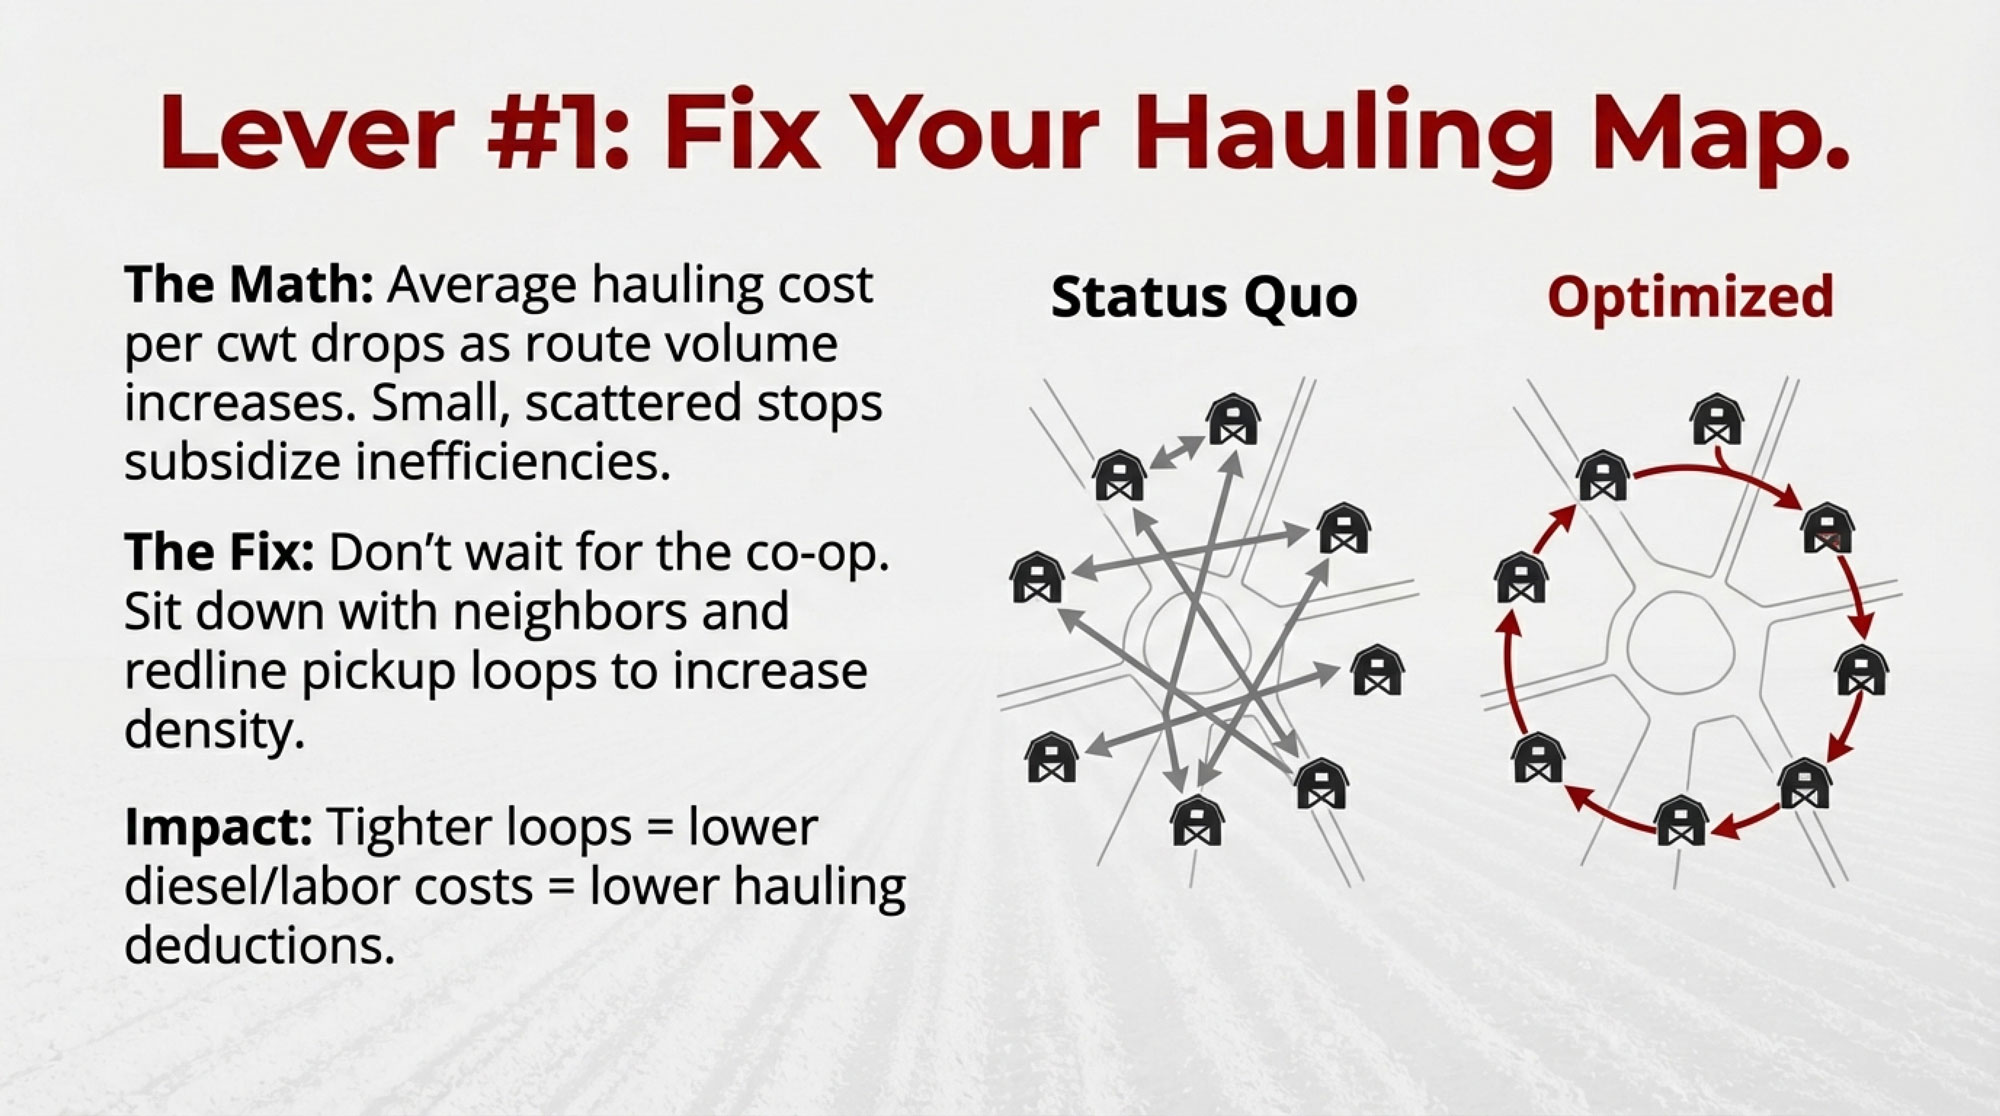
A classic bulk milk assembly report and more recent analysis of milk hauling charges in the Upper Midwest show that average hauling cost per cwt tends to decline as route volumes and individual stop volumes increase, and that smaller, scattered producers often pay higher per‑cwt hauling charges than larger or more concentrated producers. The Upper Midwest Federal Order staff paper on hauling charges, for example, documents that as producers’ milk volumes increase, their average hauling charges per hundredweight tend to fall, partly because many handlers charge flat hauling amounts regardless of volume moved.
| Service | Solo Cost $/cwt | Pooled Cost $/cwt | Savings $/cwt | % Savings |
|---|---|---|---|---|
| Hauling | $0.85 | $0.60 | $0.25 | 29% |
| Nutrition/Vet | $0.70 | $0.50 | $0.20 | 29% |
| Inputs (bulk feed, etc.) | $0.60 | $0.45 | $0.15 | 25% |
| Tech access (robots, data) | $0.45 | $0.35 | $0.10 | 22% |
| Miscellaneous services | $0.25 | $0.15 | $0.10 | 40% |
| TOTAL | $2.85 | $2.05 | $0.80 | 28% |
In practical terms, what that’s meant in places like Wisconsin is that co‑op staff and university dairy economists have sat at kitchen tables with maps and spreadsheets and redrawn pickup loops so trucks spend more time moving full loads and less time criss‑crossing between small, scattered stops. When three or four farms along a road or closely clustered on the map coordinate pickup days and tighten the loops—especially in winter when roads are rough, and diesel isn’t cheap—many of them see their hauling cost per cwt start lining up better with what those hauling studies predicted.
On the purchasing side, many Midwest producers report that forming input‑buying groups has helped them push back on feed costs. Cooperative development centers and county extension offices describe groups of anywhere from a handful of farms to a dozen or more that pool orders for grain, minerals, or certain inputs and ask suppliers to bid on the combined volume. Case reports from extension staff show that those groups often secure better per‑ton pricing or more favorable payment terms than individual farms were getting.
Then there’s the service side. In regions like the Northeast and Great Lakes, independent nutritionists and veterinarians have built models where several herds share higher‑end services—a tighter focus on the transition period, more frequent ration checks, and deeper data monitoring. Penn State Extension, for example, has summarized research showing that common transition‑period diseases—retained placenta, metritis, ketosis, displaced abomasum—can each cost several hundred dollars per cow when you factor in vet and labor costs, lost milk, extra days open, and higher culling risk. When several farms share a nutritionist or vet who’s serious about transition management, each herd pays less per cow while still seeing improvements in fresh‑cow health, milk yield, and components.
On the technology side, extension economists have done a lot of work on robotic milking. A 2025 dairy extension article on robotic milking economics notes that profitability depends heavily on things like labor savings, milk per cow, milk per robot per day, and useful life, and that high capital costs—often around $150,000–$200,000 per robot for 50–70 cows—mean payback requires realistic assumptions. Some producers have explored shared service contracts, co‑operative ownership of certain technologies, or other arrangements that spread those costs and risks across more cows and more herds.
What I’ve noticed, talking with producers who’ve gone in this direction, is that they don’t feel like they’ve lost their independence. They still make breeding decisions, determine how they manage fresh cows and the dry period, and weigh the trade-offs between robots and parlors. They’ve just decided to stay moderate in cow numbers and big where scale really pays.
That’s the stripper‑well lesson for dairy: your herd doesn’t have to be big, but how you handle hauling, purchasing, and expert support doesn’t have to stay small.
What Farmers Are Finding in Germany: Co‑ops, Producer Groups, and Pushing Back
Germany is one of the largest milk producers in the European Union, and since EU‑wide milk quotas ended in 2015, German producers have been working under the Common Agricultural Policy and single‑market rules without a national milk‑quota system like Canada’s supply management. In that environment, farmer‑owned co‑ops and legally recognized producer organizations (POs) carry significant weight in how farmers interact with processors and retailers.
Looking at this trend, the co‑operative structure is a big part of the story. A significant share of German milk is marketed through farmer co‑ops that handle both collection and processing. DMK Deutsches Milchkontor, for example, describes itself as a major dairy co‑operative owned by thousands of farmers, running multiple plants in Germany and neighboring countries, with a governance setup that includes a representative assembly and a supervisory board where farmers have a voice.
For farmers shipping to investor‑owned processors, the EU’s “Milk Package,” introduced after the 2009 dairy crisis, created a framework for recognized dairy POs that can negotiate contracts—including price formulas and volume terms—on behalf of their members within defined competition‑law limits. A European Commission inventory prepared by Wageningen University found that in 2019, more than 46 percent of German milk deliveries were marketed through POs or PO associations, and that one large association represented 137 POs and about 5.8 billion kilograms of raw milk in negotiations.
The data and case studies suggest that as a producer group’s share of a processor’s intake grows, its bargaining leverage increases, even though there isn’t a single magic percentage that works everywhere. At some point, the plant can’t treat you like just another supplier.
When German farmers have felt backed into a corner, they’ve also demonstrated they’re willing to push back—sometimes dramatically. During the 2008–2009 dairy crisis, organizations like the Bundesverband Deutscher Milchviehhalter helped coordinate “milk strikes,” where some producers withheld milk or even dumped it to protest prices they said didn’t cover costs. German and international media widely covered those actions and were later analyzed in the EU work on dairy market crises.
You don’t have to agree with every tactic to see the pattern: in Germany, farmer‑owned co‑ops with processing assets and legally recognized POs have helped producers maintain more leverage in a concentrated value chain.
Where U.S. Co‑ops Help—and Where They’ve Drifted
While German farmers were building POs and refining co‑ops within the EU framework, U.S. dairy co‑ops were taking their own path.
USDA co‑operative statistics and Rural Development reports tell that story pretty clearly. In 1964, there were 1,244 dairy cooperatives in the U.S.; by 2017, that number had dropped to around 118. Over those decades, the average co‑op grew larger, and more co‑ops owned or controlled processing plants. Many traditional “bargaining co‑ops,” which focused on negotiating price and terms with processors, either merged into larger processing co‑ops or disappeared. At the same time, investor‑owned processors were consolidating too, reshaping the processing side of the dairy business.
As co‑ops invested in plants and brands, boards and managers naturally spent more time on processing margins, plant utilization, branding, and navigating the demands of big retail chains. Farmers also know firsthand that processors and retailers are under pressure from rising labor, energy, and transportation costs.
The tension is to ensure those realities don’t pull co‑op strategy too far from the needs of member farms whose milk pays the bills.
Dairy Farmers of America (DFA) is the best‑known example, simply because of its national footprint. Congressional research and industry profiles describe DFA as a national dairy co‑op that markets a large share of U.S. milk, earns billions in annual revenue, and owns or has interests in many processing plants. DFA’s own reporting emphasizes member services, net income, patronage, and equity payments.
At the same time, the DFA has been involved in several major antitrust cases. In the Southeast, a class‑action lawsuit over milk marketing practices ended in 2013 with the DFA agreeing to a $140 million settlement while explicitly denying wrongdoing in the settlement documents. In the Northeast, a similar case concluded with a $50 million settlement finalized in 2016, again without an admission of liability. More recently in the Southwest, DFA and Select Milk Producers settled litigation involving price‑fixing and market manipulation allegations; DFA agreed to pay about $24.5 million and Select about $9.9 million, while both co‑ops continued to deny liability in court filings.
So on one side, co‑ops like DFA and many regionals still provide essential services: market access, balancing, logistics, risk pooling, and “a home for your milk” when things are messy. On the other hand, consolidation and vertical integration have led many producers to question how closely co‑op strategies align with farm‑gate needs.
Co‑op governance research adds another layer. A USDA Rural Development report on dairy co‑ops in the 21st century found that member participation—attending meetings, voting, serving on boards—is higher when members strongly support the one‑member‑one‑vote principle, feel a sense of ownership, and value working with other co‑ops. Academic studies of co‑operative governance have also found that transparency, active member involvement, and clear accountability structures tend to improve alignment between management choices and member interests.
Economists who study co‑ops often make a simple point: if members don’t read financial reports or show up with specific, numbers‑based questions, decisions about how margins are used will still get made—they just get made without much owner input.
In Canada, the tools differ—quotas, regulated prices, provincial marketing boards—but the underlying questions remain the same. A 2025 article in the Canadian Journal of Agricultural Economics used input–output data from 1997 to 2021 to examine farmers’ share of the consumer food dollar in Canada and concluded that farm share is relatively low overall, varies by product, and is particularly small in food‑away‑from‑home channels. Under supply management, how much value reaches farms depends heavily on how provincial boards negotiate with processors and how premiums for components or value‑added products get shared.
What I’ve noticed is that producers who feel most confident about their co‑ops or boards tend to treat governance as part of their risk‑management plan. They make time—even during busy seasons—to read annual reports and financial statements. They work to understand equity revolvement policies. And they walk into meetings with specific, business‑focused questions instead of general frustration.
If your co‑op or board meeting feels more like a scripted ceremony than a working business session, that’s usually a signal.
Milk Price Volatility and the Missing Share: What’s Really in Play?
This is where the big‑picture stats start to meet day‑to‑day decisions.
Right now, ERS’s Food Dollar work tells us farmers capture 15.9 cents of each dollar U.S. consumers spend on domestically produced food, with farm production’s own value‑added at 9.1 cents. Bullvine’s modeling suggests dairy farmers are probably capturing only around half as much of the retail dairy dollar as they did several decades ago. ERS and Cheese Reporter data show fluid milk consumption has declined in every decade for more than seventy years, while cheese consumption has hit record highs. ERS work also makes it clear that plant‑based beverages explain only a small slice of the fluid decline.
Lay that against recent Class III prices, higher feed costs, rising wages, interest rates, and energy bills, and it’s no surprise many farms feel like they’re running just to stand still. In that environment, a 10–20 cent per cwt shift in your favor isn’t pocket change—it can be the difference between comfortably servicing principal and slowly falling behind.
We don’t have a precise government chart that divides the “missing” share of the dairy dollar into “structural, can’t touch” and “recoverable, if you organize.” But when you combine the Food Dollar data, processing and retail consolidation, German PO experience, global trade pressures, and co‑op history, the problem naturally sorts into two piles.
On one side, you’ve got slow‑moving forces:
- Decades of consolidation among processors and retailers.
- A grocery sector where a relatively small number of chains control a large share of volume.
- Long‑standing consumer habits that reduce sit‑down meals and reshuffle beverage choices.
- Big capital investments in plants, distribution centers, and logistics networks that can’t be unwound overnight.
- Federal Milk Marketing Order rules are undergoing modernization following a national hearing and USDA’s recommended decision, with changes that will take time to implement.
- Global trade dynamics and competition from other export regions shape baseline price levels.
On the other side, you’ve got levers much closer to your driveway:
- How milk hauling is organized in your area, and whether routes and stop sizes are as efficient as they could be.
- Whether your processor contracts and co‑op policies are written, clear, and anchored to public price signals.
- How actively you and your neighbors participate in co‑op or board governance.
- Whether at least some share of your milk is tied to markets or programs that pay for something more than just volume—components, quality, production system, or specific end uses.
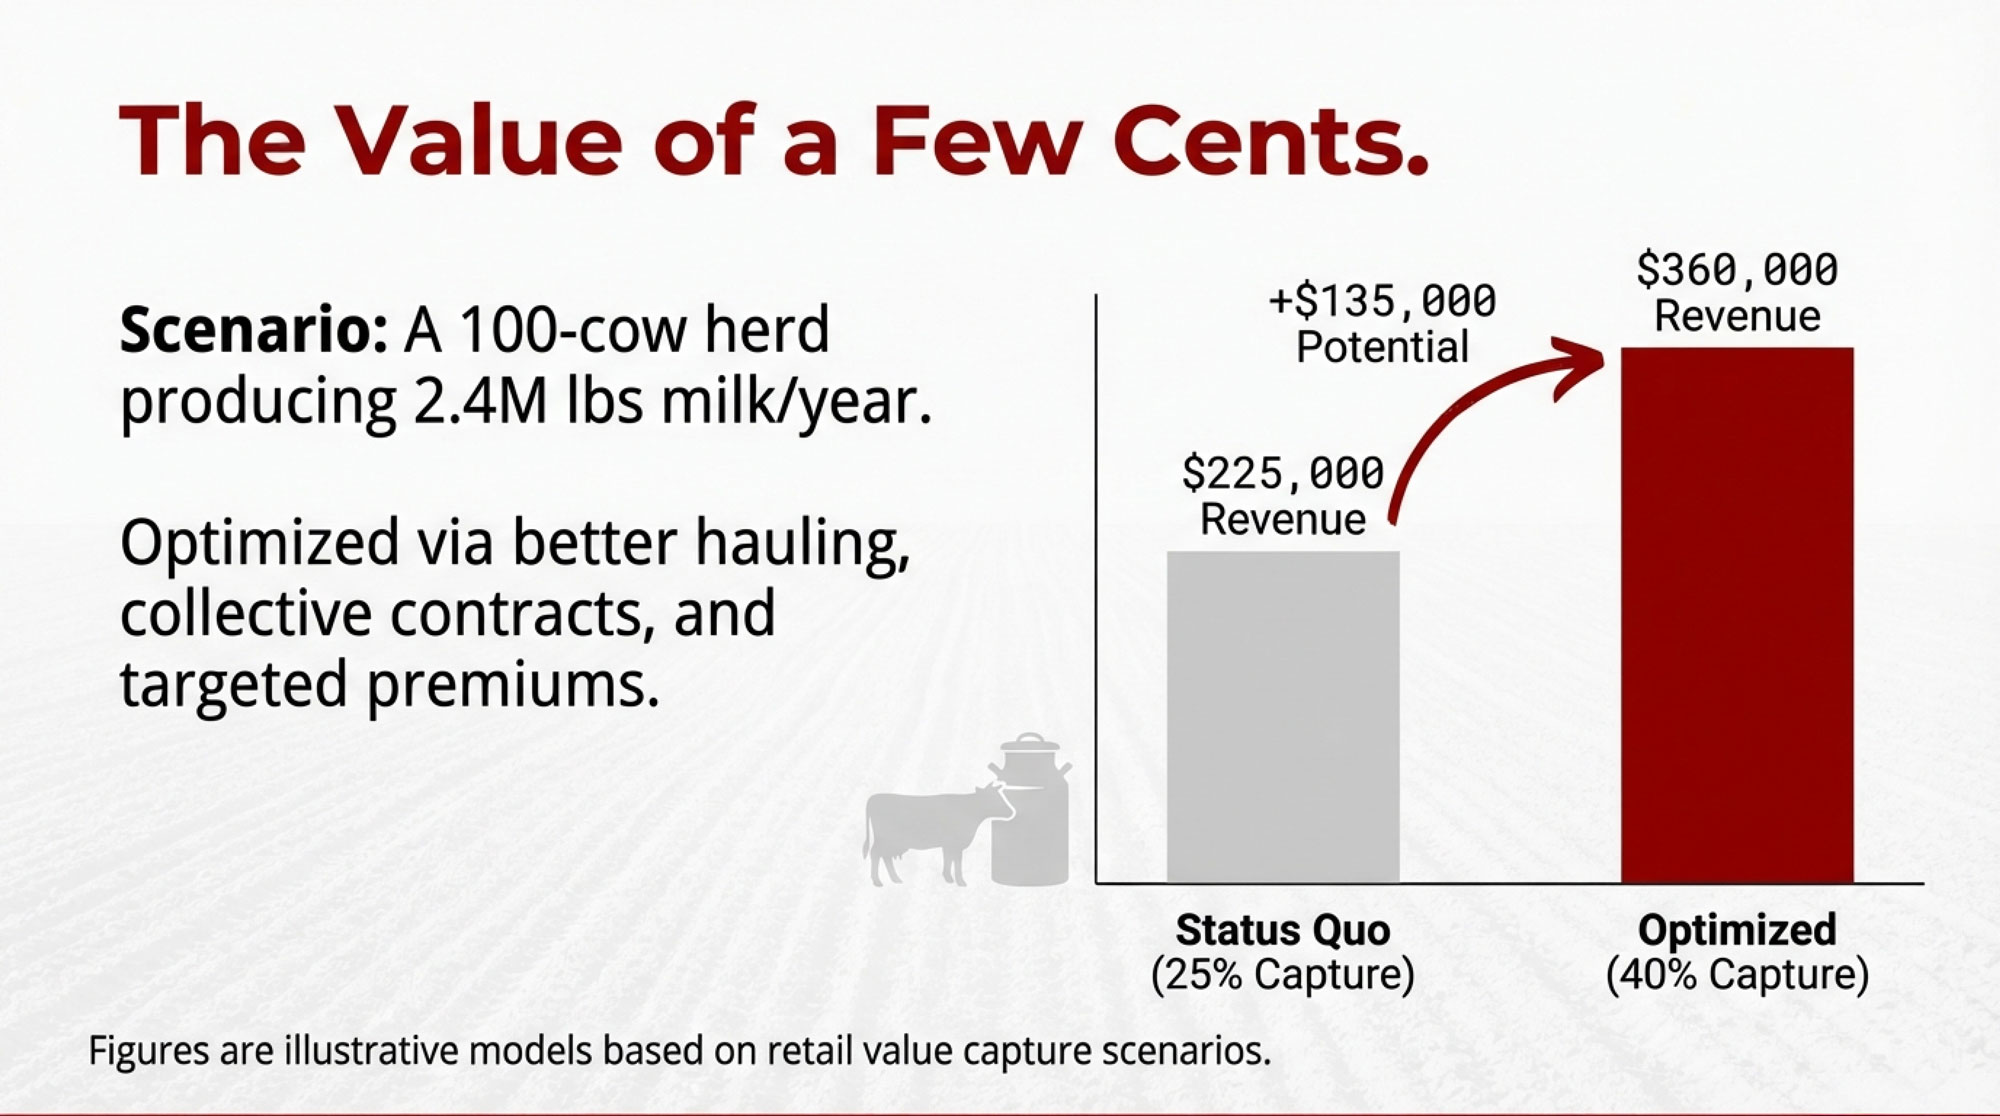
To give that some shape without pretending there’s a universal benchmark, imagine a 100‑cow freestall averaging about 24,000 pounds per cow per year. That’s around 2.4 million pounds of milk annually. Suppose—just as a model—that the dairy products made from that milk end up generating about $900,000 in retail sales across grocery and foodservice. If the farm effectively captures about a quarter of that value, that’s roughly $225,000 in farm‑level revenue. If, over time, better hauling arrangements, clearer and stronger contracts, more responsive co‑op governance, and some program milk allow similar farms to capture something closer to 40 cents of each retail dollar tied to their milk, that same volume could correspond to something like $360,000 in revenue.
Those figures are illustrative, not predictions. But they show why even recovering part of that gap—through a few more cents per cwt from better organization and targeted decisions—matters a lot. Those extra cents can come from multiple directions at once: a small saving on hauling, a modest feed discount from a buying group, a few extra cents from stronger components going into cheese, and a bit of premium from a specialty program can start to show up in your year‑end numbers.
The structural issues—retail concentration, FMMO modernization, competition policy, global trade—will take years of industry work and policy arguments. They’re real, but they move slowly.
The closer‑to‑home levers can move sooner if you decide to pull them.
Practical Paths You Can Actually Start On
So let’s bring this down from charts and hearings to things you could realistically start on this year. What farmers are finding is that you don’t have to change everything at once. You can start with one or two levers that fit your operation, your neighbors, and your appetite for change.
Path 1: Stay Small in Cows If You Want To—Think Big in Services
As many of us have seen, adding cows doesn’t automatically fix a weak cheque. Often, the bigger wins come from running certain parts of the business at a larger effective scale while keeping herd size in line with your land base, labor, and family goals.
Some practical places to look:
- Hauling and route density. Ask yourself: are you and your neighbors shipping to the same plant on routes that actually make sense today, or just routes that made sense twenty years ago? Research on bulk milk assembly and hauling charges shows that as route volumes and stop volumes go up, average hauling cost per cwt tends to go down, and small, scattered stops tend to pay more. In Wisconsin and other Upper Midwest operations, Federal Order staff and extension economists have worked with co‑ops and producers to categorize hauling charges by volume group and region, and have repeatedly found that larger, denser pickups reduce the cost per cwt. Sitting down with neighbors and your hauler or co‑op to redraw routes can nudge your hauling bill in the right direction.
- Input‑buying groups. Cooperative development centers and county extension offices have established buying groups that pool orders for feed, minerals, or other inputs and invite suppliers to bid on the combined volume. In many cases, those groups see better per‑ton pricing or more flexible terms than individual farms were getting.
- Shared expertise around the transition period. Research summarized by Penn State Extension and other university sources shows that common transition‑period diseases can each cost several hundred dollars per case when you add lost milk, extra days open, and culling risk. At the same time, herd‑level studies show that better transition‑period management improves peak milk production, milk components, and overall health. In the Northeast and Great Lakes, some independent nutritionists and veterinarians have built service models where several herds share higher‑touch transition‑period programs—more frequent ration checks, more data review, closer monitoring of fresh‑cow health—at a per‑cow cost that works for modest herd sizes.
- Robotic milking and tech, without carrying it all yourself. Extension economists have looked closely at the economics of robotic milking systems. A 2025 dairy extension analysis notes that robot profitability depends heavily on labor savings, milk per cow, milk per robot per day, and useful life, and that high capital costs—often around $150,000–$200,000 per robot for 50–70 cows—mean payback requires realistic assumptions. Some producers are exploring shared service contracts, co‑operative ownership of certain technologies, or other arrangements that spread those costs and risks across more cows and more herds.
You still control your breeding program, your fresh‑cow management, and whether the next big project is robots, a parlor remodel, or a feed center. You’re just choosing not to pay full “small farm” rates for every truck, every ton, and every specialist.
Path 2: Build Producer Groups Where Your Milk Meets the Plant
What farmers are finding—in Europe and increasingly in North America—is that a lot of leverage sits right where your milk crosses into the plant. That’s the moment it stops being “your” milk and becomes someone else’s raw material.
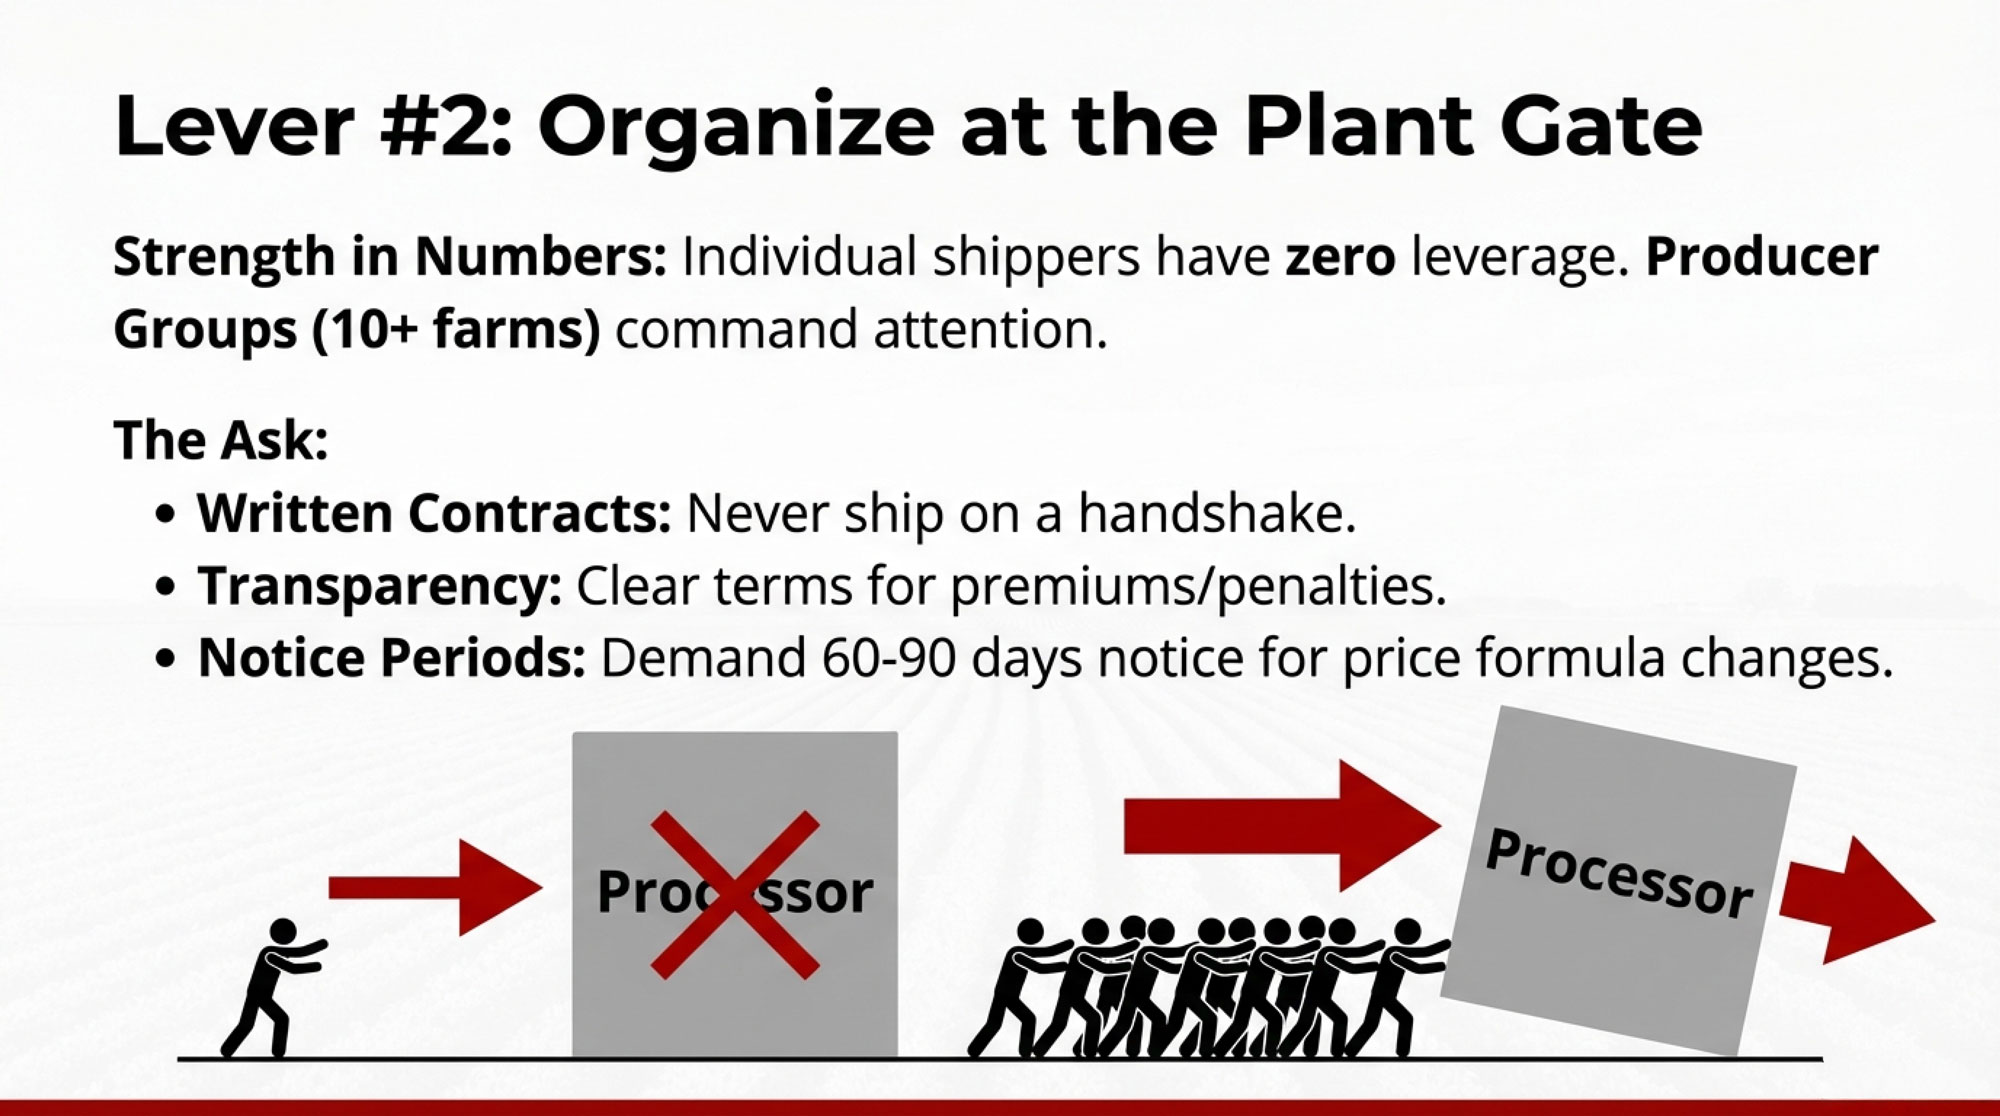
If you and other shippers want more say at that point, a practical plan might look like this:
- Map who ships to your plant. Quietly figure out which farms ship to the same plant as you. Talk one‑on‑one and see who’s open to exploring a producer group. EU research on dairy POs and North American experiences with marketing groups show that as a group’s share of a processor’s intake grows, its bargaining leverage usually increases—although there’s no single magic percentage.
- Push for clear, written contracts. The first step typically isn’t threatening to withhold milk; it’s asking for clarity. If you don’t have a written contract, work as a group to request one. If you do have a contract but the language is vague, push for more precise terms. That can mean tying payment for butterfat, protein, and other solids to published price series; clearly defining quality premiums and penalties; and including a reasonable notice period for major changes to pay formulas or terms. In practice, some producer groups have negotiated 60‑ to 90‑day notice requirements so farms can adjust.
- Use tested governance templates. USDA co‑op and rural‑development programs, along with university co‑op centers, provide model bylaws and marketing agreements that can be adapted for dairy producer groups. With guidance from an agricultural lawyer who understands your region, you can build a simple one‑farm‑one‑vote structure that keeps the group democratic and business‑focused.
You don’t have to reinvent the wheel. But you do have to decide whether you want to keep walking into the plant gate as separate, small suppliers, or as a group representing volume the plant can’t shrug off.
Path 3: Treat Co‑op and Board Governance as Risk Management, Not Politics
Given how much milk still moves through co‑ops in the U.S. and through provincial boards and co‑ops in Canada, treating governance as “just politics” can quietly cost you money.

For your next co‑op delegate meeting, AGM, or provincial board session, it might be worth walking in with a short list of specific questions, such as:
- Over the last five years, how has our average mailbox price compared with prices paid by other plants in this region for similar milk, after hauling and premiums?
- How are processing margins reported—by plant, by product, or only as an aggregate—and how much of those margins actually flows back to members through pay price, patronage, and equity revolvement?
- How does our equity revolvement plan work in practice, and what does that mean for younger producers versus older members nearing retirement?
- When big decisions like de‑pooling under a Federal Order or investing in a new plant get made, how are the impacts on member pay price and risk explained to producers?
- With Federal Milk Marketing Order modernization moving ahead, what scenarios has our co‑op modeled for changes in make allowances and component pricing, and how would those scenarios affect member pay prices?
Under Canada’s supply management system, the questions change a bit, but the spirit is the same. You’ll want to know how provincial boards negotiate with processors, how component and specialty product premiums are shared, and what the long‑term plan is for processing capacity and market access in your province.
What’s encouraging is that when producers keep showing up with these kinds of concrete, numbers‑based questions—not just general frustration—the tone of co‑op and board governance often begins to shift. Research on co‑ops suggests that higher member engagement and stronger accountability tend to improve alignment between management decisions and member interests.
If your co‑op or board meeting feels more like a polished presentation than a working business conversation, that’s a signal that something needs attention. And if you’re not ready to run as a delegate yourself, you can still support someone who will ask the tough questions on behalf of producers like you.
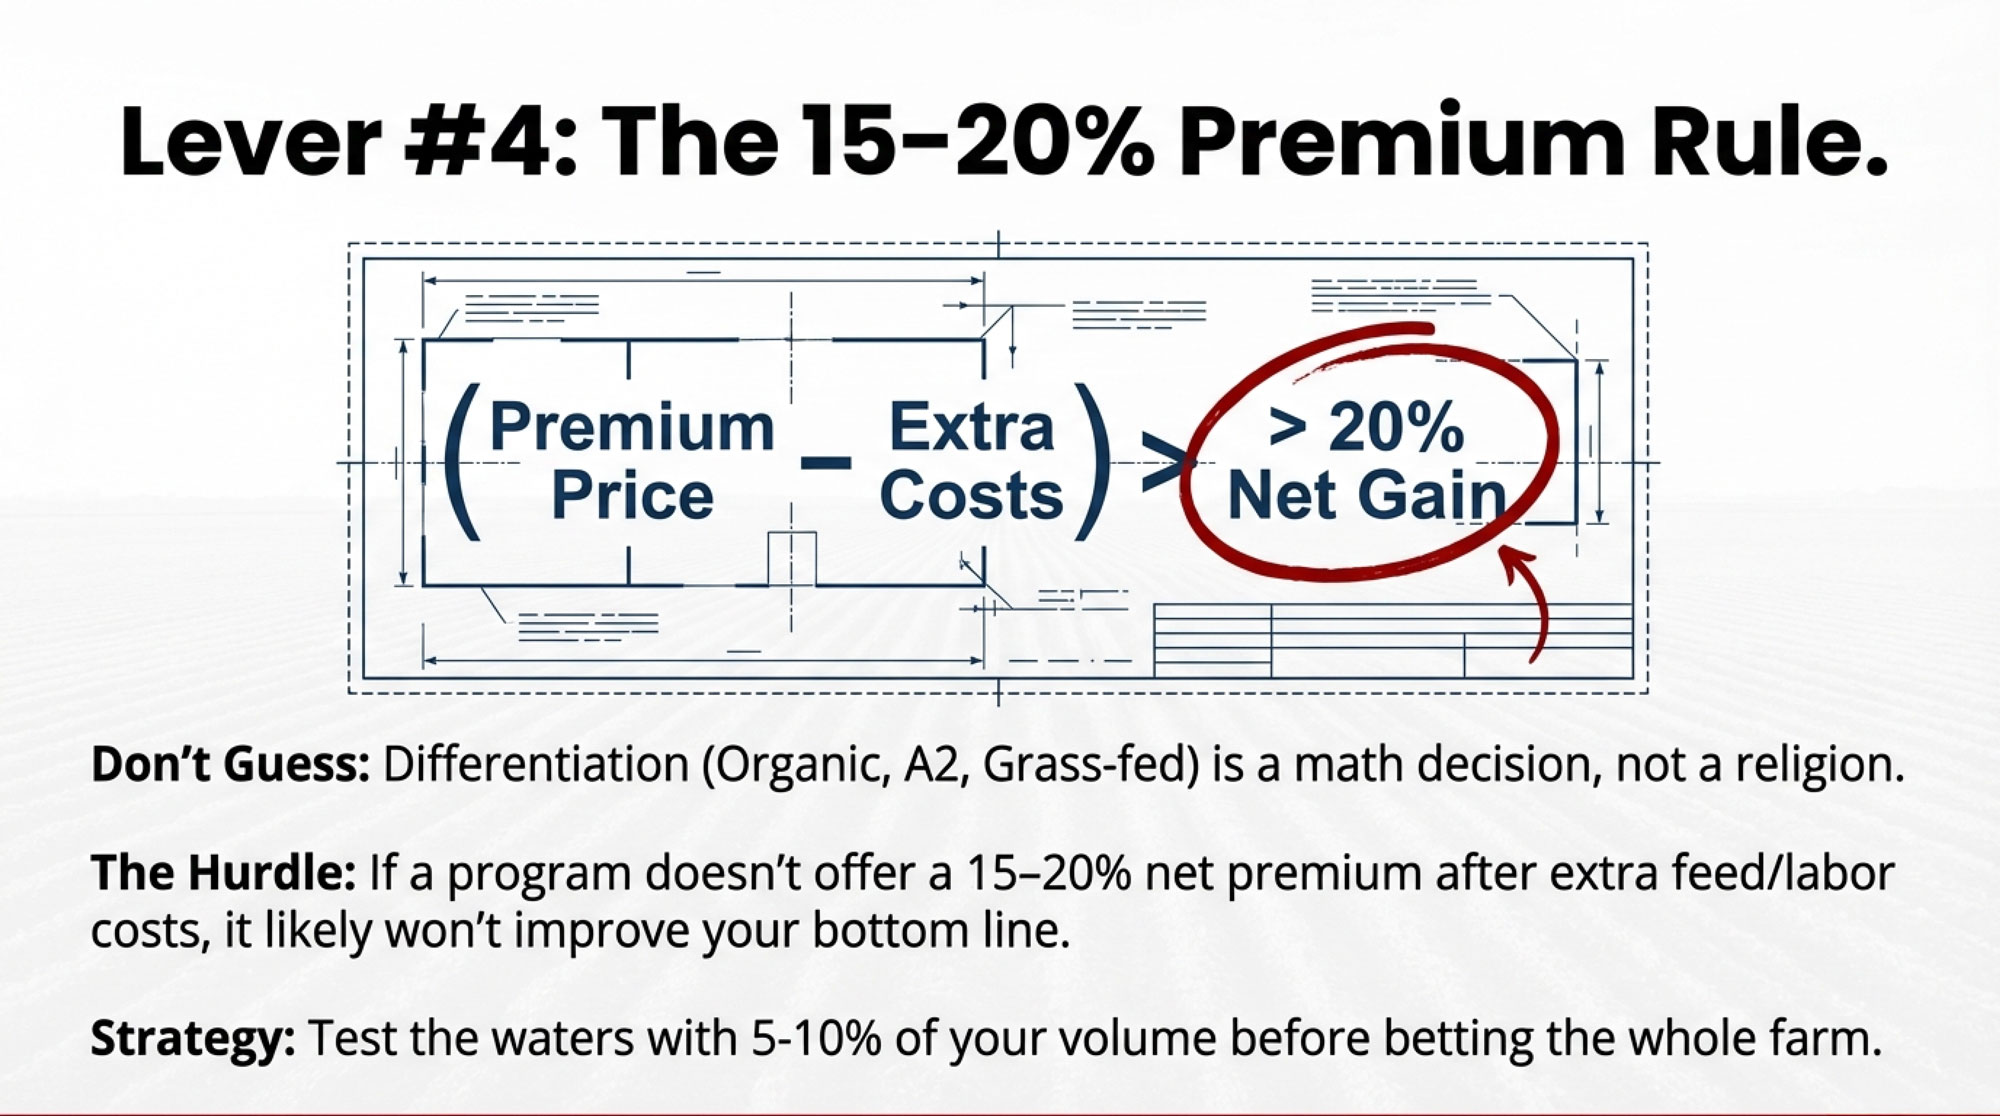
Path 4: Use Differentiation as a Risk Tool, Not a Religion
With long‑term pressure on fluid milk and a very crowded beverage aisle, relying 100 percent on undifferentiated bulk milk carries more risk than it used to. That doesn’t mean every farm should jump into organic, grass‑fed, A2, or on‑farm processing. It does mean it’s worth asking whether at least a small slice of your volume—five to ten percent—should be tied to something that pays for more than just pounds.
If none of your milk is in any kind of program—no organic, no grass‑fed, no lactose‑free stream, no direct tie to specific cheese or yogurt production—you’re essentially betting your entire milk cheque on commodity swings.
Here are some paths producers are using, with research and real‑world evidence behind them:
- Organic and grass‑fed programs. Economic analyses of organic and grass‑fed dairy systems in North America and Europe show these programs can offer higher pay prices but also entail higher feed costs, certification expenses, and, often, lower yields. When feed prices spike and program pay prices lag, margins can compress quickly. These systems work best when a farm’s land base, forage program, and family goals align with the requirements.
- Lactose‑free and specialty fluid programs. In markets with more lactose intolerance and strong demand for premium, high‑protein, or reduced‑sugar dairy drinks, processors producing lactose‑free and specialty milks sometimes offer premiums to farms that consistently hit quality and volume specs. Strong components, low bacteria counts, and reliable deliveries are usually non‑negotiable.
- A2 and other niche milk programs. In some regions, processors and brands have built A2 or other specialty fluid programs that pay premiums to herds meeting specific genetic and management criteria. Those programs require deliberate breeding and marketing, but for some farms, they fit well into existing strategies.
- Cheese and cultured alignment. Given that per‑capita cheese consumption is at record highs, aligning more of your milk with cheese and cultured plants can tie your income more closely to where demand is growing. For herds with strong components and quality, component‑based pricing at cheese plants can make butterfat and protein yields show up more directly in the milk cheque.
- On‑farm and local processing. Co‑op development centers and extension case studies showcase farms that have gone into on‑farm bottling, cheese, yogurt, or ice cream and built local brands. Those stories consistently point out that success depends on location, capital, labor, and marketing skills. It’s not a quick fix, but for the right families, it can help capture more of the dairy dollar and diversify income.
When you pull those experiences together, a pattern emerges. If only a tiny fraction of your milk is in any differentiated or program market, most of your risk still sits squarely on the commodity side. Starting by putting something like 5–10 percent of your volume into a program that genuinely fits your farm lets you learn without betting everything.
Based on economic studies of organic, grass‑fed, and other specialty programs and what farms report in their own budgets, if you can’t realistically see a path to at least a 15–20 percent price premium net of extra costs, the program often doesn’t improve the bottom line for most operations. Being honest with that math up front can save a lot of heartburn later.
| Program Type | Typical Premium % | Extra Costs $/cwt | Net Premium $/cwt | Meets 15–20% Hurdle? | Quick Notes |
| Organic | +25–35% | $3.50–$4.50 | $1.50–$2.50 | 🟡 MARGINAL | High certification costs, forage dependency, yield risk, organic feed premiums eat margin. Works IF: excellent forages + labor cost low + strong management. Risk: premium drops in weak market. |
| Grass-Fed/Pasture | +20–30% | $2.00–$3.50 | $0.50–$1.50 | 🔴 NO | High labor, seasonal feed cost volatility, lower yields. Only pencils if land base is free/cheap and labor is family. High risk in feed spikes. |
| Lactose-Free Specialty Fluid | +12–18% | $0.40–$0.80 | $0.80–$1.40 | 🟡 MARGINAL | Premiums depend on market (urban > rural). Quality/comp specs are strict. Works IF: strong components + reliability. Risk: low upside vs. commodity risk. |
| A2 Milk Program | +8–15% | $0.30–$0.60 | $0.40–$1.00 | 🔴 NO | Genetic requirements (breeding cost), buyer concentration risk, small market size. Premium often doesn’t compensate for breeding complexity. |
| Cheese-Aligned/Component | +5–12% (via butterfat/protein premium) | $0.20–$0.50 | $0.80–$1.50 | 🟢 YES | Lowest extra cost, most reliable. Butterfat/protein visibility in pay check. Market demand strongest. Best entry for testing differentiation. |
| On-Farm Processing (cheese, yogurt, bottling) | +30–60% | $5.00–$8.00 (capital, labor, marketing) | $0–$2.00 net | 🔴 NO (initially) | Very high barrier: capital, licensing, marketing skills needed. 3–5 year payback typical. Only for specific locations + entrepreneurial family. |
Bringing It Back to Your Bulk Tank
By this point, you probably don’t need another chart to know where this is heading.
ERS’s Food Dollar Series tells us that farmers currently capture about 15.9 cents of every dollar U.S. consumers spend on domestically produced food, with 9.1 cents reflecting farm production’s own value‑added in 2023. Bullvine’s modeling suggests dairy farmers now capture roughly half as much of the retail dairy dollar as they did a few decades ago. ERS and industry data show that per‑capita fluid milk consumption has declined in every decade for more than seventy years, while per‑capita cheese consumption has risen to record levels, like that 40.54‑pound mark in 2023. ERS analysis also makes it clear that plant‑based options are only a small part of the fluid story.
What’s encouraging is that not all of that missing share is gone for good. Some of it still sits in places where farmer decisions and farmer organization matter: in how you and your neighbors handle hauling and purchasing, in whether you show up at the plant gate alone or as part of a producer group, in how seriously you treat co‑op or board governance, and in whether at least a slice of your milk is tied to markets that pay for more than just volume. fmma30
Your first three moves might be simpler than they look on paper:
- Talk hauling and routes with your neighbors. One honest conversation with the farms on your road about coordinating pickups could tighten routes and trim a few cents per cwt off hauling, especially in winter when every extra mile costs more. It’s not flashy, but it’s real money on every load.
- Map who ships to your plant and explore a producer group. Find out who else is delivering to the same plant. Start a kitchen‑table conversation about contracts, change-notice periods, and tying pay formulas to public prices. The goal isn’t revolution—it’s clarity and fair, predictable terms.
- Pick one realistic differentiation angle for five to ten percent of your milk. That might mean shifting more volume to a cheese plant that pays well for components, joining a lactose‑free or specialty fluid program that fits your herd, or taking the first step toward a niche that truly aligns with your resources and values. Start small, insist on a net premium that clears that 15–20 percent hurdle after costs, and learn before you scale.
The big structural questions—FMMO modernization, retail concentration, global trade rules—will take years of industry work and policy debate. They matter, and The Bullvine will keep covering them. But they’re not going to change your milk cheque next month.
The levers closer to home might.
What I’ve noticed over the years is that when farmers start moving even one of those controllable levers, the math begins to shift—maybe just by a few cents per hundredweight at first—but this time those cents are moving in your direction.
And over the next five or ten years, those few cents of the milk dollar can be the difference between just hanging on and building something your son or daughter—or that ambitious young couple down the road—actually wants to step into.
Key Takeaways:
- Your slice of the dairy dollar has roughly halved. USDA reports farmers get just 15.9¢ of every food dollar; Bullvine modeling suggests dairy’s share of the retail dairy dollar is about half what it was a generation ago.
- Fluid keeps falling, cheese keeps climbing. Per-capita fluid milk has dropped every decade for 70+ years while cheese hit a record 40.54 lbs in 2023—your cheque now rides on butterfat and protein more than ever.
- Milk isn’t oil—and that’s why “OPEC for milk” won’t work. Consumers can swap milk for other foods and drinks far more easily than they can stop driving, so supply control alone won’t rescue margins.
- Four levers you can actually pull. Tighter hauling routes, local producer groups at the plant gate, pointed co-op governance questions, and well-chosen premium programs can each add 10–20¢/cwt without adding a single stall.
- Set a 15–20% net premium hurdle before you jump into any program. If the math doesn’t clear that bar after extra costs, it’s probably not worth the hassle.
Complete references and supporting documentation are available upon request by contacting the editorial team at editor@thebullvine.com.
Learn More
- How Your Ketosis Cut‑Point Is Leaking $25,000 a Year – And the Fresh Cow Playbook to Stop It – Stops the $25,000 annual profit leak in your fresh cow group by delivering a data-driven playbook that replaces blanket drenching rules with precise cut-points, ensuring every intervention pays for itself in peak milk performance.
- Which Lane Is Your Dairy In? The $10B Shift You Need to Map Now – Arms you with the market intelligence to navigate the $10 billion shift in processing capacity, helping you choose the right “lane” for your operation before local plant consolidation and retail contracts make the decision for you.
- Unlock $700 Per Cow: The Rumen Microbiome Strategy That Fixes Hidden Feed Efficiency Losses – Reveals how to capture an extra $700 per cow by leveraging emerging microbiome science to fix hidden feed efficiency losses, giving you a measurable metabolic advantage that undifferentiated bulk-milk producers simply can’t match.
 The Sunday Read Dairy Professionals Don’t Skip.
 The Sunday Read Dairy Professionals Don’t Skip.
Every week, thousands of producers, breeders, and industry insiders open Bullvine Weekly for genetics insights, market shifts, and profit strategies they won’t find anywhere else. One email. Five minutes. Smarter decisions all week.


